UNITED STATES
SECURITIES AND EXCHANGE COMMISSION
Washington, D.C. 20549
FORM N-CSR
CERTIFIED SHAREHOLDER REPORT OF REGISTERED
MANAGEMENT INVESTMENT COMPANIES
Investment Company Act file number:
811-22175
ALPS ETF TRUST
(Exact name of registrant as specified in charter)
1290 Broadway, Suite 1100, Denver, Colorado 80203
(Address of principal executive offices) (Zip code)
Sharon Akselrod, Assistant Secretary
ALPS ETF Trust
1290 Broadway, Suite 1100
Denver, Colorado 80203
(Name and address of agent for service)
Registrant’s Telephone Number, including Area Code:(303) 623-2577
Date of fiscal year end:November 30
Date of reporting period:May 31, 2019
Item 1.Report to Stockholders.

TABLE OF
CONTENTS
| Performance Overview | |
| Alerian MLP ETF | 1 |
| Alerian Energy Infrastructure ETF | 4 |
| Disclosure of Fund Expenses | 7 |
| Financial Statements | |
| Alerian MLP ETF | |
| Schedule of Investments | 8 |
| Statement of Assets and Liabilities | 9 |
| Statement of Operations | 10 |
| Statements of Changes in Net Assets | 11 |
| Financial Highlights | 12 |
| Alerian Energy Infrastructure ETF | |
| Schedule of Investments | 13 |
| Statement of Assets and Liabilities | 15 |
| Statement of Operations | 16 |
| Statements of Changes in Net Assets | 17 |
| Financial Highlights | 18 |
| Notes to Financial Statements | 19 |
| Additional Information | 30 |
Beginning on January 1, 2021, as permitted by regulations adopted by the U.S. Securities and Exchange Commission, paper copies of the Funds’ annual and semi-annual shareholder reports will no longer be sent by mail, unless you specifically request paper copies of the reports from your financial intermediary (such as a broker-dealer or bank). Instead, the reports will be made available on the Funds’ website (www.alpsfunds.com), and you will be notified by mail each time a report is posted and provided with a website link to access the report.
If you already elected to receive shareholder reports electronically, you will not be affected by this change and you need not take any action. You may elect to receive shareholder reports and other communications from a Fund electronically anytime by contacting your financial intermediary.
You may elect to receive all future reports in paper free of charge. You can contact your financial intermediary to request that you continue to receive paper copies of your shareholder reports. Your election to receive reports in paper will apply to all funds held in your account with your financial intermediary.
alpsfunds.com
Alerian MLP ETF
| Performance Overview | May 31, 2019 (Unaudited) |
INVESTMENT OBJECTIVE
The Alerian MLP ETF (the “Fund” or “AMLP”) seeks investment results that correspond (before fees and expenses) generally to the price and yield performance of its underlying index, the Alerian MLP Infrastructure Total Return Index (the “Underlying Index” or “AMZI”). The Shares of the Fund are listed and trade on the NYSE Arca, Inc. (“NYSE”) under the ticker symbol AMLP. The Fund generally will invest in all of the securities that comprise the Underlying Index in proportion to their weightings in the Underlying Index.
The Underlying Index is a rules based, modified capitalization weighted, float-adjusted index intended to give investors a means of tracking the overall performance of the United States energy infrastructure Master Limited Partnership (“MLP”) asset class. The Underlying Index is comprised of energy infrastructure MLPs that earn a majority of their cash flow from the transportation, storage, and processing of energy commodities.
PERFORMANCE OVERVIEW
During the six-month period from December 1, 2018, to May 31, 2019, the Fund delivered a total return of 4.61% (4.72% NAV). This compares to the Fund’s Underlying Index, which increased slightly (+1.11%) on a price-return basis but gained 5.22% on a total-return basis. The difference in the performance between the AMZI and AMLP is primarily attributable to the Fund’s operating expenses and the tax impact of the Fund’s C-corporation structure.
The methodology for the Underlying Index was updated in February to, among other things, better capture the investable universe, increase benchmarking efficiency, and minimize future index turnover.
During the period, Noble Midstream Partners (NBLX) was added to the Underlying Index. Multiple constituents were removed from the Underlying Index in special rebalancings in conjunction with acquisitions. Constituents removed in relation to their acquisition by another entity include: Spectra Energy Partners (SEP), Enbridge Energy Partners (EEP), and Antero Midstream Partners (AM). EnLink Midstream Partners (ENLK) merged with EnLink Midstream (ENLC), and ENLC is the surviving entity in the Underlying Index. Similarly, Western Gas Partners (former ticker WES) merged with Western Gas Equity Partners (WGP), and Western Midstream Partners (WES) is the surviving entity in the Underlying Index.
For the first quarter of 2019 relative to the prior quarter, 11 out of the 23 constituents in the Underlying Index grew their distributions, ten constituents kept their distributions steady, and two constituents had backdoor cuts. A backdoor cut occurs when the surviving entity in a simplification transaction has a lower distribution than its predecessor in the index. Distribution coverage for constituents of the Underlying Index averaged 1.5x in the first quarter of 2019. Distribution coverage of 1.5x implies that constituents are comfortably able to afford their distributions, with a 50% cushion on average between distributable cash flow generated and cash paid as distributions for the period.
Turning to performance, MLPs struggled in December amidst falling oil prices and a weakening broader market. A recovery in equity markets and oil prices as well as sector-specific tailwinds have helped support MLP performance in 2019. Supply interruptions from Iran, Venezuela, and Libya as well as production cuts from OPEC and its allies drove WTI crude prices to the mid-$60s per barrel in late April. However, trade tensions and global oil demand concerns caused WTI crude to erase a significant portion of its gains in May, ending the month at $53.50 per barrel. Year-to-date through May 31, WTI crude gained 17.82%, while the Underlying Index increased 10.32% on a price-return basis and 14.80% on a total-return basis. The Underlying Index outperformed the S&P 500, which increased 9.78% on a price-return basis.
Notably, the Underlying Index has outperformed other sectors of energy thus far in 2019 due to the fee-based nature of the MLP business model, which helps insulate cash flows from WTI crude price volatility. Company-level improvements have also supported MLP performance. With a focus on financial flexibility, MLPs continue to shift towards self-funding equity and reducing leverage.
Significant private equity investment in midstream has also helped highlight the MLP investment thesis and served as a catalyst for MLPs. Most recently, on May 10, AMZI constituent Buckeye Partners (BPL) announced an agreement to be acquired by Australian firm IFM Investors at a 27.5% premium to its prior closing price. Private equity involvement underscores the positive long-term outlook for energy infrastructure MLPs, which is supported by continued growth in US oil and natural gas production.
Alerian MLP ETF
| Performance Overview | May 31, 2019 (Unaudited) |
Performance(as of May 31, 2019)
| | 6 Months | 1 Year | 3 Year | 5 Year | Since Inception^ |
| Alerian MLP ETF – NAV | 4.72% | 0.58% | -0.45% | -4.94% | 1.99% |
| Alerian MLP ETF – Market Price* | 4.61% | 0.08% | -0.47% | -4.97% | 1.97% |
| Alerian MLP Infrastructure Total Return Index | 5.22% | 1.53% | 0.50% | -5.92% | 4.32% |
| Alerian MLP Total Return Index** | 3.29% | -1.12% | 0.38% | -6.62% | 3.63% |
| S&P 500® Total Return Index** | 0.74% | 3.78% | 11.72% | 9.66% | 13.96% |
Total Expense Ratio (per the current prospectus) 0.85%.
Performance data quoted represents past performance. Past performance does not guarantee future results. The table does not reflect the deduction of taxes that a shareholder would pay on Fund distributions or the redemption of Fund shares. Investment return and principal value of an investment will fluctuate so that an investor’s shares, when sold or redeemed, may be worth more or less than the original cost. Current performance data may be higher or lower than actual data quoted. For the most current month-end performance data please visit www.alpsfunds.com or call 1.877.398.8461. The Fund accrues deferred income taxes for future tax liabilities associated with the portion of MLP distributions considered to be a tax-deferred return of capital and for any net operating gains as well as capital appreciation of its investment. This deferred tax liability is reflected in the daily NAV and as a result the fund's after-tax performance could differ significantly from the underlying assets even if the pre-tax performance is closely tracked.
NAV is an exchange-traded fund’s per-share value. The per-share dollar amount of the Fund is derived by dividing the total value of all the securities in its portfolio, less any liabilities, by the number of Fund shares outstanding. Market Price is the price at which a share can currently be traded in the market. Information detailing the number of days the Market Price of the Fund was greater than the Fund’s NAV and the number of days it was less than the Fund’s NAV can be obtained at www.alpsfunds.com.
| ^ | The Fund commenced Investment Operations on August 24, 2010 with an Inception Date, the first day of trading on the NYSE ARCA, of August 25, 2010. |
| * | Market Price is based on the midpoint of the bid-ask spread at 4 p.m. ET and does not represent the returns an investor would receive if shares were traded at other times. |
| ** | Effective June 29, 2018, the Fund replaced the S&P 500 Total Return Index as the Fund’s primary benchmark for performance comparison purposes. The Adviser made this recommendation to the Board because the Fund’s new primary benchmark, the Alerian MLP Total Return Index, more closely aligns with the Fund’s investment strategies and investment restrictions. Returns for both benchmarks will be shown for a transition period. |
The Alerian MLP Infrastructure Total Return Index is comprised of 23 midstream energy Master Limited Partnerships and provides investors with an unbiased benchmark for the infrastructure component of this emerging asset class. Total return assumes reinvestment of any dividends and distributions realized during a given time period.
S&P 500® Total Return Index is the Standard & Poor’s composite index of 500 stocks, a widely recognized, unmanaged index of common stock prices. Total return assumes reinvestment of any dividends and distributions realized during a given time period.
The Alerian MLP Total Return Index is recognized as a leading gauge of energy infrastructure Master Limited Partnerships (MLPs). The capped, float-adjusted, capitalization-weighted index, whose constituents earn the majority of their cash flow from midstream activities involving energy commodities, is reported on a total-return basis (AMZX), which assumes reinvestment of any dividends and distributions realized during a given period.
The index is not actively managed and does not reflect any deductions for fees, expenses or taxes. One cannot invest directly in an index. Index performance does not reflect fund performance.
The Fund’s shares are not individually redeemable. Investors buy and sell shares of the Fund on a secondary market. Only market makers or “authorized participants” may trade directly with the Fund, typically in blocks of 50,000 shares.
The Alerian MLP ETF is not suitable for all investors. Investments in the Fund are subject to investment risks, including possible loss of the principal amount invested.
ALPS Portfolio Solutions Distributor, Inc., a FINRA member, is the distributor for the Fund.
Alerian MLP ETF
| Performance Overview | May 31, 2019 (Unaudited) |
Top 10 Holdings*(as of May 31, 2019)
| Magellan Midstream Partners LP | 10.12% |
| Enterprise Products Partners LP | 10.10% |
| Plains All American Pipeline LP | 9.70% |
| Energy Transfer LP | 9.30% |
| MPLX LP | 9.24% |
| Buckeye Partners LP | 6.66% |
| Western Midstream Partners LP | 6.28% |
| EQM Midstream Partners LP | 3.83% |
| Tallgrass Energy LP | 3.79% |
| Andeavor Logistics LP | 3.31% |
| Total % of Top 10 Holdings | 72.33% |
Future holdings are subject to change.
Growth of $10,000(as of May 31, 2019)
Comparison of change in value of a $10,000 investment in the Fund and the Indexes
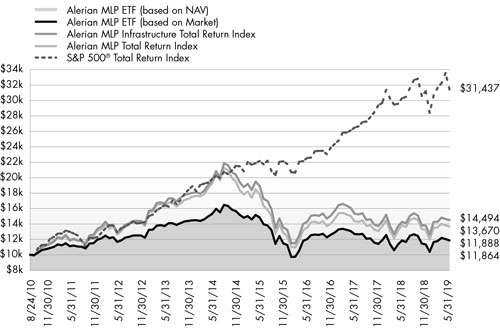
The chart above represents historical performance of a hypothetical investment of $10,000 in the Fund over the life of the Fund. Past performance does not guarantee future results. This chart does not reflect the deduction of taxes that a shareholder would pay on Fund distributions or the redemption of Fund shares.
Alerian Energy Infrastructure ETF
| Performance Overview | May 31, 2019 (Unaudited) |
INVESTMENT OBJECTIVE
The Alerian Energy Infrastructure ETF (the “Fund” or “ENFR”) seeks investment results that correspond (before fees and expenses) generally to the price and yield performance of its underlying index, the Alerian Midstream Energy Select Total Return Index (the “Underlying Index” or “AMEI”). As a secondary objective, the Fund seeks to provide total return through income and capital appreciation. The Shares of the Fund are listed and trade on the NYSE Acra, Inc. (“NYSE”) under the ticker symbol ENFR. The Fund generally will invest in all of the securities that comprise the Underlying Index in proportion to their weightings in the Underlying Index.
The Underlying Index is a composite of North American energy infrastructure companies engaged in midstream activities involving energy commodities, including gathering and processing, liquefaction, pipeline transportation, rail terminaling, and storage (also known as “midstream energy businesses”). Midstream energy companies include midstream MLPs and midstream corporations, either based in the United States or Canada. The Underlying Index has a 25% limit for companies taxed as pass-through entities.
PERFORMANCE OVERVIEW
During the six-month period from December 1, 2018, to May 31, 2019, the Fund delivered a total return of 6.77% (6.77% NAV). This compares to the Fund’s Underlying Index, which increased by 3.98% on a price-return basis and 7.30% on a total-return basis.
During the period, CNX Midstream (CNXM) and EQM Midstream Partners (EQM) were added to the Underlying Index. Constituents removed in special rebalancings in relation to their acquisition by another entity include: Valero Energy Partners (VLP), Dominion Energy Midstream Partners (DM), and EQGP Holdings (EQGP). Antero Midstream GP (AMGP) merged with Antero Midstream Partners (former ticker AM), and Antero Midstream Corporation (AM) is the surviving entity in the Underlying Index.
Turning to performance, midstream energy infrastructure companies struggled in December amid falling oil prices and a weakening broader market. On December 24, the Underlying Index reached its lowest level since March 2016. A recovery in equity markets and oil prices as well as sector-specific tailwinds have helped support energy infrastructure performance in 2019. Through May 31, WTI crude and the Underlying Index increased 17.82% and 15.28% on a price-return basis, respectively. The Underlying Index outperformed the S&P 500, which gained 9.78% on a price-return basis.
Fundamentals for energy infrastructure remain constructive given continued growth in oil and gas production from the US and steady production levels from Canada. According to the International Energy Agency (IEA), the US is expected to account for 70% of the global growth in oil production capacity through 2024. Similarly, the United States is expected to account for 35% of global natural gas production growth and 53% of the growth in global natural gas exports through 2024 according to the IEA. Increasing production and exports creates growth opportunities for energy infrastructure companies as more infrastructure is required to handle growing volumes.
In addition to solid fundamentals, midstream has benefitted from continued private equity involvement. On May 10, AMEI constituent Buckeye Partners (BPL) announced an agreement to be acquired by Australian firm IFM Investors at a 27.5% premium to its prior closing price. Private equity involvement underscores the positive long-term outlook for energy infrastructure and the value of the stable cash flows generated by these assets.
Alerian Energy Infrastructure ETF
| Performance Overview | May 31, 2019 (Unaudited) |
Performance(as of May 31, 2019)
| | 6 Months | 1 Year | 3 Year | 5 Year | Since Inception^ |
| Alerian Energy Infrastructure ETF - NAV | 6.77% | 0.85% | 4.52% | -2.67% | 0.01% |
| Alerian Energy Infrastructure ETF -Market Price* | 6.77% | 0.71% | 4.49% | -2.71% | -0.01% |
| Alerian Midstream Energy Select Total Return Index | 7.30% | 1.80% | 5.45% | -1.86% | 0.86% |
| Alerian MLP Total Return Index** | 3.29% | -1.12% | 0.38% | -6.62% | -3.93% |
| S&P 500® Total Return Index** | 0.74% | 3.78% | 11.72% | 9.66% | 10.65% |
Total Expense Ratio (per the current prospectus) 0.65%.
Performance data quoted represents past performance. Past performance does not guarantee future results. The table does not reflect the deduction of taxes that a shareholder would pay on Fund distributions or the redemption of Fund shares. Investment return and principal value of an investment will fluctuate so that an investor’s shares, when sold or redeemed, may be worth more or less than the original cost. Current performance data may be higher or lower than actual data quoted. For most current month-end performance data please visit www.alpsfunds.com or call 1.866.675.2639.
NAV is an exchange-traded fund’s per-share value. The per-share dollar amount of the Fund is derived by dividing the total value of all the securities in its portfolio, less any liabilities, by the number of Fund shares outstanding. Market Price is the price at which a share can currently be traded in the market. Information detailing the number of days the Market Price of the Fund was greater than the Fund’s NAV and the number of days it was less than the Fund’s NAV can be obtained at www.alpsfunds.com.
| ^ | The Fund commenced Investment Operations on November 1, 2013. |
| * | Market Price is based on the midpoint of the bid-ask spread at 4 p.m. ET and does not represent the returns an investor would receive if shares were traded at other times. |
| ** | Effective March 31, 2019, the Fund replaced the S&P 500 Total Return Index as the Fund’s primary benchmark for performance comparison purposes. The Adviser made this recommendation to the Board because the Fund’s new primary benchmark, the Alerian MLP Total Return Index, more closely aligns with the Fund’s investment strategies and investment restrictions. Returns for both benchmarks will be shown for a transition period. |
The Alerian Midstream Energy Select Total Return Index is comprised of 38 equity securities of issuers headquartered or incorporated in the United States and Canada that engage in the transportation, storage, and processing of energy commodities. Total return assumes reinvestment of any dividends and distributions realized during a given time period.
S&P 500® Total Return Index: the Standard & Poor’s composite index of 500 stocks, a widely recognized, unmanaged index of common stock prices. Total return assumes reinvestment of any dividends and distributions realized during a given time period.
The Alerian MLP Total Return Index is recognized as a leading gauge of energy infrastructure Master Limited Partnerships (MLPs). The capped, float-adjusted, capitalization-weighted index, whose constituents earn the majority of their cash flow from midstream activities involving energy commodities, is reported on a total-return basis (AMZX), which assumes reinvestment of any dividends and distributions realized during a given period.
The index is not actively managed and does not reflect any deductions for fees, expenses or taxes. One cannot invest directly in an index. Index performance does not reflect fund performance.
The Fund’s shares are not individually redeemable. Investors buy and sell shares of the Fund on a secondary market. Only market makers or “authorized participants” may trade directly with the Fund, typically in blocks of 50,000 shares.
The Alerian Energy Infrastructure ETF is not suitable for all investors. Investments in the Fund are subject to investment risks, including possible loss of the principal amount invested.
ALPS Portfolio Solutions Distributor, Inc., a FINRA member, is the distributor for the Fund.
Alerian Energy Infrastructure ETF
| Performance Overview | May 31, 2019 (Unaudited) |
Top 10 Holdings*(as of May 31, 2019)
| Enbridge, Inc. | 10.07% |
| TC Energy Corp. | 8.84% |
| Enterprise Products Partners LP | 7.83% |
| Kinder Morgan, Inc. | 7.48% |
| The Williams Cos., Inc. | 6.07% |
| Energy Transfer LP | 5.88% |
| Pembina Pipeline Corp. | 4.91% |
| ONEOK, Inc. | 4.89% |
| Plains GP Holdings LP | 4.87% |
| Cheniere Energy, Inc. | 4.84% |
| Total % of Top 10 Holdings | 65.68% |
| * | % of Total Investments (excluding investments purchased with collateral from securities loaned) |
Future holdings are subject to change.
Growth of $10,000(as of May 31, 2019)
Comparison of change in value of a $10,000 investment in the Fund and the Indexes

The chart above represents historical performance of a hypothetical investment of $10,000 in the Fund over the life of the Fund. Past performance does not guarantee future results. This chart does not reflect the deduction of taxes that a shareholder would pay on Fund distributions or the redemption of Fund shares.
Alerian Exchange Traded Funds
| Disclosure of Fund Expenses | May 31, 2019 (Unaudited) |
Shareholder Expense Example: As a shareholder of a Fund, you incur two types of costs: (1) transaction costs which may include creation and redemption fees or brokerage charges, and (2) ongoing costs, including management fees and other Fund expenses. These examples are intended to help you understand your ongoing costs (in dollars) of investing in the Fund and to compare these costs with the ongoing costs of investing in other funds. It is based on an investment of $1,000 invested at the beginning of the (six month) period and held through May 31, 2019.
Actual Return: The first line of the table provides information about actual account values and actual expenses. You may use the information in this line, together with the amount you invested, to estimate the expenses that you incurred over the period. Simply divide your account value by $1,000 (for example, an $8,600 account value divided by $1,000 = 8.6), then multiply the result by the number in the first line under the heading entitled “Expenses Paid During Period” to estimate the expenses attributable to your investment during this period.
Hypothetical 5% Return: The second line of the table provides information about hypothetical account values and hypothetical expenses based on the Fund’s actual expense ratio and an assumed rate of return of 5% per year before expenses, which is not the Fund’s actual return. The hypothetical account values and expenses may not be used to estimate the actual ending account balance or expenses you paid for the period. You may use this information to compare ongoing costs of investing in the Fund and other funds. To do so, compare this 5% hypothetical example with the 5% hypothetical examples that appear in the shareholder reports of other funds.
The expenses shown in the table are meant to highlight ongoing Fund costs only and do not reflect any transaction costs, such as creation and redemption fees or brokerage charges. Therefore, the second line is useful in comparing ongoing costs only, and will not help you determine the relative total costs of owning different funds. In addition, if these costs were included, your costs would have been higher.
| | Beginning Account Value 12/1/18 | Ending Account Value 5/31/19 | Expense Ratio(a) | Expenses Paid During Period 12/1/18 - 5/31/19(b) |
| Alerian MLP ETF | | | | |
| Actual | $1,000.00 | $1,047.20 | 0.85% | $4.34 |
| Hypothetical (5% return before expenses) | $1,000.00 | $1,020.69 | 0.85% | $4.28 |
| Alerian Energy Infrastructure ETF | | | | |
| Actual | $1,000.00 | $1,067.70 | 0.65% | $3.35 |
| Hypothetical (5% return before expenses) | $1,000.00 | $1,021.69 | 0.65% | $3.28 |
| (a) | Annualized, based on the Fund's most recent fiscal half-year expenses. |
| (b) | Expenses are equal to the Fund's annualized expense ratio multiplied by the average account value over the period, multiplied by the number of days in the most recent fiscal half year (182), divided by 365. |
Alerian MLP ETF
| Schedule of Investments | May 31, 2019 (Unaudited) |
| Security Description | | Shares | | | Value | |
| MASTER LIMITED PARTNERSHIPS (99.99%) |
| Gathering + Processing | Natural Gas (25.13%) | | | | | | | | |
| Crestwood Equity Partners LP(a) | | | 4,470,833 | | | $ | 158,848,696 | |
| DCP Midstream LP(a) | | | 8,183,497 | | | | 248,941,979 | |
| Enable Midstream Partners LP | | | 7,949,422 | | | | 103,262,992 | |
| EnLink Midstream LLC | | | 23,377,686 | | | | 242,660,381 | |
| MPLX LP | | | 25,596,876 | | | | 782,752,468 | |
| Noble Midstream Partners LP | | | 1,960,973 | | | | 59,319,433 | |
| Western Midstream Partners LP | | | 18,234,834 | | | | 532,274,804 | |
| Total Gathering + Processing | Natural Gas | | | | | | | 2,128,060,753 | |
| | | | | | | | | |
| Other | Liquefaction (1.81%) | | | | | | | | |
| Cheniere Energy Partners LP | | | 3,683,566 | | | | 153,752,045 | |
| | | | | | | | | |
| Pipeline Transportation | Natural Gas (25.34%) | | | | | | | | |
| | | | | | | | | |
| Energy Transfer LP | | | 57,387,799 | | | | 788,508,358 | |
| Enterprise Products Partners LP | | | 30,697,940 | | | | 856,165,547 | |
| EQM Midstream Partners LP | | | 7,524,967 | | | | 324,326,078 | |
| TC PipeLines LP(a) | | | 4,895,136 | | | | 177,350,777 | |
| Total Pipeline Transportation | Natural Gas | | | | | | | 2,146,350,760 | |
| | | | | | | | | |
| Pipeline Transportation | Petroleum (47.71%) | | | | | | | | |
| Andeavor Logistics LP | | | 8,053,750 | | | | 280,914,800 | |
| Buckeye Partners LP(a) | | | 13,855,721 | | | | 564,759,188 | |
| Genesis Energy LP(a) | | | 9,886,612 | | | | 215,725,874 | |
| Holly Energy Partners LP | | | 4,142,647 | | | | 110,152,984 | |
| Magellan Midstream Partners LP(a) | | | 13,944,858 | | | | 857,608,767 | |
| NGL Energy Partners LP(a) | | | 10,395,593 | | | | 154,270,600 | |
| NuStar Energy LP(a) | | | 8,874,382 | | | | 239,253,339 | |
| Phillips 66 Partners LP | | | 4,989,347 | | | | 239,388,869 | |
| Plains All American Pipeline LP(a) | | | 36,366,251 | | | | 822,240,935 | |
| Shell Midstream Partners LP(a) | | | 11,191,380 | | | | 235,354,721 | |
| Tallgrass Energy LP | | | 13,499,670 | | | | 321,157,149 | |
| Total Pipeline Transportation | Petroleum | | | | | | | 4,040,827,226 | |
| | | | | | | | | |
| TOTAL MASTER LIMITED PARTNERSHIPS |
| (Cost $8,198,709,701) | | | | | | | 8,468,990,784 | |
| | | 7 Day Yield | | | Shares | | | Value | |
| SHORT TERM INVESTMENTS (0.07%) |
| State Street Institutional Treasury Plus Money Market Fund | | | 2.309 | % | | | 5,585,127 | | | $ | 5,585,127 | |
| TOTAL SHORT TERM INVESTMENTS |
| (Cost $5,585,127) | | | | | | | | | | | 5,585,127 | |
| | | | | | | | | | | | | |
| TOTAL INVESTMENTS (100.06%) |
| (Cost $8,204,294,828) | | | | | | | | | | $ | 8,474,575,911 | |
| LIABILITIES IN EXCESS OF OTHER ASSETS (-0.06%) | | | | (5,272,648 | ) |
| NET ASSETS - 100.00% | | | $ | 8,469,303,263 | |
| (a) | Affiliated Company. See Note 8 in Notes to Financial Statements. |
See Notes to Financial Statements.
Alerian MLP ETF
| Statement of Assets and Liabilities | May 31, 2019 (Unaudited) |
| ASSETS: | | | |
| Investments, at value | | $ | 4,800,221,035 | |
| Investments in affiliates, at value | | | 3,674,354,876 | |
| Receivable for investments sold | | | 10,147,383 | |
| Interest receivable | | | 28,458 | |
| Deferred tax asset (Note 2) | | | – | (a) |
| Income tax receivable | | | 960,000 | |
| Franchise tax receivable | | | 138,538 | |
| Total Assets | | | 8,485,850,290 | |
| | | | | |
| LIABILITIES: | | | | |
| Payable for shares redeemed | | | 10,146,864 | |
| Payable to adviser | | | 6,400,163 | |
| Total Liabilities | | | 16,547,027 | |
| NET ASSETS | | $ | 8,469,303,263 | |
| | | | | |
| NET ASSETS CONSIST OF: | | | | |
| Paid-in capital | | $ | 9,949,631,303 | |
| Distributable earnings | | | (1,480,328,040 | ) |
| NET ASSETS | | $ | 8,469,303,263 | |
| | | | | |
| INVESTMENTS, AT COST | | $ | 4,706,162,652 | |
| INVESTMENTS IN AFFILIATES, AT COST | | | 3,498,132,176 | |
| | | | | |
| PRICING OF SHARES | | | | |
| Net Assets | | $ | 8,469,303,263 | |
| Shares of beneficial interest outstanding (Unlimited number of shares authorized, par value $0.01 per share) | | | 880,662,100 | |
| Net Asset Value, offering and redemption price per share | | $ | 9.62 | |
| (a) | Net Deferred Tax Asset of $95,009,972 is offset 100% by Valuation Allowance. |
See Notes to Financial Statements.
Alerian MLP ETF
| Statement of Operations | For the Six Months Ended May 31, 2019 (Unaudited) |
| INVESTMENT INCOME: | | | |
| Distributions from master limited partnerships | | $ | 356,410,052 | |
| Less return of capital distributions | | | (356,410,052 | ) |
| Total Investment Income | | | – | |
| | | | | |
| EXPENSES: | | | | |
| Investment adviser fee | | | 37,764,569 | |
| Total Expenses | | | 37,764,569 | |
| NET INVESTMENT LOSS, BEFORE INCOME TAXES | | | (37,764,569 | ) |
| Deferred income tax benefit/(expense) | | | 196,084 | |
| NET INVESTMENT LOSS | | | (37,568,485 | ) |
| | | | | |
| REALIZED AND UNREALIZED GAIN/(LOSS): | | | | |
| Net realized loss on investments, before income taxes | | | (454,306,487 | ) |
| Net realized loss on affiliated investments, before income taxes | | | (508,379,832 | ) |
| Deferred income tax benefit/(expense) | | | 4,998,526 | |
| Net realized loss | | | (957,687,793 | ) |
| Net change in unrealized appreciation on investments, before income taxes | | | 513,911,874 | |
| Net change in unrealized appreciation on affiliated investments, before income taxes | | | 968,024,130 | |
| Deferred income tax benefit/(expense) | | | (7,694,610 | ) |
| Net change in unrealized appreciation | | | 1,474,241,394 | |
| NET REALIZED AND UNREALIZED GAIN ON INVESTMENTS | | | 516,553,601 | |
| NET INCREASE IN NET ASSETS RESULTING FROM OPERATIONS | | $ | 478,985,116 | |
See Notes to Financial Statements.
Alerian MLP ETF
Statements of Changes in Net Assets
| | | For the Six Months Ended May 31, 2019 (Unaudited) | | | For the Year Ended November 30, 2018 | |
| OPERATIONS: | | | | | | |
| Net investment loss | | $ | (37,568,485 | ) | | $ | (83,458,686 | ) |
| Net realized gain/(loss) | | | (957,687,793 | ) | | | 1,173,533,843 | |
| Net change in unrealized appreciation/(depreciation) | | | 1,474,241,394 | | | | (1,009,447,065 | ) |
| Net increase in net assets resulting from operations | | | 478,985,116 | | | | 80,628,092 | |
| | | | | | | | | |
| DISTRIBUTIONS TO SHAREHOLDERS: | | | | | | | | |
| From distributable earnings | | | – | | | | (763,495,134 | ) |
| From tax return of capital | | | (358,161,219 | ) | | | – | |
| Total distributions | | | (358,161,219 | ) | | | (763,495,134 | ) |
| | | | | | | | | |
| CAPITAL SHARE TRANSACTIONS: | | | | | | | | |
| Proceeds from sale of shares | | | 1,032,199,369 | | | | 3,121,090,140 | |
| Cost of shares redeemed | | | (1,383,468,030 | ) | | | (3,143,758,848 | ) |
| Net decrease from share transactions | | | (351,268,661 | ) | | | (22,668,708 | ) |
| | | | | | | | | |
| Net decrease in net assets | | | (230,444,764 | ) | | | (705,535,750 | ) |
| | | | | | | | | |
| NET ASSETS: | | | | | | | | |
| Beginning of period | | | 8,699,748,027 | | | | 9,405,283,777 | |
| End of period | | $ | 8,469,303,263 | | | $ | 8,699,748,027 | |
| | | | | | | | | |
| OTHER INFORMATION: | | | | | | | | |
| SHARE TRANSACTIONS: | | | | | | | | |
| Beginning shares | | | 910,762,100 | | | | 907,362,100 | |
| Shares sold | | | 110,900,000 | | | | 301,050,000 | |
| Shares redeemed | | | (141,000,000 | ) | | | (297,650,000 | ) |
| Shares outstanding, end of period | | | 880,662,100 | | | | 910,762,100 | |
See Notes to Financial Statements.
Alerian MLP ETF
| Financial Highlights | For a Share Outstanding Throughout the Periods Presented |
| | | For the Six Months Ended May 31, 2019 (Unaudited) | | For the Year Ended November 30, 2018 | | For the Year Ended November 30, 2017 | | For the Year Ended November 30, 2016 | | For the Year Ended November 30, 2015 | | For the Year Ended November 30, 2014 | |
| NET ASSET VALUE, BEGINNING OF PERIOD | | $ | 9.55 | | $ | 10.37 | | $ | 12.31 | | $ | 12.25 | | $ | 18.10 | | $ | 17.69 | |
| | | | | | | | | | | | | | | | | | | | |
| INCOME/(LOSS) FROM OPERATIONS: |
| Net investment income/(loss)(a) | | | (0.04 | ) | | (0.09 | ) | | (0.22 | ) | | 0.04 | | | (0.13 | ) | | (0.16 | ) |
| Net realized and unrealized gain/(loss) on investments | | | 0.50 | | | 0.08 | | | (0.86 | ) | | 1.04 | | | (4.53 | ) | | 1.70 | |
| Total from investment operations | | | 0.46 | | | (0.01 | ) | | (1.08 | ) | | 1.08 | | | (4.66 | ) | | 1.54 | |
| | | | | | | | | | | | | | | | | | | | |
| DISTRIBUTIONS: | | | | | | | | | | | | | | | | | | | |
| From net realized gains | | | – | | | (0.81 | ) | | – | | | – | | | – | | | (0.73 | ) |
| From tax return of capital | | | (0.39 | ) | | – | | | (0.86 | ) | | (1.02 | ) | | (1.19 | ) | | (0.40 | ) |
| Total distributions | | | (0.39 | ) | | (0.81 | ) | | (0.86 | ) | | (1.02 | ) | | (1.19 | ) | | (1.13 | ) |
| | | | | | | | | | | | | | | | | | | | |
| NET INCREASE/(DECREASE) IN NET ASSET VALUE | | | 0.07 | | | (0.82 | ) | | (1.94 | ) | | 0.06 | | | (5.85 | ) | | 0.41 | |
| NET ASSET VALUE, END OF PERIOD | | $ | 9.62 | | $ | 9.55 | | $ | 10.37 | | $ | 12.31 | | $ | 12.25 | | $ | 18.10 | |
| TOTAL RETURN(b) | | | 4.72 | % | | (0.55 | )% | | (9.27 | )% | | 9.76 | % | | (26.84 | )% | | 8.82 | % |
| | | | | | | | | | | | | | | | | | | | |
| RATIOS/SUPPLEMENTAL DATA: |
| Net assets, end of period (000s) | | $ | 8,469,303 | | $ | 8,699,748 | | $ | 9,405,284 | | $ | 9,378,019 | | $ | 7,203,754 | | $ | 9,349,001 | |
| | | | | | | | | | | | | | | | | | | | |
| RATIO TO AVERAGE NET ASSETS: |
| Expenses (excluding net current and deferred tax expenses/benefits and franchise tax expense) | | | 0.85 | %(c) | | 0.85 | % | | 0.85 | % | | 0.85 | % | | 0.85 | % | | 0.85 | % |
| Expenses (including net current and deferred tax expenses/benefits)(d) | | | 0.90 | %(c) | | 0.85 | % | | 0.41 | % | | 1.42 | % | | (11.40 | )% | | 5.43 | % |
| Expenses (including current and deferred tax expenses/benefits)(e) | | | 0.84 | %(c) | | 0.85 | % | | 1.81 | % | | (0.36 | )% | | 1.57 | % | | 0.55 | % |
| Net investment loss (excluding deferred tax expenses/benefits and franchise tax expense) | | | (0.85 | )%(c) | | (0.85 | )% | | (0.85 | )% | | (0.85 | )% | | (0.85 | )% | | (0.85 | )% |
| Net investment income/(loss)(including deferred tax expenses/benefits)(e) | | | (0.84 | )%(c) | | (0.85 | )% | | (1.81 | )% | | 0.36 | % | | (1.57 | )% | | (0.55 | )% |
| PORTFOLIO TURNOVER RATE(f) | | | 17 | % | | 26 | % | | 23 | % | | 31 | % | | 21 | % | | 29 | % |
| (a) | Based on average shares outstanding during the period. |
| (b) | Total return is calculated assuming an initial investment made at the net assets value at the beginning of the period and redemption at the net asset value on the last day of the period and assuming all distributions are reinvested at actual reinvestment prices. Total return calculated for a period of less than one year is not annualized. |
| (d) | Includes amount of current and deferred taxes/benefits for all components of the Statement of Operations. |
| (e) | Includes amount of current and deferred tax benefit associated with net investment income/(loss). |
| (f) | Portfolio turnover for periods less than one year is not annualized and does not include securities received or delivered from processing creations or redemptions in-kind. |
See Notes to Financial Statements.
Alerian Energy Infrastructure ETF
| Schedule of Investments | May 31, 2019 (Unaudited) |
| Security Description | | Shares | | | Value | |
| CANADIAN ENERGY INFRASTRUCTURE COMPANIES (32.67%) |
| Gathering + Processing | Natural Gas (3.37%) | | | | | | | | |
| Keyera Corp. | | | 88,080 | | | $ | 2,121,844 | |
| | | | | | | | | |
| Pipeline Transportation | Natural Gas (8.78%) | | | | | | | | |
| TC Energy Corp. | | | 113,282 | | | | 5,522,456 | |
| | | | | | | | | |
| Pipeline Transportation | Petroleum (18.94%) | | | | | | | | |
| Enbridge, Inc. | | | 170,832 | | | | 6,289,287 | |
| Inter Pipeline, Ltd. | | | 167,478 | | | | 2,552,565 | |
| Pembina Pipeline Corp. | | | 85,969 | | | | 3,067,050 | |
| Total Pipeline Transportation | Petroleum | | | | | | | 11,908,902 | |
| | | | | | | | | |
| Storage | Liquids (1.58%) | | | | | | | | |
| Gibson Energy, Inc. | | | 60,720 | | | | 991,035 | |
| | | | | | | | | |
| TOTAL CANADIAN ENERGY INFRASTRUCTURE COMPANIES |
| (Cost $20,710,354) | | | | | | | 20,544,237 | |
| | | | | | | | | |
| U.S. ENERGY INFRASTRUCTURE COMPANIES (25.03%) |
| Gathering + Processing | Natural Gas (9.67%) | | | | | | | | |
| ONEOK, Inc. | | | 48,043 | | | | 3,056,496 | |
| Targa Resources Corp. | | | 78,617 | | | | 3,023,610 | |
| Total Gathering + Processing | Natural Gas | | | | | | | 6,080,106 | |
| | | | | | | | | |
| Other | Liquefaction (5.29%) | | | | | | | | |
| Cheniere Energy, Inc.(a) | | | 47,877 | | | | 3,024,869 | |
| Tellurian, Inc.(a)(b) | | | 39,150 | | | | 301,063 | |
| Total Other | Liquefaction | | | | | | | 3,325,932 | |
| | | | | | | | | |
| Pipeline Transportation | Natural Gas (7.43%) | | | | | | | | |
| Kinder Morgan, Inc. | | | 234,247 | | | | 4,673,228 | |
| | | | | | | | | |
| Pipeline Transportation | Petroleum (0.67%) | | | | | | | | |
| SemGroup Corp., Class A | | | 33,361 | | | | 420,682 | |
| | | | | | | | | |
| Storage | Liquids (1.97%) | | | | | | | | |
| Macquarie Infrastructure Corp. | | | 31,191 | | | | 1,243,585 | |
| | | | | | | | | |
| TOTAL U.S. ENERGY INFRASTRUCTURE COMPANIES |
| (Cost $17,392,278) | | | | | | | 15,743,533 | |
| | | | | | | | | |
| U.S. ENERGY INFRASTRUCTURE MLPS (27.02%) |
| Gathering + Processing | Natural Gas (3.50%) | | | | | | | | |
| CNX Midstream Partners LP | | | 4,093 | | | | 60,003 | |
| Crestwood Equity Partners LP | | | 5,492 | | | | 195,131 | |
| Enable Midstream Partners LP | | | 9,390 | | | | 121,976 | |
| MPLX LP | | | 34,051 | | | | 1,041,279 | |
| Security Description | | Shares | | | Value | |
| Gathering + Processing | Natural Gas (continued) | | | | | | | | |
| Noble Midstream Partners LP | | | 2,149 | | | $ | 65,007 | |
| Summit Midstream Partners LP | | | 3,076 | | | | 22,332 | |
| Western Midstream Partners LP | | | 23,814 | | | | 695,131 | |
| Total Gathering + Processing | Natural Gas | | | | | | | 2,200,859 | |
| | | | | | | | | |
| Pipeline Transportation | Natural Gas (14.28%) |
| Energy Transfer LP | | | 267,018 | | | | 3,668,827 | |
| Enterprise Products Partners LP | | | 175,259 | | | | 4,887,974 | |
| EQM Midstream Partners LP | | | 9,831 | | | | 423,716 | |
| Total Pipeline Transportation | Natural Gas | | | | | | | 8,980,517 | |
| | | | | | | | | |
| Pipeline Transportation | Petroleum (9.24%) | | | | | | | | |
| Andeavor Logistics LP | | | 10,159 | | | | 354,346 | |
| BP Midstream Partners LP | | | 4,760 | | | | 69,401 | |
| Buckeye Partners LP | | | 18,095 | | | | 737,552 | |
| Genesis Energy LP | | | 12,351 | | | | 269,499 | |
| Holly Energy Partners LP | | | 4,926 | | | | 130,982 | |
| Magellan Midstream Partners LP | | | 26,931 | | | | 1,656,256 | |
| NGL Energy Partners LP | | | 12,700 | | | | 188,468 | |
| NuStar Energy LP | | | 11,107 | | | | 299,445 | |
| Phillips 66 Partners LP | | | 6,258 | | | | 300,259 | |
| Shell Midstream Partners LP | | | 14,022 | | | | 294,883 | |
| Tallgrass Energy LP | | | 63,391 | | | | 1,508,072 | |
| Total Pipeline Transportation | Petroleum | | | | | | | 5,809,163 | |
| | | | | | | | | |
| TOTAL U.S. ENERGY INFRASTRUCTURE MLPS |
| (Cost $19,015,362) | | | | | | | 16,990,539 | |
| | | | | | | | | |
| U.S. GENERAL PARTNERS (14.51%) |
| Gathering + Processing | Natural Gas (9.67%) | | | | | | | | |
| Antero Midstream Partners LP | | | 94,335 | | | | 1,152,774 | |
| EnLink Midstream LLC | | | 109,768 | | | | 1,139,392 | |
| The Williams Cos., Inc. | | | 143,735 | | | | 3,791,729 | |
| Total Gathering + Processing | Natural Gas | | | | | | | 6,083,895 | |
| | | | | | | | | |
| Pipeline Transportation | Petroleum (4.84%) | | | | | | | | |
| Plains GP Holdings LP, Class A | | | 135,012 | | | | 3,040,470 | |
| | | | | | | | | |
| TOTAL U.S. GENERAL PARTNERS |
| (Cost $11,134,287) | | | | | | | 9,124,365 | |
See Notes to Financial Statements.
Alerian Energy Infrastructure ETF
| Schedule of Investments | May 31, 2019 (Unaudited) |
| | | 7 Day Yield | | | Shares | | | Value | |
| SHORT TERM INVESTMENTS (0.50%) |
| Money Market Fund (0.07%) |
| State Street Institutional Treasury Plus Money Market Fund | | | | | | | | | | | | |
| (Cost $42,525) | | | 2.309 | % | | | 42,525 | | | $ | 42,525 | |
| | | | | | | | | | | | | |
| Investments Purchased with Collateral from Securities Loaned (0.43%) | |
| State Street Navigator Securities Lending Government Money Market Portfolio, 2.34% | | | | | | | | | | | | |
| (Cost $268,727) | | | | | | | 268,727 | | | | 268,727 | |
| TOTAL SHORT TERM INVESTMENTS |
| (Cost $311,252) | | | | | | | | | | | 311,252 | |
| | | | | | | | | | | | | |
| TOTAL INVESTMENTS (99.73%) |
| (Cost $68,563,533) | | | | | | | | | | $ | 62,713,926 | |
| OTHER ASSETS IN EXCESS OF LIABILITIES (0.28%) | | | | 174,120 | |
| NET ASSETS - 100.00% | | | $ | 62,888,046 | |
| (a) | Non-income producing security. |
| (b) | Security, or a portion of the security position is currently on loan. The total market value of securities on loan is $250,486. |
See Notes to Financial Statements.
Alerian Energy Infrastructure ETF
| Statement of Assets and Liabilities | May 31, 2019 (Unaudited) |
| ASSETS: | | | |
| Investments, at value | | $ | 62,713,926 | |
| Receivable for Investments Sold | | | 364,727 | |
| Dividends receivable | | | 113,932 | |
| Total Assets | | | 63,192,585 | |
| | | | | |
| LIABILITIES: | | | | |
| Payable to adviser | | | 35,812 | |
| Payable for collateral upon return of securities loaned | | | 268,727 | |
| Total Liabilities | | | 304,539 | |
| NET ASSETS | | $ | 62,888,046 | |
| | | | | |
| NET ASSETS CONSIST OF: | | | | |
| Paid-in capital | | $ | 70,318,140 | |
| Distributable earnings | | | (7,430,094 | ) |
| NET ASSETS | | $ | 62,888,046 | |
| | | | | |
| INVESTMENTS, AT COST | | $ | 68,563,533 | |
| | | | | |
| PRICING OF SHARES | | | | |
| Net Assets | | $ | 62,888,046 | |
| Shares of beneficial interest outstanding (Unlimited number of shares authorized, par value $0.01 per share) | | | 3,000,000 | |
| Net Asset Value, offering and redemption price per share | | $ | 20.96 | |
See Notes to Financial Statements.
Alerian Energy Infrastructure ETF
| Statement of Operations | For the Six Months Ended May 31, 2019 (Unaudited) |
| | | | |
| INVESTMENT INCOME: | | | |
| Dividends | | $ | 1,883,015 | |
| Foreign taxes withheld | | | (82,328 | ) |
| Securities lending income | | | 13,787 | |
| Total Investment Income | | | 1,814,474 | |
| | | | | |
| EXPENSES: | | | | |
| Investment adviser fees | | | 187,753 | |
| Total Expenses | | | 187,753 | |
| NET INVESTMENT INCOME | | | 1,626,721 | |
| | | | | |
| REALIZED AND UNREALIZED GAIN/(LOSS): | | | | |
| Net realized gain on investments | | | 74,290 | |
| Net realized gain on foreign currency transactions | | | 1,226 | |
| Net realized gain | | | 75,516 | |
| Net change in unrealized appreciation on investments | | | 2,548,334 | |
| Net change in unrealized depreciation on translation of assets and liabilities denominated in foreign currencies | | | (205 | ) |
| Net change in unrealized appreciation | | | 2,548,129 | |
| NET REALIZED AND UNREALIZED GAIN ON INVESTMENTS AND FOREIGN CURRENCIES | | | 2,623,645 | |
| NET INCREASE IN NET ASSETS RESULTING FROM OPERATIONS | | $ | 4,250,366 | |
See Notes to Financial Statements.
Alerian Energy Infrastructure ETF
Statements of Changes in Net Assets
| | | For the Six Months Ended May 31, 2019 (Unaudited) | | | For the Year Ended November 30, 2018 | |
| OPERATIONS: | | | | | | |
| Net investment income | | $ | 1,626,721 | | | $ | 1,615,960 | |
| Net realized gain/(loss) | | | 75,516 | | | | (1,675,089 | ) |
| Net change in unrealized appreciation/(depreciation) | | | 2,548,129 | | | | (3,099,925 | ) |
| Net increase/(decrease) in net assets resulting from operations | | | 4,250,366 | | | | (3,159,054 | ) |
| | | | | | | | | |
| DISTRIBUTIONS: | | | | | | | | |
| From distributable earnings | | | (2,039,700 | ) | | | (882,519 | ) |
| Dividends to shareholders from tax return of capital | | | – | | | | (207,836 | ) |
| Total distributions | | | (2,039,700 | ) | | | (1,090,355 | ) |
| | | | | | | | | |
| CAPITAL SHARE TRANSACTIONS: | | | | | | | | |
| Proceeds from sale of shares | | | 23,246,601 | | | | 11,228,448 | |
| Cost of shares redeemed | | | (4,268,692 | ) | | | (7,649,908 | ) |
| Net increase from share transactions | | | 18,977,909 | | | | 3,578,540 | |
| Net increase/(decrease) in net assets | | | 21,188,575 | | | | (670,869 | ) |
| | | | | | | | | |
| NET ASSETS: | | | | | | | | |
| Beginning of period | | | 41,699,471 | | | | 42,370,340 | |
| End of period | | $ | 62,888,046 | | | $ | 41,699,471 | |
| | | | | | | | | |
| OTHER INFORMATION: | | | | | | | | |
| CAPITAL SHARE TRANSACTIONS: | | | | | | | | |
| Beginning shares | | | 2,050,000 | | | | 1,900,000 | |
| Shares sold | | | 1,150,000 | | | | 500,000 | |
| Shares redeemed | | | (200,000 | ) | | | (350,000 | ) |
| Shares outstanding, end of period | | | 3,000,000 | | | | 2,050,000 | |
See Notes to Financial Statements.
Alerian Energy Infrastructure ETF
| Financial Highlights | For a Share Outstanding Throughout the Periods Presented |
| | | For the Six Months Ended May 31, 2019 (Unaudited) | | For the Year Ended November 30, 2018 | | For the Year Ended November 30, 2017 | | For the Year Ended November 30, 2016 | | For the Year Ended November 30, 2015 | | For the Year Ended November 30, 2014 | |
| NET ASSET VALUE, BEGINNING OF PERIOD | | $ | 20.34 | | $ | 22.30 | | $ | 22.95 | | $ | 18.97 | | $ | 28.55 | | $ | 24.86 | |
| | | | | | | | | | | | | | | | | | | | |
| INCOME/(LOSS) FROM INVESTMENT OPERATIONS: |
| Net investment income(a) | | | 0.59 | | | 0.85 | | | 0.79 | | | 0.80 | | | 0.83 | | | 0.85 | |
| Net realized and unrealized gain/(loss) on investments | | | 0.76 | | | (2.23 | ) | | (0.72 | ) | | 3.95 | | | (9.78 | ) | | 3.40 | |
| Total from investment operations | | | 1.35 | | | (1.38 | ) | | 0.07 | | | 4.75 | | | (8.95 | ) | | 4.25 | |
| | | | | | | | | | | | | | | | | | | | |
| DISTRIBUTIONS: | | | | |
| From net investment income | | | (0.73 | ) | | (0.47 | ) | | (0.47 | ) | | (0.63 | ) | | (0.48 | ) | | (0.56 | ) |
| Tax return of capital | | | – | | | (0.11 | ) | | (0.25 | ) | | (0.14 | ) | | (0.15 | ) | | – | |
| Total distributions | | | (0.73 | ) | | (0.58 | ) | | (0.72 | ) | | (0.77 | ) | | (0.63 | ) | | (0.56 | ) |
| | | | | | | | | | | | | | | | | | | | |
| NET INCREASE/(DECREASE) IN NET ASSET VALUE | | | 0.62 | | | (1.96 | ) | | (0.65 | ) | | 3.98 | | | (9.58 | ) | | 3.69 | |
| NET ASSET VALUE, END OF PERIOD | | $ | 20.96 | | $ | 20.34 | | $ | 22.30 | | $ | 22.95 | | $ | 18.97 | | $ | 28.55 | |
| TOTAL RETURN(b) | | | 6.77 | % | | (6.27 | )% | | 0.21 | % | | 25.63 | % | | (31.83 | )% | | 17.12 | % |
| | | | | | | | | | | | | | | | | | | | |
| RATIOS/SUPPLEMENTAL DATA: | | | | |
| Net assets, end of period (000s) | | $ | 62,888 | | $ | 41,699 | | $ | 42,370 | | $ | 18,357 | | $ | 12,331 | | $ | 17,131 | |
| | | | | | | | | | | | | | | | | | | | |
| Ratio of expenses to average net assets | | | 0.65 | %(c) | | 0.65 | % | | 0.65 | % | | 0.65 | % | | 0.65 | % | | 0.65 | % |
| Ratio of net investment income to average net assets | | | 5.63 | %(c) | | 3.86 | % | | 3.39 | % | | 4.04 | % | | 3.31 | % | | 2.98 | % |
| PORTFOLIO TURNOVER RATE(d) | | | 11 | % | | 73 | % | | 37 | % | | 38 | % | | 47 | % | | 27 | % |
| (a) | Based on average shares outstanding during the period. |
| (b) | Total return is calculated assuming an initial investment made at the net assets value at the beginning of the period and redemption at the net asset value on the last day of the period and assuming all distributions are reinvested at actual reinvestment prices. Total return calculated for a period of less than one year is not annualized. |
| (d) | Portfolio turnover for periods less than one year is not annualized and does not include securities received or delivered from processing creations or redemptions in-kind. |
See Notes to Financial Statements.
Alerian Exchange Traded Funds
| Notes to Financial Statements | May 31, 2019 (Unaudited) |
1. ORGANIZATION
ALPS ETF Trust (the “Trust”), a Delaware statutory trust, is an open-end management investment company registered under the Investment Company Act of 1940, as amended (the “1940 Act”). As of May 31, 2019, the Trust consisted of eighteen separate portfolios. Each portfolio represents a separate series of the Trust. This report pertains to the Alerian MLP ETF and the Alerian Energy Infrastructure ETF (each a “Fund” and collectively, the “Funds”).
The investment objective of the Alerian MLP ETF is to seek investment results that correspond (before fees and expenses) generally to the price and yield performance of its underlying index, the Alerian MLP Infrastructure Total Return Index. The investment objective of the Alerian Energy Infrastructure ETF is to seek investment results that correspond (before fees and expenses) generally to the price and yield performance of its underlying index, the Alerian Midstream Energy Select Total Return Index. The investment advisor uses a “passive management” or indexing investment approach to try to achieve each Fund’s investment objective. Each Fund is considered non-diversified and may invest a greater portion of assets in securities of individual issuers than a diversified fund. As a result, changes in the market value of a single investment could cause greater fluctuations in share price than would occur in a diversified fund.
Each Fund’s Shares (“Shares”) are listed on the NYSE Arca, Inc. (“the NYSE Arca”). Each Fund issues and redeems Shares at net asset value (“NAV”), in blocks of 50,000 Shares, each of which is called a “Creation Unit”. Creation Units are issued and redeemed principally in-kind for securities included in the Underlying Index. Except when aggregated in Creation Units, Shares are not redeemable securities of the Fund.
Pursuant to the Trust’s organizational documents, its Officers and Trustees are indemnified against certain liability arising out of the performance of their duties to the Trust. Additionally, in the normal course of business, the Trust enters into contracts with service providers that contain general indemnification clauses. The Trust’s maximum exposure under these arrangements is unknown, as this would involve future claims that may be made against the Trust that have not yet occurred.
2. SIGNIFICANT ACCOUNTING POLICIES
The following is a summary of significant accounting policies consistently followed by the Funds in the preparation of the financial statements. The accompanying financial statements were prepared in accordance with accounting principles generally accepted in the United States of America (“U.S. GAAP”). The preparation of financial statements in conformity with U.S. GAAP requires management to make certain estimates and assumptions that affect the reported amounts of assets and liabilities and disclosures of contingent assets and liabilities at the date of the financial statements and the reported amounts of revenue and expenses during the period. Actual results could differ from those estimates. Each Fund is considered an investment company under U.S. GAAP and follows the accounting and reporting guidance applicable to investment companies in the Financial Accounting Standards Board Accounting Standards Codification Topic 946.
A. Portfolio Valuation
Each Fund’s NAV is determined daily, as of the close of regular trading on the New York Stock Exchange (“NYSE”), normally 4:00 p.m. Eastern Time, on each day the NYSE is open for trading. The NAV is computed by dividing the value of all assets of the Fund (including accrued interest and dividends), less all liabilities (including accrued expenses and dividends declared but unpaid), by the total number of shares outstanding.
Portfolio securities listed on any exchange other than the NASDAQ Stock Market LLC (“NASDAQ”) are valued at the last sale price on the business day as of which such value is being determined. If there has been no sale on such day, the securities are valued at the mean of the most recent bid and ask prices on such day. Securities traded on the NASDAQ are valued at the NASDAQ Official Closing Price as determined by NASDAQ. Portfolio securities traded on more than one securities exchange are valued at the last sale price on the business day as of which such value is being determined at the close of the exchange representing the principal market for such securities. Portfolio securities traded in the over-the-counter market, but excluding securities traded on the NASDAQ, are valued at the latest quoted sale price in such market.
Alerian Exchange Traded Funds
| Notes to Financial Statements | May 31, 2019 (Unaudited) |
The Funds’ investments are valued at market value or, in the absence of market value with respect to any portfolio securities, at fair value according to procedures adopted by the Trust’s Board of Trustees (the “Board”). When market quotations are not readily available or when events occur that make established valuation methods unreliable, securities of the Funds may be valued in good faith by or under the direction of the Board. These securities generally include, but are not limited to, restricted securities (securities which may not be publicly sold without registration under the Securities Act of 1933) for which a pricing service is unable to provide a market price; securities whose trading has been formally suspended; a security whose market price is not available from a pre-established primary pricing source or the pricing source is not willing to provide a price; a security with respect to which an event has occurred that is most likely to materially affect the value of the security after the market has closed but before the calculation of the Funds’ NAV or make it difficult or impossible to obtain a reliable market quotation; or a security whose price, as provided by the pricing service, does not reflect the security’s “fair value” due to the security being de-listed from a national exchange or the security’s primary trading market is temporarily closed at a time when, under normal conditions, it would be open. As a general principle, the current “fair value” of a security would be the amount which the owner might reasonably expect to receive from the sale on the applicable exchange or principal market. A variety of factors may be considered in determining the fair value of such securities.
B. Fair Value Measurements
Each Fund discloses the classification of its fair value measurements following a three-tier hierarchy based on the inputs used to measure fair value. Inputs refer broadly to the assumptions that market participants would use in pricing the asset or liability, including assumptions about risk. Inputs may be observable or unobservable. Observable inputs reflect the assumptions market participants would use in pricing the asset or liability that are developed based on market data obtained from sources independent of the reporting entity. Unobservable inputs reflect the reporting entity’s own assumptions about the assumptions market participants would use in pricing the asset or liability that are developed based on the best information available.
Valuation techniques used to value the Funds’ investments by major category are as follows:
Equity securities, including restricted securities, and Limited Partnerships for which market quotations are readily available, are valued at the last reported sale price or official closing price as reported by a third party pricing vendor on the primary market or exchange on which they are traded and are categorized as Level 1 in the hierarchy. In the event there were no sales during the day or closing prices are not available, securities are valued at the mean of the most recent quoted bid and ask prices on such day and are generally categorized as Level 2 in the hierarchy. Investments in open-end mutual funds are valued at their closing NAV each business day and are categorized as Level 1 in the hierarchy.
Changes in valuation techniques may result in transfers in or out of an assigned level within the disclosure hierarchy.
Various inputs are used in determining the value of the Funds’ investments as of the end of the reporting period. When inputs used fall into different levels of the fair value hierarchy, the level in the hierarchy within which the fair value measurement falls is determined based on the lowest level input that is significant to the fair value measurement in its entirety. The designated input levels are not necessarily an indication of the risk or liquidity associated with these investments.
These inputs are categorized in the following hierarchy under applicable financial accounting standards:
| Level 1 | – | Unadjusted quoted prices in active markets for identical investments, unrestricted assets or liabilities that a Fund has the ability to access at the measurement date; |
| Level 2 | – | Quoted prices which are not active, quoted prices for similar assets or liabilities in active markets or inputs other than quoted prices that are observable (either directly or indirectly) for substantially the full term of the asset or liability; and |
| Level 3 | – | Significant unobservable prices or inputs (including the Fund’s own assumptions in determining the fair value of investments) where there is little or no market activity for the asset or liability at the measurement date. |
Alerian Exchange Traded Funds
| Notes to Financial Statements | May 31, 2019 (Unaudited) |
The following is a summary of the inputs used to value each Fund’s investments at May 31, 2019:
Alerian MLP ETF
| Investments in Securities at Value | | Level 1 - Quoted and Unadjusted Prices | | Level 2 - Other Significant Observable Inputs | | Level 3 - Significant Unobservable Inputs | | Total |
| Master Limited Partnerships* | | $ | 8,468,990,784 | | | $ | – | | | $ | – | | | $ | 8,468,990,784 | |
| Short Term Investments | | | 5,585,127 | | | | – | | | | – | | | | 5,585,127 | |
| Total | | $ | 8,474,575,911 | | | $ | – | | | $ | – | | | $ | 8,474,575,911 | |
Alerian Energy Infrastructure ETF
| Investments in Securities at Value | | Level 1 - Quoted and Unadjusted Prices | | Level 2 - Other Significant Observable Inputs | | Level 3 - Significant Unobservable Inputs | | Total |
| Canadian Energy Infrastructure Companies* | | $ | 20,544,237 | | | $ | – | | | $ | – | | | $ | 20,544,237 | |
| U.S. Energy Infrastructure Companies* | | | 15,743,533 | | | | – | | | | – | | | | 15,743,533 | |
| U.S. Energy Infrastructure MLPs* | | | 16,990,539 | | | | – | | | | – | | | | 16,990,539 | |
| U.S. General Partners* | | | 9,124,365 | | | | – | | | | – | | | | 9,124,365 | |
| Short Term Investments | | | 311,252 | | | | – | | | | – | | | | 311,252 | |
| Total | | $ | 62,713,926 | | | $ | – | | | $ | – | | | $ | 62,713,926 | |
| * | For a detailed breakdown of sectors, see the accompanying Schedule of Investments. |
The Funds did not have any securities that used significant unobservable inputs (Level 3) in determining fair value and there were no transfers into or out of Level 3.
C. Foreign Currency Translation
The books and records of the Funds are maintained in U.S. dollars. Investment valuations and other assets and liabilities initially expressed in foreign currencies are converted each business day into U.S. dollars based upon current exchange rates. The portion of realized and unrealized gains or losses on investments due to fluctuations in foreign currency exchange rates is not separately disclosed and is included in realized and unrealized gains or losses on investments, when applicable.
D. Securities Transactions and Investment Income
Securities transactions are recorded as of the trade date. Realized gains and losses from securities transactions are recorded using the specific identification method. Previously, the Funds recorded realized gains and losses based on the last in, first out cost basis. Dividend income and capital gains distributions, if any, are recorded on the ex-dividend date, net of any foreign taxes withheld. Interest income, if any, is recorded on the accrual basis, including amortization of premiums and accretion of discounts.
E. Dividends and Distributions to Shareholders
Each Fund intends to declare and make quarterly distributions, or as the Board may determine from time to time. Distributions of net realized capital gains earned by the Alerian Energy Infrastructure ETF, if any, are distributed at least annually. Distributions from net investment income and capital gains are determined in accordance with income tax regulations, which may differ from U.S. GAAP. These differences are primarily due to differing treatments of income and gains on various investment securities held by the Funds, timing differences and differing characterization of distributions made by the Funds.
Distributions received from each Fund’s investments in Master Limited Partnerships (“MLPs”) may be comprised of both income and return of capital. Each Fund records investment income and return of capital based on estimates made at the time such distributions are received. Such estimates are based on historical information available from each MLP and other industry sources. These estimates may subsequently be revised based on information received from MLPs after their tax reporting periods are concluded.
The Funds each expect a portion of its distributions to shareholders might be comprised of tax deferred return of capital. Return of capital distributions are not taxable income to the shareholder, but reduce the investor’s tax basis in the investor’s Fund Shares. Such a reduction in tax basis will result in larger taxable gains and/or lower tax losses on a subsequent sale of Fund Shares. Shareholders who periodically receive the payment of dividends or other distributions consisting of a return of capital may be under the impression that they are receiving net profits from the Funds when, in fact, they are not. Shareholders should not assume that the source of the distributions is from the net profits of the Funds.
Alerian Exchange Traded Funds
| Notes to Financial Statements | May 31, 2019 (Unaudited) |
F. Federal Income Taxation and Tax Basis Information
Alerian MLP ETF
The Fund is taxed as a regular C-corporation for federal income tax purposes and as such is obligated to pay federal and state income tax. This treatment differs from most investment companies, which elect to be treated as “regulated investment companies” under the Internal Revenue Code of 1986, as amended (the “Code”) in order to avoid paying entity level income taxes. Under current law, the Fund is not eligible to elect treatment as a regulated investment company due to its investments primarily in MLPs invested in energy assets. The Fund expects that substantially all of the distributions it receives from MLPs may be treated as a tax-deferred return of capital, thus reducing the Fund’s current tax liability. However, the amount of taxes paid by the Fund will vary depending on the amount of income and gains derived from investments and/or sales of MLP interests and such taxes will reduce your return from an investment in the Fund.
Since the Fund will be subject to taxation on its taxable income, the NAV of the Fund shares will also be reduced by the accrual of any deferred tax liabilities. The Underlying Index however is calculated without any deductions for taxes. As a result, the Fund's after tax performance could differ significantly from the Underlying Index even if the pretax performance of the Fund and the performance of Underlying Index are closely related.
Cash distributions from MLPs to the Fund that exceed the Fund’s allocable share of such MLP’s net taxable income are considered a tax deferred return of capital that will reduce the Fund’s adjusted tax basis in the equity securities of the MLP. These reductions in the Fund’s adjusted tax basis in the MLP equity securities will increase the amount of any taxable gain (or decrease the amount of any tax loss) recognized by the Fund on a subsequent sale of the securities. The Fund will accrue deferred income taxes for any future tax liability associated with (i) that portion of MLP distributions considered to be a tax-deferred return of capital as well as (ii) capital appreciation of its investments. Upon the sale of an MLP security, the Fund may be liable for previously deferred taxes. The Fund will rely to some extent on information provided by the MLPs, which is not necessarily timely, to estimate the deferred tax liability for purposes of financial statement reporting and determining the Fund’s NAV. From time to time, the Adviser will modify the estimates or assumptions related to the Fund’s deferred tax liability as new information becomes available. The Fund will generally compute deferred income taxes based on the federal income tax rate applicable to corporations and an assumed rate attributable to state taxes.
The Fund’s income tax expense/(benefit) consists of the following:
| Alerian MLP ETF | | Period ended May 31, 2019 |
| | | Current | | Deferred | | Total |
| Federal | | $ | – | | | $ | 101,349,933 | | | $ | 101,349,933 | |
| State | | | 2,500,000 | | | | 11,341,540 | | | | 13,841,540 | |
| Valuation Allowance | | | – | | | | (112,691,473 | ) | | | (112,691,473 | ) |
| Total tax expense/(benefit) | | $ | 2,500,000 | | | $ | – | | | $ | 2,500,000 | |
Deferred income taxes reflect the net tax effect of temporary differences between the carrying amount of assets and liabilities for financial reporting and tax purposes.
Components of the Fund’s deferred tax assets and liabilities are as follows:
| Alerian MLP ETF | | As of May 31, 2019 |
| Deferred tax assets: | | | | |
| Capital loss carryforward | | $ | 209,828,417 | |
| Net operating loss carryforward | | | 242,162,654 | |
| Income recognized from MLP investments | | | 776,990,611 | |
| Other deferred tax assets | | | 5,753,531 | |
| Valuation allowance | | | (95,009,972 | ) |
| Less Deferred tax liabilities: | | | | |
| Net unrealized gain on investment securities | | | (1,139,725,241 | ) |
| Net Deferred Tax Asset/Liability | | $ | – | |
Alerian Exchange Traded Funds
| Notes to Financial Statements | May 31, 2019 (Unaudited) |
Due to the activities of the MLPs that the fund is invested in, the Fund is required to pay franchise tax in certain states. Generally speaking, franchise tax expense is a tax on equity of a corporation, or base minimum fees, imposed by various jurisdictions. The amounts of the tax are estimated throughout the year based upon the Fund's estimate of underlying activities conducted in the states and reconciled to actual amounts paid upon the filing of the tax returns for the states. These taxes are paid as either estimated tax payments, extension payments, or with the tax return filings of the various states.
The net operating loss carryforward is available to offset future taxable income. The Fund has net operating loss carryforwards for federal income tax purposes as follows:
| Alerian MLP ETF | Period-Ended | Amount | | Expiration |
| Federal | 11/30/2015 | | 200,624,015 | | 11/30/2035 |
| Federal | 11/30/2016 | | 481,506,187 | | 11/30/2036 |
| Federal | 11/30/2017 | | 343,920,174 | | 11/30/2037 |
| Total | | $ | 1,026,050,376 | | |
The Fund also has state tax net operating loss carryforwards of various amounts per state. The Deferred Tax Assets associated with these state tax net operating losses are as follows:
| Alerian MLP ETF | Period-Ended | Amount | | Expiration |
| State | 11/30/2013 | $ | 604,111 | | Varies by State (5-20 years) |
| State | 11/30/2014 | | 1,500,663 | | Varies by State (5-20 years) |
| State | 11/30/2015 | | 7,185,746 | | Varies by State (5-20 years) |
| State | 11/30/2016 | | 11,572,162 | | Varies by State (5-20 years) |
| State | 11/30/2017 | | 5,829,393 | | Varies by State (5-20 years) |
| Total | | $ | 26,692,075 | | |
The Tax Cuts and Jobs Act (“TCJA”) was signed into law on December 22, 2017. The TCJA made modifications to the net operating loss (“NOL”) deduction. The TCJA eliminated the NOL carryback ability and replaced the 20 year carryforward period with an indefinite carryforward period for any NOLs arising in tax years ending after December 31, 2017. The TCJA also established a limitation for any NOLs generated in tax years beginning after December 31, 2017 to the lesser of the aggregate of available NOLs or 80% of taxable income before any NOL utilization. As of the current reporting period the Fund is not estimating to have any NOLs affected by these changes.
The Fund reviews the recoverability of its deferred tax assets based upon the weight of available evidence. When assessing the recoverability of its deferred tax assets, significant weight was given to the effects of potential future realized and unrealized gains on investments and the period over which these deferred tax assets can be realized. Currently, any capital losses that may be generated by the Fund are eligible to be carried back up to three years and can be carried forward for five years to offset capital gains recognized by the Fund in those years. Any NOL generated in the current year can be carried forward indefinitely and any NOL generated in prior years is eligible for a two year carryback and 20 year carryforward period.
Based upon the Fund’s assessment, it has determined that it is “more-likely-than-not” that a portion of its deferred tax assets will not be realized through future taxable income of the appropriate character. Accordingly, a valuation allowance has been established for the Fund’s deferred tax assets. The Fund will continue to assess the need for a valuation allowance in the future. Significant increases in the fair value of its portfolio of investments may change the Fund’s assessment of the recoverability of these assets and may result in the removal of the valuation allowance against all or a portion of the Fund’s gross deferred tax assets.
Alerian Exchange Traded Funds
| Notes to Financial Statements | May 31, 2019 (Unaudited) |
Total income tax expense/(benefit) (current and deferred) differs from the amount computed by applying the federal statutory income tax rate of 21% to net investment income and realized and unrealized gain/(losses) on investment before taxes as follows:
| Alerian MLP ETF | | As of May 31, 2019 |
| Income tax expense at statutory rate | | $ | 101,111,874 | |
| State income tax benefit (net of federal benefit) | | | 11,314,901 | |
| Permanent differences, net | | | 189,643 | |
| Other | | | 2,575,055 | |
| Valuation allowance | | | (112,691,473 | ) |
| Net income tax expense | | $ | 2,500,000 | |
The following is a tabular reconciliation of the total amounts of unrecognized tax benefits:
| Alerian MLP ETF | | Inception to May 31, 2019 | |
| Unrecognized tax benefit - Beginning | | $ | – | |
| Gross increases - tax positions in prior period | | | – | |
| Gross decreases - tax positions in prior period | | | – | |
| Gross increases - tax positions in current period | | | – | |
| Settlement | | | – | |
| Lapse of statute of limitations | | | – | |
| Unrecognized tax benefit - Ending | | $ | – | |
The Fund recognizes interest accrued related to unrecognized tax benefits and penalties as income tax expense. For the period from inception to May 31, 2019, the Fund had no accrued penalties or interest.
The Fund recognizes the tax benefits of uncertain tax positions only where the position is “more-likely-than-not” to be sustained assuming examination by tax authorities. Management has analyzed the Fund’s tax positions, and has concluded that no liability for unrecognized tax benefits should be recorded related to uncertain tax positions taken on U.S. tax returns and state tax returns filed since inception of the Fund. Tax periods ended November 30, 2015 through November 30, 2017 remain subject to examination by tax authorities in the United States. Due to the nature of the Fund’s investments, the Fund may be required to file income tax returns in several states. The Fund is not aware of any tax positions for which it is reasonably possible that the total amounts of unrecognized tax benefits will change materially in the next 12 months.
Alerian Energy Infrastructure ETF
The timing and character of income and capital gain distributions are determined in accordance with income tax regulations, which may differ from U.S. GAAP. Reclassifications are made to the Fund’s capital accounts for permanent tax differences to reflect income and gains available for distribution (or available capital loss carryforwards) under income tax regulations. The amounts and characteristics of tax basis distributions and composition of distributable earnings/(accumulated losses) are finalized at fiscal year-end; accordingly, tax basis balances have not been determined as of May 31, 2019.
No provision for income taxes is included in the accompanying financial statements, as the Alerian Energy Infrastructure ETF intends to distribute to shareholders all taxable investment income and realized gains and otherwise comply with Subchapter M of the Internal Revenue Code of 1986, as amended, applicable to regulated investment companies. The Alerian Energy Infrastructure ETF evaluates tax positions taken (or expected to be taken) in the course of preparing the Fund’s tax returns to determine whether these positions meet a “more-likely-than-not” standard that, based on the technical merits, have a more than fifty percent likelihood of being sustained by a taxing authority upon examination. A tax position that meets the “more-likely-than-not” recognition threshold is measured to determine the amount of benefit to recognize in the financial statements.
Alerian Exchange Traded Funds
| Notes to Financial Statements | May 31, 2019 (Unaudited) |
As of and during the six months ended May 31, 2019, the Alerian Energy Infrastructure ETF did not have a liability for any unrecognized tax benefits. The Alerian Energy Infrastructure ETF files U.S. federal, state, and local tax returns as required. The Fund’s tax returns are subject to examination by the relevant tax authorities until expiration of the applicable statute of limitations, which is generally three years after the filing of the tax return, but may extend to four years in certain jurisdictions. Tax returns for open years have incorporated no uncertain tax positions that require a provision for income taxes.
The tax character of the distributions paid during the fiscal year ended November 30, 2018 were as follows:
| | | Ordinary Income | | Long-Term Capital Gain | | Return of Capital |
| November 30, 2018 | | | | | | |
| Alerian Energy Infrastructure ETF | | $ | 882,519 | | | $ | – | | | $ | 207,836 | |
Under current law, capital losses maintain their character as short-term or long-term and are carried forward to the next tax year without expiration. As of November 30, 2018, the following amounts are available as carry forwards to the next tax year:
| | | Short-Term | | Long-Term |
| Alerian Energy Infrastructure ETF | | $ | 1,491,438 | | | $ | 829,756 | |
As of May 31, 2019, the costs of investments for federal income tax purposes and accumulated net unrealized appreciation/(depreciation) on investments were as follows:
| | | Alerian MLP ETF | | Alerian Energy Infrastructure ETF |
| Cost of investments for income tax purposes | | $ | 6,758,253,251 | | | $ | 65,255,350 | |
| Gross appreciation (excess of value over tax cost) | | $ | 2,081,876,888 | | | $ | 6,405,264 | |
| Gross depreciation (excess of tax cost over value) | | | (365,554,228 | ) | | | (8,946,688 | ) |
| Net unrealized appreciation/(depreciation) | | $ | 1,716,322,660 | | | $ | (2,541,424 | ) |
The difference between cost amounts for financial statement purposes is due primarily to the recognition of pass-through income from a Fund’s investments in master limited partnerships and wash sales. In addition, certain tax cost basis adjustments are finalized at fiscal year-end and therefore have not been determined as of May 31, 2019.
G. Lending of Portfolio Securities
The Alerian Energy Infrastructure ETF has entered into a securities lending agreement with State Street Bank & Trust Co. (“SSB”), the Fund’s lending agent. The Fund may lend its portfolio securities only to borrowers that are approved by SSB. The Fund will limit such lending to not more than 33 1/3% of the value of its total assets. The Fund’s securities held at SSB as custodian shall be available to be lent except those securities the Fund or ALPS Advisors, Inc. specifically identifies in writing as not being available for lending. The borrower pledges and maintains with the Fund collateral consisting of cash (U.S. Dollars only), securities issued or guaranteed by the U.S. government or its agencies or instrumentalities, and cash equivalents (including irrevocable bank letters of credit) issued by a person other than the borrower or an affiliate of the borrower. The initial collateral received by the Fund is required to have a value of no less than 102% of the market value of the loaned securities for U.S equity securities and a value of no less than 105% of the market value for non-U.S. equity securities. The collateral is maintained thereafter, at a market value equal to not less than 102% of the current value of the U.S. equity securities on loan and not less than 105% of the current value of the non-U.S. equity securities on loan. The market value of the loaned securities is determined at the close of each business day and any additional required collateral is delivered to the Fund on the next business day. During the term of the loan, the Fund is entitled to all distributions made on or in respect of the loaned securities. Loans of securities are terminable at any time and the borrower, after notice, is required to return borrowed securities within the customary time period for settlement of securities transactions.
Alerian Exchange Traded Funds
| Notes to Financial Statements | May 31, 2019 (Unaudited) |
Any cash collateral received is reinvested in a money market fund managed by SSB as disclosed in the Fund’s Schedule of Investments and is reflected in the Statements of Assets and Liabilities as a payable for collateral upon return of securities loaned. Non-cash collateral, in the form of securities issued or guaranteed by the U.S. government or its agencies or instrumentalities, is not disclosed in the Fund’s Statements of Assets and Liabilities as it is held by the lending agent on behalf of the Fund, and the Fund does not have the ability to re-hypothecate these securities. Income earned by the Fund from securities lending activity is disclosed in the Statement of Operations.
The following is a summary of the Fund's securities lending agreement and related cash and non-cash collateral received as of May 31, 2019.
| | | Market Value of
Securities on Loan | | Cash
Collateral Recieved | | Non-Cash
Collateral
Received | | Total
Collateral Received |
| Alerian Energy Infrastructure ETF | | $ | 250,486 | | | $ | 268,727 | | | $ | – | | | $ | 268,727 | |
The risks of securities lending include the risk that the borrower may not provide additional collateral when required or may not return the securities when due. To mitigate these risks, the Fund benefits from a borrower default indemnity provided by SSB. SSB’s indemnity allows for full replacement of securities lent wherein SSB will purchase the unreturned loaned securities on the open market by applying the proceeds of the collateral, or to the extent such proceeds are insufficient or the collateral is unavailable, SSB will purchase the unreturned loan securities at SSB’s expense. However, the Fund could suffer a loss if the value of the investments purchased with cash collateral falls below the value of the cash collateral received.
The following table reflects a breakdown of transactions accounted for as secured borrowings, the gross obligation by the type of collateral pledged or securities loaned, and the remaining contractual maturity of those transactions as of May 31, 2019:
| Alerian Energy Infrastructure ETF | | Remaining contractual maturity of the agreements |
| | | | | | | | | | | |
| Securities Lending Transactions | | Overnight &
Continuous | | Up to 30 days | | 30-90 days | | Greater than 90 days | | Total |
| Common Stocks | | $ | 268,727 | | | $ | – | | | $ | – | | | $ | – | | | $ | 268,727 | |
| Total Borrowings | | | | | | | | | | | | | | | | | | | 268,727 | |
| Gross amount of recognized liabilities for securities lending (collateral received) | | | $ | 268,727 | |
3. INVESTMENT ADVISORY FEE AND OTHER AFFILIATED TRANSACTIONS
ALPS Advisors, Inc. (the “Adviser”) serves as the Funds’ investment adviser pursuant to an Investment Advisory Agreement with the Trust on behalf of each Fund (the “Advisory Agreement”). Pursuant to the Advisory Agreement, each Fund pays the Adviser an annual management fee for the services and facilities it provides, payable on a monthly basis as a percentage of the relevant Fund’s average daily net assets as set out below.
| Fund | | Advisory Fee |
| Alerian MLP ETF | 0.85% | up to and including $10 billion |
| | 0.80% | greater than $10 billion up to and including $15 billion |
| | 0.70% | greater than $15 billion up to and including $20 billion |
| | 0.55% | greater than $20 billion up to and including $25 billion |
| | 0.40% | greater than $25 billion |
| Fund | | Advisory Fee |
| Alerian Energy Infrastructure ETF | 0.65% | |
Alerian Exchange Traded Funds
| Notes to Financial Statements | May 31, 2019 (Unaudited) |
Out of the unitary management fees, the Adviser pays substantially all expenses of each Fund, including the cost of transfer agency, custody, fund administration, legal, audit, independent trustees and other services, except for interest expenses, distribution fees or expenses, brokerage expenses, taxes and extraordinary expenses not incurred in the ordinary course of each Fund's business. The Adviser’s unitary management fee is designed to pay substantially all of each Fund’s expenses and to compensate the Adviser for providing services for each Fund.
ALPS Fund Services, Inc., an affiliate of the Adviser, is the administrator of the Funds.
Each Trustee who is not an officer or employee of the Adviser, any sub-adviser or any of their affiliates (“Independent Trustees”) receives (1) a quarterly retainer of $5,000, (2) a per meeting fee for regularly scheduled meetings of $3,750, (3) $1,500 for any special meeting held outside of a regularly scheduled board meeting, and (4) reimbursement for all reasonable out-of-pocket expenses relating to attendance at meetings. In addition, the Chairman of the Board and Chairman of the Audit Committee each receives a quarterly retainer of $2,000, in connection with their respective roles.
| 4. | PURCHASES AND SALES OF SECURITIES |
For the six months ended May 31, 2019, the cost of purchases and proceeds from sales of investment securities, excluding short-term investments and in-kind transactions, were as follows:
| Fund | | Purchases | | | Sales | |
| Alerian MLP ETF | | $ | 1,486,015,258 | | | $ | 2,893,866,723 | |
| Alerian Energy Infrastructure ETF | | | 6,457,755 | | | | 6,360,187 | |
For the year ended May 31, 2019, the cost of in-kind purchases and proceeds from in-kind sales were as follows:
| Fund | | Purchases | | | Sales | |
| Alerian MLP ETF | | $ | 1,023,286,464 | | | $ | – | |
| Alerian Energy Infrastructure ETF | | | 23,244,307 | | | | 4,266,185 | |
For the six months ended May 31, 2019, the Alerian Energy Infrastructure ETF had in-kind net realized loss of $25,613.
Gains on in-kind transactions are not considered taxable for federal income tax purposes and losses on in-kind transactions are also not deductible for tax purposes.
| 5. | MASTER LIMITED PARTNERSHIPS |
MLPs are publicly traded partnerships engaged in, among other things, the transportation, storage and processing of minerals and natural resources, and are treated as partnerships for U.S. federal income tax purposes. By confining their operations to these specific activities, their interests, or units, are able to trade on public securities exchanges exactly like the shares of a corporation, without entity level taxation. To qualify as a MLP and to not be taxed as a corporation, a partnership must receive at least 90% of its income from qualifying sources as set forth in Section 7704(d) of the Code. These qualifying sources include, among other things, natural resource-based activities such as the processing, transportation and storage of mineral or natural resources. MLPs generally have two classes of owners, the general partner and limited partners. The general partner of an MLP is typically owned by a major energy company, an investment fund, the direct management of the MLP, or is an entity owned by one or more of such parties. The general partner may be structured as a private or publicly traded corporation or other entity. The general partner typically controls the operations and management of the MLP through an up to 2% equity interest in the MLP plus, in many cases, ownership of common units and subordinated units. Limited partners typically own the remainder of the partnership, through ownership of common units, and have a limited role in the partnership’s operations and management.
Alerian Exchange Traded Funds
| Notes to Financial Statements | May 31, 2019 (Unaudited) |
MLPs are typically structured such that common units and general partner interests have first priority to receive quarterly cash distributions up to an established minimum amount (“minimum quarterly distributions” or “MQD”). Common and general partner interests also accrue arrearages in distributions to the extent the MQD is not paid. Once common and general partner interests have been paid, subordinated units receive distributions of up to the MQD; however, subordinated units do not accrue arrearages. Distributable cash in excess of the MQD is distributed to both common and subordinated units and generally on a pro rata basis. The general partner is also eligible to receive incentive distributions if the general partner operates the business in a manner which results in distributions paid per common unit surpassing specified target levels. As the general partner increases cash distributions to the limited partners, the general partner receives an increasingly higher percentage of the incremental cash distributions.
| 6. | CAPITAL SHARE TRANSACTIONS |
Shares are created and redeemed by each Fund only in Creation Unit size aggregations of 50,000 Shares. Only broker-dealers or large institutional investors with creation and redemption agreements called Authorized Participants (“AP”) are permitted to purchase or redeem Creation Units from the Funds. Such transactions are generally permitted on an in-kind basis, with a balancing cash component to equate the transaction to the NAV per unit of each Fund on the transaction date. Cash may be substituted equivalent to the value of certain securities generally when they are not available in sufficient quantity for delivery, not eligible for trading by the AP or as a result of other market circumstances.
| 7. | RELATED PARTY TRANSACTIONS |
The Funds engaged in cross trades between other funds in the Trust during the six months ended May 31, 2019 pursuant to Rule 17a-7 under the 1940 Act. Cross trading is the buying or selling of portfolio securities between funds to which the Adviser serves as the investment adviser. The Board previously adopted procedures that apply to transactions between the Funds of the Trust pursuant to Rule 17a-7. These transactions related to cross trades during the period complied with the requirements set forth by Rule 17a-7 and the Trust’s procedures.
Transactions related to cross trades during the six months ended May 31, 2019, were as follows:
| Fund | | Purchase cost paid | | | Sale proceeds received | | | Realized gain/(loss) on sales | |
| Alerian MLP ETF | | $ | – | | | $ | 805,327 | | | $ | (390,245 | ) |
| Alerian Energy Infrastructure ETF | | | 433,449 | | | | – | | | | – | |
Alerian Exchange Traded Funds
| Notes to Financial Statements | May 31, 2019 (Unaudited) |
As defined by the Investment Company Act of 1940, an affiliated person, including an affiliated company, is one in which a Fund owns 5% or more of the outstanding voting securities, or a company which is under common ownership or control with the Fund.
For the six months ended May 31, 2019, the Alerian MLP ETF held shares in the following affiliates, as defined by the Investment Company Act of 1940.
| Security Name | | Share Balance as of November 30, 2018 | | Purchases | | Purchases In-Kind | | Sales | | Corporate Action | | Share Balance as of May 31, 2019 | | Market Value as of May 31, 2019 | | Dividends* | | Change in Unrealized Gain/(Loss) | | Realized Gain/(Loss) | |
| Buckeye Partners LP | | | 12,761,673 | | | 2,297,309 | | | 1,682,231 | | | (2,885,492 | ) | | – | | | 13,855,721 | | $ | 564,759,188 | | $ | – | | $ | 250,014,468 | | $ | (67,901,422 | ) |
| Crestwood Equity | | | | | | | | | | | | | | | | | | | | | | | | | | | | | | | |
| Partners LP | | | 4,276,648 | | | 706,754 | | | 560,476 | | | (1,073,045 | ) | | – | | | 4,470,833 | | | 158,848,696 | | | – | | | 36,325,028 | | | (3,342,253 | ) |
| DCP Midstream LP | | | 7,897,589 | | | 1,314,145 | | | 1,033,141 | | | (2,061,378 | ) | | – | | | 8,183,497 | | | 248,941,979 | | | – | | | 7,823,019 | | | (21,060,057 | ) |
| Genesis Energy LP | | | 9,545,334 | | | 1,584,662 | | | 1,248,465 | | | (2,491,849 | ) | | – | | | 9,886,612 | | | 215,725,874 | | | – | | | 48,990,786 | | | (37,252,199 | ) |
| Magellan Midstream | | | | | | | | | | | | | | | | | | | | | | | | | | | | | | | |
| Partners LP | | | 14,961,861 | | | 1,017,768 | | | 1,758,212 | | | (3,792,983 | ) | | – | | | 13,944,858 | | | 857,608,767 | | | – | | | 65,814,774 | | | (20,669,442 | ) |
| NGL Energy | | | | | | | | | | | | | | | | | | | | | | | | | | | | | | | |
| Partners LP | | | 9,846,434 | | | 1,686,258 | | | 1,303,604 | | | (2,440,703 | ) | | – | | | 10,395,593 | | | 154,270,600 | | | – | | | 69,562,762 | | | 101,488 | |
| NuStar Energy LP | | | 8,525,973 | | | 1,436,891 | | | 1,115,099 | | | (2,203,581 | ) | | – | | | 8,874,382 | | | 239,253,339 | | | – | | | 73,494,962 | | | (34,120,510 | ) |
| Plains All American | | | | | | | | | | | | | | | | | | | | | | | | | | | | | | | |
| Pipeline LP | | | 37,215,207 | | | 1,656,189 | | | 4,553,625 | | | (7,058,770 | ) | | – | | | 36,366,251 | | | 822,240,935 | | | – | | | 137,054,719 | | | (139,798,133 | ) |
| Shell Midstream | | | | | | | | | | | | | | | | | | | | | | | | | | | | | | | |
| Partners LP | | | 10,799,735 | | | 1,794,271 | | | 1,412,087 | | | (2,814,713 | ) | | – | | | 11,191,380 | | | 235,354,721 | | | – | | | 97,497,509 | | | (62,072,306 | ) |
| TC PipeLines LP | | | 4,728,180 | | | 782,330 | | | 618,659 | | | (1,234,033 | ) | | – | | | 4,895,136 | | | 177,350,777 | | | – | | | 72,822,405 | | | (32,930,792 | ) |
| | | | | | | | | | | | | | | | | | | | | $ | 3,674,354,876 | | $ | – | | $ | 859,400,432 | | $ | (419,045,626 | ) |
| | | | | | | | | | | | | | | | | | | | | | | | | | | | | | | | |
| Investments no longer affiliated as of May 31, 2019 | | | | | | | | |
| EnLink Midstream LLC | | | – | | | 25,395,493 | | | 834,513 | | | (2,852,320 | ) | | – | | | 23,377,686 | | $ | 242,660,381 | | $ | – | | $ | (6,465,442 | ) | $ | 111,336 | |
| EQM Midstream | | | | | | | | | | | | | | | | | | | | | | | | | | | | | | | |
| Partners LP | | | 7,247,759 | | | 1,208,565 | | | 947,754 | | | (1,879,111 | ) | | – | | | 7,524,967 | | | 324,326,078 | | | – | | | 55,696,549 | | | (71,281,474 | ) |
| Noble Midstream | | | | | | | | | | | | | | | | | | | | | | | | | | | | | | | |
| Partners LP | | | – | | | 2,067,196 | | | 42,428 | | | (148,651 | ) | | – | | | 1,960,973 | | | 59,319,433 | | | – | | | (12,326,710 | ) | | (335,099 | ) |
| Tallgrass Energy LP | | | 12,885,583 | | | 2,150,847 | | | 1,688,577 | | | (3,225,337 | ) | | – | | | 13,499,670 | | | 321,157,149 | | | – | | | 49,034,749 | | | (493,306 | ) |
| Western Midstream | | | | | | | | | | | | | | | | | | | | | | | | | | | | | | | |
| Partners LP(1) | | | 8,761,525 | | | 5,969,947 | | | 1,407,957 | | | (3,036,491 | ) | | 5,131,896 | | | 18,234,834 | | | 532,274,804 | | | – | | | 22,684,552 | | | (17,335,663 | ) |
| | | | | | | | | | | | | | | | | | | | | $ | 1,479,737,845 | | $ | – | | $ | 108,623,698 | | $ | (89,334,206 | ) |
| | | | | | | | | | | | | | | | | | | | | | | | | | | | | | | | |
| GRAND TOTAL | | | | | | | | | | | | | | | | | | | | $ | 5,154,092,721 | | $ | – | | $ | 968,024,130 | | $ | (508,379,832 | ) |
| * | 100% of the income received was estimated as Return of Capital. |
| (1) | Following the 2/27/2019 merger of Western Midstream Partners LP and Western Gas Partners LP, Western Gas Partners LP changed its name to Western Midstream Partners LP on 2/28/2019. |
Alerian Exchange Traded Funds
| Additional Information | May 31, 2019 (Unaudited) |
PROXY VOTING RECORDS, POLICIES AND PROCEDURES
Information regarding how each Fund voted proxies relating to portfolio securities during the most recent 12-month period ended June 30 and a description of the Funds’ proxy voting policies and procedures used in determining how to vote for proxies are available without charge on the SEC’s website at www.sec.gov and upon request, by calling (toll-free) 1-866-675-2639.
PORTFOLIO HOLDINGS
The Trust is required to disclose, after its first and third fiscal quarters, the complete schedule of each Fund’s portfolio holdings with the SEC on Form N-Q or as an exhibit to its report on Form N-PORT. Form N-Q or N-PORT reports for each Fund will be available on the SEC’s website at www.sec.gov. Each Fund’s Form N-Q or N-PORT reports will be available without charge, upon request, by calling (toll-free) 1-866-675-2639 or by writing to ALPS ETF Trust at 1290 Broadway, Suite 1100, Denver, Colorado 80203.
TAX INFORMATION
The Fund designates the following as a percentage of taxable ordinary income distributions, or up to the maximum amount allowable, for the calendar year ended December 31, 2018:
| | Qualified Dividend Income | Dividend Received Deduction |
| Alerian Energy Infrastructure ETF | 90.13% | 40.22% |
In early 2019, if applicable, shareholders of record received this information for the distribution paid to them by the Fund during the calendar year 2018 via Form 1099. The Fund will notify shareholders in early 2020 of amounts paid to them by the Fund, if any, during the calendar year 2019.
LICENSING AGREEMENTS
Alerian (the “Licensor”) has entered into an index licensing agreement with ALPS Advisors Inc. (the “Adviser”) with respect to each of the Alerian MLP ETF and the Alerian Energy Infrastructure ETF, to allow the Adviser’s use of AMZI and AMEI. The following disclosure relates to the Licensor:
Alerian is the designer of the construction and methodology for the underlying index (each an “Underlying Index”) for each of the Alerian MLP ETF and the Alerian Energy Infrastructure ETF (each a “Fund” and collectively, the “Funds”). “Alerian,” “Alerian MLP Infrastructure Index,” “Alerian Energy Infrastructure Index,” “Alerian Index Series” and “AMZI” are service marks or trademarks of Alerian. Alerian acts as brand licensor for each Underlying Index. Alerian is not responsible for the descriptions of either Underlying Index or the Funds that appear herein. Alerian is not affiliated with the Trust, the Adviser or the Distributor.
Neither Fund is issued, sponsored, endorsed, sold or promoted by Alerian (“Licensor”) or its affiliates. Licensor makes no representation or warranty, express or implied, to the owners of the Fund or any member of the public regarding the advisability of investing in securities generally or in the Fund particularly or the ability of the Alerian MLP Infrastructure Index (“Index”) to track general market performance. Licensor’s only relationship to the Licensee is the licensing of the Index which is determined, composed and calculated by Licensor without regard to the Licensee or the Fund. Licensor has no obligation to take the needs of the Licensee or the owners of the Fund into consideration in determining, composing or calculating the Index. Licensor is not responsible for and has not participated in the determination of the timing of, prices at, or quantities of the Fund to be issued or in the determination or calculation of the equation by which the Fund is to be converted into cash. Licensor has no obligation or liability in connection with the issuance, administration, marketing or trading of either Fund and is not responsible for and has not participated in the determination of pricing or the timing of the issuance or sale of the Shares of either Fund or in the determination or calculation of the NAV of the relevant Fund. Alerian MLP Infrastructure Index, Alerian MLP Infrastructure Total Return Index, AMZI and AMZIX are trademarks of GKD Index Partners, LLC and their general use is granted under a license from GKD Index Partners, LLC.
Alerian Exchange Traded Funds
| Additional Information | May 31, 2019 (Unaudited) |
LICENSOR DOES NOT GUARANTEE THE QUALITY, ACCURACY AND/OR THE COMPLETENESS OF THE INDEX OR ANY DATA INCLUDED THEREIN AND SHALL HAVE NO LIABILITY FOR ERRORS OR OMISSIONS OF ANY KIND RELATED TO THE INDEX OR DATA. LICENSOR MAKES NO WARRANTY, EXPRESS OR IMPLIED, AS TO RESULTS TO BE OBTAINED BY LICENSEE, OWNERS OF THE FUND, OR ANY OTHER PERSON OR ENTITY FROM THE USE OF THE INDEX OR ANY DATA INCLUDED THEREIN IN CONNECTION WITH THE RIGHTS LICENSED TO LICENSEE OR FOR ANY OTHER USE. LICENSOR MAKES NO EXPRESS OR IMPLIED WARRANTIES, AND HEREBY EXPRESSLY DISCLAIMS ALL WARRANTIES OF MERCHANTABILITY OR FITNESS FOR A PARTICULAR PURPOSE OR USE WITH RESPECT TO THE INDEX OR ANY DATA INCLUDED THEREIN. WITHOUT LIMITING ANY OF THE FOREGOING, IN NO EVENT SHALL LICENSOR HAVE ANY LIABILITY FOR ANY SPECIAL, PUNITIVE, INDIRECT, OR CONSEQUENTIAL DAMAGES (INCLUDING LOST PROFITS), EVEN IF NOTIFIED OF THE POSSIBILITY OF SUCH DAMAGES.
The Adviser does not guarantee the accuracy and/or the completeness of either Underlying Index or any data included therein, and the Adviser shall have no liability for any errors, omissions or interruptions therein. The Adviser makes no warranty, express or implied, as to results to be obtained by either Fund, owners of the Shares of the relevant Fund or any other person or entity from the use of either Underlying Index or any data included therein. The Adviser makes no express or implied warranties, and expressly disclaims all warranties of merchantability or fitness for a particular purpose or use with respect to either Underlying Index or any data included therein. Without limiting any of the foregoing, in no event shall the Adviser have any liability for any special, punitive, direct, indirect, or consequential damages (including lost profits) arising out of matters relating to the use of either Underlying Index, even if notified of the possibility of such damages.
(Applicable to the Alerian Energy Infrastructure ETF only)
The Underlying Index is the exclusive property of GKD Index Partners LLC d/b/a Alerian, which has contracted with S&P Opco, LLC (a subsidiary of S&P Dow Jones Indices LLC) (“S&P Dow Jones Indices”) to calculate and maintain the Underlying Index. S&P® is a registered trademark of Standard & Poor’s Financial Services LLC (“SPFS”); Dow Jones® is a registered trademark of Dow Jones Trademark Holdings LLC (“Dow Jones”); and these trademarks have been licensed to S&P Dow Jones Indices. “Calculated by S&P Dow Jones Indices” and its related stylized mark(s) have been licensed for use by Alerian.
The Fund is not sponsored, endorsed, sold or promoted by S&P Dow Jones Indices, SPFS, Dow Jones or any of their affiliates (collectively, “S&P Dow Jones Indices Entities”). S&P Dow Jones Indices Entities do not make any representation or warranty, express or implied, to the owners of the Fund or any member of the public regarding the advisability of investing in securities generally or in the Fund particularly or the ability of the Underlying Index to track general market performance. S&P Dow Jones Indices Entities only relationship to Alerian with respect to the Underlying Index is the licensing of certain trademarks, service marks and trade names of S&P Dow Jones Indices Entities and for the providing of calculation and maintenance services related to the Underlying Index. S&P Dow Jones Indices Entities are not responsible for and have not participated in the determination of the prices and amount of the Fund or the timing of the issuance or sale of the Fund or in the determination or calculation of the equation by which the Fund is to be converted into cash. S&P Dow Jones Indices Entities have no obligation or liability in connection with the administration, marketing or trading of the Fund. S&P Dow Jones Indices LLC is not an investment advisor. Inclusion of a security within the Underlying Index is not a recommendation by S&P Dow Jones Indices Entities to buy, sell, or hold such security, nor is it considered to be investment advice.
S&P DOW JONES INDICES ENTITIES DO NOT GUARANTEE THE ADEQUACY, ACCURACY, TIMELINESS AND/OR THE COMPLETENESS OF THE UNDERLYING INDEX OR ANY DATA RELATED THERETO OR ANY COMMUNICATION, INCLUDING BUT NOT LIMITED TO, ORAL OR WRITTEN COMMUNICATION (INCLUDING ELECTRONIC COMMUNICATIONS) WITH RESPECT THERETO. S&P DOW JONES INDICES ENTITIES SHALL NOT BE SUBJECT TO ANY DAMAGES OR LIABILITY FOR ANY ERRORS, OMISSIONS, OR DELAYS THEREIN. S&P DOW JONES INDICES ENTITIES MAKE NO EXPRESS OR IMPLIED WARRANTIES, AND EXPRESSLY DISCLAIMS ALL WARRANTIES, OF MERCHANTABILITY OR FITNESS FOR A PARTICULAR PURPOSE OR USE OR AS TO RESULTS TO BE OBTAINED BY ALERIAN, OWNERS OF THE FUND, OR ANY OTHER PERSON OR ENTITY FROM THE USE OF THE UNDERLYING INDEX OR WITH RESPECT TO ANY DATA RELATED THERETO. WITHOUT LIMITING ANY OF THE FOREGOING, IN NO EVENT WHATSOEVER SHALL S&P DOW JONES INDICES ENTITIES BE LIABLE FOR ANY INDIRECT, SPECIAL, INCIDENTAL, PUNITIVE, OR CONSEQUENTIAL DAMAGES INCLUDING BUT NOT LIMITED TO, LOSS OF PROFITS, TRADING LOSSES, LOST TIME OR GOODWILL, EVEN IF THEY HAVE BEEN ADVISED OF THE POSSIBILITY OF SUCH DAMAGES, WHETHER IN CONTRACT, TORT, STRICT LIABILITY, OR OTHERWISE.

TABLE OF
CONTENTS
| Performance Overview | 1 |
| Disclosure of Fund Expenses | 3 |
| Schedule of Investments | 4 |
| Statements of Assets and Liabilities | 5 |
| Statements of Operations | 6 |
| Statements of Changes in Net Assets | 7 |
| Financial Highlights | 8 |
| Notes to Financial Statements | 9 |
| Additional Information | 14 |
Beginning on January 1, 2021, as permitted by regulations adopted by the U.S. Securities and Exchange Commission, paper copies of the Fund’s annual and semi-annual shareholder reports will no longer be sent by mail, unless you specifically request paper copies of the reports from your financial intermediary (such as a broker-dealer or bank). Instead, the reports will be made available on the Fund’s website (www.alpsfunds.com), and you will be notified by mail each time a report is posted and provided with a website link to access the report.
If you already elected to receive shareholder reports electronically, you will not be affected by this change and you need not take any action. You may elect to receive shareholder reports and other communications from a Fund electronically anytime by contacting your financial intermediary.
You may elect to receive all future reports in paper free of charge. You can contact your financial intermediary to request that you continue to receive paper copies of your shareholder reports. Your election to receive reports in paper will apply to all funds held in your account with your financial intermediary.
alpsfunds.com
ALPS Equal Sector Weight ETF
| Performance Overview | May 31, 2019 (Unaudited) |
Investment Objective
The ALPS Equal Sector Weight ETF (the “Fund”) seeks investment results that replicate as closely as possible, before fees and expenses, the performance of the NYSE Select Sector Equal Weight Total Return IndexSM (the “Underlying Index”).
The Underlying Index is an index of ETFs comprised of all active Select Sector SPDR® ETFs in an equal weighted portfolio. These are the Communication Services Select Sector SPDR® Fund, Consumer Discretionary Select Sector SPDR®Fund, Consumer Staples Select Sector SPDR® Fund, Materials Select Sector SPDR® Fund, Energy Select Sector SPDR® Fund, Technology Select Sector SPDR® Fund, Utilities Select Sector SPDR®Fund, Financial Select Sector SPDR® Fund, Industrial Select Sector SPDR® Fund, Health Care Select Sector SPDR® Fund and Real Estate Select Sector SPDR® Fund (each, an “Underlying Sector ETF” and collectively, the “Underlying Sector ETFs”). In order to track the Underlying Index, the Fund will use a “fund of funds” approach, and seek to achieve its investment objective by investing at least 90% of its total assets in the shares of the Underlying Sector ETFs.
The Underlying Index is designed to track performance of the equally weighted Underlying Sector ETFs. Accordingly, the Underlying Index is rebalanced to an equal weighting quarterly during the months of March, June, September, and December.
Each Underlying Sector ETF is an “index fund” that invests in the equity securities of companies in a particular sector or group of industries. The objective of each Underlying Sector ETF is to track its respective underlying sector index by replicating the securities in the underlying sector index. Together, the Underlying Sector ETFs represent the Underlying Index as a whole.
Performance(as of May 31, 2019)
| | 6 Months | 1 Year | 3 Year | 5 Year | Since Inception^ |
| ALPS Equal Sector Weight ETF - NAV | 0.99% | 3.91% | 9.52% | 7.84% | 13.24% |
| ALPS Equal Sector Weight ETF - Market Price* | 1.18% | 3.91% | 9.52% | 7.85% | 13.27% |
| NYSE® Select Sector Equal Weight Total Return Index | 1.07% | 4.03% | 9.67% | 8.02% | 13.53% |
| S&P 500® Total Return Index | 0.74% | 3.78% | 11.72% | 9.66% | 14.33% |
Total Expense Ratio (per the current Prospectus) 0.50%. Net Expense Ratio (per the current Prospectus) 0.28%. Net expense ratio reflects the reimbursement of distribution fees for underlying sector ETFs. In addition, the Adviser has contractually agreed, through March 31, 2020, to reduce its advisory fee by 0.19%. This fee waiver may only be terminated by the Fund’s Board of Trustees (and not by the Adviser) prior to such date. Please see the prospectus for additional information.
Performance data quoted represents past performance. Past performance does not guarantee future results. The table does not reflect the deduction of taxes that a shareholder would pay on Fund distributions or the redemption of Fund shares. Investment return and principal value of an investment will fluctuate so that an investor’s shares, when sold or redeemed, may be worth more or less than the original cost. Current performance data may be higher or lower than actual data quoted. For the most current month-end performance data please visit www.alpsfunds.com or call 1.866.675.2639.
NAV is an exchange-traded fund’s per-share value. The per-share dollar amount of the Fund is derived by dividing the total value of all the securities in its portfolio, less any liabilities, by the number of Fund shares outstanding. Market Price is the price at which a share can currently be traded in the market. Information detailing the number of days the Market Price of the Fund was greater than the Fund’s NAV and the number of days it was less than the Fund’s NAV can be obtained at www.alpsfunds.com.
| ^ | The Fund commenced Investment Operations on July 6, 2009 with an Inception Date, the first day of trading on the Exchange, of July 7, 2009. |
| * | Market Price is based on the midpoint of the bid/ask spread at 4 p.m. ET and does not represent the returns an investor would receive if shares were traded at other times. |
The NYSE® Select Sector Equal Weight Total Return Index consists of a strategy that holds all active Select Sector SPDR®ETFs in an equalweighted portfolio. Total return assumes reinvestment of any dividends and distributions realized during a given time period.
S&P 500® Total Return Index: the Standard & Poor’s composite index of 500 stocks, a widely recognized, unmanaged index of common stock prices. Total return assumes reinvestment of any dividends and distributions realized during a given time period.
The indexes are not actively managed and do not reflect any deductions for fees, expenses or taxes. The indexes are reported on a total return basis, which assumes reinvestment of any dividends and distributions realized during a given time period. One cannot invest directly in an index. Index performance does not reflect fund performance.
The Fund’s shares are not individually redeemable. Investors buy and sell shares of the Fund on a secondary market. Only market makers or “authorized participants” may trade directly with the Fund, typically in blocks of 50,000 shares.
The ALPS Equal Sector Weight ETF is not suitable for all investors. Investments in the Fund are subject to investment risks, including possible loss of the principal amount invested.
ALPS Portfolio Solutions Distributor, Inc., a FINRA member, is the distributor for the Fund.
ALPS Equal Sector Weight ETF
| Performance Overview | May 31, 2019 (Unaudited) |
The following table shows the sector weights of both the Fund and the S&P 500® Total Return Index as of May 31, 2019:
Sector Weighting Comparison(as of May 31, 2019)
| | EQL* | S&P 500® | +/- |
| Real Estate | 9.5% | 3.2% | 6.3% |
| Consumer Staples | 9.4% | 7.4% | 2.0% |
| Consumer Discretionary | 9.3% | 10.2% | -0.9% |
| Communication Services | 9.3% | 10.4% | -1.1% |
| Utilities | 9.3% | 3.4% | 5.9% |
| Technology | 9.2% | 21.2% | -12.0% |
| Financials | 9.1% | 13.2% | -4.1% |
| Industrials | 9.0% | 9.3% | -0.3% |
| Materials | 8.8% | 2.6% | 6.2% |
| Healthcare | 8.8% | 14.2% | -5.4% |
| Energy | 8.3% | 4.9% | 3.4% |
| Total | 100.0% | 100.0% | |
Source: S&P 500®
| * | % of Total Investments (excluding investments purchased with collateral from securities loaned). Future holdings are subject to change. |
Growth of $10,000(as of May 31, 2019)
Comparison of Change in Value of $10,000 Investment in the Fund and the Indexes

The chart above represents historical performance of a hypothetical investment of $10,000 in the Fund over the life of the Fund. Past performance does not guarantee future results. This chart does not reflect the deduction of taxes that a shareholder would pay on Fund distributions or the redemption of Fund shares.
ALPS Equal Sector Weight ETF
| Disclosure of Fund Expenses | May 31, 2019 (Unaudited) |
Shareholder Expense Example: As a shareholder of the Fund, you incur two types of costs: (1) transaction costs which may include creation and redemption fees or brokerage charges, and (2) ongoing costs, including management fees and other Fund expenses. These examples are intended to help you understand your ongoing costs (in dollars) of investing in the Fund and to compare these costs with the ongoing costs of investing in other funds. The example is based on an investment of $1,000 invested at the beginning of the (six month) period and held through May 31, 2019.
Actual Return: The first line of the table provides information about actual account values and actual expenses. You may use the information in this line, together with the amount you invested, to estimate the expenses that you incurred over the period. Simply divide your account value by $1,000 (for example, an $8,600 account value divided by $1,000 = 8.6), then multiply the result by the number in the first line under the heading entitled “Expenses Paid During Period” to estimate the expenses attributable to your investment during this period.
Hypothetical 5% Return: The second line of the table provides information about hypothetical account values and hypothetical expenses based on the Fund’s actual expense ratio and an assumed rate of return of 5% per year before expenses, which is not the Fund’s actual return. The hypothetical account values and expenses may not be used to estimate the actual ending account balance or expenses you paid for the period. You may use this information to compare ongoing costs of investing in the Fund and other funds. To do so, compare this 5% hypothetical example with the 5% hypothetical examples that appear in the shareholder reports of other funds.
The expenses shown in the table are meant to highlight ongoing Fund costs only and do not reflect any transaction costs, such as creation and redemption fees or brokerage charges. Therefore, the second line of the table is useful in comparing ongoing costs only, and will not help you determine the relative total costs of owning different funds. In addition, if these costs were included, your costs would have been higher.
| | Beginning Account Value 12/1/18 | Ending Account Value 5/31/19 | Expense Ratio(a) | Expenses Paid
During Period
12/1/18 - 5/31/19(b) |
| ALPS Equal Sector Weight ETF | | | | |
| Actual | $1,000.00 | $1,009.90 | 0.15% | $0.75 |
| Hypothetical (5% return before expenses) | $1,000.00 | $1,024.18 | 0.15% | $0.76 |
| (a) | Annualized, based on the Fund's most recent fiscal half year expenses. |
| (b) | Expenses are equal to the Fund's annualized expense ratio multiplied by the average account value over the period, multiplied by the number of days in the most recent fiscal half year (182), divided by 365. |
ALPS Equal Sector Weight ETF
| Schedule of Investments | May 31, 2019 (Unaudited) |
| Security Description | | Shares | | | Value | |
| EXCHANGE TRADED FUNDS (99.95%) |
| Communication Services (9.28%) | | | | | | | | |
| Communication Services Select Sector SPDR®Fund | | | 297,488 | | | $ | 14,008,710 | |
| | | | | | | | | |
| Consumer Discretionary (9.30%) | | | | | | | | |
| Consumer Discretionary Select Sector SPDR® Fund | | | 126,476 | | | | 14,031,247 | |
| | | | | | | | | |
| Consumer Staples (9.42%) | | | | | | | | |
| Consumer Staples Select Sector SPDR® Fund | | | 255,716 | | | | 14,220,367 | |
| | | | | | | | | |
| Energy (8.31%) | | | | | | | | |
| Energy Select Sector SPDR® Fund | | | 213,517 | | | | 12,548,394 | |
| | | | | | | | | |
| Financials (9.05%) | | | | | | | | |
| Financial Select Sector SPDR® Fund | | | 525,260 | | | | 13,662,013 | |
| | | | | | | | | |
| Healthcare (8.79%) | | | | | | | | |
| Health Care Select Sector SPDR® Fund | | | 152,054 | | | | 13,271,273 | |
| | | | | | | | | |
| Industrials (9.03%) | | | | | | | | |
| Industrial Select Sector SPDR® Fund(a) | | | 189,045 | | | | 13,620,692 | |
| | | | | | | | | |
| Materials (8.83%) | | | | | | | | |
| Materials Select Sector SPDR® Fund(a) | | | 252,490 | | | | 13,318,847 | |
| | | | | | | | | |
| Real Estate (9.53%) | | | | | | | | |
| Real Estate Select Sector SPDR® Fund | | | 394,467 | | | | 14,386,212 | |
| | | | | | | | | |
| Technology (9.13%) | | | | | | | | |
| Technology Select Sector SPDR® Fund | | | 191,638 | | | | 13,776,856 | |
| | | | | | | | | |
| Utilities (9.28%) | | | | | | | | |
| Utilities Select Sector SPDR® Fund | | | 240,381 | | | | 14,002,193 | |
| | | | | | | | | |
| TOTAL EXCHANGE TRADED FUNDS |
| (Cost $119,860,970) | | | | | | | 150,846,804 | |
| | | 7 Day Yield | | | Shares | | | Value | |
| SHORT TERM INVESTMENTS (8.60%) |
| Money Market Fund (0.06%) | | | | | | | | | | | | |
| State Street Institutional Treasury Plus Money Market Fund | | | | | | | | | | | | |
| (Cost $87,381) | | | 2.309 | % | | | 87,381 | | | $ | 87,381 | |
| | | | | | | | | | | | | |
| Investments Purchased with Collateral from Securities Loaned (8.54%) | | | | | | | | | | | | |
| State Street Navigator Securities Lending Government Money Market Portfolio, 2.34% | | | | | | | | | | | | |
| (Cost $12,892,865) | | | | | | | 12,892,865 | | | | 12,892,865 | |
| TOTAL SHORT TERM INVESTMENTS | | | | | |
| (Cost $12,980,246) | | | | | | | | | | | 12,980,246 | |
| | | | | | | | | | | | | |
| TOTAL INVESTMENTS (108.55%) | | | | | |
| (Cost $132,841,216) | | | | | | | | | | $ | 163,827,050 | |
| LIABILITIES IN EXCESS OF OTHER ASSETS (-8.55%) | | | | (12,906,035 | ) |
| NET ASSETS - 100.00% | | | $ | 150,921,015 | |
| (a) | Security, or a portion of the security position is currently on loan. The total market value of securities on loan is $15,699,776. |
Common Abbreviations:
SPDR®- Standard & Poor's Depositary Receipts
See Notes to Financial Statements.
ALPS Equal Sector Weight ETF
| Statement of Assets and Liabilities | May 31, 2019 (Unaudited) |
| ASSETS: | | |
| Investments, at value | | $ | 163,827,050 | |
| Dividends receivable | | | 7,616 | |
| Total Assets | | | 163,834,666 | |
| | | | | |
| LIABILITIES: | | | | |
| Payable to adviser | | | 20,786 | |
| Payable for collateral upon return of securities loaned | | | 12,892,865 | |
| Total Liabilities | | | 12,913,651 | |
| NET ASSETS | | $ | 150,921,015 | |
| | | | | |
| NET ASSETS CONSIST OF: | | | | |
| Paid-in capital | | $ | 118,047,044 | |
| Total distributable earnings | | | 32,873,971 | |
| NET ASSETS | | $ | 150,921,015 | |
| | | | | |
| INVESTMENTS, AT COST | | $ | 132,841,216 | |
| | | | | |
| PRICING OF SHARES | | | | |
| Net Assets | | $ | 150,921,015 | |
| Shares of beneficial interest outstanding (Unlimited number of shares authorized, par value $0.01 per share) | | | 2,150,000 | |
| Net Asset Value, offering and redemption price per share | | $ | 70.20 | |
See Notes to Financial Statements.
ALPS Equal Sector Weight ETF
| Statement of Operations | For the Six Months Ended May 31, 2019 (Unaudited) |
| INVESTMENT INCOME: | | |
| Dividends | | $ | 1,729,284 | |
| Securities Lending Income | | | 21,712 | |
| Total Investment Income | | | 1,750,996 | |
| | | | | |
| EXPENSES: | | | | |
| Investment adviser fees | | | 280,075 | |
| Total Expenses before waiver/reimbursement | | | 280,075 | |
| Less fee waiver/reimbursement by investment adviser | | | (166,530 | ) |
| Net Expenses | | | 113,545 | |
| NET INVESTMENT INCOME | | | 1,637,451 | |
| | | | | |
| REALIZED AND UNREALIZED GAIN/(LOSS): | | | | |
| Net realized gain on investments | | | 2,294,017 | |
| Net change in unrealized depreciation on investments | | | (2,612,335 | ) |
| NET REALIZED AND UNREALIZED LOSS ON INVESTMENTS | | | (318,318 | ) |
| NET INCREASE IN NET ASSETS RESULTING FROM OPERATIONS | | $ | 1,319,133 | |
See Notes to Financial Statements.
ALPS Equal Sector Weight ETF
Statements of Changes in Net Assets
| | For the Six
Months Ended
May 31, 2019
(Unaudited) | | | For the
Year Ended
November 30, 2018 | |
| OPERATIONS: | | | | | | | | |
| Net investment income | | $ | 1,637,451 | | | $ | 3,463,259 | |
| Net realized gain | | | 2,294,017 | | | | 13,803,509 | |
| Net change in unrealized depreciation | | | (2,612,335 | ) | | | (11,552,035 | ) |
| Net increase in net assets resulting from operations | | | 1,319,133 | | | | 5,714,733 | |
| | | | | | | | | |
| DISTRIBUTIONS TO SHAREHOLDERS: | | | | | | | | |
| From distributable earnings | | | (1,727,662 | ) | | | (3,383,829 | ) |
| Total distributions | | | (1,727,662 | ) | | | (3,383,829 | ) |
| | | | | | | | | |
| CAPITAL SHARE TRANSACTIONS: | | | | | | | | |
| Proceeds from sale of shares | | | 6,741,934 | | | | 17,967,851 | |
| Cost of shares redeemed | | | (10,154,420 | ) | | | (31,840,276 | ) |
| Net decrease from capital share transactions | | | (3,412,486 | ) | | | (13,872,425 | ) |
| Net decrease in net assets | | | (3,821,015 | ) | | | (11,541,521 | ) |
| | | | | | | | | |
| NET ASSETS: | | | | | | | | |
| Beginning of period | | | 154,742,030 | | | | 166,283,551 | |
| End of period | | $ | 150,921,015 | | | $ | 154,742,030 | |
| | | | | | | | | |
| OTHER INFORMATION: | | | | | | | | |
| CAPITAL SHARE TRANSACTIONS: | | | | | | | | |
| Beginning shares | | | 2,200,000 | | | | 2,400,000 | |
| Shares sold | | | 100,000 | | | | 250,000 | |
| Shares redeemed | | | (150,000 | ) | | | (450,000 | ) |
| Shares outstanding, end of period | | | 2,150,000 | | | | 2,200,000 | |
See Notes to Financial Statements.
ALPS Equal Sector Weight ETF
| Financial Highlights | For a Share Outstanding Throughout the Periods Presented |
| | |
| | | For the
Six Months
Ended
May 31, 2019 (Unaudited) | | For the Year Ended November 30, 2018 | | For the Year Ended November 30, 2017 | | For the Year Ended November 30, 2016 | | For the Year Ended November 30, 2015 | | For the Year Ended November 30, 2014 | |
| NET ASSET VALUE, BEGINNING OF PERIOD | | $ | 70.34 | | $ | 69.28 | | $ | 59.74 | | $ | 56.16 | | $ | 57.01 | | $ | 50.11 | |
| | | | | | | | | | | | | | | | | | | | |
| INCOME FROM OPERATIONS: | | | | | | | | | | | | | | | | | | | |
| Net investment income(a) | | | 0.75 | | | 1.50 | | | 1.37 | | | 1.66 | | | 1.09 | | | 0.90 | |
| Net realized and unrealized gain/(loss) | | | (0.10 | ) | | 1.02 | | | 10.03 | | | 3.11 | | | (0.84 | ) | | 6.90 | |
| Total from investment operations | | | 0.65 | | | 2.52 | | | 11.40 | | | 4.77 | | | 0.25 | | | 7.80 | |
| | | | | | | | | | | | | | | | | | | | |
| DISTRIBUTIONS: | | | | | | | | | | | | | | | | | | | |
| From net investment income | | | (0.79 | ) | | (1.46 | ) | | (1.86 | ) | | (1.19 | ) | | (1.10 | ) | | (0.90 | ) |
| Total distributions | | | (0.79 | ) | | (1.46 | ) | | (1.86 | ) | | (1.19 | ) | | (1.10 | ) | | (0.90 | ) |
| | | | | | | | | | | | | | | | | | | | |
| NET INCREASE/(DECREASE) IN NET ASSET VALUE | | | (0.14 | ) | | 1.06 | | | 9.54 | | | 3.58 | | | (0.85 | ) | | 6.90 | |
| NET ASSET VALUE, END OF PERIOD | | $ | 70.20 | | $ | 70.34 | | $ | 69.28 | | $ | 59.74 | | $ | 56.16 | | $ | 57.01 | |
| TOTAL RETURN(b) | | | 0.99 | % | | 3.66 | % | | 19.46 | % | | 8.62 | % | | 0.48 | % | | 15.71 | % |
| | | | | | | | | | | | | | | | | | | | |
| RATIOS/SUPPLEMENTAL DATA: | | | | | | | | | | | | | | | | | | | |
| Net assets, end of period (in 000s) | | $ | 150,921 | | $ | 154,742 | | $ | 166,284 | | $ | 140,391 | | $ | 140,407 | | $ | 139,686 | |
| | | | | | | | | | | | | | | | | | | | |
| RATIOS TO AVERAGE NET ASSETS |
| Ratio of expenses excluding waiver/reimbursement to average net assets | | | 0.37 | %(c) | | 0.37 | % | | 0.37 | % | | 0.37 | % | | 0.37 | % | | 0.37 | % |
| Ratio of expenses including waiver/reimbursement to average net assets | | | 0.15 | %(c) | | 0.15 | % | | 0.15 | % | | 0.15 | % | | 0.21 | %(d) | | 0.34 | % |
| Ratio of net investment income excluding waiver/reimbursement to average net assets | | | 1.94 | %(c) | | 1.92 | % | | 1.92 | % | | 2.71 | % | | 1.78 | % | | 1.67 | % |
| Ratio of net investment income including waiver/reimbursement to average net assets | | | 2.16 | %(c) | | 2.14 | % | | 2.14 | % | | 2.93 | % | | 1.94 | %(d) | | 1.70 | % |
| Portfolio turnover rate(e) | | | 3 | % | | 14 | % | | 5 | % | | 13 | % | | 6 | % | | 3 | % |
| (a) | Based on average shares outstanding during the period. |
| (b) | Total return is calculated assuming an initial investment made at the net asset value at the beginning of the period and redemption at the net asset value on the last day of the period and assuming all distributions are reinvested at the reinvestment prices. |
| (d) | The effective expense ratio including waivers changed from 0.34% to 0.15% effective April 1, 2015 through March 31, 2016. |
| (e) | Portfolio turnover for periods less than one year are not annualized and does not include securities received or delivered from processing creations or redemptions in-kind. |
See Notes to Financial Statements.
ALPS Equal Sector Weight ETF
| Notes to Financial Statements | May 31, 2019 (Unaudited) |
1. ORGANIZATION
ALPS ETF Trust (the “Trust”), a Delaware statutory trust, is an open-end management investment company registered under the Investment Company Act of 1940, as amended (the “1940 Act”). As of May 31, 2019, the Trust consists of eighteen separate portfolios. Each portfolio represents a separate series of the Trust. This report pertains solely to the ALPS Equal Sector Weight ETF (the “Fund”). The investment objective of the Fund is to seek investment results that replicate as closely as possible, before fees and expenses, the performance of the NYSE® Select Sector Equal Weight Total Return Index (the “Underlying Index”). The Fund is considered non-diversified and may invest a greater portion of assets in securities of individual issuers than a diversified fund. As a result, changes in the market value of a single investment could cause greater fluctuations in share price than would occur in a diversified fund.
The Fund’s Shares (“Shares”) are listed on the NYSE Arca, Inc. The Fund issues and redeems Shares at net asset value (“NAV”) in blocks of 50,000 Shares each of which is called a “Creation Unit”. Creation Units are issued and redeemed principally in-kind for securities included in the Underlying Index. Except when aggregated in Creation Units, Shares are not redeemable securities of the Fund.
Pursuant to the Trust’s organizational documents, its Officers and Trustees are indemnified against certain liability arising out of the performance of their duties to the Trust. Additionally, in the normal course of business, the Trust enters into contracts with service providers that contain general indemnification clauses. The Trust’s maximum exposure under these arrangements is unknown, as this would involve future claims that may be made against the Trust that have not yet occurred.
2. SIGNIFICANT ACCOUNTING POLICIES
The following is a summary of significant accounting policies consistently followed by the Fund in the preparation of the financial statements. The accompanying financial statements were prepared in accordance with accounting principles generally accepted in the United States of America (“U.S. GAAP”). The preparation of financial statements in conformity with U.S. GAAP requires management to make certain estimates and assumptions that affect the reported amounts of assets and liabilities and disclosures of contingent assets and liabilities at the date of the financial statements and the reported amounts of revenue and expenses during the period. Actual results could differ from those estimates. The Fund is considered an investment company under U.S. GAAP and follows the accounting and reporting guidance applicable to investment companies in the Financial Accounting Standards BoardAccounting Standards CodificationTopic 946.
A. Portfolio Valuation
The Fund’s NAV is determined daily, as of the close of regular trading on the New York Stock Exchange (the “NYSE”), normally 4:00 p.m. Eastern Time, on each day the NYSE is open for trading. The NAV is computed by dividing the value of all assets of the Fund (including accrued interest and dividends), less all liabilities (including accrued expenses and dividends declared but unpaid), by the total number of shares outstanding.
Portfolio securities listed on any exchange other than the NASDAQ Stock Market LLC (“NASDAQ”) are valued at the last sale price on the business day as of which such value is being determined. If there has been no sale on such day, the securities are valued at the mean of the most recent bid and ask prices on such day. Securities traded on the NASDAQ are valued at the NASDAQ Official Closing Price as determined by NASDAQ. Portfolio securities traded on more than one securities exchange are valued at the last sale price on the business day as of which such value is being determined at the close of the exchange representing the principal market for such securities. Portfolio securities traded in the over-the-counter market, but excluding securities traded on the NASDAQ, are valued at the last quoted sale price in such market.
The Fund’s investments are valued at market value or, in the absence of market value with respect to any portfolio securities, at fair value according to procedures adopted by the Trust’s Board of Trustees (the “Board”). When market quotations are not readily available or when events occur that make established valuation methods unreliable, securities of the Fund may be valued in good faith by or under the direction of the Board. These securities generally include, but are not limited to, restricted securities (securities which may not be publicly sold without registration under the Securities Act of 1933) for which a pricing service is unable to provide a market price; securities whose trading has been formally suspended; a security whose market price is not available from a pre-established primary pricing source or the pricing source is not willing to provide a price; a security with respect to which an event has occurred that is most likely to materially affect the value of the security after the market has closed but before the calculation of the Fund’s NAV or make it difficult or impossible to obtain a reliable market quotation; or a security whose price, as provided by the pricing service, does not reflect the security’s “fair value” due to the security being de-listed from a national exchange or the security’s primary trading market is temporarily closed at a time when, under normal conditions, it would be open. As a general principle, the current “fair value” of a security would be the amount which the owner might reasonably expect to receive from the sale on the applicable exchange or principal market. A variety of factors may be considered in determining the fair value of such securities.
ALPS Equal Sector Weight ETF
| Notes to Financial Statements | May 31, 2019 (Unaudited) |
B. Fair Value Measurements
The Fund discloses the classification of its fair value measurements following a three-tier hierarchy based on the inputs used to measure fair value. Inputs refer broadly to the assumptions that market participants would use in pricing the asset or liability, including assumptions about risk. Inputs may be observable or unobservable. Observable inputs reflect the assumptions market participants would use in pricing the asset or liability that are developed based on market data obtained from sources independent of the reporting entity. Unobservable inputs reflect the reporting entity’s own assumptions about the assumptions market participants would use in pricing the asset or liability that are developed based on the best information available.
Valuation techniques used to value the Fund’s investments by major category are as follows:
Exchange Traded Funds, for which market quotations are readily available, are valued at the last reported sale price or official closing price as reported by a third party pricing vendor on the primary market or exchange on which they are traded and are categorized as Level 1 in the hierarchy. In the event there were no sales during the day or closing prices are not available, securities are valued at the mean of the most recent quoted bid and ask prices on such day and are generally categorized as Level 2 in the hierarchy. Investments in open-end mutual funds are valued at their closing NAV each business day and are categorized as Level 1 in the hierarchy.
Changes in valuation techniques may result in transfers in or out of an assigned level within the disclosure hierarchy.
Various inputs are used in determining the value of the Fund’s investments as of the end of the reporting period. When inputs used fall into different levels of the fair value hierarchy, the level in the hierarchy within which the fair value measurement falls is determined based on the lowest level input that is significant to the fair value measurement in its entirety. The designated input levels are not necessarily an indication of the risk or liquidity associated with these investments.
These inputs are categorized in the following hierarchy under applicable financial accounting standards:
| Level 1 | – | Unadjusted quoted prices in active markets for identical investments, unrestricted assets or liabilities that a Fund has the ability to access at the measurement date; |
| Level 2 | – | Quoted prices which are not active, quoted prices for similar assets or liabilities in active markets or inputs other than quoted prices that are observable (either directly or indirectly) for substantially the full term of the asset or liability; and |
| Level 3 | – | Significant unobservable prices or inputs (including the Fund’s own assumptions in determining the fair value of investments) where there is little or no market activity for the asset or liability at the measurement date. |
The following is a summary of inputs used to value the Fund’s investments at May 31, 2019:
| ALPS Equal Sector Weight ETF |
| Investments in Securities at Value | | Level 1 - Quoted and Unadjusted Prices | | | Level 2 - Other Significant Observable Inputs | | | Level 3 - Significant Unobservable Inputs | | | Total | |
| Exchange Traded Funds* | | $ | 150,846,804 | | | $ | – | | | $ | – | | | $ | 150,846,804 | |
| Short Term Investments | | | 12,980,246 | | | | – | | | | – | | | | 12,980,246 | |
| Total | | $ | 163,827,050 | | | $ | – | | | $ | – | | | $ | 163,827,050 | |
| * | For a detailed breakdown of sectors, see the accompanying Schedule of Investments. |
The Fund did not have any securities that used significant unobservable inputs (Level 3) in determining fair value and there were no transfers into or out of Level 3.
C. Securities Transactions and Investment Income
Securities transactions are recorded as of the trade date. Realized gains and losses from securities transactions are recorded on the highest cost basis. Dividend income and capital gains distributions, if any, are recorded on the ex-dividend date. Interest income, if any, is recorded on the accrual basis.
D. Dividends and Distributions to Shareholders
Dividends from net investment income of the Fund, if any, are declared and paid quarterly or as the Board may determine from time to time. Distributions of net realized capital gains earned by the Fund, if any, are distributed at least annually.
ALPS Equal Sector Weight ETF
| Notes to Financial Statements | May 31, 2019 (Unaudited) |
E. Federal Tax and Tax Basis Information
The timing and character of income and capital gain distributions are determined in accordance with income tax regulations, which may differ from U.S. GAAP. Reclassifications are made to the Fund’s capital accounts for permanent tax differences to reflect income and gains available for distribution (or available capital loss carryforwards) under income tax regulations. The amounts and characteristics of tax basis distributions and composition of distributable earnings/(accumulated losses) are finalized at fiscal year-end; accordingly, tax basis balances have not been determined as of May 31, 2019.
The tax character of the distributions paid during the fiscal year ended November 30, 2018 was as follows:
| | | Ordinary Income | |
| November 30, 2018 | | | |
| ALPS Equal Sector Weight ETF | | $ | 3,383,829 | |
Under current law, capital losses maintain their character as short-term or long-term and are carried forward to the next tax year without expiration. As of November 30, 2018, the following amounts are available as carry forwards to the next tax year:
| Fund | | Short-Term | | | Long-Term | |
| ALPS Equal Sector Weight ETF | | $ | – | | | $ | 377,895 | |
As of May 31, 2019, the cost of investments for federal income tax purposes and accumulated net unrealized appreciation/(depreciation) on investments were as follows:
| Gross appreciation (excess of value over tax cost) | | $ | 33,109,864 | |
| Gross depreciation (excess of tax cost over value) | | | (2,179,789 | ) |
| Net unrealized appreciation (depreciation) | | | 30,930,075 | |
| Cost of investments for income tax purposes | | $ | 132,896,975 | |
The differences between book-basis and tax-basis are primarily due to the deferral of losses from wash sales. In addition, certain tax cost basis adjustments are finalized at fiscal year-end and therefore have not been determined as of May 31, 2019.
F. Income Taxes
No provision for income taxes is included in the accompanying financial statements, as the Fund intends to distribute to shareholders all taxable investment income and realized gains and otherwise comply with Subchapter M of the Internal Revenue Code of 1986, as amended, applicable to regulated investment companies. The Fund evaluates tax positions taken (or expected to be taken) in the course of preparing the Fund’s tax returns to determine whether these positions meet a “more-likely-than-not” standard that, based on the technical merits, have a more than fifty percent likelihood of being sustained by a taxing authority upon examination. A tax position that meets the “more-likely-than-not” recognition threshold is measured to determine the amount of benefit to recognize in the financial statements.
As of and during the six months ended May 31, 2019, the Fund did not have a liability for any unrecognized tax benefits. The Fund files U.S. federal, state, and local tax returns as required. The Fund’s tax returns are subject to examination by the relevant tax authorities until expiration of the applicable statute of limitations, which is generally three years after the filing of the tax return, but may extend to four years in certain jurisdictions. Tax returns for open years have incorporated no uncertain tax positions that require a provision for income taxes.
G. Lending of Portfolio Securities
The Fund has entered into a securities lending agreement with State Street Bank & Trust Co. (“SSB”), the Fund’s lending agent. The Fund may lend its portfolio securities only to borrowers that are approved by SSB. The Fund will limit such lending to not more than 33 1/3% of the value of its total assets. The Fund’s securities held at SSB as custodian shall be available to be lent except those securities the Fund or ALPS Advisors, Inc. specifically identifies in writing as not being available for lending. The borrower pledges and maintains with the Fund collateral consisting of cash (U.S. Dollars only), securities issued or guaranteed by the U.S. government or its agencies or instrumentalities, and cash equivalents (including irrevocable bank letters of credit) issued by a person other than the borrower or an affiliate of the borrower. The initial collateral received by the Fund is required to have a value of no less than 102% of the market value of the loaned securities for U.S equity securities and a value of no less than 105% of the market value for non-U.S. equity securities. The collateral is maintained thereafter, at a market value equal to not less than 102% of the current value of the U.S. equity securities on loan and not less than 105% of the current value of the non-U.S. equity securities on loan. The market value of the loaned securities is determined at the close of each business day and any additional required collateral is delivered to the Fund on the next business day. During the term of the loan, the Fund is entitled to all distributions made on or in respect of the loaned securities. Loans of securities are terminable at any time and the borrower, after notice, is required to return borrowed securities within the customary time period for settlement of securities transactions.
ALPS Equal Sector Weight ETF
| Notes to Financial Statements | May 31, 2019 (Unaudited) |
Any cash collateral received is reinvested in a money market fund managed by SSB as disclosed in the Fund’s Schedule of Investments and is reflected in the Statements of Assets and Liabilities as a payable for collateral upon return of securities loaned. Non-cash collateral, in the form of securities issued or guaranteed by the U.S. government or its agencies or instrumentalities, is not disclosed in the Fund’s Statements of Assets and Liabilities as it is held by the lending agent on behalf of the Fund, and the Fund does not have the ability to re-hypothecate these securities. Income earned by the Fund from securities lending activity is disclosed in the Statement of Operations.
The following is a summary of the Fund's securities lending agreement and related cash and non-cash collateral received as of May 31, 2019.
| | | | | | | | | | | | | |
| | | Market Value
of Securities
on Loan | | | Cash Collateral
Received | | | Non-Cash Collateral
Received | | | Total Collateral
Received | |
| ALPS Equal Sector Weight ETF | | $ | 15,699,776 | | | $ | 12,892,865 | | | $ | 3,527,301 | | | $ | 16,420,166 | |
The risks of securities lending include the risk that the borrower may not provide additional collateral when required or may not return the securities when due. To mitigate these risks, the Fund benefits from a borrower default indemnity provided by SSB. SSB’s indemnity allows for full replacement of securities lent wherein SSB will purchase the unreturned loaned securities on the open market by applying the proceeds of the collateral, or to the extent such proceeds are insufficient or the collateral is unavailable, SSB will purchase the unreturned loan securities at SSB’s expense. However, the Fund could suffer a loss if the value of the investments purchased with cash collateral falls below the value of the cash collateral received.
The following table reflects a breakdown of transactions accounted for as secured borrowings, the gross obligation by the type of collateral pledged or securities loaned, and the remaining contractual maturity of those transactions as of May 31, 2019:
| ALPS Equal Sector Weight ETF | Remaining contractual maturity of the agreements | |
| | | | |
| Securities Lending Transactions | | Overnight & Continuous | | | Up to 30 days | | | 30-90 days | | | Greater than
90 days | | | Total | |
| Common Stocks | | $ | 12,892,865 | | | $ | – | | | $ | – | | | $ | – | | | $ | 12,892,865 | |
| Total Borrowings | | | | | | | | | | | | | | | | | | | 12,892,865 | |
| Gross amount of recognized liabilities for securities lending (collateral received) | | | $ | 12,892,865 | |
3. INVESTMENT ADVISORY FEE AND OTHER AFFILIATED TRANSACTIONS
ALPS Advisors, Inc. (the “Adviser”) serves as the Fund’s investment adviser pursuant to an Investment Advisory Agreement with the Trust on behalf of the Fund (the “Advisory Agreement”). Pursuant to the Advisory Agreement, the Fund pays the Adviser an annual management fee for the services and facilities it provides, payable on a monthly basis at the annual rate of 0.37% of the Fund’s average daily net assets.
Effective March 31, 2019, the Adviser has contractually agreed to waive 0.19% of its annual unitary fee payable by the Fund until at least March 31, 2020. The waiver may only be terminated by the Fund's Board of Trustees prior to such date.
ALPS Portfolio Solutions Distributor, Inc. (“APSD”) is both the distributor for the Fund as well as the Select Sector SPDR exchange traded funds (“Underlying Sector ETFs”) that the Fund invests in. As required by exemptive relief obtained by the Underlying Sector ETFs, the Adviser will reimburse the Fund an amount equal to the distribution fee received by APSD from the Underlying Sector ETFs attributable to the Fund’s investment in the Underlying Sector ETFs, for so long as APSD acts as the distributor to the Fund and the Underlying Sector ETFs. Such reimbursement is generally expected to equal 0.03% annually.
Out of the unitary management fees, the Adviser pays substantially all expenses of the Fund, including licensing fees to the Underlying Index provider, the cost of transfer agency, custody, fund administration, legal, audit, independent trustees and other services, except for acquired fund fees and expenses, interest expenses, distribution fees or expenses, brokerage expenses, taxes and extraordinary expenses not incurred in the ordinary course of the Fund's business. The Adviser’s unitary management fee is designed to pay substantially all of the Fund’s expenses and to compensate the Adviser for providing services to the Fund.
ALPS Equal Sector Weight ETF
| Notes to Financial Statements | May 31, 2019 (Unaudited) |
ALPS Fund Services, Inc., an affiliate of the Adviser, is the administrator of the Fund.
Each Trustee who is not an officer or employee of the Adviser, any sub-adviser or any of their affiliates (“Independent Trustees”) receives (1) a quarterly retainer of $5,000, (2) a per meeting fee for regularly scheduled meetings of $3,750, (3) $1,500 for any special meeting held outside of a regularly scheduled board meeting, and (4) reimbursement for all reasonable out-of-pocket expenses relating to attendance at meetings. In addition, the Chairman of the Board and Chairman of the Audit Committee each receives a quarterly retainer of $2,000, in connection with their respective roles.
4. PURCHASES AND SALES OF SECURITIES
For the six months ended May 31, 2019 the cost of purchases and proceeds from sales of investment securities, excluding short-term investments and in-kind transactions, were as follows:
| Fund | | Purchases | | | Sales | |
| ALPS Equal Sector Weight ETF | | $ | 4,751,448 | | | $ | 7,639,600 | |
For the year ended May 31, 2019, the cost of in-kind purchases and proceeds from in-kind sales were as follows:
| Fund | | Purchases | | | Sales | |
| ALPS Equal Sector Weight ETF | | $ | 6,742,235 | | | $ | 7,373,604 | |
For the six months ended May 31, 2019, the ALPS Equal Sector Weight ETF had in-kind net realized gain of $2,686,772.
Gains on in-kind transactions are not considered taxable for federal income tax purposes and losses on in-kind transactions are also not deductible for tax purposes.
5. CAPITAL SHARE TRANSACTIONS
Shares are created and redeemed by the Fund only in Creation Unit size aggregations of 50,000 Shares. Only broker-dealers or large institutional investors with creation and redemption agreements called Authorized Participants (“AP”) are permitted to purchase or redeem Creation Units from the Fund. Such transactions are generally permitted on an in-kind basis, with a balancing cash component to equate the transaction to the NAV per unit of the Fund on the transaction date. Cash may be substituted equivalent to the value of certain securities generally when they are not available in sufficient quantity for delivery, not eligible for trading by the AP or as a result of other market circumstances.
ALPS Equal Sector Weight ETF
| Additional Information | May 31, 2019 (Unaudited) |
PROXY VOTING RECORDS, POLICIES AND PROCEDURES
Information regarding how the Fund voted proxies relating to portfolio securities during the most recent 12-month period ended June 30 and a description of the Fund’s proxy voting policies and procedures used in determining how to vote for proxies are available without charge on the SEC’s website at www.sec.gov and upon request, by calling (toll-free) 1-866-675-2639.
PORTFOLIO HOLDINGS
The Trust is required to disclose, after its first and third fiscal quarters, the complete schedule of the Fund’s portfolio holdings with the SEC on Form N-Q or as an exhibit to its report on Form N-PORT. Forms N-Q or N-PORT reports for the Fund are available on the SEC’s website at www.sec.gov. The Fund’s Forms N-Q or N-PORT reports are available without charge, upon request, by calling (toll-free) 1-866-675-2639 or by writing to ALPS ETF Trust at 1290 Broadway, Suite 1100, Denver, Colorado 80203.
TAX INFORMATION
The Fund designates the following as a percentage of taxable ordinary income distributions, or up to the maximum amount allowable, for the calendar year ended December 31, 2018:
| | Qualified Dividend Income | Dividend Received Deduction |
| ALPS Equal Sector Weight ETF | 77.12% | 79.24% |
In early 2019, if applicable, shareholders of record received this information for the distribution paid to them by the Fund during the calendar year 2018 via Form 1099. The Fund will notify shareholders in early 2020 of amounts paid to them by the Fund, if any, during the calendar year 2019.
LICENSING AGREEMENT
ICE Data Indices, LLC (“ICE Data” or the “Licensor”) has entered into an index licensing agreement with ALPS Advisors Inc. to allow ALPS Advisors Inc.’s use of the Underlying Index of the ALPS Equal Sector Weight ETF. The following disclosure relates to the Licensor:
NYSE Select Sector Equal Weight IndexSM is a service mark of ICE Data Indices, LLC or its affiliates (“ICE Data”) and has been licensed for use by ALPS Advisors, Inc. (the “Adviser”) in connection with ALPS Equal Sector Weight ETF (the “Fund”). Neither the Trust nor the Fund is sponsored, endorsed, sold or promoted by ICE Data. ICE Data makes no representations or warranties regarding the Adviser or the Fund or the ability of the NYSE Select Sector Equal Weight IndexSM to track general stock market performance.
ICE DATA MAKES NO EXPRESS OR IMPLIED WARRANTIES, AND HEREBY EXPRESSLY DISCLAIMS ALL WARRANTIES OF MERCHANTABILITY OR FITNESS FOR A PARTICULAR PURPOSE WITH RESPECT TO THE NYSE SELECT SECTOR EQUAL WEIGHT INDEXSM OR ANY DATA INCLUDED THEREIN. IN NO EVENT SHALL ICE DATA HAVE ANY LIABILITY FOR ANY SPECIAL, PUNITIVE, INDIRECT, OR CONSEQUENTIAL DAMAGES (INCLUDING LOST PROFITS), EVEN IF NOTIFIED OF THE POSSIBILITY OF SUCH DAMAGES.
The Adviser does not guarantee the accuracy and/or the completeness of the Underlying Index or any data included therein, and the Adviser shall have no liability for any errors, omissions or interruptions therein. The Adviser makes no warranty, express or implied, as to results to be obtained by the Fund, owners of the Shares of the Fund or any other person or entity from the use of the Underlying Index or any data included therein. The Adviser makes no express or implied warranties, and expressly disclaims all warranties of merchantability or fitness for a particular purpose or use with respect to the Underlying Index or any data included therein. Without limiting any of the foregoing, in no event shall the Adviser have any liability for any special, punitive, direct, indirect or consequential damages (including lost profits) arising out of matters relating to the use of the Underlying Index even if notified of the possibility of such damages.
Intentionally Left Blank

TABLE OF
CONTENTS
| Performance Overview | |
| ALPS Clean Energy ETF | 1 |
| ALPS Disruptive Technologies ETF | 3 |
| ALPS Medical Breakthroughs ETF | 5 |
| Disclosure of Fund Expenses | 8 |
| Financial Statements | |
| Schedule of Investments | |
| ALPS Clean Energy ETF | 9 |
| ALPS Disruptive Technologies ETF | 10 |
| ALPS Medical Breakthroughs ETF | 12 |
| Statements of Assets and Liabilities | 14 |
| Statements of Operations | 15 |
| Statements of Changes in Net Assets | |
| ALPS Clean Energy ETF | 16 |
| ALPS Disruptive Technologies ETF | 17 |
| ALPS Medical Breakthroughs ETF | 18 |
| Financial Highlights | 19 |
| Notes to Financial Statements | 22 |
| Additional Information | 30 |
Beginning on January 1, 2021, as permitted by regulations adopted by the U.S. Securities and Exchange Commission, paper copies of the Funds’ annual and semi-annual shareholder reports will no longer be sent by mail, unless you specifically request paper copies of the reports from your financial intermediary (such as a broker-dealer or bank). Instead, the reports will be made available on the Funds’ website (www.alpsfunds.com), and you will be notified by mail each time a report is posted and provided with a website link to access the report.
If you already elected to receive shareholder reports electronically, you will not be affected by this change and you need not take any action. You may elect to receive shareholder reports and other communications from a Fund electronically anytime by contacting your financial intermediary.
You may elect to receive all future reports in paper free of charge. You can contact your financial intermediary to request that you continue to receive paper copies of your shareholder reports. Your election to receive reports in paper will apply to all funds held in your account with your financial intermediary.
alpsfunds.com
ALPS Clean Energy ETF
| Performance Overview | May 31, 2019 (Unaudited) |
Investment Objective
The ALPS Clean Energy ETF (the “Fund” or “ACES”) seeks investment results that correspond (before fees and expenses) generally to the performance of its underlying index, the CIBC Atlas Clean Energy Total Return Index (NACEX) (the “Underlying Index”). The Underlying Index utilizes a rules-based methodology developed by CIBC National Trust Company, which is designed to provide exposure to a diverse set of U.S. and Canadian companies involved in the clean energy sector including renewables and clean technology.
Fund Performance(as of May 31, 2019)
| | 6 Months | Since Inception^ |
| ALPS Clean Energy ETF - NAV | 8.61% | 8.96% |
| ALPS Clean Energy ETF - Market Price* | 7.76% | 8.75% |
| S&P 1000® Total Return Index | -4.10% | -7.64% |
| CIBC Atlas Clean Energy Total Return Index | 8.72% | 10.16% |
Total Expense Ratio (per the current prospectus) 0.65%.
Performance data quoted represents past performance. Past performance does not guarantee future results. The table does not reflect the deduction of taxes that a shareholder would pay on Fund distributions or the redemption of Fund shares. Investment return and principal value of an investment will fluctuate so that an investor’s shares, when sold or redeemed, may be worth more or less than the original cost. Current performance data may be higher or lower than actual data quoted. For the most current month-end performance data please visit www.alpsfunds.com or call 1.866.759.5679.
NAV is an exchange-traded fund’s per-share value. The per-share dollar amount of the fund is derived by dividing the total value of all the securities in its portfolio, less any liabilities, by the number of fund shares outstanding. Market Price is the price at which a share can currently be traded in the market. Information detailing the number of days the Market Price of the Fund was greater than the Fund’s NAV and the number of days it was less than the Fund’s NAV can be obtained at www.alpsfunds.com.
| ^ | The Fund commenced operations on June 28, 2018, with the first day of trading on the exchange of June 29, 2018. Total return for a period of less than one year is not annualized. |
| * | Market Price is based on the midpoint of the bid-ask spread at 4 p.m. ET and does not represent the returns an investor would receive if shares were traded at other times. |
The Fund is new with limited operating history.
CIBC Atlas Clean Energy Total Return Index is an adjusted market cap weighted index designed to provide exposure to a diverse set of U.S. or Canadian based companies involved in the clean energy sector including renewables and clean technology. The clean energy sector is comprised of companies that provide the products and services which enable the evolution of a more sustainable energy sector. Clean energy business segments include but are not limited to: solar, wind, hydro, geothermal, electric vehicles, LED, biomass, smart grid, energy efficiency and storage. Total return assumes reinvestment of any dividends and distributions realized during a given time period.
The S&P 1000® Total Return Index combines the S&P MidCap 400® and the S&P SmallCap 600®to form an investable benchmark for the mid- to small-cap segment of the U.S. equity market. Total return assumes reinvestment of any dividends and distributions realized during a given time period.
One cannot invest directly in an index. Index performance does not reflect fund performance.
The Fund’s shares are not individually redeemable. Investors buy and sell shares of the Fund on a secondary market. Only market makers or “authorized participants” may trade directly with the Fund, typically in blocks of 50,000 shares.
The ALPS Clean Energy ETF is not suitable for all investors. Investments in the Fund are subject to investment risks, including possible loss of the principal amount invested.
ALPS Portfolio Solutions Distributor, Inc., a FINRA member, is the Distributor for the ALPS Clean Energy ETF.
ALPS Clean Energy ETF
| Performance Overview | May 31, 2019 (Unaudited) |
Top Ten Holdings*(as of May 31, 2019)
| First Solar, Inc. | 5.44% |
| Pattern Energy Group, Inc. | 5.39% |
| Brookfield Renewable Partners LP | 5.36% |
| Ormat Technologies, Inc. | 5.31% |
| NextEra Energy Partners LP | 5.18% |
| Itron, Inc. | 5.09% |
| Cree, Inc. | 5.03% |
| Covanta Holding Corp. | 4.97% |
| Northland Power, Inc. | 4.95% |
| Universal Display Corp. | 4.83% |
| Total % of Top 10 Holdings | 51.55% |
| * | % of Total Investments (excluding investments purchased with collateral from securities loaned) |
Clean Energy Segment Allocation*(as of May 31, 2019)

Future holdings are subject to change.
Growth of $10,000(as of May 31, 2019)
Comparison of change in value of a $10,000 investment in the Fund and the Index

The chart above represents historical performance of a hypothetical investment of $10,000 in the Fund over the life of the Fund. Performance calculations are as of the end of each month. Past performance does not guarantee future results. This chart does not reflect the deduction of taxes that a shareholder would pay on Fund distributions or the redemption of Fund shares.
ALPS Disruptive Technologies ETF
| Performance Overview | May 31, 2019 (Unaudited) |
Investment Objective
ALPS Disruptive Technologies ETF (the “Fund” or “DTEC”) employs a “passive management” - or indexing - investment approach designed to seek investment results that correspond (before fees and expenses) generally to the performance of the Indxx Disruptive Technologies Net Total Return Index (the “Underlying Index”). The Shares of the Fund are listed and trade on the Cboe BZX under the ticker symbol DTEC. The Fund will invest at least 80% of its net assets in securities that comprise the Underlying Index.
The Underlying Index utilizes a rules-based methodology developed by Indxx, LLC (the “Index Provider”), which is designed to identify the companies using disruptive technologies in each of ten thematic areas: Healthcare Innovation, Internet of Things, Clean Energy and Smart Grid, Cloud Computing, Data and Analytics, FinTech, Robotics and Artificial Intelligence, Cybersecurity, 3D Printing, and Mobile Payments (each a “Theme” and together, the “Themes”). Companies using disruptive technologies are those that are entering traditional markets with new digital forms of production and distribution, seek to disrupt an existing market and value network, displace established market-leading firms, products and alliances and increasingly gain market share. The Underlying Index is compiled by the Index Provider and may be comprised of U.S. and non-U.S. companies, including foreign and emerging markets companies. In order to be eligible for inclusion in the Underlying Index’s Index Universe, a company’s stock must be traded on one or more major global securities exchanges, have a minimum market capitalization of at least $500 million, and have a six month minimum average daily trading volume of $2 million, and the company must derive a minimum of 50% of its revenue from a single Theme. All equity securities meeting the above criteria are selected for inclusion in the Index Universe. From the Index Universe, the Underlying Index methodology selects ten stocks in each Theme according to proprietary quantitative and qualitative factors. The eligible stocks that are selected for inclusion in the Index’s portfolio are equally weighted. The Underlying Index is reconstituted annually on the third Friday of September and rebalanced quarterly.
Fund Performance(as of May 31, 2019)
| | 6 Months | 1 Year | Since Inception^ |
| ALPS Disruptive Technologies ETF - NAV | 8.68%* | 3.17% | 9.34% |
| ALPS Disruptive Technologies ETF - Market Price** | 8.60% | 2.54% | 9.31% |
| MSCI All Country World Net Total Return Index | 1.40% | -1.29% | -0.90% |
| Indxx Disruptive Technologies Net Total Return Index | 8.49% | 3.12% | 9.47% |
Total Expense Ratio (per the current prospectus) 0.50%.
Performance data quoted represents past performance. Past performance does not guarantee future results. The table does not reflect the deduction of taxes that a shareholder would pay on Fund distributions or the redemption of Fund shares. Investment return and principal value of an investment will fluctuate so that an investor’s shares, when sold or redeemed, may be worth more or less than the original cost. Current performance data may be higher or lower than actual data quoted. For the most current month-end performance data please visit www.alpsfunds.com or call 1.866.759.5679.
NAV is an exchange-traded fund’s per-share value. The per-share dollar amount of the fund is derived by dividing the total value of all the securities in its portfolio, less any liabilities, by the number of fund shares outstanding. Market Price is the price at which a share can currently be traded in the market. Information detailing the number of days the Market Price of the Fund was greater than the Fund’s NAV and the number of days it was less than the Fund’s NAV can be obtained at www.alpsfunds.com.
| ^ | The Fund commenced operations on December 28, 2017, with the first day of trading on the exchange of December 29, 2017. |
| * | Excludes adjustments in accordance with accounting principles generally accepted in the United States of America and as such, the net asset value and total return for shareholder transactions reported to the market may differ from the net asset value for financial reporting purposes. |
| ** | Market Price is based on the midpoint of the bid-ask spread at 4 p.m. ET and does not represent the returns an investor would receive if shares were traded at other times. |
Indxx Disruptive Technologies Net Total Return Index (Ticker: IDTEC) is based around companies that enter traditional markets with new digital forms of production and distribution, are likely to disrupt an existing market and value network, displace established market leading firms, products and alliances and increasingly gain market share. Total Return assumes reinvestment of any dividends and distributions realized during a given time period. Net Total Return (NTR) is obtained by reinvesting the net dividend, which is equal to the ordinary gross dividend minus the amount of withholding tax.
The MSCI All Country World Net Total Return Index, MSCI’s flagship global equity index, is designed to represent performance of the full opportunity set of large- and mid-cap stocks across 23 developed and 24 emerging markets. As of September 2018, it covers more than 2,700 constituents across 11 sectors and approximately 85% of the free float-adjusted market capitalization in each market.
One cannot invest directly in an index. Index performance does not reflect fund performance.
ALPS Disruptive Technologies ETF
| Performance Overview | May 31, 2019 (Unaudited) |
The Fund’s shares are not individually redeemable. Investors buy and sell shares of the Fund on a secondary market. Only market makers or “authorized participants” may trade directly with the Fund, typically in blocks of 50,000 shares.
The ALPS Disruptive Technologies ETF is not suitable for all investors. Investments in the Fund are subject to investment risks, including possible loss of the principal amount invested.
ALPS Portfolio Solutions Distributor, Inc., a FINRA member, is the Distributor for the ALPS Disruptive Technologies ETF.
Top Ten Holdings*(as of May 31, 2019)
| Okta, Inc. | 1.42% |
| SLM Solutions Group AG | 1.36% |
| Worldpay, Inc. | 1.30% |
| Align Technology, Inc. | 1.25% |
| LendingTree, Inc. | 1.25% |
| Silicon Laboratories, Inc. | 1.22% |
| Temenos AG | 1.22% |
| Xero, Ltd. | 1.21% |
| Wirecard AG | 1.21% |
| Thomson Reuters Corp. | 1.19% |
| Total % of Top 10 Holdings | 12.63% |
| * | % of Total Investments (excluding investments purchased with collateral from securities loaned) |
Thematic Allocation*(as of May 31, 2019)

Future holdings are subject to change.
Growth of $10,000(as of May 31, 2019)
Comparison of change in value of a $10,000 investment in the Fund and the Index

The chart above represents historical performance of a hypothetical investment of $10,000 in the Fund over the life of the Fund. Performance calculations are as of the end of each month. Past performance does not guarantee future results. This chart does not reflect the deduction of taxes that a shareholder would pay on Fund distributions or the redemption of Fund shares.
ALPS Medical Breakthroughs ETF
| Performance Overview | May 31, 2019 (Unaudited) |
Investment Objective
ALPS Medical Breakthroughs ETF (the “Fund” or “SBIO”) employs a “passive management” - or indexing - investment approach designed to seek investment results that correspond (before fees and expenses) generally to the performance of the Poliwogg Medical Breakthroughs Total Return IndexSM (the “Underlying Index”).
The Underlying Index is comprised of small- and mid-cap stocks of biotechnology companies that have one or more drugs in either Phase II or Phase III U.S. Food and Drug Administration (“FDA”) clinical trials. In a Phase II trial, the drug is administered to a group of 100-300 people to see if it is effective and to evaluate its safety. In a Phase III trial, the drug is given to a larger group, between 500-3,000 people, to confirm its effectiveness, monitor side effects, compare it to commonly used treatments and collect information that will allow the drug or treatment to be used safely. Stocks selected for inclusion in the Underlying Index must be listed on a U.S. stock exchange. Underlying Index constituents must have a market capitalization of no less than $200 million and no more than $5 billion. Stocks included in the Underlying Index must also sustain an average daily trading volume in excess of $1 million for the 90-day period preceding an Underlying Index reconstitution. Constituents must be able to sustain the monthly rates at which they use shareholder capital (“cash burn rates”) for at least 24 months. The Underlying Index is reconstituted semi-annually on the third Fridays of June and December.
Fund Performance(as of May 31, 2019)
| | 6 Months | 1 Year | 3 Year | Since Inception^ |
| ALPS Medical Breakthroughs ETF - NAV | -1.03% | -12.97% | 10.06% | 7.44% |
| ALPS Medical Breakthroughs ETF - Market Price* | -1.00% | -12.92% | 10.06% | 7.45% |
| Poliwogg Medical Breakthroughs Total Return Index | -0.75% | -12.84% | 10.34% | 7.80% |
| NASDAQ Biotechnology Total Return Index | -8.22% | -7.39% | 2.89% | 0.11% |
Total Expense Ratio (per the current prospectus) 0.50%
Performance data quoted represents past performance. Past performance does not guarantee future results. Investment return and principal value of an investment will fluctuate so that an investor’s shares, when sold or redeemed, may be worth more or less than the original cost. Current performance data may be higher or lower than actual data quoted. For most current month-end performance data please visit www.alpsfunds.com or call 1.844.234.5852.
NAV is an exchange-traded fund’s per-share value. The per-share dollar amount of the fund is derived by dividing the total value of all the securities in its portfolio, less any liabilities, by the number of fund shares outstanding. Market Price is the price at which a share can currently be traded in the market. Information detailing the number of days the Market Price of the Fund was greater than the Fund’s NAV and the number of days it was less than the Fund’s NAV can be obtained at www.alpsfunds.com.
| ^ | The Fund commenced investment operations on December 31, 2014. |
| * | Market Price is based on the midpoint of the bid-ask spread at 4 p.m. ET and does not represent the returns an investor would receive if shares were traded at other times. |
NASDAQ Biotechnology Total Return Index (Ticker: NBI) is a modified market capitalization-weighted index designed to measure the performance of the all NASDAQ stocks in the biotechnology sector. Total return assumes reinvestment of any dividends and distributions realized during a given time period.
Poliwogg Medical Breakthroughs Total Return Indexis designed to capture research and development opportunities in the pharmaceutical industry. PMBI consists of small-cap and mid-cap pharmaceutical and biotechnology stocks listed on U.S. stock exchanges that have one or more drugs in either Phase II or Phase III U.S. FDA clinical trials. Total return assumes reinvestment of any dividends and distributions realized during a given time period.
One cannot invest directly in an index. Index performance does not reflect fund performance.
Companies in the pharmaceuticals and biotechnology industry may be subject to extensive litigation based on product liability and similar claims. Legislation introduced or considered by certain governments on such industries or on the healthcare sector cannot be predicted.
Companies in the pharmaceuticals industry are subject to competitive forces that may make it difficult to raise prices and, in fact, may result in price discounting. The profitability of some companies in the pharmaceuticals industry may be dependent on a relatively limited number of products. In addition, their products can become obsolete due to industry innovation, changes in technologies or other market developments. Many new products in the pharmaceuticals industry are subject to government approvals, regulation and reimbursement rates. The process of obtaining government approvals may be long and costly. Many companies in the pharmaceuticals industry are heavily dependent on patents and intellectual property rights. The loss or impairment of these rights may adversely affect the profitability of these companies.
ALPS Medical Breakthroughs ETF
| Performance Overview | May 31, 2019 (Unaudited) |
The development of new drugs generally has a high failure rate, and such failures may negatively impact the stock price of the company developing the failed drug. Biotechnology companies may have persistent losses during a new product’s transition from development to production. In order to fund operations, biotechnology companies may require financing from the capital markets, which may not always be available on satisfactory terms or at all.
The Fund’s shares are not individually redeemable. Investors buy and sell shares of the Fund on a secondary market. Only market makers or “authorized participants” may trade directly with the Fund, typically in blocks of 50,000 shares.
The ALPS Medical Breakthroughs ETF is not suitable for all investors. Investments in the Fund are subject to investment risks, including possible loss of the principal amount invested.
ALPS Portfolio Solutions Distributor, Inc., a FINRA member, is the Distributor for the ALPS Medical Breakthroughs ETF.
ALPS Portfolio Solutions Distributor, Inc. is not affiliated with S-Network Global Indexes, Inc.
Top Ten Holdings*(as of May 31, 2019)
| Array BioPharma, Inc. | 5.68% |
| Galapagos NV | 5.56% |
| Ascendis Pharma A/S | 4.93% |
| Global Blood Therapeutics, Inc. | 4.59% |
| United Therapeutics Corp. | 3.60% |
| Arena Pharmaceuticals, Inc. | 3.56% |
| Agios Pharmaceuticals, Inc. | 3.49% |
| Immunomedics, Inc. | 3.38% |
| Mirati Therapeutics, Inc. | 3.14% |
| FibroGen, Inc. | 3.14% |
| Total % of Top 10 Holdings | 41.07% |
| * | % of Total Investments (excluding investments purchased with collateral from securities loaned) |
Sector Allocation*(as of May 31, 2019)
Future holdings are subject to change.
ALPS Medical Breakthroughs ETF
| Performance Overview | May 31, 2019 (Unaudited) |
Growth of $10,000(as of May 31, 2019)
Comparison of change in value of a $10,000 investment in the Fund and the Index

The chart above represents historical performance of a hypothetical investment of $10,000 in the Fund over the life of the Fund. Performance calculations are as of the end of each month. Past performance does not guarantee future results. This chart does not reflect the deduction of taxes that a shareholder would pay on Fund distributions or the redemption of Fund shares.
ALPS ETF Trust
| Disclosure of Fund Expenses | May 31, 2019 (Unaudited) |
Shareholder Expense Example: As a shareholder of a Fund, you incur two types of costs: (1) transaction costs which may include creation and redemption fees or brokerage charges, and (2) ongoing costs, including management fees and other Fund expenses. These examples are intended to help you understand your ongoing costs (in dollars) of investing in a Fund and to compare these costs with the ongoing costs of investing in other funds. It is based on an investment of $1,000 invested at the beginning of the (six month) period and held through May 31, 2019.
Actual Return: The first line of the table provides information about actual account values and actual expenses. You may use the information in this line, together with the amount you invested, to estimate the expenses that you incurred over the period. Simply divide your account value by $1,000 (for example, an $8,600 account value divided by $1,000 = 8.6), then multiply the result by the number in the first line under the heading entitled “Expenses Paid During Period” to estimate the expenses attributable to your investment during this period.
Hypothetical 5% Return: The second line of the table provides information about hypothetical account values and hypothetical expenses based on the Fund’s actual expense ratio and an assumed rate of return of 5% per year before expenses, which is not the Fund’s actual return. The hypothetical account values and expenses may not be used to estimate the actual ending account balance or expenses you paid for the period. You may use this information to compare ongoing costs of investing in the Fund and other funds. To do so, compare this 5% hypothetical example with the 5% hypothetical examples that appear in the shareholder reports of the other funds.
The expenses shown in the table are meant to highlight ongoing Fund costs only and do not reflect any transaction costs, such as creation and redemption fees or brokerage charges. Therefore, the second line is useful in comparing ongoing costs only, and will not help you determine the relative total costs of owning different funds. In addition, if these costs were included, your costs would have been higher.
| | Beginning Account Value 12/1/18 | Ending Account Value 5/31/19 | Expense
Ratio(a) | Expenses Paid
During Period
12/1/18 - 5/31/19(b) |
| ALPS Clean Energy ETF | | | | |
| Actual | $1,000.00 | $1,086.10 | 0.65% | $3.38 |
| Hypothetical (5% return before expenses) | $1,000.00 | $1,021.69 | 0.65% | $3.28 |
| ALPS Disruptive Technologies ETF | | | | |
| Actual | $1,000.00 | $1,086.40 | 0.50% | $2.60 |
| Hypothetical (5% return before expenses) | $1,000.00 | $1,022.44 | 0.50% | $2.52 |
| ALPS Medical Breakthroughs ETF | | | | |
| Actual | $1,000.00 | $989.70 | 0.50% | $2.48 |
| Hypothetical (5% return before expenses) | $1,000.00 | $1,022.44 | 0.50% | $2.52 |
| (a) | Annualized, based on the Fund's most recent fiscal half year expenses. |
| (b) | Expenses are equal to the Fund's annualized expense ratio multiplied by the average account value over the period, multiplied by the number of days in the most recent fiscal half year (182), divided by 365. |
ALPS Clean Energy ETF
| Schedule of Investments | May 31, 2019 (Unaudited) |
| Security Description | | Shares | | | Value | |
| COMMON STOCKS (88.05%) |
| Consumer Discretionary (3.14%) | | | | | | | | |
| Tesla, Inc.(a) | | | 9,844 | | | $ | 1,822,715 | |
| | | | | | | | | |
| Energy (3.80%) | | | | | | | | |
| Green Plains, Inc. | | | 59,022 | | | | 770,237 | |
| Renewable Energy Group, Inc.(a) | | | 55,320 | | | | 865,205 | |
| REX American Resources Corp.(a) | | | 8,407 | | | | 567,220 | |
| Total Energy | | | | | | | 2,202,662 | |
| | | | | | | | | |
| Industrials (24.59%) | | | | | | | | |
| Acuity Brands, Inc. | | | 21,936 | | | | 2,712,824 | |
| Ameresco, Inc., Class A(a) | | | 24,637 | | | | 357,237 | |
| American Superconductor Corp.(a)(b) | | | 24,901 | | | | 242,287 | |
| Ballard Power Systems, Inc.(a)(b) | | | 236,994 | | | | 910,057 | |
| Covanta Holding Corp. | | | 170,743 | | | | 2,878,727 | |
| Enphase Energy, Inc.(a)(b) | | | 134,943 | | | | 2,047,085 | |
| Plug Power, Inc.(a)(b) | | | 353,672 | | | | 905,400 | |
| Sunrun, Inc.(a) | | | 150,978 | | | | 2,364,316 | |
| TPI Composites, Inc.(a) | | | 45,521 | | | | 949,113 | |
| Vivint Solar, Inc.(a)(b) | | | 61,485 | | | | 400,882 | |
| Willdan Group, Inc.(a) | | | 15,723 | | | | 489,300 | |
| Total Industrials | | | | | | | 14,257,228 | |
| | | | | | | | | |
| Information Technology (21.56%) | | | | | | | | |
| Cree, Inc.(a) | | | 52,773 | | | | 2,909,903 | |
| First Solar, Inc.(a) | | | 54,286 | | | | 3,150,759 | |
| Itron, Inc.(a) | | | 51,962 | | | | 2,943,647 | |
| SunPower Corp.(a) | | | 93,943 | | | | 700,815 | |
| Universal Display Corp. | | | 19,036 | | | | 2,796,959 | |
| Total Information Technology | | | | | | | 12,502,083 | |
| | | | | | | | | |
| Real Estate (4.02%) | | | | | | | | |
| Hannon Armstrong Sustainable Infrastructure Capital, Inc. | | | 89,916 | | | | 2,329,724 | |
| | | | | | | | | |
| Utilities (30.94%) | | | | | | | | |
| Boralex, Inc., Class A | | | 132,151 | | | | 1,804,903 | |
| Clearway Energy, Inc., Class C | | | 111,755 | | | | 1,676,325 | |
| Innergex Renewable Energy, Inc. | | | 185,699 | | | | 1,939,975 | |
| Northland Power, Inc. | | | 155,250 | | | | 2,867,002 | |
| Ormat Technologies, Inc. | | | 52,027 | | | | 3,071,674 | |
| Pattern Energy Group, Inc., Class A | | | 147,058 | | | | 3,119,101 | |
| TerraForm Power, Inc., Class A | | | 110,851 | | | | 1,496,489 | |
| Security Description | | Shares | | | Value | |
| Utilities (continued) | | | | | | | | |
| TransAlta Renewables, Inc. | | | 197,178 | | | $ | 1,969,446 | |
| Total Utilities | | | | | | | 17,944,915 | |
| | | | | | | | | |
| TOTAL COMMON STOCKS |
| (Cost $50,836,267) | | | | | | | 51,059,327 | |
| | | | | | | | | |
| MASTER LIMITED PARTNERSHIPS (11.68%) |
| Energy (1.17%) | | | | | | | | |
| Enviva Partners LP | | | 22,155 | | | | 675,728 | |
| | | | | | | | | |
| Utilities (10.51%) | | | | | | | | |
| Brookfield Renewable Partners LP | | | 96,307 | | | | 3,099,551 | |
| NextEra Energy Partners LP | | | 67,703 | | | | 2,995,858 | |
| Total Utilities | | | | | | | 6,095,409 | |
| | | | | | | | | |
| TOTAL MASTER LIMITED PARTNERSHIPS |
| (Cost $6,733,897) | | | | | | | 6,771,137 | |
| | | 7 Day Yield | | | Shares | | | Value | |
| SHORT TERM INVESTMENTS (6.44%) | | | | |
| Money Market Fund (0.07%) | | | | | | | | |
| State Street Institutional Treasury Plus Money Market Fund | | | | | | | | | | | | |
| (Cost $39,432) | | | 2.309 | % | | | 39,432 | | | | 39,432 | |
| | | | | | | | | | | | | |
| Investments Purchased with Collateral from Securities Loaned (6.36%) | | | | | | | | | | | | |
| State Street Navigator Securities Lending Government Money Market Portfolio, 2.34% | | | | | | | | | | | | |
| (Cost $3,688,243) | | | | | | | 3,688,243 | | | | 3,688,243 | |
| TOTAL SHORT TERM INVESTMENTS | | | | | |
| (Cost $3,727,675) | | | | | | | | | | | 3,727,675 | |
| | | | | | | | | | | | | |
| TOTAL INVESTMENTS (106.16%) |
| (Cost $61,297,839) | | | | | | | $ | 61,558,139 | |
| LIABILITIES IN EXCESS OF OTHER ASSETS (-6.16%) | | | | (3,573,944 | ) |
| NET ASSETS - 100.00% | | | $ | 57,984,195 | |
| (a) | Non-income producing security. |
| (b) | Security, or a portion of the security position is currently on loan. The total market value of securities on loan is $3,691,725. |
See Notes to Financial Statements.
ALPS Disruptive Technologies ETF
| Schedule of Investments | May 31, 2019 (Unaudited) |
| Security Description | | Shares | | | Value | |
| COMMON STOCKS (99.76%) | | | | | | | | |
| Communication Services (1.90%) | | | | | | | | |
| Netflix, Inc.(a) | | | 1,800 | | | $ | 617,904 | |
| Spotify Technology SA(a) | | | 4,528 | | | | 568,626 | |
| Total Communication Services | | | | | | | 1,186,530 | |
| | | | | | | | | |
| Consumer Discretionary (0.73%) | | | | | | | | |
| iRobot Corp.(a)(b) | | | 5,213 | | | | 454,104 | |
| | | | | | | | | |
| Financials (5.59%) | | | | | | | | |
| American Express Co. | | | 5,879 | | | | 674,380 | |
| LendingClub Corp.(a) | | | 220,419 | | | | 661,257 | |
| LendingTree, Inc.(a) | | | 2,077 | | | | 780,412 | |
| Moody's Corp. | | | 3,747 | | | | 685,251 | |
| S&P Global, Inc. | | | 3,233 | | | | 691,474 | |
| Total Financials | | | | | | | 3,492,774 | |
| | | | | | | | | |
| Health Care (11.88%) | | | | | | | | |
| ABIOMED, Inc.(a) | | | 1,999 | | | | 523,578 | |
| Align Technology, Inc.(a) | | | 2,748 | | | | 781,394 | |
| Boston Scientific Corp.(a) | | | 16,060 | | | | 616,865 | |
| Cochlear, Ltd. | | | 5,057 | | | | 702,064 | |
| CYBERDYNE, Inc.(a)(b) | | | 107,400 | | | | 572,853 | |
| Demant A/S(a) | | | 21,262 | | | | 712,158 | |
| DENTSPLY SIRONA, Inc. | | | 13,163 | | | | 709,090 | |
| DexCom, Inc.(a) | | | 4,437 | | | | 538,208 | |
| DiaSorin SpA | | | 6,508 | | | | 665,606 | |
| Intuitive Surgical, Inc.(a) | | | 1,190 | | | | 553,172 | |
| Smith & Nephew PLC, Sponsored ADR | | | 16,461 | | | | 695,806 | |
| TransEnterix, Inc.(a)(b) | | | 259,104 | | | | 347,199 | |
| Total Health Care | | | | | | | 7,417,993 | |
| | | | | | | | | |
| Industrials (19.70%) | | | | | | | | |
| ABB, Ltd., Sponsored ADR | | | 33,520 | | | | 609,394 | |
| ADT, Inc. | | | 83,747 | | | | 489,920 | |
| Aerovironment, Inc.(a) | | | 8,030 | | | | 519,943 | |
| ATS Automation Tooling Systems, Inc.(a) | | | 46,436 | | | | 699,495 | |
| Experian PLC | | | 23,783 | | | | 717,716 | |
| FANUC Corp. | | | 3,738 | | | | 637,286 | |
| IHS Markit, Ltd.(a) | | | 12,000 | | | | 688,680 | |
| Proto Labs, Inc.(a) | | | 6,011 | | | | 603,204 | |
| Prysmian SpA(a) | | | 32,743 | | | | 546,122 | |
| RELX PLC, ADR | | | 29,185 | | | | 682,053 | |
| Schneider Electric SE | | | 8,191 | | | | 647,861 | |
| Sensata Technologies Holding PLC(a) | | | 12,980 | | | | 554,116 | |
| Siemens Gamesa Renewable Energy SA | | | 42,463 | | | | 661,754 | |
| Security Description | | Shares | | | Value | |
| Industrials (continued) | | | | | | | | |
| SLM Solutions Group AG(a) | | | 75,147 | | | $ | 847,900 | |
| Thomson Reuters Corp. | | | 11,654 | | | | 740,662 | |
| Verisk Analytics, Inc. | | | 5,015 | | | | 702,100 | |
| Vestas Wind Systems A/S | | | 7,862 | | | | 644,513 | |
| Wolters Kluwer NV | | | 9,676 | | | | 676,029 | |
| Xinjiang Goldwind Science & Technology Co., Ltd., Class H | | | 602,000 | | | | 633,519 | |
| Total Industrials | | | | | | | 12,302,267 | |
| | | | | | | | | |
| Information Technology (54.85%) | | | | | | | | |
| 3D Systems Corp.(a)(b) | | | 58,197 | | | | 470,814 | |
| Alarm.com Holdings, Inc.(a) | | | 10,981 | | | | 640,302 | |
| ams AG(b) | | | 22,134 | | | | 734,816 | |
| ANSYS, Inc.(a) | | | 3,551 | | | | 637,405 | |
| Autodesk, Inc.(a) | | | 4,147 | | | | 667,294 | |
| Black Knight, Inc.(a) | | | 12,251 | | | | 694,509 | |
| Check Point Software Technologies, Ltd.(a) | | | 5,359 | | | | 590,991 | |
| Cognex Corp. | | | 12,188 | | | | 494,833 | |
| Dassault Systemes SE | | | 4,399 | | | | 652,870 | |
| FARO Technologies, Inc.(a) | | | 14,119 | | | | 622,648 | |
| First Data Corp., Class A(a) | | | 25,080 | | | | 637,534 | |
| First Solar, Inc.(a) | | | 12,607 | | | | 731,710 | |
| Fiserv, Inc.(a) | | | 7,465 | | | | 640,945 | |
| Fitbit, Inc., Class A(a) | | | 110,400 | | | | 511,152 | |
| FleetCor Technologies, Inc.(a) | | | 2,793 | | | | 721,181 | |
| Fortinet, Inc.(a) | | | 7,696 | | | | 557,806 | |
| Gartner, Inc.(a) | | | 4,480 | | | | 677,824 | |
| Guidewire Software, Inc.(a) | | | 7,036 | | | | 707,259 | |
| InterDigital, Inc. | | | 9,618 | | | | 610,936 | |
| Intuit, Inc. | | | 2,587 | | | | 633,427 | |
| Keyence Corp. | | | 1,032 | | | | 585,782 | |
| Mastercard, Inc., Class A | | | 2,854 | | | | 717,752 | |
| Nemetschek SE | | | 4,300 | | | | 659,554 | |
| NetApp, Inc. | | | 10,001 | | | | 592,059 | |
| NETGEAR, Inc.(a) | | | 17,971 | | | | 452,869 | |
| Okta, Inc.(a) | | | 7,818 | | | | 885,153 | |
| Omron Corp. | | | 14,300 | | | | 680,922 | |
| Palo Alto Networks, Inc.(a) | | | 2,709 | | | | 542,179 | |
| PayPal Holdings, Inc.(a) | | | 6,598 | | | | 724,131 | |
| Proofpoint, Inc.(a) | | | 5,593 | | | | 628,429 | |
| PTC, Inc.(a) | | | 7,081 | | | | 595,229 | |
| Qorvo, Inc.(a) | | | 9,286 | | | | 568,117 | |
| Qualys, Inc.(a) | | | 7,679 | | | | 680,436 | |
| Red Hat, Inc.(a) | | | 3,520 | | | | 648,736 | |
| salesforce.com, Inc.(a) | | | 4,080 | | | | 617,753 | |
| SAP SE, Sponsored ADR | | | 5,965 | | | | 734,172 | |
| ServiceNow, Inc.(a) | | | 2,720 | | | | 712,450 | |
ALPS Disruptive Technologies ETF
| Schedule of Investments | May 31, 2019 (Unaudited) |
| Security Description | | Shares | | | Value | |
| Information Technology (continued) | | | | | | | | |
| Silicon Laboratories, Inc.(a) | | | 8,124 | | | $ | 760,163 | |
| SimCorp A/S | | | 6,954 | | | | 678,266 | |
| Skyworks Solutions, Inc. | | | 7,982 | | | | 531,841 | |
| Splunk, Inc.(a) | | | 5,146 | | | | 586,593 | |
| Square, Inc.(a) | | | 8,567 | | | | 530,726 | |
| SS&C Technologies Holdings, Inc. | | | 10,414 | | | | 579,539 | |
| Stratasys, Ltd.(a) | | | 27,661 | | | | 606,052 | |
| Symantec Corp. | | | 29,000 | | | | 543,170 | |
| Temenos AG | | | 4,360 | | | | 759,434 | |
| Trend Micro, Inc. | | | 13,048 | | | | 586,988 | |
| Visa, Inc., Class A | | | 4,321 | | | | 697,107 | |
| VMware, Inc., Class A | | | 3,755 | | | | 664,560 | |
| Wirecard AG | | | 4,817 | | | | 753,922 | |
| Worldpay, Inc., Class A(a) | | | 6,657 | | | | 809,757 | |
| Xero, Ltd.(a) | | | 18,252 | | | | 757,279 | |
| Zscaler, Inc.(a) | | | 10,727 | | | | 736,193 | |
| Total Information Technology | | | | | | | 34,243,569 | |
| | | | | | | | | |
| Real Estate (2.22%) | | | | | | | | |
| Digital Realty Trust, Inc. | | | 5,633 | | | | 663,117 | |
| Equinix, Inc. | | | 1,488 | | | | 722,855 | |
| Total Real Estate | | | | | | | 1,385,972 | |
| | | | | | | | | |
| Utilities (2.89%) | | | | | | | | |
| Brookfield Renewable Partners LP | | | 20,769 | | | | 668,431 | |
| China Longyuan Power Group Corp., Ltd., Class H | | | 820,000 | | | | 517,759 | |
| NextEra Energy Partners LP | | | 14,004 | | | | 619,677 | |
| Total Utilities | | | | | | | 1,805,867 | |
| | | | | | | | | |
| TOTAL COMMON STOCKS | | | | | | | | |
| (Cost $62,594,254) | | | | | | | 62,289,076 | |
| | | 7 Day Yield | | | Shares | | | Value | |
| SHORT TERM INVESTMENTS (1.88%) |
| Money Market Fund (0.11%) | | | | | | | | |
| State Street Institutional Treasury Plus Money Market Fund | | | | | | | | | | | | |
| (Cost $69,150) | | | 2.309 | % | | | 69,150 | | | $ | 69,150 | |
| | | | | | | | | | | | | |
| Investments Purchased with Collateral from Securities Loaned (1.77%) | | | | | | | | | | | | |
| State Street Navigator Securities Lending Government Money Market Portfolio, 2.34% | | | | | | | | | | | | |
| (Cost $1,107,381) | | | | | | | 1,107,381 | | | | 1,107,381 | |
| TOTAL SHORT TERM INVESTMENTS | | | | | |
| (Cost $1,176,531) | | | | | | | | | | | 1,176,531 | |
| | | | | | | | | | | | | |
| TOTAL INVESTMENTS (101.64%) |
| (Cost $63,770,785) | | | | | | | | | | $ | 63,465,607 | |
| LIABILITIES IN EXCESS OF OTHER ASSETS (-1.64%) | | | | (1,026,141 | ) |
| NET ASSETS - 100.00% | | | $ | 62,439,466 | |
| (a) | Non-income producing security. |
| (b) | Security, or a portion of the security position is currently on loan. The total market value of securities on loan is $1,918,869. |
See Notes to Financial Statements.
ALPS Medical Breakthroughs ETF
| Schedule of Investments | May 31, 2019 (Unaudited) |
| Security Description | | Shares | | | Value | |
| COMMON STOCKS (100.02%) | | | | | | | | |
| Biotechnology (100.02%) | | | | | | | | |
| Abeona Therapeutics, Inc.(a)(b) | | | 113,695 | | | $ | 618,501 | |
| AC Immune SA(a)(b) | | | 159,749 | | | | 808,330 | |
| Acceleron Pharma, Inc.(a) | | | 122,224 | | | | 4,875,515 | |
| Achillion Pharmaceuticals, Inc.(a) | | | 328,724 | | | | 913,853 | |
| Acorda Therapeutics, Inc.(a) | | | 112,960 | | | | 1,049,398 | |
| Adamas Pharmaceuticals, Inc.(a)(b) | | | 64,826 | | | | 304,682 | |
| Aduro Biotech, Inc.(a) | | | 188,305 | | | | 611,991 | |
| Agios Pharmaceuticals, Inc.(a) | | | 131,976 | | | | 6,093,332 | |
| Akebia Therapeutics, Inc.(a) | | | 277,197 | | | | 1,233,527 | |
| Albireo Pharma, Inc.(a) | | | 28,386 | | | | 933,899 | |
| AMAG Pharmaceuticals, Inc.(a) | | | 82,321 | | | | 784,519 | |
| AnaptysBio, Inc.(a) | | | 63,442 | | | | 4,619,212 | |
| Apellis Pharmaceuticals, Inc.(a) | | | 133,379 | | | | 2,679,584 | |
| Arbutus Biopharma Corp.(a) | | | 131,617 | | | | 239,543 | |
| Arena Pharmaceuticals, Inc.(a) | | | 117,165 | | | | 6,210,917 | |
| ArQule, Inc.(a) | | | 258,477 | | | | 1,858,450 | |
| Array BioPharma, Inc.(a) | | | 375,382 | | | | 9,917,592 | |
| Ascendis Pharma A/S, ADR(a) | | | 69,098 | | | | 8,613,757 | |
| Atara Biotherapeutics, Inc.(a) | | | 108,253 | | | | 2,404,299 | |
| Athersys, Inc.(a)(b) | | | 336,147 | | | | 558,004 | |
| Calithera Biosciences, Inc.(a) | | | 90,415 | | | | 475,583 | |
| Cara Therapeutics, Inc.(a)(b) | | | 93,547 | | | | 1,923,326 | |
| CASI Pharmaceuticals, Inc.(a)(b) | | | 225,971 | | | | 716,328 | |
| Catalyst Pharmaceuticals, Inc.(a) | | | 243,644 | | | | 852,754 | |
| ChemoCentryx, Inc.(a) | | | 119,821 | | | | 1,351,581 | |
| Concert Pharmaceuticals, Inc.(a) | | | 55,562 | | | | 566,177 | |
| Corbus Pharmaceuticals Holdings, Inc.(a)(b) | | | 148,542 | | | | 1,041,279 | |
| CRISPR Therapeutics AG(a)(b) | | | 122,842 | | | | 4,369,490 | |
| Emergent BioSolutions, Inc.(a) | | | 121,419 | | | | 4,847,046 | |
| Enanta Pharmaceuticals, Inc.(a) | | | 46,105 | | | | 4,171,119 | |
| Fate Therapeutics, Inc.(a) | | | 153,006 | | | | 2,949,956 | |
| FibroGen, Inc.(a) | | | 151,186 | | | | 5,478,981 | |
| Five Prime Therapeutics, Inc.(a) | | | 84,106 | | | | 706,490 | |
| Flexion Therapeutics, Inc.(a)(b) | | | 89,777 | | | | 990,240 | |
| G1 Therapeutics, Inc.(a) | | | 88,184 | | | | 1,848,337 | |
| Galapagos NV, Sponsored ADR(a) | | | 85,432 | | | | 9,708,492 | |
| Global Blood Therapeutics, Inc.(a) | | | 131,685 | | | | 8,003,814 | |
| GlycoMimetics, Inc.(a) | | | 102,298 | | | | 1,211,208 | |
| Halozyme Therapeutics, Inc.(a) | | | 343,943 | | | | 5,073,159 | |
| ImmunoGen, Inc.(a) | | | 353,566 | | | | 636,419 | |
| Immunomedics, Inc.(a)(b) | | | 451,595 | | | | 5,902,347 | |
| Security Description | | Shares | | | Value | |
| Biotechnology (continued) | | | | | | | | |
| Insmed, Inc.(a) | | | 183,882 | | | $ | 4,451,783 | |
| Kiniksa Pharmaceuticals, Ltd., Class A(a)(b) | | | 43,758 | | | | 667,310 | |
| Krystal Biotech, Inc.(a)(b) | | | 34,217 | | | | 1,075,098 | |
| Kura Oncology, Inc.(a) | | | 90,203 | | | | 1,442,346 | |
| Ligand Pharmaceuticals, Inc.(a) | | | 48,484 | | | | 5,206,212 | |
| MacroGenics, Inc.(a) | | | 115,190 | | | | 2,112,585 | |
| Madrigal Pharmaceuticals, Inc.(a) | | | 36,504 | | | | 3,372,970 | |
| MediciNova, Inc.(a)(b) | | | 100,009 | | | | 992,089 | |
| MEI Pharma, Inc.(a) | | | 168,728 | | | | 482,562 | |
| Minerva Neurosciences, Inc.(a) | | | 92,182 | | | | 480,268 | |
| Mirati Therapeutics, Inc.(a)(b) | | | 80,936 | | | | 5,486,651 | |
| NuCana PLC, ADR(a)(b) | | | 76,424 | | | | 917,088 | |
| PDL BioPharma, Inc.(a) | | | 346,179 | | | | 976,225 | |
| Progenics Pharmaceuticals, Inc.(a) | | | 200,491 | | | | 840,057 | |
| PTC Therapeutics, Inc.(a) | | | 135,947 | | | | 5,451,475 | |
| Rhythm Pharmaceuticals, Inc.(a) | | | 81,605 | | | | 2,055,630 | |
| Savara, Inc.(a) | | | 83,308 | | | | 903,059 | |
| Synlogic, Inc.(a) | | | 60,348 | | | | 449,593 | |
| Syros Pharmaceuticals, Inc.(a) | | | 79,809 | | | | 470,873 | |
| Tocagen, Inc.(a) | | | 54,432 | | | | 277,059 | |
| uniQure NV(a) | | | 87,602 | | | | 5,195,675 | |
| United Therapeutics Corp.(a) | | | 74,823 | | | | 6,282,887 | |
| UroGen Pharma, Ltd.(a) | | | 46,862 | | | | 1,596,120 | |
| Vericel Corp.(a) | | | 102,796 | | | | 1,608,757 | |
| Viking Therapeutics, Inc.(a)(b) | | | 169,466 | | | | 1,303,194 | |
| Voyager Therapeutics, Inc.(a) | | | 77,207 | | | | 1,683,885 | |
| Xenon Pharmaceuticals, Inc.(a)(b) | | | 59,856 | | | | 604,546 | |
| Total Biotechnology | | | | | | | 174,539,028 | |
| | | | | | | | | |
| TOTAL COMMON STOCKS | | | | | | | | |
| (Cost $175,019,277) | | | | | | | 174,539,028 | |
| | | | | | | | | |
| WARRANTS(0.00%)(c) | | | | | | | | |
| (0.00%) | | | | | | | | |
| Corium International Inc (Expiring 4/1/2020) | | | 59,464 | | | | 595 | |
| | | | | | | | | |
| TOTAL WARRANTS | | | | | | | | |
| (Cost $-) | | | | | | | 595 | |
ALPS Medical Breakthroughs ETF
| Schedule of Investments | May 31, 2019 (Unaudited) |
| | | 7 Day Yield | | | Shares | | | Value | |
| SHORT TERM INVESTMENTS (5.38%) | | | | |
| Money Market Fund (0.01%) | | | | | | | | |
| State Street Institutional Treasury Plus Money Market Fund | | | | | | | | | | | | |
| (Cost $11,823) | | | 2.309 | % | | | 11,823 | | | $ | 11,823 | |
| | | | | | | | | | | | | |
| Investments Purchased with Collateral from Securities Loaned (5.37%) | | | | | | | | | | | | |
| State Street Navigator Securities Lending Government Money Market Portfolio, 2.34% | | | | | | | | | | | | |
| (Cost $9,366,272) | | | | | | | 9,366,272 | | | | 9,366,272 | |
| TOTAL SHORT TERM INVESTMENTS | | | | | |
| (Cost $9,378,095) | | | | | | | | | | | 9,378,095 | |
| | | | | | | | | | | | | |
| TOTAL INVESTMENTS (105.40%) | | | | | |
| (Cost $184,397,372) | | | | | | | | | | $ | 183,917,718 | |
| LIABILITIES IN EXCESS OF OTHER ASSETS (-5.40%) | | | | (9,409,963 | ) |
| NET ASSETS - 100.00% | | | $ | 174,507,755 | |
| (a) | Non-income producing security. |
| (b) | Security, or a portion of the security position is currently on loan. The total market value of securities on loan is $19,143,429. |
See Notes to Financial Statements.
ALPS ETF Trust
| Statements of Assets and Liabilities | May 31, 2019 (Unaudited) |
| | | ALPS Clean
Energy ETF | | | ALPS Disruptive
Technologies
ETF | | | ALPS Medical
Breakthroughs
ETF | |
| ASSETS: | | | | | | | | | | | | |
| Investments, at value | | $ | 61,558,139 | | | $ | 63,465,607 | | | $ | 183,917,718 | |
| Foreign Currency, at value (Cost $11,305, $3,435 and $–) | | | 11,305 | | | | 3,435 | | | | – | |
| Dividends receivable | | | 135,899 | | | | 105,189 | | | | 34,566 | |
| Receivable for investments sold | | | – | | | | 2,222 | | | | 1,615,849 | |
| Total Assets | | | 61,705,343 | | | | 63,576,453 | | | | 185,568,133 | |
| | | | | | | | | | | | | |
| LIABILITIES: | | | | | | | | | | | | |
| Payable to adviser | | | 32,867 | | | | 26,650 | | | | 78,293 | |
| Payable for investments purchased | | | 38 | | | | 2,956 | | | | 1,615,813 | |
| Payable for collateral upon return of securities loaned | | | 3,688,243 | | | | 1,107,381 | | | | 9,366,272 | |
| Total Liabilities | | | 3,721,148 | | | | 1,136,987 | | | | 11,060,378 | |
| NET ASSETS | | $ | 57,984,195 | | | $ | 62,439,466 | | | $ | 174,507,755 | |
| | | | | | | | | | | | | |
| NET ASSETS CONSIST OF: | | | | | | | | | | | | |
| Paid-in capital | | $ | 57,318,841 | | | $ | 63,518,684 | | | $ | 247,154,245 | |
| Total distributable earnings | | | 665,354 | | | | (1,079,218 | ) | | | (72,646,490 | ) |
| NET ASSETS | | $ | 57,984,195 | | | $ | 62,439,466 | | | $ | 174,507,755 | |
| | | | | | | | | | | | | |
| INVESTMENTS, AT COST | | $ | 61,297,839 | | | $ | 63,770,785 | | | $ | 184,397,372 | |
| | | | | | | | | | | | | |
| PRICING OF SHARES | | | | | | | | | | | | |
| Net Assets | | $ | 57,984,195 | | | $ | 62,439,466 | | | $ | 174,507,755 | |
| Shares of beneficial interest outstanding (Unlimited number of shares authorized, par value $0.01 per share) | | | 2,150,002 | | | | 2,200,002 | | | | 5,400,000 | |
| Net Asset Value, offering and redemption price per share | | $ | 26.97 | | | $ | 28.38 | | | $ | 32.32 | |
See Notes to Financial Statements.
ALPS ETF Trust
| Statements of Operations | For the Six Months Ended May 31, 2019 (Unaudited) |
| | | ALPS Clean
Energy ETF | | | ALPS Disruptive
Technologies
ETF | | | ALPS Medical
Breakthroughs
ETF | |
| INVESTMENT INCOME: | | | | | | | | | | | | |
| Dividends* | | $ | 445,824 | | | $ | 318,017 | | | $ | 692,698 | |
| Securities Lending Income | | | 76,797 | | | | 85,571 | | | | 142,789 | |
| Total Investment Income | | | 522,621 | | | | 403,588 | | | | 835,487 | |
| | | | | | | | | | | | | |
| EXPENSES: | | | | | | | | | | | | |
| Investment adviser fees | | | 102,869 | | | | 127,468 | | | | 468,138 | |
| Total Expenses | | | 102,869 | | | | 127,468 | | | | 468,138 | |
| NET INVESTMENT INCOME | | | 419,752 | | | | 276,120 | | | | 367,349 | |
| | | | | | | | | | | | | |
| REALIZED AND UNREALIZED GAIN/LOSS | | | | | | | | | | | | |
| Net realized gain/(loss) on investments | | | 163,317 | | | | (623,790 | ) | | | (20,354,356 | ) |
| Net realized gain/(loss) on foreign currency transactions | | | 400 | | | | (3,483 | ) | | | – | |
| Total net realized gain/(loss) | | | 163,717 | | | | (627,273 | ) | | | (20,354,356 | ) |
| Net change in unrealized appreciation on investments | | | 449,739 | | | | 3,461,578 | | | | 13,558,443 | |
| Net change in unrealized appreciation/(depreciation) on translation of assets and liabilities denominated in foreign currencies | | | (43 | ) | | | 533 | | | | – | |
| Total net change in unrealized appreciation | | | 449,696 | | | | 3,462,111 | | | | 13,558,443 | |
| NET REALIZED AND UNREALIZED GAIN/LOSS ON INVESTMENTS | | | 613,413 | | | | 2,834,838 | | | | (6,795,913 | ) |
| NET INCREASE/(DECREASE) IN NET ASSETS RESULTING FROM OPERATIONS | | $ | 1,033,165 | | | $ | 3,110,958 | | | $ | (6,428,564 | ) |
| *Net of foreign tax withholding. | | $ | 21,835 | | | $ | 16,709 | | | $ | 122,711 | |
See Notes to Financial Statements.
ALPS Clean Energy ETF
Statement of Changes in Net Assets
| | | For the Six
Months Ended
May 31, 2019
(Unaudited) | | | For the Period
June 28, 2018
(Commencement
of Operations)
to November 30,
2018 | |
| OPERATIONS: | | | | | | | | |
| Net investment income | | $ | 419,752 | | | $ | 48,640 | |
| Net realized gain/(loss) | | | 163,717 | | | | (30,533 | ) |
| Net change in unrealized appreciation/(depreciation) | | | 449,696 | | | | (189,451 | ) |
| Net increase/(decrease) in net assets resulting from operations | | | 1,033,165 | | | | (171,344 | ) |
| | | | | | | | | |
| DISTRIBUTIONS: | | | | | | | | |
| From distributable earnings | | | (180,439 | ) | | | – | |
| Total distributions | | | (180,439 | ) | | | – | |
| CAPITAL SHARE TRANSACTIONS: | | | | | | | | |
| Proceeds from sale of shares | | | 42,223,409 | | | | 18,954,155 | |
| Cost of shares redeemed | | | (1,362,989 | ) | | | (2,511,762 | ) |
| Net increase from capital share transactions | | | 40,860,420 | | | | 16,442,393 | |
| Net increase in net assets | | | 41,713,146 | | | | 16,271,049 | |
| | | | | | | | | |
| NET ASSETS: | | | | | | | | |
| Beginning of period | | | 16,271,049 | | | | – | |
| End of period | | $ | 57,984,195 | | | $ | 16,271,049 | |
| | | | | | | | | |
| OTHER INFORMATION: | | | | | | | | |
| CAPITAL SHARE TRANSACTIONS: | | | | | | | | |
| Beginning shares | | | 650,002 | | | | – | |
| Shares sold | | | 1,550,000 | | | | 750,002 | |
| Shares redeemed | | | (50,000 | ) | | | (100,000 | ) |
| Shares outstanding, end of period | | | 2,150,002 | | | | 650,002 | |
See Notes to Financial Statements.
ALPS Disruptive Technologies ETF
Statement of Changes in Net Assets
| | | For the Six
Months Ended
May 31, 2019
(Unaudited) | | | For the Period
December 28, 2017
(Commencement of
Operations)
to November 30, 2018 | |
| OPERATIONS: | | | | | | | | |
| Net investment income | | $ | 276,120 | | | $ | 131,590 | |
| Net realized gain/(loss) | | | (627,273 | ) | | | 625,009 | |
| Net change in unrealized appreciation/(depreciation) | | | 3,462,111 | | | | (3,766,883 | ) |
| Net increase/(decrease) in net assets resulting from operations | | | 3,110,958 | | | | (3,010,284 | ) |
| | | | | | | | | |
| DISTRIBUTIONS TO SHAREHOLDERS: | | | | | | | | |
| From distributable earnings | | | (147,001 | ) | | | – | |
| Total distributions | | | (147,001 | ) | | | – | |
| | | | | | | | | |
| CAPITAL SHARE TRANSACTIONS: | | | | | | | | |
| Proceeds from sale of shares | | | 14,535,496 | | | | 57,258,516 | |
| Cost of shares redeemed | | | (3,542,933 | ) | | | (5,765,286 | ) |
| Net increase from capital share transactions | | | 10,992,563 | | | | 51,493,230 | |
| Net increase in net assets | | | 13,956,520 | | | | 48,482,946 | |
| | | | | | | | | |
| NET ASSETS: | | | | | | | | |
| Beginning of period | | | 48,482,946 | | | | – | |
| End of period | | $ | 62,439,466 | | | $ | 48,482,946 | |
| | | | | | | | | |
| OTHER INFORMATION: | | | | | | | | |
| CAPITAL SHARE TRANSACTIONS: | | | | | | | | |
| Beginning shares | | | 1,850,002 | | | | – | |
| Shares sold | | | 500,000 | | | | 2,050,002 | |
| Shares redeemed | | | (150,000 | ) | | | (200,000 | ) |
| Shares outstanding, end of period | | | 2,200,002 | | | | 1,850,002 | |
See Notes to Financial Statements.
ALPS Medical Breakthroughs ETF
Statements of Changes in Net Assets
| | | For the Six
Months Ended
May 31, 2019
(Unaudited) | | | For the
Year Ended
November 30, 2018 | |
| OPERATIONS: | | | | | | | | |
| Net investment income/(loss) | | $ | 367,349 | | | $ | (557,556 | ) |
| Net realized gain/(loss) | | | (20,354,356 | ) | | | 15,057,328 | |
| Net change in unrealized appreciation/(depreciation) | | | 13,558,443 | | | | (15,342,539 | ) |
| Net decrease in net assets resulting from operations | | | (6,428,564 | ) | | | (842,767 | ) |
| | | | | | | | | |
| DISTRIBUTIONS TO SHAREHOLDERS: | | | | | | | | |
| From distributable earnings | | | (4,900,375 | ) | | | (2,404,884 | ) |
| Total distributions | | | (4,900,375 | ) | | | (2,404,884 | ) |
| | | | | | | | | |
| CAPITAL SHARE TRANSACTIONS: | | | | | | | | |
| Proceeds from sale of shares | | | 1,362,891 | | | | 141,518,675 | |
| Cost of shares redeemed | | | (37,220,203 | ) | | | (44,979,196 | ) |
| Net increase/(decrease) from capital share transactions | | | (35,857,312 | ) | | | 96,539,479 | |
| Net increase/(decrease) in net assets | | | (47,186,251 | ) | | | 93,291,828 | |
| | | | | | | | | |
| NET ASSETS: | | | | | | | | |
| Beginning of period | | | 221,694,006 | | | | 128,402,178 | |
| End of period | | $ | 174,507,755 | | | $ | 221,694,006 | |
| | | | | | | | | |
| OTHER INFORMATION: | | | | | | | | |
| CAPITAL SHARE TRANSACTIONS: | | | | | | | | |
| Beginning shares | | | 6,600,000 | | | | 4,050,000 | |
| Shares sold | | | 50,000 | | | | 3,900,000 | |
| Shares redeemed | | | (1,250,000 | ) | | | (1,350,000 | ) |
| Shares outstanding, end of period | | | 5,400,000 | | | | 6,600,000 | |
See Notes to Financial Statements.
ALPS Clean Energy ETF
| Financial Highlights | For a Share Outstanding Throughout the Periods Presented |
| | | For the
Six Months Ended
May 31, 2019
(Unaudited) | | | For the Period
June 28, 2018
(Commencement
of Operations) to
November 30,
2018 | |
| NET ASSET VALUE, BEGINNING OF PERIOD | | $ | 25.03 | | | $ | 24.95 | |
| | | | | | | | | |
| INCOME/(LOSS) FROM INVESTMENT OPERATIONS: | | | | | | | | |
| Net investment income(a) | | | 0.35 | | | | 0.09 | |
| Net realized and unrealized gain/(loss) | | | 1.79 | | | | (0.01 | ) |
| Total from investment operations | | | 2.14 | | | | 0.08 | |
| | | | | | | | | |
| DISTRIBUTIONS: | | | | | | | | |
| From net investment income | | | (0.20 | ) | | | – | |
| Total distributions | | | (0.20 | ) | | | – | |
| | | | | | | | | |
| Net increase in net asset value | | | 1.94 | | | | 0.08 | |
| NET ASSET VALUE, END OF PERIOD | | $ | 26.97 | | | $ | 25.03 | |
| TOTAL RETURN(b) | | | 8.61 | % | | | 0.32 | % |
| | | | | | | | | |
| RATIOS/SUPPLEMENTAL DATA: | | | | | | | | |
| Net assets, end of period (000s) | | $ | 57,984 | | | $ | 16,271 | |
| | | | | | | | | |
| Ratio of expenses to average net assets | | | 0.65 | %(c) | | | 0.65 | %(c) |
| Ratio of net investment income to average net assets | | | 2.65 | %(c) | | | 0.89 | %(c) |
| Portfolio turnover rate(d) | | | 6 | % | | | 9 | % |
| (a) | Based on average shares outstanding during the period. |
| (b) | Total return is calculated assuming an initial investment made at the net asset value at the beginning of the period and redemption at the net asset value on the last day of the period and assuming all distributions are reinvested at reinvestment prices. Total return calculated for a period of less than one year is not annualized. |
| (d) | Portfolio turnover for periods less than one year are not annualized and does not include securities received or delivered from processing creations or redemptions in-kind. |
See Notes to Financial Statements.
ALPS Disruptive Technologies ETF
| Financial Highlights | For a Share Outstanding Throughout the Periods Presented |
| | | For the
Six Months Ended
May 31, 2019
(Unaudited) | | | For the Period
December 28, 2017 (Commencement
of Operations) to
November 30,
2018 | |
| NET ASSET VALUE, BEGINNING OF PERIOD | | $ | 26.21 | | | $ | 25.08 | |
| | | | | | | | | |
| INCOME/(LOSS) FROM INVESTMENT OPERATIONS: | | | | | | | | |
| Net investment income(a) | | | 0.15 | | | | 0.13 | |
| Net realized and unrealized gain | | | 2.10 | | | | 1.00 | (b) |
| Total from investment operations | | | 2.25 | | | | 1.13 | |
| | | | | | | | | |
| DISTRIBUTIONS: | | | | | | | | |
| From net investment income | | | (0.08 | ) | | | – | |
| Total distributions | | | (0.08 | ) | | | – | |
| | | | | | | | | |
| Net increase in net asset value | | | 2.17 | | | | 1.13 | |
| NET ASSET VALUE, END OF PERIOD | | $ | 28.38 | | | $ | 26.21 | |
| TOTAL RETURN(c) | | | 8.64 | % | | | 4.47 | % |
| | | | | | | | | |
| RATIOS/SUPPLEMENTAL DATA: | | | | | | | | |
| Net assets, end of period (000s) | | $ | 62,439 | | | $ | 48,483 | |
| | | | | | | | | |
| Ratio of expenses to average net assets | | | 0.50 | %(d) | | | 0.50 | %(d) |
| Ratio of net investment income to average net assets | | | 1.08 | %(d) | | | 0.53 | %(d) |
| Portfolio turnover rate(e) | | | 12 | % | | | 33 | % |
| (a) | Based on average shares outstanding during the period. |
| (b) | Net realized and unrealized loss on investments per share does not correlate to aggregate of the net realized and unrealized gain in the Statements of Operations for the year ended November 30, 2018, primarily due to the timing of the sales and repurchases of the Fund's shares in relation to the fluctuating market values for the Fund's portfolio. |
| (c) | Total return is calculated assuming an initial investment made at the net asset value at the beginning of the period and redemption at the net asset value on the last day of the period and assuming all distributions are reinvested at reinvestment prices. Total return calculated for a period of less than one year is not annualized. |
| (e) | Portfolio turnover for periods less than one year are not annualized and does not include securities received or delivered from processing creations or redemptions in-kind. |
See Notes to Financial Statements.
ALPS Medical Breakthroughs ETF
| Financial Highlights | For a Share Outstanding Throughout the Periods Presented |
| | | For the
Six Months
Ended
May 31, 2019 (Unaudited) | | For the Year
Ended
November 30,
2018 | | For the Year
Ended
November 30,
2017 | | For the Year
Ended
November 30,
2016 | | For the Period
December 31, 2014 (Commencement of Operations) to November 30, 2015 | |
| NET ASSET VALUE, BEGINNING OF PERIOD | | $ | 33.59 | | $ | 31.70 | | $ | 24.16 | | $ | 32.23 | | $ | 24.64 | |
| | | | | | | | | | | | | | | | | |
| INCOME/(LOSS) FROM INVESTMENT OPERATIONS: |
| Net investment income/(loss)(a) | | | 0.06 | | | (0.10 | ) | | 0.18 | | | (0.09 | ) | | (0.13 | ) |
| Net realized and unrealized gain/(loss) | | | (0.55 | ) | | 2.57 | (b) | | 7.36 | | | (7.98 | ) | | 7.72 | |
| Total from investment operations | | | (0.49 | ) | | 2.47 | | | 7.54 | | | (8.07 | ) | | 7.59 | |
| | | | | | | | | | | | | | | | | |
| DISTRIBUTIONS: | | | | | | | | | | | | | | | | |
| From net investment income | | | (0.78 | ) | | (0.58 | ) | | – | | | – | | | – | |
| Total distributions | | | (0.78 | ) | | (0.58 | ) | | – | | | – | | | – | |
| | | | | | | | | | | | | | | | | |
| Net increase/(decrease) in net asset value | | | (1.27 | ) | | 1.89 | | | 7.54 | | | (8.07 | ) | | 7.59 | |
| NET ASSET VALUE, END OF PERIOD | | $ | 32.32 | | $ | 33.59 | | $ | 31.70 | | $ | 24.16 | | $ | 32.23 | |
| TOTAL RETURN(c) | | | (1.03 | )% | | 7.81 | % | | 31.21 | % | | (25.04 | )% | | 30.80 | % |
| | | | | | | | | | | | | | | | | |
| RATIOS/SUPPLEMENTAL DATA: | | | | | | | | | | | | | | | | |
| Net assets, end of period (000s) | | $ | 174,508 | | $ | 221,694 | | $ | 128,402 | | $ | 118,370 | | $ | 170,824 | |
| | | | | | | | | | | | | | | | | |
| Ratio of expenses to average net assets | | | 0.50 | %(d) | | 0.50 | % | | 0.50 | % | | 0.50 | % | | 0.50 | %(d) |
| Ratio of net investment income/(loss) to average net assets | | | 0.39 | %(d) | | (0.27 | )% | | 0.66 | % | | (0.38 | )% | | (0.42 | )%(d) |
| Portfolio turnover rate(e) | | | 49 | % | | 48 | % | | 43 | % | | 62 | % | | 25 | % |
| (a) | Based on average shares outstanding during the period. |
| (b) | Net realized and unrealized loss on investments per share does not correlate to aggregate of the net realized and unrealized gain in the Statements of Operations for the year ended November 30, 2018, primarily due to the timing of the sales and repurchases of the Fund's shares in relation to the fluctuating market values for the Fund's portfolio. |
| (c) | Total return is calculated assuming an initial investment made at the net asset value at the beginning of the period and redemption at the net asset value on the last day of the period and assuming all distributions are reinvested at reinvestment prices. Total return calculated for a period of less than one year is not annualized. |
| (e) | Portfolio turnover for periods less than one year are not annualized and does not include securities received or delivered from processing creations or redemptions in-kind. |
See Notes to Financial Statements.
ALPS ETF Trust
| Notes to Financial Statements | May 31, 2019 (Unaudited) |
ALPS ETF Trust (the “Trust”), a Delaware statutory trust, is an open-end management investment company registered under the Investment Company Act of 1940, as amended (the “1940 Act”). As of May 31, 2019, the Trust consisted of eighteen separate portfolios. Each portfolio represents a separate series of the Trust. This report pertains to the ALPS Clean Energy ETF, ALPS Disruptive Technologies ETF, and the ALPS Medical Breakthroughs ETF (each a “Fund” and collectively, the “Funds”). ALPS Clean Energy ETF and ALPS Disruptive Technologies ETF are considered non-diversified and may invest a greater portion of assets in securities of individual issuers than a diversified fund. As a result, changes in the market value of a single investment could cause greater fluctuations in share price than would occur in a diversified fund. ALPS Medical Breakthroughs ETF has elected to qualify as a diversified series of the Trust under the 1940 Act.
The investment objective of the ALPS Clean Energy ETF is to seek investment results that correspond generally, before fees and expenses, to the performance of the CIBC Atlas Clean Energy Total Return Index. The investment objective of the ALPS Disruptive Technologies ETF is to seek investment results that correspond generally, before fees and expenses, to the performance of the Indxx Disruptive Technologies Total Return Index. The investment objective of the ALPS Medical Breakthroughs ETF is to seek investment results that correspond generally, before fees and expenses, to the performance of the Poliwogg Medical Breakthroughs Total Return IndexSM.
The shares of the ALPS Clean Energy ETF and ALPS Disruptive Technologies ETF (“Shares”) are listed on the Cboe BZX Exchange, Inc. (the “Cboe BZX”). The shares of the ALPS Medical Breakthroughs ETF (“Shares”) are listed on the NYSE Arca, Inc. (the “NYSE Arca”). Each Fund issues and redeems Shares at net asset value (“NAV”) in blocks of 50,000 Shares, each of which is called a “Creation Unit”. Creation Units are issued and redeemed principally in-kind for securities included in the Underlying Index. Except when aggregated in Creation Units, Shares are not redeemable securities of the Fund.
Pursuant to the Trust’s organizational documents, its Officers and Trustees are indemnified against certain liability arising out of the performance of their duties to the Trust. Additionally, in the normal course of business, the Trust enters into contracts with service providers that contain general indemnification clauses. The Trust’s maximum exposure under these arrangements is unknown, as this would involve future claims that may be made against the Trust that have not yet occurred.
| 2. | SIGNIFICANT ACCOUNTING POLICIES |
The following is a summary of significant accounting policies consistently followed by the Funds in the preparation of the financial statements. The accompanying financial statements were prepared in accordance with accounting principles generally accepted in the United States of America (“U.S. GAAP”). The preparation of financial statements in conformity with U.S. GAAP requires management to make certain estimates and assumptions that affect the reported amounts of assets and liabilities and disclosures of contingent assets and liabilities at the date of the financial statements and the reported amounts of revenue and expenses during the period. Actual results could differ from those estimates. Each Fund is considered an investment company under U.S. GAAP and follows the accounting and reporting guidance applicable to investment companies in the Financial Accounting Standards Board Accounting Standards Codification Topic 946.
A. Portfolio Valuation
Each Fund’s NAV is determined daily, as of the close of regular trading on the New York Stock Exchange (the “NYSE”), normally 4:00 p.m. Eastern time, on each day the NYSE is open for trading. The NAV is computed by dividing the value of all assets of the Fund (including accrued interest and dividends), less all liabilities (including accrued expenses and dividends declared but unpaid), by the total number of shares outstanding.
Portfolio securities listed on any exchange other than the NASDAQ Stock Market LLC (“NASDAQ”) are valued at the last sale price on the business day as of which such value is being determined. If there has been no sale on such day, the securities are valued at the mean of the most recent bid and ask prices on such day. Securities traded on the NASDAQ are valued at the NASDAQ Official Closing Price as determined by NASDAQ. Portfolio securities traded on more than one securities exchange are valued at the last sale price on the business day as of which such value is being determined at the close of the exchange representing the principal market for such securities. Portfolio securities traded in the over-the-counter market, but excluding securities traded on the NASDAQ, are valued at the last quoted sale price in such market.
The Funds’ investments are valued at market value or, in the absence of market value with respect to any portfolio securities, at fair value according to procedures adopted by the Trust’s Board of Trustees (the “Board”). When market quotations are not readily available or when events occur that make established valuation methods unreliable, securities of the Funds may be valued in good faith by or under the direction of the Board. These securities generally include, but are not limited to, restricted securities (securities which may not be publicly sold without registration under the Securities Act of 1933) for which a pricing service is unable to provide a market price; securities whose trading has been formally suspended; a security whose market price is not available from a pre-established primary pricing source or the pricing source is not willing to provide a price; a security with respect to which an event has occurred that is most likely to materially affect the value of the security after the market has closed but before the calculation of the Fund’s NAV or make it difficult or impossible to obtain a reliable market quotation; or a security whose price, as provided by the pricing service, does not reflect the security’s “fair value” due to the security being de-listed from a national exchange or the security’s primary trading market is temporarily closed at a time when, under normal conditions, it would be open. As a general principle, the current “fair value” of a security would be the amount which the owner might reasonably expect to receive from the sale on the applicable exchange or principal market. A variety of factors may be considered in determining the fair value of such securities.
ALPS ETF Trust
| Notes to Financial Statements | May 31, 2019 (Unaudited) |
B. Fair Value Measurements
Each Fund discloses the classification of its fair value measurements following a three-tier hierarchy based on the inputs used to measure fair value. Inputs refer broadly to the assumptions that market participants would use in pricing the asset or liability; including assumptions about risk. Inputs may be observable or unobservable. Observable inputs reflect the assumptions market participants would use in pricing the asset or liability that are developed based on market data obtained from sources independent of the reporting entity. Unobservable inputs reflect the reporting entity’s own assumptions about the assumptions market participants would use in pricing the asset or liability that are developed based on the best information available.
Valuation techniques used to value the Funds’ investments by major category are as follows:
Equity securities, including restricted securities, for which market quotations are readily available, are valued at the last reported sale price or official closing price as reported by a third party pricing vendor on the primary market or exchange on which they are traded and are categorized as Level 1 in the hierarchy. In the event there were no sales during the day or closing prices are not available, securities are valued at the mean of the most recent quoted bid and ask prices on such day and are generally categorized as Level 2 in the hierarchy. Investments in open-end mutual funds are valued at their closing NAV each business day and are categorized as Level 1 in the hierarchy.
Changes in valuation techniques may result in transfers in or out of an assigned level within the disclosure hierarchy.
Various inputs are used in determining the value of each Fund’s investments as of the end of the reporting period. When inputs used fall into different levels of the fair value hierarchy, the level in the hierarchy within which the fair value measurement falls is determined based on the lowest level input that is significant to the fair value measurement in its entirety. The designated input levels are not necessarily an indication of the risk or liquidity associated with these investments.
These inputs are categorized in the following hierarchy under applicable financial accounting standards:
| Level 1 | – | Unadjusted quoted prices in active markets for identical investments, unrestricted assets or liabilities that a Fund has the ability to access at the measurement date; |
| Level 2 | – | Quoted prices which are not active, quoted prices for similar assets or liabilities in active markets or inputs other than quoted prices that are observable (either directly or indirectly) for substantially the full term of the asset or liability; and |
| Level 3 | – | Significant unobservable prices or inputs (including the Fund’s own assumptions in determining the fair value of investments) where there is little or no market activity for the asset or liability at the measurement date. |
ALPS ETF Trust
| Notes to Financial Statements | May 31, 2019 (Unaudited) |
The following is a summary of the inputs used to value the Funds’ investments at May 31, 2019:
ALPS Clean Energy ETF
| Investments in Securities at Value | | Level 1 -
Quoted and Unadjusted
Prices | | | Level 2 -
Other Significant Observable
Inputs | | | Level 3 -
Significant Unobservable
Inputs | | | Total | |
| Common Stocks* | | $ | 51,059,327 | | | $ | – | | | $ | – | | | $ | 51,059,327 | |
| Master Limited Partnerships* | | | 6,771,137 | | | | – | | | | – | | | | 6,771,137 | |
| Short Term Investments | | | 3,727,675 | | | | – | | | | – | | | | 3,727,675 | |
| Total | | $ | 61,558,139 | | | $ | – | | | $ | – | | | $ | 61,558,139 | |
ALPS Disruptive Technologies ETF
| Investments in Securities at Value | | Level 1 -
Quoted and Unadjusted
Prices | | | Level 2 -
Other Significant Observable
Inputs | | | Level 3 -
Significant Unobservable
Inputs | | | Total | |
| Common Stocks* | | $ | 62,289,076 | | | $ | – | | | $ | – | | | $ | 62,289,076 | |
| Short Term Investments | | | 1,176,531 | | | | – | | | | – | | | | 1,176,531 | |
| Total | | $ | 63,465,607 | | | $ | – | | | $ | – | | | $ | 63,465,607 | |
ALPS Medical Breakthroughs ETF
| Investments in Securities at Value | | Level 1 -
Quoted and Unadjusted
Prices | | | Level 2 -
Other Significant Observable
Inputs | | | Level 3 -
Significant Unobservable
Inputs | | | Total | |
| Common Stocks* | | $ | 174,539,028 | | | $ | – | | | $ | – | | | $ | 174,539,028 | |
| Warrants | | | – | | | | 595 | | | | – | | | | 595 | |
| Short Term Investments | | | 9,378,095 | | | | – | | | | – | | | | 9,378,095 | |
| Total | | $ | 183,917,123 | | | $ | 595 | | | $ | – | | | $ | 183,917,718 | |
| * | For a detailed sector breakdown, see the accompanying Schedule of Investments. |
The Funds did not have any securities that used significant unobservable inputs (Level 3) in determining fair value and there were no transfers into or out of Level 3.
C. Foreign Investment Risk
The ALPS Clean Energy ETF and the ALPS Disruptive Technologies ETF may directly purchase securities of foreign issuers. Investments in non-U.S. issuers may involve unique risks compared to investing in securities of U.S. issuers, including, among others, less liquidity generally, greater market volatility than U.S. securities and less complete financial information than for U.S. issuers. In addition, adverse political, economic or social developments could undermine the value of the Fund’s investments or prevent the Fund from realizing the full value of its investments. Financial reporting standards for companies based in foreign markets differ from those in the United States. Finally, the value of the currency of the country in which the Fund has invested could decline relative to the value of the U.S. dollar, which may affect the value of the investment to U.S. investors. The Fund will not enter into transactions to hedge against declines in the value of the Fund’s assets that are denominated in foreign currency.
Countries with emerging markets may have relatively unstable governments and may present the risks of nationalization of businesses, restrictions on foreign ownership and prohibitions on the repatriation of assets. The economies of emerging markets countries also may be based on only a few industries, making them more vulnerable to changes in local or global trade conditions and more sensitive to debt burdens, inflation rates or adverse news and events.
Because foreign markets may be open on different days than the days during which investors may purchase the shares of the Fund, the value of the Funds’ securities may change on the days when investors are not able to purchase the shares of the Fund. The value of securities denominated in foreign currencies is converted into U.S. dollars using exchange rates determined daily as of the close of regular trading on the NYSE. Any use of a different rate from the rates used by the Index may adversely affect a Fund's ability to track its Index.
ALPS ETF Trust
| Notes to Financial Statements | May 31, 2019 (Unaudited) |
D. Foreign Currency Translation
The books and records of the Funds are maintained in U.S. dollars. Investment valuations and other assets and liabilities initially expressed in foreign currencies are converted each business day into U.S. dollars based upon current exchange rates. The portion of realized and unrealized gains or losses on investments due to fluctuations in foreign currency exchange rates is not separately disclosed and is included in realized and unrealized gains or losses on investments, when applicable.
E. Other Risks
Equity Risk: A principal risk of investing in the Funds is equity risk, which is the risk that the value of the securities held by the Fund will fall due to general market and economic conditions, perceptions regarding the industries in which the issuers of securities held by the Fund participate or factors relating to specific companies in which the Fund invests. For example, an adverse event, such as an unfavorable earnings report, may depress the value of equity securities of an issuer held by a Fund; the price of common stock of an issuer may be particularly sensitive to general movements in the stock market; or a drop in the stock market may depress the price of most or all of the common stocks and other equity securities held by a Fund. In addition, common stock of an issuer in a Fund’s portfolio may decline in price if the issuer fails to make anticipated dividend payments because, among other reasons, the issuer of the security experiences a decline in its financial condition.
Small- and Mid- Capitalization Company Risk:Investments in securities of small and mid-capitalization companies are subject to the risks of common stocks. Investments in smaller companies may involve greater risks because these companies generally have a limited track record. Smaller companies often have narrower markets, more limited managerial and financial resources and a less diversified product offering than larger, more established companies. As a result, their performance can be more volatile, which may increase the volatility of the Fund’s portfolio.
Concentration Risk: Each Fund seeks to track its respective Underlying Index, which may have concentration in certain industries or sectors, as well as regions, economies or markets. Underperformance or increased risk in such other concentrated areas may result in underperformance or increased risk in a Fund.
Non-Correlation Risk:Each Fund’s return may not match the return of its respective Underlying Index for a number of reasons. For example, a Fund incurs a number of operating expenses not applicable to its Underlying Index, and incurs costs in buying and selling securities, especially when rebalancing the Fund’s securities holdings to reflect changes in the composition of the Underlying Index. In addition, the performance of a Fund and its Underlying Index may vary due to asset valuation differences and differences between the Fund’s portfolio and the Underlying Index resulting from legal restrictions. Due to legal and regulatory rules and limitations, a Fund may not be able to invest in all securities included in its Underlying Index. For tax efficiency purposes, a Fund may sell certain securities to realize losses, causing it to deviate from the Underlying Index. The Fund may not be fully invested at times, either as a result of cash flows into the Fund or reserves of cash held by the Fund to meet redemptions and expenses. If a Fund utilizes a sampling approach or otherwise does not hold all of the securities in the Underlying Index, its return may not correlate as well with the return on its Underlying Index, as would be the case if it purchased all of the securities in the Underlying Index with the same weightings as the Underlying Index.
F. Securities Transactions and Investment Income
Securities transactions are recorded as of the trade date. Realized gains and losses from securities transactions are recorded on the highest cost basis. Dividend income and capital gains distributions, if any, are recorded on the ex-dividend date, net of any foreign taxes withheld. Interest income, if any, is recorded on the accrual basis.
G. Dividends and Distributions to Shareholders
Dividends from net investment income for both ALPS Disruptive Technology ETF and ALPS Medical Breakthroughs ETF, if any, are declared and paid annually or as the Board may determine from time to time. Dividends from net investment income for ALPS Clean Energy ETF, if any, are declared and paid quarterly or as the Board may determine from time to time. Distributions of net realized capital gains earned by the Funds, if any, are distributed at least annually.
H. Federal Tax and Tax Basis Information
The timing and character of income and capital gain distributions are determined in accordance with income tax regulations, which may differ from U.S. GAAP. Reclassifications are made to the Funds’ capital accounts for permanent tax differences to reflect income and gains available for distribution (or available capital loss carryforwards) under income tax regulations. The amounts and characteristics of tax basis distributions and composition of distributable earnings/(accumulated losses) are finalized at fiscal year-end; accordingly, tax basis balances have not been determined as of May 31, 2019.
ALPS ETF Trust
| Notes to Financial Statements | May 31, 2019 (Unaudited) |
The tax character of the distributions paid during the fiscal year ended November 30, 2018 were as follows:
| | | Ordinary Income | | | Long-Term Capital Gain | | | Return of Capital | |
| November 30, 2018 | | | | | | | | | |
| ALPS Clean Energy ETF | | $ | – | | | $ | – | | | $ | – | |
| ALPS Disruptive Technologies ETF | | | – | | | | – | | | | – | |
| ALPS Medical Breakthroughs ETF | | | 2,404,884 | | | | – | | | | – | |
Under current law, capital losses maintain their character as short-term or long-term and are carried forward to the next tax year without expiration. As of November 30, 2018, the following amounts are available as carry forwards to the next tax year:
| Fund | | Short-Term | | | Long-Term | |
| ALPS Clean Energy ETF | | $ | 45,617 | | | $ | – | |
| ALPS Disruptive Technologies ETF | | | 405,478 | | | | – | |
| ALPS Medical Breakthroughs ETF | | | 29,843,793 | | | | 20,430,294 | |
As of May 31, 2019, the cost of investments for federal income tax purposes and accumulated net unrealized appreciation/(depreciation) on investments were as follows:
| | | ALPS Clean
Energy ETF | | | ALPS Disruptive Technologies ETF | | | ALPS Medical Breakthroughs ETF | |
| Gross appreciation (excess of value over tax cost) | | $ | 4,129,873 | | | $ | 5,722,829 | | | $ | 30,114,743 | |
| Gross depreciation (excess of tax cost over value) | | | (3,775,150 | ) | | | (6,056,030 | ) | | | (32,639,161 | ) |
| Net unrealized appreciation (depreciation) | | $ | 354,723 | | | $ | (333,201 | ) | | $ | (2,524,418 | ) |
| Cost of investments for income tax purposes | | $ | 61,203,416 | | | $ | 63,798,808 | | | $ | 186,442,136 | |
The differences between book-basis and tax-basis are primarily due to the deferral of losses from wash sales. In addition, certain tax cost basis adjustments are finalized at fiscal year-end and therefore have not been determined as of May 31, 2019.
I. Income Taxes
No provision for income taxes is included in the accompanying financial statements, as each Fund intends to distribute to shareholders all taxable investment income and realized gains and otherwise comply with Subchapter M of the Internal Revenue Code of 1986, as amended, applicable to regulated investment companies. Each Fund evaluates tax positions taken (or expected to be taken) in the course of preparing the Fund’s tax returns to determine whether these positions meet a “more-likely-than-not” standard that, based on the technical merits, have a more than fifty percent likelihood of being sustained by a taxing authority upon examination. A tax position that meets the “more-likely-than-not” recognition threshold is measured to determine the amount of benefit to recognize in the financial statements.
As of and during the six month period ended May 31, 2019, each Fund did not have a liability for any unrecognized tax benefits. Each Fund files U.S. federal, state, and local tax returns as required. Each Fund’s tax returns are subject to examination by the relevant tax authorities until expiration of the applicable statute of limitations, which is generally three years after the filing of the tax return, but may extend to four years in certain jurisdictions. Tax returns for open years have incorporated no uncertain tax positions that require a provision for income taxes. As the ALPS Disruptive Technologies ETF commenced operations on December 28, 2017, and the ALPS Clean Energy ETF commenced operations on June 28, 2018, no tax returns have been filed for either Fund as of the date of this report.
J. Lending of Portfolio Securities
The Funds have entered into a securities lending agreement with State Street Bank & Trust Co. (“SSB”), the Funds’ lending agent. Each Fund may lend their portfolio securities only to borrowers that are approved by SSB. Each Fund will limit such lending to not more than 33 1/3% of the value of its total assets. Each Funds’ securities held at SSB as custodian shall be available to be lent except those securities the Fund or ALPS Advisors, Inc. specifically identifies in writing as not being available for lending. The borrower pledges and maintains with each Fund collateral consisting of cash (U.S. Dollars only), securities issued or guaranteed by the U.S. government or its agencies or instrumentalities, and cash equivalents (including irrevocable bank letters of credit) issued by a person other than the borrower or an affiliate of the borrower. The initial collateral received by each Fund is required to have a value of no less than 102% of the market value of the loaned securities for U.S equity securities and a value of no less than 105% of the market value for non-U.S. equity securities. The collateral is maintained thereafter, at a market value equal to not less than 102%of the current value of the U.S. equity securities on loan and not less than 105% of the current value of the non-U.S. equity securities on loan. The market value of the loaned securities is determined at the close of each business day and any additional required collateral is delivered to each Fund on the next business day. During the term of the loan, each Fund is entitled to all distributions made on or in respect of the loaned securities. Loans of securities are terminable at any time and the borrower, after notice, is required to return borrowed securities within the customary time period for settlement of securities transactions.
ALPS ETF Trust
| Notes to Financial Statements | May 31, 2019 (Unaudited) |
Any cash collateral received is reinvested in a money market fund managed by SSB as disclosed in the Fund’s Schedule of Investments and is reflected in the Statements of Assets and Liabilities as a payable for collateral upon return of securities loaned. Non-cash collateral, in the form of securities issued or guaranteed by the U.S. government or its agencies or instrumentalities, is not disclosed in a Fund’s Statements of Assets and Liabilities as it is held by the lending agent on behalf of each Fund, and each Fund does not have the ability to re-hypothecate these securities. Income earned by the Fund from securities lending activity is disclosed in the Statement of Operations.
The following is a summary of each Fund's securities lending agreement and related cash and non-cash collateral received as of May 31, 2019:
| | | Market Value of Securities on Loan | | | Cash Collateral
Received | | | Non-Cash Collateral
Received | | | Total Collateral
Received | |
| ALPS Clean Energy ETF | | $ | 3,691,725 | | | $ | 3,688,243 | | | $ | 300,332 | | | $ | 3,988,575 | |
| ALPS Disruptive Technologies ETF | | | 1,918,869 | | | | 1,107,381 | | | | 940,543 | | | | 2,047,924 | |
| ALPS Medical Breakthroughs ETF | | | 19,143,429 | | | | 9,366,272 | | | | 11,479,372 | | | | 20,845,644 | |
The risks of securities lending include the risk that the borrower may not provide additional collateral when required or may not return the securities when due. To mitigate these risks, each Fund benefits from a borrower default indemnity provided by SSB. SSB’s indemnity allows for full replacement of securities lent wherein SSB will purchase the unreturned loaned securities on the open market by applying the proceeds of the collateral or to the extent such proceeds are insufficient or the collateral is unavailable, SSB will purchase the unreturned loan securities at SSB’s expense. However, the Funds could suffer a loss if the value of the investments purchased with cash collateral falls below the value of the cash collateral received.
The following tables reflect a breakdown of transactions accounted for as secured borrowings, the gross obligation by the type of collateral pledged or securities loaned, and the remaining contractual maturity of those transactions as of May 31, 2019:
| ALPS Clean Energy ETF | Remaining contractual maturity of the agreements |
| Securities Lending Transactions | | Overnight & Continuous | | Up to 30 days | | | 30-90 days | | | Greater than 90 days | | | Total | |
| Common Stocks | | $ | 3,688,243 | | $ | – | | | $ | – | | | $ | – | | | $ | 3,688,243 | |
| Total Borrowings | | | | | | | | | | | | | | | | | 3,688,243 | |
| Gross amount of recognized liabilities for securities lending (collateral received) | | | | | | $ | 3,688,243 | |
| ALPS Disruptive Technologies ETF | Remaining contractual maturity of the agreements |
| Securities Lending Transactions | | Overnight & Continuous | | Up to 30 days | | | 30-90 days | | | Greater than 90 days | | | Total | |
| Common Stocks | | $ | 1,107,381 | | $ | – | | | $ | – | | | $ | – | | | $ | 1,107,381 | |
| Total Borrowings | | | | | | | | | | | | | | | | | 1,107,381 | |
| Gross amount of recognized liabilities for securities lending (collateral received) | | | | | | $ | 1,107,381 | |
| ALPS Medical Breakthroughs ETF | Remaining contractual maturity of the agreements |
| Securities Lending Transactions | | Overnight & Continuous | | Up to 30 days | | | 30-90 days | | | Greater than 90 days | | | Total | |
| Common Stocks | | $ | 9,366,272 | | $ | – | | | $ | – | | | $ | – | | | $ | 9,366,272 | |
| Total Borrowings | | | | | | | | | | | | | | | | | 9,366,272 | |
| Gross amount of recognized liabilities for securities lending (collateral received) | | | | | | $ | 9,366,272 | |
ALPS ETF Trust
| Notes to Financial Statements | May 31, 2019 (Unaudited) |
| 3. | INVESTMENT ADVISORY FEE AND OTHER AFFILIATED TRANSACTIONS |
ALPS Advisors, Inc. (the “Adviser”) serves as the Funds’ investment adviser pursuant to an Investment Advisory Agreement with the Trust on behalf of each Fund (the “Advisory Agreement”). Pursuant to the Advisory Agreement, each Fund pays the Adviser an annual management fee for the services and facilities it provides, payable on a monthly basis as a percentage of the relevant Fund’s average daily net assets as set out below. From time to time, the Adviser may waive all or a portion of its fee.
| Fund | Advisory Fee |
| ALPS Clean Energy ETF | 0.65% |
| ALPS Disruptive Technologies ETF | 0.50% |
| ALPS Medical Breakthroughs ETF | 0.50% |
Out of the unitary management fee, the Adviser pays substantially all expenses of each Fund, including licensing fees to the Underlying Index provider, the cost of transfer agency, custody, fund administration, legal, audit, independent trustees and other services, except for interest expenses, distribution fees or expenses, brokerage expenses, taxes and extraordinary expenses not incurred in the ordinary course of each Fund's business. The Adviser’s unitary management fee is designed to pay substantially all of each Fund's expenses and to compensate the Adviser for providing services for each Fund.
ALPS Fund Services, Inc., an affiliate of the Adviser, is the administrator for the Funds.
Each Trustee who is not an officer or employee of the Adviser, any sub-adviser or any of their affiliates (“Independent Trustees”) receives (1) a quarterly retainer of $5,000, (2) a per meeting fee for regularly scheduled meetings of $3,750, (3) $1,500 for any special meeting held outside of a regularly scheduled board meeting, and (4) reimbursement for all reasonable out-of-pocket expenses relating to attendance at meetings. In addition, the Chairman of the Board and Chairman of the Audit Committee each receives a quarterly retainer of $2,000, in connection with their respective roles.
| 4. | PURCHASES AND SALES OF SECURITIES |
For the six months ended May 31, 2019, the cost of purchases and proceeds from sales of investment securities, excluding short-term investments and in-kind transactions, were as follows:
| Fund | | Purchases | | | Sales | |
| ALPS Clean Energy ETF | | $ | 2,099,284 | | | $ | 2,313,066 | |
| ALPS Disruptive Technologies ETF | | | 6,458,966 | | | | 6,125,779 | |
| ALPS Medical Breakthroughs ETF | | | 91,051,890 | | | | 94,732,497 | |
For the six months ended May 31, 2019, the cost of in-kind purchases and proceeds from in-kind sales were as follows:
| Fund | | Purchases | | | Sales | |
| ALPS Clean Energy ETF | | $ | 42,225,469 | | | $ | 1,014,866 | |
| ALPS Disruptive Technologies ETF | | | 14,221,768 | | | | 3,467,737 | |
| ALPS Medical Breakthroughs ETF | | | 1,364,015 | | | | 37,229,686 | |
For the six months ended May 31, 2019, the in-kind net realized gains/(losses) were as follows:
| Fund | | Net Realized Gain/(Loss) | |
| ALPS Clean Energy ETF | | $ | 415,071 | |
| ALPS Disruptive Technologies ETF | | | (53,684 | ) |
| ALPS Medical Breakthroughs ETF | | | 7,852,441 | |
| | | | | |
ALPS ETF Trust
| Notes to Financial Statements | May 31, 2019 (Unaudited) |
Gains on in-kind transactions are not considered taxable for federal income tax purposes and losses on in-kind transactions are also not deductible for tax purposes.
| 5. | CAPITAL SHARE TRANSACTIONS |
Shares are created and redeemed by each Fund only in Creation Unit size aggregations of 50,000 Shares. Only broker-dealers or large institutional investors with creation and redemption agreements called Authorized Participants (“AP”) are permitted to purchase or redeem Creation Units from the Funds. Such transactions are generally permitted on an in-kind basis, with a balancing cash component to equate the transaction to the NAV per unit of each Fund on the transaction date. Cash may be substituted equivalent to the value of certain securities generally when they are not available in sufficient quantity for delivery, not eligible for trading by the AP or as a result of other market circumstances.
| 6. | RELATED PARTY TRANSACTIONS |
The ALPS Medical Breakthroughs ETF engaged in cross trades between other funds in the Trust during the six month period ended May 31, 2019 pursuant to Rule 17a-7 under the 1940 Act. Cross trading is the buying or selling of portfolio securities between funds to which the Adviser serves as the investment adviser. The Board previously adopted procedures that apply to transactions between the Funds of the Trust pursuant to Rule 17a-7. These transactions related to cross trades during the period complied with the requirements set forth by Rule 17a-7 and the Trust’s procedures.
Transactions related to cross trades during the six month period ended May 31, 2019, were as follows:
| Fund | | Purchase cost paid | | | Sale proceeds received | | | Realized gain/(loss) on sales | |
| ALPS Medical Breakthroughs ETF | | $ | 427,299 | | | $ | – | | | $ | – | |
ALPS ETF Trust
| Additional Information | May 31, 2019 (Unaudited) |
PROXY VOTING RECORDS, POLICIES AND PROCEDURES
Information regarding how each Fund voted proxies relating to portfolio securities during the most recent 12-month period ended June 30 and a description of the Fund’s proxy voting policies and procedures used in determining how to vote for proxies are available without charge on the SEC’s website at www.sec.gov and upon request, by calling (toll-free) 1-866-675-2639.
PORTFOLIO HOLDINGS
The Trust is required to disclose, after its first and third fiscal quarters, the complete schedule of each Fund’s portfolio holdings with the SEC on Form N-Q or as an exhibit to its report on Form N-PORT. Forms N-Q or N-PORT reports for each Fund will be available on the SEC’s website at www.sec.gov. Each Fund’s Forms N-Q or N-PORT reports will be available without charge, upon request, by calling (toll-free) 1-866-675-2639 or by writing to ALPS ETF Trust at 1290 Broadway, Suite 1100, Denver, Colorado 80203.
TAX INFORMATION
The Funds designate the following as a percentage of taxable ordinary income distributions, or up to the maximum amount allowable, for the calendar year ended December 31, 2018:
| | Qualified Dividend Income | Dividend Received Deduction |
| ALPS Clean Energy ETF | 100.00% | 15.28% |
| ALPS Disruptive Technologies ETF | 100.00% | 76.16% |
| ALPS Medical Breakthroughs ETF | 14.09% | 0.00% |
In early 2019, if applicable, shareholders of record received this information for the distribution paid to them by the Funds during the calendar year 2018 via Form 1099. The Funds will notify shareholders in early 2020 of amounts paid to them by the Fund, if any, during the calendar year 2019.
LICENSING AGREEMENT
ALPS Clean Energy ETF
The CIBC Atlantic Trust Clean Energy Index (the “Underlying Index”) was created by CIBC National Trust Company (“CIBC NTC,” or the “Index Provider”). The Index Provider has entered into a license agreement with ALPS Advisors, Inc. (the “Adviser”) to use the Underlying Index (the “License Agreement”) in connection with the ALPS Clean Energy ETF (“Fund”). The following disclosure relates to the Index Provider and Adviser:
CIBC NTC is the designer of the construction and methodology for the Underlying Index. “CIBC NTC” and “CIBC Atlas Clean Energy Index” are service marks or trademarks of the Index Provider. CIBC NTC acts solely as brand licensor for the Underlying Index, and is not responsible for the descriptions of the Underlying Index or the Fund that appear herein.
The Fund is not sponsored, endorsed, sold or promoted by CIBC NTC or any of its affiliates. CIBC NTC makes no representation or warranty, express or implied, to the owners of the Fund or any member of the public regarding the advisability of investing in securities or commodities generally or in the Fund particularly or the ability of the Underlying Index to track the market generally. CIBC NTC does not guarantee the quality, accuracy or completeness of the Underlying Index or any Underlying Index data included herein or derived therefrom and assume no liability in connection with their use. The Underlying Index is determined and composed without regard to the Adviser or the Fund. CIBC NTC has no obligation to take the needs of the Adviser, the Fund or the shareholders of the Fund into consideration in determining, composing or calculating the Underlying Index. CIBC NTC is not responsible for and has not participated in the determination of the timing of, prices at, or quantities of the Fund to be issued or in the determination or calculation of the equation by which the Fund is to be converted into cash. CIBC NTC has no obligation or liability in connection with the administration, marketing or trading of the Fund and is not responsible for and has not participated in the determination of pricing or the timing of the issuance or sale of the Shares of the Fund or in the determination or calculation of the NAV of the Fund.
ALPS ETF Trust
| Additional Information | May 31, 2019 (Unaudited) |
CIBC NTC does not guarantee the quality, accuracy and/or completeness of the Underlying Index or any data included therein, and CIBC NTC shall have no liability for any errors, omissions, or interruptions of any kind related to the Underlying Index or related data. CIBC NTC makes no warranty, express or implied, as to results to be obtained by the Adviser, the Fund, Fund shareholders or any other person or entity from the use of the Underlying Index or any data included therein. CIBC NTC makes no express or implied warranties, and expressly disclaims all warranties of merchantability or fitness for a particular purpose or use with respect to the Underlying Index or any data included therein. Without limiting any of the foregoing, in no event shall CIBC NTC have any liability for any special, punitive, indirect, or consequential damages (including lost profits) arising out of matters relating to the use of the Underlying Index, even if notified of the possibility of such damages.
All intellectual property rights in the Underlying Index vests in CIBC NTC. www.alpsfunds.com 15 ALPS CLEAN ENERGY ETF The Underlying Index is the property of CIBC NTC, which has contracted with S&P Opco, LLC (a subsidiary of S&P Dow Jones Indices LLC) to calculate and maintain the Underlying Index. The Underlying Index is not sponsored by S&P Dow Jones Indices or its affiliates or its third party licensors (collectively, “S&P Dow Jones Indices”). S&P Dow Jones Indices will not be liable for any errors or omissions in calculating the Underlying Index. “Calculated by S&P Dow Jones Indices” and the related stylized mark(s) are service marks of S&P Dow Jones Indices and have been licensed for use by CIBC NTC. S&P®is a registered trademark of Standard & Poor’s Financial Services LLC (“SPFS”), and Dow Jones®is a registered trademark of Dow Jones Trademark Holdings LLC (“Dow Jones”).
The Fund is not sponsored, endorsed, sold or promoted by S&P Dow Jones Indices. S&P Dow Jones Indices does not make any representation or warranty, express or implied, to the owners of the Fund or any member of the public regarding the advisability of investing in securities generally or in the Fund particularly or the ability of the Underlying Index to track general market performance. S&P Dow Jones Indices’ only relationship to CIBC NTC with respect to the Underlying Index is the licensing of certain trademarks, service marks and trade names of S&P Dow Jones Indices, and the provision of the calculation services related to the Underlying Index. S&P Dow Jones Indices is not responsible for and has not participated in the determination of the prices and amount of the Fund or the timing of the issuance or sale of the Fund or in the determination or calculation of the equation by which the Fund may be converted into cash or other redemption mechanics. S&P Dow Jones Indices has no obligation or liability in connection with the administration, marketing or trading of the Fund. S&P Dow Jones Indices LLC is not an investment advisor. Inclusion of a security within the Underlying Index is not a recommendation by S&P Dow Jones Indices to buy, sell, or hold such security, nor is it investment advice.
S&P DOW JONES INDICES DOES NOT GUARANTEE THE ADEQUACY, ACCURACY, TIMELINESS AND/OR THE COMPLETENESS OF THE UNDERLYING INDEX OR ANY DATA RELATED THERETO OR ANY COMMUNICATION WITH RESPECT THERETO, INCLUDING, ORAL, WRITTEN, OR ELECTRONIC COMMUNICATIONS. S&P DOW JONES INDICES SHALL NOT BE SUBJECT TO ANY DAMAGES OR LIABILITY FOR ANY ERRORS, OMISSIONS, OR DELAYS THEREIN. S&P DOW JONES INDICES MAKES NO EXPRESS OR IMPLIED WARRANTIES, AND EXPRESSLY DISCLAIMS ALL WARRANTIES, OF MERCHANTABILITY OR FITNESS FOR A PARTICULAR PURPOSE OR USE OR AS TO RESULTS TO BE OBTAINED BY CIBC NTC, OWNERS OF THE FUND, OR ANY OTHER PERSON OR ENTITY FROM THE USE OF THE UNDERLYING INDEX OR WITH RESPECT TO ANY DATA RELATED THERETO. WITHOUT LIMITING ANY OF THE FOREGOING, IN NO EVENT WHATSOEVER SHALL S&P DOW JONES INDICES BE LIABLE FOR ANY INDIRECT, SPECIAL, INCIDENTAL, PUNITIVE, OR CONSEQUENTIAL DAMAGES, INCLUDING BUT NOT LIMITED TO, LOSS OF PROFITS, TRADING LOSSES, LOST TIME, OR GOODWILL, EVEN IF THEY HAVE BEEN ADVISED OF THE POSSIBILITY OF SUCH DAMAGES, WHETHER IN CONTRACT, TORT, STRICT LIABILITY, OR OTHERWISE.
The Index Provider is not affiliated with the Trust, the Adviser or ALPS Portfolio Solutions Distributor, Inc. (the “Distributor”). The Index Provider has entered into a license agreement with the Adviser (the “License Agreement”). The use of the Underlying Index by the Adviser and the Fund is subject to the terms of the License Agreement, which impose certain limitations and conditions on the Fund’s ability to use the Underlying Index.
The Adviser does not guarantee the accuracy and/or the completeness of the Underlying Index or any data included therein, and the Adviser shall have no liability for any errors, omissions or interruptions therein. The Adviser makes no warranty, express or implied, as to results to be obtained by the Fund, owners of the Shares of the Fund or any other person or entity from the use of the Underlying Index or any data included therein. The Adviser makes no express or implied warranties, and expressly disclaims all warranties of merchantability or fitness for a particular purpose or use with respect to the Underlying Index or any data included therein. Without limiting any of the foregoing, in no event shall the Adviser have any liability for any special, punitive, direct, indirect, or consequential damages (including lost profits) arising out of matters relating to the use of the Underlying Index, even if notified of the possibility of such damages.
ALPS ETF Trust
| Additional Information | May 31, 2019 (Unaudited) |
ALPS Disruptive Technology ETF
The Indxx Disruptive Technologies Index (the “Underlying Index”) is a service mark of Indxx, LLC (“Indxx” or the “Index Provider”) and has been licensed for use for certain purposes by ALPS Advisors, Inc. The ALPS Disruptive Technologies ETF is not sponsored, endorsed, sold or promoted by Indxx and Indxx makes no representation regarding the advisability of investing in the ALPS Disruptive Technologies ETF.
The ALPS Disruptive Technologies ETF is not sponsored, endorsed, sold or promoted by Indxx. Indxx makes no representation or warranty, express or implied, to the owners of the ALPS Disruptive Technologies ETF or any member of the public regarding the advisability of investing in securities generally or in the ALPS Disruptive Technologies ETF particularly. Indxx has no obligation to take the needs of ALPS Advisors, Inc. or the shareholders of ALPS Disruptive Technologies ETF into consideration in determining, composing, or calculating the Underlying Index. Indxx is not responsible for and has not participated in the determination of the timing, amount or pricing of the ALPS Disruptive Technologies ETF shares to be issued or in the determination or calculation of the equation by which the ALPS Disruptive Technologies ETF is to be converted into cash. Indxx has no obligation or liability in connection with the administration, marketing or trading of the ALPS Disruptive Technologies ETF.
INDXX MAKES NO WARRANTY, EXPRESS OR IMPLIED, AS TO THE RESULTS TO BE OBTAINED BY ANY PERSON OR ENTITY FROM THE USE OF THE INDEX(ES), TRADING BASED ON THE INDEX(ES), OR ANY DATA INCLUDED THEREIN IN CONNECTION WITH THE PRODUCTS, OR FOR ANY OTHER USE. INDXX EXPRESSLY DISCLAIMS ALL WARRANTIES AND CONDITIONS, EXPRESS, STATUTORY, OR IMPLIED, EXCEPT AS SET FORTH IN THIS AGREEMENT. EXCEPT AS OTHERWISE SPECIFICALLY SET FORTH IN THIS AGREEMENT, INDXX HEREBY EXPRESSLY DISCLAIMS ALL IMPLIED WARRANTIES AND CONDITIONS OF MERCHANTABILITY, TITLE, OR FITNESS FOR A PARTICULAR PURPOSE OR USE WITH RESPECT TO THE INDEX(ES) OR ANY DATA INCLUDED THEREIN. INDXX DOES NOT GUARANTEE THE ACCURACY AND/OR THE COMPLETENESS OF ANY DATA SUPPLIED BY IT OR ANY DATA INCLUDED THEREIN. INDXX MAKES NO WARRANTY, EXPRESS OR IMPLIED, AS TO RESULTS TO BE OBTAINED BY THE FUNDS, ITS SHAREHOLDERS OR AFFILIATES, OR ANY OTHER PERSON OR ENTITY FROM THE USE OF THE DATA SUPPLIED BY INDXX OR ANY DATA INCLUDED THEREIN. INDXX MAKES NO EXPRESS OR IMPLIED WARRANTIES, AND EXPRESSLY DISCLAIMS ALL WARRANTIES OF MERCHANTABILITY OR FITNESS FOR A PARTICULAR PURPOSE OR USE WITH RESPECT TO THE DATA SUPPLIED BY INDXX OR ANY DATA INCLUDED THEREIN. WITHOUT LIMITING ANY OF THE FOREGOING, IN NO EVENT SHALL INDXX HAVE ANY LIABILITY FOR ANY SPECIAL, PUNITIVE, INDIRECT, OR CONSEQUENTIAL DAMAGES (INCLUDING LOST PROFITS), EVEN IF NOTIFIED OF THE POSSIBILITY OF SUCH DAMAGES.
The Adviser does not guarantee the accuracy and/or the completeness of the Underlying Index or any data included therein, and the Adviser shall have no liability for any errors, omissions or interruptions therein. The Adviser makes no warranty, express or implied, as to results to be obtained by the Fund, owners of the Shares of the Fund or any other person or entity from the use of the Underlying Index or any data included therein. The Adviser makes no express or implied warranties, and expressly disclaims all warranties of merchantability or fitness for a particular purpose or use with respect to the Underlying Index or any data included therein. Without limiting any of the foregoing, in no event shall the Adviser have any liability for any special, punitive, direct, indirect or consequential damages (including lost profits) arising out of matters relating to the use of the Underlying Index, even if notified of the possibility of such damages.
ALPS Medical Breakthroughs ETF
The Poliwogg Medical Breakthroughs IndexSM is a service mark of S-Network Global Indexes, Inc. and has been licensed for use by ALPS Advisors, Inc. The ALPS Medical Breakthroughs ETF is not sponsored, endorsed, sold or promoted by S-Network Global Indexes, Inc. and S-Network Global Indexes, Inc. makes no representation regarding the advisability of investing in the ALPS Medical Breakthroughs ETF.
The ALPS Medical Breakthroughs ETF is not sponsored, endorsed, sold or promoted by Standard & Poor’s, a division of The McGraw-Hill Companies, Inc. (“S&P”) or its third party licensors. Neither S&P nor its third party licensors make any representation or warranty, express or implied, to the owners of the ALPS Medical Breakthroughs ETF or any member of the public regarding the advisability of investing in securities generally or in the ALPS Medical Breakthroughs ETF particularly or the ability of the Poliwogg Medical Breakthroughs IndexSM to track general stock market performance. S&P’s and its third party licensor’s only relationship to S-Network Global Indexes, LLC is the licensing of certain trademarks, service marks and trade names of S&P and/or its third party licensors and for the providing of calculation and maintenance services related to the Poliwogg Medical Breakthroughs IndexSM. Neither S&P nor its third party licensors is responsible for and has not participated in the determination of the prices and amount of the ALPS Medical Breakthroughs ETF or the timing of the issuance or sale of the ALPS Medical Breakthroughs ETF or in the determination or calculation of the equation by which the ALPS Medical Breakthroughs ETF is to be converted into cash. S&P has no obligation or liability in connection with the administration, marketing or trading of the ALPS Medical Breakthroughs ETF.
ALPS ETF Trust
| Additional Information | May 31, 2019 (Unaudited) |
NEITHER S&P, ITS AFFILIATES NOR THEIR THIRD PARTY LICENSORS GUARANTEE THE ADEQUACY, ACCURACY, TIMELINESS OR COMPLETENESS OF THE POLIWOGG MEDICAL BREAKTHROUGHS INDEXSM OR ANY DATA INCLUDED THEREIN OR ANY COMMUNICATIONS, INCLUDING BUT NOT LIMITED TO, ORAL OR WRITTEN COMMUNICATIONS (INCLUDING ELECTRONIC COMMUNICATIONS) WITH RESPECT THERETO. S&P, ITS AFFILIATES AND THEIR THIRD PARTY LICENSORS SHALL NOT BE SUBJECT TO ANY DAMAGES OR LIABILITY FOR ANY ERRORS, OMISSIONS OR DELAYS THEREIN. S&P MAKES NO EXPRESS OR IMPLIED WARRANTIES, AND EXPRESSLY DISCLAIMS ALL WARRANTIES OF MERCHANTABILITY OR FITNESS FOR A PARTICULAR PURPOSE OR USE WITH RESPECT TO ITS TRADEMARKS, THE INDEX OR ANY DATA INCLUDED THEREIN. WITHOUT LIMITING ANY OF THE FOREGOING, IN NO EVENT WHATSOEVER SHALL S&P, ITS AFFILIATES OR THEIR THIRD PARTY LICENSORS BE LIABLE FOR ANY INDIRECT, SPECIAL, INCIDENTAL, PUNITIVE OR CONSEQUENTIAL DAMAGES, INCLUDING BUT NOT LIMITED TO, LOSS OF PROFITS, TRADING LOSSES, LOST TIME OR GOODWILL, EVEN IF THEY HAVE BEEN ADVISED OF THE POSSIBILITY OF SUCH DAMAGES, WHETHER IN CONTRACT, TORT, STRICT LIABILITY OR OTHERWISE.
Standard & Poor’s®, and S&P® are registered trademarks of The McGraw-Hill Companies, Inc.; “Calculated by S&P Custom Indices” and its related stylized mark are service marks of The McGraw-Hill Companies, Inc. These marks have been licensed for use by S-Network Global Indexes, LLC. The Adviser does not guarantee the accuracy and/or the completeness of either Underlying Index or any data included therein, and the Adviser shall have no liability for any errors, omissions or interruptions therein. The Adviser makes no warranty, express or implied, as to results to be obtained by the Funds, owners of the Shares of the Funds or any other person or entity from the use of either Underlying Index or any data included therein. The Adviser makes no express or implied warranties, and expressly disclaims all warranties of merchantability or fitness for a particular purpose or use with respect to either Underlying Index or any data included therein. Without limiting any of the foregoing, in no event shall the Adviser have any liability for any special, punitive, direct, indirect or consequential damages (including lost profits) arising out of matters relating to the use of either Underlying Index even if notified of the possibility of such damages.

TABLE OF
CONTENTS
| Performance Overview | 1 |
| Disclosure of Fund Expenses | 7 |
| Schedule of Investments | 8 |
| Statements of Assets and Liabilities | 13 |
| Statements of Operations | 14 |
| Statements of Changes in Net Assets | 15 |
| Financial Highlights | 18 |
| Notes to Financial Statements | 21 |
| Additional Information | 27 |
Beginning on January 1, 2021, as permitted by regulations adopted by the U.S. Securities and Exchange Commission, paper copies of the Funds’ annual and semi-annual shareholder reports will no longer be sent by mail, unless you specifically request paper copies of the reports from your financial intermediary (such as a broker-dealer or bank). Instead, the reports will be made available on the Funds’ website (www.alpsfunds.com), and you will be notified by mail each time a report is posted and provided with a website link to access the report.
If you already elected to receive shareholder reports electronically, you will not be affected by this change and you need not take any action. You may elect to receive shareholder reports and other communications from a Fund electronically anytime by contacting your financial intermediary.
You may elect to receive all future reports in paper free of charge. You can contact your financial intermediary to request that you continue to receive paper copies of your shareholder reports. Your election to receive reports in paper will apply to all funds held in your account with your financial intermediary.
alpsfunds.com
ALPS Sector Dividend Dogs ETF
| Performance Overview | May 31, 2019 (Unaudited) |
Investment Objective
The ALPS Sector Dividend Dogs ETF (the “Fund”) seeks investment results that replicate as closely as possible, before fees and expenses, the performance of the S-Network® Sector Dividend Dogs Index (the “Underlying Index”). The Shares of the Fund are listed and trade on the NYSE Arca under the ticker symbol SDOG. The Fund generally will invest in all of the securities that comprise the Underlying Index in proportion to their weightings in the Underlying Index.
The Underlying Index is a rules based index intended to give investors a means of tracking the overall performance of the highest dividend paying stocks (i.e. “Dividend Dogs”) in the S&P 500® Total Return Index (“SPX”) on a sector-by-sector basis. “Dividend Dogs” refers to the five stocks in each of the Global Industry Classification Standard (“GICS”) sectors, excluding the real estate sector, that make up the S&P 500® Total Return Index which offer the highest dividend yields.
Performance(as of May 31, 2019)
| | 6 Months | 1 Year | 3 Year | 5 Year | Since Inception^ |
| ALPS Sector Dividend Dogs ETF – NAV | -7.00% | -5.77% | 4.07% | 5.52% | 11.04% |
| ALPS Sector Dividend Dogs ETF – Market Price* | -7.00% | -5.91% | 4.06% | 5.50% | 11.03% |
| S-Network®Sector Dividend Dogs Total Return Index | -6.80% | -5.38% | 4.54% | 6.00% | 11.56% |
| S&P 500® Total Return Index | 0.74% | 3.78% | 11.72% | 9.66% | 13.04% |
Total Expense Ratio (per the current prospectus) 0.40%.
Performance data quoted represents past performance. Past performance does not guarantee future results. The table does not reflect the deduction of taxes that a shareholder would pay on Fund distributions or the redemption of Fund shares. Investment return and principal value of an investment will fluctuate so that an investor’s shares, when sold or redeemed, may be worth more or less than the original cost. Current performance data may be higher or lower than actual data quoted. For the most current month-end performance data please visit www.alpsfunds.com or call 1.866.675.2639.
NAV is an exchange-traded fund’s per-share value. The per-share dollar amount of the Fund is derived by dividing the total value of all the securities in its portfolio, less any liabilities, by the number of Fund shares outstanding. Market Price is the price at which a share can currently be traded in the market. Information detailing the number of days the Market Price of the Fund was greater than the Fund’s NAV and the number of days it was less than the Fund’s NAV can be obtained at www.alpsfunds.com.
| ^ | The Fund Commencement Date was June 29, 2012. |
| * | Market Price is based on the midpoint of the bid-ask spread at 4 p.m. ET and does not represent the returns an investor would receive if shares were traded at other times. |
The S-Network® Sector Dividend Dogs Total Return Index is designed to serve as a fair, impartial and transparent measure of the performance of US large cap equities with above average dividend yields. The Underlying Index is a portfolio of fifty stocks derived from the S&P 500® Index. The index is reported on a total return basis, which assumes reinvestment of any dividends and distributions realized during a given time period.
The S&P 500® Total Return Index is an index of 500 stocks chosen for market size, liquidity and industry grouping among other factors. Total return assumes reinvestment of any dividends and distributions realized during a given time period.
The indexes are not actively managed and do not reflect any deductions for fees, expenses or taxes. One cannot invest directly in an index. Index performance does not reflect fund performance.
The Fund’s shares are not individually redeemable. Investors buy and sell shares of the Fund on a secondary market. Only market makers or “authorized participants” may trade directly with the Fund, typically in blocks of 50,000 shares.
The ALPS Sector Dividend Dogs ETF is not suitable for all investors. Investments in the Fund are subject to investment risks, including possible loss of the principal amount invested.
ALPS Portfolio Solutions Distributor, Inc., a FINRA member, is the distributor for the ETF.
ALPS Sector Dividend Dogs ETF
| Performance Overview | May 31, 2019 (Unaudited) |
Top 10 Holdings* (as of May 31, 2019)
| QUALCOMM, Inc. | 2.62% |
| Ford Motor Co. | 2.37% |
| Western Union Co. | 2.27% |
| Johnson Controls International PLC | 2.25% |
| General Mills, Inc. | 2.23% |
| Southern Co. | 2.21% |
| Invesco, Ltd. | 2.20% |
| Entergy Corp. | 2.20% |
| MetLife, Inc. | 2.20% |
| Omnicom Group, Inc. | 2.19% |
| Total % of Top 10 Holdings | 22.74% |
Sector Allocation* (as of May 31, 2019)
| Financials | 10.54% |
| Utilities | 10.45% |
| Information Technology | 10.40% |
| Communication Services | 10.14% |
| Health Care | 9.98% |
| Industrials | 9.93% |
| Consumer Staples | 9.86% |
| Consumer Discretionary | 9.59% |
| Materials | 9.51% |
| Energy | 9.46% |
| Money Market Fund | 0.14% |
| Total | 100.00% |
Future holdings are subject to change.
Growth of $10,000(as of May 31, 2019)
Comparison of Change in Value of $10,000 Investment in the Fund and the Indexes
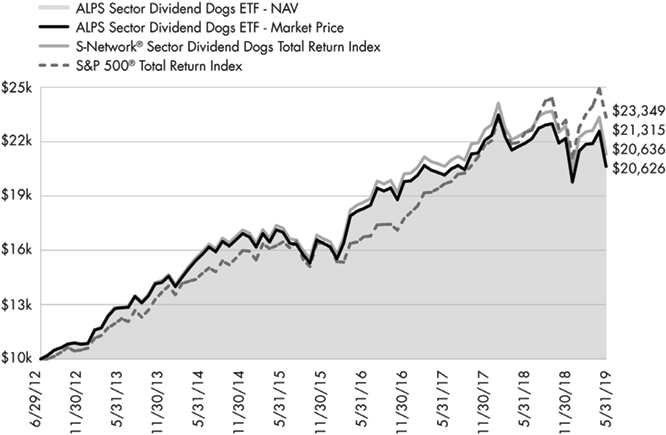
The chart above represents historical performance of a hypothetical investment of $10,000 in the Fund over the life of the Fund. Past performance does not guarantee future results. This chart does not reflect the deduction of taxes that a shareholder would pay on Fund distributions or the redemption of Fund shares.
ALPS International Sector Dividend Dogs ETF
| Performance Overview | May 31, 2019 (Unaudited) |
Investment Objective
The ALPS International Sector Dividend Dogs ETF (the “Fund”) seeks investment results that replicate as closely as possible, before fees and expenses, the performance of the S-Network® International Sector Dividend Dogs Net Total Return Index (the “Underlying Index”). The Shares of the Fund are listed and trade on the NYSE Arca under the ticker symbol IDOG. The Fund generally will invest in all of the securities that comprise the Underlying Index in proportion to their weightings in the Underlying Index.
The Underlying Index is a rules-based index intended to give investors a means of tracking the overall performance of the highest dividend paying stocks (i.e. “Dividend Dogs”) in the S-Net International Developed Markets (ex-Americas) Index, a universe of mainly large capitalization stocks in international developed markets not located in the Americas (the “S-Net Developed Markets”) on a sector-by-sector basis. “Dividend Dogs” refers to the five stocks in each of the Global Industry Classification Standard (“GICS”) sectors, excluding the real estate sector, that make up the S-Net Developed Markets which offer the highest dividend yields.
Performance(as of May 31, 2019)
| | 6 Months | 1 Year | 3 Year | 5 Year | Since Inception^ |
| ALPS International Sector Dividend Dogs ETF – NAV | 2.04% | -5.77% | 6.27% | -0.41% | 3.93% |
| ALPS International Sector Dividend Dogs ETF – Market Price* | 1.43% | -6.22% | 6.06% | -0.62% | 3.85% |
| S-Network®International Sector Dividend Dogs Net Total Return Index | 2.09% | -5.55% | 6.64% | -0.06% | 4.30% |
| MSCI EAFE®Net Total Return Index | 2.41% | -5.75% | 5.82% | 1.27% | 4.59% |
Total Expense Ratio (per the current prospectus) 0.50%.
Performance data quoted represents past performance. Past performance does not guarantee future results. The table does not reflect the deduction of taxes that a shareholder would pay on Fund distributions or the redemption of Fund shares. Investment return and principal value of an investment will fluctuate so that an investor’s shares, when sold or redeemed, may be worth more or less than the original cost. Current performance data may be higher or lower than actual data quoted. For the most current month-end performance data please visit www.alpsfunds.com or call 1.866.675.2639.
NAV is an exchange-traded fund’s per-share value. The per-share dollar amount of the Fund is derived by dividing the total value of all the securities in its portfolio, less any liabilities, by the number of Fund shares outstanding. Market Price is the price at which a share can currently be traded in the market. Information detailing the number of days the Market Price of the Fund was greater than the Fund’s NAV and the number of days it was less than the Fund’s NAV can be obtained at www.alpsfunds.com.
| ^ | The Fund Commencement Date was June 28, 2013. |
| * | Market Price is based on the midpoint of the bid-ask spread at 4 p.m. ET and does not represent the returns an investor would receive if shares were traded at other times. |
The S-Network® International Sector Dividend Dogs Net Total Return Index is designed to serve as a fair, impartial and transparent measure of the performance of international large cap equities with above average dividend yields. The Underlying Index is a portfolio of fifty stocks derived from the S-Net International Developed Markets Index (ex-Americas) Index. Total Return assumes reinvestment of any dividends and distributions realized during a given time period. Net Total Return (NTR) is obtained by reinvesting the net dividend, which is equal to the ordinary gross dividend minus the amount of withholding tax.
MSCI EAFE® Net Total Return Index is a stock market index that is designed to measure the equity market performance of developed markets outside of the U.S. & Canada.
The indexes are not actively managed and do not reflect any deductions for fees, expenses or taxes. One cannot invest directly in an index. Index performance does not reflect fund performance.
The Fund’s shares are not individually redeemable. Investors buy and sell shares of the Fund on a secondary market. Only market makers or “authorized participants” may trade directly with the Fund, typically in blocks of 50,000 shares.
The ALPS International Sector Dividend Dogs ETF is not suitable for all investors. Investments in the Fund are subject to investment risks, including possible loss of the principal amount invested.
ALPS Portfolio Solutions Distributor, Inc., a FINRA member, is the distributor for the ETF.
ALPS International Sector Dividend Dogs ETF
| Performance Overview | May 31, 2019 (Unaudited) |
Top 10 Holdings* (as of May 31, 2019)
| Hitachi, Ltd. | 2.48% |
| Telstra Corp., Ltd. | 2.31% |
| Kyocera Corp. | 2.28% |
| Rio Tinto, Ltd. | 2.25% |
| WPP PLC | 2.21% |
| Wesfarmers, Ltd. | 2.19% |
| Commonwealth Bank of Australia | 2.18% |
| Tokyo Electron, Ltd. | 2.17% |
| Hennes & Mauritz AB | 2.14% |
| Aena SME SA | 2.14% |
| Total % of Top 10 Holdings | 22.35% |
Sector Allocation* (as of May 31, 2019)
| Information Technology | 10.73% |
| Consumer Discretionary | 10.21% |
| Financials | 10.14% |
| Industrials | 10.13% |
| Energy | 10.07% |
| Communication Services | 9.98% |
| Utilities | 9.84% |
| Materials | 9.80% |
| Health Care | 9.26% |
| Consumer Staples | 9.21% |
| Money Market Fund | 0.63% |
| Total | 100.00% |
Future holdings are subject to change.
Growth of $10,000(as of May 31, 2019)
Comparison of Change in Value of $10,000 Investment in the Fund and the Indexes
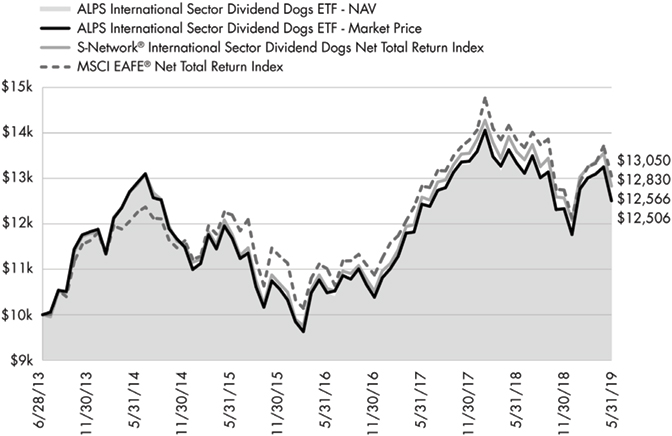
The chart above represents historical performance of a hypothetical investment of $10,000 in the Fund over the life of the Fund. Past performance does not guarantee future results. This chart does not reflect the deduction of taxes that a shareholder would pay on Fund distributions or the redemption of Fund shares.
ALPS Emerging Sector Dividend Dogs ETF
| Performance Overview | May 31, 2019 (Unaudited) |
Investment Objective
The ALPS Emerging Sector Dividend Dogs ETF (the “Fund”) seeks investment results that replicate as closely as possible, before fees and expenses, the performance of the S-Network® Emerging Sector Dividend Dogs Net Total Return Index (the “Underlying Index”). The Shares of the Fund are listed and trade on the NYSE Arca under the ticker symbol EDOG. The Fund generally will invest in all of the securities that comprise the Underlying Index in proportion to their weightings in the Underlying Index.
The Underlying Index is a rules-based index intended to give investors a means of tracking the overall performance of the highest dividend paying stocks (i.e. “Dividend Dogs”) in the S-Network® Emerging Markets Index, a universe of mainly large capitalization stocks domiciled in emerging markets (the “S-Network Emerging Markets”) on a sector-by-sector basis. “Dividend Dogs” refers to the five stocks in each of the Global Industry Classification Standard (“GICS”) sectors, excluding the real estate sector, that make up the S-Network® Emerging Markets which offer the highest dividend yields. Emerging market countries are countries that major international financial institutions, such as the World Bank, generally consider to be less economically mature than developed nations.
Performance(as of May 31, 2019)
| | 6 Months | 1 Year | 3 Year | 5 Year | Since Inception^ |
| ALPS Emerging Sector Dividend Dogs ETF – NAV | 0.48% | -4.05% | 4.19% | -1.19% | 0.20% |
| ALPS Emerging Sector Dividend Dogs ETF – Market Price* | 0.48% | -4.08% | 4.14% | -1.39% | 0.15% |
| S-Network®Emerging Sector Dividend Dogs Net Total Return Index | 0.89% | -3.45% | 4.95% | -0.32% | 1.05% |
| MSCI Emerging Markets Net Total Return Index® | 1.33% | -8.70% | 9.88% | 1.79% | 2.86% |
Total Expense Ratio (per the current prospectus) 0.60%.
Performance data quoted represents past performance. Past performance does not guarantee future results. The table does not reflect the deduction of taxes that a shareholder would pay on Fund distributions or the redemption of Fund shares. Investment return and principal value of an investment will fluctuate so that an investor’s shares, when sold or redeemed, may be worth more or less than the original cost. Current performance data may be higher or lower than actual data quoted. For the most current month-end performance data please visit www.alpsfunds.com or call 1.866.675.2639.
NAV is an exchange-traded fund’s per-share value. The per-share dollar amount of the Fund is derived by dividing the total value of all the securities in its portfolio, less any liabilities, by the number of Fund shares outstanding. Market Price is the price at which a share can currently be traded in the market. Information detailing the number of days the Market Price of the Fund was greater than the Fund’s NAV and the number of days it was less than the Fund’s NAV can be obtained at www.alpsfunds.com.
| ^ | The Fund Commencement Date was March 28, 2014. |
| * | Market Price is based on the midpoint of the bid-ask spread at 4 p.m. ET and does not represent the returns an investor would receive if shares were traded at other times. |
The S-Network® Emerging Sector Dividend Dogs Net Total Return Index is a portfolio of stocks derived from a universe of mainly large capitalization stocks domiciled in emerging markets (the “S-Network Emerging Markets Index” “SNEMX”). The index methodology selects the five stocks in each of the GICS sectors, excluding the real estate sector, that make up the universe which offer the highest dividend yields as of the last trading day of November. The fifty stocks that are selected for inclusion in the portfolio are equally weighted. The universe includes stocks whose domicile and primary exchange listings are in countries identified by the World Bank as Upper Middle Income (certain lower middle income countries are also included, as well as stocks traded on the Taiwan Stock Exchange despite non-recognition by the World Bank). The selection criteria for the universe, in addition to the aforementioned country qualifications, also include requirements for sector inclusion, primary exchange listing, minimum market capitalization, share price, average daily trading volume and other factors. Total Return assumes reinvestment of any dividends and distributions realized during a given time period. Net Total Return (NTR) is obtained by reinvesting the net dividend, which is equal to the ordinary gross dividend minus the amount of withholding tax.
The MSCI Emerging Markets Net Total Return Index® is a free float-adjusted market capitalization index that is designed to measure equity market performance in the global emerging markets.
The indexes are not actively managed and do not reflect any deductions for fees, expenses or taxes. One cannot invest directly in an index. Index performance does not reflect fund performance.
The Fund’s shares are not individually redeemable. Investors buy and sell shares of the Fund on a secondary market. Only market makers or “authorized participants” may trade directly with the Fund, typically in blocks of 50,000 shares.
The ALPS Emerging Sector Dividend Dogs ETF is not suitable for all investors. Investments in the Fund are subject to investment risks, including possible loss of the principal amount invested.
ALPS Portfolio Solutions Distributor, Inc., a FINRA member, is the distributor for the ETF.
ALPS Emerging Sector Dividend Dogs ETF
| Performance Overview | May 31, 2019 (Unaudited) |
Top 10 Holdings* (as of May 31, 2019)
| Zoomlion Heavy Industry Science and Technology Co., Ltd. | 2.66% |
| X5 Retail Group NV | 2.49% |
| Engie Brasil Energia SA | 2.42% |
| MTN Group, Ltd. | 2.41% |
| Wipro, Ltd. | 2.38% |
| Grupo Aeroportuario del Pacifico SAB de CV | 2.37% |
| BB Seguridade Participacoes SA | 2.36% |
| Intouch Holdings PCL, NVDR | 2.27% |
| Astra International Tbk PT | 2.22% |
| Severstal PJSC | 2.21% |
| Total % of Top 10 Holdings | 23.79% |
| * | % of Total Investments (excluding investments purchased with collateral from securities loaned). |
Sector Allocation* (as of May 31, 2019)
| Industrials | 11.22% |
| Consumer Staples | 10.78% |
| Communication Services | 10.72% |
| Utilities | 10.53% |
| Financials | 10.30% |
| Consumer Discretionary | 9.99% |
| Health Care | 9.66% |
| Information Technology | 9.45% |
| Energy | 8.93% |
| Materials | 8.06% |
| Money Market Fund | 0.36% |
| Total | 100.00% |
Future holdings are subject to change.
Growth of $10,000(as of May 31, 2019)
Comparison of Change in Value of $10,000 Investment in the Fund and the Indexes
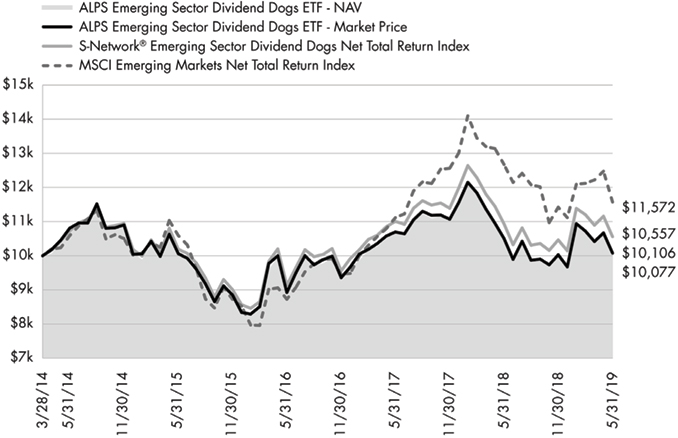
The chart above represents historical performance of a hypothetical investment of $10,000 in the Fund over the life of the Fund. Past performance does not guarantee future results. This chart does not reflect the deduction of taxes that a shareholder would pay on Fund distributions or the redemption of Fund shares.
ALPS ETF Trust
| Disclosure of Fund Expenses | May 31, 2019 (Unaudited) |
Shareholder Expense Example: As a shareholder of a Fund, you incur two types of costs: (1) transaction costs which may include creation and redemption fees or brokerage charges, and (2) ongoing costs, including management fees and other Fund expenses. These examples are intended to help you understand your ongoing costs (in dollars) of investing in the Fund and to compare these costs with the ongoing costs of investing in other funds. It is based on an investment of $1,000 invested at the beginning of the (six month) period and held through May 31, 2019.
Actual Return: The first line of the table provides information about actual account values and actual expenses. You may use the information in this line, together with the amount you invested, to estimate the expenses that you incurred over the period. Simply divide your account value by $1,000 (for example, an $8,600 account value divided by $1,000 = 8.6), then multiply the result by the number in the first line under the heading entitled “Expenses Paid During Period” to estimate the expenses attributable to your investment during this period.
Hypothetical 5% Return: The second line of the table provides information about hypothetical account values and hypothetical expenses based on the Fund’s actual expense ratio and an assumed rate of return of 5% per year before expenses, which is not the Fund’s actual return. The hypothetical account values and expenses may not be used to estimate the actual ending account balance or expenses you paid for the period. You may use this information to compare ongoing costs of investing in the Fund and other funds. To do so, compare this 5% hypothetical example with the 5% hypothetical examples that appear in the shareholder reports of other funds.
The expenses shown in the table are meant to highlight ongoing Fund costs only and do not reflect any transaction costs, such as creation and redemption fees or brokerage charges. Therefore, the second line is useful in comparing ongoing costs only, and will not help you determine the relative total costs of owning different funds. In addition, if these costs were included, your costs would have been higher.
| | Beginning Account Value 12/1/18 | Ending Account Value 5/31/19 | Expense Ratio(a) | Expenses Paid During Period 12/1/18 - 5/31/19(b) |
| ALPS Sector Dividend Dogs ETF | | | | |
| Actual | $1,000.00 | $930.00 | 0.40% | $1.92 |
| Hypothetical (5% return before expenses) | $1,000.00 | $1,022.94 | 0.40% | $2.02 |
| ALPS International Sector Dividend Dogs ETF | | | | |
| Actual | $1,000.00 | $1,020.40 | 0.50% | $2.52 |
| Hypothetical (5% return before expenses) | $1,000.00 | $1,022.44 | 0.50% | $2.52 |
| ALPS Emerging Sector Dividend Dogs ETF | | | | |
| Actual | $1,000.00 | $1,004.80 | 0.60% | $3.00 |
| Hypothetical (5% return before expenses) | $1,000.00 | $1,021.94 | 0.60% | $3.02 |
| (a) | Annualized based on the Fund's most recent half-year expenses. |
| (b) | Expenses are equal to the Fund's annualized expense ratio multiplied by the average account value over the period, multiplied by the number of days in the most recent fiscal half year (182), divided by 365. |
ALPS Sector Dividend Dogs ETF
| Schedule of Investments | May 31, 2019 (Unaudited) |
| Security Description | | Shares | | | Value | |
| COMMON STOCKS (99.66%) | | | | | | | | |
| Communication Services (10.12%) | | | | | | | | |
| AT&T, Inc. | | | 1,215,372 | | | $ | 37,166,076 | |
| CenturyLink, Inc. | | | 2,960,114 | | | | 30,933,191 | |
| Interpublic Group of Cos., Inc. | | | 1,636,375 | | | | 34,723,878 | |
| Omnicom Group, Inc. | | | 492,042 | | | | 38,064,369 | |
| Verizon Communications, Inc. | | | 644,338 | | | | 35,019,770 | |
| Total Communication Services | | | | | | | 175,907,284 | |
| | | | | | | | | |
| Consumer Discretionary (9.57%) | | | | | | | | |
| Ford Motor Co. | | | 4,321,979 | | | | 41,145,240 | |
| General Motors Co. | | | 956,815 | | | | 31,900,212 | |
| Leggett & Platt, Inc. | | | 821,821 | | | | 29,182,864 | |
| Macy's, Inc. | | | 1,574,125 | | | | 32,379,751 | |
| Newell Brands, Inc. | | | 2,358,132 | | | | 31,646,132 | |
| Total Consumer Discretionary | | | | | | | 166,254,199 | |
| | | | | | | | | |
| Consumer Staples (9.84%) | | | | | | | | |
| Altria Group, Inc. | | | 657,838 | | | | 32,273,532 | |
| Campbell Soup Co. | | | 1,011,151 | | | | 36,714,893 | |
| General Mills, Inc. | | | 782,083 | | | | 38,666,184 | |
| Kraft Heinz Co. | | | 1,132,425 | | | | 31,311,551 | |
| Philip Morris International, Inc. | | | 415,511 | | | | 32,048,363 | |
| Total Consumer Staples | | | | | | | 171,014,523 | |
| | | | | | | | | |
| Energy (9.44%) | | | | | | | | |
| Helmerich & Payne, Inc. | | | 689,443 | | | | 33,720,657 | |
| Occidental Petroleum Corp. | | | 579,593 | | | | 28,846,344 | |
| ONEOK, Inc. | | | 554,801 | | | | 35,296,440 | |
| Schlumberger, Ltd. | | | 880,563 | | | | 30,546,730 | |
| Williams Cos., Inc. | | | 1,352,172 | | | | 35,670,297 | |
| Total Energy | | | | | | | 164,080,468 | |
| | | | | | | | | |
| Financials (10.51%) | | | | | | | | |
| Invesco, Ltd. | | | 1,953,012 | | | | 38,161,854 | |
| MetLife, Inc. | | | 824,473 | | | | 38,098,897 | |
| People's United Financial, Inc. | | | 2,122,756 | | | | 32,626,760 | |
| Principal Financial Group, Inc. | | | 729,338 | | | | 37,611,960 | |
| Prudential Financial, Inc. | | | 390,097 | | | | 36,037,161 | |
| Total Financials | | | | | | | 182,536,632 | |
| | | | | | | | | |
| Health Care (9.96%) | | | | | | | | |
| AbbVie, Inc. | | | 469,447 | | | | 36,011,279 | |
| Bristol-Myers Squibb Co. | | | 708,817 | | | | 32,159,027 | |
| Cardinal Health, Inc. | | | 763,293 | | | | 32,111,737 | |
| Gilead Sciences, Inc. | | | 575,830 | | | | 35,845,417 | |
| Pfizer, Inc. | | | 890,601 | | | | 36,977,754 | |
| Total Health Care | | | | | | | 173,105,214 | |
| | | | | | | | | |
| Industrials (9.91%) | | | | | | | | |
| Cummins, Inc. | | | 235,534 | | | | 35,509,106 | |
| Eaton Corp. PLC | | | 458,817 | | | | 34,177,278 | |
| Johnson Controls International PLC | | | 1,014,407 | | | | 39,074,958 | |
| Security Description | | Shares | | | Value | |
| Industrials (continued) | | | | | | | | |
| Nielsen Holdings PLC | | | 1,398,803 | | | $ | 31,794,792 | |
| United Parcel Service, Inc., Class B | | | 340,729 | | | | 31,660,539 | |
| Total Industrials | | | | | | | 172,216,673 | |
| | | | | | | | | |
| Information Technology (10.38%) | | | | | | | | |
| International Business | | | | | | | | |
| Machines Corp. | | | 269,406 | | | | 34,211,868 | |
| QUALCOMM, Inc. | | | 679,308 | | | | 45,391,360 | |
| Seagate Technology PLC | | | 787,322 | | | | 32,949,426 | |
| Western Digital Corp. | | | 765,514 | | | | 28,492,431 | |
| Western Union Co. | | | 2,029,960 | | | | 39,381,224 | |
| Total Information Technology | | | | | | | 180,426,309 | |
| | | | | | | | | |
| Materials (9.50%) | | | | | | | | |
| CF Industries Holdings, Inc. | | | 903,062 | | | | 36,339,215 | |
| International Paper Co. | | | 795,151 | | | | 32,974,912 | |
| LyondellBasell Industries NV, Class A | | | 417,032 | | | | 30,964,626 | |
| Packaging Corp. of America | | | 373,159 | | | | 33,241,004 | |
| Westrock Co. | | | 965,650 | | | | 31,480,190 | |
| Total Materials | | | | | | | 164,999,947 | |
| | | | | | | | | |
| Utilities (10.43%) | | | | | | | | |
| Dominion Resources, Inc. | | | 480,703 | | | | 36,139,252 | |
| Edison International | | | 586,268 | | | | 34,806,731 | |
| Entergy Corp. | | | 393,038 | | | | 38,152,199 | |
| PPL Corp. | | | 1,138,644 | | | | 33,886,045 | |
| Southern Co. | | | 715,282 | | | | 38,267,587 | |
| Total Utilities | | | | | | | 181,251,814 | |
| | | | | | | | | |
| TOTAL COMMON STOCKS | | | | | | | | |
| (Cost $1,866,858,212) | | | | | | | 1,731,793,063 | |
| | | 7 Day Yield | | | Shares | | | Value | |
| SHORT TERM INVESTMENTS (0.14%) | | | | | |
| Money Market Fund | | | | | | | | | | |
| State Street Institutional Treasury Plus Money Market Fund | | | 2.309 | % | | | 2,467,595 | | | | 2,467,595 | |
| TOTAL SHORT TERM INVESTMENTS | | | | | |
| (Cost $2,467,595) | | | | | | | | | | | 2,467,595 | |
| | | | | | | | | | | | | |
| TOTAL INVESTMENTS (99.80%) | |
| (Cost $1,869,325,807) | | | | | | | $ | 1,734,260,658 | |
| OTHER ASSETS IN EXCESS OF LIABILITIES (0.20%) | | | | 3,461,063 | |
| NET ASSETS - 100.00% | | | | | | | | | | $ | 1,737,721,721 | |
See Notes to Financial Statements.
ALPS International Sector Dividend Dogs ETF
| Schedule of Investments | May 31, 2019 (Unaudited) |
| Security Description | | Shares | | | Value | |
| COMMON STOCKS (98.92%) | | | | | | | | |
| Australia (21.03%) | | | | | | | | |
| Australia & New Zealand Banking Group, Ltd. | | | 273,647 | | | $ | 5,292,432 | |
| BHP Group, Ltd. | | | 201,234 | | | | 5,271,147 | |
| Commonwealth Bank of Australia | | | 101,441 | | | | 5,524,720 | |
| National Australia Bank, Ltd. | | | 292,487 | | | | 5,374,775 | |
| Rio Tinto, Ltd. | | | 81,928 | | | | 5,700,397 | |
| South32, Ltd. | | | 1,963,978 | | | | 4,523,207 | |
| Telstra Corp., Ltd. | | | 2,305,579 | | | | 5,837,739 | |
| Wesfarmers, Ltd. | | | 215,223 | | | | 5,531,573 | |
| Westpac Banking Corp. | | | 275,117 | | | | 5,236,889 | |
| Woodside Petroleum, Ltd. | | | 210,212 | | | | 5,165,090 | |
| Total Australia | | | | | | | 53,457,969 | |
| | | | | | | | | |
| Finland (7.12%) | | | | | | | | |
| Fortum OYJ | | | 236,260 | | | | 5,049,131 | |
| Nokia OYJ | | | 868,251 | | | | 4,345,450 | |
| Nordea Bank Abp | | | 601,069 | | | | 4,244,562 | |
| UPM-Kymmene OYJ | | | 178,361 | | | | 4,467,319 | |
| Total Finland | | | | | | | 18,106,462 | |
| | | | | | | | | |
| France (5.86%) | | | | | | | | |
| Bouygues SA | | | 146,194 | | | | 5,116,835 | |
| Engie SA | | | 351,641 | | | | 4,890,805 | |
| Sanofi | | | 60,558 | | | | 4,887,207 | |
| Total France | | | | | | | 14,894,847 | |
| | | | | | | | | |
| Germany (7.16%) | | | | | | | | |
| Bayer AG | | | 67,002 | | | | 3,953,644 | |
| Daimler AG | | | 92,966 | | | | 4,822,598 | |
| Deutsche Post AG | | | 168,413 | | | | 4,963,201 | |
| Telefonica Deutschland Holding AG | | | 1,587,598 | | | | 4,453,472 | |
| Total Germany | | | | | | | 18,192,915 | |
| | | | | | | | | |
| Hong Kong (3.98%) | | | | | | | | |
| Sands China, Ltd. | | | 1,086,600 | | | | 4,920,474 | |
| WH Group, Ltd.(a)(b) | | | 5,773,000 | | | | 5,198,944 | |
| Total Hong Kong | | | | | | | 10,119,418 | |
| | | | | | | | | |
| Italy (1.86%) | | | | | | | | |
| Eni SpA | | | 311,015 | | | | 4,718,376 | |
| | | | | | | | | |
| Japan (16.64%) | | | | | | | | |
| Canon, Inc. | | | 185,663 | | | | 5,251,300 | |
| Hitachi, Ltd. | | | 184,200 | | | | 6,265,503 | |
| Japan Tobacco, Inc. | | | 207,900 | | | | 4,781,901 | |
| Kyocera Corp. | | | 94,200 | | | | 5,758,140 | |
| Mitsui & Co., Ltd. | | | 337,000 | | | | 5,216,790 | |
| Subaru Corp. | | | 221,900 | | | | 5,164,322 | |
| Takeda Pharmaceutical Co., Ltd. | | | 129,000 | | | | 4,367,656 | |
| Tokyo Electron, Ltd. | | | 40,300 | | | | 5,500,272 | |
| Total Japan | | | | | | | 42,305,884 | |
| Security Description | | Shares | | | Value | |
| Netherlands (2.11%) | | | | | | |
| Royal Dutch Shell PLC, Class A | | | 172,538 | | | $ | 5,370,038 | |
| | | | | | | | | |
| Norway (1.98%) | | | | | | | | |
| Mowi ASA | | | 217,387 | | | | 5,042,399 | |
| | | | | | | | | |
| Portugal (2.07%) | | | | | | | | |
| EDP - Energias de Portugal SA | | | 1,441,696 | | | | 5,248,915 | |
| | | | | | | | | |
| Spain (6.15%) | | | | | | | | |
| Aena SME SA(a)(b) | | | 29,332 | | | | 5,403,483 | |
| Endesa SA | | | 206,301 | | | | 5,141,767 | |
| Repsol SA | | | 315,574 | | | | 5,097,778 | |
| Total Spain | | | | | | | 15,643,028 | |
| | | | | | | | | |
| Sweden (2.13%) | | | | | | | | |
| Hennes & Mauritz AB, Class B | | | 361,005 | | | | 5,403,811 | |
| | | | | | | | | |
| Switzerland (2.01%) | | | | | | | | |
| Roche Holding AG | | | 19,402 | | | | 5,098,293 | |
| | | | | | | | | |
| United Kingdom (18.82%) | | | | | | | | |
| Anglo American PLC | | | 202,189 | | | | 4,843,949 | |
| BAE Systems PLC | | | 864,284 | | | | 4,943,243 | |
| BP PLC | | | 752,138 | | | | 5,135,758 | |
| British American Tobacco PLC | | | 130,519 | | | | 4,554,237 | |
| BT Group PLC | | | 1,862,705 | | | | 4,562,901 | |
| GlaxoSmithKline PLC | | | 265,717 | | | | 5,129,691 | |
| Imperial Brands PLC | | | 153,604 | | | | 3,718,811 | |
| SSE PLC | | | 334,422 | | | | 4,559,822 | |
| Vodafone Group PLC | | | 2,937,833 | | | | 4,806,859 | |
| WPP PLC | | | 470,851 | | | | 5,602,712 | |
| Total United Kingdom | | | | | | | 47,857,983 | |
| | | | | | | | | |
| TOTAL COMMON STOCKS | | | | | | | | |
| (Cost $268,466,196) | | | | | | | 251,460,338 | |
| | | 7 Day Yield | | | Shares | | | Value | |
| SHORT TERM INVESTMENTS (0.63%) | | | | | |
| Money Market Fund | | | | | | | | | | | | |
| State Street Institutional Treasury Plus Money Market Fund | | | 2.309 | % | | | 1,605,439 | | | | 1,605,439 | |
| TOTAL SHORT TERM INVESTMENTS | | | | | |
| (Cost $1,605,439) | | | | | | | | | | | 1,605,439 | |
| | | | | | | | | | | | | |
| TOTAL INVESTMENTS (99.55%) | | | | | | |
| (Cost $270,071,635) | | | | | | | | | | $ | 253,065,777 | |
| OTHER ASSETS IN EXCESS OF LIABILITIES (0.45%) | | | | 1,115,143 | |
| NET ASSETS - 100.00% | | | | | | | | | | $ | 254,180,920 | |
ALPS International Sector Dividend Dogs ETF
| Schedule of Investments | May 31, 2019 (Unaudited) |
| (a) | Securities exempt from registration under Rule 144A of the Securities Act of 1933. These securities may be sold in the ordinary course of business in transactions exempt from registration, normally to qualified institutional buyers. At period end, the aggregate market value of those securities was $10,602,427, representing 4.17% of net assets. |
| (b) | Securities were purchased pursuant to Regulation S under the Securities Act of 1933, which exempts securities offered and sold outside of the United States from registration. Such securities cannot be sold in the United States without either an effective registration statement filed pursuant to the Securities Act of 1933, or pursuant to an exemption from registration. As of May 31, 2019, the market value of those securities was $10,602,427 representing 4.17% of net assets. |
See Notes to Financial Statements.
ALPS Emerging Sector Dividend Dogs ETF
| Schedule of Investments | May 31, 2019 (Unaudited) |
| Security Description | | Shares | | | Value | |
| COMMON STOCKS (99.41%) |
| Brazil (8.01%) | | | | | | | | |
| BB Seguridade Participacoes SA | | | 96,696 | | | $ | 735,333 | |
| Cielo SA | | | 237,622 | | | | 405,731 | |
| Engie Brasil Energia SA | | | 64,030 | | | | 755,838 | |
| Kroton Educacional SA | | | 230,500 | | | | 607,390 | |
| Total Brazil | | | | | | | 2,504,292 | |
| | | | | | | | | |
| Chile (2.04%) | | | | | | | | |
| Aguas Andinas SA, Class A | | | 1,154,012 | | | | 636,749 | |
| | | | | | | | | |
| China (9.64%) | | | | | | | | |
| China Huarong Asset Management Co., Ltd., Class H(a)(b)(c) | | | 3,011,000 | | | | 510,824 | |
| China Petroleum & Chemical Corp., ADR | | | 8,112 | | | | 536,284 | |
| Lenovo Group, Ltd. | | | 766,000 | | | | 532,518 | |
| Livzon Pharmaceutical Group, Inc., Class H | | | 193,300 | | | | 604,097 | |
| Zoomlion Heavy Industry Science and Technology Co., Ltd., Class H | | | 1,415,800 | | | | 828,941 | |
| Total China | | | | | | | 3,012,664 | |
| | | | | | | | | |
| Czech Republic (2.06%) | | | | | | | | |
| CEZ AS | | | 27,719 | | | | 645,355 | |
| | | | | | | | | |
| Hungary (2.05%) | | | | | | | | |
| Richter Gedeon Nyrt | | | 35,734 | | | | 642,409 | |
| | | | | | | | | |
| India (8.69%) | | | | | | | | |
| Dr Reddy's Laboratories, Ltd., ADR | | | 17,744 | | | | 676,224 | |
| Infosys, Ltd., Sponsored ADR | | | 63,589 | | | | 665,777 | |
| Vedanta, Ltd., ADR | | | 68,438 | | | | 632,367 | |
| Wipro, Ltd., ADR | | | 168,099 | | | | 742,997 | |
| Total India | | | | | | | 2,717,365 | |
| | | | | | | | | |
| Indonesia (9.69%) | | | | | | | | |
| Adaro Energy Tbk PT | | | 6,805,100 | | | | 617,453 | |
| Astra International Tbk PT | | | 1,323,900 | | | | 691,053 | |
| Bukit Asam Tbk PT | | | 2,365,500 | | | | 507,159 | |
| Indofood Sukses Makmur Tbk PT | | | 1,305,200 | | | | 603,561 | |
| Kalbe Farma Tbk PT | | | 6,205,800 | | | | 610,906 | |
| Total Indonesia | | | | | | | 3,030,132 | |
| | | | | | | | | |
| Malaysia (10.17%) | | | | | | | | |
| Genting Bhd | | | 385,000 | | | | 587,078 | |
| Genting Malaysia Bhd | | | 787,800 | | | | 590,309 | |
| MISC Bhd | | | 400,500 | | | | 664,235 | |
| Sime Darby Bhd | | | 1,244,100 | | | | 688,775 | |
| Tenaga Nasional Bhd | | | 213,500 | | | | 647,047 | |
| Total Malaysia | | | | | | | 3,177,444 | |
| Security Description | | Shares | | | Value | |
| Mexico (8.52%) | | | | | | |
| Alfa Sab De Cv | | | 635,290 | | | $ | 579,901 | |
| Grupo Aeroportuario del Pacifico SAB de CV, ADR | | | 7,545 | | | | 738,505 | |
| Grupo Lala SAB de CV | | | 570,856 | | | | 665,264 | |
| Grupo Mexico SAB de CV, Series B | | | 272,138 | | | | 679,139 | |
| Total Mexico | | | | | | | 2,662,809 | |
| | | | | | | | | |
| Poland (4.23%) | | | | | | | | |
| Bank Polska Kasa Opieki SA | | | 23,445 | | | | 649,942 | |
| Powszechny Zaklad Ubezpieczen SA | | | 62,050 | | | | 670,736 | |
| Total Poland | | | | | | | 1,320,678 | |
| | | | | | | | | |
| Russia (6.89%) | | | | | | | | |
| Mobile TeleSystems PJSC, Sponsored ADR | | | 88,078 | | | | 688,770 | |
| Severstal PJSC, GDR(c) | | | 43,735 | | | | 689,701 | |
| X5 Retail Group NV, GDR(c) | | | 26,366 | | | | 775,688 | |
| Total Russia | | | | | | | 2,154,159 | |
| | | | | | | | | |
| South Africa (10.25%) | | | | | | | | |
| Absa Group, Ltd. | | | 55,496 | | | | 643,874 | |
| AVI, Ltd. | | | 105,633 | | | | 648,465 | |
| MTN Group, Ltd. | | | 106,456 | | | | 750,134 | |
| Netcare, Ltd. | | | 375,099 | | | | 478,973 | |
| Vodacom Group, Ltd. | | | 83,547 | | | | 681,396 | |
| Total South Africa | | | | | | | 3,202,842 | |
| | | | | | | | | |
| Thailand (10.02%) | | | | | | | | |
| Delta Electronics Thailand PCL | | | 298,524 | | | | 598,982 | |
| Glow Energy PCL | | | 230,900 | | | | 600,096 | |
| Intouch Holdings PCL, NVDR | | | 388,100 | | | | 708,200 | |
| Thai Beverage PCL | | | 1,133,800 | | | | 668,543 | |
| Thai Oil PCL | | | 296,500 | | | | 555,103 | |
| Total Thailand | | | | | | | 3,130,924 | |
| | | | | | | | | |
| Turkey (7.15%) | | | | | | | | |
| Eregli Demir ve Celik Fabrikalari TAS | | | 411,272 | | | | 511,839 | |
| Ford Otomotiv Sanayi AS | | | 67,778 | | | | 640,491 | |
| Tupras Turkiye Petrol Rafinerileri AS | | | 25,305 | | | | 569,042 | |
| Turkcell Iletisim Hizmetleri AS, ADR(d) | | | 103,801 | | | | 513,815 | |
| Total Turkey | | | | | | | 2,235,187 | |
| | | | | | | | | |
| TOTAL COMMON STOCKS | | | | | | | | |
| (Cost $32,757,954) | | | | | | | 31,073,009 | |
ALPS Emerging Sector Dividend Dogs ETF
| Schedule of Investments | May 31, 2019 (Unaudited) |
| | | 7 Day Yield | | | Shares | | | Value | |
| SHORT TERM INVESTMENTS (0.87%) | | | | | |
| Money Market Fund (0.36%) | | | | | |
| State Street Institutional Treasury Plus Money Market Fund | | | | | | | | | | | | |
| (Cost $113,290) | | | 2.309 | % | | | 113,290 | | | $ | 113,290 | |
| | | | | | | | | | | | | |
| Investments Purchased with Collateral from Securities Loaned (0.51%) | | | | | |
| State Street Navigator Securities Lending Government Money Market Portfolio, 2.34% | | | | | | | | | | | | |
| (Cost $158,025) | | | | | | | 158,025 | | | | 158,025 | |
| TOTAL SHORT TERM INVESTMENTS | | | | | |
| (Cost $271,315) | | | | | | | | | | | 271,315 | |
| | | | | | | | | | | | | |
| TOTAL INVESTMENTS (100.28%) | | | | | |
| (Cost $33,029,269) | | | | | | | | | | $ | 31,344,324 | |
| LIABILITIES IN EXCESS OF OTHER ASSETS (-0.28%) | | | | (88,334 | ) |
| NET ASSETS - 100.00% | | | | | | | | | | $ | 31,255,990 | |
| (a) | Non-income producing security. |
| (b) | Securities exempt from registration under Rule 144A of the Securities Act of 1933. These securities may be sold in the ordinary course of business in transactions exempt from registration, normally to qualified institutional buyers. At period end, the aggregate market value of those securities was $510,824, representing 1.63% of net assets. |
| (c) | Securities were purchased pursuant to Regulation S under the Securities Act of 1933, which exempts securities offered and sold outside of the United States from registration. Such securities cannot be sold in the United States without either an effective registration statement filed pursuant to the Securities Act of 1933, or pursuant to an exemption from registration. As of May 31, 2019, the market value of those securities was $1,976,213 representing 6.32% of net assets. |
| (d) | Security, or a portion of the security position is currently on loan. The total market value of securities on loan is $367,785. |
See Notes to Financial Statements.
ALPS ETF Trust
| May 31, 2019 (Unaudited) |
| Statements of Assets and Liabilities |
| | | ALPS Sector
Dividend Dogs
ETF | | | ALPS
International
Sector Dividend
Dogs ETF | | | ALPS Emerging
Sector Dividend
Dogs ETF | |
| ASSETS: | | | | | | | | | |
| Investments, at value | | $ | 1,734,260,658 | | | $ | 253,065,777 | | | $ | 31,344,324 | |
| Foreign currency, at value (Cost $–, $78,609 and $7,802) | | | – | | | | 78,609 | | | | 7,749 | |
| Foreign tax reclaims | | | – | | | | 593,977 | | | | 1,525 | |
| Dividends receivable | | | 7,604,486 | | | | 1,620,502 | | | | 100,062 | |
| Receivable for investments sold | | | – | | | | 2,514,979 | | | | – | |
| Total Assets | | | 1,741,865,144 | | | | 257,873,844 | | | | 31,453,660 | |
| | | | | | | | | | | | | |
| LIABILITIES: | | | | | | | | | | | | |
| Payable for investments purchased | | | 3,509,114 | | | | 1,063,271 | | | | 23,654 | |
| Payable to adviser | | | 634,309 | | | | 113,000 | | | | 15,991 | |
| Payable for shares redeemed | | | – | | | | 2,516,653 | | | | – | |
| Payable for collateral upon return of securities loaned | | | – | | | | – | | | | 158,025 | |
| Total Liabilities | | | 4,143,423 | | | | 3,692,924 | | | | 197,670 | |
| NET ASSETS | | $ | 1,737,721,721 | | | $ | 254,180,920 | | | $ | 31,255,990 | |
| | | | | | | | | | | | | |
| NET ASSETS CONSIST OF: | | | | | | | | | | | | |
| Paid-in capital | | $ | 2,043,391,106 | | | $ | 309,545,597 | | | $ | 40,471,675 | |
| Total Distributable earnings | | | (305,669,385 | ) | | | (55,364,677 | ) | | | (9,215,685 | ) |
| NET ASSETS | | $ | 1,737,721,721 | | | $ | 254,180,920 | | | $ | 31,255,990 | |
| | | | | | | | | | | | | |
| INVESTMENTS, AT COST | | $ | 1,869,325,807 | | | $ | 270,071,635 | | | $ | 33,029,269 | |
| | | | | | | | | | | | | |
| PRICING OF SHARES: | | | | | | | | | | | | |
| Net Assets | | $ | 1,737,721,721 | | | $ | 254,180,920 | | | $ | 31,255,990 | |
| Shares of beneficial interest outstanding (Unlimited number of shares authorized, par value $0.01 per share) | | | 43,009,141 | | | | 10,100,000 | | | | 1,500,000 | |
| Net Asset Value, offering and redemption price per share | | $ | 40.40 | | | $ | 25.17 | | | $ | 20.84 | |
See Notes to Financial Statements.
ALPS ETF Trust
| For the Six Months Ended May 31, 2019 (Unaudited) |
| Statements of Operations |
| | | ALPS Sector
Dividend Dogs
ETF | | | ALPS
International
Sector Dividend
Dogs ETF | | | ALPS Emerging
Sector Dividend
Dogs ETF | |
| INVESTMENT INCOME: | | | | | | | | | |
| Dividends* | | $ | 41,950,183 | | | $ | 8,906,275 | | | $ | 803,658 | |
| Securities Lending Income | | | – | | | | 8,444 | | | | 1,522 | |
| Total Investment Income | | | 41,950,183 | | | | 8,914,719 | | | | 805,180 | |
| | | | | | | | | | | | | |
| EXPENSES: | | | | | | | | | | | | |
| Investment adviser fees | | | 3,865,648 | | | | 674,605 | | | | 98,287 | |
| Total Expenses | | | 3,865,648 | | | | 674,605 | | | | 98,287 | |
| NET INVESTMENT INCOME | | | 38,084,535 | | | | 8,240,114 | | | | 706,893 | |
| | | | | | | | | | | | | |
| REALIZED AND UNREALIZED GAIN/(LOSS) | | | | | | | | | | | | |
| Net realized loss on investments | | | (60,898,199 | ) | | | (22,281,014 | ) | | | (3,250,737 | ) |
| Net realized loss on foreign currency transactions | | | – | | | | (79,920 | ) | | | (28,822 | ) |
| Total net realized loss | | | (60,898,199 | ) | | | (22,360,934 | ) | | | (3,279,559 | ) |
| Net change in unrealized appreciation/(depreciation) on investments | | | (122,945,647 | ) | | | 18,522,613 | | | | 2,564,978 | |
| Net change in unrealized depreciation on translation of assets and liabilities denominated in foreign currencies | | | – | | | | (2,731 | ) | | | (1,410 | ) |
| Total net change in unrealized appreciation/(depreciation) | | | (122,945,647 | ) | | | 18,519,882 | | | | 2,563,568 | |
| NET REALIZED AND UNREALIZED LOSS ON INVESTMENTS | | | (183,843,846 | ) | | | (3,841,052 | ) | | | (715,991 | ) |
| NET INCREASE/(DECREASE) IN NET ASSETS RESULTING FROM OPERATIONS | | $ | (145,759,311 | ) | | $ | 4,399,062 | | | $ | (9,098 | ) |
| *Net of foreign tax withholding: | | $ | – | | | $ | 726,275 | | | $ | 95,842 | |
See Notes to Financial Statements.
ALPS Sector Dividend Dogs ETF
Statements of Changes in Net Assets
| | | For the Six
Months Ended
May 31, 2019
(Unaudited) | | | For the
Year Ended
November 30, 2018 | |
| OPERATIONS: | | | | | | |
| Net investment income | | $ | 38,084,535 | | | $ | 77,375,612 | |
| Net realized gain/(loss) | | | (60,898,199 | ) | | | 206,685,007 | |
| Net change in unrealized depreciation | | | (122,945,647 | ) | | | (272,966,359 | ) |
| Net increase/(decrease) in net assets resulting from operations | | | (145,759,311 | ) | | | 11,094,260 | |
| | | | | | | | | |
| Net Equalization Credits | | | 1,128,059 | | | | 2,185,761 | |
| | | | | | | | | |
| DISTRIBUTIONS TO SHAREHOLDERS: | | | | | | | | |
| From distributable earnings | | | (35,819,845 | ) | | | (80,000,025 | ) |
| Total distributions | | | (35,819,845 | ) | | | (80,000,025 | ) |
| | | | | | | | | |
| CAPITAL SHARE TRANSACTIONS: | | | | | | | | |
| Proceeds from sale of shares | | | 6,339,997 | | | | 565,538,675 | |
| Cost of shares redeemed | | | (253,747,628 | ) | | | (652,128,952 | ) |
| Net income equalization (Note 2) | | | (1,128,059 | ) | | | (2,185,761 | ) |
| Net decrease from share transactions | | | (248,535,690 | ) | | | (88,776,038 | ) |
| Net decrease in net assets | | | (428,986,787 | ) | | | (155,496,042 | ) |
| | | | | | | | | |
| NET ASSETS: | | | | | | | | |
| Beginning of period | | | 2,166,708,508 | | | | 2,322,204,550 | |
| End of period | | $ | 1,737,721,721 | | | $ | 2,166,708,508 | |
| | | | | | | | | |
| OTHER INFORMATION: | | | | | | | | |
| CAPITAL SHARE TRANSACTIONS: | | | | | | | | |
| Beginning shares | | | 48,959,141 | | | | 50,909,141 | |
| Shares sold | | | 150,000 | | | | 12,350,000 | |
| Shares redeemed | | | (6,100,000 | ) | | | (14,300,000 | ) |
| Shares outstanding, end of period | | | 43,009,141 | | | | 48,959,141 | |
See Notes to Financial Statements.
ALPS International Sector Dividend Dogs ETF
Statements of Changes in Net Assets
| | | For the Six
Months Ended
May 31, 2019
(Unaudited) | | | For the
Year Ended
November 30, 2018 | |
| OPERATIONS: | | | | | | |
| Net investment income | | $ | 8,240,114 | | | $ | 13,792,452 | |
| Net realized gain/(loss) | | | (22,360,934 | ) | | | 25,890,526 | |
| Net change in unrealized appreciation/(depreciation) | | | 18,519,882 | | | | (63,610,558 | ) |
| Net increase/(decrease) in net assets resulting from operations | | | 4,399,062 | | | | (23,927,580 | ) |
| | | | | | | | | |
| Net Equalization Credits | | | 560,456 | | | | 584,886 | |
| | | | | | | | | |
| DISTRIBUTIONS TO SHAREHOLDERS: | | | | | | | | |
| From distributable earnings | | | (5,116,390 | ) | | | (13,263,685 | ) |
| Total distributions | | | (5,116,390 | ) | | | (13,263,685 | ) |
| | | | | | | | | |
| CAPITAL SHARE TRANSACTIONS: | | | | | | | | |
| Proceeds from sale of shares | | | 9,192,458 | | | | 92,142,123 | |
| Cost of shares redeemed | | | (39,621,357 | ) | | | (118,807,393 | ) |
| Net income equalization (Note 2) | | | (560,456 | ) | | | (584,886 | ) |
| Net decrease from share transactions | | | (30,989,355 | ) | | | (27,250,156 | ) |
| Net decrease in net assets | | | (31,146,227 | ) | | | (63,856,535 | ) |
| | | | | | | | | |
| NET ASSETS: | | | | | | | | |
| Beginning of period | | | 285,327,147 | | | | 349,183,682 | |
| End of period | | $ | 254,180,920 | | | $ | 285,327,147 | |
| | | | | | | | | |
| OTHER INFORMATION: | | | | | | | | |
| CAPITAL SHARE TRANSACTIONS: | | | | | | | | |
| Beginning shares | | | 11,350,000 | | | | 12,350,000 | |
| Shares sold | | | 350,000 | | | | 3,250,000 | |
| Shares redeemed | | | (1,600,000 | ) | | | (4,250,000 | ) |
| Shares outstanding, end of period | | | 10,100,000 | | | | 11,350,000 | |
See Notes to Financial Statements.
ALPS Emerging Sector Dividend Dogs ETF
Statements of Changes in Net Assets
| | | For the Six
Months Ended
May 31, 2019
(Unaudited) | | | For the
Year Ended
November 30, 2018 | |
| OPERATIONS: | | | | | | |
| Net investment income | | $ | 706,893 | | | $ | 1,712,483 | |
| Net realized gain/(loss) | | | (3,279,559 | ) | | | 683,042 | |
| Net change in unrealized appreciation/(depreciation) | | | 2,563,568 | | | | (6,852,091 | ) |
| Net decrease in net assets resulting from operations | | | (9,098 | ) | | | (4,456,566 | ) |
| | | | | | | | | |
| Net Equalization Credits | | | 150,512 | | | | 181,291 | |
| | | | | | | | | |
| DISTRIBUTIONS TO SHAREHOLDERS: | | | | | | | | |
| From distributable earnings | | | (925,050 | ) | | | (1,535,255 | ) |
| Total distributions | | | (925,050 | ) | | | (1,535,255 | ) |
| | | | | | | | | |
| CAPITAL SHARE TRANSACTIONS: | | | | | | | | |
| Proceeds from sale of shares | | | – | | | | 18,738,927 | |
| Cost of shares redeemed | | | (3,010,455 | ) | | | (24,902,706 | ) |
| Net income equalization (Note 2) | | | (150,512 | ) | | | (181,291 | ) |
| Net decrease from share transactions | | | (3,160,967 | ) | | | (6,345,070 | ) |
| Net decrease in net assets | | | (3,944,603 | ) | | | (12,155,600 | ) |
| | | | | | | | | |
| NET ASSETS: | | | | | | | | |
| Beginning of period | | | 35,200,593 | | | | 47,356,193 | |
| End of period | | $ | 31,255,990 | | | $ | 35,200,593 | |
| | | | | | | | | |
| OTHER INFORMATION: | | | | | | | | |
| CAPITAL SHARE TRANSACTIONS: | | | | | | | | |
| Beginning shares | | | 1,650,000 | | | | 1,950,000 | |
| Shares sold | | | – | | | | 750,000 | |
| Shares redeemed | | | (150,000 | ) | | | (1,050,000 | ) |
| Shares outstanding, end of period | | | 1,500,000 | | | | 1,650,000 | |
See Notes to Financial Statements.
ALPS Sector Dividend Dogs ETF
| Financial Highlights | For a Share Outstanding Throughout the Periods Presented |
| | | For the
Six Months
Ended May 31, 2019
(Unaudited) | | | For the
Year Ended
November 30, 2018 | | | For the
Year Ended
November 30, 2017 | | | For the
Year Ended
November 30, 2016 | | | For the
Year Ended
November 30, 2015 | | | For the
Year Ended
November 30, 2014 | |
| NET ASSET VALUE, BEGINNING OF PERIOD | | $ | 44.26 | | | $ | 45.61 | | | $ | 42.29 | | | $ | 36.23 | | | $ | 38.80 | | | $ | 33.76 | |
| | | | | | | | | | | | | | | | | | | | | | | | | |
| INCOME/(LOSS) FROM INVESTMENT OPERATIONS: | | | | |
| Net investment income(a) | | | 0.83 | | | | 1.54 | | | | 1.40 | | | | 1.26 | | | | 1.21 | | | | 1.35 | |
| Net realized and unrealized gain/(loss) | | | (3.92 | ) | | | (1.31 | ) | | | 3.39 | | | | 6.15 | | | | (2.47 | ) | | | 4.94 | |
| Total from investment operations | | | (3.09 | ) | | | 0.23 | | | | 4.79 | | | | 7.41 | | | | (1.26 | ) | | | 6.29 | |
| | | | | | | | | | | | | | | | | | | | | | | | | |
| DISTRIBUTIONS: | | | | | | | | | | | | | | | | | | | | | | | | |
| From net investment income | | | (0.77 | ) | | | (1.58 | ) | | | (1.42 | ) | | | (1.34 | ) | | | (1.31 | ) | | | (1.25 | ) |
| Tax return of capital | | | – | | | | – | | | | (0.05 | ) | | | (0.01 | ) | | | – | | | | – | |
| Total distributions | | | (0.77 | ) | | | (1.58 | ) | | | (1.47 | ) | | | (1.35 | ) | | | (1.31 | ) | | | (1.25 | ) |
| | | | | | | | | | | | | | | | | | | | | | | | | |
| Net increase/(decrease) in net asset value | | | (3.86 | ) | | | (1.35 | ) | | | 3.32 | | | | 6.06 | | | | (2.57 | ) | | | 5.04 | |
| NET ASSET VALUE, END OF PERIOD | | $ | 40.40 | | | $ | 44.26 | | | $ | 45.61 | | | $ | 42.29 | | | $ | 36.23 | | | $ | 38.80 | |
| TOTAL RETURN(b) | | | (7.00 | )% | | | 0.51 | % | | | 11.59 | % | | | 20.86 | % | | | (3.21 | )% | | | 18.96 | % |
| | | | | | | | | | | | | | | | | | | | | | | | | |
| RATIOS/SUPPLEMENTAL DATA: | | | | |
| Net assets, end of period (000s) | | $ | 1,737,722 | | | $ | 2,166,709 | | | $ | 2,322,205 | | | $ | 1,702,405 | | | $ | 1,014,899 | | | $ | 1,024,473 | |
| | | | | | | | | | | | | | | | | | | | | | | | | |
| Ratio of expenses to average net assets | | | 0.40 | %(c) | | | 0.40 | % | | | 0.40 | % | | | 0.40 | % | | | 0.40 | % | | | 0.40 | % |
| Ratio of net investment income to average net assets | | | 3.94 | %(c) | | | 3.40 | % | | | 3.24 | % | | | 3.23 | % | | | 3.25 | % | | | 3.74 | % |
| Portfolio turnover rate(d) | | | 43 | % | | | 61 | % | | | 48 | % | | | 49 | % | | | 55 | % | | | 12 | % |
| Undistributed net investment income included in price of units issued and redeemed(a)(e) | | $ | 0.02 | | | $ | 0.04 | | | $ | 0.03 | | | $ | 0.06 | | | $ | 0.06 | | | $ | 0.09 | |
| (a) | Based on average shares outstanding during the period. |
| (b) | Total return is calculated assuming an initial investment made at the net asset value at the beginning of the period and redemption at the net asset value on the last day of the period and assuming all distributions are reinvested at reinvestment prices. Total return calculated for a period of less than one year is not annualized. |
| (d) | Portfolio turnover for periods less than one year is not annualized and does not include securities received or delivered from processing creations or redemptions in-kind. |
| (e) | The per share amount of equalization is presented to show the impact of equalization on distributable earnings per share. |
See Notes to Financial Statements.
ALPS International Sector Dividend Dogs ETF
| Financial Highlights | For a Share Outstanding Throughout the Periods Presented |
| | | For the
Six Months
Ended May 31, 2019
(Unaudited) | | | For the
Year Ended
November 30, 2018 | | | For the
Year Ended
November 30, 2017 | | | For the
Year Ended
November 30, 2016 | | | For the
Year Ended
November 30, 2015 | | | For the
Year Ended
November 30, 2014 | |
| NET ASSET VALUE, BEGINNING OF PERIOD | | $ | 25.14 | | | $ | 28.27 | | | $ | 22.84 | | | $ | 24.25 | | | $ | 27.33 | | | $ | 29.21 | |
| | | | | | | | | | | | | | | | | | | | | | | | | |
| INCOME/(LOSS) FROM INVESTMENT OPERATIONS: | | | | |
| Net investment income(a) | | | 0.78 | | | | 1.15 | | | | 0.94 | | | | 1.00 | | | | 1.06 | | | | 1.19 | |
| Net realized and unrealized gain/(loss) | | | (0.27 | ) | | | (3.19 | ) | | | 5.41 | | | | (1.47 | ) | | | (3.13 | ) | | | (1.83 | ) |
| Total from investment operations | | | 0.51 | | | | (2.04 | ) | | | 6.35 | | | | (0.47 | ) | | | (2.07 | ) | | | (0.64 | ) |
| | | | | | | | | | | | | | | | | | | | | | | | | |
| DISTRIBUTIONS: | | | | | | | | | | | | | | | | | | | | | | | | |
| From net investment income | | | (0.48 | ) | | | (1.09 | ) | | | (0.92 | ) | | | (0.94 | ) | | | (0.99 | ) | | | (1.17 | ) |
| Tax return of capital | | | – | | | | – | | | | – | | | | – | | | | (0.02 | ) | | | (0.07 | ) |
| Total distributions | | | (0.48 | ) | | | (1.09 | ) | | | (0.92 | ) | | | (0.94 | ) | | | (1.01 | ) | | | (1.24 | ) |
| | | | | | | | | | | | | | | | | | | | | | | | | |
| Net increase/(decrease) in net asset value | | | 0.03 | | | | (3.13 | ) | | | 5.43 | | | | (1.41 | ) | | | (3.08 | ) | | | (1.88 | ) |
| NET ASSET VALUE, END OF PERIOD | | $ | 25.17 | | | $ | 25.14 | | | $ | 28.27 | | | $ | 22.84 | | | $ | 24.25 | | | $ | 27.33 | |
| TOTAL RETURN(b) | | | 2.04 | % | | | (7.47 | )% | | | 28.21 | % | | | (1.95 | )% | | | (7.76 | )% | | | (2.53 | )% |
| | | | | | | | | | | | | | | | | | | | | | | | | |
| RATIOS/SUPPLEMENTAL DATA: | | | | |
| Net assets, end of period (000s) | | $ | 254,181 | | | $ | 285,327 | | | $ | 349,184 | | | $ | 161,042 | | | $ | 135,778 | | | $ | 143,461 | |
| | | | | | | | | | | | | | | | | | | | | | | | | |
| Ratio of expenses to average net assets | | | 0.50 | %(c) | | | 0.50 | % | | | 0.50 | % | | | 0.50 | % | | | 0.50 | % | | | 0.50 | % |
| Ratio of net investment income to average net assets | | | 6.11 | %(c) | | | 4.16 | % | | | 3.55 | % | | | 4.28 | % | | | 4.05 | % | | | 4.05 | % |
| Portfolio turnover rate(d) | | | 46 | % | | | 72 | % | | | 37 | % | | | 47 | % | | | 67 | % | | | 19 | % |
| Undistributed net investment income included in price of units issued and redeemed(a)(e) | | $ | 0.05 | | | $ | 0.05 | | | $ | 0.12 | | | $ | 0.09 | | | $ | 0.05 | | | $ | 0.09 | |
| (a) | Based on average shares outstanding during the period. |
| (b) | Total return is calculated assuming an initial investment made at the net asset value at the beginning of the period and redemption at the net asset value on the last day of the period and assuming all distributions are reinvested at reinvestment prices. Total return calculated for a period of less than one year is not annualized. |
| (d) | Portfolio turnover for periods less than one year is not annualized and does not include securities received or delivered from processing creations or redemptions in-kind. |
| (e) | The per share amount of equalization is presented to show the impact of equalization on distributable earnings per share. |
See Notes to Financial Statements.
ALPS Emerging Sector Dividend Dogs ETF
| Financial Highlights | For a Share Outstanding Throughout the Periods Presented |
| | | For the
Six Months
Ended May
31, 2019
(Unaudited) | | | For the
Year Ended
November
30, 2018 | | | For the
Year Ended
November
30, 2017 | | | For the
Year Ended
November
30, 2016 | | | For the
Year Ended
November
30, 2015 | | | For the Period
March 28, 2014
(Commencement to November
30, 2014 | |
| NET ASSET VALUE, BEGINNING OF PERIOD | | $ | 21.33 | | | $ | 24.29 | | | $ | 21.17 | | | $ | 20.78 | | | $ | 26.57 | | | $ | 25.00 | |
| | | | | | | | | | | | | | | | | | | | | | | | | |
| INCOME/(LOSS) FROM INVESTMENT OPERATIONS: | | | | |
| Net investment income(a) | | | 0.47 | | | | 0.91 | | | | 0.80 | | | | 0.67 | | | | 1.26 | | | | 0.64 | |
| Net realized and unrealized gain/(loss) | | | (0.38 | ) | | | (3.02 | ) | | | 3.06 | | | | 0.39 | | | | (6.15 | ) | | | 1.59 | |
| Total from investment operations | | | 0.09 | | | | (2.11 | ) | | | 3.86 | | | | 1.06 | | | | (4.89 | ) | | | 2.23 | |
| | | | | | | | | | | | | | | | | | | | | | | | | |
| DISTRIBUTIONS: | | | | | | | | | | | | | | | | | | | | | | | | |
| From net investment income | | | (0.58 | ) | | | (0.85 | ) | | | (0.74 | ) | | | (0.67 | ) | | | (0.90 | ) | | | (0.54 | ) |
| Tax return of capital | | | – | | | | – | | | | – | | | | – | | | | – | | | | (0.12 | ) |
| Total distributions | | | (0.58 | ) | | | (0.85 | ) | | | (0.74 | ) | | | (0.67 | ) | | | (0.90 | ) | | | (0.66 | ) |
| | | | | | | | | | | | | | | | | | | | | | | | | |
| Net increase/(decrease) in net asset value | | | (0.49 | ) | | | (2.96 | ) | | | 3.12 | | | | 0.39 | | | | (5.79 | ) | | | 1.57 | |
| NET ASSET VALUE, END OF PERIOD | | $ | 20.84 | | | $ | 21.33 | | | $ | 24.29 | | | $ | 21.17 | | | $ | 20.78 | | | $ | 26.57 | |
| TOTAL RETURN(b) | | | 0.48 | % | | | (8.76 | )% | | | 18.37 | % | | | 5.10 | % | | | (18.66 | )% | | | 8.93 | % |
| | | | | | | | | | | | | | | | | | | | | | | | | |
| RATIOS/SUPPLEMENTAL DATA: | | | | |
| Net assets, end of period (000s) | | $ | 31,256 | | | $ | 35,201 | | | $ | 47,356 | | | $ | 19,057 | | | $ | 9,349 | | | $ | 10,629 | |
| | | | | | | | | | | | | | | | | | | | | | | | | |
| Ratio of expenses to average net assets | | | 0.60 | %(c) | | | 0.60 | % | | | 0.60 | % | | | 0.60 | % | | | 0.60 | % | | | 0.60 | %(c) |
| Ratio of net investment income to average net assets | | | 4.32 | %(c) | | | 3.88 | % | | | 3.33 | % | | | 3.11 | % | | | 5.34 | % | | | 3.54 | %(c) |
| Portfolio turnover rate(d) | | | 63 | % | | | 85 | % | | | 42 | % | | | 68 | % | | | 96 | % | | | 19 | % |
| Undistributed net investment income included in price of units issued and redeemed(a)(e) | | $ | 0.10 | | | $ | 0.10 | | | $ | 0.05 | | | $ | 0.36 | | | $ | 0.03 | | | $ | 0.16 | |
| (a) | Based on average shares outstanding during the period. |
| (b) | Total return is calculated assuming an initial investment made at the net asset value at the beginning of the period and redemption at the net asset value on the last day of the period and assuming all distributions are reinvested at reinvestment prices. Total return calculated for a period of less than one year is not annualized. |
| (d) | Portfolio turnover for periods less than one year is not annualized and does not include securities received or delivered from processing creations or redemptions in-kind. |
| (e) | The per share amount of equalization is presented to show the impact of equalization on distributable earnings per share. |
See Notes to Financial Statements.
ALPS ETF Trust
| Notes to Financial Statements | May 31, 2019 (Unaudited) |
1. ORGANIZATION
ALPS ETF Trust (the “Trust”), a Delaware statutory trust, is an open-end management investment company under the Investment Company Act of 1940, as amended (the “1940 Act”). As of May 31, 2019, the Trust consisted of eighteen separate portfolios. Each portfolio represents a separate series of the Trust. This report pertains to the ALPS Sector Dividend Dogs ETF, the ALPS International Sector Dividend Dogs ETF, and the ALPS Emerging Sector Dividend Dogs ETF (each a “Fund” and collectively, the “Funds”). Each Fund has elected to qualify as a diversified series of the Trust under the 1940 Act.
The investment objective of the ALPS Sector Dividend Dogs ETF is to seek investment results that replicate as closely as possible, before fees and expenses, the performance of the S-Network® Sector Dividend Dogs Index. The investment objective of the ALPS International Sector Dividend Dogs ETF is to seek investment results that replicate as closely as possible, before fees and expenses, the performance of the S-Network® International Sector Dividend Dogs Index. The investment objective of the ALPS Emerging Sector Dividend Dogs ETF is to seek investment results that replicate as closely as possible, before fees and expenses, the performance of the S-Network® Emerging Sector Dividend Dogs Index.
The shares of the ALPS Sector Dividend Dogs ETF, the ALPS International Sector Dividend Dogs ETF, and the ALPS Emerging Sector Dividend Dogs ETF (“Shares”) are listed on the NYSE Arca, Inc. (the “NYSE Arca”). Each Fund issues and redeems Shares, at net asset value (“NAV”) in blocks of 50,000 Shares, each of which is called a “Creation Unit”. Creation Units are issued and redeemed principally in-kind for securities included in the Underlying Index. Except when aggregated in Creation Units, Shares are not redeemable securities of the Fund.
Pursuant to the Trust’s organizational documents, its Officers and Trustees are indemnified against certain liability arising out of the performance of their duties to the Trust. Additionally, in the normal course of business, the Trust enters into contracts with service providers that contain general indemnification clauses. The Trust’s maximum exposure under these arrangements is unknown, as this would involve future claims that may be made against the Trust that have not yet occurred.
2. SIGNIFICANT ACCOUNTING POLICIES
The following is a summary of significant accounting policies consistently followed by the Funds in the preparation of the financial statements. The accompanying financial statements were prepared in accordance with accounting principles generally accepted in the United States of America (“U.S. GAAP”). The preparation of financial statements in conformity with U.S. GAAP requires management to make certain estimates and assumptions that affect the reported amounts of assets and liabilities and disclosures of contingent assets and liabilities at the date of the financial statements and the reported amounts of revenue and expenses during the period. Actual results could differ from those estimates. Each Fund is considered an investment company under U.S. GAAP and follows the accounting and reporting guidance applicable to investment companies in the Financial Accounting Standards BoardAccounting Standards CodificationTopic 946.
A. Portfolio Valuation
Each Fund’s NAV is determined daily, as of the close of regular trading on the New York Stock Exchange (“NYSE”), normally 4:00 p.m. Eastern time, on each day the NYSE is open for trading. The NAV is computed by dividing the value of all assets of the Fund (including accrued interest and dividends), less all liabilities (including accrued expenses and dividends declared but unpaid), by the total number of shares outstanding.
Portfolio securities listed on any exchange other than the NASDAQ are valued at the last sale price on the business day as of which such value is being determined. If there has been no sale on such day, the securities are valued at the mean of the most recent bid and ask prices on such day. Securities traded on the NASDAQ are valued at the NASDAQ Official Closing Price as determined by NASDAQ. Portfolio securities traded on more than one securities exchange are valued at the last sale price on the business day as of which such value is being determined at the close of the exchange representing the principal market for such securities. Portfolio securities traded in the over-the-counter market, but excluding securities traded on the NASDAQ, are valued at the latest quoted sale price in such market.
The Funds’ investments are valued at market value or, in the absence of market value with respect to any portfolio securities, at fair value according to procedures adopted by the Trust’s Board of Trustees (the “Board”). When market quotations are not readily available or when events occur that make established valuation methods unreliable, securities of the Funds may be valued in good faith by or under the direction of the Board. These securities generally include, but are not limited to, restricted securities (securities which may not be publicly sold without registration under the Securities Act of 1933) for which a pricing service is unable to provide a market price; securities whose trading has been formally suspended; a security whose market price is not available from a pre-established primary pricing source or the pricing source is not willing to provide a price; a security with respect to which an event has occurred that is most likely to materially affect the value of the security after the market has closed but before the calculation of the Fund’s NAV or make it difficult or impossible to obtain a reliable market quotation; or a security whose price, as provided by the pricing service, does not reflect the security’s “fair value” due to the security being de-listed from a national exchange or the security’s primary trading market is temporarily closed at a time when, under normal conditions, it would be open. As a general principle, the current “fair value” of a security would be the amount which the owner might reasonably expect to receive from the sale on the applicable exchange or principal market. A variety of factors may be considered in determining the fair value of such securities.
ALPS ETF Trust
| Notes to Financial Statements | May 31, 2019 (Unaudited) |
B. Fair Value Measurements
Each Fund discloses the classification of its fair value measurements following a three-tier hierarchy based on the inputs used to measure fair value. Inputs refer broadly to the assumptions that market participants would use in pricing the asset or liability, including assumptions about risk. Inputs may be observable or unobservable. Observable inputs reflect the assumptions market participants would use in pricing the asset or liability that are developed based on market data obtained from sources independent of the reporting entity. Unobservable inputs reflect the reporting entity’s own assumptions about the assumptions market participants would use in pricing the asset or liability that are developed based on the best information available.
Valuation techniques used to value the Funds’ investments by major category are as follows:
Equity securities, including restricted securities, for which market quotations are readily available, are valued at the last reported sale price or official closing price as reported by a third party pricing vendor on the primary market or exchange on which they are traded and are categorized as Level 1 in the hierarchy. In the event there were no sales during the day or closing prices are not available, securities are valued at the mean of the most recent quoted bid and ask prices on such day and are generally categorized as Level 2 in the hierarchy. Investments in open-end mutual funds are valued at their closing NAV each business day and are categorized as Level 1 in the hierarchy.
Changes in valuation techniques may result in transfers in or out of an assigned level within the disclosure hierarchy.
Various inputs are used in determining the value of each Fund’s investments as of the end of the reporting period. When inputs used fall into different levels of the fair value hierarchy, the level in the hierarchy within which the fair value measurement falls is determined based on the lowest level input that is significant to the fair value measurement in its entirety. The designated input levels are not necessarily an indication of the risk or liquidity associated with these investments.
These inputs are categorized in the following hierarchy under applicable financial accounting standards:
| Level 1 | – | Unadjusted quoted prices in active markets for identical investments, unrestricted assets or liabilities that a Fund has the ability to access at the measurement date; |
| Level 2 | – | Quoted prices which are not active, quoted prices for similar assets or liabilities in active markets or inputs other than quoted prices that are observable (either directly or indirectly) for substantially the full term of the asset or liability; and |
| Level 3 | – | Significant unobservable prices or inputs (including the Fund’s own assumptions in determining the fair value of investments) where there is little or no market activity for the asset or liability at the measurement date. |
The following is a summary of the inputs used to value the Funds’ investments at May 31, 2019:
ALPS Sector Dividend Dogs ETF
| Investments in Securities at Value | | Level 1 - Quoted and Unadjusted Prices | | | Level 2 - Other Significant Observable Inputs | | | Level 3 - Significant
Unobservable Inputs | | | Total | |
| Common Stocks* | | $ | 1,731,793,063 | | | $ | – | | | $ | – | | | $ | 1,731,793,063 | |
| Short Term Investments | | | 2,467,595 | | | | – | | | | – | | | | 2,467,595 | |
| Total | | $ | 1,734,260,658 | | | $ | – | | | $ | – | | | $ | 1,734,260,658 | |
ALPS International Sector Dividend Dogs ETF
| Investments in Securities at Value | | Level 1 - Quoted and Unadjusted Prices | | | Level 2 - Other Significant Observable Inputs | | | Level 3 - Significant Unobservable Inputs | | | Total | |
| Common Stocks* | | $ | 251,460,338 | | | $ | – | | | $ | – | | | $ | 251,460,338 | |
| Short Term Investments | | | 1,605,439 | | | | – | | | | – | | | | 1,605,439 | |
| Total | | $ | 253,065,777 | | | $ | – | | | $ | – | | | $ | 253,065,777 | |
ALPS ETF Trust
| Notes to Financial Statements | May 31, 2019 (Unaudited) |
ALPS Emerging Sector Dividend Dogs ETF
| Investments in Securities at Value | | Level 1 - Quoted and Unadjusted Prices | | | Level 2 - Other Significant Observable Inputs | | | Level 3 - Significant Unobservable Inputs | | | Total | |
| Common Stocks* | | $ | 31,073,009 | | | $ | – | | | $ | – | | | $ | 31,073,009 | |
| Short Term Investments | | | 271,315 | | | | – | | | | – | | | | 271,315 | |
| Total | | $ | 31,344,324 | | | $ | – | | | $ | – | | | $ | 31,344,324 | |
| * | For a detailed sector/country breakdown, see the accompanying Schedule of Investments. |
The Funds did not have any securities that used significant unobservable inputs (Level 3) in determining fair value and there were no transfers into or out of Level 3.
C. Foreign Securities
The ALPS International Sector Dividend Dogs ETF and the ALPS Emerging Sector Dividend Dogs ETF may directly purchase securities of foreign issuers. Investments in non-U.S. issuers may involve unique risks compared to investing in securities of U.S. issuers, including, among others, less liquidity generally, greater market volatility than U.S. securities and less complete financial information than for U.S. issuers. In addition, adverse political, economic or social developments could undermine the value of the Fund’s investments or prevent the Fund from realizing the full value of its investments. Financial reporting standards for companies based in foreign markets differ from those in the United States. Finally, the value of the currency of the country in which the Fund has invested could decline relative to the value of the U.S. dollar, which may affect the value of the investment to U.S. investors.
Because foreign markets may be open on different days than the days during which investors may purchase the shares of each Fund, the value of each Fund's securities may change on the days when investors are not able to purchase the shares of the Funds. The value of securities denominated in foreign currencies is converted into U.S. dollars using exchange rates determined daily as of the close of regular trading on the NYSE or NASDAQ. Any use of a different rate from the rates used by the Index may adversely affect a Fund's ability to track its Index.
D. Foreign Currency Translation
The books and records of the Funds are maintained in U.S. dollars. Investment valuations and other assets and liabilities initially expressed in foreign currencies are converted each business day into U.S. dollars based upon current exchange rates. The portion of realized and unrealized gains or losses on investments due to fluctuations in foreign currency exchange rates is not separately disclosed and is included in realized and unrealized gains or losses on investments, when applicable.
E. Securities Transactions and Investment Income
Securities transactions are recorded as of the trade date. Realized gains and losses from securities transactions are recorded on the highest cost basis. Dividend income and capital gains distributions, if any, are recorded on the ex-dividend date, net of any foreign taxes withheld. Interest income, if any, is recorded on the accrual basis, including any amortization of premiums and accretion of discounts.
F. Dividends and Distributions to Shareholders
Dividends from net investment income for each Fund, if any, are declared and paid quarterly or as the Board may determine from time to time. Distributions of net realized capital gains earned by the Funds, if any, are distributed at least annually.
G. Equalization
The ALPS Sector Dividend Dogs ETF, the ALPS International Sector Dividend Dogs ETF, and the ALPS Emerging Sector Dividend Dogs ETF utilize the accounting practice known as “Equalization” by which a portion of the proceeds from sales and costs of reacquiring the Funds’ shares, equivalent on a per share basis to the amount of distributable net investment income on the date of the transaction, is credited or charged to undistributed net investment income. As a result, undistributed net investment income per share is unaffected by sales or reacquisitions of the Funds’ shares. Amounts related to Equalization can be found on the Statement of Changes in Net Assets.
H. Federal Tax and Tax Basis Information
The timing and character of income and capital gain distributions are determined in accordance with income tax regulations, which may differ from U.S. GAAP. Reclassifications are made to the Funds’ capital accounts for permanent tax differences to reflect income and gains available for distribution (or available capital loss carryforwards) under income tax regulations. The amounts and characteristics of tax basis distributions and composition of distributable earnings/(accumulated losses) are finalized at fiscal year-end; accordingly, tax basis balances have not been determined as of May 31, 2019.
ALPS ETF Trust
| Notes to Financial Statements | May 31, 2019 (Unaudited) |
The tax character of the distributions paid during the fiscal year ended November 30, 2018 were as follows:
| Fund | | Ordinary Income | |
| November 30, 2018 | | | |
| ALPS Sector Dividend Dogs ETF | | $ | 80,000,025 | |
| ALPS International Sector Dividend Dogs ETF | | | 13,263,685 | |
| ALPS Emerging Sector Dividend Dogs ETF | | | 1,535,255 | |
Under current law, capital losses maintain their character as short-term or long-term and are carried forward to the next tax year without expiration. As of November 30, 2018, the following amounts are available as carry forwards to the next tax year:
| Fund | | Short-Term | | | Long-Term | |
| ALPS Sector Dividend Dogs ETF | | $ | 16,090,987 | | | $ | 89,247,096 | |
| ALPS International Sector Dividend Dogs ETF | | | 6,138,216 | | | | 13,404,064 | |
| ALPS Emerging Sector Dividend Dogs ETF | | | 1,387,625 | | | | 2,660,474 | |
As of May 31, 2019, the cost of investments for federal income tax purposes and accumulated net unrealized appreciation/(depreciation) on investments were as follows:
| | | Gross
Appreciation
(excess of value
over tax cost) | | | Gross
Depreciation
(excess of tax
cost over value) | | | Net Unrealized
Appreciation/(Depreciation) | | | Cost of
Investments for
Income Tax
Purposes | |
| ALPS Sector Dividend Dogs ETF | | $ | 92,952,032 | | | $ | (233,411,541 | ) | | $ | (140,459,509 | ) | | $ | 1,874,720,167 | |
| ALPS International Sector Dividend Dogs ETF | | | 14,622,492 | | | | (32,208,922 | ) | | | (17,586,430 | ) | | | 270,652,207 | |
| ALPS Emerging Sector Dividend Dogs ETF | | | 1,791,351 | | | | (3,929,092 | ) | | | (2,137,741 | ) | | | 33,482,065 | |
The differences between book-basis and tax-basis are primarily due to the deferral of losses from wash sales. In addition, certain tax cost basis adjustments are finalized at fiscal year-end and therefore have not been determined as of May 31, 2019.
I. Income Taxes
No provision for income taxes is included in the accompanying financial statements, as each Fund intends to distribute to shareholders all taxable investment income and realized gains and otherwise comply with Subchapter M of the Internal Revenue Code of 1986, as amended, applicable to regulated investment companies. Each Fund evaluates tax positions taken (or expected to be taken) in the course of preparing the Fund’s tax returns to determine whether these positions meet a “more-likely-than-not” standard that, based on the technical merits, have a more than fifty percent likelihood of being sustained by a taxing authority upon examination. A tax position that meets the “more-likely-than-not” recognition threshold is measured to determine the amount of benefit to recognize in the financial statements.
As of and during the six months ended May 31, 2019, each Fund did not have a liability for any unrecognized tax benefits. Each Fund files U.S. federal, state, and local tax returns as required. Each Fund’s tax returns are subject to examination by the relevant tax authorities until expiration of the applicable statute of limitations, which is generally three years after the filing of the tax return, but may extend to four years in certain jurisdictions. Each Fund’s tax returns for open years have incorporated no uncertain tax positions that require a provision for income taxes.
J. Lending of Portfolio Securities
The Funds have entered into a securities lending agreement with State Street Bank & Trust Co. (“SSB”), the Funds’ lending agent. Each Fund may lend its portfolio securities only to borrowers that are approved by SSB. Each Fund will limit such lending to not more than 33 1/3% of the value of its total assets. The Fund’s securities held at SSB as custodian shall be available to be lent except those securities the Fund or ALPS Advisors, Inc. specifically identifies in writing as not being available for lending. The borrower pledges and maintains with the Fund collateral consisting of cash (U.S. Dollars only), securities issued or guaranteed by the U.S. government or its agencies or instrumentalities, and cash equivalents (including irrevocable bank letters of credit) issued by a person other than the borrower or an affiliate of the borrower. The initial collateral received by the Fund is required to have a value of no less than 102% of the market value of the loaned securities for U.S equity securities and a value of no less than 105% of the market value for non-U.S. equity securities. The collateral is maintained thereafter, at a market value equal to not less than 102% of the current value of the U.S. equity securities on loan and not less than 105% of the current value of the non-U.S. equity securities on loan. The market value of the loaned securities is determined at the close of each business day and any additional required collateral is delivered to the Fund on the next business day. During the term of the loan, each Fund is entitled to all distributions made on or in respect of the loaned securities. Loans of securities are terminable at any time and the borrower, after notice, is required to return borrowed securities within the customary time period for settlement of securities transactions.
ALPS ETF Trust
| Notes to Financial Statements | May 31, 2019 (Unaudited) |
Any cash collateral received is reinvested in a money market fund managed by SSB as disclosed in the Fund’s Schedule of Investments and is reflected in the Statements of Assets and Liabilities as a payable for collateral upon return of securities loaned. Non-cash collateral, in the form of securities issued or guaranteed by the U.S. government or its agencies or instrumentalities, is not disclosed in the Fund’s Statement of Assets and Liabilities as it is held by the lending agent on behalf of the Fund, and the Fund does not have the ability to re-hypothecate these securities. Income earned by the Fund from securities lending activity is disclosed in the Statement of Operations.
| | | Market Value
of Securities
on Loan | | | Cash
Collateral Received | | | Non-Cash
Collateral Received | | | Total
Collateral Received | |
| ALPS Emerging Sector Dividend Dogs ETF | | $ | 367,785 | | | $ | 158,025 | | | $ | 233,493 | | | $ | 391,518 | |
The risks of securities lending include the risk that the borrower may not provide additional collateral when required or may not return the securities when due. To mitigate these risks, the Funds benefit from a borrower default indemnity provided by SSB. SSB’s indemnity allows for full replacement of securities lent wherein SSB will purchase the unreturned loaned securities on the open market by applying the proceeds of the collateral, or to the extent such proceeds are insufficient or the collateral is unavailable, SSB will purchase the unreturned loan securities at SSB’s expense. However, the Funds could suffer a loss if the value of the investments purchased with cash collateral falls below the value of the cash collateral received.
The following table reflects a breakdown of transactions accounted for as secured borrowings, the gross obligation by the type of collateral pledged or securities loaned, and the remaining contractual maturity of those transactions as of May 31, 2019:
| ALPS Emerging Sector Dividend Dogs ETF | | Remaining contractual maturity of the agreements |
| | | |
| Securities Lending Transactions | | Overnight &
Continuous | | | Up to 30 days | | 30-90 days | | | Greater than 90 days | | | Total | |
| Common Stocks | | $ | 158,025 | | | $ | – | | $ | – | | | $ | – | | | $ | 158,025 | |
| Total Borrowings | | | | | | | | | | | | | | | | | 158,025 | |
| Gross amount of recognized liabilities for securities lending (collateral received) | | | $ | 158,025 | |
3. INVESTMENT ADVISORY FEE AND OTHER AFFILIATED TRANSACTIONS
ALPS Advisors, Inc. (the “Adviser”) serves as the Funds’ investment adviser pursuant to an Investment Advisory Agreement with the Trust on behalf of each Fund (the “Advisory Agreement”). Pursuant to the Advisory Agreement, each Fund pays the Adviser an annual management fee for the services and facilities it provides, payable on a monthly basis as a percentage of the relevant Fund’s average daily net assets as set out below. From time to time, the Adviser may waive all or a portion of its fee.
| Fund | Advisory Fee |
| ALPS Sector Dividend Dogs ETF | 0.40% |
| ALPS International Sector Dividend Dogs ETF | 0.50% |
| ALPS Emerging Sector Dividend Dogs ETF | 0.60% |
Out of the unitary management fee, the Adviser pays substantially all expenses of each Fund, including licensing fees to the Underlying Index provider, the cost of transfer agency, custody, fund administration, legal, audit, independent trustees and other services, except for interest expenses, distribution fees or expenses, brokerage expenses, taxes and extraordinary expenses not incurred in the ordinary course of each Fund's business. The Adviser’s unitary management fee is designed to pay substantially all of each Fund's expenses and to compensate the Adviser for providing services for each Fund.
ALPS ETF Trust
| Notes to Financial Statements | May 31, 2019 (Unaudited) |
ALPS Fund Services, Inc., an affiliate of the Adviser, is the administrator for the Funds.
Each Trustee who is not an officer or employee of the Adviser, any sub-adviser or any of their affiliates (“Independent Trustees”) receives (1) a quarterly retainer of $5,000, (2) a per meeting fee for regularly scheduled meetings of $3,750, (3) $1,500 for any special meeting held outside of a regularly scheduled board meeting, and (4) reimbursement for all reasonable out-of-pocket expenses relating to attendance at meetings. In addition, the Chairman of the Board and Chairman of the Audit Committee each receives a quarterly retainer of $2,000, in connection with their respective roles.
4. PURCHASES AND SALES OF SECURITIES
For the six months ended May 31, 2019, the cost of purchases and proceeds from sales of investment securities, excluding short-term investments and in-kind transactions, were as follows:
| Fund | | Purchases | | | Sales | |
| ALPS Sector Dividend Dogs ETF | | $ | 835,849,327 | | | $ | 829,522,376 | |
| ALPS International Sector Dividend Dogs ETF | | | 125,534,452 | | | | 123,025,688 | |
| ALPS Emerging Sector Dividend Dogs ETF | | | 20,679,342 | | | | 21,510,973 | |
For the six months ended May 31, 2019, the cost of in-kind purchases and proceeds from in-kind sales were as follows:
| Fund | | Purchases | | | Sales | |
| ALPS Sector Dividend Dogs ETF | | $ | 6,339,744 | | | $ | 253,601,857 | |
| ALPS International Sector Dividend Dogs ETF | | | 9,196,886 | | | | 39,676,938 | |
| ALPS Emerging Sector Dividend Dogs ETF | | | – | | | | 2,429,900 | |
For the six months ended May 31, 2019, the in-kind net realized gains/(losses) were as follows:
| Fund | | Net Realized Gain/(Loss) | |
| ALPS Sector Dividend Dogs ETF | | $ | 20,726,889 | |
| ALPS International Sector Dividend Dogs ETF | | | 1,409,230 | |
| ALPS Emerging Sector Dividend Dogs ETF | | | 9,271 | |
Gains on in-kind transactions are not considered taxable for federal income tax purposes and losses on in-kind transactions are also not deductible for tax purposes.
5. CAPITAL SHARE TRANSACTIONS
Shares are created and redeemed by each Fund only in Creation Unit size aggregations of 50,000 shares. Only broker-dealers or large institutional investors with creation and redemption agreements called Authorized Participants (“AP”) are permitted to purchase or redeem Creation Units from the Funds. Such transactions are generally permitted on an in-kind basis, with a balancing cash component to equate the transaction to the NAV per unit of each Fund on the transaction date. Cash may be substituted equivalent to the value of certain securities generally when they are not available in sufficient quantity for delivery, not eligible for trading by the AP or as a result of other market circumstances.
6. RELATED PARTY TRANSACTIONS
The ALPS Sector Dvidend Dogs ETF engaged in cross trades between other funds in the Trust during the six months ended May 31, 2019 pursuant to Rule 17a-7 under the 1940 Act. Cross trading is the buying or selling of portfolio securities between funds to which the Adviser serves as the investment adviser. The Board previously adopted procedures that apply to transactions between the Funds of the Trust pursuant to Rule 17a-7. These transactions related to cross trades during the period complied with the requirements set forth by Rule 17a-7 and the Trust’s procedures.
Transactions related to cross trades during the six months ended May 31, 2019, were as follows:
| Fund | | Purchase cost paid | | | Sale proceeds received | | | Realized gain/(loss) on sales | |
| ALPS Sector Dividend Dogs ETF | | $ | 438,565 | | | $ | – | | | $ | – | |
ALPS ETF Trust
| Additional Information | May 31, 2019 (Unaudited) |
PROXY VOTING POLICIES AND PROCEDURES
Information regarding how the Fund voted proxies relating to portfolio securities during the most recent 12-month period ended June 30 and a description of the Fund’s proxy voting policies and procedures used in determining how to vote for proxies are available without charge on the SEC’s website at www.sec.gov and upon request, by calling (toll-free) 1-866-675-2639.
PORTFOLIO HOLDINGS
The Trust is required to disclose, after its first and third fiscal quarters, the complete schedule of each Fund’s portfolio holdings with the SEC on Form N-Q or as an exhibit to its report on Form N-PORT. Form N-Q or N-PORT reports for each Fund will be available on the SEC’s website at www.sec.gov. Each Fund’s Form N-Q or N-PORT reports will be available without charge, upon request, by calling (toll-free) 1-866-675-2639 or by writing to ALPS ETF Trust at 1290 Broadway, Suite 1100, Denver, Colorado 80203.
TAX INFORMATION
The Funds designate the following as a percentage of taxable ordinary income distributions, or up to the maximum amount allowable, for the calendar year ended December 31, 2018:
| | Qualified Dividend Income | Dividend Received Deduction |
| ALPS Sector Dividend Dogs ETF | 100.00% | 93.21% |
| ALPS International Sector Dividend Dogs ETF | 100.00% | 0.00% |
| ALPS Emerging Sector Dividend Dogs ETF | 73.64% | 0.00% |
In early 2019, if applicable, shareholders of record received this information for the distributions paid to them by the Funds during the calendar year 2018 via Form 1099. The Funds will notify shareholders in early 2020 of amounts paid to them by the Funds, if any, during the calendar year 2019.
LICENSING AGREEMENTS
ALPS Sector Dividend Dogs ETF, ALPS International Sector Dividend Dogs ETF, and ALPS Emerging Sector Dividend Dogs ETF
The Funds are not sponsored, endorsed, sold or promoted by the Index Provider. The Index Provider makes no representation or warranty, express or implied, to the owners of each Fund or any member of the public regarding the advisability of investing in securities generally or in each Fund particularly or the ability of each Fund to track the performance of the physical commodities market. The Index Provider’s only relationship to the Adviser or each Fund is the licensing of certain service marks and trade names of the Index Provider and of each Underlying Index that is determined, composed and calculated by the Index Provider without regard to the Adviser or the Funds. The Index Provider has no obligation to take the needs of the Adviser or the Funds or the owners of each Fund into consideration in determining, composing or calculating each Underlying Index. The Index Provider is not responsible for and has not participated in the determination of the timing of, prices at, or quantities of each Fund to be issued or in the determination or calculation of the equation by which each Fund is to be converted into cash. The Index Provider has no obligation or liability in connection with the administration, marketing or trading of each Fund.
THE INDEX PROVIDER DOES NOT GUARANTEE THE ACCURACY AND/OR THE COMPLETENESS OF EACH UNDERLYING INDEX OR ANY DATA INCLUDED THEREIN AND THE INDEX PROVIDER SHALL HAVE NO LIABILITY FOR ANY ERRORS, OMISSIONS, OR INTERRUPTIONS THEREIN. THE INDEX PROVIDER MAKES NO WARRANTY, EXPRESS OR IMPLIED, AS TO RESULTS TO BE OBTAINED BY THE ADVISER, EACH FUND, OWNERS OF EACH FUND, OR ANY OTHER PERSON OR ENTITY FROM THE USE OF THE UNDERLYING INDEX OR ANY DATA INCLUDED THEREIN. THE INDEX PROVIDER MAKES NO EXPRESS OR IMPLIED WARRANTIES, AND EXPRESSLY DISCLAIMS ALL WARRANTIES OF MERCHANTABILITY OR FITNESS FOR A PARTICULAR PURPOSE OR USE WITH RESPECT TO EACH UNDERLYING INDEX OR ANY DATA INCLUDED THEREIN. WITHOUT LIMITING ANY OF THE FOREGOING, IN NO EVENT SHALL THE INDEX PROVIDER HAVE ANY LIABILITY FOR ANY SPECIAL, PUNITIVE, INDIRECT, OR CONSEQUENTIAL DAMAGES (INCLUDING LOST PROFITS), EVEN IF NOTIFIED OF THE POSSIBILITY OF SUCH DAMAGES.
The Funds are not sponsored, endorsed, sold or promoted by Standard & Poor’s, a division of The McGraw-Hill Companies, Inc. (“S&P”) or its third party licensors. Neither S&P nor its third party licensors make any representation or warranty, express or implied, to the owners of each Fund or any member of the public regarding the advisability of investing in securities generally or in each Fund particularly or the ability of each Underlying Index to track general stock market performance. S&P’s and its third party licensor’s only relationship to the Index Provider is the licensing of certain trademarks, service marks and trade names of S&P and/or its third party licensors and for the providing of calculation and maintenance services related to the Underlying Index. Neither S&P nor its third party licensors is responsible for and has not participated in the determination of the prices and amount of each Fund or the timing of the issuance or sale of each Fund or in the determination or calculation of the equation by which each Fund is to be converted into cash. S&P has no obligation or liability in connection with the administration, marketing or trading of each Fund.
ALPS ETF Trust
| Additional Information | May 31, 2019 (Unaudited) |
NEITHER S&P, ITS AFFILIATES NOR THEIR THIRD PARTY LICENSORS GUARANTEE THE ADEQUACY, ACCURACY, TIMELINESS OR COMPLETENESS OF EACH UNDERLYING INDEX OR ANY DATA INCLUDED THEREIN OR ANY COMMUNICATIONS, INCLUDING BUT NOT LIMITED TO, ORAL OR WRITTEN COMMUNICATIONS (INCLUDING ELECTRONIC COMMUNICATIONS) WITH RESPECT THERETO. S&P, ITS AFFILIATES AND THEIR THIRD PARTY LICENSORS SHALL NOT BE SUBJECT TO ANY DAMAGES OR LIABILITY FOR ANY ERRORS, OMISSIONS OR DELAYS THEREIN. S&P MAKES NO EXPRESS OR IMPLIED WARRANTIES, AND EXPRESSLY DISCLAIMS ALL WARRANTIES OF MERCHANTABILITY OR FITNESS FOR A PARTICULAR PURPOSE OR USE WITH RESPECT TO ITS TRADEMARKS, EACH UNDERLYING INDEX OR ANY DATA INCLUDED THEREIN. WITHOUT LIMITING ANY OF THE FOREGOING, IN NO EVENT WHATSOEVER SHALL S&P, ITS AFFILIATES OR THEIR THIRD PARTY LICENSORS BE LIABLE FOR ANY INDIRECT, SPECIAL, INCIDENTAL, PUNITIVE OR CONSEQUENTIAL DAMAGES, INCLUDING BUT NOT LIMITED TO, LOSS OF PROFITS, TRADING LOSSES, LOST TIME OR GOODWILL, EVEN IF THEY HAVE BEEN ADVISED OF THE POSSIBILITY OF SUCH DAMAGES, WHETHER IN CONTRACT, TORT, STRICT LIABILITY OR OTHERWISE.
Standard & Poor’s® and S&P® are registered trademarks of The McGraw-Hill Companies, Inc.; “Calculated by S&P Custom Indices” and its related stylized mark are service marks of The McGraw-Hill Companies, Inc. These marks have been licensed for use by the Index Provider.
The S&P 500® is the property of Standard and Poor’s Financial Services LLC (“S&P”) and has been licensed by S&P for use by S-Network® Global Indexes, Inc. in connection with the S-Network®Sector Dividend Dogs Index (Ticker: SDOGX), the S-Network® Emerging Sector Dividend Dogs Index (Ticker: EDOGX), and the S-Network® International Sector Dividend Dogs Index (Ticker: IDOGX).
The Adviser does not guarantee the accuracy and/or the completeness of each Underlying Index or any data included therein, and the Adviser shall have no liability for any errors, omissions or interruptions therein. The Adviser makes no warranty, express or implied, as to results to be obtained by each Fund, owners of the Shares of each Fund or any other person or entity from the use of each Underlying Index or any data included therein. The Adviser makes no express or implied warranties, and expressly disclaims all warranties of merchantability or fitness for a particular purpose or use with respect to each Underlying Index or any data included therein. Without limiting any of the foregoing, in no event shall the Adviser have any liability for any special, punitive, direct, indirect or consequential damages (including lost profits) arising out of matters relating to the use of each Underlying Index, even if notified of the possibility of such damages.

TABLE OF CONTENTS
| Performance Overview | 1 |
| Disclosure of Fund Expenses | 3 |
| Schedule of Investments | 4 |
| Statement of Assets and Liabilities | 9 |
| Statement of Operations | 10 |
| Statements of Changes in Net Assets | 11 |
| Financial Highlights | 12 |
| Notes to Financial Statements | 13 |
| Additional Information | 18 |
Beginning on January 1, 2021, as permitted by regulations adopted by the U.S. Securities and Exchange Commission, paper copies of the Fund’s annual and semi-annual shareholder reports will no longer be sent by mail, unless you specifically request paper copies of the reports from your financial intermediary (such as a broker-dealer or bank). Instead, the reports will be made available on the Fund’s website (www.alpsfunds.com), and you will be notified by mail each time a report is posted and provided with a website link to access the report.
If you already elected to receive shareholder reports electronically, you will not be affected by this change and you need not take any action. You may elect to receive shareholder reports and other communications from the Fund electronically anytime by contacting your financial intermediary.
You may elect to receive all future reports in paper free of charge. You can contact your financial intermediary to request that you continue to receive paper copies of your shareholder reports. Your election to receive reports in paper will apply to all funds held in your account with your financial intermediary.
Barron’s 400SM ETF
| Performance Overview | May 31, 2019 (Unaudited) |
Investment Objective
The Barron’s 400SMETF (the “Fund”) seeks investment results that correspond generally, before fees and expenses, to the performance of the Barron’s 400 IndexSM (the “Underlying Index”). The Underlying Index is a rules-based index intended to give investors a means of tracking the overall performance of high performing equity securities of U.S. companies. The Fund will invest at least 80% of its total assets in the equity securities which comprise the Underlying Index.
The Underlying Index generally consists of 400 stocks. The Underlying Index’s stocks are constituents of the MarketGrader U.S. Coverage Universe. In compiling the Underlying Index, MarketGrader Capital, LLC (the “Index Provider”) selects the 400 stocks from the MarketGrader U.S. Coverage Universe by using a methodology that selects components based on the strength of their fundamentals in growth, value, profitability and cash flow and then screens such potential Underlying Index components for certain criteria regarding concentration, market capitalization and liquidity. The eligible stocks that are selected for inclusion in the Underlying Index’s portfolio are equally weighted. The Underlying Index is rebalanced by the Index Provider semiannually, on the third Friday of March and September each year.
Performance(as of May 31, 2019)
| | 6 Months | 1 Year | 3 Year | 5 Year | Since Inception^ |
| Barron’s 400SM ETF - NAV | -6.24% | -12.15% | 7.60% | 5.21% | 7.75% |
| Barron’s 400SM ETF - Market Price* | -6.39% | -12.33% | 7.56% | 5.18% | 7.73% |
| Barron’s 400 IndexSM | -6.02% | -11.68% | 8.24% | 5.88% | 8.44% |
Total Expense Ratio (per the current prospectus) 0.66%
Performance data quoted represents past performance. Past performance does not guarantee future results. The table does not reflect the deduction of taxes that a shareholder would pay on Fund distributions or the redemption of Fund shares. Investment return and principal value of an investment will fluctuate so that an investor’s shares, when sold or redeemed, may be worth more or less than the original cost. Current performance data may be higher or lower than actual data quoted. For the most current month-end performance data please visit www.alpsfunds.com or call 1.855.724.0450.
NAV is an exchange-traded fund’s per-share value. The per-share dollar amount of the Fund is derived by dividing the total value of all the securities in its portfolio, less any liabilities, by the number of Fund shares outstanding. Market Price is the price at which a share can currently be traded in the market. Information detailing the number of days the Market Price of the Fund was greater than the Fund’s NAV and the number of days it was less than the Fund’s NAV can be obtained at www.alpsfunds.com.
| ^ | The Fund commenced Investment Operations on June 4, 2013. |
| * | Market Price is based on the midpoint of the bid/ask spread at 4 p.m. ET and does not represent the returns an investor would receive if shares were traded at other times. |
The Barron’s 400 IndexSM, calculated by NYSE Arca or its affiliates, measures the performance of a diversified group of U.S. companies selected in part based on fundamentals-related rules-based criteria. The index includes companies that have scored highest according to fundamentals-related rankings calculated by MarketGrader Capital, LLC. Additional rules-based screening provides for sector and market cap diversification. The Underlying Index has been licensed by MarketGrader for use with the Barron’s 400SMETF.
The index is not actively managed and does not reflect any deductions for fees, expenses or taxes. One cannot invest directly in an index. Index performance does not reflect Fund performance.
Funds that emphasize investments in small/mid cap companies will generally experience greater price volatility.
Barron’s 400SM ETF shares are not individually redeemable. Investors buy and sell shares of the Barron’s 400SM ETF on a secondary market. Only market makers or “authorized participants” may trade directly with the Fund, typically in blocks of 50,000 shares.
The Barron’s 400SM ETF is not suitable for all investors. Investments in the Fund are subject to investment risks, including possible loss of the principal amount invested.
ALPS Portfolio Solutions Distributor, Inc., a FINRA member, is the distributor for the Fund.
Barron’s 400SM ETF
| Performance Overview | May 31, 2019 (Unaudited) |
Top 10 Holdings*(as of May 31, 2019)
| WageWorks, Inc. | 0.46% |
| DMC Global, Inc. | 0.40% |
| Sinclair Broadcast Group, Inc. | 0.38% |
| Control4 Corp. | 0.37% |
| Meta Financial Group, Inc. | 0.36% |
| Veeva Systems, Inc. | 0.35% |
| Match Group, Inc. | 0.34% |
| HEICO Corp. | 0.33% |
| Copart, Inc. | 0.32% |
| Take-Two Interactive Software, Inc. | 0.32% |
| Total % of Top 10 Holdings | 3.63% |
| * | % of Total Investments (excluding investments purchased with collateral from securities loaned). |
Future holdings are subject to change.
Sector Allocation*(as of May 31, 2019)
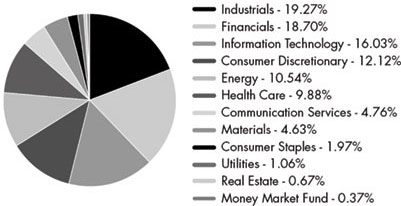
Growth of $10,000(as of May 31, 2019)
Comparison of change in value of a $10,000 investment in the Fund and the Underlying Index
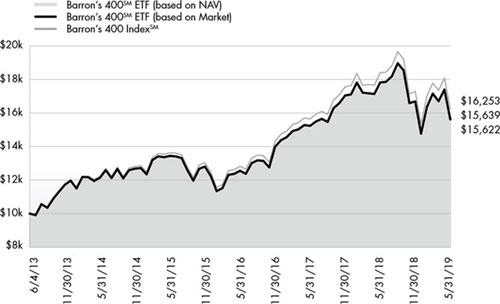
The chart above represents historical performance of a hypothetical investment of $10,000 in the Fund over the life of the Fund. Past performance does not guarantee future results. This chart does not reflect the deduction of taxes that a shareholder would pay on Fund distributions or the redemption of Fund shares.
Barron’s 400SM ETF
| Disclosure of Fund Expenses | May 31, 2019 (Unaudited) |
Shareholder Expense Example:As a shareholder of the Fund, you incur two types of costs: (1) transaction costs which may include creation and redemption fees or brokerage charges, and (2) ongoing costs, including management fees and other Fund expenses. These examples are intended to help you understand your ongoing costs (in dollars) of investing in the Fund and to compare these costs with the ongoing costs of investing in other funds. It is based on an investment of $1,000 invested at the beginning of the (six month) period and held through May 31, 2019.
Actual Return:The first line of the table provides information about actual account values and actual expenses. You may use the information in this line, together with the amount you invested, to estimate the expenses that you incurred over the period. Simply divide your account value by $1,000 (for example, an $8,600 account value divided by $1,000 = 8.6), then multiply the result by the number in the first line under the heading entitled “Expenses Paid During Period” to estimate the expenses attributable to your investment during this period.
Hypothetical 5% Return:The second line of the table provides information about hypothetical account values and hypothetical expenses based on the Fund’s actual expense ratio and an assumed rate of return of 5% per year before expenses, which is not the Fund’s actual return. The hypothetical account values and expenses may not be used to estimate the actual ending account balance or expenses you paid for the period. You may use this information to compare ongoing costs of investing in the Fund and other funds. To do so, compare this 5% hypothetical example with the 5% hypothetical examples that appear in the shareholder reports of other funds.
The expenses shown in the table are meant to highlight ongoing Fund costs only and do not reflect any transaction costs, such as creation and redemption fees or brokerage charges. Therefore, the second line is useful in comparing ongoing costs only, and will not help you determine the relative total costs of owning different funds. In addition, if these costs were included, your costs would have been higher.
| | Beginning Account Value 12/1/18 | Ending Account Value 5/31/19 | Expense Ratio(a) | Expenses Paid During Period 12/1/18 - 5/31/19(b) |
| Barron’s 400 ETF | | | | |
| Actual | $1,000.00 | $937.60 | 0.65% | $3.14 |
| Hypothetical (5% return before expenses) | $1,000.00 | $1,021.69 | 0.65% | $3.28 |
| (a) | Annualized, based on the Fund’s most recent fiscal half year expenses. |
| (b) | Expenses are equal to the Fund’s annualized expense ratio multiplied by the average account value over the period, multiplied by the number of days in the most recent fiscal half year (182), divided by 365. |
Barron’s 400SM ETF
| Schedule of Investments | May 31, 2019 (Unaudited) |
| Security Description | | Shares | | | Value | |
| COMMON STOCKS (96.52%) |
| Communication Services (4.76%) | | | | | | | | |
| Activision Blizzard, Inc. | | | 9,216 | | | $ | 399,698 | |
| Alphabet, Inc., Class A(a) | | | 328 | | | | 362,932 | |
| AMC Networks, Inc., Class A(a) | | | 6,343 | | | | 334,720 | |
| CBS Corp., Class B | | | 7,946 | | | | 383,633 | |
| Electronic Arts, Inc.(a) | | | 3,985 | | | | 370,924 | |
| Facebook, Inc., Class A(a) | | | 2,285 | | | | 405,519 | |
| Fox Corp., Class A | | | 2,573 | | | | 90,647 | |
| Gray Television, Inc.(a) | | | 16,949 | | | | 292,031 | |
| IAC/InterActiveCorp(a) | | | 1,875 | | | | 414,094 | |
| Interpublic Group of Cos., Inc. | | | 17,492 | | | | 371,180 | |
| Match Group, Inc. | | | 7,289 | | | | 500,390 | |
| Nexstar Media Group, Inc., Class A | | | 3,728 | | | | 373,359 | |
| QuinStreet, Inc.(a) | | | 30,384 | | | | 465,787 | |
| Sinclair Broadcast Group, Inc., Class A | | | 10,226 | | | | 548,931 | |
| Take-Two Interactive Software, Inc.(a) | | | 4,372 | | | | 472,832 | |
| TEGNA, Inc. | | | 26,227 | | | | 397,077 | |
| Twitter, Inc.(a) | | | 12,608 | | | | 459,435 | |
| World Wrestling Entertainment, Inc., Class A | | | 4,458 | | | | 324,275 | |
| Total Communication Services | | | | | | | 6,967,464 | |
| | | | | | | | | |
| Consumer Discretionary (12.11%) | | | | | | | | |
| Amazon.com, Inc.(a) | | | 234 | | | | 415,366 | |
| American Eagle Outfitters, Inc. | | | 18,393 | | | | 320,038 | |
| Booking Holdings, Inc.(a) | | | 226 | | | | 374,306 | |
| BorgWarner, Inc. | | | 10,112 | | | | 358,774 | |
| Burlington Stores, Inc.(a) | | | 2,758 | | | | 431,848 | |
| Columbia Sportswear Co. | | | 3,814 | | | | 357,677 | |
| Dana, Inc. | | | 20,776 | | | | 303,122 | |
| Darden Restaurants, Inc. | | | 3,589 | | | | 417,472 | |
| Dave & Buster’s Entertainment, Inc. | | | 8,282 | | | | 411,947 | |
| Deckers Outdoor Corp.(a) | | | 2,769 | | | | 421,165 | |
| Dollar General Corp. | | | 3,285 | | | | 418,115 | |
| Dollar Tree, Inc.(a) | | | 3,835 | | | | 389,598 | |
| Five Below, Inc.(a) | | | 3,349 | | | | 431,117 | |
| Floor & Decor Holdings, Inc., Class A(a) | | | 9,827 | | | | 349,055 | |
| Fox Factory Holding Corp.(a) | | | 5,832 | | | | 390,861 | |
| Gap, Inc. | | | 15,128 | | | | 282,591 | |
| Hanesbrands, Inc. | | | 22,146 | | | | 328,868 | |
| Installed Building Products, Inc.(a) | | | 8,794 | | | | 452,363 | |
| iRobot Corp.(a)(b) | | | 3,168 | | | | 275,964 | |
| K12, Inc.(a) | | | 11,737 | | | | 358,800 | |
| La-Z-Boy, Inc. | | | 11,548 | | | | 371,730 | |
| Lear Corp. | | | 2,690 | | | | 320,191 | |
| Lennar Corp., Class B | | | 10,128 | | | | 400,157 | |
| Malibu Boats, Inc., Class A(a) | | | 8,838 | | | | 317,284 | |
| MasterCraft Boat Holdings, Inc.(a) | | | 17,299 | | | | 343,558 | |
| Meritage Homes Corp.(a) | | | 9,004 | | | | 451,100 | |
| Norwegian Cruise Line Holdings, Ltd.(a) | | | 7,098 | | | | 388,332 | |
| Security Description | | Shares | | | Value | |
| Consumer Discretionary (continued) | | | | | | | | |
| NVR, Inc.(a) | | | 141 | | | $ | 451,421 | |
| O’Reilly Automotive, Inc.(a) | | | 1,074 | | | | 398,851 | |
| PetMed Express, Inc. | | | 18,298 | | | | 319,666 | |
| PulteGroup, Inc. | | | 14,026 | | | | 434,806 | |
| Ross Stores, Inc. | | | 4,310 | | | | 400,787 | |
| Royal Caribbean Cruises, Ltd. | | | 3,379 | | | | 411,427 | |
| Ruth’s Hospitality Group, Inc. | | | 15,412 | | | | 352,472 | |
| Skechers U.S.A., Inc., Class A(a) | | | 11,981 | | | | 334,629 | |
| Stamps.com, Inc.(a) | | | 4,387 | | | | 147,140 | |
| Steven Madden, Ltd. | | | 12,122 | | | | 366,812 | |
| Stoneridge, Inc.(a) | | | 13,936 | | | | 362,754 | |
| Tapestry, Inc. | | | 11,630 | | | | 332,153 | |
| TJX Cos., Inc. | | | 7,564 | | | | 380,394 | |
| Tractor Supply Co. | | | 4,337 | | | | 437,083 | |
| Ulta Beauty, Inc.(a) | | | 1,261 | | | | 420,392 | |
| Urban Outfitters, Inc.(a) | | | 13,210 | | | | 296,829 | |
| VF Corp. | | | 4,930 | | | | 403,668 | |
| Winnebago Industries, Inc. | | | 12,440 | | | | 399,822 | |
| YETI Holdings, Inc.(a) | | | 15,888 | | | | 380,041 | |
| Yum China Holdings, Inc. | | | 9,549 | | | | 382,056 | |
| ZAGG, Inc.(a) | | | 36,277 | | | | 241,605 | |
| Total Consumer Discretionary | | | | | | | 17,736,207 | |
| | | | | | | | | |
| Consumer Staples (1.97%) | | | | | | | | |
| Casey’s General Stores, Inc. | | | 2,980 | | | | 384,659 | |
| Estee Lauder Cos., Inc., Class A | | | 2,466 | | | | 397,100 | |
| Lancaster Colony Corp. | | | 2,604 | | | | 374,533 | |
| Medifast, Inc. | | | 2,897 | | | | 373,568 | |
| Monster Beverage Corp.(a) | | | 6,522 | | | | 403,451 | |
| National Beverage Corp.(b) | | | 6,651 | | | | 300,293 | |
| Sprouts Farmers Market, Inc.(a) | | | 17,898 | | | | 358,855 | |
| USANA Health Sciences, Inc.(a) | | | 4,181 | | | | 295,931 | |
| Total Consumer Staples | | | | | | | 2,888,390 | |
| | | | | | | | | |
| Energy (7.78%) | | | | | | | | |
| Arch Coal, Inc., Class A | | | 4,291 | | | | 378,252 | |
| Bonanza Creek Energy, Inc.(a) | | | 17,955 | | | | 350,661 | |
| BP Prudhoe Bay Royalty Trust | | | 15,001 | | | | 269,868 | |
| Cabot Oil & Gas Corp. | | | 15,395 | | | | 385,183 | |
| Cactus, Inc., Class A(a) | | | 10,655 | | | | 346,820 | |
| California Resources Corp.(a) | | | 17,422 | | | | 282,236 | |
| Callon Petroleum Co.(a) | | | 54,339 | | | | 339,619 | |
| Carrizo Oil & Gas, Inc.(a) | | | 36,013 | | | | 366,612 | |
| Cimarex Energy Co. | | | 5,610 | | | | 320,836 | |
| Concho Resources, Inc. | | | 3,846 | | | | 376,947 | |
| ConocoPhillips | | | 5,985 | | | | 352,876 | |
| CONSOL Energy, Inc.(a) | | | 10,668 | | | | 279,715 | |
| Denbury Resources, Inc.(a) | | | 223,225 | | | | 321,444 | |
| Diamondback Energy, Inc. | | | 3,909 | | | | 383,317 | |
| DMC Global, Inc. | | | 8,642 | | | | 584,545 | |
| EOG Resources, Inc. | | | 4,516 | | | | 369,770 | |
| Gulfport Energy Corp.(a) | | | 50,890 | | | | 278,368 | |
| HighPoint Resources Corp.(a) | | | 172,112 | | | | 321,849 | |
| HollyFrontier Corp. | | | 7,749 | | | | 294,307 | |
| Jagged Peak Energy, Inc.(a) | | | 39,327 | | | | 326,414 | |
| Mammoth Energy Services, Inc. | | | 18,350 | | | | 192,675 | |
| Matador Resources Co.(a) | | | 21,599 | | | | 355,088 | |
Barron’s 400SM ETF
| Schedule of Investments | May 31, 2019 (Unaudited) |
| Security Description | | Shares | | | Value | |
| Energy (continued) | | | | | | | | |
| Occidental Petroleum Corp. | | | 6,119 | | | $ | 304,543 | |
| Parsley Energy, Inc., Class A(a) | | | 21,480 | | | | 382,988 | |
| PDC Energy, Inc.(a) | | | 10,094 | | | | 308,069 | |
| Penn Virginia Corp(a) | | | 6,896 | | | | 210,328 | |
| Phillips 66 | | | 4,033 | | | | 325,866 | |
| ProPetro Holding Corp.(a) | | | 19,882 | | | | 386,108 | |
| Renewable Energy Group, Inc.(a) | | | 16,661 | | | | 260,578 | |
| Solaris Oilfield Infrastructure, Inc., Class A | | | 24,493 | | | | 348,535 | |
| Southwestern Energy Co.(a) | | | 89,290 | | | | 320,551 | |
| SRC Energy, Inc.(a) | | | 80,015 | | | | 379,271 | |
| Texas Pacific Land Trust | | | 546 | | | | 402,407 | |
| W&T Offshore, Inc.(a) | | | 68,583 | | | | 288,049 | |
| Total Energy | | | | | | | 11,394,695 | |
| | | | | | | | | |
| Financials (18.68%) | | | | | | | | |
| 1st Source Corp. | | | 8,438 | | | | 369,247 | |
| Associated Banc-Corp | | | 17,194 | | | | 340,613 | |
| Axos Financial, Inc.(a) | | | 13,017 | | | | 355,494 | |
| BancFirst Corp. | | | 7,161 | | | | 374,019 | |
| BancorpSouth Bank | | | 13,179 | | | | 356,887 | |
| Bank of America Corp. | | | 13,576 | | | | 361,122 | |
| Bank of Hawaii Corp. | | | 4,813 | | | | 364,152 | |
| Bank of NT Butterfield & Son, Ltd. | | | 10,601 | | | | 350,045 | |
| Bank OZK | | | 12,813 | | | | 370,296 | |
| Banner Corp. | | | 6,829 | | | | 344,591 | |
| Bryn Mawr Bank Corp. | | | 10,220 | | | | 373,643 | |
| Cadence BanCorp | | | 19,943 | | | | 368,946 | |
| Capital One Financial Corp. | | | 4,735 | | | | 406,594 | |
| Carolina Financial Corp. | | | 10,891 | | | | 361,581 | |
| Cathay General Bancorp | | | 10,758 | | | | 361,899 | |
| CenterState Bank Corp. | | | 15,431 | | | | 337,785 | |
| Central Pacific Financial Corp. | | | 13,693 | | | | 380,528 | |
| Charles Schwab Corp. | | | 8,930 | | | | 371,577 | |
| Chemical Financial Corp. | | | 9,170 | | | | 347,176 | |
| Citigroup, Inc. | | | 6,255 | | | | 388,748 | |
| Comerica, Inc. | | | 4,778 | | | | 328,822 | |
| Commerce Bancshares, Inc. | | | 6,504 | | | | 372,874 | |
| Cullen/Frost Bankers, Inc. | | | 3,879 | | | | 354,036 | |
| Eagle Bancorp, Inc. | | | 7,044 | | | | 373,896 | |
| East West Bancorp, Inc. | | | 7,571 | | | | 323,433 | |
| Enova International, Inc.(a) | | | 16,291 | | | | 347,813 | |
| Enterprise Financial Services Corp. | | | 9,126 | | | | 357,648 | |
| Evercore, Inc., Class A | | | 4,259 | | | | 328,923 | |
| Fifth Third Bancorp | | | 14,101 | | | | 373,677 | |
| First Bancorp | | | 10,495 | | | | 371,628 | |
| First Commonwealth Financial Corp. | | | 29,451 | | | | 370,199 | |
| First Financial Bancorp | | | 15,310 | | | | 341,719 | |
| First Horizon National Corp. | | | 26,456 | | | | 354,775 | |
| First Merchants Corp. | | | 9,953 | | | | 330,937 | |
| Glacier Bancorp, Inc. | | | 9,622 | | | | 379,203 | |
| Hancock Whitney Corp. | | | 9,331 | | | | 354,391 | |
| Heritage Commerce Corp. | | | 30,105 | | | | 358,551 | |
| Home BancShares, Inc. | | | 20,919 | | | | 366,501 | |
| Security Description | | Shares | | | Value | |
| Financials (continued) | | | | | | | | |
| IBERIABANK Corp. | | | 5,196 | | | $ | 371,514 | |
| Independent Bank Corp./Rockland MA | | | 4,841 | | | | 335,723 | |
| International Bancshares Corp. | | | 9,837 | | | | 358,657 | |
| JPMorgan Chase & Co. | | | 3,776 | | | | 400,105 | |
| KeyCorp | | | 23,015 | | | | 367,550 | |
| Lakeland Financial Corp. | | | 8,378 | | | | 368,213 | |
| LegacyTexas Financial Group, Inc. | | | 10,081 | | | | 367,957 | |
| LPL Financial Holdings, Inc. | | | 5,355 | | | | 429,578 | |
| Meta Financial Group, Inc. | | | 20,324 | | | | 531,879 | |
| Moelis & Co., Class A | | | 8,940 | | | | 284,113 | |
| National Bank Holdings Corp., Class A | | | 11,514 | | | | 404,026 | |
| OceanFirst Financial Corp. | | | 16,101 | | | | 383,526 | |
| Pacific Premier Bancorp, Inc. | | | 14,061 | | | | 397,926 | |
| PacWest Bancorp | | | 10,058 | | | | 365,508 | |
| Pinnacle Financial Partners, Inc. | | | 6,868 | | | | 363,661 | |
| Popular, Inc. | | | 7,240 | | | | 378,000 | |
| Preferred Bank | | | 8,056 | | | | 352,611 | |
| Renasant Corp. | | | 10,518 | | | | 355,508 | |
| S&T Bancorp, Inc. | | | 9,906 | | | | 373,456 | |
| Sandy Spring Bancorp, Inc. | | | 11,791 | | | | 379,081 | |
| ServisFirst Bancshares, Inc. | | | 11,503 | | | | 360,504 | |
| Simmons First National Corp., Class A | | | 15,425 | | | | 351,844 | |
| South State Corp. | | | 5,637 | | | | 371,422 | |
| SVB Financial Group(a) | | | 1,630 | | | | 328,282 | |
| Synchrony Financial | | | 12,197 | | | | 410,185 | |
| Synovus Financial Corp. | | | 10,185 | | | | 325,513 | |
| T Rowe Price Group, Inc. | | | 3,912 | | | | 395,660 | |
| TCF Financial Corp. | | | 18,255 | | | | 347,940 | |
| TD Ameritrade Holding Corp. | | | 7,206 | | | | 358,499 | |
| TriCo Bancshares | | | 9,901 | | | | 369,307 | |
| United Community Banks, Inc. | | | 14,978 | | | | 397,067 | |
| Virtu Financial, Inc., Class A | | | 15,491 | | | | 356,603 | |
| Webster Financial Corp. | | | 7,087 | | | | 313,812 | |
| WesBanco, Inc. | | | 9,691 | | | | 344,321 | |
| Western Alliance Bancorp(a) | | | 8,870 | | | | 365,001 | |
| WSFS Financial Corp. | | | 9,297 | | | | 368,998 | |
| Zions Bancorp NA | | | 8,031 | | | | 345,895 | |
| Total Financials | | | | | | | 27,353,414 | |
| | | | | | | | | |
| Health Care (9.87%) | | | | | | | | |
| ABIOMED, Inc.(a) | | | 1,212 | | | | 317,447 | |
| Align Technology, Inc.(a) | | | 1,566 | | | | 445,292 | |
| Amedisys, Inc.(a) | | | 3,234 | | | | 363,211 | |
| Amgen, Inc. | | | 2,133 | | | | 355,571 | |
| Baxter International, Inc. | | | 5,190 | | | | 381,154 | |
| Biogen, Inc.(a) | | | 1,256 | | | | 275,428 | |
| BioSpecifics Technologies Corp.(a) | | | 5,668 | | | | 335,262 | |
| Bristol-Myers Squibb Co. | | | 7,798 | | | | 353,795 | |
| Bruker Corp. | | | 10,338 | | | | 431,818 | |
| Celgene Corp.(a) | | | 4,589 | | | | 430,402 | |
| Charles River Laboratories International, Inc.(a) | | | 2,796 | | | | 350,758 | |
Barron’s 400SM ETF
| Schedule of Investments | May 31, 2019 (Unaudited) |
| Security Description | | Shares | | | Value | |
| Health Care (continued) | | | | | | | | |
| Chemed Corp. | | | 1,197 | | | $ | 392,544 | |
| Collegium Pharmaceutical, Inc.(a) | | | 22,908 | | | | 263,671 | |
| Corcept Therapeutics, Inc.(a) | | | 31,405 | | | | 307,141 | |
| Eagle Pharmaceuticals, Inc.(a) | | | 8,160 | | | | 414,610 | |
| Enanta Pharmaceuticals, Inc.(a) | | | 3,813 | | | | 344,962 | |
| Ensign Group, Inc. | | | 7,889 | | | | 420,168 | |
| Exelixis, Inc.(a) | | | 16,653 | | | | 326,232 | |
| Globus Medical, Inc., Class A(a) | | | 8,527 | | | | 335,111 | |
| Illumina, Inc.(a) | | | 1,286 | | | | 394,686 | |
| Incyte Corp.(a) | | | 4,628 | | | | 363,900 | |
| Innoviva, Inc.(a) | | | 27,512 | | | | 376,089 | |
| Johnson & Johnson | | | 2,823 | | | | 370,237 | |
| LeMaitre Vascular, Inc. | | | 13,113 | | | | 338,447 | |
| Ligand Pharmaceuticals, Inc.(a) | | | 3,466 | | | | 372,179 | |
| Medpace Holdings, Inc.(a) | | | 7,410 | | | | 399,992 | |
| Mettler-Toledo International, Inc.(a) | | | 568 | | | | 410,715 | |
| Nektar Therapeutics(a) | | | 10,850 | | | | 339,822 | |
| Quidel Corp.(a) | | | 5,898 | | | | 326,159 | |
| Regeneron Pharmaceuticals, Inc.(a) | | | 940 | | | | 283,617 | |
| REGENXBIO, Inc.(a) | | | 6,833 | | | | 293,956 | |
| SIGA Technologies, Inc.(a) | | | 63,779 | | | | 340,580 | |
| Stryker Corp. | | | 2,060 | | | | 377,474 | |
| Supernus Pharmaceuticals, Inc.(a) | | | 10,268 | | | | 308,348 | |
| Tivity Health, Inc.(a) | | | 21,398 | | | | 391,583 | |
| Vanda Pharmaceuticals, Inc.(a) | | | 20,820 | | | | 305,638 | |
| Veeva Systems, Inc., Class A(a) | | | 3,301 | | | | 509,311 | |
| Vertex Pharmaceuticals, Inc.(a) | | | 2,151 | | | | 357,453 | |
| Waters Corp.(a) | | | 1,629 | | | | 326,957 | |
| Zoetis, Inc. | | | 4,102 | | | | 414,507 | |
| Total Health Care | | | | | | | 14,446,227 | |
| | | | | | | | | |
| Industrials (19.25%) | | | | | | | | |
| Acuity Brands, Inc. | | | 2,999 | | | | 370,886 | |
| Albany International Corp., Class A | | | 5,434 | | | | 380,760 | |
| Allison Transmission Holdings, Inc. | | | 8,500 | | | | 351,815 | |
| AO Smith Corp. | | | 7,637 | | | | 309,298 | |
| Applied Industrial Technologies, Inc. | | | 6,758 | | | | 367,162 | |
| Atlas Air Worldwide Holdings, Inc.(a) | | | 7,969 | | | | 282,023 | |
| BMC Stock Holdings, Inc.(a) | | | 21,670 | | | | 434,050 | |
| Boeing Co. | | | 1,047 | | | | 357,666 | |
| Brady Corp., Class A | | | 8,515 | | | | 394,244 | |
| Builders FirstSource, Inc.(a) | | | 28,490 | | | | 401,139 | |
| Caterpillar, Inc. | | | 2,965 | | | | 355,237 | |
| CH Robinson Worldwide, Inc. | | | 4,426 | | | | 352,442 | |
| Cintas Corp. | | | 1,924 | | | | 426,801 | |
| Comfort Systems USA, Inc. | | | 7,471 | | | | 352,482 | |
| Continental Building Products, Inc.(a) | | | 14,671 | | | | 334,792 | |
| Copart, Inc.(a) | | | 6,641 | | | | 474,699 | |
| CoStar Group, Inc.(a) | | | 843 | | | | 429,626 | |
| Security Description | | Shares | | | Value | |
| Industrials (continued) | | | | | | | | |
| Covenant Transportation Group, Inc.(a) | | | 17,315 | | | $ | 260,071 | |
| Crane Co. | | | 4,760 | | | | 363,950 | |
| CSW Industrials, Inc. | | | 6,933 | | | | 443,227 | |
| Cummins, Inc. | | | 2,479 | | | | 373,734 | |
| Curtiss-Wright Corp. | | | 3,437 | | | | 383,191 | |
| EMCOR Group, Inc. | | | 5,490 | | | | 442,274 | |
| Encore Wire Corp. | | | 6,559 | | | | 327,360 | |
| Ennis, Inc. | | | 18,316 | | | | 339,212 | |
| Expeditors International of Washington, Inc. | | | 5,130 | | | | 356,997 | |
| Exponent, Inc. | | | 6,966 | | | | 390,444 | |
| Fastenal Co. | | | 12,638 | | | | 386,596 | |
| Federal Signal Corp. | | | 16,127 | | | | 385,274 | |
| FedEx Corp. | | | 2,218 | | | | 342,193 | |
| Fortive Corp. | | | 4,784 | | | | 364,302 | |
| Forward Air Corp. | | | 6,236 | | | | 348,156 | |
| Franklin Electric Co., Inc. | | | 7,594 | | | | 332,845 | |
| Generac Holdings, Inc.(a) | | | 7,458 | | | | 411,309 | |
| General Dynamics Corp. | | | 2,327 | | | | 374,228 | |
| GrafTech International, Ltd. | | | 29,763 | | | | 294,951 | |
| Harris Corp. | | | 2,435 | | | | 455,808 | |
| HEICO Corp., Class A | | | 4,956 | | | | 486,977 | |
| Heidrick & Struggles International, Inc. | | | 9,664 | | | | 293,399 | |
| Hubbell, Inc. | | | 3,309 | | | | 379,013 | |
| Huntington Ingalls Industries, Inc. | | | 1,928 | | | | 395,471 | |
| Illinois Tool Works, Inc. | | | 2,728 | | | | 380,938 | |
| Insperity, Inc. | | | 3,173 | | | | 361,405 | |
| ITT, Inc. | | | 6,817 | | | | 392,796 | |
| John Bean Technologies Corp. | | | 4,363 | | | | 447,426 | |
| Kadant, Inc. | | | 4,509 | | | | 366,041 | |
| Kennametal, Inc. | | | 10,670 | | | | 328,102 | |
| Kforce, Inc. | | | 11,116 | | | | 386,281 | |
| Knight-Swift Transportation Holdings, Inc. | | | 11,623 | | | | 321,260 | |
| Landstar System, Inc. | | | 3,573 | | | | 343,901 | |
| Lincoln Electric Holdings, Inc. | | | 4,611 | | | | 350,159 | |
| Lockheed Martin Corp. | | | 1,300 | | | | 440,102 | |
| Meritor, Inc.(a) | | | 18,726 | | | | 377,516 | |
| MSA Safety, Inc. | | | 3,772 | | | | 374,861 | |
| MSC Industrial Direct Co., Inc., Class A | | | 4,731 | | | | 334,292 | |
| Northrop Grumman Corp. | | | 1,428 | | | | 433,041 | |
| Old Dominion Freight Line, Inc. | | | 2,685 | | | | 355,601 | |
| Oshkosh Corp. | | | 5,073 | | | | 361,147 | |
| PACCAR, Inc. | | | 5,757 | | | | 378,926 | |
| Parker-Hannifin Corp. | | | 2,296 | | | | 349,727 | |
| Patrick Industries, Inc.(a) | | | 8,562 | | | | 349,244 | |
| Primoris Services Corp. | | | 17,554 | | | | 320,185 | |
| Raven Industries, Inc. | | | 10,301 | | | | 337,358 | |
| Raytheon Co. | | | 2,182 | | | | 380,759 | |
| Robert Half International, Inc. | | | 6,030 | | | | 323,570 | |
| Saia, Inc.(a) | | | 6,337 | | | | 373,883 | |
| Snap-on, Inc. | | | 2,452 | | | | 382,316 | |
| Spirit AeroSystems Holdings, Inc., Class A | | | 4,274 | | | | 346,365 | |
Barron’s 400SM ETF
| Schedule of Investments | May 31, 2019 (Unaudited) |
| Security Description | | Shares | | | Value | |
| Industrials (continued) | | | | | | | | |
| The Timken Co. | | | 9,042 | | | $ | 397,938 | |
| Toro Co. | | | 5,804 | | | | 378,189 | |
| Trex Co., Inc.(a) | | | 5,472 | | | | 327,335 | |
| Vicor Corp.(a) | | | 12,776 | | | | 387,241 | |
| WageWorks, Inc.(a) | | | 13,477 | | | | 673,446 | |
| Werner Enterprises, Inc. | | | 12,761 | | | | 355,777 | |
| Woodward, Inc. | | | 4,206 | | | | 458,117 | |
| Total Industrials | | | | | | | 28,181,349 | |
| | | | | | | | | |
| Information Technology (16.02%) | | | | | | | | |
| Adobe, Inc.(a) | | | 1,491 | | | | 403,912 | |
| Advanced Energy Industries, Inc.(a) | | | 8,206 | | | | 411,695 | |
| Amphenol Corp., Class A | | | 4,178 | | | | 363,486 | |
| Analog Devices, Inc. | | | 3,640 | | | | 351,697 | |
| ANSYS, Inc.(a) | | | 2,170 | | | | 389,515 | |
| Apple, Inc. | | | 2,171 | | | | 380,077 | |
| Applied Materials, Inc. | | | 10,149 | | | | 392,665 | |
| Arista Networks, Inc.(a) | | | 1,377 | | | | 336,800 | |
| Aspen Technology, Inc.(a) | | | 3,908 | | | | 443,988 | |
| Automatic Data Processing, Inc. | | | 2,585 | | | | 413,910 | |
| AVX Corp. | | | 21,960 | | | | 324,788 | |
| Booz Allen Hamilton Holding Corp. | | | 7,054 | | | | 445,601 | |
| Broadcom, Inc. | | | 1,456 | | | | 366,388 | |
| Cabot Microelectronics Corp. | | | 3,508 | | | | 341,925 | |
| Cadence Design Systems, Inc.(a) | | | 6,481 | | | | 411,997 | |
| Cisco Systems, Inc. | | | 7,533 | | | | 391,942 | |
| Cognizant Technology Solutions Corp., Class A | | | 5,473 | | | | 338,943 | |
| Coherent, Inc.(a) | | | 2,868 | | | | 315,566 | |
| Comtech Telecommunications Corp. | | | 17,360 | | | | 367,164 | |
| Control4 Corp.(a) | | | 23,029 | | | | 544,866 | |
| CSG Systems International, Inc. | | | 9,451 | | | | 423,877 | |
| Digi International, Inc.(a) | | | 29,990 | | | | 326,591 | |
| Diodes, Inc.(a) | | | 10,380 | | | | 321,053 | |
| Dolby Laboratories, Inc., Class A | | | 6,088 | | | | 377,273 | |
| Entegris, Inc. | | | 11,089 | | | | 380,796 | |
| EPAM Systems, Inc.(a) | | | 2,374 | | | | 409,729 | |
| Euronet Worldwide, Inc.(a) | | | 2,841 | | | | 440,469 | |
| EVERTEC, Inc. | | | 14,011 | | | | 401,555 | |
| F5 Networks, Inc.(a) | | | 2,624 | | | | 346,578 | |
| Fair Isaac Corp.(a) | | | 1,529 | | | | 452,431 | |
| Fortinet, Inc.(a) | | | 4,768 | | | | 345,585 | |
| II-VI, Inc.(a) | | | 10,012 | | | | 314,677 | |
| Immersion Corp.(a) | | | 47,051 | | | | 354,765 | |
| Insight Enterprises, Inc.(a) | | | 7,073 | | | | 364,118 | |
| Intel Corp. | | | 7,334 | | | | 322,989 | |
| Intuit, Inc. | | | 1,569 | | | | 384,170 | |
| KEMET Corp. | | | 21,599 | | | | 343,424 | |
| KLA-Tencor Corp. | | | 3,367 | | | | 347,037 | |
| Knowles Corp.(a) | | | 23,041 | | | | 362,435 | |
| Lam Research Corp. | | | 2,283 | | | | 398,635 | |
| Littelfuse, Inc. | | | 2,058 | | | | 335,886 | |
| Micron Technology, Inc.(a) | | | 10,009 | | | | 326,394 | |
| Security Description | | Shares | | | Value | |
| Information Technology (continued) | | | | | | | | |
| Microsoft Corp. | | | 3,458 | | | $ | 427,685 | |
| MKS Instruments, Inc. | | | 4,860 | | | | 347,296 | |
| Monolithic Power Systems, Inc. | | | 2,852 | | | | 332,115 | |
| Nanometrics, Inc.(a) | | | 13,514 | | | | 384,473 | |
| NIC, Inc. | | | 23,596 | | | | 376,592 | |
| NVIDIA Corp. | | | 2,417 | | | | 327,407 | |
| ON Semiconductor Corp.(a) | | | 17,484 | | | | 310,516 | |
| Paychex, Inc. | | | 5,053 | | | | 433,497 | |
| Paycom Software, Inc.(a) | | | 2,154 | | | | 456,863 | |
| Qualys, Inc.(a) | | | 4,573 | | | | 405,214 | |
| Rudolph Technologies, Inc.(a) | | | 17,777 | | | | 410,115 | |
| Skyworks Solutions, Inc. | | | 4,776 | | | | 318,225 | |
| SMART Global Holdings, Inc.(a) | | | 16,548 | | | | 281,812 | |
| SPS Commerce, Inc.(a) | | | 3,657 | | | | 372,758 | |
| Teradyne, Inc. | | | 9,924 | | | | 418,197 | |
| Texas Instruments, Inc. | | | 3,689 | | | | 384,800 | |
| Trade Desk, Inc., Class A(a) | | | 1,891 | | | | 375,950 | |
| Ubiquiti Networks, Inc. | | | 2,758 | | | | 331,815 | |
| Vishay Intertechnology, Inc. | | | 19,202 | | | | 292,639 | |
| Xilinx, Inc. | | | 3,210 | | | | 328,415 | |
| Zebra Technologies Corp., Class A(a) | | | 1,864 | | | | 319,564 | |
| Total Information Technology | | | | | | | 23,453,340 | |
| | | | | | | | | |
| Materials (4.63%) | | | | | | | | |
| AK Steel Holding Corp.(a)(b) | | | 139,317 | | | | 239,625 | |
| Albemarle Corp. | | | 4,596 | | | | 290,927 | |
| Avery Dennison Corp. | | | 3,552 | | | | 369,621 | |
| Celanese Corp. | | | 3,882 | | | | 368,518 | |
| Chemours Co. | | | 10,180 | | | | 214,696 | |
| Cliffs Natural Resources, Inc. | | | 39,406 | | | | 342,832 | |
| Crown Holdings, Inc.(a) | | | 7,189 | | | | 398,486 | |
| FutureFuel Corp. | | | 22,246 | | | | 230,914 | |
| Huntsman Corp. | | | 16,315 | | | | 283,392 | |
| Ingevity Corp.(a) | | | 3,526 | | | | 309,230 | |
| Innospec, Inc. | | | 4,692 | | | | 378,691 | |
| Kronos Worldwide, Inc. | | | 28,163 | | | | 355,136 | |
| Louisiana-Pacific Corp. | | | 15,689 | | | | 358,023 | |
| Nucor Corp. | | | 6,652 | | | | 319,296 | |
| Packaging Corp. of America | | | 3,960 | | | | 352,757 | |
| Reliance Steel & Aluminum Co. | | | 4,448 | | | | 370,385 | |
| Schnitzer Steel Industries, Inc., Class A | | | 16,718 | | | | 352,917 | |
| Schweitzer-Mauduit International, Inc. | | | 10,335 | | | | 323,382 | |
| Steel Dynamics, Inc. | | | 10,807 | | | | 271,796 | |
| United States Steel Corp. | | | 19,239 | | | | 227,405 | |
| Warrior Met Coal, Inc. | | | 16,213 | | | | 418,458 | |
| Total Materials | | | | | | | 6,776,487 | |
| | | | | | | | | |
| Real Estate (0.67%) | | | | | | | | |
| HFF, Inc., Class A | | | 8,786 | | | | 379,380 | |
| Marcus & Millichap, Inc.(a) | | | 10,259 | | | | 313,310 | |
| RMR Group, Inc., Class A | | | 5,851 | | | | 282,135 | |
| Total Real Estate | | | | | | | 974,825 | |
Barron’s 400SM ETF
| Schedule of Investments | May 31, 2019 (Unaudited) |
| Security Description | | Shares | | | Value | |
| Utilities (0.78%) | | | | | | |
| AES Corp. | | | 21,681 | | | $ | 342,560 | |
| Dominion Energy, Inc. | | | 5,147 | | | | 386,951 | |
| NextEra Energy, Inc. | | | 2,058 | | | | 407,916 | |
| Total Utilities | | | | | | | 1,137,427 | |
| | | | | | | | | |
| TOTAL COMMON STOCKS | | | | | | | | |
| (Cost $149,821,884) | | | | | | | 141,309,825 | |
| | | | | | | | | |
| LIMITED PARTNERSHIPS (3.03%) | | | | | | | | |
| Energy (2.75%) | | | | | | | | |
| Alliance Resource Partners LP | | | 19,249 | | | | 331,275 | |
| Black Stone Minerals LP | | | 22,735 | | | | 371,263 | |
| Cheniere Energy Partners LP | | | 8,953 | | | | 373,698 | |
| CNX Midstream Partners LP | | | 26,227 | | | | 384,488 | |
| Holly Energy Partners LP | | | 13,833 | | | | 367,820 | |
| Magellan Midstream Partners LP | | | 6,527 | | | | 401,411 | |
| MPLX LP | | | 11,668 | | | | 356,808 | |
| Noble Midstream Partners LP | | | 10,569 | | | | 319,712 | |
| Phillips 66 Partners LP | | | 7,627 | | | | 365,943 | |
| Shell Midstream Partners LP | | | 20,667 | | | | 434,627 | |
| Viper Energy Partners LP | | | 11,548 | | | | 323,344 | |
| Total Energy | | | | | | | 4,030,389 | |
| | | | | | | | | |
| Utilities (0.28%) | | | | | | | | |
| Suburban Propane Partners LP | | | 18,021 | | | | 412,681 | |
| | | | | | | | | |
| TOTAL LIMITED PARTNERSHIPS |
| (Cost $4,991,870) | | | | | | | 4,443,070 | |
| | | | | | | | | |
| | | | 7 Day Yield | | | Shares | | | | Value | |
| SHORT TERM INVESTMENTS (0.51%) |
| Money Market Fund (0.37%) | | | | | | | | |
| State Street Institutional Treasury Plus Money Market Fund | | | | | | | | |
| (Cost $535,436) | | | 2.309 | % | | | 535,436 | | | | 535,436 | |
| Investments Purchased with Collateral from Securities Loaned (0.14%) | | | | | | | | | |
| State Street Navigator Securities Lending Government Money Market Portfolio, 2.34% | | | | | | | | | |
| (Cost $218,345) | | | 218,345 | | | | 218,345 | |
| TOTAL SHORT TERM INVESTMENTS | | | | | |
| (Cost $753,781) | | | | | | | 753,781 | |
| | | | | | | | | |
| TOTAL INVESTMENTS (100.06%) | | | | | |
| (Cost $155,567,535) | | | | | | $ | 146,506,676 | |
| LIABILITIES IN EXCESS OF OTHER ASSETS (-0.06%) | | | | (91,597 | ) |
| NET ASSETS - 100.00% | | | $ | 146,415,079 | |
| (a) | Non-income producing security. |
| (b) | Security, or a portion of the security position is currently on loan. The total market value of securities on loan is $599,077. |
See Notes to Financial Statements.
Barron’s 400SM ETF
| Statement of Assets and Liabilities | May 31, 2019 (Unaudited) |
| ASSETS: | | | |
| Investments, at value | | $ | 146,506,676 | |
| Receivable for investments sold | | | 1,872,416 | |
| Dividends receivable | | | 218,912 | |
| Total Assets | | | 148,598,004 | |
| | | | | |
| LIABILITIES: | | | | |
| Payable for capital shares redeemed | | | 1,877,116 | |
| Payable to adviser | | | 87,464 | |
| Payable for collateral upon return of securities loaned | | | 218,345 | |
| Total Liabilities | | | 2,182,925 | |
| NET ASSETS | | $ | 146,415,079 | |
| | | | | |
| NET ASSETS CONSIST OF: | | | | |
| Paid-in capital | | $ | 190,883,638 | |
| Total distributable earnings | | | (44,468,559 | ) |
| NET ASSETS | | $ | 146,415,079 | |
| | | | | |
| INVESTMENTS, AT COST | | $ | 155,567,535 | |
| | | | | |
| PRICING OF SHARES | | | | |
| Net Assets | | $ | 146,415,079 | |
| Shares of beneficial interest outstanding (Unlimited number of shares authorized, par value $0.01 per share) | | | 3,900,000 | |
| Net Asset Value, offering and redemption price per share | | $ | 37.54 | |
See Notes to Financial Statements.
Barron’s 400SMETF
| Statement of Operations | For the Six Months Ended May 31, 2019 (Unaudited) |
| INVESTMENT INCOME: | | | |
| Dividends(a) | | $ | 1,483,299 | |
| Securities Lending Income | | | 13,464 | |
| Total Investment Income | | | 1,496,763 | |
| | | | | |
| EXPENSES: | | | | |
| Investment adviser fees | | | 512,188 | |
| Net Expenses | | | 512,188 | |
| NET INVESTMENT INCOME | | | 984,575 | |
| | | | | |
| REALIZED AND UNREALIZED GAIN/(LOSS) | | | | |
| Net realized loss on investments | | | (6,710,351 | ) |
| Net change in unrealized depreciation on investments | | | (4,266,179 | ) |
| NET REALIZED AND UNREALIZED LOSS ON INVESTMENTS | | | (10,976,530 | ) |
| NET DECREASE IN NET ASSETS RESULTING FROM OPERATIONS | | $ | (9,991,955 | ) |
| (a) | Net of foreign tax withholding of $291. |
See Notes to Financial Statements.
Barron’s 400SMETF
| Statements of Changes in Net Assets |
| | | | | | | |
| | | For the
Six Months
Ended
May 31, 2019 (Unaudited) | | | For the
Year Ended
November 30,
2018 | |
| OPERATIONS: | | | | | | |
| Net investment income | | $ | 984,575 | | | $ | 1,772,954 | |
| Net realized gain/(loss) | | | (6,710,351 | ) | | | 34,798,091 | |
| Net change in unrealized depreciation | | | (4,266,179 | ) | | | (39,573,824 | ) |
| Net decrease in net assets resulting from operations | | | (9,991,955 | ) | | | (3,002,779 | ) |
| | | | | | | | | |
| DISTRIBUTIONS TO SHAREHOLDERS: | | | | | | | | |
| From distributable earnings | | | (1,353,834 | ) | | | (1,229,976 | ) |
| Total distributions | | | (1,353,834 | ) | | | (1,229,976 | ) |
| | | | | | | | | |
| CAPITAL SHARE TRANSACTIONS: | | | | | | | | |
| Proceeds from sale of shares | | | – | | | | 82,914,634 | |
| Cost of shares redeemed | | | (5,947,496 | ) | | | (120,574,045 | ) |
| Net decrease from capital share transactions | | | (5,947,496 | ) | | | (37,659,411 | ) |
| Net decrease in net assets | | | (17,293,285 | ) | | | (41,892,166 | ) |
| | | | | | | | | |
| NET ASSETS: | | | | | | | | |
| Beginning of period | | | 163,708,364 | | | | 205,600,530 | |
| End of period | | $ | 146,415,079 | | | $ | 163,708,364 | |
| | | | | | | | | |
| OTHER INFORMATION: | | | | | | | | |
| CAPITAL SHARE TRANSACTIONS: | | | | | | | | |
| Beginning shares | | | 4,050,000 | | | | 4,950,000 | |
| Shares sold | | | – | | | | 1,900,000 | |
| Shares redeemed | | | (150,000 | ) | | | (2,800,000 | ) |
| Shares outstanding, end of period | | | 3,900,000 | | | | 4,050,000 | |
See Notes to Financial Statements.
Barron’s 400SMETF
| Financial Highlights | For a Share Outstanding Throughout the Periods Presented |
| | | | | | | | | | | | | | | | | | |
| | | For the
Six Months
Ended
May 31, 2019
(Unaudited) | | For the Year Ended
November 30,
2018 | | | For the Year Ended
November 30,
2017 | | | For the Year Ended
November 30,
2016 | | | For the Year Ended
November 30,
2015 | | | For the Year Ended
November 30,
2014 | |
| NET ASSET VALUE, BEGINNING OF PERIOD | | $ | 40.42 | | $ | 41.54 | | | $ | 34.35 | | | $ | 31.75 | | | $ | 31.64 | | | $ | 29.30 | |
| | | | | | | | | | | | | | | | | | | | | | | | |
| INCOME FROM OPERATIONS: | | | | | | | | | | | | | | | | | | | | | | | |
| Net investment income(a) | | | 0.25 | | | 0.40 | | | | 0.29 | | | | 0.33 | | | | 0.32 | | | | 0.23 | |
| Net realized and unrealized gain/(loss) | | | (2.80 | ) | | (1.27 | ) | | | 7.17 | | | | 2.53 | | | | 0.02 | | | | 2.16 | |
| Total from investment operations | | | (2.55 | ) | | (0.87 | ) | | | 7.46 | | | | 2.86 | | | | 0.34 | | | | 2.39 | |
| | | | | | | | | | | | | | | | | | | | | | | | |
| DISTRIBUTIONS: | | | | | | | | | | | | | | | | | | | | | | | |
| From net investment income | | | (0.33 | ) | | (0.25 | ) | | | (0.27 | ) | | | (0.26 | ) | | | (0.23 | ) | | | (0.05 | ) |
| Total distributions | | | (0.33 | ) | | (0.25 | ) | | | (0.27 | ) | | | (0.26 | ) | | | (0.23 | ) | | | (0.05 | ) |
| | | | | | | | | | | | | | | | | | | | | | | | |
| NET INCREASE/(DECREASE) IN NET ASSET VALUE | | | (2.88 | ) | | (1.12 | ) | | | 7.19 | | | | 2.60 | | | | 0.11 | | | | 2.34 | |
| NET ASSET VALUE, END OF PERIOD | | $ | 37.54 | | $ | 40.42 | | | $ | 41.54 | | | $ | 34.35 | | | $ | 31.75 | | | $ | 31.64 | |
| TOTAL RETURN(b) | | | (6.24 | )% | | (2.12 | )% | | | 21.87 | % | | | 9.12 | % | | | 1.07 | % | | | 8.18 | % |
| | | | | | | | | | | | | | | | | | | | | | | | |
| RATIOS/SUPPLEMENTAL DATA: | | | | | | | | | | | | | | | | | | | | | | | |
| Net assets, end of period (in 000s) | | $ | 146,415 | | $ | 163,708 | | | $ | 205,601 | | | $ | 178,612 | | | $ | 204,805 | | | $ | 219,901 | |
| | | | | | | | | | | | | | | | | | | | | | | | |
| RATIOS TO AVERAGE NET ASSETS | | | | | | | | | | | | | | | | | | | | | | | |
| Ratio of expenses to average net assets | | | 0.65 | %(c) | | 0.65 | % | | | 0.65 | % | | | 0.65 | % | | | 0.65 | % | | | 0.65 | % |
| Ratio of net investment income to average net assets | | | 1.25 | %(c) | | 0.93 | % | | | 0.78 | % | | | 1.07 | % | | | 1.00 | % | | | 0.75 | % |
| Portfolio turnover rate(d) | | | 55 | % | | 88 | % | | | 84 | % | | | 88 | % | | | 87 | % | | | 55 | % |
| (a) | Based on average shares outstanding during the period. |
| (b) | Total return is calculated assuming an initial investment made at the net asset value at the beginning of the period and redemption at the net asset value on the last day of the period and assuming all distributions are reinvested at the reinvestment prices. |
| (d) | Portfolio turnover for periods less than one year are not annualized and does not include securities received or delivered from processing creations or redemptions in-kind. |
See Notes to Financial Statements.
Barron’s 400SMETF
| Notes to Financial Statements | May 31, 2019 (Unaudited) |
1. ORGANIZATION
ALPS ETF Trust (the “Trust”), a Delaware statutory trust, is an open-end management investment company registered under the Investment Company Act of 1940, as amended (the “1940 Act”). As of May 31, 2019, the Trust consisted of eighteen separate portfolios. Each portfolio represents a separate series of the Trust. This report pertains solely to the Barron’s 400SM ETF (the “Fund”). The investment objective of the Fund is to seek investment results that correspond generally, before fees and expenses, to the performance of the Barron’s 400 IndexSM (the “Underlying Index”). The Fund has elected to qualify as a diversified series of the Trust under the 1940 Act.
The Fund’s Shares (“Shares”) are listed on the NYSE Arca, Inc. (the “NYSE Arca”). The Fund issues and redeems Shares at net asset value (“NAV”) in blocks of 50,000 Shares, each of which is called a “Creation Unit”. Creation Units are issued and redeemed principally in-kind for securities included in the Underlying Index. Except when aggregated in Creation Units, Shares are not redeemable securities of the Fund.
Pursuant to the Trust’s organizational documents, its Officers and Trustees are indemnified against certain liability arising out of the performance of their duties to the Trust. Additionally, in the normal course of business, the Trust enters into contracts with service providers that contain general indemnification clauses. The Trust’s maximum exposure under these arrangements is unknown, as this would involve future claims that may be made against the Trust that have not yet occurred.
2. SIGNIFICANT ACCOUNTING POLICIES
The following is a summary of significant accounting policies consistently followed by the Fund in the preparation of the financial statements. The accompanying financial statements were prepared in accordance with accounting principles generally accepted in the United States of America (“U.S. GAAP”). The preparation of financial statements in conformity with U.S. GAAP requires management to make certain estimates and assumptions that affect the reported amounts of assets and liabilities and disclosures of contingent assets and liabilities at the date of the financial statements and the reported amounts of revenue and expenses during the period. Actual results could differ from those estimates. The Fund is considered an investment company under U.S. GAAP and follows the accounting and reporting guidance applicable to investment companies in the Financial Accounting Standards BoardAccounting Standards CodificationTopic 946.
A. Portfolio Valuation
The Fund’s NAV is determined daily, as of the close of regular trading on the New York Stock Exchange (the “NYSE”), normally 4:00 p.m. Eastern time, on each day the NYSE is open for trading. The NAV is computed by dividing the value of all assets of the Fund (including accrued interest and dividends), less all liabilities (including accrued expenses and dividends declared but unpaid), by the total number of shares outstanding.
Portfolio securities listed on any exchange other than the NASDAQ Stock Market LLC (“NASDAQ”) are valued at the last sale price on the business day as of which such value is being determined. If there has been no sale on such day, the securities are valued at the mean of the most recent bid and ask prices on such day. Securities traded on the NASDAQ are valued at the NASDAQ Official Closing Price as determined by NASDAQ. Portfolio securities traded on more than one securities exchange are valued at the last sale price on the business day as of which such value is being determined at the close of the exchange representing the principal market for such securities. Portfolio securities traded in the over-the-counter market, but excluding securities traded on the NASDAQ, are valued at the latest quoted sale price in such market.
The Fund’s investments are valued at market value or, in the absence of market value with respect to any portfolio securities, at fair value according to procedures adopted by the Trust’s Board of Trustees (the “Board”). When market quotations are not readily available or when events occur that make established valuation methods unreliable, securities of the Fund may be valued in good faith by or under the direction of the Board. These securities generally include, but are not limited to, restricted securities (securities which may not be publicly sold without registration under the Securities Act of 1933) for which a pricing service is unable to provide a market price; securities whose trading has been formally suspended; a security whose market price is not available from a pre-established primary pricing source or the pricing source is not willing to provide a price; a security with respect to which an event has occurred that is most likely to materially affect the value of the security after the market has closed but before the calculation of the Fund’s NAV or make it difficult or impossible to obtain a reliable market quotation; or a security whose price, as provided by the pricing service, does not reflect the security’s “fair value” due to the security being de-listed from a national exchange or the security’s primary trading market is temporarily closed at a time when, under normal conditions, it would be open. As a general principle, the current “fair value” of a security would be the amount which the owner might reasonably expect to receive from the sale on the applicable exchange or principal market. A variety of factors may be considered in determining the fair value of such securities.
Barron’s 400SMETF
| Notes to Financial Statements | May 31, 2019 (Unaudited) |
B. Fair Value Measurements
The Fund discloses the classification of its fair value measurements following a three-tier hierarchy based on the inputs used to measure fair value. Inputs refer broadly to the assumptions that market participants would use in pricing the asset or liability; including assumptions about risk. Inputs may be observable or unobservable. Observable inputs reflect the assumptions market participants would use in pricing the asset or liability that are developed based on market data obtained from sources independent of the reporting entity. Unobservable inputs reflect the reporting entity’s own assumptions about the assumptions market participants would use in pricing the asset or liability that are developed based on the best information available.
Valuation techniques used to value the Fund's investments by major category are as follows:
Equity securities and Limited Partnerships, including restricted securities, for which market quotations are readily available, are valued at the last reported sale price or official closing price as reported by a third party pricing vendor on the primary market or exchange on which they are traded and are categorized as Level 1 in the hierarchy. In the event there were no sales during the day or closing prices are not available, securities are valued at the mean of the most recent quoted bid and ask prices on such day and are generally categorized as Level 2 in the hierarchy. Investments in open-end mutual funds are valued at their closing NAV each business day and are categorized as Level 1 in the hierarchy.
Changes in valuation techniques may result in transfers in or out of an assigned level within the disclosure hierarchy.
Various inputs are used in determining the value of the Fund’s investments as of the end of the reporting period. When inputs used fall into different levels of the fair value hierarchy, the level in the hierarchy within which the fair value measurement falls is determined based on the lowest level input that is significant to the fair value measurement in its entirety. The designated input levels are not necessarily an indication of the risk or liquidity associated with these investments.
These inputs are categorized in the following hierarchy under applicable financial accounting standards:
| Level 1 | – | Unadjusted quoted prices in active markets for identical investments, unrestricted assets or liabilities that a Fund has the ability to access at the measurement date; |
| Level 2 | – | Quoted prices which are not active, quoted prices for similar assets or liabilities in active markets or inputs other than quoted prices that are observable (either directly or indirectly) for substantially the full term of the asset or liability; and |
| Level 3 | – | Significant unobservable prices or inputs (including the Fund’s own assumptions in determining the fair value of investments) where there is little or no market activity for the asset or liability at the measurement date. |
The following is a summary of the inputs used to value the Fund’s investments as of May 31, 2019:
| Investments in Securities at Value | | Level 1 -
Quoted and
Unadjusted
Prices | | | Level 2 - Other Significant Observable Inputs | | | Level 3 - Significant Unobservable Inputs | | | Total | |
| Common Stocks* | | $ | 141,309,825 | | | $ | – | | | $ | – | | | $ | 141,309,825 | |
| Limited Partnerships* | | | 4,443,070 | | | | – | | | | – | | | | 4,443,070 | |
| Short Term Investments | | | 753,781 | | | | – | | | | – | | | | 753,781 | |
| Total | | $ | 146,506,676 | | | $ | – | | | $ | – | | | $ | 146,506,676 | |
| * | For a detailed sector breakdown, see the accompanying Schedule of Investments. |
The Fund did not have any securities that used significant unobservable inputs (Level 3) in determining fair value and there were no transfers into or out of Level 3.
C. Securities Transactions and Investment Income
Securities transactions are recorded as of the trade date. Realized gains and losses from securities transactions are recorded on the highest cost basis. Dividend income and capital gains distributions, if any, are recorded on the ex-dividend date. Interest income, if any, is recorded on the accrual basis.
Barron’s 400SMETF
| Notes to Financial Statements | May 31, 2019 (Unaudited) |
D. Dividends and Distributions to Shareholders
Dividends from net investment income of the Fund, if any, are declared and paid annually or as the Board may determine from time to time. Distributions of net realized capital gains earned by the Fund, if any, are distributed at least annually.
E. Federal Tax and Tax Basis Information
The timing and character of income and capital gain distributions are determined in accordance with income tax regulations, which may differ from U.S. GAAP. Reclassifications are made to the Fund’s capital accounts for permanent tax differences to reflect income and gains available for distribution (or available capital loss carryforwards) under income tax regulations. The amounts and characteristics of tax basis distributions and composition of distributable earnings/(accumulated losses) are finalized at fiscal year-end; accordingly, tax basis balances have not been determined as of May 31, 2019.
The tax character of the distributions paid during the fiscal year ended November 30, 2018 was as follows:
| | | Ordinary Income | |
| November 30, 2018 | | | |
| Barron’s 400SM ETF | | $ | 1,229,976 | |
Under current law, capital losses maintain their character as short-term or long-term and are carried forward to the next tax year without expiration. As of November 30, 2018, the following amounts are available as carry forwards to the next tax year:
| Fund | | Short-Term | | | Long-Term | |
| Barron’s 400SM ETF | | $ | 20,057,005 | | | $ | 9,850,985 | |
As of May 31, 2019, the cost of investments for federal income tax purposes and accumulated net unrealized appreciation/(depreciation) on investments were as follows:
| | | Barron’s 400SM ETF | |
| Gross appreciation (excess of value over tax cost) | | $ | 12,040,186 | |
| Gross depreciation (excess of tax cost over value) | | | (20,058,148 | ) |
| Net unrealized appreciation (depreciation) | | | (8,017,962 | ) |
| Cost of investments for income tax purposes | | $ | 154,524,638 | |
The differences between book-basis and tax-basis are primarily due to the deferral of losses from wash sales. In addition, certain tax cost basis adjustments are finalized at fiscal year-end and therefore have not been determined as of May 31, 2019.
F. Income Taxes
No provision for income taxes is included in the accompanying financial statements, as the Fund intends to distribute to shareholders all taxable investment income and realized gains and otherwise comply with Subchapter M of the Internal Revenue Code of 1986, as amended, applicable to regulated investment companies. The Fund evaluates tax positions taken (or expected to be taken) in the course of preparing the Fund’s tax returns to determine whether these positions meet a “more-likely-than-not” standard that, based on the technical merits, have a more than fifty percent likelihood of being sustained by a taxing authority upon examination. A tax position that meets the “more-likely-than-not” recognition threshold is measured to determine the amount of benefit to recognize in the financial statements.
As of and during the six months ended May 31, 2019, the Fund did not have a liability for any unrecognized tax benefits. The Fund files U.S. federal, state, and local tax returns as required. The Fund’s tax returns are subject to examination by the relevant tax authorities until expiration of the applicable statute of limitations, which is generally three years after the filing of the tax return, but may extend to four years in certain jurisdictions. Tax returns for open years have incorporated no uncertain tax positions that require a provision for income taxes.
G.Lending of Portfolio Securities
The Fund has entered into a securities lending agreement with State Street Bank & Trust Co. (“SSB”), the Fund’s lending agent. The Fund may lend its portfolio securities only to borrowers that are approved by SSB. The Fund will limit such lending to not more than 33 1/3% of the value of its total assets. The Fund’s securities held at SSB as custodian shall be available to be lent except those securities the Fund or ALPS Advisors, Inc. specifically identifies in writing as not being available for lending. The borrower pledges and maintains with the Fund collateral consisting of cash (U.S. Dollars only), securities issued or guaranteed by the U.S. government or its agencies or instrumentalities, and cash equivalents (including irrevocable bank letters of credit) issued by a person other than the borrower or an affiliate of the borrower. The initial collateral received by the Fund is required to have a value of no less than 102% of the market value of the loaned securities for U.S equity securities and a value of no less than 105% of the market value for non-U.S. equity securities. The collateral is maintained thereafter, at a market value equal to not less than 102% of the current value of the U.S. equity securities on loan and not less than 105% of the current value of the non-U.S. equity securities on loan. The market value of the loaned securities is determined at the close of each business day and any additional required collateral is delivered to the Fund on the next business day. During the term of the loan, the Fund is entitled to all distributions made on or in respect of the loaned securities. Loans of securities are terminable at any time and the borrower, after notice, is required to return borrowed securities within the customary time period for settlement of securities transactions.
Barron’s 400SMETF
| Notes to Financial Statements | May 31, 2019 (Unaudited) |
Any cash collateral received is reinvested in a money market fund managed by SSB as disclosed in the Fund’s Schedule of Investments and is reflected in the Statements of Assets and Liabilities as a payable for collateral upon return of securities loaned. Non-cash collateral, in the form of securities issued or guaranteed by the U.S. government or its agencies or instrumentalities, is not disclosed in the Fund’s Statements of Assets and Liabilities as it is held by the lending agent on behalf of the Fund, and the Fund does not have the ability to re-hypothecate these securities. Income earned by the Fund from securities lending activity is disclosed in the Statement of Operations.
The following is a summary of the Fund's securities lending agreement and related cash and non-cash collateral received as of May 31, 2019:
| | | Market Value of Securities on
Loan | | | Cash
Collateral
Received | | | Non-Cash
Collateral
Received | | | Total
Collateral
Received | |
| Barron's 400 ETF | | $ | 599,077 | | | $ | 218,345 | | | $ | 413,087 | | | $ | 631,432 | |
The risks of securities lending include the risk that the borrower may not provide additional collateral when required or may not return the securities when due. To mitigate these risks, the Fund benefits from a borrower default indemnity provided by SSB. SSB’s indemnity allows for full replacement of securities lent wherein SSB will purchase the unreturned loaned securities on the open market by applying the proceeds of the collateral, or to the extent such proceeds are insufficient or the collateral is unavailable, SSB will purchase the unreturned loan securities at SSB’s expense. However, the Fund could suffer a loss if the value of the investments purchased with cash collateral falls below the value of the cash collateral received.
The following table reflects a breakdown of transactions accounted for as secured borrowings, the gross obligation by the type of collateral pledged or securities loaned, and the remaining contractual maturity of those transactions as of May 31, 2019:
| Barron's 400 ETF | | | | | Remaining contractual maturity of the agreements | | | | |
| | | | | | | | | | |
| Securities Lending Transactions | | Overnight & Continuous | | | Up to 30 days | | 30-90 days | | | Greater than
90 days | | | Total | |
| Common Stocks | | $ | 218,345 | | | $ | – | | $ | – | | | $ | – | | | $ | 218,345 | |
| Total Borrowings | | | | | | | | | | | | | | | | | 218,345 | |
| Gross amount of recognized liabilities for securities lending (collateral received) | | | | | | | $ | 218,345 | |
3. INVESTMENT ADVISORY FEE AND OTHER AFFILIATED TRANSACTIONS
ALPS Advisors, Inc. (the “Adviser”) serves as the Fund’s investment adviser pursuant to an Investment Advisory Agreement with the Trust on behalf of the Fund (the “Advisory Agreement”). Pursuant to the Advisory Agreement, the Fund pays the Adviser an annual management fee for the services and facilities it provides, payable on a monthly basis at the annual rate of 0.65% of the Fund’s average daily net assets. From time to time, the Adviser may waive all or a portion of its fee.
Out of the unitary management fees, the Adviser pays substantially all expenses of the Fund, including the cost of transfer agency, custody, fund administration, legal, audit, independent trustees and other services, except for interest expenses, distribution fees or expenses, brokerage expenses, taxes and extraordinary expenses not incurred in the ordinary course of the Fund's business. The Adviser’s unitary management fee is designed to pay substantially all of the Fund’s expenses and to compensate the Adviser for providing services to the Fund.
ALPS Fund Services, Inc., an affiliate of the Adviser, is the administrator of the Fund.
Each Trustee who is not an officer or employee of the Adviser, any sub-adviser or any of their affiliates (“Independent Trustees”) receives (1) a quarterly retainer of $5,000, (2) a per meeting fee for regularly scheduled meetings of $3,750, (3) $1,500 for any special meeting held outside of a regularly scheduled board meeting, and (4) reimbursement for all reasonable out-of-pocket expenses relating to attendance at meetings. In addition, the Chairman of the Board and Chairman of the Audit Committee each receives a quarterly retainer of $2,000, in connection with their respective roles.
Barron’s 400SMETF
| Notes to Financial Statements | May 31, 2019 (Unaudited) |
4. PURCHASES AND SALES OF SECURITIES
For the six months ended May 31, 2019, the cost of purchases and proceeds from sales of investment securities, excluding in-kind transactions and short-term investments, were as follows:
| Fund | | Purchases | | | Sales | |
| Barron's 400 ETF | | $ | 86,432,830 | | | $ | 86,086,252 | |
For the year ended May 31, 2019, the cost of in-kind purchases and proceeds from in-kind sales were as follows:
| Fund | | Purchases | | | Sales | |
| Barron's 400 ETF | | $ | – | | | $ | 5,889,320 | |
For the six months ended May 31, 2019, the Barron's 400SM ETF had in-kind net realized gains of $225,290.
Gains on in-kind transactions are not considered taxable for federal income tax purposes and losses on in-kind transactions are also not deductible for tax purposes.
5. CAPITAL SHARE TRANSACTIONS
Shares are created and redeemed by the Fund only in Creation Unit size aggregations of 50,000 Shares. Only broker-dealers or large institutional investors with creation and redemption agreements called Authorized Participants (“AP”) are permitted to purchase or redeem Creation Units from the Fund. Such transactions are generally permitted on an in-kind basis, with a balancing cash component to equate the transaction to the NAV per unit of the Fund on the transaction date. Cash may be substituted equivalent to the value of certain securities generally when they are not available in sufficient quantity for delivery, not eligible for trading by the AP or as a result of other market circumstances.
6. RELATED PARTY TRANSACTIONS
The Fund engaged in cross trades between other funds in the Trust during the six months ended May 31, 2019 pursuant to Rule 17a-7 under the 1940 Act. Cross trading is the buying or selling of portfolio securities between funds to which the Adviser serves as the investment adviser. The Board previously adopted procedures that apply to transactions between the Funds of the Trust pursuant to Rule 17a-7. These transactions related to cross trades during the period complied with the requirements set forth by Rule 17a-7 and the Trust’s procedures.
Transactions related to cross trades during the six months ended May 31, 2019, were as follows:
| Fund | | Purchase cost paid | | �� | Sale proceeds received | | | Realized gain/(loss) on sales | |
| Barron's 400 ETF | | $ | 384,400 | | | $ | 878,385 | | | $ | 47,111 | |
Barron’s 400SMETF
| Additional Information | May 31, 2019 (Unaudited) |
PROXY VOTING RECORDS, POLICIES AND PROCEDURES
Information regarding how the Fund voted proxies relating to portfolio securities during the most recent 12-month period ended June 30 and a description of the Fund’s proxy voting policies and procedures used in determining how to vote for proxies are available without charge on the SEC’s website at www.sec.gov and upon request, by calling (toll-free) 1-866-675-2639.
PORTFOLIO HOLDINGS
The Trust is required to disclose, after its first and third fiscal quarters, the complete schedule of the Fund’s portfolio holdings with the SEC on Form N-Q or as an exhibit to its report on Form N-PORT. Forms N-Q or N-PORT reports for the Fund are available on the SEC’s website at www.sec.gov. The Fund’s Forms N-Q or N-PORT reports are available without charge, upon request, by calling (toll-free) 1-866-675-2639 or by writing to ALPS ETF Trust at 1290 Broadway, Suite 1100, Denver, Colorado 80203.
TAX INFORMATION
The Fund designates the following as a percentage of taxable ordinary income distributions, or up to the maximum amount allowable, for the calendar year ended December 31, 2018:
| | Qualified Dividend
Income | Dividend Received
Deduction |
| Barron's 400 ETF | 100.00% | 100.00% |
In early 2019, if applicable, shareholders of record received this information for the distribution paid to them by the Fund during the calendar year 2018 via Form 1099. The Fund will notify shareholders in early 2020 of amounts paid to them by the Fund, if any, during the calendar year 2019.
LICENSING AGREEMENT
MarketGrader Capital, LLC has entered into a license agreement with Dow Jones & Company to use the “Barron’s” name and certain related intellectual property in connection with the Underlying Index. MarketGrader Capital, LLC also has entered into a license and services agreement with its parent company, MarketGrader.com, to use the methodology for constructing the Underlying Index. MarketGrader Capital, LLC in turn has entered into the Sublicense Agreement with ALPS Advisers, Inc. to use the Underlying Index. The following disclosure relates to such licensing agreements:
The Barron’s 400SM ETF (the “Fund”) is not sponsored, endorsed, sold or promoted by the MarketGrader Capital, LLC (the “Index Provider”). The Index Provider makes no representation or warranty, express or implied, to the owners of the Fund or any member of the public regarding the advisability of investing in securities generally or in the Fund particularly or the ability of the Fund to track the performance of the physical commodities market. The Index Provider’s only relationship to the ALPS Advisors, Inc. (the “Adviser”) or the Fund is the licensing of certain service marks and trade names of the Index Provider and of the Underlying Index that is determined, composed and calculated by the Index Provider without regard to the Adviser or the Fund. The Index Provider has no obligation to take the needs of the Adviser or the Fund or the owners of the Fund into consideration in determining, composing or calculating the Underlying Index. The Index Provider is not responsible for and has not participated in the determination of the timing of, prices at, or quantities of the Fund to be issued or in the determination or calculation of the equation by which the Fund is to be converted into cash. The Index Provider has no obligation or liability in connection with the administration, marketing or trading of the Fund.
THE INDEX PROVIDER DOES NOT GUARANTEE THE ACCURACY AND/OR THE COMPLETENESS OF THE UNDERLYING INDEX OR ANY DATA INCLUDED THEREIN AND THE INDEX PROVIDER SHALL HAVE NO LIABILITY FOR ANY ERRORS, OMISSIONS, OR INTERRUPTIONS THEREIN. THE INDEX PROVIDER MAKES NO WARRANTY, EXPRESS OR IMPLIED, AS TO RESULTS TO BE OBTAINED BY THE ADVISER, THE FUND, OWNERS OF THE FUND, OR ANY OTHER PERSON OR ENTITY FROM THE USE OF THE UNDERLYING INDEX OR ANY DATA INCLUDED THEREIN. THE INDEX PROVIDER MAKES NO EXPRESS OR IMPLIED WARRANTIES, AND EXPRESSLY DISCLAIMS ALL WARRANTIES OF MERCHANTABILITY OR FITNESS FOR A PARTICULAR PURPOSE OR USE WITH RESPECT TO THE UNDERLYING INDEX OR ANY DATA INCLUDED THEREIN. WITHOUT LIMITING ANY OF THE FOREGOING, IN NO EVENT SHALL THE INDEX PROVIDER HAVE ANY LIABILITY FOR ANY SPECIAL, PUNITIVE, INDIRECT, OR CONSEQUENTIAL DAMAGES (INCLUDING LOST PROFITS), EVEN IF NOTIFIED OF THE POSSIBILITY OF SUCH DAMAGES.
Barron’s 400SMETF
| Additional Information | May 31, 2019 (Unaudited) |
“The Barron’s 400 IndexSM” is calculated and published by MarketGrader Capital, LLC (“MarketGrader”). “Barron’s,” “Barron’s 400” and “Barron’s 400 Index” are trademarks or service marks of DJC & Company, Inc. or its affiliates and have been licensed to MarketGrader and sublicensed for certain purposes by Barron’s 400 Exchange Traded Fund, a sub-fund of that certain ALPS ETF Trust, a Delaware Statutory Trust (“Sub-Licensee”).
The Barron’s 400 ETF (the “Product”) is not sponsored, endorsed, sold or promoted by DJC or its affiliates. DJC and its affiliates make no representation or warranty, express or implied, to the owners of the Fund or any member of the public regarding the advisability of trading in the Fund particularly. DJC and its affiliates’ only relationship to the Licensee is the licensing of certain trademarks and trade names of DJC. DJC has no obligation to take the needs of the Licensee or the owners of the Fund into consideration in connection with its licensing of the Barron’s 400 Index to MarketGrader or the sublicense to Licensee. DJC and its affiliates are not responsible for and have not participated in the determination of the timing of, prices at, or quantities of the Fund to be sold or in the determination or calculation of the equation by which the Product are to be converted into cash. DJC and its affiliates have no obligation or liability in connection with the administration, marketing or trading of the Barron’s 400 Index or the Product.
DOW JONES DOES NOT GUARANTEE THE ACCURACY AND/OR THE COMPLETENESS OF THE BARRON’S 400 INDEX OR ANY DATA INCLUDED THEREIN AND DOW JONES AND ITS AFFILIATES SHALL HAVE NO LIABILITY FOR ANY ERRORS, OMISSIONS, OR INTERRUPTIONS THEREIN. DOW JONESAND ITS AFFILIATES MAKE NO WARRANTY, EXPRESS OR IMPLIED, AS TO RESULTS TO BE OBTAINED BY THE LICENSEE, OWNERS OF THE FUND, OR ANY OTHER PERSON OR ENTITY FROM THE USE OF THE BARRON’S 400 INDEX OR ANY DATA INCLUDED THEREIN. DOW JONES AND ITS AFFILIATES MAKE NO EXPRESS OR IMPLIED WARRANTIES. AND EXPRESSLY DISCLAIM ALL WARRANTIES, OF MERCHANTABILITY OR FITNESS FOR A PARTICULAR PURPOSE OR USE WITH RESPECT TO THE BARRON’S 400 INDEX OR ANY DATA INCLUDED THEREIN. WITHOUT LIMITING ANY OF THE FOREGOING, IN NO EVENT SHALL DOW JONES AND ITS AFFILIATES HAVE ANY LIABILITY FOR ANY LOST PROFITS OR INDIRECT, PUNITIVE, SPECIAL OR CONSEQUENTIAL DAMAGES OR LOSSES, EVEN IF NOTIFIED OF THE POSSIBILITY OF SUCH DAMAGES. THERE ARE NO THIRD PARTY BENEFICIARIES OF ANY AGREEMENTS OR ARRANGEMENTS BETWEEN DJC AND THE LICENSEE, OTHER THAN THE LICENSORS OF MARKETGRADER.
The Adviser does not guarantee the accuracy and/or the completeness of the Underlying Index or any data included therein, and the Adviser shall have no liability for any errors, omissions or interruptions therein. The Adviser makes no warranty, express or implied, as to results to be obtained by the Fund, owners of the Shares of the Fund or any other person or entity from the use of the Underlying Index or any data included therein. The Adviser makes no express or implied warranties, and expressly disclaims all warranties of merchantability or fitness for a particular purpose or use with respect to the Underlying Index or any data included therein. Without limiting any of the foregoing, in no event shall the Adviser have any liability for any special, punitive, direct, indirect or consequential damages (including lost profits) arising out of matters relating to the use of the Underlying Index, even if notified of the possibility of such damages.

Must be accompanied or preceded by a prospectus.
ALPS Portfolio Solutions Distributor, Inc., a FINRA member, is the Distributor for the Barron’s 400SM ETF.
TABLE OF
CONTENTS
| Performance Overview | 1 |
| Disclosure of Fund Expenses | 4 |
| Schedule of Investments | 5 |
| Statement of Assets and Liabilities | 7 |
| Statement of Operations | 8 |
| Statements of Changes in Net Assets | 9 |
| Financial Highlights | 10 |
| Notes to Financial Statements | 11 |
| Additional Information | 16 |
Beginning on January 1, 2021, as permitted by regulations adopted by the U.S. Securities and Exchange Commission, paper copies of the Fund’s annual and semi-annual shareholder reports will no longer be sent by mail, unless you specifically request paper copies of the reports from your financial intermediary (such as a broker-dealer or bank). Instead, the reports will be made available on the Fund’s website (www.alpsfunds.com), and you will be notified by mail each time a report is posted and provided with a website link to access the report.
If you already elected to receive shareholder reports electronically, you will not be affected by this change and you need not take any action. You may elect to receive shareholder reports and other communications from a Fund electronically anytime by contacting your financial intermediary.
You may elect to receive all future reports in paper free of charge. You can contact your financial intermediary to request that you continue to receive paper copies of your shareholder reports. Your election to receive reports in paper will apply to all funds held in your account with your financial intermediary.
alpsfunds.com
Cohen & Steers Global Realty Majors ETF
| Performance Overview | May 31, 2019 (Unaudited) |
Investment Objective
The Cohen & Steers Global Realty Majors ETF (the “Fund”) seeks investment results that correspond generally to the performance, before the Fund’s fees and expenses, of an index called the Cohen & Steers Global Realty Majors Index (the “Underlying Index”). The Fund will normally invest at least 90% of its total assets in common stocks and other equity securities (which may include American Depositary Receipts (“ADRs”), American Depositary Shares (“ADSs”) and Global Depositary Receipts (“GDRs”)) that comprise the Underlying Index.
The Underlying Index consists of the largest and most liquid securities within the global real estate universe that Cohen & Steers Capital Management, Inc. (“Cohen & Steers” or the “Index Provider”) believes are likely to lead the global securitization of real estate. The Underlying Index is free float and modified market-capitalization weighted, with a limit of 4.0% on any security’s weighting. Underlying Index constituents must have a free float adjusted market-capitalization of $750 million or greater for initial inclusion in the Underlying Index. Cohen & Steers considers country weights relative to each country’s GDP share representing the real estate securities universe and share of the private market for real estate, with up to 10% being allocated to securities of emerging markets. The Underlying Index is rebalanced quarterly.
Performance(as of May 31, 2019)
| | 6 Months | 1 Year | 5 Year | 10 Year | Since
Inception^ |
| Cohen & Steers Global Realty Majors ETF - NAV | 8.01% | 10.78% | 5.24% | 10.77% | 3.32% |
| Cohen & Steers Global Realty Majors ETF - Market Price* | 8.28% | 11.28% | 5.27% | 10.78% | 3.32% |
| Cohen & Steers Global Realty Majors®Index | 8.43% | 11.56% | 5.99% | 11.58% | 4.13% |
| FTSE EPRA/ NAREIT Developed Real Estate Index | 7.03% | 8.51% | 5.72% | 11.26% | 4.15% |
| S&P 500®Total Return Index | 0.74% | 3.78% | 9.66% | 13.95% | 8.65% |
Total Expense Ratio (per the current Prospectus) 0.55%
Data quoted represents past performance, which is no guarantee of future results. The table does not reflect the deduction of taxes that a shareholder would pay on Fund distributions or the redemption of Fund shares. The Fund's portfolio holdings are subject to change without notice. Investment return and principal value of an investment will fluctuate so that an investor’s shares, when sold or redeemed, may be worth more or less than the original cost. Current performance data may be higher or lower than actual data quoted. For the most current month-end performance data please visit www.alpsfunds.com or call 1.866.513.5856.
NAV is an exchange-traded fund’s per-share value. The per-share dollar amount of the Fund is derived by dividing the total value of all the securities in its portfolio, less any liabilities, by the number of Fund shares outstanding. Market Price is the price at which a share can currently be traded in the market. Information detailing the number of days the Market Price of the Fund was greater than the Fund’s NAV and the number of days it was less than the Fund’s NAV can be obtained at www.alpsfunds.com.
| ^ | Fund Inception May 7, 2008. |
| * | Market Price is based on the midpoint of the bid/ask spread at 4p.m. ET and does not represent the returns an investor would receive if shares were traded at other times. |
Risks of Investing in Real Estate Securities
Risks of investing in real estate securities are similar to those associated with direct investments in real estate, including falling property values due to increasing vacancies or declining rents resulting from economic, legal, political or technological developments, lack of liquidity, limited diversification and sensitivity to certain economic factors such as interest rate changes and market recessions. Foreign securities involve special risks, including currency fluctuations, lower liquidity, political and economic uncertainties, and differences in accounting standards. Some international securities may represent small- and medium-sized companies, which may be more susceptible to price volatility and less liquidity than larger companies.
Cohen & Steers Global Realty Majors®Index:A free-float adjusted, modified market capitalization-weighted index of global real estate equities. The modified market capitalization weighting approach and qualitative screening process emphasize those companies that, in the opinion of the Cohen & Steers investment committee, are leading the securitization of real estate globally.
FTSE EPRA/NAREIT Developed Real Estate Index:An unmanaged market-weighted total return index that consists of many companies from developed markets whose floats are larger than $100 million and which derive more than half of their revenue from property-related activities.
S&P 500®Total Return Index:The Standard & Poor’s composite index of 500 stocks, a widely recognized, unmanaged index of common stock prices.
Cohen & Steers Global Realty Majors ETF
| Performance Overview | May 31, 2019 (Unaudited) |
The indexes are not actively managed and do not reflect any deductions for fees, expenses or taxes. Total return assumes reinvestment of any dividends and distributions realized during a given time period. One cannot invest directly in an index. Index performance does not reflect fund performance.
The Fund’s shares are not individually redeemable. Investors buy and sell shares of the Fund on a secondary market. Only market makers or “authorized participants” may trade directly with the Fund, typically in blocks of 50,000 shares.
The Cohen & Steers Global Realty Majors ETF is not suitable for all investors. An investor should consider investment objectives, risks, charges and expenses carefully before investing. Investments in the Fund are subject to investment risks, including possible loss of the principal amount invested.
ALPS Portfolio Solutions Distributor, Inc., a FINRA member, is the distributor for the Cohen & Steers Global Realty Majors ETF.
ALPS Portfolio Solutions Distributor, Inc. is not affiliated with Cohen & Steers.
Cohen & Steers Global Realty Majors ETF
| Performance Overview | May 31, 2019 (Unaudited) |
Top 10 Holdings*(as of May 31, 2019)
| American Tower Corp. | 4.35% |
| Equinix, Inc. | 4.09% |
| Prologis, Inc. | 3.86% |
| Simon Property Group, Inc. | 3.64% |
| Public Storage | 3.60% |
| Welltower, Inc. | 3.17% |
| Equity Residential | 2.86% |
| AvalonBay Communities, Inc. | 2.84% |
| Vonovia SE | 2.75% |
| Mitsubishi Estate Co., Ltd. | 2.59% |
| Total % of Top 10 Holdings | 33.75% |
Future holdings are subject to change.
Country Allocation*(as of May 31, 2019)
| United States | 56.00% |
| Japan | 10.32% |
| Hong Kong | 10.24% |
| Australia | 5.99% |
| Germany | 5.45% |
| France | 4.27% |
| United Kingdom | 3.15% |
| Singapore | 2.01% |
| Canada | 1.10% |
| Sweden | 0.53% |
| Switzerland | 0.46% |
| Spain | 0.31% |
| Brazil | 0.17% |
| Total | 100.00% |
Growth of $10,000(as of May 31, 2019)
Comparison of Change in Value of $10,000 Investment in the Fund and the Indexes
The chart above represents historical performance of a hypothetical investment of $10,000 in the Fund over the life of the Fund. Past performance does not guarantee future results. This chart does not reflect the deduction of taxes that a shareholder would pay on Fund distributions or the redemption of Fund shares.
Cohen & Steers Global Realty Majors ETF
| Disclosure of Fund Expenses | May 31, 2019 (Unaudited) |
Shareholder Expense Example:As a shareholder of the Fund, you incur two types of costs: (1) transaction costs which may include creation and redemption fees or brokerage charges, and (2) ongoing costs, including management fees and other Fund expenses. These examples are intended to help you understand your ongoing costs (in dollars) of investing in the Fund and to compare these costs with the ongoing costs of investing in other funds. It is based on an investment of $1,000 invested at the beginning of the (six month) period and held through May 31, 2019.
Actual Return:The first line of the table provides information about actual account values and actual expenses. You may use the information in this line, together with the amount you invested, to estimate the expenses that you incurred over the period. Simply divide your account value by $1,000 (for example, an $8,600 account value divided by $1,000 = 8.6), then multiply the result by the number in the first line under the heading entitled “Expenses Paid During Period” to estimate the expenses attributable to your investment during this period.
Hypothetical 5% Return:The second line of the table provides information about hypothetical account values and hypothetical expenses based on the Fund’s actual expense ratio and an assumed rate of return of 5% per year before expenses, which is not the Fund’s actual return. The hypothetical account values and expenses may not be used to estimate the actual ending account balance or expenses you paid for the period. You may use this information to compare ongoing costs of investing in the Fund and other funds. To do so, compare this 5% hypothetical example with the 5% hypothetical examples that appear in the shareholder reports of other funds.
The expenses shown in the table are meant to highlight ongoing Fund costs only and do not reflect any transaction costs, such as creation and redemption fees or brokerage charges. Therefore, the second line is useful in comparing ongoing costs only, and will not help you determine the relative total costs of owning different funds. In addition, if these costs were included, your costs would have been higher.
| | Beginning Account
Value
12/1/18 | Ending Account
Value
5/31/19 | Expense
Ratio(a) | Expenses Paid
During Period
12/1/18 - 5/31/19(b) |
| Cohen & Steers Global Realty Majors ETF | | | | |
| Actual | $1,000.00 | $1,080.10 | 0.55% | $2.85 |
| Hypothetical (5% return before expenses) | $1,000.00 | $1,022.19 | 0.55% | $2.77 |
| (a) | Annualized, based on the Fund's most recent fiscal half year expenses. |
| (b) | Expenses are equal to the Fund's annualized expense ratio multiplied by the average account value over the period, multiplied by the number of days in the most recent fiscal half year (182), divided by 365. |
Cohen & Steers Global Realty Majors ETF
| Schedule of Investments | May 31, 2019 (Unaudited) |
| Security Description | | Shares | | | Value | |
| COMMON STOCKS (99.36%) | | | | | | | | |
| Australia (5.98%) | | | | | | | | |
| Dexus | | | 56,350 | | | $ | 503,479 | |
| Goodman Group | | | 83,219 | | | | 773,569 | |
| Mirvac Group | | | 193,000 | | | | 405,669 | |
| Scentre Group, Ltd. | | | 276,109 | | | | 727,840 | |
| The GPT Group | | | 93,759 | | | | 374,634 | |
| Vicinity Centres | | | 167,407 | | | | 299,616 | |
| Total Australia | | | | | | | 3,084,807 | |
| | | | | | | | | |
| Brazil (0.17%) | | | | | | | | |
| Multiplan Empreendimentos Imobiliarios SA | | | 13,734 | | | | 86,941 | |
| | | | | | | | | |
| Canada (1.09%) | | | | | | | | |
| Allied Properties Real Estate Investment Trust | | | 5,601 | | | | 201,439 | |
| Boardwalk Real Estate Investment Trust | | | 1,961 | | | | 59,021 | |
| RioCan Real Estate Investment Trust | | | 15,759 | | | | 304,080 | |
| Total Canada | | | | | | | 564,540 | |
| | | | | | | | | |
| France (4.26%) | | | | | | | | |
| Covivio | | | 3,207 | | | | 336,416 | |
| Gecina SA | | | 2,865 | | | | 409,681 | |
| Klepierre SA | | | 10,826 | | | | 368,512 | |
| Unibail-Rodamco-Westfield | | | 7,155 | | | | 1,081,881 | |
| Total France | | | | | | | 2,196,490 | |
| | | | | | | | | |
| Germany (5.43%) | | | | | | | | |
| alstria office REIT-AG | | | 8,221 | | | | 128,486 | |
| Deutsche Wohnen SE | | | 18,442 | | | | 870,455 | |
| LEG Immobilien AG | | | 3,282 | | | | 391,947 | |
| Vonovia SE | | | 26,927 | | | | 1,412,627 | |
| Total Germany | | | | | | | 2,803,515 | |
| | | | | | | | | |
| Hong Kong (10.21%) | | | | | | | | |
| China Overseas Land & Investment, Ltd. | | | 193,000 | | | | 669,630 | |
| CK Asset Holdings, Ltd. | | | 138,500 | | | | 1,001,709 | |
| Hang Lung Properties, Ltd. | | | 103,000 | | | | 216,786 | |
| Hongkong Land Holdings, Ltd. | | | 60,400 | | | | 393,808 | |
| Link REIT | | | 109,664 | | | | 1,312,127 | |
| Sun Hung Kai Properties, Ltd. | | | 80,000 | | | | 1,266,399 | |
| Wharf Real Estate Investment Co., Ltd. | | | 60,000 | | | | 409,845 | |
| Total Hong Kong | | | | | | | 5,270,304 | |
| | | | | | | | | |
| Japan (10.29%) | | | | | | | | |
| Japan Real Estate Investment Corp. | | | 72 | | | | 428,552 | |
| Japan Retail Fund Investment Corp. | | | 137 | | | | 276,364 | |
| Mitsubishi Estate Co., Ltd. | | | 72,300 | | | | 1,332,378 | |
| Mitsui Fudosan Co., Ltd. | | | 51,500 | | | | 1,250,609 | |
| Nippon Building Fund, Inc. | | | 72 | | | | 493,000 | |
| Security Description | | Shares | | | Value | |
| Japan (continued) | | | | | | | | |
| Nippon Prologis REIT, Inc. | | | 111 | | | $ | 241,841 | |
| Nomura Real Estate Master Fund, Inc. | | | 239 | | | | 371,408 | |
| Sumitomo Realty & Development Co., Ltd. | | | 24,800 | | | | 917,027 | |
| Total Japan | | | | | | | 5,311,179 | |
| | | | | | | | | |
| Singapore (2.01%) | | | | | | | | |
| Ascendas Real Estate Investment Trust | | | 133,105 | | | | 282,934 | |
| CapitaLand Mall Trust | | | 145,647 | | | | 255,521 | |
| CapitaLand, Ltd. | | | 130,100 | | | | 304,959 | |
| City Developments, Ltd. | | | 32,100 | | | | 192,081 | |
| Total Singapore | | | | | | | 1,035,495 | |
| | | | | | | | | |
| Spain (0.30%) | | | | | | | | |
| Inmobiliaria Colonial Socimi SA | | | 14,212 | | | | 157,340 | |
| | | | | | �� | | | |
| Sweden (0.53%) | | | | | | | | |
| Castellum AB | | | 14,280 | | | | 271,333 | |
| | | | | | | | | |
| Switzerland (0.45%) | | | | | | | | |
| PSP Swiss Property AG | | | 2,096 | | | | 234,878 | |
| | | | | | | | | |
| United Kingdom (3.14%) | | | | | | | | |
| British Land Co. PLC | | | 50,195 | | | | 338,871 | |
| Derwent London PLC | | | 5,784 | | | | 235,167 | |
| Hammerson PLC | | | 40,044 | | | | 137,145 | |
| Land Securities Group PLC | | | 38,963 | | | | 408,160 | |
| Segro PLC | | | 56,629 | | | | 499,434 | |
| Total United Kingdom | | | | | | | 1,618,777 | |
| | | | | | | | | |
| United States (55.50%) | | | | | | | | |
| Alexandria Real Estate Equities, Inc. | | | 5,873 | | | | 859,866 | |
| American Campus Communities, Inc. | | | 7,106 | | | | 329,150 | |
| American Homes 4 Rent, Class A | | | 13,352 | | | | 325,922 | |
| American Tower Corp. | | | 10,729 | | | | 2,239,893 | |
| AvalonBay Communities, Inc. | | | 7,202 | | | | 1,462,078 | |
| Boston Properties, Inc. | | | 8,014 | | | | 1,048,472 | |
| Cousins Properties, Inc. | | | 22,000 | | | | 199,100 | |
| Digital Realty Trust, Inc. | | | 10,799 | | | | 1,271,258 | |
| Douglas Emmett, Inc. | | | 8,375 | | | | 337,429 | |
| Duke Realty Corp. | | | 18,684 | | | | 562,202 | |
| Equinix, Inc. | | | 4,332 | | | | 2,104,442 | |
| Equity LifeStyle Properties, Inc. | | | 4,656 | | | | 566,449 | |
| Equity Residential | | | 19,241 | | | | 1,473,283 | |
| Essex Property Trust, Inc. | | | 3,423 | | | | 998,626 | |
| Extra Space Storage, Inc. | | | 6,627 | | | | 710,149 | |
| Federal Realty Investment Trust | | | 3,868 | | | | 505,664 | |
| Host Hotels & Resorts, Inc. | | | 38,479 | | | | 696,855 | |
| Kilroy Realty Corp. | | | 5,231 | | | | 385,577 | |
| National Retail Properties, Inc. | | | 8,407 | | | | 450,027 | |
Cohen & Steers Global Realty Majors ETF
| Schedule of Investments | May 31, 2019 (Unaudited) |
| Security Description | | Shares | | | Value | |
| United States (continued) | | | | | | | | |
| Park Hotels & Resorts, Inc. | | | 10,433 | | | $ | 288,159 | |
| Prologis, Inc. | | | 26,951 | | | | 1,985,480 | |
| Public Storage | | | 7,787 | | | | 1,852,372 | |
| Realty Income Corp. | | | 15,821 | | | | 1,108,736 | |
| Regency Centers Corp. | | | 8,691 | | | | 573,258 | |
| Simon Property Group, Inc. | | | 11,544 | | | | 1,871,167 | |
| SL Green Realty Corp. | | | 4,348 | | | | 373,928 | |
| UDR, Inc. | | | 14,304 | | | | 640,533 | |
| Ventas, Inc. | | | 18,503 | | | | 1,189,743 | |
| Vornado Realty Trust | | | 8,993 | | | | 595,606 | |
| Welltower, Inc. | | | 20,109 | | | | 1,633,253 | |
| Total United States | | | | | | | 28,638,677 | |
| | | | | | | | | |
| TOTAL COMMON STOCKS | | | | | | | | |
| (Cost $42,824,043) | | | | | | | 51,274,276 | |
| | | 7 Day
Yield | | | Shares | | | Value | |
| SHORT TERM INVESTMENTS (0.34%) | | | | |
| State Street Institutional Treasury Plus Money Market Fund | | | 2.309 | % | | | 177,856 | | | | 177,856 | |
| TOTAL SHORT TERM INVESTMENTS | | | | | |
| (Cost $177,856) | | | | | | | | | | | 177,856 | |
| | | | | | | | | | | | | |
| TOTAL INVESTMENTS (99.70%) | | | | | |
| (Cost $43,001,899) | | | | | | | | | | $ | 51,452,132 | |
| OTHER ASSETS IN EXCESS OF LIABILITIES (0.30%) | | | | 153,306 | |
| NET ASSETS - 100.00% | | | | | | $ | 51,605,438 | |
See Notes to Financial Statements.
Cohen & Steers Global Realty Majors ETF
| Statement of Assets and Liabilities | May 31, 2019 (Unaudited) |
| ASSETS: | | | |
| Investments, at value | | $ | 51,452,132 | |
| Foreign currency, at value (Cost $26,330) | | | 26,334 | |
| Foreign tax reclaims | | | 37,638 | |
| Dividends receivable | | | 114,101 | |
| Total Assets | | | 51,630,205 | |
| | | | | |
| LIABILITIES: | | | | |
| Payable to adviser | | | 24,767 | |
| Total Liabilities | | | 24,767 | |
| NET ASSETS | | $ | 51,605,438 | |
| | | | | |
| NET ASSETS CONSIST OF: | | | | |
| Paid-in capital | | $ | 48,007,780 | |
| Total distributable earnings | | | 3,597,658 | |
| NET ASSETS | | $ | 51,605,438 | |
| | | | | |
| INVESTMENTS, AT COST | | $ | 43,001,899 | |
| | | | | |
| PRICING OF SHARES | | | | |
| Net Assets | | $ | 51,605,438 | |
| Shares of beneficial interest outstanding (Unlimited number of shares authorized, par value $0.01 per share) | | | 1,100,000 | |
| Net Asset Value, offering and redemption price per share | | $ | 46.91 | |
See Notes to Financial Statements.
Cohen & Steers Global Realty Majors ETF
| Statement of Operations | For the Six Months Ended May 31, 2019 (Unaudited) |
| INVESTMENT INCOME: | | | |
| Dividends(a) | | $ | 920,954 | |
| Total Investment Income | | | 920,954 | |
| | | | | |
| EXPENSES: | | | | |
| Investment adviser fees | | | 148,762 | |
| Total Expenses | | | 148,762 | |
| NET INVESTMENT INCOME | | | 772,192 | |
| | | | | |
| REALIZED AND UNREALIZED GAIN/(LOSS) | | | | |
| Net realized gain on investments | | | 1,391,476 | |
| Net realized loss on foreign currency transactions | | | (349 | ) |
| Total Net realized gain | | | 1,391,127 | |
| Net change in unrealized appreciation on investments | | | 2,030,668 | |
| Net change in unrealized appreciation on translation of assets and liabilities denominated in foreign currencies | | | 770 | |
| Total net change in unrealized appreciation | | | 2,031,438 | |
| NET REALIZED AND UNREALIZED GAIN ON INVESTMENTS | | | 3,422,565 | |
| NET INCREASE IN NET ASSETS RESULTING FROM OPERATIONS | | $ | 4,194,757 | |
| (a) | Net of foreign tax withholding of $49,647. |
See Notes to Financial Statements.
Cohen & Steers Global Realty Majors ETF
Statements of Changes in Net Assets
| | | For the Six Months Ended May 31, 2019 (Unaudited) | | | For the Year Ended November 30, 2018 | |
| OPERATIONS: | | | | | | |
| Net investment income | | $ | 772,192 | | | $ | 1,604,135 | |
| Net realized gain | | | 1,391,127 | | | | 1,545,197 | |
| Net change in unrealized appreciation/depreciation | | | 2,031,438 | | | | (2,489,161 | ) |
| Net increase in net assets resulting from operations | | | 4,194,757 | | | | 660,171 | |
| | | | | | | | | |
| DISTRIBUTIONS TO SHAREHOLDERS: | | | | | | | | |
| From distributable earnings | | | (927,527 | ) | | | (2,627,653 | ) |
| Total distributions | | | (927,527 | ) | | | (2,627,653 | ) |
| | | | | | | | | |
| CAPITAL SHARE TRANSACTIONS: | | | | | | | | |
| Cost of shares redeemed | | | (6,883,880 | ) | | | (10,860,609 | ) |
| Net decrease from capital share transactions | | | (6,883,880 | ) | | | (10,860,609 | ) |
| Net decrease in net assets | | | (3,616,650 | ) | | | (12,828,091 | ) |
| | | | | | | | | |
| NET ASSETS: | | | | | | | | |
| Beginning of period | | | 55,222,088 | | | | 68,050,179 | |
| End of period | | $ | 51,605,438 | | | $ | 55,222,088 | |
| | | | | | | | | |
| OTHER INFORMATION: | | | | | | | | |
| CAPITAL SHARE TRANSACTIONS: | | | | | | | | |
| Beginning shares | | | 1,250,000 | | | | 1,500,000 | |
| Shares sold | | | – | | | | – | |
| Shares redeemed | | | (150,000 | ) | | | (250,000 | ) |
| Shares outstanding, end of period | | | 1,100,000 | | | | 1,250,000 | |
See Notes to Financial Statements.
Cohen & Steers Global Realty Majors ETF
| Financial Highlights | For a Share Outstanding Throughout the Periods Presented |
| | | For the Six Months Ended May 31, 2019 (Unaudited) | | | For the Year Ended November 30, 2018 | | | For the Year Ended November 30, 2017 | | | For the Year Ended November 30, 2016 | | | For the Year Ended November 30, 2015 | | | For the Year Ended November 30, 2014 | |
| NET ASSET VALUE, BEGINNING OF PERIOD | | $ | 44.18 | | | $ | 45.37 | | | $ | 41.31 | | | $ | 42.25 | | | $ | 44.07 | | | $ | 39.32 | |
| | | | | | | | | | | | | | | | | | | | | | | | | |
| INCOME FROM OPERATIONS: | | | | | | | | | | | | | | | | | | | | | | | | |
| Net investment income(a) | | | 0.65 | | | | 1.17 | | | | 0.75 | | | | 1.24 | | | | 1.41 | | | | 0.92 | |
| Net realized and unrealized gain/(loss) | | | 2.84 | | | | (0.53 | ) | | | 4.45 | | | | (0.90 | ) | | | (1.57 | ) | | | 4.85 | |
| Total from investment operations | | | 3.49 | | | | 0.64 | | | | 5.20 | | | | 0.34 | | | | (0.16 | ) | | | 5.77 | |
| | | | | | | | | | | | | | | | | | | | | | | | | |
| DISTRIBUTIONS: | | | | | | | | | | | | | | | | | | | | | | | | |
| From net investment income | | | (0.76 | ) | | | (1.83 | ) | | | (1.14 | ) | | | (1.28 | ) | | | (1.66 | ) | | | (1.02 | ) |
| Total distributions | | | (0.76 | ) | | | (1.83 | ) | | | (1.14 | ) | | | (1.28 | ) | | | (1.66 | ) | | | (1.02 | ) |
| | | | | | | | | | | | | | | | | | | | | | | | | |
| NET INCREASE/(DECREASE) IN NET ASSET VALUE | | | 2.73 | | | | (1.19 | ) | | | 4.06 | | | | (0.94 | ) | | | (1.82 | ) | | | 4.75 | |
| NET ASSET VALUE, END OF PERIOD | | $ | 46.91 | | | $ | 44.18 | | | $ | 45.37 | | | $ | 41.31 | | | $ | 42.25 | | | $ | 44.07 | |
| TOTAL RETURN(b) | | | 8.01 | % | | | 1.47 | % | | | 12.77 | % | | | 0.61 | % | | | (0.38 | )% | | | 14.90 | % |
| | | | | | | | | | | | | | | | | | | | | | | | | |
| RATIOS/SUPPLEMENTAL DATA: | | | | | | | | | | | | | | | | | | | | | | | | |
| Net assets, end of period (in 000s) | | $ | 51,605 | | | $ | 55,222 | | | $ | 68,050 | | | $ | 80,550 | | | $ | 99,298 | | | $ | 96,953 | |
| | | | | | | | | | | | | | | | | | | | | | | | | |
| RATIOS TO AVERAGE NET ASSETS | | | | | | | | | | | | | | | | | | | | | | | | |
| Ratio of expenses to average net assets | | | 0.55 | %(c) | | | 0.55 | % | | | 0.55 | % | | | 0.55 | % | | | 0.55 | % | | | 0.55 | % |
| Ratio of net investment income to average net assets | | | 2.85 | %(c) | | | 2.67 | % | | | 1.71 | % | | | 2.86 | % | | | 3.24 | % | | | 2.21 | % |
| Portfolio turnover rate(d) | | | 3 | % | | | 14 | % | | | 10 | % | | | 8 | % | | | 7 | % | | | 11 | % |
| (a) | Based on average shares outstanding during the period. |
| (b) | Total return is calculated assuming an initial investment made at the net asset value at the beginning of the period and redemption at the net asset value on the last day of the period and assuming all distributions are reinvested at the reinvestment prices. |
| (d) | Portfolio turnover for periods less than one year are not annualized and does not include securities received or delivered from processing creations or redemptions in-kind. |
See Notes to Financial Statements.
Cohen & Steers Global Realty Majors ETF
| Notes to Financial Statements | May 31, 2019 (Unaudited) |
1. ORGANIZATION
ALPS ETF Trust (the “Trust”), a Delaware statutory trust, is an open-end management investment company registered under the Investment Company Act of 1940, as amended (the “1940 Act”). As of May 31, 2019, the Trust consisted of eighteen separate portfolios. Each portfolio represents a separate series of the Trust. This report pertains solely to the Cohen & Steers Global Realty Majors ETF (the “Fund”). The investment objective of the Fund is to seek investment results that correspond generally to the performance, before the Fund’s fees and expenses, of an index called the Cohen & Steers Global Realty Majors Index (the “Underlying Index”). The investment advisor uses a “passive” or indexing approach to try to achieve the Fund’s investment objective. The Fund has elected to qualify as a diversified series of the Trust under the 1940 Act.
The Fund’s Shares (“Shares”) are listed on the NYSE Arca, Inc. (the “NYSE Arca”). The Fund issues and redeems Shares at net asset value (“NAV”) in blocks of 50,000 Shares, each of which is called a “Creation Unit”. Creation Units are issued and redeemed principally in-kind for securities included in the Underlying Index. Except when aggregated in Creation Units, Shares are not redeemable securities of the Fund.
Pursuant to the Trust’s organizational documents, its Officers and Trustees are indemnified against certain liability arising out of the performance of their duties to the Trust. Additionally, in the normal course of business, the Trust enters into contracts with service providers that contain general indemnification clauses. The Trust’s maximum exposure under these arrangements is unknown, as this would involve future claims that may be made against the Trust that have not yet occurred.
2. SIGNIFICANT ACCOUNTING POLICIES
The following is a summary of significant accounting policies consistently followed by the Fund in the preparation of the financial statements. The accompanying financial statements were prepared in accordance with accounting principles generally accepted in the United States of America (“U.S. GAAP”). The preparation of financial statements in conformity with U.S. GAAP requires management to make certain estimates and assumptions that affect the reported amounts of assets and liabilities and disclosures of contingent assets and liabilities at the date of the financial statements and the reported amounts of revenue and expenses during the period. Actual results could differ from those estimates. The Fund is considered an investment company under U.S. GAAP and follows the accounting and reporting guidance applicable to investment companies in the Financial Accounting Standards BoardAccounting Standards CodificationTopic 946.
A. Portfolio Valuation
The Fund’s NAV is determined daily, as of the close of regular trading on the New York Stock Exchange (the “NYSE”), normally 4:00 p.m. Eastern time, on each day the NYSE is open for trading. The NAV is computed by dividing the value of all assets of the Fund (including accrued interest and dividends), less all liabilities (including accrued expenses and dividends declared but unpaid), by the total number of shares outstanding.
Portfolio securities listed on any exchange other than the NASDAQ Stock Market LLC (“NASDAQ”) are valued at the last sale price on the business day as of which such value is being determined. If there has been no sale on such day, the securities are valued at the mean of the most recent bid and asked prices on such day. Securities traded on the NASDAQ are valued at the NASDAQ Official Closing Price as determined by NASDAQ. Portfolio securities traded on more than one securities exchange are valued at the last sale price on the business day as of which such value is being determined at the close of the exchange representing the principal market for such securities. Portfolio securities traded in the over-the-counter market, but excluding securities traded on the NASDAQ, are valued at the latest quoted sale price in such market.
The Fund’s investments are valued at market value or, in the absence of market value with respect to any portfolio securities, at fair value according to procedures adopted by the Trust’s Board of Trustees (the “Board”). When market quotations are not readily available or when events occur that make established valuation methods unreliable, securities of the Fund may be valued in good faith by or under the direction of the Board. These securities generally include, but are not limited to, restricted securities (securities which may not be publicly sold without registration under the Securities Act of 1933) for which a pricing service is unable to provide a market price; securities whose trading has been formally suspended; a security whose market price is not available from a pre-established primary pricing source or the pricing source is not willing to provide a price; a security with respect to which an event has occurred that is most likely to materially affect the value of the security after the market has closed but before the calculation of the Fund’s NAV or make it difficult or impossible to obtain a reliable market quotation; or a security whose price, as provided by the pricing service, does not reflect the security’s “fair value” due to the security being de-listed from a national exchange or the security’s primary trading market is temporarily closed at a time when, under normal conditions, it would be open. As a general principle, the current “fair value” of a security would be the amount which the owner might reasonably expect to receive from the sale on the applicable exchange or principal market. A variety of factors may be considered in determining the fair value of such securities.
Cohen & Steers Global Realty Majors ETF
| Notes to Financial Statements | May 31, 2019 (Unaudited) |
B. Fair Value Measurements
The Fund discloses the classification of its fair value measurements following a three-tier hierarchy based on the inputs used to measure fair value. Inputs refer broadly to the assumptions that market participants would use in pricing the asset or liability, including assumptions about risk. Inputs may be observable or unobservable. Observable inputs reflect the assumptions market participants would use in pricing the asset or liability that are developed based on market data obtained from sources independent of the reporting entity. Unobservable inputs reflect the reporting entity’s own assumptions about the assumptions market participants would use in pricing the asset or liability that are developed based on the best information available.
Valuation techniques used to value the Fund’s investments by major category are as follows:
Equity securities, including restricted securities, for which market quotations are readily available, are valued at the last reported sale price or official closing price as reported by a third party pricing vendor on the primary market or exchange on which they are traded and are categorized as Level 1 in the hierarchy. In the event there were no sales during the day or closing prices are not available, securities are valued at the mean of the most recent quoted bid and ask prices on such day and are generally categorized as Level 2 in the hierarchy. Investments in open-end mutual funds are valued at their NAV each business day and are categorized as Level 1 in the hierarchy.
Changes in valuation techniques may result in transfers in or out of an assigned level within the disclosure hierarchy.
Various inputs are used in determining the value of the Fund’s investments as of the end of the reporting period. When inputs used fall into different levels of the fair value hierarchy, the level in the hierarchy within which the fair value measurement falls is determined based on the lowest level input that is significant to the fair value measurement in its entirety. The designated input levels are not necessarily an indication of the risk or liquidity associated with these investments.
These inputs are categorized in the following hierarchy under applicable financial accounting standards:
| Level 1– | Unadjusted quoted prices in active markets for identical investments, unrestricted assets or liabilities that a Fund has the ability to access at the measurement date; |
| Level 2– | Quoted prices which are not active, quoted prices for similar assets or liabilities in active markets or inputs other than quoted prices that are observable (either directly or indirectly) for substantially the full term of the asset or liability; and |
| Level 3– | Significant unobservable prices or inputs (including the Fund’s own assumptions in determining the fair value of investments) where there is little or no market activity for the asset or liability at the measurement date. |
The following is a summary of the inputs used to value the Fund’s investments as of May 31, 2019:
| Investments in Securities at Value* | | Level 1- Unadjusted Quoted Prices | | | Level 2- Other Significant Observable Inputs | | | Level 3- Significant Unobservable Inputs | | | Total | |
| Common Stocks | | $ | 51,274,276 | | | $ | – | | | $ | – | | | $ | 51,274,276 | |
| Short Term Investments | | | 177,856 | | | | – | | | | – | | | | 177,856 | |
| TOTAL | | $ | 51,452,132 | | | $ | – | | | $ | – | | | $ | 51,452,132 | |
| * | For a detailed geographical breakdown, see the accompanying Schedule of Investments. |
The Fund did not have any securities that used significant unobservable inputs (Level 3) in determining fair value and there were no transfers into or out of Level 3.
C. Foreign Securities
The Fund may directly purchase securities of non-U.S. issuers. Investing in securities of non-U.S. issuers may involve unique risks compared to investing in securities of U.S. issuers, including, among others, less liquidity generally, greater market volatility than U.S. securities and less complete financial information than for U.S. issuers. In addition, adverse political, economic or social developments could undermine the value of the Fund’s investments or prevent the Fund from realizing the full value of its investments. Financial reporting standards for companies based in foreign markets differ from those in the United States. Finally, the value of the currency of the country in which the Fund has invested could decline relative to the value of the U.S. dollar, which may affect the value of the investment to U.S. investors.
Cohen & Steers Global Realty Majors ETF
| Notes to Financial Statements | May 31, 2019 (Unaudited) |
D. Foreign Currency Translation
The books and records of the Fund are maintained in U.S. dollars. Investment valuations and other assets and liabilities initially expressed in foreign currencies are converted each business day into U.S. dollars based upon current exchange rates. The portion of realized and unrealized gains or losses on investments due to fluctuations in foreign currency exchange rates is not separately disclosed and is included in realized and unrealized gains or losses on investments, when applicable.
E. Securities Transactions and Investment Income
Securities transactions are recorded as of the trade date. Realized gains and losses from securities transactions are recorded on the highest cost basis. Dividend income and capital gains distributions, if any, are recorded on the ex-dividend date, net of any foreign taxes withheld. Interest income, if any, is recorded on the accrual basis.
F. Dividends and Distributions to Shareholders
Dividends from net investment income of the Fund, if any, are declared and paid quarterly or as the Board may determine from time to time. Distributions of net realized capital gains earned by the Fund, if any, are distributed at least annually.
G. Real Estate Investment Trusts (“REITs”)
As part of its investments in real estate related securities, the Fund will invest in REITs and is subject to certain risks associated with direct investment in REITs. REITs possess certain risks which differ from an investment in common stocks. REITs are financial vehicles that pool investors’ capital to acquire, develop and/or finance real estate and provide services to their tenants. REITs may concentrate their investments in specific geographic areas or in specific property types, e.g., regional malls, shopping centers, office buildings, apartment buildings and industrial warehouses. REITs may be affected by changes in the value of their underlying properties and by defaults by borrowers or tenants. REITs depend generally on their ability to generate cash flow to make distributions to shareowners, and certain REITs have self-liquidation provisions by which mortgages held may be paid in full and distributions of capital returns may be made at any time.
As REITs generally pay a higher rate of dividends than most other operating companies, to the extent application of the Fund’s investment strategy results in the Fund investing in REIT shares, the percentage of the Fund’s dividend income received from REIT shares will likely exceed the percentage of the Fund’s portfolio that is comprised of REIT shares. Distributions received by the Fund from REITs may consist of dividends, capital gains and/or return of capital.
Dividend income from REITs is recognized on the ex-dividend date. The calendar year-end amounts of ordinary income, capital gains, and return of capital included in distributions received from the Fund’s investments in REITs are reported to the Fund after the end of the calendar year; accordingly, the Fund estimates these amounts for accounting purposes until the characterization of REIT distributions is reported to the Fund after the end of the calendar year. Estimates are based on the most recent REIT distribution information available.
The performance of a REIT may be affected by its failure to qualify for tax-free pass-through of income under the Internal Revenue Code of 1986, as amended (the “Code”), or its failure to maintain exemption from registration under the 1940 Act. Due to the Fund’s investments in REITs, the Fund may also make distributions in excess of the Fund’s earnings and capital gains. Distributions, if any, in excess of the Fund’s earnings and profits will first reduce the adjusted tax basis of a holder’s shares and, after that basis has been reduced to zero, will constitute capital gains to the shareholder.
H. Federal Tax and Tax Basis Information
The timing and character of income and capital gain distributions are determined in accordance with income tax regulations, which may differ from U.S. GAAP. Reclassifications are made to the Fund’s capital accounts for permanent tax differences to reflect income and gains available for distribution (or available capital loss carryforwards) under income tax regulations. The amounts and characteristics of tax basis distributions and composition of distributable earnings/(accumulated losses) are finalized at fiscal year-end; accordingly, tax basis balances have not been determined as of May 31, 2019.
The tax character of the distributions paid during the fiscal year ended November 30, 2018 was as follows:
| | | Ordinary Income | |
| November 30, 2018 | | | |
| Cohen & Steers Global Realty Majors ETF | | $ | 2,627,653 | |
Cohen & Steers Global Realty Majors ETF
| Notes to Financial Statements | May 31, 2019 (Unaudited) |
Under current law, capital losses maintain their character as short-term or long-term and are carried forward to the next tax year without expiration. As of November 30, 2018, the following amounts are available as carry forwards to the next tax year:
| Fund | | Short-Term | | | Long-Term | |
| Cohen & Steers Global Realty Majors ETF | | $ | 1,091,915 | | | $ | 3,452,476 | |
As of May 31, 2019, the cost of investments for federal income tax purposes and accumulated net unrealized appreciation/(depreciation) on investments were as follows:
| Gross appreciation (excess of value over tax cost) | | $ | 10,593,456 | |
| Gross depreciation (excess of tax cost over value) | | | (2,459,000 | ) |
| Net unrealized appreciation (depreciation) | | | 8,134,456 | |
| Cost of investments for income tax purposes | | $ | 43,317,676 | |
The differences between book-basis and tax-basis are primarily due to the deferral of losses from wash sales. In addition, certain tax cost basis adjustments are finalized at fiscal year-end and therefore have not been determined as of May 31, 2019.
I. Income Taxes
No provision for income taxes is included in the accompanying financial statements, as the Fund intends to distribute to shareholders all taxable investment income and realized gains and otherwise comply with Subchapter M of the Internal Revenue Code of 1986, as amended, applicable to regulated investment companies. The Fund evaluates tax positions taken (or expected to be taken) in the course of preparing the Fund’s tax returns to determine whether these positions meet a “more-likely-than-not” standard that, based on the technical merits, have a more than fifty percent likelihood of being sustained by a taxing authority upon examination. A tax position that meets the “more-likely-than-not” recognition threshold is measured to determine the amount of benefit to recognize in the financial statements.
As of and during the six months ended May 31, 2019, the Fund did not have a liability for any unrecognized tax benefits. The Fund files U.S. federal, state, and local tax returns as required. The Fund’s tax returns are subject to examination by the relevant tax authorities until expiration of the applicable statute of limitations, which is generally three years after the filing of the tax return, but may extend to four years in certain jurisdictions. Tax returns for open years have incorporated no uncertain tax positions that require a provision for income taxes.
J. Lending of Portfolio Securities
The Fund has entered into a securities lending agreement with State Street Bank & Trust Co. (“SSB”), the Fund’s lending agent. The Fund may lend its portfolio securities only to borrowers that are approved by SSB. The Fund will limit such lending to not more than 33 1/3% of the value of its total assets. The Fund’s securities held at SSB as custodian shall be available to be lent except those securities the Fund or ALPS Advisors, Inc. specifically identifies in writing as not being available for lending. The borrower pledges and maintains with the Fund collateral consisting of cash (U.S. Dollars only), securities issued or guaranteed by the U.S. government or its agencies or instrumentalities, and cash equivalents (including irrevocable bank letters of credit) issued by a person other than the borrower or an affiliate of the borrower. The initial collateral received by the Fund is required to have a value of no less than 102% of the market value of the loaned securities for U.S equity securities and a value of no less than 105% of the market value for non-U.S. equity securities. The collateral is maintained thereafter, at a market value equal to not less than 102% of the current value of the U.S. equity securities on loan and not less than 105% of the current value of the non-U.S. equity securities on loan. The market value of the loaned securities is determined at the close of each business day and any additional required collateral is delivered to the Fund on the next business day. During the term of the loan, the Fund is entitled to all distributions made on or in respect of the loaned securities. Loans of securities are terminable at any time and the borrower, after notice, is required to return borrowed securities within the customary time period for settlement of securities transactions.
Any cash collateral received is reinvested in a money market fund managed by SSB as disclosed in the Fund’s Schedule of Investments and is reflected in the Statement of Assets and Liabilities as a payable for collateral upon return of securities loaned. Non-cash collateral, in the form of securities issued or guaranteed by the U.S. government or its agencies or instrumentalities, is not disclosed in the Fund’s Statement of Assets and Liabilities as it is held by the lending agent on behalf of the Fund, and the Fund does not have the ability to re-hypothecate these securities. Income earned by the Fund from securities lending activity is disclosed in the Statement of Operations. As of May 31, 2019, the Fund had no securities on loan.
The risks of securities lending include the risk that the borrower may not provide additional collateral when required or may not return the securities when due. To mitigate these risks, the Fund benefits from a borrower default indemnity provided by SSB. SSB’s indemnity allows for full replacement of securities lent wherein SSB will purchase the unreturned loaned securities on the open market by applying the proceeds of the collateral, or to the extent such proceeds are insufficient or the collateral is unavailable, SSB will purchase the unreturned loan securities at SSB’s expense. However, the Fund could suffer a loss if the value of the investments purchased with cash collateral falls below the value of the cash collateral received.
Cohen & Steers Global Realty Majors ETF
| Notes to Financial Statements | May 31, 2019 (Unaudited) |
3. INVESTMENT ADVISORY FEE AND OTHER AFFILIATED TRANSACTIONS
ALPS Advisors, Inc. (the “Adviser”) serves as the Fund’s investment adviser pursuant to an Investment Advisory Agreement with the Trust on behalf of the Fund (the “Advisory Agreement”). Pursuant to the Advisory Agreement, the Fund pays the Adviser an annual management fee for the services and facilities it provides, payable on a monthly basis at the annual rate of 0.55% of the Fund’s average daily net assets. From time to time, the Adviser may waive all or a portion of its fee.
Out of the unitary management fees, the Adviser pays substantially all expenses of the Fund, including the cost of transfer agency, custody, fund administration, legal, audit, independent trustees and other services, except for interest expenses, distribution fees or expenses, brokerage expenses, taxes and extraordinary expenses not incurred in the ordinary course of the Fund’s business. The Adviser’s unitary management fee is designed to pay substantially all of the Fund’s expenses and to compensate the Adviser for providing services to the Fund.
ALPS Fund Services, Inc., an affiliate of the Adviser, is the administrator of the Fund.
Each Trustee who is not an officer or employee of the Adviser, any sub-adviser or any of their affiliates (“Independent Trustees”) receives (1) a quarterly retainer of $5,000, (2) a per meeting fee for regularly scheduled meetings of $3,750, (3) $1,500 for any special meeting held outside of a regularly scheduled board meeting, and (4) reimbursement for all reasonable out-of-pocket expenses relating to attendance at meetings. In addition, the Chairman of the Board and Chairman of the Audit Committee each receives a quarterly retainer of $2,000, in connection with their respective roles.
4. PURCHASES AND SALES OF SECURITIES
For the six months ended May 31, 2019, the cost of purchases and proceeds from sales of investment securities, excluding in-kind transactions and short-term investments, were as follows:
| Purchases | | | Sales | |
| $ | 1,696,160 | | | $ | 1,971,880 | |
For the six months ended May 31, 2019, the cost of in-kind purchases and proceeds from in-kind sales were as follows:
| Purchases | | | Sales | |
| $ | – | | | $ | 6,848,458 | |
For the six months ended May 31, 2019, the Cohen and Steers Global Realty Majors ETF had in-kind net realized gains of $1,413,904.
Gains on in-kind transactions are not considered taxable for federal income tax purposes and losses on in-kind transactions are also not deductible for tax purposes.
5. CAPITAL SHARE TRANSACTIONS
Shares are created and redeemed by the Fund only in Creation Unit size aggregations of 50,000 Shares. Only broker-dealers or large institutional investors with creation and redemption agreements called Authorized Participants (“AP”) are permitted to purchase or redeem Creation Units from the Fund. Such transactions are generally permitted on an in-kind basis, with a balancing cash component to equate the transaction to the NAV per unit of the Fund on the transaction date. Cash may be substituted equivalent to the value of certain securities generally when they are not available in sufficient quantity for delivery, not eligible for trading by the AP or as a result of other market circumstances.
Cohen & Steers Global Realty Majors ETF
| Additional Information | May 31, 2019 (Unaudited) |
PROXY VOTING POLICIES AND PROCEDURES
Information regarding how the Fund voted proxies relating to portfolio securities during the most recent 12-month period ended June 30 and a description of the Fund’s proxy voting policies and procedures used in determining how to vote for proxies are available without charge on the SEC’s website at www.sec.gov and upon request, by calling (toll-free) 1-866-675-2639.
PORTFOLIO HOLDINGS
The Trust is required to disclose, after its first and third fiscal quarters, the complete schedule of the Fund’s portfolio holdings with the SEC on Form N-Q or as an exhibit to its report on Form N-PORT. Forms N-Q or N-PORT reports for the Fund are available on the SEC’s website at www.sec.gov. The Fund’s Forms N-Q or N-PORT reports are available without charge, upon request, by calling (toll-free) 1-866-675-2639 or by writing to ALPS ETF Trust at 1290 Broadway, Suite 1100, Denver, Colorado 80203.
TAX INFORMATION
The Fund designates the following as a percentage of taxable ordinary income distributions, or up to the maximum amount allowable, for the calendar year ended December 31, 2018:
| | Qualified Dividend Income | Dividend Received Deduction |
| Cohen and Steers Global Realty Majors ETF | 39.21% | 0.00% |
In early 2019, if applicable, shareholders of record received this information for the distribution paid to them by the Fund during the calendar year 2018 via Form 1099. The Fund will notify shareholders in early 2020 of amounts paid to them by the Fund, if any, during the calendar year 2019.
LICENSING AGREEMENT
Cohen & Steers is the Index Provider for the Cohen & Steers Global Realty Majors ETF. Cohen & Steers is not affiliated with the Trust, the Adviser or the Distributor. ALPS Fund Services, Inc. (“ALPS”), an affiliate of the Adviser, and the Trust have entered into a license agreement with Cohen & Steers to use the Index.
THE FUND IS NOT SPONSORED, MANAGED OR ADVISED BY COHEN & STEERS CAPTIAL MANAGEMENT, INC. (“C&S”). C&S MAKES NO REPRESENTATION OR WARRANTY, EXPRESS OR IMPLIED, TO THE SHAREHOLDERS OF THE FUND OR ANY MEMBER OF THE PUBLIC REGARDING THE ADVISABILITY OF INVESTING IN SECURITIES GENERALLY OR IN THE FUND PARTICULARLY OR THE ABILITY OF THE COHEN & STEERS GLOBAL REALTY MAJORS INDEX TO TRACK PERFORMANCE OF A MARKET OR SECTOR. C&S’S ONLY RELATIONSHIP TO ALPS IS IN RELATION TO THE LICENSING OF CERTAIN TRADEMARKS AND TRADE NAMES OF C&S AND OF ONE OR MORE C&S INDEXES, INCLUDING THE COHEN & STEERS GLOBAL REALTY MAJORS INDEX WHICH IS DETERMINED, COMPOSED AND CALCULATED BY C&S WITHOUT REGARD TO ALPS OR THE FUND. C&S HAS NO OBLIGATION TO TAKE THE NEEDS OF ALPS, THE FUND OR THE FUND SHAREHOLDERS INTO CONSIDERATION IN DETERMINING, COMPOSING OR CALCULATING THE COHEN & STEERS GLOBAL REALTY MAJORS INDEX. C&S IS NOT RESPONSIBLE FOR AND HAS NOT PARTICIPATED IN THE TIMING OF THE ISSUANCE OR SALE OF FUND SHARES OR IN THE DETERMINATION OR CALCULATION OF THE VALUATION OF THE FUND’S ASSETS. C&S HAS NO OBLIGATION OR LIABILITY IN CONNECTION WITH THE ADMINISTRATION, MARKETING OR PORTFOLIO MANAGEMENT OF THE FUND. C&S DOES NOT GUARANTEE THE ACCURACY AND/OR THE COMPLETENESS OF THE COHEN & STEERS GLOBAL REALTY MAJORS INDEX OR ANY DATA INCLUDED THEREIN AND C&S SHALL HAVE NO LIABILITY FOR ANY ERRORS, OMISSIONS, OR INTERRUPTIONS THEREIN. C&S MAKES NO WARRANTY, EXPRESS OR IMPLIED, AS TO RESULTS TO BE OBTAINED BY ALPS, THE FUND, FUND SHAREHOLDERS, OR ANY OTHER PERSON OR ENTITY FROM THE USE OF THE COHEN & STEERS GLOBAL REALTY MAJORS INDEX OR ANY DATA INCLUDED THEREIN. C&S MAKES NO EXPRESS OR IMPLIED WARRANTIES, AND EXPRESSLY DISCLAIMS ALL WARRANTIES OF MERCHANTABILITY OR FITNESS FOR A PARTICULAR PURPOSE OF USE WITH RESPECT TO THE COHEN & STEERS GLOBAL REALTY MAJORS INDEX OR ANY DATA INCLUDED THEREIN. WITHOUT LIMITING ANY OF THE FOREGOING, IN NO EVENT SHALL C&S HAVE ANY LIABILITY FOR ANY SPECIAL, PUNITIVE, INDIRECT OR CONSEQUENTIAL DAMAGES (INCLUDING LOST PROFITS) RESULTING FROM THE USE OF THE COHEN & STEERS GLOBAL REALTY MAJORS INDEX OR ANY DATA INCLUDED THEREIN, EVEN IF NOTIFIED OF THE POSSIBILITY OF SUCH DAMAGES.
The Advisor does not guarantee the accuracy and/or the completeness of the Index or any data included therein, and the Advisor shall have no liability for any errors, omissions or interruptions therein. The Advisor makes no warranty, express or implied, as to results to be obtained by the Fund, owners of the Shares of the Fund or any other person or entity from the use of the Index or any data included therein. The Advisor makes no express or implied warranties, and expressly disclaims all warranties of merchantability or fitness for a particular purpose or use with respect to the Index or any data included therein. Without limiting any of the foregoing, in no event shall the Advisor have any liability for any special, punitive, direct, indirect or consequential damages (including lost profits) arising out of matters relating to the use of the Index even if notified of the possibility of such damages.

TABLE OF
CONTENTS
| Performance Overview | |
| RiverFront Dynamic Core Income ETF | 1 |
| RiverFront Dynamic Unconstrained Income ETF | 3 |
| RiverFront Dynamic US Dividend Advantage ETF | 5 |
| RiverFront Dynamic US Flex-Cap ETF | 7 |
| RiverFront Strategic Income Fund | 9 |
| Disclosure of Fund Expenses | 11 |
| Financial Statements | |
| Schedule of Investments | |
| RiverFront Dynamic Core Income ETF | 12 |
| RiverFront Dynamic Unconstrained Income ETF | 19 |
| RiverFront Dynamic US Dividend Advantage ETF | 23 |
| RiverFront Dynamic US Flex-Cap ETF | 25 |
| RiverFront Strategic Income Fund | 27 |
| Statement of Assets and Liabilities | 30 |
| Statement of Operations | 31 |
| Statements of Changes in Net Assets | |
| RiverFront Dynamic Core Income ETF | 32 |
| RiverFront Dynamic Unconstrained Income ETF | 33 |
| RiverFront Dynamic US Dividend Advantage ETF | 34 |
| RiverFront Dynamic US Flex-Cap ETF | 35 |
| RiverFront Strategic Income Fund | 36 |
| Financial Highlights | 37 |
| Notes to Financial Statements | 42 |
| Additional Information | 50 |
Beginning on January 1, 2021, as permitted by regulations adopted by the U.S. Securities and Exchange Commission, paper copies of the Funds’ annual and semi-annual shareholder reports will no longer be sent by mail, unless you specifically request paper copies of the reports from your financial intermediary (such as a broker-dealer or bank). Instead, the reports will be made available on the Funds’ website (www.alpsfunds. com), and you will be notified by mail each time a report is posted and provided with a website link to access the report.
If you already elected to receive shareholder reports electronically, you will not be affected by this change and you need not take any action. You may elect to receive shareholder reports and other communications from a Fund electronically anytime by contacting your financial intermediary.
You may elect to receive all future reports in paper free of charge. You can contact your financial intermediary to request that you continue to receive paper copies of your shareholder reports. Your election to receive reports in paper will apply to all funds held in your account with your financial intermediary.
alpsfunds.com
RiverFront Dynamic Core Income ETF
| Performance Overview | May 31, 2019 (Unaudited) |
Investment Objective
RiverFront Dynamic Core Income ETF (the “Fund”) seeks total return, with an emphasis on income as the source of that total return. The Fund seeks to achieve its investment objective by investing in a global portfolio of fixed income securities of various maturities, ratings and currency denominations.
Performance Overview
RFCI underperformed its benchmark by 0.13% over the six-month period ended 5/31/19, based on its returns at NAV. The Fund continues to prefer corporate bonds, which offer a yield advantage to US Treasuries and Mortgages. In this timeframe, investment grade corporate bond spreads tightened by about 10 basis points, according to the BofAML US Corporate Index (C0A0). As of 5/31/19, the Fund’s option-adjusted duration was 5.64 years compared to 5.66 years for its benchmark. Additionally, the average credit quality of the Fund was approximately A, compared to AA for its benchmark.
Performance(as of May 31, 2019)
| | 6 Months | 1 Year | Since Inception^ |
| RiverFront Dynamic Core Income ETF – NAV | 6.59% | 6.06% | 2.02% |
| RiverFront Dynamic Core Income ETF – Market Price* | 6.72% | 6.15% | 2.07% |
| Bloomberg Barclays U.S. Aggregate Bond Total Return Index | 6.72% | 6.40% | 2.16% |
Total Expense Ratio (per the current prospectus) 0.53%.
Performance data quoted represents past performance. Past performance does not guarantee future results. The table does not reflect the deduction of taxes that a shareholder would pay on Fund distributions or the redemption of Fund shares. Investment return and principal value of an investment will fluctuate so that an investor’s shares, when sold or redeemed, may be worth more or less than the original cost. Current performance data may be higher or lower than actual data quoted. For the most current month-end performance data please visit www.alpsfunds.com or call 1.866.759.5679.
NAV is an exchange-traded fund’s per-share value. The per-share dollar amount of the fund is derived by dividing the total value of all the securities in its portfolio, less any liabilities, by the number of fund shares outstanding. Market Price is the price at which a share can currently be traded in the market. Information detailing the number of days the Market Price of the Fund was greater than the Fund’s NAV and the number of days it was less than the Fund’s NAV can be obtained at www.alpsfunds.com.
| ^ | The Fund commenced operations on June 14, 2016. |
| * | Market Price is based on the midpoint of the bid-ask spread at 4 p.m. ET and does not represent the returns an investor would receive if shares were traded at other times. |
Bloomberg Barclays U.S. Aggregate Bond Total Return Indexis a broad-based benchmark that measures the investment grade, U.S. dollardenominated, fixed-rate taxable bond market, including Treasuries, government-related and corporate securities, MBS (agency fixed-rate and hybrid ARM pass-throughs), ABS, and CMBS (agency and non-agency). The index is reported on a total return basis, which assumes reinvestment of any dividends and distributions realized during a given time period. The index is not actively managed and does not reflect any deductions for fees, expenses or taxes. One cannot invest directly in an index. Index performance does not reflect fund performance.
The RiverFront Dynamic Core Income ETF is not suitable for all investors. Investments in the Fund are subject to investment risks, including possible loss of the principal amount invested.
The Fund’s shares are not individually redeemable. Investors buy and sell shares of the Fund on a secondary market. Only market makers or “authorized participants” may trade directly with the Fund, typically in blocks of 50,000 shares.
ALPS Portfolio Solutions Distributor, Inc., a FINRA member, is the Distributor for the RiverFront Dynamic Core Income ETF.
RiverFront Dynamic Core Income ETF
| Performance Overview | May 31, 2019 (Unaudited) |
Top 10 Holdings*^(as of May 31, 2019)
| United States Treasury Bond 2.75%, 2/15/2028 | 6.91% |
| United States Treasury Note 3.00%, 10/31/2025 | 3.48% |
| United States Treasury Note 2.875%, 11/15/2021 | 3.36% |
| United States Treasury Strip Principal 08/15/2039 | 2.43% |
| United States Treasury Strip Principal 02/15/2038 | 2.12% |
| United States Treasury Note 2.875%, 10/31/2023 | 2.05% |
| United States Treasury Bond 2.75%, 11/15/2047 | 1.29% |
| United States Treasury Strip Principal 05/15/2048 | 1.23% |
| United States Treasury Bond 3.875%, 08/15/2040 | 1.14% |
| United States Treasury Strip Principal 11/15/2046 | 0.96% |
| Total % of Top 10 Holdings | 24.99% |
| ^ | Excludes Money Market Fund |
Asset Allocation*(as of May 31, 2019)
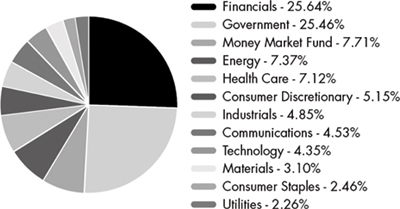
Future holdings are subject to change.
Growth of $10,000(as of May 31, 2019)
Comparison of Change in Value of $10,000 Investment in the Fund and the Fund’s benchmark
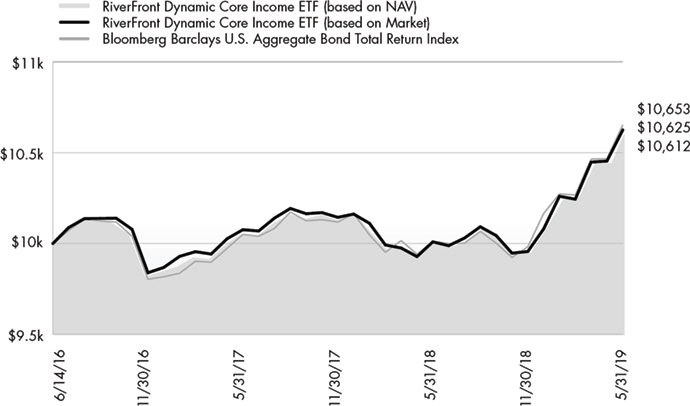
The chart above represents historical performance of a hypothetical investment of $10,000 in the Fund over the life of the Fund. Past performance does not guarantee future results. This chart does not reflect the deduction of taxes that a shareholder would pay on Fund distributions or the redemption of Fund shares.
RiverFront Dynamic Unconstrained Income ETF
| Performance Overview | May 31, 2019 (Unaudited) |
Investment Objective
RiverFront Dynamic Unconstrained Income ETF (the “Fund”) seeks total return, with an emphasis on income as the source of that total return. The Fund seeks to achieve its investment objective by investing in a global portfolio of fixed income securities of various maturities, ratings and currency denominations.
Performance Overview
RFUN underperformed its benchmark by 0.71% over the six months ending 5/31/19, based on its return at NAV. The primary reason for the Fund’s underperformance was due to an elevated cash position. Furthermore, the Fund continues to hold a significant underweight to the lowest rated (CCC) bonds. As of 5/31/19, the Fund’s SEC yield was 4.88%, its yield-to-worst was 5.24% and its option-adjusted duration was 2.77 years. Additionally, the average credit quality of the Fund was approximately B+.
Performance(as of May 31, 2019)
| | 6 Months | 1 Year | Since Inception^ |
| RiverFront Dynamic Unconstrained Income ETF – NAV | 4.45% | 4.71% | 4.93% |
| RiverFront Dynamic Unconstrained Income ETF – Market Price* | 4.42% | 4.04% | 4.77% |
| ICE BofAML U.S. High Yield Master II Total Return Index | 5.16% | 5.37% | 6.90% |
Total Expense Ratio (per the current prospectus) 0.52%.
Performance data quoted represents past performance. Past performance does not guarantee future results. The table does not reflect the deduction of taxes that a shareholder would pay on Fund distributions or the redemption of Fund shares. Investment return and principal value of an investment will fluctuate so that an investor’s shares, when sold or redeemed, may be worth more or less than the original cost. Current performance data may be higher or lower than actual data quoted. For the most current month-end performance data please visit www.alpsfunds.com or call 1.866.759.5679.
NAV is an exchange-traded fund’s per-share value. The per-share dollar amount of the fund is derived by dividing the total value of all the securities in its portfolio, less any liabilities, by the number of fund shares outstanding. Market Price is the price at which a share can currently be traded in the market. Information detailing the number of days the Market Price of the Fund was greater than the Fund’s NAV and the number of days it was less than the Fund’s NAV can be obtained at www.alpsfunds.com.
| ^ | The Fund commenced operations on June 14, 2016. |
| * | Market Price is based on the midpoint of the bid-ask spread at 4 p.m. ET and does not represent the returns an investor would receive if shares were traded at other times. |
ICE BofAML U.S. High Yield Master II Total Return Indextracks the performance of below-investment grade U.S. dollar-denominated corporate bonds issued in the U.S. Domestic market. The index is reported on a total return basis, which assumes reinvestment of any dividends and distributions realized during a given time period. The index is not actively managed and does not reflect any deductions for fees, expenses or taxes. One cannot invest directly in an index. Index performance does not reflect fund performance.
The RiverFront Dynamic Unconstrained Income ETF is not suitable for all investors. Investments in the Fund are subject to investment risks, including possible loss of the principal amount invested.
The Fund’s shares are not individually redeemable. Investors buy and sell shares of the Fund on a secondary market. Only market makers or “authorized participants” may trade directly with the Fund, typically in blocks of 50,000 shares.
ALPS Portfolio Solutions Distributor, Inc., a FINRA member, is the Distributor for the RiverFront Dynamic Unconstrained Income ETF.
RiverFront Dynamic Unconstrained Income ETF
| Performance Overview | May 31, 2019 (Unaudited) |
Top 10 Holdings*^(as of May 31, 2019)
| Altice Financing SA | 1.37% |
| CenturyLink, Inc. | 1.18% |
| T-Mobile USA, Inc. | 1.17% |
| CIT Group, Inc. | 1.08% |
| HCA, Inc. | 1.07% |
| Sprint Communications, Inc. | 0.96% |
| XPO Logistics, Inc. | 0.95% |
| Ally Financial, Inc. | 0.94% |
| Ascent Resources Utica Holdings LLC / ARU Finance Corp. | 0.93% |
| CHS/Community Health Systems, Inc. | 0.92% |
| Total % of Top 10 Holdings | 10.57% |
| ^ | Excludes Money Market Fund |
Asset Allocation*(as of May 31, 2019)
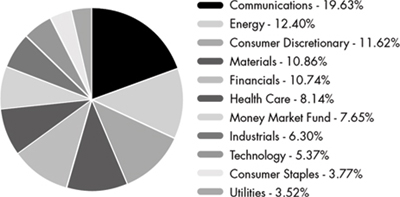
Future holdings are subject to change.
Growth of $10,000(as of May 31, 2019)
Comparison of Change in Value of $10,000 Investment in the Fund and the Fund’s benchmark
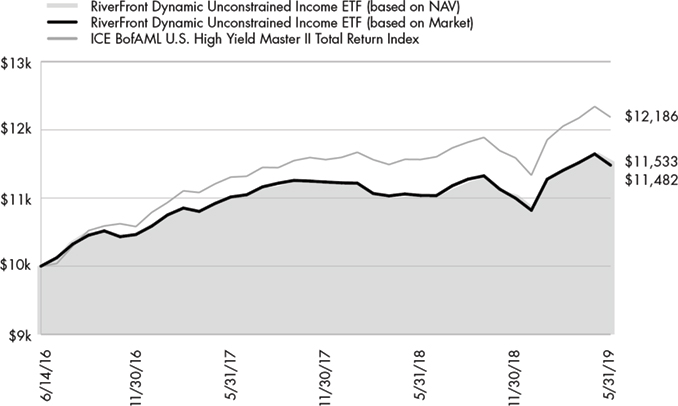
The chart above represents historical performance of a hypothetical investment of $10,000 in the Fund over the life of the Fund. Past performance does not guarantee future results. This chart does not reflect the deduction of taxes that a shareholder would pay on Fund distributions or the redemption of Fund shares.
RiverFront Dynamic US Dividend Advantage ETF
| Performance Overview | May 31, 2019 (Unaudited) |
Investment Objective
RiverFront Dynamic US Dividend Advantage ETF (the “Fund”) seeks to provide capital appreciation and dividend income. The Fund seeks to achieve its investment objective by investing at least 65% of its net assets in a portfolio of equity securities of publicly traded U.S. companies with the potential for dividend growth. Equity securities include common stocks and common or preferred shares of real estate investment trusts (“REITs”).
Performance Overview
The Fund underperformed its S&P 500 benchmark over the six-month period ended May 31, 2019, due largely to stock selection decisions. The period was dominated by policy headlines including the ‘on again, off again’ trade discussions between the US and China, the Federal Government shutdown and the Fed’s shift toward more accommodative monetary policy.
Security selection weakness was led by technology, consumer staples and consumer discretionary stocks. The only security selection bright spots occurred in healthcare and materials. The period was also a time where companies with ‘value’ characteristics, a bias in our portfolios, significantly underperformed their peers.
Performance(as of May 31, 2019)
| | 6 Months | 1 Year | Since Inception^ |
| RiverFront Dynamic US Dividend Advantage ETF – NAV | -1.93% | -3.67% | 8.58% |
| RiverFront Dynamic US Dividend Advantage ETF – Market Price* | -1.84% | -3.76% | 8.58% |
| S&P 500® Total Return Index | 0.74% | 3.78% | 11.56% |
Total Expense Ratio (per the current prospectus) 0.52%.
Performance data quoted represents past performance. Past performance does not guarantee future results. The table does not reflect the deduction of taxes that a shareholder would pay on Fund distributions or the redemption of Fund shares. Investment return and principal value of an investment will fluctuate so that an investor’s shares, when sold or redeemed, may be worth more or less than the original cost. Current performance data may be higher or lower than actual data quoted. For the most current month-end performance data please visit www.alpsfunds.com or call 1.866.759.5679.
NAV is an exchange-traded fund’s per-share value. The per-share dollar amount of the fund is derived by dividing the total value of all the securities in its portfolio, less any liabilities, by the number of fund shares outstanding. Market Price is the price at which a share can currently be traded in the market. Information detailing the number of days the Market Price of the Fund was greater than the Fund’s NAV and the number of days it was less than the Fund’s NAV can be obtained at www.alpsfunds.com.
| ^ | The Fund commenced operations on June 7, 2016. |
| * | Market Price is based on the midpoint of the bid-ask spread at 4 p.m. ET and does not represent the returns an investor would receive if shares were traded at other times. |
S&P 500® Total Return Indexis the Standard & Poor’s composite index of 500 stocks, a widely recognized, unmanaged index of common stock prices. The index is reported on a total return basis, which assumes reinvestment of any dividends and distributions realized during a given time period. The index is not actively managed and does not reflect any deductions for fees, expenses or taxes. One cannot invest directly in an index. Index performance does not reflect fund performance.
The RiverFront Dynamic US Dividend Advantage ETF is not suitable for all investors. Investments in the Fund are subject to investment risks, including possible loss of the principal amount invested.
The Fund’s shares are not individually redeemable. Investors buy and sell shares of the Fund on a secondary market. Only market makers or “authorized participants” may trade directly with the Fund, typically in blocks of 50,000 shares.
ALPS Portfolio Solutions Distributor, Inc., a FINRA member, is the Distributor for the RiverFront Dynamic US Dividend Advantage ETF.
RiverFront Dynamic US Dividend Advantage ETF
| Performance Overview | May 31, 2019 (Unaudited) |
Top 10 Holdings*(as of May 31, 2019)
| Apple, Inc. | 4.30% |
| Amazon.com, Inc. | 3.99% |
| Microsoft Corp. | 3.02% |
| JPMorgan Chase & Co. | 2.39% |
| Procter & Gamble Co. | 2.23% |
| Pfizer, Inc. | 2.08% |
| Bank of America Corp. | 2.05% |
| Home Depot, Inc. | 2.04% |
| Merck & Co., Inc. | 1.94% |
| Eli Lilly & Co. | 1.82% |
| Total % of Top 10 Holdings | 25.86% |
Asset Allocation*(as of May 31, 2019)
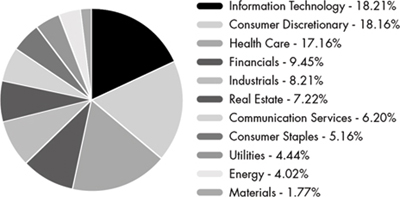
Future holdings are subject to change.
Growth of $10,000(as of May 31, 2019)
Comparison of Change in Value of $10,000 Investment in the Fund and the Fund’s benchmark
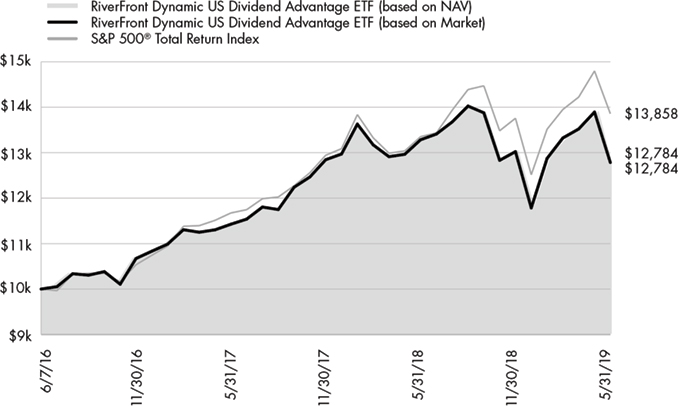
The chart above represents historical performance of a hypothetical investment of $10,000 in the Fund over the life of the Fund. Past performance does not guarantee future results. This chart does not reflect the deduction of taxes that a shareholder would pay on Fund distributions or the redemption of Fund shares.
RiverFront Dynamic US Flex-Cap ETF
| Performance Overview | May 31, 2019 (Unaudited) |
Investment Objective
RiverFront Dynamic US Flex-Cap ETF (the “Fund”) seeks to provide capital appreciation. The Fund seeks to achieve its investment objective by investing at least 65% of its net assets in a portfolio of equity securities of publicly traded U.S. companies. Equity securities include common stocks and common or preferred shares of real estate investment trusts (“REITs”).
Performance Overview
The Fund underperformed its S&P 1500 benchmark over the six-month period ended May 31, 2019, due largely to stock selection decisions. The period was dominated by policy headlines including the ‘on again, off again’ trade discussions between the US and China, the Federal Government shutdown and the Fed’s shift toward more accommodative monetary policy.
Security selection weakness was led by financials, consumer discretionary and industrial stocks, which significantly overshadowed the smaller positive contributions from material, telecommunication and technology stocks. The period was also a time where companies with ‘value’ characteristics, a bias in our portfolios, significantly underperformed their peers.
Performance(as of May 31, 2019)
| | 6 Months | 1 Year | Since Inception^ |
| RiverFront Dynamic US Flex-Cap ETF – NAV | -4.71% | -6.49% | 8.54% |
| RiverFront Dynamic US Flex-Cap ETF – Market Price* | -4.77% | -6.63% | 8.53% |
| S&P Composite 1500® Total Return Index | 0.28% | 2.70% | 11.24% |
Total Expense Ratio (per the current prospectus) 0.52%.
Performance data quoted represents past performance. Past performance does not guarantee future results. The table does not reflect the deduction of taxes that a shareholder would pay on Fund distributions or the redemption of Fund shares. Investment return and principal value of an investment will fluctuate so that an investor’s shares, when sold or redeemed, may be worth more or less than the original cost. Current performance data may be higher or lower than actual data quoted. For the most current month-end performance data please visit www.alpsfunds.com or call 1.866.759.5679.
NAV is an exchange-traded fund’s per-share value. The per-share dollar amount of the fund is derived by dividing the total value of all the securities in its portfolio, less any liabilities, by the number of fund shares outstanding. Market Price is the price at which a share can currently be traded in the market. Information detailing the number of days the Market Price of the Fund was greater than the Fund’s NAV and the number of days it was less than the Fund’s NAV can be obtained at www.alpsfunds.com.
| ^ | The Fund commenced operations on June 7, 2016. |
| * | Market Price is based on the midpoint of the bid-ask spread at 4 p.m. ET and does not represent the returns an investor would receive if shares were traded at other times. |
S&P Composite 1500® Total Return Indexis the Standard & Poor’s broad-based unmanaged capitalization-weighted index comprising 1,500 stocks of Large-cap, Mid-cap, and Small-cap U.S. companies. The index is reported on a total return basis, which assumes reinvestment of any dividends and distributions realized during a given time period. The index is not actively managed and does not reflect any deductions for fees, expenses or taxes. One cannot invest directly in an index. Index performance does not reflect fund performance.
The RiverFront Dynamic US Flex-Cap ETF is not suitable for all investors. Investments in the Fund are subject to investment risks, including possible loss of the principal amount invested.
The Fund’s shares are not individually redeemable. Investors buy and sell shares of the Fund on a secondary market. Only market makers or “authorized participants” may trade directly with the Fund, typically in blocks of 50,000 shares.
ALPS Portfolio Solutions Distributor, Inc., a FINRA member, is the Distributor for the RiverFront Dynamic US Flex-Cap ETF.
RiverFront Dynamic US Flex-Cap ETF
| Performance Overview | May 31, 2019 (Unaudited) |
Top 10 Holdings*(as of May 31, 2019)
| Microsoft Corp. | 4.12% |
| Apple, Inc. | 3.45% |
| Amazon.com, Inc. | 3.41% |
| Facebook, Inc. | 2.34% |
| Alphabet, Inc., Class A | 1.99% |
| Johnson & Johnson | 1.96% |
| Alphabet, Inc., Class C | 1.94% |
| Exxon Mobil Corp. | 1.73% |
| Bank of America Corp. | 1.60% |
| Comcast Corp. | 1.51% |
| Total % of Top 10 Holdings | 24.05% |
Asset Allocation*(as of May 31, 2019)
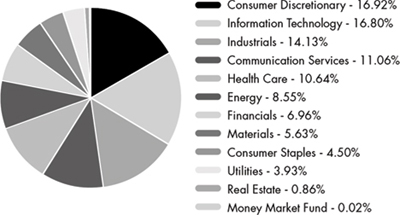
Future holdings are subject to change.
Growth of $10,000(as of May 31, 2019)
Comparison of Change in Value of $10,000 Investment in the Fund and the Fund’s benchmark
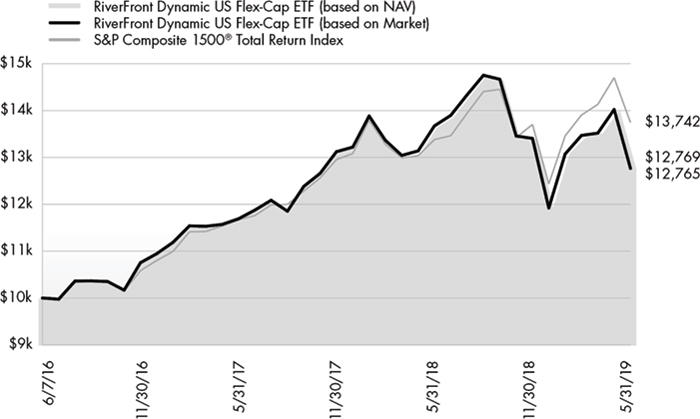
The chart above represents historical performance of a hypothetical investment of $10,000 in the Fund over the life of the Fund. Past performance does not guarantee future results. This chart does not reflect the deduction of taxes that a shareholder would pay on Fund distributions or the redemption of Fund shares.
RiverFront Strategic Income Fund
| Performance Overview | May 31, 2019 (Unaudited) |
Investment Objective
The RiverFront Strategic Income Fund (the “Fund”) seeks total return, with an emphasis on income as the source of that total return. The Fund seeks to achieve its investment objective by investing in a global portfolio of fixed income securities of various maturities, ratings and currency denominations. The Fund intends to utilize various investment strategies in a broad array of fixed income sectors.
Performance Overview
RIGS underperformed its benchmark by 3.41% over the six-month period ending 5/31/19, based on its return at NAV. The primary sources of the fund’s underperformance were its shorter duration and its lower credit quality. Over the preceding six months, the fund continued to be invested primarily in shorter-maturity, higher quality, below investment grade rated bonds. The fund’s performance was in-line with the performance of the Ice BofAML 1-5 Year US Cash Pay High Yield Index (3.5%). Treasury yields fell significantly during this period, leading shorter duration securities to underperform. As of 5/31/19, the duration of the fund was about 1.4 years compared to about 5.9 years for its benchmark. In addition, high yield spreads widened during this period, while investment grade corporate bond spreads tightened. The average credit quality of the fund was approximately BB-rated, compared to AA-rated for its benchmark.
Performance(as of May 31, 2019)
| | 6 Months | 1 Year | 3 Year | 5 Year | Since Inception^ |
| RiverFront Strategic Income Fund – NAV | 3.31% | 4.52% | 4.24% | 3.50% | 4.12% |
| RiverFront Strategic Income Fund – Market Price* | 4.20% | 5.51% | 4.49% | 3.58% | 4.26% |
| Bloomberg Barclays U.S. Aggregate Bond Total Return Index | 6.72% | 6.40% | 2.50% | 2.70% | 3.05% |
Total Expense Ratio (per the current prospectus) 0.48%. The Fund’s management fees consist of a fee of 0.11% paid to the Fund’s investment adviser and a fee of 0.35% paid to the Fund’s sub-adviser.
Performance data quoted represents past performance. Past performance does not guarantee future results. The table does not reflect the deduction of taxes that a shareholder would pay on Fund distributions or the redemption of Fund shares. Investment return and principal value of an investment will fluctuate so that an investor’s shares, when sold or redeemed, may be worth more or less than the original cost. Current performance data may be higher or lower than actual data quoted. For most current month-end performance data please visit www.alpsfunds.com or call 1.866.759.5679.
NAV is an exchange-traded fund’s per-share value. The per-share dollar amount of the Fund is derived by dividing the total value of all the securities in its portfolio, less any liabilities, by the number of Fund shares outstanding. Market Price is the price at which a share can currently be traded in the market. Information detailing the number of days the Market Price of the Fund was greater than the Fund’s NAV and the number of days it was less than the Fund’s NAV can be obtained at www.alpsfunds.com.
| ^ | The Fund commenced Investment Operations on October 8, 2013. |
| * | Market Price is based on the midpoint of the bid/ask spread at 4 p.m. ET and does not represent the returns an investor would receive if shares were traded at other times |
Duration is a measure of the sensitivity of the price (the value of principal) of a fixed-income investment to a change in interest rates. Duration is expressed as a number of years. The duration number is a calculation involving present value, yield, coupon, final maturity and call features. The bigger the duration number, the greater the interest-rate risk or reward for bond prices. Rising interest rates mean falling bond prices, while declining interest rates mean rising bond prices.
Bloomberg Barclays U.S. Aggregate Bond Total Return Indexis a broad-based benchmark that measures the investment grade, U.S. dollardenominated, fixed-rate taxable bond market, including Treasuries, government-related and corporate securities, MBS (agency fixed-rate and hybrid ARM pass-throughs), ABS, and CMBS (agency and non-agency). The index is reported on a total return basis, which assumes reinvestment of any dividends and distributions realized during a given time period. The index is not actively managed and does not reflect any deductions for fees, expenses or taxes. One cannot invest directly in an index. Index performance does not reflect fund performance.
The RiverFront Strategic Income Fund is not suitable for all investors. Investments in the Fund are subject to investment risks, including possible loss of the principal amount invested.
ALPS Portfolio Solutions Distributor, Inc., a FINRA member, is the distributor for the RiverFront Strategic Income Fund.
RiverFront Strategic Income Fund
| Performance Overview | May 31, 2019 (Unaudited) |
Top 10 Holdings*^(as of May 31, 2019)
| Sprint Communications, Inc. | 1.51% |
| HCA, Inc. | 1.46% |
| CIT Group, Inc. | 1.45% |
| Park Aerospace Holdings, Ltd. | 1.43% |
| WESCO Distribution, Inc. | 1.42% |
| Cablevision Systems Corp. | 1.42% |
| DISH DBS Corp. | 1.41% |
| T-Mobile USA, Inc. | 1.39% |
| CenturyLink, Inc. | 1.34% |
| Energy Transfer Operating LP | 1.33% |
| Total % of Top 10 Holdings | 14.16% |
| ^ | Excludes Money Market Fund |
Asset Allocation*(as of May 31, 2019)
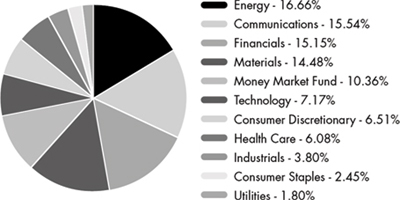
Future holdings are subject to change.
Growth of $10,000(as of May 31, 2019)
Comparison of Change in Value of $10,000 Investment in the Fund and the Fund’s benchmark

The chart above represents historical performance of a hypothetical investment of $10,000 in the Fund over the life of the Fund. Past performance does not guarantee future results. This chart does not reflect the deduction of taxes that a shareholder would pay on Fund distributions or the redemption of Fund shares.
RiverFront ETFs
| Disclosure of Fund Expenses | May 31, 2019 (Unaudited) |
Shareholder Expense Example:As a shareholder of a Fund, you incur two types of costs: (1) transaction costs which may include creation and redemption fees or brokerage charges, and (2) ongoing costs, including management fees and other Fund expenses. These examples are intended to help you understand your ongoing costs (in dollars) of investing in a Fund and to compare these costs with the ongoing costs of investing in other funds. It is based on an investment of $1,000 invested at the beginning of the (six month) period and held through May 31, 2019.
Actual Return:The first line of the table provides information about actual account values and actual expenses. You may use the information in this line, together with the amount you invested, to estimate the expenses that you incurred over the period. Simply divide your account value by $1,000 (for example, an $8,600 account value divided by $1,000 = 8.6), then multiply the result by the number in the first line under the heading entitled “Expenses Paid During Period” to estimate the expenses attributable to your investment during this period.
Hypothetical 5% Return:The second line of the table provides information about hypothetical account values and hypothetical expenses based on the Fund’s actual expense ratio and an assumed rate of return of 5% per year before expenses, which is not the Fund’s actual return. The hypothetical account values and expenses may not be used to estimate the actual ending account balance or expenses you paid for the period. You may use this information to compare ongoing costs of investing in the Fund and other funds. To do so, compare this 5% hypothetical example with the 5% hypothetical examples that appear in the shareholder reports of other funds.
The expenses shown in the table are meant to highlight ongoing Fund costs only and do not reflect any transaction costs, such as creation and redemption fees or brokerage charges. Therefore, the second line is useful in comparing ongoing costs only, and will not help you determine the relative total costs of owning different funds. In addition, if these costs were included, your costs would have been higher.
| | Beginning Account Value 12/1/18 | Ending Account Value 5/31/19 | Expense
Ratio(a) | Expenses Paid During Period 12/1/18- 5/31/19(b) |
| RiverFront Dynamic Core Income ETF | | | | |
| Actual | $1,000.00 | $1,065.90 | 0.51% | $2.63 |
| Hypothetical (5% return before expenses) | $1,000.00 | $1,022.39 | 0.51% | $2.57 |
| RiverFront Dynamic Unconstrained Income ETF | | | | |
| Actual | $1,000.00 | $1,044.50 | 0.51% | $2.60 |
| Hypothetical (5% return before expenses) | $1,000.00 | $1,022.39 | 0.51% | $2.57 |
| RiverFront Dynamic US Dividend Advantage ETF | | | | |
| Actual | $1,000.00 | $980.70 | 0.52% | $2.57 |
| Hypothetical (5% return before expenses) | $1,000.00 | $1,022.34 | 0.52% | $2.62 |
| RiverFront Dynamic US Flex-Cap ETF | | | | |
| Actual | $1,000.00 | $952.90 | 0.52% | $2.53 |
| Hypothetical (5% return before expenses) | $1,000.00 | $1,022.34 | 0.52% | $2.62 |
| RiverFront Strategic Income Fund | | | | |
| Actual | $1,000.00 | $1,033.10 | 0.46% | $2.33 |
| Hypothetical (5% return before expenses) | $1,000.00 | $1,022.64 | 0.46% | $2.32 |
| (a) | Annualized, based on the Fund's most recent fiscal half year expenses. |
| (b) | Expenses are equal to the Fund's annualized expense ratio multiplied by the average account value over the period, multiplied by the number of days in the most recent fiscal half year (182), divided by 365. |
RiverFront Dynamic Core Income ETF
| Schedule of Investments | May 31, 2019 (Unaudited) |
| Security Description | | Principal
Amount | | | Value | |
| CORPORATE BONDS (66.30%) | | | | | | | | |
| Communications (4.49%) | | | | | | | | |
| Alphabet, Inc. | | | | | | | | |
| 2.00%, 08/15/2026 | | $ | 300,000 | | | $ | 287,395 | |
| AT&T, Inc. | | | | | | | | |
| 3.40%, 05/15/2025 | | | 200,000 | | | | 202,612 | |
| 4.10%, 02/15/2028 | | | 500,000 | | | | 515,311 | |
| CBS Corp. | | | | | | | | |
| 2.50%, 02/15/2023 | | | 150,000 | | | | 148,221 | |
| 3.50%, 01/15/2025 | | | 539,000 | | | | 545,659 | |
| 3.70%, 06/01/2028 | | | 54,000 | | | | 53,628 | |
| Charter Communications Operating LLC / Charter Communications Operating Capital | | | | | | | | |
| 3.58%, 07/23/2020 | | | 400,000 | | | | 403,418 | |
| Comcast Corp. | | | | | | | | |
| 5.15%, 03/01/2020 | | | 400,000 | | | | 407,606 | |
| 3.60%, 03/01/2024 | | | 106,000 | | | | 110,111 | |
| 3.55%, 05/01/2028 | | | 300,000 | | | | 308,638 | |
| 4.15%, 10/15/2028 | | | 200,000 | | | | 214,917 | |
| Discovery Communications LLC | | | | | | | | |
| 2.95%, 03/20/2023 | | | 200,000 | | | | 200,069 | |
| 3.95%, 03/20/2028 | | | 200,000 | | | | 201,103 | |
| Lamar Media Corp. | | | | | | | | |
| 5.00%, 05/01/2023 | | | 400,000 | | | | 408,000 | |
| 5.38%, 01/15/2024 | | | 200,000 | | | | 205,200 | |
| Level 3 Financing, Inc. | | | | | | | | |
| 5.13%, 05/01/2023 | | | 90,000 | | | | 90,252 | |
| Time Warner Cable LLC | | | | | | | | |
| 5.00%, 02/01/2020 | | | 390,000 | | | | 394,930 | |
| 4.00%, 09/01/2021 | | | 125,000 | | | | 127,521 | |
| T-Mobile USA, Inc. | | | | | | | | |
| 4.00%, 04/15/2022 | | | 300,000 | | | | 303,000 | |
| TWDC Enterprises 18 Corp. | | | | | | | | |
| 2.45%, 03/04/2022 | | | 100,000 | | | | 100,247 | |
| 3.15%, 09/17/2025 | | | 67,000 | | | | 69,085 | |
| VeriSign, Inc. | | | | | | | | |
| 4.63%, 05/01/2023 | | | 300,000 | | | | 303,660 | |
| Verizon Communications, Inc. | | | | | | | | |
| 3.38%, 02/15/2025 | | | 27,000 | | | | 27,746 | |
| 3M US L + 1.10%, | | | | | | | | |
| 05/15/2025(a) | | | 175,000 | | | | 176,261 | |
| 4.33%, 09/21/2028 | | | 300,000 | | | | 325,199 | |
| 4.02%, 12/03/2029(b) | | | 174,000 | | | | 183,939 | |
| Virgin Media Secured Finance PLC | | | | | | | | |
| 5.25%, 01/15/2021 | | | 350,000 | | | | 360,833 | |
| Walt Disney Co. | | | | | | | | |
| 3.00%, 09/15/2022(b) | | | 200,000 | | | | 203,199 | |
| Total Communications | | | | | | | 6,877,760 | |
| | | | | | | | | |
| Consumer Discretionary (5.11%) | | | | | | | | |
| Alibaba Group Holding, Ltd. | | | | | | | | |
| 3.60%, 11/28/2024 | | | 400,000 | | | | 407,691 | |
| 3.40%, 12/06/2027 | | | 300,000 | | | | 296,457 | |
| Amazon.com, Inc. | | | | | | | | |
| 3.15%, 08/22/2027 | | | 577,000 | | | | 593,300 | |
| Security Description | | Principal
Amount | | | Value | |
| Consumer Discretionary (continued) | | | | | |
| American Honda Finance Corp. | | | | | | | | |
| 2.60%, 11/16/2022 | | $ | 218,000 | | | $ | 218,568 | |
| Aramark Services, Inc. | | | | | | | | |
| 5.13%, 01/15/2024 | | | 320,000 | | | | 324,733 | |
| Delta Air Lines, Inc. | | | | | | | | |
| 3.40%, 04/19/2021 | | | 300,000 | | | | 303,043 | |
| eBay, Inc. | | | | | | | | |
| 2.88%, 08/01/2021 | | | 200,000 | | | | 200,942 | |
| 3.45%, 08/01/2024 | | | 200,000 | | | | 203,762 | |
| Ford Motor Credit Co. LLC | | | | | | | | |
| 3M US L + 1.00%, | | | | | | | | |
| 01/09/2020(a) | | | 300,000 | | | | 300,425 | |
| General Motors Financial Co., Inc. | | | | | | | | |
| 3.20%, 07/13/2020 | | | 150,000 | | | | 150,452 | |
| 4.38%, 09/25/2021 | | | 100,000 | | | | 102,484 | |
| 3.70%, 05/09/2023 | | | 500,000 | | | | 500,364 | |
| Goodyear Tire & Rubber Co. | | | | | | | | |
| 5.13%, 11/15/2023 | | | 300,000 | | | | 298,875 | |
| Hilton Worldwide Finance LLC / Hilton Worldwide Finance Corp. | | | | | | | | |
| 4.63%, 04/01/2025 | | | 100,000 | | | | 100,625 | |
| Home Depot, Inc. | | | | | | | | |
| 2.70%, 04/01/2023 | | | 400,000 | | | | 404,045 | |
| Lennar Corp. | | | | | | | | |
| 4.50%, 06/15/2019 | | | 100,000 | | | | 100,062 | |
| 4.50%, 11/15/2019 | | | 300,000 | | | | 301,875 | |
| Lowe's Cos., Inc. | | | | | | | | |
| 2.50%, 04/15/2026 | | | 200,000 | | | | 192,383 | |
| 3.10%, 05/03/2027 | | | 200,000 | | | | 197,645 | |
| Marriott International, Inc. | | | | | | | | |
| 4.00%, 04/15/2028 | | | 250,000 | | | | 260,889 | |
| McDonald's Corp. | | | | | | | | |
| 3.70%, 01/30/2026 | | | 300,000 | | | | 313,127 | |
| 3.50%, 03/01/2027 | | | 100,000 | | | | 103,054 | |
| Service Corp. International | | | | | | | | |
| 5.38%, 05/15/2024 | | | 300,000 | | | | 308,250 | |
| Starbucks Corp. | | | | | | | | |
| 3.85%, 10/01/2023 | | | 300,000 | | | | 314,714 | |
| TJX Cos., Inc. | | | | | | | | |
| 2.75%, 06/15/2021 | | | 100,000 | | | | 100,784 | |
| Toyota Motor Credit Corp. | | | | | | | | |
| 3M US L + 0.39%, | | | | | | | | |
| 01/11/2023(a) | | | 300,000 | | | | 299,084 | |
| 3.42%, 07/20/2023 | | | 700,000 | | | | 724,580 | |
| 3.20%, 01/11/2027 | | | 200,000 | | | | 204,869 | |
| Total Consumer Discretionary | | | | | | | 7,827,082 | |
| | | | | | | | | |
| Consumer Staples (2.44%) | | | | | | | | |
| Anheuser-Busch InBev Worldwide, Inc. | | | | | | | | |
| 4.00%, 04/13/2028 | | | 200,000 | | | | 208,696 | |
| Constellation Brands, Inc. | | | | | | | | |
| 2.70%, 05/09/2022 | | | 100,000 | | | | 100,051 | |
| 4.25%, 05/01/2023 | | | 300,000 | | | | 315,655 | |
| 4.75%, 12/01/2025 | | | 100,000 | | | | 108,289 | |
See Notes to Financial Statements.
RiverFront Dynamic Core Income ETF
| Schedule of Investments | May 31, 2019 (Unaudited) |
| Security Description | | Principal
Amount | | | Value | |
| Consumer Staples (continued) | | | | | | | | |
| Kellogg Co. | | | | | | | | |
| 3.25%, 05/14/2021 | | $ | 300,000 | | | $ | 304,670 | |
| Kraft Heinz Foods Co. | | | | | | | | |
| 5.38%, 02/10/2020 | | | 200,000 | | | | 203,599 | |
| Kroger Co. | | | | | | | | |
| 3.70%, 08/01/2027 | | | 101,000 | | | | 102,337 | |
| PepsiCo, Inc. | | | | | | | | |
| 1.70%, 10/06/2021 | | | 700,000 | | | | 690,967 | |
| 3.10%, 07/17/2022 | | | 300,000 | | | | 307,320 | |
| Procter & Gamble Co. | | | | | | | | |
| 2.45%, 11/03/2026 | | | 300,000 | | | | 296,077 | |
| Tyson Foods, Inc. | | | | | | | | |
| 2.65%, 08/15/2019 | | | 200,000 | | | | 199,954 | |
| Walmart, Inc. | | | | | | | | |
| 3.40%, 06/26/2023 | | | 261,000 | | | | 271,297 | |
| 3.30%, 04/22/2024 | | | 300,000 | | | | 309,746 | |
| 3.70%, 06/26/2028 | | | 300,000 | | | | 319,462 | |
| Total Consumer Staples | | | | | | | 3,738,120 | |
| | | | | | | | | |
| Energy (7.31%) | | | | | | | | |
| Andeavor Logistics LP / Tesoro Logistics Finance Corp. | | | | | | | | |
| 5.25%, 01/15/2025 | | | 300,000 | | | | 315,301 | |
| BP Capital Markets America, Inc. | | | | | | | | |
| 3.25%, 05/06/2022 | | | 1,000,000 | | | | 1,023,147 | |
| BP Capital Markets PLC | | | | | | | | |
| 3.51%, 03/17/2025 | | | 250,000 | | | | 259,091 | |
| 3.72%, 11/28/2028 | | | 200,000 | | | | 208,332 | |
| Chevron Corp. | | | | | | | | |
| 2.90%, 03/03/2024 | | | 500,000 | | | | 509,025 | |
| 3.33%, 11/17/2025 | | | 300,000 | | | | 312,316 | |
| 2.95%, 05/16/2026 | | | 280,000 | | | | 284,775 | |
| Concho Resources, Inc. | | | | | | | | |
| 3.75%, 10/01/2027 | | | 200,000 | | | | 202,911 | |
| ConocoPhillips Co. | | | | | | | | |
| 4.95%, 03/15/2026 | | | 200,000 | | | | 224,434 | |
| Continental Resources, Inc. | | | | | | | | |
| 4.50%, 04/15/2023 | | | 300,000 | | | | 310,114 | |
| 3.80%, 06/01/2024 | | | 300,000 | | | | 301,656 | |
| DCP Midstream Operating LP | | | | | | | | |
| 5.35%, 03/15/2020(b) | | | 200,000 | | | | 202,750 | |
| Energy Transfer Operating LP | | | | | | | | |
| 3.60%, 02/01/2023 | | | 178,000 | | | | 179,979 | |
| 4.25%, 03/15/2023 | | | 35,000 | | | | 35,985 | |
| Enterprise Products Operating LLC | | | | | | | | |
| 3.35%, 03/15/2023 | | | 500,000 | | | | 508,553 | |
| Exxon Mobil Corp. | | | | | | | | |
| 2.22%, 03/01/2021 | | | 500,000 | | | | 499,779 | |
| 3.04%, 03/01/2026 | | | 700,000 | | | | 715,225 | |
| Halliburton Co. | | | | | | | | |
| 3.80%, 11/15/2025 | | | 200,000 | | | | 206,073 | |
| Kinder Morgan Energy Partners LP | | | | | | | | |
| 4.25%, 09/01/2024 | | | 300,000 | | | | 314,057 | |
| Kinder Morgan, Inc. | | | | | | | | |
| 3.05%, 12/01/2019 | | | 500,000 | | | | 500,490 | |
| Security Description | | Principal
Amount | | | Value | |
| Energy (continued) | | | | | | | | |
| Marathon Oil Corp. | | | | | | | | |
| 4.40%, 07/15/2027 | | $ | 56,000 | | | $ | 58,135 | |
| Marathon Petroleum Corp. | | | | | | | | |
| 3.80%, 04/01/2028 | | | 200,000 | | | | 199,828 | |
| MPLX LP | | | | | | | | |
| 4.50%, 07/15/2023 | | | 250,000 | | | | 262,523 | |
| Nabors Industries, Inc. | | | | | | | | |
| 5.00%, 09/15/2020 | | | 300,000 | | | | 305,250 | |
| Newfield Exploration Co. | | | | | | | | |
| 5.63%, 07/01/2024 | | | 300,000 | | | | 328,451 | |
| ONEOK Partners LP | | | | | | | | |
| 3.38%, 10/01/2022 | | | 500,000 | | | | 507,645 | |
| Sabine Pass Liquefaction LLC | | | | | | | | |
| 5.63%, 02/01/2021 | | | 100,000 | | | | 103,759 | |
| 5.63%, 04/15/2023 | | | 400,000 | | | | 431,106 | |
| 5.75%, 05/15/2024 | | | 200,000 | | | | 219,741 | |
| Schlumberger Investment SA | | | | | | | | |
| 3.65%, 12/01/2023 | | | 800,000 | | | | 832,092 | |
| Shell International Finance BV | | | | | | | | |
| 2.88%, 05/10/2026 | | | 300,000 | | | | 300,047 | |
| Williams Cos., Inc. | | | | | | | | |
| 4.55%, 06/24/2024 | | | 200,000 | | | | 212,233 | |
| 3.90%, 01/15/2025 | | | 313,000 | | | | 322,235 | |
| Total Energy | | | | | | | 11,197,038 | |
| | | | | | | | | |
| Financials (25.45%) | | | | | | | | |
| Aflac, Inc. | | | | | | | | |
| 3.63%, 11/15/2024 | | | 400,000 | | | | 415,925 | |
| Aircastle, Ltd. | | | | | | | | |
| 5.50%, 02/15/2022 | | | 400,000 | | | | 422,236 | |
| Ally Financial, Inc. | | | | | | | | |
| 4.13%, 02/13/2022 | | | 723,000 | | | | 729,435 | |
| American Express Credit Corp. | | | | | | | | |
| 2.25%, 05/05/2021 | | | 400,000 | | | | 397,799 | |
| American International Group, Inc. | | | | | | | | |
| 4.13%, 02/15/2024 | | | 150,000 | | | | 157,694 | |
| 3.90%, 04/01/2026 | | | 200,000 | | | | 205,133 | |
| Bank of America Corp. | | | | | | | | |
| 3M US L + 0.77%, | | | | | | | | |
| 02/05/2026(a) | | | 1,000,000 | | | | 982,599 | |
| 4.25%, 10/22/2026 | | | 500,000 | | | | 521,215 | |
| Bank of Montreal | | | | | | | | |
| 1.90%, 08/27/2021 | | | 1,000,000 | | | | 988,316 | |
| 2.35%, 09/11/2022 | | | 300,000 | | | | 298,974 | |
| 2.55%, 11/06/2022 | | | 200,000 | | | | 201,019 | |
| Bank of New York Mellon Corp. | | | | | | | | |
| 2.45%, 11/27/2020 | | | 652,000 | | | | 652,715 | |
| 3M US L + 1.05%, | | | | | | | | |
| 10/30/2023(a) | | | 484,000 | | | | 492,238 | |
| 3.25%, 05/16/2027 | | | 85,000 | | | | 86,730 | |
| Barclays PLC | | | | | | | | |
| 3M US L + 1.38%, | | | | | | | | |
| 05/16/2024(a) | | | 500,000 | | | | 491,800 | |
| BB&T Corp. | | | | | | | | |
| 2.63%, 06/29/2020 | | | 150,000 | | | | 150,124 | |
See Notes to Financial Statements.
RiverFront Dynamic Core Income ETF
| Schedule of Investments | May 31, 2019 (Unaudited) |
| Security Description | | Principal
Amount | | | Value | |
| Financials (continued) | | | | | | | | |
| Berkshire Hathaway, Inc. | | | | | | | | |
| 3.13%, 03/15/2026 | | $ | 500,000 | | | $ | 508,295 | |
| BNP Paribas SA | | | | | | | | |
| 2.38%, 05/21/2020 | | | 200,000 | | | | 199,598 | |
| 5.00%, 01/15/2021 | | | 150,000 | | | | 155,677 | |
| 3.25%, 03/03/2023 | | | 250,000 | | | | 255,826 | |
| Boston Properties LP | | | | | | | | |
| 3.85%, 02/01/2023 | | | 800,000 | | | | 829,901 | |
| Branch Banking & Trust Co. | | | | | | | | |
| 2.10%, 01/15/2020 | | | 300,000 | | | | 299,229 | |
| 2.25%, 06/01/2020 | | | 300,000 | | | | 299,177 | |
| Capital One Financial Corp. | | | | | | | | |
| 3.50%, 06/15/2023 | | | 600,000 | | | | 615,354 | |
| 3.30%, 10/30/2024 | | | 125,000 | | | | 126,007 | |
| 3.80%, 01/31/2028 | | | 72,000 | | | | 71,984 | |
| Capital One NA | | | | | | | | |
| 2.25%, 09/13/2021 | | | 300,000 | | | | 297,124 | |
| Charles Schwab Corp. | | | | | | | | |
| 2.65%, 01/25/2023 | | | 300,000 | | | | 301,065 | |
| Chubb INA Holdings, Inc. | | | | | | | | |
| 2.70%, 03/13/2023 | | | 115,000 | | | | 115,938 | |
| 3.35%, 05/03/2026 | | | 475,000 | | | | 489,112 | |
| Citigroup, Inc. | | | | | | | | |
| 2.65%, 10/26/2020 | | | 300,000 | | | | 300,642 | |
| 2.70%, 03/30/2021 | | | 350,000 | | | | 350,374 | |
| 3M US L + 1.43%, | | | | | | | | |
| 09/01/2023(a) | | | 500,000 | | | | 508,782 | |
| 4.45%, 09/29/2027 | | | 300,000 | | | | 313,976 | |
| CME Group, Inc. | | | | | | | | |
| 3.75%, 06/15/2028 | | | 100,000 | | | | 107,089 | |
| Cooperatieve Rabobank UA | | | | | | | | |
| 4.63%, 12/01/2023 | | | 500,000 | | | | 526,264 | |
| CoreCivic, Inc. | | | | | | | | |
| 4.63%, 05/01/2023 | | | 300,000 | | | | 295,875 | |
| Credit Suisse Group Funding Guernsey, Ltd. | | | | | | | | |
| 3.13%, 12/10/2020 | | | 175,000 | | | | 175,927 | |
| 3.45%, 04/16/2021 | | | 150,000 | | | | 151,524 | |
| 4.55%, 04/17/2026 | | | 450,000 | | | | 477,104 | |
| Crown Castle International Corp. | | | | | | | | |
| 4.88%, 04/15/2022 | | | 135,000 | | | | 142,814 | |
| Deutsche Bank AG | | | | | | | | |
| 4.25%, 10/14/2021 | | | 300,000 | | | | 302,084 | |
| 3.95%, 02/27/2023 | | | 200,000 | | | | 197,454 | |
| Discover Bank | | | | | | | | |
| 7.00%, 04/15/2020 | | | 175,000 | | | | 181,158 | |
| 3.20%, 08/09/2021 | | | 100,000 | | | | 101,012 | |
| 4.65%, 09/13/2028 | | | 250,000 | | | | 265,267 | |
| Fidelity National Information Services, Inc. | | | | | | | | |
| 2.25%, 08/15/2021 | | | 200,000 | | | | 198,530 | |
| 3.50%, 04/15/2023 | | | 152,000 | | | | 155,729 | |
| GE Capital International Funding Co. | | | | | | | | |
| 2.34%, 11/15/2020 | | | 200,000 | | | | 198,053 | |
| Security Description | | Principal
Amount | | | Value | |
| Financials (continued) | | | | | | | | |
| GLP Capital LP / GLP Financing II, Inc. | | | | | | | | |
| 4.88%, 11/01/2020 | | $ | 500,000 | | | $ | 509,800 | |
| Goldman Sachs Group, Inc. | | | | | | | | |
| 3M US L + 0.75%, | | | | | | | | |
| 02/23/2023(a) | | | 800,000 | | | | 795,338 | |
| 3M US L + 1.60%, | | | | | | | | |
| 11/29/2023(a) | | | 500,000 | | | | 511,604 | |
| 3.50%, 11/16/2026 | | | 40,000 | | | | 40,114 | |
| Host Hotels & Resorts LP | | | | | | | | |
| 4.00%, 06/15/2025 | | | 200,000 | | | | 203,481 | |
| HSBC Holdings PLC | | | | | | | | |
| 4.30%, 03/08/2026 | | | 250,000 | | | | 262,528 | |
| 3.90%, 05/25/2026 | | | 400,000 | | | | 409,584 | |
| 3M US L + 1.38%, | | | | | | | | |
| 09/12/2026(a) | | | 300,000 | | | | 299,443 | |
| 4.38%, 11/23/2026 | | | 200,000 | | | | 206,363 | |
| Huntington Bancshares, Inc. | | | | | | | | |
| 3.15%, 03/14/2021 | | | 400,000 | | | | 403,717 | |
| 4.00%, 05/15/2025 | | | 45,000 | | | | 47,593 | |
| Huntington National Bank | | | | | | | | |
| 3.25%, 05/14/2021 | | | 400,000 | | | | 404,632 | |
| Intercontinental Exchange, Inc. | | | | | | | | |
| 3.75%, 12/01/2025 | | | 200,000 | | | | 210,964 | |
| 3.10%, 09/15/2027 | | | 244,000 | | | | 246,467 | |
| 3.75%, 09/21/2028 | | | 300,000 | | | | 315,957 | |
| International Lease Finance Corp. | | | | | | | | |
| 8.25%, 12/15/2020 | | | 750,000 | | | | 808,495 | |
| 5.88%, 08/15/2022 | | | 250,000 | | | | 270,404 | |
| Iron Mountain, Inc. | | | | | | | | |
| 6.00%, 08/15/2023 | | | 60,000 | | | | 61,350 | |
| iStar, Inc. | | | | | | | | |
| 4.63%, 09/15/2020 | | | 200,000 | | | | 201,250 | |
| JPMorgan Chase & Co. | | | | | | | | |
| 3.38%, 05/01/2023 | | | 400,000 | | | | 408,468 | |
| 3M US L + 1.23%, | | | | | | | | |
| 10/24/2023(a) | | | 1,159,000 | | | | 1,178,894 | |
| KeyBank NA/Cleveland OH | | | | | | | | |
| 3.38%, 03/07/2023 | | | 250,000 | | | | 257,760 | |
| KeyCorp | | | | | | | | |
| 5.10%, 03/24/2021 | | | 600,000 | | | | 626,291 | |
| Lincoln National Corp. | | | | | | | | |
| 3.35%, 03/09/2025 | | | 400,000 | | | | 406,715 | |
| 3.80%, 03/01/2028 | | | 100,000 | | | | 103,586 | |
| M&T Bank Corp. | | | | | | | | |
| 3M US L + 0.68%, | | | | | | | | |
| 07/26/2023(a) | | | 500,000 | | | | 500,334 | |
| Manufacturers & Traders Trust Co. | | | | | | | | |
| 3M US L + 0.27%, | | | | | | | | |
| 01/25/2021(a) | | | 600,000 | | | | 598,937 | |
| MetLife, Inc. | | | | | | | | |
| 3.60%, 04/10/2024 | | | 477,000 | | | | 499,526 | |
| 6.50%, 12/15/2032 | | | 50,000 | | | | 66,031 | |
See Notes to Financial Statements.
RiverFront Dynamic Core Income ETF
| Schedule of Investments | May 31, 2019 (Unaudited) |
| Security Description | | Principal
Amount | | | Value | |
| Financials (continued) | | | | | | | | |
| Mitsubishi UFJ Financial Group, Inc. | | | | | | | | |
| 3.85%, 03/01/2026 | | $ | 400,000 | | | $ | 422,394 | |
| Mizuho Financial Group, Inc. | | | | | | | | |
| 2.95%, 02/28/2022 | | | 300,000 | | | | 302,348 | |
| 3M US L + 1.00%, | | | | | | | | |
| 09/11/2024(a) | | | 1,000,000 | | | | 1,009,487 | |
| 3.17%, 09/11/2027 | | | 100,000 | | | | 101,389 | |
| Morgan Stanley | | | | | | | | |
| 5.63%, 09/23/2019 | | | 400,000 | | | | 403,413 | |
| 3M US L + 1.40%, | | | | | | | | |
| 10/24/2023(a) | | | 1,000,000 | | | | 1,017,475 | |
| 5.00%, 11/24/2025 | | | 600,000 | | | | 653,963 | |
| National Australia Bank, Ltd. | | | | | | | | |
| 2.50%, 07/12/2026 | | | 100,000 | | | | 97,163 | |
| PNC Financial Services Group, Inc. | | | | | | | | |
| 3.15%, 05/19/2027 | | | 400,000 | | | | 404,712 | |
| Prudential Financial, Inc. | | | | | | | | |
| 4.50%, 11/16/2021 | | | 200,000 | | | | 209,218 | |
| Royal Bank of Canada | | | | | | | | |
| 2.15%, 10/26/2020 | | | 300,000 | | | | 298,891 | |
| Royal Bank of Scotland Group PLC | | | | | | | | |
| 3M US L + 1.48%, | | | | | | | | |
| 05/15/2023(a) | | | 400,000 | | | | 398,899 | |
| 3M US L + 1.47%, | | | | | | | | |
| 05/15/2023(a) | | | 500,000 | | | | 496,230 | |
| Simon Property Group LP | | | | | | | | |
| 4.13%, 12/01/2021 | | | 400,000 | | | | 413,012 | |
| 3.38%, 10/01/2024 | | | 100,000 | | | | 102,989 | |
| 3.38%, 12/01/2027 | | | 200,000 | | | | 204,332 | |
| Starwood Property Trust, Inc. | | | | | | | | |
| 5.00%, 12/15/2021 | | | 250,000 | | | | 252,070 | |
| State Street Corp. | | | | | | | | |
| 3.30%, 12/16/2024 | | | 300,000 | | | | 308,731 | |
| 3.55%, 08/18/2025 | | | 125,000 | | | | 130,705 | |
| SunTrust Bank/Atlanta GA | | | | | | | | |
| 3.30%, 05/15/2026 | | | 400,000 | | | | 402,850 | |
| Toronto-Dominion Bank | | | | | | | | |
| 3.15%, 09/17/2020 | | | 500,000 | | | | 505,201 | |
| UBS Group Funding Switzerland AG | | | | | | | | |
| 3.49%, 05/23/2023(b) | | | 200,000 | | | | 202,514 | |
| 4.13%, 09/24/2025(b) | | | 150,000 | | | | 157,333 | |
| 4.13%, 04/15/2026(b) | | | 100,000 | | | | 104,591 | |
| US Bancorp | | | | | | | | |
| 2.63%, 01/24/2022 | | | 200,000 | | | | 201,036 | |
| 3.00%, 03/15/2022 | | | 400,000 | | | | 405,578 | |
| Visa, Inc. | | | | | | | | |
| 3.15%, 12/14/2025 | | | 300,000 | | | | 309,000 | |
| 2.75%, 09/15/2027 | | | 250,000 | | | | 249,964 | |
| Security Description | | Principal
Amount | | | Value | |
| Financials (continued) | | | | | | | | |
| Wells Fargo & Co. | | | | | | | | |
| 2.55%, 12/07/2020 | | $ | 200,000 | | | $ | 200,135 | |
| 3M US L + 0.93%, | | | | | | | | |
| 02/11/2022(a) | | | 200,000 | | | | 201,219 | |
| 3M US L + 1.23%, | | | | | | | | |
| 10/31/2023(a) | | | 300,000 | | | | 305,165 | |
| 3.00%, 04/22/2026 | | | 200,000 | | | | 198,157 | |
| Westpac Banking Corp. | | | | | | | | |
| 2.10%, 05/13/2021 | | | 340,000 | | | | 337,348 | |
| 3.65%, 05/15/2023 | | | 300,000 | | | | 311,213 | |
| 2.70%, 08/19/2026 | | | 100,000 | | | | 98,448 | |
| Total Financials | | | | | | | 38,980,696 | |
| | | | | | | | | |
| Health Care (7.06%) | | | | | | | | |
| Abbott Laboratories | | | | | | | | |
| 2.90%, 11/30/2021 | | | 250,000 | | | | 252,368 | |
| AbbVie, Inc. | | | | | | | | |
| 2.90%, 11/06/2022 | | | 600,000 | | | | 601,520 | |
| 3.60%, 05/14/2025 | | | 100,000 | | | | 101,957 | |
| Aetna, Inc. | | | | | | | | |
| 3.50%, 11/15/2024 | | | 300,000 | | | | 303,944 | |
| Allergan Funding SCS | | | | | | | | |
| 3.00%, 03/12/2020 | | | 700,000 | | | | 700,890 | |
| 3.85%, 06/15/2024 | | | 300,000 | | | | 305,179 | |
| Amgen, Inc. | | | | | | | | |
| 3.63%, 05/22/2024 | | | 400,000 | | | | 413,489 | |
| Anthem, Inc. | | | | | | | | |
| 3.50%, 08/15/2024 | | | 100,000 | | | | 102,333 | |
| Becton Dickinson and Co. | | | | | | | | |
| 2.13%, 06/06/2019 | | | 200,000 | | | | 199,992 | |
| 3M US L + 0.875%, | | | | | | | | |
| 12/29/2020(a) | | | 150,000 | | | | 150,042 | |
| Centene Corp. | | | | | | | | |
| 5.63%, 02/15/2021 | | | 37,000 | | | | 37,462 | |
| 4.75%, 05/15/2022 | | | 400,000 | | | | 405,384 | |
| Cigna Corp. | | | | | | | | |
| 4.38%, 10/15/2028(b) | | | 200,000 | | | | 209,810 | |
| CVS Health Corp. | | | | | | | | |
| 2.25%, 08/12/2019 | | | 300,000 | | | | 299,699 | |
| 3M US L + 0.63%, | | | | | | | | |
| 03/09/2020(a) | | | 400,000 | | | | 401,126 | |
| 4.00%, 12/05/2023 | | | 150,000 | | | | 155,156 | |
| Eli Lilly & Co. | | | | | | | | |
| 2.75%, 06/01/2025 | | | 140,000 | | | | 141,269 | |
| Endo Dac / Endo Finance LLC / Endo Finco, Inc. | | | | | | | | |
| 5.88%, 10/15/2024(b) | | | 200,000 | | | | 191,000 | |
| Express Scripts Holding Co. | | | | | | | | |
| 4.75%, 11/15/2021 | | | 250,000 | | | | 262,135 | |
| 3.00%, 07/15/2023 | | | 500,000 | | | | 501,617 | |
| Fresenius Medical Care US Finance II, Inc. | | | | | | | | |
| 4.13%, 10/15/2020(b) | | | 400,000 | | | | 405,202 | |
| Gilead Sciences, Inc. | | | | | | | | |
| 4.40%, 12/01/2021 | | | 200,000 | | | | 208,142 | |
| 2.50%, 09/01/2023 | | | 200,000 | | | | 198,641 | |
See Notes to Financial Statements.
RiverFront Dynamic Core Income ETF
| Schedule of Investments | May 31, 2019 (Unaudited) |
| Security Description | | Principal
Amount | | | Value | |
| Health Care (continued) | | | | | | | | |
| HCA, Inc. | | | | | | | | |
| 6.50%, 02/15/2020 | | $ | 600,000 | | | $ | 614,317 | |
| Johnson & Johnson | | | | | | | | |
| 2.45%, 03/01/2026 | | | 500,000 | | | | 493,145 | |
| Medtronic, Inc. | | | | | | | | |
| 3.50%, 03/15/2025 | | | 300,000 | | | | 312,813 | |
| Merck & Co., Inc. | | | | | | | | |
| 2.80%, 05/18/2023 | | | 980,000 | | | | 995,234 | |
| Pfizer, Inc. | | | | | | | | |
| 3.20%, 09/15/2023 | | | 423,000 | | | | 435,065 | |
| 3.00%, 12/15/2026 | | | 200,000 | | | | 202,553 | |
| Teva Pharmaceutical Finance Netherlands III BV | | | | | | | | |
| 1.70%, 07/19/2019 | | | 152,000 | | | | 151,757 | |
| Thermo Fisher Scientific, Inc. | | | | | | | | |
| 3.65%, 12/15/2025 | | | 150,000 | | | | 156,200 | |
| UnitedHealth Group, Inc. | | | | | | | | |
| 2.88%, 03/15/2023 | | | 300,000 | | | | 302,917 | |
| 3.75%, 07/15/2025 | | | 400,000 | | | | 420,182 | |
| 3.10%, 03/15/2026 | | | 183,000 | | | | 185,125 | |
| Total Health Care | | | | | | | 10,817,665 | |
| | | | | | | | | |
| Industrials (4.81%) | | | | | | | | |
| ADT Security Corp. | | | | | | | | |
| 4.13%, 06/15/2023 | | | 125,000 | | | | 121,406 | |
| Boeing Co. | | | | | | | | |
| 3.45%, 11/01/2028 | | | 300,000 | | | | 308,968 | |
| Burlington Northern Santa Fe LLC | | | | | | | | |
| 3.05%, 09/01/2022 | | | 300,000 | | | | 304,946 | |
| Caterpillar Financial Services Corp. | | | | | | | | |
| 2.75%, 08/20/2021 | | | 50,000 | | | | 50,328 | |
| 2.40%, 06/06/2022 | | | 300,000 | | | | 299,606 | |
| CNH Industrial Capital LLC | | | | | | | | |
| 4.88%, 04/01/2021 | | | 300,000 | | | | 309,210 | |
| CNH Industrial NV | | | | | | | | |
| 4.50%, 08/15/2023 | | | 400,000 | | | | 413,716 | |
| CSX Corp. | | | | | | | | |
| 3.40%, 08/01/2024 | | | 300,000 | | | | 311,115 | |
| 2.60%, 11/01/2026 | | | 100,000 | | | | 96,944 | |
| FedEx Corp. | | | | | | | | |
| 3.40%, 02/15/2028 | | | 300,000 | | | | 303,537 | |
| General Dynamics Corp. | | | | | | | | |
| 3.50%, 05/15/2025 | | | 375,000 | | | | 393,168 | |
| 2.63%, 11/15/2027 | | | 300,000 | | | | 295,117 | |
| General Electric Co. | | | | | | | | |
| 2.70%, 10/09/2022 | | | 200,000 | | | | 197,946 | |
| Honeywell International, Inc. | | | | | | | | |
| 2.50%, 11/01/2026 | | | 300,000 | | | | 294,865 | |
| John Deere Capital Corp. | | | | | | | | |
| 3M US L + 0.16%, | | | | | | | | |
| 01/08/2021(a) | | | 200,000 | | | | 199,778 | |
| 2.65%, 06/24/2024 | | | 400,000 | | | | 400,418 | |
| Lockheed Martin Corp. | | | | | | | | |
| 3.55%, 01/15/2026 | | | 300,000 | | | | 313,419 | |
| Security Description | | Principal
Amount | | | Value | |
| Industrials (continued) | | | | | | | | |
| Northrop Grumman Corp. | | | | | | | | |
| 3.50%, 03/15/2021 | | $ | 35,000 | | | $ | 35,576 | |
| 3.25%, 01/15/2028 | | | 300,000 | | | | 299,815 | |
| Textron, Inc. | | | | | | | | |
| 3.65%, 03/01/2021 | | | 89,000 | | | | 90,280 | |
| 3.65%, 03/15/2027 | | | 250,000 | | | | 252,722 | |
| United Parcel Service, Inc. | | | | | | | | |
| 2.50%, 04/01/2023 | | | 587,000 | | | | 587,029 | |
| 2.40%, 11/15/2026 | | | 72,000 | | | | 70,320 | |
| United Rentals North America, Inc. | | | | | | | | |
| 4.63%, 07/15/2023 | | | 500,000 | | | | 510,625 | |
| United Technologies Corp. | | | | | | | | |
| 2.80%, 05/04/2024 | | | 400,000 | | | | 400,065 | |
| WESCO Distribution, Inc. | | | | | | | | |
| 5.38%, 12/15/2021 | | | 200,000 | | | | 202,000 | |
| XPO Logistics, Inc. | | | | | | | | |
| 6.13%, 09/01/2023(b) | | | 300,000 | | | | 302,676 | |
| Total Industrials | | | | | | | 7,365,595 | |
| | | | | | | | | |
| Materials (3.08%) | | | | | | | | |
| 3M Co. | | | | | | | | |
| 3.25%, 02/14/2024 | | | 800,000 | | | | 825,890 | |
| Ashland LLC | | | | | | | | |
| 4.75%, 08/15/2022 | | | 300,000 | | | | 310,125 | |
| Ball Corp. | | | | | | | | |
| 4.00%, 11/15/2023 | | | 300,000 | | | | 302,625 | |
| Celanese US Holdings LLC | | | | | | | | |
| 5.88%, 06/15/2021 | | | 200,000 | | | | 211,450 | |
| 4.63%, 11/15/2022 | | | 200,000 | | | | 210,534 | |
| Dow Chemical Co. | | | | | | | | |
| 4.25%, 11/15/2020 | | | 200,000 | | | | 203,825 | |
| 3.00%, 11/15/2022 | | | 300,000 | | | | 302,177 | |
| Glencore Funding LLC | | | | | | | | |
| 3.00%, 10/27/2022(b) | | | 500,000 | | | | 495,275 | |
| Graphic Packaging International LLC | | | | | | | | |
| 4.75%, 04/15/2021 | | | 200,000 | | | | 203,750 | |
| International Paper Co. | | | | | | | | |
| 3.00%, 02/15/2027 | | | 200,000 | | | | 193,580 | |
| LyondellBasell Industries NV | | | | | | | | |
| 5.75%, 04/15/2024 | | | 300,000 | | | | 332,110 | |
| Nutrien, Ltd. | | | | | | | | |
| 3.50%, 06/01/2023 | | | 300,000 | | | | 305,959 | |
| Sealed Air Corp. | | | | | | | | |
| 6.50%, 12/01/2020(b) | | | 200,000 | | | | 207,000 | |
| Sherwin-Williams Co. | | | | | | | | |
| 3.45%, 08/01/2025 | | | 300,000 | | | | 304,426 | |
| 3.45%, 06/01/2027 | | | 200,000 | | | | 199,576 | |
| Steel Dynamics, Inc. | | | | | | | | |
| 5.50%, 10/01/2024 | | | 100,000 | | | | 102,099 | |
| Total Materials | | | | | | | 4,710,401 | |
See Notes to Financial Statements.
RiverFront Dynamic Core Income ETF
| Schedule of Investments | May 31, 2019 (Unaudited) |
| Security Description | | Principal
Amount | | | Value | |
| Technology (4.31%) | | | | | | |
| Apple, Inc. | | | | | | | | |
| 2.40%, 05/03/2023 | | $ | 500,000 | | | $ | 499,288 | |
| 3.45%, 05/06/2024 | | | 300,000 | | | | 310,515 | |
| 2.75%, 01/13/2025 | | | 125,000 | | | | 125,408 | |
| 3.20%, 05/11/2027 | | | 300,000 | | | | 308,610 | |
| Broadcom Corp. / Broadcom Cayman Finance, Ltd. | | | | | | | | |
| 3.00%, 01/15/2022 | | | 200,000 | | | | 198,925 | |
| 3.63%, 01/15/2024 | | | 300,000 | | | | 297,184 | |
| Cisco Systems, Inc. | | | | | | | | |
| 2.20%, 09/20/2023 | | | 200,000 | | | | 198,238 | |
| Corning, Inc. | | | | | | | | |
| 2.90%, 05/15/2022 | | | 100,000 | | | | 101,081 | |
| Dell International LLC / EMC Corp. | | | | | | | | |
| 4.42%, 06/15/2021(b) | | | 300,000 | | | | 307,478 | |
| 5.88%, 06/15/2021(b) | | | 50,000 | | | | 50,739 | |
| Flex, Ltd. | | | | | | | | |
| 5.00%, 02/15/2023 | | | 400,000 | | | | 417,179 | |
| IBM Credit LLC | | | | | | | | |
| 3M US L + 0.16%, | | | | | | | | |
| 02/05/2021(a) | | | 750,000 | | | | 748,701 | |
| Intel Corp. | | | | | | | | |
| 2.60%, 05/19/2026 | | | 300,000 | | | | 296,232 | |
| International Business Machines Corp. | | | | | | | | |
| 2.50%, 01/27/2022 | | | 500,000 | | | | 499,308 | |
| 3.63%, 02/12/2024 | | | 300,000 | | | | 310,443 | |
| Microsoft Corp. | | | | | | | | |
| 3.45%, 08/08/2036 | | | 250,000 | | | | 256,669 | |
| Moody's Corp. | | | | | | | | |
| 4.50%, 09/01/2022 | | | 72,000 | | | | 75,725 | |
| NCR Corp. | | | | | | | | |
| 5.00%, 07/15/2022 | | | 100,000 | | | | 100,220 | |
| Oracle Corp. | | | | | | | | |
| 3.40%, 07/08/2024 | | | 300,000 | | | | 309,787 | |
| QUALCOMM, Inc. | | | | | | | | |
| 2.60%, 01/30/2023 | | | 400,000 | | | | 396,562 | |
| 2.90%, 05/20/2024 | | | 375,000 | | | | 375,317 | |
| S&P Global, Inc. | | | | | | | | |
| 4.00%, 06/15/2025 | | | 300,000 | | | | 322,391 | |
| Xerox Corp. | | | | | | | | |
| 3.50%, 08/20/2020 | | | 100,000 | | | | 100,000 | |
| Total Technology | | | | | | | 6,606,000 | |
| | | | | | | | | |
| Utilities (2.24%) | | | | | | | | |
| AES Corp. | | | | | | | | |
| 4.50%, 03/15/2023 | | | 300,000 | | | | 302,625 | |
| Alabama Power Co. | | | | | | | | |
| 3.55%, 12/01/2023 | | | 150,000 | | | | 156,335 | |
| CMS Energy Corp. | | | | | | | | |
| 3.60%, 11/15/2025 | | | 150,000 | | | | 154,500 | |
| Consumers Energy Co. | | | | | | | | |
| 3.38%, 08/15/2023 | | | 200,000 | | | | 206,446 | |
| 3.13%, 08/31/2024 | | | 200,000 | | | | 204,884 | |
| Security Description | | Principal
Amount | | | Value | |
| Utilities (continued) | | | | | | | | |
| Dominion Energy, Inc. | | | | | | | | |
| 5.20%, 08/15/2019 | | $ | 150,000 | | | $ | 150,653 | |
| 4.25%, 06/01/2028 | | | 250,000 | | | | 266,037 | |
| Duke Energy Carolinas LLC | | | | | | | | |
| 2.95%, 12/01/2026 | | | 200,000 | | | | 200,905 | |
| Duke Energy Corp. | | | | | | | | |
| 1.80%, 09/01/2021 | | | 600,000 | | | | 590,306 | |
| Exelon Corp. | | | | | | | | |
| 3.50%, 06/01/2022 | | | 200,000 | | | | 203,695 | |
| 3.40%, 04/15/2026 | | | 175,000 | | | | 176,685 | |
| Exelon Generation Co. LLC | | | | | | | | |
| 4.25%, 06/15/2022 | | | 100,000 | | | | 104,183 | |
| Southern Co. | | | | | | | | |
| 2.95%, 07/01/2023 | | | 500,000 | | | | 502,556 | |
| Southwestern Electric Power Co. | | | | | | | | |
| 4.10%, 09/15/2028 | | | 200,000 | | | | 212,595 | |
| Total Utilities | | | | | | | 3,432,405 | |
| | | | | | | | | |
| TOTAL CORPORATE BONDS | | | | | |
| (Cost $99,136,925) | | | | | | | 101,552,762 | |
| | | | | | | | | |
| GOVERNMENT BONDS (25.26%) | | | | | | | | |
| United States Treasury Bond | | | | | | | | |
| 2.75%, 02/15/2028 | | | 10,000,000 | | | | 10,506,055 | |
| 3.88%, 08/15/2040 | | | 1,402,300 | | | | 1,732,032 | |
| 2.75%, 11/15/2047 | | | 1,900,000 | | | | 1,962,344 | |
| United States Treasury Inflation Indexed Bonds | | | | | | | | |
| 2.13%, 02/15/2040(c) | | | 560,664 | | | | 718,716 | |
| United States Treasury Note | | | | | | | | |
| 2.88%, 11/15/2021 | | | 5,000,000 | | | | 5,113,280 | |
| 2.88%, 10/31/2023 | | | 3,000,000 | | | | 3,118,653 | |
| 3.00%, 10/31/2025 | | | 5,000,000 | | | | 5,295,703 | |
| United States Treasury Strip Principal | | | | | | | | |
| 0.00%, 02/15/2038(d) | | | 5,000,000 | | | | 3,225,497 | |
| 0.00%, 08/15/2039(d) | | | 6,000,000 | | | | 3,691,050 | |
| 0.00%, 11/15/2046(d) | | | 3,000,000 | | | | 1,466,238 | |
| 0.00%, 05/15/2048(d) | | | 4,000,000 | | | | 1,870,726 | |
| TOTAL GOVERNMENT BONDS | | | | | | | | |
| (Cost $36,100,129) | | | | | | | 38,700,294 | |
| | | 7 Day
Yield | | | Shares | | | Value | |
| SHORT TERM INVESTMENTS (7.85%) | | | | | |
| State Street Institutional Treasury Plus Money Market Fund | | | 2.309 | % | | | 12,030,684 | | | | 12,030,684 | |
| TOTAL SHORT TERM INVESTMENTS | | | | | | |
| (Cost $12,030,684) | | | | | | | | | | | 12,030,684 | |
| | | | | | | | | | | | | |
| TOTAL INVESTMENTS (99.42%) | | | | | | |
| (Cost $147,267,738) | | | | | | | $ | 152,283,740 | |
| OTHER ASSETS IN EXCESS OF LIABILITIES (0.58%) | | | | | 895,304 | |
| NET ASSETS - 100.00% | | | | $ | 153,179,044 | |
See Notes to Financial Statements.
RiverFront Dynamic Core Income ETF
| Schedule of Investments | May 31, 2019 (Unaudited) |
Investment Abbreviations:
LIBOR - London Interbank Offered Rate
Libor Rates:
3M US L - 3 Month LIBOR as of May 31, 2019 was 2.50%
| (a) | Floating or variable rate security. The reference rate is described above. The rate in effect as of May 31, 2019 is based on the reference rate plus the displayed spread as of the security's last reset date. |
| (b) | Securities exempt from registration under Rule 144A of the Securities Act of 1933. These securities may be sold in the ordinary course of business in transactions exempt from registration, normally to qualified institutional buyers. At period end, the aggregate market value of those securities was $3,223,506, representing 2.10% of net assets. |
| (c) | Principal amount of security is adjusted for inflation. |
See Notes to Financial Statements.
RiverFront Dynamic Unconstrained Income ETF
| Schedule of Investments | May 31, 2019 (Unaudited) |
| Security Description | | Principal Amount | | | Value | |
| CORPORATE BONDS (91.06%) | | | | | | | | |
| Communications (19.34%) | | | | | | | | |
| Altice Financing SA | | | | | | | | |
| 6.63%, 02/15/2023(a) | | $ | 215,000 | | | $ | 218,762 | |
| Cablevision Systems Corp. | | | | | | | | |
| 5.88%, 09/15/2022 | | | 140,000 | | | | 145,208 | |
| CCO Holdings LLC / CCO Holdings Capital Corp. | | | | | | | | |
| 5.13%, 05/01/2027(a) | | | 140,000 | | | | 140,437 | |
| CenturyLink, Inc. | | | | | | | | |
| 6.45%, 06/15/2021 | | | 180,000 | | | | 187,651 | |
| 7.50%, 04/01/2024 | | | 35,000 | | | | 37,450 | |
| Clear Channel Worldwide Holdings, Inc. | | | | | | | | |
| 6.50%, 11/15/2022 | | | 105,000 | | | | 107,625 | |
| CSC Holdings LLC | | | | | | | | |
| 5.13%, 12/15/2021(a) | | | 140,000 | | | | 140,000 | |
| 5.38%, 07/15/2023(a) | | | 140,000 | | | | 142,450 | |
| DISH DBS Corp. | | | | | | | | |
| 5.88%, 07/15/2022 | | | 105,000 | | | | 103,588 | |
| Hughes Satellite Systems Corp. | | | | | | | | |
| 7.63%, 06/15/2021 | | | 70,000 | | | | 74,486 | |
| 6.63%, 08/01/2026 | | | 70,000 | | | | 70,088 | |
| Lamar Media Corp. | | | | | | | | |
| 5.75%, 02/01/2026 | | | 70,000 | | | | 73,457 | |
| Level 3 Financing, Inc. | | | | | | | | |
| 5.38%, 01/15/2024 | | | 105,000 | | | | 105,525 | |
| Netflix, Inc. | | | | | | | | |
| 5.50%, 02/15/2022 | | | 130,000 | | | | 135,850 | |
| Outfront Media Capital LLC / Outfront Media Capital Corp. | | | | | | | | |
| 5.25%, 02/15/2022 | | | 105,000 | | | | 106,366 | |
| Sinclair Television Group, Inc. | | | | | | | | |
| 5.13%, 02/15/2027(a) | | | 35,000 | | | | 33,516 | |
| Sirius XM Radio, Inc. | | | | | | | | |
| 4.63%, 05/15/2023(a) | | | 105,000 | | | | 106,050 | |
| Sprint Communications, Inc. | | | | | | | | |
| 6.00%, 11/15/2022 | | | 150,000 | | | | 153,423 | |
| Sprint Corp. | | | | | | | | |
| 7.88%, 09/15/2023 | | | 70,000 | | | | 75,250 | |
| 7.13%, 06/15/2024 | | | 70,000 | | | | 72,975 | |
| T-Mobile USA, Inc. | | | | | | | | |
| 6.50%, 01/15/2024 | | | 180,000 | | | | 186,300 | |
| Unitymedia GmbH | | | | | | | | |
| 6.13%, 01/15/2025(a) | | | 105,000 | | | | 108,203 | |
| Univision Communications, Inc. | | | | | | | | |
| 5.13%, 05/15/2023(a) | | | 70,000 | | | | 66,500 | |
| VeriSign, Inc. | | | | | | | | |
| 4.75%, 07/15/2027 | | | 70,000 | | | | 71,502 | |
| Viacom, Inc. | | | | | | | | |
| 3M US L + 3.895%, | | | | | | | | |
| 02/28/2057(b) | | | 115,000 | | | | 114,281 | |
| Virgin Media Finance PLC | | | | | | | | |
| 6.00%, 10/15/2024(a) | | | 105,000 | | | | 107,756 | |
| Security Description | | Principal Amount | | | Value | |
| Communications (continued) | | | | | | | | |
| Zayo Group LLC / Zayo Capital, Inc. | | | | | | | | |
| 6.38%, 05/15/2025 | | $ | 70,000 | | | $ | 72,275 | |
| 5.75%, 01/15/2027(a) | | | 70,000 | | | | 72,100 | |
| Ziggo BV | | | | | | | | |
| 5.50%, 01/15/2027(a) | | | 105,000 | | | | 102,900 | |
| Total Communications | | | | | | | 3,131,974 | |
| | | | | | | | | |
| Consumer Discretionary (11.46%) | | | | | | | | |
| Aramark Services, Inc. | | | | | | | | |
| 5.13%, 01/15/2024 | | | 105,000 | | | | 106,553 | |
| Avis Budget Car Rental LLC / Avis Budget Finance, Inc. | | | | | | | | |
| 5.50%, 04/01/2023 | | | 105,000 | | | | 105,787 | |
| Boyd Gaming Corp. | | | | | | | | |
| 6.38%, 04/01/2026 | | | 105,000 | | | | 108,554 | |
| Dana, Inc. | | | | | | | | |
| 5.50%, 12/15/2024 | | | 105,000 | | | | 105,138 | |
| Hanesbrands, Inc. | | | | | | | | |
| 4.88%, 05/15/2026(a) | | | 70,000 | | | | 69,091 | |
| Hertz Corp. | | | | | | | | |
| 7.63%, 06/01/2022(a) | | | 35,000 | | | | 35,569 | |
| Hilton Worldwide Finance LLC / Hilton Worldwide Finance Corp. | | | | | | | | |
| 4.63%, 04/01/2025 | | | 70,000 | | | | 70,437 | |
| International Game Technology PLC | | | | | | | | |
| 6.25%, 02/15/2022(a) | | | 140,000 | | | | 145,600 | |
| KB Home | | | | | | | | |
| 7.50%, 09/15/2022 | | | 92,000 | | | | 100,625 | |
| KFC Holding Co./Pizza Hut Holdings LLC/Taco Bell of America LLC | | | | | | | | |
| 5.00%, 06/01/2024(a) | | | 70,000 | | | | 71,050 | |
| L Brands, Inc. | | | | | | | | |
| 5.63%, 02/15/2022 | | | 70,000 | | | | 72,100 | |
| LKQ Corp. | | | | | | | | |
| 4.75%, 05/15/2023 | | | 105,000 | | | | 105,525 | |
| Mattamy Group Corp. | | | | | | | | |
| 6.88%, 12/15/2023(a) | | | 70,000 | | | | 72,100 | |
| MGM Resorts International | | | | | | | | |
| 6.63%, 12/15/2021 | | | 70,000 | | | | 74,812 | |
| PulteGroup, Inc. | | | | | | | | |
| 5.00%, 01/15/2027 | | | 70,000 | | | | 71,050 | |
| Service Corp. International | | | | | | | | |
| 4.63%, 12/15/2027 | | | 70,000 | | | | 70,438 | |
| ServiceMaster Co. LLC | | | | | | | | |
| 5.13%, 11/15/2024(a) | | | 125,000 | | | | 125,313 | |
| Six Flags Entertainment Corp. | | | | | | | | |
| 4.88%, 07/31/2024(a) | | | 70,000 | | | | 69,314 | |
| Toll Brothers Finance Corp. | | | | | | | | |
| 4.88%, 03/15/2027 | | | 70,000 | | | | 70,175 | |
| Wynn Las Vegas LLC / Wynn Las Vegas Capital Corp. | | | | | | | | |
| 5.50%, 03/01/2025(a) | | | 70,000 | | | | 68,775 | |
See Notes to Financial Statements.
RiverFront Dynamic Unconstrained Income ETF
| Schedule of Investments | May 31, 2019 (Unaudited) |
| Security Description | | Principal Amount | | | Value | |
| Consumer Discretionary (continued) | | | | | | | | |
| Wynn Macau, Ltd. | | | | | | | | |
| 4.88%, 10/01/2024(a) | | $ | 140,000 | | | $ | 137,200 | |
| Total Consumer Discretionary | | | | | | | 1,855,206 | |
| | | | | | | | | |
| Consumer Staples (3.72%) | | | | | | | | |
| B&G Foods, Inc. | | | | | | | | |
| 5.25%, 04/01/2025 | | | 70,000 | | | | 67,943 | |
| Energizer Holdings, Inc. | | | | | | | | |
| 6.38%, 07/15/2026(a) | | | 105,000 | | | | 105,525 | |
| JBS Investments GmbH | | | | | | | | |
| 7.25%, 04/03/2024(a) | | | 70,000 | | | | 72,538 | |
| Pilgrim's Pride Corp. | | | | | | | | |
| 5.75%, 03/15/2025(a) | | | 70,000 | | | | 71,050 | |
| Post Holdings, Inc. | | | | | | | | |
| 5.50%, 03/01/2025(a) | | | 70,000 | | | | 70,875 | |
| Spectrum Brands, Inc. | | | | | | | | |
| 5.75%, 07/15/2025 | | | 105,000 | | | | 107,095 | |
| TreeHouse Foods, Inc. | | | | | | | | |
| 6.00%, 02/15/2024(a) | | | 105,000 | | | | 107,285 | |
| Total Consumer Staples | | | | | | | 602,311 | |
| | | | | | | | | |
| Energy (12.23%) | | | | | | | | |
| Antero Resources Corp. | | | | | | | | |
| 5.38%, 11/01/2021 | | | 125,000 | | | | 125,034 | |
| Ascent Resources Utica Holdings LLC / ARU Finance Corp. | | | | | | | | |
| 10.00%, 04/01/2022(a) | | | 140,000 | | | | 149,260 | |
| Bruin E&P Partners LLC | | | | | | | | |
| 8.88%, 08/01/2023(a) | | | 70,000 | | | | 63,175 | |
| Callon Petroleum Co. | | | | | | | | |
| 6.38%, 07/01/2026 | | | 70,000 | | | | 68,425 | |
| Chesapeake Energy Corp. | | | | | | | | |
| 8.00%, 01/15/2025 | | | 35,000 | | | | 32,375 | |
| CNX Resources Corp. | | | | | | | | |
| 5.88%, 04/15/2022 | | | 68,000 | | | | 65,544 | |
| CrownRock LP / CrownRock Finance, Inc. | | | | | | | | |
| 5.63%, 10/15/2025(a) | | | 70,000 | | | | 67,287 | |
| Endeavor Energy Resources LP /EER Finance, Inc. | | | | | | | | |
| 5.50%, 01/30/2026(a) | | | 70,000 | | | | 71,750 | |
| Gulfport Energy Corp. | | | | | | | | |
| 6.00%, 10/15/2024 | | | 105,000 | | | | 87,150 | |
| Murphy Oil Corp. | | | | | | | | |
| 5.75%, 08/15/2025 | | | 105,000 | | | | 105,300 | |
| Nabors Industries, Inc. | | | | | | | | |
| 5.50%, 01/15/2023 | | | 70,000 | | | | 61,754 | |
| NGL Energy Partners LP / NGL Energy Finance Corp. | | | | | | | | |
| 6.13%, 03/01/2025 | | | 130,000 | | | | 128,375 | |
| Parkland Fuel Corp. | | | | | | | | |
| 6.00%, 04/01/2026(a) | | | 105,000 | | | | 106,837 | |
| Parsley Energy LLC / Parsley Finance Corp. | | | | | | | | |
| 5.38%, 01/15/2025(a) | | | 105,000 | | | | 105,262 | |
| Security Description | | Principal Amount | | | Value | |
| Energy (continued) | | | | | | | | |
| Peabody Energy Corp. | | | | | | | | |
| 6.00%, 03/31/2022(a) | | $ | 70,000 | | | $ | 69,300 | |
| Range Resources Corp. | | | | | | | | |
| 5.00%, 08/15/2022 | | | 115,000 | | | | 109,195 | |
| Rowan Cos., Inc. | | | | | | | | |
| 4.88%, 06/01/2022 | | | 70,000 | | | | 63,700 | |
| SM Energy Co. | | | | | | | | |
| 6.13%, 11/15/2022 | | | 70,000 | | | | 68,075 | |
| Sunoco LP / Sunoco Finance Corp. | | | | | | | | |
| 5.50%, 02/15/2026 | | | 70,000 | | | | 70,875 | |
| Targa Resources Partners LP / Targa Resources Partners Finance Corp. | | | | | | | | |
| 5.88%, 04/15/2026 | | | 105,000 | | | | 108,806 | |
| Transocean, Inc. | | | | | | | | |
| 9.00%, 07/15/2023(a) | | | 8,000 | | | | 8,250 | |
| USA Compression Partners LP / USA Compression Finance Corp. | | | | | | | | |
| 6.88%, 04/01/2026 | | | 105,000 | | | | 108,150 | |
| Whiting Petroleum Corp. | | | | | | | | |
| 6.63%, 01/15/2026 | | | 35,000 | | | | 32,200 | |
| WPX Energy, Inc. | | | | | | | | |
| 5.75%, 06/01/2026 | | | 105,000 | | | | 104,541 | |
| Total Energy | | | | | | | 1,980,620 | |
| | | | | | | | | |
| Financials (10.59%) | | | | | | | | |
| Ally Financial, Inc. | | | | | | | | |
| 5.75%, 11/20/2025 | | | 140,000 | | | | 150,325 | |
| CIT Group, Inc. | | | | | | | | |
| 5.00%, 08/15/2022 | | | 166,000 | | | | 172,560 | |
| 5.25%, 03/07/2025 | | | 55,000 | | | | 58,239 | |
| Equinix, Inc. | | | | | | | | |
| 5.75%, 01/01/2025 | | | 105,000 | | | | 108,827 | |
| First Data Corp. | | | | | | | | |
| 5.38%, 08/15/2023(a) | | | 105,000 | | | | 106,562 | |
| Genworth Holdings, Inc. | | | | | | | | |
| 7.70%, 06/15/2020 | | | 140,000 | | | | 140,770 | |
| Icahn Enterprises LP / Icahn Enterprises Finance Corp. | | | | | | | | |
| 5.88%, 02/01/2022 | | | 105,000 | | | | 106,312 | |
| Iron Mountain, Inc. | | | | | | | | |
| 5.75%, 08/15/2024 | | | 105,000 | | | | 104,425 | |
| iStar, Inc. | | | | | | | | |
| 5.25%, 09/15/2022 | | | 105,000 | | | | 105,656 | |
| Jefferies Finance LLC / JFIN Co.- Issuer Corp. | | | | | | | | |
| 7.38%, 04/01/2020(a) | | | 105,000 | | | | 105,000 | |
| Jefferies Financial Group, Inc. | | | | | | | | |
| 5.50%, 10/18/2023 | | | 70,000 | | | | 74,297 | |
| MGM Growth Properties Operating Partnership LP / MGP Finance Co.-Issuer, Inc. | | | | | | | | |
| 5.63%, 05/01/2024 | | | 70,000 | | | | 72,538 | |
See Notes to Financial Statements.
RiverFront Dynamic Unconstrained Income ETF
| Schedule of Investments | May 31, 2019 (Unaudited) |
| Security Description | | Principal Amount | | | Value | |
| Financials (continued) | | | | | | | | |
| Navient Corp. | | | | | | | | |
| 8.00%, 03/25/2020 | | $ | 55,000 | | | $ | 56,719 | |
| 6.50%, 06/15/2022 | | | 125,000 | | | | 130,312 | |
| Park Aerospace Holdings, Ltd. | | | | | | | | |
| 5.25%, 08/15/2022(a) | | | 105,000 | | | | 109,463 | |
| Springleaf Finance Corp. | | | | | | | | |
| 5.63%, 03/15/2023 | | | 110,000 | | | | 113,163 | |
| Total Financials | | | | | | | 1,715,168 | |
| | | | | | | | | |
| Health Care (8.03%) | | | | | | | | |
| Avantor, Inc. | | | | | | | | |
| 6.00%, 10/01/2024(a) | | | 105,000 | | | | 109,305 | |
| Bausch Health Cos., Inc. | | | | | | | | |
| 5.50%, 03/01/2023(a) | | | 28,000 | | | | 28,175 | |
| 6.13%, 04/15/2025(a) | | | 35,000 | | | | 34,191 | |
| Centene Corp. | | | | | | | | |
| 6.13%, 02/15/2024 | | | 140,000 | | | | 146,318 | |
| CHS/Community Health Systems, Inc. | | | | | | | | |
| 5.13%, 08/01/2021 | | | 150,000 | | | | 147,375 | |
| DaVita, Inc. | | | | | | | | |
| 5.00%, 05/01/2025 | | | 140,000 | | | | 132,923 | |
| Encompass Health Corp. | | | | | | | | |
| 5.75%, 11/01/2024 | | | 105,000 | | | | 106,181 | |
| HCA, Inc. | | | | | | | | |
| 5.88%, 05/01/2023 | | | 160,000 | | | | 170,301 | |
| Kinetic Concepts, Inc. / KCI USA, Inc. | | | | | | | | |
| 7.88%, 02/15/2021(a) | | | 125,000 | | | | 128,384 | |
| Tenet Healthcare Corp. | | | | | | | | |
| 4.38%, 10/01/2021 | | | 140,000 | | | | 141,764 | |
| 8.13%, 04/01/2022 | | | 35,000 | | | | 36,720 | |
| Teva Pharmaceutical Finance Netherlands III BV | | | | | | | | |
| 6.75%, 03/01/2028 | | | 131,000 | | | | 118,227 | |
| Total Health Care | | | | | | | 1,299,864 | |
| | | | | | | | | |
| Industrials (6.21%) | | | | | | | | |
| ADT Security Corp. | | | | | | | | |
| 6.25%, 10/15/2021 | | | 140,000 | | | | 147,000 | |
| Bombardier, Inc. | | | | | | | | |
| 6.13%, 01/15/2023(a) | | | 70,000 | | | | 68,229 | |
| Covanta Holding Corp. | | | | | | | | |
| 5.88%, 03/01/2024 | | | 105,000 | | | | 107,887 | |
| Novelis Corp. | | | | | | | | |
| 6.25%, 08/15/2024(a) | | | 70,000 | | | | 71,750 | |
| Terex Corp. | | | | | | | | |
| 5.63%, 02/01/2025(a) | | | 140,000 | | | | 137,830 | |
| TransDigm, Inc. | | | | | | | | |
| 6.00%, 07/15/2022 | | | 140,000 | | | | 141,050 | |
| United Rentals North America, Inc. | | | | | | | | |
| 5.88%, 09/15/2026 | | | 70,000 | | | | 72,800 | |
| WESCO Distribution, Inc. | | | | | | | | |
| 5.38%, 06/15/2024 | | | 105,000 | | | | 107,363 | |
| Security Description | | Principal Amount | | | Value | |
| Industrials (continued) | | | | | | | | |
| XPO Logistics, Inc. | | | | | | | | |
| 6.50%, 06/15/2022(a) | | $ | 149,000 | | | $ | 151,868 | |
| Total Industrials | | | | | | | 1,005,777 | |
| | | | | | | | | |
| Materials (10.71%) | | | | | | | | |
| AK Steel Corp. | | | | | | | | |
| 7.63%, 10/01/2021 | | | 35,000 | | | | 33,950 | |
| 7.50%, 07/15/2023 | | | 119,000 | | | | 118,405 | |
| Allegheny Technologies, Inc. | | | | | | | | |
| 5.95%, 01/15/2021 | | | 105,000 | | | | 104,706 | |
| Ardagh Packaging Finance PLC / Ardagh Holdings USA, Inc. | | | | | | | | |
| 7.25%, 05/15/2024(a) | | | 105,000 | | | | 109,725 | |
| Ball Corp. | | | | | | | | |
| 4.88%, 03/15/2026 | | | 70,000 | | | | 72,012 | |
| BWAY Holding Co. | | | | | | | | |
| 5.50%, 04/15/2024(a) | | | 70,000 | | | | 68,694 | |
| Cascades, Inc. | | | | | | | | |
| 5.50%, 07/15/2022(a) | | | 144,000 | | | | 144,360 | |
| Chemours Co. | | | | | | | | |
| 7.00%, 05/15/2025 | | | 140,000 | | | | 140,350 | |
| FMG Resources August 2006 Pty, Ltd. | | | | | | | | |
| 5.13%, 03/15/2023(a) | | | 70,000 | | | | 70,875 | |
| Freeport-McMoRan, Inc. | | | | | | | | |
| 3.88%, 03/15/2023 | | | 105,000 | | | | 101,325 | |
| Koppers, Inc. | | | | | | | | |
| 6.00%, 02/15/2025(a) | | | 70,000 | | | | 66,106 | |
| NOVA Chemicals Corp. | | | | | | | | |
| 5.25%, 06/01/2027(a) | | | 105,000 | | | | 95,944 | |
| OCI NV | | | | | | | | |
| 6.63%, 04/15/2023(a) | | | 70,000 | | | | 71,750 | |
| Owens-Brockway Glass Container, Inc. | | | | | | | | |
| 5.00%, 01/15/2022(a) | | | 105,000 | | | | 106,969 | |
| Rayonier AM Products, Inc. | | | | | | | | |
| 5.50%, 06/01/2024(a) | | | 70,000 | | | | 56,841 | |
| Reynolds Group Issuer, Inc. / Reynolds Group Issuer LLC / Reynolds Group Issuer Lu | | | | | | | | |
| 5.13%, 07/15/2023(a) | | | 135,000 | | | | 135,196 | |
| Sealed Air Corp. | | | | | | | | |
| 5.25%, 04/01/2023(a) | | | 70,000 | | | | 72,625 | |
| SunCoke Energy Partners LP / SunCoke Energy Partners Finance Corp. | | | | | | | | |
| 7.50%, 06/15/2025(a) | | | 105,000 | | | | 103,819 | |
| United States Steel Corp. | | | | | | | | |
| 6.88%, 08/15/2025 | | | 70,000 | | | | 60,935 | |
| Total Materials | | | | | | | 1,734,587 | |
| | | | | | | | | |
| Technology (5.30%) | | | | | | | | |
| Anixter, Inc. | | | | | | | | |
| 5.50%, 03/01/2023 | | | 105,000 | | | | 109,200 | |
| CommScope Technologies LLC | | | | | | | | |
| 6.00%, 06/15/2025(a) | | | 70,000 | | | | 63,841 | |
See Notes to Financial Statements.
RiverFront Dynamic Unconstrained Income ETF
| Schedule of Investments | May 31, 2019 (Unaudited) |
| Security Description | | Principal Amount | | | Value | |
| Technology (continued) | | | | | | | | |
| Dell International LLC / EMC Corp. | | | | | | | | |
| 5.88%, 06/15/2021(a) | | $ | 105,000 | | | $ | 106,552 | |
| 7.13%, 06/15/2024(a) | | | 35,000 | | | | 36,892 | |
| j2 Cloud Services LLC / j2 Global Co.-Obligor, Inc. | | | | | | | | |
| 6.00%, 07/15/2025(a) | | | 105,000 | | | | 107,494 | |
| MSCI, Inc. | | | | | | | | |
| 5.38%, 05/15/2027(a) | | | 70,000 | | | | 73,762 | |
| NCR Corp. | | | | | | | | |
| 5.00%, 07/15/2022 | | | 119,000 | | | | 119,262 | |
| Nielsen Finance LLC / Nielsen Finance Co. | | | | | | | | |
| 5.00%, 04/15/2022(a) | | | 105,000 | | | | 104,380 | |
| Symantec Corp. | | | | | | | | |
| 5.00%, 04/15/2025(a) | | | 70,000 | | | | 70,012 | |
| Western Digital Corp. | | | | | | | | |
| 4.75%, 02/15/2026 | | | 70,000 | | | | 66,554 | |
| Total Technology | | | | | | | 857,949 | |
| | | | | | | | | |
| Utilities (3.47%) | | | | | | | | |
| AmeriGas Partners LP / AmeriGas Finance Corp. | | | | | | | | |
| 5.75%, 05/20/2027 | | | 105,000 | | | | 108,152 | |
| Calpine Corp. | | | | | | | | |
| 5.38%, 01/15/2023 | | | 140,000 | | | | 138,775 | |
| Cemig Geracao e Transmissao SA | | | | | | | | |
| 9.25%, 12/05/2024(a) | | | 70,000 | | | | 77,962 | |
| NRG Energy, Inc. | | | | | | | | |
| 6.63%, 01/15/2027 | | | 125,000 | | | | 133,438 | |
| Suburban Propane Partners LP/Suburban Energy Finance Corp. | | | | | | | | |
| 5.50%, 06/01/2024 | | | 105,000 | | | | 103,425 | |
| Total Utilities | | | | | | | 561,752 | |
| | | | | | | | | |
| TOTAL CORPORATE BONDS | | | | | | | | |
| (Cost $14,686,787) | | | | | | | 14,745,208 | |
| | | 7 Day Yield | | | Shares | | | Value | |
| SHORT TERM INVESTMENTS (7.54%) | | | | | |
| State Street Institutional Treasury Plus Money Market Fund | | | 2.309 | % | | | 1,221,699 | | | | 1,221,699 | |
| TOTAL SHORT TERM INVESTMENTS | | | | | | |
| (Cost $1,221,699) | | | | | | | | | | | 1,221,699 | |
| | | | | | | | | | | | | |
| TOTAL INVESTMENTS (98.60%) | | | | | | |
| (Cost $15,908,486) | | | | | | | | | | $ | 15,966,907 | |
| OTHER ASSETS IN EXCESS OF LIABILITIES (1.40%) | | | | 226,502 | |
| NET ASSETS - 100.00% | $ | 16,193,409 | |
Investment Abbreviations:
LIBOR - London Interbank Offered Rate
Libor Rates:
3M US L - 3 Month LIBOR as of May 31, 2019 was 2.50%
| (a) | Securities exempt from registration under Rule 144A of the Securities Act of 1933. These securities may be sold in the ordinary course of business in transactions exempt from registration, normally to qualified institutional buyers. At period end, the aggregate market value of those securities was $5,895,636, representing 36.41% of net assets. |
| (b) | Floating or variable rate security. The reference rate is described above. The rate in effect as of May 31, 2019 is based on the reference rate plus the displayed spread as of the security's last reset date. |
See Notes to Financial Statements.
RiverFront Dynamic US Dividend Advantage ETF
| Schedule of Investments | May 31, 2019 (Unaudited) |
| Security Description | | Shares | | | Value | |
| COMMON STOCKS (99.82%) | | | | | | | | |
| Communication Services (6.19%) | | | | | | | | |
| Alphabet, Inc., Class A(a) | | | 1,793 | | | $ | 1,983,955 | |
| Alphabet, Inc., Class C(a) | | | 1,815 | | | | 2,003,088 | |
| AT&T, Inc. | | | 10,519 | | | | 321,671 | |
| Facebook, Inc., Class A(a) | | | 12,236 | | | | 2,171,523 | |
| TripAdvisor, Inc.(a) | | | 16,138 | | | | 682,153 | |
| Verizon Communications, Inc. | | | 16,300 | | | | 885,905 | |
| Total Communication Services | | | | | | | 8,048,295 | |
| | | | | | | | | |
| Consumer Discretionary (18.13%) | | | | | | | | |
| Abercrombie & Fitch Co., Class A | | | 58,018 | | | | 1,003,711 | |
| Amazon.com, Inc.(a) | | | 2,918 | | | | 5,179,654 | |
| Best Buy Co., Inc. | | | 14,123 | | | | 885,089 | |
| Dana, Inc. | | | 47,877 | | | | 698,526 | |
| Domino's Pizza, Inc. | | | 5,488 | | | | 1,533,896 | |
| Expedia Group, Inc. | | | 8,259 | | | | 949,785 | |
| H&R Block, Inc. | | | 53,339 | | | | 1,400,149 | |
| Home Depot, Inc. | | | 13,986 | | | | 2,655,242 | |
| Kohl's Corp. | | | 13,771 | | | | 679,186 | |
| Macy's, Inc. | | | 56,602 | | | | 1,164,303 | |
| Modine Manufacturing Co.(a) | | | 48,652 | | | | 625,178 | |
| NIKE, Inc., Class B | | | 23,260 | | | | 1,794,276 | |
| NVR, Inc.(a) | | | 252 | | | | 806,796 | |
| Six Flags Entertainment Corp. | | | 12,183 | | | | 601,353 | |
| Thor Industries, Inc. | | | 10,211 | | | | 527,296 | |
| Tiffany & Co. | | | 9,411 | | | | 838,614 | |
| Tupperware Brands Corp. | | | 32,281 | | | | 601,072 | |
| Yum! Brands, Inc. | | | 16,071 | | | | 1,644,867 | |
| Total Consumer Discretionary | | | | | | | 23,588,993 | |
| | | | | | | | | |
| Consumer Staples (5.16%) | | | | | | | | |
| Molson Coors Brewing Co., Class B | | | 13,551 | | | | 745,034 | |
| Philip Morris International, Inc. | | | 10,710 | | | | 826,062 | |
| Procter & Gamble Co. | | | 28,158 | | | | 2,897,740 | |
| Walmart, Inc. | | | 22,083 | | | | 2,240,100 | |
| Total Consumer Staples | | | | | | | 6,708,936 | |
| | | | | | | | | |
| Energy (4.01%) | | | | | | | | |
| Exxon Mobil Corp. | | | 32,488 | | | | 2,299,176 | |
| Marathon Petroleum Corp. | | | 8,737 | | | | 401,815 | |
| Occidental Petroleum Corp. | | | 12,961 | | | | 645,069 | |
| ONEOK, Inc. | | | 15,991 | | | | 1,017,347 | |
| PBF Energy, Inc., Class A | | | 14,262 | | | | 376,517 | |
| Phillips 66 | | | 5,918 | | | | 478,174 | |
| Total Energy | | | | | | | 5,218,098 | |
| | | | | | | | | |
| Financials (9.43%) | | | | | | | | |
| Bank of America Corp. | | | 99,921 | | | | 2,657,899 | |
| Berkshire Hathaway, Inc., Class B(a) | | | 6,308 | | | | 1,245,325 | |
| Everest Re Group, Ltd. | | | 5,283 | | | | 1,308,388 | |
| JPMorgan Chase & Co. | | | 29,295 | | | | 3,104,098 | |
| M&T Bank Corp. | | | 987 | | | | 157,525 | |
| Navient Corp. | | | 104,704 | | | | 1,365,340 | |
| Security Description | | Shares | | | Value | |
| Financials (continued) | | | | | | | | |
| Principal Financial Group, Inc. | | | 19,095 | | | $ | 984,729 | |
| Synchrony Financial | | | 43,142 | | | | 1,450,866 | |
| Total Financials | | | | | | | 12,274,170 | |
| | | | | | | | | |
| Health Care (17.12%) | | | | | | | | |
| AbbVie, Inc. | | | 25,421 | | | | 1,950,045 | |
| Agilent Technologies, Inc. | | | 15,413 | | | | 1,033,441 | |
| Amgen, Inc. | | | 11,020 | | | | 1,837,034 | |
| Baxter International, Inc. | | | 20,936 | | | | 1,537,540 | |
| Bristol-Myers Squibb Co. | | | 35,239 | | | | 1,598,793 | |
| Edwards Lifesciences Corp.(a) | | | 7,057 | | | | 1,204,630 | |
| Eli Lilly & Co. | | | 20,435 | | | | 2,369,234 | |
| IDEXX Laboratories, Inc.(a) | | | 3,537 | | | | 883,436 | |
| Merck & Co., Inc. | | | 31,871 | | | | 2,524,502 | |
| Pfizer, Inc. | | | 65,167 | | | | 2,705,734 | |
| Thermo Fisher Scientific, Inc. | | | 6,402 | | | | 1,709,206 | |
| UnitedHealth Group, Inc. | | | 1,966 | | | | 475,379 | |
| Waters Corp.(a) | | | 5,527 | | | | 1,109,324 | |
| Zoetis, Inc. | | | 13,314 | | | | 1,345,380 | |
| Total Health Care | | | | | | | 22,283,678 | |
| | | | | | | | | |
| Industrials (8.19%) | | | | | | | | |
| AO Smith Corp. | | | 10,410 | | | | 421,605 | |
| Boeing Co. | | | 6,270 | | | | 2,141,895 | |
| Eaton Corp. PLC | | | 2,632 | | | | 196,058 | |
| General Electric Co. | | | 93,755 | | | | 885,047 | |
| Lennox International, Inc. | | | 4,836 | | | | 1,277,236 | |
| Matson, Inc. | | | 34,529 | | | | 1,181,582 | |
| Nordson Corp. | | | 10,021 | | | | 1,258,838 | |
| Rockwell Automation, Inc. | | | 6,312 | | | | 939,541 | |
| Roper Technologies, Inc. | | | 4,805 | | | | 1,652,536 | |
| Ryder System, Inc. | | | 14,037 | | | | 708,868 | |
| Total Industrials | | | | | | | 10,663,206 | |
| | | | | | | | | |
| Information Technology (18.18%) | | | | | | | | |
| Accenture PLC, Class A | | | 12,095 | | | | 2,153,757 | |
| Apple, Inc. | | | 31,918 | | | | 5,587,884 | |
| Broadcom, Inc. | | | 6,626 | | | | 1,667,367 | |
| Cadence Design Systems, Inc.(a) | | | 23,842 | | | | 1,515,636 | |
| CommVault Systems, Inc.(a) | | | 18,935 | | | | 871,957 | |
| Intuit, Inc. | | | 6,154 | | | | 1,506,807 | |
| j2 Global, Inc. | | | 11,819 | | | | 996,224 | |
| KLA-Tencor Corp. | | | 11,714 | | | | 1,207,362 | |
| Lam Research Corp. | | | 3,851 | | | | 672,423 | |
| Manhattan Associates, Inc.(a) | | | 26,090 | | | | 1,708,112 | |
| Micron Technology, Inc.(a) | | | 20,612 | | | | 672,157 | |
| Microsoft Corp. | | | 31,709 | | | | 3,921,769 | |
| National Instruments Corp. | | | 30,490 | | | | 1,176,609 | |
| Total Information Technology | | | | | | | 23,658,064 | |
| | | | | | | | | |
| Materials (1.77%) | | | | | | | | |
| CF Industries Holdings, Inc. | | | 22,342 | | | | 899,042 | |
| LyondellBasell Industries NV, Class A | | | 10,813 | | | | 802,865 | |
See Notes to Financial Statements.
RiverFront Dynamic US Dividend Advantage ETF
| Schedule of Investments | May 31, 2019 (Unaudited) |
| Security Description | | Shares | | | Value | |
| Materials (continued) | | | | | | | | |
| Westrock Co. | | | 18,245 | | | $ | 594,787 | |
| Total Materials | | | | | | | 2,296,694 | |
| | | | | | | | | |
| Real Estate (7.21%) | | | | | | | | |
| CoreCivic, Inc. | | | 48,130 | | | | 1,054,047 | |
| Hospitality Properties Trust | | | 39,357 | | | | 978,809 | |
| Iron Mountain, Inc. | | | 20,310 | | | | 622,502 | |
| Kimco Realty Corp. | | | 42,546 | | | | 740,300 | |
| Macerich Co. | | | 20,407 | | | | 741,386 | |
| RMR Group, Inc., Class A | | | 9,204 | | | | 443,817 | |
| Senior Housing Properties Trust | | | 73,841 | | | | 581,867 | |
| SITE Centers Corp. | | | 75,720 | | | | 966,944 | |
| Tanger Factory Outlet Centers, Inc. | | | 40,119 | | | | 680,418 | |
| The GEO Group, Inc. | | | 48,248 | | | | 1,058,079 | |
| Uniti Group, Inc. | | | 85,768 | | | | 824,230 | |
| Washington Prime Group, Inc. | | | 168,245 | | | | 689,805 | |
| Total Real Estate | | | | | | | 9,382,204 | |
| | | | | | | | | |
| Utilities (4.43%) | | | | | | | | |
| Consolidated Edison, Inc. | | | 8,182 | | | | 706,107 | |
| Dominion Energy, Inc. | | | 22,710 | | | | 1,707,338 | |
| Duke Energy Corp. | | | 12,240 | | | | 1,047,866 | |
| PPL Corp. | | | 46,284 | | | | 1,377,412 | |
| Southern Co. | | | 17,388 | | | | 930,258 | |
| Total Utilities | | | | | | | 5,768,981 | |
| | | | | | | | | |
| TOTAL COMMON STOCKS | | | | | | | | |
| (Cost $135,351,301) | | | | | | | 129,891,319 | |
| | | | | | | | | |
| TOTAL INVESTMENTS (99.82%) | | | | | | | | |
| (Cost $135,351,301) | | | | | | $ | 129,891,319 | |
| OTHER ASSETS IN EXCESS OF LIABILITIES (0.18%) | | | 236,832 | |
| NET ASSETS - 100.00% | | | | | | $ | 130,128,151 | |
| (a) | Non-income producing security. |
See Notes to Financial Statements.
RiverFront Dynamic US Flex-Cap ETF
| Schedule of Investments | May 31, 2019 (Unaudited) |
| Security Description | | Shares | | | Value | |
| COMMON STOCKS (99.81%) | | | | | | | | |
| Communication Services (11.04%) | | | | | | | | |
| Alphabet, Inc., Class A(a) | | | 2,393 | | | $ | 2,647,854 | |
| Alphabet, Inc., Class C(a) | | | 2,333 | | | | 2,574,769 | |
| CBS Corp., Class B | | | 19,120 | | | | 923,114 | |
| Charter Communications, Inc., Class A(a) | | | 3,884 | | | | 1,463,491 | |
| Comcast Corp., Class A | | | 48,913 | | | | 2,005,433 | |
| Discovery, Inc., Class C(a) | | | 28,180 | | | | 722,535 | |
| Facebook, Inc., Class A(a) | | | 17,549 | | | | 3,114,421 | |
| News Corp. | | | 56,157 | | | | 639,628 | |
| News Corp., Class B | | | 53,570 | | | | 624,091 | |
| Total Communication Services | | | | | | | 14,715,336 | |
| | | | | | | | | |
| Consumer Discretionary (16.89%) | | | | | | | | |
| Aaron's, Inc. | | | 16,423 | | | | 874,689 | |
| Abercrombie & Fitch Co., Class A | | | 50,977 | | | | 881,902 | |
| Amazon.com, Inc.(a) | | | 2,552 | | | | 4,529,979 | |
| Core-Mark Holding Co., Inc. | | | 27,228 | | | | 1,004,169 | |
| Designer Brands, Inc. | | | 29,224 | | | | 528,662 | |
| Dine Brands Global, Inc. | | | 7,481 | | | | 706,356 | |
| Domino's Pizza, Inc. | | | 3,388 | | | | 946,946 | |
| Expedia Group, Inc. | | | 6,321 | | | | 726,915 | |
| Fossil Group, Inc.(a) | | | 46,141 | | | | 451,720 | |
| Fox Factory Holding Corp.(a) | | | 13,882 | | | | 930,372 | |
| General Motors Co. | | | 24,626 | | | | 821,031 | |
| Genesco, Inc.(a) | | | 20,238 | | | | 910,305 | |
| Genuine Parts Co. | | | 7,555 | | | | 747,189 | |
| Home Depot, Inc. | | | 10,192 | | | | 1,934,951 | |
| Kohl's Corp. | | | 12,843 | | | | 633,417 | |
| Macy's, Inc. | | | 30,604 | | | | 629,524 | |
| MarineMax, Inc.(a) | | | 37,449 | | | | 583,455 | |
| MGM Resorts International | | | 29,196 | | | | 724,645 | |
| NIKE, Inc., Class B | | | 14,621 | | | | 1,127,864 | |
| PulteGroup, Inc. | | | 23,885 | | | | 740,435 | |
| Signet Jewelers, Ltd. | | | 26,336 | | | | 496,697 | |
| Tailored Brands, Inc. | | | 60,341 | | | | 317,394 | |
| Yum! Brands, Inc. | | | 12,357 | | | | 1,264,739 | |
| Total Consumer Discretionary | | | | | | | 22,513,356 | |
| | | | | | | | | |
| Consumer Staples (4.49%) | | | | | | | | |
| Altria Group, Inc. | | | 22,830 | | | | 1,120,040 | |
| Colgate-Palmolive Co. | | | 15,102 | | | | 1,051,401 | |
| Constellation Brands, Inc., Class A | | | 4,160 | | | | 734,032 | |
| Procter & Gamble Co. | | | 6,360 | | | | 654,508 | |
| Unilever NV | | | 16,305 | | | | 980,257 | |
| Walmart, Inc. | | | 14,242 | | | | 1,444,708 | |
| Total Consumer Staples | | | | | | | 5,984,946 | |
| | | | | | | | | |
| Energy (8.54%) | | | | | | | | |
| Baker Hughes, a GE Co. | | | 34,283 | | | | 733,999 | |
| Chevron Corp. | | | 15,259 | | | | 1,737,237 | |
| Exxon Mobil Corp. | | | 32,533 | | | | 2,302,361 | |
| Kinder Morgan, Inc. | | | 60,177 | | | | 1,200,531 | |
| Marathon Petroleum Corp. | | | 15,204 | | | | 699,232 | |
| Security Description | | Shares | | | Value | |
| Energy (continued) | | | | | | | | |
| National Oilwell Varco, Inc. | | | 27,160 | | | $ | 566,286 | |
| Noble Corp. PLC(a) | | | 239,191 | | | | 464,031 | |
| Occidental Petroleum Corp. | | | 14,426 | | | | 717,982 | |
| Phillips 66 | | | 9,500 | | | | 767,600 | |
| Schlumberger Ltd. | | | 23,558 | | | | 817,227 | |
| Transocean, Ltd.(a) | | | 89,807 | | | | 556,803 | |
| Valero Energy Corp. | | | 11,520 | | | | 811,008 | |
| Total Energy | | | | | | | 11,374,297 | |
| | | | | | | | | |
| Financials (6.95%) | | | | | | | | |
| Bank of America Corp. | | | 80,017 | | | | 2,128,452 | |
| Banner Corp. | | | 12,054 | | | | 608,245 | |
| Comerica, Inc. | | | 9,085 | | | | 625,230 | |
| Everest Re Group, Ltd. | | | 4,526 | | | | 1,120,909 | |
| First BanCorp | | | 46,251 | | | | 460,660 | |
| JPMorgan Chase & Co. | | | 9,385 | | | | 994,435 | |
| M&T Bank Corp. | | | 4,829 | | | | 770,708 | |
| Prudential Financial, Inc. | | | 9,441 | | | | 872,160 | |
| S&P Global, Inc. | | | 4,815 | | | | 1,029,832 | |
| Zions Bancorp NA | | | 15,036 | | | | 647,600 | |
| Total Financials | | | | | | | 9,258,231 | |
| | | | | | | | | |
| Health Care (10.63%) | | | | | | | | |
| Abbott Laboratories | | | 22,300 | | | | 1,697,699 | |
| AbbVie, Inc. | | | 16,369 | | | | 1,255,666 | |
| Allergan PLC | | | 6,724 | | | | 819,723 | |
| Cerner Corp.(a) | | | 14,519 | | | | 1,015,894 | |
| Cigna Corp. | | | 5,961 | | | | 882,347 | |
| Danaher Corp. | | | 8,745 | | | | 1,154,427 | |
| Eli Lilly & Co. | | | 10,290 | | | | 1,193,023 | |
| Johnson & Johnson | | | 19,915 | | | | 2,611,852 | |
| McKesson Corp. | | | 6,893 | | | | 841,911 | |
| UnitedHealth Group, Inc. | | | 7,932 | | | | 1,917,958 | |
| Zimmer Biomet Holdings, Inc. | | | 6,750 | | | | 769,028 | |
| Total Health Care | | | | | | | 14,159,528 | |
| | | | | | | | | |
| Industrials (14.10%) | | | | | | | | |
| AECOM(a) | | | 30,793 | | | | 982,297 | |
| AGCO Corp. | | | 11,185 | | | | 744,474 | |
| Arconic, Inc. | | | 48,377 | | | | 1,059,456 | |
| Boeing Co. | | | 4,810 | | | | 1,643,144 | |
| Cornerstone Building Brands, Inc.(a) | | | 97,523 | | | | 428,126 | |
| CSX Corp. | | | 16,936 | | | | 1,261,224 | |
| Expeditors International of Washington, Inc. | | | 10,362 | | | | 721,092 | |
| Fluor Corp. | | | 20,186 | | | | 559,556 | |
| General Electric Co. | | | 111,874 | | | | 1,056,091 | |
| Hillenbrand, Inc. | | | 16,938 | | | | 630,602 | |
| Hub Group, Inc., Class A(a) | | | 17,375 | | | | 676,930 | |
| Hubbell, Inc. | | | 7,046 | | | | 807,049 | |
| Kaman Corp. | | | 14,930 | | | | 830,257 | |
| National Presto Industries, Inc. | | | 5,894 | | | | 576,964 | |
| Nordson Corp. | | | 5,880 | | | | 738,646 | |
| Norfolk Southern Corp. | | | 6,401 | | | | 1,249,091 | |
| Rockwell Automation, Inc. | | | 5,570 | | | | 829,094 | |
| Roper Technologies, Inc. | | | 2,731 | | | | 939,245 | |
See Notes to Financial Statements.
RiverFront Dynamic US Flex-Cap ETF
| Schedule of Investments | May 31, 2019 (Unaudited) |
| Security Description | | Shares | | | Value | |
| Industrials (continued) | | | | | | | | |
| UniFirst Corp. | | | 5,258 | | | $ | 834,865 | |
| Union Pacific Corp. | | | 9,498 | | | | 1,584,076 | |
| United Rentals, Inc.(a) | | | 5,802 | | | | 638,800 | |
| Total Industrials | | | | | | | 18,791,079 | |
| | | | | | | | | |
| Information Technology (16.77%) | | | | | | | | |
| Alliance Data Systems Corp. | | | 4,390 | | | | 603,625 | |
| Apple, Inc. | | | 26,192 | | | | 4,585,434 | |
| Avnet, Inc. | | | 18,362 | | | | 749,904 | |
| Broadcom, Inc. | | | 5,653 | | | | 1,422,521 | |
| Broadridge Financial Solutions,Inc. | | | 7,755 | | | | 968,367 | |
| CACI International, Inc., Class A(a) | | | 5,347 | | | | 1,088,222 | |
| Cognizant Technology Solutions Corp., Class A | | | 15,177 | | | | 939,912 | |
| Gartner, Inc.(a) | | | 3,148 | | | | 476,292 | |
| HP, Inc. | | | 25,196 | | | | 470,661 | |
| Insight Enterprises, Inc.(a) | | | 16,304 | | | | 839,330 | |
| LogMeIn, Inc. | | | 9,423 | | | | 676,854 | |
| Micron Technology, Inc.(a) | | | 26,188 | | | | 853,991 | |
| Microsoft Corp. | | | 44,281 | | | | 5,476,674 | |
| ScanSource, Inc.(a) | | | 19,101 | | | | 557,940 | |
| Science Applications International Corp. | | | 10,277 | | | | 788,657 | |
| Tech Data Corp.(a) | | | 13,608 | | | | 1,233,565 | |
| Virtusa Corp.(a) | | | 14,481 | | | | 613,994 | |
| Total Information Technology | | | | | | | 22,345,943 | |
| | | | | | | | | |
| Materials (5.62%) | | | | | | | | |
| Boise Cascade Co. | | | 26,123 | | | | 579,930 | |
| Celanese Corp. | | | 7,652 | | | | 726,404 | |
| CF Industries Holdings, Inc. | | | 19,082 | | | | 767,860 | |
| Eastman Chemical Co. | | | 9,366 | | | | 608,041 | |
| FMC Corp. | | | 9,909 | | | | 727,816 | |
| Louisiana-Pacific Corp. | | | 33,772 | | | | 770,677 | |
| LyondellBasell Industries NV, Class A | | | 10,899 | | | | 809,251 | |
| Olin Corp. | | | 34,337 | | | | 673,348 | |
| Packaging Corp. of America | | | 6,315 | | | | 562,540 | |
| PolyOne Corp. | | | 23,776 | | | | 597,491 | |
| Westrock Co. | | | 20,296 | | | | 661,650 | |
| Total Materials | | | | | | | 7,485,008 | |
| | | | | | | | | |
| Real Estate (0.85%) | | | | | | | | |
| Pennsylvania Real Estate | | | | | | | | |
| Investment Trust | | | 117,222 | | | | 751,393 | |
| Realogy Holdings Corp. | | | 54,692 | | | | 387,766 | |
| Total Real Estate | | | | | | | 1,139,159 | |
| | | | | | | | | |
| Utilities (3.93%) | | | | | | | | |
| American Electric Power Co., Inc. | | | 11,255 | | | | 969,280 | |
| Avangrid, Inc. | | | 14,787 | | | | 740,237 | |
| Avista Corp. | | | 17,951 | | | | 749,634 | |
| Dominion Energy, Inc. | | | 13,334 | | | | 1,002,450 | |
| Evergy, Inc. | | | 14,306 | | | | 831,751 | |
| Security Description | | Shares | | | Value | |
| Utilities (continued) | | | | | | | | |
| Exelon Corp. | | | 19,533 | | | $ | 939,147 | |
| Total Utilities | | | | | | | 5,232,499 | |
| | | | | | | | | |
| TOTAL COMMON STOCKS | | | | | | | | |
| (Cost $142,484,069) | | | | | | | 132,999,382 | |
| | | 7 Day Yield | | | Shares | | | Value | |
| SHORT TERM INVESTMENTS (0.02%) | | | | | |
| State Street Institutional Treasury Plus Money Market Fund | | | 2.309 | % | | | 28,171 | | | | 28,171 | |
| TOTAL SHORT TERM INVESTMENTS | | | | | |
| (Cost $28,171) | | | | | | | | | | | 28,171 | |
| | | | | | | | | | | | | |
| TOTAL INVESTMENTS (99.83%) | | | | | |
| (Cost $142,512,240) | | | | | | | | | | $ | 133,027,553 | |
| OTHER ASSETS IN EXCESS OF LIABILITIES (0.17%) | | | | | 231,548 | |
| NET ASSETS - 100.00% | | | | | | | | | | $ | 133,259,101 | |
| (a) | Non-income producing security. |
See Notes to Financial Statements.
RiverFront Strategic Income Fund
| Schedule of Investments | May 31, 2019 (Unaudited) |
| Security Description | | Principal
Amount | | | Value | |
| CORPORATE BONDS (87.92%) | | | | | | | | |
| Communications (15.24%) | | | | | | | | |
| Cablevision Systems Corp. | | | | | | | | |
| 8.00%, 04/15/2020 | | $ | 2,014,000 | | | $ | 2,079,455 | |
| CenturyLink, Inc. | | | | | | | | |
| 5.63%, 04/01/2020 | | | 1,933,000 | | | | 1,966,441 | |
| Charter Communications Operating LLC / Charter Communications Operating Capital | | | | | | | | |
| 3.58%, 07/23/2020 | | | 1,771,000 | | | | 1,786,132 | |
| DISH DBS Corp. | | | | | | | | |
| 7.88%, 09/01/2019 | | | 2,049,000 | | | | 2,067,666 | |
| Hughes Satellite Systems Corp. | | | | | | | | |
| 6.50%, 06/15/2019 | | | 799,000 | | | | 799,020 | |
| 7.63%, 06/15/2021 | | | 1,180,000 | | | | 1,255,626 | |
| Lamar Media Corp. | | | | | | | | |
| 5.00%, 05/01/2023 | | | 1,452,000 | | | | 1,481,040 | |
| Level 3 Financing, Inc. | | | | | | | | |
| 5.38%, 08/15/2022 | | | 1,591,000 | | | | 1,600,944 | |
| Netflix, Inc. | | | | | | | | |
| 5.38%, 02/01/2021 | | | 1,474,000 | | | | 1,518,058 | |
| Sinclair Television Group, Inc. | | | | | | | | |
| 5.38%, 04/01/2021 | | | 1,376,000 | | | | 1,379,440 | |
| Sprint Communications, Inc. | | | | | | | | |
| 7.00%, 08/15/2020 | | | 2,137,000 | | | | 2,217,138 | |
| T-Mobile USA, Inc. | | | | | | | | |
| 6.50%, 01/15/2024 | | | 1,974,000 | | | | 2,043,090 | |
| Videotron, Ltd. | | | | | | | | |
| 5.00%, 07/15/2022 | | | 982,000 | | | | 1,017,598 | |
| Virgin Media Secured Finance PLC | | | | | | | | |
| 5.25%, 01/15/2021 | | | 1,554,000 | | | | 1,602,096 | |
| Total Communications | | | | | | | 22,813,744 | |
| | | | | | | | | |
| Consumer Discretionary (6.38%) | | | | | | | | |
| American Airlines Group, Inc. | | | | | | | | |
| 5.50%, 10/01/2019(a) | | | 1,818,000 | | | | 1,833,907 | |
| DR Horton, Inc. | | | | | | | | |
| 4.38%, 09/15/2022 | | | 1,682,000 | | | | 1,744,652 | |
| Ford Motor Credit Co. LLC | | | | | | | | |
| 3.16%, 08/04/2020 | | | 1,009,000 | | | | 1,007,983 | |
| International Game Technology PLC | | | | | | | | |
| 6.25%, 02/15/2022(a) | | | 1,776,000 | | | | 1,847,040 | |
| Lennar Corp. | | | | | | | | |
| 4.50%, 11/15/2019 | | | 1,474,000 | | | | 1,483,213 | |
| MGM Resorts International | | | | | | | | |
| 6.75%, 10/01/2020 | | | 1,572,000 | | | | 1,636,845 | |
| Total Consumer Discretionary | | | | | | | 9,553,640 | |
| | | | | | | | | |
| Consumer Staples (2.40%) | | | | | | | | |
| B&G Foods, Inc. | | | | | | | | |
| 4.63%, 06/01/2021 | | | 982,000 | | | | 983,227 | |
| JBS USA LUX SA / JBS USA Finance, Inc. | | | | | | | | |
| 5.88%, 07/15/2024(a) | | | 1,009,000 | | | | 1,038,009 | |
| Security Description | | Principal
Amount | | | Value | |
| Consumer Staples (continued) | | | | | | | | |
| Spectrum Brands, Inc. | | | | | | | | |
| 5.75%, 07/15/2025 | | $ | 256,000 | | | $ | 261,107 | |
| TreeHouse Foods, Inc. | | | | | | | | |
| 6.00%, 02/15/2024(a) | | | 1,288,000 | | | | 1,316,027 | |
| Total Consumer Staples | | | | | | | 3,598,370 | |
| | | | | | | | | |
| Energy (16.34%) | | | | | | | | |
| Antero Resources Corp. | | | | | | | | |
| 5.38%, 11/01/2021 | | | 1,493,000 | | | | 1,493,403 | |
| Cheniere Corpus Christi Holdings LLC | | | | | | | | |
| 7.00%, 06/30/2024 | | | 1,234,000 | | | | 1,378,625 | |
| Concho Resources, Inc. | | | | | | | | |
| 4.38%, 01/15/2025 | | | 1,406,000 | | | | 1,457,015 | |
| Continental Resources, Inc. | | | | | | | | |
| 5.00%, 09/15/2022 | | | 1,226,000 | | | | 1,236,189 | |
| DCP Midstream Operating LP | | | | | | | | |
| 5.35%, 03/15/2020(a) | | | 1,719,000 | | | | 1,742,636 | |
| Energy Transfer Operating LP | | | | | | | | |
| 7.50%, 10/15/2020 | | | 1,843,000 | | | | 1,956,546 | |
| EnLink Midstream Partners LP | | | | | | | | |
| 4.40%, 04/01/2024 | | | 653,000 | | | | 644,021 | |
| EQM Midstream Partners LP | | | | | | | | |
| 4.75%, 07/15/2023 | | | 1,009,000 | | | | 1,029,748 | |
| Kinder Morgan Energy Partners LP | | | | | | | | |
| 5.00%, 10/01/2021 | | | 1,444,000 | | | | 1,509,281 | |
| Marathon Petroleum Corp. | | | | | | | | |
| 5.38%, 10/01/2022 | | | 1,862,000 | | | | 1,893,106 | |
| Nabors Industries, Inc. | | | | | | | | |
| 5.00%, 09/15/2020 | | | 1,371,000 | | | | 1,394,992 | |
| Newfield Exploration Co. | | | | | | | | |
| 5.75%, 01/30/2022 | | | 1,696,000 | | | | 1,813,108 | |
| Petroleos Mexicanos | | | | | | | | |
| 5.50%, 01/21/2021 | | | 1,009,000 | | | | 1,038,766 | |
| Range Resources Corp. | | | | | | | | |
| 5.75%, 06/01/2021 | | | 294,000 | | | | 294,000 | |
| 5.00%, 08/15/2022 | | | 1,303,000 | | | | 1,237,225 | |
| Rockies Express Pipeline LLC | | | | | | | | |
| 5.63%, 04/15/2020(a) | | | 1,326,000 | | | | 1,352,480 | |
Tallgrass Energy Partners LP / Tallgrass Energy Finance Corp. | | | | | | | | |
| 4.75%, 10/01/2023(a) | | | 836,000 | | | | 843,332 | |
Targa Resources Partners LP / Targa Resources Partners Finance Corp. | | | | | | | | |
| 5.25%, 05/01/2023 | | | 1,639,000 | | | | 1,648,752 | |
| Whiting Petroleum Corp. | | | | | | | | |
| 5.75%, 03/15/2021 | | | 492,000 | | | | 488,212 | |
| Total Energy | | | | | | | 24,451,437 | |
| | | | | | | | | |
| Financials (14.86%) | | | | | | | | |
AerCap Ireland Capital DAC / AerCap Global Aviation Trust | | | | | | | | |
| 4.63%, 10/30/2020 | | | 1,700,000 | | | | 1,740,588 | |
| Air Lease Corp. | | | | | | | | |
| 4.25%, 02/01/2024 | | | 982,000 | | | | 1,020,370 | |
See Notes to Financial Statements.
RiverFront Strategic Income Fund
| Schedule of Investments | May 31, 2019 (Unaudited) |
| Security Description | | Principal
Amount | | | Value | |
| Financials (continued) | | | | | | | | |
| Aircastle, Ltd. | | | | | | | | |
| 6.25%, 12/01/2019 | | $ | 1,774,000 | | | $ | 1,802,914 | |
| Ally Financial, Inc. | | | | | | | | |
| 4.25%, 04/15/2021 | | | 1,499,000 | | | | 1,519,611 | |
| CIT Group, Inc. | | | | | | | | |
| 5.00%, 08/15/2022 | | | 2,049,000 | | | | 2,129,976 | |
| First Data Corp. | | | | | | | | |
| 5.38%, 08/15/2023(a) | | | 982,000 | | | | 996,612 | |
| GLP Capital LP / GLP Financing II, Inc. | | | | | | | | |
| 4.88%, 11/01/2020 | | | 1,474,000 | | | | 1,502,890 | |
Icahn Enterprises LP / Icahn Enterprises
Finance Corp. | | | | | | | | |
| 6.00%, 08/01/2020 | | | 1,551,000 | | | | 1,552,939 | |
| Iron Mountain, Inc. | | | | | | | | |
| 4.38%, 06/01/2021(a) | | | 1,563,000 | | | | 1,564,954 | |
| iStar, Inc. | | | | | | | | |
| 4.63%, 09/15/2020 | | | 1,572,000 | | | | 1,581,825 | |
| Omega Healthcare Investors, Inc. | | | | | | | | |
| 4.38%, 08/01/2023 | | | 1,572,000 | | | | 1,623,287 | |
| Park Aerospace Holdings, Ltd. | | | | | | | | |
| 5.25%, 08/15/2022(a) | | | 2,009,000 | | | | 2,094,383 | |
| SBA Communications Corp. | | | | | | | | |
| 4.88%, 07/15/2022 | | | 984,500 | | | | 993,065 | |
| Springleaf Finance Corp. | | | | | | | | |
| 8.25%, 12/15/2020 | | | 590,000 | | | | 630,563 | |
| Starwood Property Trust, Inc. | | | | | | | | |
| 5.00%, 12/15/2021 | | | 1,474,000 | | | | 1,486,205 | |
| Total Financials | | | | | | | 22,240,182 | |
| | | | | | | | | |
| Health Care (5.96%) | | | | | | | | |
| Centene Corp. | | | | | | | | |
| 5.63%, 02/15/2021 | | | 1,916,000 | | | | 1,939,950 | |
| DaVita, Inc. | | | | | | | | |
| 5.75%, 08/15/2022 | | | 1,460,000 | | | | 1,476,425 | |
| HCA, Inc. | | | | | | | | |
| 5.88%, 03/15/2022 | | | 2,007,000 | | | | 2,147,936 | |
| Kinetic Concepts, Inc. / KCI USA, Inc. | | | | | | | | |
| 7.88%, 02/15/2021(a) | | | 944,000 | | | | 969,554 | |
| Tenet Healthcare Corp. | | | | | | | | |
| 6.00%, 10/01/2020 | | | 1,597,000 | | | | 1,646,587 | |
Teva Pharmaceutical Finance
Netherlands III BV | | | | | | | | |
| 1.70%, 07/19/2019 | | | 745,000 | | | | 743,808 | |
| Total Health Care | | | | | | | 8,924,260 | |
| | | | | | | | | |
| Industrials (3.73%) | | | | | | | | |
| ADT Security Corp. | | | | | | | | |
| 6.25%, 10/15/2021 | | | 1,524,000 | | | | 1,600,200 | |
| 3.50%, 07/15/2022 | | | 88,000 | | | | 85,580 | |
| WESCO Distribution, Inc. | | | | | | | | |
| 5.38%, 12/15/2021 | | | 2,064,000 | | | | 2,084,640 | |
| Security Description | | Principal
Amount | | | Value | |
| Industrials (continued) | | | | | | | | |
| XPO Logistics, Inc. | | | | | | | | |
| 6.50%, 06/15/2022(a) | | $ | 1,778,000 | | | $ | 1,812,227 | |
| Total Industrials | | | | | | | 5,582,647 | |
| | | | | | | | | |
| Materials (14.21%) | | | | | | | | |
| AK Steel Corp. | | | | | | | | |
| 7.50%, 07/15/2023 | | | 1,474,000 | | | | 1,466,630 | |
| ArcelorMittal | | | | | | | | |
| 5.13%, 06/01/2020 | | | 492,000 | | | | 501,901 | |
| 6.00%, 08/05/2020 | | | 1,083,000 | | | | 1,110,140 | |
| Ashland LLC | | | | | | | | |
| 4.75%, 08/15/2022 | | | 1,488,000 | | | | 1,538,220 | |
| Ball Corp. | | | | | | | | |
| 4.38%, 12/15/2020 | | | 1,670,000 | | | | 1,703,400 | |
| Berry Global, Inc. | | | | | | | | |
| 6.00%, 10/15/2022 | | | 365,000 | | | | 372,300 | |
| Cascades, Inc. | | | | | | | | |
| 5.50%, 07/15/2022(a) | | | 672,000 | | | | 673,680 | |
| 5.75%, 07/15/2023(a) | | | 1,338,000 | | | | 1,348,035 | |
| Celanese US Holdings LLC | | | | | | | | |
| 5.88%, 06/15/2021 | | | 1,494,000 | | | | 1,579,532 | |
| CF Industries, Inc. | | | | | | | | |
| 7.13%, 05/01/2020 | | | 1,278,000 | | | | 1,314,410 | |
| 3.45%, 06/01/2023 | | | 170,000 | | | | 165,963 | |
| Crown Americas LLC / Crown | | | | | | | | |
| Americas Capital Corp. IV | | | | | | | | |
| 4.50%, 01/15/2023 | | | 1,050,000 | | | | 1,065,624 | |
| Freeport-McMoRan, Inc. | | | | | | | | |
| 3.88%, 03/15/2023 | | | 148,000 | | | | 142,820 | |
| Graphic Packaging International LLC | | | | | | | | |
| 4.75%, 04/15/2021 | | | 733,000 | | | | 746,744 | |
| 4.88%, 11/15/2022 | | | 1,435,000 | | | | 1,467,287 | |
| Owens-Brockway Glass Container, Inc. | | | | | | | | |
| 5.00%, 01/15/2022(a) | | | 1,529,000 | | | | 1,557,669 | |
Reynolds Group Issuer, Inc. / Reynolds Group Issuer LLC / Reynolds Group Issuer Lu | | | | | | | | |
| 5.75%, 10/15/2020 | | | 1,238,520 | | | | 1,241,988 | |
| Sealed Air Corp. | | | | | | | | |
| 6.50%, 12/01/2020(a) | | | 1,376,000 | | | | 1,424,160 | |
| WR Grace & Co.-Conn | | | | | | | | |
| 5.13%, 10/01/2021(a) | | | 1,809,000 | | | | 1,840,115 | |
| Total Materials | | | | | | | 21,260,618 | |
| | | | | | | | | |
| Technology (7.03%) | | | | | | | | |
| Broadcom, Inc. | | | | | | | | |
| 3.13%, 04/15/2021(a) | | | 1,009,000 | | | | 1,011,287 | |
| CommScope, Inc. | | | | | | | | |
| 5.50%, 03/01/2024(a) | | | 982,000 | | | | 991,820 | |
| Dell, Inc. | | | | | | | | |
| 4.63%, 04/01/2021 | | | 98,000 | | | | 99,630 | |
| Flex, Ltd. | | | | | | | | |
| 5.00%, 02/15/2023 | | | 1,052,000 | | | | 1,097,180 | |
See Notes to Financial Statements.
RiverFront Strategic Income Fund
| Schedule of Investments | May 31, 2019 (Unaudited) |
| Security Description | | Principal
Amount | | | Value | |
| Technology (continued) | | | | | | | | |
| Micron Technology, Inc. | | | | | | | | |
| 4.64%, 02/06/2024 | | $ | 982,000 | | | $ | 1,001,494 | |
| NCR Corp. | | | | | | | | |
| 4.63%, 02/15/2021 | | | 1,474,000 | | | | 1,473,558 | |
Nielsen Finance LLC / Nielsen Finance Co. | | | | | | | | |
| 4.50%, 10/01/2020 | | | 1,572,000 | | | | 1,572,314 | |
| NXP BV / NXP Funding LLC | | | | | | | | |
| 4.13%, 06/15/2020(a) | | | 1,474,000 | | | | 1,490,008 | |
| Pitney Bowes, Inc. | | | | | | | | |
| 3.88%, 10/01/2021 | | | 152,000 | | | | 146,923 | |
| Seagate HDD Cayman | | | | | | | | |
| 4.25%, 03/01/2022 | | | 492,000 | | | | 492,674 | |
| Symantec Corp. | | | | | | | | |
| 3.95%, 06/15/2022 | | | 148,000 | | | | 146,948 | |
| Xerox Corp. | | | | | | | | |
| 4.50%, 05/15/2021 | | | 982,000 | | | | 995,365 | |
| Total Technology | | | | | | | 10,519,201 | |
| | | | | | | | | |
| Utilities (1.77%) | | | | | | | | |
| Calpine Corp. | | | | | | | | |
| 6.00%, 01/15/2022(a) | | | 1,622,000 | | | | 1,640,247 | |
| DPL, Inc. | | | | | | | | |
| 7.25%, 10/15/2021 | | | 945,000 | | | | 1,009,969 | |
| Total Utilities | | | | | | | 2,650,216 | |
| | | | | | | | | |
| TOTAL CORPORATE BONDS | | | | | | | | |
| (Cost $130,267,266) | | | | | | | 131,594,315 | |
| | | 7 Day Yield | | | Shares | | | Value | |
| SHORT TERM INVESTMENTS (10.84%) | | | | |
| State Street Institutional Treasury Plus Money Market Fund | | | 2.309 | % | | | 16,217,863 | | | | 16,217,863 | |
| TOTAL SHORT TERM INVESTMENTS | | | | | |
| (Cost $16,217,863) | | | | | | | | | | | 16,217,863 | |
| | | | | | | | | | | | | |
| TOTAL INVESTMENTS (98.75%) | | | | | |
| (Cost $146,485,129) | | | | | | | | | | $ | 147,812,178 | |
| OTHER ASSETS IN EXCESS OF LIABILITIES (1.25%) | | | | | 1,863,785 | |
| NET ASSETS - 100.00% | | | | | | | | | | $ | 149,675,963 | |
| (a) | Securities exempt from registration under Rule 144A of the Securities Act of 1933. These securities may be sold in the ordinary course of business in transactions exempt from registration, normally to qualified institutional buyers. At period end, the aggregate market value of those securities was $29,388,182, representing 19.63% of net assets. |
See Notes to Financial Statements.
RiverFront ETFs
| Statement of Assets and Liabilities | May 31, 2019 (Unaudited) |
| | | RiverFront Dynamic Core Income ETF | | | RiverFront Dynamic Unconstrained Income ETF | | | RiverFront Dynamic US Dividend Advantage ETF | | | RiverFront Dynamic US Flex-Cap ETF | | | RiverFront Strategic Income Fund | |
| ASSETS: | | | | | | | | | | | | | | | |
| Investments, at value | | $ | 152,283,740 | | | $ | 15,966,907 | | | $ | 129,891,319 | | | $ | 133,027,553 | | | $ | 147,812,178 | |
| Dividend receivable | | | – | | | | – | | | | 317,883 | | | | 292,811 | | | | – | |
| Interest receivable | | | 961,008 | | | | 233,585 | | | | – | | | | – | | | | 1,921,833 | |
| Receivable for shares sold | | | – | | | | – | | | | – | | | | 4,715,487 | | | | – | |
| Total Assets | | | 153,244,748 | | | | 16,200,492 | | | | 130,209,202 | | | | 138,035,851 | | | | 149,734,011 | |
| | | | | | | | | | | | | | | | | | | | | |
| LIABILITIES: | | | | | | | | | | | | | | | | | | | | |
| Payable to adviser | | | 65,704 | | | | 7,083 | | | | 60,670 | | | | 60,355 | | | | 58,048 | |
| Payable for investments purchased | | | – | | | | – | | | | – | | | | 4,716,395 | | | | – | |
| Due to custodian | | | – | | | | – | | | | 20,381 | | | | – | | | | – | |
| Total Liabilities | | | 65,704 | | | | 7,083 | | | | 81,051 | | | | 4,776,750 | | | | 58,048 | |
| NET ASSETS | | $ | 153,179,044 | | | $ | 16,193,409 | | | $ | 130,128,151 | | | $ | 133,259,101 | | | $ | 149,675,963 | |
| | | | | | | | | | | | | | | | | | | | | |
| NET ASSETS CONSIST OF: | | | | | | | | | | | | | | | | | | | | |
| Paid-in capital | | $ | 148,646,490 | | | $ | 16,540,827 | | | $ | 143,215,870 | | | $ | 151,884,034 | | | $ | 157,692,235 | |
| Total distributable earnings | | | 4,532,554 | | | | (347,418 | ) | | | (13,087,719 | ) | | | (18,624,933 | ) | | | (8,016,272 | ) |
| NET ASSETS | | $ | 153,179,044 | | | $ | 16,193,409 | | | $ | 130,128,151 | | | $ | 133,259,101 | | | $ | 149,675,963 | |
| | | | | | | | | | | | | | | | | | | | | |
| INVESTMENTS, AT COST | | $ | 147,267,738 | | | $ | 15,908,486 | | | $ | 135,351,301 | | | $ | 142,512,240 | | | $ | 146,485,129 | |
| | | | | | | | | | | | | | | | | | | | | |
| PRICING OF SHARES | | | | | | | | | | | | | | | | | | | | |
| Net Assets | | $ | 153,179,044 | | | $ | 16,193,409 | | | $ | 130,128,151 | | | $ | 133,259,101 | | | $ | 149,675,963 | |
| Shares of beneficial interest outstanding (Unlimited number of shares authorized, par value $0.01 per share) | | | 6,200,000 | | | | 650,000 | | | | 4,300,002 | | | | 4,300,002 | | | | 6,100,000 | |
| Net Asset Value, offering and redemption price per share | | $ | 24.71 | | | $ | 24.91 | | | $ | 30.26 | | | $ | 30.99 | | | $ | 24.54 | |
See Notes to Financial Statements.
RiverFront ETFs
| Statement of Operations | For the Six Months Ended May 31, 2019 (Unaudited) |
| | | RiverFront Dynamic Core Income ETF | | | RiverFront Dynamic Unconstrained Income ETF | | | RiverFront Dynamic US Dividend Advantage ETF | | | RiverFront Dynamic US Flex-Cap ETF | | | RiverFront Strategic Income Fund | |
| INVESTMENT INCOME: | | | | | | | | | | | | | | | |
| Interest | | $ | 2,393,171 | | | $ | 556,409 | | | $ | – | | | $ | – | | | $ | 3,227,428 | |
| Dividends(a) | | | 120,100 | | | | 17,292 | | | | 1,889,306 | | | | 1,451,462 | | | | 145,226 | |
| Securities Lending Income | | | – | | | | – | | | | 47 | | | | 1,291 | | | | – | |
| Total Investment Income | | | 2,513,271 | | | | 573,701 | | | | 1,889,353 | | | | 1,452,753 | | | | 3,372,654 | |
| | | | | | | | | | | | | | | | | | | | | |
| EXPENSES: | | | | | | | | | | | | | | | | | | | | |
| Investment adviser and sub-adviser fees (Note 3) | | | 377,176 | | | | 53,452 | | | | 361,424 | | | | 362,477 | | | | 347,739 | |
| Total Expenses | | | 377,176 | | | | 53,452 | | | | 361,424 | | | | 362,477 | | | | 347,739 | |
| NET INVESTMENT INCOME | | | 2,136,095 | | | | 520,249 | | | | 1,527,929 | | | | 1,090,276 | | | | 3,024,915 | |
| | | | | | | | | | | | | | | | | | | | | |
| REALIZED AND UNREALIZED GAIN/(LOSS) | | | | | | | | | | | | | | | | | | | | |
| Net realized gain/(loss) on investments | | | 1,793 | | | | (30,792 | ) | | | (2,936,349 | ) | | | (6,713,645 | ) | | | (47,152 | ) |
| NET REALIZED GAIN/(LOSS) | | | 1,793 | | | | (30,792 | ) | | | (2,936,349 | ) | | | (6,713,645 | ) | | | (47,152 | ) |
| Net change in unrealized appreciation/(depreciation) on investments | | | 7,329,497 | | | | 475,886 | | | | (1,883,720 | ) | | | (1,330,349 | ) | | | 2,040,306 | |
| NET CHANGE IN UNREALIZED APPRECIATION/(DEPRECIATION) | | | 7,329,497 | | | | 475,886 | | | | (1,883,720 | ) | | | (1,330,349 | ) | | | 2,040,306 | |
| NET REALIZED AND UNREALIZED GAIN/(LOSS) ON INVESTMENTS | | | 7,331,290 | | | | 445,094 | | | | (4,820,069 | ) | | | (8,043,994 | ) | | | 1,993,154 | |
| NET INCREASE/(DECREASE) IN NET ASSETS RESULTING FROM OPERATIONS | | $ | 9,467,385 | | | $ | 965,343 | | | $ | (3,292,140 | ) | | $ | (6,953,718 | ) | | $ | 5,018,069 | |
| (a) | Net of foreign tax withholding in the amounts of $2,066, $1,018, $0, $2,448 and $0 respectively. |
See Notes to Financial Statements.
RiverFront Dynamic Core Income ETF
Statements of Changes in Net Assets
| | | For the Six Months Ended May 31, 2019 (Unaudited) | | | For the Year Ended November 30, 2018 | |
| OPERATIONS: | | | | | | |
| Net investment income | | $ | 2,136,095 | | | $ | 2,915,518 | |
| Net realized gain/(loss) | | | 1,793 | | | | (1,596,850 | ) |
| Net change in unrealized appreciation/(depreciation) | | | 7,329,497 | | | | (2,358,587 | ) |
| Net Increase/(Decrease) in net assets resulting from operations | | | 9,467,385 | | | | (1,039,919 | ) |
| | | | | | | | | |
| DISTRIBUTIONS TO SHAREHOLDERS: | | | | | | | | |
| From distributable earnings | | | (2,149,968 | ) | | | (2,905,391 | ) |
| Total distributions | | | (2,149,968 | ) | | | (2,905,391 | ) |
| | | | | | | | | |
| CAPITAL SHARE TRANSACTIONS: | | | | | | | | |
| Proceeds from sale of shares | | | 7,266,813 | | | | 175,961,356 | |
| Shares redeemed | | | (11,932,103 | ) | | | (69,450,831 | ) |
| Net increase/(decrease) from share transactions | | | (4,665,290 | ) | | | 106,510,525 | |
| | | | | | | | | |
| Net increase in net assets | | | 2,652,127 | | | | 102,565,215 | |
| | | | | | | | | |
| NET ASSETS: | | | | | | | | |
| Beginning of period | | | 150,526,917 | | | | 47,961,702 | |
| End of period | | $ | 153,179,044 | | | $ | 150,526,917 | |
| | | | | | | | | |
| OTHER INFORMATION: | | | | | | | | |
| CAPITAL SHARE TRANSACTIONS: | | | | | | | | |
| Beginning shares | | | 6,400,000 | | | | 1,950,000 | |
| Shares sold | | | 300,000 | | | | 7,350,000 | |
| Shares redeemed | | | (500,000 | ) | | | (2,900,000 | ) |
| Shares outstanding, end of period | | | 6,200,000 | | | | 6,400,000 | |
See Notes to Financial Statements.
RiverFront Dynamic Unconstrained Income ETF
Statements of Changes in Net Assets
| | | For the Six Months Ended May 31, 2019 (Unaudited) | | | For the Year Ended November 30, 2018 | |
| OPERATIONS: | | | | | | |
| Net investment income | | $ | 520,249 | | | $ | 1,855,468 | |
| Net realized loss | | | (30,792 | ) | | | (1,550,548 | ) |
| Net change in unrealized appreciation/(depreciation) | | | 475,886 | | | | (579,055 | ) |
| Net Increase/(Decrease) in net assets resulting from operations | | | 965,343 | | | | (274,135 | ) |
| | | | | | | | | |
| DISTRIBUTIONS TO SHAREHOLDERS: | | | | | | | | |
| From distributable earnings | | | (539,898 | ) | | | (1,895,888 | ) |
| From return of capital | | | – | | | | (38,248 | ) |
| Total distributions | | | (539,898 | ) | | | (1,934,136 | ) |
| | | | | | | | | |
| CAPITAL SHARE TRANSACTIONS: | | | | | | | | |
| Proceeds from sale of shares | | | – | | | | 45,458,974 | |
| Shares redeemed | | | (8,712,993 | ) | | | (30,529,047 | ) |
| Net increase/(decrease) from share transactions | | | (8,712,993 | ) | | | 14,929,927 | |
| | | | | | | | | |
| Net increase/(decrease) in net assets | | | (8,287,548 | ) | | | 12,721,656 | |
| | | | | | | | | |
| NET ASSETS: | | | | | | | | |
| Beginning of period | | | 24,480,957 | | | | 11,759,301 | |
| End of period | | $ | 16,193,409 | | | $ | 24,480,957 | |
| | | | | | | | | |
| OTHER INFORMATION: | | | | | | | | |
| CAPITAL SHARE TRANSACTIONS: | | | | | | | | |
| Beginning shares | | | 1,000,000 | | | | 450,000 | |
| Shares sold | | | – | | | | 1,800,000 | |
| Shares redeemed | | | (350,000 | ) | | | (1,250,000 | ) |
| Shares outstanding, end of period | | | 650,000 | | | | 1,000,000 | |
See Notes to Financial Statements.
RiverFront Dynamic US Dividend Advantage ETF
Statements of Changes in Net Assets
| | | For the Six Months Ended May 31, 2019 (Unaudited) | | | For the Year Ended November 30, 2018 | |
| OPERATIONS: | | | | | | |
| Net investment income | | $ | 1,527,929 | | | $ | 2,559,340 | |
| Net realized gain/(loss) | | | (2,936,349 | ) | | | 5,455,249 | |
| Net change in unrealized depreciation | | | (1,883,720 | ) | | | (9,969,237 | ) |
| Net decrease in net assets resulting from operations | | | (3,292,140 | ) | | | (1,954,648 | ) |
| | | | | | | | | |
| DISTRIBUTIONS TO SHAREHOLDERS: | | | | | | | | |
| From distributable earnings | | | (1,478,523 | ) | | | (2,425,732 | ) |
| Total distributions | | | (1,478,523 | ) | | | (2,425,732 | ) |
| | | | | | | | | |
| CAPITAL SHARE TRANSACTIONS: | | | | | | | | |
| Proceeds from sale of shares | | | 3,033,971 | | | | 153,655,693 | |
| Shares redeemed | | | (19,427,786 | ) | | | (57,626,629 | ) |
| Net increase/(decrease) from share transactions | | | (16,393,815 | ) | | | 96,029,064 | |
| | | | | | | | | |
| Net increase/(decrease) in net assets | | | (21,164,478 | ) | | | 91,648,684 | |
| | | | | | | | | |
| NET ASSETS: | | | | | | | | |
| Beginning of period | | | 151,292,629 | | | | 59,643,945 | |
| End of period | | $ | 130,128,151 | | | $ | 151,292,629 | |
| | | | | | | | | |
| OTHER INFORMATION: | | | | | | | | |
| CAPITAL SHARE TRANSACTIONS: | | | | | | | | |
| Beginning shares | | | 4,850,002 | | | | 1,900,002 | |
| Shares sold | | | 100,000 | | | | 4,750,000 | |
| Shares redeemed | | | (650,000 | ) | | | (1,800,000 | ) |
| Shares outstanding, end of period | | | 4,300,002 | | | | 4,850,002 | |
See Notes to Financial Statements.
RiverFront Dynamic US Flex-Cap ETF
Statements of Changes in Net Assets
| | | For the Six Months Ended May 31, 2019 (Unaudited) | | | For the Year Ended November 30, 2018 | |
| OPERATIONS: | | | | | | |
| Net investment income | | $ | 1,090,276 | | | $ | 1,430,016 | |
| Net realized gain/(loss) | | | (6,713,645 | ) | | | 9,907,208 | |
| Net change in unrealized depreciation | | | (1,330,349 | ) | | | (13,055,066 | ) |
| Net decrease in net assets resulting from operations | | | (6,953,718 | ) | | | (1,717,842 | ) |
| | | | | | | | | |
| DISTRIBUTIONS TO SHAREHOLDERS: | | | | | | | | |
| From distributable earnings | | | (1,125,248 | ) | | | (1,321,640 | ) |
| Total distributions | | | (1,125,248 | ) | | | (1,321,640 | ) |
| | | | | | | | | |
| CAPITAL SHARE TRANSACTIONS: | | | | | | | | |
| Proceeds from sale of shares | | | 9,394,664 | | | | 177,753,277 | |
| Shares redeemed | | | (20,521,094 | ) | | | (62,825,568 | ) |
| Net increase/(decrease) from share transactions | | | (11,126,430 | ) | | | 114,927,709 | |
| | | | | | | | | |
| Net increase/(decrease) in net assets | | | (19,205,396 | ) | | | 111,888,227 | |
| | | | | | | | | |
| NET ASSETS: | | | | | | | | |
| Beginning of period | | | 152,464,497 | | | | 40,576,270 | |
| End of period | | $ | 133,259,101 | | | $ | 152,464,497 | |
| | | | | | | | | |
| OTHER INFORMATION: | | | | | | | | |
| CAPITAL SHARE TRANSACTIONS: | | | | | | | | |
| Beginning shares | | | 4,650,002 | | | | 1,250,002 | |
| Shares sold | | | 300,000 | | | | 5,250,000 | |
| Shares redeemed | | | (650,000 | ) | | | (1,850,000 | ) |
| Shares outstanding, end of period | | | 4,300,002 | | | | 4,650,002 | |
See Notes to Financial Statements.
RiverFront Strategic Income Fund
Statements of Changes in Net Assets
| | | For the Six Months Ended May 31, 2019 (Unaudited) | | | For the Year Ended November 30, 2018 | |
| OPERATIONS: | | | | | | |
| Net investment income | | $ | 3,024,915 | | | $ | 10,779,152 | |
| Net realized loss | | | (47,152 | ) | | | (2,535,051 | ) |
| Net change in unrealized appreciation/(depreciation) | | | 2,040,306 | | | | (8,164,421 | ) |
| Net increase in net assets resulting from operations | | | 5,018,069 | | | | 79,680 | |
| | | | | | | | | |
| DISTRIBUTIONS TO SHAREHOLDERS: | | | | | | | | |
| From distributable earnings | | | (3,234,876 | ) | | | (10,733,170 | ) |
| Total distributions | | | (3,234,876 | ) | | | (10,733,170 | ) |
| | | | | | | | | |
| CAPITAL SHARE TRANSACTIONS: | | | | | | | | |
| Proceeds from sale of shares | | | 9,686,682 | | | | 70,270,323 | |
| Shares redeemed | | | (14,673,902 | ) | | | (244,506,109 | ) |
| Net decrease from share transactions | | | (4,987,220 | ) | | | (174,235,786 | ) |
| | | | | | | | | |
| Net decrease in net assets | | | (3,204,027 | ) | | | (184,889,276 | ) |
| | | | | | | | | |
| NET ASSETS: | | | | | | | | |
| Beginning of period | | | 152,879,990 | | | | 337,769,266 | |
| End of period | | $ | 149,675,963 | | | $ | 152,879,990 | |
| | | | | | | | | |
| OTHER INFORMATION: | | | | | | | | |
| CAPITAL SHARE TRANSACTIONS: | | | | | | | | |
| Beginning shares | | | 6,300,000 | | | | 13,400,000 | |
| Shares sold | | | 400,000 | | | | 2,850,000 | |
| Shares redeemed | | | (600,000 | ) | | | (9,950,000 | ) |
| Shares outstanding, end of period | | | 6,100,000 | | | | 6,300,000 | |
See Notes to Financial Statements.
RiverFront Dynamic Core Income ETF
| Financial Highlights | For a share outstanding throughout the periods presented |
| | | For the Six Months Ended May 31, 2019 (Unaudited) | | For the Year Ended November 30, 2018 | | For the Year Ended November 30, 2017 | | For the Period June 14, 2016 (Commencement) to November 30, 2016 | |
| NET ASSET VALUE, BEGINNING OF PERIOD | | $ | 23.52 | | $ | 24.60 | | $ | 24.32 | | $ | 25.00 | |
| | | | | | | | | | | | | | |
| INCOME/(LOSS) FROM INVESTMENT OPERATIONS: | | | | | | | | | | | | | |
| Net investment income(a) | | | 0.35 | | | 0.68 | | | 0.53 | | | 0.24 | |
| Net realized and unrealized gain/(loss) | | | 1.19 | | | (1.10 | ) | | 0.23 | | | (0.68 | ) |
| Total from investment operations | | | 1.54 | | | (0.42 | ) | | 0.76 | | | (0.44 | ) |
| | | | | | | | | | | | | | |
| DISTRIBUTIONS: | | | | | | | | | | | | | |
| From net investment income | | | (0.35 | ) | | (0.66 | ) | | (0.48 | ) | | (0.24 | ) |
| Total distributions | | | (0.35 | ) | | (0.66 | ) | | (0.48 | ) | | (0.24 | ) |
| | | | | | | | | | | | | | |
| NET INCREASE/(DECREASE) IN NET ASSET VALUE | | | 1.19 | | | (1.08 | ) | | 0.28 | | | (0.68 | ) |
| NET ASSET VALUE, END OF PERIOD | | $ | 24.71 | | $ | 23.52 | | $ | 24.60 | | $ | 24.32 | |
| TOTAL RETURN(b) | | | 6.59 | % | | (1.74 | )% | | 3.15 | % | | (1.77 | )% |
| | | | | | | | | | | | | | |
| RATIOS/SUPPLEMENTAL DATA: | | | | | | | | | | | | | |
| Net assets, end of period (000s) | | $ | 153,179 | | $ | 150,527 | | $ | 47,962 | | $ | 6,081 | |
| | | | | | | | | | | | | | |
| Ratio of expenses excluding waiver/reimbursement to average net assets | | | 0.51 | %(c) | | 0.51 | % | | 0.51 | % | | 0.51 | %(c) |
| Ratio of expenses including waiver/reimbursement to average net assets | | | 0.51 | %(c) | | 0.51 | % | | 0.51 | % | | 0.51 | %(c) |
| Ratio of net investment income including expenses waiver/reimbursement to average net assets | | | 2.89 | %(c) | | 2.83 | % | | 2.15 | % | | 2.12 | %(c) |
| Portfolio turnover rate(d) | | | 7 | % | | 15 | % | | 18 | % | | 26 | % |
| (a) | Based on average shares outstanding during the period. |
| (b) | Total return is calculated assuming an initial investment made at the net asset value at the beginning of the period and the redemption at the net asset value on the last day of the period and assuming all distributions are reinvested at the actual reinvestment prices. Total return calculated for a period of less than one year is not annualized. |
| (d) | Portfolio turnover for periods less than one year are not annualized and does not include securities received or delivered from processing creations or redemptions in-kind. |
See Notes to Financial Statements.
RiverFront Dynamic Unconstrained Income ETF
| Financial Highlights | For a share outstanding throughout the periods presented |
| | | For the Six Months Ended May 31, 2019 (Unaudited) | | For the Year Ended November 30, 2018 | | For the Year Ended November 30, 2017 | | For the Period June 14, 2016 (Commencement) to November 30, 2016 | |
| NET ASSET VALUE, BEGINNING OF PERIOD | | $ | 24.48 | | $ | 26.13 | | $ | 25.55 | | $ | 25.00 | |
| | | | | | | | | | | | | | |
| INCOME/(LOSS) FROM INVESTMENT OPERATIONS: | | | | | | | | | | | | | |
| Net investment income(a) | | | 0.62 | | | 1.24 | | | 1.22 | | | 0.63 | |
| Net realized and unrealized gain/(loss) | | | 0.46 | | | (1.63 | ) | | 0.56 | | | 0.55 | |
| Total from investment operations | | | 1.08 | | | (0.39 | ) | | 1.78 | | | 1.18 | |
| | | | | | | | | | | | | | |
| DISTRIBUTIONS: | | | | | | | | | | | | | |
| From net investment income | | | (0.65 | ) | | (1.15 | ) | | (1.20 | ) | | (0.63 | ) |
| From net realized gains | | | – | | | (0.09 | ) | | – | | | – | |
| Tax return of capital | | | – | | | (0.02 | ) | | – | | | – | |
| Total distributions | | | (0.65 | ) | | (1.26 | ) | | (1.20 | ) | | (0.63 | ) |
| | | | | | | | | | | | | | |
| NET INCREASE/(DECREASE) IN NET ASSET VALUE | | | 0.43 | | | (1.65 | ) | | 0.58 | | | 0.55 | |
| NET ASSET VALUE, END OF PERIOD | | $ | 24.91 | | $ | 24.48 | | $ | 26.13 | | $ | 25.55 | |
| TOTAL RETURN(b) | | | 4.45 | % | | (1.52 | )% | | 7.06 | % | | 4.72 | % |
| | | | | | | | | | | | | | |
| RATIOS/SUPPLEMENTAL DATA: | | | | | | | | | | | | | |
| Net assets, end of period (000s) | | $ | 16,193 | | $ | 24,481 | | $ | 11,759 | | $ | 5,110 | |
| | | | | | | | | | | | | | |
| Ratio of expenses excluding waiver/reimbursement to average net assets | | | 0.51 | %(c) | | 0.51 | % | | 0.51 | % | | 0.51 | %(c) |
| Ratio of expenses including waiver/reimbursement to average net assets | | | 0.51 | %(c) | | 0.51 | % | | 0.51 | % | | 0.51 | %(c) |
| Ratio of net investment income including expenses waiver/reimbursement to average net assets | | | 4.96 | %(c) | | 4.93 | % | | 4.65 | % | | 5.31 | %(c) |
| Portfolio turnover rate(d) | | | 7 | % | | 51 | % | | 30 | % | | 11 | % |
| (a) | Based on average shares outstanding during the period. |
| (b) | Total return is calculated assuming an initial investment made at the net asset value at the beginning of the period and the redemption at the net asset value on the last day of the period and assuming all distributions are reinvested at the actual reinvestment prices. Total return calculated for a period of less than one year is not annualized. |
| (d) | Portfolio turnover for periods less than one year are not annualized and does not include securities received or delivered from processing creations or redemptions in-kind. |
See Notes to Financial Statements.
RiverFront Dynamic US Dividend Advantage ETF
| Financial Highlights | For a share outstanding throughout the periods presented |
| | | For the Six Months Ended May 31, 2019 (Unaudited) | | For the Year Ended November 30, 2018 | | For the Year Ended November 30, 2017 | | For the Period June 7, 2016 (Commencement) to November 30, 2016 | |
| NET ASSET VALUE, BEGINNING OF PERIOD | | $ | 31.19 | | $ | 31.39 | | $ | 26.59 | | $ | 25.14 | |
| | | | | | | | | | | | | | |
| INCOME/(LOSS) FROM INVESTMENT OPERATIONS: | | | | | | | | | | | | | |
| Net investment income(a) | | | 0.34 | | | 0.73 | | | 0.63 | | | 0.26 | |
| Net realized and unrealized gain/(loss) | | | (0.94 | ) | | (0.26 | ) | | 4.76 | | | 1.40 | |
| Total from investment operations | | | (0.60 | ) | | 0.47 | | | 5.39 | | | 1.66 | |
| | | | | | | | | | | | | | |
| DISTRIBUTIONS: | | | | | | | | | | | | | |
| From net investment income | | | (0.33 | ) | | (0.67 | ) | | (0.59 | ) | | (0.21 | ) |
| Total distributions | | | (0.33 | ) | | (0.67 | ) | | (0.59 | ) | | (0.21 | ) |
| | | | | | | | | | | | | | |
| NET INCREASE/(DECREASE) IN NET ASSET VALUE | | | (0.93 | ) | | (0.20 | ) | | 4.80 | | | 1.45 | |
| NET ASSET VALUE, END OF PERIOD | | $ | 30.26 | | $ | 31.19 | | $ | 31.39 | | $ | 26.59 | |
| TOTAL RETURN(b) | | | (1.93 | )% | | 1.45 | % | | 20.49 | % | | 6.64 | % |
| | | | | | | | | | | | | | |
| RATIOS/SUPPLEMENTAL DATA: | | | | | | | | | | | | | |
| Net assets, end of period (000s) | | $ | 130,128 | | $ | 151,293 | | $ | 59,644 | | $ | 13,297 | |
| | | | | | | | | | | | | | |
| Ratio of expenses excluding waiver/reimbursement to average net assets | | | 0.52 | %(c) | | 0.52 | % | | 0.52 | % | | 0.52 | %(c) |
| Ratio of expenses including waiver/reimbursement to average net assets | | | 0.52 | %(c) | | 0.52 | % | | 0.52 | % | | 0.52 | %(c) |
| Ratio of net investment income including expenses waiver/reimbursement to average net assets | | | 2.20 | %(c) | | 2.27 | % | | 2.19 | % | | 2.13 | %(c) |
| Portfolio turnover rate(d) | | | 41 | % | | 96 | % | | 54 | % | | 45 | % |
| (a) | Based on average shares outstanding during the period. |
| (b) | Total return is calculated assuming an initial investment made at the net asset value at the beginning of the period and the redemption at the net asset value on the last day of the period and assuming all distributions are reinvested at the actual reinvestment prices. Total return calculated for a period of less than one year is not annualized. |
| (d) | Portfolio turnover for periods less than one year are not annualized and does not include securities received or delivered from processing creations or redemptions in-kind. |
See Notes to Financial Statements.
RiverFront Dynamic US Flex-Cap ETF
| Financial Highlights | For a share outstanding throughout the periods presented |
| | | For the Six Months Ended May 31, 2019 (Unaudited) | | For the Year Ended November 30, 2018 | | For the Year Ended November 30, 2017 | | For the Period June 7, 2016 (Commencement) to November 30, 2016 | |
| NET ASSET VALUE, BEGINNING OF PERIOD | | $ | 32.79 | | $ | 32.46 | | $ | 26.84 | | $ | 25.13 | |
| | | | | | | | | | | | | | |
| INCOME/(LOSS) FROM INVESTMENT OPERATIONS: | | | | | | | | | | | | | |
| Net investment income(a) | | | 0.25 | | | 0.44 | | | 0.31 | | | 0.17 | |
| Net realized and unrealized gain/(loss) | | | (1.79 | ) | | 0.27 | (b) | | 5.59 | | | 1.70 | |
| Total from investment operations | | | (1.54 | ) | | 0.71 | | | 5.90 | | | 1.87 | |
| | | | | | | | | | | | | | |
| DISTRIBUTIONS: | | | | | | | | | | | | | |
| From net investment income | | | (0.26 | ) | | (0.38 | ) | | (0.28 | ) | | (0.16 | ) |
| Total distributions | | | (0.26 | ) | | (0.38 | ) | | (0.28 | ) | | (0.16 | ) |
| | | | | | | | | | | | | | |
| NET INCREASE/(DECREASE) IN NET ASSET VALUE | | | (1.80 | ) | | 0.33 | | | 5.62 | | | 1.71 | |
| NET ASSET VALUE, END OF PERIOD | | $ | 30.99 | | $ | 32.79 | | $ | 32.46 | | $ | 26.84 | |
| TOTAL RETURN(c) | | | (4.71 | )% | | 2.16 | % | | 22.08 | % | | 7.45 | % |
| | | | | | | | | | | | | | |
| RATIOS/SUPPLEMENTAL DATA: | | | | | | | | | | | | | |
| Net assets, end of period (000s) | | $ | 133,259 | | $ | 152,464 | | $ | 40,576 | | $ | 8,053 | |
| | | | | | | | | | | | | | |
| Ratio of expenses excluding waiver/reimbursement to average net assets | | | 0.52 | %(d) | | 0.52 | % | | 0.52 | % | | 0.52 | %(d) |
| Ratio of expenses including waiver/reimbursement to average net assets | | | 0.52 | %(d) | | 0.52 | % | | 0.52 | % | | 0.52 | %(d) |
| Ratio of net investment income including expenses waiver/reimbursement to average net assets | | | 1.56 | %(d) | | 1.30 | % | | 1.05 | % | | 1.34 | %(d) |
| Portfolio turnover rate(e) | | | 64 | % | | 152 | % | | 86 | % | | 41 | % |
| (a) | Based on average shares outstanding during the period. |
| (b) | Net realized and unrealized loss on investments per share does not correlate to aggregate of the net realized and unrealized gain in the Statements of Operations for the year ended November 30, 2018, primarily due to the timing of the sales and repurchases of the Fund's shares in relation to the fluctuating market values for the Fund's portfolio. |
| (c) | Total return is calculated assuming an initial investment made at the net asset value at the beginning of the period and the redemption at the net asset value on the last day of the period and assuming all distributions are reinvested at the actual reinvestment prices. Total return calculated for a period of less than one year is not annualized. |
| (e) | Portfolio turnover for periods less than one year are not annualized and does not include securities received or delivered from processing creations or redemptions in-kind. |
See Notes to Financial Statements.
RiverFront Strategic Income Fund
| Financial Highlights | For a share outstanding throughout the periods presented |
| | | For the Six Months Ended May 31, 2019 (Unaudited) | | For the Year Ended November 30, 2018 | | For the Year Ended November 30, 2017 | | For the Year Ended November 30, 2016 | | For the Year Ended November 30, 2015 | | | For the Year Ended November 30, 2014 | |
| NET ASSET VALUE, BEGINNING OF PERIOD | | $ | 24.27 | | $ | 25.21 | | $ | 25.02 | | $ | 24.36 | | $ | 25.02 | | | $ | 24.90 | |
| | | | | | | | | | | | | | | | | | | | | |
| INCOME/(LOSS) FROM INVESTMENT OPERATIONS: | | | | | | | | | | | | | | | | | | | | |
| Net investment income(a) | | | 0.49 | | | 1.06 | | | 1.11 | | | 1.05 | | | 0.88 | | | | 0.83 | |
| Net realized and unrealized gain/(loss) | | | 0.31 | | | (0.92 | ) | | 0.19 | | | 0.71 | | | (0.65 | ) | | | 0.11 | |
| Total from investment operations | | | 0.80 | | | 0.14 | | | 1.30 | | | 1.76 | | | 0.23 | | | | 0.94 | |
| | | | | | | | | | | | | | | | | | | | | |
| DISTRIBUTIONS: | | | | | | | | | | | | | | | | | | | | |
| From net investment income | | | (0.53 | ) | | (1.08 | ) | | (1.11 | ) | | (1.10 | ) | | (0.87 | ) | | | (0.82 | ) |
| From net realized gains | | | – | | | – | | | – | | | – | | | (0.02 | ) | | | – | |
| Total distributions | | | (0.53 | ) | | (1.08 | ) | | (1.11 | ) | | (1.10 | ) | | (0.89 | ) | | | (0.82 | ) |
| | | | | | | | | | | | | | | | | | | | | |
| NET INCREASE/(DECREASE) IN NET ASSET VALUE | | | 0.27 | | | (0.94 | ) | | 0.19 | | | 0.66 | | | (0.66 | ) | | | 0.12 | |
| NET ASSET VALUE, END OF PERIOD | | $ | 24.54 | | $ | 24.27 | | $ | 25.21 | | $ | 25.02 | | $ | 24.36 | | | $ | 25.02 | |
| TOTAL RETURN(b) | | | 3.31 | % | | 0.57 | % | | 5.29 | % | | 7.38 | % | | 0.91 | % | | | 3.80 | % |
| | | | | | | | | | | | | | | | | | | | | |
| RATIOS/SUPPLEMENTAL DATA: | | | | | | | | | | | | | | | | | | | | |
| Net assets, end of period (000s) | | $ | 149,676 | | $ | 152,880 | | $ | 337,769 | | $ | 326,515 | | $ | 464,007 | | | $ | 369,065 | |
| | | | | | | | | | | | | | | | | | | | | |
| Ratio of expenses excluding waiver/reimbursement to average net assets | | | 0.46 | %(c) | | 0.46 | % | | 0.46 | % | | 0.46 | % | | 0.46 | % | | | 0.46 | % |
| Ratio of expenses including waiver/reimbursement to average net assets | | | 0.46 | %(c) | | 0.17 | %(d) | | 0.16 | %(e) | | 0.17 | %(e) | | 0.22 | % | | | 0.22 | % |
| Ratio of net investment income including expenses waiver/reimbursement to average net assets | | | 4.00 | %(c) | | 4.31 | % | | 4.41 | % | | 4.26 | % | | 3.54 | % | | | 3.30 | % |
| Portfolio turnover rate(f) | | | 11 | % | | 35 | % | | 32 | % | | 52 | % | | 36 | % | | | 27 | % |
| (a) | Based on average shares outstanding during the period. |
| (b) | Total return is calculated assuming an initial investment made at the net asset value at the beginning of the period and the redemption at the net asset value on the last day of the period and assuming all distributions are reinvested at the actual reinvestment prices. Total return calculated for a period of less than one year is not annualized. |
| (d) | Effective November 1, 2018, the Fund’s management fee consists of a fee of 0.11% paid to the Fund’s investment adviser and a fee of 0.35% paid to the Fund’s sub-adviser. The Fund’s sub-adviser ceased its voluntary waiver effective November 1, 2018. |
| (e) | Effective July 1, 2016, the Fund’s management fee consists of a fee of 0.16% paid to the Fund’s investment adviser and a fee of 0.30% paid to the Fund’s sub-adviser. The Fund’s sub-adviser voluntarily waived all of its 0.30% annual sub-advisory fee payable by the Fund until November 1, 2018. |
| (f) | Portfolio turnover for periods less than one year are not annualized and does not include securities received or delivered from processing creations or redemptions in-kind. |
See Notes to Financial Statements.
RiverFront ETFs
| Notes to Financial Statements | May 31, 2019 (Unaudited) |
1. ORGANIZATION
ALPS ETF Trust (the “Trust”), a Delaware statutory trust, is an open-end management investment company registered under the Investment Company Act of 1940, as amended (the “1940 Act”). As of May 31, 2019, the Trust consists of eighteen separate portfolios. Each portfolio represents a separate series of the Trust. This report pertains solely to the RiverFront Dynamic Core Income ETF, the RiverFront Dynamic Unconstrained Income ETF, the RiverFront Dynamic US Dividend Advantage ETF, the RiverFront Dynamic US Flex-Cap ETF, and the RiverFront Strategic Income Fund (each a “Fund” and collectively, the “Funds”).
The investment objective of the RiverFront Dynamic Core Income ETF Fund is to seek total return, with an emphasis on income as the source of that total return. The Fund is considered non-diversified and may invest a greater portion of assets in securities of individual issuers than a diversified fund. As a result, changes in the market value of a single investment could cause greater fluctuations in share price than would occur in a diversified fund.
The investment objective of the RiverFront Dynamic Unconstrained Income ETF Fund is to seek total return, with an emphasis on income as the source of that total return. The Fund is considered non-diversified and may invest a greater portion of assets in securities of individual issuers than a diversified fund. As a result, changes in the market value of a single investment could cause greater fluctuations in share price than would occur in a diversified fund.
The investment objective of the RiverFront Dynamic US Dividend Advantage ETF Fund is to seek to provide capital appreciation and dividend income. The Fund is considered non-diversified and may invest a greater portion of assets in securities of individual issuers than a diversified fund. As a result, changes in the market value of a single investment could cause greater fluctuations in share price than would occur in a diversified fund.
The investment objective of the RiverFront Dynamic US Flex-Cap ETF Fund is to seek to provide capital appreciation. The Fund is considered non-diversified and may invest a greater portion of assets in securities of individual issuers than a diversified fund. As a result, changes in the market value of a single investment could cause greater fluctuations in share price than would occur in a diversified fund.
The investment objective of the RiverFront Strategic Income Fund is to seek total return, with an emphasis on income as the source of that total return. The Fund has elected to qualify as a diversified series of the Trust under the 1940 Act.
Each Fund’s Shares (“Shares”) are listed on the NYSE Arca, Inc. Each Fund issues and redeems Shares at net asset value (“NAV”) in blocks of 50,000 Shares, each of which is called a “Creation Unit”. Creation Units are issued and redeemed principally in-kind for securities and/or cash. Except when aggregated in Creation Units, Shares are not redeemable securities of a Fund.
Pursuant to the Trust’s organizational documents, its Officers and Trustees are indemnified against certain liability arising out of the performance of their duties to the Trust. Additionally, in the normal course of business, the Trust enters into contracts with service providers that contain general indemnification clauses. The Trust’s maximum exposure under these arrangements is unknown, as this would involve future claims that may be made against the Trust that have not yet occurred.
2. SIGNIFICANT ACCOUNTING POLICIES
The following is a summary of significant accounting policies consistently followed by the Funds in the preparation of the financial statements. The accompanying financial statements were prepared in accordance with accounting principles generally accepted in the United States of America (“U.S. GAAP”). The preparation of financial statements in conformity with U.S. GAAP requires management to make certain estimates and assumptions that affect the reported amounts of assets and liabilities and disclosures of contingent assets and liabilities at the date of the financial statements and the reported amounts of revenue and expenses during the period. Actual results could differ from those estimates. Each Fund is considered an investment company under U.S. GAAP and follows the accounting and reporting guidance applicable to investment companies in the Financial Accounting Standards BoardAccounting Standards CodificationTopic 946.
A. Portfolio Valuation
Each Fund’s NAV is determined daily, as of the close of regular trading on the New York Stock Exchange (the “NYSE”), normally 4:00 p.m. Eastern time, on each day the NYSE is open for trading. The NAV is computed by dividing the value of all assets of each Fund (including accrued interest and dividends), less all liabilities (including accrued expenses and dividends declared but unpaid), by the total number of shares outstanding.
Portfolio securities listed on any exchange other than the NASDAQ Stock Market LLC (“NASDAQ”) are valued at the last sale price on the business day as of which such value is being determined. If there has been no sale on such day, the securities are valued at the mean of the most recent bid and ask prices on such day. Securities traded on the NASDAQ are valued at the NASDAQ Official Closing Price as determined by NASDAQ. Portfolio securities traded on more than one securities exchange are valued at the last sale price on the business day as of which such value is being determined at the close of the exchange representing the principal market for such securities. Portfolio securities traded in the over-the-counter market, but excluding securities traded on the NASDAQ, are valued at the last quoted sale price in such market.
RiverFront ETFs
| Notes to Financial Statements | May 31, 2019 (Unaudited) |
Corporate bonds and United States government bonds are typically valued at the mean between the evaluated bid and ask prices formulated by an independent pricing service.
Each Fund’s investments are valued at market value or, in the absence of market value with respect to any portfolio securities, at fair value according to procedures adopted by the Trust’s Board of Trustees (the “Board”). When market quotations are not readily available or when events occur that make established valuation methods unreliable, securities of the Funds may be valued in good faith by or under the direction of the Board. These securities generally include, but are not limited to, restricted securities (securities which may not be publicly sold without registration under the Securities Act of 1933) for which a pricing service is unable to provide a market price; securities whose trading has been formally suspended; a security whose market price is not available from a pre-established primary pricing source or the pricing source is not willing to provide a price; a security with respect to which an event has occurred that is most likely to materially affect the value of the security after the market has closed but before the calculation of a Fund’s NAV or make it difficult or impossible to obtain a reliable market quotation; or a security whose price, as provided by the pricing service, does not reflect the security’s “fair value” due to the security being de-listed from a national exchange or the security’s primary trading market is temporarily closed at a time when, under normal conditions, it would be open. As a general principle, the current “fair value” of a security would be the amount which the owner might reasonably expect to receive from the sale on the applicable exchange or principal market. A variety of factors may be considered in determining the fair value of such securities.
B. Fair Value Measurements
Each Fund discloses the classification of its fair value measurements following a three-tier hierarchy based on the inputs used to measure fair value. Inputs refer broadly to the assumptions that market participants would use in pricing the asset or liability, including assumptions about risk. Inputs may be observable or unobservable. Observable inputs reflect the assumptions market participants would use in pricing the asset or liability that are developed based on market data obtained from sources independent of the reporting entity. Unobservable inputs reflect the reporting entity’s own assumptions about the assumptions market participants would use in pricing the asset or liability that are developed based on the best information available.
Valuation techniques used to value the Funds’ investments by major category are as follows:
Equity securities, including restricted securities, for which market quotations are readily available, are valued at the last reported sale price or official closing price as reported by a third party pricing vendor on the primary market or exchange on which they are traded and are categorized as Level 1 in the hierarchy. In the event there were no sales during the day or closing prices are not available, securities are valued at the mean of the most recent quoted bid and ask prices on such day and are generally categorized as Level 2 in the hierarchy. Investments in open-end mutual funds are valued at their closing NAV each business day and are categorized as Level 1 in the hierarchy.
Debt securities, including restricted securities, are valued based on evaluated prices received from third party pricing vendors or from brokers who make markets in such securities. For corporate bonds, pricing vendors utilize matrix pricing which considers yield or price of bonds of comparable quality, coupon, maturity and type as well as broker-supplied prices. When independent prices are unavailable or unreliable, debt securities may be valued utilizing pricing methodologies which consider similar factors that would be used by third party pricing vendors. Debt securities are generally categorized as Level 2 in the hierarchy but may be Level 3 depending on the circumstances. The RiverFront Dynamic Core Income ETF, the RiverFront Dynamic Unconstrained Income ETF, and the RiverFront Strategic Income Fund may invest a significant portion of their assets in below investment grade securities. The value of these securities can be more volatile due to changes in the credit quality of the issuer and is sensitive to changes in economic, market and regulatory conditions.
Changes in valuation techniques may result in transfers in or out of an assigned level within the disclosure hierarchy.
Various inputs are used in determining the value of each Fund’s investments as of the end of the reporting period. When inputs used fall into different levels of the fair value hierarchy, the level in the hierarchy within which the fair value measurement falls is determined based on the lowest level input that is significant to the fair value measurement in its entirety. The designated input levels are not necessarily an indication of the risk or liquidity associated with these investments.
RiverFront ETFs
| Notes to Financial Statements | May 31, 2019 (Unaudited) |
These inputs are categorized in the following hierarchy under applicable financial accounting standards:
| Level 1 | – | Unadjusted quoted prices in active markets for identical investments, unrestricted assets or liabilities that a Fund has the ability to access at the measurement date; |
| Level 2 | – | Quoted prices which are not active, quoted prices for similar assets or liabilities in active markets or inputs other than quoted prices that are observable (either directly or indirectly) for substantially the full term of the asset or liability; and |
| Level 3 | – | Significant unobservable prices or inputs (including the Fund's own assumptions in determining the fair value of investments) where there is little or no market activity for the asset or liability at the measurement date. |
The following is a summary of the inputs used to value the Funds' investments as of May 31, 2019:
RiverFront Dynamic Core Income ETF
| Investments in Securities at Value | | Level 1 -
Unadjusted
Quoted
Prices | | Level 2 –
Other
Significant
Observable
Inputs | | Level 3 -
Significant
Unobservable
Inputs | | Total |
| Corporate Bonds* | | $ | – | | | $ | 101,552,762 | | | $ | – | | | $ | 101,552,762 | |
| Government Bonds | | | – | | | | 38,700,294 | | | | – | | | | 38,700,294 | |
| Short-Term Investments | | | 12,030,684 | | | | – | | | | – | | | | 12,030,684 | |
| TOTAL | | $ | 12,030,684 | | | $ | 140,253,056 | | | $ | – | | | $ | 152,283,740 | |
RiverFront Dynamic Unconstrained Income ETF
| Investments in Securities at Value | | Level 1 -
Unadjusted
Quoted
Prices | | Level 2 -
Other
Significant
Observable
Inputs | | Level 3 -
Significant
Unobservable
Inputs | | Total |
| Corporate Bonds* | | $ | – | | | $ | 14,745,208 | | | $ | – | | | $ | 14,745,208 | |
| Short-Term Investments | | | 1,221,699 | | | | – | | | | – | | | | 1,221,699 | |
| TOTAL | | $ | 1,221,699 | | | $ | 14,745,208 | | | $ | – | | | $ | 15,966,907 | |
RiverFront Dynamic US Dividend Advantage ETF
| Investments in Securities at Value | | Level 1 -
Unadjusted
Quoted
Prices | | Level 2 -
Other
Significant
Observable
Inputs | | Level 3 -
Significant
Unobservable
Inputs | | Total |
| Common Stocks* | | $ | 129,891,319 | | | $ | – | | | $ | – | | | $ | 129,891,319 | |
| TOTAL | | $ | 129,891,319 | | | $ | – | | | $ | – | | | $ | 129,891,319 | |
RiverFront Dynamic US Flex-Cap ETF
| Investments in Securities at Value | | Level 1 -
Unadjusted
Quoted
Prices | | Level 2 -
Other
Significant
Observable Inputs | | Level 3 -
Significant
Unobservable
Inputs | | Total |
| Common Stocks* | | $ | 132,999,382 | | | $ | – | | | $ | – | | | $ | 132,999,382 | |
| Short-Term Investments | | | 28,171 | | | | – | | | | – | | | | 28,171 | |
| TOTAL | | $ | 133,027,553 | | | $ | – | | | $ | – | | | $ | 133,027,553 | |
RiverFront ETFs
| Notes to Financial Statements | May 31, 2019 (Unaudited) |
RiverFront Strategic Income Fund
| Investments in Securities at Value | | Level 1 -
Unadjusted
Quoted Prices | | Level 2 -
Other
Significant
Observable
Inputs | | Level 3 -
Significant
Unobservable
Inputs | | Total |
| Corporate Bonds* | | $ | – | | | $ | 131,594,315 | | | $ | – | | | $ | 131,594,315 | |
| Short-Term Investments | | | 16,217,863 | | | | – | | | | – | | | | 16,217,863 | |
| TOTAL | | $ | 16,217,863 | | | $ | 131,594,315 | | | $ | – | | | $ | 147,812,178 | |
| * | For a detailed sector breakdown, see the accompanying Schedule of Investments. |
The Funds did not have any securities that used significant unobservable inputs (Level 3) in determining fair value and there were no transfers into or out of Level 3.
For liabilities arising from overdrafts in the custody account, the carrying amount reported in the Statement of Assets and Liabilities approximates fair value due to the relatively short-term maturity of these financial instruments. As of May 31, 2019, the liability related to custody overdrafts in RiverFront Dynamic US Dividend Advantage ETF is based on level 2 inputs.
C. Securities Transactions and Investment Income
Securities transactions are recorded as of the trade date. Realized gains and losses from securities transactions are recorded on the highest cost basis. Dividend income and capital gains distributions, if any, are recorded on the ex-dividend date. Interest income, if any, is recorded on the accrual basis, including amortization of premiums and accretion of discounts.
D. Dividends and Distributions to Shareholders
Dividends from net investment income for each Fund, if any, are declared and paid monthly or as the Board may determine from time to time. Distributions of net realized capital gains earned by the Funds, if any, are distributed at least annually.
E. Federal Tax and Tax Basis Information
The timing and character of income and capital gain distributions are determined in accordance with income tax regulations, which may differ from U.S. GAAP. Reclassifications are made to the Funds' capital accounts for permanent tax differences to reflect income and gains available for distribution (or available capital loss carryforwards) under income tax regulations. The amounts and characteristics of tax basis distributions and composition of distributable earnings/(accumulated losses) are finalized at fiscal year-end; accordingly, tax basis balances have not been determined as of May 31, 2019.
The tax character of the distributions paid during the fiscal year ended November 30, 2018 were as follows:
| | | Ordinary Income | | Long-Term Capital Gain | | Return of Capital |
| November 30, 2018 | | | | | | |
| RiverFront Dynamic Core Income ETF | | $ | 2,905,391 | | | $ | – | | | $ | – | |
| RiverFront Dynamic Unconstrained Income ETF | | | 1,868,455 | | | | 27,433 | | | | 38,248 | |
| RiverFront Dynamic US Dividend Advantage ETF | | | 2,425,732 | | | | – | | | | – | |
| RiverFront Dynamic US Flex-Cap ETF | | | 1,321,640 | | | | – | | | | – | |
| RiverFront Strategic Income Fund | | | 10,733,170 | | | | – | | | | – | |
Under current law, capital losses maintain their character as short-term or long-term and are carried forward to the next tax year without expiration. As of November 30, 2018, the following amounts are available as carry forwards to the next tax year:
| Fund | | Short-Term | | Long-Term |
| RiverFront Dynamic Core Income ETF | | $ | 343,434 | | | $ | 145,326 | |
| RiverFront Dynamic Unconstrained Income ETF | | | 355,398 | | | | – | |
| RiverFront Dynamic US Dividend Advantage ETF | | | 4,899,426 | | | | – | |
| RiverFront Dynamic US Flex-Cap ETF | | | 2,515,359 | | | | – | |
| RiverFront Strategic Income Fund | | | 6,037,902 | | | | 3,129,919 | |
RiverFront ETFs
| Notes to Financial Statements | May 31, 2019 (Unaudited) |
As of May 31, 2019, the cost of investments for federal income tax purposes and accumulated net unrealized appreciation/(depreciation) on investments were as follows:
| | | RiverFront
Dynamic Core
Income ETF | | RiverFront
Dynamic
Unconstrained
Income ETF | | RiverFront
Dynamic US
Dividend
Advantage ETF | | RiverFront
Dynamic US
Flex-Cap ETF | | RiverFront Strategic Income Fund |
| Gross appreciation (excess of value over tax cost) | | $ | 5,099,381 | | | $ | 206,766 | | | $ | 7,044,065 | | | $ | 6,322,685 | | | $ | 1,549,292 | |
| Gross depreciation (excess of tax cost over value) | | | (84,127 | ) | | | (148,345 | ) | | | (12,522,906 | ) | | | (15,813,827 | ) | | | (222,243 | ) |
| Net unrealized appreciation/(depreciation) | | | 5,015,254 | | | | 58,421 | | | | (5,478,841 | ) | | | (9,491,142 | ) | | | 1,327,049 | |
| Cost of investments for income tax purposes | | $ | 147,268,486 | | | $ | 15,908,486 | | | $ | 135,370,160 | | | $ | 142,518,695 | | | $ | 146,485,129 | |
The differences between book-basis and tax-basis are primarily due to the deferral of losses from wash sales. In addition, certain tax cost basis adjustments are finalized at fiscal year-end and therefore have not been determined as of May 31, 2019.
F. Income Taxes
No provision for income taxes is included in the accompanying financial statements, as each Fund intends to distribute to shareholders all taxable investment income and realized gains and otherwise comply with Subchapter M of the Internal Revenue Code of 1986, as amended, applicable to regulated investment companies. Each Fund evaluates tax positions taken (or expected to be taken) in the course of preparing the Funds' tax returns to determine whether these positions meet a “more-likely-than-not” standard that, based on the technical merits, have a more than fifty percent likelihood of being sustained by a taxing authority upon examination. A tax position that meets the “more-likely-than-not” recognition threshold is measured to determine the amount of benefit to recognize in the financial statements.
As of and during the six months ended May 31, 2019, the Funds did not have a liability for any unrecognized tax benefits. Each Fund files U.S. federal, state, and local tax returns as required. Each Fund's tax returns are subject to examination by the relevant tax authorities until expiration of the applicable statute of limitations, which is generally three years after the filing of the tax return, but may extend to four years in certain jurisdictions. Tax returns for open years have incorporated no uncertain tax positions that require a provision for income taxes.
G. Lending of Portfolio Securities
The Funds have entered into a securities lending agreement with State Street Bank & Trust Co. (“SSB”), the Funds' lending agent. Each Fund may lend its portfolio securities only to borrowers that are approved by SSB. Each Fund will limit such lending to not more than 33 1/3% of the value of its total assets. Each Fund's securities held at SSB as custodian shall be available to be lent except those securities the Fund or ALPS Advisors, Inc. specifically identifies in writing as not being available for lending. The borrower pledges and maintains with the Fund collateral consisting of cash (U.S. Dollars only), securities issued or guaranteed by the U.S. government or its agencies or instrumentalities, and cash equivalents (including irrevocable bank letters of credit) issued by a person other than the borrower or an affiliate of the borrower. The initial collateral received by each Fund is required to have a value of no less than 102% of the market value of the loaned securities for U.S equity securities and a value of no less than 105% of the market value for non-U.S. equity securities. The collateral is maintained thereafter, at a market value equal to not less than 102% of the current value of the U.S. equity securities on loan and not less than 105% of the current value of the non-U.S. equity securities on loan. The market value of the loaned securities is determined at the close of each business day and any additional required collateral is delivered to each Fund on the next business day. During the term of the loan, each Fund is entitled to all distributions made on or in respect of the loaned securities. Loans of securities are terminable at any time and the borrower, after notice, is required to return borrowed securities within the customary time period for settlement of securities transactions.
Any cash collateral received is reinvested in a money market fund managed by SSB as disclosed in the Fund's Schedule of Investments and is reflected in the Statements of Assets and Liabilities as a payable for collateral upon return of securities loaned. Non-cash collateral, in the form of securities issued or guaranteed by the U.S. government or its agencies or instrumentalities, is not disclosed in the Fund's Statements of Assets and Liabilities as it is held by the lending agent on behalf of the Fund, and the Fund does not have the ability to re-hypothecate these securities. Income earned by the Fund from securities lending activity is disclosed in the Statement of Operations. As of May 31, 2019, the Funds had no securities on loan.
RiverFront ETFs
| Notes to Financial Statements | May 31, 2019 (Unaudited) |
The risks of securities lending include the risk that the borrower may not provide additional collateral when required or may not return the securities when due. To mitigate these risks, the Funds benefit from a borrower default indemnity provided by SSB. SSB's indemnity allows for full replacement of securities lent wherein SSB will purchase the unreturned loaned securities on the open market by applying the proceeds of the collateral, or to the extent such proceeds are insufficient or the collateral is unavailable, SSB will purchase the unreturned loan securities at SSB's expense. However, the Funds could suffer a loss if the value of the investments purchased with cash collateral falls below the value of the cash collateral received.
3. INVESTMENT ADVISORY FEE AND OTHER AFFILIATED TRANSACTIONS
ALPS Advisors, Inc. (the “Adviser”) serves as the Funds' investment adviser pursuant to an Investment Advisory Agreement with the Trust on behalf of each Fund (the “Advisory Agreement”). Pursuant to the Advisory Agreement, each Fund pays the Adviser an annual management fee for the services and facilities it provides, payable on a monthly basis as a percentage of the relevant Fund's average daily net assets as set out below:
| Fund | Advisory Fee |
| RiverFront Dynamic Core Income ETF | 0.51%(a) |
| RiverFront Dynamic Unconstrained Income ETF | 0.51%(a) |
| RiverFront Dynamic US Dividend Advantage ETF | 0.52%(b) |
| RiverFront Dynamic US Flex-Cap ETF | 0.52%(b) |
| RiverFront Strategic Income Fund | 0.46% |
| (a) | The unitary advisory fee as a percentage of net assets is subject to the following breakpoints: (i) 0.51% for average net assets up to $600 million, (ii) 0.48% for average net assets equal to or greater than $600 million. |
| (b) | The unitary advisory fee as a percentage of net assets is subject to the following breakpoints: (i) 0.52% for average net assets up to $600 million, (ii) 0.49% for average net assets equal to or greater than $600 million. |
Out of the unitary management fee, the Adviser pays substantially all expenses of each Fund, including the cost of transfer agency, custody, fund administration, legal, audit, independent trustees and other services, except for interest expenses, distribution fees or expenses, brokerage expenses, taxes and extraordinary expenses not incurred in the ordinary course of each Fund's business. The Adviser's unitary management fee is designed to pay substantially all of each Fund's expenses and to compensate the Adviser for providing services for each Fund.
RiverFront Investment Group, LLC (the “Sub-Adviser”) serves as each Fund's sub-adviser pursuant to a sub-advisory agreement with the Trust (the “Sub-Advisory Agreement”). Pursuant to the Sub-Advisory Agreement, the Adviser pays the Sub-Adviser a sub-advisory fee out of the Adviser's advisory fee for the services it provides besides RiverFront Strategic Income Fund, in which the Fund directly pays the Sub-Adviser. The fee is payable on a monthly basis at the annual rate of the relevant Fund's average daily net assets as set out below:
| Fund | Sub-Advisory Fee |
| RiverFront Dynamic Core Income ETF | 0.35% |
| RiverFront Dynamic Unconstrained Income ETF | 0.35% |
| RiverFront Dynamic US Dividend Advantage ETF | 0.35% |
| RiverFront Dynamic US Flex-Cap ETF | 0.35% |
| RiverFront Strategic Income Fund | 0.35% |
ALPS Fund Services, Inc., an affiliate of the Adviser, is the administrator of the Funds.
Each Trustee who is not an officer or employee of the Adviser, any sub-adviser or any of their affiliates (“Independent Trustees”) receives (1) a quarterly retainer of $5,000, (2) a per meeting fee for regularly scheduled meetings of $3,750, (3) $1,500 for any special meeting held outside of a regularly scheduled board meeting, and (4) reimbursement for all reasonable out-of-pocket expenses relating to attendance at meetings. In addition, the Chairman of the Board and Chairman of the Audit Committee each receives a quarterly retainer of $2,000, in connection with their respective roles.
RiverFront ETFs
| Notes to Financial Statements | May 31, 2019 (Unaudited) |
4. PURCHASES AND SALES OF SECURITIES
For the six months ended May 31, 2019, the cost of purchases and proceeds from sales of investment securities, excluding in-kind transactions and short-term investments, were as follows:
| Fund | | Purchases | | | Sales | |
| RiverFront Dynamic Core Income ETF | | $ | 174,971 | | | $ | 9,239,263 | |
| RiverFront Dynamic Unconstrained Income ETF | | | 1,415,660 | | | | 1,378,366 | |
| RiverFront Dynamic US Dividend Advantage ETF | | | 56,806,066 | | | | 56,726,630 | |
| RiverFront Dynamic US Flex-Cap ETF | | | 89,648,511 | | | | 89,805,208 | |
| RiverFront Strategic Income Fund | | | 14,938,133 | | | | 26,670,246 | |
For the six months ended May 31, 2019, the cost of U.S. Government security purchases and proceeds from U.S. Government security sales were as follows:
| Fund | | Purchases | | | Sales | |
| RiverFront Dynamic Core Income ETF | | $ | 12,121,719 | | | $ | 4,051,094 | |
For the six months ended May 31, 2019, the cost of in-kind purchases and proceeds from in-kind sales were as follows:
| Fund | | Purchases | | | Sales | |
| RiverFront Dynamic Core Income ETF | | $ | – | | | $ | 8,341,350 | |
| RiverFront Dynamic Unconstrained Income ETF | | | – | | | | 8,548,407 | |
| RiverFront Dynamic US Dividend Advantage ETF | | | 3,032,596 | | | | 19,418,360 | |
| RiverFront Dynamic US Flex-Cap ETF | | | 9,394,996 | | | | 20,519,356 | |
| RiverFront Strategic Income Fund | | | 6,861,495 | | | | 8,384,018 | |
For the six months ended May 31, 2019, the in-kind net realized gains/(losses) were as follows:
| Fund | | Net Realized Gain/(Loss) | |
| RiverFront Dynamic Core Income ETF | | $ | (60,975 | ) |
| RiverFront Dynamic Unconstrained Income ETF | | | 11,856 | |
| RiverFront Dynamic US Dividend Advantage ETF | | | 957,480 | |
| RiverFront Dynamic US Flex-Cap ETF | | | 862,595 | |
| RiverFront Strategic Income Fund | | | (15,825 | ) |
Gains on in-kind transactions are not considered taxable for federal income tax purposes and losses on in-kind transactions are also not deductible for tax purposes.
5. CAPITAL SHARE TRANSACTIONS
Shares are created and redeemed by each Fund only in Creation Unit size aggregations of 50,000 Shares. Only broker-dealers or large institutional investors with creation and redemption agreements called Authorized Participants (“AP”) are permitted to purchase or redeem Creation Units from each Fund. Such transactions are generally permitted on an in-kind basis, with a balancing cash component to equate the transaction to the NAV per unit of each Fund on the transaction date. Cash may be substituted equivalent to the value of certain securities generally when they are not available in sufficient quantity for delivery, not eligible for trading by the AP or as a result of other market circumstances.
6. RELATED PARTY TRANSACTIONS
The Fund engaged in cross trades between other funds in the Trust during the six months ended May 31, 2019 pursuant to Rule 17a-7 under the 1940 Act. Cross trading is the buying or selling of portfolio securities between funds to which the Adviser serves as the investment adviser. The Board previously adopted procedures that apply to transactions between the Funds of the Trust pursuant to Rule 17a-7. These transactions related to cross trades during the period complied with the requirements set forth by Rule 17a-7 and the Trust's procedures.
RiverFront ETFs
| Notes to Financial Statements | May 31, 2019 (Unaudited) |
Transactions related to cross trades during the six months ended May 31, 2019, were as follows:
| Fund | | Purchase
cost paid | | | Sale proceeds
received | | | Realized gain/(loss)
on sales | |
| Riverfront Dynamic US Dividend Advantage ETF | | $ | 2,260,851 | | | $ | 847,978 | | | $ | 159,080 | |
| Riverfront Dynamic US Flex-Cap ETF | | $ | 847,978 | | | $ | 2,260,851 | | | $ | 162,158 | |
7. RECENT ACCOUNTING PRONOUNCEMENTS
In March 2017, the Financial Accounting Standards Board (“FASB”) issued Accounting Standards Update No. 2017-08 (“ASU 2017-08”), “Receivables—Nonrefundable Fees and Other Costs (Subtopic 310-20): Premium Amortization on Purchased Callable Debt Securities.” ASU 2017-08 changed the amortization period for certain callable debt securities held at a premium. Specifically, it required the premium to be amortized to the earliest call date. The Funds have adopted and applied ASU 2017-08 on a modified retrospective basis through a cumulative-effect adjustment to distributable earnings as of the beginning of the period of adoption. As a result of the adoption of ASU 2017-08, as of December 1, 2018, the amortized cost basis of investments were reduced by the amounts in the following table. The unrealized appreciation of investments were increased by corresponding amounts. The adoption of ASU 2017-08 had no impact on beginning net assets, the current period results from operations, or any prior period information presented in the financial statements.
| Fund | | | |
| RiverFront Dynamic Core Income ETF | | $ | 7,862 | |
| RiverFront Dynamic Unconstrained Income ETF | | | 17,004 | |
| RiverFront Strategic Income Fund | | | 159,150 | |
RiverFront ETFs
| Additional Information | May 31, 2019 (Unaudited) |
PROXY VOTING RECORDS, POLICIES AND PROCEDURES
Information regarding how each Fund voted proxies relating to portfolio securities during the most recent 12-month period ended June 30 and a description of the Funds' proxy voting policies and procedures used in determining how to vote for proxies are available without charge on the SEC's website at www.sec.gov and upon request, by calling (toll-free) 1-866-675-2639.
PORTFOLIO HOLDINGS
The Trust is required to disclose, after its first and third fiscal quarters, the complete schedule of each Fund's portfolio holdings with the SEC on Form N-Q or as an exhibit to its report on Form N-PORT. Forms N-Q or N-PORT reports for each Fund are available on the SEC's website at www.sec.gov. Each Fund's Forms N-Q or N-PORT reports are available without charge, upon request, by calling (toll-free) 1-866-675-2639 or by writing to ALPS ETF Trust at 1290 Broadway, Suite 1100, Denver, Colorado 80203.
TAX INFORMATION
The Funds designate the following as a percentage of taxable ordinary income distributions, or up to the maximum amount allowable, for the calendar year ended December 31, 2018:
| | Qualified Dividend
Income | Dividend Received
Deduction |
| RiverFront Dynamic Core Income ETF | 0.00% | 0.00% |
| RiverFront Dynamic Unconstrained Income ETF | 0.00% | 0.00% |
| Riverfront Dynamic US Dividend Advantage ETF | 100.00% | 98.26% |
| Riverfront Dynamic US Flex-Cap ETF | 100.00% | 100.00% |
| Riverfront Strategic Income Fund | 0.00% | 0.00% |
In early 2019, if applicable, shareholders of record received this information for the distributions paid to them by the Funds during the calendar year 2018 via Form 1099. The Funds will notify shareholders in early 2020 of amounts paid to them by the Funds, if any, during the calendar year 2019.
Intentionally Left Blank


TABLE OF
CONTENTS
| Performance Overview | |
| Sprott Gold Miners ETF | 1 |
| Sprott Junior Gold Miners ETF | 3 |
| Disclosure of Fund Expenses | 5 |
| Financial Statements | |
| Schedule of Investments | |
| Sprott Gold Miners ETF | 6 |
| Sprott Junior Gold Miners ETF | 7 |
| Statements of Assets and Liabilities | 8 |
| Statements of Operations | 9 |
| Statements of Changes in Net Assets | |
| Sprott Gold Miners ETF | 10 |
| Sprott Junior Gold Miners ETF | 11 |
| Financial Highlights | 12 |
| Notes to Financial Statements | 14 |
| Additional Information | 21 |
Beginning on January 1, 2021, as permitted by regulations adopted by the U.S. Securities and Exchange Commission, paper copies of the Funds’ annual and semi-annual shareholder reports will no longer be sent by mail, unless you specifically request paper copies of the reports from your financial intermediary (such as a broker-dealer or bank). Instead, the reports will be made available on the Funds’ website (www.alpsfunds.com), and you will be notified by mail each time a report is posted and provided with a website link to access the report.
If you already elected to receive shareholder reports electronically, you will not be affected by this change and you need not take any action. You may elect to receive shareholder reports and other communications from a Fund electronically anytime by contacting your financial intermediary.
You may elect to receive all future reports in paper free of charge. You can contact your financial intermediary to request that you continue to receive paper copies of your shareholder reports. Your election to receive reports in paper will apply to all funds held in your account with your financial intermediary.
| PERFORMANCEOVERVIEW | May 31, 2019 (Unaudited) |
Investment Objective
Sprott Gold Miners ETF (the “Fund”) employs a “passive management”—or indexing—investment approach designed to seek investment results that correspond (before fees and expenses) generally to the performance of the Sprott Zacks Gold Miners Total Return Index (the “Underlying Index”).
The Underlying Index was created by Zacks Index Services to provide a means of generally tracking the performance of gold and silver mining companies whose stocks are traded on major U.S. exchanges. The Underlying Index uses a transparent, rules-based methodology that is designed to identify the stocks of 25 gold and silver mining companies with the highest beta† to the spot price of gold, with each stock’s weighting in the index adjusted based on its quarterly revenue growth on a year-over-year basis and the quality of its balance sheet, as measured by long-term debt to equity. The Underlying Index is rebalanced on a quarterly basis to incorporate the latest financial data into the screening process. At least 80% of the Underlying Index (by weight) must consist of gold mining companies while no more than 20% may consist of silver mining companies.
Performance(as of May 31, 2019)
| | 6 Months | 1 Year | 3 Year | Since Inception^ |
| Sprott Gold Miners ETF - NAV | 21.12% | -6.32% | -3.76% | -5.56% |
| Sprott Gold Miners ETF - Market Price* | 21.50% | -6.42% | -3.76% | -5.55% |
| Sprott Zacks Gold Miners Total Return Index | 21.58% | -5.62% | -3.09% | -4.87% |
| S&P 500® Total Return Index | 0.74% | 3.78% | 11.72% | 9.24% |
Total Expense Ratio (per the current prospectus) 0.57%
Performance data quoted represents past performance. Past performance does not guarantee future results. The table does not reflect the deduction of taxes that a shareholder would pay on Fund distributions or the redemption of Fund shares. Investment return and principal value of an investment will fluctuate so that an investor’s shares, when sold or redeemed, may be worth more or less than the original cost. Current performance data may be higher or lower than actual data quoted. For the most current month-end performance data please visit www.sprottetfs.com or call 888.622.1813.
NAV is an exchange-traded fund’s per-share value. The per-share dollar amount of the Fund is derived by dividing the total value of all the securities in its portfolio, less any liabilities, by the number of Fund shares outstanding. Market Price is the price at which a share can currently be traded in the market. Information detailing the number of days the Market Price of the Fund was greater than the Fund’s NAV and the number of days it was less than the Fund’s NAV can be obtained at www.sprottetfs.com.
† | Beta is defined as a sensitivity measure based on regression against the spot gold price movement during the trailing 36 months. |
| ^ | The Fund’s Commencement date was July 15, 2014. |
| * | Market Price is based on the midpoint of the bid-ask spread at 4 p.m. ET and does not represent the returns an investor would receive if shares were traded at other times. |
Sprott Zacks Gold Miners Total Return Indexis comprised of approximately 25 stocks selected, based on investment and other criteria, from a universe of gold and silver mining companies whose stock is listed on a major U.S. exchange. The stocks are selected using a proprietary, quantitative rules-based methodology developed by Zacks Index Services.
S&P 500® Total Return Indexis the Standard & Poor’s composite index of 500 stocks, a widely recognized, unmanaged index of common stock prices.
The indexes are reported on a total return basis, which assumes reinvestment of any dividends and distributions realized during a given time period. The indexes are not actively managed and do not reflect any deductions for fees, expenses or taxes. One cannot invest directly in an index. Index performance does not reflect fund performance.
The Fund is concentrated in the gold and silver mining industry. As a result, the Fund will be sensitive to changes in, and its performance will depend to a greater extent on, the overall condition of the gold and silver mining industry. Also, gold and silver mining companies are highly dependent on the price of gold and silver bullion. These prices may fluctuate substantially over short periods of time so the Fund’s Share price may be more volatile than other types of investments.
Funds that emphasize investments in small-cap and mid-cap companies will generally experience greater price volatility.
Funds investing in foreign and emerging markets will also generally experience greater price volatility.
The Fund’s shares are not individually redeemable. Investors buy and sell shares of the Fund on a secondary market. Only market makers or “authorized participants” may trade directly with the Fund, typically in blocks of 50,000 shares.
The Sprott Gold Miners ETF is not suitable for all investors. Investments in the Fund are subject to investment risks, including possible loss of the principal amount invested.
ALPS Portfolio Solutions Distributor, Inc., a FINRA member, is the distributor for the Sprott Gold Miners ETF.
ALPS Portfolio Solutions Distributor, Inc. is not affiliated with Sprott or Zacks Index Services, a division of Zacks Investment Management.
| PERFORMANCEOVERVIEW | May 31, 2019 (Unaudited) |
Top 10 Holdings*(as of May 31, 2019)
| Kirkland Lake Gold, Ltd. | 16.55% |
| Wheaton Precious Metals Corp. | 14.44% |
| Agnico Eagle Mines, Ltd. | 13.96% |
| Royal Gold, Inc. | 4.57% |
| Kinross Gold Corp. | 4.54% |
| B2Gold Corp. | 4.47% |
| Barrick Gold Corp. | 4.34% |
| Cia de Minas Buenaventura SAA | 4.25% |
| Alamos Gold, Inc. | 4.12% |
| AngloGold Ashanti, Ltd. | 3.83% |
| Total % of Top 10 Holdings | 75.07% |
Country Allocation*(as of May 31, 2019)
| Canada | 80.80% |
| South Africa | 8.68% |
| United States | 6.19% |
| Peru | 4.25% |
| Money Market Fund | 0.08% |
| Total | 100.00% |
| * | % of Total Investments (excluding investments purchased with collateral from securities loaned) |
Future holdings are subject to change.
Growth of $10,000(as of May 31, 2019)
Comparison of Change in Value of $10,000 Investment in the Fund and the Underlying Index

The chart above represents historical performance of a hypothetical investment of $10,000 in the Fund over the life of the Fund. Past performance does not guarantee future results. This chart does not reflect the deduction of taxes that a shareholder would pay on Fund distributions or the redemption of Fund shares.
| Sprott Junior Gold Miners ETF | |
| PERFORMANCEOVERVIEW | May 31, 2019 (Unaudited) |
Investment Objective
Sprott Junior Gold Miners ETF (the “Fund”) employs a “passive management”—or indexing—investment approach designed to seek investment results that correspond (before fees and expenses) generally to the performance of the Sprott Zacks Junior Gold Miners Total Return Index (the “Underlying Index”).
The Underlying Index was created by Zacks Index Services to provide a means of generally tracking the performance of “junior” gold and silver mining companies whose stocks are traded on major U.S. or Canadian exchanges. Junior companies include early stage mining companies that are in the exploration stage only or that hold properties that might not ultimately produce gold or silver. The Underlying Index uses a transparent, rules-based methodology that is designed to identify between 30 to 40 junior gold and silver stocks with market capitalization between $250 million and $2 billion. Excluding companies with market capitalization below $250 million aims to exclude very early stage exploration companies whose historical success rate is low. Each stock’s weighting in the Underlying Index is adjusted based on 2 company factors: 1) Revenue Growth and 2) Price Momentum. The Underlying Index is reconstituted on a semi-annual basis, in November and May, to incorporate the latest factor scores into the selection and weighting process. At least 80% of the Underlying Index (by weight) must consist of junior gold mining companies while no more than 20% may consist of junior silver mining companies.
Performance(as of May 31, 2019)
| | 6 Months | 1 Year | 3 Year | Since Inception^ |
| Sprott Junior Gold Miners ETF - NAV | 17.11% | -14.22% | -7.66% | 1.77% |
| Sprott Junior Gold Miners ETF - Market Price* | 17.61% | -14.14% | -7.58% | 1.81% |
| Sprott Zacks Junior Gold Miners Total Return Index | 17.40% | -13.77% | -6.98% | 2.59% |
| S&P 500® Total Return Index | 0.74% | 3.78% | 11.72% | 9.10% |
Total Expense Ratio (per the current prospectus) 0.57%
Performance data quoted represents past performance. Past performance does not guarantee future results. The table does not reflect the deduction of taxes that a shareholder would pay on Fund distributions or the redemption of Fund shares. Investment return and principal value of an investment will fluctuate so that an investor’s shares, when sold or redeemed, may be worth more or less than the original cost. Current performance data may be higher or lower than actual data quoted. For the most current month-end performance data please visit www.sprottetfs.com or call 888.622.1813.
NAV is an exchange-traded fund’s per-share value. The per-share dollar amount of the Fund is derived by dividing the total value of all the securities in its portfolio, less any liabilities, by the number of Fund shares outstanding. Market Price is the price at which a share can currently be traded in the market. Information detailing the number of days the Market Price of the Fund was greater than the Fund’s NAV and the number of days it was less than the Fund’s NAV can be obtained at www.sprottetfs.com.
| ^ | The Fund’s Commencement date was March 31, 2015. |
| * | Market Price is based on the midpoint of the bid-ask spread at 4 p.m. ET and does not represent the returns an investor would receive if shares were traded at other times. |
Sprott Zacks Junior Gold Miners Total Return Indexis comprised of between 30 to 40 stocks selected, based on investment and other criteria, from a universe of gold and silver mining companies whose stocks are listed on a major U.S. or Canadian exchange. The stocks are selected using a proprietary, quantitative rules-based methodology developed by Zacks Index Services.
S&P 500® Total Return Indexis the Standard & Poor’s composite index of 500 stocks, a widely recognized, unmanaged index of common stock prices.
The indexes are reported on a total return basis, which assumes reinvestment of any dividends and distributions realized during a given time period. The indexes are not actively managed and do not reflect any deductions for fees, expenses or taxes. One cannot invest directly in an index. Index performance does not reflect fund performance.
The Fund is concentrated in the gold and silver mining industry. As a result, the Fund will be sensitive to changes in, and its performance will depend to a greater extent on, the overall condition of the gold and silver mining industry. Also, gold and silver mining companies are highly dependent on the price of gold and silver bullion. These prices may fluctuate substantially over short periods of time so the Fund’s Share price may be more volatile than other types of investments.
Funds that emphasize investments in small-cap and mid-cap companies will generally experience greater price volatility. Micro-cap stocks involve substantially greater risks of loss and price fluctuations because their earnings and revenues tend to be less predictable. These companies may be newly formed or in the early stages of development, with limited product lines, markets or financial resources and may lack management depth.
Funds investing in foreign and emerging markets will also generally experience greater price volatility.
The Fund’s shares are not individually redeemable. Investors buy and sell shares of the Fund on a secondary market. Only market makers or “authorized participants” may trade directly with the Fund, typically in blocks of 50,000 shares.
The Sprott Junior Gold Miners ETF is not suitable for all investors. Investments in the Fund are subject to investment risks, including possible loss of the principal amount invested.
ALPS Portfolio Solutions Distributor, Inc., a FINRA member, is the distributor for the Sprott Junior Gold Miners ETF.
ALPS Portfolio Solutions Distributor, Inc. is not affiliated with Sprott or Zacks Index Services, a division of Zacks Investment Management.
| Sprott Junior Gold Miners ETF | |
| PERFORMANCEOVERVIEW | May 31, 2019 (Unaudited) |
Top 10 Holdings*(as of May 31, 2019)
| Alamos Gold, Inc. | 7.05% |
| Centerra Gold, Inc. | 6.73% |
| Endeavour Mining Corp. | 6.69% |
| Osisko Gold Royalties, Ltd. | 6.56% |
| Pretium Resources, Inc. | 6.42% |
| SSR Mining, Inc. | 6.38% |
| OceanaGold Corp. | 5.17% |
| SEMAFO, Inc. | 4.77% |
| Detour Gold Corp. | 4.68% |
| Harmony Gold Mining Co., Ltd. | 4.52% |
| Total % of Top 10 Holdings | 58.97% |
Country Allocation*(as of May 31, 2019)
| Canada | 77.10% |
| Monaco | 6.69% |
| United States | 6.49% |
| Australia | 5.17% |
| South Africa | 4.52% |
| Money Market Fund | 0.03% |
| Total | 100.00% |
| * | % of Total Investments (excluding investments purchased with collateral from securities loaned) |
Future holdings are subject to change.
Growth of $10,000(as of May 31, 2019)
Comparison of Change in Value of $10,000 Investment in the Fund and the Underlying Index

The chart above represents historical performance of a hypothetical investment of $10,000 in the Fund over the life of the Fund. Past performance does not guarantee future results. This chart does not reflect the deduction of taxes that a shareholder would pay on Fund distributions or the redemption of Fund shares.
| Disclosure of Fund Expenses | May 31, 2019 (Unaudited) |
Shareholder Expense Example:As a shareholder of a Fund, you incur two types of costs: (1) transaction costs which may include creation and redemption fees or brokerage charges, and (2) ongoing costs, including management fees and other Fund expenses. These examples are intended to help you understand your ongoing costs (in dollars) of investing in a Fund and to compare these costs with the ongoing costs of investing in other funds. It is based on an investment of $1,000 invested at the beginning of the (six month) period and held through May 31, 2018.
Actual Return:The first line of the table provides information about actual account values and actual expenses. You may use the information in this line, together with the amount you invested, to estimate the expenses that you incurred over the period. Simply divide your account value by $1,000 (for example, an $8,600 account value divided by $1,000 = 8.6), then multiply the result by the number in the first line under the heading entitled “Expenses Paid During Period” to estimate the expenses attributable to your investment during this period.
Hypothetical 5% Return:The second line of the table provides information about hypothetical account values and hypothetical expenses based on each Fund’s actual expense ratio and an assumed rate of return of 5% per year before expenses, which is not the Fund’s actual return. The hypothetical account values and expenses may not be used to estimate the actual ending account balance or expenses you paid for the period. You may use this information to compare ongoing costs of investing in each Fund and other funds. To do so, compare this 5% hypothetical example with the 5% hypothetical examples that appear in the shareholder reports of other funds.
The expenses shown in the table are meant to highlight ongoing Fund costs only and do not reflect any transaction costs, such as creation and redemption fees or brokerage charges. Therefore, the second line is useful in comparing ongoing costs only, and will not help you determine the relative total costs of owning different funds. In addition, if these costs were included, your costs would have been higher.
| | Beginning Account
Value
12/1/18 | Ending Account
Value
5/31/19 | Expense
Ratio(a) | Expenses Paid During Period 12/1/18 - 5/31/19(b) |
| Sprott Gold Miners ETF | | | | |
| Actual | $1,000.00 | $1,211.20 | 0.57% | $3.14 |
| Hypothetical (5% return before expenses) | $1,000.00 | $1,022.09 | 0.57% | $2.87 |
| Sprott Junior Gold Miners ETF | | | | |
| Actual | $1,000.00 | $1,171.10 | 0.57% | $3.09 |
| Hypothetical (5% return before expenses) | $1,000.00 | $1,022.09 | 0.57% | $2.87 |
| (a) | Annualized, based on the Fund’s most recent fiscal half year expenses. |
| (b) | Expenses are equal to the Fund’s annualized expense ratio multiplied by the average account value over the period, multiplied by the number of days in the most recent fiscal half year (182), divided by 365. |
| Schedule of Investments | May 31, 2019 (Unaudited) |
| Security Description | | Shares | | | Value | |
| COMMON STOCKS (99.85%) | | | | | | | | |
| Gold Mining (75.31%) | | | | | | | | |
| Agnico Eagle Mines, Ltd. | | | 450,214 | | | $ | 19,624,828 | |
| Alamos Gold, Inc., Class A | | | 1,188,470 | | | | 5,787,849 | |
| AngloGold Ashanti, Ltd., Sponsored ADR | | | 405,322 | | | | 5,386,729 | |
| B2Gold Corp.(a) | | | 2,316,317 | | | | 6,277,219 | |
| Cia de Minas Buenaventura SAA, ADR | | | 393,953 | | | | 5,976,267 | |
| Gold Fields, Ltd., Sponsored ADR | | | 835,183 | | | | 3,724,916 | |
| Harmony Gold Mining Co., Ltd., Sponsored ADR(a)(b) | | | 409,141 | | | | 728,271 | |
| IAMGOLD Corp.(a) | | | 1,522,839 | | | | 3,822,326 | |
| Kinross Gold Corp.(a) | | | 1,953,252 | | | | 6,387,134 | |
| Kirkland Lake Gold, Ltd. | | | 674,348 | | | | 23,271,750 | |
| McEwen Mining, Inc.(b) | | | 1,540,780 | | | | 2,080,053 | |
| New Gold, Inc.(a) | | | 872,152 | | | | 564,282 | |
| Pretium Resources, Inc.(a) | | | 577,915 | | | | 4,929,615 | |
| Royal Gold, Inc. | | | 73,042 | | | | 6,426,966 | |
| Sandstorm Gold, Ltd.(a)(b) | | | 571,578 | | | | 3,115,100 | |
| Seabridge Gold, Inc.(a)(b) | | | 58,582 | | | | 702,984 | |
| Sibanye Gold, Ltd., Sponsored ADR(a)(b) | | | 612,093 | | | | 2,368,800 | |
| SSR Mining, Inc.(a) | | | 244,604 | | | | 2,856,975 | |
| Yamana Gold, Inc. | | | 954,495 | | | | 1,899,445 | |
| Total Gold Mining | | | | | | | 105,931,509 | |
| | | | | | | | | |
| Gold Mining Mining (4.33%) | | | | | | | | |
| Barrick Gold Corp. | | | 491,048 | | | | 6,098,816 | |
| | | | | | | | | |
| Silver Mining (20.21%) | | | | | | | | |
| Coeur Mining, Inc.(a) | | | 213,618 | | | | 606,675 | |
| First Majestic Silver Corp.(a)(b) | | | 634,897 | | | | 3,860,174 | |
| Fortuna Silver Mines, Inc.(a) | | | 767,708 | | | | 1,988,364 | |
| Hecla Mining Co. | | | 1,274,166 | | | | 1,669,157 | |
| Wheaton Precious Metals Corp. | | | 918,698 | | | | 20,303,226 | |
| Total Silver Mining | | | | | | | 28,427,596 | |
| | | | | | | | | |
| TOTAL COMMON STOCKS | | | | | | | | |
| (Cost $132,287,811) | | | | | | | 140,457,921 | |
| 7 Day Yield | | Shares | | | Value | |
| SHORT TERM INVESTMENTS (5.18%) | | | | | | | | | |
| Money Market Fund (0.08%) | | | | | | | | | |
| State Street Institutional Treasury Plus Money Market Fund | | | | | | | | | |
| (Cost $117,761) | 2.309% | | | 117,761 | | | $ | 117,761 | |
| | | | | | | | | | |
| Investments Purchased with Collateral from Securities Loaned (5.10%) | | | | | | | | | |
| State Street Navigator Securities Lending Government Money Market Portfolio, 2.34% | | | | | | | | | |
| (Cost $7,168,479) | | | | 7,168,479 | | | | 7,168,479 | |
| TOTAL SHORT TERM INVESTMENTS | | | | | | | | | |
| (Cost $7,286,240) | | | | | | | | 7,286,240 | |
| | | | | | | | | | |
| TOTAL INVESTMENTS (105.04%) | | | | | | | | | |
| (Cost $139,574,051) | | | | | | | $ | 147,744,161 | |
| LIABILITIES IN EXCESS OF OTHER ASSETS (-5.04%) | | | | | | | | (7,075,530 | ) |
| NET ASSETS - 100.00% | | | | | | | $ | 140,668,631 | |
| (a) | Non-income producing security. |
| (b) | Security, or a portion of the security position is currently on loan. The total market value of securities on loan is $7,841,905. |
See Notes to Financial Statements.
Sprott Junior Gold Miners ETF
| Schedule of Investments | May 31, 2019 (Unaudited) |
| Security Description | | Shares | | | Value | |
| COMMON STOCKS (99.99%) |
| Gold Mining (89.13%) | | | | | | | | |
| Alacer Gold Corp.(a) | | | 665,560 | | | $ | 2,004,165 | |
| Alamos Gold, Inc., Class A | | | 696,285 | | | | 3,390,908 | |
| Centerra Gold, Inc.(a) | | | 565,883 | | | | 3,240,555 | |
| Continental Gold, Inc.(a)(b) | | | 172,499 | | | | 325,446 | |
| Detour Gold Corp.(a) | | | 238,534 | | | | 2,250,154 | |
| Eldorado Gold Corp.(a) | | | 290,704 | | | | 1,081,419 | |
| Endeavour Mining Corp.(a) | | | 215,723 | | | | 3,220,842 | |
| Golden Star Resources, Ltd.(a) | | | 201,790 | | | | 692,140 | |
| Harmony Gold Mining Co., | | | | | | | | |
| Ltd., Sponsored ADR(a) | | | 1,223,263 | | | | 2,177,408 | |
| IAMGOLD Corp.(a) | | | 442,928 | | | | 1,111,749 | |
| New Gold, Inc.(a) | | | 1,072,556 | | | | 693,944 | |
| Novagold Resources, Inc.(a) | | | 298,174 | | | | 1,207,605 | |
| OceanaGold Corp. | | | 900,970 | | | | 2,486,400 | |
| Osisko Gold Royalties, Ltd. | | | 303,183 | | | | 3,158,343 | |
| Premier Gold Mines, Ltd.(a)(b) | | | 379,158 | | | | 527,387 | |
| Pretium Resources, Inc.(a) | | | 362,203 | | | | 3,089,592 | |
| Sandstorm Gold, Ltd.(a)(b) | | | 327,539 | | | | 1,785,087 | |
| Seabridge Gold, Inc.(a)(b) | | | 57,957 | | | | 695,484 | |
| SEMAFO, Inc.(a) | | | 766,418 | | | | 2,296,532 | |
| SSR Mining, Inc.(a) | | | 262,825 | | | | 3,069,796 | |
| Teranga Gold Corp.(a) | | | 203,640 | | | | 473,091 | |
| TMAC Resources, Inc.(a)(b)(c) | | | 207,365 | | | | 940,476 | |
| Torex Gold Resources, Inc.(a) | | | 199,502 | | | | 1,830,294 | |
| Wesdome Gold Mines, Ltd.(a) | | | 330,041 | | | | 1,140,346 | |
| Total Gold Mining | | | | | | | 42,889,163 | |
| | | | | | | | | |
| Silver Mining (10.86%) | | | | | | | | |
| Coeur Mining, Inc.(a) | | | 186,815 | | | | 530,555 | |
| Endeavour Silver Corp.(a)(b) | | | 122,241 | | | | 218,811 | |
| First Majestic Silver Corp.(a)(b) | | | 333,047 | | | | 2,024,926 | |
| Fortuna Silver Mines, Inc.(a) | | | 147,699 | | | | 382,540 | |
| Hecla Mining Co. | | | 449,442 | | | | 588,769 | |
| MAG Silver Corp.(a) | | | 80,495 | | | | 787,322 | |
| Silvercorp Metals, Inc. | | | 316,433 | | | | 692,987 | |
| Total Silver Mining | | | | | | | 5,225,910 | |
| | | | | | | | | |
| TOTAL COMMON STOCKS |
| (Cost $54,183,033) | | | | | | | 48,115,073 | |
| | | 7 Day Yield | | | Shares | | | Value | |
| SHORT TERM INVESTMENTS (5.87%) |
| Money Market Fund (0.03%) | | | | | | | | | | | | |
| State Street Institutional Treasury Plus Money Market Fund | | | | | | | | | | | | |
| (Cost $16,545) | | | 2.309 | % | | | 16,545 | | | $ | 16,545 | |
| | | | | | | | | | | | | |
| Investments Purchased with Collateral from Securities Loaned (5.84%) | | | | | | | | | | | | |
| State Street Navigator Securities Lending Government Money Market Portfolio, 2.34% | | | | | | | | | | | | |
| (Cost $2,807,631) | | | | | | | 2,807,631 | | | | 2,807,631 | |
| TOTAL SHORT TERM INVESTMENTS | | | | |
| (Cost $2,824,176) | | | | | | | | | | | 2,824,176 | |
| | | | | | | | | | | | | |
| TOTAL INVESTMENTS (105.86%) | | | | |
| (Cost $57,007,209) | | | | | | | | | | $ | 50,939,249 | |
| LIABILITIES IN EXCESS OF OTHER ASSETS (-5.86%) | | | (2,818,084 | ) |
| NET ASSETS - 100.00% | | | $ | 48,121,165 | |
| (a) | Non-income producing security. |
| (b) | Security, or a portion of the security position is currently on loan. The total market value of securities on loan is $3,287,795. |
| (c) | Securities were purchased pursuant to Regulation S under the Securities Act of 1933, which exempts securities offered and sold outside of the United States from registration. Such securities cannot be sold in the United States without either an effective registration statement filed pursuant to the Securities Act of 1933, or pursuant to an exemption from registration. As of May 31, 2019, the market value of those securities was $940,476 representing 1.95% of net assets. |
See Notes to Financial Statements.
Sprott ETFs
| Statements of Assets and Liabilities | May 31, 2019 (Unaudited) |
| | | | Sprott Gold
Miners ETF | | | | Sprott Junior
Gold Miners ETF | |
| ASSETS: | | | | | | | | |
| Investments, at value | | $ | 147,744,161 | | | $ | 50,939,249 | |
| Foreign tax reclaims | | | 10,745 | | | | 4,405 | |
| Dividends receivable | | | 147,448 | | | | 8,077 | |
| Total Assets | | | 147,902,354 | | | | 50,951,731 | |
| | | | | | | | | |
| LIABILITIES: | | | | | | | | |
| Payable to adviser | | | 65,244 | | | | 22,935 | |
| Payable for collateral upon return of securities loaned | | | 7,168,479 | | | | 2,807,631 | |
| Total Liabilities | | | 7,233,723 | | | | 2,830,566 | |
| NET ASSETS | | $ | 140,668,631 | | | $ | 48,121,165 | |
| | | | | | | | | |
| NET ASSETS CONSIST OF: | | | | | | | | |
| Paid-in capital | | $ | 232,523,143 | | | $ | 84,049,031 | |
| Total distributable earnings | | | (91,854,512 | ) | | | (35,927,866 | ) |
| NET ASSETS | | $ | 140,668,631 | | | $ | 48,121,165 | |
| | | | | | | | | |
| INVESTMENTS, AT COST | | $ | 139,574,051 | | | $ | 57,007,209 | |
| | | | | | | | | |
| PRICING OF SHARES | | | | | | | | |
| Net Assets | | $ | 140,668,631 | | | $ | 48,121,165 | |
| Shares of beneficial interest outstanding (Unlimited number of shares authorized, par value $0.01 per share) | | | 7,650,000 | | | | 1,900,000 | |
| Net Asset Value, offering and redemption price per share | | $ | 18.39 | | | $ | 25.33 | |
See Notes to Financial Statements.
Sprott ETFs
| Statements of Operations | For the Six Months Ended May 31, 2019 (Unaudited) |
| | | Sprott Gold
Miners ETF | | | Sprott Junior
Gold Miners ETF | |
| INVESTMENT INCOME: | | | | | | |
| Dividends(a) | | $ | 493,110 | | | $ | 35,157 | |
| Securities lending income | | | 55,626 | | | | 40,271 | |
| Total Investment Income | | | 548,736 | | | | 75,428 | |
| | | | | | | | | |
| EXPENSES: | | | | | | | | |
| Investment adviser fees | | | 396,565 | | | | 133,438 | |
| Total Expense | | | 396,565 | | | | 133,438 | |
| NET INVESTMENT INCOME/(LOSS) | | | 152,171 | | | | (58,010 | ) |
| | | | | | | | | |
| REALIZED AND UNREALIZED GAIN/(LOSS) | | | | | | | | |
| Net realized loss on investments | | | (3,824,321 | ) | | | (1,558,279 | ) |
| Net realized gain/(loss) on foreign currency transactions | | | 354 | | | | (2,995 | ) |
| Net realized gain/(loss) | | | (3,823,967 | ) | | | (1,561,274 | ) |
| Net change in unrealized appreciation on investments | | | 28,564,583 | | | | 7,082,101 | |
| Net change in unrealized depreciation on translation of assets and liabilities denominated in foreign currencies | | | – | | | | (10 | ) |
| Net change in unrealized appreciation/(depreciation) | | | 28,564,583 | | | | 7,082,091 | |
| NET REALIZED AND UNREALIZED GAIN ON INVESTMENTS | | | 24,740,616 | | | | 5,520,817 | |
| NET INCREASE IN NET ASSETS RESULTING FROM OPERATIONS | | $ | 24,892,787 | | | $ | 5,462,807 | |
| (a) | Net of foreign tax withholding in the amounts of $71,624 and $5,796 respectively. |
See Notes to Financial Statements.
Sprott Gold Miners ETF
Statements of Changes in Net Assets
| | | For the
Six Months Ended
May 31, 2019 (Unaudited) | | | For the
Year Ended
November 30,
2018 | |
| OPERATIONS: | | | | | | |
| Net investment income | | $ | 152,171 | | | $ | 640,844 | |
| Net realized loss | | | (3,823,967 | ) | | | (18,176,992 | ) |
| Net change in unrealized appreciation/(depreciation) | | | 28,564,583 | | | | (21,732,492 | ) |
| Net increase/(decrease) in net assets resulting from operations | | | 24,892,787 | | | | (39,268,640 | ) |
| | | | | | | | | |
| DISTRIBUTIONS TO SHAREHOLDERS: | | | | | | | | |
| From distributable earnings | | | (644,007 | ) | | | (1,074,960 | ) |
| Total distributions | | | (644,007 | ) | | | (1,074,960 | ) |
| | | | | | | | | |
| CAPITAL SHARE TRANSACTIONS: | | | | | | | | |
| Proceeds from sale of shares | | | 10,818,519 | | | | 26,707,445 | |
| Cost of shares redeemed | | | (17,974,244 | ) | | | (27,333,679 | ) |
| Net decrease from capital share transactions | | | (7,155,725 | ) | | | (626,234 | ) |
| Net increase/(decrease) in net assets | | | 17,093,055 | | | | (40,969,834 | ) |
| | | | | | | | | |
| NET ASSETS: | | | | | | | | |
| Beginning of period | | | 123,575,576 | | | | 164,545,410 | |
| End of period | | $ | 140,668,631 | | | $ | 123,575,576 | |
| | | | | | | | | |
| OTHER INFORMATION: | | | | | | | | |
| CAPITAL SHARE TRANSACTIONS: | | | | | | | | |
| Beginning shares | | | 8,100,000 | | | | 8,300,000 | |
| Shares sold | | | 600,000 | | | | 1,350,000 | |
| Shares redeemed | | | (1,050,000 | ) | | | (1,550,000 | ) |
| Shares outstanding, end of period | | | 7,650,000 | | | | 8,100,000 | |
See Notes to Financial Statements.
Sprott Junior Gold Miners ETF
Statements of Changes in Net Assets
| | | For the Six Months Ended
May 31, 2019
(Unaudited) | | | For the
Year Ended
November 30,
2018 | |
| OPERATIONS: | | | | | | |
| Net investment loss | | $ | (58,010 | ) | | $ | (266,197 | ) |
| Net realized loss | | | (1,561,274 | ) | | | (31,413,048 | ) |
| Net change in unrealized appreciation/(depreciation) | | | 7,082,091 | | | | (5,838,502 | ) |
| Net increase/(decrease) in net assets resulting from operations | | | 5,462,807 | | | | (37,517,747 | ) |
| | | | | | | | | |
| DISTRIBUTIONS TO SHAREHOLDERS: | | | | | | | | |
| From distributable earnings | | | – | | | | (223,108 | ) |
| Total distributions | | | – | | | | (223,108 | ) |
| | | | | | | | | |
| CAPITAL SHARE TRANSACTIONS: | | | | | | | | |
| Proceeds from sale of shares | | | 8,483,193 | | | | 8,988,193 | |
| Cost of shares redeemed | | | (2,601,003 | ) | | | (84,021,633 | ) |
| Net increase/(decrease) from capital share transactions | | | 5,882,190 | | | | (75,033,440 | ) |
| Net increase/(decrease) in net assets | | | 11,344,997 | | | | (112,774,295 | ) |
| | | | | | | | | |
| NET ASSETS: | | | | | | | | |
| Beginning of period | | | 36,776,168 | | | | 149,550,463 | |
| End of period | | $ | 48,121,165 | | | $ | 36,776,168 | |
| | | | | | | | | |
| OTHER INFORMATION: | | | | | | | | |
| CAPITAL SHARE TRANSACTIONS: | | | | | | | | |
| Beginning shares | | | 1,700,000 | | | | 4,750,000 | |
| Shares sold | | | 300,000 | | | | 300,000 | |
| Shares redeemed | | | (100,000 | ) | | | (3,350,000 | ) |
| Shares outstanding, end of period | | | 1,900,000 | | | | 1,700,000 | |
See Notes to Financial Statements.
Sprott Gold Miners ETF
| Financial Highlights | For a Share Outstanding Throughout the Periods Presented |
| | | For the
Six Months
Ended
May 31, 2019
(Unaudited) | | For the Year
Ended
November 30,
2018 | | For the Year
Ended
November 30,
2017 | | For the Year
Ended
November 30,
2016 | | For the Year
Ended
November 30,
2015 | | For the Period
July 15, 2014
(Commencement
of Operations) to
November 30,
2014 | |
| NET ASSET VALUE, BEGINNING OF PERIOD | | $ | 15.26 | | $ | 19.82 | | $ | 19.15 | | $ | 12.97 | | $ | 17.44 | | $ | 25.00 | |
| | | | | | | | | | | | | | | | | | | | |
| INCOME/(LOSS) FROM INVESTMENT OPERATIONS: |
| Net investment income(a) | | | 0.02 | | | 0.07 | | | 0.04 | | | (0.00 | )(b) | | 0.10 | | | 0.02 | |
| Net realized and unrealized gain/(loss) | | | 3.20 | | | (4.51 | ) | | 0.63 | | | 6.37 | | | (4.52 | ) | | (7.58 | ) |
| Total from investment operations | | | 3.22 | | | (4.44 | ) | | 0.67 | | | 6.37 | | | (4.42 | ) | | (7.56 | ) |
| | | | | | | | | | | | | | | | | | | | |
| DISTRIBUTIONS: | | | | | | | | | | | | | | | | | | | |
| From net investment income | | | (0.09 | ) | | (0.12 | ) | | (0.00 | )(b) | | (0.19 | ) | | (0.05 | ) | | – | |
| Total distributions | | | (0.09 | ) | | (0.12 | ) | | (0.00 | )(b) | | (0.19 | ) | | (0.05 | ) | | – | |
| | | | | | | | | | | | | | | | | | | | |
| Net increase/(decrease) in net asset value | | | 3.13 | | | (4.56 | ) | | 0.67 | | | 6.18 | | | (4.47 | ) | | (7.56 | ) |
| NET ASSET VALUE, END OF PERIOD | | $ | 18.39 | | $ | 15.26 | | $ | 19.82 | | $ | 19.15 | | $ | 12.97 | | $ | 17.44 | |
| TOTAL RETURN(c) | | | 21.12 | % | | (22.56 | )% | | 3.52 | % | | 49.82 | % | | (25.44 | )% | | (30.24 | )% |
| | | | | | | | | | | | | | | | | | | | |
| RATIOS/SUPPLEMENTAL DATA: | | | | | | | | | | | | | | | | | | | |
| Net assets, end of period (000s) | | $ | 140,669 | | $ | 123,576 | | $ | 164,545 | | $ | 183,865 | | $ | 112,158 | | $ | 88,956 | |
| | | | | | | | | | | | | | | | | | | | |
| Ratio of expenses to average net assets | | | 0.57 | %(d) | | 0.57 | % | | 0.57 | % | | 0.57 | % | | 0.57 | % | | 0.57 | %(d) |
| Ratio of net investment income/(loss) to average net assets | | | 0.22 | %(d) | | 0.39 | % | | 0.21 | % | | (0.01 | )% | | 0.61 | % | | 0.31 | %(d) |
| Portfolio turnover rate(e) | | | 33 | % | | 82 | % | | 101 | % | | 74 | % | | 78 | % | | 36 | % |
| (a) | Based on average shares outstanding during the period. |
| (b) | Less than $0.005 per share. |
| (c) | Total return is calculated assuming an initial investment made at the net asset value at the beginning of the period and redemption at the net asset value on the last day of the period and assuming all distributions are reinvested at reinvestment prices. Total return calculated for a period of less than one year is not annualized. |
| (e) | Portfolio turnover for periods less than one year are not annualized and does not include securities received or delivered from processing creations or redemptions in-kind. |
See Notes to Financial Statements.
Sprott Junior Gold Miners ETF
| Financial Highlights | For a Share Outstanding Throughout the Periods Presented |
| | | For the
Six Months
Ended
May 31, 2019
(Unaudited) | | For the Year
Ended
November 30,
2018 | | For the Year
Ended
November 30,
2017 | | For the Year
Ended
November 30,
2016 | | For the Period
March 31, 2015
(Commencement of Operations) to November 30, 2015 | |
| NET ASSET VALUE, BEGINNING OF PERIOD | | $ | 21.63 | | $ | 31.48 | | $ | 33.00 | | $ | 19.65 | | $ | 24.18 | |
| | | | | | | | | | | | | | | | | |
| INCOME/(LOSS) FROM INVESTMENT OPERATIONS: |
| Net investment income/(loss)(a) | | | (0.03 | ) | | (0.06 | ) | | (0.09 | ) | | (0.05 | ) | | 0.04 | |
| Net realized and unrealized gain/(loss) | | | 3.73 | | | (9.74 | ) | | (0.87 | ) | | 13.56 | | | (4.57 | ) |
| Total from investment operations | | | 3.70 | | | (9.80 | ) | | (0.96 | ) | | 13.51 | | | (4.53 | ) |
| | | | | | | | | | | | | | | | | |
| DISTRIBUTIONS: | | | | | | | | | | | | | | | | |
| From net investment income | | | – | | | (0.05 | ) | | (0.56 | ) | | (0.16 | ) | | – | |
| Total distributions | | | – | | | (0.05 | ) | | (0.56 | ) | | (0.16 | ) | | – | |
| | | | | | | | | | | | | | | | | |
| Net increase/(decrease) in net asset value | | | 3.70 | | | (9.85 | ) | | (1.52 | ) | | 13.35 | | | (4.53 | ) |
| NET ASSET VALUE, END OF PERIOD | | $ | 25.33 | | $ | 21.63 | | $ | 31.48 | | $ | 33.00 | | $ | 19.65 | |
| TOTAL RETURN(b) | | | 17.11 | % | | (31.19 | )% | | (2.99 | )% | | 69.35 | % | | (18.73 | )% |
| | | | | | | | | | | | | | | | | |
| RATIOS/SUPPLEMENTAL DATA: | | | | | | | | | | | | | | | | |
| Net assets, end of period (000s) | | $ | 48,121 | | $ | 36,776 | | $ | 149,550 | | $ | 47,857 | | $ | 23,579 | |
| | | | | | | | | | | | | | | | | |
| Ratio of expenses to average net assets | | | 0.57 | %(c) | | 0.57 | % | | 0.57 | % | | 0.57 | % | | 0.57 | %(c) |
| Ratio of net investment income/(loss) to average net assets | | | (0.25 | )%(c) | | (0.22 | )% | | (0.26 | )% | | (0.14 | )% | | 0.29 | %(c) |
| Portfolio turnover rate(d) | | | 17 | % | | 37 | % | | 74 | % | | 61 | % | | 71 | % |
| (a) | Based on average shares outstanding during the period. |
| (b) | Total return is calculated assuming an initial investment made at the net asset value at the beginning of the period and redemption at the net asset value on the last day of the period and assuming all distributions are reinvested at reinvestment prices. Total return calculated for a period of less than one year is not annualized. |
| (d) | Portfolio turnover for periods less than one year are not annualized and does not include securities received or delivered from processing creations or redemptions in-kind. |
See Notes to Financial Statements.
Sprott ETFs
| Notes to Financial Statements | May 31, 2019 (Unaudited) |
ALPS ETF Trust (the “Trust”), a Delaware statutory trust, is an open-end management investment company under the Investment Company Act of 1940, as amended (the “1940 Act”). As of May 31, 2019, the Trust consisted of eighteen separate portfolios. Each portfolio represents a separate series of the Trust. This report pertains to the Sprott Gold Miners ETF and the Sprott Junior Gold Miners ETF (each a “Fund” and collectively, the “Funds”).
The investment objective of the Sprott Gold Miners ETF is to seek investment results that correspond (before fees and expenses) generally to the performance of its underlying index, the Sprott Zacks Gold Miners Total Return Index (the “Underlying Index”). The investment advisor uses a “passive” or indexing approach to try to achieve the Fund’s investment objective. The Sprott Gold Miners ETF is considered non-diversified and may invest a greater portion of assets in securities of individual issuers than a diversified fund. As a result, changes in the market value of a single investment could cause greater fluctuations in share price than would occur in a diversified fund.
The investment objective of the Sprott Junior Gold Miners ETF is to seek investment results that correspond (before fees and expenses) generally to the performance of its underlying index, the Sprott Zacks Junior Gold Miners Total Return Index (the “Underlying Index”). The investment advisor uses a “passive” or indexing approach to try to achieve the Fund’s investment objective. The Sprott Junior Gold Miners ETF is considered non-diversified and may invest a greater portion of assets in securities of individual issuers than a diversified fund. As a result, changes in the market value of a single investment could cause greater fluctuations in share price than would occur in a diversified fund.
The Funds’ Shares (“Shares”) are listed on the New York Stock Exchange (“NYSE”) Arca. Each Fund issues and redeems Shares, at net asset value (“NAV”) in blocks of 50,000 Shares, each of which is called a “Creation Unit”. Creation Units are issued and redeemed principally in-kind for securities included in the specified Underlying Index. Except when aggregated in Creation Units, Shares are not redeemable securities of the Fund.
Pursuant to the Trust’s organizational documents, its Officers and Trustees are indemnified against certain liability arising out of the performance of their duties to the Trust. Additionally, in the normal course of business, the Trust enters into contracts with service providers that contain general indemnification clauses. The Trust’s maximum exposure under these arrangements is unknown, as this would involve future claims that may be made against the Trust that have not yet occurred.
| 2. | SIGNIFICANT ACCOUNTING POLICIES |
The following is a summary of significant accounting policies consistently followed by the Funds in the preparation of the financial statements. The accompanying financial statements were prepared in accordance with accounting principles generally accepted in the United States of America (“U.S. GAAP”). The preparation of financial statements in conformity with U.S. GAAP requires management to make certain estimates and assumptions that affect the reported amounts of assets and liabilities and disclosures of contingent assets and liabilities at the date of the financial statements and the reported amounts of revenue and expenses during the period. Actual results could differ from those estimates. Each Fund is considered an investment company under U.S. GAAP and follows the accounting and reporting guidance applicable to investment companies in the Financial Accounting Standards BoardAccounting Standards CodificationTopic 946.
A. Portfolio Valuation
Each Fund’s NAV is determined daily, as of the close of regular trading on the NYSE, normally 4:00 p.m. Eastern time, on each day the NYSE is open for trading. The NAV is computed by dividing the value of all assets of the Fund (including accrued interest and dividends), less all liabilities (including accrued expenses and dividends declared but unpaid), by the total number of shares outstanding.
Portfolio securities listed on any exchange other than the NASDAQ Stock Market LLC (“NASDAQ”) are valued at the last sale price on the business day as of which such value is being determined. If there has been no sale on such day, the securities are valued at the mean of the most recent bid and ask prices on such day. Securities traded on the NASDAQ are valued at the NASDAQ Official Closing Price as determined by NASDAQ. Portfolio securities traded on more than one securities exchange are valued at the last sale price on the business day as of which such value is being determined at the close of the exchange representing the principal market for such securities. Portfolio securities traded in the over-the-counter market, but excluding securities traded on the NASDAQ, are valued at the last quoted sale price in such market.
The Funds’ investments are valued at market value or, in the absence of market value with respect to any portfolio securities, at fair value according to procedures adopted by the Trust’s Board of Trustees (the “Board”). When market quotations are not readily available or when events occur that make established valuation methods unreliable, securities of the Funds may be valued in good faith by or under the direction of the Board. These securities generally include, but are not limited to, restricted securities (securities which may not be publicly sold without registration under the Securities Act of 1933) for which a pricing service is unable to provide a market price; securities whose trading has been formally suspended; a security whose market price is not available from a pre-established primary pricing source or the pricing source is not willing to provide a price; a security with respect to which an event has occurred that is most likely to materially affect the value of the security after the market has closed but before the calculation of the Fund’s NAV or make it difficult or impossible to obtain a reliable market quotation; or a security whose price, as provided by the pricing service, does not reflect the security’s “fair value” due to the security being de-listed from a national exchange or the security’s primary trading market is temporarily closed at a time when, under normal conditions, it would be open. As a general principle, the current “fair value” of a security would be the amount which the owner might reasonably expect to receive from the sale on the applicable exchange or principal market. A variety of factors may be considered in determining the fair value of such securities.
Sprott ETFs
| Notes to Financial Statements | May 31, 2019 (Unaudited) |
B. Fair Value Measurements
Each Fund discloses the classification of its fair value measurements following a three-tier hierarchy based on the inputs used to measure fair value. Inputs refer broadly to the assumptions that market participants would use in pricing the asset or liability, including assumptions about risk. Inputs may be observable or unobservable. Observable inputs reflect the assumptions market participants would use in pricing the asset or liability that are developed based on market data obtained from sources independent of the reporting entity. Unobservable inputs reflect the reporting entity’s own assumptions about the assumptions market participants would use in pricing the asset or liability that are developed based on the best information available.
Valuation techniques used to value the Funds’ investments by major category are as follows:
Equity securities, including restricted securities, for which market quotations are readily available, are valued at the last reported sale price or official closing price as reported by a third party pricing vendor on the primary market or exchange on which they are traded and are categorized as Level 1 in the hierarchy. In the event there were no sales during the day or closing prices are not available, securities are valued at the mean of the most recent quoted bid and ask prices on such day and are generally categorized as Level 2 in the hierarchy. Investments in open-end mutual funds are valued at their closing NAV each business day and are categorized as Level 1 in the hierarchy.
Changes in valuation techniques may result in transfers in or out of an assigned level within the disclosure hierarchy.
Various inputs are used in determining the value of each Fund’s investments as of the end of the reporting period. When inputs used fall into different levels of the fair value hierarchy, the level in the hierarchy within which the fair value measurement falls is determined based on the lowest level input that is significant to the fair value measurement in its entirety. The designated input levels are not necessarily an indication of the risk or liquidity associated with these investments.
These inputs are categorized in the following hierarchy under applicable financial accounting standards:
| Level 1 – | Unadjusted quoted prices in active markets for identical investments, unrestricted assets or liabilities that a Fund has the ability to access at the measurement date; |
| Level 2 – | Quoted prices which are not active, quoted prices for similar assets or liabilities in active markets or inputs other than quoted prices that are observable (either directly or indirectly) for substantially the full term of the asset or liability; and |
| Level 3 – | Significant unobservable prices or inputs (including the Fund’s own assumptions in determining the fair value of investments) where there is little or no market activity for the asset or liability at the measurement date. |
The following is a summary of the inputs used to value the Funds’ investments at May 31, 2019:
Sprott Gold Miners ETF
| Investments in Securities at Value | | Level 1 - Quoted and Unadjusted Prices | | | Level 2 - Other Significant Observable Inputs | | | Level 3 - Significant Unobservable Inputs | | | Total | |
| Common Stocks* | | $ | 140,457,921 | | | $ | – | | | $ | – | | | $ | 140,457,921 | |
| Short Term Investments | | | 7,286,240 | | | | – | | | | – | | | | 7,286,240 | |
| Total | | $ | 147,744,161 | | | $ | – | | | $ | – | | | $ | 147,744,161 | |
Sprott Junior Gold Miners ETF
| Investments in Securities at Value | | Level 1 - Quoted and Unadjusted Prices | | | Level 2 - Other Significant Observable Inputs | | | Level 3 - Significant Unobservable Inputs | | | Total | |
| Common Stocks* | | $ | 48,115,073 | | | $ | – | | | $ | – | | | $ | 48,115,073 | |
| Short Term Investments | | | 2,824,176 | | | | – | | | | – | | | | 2,824,176 | |
| Total | | $ | 50,939,249 | | | $ | – | | | $ | – | | | $ | 50,939,249 | |
| * | For a detailed sector breakdown, see the accompanying Schedule of Investments. |
Sprott ETFs
| Notes to Financial Statements | May 31, 2019 (Unaudited) |
The Funds did not have any securities that used significant unobservable inputs (Level 3) in determining fair value and there were no transfers into or out of Level 3.
| C. | Gold and Silver Mining Industry Risk |
The Funds are concentrated in the gold and silver mining industry. As a result, these Funds will be sensitive to changes in, and their performance will depend to a greater extent on, the overall condition of the gold and silver mining industry. Competitive pressures may have a significant effect on the financial condition of such companies in the gold and silver mining industry. Also, gold and silver mining companies are highly dependent on the price of gold and silver bullion. These prices may fluctuate substantially over short periods of time so a Fund’s Share price may be more volatile than other types of investments. In times of significant inflation or great economic uncertainty, gold, silver and other precious metals may outperform traditional investments such as bonds and stocks. However, in times of stable economic growth, traditional equity and debt investments could offer greater appreciation potential and the value of gold, silver and other precious metals may be adversely affected, which could in turn affect a Fund’s returns. The production and sale of precious metals by governments or central banks or other large holders can be affected by various economic, financial, social and political factors, which may be unpredictable and may have a significant impact on the supply and prices of precious metals. Economic and political conditions in those countries that are the largest producers of gold may have a direct effect on the production and marketing of gold and on sales of central bank gold holdings. Some gold and precious metals mining operation companies may hedge their exposure to falls in gold and precious metals prices by selling forward future production, which may result in lower returns during periods when the price of gold and precious metals increases. The gold and precious metals industry can be significantly affected by events relating to international political developments, the success of exploration projects, commodity prices and tax and government regulations. If a natural disaster or other event with a significant economic impact occurs in a region where the companies in which each Fund invests operate, such disaster or event could negatively affect the profitability of such companies and, in turn, the Funds’ investment in them.
| D. | Foreign Investment Risk |
The Funds’ investments in non-U.S. issuers may involve unique risks compared to investing in securities of U.S. issuers, including, among others, greater market volatility than U.S. securities and less complete financial information than for U.S. issuers. In addition, adverse political, economic or social developments could undermine the value of a Fund’s investments or prevent a Fund from realizing the full value of its investments. Financial reporting standards for companies based in foreign markets differ from those in the United States. Finally, the value of the currency of the country in which a Fund has invested could decline relative to the value of the U.S. dollar, which may affect the value of the investment to U.S. investors. The Funds will not enter into transactions to hedge against declines in the value of a Fund’s assets that are denominated in a foreign currency.
Countries with emerging markets may have relatively unstable governments and may present the risks of nationalization of businesses, restrictions on foreign ownership and prohibitions on the repatriation of assets. The economies of emerging markets countries also may be based on only a few industries, making them more vulnerable to changes in local or global trade conditions and more sensitive to debt burdens or inflation rates.
| E. | Foreign Currency Translation |
The books and records of the Funds are maintained in U.S. dollars. Investment valuations and other assets and liabilities initially expressed in foreign currencies are converted each business day into U.S. dollars based upon current exchange rates. The portion of realized and unrealized gains or losses on investments due to fluctuations in foreign currency exchange rates is not separately disclosed and is included in realized and unrealized gains or losses on investments, when applicable.
Each Fund seeks to track its respective Underlying Index, which itself may have concentration in certain regions, economies, countries, markets, industries or sectors. Based on the current composition of their respective Underlying Indexes, the Funds will be concentrated in the gold and silver mining industry. Underperformance or increased risk in such concentrated areas may result in underperformance or increased risk in each Fund.
| G. | Securities Transactions and Investment Income |
Securities transactions are recorded as of the trade date. Realized gains and losses from securities transactions are recorded on the highest cost basis. Dividend income and capital gains distributions, if any, are recorded on the ex-dividend date. Interest income, if any, is recorded on the accrual basis.
| H. | Dividends and Distributions to Shareholders |
Dividends from net investment income for each Fund, if any, are declared and paid annually or as the Board may determine from time to time. Distributions of net realized capital gains earned by the Funds, if any, are distributed at least annually.
Sprott ETFs
| Notes to Financial Statements | May 31, 2019 (Unaudited) |
| I. | Federal Tax and Tax Basis Information |
The timing and character of income and capital gain distributions are determined in accordance with income tax regulations, which may differ from U.S. GAAP. Reclassifications are made to the Funds’ capital accounts for permanent tax differences to reflect income and gains available for distribution (or available capital loss carryforwards) under income tax regulations. The amounts and characteristics of tax basis distributions and composition of distributable earnings/(accumulated losses) are finalized at fiscal year-end; accordingly, tax basis balances have not been determined as of May 31, 2019.
The tax character of the distributions paid during the fiscal year ended November 30, 2018 were as follows:
| | | Ordinary Income | |
| November 30, 2018 | | | |
| Sprott Gold Miners ETF | | $ | 1,074,960 | |
| Sprott Junior Gold Miners ETF | | | 223,108 | |
Under current law, capital losses maintain their character as short-term or long-term and are carried forward to the next tax year without expiration. As of November 30, 2018, the following amounts are available as carry forwards to the next tax year:
| Fund | | Short-Term | | | Long-Term | |
| Sprott Gold Miners ETF | | $ | 67,552,573 | | | $ | 28,696,456 | |
| Sprott Junior Gold Miners ETF | | | 19,210,513 | | | | 8,511,041 | |
The following fund elected to defer to the period ending November 30, 2019, late year ordinary losses:
| Fund | | Amount | |
| Sprott Junior Gold Miners ETF | | $ | 220,134 | |
As of May 31, 2019, the cost of investments for federal income tax purposes and accumulated net unrealized appreciation/(depreciation) on investments were as follows:
| | | Sprott Gold Miners ETF | | | Sprott Junior Gold Miners ETF | |
| Gross appreciation (excess of value over tax cost) | | $ | 17,525,973 | | | $ | 2,571,243 | |
| Gross depreciation (excess of tax cost over value) | | | (9,936,435 | ) | | | (8,866,273 | ) |
| Net unrealized appreciation (depreciation) | | | 7,589,538 | | | | (6,295,030 | ) |
| Cost of investments for income tax purposes | | $ | 140,154,623 | | | $ | 57,234,279 | |
The differences between book-basis and tax-basis are primarily due to the deferral of losses from wash sales. In addition, certain tax cost basis adjustments are finalized at fiscal year-end and therefore have not been determined as of May 31, 2019.
No provision for income taxes is included in the accompanying financial statements, as each Fund intends to distribute to shareholders all taxable investment income and realized gains and otherwise comply with Subchapter M of the Internal Revenue Code of 1986, as amended, applicable to regulated investment companies. Each Fund evaluates tax positions taken (or expected to be taken) in the course of preparing the Fund’s tax returns to determine whether these positions meet a “more-likely-than-not” standard that, based on the technical merits, have a more than fifty percent likelihood of being sustained by a taxing authority upon examination. A tax position that meets the “more-likely-than-not” recognition threshold is measured to determine the amount of benefit to recognize in the financial statements.
As of and during the six months ended May 31, 2019, the Funds did not have a liability for any unrecognized tax benefits. Each Fund files U.S. federal, state, and local tax returns as required. Each Fund’s tax returns are subject to examination by the relevant tax authorities until expiration of the applicable statute of limitations, which is generally three years after the filing of the tax return, but may extend to four years in certain jurisdictions. Tax returns for open years for the Sprott Gold Miners ETF and the Sprott Junior Gold Miners ETF have incorporated no uncertain tax positions that require a provision for income taxes.
Sprott ETFs
| Notes to Financial Statements | May 31, 2019 (Unaudited) |
| K. | Lending of Portfolio Securities |
The Funds have entered into a securities lending agreement with State Street Bank & Trust Co. (“SSB”), the Funds’ lending agent. The Funds may lend their portfolio securities only to borrowers that are approved by SSB. Each Fund will limit such lending to not more than 33 1/3% of the value of its total assets. Each Fund’s securities held at SSB as custodian shall be available to be lent except those securities the Fund or ALPS Advisors, Inc. specifically identifies in writing as not being available for lending. The borrower pledges and maintains with each Fund collateral consisting of cash (U.S. Dollars only), securities issued or guaranteed by the U.S. government or its agencies or instrumentalities, and by cash equivalents (including irrevocable bank letters of credit issued by a person other than the borrower or an affiliate of the borrower). The initial collateral received by each Fund is required to have a value of no less than 102% of the market value of the loaned securities for U.S. equity securities and a value of no less than 105% of the market value for non-U.S. equity securities. The collateral is maintained thereafter, at a market value equal to not less than 102% of the current value of the U.S. equity securities on loan and not less than 105% of the current value of the non-U.S. equity securities on loan. The market value of the loaned securities is determined at the close of each business day and any additional required collateral is delivered to each Fund on the next business day. During the term of the loan, each Fund is entitled to all distributions made on or in respect of the loaned securities. Loans of securities are terminable at any time and the borrower, after notice, is required to return borrowed securities within the customary time period for settlement of securities transactions.
Any cash collateral received is reinvested in a money market fund managed by SSB as disclosed in each Fund’s Schedule of Investments and is reflected in the Statements of Assets and Liabilities as a payable for collateral upon return of securities loaned. Non-cash collateral, in the form of securities issued or guaranteed by the U.S. government or its agencies or instrumentalities, is not disclosed in a Fund’s Statements of Assets and Liabilities as it is held by the lending agent on behalf of each Fund, and each Fund does not have the ability to re-hypothecate these securities. Income earned by the Fund from securities lending activity is disclosed in the Statement of Operations.
The following is a summary of each Fund’s securities lending agreements and related cash and non-cash collateral received as of May 31, 2019:
| | | Market Value of Securities on Loan | | | Cash Collateral Received | | | Non-Cash Collateral Received | | | Total Collateral Received | |
| Sprott Gold Miners ETF | | $ | 7,841,905 | | | $ | 7,168,479 | | | $ | 740,251 | | | $ | 7,908,730 | |
| Sprott Junior Gold Miners ETF | | | 3,287,795 | | | | 2,807,631 | | | | 523,543 | | | | 3,331,174 | |
The risks of securities lending include the risk that the borrower may not provide additional collateral when required or may not return the securities when due. To mitigate these risks, each Fund benefits from a borrower default indemnity provided by SSB. SSB’s indemnity allows for full replacement of securities lent wherein SSB will purchase the unreturned loaned securities on the open market by applying the proceeds of the collateral, or to the extent such proceeds are insufficient or the collateral is unavailable, SSB will purchase the unreturned loan securities at SSB’s expense. However, the Funds could suffer a loss if the value of the investments purchased with cash collateral falls below the value of the cash collateral received.
The following tables reflect a breakdown of transactions accounted for as secured borrowings, the gross obligation by the type of collateral pledged or securities loaned, and the remaining contractual maturity of those transactions as of May 31, 2019:
| Sprott Gold Miners ETF | Remaining contractual maturity of the agreements |
| Securities Lending Transactions | | Overnight & Continuous | | | Up to 30 days | | | 30-90 days | | | Greater than 90 days | | | Total | |
| Common Stocks | | $ | 7,168,479 | | | $ | – | | | $ | – | | | $ | – | | | $ | 7,168,479 | |
| Total Borrowings | | | | | | | | | | | | | | | | | | | 7,168,479 | |
| Gross amount of recognized liabilities for securities lending (collateral received) | | | | | | | | $ | 7,168,479 | |
| Sprott Junior Gold Miners ETF | Remaining contractual maturity of the agreements |
| Securities Lending Transactions | | Overnight & Continuous | | | Up to 30 days | | | 30-90 days | | | Greater than 90 days | | | Total | |
| Common Stocks | | $ | 2,807,631 | | | $ | – | | | $ | – | | | $ | – | | | $ | 2,807,631 | |
| Total Borrowings | | | | | | | | | | | | | | | | | | | 2,807,631 | |
| Gross amount of recognized liabilities for securities lending (collateral received) | | | | | | | | $ | 2,807,631 | |
Sprott ETFs
| Notes to Financial Statements | May 31, 2019 (Unaudited) |
| 3. | INVESTMENT ADVISORY FEE AND OTHER AFFILIATED TRANSACTIONS |
ALPS Advisors, Inc. (the “Adviser”) serves as the Funds’ investment adviser pursuant to an Investment Advisory Agreement with the Trust on behalf of each Fund (the “Advisory Agreement”). Pursuant to the Advisory Agreement, each Fund pays the Adviser an annual management fee for the services and facilities it provides, payable on a monthly basis as a percentage of the relevant Fund’s average daily net assets as set out below. From time to time, the Adviser may waive all or a portion of its fee.
| Fund | Advisory Fee |
| Sprott Gold Miners ETF | 0.57% |
| Sprott Junior Gold Miners ETF | 0.57% |
Out of the unitary management fee, the Adviser pays substantially all expenses of each Fund, including licensing fees to the Underlying Index provider, the cost of transfer agency, custody, fund administration, legal, audit, independent trustees and other services, except for interest expenses, distribution fees or expenses, brokerage expenses, taxes and extraordinary expenses not incurred in the ordinary course of each Fund’s business. The Adviser’s unitary management fee is designed to pay substantially all of each Fund’s expenses and to compensate the Adviser for providing services for each Fund.
ALPS Fund Services, Inc., an affiliate of the Adviser, is the administrator to the Funds.
Each Trustee who is not an officer or employee of the Adviser, any sub-adviser or any of their affiliates (“Independent Trustees”) receives (1) a quarterly retainer of $5,000, (2) a per meeting fee for regularly scheduled meetings of $3,750, (3) $1,500 for any special meeting held outside of a regularly scheduled board meeting, and (4) reimbursement for all reasonable out-of-pocket expenses relating to attendance at meetings. In addition, the Chairman of the Board and Chairman of the Audit Committee each receives a quarterly retainer of $2,000, in connection with their respective roles.
| 4. | PURCHASES AND SALES OF SECURITIES |
For the six months ended May 31, 2019, the cost of purchases and proceeds from sales of investment securities, excluding short-term investments and in-kind transactions, were as follows:
| Fund | | Purchases | | | Sales | |
| Sprott Gold Miners ETF | | $ | 46,718,299 | | | $ | 47,266,336 | |
| Sprott Junior Gold Miners ETF | | | 8,001,259 | | | | 8,054,847 | |
For the six months May 31, 2019, the cost of in-kind purchases and proceeds from in-kind sales were as follows:
| Fund | | Purchases | | | Sales | |
| Sprott Gold Miners ETF | | $ | 10,818,192 | | | $ | 17,974,446 | |
| Sprott Junior Gold Miners ETF | | | 8,483,255 | | | | 2,601,025 | |
For the six months ended May 31, 2019, the Sprott Gold Miners ETF and the Sprott Junior Gold Miners ETF had in-kind net realized gains/(losses) of $1,862,758 and $297,733 respectively.
Gains on in-kind transactions are not considered taxable for federal income tax purposes and losses on in-kind transactions are also not deductible for tax purposes.
| 5. | CAPITAL SHARE TRANSACTIONS |
Shares are created and redeemed by each Fund only in Creation Unit size aggregations of 50,000 Shares. Only broker-dealers or large institutional investors with creation and redemption agreements called Authorized Participants (“AP”) are permitted to purchase or redeem Creation Units from the Funds. Such transactions are generally permitted on an in-kind basis, with a balancing cash component to equate the transaction to the NAV per unit of each Fund on the transaction date. Cash may be substituted equivalent to the value of certain securities generally when they are not available in sufficient quantity for delivery, not eligible for trading by the AP or as a result of other market circumstances.
Sprott ETFs
| Notes to Financial Statements | May 31, 2019 (Unaudited) |
| 6. | RELATED PARTY TRANSACTIONS |
Each Fund engaged in cross trades between other funds in the Trust during the year ended May 31, 2019 pursuant to Rule 17a-7 under the 1940 Act. Cross trading is the buying or selling of portfolio securities between funds to which the Adviser serves as the investment adviser. The Board previously adopted procedures that apply to transactions between the Funds of the Trust pursuant to Rule 17a-7. These transactions related to cross trades during the period complied with the requirements set forth by Rule 17a-7 and the Trust’s procedures.
Transactions related to cross trades during the year ended May 31, 2019 was as follows:
| Fund | | Purchase cost paid | | | Sale proceeds received | | | Realized gain/(loss) on sales | |
| Sprott Gold Miners ETF | | $ | 937,669 | | | $ | 1,130,818 | | | $ | (294,554 | ) |
| Sprott Junior Gold Miners ETF | | $ | 1,130,818 | | | $ | 937,669 | | | $ | 134,452 | |
On September 20, 2018 the Board approved an Agreement and Plan of Reorganization (“Agreement”) providing for the reorganization (the “Reorganizations”) of the Sprott Gold Miners ETF and the Sprott Junior Gold Miners ETF (each, a “Target Fund”) into corresponding newly-created exchange-traded funds (ETFs) of the Sprott ETF Trust (the “Acquiring Funds”). Each Acquiring Fund will have the same name as its corresponding Target Fund, and will be subject to substantially the same investment objective, investment strategies, policies, and risks as the corresponding Target Fund, except with respect to each Target Fund’s respective Underlying Index (as defined in each Target Fund’s prospectus). The change in indices will not be effective until after the closing of the Reorganizations. The Acquiring Funds will be advised by Sprott Asset Management LP and the Target Funds’ current investment adviser, ALPS Advisors, Inc., will continue to be responsible for day-to-day portfolio management as sub-adviser to the Acquiring Funds. Each Acquiring Fund is expected to have a lower expense ratio relative to its corresponding Target Fund. Pursuant to the Agreement, all of the assets and liabilities of each Target Fund will be transferred to its corresponding Acquiring Fund in exchange for shares of beneficial interest of the Acquiring Fund and cash in lieu of fractional shares. As a result of the Reorganizations, shareholders of each Target Fund will become shareholders of the corresponding Acquiring Fund. Shareholders of each Target Fund will receive shares of the corresponding Acquiring Fund (and cash with respect to any fractional shares held by a Target Fund shareholder) with a value equal to the aggregate net asset value of their shares of the Target Fund held immediately prior to the Reorganizations. On July 8, 2019, shareholders of the Target Funds approved the Agreements and the reorganization were completed as of the close of business on July 19, 2019 in a tax-free transaction.
Sprott ETFs
| Additional Information | May 31, 2019 (Unaudited) |
PROXY VOTING RECORDS, POLICIES AND PROCEDURES
Information regarding how each Fund voted proxies relating to portfolio securities during the most recent 12-month period ended June 30 and a description of the Funds’ proxy voting policies and procedures used in determining how to vote for proxies are available without charge on the SEC’s website at www.sec.gov and upon request, by calling (toll-free) 1-866-675-2639.
PORTFOLIO HOLDINGS
The Trust is required to disclose, after its first and third fiscal quarters, the complete schedule of each Fund’s portfolio holdings with the SEC on Form N-Q or as an exhibit to its report on Form N-PORT. Form N-Q or N-PORT reports for each Fund will be available on the SEC’s website at www.sec.gov. Each Fund’s Form N-Q or N-PORT reports will be available without charge, upon request, by calling (toll-free) 1-866-675-2639 or by writing to ALPS ETF Trust at 1290 Broadway, Suite 1100, Denver, Colorado 80203.
TAX INFORMATION
The Funds designate the following as a percentage of taxable ordinary income distributions, or up to the maximum amount allowable, for the calendar year ended December 31, 2018:
| | Qualified Dividend Income | Dividend Received Deduction |
| Sprott Gold Miners ETF | 100.00% | 48.01% |
| Sprott Gold Miners Junior ETF | 0.00% | 0.00% |
In early 2019, if applicable, shareholders of record received this information for the distribution paid to them by the Funds during the calendar year 2018 via Form 1099. The Funds will notify shareholders in early 2020 of amounts paid to them by the Funds, if any, during the calendar year 2019.
LICENSING AGREEMENTS
Sprott Gold Miners ETF
Zacks Investment Management, Inc. (the “Licensor”) has entered into a license agreement with Sprott Asset Management LP (“Sprott”) to use the “Sprott” name and certain related intellectual property in connection with the underlying index, the Sprott Zacks Gold Miners Index (the “Underlying Index”) (the “Sprott License Agreement”). Pursuant to the Sprott License Agreement, Sprott in turn has entered into a sublicense agreement with ALPS Advisers, Inc. to use the Underlying Index (the “Sublicense Agreement”) in connection with the Sprott Gold Miners ETF (the “Product”).
The following disclosure relates to the Licensor and Sprott:
The Product(s) is not sponsored, endorsed, sold or promoted by ZACKS INVESTMENT MANAGEMENT, INC. (“Licensor”) Licensor makes no representation or warranty, express or implied, regarding the advisability of investing in securities generally or in the Product(s) particularly or the ability of the Index to track general market performance. Licensor’s only relationship to the Licensee is the licensing of the Index which is determined and composed by Licensor without regard to the Licensee or the owners of the Product(s). Licensor has no obligation to take the needs of the Licensee or the owners of the Product(s) into consideration in determining or composing the Index. Licensor shall not be liable to any person for any error in the Index nor shall it be under any obligation to advise any person of any error therein.
The Fund is not sponsored by Sprott. Sprott makes no representation or warranty, express or implied, to the owners of the Fund or any member of the public regarding the advisability of investing in securities or commodities generally or in the Fund particularly and does not guarantee the quality, accuracy or completeness of the Underlying Index or any Underlying Index data included herein or derived therefrom and assume no liability in connection with their use. The Underlying Index is determined and composed without regard to the Adviser or the Fund. Sprott has no obligation to take the needs of the Adviser, the Fund or the shareholders of the Fund into consideration in connection with the foregoing. Sprott is not responsible for and has not participated in the determination of pricing or the timing of the issuance or sale of the Shares of the Fund or in the determination or calculation of the NAV of the Fund. Sprott has no obligation or liability in connection with the administration or trading of the Fund.
Sprott does not guarantee the accuracy and/or completeness of the Underlying Index or any data included therein, and Sprott shall have no liability for any errors, omissions, or interruptions therein. Sprott makes no warranty, express or implied, as to results to be obtained by the Adviser, the Fund, Fund shareholders or any other person or entity from the use of the Underlying Index or any data included therein. Sprott makes no express or implied warranties, and expressly disclaims all warranties of merchantability or fitness for a particular purpose or use with respect to the Underlying Index or any data included therein. Without limiting any of the foregoing, in no event shall Sprott have any liability for any special, punitive, indirect, or consequential damages (including lost profits) arising out of matters relating to the use of the Underlying Index, even if notified of the possibility of such damages.
Sprott ETFs
| Additional Information | May 31, 2019 (Unaudited) |
Sprott Junior Gold Miners ETF
Zacks Investment Management, Inc. (the “Licensor”) has entered into a license agreement with Sprott Asset Management LP (“Sprott”) to use the “Sprott” name and certain related intellectual property in connection with the underlying index, the Sprott Zacks Junior Gold Miners Index (the “Underlying Index”) (the “Sprott License Agreement”). Pursuant to the Sprott License Agreement, Sprott in turn has entered into a sublicense agreement with ALPS Advisers, Inc. to use the Underlying Index (the “Sublicense Agreement”) in connection with the Sprott Junior Gold Miners ETF (the “Product”).
The following disclosure relates to the Licensor and Sprott:
The Product(s) is not sponsored, endorsed, sold or promoted by ZACKS INVESTMENT MANAGEMENT, INC. (“Licensor”) Licensor makes no representation or warranty, express or implied, regarding the advisability of investing in securities generally or in the Product(s) particularly or the ability of the Index to track general market performance. Licensor’s only relationship to the Licensee is the licensing of the Index which is determined and composed by Licensor without regard to the Licensee or the owners of the Product(s). Licensor has no obligation to take the needs of the Licensee or the owners of the Product(s) into consideration in determining or composing the Index. Licensor shall not be liable to any person for any error in the Index nor shall it be under any obligation to advise any person of any error therein.
The Fund is not sponsored by Sprott. Sprott makes no representation or warranty, express or implied, to the owners of the Fund or any member of the public regarding the advisability of investing in securities or commodities generally or in the Fund particularly and does not guarantee the quality, accuracy or completeness of the Underlying Index or any Underlying Index data included herein or derived therefrom and assume no liability in connection with their use. The Underlying Index is determined and composed without regard to the Adviser or the Fund. Sprott has no obligation to take the needs of the Adviser, the Fund or the shareholders of the Fund into consideration in connection with the foregoing. Sprott is not responsible for and has not participated in the determination of pricing or the timing of the issuance or sale of the Shares of the Fund or in the determination or calculation of the NAV of the Fund. Sprott has no obligation or liability in connection with the administration or trading of the Fund.
Sprott does not guarantee the accuracy and/or completeness of the Underlying Index or any data included therein, and Sprott shall have no liability for any errors, omissions, or interruptions therein. Sprott makes no warranty, express or implied, as to results to be obtained by the Adviser, the Fund, Fund shareholders or any other person or entity from the use of the Underlying Index or any data included therein. Sprott makes no express or implied warranties, and expressly disclaims all warranties of merchantability or fitness for a particular purpose or use with respect to the Underlying Index or any data included therein. Without limiting any of the foregoing, in no event shall Sprott have any liability for any special, punitive, indirect, or consequential damages (including lost profits) arising out of matters relating to the use of the Underlying Index, even if notified of the possibility of such damages.
Intentionally Left Blank

Not Applicable to this Report.
| Item 3. | Audit Committee Financial Expert. |
Not Applicable to this Report.
| Item 4. | Principal Accountant Fees and Services. |
Not Applicable to this Report.
| Item 5. | Audit Committee of Listed Registrants. |
Not applicable to Registrant.
| (a) | Schedule of Investments is included as part of the Report to Stockholders filed under Item 1 of this Form N-CSR. |
| Item 7. | Disclosure of Proxy Voting Policies and Procedures for Closed-End Management Investment Companies. |
Not applicable to Registrant.
| Item 8. | Portfolio Managers of Closed-End Management Investment Companies. |
Not applicable to Registrant.
| Item 9. | Purchases of Equity Securities by Closed-End Management Investment Company and Affiliated Purchasers. |
Not applicable to Registrant.
| Item 10. | Submission of Matters to a Vote of Security Holders. |
No material changes to the procedures by which the shareholders may recommend nominees to the Registrant’s Board of Trustees have been implemented after the Registrant’s last provided disclosure in response to the requirements of Item 407(c)(2)(iv) of Regulation S-K (17 CFR 229.407) (as required by Item 22(b)(15) of Schedule 14A (17 CFR 240.14a-101)), or this Item.
| Item 11. | Controls and Procedures. |
| (a) | The Registrant’s principal executive officer and principal financial officer have concluded that the Registrant’s disclosure controls and procedures (as defined in Rule 30a-3(c) under the Investment Company Act of 1940, as amended) are effective based on their evaluation of these controls and procedures as of a date within 90 days of the filing date of this report. |
| (b) | There was no change in the Registrant's internal control over financial reporting (as defined in Rule 30a-3(d) under the Investment Company Act of 1940, as amended) that occurred during the period covered by this report that has materially affected, or is reasonably likely to materially affect, the Registrant's internal control over financial reporting. |
| Item 12. | Disclosure of Securities Lending Activities for Closed-End Management Investment Companies. |
Not applicable.
| (a)(1) | Not applicable to this Report. |
| (a)(2) | The certifications required by Rule 30a-2(a) of the Investment Company Act of 1940, as amended, and Section 302 of the Sarbanes-Oxley Act of 2002 are attached hereto as Exhibit 99.Cert. |
| (b) | The certifications by the Registrant’s principal executive officer and principal financial officer, as required by Rule 30a-2(b) of the Investment Company Act of 1940, as amended, and Section 906 of the Sarbanes-Oxley Act of 2002 are attached hereto as Exhibit 99.906Cert. |
SIGNATURES
Pursuant to the requirements of the Securities Exchange Act of 1934 and the Investment Company Act of 1940, the Registrant has duly caused this report to be signed on its behalf by the undersigned, thereunto duly authorized.
| ALPS ETF TRUST | |
| | | |
| By: | /s/ Bradley J. Swenson | |
| | Bradley J. Swenson (Principal Executive Officer) | |
| | President | |
| | | |
| Date: | August 2, 2019 | |
Pursuant to the requirements of the Securities Exchange Act of 1934 and the Investment Company Act of 1940, this report has been signed below by the following persons on behalf of the Registrant and in the capacities and on the dates indicated.
| By: | /s/ Bradley J. Swenson | |
| | Bradley J. Swenson (Principal Executive Officer) | |
| | President | |
| | | |
| Date: | August 2, 2019 | |
| By: | /s/ Kathryn Burns | |
| | Kathryn Burns (Principal Financial Officer) | |
| | Treasurer | |
| | | |
| Date: | August 2, 2019 | |
-4-