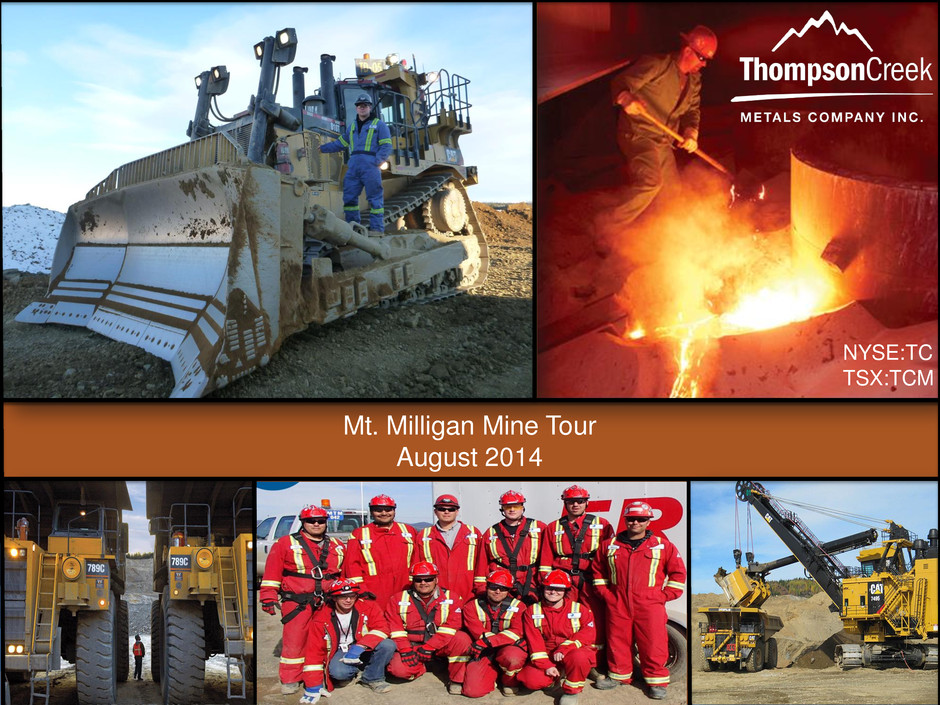
NYSE:TC TSX:TCM Mt. Milligan Mine Tour August 2014

2 Cautionary Statement This document contains ‘‘forward-looking statements’’ within the meaning of the United States Private Securities Litigation Reform Act of 1995, Section 27A of the Securities Act of 1933, as amended, Section 21E of the Securities Act of 1934, as amended and applicable Canadian securities legislation, which are intended to be covered by the safe harbor created by those sections and other applicable laws. These forward-looking statements generally are identified by the words "believe," "project," "expect," "anticipate," "estimate," "intend," "future," "opportunity," "plan," "may," "should," "will," "would," "will be," "will continue," "will likely result," and similar expressions. Our forward-looking statements may include, without limitation, statements with respect to: future financial or operating performance of the Company or its subsidiaries and its projects; the availability of, and terms and costs related to, future borrowing, debt repayment, and refinancing ; future inventory, production, sales, cash costs, capital expenditures and exploration expenditures; future earnings and operating results; expected concentrate and recovery grades; estimates of mineral reserves and resources, including estimated mine life and annual production; projected timing to ramp-up to design capacity at Mt. Milligan Mine; the potential development of our development properties and future exploration at our operations; future concentrate shipment dates and sizes; future operating plans and goals; and future copper, gold and molybdenum prices. Where we express an expectation or belief as to future events or results, such expectation or belief is expressed in good faith and believed to have a reasonable basis. However, our forward-looking statements are based on current expectations and assumptions that are subject to risks and uncertainties which may cause actual results to differ materially from future results expressed, projected or implied by those forward-looking statements. Important factors that could cause actual results and events to differ from those described in such forward- looking statements can be found in the section entitled ‘‘Risk Factors’’ in Thompson Creek’s Annual Report on Form 10-K, Quarterly Reports on Form 10-Q and other documents filed on EDGAR at www.sec.gov and on SEDAR at www.sedar.com. Although we have attempted to identify those material factors that could cause actual results or events to differ from those described in such forward-looking statements, there may be other factors, currently unknown to us or deemed immaterial at the present time, that could cause results or events to differ from those anticipated, estimated or intended. Many of these factors are beyond our ability to control or predict. Given these uncertainties, the reader is cautioned not to place undue reliance on our forward-looking statements. We undertake no obligation to update or revise publicly any forward-looking statements, whether as a result of new information, future events, or otherwise, and investors should not assume that any lack of update to a previously issued forward-looking statement constitutes a reaffirmation of that statement. Cautionary Note to our United States and Other Investors Concerning Estimates of Measured and Indicated Mineral Resources: This presentation uses the terms “Measured” and “Indicated” Resources. United States investors are advised that while such terms are recognized by Canadian regulations, the United States Securities and Exchange Commission (the “SEC”) only permits United States mining companies, in their filings with the SEC, to disclose those mineral deposits that a company can economically and legally extract or produce in accordance with SEC Industry Guide 7. Our United States and other investors are cautioned not to assume that all or any part of Measured or Indicated Mineral Resources will ever be converted into Mineral Reserves. Compliance with NI 43-101 Unless otherwise indicated, we have prepared the technical information in this presentation based on information contained in the technical reports available under our company profile on SEDAR at www.sedar.com. Each technical report was prepared by or under the supervision of a qualified person (a “Qualified Person”) as defined in National Instrument 43-101 – Standards of Disclosure for Mineral Projects of the Canadian Securities Administrators (“NI 43-101”). For readers to fully understand the information in this presentation, they should read the technical reports n their entirety, including all qualifications, assumptions and exclusions that relate to the information set out in this presentation which qualifies such information. This presentation summarizes some of the information contained in the following technical reports: "Technical Report Thompson Creek Molybdenum Mine" dated February 9, 2011 and filed on SEDAR on February 24, 2011; "Technical Report Endako Molybdenum Mine" dated and filed on SEDAR on September 12, 2011; "Technical Report—Feasibility Update Mt. Milligan Property—Northern BC" dated October 13, 2009 and filed on our SEDAR profile on October 13, 2011 The Mineral Reserves estimates included in this presentation have been prepared in accordance with NI 43-101 and are classified in accordance with the Canadian Institute of Mining, Metallurgy and Petroleum's "CIM Definition Standards -– For Mineral Resources and Mineral Reserves." Mineral Reserves are equivalent to Proven and Probable Reserves as defined by the SEC Industry Guide 7. The Mineral Resources estimates included in this presentation were estimated in accordance with the definitions and requirements of NI 43-101. The Mineral Resources are equivalent to Mineralized Material as defined by the SEC Industry Guide 7. The Mineral Resources are not included in and are in addition to the Mineral Reserves.
3 Agenda Company Overview Jacques Perron, Chief Executive Officer Operations Overview Mt. Milligan Mine Ian Berzins, Vice President and General Manager John Hollow, Vice President Technical Services Bruce Parker, Mine Manager Thompson Creek Mine Scott Shellhaas, President and Chief Operating Officer Endako Mine Chris Gibbs, Vice President and General Manager Langeloth Metallurgical Facility Mark Wilson, Executive Vice President and Chief Commercial Officer

4 Company Overview NYSE: TC; TSX: TCM Overview: One of the largest molybdenum producers in the world with three operating mines Mt. Milligan Mine in B.C. (100% ownership) Thompson Creek Mine in Idaho (100% ownership) Endako Mine in B.C. (75% ownership) Langeloth metallurgical refinery in Pennsylvania (100% ownership) Diversified into copper and gold with the start-up of the Mt. Milligan mine in B.C. Start-up commenced August 2013 52.25% of life of mine gold production sold to Royal Gold

5 Company All Incidence Recordable Rate (AIRR)1 2007 – 2014 YTD 7.00 5.94 5.03 2.60 2.30 1.32 2.48 3.43 3.0 3.2 3.2 2.5 1.8 1.7 2.1 2007 2008 2009 2010 2011 2012 2013 YTD 2014 Thompson Creek Metals Company Metals Mining U.S. AIRR Average 1 Includes lost time and reportable incidents.
6 Q214 Highlights Improving safety performance Cash flow from operations of $51 million, revenue of $248 million, operating income of $57 million, net income of $62 million and adjusted non-GAAP net income of $22 million Positive net cash flow Continued progress at Mt. Milligan Achieved average daily mill throughput of 48,065 tonnes in June, with daily record of 63,970 tonnes on June 16 Completed three shipments and recorded four sales (one sale from Q1 shipment) Copper and gold sales contributed $119 million to total revenue Molybdenum business significantly contributed to cash flow from operations S&P increased Company’s corporate credit rating to B- from CCC+ Completed exchange offer for 7,206,862 units, or 86.4% of the tMEDS Issued 42,129,829 shares of common stock, compared to 38,829,852 shares which would have been issued on mandatory conversion on May 15, 2014 Extinguished $10.4 million of future cash principal and interest payments

7 Updated 2014 Production and Cash Cost Guidance Updated 2014 Estimate Previous 2014 Estimate Mt. Milligan Copper and Gold 1 Concentrate production (000’s wet tonnes) (000’s dry tonnes) 135 – 150 125 – 140 135 – 150 125 – 140 Copper payable production (000’s lb) 65,000 – 75,000 65,000 – 75,000 Gold payable production (000’s oz) 185 – 195 165 – 175 Unit cash cost – By-product ($/payable lb copper production) 2,3 1.00 – 1.50 1.55 – 1.70 Molybdenum (000’s lb): 4 TC Mine 15,000 – 17,000 14,000 – 16,000 Endako Mine (75%) 9,000 – 10,000 10,000 – 12,000 Total molybdenum production (000’s lb) 24,000 – 27,000 24,000 – 28,000 Cash Cost ($/lb produced): TC Mine 4.50 – 5.25 4.75 – 5.75 Endako Mine 3 10.50 – 12.00 9.00 – 10.50 Total molybdenum cash cost ($/lb produced) 6.75 – 7.75 6.50 – 7.75 1 For Mt. Milligan guidance assumes that 100% of design capacity mill throughput and designed copper and gold recoveries are not achieved until year-end 2015. 2 Copper by-product unit cash cost is calculated using payable production, with an assumed gold price for the gold by-product of approximately $1,290 per ounce, which is then adjusted to take into account the contractual price of $435 per ounce under the Gold Stream Arrangement. See “Non-GAAP Financial Measures” for the definition and reconciliation of these non-GAAP measures. 3 Estimates for cash costs assume a foreign exchange rate of US$1.00 = C$1.05. 4 Molybdenum production pounds represented are molybdenum oxide and high performance molybdenum disulfide (“HPM”) from our share of production from the mines but exclude molybdenum processed from purchased product.

8 Updated 2014 Cash Capital Expenditure Guidance Updated 2014 Estimate1,2 Previous 2014 Estimate1,2 Mt. Milligan Permanent Operations Residence 25 20 Mt. Milligan Operations 35 30 Operations (excludes Mt. Milligan) 5 10 TOTAL3 65 60 1 Cash capital expenditures guidance numbers are as of August 5, 2014. Canadian to US foreign exchange rate for 2014 assumes C$1.00 = US$1.05. 2 Plus or minus 10%. 3 Excludes approximately $22 million of accruals related to the Mt. Milligan Mine as of December 31, 2013, which will be paid in 2014. [millions of US$]
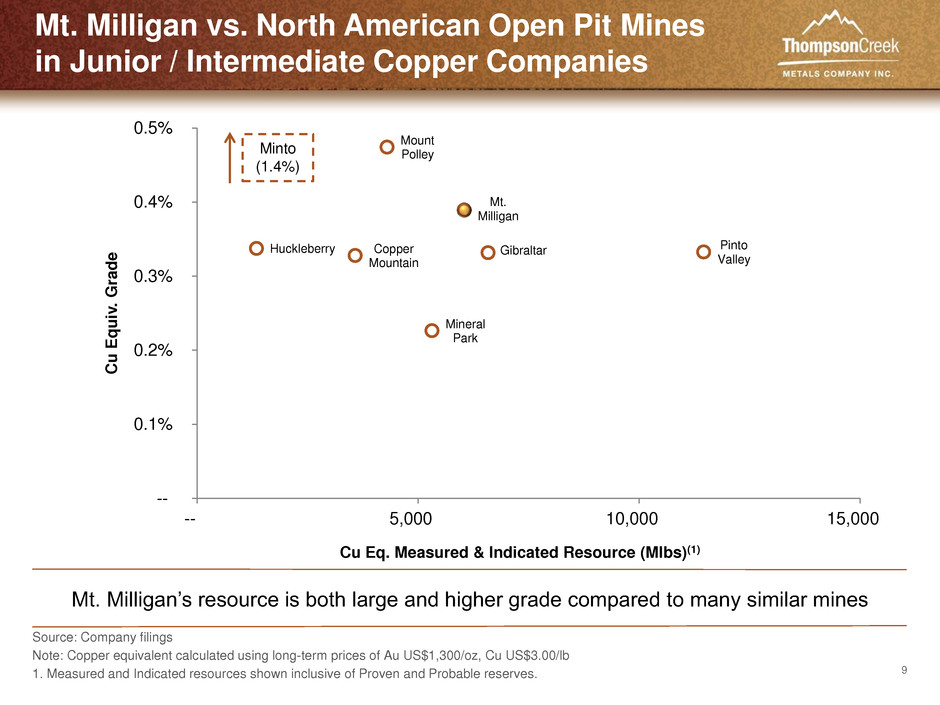
9 Mt. Milligan vs. North American Open Pit Mines in Junior / Intermediate Copper Companies Source: Company filings Note: Copper equivalent calculated using long-term prices of Au US$1,300/oz, Cu US$3.00/lb 1. Measured and Indicated resources shown inclusive of Proven and Probable reserves. Copper Mountain Huckleberry Mount Polley Mt. Milligan Mineral Park Gibraltar Pinto Valley -- 0.1% 0.2% 0.3% 0.4% 0.5% -- 5,000 10,000 15,000 Cu E qu iv. G ra de Cu Eq. Measured & Indicated Resource (Mlbs)(1) Minto (1.4%) Mt. Milligan’s resource is both large and higher grade compared to many similar mines
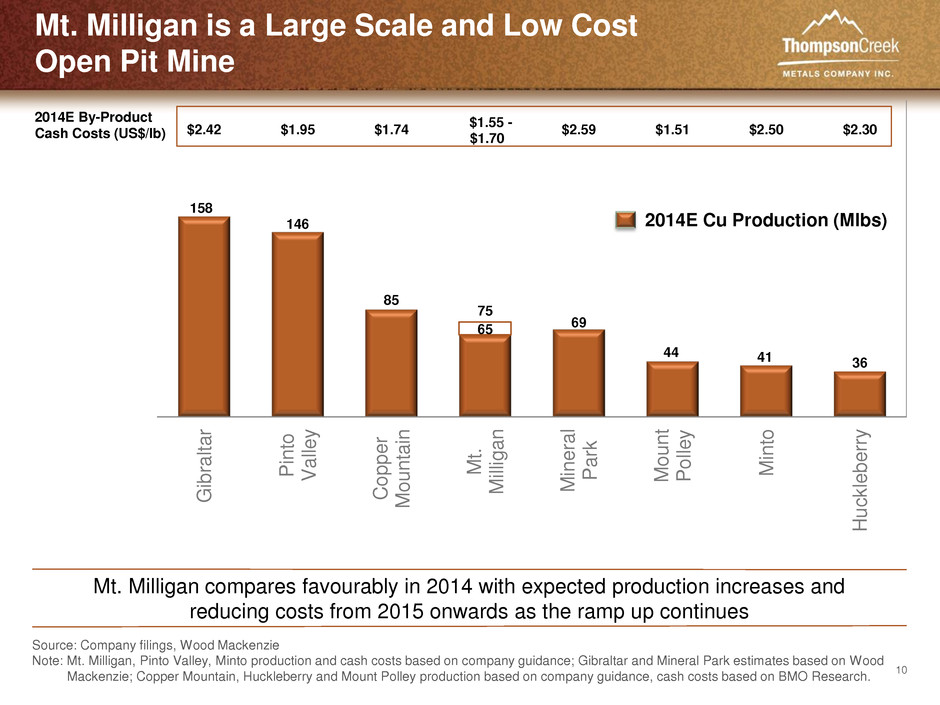
10 Mt. Milligan is a Large Scale and Low Cost Open Pit Mine Source: Company filings, Wood Mackenzie Note: Mt. Milligan, Pinto Valley, Minto production and cash costs based on company guidance; Gibraltar and Mineral Park estimates based on Wood Mackenzie; Copper Mountain, Huckleberry and Mount Polley production based on company guidance, cash costs based on BMO Research. 158 146 85 65 69 44 41 36 75 $2.42 $1.95 $1.74 $1.55 - $1.70 $2.59 $1.51 $2.50 $2.30 Gib ral tar Pin to Vall ey Coppe r Moun tai n Mt . Milliga n Minera l Par k Moun t Poll ey Min to Hu ck leb err y 2014E By-Product Cash Costs (US$/lb) 2014E Cu Production (Mlbs) Mt. Milligan compares favourably in 2014 with expected production increases and reducing costs from 2015 onwards as the ramp up continues
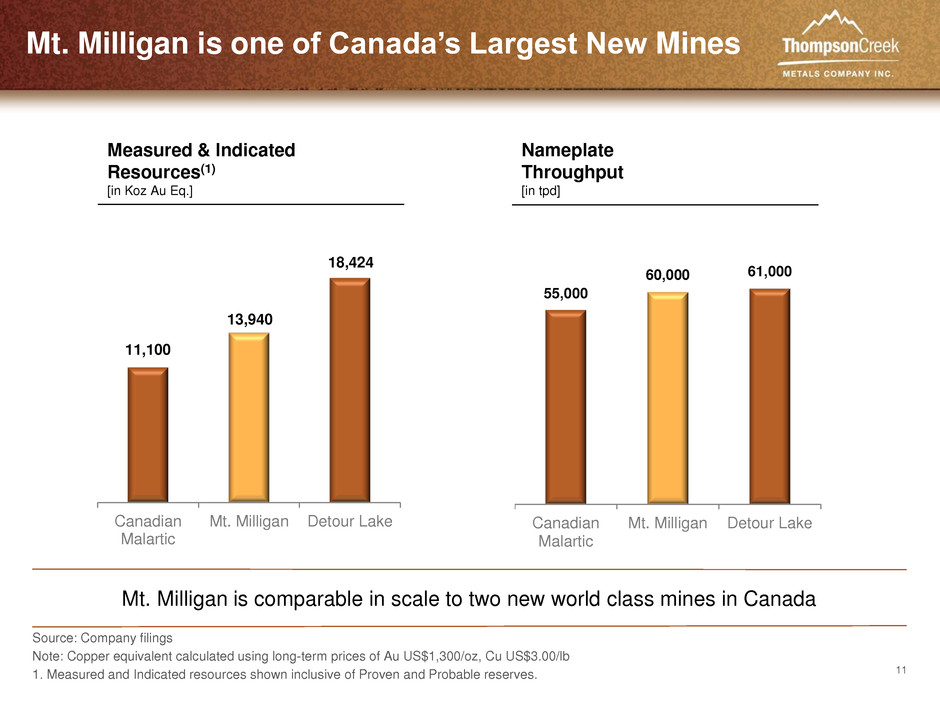
11 Mt. Milligan is one of Canada’s Largest New Mines Nameplate Throughput [in tpd] 55,000 60,000 61,000 Canadian Malartic Mt. Milligan Detour Lake Measured & Indicated Resources(1) [in Koz Au Eq.] 11,100 13,940 18,424 Canadian Malartic Mt. Milligan Detour Lake Mt. Milligan is comparable in scale to two new world class mines in Canada Source: Company filings Note: Copper equivalent calculated using long-term prices of Au US$1,300/oz, Cu US$3.00/lb 1. Measured and Indicated resources shown inclusive of Proven and Probable reserves.

12 $2.78 -- 3 6 9 $2.00 $2.50 $3.00 $3.50 Jan-14 Feb-14 Mar-14 Apr-14 May-14 Jun-14 Jul-14 Aug-14 Vo lu m e (m illio n s )S h a re P ri ce ( U S$ ) Volume Price Share Price & Volume (YTD) Bond Trading Price (YTD) Shares and Notes Trading Overview Source: Bloomberg, FactSet 98.500 109.948 111.400 80 90 100 110 120 Jan-14 Feb-14 Mar-14 Apr-14 May-14 Jun-14 Jul-14 Aug-14 B o n d T ra d in g P ri c e 9.75% (Due 2017) 7.375% (Due 2018) 12.5% (Due 2019) Feb. 20, 2014 Commercial production declared at Mt. Milligan
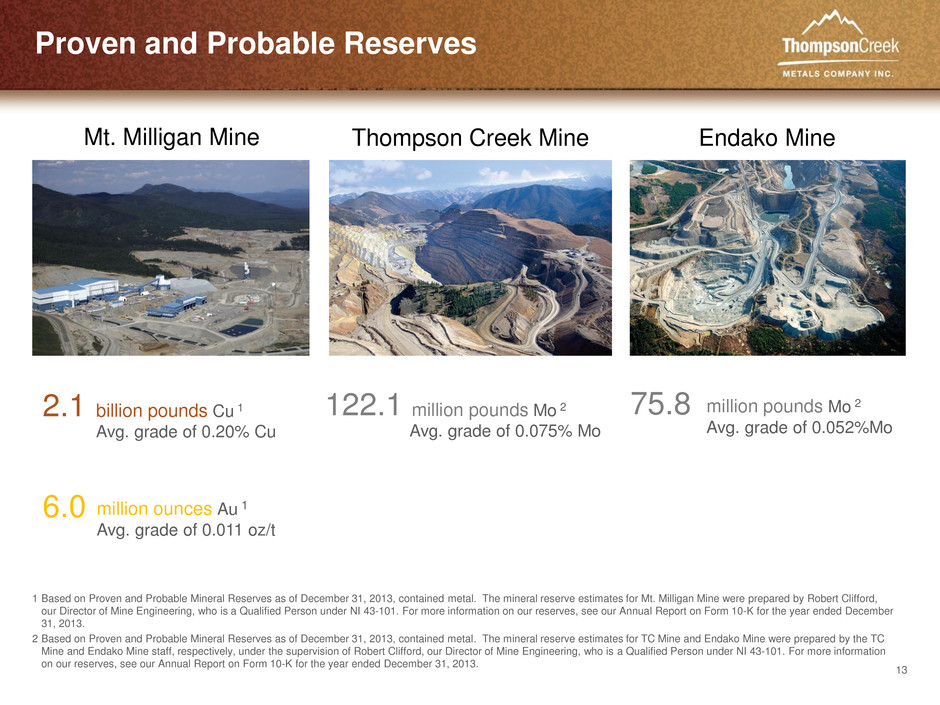
13 Proven and Probable Reserves billion pounds Cu 1 Avg. grade of 0.20% Cu million pounds Mo 2 Avg. grade of 0.075% Mo million pounds Mo 2 Avg. grade of 0.052%Mo 1 Based on Proven and Probable Mineral Reserves as of December 31, 2013, contained metal. The mineral reserve estimates for Mt. Milligan Mine were prepared by Robert Clifford, our Director of Mine Engineering, who is a Qualified Person under NI 43-101. For more information on our reserves, see our Annual Report on Form 10-K for the year ended December 31, 2013. 2 Based on Proven and Probable Mineral Reserves as of December 31, 2013, contained metal. The mineral reserve estimates for TC Mine and Endako Mine were prepared by the TC Mine and Endako Mine staff, respectively, under the supervision of Robert Clifford, our Director of Mine Engineering, who is a Qualified Person under NI 43-101. For more information on our reserves, see our Annual Report on Form 10-K for the year ended December 31, 2013. Endako Mine Thompson Creek Mine Mt. Milligan Mine 2.1 6.0 million ounces Au 1 Avg. grade of 0.011 oz/t 122.1 75.8
14 Key Messages Mt. Milligan continues to progress very well and exceed our expectations at this stage of the ramp-up Expect to consistently achieve approximately 80% of mill throughput design capacity by year-end 2014 and 100% by year-end 2015 Company’s financial performance turned the corner in Q2 233% increase operating income Positive net cash flow Company will continue to evaluate opportunities to strengthen the balance sheet Recent exchange offer of the tMEDS was just the first step towards reducing debt First repayment not due until December 2017


