UNITED STATES
SECURITIES AND EXCHANGE COMMISSION
Washington, D.C. 20549
FORM N-CSR
CERTIFIED SHAREHOLDER REPORT OF REGISTERED
MANAGEMENT INVESTMENT COMPANIES
Investment Company Act file number 811-22135
Academy Funds Trust
(Exact name of registrant as specified in charter)
123 South Broad Street, Suite 1630
Philadelphia, PA 19109
(Address of principal executive offices) (Zip code)
Jonathan Kopcsik
Stradley Ronon Stevens & Young, LLP
2600 One Commerce Square
Philadelphia, PA 19103
(Name and address of agent for service)
215-979-3754
Registrant's telephone number, including area code
Date of fiscal year end: December 31, 2009
Date of reporting period: June 30, 2009
Item 1. Reports to Stockholders.
SEMI-ANNUAL REPORT
 | ||
| June 30, 2009 |

ACADEMY FUNDS TRUST
Dear Fellow Shareholders,
The six months leading up to June 30, 2009 featured a full year’s worth of excitement. Any investor confidence restored at the end of 2008 quickly dissipated in view of dire economic perils, both real and imagined. I am proud to report that against this backdrop the Academy Funds remained focused on our mission: targeting capital appreciation through long-term investment in select businesses.
Fears of a systemic meltdown, including the nationalization of banks, reached a crescendo in early March when the S&P 500 Index closed at 676, a level we had not seen in 12 ½ years (the lowest close in the post-tech bubble/September 11 period was approximately 100 points, or 15%, higher). Nonetheless, as of June 30, we find the stock market indices virtually unchanged from the start of the year, having steadily climbed from the March abyss. Major government intervention has extinguished some very real balance-sheet fires (though the embers still smolder). More importantly, investor fears of economic Armageddon have largely passed and confidence in future economic growth has returned.
Amid this erratic climate; Academy’s strategy remains simple; long-term investment in select businesses through publicly-traded securities. One of the greatest challenges of this approach is persisting with our long-term goals in the face of a continuum of volatile prices, mercurial pundits, and analysts with short-term objectives. We cannot shut our eyes and muffle our ears, but we must process the relentless flow of information within the framework of our philosophy and in context of the fundamentals of our long-term investments. We must distinguish short-term hiccups from long-term impairments. Academy strives to be dynamic, but never reactionary.
Constancy of process and consistency in execution are the keys to the Academy Funds’ investment approach, the success of which must be measured over years rather than months or quarters. While the outperformance of both funds relative to their benchmark in the past six months is encouraging (the Core Equity Fund returned 3.32% outperforming the S&P 500® Total Return Index by 0.16%, the Select Opportunities Fund returned 16.03% outperforming the S&P 500® Total Return Index by 12.87%), it is our resolute commitment to long-term investing that distinguishes our process. I commend your confidence in this sound financial theory and look forward to continuing our efforts toward the goal of realizing Academy’s vision.
Sincerely,
David Jacovini
President & Portfolio Manager
Past performance does not guarantee future results.
Mutual Fund investing involves risk; principal loss is possible. Along with general market risks, investors should also note that both Funds are classified as non-diversified and may be more volatile than diversified funds that hold a greater number of securities. Additionally, both Funds may invest in securities of foreign companies, which can be more volatile, less liquid, and subject to the risk of currency fluctuations. The Select Opportunities Fund is subject to additional principal risks. A possible higher turnover rate can lead to additional tax consequences and higher transaction costs. The Fund may hold short positions and buy derivatives, which involve risks that vary from, and
3
ACADEMY FUNDS TRUST
can exceed, the risks presented by holding long positions only. The Fund may also invest in small and mid-cap companies, which involve additional risks such as limited liquidity and greater volatility than large-cap companies. The Fund may also invest in debt securities, which will typically decrease when interest rates rise. This risk is usually greater for longer-term debt securities. The Fund may use derivative instruments, such as options, futures and options on futures. Derivatives can be highly volatile, illiquid and difficult to value, and there is the risk that changes in the value of a derivative held by the Fund will not correlate with underlying instruments or the Fund’s other investments.
The above discussion is not intended to be a forecast of future events, a guarantee of future results and should not be considered a recommendation to buy or sell any security.
The S&P 500 is a broad based, market value weighted index consisting of 500 stocks, and is widely recognized as representative of the equity market in general. The index is unmanaged and it is not possible to invest directly in an index.
Must be preceded or accompanied by a prospectus.
The Academy Funds are distributed by Quasar Distributors, LLC.
4
ACADEMY FUNDS TRUST
Expense Example
For the Six Month Period Ended June 30, 2009 (Unaudited)
As a shareholder of the Funds, you incur two types of costs: (1) ongoing costs, including management fees, distribution and shareholder servicing (12b-1) fees, and other Fund expenses; and (2) a redemption fee if you sell your shares shortly after purchasing them. This Example is intended to help you understand your ongoing costs (in dollars) of investing in the Funds and to compare these costs with the ongoing costs of investing in other mutual funds.
The Example is based on an investment of $1,000 invested at the beginning of the period and held for the entire period from January 1, 2009 to June 30, 2009.
Actual Expenses
The table below provides information about actual account values and actual expenses. You may use the information in this line, together with the amount you invested, to estimate the expenses you paid over the period. Simply divide your account value by $1,000 (for example, an $8,600 account value divided by $1,000 equals 8.6), then multiply the result by the number in the first line under the heading entitled “Expenses Paid During Period” to estimate the expenses you paid on your account during the period.
| Expenses Paid | ||||||||||||
| Beginning | Ending | During the | ||||||||||
| Account Value | Account Value | Period Ended | ||||||||||
| January 1, 2009 | June 30, 2009 | June 30, 2009* | ||||||||||
| Core Equity Fund | $ | 1,000.00 | $ | 1,033.20 | $ | 10.08 | ||||||
| Select Opportunities Fund | $ | 1,000.00 | $ | 1,160.30 | $ | 10.71 | ||||||
| * | Expenses are equal to the Funds’ annualized expense ratio of 2.00%, multiplied by the average account value over the period, multiplied by 181/365 (to reflect the period). |
Hypothetical Example for Comparison Purposes
The table below provides information about hypothetical account values and hypothetical expenses based on each Fund’s actual expense ratio and an assumed rate of return of 5% per year before expenses, which is not the Fund’s actual return. The hypothetical account values and expenses may not be used to estimate the actual ending account balance or expenses you paid for the period. You may use this information to compare the ongoing costs of investing in the Funds with other funds. To do so, compare this 5% hypothetical example with the 5% hypothetical examples that appear in the shareholder reports of other funds.
Please note that the expenses shown in the table are meant to highlight your ongoing costs only and do not reflect any transactional costs, such as any redemption
5
ACADEMY FUNDS TRUST
Expense Example
June 30, 2009 (Unaudited)(Continued)
fees. Therefore, the table below is useful in comparing the ongoing costs only, and will not help you determine the relative total costs owning different funds. In addition, if redemption fees were included, your costs could have been higher.
| Expenses Paid | ||||||||||||
| Beginning | Ending | During the | ||||||||||
| Account Value | Account Value | Period Ended | ||||||||||
| January 1, 2009 | June 30, 2009 | June 30, 2009* | ||||||||||
| Core Equity Fund | $ | 1,000.00 | $ | 1,014.88 | $ | 9.99 | ||||||
| Select Opportunities Fund | $ | 1,000.00 | $ | 1,014.88 | $ | 9.99 | ||||||
| * | Expenses are equal to the Funds’ annualized expense ratio of 2.00%, multiplied by the average account value over the period, multiplied by 181/365 (to reflect the period). |
6
ACADEMY FUNDS TRUST
Index Comparison (Unaudited)
The following chart compares the value of a hypothetical $10,000 investment in the Academy Core Equity Fund from its inception (December 31, 2007) to June 30, 2009 as compared with the S&P 500® Total Return Index.
Academy Core Equity Fund
Growth of a Hypothetical $10,000 Investment
at June 30, 2009 vs. S&P 500® Total Return Index

| Total Return | ||||||||||||
Periods Ended June 30, 2009 | ||||||||||||
| Six Month | One Year | Since Inception | ||||||||||
| Academy Core Equity Fund | 3.32% | -31.69% | -39.14% | |||||||||
S&P 500® Total Return Index | 3.16% | -26.21% | -35.00% | |||||||||
Performance data quoted represents past performance and does not guarantee future results. The investment return and principal value of an investment will fluctuate so that an investor’s shares, when redeemed, may be worth more or less than their original cost. Current performance of the Fund may be lower or higher than the performance quoted. Performance data current to the most recent month end may be obtained by calling 1-877-386-3890.
The line graph and performance table do not reflect the deduction of taxes that a shareholder may pay on fund distributions or the redemption of Fund shares. Total return calculations reflect the effect of the Advisor’s expense limitation agreement for the Fund. Returns shown for the Fund and the S&P 500® Total Return Index include the reinvestment of all dividends, if any.
The S&P 500® Total Return Index is an unmanaged, capitalization-weighted index generally representative of the U.S. market for large capitalization stocks.
The Fund’s portfolio holdings may differ significantly from the securities held in the relevant index and, unlike a mutual fund, the performance of an unmanaged index does not reflect deductions for transaction costs, taxes, management fees or other expenses. You cannot invest directly in an index.
7
ACADEMY FUNDS TRUST
Index Comparison (Unaudited)
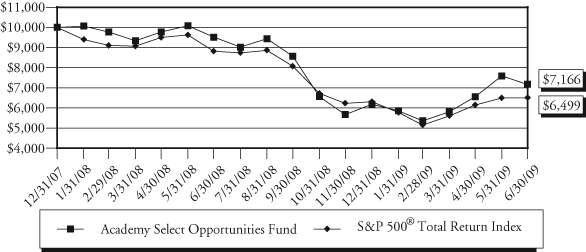
The following chart compares the value of a hypothetical $10,000 investment in the Academy Select Opportunities Fund from its inception (December 31, 2007) to June 30, 2009 as compared with the S&P 500® Total Return Index.
Academy Select Opportunities Fund
Growth of a Hypothetical $10,000 Investment
at June 30, 2009 vs. S&P 500® Total Return Index
| Total Return | ||||||||||||
Periods Ended June 30, 2009 | ||||||||||||
| Six Month | One Year | Since Inception | ||||||||||
| Academy Select Opportunities Fund | 16.03% | -24.65% | -28.34% | |||||||||
S&P 500® Total Return Index | 3.16% | -26.21% | -35.00% | |||||||||
Performance data quoted represents past performance and does not guarantee future results. The investment return and principal value of an investment will fluctuate so that an investor’s shares, when redeemed, may be worth more or less than their original cost. Current performance of the Fund may be lower or higher than the performance quoted. Performance data current to the most recent month end may be obtained by calling 1-877-386-3890.
The line graph and performance table do not reflect the deduction of taxes that a shareholder may pay on fund distributions or the redemption of Fund shares. Total return calculations reflect the effect of the Advisor’s expense limitation agreement for the Fund. Returns shown for the Fund and the S&P 500® Total Return Index include the reinvestment of all dividends, if any.
The S&P 500® Total Return Index is an unmanaged, capitalization-weighted index generally representative of the U.S. market for large capitalization stocks.
The Fund’s portfolio holdings may differ significantly from the securities held in the relevant index and, unlike a mutual fund, the performance of an unmanaged index does not reflect deductions for transaction costs, taxes, management fees or other expenses. You cannot invest directly in an index.
8
ACADEMY FUNDS TRUST
Academy Core Equity Fund
Schedule of Investments – June 30, 2009 (Unaudited)
| Shares | Value | |||||||
| COMMON STOCKS – 100.92% | ||||||||
Aerospace & Defense – 3.91% | ||||||||
| Boeing Co. | 1,400 | $ | 59,500 | |||||
| L-3 Communications Holdings, Inc. | 775 | 53,769 | ||||||
| 113,269 | ||||||||
| Biotechnology – 4.51% | ||||||||
| Genzyme Corp. (a) | 2,350 | 130,825 | ||||||
Commercial Banks – 2.28% | ||||||||
| Bank of America Corp. | 5,000 | 66,000 | ||||||
Computers & Peripherals – 2.06% | ||||||||
| EMC Corp. (a) | 4,550 | 59,605 | ||||||
Diversified Financial Services – 4.20% | ||||||||
| CIT Group, Inc. | 35,000 | 75,250 | ||||||
| CME Group, Inc. | 150 | 46,666 | ||||||
| 121,916 | ||||||||
| Diversified Telecommunication Services – 3.55% | ||||||||
| Verizon Communications, Inc. | 3,350 | 102,946 | ||||||
Electric Utilities – 0.79% | ||||||||
| Exelon Corp. | 450 | 23,045 | ||||||
Energy Equipment & Services – 2.12% | ||||||||
| Nabors Industries Ltd. (a) | 3,950 | 61,541 | ||||||
Food & Staples Retailing – 12.70% | ||||||||
| CVS Caremark Corp. | 11,550 | 368,099 | ||||||
Health Care Equipment & Supplies – 5.51% | ||||||||
| Covidien PLC | 1,100 | 41,184 | ||||||
| Medtronic, Inc. | 3,400 | 118,626 | ||||||
| 159,810 | ||||||||
| Health Care Providers & Services – 3.91% | ||||||||
| Aetna, Inc. | 2,200 | 55,110 | ||||||
| WellPoint, Inc. (a) | 1,146 | 58,320 | ||||||
| 113,430 | ||||||||
| Industrial Conglomerates – 5.46% | ||||||||
| General Electric Co. | 13,500 | 158,220 | ||||||
The accompanying notes are an integral part of these financial statements.
9
ACADEMY FUNDS TRUST
Academy Core Equity Fund
Schedule of Investments – June 30, 2009 (Unaudited)(Continued)
| Shares | Value | |||||||
| COMMON STOCKS (Continued) | ||||||||
Insurance – 5.77% | ||||||||
| Hartford Financial Services Group, Inc. | 8,400 | $ | 99,708 | |||||
| Travelers Companies, Inc. | 1,650 | 67,716 | ||||||
| 167,424 | ||||||||
| Internet Software & Services – 2.55% | ||||||||
| Yahoo!, Inc. (a) | 4,730 | 74,072 | ||||||
Media – 2.40% | ||||||||
| Comcast Corp. | 4,805 | 69,624 | ||||||
Metals & Mining – 3.59% | ||||||||
| Nucor Corp. | 2,345 | 104,188 | ||||||
Multiline Retail – 6.09% | ||||||||
| Target Corp. | 4,473 | 176,549 | ||||||
Multi-Utilities – 3.21% | ||||||||
| Duke Energy Corp. | 6,380 | 93,084 | ||||||
Oil, Gas & Consumable Fuels – 10.60% | ||||||||
| Marathon Oil Corp. | 6,838 | 206,029 | ||||||
| XTO Energy, Inc. | 2,654 | 101,224 | ||||||
| 307,253 | ||||||||
| Real Estate Investment Trust – 1.46% | ||||||||
| ProLogis | 5,250 | 42,315 | ||||||
Semiconductor & Semiconductor Equipment – 1.82% | ||||||||
| NVIDIA Corp. (a) | 4,684 | 52,882 | ||||||
Semiconductors & Semiconductor Equipment – 3.42% | ||||||||
| Texas Instruments, Inc. | 4,650 | 99,045 | ||||||
Software – 9.01% | ||||||||
| Adobe Systems, Inc. (a) | 2,500 | 70,750 | ||||||
| Oracle Corp. | 8,890 | 190,424 | ||||||
| 261,174 | ||||||||
| TOTAL COMMON STOCKS | ||||||||
| (Cost $3,650,892) | 2,926,316 | |||||||
The accompanying notes are an integral part of these financial statements.
10
ACADEMY FUNDS TRUST
Academy Core Equity Fund
Schedule of Investments – June 30, 2009 (Unaudited)(Continued)
| Principal | ||||||||
| Amount | Value | |||||||
| SHORT-TERM INVESTMENTS – 2.75% | ||||||||
| Fidelity Institutional Government Portfolio | $ | 79,760 | $ | 79,760 | ||||
| TOTAL SHORT-TERM INVESTMENTS | ||||||||
| (Cost $79,760) | 79,760 | |||||||
| Total Investments | ||||||||
| (Cost $3,730,652) – 103.67% | 3,006,076 | |||||||
| Liabilities in Excess of Other Assets – (3.67)% | (106,513 | ) | ||||||
| TOTAL NET ASSETS – 100.00% | $ | 2,899,563 | ||||||
Percentages are stated as a percent of net assets.
| (a) | Non Income Producing. |
The accompanying notes are an integral part of these financial statements.
11
ACADEMY FUNDS TRUST
Academy Select Opportunities Fund
Schedule of Investments – June 30, 2009 (Unaudited)
| Shares | Value | |||||||
| COMMON STOCKS – 77.63% | ||||||||
Commercial Services & Supplies – 3.73% | ||||||||
| RSC Holdings, Inc. (a) | 15,000 | $ | 100,800 | |||||
Diversified Financial Services – 7.95% | ||||||||
| CIT Group, Inc. | 100,000 | 215,000 | ||||||
Energy Equipment & Services – 6.40% | ||||||||
| Exterran Holdings, Inc. (a) | 5,000 | 80,200 | ||||||
| Helmerich & Payne, Inc. | 3,000 | 92,610 | ||||||
| 172,810 | ||||||||
| Health Care Equipment & Supplies – 5.27% | ||||||||
| Hologic, Inc. (a) | 10,000 | 142,300 | ||||||
Leisure Equipment & Products – 4.15% | ||||||||
| Marvel Entertainment, Inc. (a) | 3,150 | 112,108 | ||||||
Marine – 2.28% | ||||||||
| Seaspan Corp. | 10,000 | 61,500 | ||||||
Media – 8.29% | ||||||||
| Lions Gate Entertainment Corp. (a) | 40,000 | 224,000 | ||||||
Oil & Gas – 4.22% | ||||||||
| Ultra Petroleum Corp. (a) | 1,000 | 39,000 | ||||||
| Valero Energy Corp. | 4,438 | 74,958 | ||||||
| 113,958 | ||||||||
| Oil, Gas & Consumable Fuels – 5.01% | ||||||||
| Spectra Energy Corp. | 8,000 | 135,360 | ||||||
Pharmaceuticals – 1.71% | ||||||||
| Xenoport, Inc. (a) | 2,000 | 46,340 | ||||||
Real Estate Management & Development – 3.78% | ||||||||
| Tejon Ranch Co. (a) | 3,859 | 102,225 | ||||||
Semiconductor & Semiconductor Equipment – 6.20% | ||||||||
| ANADIGICS, Inc. (a) | 40,000 | 167,600 | ||||||
Software – 9.87% | ||||||||
| ArcSight, Inc. (a) | 15,000 | 266,550 | ||||||
Specialty Retail – 6.81% | ||||||||
| Borders Group, Inc. (a) | 50,000 | 184,000 | ||||||
The accompanying notes are an integral part of these financial statements.
12
ACADEMY FUNDS TRUST
Academy Select Opportunities Fund
Schedule of Investments – June 30, 2009 (Unaudited)(Continued)
| Shares | Value | |||||||
| COMMON STOCKS (Continued) | ||||||||
Textiles, Apparel & Luxury Goods – 1.96% | ||||||||
| Crocs, Inc. (a) | 15,600 | $ | 53,040 | |||||
| TOTAL COMMON STOCKS | ||||||||
| (Cost $2,863,562) | 2,097,591 | |||||||
| CONVERTIBLE PREFERRED STOCKS – 3.23% | ||||||||
Diversified Financial Services – 3.23% | ||||||||
| CIT Group, Inc., 8.750% | 5,000 | 87,300 | ||||||
| TOTAL CONVERTIBLE PREFERRED STOCKS | ||||||||
| (Cost $176,150) | 87,300 | |||||||
| Principal | ||||||||
| Amount | Value | |||||||
| CONVERTIBLE BONDS – 3.40% | ||||||||
Real Estate Investment Trusts (REITs) – 3.40% | ||||||||
| Prologis, 1.875%, 11/15/2037 | $ | 50,000 | 37,063 | |||||
| Prologis, 2.625%, 05/15/2038 | 75,000 | 54,656 | ||||||
| 91,719 | ||||||||
| TOTAL CONVERTIBLE BONDS | ||||||||
| (Cost $50,495) | 91,719 | |||||||
| Shares | Value | |||||||
| SHORT-TERM INVESTMENTS – 16.54% | ||||||||
| Fidelity Institutional Government Portfolio | 446,982 | 446,982 | ||||||
| TOTAL SHORT-TERM INVESTMENTS | ||||||||
| (Cost $446,982) | 446,982 | |||||||
| Total Investments | ||||||||
| (Cost $3,537,189) – 100.80% | 2,723,592 | |||||||
| Liabilities in Excess of Other Assets – (0.80)% | (21,622 | ) | ||||||
| TOTAL NET ASSETS – 100.00% | $ | 2,701,970 | ||||||
Percentages are stated as a percent of net assets.
| (a) | Non Income Producing. |
The accompanying notes are an integral part of these financial statements.
13
ACADEMY FUNDS TRUST
Statements of Assets and Liabilities
June 30, 2009 (Unaudited)
| Academy | Academy Select | |||||||
| Core Equity | Opportunities | |||||||
| Fund | Fund | |||||||
| Assets: | ||||||||
| Investments, at value* | $ | 3,006,076 | $ | 2,723,592 | ||||
| Receivable for fund shares sold | 300 | 300 | ||||||
| Dividends, interest and other receivables | 2,926 | 477 | ||||||
| Receivable from Advisor | 2,227 | 2,036 | ||||||
| Prepaid assets | 3,595 | 3,247 | ||||||
| Total Assets | 3,015,124 | 2,729,652 | ||||||
| Liabilities: | ||||||||
| Payable for investments purchased | 77,070 | — | ||||||
| Accrued 12b-1 fees | 1,189 | 1,087 | ||||||
| Accrued expenses and other liabilities | 37,302 | 26,595 | ||||||
| Total Liabilities | 115,561 | 27,682 | ||||||
| Net Assets | $ | 2,899,563 | $ | 2,701,970 | ||||
| Net Assets Consist of: | ||||||||
| Capital stock | $ | 4,463,957 | $ | 3,577,363 | ||||
| Accumulated net investment income | 1,676 | 3,593 | ||||||
| Accumulated net realized loss | (841,494 | ) | (65,389 | ) | ||||
| Net unrealized depreciation on investments | (724,576 | ) | (813,597 | ) | ||||
| Net Assets | $ | 2,899,563 | $ | 2,701,970 | ||||
| Shares of beneficial interest outstanding | ||||||||
| (unlimited shares without par value authorized) | 239,002 | 198,572 | ||||||
| Net asset value price per share | $ | 12.13 | $ | 13.61 | ||||
| * Cost of Investments | $ | 3,730,652 | $ | 3,537,189 | ||||
The accompanying notes are an integral part of these financial statements.
14
ACADEMY FUNDS TRUST
Statements of Operations
For the Six Months Ended June 30, 2009 (Unaudited)
| Academy | Academy Select | |||||||
| Core Equity | Opportunities | |||||||
| Fund | Fund | |||||||
| Investment Income: | ||||||||
| Dividends | $ | 26,640 | $ | 22,828 | ||||
| Interest | 40 | 2,581 | ||||||
| 26,680 | 25,409 | |||||||
| Expenses: | ||||||||
| Investment advisory fee | 10,627 | 10,908 | ||||||
| 12b-1 fees | 3,125 | 2,727 | ||||||
| Administration fee | 20,966 | 11,386 | ||||||
| Professional fees | 10,885 | 10,547 | ||||||
| Transfer agent fees and expenses | 12,338 | 9,927 | ||||||
| Fund accounting fees | 18,065 | 13,997 | ||||||
| Registration fees | 1,707 | 1,707 | ||||||
| Trustee fees and expenses | 4,699 | 4,015 | ||||||
| Insurance expense | 583 | 309 | ||||||
| Custody fees | 3,286 | 1,908 | ||||||
| Printing and mailing expense | 1,810 | 1,360 | ||||||
| Other expenses | 1,458 | 1,096 | ||||||
| Total expenses before expense limitation | 89,549 | 69,887 | ||||||
| Less: Fees waived/Expenses Paid by Advisor | (64,545 | ) | (48,071 | ) | ||||
| Net expenses | 25,004 | 21,816 | ||||||
| Net Investment Income | 1,676 | 3,593 | ||||||
| Realized and Unrealized Gain/(Loss): | ||||||||
| Net realized loss on investments | (103,322 | ) | (23,095 | ) | ||||
| Net change in unrealized depreciation on investments | 207,646 | 379,552 | ||||||
| Net realized and unrealized gain on investments | 104,324 | 356,457 | ||||||
| Net Increase in Net Assets | ||||||||
| Resulting from Operations | $ | 106,000 | $ | 360,050 | ||||
The accompanying notes are an integral part of these financial statements.
15
ACADEMY FUNDS TRUST
Statements of Changes in Net Assets
| Academy Core | Academy Select | |||||||||||||||
| Equity Fund | Opportunities Fund | |||||||||||||||
| Six Months | Year | Six Months | Year | |||||||||||||
| Ended | Ended | Ended | Ended | |||||||||||||
| June 30, | December 31, | June 30, | December 31, | |||||||||||||
| 2009 | 2008 | 2009 | 2008 | |||||||||||||
| (Unaudited) | (Unaudited) | |||||||||||||||
| Operations: | ||||||||||||||||
| Net investment income | $ | 1,676 | $ | 8,843 | $ | 3,593 | $ | 1,644 | ||||||||
| Net realized gain/(loss) on investments | (103,322 | ) | (738,172 | ) | (23,095 | ) | 39,284 | |||||||||
| Net realized gain on options written | — | — | — | 3,700 | ||||||||||||
| Net change in unrealized | ||||||||||||||||
| depreciation on investments | 207,646 | (932,222 | ) | 379,552 | (1,193,149 | ) | ||||||||||
| Net increase/(decrease) in net assets | ||||||||||||||||
| resulting from operations | 106,000 | (1,661,551 | ) | 360,050 | (1,148,521 | ) | ||||||||||
| Dividends and distributions | ||||||||||||||||
| to shareholders: | ||||||||||||||||
| Net investment income | — | (8,875 | ) | — | (1,643 | ) | ||||||||||
| Tax return of capital | — | — | — | (3,278 | ) | |||||||||||
| Net realized gains | — | — | — | (85,279 | ) | |||||||||||
| Total dividends and distributions | — | (8,875 | ) | — | (90,200 | ) | ||||||||||
| Fund Share Transactions: | ||||||||||||||||
| Proceeds from shares sold | 322,220 | 4,867,864 | 363,212 | 3,738,683 | ||||||||||||
| Shares issued to holders in | ||||||||||||||||
| reinvestment of dividends | — | 8,875 | — | 90,200 | ||||||||||||
| Cost of shares redeemed* | (4,800 | ) | (730,170 | ) | (6,790 | ) | (604,664 | ) | ||||||||
| Net increase in net assets from | ||||||||||||||||
| capital share transactions | 317,420 | 4,146,569 | 356,422 | 3,224,219 | ||||||||||||
| Total increase in net assets | 423,420 | 2,476,143 | 716,472 | 1,985,498 | ||||||||||||
| Net Assets: | ||||||||||||||||
| Beginning of period | 2,476,143 | — | 1,985,498 | — | ||||||||||||
| End of period** | $ | 2,899,563 | $ | 2,476,143 | $ | 2,701,970 | $ | 1,985,498 | ||||||||
| *Net of redemption fees of | $ | — | $ | — | $ | 82 | $ | — | ||||||||
| **Including undistributed net | ||||||||||||||||
| investment income of | $ | 1,676 | $ | — | $ | 3,593 | $ | — | ||||||||
| Change in Shares Outstanding: | ||||||||||||||||
| Shares sold | 28,330 | 269,730 | 29,790 | 202,296 | ||||||||||||
| Shares issued to holders in | ||||||||||||||||
| reinvestment of dividends | — | 770 | — | 8,018 | ||||||||||||
| Shares redeemed | (378 | ) | (59,450 | ) | (526 | ) | (41,006 | ) | ||||||||
| Net increase | 27,952 | 211,050 | 29,264 | 169,308 | ||||||||||||
The accompanying notes are an integral part of these financial statements.
16
ACADEMY FUNDS TRUST
Academy Core Equity Fund
Financial Highlights
| Six Months Ended | Year Ended | |||||||
| June 30, | December 31, | |||||||
| 2009 | 2008 | |||||||
| (Unaudited) | ||||||||
| Per share operating performance | ||||||||
| (For a share outstanding throughout the period) | ||||||||
| Net asset value, beginning of period | $ | 11.73 | $ | 20.00 | ||||
| Operations: | ||||||||
| Net investment income | 0.01 | 0.04 | ||||||
| Net realized and unrealized gain/(loss) | 0.39 | (8.27 | ) | |||||
| Total from investment operations | 0.40 | (8.23 | ) | |||||
| Dividends and distributions to shareholders: | ||||||||
| Dividends from net investment income | — | (0.04 | ) | |||||
| Total dividends and distributions | — | (0.04 | ) | |||||
| Change in net asset value for the period | 0.40 | (8.27 | ) | |||||
| Net asset value, end of period | $ | 12.13 | $ | 11.73 | ||||
| Total return | 3.32 | % | (41.14 | )% | ||||
| Ratios/Supplemental Data | ||||||||
| Net assets, end of period (000) | $ | 2,900 | $ | 2,476 | ||||
| Ratio of net expenses to average net assets: | ||||||||
| Before expense limitation arrangement | 7.16 | % | 9.09 | % | ||||
| After expense limitation arrangement | 2.00 | % | 2.00 | % | ||||
| Ratio of net investment income to average net assets: | ||||||||
| Before expense limitation arrangement | (5.03 | )% | (6.72 | )% | ||||
| After expense limitation arrangement | 0.13 | % | 0.37 | % | ||||
| Portfolio turnover rate | 5.28 | % | 98.44 | % | ||||
The accompanying notes are an integral part of these financial statements.
17
ACADEMY FUNDS TRUST
Academy Select Opportunities Fund
Financial Highlights
| Six Months Ended | Year Ended | |||||||
| June 30, | December 31, | |||||||
| 2009 | 2008 | |||||||
| (Unaudited) | ||||||||
| Per share operating performance | ||||||||
| (For a share outstanding throughout the period) | ||||||||
| Net asset value, beginning of period | $ | 11.73 | $ | 20.00 | ||||
| Operations: | ||||||||
| Net investment income | 0.02 | 0.01 | ||||||
| Net realized and unrealized gain/(loss) | 1.86 | (7.69 | ) | |||||
| Total from investment operations | 1.88 | (7.68 | ) | |||||
| Dividends and distributions to shareholders: | ||||||||
| Dividends from net investment income | — | (0.01 | ) | |||||
| Dividends from tax return of capital | — | (0.02 | ) | |||||
| Distributions from net realized gains | — | (0.56 | ) | |||||
| Total dividends and distributions | — | (0.59 | ) | |||||
| Change in net asset value for the period | 1.88 | (8.27 | ) | |||||
| Net asset value, end of period | $ | 13.61 | $ | 11.73 | ||||
| Total return | 16.03 | % | (38.24 | )% | ||||
| Ratios/Supplemental Data | ||||||||
| Net assets, end of period (000) | $ | 2,702 | $ | 1,985 | ||||
| Ratio of net expenses to average net assets: | ||||||||
| Before expense limitation arrangement | 6.41 | % | 10.91 | % | ||||
| After expense limitation arrangement | 2.00 | % | 2.00 | % | ||||
| Ratio of net investment income to average net assets: | ||||||||
| Before expense limitation arrangement | (4.08 | )% | (8.82 | )% | ||||
| After expense limitation arrangement | 0.33 | % | 0.09 | % | ||||
| Portfolio turnover rate | 8.82 | % | 37.75 | % | ||||
The accompanying notes are an integral part of these financial statements.
18
ACADEMY FUNDS TRUST
Notes to Financial Statements (Unaudited)
1.ORGANIZATION
Academy Funds Trust (the “Trust”) was organized under Delaware law as a Delaware statutory trust on October 17, 2007 and is registered under the Investment Company Act of 1940, as amended (the “1940 Act”) and classified as an open-end management investment company. The Trust consists of two separate mutual funds: the Academy Core Equity Fund and the Academy Select Opportunities Fund (each a “Fund,” and collectively, the “Funds”), each of which commenced operations on December 31, 2007.
2.SIGNIFICANT ACCOUNTING POLICIES
The following is a summary of significant accounting policies consistently followed by the Trust in the preparation of its financial statements. These policies are in conformity with accounting principles generally accepted in the United States of America (“GAAP”).
Security Valuation:
Portfolio securities primarily listed or traded on a national or foreign securities exchange, except for bonds, are generally valued at the closing price on that exchange, unless such closing prices are determined to be not readily available pursuant to the Funds’ pricing procedures. Exchange traded options are valued at the last reported sale price or, if no sales are reported, at the mean between bid and asked prices. Non-exchange traded options are valued at fair value using a mathematical model. Securities not traded on a particular day, over-the-counter securities, and government and agency securities are valued at the mean value between bid and asked prices. Money market instruments having a maturity of less than 60 days are valued at amortized cost, which approximates market value. Debt securities (other than short-term obligations) are valued on the basis of valuations provided by a pricing service when such prices are believed to reflect the fair value of such securities. Foreign securities and the prices of foreign securities denominated in foreign currencies are translated to U.S. dollars at the mean between the bid and offer quotations of such currencies based on rates in effect as of the close of the London Stock Exchange. Securities for which market quotations are not readily available are valued at fair value as determined in good faith by a method approved by the Board. The Trust will also use the fair value of a foreign security at the time of calculating its NAV when events following the close of foreign markets on which the foreign security trades indicate that such closing price does not reflect the foreign securities fair value.
19
ACADEMY FUNDS TRUST
Notes to Financial Statements (Unaudited)(Continued)
Options:
Each Fund may purchase and write put and call options on securities, currencies or indices and enter into related closing transactions. When a Fund writes an option, an amount equal to the premium received by the Fund is recorded as a liability and is subsequently adjusted to the current fair value of the option written. Premiums received from writing options that expire unexercised are treated by the Fund on the expiration date as realized gains from investments. The difference between the premium and the amount paid on effecting a closing purchase transaction, including brokerage commissions, is also treated as a realized gain, or, if the premium is less than the amount paid for the closing purchase transaction, as a realized loss. If a call option is exercised, the premium is added to the proceeds from the sale of the underlying security or currency in determining whether the Fund has realized a gain or loss. If a put option is exercised, the premium reduces the cost basis of the securities purchased by the Fund. The Fund, as writer of an option, bears the market risk of an unfavorable change in the price of the security underlying the written option.
Use of Estimates:
In preparing financial statements in conformity with GAAP, management is required to make estimates and assumptions that affect the reported amounts of assets and liabilities and disclosure of contingent assets and liabilities as of the date of the financial statements and the reported amounts of increases and decreases in net assets from operations during the reporting period. Actual results could differ from these estimates.
Expenses:
Expenses directly attributable to a Fund are charged to the Fund, while expenses attributable to more than one Fund within the Trust are allocated among the respective Funds based on relative net assets or another appropriate basis.
Federal Income Taxes:
The Funds intend to meet the requirements of the Internal Revenue Code (the “Code”) applicable to regulated investment companies and to distribute substantially all net investment taxable income and net capital gains to shareholders in a manner which results in no tax cost to the Funds. Therefore, no federal income or excise tax provision is recorded.
20
ACADEMY FUNDS TRUST
Notes to Financial Statements (Unaudited)(Continued)
Distributions to Shareholders:
Dividends from net investment income are declared and paid at least annually. Distributions of net realized capital gains, if any, will be declared and paid at least annually. Distributions to shareholders are recorded on the ex-dividend date. The Funds may periodically make reclassifications among certain of its capital accounts as a result of the recognition and characterization of certain income and capital gain distributions determined annually in accordance with federal tax regulations which may differ from GAAP.
Guarantees and Indemnifications:
In the normal course of business, the Trust may enter into a contract with service providers that contain general indemnification clauses. The Trust’s maximum exposure under these arrangements is unknown as this would involve future claims against the Trust that have not yet occurred. Based on experience, the Trust expects the risk of loss to be remote.
Other:
Investment transactions are recorded on the trade date. The Trust determines the gain or loss realized from investment transactions on the basis of identified cost. Dividend income is recognized on the ex-dividend date and interest income is recognized on an accrual basis.
Effective January 1, 2008, the Trust became subject to Financial Accounting Standards Board (“FASB”) Interpretation No. 48 Accounting For Uncertainty in Income Taxes (“FIN 48”), a clarification of FASB Statement No. 109 Accounting for Income Taxes. FIN 48 establishes financial reporting rules regarding recognition and measurement of tax positions taken or expected to be taken on a tax return. Management of the Trust reviewed the tax positions in the open tax year ended 2008 and determined FIN 48 had no impact on the Trust’s net assets or results of operations as of December 31, 2008.
Statement of Financial Accounting Standards No. 157 Fair Value Measurements (“SFAS 157”) establishes an authoritative definition of fair value and sets out a hierarchy for measuring fair value. SFAS 157 requires additional disclosures about the various inputs used to develop the measurements of fair value. These inputs are summarized in the three broad levels listed below:
| • | Level 1 – Quoted prices in active markets for identical securities. |
| • | Level 2 – Other significant observable inputs (including quoted prices for similar securities, interest rates, prepayment speeds, credit risk, etc.). |
21
ACADEMY FUNDS TRUST
Notes to Financial Statements (Unaudited)(Continued)
| • | Level 3 – Significant unobservable inputs (including each Fund's own assumptions in determining the fair value of investments). |
The inputs or methodology used for valuing securities are not necessarily an indication of the risk associated with investing in those securities. The following is a summary of the inputs used to value the Funds’ net assets as of June 30, 2009:
| Core Equity Fund | ||||||||||||||||
| Level 1 | Level 2 | Level 3 | Total | |||||||||||||
| Equity | ||||||||||||||||
| Information Technology | $ | 546,778 | $ | — | $ | — | $ | 546,778 | ||||||||
| Health Care | 404,064 | — | — | 404,064 | ||||||||||||
| Financials | 397,656 | — | — | 397,656 | ||||||||||||
| Energy | 368,794 | — | — | 368,794 | ||||||||||||
| Consumer Staples | 368,099 | — | — | 368,099 | ||||||||||||
| Industrials | 271,489 | — | — | 271,489 | ||||||||||||
| Consumer Discretionary | 246,174 | — | — | 246,174 | ||||||||||||
| Utilities | 116,129 | — | — | 116,129 | ||||||||||||
| Materials | 104,188 | — | — | 104,188 | ||||||||||||
| Telecommunication Services | 102,945 | — | — | 102,945 | ||||||||||||
| Total Equity | $ | 2,926,316 | $ | — | $ | — | $ | 2,926,316 | ||||||||
| Short-Term Investments | $ | 79,760 | $ | — | $ | — | $ | 79,760 | ||||||||
| Total Investments in Securities | $ | 3,006,076 | $ | — | $ | — | $ | 3,006,076 | ||||||||
| Select Opportunities Fund | ||||||||||||||||
| Level 1 | Level 2 | Level 3 | Total | |||||||||||||
| Equity | ||||||||||||||||
| Consumer Discretionary | $ | 573,148 | $ | — | $ | — | $ | 573,148 | ||||||||
| Information Technology | 434,150 | — | — | 434,150 | ||||||||||||
| Energy | 422,128 | — | — | 422,128 | ||||||||||||
| Financials | 404,525 | — | — | 404,525 | ||||||||||||
| Health Care | 188,640 | — | — | 188,640 | ||||||||||||
| Industrials | 162,300 | — | — | 162,300 | ||||||||||||
| Total Equity | $ | 2,184,891 | $ | — | $ | — | $ | 2,184,891 | ||||||||
| Fixed Income | ||||||||||||||||
| Corporate Bonds | — | 91,719 | — | 91,719 | ||||||||||||
| Total Fixed Income | $ | — | $ | 91,719 | $ | — | $ | 91,719 | ||||||||
| Short-Term Investments | $ | 446,982 | $ | — | $ | — | $ | 446,982 | ||||||||
| Total Investments in Securities | $ | 2,631,873 | $ | 91,719 | $ | — | $ | 2,723,592 | ||||||||
22
ACADEMY FUNDS TRUST
Notes to Financial Statements (Unaudited)(Continued)
In March 2008, Statement of Financial Accounting Standards No. 161, Disclosures about Derivative Instruments and Hedging Activities (“SFAS 161”) was issued and is effective for fiscal years beginning after November 15, 2008. SFAS 161 is intended to improve financial reporting for derivative instruments by requiring enhanced disclosure that enables investors to understand how and why an entity uses derivatives, how derivatives are accounted for, and how derivative instruments affect an entity’s results of operations and financial position. Management has evaluated SFAS 161 and has determined that there is no impact on the Funds’ financial statements, as the Funds currently do not hold derivative financial instruments.
In preparing these financial statements, the Funds have evaluated events and transactions for potential recognition or disclosure through August 26, 2009, the date the financial statements were issued.
3.DISTRIBUTION PLAN
The Trust has adopted a Distribution and Service (12b-1) Plan (the “Plan”) pursuant to Rule 12b-1 under the 1940 Act. The Plan is designed to compensate the Funds’ distributor, advisor, or others for certain promotional and other sales related costs and for providing related services. For the six months ended June 30, 2009, the Academy Core Equity Fund and the Academy Select Opportunities Fund paid $3,125 and $2,727, respectively, pursuant to the Plan.
4.INVESTMENT ADVISOR AND OTHER AFFILIATES
The Trust has entered into an Investment Advisory Agreement (the “Advisory Agreement”) with Academy Asset Management LLC (the “Advisor”). The Advisory Agreement provides for advisory fees computed daily and paid monthly at an annual rate of 0.85% and 1.00% of the Academy Core Equity Fund’s and Academy Select Opportunities Fund’s average daily net assets, respectively.
Under the terms of an Expense Limitations Agreement, the Advisor has contractually agreed, through April 30, 2010, to waive its advisory fees and/or assume as its own expense certain expenses otherwise payable by each Fund to the extent necessary to ensure that net annual fund operating expenses (excluding any taxes, interest, brokerage fees, certain insurance costs and extraordinary expenses) do not exceed 2.00% of average daily net assets. Pursuant to its expense limitation agreement for each Fund, the Advisor is entitled to recoup any fees that it waived and/or Fund expenses that it paid for a period of three years following such fee waivers and expense payments, to the extent that such recoupment by the Advisor will not cause the Fund to exceed any applicable expense limitation that was in place for the Fund when the fees were waived
23
ACADEMY FUNDS TRUST
Notes to Financial Statements (Unaudited)(Continued)
or expenses were paid. For the six months ended June 30, 2009, the Advisor waived fees and assumed Fund expenses for the Academy Core Equity Fund and the Academy Select Opportunities Fund in the following amounts: $64,545 and $48,071, respectively.
The following table shows the amount of fees waived or expenses assumed by the Advisor subject to potential recovery expiring in:
| Academy Core Equity Fund | Academy Select Opportunities Fund | |
| 2011 . . . . . . . $168,117 | 2011 . . . . . . . $164,949 | |
| 2012 . . . . . . . $ 64,545 | 2012 . . . . . . . $ 48,071 |
5.INVESTMENT TRANSACTIONS
For the six months ended June 30, 2009, purchases and sales of investment securities, other than short-term investments and short-term U.S. Government obligations were as follows:
| Academy Core | Academy Select | |||||||
| Equity Fund | Opportunities Fund | |||||||
| Purchases: | ||||||||
| U.S. Government | $ | — | $ | — | ||||
| Other | 506,597 | 488,453 | ||||||
| Sales: | ||||||||
| U.S. Government | $ | — | $ | — | ||||
| Other | 133,031 | 168,183 | ||||||
6. FEDERAL INCOME TAX INFORMATION
At December 31, 2008, gross unrealized appreciation and depreciation of investments, based on cost for federal income tax purposes were as follows:
| Academy Core | Academy Select | |||||||
| Equity Fund | Opportunities Fund | |||||||
| Cost of Investments | $ | 3,702,119 | $ | 3,123,014 | ||||
| Gross Unrealized Appreciation | $ | 140,147 | $ | 107,952 | ||||
| Gross Unrealized Depreciation | (1,392,939 | ) | (1,301,101 | ) | ||||
| Net Unrealized Appreciation/ | ||||||||
| (Depreciation) on investments | $ | (1,252,792 | ) | $ | (1,193,149 | ) | ||
24
ACADEMY FUNDS TRUST
Notes to Financial Statements (Unaudited)(Continued)
As of December 31, 2008, the components of accumulated/(deficit) earnings on a tax basis were as follows:
| Academy Core | Academy Select | |||||||
| Equity Fund | Opportunities Fund | |||||||
| Accumulated Capital | ||||||||
| and Other Losses | $ | (417,602 | ) | $ | (42,294 | ) | ||
| Unrealized Appreciation/ | ||||||||
| (Depreciation) on Investments | (1,252,792 | ) | (1,193,149 | ) | ||||
| Total Accumulated/(Deficit) | $ | (1,670,394 | ) | $ | (1,235,443 | ) | ||
The tax basis of investments for tax and financial reporting purposes differs principally due to the deferral of losses on wash sales.
As of December 31, 2008, the Academy Core Equity Fund and the Academy Select Opportunities Fund deferred, on a tax basis, post-October losses of $135,087 and $42,294, respectively.
As of December 31, 2008, the Academy Core Equity Fund had an accumulated capital loss carryforward for federal income tax purposes of $282,515 expiring on December 31, 2016. To the extent that the Academy Core Equity Fund may realize future net capital gains, those gains will be offset by their unused capital loss carryforward.
25
ACADEMY FUNDS TRUST
Notes to Financial Statements (Unaudited)(Continued)
7.DISTRIBUTION TO SHAREHOLDERS
The tax character of distributions paid during the fiscal year ended December 31, 2008 were as follows:
| Academy Core | Academy Select | |||||||
| Equity Fund | Opportunities Fund | |||||||
| Year Ended | Year Ended | |||||||
| December 31, 2008 | December 31, 2008 | |||||||
| Distributions paid from: | ||||||||
| Ordinary Income | $ | 8,875 | $ | 86,922 | ||||
| Tax Return of Capital | — | 3,278 | ||||||
| Total Distribution Paid | $ | 8,875 | $ | 90,200 | ||||
The character of distributions made during the year from net investment income or net realized gains may differ from their ultimate characterization for federal income tax purposes. These differences reflect the dissimilar character of certain income items and net realized gains and losses for financial statement and tax purposes. Any permanent differences will result in reclassification among certain capital accounts in the financial statements. For the year ended December 31, 2008 the Academy Core Equity Fund increased undistributed net investment income by $32 and decreased paid-in-capital by $32. The Academy Select Opportunities Fund decreased undistributed net investment loss by $3,277, decreased accumulated net realized losses by $1, and decreased paid-in-capital by $3,278.
26
INVESTMENT ADVISOR
Academy Asset Management LLC
123 South Broad Street, Suite 1630
Philadelphia, PA 19109
ADMINISTRATOR, FUND ACCOUNTANT & TRANSFER AGENT
U.S. Bancorp Fund Services, LLC
615 East Michigan Street
Milwaukee, WI 53202
DISTRIBUTOR
Quasar Distributors, LLC
615 East Michigan Street
Milwaukee, WI 53202
CUSTODIAN
U.S. Bank, N.A.
1555 North RiverCenter Drive, Suite 302
Milwaukee, WI 53212
LEGAL COUNSEL
Stradley Ronon Stevens & Young, LLP
2600 One Commerce Square
Philadelphia, PA 19103
INDEPENDENT REGISTERED PUBLIC ACCOUNTING FIRM
Tait, Weller & Baker LLP
1818 Market Street, Suite 2400
Philadelphia, PA 19103
This report has been prepared for shareholders and may be distributed to others only if preceded or accompanied by a current prospectus.
The Funds’ Proxy Voting Policies and Procedures are available without charge, upon request, by calling 1-877-386-3890 and on the SEC’s website at www.sec.gov. Information regarding how the Funds voted proxies relating to portfolio securities during the period ended June 30, 2008 is available without charge, upon request, by calling 1-877-386-3890 and on the SEC’s website at www.sec.gov.
The Funds’ complete schedule of portfolio holdings for the first and third quarters is filed with the SEC on Form N-Q. The Funds’ Form N-Q is available without charge, upon request, by calling 1-877-386-3890, on the SEC’s website at www.sec.gov, or at the SEC’s Public Reference Room in Washington, DC. Information on the operation of the Public Reference Room may be obtained by calling 1-800-SEC-0330.
Item 2. Code of Ethics.
Not applicable for semi-annual reports.
Item 3. Audit Committee Financial Expert.
Not applicable for semi-annual reports.
Item 4. Principal Accountant Fees and Services.
Not applicable for semi-annual reports.
Item 5. Audit Committee of Listed Registrants.
Not applicable to registrants who are not listed issuers (as defined in Rule 10A-3 under the Securities Exchange Act of 1934).
Item 6. Investments.
| (a) | Schedule of Investments is included as part of the report to shareholders filed under Item 1 of this Form. |
| (b) | Not Applicable. |
Item 7. Disclosure of Proxy Voting Policies and Procedures for Closed-End Management Investment Companies.
Not applicable to open-end investment companies.
Item 8. Portfolio Managers of Closed-End Management Investment Companies.
Not applicable to open-end investment companies.
Item 9. Purchases of Equity Securities by Closed-End Management Investment Company and Affiliated Purchasers.
Not applicable to open-end investment companies.
Item 10. Submission of Matters to a Vote of Security Holders.
There have been no material changes to the procedures by which shareholders may recommend nominees to the registrant’s board of trustees.
Item 11. Controls and Procedures.
| (a) | The Registrant’s President and Treasurer have reviewed the Registrant's disclosure controls and procedures (as defined in Rule 30a-3(c) under the Investment Company Act of 1940 (the “Act”)) as of a date within 90 days of the filing of this report, as required by Rule 30a-3(b) under the Act and Rules 13a-15(b) or 15d-15(b) under the Securities Exchange Act of 1934. Based on their review, such officers have concluded that the disclosure controls and procedures are effective in ensuring that information required to be disclosed in this report is appropriately recorded, processed, summarized, including ensuring that information required to be disclosed in this Form N-CSR is accumulated and communicated to the Registrant's officer that is making certifications in this Form N-CSR, as appropriate, to allow timely decisions regarding required disclosure. |
| (b) | There were no changes in the Registrant's internal control over financial reporting (as defined in Rule 30a-3(d) under the Act) that occurred during the second fiscal quarter of the period covered by this report that has materially affected, or is reasonably likely to materially affect, the Registrant's internal control over financial reporting. |
Item 12. Exhibits.
| (a) | (1) Any code of ethics or amendment thereto, that is the subject of the disclosure required by Item 2, to the extent that the registrant intends to satisfy Item 2 requirements through filing an exhibit. Not applicable. |
(2) A separate certification for each principal executive and principal financial officer pursuant to Section 302 of the Sarbanes-Oxley Act of 2002. Filed herewith.
(3) Any written solicitation to purchase securities under Rule 23c-1 under the Act sent or given during the period covered by the report by or on behalf of the registrant to 10 or more persons. Not applicable to open-end investment companies.
| (b) | Certifications pursuant to Section 906 of the Sarbanes-Oxley Act of 2002. Furnished herewith. |
SIGNATURES
Pursuant to the requirements of the Securities Exchange Act of 1934 and the Investment Company Act of 1940, the registrant has duly caused this report to be signed on its behalf by the undersigned, thereunto duly authorized.
(Registrant) Academy Funds Trust
By (Signature and Title)* /s/ David Jacovini
David Jacovini, President
Date 9/2/2009
Pursuant to the requirements of the Securities Exchange Act of 1934 and the Investment Company Act of 1940, this report has been signed below by the following persons on behalf of the registrant and in the capacities and on the dates indicated.
By (Signature and Title)* /s/ David Jacovini
David Jacovini, President & Treasurer
Date 9/2/2009
* Print the name and title of each signing officer under his or her signature.