UNITED STATES
SECURITIES AND EXCHANGE COMMISSION
Washington, D.C. 20549
FORM N-CSR
CERTIFIED SHAREHOLDER REPORT OF REGISTERED
MANAGEMENT INVESTMENT COMPANIES
Investment Company Act file number 811-22135
Academy Funds Trust
(Exact name of registrant as specified in charter)
123 South Broad Street
Philadelphia, PA 19109
(Address of principal executive offices) (Zip code)
Jonathan Kopcsik
Stradley Ronon Stevens & Young, LLP
2600 One Commerce Square
Philadelphia, PA 19103
(Name and address of agent for service)
215-979-3754
Registrant's telephone number, including area code
Date of fiscal year end: December 31, 2012
Date of reporting period: June 30, 2012
Item 1. Reports to Stockholders.
| SEMI-ANNUAL REPORT |
INNOVATOR
MATRIX INCOME® FUND
(IMIFX)
| June 30, 2012 |
| ACADEMY FUNDS TRUST |
Dear shareholders,
It is a great pleasure to offer this initial semiannual discussion of the Innovator Matrix Income® Fund portfolio to our current and prospective shareholders.
The Innovator Matrix Income® Fund is designed to bring a fresh approach to the targeting of high-income returns. Rather than focusing on dividend paying stocks or traditional bonds, it focuses on a broad range of exchange-traded pass-through securities. These are publicly traded entities which are generally exempt from U.S. corporate income tax on the condition that they distribute substantially all of their profits to shareholders. There are many types of pass-through securities, including real estate investment trusts (REITs), closed-end funds, royalty trusts, master limited partnerships, and business development companies. Although there are funds which invest in one or another of these security types, the Innovator Matrix Income® Fund has the flexibility to manage the portfolio to emphasize whatever types of pass-throughs it feels are best adapted to current market conditions. Regardless of the economic cycle, the Fund strives to consistently identify underlying securities which can offer yields (before expenses) in the 7-9 percent range. This is intended to give our investors access to holdings that can generate much higher yields than high quality bonds and can be more stable than more speculative stocks.
The first half of the year was dramatic for most asset classes, beginning with a strong uptrend as U.S. growth appeared to surprise to the upside and the European debt crisis appeared to subside. Launching as it did on January 31, the Fund caught the last three months of the positive trend, which continued into April. Among the strongest holdings in this period were those benefiting from low natural gas prices such as fertilizer processor Terra Nitrogen (which uses natural gas as a raw material) and Teekay LNG Partners, which owns liquified natural gas tankers which enable the transport of gas from low cost regions to high price regions. Business development companies, commercial mortgage REITs, and a closed-end emerging market debt funds also did quite well. Names added to the portfolio in the period included Fifth Street Finance, a business development company, and the high-yielding common stock of Southern Copper Corp.
The second quarter was a challenging one for virtually all asset classes, as financial markets witnessed a global sell-off in May prompted by renewed financial stresses in Europe along with visible slowing of economic growth in the U. S. and China. The most dramatic breakdown was the near collapse of the Spanish banking system, accompanied by fears that insufficient response by European authorities could lead to a liquidity crisis in Europe and perhaps beyond. As we expected, the Fund tracked the equity markets during the liquidity scare. However, as the situation stabilized, the Fund recovered. Most importantly for shareholders focused on income, the portfolio’s income generally remained steady compared to the choppy short-term market conditions. For the five-month period since inception (January 31, 2012), the Fund had a total return of -0.52%, underperforming the S&P 500 Index’s total return of 4.79% by 5.31%, and the Barclays Aggregate Bond Index’s total return of 1.48% by 2.00%.
3
ACADEMY FUNDS TRUST
Consistent with the low-turnover style of the Fund, there were few changes in the portfolio. The one major shift was the sale of Terra Nitrogen, the largest holding at the end of the first quarter. This was based on our research evaluation that the peak in fertilizer pricing and profits was close and that this holding was fully priced. During the second quarter strong performance was provided by more defensive bond-like holdings such as mortgage REITs, specifically American Capital Agency Corp., Annaly Capital Management Inc., and Starwood Property Trust Inc. among the larger holdings. Penn Virginia Resource Partners LP also experienced significant gains as a result of a successful acquisition of a major pipeline system serving the Marcellus Shale gas fields. The majority of closed-end bond funds held in the portfolio also performed well. Partially offsetting these gains was weakness among holdings concentrated in energy production.
As of the end of the second quarter, the greatest concentration in the Fund was in high-yielding security types which in our judgment would benefit from moderately brisk growth in the U.S. economy, accompanied by modest inflation. These securities included closed-end high-yield corporate bond funds; closed-end funds focused on convertible and preferred securities; master limited partnerships operating energy pipelines, tankers, and refineries; business development companies making investments in middle market companies; and a few very high-yielding common stocks.
The second greatest concentration in the Fund was in securities which we anticipate would benefit from growth in the economy accompanied by higher commodity prices. We believe that although inflation measured by the Consumer Price Index is likely to be well contained, we are likely to witness higher prices for many basic commodities due to rapid growth in emerging economies. Accordingly, the portfolio holds significant positions in securities which traditionally benefit from these trends, such as royalty trusts owning oil, gas, and coal; a copper company; a REIT owning medical properties; and closed-end funds which own the debt of emerging market governments and companies.
The third major component of the portfolio consisted of holdings of bond-like securities which have had high yields and which are sustainable in our estimation even if the U.S. economy slows. Although we are of the view that on a longer-term basis U.S. bond yields will probably go higher due to inflation and greater government issuance, on a shorter-term basis there is realistic risk of a slowdown due to the overhang of debt from the subprime crisis and the possibility of fiscal contraction in U.S. government spending with the end of current tax law and planned spending cuts. This portion of the portfolio consists primarily of mortgage-based REITs, some of which hold residential mortgages (most guaranteed by one of the major federal guarantors) and some of which hold mortgages on revenue producing commercial properties.
Perhaps more important than these relative concentrations in the Fund, however, is its overall balance. This is intended to provide a robust and stable income at the portfolio level which can be sustained within the broadest possible range of economic scenarios.
4
ACADEMY FUNDS TRUST
Although we are currently experiencing a slowdown in the global economy, we note that fiscal and monetary authorities around the world are executing and planning new initiatives to provide stimulus to economic growth. In recent years these initiatives have tended to be executed late in the calendar year and helped market returns. We do not expect these actions to be especially effective in promoting jobs and growth in developed markets due to the overhang of consumer and government debt which inhibits lending and borrowing. However, we believe these actions could be effective in sustaining values of securities which target consistent income such as those in this Fund.
Should economic conditions change, we will adjust the portfolio to target a continuation of high levels of income while endeavoring to minimize significant long-term risk to principal. In addition to monitoring economic conditions and the sectoral concentrations in the fund, our research program is constantly reviewing individual holdings and possible alternatives. We will substitute fresh individual ideas for existing holdings whenever the risk/reward opportunity appears more attractive.
While no guarantees are possible in any investment management endeavor, be assured that the main objective of our portfolio discipline is to target current income and, as a secondary objective, long term capital appreciation – regardless of the economic scenario.
Thank you for your interest in the Innovator Matrix Income® Fund.
Sincerely,
Steven Carhart
Portfolio Manager
Please see the following page for important information.
5
ACADEMY FUNDS TRUST
Past performance does not guarantee future results.
Mutual fund investing involves risk; principal loss is possible. Along with general market risks, investors should also note that the Innovator Matrix Income® Fund is classified as non-diversified and may be more volatile than diversified funds that hold a greater number of securities. The Fund may invest in securities of foreign companies, which can be more volatile, less liquid and subject to risk of currency fluctuations. Additionally, the Fund may invest in smaller companies, which may involve additional risks such as limited liquidity and greater volatility than with larger companies. It may also invest in debt securities which typically decrease when interest rates rise. This risk is usually greater for longer-term debt securities. Lower-rated and non-rated securities present a greater risk of loss to principal and interest than higher-rated securities. Closed-end funds are subject to additional risks that do not apply to conventional mutual funds, including the risks that the market price of a closed-end fund’s shares may trade at a discount to its net asset value, an active secondary trading market may not develop or be maintained, or trading may be halted by the exchange on which they trade, which may impact the Fund’s ability to sell its shares. Closed-end funds and exchange-traded funds may experience many of the same risks associated with individual securities. Holders of the units of master limited partnerships have more limited control and limited rights to vote on matters affecting the partnership. There are also certain tax risks associated with an investment in units of master limited partnerships. The Fund does not receive the same tax benefits of a direct investment in a master limited partnership. The Fund may have concentrations in REITs and real estate securities with additional risks such as declines in the value of real estate and increased susceptibility to adverse economic or regulatory developments. Royalty trusts are subject to additional risks such as: cash-flow fluctuations and revenue decreases due to a sustained decline in demand for crude oil, natural gas and refined petroleum products, risks related to economic conditions, higher taxes or other regulatory actions that increase costs for royalty trusts. Diversification does not assure a profit or protect against a loss in a declining market.
The above discussion is not intended to be a forecast of future events, a guarantee of future results and should not be considered a recommendation to buy or sell any security.
The S&P 500® Total Return Index is a broad-based unmanaged index of 500 stocks, which is widely recognized as representative of the equity market in general. You cannot invest directly in an index.
The Consumer Price Index (CPI) is a measure that examines the weighted average of prices of a basket of consumer goods and services. Changes in the CPI are used to assess price changes associated with the cost of living.
Fund holdings and sector allocations are subject to change at any time and should not be considered recommendations to buy or sell any security. Please refer to the Schedule of Investments in this report for a complete list of fund holdings.
Must be preceded or accompanied by a prospectus.
Academy Funds are distributed by Quasar Distributors, LLC.
6
ACADEMY FUNDS TRUST
Index Comparison (Unaudited)
The following chart compares the value of a hypothetical $10,000 investment in the Innovator Matrix Income® Fund from its inception (January 31, 2012) to June 30, 2012 as compared with the S&P 500® Total Return Index and Barclays Aggregate Bond Index.
Innovator Matrix Income® Fund
Growth of a Hypothetical $10,000 Investment at June 30, 2012 vs.
S&P 500® Total Return Index and Barclays Aggregate Bond Index

| Cumulative total returns | ||||||||
| For the periods ended June 30, 2012 | ||||||||
| Three Month | Since Inception | |||||||
Innovator Matrix Income® Fund | -1.10% | -0.52% | ||||||
S&P 500® Total Return Index | -2.75% | 4.79% | ||||||
| Barclays Aggregate Bond Index | 2.06% | 1.48% | ||||||
Performance data quoted represents past performance and does not guarantee future results. The investment return and principal value of an investment will fluctuate so that an investor’s shares, when redeemed, may be worth more or less than their original cost. Current performance of the Fund may be lower or higher than the performance quoted. Performance data current to the most recent month end may be obtained by calling 1-877-386-3890.
The line graph and performance table do not reflect the deduction of taxes that a shareholder may pay on fund distributions or the redemption of Fund shares. Total return calculations reflect the effect of the Advisor’s expense limitation agreement for the Fund. Returns shown for the Fund and the S&P 500® Total Return Index include the reinvestment of all dividends, if any.
The S&P 500® Total Return Index is an unmanaged, capitalization-weighted index generally representative of the U.S. market for large capitalization stocks.
7
ACADEMY FUNDS TRUST
Index Comparison (Unaudited) (Continued)
The Barclays Aggregate Bond Index is an unmanaged, capitalization-weighted index generally representative of the market for investment grade government and corporate debt securities.
The Fund’s portfolio holdings may differ significantly from the securities held in the relevant index and, unlike a mutual fund, the performance of an unmanaged index does not reflect deductions for transaction costs, taxes, management fees or other expenses. You cannot invest directly in an index.
8
ACADEMY FUNDS TRUST
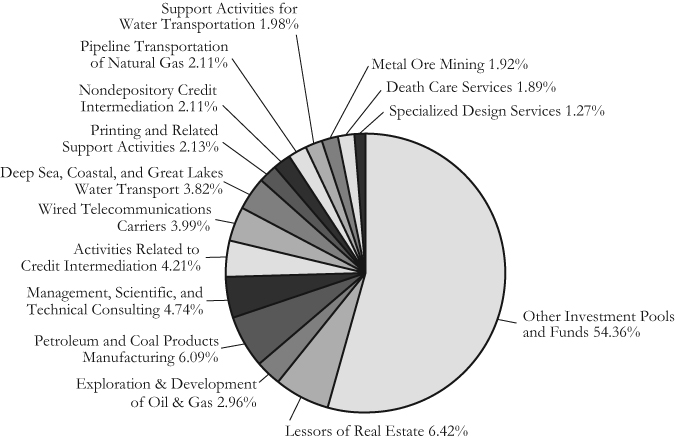
Innovator Matrix Income® Fund
Investments by Sector as of June 30, 2012
(as a Percentage of Total Investments) (Unaudited)
9
ACADEMY FUNDS TRUST
Expense Example
For the Period Ended June 30, 2012 (Unaudited)
As a shareholder of the Fund, you incur two types of costs: (1) ongoing costs, including management fees, distribution and shareholder servicing (12b-1) fees, and other Fund expenses; and (2) transaction costs, including sales charges (loads) on purchase payments. This Example is intended to help you understand your ongoing costs (in dollars) of investing in the Fund and to compare these costs with the ongoing costs of investing in other mutual funds.
The Example is based on an investment of $1,000 invested at the beginning of the period and held for the entire period from January 31, 2012 to June 30, 2012.
Actual Expenses
The table below provides information about actual account values and actual expenses. You may use the information in this line, together with the amount you invested, to estimate the expenses you paid over the period. Simply divide your account value by $1,000 (for example, an $8,600 account value divided by $1,000 equals 8.6), then multiply the result by the number in the first line under the heading entitled “Expenses Paid During Period” to estimate the expenses you paid on your account during the period.
| Expenses paid | |||
| Beginning | Ending | during the | |
| account value | account value | period ended | |
| January 31, 2012 | June 30, 2012 | June 30, 2012* | |
| Innovator Matrix | |||
Income® Fund | $1,000.00 | $994.80 | $5.56 |
| * | Expenses are equal to the Fund’s annualized expense ratio of 1.35%, multiplied by the average account value over the period, multiplied by 151/366 (to reflect the period). |
Hypothetical Example for Comparison Purposes
The table below provides information about hypothetical account values and hypothetical expenses based on the Fund’s actual expense ratio and an assumed rate of return of 5% per year before expenses, which is not the Fund’s actual return. The hypothetical account values and expenses may not be used to estimate the actual ending account balance or expenses you paid for the period. You may use this information to compare the ongoing costs of investing in the Fund with other funds. To do so, compare this 5% hypothetical example with the 5% hypothetical examples that appear in the shareholder reports of other funds.
Please note that the expenses shown in the table are meant to highlight your ongoing costs only and do not reflect any transactional costs, such as sales charges (loads). Therefore, the table below is useful in comparing the ongoing costs only, and
10
ACADEMY FUNDS TRUST
Expense Example
For the Period Ended June 30, 2012 (Unaudited) (Continued)
will not help you determine the relative total costs of owning different funds. In addition, if these transactional costs were included, your costs could have been higher.
| Expenses paid | |||
| Beginning | Ending | during the | |
| account value | account value | period ended | |
| January 31, 2012 | June 30, 2012 | June 30, 2012* | |
| Innovator Matrix | |||
Income® Fund | $1,000.00 | $1,015.06 | $5.61 |
| * | Expenses are equal to the Fund’s annualized expense ratio of 1.35%, multiplied by the average account value over the period, multiplied by 151/366 (to reflect the period). |
11
ACADEMY FUNDS TRUST
Innovator Matrix Income® Fund
Schedule of Investments – June 30, 2012 (Unaudited)
| Shares | Value | |||||||
| REAL ESTATE INVESTMENT TRUSTS – 24.38% | ||||||||
| Activities Related to Credit Intermediation – 4.08% | ||||||||
| Starwood Property Trust, Inc. | 137,377 | $ | 2,927,504 | |||||
| Lessors of Real Estate – 2.13% | ||||||||
| Medical Properties Trust, Inc. | 159,068 | 1,530,234 | ||||||
| Other Investment Pools and Funds – 18.17% | ||||||||
| American Capital Agency Corp. | 101,225 | 3,402,172 | ||||||
| Annaly Capital Management, Inc. | 180,759 | 3,033,136 | ||||||
| Apollo Commercial Real Estate Finance, Inc. | 101,225 | 1,626,686 | ||||||
| Chimera Investment Corp. | 931,273 | 2,197,805 | ||||||
| Crexus Investment Corp. | 274,754 | 2,794,248 | ||||||
| 13,054,047 | ||||||||
| TOTAL REAL ESTATE INVESTMENT TRUSTS | ||||||||
| (Cost $17,564,011) | $ | 17,511,785 | ||||||
| COMMON STOCKS – 33.34% | ||||||||
| Death Care Services – 1.83% | ||||||||
| StoneMor Partners L.P. | 50,613 | $ | 1,311,889 | |||||
| Deep Sea, Coastal, and Great Lakes | ||||||||
| Water Transportation – 3.70% | ||||||||
| Navios Maritime Partners L.P. | 86,765 | 1,179,136 | ||||||
| Teekay LNG Partners L.P. | 38,321 | 1,477,275 | ||||||
| 2,656,411 | ||||||||
| Lessors of Real Estate – 4.08% | ||||||||
| Penn Virginia Resources Partners L.P. | 119,590 | 2,929,955 | ||||||
| Metal Ore Mining – 1.86% | ||||||||
| Southern Copper Corp. | 42,370 | 1,335,079 | ||||||
| Nondepository Credit Intermediation – 2.04% | ||||||||
| Fifth Street Finance Corp. | 146,777 | 1,464,834 | ||||||
| Exploration & Development of Oil & Gas – 2.86% | ||||||||
| Enerplus Corp. | 159,791 | 2,056,510 | ||||||
| Petroleum and Coal Products Manufacturing – 5.88% | ||||||||
| BP Prudhoe Bay Royalty Trust | 23,137 | 2,697,080 | ||||||
| Calumet Specialty Products Partners, L.P. | 64,350 | 1,530,243 | ||||||
| 4,227,323 | ||||||||
The accompanying notes are an integral part of these financial statements.
12
ACADEMY FUNDS TRUST
Innovator Matrix Income® Fund
Schedule of Investments – June 30, 2012 (Unaudited) (Continued)
| Shares | Value | |||||||
| COMMON STOCKS (Continued) | ||||||||
| Pipeline Transportation of Natural Gas – 2.04% | ||||||||
| Niska Gas Storage Partners LLC | 120,747 | $ | 1,462,246 | |||||
| Printing and Related Support Activities – 2.06% | ||||||||
| R.R. Donnelley & Sons Co. | 125,809 | 1,480,772 | ||||||
| Specialized Design Services – 1.22% | ||||||||
| Collectors Universe, Inc. | 59,910 | 879,479 | ||||||
| Support Activities for Water Transportation – 1.91% | ||||||||
| Martin Midstream Partners L.P. | 41,936 | 1,372,985 | ||||||
| Wired Telecommunications Carriers – 3.86% | ||||||||
| Frontier Communications Corp. | 723,761 | 2,772,004 | ||||||
| TOTAL COMMON STOCKS | ||||||||
| (Cost $26,018,331) | $ | 23,949,487 | ||||||
| INVESTMENT COMPANIES – 38.98% | ||||||||
| Management, Scientific, and | ||||||||
| Technical Consulting Services – 4.59% | ||||||||
| Blackrock Kelso Capital Corp. | 337,659 | $ | 3,295,552 | |||||
| Other Investment Pools and Funds – 34.39% | ||||||||
| Avenue Income Credit Strategies Fund | 86,041 | 1,423,978 | ||||||
| Blackrock Corporate High Yield Fund V | 253,063 | 3,221,492 | ||||||
| Blackrock Debt Strategies Fund, Inc. | 650,734 | 2,681,024 | ||||||
| Eaton Vance Limited Duration Income Fund | 166,299 | 2,710,674 | ||||||
| First Trust Aberdeen Global Opportunity Fund | 171,360 | 2,928,542 | ||||||
| Global High Income Fund, Inc. | 220,527 | 2,708,072 | ||||||
| Morgan Stanley Emerging Markets Domestic Debt | 177,867 | 2,792,512 | ||||||
| Nuveen Preferred Income Opportunities Fund(a) | 361,519 | 3,264,517 | ||||||
| Wells Fargo Advantage Multi-Sector Income Fund | 195,220 | 2,977,105 | ||||||
| 24,707,916 | ||||||||
| TOTAL INVESTMENT COMPANIES | ||||||||
| (Cost $28,580,366) | $ | 28,003,468 | ||||||
| Total Investments | ||||||||
| (Cost $72,162,708) – 96.70% | 69,464,740 | |||||||
| Other Assets in Excess of Liabilities – 3.30% | 2,373,937 | |||||||
| TOTAL NET ASSETS – 100.00% | $ | 71,838,677 | ||||||
Percentages are stated as a percent of net assets.
| (a) | Security changed its name from Nuveen Multi-Strategy Income and Growth Fund to Nuveen Preferred Income Opportunities Fund subsequent to the June 30, 2012 reporting period. |
The accompanying notes are an integral part of these financial statements.
13
ACADEMY FUNDS TRUST
Statement of Assets and Liabilities
June 30, 2012 (Unaudited)
| Innovator | ||||
Matrix Income® | ||||
| Fund | ||||
| Assets: | ||||
| Investments, at value* | $ | 69,464,740 | ||
| Receivable for investments sold | 4,808,953 | |||
| Receivable for fund shares sold | 292,136 | |||
| Dividends, interest and other receivables | 748,860 | |||
| Prepaid expenses | 42,382 | |||
| Total Assets | 75,357,071 | |||
| Liabilities: | ||||
| Payable for fund shares redeemed | 519,938 | |||
| Distribution payable | 341 | |||
| Payable to Advisor | 43,011 | |||
| Due to custodian | 2,902,500 | |||
| Accrued 12b-1 fees | 12,199 | |||
| Accrued expenses and other liabilities | 40,405 | |||
| Total Liabilities | 3,518,394 | |||
| Net Assets | $ | 71,838,677 | ||
| Net Assets Consist of: | ||||
| Capital stock | $ | 73,990,227 | ||
| Undistributed net investment income | 515,081 | |||
| Accumulated net realized gain | 31,337 | |||
| Net unrealized depreciation on investments | (2,697,968 | ) | ||
| Net Assets | $ | 71,838,677 | ||
| Shares of beneficial interest outstanding | ||||
| (unlimited shares without par value authorized) | 3,669,299 | |||
| Net asset value and redemption price per share | $ | 19.58 | ||
Maximum offering price per share(1) | $ | 20.77 | ||
| * Cost of investments | $ | 72,162,708 | ||
| (1) | Includes a sales load of 5.75% (see note 7). |
The accompanying notes are an integral part of these financial statements.
14
ACADEMY FUNDS TRUST
Statement of Operations
For the Period Ended June 30, 2012 (Unaudited)
| Innovator Matrix Income® Fund | ||||
| From January 31, 2012 | ||||
| (Inception Date) to June 30, 2012 | ||||
| Investment Income: | ||||
| Dividends (Net of foreign taxes withheld of $12,118) | $ | 1,898,963 | ||
| Interest | 128 | |||
| 1,899,091 | ||||
| Expenses: | ||||
| Investment advisory fee | 215,202 | |||
| Professional fees | 19,007 | |||
| Administration fee | 20,021 | |||
| Fund accounting fees | 13,073 | |||
| Transfer agent fees and expenses | 15,589 | |||
| 12b-1 fees | 53,801 | |||
| Trustee fees and expenses | 6,397 | |||
| Printing and mailing expense | 3,864 | |||
| Custody fees | 2,875 | |||
| Insurance expense | 1,410 | |||
| Registration fees | 12,585 | |||
| Other expenses | 8,996 | |||
| Total expenses before expense limitation | 372,820 | |||
| Less: Fees waived/Expenses paid by Advisor | (82,297 | ) | ||
| Net expenses | 290,523 | |||
| Net Investment Income | 1,608,568 | |||
| Realized and Unrealized Gain/(Loss): | ||||
| Net realized gain on investments | 31,337 | |||
| Net change in unrealized depreciation | ||||
| on investments | (2,697,968 | ) | ||
| Net realized and unrealized loss on investments | (2,666,631 | ) | ||
| Net Decrease in Net Assets | ||||
| Resulting from Operations | $ | (1,058,063 | ) | |
The accompanying notes are an integral part of these financial statements.
15
ACADEMY FUNDS TRUST
Statement of Changes in Net Assets
| Innovator Matrix Income® Fund | ||||
| From January 31, 2012 | ||||
| (Inception Date) to June 30, 2012 | ||||
| (Unaudited) | ||||
| Operations: | ||||
| Net investment income | $ | 1,608,568 | ||
| Net realized gain on investments | 31,337 | |||
| Net change in unrealized depreciation | ||||
| on investments | (2,697,968 | ) | ||
| Net decrease in net assets resulting from operations | (1,058,063 | ) | ||
| Dividends and Distributions to Shareholders: | ||||
| Net investment income | (1,093,487 | ) | ||
| Total dividends and distributions | (1,093,487 | ) | ||
| Fund Share Transactions: | ||||
| Proceeds from shares sold | 82,594,136 | |||
| Shares issued to holders in reinvestment of dividends | 1,092,784 | |||
| Cost of shares redeemed* | (9,696,693 | ) | ||
| Net increase in net assets from capital share transactions | 73,990,227 | |||
| Total increase in net assets | 71,838,677 | |||
| Net Assets: | ||||
| Beginning of period | — | |||
| End of period** | $ | 71,838,677 | ||
| * Net of redemption fees of | $ | 4,614 | ||
| ** Including undistributed net investment income of | $ | 515,081 | ||
| Change in Shares Outstanding: | ||||
| Shares sold | 4,118,224 | |||
| Shares issued to holders in reinvestment of dividends | 55,294 | |||
| Shares redeemed | (504,219 | ) | ||
| Net increase | 3,669,299 | |||
The accompanying notes are an integral part of these financial statements.
16
ACADEMY FUNDS TRUST
Financial Highlights
| Innovator Matrix Income® Fund | ||||
| From January 31, 2012 | ||||
| (Inception Date) to June 30, 2012 | ||||
| (Unaudited) | ||||
| Per share operating performance | ||||
| (For a share outstanding throughout each period) | ||||
| Net asset value, beginning of period | $ | 20.00 | ||
| Operations: | ||||
| Net investment income | 0.46 | |||
| Net realized and unrealized loss | (0.56 | ) | ||
| Total from investment operations | (0.10 | ) | ||
| Dividends and distributions to shareholders: | ||||
| Dividends from net investment income | (0.32 | ) | ||
| Total dividends and distributions | (0.32 | ) | ||
| Change in net asset value for the period | (0.42 | ) | ||
| Redemption fees per share | — | (3) | ||
| Net asset value, end of period | $ | 19.58 | ||
Total return(2) | (0.52 | )% | ||
| Ratios/supplemental data | ||||
| Net assets, end of period (000) | $ | 71,839 | ||
| Ratio of net expenses to average net assets: | ||||
| Before expense limitation arrangement | 1.73 | %(1) | ||
| After expense limitation arrangement | 1.35 | %(1) | ||
| Ratio of net investment income | ||||
| to average net assets: | ||||
| Before expense limitation arrangement | 7.07 | %(1) | ||
| After expense limitation arrangement | 7.45 | %(1) | ||
| Portfolio turnover rate | 14 | % | ||
| (1) | Annualized. |
| (2) | Since Inception (January 31, 2012). |
| (3) | Amount calculated is less than $0.005 per share. |
The accompanying notes are an integral part of these financial statements.
17
ACADEMY FUNDS TRUST
Notes to Financial Statements (Unaudited)
1.ORGANIZATION
Academy Funds Trust (the “Trust”) was organized under Delaware law as a Delaware statutory trust on October 17, 2007 and is registered under the Investment Company Act of 1940, as amended (the “1940 Act”) and classified as an open-end management investment company. The Trust currently consists of one mutual fund: the Innovator Matrix Income® Fund (the “Fund”), which commenced operations on January 31, 2012. The Innovator Matrix Income® Fund seeks current income and long-term capital appreciation.
2.SIGNIFICANT ACCOUNTING POLICIES
The following is a summary of significant accounting policies consistently followed by the Trust in the preparation of its financial statements. These policies are in conformity with accounting principles generally accepted in the United States of America (“GAAP”).
Security Valuation:
Portfolio securities primarily listed or traded on a national or foreign securities exchange, except for bonds, are generally valued at the closing price on that exchange, unless such closing prices are determined to be not readily available pursuant to the Fund’s pricing procedures. Exchange traded options are valued using composite pricing. If no sales are reported, the options will be valued by calculating the mean between the highest bid price and the lowest ask price across the exchanges where the option is traded. Non-exchange traded options are valued at fair value using a mathematical model. Securities not traded on a particular day, over-the-counter securities, and government and agency securities are valued at the mean value between bid and asked prices. Open-ended Mutual Funds are valued at that day’s NAV. Money market instruments having a maturity of less than 60 days are valued at amortized cost, which approximates market value. Debt securities (other than short-term obligations) are valued on the basis of valuations provided by a pricing service when such prices are believed to reflect the fair value of such securities. Foreign securities and the prices of foreign securities denominated in foreign currencies are translated to U.S. dollars at the mean between the bid and offer quotations of such currencies based on rates in effect as of the close of the London Stock Exchange. Securities for which market quotations are not readily available are valued at fair value as determined in good faith by a method approved by the Board. The Trust will also use the fair value of a foreign security at the time of calculating its NAV when events following the close of foreign markets on which the foreign security trades indicate that such closing price does not reflect the foreign securities fair value. The Trust concluded that a price determined under the Fund’s
18
ACADEMY FUNDS TRUST
Notes to Financial Statements (Unaudited) (Continued)
valuation procedures was not readily available if, among other things, the Trust believed that the value of the security might have been materially affected by an intervening significant event. A significant event may be related to a single issuer, to an entire market sector, or to the entire market. These events may include, among other things: issuer–specific events including rating agency action, earnings announcements and corporate actions, significant fluctuations in domestic or foreign markets, natural disasters, armed conflicts, and government actions. In the event that the market quotations are not readily available, the fair value of such securities will be determined in good faith, taking into consideration: (i) fundamental analytical data relating to the investment; (ii) the nature and duration of restrictions on disposition of the securities; and (iii) an evaluation of the forces which influence the market in which these securities are purchased and sold. The members of the Trust shall continuously monitor for significant events that might necessitate the use of fair value procedures.
Use of Estimates:
In preparing financial statements in conformity with GAAP, management is required to make estimates and assumptions that affect the reported amounts of assets and liabilities and disclosure of contingent assets and liabilities as of the date of the financial statements and the reported amounts of increases and decreases in net assets from operations during the reporting period. Actual results could differ from these estimates.
Federal Income Taxes:
The Fund intends to meet the requirements of the Internal Revenue Code (the “Code”) applicable to regulated investment companies and to distribute substantially all net investment taxable income and net capital gains to shareholders in a manner which results in no tax cost to the Fund. Therefore, no federal income or excise tax provision is recorded. The Fund recognizes interest and penalties, if any, related to unrecognized tax benefits as income tax expense in the Statement of Operations.
The Fund commenced operations on January 31, 2012, therefore the Fund has no prior tax years.
GAAP requires that certain components of net assets be reclassified between financial and tax reporting. These reclassifications have no effect on net assets or net asset value per share.
Distributions to Shareholders:
The Fund intends to declare and distribute its net investment income, if any, as dividends monthly. Distributions of net realized capital gains, if any, will be declared
19
ACADEMY FUNDS TRUST
Notes to Financial Statements (Unaudited) (Continued)
and paid at least annually. Distributions to shareholders are recorded on the ex-dividend date. The Fund may periodically make reclassifications among certain of its capital accounts as a result of the recognition and characterization of certain income and capital gain distributions determined annually in accordance with federal tax regulations which may differ from GAAP.
Guarantees and Indemnifications:
In the normal course of business, the Trust may enter into a contract with service providers that contain general indemnification clauses. The Trust’s maximum exposure under these arrangements is unknown as this would involve future claims against the Trust that have not yet occurred. Based on experience, the Trust expects the risk of loss to be remote.
Other:
Investment transactions are recorded on the trade date. The Trust determines the gain or loss realized from investment transactions on the basis of identified cost. Dividend income is recognized on the ex-dividend date and interest income is recognized on an accrual basis. Distributions received from the Fund’s investment in master limited partnerships (“MLPs”), real estate investment trusts (“REITs”) and royalty trusts are comprised of ordinary income, capital gains and return of capital. For financial statement purposes, the Fund uses estimates to characterize these distributions received as return of capital, capital gains or ordinary income. Such estimates are based on historical information available from each MLP, REIT or royalty trust and other industry sources. These estimates may subsequently be revised based on information received for the security after its tax reporting periods are concluded, as the actual character of these distributions is not known until after the fiscal year end of the Fund. The distributions received from MLP, REIT and royalty trust securities that have been classified as income and capital gains are included in dividend income and Net Realized Loss on Investments, respectively, on the Statement of Operations. The distributions received that are classified as return of capital reduce the cost of investments on the Statement of Assets and Liabilities.
As described in note 2, the Fund utilizes various methods to measure the fair value of most of its investments on a recurring basis. U.S. GAAP establishes a hierarchy that prioritizes inputs to valuation methods. The three levels of inputs are:
| • | Level 1 – Unadjusted quoted prices in active markets for identical assets or liabilities that the company has the ability to access. |
20
ACADEMY FUNDS TRUST
Notes to Financial Statements (Unaudited) (Continued)
| • | Level 2 – Observable inputs other than quoted prices included in level 1 that are observable for the asset or liability, either directly or indirectly. These inputs may include quoted prices for the identical instrument on an inactive market, prices for similar instruments, interest rates, prepayment speeds, credit risk, yield curves, default rates and similar data. |
| • | Level 3 – Unobservable inputs for the asset or liability, to the extent relevant observable inputs are not available, representing the company’s own assumptions about the assumptions a market participant would use in valuing the asset or liability, and would be based on the best information available. |
The availability of observable inputs can vary from security to security and is affected by a wide variety of factors, including, for example, the type of security, whether the security is new and not yet established in the marketplace, the liquidity of markets, and other characteristics particular to the security. To the extent that valuation is based on models or inputs that are less observable or unobservable in the market, the determination of fair value requires more judgement. Accordingly, the degree of judgement exercised in determining fair value is greatest for instruments categorized in level 3.
The inputs used to measure fair value may fall into different levels of the fair value hierarchy. In such cases, for disclosure purposes, the level in the fair value hierarchy within which the fair value measurement falls in its entirety, is determined based on the lowest level input that is significant to the fair value measurement in its entirety.
There were no significant transfers between Levels 1 and 2 during the period. Transfers between levels are recognized at the end of the reporting period.
| Level 1 | Level 2 | Level 3 | Total | |||||||||||||
| Real Estate Investment Trusts | $ | 17,511,785 | $ | — | $ | — | $ | 17,511,785 | ||||||||
| Common Stock | 23,949,487 | — | — | 23,949,487 | ||||||||||||
| Investment Companies | 28,003,468 | — | — | 28,003,468 | ||||||||||||
| Total Investments in Securities | $ | 69,464,740 | $ | — | $ | — | $ | 69,464,740 | ||||||||
See the Schedule of Investments for the investments detailed by industry classification.
Subsequent Events:
In preparing these financial statements, the Trust has evaluated events and transactions for potential recognition or disclosure through the date the financial statements were issued.
21
ACADEMY FUNDS TRUST
Notes to Financial Statements (Unaudited) (Continued)
3.DISTRIBUTION PLAN
The Trust has adopted a Distribution and Service (12b-1) Plan (the “Plan”) pursuant to Rule 12b-1 under the 1940 Act. The Plan is designed to compensate the Fund’s distributor, advisor, or others for certain promotional and other sales related costs and for providing related services. The Fund paid a monthly fee at the annual rate of 0.25% of the average daily net assets of the Fund in regards to qualified expenses under the Plan. The Plan may be continued in effect from year to year if such continuance is approved annually by the Board of Trustees of the Trust, including the vote of a majority of the Independent Trustees. For the period ended June 30, 2012, the Fund paid $53,801 pursuant to the Plan.
4.INVESTMENT ADVISOR AND OTHER AFFILIATES
The Trust has entered into an Investment Advisory Agreement (the “Advisory Agreement”) with Innovator Management LLC (the “Advisor”). The Advisory Agreement provides for advisory fees computed daily and paid monthly at an annual rate of 1.00% of the Fund’s average daily net assets. The Advisor has appointed Trust & Fiduciary Management Services, Inc., sub-advisor to serve as portfolio manager of the Fund. The Advisor will be responsible for compensating the sub-advisor for its services to the Fund.
Under the terms of an Expense Limitations Agreement, the Advisor has contractually agreed, through December 10, 2012, to waive its advisory fees and/or assume as its own expense, certain expenses otherwise payable by the Fund to the extent necessary to ensure that net annual fund operating expenses (excluding any taxes, interest, brokerage fees, certain insurance costs and extraordinary expenses) do not exceed 1.35% of average daily net assets. Pursuant to its expense limitation agreement for the Fund, the Advisor is entitled to recoup any fees that it waived and/or Fund expenses that it paid for a period of three years following such fee waivers and expense payments, to the extent that such recoupment by the Advisor will not cause the Fund to exceed any applicable expense limitation that was in place for the Fund when the fees were waived or expenses were paid. For the period ended June 30, 2012, the Advisor waived $82,297 of its advisory fees.
5.INVESTMENT TRANSACTIONS
For the period ended June 30, 2012, purchases and sales of investment securities, other than short-term investments and short-term U.S. Government obligations were as follows:
22
ACADEMY FUNDS TRUST
Notes to Financial Statements (Unaudited) (Continued)
| Innovator Matrix | ||||
Income® Fund | ||||
| Purchases: | ||||
| U.S. Government | $ | — | ||
| Other | 80,320,033 | |||
| Sales: | ||||
| U.S. Government | $ | — | ||
| Other | 7,913,989 | |||
6. FEDERAL INCOME TAX INFORMATION
The Fund commenced operations on January 31, 2012, therefore the Fund has no prior year tax information.
7.OFFERING PRICE PER SHARE
The Fund’s public offering price is the net asset value plus a sales charge, which varies in accordance with the amount of the purchase up to a maximum of 5.75%. Sales charges are not an expense of the Fund and are not reflected in the financial statements.
23
ACADEMY FUNDS TRUST
Discussion Regarding Approval of Investment Advisory and Sub-Advisory Agreements
At a meeting held on December 7, 2011 (the “Meeting”), the Board of Trustees (the “Board”), including a majority of independent Trustees, approved an investment advisory agreement with Innovator Management LLC (“Innovator”) and a sub-advisory agreement with Trust & Fiduciary Management Services, Inc. (“TFMS”) for the Innovator Matrix Income® Fund (the “Fund”). The Board reviewed and considered materials provided by Innovator and TFMS at the Meeting and prior board meetings concerning the management of the Fund. In considering information relating to the approval of the Fund’s investment advisory and sub-advisory agreements, the Board received assistance and advice from counsel and was provided with a written description of their responsibilities in approving investment advisory and sub-advisory agreements.
In making its decision, the Board considered information furnished in connection with the process of approving the investment advisory and sub-advisory agreements, which included materials provided by Innovator and TFMS concerning, among other things, the nature, extent and quality of services provided to the Fund, and the financial condition of Innovator and TFMS. In addition, reports were provided to the Board that included independent comparative reports prepared by Lipper Inc. (“Lipper”), an independent statistical compilation organization and Morningstar, Inc. (“Morningstar”). The Lipper and Morningstar reports compared the Fund’s proposed expenses with a universe of domestic equity income mutual funds.
The Board carefully considered Innovator’s proposed advisory fee and compared it to the advisory fees charged by other equity income funds within the Fund’s comparative Lipper and Morningstar peer groups. The Board also considered and was satisfied with Innovator’s proposed expense ratio relative to the expense ratios of other funds within the Fund’s peer group and it also considered the Fund’s proposed 1.35% expense limitation. The Board was satisfied with the Fund’s proposed fees and expense ratio. Innovator also discussed with the Board the proposed fees to be paid by it to TFMS for its sub-advisory services; TFMS’s experience managing equity income accounts; and an overview of the role and functions of TFMS under the sub-advisory agreement.
Following additional discussion, the Board concluded that it was satisfied with the nature, extent and quality of the proposed services by Innovator and TFMS, and the Fund’s proposed level of fees and expenses. The Board approved the investment advisory and sub-advisory agreements with Innovator and TFMS for an initial two-year period.
24
(This Page Intentionally Left Blank.)
INVESTMENT ADVISOR
Innovator Management LLC
123 South Broad Street, Suite 1630
Philadelphia, PA 19109
INVESTMENT SUB-ADVISOR
Trust & Fiduciary Management Services, Inc.
50 Federal Street, 6th Floor
Boston, MA 02110
ADMINISTRATOR, FUND ACCOUNTANT & TRANSFER AGENT
U.S. Bancorp Fund Services, LLC
615 East Michigan Street
Milwaukee, WI 53202
DISTRIBUTOR
Quasar Distributors, LLC
615 East Michigan Street
Milwaukee, WI 53202
CUSTODIAN
U.S. Bank, N.A.
1555 North RiverCenter Drive, Suite 302
Milwaukee, WI 53212
LEGAL COUNSEL
Stradley Ronon Stevens & Young, LLP
2600 One Commerce Square
Philadelphia, PA 19103
INDEPENDENT REGISTERED PUBLIC ACCOUNTING FIRM
Tait, Weller & Baker LLP
1818 Market Street, Suite 2400
Philadelphia, PA 19103
This report has been prepared for shareholders and may be distributed to others only if preceded or accompanied by a current prospectus.
The Fund’s Proxy Voting Policies and Procedures are available without charge, upon request, by calling 1-877-386-3890 and on the SEC’s website at www.sec.gov.
The Fund’s complete schedule of portfolio holdings for the first and third quarters is filed with the SEC on Form N-Q. The Fund’s Form N-Q is available without charge, upon request, by calling 1-877-386-3890, or on the SEC’s website at www.sec.gov. The Fund’s Forms N-Q may be reviewed and copied at the SEC’s Public Reference Room in Washington, DC. Information on the operation of the Public Reference Room may be obtained by calling 1-800-SEC-0330.
Item 2. Code of Ethics.
Not applicable for semi-annual reports.
Item 3. Audit Committee Financial Expert.
Not applicable for semi-annual reports.
Item 4. Principal Accountant Fees and Services.
Not applicable for semi-annual reports.
Item 5. Audit Committee of Listed Registrants.
Not applicable to registrants who are not listed issuers (as defined in Rule 10A-3 under the Securities Exchange Act of 1934).
Item 6. Investments.
| (a) | Schedule of Investments is included as part of the report to shareholders filed under Item 1 of this Form. |
| (b) | Not Applicable |
Item 7. Disclosure of Proxy Voting Policies and Procedures for Closed-End Management Investment Companies.
Not applicable to open-end investment companies.
Item 8. Portfolio Managers of Closed-End Management Investment Companies.
Not applicable to open-end investment companies.
Item 9. Purchases of Equity Securities by Closed-End Management Investment Company and Affiliated Purchasers.
Not applicable to open-end investment companies.
Item 10. Submission of Matters to a Vote of Security Holders.
There have been no material changes to the procedures by which shareholders may recommend nominees to the registrant’s board of trustees.
Item 11. Controls and Procedures.
| (a) | The Registrant’s President and Treasurer have reviewed the Registrant's disclosure controls and procedures (as defined in Rule 30a-3(c) under the Investment Company Act of 1940 (the “Act”)) as of a date within 90 days of the filing of this report, as required by Rule 30a-3(b) under the Act and Rules 13a-15(b) or 15d-15(b) under the Securities Exchange Act of 1934. Based on their review, such officers have concluded that the disclosure controls and procedures are effective in ensuring that information required to be disclosed in this report is appropriately recorded, processed, summarized and reported and made known to them by others within the Registrant and by the Registrant’s service provider. |
| (b) | There were no changes in the Registrant's internal control over financial reporting (as defined in Rule 30a-3(d) under the Act) that occurred during the second fiscal quarter of the period covered by this report that has materially affected, or is reasonably likely to materially affect, the Registrant's internal control over financial reporting. |
Item 12. Exhibits.
| (a) | (1) Any code of ethics or amendment thereto, that is the subject of the disclosure required by Item 2, to the extent that the registrant intends to satisfy Item 2 requirements through filing an exhibit. Not Applicable. |
(2) A separate certification for each principal executive and principal financial officer pursuant to Section 302 of the Sarbanes-Oxley Act of 2002. Filed herewith.
(3) Any written solicitation to purchase securities under Rule 23c-1 under the Act sent or given during the period covered by the report by or on behalf of the registrant to 10 or more persons. Not applicable to open-end investment companies.
| (b) | Certifications pursuant to Section 906 of the Sarbanes-Oxley Act of 2002. Furnished herewith. |
SIGNATURES
Pursuant to the requirements of the Securities Exchange Act of 1934 and the Investment Company Act of 1940, the registrant has duly caused this report to be signed on its behalf by the undersigned, thereunto duly authorized.
(Registrant) Academy Funds Trust
By (Signature and Title)* /s/ David Jacovini
David Jacovini, President
Date 8/8/2012
Pursuant to the requirements of the Securities Exchange Act of 1934 and the Investment Company Act of 1940, this report has been signed below by the following persons on behalf of the registrant and in the capacities and on the dates indicated.
By (Signature and Title)* /s/ David Jacovini
David Jacovini, President & Treasurer
Date 8/8/2012