INNOVATOR
MCKINLEY INCOME FUND
Investor Class (IMIFX)
Class I (IMIIX)
IBD® 50 FUND (FFTY)
| |
| |
| May 31, 2017 |
| |
| |
| |
| |
| |
| ACADEMY FUNDS TRUST |
| |
| |
| |
| |
ACADEMY FUNDS TRUST
Dear Valued Shareholders,
Thank you for your continued support of the Innovator IBD® 50 Fund (FFTY) and the Innovator McKinley Income Fund. Innovator Capital Management, LLC looks forward to continuing to work together. As we look to the near future, we are hopeful to offer exciting new solutions that will continue to incorporate Investor’s Business Daily’s (“IBD”) proprietary stock evaluation process and McKinley’s broad institutional investment research capabilities.
The following shareholder letter covers the first half of the funds’ fiscal 2017 (December 1, 2016 through May 31, 2017).
Innovator IBD®50 Fund
We are excited to highlight the strong performance of the IBD 50® Fund (FFTY), which is the only ETF to provide access to IBD’s signature IBD® 50 list of companies. Published by IBD for over a decade, the IBD® 50 provides investors access to a select list of growth companies exhibiting both strong relative strength and fundamentals.
Over the trailing six months the ETF returned +14.28% compared to +10.81% for the S&P 500 Index. The outperformance relative to the benchmark was driven by a heavy allocation to the technology sector, a significant underweight to energy and strong stock selection into names including Nvidia, Cognex and Dave & Buster’s Entertainment.
The ETF remains positioned in the market to provide investors with exposure to a highly concentrated growth portfolio based on the time-tested investment strategy of IBD.
Innovator McKinley Income Fund
The first half of fiscal 2017 saw equity markets move ever higher, yields on income producing assets remain at historically low levels and uncertainty around future rate hikes by the U.S. Federal Reserve linger over the markets.
Despite ongoing volatility in the oil markets, U.S. equities were a top performing asset class as lower long-term rates continue to push the value of risk assets higher. The yield curve flattened as yields on 3-month US Treasury Bills rose from 0.5% to just under 1% while 30-year US Treasury yields fell from 3.1% to 2.9%. As a result, we see demand for high income producing assets and strategies persisting.
IMIFX performance was +8.45% in the first half, led by a heavy allocation to the financial sector and an overweight to large cap names. There was strong selection within the health care space, specifically an allocation to AstraZeneca. MLPs stabilized but overall were a relative drag on fund performance though higher yields provide attractive income prospects. Over the same time frame, the S&P 500 Index returned +10.81% and the Barclays US Aggregate Bond Index returned +2.52%.
Opinions expressed are those of the Advisor/Sub-Advisor. The above discussion is not intended to be a forecast of future events, a guarantee of future results and should not be considered a recommendation to buy or sell any security.
Past performance does not guarantee future results.
ACADEMY FUNDS TRUST
ETF investing involves risks. Principal loss is possible. Along with general market risks, an ETF that concentrates its investments in the securities of a particular industry, market, sector, or geographic area may be more volatile than a fund that invests in a broader range of industries. Additionally, the Innovator IBD® 50 Fund may invest in securities that have additional risks. Foreign companies can be more volatile, less liquid, and subject to the risk of currency fluctuations. This risk is greater for emerging markets. Small and mid-cap companies can have limited liquidity and greater volatility than large-cap companies. Also, ETFs face numerous market trading risks, including the potential lack of an active market for Fund shares, losses from trading in secondary markets, periods of high volatility and disruption in the creation/redemption process of the Fund. Unlike mutual funds, ETFs may trade at a premium or discount to their net asset value. ETFs are bought and sold at market price and not individually redeemed from the fund. Brokerage commissions will reduce returns.
Mutual Fund investing involves risk. Principal loss is possible. While the Innovator McKinley Income Fund is classified as diversified, diversification does not ensure a profit, nor does it protect against a loss in a declining market. Additionally, it may invest in securities that have additional risks. Foreign companies can be more volatile, less liquid, and subject to the risk of currency fluctuations. Small and mid-cap companies can have limited liquidity and greater volatility than large-cap companies. Debt securities will typically decrease in value when interest rates rise. This risk is usually greater for longer term debt securities. Lower-rated and non-rated securities present a greater risk of loss to principal and interest than higher-rated securities. Closed-end funds and Business Development Companies (BDCs) are subject to additional risks that do not apply to conventional mutual funds, including the risks that the market price of their shares may trade at a discount to their net asset value, an active secondary trading market may not develop or be maintained, or trading may be halted by the exchange on which they trade, which may impact their ability to sell shares. Additionally, they may employ leverage which can increase volatility. BDCs may invest in smaller companies and may therefore carry risks similar to those of private equity or venture capital funds. Closed-end funds, BDCs, and exchange-traded funds may experience many of the same risks associated with individual securities. Holders of the units of master limited partnerships have more limited control and limited rights to vote on matters affecting the partnership. There are also certain tax risks associated with an investment in units of master limited partnerships. The fund may not receive the same tax treatment as a direct investment in a master limited partnership. The Fund may have concentrations in REITs and real estate securities with additional risks such as declines in the value of real estate and increased susceptibility to adverse economic or regulatory developments. Royalty trusts are subject to additional risks such as: cash-flow fluctuations and revenue decreases due to a sustained decline in demand for crude oil, natural gas and refined petroleum products, risks related to economic conditions, higher taxes or other regulatory actions that increase costs for royalty trusts.
The S&P 500 Index is a broad-based unmanaged index of 500 stocks, which is widely regarded as representative of the equity market in general.
The Barclays Capital U.S. Aggregate Bond Index is a market-capitalization-weighted index of investment-grade fixed-rate debt issues, including government, corporate, asset-backed, and mortgage-backed securities with maturities of at least one year. You cannot invest directly in an index.
Yield Curve A line that plots the interest rates, at a set point in time, of bonds having equal credit quality but differing maturity dates. It is used as a benchmark for other debt in the market, such as mortgage rates and bank lending rates, and it is also used to predict changes in economic output and growth.
Fund holdings and sector allocations are subject to change at any time and should not be considered a recommendation to buy or sell any security. Please refer to the Schedule of Investments in this report for a complete list of fund holdings.
This report must be preceded or accompanied by a prospectus.
The Funds are distributed by Quasar Distributors, LLC.
INNOVATOR MCKINLEY INCOME FUND
Index Comparison
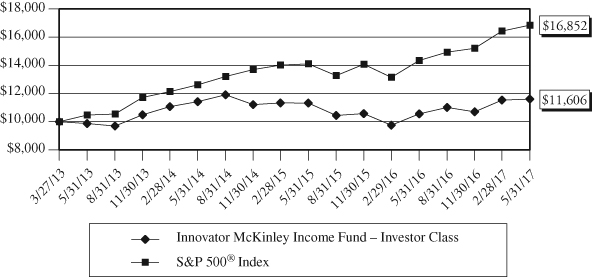
The following chart compares the value of a hypothetical $10,000 investment in the Innovator McKinley Income Fund – Investor Class from its performance inception date(1) to May 31, 2017 as compared with the S&P 500® Index.
Innovator McKinley Income Fund – Investor Class
Growth of a Hypothetical $10,000 Investment
at May 31, 2017 vs. S&P 500® Index
(Unaudited)
| | Average Annual Total Returns |
| | For the period ended May 31, 2017 |
| | | | Since |
| | 1 Year | 3 Years | Inception(1) |
| Innovator McKinley Income Fund | | | |
| Investor Class | 9.95% | 0.55% | 3.63% |
| Class I | 10.07% | 0.57% | 3.66% |
S&P 500® Index | 17.47% | 10.14% | 13.31% |
| (1) | Inception date for performance is March 27, 2013 for the Investor Class Shares and Class I Shares. Prior to December 1, 2015 the Investor Class Shares were designated as Class A Shares. |
Performance data quoted represents past performance and does not guarantee future results. On February 12, 2016, the Innovator McKinley Income Fund acquired the McKinley Diversified Income Fund (the “Predecessor Fund”), a series of Professionally Managed Portfolios, in a reorganization (the “Reorganization”). The Predecessor Fund’s performance prior to February 12, 2016 has been adopted by the Fund following the Reorganization. The Predecessor Fund was advised by McKinley Capital Management, LLC. The performance of the Investor Class and Class I shares of the Fund is based off of the performance of the Investor Class shares of the Predecessor Fund. The Investor Class and Class I shares’ returns of the Fund will be different from the Predecessor Fund as they have different expenses. The
INNOVATOR MCKINLEY INCOME FUND
Index Comparison (Continued)
investment return and principal value of an investment will fluctuate so that an investor’s shares, when redeemed, may be worth more or less than their original cost. Current performance of the Fund may be lower or higher than the performance quoted. Performance data current to the most recent month end may be obtained by calling 1-877-386-3890.
The line graph and performance table do not reflect the deduction of taxes that a shareholder may pay on fund distributions or the redemption of Fund shares. Total return calculations reflect the effect of the Advisor’s expense limitation agreement for the Fund. Returns shown for the Fund and the S&P 500® Index include the reinvestment of all dividends, if any.
The S&P 500® Index is an unmanaged, capitalization-weighted index generally representative of the U.S. market for large capitalization stocks.
The Fund’s portfolio holdings may differ significantly from the securities held in the relevant index and, unlike a mutual fund, the performance of an unmanaged index does not reflect deductions for transaction costs, taxes, management fees or other expenses.
You cannot invest directly in an index.
INNOVATOR IBD® 50 FUND
Index Comparison
The following chart compares the value of a hypothetical $10,000 investment in the Innovator IBD® 50 Fund from its inception (April 8, 2015) to May 31, 2017 as compared with the S&P 500® Index.
Innovator IBD® 50 Fund
Growth of a Hypothetical $10,000 Investment
at May 31, 2017 vs. S&P 500® Index
(Unaudited)
| | Average Annual |
| | Total Returns |
| | For the period ended |
| | May 31, 2017 |
| | | Since |
| | 1 Year | Inception(1) |
Innovator IBD® 50 Fund | | |
| NAV Return | 28.09% | 4.33% |
| Price Return | 28.22% | 4.37% |
S&P 500® Index | 17.47% | 9.42% |
| (1) | Inception date is April 8, 2015 |
Performance data quoted represents past performance and does not guarantee future results. The investment return and principal value of an investment will fluctuate so that an investor’s shares, when redeemed, may be worth more or less than their original cost. Current performance of the Fund may be lower or higher than the performance quoted.
The line graph and performance table do not reflect the deduction of taxes that a shareholder may pay on fund distributions or the redemption of Fund shares. Total return calculations reflect the effect of the Advisor’s expense limitation agreement for the Fund. Returns shown for the Fund and the S&P 500® Index include the reinvestment of all dividends, if any.
INNOVATOR IBD® 50 FUND
Index Comparison (Continued)
The S&P 500® Index is an unmanaged, capitalization-weighted index generally representative of the U.S. market for large capitalization stocks.
The Fund’s portfolio holdings may differ significantly from the securities held in the relevant index and, unlike a mutual fund, the performance of an unmanaged index does not reflect deductions for transaction costs, taxes, management fees or other expenses.
You cannot invest directly in an index.
Premium/Discount Information:
Information regarding the differences between the price of the Fund’s shares on the secondary market and the Fund’s net asset value is available at Innovatoretfs.com/fundETF.php.
ACADEMY FUNDS TRUST
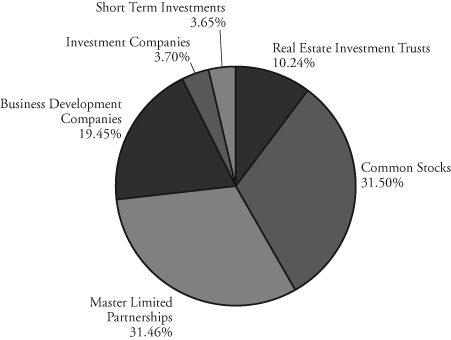
Innovator McKinley Income Fund
Investments by Security Type as of May 31, 2017
(as a Percentage of Total Investments)
(Unaudited)
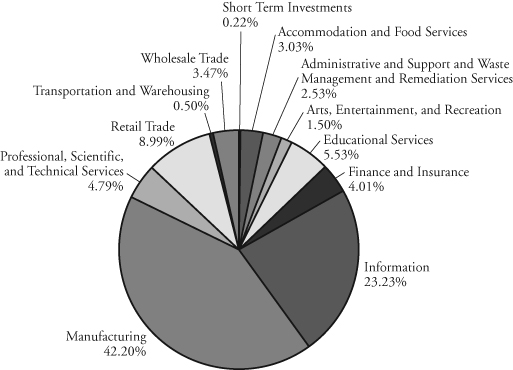
Innovator IBD® 50 Fund
Investments by Sector as of May 31, 2017
(as a Percentage of Total Investments)
(Unaudited)
ACADEMY FUNDS TRUST
Expense Example
For the Period Ended May 31, 2017 (Unaudited)
As a shareholder of the Funds, you incur two types of costs: (1) ongoing costs, including management fees, distribution and shareholder servicing (12b-1) fees (with respect to the Innovator McKinley Income Fund), and other Fund expenses; and (2) transaction costs, including brokerage commissions on the purchase and sale of Fund shares. This Example is intended to help you understand your ongoing costs (in dollars) of investing in the Funds and to compare these costs with the ongoing costs of investing in other funds.
The Example is based on an investment of $1,000 invested at the beginning of the period and held for the entire period from December 1, 2016 to May 31, 2017 for each Fund.
Actual Expenses
The table below provides information about actual account values and actual expenses. You may use the information in this line, together with the amount you invested, to estimate the expenses you paid over the period. Simply divide your account value by $1,000 (for example, an $8,600 account value divided by $1,000 equals 8.6), then multiply the result by the number in the applicable line under the heading titled “Expenses paid during the period ended” to estimate the expenses you paid on your account during the period.
| | | | Expenses paid |
| | Beginning | Ending | during the |
| | account value | account value | period* |
| Innovator McKinley Income Fund | | | |
| Investor Class | $1,000.00 | $1,084.50 | $6.24 |
| Class I | $1,000.00 | $1,084.80 | $5.72 |
| | | | |
Innovator IBD® 50 Fund (NAV) | $1,000.00 | $1,142.80 | $4.27 |
| * | Expenses are equal to the Funds’ annualized expense ratios, multiplied by the average account value over the period, multiplied by 182/365 (to reflect the six month period). |
ACADEMY FUNDS TRUST
Expense Example
For the Period Ended May 31, 2017 (Unaudited) (Continued)
Hypothetical Example for Comparison Purposes
The table below provides information about hypothetical account values and hypothetical expenses based on the Funds’ actual expense ratio and an assumed rate of return of 5% per year before expenses, which is not the Funds’ actual return. The hypothetical account values and expenses may not be used to estimate the actual ending account balance or expenses you paid for the period. You may use this information to compare the ongoing costs of investing in the Funds with other funds. To do so, compare this 5% hypothetical example with the 5% hypothetical examples that appear in the shareholder reports of other funds.
Please note that the expenses shown in the table are meant to highlight your ongoing costs only and do not reflect any transactional costs, such as brokerage commissions on the purchase and sale of Fund shares with respect to the Innovator IBD® 50 Fund. Therefore, the table below is useful in comparing the ongoing costs only, and will not help you determine the relative total costs of owning different funds. In addition, if these transactional costs were included, your costs could have been higher.
| | | | Expenses paid |
| | Beginning | Ending | during the |
| | account value | account value | period* |
| Innovator McKinley Income Fund | | | |
| Investor Class | $1,000.00 | $1,018.95 | $6.04 |
| Class I | $1,000.00 | $1,019.45 | $5.54 |
| | | | |
Innovator IBD® 50 Fund (NAV) | $1,000.00 | $1,020.94 | $4.03 |
| * | Expenses are equal to the Funds’ annualized expense ratios, multiplied by the average account value over the period, multiplied by 182/365 (to reflect the six month period). |
INNOVATOR MCKINLEY INCOME FUND
Schedule of Investments – May 31, 2017 (Unaudited)
| | | Shares | | | Value | |
| REAL ESTATE INVESTMENT TRUSTS – 10.27% | | | | | | |
| | | | | | | |
| Diversified – 2.30% | | | | | | |
| Hannon Armstrong Sustainable | | | | | | |
| Infrastructure Capital, Inc. | | | 33,046 | | | $ | 724,038 | |
| | | | | | | | | |
| Health Care – 2.52% | | | | | | | | |
| Omega Healthcare Investors, Inc. | | | 9,940 | | | | 311,321 | |
| Physicians Realty Trust | | | 23,784 | | | | 483,766 | |
| | | | | | | | 795,087 | |
| | | | | | | | | |
| Hotels – 1.26% | | | | | | | | |
| Hospitality Properties Trust | | | 13,710 | | | | 396,493 | |
| | | | | | | | | |
| Mortgage – 4.19% | | | | | | | | |
| Agree Realty Corp. | | | 5,503 | | | | 250,552 | |
| Capstead Mortgage Corp. | | | 29,461 | | | | 310,519 | |
| Invesco Mortgage Capital, Inc. | | | 27,128 | | | | 437,846 | |
| MFA Financial, Inc. | | | 38,403 | | | | 319,513 | |
| | | | | | | | 1,318,430 | |
| TOTAL REAL ESTATE INVESTMENT TRUSTS | | | | | | | | |
| (Cost $3,106,334) | | | | | | $ | 3,234,048 | |
| | | | | | | | | |
| COMMON STOCKS – 31.57% | | | | | | | | |
| | | | | | | | | |
| Amusement Parks and Arcades – 1.52% | | | | | | | | |
| Six Flags Entertainment Corp. | | | 7,932 | | | $ | 478,934 | |
| | | | | | | | | |
| Depository Credit Intermediation – 3.63% | | | | | | | | |
| Banco Santander SA – ADR | | | 87,519 | | | | 572,374 | |
| PacWest Bancorp. | | | 12,218 | | | | 570,214 | |
| | | | | | | | 1,142,588 | |
| | | | | | | | | |
| Other Financial Investment Activities – 1.31% | | | | | | | | |
| Just Energy Group, Inc. | | | 79,232 | | | | 414,383 | |
| | | | | | | | | |
| Other Telecommunications – 5.54% | | | | | | | | |
| AT&T, Inc. | | | 19,286 | | | | 743,090 | |
| CenturyLink, Inc. | | | 25,219 | | | | 629,214 | |
| Verizon Communications, Inc. | | | 8,033 | | | | 374,659 | |
| | | | | | | | 1,746,963 | |
The accompanying notes are an integral part of these financial statements.
INNOVATOR MCKINLEY INCOME FUND
Schedule of Investments – May 31, 2017 (Unaudited) (Continued)
| | | Shares | | | Value | |
| COMMON STOCKS (Continued) | | | | | | |
| | | | | | | |
| Other Transportation | | | | | | |
| Equipment Manufacturing – 0.59% | | | | | | |
| Ship Finance International Ltd. | | | 13,856 | | | $ | 187,056 | |
| | | | | | | | | |
| Petroleum and Coal Products Manufacturing – 3.54% | | | | | | | | |
| BP Plc – ADR | | | 13,822 | | | | 499,665 | |
| Royal Dutch Shell Plc – ADR | | | 11,309 | | | | 615,323 | |
| | | | | | | | 1,114,988 | |
| | | | | | | | | |
| Pharmaceutical and Medicine Manufacturing – 5.95% | | | | | | | | |
| AstraZeneca Plc – ADR | | | 23,538 | | | | 809,472 | |
| GlaxoSmithKline Plc – ADR | | | 12,621 | | | | 558,227 | |
| Merck & Co., Inc. | | | 7,775 | | | | 506,230 | |
| | | | | | | | 1,873,929 | |
| | | | | | | | | |
| Resin, Synthetic Rubber, and Artificial Synthetic | | | | | | | | |
| Fibers and Filaments Manufacturing – 0.88% | | | | | | | | |
| LyondellBasell Industries N.V. – Class A | | | 3,444 | | | | 277,311 | |
| | | | | | | | | |
| Tobacco Manufacturing – 7.53% | | | | | | | | |
| Altria Group, Inc. | | | 11,556 | | | | 871,784 | |
| Imperial Brands Plc – ADR | | | 6,471 | | | | 307,955 | |
| Reynolds American, Inc. | | | 6,283 | | | | 422,532 | |
| Vector Group Ltd. | | | 35,374 | | | | 769,031 | |
| | | | | | | | 2,371,302 | |
| | | | | | | | | |
| Traveler Accommodation – 1.08% | | | | | | | | |
| InterContinental Hotels Group Plc – ADR | | | 6,015 | | | | 340,088 | |
| TOTAL COMMON STOCKS | | | | | | | | |
| (Cost $9,102,183) | | | | | | $ | 9,947,542 | |
| | | | | | | | | |
| MASTER LIMITED PARTNERSHIPS – 31.54% | | | | | | | | |
| | | | | | | | | |
| Amusement Parks and Arcades – 3.14% | | | | | | | | |
| Cedar Fair L.P. | | | 13,934 | | | $ | 989,593 | |
| | | | | | | | | |
| Gasoline Stations – 2.39% | | | | | | | | |
| AmeriGas Partners L.P. | | | 16,952 | | | | 751,652 | |
The accompanying notes are an integral part of these financial statements.
INNOVATOR MCKINLEY INCOME FUND
Schedule of Investments – May 31, 2017 (Unaudited) (Continued)
| | | Shares | | | Value | |
| | | | | | | |
| MASTER LIMITED PARTNERSHIPS (Continued) | | | | | | |
| | | | | | | |
| Lessors of Real Estate – 2.07% | | | | | | |
| Icahn Enterprises L.P. | | | 13,683 | | | $ | 652,679 | |
| | | | | | | | | |
| Natural Gas Distribution – 1.61% | | | | | | | | |
| Antero Midstream Partners L.P. | | | 14,641 | | | | 507,164 | |
| | | | | | | | | |
| Oil and Gas Extraction – 1.90% | | | | | | | | |
| Enterprise Products Partners L.P. | | | 22,292 | | | | 597,649 | |
| | | | | | | | | |
| Other Financial Investment Activities – 13.12% | | | | | | | | |
| AllianceBernstein Holding L.P. | | | 34,644 | | | | 781,222 | |
| Apollo Global Management, LLC | | | 33,612 | | | | 908,532 | |
| Blackstone Group L.P. | | | 27,947 | | | | 918,897 | |
| KKR & Co. L.P. | | | 47,670 | | | | 878,082 | |
| The Carlyle Group L.P. | | | 36,709 | | | | 647,914 | |
| | | | | | | | 4,134,647 | |
| | | | | | | | | |
| Pipeline Transportation of Crude Oil – 5.12% | | | | | | | | |
| Energy Transfer Partners L.P. | | | 27,969 | | | | 608,605 | |
| Magellan Midstream Partners L.P. | | | 8,639 | | | | 627,105 | |
| Nustar Energy L.P. | | | 8,312 | | | | 378,861 | |
| | | | | | | | 1,614,571 | |
| | | | | | | | | |
| Scientific Research and Development Services – 2.19% | | | | | | | | |
| Enviva Partners L.P. | | | 24,523 | | | | 689,096 | |
| TOTAL MASTER LIMITED PARTNERSHIPS | | | | | | | | |
| (Cost $8,566,593) | | | | | | $ | 9,937,051 | |
| | | | | | | | | |
| BUSINESS DEVELOPMENT COMPANIES – 19.49% | | | | | | | | |
| | | | | | | | | |
| Closed-end Funds – 19.49% | | | | | | | | |
| Ares Capital Corp. | | | 59,775 | | | $ | 995,254 | |
| Goldman Sachs BDC, Inc. | | | 28,081 | | | | 626,487 | |
| Golub Capital BDC, Inc. | | | 15,976 | | | | 324,792 | |
| Hercules Capital, Inc. | | | 45,642 | | | | 594,715 | |
| Main Street Capital Corp. | | | 24,401 | | | | 930,166 | |
| Newtek Business Services Corp. | | | 36,890 | | | | 624,179 | |
| OFS Capital Corp. | | | 27,679 | | | | 389,443 | |
The accompanying notes are an integral part of these financial statements.
INNOVATOR MCKINLEY INCOME FUND
Schedule of Investments – May 31, 2017 (Unaudited) (Continued)
| | | Shares | | | Value | |
| | | | | | | |
| BUSINESS DEVELOPMENT COMPANIES (Continued) | | | | | | |
| | | | | | | |
| Closed-end Funds (Continued) | | | | | | |
| Prospect Capital Corp. | | | 92,748 | | | $ | 740,129 | |
| Solar Capital Ltd. | | | 42,419 | | | | 916,675 | |
| TOTAL BUSINESS DEVELOPMENT COMPANIES | | | | | | | | |
| (Cost $5,423,912) | | | | | | $ | 6,141,840 | |
| | | | | | | | | |
| | | | | | | | | |
| INVESTMENT COMPANIES – 3.71% | | | | | | | | |
| | | | | | | | | |
| Closed-end Funds – 3.71% | | | | | | | | |
| Cohen & Steers Infrastructure Fund, Inc. | | | 26,471 | | | $ | 611,745 | |
| Nuveen Floating Rate Income Fund | | | 46,579 | | | | 556,619 | |
| TOTAL INVESTMENT COMPANIES | | | | | | | | |
| (Cost $1,083,030) | | | | | | $ | 1,168,364 | |
| | | | | | | | | |
| | | | | | | | | |
| SHORT TERM INVESTMENTS – 3.66% | | | | | | | | |
| | | | | | | | | |
| Money Market Funds – 3.66% | | | | | | | | |
| Fidelity Government Portfolio – Class I, 0.64% (a) | | | 1,153,874 | | | $ | 1,153,874 | |
| TOTAL SHORT TERM INVESTMENTS | | | | | | | | |
| (Cost $1,153,874) | | | | | | $ | 1,153,874 | |
| | | | | | | | | |
| Total Investments (Cost $28,435,926) – 100.24% | | | | | | $ | 31,582,719 | |
| Liabilities in Excess of Other Assets – (0.24)% | | | | | | | (74,440 | ) |
| TOTAL NET ASSETS – 100.00% | | | | | | $ | 31,508,279 | |
| | | | | | | | | |
Percentages are stated as a percent of net assets.
| (a) | Represents annualized seven-day yield as of the end of the reporting period. |
ADR American Depositary Receipt
The accompanying notes are an integral part of these financial statements.
INNOVATOR IBD® 50 FUND
Schedule of Investments – May 31, 2017 (Unaudited)
| | | Shares | | | Value | |
| | | | | | | |
| COMMON STOCKS – 99.93% | | | | | | |
| | | | | | | |
| Business Support Services – 2.54% | | | | | | |
| PayPal Holdings, Inc. (a) | | | 4,027 | | | $ | 210,250 | |
| TransUnion (a) | | | 19,092 | | | | 834,511 | |
| | | | | | | | 1,044,761 | |
| | | | | | | | | |
| Communications Equipment Manufacturing – 3.42% | | | | | | | | |
| Lumentum Holdings, Inc. (a) | | | 24,604 | | | | 1,403,658 | |
| | | | | | | | | |
| Computer and Peripheral | | | | | | | | |
| Equipment Manufacturing – 3.51% | | | | | | | | |
| Arista Networks, Inc. (a) | | | 9,777 | | | | 1,440,934 | |
| | | | | | | | | |
| Computer Systems Design and Related Services – 3.79% | | | | | | | | |
| Control4 Corp. (a) | | | 78,366 | | | | 1,555,565 | |
| | | | | | | | | |
| Depository Credit Intermediation – 0.51% | | | | | | | | |
| HDFC Bank Ltd. – ADR | | | 2,367 | | | | 207,823 | |
| | | | | | | | | |
| Electronic Shopping and Mail-Order Houses – 2.95% | | | | | | | | |
| MercadoLibre, Inc. | | | 4,406 | | | | 1,212,135 | |
| | | | | | | | | |
| Health and Personal Care Stores – 1.01% | | | | | | | | |
| ULTA Salon, Cosmetics & Fragrance, Inc. (a) | | | 1,357 | | | | 413,668 | |
| | | | | | | | | |
| Home Furnishings Stores – 2.97% | | | | | | | | |
| Floor & Decor Holdings, Inc. (a) | | | 31,469 | | | | 1,218,164 | |
| | | | | | | | | |
| Independent Artists, Writers, and Performers – 1.00% | | | | | | | | |
| Activision Blizzard, Inc. | | | 7,020 | | | | 411,232 | |
| | | | | | | | | |
| Insurance Carriers – 3.01% | | | | | | | | |
| Essent Group Ltd. (a) | | | 34,059 | | | | 1,235,320 | |
| | | | | | | | | |
| Medical Equipment and | | | | | | | | |
| Supplies Manufacturing – 1.51% | | | | | | | | |
| Align Technology, Inc. (a) | | | 1,434 | | | | 208,216 | |
| Edwards Lifesciences Corp. (a) | | | 1,794 | | | | 206,436 | |
| Stryker Corp. | | | 1,448 | | | | 207,006 | |
| | | | | | | | 621,658 | |
The accompanying notes are an integral part of these financial statements.
INNOVATOR IBD® 50 FUND
Schedule of Investments – May 31, 2017 (Unaudited) (Continued)
| | | Shares | | | Value | |
| COMMON STOCKS (Continued) | | | | | | |
| | | | | | | |
| Navigational, Measuring, Electromedical, and | | | | | | |
| Control Instruments Manufacturing – 8.44% | | | | | | |
| Cognex Corp. | | | 15,488 | | | $ | 1,417,307 | |
| Coherent, Inc. (a) | | | 4,944 | | | | 1,226,854 | |
| Mercury Systems, Inc. (a) | | | 20,703 | | | | 823,358 | |
| | | | | | | | 3,467,519 | |
| | | | | | | | | |
| Other Amusement and Recreation Industries – 0.50% | | | | | | | | |
| Global Payments, Inc. | | | 2,235 | | | | 204,748 | |
| | | | | | | | | |
| Other General Merchandise Stores – 0.98% | | | | | | | | |
| Five Below, Inc. (a) | | | 7,875 | | | | 403,988 | |
| | | | | | | | | |
| Other Information Services – 5.97% | | | | | | | | |
| Alibaba Group Holding Ltd. – ADR (a) | | | 6,637 | | | | 812,767 | |
| Facebook, Inc. (a) | | | 2,698 | | | | 408,639 | |
| NetEase, Inc. – ADR | | | 1,425 | | | | 405,812 | |
| YY, Inc. – ADR (a) | | | 14,120 | | | | 823,760 | |
| | | | | | | | 2,450,978 | |
| | | | | | | | | |
| Other Miscellaneous Store Retailers – 2.04% | | | | | | | | |
| Stamps.com, Inc. (a) | | | 6,076 | | | | 837,880 | |
| | | | | | | | | |
| Other Schools and Instruction – 5.53% | | | | | | | | |
| New Oriental Education & | | | | | | | | |
| Technology Group, Inc. – ADR (a) | | | 11,646 | | | | 834,669 | |
| TAL Education Group – ADR | | | 12,345 | | | | 1,437,822 | |
| | | | | | | | 2,272,491 | |
| | | | | | | | | |
| Other Telecommunications – 3.00% | | | | | | | | |
| Autohome, Inc. – ADR (a) | | | 29,056 | | | | 1,231,393 | |
| | | | | | | | | |
| Pesticide, Fertilizer, and Other | | | | | | | | |
| Agricultural Chemical Manufacturing – 0.48% | | | | | | | | |
| The Chemours Co. | | | 4,968 | | | | 198,670 | |
| | | | | | | | | |
| Pharmaceutical and Medicine Manufacturing – 3.01% | | | | | | | | |
| IDEXX Laboratories, Inc. (a) | | | 7,346 | | | | 1,236,993 | |
The accompanying notes are an integral part of these financial statements.
INNOVATOR IBD® 50 FUND
Schedule of Investments – May 31, 2017 (Unaudited) (Continued)
| | | Shares | | | Value | |
| COMMON STOCKS (Continued) | | | | | | |
| | | | | | | |
| Professional and Commercial Equipment and | | | | | | |
| Supplies Merchant Wholesalers – 3.47% | | | | | | |
| Paycom Software, Inc. (a) | | | 21,782 | | | $ | 1,425,414 | |
| | | | | | | | | |
| Rail Transportation – 0.50% | | | | | | | | |
| CSX Corp. | | | 3,792 | | | | 205,413 | |
| | | | | | | | | |
| Restaurants and Other Eating Places – 3.04% | | | | | | | | |
| Dave & Buster’s Entertainment, Inc. (a) | | | 18,698 | | | | 1,247,157 | |
| | | | | | | | | |
| Scientific Research and Development Services – 1.01% | | | | | | | | |
| PRA Health Sciences, Inc. (a) | | | 5,723 | | | | 413,487 | |
| | | | | | | | | |
| Securities and Commodity Exchanges – 0.50% | | | | | | | | |
| CBOE Holdings, Inc. | | | 2,373 | | | | 204,956 | |
| | | | | | | | | |
| Semiconductor and Other Electronic | | | | | | | | |
| Component Manufacturing – 21.88% | | | | | | | | |
| Applied Materials, Inc. | | | 27,079 | | | | 1,242,385 | |
| Cavium, Inc. (a) | | | 11,104 | | | | 810,259 | |
| Cirrus Logic, Inc. (a) | | | 6,244 | | | | 411,792 | |
| Ichor Holdings Ltd. (a) | | | 16,972 | | | | 398,503 | |
| Lam Research Corp. | | | 9,175 | | | | 1,423,685 | |
| MACOM Technology Solutions Holdings, Inc. (a) | | | 13,499 | | | | 823,034 | |
| Microchip Technology, Inc. | | | 9,968 | | | | 830,334 | |
| NVIDIA Corp. | | | 9,935 | | | | 1,434,116 | |
| Taiwan Semiconductor Manufacturing Co. Ltd. – ADR | | | 11,503 | | | | 406,746 | |
| Zebra Technologies Corp. (a) | | | 11,559 | | | | 1,206,066 | |
| | | | | | | | 8,986,920 | |
| | | | | | | | | |
| Software Publishers – 7.97% | | | | | | | | |
| LogMeIn, Inc. | | | 11,170 | | | | 1,239,870 | |
| Medidata Solutions, Inc. (a) | | | 5,784 | | | | 411,705 | |
| Momo, Inc. – ADR (a) | | | 5,533 | | | | 210,475 | |
| Veeva Systems, Inc. (a) | | | 22,178 | | | | 1,409,191 | |
| | | | | | | | 3,271,241 | |
| | | | | | | | | |
| Sound Recording Industries – 3.39% | | | | | | | | |
| SINA Corp. (a) | | | 14,203 | | | | 1,391,468 | |
The accompanying notes are an integral part of these financial statements.
INNOVATOR IBD® 50 FUND
Schedule of Investments – May 31, 2017 (Unaudited) (Continued)
| | | Shares | | | Value | |
| COMMON STOCKS (Continued) | | | | | | |
| | | | | | | |
| Specialty Food Stores – 2.00% | | | | | | |
| GrubHub, Inc. (a) | | | 18,912 | | | $ | 822,105 | |
| TOTAL COMMON STOCKS | | | | | | | | |
| (Cost $35,993,343) | | | | | | $ | 41,037,739 | |
| | | | | | | | | |
| SHORT TERM INVESTMENTS – 0.22% | | | | | | | | |
| | | | | | | | | |
| Money Market Funds – 0.22% | | | | | | | | |
| Fidelity Government Portfolio – Class I, 0.64% (b) | | | 90,058 | | | $ | 90,058 | |
| TOTAL SHORT TERM INVESTMENTS | | | | | | | | |
| (Cost $90,058) | | | | | | $ | 90,058 | |
| | | | | | | | | |
| Total Investments (Cost $36,083,401) – 100.15% | | | | | | $ | 41,127,797 | |
| Liabilities in Excess of Other Assets – (0.15)% | | | | | | | (62,331 | ) |
| TOTAL NET ASSETS – 100.00% | | | | | | $ | 41,065,466 | |
Percentages are stated as a percent of net assets.
| (a) | Non-income producing security. |
| (b) | Represents annualized seven-day yield as of the end of the reporting period. |
ADR American Depositary Receipt
The accompanying notes are an integral part of these financial statements.
ACADEMY FUNDS TRUST
Statement of Assets and Liabilities
May 31, 2017 (Unaudited)
| | | Innovator | | | Innovator | |
| | | McKinley Income | | | IBD® 50 | |
| | | Fund | | | Fund | |
| Assets: | | | | | | |
| Investments, at value* | | $ | 31,582,719 | | | $ | 41,127,797 | |
| Dividends, interest and other receivables | | | 85,148 | | | | 14,189 | |
| Receivable for investments sold | | | — | | | | 3,817,011 | |
| Prepaid expenses | | | 17,413 | | | | 3,226 | |
| Total Assets | | | 31,685,280 | | | | 44,962,223 | |
| | | | | | | | | |
| Liabilities: | | | | | | | | |
| Payable for fund shares redeemed | | | 300 | | | | — | |
| Payable to Advisor | | | 12,763 | | | | 13,673 | |
| Payable for investments purchased | | | — | | | | 3,814,216 | |
| Accrued 12b-1 fees – Investor Class | | | 81,612 | | | | — | |
| Payable to Trustees | | | 1,310 | | | | 2,062 | |
| Accrued expenses and other liabilities | | | 81,016 | | | | 66,806 | |
| Total Liabilities | | | 177,001 | | | | 3,896,757 | |
| Net Assets | | $ | 31,508,279 | | | $ | 41,065,466 | |
| | | | | | | | | |
| Net Assets Consist of: | | | | | | | | |
| Capital Stock | | $ | 50,178,614 | | | $ | 46,053,637 | |
| Undistributed net investment income/(loss) | | | (75,742 | ) | | | (131,073 | ) |
| Accumulated net realized gain/(loss) | | | (21,741,386 | ) | | | (9,901,494 | ) |
| Net unrealized appreciation/(depreciation) on | | | | | | | | |
| investments and foreign currency | | | 3,146,793 | | | | 5,044,396 | |
| Net Assets | | $ | 31,508,279 | | | $ | 41,065,466 | |
| | | | | | | | | |
| | | | | | | | | |
| Total Fund: | | | | | | | | |
| Net Assets | | | N/A | | | | 41,065,466 | |
| Shares of beneficial interest outstanding | | | | | | | | |
| (unlimited shares without par value authorized) | | | N/A | | | | 1,500,000 | |
| Net asset value price per share | | | N/A | | | $ | 27.38 | |
| | | | | | | | | |
| Investor Class: | | | | | | | | |
| Net Assets | | | 31,502,603 | | | | N/A | |
| Shares of beneficial interest outstanding | | | | | | | | |
| (unlimited shares without par value authorized) | | | 1,980,111 | | | | N/A | |
| Net asset value price per share | | $ | 15.91 | | | | N/A | |
| | | | | | | | | |
| Class I: | | | | | | | | |
| Net Assets | | | 5,676 | | | | N/A | |
| Shares of beneficial interest outstanding | | | | | | | | |
| (unlimited shares without par value authorized) | | | 318 | | | | N/A | |
| Net asset value price per share | | $ | 17.87 | | | | N/A | |
| * Cost of investments | | $ | 28,435,926 | | | $ | 36,083,401 | |
| | | | | | | | | |
The accompanying notes are an integral part of these financial statements.
ACADEMY FUNDS TRUST
Statement of Operations
For the Period Ended May 31, 2017 (Unaudited)
| | | Innovator | | | Innovator | |
| | | McKinley Income | | | IBD® 50 | |
| | | Fund | | | Fund | |
| Investment Income: | | | | | | |
| Dividends | | $ | 863,650 | (1) | | $ | 110,873 | |
| Interest | | | 2,760 | | | | 184 | |
| | | | 866,410 | | | | 111,057 | |
| Expenses: | | | | | | | | |
| Investment advisory fee | | | 156,933 | | | | 130,924 | |
| Professional fees | | | 19,208 | | | | 19,838 | |
| Administration fees | | | 17,472 | | | | 26,572 | |
| Fund accounting fees | | | 15,567 | | | | 2,087 | |
| Transfer agent fees and expenses | | | 16,259 | | | | — | |
| 12b-1 fees – Investor Class | | | 15,690 | | | | N/A | |
| Trustee fees and expenses | | | 3,009 | | | | 3,264 | |
| Printing and mailing expenses | | | 7,765 | | | | 6,892 | |
| Custody fees | | | 2,768 | | | | 8,045 | |
| Insurance expense | | | 2,208 | | | | 3,155 | |
| Registration fees | | | 13,941 | | | | — | |
| Other expenses | | | 1,941 | | | | 7,280 | |
| Total expenses before expense limitation | | | 272,761 | | | | 208,057 | |
| Less: Advisory fees waived | | | (84,444 | ) | | | (58,429 | ) |
| Net expenses | | | 188,317 | | | | 149,628 | |
| Net Investment Income/(Loss) | | | 678,093 | | | | (38,571 | ) |
| | | | | | | | | |
| Realized and Unrealized Gain/(Loss): | | | | | | | | |
| Net realized gain/(loss) on: | | | | | | | | |
| investments | | | 531,683 | | | | 4,025,860 | |
| redemptions sold in-kind | | | — | | | | 189,346 | |
| Net change in unrealized appreciation/(depreciation) | | | | | | | | |
| on investments and foreign currency transactions | | | 1,327,765 | | | | 860,996 | |
| Net realized and unrealized gain/(loss) on investments | | | 1,859,448 | | | | 5,076,202 | |
| | | | | | | | | |
| Net Increase/(Decrease) in Net Assets | | | | | | | | |
| Resulting from Operations | | $ | 2,537,541 | | | $ | 5,037,631 | |
| (1) | Net of foreign withholding taxes of $5,459. |
The accompanying notes are an integral part of these financial statements.
INNOVATOR MCKINLEY INCOME FUND
Statement of Changes in Net Assets
| | | Period Ended | | | Year Ended | |
| | | May 31, | | | November 30, | |
| | | 2017 | | | 2016 | |
| | | (Unaudited) | | | | |
| Operations: | | | | | | |
| Net investment income/(loss) | | $ | 678,093 | | | $ | 1,160,293 | |
| Net realized gain/(loss) on investments | | | 531,683 | | | | (4,233,311 | ) |
| Net change in unrealized appreciation/(depreciation) | | | | | | | | |
| on investments and foreign currency | | | 1,327,765 | | | | 4,546,719 | |
| Net increase/(decrease) in net assets | | | | | | | | |
| resulting from operations | | | 2,537,541 | | | | 1,473,701 | |
| | | | | | | | | |
| Dividends and distributions to shareholders: | | | | | | | | |
| Net investment income – Investor Class | | | (2,029,417 | ) | | | (2,474,890 | ) |
| Net investment income – Class I | | | (320 | ) | | | (344 | ) |
| Total dividends and distributions | | | (2,029,737 | ) | | | (2,475,234 | ) |
| | | | | | | | | |
| Fund Share Transactions: | | | | | | | | |
| Investor Class Shares | | | | | | | | |
| Proceeds from shares sold | | | 1,091,302 | | | | 1,330,989 | |
| Proceeds from shares issued in connection | | | | | | | | |
with acquisition(1) | | | — | | | | 18,539,338 | |
| Shares issued to holders in | | | | | | | | |
| reinvestment of dividends | | | 1,912,343 | | | | 2,358,559 | |
| Cost of shares redeemed | | | (3,266,574 | ) | | | (26,732,499 | ) |
| Net increase/(decrease) in net assets from | | | | | | | | |
| capital share transactions | | | (262,929 | ) | | | (4,503,613 | ) |
| Class I Shares | | | | | | | | |
| Proceeds from shares sold | | | — | | | | — | |
| Shares issued to holders in reinvestment of dividends | | | 320 | | | | 344 | |
| Cost of shares redeemed | | | — | | | | (4,572,041 | ) |
| Net increase/(decrease) in net assets | | | | | | | | |
| from capital share transactions | | | 320 | | | | (4,571,697 | ) |
| Total increase/(decrease) in net assets | | $ | 245,195 | | | $ | (10,076,843 | ) |
The accompanying notes are an integral part of these financial statements.
INNOVATOR MCKINLEY INCOME FUND
Statement of Changes in Net Assets (Continued)
| | | Period Ended | | | Year Ended | |
| | | May 31, | | | November 30, | |
| | | 2017 | | | 2016 | |
| | | (Unaudited) | | | | |
| Net Assets: | | | | | | |
| Beginning of period | | $ | 31,263,084 | | | $ | 41,339,927 | |
| End of period* | | $ | 31,508,279 | | | $ | 31,263,084 | |
| * Including undistributed net investment income/(loss) of | | $ | (75,742 | ) | | $ | 1,275,902 | |
| | | | | | | | | |
| Change in Shares Outstanding: | | | | | | | | |
| Investor Class | | | | | | | | |
| Shares sold | | | 68,682 | | | | 87,219 | |
Shares sold in connection with acquisition(1) | | | — | | | | 1,320,286 | |
| Shares issued to holders in reinvestment of dividends | | | 123,902 | | | | 149,456 | |
| Shares redeemed | | | (205,364 | ) | | | (1,727,624 | ) |
| Net increase/(decrease) | | | (12,780 | ) | | | (170,663 | ) |
| Class I | | | | | | | | |
| Shares sold | | | — | | | | — | |
| Shares issued to holders in reinvestment of dividends | | | 19 | | | | 19 | |
| Shares redeemed | | | — | | | | (273,284 | ) |
| Net increase/(decrease) | | | 19 | | | | (273,265 | ) |
| (1) | On February 12, 2016, the McKinley Diversified Income Fund merged into the Investor Class of IMIFX-IMIIX. See Note 1 of the Notes to the Financial Statements. |
The accompanying notes are an integral part of these financial statements.
INNOVATOR IBD® 50 FUND
Statement of Changes in Net Assets
| | | Period Ended | | | Year Ended | |
| | | May 31, | | | November 30, | |
| | | 2017 | | | 2016 | |
| | (Unaudited) | | | | |
| Operations: | | | | | | |
| Net investment income/(loss) | | $ | (38,571 | ) | | $ | (56,528 | ) |
| Net realized gain/(loss) on investments | | | 4,215,206 | | | | (1,841,798 | ) |
| Net change in unrealized appreciation/(depreciation) | | | | | | | | |
| on investments | | | 860,996 | | | | (1,434,392 | ) |
| Net increase/(decrease) in net assets | | | | | | | | |
| resulting from operations | | | 5,037,631 | | | | (3,332,718 | ) |
| | | | | | | | | |
| Dividends and distributions to shareholders: | | | | | | | | |
| Net investment income | | | — | | | | — | |
| Net realized gains | | | — | | | | — | |
| Total dividends and distributions | | | — | | | | — | |
| | | | | | | | | |
| Fund Share Transactions: | | | | | | | | |
| Total Fund Shares | | | | | | | | |
| Proceeds from shares sold | | | 1,365,880 | | | | — | |
| Shares issued to holders in reinvestment of dividends | | | — | | | | — | |
| Cost of shares redeemed in-kind | | | (1,268,980 | ) | | | (31,348,295 | ) |
| Net increase/(decrease) in net assets | | | | | | | | |
| from capital share transactions | | | 96,900 | | | | (31,348,295 | ) |
| Total increase/(decrease) in net assets | | | 5,134,531 | | | | (34,681,013 | ) |
| Net Assets: | | | | | | | | |
| Beginning of period | | | 35,930,935 | | | | 70,611,948 | |
| End of period* | | $ | 41,065,466 | | | $ | 35,930,935 | |
| * Including undistributed net | | | | | | | | |
| investment income/(loss) of | | $ | (131,073 | ) | | $ | (92,502 | ) |
| | | | | | | | | |
| | | | | | | | | |
| Change in Shares Outstanding: | | | | | | | | |
| Total Fund | | | | | | | | |
| Shares sold | | | 50,000 | | | | — | |
| Shares issued to holders in reinvestment of dividends | | | — | | | | — | |
| Shares redeemed in-kind | | | (50,000 | ) | | | (1,500,000 | ) |
| Net increase/(decrease) | | | — | | | | (1,500,000 | ) |
The accompanying notes are an integral part of these financial statements.
(This Page Intentionally Left Blank.)
INNOVATOR MCKINLEY INCOME FUND
Financial Highlights
INVESTOR CLASS
| | | | | | | | | | | | | | | | | | From | |
| | | | | | | | | | | | | | | | | | January 31, | |
| | | | | | | | | | | | | | | | | | 2012 | |
| | | Period | | | | | | | | | Period | | | Year | | | (Inception | |
| | | Ended | | | Year Ended | | | Ended | | | Ended | | | Date) to | |
| | | May 31, | | | November 30, | | | Nov. 30, | | | Dec. 31, | | | Dec. 31, | |
| | | 2017 | | | 2016 | | | 2015 | | | 2014(6) | | | 2013 | | | 2012 | |
| | | (Unaudited) | | | | | | | | | | | | | | | | |
| Per share operating | | | | | | | | | | | | | | | | | | |
| performance | | | | | | | | | | | | | | | | | | |
| (For a share outstanding | | | | | | | | | | | | | | | | | | |
| throughout each period) | | | | | | | | | | | | | | | | | | |
| Net asset value, | | | | | | | | | | | | | | | | | | |
| beginning of period | | $ | 15.68 | | | $ | 16.97 | | | $ | 19.72 | | | $ | 20.27 | | | $ | 19.28 | | | $ | 20.00 | |
| | | | | | | | | | | | | | | | | | | | | | | | | |
| Operations: | | | | | | | | | | | | | | | | | | | | | | | | |
| Net investment | | | | | | | | | | | | | | | | | | | | | | | | |
| income/(loss) | | | 0.34 | (5) | | | 0.54 | (5) | | | 0.98 | (5) | | | 0.74 | (5) | | | 1.02 | (5) | | | 1.02 | |
| Net realized and | | | | | | | | | | | | | | | | | | | | | | | | |
| unrealized gain/(loss) | | | 0.94 | | | | (0.65 | ) | | | (2.77 | ) | | | (0.35 | ) | | | 0.95 | | | | (0.72 | ) |
| Total from investment | | | | | | | | | | | | | | | | | | | | | | | | |
| operations | | | 1.28 | | | | (0.11 | ) | | | (1.79 | ) | | | 0.39 | | | | 1.97 | | | | 0.30 | |
| | | | | | | | | | | | | | | | | | | | | | | | | |
| Dividends and distributions | | | | | | | | | | | | | | | | | | | | | | | | |
| to shareholders: | | | | | | | | | | | | | | | | | | | | | | | | |
| Dividends from net | | | | | | | | | | | | | | | | | | | | | | | | |
| investment income | | | (1.05 | ) | | | (1.18 | ) | | | (0.96 | ) | | | (0.78 | ) | | | (0.94 | ) | | | (1.02 | ) |
| Distributions from | | | | | | | | | | | | | | | | | | | | | | | | |
| net realized gains | | | — | | | | — | | | | — | | | | — | | | | (0.04 | ) | | | — | |
| Return of | | | | | | | | | | | | | | | | | | | | | | | | |
| capital distributions | | | — | | | | — | | | | — | | | | (0.16 | ) | | | — | | | | — | |
| Total dividends | | | | | | | | | | | | | | | | | | | | | | | | |
| and distributions | | | (1.05 | ) | | | (1.18 | ) | | | (0.96 | ) | | | (0.94 | ) | | | (0.98 | ) | | | (1.02 | ) |
| Change in net asset | | | | | | | | | | | | | | | | | | | | | | | | |
| value for the period | | | 0.23 | | | | (1.29 | ) | | | (2.75 | ) | | | (0.55 | ) | | | 0.99 | | | | (0.72 | ) |
| Redemption fees per share | | | — | | | | — | | | | 0.00 | (3)(5) | | | 0.00 | (3)(5) | | | 0.00 | (3)(5) | | | 0.00 | (3) |
| Net asset value, | | | | | | | | | | | | | | | | | | | | | | | | |
| end of period | | $ | 15.91 | | | $ | 15.68 | | | $ | 16.97 | | | $ | 19.72 | | | $ | 20.27 | | | $ | 19.28 | |
| | | | | | | | | | | | | | | | | | | | | | | | | |
| Total return | | | 8.45 | %(2) | | | 1.15 | %(8) | | | -9.36 | % | | | 1.79 | %(2) | | | 10.39 | % | | | 1.48 | %(2) |
The accompanying notes are an integral part of these financial statements.
INNOVATOR MCKINLEY INCOME FUND
Financial Highlights (Continued)
INVESTOR CLASS
| | | | | | | | | | | | | | | | | | From | |
| | | | | | | | | | | | | | | | | | January 31, | |
| | | | | | | | | | | | | | | | | | 2012 | |
| | | Period | | | | | | | | | Period | | | Year | | | (Inception | |
| | | Ended | | | Year Ended | | | Ended | | | Ended | | | Date) to | |
| | | May 31, | | | November 30, | | | Nov. 30, | | | Dec. 31, | | | Dec. 31, | |
| | | 2017 | | | 2016 | | | 2015 | | | 2014(6) | | | 2013 | | | 2012 | |
| | | (Unaudited) | | | | | | | | | | | | | | | | |
| Ratios/supplemental data: | | | | | | | | | | | | | | | | | | |
| Net assets, | | | | | | | | | | | | | | | | | | |
| end of period (000) | | $ | 31,503 | | | $ | 31,258 | | | $ | 36,706 | | | $ | 97,659 | | | $ | 104,097 | | | $ | 75,884 | |
| Ratio of net expenses | | | | | | | | | | | | | | | | | | | | | | | | |
| to average net assets: | | | | | | | | | | | | | | | | | | | | | | | | |
| Before expense limitation | | | | | | | | | | | | | | | | | | | | | | | | |
arrangement(4)(7) | | | 1.74 | %(1) | | | 1.81 | % | | | 1.63 | % | | | 1.54 | %(1) | | | 1.57 | % | | | 1.68 | %(1) |
| After expense limitation | | | | | | | | | | | | | | | | | | | | | | | | |
arrangement(4)(7) | | | 1.20 | %(1) | | | 1.22 | % | | | 1.36 | % | | | 1.36 | %(1) | | | 1.35 | % | | | 1.35 | %(1) |
| Ratio of net investment | | | | | | | | | | | | | | | | | | | | | | | | |
| income/(loss) to | | | | | | | | | | | | | | | | | | | | | | | | |
| average net assets: | | | | | | | | | | | | | | | | | | | | | | | | |
| Before expense limitation | | | | | | | | | | | | | | | | | | | | | | | | |
arrangement(4) | | | 3.78 | %(1) | | | 2.83 | % | | | 4.99 | % | | | 3.67 | %(1) | | | 4.86 | % | | | 6.05 | %(1) |
| After expense limitation | | | | | | | | | | | | | | | | | | | | | | | | |
arrangement(4) | | | 4.32 | %(1) | | | 3.42 | % | | | 5.26 | % | | | 3.85 | %(1) | | | 5.08 | % | | | 6.38 | %(1) |
| Portfolio turnover rate | | | 23 | % | | | 64 | % | | | 73 | % | | | 40 | % | | | 91 | % | | | 46 | % |
| (1) | Annualized. |
| (2) | Not annualized. |
| (3) | Amount calculated is less than $0.005 per share. |
| (4) | Does not include expenses of investment companies in which the Fund invests. |
| (5) | Net investment income/(loss) and redemption fees per share have been calculated based on average shares outstanding during the period. |
| (6) | The period ended November 30, 2014 consists of eleven months due to the Fund’s fiscal year end change. |
| (7) | The ratio of expenses to average net assets includes interest expense and proxy expense where applicable. See Note 4 in the Notes to the Financial Statements. |
| (8) | Includes performance history based off of the historical performance of an acquired fund in a Plan of Reorganization. See Note 1 in the Notes to the Financial Statements. |
The accompanying notes are an integral part of these financial statements.
INNOVATOR MCKINLEY INCOME FUND
Financial Highlights
CLASS I
| | | | | | | | | | | | | | | From | |
| | | | | | | | | | | | | | | April 2, | |
| | | | | | | | | | | | | | | 2013 | |
| | | Period | | | | | | | | | Period | | | (Inception | |
| | | Ended | | | Year Ended | | | Ended | | | Date) to | |
| | | May 31, | | | November 30, | | | November 30, | | | December 31, | |
| | | 2017 | | | 2016 | | | 2015 | | | 2014(5) | | | 2013 | |
| | | (Unaudited) | | | | | | | | | | | | | |
| Per share operating | | | | | | | | | | | | | | | |
| performance | | | | | | | | | | | | | | | |
| (For a share outstanding | | | | | | | | | | | | | | | |
| throughout each period) | | | | | | | | | | | | | | | |
| Net asset value, | | | | | | | | | | | | | | | |
| beginning of period | | $ | 17.49 | | | $ | 16.94 | | | $ | 19.69 | | | $ | 20.24 | | | $ | 20.57 | |
| | | | | | | | | | | | | | | | | | | | | |
| Operations: | | | | | | | | | | | | | | | | | | | | |
| Net investment | | | | | | | | | | | | | | | | | | | | |
income/(loss)(4) | | | 0.39 | | | | 0.43 | | | | 1.02 | | | | 0.78 | | | | 0.79 | |
| Net realized and | | | | | | | | | | | | | | | | | | | | |
| unrealized gain/(loss) | | | 1.05 | | | | 1.32 | | | | (2.77 | ) | | | (0.34 | ) | | | (0.37 | ) |
| Total from investment | | | | | | | | | | | | | | | | | | | | |
| operations | | | 1.44 | | | | 1.75 | | | | (1.75 | ) | | | 0.44 | | | | 0.42 | |
| | | | | | | | | | | | | | | | | | | | | |
| Dividends and distributions | | | | | | | | | | | | | | | | | | | | |
| to shareholders: | | | | | | | | | | | | | | | | | | | | |
| Dividends from net | | | | | | | | | | | | | | | | | | | | |
| investment income | | | (1.06 | ) | | | (1.20 | ) | | | (1.00 | ) | | | (0.83 | ) | | | (0.71 | ) |
| Distributions from | | | | | | | | | | | | | | | | | | | | |
| net realized gains | | | — | | | | — | | | | — | | | | — | | | | (0.04 | ) |
| Return of | | | | | | | | | | | | | | | | | | | | |
| capital distributions | | | — | | | | — | | | | — | | | | (0.16 | ) | | | — | |
| Total dividends | | | | | | | | | | | | | | | | | | | | |
| and distributions | | | (1.06 | ) | | | (1.20 | ) | | | (1.00 | ) | | | (0.99 | ) | | | (0.75 | ) |
| Change in net asset | | | | | | | | | | | | | | | | | | | | |
| value for the period | | | 0.38 | | | | 0.55 | | | | (2.75 | ) | | | (0.55 | ) | | | (0.33 | ) |
| Net asset value, | | | | | | | | | | | | | | | | | | | | |
| end of period | | $ | 17.87 | | | $ | 17.49 | | | $ | 16.94 | | | $ | 19.69 | | | $ | 20.24 | |
| | | | | | | | | | | | | | | | | | | | | |
| Total return | | | 8.48 | %(3) | | | 1.21 | %(7) | | | -9.15 | % | | | 2.03 | %(3) | | | 2.19 | %(3) |
The accompanying notes are an integral part of these financial statements.
INNOVATOR MCKINLEY INCOME FUND
Financial Highlights (Continued)
CLASS I
| | | | | | | | | | | | | | | From | |
| | | | | | | | | | | | | | | April 2, | |
| | | | | | | | | | | | | | | 2013 | |
| | | Period | | | | | | | | | Period | | | (Inception | |
| | | Ended | | | Year Ended | | | Ended | | | Date) to | |
| | | May 31, | | | November 30, | | | November 30, | | | December 31, | |
| | | 2017 | | | 2016 | | | 2015 | | | 2014(5) | | | 2013 | |
| | | (Unaudited) | | | | | | | | | | | | | |
| Ratios/supplemental data: | | | | | | | | | | | | | | | |
| Net assets, end of period (000) | | $ | 6 | | | $ | 5 | | | $ | 4,634 | | | $ | 5,101 | | | $ | 5,001 | |
| Ratio of net expenses | | | | | | | | | | | | | | | | | | | | |
| to average net assets: | | | | | | | | | | | | | | | | | | | | |
| Before expense limitation | | | | | | | | | | | | | | | | | | | | |
arrangement(2)(6) | | | 1.64 | %(1) | | | 1.70 | % | | | 1.38 | % | | | 1.29 | %(1) | | | 1.32 | %(1) |
| After expense limitation | | | | | | | | | | | | | | | | | | | | |
arrangement(2)(6) | | | 1.10 | %(1) | | | 1.11 | % | | | 1.11 | % | | | 1.11 | %(1) | | | 1.10 | %(1) |
| Ratio of net investment | | | | | | | | | | | | | | | | | | | | |
| income/(loss) to | | | | | | | | | | | | | | | | | | | | |
| average net assets: | | | | | | | | | | | | | | | | | | | | |
| Before expense limitation | | | | | | | | | | | | | | | | | | | | |
arrangement(2) | | | 3.88 | %(1) | | | 2.94 | % | | | 5.24 | % | | | 3.92 | %(1) | | | 4.94 | %(1) |
| After expense limitation | | | | | | | | | | | | | | | | | | | | |
arrangement(2) | | | 4.42 | %(1) | | | 3.53 | % | | | 5.51 | % | | | 4.10 | %(1) | | | 5.16 | %(1) |
| Portfolio turnover rate | | | 23 | % | | | 64 | % | | | 73 | % | | | 40 | % | | | 91 | % |
| (1) | Annualized. |
| (2) | Does not include expenses of investment companies in which the Fund invests. |
| (3) | Not annualized. |
| (4) | Net investment income/(loss) and redemption fees per share have been calculated based on average shares outstanding during the period. |
| (5) | The period ended November 30, 2014 consists of eleven months due to the Fund’s fiscal year end change. |
| (6) | The ratio of expenses to average net assets includes interest expense and proxy expense where applicable. See Note 4 in the Notes to the Financial Statements. |
| (7) | Includes performance history based off of the historical performance of an acquired fund in a Plan of Reorganization. See Note 1 in the Notes to the Financial Statements. |
The accompanying notes are an integral part of these financial statements.
INNOVATOR IBD® 50 FUND
Financial Highlights
TOTAL FUND
| | | Period Ended | | | Year Ended | | | Period Ended | |
| | | May 31, | | | November 30, | | | November 30, | |
| | | 2017 | | | 2016 | | | 2015(3) | |
| | | (Unaudited) | | | | | | | |
| Per share operating performance | | | | | | | | | |
| (For a share outstanding | | | | | | | | | |
| throughout each period) | | | | | | | | | |
| Net asset value, beginning of period | | $ | 23.95 | | | $ | 23.54 | | | $ | 25.00 | |
| | | | | | | | | | | | | |
| Operations: | | | | | | | | | | | | |
| Net investment income/(loss) | | | (0.03 | ) | | | (0.06 | ) | | | (0.04 | ) |
| Net realized and unrealized gain/(loss) | | | 3.46 | | | | 0.47 | | | | (1.42 | ) |
| Total from investment operations | | | 3.43 | | | | 0.41 | | | | (1.46 | ) |
| | | | | | | | | | | | | |
| Dividends and distributions to shareholders: | | | | | | | | | | | | |
| Dividends from net investment income | | | — | | | | — | | | | — | |
| Distributions from net realized gains | | | — | | | | — | | | | — | |
| Total dividends and distributions | | | — | | | | — | | | | — | |
| Change in net asset value for the period | | | 3.43 | | | | 0.41 | | | | (1.46 | ) |
| Net asset value, end of period | | $ | 27.38 | | | $ | 23.95 | | | $ | 23.54 | |
| | | | | | | | | | | | | |
| Total return | | | 14.28 | %(2) | | | 1.78 | % | | | -5.84 | %(2) |
| | | | | | | | | | | | | |
| Ratios/supplemental data: | | | | | | | | | | | | |
| Net assets, end of period (000) | | $ | 41,065 | | | $ | 35,931 | | | $ | 70,612 | |
| Ratio of net expenses to average net assets: | | | | | | | | | | | | |
| Before expense limitation arrangement | | | 1.11 | %(1) | | | 1.13 | % | | | 1.13 | %(1) |
| After expense limitation arrangement | | | 0.80 | %(1) | | | 0.80 | % | | | 0.80 | %(1) |
| Ratio of net investment income/(loss) | | | | | | | | | | | | |
| to average net assets: | | | | | | | | | | | | |
| Before expense limitation arrangement | | | -0.52 | %(1) | | | -0.47 | % | | | -0.67 | %(1) |
| After expense limitation arrangement | | | -0.21 | %(1) | | | -0.14 | % | | | -0.34 | %(1) |
Portfolio turnover rate(4) | | | 374 | % | | | 1041 | % | | | 546 | % |
| (1) | Annualized. |
| (2) | Not annualized. |
| (3) | Since Commencement of Operations on April 8, 2015 |
| (4) | Excludes in-kind transactions associated with creations and redemptions of the Fund. |
The accompanying notes are an integral part of these financial statements.
ACADEMY FUNDS TRUST
Notes to Financial Statements
Academy Funds Trust (the “Trust”) was organized under Delaware law as a Delaware statutory trust on October 17, 2007 and is registered under the Investment Company Act of 1940, as amended (the “1940 Act”) and classified as an open-end management investment company. The Trust currently consists of two operational series, collectively the (“Funds”): the Innovator McKinley Income Fund (“IMIFX-IMIIX”), consisting of two classes, the Investor Class which commenced operations on January 31, 2012 and Class I which commenced operations on April 2, 2013; and the Innovator IBD® 50 Fund (“FFTY”) which commenced operations on April 8, 2015. Prior to December 1, 2015 IMIFX-IMIIX’s Investor Class was designated as Class A shares. On February 12, 2016 the Investor Class of IMIFX-IMIIX acquired all the net assets of the McKinley Diversified Income Fund, a series of Professionally Managed Portfolios (the “Predecessor Fund”), in a reorganization. The Predecessor Fund’s performance history has been adopted by IMIFX-IMIIX following the reorganization. The performance of the Investor Class shares and Class I shares of IMIFX-IMIIX are based off of the historical performance of the Investor Class shares of the Predecessor Fund prior to the reorganization. IMIFX-IMIIX’s Class I is an institutional class and does not charge a 12b-1 fee to its shareholders. IMIFX-IMIIX seeks current income and long-term capital appreciation. FFTY is an exchange traded fund that does not charge a sales load, have a redemption fee and currently does not charge a 12b-1 fee to its shareholders. FFTY seeks long-term capital appreciation.
The Funds are investment companies and accordingly follow the investment company accounting and reporting guidance of the Financial Accounting Standards Board (FASB) Accounting Standard Codification Topic 946 “Financial Services — Investment Companies”.
| 2. | SIGNIFICANT ACCOUNTING POLICIES |
The following is a summary of significant accounting policies consistently followed by the Trust in the preparation of its financial statements. These policies are in conformity with accounting principles generally accepted in the United States of America (“GAAP”).
Security Valuation:
Portfolio securities primarily listed or traded on a national or foreign securities exchange, except for bonds, are generally valued at the closing price on that exchange, unless such closing prices are determined to be not readily available pursuant to the Trust’s pricing procedures. Exchange traded options are valued using composite pricing. If no sales are reported, the options will be valued by calculating the mean between the highest bid price and the lowest ask price across the exchanges where the option is traded. Non-exchange traded options are valued at fair value using a mathematical model. Futures
ACADEMY FUNDS TRUST
Notes to Financial Statements (Continued)
contracts are valued at their daily quoted settlement price. Securities not traded on a particular day, over-the-counter securities, and government and agency securities are valued at the mean value between bid and asked prices. Open-ended mutual funds are valued at that day’s NAV. Government and retail money-market funds, which are not eligible for vendor pricing, are valued at amortized cost, which approximates market value. Debt securities (other than short-term obligations) are valued on the basis of valuations provided by a pricing service when such prices are believed to reflect the fair value of such securities. Foreign securities and the prices of foreign securities denominated in foreign currencies are translated to U.S. dollars at the mean between the bid and offer quotations of such currencies based on rates in effect as of the close of the New York Stock Exchange. Securities for which market quotations are not readily available are valued at fair value as determined in good faith by a method approved by the Board. The Trust will also use the fair value of a foreign security at the time of calculating its NAV when events following the close of foreign markets on which the foreign security trades indicate that such closing price does not reflect the foreign securities fair value. The Trust concluded that a price determined under the Trust’s valuation procedures was not readily available if, among other things, the Trust believed that the value of the security might have been materially affected by an intervening significant event. A significant event may be related to a single issuer, to an entire market sector, or to the entire market. These events may include, among other things: issuer–specific events including rating agency action, earnings announcements and corporate actions, significant fluctuations in domestic or foreign markets, natural disasters, armed conflicts, and government actions. In the event that the market quotations are not readily available, the fair value of such securities will be determined in good faith, taking into consideration: (i) fundamental analytical data relating to the investment; (ii) the nature and duration of restrictions on disposition of the securities; and (iii) an evaluation of the forces which influence the market in which these securities are purchased and sold. The investment advisor shall continuously monitor for significant events that might necessitate the use of fair value procedures.
Use of Estimates:
In preparing financial statements in conformity with GAAP, management is required to make estimates and assumptions that affect the reported amounts of assets and liabilities and disclosure of contingent assets and liabilities as of the date of the financial statements and the reported amounts of increases and decreases in net assets from operations during the reporting period. Actual results could differ from these estimates.
Federal Income Taxes:
The Funds intend to meet the requirements of the Internal Revenue Code (the “Code”) applicable to regulated investment companies and to distribute substantially all
ACADEMY FUNDS TRUST
Notes to Financial Statements (Continued)
net investment taxable income and net capital gains to shareholders in a manner which results in no tax cost to the Funds. Therefore, no federal income or excise tax provision is recorded.
Management of the Funds has reviewed the Funds’ tax positions for all open tax years and major jurisdictions and concluded that there is no tax liability resulting from unrecognized tax benefits relating to uncertain tax positions taken or expected to be taken on the tax return for the fiscal year ended November 30, 2016. The Funds are also not aware of any tax position for which it is reasonably possible that the total amounts of unrecognized tax benefits will significantly change in the next year. The Funds recognize interest and penalties, if any, related to unrecognized tax benefits as income tax expense in the Statement of Operations. During the period ended May 31, 2017, the Funds did not incur any interest or penalties.
GAAP requires that certain components of net assets be reclassified between financial and tax reporting. These reclassifications have no effect on net assets or net asset value per share. For the year ended November 30, 2016 IMIFX-IMIIX increased undistributed net investment income by $1,949,780, increased paid in capital by $2,491,142 and increased accumulated net realized loss by $4,440,922. For the year ended November 30, 2016 FFTY decreased undistributed net investment loss by $24,562, increased paid in capital by $1,022,203 and increased accumulated net realized loss by $1,046,765.
Distributions to Shareholders:
IMIFX-IMIIX intends to declare and distribute its net investment income, if any, as dividends quarterly. FFTY intends to declare and distribute its net investment income, if any, as dividends annually. Distributions of net realized capital gains, if any, will be declared and paid at least annually by the Funds. Distributions to shareholders are recorded on the ex-dividend date. The Funds may periodically make reclassifications among certain of its capital accounts as a result of the recognition and characterization of certain income and capital gain distributions determined annually in accordance with federal tax regulations which may differ from GAAP.
Guarantees and Indemnifications:
In the normal course of business, the Trust may enter into a contract with service providers that contain general indemnification clauses. The Trust’s maximum exposure under these arrangements is unknown as this would involve future claims against the Trust that have not yet occurred. Based on experience, the Trust expects the risk of loss to be remote.
ACADEMY FUNDS TRUST
Notes to Financial Statements (Continued)
Other:
Investment transactions are recorded on the trade date. The Trust determines the gain or loss realized from investment transactions on the basis of identified cost. Dividend income is recognized on the ex-dividend date and interest income is recognized on an accrual basis. Distributions received from IMIFX-IMIIX’s investments in master limited partnerships (“MLPs”), real estate investment trusts (“REITs”) and royalty trusts are comprised of ordinary income, capital gains and return of capital. For financial statement purposes, IMIFX-IMIIX uses estimates to characterize these distributions received as return of capital, capital gains or ordinary income. Such estimates are based on historical information available from each MLP, REIT or royalty trust and other industry sources. These estimates may subsequently be revised based on information received for the security after its tax reporting periods are concluded, as the actual character of these distributions is not known until after the fiscal year end of IMIFX-IMIIX. The distributions received from MLP, REIT and royalty trust securities that have been classified as income and capital gains are included in dividend income and Net Realized Loss on Investments, respectively, on the Statement of Operations. The distributions received that are classified as return of capital reduce the cost of investments on the Statement of Assets and Liabilities.
Net investment income, other than class specific expenses, and realized and unrealized gains and losses are allocated daily to each class of shares of IMIFX-IMIIX based upon the relative net asset value of outstanding shares of each class of shares at the beginning of the day (after adjusting for the current capital shares activity of the respective class).
Values of investments denominated in foreign currencies are converted into U.S. dollars using the spot market rates of exchange at the time of valuation. Purchases and sales of investments and dividend and interest income are translated into U.S. dollars using the spot market rates of exchange prevailing on the respective dates of such translations. The gain or loss resulting from changes in foreign exchange rates is included with net realized and unrealized gain or loss from investments, as appropriate. Foreign securities and currency transactions may involve certain considerations and risks not typically associated with those of domestic origin. Foreign securities are recorded in the financial statements after translation to U.S. dollars based on the applicable exchange rate at the end of the period. The Funds report certain foreign currency-related transactions as components of realized gains or losses for financial reporting purposes, whereas such components are treated as ordinary income for federal income tax purposes.
The Funds utilize various methods to measure the fair value of most of their investments on a recurring basis. U.S. GAAP establishes a hierarchy that prioritizes inputs to valuation methods. The three levels of inputs are:
| | • | Level 1 – | Unadjusted quoted prices in active markets for identical assets or liabilities that the company has the ability to access. |
ACADEMY FUNDS TRUST
Notes to Financial Statements (Continued)
| | • | Level 2 – | Observable inputs other than quoted prices included in level 1 that are observable for the asset or liability, either directly or indirectly. These inputs may include quoted prices for the identical instrument on an inactive market, prices for similar instruments, interest rates, prepayment speeds, credit risk, yield curves, default rates and similar data. |
| | | | |
| | • | Level 3 – | Unobservable inputs for the asset or liability, to the extent relevant observable inputs are not available, representing the company’s own assumptions about the assumptions a market participant would use in valuing the asset or liability, and would be based on the best information available. |
The availability of observable inputs can vary from security to security and is affected by a wide variety of factors, including, for example, the type of security, whether the security is new and not yet established in the marketplace, the liquidity of markets, and other characteristics particular to the security. To the extent that valuation is based on models or inputs that are less observable or unobservable in the market, the determination of fair value requires more judgement. Accordingly, the degree of judgement exercised in determining fair value is greatest for instruments categorized in Level 3.
The inputs used to measure fair value may fall into different levels of the fair value hierarchy. In such cases, for disclosure purposes, the level in the fair value hierarchy within which the fair value measurement falls in its entirety, is determined based on the lowest level input that is significant to the fair value measurement in its entirety.
There were no transfers between Levels 1 and 2 during the year for the Funds. Transfers between levels are recognized at the end of the reporting period.
| IMIFX-IMIIX | | | | | | | | | | | | |
| | | Level 1 | | | Level 2 | | | Level 3 | | | Total | |
| Real Estate Investment Trusts | | $ | 3,234,048 | | | $ | — | | | $ | — | | | $ | 3,234,048 | |
| Common Stocks | | | 9,947,542 | | | | — | | | | — | | | | 9,947,542 | |
| Master Limited Partnerships | | | 9,937,051 | | | | — | | | | — | | | | 9,937,051 | |
| Business Development Companies | | | 6,141,840 | | | | — | | | | — | | | | 6,141,840 | |
| Investment Companies | | | 1,168,364 | | | | — | | | | — | | | | 1,168,364 | |
| Short Term Investments | | | 1,153,874 | | | | — | | | | — | | | | 1,153,874 | |
| Total Investments in Securities | | $ | 31,582,719 | | | $ | — | | | $ | — | | | $ | 31,582,719 | |
| | | | | | | | | | | | | | | | | |
| FFTY | | | | | | | | | | | | | | | | |
| | | Level 1 | | | Level 2 | | | Level 3 | | | Total | |
| Common Stocks | | $ | 41,037,739 | | | $ | — | | | $ | — | | | $ | 41,037,739 | |
| Short Term Investments | | | 90,058 | | | | — | | | | — | | | | 90,058 | |
| Total Investments in Securities | | $ | 41,127,797 | | | $ | — | | | $ | — | | | $ | 41,127,797 | |
See the Schedule of Investments for the investments detailed by industry classification.
ACADEMY FUNDS TRUST
Notes to Financial Statements (Continued)
The Trust has adopted a Distribution and Service (12b-1) Plan (the “Plan”) pursuant to Rule 12b-1 under the 1940 Act for IMIFX-IMIIX’s Investor Class shares. The Plan is designed to compensate IMIFX-IMIIX’s distributor, advisor, or others for certain promotional and other sales related costs and for providing related services. Effective January 1, 2016, IMIFX-IMIIX paid a monthly fee at the annual rate of up to 0.10% of the average daily net assets of IMIFX-IMIIX’s Investor Class shares in regards to qualified expenses under the Plan. On January 1, 2016, the annual 12b-1 fee applicable to the Investor Class was reduced from no greater than 0.25% to no greater than 0.10% of average daily net assets of the Investor Class. The Plan may be continued in effect from year to year if such continuance is approved annually by the Board of Trustees of the Trust, including the vote of a majority of the Independent Trustees. For the period ended May 31, 2017, the Investor Class of IMIFX-IMIIX incurred $15,690 of expenses pursuant to the Plan. The Trust has adopted a Distribution and Service (12b-1) Plan for FFTY, however no 12b-1 fees are currently paid by FFTY, and there are no plans to impose these fees.
| 4. | INVESTMENT ADVISOR AND OTHER AFFILIATES |
From December 1, 2016 to May 8, 2017 the Trust entered into investment advisory agreements and expense limitation agreements with Innovator Management LLC (the “Prior Advisor”). The assets of the Prior Advisor were purchased by Innovator Capital Management, LLC (the “Advisor”) effective May 9, 2017 (the “Transaction”). In anticipation of the Transaction, the Board of the Trust approved interim Advisory Agreements and interim Expense Limitation Agreements as of May 9, 2017 between the Trust, on behalf of each Fund, and the Advisor that contained terms and conditions substantially identical to the investment advisory agreements and expense limitation agreements with the Prior Advisor, including advisor compensation, except that the interim Agreements each provide for a term of not more than 150 days and require that investment advisory fees earned under the interim Agreements be paid into an escrow account, pending shareholder approval of new investment advisory agreements.
The prior and interim Advisory Agreements provided for advisory fees computed daily and paid monthly at an annual rate of 1.00% of IMIFX-IMIIX’s average daily net assets and 0.70% of FFTY’s average daily net assets. The Prior Advisor appointed McKinley Capital Management, LLC and Penserra Capital Management LLC, as sub-advisors to IMIFX-IMIIX and FFTY, respectively. The Advisor is responsible for compensating the sub-advisors for their services to the Funds.
The Trust entered into Expense Limitation Agreements on behalf of each Fund with the Prior Advisor and Advisor. Under the terms of the Expense Limitation Agreement with IMIFX-IMIIX, the Prior Advisor and Advisor contractually agreed to waive their advisory fees and/or assume as their own expense, certain expenses otherwise
ACADEMY FUNDS TRUST
Notes to Financial Statements (Continued)
payable by the Fund to the extent necessary to ensure that total annual fund operating expenses (excluding any Rule 12b-1 fees, taxes, interest, brokerage fees, acquired fund fees and expenses, expenses incurred in connection with any merger, reorganization or proxy solicitation, litigation, and other extraordinary expenses) do not exceed 1.10% of average daily net assets for both Investor Class and Class I of IMIFX-IMIIX. Under the terms of the Expense Limitation Agreement with FFTY, the Prior Advisor and Advisor contractually agreed to waive their advisory fees and/or assume as their own expense, certain expenses otherwise payable by the Fund to the extent necessary to ensure that total annual fund operating expenses (excluding any Rule 12b-1 fees, taxes, interest, brokerage fees, acquired fund fees and expenses, expenses incurred in connection with any merger, reorganization or proxy solicitation, litigation, and other extraordinary expenses) do not exceed 0.80% of average daily net assets of FFTY. Pursuant to the Expense Limitation Agreements for the Funds, the Advisor is entitled to recoup any fees that the Prior Advisor or it waived and/or Fund expenses that the Prior Advisor or it paid for a period of three years following such fee waivers and expense payments, to the extent that such recoupment by the Advisor will not cause the respective Fund to exceed any applicable expense limitation that was in place for the respective Fund when the fees were waived or expenses were paid. For the period ended May 31, 2017, the Prior Advisor and the Advisor in aggregate waived $84,444 and $58,429 of their advisory fees for IMIFX-IMIIX and FFTY, respectively, and did not recoup any of their waived fees. The table below indicates the amount of fees that the Advisor may recoup:
| | | | Recovery Expiring on | |
| | | | 11/30/2017 | | | 11/30/2018 | | | 11/30/19 | | | Total | |
| | IMIFX-IMIIX | | $ | 181,775 | | | $ | 184,718 | | | $ | 199,114 | | | $ | 565,607 | |
| | FFTY | | | N/A | | | | 116,340 | | | | 135,975 | | | | 252,315 | |
| 5. | INVESTMENT TRANSACTIONS |
For the period ended May 31, 2017, purchases and sales of investment securities, other than short-term investments and short-term U.S. Government obligations were as follows:
| | | | IMIFX-IMIIX | | | FFTY | |
| | Purchases: | | | | | | |
| | U.S. Government | | $ | — | | | $ | — | |
| | Other | | | 6,919,966 | | | | 142,727,385 | |
| | Sales: | | | | | | | | |
| | U.S. Government | | $ | — | | | $ | — | |
| | Other | | | 9,381,704 | | | | 142,605,808 | |
For the period ended May 31, 2017, in-kind transactions associated with creations and redemptions of FFTY were $1,363,115 and $1,265,617, respectively. Net capital gains or losses resulting from in-kind redemptions are excluded from FFTY’s taxable gains and are not distributed to shareholders.
ACADEMY FUNDS TRUST
Notes to Financial Statements (Continued)
For the period ended May 31, 2017, FFTY paid $17,333 in brokerage commissions on trades of securities to Penserra Securities LLC, an affiliated broker of FFTY.
| 6. | FEDERAL INCOME TAX INFORMATION |
At November 30, 2016, gross unrealized appreciation and depreciation of investments, based on cost for federal income tax purposes were as follows:
| | | | IMIFX-IMIIX | | | FFTY | |
| | Cost of Investments | | $ | 31,552,768 | | | $ | 32,137,038 | |
| | Gross Unrealized Appreciation | | $ | 3,006,646 | | | $ | 4,209,217 | |
| | Gross Unrealized Depreciation | | | (2,714,009 | ) | | | (464,872 | ) |
| | Net Unrealized Appreciation/ | | | | | | | | |
| | (Depreciation) on Investments | | $ | 292,637 | | | $ | 3,744,345 | |
As of November 30, 2016, the components of accumulated earnings on a tax basis were as follows:
| | | | IMIFX-IMIIX | | | FFTY | |
| | Accumulated Capital and Other Losses | | $ | (20,924,560 | ) | | $ | (13,770,147 | )(1) |
| | Undistributed Ordinary Income | | | 1,453,784 | | | | — | |
| | Unrealized Appreciation/(Depreciation) | | | | | | | | |
| | on Investments and Foreign Currency | | | 292,637 | | | | 3,744,345 | |
| | Total Accumulated Loss | | $ | (19,178,139 | ) | | $ | (10,025,802 | ) |
| | (1) | Includes $56,313 in non-deductible organizational costs. |
At November 30, 2016, IMIFX-IMIIX and FFTY deferred on a tax basis, late year ordinary losses of $0 and $36,189, respectively. At November 30, 2016, IMIFX-IMIIX and FFTY did not defer any post-October losses.
At November 30, 2016, the Funds had capital loss carryforwards as indicated below:
| | | | IMIFX-IMIIX | | | FFTY | |
| | Indefinite Short-Term | | $ | 8,228,136 | | | $ | 13,677,645 | |
| | Indefinite Long-Term | | $ | 12,696,424 | | | $ | — | |
The tax character of distributions paid by the Funds during the fiscal periods ended November 30, 2016 and November 30, 2015 were as follows:
| | | | IMIFX-IMIIX | | | FFTY | |
| | | | 2016 | | | 2015 | | | 2016 | | | 2015 | |
| | Distributions paid from: | | | | | | | | | | | | |
| | Ordinary Income | | $ | 2,475,234 | | | $ | 3,746,830 | | | $ | — | | | $ | — | |
| | Long-Term Capital Gains | | | — | | | | — | | | | — | | | | — | |
| | Return of Capital | | | — | | | | — | | | | — | | | | — | |
| | Total Distributions Paid | | $ | 2,475,234 | | | $ | 3,746,830 | | | $ | — | | | $ | — | |
ACADEMY FUNDS TRUST
Notes to Financial Statements (Continued)
| 7. | OFFERING PRICE PER SHARE |
The public offering price for the Investor Class and Class I of IMIFX-IMIIX is the net asset value.
Shares of FFTY are listed and traded on the NYSE Arca, Inc. Market prices for the shares may be different from their net asset value (“NAV”). FFTY issues and redeems shares on a continuous basis at NAV only in blocks of 50,000 shares, called “Creation Units.” Creation Units are issued and redeemed principally in-kind for securities included in a specified universe. Once created, shares generally trade in the secondary market at market prices that change throughout the day in amounts less than a Creation Unit. Except when aggregated in Creation Units, shares are not redeemable securities of FFTY. Shares of FFTY may only be purchased or redeemed by certain financial institutions (“Authorized Participants”). An Authorized Participant is either (i) a broker-dealer or other participant in the clearing process through the Continuous Net Settlement System of the National Securities Clearing Corporation or (ii) a DTC participant and, in each case, must have executed a Participant Agreement with the Distributor. Most retail investors do not qualify as Authorized Participants nor have the resources to buy and sell whole Creation Units. Therefore, they are unable to purchase or redeem the shares directly from FFTY. Rather, most retail investors may purchase shares in the secondary market with the assistance of a broker and are subject to customary brokerage commissions or fees.
| 8. | LINE OF CREDIT ARRANGEMENT |
IMIFX-IMIIX is a party to an unsecured line of credit agreement with U.S. Bank, N.A., expiring September 14, 2017. IMIFX-IMIIX may borrow up to $5 million. Interest is charged on borrowings at the prevailing prime rate and reflected as interest expense on the Statement of Operations. IMIFX-IMIIX intends to use this line of credit to increase the efficiency of cash flow management. For the period ended May 31, 2017, IMIFX-IMIIX had average daily borrowings of $71 and a maximum daily borrowing of $13,000.
This report has been prepared for shareholders and may be distributed to others only if preceded or accompanied by a current prospectus.
PROXY VOTING POLICIES AND PROCEDURE
The Trust’s Proxy Voting Policies and Procedures are available without charge, upon request, by calling 1-877-386-3890 and on the SEC’s website at www.sec.gov. Information relating to how each Fund voted proxies relating to portfolio securities held during each year ended June 30 is also available on the SEC’S website at www.sec.gov.
INFORMATION ABOUT PORTFOLIO SECURITIES
Each Funds’ complete schedule of portfolio holdings for the first and third quarters is filed with the SEC on Form N-Q. The Trust’s Form N-Q is available without charge, upon request, by calling 1-877-386-3890, or on the SEC’s website at www.sec.gov. The Trust’s Form N-Q may be reviewed and copied at the SEC’s Public Reference Room in Washington, DC. Information on the operation of the Public Reference Room may be obtained by calling 1-800-SEC-0330.
HOUSEHOLD DELIVERY OF SHAREHOLDER DOCUMENTS
In order to reduce expenses, the Trust delivers one copy of an annual/semi-annual report, prospectus and/or proxy statement on behalf of two or more shareholders at a shared address (householding). If you do not wish to participate in householding, please indicate this preference on your new account application (if you are opening a new account) or call 1-877-FUND890 (877-386-3890) to change the status of your existing account. You may change your status at any time.
ELECTRONIC DELIVERY OF SHAREHOLDER DOCUMENTS
You may choose to receive a Fund’s prospectus and annual and semi-annual reports electronically. To sign up for electronic delivery, visit www.icsdelivery.com and select the first letter of your brokerage firm’s name. Then, select your brokerage institution from the list that follows, fill out the appropriate information and provide an e-mail address where you would like your information sent. If your brokerage firm is not listed, electronic delivery may not be available. Please contact your brokerage firm or financial adviser.
(This Page Intentionally Left Blank.)
INVESTMENT ADVISOR
Innovator Capital Management, LLC
120 North Hale Street, Suite 200
Wheaton, IL 60187
INNOVATOR MCKINLEY INCOME FUND
INVESTMENT SUB-ADVISOR
McKinley Capital Management, LLC
3301 C Street, Suite 500
Anchorage, AK 99503
INNOVATOR IBD® 50 FUND
INVESTMENT SUB-ADVISOR
Penserra Capital Management LLC
140 Broadway, 26th Floor
New York, NY 10005
ADMINISTRATOR, FUND ACCOUNTANT & TRANSFER AGENT
U.S. Bancorp Fund Services, LLC
615 East Michigan Street
Milwaukee, WI 53202
DISTRIBUTOR
Quasar Distributors, LLC
615 East Michigan Street
Milwaukee, WI 53202
CUSTODIAN
U.S. Bank, N.A.
1555 North RiverCenter Drive, Suite 302
Milwaukee, WI 53212
LEGAL COUNSEL
Stradley Ronon Stevens & Young, LLP
2600 One Commerce Square
Philadelphia, PA 19103
INDEPENDENT REGISTERED PUBLIC ACCOUNTING FIRM
Tait, Weller & Baker LLP
1818 Market Street, Suite 2400
Philadelphia, PA 19103