UNITED STATES
SECURITIES AND EXCHANGE COMMISSION
Washington, D.C. 20549
FORM N-CSR
CERTIFIED SHAREHOLDER REPORT OF REGISTERED
MANAGEMENT INVESTMENT COMPANIES
Investment Company Act file number 811-22135
Innovator ETFs Trust
(Exact name of registrant as specified in charter)
120 N. Hale Street, Suite 200
Wheaton, IL 60187
(Address of principal executive offices) (Zip code)
Chapman and Cutler LLP
111 West Monroe St
Chicago, IL 60603
(Name and address of agent for service)
800-208-5212
Registrant's telephone number, including area code
Date of fiscal year end: October 31, 2019
Date of reporting period: April 30, 2019
Item 1. Reports to Stockholders.

TABLE OF CONTENTS
Letter to Shareholders | 3 |
Fund Performance | 4 |
Expense Example | 12 |
Schedules of Investments | 14 |
Statements of Assets and Liabilities | 27 |
Statements of Operations | 28 |
Statements of Changes in Net Assets | 29 |
Financial Highlights | 31 |
Notes to Financial Statements | 33 |
Additional Information | 45 |
INNOVATOR ETFs TRUST
Letter to Shareholders (Unaudited)
Dear Valued Shareholders,
Thank you for your continued support of the Innovator IBD® ETFs and Innovator Loup Frontier Tech ETF. The following shareholder letter covers the six-month period ended April 30, 2019. Following a bout of volatility in the market at the end of last year, growth stocks recovered over the period and outperformed the market. The high conviction growth nature of the IBD® strategies resulted in a mixed bag of results relative to the market during the period. This was highlighted by the Innovator IBD® 50 ETF returning 10.75% over the period versus 9.76% for the S&P 500 Index compared to the Innovator IBD® Breakout Opportunities ETF only returning 2.46%. The IBD® ETFs remain uniquely positioned in the market as they offer exposure to widely followed, high turnover, high conviction growth strategies published by Investor’s Business Daily. The flagship IBD® 50 List has been published live since 2003 carrying a long-term track record of significant outperformance relative to the market.
The Innovator Loup Frontier Tech ETF provides investors exposure to the next wave of technology through the expertise of Loup Ventures, a tech focused private equity firm lead by expert Gene Munster. The ETF outperformed the broader market during the period due to rebound in the broader technology sector, particularly within niche high growth tech. We believe the economy will continue to be driven by technological innovations and the Loup ETF offers investors a research backed solution to access the space.
Sincerely,

Bruce Bond
Chief Executive Officer
The views in this report were those of the Fund’s CEO as of April 30, 2019 and may not reflect his views on the date that this report is first published or anytime thereafter. These views are intended to assist shareholders in understanding their investments and do not constitute investment advice.
Investing involves risks. Principal loss is possible. An ETF that concentrates its investments in the securities of a particular industry, market, sector, or geographic area may be more volatile than a fund that invests in a broader range of industries. Additionally, the Fund may invest in securities that have additional risks. Foreign companies can be more volatile, less liquid, and subject to the risk of currency fluctuations. This risk is greater for emerging markets. Small- and mid-cap companies can have limited liquidity and greater volatility than large-cap companies.
INNOVATOR IBD® 50 ETF
Fund Performance
April 30, 2019 (Unaudited)
The following chart compares the value of a hypothetical $10,000 investment in the Innovator IBD® 50 ETF from its inception (April 8, 2015) to April 30, 2019 as compared with the S&P 500® Index.
Growth of a Hypothetical $10,000 Investment
at April 30, 2019

Average Annual Total Returns As of April 30, 2019 | ||||||||||||
1 Year | 3 Years | Since Inception (a) | ||||||||||
Innovator IBD® 50 ETF | ||||||||||||
NAV Return | 4.57 | % | 18.46 | % | 8.37 | % | ||||||
Market Return | 4.44 | % | 18.50 | % | 8.37 | % | ||||||
S&P 500® Index | 13.49 | % | 14.87 | % | 11.18 | % | ||||||
IBD® 50 Index (b) | 5.60 | % | N/A | 1.93 | %(c) | |||||||
(a) | Inception date is April 8, 2015. |
(b) | The Fund began tracking the IBD® 50 Index on November 20, 2017. |
(c) | Since Inception return is cumulative and from the date the Fund began tracking the IBD® 50 Index, November 20, 2017. |
Performance data quoted represents past performance and does not guarantee future results. The investment return and principal value of an investment will fluctuate so that an investor’s shares, when redeemed, may be worth more or less than their original cost. Current performance of the Fund may be lower or higher than the performance quoted. As of the latest prospectus, the gross and net expense ratios of the Fund were 0.84% and 0.80%, respectively. For the most recent month-end performance, please visit the Fund’s website at innovatoretfs.com
INNOVATOR IBD® 50 ETF
Fund Performance
April 30, 2019 (Unaudited) (Continued)
The line graph and performance table do not reflect the deduction of taxes that a shareholder may pay on fund distributions or the redemption of Fund shares. Total return calculations reflect the effect of the Advisor’s expense limitation agreement for the Fund. Returns shown for the Fund, the S&P 500® Index and the IBD® 50 Index include the reinvestment of all dividends, if any.
The S&P 500® Index is an unmanaged, capitalization-weighted index generally representative of the U.S. market for large capitalization stocks.
The IBD® 50 Index is a weekly, rule-based, computer-generated stock index compiled and published by Investor’s Business Daily® that seeks to identify the current top 50 growth stocks.
The Fund’s portfolio holdings may differ significantly from the securities held in the relevant index and, unlike an exchange-traded fund, the performance of an unmanaged index does not reflect deductions for transaction costs, taxes, management fees or other expenses.
You cannot invest directly in an index.
Premium/Discount Information:
Information regarding the differences between the price of the Fund’s shares on the secondary market and the Fund’s net asset value is available at Innovatoretfs.com/FFTY.
INNOVATOR IBD® ETF LEADERS ETF
Fund Performance
April 30, 2019 (Unaudited)
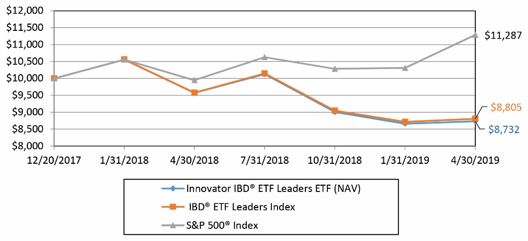
The following chart compares the value of a hypothetical $10,000 investment in the Innovator IBD® ETF Leaders ETF from its inception (December 20, 2017) to April 30, 2019 as compared with the S&P 500® Index and IBD® ETF Leaders Index.
Growth of a Hypothetical $10,000 Investment
at April 30, 2019
Average Annual Total Returns As of | ||||||||
April 30, 2019 | ||||||||
1 Year | Since Inception (a) | |||||||
Innovator IBD® ETF Leaders ETF | ||||||||
NAV Return | -8.78 | % | -9.50 | % | ||||
Market Return | -8.81 | % | -9.63 | % | ||||
S&P 500® Index | 13.49 | % | 9.32 | % | ||||
IBD® ETF Leaders Index | -8.07 | % | -8.94 | % | ||||
(a) | Inception date is December 20, 2017. |
Performance data quoted represents past performance and does not guarantee future results. The investment return and principal value of an investment will fluctuate so that an investor’s shares, when redeemed, may be worth more or less than their original cost. Current performance of the Fund may be lower or higher than the performance quoted. As of the latest prospectus, the net expense ratio of the Fund was 1.08%. This expense ratio includes acquired fund fees and expenses of 0.48%. For the most recent performance, please visit the Fund’s website at innovatoretfs.com.
INNOVATOR IBD® ETF LEADERS ETF
Fund Performance
April 30, 2019 (Unaudited) (Continued)
The line graph and performance table do not reflect the deduction of taxes that a shareholder may pay on fund distributions or the redemption of Fund shares. Returns shown for the Fund, the S&P 500® Index and the IBD® ETF Leaders Index include the reinvestment of all dividends, if any.
The S&P 500® Index is an unmanaged, capitalization-weighted index generally representative of the U.S. market for large capitalization stocks.
The IBD® ETF Leaders Index is a rule-based index compiled and published by Investor’s Business Daily® that seeks to outperform the broader equity and fixed income markets.
The Fund’s portfolio holdings may differ significantly from the securities held in the relevant index and, unlike an exchange-traded fund, the performance of an unmanaged index does not reflect deductions for transaction costs, taxes, management fees or other expenses.
You cannot invest directly in an index.
Premium/Discount Information:
Information regarding the differences between the price of the Fund’s shares on the secondary market and the Fund’s net asset value is available at Innovatoretfs.com/LDRS.
INNOVATOR IBD® BREAKOUT OPPORTUNITIES ETF
Fund Performance
April 30, 2019 (Unaudited)
The following chart compares the value of a hypothetical $10,000 investment in the Innovator IBD® Breakout Opportunities ETF from its inception (September 12, 2018) to April 30, 2019 as compared with the S&P 500® Index and IBD® Breakout Stocks Index.
Growth of a Hypothetical $10,000 Investment
at April 30, 2019

| Total Returns As of | ||||
| April 30, 2019 | ||||
Since Inception (a) | ||||
Innovator IBD® Breakout Opportunities ETF | ||||
NAV Return | -16.95 | % | ||
Market Return | -17.09 | % | ||
S&P 500® Index | 3.24 | % | ||
IBD® Breakout Stocks Index | -16.28 | % | ||
(a) | Inception date is September 12, 2018. |
Performance data quoted represents past performance and does not guarantee future results. The investment return and principal value of an investment will fluctuate so that an investor’s shares, when redeemed, may be worth more or less than their original cost. Current performance of the Fund may be lower or higher than the performance quoted. As of the latest prospectus, the net expense ratio of the Fund was 0.80%. For the most recent month-end performance, please visit the Fund’s website at innovatoretfs.com
INNOVATOR IBD® BREAKOUT OPPORTUNITIES ETF
Fund Performance
April 30, 2019 (Unaudited) (Continued)
The line graph and performance table do not reflect the deduction of taxes that a shareholder may pay on fund distributions or the redemption of Fund shares. Returns shown for the Fund, the S&P 500® Index and the IBD® Breakout Stocks Index include the reinvestment of all dividends, if any.
The S&P 500® Index is an unmanaged, capitalization-weighted index generally representative of the U.S. market for large capitalization stocks.
The IBD® Breakout Stocks Index is a rule-based index compiled and published by Investor’s Business Daily® that seeks to provide opportunistic investment exposure to those stocks with the potential to “break out” or experience a period of sustained price growth beyond the stock’s recent “resistance level,” with consideration for various market conditions.
The Fund’s portfolio holdings may differ significantly from the securities held in the relevant index and, unlike an exchange-traded fund, the performance of an unmanaged index does not reflect deductions for transaction costs, taxes, management fees or other expenses.
You cannot invest directly in an index.
Premium/Discount Information:
Information regarding the differences between the price of the Fund’s shares on the secondary market and the Fund’s net asset value is available at Innovatoretfs.com/BOUT.
INNOVATOR LOUP FRONTIER TECH ETF
Fund Performance
April 30, 2019 (Unaudited)
The following chart compares the value of a hypothetical $10,000 investment in the Innovator Loup Frontier Tech ETF from its inception (July 24, 2018) to April 30, 2019 as compared with the Dow Jones Global Index and Loup Frontier Tech Index.
Growth of a Hypothetical $10,000 Investment
at April 30, 2019

| Total Returns As of | ||||
| April 30, 2019 | ||||
Since Inception (a) | ||||
Innovator Loup Frontier Tech ETF | ||||
NAV Return | 2.66 | % | ||
Market Return | 2.36 | % | ||
Dow Jones Global Index | 2.32 | % | ||
Loup Frontier Tech Index | 2.76 | % | ||
(a) | Inception date is July 24, 2018. |
Performance data quoted represents past performance and does not guarantee future results. The investment return and principal value of an investment will fluctuate so that an investor’s shares, when redeemed, may be worth more or less than their original cost. Current performance of the Fund may be lower or higher than the performance quoted. As of the latest prospectus, the net expense ratio of the Fund was 0.70%. For the most recent performance, please visit the Fund’s website at innovatoretfs.com.
INNOVATOR LOUP FRONTIER TECH ETF
Fund Performance
April 30, 2019 (Unaudited) (Continued)
The line graph and performance table do not reflect the deduction of taxes that a shareholder may pay on fund distributions or the redemption of Fund shares. Returns shown for the Fund, the Dow Jones Global Index and the Loup Frontier Tech Index include the reinvestment of all dividends, if any.
The Dow Jones Global Index is an unmanaged, capitalization-weighted index generally representative of the global market.
The Loup Frontier Tech Index is a rules-based stock index that seeks to identify and track those companies identified as being on the frontier of the development of new technologies that have the potential to have an outsized influence on the future.
The Fund’s portfolio holdings may differ significantly from the securities held in the relevant index and, unlike an exchange-traded fund, the performance of an unmanaged index does not reflect deductions for transaction costs, taxes, management fees or other expenses.
You cannot invest directly in an index.
Premium/Discount Information:
Information regarding the differences between the price of the Fund’s shares on the secondary market and the Fund’s net asset value is available at Innovatoretfs.com/LOUP.
INNOVATOR ETFs TRUST
Expense Example
For the Period Ended April 30, 2019 (Unaudited)
As a shareholder of the Funds, you incur two types of costs: (1) ongoing costs, including management fees, and other Fund expenses; and (2) transaction costs, including brokerage commissions on the purchase and sale of Fund shares. This Example is intended to help you understand your ongoing costs (in dollars) of investing in the Funds and to compare these costs with the ongoing costs of investing in other funds.
The Example is based on an investment of $1,000 invested at the beginning of the period and held for the entire period from November 1, 2018 to April 30, 2019 for each Fund.
Actual Expenses
The first line under each Fund in the following table provides information about actual account values and actual expenses. You may use the information in this line, together with the amount you invested, to estimate the expenses you paid over the period. Simply divide your account value by $1,000 (for example, an $8,600 account value divided by $1,000 equals 8.6), then multiply the result by the number in the applicable line under the heading titled “Expenses Paid During the Period” to estimate the expenses you paid on your account during the period.
Hypothetical Example for Comparison Purposes
The second line under each Fund in the following table provides information about hypothetical account values and hypothetical expenses based on the Funds’ actual expense ratios and an assumed rate of return of 5% per year before expenses, which are not the Funds’ actual returns. The hypothetical account values and expenses may not be used to estimate the actual ending account balance or expenses you paid for the period. You may use this information to compare the ongoing costs of investing in the Funds with other funds. To do so, compare this 5% hypothetical example with the 5% hypothetical examples that appear in the shareholder reports of other funds.
Please note that the expenses shown in the table are meant to highlight your ongoing costs only and do not reflect any transactional costs, such as brokerage commissions on the purchase and sale of Fund shares with respect to the Funds. Therefore, the table below is useful in comparing the ongoing costs only, and will not help you determine the relative total costs of owning different funds. In addition, if these transactional costs were included, your costs could have been higher.
INNOVATOR ETFs TRUST
Expense Example
For the Period Ended April 30, 2019 (Unaudited) (Continued)
Expenses Paid | ||||||||||||
Beginning | Ending | During the | ||||||||||
Account Value | Account Value | Period (a) | ||||||||||
Innovator IBD 50® ETF (NAV) | ||||||||||||
Actual | $ | 1,000.00 | $ | 1,107.50 | $ | 4.18 | ||||||
Hypothetical | 1,000.00 | 1,020.83 | 4.01 | |||||||||
Innovator IBD® ETF Leaders ETF (NAV) | ||||||||||||
Actual | 1,000.00 | 969.70 | 2.93 | |||||||||
Hypothetical | 1,000.00 | 1,021.82 | 3.01 | |||||||||
Innovator IBD® Breakout Opportunities ETF (NAV) | ||||||||||||
Actual | 1,000.00 | 1,024.60 | 4.02 | |||||||||
Hypothetical | 1,000.00 | 1,020.83 | 4.01 | |||||||||
Innovator Loup Frontier Tech ETF (NAV) | ||||||||||||
Actual | 1,000.00 | 1,127.20 | 3.69 | |||||||||
Hypothetical | 1,000.00 | 1,021.32 | 3.51 | |||||||||
(a) | Expenses are equal to the Fund’s annualized expense ratio, multiplied by the average account value over the period, multiplied by 181/365 (to reflect the six month period). |
INNOVATOR IBD® 50 ETF
Schedule of Investments
April 30, 2019 (Unaudited)
Shares | Value | |||||||
COMMON STOCKS - 90.87% | ||||||||
Advertising - 0.53% | ||||||||
The Trade Desk, Inc. - Class A (a)(b) | 11,446 | $ | 2,535,060 | |||||
Airlines - 0.46% | ||||||||
Spirit Airlines, Inc. (a) | 40,795 | 2,218,432 | ||||||
Auto Parts & Equipment - 2.93% | ||||||||
Meritor, Inc. (a) | 576,321 | 13,981,547 | ||||||
Banks - 0.49% | ||||||||
HDFC Bank Ltd. - ADR | 20,502 | 2,350,554 | ||||||
Biotechnology - 0.52% | ||||||||
Alexion Pharmaceuticals, Inc. (a) | 18,282 | 2,488,729 | ||||||
Building Materials - 2.92% | ||||||||
Armstrong World Industries, Inc. | 161,003 | 13,954,130 | ||||||
Commercial Services - 7.76% | ||||||||
Booz Allen Hamilton Holding Corp. | 161,954 | 9,602,253 | ||||||
New Oriental Education & Technology Group, Inc. - ADR (a) | 105,304 | 10,052,320 | ||||||
PayPal Holdings, Inc. (a) | 133,089 | 15,008,447 | ||||||
United Rentals, Inc. (a) | 17,001 | 2,395,781 | ||||||
| 37,058,801 | ||||||||
Computers - 3.53% | ||||||||
Fortinet, Inc. (a)(b) | 180,447 | 16,857,359 | ||||||
Distribution/Wholesale - 1.97% | ||||||||
Fastenal Co. (b) | 133,331 | 9,406,502 | ||||||
Diversified Financial Services - 3.02% | ||||||||
LPL Financial Holdings, Inc. | 63,967 | 4,739,315 | ||||||
Visa, Inc. | 58,910 | 9,686,571 | ||||||
| 14,425,886 | ||||||||
Electronics - 1.87% | ||||||||
Keysight Technologies, Inc. (a) | 102,523 | 8,922,577 | ||||||
Engineering & Construction - 2.88% | ||||||||
MasTec, Inc. (a)(b) | 271,237 | 13,738,154 | ||||||
The accompanying notes are an integral part of these financial statements.
INNOVATOR IBD® 50 ETF
Schedule of Investments
April 30, 2019 (Unaudited) (Continued)
Shares | Value | |||||||
Insurance - 3.05% | ||||||||
NMI Holdings, Inc. - Class A (a) | 171,656 | $ | 4,820,100 | |||||
Willis Towers Watson PLC | 52,981 | 9,766,518 | ||||||
| 14,586,618 | ||||||||
Internet - 11.19% | ||||||||
Alibaba Group Holding Ltd. - ADR (a) | 12,809 | 2,376,966 | ||||||
Amazon.com, Inc. (a) | 7,503 | 14,454,679 | ||||||
Autohome, Inc. - ADR (a)(b) | 145,411 | 16,793,516 | ||||||
Baozun, Inc. - ADR (a) | 106,889 | 5,184,117 | ||||||
Palo Alto Networks, Inc. (a)(b) | 58,697 | 14,605,575 | ||||||
| 53,414,853 | ||||||||
Leisure Time - 3.52% | ||||||||
Planet Fitness, Inc. - Class A (a)(b) | 221,886 | 16,796,770 | ||||||
Machinery-Diversified - 0.99% | ||||||||
Cummins, Inc. | 14,313 | 2,380,109 | ||||||
Middleby Corp. (a)(b) | 17,595 | 2,324,827 | ||||||
| 4,704,936 | ||||||||
Media - 3.09% | ||||||||
Comcast Corp. - Class A | 227,317 | 9,895,109 | ||||||
Discovery, Inc. - Class A (a)(b) | 156,570 | 4,838,013 | ||||||
| 14,733,122 | ||||||||
Metal Fabricate/Hardware - 0.50% | ||||||||
The Timken Co. | 49,651 | 2,380,765 | ||||||
Mining - 3.51% | ||||||||
Kirkland Lake Gold Ltd. | 518,952 | 16,772,529 | ||||||
Oil & Gas Services - 2.76% | ||||||||
ProPetro Holding Corp. (a)(b) | 203,795 | 4,509,983 | ||||||
Solaris Oilfield Infrastructure, Inc. - Class A | 510,910 | 8,680,361 | ||||||
| 13,190,344 | ||||||||
Packaging & Containers - 1.01% | ||||||||
Berry Global Group, Inc. (a) | 82,081 | 4,826,363 | ||||||
Retail - 5.89% | ||||||||
Lululemon Athletica, Inc. (a)(b) | 80,046 | 14,116,112 | ||||||
ULTA Salon, Cosmetics & Fragrance, Inc. (a) | 40,102 | 13,994,796 | ||||||
| 28,110,908 | ||||||||
Semiconductors - 2.22% | ||||||||
Microchip Technology, Inc. (b) | 24,062 | 2,403,553 | ||||||
Xilinx, Inc. | 68,087 | 8,179,972 | ||||||
| 10,583,525 | ||||||||
The accompanying notes are an integral part of these financial statements.
INNOVATOR IBD® 50 ETF
Schedule of Investments
April 30, 2019 (Unaudited) (Continued)
Shares | Value | |||||||
Software - 17.38% | ||||||||
Atlassian Corp. PLC - Class A (a)(b) | 161,365 | $ | 17,774,354 | |||||
Intuit, Inc. | 54,044 | 13,568,287 | ||||||
Paycom Software, Inc. (a)(b) | 86,438 | 17,506,288 | ||||||
SS&C Technologies Holdings, Inc. | 252,243 | 17,066,762 | ||||||
Veeva Systems, Inc. - Class A (a)(b) | 121,830 | 17,040,362 | ||||||
| 82,956,053 | ||||||||
Telecommunications - 6.88% | ||||||||
Arista Networks, Inc. (a) | 51,189 | 15,985,814 | ||||||
Ubiquiti Networks, Inc. (b) | 98,889 | 16,855,630 | ||||||
| 32,841,444 | ||||||||
TOTAL COMMON STOCKS (Cost $381,994,504) | 433,835,961 | |||||||
REAL ESTATE INVESTMENT TRUSTS - 9.09% | ||||||||
Diversified - 1.01% | ||||||||
American Tower Corp. (b) | 24,616 | 4,807,505 | ||||||
Health Care - 3.05% | ||||||||
CareTrust REIT, Inc. | 600,323 | 14,557,833 | ||||||
Hotels - 0.99% | ||||||||
MGM Growth Properties LLC - Class A | 146,672 | 4,731,639 | ||||||
Single Tenant - 2.02% | ||||||||
STORE Capital Corp. | 289,241 | 9,637,510 | ||||||
Warehouse/Industrial - 2.02% | ||||||||
Innovative Industrial Properties, Inc. (b) | 56,471 | 4,807,941 | ||||||
Rexford Industrial Realty, Inc. (b) | 128,001 | 4,849,957 | ||||||
| 9,657,898 | ||||||||
TOTAL REAL ESTATE INVESTMENT TRUSTS (Cost $40,192,817) | 43,392,385 | |||||||
INVESTMENTS PURCHASED WITH PROCEEDS FROM SECURITIES LENDING - 25.56% | ||||||||
Mount Vernon Liquid Assets Portfolio, LLC, 2.61% (c) | 122,015,010 | 122,015,010 | ||||||
TOTAL INVESTMENTS PURCHASED WITH PROCEEDS FROM SECURITIES LENDING (Cost $122,015,010) | 122,015,010 | |||||||
The accompanying notes are an integral part of these financial statements.
INNOVATOR IBD® 50 ETF
Schedule of Investments
April 30, 2019 (Unaudited) (Continued)
Shares | Value | |||||||
SHORT TERM INVESTMENTS - 0.11% | ||||||||
Money Market Funds - 0.11% | ||||||||
Fidelity Government Portfolio - Class I, 2.31% (c) | 503,150 | $ | 503,150 | |||||
TOTAL SHORT TERM INVESTMENTS (Cost $503,150) | 503,150 | |||||||
Total Investments (Cost $544,705,481) - 125.63% | 599,746,506 | |||||||
Liabilities in Excess of Other Assets - (25.63)% | (122,356,081 | ) | ||||||
TOTAL NET ASSETS - 100.00% | $ | 477,390,425 | ||||||
Percentages are stated as a percent of net assets.
ADR | American Depositary Receipt |
(a) | Non-income producing security. |
(b) | All or a portion of this security is on loan as of April 30, 2019. The total value of securities on loan is $119,331,356, or 25.00% of net assets. See Note 5. |
(c) | Represents annualized seven-day yield as of the end of the reporting period. |
Asset Type | % of Net Assets | |||
Common Stocks | 90.87 | % | ||
Real Estate Investment Trusts | 9.09 | |||
Short Term Investments | 0.11 | |||
Investments Purchased with Proceeds From Securities Lending | 25.56 | |||
Total Investments | 125.63 | |||
Liabilities in Excess of Other Assets | (25.63 | ) | ||
Net Assets | 100.00 | % | ||
The accompanying notes are an integral part of these financial statements.
INNOVATOR IBD® ETF LEADERS ETF
Schedule of Investments
April 30, 2019 (Unaudited)
EXCHANGE TRADED FUNDS - 99.87% | ||||||||
Other Investment Pools and Funds - 99.87% | ||||||||
First Trust Cloud Computing ETF (a) | 27,586 | $ | 1,675,574 | |||||
First Trust Technology AlphaDEX Fund | 24,861 | 1,699,995 | ||||||
Invesco Russell MidCap Pure Growth ETF (a) | 84,272 | 4,980,475 | ||||||
iShares Cohen & Steers REIT ETF | 10,722 | 1,190,142 | ||||||
iShares Expanded Tech-Software Sector ETF | 7,537 | 1,672,310 | ||||||
iShares U.S. Medical Devices ETF (a) | 20,590 | 4,628,426 | ||||||
iShares U.S. Real Estate ETF | 13,689 | 1,190,943 | ||||||
Schwab U.S. REIT ETF | 26,816 | 1,189,021 | ||||||
Vanguard Real Estate ETF | 13,715 | 1,190,051 | ||||||
TOTAL EXCHANGE TRADED FUNDS (Cost $18,941,580) | 19,416,937 | |||||||
INVESTMENTS PURCHASED WITH PROCEEDS FROM SECURITIES LENDING - 28.82% | ||||||||
Mount Vernon Liquid Assets Portfolio, LLC, 2.61% (b) | 5,603,050 | 5,603,050 | ||||||
TOTAL INVESTMENTS PURCHASED WITH PROCEEDS FROM SECURITIES LENDING (Cost $5,603,050) | 5,603,050 | |||||||
SHORT TERM INVESTMENTS - 0.16% | ||||||||
Money Market Funds - 0.16% | ||||||||
Fidelity Government Portfolio - Class I, 2.31% (b) | 32,309 | 32,309 | ||||||
TOTAL SHORT TERM INVESTMENTS (Cost $32,309) | 32,309 | |||||||
Total Investments (Cost $24,576,939) - 128.85% | 25,052,296 | |||||||
Liabilities in Excess of Other Assets - (28.85)% | (5,609,908 | ) | ||||||
TOTAL NET ASSETS - 100.00% | $ | 19,442,388 |
Percentages are stated as a percent of net assets.
(a) | All or a portion of this security is on loan as of April 30, 2019. The total value of securities on loan is $5,524,885, or 28.42% of net assets. See Note 5. |
(b) | Represents annualized seven-day yield as of the end of the reporting period. |
Asset Type | % of Net Assets | |||
Exchange Traded Funds | 99.87 | % | ||
Short Term Investments | 0.16 | |||
Investments Purchased with Proceeds From Securities Lending | 28.82 | |||
Total Investments | 128.85 | |||
Liabilities in Excess of Other Assets | (28.85 | ) | ||
Net Assets | 100.00 | % | ||
The accompanying notes are an integral part of these financial statements.
INNOVATOR IBD® BREAKOUT OPPORTUNITIES ETF
Schedule of Investments
April 30, 2019 (Unaudited)
Shares | Value | |||||||
COMMON STOCKS - 99.65% | ||||||||
Aerospace/Defense - 3.99% | ||||||||
Harris Corp. (a) | 1,584 | $ | 266,904 | |||||
HEICO Corp. - Class A | 374 | 33,447 | ||||||
Lockheed Martin Corp. | 462 | 153,998 | ||||||
| 454,349 | ||||||||
Airlines - 2.34% | ||||||||
United Continental Holdings, Inc. (b) | 3,003 | 266,847 | ||||||
Apparel - 4.71% | ||||||||
Under Armour, Inc. - Class A (b) | 11,594 | 267,705 | ||||||
Under Armour, Inc. - Class C (b) | 12,958 | 268,489 | ||||||
| 536,194 | ||||||||
Banks - 7.05% | ||||||||
Citigroup, Inc. | 3,806 | 269,084 | ||||||
JPMorgan Chase & Co. | 2,299 | 266,799 | ||||||
Popular, Inc. | 4,642 | 267,890 | ||||||
| 803,773 | ||||||||
Building Materials - 1.61% | ||||||||
Armstrong World Industries, Inc. (a) | 1,716 | 148,726 | ||||||
Vulcan Materials Co. | 275 | 34,680 | ||||||
| 183,406 | ||||||||
Chemicals - 1.32% | ||||||||
Ingevity Corp. (b) | 1,309 | 150,548 | ||||||
Commercial Services - 9.73% | ||||||||
Aaron's, Inc. (a) | 4,631 | 257,900 | ||||||
Automatic Data Processing, Inc. (a) | 1,375 | 226,036 | ||||||
Chegg, Inc. (b) | 3,773 | 134,507 | ||||||
Cintas Corp. | 693 | 150,478 | ||||||
CoStar Group, Inc. (b) | 308 | 152,845 | ||||||
Euronet Worldwide, Inc. (a)(b) | 517 | 77,493 | ||||||
EVERTEC, Inc. | 1,078 | 33,752 | ||||||
TransUnion | 1,078 | 75,083 | ||||||
| 1,108,094 | ||||||||
Computers - 1.18% | ||||||||
CyberArk Software Ltd. (b) | 264 | 34,038 | ||||||
EPAM Systems, Inc. (b) | 187 | 33,540 | ||||||
Fortinet, Inc. (a)(b) | 363 | 33,912 | ||||||
Mercury Systems, Inc. (a)(b) | 451 | 32,932 | ||||||
| 134,422 | ||||||||
The accompanying notes are an integral part of these financial statements.
INNOVATOR IBD® BREAKOUT OPPORTUNITIES ETF
Schedule of Investments
April 30, 2019 (Unaudited) (Continued)
|
| Shares |
|
| Value |
| ||
Cosmetics & Personal Care - 1.33% |
|
|
|
|
|
|
|
|
The Estee Lauder Cos, Inc. - Class A |
|
| 880 |
|
| $ | 151,193 |
|
|
|
|
|
|
|
|
|
|
Distribution/Wholesale - 2.65% |
|
|
|
|
|
|
|
|
Copart, Inc. (a)(b) |
|
| 1,122 |
|
|
| 75,533 |
|
HD Supply Holdings, Inc. (b) |
|
| 4,961 |
|
|
| 226,669 |
|
|
|
|
|
|
|
| 302,202 |
|
Diversified Financial Services - 3.98% |
|
|
|
|
|
|
|
|
Discover Financial Services |
|
| 924 |
|
|
| 75,297 |
|
Intercontinental Exchange, Inc. |
|
| 2,794 |
|
|
| 227,292 |
|
Mastercard, Inc. - Class A |
|
| 297 |
|
|
| 75,509 |
|
Visa, Inc. - Class A |
|
| 462 |
|
|
| 75,967 |
|
|
|
|
|
|
|
| 454,065 |
|
Electrical Components & Equipment - 2.30% |
|
|
|
|
|
|
|
|
AMETEK, Inc. |
|
| 2,596 |
|
|
| 228,889 |
|
Novanta, Inc. (b) |
|
| 385 |
|
|
| 33,503 |
|
|
|
|
|
|
|
| 262,392 |
|
Electronics - 4.12% |
|
|
|
|
|
|
|
|
Fortive Corp. (a) |
|
| 2,651 |
|
|
| 228,887 |
|
Woodward, Inc. |
|
| 2,211 |
|
|
| 240,777 |
|
|
|
|
|
|
|
| 469,664 |
|
Environmental Control - 2.38% |
|
|
|
|
|
|
|
|
Clean Harbors, Inc. (b) |
|
| 3,564 |
|
|
| 270,864 |
|
|
|
|
|
|
|
|
|
|
Healthcare Products - 4.81% |
|
|
|
|
|
|
|
|
Shockwave Medical, Inc. (b) |
|
| 6,402 |
|
|
| 272,789 |
|
Silk Road Medical, Inc. (b) |
|
| 6,600 |
|
|
| 274,824 |
|
|
|
|
|
|
|
| 547,613 |
|
Insurance - 2.74% |
|
|
|
|
|
|
|
|
Kemper Corp. (a) |
|
| 2,618 |
|
|
| 235,306 |
|
Willis Towers Watson PLC |
|
| 418 |
|
|
| 77,054 |
|
|
|
|
|
|
|
| 312,360 |
|
Internet - 4.10% |
|
|
|
|
|
|
|
|
Amazon.com, Inc. (b) |
|
| 44 |
|
|
| 84,767 |
|
GoDaddy, Inc. - Class A (b) |
|
| 924 |
|
|
| 75,306 |
|
Wix.com Ltd. (a)(b) |
|
| 561 |
|
|
| 75,264 |
|
Zscaler, Inc. (b) |
|
| 3,388 |
|
|
| 231,434 |
|
|
|
|
|
|
|
| 466,771 |
|
|
|
|
|
|
|
|
|
|
Leisure Time - 1.32% |
|
|
|
|
|
|
|
|
Fox Factory Holding Corp. (b) |
|
| 1,936 |
|
|
| 150,234 |
|
|
|
|
|
|
|
|
|
|
Machinery-Diversified - 2.33% |
|
|
|
|
|
|
|
|
XYLEM, Inc. (a) |
|
| 3,179 |
|
|
| 265,129 |
|
The accompanying notes are an integral part of these financial statements.
INNOVATOR IBD® BREAKOUT OPPORTUNITIES ETF
Schedule of Investments
April 30, 2019 (Unaudited) (Continued)
|
| Shares |
|
| Value |
| ||
Media - 3.02% |
|
|
|
|
|
|
|
|
Discovery, Inc. - Class A (b) |
|
| 2,398 |
|
| $ | 74,098 |
|
FactSet Research Systems, Inc. (a) |
|
| 979 |
|
|
| 270,077 |
|
|
|
|
|
|
|
| 344,175 |
|
Metal Fabricate/Hardware - 2.00% |
|
|
|
|
|
|
|
|
The Timken Co. |
|
| 4,752 |
|
|
| 227,858 |
|
|
|
|
|
|
|
|
|
|
Miscellaneous Manufacturing - 2.01% |
|
|
|
|
|
|
|
|
Carlisle Cos, Inc. |
|
| 1,617 |
|
|
| 228,676 |
|
|
|
|
|
|
|
|
|
|
Office/Business Equipment - 0.26% |
|
|
|
|
|
|
|
|
Zebra Technologies Corp. - Class A(b) |
|
| 143 |
|
|
| 30,193 |
|
|
|
|
|
|
|
|
|
|
Pharmaceuticals - 1.31% |
|
|
|
|
|
|
|
|
Zoetis, Inc. (a) |
|
| 1,463 |
|
|
| 148,992 |
|
|
|
|
|
|
|
|
|
|
Retail - 3.57% |
|
|
|
|
|
|
|
|
Five Below, Inc. (a)(b) |
|
| 517 |
|
|
| 75,684 |
|
Ollie's Bargain Outlet Holdings, Inc. (a)(b) |
|
| 2,354 |
|
|
| 225,137 |
|
Starbucks Corp. (a) |
|
| 968 |
|
|
| 75,194 |
|
ULTA Salon, Cosmetics & Fragrance, Inc. (b) |
|
| 88 |
|
|
| 30,710 |
|
|
|
|
|
|
|
| 406,725 |
|
Semiconductors - 0.30% |
|
|
|
|
|
|
|
|
Cabot Microelectronics Corp. |
|
| 275 |
|
|
| 34,719 |
|
|
|
|
|
|
|
|
|
|
Software - 18.61% |
|
|
|
|
|
|
|
|
Akamai Technologies, Inc. (b) |
|
| 1,914 |
|
|
| 153,235 |
|
Autodesk, Inc. (b) |
|
| 429 |
|
|
| 76,452 |
|
Black Knight, Inc. (b) |
|
| 4,675 |
|
|
| 263,764 |
|
Cadence Design Systems, Inc. (b) |
|
| 1,111 |
|
|
| 77,081 |
|
Ceridian HCM Holding, Inc. (b) |
|
| 4,312 |
|
|
| 229,183 |
|
Fair Isaac Corp. (b) |
|
| 803 |
|
|
| 224,639 |
|
Guidewire Software, Inc. (a)(b) |
|
| 1,419 |
|
|
| 151,124 |
|
Microsoft Corp. |
|
| 1,155 |
|
|
| 150,843 |
|
MSCI, Inc. |
|
| 671 |
|
|
| 151,230 |
|
Paycom Software, Inc. (a)(b) |
|
| 165 |
|
|
| 33,417 |
|
Pluralsight, Inc. - Class A(b) |
|
| 7,788 |
|
|
| 276,396 |
|
PROS Holdings, Inc. (b) |
|
| 4,488 |
|
|
| 229,965 |
|
ServiceNow, Inc. (b) |
|
| 121 |
|
|
| 32,853 |
|
Tyler Technologies, Inc. (b) |
|
| 154 |
|
|
| 35,714 |
|
Veeva Systems, Inc. - Class A (a)(b) |
|
| 242 |
|
|
| 33,849 |
|
|
|
|
|
|
|
| 2,119,745 |
|
Telecommunications - 0.29% |
|
|
|
|
|
|
|
|
Viavi Solutions, Inc. (b) |
|
| 2,508 |
|
|
| 33,356 |
|
The accompanying notes are an integral part of these financial statements.
INNOVATOR IBD® BREAKOUT OPPORTUNITIES ETF
Schedule of Investments
April 30, 2019 (Unaudited) (Continued)
|
| Shares |
|
| Value |
| ||
Transportation - 4.29% |
|
|
|
|
|
|
|
|
Arista Networks, Inc. (b) |
|
| 473 |
|
| $ | 147,713 |
|
AudioCodes Ltd. |
|
| 13,717 |
|
|
| 193,273 |
|
Canadian National Railway Co. |
|
| 1,595 |
|
|
| 147,984 |
|
|
|
|
|
|
|
| 488,970 |
|
TOTAL COMMON STOCKS (Cost $10,579,173) |
|
|
|
|
|
| 11,353,529 |
|
|
|
|
|
|
|
|
|
|
REAL ESTATE INVESTMENT TRUSTS - 0.30% |
|
|
|
|
|
|
|
|
Single Tenant - 0.30% |
|
|
|
|
|
|
|
|
Essential Properties Realty Trust, Inc. |
|
| 1,650 |
|
|
| 34,122 |
|
TOTAL REAL ESTATE INVESTMENT TRUSTS (Cost $25,226) |
|
|
|
|
|
| 34,122 |
|
|
|
|
|
|
|
|
|
|
INVESTMENTS PURCHASED WITH PROCEEDS FROM SECURITIES LENDING - 24.76% |
|
|
|
|
|
|
|
|
Mount Vernon Liquid Assets Portfolio, LLC, 2.61% (c) |
|
| 2,820,544 |
|
|
| 2,820,544 |
|
TOTAL INVESTMENTS PURCHASED WITH PROCEEDS FROM SECURITIES LENDING (Cost $2,820,544) |
|
|
|
|
|
| 2,820,544 |
|
|
|
|
|
|
|
|
|
|
SHORT TERM INVESTMENTS - 0.43% |
|
|
|
|
|
|
|
|
Money Market Funds - 0.43% |
|
|
|
|
|
|
|
|
Fidelity Government Portfolio - Class I, 2.31% (c) |
|
| 49,533 |
|
|
| 49,533 |
|
TOTAL SHORT TERM INVESTMENTS (Cost $49,533) |
|
|
|
|
|
| 49,533 |
|
|
|
|
|
|
|
|
|
|
Total Investments (Cost $13,474,476) - 125.14% |
|
|
|
|
|
| 14,257,728 |
|
Liabilities in Excess of Other Assets - (25.14)% |
|
|
|
|
|
| (2,864,765 | ) |
TOTAL NET ASSETS - 100.00% |
|
|
|
|
| $ | 11,392,963 |
|
Percentages are stated as a percent of net assets.
(a) | All or a portion of this security is on loan as of April 30, 2019. The total value of securities on loan is $2,772,723, or 24.34% of net assets. See Note 5. |
(b) | Non-income producing security. |
(c) | Represents annualized seven-day yield as of the end of the reporting period. |
The accompanying notes are an integral part of these financial statements.
INNOVATOR IBD® BREAKOUT OPPORTUNITIES ETF
Schedule of Investments
April 30, 2019 (Unaudited) (Continued)
Asset Type | % of Net Assets | |||
Common Stocks | 99.65 | % | ||
Real Estate Investment Trusts | 0.30 | |||
Short Term Investments | 0.43 | |||
Investments Purchased with Proceeds From Securities Lending | 24.76 | |||
Total Investments | 125.14 | |||
Liabilities in Excess of Other Assets | (25.14 | ) | ||
Net Assets | 100.00 | % | ||
The accompanying notes are an integral part of these financial statements.
INNOVATOR LOUP FRONTIER TECH ETF
Schedule of Investments
April 30, 2019 (Unaudited)
Shares | Value | |||||||
COMMON STOCKS - 99.88% | ||||||||
Aerospace/Defense - 2.35% | ||||||||
Aerovironment, Inc. (a) | 4,851 | $ | 332,585 | |||||
Auto Manufacturers - 5.26% | ||||||||
Geely Automobile Holdings Ltd. | 209,000 | 419,343 | ||||||
Tesla, Inc. (a)(b) | 1,353 | 322,948 | ||||||
| 742,291 | ||||||||
Computers - 6.54% | ||||||||
CRAY, Inc. (a) | 15,686 | 411,914 | ||||||
Lumentum Holdings, Inc. (a)(b) | 8,261 | 511,935 | ||||||
| 923,849 | ||||||||
Electrical Components & Equipment - 5.82% | ||||||||
LG Innotek Co., Ltd. | 3,993 | 418,733 | ||||||
Novanta, Inc. (a) | 4,631 | 402,990 | ||||||
| 821,723 | ||||||||
Electronics - 14.19% | ||||||||
FARO Technologies, Inc. (a) | 14,344 | 806,849 | ||||||
FLIR Systems, Inc. | 7,656 | 405,309 | ||||||
II-VI, Inc. (a)(b) | 10,054 | 400,551 | ||||||
Trimble, Inc. (a) | 9,548 | 389,749 | ||||||
| 2,002,458 | ||||||||
Healthcare-Products - 2.51% | ||||||||
Intuitive Surgical, Inc. (a) | 693 | 353,867 | ||||||
Home Furnishings - 4.67% | ||||||||
iRobot Corp. (a)(b) | 3,146 | 325,737 | ||||||
Sony Corp. - ADR (a) | 6,611 | 332,996 | ||||||
| 658,733 | ||||||||
Internet - 4.52% | ||||||||
BAIDU, Inc. - ADR (a) | 3,839 | 638,157 | ||||||
Machinery-Diversified - 13.54% | ||||||||
FANUC Corp. | 2,200 | 410,297 | ||||||
Keyence Corp. | 1,100 | 682,543 | ||||||
Rockwell Automation, Inc. | 2,068 | 373,708 | ||||||
Yaskawa Electric Corp. | 12,100 | 444,809 | ||||||
| 1,911,357 | ||||||||
Miscellaneous Manufacturing - 8.60% | ||||||||
Ambarella, Inc. (a) | 15,840 | 793,901 | ||||||
Fabrinet Co., Ltd. (a)(b) | 6,952 | 420,735 | ||||||
| 1,214,636 | ||||||||
The accompanying notes are an integral part of these financial statements.
INNOVATOR LOUP FRONTIER TECH ETF
Schedule of Investments
April 30, 2019 (Unaudited) (Continued)
Shares | Value | |||||||
Office/Business Equip - 4.11% | ||||||||
Datalogic SpA | 24,508 | $ | 580,003 | |||||
Semiconductors - 21.84% | ||||||||
Advanced Micro Devices, Inc. (a)(b) | 29,249 | 808,149 | ||||||
AMS AG | 14,113 | 595,434 | ||||||
Himax Technologies, Inc. - ADR (b) | 106,865 | 346,243 | ||||||
Micron Technology, Inc. (a)(b) | 10,065 | 423,334 | ||||||
NVIDIA Corp. | 2,574 | 465,893 | ||||||
STMicroelectronics NV | 24,167 | 443,858 | ||||||
| 3,082,911 | ||||||||
Software - 2.77% | ||||||||
Nuance Communications, Inc. (a) | 23,243 | 391,180 | ||||||
Telecommunications - 3.16% | ||||||||
HTC Corp. (a) | 330,000 | 446,393 | ||||||
TOTAL COMMON STOCKS (Cost $13,711,959) | 14,100,143 | |||||||
INVESTMENTS PURCHASED WITH PROCEEDS FROM SECURITIES LENDING - 22.35% | ||||||||
Mount Vernon Liquid Assets Portfolio, LLC, 2.61% (c) | 3,155,022 | 3,155,022 | ||||||
TOTAL INVESTMENTS PURCHASED WITH PROCEEDS FROM SECURITIES LENDING (Cost $3,155,022) | 3,155,022 | |||||||
SHORT TERM INVESTMENTS - 0.09% | ||||||||
Money Market Funds - 0.09% | ||||||||
Fidelity Government Portfolio - Class I, 2.31% (c) | 12,382 | 12,382 | ||||||
TOTAL SHORT TERM INVESTMENTS (Cost $12,382) | 12,382 | |||||||
Total Investments (Cost $16,879,363) - 122.32% | 17,267,547 | |||||||
Liabilities in Excess of Other Assets - (22.32)% | (3,151,361 | ) | ||||||
TOTAL NET ASSETS - 100.00% | $ | 14,116,186 | ||||||
Percentages are stated as a percent of net assets.
ADR | American Depositary Receipt |
(a) | Non-income producing security. |
(b) | All or a portion of this security is on loan as of April 30, 2019. The total value of securities on loan is $3,087,931, or 21.88% of net assets. See Note 5. |
(c) | Represents annualized seven-day yield as of the end of the reporting period. |
The accompanying notes are an integral part of these financial statements.
INNOVATOR LOUP FRONTIER TECH ETF
Schedule of Investments
April 30, 2019 (Unaudited) (Continued)
Country | % of Net Assets | |||
Austria | 4.22 | % | ||
China | 7.49 | |||
Italy | 4.11 | |||
Japan | 13.25 | |||
South Korea | 2.97 | |||
Switzerland | 3.14 | |||
Taiwan | 5.61 | |||
Thailand | 2.98 | |||
United States | 56.11 | |||
Total Country | 99.88 | |||
Short Term Investments | 0.09 | |||
Investments Purchased with Proceeds From Securities Lending | 22.35 | |||
Total Investments | 122.32 | |||
Liabilities in Excess of Other Assets | (22.32 | ) | ||
Net Assets | 100.00 | % | ||
The accompanying notes are an integral part of these financial statements.
INNOVATOR ETFs TRUST
Statements of Assets and Liabilities
April 30, 2019 (Unaudited)
Innovator IBD® 50 ETF | Innovator IBD® ETF Leaders ETF | Innovator IBD® Breakout Opportunities ETF | Innovator Loup Frontier Tech ETF | |||||||||||||
Assets: | ||||||||||||||||
Investments, at value (a)(b) | $ | 599,746,506 | $ | 25,052,296 | $ | 14,257,728 | $ | 17,267,547 | ||||||||
Dividends, interest and other receivables | 63,168 | 68 | 2,728 | 11,823 | ||||||||||||
Receivable for investments sold | 1,725,999 | – | 2,474,234 | – | ||||||||||||
Securities lending income receivable | 30,158 | 2,541 | 256 | 1,100 | ||||||||||||
Prepaid expenses | 953 | – | – | – | ||||||||||||
Total Assets | 601,566,784 | 25,054,905 | 16,734,946 | 17,280,470 | ||||||||||||
Liabilities: | ||||||||||||||||
Payable for fund shares redeemed | 1,729,765 | – | – | – | ||||||||||||
Payable for collateral upon return of securities loaned | 122,015,010 | 5,603,050 | 2,820,544 | 3,155,022 | ||||||||||||
Payable to Adviser | 297,410 | 9,467 | 7,385 | 8,081 | ||||||||||||
Payable for investments purchased | – | – | 2,513,814 | – | ||||||||||||
Payable to Trustees | 26,608 | – | – | – | ||||||||||||
Payable to Custodian | 6,097 | – | – | – | ||||||||||||
Accrued expenses and other liabilities | 101,469 | – | 240 | 1,181 | ||||||||||||
Total Liabilities | 124,176,359 | 5,612,517 | 5,341,983 | 3,164,284 | ||||||||||||
Net Assets | $ | 477,390,425 | $ | 19,442,388 | $ | 11,392,963 | $ | 14,116,186 | ||||||||
Net Assets Consist of: | ||||||||||||||||
Paid-in capital | $ | 548,084,464 | $ | 30,140,381 | $ | 13,011,181 | $ | 14,637,838 | ||||||||
Total distributable earnings/(accumulated deficit) | (70,694,039 | ) | (10,697,993 | ) | (1,618,218 | ) | (521,652 | ) | ||||||||
Net Assets | $ | 477,390,425 | $ | 19,442,388 | $ | 11,392,963 | $ | 14,116,186 | ||||||||
Net Asset Value: | ||||||||||||||||
Net Assets | $ | 477,390,425 | $ | 19,442,388 | $ | 11,392,963 | $ | 14,116,186 | ||||||||
Shares of beneficial interest outstanding (unlimted shares authorized) | 13,800,000 | 900,002 | 550,000 | 550,001 | ||||||||||||
Net asset value price per share | $ | 34.59 | $ | 21.60 | $ | 20.71 | $ | 25.67 | ||||||||
(a) Cost of investments | $ | 544,705,481 | $ | 24,576,939 | $ | 13,474,476 | $ | 16,879,363 | ||||||||
(b) Including securities on loan at a value of | $ | 119,331,356 | $ | 5,524,885 | $ | 2,772,723 | $ | 3,087,931 | ||||||||
The accompanying notes are an integral part of these financial statements.
INNOVATOR ETFs TRUST
Statements of Operations
For the Period Ended April 30, 2019 (Unaudited)
Innovator IBD® 50 ETF | Innovator IBD® ETF Leaders ETF | Innovator IBD® Breakout Opportunities ETF | Innovator Loup Frontier Tech ETF | |||||||||||||
Investment Income: | ||||||||||||||||
Dividends | $ | 1,328,166 | $ | 308,860 | $ | 44,519 | $ | 39,427 | ||||||||
Less: Foreign witholding taxes and issuance fees | (6,217 | ) | – | (541 | ) | (4,356 | ) | |||||||||
Interest | 8,723 | 664 | 248 | 238 | ||||||||||||
Securities lending income, net | 31,616 | 2,851 | 257 | 1,338 | ||||||||||||
Total Investment Income | 1,362,288 | 312,375 | 44,483 | 36,647 | ||||||||||||
Expenses: | ||||||||||||||||
Investment advisory fee | 1,484,687 | 75,347 | 42,552 | 44,136 | ||||||||||||
Professional fees | 86,805 | – | – | – | ||||||||||||
Administration fees | 19,606 | – | – | – | ||||||||||||
Fund accounting fees | 1,532 | – | – | – | ||||||||||||
Trustees fees and expenses | 23,788 | – | – | – | ||||||||||||
Printing and mailing expenses | 33,853 | – | – | – | ||||||||||||
Custody fees | 10,925 | – | – | – | ||||||||||||
Insurance expense | 8,365 | – | – | – | ||||||||||||
Tax expense | – | 2,877 | – | – | ||||||||||||
Other expenses | 3,234 | – | – | – | ||||||||||||
Total Expenses Before Expense Limitation | 1,672,795 | 78,224 | 42,552 | 44,136 | ||||||||||||
Net advisory recoupment/(waivers) | 23,990 | – | – | – | ||||||||||||
Net Expenses | 1,696,785 | 78,224 | 42,552 | 44,136 | ||||||||||||
Net Investment Income/(Loss) | (334,497 | ) | 234,151 | 1,931 | (7,489 | ) | ||||||||||
Realized & Unrealized Gain/(Loss): | ||||||||||||||||
Net realized gain/(loss) on: | ||||||||||||||||
Investments and foreign currency transactions | (61,403,918 | ) | (5,023,626 | ) | (1,199,312 | ) | (951,825 | ) | ||||||||
Redemptions sold in-kind | 42,785,175 | 181,845 | 737,268 | 398,994 | ||||||||||||
Investments in affiliates | – | (221,702 | ) | – | – | |||||||||||
Net change in unrealized appreciation/(depreciation) on: | ||||||||||||||||
Investments and foreign currency transactions | 58,744,006 | 3,738,203 | 842,501 | 2,159,251 | ||||||||||||
Investments in affiliates | – | 225,862 | – | – | ||||||||||||
Net Realized and Unrealized Gain/(Loss) | 40,125,263 | (1,099,418 | ) | 380,457 | 1,606,420 | |||||||||||
Net Increase/(Decrease) in Net Assets Resulting From Operations | $ | 39,790,766 | $ | (865,267 | ) | $ | 382,388 | $ | 1,598,931 | |||||||
The accompanying notes are an integral part of these financial statements.
INNOVATOR ETFs TRUST
Statements of Changes in Net Assets
Innovator IBD® 50 ETF | ||||||||
Period Ended | Year Ended | |||||||
April 30, 2019 | October 31, 2018 | |||||||
(Unaudited) | ||||||||
Operations: | ||||||||
Net investment income/(loss) | $ | (334,497 | ) | $ | (1,674,366 | ) | ||
Net realized gain/(loss) | (18,618,743 | ) | (30,017,508 | ) | ||||
Net change in unrealized appreciation/(depreciation) | 58,744,006 | (19,992,056 | ) | |||||
Net Increase/(Decrease) in Net Assets Resulting from Operations | 39,790,766 | (51,683,930 | ) | |||||
Distributions to Shareholders: | ||||||||
Net distributions to shareholders | — | (477,422 | ) | |||||
Fund Share Transactions: | ||||||||
Proceeds from shares sold in-kind | 322,546,460 | 824,544,395 | ||||||
Cost of shares redeemed in-kind | (325,398,025 | ) | (513,641,950 | ) | ||||
Transaction fees (see Note 7) | 29 | 341 | ||||||
Net Increase/(Decrease) in Net Assets from Capital Share Transactions | (2,851,536 | ) | 310,902,786 | |||||
Total Increase/(Decrease) in Net Assets | $ | 36,939,230 | $ | 258,741,434 | ||||
Net Assets: | ||||||||
Beginning of period | $ | 440,451,195 | $ | 181,709,761 | ||||
End of period | $ | 477,390,425 | $ | 440,451,195 | ||||
Change in Shares Outstanding: | ||||||||
Shares sold in-kind | 10,100,000 | 23,500,000 | ||||||
Shares redeemed in-kind | (10,400,000 | ) | (14,850,000 | ) | ||||
Net Increase/(Decrease) | (300,000 | ) | 8,650,000 | |||||
(a) | Since Commencement of Operations on December 20, 2017. |
(b) | Since Commencement of Operations on September 12, 2018. |
(c) | Since Commencement of Operations on July 24, 2018. |
The accompanying notes are an integral part of these financial statements.
INNOVATOR ETFs TRUST
Innovator IBD® ETF Leaders ETF | Innovator IBD® Breakout Opportunities ETF | Innovator Loup Frontier Tech ETF | ||||||||||||||||||||
Period Ended | Period Ended | Period Ended | Period Ended | Period Ended | Period Ended | |||||||||||||||||
April 30, 2019 | October 31, 2018 (a) | April 30, 2019 | October 31, 2018 (b) | April 30, 2019 | October 31, 2018 (c) | |||||||||||||||||
(Unaudited) | (Unaudited) | (Unaudited) | ||||||||||||||||||||
| $ | 234,151 | $ | (13,921 | ) | $ | 1,931 | $ | (4,450 | ) | $ | (7,489 | ) | $ | (6,260 | ) | |||||||
| (5,063,483 | ) | (3,845,865 | ) | (462,044 | ) | (2,004,288 | ) | (552,831 | ) | (1,617 | ) | |||||||||||
| 3,964,065 | (3,488,708 | ) | 842,501 | (59,249 | ) | 2,159,251 | (1,771,131 | ) | ||||||||||||||
| (865,267 | ) | (7,348,494 | ) | 382,388 | (2,067,987 | ) | 1,598,931 | (1,779,008 | ) | |||||||||||||
| (250,719 | ) | (36,672 | ) | (21,386 | ) | — | — | — | ||||||||||||||
| 2,356,010 | 140,583,835 | 10,615,835 | 12,338,055 | 1,201,775 | 15,611,540 | |||||||||||||||||
| (14,464,820 | ) | (100,531,485 | ) | (7,688,660 | ) | (2,165,295 | ) | (1,208,265 | ) | (1,311,490 | ) | |||||||||||
| — | — | 13 | — | — | 2,703 | |||||||||||||||||
| (12,108,810 | ) | 40,052,350 | 2,927,188 | 10,172,760 | (6,490 | ) | 14,302,753 | |||||||||||||||
| $ | (13,224,796 | ) | $ | 32,667,184 | $ | 3,288,190 | $ | 8,104,773 | $ | 1,592,441 | $ | 12,523,745 | ||||||||||
| $ | 32,667,184 | $ | — | $ | 8,104,773 | $ | — | $ | 12,523,745 | $ | — | |||||||||||
| $ | 19,442,388 | $ | 32,667,184 | $ | 11,392,963 | $ | 8,104,773 | $ | 14,116,186 | $ | 12,523,745 | |||||||||||
| 100,000 | 5,450,002 | 550,000 | 500,000 | 50,000 | 600,001 | |||||||||||||||||
| (650,000 | ) | (4,000,000 | ) | (400,000 | ) | (100,000 | ) | (50,000 | ) | (50,000 | ) | |||||||||||
| (550,000 | ) | 1,450,002 | 150,000 | 400,000 | — | 550,001 | ||||||||||||||||
The accompanying notes are an integral part of these financial statements.
INNOVATOR ETFs TRUST
Financial Highlights
| Per Share Operating Performance (For a share outstanding throughout each period) | ||||||||||||||||||||||||||||
Operations: | Capital Share Transactions: | Less Distributions: | ||||||||||||||||||||||||||
Net Asset Value, Beginning of Period | Net investment income/(loss) | Net realized and unrealized gain/(loss) | Total From Investment Operations | Transaction fees (see Note 7) | Distributions from net investment income | Total Distributions | ||||||||||||||||||||||
Innovator IBD® 50 ETF | ||||||||||||||||||||||||||||
For the period ended April 30, 2019 (Unaudited) | $ | 31.24 | (0.02 | ) | 3.37 | 3.35 | — | (f) | — | — | ||||||||||||||||||
For the year ended October 31, 2018 | $ | 33.34 | (0.12 | ) | (1.92 | ) | (2.04 | ) | — | (f) | (0.06 | ) | (0.06 | ) | ||||||||||||||
For the period ended October 31, 2017 (e) | $ | 23.95 | 0.03 | 9.36 | 9.39 | — | — | — | ||||||||||||||||||||
For the year ended November 30, 2016 | $ | 23.54 | (0.06 | ) | 0.47 | 0.41 | — | — | — | |||||||||||||||||||
For the period 4/8/15 (d) - 11/30/15 | $ | 25.00 | (0.04 | ) | (1.42 | ) | (1.46 | ) | — | — | — | |||||||||||||||||
Innovator IBD® ETF Leaders ETF | ||||||||||||||||||||||||||||
For the period ended April 30, 2019 (Unaudited) | $ | 22.53 | 0.44 | (1.13 | ) | (0.69 | ) | — | (0.24 | ) | (0.24 | ) | ||||||||||||||||
For the period 12/20/17 (d) - 10/31/18 | $ | 25.07 | 0.02 | (2.51 | ) | (2.49 | ) | — | (0.05 | ) | (0.05 | ) | ||||||||||||||||
Innovator IBD® Breakout Opportunities ETF | ||||||||||||||||||||||||||||
For the period ended April 30, 2019 (Unaudited) | $ | 20.26 | 0.04 | 0.45 | 0.49 | — | (f) | (0.04 | ) | (0.04 | ) | |||||||||||||||||
For the period 9/12/18 (d) - 10/31/18 | $ | 25.00 | (0.01 | ) | (4.73 | ) | (4.74 | ) | — | — | — | |||||||||||||||||
Innovator Loup Frontier Tech ETF | ||||||||||||||||||||||||||||
For the period ended April 30, 2019 (Unaudited) | $ | 22.77 | (0.01 | ) | 2.91 | 2.90 | — | — | — | |||||||||||||||||||
For the period 7/24/18 (d) - 10/31/18 | $ | 25.00 | (0.01 | ) | (2.22 | ) | (2.23 | ) | — | (f) | — | — | ||||||||||||||||
(a) | Annualized for periods less than one year. |
(b) | Not annualized for periods less than one year. |
(c) | Does not include the impact of the expenses of the underlying funds in which the Fund invests. |
(d) | Inception date. |
(e) | The period ended October 31, 2017 consists of eleven months due to the Fund's fiscal year end change. |
(f) | Amount represents less than $0.01 per share. |
(g) | Excludes in-kind transactions associated with creations and redemptions of the Funds. |
(h) | Recognition of net investment income by the Funds are affected by the timing of the declaration of dividends by the underlying investment companies in which the Funds invest. This ratio does not include net investment income of the underlying investment companies in which the Funds invest. |
(i) | The ratio of net expenses to average net assets includes tax expense of 0.02%. |
The accompanying notes are an integral part of these financial statements.
INNOVATOR ETFs TRUST
| Ratios/Supplemental Data: | |||||||||||||||||||||||||||||
Ratio to Average Net Assets of: (a) | |||||||||||||||||||||||||||||
Change in Net Asset Value for the Period | Net Asset Value, End of Period | Total return (b) |
Net assets, end of period (000) | Expenses, before waivers (c) | Expenses, net of waivers (c) | Net investment income/(loss) (h) | Portfolio turnover rate (b)(g) | ||||||||||||||||||||||
| 3.35 | $ | 34.59 | 10.75 | % | $ | 477,390 | 0.79 | % | 0.80 | % | (0.16 | )% | 432 | % | |||||||||||||||
| (2.10 | ) | $ | 31.24 | (6.15 | )% | $ | 440,451 | 0.84 | % | 0.80 | % | (0.43 | )% | 719 | % | ||||||||||||||
| 9.39 | $ | 33.34 | 39.17 | % | $ | 181,710 | 1.03 | % | 0.80 | % | (0.24 | )% | 501 | % | |||||||||||||||
| 0.41 | $ | 23.95 | 1.78 | % | $ | 35,931 | 1.13 | % | 0.80 | % | (0.14 | )% | 1,041 | % | |||||||||||||||
| (1.46 | ) | $ | 23.54 | (5.84 | )% | $ | 70,612 | 1.13 | % | 0.80 | % | (0.34 | )% | 546 | % | ||||||||||||||
| (0.93 | ) | $ | 21.60 | (3.03 | )% | $ | 19,442 | 0.62 | % (i) | 0.62 | % (i) | 1.86 | % | 603 | % | ||||||||||||||
| (2.54 | ) | $ | 22.53 | (9.95 | )% | $ | 32,667 | 0.60 | % | 0.60 | % | (0.03 | )% | 619 | % | ||||||||||||||
| 0.45 | $ | 20.71 | 2.46 | % | $ | 11,393 | 0.80 | % | 0.80 | % | 0.04 | % | 944 | % | |||||||||||||||
| (4.74 | ) | $ | 20.26 | (18.95 | )% | $ | 8,105 | 0.80 | % | 0.80 | % | (0.38 | )% | 289 | % | ||||||||||||||
| 2.90 | $ | 25.67 | 12.72 | % | $ | 14,116 | 0.70 | % | 0.70 | % | (0.12 | )% | 60 | % | |||||||||||||||
| (2.23 | ) | $ | 22.77 | (8.92 | )% | $ | 12,524 | 0.70 | % | 0.70 | % | (0.23 | )% | 53 | % | ||||||||||||||
The accompanying notes are an integral part of these financial statements.
INNOVATOR ETFs TRUST
Notes to Financial Statements (Unaudited)
1. | ORGANIZATION |
Innovator ETFs Trust (the “Trust”) was organized under Delaware law as a Delaware statutory trust on October 17, 2007, and is registered with the Securities and Exchange Commission (“SEC”) under the Investment Company Act of 1940, as amended (the “1940 Act”) and is classified as an open-end management investment company. The Trust currently consists of multiple operational series, of which four are covered in this report, collectively the (“Funds”):
Name |
| Ticker |
| Commencement of Operations |
Innovator IBD® 50 ETF |
| FFTY |
| April 8, 2015 |
Innovator IBD® ETF Leaders ETF |
| LDRS |
| December 20, 2017 |
Innovator IBD® Breakout Opportunities ETF |
| BOUT |
| September 12, 2018 |
Innovator Loup Frontier Tech ETF |
| LOUP |
| July 24, 2018 |
The twelve operational series of the Trust covered outside of this report consist of:
Name |
| Ticker |
| Commencement of Operations |
Innovator S&P 500® Buffer ETF – January |
| BJAN |
| December 31, 2018 |
Innovator S&P 500® Buffer ETF – April |
| BAPR |
| March 29, 2019 |
Innovator S&P 500® Buffer ETF – July |
| BJUL |
| August 28, 2018 |
Innovator S&P 500® Buffer ETF – October |
| BOCT |
| September 28, 2018 |
Innovator S&P 500® Power Buffer ETF – January |
| PJAN |
| December 31, 2018 |
Innovator S&P 500® Power Buffer ETF – April |
| PAPR |
| March 29, 2019 |
Innovator S&P 500® Power Buffer ETF – July |
| PJUL |
| August 7, 2018 |
Innovator S&P 500® Power Buffer ETF – October |
| POCT |
| September 28, 2018 |
Innovator S&P 500® Ultra Buffer ETF – January |
| UJAN |
| December 31, 2018 |
Innovator S&P 500® Ultra Buffer ETF – April |
| UAPR |
| March 29, 2019 |
Innovator S&P 500® Ultra Buffer ETF – July |
| UJUL |
| August 7, 2018 |
Innovator S&P 500® Ultra Buffer ETF – October |
| UOCT |
| September 28, 2018 |
The Funds are exchange traded funds that offer one class of shares, do not charge a sales load, do not have a redemption fee and currently do not charge a 12b-1 fee to its shareholders. FFTY seeks to track, before fees and expenses, the performance of the IBD® 50 Index. LDRS seeks to track, before fees and expenses, the performance of the IBD® ETF Leaders Index. BOUT seeks to track, before fees and expenses, the performance of the IBD® Breakout Stocks Index. LOUP seeks to track, before fees and expenses, the performance of the LOUP Frontier Tech Index.
The Funds are investment companies and accordingly follow the investment company accounting and reporting guidance of the Financial Accounting Standards Board (“FASB”) Accounting Standards Codification (“ASC”) Topic 946 “Financial Services — Investment Companies”.
INNOVATOR ETFs TRUST
Notes to Financial Statements (Unaudited) (Continued)
2. | SIGNIFICANT ACCOUNTING POLICIES |
The following is a summary of significant accounting policies consistently followed by the Trust in the preparation of its financial statements. These policies are in conformity with accounting principles generally accepted in the United States of America (“U.S. GAAP”).
Valuation:
The net asset value (“NAV”) of the Funds are determined as of the close of regular trading on the NYSE (normally 4:00 p.m. ET). If the NYSE closes early on a valuation day, the Funds shall determine NAV as of that time.
Portfolio securities generally shall be valued utilizing prices provided by independent pricing services. The Trust’s Pricing Committee (“Pricing Committee”) is responsible for establishing valuation of portfolio securities and other instruments held by the Funds in accordance with the Trust’s valuation procedures.
Common stocks, preferred stocks and other equity securities listed on any national or foreign exchange (excluding the NASDAQ National Market (“NASDAQ”) and the London Stock Exchange Alternative Investment Market (“AIM”)) are generally valued at the last sale price on the exchange on which they are principally traded or, for NASDAQ and AIM securities, the official closing price. Securities traded on more than one securities exchange are valued at the last sale price or official closing price, as applicable, at the close of the exchange representing the principal market for such securities. Securities traded in the over-the-counter market are valued at the mean of the bid and the asked price, if available, and otherwise at their closing bid price. Redeemable securities issued by open-end investment companies shall be valued at the investment company’s applicable net asset value, with the exception of exchange-traded open-end investment companies which are priced as equity securities. Government and retail money-market funds, which are not eligible for vendor pricing, are valued at amortized cost, which approximates fair value. Fixed income securities, swaps, currency-, credit- and commodity-linked notes, and other similar instruments will be valued using a pricing service. Fixed income securities having a remaining maturity of 60 days or less when purchased will be valued at cost adjusted for amortization of premiums and accretion of discounts, provided the Pricing Committee has determined that the use of amortized cost is an appropriate reflection of fair value given market and issuer specific conditions existing at the time of the determination. Foreign securities and other assets denominated in foreign currencies are translated into U.S. dollars at the exchange rate of such currencies against the U.S. dollar as provided by the pricing service. All assets denominated in foreign currencies will be converted into U.S. dollars at the exchange rates in effect at the time of valuation. Restricted securities (with the exception of Rule 144A Securities for which market quotations are available) will normally be valued at fair value as determined by the Pricing Committee.
If no quotation can be obtained from a pricing service, then the Pricing Committee will then attempt to obtain one or more broker quotes for the security. If no quotation is available from either a pricing service or one or more brokers or if the Pricing Committee has reason to question the reliability or accuracy of a quotation supplied or the use of amortized cost, the value of any portfolio security held by the Funds for which reliable market quotations are not readily available will be determined by the Pricing Committee in a manner that most appropriately reflects fair market value of the security on the valuation date. The use of a fair valuation method may be appropriate if, for example: (i) market quotations do not accurately reflect fair value of an investment; (ii) an investment’s value has been materially affected by events occurring after the close of the exchange or market on which the investment is principally traded (for example, a foreign exchange or market); (iii) a trading halt closes an exchange or market early; or (iv) other events result in an exchange or market delaying its normal close.
The Funds utilize various methods to measure the fair value of most of their investments on a recurring basis. U.S. GAAP establishes a hierarchy that prioritizes inputs to valuation methods. The three levels of inputs are:
| • | Level 1 – | Unadjusted quoted prices in active markets for identical assets or liabilities that the Funds have the ability to access. |
| • | Level 2 – | Observable inputs other than quoted prices included in level 1 that are observable for the asset or liability, either directly or indirectly. These inputs may include quoted prices for the identical instrument on an inactive market, prices for similar instruments, interest rates, prepayment speeds, credit risk, yield curves, default rates and similar data. |
| • | Level 3 – | Unobservable inputs for the asset or liability, to the extent relevant observable inputs are not available, representing the Funds’ own assumptions about the assumptions a market participant would use in valuing the asset or liability, and would be based on the best information available. |
The availability of observable inputs can vary from security to security and is affected by a wide variety of factors, including, for example, the type of security, whether the security is new and not yet established in the marketplace, the liquidity of markets, and other characteristics particular to the security. To the extent that valuation is based on models or inputs that are less observable or unobservable in the market, the determination of fair value requires more judgement. Accordingly, the degree of judgement exercised in determining fair value is greatest for instruments categorized in Level 3.
The inputs used to measure fair value may fall into different levels of the fair value hierarchy. In such cases, for disclosure purposes, the level in the fair value hierarchy within which the fair value measurement falls in its entirety, is determined based on the lowest level input that is significant to the fair value measurement in its entirety.
INNOVATOR ETFs TRUST
Notes to Financial Statements (Unaudited) (Continued)
FFTY | ||||||||||||||||
Level 1 | Level 2 | Level 3 | Total | |||||||||||||
Assets | ||||||||||||||||
Common Stocks | $ | 433,835,961 | $ | – | $ | – | $ | 433,835,961 | ||||||||
Real Estate Investment Trusts | 43,392,385 | – | – | 43,392,385 | ||||||||||||
Short Term Investments | 503,150 | – | – | 503,150 | ||||||||||||
Investments Purchased with Proceeds From Securities Lending | – | 122,015,010 | – | 122,015,010 | ||||||||||||
Total Assets | $ | 477,731,496 | $ | 122,015,010 | $ | – | $ | 599,746,506 | ||||||||
LDRS | ||||||||||||||||
Level 1 | Level 2 | Level 3 | Total | |||||||||||||
Assets | ||||||||||||||||
Exchange Traded Funds | $ | 19,416,937 | $ | – | $ | – | $ | 19,416,937 | ||||||||
Short Term Investments | 32,309 | – | – | 32,309 | ||||||||||||
Investments Purchased with Proceeds From Securities Lending | – | 5,603,050 | – | 5,603,050 | ||||||||||||
Total Assets | $ | 19,449,246 | $ | 5,603,050 | $ | – | $ | 25,052,296 | ||||||||
BOUT | ||||||||||||||||
Level 1 | Level 2 | Level 3 | Total | |||||||||||||
Assets | ||||||||||||||||
Common Stocks | $ | 11,353,529 | $ | – | $ | – | $ | 11,353,529 | ||||||||
Real Estate Investment Trusts | 34,122 | – | – | 34,122 | ||||||||||||
Short Term Investments | 49,533 | – | – | 49,533 | ||||||||||||
Investments Purchased with Proceeds From Securities Lending | – | 2,820,544 | – | 2,820,544 | ||||||||||||
Total Assets | $ | 11,437,184 | $ | 2,820,544 | $ | – | $ | 14,257,728 | ||||||||
LOUP | ||||||||||||||||
Level 1 | Level 2 | Level 3 | Total | |||||||||||||
Assets | ||||||||||||||||
Common Stocks | $ | 14,100,143 | $ | – | $ | – | $ | 14,100,143 | ||||||||
Short Term Investments | 12,382 | – | – | 12,382 | ||||||||||||
Investments Purchased with Proceeds From Securities Lending | – | 3,155,022 | – | 3,155,022 | ||||||||||||
Total Assets | $ | 14,112,525 | $ | 3,155,022 | $ | – | $ | 17,267,547 | ||||||||
See the Schedules of Investments for the investments detailed by industry classification.
There were no Level 3 investments for the Funds during the reporting period.
Use of Estimates:
In preparing financial statements in conformity with U.S. GAAP, management is required to make estimates and assumptions that affect the reported amounts of assets and liabilities and disclosure of contingent assets and liabilities as of the date of the financial statements and the reported amounts of increases and decreases in net assets from operations during the reporting period. Actual results could differ from these estimates.
INNOVATOR ETFs TRUST
Notes to Financial Statements (Unaudited) (Continued)
Federal Income Taxes:
The Funds intend to meet the requirements of the Internal Revenue Code (the “Code”) applicable to regulated investment companies and to distribute substantially all net investment taxable income and net capital gains to shareholders in a manner which results in no tax cost to the Funds. Therefore, no federal income or excise tax provision is recorded.
Management of the Funds has reviewed the Funds’ tax positions for all open tax years (the prior three years of tax filings or since inception, if shorter) and major jurisdictions and concluded that there is no tax liability resulting from unrecognized tax benefits relating to uncertain tax positions taken or expected to be taken on the tax return for the fiscal year or period ended October 31, 2018. The Funds are also not aware of any tax position for which it is reasonably possible that the total amounts of unrecognized tax benefits will significantly change in the next year. The Funds recognize interest and penalties, if any, related to unrecognized tax benefits as income tax expense in the Statements of Operations. During the period ended April 30, 2019, the Funds did not incur any interest or penalties.
U.S. GAAP requires that certain components of net assets be reclassified between financial and tax reporting. These reclassifications have no effect on net assets or net asset value per share. For the year/period ended October 31, 2018, the Funds made the following permanent book-to-tax reclassifications primarily related to net operating loss forfeiture and redemptions in kind:
Distributable Earnings\ (Accumulated Deficit) | Paid-In Capital | |||||||
FFTY | $ | (66,326,223 | ) | $ | 66,326,223 | |||
LDRS | (2,196,841 | ) | 2,196,841 | |||||
BOUT | 88,767 | (88,767 | ) | |||||
LOUP | (341,575 | ) | 341,575 | |||||
Distributions to Shareholders:
FFTY, BOUT and LOUP intend to declare and distribute their respective net investment income, if any, as dividends annually. LDRS intends to declare and distribute its net investment income, if any, as dividends quarterly. Distributions of net realized capital gains, if any, will be declared and paid at least annually by the Funds. Distributions to shareholders are recorded on the ex-dividend date. The Funds may periodically make reclassifications among certain of its capital accounts as a result of the recognition and characterization of certain income and capital gain distributions determined annually in accordance with federal tax regulations which may differ from U.S. GAAP.
INNOVATOR ETFs TRUST
Notes to Financial Statements (Unaudited) (Continued)
Guarantees and Indemnifications:
In the normal course of business, the Trust may enter into a contract with service providers that contain general indemnification clauses. The Trust’s maximum exposure under these arrangements is unknown as this would involve future claims against the Trust that have not yet occurred. Based on experience, the Trust expects the risk of loss to be remote.
Other:
Investment transactions are recorded on the trade date. The Trust determines the gain or loss realized from investment transactions on the basis of identified cost. Dividend income is recognized on the ex-dividend date and interest income is recognized on an accrual basis using the effective yield method. Distributions received from investments in master limited partnerships (“MLPs”), closed-end funds, real estate investment trusts (“REITs”) and royalty trusts are comprised of ordinary income, capital gains and return of capital. For financial statement purposes, estimates are used to characterize these distributions received as return of capital, capital gains or ordinary income. Such estimates are based on historical information available from each MLP, closed-end fund, REIT or royalty trust and other industry sources. These estimates may subsequently be revised based on information received for the security after its tax reporting periods are concluded, as the actual character of these distributions is not known until after the fiscal year end. The distributions received from MLPs, REITs, closed-end funds, and royalty trust securities that have been classified as income and capital gains are included in dividend income and net realized gain/(loss) on investments, respectively, on the Statements of Operations. The distributions received that are classified as return of capital reduce the cost of investments on the Statements of Assets and Liabilities.
Purchases and sales of investments and dividend and interest income are translated into U.S. dollars using the spot market rates of exchange prevailing on the respective dates of such translations. The gain or loss resulting from changes in foreign exchange rates is included with net realized and unrealized gain or loss from investments, as appropriate. Foreign securities and currency transactions may involve certain considerations and risks not typically associated with those of domestic origin. Foreign securities are recorded in the financial statements after translation to U.S. dollars based on the applicable exchange rate at the end of the period. The Funds report certain foreign currency-related transactions as components of realized gains or losses for financial reporting purposes, whereas such components are treated as ordinary income for federal income tax purposes.
INNOVATOR ETFs TRUST
Notes to Financial Statements (Unaudited) (Continued)
3. | INVESTMENT ADVISOR AND OTHER AFFILIATES |
Innovator Capital Management, LLC (the “Adviser”) acts as investment adviser to the Funds pursuant to investment advisory agreements between the Trust and the Adviser with respect to the Funds (“Advisory Agreements”) and, pursuant to the Advisory Agreements, is responsible for the day-to-day management of the Fund.
Pursuant to an investment advisory agreement between the Trust and the Adviser with respect to FFTY, FFTY pays monthly the Adviser a management fee calculated daily based on the average daily net assets of the Fund at the annual rate of 0.70%.
Pursuant to investment advisory agreements between the Trust and the Adviser with respect to LDRS, BOUT and LOUP, LDRS pays monthly the Adviser a unitary fee calculated daily based on the average daily net assets of the Fund at the annual rate of 0.60%, BOUT pays monthly the Adviser a unitary fee calculated daily based on the average daily net assets of the Fund at the annual rate of 0.80% and LOUP pays monthly the Adviser a unitary fee calculated daily based on the average daily net assets of the Fund at the annual rate of 0.70%. Out of the unitary management fee, the Adviser is obligated to pay or arrange for the payment of substantially all expenses of LDRS, BOUT and LOUP (“Fund Expenses”), including the cost of transfer agency, custody, fund administration, legal, audit, and other services and license fees, except for interest, taxes, brokerage commissions and other expenses connected with the execution of portfolio transactions, distribution and service fees payable pursuant to a Rule 12b-1 plan, if any, and extraordinary expenses. The Adviser’s unitary management fee is designed to cause substantially all of the Funds’ expenses to be paid and to compensate the Adviser for providing services for the Fund.
Penserra Capital Management LLC (the “Sub-Adviser”) acts as sub-adviser to the Funds pursuant to sub-advisory agreements between the Adviser and the Sub-Adviser with respect to the Funds (“Sub-Advisory Agreements”) and, pursuant to the Sub-Advisory Agreements, is responsible for execution of the Sub-Adviser’s strategy for each of the Funds. The Sub-Adviser is responsible for the day-to-day management of the Fund’s portfolio. Pursuant to the Sub-Advisory Agreements between the Adviser and the Sub-Adviser, the Adviser pays the Sub-Adviser a fee for the services and facilities it provides payable on a monthly basis.
The Trust entered into an Expense Limitation Agreement on behalf of FFTY with the Advisor. Under the terms of the Expense Limitation Agreement with FFTY, the Advisor contractually agreed to waive their advisory fees and/or assume as their own expense, certain expenses otherwise payable by the Fund to the extent necessary to ensure that total annual fund operating expenses (excluding any Rule 12b-1 fees, taxes, interest, brokerage fees, acquired fund fees and expenses, expenses incurred in connection with any merger, reorganization or proxy solicitation, litigation, and other extraordinary expenses) do not exceed 0.80% of average daily net assets of FFTY until May 9, 2020. Pursuant to the Expense Limitation Agreement, the Advisor is entitled to recoup any fees that the Advisor waived and/or Fund expense payments that the Advisor paid under the Expense Limitation Agreement for FFTY subsequent to May 9, 2017, for a monthly rolling period of three years following such fee waivers and expense payments, to the extent that such recoupment by the Advisor will not cause the Fund to exceed any applicable expense limitation that was in place for the Fund when the fees were waived or expenses were paid. For the period ended April 30, 2019, the Advisor waived $24,385 of their advisory fees for FFTY and recouped $48,375 of their previously waived fees. The table below indicates the amount of fees that the Advisor may recoup:
Recovery Expiring in*: | ||||||||||||
FYE 10/31/2021 | FYE 10/31/2022 | Total | ||||||||||
FFTY | $ | 170,185 | $ | 24,385 | $ | 194,570 | ||||||
* Recoupment expires on a rolling monthly basis three years following the respective fee waivers.
4. | INVESTMENT TRANSACTIONS |
For the period ended April 30, 2019, purchases and sales of investment securities, other than in-kind purchases and sales, short-term investments and short-term U.S. Government obligations were as follows:
Purchases | Sales | |||||||||||||||
U.S. Governement | Other | U.S. Governement | Other | |||||||||||||
FFTY | $ | – | $ | 1,932,793,392 | $ | – | $ | 1,889,727,862 | ||||||||
LDRS | – | 151,279,462 | – | 151,391,258 | ||||||||||||
BOUT | – | 99,190,706 | – | 99,373,012 | ||||||||||||
LOUP | – | 7,739,224 | – | 7,633,837 | ||||||||||||
For the period ended April 30, 2019, in-kind transactions associated with creations and redemptions were as follows:
In-Kind | In-Kind | |||||||
Creations | Redemptions | |||||||
FFTY | $ | 276,191,742 | $ | 322,793,400 | ||||
LDRS | 2,355,083 | 14,393,965 | ||||||
BOUT | 10,561,868 | 7,474,865 | ||||||
LOUP | 1,078,981 | 1,208,722 | ||||||
Net capital gains or losses resulting from in-kind redemptions are excluded for the Funds’ taxable gains and are not distributed to shareholders.
INNOVATOR ETFs TRUST
Notes to Financial Statements (Unaudited) (Continued)
5. | SECURITIES LENDING |
The Funds may lend up to 331/3% of the value of the securities in its respective portfolio to brokers, dealers and financial institutions (but not individuals) under terms of participation in a securities lending program administered by the Securities Lending Agent. The Trust has entered into a Securities Lending Agreement (“SLA”) with U.S. Bank National Association (the “Agent”). Under the terms of the SLA, the Funds may lend securities to certain broker-dealers and banks in exchange for collateral in the amount of at least 102% of the value of U.S. securities loaned or at least 105% of the value of non-U.S. securities loaned, marked to market daily. The collateral can be received in the form of cash collateral and/or non-cash collateral. Non-cash collateral can include U.S. Government Securities and letters of credit. The cash collateral is invested in the Mount Vernon Liquid Assets Portfolio, LLC (“Mount Vernon”), as noted in the Funds’ Schedule of Investments. Mount Vernon seeks to maximize current income to the extent consistent with the preservation of capital and liquidity; and to maintain a stable NAV of $1.00. The market value of the loaned securities is determined daily at the close of business of the Funds and any additional required collateral is delivered to the Funds on the next business day. The Funds continues to benefit from interest or dividends on the securities loaned and may also earn a return from the collateral. The Funds pay various fees in connection with the investment of cash collateral. The Funds pay the Agent fees based on the investment income received from securities lending activities. Although risk is mitigated by the collateral, the Funds could experience a delay in recovering its securities and possible loss of income or value if the borrower fails to return them. Cash and cash equivalent collateral on securities lending transactions are on an overnight and continuous basis.
As of April 30, 2019, the values of the securities on loan, cash collateral received, and fees and interest were as follows:
Value of Securities on Loan | Cash Collateral Received | Fees and Interest Earned | ||||||||||
FFTY | $ | 119,331,356 | $ | 122,015,010 | $ | 31,616 | ||||||
LDRS | 5,524,885 | 5,603,050 | 2,851 | |||||||||
BOUT | 2,772,723 | 2,820,544 | 257 | |||||||||
LOUP | 3,087,931 | 3,155,022 | 1,338 | |||||||||
Due to the absence of a master netting agreement related to the Funds’ participation in securities lending, no additional offsetting disclosures have been made on behalf of the Funds for the total borrowings listed above.
INNOVATOR ETFs TRUST
Notes to Financial Statements (Unaudited) (Continued)
6. | FEDERAL INCOME TAX INFORMATION |
At October 31, 2018, gross unrealized appreciation and depreciation of investments, based on cost for federal income tax purposes were as follows:
FFTY | LDRS | BOUT | LOUP | |||||||||||||
Cost of Portfolio | $ | 473,838,154 | $ | 36,181,595 | $ | 8,196,759 | $ | 14,392,249 | ||||||||
Gross Unrealized Appreciation | $ | 11,572,332 | $ | – | $ | 117,756 | $ | 158,557 | ||||||||
Gross Unrealized Depreciation | (44,514,480 | ) | (3,491,536 | ) | (196,013 | ) | (2,021,382 | ) | ||||||||
Net Unrealized Appreciation / (Depreciation) | $ | (32,942,148 | ) | $ | (3,491,536 | ) | $ | (78,257 | ) | $ | (1,862,825 | ) | ||||
The differences between book basis and tax basis cost on investments is primarily attributable to wash sale loss deferrals and differences in the tax treatment of partnership securities.
As of October 31, 2018, the components of accumulated earnings on a tax basis were as follows:
FFTY | LDRS | BOUT | LOUP | |||||||||||||
Accumulated Capital and Other Losses | $ | (77,542,657 | ) | $ | (6,098,851 | ) | $ | (1,900,963 | ) | $ | (257,758 | ) | ||||
Other Gains / (Losses) | – | – | – | – | ||||||||||||
Undistributed Net Ordinary Income | – | 8,380 | – | – | ||||||||||||
Unrealized Appreciation/(Depreciation) on Investments | (32,942,148 | ) | (3,491,536 | ) | (78,257 | ) | (1,862,825 | ) | ||||||||
Total Distributable Earnings/(Accumulated Deficit) | $ | (110,484,805 | ) | $ | (9,582,007 | ) | $ | (1,979,220 | ) | $ | (2,120,583 | ) | ||||
At October 31, 2018, the Funds deferred the following post-October capital or late year ordinary losses:
FFTY | LDRS | BOUT | LOUP | |||||||||||||
Post-October Losses | $ | – | $ | – | $ | – | $ | – | ||||||||
Late Year Ordinary Losses | 1,562,199 | 58,973 | 4,450 | 18,909 | ||||||||||||
At October 31, 2018, for federal income tax purposes, the Funds had capital loss carryforwards available to offset future capital gains as indicated below:
FFTY | LDRS | BOUT | LOUP | |||||||||||||
Indefinite Short-Term | $ | 75,946,470 | $ | 6,039,878 | $ | 1,896,513 | $ | 238,849 | ||||||||
Indefinite Long-Term | – | – | – | – | ||||||||||||
INNOVATOR ETFs TRUST
Notes to Financial Statements (Unaudited) (Continued)
The tax character of the distributions paid by the Funds during the fiscal periods ended October 31, 2018 and October 31, 2017 were as follows:
FFTY | LDRS | BOUT | LOUP | |||||||||||||||||
2018 | 2017 | 2018 | 2018 | 2018 | ||||||||||||||||
Distributions paid from: | ||||||||||||||||||||
Net Ordinary Income | $ | 477,422 | $ | – | $ | 36,672 | $ | – | $ | – | ||||||||||
Net Long-Term Capital Gains | – | – | – | – | – | |||||||||||||||
Return of Capital | – | – | – | – | – | |||||||||||||||
Total Distributions Paid | $ | 477,422 | $ | – | $ | 36,672 | $ | – | $ | – | ||||||||||
7. | OFFERING PRICE PER SHARE |
Shares of the Funds are listed and traded on the NYSE Arca, Inc. Market prices for the shares may be different from their net asset value (“NAV”). The Funds issue and redeem shares on a continuous basis at NAV only in blocks of 50,000 shares, called “Creation Units.” Creation Units are issued and redeemed principally in-kind for securities included in a specified universe. Once created, shares generally trade in the secondary market at market prices that change throughout the day in amounts less than a Creation Unit. Except when aggregated in Creation Units, shares are not redeemable securities of the Funds. Shares of the Funds may only be purchased or redeemed by certain financial institutions (“Authorized Participants”). An Authorized Participant is either (i) a broker-dealer or other participant in the clearing process through the Continuous Net Settlement System of the National Securities Clearing Corporation or (ii) a DTC participant and, in each case, must have executed a Participant Agreement with the Distributor. A fixed transaction fee is applicable to each transaction regardless of the number of units purchased or sold in the transaction. FFTY, LDRS and BOUT each charge a $250 transaction fee on creations and redemptions of the respective Fund. LOUP charges a $500 transaction fee on creations and redemptions of the Fund. An additional charge of up to four times the creation transaction fee may be imposed with respect to custom order transactions effected outside of the clearing process through a DTC Participant or to the extent that cash is used in lieu of securities to purchase Creation Units through a custom order. Most retail investors do not qualify as Authorized Participants nor have the resources to buy and sell whole Creation Units. Therefore, they are unable to purchase or redeem the shares directly from the Funds. Rather, most retail investors may purchase shares in the secondary market with the assistance of a broker and are subject to customary brokerage commissions or fees.
INNOVATOR ETFs TRUST
Notes to Financial Statements (Unaudited) (Continued)
8. | TRANSACTIONS WITH AFFILIATES |
LDRS had the following transactions during the period ended April 30, 2019 with the affiliated FFTY Fund:
Share Activity | Period Ended April 30, 2019 | |||||||||||||||||||||||||||||||
Security Name | Balance November 1, 2018 | Purchases | Sales | Balance April 30, 2019 | Value | Dividend Income | Gain (Loss) Realized on Sale of Shares | Net Change in Unrealized Appreciation (Depreciation) on Investments in Affiliates | ||||||||||||||||||||||||
Innovator IBD® 50 ETF | 37,960 | – | 37,960 | – | $ | – | $ | – | $ | (221,702 | ) | $ | 225,862 | |||||||||||||||||||
9. | NEW ACCOUNTING PRONOUNCEMENTS |
In August 2018, FASB issued ASU 2018-13, Fair Value Measurement (Topic 820): Disclosure Framework—Changes to the Disclosure Requirements for Fair Value Measurement (“ASU 2018-13”). The primary focus of ASU 2018-13 is to improve the effectiveness of the disclosure requirements for fair value measurements. The changes affect all companies that are required to include fair value measurement disclosures. In general, the amendments in ASU 2018-13 are effective for all entities for fiscal years and interim periods within those fiscal years, beginning after December 15, 2019. An entity is permitted to early adopt the removed or modified disclosures upon the issuance of ASU 2018-13 and may delay adoption of the additional disclosures, which are required for public companies only, until their effective date. Management has evaluated ASU 2018-13 and has adopted the disclosure framework.
In August 2018, the Securities and Exchange Commission issued Final Rule Release No. 33-10532, Disclosure Update and Simplification, which in part amends certain disclosure requirements of Regulation S-X that have become redundant, duplicative, overlapping, outdated, or superseded, in light of other Commission disclosure requirements, U.S. Generally Accepted Accounting Principles, or changes in the information environment. The amendments are intended to facilitate the disclosure of information to investors and simplify compliance without significantly altering the total mix of information provided to investors. The effective date for these disclosures is November 5, 2018. Management has evaluated the amendments and their impact and has adopted the disclosure framework.
10. | OWNERSHIP BY AFFILIATES |
As of April 30, 2019, an affiliate of the Funds owned shares in the secondary market of LOUP.
INNOVATOR ETFs TRUST
Notes to Financial Statements (Unaudited) (Continued)
11. | SUBSEQUENT EVENT |
Management has evaluated the impact of all subsequent events of the Funds through the date of the financial statements were issued, and has determined that there were no subsequent events requiring recognition or disclosure in the financial statements.
INNOVATOR ETFs TRUST
Additional Information (Unaudited)
1. | ADDITIONAL DISCLOSURE REGARDING FUND TRUSTEES AND OFFICERS |
Name, Address and Year of Birth | Position with the Trust | Length of Time Served* | Principal Occupation(s) During Past 5 Years | Number of Portfolios in Fund Complex Overseen by Trustee or Officer | Other Directorships Held by Trustee or Officer |
Independent Trustees | |||||
Mark Berg 120 N. Hale Street Suite 200, Wheaton, IL 60187 Year of Birth: 1971 | Trustee | Since 2017 | Founding Principal and Chief Executive Officer (May 2019-present), Founding Principal and President (2001-May 2019), Timothy Financial Counsel Inc. | 18 | None |
Joe Stowell 120 N. Hale Street Suite 200, Wheaton, IL 60187 Year of Birth: 1968 | Trustee | Since 2017 | Chief Operating Officer, Woodmen Valley Chapel (September 2015-present); Executive Vice President and Chief Operating Officer, English Language Institute/China (2007-2015). | 18 | Board of Advisors, Westmont College |
Brian J. Wildman 120 N. Hale Street Suite 200, Wheaton, IL 60187 Year of Birth: 1963 | Trustee | Since 2017 | President, Timothy Financial Counsel Inc. (May 2019-present); Executive Vice President, Consumer Banking (March 2016-May 2019), Chief Risk Officer (April 2013-March 2016), Head of Wealth Management (2003-2013) and Head of Commercial Services (2010-2013), MB Financial Bank. | 18 | MB Financial Bank (2003-May 2019); Missionary Furlough Homes, Inc. (since 2008). |
INNOVATOR ETFs TRUST
Additional Information (Unaudited) (Continued)
Interested Trustee & Officer | |||||
H. Bruce Bond (a) 120 N. Hale Street Suite 200, Wheaton, IL 60187 Year of Birth: 1963 | Interested Trustee, President and Principal Executive Officer | Since 2017 | Chief Executive Officer of Innovator Capital Management, LLC (May 2017-present); formerly Chairman (2010-2013) and President and CEO (2006-2010), Invesco PowerShares Capital Management LLC; formerly Co-Founder, President and CEO, PowerShares Capital Management (2002-2006); formerly Chairman; PowerShares Fund Board (2002-2013). | 18 | None |
Officers | |||||
John W. Southard 120 N. Hale Street, Suite 200, Wheaton, IL 60187 Year of Birth: 1969 | Vice President, Treasurer and Principal Financial Accounting Officer | Since May 2017 | Chief Investment Officer, Innovator Capital Management, LLC (May 2017-present); Director and Co-Founder, T2 Capital Management, LLC (2010-present). | 18 | Independent Trustee, ETF Managers Group, LLC (2012 - March 8, 2018) |
James Nash (b) 10 High Street, Suite 302, Boston, MA 02110 Year of Birth: 1981 | Chief Compliance Officer and Anti-Money Laundering Officer | Since June 2018 | Fund Chief Compliance Officer, Foreside Fund Officer Services, LLC (2016-Present); Senior Associate and Regulatory Administration Advisor, JPMorgan Chase & Co. (2014-2016); Product Analyst, Linedata Services (2011-2014). | 18 | None |
* | The Funds’ Trustees serve for an indefinite term until their resignation, death or removal. The Funds’ officers are elected annually by the Board and serve at the Board’s pleasure. |
(a) | H. Bruce Bond is deemed to be an interested person of the Trust (as defined in the 1940 Act) because of his affiliation with the Adviser. |
(b) | Jim Nash is an employee of Foreside Fund Officer Services, LLC, a wholly-owned subsidiary of the Funds’ principal underwriter. |
The Statement of Additional Information includes additional information about the Trustees and is available upon request, without charge, by calling 1-877-386-3890.
INNOVATOR ETFs TRUST
Additional Information (Unaudited) (Continued)
2. | INFORMATION ABOUT PROSPECTUS |
This report has been prepared for shareholders and may be distributed to others only if preceded or accompanied by a current prospectus. Investors should consider the investment objective and policies, risk considerations, charges and ongoing expenses of an investment carefully before investing. The prospectus contains this and other information relevant to an investment in the respective Fund. Please read the Prospectus carefully before investing. A copy of the Prospectus may be obtained without charge by writing to the Trust’s Distributor, or by calling toll free at 1-800-208-5212 or visiting www.innovatoretfs.com.
3. | PROXY VOTING POLICIES AND PROCEDURE |
The Trust’s Proxy Voting Policies and Procedures are available without charge, upon request, by calling 1-877-386-3890 and on the SEC’s website at www.sec.gov. Information relating to how each Fund voted proxies relating to portfolio securities held during each year ended June 30 is also available on the SEC’S website at www.sec.gov.
4. | INFORMATION ABOUT PORTFOLIO SECURITIES |
Each Funds’ complete schedule of portfolio holdings for the first and third quarters is filed with the SEC on Form N-Q. The Trust’s Form N-Q is available without charge, upon request, by calling 1-877-386-3890, or on the SEC’s website at www.sec.gov. The Trust’s Form N-Q may be reviewed and copied at the SEC’s Public Reference Room in Washington, DC. Information on the operation of the Public Reference Room may be obtained by calling 1-800-SEC-0330.
5. | HOUSEHOLD DELIVERY OF SHAREHOLDER DOCUMENTS |
In order to reduce expenses, the Trust delivers one copy of an annual/semi-annual report, prospectus and/or proxy statement on behalf of two or more shareholders at a shared address (householding). If you do not wish to participate in householding, please indicate this preference on your new account application (if you are opening a new account) or call 1-877-FUND890 (877-386-3890) to change the status of your existing account. You may change your status at any time.
INNOVATOR ETFs TRUST
Additional Information (Unaudited) (Continued)
6. | ELECTRONIC DELIVERY OF SHAREHOLDER DOCUMENTS |
You may choose to receive a Fund’s prospectus and annual and semi-annual reports electronically. To sign up for electronic delivery, visit www.icsdelivery.com and select the first letter of your brokerage firm’s name. Then, select your brokerage institution from the list that follows, fill out the appropriate information and provide an e-mail address where you would like your information sent. If your brokerage firm is not listed, electronic delivery may not be available. Please contact your brokerage firm or financial adviser.
INVESTMENT ADVISOR
Innovator Capital Management, LLC
120 North Hale Street, Suite 200
Wheaton, IL 60187
INVESTMENT SUB-ADVISOR
Penserra Capital Management LLC
140 Broadway, 26th Floor
New York, NY 10005
ADMINISTRATOR, FUND ACCOUNTANT & TRANSFER AGENT
U.S. Bancorp Fund Services, LLC
615 East Michigan Street
Milwaukee, WI 53202
DISTRIBUTOR
Foreside Fund Services, LLC
Three Canal Plaza
Portland, ME 04101
CUSTODIAN
U.S. Bank, N.A.
1555 North RiverCenter Drive, Suite 302
Milwaukee, WI 53212
LEGAL COUNSEL
Chapman and Cutler LLP
111 West Monroe Street
Chicago, IL 60603
INDEPENDENT REGISTERED PUBLIC ACCOUNTING FIRM
Cohen & Company, Ltd.
1350 Euclid Ave., Suite 800
Cleveland, OH 44115
TABLE OF CONTENTS
Letter to Shareholders | 3 |
Fund Performance | 5 |
Expense Example | 26 |
Schedules of Investments | 28 |
Statements of Assets and Liabilities | 52 |
Statements of Operations | 58 |
Statements of Changes in Net Assets | 64 |
Financial Highlights | 70 |
Notes to Financial Statements | 76 |
Additional Information | 91 |
Letter to Shareholders (Unaudited)
Dear Valued Shareholders,
The following shareholder letter covers the period ended April 30, 2019.
Thank you for your continued support of our growing family of ETFs which now includes our Defined Outcome ETFs, providing investors with exposure to the S&P 500 to a cap, with downside buffer levels of 9%, 15% and 30%. We are pleased to offer investors these types of investment profiles in a low cost, liquid and transparent ETF structure.
The first of the Defined Outcome ETFs were launched in August of 2018. Timing was good as volatility returned to the markets and investors sought protection from market downturns. Concerns of a recession continued to weigh on investors while precarious trade negotiations caused volatility in both domestic and foreign markets as analysts grew increasingly concerned that we are late in the business cycle.
Demand for our Defined Outcome ETFs has been strong, as investors seek the benefits provided. The S&P 500 Defined Outcome ETFs were launched on a quarterly basis, but we are pleased to provide on a monthly basis going forward. We are also excited to provide buffered exposure to other markets in the near future, including MSCI Emerging Markets and MSCI EAFE.
Sincerely,
Bruce Bond
Chief Executive Officer
The views in this report were those of the Fund’s CEO as of April 30, 2019 and may not reflect his views on the date that this report is first published or anytime thereafter. These views are intended to assist shareholders in understanding their investments and do not constitute investment advice.
Letter to Shareholders (Unaudited) (Continued)
Investing involves risks. The Funds face numerous market trading risks, including active markets risk, authorized participation concentration risk, buffered loss risk, cap change risk, capped upside return risk, correlation risk, FLEX Option counterparty risk, cyber security risk, fluctuation of net asset value risk, investment objective risk, limitations of intraday indicative value risk, liquidity risk, management risk, market maker risk, market risk, non-diversification risk, operation risk, options risk, Outcome Period risk, tax risk, trading issues risk, upside participation risk and valuation risk. Unlike mutual funds, the Funds may trade at a premium or discount to their net asset value. ETFs are bought and sold at market price and not individually redeemed from the fund. Brokerage commissions will reduce returns.
FLEX Options Risk. The Funds will utilize FLEX Options issued and guaranteed for settlement by the OCC. The Funds bear the risk that the OCC will be unable or unwilling to perform its obligations under the FLEX Options contracts. In the unlikely event that the OCC becomes insolvent or is otherwise unable to meet its settlement obligations, the Funds could suffer significant losses. Additionally, FLEX Options may be less liquid than certain other securities such as standardized options. In less liquid market for the FLEX Options, the Funds may have difficulty closing out certain FLEX Options positions at desired times and prices. The values of FLEX Options do not increase or decrease at the same rate as the reference asset and may vary due to factors other than the price of reference asset. These Funds are designed to provide point-to-point exposure to the price return of the S&P 500 via a basket of Flex Options. As a result, the ETFs are not expected to move directly in line with the S&P 500 during the interim period. Investors purchasing shares in after an outcome period has begun may experience very different results than Funds' investment objective. Initial outcome periods are approximately 1-year beginning on the Funds’ inception date. Following the initial outcome period, each subsequent outcome period will begin on the first day of the month the Fund was incepted. After the conclusion of an outcome period, another will begin.
Fund shareholders are subject to an upside return cap (the “Cap”) that represents the maximum percentage return an investor can achieve from an investment in the Funds’ for the Outcome Period, before fees and expenses. If the Outcome Period has begun and the Fund has increased in value to a level near to the Cap, an investor purchasing at that price has little or no ability to achieve gains but remains vulnerable to downside risks. Additionally, the Cap may rise or fall from one Outcome Period to the next. The Cap, and the Fund’s position relative to it, should be considered before investing in the Fund. The Funds’ website, www.innovatoretfs.com, provides important Fund information as well information relating to the potential outcomes of an investment in a Fund on a daily basis.
The Funds only seek to provide shareholders that hold shares for the entire Outcome Period with their respective buffer level against S&P 500 Price Index losses during the Outcome Period. You will bear all S&P 500 Price Index losses exceeding 9%. Shares purchased after the Outcome Period has begun or sold prior to the Outcome Period’s conclusion, may experience investment returns very different from those that the Fund seeks to provide. Depending upon market conditions at the time of purchase, a shareholder that purchases shares after the Outcome Period has begun may also lose their entire investment. For instance, if the Outcome Period has begun and the Fund has decreased in value beyond the pre-determined buffer, an investor purchasing shares at that price may not benefit from the buffer. Similarly, if the Outcome Period has begun and the Fund has increased in value, an investor purchasing shares at that price may not benefit from the buffer until the Fund’s value has decreased to its value at the commencement of the Outcome Period.
INNOVATOR S&P 500® BUFFER ETF – JANUARY
Fund Performance
April 30, 2019 (Unaudited)
The following chart compares the value of a hypothetical $10,000 investment in the Innovator S&P 500® Buffer ETF – January from its inception (December 31, 2018) to April 30, 2019 as compared with the S&P 500® Index.
Growth of a Hypothetical $10,000 Investment
at April 30, 2019

Total Returns as of April 30, 2019 | ||||||||
Since Inception (a) | ||||||||
Innovator S&P 500® Buffer ETF - January | ||||||||
NAV Return | 13.73 | % | ||||||
Market Return | 13.87 | % | ||||||
S&P 500® Index | 17.51 | % | ||||||
(a) Inception date is December 31, 2018.
Performance data quoted represents past performance and does not guarantee future results. The investment return and principal value of an investment will fluctuate so that an investor’s shares, when redeemed, may be worth more or less than their original cost. Current performance of the Fund may be lower or higher than the performance quoted. As of the latest prospectus, the net expense ratio of the Fund was 0.79%. For the most recent performance, please visit the Fund’s website at innovatoretfs.com.
INNOVATOR S&P 500® BUFFER ETF – JANUARY
Fund Performance
April 30, 2019 (Unaudited) (Continued)
The line graph and performance table do not reflect the deduction of taxes that a shareholder may pay on fund distributions or the redemption of Fund shares. Returns shown for the Fund include the reinvestment of all dividends, if any. Returns shown for the S&P 500® Index do not include the reinvestment of dividends, if any.
The S&P 500® Index is an unmanaged, capitalization-weighted index generally representative of the U.S. market for large capitalization stocks.
The Fund’s portfolio holdings may differ significantly from the securities held in the relevant index and, unlike an exchange-traded fund, the performance of an unmanaged index does not reflect deductions for transaction costs, taxes, management fees or other expenses.
You cannot invest directly in an index.
Premium/Discount Information:
Information regarding the differences between the price of the Fund’s shares on the secondary market and the Fund’s net asset value is available at Innovatoretfs.com/BJAN.
INNOVATOR S&P 500® BUFFER ETF – APRIL
Fund Performance
April 30, 2019 (Unaudited)
Total Returns as of April 30, 2019 | ||||||||
Since Inception (a) | ||||||||
Innovator S&P 500® Buffer ETF - April | ||||||||
NAV Return | 3.40 | % | ||||||
Market Return | 3.57 | % | ||||||
S&P 500® Index | 3.93 | % | ||||||
(a) Inception date is March 29, 2019.
Performance data quoted represents past performance and does not guarantee future results. The investment return and principal value of an investment will fluctuate so that an investor’s shares, when redeemed, may be worth more or less than their original cost. Current performance of the Fund may be lower or higher than the performance quoted. As of the latest prospectus, the net expense ratio of the Fund was 0.79%. For the most recent performance, please visit the Fund’s website at innovatoretfs.com.
The performance table does not reflect the deduction of taxes that a shareholder may pay on fund distributions or the redemption of Fund shares. Returns shown for the Fund include the reinvestment of all dividends, if any. Returns shown for the S&P 500® Index do not include the reinvestment of dividends, if any.
The S&P 500® Index is an unmanaged, capitalization-weighted index generally representative of the U.S. market for large capitalization stocks.
The Fund’s portfolio holdings may differ significantly from the securities held in the relevant index and, unlike an exchange-traded fund, the performance of an unmanaged index does not reflect deductions for transaction costs, taxes, management fees or other expenses.
You cannot invest directly in an index.
Premium/Discount Information:
Information regarding the differences between the price of the Fund’s shares on the secondary market and the Fund’s net asset value is available at Innovatoretfs.com/BAPR.
INNOVATOR S&P 500® BUFFER ETF – JULY
Fund Performance
April 30, 2019 (Unaudited)
The following chart compares the value of a hypothetical $10,000 investment in the Innovator S&P 500® Buffer ETF – July from its inception (August 28, 2018) to April 30, 2019 as compared with the S&P 500® Index.
Growth of a Hypothetical $10,000 Investment
at April 30, 2019
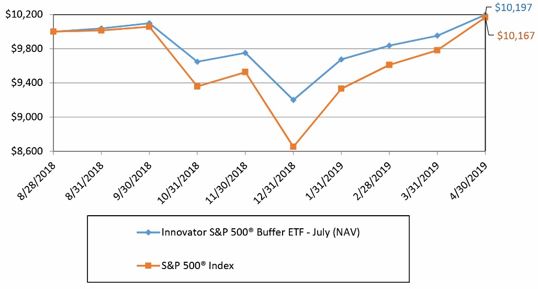
Total Returns as of April 30, 2019 | ||||||||
Since Inception (a) | ||||||||
Innovator S&P 500® Buffer ETF - July | ||||||||
NAV Return | 1.97 | % | ||||||
Market Return | 2.08 | % | ||||||
S&P 500® Index | 1.67 | % | ||||||
(a) | Inception date is August 28, 2018. |
Performance data quoted represents past performance and does not guarantee future results. The investment return and principal value of an investment will fluctuate so that an investor’s shares, when redeemed, may be worth more or less than their original cost. Current performance of the Fund may be lower or higher than the performance quoted. As of the latest prospectus, the net expense ratio of the Fund was 0.79%. For the most recent month-end performance, please visit the Fund’s website at innovatoretfs.com
INNOVATOR S&P 500® BUFFER ETF – JULY
Fund Performance
April 30, 2019 (Unaudited) (Continued)
The line graph and performance table do not reflect the deduction of taxes that a shareholder may pay on fund distributions or the redemption of Fund shares. Returns shown for the Fund include the reinvestment of all dividends, if any. Returns shown for the S&P 500® Index do not include the reinvestment of dividends, if any.
The S&P 500® Index is an unmanaged, capitalization-weighted index generally representative of the U.S. market for large capitalization stocks.
The Fund’s portfolio holdings may differ significantly from the securities held in the relevant index and, unlike an exchange-traded fund, the performance of an unmanaged index does not reflect deductions for transaction costs, taxes, management fees or other expenses.
You cannot invest directly in an index.
Premium/Discount Information:
Information regarding the differences between the price of the Fund’s shares on the secondary market and the Fund’s net asset value is available at Innovatoretfs.com/BJUL.
INNOVATOR S&P 500® BUFFER ETF – OCTOBER
Fund Performance
April 30, 2019 (Unaudited)
The following chart compares the value of a hypothetical $10,000 investment in the Innovator S&P 500® Buffer ETF – October from its inception (September 28, 2018) to April 30, 2019 as compared with the S&P 500® Index.
Growth of a Hypothetical $10,000 Investment
at April 30, 2019
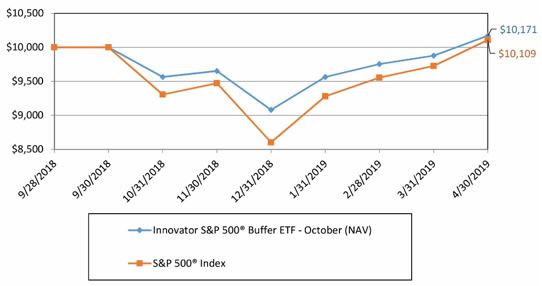
Total Returns as of April 30, 2019 | ||||||||
Since Inception (a) | ||||||||
Innovator S&P 500® Buffer ETF - October | ||||||||
NAV Return | 1.71 | % | ||||||
Market Return | 1.92 | % | ||||||
S&P 500® Index | 1.09 | % | ||||||
(a) | Inception date is September 28, 2018. |
Performance data quoted represents past performance and does not guarantee future results. The investment return and principal value of an investment will fluctuate so that an investor’s shares, when redeemed, may be worth more or less than their original cost. Current performance of the Fund may be lower or higher than the performance quoted. As of the latest prospectus, the net expense ratio of the Fund was 0.79%. For the most recent performance, please visit the Fund’s website at innovatoretfs.com.
INNOVATOR S&P 500® BUFFER ETF – OCTOBER
Fund Performance
April 30, 2019 (Unaudited) (Continued)
The line graph and performance table do not reflect the deduction of taxes that a shareholder may pay on fund distributions or the redemption of Fund shares. Returns shown for the Fund include the reinvestment of all dividends, if any. Return shown for the S&P 500® Index do not include the reinvestment of dividends, if any.
The S&P 500® Index is an unmanaged, capitalization-weighted index generally representative of the U.S. market for large capitalization stocks.
The Fund’s portfolio holdings may differ significantly from the securities held in the relevant index and, unlike an exchange-traded fund, the performance of an unmanaged index does not reflect deductions for transaction costs, taxes, management fees or other expenses.
You cannot invest directly in an index.
Premium/Discount Information:
Information regarding the differences between the price of the Fund’s shares on the secondary market and the Fund’s net asset value is available at Innovatoretfs.com/BOCT.
INNOVATOR S&P 500® POWER BUFFER ETF – JANUARY
Fund Performance
April 30, 2019 (Unaudited)
The following chart compares the value of a hypothetical $10,000 investment in the Innovator S&P 500® Power Buffer ETF – January from its inception (December 31, 2018) to April 30, 2019 as compared with the S&P 500® Index.
Growth of a Hypothetical $10,000 Investment
at April 30, 2019
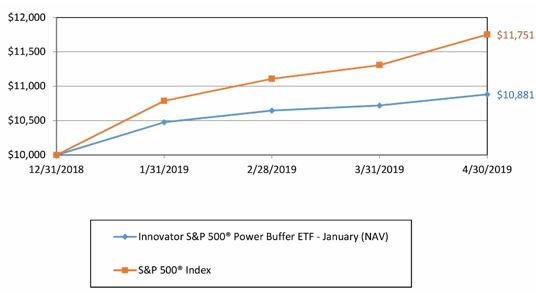
Total Returns as of April 30, 2019 | ||||||||
Since Inception (a) | ||||||||
Innovator S&P 500® Power Buffer ETF - January | ||||||||
NAV Return | 8.81 | % | ||||||
Market Return | 9.11 | % | ||||||
S&P 500® Index | 17.51 | % | ||||||
(a) Inception date is December 31, 2018.
Performance data quoted represents past performance and does not guarantee future results. The investment return and principal value of an investment will fluctuate so that an investor’s shares, when redeemed, may be worth more or less than their original cost. Current performance of the Fund may be lower or higher than the performance quoted. As of the latest prospectus, the net expense ratio of the Fund was 0.79%. For the most recent performance, please visit the Fund’s website at innovatoretfs.com.
INNOVATOR S&P 500® POWER BUFFER ETF – JANUARY
Fund Performance
April 30, 2019 (Unaudited) (Continued)
The line graph and performance table do not reflect the deduction of taxes that a shareholder may pay on fund distributions or the redemption of Fund shares. Returns shown for the Fund include the reinvestment of all dividends, if any. Returns shown for the S&P 500® Index do not include the reinvestment of dividends, if any.
The S&P 500® Index is an unmanaged, capitalization-weighted index generally representative of the U.S. market for large capitalization stocks.
The Fund’s portfolio holdings may differ significantly from the securities held in the relevant index and, unlike an exchange-traded fund, the performance of an unmanaged index does not reflect deductions for transaction costs, taxes, management fees or other expenses.
You cannot invest directly in an index.
Premium/Discount Information:
Information regarding the differences between the price of the Fund’s shares on the secondary market and the Fund’s net asset value is available at Innovatoretfs.com/PJAN.
INNOVATOR S&P 500® POWER BUFFER ETF – APRIL
Fund Performance
April 30, 2019 (Unaudited)
Total Returns as of April 30, 2019 | ||||||||
Since Inception (a) | ||||||||
Innovator S&P 500® Power Buffer ETF - April | ||||||||
NAV Return | 2.42 | % | ||||||
Market Return | 2.47 | % | ||||||
S&P 500® Index | 3.93 | % | ||||||
(a) Inception date is March 29, 2019.
Performance data quoted represents past performance and does not guarantee future results. The investment return and principal value of an investment will fluctuate so that an investor’s shares, when redeemed, may be worth more or less than their original cost. Current performance of the Fund may be lower or higher than the performance quoted. As of the latest prospectus, the net expense ratio of the Fund was 0.79%. For the most recent performance, please visit the Fund’s website at innovatoretfs.com.
The performance table does not reflect the deduction of taxes that a shareholder may pay on fund distributions or the redemption of Fund shares. Returns shown for the Fund include the reinvestment of all dividends, if any. Returns shown for the S&P 500® Index do not include the reinvestment of dividends, if any.
The S&P 500® Index is an unmanaged, capitalization-weighted index generally representative of the U.S. market for large capitalization stocks.
The Fund’s portfolio holdings may differ significantly from the securities held in the relevant index and, unlike an exchange-traded fund, the performance of an unmanaged index does not reflect deductions for transaction costs, taxes, management fees or other expenses.
You cannot invest directly in an index.
Premium/Discount Information:
Information regarding the differences between the price of the Fund’s shares on the secondary market and the Fund’s net asset value is available at Innovatoretfs.com/PAPR.
INNOVATOR S&P 500® POWER BUFFER ETF – JULY
Fund Performance
April 30, 2019 (Unaudited)
The following chart compares the value of a hypothetical $10,000 investment in the Innovator S&P 500® Power Buffer ETF – July from its inception (August 7, 2018) to April 30, 2019 as compared with the S&P 500® Index.
Growth of a Hypothetical $10,000 Investment
at April 30, 2019

Total Returns as of April 30, 2019 | ||||||||
Since Inception (a) | ||||||||
Innovator S&P 500® Power Buffer ETF - July | ||||||||
NAV Return | 3.02 | % | ||||||
Market Return | 3.03 | % | ||||||
S&P 500® Index | 3.06 | % | ||||||
(a) | Inception date is August 7, 2018. |
Performance data quoted represents past performance and does not guarantee future results. The investment return and principal value of an investment will fluctuate so that an investor’s shares, when redeemed, may be worth more or less than their original cost. Current performance of the Fund may be lower or higher than the performance quoted. As of the latest prospectus, the net expense ratio of the Fund was 0.79%. For the most recent performance, please visit the Fund’s website at innovatoretfs.com.
INNOVATOR S&P 500® POWER BUFFER ETF – JULY
Fund Performance
April 30, 2019 (Unaudited) (Continued)
The line graph and performance table do not reflect the deduction of taxes that a shareholder may pay on fund distributions or the redemption of Fund shares. Returns shown for the Fund include the reinvestment of all dividends, if any. Returns shown for the S&P 500® Index do not include the reinvestment of dividends, if any.
The S&P 500® Index is an unmanaged, capitalization-weighted index generally representative of the U.S. market for large capitalization stocks.
The Fund’s portfolio holdings may differ significantly from the securities held in the relevant index and, unlike an exchange-traded fund, the performance of an unmanaged index does not reflect deductions for transaction costs, taxes, management fees or other expenses.
You cannot invest directly in an index.
Premium/Discount Information:
Information regarding the differences between the price of the Fund’s shares on the secondary market and the Fund’s net asset value is available at Innovatoretfs.com/PJUL.
INNOVATOR S&P 500® POWER BUFFER ETF – OCTOBER
Fund Performance
April 30, 2019 (Unaudited)
The following chart compares the value of a hypothetical $10,000 investment in the Innovator S&P 500® Power Buffer ETF – October from its inception (September 28, 2018) to April 30, 2019 as compared with the S&P 500® Index.
Growth of a Hypothetical $10,000 Investment
at April 30, 2019

Total Returns as of April 30, 2019 | ||||||||
Since Inception (a) | ||||||||
Innovator S&P 500® Power Buffer ETF - October | ||||||||
NAV Return | 1.82 | % | ||||||
Market Return | 2.10 | % | ||||||
S&P 500® Index | 1.09 | % | ||||||
(a) | Inception date is September 28, 2018. |
Performance data quoted represents past performance and does not guarantee future results. The investment return and principal value of an investment will fluctuate so that an investor’s shares, when redeemed, may be worth more or less than their original cost. Current performance of the Fund may be lower or higher than the performance quoted. As of the latest prospectus, the net expense ratio of the Fund was 0.79%. For the most recent performance, please visit the Fund’s website at innovatoretfs.com.
INNOVATOR S&P 500® POWER BUFFER ETF – OCTOBER
Fund Performance
April 30, 2019 (Unaudited) (Continued)
The line graph and performance table do not reflect the deduction of taxes that a shareholder may pay on fund distributions or the redemption of Fund shares. Returns shown for the Fund include the reinvestment of all dividends, if any. Returns shown for the S&P 500® Index do not include the reinvestment of dividends, if any.
The S&P 500® Index is an unmanaged, capitalization-weighted index generally representative of the U.S. market for large capitalization stocks.
The Fund’s portfolio holdings may differ significantly from the securities held in the relevant index and, unlike an exchange-traded fund, the performance of an unmanaged index does not reflect deductions for transaction costs, taxes, management fees or other expenses.
You cannot invest directly in an index.
Premium/Discount Information:
Information regarding the differences between the price of the Fund’s shares on the secondary market and the Fund’s net asset value is available at Innovatoretfs.com/POCT.
INNOVATOR S&P 500® ULTRA BUFFER ETF – JANUARY
Fund Performance
April 30, 2019 (Unaudited)
The following chart compares the value of a hypothetical $10,000 investment in the Innovator S&P 500® Ultra Buffer ETF – January from its inception (December 31, 2018) to April 30, 2019 as compared with the S&P 500® Index.
Growth of a Hypothetical $10,000 Investment
at April 30, 2019

Total Returns as of April 30, 2019 | ||||||||
Since Inception (a) | ||||||||
Innovator S&P 500® Ultra Buffer ETF - January | ||||||||
NAV Return | 7.34 | % | ||||||
Market Return | 7.58 | % | ||||||
S&P 500® Index | 17.51 | % | ||||||
(a) Inception date is December 31, 2018.
Performance data quoted represents past performance and does not guarantee future results. The investment return and principal value of an investment will fluctuate so that an investor’s shares, when redeemed, may be worth more or less than their original cost. Current performance of the Fund may be lower or higher than the performance quoted. As of the latest prospectus, the net expense ratio of the Fund was 0.79%. For the most recent performance, please visit the Fund’s website at innovatoretfs.com.
INNOVATOR S&P 500® ULTRA BUFFER ETF – JANUARY
Fund Performance
April 30, 2019 (Unaudited) (Continued)
The line graph and performance table do not reflect the deduction of taxes that a shareholder may pay on fund distributions or the redemption of Fund shares. Returns shown for the Fund include the reinvestment of all dividends, if any. Returns shown for the S&P 500® Index do not include the reinvestment of dividends, if any.
The S&P 500® Index is an unmanaged, capitalization-weighted index generally representative of the U.S. market for large capitalization stocks.
The Fund’s portfolio holdings may differ significantly from the securities held in the relevant index and, unlike an exchange-traded fund, the performance of an unmanaged index does not reflect deductions for transaction costs, taxes, management fees or other expenses.
You cannot invest directly in an index.
Premium/Discount Information:
Information regarding the differences between the price of the Fund’s shares on the secondary market and the Fund’s net asset value is available at Innovatoretfs.com/UJAN.
INNOVATOR S&P 500® ULTRA BUFFER ETF – APRIL
Fund Performance
April 30, 2019 (Unaudited)
Total Returns as of April 30, 2019 | ||||||||
Since Inception (a) | ||||||||
Innovator S&P 500® Ultra Buffer ETF - April | ||||||||
NAV Return | 2.45 | % | ||||||
Market Return | 2.29 | % | ||||||
S&P 500® Index | 3.93 | % | ||||||
(a) Inception date is March 29, 2019.
Performance data quoted represents past performance and does not guarantee future results. The investment return and principal value of an investment will fluctuate so that an investor’s shares, when redeemed, may be worth more or less than their original cost. Current performance of the Fund may be lower or higher than the performance quoted. As of the latest prospectus, the net expense ratio of the Fund was 0.79%. For the most recent performance, please visit the Fund’s website at innovatoretfs.com.
The performance table does not reflect the deduction of taxes that a shareholder may pay on fund distributions or the redemption of Fund shares. Returns shown for the Fund include the reinvestment of all dividends, if any. Returns shown for the S&P 500® Index do not include the reinvestment of dividends, if any.
The S&P 500® Index is an unmanaged, capitalization-weighted index generally representative of the U.S. market for large capitalization stocks.
The Fund’s portfolio holdings may differ significantly from the securities held in the relevant index and, unlike an exchange-traded fund, the performance of an unmanaged index does not reflect deductions for transaction costs, taxes, management fees or other expenses.
You cannot invest directly in an index.
Premium/Discount Information:
Information regarding the differences between the price of the Fund’s shares on the secondary market and the Fund’s net asset value is available at Innovatoretfs.com/UAPR.
INNOVATOR S&P 500® ULTRA BUFFER ETF – JULY
Fund Performance
April 30, 2019 (Unaudited)
The following chart compares the value of a hypothetical $10,000 investment in the Innovator S&P 500® Ultra Buffer ETF – July from its inception (August 7, 2018) to April 30, 2019 as compared with the S&P 500® Index.
Growth of a Hypothetical $10,000 Investment
at April 30, 2019

Total Returns as of April 30, 2019 | ||||||||
Since Inception (a) | ||||||||
Innovator S&P 500® Ultra Buffer ETF - July | ||||||||
NAV Return | 2.67 | % | ||||||
Market Return | 2.70 | % | ||||||
S&P 500® Index | 3.06 | % | ||||||
(a) | Inception date is August 7, 2018. |
Performance data quoted represents past performance and does not guarantee future results. The investment return and principal value of an investment will fluctuate so that an investor’s shares, when redeemed, may be worth more or less than their original cost. Current performance of the Fund may be lower or higher than the performance quoted. As of the latest prospectus, the net expense ratio of the Fund was 0.79%. For the most recent performance, please visit the Fund’s website at innovatoretfs.com.
INNOVATOR S&P 500® ULTRA BUFFER ETF – JULY
Fund Performance
April 30, 2019 (Unaudited) (Continued)
The line graph and performance table do not reflect the deduction of taxes that a shareholder may pay on fund distributions or the redemption of Fund shares. Returns shown for the Fund include the reinvestment of all dividends, if any. Returns shown for the S&P 500® Index do not include the reinvestment of dividends, if any.
The S&P 500® Index is an unmanaged, capitalization-weighted index generally representative of the U.S. market for large capitalization stocks.
The Fund’s portfolio holdings may differ significantly from the securities held in the relevant index and, unlike an exchange-traded fund, the performance of an unmanaged index does not reflect deductions for transaction costs, taxes, management fees or other expenses.
You cannot invest directly in an index.
Premium/Discount Information:
Information regarding the differences between the price of the Fund’s shares on the secondary market and the Fund’s net asset value is available at Innovatoretfs.com/UJUL.
INNOVATOR S&P 500® ULTRA BUFFER ETF – OCTOBER
Fund Performance
April 30, 2019 (Unaudited)
The following chart compares the value of a hypothetical $10,000 investment in the Innovator S&P 500® Ultra Buffer ETF – October from its inception (September 28, 2018) to April 30, 2019 as compared with the S&P 500® Index.
Growth of a Hypothetical $10,000 Investment
at April 30, 2019

Total Returns as of April 30, 2019 | ||||||||
Since Inception (a) | ||||||||
Innovator S&P 500® Ultra Buffer ETF - October | ||||||||
NAV Return | 1.40 | % | ||||||
Market Return | 1.41 | % | ||||||
S&P 500® Index | 1.09 | % | ||||||
(a) | Inception date is September 28, 2018. |
Performance data quoted represents past performance and does not guarantee future results. The investment return and principal value of an investment will fluctuate so that an investor’s shares, when redeemed, may be worth more or less than their original cost. Current performance of the Fund may be lower or higher than the performance quoted. As of the latest prospectus, the net expense ratio of the Fund was 0.79%. For the most recent performance, please visit the Fund’s website at innovatoretfs.com.
INNOVATOR S&P 500® ULTRA BUFFER ETF – OCTOBER
Fund Performance
April 30, 2019 (Unaudited) (Continued)
The line graph and performance table do not reflect the deduction of taxes that a shareholder may pay on fund distributions or the redemption of Fund shares. Returns shown for the Fund include the reinvestment of all dividends, if any. Returns shown for the S&P 500® Index do not include the reinvestment of dividends, if any.
The S&P 500® Index is an unmanaged, capitalization-weighted index generally representative of the U.S. market for large capitalization stocks.
The Fund’s portfolio holdings may differ significantly from the securities held in the relevant index and, unlike an exchange-traded fund, the performance of an unmanaged index does not reflect deductions for transaction costs, taxes, management fees or other expenses.
You cannot invest directly in an index.
Premium/Discount Information:
Information regarding the differences between the price of the Fund’s shares on the secondary market and the Fund’s net asset value is available at Innovatoretfs.com/UOCT.
INNOVATOR ETFs TRUST
Expense Example
For the Period Ended April 30, 2019 (Unaudited)
As a shareholder of the Funds, you incur two types of costs: (1) ongoing costs, including management fees, and other Fund expenses; and (2) transaction costs, including brokerage commissions on the purchase and sale of Fund shares. This Example is intended to help you understand your ongoing costs (in dollars) of investing in the Funds and to compare these costs with the ongoing costs of investing in other funds.
The Example is based on an investment of $1,000 invested at the beginning of the period and held for the entire period from November 1, 2018 to April 30, 2019 for each Fund.
For the Innovator S&P 500® Buffer ETF – January, S&P 500® Power Buffer ETF – January and S&P 500® Ultra Buffer ETF – January the actual account values and actual expenses are based on the period from December 31, 2018 (the inception date of the Funds) to April 30, 2019.
For the Innovator S&P 500® Buffer ETF – April, S&P 500® Power Buffer ETF – April and S&P 500® Ultra Buffer ETF – April the actual account values and actual expenses are based on the period from March 31, 2019 (the inception date of the Funds) to April 30, 2019.
Actual Expenses
The following table provides information about actual account values and actual expenses. You may use the information in this line, together with the amount you invested, to estimate the expenses you paid over the period. Simply divide your account value by $1,000 (for example, an $8,600 account value divided by $1,000 equals 8.6), then multiply the result by the number in the applicable line under the heading titled “Expenses Paid During the Period” to estimate the expenses you paid on your account during the period.
Hypothetical Example for Comparison Purposes
The following table also provides information about hypothetical account values and hypothetical expenses based on the Funds’ actual expense ratios and an assumed rate of return of 5% per year before expenses, which are not the Funds’ actual returns. The hypothetical account values and expenses may not be used to estimate the actual ending account balance or expenses you paid for the period. You may use this information to compare the ongoing costs of investing in the Funds with other funds. To do so, compare this 5% hypothetical example with the 5% hypothetical examples that appear in the shareholder reports of other funds.
Please note that the expenses shown in the table are meant to highlight your ongoing costs only and do not reflect any transactional costs, such as brokerage commissions on the purchase and sale of Fund shares with respect to the Funds. Therefore, the table below is useful in comparing the ongoing costs only, and will not help you determine the relative total costs of owning different funds. In addition, if these transactional costs were included, your costs could have been higher.
INNOVATOR ETFs TRUST
Expense Example
For the Period Ended April 30, 2019 (Unaudited) (Continued)
Expenses | ||||||||||||
Beginning | Ending | Paid | ||||||||||
Account Value | Account Value | During the Period | ||||||||||
Innovator S&P 500® Buffer ETF - January (NAV) | ||||||||||||
Actual | $ | 1,000.00 | $ | 1,137.30 | $ | 2.75 | (b) | |||||
Hypothetical | 1,000.00 | 1,020.88 | 3.96 | (a)(d) | ||||||||
Innovator S&P 500® Buffer ETF - April (NAV) | ||||||||||||
Actual | 1,000.00 | 1,034.00 | 0.66 | (c) | ||||||||
Hypothetical | 1,000.00 | 1,020.88 | 3.96 | (a)(d) | ||||||||
Innovator S&P 500® Buffer ETF - July (NAV) | ||||||||||||
Actual | 1,000.00 | 1,057.00 | 4.03 | (a) | ||||||||
Hypothetical | 1,000.00 | 1,020.88 | 3.96 | (a) | ||||||||
Innovator S&P 500® Buffer ETF - October (NAV) | ||||||||||||
Actual | 1,000.00 | 1,063.30 | 4.04 | (a) | ||||||||
Hypothetical | 1,000.00 | 1,020.88 | 3.96 | (a) | ||||||||
Innovator S&P 500® Power Buffer ETF - January (NAV) | ||||||||||||
Actual | 1,000.00 | 1,088.10 | 2.69 | (b) | ||||||||
Hypothetical | 1,000.00 | 1,020.88 | 3.96 | (a)(d) | ||||||||
Innovator S&P 500® Power Buffer ETF - April (NAV) | ||||||||||||
Actual | 1,000.00 | 1,024.20 | 0.66 | (c) | ||||||||
Hypothetical | 1,000.00 | 1,020.88 | 3.96 | (a)(d) | ||||||||
Innovator S&P 500® Power Buffer ETF - July (NAV) | ||||||||||||
Actual | 1,000.00 | 1,047.80 | 4.01 | (a) | ||||||||
Hypothetical | 1,000.00 | 1,020.88 | 3.96 | (a) | ||||||||
Innovator S&P 500® Power Buffer ETF - October (NAV) | ||||||||||||
Actual | 1,000.00 | 1,059.50 | 4.03 | (a) | ||||||||
Hypothetical | 1,000.00 | 1,020.88 | 3.96 | (a) | ||||||||
Innovator S&P 500® Ultra Buffer ETF - January (NAV) | ||||||||||||
Actual | 1,000.00 | 1,073.40 | 2.67 | (b) | ||||||||
Hypothetical | 1,000.00 | 1,020.88 | 3.96 | (a)(d) | ||||||||
Innovator S&P 500® Ultra Buffer ETF - April (NAV) | ||||||||||||
Actual | 1,000.00 | 1,024.50 | 0.66 | (c) | ||||||||
Hypothetical | 1,000.00 | 1,020.88 | 3.96 | (a)(d) | ||||||||
Innovator S&P 500® Ultra Buffer ETF - July (NAV) | ||||||||||||
Actual | 1,000.00 | 1,047.20 | 4.01 | (a) | ||||||||
Hypothetical | 1,000.00 | 1,020.88 | 3.96 | (a) | ||||||||
Innovator S&P 500® Ultra Buffer ETF - October (NAV) | ||||||||||||
Actual | 1,000.00 | 1,050.40 | 4.02 | (a) | ||||||||
Hypothetical | 1,000.00 | 1,020.88 | 3.96 | (a) | ||||||||
(a) | Expenses are equal to the Fund’s annualized expense ratio, multiplied by the average account value over the period, multiplied by 181/365 (to reflect the period since the six month period). |
(b) | Expenses are equal to the Fund’s annualized expense ratio, multiplied by the average account value over the period, multiplied by 119/365 (to reflect the period since the Fund’s inception on December 31, 2018). |
(c) | Expenses are equal to the Fund’s annualized expense ratio, multiplied by the average account value over the period, multiplied by 30/365 (to reflect the period since the Fund’s inception on March 29, 2018). |
(d) | For comparative purposes only as the Fund was not in operation for the full six month period. |
INNOVATOR S&P 500® BUFFER ETF – JANUARY
Schedule of Investments
April 30, 2019 (Unaudited)
Contracts | Notional Amount | Value | ||||||||||
PURCHASED OPTIONS - 106.92% (a) | ||||||||||||
CALL OPTIONS - 100.54% | ||||||||||||
SPX S&P 500® Index, Expires 12/31/2019, Strike Price $1,504.16 | 132 | $ | 38,884,956 | $ | 18,927,578 | |||||||
XSP S&P 500® Mini Index, Expires 12/31/2019, Strike Price $150.43 | 330 | 9,721,140 | 4,731,441 | |||||||||
| 23,659,019 | ||||||||||||
PUT OPTIONS - 6.38% | ||||||||||||
SPX S&P 500® Index, Expires 12/31/2019, Strike Price $3,008.32 | 66 | 19,442,478 | 956,600 | |||||||||
SPX S&P 500® Index, Expires 12/31/2019, Strike Price $2,506.91 | 66 | 19,442,478 | 243,261 | |||||||||
XSP S&P 500® Mini Index, Expires 12/31/2019, Strike Price $300.87 | 165 | 4,860,570 | 239,414 | |||||||||
XSP S&P 500® Mini Index, Expires 12/31/2019, Strike Price $250.70 | 165 | 4,860,570 | 60,831 | |||||||||
| 1,500,106 | ||||||||||||
TOTAL PURCHASED OPTIONS (Cost $21,437,430) | 25,159,125 | |||||||||||
SHORT TERM INVESTMENTS - 0.01% | Shares | |||||||||||
MONEY MARKET FUNDS - 0.01% | ||||||||||||
Fidelity Government Portfolio - Class I, 2.30% (b) | 100 | 100 | ||||||||||
Fidelity Investments Money Market Funds - Treasury Portfolio - Class I, 2.30% (b) | 100 | 100 | ||||||||||
First American Government Obligations Fund - Class X, 2.35% (b) | 100 | 100 | ||||||||||
First American Treasury Obligations Fund - Class X, 2.35% (b) | 811 | 811 | ||||||||||
Morgan Stanley Institutional Liquidity Funds - Treasury Portfolio - Class I, 2.30% (b) | 100 | 100 | ||||||||||
STIT - Treasury Portfolio - Class I, 2.31% (b) | 100 | 100 | ||||||||||
Wells Fargo Treasury Plus Money Market Fund - Class I, 2.29% (b) | 100 | 100 | ||||||||||
TOTAL SHORT TERM INVESTMENTS (Cost $1,411) | 1,411 | |||||||||||
Total Investments (Cost $21,438,841) - 106.93% | 25,160,536 | |||||||||||
Liabilities in Excess of Other Assets - (6.93)% | (1,629,486 | ) | ||||||||||
TOTAL NET ASSETS - 100.00% | $ | 23,531,050 | ||||||||||
Percentages are stated as a percent of net assets.
The accompanying notes are an integral part of these financial statements.
INNOVATOR S&P 500® BUFFER ETF – JANUARY
Schedule of Investments
April 30, 2019 (Unaudited) (Continued)
Asset Type | % of Net Assets | |||
Purchased Options | 106.92 | % | ||
Short Term Investments | 0.01 | |||
Total Investments | 106.93 | |||
Liabilities in Excess of Other Assets | (6.93 | ) | ||
Net Assets | 100.00 | % | ||
(a) Exchange-Traded.
(b) Represents annualized seven-day yield as of the end of the reporting period.
Schedule of Options Written (a) | ||||||||||||||||||
April 30, 2019 (Unaudited) | ||||||||||||||||||
Description | Expiration | Strike Price | Contracts | Notional Amount | Value | |||||||||||||
Call Options | ||||||||||||||||||
SPX S&P 500® Index | 12/31/2019 | $ | 3,065.94 | 66 | $ | (19,442,478 | ) | $ | (464,876 | ) | ||||||||
SPX S&P 500® Index | 12/31/2019 | 3,008.32 | 66 | (19,442,478 | ) | (663,064 | ) | |||||||||||
XSP S&P 500® Mini Index | 12/31/2019 | 306.59 | 165 | (4,860,570 | ) | (116,250 | ) | |||||||||||
XSP S&P 500® Mini Index | 12/31/2019 | 300.87 | 165 | (4,860,570 | ) | (165,413 | ) | |||||||||||
| (1,409,603 | ) | |||||||||||||||||
Put Options | ||||||||||||||||||
SPX S&P 500® Index | 12/31/2019 | 2,281.28 | 66 | (19,442,478 | ) | (128,703 | ) | |||||||||||
SPX S&P 500® Index | 12/31/2019 | 1,504.16 | 132 | (38,884,956 | ) | (23,964 | ) | |||||||||||
XSP S&P 500® Mini Index | 12/31/2019 | 228.13 | 165 | (4,860,570 | ) | (32,177 | ) | |||||||||||
XSP S&P 500® Mini Index | 12/31/2019 | 150.43 | 330 | (9,721,140 | ) | (5,993 | ) | |||||||||||
| (190,837 | ) | |||||||||||||||||
Total Options Written (Premiums Received $1,465,246) | $ | (1,600,440 | ) | |||||||||||||||
(a) Exchange-Traded. | ||||||||||||||||||
The accompanying notes are an integral part of these financial statements.
INNOVATOR S&P 500® BUFFER ETF – APRIL
Schedule of Investments
April 30, 2019 (Unaudited)
Contracts | Notional Amount | Value | ||||||||||
PURCHASED OPTIONS - 103.60% (a) | ||||||||||||
CALL OPTIONS - 84.84% | ||||||||||||
SPX S&P 500® Index, Expires 3/31/2020, Strike Price $1,700.65 | 184 | $ | 54,203,272 | $ | 22,884,624 | |||||||
XSP S&P 500® Mini Index, Expires 3/31/2020, Strike Price $170.08 | 184 | 5,420,272 | 2,288,199 | |||||||||
| 25,172,823 | ||||||||||||
PUT OPTIONS - 18.76% | ||||||||||||
SPX S&P 500® Index, Expires 3/31/2020, Strike Price $3,401.31 | 92 | 27,101,636 | 4,000,949 | |||||||||
SPX S&P 500® Index, Expires 3/31/2020, Strike Price $2,834.4 | 92 | 27,101,636 | 1,058,169 | |||||||||
XSP S&P 500® Mini Index, Expires 3/31/2020, Strike Price $340.17 | 92 | 2,710,136 | 400,420 | |||||||||
XSP S&P 500® Mini Index, Expires 3/31/2020, Strike Price $283.45 | 92 | 2,710,136 | 105,840 | |||||||||
| 5,565,378 | ||||||||||||
TOTAL PURCHASED OPTIONS (Cost $30,204,248) | 30,738,201 | |||||||||||
Total Investments (Cost $30,204,248) - 103.60% | 30,738,201 | |||||||||||
Liabilities in Excess of Other Assets - (3.60)% | (1,069,140 | ) | ||||||||||
TOTAL NET ASSETS - 100.00% | $ | 29,669,061 | ||||||||||
Percentages are stated as a percent of net assets.
Asset Type | % of Net Assets | |||
Purchased Options | 103.60 | % | ||
Total Investments | 103.60 | |||
Liabilities in Excess of Other Assets | (3.60 | ) | ||
Net Assets | 100.00 | % | ||
(a) Exchange-Traded.
The accompanying notes are an integral part of these financial statements.
INNOVATOR S&P 500® BUFFER ETF – APRIL
Schedule of Options Written (a) | ||||||||||||||||||
April 30, 2019 (Unaudited) | ||||||||||||||||||
Description | Expiration | Strike Price | Contracts | Notional Amount | Value | |||||||||||||
Call Options | ||||||||||||||||||
SPX S&P 500® Index | 3/31/2020 | $ | 3,401.31 | 92 | $ | (27,101,636 | ) | $ | (106,309 | ) | ||||||||
SPX S&P 500® Index | 3/31/2020 | 3,323.12 | 92 | (27,101,636 | ) | (179,421 | ) | |||||||||||
XSP S&P 500® Mini Index | 3/31/2020 | 340.17 | 92 | (2,710,136 | ) | (10,605 | ) | |||||||||||
XSP S&P 500® Mini Index | 3/31/2020 | 332.31 | 92 | (2,710,136 | ) | (17,945 | ) | |||||||||||
| (314,280 | ) | |||||||||||||||||
Put Options | ||||||||||||||||||
SPX S&P 500® Index | 3/31/2020 | 2,579.29 | 92 | (27,101,636 | ) | (589,599 | ) | |||||||||||
SPX S&P 500® Index | 3/31/2020 | 1,700.65 | 184 | (54,203,272 | ) | (114,307 | ) | |||||||||||
XSP S&P 500® Mini Index | 3/31/2020 | 257.93 | 92 | (2,710,136 | ) | (58,961 | ) | |||||||||||
XSP S&P 500® Mini Index | 3/31/2020 | 170.08 | 184 | (5,420,272 | ) | (11,436 | ) | |||||||||||
| (774,303 | ) | |||||||||||||||||
Total Options Written (Premiums Received $1,180,497) | $ | (1,088,583 | ) | |||||||||||||||
(a) Exchange-Traded. | ||||||||||||||||||
The accompanying notes are an integral part of these financial statements.
INNOVATOR S&P 500® BUFFER ETF – JULY
Schedule of Investments
April 30, 2019 (Unaudited)
Contracts | Notional Amount | Value | ||||||||||
PURCHASED OPTIONS - 90.56% (a) | ||||||||||||
CALL OPTIONS - 73.38% | ||||||||||||
SPX S&P 500® Index, Expires 6/28/2019, Strike Price $1,738.54 | 108 | $ | 31,814,964 | $ | 13,015,836 | |||||||
XSP S&P 500® Mini Index, Expires 6/28/2019, Strike Price $173.87 | 108 | 3,181,464 | 1,300,968 | |||||||||
| 14,316,804 | ||||||||||||
PUT OPTIONS - 17.18% | ||||||||||||
SPX S&P 500® Index, Expires 6/28/2019, Strike Price $3,477.08 | 54 | 15,907,482 | 2,845,044 | |||||||||
SPX S&P 500® Index, Expires 6/28/2019, Strike Price $2,897.54 | 54 | 15,907,482 | 202,014 | |||||||||
XSP S&P 500® Mini Index, Expires 6/28/2019, Strike Price $347.74 | 54 | 1,590,732 | 284,688 | |||||||||
XSP S&P 500® Mini Index, Expires 6/28/2019, Strike Price $289.76 | 54 | 1,590,732 | 20,196 | |||||||||
| 3,351,942 | ||||||||||||
TOTAL PURCHASED OPTIONS (Cost $17,476,723) | 17,668,746 | |||||||||||
SHORT TERM INVESTMENTS - 0.00% (b) | Shares | |||||||||||
MONEY MARKET FUNDS - 0.00% (b) | ||||||||||||
Fidelity Government Portfolio - Class I, 2.30% (c) | 100 | 100 | ||||||||||
Fidelity Investments Money Market Funds - Treasury Portfolio - Class I, 2.30% (c) | 100 | 100 | ||||||||||
First American Government Obligations Fund - Class X, 2.35% (c) | 100 | 100 | ||||||||||
First American Treasury Obligations Fund - Class X, 2.35% (c) | 102 | 102 | ||||||||||
Morgan Stanley Institutional Liquidity Funds - Treasury Portfolio - Class I, 2.30% (c) | 100 | 100 | ||||||||||
STIT - Treasury Portfolio - Class I, 2.31% (c) | 100 | 100 | ||||||||||
Wells Fargo Treasury Plus Money Market Fund - Class I, 2.29% (c) | 100 | 100 | ||||||||||
TOTAL SHORT TERM INVESTMENTS (Cost $702) | 702 | |||||||||||
Total Investments (Cost $17,477,425) - 90.56% | 17,669,448 | |||||||||||
Other Assets in Excess of Liabilities - 9.44% | 1,840,844 | |||||||||||
TOTAL NET ASSETS - 100.00% | $ | 19,510,292 | ||||||||||
Percentages are stated as a percent of net assets.
The accompanying notes are an integral part of these financial statements.
INNOVATOR S&P 500® BUFFER ETF – JULY
Schedule of Investments
April 30, 2019 (Unaudited) (Continued)
Asset Type | % of Net Assets | |||
Purchased Options | 90.56 | % | ||
Short Term Investments | 0.00 | (b) | ||
Total Investments | 90.56 | |||
Other Assets in Excess of Liabilities | 9.44 | |||
Net Assets | 100.00 | % | ||
(a) Exchange-Traded.
(b) Less than 0.05%.
(c) Represents annualized seven-day yield as of the end of the reporting period.
Schedule of Options Written (a)
April 30, 2019 (Unaudited)
Description | Expiration | Strike Price | Contracts | Notional Amount | Value | |||||||||||||
Call Options | ||||||||||||||||||
SPX S&P 500® Index | 6/28/2019 | $ | 3,477.08 | 54 | $ | (15,907,482 | ) | $ | (270 | ) | ||||||||
SPX S&P 500® Index | 6/28/2019 | 3,211.91 | 54 | (15,907,482 | ) | (3,348 | ) | |||||||||||
XSP S&P 500® Mini Index | 6/28/2019 | 347.74 | 54 | (1,590,732 | ) | (270 | ) | |||||||||||
XSP S&P 500® Mini Index | 6/28/2019 | 321.19 | 54 | (1,590,732 | ) | (324 | ) | |||||||||||
| (4,212 | ) | |||||||||||||||||
Put Options | ||||||||||||||||||
SPX S&P 500® Index | 6/28/2019 | 2,636.75 | 54 | (15,907,482 | ) | (46,872 | ) | |||||||||||
SPX S&P 500® Index | 6/28/2019 | 1,738.54 | 108 | (31,814,964 | ) | (540 | ) | |||||||||||
XSP S&P 500® Mini Index | 6/28/2019 | 263.68 | 54 | (1,590,732 | ) | (4,698 | ) | |||||||||||
XSP S&P 500® Mini Index | 6/28/2019 | 173.87 | 108 | (3,181,464 | ) | (540 | ) | |||||||||||
| (52,650 | ) | |||||||||||||||||
Total Options Written (Premiums Received $266,780) | $ | (56,862 | ) | |||||||||||||||
(a) Exchange-Traded.
The accompanying notes are an integral part of these financial statements.
INNOVATOR S&P 500® BUFFER ETF – OCTOBER
Schedule of Investments
April 30, 2019 (Unaudited)
|
| Contracts |
|
| Notional Amount |
|
| Value |
| |||
PURCHASED OPTIONS - 101.55% (a) |
|
|
|
|
|
|
|
|
|
|
|
|
CALL OPTIONS - 80.76% |
|
|
|
|
|
|
|
|
|
|
|
|
SPX S&P 500® Index, Expires 9/30/2019, Strike Price $1,748.38 |
|
| 236 |
|
| $ | 69,521,588 |
|
| $ | 28,257,594 |
|
XSP S&P 500® Mini Index, Expires 9/30/2019, Strike Price $174.86 |
|
| 118 |
|
|
| 3,476,044 |
|
|
| 1,412,623 |
|
|
|
|
|
|
|
|
|
|
|
| 29,670,217 |
|
PUT OPTIONS - 20.79% |
|
|
|
|
|
|
|
|
|
|
|
|
SPX S&P 500® Index, Expires 9/30/2019, Strike Price $3,496.77 |
|
| 118 |
|
|
| 34,760,794 |
|
|
| 6,312,152 |
|
SPX S&P 500® Index, Expires 9/30/2019, Strike Price $2,913.95 |
|
| 118 |
|
|
| 34,760,794 |
|
|
| 961,499 |
|
XSP S&P 500® Mini Index, Expires 9/30/2019, Strike Price $349.71 |
|
| 59 |
|
|
| 1,738,022 |
|
|
| 315,799 |
|
XSP S&P 500® Mini Index, Expires 9/30/2019, Strike Price $291.40 |
|
| 59 |
|
|
| 1,738,022 |
|
|
| 48,084 |
|
|
|
|
|
|
|
|
|
|
|
| 7,637,534 |
|
TOTAL PURCHASED OPTIONS (Cost $34,414,878) |
|
|
|
|
|
|
|
|
|
| 37,307,751 |
|
|
|
|
|
|
|
|
|
|
|
|
|
|
SHORT TERM INVESTMENTS - 0.00% (b) |
| Shares |
|
|
|
|
|
|
|
|
| |
MONEY MARKET FUNDS - 0.00% (b) |
|
|
|
|
|
|
|
|
|
|
|
|
Fidelity Government Portfolio - Class I, 2.30% (c) |
|
| 100 |
|
|
|
|
|
|
| 100 |
|
Fidelity Investments Money Market Funds - Treasury Portfolio - Class I, 2.30% (c) |
|
| 100 |
|
|
|
|
|
|
| 100 |
|
First American Government Obligations Fund - Class X, 2.35% (c) |
|
| 100 |
|
|
|
|
|
|
| 100 |
|
First American Treasury Obligations Fund - Class X, 2.35% (c) |
|
| 97 |
|
|
|
|
|
|
| 97 |
|
Morgan Stanley Institutional Liquidity Funds - Treasury Portfolio - Class I, 2.30% (c) |
|
| 100 |
|
|
|
|
|
|
| 100 |
|
STIT - Treasury Portfolio - Class I, 2.31% (c) |
|
| 100 |
|
|
|
|
|
|
| 100 |
|
Wells Fargo Treasury Plus Money Market Fund - Class I, 2.29% (c) |
|
| 100 |
|
|
|
|
|
|
| 100 |
|
TOTAL SHORT TERM INVESTMENTS (Cost $697) |
|
|
|
|
|
|
|
|
|
| 697 |
|
|
|
|
|
|
|
|
|
|
|
|
|
|
Total Investments (Cost $34,415,575) - 101.55% |
|
|
|
|
|
|
|
|
|
| 37,308,448 |
|
Liabilities in Excess of Other Assets - (1.55)% |
|
|
|
|
|
|
|
|
|
| (569,614 | ) |
TOTAL NET ASSETS - 100.00% |
|
|
|
|
|
|
|
|
| $ | 36,738,834 |
|
Percentages are stated as a percent of net assets.
The accompanying notes are an integral part of these financial statements.
INNOVATOR S&P 500® BUFFER ETF – OCTOBER
Schedule of Investments
April 30, 2019 (Unaudited) (Continued)
Asset Type | % of Net Assets | |||
Purchased Options | 101.55 | % | ||
Short Term Investments | 0.00 | (b) | ||
Total Investments | 101.55 | |||
Liabilities in Excess of Other Assets | (1.55 | ) | ||
Net Assets | 100.00 | % | ||
(a) Exchange-Traded.
(b) Less than 0.05%.
(c) Represents annualized seven-day yield as of the end of the reporting period.
Schedule of Options Written (a) | ||||||||||||||||||
April 30, 2019 (Unaudited) | ||||||||||||||||||
Description | Expiration | Strike Price | Contracts | Notional Amount | Value | |||||||||||||
Call Options | ||||||||||||||||||
SPX S&P 500® Index | 9/30/2019 | $ | 3,496.77 | 118 | $ | (34,760,794 | ) | $ | (12,026 | ) | ||||||||
SPX S&P 500® Index | 9/30/2019 | 3,359.77 | 118 | (34,760,794 | ) | (26,956 | ) | |||||||||||
XSP S&P 500® Mini Index | 9/30/2019 | 349.71 | 59 | (1,738,022 | ) | (600 | ) | |||||||||||
XSP S&P 500® Mini Index | 9/30/2019 | 335.98 | 59 | (1,738,022 | ) | (1,347 | ) | |||||||||||
| (40,929 | ) | |||||||||||||||||
Put Options | ||||||||||||||||||
SPX S&P 500® Index | 9/30/2019 | 2,651.69 | 118 | (34,760,794 | ) | (386,881 | ) | |||||||||||
SPX S&P 500® Index | 9/30/2019 | 1,748.38 | 236 | (69,521,588 | ) | (42,862 | ) | |||||||||||
XSP S&P 500® Mini Index | 9/30/2019 | 265.17 | 59 | (1,738,022 | ) | (19,345 | ) | |||||||||||
XSP S&P 500® Mini Index | 9/30/2019 | 174.86 | 118 | (3,476,044 | ) | (2,144 | ) | |||||||||||
| (451,232 | ) | |||||||||||||||||
Total Options Written (Premiums Received $2,041,087) | $ | (492,161 | ) | |||||||||||||||
(a) Exchange-Traded.
The accompanying notes are an integral part of these financial statements.
INNOVATOR S&P 500® POWER BUFFER ETF – JANUARY
Schedule of Investments
April 30, 2019 (Unaudited)
Contracts | Notional Amount | Value | ||||||||||
PURCHASED OPTIONS - 110.62% (a) | ||||||||||||
CALL OPTIONS - 103.94% | ||||||||||||
SPX S&P 500® Index, Expires 12/31/2019, Strike Price $1,504.14 | 452 | $ | 133,151,516 | $ | 64,668,544 | |||||||
XSP S&P 500® Mini Index, Expires 12/31/2019, Strike Price $150.41 | 1,130 | 33,287,540 | 16,166,910 | |||||||||
| 80,835,454 | ||||||||||||
PUT OPTIONS - 6.68% | ||||||||||||
SPX S&P 500® Index, Expires 12/31/2019, Strike Price $3,008.28 | 226 | 66,575,758 | 3,329,884 | |||||||||
SPX S&P 500® Index, Expires 12/31/2019, Strike Price $2,506.90 | 226 | 66,575,758 | 828,290 | |||||||||
XSP S&P 500® Mini Index, Expires 12/31/2019, Strike Price $300.83 | 565 | 16,643,770 | 832,245 | |||||||||
XSP S&P 500® Mini Index, Expires 12/31/2019, Strike Price $250.69 | 565 | 16,643,770 | 206,790 | |||||||||
| 5,197,209 | ||||||||||||
TOTAL PURCHASED OPTIONS (Cost $73,354,136) | 86,032,663 | |||||||||||
SHORT TERM INVESTMENTS - 0.00% (b) | Shares | |||||||||||
MONEY MARKET FUNDS - 0.00% (b) | ||||||||||||
Fidelity Government Portfolio - Class I, 2.30% (c) | 100 | 100 | ||||||||||
Fidelity Investments Money Market Funds - Treasury Portfolio - Class I, 2.30% (c) | 100 | 100 | ||||||||||
First American Government Obligations Fund - Class X, 2.35% (c) | 100 | 100 | ||||||||||
First American Treasury Obligations Fund - Class X, 2.35% (c) | 100 | 100 | ||||||||||
Morgan Stanley Institutional Liquidity Funds - Treasury Portfolio - Class I, 2.30% (c) | 100 | 100 | ||||||||||
STIT - Treasury Portfolio - Class I, 2.31% (c) | 100 | 100 | ||||||||||
Wells Fargo Treasury Plus Money Market Fund - Class I, 2.29% (c) | 100 | 100 | ||||||||||
TOTAL SHORT TERM INVESTMENTS (Cost $700) | 700 | |||||||||||
Total Investments (Cost $73,354,836) - 110.62% | 86,033,363 | |||||||||||
Liabilities in Excess of Other Assets - (10.62)% | (8,259,138 | ) | ||||||||||
TOTAL NET ASSETS - 100.00% | $ | 77,774,225 | ||||||||||
Percentages are stated as a percent of net assets.
The accompanying notes are an integral part of these financial statements.
INNOVATOR S&P 500® POWER BUFFER ETF – JANUARY
Schedule of Investments
April 30, 2019 (Unaudited) (Continued)
Asset Type | % of Net Assets | |||
Purchased Options | 110.62 | % | ||
Short Term Investments | 0.00 | (b) | ||
Total Investments | 110.62 | |||
Liabilities in Excess of Other Assets | (10.62 | ) | ||
Net Assets | 100.00 | % | ||
(a) Exchange-Traded.
(b) Less than 0.05%.
(c) Represents annualized seven-day yield as of the end of the reporting period.
Schedule of Options Written (a)
April 30, 2019 (Unaudited)
Description | Expiration | Strike Price | Contracts | Notional Amount | Value | |||||||||||||
Call Options | ||||||||||||||||||
SPX S&P 500® Index | 12/31/2019 | $ | 3,008.28 | 226 | $ | (66,575,758 | ) | $ | (2,252,316 | ) | ||||||||
SPX S&P 500® Index | 12/31/2019 | 2,855.36 | 226 | (66,575,758 | ) | (4,489,038 | ) | |||||||||||
XSP S&P 500® Mini Index | 12/31/2019 | 300.83 | 565 | (16,643,770 | ) | (563,305 | ) | |||||||||||
XSP S&P 500® Mini Index | 12/31/2019 | 285.54 | 565 | (16,643,770 | ) | (1,122,090 | ) | |||||||||||
| (8,426,749 | ) | |||||||||||||||||
Put Options | ||||||||||||||||||
SPX S&P 500® Index | 12/31/2019 | 2,130.87 | 226 | (66,575,758 | ) | (286,342 | ) | |||||||||||
SPX S&P 500® Index | 12/31/2019 | 1,504.14 | 452 | (133,151,516 | ) | (56,952 | ) | |||||||||||
XSP S&P 500® Mini Index | 12/31/2019 | 213.09 | 565 | (16,643,770 | ) | (71,755 | ) | |||||||||||
XSP S&P 500® Mini Index | 12/31/2019 | 150.41 | 1,130 | (33,287,540 | ) | (14,690 | ) | |||||||||||
| (429,739 | ) | |||||||||||||||||
Total Options Written (Premiums Received $5,298,121) | $ | (8,856,488 | ) | |||||||||||||||
(a) Exchange-Traded.
The accompanying notes are an integral part of these financial statements.
INNOVATOR S&P 500® POWER BUFFER ETF – APRIL
Schedule of Investments
April 30, 2019 (Unaudited)
Contracts | Notional Amount | Value | ||||||||||
PURCHASED OPTIONS - 104.60% (a) | ||||||||||||
CALL OPTIONS - 85.66% | ||||||||||||
SPX S&P 500® Index, Expires 3/31/2020, Strike Price $1,700.63 | 612 | $ | 180,284,796 | $ | 76,117,420 | |||||||
XSP S&P 500® Mini Index, Expires 3/31/2020, Strike Price $170.06 | 612 | 18,028,296 | 7,611,917 | |||||||||
| 83,729,337 | ||||||||||||
PUT OPTIONS - 18.94% | ||||||||||||
SPX S&P 500® Index, Expires 3/31/2020, Strike Price $3,401.27 | 306 | 90,142,398 | 13,306,395 | |||||||||
SPX S&P 500® Index, Expires 3/31/2020, Strike Price $2,834.39 | 306 | 90,142,398 | 3,519,483 | |||||||||
XSP S&P 500® Mini Index, Expires 3/31/2020, Strike Price $340.13 | 306 | 9,014,148 | 1,330,723 | |||||||||
XSP S&P 500® Mini Index, Expires 3/31/2020, Strike Price $283.44 | 306 | 9,014,148 | 351,956 | |||||||||
| 18,508,557 | ||||||||||||
TOTAL PURCHASED OPTIONS (Cost $100,366,327) | 102,237,894 | |||||||||||
SHORT TERM INVESTMENTS - 0.02% | Shares | |||||||||||
MONEY MARKET FUNDS - 0.02% | ||||||||||||
Fidelity Government Portfolio - Class I, 2.30% (b) | 100 | 100 | ||||||||||
Fidelity Investments Money Market Funds - Treasury Portfolio - Class I, 2.30% (b) | 100 | 100 | ||||||||||
First American Government Obligations Fund - Class X, 2.35% (b) | 100 | 100 | ||||||||||
First American Treasury Obligations Fund - Class X, 2.35% (b) | 20,881 | 20,881 | ||||||||||
Morgan Stanley Institutional Liquidity Funds - Treasury Portfolio - Class I, 2.30% (b) | 100 | 100 | ||||||||||
STIT - Treasury Portfolio - Class I, 2.31% (b) | 100 | 100 | ||||||||||
Wells Fargo Treasury Plus Money Market Fund - Class I, 2.29% (b) | 100 | 100 | ||||||||||
TOTAL SHORT TERM INVESTMENTS (Cost $21,481) | 21,481 | |||||||||||
Total Investments (Cost $100,387,808) - 104.62% | 102,259,375 | |||||||||||
Liabilities in Excess of Other Assets - (4.62)% | (4,517,554 | ) | ||||||||||
TOTAL NET ASSETS - 100.00% | $ | 97,741,821 | ||||||||||
Percentages are stated as a percent of net assets.
The accompanying notes are an integral part of these financial statements.
INNOVATOR S&P 500® POWER BUFFER ETF – APRIL
Schedule of Investments
April 30, 2019 (Unaudited) (Continued)
Asset Type | % of Net Assets | |||
Purchased Options | 104.60 | % | ||
Short Term Investments | 0.02 | |||
Total Investments | 104.62 | |||
Liabilities in Excess of Other Assets | (4.62 | ) | ||
Net Assets | 100.00 | % | ||
(a) Exchange-Traded.
(b) Represents annualized seven-day yield as of the end of the reporting period.
Schedule of Options Written (a)
April 30, 2019 (Unaudited)
Description | Expiration | Strike Price | Contracts | Notional Amount | Value | |||||||||||||
Call Options | ||||||||||||||||||
SPX S&P 500® Index | 3/31/2020 | $ | 3,401.27 | 306 | $ | (90,142,398 | ) | $ | (353,684 | ) | ||||||||
SPX S&P 500® Index | 3/31/2020 | 3,135.12 | 306 | (90,142,398 | ) | (2,102,629 | ) | |||||||||||
XSP S&P 500® Mini Index | 3/31/2020 | 340.13 | 306 | (9,014,148 | ) | (35,362 | ) | |||||||||||
XSP S&P 500® Mini Index | 3/31/2020 | 313.51 | 306 | (9,014,148 | ) | (210,288 | ) | |||||||||||
| (2,701,963 | ) | |||||||||||||||||
Put Options | ||||||||||||||||||
SPX S&P 500® Index | 3/31/2020 | 2,409.23 | 306 | (90,142,398 | ) | (1,303,812 | ) | |||||||||||
SPX S&P 500® Index | 3/31/2020 | 1,700.63 | 612 | (180,284,796 | ) | (380,172 | ) | |||||||||||
XSP S&P 500® Mini Index | 3/31/2020 | 240.92 | 306 | (9,014,148 | ) | (130,372 | ) | |||||||||||
XSP S&P 500® Mini Index | 3/31/2020 | 170.06 | 612 | (18,028,296 | ) | (38,014 | ) | |||||||||||
| (1,852,370 | ) | |||||||||||||||||
Total Options Written (Premiums Received $4,183,812) | $ | (4,554,333 | ) | |||||||||||||||
(a) Exchange-Traded.
The accompanying notes are an integral part of these financial statements.
INNOVATOR S&P 500® POWER BUFFER ETF – JULY
Schedule of Investments
April 30, 2019 (Unaudited)
Contracts | Notional Amount | Value | ||||||||||
PURCHASED OPTIONS - 100.69% (a) | ||||||||||||
CALL OPTIONS - 83.54% | ||||||||||||
SPX S&P 500® Index, Expires 6/28/2019, Strike Price $1,715.08 | 196 | $ | 57,738,268 | $ | 24,123,969 | |||||||
XSP S&P 500® Mini Index, Expires 6/28/2019, Strike Price $171.51 | 196 | 5,773,768 | 2,412,358 | |||||||||
| 26,536,327 | ||||||||||||
PUT OPTIONS - 17.15% | ||||||||||||
SPX S&P 500® Index, Expires 6/28/2019, Strike Price $3,430.15 | 98 | 28,869,134 | 4,673,920 | |||||||||
SPX S&P 500® Index, Expires 6/28/2019, Strike Price $2,858.46 | 98 | 28,869,134 | 276,677 | |||||||||
XSP S&P 500® Mini Index, Expires 6/28/2019, Strike Price $343.02 | 98 | 2,886,884 | 467,441 | |||||||||
XSP S&P 500® Mini Index, Expires 6/28/2019, Strike Price $285.85 | 98 | 2,886,884 | 27,674 | |||||||||
| 5,445,712 | ||||||||||||
TOTAL PURCHASED OPTIONS (Cost $31,270,215) | 31,982,039 | |||||||||||
SHORT TERM INVESTMENTS - 0.00% (b) | Shares | |||||||||||
MONEY MARKET FUNDS - 0.00% (b) | ||||||||||||
Fidelity Government Portfolio - Class I, 2.30% (c) | 100 | 100 | ||||||||||
Fidelity Investments Money Market Funds - Treasury Portfolio - Class I, 2.30% (c) | 100 | 100 | ||||||||||
First American Government Obligations Fund - Class X, 2.35% (c) | 100 | 100 | ||||||||||
First American Treasury Obligations Fund - Class X, 2.35% (c) | 99 | 99 | ||||||||||
Morgan Stanley Institutional Liquidity Funds - Treasury Portfolio - Class I, 2.30% (c) | 100 | 100 | ||||||||||
STIT - Treasury Portfolio - Class I, 2.31% (c) | 100 | 100 | ||||||||||
Wells Fargo Treasury Plus Money Market Fund - Class I, 2.29% (c) | 100 | 100 | ||||||||||
TOTAL SHORT TERM INVESTMENTS (Cost $699) | 699 | |||||||||||
Total Investments (Cost $31,270,914) - 100.69% | 31,982,738 | |||||||||||
Liabilities in Excess of Other Assets - (0.69)% | (219,157 | ) | ||||||||||
TOTAL NET ASSETS - 100.00% | $ | 31,763,581 | ||||||||||
Percentages are stated as a percent of net assets.
The accompanying notes are an integral part of these financial statements.
INNOVATOR S&P 500® POWER BUFFER ETF – JULY
Schedule of Investments
April 30, 2019 (Unaudited) (Continued)
Asset Type | % of Net Assets | |||
Purchased Options | 100.69 | % | ||
Short Term Investments | 0.00 | (b) | ||
Total Investments | 100.69 | |||
Liabilities in Excess of Other Assets | (0.69 | ) | ||
Net Assets | 100.00 | % | ||
(a) Exchange-Traded.
(b) Less than 0.05%.
(c) Represents annualized seven-day yield as of the end of the reporting period.
Schedule of Options Written (a)
April 30, 2019 (Unaudited)
Description | Expiration | Strike Price | Contracts | Notional Amount | Value | |||||||||||||
Call Options | ||||||||||||||||||
SPX S&P 500® Index | 6/28/2019 | $ | 3,430.15 | 98 | $ | (28,869,134 | ) | $ | (1,261 | ) | ||||||||
SPX S&P 500® Index | 6/28/2019 | 3,090.28 | 98 | (28,869,134 | ) | (51,215 | ) | |||||||||||
XSP S&P 500® Mini Index | 6/28/2019 | 343.02 | 98 | (2,886,884 | ) | (126 | ) | |||||||||||
XSP S&P 500® Mini Index | 6/28/2019 | 309.03 | 98 | (2,886,884 | ) | (5,120 | ) | |||||||||||
| (57,722 | ) | |||||||||||||||||
Put Options | ||||||||||||||||||
SPX S&P 500® Index | 6/28/2019 | 2,429.69 | 98 | (28,869,134 | ) | (35,720 | ) | |||||||||||
SPX S&P 500® Index | 6/28/2019 | 1,715.08 | 196 | (57,738,268 | ) | (4,986 | ) | |||||||||||
XSP S&P 500® Mini Index | 6/28/2019 | 242.97 | 98 | (2,886,884 | ) | (3,572 | ) | |||||||||||
XSP S&P 500® Mini Index | 6/28/2019 | 171.51 | 196 | (5,773,768 | ) | (499 | ) | |||||||||||
| (44,777 | ) | |||||||||||||||||
Total Options Written (Premiums Received $414,621) | $ | (102,499 | ) | |||||||||||||||
(a) Exchange-Traded.
The accompanying notes are an integral part of these financial statements.
INNOVATOR S&P 500® POWER BUFFER ETF – OCTOBER
Schedule of Investments
April 30, 2019 (Unaudited)
Contracts | Notional Amount | Value | ||||||||||
PURCHASED OPTIONS - 93.57% (a) | ||||||||||||
CALL OPTIONS - 74.27% | ||||||||||||
SPX S&P 500® Index, Expires 9/30/2019, Strike Price $1,748.36 | 636 | $ | 187,354,788 | $ | 75,846,180 | |||||||
XSP S&P 500® Mini Index, Expires 9/30/2019, Strike Price $174.84 | 318 | 9,367,644 | 3,792,150 | |||||||||
| 79,638,330 | ||||||||||||
PUT OPTIONS - 19.30% | ||||||||||||
SPX S&P 500® Index, Expires 9/30/2019, Strike Price $3,496.73 | 318 | 93,677,394 | 17,109,036 | |||||||||
SPX S&P 500® Index, Expires 9/30/2019, Strike Price $2,913.94 | 318 | 93,677,394 | 2,599,968 | |||||||||
XSP S&P 500® Mini Index, Expires 9/30/2019, Strike Price $349.67 | 159 | 4,683,822 | 855,420 | |||||||||
XSP S&P 500® Mini Index, Expires 9/30/2019, Strike Price $291.39 | 159 | 4,683,822 | 129,903 | |||||||||
| 20,694,327 | ||||||||||||
TOTAL PURCHASED OPTIONS (Cost $97,600,395) | 100,332,657 | |||||||||||
SHORT TERM INVESTMENTS - 0.00% (b) | Shares | |||||||||||
MONEY MARKET FUNDS - 0.00% (b) | ||||||||||||
Fidelity Government Portfolio - Class I, 2.30% (c) | 100 | 100 | ||||||||||
Fidelity Investments Money Market Funds - Treasury Portfolio - Class I, 2.30% (c) | 100 | 100 | ||||||||||
First American Government Obligations Fund - Class X, 2.35% (c) | 100 | 100 | ||||||||||
First American Treasury Obligations Fund - Class X, 2.35% (c) | 705 | 705 | ||||||||||
Morgan Stanley Institutional Liquidity Funds - Treasury Portfolio - Class I, 2.30% (c) | 100 | 100 | ||||||||||
STIT - Treasury Portfolio - Class I, 2.31% (c) | 100 | 100 | ||||||||||
Wells Fargo Treasury Plus Money Market Fund - Class I, 2.29% (c) | 100 | 100 | ||||||||||
TOTAL SHORT TERM INVESTMENTS (Cost $1,305) | 1,305 | |||||||||||
Total Investments (Cost $97,601,700) - 93.57% | 100,333,962 | |||||||||||
Other Assets in Excess of Liabilities - 6.43% | 6,892,941 | |||||||||||
TOTAL NET ASSETS - 100.00% | $ | 107,226,903 | ||||||||||
Percentages are stated as a percent of net assets.
The accompanying notes are an integral part of these financial statements.
INNOVATOR S&P 500® POWER BUFFER ETF – OCTOBER
Schedule of Investments
April 30, 2019 (Unaudited) (Continued)
Asset Type | % of Net Assets | |||
Purchased Options | 93.57 | % | ||
Short Term Investments | 0.00 | (b) | ||
Total Investments | 93.57 | |||
Other Assets in Excess of Liabilities | 6.43 | |||
Net Assets | 100.00 | % | ||
(a) Exchange-Traded.
(b) Less than 0.05%.
(c) Represents annualized seven-day yield as of the end of the reporting period.
Schedule of Options Written (a)
April 30, 2019 (Unaudited)
Description | Expiration | Strike Price | Contracts | Notional Amount | Value | |||||||||||||
Call Options | ||||||||||||||||||
SPX S&P 500® Index | 9/30/2019 | $ | 3,496.73 | 318 | $ | (93,677,394 | ) | $ | (35,616 | ) | ||||||||
SPX S&P 500® Index | 9/30/2019 | 3,205.33 | 318 | (93,677,394 | ) | (292,878 | ) | |||||||||||
XSP S&P 500® Mini Index | 9/30/2019 | 349.67 | 159 | (4,683,822 | ) | (1,749 | ) | |||||||||||
XSP S&P 500® Mini Index | 9/30/2019 | 320.53 | 159 | (4,683,822 | ) | (14,628 | ) | |||||||||||
| (344,871 | ) | |||||||||||||||||
Put Options | ||||||||||||||||||
SPX S&P 500® Index | 9/30/2019 | 2,476.85 | 318 | (93,677,394 | ) | (590,526 | ) | |||||||||||
SPX S&P 500® Index | 9/30/2019 | 1,748.36 | 636 | (187,354,788 | ) | (43,884 | ) | |||||||||||
XSP S&P 500® Mini Index | 9/30/2019 | 247.68 | 159 | (4,683,822 | ) | (29,574 | ) | |||||||||||
XSP S&P 500® Mini Index | 9/30/2019 | 174.84 | 318 | (9,367,644 | ) | (2,226 | ) | |||||||||||
| (666,210 | ) | |||||||||||||||||
Total Options Written (Premiums Received $3,185,809) | $ | (1,011,081 | ) | |||||||||||||||
(a) Exchange-Traded.
The accompanying notes are an integral part of these financial statements.
INNOVATOR S&P 500® ULTRA BUFFER ETF – JANUARY
Schedule of Investments
April 30, 2019 (Unaudited)
Contracts | Notional Amount | Value | ||||||||||
PURCHASED OPTIONS - 112.88% (a) | ||||||||||||
CALL OPTIONS - 106.53% | ||||||||||||
SPX S&P 500® Index, Expires 12/31/2019, Strike Price $1,504.15 | 220 | $ | 64,808,260 | $ | 31,546,179 | |||||||
XSP S&P 500® Mini Index, Expires 12/31/2019, Strike Price $150.42 | 550 | 16,201,900 | 7,886,275 | |||||||||
| 39,432,454 | ||||||||||||
PUT OPTIONS - 6.35% | ||||||||||||
SPX S&P 500® Index, Expires 12/31/2019, Strike Price $3,008.30 | 110 | 32,404,130 | 1,594,241 | |||||||||
SPX S&P 500® Index, Expires 12/31/2019, Strike Price $2,381.56 | 110 | 32,404,130 | 284,691 | |||||||||
XSP S&P 500® Mini Index, Expires 12/31/2019, Strike Price $300.85 | 275 | 8,100,950 | 398,792 | |||||||||
XSP S&P 500® Mini Index, Expires 12/31/2019, Strike Price $238.16 | 275 | 8,100,950 | 71,181 | |||||||||
| 2,348,905 | ||||||||||||
TOTAL PURCHASED OPTIONS (Cost $35,691,937) | 41,781,359 | |||||||||||
SHORT TERM INVESTMENTS - 0.00% (b) | Shares | |||||||||||
MONEY MARKET FUNDS - 0.00% (b) | ||||||||||||
Fidelity Government Portfolio - Class I, 2.30% (c) | 100 | 100 | ||||||||||
Fidelity Investments Money Market Funds - Treasury Portfolio - Class I, 2.30% (c) | 100 | 100 | ||||||||||
First American Government Obligations Fund - Class X, 2.35% (c) | 100 | 100 | ||||||||||
First American Treasury Obligations Fund - Class X, 2.35% (c) | 100 | 100 | ||||||||||
Morgan Stanley Institutional Liquidity Funds - Treasury Portfolio - Class I, 2.30% (c) | 100 | 100 | ||||||||||
STIT - Treasury Portfolio - Class I, 2.31% (c) | 100 | 100 | ||||||||||
Wells Fargo Treasury Plus Money Market Fund - Class I, 2.29% (c) | 100 | 100 | ||||||||||
TOTAL SHORT TERM INVESTMENTS (Cost $700) | 700 | |||||||||||
Total Investments (Cost $35,692,637) - 112.88% | 41,782,059 | |||||||||||
Liabilities in Excess of Other Assets - (12.88)% | (4,766,348 | ) | ||||||||||
TOTAL NET ASSETS - 100.00% | $ | 37,015,711 | ||||||||||
Percentages are stated as a percent of net assets.
The accompanying notes are an integral part of these financial statements.
INNOVATOR S&P 500® ULTRA BUFFER ETF – JANUARY
Schedule of Investments
April 30, 2019 (Unaudited) (Continued)
Asset Type | % of Net Assets | |||
Purchased Options | 112.88 | % | ||
Short Term Investments | 0.00 | (b) | ||
Total Investments | 112.88 | |||
Liabilities in Excess of Other Assets | (12.88 | ) | ||
Net Assets | 100.00 | % | ||
(a) Exchange-Traded.
(b) Less than 0.05%.
(c) Represents annualized seven-day yield as of the end of the reporting period.
Schedule of Options Written (a)
April 30, 2019 (Unaudited)
Description | Expiration | Strike Price | Contracts | Notional Amount | Value | |||||||||||||
Call Options | ||||||||||||||||||
SPX S&P 500® Index | 12/31/2019 | $ | 3,008.30 | 110 | $ | (32,404,130 | ) | $ | (1,105,230 | ) | ||||||||
SPX S&P 500® Index | 12/31/2019 | 2,807.73 | 110 | (32,404,130 | ) | (2,597,823 | ) | |||||||||||
XSP S&P 500® Mini Index | 12/31/2019 | 300.85 | 275 | (8,100,950 | ) | (275,998 | ) | |||||||||||
XSP S&P 500® Mini Index | 12/31/2019 | 280.77 | 275 | (8,100,950 | ) | (649,518 | ) | |||||||||||
| (4,628,569 | ) | |||||||||||||||||
Put Options | ||||||||||||||||||
SPX S&P 500® Index | 12/31/2019 | 1,629.49 | 110 | (32,404,130 | ) | (29,018 | ) | |||||||||||
SPX S&P 500® Index | 12/31/2019 | 1,504.15 | 220 | (64,808,260 | ) | (39,939 | ) | |||||||||||
XSP S&P 500® Mini Index | 12/31/2019 | 162.95 | 275 | (8,100,950 | ) | (7,255 | ) | |||||||||||
XSP S&P 500® Mini Index | 12/31/2019 | 150.42 | 550 | (16,201,900 | ) | (9,986 | ) | |||||||||||
| (86,198 | ) | |||||||||||||||||
Total Options Written (Premiums Received $1,762,801) | $ | (4,714,767 | ) | |||||||||||||||
(a) Exchange-Traded.
The accompanying notes are an integral part of these financial statements.
INNOVATOR S&P 500® ULTRA BUFFER ETF – APRIL
Schedule of Investments
April 30, 2019 (Unaudited)
|
| Contracts |
|
| Notional Amount |
|
| Value |
| |||
PURCHASED OPTIONS - 103.47% (a) |
|
|
|
|
|
|
|
|
|
|
|
|
CALL OPTIONS - 85.63% |
|
|
|
|
|
|
|
|
|
|
|
|
SPX S&P 500® Index, Expires 3/31/2020, Strike Price $1,700.64 |
|
| 100 |
|
| $ | 29,458,300 |
|
| $ | 12,437,391 |
|
XSP S&P 500® Mini Index, Expires 3/31/2020, Strike Price $170.07 |
|
| 100 |
|
|
| 2,945,800 |
|
|
| 1,243,682 |
|
|
|
|
|
|
|
|
|
|
|
| 13,681,073 |
|
PUT OPTIONS - 17.84% |
|
|
|
|
|
|
|
|
|
|
|
|
SPX S&P 500® Index, Expires 3/31/2020, Strike Price $3,401.29 |
|
| 50 |
|
|
| 14,729,150 |
|
|
| 2,174,338 |
|
SPX S&P 500® Index, Expires 3/31/2020, Strike Price $2,692.67 |
|
| 50 |
|
|
| 14,729,150 |
|
|
| 416,984 |
|
XSP S&P 500® Mini Index, Expires 3/31/2020, Strike Price $340.15 |
|
| 50 |
|
|
| 1,472,900 |
|
|
| 217,529 |
|
XSP S&P 500® Mini Index, Expires 3/31/2020, Strike Price $269.27 |
|
| 50 |
|
|
| 1,472,900 |
|
|
| 41,701 |
|
|
|
|
|
|
|
|
|
|
|
| 2,850,552 |
|
TOTAL PURCHASED OPTIONS (Cost $16,163,678) |
|
|
|
|
|
|
|
|
|
| 16,531,625 |
|
|
|
|
|
|
|
|
|
|
|
|
|
|
SHORT TERM INVESTMENTS - 0.00% (b) |
| Shares |
|
|
|
|
|
|
|
|
| |
MONEY MARKET FUNDS - 0.00% (b) |
|
|
|
|
|
|
|
|
|
|
|
|
First American Treasury Obligations Fund - Class X, 2.35% (c) |
|
| 3 |
|
|
|
|
|
|
| 3 |
|
TOTAL SHORT TERM INVESTMENTS (Cost $3) |
|
|
|
|
|
|
|
|
|
| 3 |
|
|
|
|
|
|
|
|
|
|
|
|
|
|
Total Investments (Cost $16,163,681) - 103.47% |
|
|
|
|
|
|
|
|
|
| 16,531,628 |
|
Liabilities in Excess of Other Assets - (3.47)% |
|
|
|
|
|
|
|
|
|
| (555,385 | ) |
TOTAL NET ASSETS - 100.00% |
|
|
|
|
|
|
|
|
| $ | 15,976,243 |
|
Percentages are stated as a percent of net assets.
Asset Type | % of Net Assets | |||
Purchased Options | 103.47 | % | ||
Short Term Investments | 0.00 | (b) | ||
Total Investments | 103.47 | |||
Liabilities in Excess of Other Assets | (3.47 | ) | ||
Net Assets | 100.00 | % | ||
(a) Exchange-Traded.
(b) Less than 0.05%.
(c) Represents annualized seven-day yield as of the end of the reporting period.
The accompanying notes are an integral part of these financial statements.
INNOVATOR S&P 500® ULTRA BUFFER ETF – APRIL
Schedule of Options Written (a)
April 30, 2019 (Unaudited)
Description | Expiration | Strike Price | Contracts | Notional Amount | Value | |||||||||||||
Call Options | ||||||||||||||||||
SPX S&P 500® Index | 3/31/2020 | $ | 3,401.29 | 50 | $ | (14,729,150 | ) | $ | (57,784 | ) | ||||||||
SPX S&P 500® Index | 3/31/2020 | 3,133.90 | 50 | (14,729,150 | ) | (346,055 | ) | |||||||||||
XSP S&P 500® Mini Index | 3/31/2020 | 340.15 | 50 | (1,472,900 | ) | (5,771 | ) | |||||||||||
XSP S&P 500® Mini Index | 3/31/2020 | 313.39 | 50 | (1,472,900 | ) | (34,605 | ) | |||||||||||
| (444,215 | ) | |||||||||||||||||
Put Options | ||||||||||||||||||
SPX S&P 500® Index | 3/31/2020 | 1,842.35 | 50 | (14,729,150 | ) | (47,217 | ) | |||||||||||
SPX S&P 500® Index | 3/31/2020 | 1,700.64 | 100 | (29,458,300 | ) | (62,122 | ) | |||||||||||
XSP S&P 500® Mini Index | 3/31/2020 | 184.24 | 50 | (1,472,900 | ) | (4,722 | ) | |||||||||||
XSP S&P 500® Mini Index | 3/31/2020 | 170.07 | 100 | (2,945,800 | ) | (6,213 | ) | |||||||||||
| (120,274 | ) | |||||||||||||||||
Total Options Written (Premiums Received $455,960) | $ | (564,489 | ) | |||||||||||||||
(a) Exchange-Traded.
The accompanying notes are an integral part of these financial statements.
INNOVATOR S&P 500® ULTRA BUFFER ETF – JULY
Schedule of Investments
April 30, 2019 (Unaudited)
Contracts | Notional Amount | Value | ||||||||||
PURCHASED OPTIONS - 97.24% (a) | ||||||||||||
CALL OPTIONS - 80.97% | ||||||||||||
SPX S&P 500® Index, Expires 6/28/2019, Strike Price $1,715.09 | 360 | $ | 106,049,880 | $ | 44,229,240 | |||||||
XSP S&P 500® Mini Index, Expires 6/28/2019, Strike Price $171.52 | 360 | 10,604,880 | 4,420,800 | |||||||||
| 48,650,040 | ||||||||||||
PUT OPTIONS - 16.27% | ||||||||||||
SPX S&P 500® Index, Expires 6/28/2019, Strike Price $3,430.17 | 180 | 53,024,940 | 8,643,960 | |||||||||
SPX S&P 500® Index, Expires 6/28/2019, Strike Price $2,715.54 | 180 | 53,024,940 | 242,820 | |||||||||
XSP S&P 500® Mini Index, Expires 6/28/2019, Strike Price $343.04 | 180 | 5,302,440 | 864,720 | |||||||||
XSP S&P 500® Mini Index, Expires 6/28/2019, Strike Price $271.55 | 180 | 5,302,440 | 24,300 | |||||||||
| 9,775,800 | ||||||||||||
TOTAL PURCHASED OPTIONS (Cost $54,052,548) | 58,425,840 | |||||||||||
SHORT TERM INVESTMENTS - 0.00% (b) | Shares | |||||||||||
MONEY MARKET FUNDS - 0.00% (b) | ||||||||||||
Fidelity Government Portfolio - Class I, 2.30% (c) | 100 | 100 | ||||||||||
Fidelity Investments Money Market Funds - Treasury Portfolio - Class I, 2.30% (c) | 100 | 100 | ||||||||||
First American Government Obligations Fund - Class X, 2.35% (c) | 100 | 100 | ||||||||||
First American Treasury Obligations Fund - Class X, 2.35% (c) | 100 | 100 | ||||||||||
Morgan Stanley Institutional Liquidity Funds - Treasury Portfolio - Class I, 2.30% (c) | 100 | 100 | ||||||||||
STIT - Treasury Portfolio - Class I, 2.31% (c) | 100 | 100 | ||||||||||
Wells Fargo Treasury Plus Money Market Fund - Class I, 2.29% (c) | 100 | 100 | ||||||||||
TOTAL SHORT TERM INVESTMENTS (Cost $700) | 700 | |||||||||||
Total Investments (Cost $54,053,248) - 97.24% | 58,426,540 | |||||||||||
Other Assets in Excess of Liabilities - 2.76% | 1,658,424 | |||||||||||
TOTAL NET ASSETS - 100.00% | $ | 60,084,964 | ||||||||||
Percentages are stated as a percent of net assets.
The accompanying notes are an integral part of these financial statements.
INNOVATOR S&P 500® ULTRA BUFFER ETF – JULY
Schedule of Investments
April 30, 2019 (Unaudited) (Continued)
Asset Type | % of Net Assets | ||
Purchased Options | 97.24 | % | |
Short Term Investments | 0.00 | (b) | |
Total Investments | 97.24 | ||
Other Assets in Excess of Liabilities | 2.76 | ||
Net Assets | 100.00 | % | |
(a) Exchange-Traded.
(b) Less than 0.05%.
(c) Represents annualized seven-day yield as of the end of the reporting period.
Schedule of Options Written (a)
April 30, 2019 (Unaudited)
Description | Expiration | Strike Price | Contracts | Notional Amount | Value | |||||||||||||
Call Options | ||||||||||||||||||
SPX S&P 500® Index | 6/28/2019 | $ | 3,430.17 | 180 | $ | (53,024,940 | ) | $ | (900 | ) | ||||||||
SPX S&P 500® Index | 6/28/2019 | 3,109.15 | 180 | (53,024,940 | ) | (60,480 | ) | |||||||||||
XSP S&P 500® Mini Index | 6/28/2019 | 343.04 | 180 | (5,302,440 | ) | (900 | ) | |||||||||||
XSP S&P 500® Mini Index | 6/28/2019 | 310.91 | 180 | (5,302,440 | ) | (6,120 | ) | |||||||||||
| (68,400 | ) | |||||||||||||||||
Put Options | ||||||||||||||||||
SPX S&P 500® Index | 6/28/2019 | 1,858.00 | 180 | (53,024,940 | ) | (2,700 | ) | |||||||||||
SPX S&P 500® Index | 6/28/2019 | 1,715.09 | 360 | (106,049,880 | ) | (1,800 | ) | |||||||||||
XSP S&P 500® Mini Index | 6/28/2019 | 185.80 | 180 | (5,302,440 | ) | (900 | ) | |||||||||||
XSP S&P 500® Mini Index | 6/28/2019 | 171.52 | 360 | (10,604,880 | ) | (1,800 | ) | |||||||||||
| (7,200 | ) | |||||||||||||||||
Total Options Written (Premiums Received $690,272) | $ | (75,600 | ) | |||||||||||||||
(a) Exchange-Traded.
The accompanying notes are an integral part of these financial statements.
INNOVATOR S&P 500® ULTRA BUFFER ETF – OCTOBER
Schedule of Investments
April 30, 2019 (Unaudited)
Contracts | Notional Amount | Value | ||||||||||
PURCHASED OPTIONS - 100.75% (a) | ||||||||||||
CALL OPTIONS - 81.00% | ||||||||||||
SPX S&P 500® Index, Expires 9/30/2019, Strike Price $1,748.37 | 584 | $ | 172,036,472 | $ | 69,926,150 | |||||||
XSP S&P 500® Mini Index, Expires 9/30/2019, Strike Price $174.85 | 292 | 8,601,736 | 3,495,931 | |||||||||
| 73,422,081 | ||||||||||||
PUT OPTIONS - 19.75% | ||||||||||||
SPX S&P 500® Index, Expires 9/30/2019, Strike Price $3,496.75 | 292 | 86,018,236 | 15,619,329 | |||||||||
SPX S&P 500® Index, Expires 9/30/2019, Strike Price $2,768.24 | 292 | 86,018,236 | 1,426,461 | |||||||||
XSP S&P 500® Mini Index, Expires 9/30/2019, Strike Price $349.69 | 146 | 4,300,868 | 781,182 | |||||||||
XSP S&P 500® Mini Index, Expires 9/30/2019, Strike Price $276.82 | 146 | 4,300,868 | 71,313 | |||||||||
| 17,898,285 | ||||||||||||
TOTAL PURCHASED OPTIONS (Cost $85,707,381) | 91,320,366 | |||||||||||
SHORT TERM INVESTMENTS - 0.00% (b) | Shares | |||||||||||
MONEY MARKET FUNDS - 0.00% (b) | ||||||||||||
Fidelity Government Portfolio - Class I, 2.30% (c) | 100 | 100 | ||||||||||
Fidelity Investments Money Market Funds - Treasury Portfolio - Class I, 2.30% (c) | 100 | 100 | ||||||||||
First American Government Obligations Fund - Class X, 2.35% (c) | 100 | 100 | ||||||||||
First American Treasury Obligations Fund - Class X, 2.35% (c) | 97 | 97 | ||||||||||
Morgan Stanley Institutional Liquidity Funds - Treasury Portfolio - Class I, 2.30% (c) | 100 | 100 | ||||||||||
STIT - Treasury Portfolio - Class I, 2.31% (c) | 100 | 100 | ||||||||||
Wells Fargo Treasury Plus Money Market Fund - Class I, 2.29% (c) | 100 | 100 | ||||||||||
TOTAL SHORT TERM INVESTMENTS (Cost $697) | 697 | |||||||||||
Total Investments (Cost $85,708,078) - 100.75% | 91,321,063 | |||||||||||
Liabilities in Excess of Other Assets - (0.75)% | (683,584 | ) | ||||||||||
TOTAL NET ASSETS - 100.00% | $ | 90,637,479 | ||||||||||
Percentages are stated as a percent of net assets.
The accompanying notes are an integral part of these financial statements.
INNOVATOR S&P 500® ULTRA BUFFER ETF – OCTOBER
Schedule of Investments
April 30, 2019 (Unaudited) (Continued)
Asset Type | % of Net Assets | |||
Purchased Options | 100.75 | % | ||
Short Term Investments | 0.00 | (b) | ||
Total Investments | 100.75 | |||
Liabilities in Excess of Other Assets | (0.75 | ) | ||
Net Assets | 100.00 | % | ||
(a) Exchange-Traded.
(b) Less than 0.05%.
(c) Represents annualized seven-day yield as of the end of the reporting period.
Schedule of Options Written (a)
April 30, 2019 (Unaudited)
Description | Expiration | Strike Price | Contracts | Notional Amount | Value | |||||||||||||
Call Options | ||||||||||||||||||
SPX S&P 500® Index | 9/30/2019 | $ | 3,496.75 | 292 | $ | (86,018,236 | ) | $ | (29,762 | ) | ||||||||
SPX S&P 500® Index | 9/30/2019 | 3,205.04 | 292 | (86,018,236 | ) | (256,069 | ) | |||||||||||
XSP S&P 500® Mini Index | 9/30/2019 | 349.69 | 146 | (4,300,868 | ) | (1,487 | ) | |||||||||||
XSP S&P 500® Mini Index | 9/30/2019 | 320.50 | 146 | (4,300,868 | ) | (12,809 | ) | |||||||||||
| (300,127 | ) | |||||||||||||||||
Put Options | ||||||||||||||||||
SPX S&P 500® Index | 9/30/2019 | 1,849.06 | 292 | (86,018,236 | ) | (83,883 | ) | |||||||||||
SPX S&P 500® Index | 9/30/2019 | 1,748.37 | 584 | (172,036,472 | ) | (106,061 | ) | |||||||||||
XSP S&P 500® Mini Index | 9/30/2019 | 189.41 | 146 | (4,300,868 | ) | (4,195 | ) | |||||||||||
XSP S&P 500® Mini Index | 9/30/2019 | 174.85 | 292 | (8,601,736 | ) | (5,305 | ) | |||||||||||
| (199,444 | ) | |||||||||||||||||
Total Options Written (Premiums Received $2,021,523) | $ | (499,571 | ) | |||||||||||||||
(a) Exchange-Traded.
The accompanying notes are an integral part of these financial statements.
INNOVATOR ETFs TRUST
Statements of Assets and Liabilities
April 30, 2019 (Unaudited)
Innovator S&P 500® Buffer ETF - January | ||||
Assets: | ||||
Investments, at value (a) | $ | 25,160,536 | ||
Deposit at broker for options | – | |||
Interest and other receivables | 5 | |||
Receivable for investments sold | – | |||
Receivable for fund shares sold | – | |||
Total Assets | 25,160,541 | |||
Liabilities: | ||||
Payable for investments purchased | – | |||
Payable to Adviser | 16,408 | |||
Other liabilities | 22 | |||
Due to broker for options | 12,621 | |||
Options written, at value (b) | 1,600,440 | |||
Total Liabilities | 1,629,491 | |||
Net Assets | $ | 23,531,050 | ||
Net Assets Consist of: | ||||
Capital stock | $ | 20,563,315 | ||
Total distributable earnings/(accumulated deficit) | 2,967,735 | |||
Net Assets | $ | 23,531,050 | ||
Total Fund: | ||||
Net Assets | $ | 23,531,050 | ||
Shares of beneficial interest outstanding (unlimited shares authorized) | 825,000 | |||
Net asset value price per share | $ | 28.52 | ||
(a) Cost of investments | $ | 21,438,841 | ||
(b) Premiums received | 1,465,246 | |||
The accompanying notes are an integral part of these financial statements.
INNOVATOR ETFs TRUST
Innovator S&P 500® Buffer ETF - April | Innovator S&P 500® Buffer ETF - July | Innovator S&P 500® Buffer ETF - October | ||||||||
| $ | 30,738,201 | $ | 17,669,448 | $ | 37,308,448 | |||||
| 34,259 | 3,853,206 | – | ||||||||
| 38 | 976 | – | ||||||||
| – | 12,515 | – | ||||||||
| – | 1,961,590 | – | ||||||||
| 30,772,498 | 23,497,735 | 37,308,448 | ||||||||
| – | 3,923,905 | – | ||||||||
| 14,824 | 6,604 | 16,885 | ||||||||
| 30 | 72 | 101 | ||||||||
| – | – | 60,467 | ||||||||
| 1,088,583 | 56,862 | 492,161 | ||||||||
| 1,103,437 | 3,987,443 | 569,614 | ||||||||
| $ | 29,669,061 | $ | 19,510,292 | $ | 36,738,834 | |||||
| $ | 29,057,984 | $ | 19,199,673 | $ | 35,355,230 | |||||
| 611,077 | 310,619 | 1,383,604 | ||||||||
| $ | 29,669,061 | $ | 19,510,292 | $ | 36,738,834 | |||||
| $ | 29,669,061 | $ | 19,510,292 | $ | 36,738,834 | |||||
| 1,150,000 | 750,000 | 1,475,000 | ||||||||
| $ | 25.80 | $ | 26.01 | $ | 24.91 | |||||
| $ | 30,204,248 | $ | 17,477,425 | $ | 34,415,575 | |||||
| 1,180,497 | 266,780 | 2,041,087 | ||||||||
The accompanying notes are an integral part of these financial statements.
INNOVATOR ETFs TRUST
Statements of Assets and Liabilities
April 30, 2019 (Unaudited)
Innovator S&P 500® Power Buffer ETF - January | ||||
Assets: | ||||
Investments, at value (a) | $ | 86,033,363 | ||
Deposit at broker for options | – | |||
Interest and other receivables | 14 | |||
Receivable for fund shares sold | 682,230 | |||
Total Assets | 86,715,607 | |||
Liabilities: | ||||
Payable for investments purchased | – | |||
Payable to Adviser | 50,853 | |||
Other liabilities | 42 | |||
Due to broker for options | 33,999 | |||
Options written, at value (b) | 8,856,488 | |||
Total Liabilities | 8,941,382 | |||
Net Assets | $ | 77,774,225 | ||
Net Assets Consist of: | ||||
Capital stock | $ | 71,292,204 | ||
Total distributable earnings/(accumulated deficit) | 6,482,021 | |||
Net Assets | $ | 77,774,225 | ||
Total Fund: | ||||
Net Assets | $ | 77,774,225 | ||
Shares of beneficial interest outstanding (unlimited shares authorized) | 2,850,000 | |||
Net asset value price per share | $ | 27.29 | ||
(a) Cost of investments | $ | 73,354,836 | ||
(b) Premiums received | 5,298,121 | |||
The accompanying notes are an integral part of these financial statements.
INNOVATOR ETFs TRUST
Innovator S&P 500® Power Buffer ETF - April | Innovator S&P 500® Power Buffer ETF - July | Innovator S&P 500® Power Buffer ETF - October | ||||||||
| $ | 102,259,375 | $ | 31,982,738 | $ | 100,333,962 | |||||
| 89,227 | 553,405 | – | ||||||||
| 103 | 2 | 3 | ||||||||
| – | – | 8,104,362 | ||||||||
| 102,348,705 | 32,536,145 | 108,438,327 | ||||||||
| – | 650,266 | – | ||||||||
| 52,370 | 19,566 | 47,613 | ||||||||
| 181 | 233 | 282 | ||||||||
| – | – | 152,448 | ||||||||
| 4,554,333 | 102,499 | 1,011,081 | ||||||||
| 4,606,884 | 772,564 | 1,211,424 | ||||||||
| $ | 97,741,821 | $ | 31,763,581 | $ | 107,226,903 | |||||
| $ | 96,293,243 | $ | 30,796,463 | $ | 103,859,028 | |||||
| 1,448,578 | 967,118 | 3,367,875 | ||||||||
| $ | 97,741,821 | $ | 31,763,581 | $ | 107,226,903 | |||||
| $ | 97,741,821 | $ | 31,763,581 | $ | 107,226,903 | |||||
| 3,825,000 | 1,225,000 | 4,300,000 | ||||||||
| $ | 25.55 | $ | 25.93 | $ | 24.94 | |||||
| $ | 100,387,808 | $ | 31,270,914 | $ | 97,601,700 | |||||
| 4,183,812 | 414,621 | 3,185,809 | ||||||||
The accompanying notes are an integral part of these financial statements.
INNOVATOR ETFs TRUST
Statements of Assets and Liabilities
April 30, 2019 (Unaudited)
Innovator S&P 500® Ultra Buffer ETF - January | ||||
Assets: | ||||
Investments, at value (a) | $ | 41,782,059 | ||
Deposit at broker for options | – | |||
Interest and other receivables | 2 | |||
Receivable for fund shares sold | – | |||
Total Assets | 41,782,061 | |||
Liabilities: | ||||
Payable to Adviser | 25,141 | |||
Other liabilities | 45 | |||
Due to broker for options | 26,397 | |||
Options written, at value (b) | 4,714,767 | |||
Total Liabilities | 4,766,350 | |||
Net Assets | $ | 37,015,711 | ||
Net Assets Consist of: | ||||
Capital stock | $ | 34,394,397 | ||
Total distributable earnings/(accumulated deficit) | 2,621,314 | |||
Net Assets | $ | 37,015,711 | ||
Total Fund: | ||||
Net Assets | $ | 37,015,711 | ||
Shares of beneficial interest outstanding (unlimited shares authorized) | 1,375,000 | |||
Net asset value price per share | $ | 26.92 | ||
(a) Cost of investments | $ | 35,692,637 | ||
(b) Premiums received | 1,762,801 | |||
The accompanying notes are an integral part of these financial statements.
INNOVATOR ETFs TRUST
Innovator S&P 500® Ultra Buffer ETF - April | Innovator S&P 500® Ultra Buffer ETF - July | Innovator S&P 500® Ultra Buffer ETF - October | ||||||||
| $ | 16,531,628 | $ | 58,426,540 | $ | 91,321,063 | |||||
| 17,570 | – | – | ||||||||
| 120 | 1 | 1 | ||||||||
| – | 1,938,225 | – | ||||||||
| 16,549,318 | 60,364,766 | 91,321,064 | ||||||||
| 8,586 | 37,019 | 54,577 | ||||||||
| – | 380 | 248 | ||||||||
| – | 166,803 | 129,189 | ||||||||
| 564,489 | 75,600 | 499,571 | ||||||||
| 573,075 | 279,802 | 683,585 | ||||||||
| $ | 15,976,243 | $ | 60,084,964 | $ | 90,637,479 | |||||
| $ | 15,725,294 | $ | 56,563,757 | $ | 86,155,422 | |||||
| 250,949 | 3,521,207 | 4,482,057 | ||||||||
| $ | 15,976,243 | $ | 60,084,964 | $ | 90,637,479 | |||||
| $ | 15,976,243 | $ | 60,084,964 | $ | 90,637,479 | |||||
| 625,000 | 2,325,000 | 3,650,000 | ||||||||
| $ | 25.56 | $ | 25.84 | $ | 24.83 | |||||
| $ | 16,163,681 | $ | 54,053,248 | $ | 85,708,078 | |||||
| 455,960 | 690,272 | 2,021,523 | ||||||||
The accompanying notes are an integral part of these financial statements.
INNOVATOR ETFs TRUST
Statements of Operations
Period Ended April 30, 2019 (Unaudited)
Innovator S&P 500® Buffer ETF - January (a) | ||||
Investment Income: | ||||
Interest | $ | 62 | ||
Total Investment Income | 62 | |||
Expenses: | ||||
Investment advisory fee | 60,284 | |||
Broker interest | 22 | |||
Expenses | 60,306 | |||
Net Investment Income/(Loss) | (60,244 | ) | ||
Realized and Unrealized Gain/(Loss): | ||||
Net realized gain/(loss) on: | ||||
Investments | (424,495 | ) | ||
Options written | (134,027 | ) | ||
Net change in unrealized appreciation/(depreciation) on: | ||||
Investments | 3,721,695 | |||
Options written | (135,194 | ) | ||
Net Realized and Unrealized Gain/(Loss) on Investments and Options Written | 3,027,979 | |||
Net Increase/(Decrease) in Net Assets Resulting from Operations | $ | 2,967,735 | ||
(a) Since Commencement of Operations on December 31, 2018. |
(b) Since Commencement of Operations on March 29, 2019. |
The accompanying notes are an integral part of these financial statements.
INNOVATOR ETFs TRUST
Innovator S&P 500® Buffer ETF - April (b) | Innovator S&P 500® Buffer ETF - July | Innovator S&P 500® Buffer ETF - October | ||||||||
| $ | 34 | $ | 8 | $ | 64 | |||||
| 34 | 8 | 64 | ||||||||
| 14,824 | 21,154 | 90,861 | ||||||||
| – | 352 | 174 | ||||||||
| 14,824 | 21,506 | 91,035 | ||||||||
| (14,790 | ) | (21,498 | ) | (90,971 | ) | |||||
| – | (54,354 | ) | (2,598,462 | ) | ||||||
| – | (2,051 | ) | (362,900 | ) | ||||||
| 533,953 | 237,577 | 2,883,281 | ||||||||
| 91,914 | 267,814 | 1,664,053 | ||||||||
| 625,867 | 448,986 | 1,585,972 | ||||||||
| $ | 611,077 | $ | 427,488 | $ | 1,495,001 | |||||
The accompanying notes are an integral part of these financial statements.
INNOVATOR ETFs TRUST
Statements of Operations
Period Ended April 30, 2019 (Unaudited)
Innovator S&P 500® Power Buffer ETF - January (a) | ||||
Investment Income: | ||||
Interest | $ | 269 | ||
Total Investment Income | 269 | |||
Expenses: | ||||
Investment advisory fee | 201,074 | |||
Broker interest | 42 | |||
Expenses | 201,116 | |||
Net Investment Income/(Loss) | (200,847 | ) | ||
Realized and Unrealized Gain/(Loss): | ||||
Net realized gain/(loss) on: | ||||
Investments | (1,542,809 | ) | ||
Options written | (894,483 | ) | ||
Net change in unrealized appreciation/(depreciation) on: | ||||
Investments | 12,678,527 | |||
Options written | (3,558,367 | ) | ||
Net Realized and Unrealized Gain/(Loss) on Investments and Options Written | 6,682,868 | |||
Net Increase/(Decrease) in Net Assets Resulting from Operations | $ | 6,482,021 | ||
(a) Since Commencement of Operations on December 31, 2018. |
(b) Since Commencement of Operations on March 29, 2019. |
The accompanying notes are an integral part of these financial statements.
INNOVATOR ETFs TRUST
Innovator S&P 500® Power Buffer ETF - April (b) | Innovator S&P 500® Power Buffer ETF - July | Innovator S&P 500® Power Buffer ETF - October | ||||||||
| $ | 83 | $ | 7 | $ | 67 | |||||
| 83 | 7 | 67 | ||||||||
| 52,370 | 50,555 | 141,242 | ||||||||
| 181 | 492 | 421 | ||||||||
| 52,551 | 51,047 | 141,663 | ||||||||
| (52,468 | ) | (51,040 | ) | (141,596 | ) | |||||
| – | – | (1,403,714 | ) | |||||||
| – | – | 10,422 | ||||||||
| 1,871,567 | 764,960 | 2,924,892 | ||||||||
| (370,521 | ) | 331,891 | 2,196,975 | |||||||
| 1,501,046 | 1,096,851 | 3,728,575 | ||||||||
| $ | 1,448,578 | $ | 1,045,811 | $ | 3,586,979 | |||||
The accompanying notes are an integral part of these financial statements.
INNOVATOR ETFs TRUST
Statements of Operations
Period Ended April 30, 2019 (Unaudited)
Innovator S&P 500® Ultra Buffer ETF - January (a) | ||||
Investment Income: | ||||
Interest | $ | 79 | ||
Total Investment Income | 79 | |||
Expenses: | ||||
Investment advisory fee | 87,736 | |||
Broker interest | 45 | |||
Expenses | 87,781 | |||
Net Investment Income/(Loss) | (87,702 | ) | ||
Realized and Unrealized Gain/(Loss): | ||||
Net realized gain/(loss) on: | ||||
Investments | (246,835 | ) | ||
Options written | (181,605 | ) | ||
Net change in unrealized appreciation/(depreciation) on: | ||||
Investments | 6,089,422 | |||
Options written | (2,951,966 | ) | ||
Net Realized and Unrealized Gain/(Loss) on Investments and Options Written | 2,709,016 | |||
Net Increase/(Decrease) in Net Assets Resulting from Operations | $ | 2,621,314 | ||
(a) Since Commencement of Operations on December 31, 2018. |
(b) Since Commencement of Operations on March 29, 2019. |
The accompanying notes are an integral part of these financial statements.
INNOVATOR ETFs TRUST
Innovator S&P 500® Ultra Buffer ETF - April (b) | Innovator S&P 500® Ultra Buffer ETF - July | Innovator S&P 500® Ultra Buffer ETF - October | ||||||||
| $ | 117 | $ | 11 | $ | 1,356 | |||||
| 117 | 11 | 1,356 | ||||||||
| 8,586 | 146,465 | 239,770 | ||||||||
| – | 1,014 | 380 | ||||||||
| 8,586 | 147,479 | 240,150 | ||||||||
| (8,469 | ) | (147,468 | ) | (238,794 | ) | |||||
| – | (1,295,857 | ) | (2,337,513 | ) | ||||||
| – | (17,649 | ) | (73,119 | ) | ||||||
| 367,947 | 4,462,308 | 5,766,641 | ||||||||
| (108,529 | ) | 609,866 | 1,484,703 | |||||||
| 259,418 | 3,758,668 | 4,840,712 | ||||||||
| $ | 250,949 | $ | 3,611,200 | $ | 4,601,918 | |||||
The accompanying notes are an integral part of these financial statements.
INNOVATOR ETFs TRUST
Statement of Changes in Net Assets
Innovator S&P 500® Buffer ETF - January | Innovator S&P 500® Buffer ETF - April | |||||||
Period Ended April 30, 2019 (Unaudited) (a) | Period Ended April 30, 2019 (Unaudited) (b) | |||||||
Operations: | ||||||||
Net investment income/(loss) | $ | (60,244 | ) | $ | (14,790 | ) | ||
Net realized gain/(loss) | (558,522 | ) | – | |||||
Net change in unrealized appreciation/(depreciation) | 3,586,501 | 625,867 | ||||||
Net Increase/(Decrease) in Net Assets Resulting from Operations | 2,967,735 | 611,077 | ||||||
Fund Share Transactions: | ||||||||
Proceeds from shares sold | 27,555,273 | 29,043,462 | ||||||
Cost of shares redeemed | (7,009,240 | ) | – | |||||
Transaction fees (see Note 6) | 17,282 | 14,522 | ||||||
Net Increase/(Decrease) in Net Assets from Capital Share Transactions | 20,563,315 | 29,057,984 | ||||||
Total Increase/(Decrease) in Net Assets | 23,531,050 | 29,669,061 | ||||||
Net Assets: | ||||||||
Beginning of period | – | – | ||||||
End of period | $ | 23,531,050 | $ | 29,669,061 | ||||
Change in Shares Outstanding: | ||||||||
Shares sold | 1,075,000 | 1,150,000 | ||||||
Shares redeemed | (250,000 | ) | – | |||||
Net Increase/(Decrease) | 825,000 | 1,150,000 | ||||||
(a) Since Commencement of Operations on December 31, 2018.
(b) Since Commencement of Operations on March 29, 2019.
(c) Since Commencement of Operations on August 28, 2018.
(d) Since Commencement of Operations on September 28, 2018.
The accompanying notes are an integral part of these financial statements.
INNOVATOR ETFs TRUST
Innovator S&P 500® Buffer ETF - July | Innovator S&P 500® Buffer ETF - October | |||||||||||||
Period Ended April 30, 2019 (Unaudited) | Period Ended October 31, 2018 (c) | Period Ended April 30, 2019 (Unaudited) | Period Ended October 30, 2018 (d) | |||||||||||
| $ | (21,498 | ) | $ | (4,814 | ) | $ | (90,971 | ) | $ | (5,862 | ) | |||
| (56,405 | ) | (8,605 | ) | (2,961,362 | ) | – | ||||||||
| 505,391 | (103,450 | ) | 4,547,334 | (105,535 | ) | |||||||||
| 427,488 | (116,869 | ) | 1,495,001 | (111,397 | ) | |||||||||
| 16,008,782 | 5,708,575 | 29,532,558 | 21,183,067 | |||||||||||
| (625,698 | ) | (1,904,110 | ) | (15,393,450 | ) | – | ||||||||
| 8,317 | 3,807 | 22,463 | 10,592 | |||||||||||
| 15,391,401 | 3,808,272 | 14,161,571 | 21,193,659 | |||||||||||
| 15,818,889 | 3,691,403 | 15,656,572 | 21,082,262 | |||||||||||
| 3,691,403 | — | 21,082,262 | — | |||||||||||
| $ | 19,510,292 | $ | 3,691,403 | $ | 36,738,834 | $ | 21,082,262 | |||||||
| 625,000 | 225,000 | 1,250,000 | 900,000 | |||||||||||
| (25,000 | ) | (75,000 | ) | (675,000 | ) | – | ||||||||
| 600,000 | 150,000 | 575,000 | 900,000 | |||||||||||
The accompanying notes are an integral part of these financial statements.
INNOVATOR ETFs TRUST
Statement of Changes in Net Assets
Innovator S&P 500® Power Buffer ETF - January | Innovator S&P 500® Power Buffer ETF - April | |||||||
Period Ended April 30, 2019 (Unaudited) (a) | Period Ended April 30, 2019 (Unaudited) (b) | |||||||
Operations: | ||||||||
Net investment income/(loss) | $ | (200,847 | ) | $ | (52,468 | ) | ||
Net realized gain/(loss) | (2,437,292 | ) | – | |||||
Net change in unrealized appreciation/(depreciation) | 9,120,160 | 1,501,046 | ||||||
Net Increase/(Decrease) in Net Assets Resulting from Operations | 6,482,021 | 1,448,578 | ||||||
Fund Share Transactions: | ||||||||
Proceeds from shares sold | 87,460,730 | 96,245,120 | ||||||
Cost of shares redeemed | (16,220,025 | ) | – | |||||
Transaction fees (see Note 6) | 51,499 | 48,123 | ||||||
Net Increase/(Decrease) in Net Assets from Capital Share Transactions | 71,292,204 | 96,293,243 | ||||||
Total Increase/(Decrease) in Net Assets | 77,774,225 | 97,741,821 | ||||||
Net Assets: | ||||||||
Beginning of period | — | — | ||||||
End of period | $ | 77,774,225 | $ | 97,741,821 | ||||
Change in Shares Outstanding: | ||||||||
Shares sold | 3,450,000 | 3,825,000 | ||||||
Shares redeemed | (600,000 | ) | – | |||||
Net Increase/(Decrease) | 2,850,000 | 3,825,000 | ||||||
(a) Since Commencement of Operations on December 31, 2018.
(b) Since Commencement of Operations on March 29, 2019.
(c) Since Commencement of Operations on August 7, 2018.
(d) Since Commencement of Operations on September 28, 2018.
The accompanying notes are an integral part of these financial statements.
INNOVATOR ETFs TRUST
Innovator S&P 500® Power Buffer ETF - July | Innovator S&P 500® Power Buffer ETF - October | |||||||||||||
Period Ended April 30, 2019 (Unaudited) | Period Ended October 31, 2018 (c) | Period Ended April 30, 2019 (Unaudited) | Period Ended October 30, 2018 (d) | |||||||||||
| $ | (51,040 | ) | $ | (5,788 | ) | $ | (141,596 | ) | $ | (4,227 | ) | |||
| – | – | (1,393,292 | ) | – | ||||||||||
| 1,096,851 | (72,905 | ) | 5,121,867 | (214,877 | ) | |||||||||
| 1,045,811 | (78,693 | ) | 3,586,979 | (219,104 | ) | |||||||||
| 26,992,173 | 3,788,900 | 96,628,427 | 11,393,567 | |||||||||||
| – | – | (4,215,033 | ) | – | ||||||||||
| 13,496 | 1,894 | 46,664 | 5,403 | |||||||||||
| 27,005,669 | 3,790,794 | 92,460,058 | 11,398,970 | |||||||||||
| 28,051,480 | 3,712,101 | 96,047,037 | 11,179,866 | |||||||||||
| 3,712,101 | — | 11,179,866 | — | |||||||||||
| $ | 31,763,581 | $ | 3,712,101 | $ | 107,226,903 | $ | 11,179,866 | |||||||
| 1,075,000 | 150,000 | 4,000,000 | 475,000 | |||||||||||
| – | – | (175,000 | ) | – | ||||||||||
| 1,075,000 | 150,000 | 3,825,000 | 475,000 | |||||||||||
The accompanying notes are an integral part of these financial statements.
INNOVATOR ETFs TRUST
Statement of Changes in Net Assets
Innovator S&P 500® Ultra Buffer ETF - January | Innovator S&P 500® Ultra Buffer ETF - April | |||||||
Period Ended April 30, 2019 (unaudited) (a) | Period Ended April 30, 2019 (Unaudited) (b) | |||||||
Operations: | ||||||||
Net investment income/(loss) | $ | (87,702 | ) | $ | (8,469 | ) | ||
Net realized gain/(loss) | (428,440 | ) | – | |||||
Net change in unrealized appreciation/(depreciation) | 3,137,456 | 259,418 | ||||||
Net Increase/(Decrease) in Net Assets Resulting from Operations | 2,621,314 | 250,949 | ||||||
Fund Share Transactions: | ||||||||
Proceeds from shares sold | 36,389,973 | 15,717,435 | ||||||
Cost of shares redeemed | (2,014,778 | ) | – | |||||
Transaction fees (see Note 6) | 19,202 | 7,859 | ||||||
Net Increase/(Decrease) in Net Assets from Capital Share Transactions | 34,394,397 | 15,725,294 | ||||||
Total Increase/(Decrease) in Net Assets | 37,015,711 | 15,976,243 | ||||||
Net Assets: | ||||||||
Beginning of period | — | — | ||||||
End of period | $ | 37,015,711 | $ | 15,976,243 | ||||
Change in Shares Outstanding: | ||||||||
Shares sold | 1,450,000 | 625,000 | ||||||
Shares redeemed | (75,000 | ) | – | |||||
Net Increase/(Decrease) | 1,375,000 | 625,000 | ||||||
(a) Since Commencement of Operations on December 31, 2018.
(b) Since Commencement of Operations on March 29, 2019.
(c) Since Commencement of Operations on August 7, 2018.
(d) Since Commencement of Operations on September 28, 2018.
The accompanying notes are an integral part of these financial statements.
INNOVATOR ETFs TRUST
Innovator S&P 500® Ultra Buffer ETF - July | Innovator S&P 500® Ultra Buffer ETF - October | |||||||||||||
Period Ended April 30, 2019 (Unaudited) | Period Ended October 31, 2018 (c) | Period Ended April 30, 2019 (Unaudited) | Period Ended October 30, 2018 (d) | |||||||||||
| $ | (147,468 | ) | $ | (5,783 | ) | $ | (238,794 | ) | $ | (3,454 | ) | |||
| (1,313,506 | ) | – | (2,410,632 | ) | – | |||||||||
| 5,072,174 | (84,210 | ) | 7,251,344 | (116,407 | ) | |||||||||
| 3,611,200 | (89,993 | ) | 4,601,918 | (119,861 | ) | |||||||||
| 57,495,370 | 3,789,807 | 80,438,520 | 13,706,003 | |||||||||||
| (4,753,470 | ) | – | (8,040,193 | ) | – | |||||||||
| 30,155 | 1,895 | 44,535 | 6,557 | |||||||||||
| 52,772,055 | 3,791,702 | 72,442,862 | 13,712,560 | |||||||||||
| 56,383,255 | 3,701,709 | 77,044,780 | 13,592,699 | |||||||||||
| 3,701,709 | — | 13,592,699 | — | |||||||||||
| $ | 60,084,964 | $ | 3,701,709 | $ | 90,637,479 | $ | 13,592,699 | |||||||
| 2,375,000 | 150,000 | 3,425,000 | 575,000 | |||||||||||
| (200,000 | ) | – | (350,000 | ) | – | |||||||||
| 2,175,000 | 150,000 | 3,075,000 | 575,000 | |||||||||||
The accompanying notes are an integral part of these financial statements.
INNOVATOR ETFs TRUST
Financial Highlights
| Per Share Operating Performance (For a share outstanding throughout | ||||||||||||||||||||
Operations: | Capital Share Transactions: | |||||||||||||||||||
Net Asset Value, Beginning of Period | Net investment income/(loss) | Net realized and unrealized gain/(loss) | Total From Investment Operations | Transaction fees (see Note 6) | ||||||||||||||||
Innovator S&P 500® Buffer ETF - January | ||||||||||||||||||||
For the period 12/31/18 (d) - 4/30/19 (Unaudited) | $ | 25.08 | (0.07 | ) | 3.49 | 3.42 | 0.02 | |||||||||||||
Innovator S&P 500® Buffer ETF - April | ||||||||||||||||||||
For the period 3/29/19 (d) - 4/30/19 (Unaudited) | $ | 24.95 | (0.02 | ) | 0.85 | 0.83 | 0.02 | |||||||||||||
Innovator S&P 500® Buffer ETF - July | ||||||||||||||||||||
For the period ended April 30, 2019 (Unaudited) | $ | 24.61 | (0.10 | ) | 1.46 | 1.36 | 0.04 | |||||||||||||
For the period 8/28/18 (d) - 10/31/18 | $ | 25.51 | (0.03 | ) | (0.90 | ) | (0.93 | ) | 0.03 | |||||||||||
Innovator S&P 500® Buffer ETF - October | ||||||||||||||||||||
For the period ended April 30, 2019 (Unaudited) | $ | 23.42 | (0.09 | ) | 1.56 | 1.47 | 0.02 | |||||||||||||
For the period 9/28/18 (d) - 10/31/18 | $ | 24.49 | (0.01 | ) | (1.07 | ) | (1.08 | ) | 0.01 | |||||||||||
(a) Annualized for periods less than one year.
(b) Not annualized for periods less than one year.
(c) Does not include the impact of the expenses of the underlying funds in which the Fund invests.
(d) Inception date.
(e) Includes broker interest expense of 0.01%.
The accompanying notes are an integral part of these financial statements.
INNOVATOR ETFs TRUST
Financial Highlights
| each period) | Ratios/Supplemental Data: | |||||||||||||||||||||||||
Ratio to Average Net Assets of: (a) | ||||||||||||||||||||||||||
Change in Net Asset Value for the Period | Net Asset Value, End of Period | Total return (b) | Net assets, end of period (000) | Net expenses (c) | Net investment income/(loss) | Portfolio turnover rate (b) | ||||||||||||||||||||
| 3.44 | $ | 28.52 | 13.73 | % | $ | 23,531 | 0.79 | % | (0.79 | )% | 0 | % | ||||||||||||||
| 0.85 | $ | 25.80 | 3.40 | % | $ | 29,669 | 0.79 | % | (0.79 | )% | 0 | % | ||||||||||||||
| 1.40 | $ | 26.01 | 5.70 | % | $ | 19,510 | 0.80 | % | (e) | (0.80 | )% | 0 | % | |||||||||||||
| (0.90 | ) | $ | 24.61 | (3.53 | )% | $ | 3,691 | 0.79 | % | (0.78 | )% | 0 | % | |||||||||||||
| 1.49 | $ | 24.91 | 6.33 | % | $ | 36,739 | 0.79 | % | (0.79 | )% | 0 | % | ||||||||||||||
| (1.07 | ) | $ | 23.42 | (4.35 | )% | $ | 21,082 | 0.79 | % | (0.79 | )% | 4 | % | |||||||||||||
The accompanying notes are an integral part of these financial statements.
INNOVATOR ETFs TRUST
Financial Highlights
| Per Share Operating Performance (For a share outstanding throughout | ||||||||||||||||||||
Operations: | Capital Share Transactions: | |||||||||||||||||||
Net Asset Value, Beginning of Period | Net investment income/(loss) | Net realized and unrealized gain/(loss) | Total From Investment Operations | Transaction fees (see Note 6) | ||||||||||||||||
Innovator S&P 500® Power Buffer ETF - January | ||||||||||||||||||||
For the period 12/31/18 (d) - 4/30/19 (Unaudited) | $ | 25.08 | (0.07 | ) | 2.26 | 2.19 | 0.02 | |||||||||||||
Innovator S&P 500® Power Buffer ETF - April | ||||||||||||||||||||
For the period 3/29/19 (d) - 4/30/19 (Unaudited) | $ | 24.95 | (0.02 | ) | 0.60 | 0.58 | 0.02 | |||||||||||||
Innovator S&P 500® Power Buffer ETF - July | ||||||||||||||||||||
For the period ended April 30, 2019 (Unaudited) | $ | 24.75 | (0.10 | ) | 1.25 | 1.15 | 0.03 | |||||||||||||
For the period 8/7/18 (d) - 10/31/18 | $ | 25.17 | (0.04 | ) | (0.39 | ) | (0.43 | ) | 0.01 | |||||||||||
Innovator S&P 500® Power Buffer ETF - October | ||||||||||||||||||||
For the period ended April 30, 2019 (Unaudited) | $ | 23.54 | (0.09 | ) | 1.46 | 1.37 | 0.03 | |||||||||||||
For the period 9/28/18 (d) - 10/31/18 | $ | 24.49 | (0.01 | ) | (0.95 | ) | (0.96 | ) | 0.01 | |||||||||||
(a) Annualized for periods less than one year.
(b) Not annualized for periods less than one year.
(c) Does not include the impact of the expenses of the underlying funds in which the Fund invests.
(d) Inception date.
(e) Includes broker interest expense of 0.01%.
The accompanying notes are an integral part of these financial statements.
INNOVATOR ETFs TRUST
Financial Highlights
| each period) | Ratios/Supplemental Data: | |||||||||||||||||||||||||
Ratio to Average Net Assets of: (a) | ||||||||||||||||||||||||||
Change in Net Asset Value for the Period | Net Asset Value, End of Period | Total return (b) | Net assets, end of period (000) | Net expenses (c) | Net investment income/(loss) | Portfolio turnover rate (b) | ||||||||||||||||||||
| 2.21 | $ | 27.29 | 8.81 | % | $ | 77,774 | 0.79 | % | (0.79 | )% | 0 | % | ||||||||||||||
| 0.60 | $ | 25.55 | 2.42 | % | $ | 97,742 | 0.79 | % | (0.79 | )% | 0 | % | ||||||||||||||
| 1.18 | $ | 25.93 | 4.78 | % | $ | 31,764 | 0.80 | % | (e) | (0.80 | )% | 0 | % | |||||||||||||
| (0.42 | ) | $ | 24.75 | (1.68 | )% | $ | 3,712 | 0.79 | % | (0.79 | )% | 0 | % | |||||||||||||
| 1.40 | $ | 24.94 | 5.95 | % | $ | 107,227 | 0.79 | % | (0.79 | )% | 0 | % | ||||||||||||||
| (0.95 | ) | $ | 23.54 | (3.89 | )% | $ | 11,180 | 0.79 | % | (0.79 | )% | 4 | % | |||||||||||||
The accompanying notes are an integral part of these financial statements.
INNOVATOR ETFs TRUST
Financial Highlights
| Per Share Operating Performance (For a share outstanding throughout | ||||||||||||||||||||
Operations: | Capital Share Transactions: | |||||||||||||||||||
Net Asset Value, Beginning of Period | Net investment income/(loss) | Net realized and unrealized gain/(loss) | Total From Investment Operations | Transaction fees (see Note 6) | ||||||||||||||||
Innovator S&P 500® Ultra Buffer ETF - January | ||||||||||||||||||||
For the period 12/31/18 (d) - 4/30/19 (Unaudited) | $ | 25.08 | (0.07 | ) | 1.89 | 1.82 | 0.02 | |||||||||||||
Innovator S&P 500® Ultra Buffer ETF - April | ||||||||||||||||||||
For the period 3/29/19 (d) - 4/30/19 (Unaudited) | $ | 24.95 | (0.02 | ) | 0.61 | 0.59 | 0.02 | |||||||||||||
Innovator S&P 500® Ultra Buffer ETF – July | ||||||||||||||||||||
For the period ended April 30, 2019 (Unaudited) | $ | 24.68 | (0.10 | ) | 1.24 | 1.14 | 0.02 | |||||||||||||
For the period 8/7/18 (d) - 10/31/18 | $ | 25.17 | (0.04 | ) | (0.46 | ) | (0.50 | ) | 0.01 | |||||||||||
Innovator S&P 500® Ultra Buffer ETF - October | ||||||||||||||||||||
For the period ended April 30, 2019 (Unaudited) | $ | 23.64 | (0.09 | ) | 1.26 | 1.17 | 0.02 | |||||||||||||
For the period 9/28/18 (d) - 10/31/18 | $ | 24.49 | (0.01 | ) | (0.85 | ) | (0.86 | ) | 0.01 | |||||||||||
(a) Annualized for periods less than one year.
(b) Not annualized for periods less than one year.
(c) Does not include the impact of the expenses of the underlying funds in which the Fund invests.
(d) Inception date.
(e) Includes broker interest expense of 0.01%.
The accompanying notes are an integral part of these financial statements.
INNOVATOR ETFs TRUST
Financial Highlights
| each period) | Ratios/Supplemental Data: | |||||||||||||||||||||||||
Ratio to Average Net Assets of: (a) | ||||||||||||||||||||||||||
Change in Net Asset Value for the Period | Net Asset Value, End of Period | Total return (b) | Net assets, end of period (000) | Net expenses (c) | Net investment income/(loss) | Portfolio turnover rate (b) | ||||||||||||||||||||
| 1.84 | $ | 26.92 | 7.34 | % | $ | 37,016 | 0.79 | % | (0.79 | )% | 0 | % | ||||||||||||||
| 0.61 | $ | 25.56 | 2.45 | % | $ | 15,976 | 0.79 | % | (0.78 | )% | 0 | % | ||||||||||||||
| 1.16 | $ | 25.84 | 4.72 | % | $ | 60,085 | 0.80 | % | (e) | (0.80 | )% | 0 | % | |||||||||||||
| (0.49 | ) | $ | 24.68 | (1.95 | )% | $ | 3,702 | 0.79 | % | (0.79 | )% | 0 | % | |||||||||||||
| 1.19 | $ | 24.83 | 5.04 | % | $ | 90,637 | 0.79 | % | (0.79 | )% | 0 | % | ||||||||||||||
| (0.85 | ) | $ | 23.64 | (3.47 | )% | $ | 13,593 | 0.79 | % | (0.79 | )% | 3 | % | |||||||||||||
The accompanying notes are an integral part of these financial statements.
INNOVATOR ETFs TRUST
Notes to Financial Statements (Unaudited)
1. | ORGANIZATION |
Innovator ETFs Trust (the “Trust”) was organized under Delaware law as a Delaware statutory trust on October 17, 2007, and is registered with the Securities and Exchange Commission (“SEC”) under the Investment Company Act of 1940, as amended (the “1940 Act”) and is classified as an open-end management investment company. The Trust currently consists of multiple operational series, of which twelve are covered in this report, collectively the (“Funds”):
Name | Ticker | Commencement of Operations | |||
Innovator S&P 500® Buffer ETF – January | BJAN | December 31, 2018 | |||
Innovator S&P 500® Buffer ETF – April | BAPR | March 29, 2019 | |||
Innovator S&P 500® Buffer ETF – July | BJUL | August 28, 2018 | |||
Innovator S&P 500® Buffer ETF – October | BOCT | September 28, 2018 | |||
Innovator S&P 500® Power Buffer ETF – January | PJAN | December 31, 2018 | |||
Innovator S&P 500® Power Buffer ETF – April | PAPR | March 29, 2019 | |||
Innovator S&P 500® Power Buffer ETF – July | PJUL | August 7, 2018 | |||
Innovator S&P 500® Power Buffer ETF – October | POCT | September 28, 2018 | |||
Innovator S&P 500® Ultra Buffer ETF – January | UJAN | December 31, 2018 | |||
Innovator S&P 500® Ultra Buffer ETF – April | UAPR | March 29, 2019 | |||
Innovator S&P 500® Ultra Buffer ETF – July | UJUL | August 7, 2018 | |||
Innovator S&P 500® Ultra Buffer ETF – October | UOCT | September 28, 2018 | |||
The four operational series of the Trust covered outside of this report consist of:
Name | Ticker | Commencement of Operations | ||
Innovator IBD® 50 ETF | FFTY | April 8, 2015 | ||
Innovator IBD® ETF Leaders ETF | LDRS | December 20, 2017 | ||
Innovator IBD® Breakout Opportunities ETF | BOUT | September 12, 2018 | ||
Innovator Loup Frontier Tech ETF | LOUP | July 24, 2018 |
The Funds are exchange traded funds that offer one class of shares, do not charge a sales load, do not have a redemption fee and currently do not charge a 12b-1 fee to its shareholders. The Funds individually seek to track, before fees and expenses the S&P 500® Price Index up to a respective upside cap while providing a respective buffer for a given annual period.
The Funds are investment companies and accordingly follow the investment company accounting and reporting guidance of the Financial Accounting Standards Board (“FASB”) Accounting Standards Codification (“ASC”) Topic 946 “Financial Services — Investment Companies”.
2. | SIGNIFICANT ACCOUNTING POLICIES |
The following is a summary of significant accounting policies consistently followed by the Trust in the preparation of its financial statements. These policies are in conformity with accounting principles generally accepted in the United States of America (“U.S. GAAP”).
INNOVATOR ETFs TRUST
Notes to Financial Statements (Unaudited) (Continued)
Valuation:
The net asset value (“NAV”) of the Funds are determined as of the close of regular trading on the NYSE (normally 4:00 p.m. ET). If the NYSE closes early on a valuation day, the Funds shall determine NAV as of that time.
Portfolio securities generally shall be valued utilizing prices provided by independent pricing services. The Trust’s Pricing Committee (“Pricing Committee”) is responsible for establishing valuation of portfolio securities and other instruments held by the Funds in accordance with the Trust’s valuation procedures.
Common stocks, preferred stocks and other equity securities listed on any national or foreign exchange (excluding the NASDAQ National Market (“NASDAQ”) and the London Stock Exchange Alternative Investment Market (“AIM”)) are generally valued at the last sale price on the exchange on which they are principally traded or, for NASDAQ and AIM securities, the official closing price. Securities traded on more than one securities exchange are valued at the last sale price or official closing price, as applicable, at the close of the exchange representing the principal market for such securities. Securities traded in the over-the-counter market are valued at the mean of the bid and the asked price, if available, and otherwise at their closing bid price. Redeemable securities issued by open-end investment companies shall be valued at the investment company’s applicable net asset value, with the exception of exchange-traded open-end investment companies which are priced as equity securities. Government and retail money-market funds, which are not eligible for vendor pricing, are valued at amortized cost, which approximates fair value. Fixed income securities, swaps, currency-, credit- and commodity-linked notes, and other similar instruments will be valued using a pricing service. Fixed income securities having a remaining maturity of 60 days or less when purchased will be valued at cost adjusted for amortization of premiums and accretion of discounts, provided the Pricing Committee has determined that the use of amortized cost is an appropriate reflection of fair value given market and issuer specific conditions existing at the time of the determination. Foreign securities and other assets denominated in foreign currencies are translated into U.S. dollars at the exchange rate of such currencies against the U.S. dollar as provided by the pricing service. All assets denominated in foreign currencies will be converted into U.S. dollars at the exchange rates in effect at the time of valuation. Restricted securities (with the exception of Rule 144A Securities for which market quotations are available) will normally be valued at fair value as determined by the Pricing Committee.
INNOVATOR ETFs TRUST
Notes to Financial Statements (Unaudited) (Continued)
Exchange-traded option contracts (other than FLexible EXchange Option or “FLEX Option” contracts) will be valued at the closing price in the market where such contracts are principally traded. If no closing price is available, they will be fair valued at the mean of their most recent bid and asked price, if available, and otherwise at their closing bid price. OTC options are fair valued at the mean of the most recent bid and asked price, if available, and otherwise at their closing bid price. FLEX Options will be valued at a model-based price provided by the exchange on which the option is traded at the official close of that exchange’s trading date. If the exchange on which the option is traded is unable to provide a model price, FLEX Options prices will be provided by backup provider Super Derivatives. Otherwise, the value of a FLEX Option will be determined by the Pricing Committee in accordance with the Trust’s valuation procedures.
If no quotation can be obtained from a pricing service, then the Pricing Committee will then attempt to obtain one or more broker quotes for the security. If no quotation is available from either a pricing service or one or more brokers or if the Pricing Committee has reason to question the reliability or accuracy of a quotation supplied or the use of amortized cost, the value of any portfolio security held by the Funds for which reliable market quotations are not readily available will be determined by the Pricing Committee in a manner that most appropriately reflects fair market value of the security on the valuation date. The use of a fair valuation method may be appropriate if, for example: (i) market quotations do not accurately reflect fair value of an investment; (ii) an investment’s value has been materially affected by events occurring after the close of the exchange or market on which the investment is principally traded (for example, a foreign exchange or market); (iii) a trading halt closes an exchange or market early; or (iv) other events result in an exchange or market delaying its normal close.
INNOVATOR ETFs TRUST
Notes to Financial Statements (Unaudited) (Continued)
The Funds utilize various methods to measure the fair value of most of their investments on a recurring basis. U.S. GAAP establishes a hierarchy that prioritizes inputs to valuation methods. The three levels of inputs are:
| • | Level 1 – | Unadjusted quoted prices in active markets for identical assets or liabilities that the Funds have the ability to access. |
| • | Level 2 – | Observable inputs other than quoted prices included in level 1 that are observable for the asset or liability, either directly or indirectly. These inputs may include quoted prices for the identical instrument on an inactive market, prices for similar instruments, interest rates, prepayment speeds, credit risk, yield curves, default rates and similar data. |
| • | Level 3 – | Unobservable inputs for the asset or liability, to the extent relevant observable inputs are not available, representing the Funds’ own assumptions about the assumptions a market participant would use in valuing the asset or liability, and would be based on the best information available. |
The availability of observable inputs can vary from security to security and is affected by a wide variety of factors, including, for example, the type of security, whether the security is new and not yet established in the marketplace, the liquidity of markets, and other characteristics particular to the security. To the extent that valuation is based on models or inputs that are less observable or unobservable in the market, the determination of fair value requires more judgement. Accordingly, the degree of judgement exercised in determining fair value is greatest for instruments categorized in Level 3.
The inputs used to measure fair value may fall into different levels of the fair value hierarchy. In such cases, for disclosure purposes, the level in the fair value hierarchy within which the fair value measurement falls in its entirety, is determined based on the lowest level input that is significant to the fair value measurement in its entirety.
INNOVATOR ETFs TRUST
Notes to Financial Statements (Unaudited) (Continued)
BJAN | ||||||||||||||||
Level 1 | Level 2 | Level 3 | Total | |||||||||||||
Assets | ||||||||||||||||
Purchased Options | $ | - | $ | 25,159,125 | $ | - | $ | 25,159,125 | ||||||||
Short Term Investments | 1,411 | - | - | 1,411 | ||||||||||||
Total Assets | $ | 1,411 | $ | 25,159,125 | $ | - | $ | 25,160,536 | ||||||||
Liabilities | ||||||||||||||||
Options Written | $ | - | $ | 1,600,440 | $ | - | $ | 1,600,440 | ||||||||
Total Liabilities | $ | - | $ | 1,600,440 | $ | - | $ | 1,600,440 | ||||||||
BAPR | ||||||||||||||||
Level 1 | Level 2 | Level 3 | Total | |||||||||||||
Assets | ||||||||||||||||
Purchased Options | $ | - | $ | 30,738,201 | $ | - | $ | 30,738,201 | ||||||||
Total Assets | $ | - | $ | 30,738,201 | $ | - | $ | 30,738,201 | ||||||||
Liabilities | ||||||||||||||||
Options Written | $ | - | $ | 1,088,583 | $ | - | $ | 1,088,583 | ||||||||
Total Liabilities | $ | - | $ | 1,088,583 | $ | - | $ | 1,088,583 | ||||||||
BJUL | ||||||||||||||||
Level 1 | Level 2 | Level 3 | Total | |||||||||||||
Assets | ||||||||||||||||
Purchased Options | $ | - | $ | 17,668,746 | $ | - | $ | 17,668,746 | ||||||||
Short Term Investments | 702 | - | - | 702 | ||||||||||||
Total Assets | $ | 702 | $ | 17,668,746 | $ | - | $ | 17,669,448 | ||||||||
Liabilities | ||||||||||||||||
Options Written | $ | - | $ | 56,862 | $ | - | $ | 56,862 | ||||||||
Total Liabilities | $ | - | $ | 56,862 | $ | - | $ | 56,862 | ||||||||
BOCT | ||||||||||||||||
Level 1 | Level 2 | Level 3 | Total | |||||||||||||
Assets | ||||||||||||||||
Purchased Options | $ | - | $ | 37,307,751 | $ | - | $ | 37,307,751 | ||||||||
Short Term Investments | 697 | - | - | 697 | ||||||||||||
Total Assets | $ | 697 | $ | 37,307,751 | $ | - | $ | 37,308,448 | ||||||||
Liabilities | ||||||||||||||||
Options Written | $ | - | $ | 492,161 | $ | - | $ | 492,161 | ||||||||
Total Liabilities | $ | - | $ | 492,161 | $ | - | $ | 492,161 | ||||||||
INNOVATOR ETFs TRUST
Notes to Financial Statements (Unaudited) (Continued)
PJAN |
Level 1 | Level 2 | Level 3 | Total | |||||||||||||
Assets | ||||||||||||||||
Purchased Options | $ | - | $ | 86,032,663 | $ | - | $ | 86,032,663 | ||||||||
Short Term Investments | 700 | - | - | 700 | ||||||||||||
Total Assets | $ | 700 | $ | 86,032,663 | $ | - | $ | 86,033,363 | ||||||||
Liabilities | ||||||||||||||||
Options Written | $ | - | $ | 8,856,488 | $ | - | $ | 8,856,488 | ||||||||
Total Liabilities | $ | - | $ | 8,856,488 | $ | - | $ | 8,856,488 | ||||||||
PAPR |
Level 1 | Level 2 | Level 3 | Total | |||||||||||||
Assets | ||||||||||||||||
Purchased Options | $ | - | $ | 102,237,894 | $ | - | $ | 102,237,894 | ||||||||
Short Term Investments | 21,481 | - | - | 21,481 | ||||||||||||
Total Assets | $ | 21,481 | $ | 102,237,894 | $ | - | $ | 102,259,375 | ||||||||
Liabilities | ||||||||||||||||
Options Written | $ | - | $ | 4,554,333 | $ | - | $ | 4,554,333 | ||||||||
Total Liabilities | $ | - | $ | 4,554,333 | $ | - | $ | 4,554,333 | ||||||||
PJUL |
Level 1 | Level 2 | Level 3 | Total | |||||||||||||
Assets | ||||||||||||||||
Purchased Options | $ | - | $ | 31,982,039 | $ | - | $ | 31,982,039 | ||||||||
Short Term Investments | 699 | - | - | 699 | ||||||||||||
Total Assets | $ | 699 | $ | 31,982,039 | $ | - | $ | 31,982,738 | ||||||||
Liabilities | ||||||||||||||||
Options Written | $ | - | $ | 102,499 | $ | - | $ | 102,499 | ||||||||
Total Liabilities | $ | - | $ | 102,499 | $ | - | $ | 102,499 | ||||||||
POCT |
Level 1 | Level 2 | Level 3 | Total | |||||||||||||
Assets | ||||||||||||||||
Purchased Options | $ | - | $ | 100,332,657 | $ | - | $ | 100,332,657 | ||||||||
Short Term Investments | 1,305 | - | - | 1,305 | ||||||||||||
Total Assets | $ | 1,305 | $ | 100,332,657 | $ | - | $ | 100,333,962 | ||||||||
Liabilities | ||||||||||||||||
Options Written | $ | - | $ | 1,011,081 | $ | - | $ | 1,011,081 | ||||||||
Total Liabilities | $ | - | $ | 1,011,081 | $ | - | $ | 1,011,081 | ||||||||
INNOVATOR ETFs TRUST
Notes to Financial Statements (Unaudited) (Continued)
UJAN |
Level 1 | Level 2 | Level 3 | Total | |||||||||||||
Assets | ||||||||||||||||
Purchased Options | $ | - | $ | 41,781,359 | $ | - | $ | 41,781,359 | ||||||||
Short Term Investments | 700 | - | - | 700 | ||||||||||||
Total Assets | $ | 700 | $ | 41,781,359 | $ | - | $ | 41,782,059 | ||||||||
Liabilities | ||||||||||||||||
Options Written | $ | - | $ | 4,714,767 | $ | - | $ | 4,714,767 | ||||||||
Total Liabilities | $ | - | $ | 4,714,767 | $ | - | $ | 4,714,767 | ||||||||
UAPR |
Level 1 | Level 2 | Level 3 | Total | |||||||||||||
Assets | ||||||||||||||||
Purchased Options | $ | - | $ | 16,531,625 | $ | - | $ | 16,531,625 | ||||||||
Short Term Investments | 3 | - | - | 3 | ||||||||||||
Total Assets | $ | 3 | $ | 16,531,625 | $ | - | $ | 16,531,628 | ||||||||
Liabilities | ||||||||||||||||
Options Written | $ | - | $ | 564,489 | $ | - | $ | 564,489 | ||||||||
Total Liabilities | $ | - | $ | 564,489 | $ | - | $ | 564,489 | ||||||||
UJUL |
Level 1 | Level 2 | Level 3 | Total | |||||||||||||
Assets | ||||||||||||||||
Purchased Options | $ | - | $ | 58,425,840 | $ | - | $ | 58,425,840 | ||||||||
Short Term Investments | 700 | - | - | 700 | ||||||||||||
Total Assets | $ | 700 | $ | 58,425,840 | $ | - | $ | 58,426,540 | ||||||||
Liabilities | ||||||||||||||||
Options Written | $ | - | $ | 75,600 | $ | - | $ | 75,600 | ||||||||
Total Liabilities | $ | - | $ | 75,600 | $ | - | $ | 75,600 | ||||||||
UOCT |
Level 1 | Level 2 | Level 3 | Total | |||||||||||||
Assets | ||||||||||||||||
Purchased Options | $ | - | $ | 91,320,366 | $ | - | $ | 91,320,366 | ||||||||
Short Term Investments | 697 | - | - | 697 | ||||||||||||
Total Assets | $ | 697 | $ | 91,320,366 | $ | - | $ | 91,321,063 | ||||||||
Liabilities | ||||||||||||||||
Options Written | $ | - | $ | 499,571 | $ | - | $ | 499,571 | ||||||||
Total Liabilities | $ | - | $ | 499,571 | $ | - | $ | 499,571 | ||||||||
INNOVATOR ETFs TRUST
Notes to Financial Statements (Unaudited) (Continued)
There were no Level 3 investments for the Funds during the reporting period.
Option Contracts:
In general, an option contract is an agreement between a buyer and seller that gives the purchaser of the option the right to buy or sell a particular asset at a specified future date at an agreed upon price (commonly known as the “strike price”).
The Funds invest primarily in FLEX Option contracts. FLEX Options are customized option contracts that trade on an exchange but provide investors with the ability to customize key contract terms like strike price, style and expiration date while achieving price discovery in competitive, transparent auctions markets and avoiding the counterparty exposure of over-the-counter options positions. Like traditional exchange-traded options, FLEX Options are guaranteed for settlement by the OCC, a market clearinghouse that guarantees performance by counterparties to certain derivatives contracts. The FLEX Options in which the Fund will invest are all European style options (options that are exercisable only on the expiration date). The FLEX Options are listed on the Chicago Board Options Exchange.
The Fund will purchase and sell call and put FLEX Options. In general, put options give the holder (i.e., the buyer) the right to sell an asset (or deliver the cash value of the index, in case of an index put option) and the seller (i.e., the writer) of the put has the obligation to buy the asset (or receive cash value of the index, in case of an index put option) at a certain defined price. Call options give the holder (i.e., the buyer) the right to buy an asset (or receive cash value of the index, in case of an index call option) and the seller (i.e., the writer) the obligation to sell the asset (or deliver cash value of the index, in case of an index call option) at a certain defined price.
The value of derivative instruments on the Statements of Assets and Liabilities for the Funds as of April 30, 2019 are as follows:
INNOVATOR ETFs TRUST
Notes to Financial Statements (Unaudited) (Continued)
The effect of Derivative Investments on the Statement of Assets and Liabilities as of the period ended April 30, 2019
Equity Risk - Call and Put Options not Accounted for as Hedging Instruments | ||||||||
Asset Derivatives | Liability Derivatives | |||||||
Investments, at value | Options written, at value | |||||||
BJAN | $ | 25,159,125 | $ | (1,600,440 | ) | |||
BAPR | 30,738,201 | (1,088,583 | ) | |||||
BJUL | 17,668,746 | (56,862 | ) | |||||
BOCT | 37,307,751 | (492,161 | ) | |||||
PJAN | 86,032,663 | (8,856,488 | ) | |||||
PAPR | 102,237,894 | (4,554,333 | ) | |||||
PJUL | 31,982,039 | (102,499 | ) | |||||
POCT | 100,332,657 | (1,011,081 | ) | |||||
UJAN | 41,781,359 | (4,714,767 | ) | |||||
UAPR | 16,531,625 | (564,489 | ) | |||||
UJUL | 58,425,840 | (75,600 | ) | |||||
UOCT | 91,320,366 | (499,571 | ) | |||||
The effect of Derivative Instruments on the Statement of Operations for the period ended April 30, 2019
Equity Risk - Call and Put Options not Accounted for as Hedging Instruments | ||||||||||||||||
Amount of Realized Gain on Derivatives Recognized in Income | Change in Unrealized Appreciation on Derivatives Recognized in Income | |||||||||||||||
Investments | Options written | Investments | Options written | |||||||||||||
BJAN | $ | (424,495 | ) | $ | (134,027 | ) | $ | 3,721,695 | $ | (135,194 | ) | |||||
BAPR | - | - | 533,953 | 91,914 | ||||||||||||
BJUL | (54,354 | ) | (2,051 | ) | 237,577 | 267,814 | ||||||||||
BOCT | (2,598,462 | ) | (362,900 | ) | 2,883,281 | 1,664,053 | ||||||||||
PJAN | (1,542,809 | ) | (894,483 | ) | 12,678,527 | (3,558,367 | ) | |||||||||
PAPR | - | - | 1,871,567 | (370,521 | ) | |||||||||||
PJUL | - | - | 764,960 | 331,891 | ||||||||||||
POCT | (1,403,714 | ) | 10,422 | 2,924,892 | 2,196,975 | |||||||||||
UJAN | (246,835 | ) | (181,605 | ) | 6,089,422 | (2,951,966 | ) | |||||||||
UAPR | - | - | 367,947 | (108,529 | ) | |||||||||||
UJUL | (1,295,857 | ) | (17,649 | ) | 4,462,308 | 609,866 | ||||||||||
UOCT | (2,337,513 | ) | (73,119 | ) | 5,766,641 | 1,484,703 | ||||||||||
INNOVATOR ETFs TRUST
Notes to Financial Statements (Unaudited) (Continued)
The average volume of derivative activity during the period ended April 30, 2019, is as follows:
Purchased Options | Options Written | |||||||
Average Monthly Market Value | Average Monthly Market Value | |||||||
BJAN | $ | 26,659,872 | $ | (1,313,007 | ) | |||
BAPR | 30,738,201 | (1,088,583 | ) | |||||
BJUL | 7,219,174 | (135,263 | ) | |||||
BOCT | 27,808,086 | (1,207,771 | ) | |||||
PJAN | 91,398,994 | (7,030,651 | ) | |||||
PAPR | 102,237,894 | (4,554,333 | ) | |||||
PJUL | 15,612,702 | (155,821 | ) | |||||
POCT | 46,452,425 | (1,100,481 | ) | |||||
UJAN | 39,370,032 | (3,257,765 | ) | |||||
UAPR | 16,531,625 | (564,489 | ) | |||||
UJUL | 43,191,786 | (207,203 | ) | |||||
UOCT | 70,635,562 | (839,895 | ) | |||||
Use of Estimates:
In preparing financial statements in conformity with U.S. GAAP, management is required to make estimates and assumptions that affect the reported amounts of assets and liabilities and disclosure of contingent assets and liabilities as of the date of the financial statements and the reported amounts of increases and decreases in net assets from operations during the reporting period. Actual results could differ from these estimates.
Federal Income Taxes:
The Funds intend to meet the requirements of the Internal Revenue Code (the “Code”) applicable to regulated investment companies and to distribute substantially all net investment taxable income and net capital gains to shareholders in a manner which results in no tax cost to the Funds. Therefore, no federal income or excise tax provision is recorded.
Management of the Funds has reviewed the Funds’ tax positions for all open tax years (the prior three years of tax filings or since inception, if shorter) and major jurisdictions and concluded that there is no tax liability resulting from unrecognized tax benefits relating to uncertain tax positions taken or expected to be taken on the tax returns for the fiscal periods ended October 31, 2018. The Funds are also not aware of any tax position for which it is reasonably possible that the total amounts of unrecognized tax benefits will significantly change in the next year. The Funds recognize interest and penalties, if any, related to unrecognized tax benefits as income tax expense in the Statement of Operations. During the period ended April 30, 2019, the Funds did not incur any interest or penalties.
INNOVATOR ETFs TRUST
Notes to Financial Statements (Unaudited) (Continued)
U.S. GAAP requires that certain components of net assets be reclassified between financial and tax reporting. These reclassifications have no effect on net assets or net asset value per share. For the period ended October 31, 2018, the Funds made no such permanent book-to-tax reclassifications.
Distributions to Shareholders:
The Funds intend to declare and distribute net investment income, if any, as dividends annually. Distributions of net realized capital gains, if any, will be declared and paid at least annually by the Funds. Distributions to shareholders are recorded on the ex-dividend date. The Funds may periodically make reclassifications among certain of its capital accounts as a result of the recognition and characterization of certain income and capital gain distributions determined annually in accordance with federal tax regulations which may differ from U.S. GAAP.
Guarantees and Indemnifications:
In the normal course of business, the Trust may enter into a contract with service providers that contain general indemnification clauses. The Trust’s maximum exposure under these arrangements is unknown as this would involve future claims against the Trust that have not yet occurred. Based on experience, the Trust expects the risk of loss to be remote.
Other:
Investment transactions are recorded on the trade date. The Trust determines the gain or loss realized from investment transactions on the basis of identified cost. Dividend income is recognized on the ex-dividend date and interest income is recognized on an accrual basis using the effective yield method.
INNOVATOR ETFs TRUST
Notes to Financial Statements (Unaudited) (Continued)
3. | INVESTMENT ADVISOR AND OTHER AFFILIATES |
Innovator Capital Management, LLC (the “Adviser”) acts as investment adviser to the Funds pursuant to a investment advisory agreement between the Trust and the Adviser with respect to the Funds (“Advisory Agreement”) and, pursuant to the Advisory Agreement, is responsible for the day-to-day management of the Funds.
Pursuant to an investment advisory agreement between the Trust and the Adviser with respect to the Funds, each respective Fund pays monthly the Adviser a unitary fee calculated daily based on the average daily net assets of the Fund at the annual rate of 0.79%. Out of the unitary management fee, the Adviser is obligated to pay or arrange for the payment of substantially all expenses of the Funds (“Fund Expenses”), including the cost of transfer agency, custody, fund administration, legal, audit, and other services and license fees, except for interest, taxes, brokerage commissions and other expenses connected with the execution of portfolio transactions, distribution and service fees payable pursuant to a Rule 12b-1 plan, if any, and extraordinary expenses. The Adviser’s unitary management fee is designed to cause substantially all of the Fund’s expenses to be paid and to compensate the Adviser for providing services for the Funds.
Milliman Financial Risk Management LLC (the “Sub-Adviser”) acts as sub-adviser to the Funds pursuant to a sub-advisory agreement between the Adviser and the Sub-Adviser with respect to the Funds (“Sub-Advisory Agreement”) and, pursuant to the Sub-Advisory Agreement, is responsible for execution of the Sub-Adviser’s strategy for each of the Funds. The Sub-Adviser is responsible for the day-to-day management of the Funds’ portfolios. Pursuant to the Sub-Advisory Agreement between the Adviser and the Sub-Adviser, the Adviser pays the Sub-Adviser a fee for the services and facilities it provides payable on a monthly basis.
INNOVATOR ETFs TRUST
Notes to Financial Statements (Unaudited) (Continued)
4. | INVESTMENT TRANSACTIONS |
For the period ended April 30, 2019, the Funds had the following purchases and sales of investment securities, other than short-term investments:
Purchases | Sales | |||||||||||||||
U.S. Government | Other | U.S. Government | Other | |||||||||||||
BJAN | $ | – | $ | – | $ | – | $ | – | ||||||||
BAPR | – | 2,711,750 | – | – | ||||||||||||
BJUL | – | – | – | – | ||||||||||||
BOCT | – | – | – | 1,505,672 | ||||||||||||
PJAN | – | – | – | – | ||||||||||||
PAPR | – | 2,710,918 | – | – | ||||||||||||
PJUL | – | – | – | – | ||||||||||||
POCT | – | – | – | 1,757,589 | ||||||||||||
UJAN | – | – | – | – | ||||||||||||
UAPR | – | 2,630,710 | – | – | ||||||||||||
UJUL | – | – | – | – | ||||||||||||
UOCT | – | – | – | 1,316,408 | ||||||||||||
For the period ended April 30, 2019, the Funds did not have in-kind transactions associated with creations and redemptions.
5. | FEDERAL INCOME TAX INFORMATION |
At October 31, 2018, gross unrealized appreciation and depreciation of investments, based on cost for federal income tax purposes were as follows:
BJUL | BOCT | PJUL | POCT | UJUL | UOCT | |||||||||||||||||||
Cost of Portfolio | $ | 3,693,023 | $ | 21,071,926 | $ | 3,715,360 | $ | 10,587,427 | $ | 3,704,963 | $ | 13,585,752 | ||||||||||||
Gross Unrealized Appreciation | $ | – | $ | – | $ | – | $ | – | $ | – | $ | – | ||||||||||||
Gross Unrealized Depreciation | – | – | – | – | – | – | ||||||||||||||||||
Net Unrealized Appreciation / (Depreciation) | $ | – | $ | – | $ | – | $ | – | $ | – | $ | – | ||||||||||||
The differences between book basis and tax basis cost on investments is primarily attributable to non-equity options marked-to-market.
INNOVATOR ETFs TRUST
Notes to Financial Statements (Unaudited) (Continued)
As of October 31, 2018, the components of accumulated earnings on a tax basis were as follows:
BJUL | BOCT | PJUL | POCT | UJUL | UOCT | |||||||||||||||||||
Accumulated Capital and Other Losses | $ | (116,869 | ) | $ | (111,397 | ) | $ | (78,693 | ) | $ | (219,104 | ) | $ | (89,993 | ) | $ | (119,861 | ) | ||||||
Other Gains / (Losses) | – | – | – | – | – | – | ||||||||||||||||||
Undistributed Net Ordinary Income | – | – | – | – | – | – | ||||||||||||||||||
Unrealized Appreciation/(Depreciation) on Investments | – | – | – | – | – | – | ||||||||||||||||||
Total Distributable Earnings/(Accumulated Deficit) | $ | (116,869 | ) | $ | (111,397 | ) | $ | (78,693 | ) | $ | (219,104 | ) | $ | (89,993 | ) | $ | (119,861 | ) | ||||||
At October 31, 2018, the Funds deferred the following post-October losses or late year ordinary losses:
BJUL | BOCT | PJUL | POCT | UJUL | UOCT | |||||||||||||||||||
Post-October Losses | $ | – | $ | – | $ | – | $ | – | $ | – | $ | – | ||||||||||||
Late Year Ordinary Losses | 4,814 | 5,862 | 5,788 | 4,227 | 5,783 | 3,454 | ||||||||||||||||||
At October 31, 2018, the Funds had capital loss carryforwards as indicated below:
BJUL | BOCT | PJUL | POCT | UJUL | UOCT | |||||||||||||||||||
Indefinite Short-Term | $ | 44,822 | $ | 42,214 | $ | 29,162 | $ | 85,951 | $ | 33,684 | $ | 46,563 | ||||||||||||
Indefinite Long-Term | 67,233 | 63,321 | 43,743 | 128,926 | 50,526 | 69,844 | ||||||||||||||||||
The Funds did not pay any distributions during the fiscal period ended October 31, 2018.
INNOVATOR ETFs TRUST
Notes to Financial Statements (Unaudited) (Continued)
6. OFFERING PRICE PER SHARE
Shares of the Funds are listed and traded on the Cboe BZX Exchange, Inc. Market prices for the shares may be different from their net asset value (“NAV”). The Funds issue and redeem shares on a continuous basis at NAV only in blocks of 25,000 shares, called “Creation Units.” Creation Units are issued and redeemed principally for cash. Once created, shares generally trade in the secondary market at market prices that change throughout the day in amounts less than a Creation Unit. Except when aggregated in Creation Units, shares are not redeemable securities of the Funds. Shares of the Funds may only be purchased or redeemed by certain financial institutions (“Authorized Participants”). An Authorized Participant is either (i) a broker-dealer or other participant in the clearing process through the Continuous Net Settlement System of the National Securities Clearing Corporation or (ii) a DTC participant and, in each case, must have executed a Participant Agreement with the Distributor. A transaction fee is applicable to each transaction regardless of the number of units purchased or sold in the transaction. The Funds assess investors a transaction fee of $250 plus 0.05% of the value of the transaction on creations and redemptions of the respective Fund. Most retail investors do not qualify as Authorized Participants nor have the resources to buy and sell whole Creation Units. Therefore, they are unable to purchase or redeem the shares directly from the Funds. Rather, most retail investors may purchase shares in the secondary market with the assistance of a broker and are subject to customary brokerage commissions or fees.
7. NEW ACCOUNTING PRONOUNCEMENT
In August 2018, FASB issued ASU 2018-13, Fair Value Measurement (Topic 820): Disclosure Framework—Changes to the Disclosure Requirements for Fair Value Measurement (“ASU 2018-13”). The primary focus of ASU 2018-13 is to improve the effectiveness of the disclosure requirements for fair value measurements. The changes affect all companies that are required to include fair value measurement disclosures. In general, the amendments in ASU 2018-13 are effective for all entities for fiscal years and interim periods within those fiscal years, beginning after December 15, 2019. An entity is permitted to early adopt the removed or modified disclosures upon the issuance of ASU 2018-13 and may delay adoption of the additional disclosures, which are required for public companies only, until their effective date. Management has evaluated ASU 2018-13 and has adopted the disclosure framework.
In August 2018, the Securities and Exchange Commission issued Final Rule Release No. 33-10532, Disclosure Update and Simplification, which in part amends certain disclosure requirements of Regulation S-X that have become redundant, duplicative, overlapping, outdated, or superseded, in light of other Commission disclosure requirements, U.S. Generally Accepted Accounting Principles, or changes in the information environment. The amendments are intended to facilitate the disclosure of information to investors and simplify compliance without significantly altering the total mix of information provided to investors. The effective date for these disclosures is November 5, 2018. Management has evaluated the amendments and their impact and has adopted the disclosure framework.
INNOVATOR ETFs TRUST
Additional Information (Unaudited)
1. | ADDITIONAL DISCLOSURE REGARDING FUND TRUSTEES AND OFFICERS |
Name, Address and Year of Birth | Position with the Trust | Length of Time Served* | Principal Occupation(s) During Past 5 Years | Number of Portfolios in Fund Complex Overseen by Trustee or Officer | Other Directorships Held by Trustee or Officer |
Independent Trustees | |||||
Mark Berg 120 N. Hale Street Suite 200, Wheaton, IL 60187 Year of Birth: 1971 | Trustee | Since 2017 | Founding Principal and Chief Executive Officer (May 2019-present), Founding Principal and President (2001-May 2019), Timothy Financial Counsel Inc. | 18 | None |
Joe Stowell 120 N. Hale Street Suite 200, Wheaton, IL 60187 Year of Birth: 1968 | Trustee | Since 2017 | Chief Operating Officer, Woodmen Valley Chapel (September 2015-present); Executive Vice President and Chief Operating Officer, English Language Institute/China (2007-2015). | 18 | Board of Advisors, Westmont College |
Brian J. Wildman 120 N. Hale Street Suite 200, Wheaton, IL 60187 Year of Birth: 1963 | Trustee | Since 2017 | President, Timothy Financial Counsel Inc. (May 2019-present); Executive Vice President, Consumer Banking (March 2016-May 2019), Chief Risk Officer (April 2013-March 2016), Head of Wealth Management (2003-2013) and Head of Commercial Services (2010-2013), MB Financial Bank. | 18 | MB Financial Bank (2003-May 2019); Missionary Furlough Homes, Inc. (since 2008). |
INNOVATOR ETFs TRUST
Additional Information (Unaudited) (Continued)
Interested Trustee & Officer | |||||
H. Bruce Bond (a) 120 N. Hale Street Suite 200, Wheaton, IL 60187 Year of Birth: 1963 | Interested Trustee, President and Principal Executive Officer | Since 2017 | Chief Executive Officer of Innovator Capital Management, LLC (May 2017-present); formerly Chairman (2010-2013) and President and CEO (2006-2010), Invesco PowerShares Capital Management LLC; formerly Co-Founder, President and CEO, PowerShares Capital Management (2002-2006); formerly Chairman; PowerShares Fund Board (2002-2013). | 18 | None |
Officers | |||||
John W. Southard 120 N. Hale Street, Suite 200, Wheaton, IL 60187 Year of Birth: 1969 | Vice President, Treasurer and Principal Financial Accounting Officer | Since May 2017 | Chief Investment Officer, Innovator Capital Management, LLC (May 2017-present); Director and Co-Founder, T2 Capital Management, LLC (2010-present). | 18 | Independent Trustee, ETF Managers Group, LLC (2012 - March 8, 2018) |
James Nash (b) 10 High Street, Suite 302, Boston, MA 02110 Year of Birth: 1981 | Chief Compliance Officer and Anti-Money Laundering Officer | Since June 2018 | Fund Chief Compliance Officer, Foreside Fund Officer Services, LLC (2016-Present); Senior Associate and Regulatory Administration Advisor, JPMorgan Chase & Co. (2014-2016); Product Analyst, Linedata Services (2011-2014). | 18 | None |
* | The Funds’ Trustees serve for an indefinite term until their resignation, death or removal. The Funds’ officers are elected annually by the Board and serve at the Board’s pleasure. |
(a) | H. Bruce Bond is deemed to be an interested person of the Trust (as defined in the 1940 Act) because of his affiliation with the Adviser. |
(b) | Jim Nash is an employee of Foreside Fund Officer Services, LLC, a wholly-owned subsidiary of the Funds’ principal underwriter. |
The Statement of Additional Information includes additional information about the Trustees and is available upon request, without charge, by calling 1-877-386-3890.
INNOVATOR ETFs TRUST
Additional Information (Unaudited) (Continued)
2. | BOARD CONSIDERATIONS REGARDING APPROVAL OF INVESTMENT MANAGEMENT AGREEMENT AND INVESTMENT SUB-ADVISORY AGREEMENT FOR THE INNOVATOR S&P 500® BUFFER ETF-JANUARY, INNOVATOR S&P 500® POWER BUFFER ETF-JANUARY AND INNOVATOR S&P 500® ULTRA BUFFER ETF-JANUARY |
At a quarterly in-person Board meeting held on December 17, 2018, the Trust’s Board considered approval of the Advisory Agreements with Innovator Capital Management, LLC (the “Adviser”), on behalf of the Innovator S&P 500® Buffer ETF – January, Innovator S&P 500® Power Buffer ETF – January and Innovator S&P 500® Ultra Buffer ETF – January ETFs (the “Funds”), and the Sub-Advisory Agreements among the Trust, on behalf of the Funds, the Adviser and Milliman Financial Risk Management LLC (the “Sub-Adviser”), for an initial two-year term. The Board determined that the agreements were in the best interests of the Funds in light of the extent and quality of the services expected to be provided and such other matters as the Board considered to be relevant in the exercise of its reasonable business judgment.
To reach this determination, the Board considered its duties under the Investment Company Act of 1940, as amended (the “1940 Act”), as well as under the general principles of state law in reviewing and approving advisory contracts; the requirements of the 1940 Act in such matters; the fiduciary duty of investment advisers with respect to advisory agreements and compensation; the standards used by courts in determining whether investment company boards have fulfilled their duties; and the factors to be considered by the Board in voting on such agreements. To assist the Board in its evaluation of the agreements, the Independent Trustees received a separate report from each of the Adviser and the Sub-Adviser in advance of the Meeting responding to a request for information provided on behalf of the Independent Trustees that, among other things, outlined the services to be provided by the Adviser and the Sub-Adviser to the Funds (including the relevant personnel responsible for these services and their experience); the proposed unitary fee rate payable by each Fund as compared to fees charged to peer groups of the Funds and as compared to fees charged to other clients of the Adviser and the Sub-Adviser, including other ETFs managed by the Adviser and the Sub-Adviser; the estimated expenses of the Funds as compared to expense ratios of the funds in the respective Fund’s peer group; the nature of the expenses to be incurred in providing services to the Funds and the potential for economies of scale, if any; financial data on the Adviser and the Sub-Adviser; any fall-out benefits accruing to the Adviser or the Sub-Adviser; and information on the Adviser’s and the Sub-Adviser’s compliance programs. The Independent Trustees also met separately with their Independent Counsel to discuss the information provided by the Adviser and the Sub-Adviser. The Board applied its business judgment to determine whether the arrangements between the Trust and the Adviser and among the Trust, the Adviser and the Sub-Adviser are reasonable business arrangements from each Fund’s perspective as well as from the perspective of each Fund’s shareholders.
INNOVATOR ETFs TRUST
Additional Information (Unaudited) (Continued)
In evaluating whether to approve the agreements, the Board applied its business judgment and considered the nature, extent and quality of the services to be provided by the Adviser and Milliman pursuant to the agreements. With respect to the investment management agreement, the Board considered that the Adviser will be responsible for the overall management and administration of the Funds and reviewed all of the services to be provided by the Adviser to the Funds, including oversight of Milliman, as well as the background and experience of the persons responsible for such services. The Board noted that the Adviser will oversee Milliman’s day-to-day management of each of the Fund’s investments, including portfolio risk monitoring and performance review. In reviewing the services to be provided, the Board noted the compliance program that had been developed by the Adviser included an adequate program for monitoring the Adviser’s, Milliman’s and each Fund’s compliance with the 1940 Act, as well as each Fund’s compliance with its investment objective and policies. With respect to the sub-advisory agreement, the Board reviewed the materials provided by Milliman and noted the background and experience of Milliman’s portfolio management team and Milliman’s investment style. In light of the information presented and the considerations made, the Board concluded that the nature, extent and quality of the services to be provided to the Funds by the Adviser and Milliman under the agreements were expected to be satisfactory.
Since the Funds had yet to commence investment operations, the Board could not consider the historical investment performance of the Funds.
The Board considered the proposed unitary fee rate payable by each Fund under the investment management agreement for the services to be provided. The Board noted that, under the unitary fee arrangement, each Fund would pay the Adviser a unitary fee equal to an annual rate of 0.79% of its average daily net assets. The Board considered that, from the unitary fee for each of the Funds, the Adviser would pay Milliman an annual sub-advisory fee equal to 0.12% on the Fund assets under management.
The Board noted that the Adviser would be responsible for the Funds’ expenses, including the cost of transfer agency, custody, fund administration, legal, audit and other services and license fees (if any), but excluding the fee payment under the investment management agreement, interest, taxes, brokerage commissions and other expenses connected with the execution of portfolio transactions, and extraordinary expenses. The Board received and reviewed information for the Funds showing the advisory fee rates and expense ratios of the funds comprising of each Fund’s peer group, as well as advisory fee rates charged by the Adviser and Milliman to other funds (including ETFs) and non-fund clients, as applicable. In light of the information considered and the nature, extent and quality of the services expected to be provided to the Funds under the agreements, the Board determined that the proposed unitary fee for each of the Funds, including the fee rate to be paid by the Adviser to Milliman from the unitary fee, was fair.
INNOVATOR ETFs TRUST
Additional Information (Unaudited) (Continued)
The Board noted that the proposed unitary fee for each of the Funds were structured to pass the benefits of any economies of scale on to shareholders as the respective Fund’s assets grow. The Board noted that any reduction in fixed costs associated with the management of the respective Fund would benefit the Adviser and Milliman, but that the unitary fee structure provides a level of certainty in expenses for each of the Funds. The Board noted that the Adviser is continuing to invest in personnel and infrastructure for the Innovator fund complex.
Because the Funds have not yet commenced operations and the actual asset base of the Funds have not yet been determined, the Board noted that there was no historical profitability information with respect to the Funds to be reviewed. The Board noted that it would review profitability information in connection with subsequent renewals of the agreements. The Board also noted that, as a startup, the Adviser will likely have little to no profitability in the first few years of the Funds’ operation.
The Board considered potential “fall-out” or ancillary benefits anticipated to be received by the Adviser and Milliman. The Board concluded that the character and amount of potential fall-out benefits to the Adviser and Milliman were consistent with the types of benefits generally derived by investment managers and sub-advisers to funds.
Based on all of the information considered and the conclusions reached, the Board, including the Independent Trustees, unanimously determined that the terms of the agreements are fair and that the approval of the agreements is in the best interests of the Funds. No single factor was determinative in the Board’s analysis.
INNOVATOR ETFs TRUST
Additional Information (Unaudited) (Continued)
BOARD CONSIDERATIONS REGARDING APPROVAL OF INVESTMENT MANAGEMENT AGREEMENT AND INVESTMENT SUB-ADVISORY AGREEMENT FOR THE INNOVATOR S&P 500® BUFFER ETF-APRIL, INNOVATOR S&P 500® POWER BUFFER ETF-APRIL AND INNOVATOR S&P 500® ULTRA BUFFER ETF-APRIL
At a quarterly in-person Board meeting held on March 21, 2019, the Trust’s Board considered approval of the Advisory Agreements with Innovator Capital Management, LLC (the “Adviser”), on behalf of the Innovator S&P 500® Buffer ETF – April, Innovator S&P 500® Power Buffer ETF – April and Innovator S&P 500® Ultra Buffer ETF – April ETFs (the “Funds”), and the Sub-Advisory Agreements among the Trust, on behalf of the Funds, the Adviser and Milliman Financial Risk Management LLC (the “Sub-Adviser”), for an initial two-year term. The Board determined that the agreements were in the best interests of the Funds in light of the extent and quality of the services expected to be provided and such other matters as the Board considered to be relevant in the exercise of its reasonable business judgment.
To reach this determination, the Board considered its duties under the Investment Company Act of 1940, as amended (the “1940 Act”), as well as under the general principles of state law in reviewing and approving advisory contracts; the requirements of the 1940 Act in such matters; the fiduciary duty of investment advisers with respect to advisory agreements and compensation; the standards used by courts in determining whether investment company boards have fulfilled their duties; and the factors to be considered by the Board in voting on such agreements. To assist the Board in its evaluation of the agreements, the Independent Trustees received a separate report from each of the Adviser and the Sub-Adviser in advance of the Meeting responding to a request for information provided on behalf of the Independent Trustees that, among other things, outlined the services to be provided by the Adviser and the Sub-Adviser to the Funds (including the relevant personnel responsible for these services and their experience); the proposed unitary fee rate payable by each Fund as compared to fees charged to peer groups of the Funds and as compared to fees charged to other clients of the Adviser and the Sub-Adviser, including other ETFs managed by the Adviser and the Sub-Adviser; the estimated expenses of the Funds as compared to expense ratios of the funds in the respective Fund’s peer group; the nature of the expenses to be incurred in providing services to the Funds and the potential for economies of scale, if any; financial data on the Adviser and the Sub-Adviser; any fall-out benefits accruing to the Adviser or the Sub-Adviser; and information on the Adviser’s and the Sub-Adviser’s compliance programs. The Independent Trustees also met separately with their Independent Counsel to discuss the information provided by the Adviser and the Sub-Adviser. The Board applied its business judgment to determine whether the arrangements between the Trust and the Adviser and among the Trust, the Adviser and the Sub-Adviser are reasonable business arrangements from each Fund’s perspective as well as from the perspective of each Fund’s shareholders.
INNOVATOR ETFs TRUST
Additional Information (Unaudited) (Continued)
In evaluating whether to approve the agreements, the Board applied its business judgment and considered the nature, extent and quality of the services to be provided by the Adviser and Milliman pursuant to the agreements. With respect to the investment management agreement, the Board considered that the Adviser will be responsible for the overall management and administration of the Funds and reviewed all of the services to be provided by the Adviser to the Funds, including oversight of Milliman, as well as the background and experience of the persons responsible for such services. The Board noted that the Adviser will oversee Milliman’s day-to-day management of each of the Fund’s investments, including portfolio risk monitoring and performance review. In reviewing the services to be provided, the Board noted the compliance program that had been developed by the Adviser included an adequate program for monitoring the Adviser’s, Milliman’s and each Fund’s compliance with the 1940 Act, as well as each Fund’s compliance with its investment objective and policies. With respect to the sub-advisory agreement, the Board reviewed the materials provided by Milliman and noted the background and experience of Milliman’s portfolio management team and Milliman’s investment style. In light of the information presented and the considerations made, the Board concluded that the nature, extent and quality of the services to be provided to the Funds by the Adviser and Milliman under the agreements were expected to be satisfactory.
Since the Funds had yet to commence investment operations, the Board could not consider the historical investment performance of the New Funds.
The Board considered the proposed unitary fee rate payable by each Fund under the investment management agreement for the services to be provided. The Board noted that, under the unitary fee arrangement, each Fund would pay the Adviser a unitary fee equal to an annual rate of 0.79% of its average daily net assets. The Board considered that, from the unitary fee for each of the Funds, the Adviser would pay Milliman an annual sub-advisory fee equal to 0.12% on the Fund assets under management.
The Board noted that the Adviser would be responsible for the Funds’ expenses, including the cost of transfer agency, custody, fund administration, legal, audit and other services and license fees (if any), but excluding the fee payment under the investment management agreement, interest, taxes, brokerage commissions and other expenses connected with the execution of portfolio transactions, and extraordinary expenses. The Board received and reviewed information for the Funds showing the advisory fee rates and expense ratios of the funds comprising of each Fund’s peer group, as well as advisory fee rates charged by the Adviser and Milliman to other funds (including ETFs) and non-fund clients, as applicable. In light of the information considered and the nature, extent and quality of the services expected to be provided to the Funds under the agreements, the Board determined that the proposed unitary fee for each of the Funds, including the fee rate to be paid by the Adviser to Milliman from the unitary fee, was fair.
INNOVATOR ETFs TRUST
Additional Information (Unaudited) (Continued)
The Board noted that the proposed unitary fee for each of the Funds were structured to pass the benefits of any economies of scale on to shareholders as the respective Fund’s assets grow. The Board noted that any reduction in fixed costs associated with the management of the respective Fund would benefit the Adviser and Milliman, but that the unitary fee structure provides a level of certainty in expenses for each of the Funds. The Board noted that the Adviser is continuing to invest in personnel and infrastructure for the Innovator fund complex.
Because the Funds have not yet commenced operations and the actual asset base of the Funds have not yet been determined, the Board noted that there was no historical profitability information with respect to the Funds to be reviewed. The Board noted that it would review profitability information in connection with subsequent renewals of the agreements. The Board also noted that, as a startup, the Adviser will likely have little to no profitability in the first few years of the Funds’ operation.
The Board considered potential “fall-out” or ancillary benefits anticipated to be received by the Adviser and Milliman. The Board concluded that the character and amount of potential fall-out benefits to the Adviser and Milliman were consistent with the types of benefits generally derived by investment managers and sub-advisers to funds.
Based on all of the information considered and the conclusions reached, the Board, including the Independent Trustees, unanimously determined that the terms of the agreements are fair and that the approval of the agreements is in the best interests of the Funds. No single factor was determinative in the Board’s analysis.
INNOVATOR ETFs TRUST
Additional Information (Unaudited) (Continued)
3. INFORMATION ABOUT PROSPECTUS
This report has been prepared for shareholders and may be distributed to others only if preceded or accompanied by a current prospectus. Investors should consider the investment objective and policies, risk considerations, charges and ongoing expenses of an investment carefully before investing. The prospectus contains this and other information relevant to an investment in the respective Fund. Please read the Prospectus carefully before investing. A copy of the Prospectus may be obtained without charge by writing to the Trust’s Distributor, or by calling toll free at 1-800-208-5212 or visiting www.innovatoretfs.com.
4. PROXY VOTING POLICIES AND PROCEDURE
The Trust’s Proxy Voting Policies and Procedures are available without charge, upon request, by calling 1-877-386-3890 and on the SEC’s website at www.sec.gov. Information relating to how each Fund voted proxies relating to portfolio securities held during each year ended June 30 is also available on the SEC’S website at www.sec.gov.
5. INFORMATION ABOUT PORTFOLIO SECURITIES
Each Funds’ complete schedule of portfolio holdings for the first and third quarters is filed with the SEC on Form N-Q. The Trust’s Form N-Q is available without charge, upon request, by calling 1-877-386-3890, or on the SEC’s website at www.sec.gov. The Trust’s Form N-Q may be reviewed and copied at the SEC’s Public Reference Room in Washington, DC. Information on the operation of the Public Reference Room may be obtained by calling 1-800-SEC-0330.
6. HOUSEHOLD DELIVERY OF SHAREHOLDER DOCUMENTS
In order to reduce expenses, the Trust delivers one copy of an annual/semi-annual report, prospectus and/or proxy statement on behalf of two or more shareholders at a shared address (householding). If you do not wish to participate in householding, please indicate this preference on your new account application (if you are opening a new account) or call 1-877-FUND890 (877-386-3890) to change the status of your existing account. You may change your status at any time.
7. ELECTRONIC DELIVERY OF SHAREHOLDER DOCUMENTS
You may choose to receive a Fund’s prospectus and annual and semi-annual reports electronically. To sign up for electronic delivery, visit www.icsdelivery.com and select the first letter of your brokerage firm’s name. Then, select your brokerage institution from the list that follows, fill out the appropriate information and provide an e-mail address where you would like your information sent. If your brokerage firm is not listed, electronic delivery may not be available. Please contact your brokerage firm or financial adviser.
INVESTMENT ADVISOR
Innovator Capital Management, LLC
120 North Hale Street, Suite 200
Wheaton, IL 60187
INVESTMENT SUB-ADVISOR
Milliman Financial Risk Management LLC
71 S. Wacker Drive, 31st Floor
Chicago, IL 60606
ADMINISTRATOR, FUND ACCOUNTANT & TRANSFER AGENT
U.S. Bancorp Fund Services, LLC
615 East Michigan Street
Milwaukee, WI 53202
DISTRIBUTOR
Foreside Fund Services, LLC
Three Canal Plaza
Portland, ME 04101
CUSTODIAN
U.S. Bank, N.A.
1555 North RiverCenter Drive, Suite 302
Milwaukee, WI 53212
LEGAL COUNSEL
Chapman and Cutler LLP
111 West Monroe Street
Chicago, IL 60603
INDEPENDENT REGISTERED PUBLIC ACCOUNTING FIRM
Cohen & Company, Ltd.
1350 Euclid Ave., Suite 800
Cleveland, OH 44115
Item 2. Code of Ethics.
Not applicable for semi-annual reports.
Item 3. Audit Committee Financial Expert.
Not applicable for semi-annual reports.
Item 4. Principal Accountant Fees and Services.
Not applicable for semi-annual reports.
Item 5. Audit Committee of Listed Registrants.
Not applicable to registrants who are not listed issuers (as defined in Rule 10A-3 under the Securities Exchange Act of 1934).
The registrant is an issuer as defined in Rule 10A-3 under the Securities Exchange Act of 1934, (the “Act”) and has a separately-designated standing audit committee established in accordance with Section 3(a)(58)(A) of the Act. The independent members of the committee, consisting of the entire Board, are as follows: Brian Wildman, Joe Stowell and Mark Berg.
Item 6. Investments.
(a) | Schedule of Investments is included as part of the report to shareholders filed under Item 1 of this Form. | |
| (b) | Not Applicable |
Item 7. Disclosure of Proxy Voting Policies and Procedures for Closed-End Management Investment Companies.
Not applicable to open-end investment companies.
Item 8. Portfolio Managers of Closed-End Management Investment Companies.
Not applicable to open-end investment companies.
Item 9. Purchases of Equity Securities by Closed-End Management Investment Company and Affiliated Purchasers.
Not applicable to open-end investment companies.
Item 10. Submission of Matters to a Vote of Security Holders.
There have been no material changes to the procedures by which shareholders may recommend nominees to the registrant’s board of trustees.
Item 11. Controls and Procedures.
(a) The Registrant’s Principal Executive Officer and Principal Financial Officer have reviewed the Registrant's disclosure controls and procedures (as defined in Rule 30a-3(c) under the Investment Company Act of 1940 (the “Act”)) as of a date within 90 days of the filing of this report, as required by Rule 30a-3(b) under the Act and Rules 13a-15(b) or 15d-15(b) under the Securities Exchange Act of 1934. Based on their review, such officers have concluded that the disclosure controls and procedures are effective in ensuring that information required to be disclosed in this report is appropriately recorded, processed, summarized and reported and made known to them by others within the Registrant and by the Registrant’s service provider.
(b) There were no changes in the Registrant's internal control over financial reporting (as defined in Rule 30a-3(d) under the Act) that occurred during the second fiscal quarter of the period covered by this report that have materially affected, or are reasonably likely to materially affect, the Registrant's internal control over financial reporting.
Item 12. Disclosure of Securities Lending Activities for Closed-End Management Investment Companies
Not applicable to open-end investment companies.
Item 13. Exhibits.
(a) (1) Any code of ethics or amendment thereto, that is the subject of the disclosure required by Item 2, to the extent that the registrant intends to satisfy Item 2 requirements through filing an exhibit. Not Applicable.
(2) A separate certification for each principal executive officer and principal financial officer pursuant to Section 302 of the Sarbanes-Oxley Act of 2002. Filed herewith.
(3) Any written solicitation to purchase securities under Rule 23c-1 under the Act sent or given during the period covered by the report by or on behalf of the registrant to 10 or more persons. Not applicable to open-end investment companies.
(4) Change in the registrant’s independent public accountant. Not Applicable.
(b) Certifications pursuant to Section 906 of the Sarbanes-Oxley Act of 2002. Furnished herewith.
SIGNATURES
Pursuant to the requirements of the Securities Exchange Act of 1934 and the Investment Company Act of 1940, the registrant has duly caused this report to be signed on its behalf by the undersigned, thereunto duly authorized.
(Registrant) Innovator ETFs Trust
By (Signature and Title)* /s/ Bruce Bond
Bruce Bond, Principal Executive Officer
Date 6/24/2019
Pursuant to the requirements of the Securities Exchange Act of 1934 and the Investment Company Act of 1940, this report has been signed below by the following persons on behalf of the registrant and in the capacities and on the dates indicated.
By (Signature and Title)* /s/ Bruce Bond
Bruce Bond, Principal Executive Officer
Date 6/24/2019
By (Signature and Title)* /s/ John Southard
John Southard, Principal Financial Officer
Date 6/24/2019
* Print the name and title of each signing officer under his or her signature.