UNITED STATES
SECURITIES AND EXCHANGE COMMISSION
Washington, D.C. 20549
FORM N-CSR
CERTIFIED SHAREHOLDER REPORT OF REGISTERED MANAGEMENT INVESTMENT COMPANIES
Investment Company Act file number 811-22227
IndexIQ ETF Trust
(Exact name of registrant as specified in charter)
800 Westchester Ave., Suite S-710
Rye Brook, NY 10573
(Address of principal executive offices) (Zip code)
Adam S. Patti
IndexIQ Advisors LLC
800 Westchester Ave., Suite S-710
Rye Brook, NY 10573
(Name and address of agent for service)
Registrant's telephone number, including area code: 1-888-934-0777
Date of fiscal year end: April 30
Date of reporting period: April 30, 2015
Form N-CSR is to be used by management investment companies to file reports with the Commission not later than 10 days after the transmission to stockholders of any report that is required to be transmitted to stockholders under Rule 30e-1 under the Investment Company Act of 1940 (17 CFR 270.30e-1). The Commission may use the information provided on Form N-CSR in its regulatory, disclosure review, inspection, and policymaking roles.
A registrant is required to disclose the information specified by Form N-CSR, and the Commission will make this information public. A registrant is not required to respond to the collection of information contained in Form N-CSR unless the Form displays a currently valid Office of Management and Budget ("OMB") control number. Please direct comments concerning the accuracy of the information collection burden estimate and any suggestions for reducing the burden to Secretary, Securities and Exchange Commission, 100 F Street, NE, Washington, DC 20549. The OMB has reviewed this collection of information under the clearance requirements of 44 U.S.C. § 3507.
Item 1. Reports to Stockholders.
The Report to Shareholders is attached herewith.
ANNUAL REPORT | APRIL 30, 2015
IndexIQ ETF Trust
IQ Hedge Multi-Strategy Tracker ETF (QAI)
IQ Hedge Macro Tracker ETF (MCRO)
IQ Hedge Market Neutral Tracker ETF (QMN)
IQ Hedge Long/Short Tracker ETF (QLS)
IQ Hedge Event-Driven Tracker ETF (QED)
IQ Global Resources ETF (GRES)
IQ Merger Arbitrage ETF (MNA)
IQ Real Return ETF (CPI)
IQ Australia Small Cap ETF (KROO)
IQ Canada Small Cap ETF (CNDA)
IQ Global Agribusiness Small Cap ETF (CROP)
IQ Global Oil Small Cap ETF (IOIL)
IQ U.S. Real Estate Small Cap ETF (ROOF)

The investment return and value of each of the Funds’ shares will fluctuate so that an investor’s shares, when sold, may be worth more or less than their original cost. Performance may be lower or higher than performance data quoted. Consider the Funds’ investment objectives, risks, charges and expenses carefully before investing. The prospectus and the statement of additional information include this and other relevant information about the Funds and are available by visiting www.indexiq.com or by calling 1-888-934-0777. Read the prospectus carefully before investing.
Each of the Funds’ performance that is current to the most recent month-end is available by visiting www.indexiq.com or by calling 1-888-934-0777.
You may obtain a description of the IndexIQ ETF Trust proxy voting, policies, procedures and information regarding how each Fund voted proxies relating to portfolio securities during the 12-month period ending June 30 (available by August 31) without charge, upon request, by calling 1-888-934-0777 or by accessing the SEC’s website at www.sec.gov. Such reports may be reviewed and copied at the SEC’s Public Reference Room in Washington, DC. Information on the operation of the Public Reference Room may be obtained by calling 800.SEC.0330.
The Funds file their complete schedules of portfolio holdings with the Commission for the first and third quarters of each fiscal year on Form N-Q. The Funds’ Forms N-Q are available on the Commission’s web site at www.sec.gov. The Funds’ Forms N-Q also may be reviewed and copied at the Commission’s Public Reference Room in Washington, DC; information on the operation of the Public Reference Room may be obtained by calling 1-800-SEC-0330.
Each Funds’ premium/discount information is available, free of charge, on the Funds’ website, www.indexiq.com or by calling 1-888-934-0777.
The Funds are distributed by ALPS Distributors, Inc., which is not affiliated with IndexIQ or the Funds’ investment advisor.
IndexIQ® and IQ® are registered service marks of IndexIQ.
Help Preserve the Environment — Go Green!
With e-Delivery, you can:
| • | Receive email notifications when your most recent shareholder communications are available for review. |
| • | Access prospectuses, annual reports and semiannual reports online. |
It’s easy to enroll:
| 1. | Visit https://www.icsdelivery.com/live/ |
| 2. | Follow the simple enrollment instructions |
If you have questions about IndexIQ e-Delivery services, contact a representative at 888-934-0777.

| Table of Contents |
| 4 |
| Shareholder Letter (unaudited) |
Dear Shareholder:
We are pleased to present you with the annual report for IndexIQ ETF Trust for the year ended April 30, 2015, the first since the acquisition of IndexIQ by New York Life Investment Management was completed on April 15, 2015.
The annual period was clearly highlighted by the merger of our robust exchange-traded fund (ETF) manufacturing capabilities and market-leading investment solutions with New York Life’s financial strength, reputation and powerful distribution capabilities. Also within the IndexIQ ETF Trust, we introduced two new ETFs, focused on Event-Driven and Long/Short hedge fund strategies, respectively, bringing the number of ETFs within the IndexIQ ETF Trust to 13. With these new ETFs, retail and institutional investors now have the ability to build their own diversified hedge fund replication portfolios by managing the weightings of the various strategies offered by the ETFs within the IndexIQ ETF Trust.
While the integration of IndexIQ into New York Life Investment Management’s family of investment boutiques has been most rewarding, it was a challenging annual period for many ETF shareholders, as high levels of volatility and disparity in performance were evident in the returns of various global asset classes. Despite heated debates about when the U.S. Federal Reserve (the Fed) would increase short-term interest rates, interest rates remained historically low. This low rate environment, coupled with non-inflationary economic growth, powered U.S. equities towards record high levels. Developed international markets, however, did not fare quite as well. Largely stemming from concerns over Greece’s ability to repay debt and the drag of a surging U.S. dollar versus other major world currencies, global investment strategies broadly and European equity markets more specifically had sub-par returns.
The annual period also saw a precipitous drop in oil prices, driven by concerns about global economic growth and increases in U.S.-led oil output. The annual period saw an approximately 40% decline in the price of crude oil, which weighed heavily on commodity prices in general. Indeed, in addition to oil, prices of precious metals, industrial metals, coal and agricultural commodities were weak, albeit somewhat less so. Emerging markets generally were weaker than developed markets on the downward move in oil prices and concerns about economic growth, particularly in China. A partial recovery in oil prices in April 2015 helped the broad emerging market indices to end the annual period with positive returns but not without some sharp moves in both directions.
As interest rates remained stubbornly low, investors continued their search for yield. Real estate investment trusts (REITs) and longer-dated bonds were primary beneficiaries of this trend. Overall, the bond market was bolstered by the low rates, and stronger corporate earnings results helped drive the credit spread, or yield differential to U.S. Treasuries, lower, benefiting below investment- grade bonds more than investment-grade bonds.
The backdrop to all of these asset class returns was low inflation, which enabled the Fed to keep delaying the inevitable hike in interest rates, widely anticipated to occur some time later in 2015.
On the following pages, you will find a detailed discussion of the key factors influencing performance of each of the ETFs in the IndexIQ ETF Trust during the annual period. You will also find a schedule of investments and financial statements for each.
Despite the macro challenges of the annual period, we believe the solutions provided by IndexIQ’s ETFs give investors the opportunity to enhance portfolio construction in a liquid and transparent manner relative to typical alternative asset strategies, and we look forward to adding new and innovative ETF solutions in the future.
We thank you for choosing IndexIQ ETFs, and we honor the responsibility you have placed on us. For more information on our broad array of alternative investment solutions, please visit us at www.indexiq.com or call us at 888-934-0777.
Adam S. Patti
Chief Executive Officer
| 5 |
| Management’s Discussion of Fund Performance (unaudited) |
IQ Hedge Multi-Strategy Tracker ETF
How did IQ Hedge Multi-Strategy Tracker ETF perform during the 12 months ended April 30, 2015?
For the 12 months ended April 30, 2015, IQ Hedge Multi-Strategy Tracker ETF returned 3.90% at NAV (net asset value) and 3.79% at market price.1 To compare, the Fund’s Underlying Index, the IQ Hedge Multi-Strategy Index,2 returned 5.36% for the same time period. The HFRI Fund of Funds Composite Index2 and S&P 500® Index2 returned 6.60% and 12.98%, respectively, for the same period.
What factors affected the Fund’s performance during the reporting period?
The Fund’s net long positions in equity and bond ETFs were the primary positive contributors to returns. Specifically, the Fund’s long position in a convertible bond ETF was the single largest positive contributor to performance. With economic conditions and interest rates favoring both equities and fixed-income instruments during the reporting period, the hybrid characteristics of convertible bonds made this ETF particularly well suited for such conditions. Via underlying ETFs, the Fund’s long position in aggregate bonds also boosted returns, although its short exposure to investment-grade bonds detracted.
Long positions in growth-oriented U.S. equity ETFs contributed positively to the Fund’s performance during the reporting period. However, these gains were partially offset by hedging positions in value-oriented U.S. equity ETFs, which detracted.
Smaller positive contributions came from short positions in currency-based ETFs, particularly a short position in a euro ETF.
During the reporting period, how was the Fund’s performance materially affected by investments in derivatives?
The Fund used derivative positions where necessary to help it track its Underlying Index, which contains both long and short positions. Primarily, the Fund used total return swaps on ETFs to gain exposure to the weightings of the ETFs within the Underlying Index. Derivatives are not used to gain additional leverage, but rather are used exclusively to enable the Fund to track its Underlying Index.
The Fund used derivatives to obtain exposure to long and short positions of the Underlying Index. The long exposures included certain Underlying Index positions, such as the aggregate U.S. bond market, convertible bonds, and U.S. Treasuries. The short exposures included all of the Underlying Index positions, including principally investment grade corporate bonds, U.S. small-and mid-capitalization equities, and the Euro currency.
How were the Fund’s assets allocated during the reporting period and why?
The Fund’s allocations are driven by quantitative models that determine the weights across the various assets within the Underlying Index universe. Given the rules-based nature of the process, there is no subjectivity involved in the allocation decision process.
During the reporting period, the Fund had positive, or long, allocations to the following hedge fund strategies: Long/Short Equity, Equity Market Neutral, Event Driven and Fixed Income Arbitrage. The Fund had negative, or short, allocations to the following hedge fund strategies: Emerging Markets and Global Macro. These allocations are driven by a proprietary quantitative model that overweights strategies with high price momentum, high correlation to the broad hedge fund universe and low total variance. The Fund underweights strategies with the opposite characteristics.
At the asset class level, the Fund was net long in bonds, particularly convertible bonds, aggregate bonds, short-term bonds and floating rate bank loans. The Fund was also net long equities, particularly U.S. growth-oriented equities, as well as real estate investment trusts (REITs). The Fund was net short volatility and currencies, especially the euro, during the reporting period.
How did the Fund’s allocations change over the course of the reporting period?
Based on our proprietary quantitative models, the Fund’s net long equity exposure gradually decreased, primarily via reductions in its underlying ETF positions focused on European equities and U.S. large-cap growth-oriented equities. The assets in the Fund were moved into a short-term bond ETF and a currency harvest strategy ETF. The net effect was a reduction in the overall volatility profile of the Fund.
| 1 | The price used to calculate the market price returns is determined by using the closing price listed on the NYSE Arca and does not represent returns an investor would receive if shares were traded at other times. |
| 2 | See page 7 for more information on this index. |
| 6 |
| Management’s Discussion of Fund Performance (unaudited) (continued) |
During the reporting period, which underlying ETFs had the highest total returns and which underlying ETFs had the lowest total returns?
In terms of total return, the best-performing underlying ETFs in the Fund were Vanguard Growth Index Fund (VUG), iShares Russell 1000 Growth ETF (IWF) and iShares MSCI All Country Asia ex Japan ETF (AAXJ). During the reporting period, ProShares VIX Mid-Term Futures ETF (VIXM), CurrencyShares Euro Trust (FXE) and PowerShares DB Commodity Index Tracking Fund (DBC) recorded the lowest total returns.
Which underlying ETFs were the strongest positive contributors to the Fund’s performance and which underlying ETFs were particularly weak?
On the basis of impact, which takes weightings and total returns into consideration, the underlying ETFs that made the greatest positive contributions to the Fund’s performance during the reporting period were SPDR Barclays Convertible Securities ETF (CWB), iShares Russell 2000 Growth ETF (IWO) and iShares Russell 1000 Growth ETF (IWF). The weakest contributors were iShares Russell 2000 Value ETF (IWN), Vanguard Small Cap Value Index Fund (VBR) and iShares iBoxx USD Investment Grade Corporate Bond ETF (LQD).
The opinions expressed are those of the portfolio managers as of the date of this report and are subject to change. There is no guarantee that any forecast made will come to pass. This material does not constitute investment advice and is not intended as an endorsement of any specific investment.
Hypothetical Growth of a $10,000 Investment (Since Inception Through 4/30/2015)
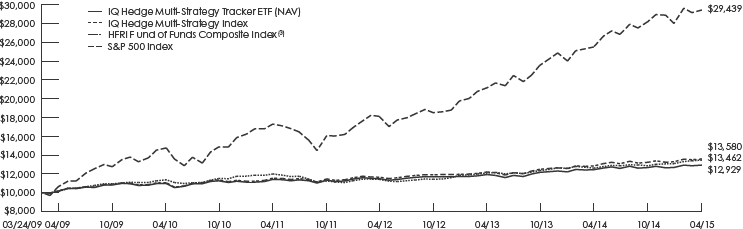
This chart illustrates the performance of a hypothetical $10,000 investment made on the Fund’s inception, and is not intended to imply any future performance.
Fund Performance History
IQ Hedge Multi-Strategy Tracker ETF
(as of April 30, 2015)
| 1 Year | 3 Year | 5 Year | Since Inception1 | |||||||||||||||||
| Average Annual | Average Annual | Average Annual | Average Annual | Cumulative | ||||||||||||||||
| IQ Hedge Multi-Strategy Tracker ETF Market Price2 | 3.79% | 4.03% | 3.36% | 4.29% | 29.22% | |||||||||||||||
| IQ Hedge Multi-Strategy Tracker ETF NAV | 3.90% | 4.03% | 3.33% | 4.30% | 29.29% | |||||||||||||||
| IQ Hedge Multi-Strategy Index | 5.36% | 5.12% | 4.13% | 5.14% | 35.80% | |||||||||||||||
| HFRI Fund of Funds Composite Index3 | 6.60% | 5.66% | 3.44% | 5.01% | 34.62% | |||||||||||||||
| S&P 500 Index | 12.98% | 16.73% | 14.32% | 19.35% | 194.39% | |||||||||||||||
| 1 | Fund Inception Date: 3/24/2009. |
| 2 | The price used to calculate the Market Price returns is determined by using the closing price listed on the NYSE Arca and does not represent returns an investor would receive if shares were traded at other times. |
| 3 | Data shown above for the HFRI Fund of Funds Composite Index is from 3/31/2009 to 4/30/2015. |
| 7 |
| Management’s Discussion of Fund Performance (unaudited) (continued) |
Since the shares of the Fund did not trade in the secondary market until the day after the Fund’s inception, for the period from inception (3/24/2009) to the first day of secondary market trading in shares of the Fund (3/25/2009), the NAV of the Fund is used as a proxy for the secondary market trading price to calculate market returns.
The performance data quoted above represents past performance. Past performance does not guarantee future results. The investment return and value of the Fund shares will fluctuate so that an investor’s shares, when sold, may be worth more or less than their original cost. Current Fund performance may be lower or higher than performance data quoted. Fund performance that is current to the most recent month-end is available by calling 1-888-934-0777 or by visiting www.indexiq.com. Returns shown include the reinvestment of all dividends and other distributions and do not reflect taxes that a shareholder would pay on the Fund’s distributions or redemption of the Fund’s shares.
Index performance is for illustrative purposes only and does not represent actual Fund performance. One cannot invest directly in an index. Performance data for the Index assumes reinvestment of dividends and is net of the management fees for the Index’s components, as applicable, but it does not reflect management fees, transaction costs or other expenses that you would pay if you invested in the Fund directly.
The HFRI Fund of Funds Composite Index is an equally weighted hedge fund index including over 500 domestic and off-shore funds of funds.
The S&P 500 Index is a broad-based unmanaged index of 500 stocks, which is designed to represent the equity market in general (performance data assumes reinvestment of dividends, but it does not reflect management fees, transaction costs or other expenses).
The Fund may invest in a small number of holdings and may be susceptible to greater losses if a single portfolio investment declines than would a diversified Fund that invests in a large number of holdings. The Fund is not suitable for all investors. The Fund does not invest in hedge funds.
There is no guarantee that the Fund itself, or each of the ETFs in the Fund’s portfolio, will perform exactly as its underlying index. The Fund’s investment performance depends on the investment performance of the underlying ETFs in which it invests. The Fund’s underlying ETFs invest in: foreign securities, which subject them to risk of loss not typically associated with domestic markets, such as currency fluctuations and political uncertainty; commodities markets, which subject them to greater volatility than investments in traditional securities, such as stocks and bonds; and fixed income securities, which subject them to credit risk, the possibility that the issuer of a security will be unable to make interest payments and/or repay the principal on its debt, and interest rate risk, changes in the value of a fixed income security resulting from changes in interest rates. Leverage, including borrowing, will cause some of the Fund’s underlying ETFs to be more volatile than if the underlying ETFs had not been leveraged.
| 8 |
| Management’s Discussion of Fund Performance (unaudited) (continued) |
IQ Hedge Macro Tracker ETF
How did IQ Hedge Macro Tracker ETF perform during the 12 months ended April 30, 2015?
For the 12 months ended April 30, 2015, IQ Hedge Macro Tracker ETF returned –1.77% at NAV (net asset value) and –1.47% at market price.1 To compare, the Fund’s Underlying Index, the IQ Hedge Macro Index,2 returned –1.04% for the same time period. The HFRI Fund of Funds Composite Index2 and MSCI® World Index2 returned 6.60% and 7.99%, respectively, for the same period.
What factors affected the Fund’s performance during the reporting period?
The Fund’s net long positions in equity and bond ETFs were the primary positive contributors to returns. Specifically, the Fund’s long position in an investment grade corporate bond ETF was the single largest positive contributor to performance. Additional positive contributions to performance came from positions in short-term bond ETFs.
Long positions in small-cap equity ETFs, particularly those focused on the U.S. and on emerging markets, played a significant role in the Fund’s performance during the reporting period. Via underlying ETFs, a positive, or long, allocation to China later in the reporting period was a positive contributor. However, these gains were partially offset by losses resulting from a long position in India and from short positions in Brazil and Russia.
Detracting from the Fund’s performance was a net short position in an international real estate investment trust (REIT) ETF and a long position in a euro ETF, as the currency was weak relative to the U.S. dollar during the reporting period.
During the reporting period, how was the Fund’s performance materially affected by investments in derivatives?
The Fund used derivative positions where necessary to help it track its Underlying Index, which contains both long and short positions. Primarily, the Fund used total return swaps on ETFs to gain exposure to the weightings of the ETFs within the Underlying Index. Derivatives are not used to gain additional leverage, but rather are used exclusively to enable the Fund to track its Underlying Index.
The Fund used derivatives to obtain exposure to long and short positions of the Underlying Index. The long exposures included certain Underlying Index positions, such as investment grade corporate, sovereign, and local authority bonds; short-term Treasuries; equity volatility; and domestic small-capitalization equities. The short exposures included all of the Underlying Index positions, including principally domestic and international real estate investment trusts; commodities and G10 currencies.
How were the Fund’s assets allocated during the reporting period and why?
The Fund’s allocations are driven by quantitative models that determine the weights across the various assets within the Underlying Index universe. Given the rules-based nature of the process, there is no subjectivity involved in the allocation decision process.
At the asset class level, the Fund was net long in bonds, particularly investment grade bonds and short-term bonds. The Fund was also net long equities, particularly small-cap equities and China and India equities, as well as currencies, especially the euro. The Fund was net short international REITs and Russian and Brazilian equities during the reporting period.
How did the Fund’s allocations change over the course of the reporting period?
Based on our proprietary quantitative models, the Fund’s net long currency exposure gradually decreased, primarily via reductions in its underlying ETF position in a euro-focused ETF. There was a similar decrease in exposure to commodities. While neither was a very large change, the net result was an increase in the Fund’s exposure to bonds, specifically in short-term bonds.
| 1 | The price used to calculate the market price returns is determined by using the closing price listed on the NYSE Arca and does not represent returns an investor would receive if shares were traded at other times. |
| 2 | See page 10 for more information on this index. |
| 9 |
| Management’s Discussion of Fund Performance (unaudited) (continued) |
During the reporting period, which underlying ETFs had the highest total returns and which underlying ETFs had the lowest total returns?
In terms of total return, the best-performing underlying ETFs in the Fund were iShares MSCI Russia Capped ETF (ERUS), Market Vectors Russia ETF (RSX) and iShares China Large-Cap ETF (FXI). During the reporting period, ProShares VIX Mid-Term Futures ETF (VIXM), CurrencyShares Euro Trust (FXE) and PowerShares DB Commodity Index Tracking Fund (DBC) recorded the lowest total returns.
Which underlying ETFs were the strongest positive contributors to the Fund’s performance and which underlying ETFs were particularly weak?
On the basis of impact, which takes weightings and total returns into consideration, the underlying ETFs that made the greatest positive contributions to the Fund’s performance during the reporting period were iShares iBoxx USD Investment Grade Corporate Bond ETF (LQD), iShares Russell 2000 ETF (IWM) and iShares China Large-Cap ETF (FXI). The weakest contributors were iShares MSCI Brazil Capped ETF (EWZ), WisdomTree Emerging Currency Fund (CEW) and Currency Shares Euro Trust (FXE).
The opinions expressed are those of the portfolio managers as of the date of this report and are subject to change. There is no guarantee that any forecast made will come to pass. This material does not constitute investment advice and is not intended as an endorsement of any specific investment.
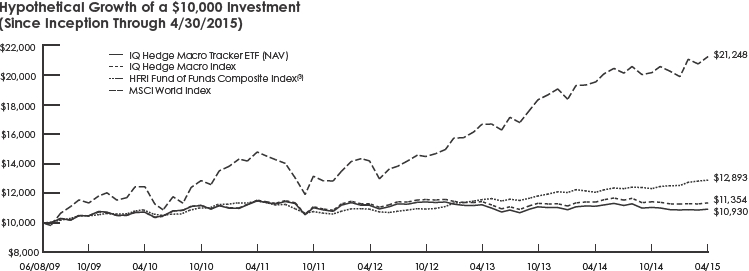
This chart illustrates the performance of a hypothetical $10,000 investment made on the Fund’s inception, and is not intended to imply any future performance.
Fund Performance History
IQ Hedge Macro Tracker ETF
(as of April 30, 2015)
| 1 Year | 3 Year | 5 Year | Since Inception1 | |||||||||||||||||
| Average Annual | Average Annual | Average Annual | Average Annual | Cumulative | ||||||||||||||||
| IQ Hedge Macro Tracker ETF Market Price2 | –1.47% | –0.69% | 0.38% | 1.55% | 9.50% | |||||||||||||||
| IQ Hedge Macro Tracker ETF NAV | –1.77% | –0.78% | 0.40% | 1.52% | 9.30% | |||||||||||||||
| IQ Hedge Macro Index | –1.04% | –0.02% | 1.04% | 2.18% | 13.54% | |||||||||||||||
| HFRI Fund of Funds Composite Index3 | 6.60% | 5.66% | 3.44% | 4.39% | 28.93% | |||||||||||||||
| MSCI World Index | 7.99% | 14.12% | 11.12% | 13.64% | 112.48% | |||||||||||||||
| 1 | Fund Inception Date: 6/08/2009. |
| 2 | The price used to calculate the Market Price returns is determined by using the closing price listed on the NYSE Arca and does not represent returns an investor would receive if shares were traded at other times. |
| 3 | Data shown above for the HFRI Fund of Funds Composite Index is from 5/31/2009 to 4/30/2015. |
| 10 |
| Management’s Discussion of Fund Performance (unaudited) (continued) |
Since the shares of the Fund did not trade in the secondary market until the day after the Fund’s inception, for the period from inception (6/8/2009) to the first day of secondary market trading in shares of the Fund (6/9/2009), the NAV of the Fund is used as a proxy for the secondary market trading price to calculate market returns.
The performance data quoted above represents past performance. Past performance does not guarantee future results. The investment return and value of the Fund shares will fluctuate so that an investor’s shares, when sold, may be worth more or less than their original cost. Current Fund performance may be lower or higher than performance data quoted. Fund performance that is current to the most recent month-end is available by calling 1-888-934-0777 or by visiting www.indexiq.com. Returns shown include the reinvestment of all dividends and other distributions and do not reflect taxes that a shareholder would pay on the Fund’s distributions or redemption of the Fund’s shares.
Index performance is for illustrative purposes only and does not represent actual Fund performance. One cannot invest directly in an index. Performance data for the Index assumes reinvestment of dividends and is net of the management fees for the Index’s components, as applicable, but it does not reflect management fees, transaction costs or other expenses that you would pay if you invested in the Fund directly.
The HFRI Fund of Funds Composite Index is an equally weighted hedge fund index including over 500 domestic and off-shore funds of funds.
The MSCI World Index is a free float-adjusted market capitalization weighted index that is designed to measure the equity market performance of developed markets (performance data assumes reinvestment of dividends, but it does not reflect management fees, transaction costs or other expenses).
The Fund may invest in a small number of holdings and may be susceptible to greater losses if a single portfolio investment declines than would a diversified Fund that invests in a large number of holdings. The Fund is not suitable for all investors. The Fund does not invest in hedge funds.
There is no guarantee that the Fund itself, or each of the ETFs in the Fund’s portfolio, will perform exactly as its underlying index. The Fund’s investment performance depends on the investment performance of the underlying ETFs in which it invests. The Fund’s underlying ETFs invest in: foreign securities, which subject them to risk of loss not typically associated with domestic markets, such as currency fluctuations and political uncertainty; commodities markets, which subject them to greater volatility than investments in traditional securities, such as stocks and bonds; and fixed income securities, which subject them to credit risk, the possibility that the issuer of a security will be unable to make interest payments and/or repay the principal on its debt, and interest rate risk, changes in the value of a fixed income security resulting from changes in interest rates. Leverage, including borrowing, will cause some of the Fund’s underlying ETFs to be more volatile than if the underlying ETFs had not been leveraged.
| 11 |
| Management’s Discussion of Fund Performance (unaudited) (continued) |
IQ Hedge Market Neutral Tracker ETF
How did IQ Hedge Market Neutral Tracker ETF perform during the 12 months ended April 30, 2015?
For the 12 months ended April 30, 2015, IQ Hedge Market Neutral Tracker ETF returned 0.40% at NAV (net asset value) and 0.43% at market price1. To compare, the IQ Hedge Market Neutral Index,2 returned 1.81% for the same time period. The Barclays Capital U.S. Short Term Treasury Bond Index2 and the HFRI Equity Market Neutral Index2 returned 0.11% and 3.18%, respectively, for the same period.
What factors affected the Fund’s performance during the reporting period?
The Fund’s net long positions in equity and bond ETFs were the primary positive contributors to returns. Specifically, the Fund’s long positions in a convertible bond ETF and in aggregate bond ETFs were the largest positive contributors to performance. Additionally, a positive contribution to performance came from a position in a short-term bond ETF.
The Fund had both long and short positions in equity ETFs representing different equity risk premia. The Fund was long U.S. large-cap value, U.S. large-cap growth and U.S. small-cap growth ETFs and was short U.S. small-cap value ETFs. The net contribution was a positive contribution to returns. Via underlying ETFs, the Fund was long European equities and short Asia ex Japan equities. Both assets declined in value, but European equities fell more than Asia ex Japan equities, so the net contribution from this trade was negative. Also via underlying ETFs, the Fund was long emerging markets equities and short developed markets equities. With both sides of the trade proving effective, the net contribution was positive.
During the reporting period, how was the Fund’s performance materially affected by investments in derivatives?
The Fund used derivative positions where necessary to help it track its Underlying Index, which contains both long and short positions. Primarily, the Fund used total return swaps on ETFs to gain exposure to the weightings of the ETFs within the Underlying Index. Derivatives are not used to gain additional leverage or for hedging purposes, but rather are used exclusively to enable the Fund to track its Underlying Index.
The Fund used derivatives to obtain exposure to long and short positions of the Underlying Index. The long exposures included certain Underlying Index positions, such as convertible bonds; equities listed in developed European countries; domestic real estate investment trusts; short-term U.S. Treasuries; the aggregate U.S. bond market, including corporate investment grade bonds; and the Euro currency. The short exposures included all of the Underlying Index positions, including principally domestic small-capitalization equities; international developed markets equities; and U.S senior bank loans.
How were the Fund’s assets allocated during the reporting period and why?
The Fund’s allocations are driven by quantitative models that determine the weights across the various assets within the Underlying Index universe. Given the rules-based nature of the process, there is no subjectivity involved in the allocation decision process.
At the asset class level, the Fund was net long in bonds, particularly aggregate bonds and short-term bonds. The Fund was slightly net long equities, with long positions in U.S. large-cap growth equities, U.S. large-cap value equities and U.S. small-cap growth equities with a partial hedge in U.S. small-cap value equities. Internationally, the Fund was long Europe, short Asia ex Japan and long emerging markets equities with a short position in developed international equities.
How did the Fund’s allocations change over the course of the reporting period?
Based on our proprietary quantitative models, the Fund’s overall bond allocation was little changed over the course of the reporting period, but, within that the overall bond allocation, some of the Fund’s allocation from aggregate bonds was moved into short-term bonds. Similarly on the equity side, the overall equity allocation did not change significantly, but within the asset class, the Fund’s long position in European equities and its short position in international equities was reduced. Also, the Fund’s allocation in U.S. large-cap growth equities shifted from a long position to a short position, and its long position in U.S. large-cap value equities increased. In U.S. small-cap equities, the Fund’s long position in small-cap growth equities and its short position in small-cap value equities both increased.
| 1 | The price used to calculate the market price returns is determined by using the closing price listed on the NYSE Arca and does not represent returns an investor would receive if shares were traded at other times. |
| 2 | See page 13 for more information on this index. |
| 12 |
| Management’s Discussion of Fund Performance (unaudited) (continued) |
During the reporting period, which underlying ETFs had the highest total returns and which underlying ETFs had the lowest total returns?
In terms of total return, the best-performing underlying ETFs in the Fund were Vanguard Growth Index Fund (VUG), iShares Russell 1000 Growth ETF (IWF) and iShares MSCI All Country Asia ex Japan ETF (AAXJ). During the reporting period, PowerShares DB G10 Currency Harvest Fund (DBV), iShares MSCI EMU ETF (EZU) and CurrencyShares Euro Trust (FXE) recorded the lowest total returns.
Which underlying ETFs were the strongest positive contributors to the Fund’s performance and which underlying ETFs were particularly weak?
On the basis of impact, which takes weightings and total returns into consideration, the underlying ETFs that made the greatest positive contributions to the Fund’s performance during the reporting period were iShares Russell 2000 Growth ETF (IWO), Vanguard Total Bond Market Index Fund (BND) and Vanguard Short Term Bond Index Fund ETF (BSV). The weakest contributors were Vanguard Small Cap Value Index Fund (VBR), iShares MSCI EMU ETF (EZU) and Vanguard FTSE Europe ETF (VGK).
The opinions expressed are those of the portfolio managers as of the date of this report and are subject to change. There is no guarantee that any forecast made will come to pass. This material does not constitute investment advice and is not intended as an endorsement of any specific investment.
Hypothetical Growth of a $10,000 Investment (Since Inception Through 4/30/2015)
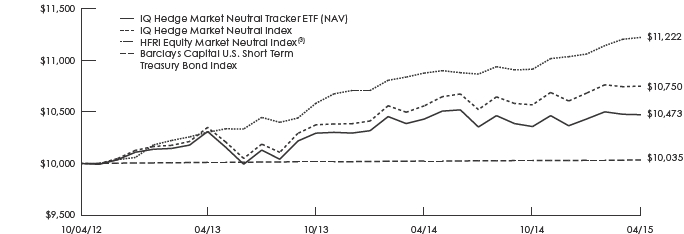
This chart illustrates the performance of a hypothetical $10,000 investment made on the Fund’s inception, and is not intended to imply any future performance.
Fund Performance History
IQ Hedge Market Neutral Tracker ETF
(as of April 30, 2015)
| 1 Year | Since Inception1 | |||||||||||
| Average Annual | Average Annual | Cumulative | ||||||||||
| IQ Hedge Market Neutral Tracker ETF Market Price2 | 0.43% | 1.76% | 4.59% | |||||||||
| IQ Hedge Market Neutral Tracker ETF NAV | 0.40% | 1.81% | 4.73% | |||||||||
| IQ Hedge Market Neutral Index | 1.81% | 2.85% | 7.50% | |||||||||
| HFRI Equity Market Neutral Index3 | 3.18% | 4.73% | 12.22% | |||||||||
| Barclays Capital U.S. Short Term Treasury Bond Index | 0.11% | 0.13% | 0.35% | |||||||||
| 1 | Fund Inception Date: 10/04/2012. |
| 2 | The price used to calculate the Market Price returns is determined by using the closing price listed on the NYSE Arca and does not represent returns an investor would receive if shares were traded at other times. |
| 3 | Data shown above for the HFRI Equity Market Neutral Index is from 9/30/2012 to 4/30/2015. |
| 13 |
| Management’s Discussion of Fund Performance (unaudited) (continued) |
Since the shares of the Fund did not trade in the secondary market until the day after the Fund’s inception, for the period from inception (10/4/2012) to the first day of secondary market trading in shares of the Fund (10/5/2012), the NAV of the Fund is used as a proxy for the secondary market trading price to calculate market returns.
The performance data quoted above represents past performance. Past performance does not guarantee future results. The investment return and value of the Fund shares will fluctuate so that an investor’s shares, when sold, may be worth more or less than their original cost. Current Fund performance may be lower or higher than performance data quoted. Fund performance that is current to the most recent month-end is available by calling 1-888-934-0777 or by visiting www.indexiq.com. Returns shown include the reinvestment of all dividends and other distributions and do not reflect taxes that a shareholder would pay on the Fund’s distributions or redemption of the Fund’s shares.
Index performance is for illustrative purposes only and does not represent actual Fund performance. One cannot invest directly in an index. Performance data for the Index assumes reinvestment of dividends and is net of the management fees for the Index’s components, as applicable, but it does not reflect management fees, transaction costs or other expenses that you would pay if you invested in the Fund directly.
The HFRI Equity Market Neutral Index is an equally weighted hedge fund index including domestic and off-shore equity market neutral hedge funds.
The Barclays Capital U.S. Short Treasury Bond Index measures the performance of public obligations of the U.S. Treasury that have a remaining maturity of between 1 and 12 months.
The Fund may invest in a small number of holdings and may be susceptible to greater losses if a single portfolio investment declines than would a diversified Fund that invests in a large number of holdings. The Fund is not suitable for all investors. The Fund does not invest in hedge funds.
There is no guarantee that the Fund itself, or each of the ETFs in the Fund’s portfolio, will perform exactly as its underlying index. The Fund’s investment performance depends on the investment performance of the underlying ETFs in which it invests. The Fund’s underlying ETFs invest in: foreign securities, which subject them to risk of loss not typically associated with domestic markets, such as currency fluctuations and political uncertainty; commodities markets, which subject them to greater volatility than investments in traditional securities, such as stocks and bonds; and fixed income securities, which subject them to credit risk, the possibility that the issuer of a security will be unable to make interest payments and/or repay the principal on its debt, and interest rate risk, changes in the value of a fixed income security resulting from changes in interest rates. Leverage, including borrowing, will cause some of the Fund’s underlying ETFs to be more volatile than if the underlying ETFs had not been leveraged.
| 14 |
| Management’s Discussion of Fund Performance (unaudited) (continued) |
IQ Hedge Long/Short Tracker ETF
How did IQ Hedge Long/Short Tracker ETF perform from its inception on March 23, 2015 through April 30, 2015?
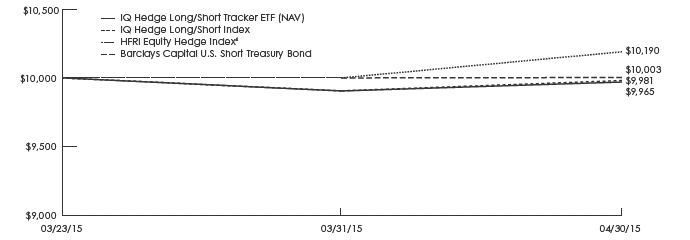
From its inception on March 23, 2015 through April 30, 2015 (the “reporting period”), IQ Hedge Long/Short ETF returned –0.35% at NAV (net asset value) and 3.95% at market price.1 To compare, the Fund’s Underlying Index, the IQ Hedge Long/Short Index2, returned –0.19% for the same time period. The Barclays U.S. Short Treasury Bond Index2 and the HFRI Equity Hedge Index2, 3 returned 0.03% and 1.90%, respectively, for the same period.
What factors affected the Fund’s performance during the reporting period?
The Fund’s net long positions in bond ETFs were the primary positive contributors to returns. Specifically, the Fund’s long position in a floating rate bond ETF was the largest positive contributor to performance. Partially offsetting these gains was a net long position in investment grade bonds, via underlying ETFs, which generated negative returns during the reporting period and thus detracted.
Long positions in select U.S. equity ETFs, particularly growth-oriented equity ETFs, negatively impacted the Fund’s performance during the reporting period. These losses were partially offset by hedging positions in U.S. value-oriented equity ETFs. Internationally, the Fund was helped by long positions in developed and emerging markets equity ETFs.
During the reporting period, how was the Fund’s performance materially affected by investments in derivatives?
The Fund used derivative positions where necessary to help it track its Underlying Index, which contains both long and short positions. Primarily, the Fund used total return swaps on ETFs to gain exposure to the weightings of the ETFs within the Underlying Index. Derivatives are not used to gain additional leverage, but rather are used exclusively to enable the Fund to track its Underlying Index.
The Fund used derivatives to obtain exposure to long and short positions of the Underlying Index. The long exposures included certain Underlying Index positions, such as investment grade corporate bonds; U.S. senior bank loans; U.S. small- and large-capitalization equities; and international developed markets equities. The short exposures included all of the Underlying Index positions, including principally U.S. small-capitalization equities.
How were the Fund’s assets allocated during the reporting period and why?
The Fund’s allocations are driven by quantitative models that determine the weights across the various assets within the Underlying Index universe. Given the rules-based nature of the process, there is no subjectivity involved in the allocation decision process.
At the asset class level, the Fund was net long in bonds, particularly investment grade bonds and floating rate bank loans. The Fund was also net long equities, with long positions in U.S. growth-oriented equities and international equities. The Fund was short U.S. small-cap value-oriented equities.
How did the Fund’s allocations change over the course of the reporting period?
Given the Fund’s launch date on March 23, 2015, there was little change in the Fund’s allocations during the reporting period.
During the reporting period, which underlying ETFs had the highest total returns and which underlying ETFs had the lowest total returns?
In terms of total return, the best-performing underlying ETFs in the Fund were Vanguard FTSE Emerging Markets ETF (VWO), iShares MSCI Emerging Markets ETF (EEM) and Vanguard Developed Markets Index Fund ETF (VEA). During the reporting period, iShares S&P Small-Cap 600 Growth ETF (IJT), iShares Russell 2000 Growth ETF (IWO) and Vanguard Small Cap Growth Index Fund (VBK) recorded the lowest total returns.
| 1 | The price used to calculate the market price returns is determined by using the closing price listed on the NYSE Arca and does not represent returns an investor would receive if shares were traded at other times. |
| 2 | See page 16 for more information on this index. |
| 3 | Data for the HFRI Equity Hedge Index is from March 31, 2015 through April 30, 2015. |
| 15 |
| Management’s Discussion of Fund Performance (unaudited) (continued) |
Which underlying ETFs were the strongest positive contributors to the Fund’s performance and which underlying ETFs were particularly weak?
On the basis of impact, which takes weightings and total returns into consideration, the underlying ETFs that made the greatest positive contributions to the Fund’s performance during the reporting period were PowerShares Senior Loan Portfolio (BKLN), iShares Russell 2000 Value ETF (IWN) and iShares S&P Small-Cap 600 Value ETF (IJS). The weakest contributors were iShares Russell 2000 Growth ETF (IWO), iShares iBoxx USD Investment Grade Corporate Bond ETF (LQD) and iShares S&P Small-Cap 600 Growth ETF (IJT).
The opinions expressed are those of the portfolio managers as of the date of this report and are subject to change. There is no guarantee that any forecast made will come to pass. This material does not constitute investment advice and is not intended as an endorsement of any specific investment.
Hypothetical Growth of a $10,000 Investment (Since Inception Through 4/30/2015)
Fund Performance History
IQ Hedge Long/Short Tracker ETF
(as of April 30, 2015)
| Since Inception1,3 | ||||
| Cumulative | ||||
| IQ Hedge Long/Short Tracker ETF Market Price2 | 3.95% | |||
| IQ Hedge Long/Short Tracker ETF NAV | –0.35% | |||
| IQ Hedge Long/Short Index | –0.19% | |||
| HFRI Equity Hedge Index4 | 1.90% | |||
| Barclays Capital U.S. Short Treasury Bond Index | 0.03% | |||
| 1 | Fund Inception Date: 03/23/2015. |
| 2 | The price used to calculate the Market Price returns is determined by using the closing price listed on the NYSE Arca and does not represent returns an investor would receive if shares were traded at other times. |
| 3 | Total return calculated for a period of less than one year is not annualized. |
| 4 | Data shown above for the HFRI Equity Hedge Index is from 3/31/2015 to 4/30/2015. |
| 16 |
| Management’s Discussion of Fund Performance (unaudited) (continued) |
Since the shares of the Fund did not trade in the secondary market until the day after the Fund’s inception, for the period from inception (3/23/2015) to the first day of secondary market trading in shares of the Fund (3/24/2015), the NAV of the Fund is used as a proxy for the secondary market trading price to calculate market returns.
The performance data quoted above represents past performance. Past performance does not guarantee future results. The investment return and value of the Fund shares will fluctuate so that an investor’s shares, when sold, may be worth more or less than their original cost. Current Fund performance may be lower or higher than performance data quoted. Fund performance that is current to the most recent month-end is available by calling 1-888-934-0777 or by visiting www.indexiq.com. Returns shown include the reinvestment of all dividends and other distributions and do not reflect taxes that a shareholder would pay on the Fund’s distributions or redemption of the Fund’s shares.
Index performance is for illustrative purposes only and does not represent actual Fund performance. One cannot invest directly in an index. Performance data for the Index assumes reinvestment of dividends and is net of the management fees for the Index’s components, as applicable, but it does not reflect management fees, transaction costs or other expenses that you would pay if you invested in the Fund directly.
The HFRI Equity Hedge Index is an equal weighted index including over 2400 domestic and offshore funds that report Net of All Fee returns in USD and have at least $50M in AUM or have been actively trading for at least 12 months.
The Barclays Capital U.S. Short Treasury Bond Index measures the performance of public obligations of the U.S. Treasury that have a remaining maturity of between 1 and 12 months.
The Fund may invest in a small number of holdings and may be susceptible to greater losses if a single portfolio investment declines than would a diversified Fund that invests in a large number of holdings. The Fund is not suitable for all investors. The Fund does not invest in hedge funds.
There is no guarantee that the Fund itself, or each of the ETFs in the Fund’s portfolio, will perform exactly as its underlying index. The Fund’s investment performance depends on the investment performance of the underlying ETFs in which it invests. The Fund’s underlying ETFs invest in: foreign securities, which subject them to risk of loss not typically associated with domestic markets, such as currency fluctuations and political uncertainty; commodities markets, which subject them to greater volatility than investments in traditional securities, such as stocks and bonds; and fixed income securities, which subject them to credit risk, the possibility that the issuer of a security will be unable to make interest payments and/or repay the principal on its debt, and interest rate risk, changes in the value of a fixed income security resulting from changes in interest rates. Leverage, including borrowing, will cause some of the Fund’s underlying ETFs to be more volatile than if the underlying ETFs had not been leveraged.
| 17 |
| Management’s Discussion of Fund Performance (unaudited) (continued) |
IQ Hedge Event-Driven Tracker ETF
How did IQ Hedge Event-Driven Tracker ETF perform from its inception on March 23, 2015 through April 30, 2015?
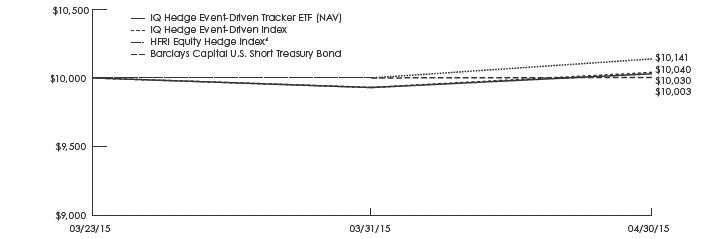
From its inception on March 23, 2015 through April 30, 2015 (the “reporting period”), IQ Hedge Event-Driven ETF returned 0.30% at NAV (net asset value) and 0.25% at market price.1 To compare, the Fund’s Underlying Index, the IQ Hedge Event-Driven Index,2 returned 0.40% for the same time period. The Barclays U.S. Short Treasury Bond Index2 and the HFRI Event-Driven Index2, 3 returned 0.03% and 1.41%, respectively, for the same time period.
What factors affected the Fund’s performance during the reporting period?
The Fund’s net long positions in equity and bond ETFs were the primary positive contributors to returns. Specifically, the Fund’s long position in a convertible bond ETF was the largest positive contributor to performance. Additionally, a positive contribution to performance came from a short position in an investment grade bond ETF, as investment grade bonds posted negative returns during the reporting period. Partially offsetting these gains was a net long position in aggregate bonds, which generated negative returns during the reporting period and thus detracted.
Long positions in select equity ETFs, particularly emerging market ETFs, contributed positively to the Fund’s performance. These gains were partially offset by long positions in U.S. growth-oriented equity ETFs, which detracted.
During the reporting period, how was the Fund’s performance materially affected by investments in derivatives?
The Fund used derivative positions where necessary to help it track its Underlying Index, which contains both long and short positions. Primarily, the Fund used total return swaps on ETFs to gain exposure to the weightings of the ETFs within the Underlying Index or for hedging purposes. Derivatives are not used to gain additional leverage, but rather are used exclusively to enable the Fund to track its Underlying Index.
The Fund used derivatives to obtain exposure to long and short positions of the Underlying Index. The long exposures included certain Underlying Index positions, such as the aggregate U.S bond market; convertible bonds; and U.S. small- and large-capitalization equities. The short exposures included all of the Underlying Index positions, including principally investment grade corporate bonds.
How were the Fund’s assets allocated during the reporting period and why?
The Fund’s allocations are driven by quantitative models that determine the weights across the various assets within the Underlying Index universe. Given the rules-based nature of the process, there is no subjectivity involved in the allocation decision process.
At the asset class level, the Fund was net long in bonds, particularly convertible bonds and aggregate bonds, although the Fund had a short position in investment grade corporate bonds. The Fund was also net long equities, with long positions in U.S. growth-oriented equities and emerging markets equities.
How did the Fund’s allocations change over the course of the reporting period?
Given the Fund’s launch date on March 23, 2015, there was little change in the Fund’s allocations during the reporting period.
During the reporting period, which underlying ETFs had the highest total returns and which underlying ETFs had the lowest total returns?
In terms of total return, the best-performing underlying ETFs in the Fund were Vanguard FTSE Emerging Markets ETF (VWO), iShares MSCI Emerging Markets ETF (EEM) and SPDR Barclays Convertible Securities ETF (CWB). During the reporting period, Guggenheim S&P 500 Pure Growth ETF (RPG), Vanguard Growth Index Fund (VUG) and iShares iBoxx USD Investment Grade Corporate Bond ETF (LQD) recorded the lowest total returns.
| 1 | The price used to calculate the market price returns is determined by using the closing price listed on the NYSE Arca and does not represent returns an investor would receive if shares were traded at other times. |
| 2 | See page 19 for more information on this index. |
| 3 | Data for the HFRI Event-Driven Index is from March 31, 2015 through April 30, 2015. |
| 18 |
| Management’s Discussion of Fund Performance (unaudited) (continued) |
Which underlying ETFs were the strongest positive contributors to the Fund’s performance and which underlying ETFs were particularly weak?
On the basis of impact, which takes weightings and total returns into consideration, the underlying ETFs that made the greatest positive contributions to the Fund’s performance during the reporting period were SPDR Barclays Convertible Securities ETF (CWB), Vanguard FTSE Emerging Markets ETF (VWO) and iShares iBoxx USD Investment Grade Corporate Bond ETF (LQD). The weakest contributors were Vanguard Total Bond Market Index Fund (BND), iShares Core U.S. Aggregate Bond ETF (AGG) and Vanguard Growth Index Fund (VUG).
The opinions expressed are those of the portfolio managers as of the date of this report and are subject to change. There is no guarantee that any forecast made will come to pass. This material does not constitute investment advice and is not intended as an endorsement of any specific investment.
Hypothetical Growth of a $10,000 Investment (Since Inception Through 4/30/2015)
Fund Performance History
IQ Hedge Event-Driven Tracker ETF
(as of April 30, 2015)
| Since Inception1,3 | ||||
| Cumulative | ||||
| IQ Hedge Event-Driven Tracker ETF Market Price2 | 0.25% | |||
| IQ Hedge Event-Driven Tracker ETF NAV | 0.30% | |||
| IQ Hedge Event-Driven Index | 0.40% | |||
| HFRI Event-Driven Index4 | 1.41% | |||
| Barclays Capital U.S. Short Treasury Bond Index | 0.03% | |||
| 1 | Fund Inception Date: 03/23/2015. |
| 2 | The price used to calculate the Market Price returns is determined by using the closing price listed on the NYSE Arca and does not represent returns an investor would receive if shares were traded at other times. |
| 3 | Total return calculated for a period of less than one year is not annualized. |
| 4 | Data shown above for the HFRI Equity Hedge Index is from 3/31/2015 to 4/30/2015. |
| 19 |
| Management’s Discussion of Fund Performance (unaudited) (continued) |
Since the shares of the Fund did not trade in the secondary market until the day after the Fund’s inception, for the period from inception (3/23/2015) to the first day of secondary market trading in shares of the Fund (3/24/2015), the NAV of the Fund is used as a proxy for the secondary market trading price to calculate market returns.
The performance data quoted above represents past performance. Past performance does not guarantee future results. The investment return and value of the Fund shares will fluctuate so that an investor’s shares, when sold, may be worth more or less than their original cost. Current Fund performance may be lower or higher than performance data quoted. Fund performance that is current to the most recent month-end is available by calling 1-888-934-0777 or by visiting www.indexiq.com. Returns shown include the reinvestment of all dividends and other distributions and do not reflect taxes that a shareholder would pay on the Fund’s distributions or redemption of the Fund’s shares.
Index performance is for illustrative purposes only and does not represent actual Fund performance. One cannot invest directly in an index. Performance data for the Index assumes reinvestment of dividends and is net of the management fees for the Index’s components, as applicable, but it does not reflect management fees, transaction costs or other expenses that you would pay if you invested in the Fund directly.
The HFRI Event-Driven Index is an equal weighted index including over 400 domestic and offshore funds that report Net of All Fee returns in USD and have at least $50M in AUM or have been actively trading for at least 12 months.
The Barclays Capital U.S. Short Treasury Bond Index measures the performance of public obligations of the U.S. Treasury that have a remaining maturity of between 1 and 12 months.
The Fund may invest in a small number of holdings and may be susceptible to greater losses if a single portfolio investment declines than would a diversified Fund that invests in a large number of holdings. The Fund is not suitable for all investors. The Fund does not invest in hedge funds.
There is no guarantee that the Fund itself, or each of the ETFs in the Fund’s portfolio, will perform exactly as its underlying index. The Fund’s investment performance depends on the investment performance of the underlying ETFs in which it invests. The Fund’s underlying ETFs invest in: foreign securities, which subject them to risk of loss not typically associated with domestic markets, such as currency fluctuations and political uncertainty; commodities markets, which subject them to greater volatility than investments in traditional securities, such as stocks and bonds; and fixed income securities, which subject them to credit risk, the possibility that the issuer of a security will be unable to make interest payments and/or repay the principal on its debt, and interest rate risk, changes in the value of a fixed income security resulting from changes in interest rates. Leverage, including borrowing, will cause some of the Fund’s underlying ETFs to be more volatile than if the underlying ETFs had not been leveraged.
| 20 |
| Management’s Discussion of Fund Performance (unaudited) (continued) |
IQ Global Resources ETF
How did IQ Global Resources ETF perform during the 12 months ended April 30, 2015?
For the 12 months ended April 30, 2015, IQ Global Resources ETF returned –5.84% at NAV (net asset value) and –5.97% at market price.1 To compare, the Fund’s Underlying Index, the IQ Global Resources Index,2 returned –4.91% for the same time period. The MSCI® World Index2 and the Bloomberg Commodity Index2 returned 7.99% and –24.69%, respectively, during the period.
What factors affected the Fund’s performance during the reporting period?
As a global strategy focused on commodities, the combination of weak performance in the commodities asset class, primarily due to the decline in energy prices, along with the relative strength of the U.S. dollar versus other major world currencies had a negative impact on the overall performance of the Fund. The currency effect was the largest factor detracting from performance. More specifically, exposure to 11 foreign currencies negatively affected performance, with the euro, Swedish krona and Australian dollar having the greatest negative impact.
Additionally, the Fund entered into hedges against the performance of the S&P 500® Index and the MSCI® EAFE Index. However, both indices concluded the reporting period in positive territory, thus further detracting from overall performance of the Fund.
The Fund’s sector and industry exposure generated mixed results. Due to the overall underperformance of the energy sector, driven by declining crude oil prices, the Fund’s exposures to energy and coal companies detracted from returns. Despite these headwinds, exposures to agribusiness, real assets (timber) and water contributed positively to performance.
During the reporting period, how was the Fund’s performance materially affected by investments in derivatives?
The Fund used derivatives in limited quantities and solely to replicate the economic exposures that are reflected in the Underlying Index. Primarily, the Fund used broad equity market futures contracts during the reporting period. The use of derivatives had a negative impact on the Fund’s performance during the reporting period.
During the reporting period, which industries had the highest total returns and which industries had the lowest total returns?
In terms of total return, the best-performing industries in the Underlying Index were livestock, grains food fiber, and water. During the reporting period, precious metals, industrial metals and coal recorded the lowest total returns.
During the reporting period, which industries made the strongest contributions to the Fund’s absolute performance and which industries made the weakest contributions?
On the basis of impact, which takes weightings and total returns into account, the industries that made the strongest positive contributions to the Fund’s absolute performance were grains food fiber, water and precious metals. The industries that made the weakest contributions to the Fund’s absolute performance were timber, coal and industrial metals.
During the reporting period, which individual stocks had the highest total returns and which stocks had the lowest total returns?
Within the Underlying Index, the stocks with the highest total return during the reporting period were steel and steel products manufacturer Evraz, meat-centric food solutions provider for the retail and food service markets Hillshire Brands and crude palm oil products producer and distributor New Britain Palm Oil. The Underlying Index components with the lowest total returns for the reporting period were iron ore exploration and development company BC Iron, iron ore exploration, development and mining company Atlas Iron and coal exploration and supply company Alpha Natural Resources.
| 1 | The price used to calculate the market price returns is determined by using the closing price listed on the NYSE Arca and does not represent returns an investor would receive if shares were traded at other times. |
| 2 | See page 22 for more information on this index. |
| 21 |
| Management’s Discussion of Fund Performance (unaudited) (continued) |
Which individual stocks made the strongest contributions to the Fund’s absolute performance during the reporting period and which stocks made the weakest contributions?
On the basis of impact, which takes weightings and total returns into consideration, the stocks that made the strongest contributions to the Fund’s absolute performance during the reporting period were Hormel Foods, which engages in the business of manufacturing and marketing of meat products and other prepared foods; Hillshire Brands, discussed above; and MeadWestvaco, which manufactures and distributes packaging products, office supplies and specialty chemicals. The weakest contributors were BHP Billiton, which engages in the discovery, acquisition, development and marketing of natural resources; CONSOL Energy, which produces coal and gas and provides electric services; and Peabody Energy, which mines and markets low-sulfur coal.
Were there any changes in the Underlying Index during the reporting period?
The Underlying Index is reconstituted annually with periodic monthly rebalances. In turn, the Fund rebalances its sector weights each month according to a proprietary methodology that overweights sectors that have high price momentum and low valuation and underweights sectors with the opposite characteristics. Further, the Fund applies a representative sampling of the Underlying Index.
The opinions expressed are those of the portfolio managers as of the date of this report and are subject to change. There is no guarantee that any forecast made will come to pass. This material does not constitute investment advice and is not intended as an endorsement of any specific investment.
Hypothetical Growth of a $10,000 Investment (Since Inception Through 4/30/2015)
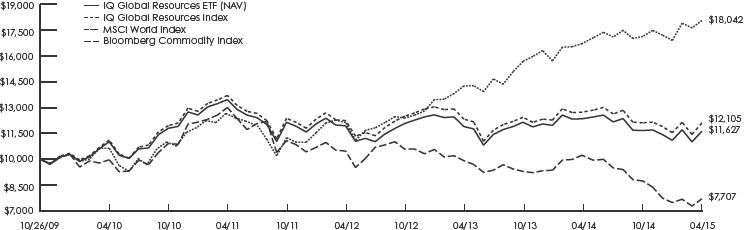
This chart illustrates the performance of a hypothetical $10,000 investment made on the Fund’s inception, and is not intended to imply any future performance.
Fund Performance History
IQ Global Resources ETF
(as of April 30, 2015)
| 1 Year | 3 Year | 5 Year | Since Inception1 | |||||||||||||||||
| Average Annual | Average Annual | Average Annual | Average Annual | Cumulative | ||||||||||||||||
| IQ Global Resources ETF Market Price2 | –5.97% | –0.87% | 1.08% | 2.76% | 16.17% | |||||||||||||||
| IQ Global Resources ETF NAV | –5.84% | –0.88% | 1.08% | 2.77% | 16.27% | |||||||||||||||
| IQ Global Resources Index | –4.91% | –0.38% | 1.73% | 3.53% | 21.05% | |||||||||||||||
| MSCI World Index | 7.99% | 14.12% | 11.12% | 11.30% | 80.42% | |||||||||||||||
| Bloomberg Commodity Index | –24.69% | –9.73% | –5.02% | –4.61% | –22.93% | |||||||||||||||
| 1 | Fund Inception Date: 10/26/2009. |
| 2 | The price used to calculate the Market Price returns is determined by using the closing price listed on the NYSE Arca and does not represent returns an investor would receive if shares were traded at other times. |
| 22 |
| Management’s Discussion of Fund Performance (unaudited) (continued) |
Since the shares of the Fund did not trade in the secondary market until the day after the Fund’s inception, for the period from inception (10/26/2009) to the first day of secondary market trading in shares of the Fund (10/27/2009), the NAV of the Fund is used as a proxy for the secondary market trading price to calculate market returns.
The performance data quoted above represents past performance. Past performance does not guarantee future results. The investment return and value of the Fund shares will fluctuate so that an investor’s shares, when sold, may be worth more or less than their original cost. Current Fund performance may be lower or higher than performance data quoted. Fund performance that is current to the most recent month-end is available by calling 1-888-934-0777 or by visiting www.indexiq.com. Returns shown include the reinvestment of all dividends and other distributions and do not reflect taxes that a shareholder would pay on the Fund’s distributions or redemption of the Fund’s shares.
Index performance is for illustrative purposes only and does not represent actual Fund performance. One cannot invest directly in an index. Performance data for the Index assumes reinvestment of dividends and is net of the management fees for the Index’s components, as applicable, but it does not reflect management fees, transaction costs or other expenses that you would pay if you invested in the Fund directly.
The MSCI World Index is a free float-adjusted market capitalization weighted index that is designed to measure the equity market performance of developed markets (performance data assumes reinvestment of dividends, but it does not reflect management fees, transaction costs or other expenses).
The Bloomberg Commodity Index is composed of futures contracts on physical commodities traded on U.S. exchanges, with the exception of aluminum, nickel and zinc, which trade on the London Metal Exchange.
As the Fund’s investments are concentrated in the global resources sector, the value of its shares will be affected by factors specific to that sector and generally will fluctuate more widely than that of a fund which invests in a broad range of industries. The Fund is susceptible to foreign securities risk. Since the Fund invests in foreign markets, it will be subject to risk of loss not typically associated with domestic markets. Loss may result because of less foreign government regulation, less public information, less economic, political and social stability, or other factors. The Fund is exposed to mid and small capitalization companies risk. Stock prices of mid and small capitalization companies generally are more volatile than those of larger companies and also are more vulnerable than those of large capitalization companies to adverse business and economic developments. Since the Fund may invest directly in foreign currencies or in securities that trade in, and receive revenues in, foreign currencies, the Fund is subject to the risk that those currencies will decline in value relative to the U.S. that the U.S. dollar will decline in value relative to the currency being hedged. The ETF should be considered a speculative investment with a high degree of risk, does not represent a complete investment program and is not suitable for all investors.
| 23 |
| Management’s Discussion of Fund Performance (unaudited) (continued) |
IQ Merger Arbitrage ETF
How did IQ Merger Arbitrage ETF perform during the 12 months ended April 30, 2015?
For the 12 months ended April 30, 2015, IQ Merger Arbitrage ETF returned 6.76% at NAV (net asset value) and 6.31% at market price.1 To compare, the Fund’s Underlying Index, the IQ Merger Arbitrage Index,2 returned 7.81% for the same time period. The S&P 500® Index2 and the MSCI® World Index2 returned 12.98% and 7.99%, respectively, for the same time period.
What factors affected the Fund’s performance during the reporting period?
The Underlying Index seeks to capture the premium discount of merger targets. Through a proprietary merger selection process, the Underlying Index will select target companies satisfying all required selection criteria and will hold securities until the premium has been realized through a successful merger or when any of the selection criteria are not met during the monthly reconstitution.
Key risks of the strategy include potential withdrawal or cancellation of a pending merger, the failure to meet selection criteria pertaining to liquidity, deal age or size requirements, and the risks associated with deal payment through the use of the acquiring company’s stock. Any or all of these conditions can result in under-realization of the deal premium. During the reporting period, approximately 52% of all deals were successfully completed; 7% were cancelled; and 21% were removed due to age or deteriorating liquidity. The remaining deals constitute the holdings of the Fund.
A major factor affecting the Fund’s performance during the reporting period was the pipeline of merger activity, as the Underlying Index is, by definition, based on an event-driven strategy. Compared to the prior reporting period, i.e., May 2013 through April 2014, there was a 15% increase in the average number of deals during the reporting period, but a 14% reduction in the average premium size. The performance of the Underlying Index and the Fund depends on capturing the premium discount of each deal added to the Underlying Index.
Transactions in the pharmaceuticals/health care industry dominated the merger and acquisition pipeline during the reporting period and were heavily represented in the Underlying Index. On average during the reporting period, the health care industry accounted for approximately 21% of the Underlying Index. The sector’s acquisitions, both potential and completed, were closely tied with tax inversions during the second and third quarters of 2014. Deals such as Pfizer’s attempted acquisition of AstraZeneca and AbbVie’s attempted acquisition of Shire failed to be completed. (A tax inversion is a transaction used by a company whereby it becomes a subsidiary of a new parent company in another country for the purpose of falling under beneficial tax laws.)
As a global strategy, the Underlying Index was also subject to currency risks. The U.S. dollar appreciated strongly during the reporting period, outperforming other major world currencies, as represented by the Bloomberg Dollar Spot Index.2 In turn, the relative strength in the U.S. dollar detracted from the local currency return for non-U.S. merger targets. Approximately 8% of the Underlying Index’s exposure was outside the U.S.
During the reporting period, how was the Fund’s performance materially affected by investments in derivatives?
The Fund used hedges to dampen potential downward price performance of the acquiring company’s stock used in stock-based transactions. In cases when the acquiring company’s economic sector performs positively, the hedge will detract from performance; if the acquiring company’s economic sector performs negatively, the hedge will contribute to performance. The Fund only hedges the exposure to stock-based transactions.
During the reporting period, which sectors had the highest total returns and which sectors had the lowest total returns?
In terms of total return, the best-performing sectors in the Underlying Index were information technology, health care and utilities. During the reporting period, telecommunication services, industrials and energy recorded the lowest total returns.
| 1 | The price used to calculate the market price returns is determined by using the closing price listed on the NYSE Arca and does not represent returns an investor would receive if shares were traded at other times. |
| 2 | See page 26 for more information on this index. |
| 24 |
| Management’s Discussion of Fund Performance (unaudited) (continued) |
During the reporting period, which sectors made the strongest contributions to the Fund’s absolute performance and which sectors made the weakest contributions?
On the basis of impact, which takes weightings and total returns into account, the sectors that made the strongest positive contributions to the Fund’s absolute performance were health care, consumer discretionary and information technology. The sectors that made the weakest contributions to the Fund’s absolute performance were industrials, telecommunication services and materials.
During the reporting period, which individual stocks had the highest total returns and which stocks had the lowest total returns?
Within the Underlying Index, the stocks with the highest total returns during the reporting period were Allergan, TriQuint Semiconductor and Gentiva Health Services. Allergan was acquired by Actavis. Allergan was a multi-specialty pharmaceutical company focused on ophthalmic, neurological, medical aesthetics, medical dermatology, breast aesthetics, obesity intervention, urological and other specialty markets. TriQuint Semiconductor was acquired by RF Micro Devices. TriQuint Semiconductor designed and manufactured mixed signal integrated circuits for the communications market, using a proprietary technology to improve performance in silicon devices. Gentiva Health Services was acquired by Kindred Healthcare. Gentiva provided specialty pharmaceutical and home health care services. By the end of the reporting period, Allergan was no longer held in the Underlying Index.
The individual Fund holdings with the lowest total returns for the reporting period were Kodiak Oil & Gas, Portugal Telecom and CGG. Kodiak Oil & Gas was acquired by Whiting Petroleum. Kodiak Oil & Gas was an oil and natural gas exploration and production company. Portugal Telecom’s acquisition by Terra Peregrin was terminated, and the company continues to trade on its domestic exchange. The company offers telecommunication services in Portugal. CGG’s acquisition by Technip was terminated, and the company continues to trade on its domestic exchange. The company provides geophysical services and products for use in oil and gas exploration. By the end of the reporting period, Portugal Telecom and CGG were no longer held in the Underlying Index.
Which individual stocks made the strongest contributions to the Fund’s absolute performance during the reporting period and which stocks made the weakest contributions?
On the basis of impact, which takes weightings and total returns into consideration, the stocks that made the strongest contributions to the Fund’s absolute performance during the reporting period were Allergan, Baker Hughes and TriQuint Semiconductor. The acquisitions of Allergan and TriQuint Semiconductor discussed above. At the end of the reporting period, Baker Hughes remained a constituent of the Underlying Index and was in the process of undergoing a merger with Halliburton. Baker Hughes provides oil and gas services and equipment used for exploration, drilling, completion and production. At the time of the announcement, this was the largest acquisition in the oil field services industry.
The weakest contributors were AstraZeneca, Time Warner and CGG. Pfizer failed to acquire AstraZeneca. AstraZeneca rejected the takeover attempt, which was connected with a tax inversion plan. AstraZeneca is a major pharmaceutical company focused on eight therapeutic areas — gastrointestinal, oncology, cardiovascular, respiratory, central nervous system, pain control, anesthesia and infection. 21st Century Fox withdrew its acquisition of Time Warner. Time Warner is a media and entertainment company focused on cable networks, feature films, television and home video production and distribution, and magazine publishing. The terminated acquisition of CGG discussed above. By the end of the reporting period, AstraZeneca, Time Warner and CGG were no longer held in the Underlying Index.
| 25 |
| Management’s Discussion of Fund Performance (unaudited) (continued) |
Were there any changes in the Underlying Index during the reporting period?
The Underlying Index is reconstituted and rebalanced monthly. Intra-month removal of deals occurs only for completed transactions. All other deals are removed at the monthly rebalance. The timing of the rebalance can have both positive and potentially adverse effects, depending on the circumstance of the deal, the number of competing offers, and if new acquirers attempt to acquire existing targets. The Fund’s hedges are also reset at this time.
The opinions expressed are those of the portfolio managers as of the date of this report and are subject to change. There is no guarantee that any forecast made will come to pass. This material does not constitute investment advice and is not intended as an endorsement of any specific investment.
Hypothetical Growth of a $10,000 Investment
(Since Inception Through 4/30/2015)
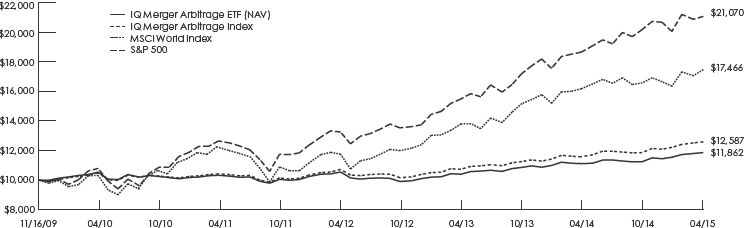
This chart illustrates the performance of a hypothetical $10,000 investment made on the Fund’s inception, and is not intended to imply any future performance.
Fund Performance History
IQ Merger Arbitrage ETF
(as of April 30, 2015)
| 1 Year | 3 Year | 5 Year | Since Inception2 | |||||||||||||||||
| Average Annual | Average Annual | Average Annual | Average Annual | Cumulative | ||||||||||||||||
| IQ Merger Arbitrage ETF Market Price1 | 6.31% | 4.20% | 2.39% | 3.22% | 18.84% | |||||||||||||||
| IQ Merger Arbitrage ETF NAV | 6.76% | 4.00% | 2.40% | 3.18% | 18.62% | |||||||||||||||
| IQ Merger Arbitrage Index | 7.81% | 5.18% | 3.52% | 4.31% | 25.87% | |||||||||||||||
| MSCI World Index | 7.99% | 14.12% | 11.12% | 10.76% | 74.66% | |||||||||||||||
| S&P 500 Index | 12.98% | 16.73% | 14.32% | 14.64% | 110.70% | |||||||||||||||
| 1 | The price used to calculate the market price returns is determined by using the closing price listed on the NYSE Arca and does not represent returns an investor would receive if shares were traded at other times. |
| 2 | Fund Inception Date: 11/16/2009. |
| 26 |
| Management’s Discussion of Fund Performance (unaudited) (continued) |
Since the shares of the Fund did not trade in the secondary market until the day after the Fund’s inception, for the period from inception (11/16/2009) to the first day of secondary market trading in shares of the Fund (11/17/2009), the NAV of the Fund is used as a proxy for the secondary market trading price to calculate market returns.
The performance data quoted above represents past performance. Past performance does not guarantee future results. The investment return and value of the Fund shares will fluctuate so that an investor’s shares, when sold, may be worth more or less than their original cost. Current Fund performance may be lower or higher than performance data quoted. Fund performance that is current to the most recent month-end is available by calling 1-888-934-0777 or by visiting www.indexiq.com. Returns shown include the reinvestment of all dividends and other distributions and do not reflect taxes that a shareholder would pay on the Fund’s distributions or redemption of the Fund’s shares.
Index performance is for illustrative purposes only and does not represent actual Fund performance. One cannot invest directly in an index. Performance data for the Index assumes reinvestment of dividends and is net of the management fees for the Index’s components, as applicable, but it does not reflect management fees, transaction costs or other expenses that you would pay if you invested in the Fund directly.
The MSCI World Index is a free-float adjusted market capitalization weighted index that is designed to measure the equity market performance of developed market (performance data assumes reinvestment of dividends, but it does not reflect management fees, transaction costs or other expenses).
The S&P 500 Index is a broad-based unmanaged index of 500 stocks, which is designed to represent the equity market in general (performance data assumes reinvestment of dividends, but it does not reflect management fees, transaction costs or other expenses).
Certain of the proposed takeover transactions in which the Fund invests may be renegotiated, terminated or involve a longer time frame than originally contemplated, which may negatively impact the Fund’s returns. The Fund’s investment strategy may result in high portfolio turnover, which, in turn, may result in increased transaction costs to the Fund and lower total returns. The Fund is susceptible to foreign securities risk — since the Fund invests in foreign markets, it will be subject to risk of loss not typically associated with domestic markets, including currency transaction risk. Diversification does not eliminate the risk of experiencing investment losses. Stock prices of mid and small capitalization companies generally are more volatile than those of larger companies and also more vulnerable than those of larger capitalization companies to adverse economic developments.
The ETF should be considered a speculative investment with a high degree of risk, does not represent a complete investment program and is not suitable for all investors.
| 27 |
| Management’s Discussion of Fund Performance (unaudited) (continued) |
IQ Real Return ETF
How did IQ Real Return ETF perform during the 12 months ended April 30, 2015?
For the 12 months ended April 30, 2015, IQ Real Return ETF returned 1.50% at NAV (net asset value) and 1.96% at market price.1 To compare, the Fund’s Underlying Index, the IQ Real Return Index,2 returned 1.92% for the same time period. The Barclays U.S. Short Treasury Bond Index2 returned 0.11% for the same period.
What factors affected the Fund’s performance during the reporting period?
The Fund holds a core position in short-term U.S. Treasury bond ETFs. Despite being a large weight in the Fund’s portfolio, the impact of these ETFs on performance was muted in the low interest rate environment that persisted through the reporting period.
The Fund also held long positions in equities, currencies and certain real assets (i.e., oil and real estate) via underlying ETFs. Additionally, the Fund held medium-term and long-term U.S. Treasury bonds, via underlying ETFs, as hedges against deflation. During the reporting period, the equity positions, both U.S. and international, were the largest positive contributors to return. The medium-term bonds also added value, as they were held during a period of declining interest rates. The Fund’s long position in real estate investment trusts (REITs), via underlying ETFs, added further value. Conversely, the Fund held a small long position in oil for a brief time when oil prices were declining. This position was the largest detractor from the Fund’s performance during the reporting period. To a lesser degree, the Fund’s currency exposure, especially a long position in the British pound, detracted.
During the reporting period, how was the Fund’s performance materially affected by investments in derivatives?
The Fund did not use derivatives during the reporting period.
How were the Fund’s assets allocated during the reporting period and why?
The Fund’s allocations are driven by a quantitative model that determines the weights of the asset classes that are most likely to help the Fund achieve its target risk and return objective. Given the rules-based nature of the process, there is no subjectivity involved in the allocation decision process.
During the reporting period, the Fund had a core position in a short-term U.S. Treasury bond ETF that ranged in allocation from 65% to 70% of Fund assets. The Fund’s next largest allocation was to equities, with a weight that ranged from 12% to 15% of Fund assets. The Fund also held REIT ETFs. At certain times during the period, the Fund also held positions in currency and oil.
How did the Fund’s allocations change over the course of the reporting period?
Based on our proprietary quantitative model, the Fund’s short-term U.S. Treasury bond allocation and equity allocation were little changed over the course of the reporting period. The Fund’s allocation to medium-term U.S. Treasury bonds declined through the reporting period, as lower rates started to give way to higher rates. The Fund’s exposure to REITs was reduced during the reporting period, and the proceeds were used to establish a position in the British pound.
During the reporting period, which underlying ETFs had the highest total returns and which underlying ETFs had the lowest total returns?
In terms of total return, the best-performing underlying ETFs in the Fund were iShares Core S&P 500 ETF (IVV), SPDR S&P 500 ETF Trust (SPY) and SPDR Dow Jones REIT ETF (RWR). During the reporting period, CurrencyShares British Pound Sterling Trust (FXB), CurrencyShares Euro Trust (FXE) and PowerShares DB Oil Fund (DBO) recorded the lowest total returns.
| 1 | The price used to calculate the market price returns is determined by using the closing price listed on the NYSE Arca and does not represent returns an investor would receive if shares were traded at other times. |
| 2 | See page 29 for more information on this index. |
| 28 |
| Management’s Discussion of Fund Performance (unaudited) (continued) |
Which underlying ETFs were the strongest positive contributors to the Fund’s performance and which underlying ETFs were particularly weak?
On the basis of impact, which takes weightings and total returns into consideration, the underlying ETFs that made the greatest positive contributions to the Fund’s performance during the reporting period were SPDR S&P 500 ETF Trust (SPY), Vanguard REIT Index Fund (VNQ) and iShares MSCI EAFE ETF (EFA). The weakest contributors were CurrencyShares British Pound Sterling Trust (FXB), CurrencyShares Euro Trust (FXE) and PowerShares DB Oil Fund (DBO).
The opinions expressed are those of the portfolio managers as of the date of this report and are subject to change. There is no guarantee that any forecast made will come to pass. This material does not constitute investment advice and is not intended as an endorsement of any specific investment.
Hypothetical Growth of a $10,000 Investment (Since Inception Through 4/30/2015)

This chart illustrates the performance of a hypothetical $10,000 investment made on the Fund’s inception, and is not intended to imply any future performance.
Fund Performance History
IQ Real Return ETF
(as of April 30, 2015)
| 1 Year | 3 Year | 5 Year | Since Inception1 | |||||||||||||||||
| Average Annual | Average Annual | Average Annual | Average Annual | Cumulative | ||||||||||||||||
| IQ Real Return ETF Market Price2 | 1.96% | 0.77% | 1.55% | 1.37% | 7.76% | |||||||||||||||
| IQ Real Return ETF NAV | 1.50% | 0.68% | 1.43% | 1.29% | 7.32% | |||||||||||||||
| IQ Real Return Index | 1.92% | 1.11% | 1.93% | 1.80% | 10.30% | |||||||||||||||
| Barclays Capital U.S. Short Term Bond Index | 0.11% | 0.14% | 0.18% | 0.18% | 1.00% | |||||||||||||||
| 1 | Fund Inception Date: 10/26/2009. |
| 2 | The price used to calculate the Market Price returns is determined by using the closing price listed on the NYSE Arca and does not represent returns an investor would receive if shares were traded at other times. |
| 29 |
| Management’s Discussion of Fund Performance (unaudited) (continued) |
Since the shares of the Fund did not trade in the secondary market until the day after the Fund’s inception, for the period from inception (10/26/2009) to the first day of secondary market trading in shares of the Fund (10/27/2009), the NAV of the Fund is used as a proxy for the secondary market trading price to calculate market returns.
The performance data quoted above represents past performance. Past performance does not guarantee future results. The investment return and value of the Fund shares will fluctuate so that an investor’s shares, when sold, may be worth more or less than their original cost. Current Fund performance may be lower or higher than performance data quoted. Fund performance that is current to the most recent month-end is available by calling 1-888-934-0777 or by visiting www.indexiq.com. Returns shown include the reinvestment of all dividends and other distributions and do not reflect taxes that a shareholder would pay on the Fund’s distributions or redemption of the Fund’s shares.
Index performance is for illustrative purposes only and does not represent actual Fund performance. One cannot invest directly in an index. Performance data for the Index assumes reinvestment of dividends and is net of the management fees for the Index’s components, as applicable, but it does not reflect management fees, transaction costs or other expenses that you would pay if you invested in the Fund directly.
The Barclays Capital U.S. Short Treasury Bond Index measures the performance of public obligations of the U.S. Treasury that have a remaining maturity of between 1 and 12 months.
The Fund may invest in a small number of holdings and may be susceptible to greater losses if a single portfolio investment declines than would a diversified Fund that invests in a large number of holdings. The Fund is not suitable for all investors. The Fund does not invest in hedge funds.
There is no guarantee that the Fund itself, or each of the ETFs in the Fund’s portfolio, will perform exactly as its underlying index. The Fund’s investment performance depends on the investment performance of the underlying ETFs in which it invests. The Fund’s underlying ETFs invest in: foreign securities, which subject them to risk of loss not typically associated with domestic markets, such as currency fluctuations and political uncertainty; commodities markets, which subject them to greater volatility than investments in traditional securities, such as stocks and bonds; and fixed income securities, which subject them to credit risk, the possibility that the issuer of a security will be unable to make interest payments and/or repay the principal on its debt, and interest rate risk, changes in the value of a fixed income security resulting from changes in interest rates.
| 30 |
| Management’s Discussion of Fund Performance (unaudited) (continued) |
IQ Australia Small Cap ETF
How did IQ Australia Small Cap ETF perform during the 12 months ended April 30, 2015?
For the 12 months ended April 30, 2015, IQ Australia Small Cap ETF returned –10.43% at NAV (net asset value) and –9.84% at market price.1 To compare, the Fund’s Underlying Index, the IQ Australia Small Cap Index,2 returned –9.83% for the same time period. The MSCI® EAFE Index2 returned 2.10% for the same time period.
What factors affected the Fund’s performance during the reporting period?
The Underlying Index seeks to capture the performance of the small-cap Australian equity market. The investable universe is limited to the 100 companies that satisfy the market capitalization and liquidity requirements of the Underlying Index selection criteria, and Underlying Index components are weighted by their float-adjusted market capitalization. During the reporting period, Australian small-cap equities underperformed their broader market counterpart. The MSCI Australia Small Cap Gross DTR Index returned 5.18% (in Australian dollars) versus the MSCI Australia Gross DTR Index return of 9.87% (in Australian dollars). The combined impact of local currency underperformance and the Australian dollar’s depreciation to the strong U.S. dollar further lowered returns when presented in U.S. dollars. During the reporting period, the Australian dollar depreciated 14.88% relative to the U.S. dollar.
The Fund’s sector exposure also contributed to its negative absolute performance. For example, materials and industrials, which together with consumer discretionary, account for approximately 61% of the Underlying Index’s sector exposure, were the largest negative contributors to the Fund’s absolute performance, impacted significantly by declining commodity prices during the reporting period. Further, underweighting better performing sectors, such as telecommunication services, health care and information technology, were missed opportunities but were based on the constraints of the selection criteria used to track the overall small-cap equity market of Australia, as defined by the Underlying Index.
During the reporting period, how was the Fund’s performance materially affected by investments in derivatives?
The Fund did not use derivatives during the reporting period.
During the reporting period, which sectors had the highest total returns and which sectors had the lowest total returns?
In terms of total return, the best-performing sectors in the Underlying Index were telecommunication services, health care and information technology. During the reporting period, consumer staples, energy and materials recorded the lowest total returns.
During the reporting period, which sectors made the strongest contributions to the Fund’s absolute performance and which sectors made the weakest contributions?
On the basis of impact, which takes weightings and total returns into account, the sectors that made the strongest positive contributions to the Fund’s absolute performance were telecommunication services, health care and financials. The sectors that made the weakest contributions to the Fund’s absolute performance were materials, industrials and consumer staples.
During the reporting period, which individual stocks had the highest total returns and which stocks had the lowest total returns?
Within the Underlying Index, the stocks with the highest total returns during the reporting period were M2 Group, Qantas Airways and Nufarm. M2 Group is a diversified telecommunications company providing fixed line, broadband, digital and mobile services focused on small- and medium-sized enterprises. Qantas Airways operates Qantas and Jetstar Airlines, carriers that operate international, domestic and regional services. Nufarm manufactures agricultural chemicals used to protect crops from weeds, pests and disease.
The Underlying Index components with the lowest total returns for the reporting period were full service vocational education and training provider Vocation, steel producer and recycler Arrium and iron ore producer Atlas Iron.
| 1 | The price used to calculate the market price returns is determined by using the closing price listed on the NYSE Arca and does not represent returns an investor would receive if shares were traded at other times. |
| 2 | See page 32 for more information on this index. |
| 31 |
| Management’s Discussion of Fund Performance (unaudited) (continued) |
Which individual stocks made the strongest contributions to the Fund’s absolute performance during the reporting period and which stocks made the weakest contributions?
On the basis of impact, which takes weightings and total returns into consideration, the stocks that made the strongest contributions to the Fund’s absolute performance during the reporting period were Qantas Airways, discussed above; Echo Entertainment, which owns interests in casino hotels within Australia; and Tabcorp Holdings, a gambling and entertainment group focused on hotel casinos, wagering and gaming. The weakest contributors were Bluescope Steel, which manufactures and distributes rolled coil and plate and coated steel products to the building and construction industry; Metcash, which operates distribution centers serving grocery, liquor, food services and convenience stores; and Arrium, discussed above.
Were there any changes in the Underlying Index during the reporting period?
The Underlying Index is reconstituted and rebalanced quarterly. During the reporting period, oil and gas exploration company Aurora Oil and Gas, department store retailer David Jones, natural gas distribution network owner and operator Envestra, online travel services company Wotif.com and diversified food service provider Goodman Fielder were acquired and subsequently removed from the Underlying Index.
The opinions expressed are those of the portfolio managers as of the date of this report and are subject to change. There is no guarantee that any forecast made will come to pass. This material does not constitute investment advice and is not intended as an endorsement of any specific investment.
Hypothetical Growth of a $10,000 Investment (Since Inception Through 4/30/2015)

This chart illustrates the performance of a hypothetical $10,000 investment made on the Fund’s inception, and is not intended to imply any future performance.
Fund Performance History
IQ Australia Small Cap ETF
(as of April 30, 2015)
| 1 Year | 3 Year | 5 Year | Since Inception1 | ||||||
| Average Annual | Average Annual | Average Annual | Average Annual | Cumulative | |||||
| IQ Australia Small Cap ETF Market Price2 | –9.84% | –7.52% | –3.51% | –3.24% | –15.48% | ||||
| IQ Australia Small Cap ETF NAV | –10.43% | –7.77% | –3.95% | –3.39% | –16.17% | ||||
| IQ Australia Small Cap Index | –9.83% | –7.06% | –3.20% | –2.64% | –12.77% | ||||
| MSCI EAFE Index | 2.10% | 11.71% | 7.89% | 7.57% | 45.22% | ||||
| 1 | Fund Inception Date: 3/22/2010. |
| 2 | The price used to calculate the Market Price returns is determined by using the closing price listed on the NYSE Arca and does not represent returns an investor would receive if shares were traded at other times. |
| 32 |
| Management’s Discussion of Fund Performance (unaudited) (continued) |
Since the shares of the Fund did not trade in the secondary market until the day after the Fund’s inception, for the period from inception (3/22/2010) to the first day of secondary market trading in shares of the Fund (3/23/2010), the NAV of the Fund is used as a proxy for the secondary market trading price to calculate market returns.
The performance data quoted above represents past performance. Past performance does not guarantee future results. The investment return and value of the Fund shares will fluctuate so that an investor’s shares, when sold, may be worth more or less than their original cost. Current Fund performance may be lower or higher than performance data quoted. Fund performance that is current to the most recent month-end is available by calling 1-888-934-0777 or by visiting www.indexiq.com. Returns shown include the reinvestment of all dividends and other distributions and do not reflect taxes that a shareholder would pay on the Fund’s distributions or redemption of the Fund’s shares.
Index performance is for illustrative purposes only and does not represent actual Fund performance. One cannot invest directly in an index. Performance data for the Index assumes reinvestment of dividends and is net of the management fees for the Index’s components, as applicable, but it does not reflect management fees, transaction costs or other expenses that you would pay if you invested in the Fund directly.
The MSCI EAFE Index (Europe, Australasia, Far East) is a free float-adjusted market capitalization index that is designed to measure the equity market performance of developed markets, excluding the U.S. and Canada.
As the Fund’s investments are concentrated in Australia, the value of its shares will be affected by factors specific to Australia and may fluctuate more widely than that of a fund which invests in a more diversified manner. Any negative changes in the agricultural or mining industries could have an adverse impact on the Australian economy. The Australian economy is heavily dependent upon trading with its key partners, including the U.S., Asia and Europe. Any reduction in this trading may cause an adverse impact on the economy in which the Fund invests. The Fund is susceptible to foreign securities risk — since the Fund invests in foreign markets, it will be subject to risk of loss not typically associated with domestic markets. The Fund is concentrated in small capitalization companies, whose stock prices generally are more volatile than those of larger companies and also are more vulnerable than those of large capitalization companies to adverse business and economic developments. Both the Fund’s ability to track its Index and Fund returns in general may be adversely impacted by changes in currency exchange rates. The Fund is not suitable for all investors. Investors in the Fund should be willing to accept a high degree of volatility in the price of the Fund’s Shares and the possibility of significant losses. An investment in the Fund involves a substantial degree of risk and the Fund does not represent a complete investment program.
| 33 |
| Management’s Discussion of Fund Performance (unaudited) (continued) |
IQ Canada Small Cap ETF
How did IQ Canada Small Cap ETF perform during the 12 months ended April 30, 2015?
For the 12 months ended April 30, 2015, IQ Canada Small Cap ETF returned –20.81% at NAV (net asset value) and –20.71% at market price.1 To compare, the Fund’s Underlying Index, the IQ Canada Small Cap Index,2 returned –19.98% for the same time period. The MSCI® EAFE Index2 and MSCI Canada Index2 returned 2.10% and –17.70%, respectively, for the same time period.
What factors affected the Fund’s performance during the reporting period?
The Underlying Index seeks to capture the performance of the small-cap Canadian equity market. The investable universe is limited to the 100 companies that satisfy the market capitalization and liquidity requirements of the Underlying Index selection criteria, and Underlying Index components are weighted by their float-adjusted market capitalization. During the reporting period, Canadian small-cap equities underperformed their broader market counterpart. The MSCI Canada Small Cap Gross DTR Index returned –5.24% (in Canadian dollars) versus the MSCI Canada Gross DTR Index return of 8.50% (in Canadian dollars). The impact of the Canadian dollar’s depreciation to the strong U.S. dollar further lowered returns when presented in U.S. dollars. During the reporting period, the Canadian dollar depreciated 9.21% relative to the U.S. dollar.
The Fund’s sector exposure also contributed to its negative absolute performance. For example, energy and materials, which together account for approximately 62% of the Underlying Index’s sector exposure, were the largest negative contributors to the Fund’s absolute performance both in local currency and in U.S. dollars, impacted significantly by declining commodity prices during the reporting period. While health care, consumer discretionary and information technology provided significant positive total returns, their relatively small weighting in the Underlying Index provided minimal contributions to performance.
During the reporting period, how was the Fund’s performance materially affected by investments in derivatives?
The Fund did not use derivatives during the reporting period.
During the reporting period, which sectors had the highest total returns and which sectors had the lowest total returns?
In terms of total return, the best-performing sectors in the Underlying Index were health care, consumer discretionary and information technology. During the reporting period, energy, materials and telecommunication services recorded the lowest total returns.
During the reporting period, which sectors made the strongest contributions to the Fund’s absolute performance and which sectors made the weakest contributions?
On the basis of impact, which takes weightings and total returns into account, the sectors that made the strongest positive contributions to the Fund’s absolute performance were information technology, consumer discretionary and financials. In aggregate, these sectors represented approximately 14% of the Underlying Index’s sector exposure. The sectors that detracted the most from the Fund’s absolute performance were energy, materials and industrials. In aggregate, these sectors represented approximately 75% of the Underlying Index, with energy and materials accounting sectors representing approximately 62% of the Underlying Index and contributing the largest negative total returns.
During the reporting period, which individual stocks had the highest total returns and which stocks had the lowest total returns?
Within the Underlying Index, the stocks with the highest total returns during the reporting period were ProMetic Life Sciences, DHX Media and Hudson’s Bay. ProMetic Life Sciences is a life sciences firm focused on protein technologies. DHX Media produces television programming and movies primarily for children and families. Hudson’s Bay is a merchandise retailer offering kitchen, bed and bath products. The large Canadian dollar-denominated returns of these securities were able to overcome the negative currency effect of the depreciation of the Canadian dollar to the U.S. dollar.
The Underlying Index components with the lowest total returns for the reporting period were Long Run Exploration, Lightstream Resources and Legacy Oil + Gas, each exploration and production companies in the energy sector. During the reporting period, the energy sector was hard hit by the declining price of crude oil.
| 1 | The price used to calculate the market price returns is determined by using the closing price listed on the NYSE Arca and does not represent returns an investor would receive if shares were traded at other times. |
| 2 | See page 35 for more information on this index. |
| 34 |
| Management’s Discussion of Fund Performance (unaudited) (continued) |
Which individual stocks made the strongest contributions to the Fund’s absolute performance during the reporting period and which stocks made the weakest contributions?
On the basis of impact, which takes weightings and total returns into consideration, the stocks that made the strongest contributions to the Fund’s absolute performance during the reporting period were Element Financial, which offers commercial financing for heavy machinery; DH Corporation, which provides computerized technology related to transaction processing for financial institutions; and Hudson’s Bay, which is discussed above. The weakest contributors were each from the energy sector — oil and gas services and equipment companies Trican Well Service and Precision Drilling and oil sands exploration and production company Athabasca Oil.
Were there any changes in the Underlying Index during the reporting period?
The Underlying Index is reconstituted and rebalanced quarterly. During the reporting period, precious metals mining company Osisko Mining was acquired by Yamana Gold and Agnico Eagle Mines; timber manufacturing company Ainsworth Lumber was acquired by Norbord; and precious metals mining company Rio Alto Mining was acquired by Tahoe Resources. Each acquired company was subsequently removed from the Underlying Index.
The opinions expressed are those of the portfolio managers as of the date of this report and are subject to change. There is no guarantee that any forecast made will come to pass. This material does not constitute investment advice and is not intended as an endorsement of any specific investment.
Hypothetical Growth of a $10,000 Investment (Since Inception Through 4/30/2015)
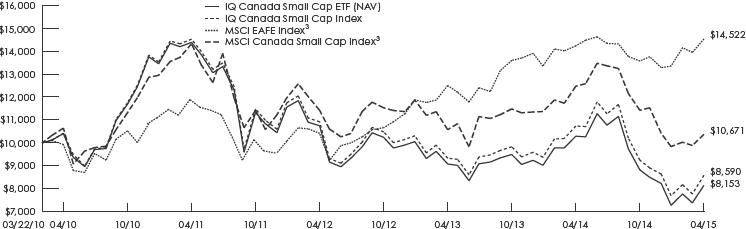
This chart illustrates the performance of a hypothetical $10,000 investment made on the Fund’s inception, and is not intended to imply any future performance.
Fund Performance History
IQ Canada Small Cap ETF
(as of April 30, 2015)
| 1 Year | 3 Year | 5 Year | Since Inception3 | |||||||||||||||||
| Average Annual | Average Annual | Average Annual | Average Annual | Cumulative | ||||||||||||||||
| IQ Canada Small Cap ETF Market Price1 | –20.71% | –8.71% | –4.79% | –3.96% | –18.65% | |||||||||||||||
| IQ Canada Small Cap ETF NAV | –20.81% | –8.80% | –4.77% | –3.92% | –18.47% | |||||||||||||||
| IQ Canada Small Cap Index | –19.98% | –7.70% | –3.79% | –2.93% | –14.10% | |||||||||||||||
| MSCI EAFE Index3 | 2.10% | 11.71% | 7.89% | 7.57% | 45.22% | |||||||||||||||
| MSCI Canada Small Cap Index3 | –17.70% | –0.43% | 1.44% | 0.59% | 6.71% | |||||||||||||||
| 1 | Fund Inception Date: 3/22/2010. |
| 2 | The price used to calculate the Market Price returns is determined by using the closing price listed on the NYSE Arca and does not represent returns an investor would receive if shares were traded at other times. |
| 3 | The MSCI Canada Small Cap Index has replaced the MSCI EAFE Index as the Fund’s benchmark index. The new index more closely aligns with the Fund's investment strategies. |
| 35 |
| Management’s Discussion of Fund Performance (unaudited) (continued) |
Since the shares of the Fund did not trade in the secondary market until the day after the Fund’s inception, for the period from inception (3/22/2010) to the first day of secondary market trading in shares of the Fund (3/23/2010), the NAV of the Fund is used as a proxy for the secondary market trading price to calculate market returns.
The performance data quoted above represents past performance. Past performance does not guarantee future results. The investment return and value of the Fund shares will fluctuate so that an investor’s shares, when sold, may be worth more or less than their original cost. Current Fund performance may be lower or higher than performance data quoted. Fund performance that is current to the most recent month-end is available by calling 1-888-934-0777 or by visiting www.indexiq.com. Returns shown include the reinvestment of all dividends and other distributions and do not reflect taxes that a shareholder would pay on the Fund’s distributions or redemption of the Fund’s shares.
Index performance is for illustrative purposes only and does not represent actual Fund performance. One cannot invest directly in an index. Performance data for the Index assumes reinvestment of dividends and is net of the management fees for the Index’s components, as applicable, but it does not reflect management fees, transaction costs or other expenses that you would pay if you invested in the Fund directly.
The MSCI EAFE Index (Europe, Australasia, Far East) is a free float-adjusted market capitalization index that is designed to measure the equity market performance of developed markets, excluding the U.S. and Canada.
The MSCI Canada Small Cap Index is designed to measure the performance of the small cap segment of the Canada market. With 252 constituents, the index covers approximately 14% of the free float-adjusted market capitalization in Canada.
As the Fund’s investments are concentrated in Canada, the value of its shares will be affected by factors specific to Canada and may fluctuate more widely than that of a fund which invests in a broad range of countries. Any negative changes in the agricultural or mining industries could have an adverse impact on the Canadian economy. The Canadian economy is heavily dependent upon trading with its key partners. Any reduction in this trading may cause an adverse impact on the economy in which the Fund invests. The Fund is susceptible to foreign securities risk. Since the Fund invests in foreign markets, it will be subject to risk of loss not typically associated with domestic markets. The Fund is concentrated in small capitalization companies, whose stock prices generally are more volatile than those of larger companies and also are more vulnerable than those of large capitalization companies to adverse business and economic developments. Both the Fund’s ability to track its Index and Fund returns in general may be adversely impacted by changes in currency exchange rates. The Fund is not suitable for all investors. Investors in the Fund should be willing to accept a high degree of volatility in the price of the Fund’s Shares and the possibility of significant losses. An investment in the Fund involves a substantial degree of risk and the Fund does not represent a complete investment program.
| 36 |
| Management’s Discussion of Fund Performance (unaudited) (continued) |
IQ Global Agribusiness Small Cap ETF
How did IQ Global Agribusiness Small Cap ETF perform during the 12 months ended April 30, 2015?
For the 12 months ended April 30, 2015, IQ Global Agribusiness Small Cap ETF returned 2.92% at NAV (net asset value) and 3.15% at market price.1 To compare, the Fund's Underlying Index, the IQ Global Agribusiness Small Cap Index2, returned 3.52% and Russell Global Small Cap Agriculture Fishing & Ranching Index2 and MSCI World Small Index2 returned –1.52% and 6.24%, respectively, for the same time period.
What factors affected the Fund’s performance during the reporting period?
The Underlying Index applies size, liquidity and business operations rules to select small capitalization agribusiness companies and uses a float-adjusted market capitalization weighting methodology. During the reporting period, absolute returns were pressured by the relative strength of the U.S. dollar versus other major world currencies and by declining commodity prices within the agriculture and livestock industries.
The Fund’s sector exposure contributed positively to its performance. The largest allocations in the Underlying Index and in the Fund were to positively performing sectors, with the largest sector being Crop Production and Farming. Livestock Operations produced a negative absolute total return during the reporting period; however, the Underlying Index’s largest position in the Livestock Operations sector produced a positive total return, thereby generating a positive contribution to return. The smallest sector in the Underlying Index, agricultural machinery, was the only sector that contributed negatively.
During the reporting period, how was the Fund’s performance materially affected by investments in derivatives?
The Fund did not use derivatives during the reporting period.
During the reporting period, which sectors had the highest total returns and which sectors had the lowest total returns?
The Underlying Index is organized into five sectors. In terms of total return, the best-performing sectors in the Underlying Index were agricultural supplies and logistics; agricultural chemicals; and crop production and farming. During the reporting period, agricultural machinery and livestock operations recorded negative total returns.
During the reporting period, which sectors made the strongest contributions to the Fund’s absolute performance and which sectors made the weakest contributions?
On the basis of impact, which takes weightings and total returns into account, the sectors that made the strongest positive contributions to the Fund’s absolute performance were agricultural supplies and logistics; crop production and farming; and agricultural chemicals. Livestock Operations contributed positively despite the sector’s overall negative total return. This was due to the Fund’s largest position in the sector generating a positive total return which overcame the negative performance of the other positions. The only sector that contributed negatively was Agricultural Machinery.
During the reporting period, which individual stocks had the highest total returns and which stocks had the lowest total returns?
Within the Underlying Index, the stocks with the highest total returns during the reporting period were Sinofert Holdings, First Tractor and Leyou Technologies. Sinofert Holdings manufactures and distributes fertilizers. First Tractor manufactures and sells agricultural tractors, road rollers and other construction machines. Leyou Technologies operates subsidiaries that breed chickens, manufacture chicken meat products and produce animal feeds.
The Underlying Index components with the lowest total returns for the reporting period were PT Malindo Feedmill, PT Perusahaan Perkebunana and Amira Nature Foods. PT Malindo Feedmill produces animal feeds and breeds commercial chicks. PT Perusahaan Perkebunana cultivates, harvests and processes palm oil, rubber, coconut, cocoa, coffee and tea. Amira Nature Foods provides packaged Indian specialty rice and bulk commodities to international and regional trading firms.
| 1 | The price used to calculate the market price returns is determined by using the closing price listed on the NYSE Arca and does not represent returns an investor would receive if shares were traded at other times. |
| 2 | See page 38 for more information on this index. |
| 37 |
| Management’s Discussion of Fund Performance (unaudited) (continued) |
Which individual stocks made the strongest contributions to the Fund’s absolute performance during the reporting period and which stocks made the weakest contributions?
On the basis of impact, which takes weightings and total returns into consideration, the stocks that made the strongest contributions to the Fund’s absolute performance during the reporting period were Nutreco, which produces premixes and feed specialties for pigs and poultry; NH Foods, which breeds and raises cattle and produces and sells pork and processed meat products; and Nisshin Seifun Group, which produces and sells flour, fodder, processed foods and medicines. Nutreco was acquired by SHV Holdings in an all-cash transaction during the reporting period. The weakest contributors were Sanderson Farms, which produces, processes, markets and distributes fresh and frozen chicken products; First Resources, which produces crude palm oil; and PT Perusahaan Perkebunana, which is discussed above.
Were there any changes in the Underlying Index during the reporting period?
The Underlying Index is reconstituted and rebalanced quarterly. During the reporting period, Chiquita Brands, which markets, produces and distributes fresh bananas and other fresh produce, and Nutreco, were removed from the Underlying Index as a result of respective acquisition and merger deals. At the time of its removal, Nutreco comprised 8% of the Underlying Index.
The opinions expressed are those of the portfolio managers as of the date of this report and are subject to change. There is no guarantee that any forecast made will come to pass. This material does not constitute investment advice and is not intended as an endorsement of any specific investment.
Hypothetical Growth of a $10,000 Investment (Since Inception Through 4/30/2015)
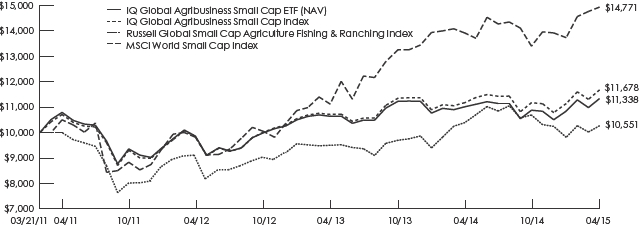
This chart illustrates the performance of a hypothetical $10,000 investment made on the Fund’s inception, and is not intended to imply any future performance.
Fund Performance History
IQ Global Agribusiness Small Cap ETF
(as of April 30, 2015)
| 1 Year | 3 Year | Since Inception1 | ||||||||||||||
| Average Annual | Average Annual | Average Annual | Cumulative | |||||||||||||
| IQ Global Agribusiness Small Cap ETF Market Price2 | 3.15% | 5.01% | 3.11% | 13.42% | ||||||||||||
| IQ Global Agribusiness Small Cap ETF NAV | 2.92% | 4.76% | 3.10% | 13.38% | ||||||||||||
| IQ Global Agribusiness Small Cap Index | 3.52% | 5.55% | 3.85% | 16.78% | ||||||||||||
| Russell Global Small Cap Agriculture | ||||||||||||||||
| Fishing & Ranching Index | –1.52% | 3.66% | 1.94% | 8.21% | ||||||||||||
| MSCI World Small Cap Index | 6.24% | 14.04% | 9.95% | 47.71% | ||||||||||||
| 1 | Fund Inception Date: 3/21/2011. |
| 2 | The price used to calculate the Market Price returns is determined by using the closing price listed on the NYSE Arca and does not represent returns an investor would receive if shares were traded at other times. |
| 38 |
| Management’s Discussion of Fund Performance (unaudited) (continued) |
Since the shares of the Fund did not trade in the secondary market until the day after the Fund’s inception, for the period from inception (3/21/2011) to the first day of secondary market trading in shares of the Fund (3/22/2011), the NAV of the Fund is used as a proxy for the secondary market trading price to calculate market returns.
The performance data quoted above represents past performance. Past performance does not guarantee future results. The investment return and value of the Fund shares will fluctuate so that an investor’s shares, when sold, may be worth more or less than their original cost. Current Fund performance may be lower or higher than performance data quoted. Fund performance that is current to the most recent month-end is available by calling 1-888-934-0777 or by visiting www.indexiq.com. Returns shown include the reinvestment of all dividends and other distributions and do not reflect taxes that a shareholder would pay on the Fund’s distributions or redemption of the Fund’s shares.
Index performance is for illustrative purposes only and does not represent actual Fund performance. One cannot invest directly in an index. Performance data for the Index assumes reinvestment of dividends and is net of the management fees for the Index’s components, as applicable, but it does not reflect management fees, transaction costs or other expenses that you would pay if you invested in the Fund directly.
The Russell Global Small Cap Agriculture Fishing & Ranching Index offers investors access to the Agriculture Fishing & Ranching Industry small-cap segment of the global equity universe. The Russell Global Small Cap Agriculture Fishing & Ranching Index is constructed to provide a comprehensive and unbiased barometer for the Agriculture Fishing & Ranching Industry small-cap segment and is completely reconstituted annually to accurately reflect the changes in the market over time.
The MSCI World Small Cap Index captures small cap representation across 23 Developed Markets (DM) countries. With 4,275 constituents, the index covers approximately 14% of the free float-adjusted market capitalization in each country.
As the Fund’s investments are concentrated in the Agribusiness sector, adverse weather conditions, economic forces and government policy and regulation could adversely affect the Fund’s portfolio companies and, thus, the Fund’s financial situation and performance. The Fund is susceptible to foreign securities risk. Since the Fund invests in foreign markets, it will be subject to risk of loss not typically associated with domestic markets. The Fund is concentrated in small capitalization companies, whose stock prices generally are more volatile than those of larger companies and also are more vulnerable than those of large capitalization companies to adverse business and economic developments. Both the Fund’s ability to track its Index and Fund returns in general may be adversely impacted by changes in currency exchange rates. The Fund is not suitable for all investors. Investors in the Fund should be willing to accept a high degree of volatility in the price of the Fund’s shares and the possibility of significant losses. An investment in the Fund involves a substantial degree of risk and the Fund does not represent a complete investment program.
| 39 |
| Management’s Discussion of Fund Performance (unaudited) (continued) |
IQ Global Oil Small Cap ETF
How did IQ Global Oil Small Cap ETF perform during the 12 months ended April 30, 2015?
For the 12 months ended April 30, 2015, IQ Global Oil Small Cap ETF returned –21.80% at NAV (net asset value) and –21.58% at market price.1 To compare, the Fund’s Underlying Index, the IQ Global Oil Small Cap Index2, returned –21.21%, and the Russell Global Small Cap Energy Index2 and MSCI World Small Cap Index2, returned –35.14% and 6.58%, receptively, for the same time period.
What factors affected the Fund’s performance during the reporting period?
The Underlying Index applies size and liquidity rules to select small capitalization pure-oil companies and uses a float-adjusted market capitalization weighting methodology. Absolute returns were pressured by the 40% decline in the price of crude oil during the reporting period, a price decline that impacted the energy sector as a whole and oil companies in particular. As a global strategy, the Underlying Index was also subject to currency risks. The U.S. dollar appreciated strongly during the reporting period, outperforming other major world currencies, as represented by the Bloomberg Dollar Spot Index.2
The Fund’s industry exposure also contributed negatively to its performance. The largest allocations in the Underlying Index and in the Fund were to the exploration and production industry and the refining and marketing industry. The exploration and production industry generated the largest negative contribution, but the effect was slightly dampened by the positive contribution of exposure to refining and marketing. The third industry — equipment, services and drilling — was the smallest relative industry in the Underlying Index but produced the largest negative total return.
During the reporting period, how was the Fund’s performance materially affected by investments in derivatives?
The Fund did not use derivatives during the reporting period.
During the reporting period, which industries had the highest total returns and which industries had the lowest total returns?
The Underlying Index is organized into three industries. In terms of total return, the best-performing industry in the Underlying Index was refining and marketing, followed by exploration and production and then equipment, services and drilling.
During the reporting period, which industries made the strongest contributions to the Fund’s absolute performance and which industries made the weakest contributions?
On the basis of impact, which takes weightings and total returns into account, refining and marketing made the strongest positive contribution to the Fund’s absolute performance. Equipment, services and drilling and exploration and production negatively affected the Fund’s performance.
During the reporting period, which individual stocks had the highest total returns and which stocks had the lowest total returns?
Within the Underlying Index, the stocks with the highest total returns during the reporting period were Shandong Molong Petroleum, Sinopec Shanghai Petrochemical and California Resources. Shandong Molong Petroleum sells petroleum extraction machinery and accessories. Sinopec Shanghai Petrochemical processes crude oil into intermediate petrochemical products and petroleum products. California Resources, a spinoff of Occidental Petroleum, explores for and produces oil.
The Underlying Index components with the lowest total returns for the reporting period were BPZ Resources, Emerald Oil and Lightstream Resources. BPZ Resources is an oil exploration company with properties in Peru and Ecuador. Emerald Oil is an independent exploration and production oil company focused on developing oil wells. Lightstream Resources is an oil and exploration company in Canada.
| 1. | The price used to calculate the market price returns is determined by using the closing price listed on the NYSE Arca and does not represent returns an investor would receive if shares were traded at other times. |
| 2. | See page 41 for more information on this index. |
| 40 |
| Management’s Discussion of Fund Performance (unaudited) (continued) |
Which individual stocks made the strongest contributions to the Fund’s absolute performance during the reporting period and which stocks made the weakest contributions?
On the basis of impact, which takes weightings and total returns into consideration, the stocks that made the strongest contributions to the Fund’s absolute performance during the reporting period were California Resources, discussed above; Sinopec Shanghai Petrochemical, also discussed above; and SemGroup, which transports oil through a network of pipelines, terminals and storage tanks. The weakest contributors were Kodiak Oil & Gas, a crude oil producer acquired by Whiting Petroleum; Gulfport Energy, which owns and operates oil properties in the Louisiana Gulf Coast; and Pengrowth Energy, an exploration and production company operating in light and heavy oil.
Were there any changes in the Underlying Index during the reporting period?
The Underlying Index is reconstituted and rebalanced quarterly. During the reporting period, Caracal Energy, QR Energy, Kodiak Oil & Gas and Salamander Energy were removed as a result of respective acquisition and merger deals. Caracal Energy, an exploration and production company operating in Canada, was acquired by Glencore. QR Energy, an exploration and production company, was acquired by Breitburn Energy Partners. As mentioned earlier, Kodiak Oil & Gas, a crude oil producer, was acquired by Whiting Petroleum. Salamander Energy, an exploration and production company, was acquired by Ophir Energy.
The opinions expressed are those of the portfolio managers as of the date of this report and are subject to change. There is no guarantee that any forecast made will come to pass. This material does not constitute investment advice and is not intended as an endorsement of any specific investment.
Hypothetical Growth of a $10,000 Investment Since Inception Through 4/30/2015)
![]()
This chart illustrates the performance of a hypothetical $10,000 investment made on the Fund’s inception, and is not intended to imply any future performance.
Fund Performance History
IQ Global Oil Small Cap ETF
(as of April 30, 2015)
| 1 Year | 3 Year | Since Inception1 | ||||||||||||||
| Average Annual | Average Annual | Average Annual | Cumulative | |||||||||||||
| IQ Global Oil Small Cap ETF Market Price2 | –21.58% | 1.28% | –1.58% | –6.18% | ||||||||||||
| IQ Global Oil Small Cap ETF NAV | –21.80% | 1.26% | –1.52% | –5.93% | ||||||||||||
| IQ Global Oil Small Cap Index | –21.21% | 2.38% | –0.50% | –1.99% | ||||||||||||
| Russell Global Small Cap Energy Index | –35.14% | –10.08% | –10.99% | –37.17% | ||||||||||||
| MSCI World Small Cap Index | 6.58% | 18.21% | 9.20% | 41.12% | ||||||||||||
| 1 | Fund Inception Date: 5/4/2011. |
| 2 | The price used to calculate the Market Price returns is determined by using the closing price listed on the NYSE Arca and does not represent returns an investor would receive if shares were traded at other times. |
| 41 |
| Management’s Discussion of Fund Performance (unaudited) (continued) |
Since the shares of the Fund did not trade in the secondary market until the day after the Fund’s inception, for the period from inception (5/4/2011) to the first day of secondary market trading in shares of the Fund (5/5/2011), the NAV of the Fund is used as a proxy for the secondary market trading price to calculate market returns.
The performance data quoted above represents past performance. Past performance does not guarantee future results. The investment return and value of the Fund shares will fluctuate so that an investor’s shares, when sold, may be worth more or less than their original cost. Current Fund performance may be lower or higher than performance data quoted. Fund performance that is current to the most recent month-end is available by calling 1-888-934-0777 or by visiting www.indexiq.com. Returns shown include the reinvestment of all dividends and other distributions and do not reflect taxes that a shareholder would pay on the Fund’s distributions or redemption of the Fund’s shares.
Index performance is for illustrative purposes only and does not represent actual Fund performance. One cannot invest directly in an index. Performance data for the Index assumes reinvestment of dividends and is net of the management fees for the Index’s components, as applicable, but it does not reflect management fees, transaction costs or other expenses that you would pay if you invested in the Fund directly.
The Russell Global Small Cap Energy Index offers investors access to the Energy Sector small-cap segment of the global equity universe. The Russell Global Small Cap Energy Index is constructed to provide a comprehensive and unbiased barometer for the Energy Sector small-cap segment and is completely reconstituted annually to accurately reflect the changes in the market over time.
The MSCI World Small Cap Index captures small cap representation across 23 Developed Markets (DM) countries*. With 4,275 constituents, the index covers approximately 14% of the free float-adjusted market capitalization in each country.
As the Fund’s investments are concentrated in the Oil sector, the uncertainty and risks associated with oil exploration, economic forces and government policy and regulation could adversely affect the Fund’s portfolio companies and, thus, the Fund’s financial situation and performance. The Fund is susceptible to foreign securities risk. Since the Fund invests in foreign markets, it will be subject to risk of loss not typically associated with domestic markets. The Fund is concentrated in small capitalization companies, whose stock prices generally are more volatile than those of larger companies and also are more vulnerable than those of large capitalization companies to adverse business and economic developments. Both the Fund’s ability to track its Index and Fund returns in general may be adversely impacted by changes in currency exchange rates. The Fund is not suitable for all investors. Investors in the Fund should be willing to accept a high degree of volatility in the price of the Fund’s shares and the possibility of significant losses. An investment in the Fund involves a substantial degree of risk and the Fund does not represent a complete investment program.
| 42 |
| Management’s Discussion of Fund Performance (unaudited) (continued) |
IQ U.S. Real Estate Small Cap ETF
How did IQ U.S. Real Estate Small Cap ETF perform during the 12 months ended April 30, 2015?
For the 12 months ended April 30, 2015, IQ U.S. Real Estate Small Cap ETF returned 10.44% at NAV (net asset value) and 10.51% at market price.1 To compare, the Fund’s Underlying Index, the IQ U.S. Real Estate Small Cap Index,2 returned 11.37% for the same time period. The Dow Jones U.S. Real Estate Index2 returned 12.74% for the same time period.
What factors affected the Fund’s performance during the reporting period?
The Underlying Index seeks to capture the performance of the small-cap U.S. real estate equity market. The investable universe is limited to, at most, 100 companies that satisfy the market capitalization and liquidity requirements of the Underlying Index selection criteria, and Underlying Index components are weighted by their float-adjusted market capitalization. During the reporting period, the IQ U.S. Real Estate Small Cap Index slightly underperformed the broader market Dow Jones U.S. Real Estate Index
On the positive side, real estate investment trusts (REITs) recorded robust absolute gains during the reporting period. As a subset of the financials sector, REITS have similar sensitivities to interest rates as the broader financials sector. During the reporting period, the financials sector posted positive total returns, as did U.S. small-cap equities in general. Interest rates remained low, while housing indicators and GDP growth were positive.
The Fund’s sector exposure also contributed to its positive absolute performance. The Underlying Index is limited to U.S. small-cap REITs with operations in residential, hotel, retail, office, diversified, specialized and mortgage sectors. All sectors, except office and diversified, experienced double-digit growth during the reporting period, with the residential and hotel sectors each generating gains of more than 20%. Partially offsetting these positive contributions was sector allocation. The Underlying Index was under-allocated to residential and over-allocated to office and diversified, which contributed negatively.
During the reporting period, how was the Fund’s performance materially affected by investments in derivatives?
The Fund did not use derivatives during the reporting period.
During the reporting period, which sectors had the highest total returns and which sectors had the lowest total returns?
In terms of total return, the best-performing sectors in the Underlying Index were residential, hotel and retail. During the reporting period, diversified, office and mortgage recorded the lowest total returns.
During the reporting period, which sectors made the strongest contributions to the Fund’s absolute performance and which sectors made the weakest contributions?
On the basis of impact, which takes weightings and total returns into account, the sectors that made the strongest positive contributions to the Fund’s absolute performance were hotel, retail and specialized. The sectors that made the weakest contributions to the Fund’s absolute performance were diversified, office and residential.
During the reporting period, which individual stocks had the highest total returns and which stocks had the lowest total returns?
Within the Underlying Index, the stocks with the highest total returns during the reporting period were Associated Estates Realty, CyrusOne and New Residential Investment. Associated Estates Realty specializes in owning and managing multi-family properties. CyrusOne is an owner, operator and developer of enterprise-class, carrier neutral data center properties. New Residential Investment is a public REIT investing in mortgage assets.
The Underlying Index components with the lowest total returns for the reporting period were Campus Crest Communities, ARMOUR Residential REIT and Redwood Trust. Campus Crest Communities develops, builds, owns and manages student housing. ARMOUR Residential REIT invests in mortgage-backed securities. Redwood Trust is engaged in residential and commercial mortgage banking activities and investing in mortgage and real estate assets.
| 1 | The price used to calculate the market price returns is determined by using the closing price listed on the NYSE Arca and does not represent returns an investor would receive if shares were traded at other times. |
| 2 | See page 44 for more information on this index. |
| 43 |
| Management’s Discussion of Fund Performance (unaudited) (continued) |
Which individual stocks made the strongest contributions to the Fund’s absolute performance during the reporting period and which stocks made the weakest contributions?
On the basis of impact, which takes weightings and total returns into consideration, the stocks that made the strongest contributions to the Fund’s absolute performance during the reporting period were New Residential Investment, discussed above; Pebblebrook Hotel Trust, which is an internally-managed hotel investment company that acquires and invests in hotel properties; and Glimcher Realty Trust, which is a REIT that owns, leases, manages, acquires and develops enclosed regional malls, shopping centers and single tenant retail properties. The weakest contributors were Redwood Trust, discussed above; Cousins Properties, which acquires, finances, develops, manages and leases commercial properties; and ARMOUR Residential REIT, also discussed above.
Were there any changes in the Underlying Index during the reporting period?
The Underlying Index is reconstituted and rebalanced quarterly, with weights reflecting the then-current float-adjusted market capitalizations.
During the period, Aviv REIT was acquired by Omega Healthcare and Glimcher Realty Trust was acquired by Washington Prime Groups. Aviv REIT and Glimcher Realty Trust and were subsequently removed from the Underlying Index.
The opinions expressed are those of the portfolio managers as of the date of this report and are subject to change. There is no guarantee that any forecast made will come to pass. This material does not constitute investment advice and is not intended as an endorsement of any specific investment.
Hypothetical Growth of a $10,000 Investment (Since Inception Through 4/30/2015)
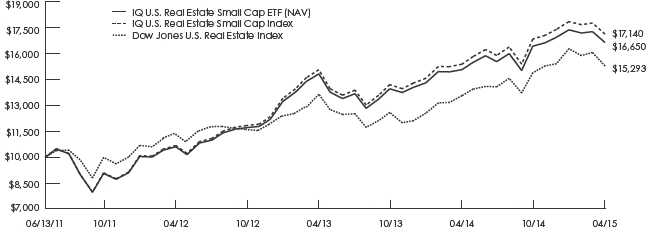
This chart illustrates the performance of a hypothetical $10,000 investment made on the Fund’s inception, and is not intended to imply any future performance.
Fund Performance History
IQ U.S. Real Estate Small Cap ETF
(as of April 30, 2015)
| 1 Year | 3 Year | Since Inception1 | ||||||||||||||
| Average Annual | Average Annual | Average Annual | Cumulative | |||||||||||||
| IQ U.S. Real Estate Small Cap ETF Market Price2 | 10.51% | 16.25% | 13.55% | 63.77% | ||||||||||||
| IQ U.S. Real Estate Small Cap ETF NAV | 10.44% | 16.23% | 14.03% | 66.50% | ||||||||||||
| IQ U.S. Real Estate Small Cap Index | 11.37% | 17.10% | 14.90% | 71.40% | ||||||||||||
| Dow Jones U.S. Real Estate Index | 12.74% | 10.37% | 11.56% | 52.93% | ||||||||||||
| 1 | Fund Inception Date: 6/13/2011. |
| 2 | The price used to calculate the Market Price returns is determined by using the closing price listed on the NYSE Arca and does not represent returns an investor would receive if shares were traded at other times. |
| 44 |
| Management’s Discussion of Fund Performance (unaudited) (continued) |
Since the shares of the Fund did not trade in the secondary market until the day after the Fund’s inception, for the period from inception (6/13/2011) to the first day of secondary market trading in shares of the Fund (6/14/2011), the NAV of the Fund is used as a proxy for the secondary market trading price to calculate market returns.
The performance data quoted above represents past performance. Past performance does not guarantee future results. The investment return and value of the Fund shares will fluctuate so that an investor’s shares, when sold, may be worth more or less than their original cost. Current Fund performance may be lower or higher than performance data quoted. Fund performance that is current to the most recent month-end is available by calling 1-888-934-0777 or by visiting www.indexiq.com. Returns shown include the reinvestment of all dividends and other distributions and do not reflect taxes that a shareholder would pay on the Fund’s distributions or redemption of the Fund’s shares.
Index performance is for illustrative purposes only and does not represent actual Fund performance. One cannot invest directly in an index. Performance data for the Index assumes reinvestment of dividends and is net of the management fees for the Index’s components, as applicable, but it does not reflect management fees, transaction costs or other expenses that you would pay if you invested in the Fund directly.
The Dow Jones U.S. Real Estate Index measures the stock performance of REITs and real estate operating companies in the U.S.
As the Fund’s investments are concentrated in the real estate sector, it is exposed to concentration risk, interest rate risk, leverage risk, property risk and management risk. The Fund is concentrated in small capitalization companies, whose stock prices generally are more volatile than those of larger companies. The Fund is non-diversified and is susceptible to greater losses if a single portfolio investment declines than would a diversified fund. The Fund is not suitable for all investors. Investors in the Fund should be willing to accept a high degree of volatility in the price of the Fund’s shares and the possibility of significant losses. An investment in the Fund involves a substantial degree of risk and the Fund does not represent a complete investment program.
| 45 |
| Fund Expenses (unaudited) |
As a shareholder of a Fund, you incur two types of costs: (1) transaction costs and (2) ongoing costs, including Advisory fees and other Fund expenses. This example is intended to help you understand your ongoing costs (in dollars) of investing in a Fund and to compare these costs with the ongoing costs of investing in other mutual funds.
The examples are based on an investment of $1,000 invested at the beginning of the period and held for the entire period as indicated below.
Actual Expenses
The first line of the table below provides information about actual account values and actual expenses. You may use the information together with the amount you invested, in a particular Fund, to estimate the expenses that you paid over the period. Simply divide your account value by $1,000 (for example, an $8,600 account value divided by $1,000 = 8.6), then multiply the result by the number in the first line under the heading entitled “Expenses Paid for Period 11/01/14 to 04/30/15” to estimate the expenses you paid on your account during this period. Each Fund will indirectly bear its pro rata share of the expenses incurred by the underlying ETF investments in which each Fund invests. These expenses are not included in the table.
Hypothetical Example for Comparison Purposes
The second line of the table below also provides information about hypothetical account values and hypothetical expenses based on each Fund’s actual expense ratio and an assumed annual rate of return of 5% before expenses, which are not the Funds’ actual returns. The hypothetical account values and expenses may not be used to estimate the actual ending account balance or expenses you paid for the period. You may use this information to compare the ongoing costs of investing in the Fund and other funds. To do so, compare this 5% hypothetical example with the 5% hypothetical examples that appear in the shareholder reports of other funds. The Funds will indirectly bear their pro rata share of the expenses incurred by the underlying fund investments in which the Funds invest. These expenses are not included in the table.
Please note that the expenses shown in the table are meant to highlight your ongoing costs only and do not reflect any transactional costs. Therefore, the hypothetical example is useful in comparing ongoing costs only, and will not help you determine the relative total costs of owning different funds. In addition, if these transactional costs were included, your costs would have been higher.
| 46 |
| Fund Expenses (unaudited) (continued) |
| Beginning Account Value | Ending Account Value 04/30/15 | Annualized Expense Ratios for the Period 11/01/14 to 04/30/15 | Expenses1 Paid for Period 11/01/14 to 04/30/15 | |||||
| IQ Hedge Multi-Strategy Tracker ETF | ||||||||
| Actual | $1,000.00 | $1,020.50 | 0.76% | $3.81 | ||||
| Hypothetical (5% return before expenses) | $1,000.00 | $1,021.03 | 0.76% | $3.81 | ||||
| IQ Hedge Macro Tracker ETF | ||||||||
| Actual | $1,000.00 | $989.40 | 0.75% | $3.70 | ||||
| Hypothetical (5% return before expenses) | $1,000.00 | $1,021.08 | 0.75% | $3.76 | ||||
| IQ Hedge Market Neutral Tracker ETF | ||||||||
| Actual | $1,000.00 | $1,011.00 | 0.76% | $3.79 | ||||
| Hypothetical (5% return before expenses) | $1,000.00 | $1,021.03 | 0.76% | $3.81 | ||||
| IQ Hedge Long/Short Tracker ETF | ||||||||
| Actual2 | $1,000.00 | $997.00 | 0.75% | $0.78 | ||||
| Hypothetical (5% return before expenses)1 | $1,000.00 | $1,021.08 | 0.75% | $3.76 | ||||
| IQ Hedge Event-Driven Tracker ETF | ||||||||
| Actual2 | $1,000.00 | $1,003.00 | 0.75% | $0.78 | ||||
| Hypothetical (5% return before expenses)1 | $1,000.00 | $1,021.08 | 0.75% | $3.76 | ||||
| IQ Global Resources ETF | ||||||||
| Actual | $1,000.00 | $996.80 | 0.75% | $3.71 | ||||
| Hypothetical (5% return before expenses) | $1,000.00 | $1,021.08 | 0.75% | $3.76 | ||||
| IQ Merger Arbitrage ETF | ||||||||
| Actual | $1,000.00 | $1,055.10 | 0.76% | $3.87 | ||||
| Hypothetical (5% return before expenses) | $1,000.00 | $1,021.03 | 0.76% | $3.81 | ||||
| IQ Real Return ETF | ||||||||
| Actual | $1,000.00 | $1,000.60 | 0.48% | $2.38 | ||||
| Hypothetical (5% return before expenses) | $1,000.00 | $1,022.41 | 0.48% | $2.41 | ||||
| IQ Australia Small Cap ETF | ||||||||
| Actual | $1,000.00 | $944.40 | 0.70% | $3.37 | ||||
| Hypothetical (5% return before expenses) | $1,000.00 | $1,021.32 | 0.70% | $3.51 | ||||
| IQ Canada Small Cap ETF | ||||||||
| Actual | $1,000.00 | $923.50 | 0.70% | $3.34 | ||||
| Hypothetical (5% return before expenses) | $1,000.00 | $1,021.32 | 0.70% | $3.51 | ||||
| IQ Global Agribusiness Small Cap ETF | ||||||||
| Actual | $1,000.00 | $1,042.00 | 0.75% | $3.80 | ||||
| Hypothetical (5% return before expenses) | $1,000.00 | $1,021.08 | 0.75% | $3.76 | ||||
| IQ Global Oil Small Cap ETF | ||||||||
| Actual | $1,000.00 | $966.30 | 0.76% | $3.71 | ||||
| Hypothetical (5% return before expenses) | $1,000.00 | $1,021.03 | 0.76% | $3.81 | ||||
| IQ U.S. Real Estate Small Cap ETF | ||||||||
| Actual | $1,000.00 | $1,013.00 | 0.69% | $3.44 | ||||
| Hypothetical (5% return before expenses) | $1,000.00 | $1,021.37 | 0.69% | $3.46 |
| 1 | Unless otherwise indicated, expenses are calculated using the Fund’s annualized expense ratio, multiplied by the average account value for the period, multiplied by 181/365 (to reflect the six-month period). |
| 2 | Expenses are calculated using the Fund’s annualized expense ratio, multiplied by the average account value for the period, multiplied by 38/365 (to reflect the period March 24, 2015 to April 30, 2015). |
| 47 |
| Portfolio Summaries (unaudited) |
| April 30, 2015 |
SCHEDULES OF INVESTMENTS SUMMARY TABLE
IQ Hedge Multi-Strategy Tracker ETF
Net Assets ($mil): $1,000.8
| Industry | % of Net Assets | |||
| Short-Term Treasury Bond Funds | 29.9 | % | ||
| Aggregate Bond Funds | 26.5 | |||
| Money Market Fund | 10.2 | |||
| Currency Harvest Fund | 8.9 | |||
| U.S. Large Cap Equity Funds | 7.3 | |||
| U.S. Small Cap Equity Funds | 7.2 | |||
| Senior Loan Funds | 7.1 | |||
| Equity Funds | 5.8 | |||
| Emerging Equity Funds | 1.9 | |||
| Real Estate Funds | 1.8 | |||
| Currency Fund | 1.2 | |||
| Debt Fund | 0.6 | |||
| Commodity Fund | 0.0 | 1 | ||
| Total Investments | 108.4 | |||
| Liabilities in Excess of Other Assets | (8.4 | ) | ||
| Total Net Assets | 100.0 | % | ||
| 1 | Less than 0.05% |
IQ Hedge Macro Tracker ETF
Net Assets ($mil): $21.8
| Industry | % of Net Assets | |||
| Short-Term Treasury Bond Funds | 45.4 | % | ||
| Money Market Fund | 21.8 | |||
| Corporate Bond Fund | 18.4 | |||
| Currency Fund | 9.7 | |||
| Equity Funds | 8.9 | |||
| Emerging Equity Funds | 6.8 | |||
| Debt Fund | 5.1 | |||
| Currency Harvest Fund | 4.6 | |||
| Equity | 0.6 | |||
| Commodity Fund | 0.4 | |||
| Real Estate Fund | 0.1 | |||
| Total Investments | 121.8 | |||
| Liabilities in Excess of Other Assets | (21.8 | ) | ||
| Total Net Assets | 100.0 | % | ||
IQ Hedge Market Neutral Tracker ETF
Net Assets ($mil): $12.8
| Industry | % of Net Assets | |||
| Short-Term Treasury Bond Funds | 49.9 | % | ||
| U.S. Large Cap Equity Funds | 10.7 | |||
| U.S. Small Cap Equity Funds | 9.9 | |||
| Aggregate Bond Funds | 9.6 | |||
| Senior Loan Funds | 6.1 | |||
| Currency Harvest Funds | 5.8 | |||
| Corporate Bond Funds | 4.7 | |||
| Money Market Fund | 3.9 | |||
| Emerging Equity Funds | 2.3 | |||
| Equity Fund | 0.7 | |||
| Total Investments | 103.6 | |||
| Liabilities in Excess of Other Assets | (3.6 | ) | ||
| Total Net Assets | 100.0 | % | ||
IQ Hedge Long/Short Tracker ETF
Net Assets ($mil): $2.0
| Industry | % of Net Assets | |||
| Senior Loan Funds | 32.9 | % | ||
| U.S. Large Cap Equity Funds | 22.3 | |||
| U.S. Small Cap Equity Funds | 20.3 | |||
| Corporate Bond Funds | 15.2 | |||
| Equity Funds | 6.6 | |||
| Emerging Equity Funds | 1.9 | |||
| Money Market Fund | 0.4 | |||
| Total Investments | 99.6 | |||
| Other Assets in Excess of Liabilities | 0.4 | |||
| Total Net Assets | 100.0 | % | ||
IQ Hedge Event-Driven Tracker ETF
Net Assets ($mil): $2.0
| Industry | % of Net Assets | |||
| Convertible Bond Fund | 45.3 | % | ||
| Aggregate Bond Funds | 44.5 | |||
| U.S. Large Cap Equity Funds | 8.5 | |||
| Emerging Equity Funds | 1.2 | |||
| Money Market Fund | 0.4 | |||
| Total Investments | 99.9 | |||
| Other Assets in Excess of Liabilities | 0.1 | |||
| Total Net Assets | 100.0 | % | ||
See notes to financial statements.
| 48 |
| Portfolio Summaries (unaudited) (continued) |
| April 30, 2015 |
IQ Global Resources ETF
Net Assets ($mil): $66.6
| Industry | % of Net Assets | |||
| Industrial Metals | 21.0 | % | ||
| Energy | 19.1 | |||
| Precious Metals | 18.1 | |||
| Timber | 13.7 | |||
| Money Market Fund | 12.1 | |||
| Water | 10.1 | |||
| Coal | 4.0 | |||
| Grains Food Fiber | 3.2 | |||
| Livestock | 2.1 | |||
| Total Investments | 103.4 | |||
| Liabilities in Excess of Other Assets | (3.4 | ) | ||
| Total Net Assets | 100.0 | % | ||
IQ Merger Arbitrage ETF
Net Assets ($mil): $121.4
| Industry | % of Net Assets | |||
| Health Care | 24.3 | % | ||
| Consumer Staples | 15.8 | |||
| Consumer Discretionary | 11.9 | |||
| Energy | 11.2 | |||
| Information Technology | 10.8 | |||
| Industrials | 10.0 | |||
| Materials | 8.3 | |||
| Money Market Fund | 4.3 | |||
| Financials | 3.5 | |||
| Utilities | 1.4 | |||
| Telecommunication Services | 0.3 | |||
| Total Investments | 101.8 | |||
| Liabilities in Excess of Other Assets | (1.8 | ) | ||
| Total Net Assets | 100.0 | % | ||
IQ Real Return ETF
Net Assets ($mil): $28.0
| Industry | % of Net Assets | |||
| Short-Term Treasury Bond Funds | 70.5 | % | ||
| Money Market Fund | 15.7 | |||
| Currency Harvest Fund | 10.3 | |||
| U.S. Large Cap Equity Funds | 9.9 | |||
| Real Estate Funds | 4.2 | |||
| Long-Term Bond Fund | 2.4 | |||
| U.S. Small Cap Equity Fund | 2.0 | |||
| Intermediate-Term Treasury Bond Fund | 0.4 | |||
| Total Investments | 115.4 | |||
| Liabilities in Excess of Other Assets | (15.4 | ) | ||
| Total Net Assets | 100.0 | % | ||
IQ Australia Small Cap ETF
Net Assets ($mil): $5.7
| Industry | % of Net Assets | |||
| Consumer Discretionary | 24.6 | % | ||
| Materials | 21.4 | |||
| Money Market Fund | 16.9 | |||
| Industrials | 15.8 | |||
| Health Care | 11.5 | |||
| Financials | 9.3 | |||
| Energy | 5.3 | |||
| Consumer Staples | 4.9 | |||
| Information Technology | 3.8 | |||
| Telecommunication Services | 3.5 | |||
| Total Investments | 117.0 | |||
| Liabilities in Excess of Other Assets | (17.0 | ) | ||
| Total Net Assets | 100.0 | % | ||
IQ Canada Small Cap ETF
Net Assets ($mil): $10.3
| Industry | % of Net Assets | |||
| Energy | 31.9 | % | ||
| Materials | 24.1 | |||
| Money Market Fund | 19.1 | |||
| Industrials | 12.1 | |||
| Consumer Discretionary | 10.4 | |||
| Utilities | 7.6 | |||
| Financials | 5.2 | |||
| Information Technology | 2.9 | |||
| Consumer Staples | 2.7 | |||
| Health Care | 1.5 | |||
| Telecommunication Services | 1.3 | |||
| Total Investments | 118.8 | |||
| Liabilities in Excess of Other Assets | (18.8 | ) | ||
| Total Net Assets | 100.0 | % | ||
IQ Global Agribusiness Small Cap ETF
Net Assets ($mil): $13.6
| Industry | % of Net Assets | |||
| Crop Production and Farming | 68.0 | % | ||
| Money Market Fund | 17.8 | |||
| Agricultural Chemicals | 12.8 | |||
| Livestock Operations | 7.3 | |||
| Agricultural Machinery | 6.1 | |||
| Agricultural Supplies and Logistics | 4.9 | |||
| Total Investments | 116.9 | |||
| Liabilities in Excess of Other Assets | (16.9 | ) | ||
| Total Net Assets | 100.0 | % | ||
See notes to financial statements.
| 49 |
| Portfolio Summaries (unaudited) (continued) |
| April 30, 2015 |
IQ Global Oil Small Cap ETF
Net Assets ($mil): $5.2
| Industry | % of Net Assets | |||
| Exploration & Production | 51.4 | % | ||
| Refining & Marketing | 27.8 | |||
| Equipment, Services & Drilling | 20.6 | |||
| Money Market Fund | 20.5 | |||
| Total Investments | 120.3 | |||
| Liabilities in Excess of Other Assets | (20.3 | ) | ||
| Total Net Assets | 100.0 | % | ||
IQ U.S. Real Estate Small Cap ETF
Net Assets ($mil): $95.0
| Industry | % of Net Assets | |||
| Mortgage REITs | 24.0 | % | ||
| Office REITs | 20.0 | |||
| Diversified REITs | 18.0 | |||
| Retail REITs | 12.5 | |||
| Specialized REITs | 10.1 | |||
| Residential REITs | 7.9 | |||
| Hotel REITs | 7.5 | |||
| Money Market Fund | 3.8 | |||
| Total Investments | 103.8 | |||
| Liabilities in Excess of Other Assets | (3.8 | ) | ||
| Total Net Assets | 100.0 | % | ||
See notes to financial statements.
| 50 |
| Schedules of Investments — IQ Hedge Multi-Strategy Tracker ETF |
| April 30, 2015 |
| Shares | Value | |||||||
| Investment Companies — 98.2% | ||||||||
| Aggregate Bond Funds — 26.5% | ||||||||
| iShares Core U.S. Aggregate | ||||||||
| Bond ETF(a) | 498,344 | $ | 55,246,416 | |||||
| SPDR Barclays Aggregate Bond ETF(b) | 122,375 | 7,176,070 | ||||||
| Vanguard Total Bond Market ETF(a) | 2,440,919 | 202,376,594 | ||||||
| Total Aggregate Bond Funds | 264,799,080 | |||||||
| Commodity Fund — 0.0%(c) | ||||||||
| iShares Silver Trust* | 22,223 | 342,901 | ||||||
| Currency Fund — 1.2% | ||||||||
| Market Vectors Emerging Markets Local | ||||||||
| Currency Bond ETF(b) | 562,778 | 11,559,460 | ||||||
| Currency Harvest Funds — 8.9% | ||||||||
| CurrencyShares Euro Trust*(b)† | 195,487 | 21,575,900 | ||||||
| CurrencyShares Japanese Yen Trust*(b)† | 190,684 | 15,517,864 | ||||||
| PowerShares DB G10 Currency | ||||||||
| Harvest Fund*(a)(b)† | 2,127,190 | 52,945,759 | ||||||
| Total Currency Harvest Funds | 90,039,523 | |||||||
| Debt Fund — 0.6% | ||||||||
| WisdomTree Emerging Markets Local | ||||||||
| Debt Fund(b) | 148,720 | 6,063,315 | ||||||
| Emerging Equity Funds — 1.9% | ||||||||
| iShares MSCI Emerging Markets ETF(b) | 112,481 | 4,823,185 | ||||||
| SPDR S&P Emerging Markets | ||||||||
| SmallCap ETF | 154,054 | 7,306,781 | ||||||
| Vanguard FTSE Emerging Markets ETF | 173,143 | 7,595,784 | ||||||
| Total Emerging Equity Funds | 19,725,750 | |||||||
| Equity Funds — 5.8% | ||||||||
| iShares China Large-Cap ETF(b) | 97,347 | 4,996,821 | ||||||
| iShares Europe ETF(b) | 75,335 | 3,471,437 | ||||||
| iShares India 50 ETF | 44,902 | 1,316,078 | ||||||
| iShares MSCI China ETF | 22,280 | 1,396,510 | ||||||
| iShares MSCI EAFE ETF | 55,851 | 3,714,650 | ||||||
| iShares MSCI EAFE Small-Cap ETF | 100,300 | 5,174,477 | ||||||
| iShares MSCI EMU ETF(b) | 307,499 | 12,127,761 | ||||||
| iShares MSCI India ETF | 150,163 | 4,412,540 | ||||||
| SPDR S&P China ETF | 9,263 | 900,827 | ||||||
| SPDR S&P International Small | ||||||||
| Capital ETF(b) | 29,156 | 891,882 | ||||||
| Vanguard FTSE Developed Markets ETF | 39,981 | 1,654,014 | ||||||
| Vanguard FTSE Europe ETF | 291,525 | 16,476,993 | ||||||
| WisdomTree International SmallCap | ||||||||
| Dividend Fund(b) | 18,361 | 1,145,726 | ||||||
| Total Equity Funds | 57,679,716 | |||||||
| Real Estate Funds — 1.8% | ||||||||
| iShares U.S. Real Estate ETF(b) | 36,916 | 2,787,158 | ||||||
| SPDR Dow Jones International | ||||||||
| Real Estate ETF | 3,609 | 159,987 | ||||||
| SPDR Dow Jones REIT ETF(b) | 17,046 | 1,517,094 | ||||||
| Vanguard REIT ETF(b) | 166,442 | 13,212,166 | ||||||
| Total Real Estate Funds | 17,676,405 | |||||||
| Senior Loan Funds — 7.1% | ||||||||
| PowerShares Senior Loan Portfolio(a)(b) | 2,613,583 | 63,196,437 | ||||||
| SPDR Blackstone / GSO Senior | ||||||||
| Loan ETF(b) | 148,354 | 7,356,875 | ||||||
| Total Senior Loan Funds | 70,553,312 | |||||||
| Shares | Value | |||||||
| Short-Term Treasury Bond Funds — 29.9% | ||||||||
| iShares 1-3 Year Treasury Bond ETF(a) | 906,667 | $ | 76,948,828 | |||||
| iShares Short Treasury Bond ETF(a)(b) | 431,464 | 47,581,850 | ||||||
| SPDR Barclays 1-3 Month T-Bill ETF*(b) | 315,144 | 14,408,384 | ||||||
| Vanguard Short-Term Bond ETF(a) | 1,989,404 | 159,888,399 | ||||||
| Total Short-Term Treasury Bond Funds | 298,827,461 | |||||||
| U.S. Large Cap Equity Funds — 7.3% | ||||||||
| Guggenheim S&P 500 Pure Growth ETF | 1,173 | 95,998 | ||||||
| Guggenheim S&P 500 Pure Value ETF | 21,647 | 1,195,131 | ||||||
| iShares Russell 1000 Growth ETF(a)(b) | 13,699 | 1,362,503 | ||||||
| iShares Russell 1000 Value ETF(a)(b) | 286,559 | 29,799,270 | ||||||
| iShares S&P 500 Growth ETF(b) | 5,201 | 595,566 | ||||||
| iShares S&P 500 Value ETF | 100,410 | 9,427,495 | ||||||
| SPDR S&P 500 ETF Trust(b) | 41,594 | 8,673,181 | ||||||
| Vanguard Growth ETF | 7,973 | 857,496 | ||||||
| Vanguard Value ETF | 247,315 | 20,964,893 | ||||||
| Total U.S. Large Cap Equity Funds | 72,971,533 | |||||||
| U.S. Small Cap Equity Funds — 7.2% | ||||||||
| iShares Russell 2000 Growth ETF(a)(b) | 238,090 | 35,011,135 | ||||||
| iShares S&P Small-Cap 600 Growth ETF(b) | 129,891 | 16,416,923 | ||||||
| Vanguard Small-Cap Growth ETF | 160,606 | 21,010,477 | ||||||
| Total U.S. Small Cap Equity Funds | 72,438,535 | |||||||
| Total Investment Companies — 98.2% | ||||||||
| (Cost $973,975,955) | 982,676,991 | |||||||
| Short-Term Investment — 1.3% | ||||||||
| Money Market Fund — 1.3% | ||||||||
| Morgan Stanley Institutional Liquidity | ||||||||
| Funds Treasury Portfolio — Institutional | ||||||||
| Class, 0.03%(d) | ||||||||
| (Cost $12,541,054) | 12,541,054 | 12,541,054 | ||||||
| Investment of Cash Collateral For | ||||||||
| Securities Loaned — 8.9% | ||||||||
| Money Market Fund — 8.9% | ||||||||
| Dreyfus Government Cash | ||||||||
| Management Fund, 0.00%(e) | ||||||||
| (Cost $89,667,333) | 89,667,333 | 89,667,333 | ||||||
| Total Investments — 108.4% | ||||||||
| (Cost $1,076,184,342) | 1,084,885,378 | |||||||
| Liabilities in Excess of Other | ||||||||
| Assets — (8.4)% | (84,045,237 | ) | ||||||
| Net Assets — 100.0% | $ | 1,000,840,141 | ||||||
| * | Non-income producing securities. |
| † | Affiliated Fund. |
| (a) | All or a portion of these securities have been segregated as collateral for swap contracts. The total value of securities segregated amounted to $201,906,283. |
| (b) | All or a portion of the security was on loan. The aggregate market value of securities on loan was $89,389,461; total market value of collateral held by the Fund was $92,304,361. Market value of the collateral held includes non-cash U.S. Treasury securities having a value of $2,637,028. |
| (c) | Less than 0.05%. |
| (d) | Rate shown reflects the 7-day yield at April 30, 2015. |
| (e) | Rate shown reflects the 1-day yield at April 30, 2015. |
ETF — Exchange Traded Fund
REIT — Real Estate Investment Trust
See notes to financial statements.
| 51 |
| Schedules of Investments — IQ Hedge Multi-Strategy Tracker ETF (continued) |
| April 30, 2015 |
Total return swap contracts outstanding at April 30, 2015:
| Total Return Benchmark | Annual Financing Rate (Received) Paid | Expiration Date | Notional Amount Long (short) | Unrealized Appreciation (Depreciation)1 | ||||||||||||
| iPath Bloomberg Commodity Index Total Return ETN | (2.24)% | 5/19/2015 | $ | (379,754 | ) | $ | — | |||||||||
| iPath S&P 500 VIX Mid-Term Futures ETN | (2.73)% | 5/19/2015 | (6,376,914 | ) | — | |||||||||||
| iShares Core U.S. Aggregate Bond ETF | 1.13% | 5/19/2015 | 124,473,054 | — | ||||||||||||
| iShares Core U.S. Credit Bond ETF | (4.98)% | 5/19/2015 | (2,651,377 | ) | — | |||||||||||
| iShares iBoxx $ High Yield Corporate Bond ETF | (1.51)% | 5/19/2015 | (26,895,916 | ) | — | |||||||||||
| iShares iBoxx $ Investment Grade Corporate Bond ETF | (0.69)% | 5/19/2015 | (74,736,773 | ) | — | |||||||||||
| iShares MSCI All Country Asia ex Japan ETF | (3.98)% | 5/19/2015 | (13,791,117 | ) | — | |||||||||||
| iShares MSCI Brazil Capped ETF | (0.99)% | 5/19/2015 | (4,426,673 | ) | — | |||||||||||
| iShares MSCI Pacific ex Japan ETF | (1.80)% | 5/19/2015 | (9,269,373 | ) | — | |||||||||||
| iShares MSCI Russia Capped ETF | (2.49)% | 5/19/2015 | (372,706 | ) | — | |||||||||||
| iShares Russell 2000 ETF | (0.78)% | 5/19/2015 | (12,977,932 | ) | — | |||||||||||
| iShares Russell 2000 Value ETF | (0.96)% | 5/19/2015 | (25,225,638 | ) | — | |||||||||||
| iShares S&P Small-Cap 600 Value ETF | (1.95)% | 5/19/2015 | (14,170,952 | ) | — | |||||||||||
| Market Vectors Russia ETF | (0.49)% | 5/19/2015 | (2,786,092 | ) | — | |||||||||||
| PowerShares DB Commodity Index Tracking Fund | (0.37)% | 5/19/2015 | (1,173,797 | ) | — | |||||||||||
| PowerShares DB Gold Fund | (4.37)% | 5/19/2015 | (191,246 | ) | — | |||||||||||
| PowerShares DB U.S. Dollar Index Bullish Fund | (2.99)% | 5/19/2015 | (23,999,415 | ) | — | |||||||||||
| SPDR Barclays Convertible Securities ETF | 1.13% | 5/19/2015 | 193,085,881 | — | ||||||||||||
| SPDR Barclays High Yield Bond ETF | (1.46)% | 5/19/2015 | (18,268,647 | ) | — | |||||||||||
| Vanguard FTSE Pacific ETF | (0.85)% | 5/19/2015 | (10,957,802 | ) | — | |||||||||||
| Vanguard Small-Cap Value ETF | (2.96)% | 5/19/2015 | (22,274,762 | ) | — | |||||||||||
| $ | — | |||||||||||||||
Cash posted has been segregated as collateral for swaps in the amount of $3,379,724 at April 30, 2015.
Morgan Stanley acts as the counterparty to the total return swap contracts listed above. The Fund either receives from, or pays to, the counterparty, depending upon the total return of the benchmark and the agreed-upon financing rate.
| 1 | Reflects a reset date of April 30, 2015. |
The following is a summary of the fair valuations according to the inputs used as of April 30, 2015 for valuing the Fund's assets and liabilities.
Asset Valuation Inputs
| Description | Quoted Prices in Active Markets for Identical Assets (Level 1) | Significant Other Observable Inputs (Level 2) | Significant Unobservable Inputs (Level 3) | Total | ||||||||||||
| Investments in Securities:(a) | ||||||||||||||||
| Investment Companies | $ | 982,676,991 | $ | — | $ | — | $ | 982,676,991 | ||||||||
| Short-Term Investment: | ||||||||||||||||
| Money Market Fund | 12,541,054 | — | — | 12,541,054 | ||||||||||||
| Investment of Cash Collateral for Securities Loaned | 89,667,333 | — | — | 89,667,333 | ||||||||||||
| Total Investments in Securities | 1,084,885,378 | — | — | 1,084,885,378 | ||||||||||||
| Other Financial Instruments: | ||||||||||||||||
| Swap Contracts | — | — | (b) | — | — | |||||||||||
| Total Investments in Securities and Other Financial Instruments | $ | 1,084,885,378 | $ | — | $ | — | $ | 1,084,885,378 | ||||||||
Liability Valuation Inputs
| Description | Quoted Prices in Active Markets for Identical Assets (Level 1) | Significant Other Observable Inputs (Level 2) | Significant Unobservable Inputs (Level 3) | Total | ||||||||||||
| Other Financial Instruments | ||||||||||||||||
| Swap Contracts | $ | — | $ | — | (b) | $ | — | $ | — | |||||||
| Total Other Financial Instruments | $ | — | $ | — | $ | — | $ | — | ||||||||
| (a) | For a complete listing of investments and their industries, see the Schedule of Investments. |
| (b) | The value listed for these securities reflects the unrealized appreciation (depreciation) of the instruments. |
The Fund recognizes transfers between the levels as of the beginning of the period.
For the year ended April 30, 2015, the Fund did not have any transfers between any levels within the fair value hierarchy. (See Note 2) The Fund did not hold any level 3 securities as of April 30, 2015 or April 30, 2014.
See notes to financial statements.
| 52 |
| Schedules of Investments — IQ Hedge Macro Tracker ETF |
| April 30, 2015 |
| Shares | Value | |||||||
| Exchange Traded Notes — 0.6% | ||||||||
| Equity — 0.6% | ||||||||
| iPath S&P 500 VIX Mid-Term Futures*(a) | ||||||||
| (Cost $149,983) | 11,228 | $ | 134,175 | |||||
| Investment Companies — 99.4% | ||||||||
| Commodity Fund — 0.4% | ||||||||
| PowerShares DB Gold Fund*(a) | 2,180 | 84,998 | ||||||
| Corporate Bond Fund — 18.4% | ||||||||
| iShares iBoxx $ Investment Grade | ||||||||
| Corporate Bond ETF | 33,465 | 4,013,792 | ||||||
| Currency Fund — 9.7% | ||||||||
| Market Vectors Emerging Markets | ||||||||
| Local Currency Bond ETF(a) | 103,277 | 2,121,310 | ||||||
| Currency Harvest Fund — 4.6% | ||||||||
| CurrencyShares Euro Trust*(b) | 9,150 | 1,009,885 | ||||||
| Debt Fund — 5.1% | ||||||||
| WisdomTree Emerging Markets Local | ||||||||
| Debt Fund(a) | 27,292 | 1,112,695 | ||||||
| Emerging Equity Funds — 6.8% | ||||||||
| iShares MSCI Emerging Markets ETF(a) | 1,172 | 50,255 | ||||||
| SPDR S&P Emerging Markets | ||||||||
| SmallCap ETF | 28,271 | 1,340,893 | ||||||
| Vanguard FTSE Emerging Markets ETF | 1,804 | 79,142 | ||||||
| Total Emerging Equity Funds | 1,470,290 | |||||||
| Equity Funds — 8.9% | ||||||||
| iShares China Large-Cap ETF(a) | 17,864 | 916,959 | ||||||
| iShares India 50 ETF | 8,240 | 241,514 | ||||||
| iShares MSCI China ETF | 4,089 | 256,299 | ||||||
| SPDR S&P China ETF | 1,700 | 165,325 | ||||||
| SPDR S&P International Small | ||||||||
| Cap ETF(a) | 5,351 | 163,687 | ||||||
| WisdomTree International SmallCap | ||||||||
| Dividend Fund(a) | 3,368 | 210,163 | ||||||
| Total Equity Funds | 1,953,947 | |||||||
| Real Estate Fund — 0.1% | ||||||||
| SPDR Dow Jones International Real | ||||||||
| Estate ETF | 663 | 29,391 | ||||||
| Shares | Value | |||||||
| Short-Term Treasury Bond Funds — 45.4% | ||||||||
| iShares 1-3 Year Treasury Bond ETF | 31,304 | $ | 2,656,770 | |||||
| iShares Short Treasury Bond ETF | 14,897 | 1,642,841 | ||||||
| SPDR Barclays 1-3 Month T-Bill ETF* | 2,112 | 96,561 | ||||||
| Vanguard Short-Term Bond ETF(b) | 68,688 | 5,520,455 | ||||||
| Total Short-Term Treasury Bond Funds | 9,916,627 | |||||||
| Total Investment Companies — 99.4% | ||||||||
| (Cost $21,657,477) | 21,712,935 | |||||||
| Short-Term Investment — 0.2% | ||||||||
| Money Market Fund — 0.2% | ||||||||
| Morgan Stanley Institutional Liquidity | ||||||||
| Funds Treasury Portfolio — Institutional | ||||||||
| Class, 0.03%(c) | ||||||||
| (Cost $44,638) | 44,638 | 44,638 | ||||||
| Investment of Cash Collateral For | ||||||||
| Securities Loaned — 21.6% | ||||||||
| Money Market Fund — 21.6% | ||||||||
| Dreyfus Government Cash | ||||||||
| Management Fund, 0.01%(d) | ||||||||
| (Cost $4,716,270) | 4,716,270 | 4,716,270 | ||||||
| Total Investments — 121.8% | ||||||||
| (Cost $26,568,368) | 26,608,018 | |||||||
| Liabilities in Excess of | ||||||||
| Other Assets — (21.8)% | (4,771,173 | ) | ||||||
| Net Assets — 100.0% | $ | 21,836,845 | ||||||
| * | Non-income producing securities. |
| (a) | All or a portion of the security was on loan. The aggregate market value of securities on loan was $4,622,477; total market value of collateral held by the Fund was $4,767,276. Market value of the collateral held includes non-cash U.S. Treasury securities collateral having a value of $51,006. |
| (b) | All or a portion of these securities have been segregated as collateral for swap contracts. The total value of securities segregated amounted to $1,233,891. |
| (c) | Rate shown reflects the 7-day yield at April 30, 2015. |
| (d) | Rate shown reflects the 1-day yield at April 30, 2015. |
ETF — Exchange Traded Fund
See notes to financial statements.
| 53 |
| Schedules of Investments — IQ Hedge Macro Tracker ETF (continued) |
| April 30, 2015 |
Total return swap contracts outstanding at April 30, 2015:
| Total Return Benchmark | Annual Financing Rate (Received) Paid | Expiration Date | Notional Amount Long (short) | Unrealized Appreciation (Depreciation)1 | ||||||||||||
| CurrencyShares Japanese Yen Trust | (1.74)% | 4/07/2016 | $ | (531,330 | ) | $ | — | |||||||||
| iPath Bloomberg Commodity Index Total Return ETN | (2.24)% | 4/07/2016 | (96,229 | ) | — | |||||||||||
| iShares Core U.S. Credit Bond ETF | 0.63% | 5/19/2015 | 143,363 | — | ||||||||||||
| iShares MSCI Brazil Capped ETF | (0.99)% | 4/07/2016 | (753,784 | ) | — | |||||||||||
| iShares MSCI EAFE Small-Cap ETF | 0.63% | 5/19/2015 | 948,895 | — | ||||||||||||
| iShares MSCI India ETF | 0.63% | 5/19/2015 | 809,292 | — | ||||||||||||
| iShares MSCI Russia Capped ETF | (2.49)% | 4/07/2016 | (89,328 | ) | — | |||||||||||
| iShares Russell 2000 ETF | 0.13% | 5/19/2015 | 418,971 | — | ||||||||||||
| iShares Silver Trust | (0.27)% | 4/07/2016 | (11,742 | ) | — | |||||||||||
| iShares U.S. Real Estate ETF | (0.70)% | 4/07/2016 | (102,227 | ) | — | |||||||||||
| Market Vectors Russia ETF | (0.49)% | 4/07/2016 | (667,751 | ) | — | |||||||||||
| PowerShares DB Commodity Index Tracking Fund | (0.37)% | 4/07/2016 | (297,469 | ) | — | |||||||||||
| PowerShares DB G10 Currency Harvest Fund | (1.99)% | 4/07/2016 | (135,377 | ) | — | |||||||||||
| ProShares VIX Mid-Term Futures ETF | 0.13% | 5/19/2015 | 57,084 | — | ||||||||||||
| SPDR Barclays 1-3 Month T-Bill ETF | 1.13% | 5/19/2015 | 399,867 | — | ||||||||||||
| SPDR DB International Government Inflation-Protected Bond ETF | 0.63% | 5/19/2015 | 491,616 | — | ||||||||||||
| SPDR Dow Jones REIT ETF | (1.04)% | 4/07/2016 | (55,625 | ) | — | |||||||||||
| Vanguard REIT ETF | (0.60)% | 4/07/2016 | (484,694 | ) | — | |||||||||||
| $ | — | |||||||||||||||
Cash posted has been segregated as collateral for swaps in the amount of $113,760 at April 30, 2015.
Morgan Stanley acts as the counterparty to the total return swap contracts listed above. The Fund either receives from, or pays to, the counterparty, the total return of the benchmark for the period and the agreed-upon financing rate.
| 1 | Reflects a reset date of April 30, 2015. |
The following is a summary of the fair valuations according to the inputs used as of April 30, 2015, for valuing the Fund’s assets and liabilities.
Asset Valuation Inputs
| Description | Quoted Prices in Active Markets for Identical Assets (Level 1) | Significant Other Observable Inputs (Level 2) | Significant Unobservable Inputs (Level 3) | Total | ||||||||||||
| Investments in Securities:(a) | ||||||||||||||||
| Exchange Traded Notes | $ | 134,175 | $ | — | $ | — | $ | 134,175 | ||||||||
| Investment Companies | 21,712,935 | — | — | 21,712,935 | ||||||||||||
| Short-Term Investment: | ||||||||||||||||
| Money Market Fund | 44,638 | — | — | 44,638 | ||||||||||||
| Investment of Cash Collateral for Securities Loaned | 4,716,270 | — | — | 4,716,270 | ||||||||||||
| Total Investments in Securities | 26,608,018 | — | — | 26,608,018 | ||||||||||||
| Other Financial Instruments: | ||||||||||||||||
| Swap Contracts | — | — | (b) | — | — | |||||||||||
| Total Investments in Securities and Other Financial Instruments | $ | 26,608,018 | $ | — | $ | — | $ | 26,608,018 | ||||||||
Liability Valuation Inputs
| Description | Quoted Prices in Active Markets for Identical Assets (Level 1) | Significant Other Observable Inputs (Level 2) | Significant Unobservable Inputs (Level 3) | Total | ||||||||||||
| Other Financial Instruments | ||||||||||||||||
| Swap Contracts | $ | — | $ | — | (b) | $ | — | $ | — | |||||||
| Total Other Financial Instruments | $ | — | $ | — | $ | — | $ | — | ||||||||
| (a) | For a complete listing of investments and their industries, see the Schedule of Investments. |
| (b) | The value listed for these securities reflects the unrealized appreciation (depreciation) of the instrument. |
The Fund recognizes transfers between the levels as of the beginning of the period.
For the year ended April 30, 2015, the Fund did not have any transfers between any levels within the fair value hierarchy. (See Note 2).
The Fund did not hold any level 3 securities as of April 30, 2015 or April 30, 2014.
See notes to financial statements.
| 54 |
| Schedules of Investments — IQ Hedge Market Neutral Tracker ETF |
| April 30, 2015 |
| Shares | Value | |||||||
| Investment Companies — 99.7% | ||||||||
| Aggregate Bond Funds — 9.6% | ||||||||
| SPDR Barclays Aggregate Bond ETF | 717 | $ | 42,045 | |||||
| Vanguard Total Bond Market ETF(a) | 14,307 | 1,186,193 | ||||||
| Total Aggregate Bond Funds | 1,228,238 | |||||||
| Corporate Bond Funds — 4.7% | ||||||||
| iShares Core U.S. Credit Bond ETF | 610 | 68,375 | ||||||
| iShares iBoxx $ Investment Grade | ||||||||
| Corporate Bond ETF | 4,478 | 537,091 | ||||||
| Total Corporate Bond Funds | 605,466 | |||||||
| Currency Harvest Funds — 5.8% | ||||||||
| CurrencyShares Euro Trust* | 2,453 | 270,738 | ||||||
| PowerShares DB G10 Currency | ||||||||
| Harvest Fund*(b) | 18,829 | 468,653 | ||||||
| Total Currency Harvest Funds | 739,391 | |||||||
| Emerging Equity Funds — 2.3% | ||||||||
| iShares MSCI Emerging Markets ETF | 2,691 | 115,390 | ||||||
| Vanguard FTSE Emerging Markets ETF | 4,142 | 181,710 | ||||||
| Total Emerging Equity Funds | 297,100 | |||||||
| Equity Fund — 0.7% | ||||||||
| iShares Europe ETF | 2,056 | 94,740 | ||||||
| Senior Loan Funds — 6.1% | ||||||||
| PowerShares Senior Loan Portfolio | 28,671 | 693,265 | ||||||
| SPDR Blackstone / GSO Senior Loan ETF | 1,627 | 80,683 | ||||||
| Total Senior Loan Funds | 773,948 | |||||||
| Short-Term Treasury Bond Funds — 49.9% | ||||||||
| iShares 1-3 Year Treasury Bond ETF | 19,926 | 1,691,120 | ||||||
| iShares Short Treasury Bond ETF(a) | 7,554 | 833,055 | ||||||
| SPDR Barclays 1-3 Month T-Bill ETF* | 6,926 | 316,657 | ||||||
| Vanguard Short-Term Bond ETF(a) | 43,722 | 3,513,937 | ||||||
| Total Short-Term Treasury Bond Funds | 6,354,769 | |||||||
| U.S. Large Cap Equity Funds — 10.7% | ||||||||
| Guggenheim S&P 500 Pure Value ETF | 481 | 26,556 | ||||||
| iShares Russell 1000 Value ETF | 6,369 | 662,313 | ||||||
| iShares S&P 500 Value ETF | 2,232 | 209,562 | ||||||
| Vanguard Value ETF | 5,497 | 465,981 | ||||||
| Total U.S. Large Cap Equity Funds | 1,364,412 | |||||||
| Shares | Value | |||||||
| U.S. Small Cap Equity Funds — 9.9% | ||||||||
| iShares Russell 2000 Growth ETF | 4,164 | $ | 612,316 | |||||
| iShares S&P Small-Cap 600 Growth ETF | 2,271 | 287,032 | ||||||
| Vanguard Small-Cap Growth ETF | 2,809 | 367,473 | ||||||
| Total U.S. Small Cap Equity Funds | 1,266,821 | |||||||
| Total Investment Companies — 99.7% | ||||||||
| (Cost $12,523,426) | 12,724,885 | |||||||
| Short-Term Investment — 0.5% | ||||||||
| Money Market Fund — 0.5% | ||||||||
| Morgan Stanley Institutional Liquidity | ||||||||
| Funds Treasury Portfolio — Institutional | ||||||||
| Class, 0.03%(c) | ||||||||
| (Cost $65,860) | 65,860 | 65,860 | ||||||
| Investment of Cash Collateral For | ||||||||
| Securities Loaned — 3.4% | ||||||||
| Money Market Fund — 3.4% | ||||||||
| Dreyfus Government Cash | ||||||||
| Management Fund, 0.01%(d) | ||||||||
| (Cost $438,854) | 438,854 | 438,854 | ||||||
| Total Investments — 103.6% | ||||||||
| (Cost $13,028,140) | 13,229,599 | |||||||
| Liabilities in Excess of | ||||||||
| Other Assets — (3.6)% | (463,183 | ) | ||||||
| Net Assets — 100.0% | $ | 12,766,416 | ||||||
| * | Non-income producing securities. |
| (a) | All or a portion of these securities have been segregated as collateral for swap contracts. The total value of securities segregated amounted to $3,934,875. |
| (b) | All or a portion of the security was on loan. The aggregate market value of securities on loan was $420,118; total market value of collateral held by the Fund was $438,854. |
| (c) | Rate shown reflects the 7-day yield at April 30, 2015. |
| (d) | Rate shown reflects the 1-day yield at April 30, 2015. |
ETF — Exchange Traded Fund
See notes to financial statements.
| 55 |
| Schedules of Investments — IQ Hedge Market Neutral Tracker ETF (continued) |
| April 30, 2015 |
Total return swap contracts outstanding at April 30, 2015:
| Total Return Benchmark | Annual Financing Rate (Received) Paid | Expiration Date | Notional Amount Long (short) | Unrealized Appreciation (Depreciation)1 | ||||||||||||
| iShares Core U.S. Aggregate Bond ETF | 1.13% | 5/19/2015 | $ | 1,053,281 | $ | — | ||||||||||
| iShares iBoxx $ High Yield Corporate Bond ETF | (1.21)% | 4/07/2016 | (253,589 | ) | — | |||||||||||
| iShares iBoxx $ Investment Grade Corporate Bond ETF | 0.13% | 5/19/2015 | 1,389,625 | — | ||||||||||||
| iShares MSCI All Country Asia ex Japan ETF | (3.98)% | 4/07/2016 | (390,066 | ) | — | |||||||||||
| iShares MSCI EAFE ETF | (0.30)% | 4/07/2016 | (56,400 | ) | — | |||||||||||
| iShares MSCI EMU ETF | 0.63% | 5/19/2015 | 331,493 | — | ||||||||||||
| iShares MSCI Pacific ex Japan ETF | (1.28)% | 4/07/2016 | (262,200 | ) | — | |||||||||||
| iShares Russell 1000 Growth ETF | (0.62)% | 4/07/2016 | (409,974 | ) | — | |||||||||||
| iShares Russell 2000 Value ETF | (0.96)% | 4/07/2016 | (403,779 | ) | — | |||||||||||
| iShares S&P 500 Growth ETF | (1.49)% | 4/07/2016 | (179,208 | ) | — | |||||||||||
| iShares S&P Small-Cap 600 Value ETF | (1.89)% | 4/07/2016 | (226,826 | ) | — | |||||||||||
| iShares Short Treasury Bond ETF | 0.63% | 5/19/2015 | 213,061 | — | ||||||||||||
| PowerShares DB US Dollar Index Bullish Fund | (2.99)% | 4/07/2016 | (301,685 | ) | — | |||||||||||
| SPDR Barclays Convertible Securities ETF | 1.13% | 5/19/2015 | 473,833 | — | ||||||||||||
| SPDR Barclays High Yield Bond ETF | (1.35)% | 4/07/2016 | (172,234 | ) | — | |||||||||||
| Vanguard FTSE Developed Markets ETF | (0.48)% | 4/07/2016 | (25,112 | ) | — | |||||||||||
| Vanguard FTSE Europe ETF | 0.63% | 5/19/2015 | 450,182 | — | ||||||||||||
| Vanguard FTSE Pacific ETF | (0.85)% | 4/07/2016 | (309,963 | ) | — | |||||||||||
| Vanguard Growth ETF | (0.74)% | 4/07/2016 | (258,120 | ) | — | |||||||||||
| Vanguard Small-Cap Value ETF | (2.96)% | 4/07/2016 | (356,550 | ) | — | |||||||||||
| $ | — | |||||||||||||||
Morgan Stanley acts as the counterparty to the total return swap contracts listed above. The Fund either receives from, or pays to, the counterparty, the total return of the benchmark for the period and the agreed-upon financing rate.
| 1 | Reflects a reset date of April 30, 2015. |
The following is a summary of the fair valuations according to the inputs used as of April 30, 2015, for valuing the Fund’s assets and liabilities.
Asset Valuation Inputs
| Description | Quoted Prices in Active Markets for Identical Assets (Level 1) | Significant Other Observable Inputs (Level 2) | Significant Unobservable Inputs (Level 3) | Total | ||||||||||||
| Investments in Securities:(a) | ||||||||||||||||
| Investment Companies | $ | 12,724,885 | $ | — | $ | — | $ | 12,724,885 | ||||||||
| Short-Term Investment: | ||||||||||||||||
| Money Market Fund | 65,860 | — | — | 65,860 | ||||||||||||
| Investment of Cash Collateral for Securities Loaned | 438,854 | — | — | 438,854 | ||||||||||||
| Total Investments in Securities | 13,229,599 | — | — | 13,229,599 | ||||||||||||
| Other Financial Instruments: | ||||||||||||||||
| Swap Contracts | — | — | (b) | — | — | |||||||||||
| Total Investments in Securities and Other Financial Instruments | $ | 13,229,599 | $ | — | $ | — | $ | 13,229,599 | ||||||||
Liability Valuation Inputs
| Description | Quoted Prices in Active Markets for Identical Assets (Level 1) | Significant Other Observable Inputs (Level 2) | Significant Unobservable Inputs (Level 3) | Total | ||||||||||||
| Other Financial Instruments | ||||||||||||||||
| Swap Contracts | $ | — | $ | — | (b) | $ | — | $ | — | |||||||
| Total Other Financial Instruments | $ | — | $ | — | $ | — | $ | — | ||||||||
| (a) | For a complete listing of investments and their industries, see the Schedule of Investments. |
| (b) | The value listed for these securities reflects the unrealized appreciation (depreciation) of the instrument. The Fund recognizes transfers between the levels as of the beginning of the period. |
For the year ended April 30, 2015, the Fund did not have any transfers between any levels within the fair value hierarchy. (See Note 2).
The Fund did not hold any level 3 securities as of April 30, 2015 or April 30, 2014.
See notes to financial statements.
| 56 |
| Schedules of Investments — IQ Hedge Long/Short Tracker ETF |
| April 30, 2015 |
| Shares | Value | |||||||
| Investment Companies — 99.2% | ||||||||
| Corporate Bond Funds — 15.2% | ||||||||
| iShares Core U.S. Credit Bond ETF | 92 | $ | 10,312 | |||||
| iShares iBoxx $ Investment Grade | ||||||||
| Corporate Bond ETF | 2,434 | 291,934 | ||||||
| Total Corporate Bond Funds | 302,246 | |||||||
| Emerging Equity Funds — 1.9% | ||||||||
| iShares MSCI Emerging Markets ETF | 336 | 14,408 | ||||||
| Vanguard FTSE Emerging Markets ETF | 517 | 22,681 | ||||||
| Total Emerging Equity Funds | 37,089 | |||||||
| Equity Funds — 6.6% | ||||||||
| iShares MSCI EAFE ETF | 1,369 | 91,052 | ||||||
| Vanguard FTSE Developed | ||||||||
| Markets ETF | 980 | 40,543 | ||||||
| Total Equity Funds | 131,595 | |||||||
| Senior Loan Funds — 32.9% | ||||||||
| PowerShares Senior Loan Portfolio(a) | 24,321 | 588,082 | ||||||
| SPDR Blackstone / GSO Senior | ||||||||
| Loan ETF | 1,381 | 68,484 | ||||||
| Total Senior Loan Funds | 656,566 | |||||||
| U.S. Large Cap Equity Funds — 22.3% | ||||||||
| Guggenheim S&P 500 Pure | ||||||||
| Growth ETF | 53 | 4,338 | ||||||
| Guggenheim S&P 500 Pure Value ETF | 62 | 3,423 | ||||||
| iShares Russell 1000 Growth ETF | 623 | 61,964 | ||||||
| iShares Russell 1000 Value ETF | 827 | 86,000 | ||||||
| iShares S&P 500 Growth ETF | 237 | 27,139 | ||||||
| iShares S&P 500 Value ETF | 290 | 27,228 | ||||||
| SPDR S&P 500 ETF Trust | 647 | 134,911 | ||||||
| Vanguard Growth ETF | 363 | 39,041 | ||||||
| Vanguard Value ETF | 714 | 60,526 | ||||||
| Total U.S. Large Cap Equity Funds | 444,570 | |||||||
| Shares | Value | |||||||
| U.S. Small Cap Equity Funds — 20.3% | ||||||||
| iShares Russell 2000 Growth ETF(b) | 1,331 | $ | 195,724 | |||||
| iShares S&P Small-Cap 600 Growth ETF | 726 | 91,759 | ||||||
| Vanguard Small-Cap Growth ETF | 898 | 117,476 | ||||||
| Total U.S. Small Cap Equity Funds | 404,959 | |||||||
| Total Investment Companies — 99.2% | ||||||||
| (Cost $1,994,908) | 1,977,025 | |||||||
| Short-Term Investment — 0.4% | ||||||||
| Money Market Fund — 0.4% | ||||||||
| Morgan Stanley Institutional Liquidity | ||||||||
| Funds Treasury Portfolio — Institutional | ||||||||
| Class, 0.03%(c) | ||||||||
| (Cost $7,022) | 7,022 | 7,022 | ||||||
| Investment of Cash Collateral For | ||||||||
| Securities Loaned — 0.0%(d) | ||||||||
| Money Market Fund — 0.0%(d) | ||||||||
| Dreyfus Government Cash | ||||||||
| Management Fund, 0.00%(e) | ||||||||
| (Cost $615) | 615 | 615 | ||||||
| Total Investments — 99.6% | ||||||||
| (Cost $2,002,545) | 1,984,662 | |||||||
| Other Assets in Excess of | ||||||||
| Liabilities — 0.4% | 7,999 | |||||||
| Net Assets — 100.0% | $ | 1,992,661 | ||||||
| (a) | All or a portion of these securities have been segregated as collateral for swap contracts. The total value of securities segregated amounted to $374,790. |
| (b) | All or a portion of the security was on loan. The aggregate market value of securities on loan was $588; total market value of collateral held by the Fund was $615. |
| (c) | Rate shown reflects the 7-day yield at April 30, 2015. |
| (d) | Less than 0.05%. |
| (e) | Rate shown reflects the 1-day yield at April 30, 2015. |
ETF — Exchange Traded Fund
See notes to financial statements.
| 57 |
| Schedules of Investments — IQ Hedge Long/Short Tracker ETF (continued) |
| April 30, 2015 |
Total return swap contracts outstanding at April 30, 2015:
| Total Return Benchmark | Annual Financing Rate (Received) Paid | Expiration Date | Notional Amount Long (short) | Unrealized Appreciation (Depreciation)1 | ||||||||||||
| Guggenheim S&P 500 Pure Growth ETF | 0.63% | 3/28/2017 | $ | 1,309 | $ | — | ||||||||||
| Guggenheim S&P 500 Pure Value ETF | 0.63% | 3/28/2017 | 1,049 | — | ||||||||||||
| iShares Core U.S. Credit Bond ETF | 0.63% | 3/28/2017 | 3,026 | — | ||||||||||||
| iShares iBoxx $ Investment Grade Corporate Bond ETF | 0.13% | 3/28/2017 | 86,837 | — | ||||||||||||
| iShares MSCI EAFE ETF | 0.63% | 3/28/2017 | 27,070 | — | ||||||||||||
| iShares MSCI Emerging Markets ETF | 0.63% | 3/28/2017 | 4,288 | — | ||||||||||||
| iShares Russell 1000 Growth ETF | 1.13% | 3/28/2017 | 18,400 | — | ||||||||||||
| iShares Russell 1000 Value ETF | 0.63% | 3/28/2017 | 25,582 | — | ||||||||||||
| iShares Russell 2000 Growth ETF | 0.63% | 3/28/2017 | 58,232 | — | ||||||||||||
| iShares Russell 2000 Value ETF | (0.99)% | 3/28/2017 | (236,573 | ) | — | |||||||||||
| iShares S&P 500 Growth ETF | 0.63% | 3/28/2017 | 8,016 | — | ||||||||||||
| iShares S&P 500 Value ETF | 0.63% | 3/28/2017 | 8,075 | — | ||||||||||||
| iShares S&P Small-Cap 600 Growth ETF | 0.63% | 3/28/2017 | 27,300 | — | ||||||||||||
| iShares S&P Small-Cap 600 Value ETF | (1.99)% | 3/28/2017 | (132,967 | ) | — | |||||||||||
| PowerShares Senior Loan Portfolio | 1.13% | 3/28/2017 | 174,918 | — | ||||||||||||
| SPDR Blackstone / GSO Senior Loan ETF | 0.63% | 3/28/2017 | 20,381 | — | ||||||||||||
| SPDR S&P 500 ETF Trust | 0.63% | 3/28/2017 | 40,244 | — | ||||||||||||
| Vanguard FTSE Developed Markets ETF | 0.63% | 3/28/2017 | 12,039 | — | ||||||||||||
| Vanguard FTSE Emerging Markets ETF | 0.63% | 3/28/2017 | 6,756 | — | ||||||||||||
| Vanguard Growth ETF | 0.63% | 3/28/2017 | 11,615 | — | ||||||||||||
| Vanguard Small-Cap Growth ETF | 0.63% | 3/28/2017 | 34,929 | — | ||||||||||||
| Vanguard Small-Cap Value ETF | (2.99)% | 3/28/2017 | (208,941 | ) | — | |||||||||||
| Vanguard Value ETF | 0.63% | 3/28/2017 | 17,971 | — | ||||||||||||
| $ | — | |||||||||||||||
Morgan Stanley acts as the counterparty to the total return swap contracts listed above. The Fund either receives from, or pays to, the counterparty, depending upon the total return of the benchmark and the agreed-upon financing rate.
| 1 | Reflects a reset date of April 30, 2015. |
The following is a summary of the fair valuations according to the inputs used as of April 30, 2015 for valuing the Fund’s assets and liabilities.
Asset Valuation Inputs
| Description | Quoted Prices in Active Markets for Identical Assets (Level 1) | Significant Other Observable Inputs (Level 2) | Significant Unobservable Inputs (Level 3) | Total | ||||||||||||
| Investments in Securities:(a) | ||||||||||||||||
| Investment Companies | $ | 1,977,025 | $ | — | $ | — | $ | 1,977,025 | ||||||||
| Short-Term Investment: | ||||||||||||||||
| Money Market Fund | 7,022 | — | — | 7,022 | ||||||||||||
| Investment of Cash Collateral for Securities Loaned | 615 | — | — | 615 | ||||||||||||
| Total Investments in Securities | 1,984,662 | — | — | 1,984,662 | ||||||||||||
| Other Financial Instruments: | ||||||||||||||||
| Swap Contracts | — | — | (b) | — | — | |||||||||||
| Total Investments in Securities and Other Financial Instruments | $ | 1,984,662 | $ | — | $ | — | $ | 1,984,662 | ||||||||
Liability Valuation Inputs
| Description | Quoted Prices in Active Markets for Identical Assets (Level 1) | Significant Other Observable Inputs (Level 2) | Significant Unobservable Inputs (Level 3) | Total | ||||||||||||
| Other Financial Instruments | ||||||||||||||||
| Swap Contracts | $ | — | $ | — | (b) | $ | — | $ | — | |||||||
| Total Other Financial Instruments | $ | — | $ | — | $ | — | $ | — | ||||||||
| (a) | For a complete listing of investments and their industries, see the Schedule of Investments. |
| (b) | The value listed for these securities reflects the unrealized appreciation (depreciation) of the instruments. |
The Fund recognizes transfers between the levels as of the beginning of the period.
For the year ended April 30, 2015, the Fund did not have any transfers between any levels within the fair value hierarchy. (See Note 2) The Fund did not hold any level 3 securities as of April 30, 2015 or April 30. 2014.
See notes to financial statements.
| 58 |
| Schedules of Investments — IQ Hedge Event-Driven Tracker ETF |
| April 30, 2015 |
| Shares | Value | |||||||
| Investment Companies — 99.5% | ||||||||
| Aggregate Bond Funds — 44.5% | ||||||||
| iShares Core U.S. Aggregate Bond ETF | 3,707 | $ | 410,958 | |||||
| SPDR Barclays Aggregate Bond ETF | 280 | 16,419 | ||||||
| Vanguard Total Bond Market ETF | 5,584 | 462,970 | ||||||
| Total Aggregate Bond Funds | 890,347 | |||||||
| Convertible Bond Fund — 45.3% | ||||||||
| SPDR Barclays Convertible | ||||||||
| Securities ETF | 18,742 | 906,551 | ||||||
| Emerging Equity Funds — 1.2% | ||||||||
| iShares MSCI Emerging Markets ETF | 215 | 9,219 | ||||||
| Vanguard FTSE Emerging Markets ETF | 332 | 14,565 | ||||||
| Total Emerging Equity Funds | 23,784 | |||||||
| U.S. Large Cap Equity Funds — 8.5% | ||||||||
| Guggenheim S&P 500 Pure | ||||||||
| Growth ETF | 68 | 5,565 | ||||||
| iShares Russell 1000 Growth ETF | 800 | 79,568 | ||||||
| Shares | Value | |||||||
| U.S. Large Cap Equity Funds (continued) | ||||||||
| iShares S&P 500 Growth ETF | 304 | $ | 34,811 | |||||
| Vanguard Growth ETF | 466 | 50,118 | ||||||
| Total U.S. Large Cap Equity Funds | 170,062 | |||||||
| Total Investment Companies — 99.5% | ||||||||
| (Cost $1,992,122) | 1,990,744 | |||||||
| Short-Term Investment — 0.4% | ||||||||
| Money Market Fund — 0.4% | ||||||||
| Morgan Stanley Institutional Liquidity | ||||||||
| Funds Treasury Portfolio — Institutional | ||||||||
| Class, 0.03%(a) | ||||||||
| (Cost $8,122) | 8,122 | 8,122 | ||||||
| Total Investments — 99.9% | ||||||||
| (Cost $2,000,244) | 1,998,866 | |||||||
| Other Assets in Excess of | ||||||||
| Liabilities — 0.1% | 2,568 | |||||||
| Net Assets — 100.0% | $ | 2,001,434 | ||||||
| (a) | Rate shown reflects the 7-day yield at April 30, 2015. |
ETF — Exchange Traded Fund
Total return swap contracts outstanding at April 30, 2015:
| Total Return Benchmark | Annual Financing Rate (Received) Paid | Expiration Date | Notional Amount Long (short) | Unrealized Appreciation (Depreciation)1 | ||||||||||||
| Guggenheim S&P 500 Pure Growth ETF | 0.63% | 3/28/2017 | $ | 573 | $ | — | ||||||||||
| iShares Core U.S. Aggregate Bond ETF | 1.13% | 3/28/2017 | 43,790 | — | ||||||||||||
| iShares Core U.S. Credit Bond ETF | (4.99)% | 3/28/2017 | (7,062 | ) | — | |||||||||||
| iShares iBoxx $ Investment Grade Corporate Bond ETF | (0.62)% | 3/28/2017 | (200,420 | ) | — | |||||||||||
| iShares MSCI Emerging Markets ETF | 0.63% | 3/28/2017 | 986 | — | ||||||||||||
| iShares Russell 1000 Growth ETF | 1.13% | 3/28/2017 | 8,454 | — | ||||||||||||
| iShares S&P 500 Growth ETF | 0.63% | 3/28/2017 | 3,664 | — | ||||||||||||
| SPDR Barclays Aggregate Bond ETF | 0.63% | 3/28/2017 | 1,759 | — | ||||||||||||
| SPDR Barclays Convertible Securities ETF | 1.13% | 3/28/2017 | 96,498 | — | ||||||||||||
| Vanguard FTSE Emerging Markets ETF | 0.63% | 3/28/2017 | 1,535 | — | ||||||||||||
| Vanguard Growth ETF | 0.63% | 3/28/2017 | 5,378 | — | ||||||||||||
| Vanguard Total Bond Market ETF | 0.63% | 3/28/2017 | 49,331 | — | ||||||||||||
| $ | — | |||||||||||||||
Morgan Stanley acts as the counterparty to the total return swap contracts listed above. The Fund either receives from, or pays to, the counterparty, depending upon the total return of the benchmark, and the agreed-upon financing rate.
| 1 | Reflects a reset date of April 30, 2015. |
See notes to financial statements.
| 59 |
| Schedules of Investments — IQ Hedge Event-Driven Tracker ETF (continued) |
| April 30, 2015 |
The following is a summary of the fair valuations according to the inputs used as of April 30, 2015 for valuing the Fund’s assets and liabilities.
Asset Valuation Inputs
| Description | Quoted Prices in Active Markets for Identical Assets (Level 1) | Significant Other Observable Inputs (Level 2) | Significant Unobservable Inputs (Level 3) | Total | ||||||||||||
| Investments in Securities:(a) | ||||||||||||||||
| Investment Companies | $ | 1,990,744 | $ | — | $ | — | $ | 1,990,744 | ||||||||
| Short-Term Investment: | ||||||||||||||||
| Money Market Fund | 8,122 | 8,122 | ||||||||||||||
| Total Investments in Securities | 1,998,866 | — | — | 1,998,866 | ||||||||||||
| Other Financial Instruments: | ||||||||||||||||
| Swap Contracts | — | — | (b) | — | — | |||||||||||
| Total Investments in Securities and Other Financial Instruments | $ | 1,998,866 | $ | — | $ | — | $ | 1,998,866 | ||||||||
Liability Valuation Inputs
| Description | Quoted Prices in Active Markets for Identical Assets (Level 1) | Significant Other Observable Inputs (Level 2) | Significant Unobservable Inputs (Level 3) | Total | ||||||||||||
| Other Financial Instruments | ||||||||||||||||
| Swap Contracts | $ | — | $ | — | (b) | $ | — | $ | — | |||||||
| Total Other Financial Instruments | $ | — | $ | — | $ | — | $ | — | ||||||||
| (a) | For a complete listing of investments and their industries, see the Schedule of Investments. |
| (b) | The value listed for these securities reflects the unrealized appreciation (depreciation) of the instruments. |
The Fund recognizes transfers between the levels as of the beginning of the period.
For the year ended April 30, 2015, the Fund did not have any transfers between any levels within the fair value hierarchy. (See Note 2) The Fund did not hold any level 3 securities as of April 30, 2015 or April 30, 2014.
See notes to financial statements.
| 60 |
| Schedules of Investments — IQ Global Resources ETF |
| April 30, 2015 |
| Shares | Value | |||||||
| Common Stocks — 91.3% | ||||||||
| Australia — 9.4% | ||||||||
| BHP Billiton Ltd. | 162,964 | $ | 4,109,355 | |||||
| Fortescue Metals Group Ltd.(a) | 95,311 | 163,133 | ||||||
| Newcrest Mining Ltd.* | 75,325 | 858,512 | ||||||
| Northern Star Resources Ltd. | 58,222 | 101,489 | ||||||
| Sandfire Resources NL | 210,967 | 818,689 | ||||||
| Whitehaven Coal Ltd.* | 63,734 | 82,946 | ||||||
| Woodside Petroleum Ltd. | 4,432 | 122,526 | ||||||
| Total Australia | 6,256,650 | |||||||
| Canada — 17.7% | ||||||||
| Agnico Eagle Mines Ltd. | 21,223 | 639,888 | ||||||
| B2Gold Corp.* | 90,521 | 141,246 | ||||||
| Barrick Gold Corp. | 114,438 | 1,481,435 | ||||||
| Canadian Natural Resources Ltd.(a) | 5,913 | 195,709 | ||||||
| Canfor Corp.* | 50,749 | 1,001,782 | ||||||
| Centerra Gold, Inc. | 23,241 | 119,731 | ||||||
| Detour Gold Corp.* | 16,770 | 176,526 | ||||||
| Eldorado Gold Corp. | 70,474 | 349,679 | ||||||
| Enbridge, Inc. | 4,568 | 237,819 | ||||||
| Goldcorp, Inc. | 81,440 | 1,526,937 | ||||||
| Imperial Oil Ltd. | 4,540 | 199,329 | ||||||
| Interfor Corp.* | 25,000 | 356,450 | ||||||
| Kinross Gold Corp.* | 112,463 | 272,047 | ||||||
| New Gold, Inc.* | 49,978 | 167,109 | ||||||
| Norbord, Inc.(a) | 20,100 | 403,908 | ||||||
| Pan American Silver Corp. | 14,878 | 141,871 | ||||||
| SEMAFO, Inc.* | 28,900 | 88,519 | ||||||
| Silver Wheaton Corp. | 39,717 | 780,404 | ||||||
| Suncor Energy, Inc. | 7,809 | 253,305 | ||||||
| Tahoe Resources, Inc. | 14,500 | 204,108 | ||||||
| Teck Resources Ltd., Class B | 17,679 | 266,955 | ||||||
| TransCanada Corp. | 3,843 | 177,674 | ||||||
| Turquoise Hill Resources Ltd.* | 124,980 | 519,917 | ||||||
| West Fraser Timber Co., Ltd. | 31,352 | 1,606,879 | ||||||
| Westshore Terminals Investment Corp. | 4,600 | 121,186 | ||||||
| Yamana Gold, Inc. | 92,177 | 350,824 | ||||||
| Total Canada | 11,781,237 | |||||||
| France — 3.3% | ||||||||
| Suez Environnement Co. | 36,014 | 734,470 | ||||||
| Total SA | 12,240 | 664,997 | ||||||
| Veolia Environnement SA* | 36,735 | 778,811 | ||||||
| Total France | 2,178,278 | |||||||
| Germany — 0.0%(b) | ||||||||
| Suedzucker AG | 1,514 | 22,886 | ||||||
| Hong Kong — 1.8% | ||||||||
| Beijing Enterprises Water Group Ltd.* | 579,671 | 501,808 | ||||||
| China Modern Dairy Holdings Ltd.*(a) | 136,843 | 55,788 | ||||||
| CNOOC Ltd. | 240,268 | 407,310 | ||||||
| Hong Kong & China Gas Co., Ltd. | 56,806 | 135,581 | ||||||
| Shougang Fushan Resources | ||||||||
| Group Ltd. | 329,358 | 84,558 | ||||||
| Total Hong Kong | 1,185,045 | |||||||
| Ireland — 0.2% | ||||||||
| Kerry Group PLC, Class A | 1,305 | 95,826 | ||||||
| Origin Enterprises PLC | 3,500 | 31,493 | ||||||
| Total Ireland | 127,319 | |||||||
| Shares | Value | |||||||
| Common Stocks (continued) | ||||||||
| Italy — 0.6% | ||||||||
| Eni SpA | 19,411 | $ | 373,682 | |||||
| Japan — 3.8% | ||||||||
| Ajinomoto Co., Inc. | 3,956 | 87,966 | ||||||
| Itoham Foods, Inc.(a) | 6,105 | 33,058 | ||||||
| Mitsubishi Materials Corp. | 40,000 | 145,066 | ||||||
| Mitsui & Co., Ltd. | 9,611 | 134,965 | ||||||
| NH Foods Ltd. | 6,285 | 137,391 | ||||||
| Nisshin Seifun Group, Inc. | 2,225 | 26,104 | ||||||
| Oji Holdings Corp. | 371,000 | 1,655,503 | ||||||
| Sumitomo Metal Mining Co., Ltd. | 17,314 | 255,724 | ||||||
| Toyo Suisan Kaisha Ltd. | 793 | 27,765 | ||||||
| Yamazaki Baking Co., Ltd. | 2,000 | 35,715 | ||||||
| Total Japan | 2,539,257 | |||||||
| New Zealand — 2.4% | ||||||||
| Fletcher Building Ltd. | 256,995 | 1,625,961 | ||||||
| Norway — 1.0% | ||||||||
| Norsk Hydro ASA | 62,444 | 294,922 | ||||||
| Statoil ASA | 17,094 | 360,686 | ||||||
| Total Norway | 655,608 | |||||||
| Singapore — 0.4% | ||||||||
| Golden Agri-Resources Ltd. | 95,240 | 30,200 | ||||||
| Sakari Resources Ltd.*(c)(d) | 240,456 | 98,030 | ||||||
| Wilmar International Ltd. | 47,466 | 116,824 | ||||||
| Total Singapore | 245,054 | |||||||
| Spain — 0.8% | ||||||||
| Ebro Foods SA | 1,152 | 22,319 | ||||||
| Ence Energia y Celulosa SA | 92,754 | 334,152 | ||||||
| Repsol SA | 7,392 | 152,533 | ||||||
| Total Spain | 509,004 | |||||||
| Sweden — 1.7% | ||||||||
| Boliden AB | 8,372 | 182,372 | ||||||
| Sandvik AB(a) | 77,910 | 979,666 | ||||||
| Total Sweden | 1,162,038 | |||||||
| United Kingdom — 18.7% | ||||||||
| Acacia Mining PLC | 40,306 | 178,945 | ||||||
| Anglo American PLC | 42,755 | 726,026 | ||||||
| Antofagasta PLC | 30,180 | 362,453 | ||||||
| Associated British Foods PLC | 5,876 | 257,985 | ||||||
| BG Group PLC | 18,354 | 333,530 | ||||||
| BP PLC | 98,068 | 708,469 | ||||||
| Evraz PLC | 46,103 | 134,400 | ||||||
| Fresnillo PLC | 72,424 | 800,786 | ||||||
| Glencore PLC* | 400,324 | 1,908,651 | ||||||
| Pennon Group PLC | 26,699 | 352,035 | ||||||
| Polymetal International PLC | 41,362 | 336,566 | ||||||
| Polyus Gold International Ltd.(a) | 297,997 | 859,795 | ||||||
| Randgold Resources Ltd. | 9,108 | 694,797 | ||||||
| Rio Tinto PLC | 56,636 | 2,510,970 | ||||||
| Royal Dutch Shell PLC, Class A | 34,071 | 1,083,117 | ||||||
| Severn Trent PLC | 16,047 | 524,030 | ||||||
| Tate & Lyle PLC | 3,470 | 31,809 | ||||||
| United Utilities Group PLC | 45,665 | 681,406 | ||||||
| Total United Kingdom | 12,485,770 | |||||||
See notes to financial statements.
| 61 |
| Schedules of Investments — IQ Global Resources ETF (continued) |
| April 30, 2015 |
| Shares | Value | |||||||
| Common Stocks (continued) | ||||||||
| United States — 29.5% | ||||||||
| Alcoa, Inc. | 37,415 | $ | 502,110 | |||||
| American Water Works Co., Inc. | 12,041 | 656,476 | ||||||
| Anadarko Petroleum Corp. | 2,772 | 260,845 | ||||||
| Apache Corp. | 2,026 | 138,578 | ||||||
| Aqua America, Inc.(a) | 11,843 | 317,629 | ||||||
| Archer-Daniels-Midland Co. | 4,708 | 230,127 | ||||||
| Boise Cascade Co.* | 14,805 | 513,734 | ||||||
| Bunge Ltd. | 1,080 | 93,280 | ||||||
| Chevron Corp. | 10,112 | 1,123,039 | ||||||
| ConAgra Foods, Inc. | 3,161 | 114,270 | ||||||
| ConocoPhillips | 6,623 | 449,834 | ||||||
| CONSOL Energy, Inc. | 14,303 | 464,561 | ||||||
| Devon Energy Corp. | 2,211 | 150,812 | ||||||
| EOG Resources, Inc. | 2,950 | 291,903 | ||||||
| Exxon Mobil Corp. | 22,560 | 1,971,067 | ||||||
| Flowserve Corp. | 9,022 | 528,058 | ||||||
| Freeport-McMoRan, Inc.(a) | 31,830 | 740,684 | ||||||
| General Mills, Inc. | 4,423 | 244,769 | ||||||
| Hain Celestial Group, Inc. (The)* | 755 | 45,481 | ||||||
| Halliburton Co.(a) | 4,570 | 223,702 | ||||||
| Hormel Foods Corp. | 7,512 | 408,277 | ||||||
| IDEX Corp. | 5,239 | 392,977 | ||||||
| Ingredion, Inc. | 530 | 42,082 | ||||||
| JM Smucker Co. (The) | 888 | 102,937 | ||||||
| Joy Global, Inc.(a) | 6,049 | 257,929 | ||||||
| Kellogg Co. | 2,646 | 167,571 | ||||||
| Kinder Morgan, Inc. | 11,538 | 495,557 | ||||||
| Louisiana-Pacific Corp.* | 53,388 | 813,633 | ||||||
| Marathon Petroleum Corp. | 1,468 | 144,701 | ||||||
| Mercer International, Inc.* | 24,158 | 345,459 | ||||||
| Mondelez International, Inc., Class A | 12,241 | 469,687 | ||||||
| Newmont Mining Corp. | 49,030 | 1,298,805 | ||||||
| Occidental Petroleum Corp. | 4,145 | 332,015 | ||||||
| Peabody Energy Corp.(a) | 17,257 | 81,626 | ||||||
| Pentair PLC | 12,040 | 748,286 | ||||||
| Phillips 66 | 2,923 | 231,823 | ||||||
| Pilgrim’s Pride Corp.(a) | 7,387 | 182,459 | ||||||
| Pioneer Natural Resources Co. | 801 | 138,397 | ||||||
| Resolute Forest Products, Inc.* | 35,548 | 548,150 | ||||||
| Royal Gold, Inc. | 6,408 | 413,508 | ||||||
| Sanderson Farms, Inc.(a) | 659 | 49,504 | ||||||
| Schlumberger Ltd. | 6,859 | 648,930 | ||||||
| Seaboard Corp.* | 33 | 118,800 | ||||||
| Southern Copper Corp.(a) | 24,693 | 804,498 | ||||||
| Shares | Value | |||||||
| Common Stocks (continued) | ||||||||
| United States (continued) | ||||||||
| Spectra Energy Corp. | 3,609 | $ | 134,435 | |||||
| Tyson Foods, Inc., Class A | 10,656 | 420,912 | ||||||
| Valero Energy Corp. | 2,769 | 157,556 | ||||||
| Williams Cos., Inc. (The) | 4,022 | 205,886 | ||||||
| Xylem, Inc. | 12,210 | 452,014 | ||||||
| Total United States | 19,669,373 | |||||||
| Total Common Stocks — 91.3% | ||||||||
| (Cost $63,087,972) | 60,817,162 | |||||||
| Short-Term Investment — 7.5% | ||||||||
| Money Market Fund — 7.5% | ||||||||
| Morgan Stanley Institutional Liquidity | ||||||||
| Funds Treasury Portfolio — Institutional | ||||||||
| Class, 0.03%(e) | ||||||||
| (Cost $5,002,172) | 5,002,172 | 5,002,172 | ||||||
| Investment of Cash Collateral | ||||||||
| For Securities Loaned — 4.6% | ||||||||
| Money Market Fund — 4.6% | ||||||||
| Dreyfus Government Cash | ||||||||
| Management Fund, 0.01%(f) | ||||||||
| (Cost $3,041,309) | 3,041,309 | 3,041,309 | ||||||
| Total Investments — 103.4% | ||||||||
| (Cost $71,131,453) | 68,860,643 | |||||||
| Liabilities in Excess of | ||||||||
| Other Assets — (3.4)% | (2,273,283 | ) | ||||||
| Net Assets — 100.0% | $ | 66,587,360 | ||||||
| * | Non-income producing securities. |
| (a) | All or a portion of the security was on loan. The aggregate market value of securities on loan was $3,899,829; total market value of collateral held by the Fund was $3,988,939. Market value of the collateral held includes non-cash U.S. Treasury securities collateral having a value of $947,630. |
| (b) | Less than 0.05%. |
| (c) | Security has been deemed illiquid because it may not be able to be resold within seven days. At April 30, 2015, the value of these securities were $98,030. |
| (d) | Security fair valued as determined in good faith in accordance with procedures established by the Board of Trustees. |
| (e) | Rate shown reflects the 7-day yield at April 30, 2015. |
| (f) | Rate shown reflects the 1-day yield at April 30, 2015. |
PLC — Public Limited Company
See notes to financial statements.
| 62 |
| Schedules of Investments — IQ Global Resources ETF (continued) |
| April 30, 2015 |
Open futures contracts outstanding at April 30, 2015:
| Type | Broker | Expiration Date | Number of Contracts Sold | Notional Value at Trade Date | Notional Value at April 30, 2015 | Unrealized Depreciation | ||||||||||||||
| E-mini S&P 500 Future | Morgan Stanley | June 2015 | (62 | ) | $ | (6,374,279 | ) | $ | (6,444,590 | ) | $ | (70,311 | ) | |||||||
| Mini MSCI EAFE Index Future | Morgan Stanley | June 2015 | (67 | ) | (6,063,091 | ) | (6,345,570 | ) | (282,479 | ) | ||||||||||
| $ | (352,790 | ) | ||||||||||||||||||
Cash posted as collateral to broker for futures contracts was $506,300 at April 30, 2015.
The following is a summary of the fair valuations according to the inputs used as of April 30, 2015 for valuing the Fund’s assets and liabilities.
Asset Valuation Inputs
| Description | Quoted Prices in Active Markets for Identical Assets (Level 1) | Significant Other Observable Inputs (Level 2) | Significant Unobservable Inputs (Level 3) | Total | ||||||||||||
| Investments in Securities:(a) | ||||||||||||||||
| Common Stocks | $ | 60,719,132 | $ | — | $ | 98,030 | (c) | $ | 60,817,162 | |||||||
| Short-Term Investments: | ||||||||||||||||
| Money Market Fund | 5,002,172 | — | — | 5,002,172 | ||||||||||||
| Investment of Cash Collateral for Securities Loaned | 3,041,309 | — | — | 3,041,309 | ||||||||||||
| Total Investments in Securities | 68,762,613 | — | 98,030 | 68,860,643 | ||||||||||||
| Other Financial Instruments: | ||||||||||||||||
| Futures Contracts | — | — | — | — | ||||||||||||
| Total Investments in Securities and Other Financial Instruments | $ | 68,762,613 | $ | — | $ | 98,030 | $ | 68,860,643 | ||||||||
Liability Valuation Inputs
| Description | Quoted Prices in Active Markets for Identical Assets (Level 1) | Significant Other Observable Inputs (Level 2) | Significant Unobservable Inputs (Level 3) | Total | ||||||||||||
| Other Financial Instruments | ||||||||||||||||
| Futures Contracts | $ | (352,790 | )(b) | $ | — | $ | — | $ | (352,790 | ) | ||||||
| Total Other Financial Instruments | $ | (352,790 | ) | $ | — | $ | — | $ | (352,790 | ) | ||||||
| (a) | For a complete listing of investments and their industries, see the Schedules of Investments. |
| (b) | The value listed for these securities reflects the unrealized appreciation (depreciation) of the instruments. |
| (c) | The Level 3 security valued at $98,030 has been deemed illiquid in good faith in accordance with procedures established by the Board of Trustees. |
The Fund recognizes transfers between the levels as of the beginning of the period.
For the year ended April 30, 2015, the Fund did not have any transfers between any levels within the fair value hierarchy. (See Note 2)
The following is a reconciliation of investments in which significant unobservable inputs (Level 3) were used in determining value:
| Investments in Securities | Balance as of April 30, 2014 | Accrued Discounts (Premiums) | Realized Gain (Loss) | Change in Unrealized Appreciation (Depreciation) | Purchases | Sales | Transfers into Level 3 | Transfers out of Level 3 | Balance as of April 30, 2015 | Change in Unrealized Appreciation (Depreciation) from Investments Still Held at April 30, 2015(a) | ||||||||||||||||||||||||||||||
| Common Stock | ||||||||||||||||||||||||||||||||||||||||
| Sakari Resources Ltd(b) | $ | 216,410 | $ | — | $ | — | $ | (118,380 | ) | $ | — | $ | — | $ | — | $ | — | $ | 98,030 | $ | (118,380 | ) | ||||||||||||||||||
| Total | $ | 216,410 | $ | — | $ | — | $ | (118,380 | ) | $ | — | $ | — | $ | — | $ | — | $ | 98,030 | $ | (118,380 | ) | ||||||||||||||||||
| (a) | Included in “Net change in unrealized appreciation (depreciation) on investments” in the Statements of Operations. |
| (b) | Security has been deemed illiquid in good faith in accordance with procedures established by the Board of Trustees. |
Information about Level 3 fair value measurements as of April 30, 2015.
| Security Type | Fair Value | Valuation Technique | Unobservable Inputs | |||||
| Common Stock | $ | 98,030 | Peer Analysis | Comparable Securities | ||||
See notes to financial statements.
| 63 |
| Schedules of Investments — IQ Merger Arbitrage ETF |
| April 30, 2015 |
| Shares | Value | |||||||
| Common Stocks — 97.5% | ||||||||
| Consumer Discretionary — 11.9% | ||||||||
| Life Time Fitness, Inc.* | 23,877 | $ | 1,707,206 | |||||
| Office Depot, Inc.*(a) | 624,167 | 5,754,820 | ||||||
| Orbitz Worldwide, Inc.* | 223,495 | 2,619,361 | ||||||
| TRW Automotive Holdings Corp.*(a) | 42,018 | 4,414,411 | ||||||
| Total Consumer Discretionary | 14,495,798 | |||||||
| Consumer Staples — 15.8% | ||||||||
| Kraft Foods Group, Inc.(a) | 134,644 | 11,411,079 | ||||||
| Lorillard, Inc.(a) | 111,613 | 7,797,284 | ||||||
| Total Consumer Staples | 19,208,363 | |||||||
| Energy — 11.2% | ||||||||
| Baker Hughes, Inc.(a) | 150,623 | 10,311,651 | ||||||
| Dresser-Rand Group, Inc.*(a) | 31,100 | 2,571,037 | ||||||
| Sakari Resources Ltd.*(b)(c) | 425 | 173 | ||||||
| Talisman Energy, Inc. | 90,023 | 715,725 | ||||||
| Total Energy | 13,598,586 | |||||||
| Financials — 3.5% | ||||||||
| City National Corp.(a) | 20,525 | 1,912,930 | ||||||
| Conwert Immobilien Invest SE* | 26,405 | 334,050 | ||||||
| Novion Property Group | 458,788 | 893,816 | ||||||
| Susquehanna Bancshares, Inc.(a) | 49,445 | 664,541 | ||||||
| TSB Banking Group PLC* | 93,030 | 479,072 | ||||||
| Total Financials | 4,284,409 | |||||||
| Health Care — 24.3% | ||||||||
| Auspex Pharmaceuticals, Inc.* | 23,855 | 2,406,731 | ||||||
| Catamaran Corp.* | 97,292 | 5,774,280 | ||||||
| Hospira, Inc.*(a) | 110,588 | 9,653,227 | ||||||
| Hyperion Therapeutics, Inc.* | 35,673 | 1,639,531 | ||||||
| Pharmacyclics, Inc.*(d) | 39,379 | 10,088,900 | ||||||
| Total Health Care | 29,562,669 | |||||||
| Industrials — 10.0% | ||||||||
| Ansaldo STS SpA | 177,121 | 1,883,508 | ||||||
| Exelis, Inc. | 104,254 | 2,556,308 | ||||||
| Polypore International, Inc.*(a) | 98,642 | 5,776,476 | ||||||
| Toll Holdings Ltd. | 270,543 | 1,916,249 | ||||||
| Total Industrials | 12,132,541 | |||||||
| Information Technology — 10.8% | ||||||||
| Advent Software, Inc. | 25,388 | 1,102,093 | ||||||
| Aruba Networks, Inc.* | 96,031 | 2,363,323 | ||||||
| Emulex Corp.* | 58,332 | 467,823 | ||||||
| Freescale Semiconductor Ltd.* | 88,895 | 3,474,905 | ||||||
| Integrated Silicon Solution, Inc. | 23,758 | 440,711 | ||||||
| InterXion Holding NV* | 15,225 | 463,601 | ||||||
| Kofax Ltd.* | 228,844 | 2,524,149 | ||||||
| Mitel Networks Corp.* | 41,676 | 387,170 | ||||||
| OmniVision Technologies, Inc.*(a) | 64,031 | 1,786,145 | ||||||
| Total Information Technology | 13,009,920 | |||||||
| Materials — 8.3% | ||||||||
| MeadWestvaco Corp.(a) | 44,328 | 2,163,206 | ||||||
| Rexam PLC | 267,848 | 2,385,311 | ||||||
| RTI International Metals, Inc.*(d) | 32,533 | 1,224,868 | ||||||
| Sigma-Aldrich Corp.(a) | 30,582 | 4,248,451 | ||||||
| Total Materials | 10,021,836 | |||||||
| Shares | Value | |||||||
| Common Stocks (continued) | ||||||||
| Telecommunication Services — 0.3% | ||||||||
| iiNET Ltd.(d) | 49,385 | $ | 387,187 | |||||
| Utilities — 1.4% | ||||||||
| Cleco Corp.(a) | 15,901 | 864,219 | ||||||
| UIL Holdings Corp. | 17,202 | 858,036 | ||||||
| Total Utilities | 1,722,255 | |||||||
| Total Common Stocks — 97.5% | ||||||||
| (Cost $116,840,006) | 118,423,564 | |||||||
| Rights — 0.0% (e) | ||||||||
| Health Care — 0.0% (e) | ||||||||
| Furiex Pharmaceuticals CVR*(b)(c) | 2,059 | 20,116 | ||||||
| Trius Therapeutics CVR*(b)(c) | 6,177 | — | ||||||
| Total Rights — 0.0%(e) | ||||||||
| (Cost $20,116) | 20,116 | |||||||
| Short-Term Investment — 1.5% | ||||||||
| Money Market Fund — 1.5% | ||||||||
| Morgan Stanley Institutional Liquidity | ||||||||
| Funds Treasury Portfolio — Institutional | ||||||||
| Class, 0.03%(f) | ||||||||
| (Cost $1,850,896) | 1,850,896 | 1,850,896 | ||||||
| Investment of Cash Collateral For | ||||||||
| Securities Loaned — 2.8% | ||||||||
| Money Market Fund — 2.8% | ||||||||
| Dreyfus Government Cash | ||||||||
| Management Fund, 0.01%(g) | ||||||||
| (Cost $3,359,287) | 3,359,287 | 3,359,287 | ||||||
| Total Investments — 101.8% | ||||||||
| (Cost $122,070,305) | 123,653,863 | |||||||
| Liabilities in Excess of Other | ||||||||
| Assets — (1.8)% | (2,206,690 | ) | ||||||
| Net Assets — 100.0% | $ | 121,447,173 | ||||||
| * | Non-income producing securities. |
| (a) | All or a portion of these securities have been segregated as collateral for swap contracts. The total value of securities segregated amounted to $12,679,677. |
| (b) | Security has been deemed illiquid because it may not be able to be resold within seven days. At April 30, 2015, the value of these securities were $20,289. |
| (c) | Security fair valued as determined in good faith in accordance with the procedures established by the Board of Trustees. |
| (d) | All or a portion of the security was on loan. The aggregate market value of securities on loan was $2,577,965; total market value of collateral held by the Fund was $3,359,287. |
| (e) | Less than 0.05%. |
| (f) | Rate shown reflects the 7-day yield at April 30, 2015. |
| (g) | Rate shown reflects the 1-day yield at April 30, 2015. |
CVR — Contingent Value Right
PLC — Public Limited Company
See notes to financial statements.
| 64 |
| Schedules of Investments — IQ Merger Arbitrage ETF (continued) |
| April 30, 2015 |
Total return swap contracts outstanding at April 30, 2015:
| Total Return Benchmark | Annual Financing Rate (Received) Paid | Expiration Date | Notional Amount Long (short) | Unrealized Appreciation (Depreciation)1 | ||||||||||||
| Consumer Discretionary Select Sector SPDR Fund | (0.34)% | 1/11/2017 | $ | (2,098,513 | ) | $ | — | |||||||||
| Consumer Staples Select Sector SPDR Fund | (0.34)% | 1/11/2017 | (11,355,438 | ) | — | |||||||||||
| Energy Select Sector SPDR Fund | (0.42)% | 1/11/2017 | (7,915,039 | ) | — | |||||||||||
| Financial Select Sector SPDR Fund | (0.27)% | 1/11/2017 | (1,390,853 | ) | — | |||||||||||
| Health Care Select Sector SPDR Fund | (0.34)% | 1/11/2017 | (4,167,762 | ) | — | |||||||||||
| Industrial Select Sector SPDR Fund | (0.34)% | 1/11/2017 | (801,461 | ) | — | |||||||||||
| iShares MSCI Pacific ex Japan ETF | (1.55)% | 1/11/2017 | (920,469 | ) | — | |||||||||||
| Materials Select Sector SPDR Fund | (0.34)% | 1/11/2017 | (4,360,070 | ) | — | |||||||||||
| Technology Select Sector SPDR Fund | (0.27)% | 1/11/2017 | (3,247,364 | ) | — | |||||||||||
| Vanguard FTSE Europe ETF | (0.34)% | 1/11/2017 | (1,189,576 | ) | — | |||||||||||
| $ | — | |||||||||||||||
Morgan Stanley acts as the counterparty to the total return swap contracts listed above. The Fund either receives from, or pays to, the counterparty, depending upon the total return of the benchmark and the agreed-upon financing rate.
| 1 | Reflects a reset date of April 30, 2015. |
The following is a summary of the fair valuations according to the inputs used as of April 30, 2015 for valuing the Fund’s assets and liabilities.
Asset Valuation Inputs
| Description | Quoted Prices in Active Markets for Identical Assets (Level 1) | Significant Other Observable Inputs (Level 2) | Significant Unobservable Inputs (Level 3) | Total | ||||||||||||
| Investments in Securities:(a) | ||||||||||||||||
| Common Stocks | $ | 118,423,391 | $ | — | $ | 173 | (c) | $ | 118,423,564 | |||||||
| Rights | — | 20,116 | — | * | 20,116 | |||||||||||
| Short-Term Investment: | ||||||||||||||||
| Money Market Fund | 1,850,896 | — | — | 1,850,896 | ||||||||||||
| Investment of Cash Collateral for Securities Loaned | 3,359,287 | — | — | 3,359,287 | ||||||||||||
| Total Investments in Securities | $ | 123,633,574 | $ | 20,116 | $ | 173 | $ | 123,653,863 | ||||||||
| Other Financial Instruments: | ||||||||||||||||
| Swap Contracts | — | — | (b) | — | — | |||||||||||
| Total Investments in Securities and Other Financial Instruments | $ | — | $ | — | $ | — | $ | — | ||||||||
Liability Valuation Inputs
| Description | Quoted Prices in Active Markets for Identical Assets (Level 1) | Significant Other Observable Inputs (Level 2) | Significant Unobservable Inputs (Level 3) | Total | ||||||||||||
| Other Financial Instruments | ||||||||||||||||
| Swap Contracts | $ | — | $ | — | (b) | $ | — | $ | — | |||||||
| Total Other Financial Instruments | $ | — | $ | — | $ | — | $ | — | ||||||||
| * | Includes level 3 security valued at $0. |
| (a) | For a complete listing of investments and their industries, see the Schedules of Investments. |
| (b) | The value listed for these securities reflects the unrealized appreciation (depreciation) of the instruments. |
| (c) | The Level 3 security valued at $173 has been deemed illiquid in good faith in accordance with procedures established by the Board of Trustees. |
The Fund recognizes transfers between the levels as of the beginning of the period.
For the year ended April 30, 2015, the Fund did not have any transfers between any levels within the fair value hierarchy. (See Note 2) The following is a reconciliation of investments in which significant unobservable inputs (Level 3) were used in determining value:
| Investments in Securities | Balance as of April 30, 2014 | Accrued Discounts (Premiums) | Realized Gain (Loss) | Change in Unrealized Appreciation (Depreciation) | Purchases | Sales | Transfers into Level 3 | Transfers out of Level 3 | Balance as of April 30, 2015 | Change in Unrealized Appreciation (Depreciation) from Investments Still Held at April 30, 2015(a) | ||||||||||||||||||||||||||||||
| Common Stock | ||||||||||||||||||||||||||||||||||||||||
| Sakari Resources Ltd(b) | ||||||||||||||||||||||||||||||||||||||||
| Rights | $ | 382 | $ | — | $ | — | $ | (209 | ) | $ | — | $ | — | $ | — | $ | — | $ | 173 | $ | (209 | ) | ||||||||||||||||||
| Trius Therapeutics CVR | — | * | — | — | — | — | — | — | — | — | * | — | ||||||||||||||||||||||||||||
| Total | $ | 382 | $ | — | $ | — | $ | (209 | ) | $ | — | $ | — | $ | — | $ | — | $ | 173 | $ | (209 | ) | ||||||||||||||||||
| * | Includes level 3 security valued at $0. |
| (a) | Included in “Net change in unrealized appreciation (depreciation) on investments” in the Statements of Operations. |
| (b) | Security has been deemed illiquid in good faith in accordance with procedures established by the Board of Trustees. Information about level 3 fair value measurements as of April 30, 2015. |
| Security Type | Fair Value | Valuation Technique | Unobservable Inputs | |||||
| Common Stock | $ | 173 | Peer Analysis | Comparable Securities | ||||
| Rights | — | Issuer Specific Facts | Contingent Payment Terms | |||||
See notes to financial statements.
| 65 |
| Schedules of Investments — IQ Real Return ETF |
| April 30, 2015 |
| Shares | Value | |||||||
| Investment Companies — 99.7% | ||||||||
| Currency Harvest Fund — 10.3% | ||||||||
| CurrencyShares British Pound | ||||||||
| Sterling Trust*(a)† | 19,093 | $ | 2,876,551 | |||||
| Intermediate-Term Treasury | ||||||||
| Bond Fund — 0.4% | ||||||||
| iShares 7-10 Year Treasury Bond ETF | 1,035 | 111,293 | ||||||
| Long-Term Bond Fund — 2.4% | ||||||||
| iShares 20+ Year Treasury Bond ETF | 5,383 | 677,989 | ||||||
| Real Estate Funds — 4.2% | ||||||||
| iShares U.S. Real Estate ETF | 2,533 | 191,242 | ||||||
| SPDR Dow Jones REIT ETF | 1,133 | 100,837 | ||||||
| Vanguard REIT ETF | 11,048 | 876,990 | ||||||
| Total Real Estate Funds | 1,169,069 | |||||||
| Short-Term Treasury Bond Funds — 70.5% | ||||||||
| iShares 1-3 Year Treasury Bond ETF | 23,379 | 1,984,176 | ||||||
| iShares Short Treasury Bond ETF(a) | 122,506 | 13,509,962 | ||||||
| SPDR Barclays 1-3 Month T-Bill ETF* | 93,606 | 4,279,666 | ||||||
| Total Short-Term Treasury Bond Funds | 19,773,804 | |||||||
| U.S. Large Cap Equity Funds — 9.9% | ||||||||
| iShares Core S&P 500 ETF | 25 | 5,246 | ||||||
| SPDR S&P 500 ETF Trust(a) | 13,276 | 2,768,312 | ||||||
| Total U.S. Large Cap Equity Funds | 2,773,558 | |||||||
| U.S. Small Cap Equity Fund — 2.0% | ||||||||
| iShares Russell 2000 ETF(a) | 4,663 | 564,969 | ||||||
| Total Investment Companies — 99.7% | ||||||||
| (Cost $27,724,144) | 27,947,233 | |||||||
| Shares | Value | |||||||
| Short-Term Investment — 0.3% | ||||||||
| Money Market Fund — 0.3% | ||||||||
| Morgan Stanley Institutional Liquidity | ||||||||
| Funds Treasury Portfolio — Institutional | ||||||||
| Class, 0.03%(b) | ||||||||
| (Cost $92,459) | 92,459 | $ | 92,459 | |||||
| Investment of Cash Collateral For Securities Loaned — 15.4% | ||||||||
| Money Market Fund — 15.4% | ||||||||
| Dreyfus Government Cash | ||||||||
| Management Fund, 0.01%(c) | ||||||||
| (Cost $4,305,369) | 4,305,369 | 4,305,369 | ||||||
| Total Investments — 115.4% | ||||||||
| (Cost $32,121,972) | 32,345,061 | |||||||
| Liabilities in Excess of Other | ||||||||
| Assets — (15.4)% | (4,314,019 | ) | ||||||
| Net Assets — 100.0% | $ | 28,031,042 | ||||||
| * | Non-income producing securities. |
| † | Affiliated Fund. |
| (a) | All or a portion of the security was on loan. The aggregate market value of securities on loan was $4,197,868; total market value of collateral held by the Fund was $4,305,369. |
| (b) | Rate shown reflects the 7-day yield at April 30, 2015. |
| (c) | Rate shown reflects the 1-day yield at April 30, 2015. |
ETF — Exchange Traded Fund
REIT — Real Estate Investment Trust
The following is a summary of the fair valuations according to the inputs used as of April 30, 2015 for valuing the Fund’s assets and liabilities.
Asset Valuation Inputs
| Description | Quoted Prices in Active Markets for Identical Assets (Level 1) | Significant Other Observable Inputs (Level 2) | Significant Unobservable Inputs (Level 3) | Total | ||||||||||||
| Investments in Securities:(a) | ||||||||||||||||
| Investment Companies | $ | 27,947,233 | $ | — | $ | — | $ | 27,947,233 | ||||||||
| Short-Term Investment: | ||||||||||||||||
| Money Market Fund | 92,459 | — | — | 92,459 | ||||||||||||
| Investment of Cash Collateral for Securities Loaned | 4,305,369 | — | — | 4,305,369 | ||||||||||||
| Total Investments in Securities | $ | 32,345,061 | $ | — | $ | — | $ | 32,345,061 | ||||||||
| (a) | For a complete listing of investments and their industries, see the Schedules of Investments. |
The Fund recognizes transfers between the levels as of the beginning of the period.
For the year ended April 30, 2015, the Fund did not have any transfers between any levels within the fair value hierarchy. (See Note 2) The Fund did not hold any level 3 securities as of April 30, 2015 or April 30, 2014.
See notes to financial statements.
| 66 |
| Schedules of Investments — IQ Australia Small Cap ETF |
| April 30, 2015 |
| Shares | Value | |||||||
| Common Stocks — 100.1% | ||||||||
| Consumer Discretionary — 24.6% | ||||||||
| Ainsworth Game Technology Ltd.(a) | 6,972 | $ | 15,398 | |||||
| APN News & Media Ltd.*(a) | 28,769 | 21,330 | ||||||
| APN Outdoor Group Ltd. | 8,664 | 22,073 | ||||||
| Automotive Holdings Group Ltd.* | 13,261 | 44,662 | ||||||
| Breville Group Ltd. | 8,201 | 49,808 | ||||||
| Dick Smith Holdings Ltd. | 13,462 | 22,192 | ||||||
| Echo Entertainment Group Ltd. | 50,859 | 182,122 | ||||||
| Fairfax Media Ltd. | 159,090 | 131,129 | ||||||
| G8 Education Ltd.(a) | 19,796 | 56,367 | ||||||
| Invocare Ltd. | 7,115 | 75,256 | ||||||
| JB Hi-Fi Ltd.(a) | 6,040 | 93,328 | ||||||
| Myer Holdings Ltd. | 37,849 | 41,198 | ||||||
| Navitas Ltd. | 16,214 | 59,212 | ||||||
| Nine Entertainment Co. Holdings Ltd. | 37,991 | 69,520 | ||||||
| Retail Food Group Ltd. | 8,323 | 45,625 | ||||||
| Seven West Media Ltd. | 42,220 | 42,126 | ||||||
| Slater & Gordon Ltd. | 18,453 | 92,277 | ||||||
| Southern Cross Media Group Ltd. | 35,156 | 29,670 | ||||||
| Super Retail Group Ltd.(a) | 8,186 | 63,792 | ||||||
| Tabcorp Holdings Ltd. | 54,676 | 210,022 | ||||||
| Ten Network Holdings Ltd.* | 110,831 | 17,921 | ||||||
| Village Roadshow Ltd. | 4,876 | 21,653 | ||||||
| Total Consumer Discretionary | 1,406,681 | |||||||
| Consumer Staples — 4.9% | ||||||||
| Asaleo Care Ltd. | 26,733 | 38,903 | ||||||
| Australian Agricultural Co., Ltd.* | 25,219 | 32,224 | ||||||
| Bega Cheese Ltd. | 7,505 | 28,592 | ||||||
| GrainCorp Ltd., Class A(a) | 11,492 | 89,827 | ||||||
| Metcash Ltd.(a) | 61,300 | 64,064 | ||||||
| Tassal Group Ltd. | 9,076 | 23,194 | ||||||
| Total Consumer Staples | 276,804 | |||||||
| Energy — 5.3% | ||||||||
| AWE Ltd.* | 34,212 | 38,723 | ||||||
| Beach Energy Ltd. | 73,074 | 63,977 | ||||||
| Karoon Gas Australia Ltd.*(a) | 15,022 | 32,584 | ||||||
| Liquefied Natural Gas Ltd.* | 27,555 | 99,107 | ||||||
| Paladin Energy Ltd.* | 86,165 | 23,787 | ||||||
| Whitehaven Coal Ltd.*(a) | 33,091 | 43,066 | ||||||
| Total Energy | 301,244 | |||||||
| Financials — 9.3% | ||||||||
| BT Investment Management Ltd. | 3,769 | 28,390 | ||||||
| Cover-More Group Ltd.(a) | 18,999 | 32,968 | ||||||
| FlexiGroup Ltd.(a) | 14,639 | 39,374 | ||||||
| Genworth Mortgage Insurance | ||||||||
| Australia Ltd.(a) | 14,548 | 38,555 | ||||||
| IOOF Holdings Ltd. | 16,820 | 133,729 | ||||||
| Magellan Financial Group Ltd. | 6,833 | 107,575 | ||||||
| nib holdings Ltd. | 28,712 | 82,660 | ||||||
| OzForex Group Ltd. | 14,454 | 25,765 | ||||||
| Steadfast Group Ltd. | 34,354 | 40,916 | ||||||
| Total Financials | 529,932 | |||||||
| Health Care — 11.5% | ||||||||
| Ansell Ltd. | 10,113 | 208,110 | ||||||
| Estia Health Ltd.* | 10,794 | 51,168 | ||||||
| Greencross Ltd.(a) | 5,214 | 27,348 | ||||||
| Japara Healthcare Ltd.(a) | 14,579 | 31,738 | ||||||
| Shares | Value | |||||||
| Common Stocks (continued) | ||||||||
| Health Care (continued) | ||||||||
| Mesoblast Ltd.*(a) | 11,995 | $ | 34,060 | |||||
| Primary Health Care Ltd. | 32,534 | 127,280 | ||||||
| Regis Healthcare Ltd.* | 8,813 | 38,927 | ||||||
| Sigma Pharmaceuticals Ltd. | 68,965 | 47,325 | ||||||
| Sirtex Medical Ltd. | 3,626 | 60,775 | ||||||
| Virtus Health Ltd. | 4,700 | 28,322 | ||||||
| Total Health Care | 655,053 | |||||||
| Industrials — 15.8% | ||||||||
| ALS Ltd. | 24,499 | 101,835 | ||||||
| Bradken Ltd. | 10,985 | 19,841 | ||||||
| Cabcharge Australia Ltd. | 6,710 | 23,975 | ||||||
| Cardno Ltd.(a) | 9,737 | 26,573 | ||||||
| Downer EDI Ltd. | 27,318 | 95,453 | ||||||
| GWA Group Ltd.(a) | 14,369 | 28,334 | ||||||
| IPH Ltd. | 10,018 | 34,135 | ||||||
| McMillan Shakespeare Ltd. | 4,599 | 42,079 | ||||||
| Mineral Resources Ltd.(a) | 9,315 | 47,757 | ||||||
| MMA Offshore Ltd. | 23,514 | 12,983 | ||||||
| Monadelphous Group Ltd.(a) | 5,572 | 43,598 | ||||||
| Recall Holdings Ltd. | 20,649 | 118,894 | ||||||
| SAI Global Ltd. | 13,081 | 40,755 | ||||||
| Spotless Group Holdings Ltd. | 43,108 | 77,523 | ||||||
| Transfield Services Ltd.* | 29,744 | 33,901 | ||||||
| Transpacific Industries Group Ltd. | 96,283 | 58,097 | ||||||
| Veda Group Ltd. | 46,875 | 84,667 | ||||||
| Virgin Australia Holdings Ltd.* | 32,973 | 13,264 | ||||||
| Total Industrials | 903,664 | |||||||
| Information Technology — 3.8% | ||||||||
| Altium Ltd. | 6,445 | 26,434 | ||||||
| carsales.com Ltd. | 9,891 | 73,646 | ||||||
| iProperty Group Ltd.* | 7,064 | 14,097 | ||||||
| Iress Ltd. | 7,009 | 57,550 | ||||||
| Technology One Ltd. | 14,368 | 44,198 | ||||||
| Total Information Technology | 215,925 | |||||||
| Materials — 21.4% | ||||||||
| Adelaide Brighton Ltd. | 28,224 | 100,623 | ||||||
| Arrium Ltd. | 169,146 | 23,347 | ||||||
| BlueScope Steel Ltd. | 37,333 | 103,062 | ||||||
| CSR Ltd. | 31,249 | 89,964 | ||||||
| DuluxGroup Ltd. | 25,220 | 125,918 | ||||||
| Evolution Mining Ltd. | 37,558 | 29,624 | ||||||
| Independence Group NL | 15,248 | 70,958 | ||||||
| Jacana Minerals Ltd.*(b)(c) | 2,006 | 224 | ||||||
| Northern Star Resources Ltd. | 33,010 | 57,541 | ||||||
| Nufarm Ltd. | 11,720 | 67,390 | ||||||
| Orora Ltd. | 79,742 | 139,001 | ||||||
| OZ Minerals Ltd. | 18,655 | 69,009 | ||||||
| Pact Group Holdings Ltd. | 10,325 | 33,553 | ||||||
| PanAust Ltd. | 31,524 | 43,389 | ||||||
| Regis Resources Ltd.*(a) | 20,789 | 20,579 | ||||||
| Sandfire Resources NL | 6,317 | 24,514 | ||||||
| Sims Metal Management Ltd.(a) | 11,031 | 93,880 | ||||||
| Sirius Resources NL*(a) | 21,046 | 48,140 | ||||||
| Syrah Resources Ltd.* | 7,056 | 21,761 | ||||||
| TFS Corp., Ltd. | 16,929 | 22,166 | ||||||
| Western Areas Ltd. | 12,994 | 37,819 | ||||||
| Total Materials | 1,222,462 | |||||||
See notes to financial statements.
| 67 |
| Schedules of Investments — IQ Australia Small Cap ETF (continued) |
| April 30, 2015 |
| Shares | Value | |||||||
| Common Stocks (continued) | ||||||||
| Telecommunication Services — 3.5% | ||||||||
| Amcom Telecommunications Ltd. | 9,529 | $ | 17,287 | |||||
| iiNET Ltd.(a) | 9,244 | 72,474 | ||||||
| M2 Group Ltd. | 9,811 | 84,968 | ||||||
| Vocus Communications Ltd.(a) | 5,225 | 23,944 | ||||||
| Total Telecommunication Services | 198,673 | |||||||
| Total Common Stocks — 100.1% | ||||||||
| (Cost $6,661,348) | 5,710,438 | |||||||
| Rights — 0.0%(d) | ||||||||
| Consumer Discretionary — 0.0%(d) | ||||||||
| Seven West Media Ltd., expiring 6/15/15* | ||||||||
| (Cost $0) | 31,946 | 378 | ||||||
| Shares | Value | |||||||
| Investment of Cash Collateral For | ||||||||
| Securities Loaned — 16.9% | ||||||||
| Money Market Fund — 16.9% | ||||||||
| Dreyfus Government Cash | ||||||||
| Management Fund, 0.01%(e) | ||||||||
| (Cost $967,222) | 967,222 | $ | 967,222 | |||||
| Total Investments — 117.0% | ||||||||
| (Cost $7,628,570) | 6,678,038 | |||||||
| Liabilities in Excess of | ||||||||
| Other Assets — (17.0)% | (970,442 | ) | ||||||
| Net Assets — 100.0% | $ | 5,707,596 | ||||||
| * | Non-income producing securities. |
| (a) | All or a portion of the security was on loan. The aggregate market value of securities on loan was $864,341; total market value of collateral held by the Fund was $967,222. |
| (b) | Security has been deemed illiquid because it may not be able to be resold within seven days. At April 30, 2015, the value of this security was $224. |
| (c) | Security fair valued as determined in good faith in accordance with the procedures established by the Board of Trustees. |
| (d) | Less than 0.05%. |
| (e) | Rate shown reflects the 1-day yield at April 30, 2015. |
The following is a summary of the fair valuations according to the inputs used as of April 30, 2015 for valuing the Fund’s assets and liabilities.
Asset Valuation Inputs
| Description | Quoted Prices in Active Markets for Identical Assets (Level 1) | Significant Other Observable Inputs (Level 2) | Significant Unobservable Inputs (Level 3) | Total | ||||||||||||
| Investments in Securities:(a) | ||||||||||||||||
| Common Stocks | $ | 5,710,214 | $ | — | $ | 224 | $ | 5,710,438 | ||||||||
| Rights | — | 378 | — | 378 | ||||||||||||
| Short-Term Investment: | ||||||||||||||||
| Investment of Cash Collateral for Securities Loaned | 967,222 | — | — | 967,222 | ||||||||||||
| Total Investments in Securities | $ | 6,677,436 | $ | 378 | $ | 224 | $ | 6,678,038 | ||||||||
| (a) | For a complete listing of investments and their industries, see the Schedule of Investments. The Fund recognizes transfers between the levels as of the beginning of the period. |
For the year ended April 30, 2015, the Fund did not have any transfers between any levels within the fair value hierarchy (See Note 2)
The following is a reconciliation of investments in which significant unobservable inputs (Level 3) were used in determining value:
| Investments in Securities | Balance as of April 30, 2014 | Accrued Discounts (Premiums) | Realized Gain (Loss) | Change in Unrealized Appreciation (Depreciation) | Purchases | Sales | Transfers into Level 3 | Transfers out of Level 3 | Balance as of April 30, 2015 | Change in Unrealized Appreciation (Depreciation) from Investments Still Held at April 30, 2015(a) | ||||||||||||||||||||||||||||||
| Common Stock | ||||||||||||||||||||||||||||||||||||||||
| Jacana Minerals Ltd(b) | $ | — | $ | — | $ | — | $ | (223 | ) | $ | 447 | $ | — | $ | — | $ | — | $ | 224 | $ | (223 | ) | ||||||||||||||||||
| Total | $ | — | $ | — | $ | — | $ | (223 | ) | $ | 447 | $ | — | $ | — | $ | — | $ | 224 | $ | (223 | ) | ||||||||||||||||||
| (a) | Included in “Net change in unrealized appreciation (depreciation) on investments” in the Statement of Operations. |
| (b) | Security has been deemed illiquid in good faith in accordance with procedures established by the Board of Trustees. |
Information about Level 3 fair value measurements as of April 30, 2015.
| Security Type | Fair Value | Valuation Technique | Unobservable Inputs | |||||
| Common Stock | $ | 224 | Peer Analysis | Comparable Securities | ||||
See notes to financial statements.
| 68 |
| Schedules of Investments — IQ Canada Small Cap ETF |
| April 30, 2015 |
| Shares | Value | |||||||
| Common Stocks — 99.7% | ||||||||
| Consumer Discretionary — 10.4% | ||||||||
| Aimia, Inc. | 14,124 | $ | 156,253 | |||||
| Amaya, Inc.* | 8,895 | 207,311 | ||||||
| DHX Media Ltd., Class B | 5,390 | 36,445 | ||||||
| EnerCare, Inc. | 7,559 | 92,112 | ||||||
| Hudson’s Bay Co. | 9,072 | 197,506 | ||||||
| Martinrea International, Inc. | 6,922 | 68,863 | ||||||
| Quebecor, Inc., Class B | 6,887 | 188,657 | ||||||
| RONA, Inc. | 9,090 | 119,174 | ||||||
| Total Consumer Discretionary | 1,066,321 | |||||||
| Consumer Staples — 2.7% | ||||||||
| Jean Coutu Group (PJC), Inc. (The), | ||||||||
| Class A | 6,529 | 126,564 | ||||||
| Maple Leaf Foods, Inc. | 7,830 | 149,651 | ||||||
| Total Consumer Staples | 276,215 | |||||||
| Energy — 31.9% | ||||||||
| Advantage Oil & Gas Ltd.* | 13,773 | 84,941 | ||||||
| Athabasca Oil Corp.* | 28,921 | 52,768 | ||||||
| Bankers Petroleum Ltd.* | 21,187 | 62,796 | ||||||
| Bellatrix Exploration Ltd.* | 13,221 | 41,369 | ||||||
| Birchcliff Energy Ltd.* | 8,837 | 63,619 | ||||||
| Bonavista Energy Corp.(a) | 15,652 | 107,383 | ||||||
| Calfrac Well Services Ltd. | 5,946 | 49,286 | ||||||
| Canadian Energy Services & | ||||||||
| Technology Corp.(a) | 15,840 | 79,641 | ||||||
| Cardinal Energy Ltd. | 4,317 | 57,097 | ||||||
| Crew Energy, Inc.* | 11,183 | 49,394 | ||||||
| Ensign Energy Services, Inc. | 10,302 | 81,821 | ||||||
| Freehold Royalties Ltd.(a) | 4,373 | 64,336 | ||||||
| Gibson Energy, Inc. | 10,189 | 234,021 | ||||||
| Kelt Exploration Ltd.* | 8,384 | 64,442 | ||||||
| Mullen Group Ltd.(a) | 7,429 | 128,309 | ||||||
| Northern Blizzard Resources, Inc. | 2,362 | 18,526 | ||||||
| NuVista Energy Ltd.* | 10,917 | 80,576 | ||||||
| Pacific Rubiales Energy Corp. | 20,700 | 69,726 | ||||||
| Painted Pony Petroleum Ltd.* | 8,042 | 49,597 | ||||||
| Parex Resources, Inc.* | 9,599 | 76,713 | ||||||
| Parkland Fuel Corp.(a) | 6,712 | 145,960 | ||||||
| Pengrowth Energy Corp.(a) | 43,907 | 146,810 | ||||||
| Penn West Petroleum Ltd.(a) | 38,897 | 96,339 | ||||||
| Poseidon Concepts Corp.*(b)(c) | 13,377 | — | ||||||
| Precision Drilling Corp. | 23,764 | 172,258 | ||||||
| Raging River Exploration, Inc.* | 14,032 | 109,476 | ||||||
| RMP Energy, Inc.* | 9,592 | 25,658 | ||||||
| Secure Energy Services, Inc.(a) | 9,412 | 132,564 | ||||||
| Spartan Energy Corp.* | 19,032 | 53,580 | ||||||
| Surge Energy, Inc.(a) | 17,647 | 63,959 | ||||||
| TORC Oil & Gas Ltd.(a) | 8,786 | 76,163 | ||||||
| Trican Well Service Ltd. | 12,106 | 50,973 | ||||||
| Trilogy Energy Corp. | 5,283 | 40,170 | ||||||
| Trinidad Drilling Ltd. | 10,905 | 45,646 | ||||||
| Veresen, Inc.(a) | 23,587 | 353,245 | ||||||
| Whitecap Resources, Inc.(a) | 20,381 | 251,555 | ||||||
| Total Energy | 3,280,717 | |||||||
| Financials — 5.2% | ||||||||
| AGF Management Ltd., Class B | 5,586 | 35,603 | ||||||
| Canaccord Genuity Group, Inc. | 6,348 | 36,319 | ||||||
| Shares | Value | |||||||
| Common Stocks (continued) | ||||||||
| Financials (continued) | ||||||||
| Canadian Western Bank | 6,345 | $ | 164,328 | |||||
| Element Financial Corp.* | 20,827 | 297,467 | ||||||
| Total Financials | 533,717 | |||||||
| Health Care — 1.5% | ||||||||
| Extendicare, Inc. | 7,115 | 46,288 | ||||||
| Knight Therapeutics, Inc.* | 5,810 | 35,496 | ||||||
| ProMetic Life Sciences, Inc.* | 36,787 | 72,587 | ||||||
| Total Health Care | 154,371 | |||||||
| Industrials — 12.1% | ||||||||
| Aecon Group, Inc. | 4,513 | 48,847 | ||||||
| Air Canada* | 19,750 | 187,839 | ||||||
| CAE, Inc. | 21,763 | 268,972 | ||||||
| Progressive Waste Solutions Ltd. | 8,954 | 257,772 | ||||||
| Russel Metals, Inc. | 5,053 | 115,140 | ||||||
| TransForce, Inc. | 7,403 | 166,548 | ||||||
| WestJet Airlines Ltd. | 8,582 | 193,214 | ||||||
| Total Industrials | 1,238,332 | |||||||
| Information Technology — 2.9% | ||||||||
| Avigilon Corp.* | 3,116 | 53,561 | ||||||
| DH Corp. | 7,067 | 246,681 | ||||||
| Total Information Technology | 300,242 | |||||||
| Materials — 24.1% | ||||||||
| Alacer Gold Corp.* | 23,752 | 53,534 | ||||||
| Alamos Gold, Inc. | 10,452 | 71,967 | ||||||
| AuRico Gold, Inc. | 20,547 | 71,416 | ||||||
| B2Gold Corp.* | 73,116 | 114,088 | ||||||
| Canfor Corp.* | 3,612 | 71,301 | ||||||
| Capstone Mining Corp.* | 28,046 | 38,900 | ||||||
| Centerra Gold, Inc. | 13,100 | 67,487 | ||||||
| China Gold International Resources | ||||||||
| Corp., Ltd.*(a) | 19,845 | 33,095 | ||||||
| Detour Gold Corp.* | 13,824 | 145,516 | ||||||
| First Majestic Silver Corp.* | 9,303 | 45,161 | ||||||
| Fortuna Silver Mines, Inc.* | 10,545 | 39,786 | ||||||
| HudBay Minerals, Inc. | 19,246 | 189,560 | ||||||
| IAMGOLD Corp.* | 31,947 | 71,213 | ||||||
| Interfor Corp.* | 5,450 | 77,706 | ||||||
| Intertape Polymer Group, Inc. | 4,497 | 61,000 | ||||||
| Ivanhoe Mines Ltd., Class A* | 42,622 | 40,819 | ||||||
| Labrador Iron Ore Royalty Corp.(a) | 5,277 | 62,736 | ||||||
| Lundin Mining Corp.* | 51,296 | 254,098 | ||||||
| Nevsun Resources Ltd. | 16,196 | 63,647 | ||||||
| New Gold, Inc.* | 40,741 | 136,224 | ||||||
| Norbord, Inc.(a) | 3,261 | 65,530 | ||||||
| NOVAGOLD RESOURCES, Inc.* | 19,101 | 72,856 | ||||||
| Pan American Silver Corp. | 12,286 | 117,154 | ||||||
| Pretium Resources, Inc.* | 7,583 | 43,510 | ||||||
| Primero Mining Corp.* | 13,222 | 48,576 | ||||||
| SEMAFO, Inc.* | 24,186 | 74,080 | ||||||
| Sherritt International Corp. | 23,189 | 47,862 | ||||||
| Tahoe Resources, Inc. | 12,968 | 182,542 | ||||||
| Torex Gold Resources, Inc.* | 64,608 | 59,741 | ||||||
| Western Forest Products, Inc. | 32,525 | 49,140 | ||||||
| Total Materials | 2,470,245 | |||||||
See notes to financial statements.
| 69 |
| Schedules of Investments — IQ Canada Small Cap ETF (continued) |
| April 30, 2015 |
| Shares | Value | |||||||
| Telecommunication Services — 1.3% | ||||||||
| Manitoba Telecom Services, Inc.(a) | 6,457 | $ | 138,442 | |||||
| Utilities — 7.6% | ||||||||
| Algonquin Power & Utilities Corp. | 15,444 | 125,337 | ||||||
| Capital Power Corp. | 6,907 | 141,704 | ||||||
| Just Energy Group, Inc. | 8,232 | 44,040 | ||||||
| Northland Power, Inc. | 8,888 | 126,578 | ||||||
| Superior Plus Corp.(a) | 10,249 | 117,361 | ||||||
| TransAlta Corp. | 22,755 | 225,437 | ||||||
| Total Utilities | 780,457 | |||||||
| Total Common Stocks — 99.7% | ||||||||
| (Cost $12,824,092) | 10,239,059 | |||||||
| Shares | Value | |||||||
| Investment of Cash Collateral For | ||||||||
| Securities Loaned — 19.1% | ||||||||
| Money Market Fund — 19.1% | ||||||||
| Dreyfus Government Cash | ||||||||
| Management Fund, 0.01%(d) | ||||||||
| (Cost $1,963,066) | 1,963,066 | $ | 1,963,066 | |||||
| Total Investments — 118.8% | ||||||||
| (Cost $14,787,158) | 12,202,125 | |||||||
| Liabilities in Excess of Other | ||||||||
| Assets — (18.8)% | (1,932,046 | ) | ||||||
| Net Assets — 100.0% | $ | 10,270,079 | ||||||
| * | Non-income producing securities. |
| (a) | All or a portion of the security was on loan. The aggregate market value of securities on loan was $1,842,394; total market value of collateral held by the Fund was $1,963,066. |
| (b) | Security has been deemed illiquid because it may not be able to be resold within seven days. At April 30, 2015, the value of this security was $0. |
| (c) | Security fair valued as determined in good faith in accordance with the procedures established by the Board of Trustees. |
| (d) | Rate shown reflects the 1-day yield at April 30, 2015. |
The following is a summary of the fair valuations according to the inputs used as of April 30, 2015 for valuing the Fund’s assets and liabilities.
Asset Valuation Inputs
| Description | Quoted Prices in Active Markets for Identical Assets (Level 1) | Significant Other Observable Inputs (Level 2) | Significant Unobservable Inputs (Level 3) | Total | ||||||||||||
| Investments in Securities:(a) | ||||||||||||||||
| Common Stocks | $ | 10,239,059 | $ | — | $ | — | (b) | $ | 10,239,059 | |||||||
| Short-Term Investment: | ||||||||||||||||
| Investment of Cash Collateral for Securities Loaned | 1,963,066 | — | — | 1,963,066 | ||||||||||||
| Total Investments in Securities | $ | 12,202,125 | $ | — | $ | — | $ | 12,202,125 | ||||||||
| (a) | For a complete listing of investments and their industries, see the Schedules of Investments. |
| (b) | The Level 3 Security, valued at $—, has been deemed illiquid in good faith in accordance with procedures established by the Board of Trustees. |
The Fund recognizes transfers between the levels as of the beginning of the period.
For the year ended April 30, 2015, the Fund did not have any transfers between any levels within the fair value hierarchy (See Note 2)
The following is a reconciliation of investments in which significant unobservable inputs (Level 3) were used in determining value:
| Investments in Securities | Balance as of April 30, 2014 | Accrued Discounts (Premiums) | Realized Gain (Loss) | Change in Unrealized Appreciation (Depreciation) | Purchases | Sales | Transfers into Level 3 | Transfers out of Level 3 | Balance as of April 30, 2015 | Change in Unrealized Appreciation (Depreciation) from Investments Still Held at April 30, 2015(a) | ||||||||||||||||||||||||||||||
| Common Stocks | ||||||||||||||||||||||||||||||||||||||||
| Poseidon Concepts | ||||||||||||||||||||||||||||||||||||||||
| Corp.(b) | $ | 3,291 | $ | — | $ | — | $ | (3,291 | ) | $ | — | $ | — | $ | — | $ | — | $ | — | * | $ | (3,291 | ) | |||||||||||||||||
| Total | $ | 3,291 | $ | — | $ | — | $ | (3,291 | ) | $ | — | $ | — | $ | — | $ | — | $ | — | * | $ | (3,291 | ) | |||||||||||||||||
| * | Includes level 3 security valued at $0. |
| (a) | Included in “Net change in unrealized appreciation (depreciation) on investment” in Statements of Operations. |
| (b) | Security has been deemed illiquid in good faith in accordance with procedures established by the Board of Trustees. |
Information about level 3 fair value measurements as of April 30, 2015.
| Security Type | Fair Value | Valuation Technique | Unobservable Inputs | |||||
| Common Stock | $ | — | Issuer Specific Facts | Bankruptcy | ||||
See notes to financial statements.
| 70 |
| Schedules of Investments — IQ Global Agribusiness Small Cap ETF |
| April 30, 2015 |
| Shares | Value | |||||||
| Common Stocks — 99.1% | ||||||||
| Australia — 10.4% | ||||||||
| Australian Agricultural Co. Ltd.* | 187,726 | $ | 239,871 | |||||
| GrainCorp Ltd., Class A(a) | 85,542 | 668,640 | ||||||
| Nufarm Ltd. | 87,240 | 501,629 | ||||||
| Total Australia | 1,410,140 | |||||||
| Canada — 6.6% | ||||||||
| Maple Leaf Foods, Inc. | 46,787 | 894,216 | ||||||
| China — 6.4% | ||||||||
| China BlueChemical Ltd., Class H | 830,214 | 370,595 | ||||||
| First Tractor Co., Ltd., Class H(a) | 198,231 | 179,277 | ||||||
| Leyou Technologies Holdings Ltd.* | 879,093 | 164,451 | ||||||
| Shenguan Holdings Group Ltd. | 517,583 | 162,931 | ||||||
| Total China | 877,254 | |||||||
| Hong Kong — 10.4% | ||||||||
| China Huishan Dairy Holdings Co., Ltd. | 2,338,108 | 500,733 | ||||||
| China Modern Dairy Holdings Ltd.*(a) | 934,492 | 380,975 | ||||||
| China Yurun Food Group Ltd.*(a) | 666,644 | 231,356 | ||||||
| Sinofert Holdings Ltd.* | 869,123 | 239,954 | ||||||
| YuanShengTai Dairy Farm Ltd.* | 509,285 | 70,961 | ||||||
| Total Hong Kong | 1,423,979 | |||||||
| Indonesia — 6.4% | ||||||||
| First Resources Ltd. | 244,168 | 328,126 | ||||||
| PT Astra Agro Lestari Tbk | 157,757 | 247,665 | ||||||
| PT Malindo Feedmill Tbk | 389,166 | 43,382 | ||||||
| PT Perusahaan Perkebunan London | ||||||||
| Sumatra Indonesia Tbk | 1,363,059 | 149,844 | ||||||
| PT Sawit Sumbermas Sarana Tbk | 739,687 | 108,421 | ||||||
| Total Indonesia | 877,438 | |||||||
| Japan — 33.1% | ||||||||
| Fuji Oil Co., Ltd. | 29,174 | 425,165 | ||||||
| Iseki & Co., Ltd. | 95,887 | 199,514 | ||||||
| Itoham Foods, Inc.(a) | 56,932 | 308,281 | ||||||
| J-Oil Mills, Inc. | 44,646 | 151,096 | ||||||
| Mitsui Sugar Co., Ltd. | 39,061 | 141,007 | ||||||
| Morinaga Milk Industry Co., Ltd. | 97,889 | 363,188 | ||||||
| Nichirei Corp. | 131,131 | 698,007 | ||||||
| Nihon Nohyaku Co., Ltd. | 23,877 | 251,799 | ||||||
| Nippon Flour Mills Co., Ltd. | 61,405 | 303,254 | ||||||
| Nisshin Oillio Group Ltd. (The) | 61,106 | 224,673 | ||||||
| Nisshin Seifun Group, Inc. | 108,844 | 1,276,986 | ||||||
| Prima Meat Packers Ltd. | 61,361 | 175,361 | ||||||
| Total Japan | 4,518,331 | |||||||
| Singapore — 0.8% | ||||||||
| Indofood Agri Resources Ltd. | 193,108 | 106,428 | ||||||
| Spain — 4.9% | ||||||||
| Deoleo SA*(a) | 236,955 | 120,812 | ||||||
| Ebro Foods SA | 28,209 | 546,530 | ||||||
| Total Spain | 667,342 | |||||||
| Shares | Value | |||||||
| Common Stocks (continued) | ||||||||
| Thailand — 1.2% | ||||||||
| GFPT PCL | 174,151 | $ | 62,338 | |||||
| Kaset Thai International Sugar | ||||||||
| Corp. PCL | 316,520 | 93,616 | ||||||
| Total Thailand | 155,954 | |||||||
| United Arab Emirates — 0.5% | ||||||||
| Amira Nature Foods Ltd.*(a) | 7,871 | 68,242 | ||||||
| United Kingdom — 3.5% | ||||||||
| Dairy Crest Group PLC | 67,331 | 472,965 | ||||||
| United States — 14.9% | ||||||||
| Adecoagro SA* | 46,354 | 450,097 | ||||||
| American Vanguard Corp. | 12,494 | 136,310 | ||||||
| CVR Partners LP(a) | 16,754 | 243,938 | ||||||
| Lindsay Corp.(a) | 5,694 | 450,908 | ||||||
| Sanderson Farms, Inc.(a) | 10,058 | 755,557 | ||||||
| Total United States | 2,036,810 | |||||||
| Total Common Stocks — 99.1% | ||||||||
| (Cost $15,736,527) | 13,509,099 | |||||||
| Short-Term Investment — 0.5% | ||||||||
| Money Market Fund — 0.5% | ||||||||
| Morgan Stanley Institutional Liquidity | ||||||||
| Funds Treasury Portfolio — Institutional | ||||||||
| Class, 0.03%(b) | ||||||||
| (Cost $63,486) | 63,486 | 63,486 | ||||||
| Investment of Cash Collateral For | ||||||||
| Securities Loaned — 17.3% | ||||||||
| Money Market Fund — 17.3% | ||||||||
| Dreyfus Government Cash | ||||||||
| Management Fund, 0.01%(c) | ||||||||
| (Cost $2,359,522) | 2,359,522 | 2,359,522 | ||||||
| Total Investments — 116.9% | ||||||||
| (Cost $18,159,535) | 15,932,107 | |||||||
| Liabilities in Excess of Other | ||||||||
| Assets — (16.9)% | (2,302,452 | ) | ||||||
| Net Assets — 100.0% | $ | 13,629,655 | ||||||
| * | Non-income producing securities. |
| (a) | All or a portion of the security was on loan. The aggregate market value of securities on loan was $2,463,889; total market value of collateral held by the Fund was $2,598,001. Market value of the collateral held includes non-cash U.S. Treasury securities collateral having a value of $238,479. |
| (b) | Rate shown reflects the 7-day yield at April 30, 2015. |
| (c) | Rate shown reflects the 1-day yield at April 30, 2015. |
LP — Limited Partnership
PCL — Public Company Limited
PLC — Public Limited Company
PT — Perseroa Terbatas (Limited Liability Company)
See notes to financial statements.
| 71 |
| Schedules of Investments — IQ Global Agribusiness Small Cap ETF (continued) |
| April 30, 2015 |
The following is a summary of the fair valuations according to the inputs used as of April 30, 2015 for valuing the Fund’s assets and liabilities.
Asset Valuation Inputs
| Description | Quoted Prices in Active Markets for Identical Assets (Level 1) | Significant Other Observable Inputs (Level 2) | Significant Unobservable Inputs (Level 3) | Total | ||||||||||||
| Investments in Securities:(a) | ||||||||||||||||
| Common Stocks | $ | 13,509,099 | $ | — | $ | — | $ | 13,509,099 | ||||||||
| Short-Term Investment: | ||||||||||||||||
| Money Market Fund | 63,486 | — | — | 63,486 | ||||||||||||
| Investment of Cash Collateral for Securities Loaned | 2,359,522 | — | — | 2,359,522 | ||||||||||||
| Total Investments in Securities | $ | 15,932,107 | $ | — | $ | — | $ | 15,932,107 | ||||||||
| (a) | For a complete listing of investments and their industries, see the Schedules of Investments. |
The Fund recognizes transfers between the levels as of the beginning of the period.
For the year ended April 30, 2015, the fund did not have any transfers between any levels within the fair value hierarchy (See Note 2) The Fund did not hold any level 3 securities as of April 30, 2015 or April 30, 2014.
See notes to financial statements.
| 72 |
| Schedules of Investments — IQ Global Oil Small Cap ETF |
| April 30, 2015 |
| Shares | Value | |||||||
| Common Stocks — 99.8% | ||||||||
| Australia — 0.3% | ||||||||
| FAR Ltd.* | 211,490 | $ | 17,515 | |||||
| Canada — 15.7% | ||||||||
| Canyon Services Group, Inc. | 5,356 | 36,348 | ||||||
| Cardinal Energy Ltd. | 4,400 | 58,194 | ||||||
| Ensign Energy Services, Inc. | 10,378 | 82,424 | ||||||
| Horizon North Logistics, Inc. | 8,249 | 22,814 | ||||||
| Ithaca Energy, Inc.* | 26,130 | 22,867 | ||||||
| Lightstream Resources Ltd.(a) | 15,450 | 17,220 | ||||||
| Mullen Group Ltd.(a) | 7,500 | 129,536 | ||||||
| Pacific Rubiales Energy Corp. | 20,900 | 70,400 | ||||||
| Pengrowth Energy Corp.(a) | 44,215 | 147,840 | ||||||
| Penn West Petroleum Ltd.(a) | 39,200 | 97,090 | ||||||
| Sunshine Oilsands Ltd.* | 196,318 | 17,476 | ||||||
| TORC Oil & Gas Ltd.(a) | 8,856 | 76,770 | ||||||
| TransGlobe Energy Corp. | 5,717 | 25,960 | ||||||
| Twin Butte Energy Ltd.(a) | 28,175 | 19,539 | ||||||
| Total Canada | 824,478 | |||||||
| China — 3.7% | ||||||||
| Shandong Molong Petroleum | ||||||||
| Machinery Co., Ltd., Class H* | 20,931 | 14,933 | ||||||
| Sinopec Shanghai Petrochemical Co., | ||||||||
| Ltd., Class H | 291,247 | 176,225 | ||||||
| Total China | 191,158 | |||||||
| France — 1.3% | ||||||||
| Etablissements Maurel et Prom* | 7,234 | 67,686 | ||||||
| Indonesia — 0.2% | ||||||||
| PT Elnusa Tbk | 249,402 | 11,448 | ||||||
| Ireland — 3.4% | ||||||||
| Dragon Oil PLC | 18,804 | 179,306 | ||||||
| Italy — 0.7% | ||||||||
| Saras SpA* | 19,668 | 38,127 | ||||||
| Japan — 4.8% | ||||||||
| Cosmo Oil Co., Ltd.* | 66,961 | 99,599 | ||||||
| Showa Shell Sekiyu K.K. | 15,548 | 150,452 | ||||||
| Total Japan | 250,051 | |||||||
| Norway — 4.3% | ||||||||
| Archer Ltd.* | 19,681 | 7,287 | ||||||
| BW Offshore Ltd. | 27,921 | 20,749 | ||||||
| Det Norske Oljeselskap ASA* | 7,371 | 53,750 | ||||||
| DNO ASA* | 47,824 | 89,803 | ||||||
| Fred Olsen Energy ASA | 2,412 | 21,606 | ||||||
| Ocean Rig UDW, Inc. | 3,867 | 29,041 | ||||||
| Total Norway | 222,236 | |||||||
| Thailand — 5.9% | ||||||||
| Bangchak Petroleum PCL (The) | 61,712 | 66,458 | ||||||
| IRPC PCL | 864,943 | 120,696 | ||||||
| Thai Oil PCL | 68,869 | 122,216 | ||||||
| Total Thailand | 309,370 | |||||||
| United Kingdom — 2.2% | ||||||||
| Genel Energy PLC* | 8,062 | 77,805 | ||||||
| Rockhopper Exploration PLC*(a) | 24,110 | 23,527 | ||||||
| Xcite Energy Ltd.*(a) | 24,649 | 12,311 | ||||||
| Total United Kingdom | 113,643 | |||||||
| Shares | Value | |||||||
| Common Stocks (continued) | ||||||||
| United States — 57.3% | ||||||||
| Alon USA Energy, Inc. | 1,896 | $ | 30,507 | |||||
| Alon USA Partners LP | 742 | 14,506 | ||||||
| Bonanza Creek Energy, Inc.* | 2,696 | 74,302 | ||||||
| California Resources Corp. | 20,876 | 194,147 | ||||||
| CVR Energy, Inc.(a) | 1,016 | 40,681 | ||||||
| CVR Refining LP | 2,922 | 62,940 | ||||||
| Denbury Resources, Inc.(a) | 23,169 | 204,119 | ||||||
| EP Energy Corp., Class A*(a) | 2,229 | 32,922 | ||||||
| GulfMark Offshore, Inc., Class A(a) | 1,514 | 22,725 | ||||||
| Gulfport Energy Corp.* | 5,608 | 274,455 | ||||||
| JP Energy Partners LP(a) | 912 | 12,494 | ||||||
| Key Energy Services, Inc.* | 8,712 | 21,257 | ||||||
| Legacy Reserves LP(a) | 3,902 | 50,453 | ||||||
| Mid-Con Energy Partners LP(a) | 1,573 | 10,335 | ||||||
| Northern Tier Energy LP | 3,764 | 95,455 | ||||||
| Oasis Petroleum, Inc.*(a) | 8,570 | 153,746 | ||||||
| Oil States International, Inc.* | 3,346 | 159,236 | ||||||
| PBF Energy, Inc., Class A | 5,691 | 161,511 | ||||||
| Pioneer Energy Services Corp.* | 4,137 | 30,821 | ||||||
| Rowan Cos. PLC, Class A | 8,190 | 173,546 | ||||||
| RPC, Inc. | 3,814 | 60,681 | ||||||
| Sanchez Energy Corp.*(a) | 3,582 | 52,620 | ||||||
| SemGroup Corp., Class A | 2,882 | 242,636 | ||||||
| SM Energy Co. | 4,416 | 255,995 | ||||||
| Stone Energy Corp.* | 3,572 | 60,974 | ||||||
| Synergy Resources Corp.* | 5,548 | 66,465 | ||||||
| Tesco Corp. | 2,447 | 31,469 | ||||||
| Tesoro Logistics LP(a) | 3,450 | 193,303 | ||||||
| VAALCO Energy, Inc.* | 3,654 | 9,025 | ||||||
| Western Refining, Inc. | 4,710 | 207,475 | ||||||
| Total United States | 3,000,801 | |||||||
| Total Common Stocks — 99.8% | ||||||||
| (Cost $4,723,853) | 5,225,819 | |||||||
| Investment of Cash Collateral For | ||||||||
| Securities Loaned — 20.5% | ||||||||
| Money Market Fund — 20.5% | ||||||||
| Dreyfus Government Cash | ||||||||
| Management Fund, 0.01%(b) | ||||||||
| (Cost $1,075,513) | 1,075,513 | 1,075,513 | ||||||
| Total Investments — 120.3% | ||||||||
| (Cost $5,799,366) | 6,301,332 | |||||||
| Liabilities in Excess of Other | ||||||||
| Assets — (20.3)% | (1,061,778 | ) | ||||||
| Net Assets — 100.0% | $ | 5,239,554 | ||||||
| * | Non-income producing securities. |
| (a) | All or a portion of the security was on loan. The aggregate market value of securities on loan was $1,025,116; total market value of collateral held by the Fund was $1,075,513. |
| (b) | Rate shown reflects the 1-day yield at April 30, 2015. |
ASA — Allmeennaksjeselskap (stock company)
K.K. — Kabushiki Kaisha
LP — Limited Partnership
PCL — Public Company Limited
PLC — Public Limited Company
PT — Perseroan Terbatas (Limited Liability Company)
SpA — Societa per azioni (public company)
Tbk — Perseroan Terbatas (public limited)
See notes to financial statements.
| 73 |
| Schedules of Investments — IQ Global Oil Small Cap ETF (continued) |
| April 30, 2015 |
The following is a summary of the fair valuations according to the inputs used as of April 30, 2015, for valuing the Fund’s assets and liabilities.
Asset Valuation Inputs
| Description | Quoted Prices in Active Markets for Identical Assets (Level 1) | Significant Other Observable Inputs (Level 2) | Significant Unobservable Inputs (Level 3) | Total | ||||||||||||
| Investments in Securities:(a) | ||||||||||||||||
| Common Stocks | $ | 5,225,819 | $ | — | $ | — | $ | 5,225,819 | ||||||||
| Short-Term Investment: | ||||||||||||||||
| Investment of Cash Collateral for Securities Loaned | 1,075,513 | — | — | 1,075,513 | ||||||||||||
| Total Investments in Securities | $ | 6,301,332 | $ | — | $ | — | $ | 6,301,332 | ||||||||
| (a) | For a complete listing of investments and their industries, see the Schedule of Investments. |
The Fund recognizes transfers between the levels as of the beginning of the period.
For the year ended April 30, 2015, the Fund did not have any transfers between any levels within the fair value hierarchy. (See Note 2) The Fund did not hold any level 3 securities as of April 30, 2015 or April 30, 2014.
See notes to financial statements.
| 74 |
| Schedules of Investments — IQ U.S. Real Estate Small Cap ETF |
| April 30, 2015 |
| Shares | Value | |||||||
| Common Stocks — 100.0% | ||||||||
| Diversified REITs — 18.0% | ||||||||
| Cousins Properties, Inc. | 237,487 | $ | 2,313,123 | |||||
| Empire State Realty Trust, Inc., Class A | 118,711 | 2,136,798 | ||||||
| Excel Trust, Inc. | 68,432 | 1,084,647 | ||||||
| Investors Real Estate Trust(a) | 141,366 | 1,013,594 | ||||||
| Kennedy-Wilson Holdings, Inc. | 82,094 | 2,034,289 | ||||||
| Monmouth Real Estate | ||||||||
| Investment Corp. | 61,616 | 636,493 | ||||||
| New Senior Investment Group, Inc. | 76,908 | 1,242,833 | ||||||
| New York REIT, Inc. | 189,184 | 1,869,138 | ||||||
| Redwood Trust, Inc. | 96,076 | 1,651,547 | ||||||
| Resource Capital Corp. | 151,149 | 666,567 | ||||||
| Washington Real Estate | ||||||||
| Investment Trust | 78,783 | 1,947,516 | ||||||
| Winthrop Realty Trust | 38,342 | 631,109 | ||||||
| Total Diversified REITs | 17,227,654 | |||||||
| Hotel REITs — 7.5% | ||||||||
| Ashford Hospitality Trust, Inc. | 111,903 | 1,013,841 | ||||||
| Chesapeake Lodging Trust | 62,934 | 1,998,155 | ||||||
| FelCor Lodging Trust, Inc. | 131,643 | 1,462,554 | ||||||
| Hersha Hospitality Trust | 225,796 | 1,451,868 | ||||||
| Summit Hotel Properties, Inc. | 97,565 | 1,284,931 | ||||||
| Total Hotel REITs | 7,211,349 | |||||||
| Mortgage REITs — 24.0% | ||||||||
| AG Mortgage Investment Trust, Inc. | 32,747 | 629,397 | ||||||
| Anworth Mortgage Asset Corp. | 122,340 | 621,487 | ||||||
| Apollo Commercial Real Estate | ||||||||
| Finance, Inc. | 67,580 | 1,154,942 | ||||||
| Apollo Residential Mortgage, Inc. | 37,075 | 588,010 | ||||||
| Ares Commercial Real Estate Corp. | 30,272 | 343,587 | ||||||
| ARMOUR Residential REIT, Inc. | 405,742 | 1,217,226 | ||||||
| Colony Capital, Inc., Class A | 127,052 | 3,291,917 | ||||||
| Dynex Capital, Inc. | 58,931 | 471,448 | ||||||
| Gramercy Property Trust, Inc. | 51,252 | 1,401,230 | ||||||
| Hatteras Financial Corp. | 111,595 | 2,015,406 | ||||||
| Invesco Mortgage Capital, Inc. | 143,488 | 2,209,715 | ||||||
| iStar Financial, Inc.*(a) | 95,787 | 1,296,956 | ||||||
| New Residential Investment Corp. | 160,705 | 2,738,413 | ||||||
| New York Mortgage Trust, Inc.(a) | 121,578 | 949,524 | ||||||
| Newcastle Investment Corp. | 75,238 | 401,019 | ||||||
| Orchid Island Capital, Inc.(a) | 18,268 | 252,281 | ||||||
| PennyMac Mortgage Investment Trust | 84,807 | 1,776,707 | ||||||
| RAIT Financial Trust | 94,991 | 615,542 | ||||||
| Western Asset Mortgage | ||||||||
| Capital Corp.(a) | 47,975 | 700,915 | ||||||
| Total Mortgage REITs | 22,675,722 | |||||||
| Office REITs — 20.0% | ||||||||
| Brandywine Realty Trust | 206,486 | 3,010,566 | ||||||
| Chambers Street Properties | 275,523 | 2,066,423 | ||||||
| First Industrial Realty Trust, Inc. | 126,946 | 2,504,645 | ||||||
| First Potomac Realty Trust | 67,156 | 719,912 | ||||||
| Franklin Street Properties Corp. | 105,808 | 1,249,593 | ||||||
| Government Properties Income Trust | 80,956 | 1,687,123 | ||||||
| Hudson Pacific Properties, Inc. | 81,338 | 2,453,154 | ||||||
| Lexington Realty Trust | 219,908 | 2,038,547 | ||||||
| Shares | Value | |||||||
| Common Stocks (continued) | ||||||||
| Office REITs (continued) | ||||||||
| Mack-Cali Realty Corp. | 93,252 | $ | 1,673,873 | |||||
| Parkway Properties, Inc. | 96,211 | 1,565,353 | ||||||
| Total Office REITs | 18,969,189 | |||||||
| Residential REITs — 7.9% | ||||||||
| American Residential Properties, Inc.* | 37,358 | 700,836 | ||||||
| Associated Estates Realty Corp. | 65,347 | 1,862,390 | ||||||
| Campus Crest Communities, Inc. | 74,243 | 469,958 | ||||||
| Education Realty Trust, Inc. | 55,666 | 1,871,491 | ||||||
| Independence Realty Trust, Inc. | 28,519 | 262,375 | ||||||
| Monogram Residential Trust, Inc. | 185,998 | 1,755,821 | ||||||
| Silver Bay Realty Trust Corp. | 39,345 | 608,667 | ||||||
| Total Residential REITs | 7,531,538 | |||||||
| Retail REITs — 12.5% | ||||||||
| Acadia Realty Trust | 78,959 | 2,439,833 | ||||||
| Cedar Realty Trust, Inc. | 90,304 | 631,225 | ||||||
| Inland Real Estate Corp. | 102,921 | 1,059,057 | ||||||
| Kite Realty Group Trust | 96,546 | 2,529,505 | ||||||
| Pennsylvania Real Estate | ||||||||
| Investment Trust | 78,043 | 1,764,552 | ||||||
| Ramco-Gershenson Properties Trust | 89,092 | 1,557,328 | ||||||
| Retail Opportunity Investments Corp. | 106,557 | 1,788,027 | ||||||
| Total Retail REITs | 11,769,527 | |||||||
| Specialized REITs — 10.1% | ||||||||
| CyrusOne, Inc. | 40,670 | 1,320,962 | ||||||
| Medical Properties Trust, Inc. | 237,709 | 3,323,172 | ||||||
| Physicians Realty Trust | 81,454 | 1,352,136 | ||||||
| Sabra Health Care REIT, Inc. | 67,376 | 2,013,195 | ||||||
| STAG Industrial, Inc. | 74,940 | 1,628,446 | ||||||
| Total Specialized REITs | 9,637,911 | |||||||
| Total Common Stocks — 100.0% | ||||||||
| (Cost $94,707,017) | 95,022,890 | |||||||
| Investment of Cash Collateral For | ||||||||
| Securities Loaned — 3.8% | ||||||||
| Money Market Fund — 3.8% | ||||||||
| Dreyfus Government Cash | ||||||||
| Management Fund, 0.01%(b) | ||||||||
| (Cost $3,608,647) | 3,608,647 | 3,608,647 | ||||||
| Total Investments — 103.8% | ||||||||
| (Cost $98,315,664) | 98,631,537 | |||||||
| Liabilities in Excess of Other | ||||||||
| Assets — (3.8)% | (3,583,353 | ) | ||||||
| Net Assets — 100.0% | $ | 95,048,184 | ||||||
| * | Non-income producing securities. |
| (a) | All or a portion of the security was on loan. The aggregate market value of securities on loan was $3,449,950; total market value of collateral held by the Fund was $3,608,647. |
| (b) | Rate shown reflects the 1-day yield at April 30, 2015. |
REIT — Real Estate Investment Trust
See notes to financial statements.
| 75 |
| Schedules of Investments — IQ U.S. Real Estate Small Cap ETF (continued) |
| April 30, 2015 |
The following is a summary of the fair valuations according to the inputs used as of April 30, 2015 for valuing the Fund’s assets and liabilities.
Asset Valuation Inputs
| Description | Quoted Prices in Active Markets for Identical Assets (Level 1) | Significant Other Observable Inputs (Level 2) | Significant Unobservable Inputs (Level 3) | Total | ||||||||||||
| Investments in Securities:(a) | ||||||||||||||||
| Common Stocks | $ | 95,022,890 | $ | — | $ | — | $ | 95,022,890 | ||||||||
| Short-Term Investment: | ||||||||||||||||
| Investment of Cash Collateral for Securities Loaned | 3,608,647 | — | — | 3,608,647 | ||||||||||||
| Total Investments in Securities | $ | 98,631,537 | $ | — | $ | — | $ | 98,631,537 | ||||||||
| (a) | For a complete listing of investments and their industries, see the Schedule of Investments. |
The Fund recognizes transfers between the levels as of the beginning of the period.
For the year ended April 30, 2015, the Fund did not have any transfers between any levels within the fair value hierarchy. (See Note 2) The Fund did not hold any level 3 securities as of April 30, 2015 or April 30, 2014.
See notes to financial statements.
| 76 |
| Statements of Assets and Liabilities |
| April 30, 2015 |
| IQ Hedge Multi-Strategy Tracker ETF | IQ Hedge Macro Tracker ETF | IQ Hedge Market Neutral Tracker ETF | IQ Hedge Long/Short Tracker ETF | IQ Hedge Event-Driven Tracker ETF | IQ Global Resources ETF | |||||||||||||||||||
| Assets | ||||||||||||||||||||||||
| Investments, at value (including | ||||||||||||||||||||||||
| securities on loan)1 | $ | 994,845,855 | $ | 26,608,018 | $ | 13,229,599 | $ | 1,984,662 | $ | 1,998,866 | $ | 68,860,643 | ||||||||||||
| Investments in Affiliates, at value | 90,039,523 | — | — | — | — | — | ||||||||||||||||||
| Cash | 8,840 | — | — | 578 | — | — | ||||||||||||||||||
| Due from broker | 5,743,813 | — | 56,856 | 14,778 | 4,634 | — | ||||||||||||||||||
| Foreign currency2 | — | — | — | — | — | 39,383 | ||||||||||||||||||
| Cash deposited at broker for | ||||||||||||||||||||||||
| futures collateral | — | — | — | — | — | 506,300 | ||||||||||||||||||
| Cash deposited at broker for | ||||||||||||||||||||||||
| swap collateral | 3,379,724 | 113,760 | — | — | — | — | ||||||||||||||||||
| Receivable for capital shares | ||||||||||||||||||||||||
| transactions | 9,026,181 | — | — | — | — | — | ||||||||||||||||||
| Dividend, interest and reclaims | ||||||||||||||||||||||||
| receivable | 65,710 | 71,616 | 363 | 71 | 16 | 123,004 | ||||||||||||||||||
| Receivable for investments sold | — | — | — | — | — | 1,455 | ||||||||||||||||||
| Variation margin receivable | — | — | — | — | — | 139,360 | ||||||||||||||||||
| Total Assets | 1,103,109,646 | 26,793,394 | 13,286,818 | 2,000,089 | 2,003,516 | 69,670,145 | ||||||||||||||||||
| Liabilities | ||||||||||||||||||||||||
| Collateral for securities on loan | 89,667,333 | 4,716,270 | 438,854 | 615 | — | 3,041,309 | ||||||||||||||||||
| Payable for investments | ||||||||||||||||||||||||
| purchased | 8,875,919 | — | — | — | — | 1,439 | ||||||||||||||||||
| Due to broker | 3,112,401 | 225,588 | 73,571 | 5,574 | 844 | — | ||||||||||||||||||
| Advisory fees payable | 612,361 | 14,571 | 7,897 | 1,236 | 1,235 | 39,853 | ||||||||||||||||||
| Compliance fees payable | 1,437 | 60 | 26 | 3 | 3 | 130 | ||||||||||||||||||
| Trustee fees payable | — | 6 | — | — | — | — | ||||||||||||||||||
| Accrued expenses and | ||||||||||||||||||||||||
| other liabilities | 54 | 54 | 54 | — | — | 54 | ||||||||||||||||||
| Total Liabilities | 102,269,505 | 4,956,549 | 520,402 | 7,428 | 2,082 | 3,082,785 | ||||||||||||||||||
| Net Assets | $ | 1,000,840,141 | $ | 21,836,845 | $ | 12,766,416 | $ | 1,992,661 | $ | 2,001,434 | $ | 66,587,360 | ||||||||||||
| Composition of Net Assets | ||||||||||||||||||||||||
| Paid-in capital | $ | 1,028,601,962 | $ | 27,636,655 | $ | 12,992,093 | $ | 1,999,620 | $ | 1,995,348 | $ | 107,359,775 | ||||||||||||
| Undistributed (accumulated) | ||||||||||||||||||||||||
| net investment income (loss) | 1,939,577 | (350,908 | ) | (7,962 | ) | 11,705 | 3,814 | 1,008,848 | ||||||||||||||||
| Undistributed (accumulated) net | ||||||||||||||||||||||||
| realized gain (loss) on | ||||||||||||||||||||||||
| investments, swap transactions, | ||||||||||||||||||||||||
| futures contracts and foreign | ||||||||||||||||||||||||
| currency translations | (38,402,434 | ) | (5,488,552 | ) | (419,174 | ) | (781 | ) | 3,650 | (39,159,016 | ) | |||||||||||||
| Net unrealized appreciation | ||||||||||||||||||||||||
| (depreciation) on investments, | ||||||||||||||||||||||||
| futures contracts and foreign | ||||||||||||||||||||||||
| currency translations | 8,701,036 | 39,650 | 201,459 | (17,883 | ) | (1,378 | ) | (2,622,247 | ) | |||||||||||||||
| Net Assets | $ | 1,000,840,141 | $ | 21,836,845 | $ | 12,766,416 | $ | 1,992,661 | $ | 2,001,434 | $ | 66,587,360 | ||||||||||||
| NET ASSET VALUE PER SHARE | ||||||||||||||||||||||||
| Shares Outstanding (no par value, | ||||||||||||||||||||||||
| unlimited shares authorized) | 33,350,000 | 850,000 | 500,000 | 100,001 | 100,001 | 2,450,000 | ||||||||||||||||||
| Net Asset Value | $ | 30.01 | $ | 25.69 | $ | 25.53 | $ | 19.93 | $ | 20.01 | $ | 27.18 | ||||||||||||
| Investments, at cost: | $ | 985,862,117 | $ | 26,568,368 | $ | 13,028,140 | $ | 2,002,545 | $ | 2,000,244 | $ | 71,131,453 | ||||||||||||
| Investments in Affiliates, at cost: | $ | 90,322,225 | $ | — | $ | — | $ | — | $ | — | $ | — | ||||||||||||
| 1 Market value of securities | ||||||||||||||||||||||||
| on loan: | $ | 89,389,461 | $ | 4,622,477 | $ | 420,118 | $ | 588 | $ | — | $ | 3,899,829 | ||||||||||||
| 2 Cost of foreign currency: | $ | — | $ | — | $ | — | $ | — | $ | — | $ | 38,002 | ||||||||||||
See notes to financial statements.
| 77 |
| Statements of Assets and Liabilities (continued) |
| April 30, 2015 |
| IQ Merger Arbitrage ETF | IQ Real Return ETF | IQ Australia Small Cap ETF | IQ Canada Small Cap ETF | IQ Global Agribusiness Small Cap ETF | ||||||||||||||||
| Assets | ||||||||||||||||||||
| Investments, at value (including securities | ||||||||||||||||||||
| on loan)1 | $ | 123,653,863 | $ | 29,468,510 | $ | 6,678,038 | $ | 12,202,125 | $ | 15,932,107 | ||||||||||
| Investments in Affiliates, at value | — | 2,876,551 | — | — | — | |||||||||||||||
| Cash | 632,416 | — | — | — | — | |||||||||||||||
| Due from broker | 271,802 | — | — | — | — | |||||||||||||||
| Foreign Currency2 | 11,819 | — | — | 37,822 | 445 | |||||||||||||||
| Receivable for investments sold | 1,069,360 | — | — | — | — | |||||||||||||||
| Dividend, interest and reclaims receivable | 55,959 | 2,571 | 3,943 | 7,987 | 65,537 | |||||||||||||||
| Total Assets | 125,695,219 | 32,347,632 | 6,681,981 | 12,247,934 | 15,998,089 | |||||||||||||||
| Liabilities | ||||||||||||||||||||
| Collateral for securities on loan | 3,359,287 | 4,305,369 | 967,222 | 1,963,066 | 2,359,522 | |||||||||||||||
| Due to broker | 815,505 | — | — | — | — | |||||||||||||||
| Advisory fees payable | 72,794 | 11,063 | 3,181 | 5,594 | 8,597 | |||||||||||||||
| Payable for investments purchased | 245 | — | — | — | — | |||||||||||||||
| Compliance fees payable | 161 | 88 | 31 | 44 | 159 | |||||||||||||||
| Due to custodian | — | — | 3,888 | 9,094 | — | |||||||||||||||
| Trustee fees payable | — | 16 | 9 | 3 | 102 | |||||||||||||||
| Accrued expenses and other liabilities | 54 | 54 | 54 | 54 | 54 | |||||||||||||||
| Total Liabilities | 4,248,046 | 4,316,590 | 974,385 | 1,977,855 | 2,368,434 | |||||||||||||||
| Net Assets | $ | 121,447,173 | $ | 28,031,042 | $ | 5,707,596 | $ | 10,270,079 | $ | 13,629,655 | ||||||||||
| Composition of Net Assets | ||||||||||||||||||||
| Paid-in capital | $ | 120,872,043 | $ | 29,766,646 | $ | 14,515,363 | $ | 30,799,053 | $ | 21,839,596 | ||||||||||
| Undistributed (accumulated) net investment | ||||||||||||||||||||
| income (loss) | (995,469 | ) | 2,300 | 191,951 | 31,556 | 49,653 | ||||||||||||||
| Undistributed (accumulated) net realized gain | ||||||||||||||||||||
| (loss) on investments, swap transactions, futures | ||||||||||||||||||||
| contracts and foreign currency translations | (13,394 | ) | (1,960,993 | ) | (8,049,196 | ) | (17,976,499 | ) | (6,030,562 | ) | ||||||||||
| Net unrealized appreciation (depreciation) on | ||||||||||||||||||||
| investments, futures contracts and foreign | ||||||||||||||||||||
| currency translations | 1,583,993 | 223,089 | (950,522 | ) | (2,584,031 | ) | (2,229,032 | ) | ||||||||||||
| Net Assets | $ | 121,447,173 | $ | 28,031,042 | $ | 5,707,596 | $ | 10,270,079 | $ | 13,629,655 | ||||||||||
| NET ASSET VALUE PER SHARE | ||||||||||||||||||||
| Shares Outstanding (no par value, unlimited | ||||||||||||||||||||
| shares authorized) | 4,200,000 | 1,050,000 | 350,000 | 550,000 | 500,000 | |||||||||||||||
| Net Asset Value | $ | 28.92 | $ | 26.70 | $ | 16.31 | $ | 18.67 | $ | 27.26 | ||||||||||
| Investments, at cost: | $ | 122,070,305 | $ | 29,319,437 | $ | 7,628,570 | $ | 14,787,158 | $ | 18,159,535 | ||||||||||
| Investments in Affiliates, at cost | $ | — | $ | 2,802,535 | $ | — | $ | — | $ | — | ||||||||||
| 1 Market value of securities on loan: | $ | 3,211,970 | $ | 4,197,868 | $ | 864,341 | $ | 1,842,394 | $ | 2,463,889 | ||||||||||
| 2 Cost of foreign currency: | $ | 11,348 | $ | — | $ | — | $ | 36,790 | $ | 450 | ||||||||||
See notes to financial statements.
| 78 |
| Statements of Assets and Liabilities (continued) |
| April 30, 2015 |
| IQ Global Oil Small Cap ETF | IQ U.S. Real Estate Small Cap ETF | |||||||
| Assets | ||||||||
| Investments, at value (including securities on loan)1 | $ | 6,301,332 | $ | 98,631,537 | ||||
| Foreign currency2 | 18,648 | — | ||||||
| Receivable for investments sold | 3,764 | — | ||||||
| Dividend, interest and reclaims receivable | 3,086 | 136,293 | ||||||
| Total Assets | 6,326,830 | 98,767,830 | ||||||
| Liabilities | ||||||||
| Collateral for securities on loan | 1,075,513 | 3,608,647 | ||||||
| Due to custodian | 8,626 | 55,451 | ||||||
| Advisory fees payable | 3,073 | 55,353 | ||||||
| Compliance fees payable | 9 | 141 | ||||||
| Trustee fees payable | 1 | — | ||||||
| Accrued expenses and other liabilities | 54 | 54 | ||||||
| Total Liabilities | 1,087,276 | 3,719,646 | ||||||
| Net Assets | $ | 5,239,554 | $ | 95,048,184 | ||||
| Composition of Net Assets | ||||||||
| Paid-in capital | $ | 5,519,491 | $ | 96,384,453 | ||||
| Undistributed (accumulated) net investment income (loss) | 9,580 | 16,889 | ||||||
| Undistributed (accumulated) net realized gain (loss) on investments and | ||||||||
| foreign currency translations | (791,969 | ) | (1,669,031 | ) | ||||
| Net unrealized appreciation on investments and foreign currency translations | 502,452 | 315,873 | ||||||
| Net Assets | $ | 5,239,554 | $ | 95,048,184 | ||||
| NET ASSET VALUE PER SHARE | ||||||||
| Shares Outstanding (no par value, unlimited shares authorized) | 300,000 | 3,550,000 | ||||||
| Net Asset Value | $ | 17.47 | $ | 26.77 | ||||
| Investments, at cost: | $ | 5,799,366 | $ | 98,315,664 | ||||
| 1 Market value of securities on loan: | $ | 1,025,116 | $ | 3,449,950 | ||||
| 2 Cost of foreign currency: | $ | 18,157 | $ | — | ||||
See notes to financial statements.
| 79 |
| Statements of Operations |
| For the period ended April 30, 2015 |
| IQ Hedge Multi-Strategy Tracker ETF | IQ Hedge Macro Tracker ETF | IQ Hedge Market Neutral Tracker ETF | IQ Hedge Long/Short Tracker ETF** | IQ Hedge Event-Driven Tracker ETF** | IQ Global Resources ETF | |||||||||||||||||||
| Investment Income | �� | |||||||||||||||||||||||
| Dividend income* | $ | 17,267,750 | $ | 412,481 | $ | 215,896 | $ | 5,080 | $ | 4,273 | $ | 1,729,280 | ||||||||||||
| Securities lending income, net | 737,344 | 70,163 | 7,987 | 96 | 16 | 28,197 | ||||||||||||||||||
| Total investment income | 18,005,094 | 482,644 | 223,883 | 5,176 | 4,289 | 1,757,477 | ||||||||||||||||||
| Expenses | ||||||||||||||||||||||||
| Advisory fees | 6,665,961 | 182,612 | 119,821 | 1,562 | 1,561 | 635,219 | ||||||||||||||||||
| Trustee fees | 23,945 | 595 | 433 | — | — | 2,303 | ||||||||||||||||||
| Compliance fees | 18,362 | 452 | 334 | 4 | 4 | 1,693 | ||||||||||||||||||
| Miscellaneous | 7,835 | 58 | 297 | — | — | 78 | ||||||||||||||||||
| Total expenses | 6,716,103 | 183,717 | 120,885 | 1,566 | 1,565 | 639,293 | ||||||||||||||||||
| Net investment income | 11,288,991 | 298,927 | 102,998 | 3,610 | 2,724 | 1,118,184 | ||||||||||||||||||
| Realized and Unrealized Gain (Loss) | ||||||||||||||||||||||||
| on Investments, Swap Transactions, | ||||||||||||||||||||||||
| Futures Contracts and Foreign | ||||||||||||||||||||||||
| Currency Translations | ||||||||||||||||||||||||
| Net realized gain (loss) from: | ||||||||||||||||||||||||
| Investment securities | (9,705,270 | ) | (1,045,890 | ) | (64,756 | ) | (936 | ) | 1,905 | (11,998,525 | ) | |||||||||||||
| Investments in Affiliates | (106,824 | ) | — | — | — | — | — | |||||||||||||||||
| In-Kind redemptions | 35,277,658 | 131,068 | 184,603 | — | — | 6,112,357 | ||||||||||||||||||
| Swap transactions | (4,879,049 | ) | (33,385 | ) | (422,607 | ) | 8,250 | 2,707 | — | |||||||||||||||
| Distributions from investments in | ||||||||||||||||||||||||
| other investment companies | 695,603 | 7,902 | 12,770 | — | 128 | — | ||||||||||||||||||
| Futures contracts | — | — | — | — | — | (818,805 | ) | |||||||||||||||||
| Foreign currency transactions | — | — | — | — | — | (109,148 | ) | |||||||||||||||||
| Net realized gain (loss) | 21,282,118 | (940,305 | ) | (289,990 | ) | 7,314 | 4,740 | (6,814,121 | ) | |||||||||||||||
| Net change in net unrealized | ||||||||||||||||||||||||
| appreciation (depreciation) | ||||||||||||||||||||||||
| Investment securities | 1,680,999 | 242,089 | 238,845 | (17,883 | ) | (1,378 | ) | (419,232 | ) | |||||||||||||||
| Futures contracts | — | — | — | — | — | (139,947 | ) | |||||||||||||||||
| Foreign currency translations | — | — | — | — | — | 579 | ||||||||||||||||||
| Net change in net unrealized | ||||||||||||||||||||||||
| appreciation (depreciation) | 1,680,999 | 242,089 | 238,845 | (17,883 | ) | (1,378 | ) | (558,600 | ) | |||||||||||||||
| Net realized and unrealized | ||||||||||||||||||||||||
| gain (loss) | 22,963,117 | (698,216 | ) | (51,145 | ) | (10,569 | ) | 3,362 | (7,372,721 | ) | ||||||||||||||
| Net Increase (Decrease) in Net | ||||||||||||||||||||||||
| Assets Resulting from Operations | $ | 34,252,108 | $ | (399,289 | ) | $ | 51,853 | $ | (6,959 | ) | $ | 6,086 | $ | (6,254,537 | ) | |||||||||
| * Net of foreign taxes withheld of: | $ | — | $ | — | $ | — | $ | — | $ | — | $ | 81,850 | ||||||||||||
| ** Commencement of operations March 24, 2015. | ||||||||||||||||||||||||
See notes to financial statements.
| 80 |
| Statements of Operations (continued) |
| For the year ended April 30, 2015 |
| IQ Merger Arbitrage ETF | IQ Real Return ETF | IQ Australia Small Cap ETF | IQ Canada Small Cap ETF | IQ Global Agribusiness Small Cap ETF | ||||||||||||||||
| Investment Income | ||||||||||||||||||||
| Dividend income* | $ | 616,427 | $ | 132,356 | $ | 276,159 | $ | 282,877 | $ | 289,360 | ||||||||||
| Securities lending income, net | 21,713 | 38,796 | 7,209 | 9,296 | 71,254 | |||||||||||||||
| Total investment income | 638,140 | 171,152 | 283,368 | 292,173 | 360,614 | |||||||||||||||
| Expenses | ||||||||||||||||||||
| Advisory fees | 532,230 | 124,446 | 49,928 | 103,425 | 141,362 | |||||||||||||||
| Trustee fees | 1,716 | 363 | 195 | 396 | 545 | |||||||||||||||
| Compliance fees | 1,393 | 295 | 167 | 273 | 382 | |||||||||||||||
| Miscellaneous | 3,178 | 58 | 282 | 58 | 58 | |||||||||||||||
| Total expenses | 538,517 | 125,162 | 50,572 | 104,152 | 142,347 | |||||||||||||||
| Net investment income | 99,623 | 45,990 | 232,796 | 188,021 | 218,267 | |||||||||||||||
| Realized and Unrealized Gain (Loss) on | ||||||||||||||||||||
| Investments, Swap Transactions, Futures | ||||||||||||||||||||
| Contracts and Foreign Currency Translations | ||||||||||||||||||||
| Net realized gain (loss) from: | ||||||||||||||||||||
| Investment securities | 3,310,628 | (265,619 | ) | (1,008,503 | ) | (3,175,742 | ) | (17,867 | ) | |||||||||||
| In-Kind redemptions | 2,049,310 | 766,092 | 173,732 | (45,638 | ) | 1,662,313 | ||||||||||||||
| Swap transactions | (2,398,186 | ) | — | — | — | — | ||||||||||||||
| Futures contracts | 541,489 | — | — | — | — | |||||||||||||||
| Foreign currency transactions | (68,616 | ) | — | 5,209 | (9,779 | ) | (8,705 | ) | ||||||||||||
| Net realized gain (loss) | 3,434,625 | 500,473 | (829,562 | ) | (3,231,159 | ) | 1,635,741 | |||||||||||||
| Net change in net unrealized appreciation | ||||||||||||||||||||
| (depreciation) | ||||||||||||||||||||
| Investment securities | 1,330,024 | (167,593 | ) | (331,361 | ) | (1,058,909 | ) | (1,482,811 | ) | |||||||||||
| Futures contracts | 152,139 | — | — | — | — | |||||||||||||||
| Foreign currency translations | 1,118 | — | 93 | 86 | (1,668 | ) | ||||||||||||||
| Net change in net unrealized | ||||||||||||||||||||
| appreciation (depreciation) | 1,483,281 | (167,593 | ) | (331,268 | ) | (1,058,823 | ) | (1,484,479 | ) | |||||||||||
| Net realized and unrealized gain (loss) | 4,917,906 | 332,880 | (1,160,830 | ) | (4,289,982 | ) | 151,262 | |||||||||||||
| Net Increase (Decrease) in Net Assets Resulting | ||||||||||||||||||||
| from Operations | $ | 5,017,529 | $ | 378,870 | $ | (928,034 | ) | $ | (4,101,961 | ) | $ | 369,529 | ||||||||
| * Net of foreign taxes withheld of: | $ | 6,091 | $ | — | $ | 2,918 | $ | 50,049 | $ | 22,135 | ||||||||||
See notes to financial statements.
| 81 |
| Statements of Operations (continued) |
| For the year ended April 30, 2015 |
| IQ Global Oil Small Cap ETF | IQ U.S. Real Estate Small Cap ETF | |||||||
| Investment Income | ||||||||
| Dividend income* | $ | 51,878 | $ | 3,458,072 | ||||
| Securities lending income, net | 2,468 | 16,653 | ||||||
| Total investment income | 54,346 | 3,474,725 | ||||||
| Expenses | ||||||||
| Advisory fees | 18,828 | 514,418 | ||||||
| Trustee fees | 53 | 1,896 | ||||||
| Compliance fees | 22 | 1,468 | ||||||
| Miscellaneous | 58 | 58 | ||||||
| Total expenses | 18,961 | 517,840 | ||||||
| Net investment income | 35,385 | 2,956,885 | ||||||
| Realized and Unrealized Gain (Loss) on Investments, Swap Transactions, | ||||||||
| Futures Contracts and Foreign Currency Translations | ||||||||
| Net realized gain (loss) from: | ||||||||
| Investment securities | (502,183 | ) | 313,285 | |||||
| In-Kind redemptions | 43,471 | 2,934,084 | ||||||
| Foreign currency transactions | (5,222 | ) | — | |||||
| Net realized gain (loss) | (463,934 | ) | 3,247,369 | |||||
| Net change in net unrealized appreciation (depreciation) | ||||||||
| Investment securities | 378,298 | (440,574 | ) | |||||
| Foreign currency translations | 67 | — | ||||||
| Net change in net unrealized appreciation | 378,365 | (440,574 | ) | |||||
| Net realized and unrealized gain (loss) | (85,569 | ) | 2,806,795 | |||||
| Net Increase (Decrease) in Net Assets Resulting from Operations | $ | (50,184 | ) | $ | 5,763,680 | |||
| * Net of foreign taxes withheld of: | $ | 4,169 | $ | — |
See notes to financial statements.
| 82 |
| Statements of Changes in Net Assets |
| IQ Hedge Multi-Strategy Tracker ETF | IQ Hedge Macro Tracker ETF | IQ Hedge Market Neutral Tracker ETF | ||||||||||||||||||||||
| For the Year Ended April 30, | For the Year Ended April 30, | For the Year Ended April 30, | ||||||||||||||||||||||
| 2015 | 2014 | 2015 | 2014 | 2015 | 2014 | |||||||||||||||||||
| Increase (Decrease) in Net | ||||||||||||||||||||||||
| Assets from Operations | ||||||||||||||||||||||||
| Net investment income | $ | 11,288,991 | $ | 6,339,243 | $ | 298,927 | $ | 482,953 | $ | 102,998 | $ | 114,629 | ||||||||||||
| Net realized gain (loss) | 21,282,118 | 19,787,702 | (940,305 | ) | (109,859 | ) | (289,990 | ) | 337,148 | |||||||||||||||
| Net change in net unrealized | ||||||||||||||||||||||||
| appreciation (depreciation) | 1,680,999 | (488,069 | ) | 242,089 | (1,206,499 | ) | 238,845 | (99,144 | ) | |||||||||||||||
| Net increase (decrease) in net | ||||||||||||||||||||||||
| assets resulting from operations | 34,252,108 | 25,638,876 | (399,289 | ) | (833,405 | ) | 51,853 | 352,633 | ||||||||||||||||
| Dividends and Distributions to | ||||||||||||||||||||||||
| Shareholders from: | ||||||||||||||||||||||||
| Net investment income | (13,005,300 | ) | (7,853,060 | ) | (304,929 | ) | (203,047 | ) | (221,006 | ) | (163,748 | ) | ||||||||||||
| Capital Share Transactions | ||||||||||||||||||||||||
| Proceeds from shares created | 792,465,144 | 570,060,459 | 1,260,589 | 10,533,133 | 3,851,427 | 25,541,942 | ||||||||||||||||||
| Cost of shares redeemed | (535,715,447 | ) | (248,503,915 | ) | (5,223,810 | ) | (46,217,676 | ) | (7,664,158 | ) | (14,119,595 | ) | ||||||||||||
| Net increase (decrease) from | ||||||||||||||||||||||||
| capital share transactions | 256,749,697 | 321,556,544 | (3,963,221 | ) | (35,684,543 | ) | (3,812,731 | ) | 11,422,347 | |||||||||||||||
| Total increase (decrease) in | ||||||||||||||||||||||||
| net assets | 277,996,505 | 339,342,360 | (4,667,439 | ) | (36,720,995 | ) | (3,981,884 | ) | 11,611,232 | |||||||||||||||
| Net Assets | ||||||||||||||||||||||||
| Beginning of year | 722,843,636 | 383,501,276 | 26,504,284 | 63,225,279 | 16,748,300 | 5,137,068 | ||||||||||||||||||
| End of year | $ | 1,000,840,141 | $ | 722,843,636 | $ | 21,836,845 | $ | 26,504,284 | $ | 12,766,416 | $ | 16,748,300 | ||||||||||||
| Including undistributed | ||||||||||||||||||||||||
| (accumulated) net investment | ||||||||||||||||||||||||
| income (loss) as follows: | $ | 1,939,577 | $ | 7,243,480 | $ | (350,908 | ) | $ | 46,042 | $ | (7,962 | ) | $ | 221,070 | ||||||||||
| Changes in Shares Outstanding | ||||||||||||||||||||||||
| Shares outstanding, beginning | ||||||||||||||||||||||||
| of year | 24,700,000 | 13,500,000 | 1,000,000 | 2,350,000 | 650,000 | 200,000 | ||||||||||||||||||
| Shares created | 26,600,000 | 19,800,000 | 50,000 | 400,000 | 150,000 | 1,000,000 | ||||||||||||||||||
| Shares redeemed | (17,950,000 | ) | (8,600,000 | ) | (200,000 | ) | (1,750,000 | ) | (300,000 | ) | (550,000 | ) | ||||||||||||
| Shares outstanding, | ||||||||||||||||||||||||
| end of year | 33,350,000 | 24,700,000 | 850,000 | 1,000,000 | 500,000 | 650,000 | ||||||||||||||||||
See notes to financial statements.
| 83 |
| Statements of Changes in Net Assets (continued) |
| IQ Hedge Long/Short Tracker ETF | IQ Hedge Event-Driven Tracker ETF | IQ Global Resources ETF | IQ Merger Arbitrage ETF | |||||||||||||||||||||
| For the Period March 24, 2015* to April 30, 2015 | For the Period March 24, 2015* to April 30, 2015 | For the Year Ended April 30, | For the Year Ended April 30, | |||||||||||||||||||||
| 2015 | 2014 | 2015 | 2014 | |||||||||||||||||||||
| Increase (Decrease) in Net | ||||||||||||||||||||||||
| Assets from Operations | ||||||||||||||||||||||||
| Net investment income | $ | 3,610 | $ | 2,724 | $ | 1,118,184 | $ | 1,187,580 | $ | 99,623 | $ | 27,331 | ||||||||||||
| Net realized gain (loss) | 7,314 | 4,740 | (6,814,121 | ) | (317,339 | ) | 3,434,625 | 1,532,879 | ||||||||||||||||
| Net change in net unrealized | ||||||||||||||||||||||||
| appreciation (depreciation) | (17,883 | ) | (1,378 | ) | (558,600 | ) | 2,018,777 | 1,483,281 | (212,305 | ) | ||||||||||||||
| Net increase (decrease) in | ||||||||||||||||||||||||
| net assets resulting from | ||||||||||||||||||||||||
| operations | (6,959 | ) | 6,086 | (6,254,537 | ) | 2,889,018 | 5,017,529 | 1,347,905 | ||||||||||||||||
| Dividends and Distributions to | ||||||||||||||||||||||||
| Shareholders from: | ||||||||||||||||||||||||
| Net investment income | — | — | (1,147,080 | ) | (881,676 | ) | — | (237,312 | ) | |||||||||||||||
| Capital Share Transactions | ||||||||||||||||||||||||
| Proceeds from shares created | 1,999,620 | 1,995,348 | 66,327,418 | 66,157,512 | 116,282,725 | 40,021,900 | ||||||||||||||||||
| Cost of shares redeemed | — | — | (77,057,048 | ) | (68,956,992 | ) | (33,715,417 | ) | (21,348,239 | ) | ||||||||||||||
| Net increase (decrease) from | ||||||||||||||||||||||||
| capital share transactions | 1,999,620 | 1,995,348 | (10,729,630 | ) | (2,799,480 | ) | 82,567,308 | 18,673,661 | ||||||||||||||||
| Total increase (decrease) | ||||||||||||||||||||||||
| in net assets | 1,992,661 | �� | 2,001,434 | (18,131,247 | ) | (792,138 | ) | 87,584,837 | 19,784,254 | |||||||||||||||
| Net Assets | ||||||||||||||||||||||||
| Beginning of period | — | — | 84,718,607 | 85,510,745 | 33,862,336 | 14,078,082 | ||||||||||||||||||
| End of period | $ | 1,992,661 | $ | 2,001,434 | $ | 66,587,360 | $ | 84,718,607 | $ | 121,447,173 | $ | 33,862,336 | ||||||||||||
| Including undistributed | ||||||||||||||||||||||||
| (accumulated) net investment | ||||||||||||||||||||||||
| income (loss) as follows: | $ | 11,705 | $ | 3,814 | $ | 1,008,848 | $ | 1,139,367 | $ | (995,469 | ) | $ | (22,005 | ) | ||||||||||
| Changes in Shares Outstanding | ||||||||||||||||||||||||
| Shares outstanding, | ||||||||||||||||||||||||
| beginning of period | — | — | 2,900,000 | 3,000,000 | 1,250,000 | 550,000 | ||||||||||||||||||
| Shares created | 100,001 | 100,001 | 2,350,000 | 2,300,000 | 4,150,000 | 1,500,000 | ||||||||||||||||||
| Shares redeemed | — | — | (2,800,000 | ) | (2,400,000 | ) | (1,200,000 | ) | (800,000 | ) | ||||||||||||||
| Shares outstanding, | ||||||||||||||||||||||||
| end of period | 100,001 | 100,001 | 2,450,000 | 2,900,000 | 4,200,000 | 1,250,000 | ||||||||||||||||||
| * | Commencement of operations. |
See notes to financial statements.
| 84 |
| Statements of Changes in Net Assets (continued) |
| IQ Real Return ETF | IQ Australia Small Cap ETF | IQ Canada Small Cap ETF | ||||||||||||||||||||||
| For the Year Ended April 30, | For the Year Ended April 30, | For the Year Ended April 30, | ||||||||||||||||||||||
| 2015 | 2014 | 2015 | 2014 | 2015 | 2014 | |||||||||||||||||||
| Increase (Decrease) in Net | ||||||||||||||||||||||||
| Assets from Operations | ||||||||||||||||||||||||
| Net investment income | $ | 45,990 | $ | 146,741 | $ | 232,796 | $ | 274,536 | $ | 188,021 | $ | 217,528 | ||||||||||||
| Net realized gain (loss) | 500,473 | (706,781 | ) | (829,562 | ) | (2,497,961 | ) | (3,231,159 | ) | (2,757,447 | ) | |||||||||||||
| Net change in net unrealized | ||||||||||||||||||||||||
| appreciation (depreciation) | (167,593 | ) | (165,221 | ) | (331,268 | ) | 1,086,279 | (1,058,823 | ) | 4,496,333 | ||||||||||||||
| Net increase (decrease) in | ||||||||||||||||||||||||
| net assets resulting from | ||||||||||||||||||||||||
| operations | 378,870 | (725,261 | ) | (928,034 | ) | (1,137,146 | ) | (4,101,961 | ) | 1,956,414 | ||||||||||||||
| Dividends and Distributions to | ||||||||||||||||||||||||
| Shareholders from: | ||||||||||||||||||||||||
| Net investment income | (24,006 | ) | (24,255 | ) | (351,608 | ) | (359,750 | ) | (106,182 | ) | (232,680 | ) | ||||||||||||
| Capital Share Transactions | ||||||||||||||||||||||||
| Proceeds from shares created | 15,983,426 | 7,836,655 | 1,863,266 | 931,445 | 5,232,999 | — | ||||||||||||||||||
| Cost of shares redeemed | (14,636,254 | ) | (41,712,193 | ) | (3,524,767 | ) | (4,655,665 | ) | (7,417,277 | ) | (1,042,622 | ) | ||||||||||||
| Net increase (decrease) from | ||||||||||||||||||||||||
| capital share transactions | 1,347,172 | (33,875,538 | ) | (1,661,501 | ) | (3,724,220 | ) | (2,184,278 | ) | (1,042,622 | ) | |||||||||||||
| Total increase (decrease) in | ||||||||||||||||||||||||
| net assets | 1,702,036 | (34,625,054 | ) | (2,941,143 | ) | (5,221,116 | ) | (6,392,421 | ) | 681,112 | ||||||||||||||
| Net Assets | ||||||||||||||||||||||||
| Beginning of year | 26,329,006 | 60,954,060 | 8,648,739 | 13,869,855 | 16,662,500 | 15,981,388 | ||||||||||||||||||
| End of year | $ | 28,031,042 | $ | 26,329,006 | $ | 5,707,596 | $ | 8,648,739 | $ | 10,270,079 | $ | 16,662,500 | ||||||||||||
| Including undistributed | ||||||||||||||||||||||||
| (accumulated) net investment | ||||||||||||||||||||||||
| income (loss) as follows: | $ | 2,300 | $ | 3,584 | $ | 191,951 | $ | 157,260 | $ | 31,556 | $ | (260,163 | ) | |||||||||||
| Changes in Shares Outstanding | ||||||||||||||||||||||||
| Shares outstanding, | ||||||||||||||||||||||||
| beginning of year | 1,000,000 | 2,300,000 | 450,000 | 650,000 | 700,000 | 750,000 | ||||||||||||||||||
| Shares created | 600,000 | 300,000 | 100,000 | 50,000 | 200,000 | — | ||||||||||||||||||
| Shares redeemed | (550,000 | ) | (1,600,000 | ) | (200,000 | ) | (250,000 | ) | (350,000 | ) | (50,000 | ) | ||||||||||||
| Shares outstanding, | ||||||||||||||||||||||||
| end of year | 1,050,000 | 1,000,000 | 350,000 | 450,000 | 550,000 | 700,000 | ||||||||||||||||||
See notes to financial statements.
| 85 |
| Statements of Changes in Net Assets (continued) |
| IQ Global Agribusiness Small Cap ETF | IQ Global Oil Small Cap ETF | IQ U.S. Real Estate Small Cap ETF | ||||||||||||||||||||||
| For the Year Ended April 30, | For the Year Ended April 30, | For the Year Ended April 30, | ||||||||||||||||||||||
| 2015 | 2014 | 2015 | 2014 | 2015 | 2014 | |||||||||||||||||||
| Increase (Decrease) in Net | ||||||||||||||||||||||||
| Assets from Operations | ||||||||||||||||||||||||
| Net investment income | $ | 218,267 | $ | 429,356 | $ | 35,385 | $ | 18,899 | $ | 2,956,885 | $ | 2,335,779 | ||||||||||||
| Net realized gain (loss) | 1,635,741 | 713,593 | (463,934 | ) | (21,050 | ) | 3,247,369 | 1,610,473 | ||||||||||||||||
| Net change in net unrealized | ||||||||||||||||||||||||
| appreciation (depreciation) | (1,484,479 | ) | 145,328 | 378,365 | 357,366 | (440,574 | ) | (5,011,453 | ) | |||||||||||||||
| Net increase (decrease) in net | ||||||||||||||||||||||||
| assets resulting from operations | 369,529 | 1,288,277 | (50,184 | ) | 355,215 | 5,763,680 | (1,065,201 | ) | ||||||||||||||||
| Dividends and Distributions to | ||||||||||||||||||||||||
| Shareholders from: | ||||||||||||||||||||||||
| Net investment income | (267,937 | ) | (569,025 | ) | (28,982 | ) | (15,442 | ) | (2,917,585 | ) | (2,286,196 | ) | ||||||||||||
| Return of Capital | — | — | — | — | (787,254 | ) | (1,208,211 | ) | ||||||||||||||||
| Total Dividends and Distributions | (267,937 | ) | (569,025 | ) | (28,982 | ) | (15,442 | ) | (3,704,839 | ) | (3,494,407 | ) | ||||||||||||
| Capital Share Transactions | ||||||||||||||||||||||||
| Proceeds from shares created | 5,217,969 | 7,949,938 | 4,209,748 | 920,290 | 54,872,727 | 27,755,277 | ||||||||||||||||||
| Cost of shares redeemed | (17,262,063 | ) | (20,074,172 | ) | (1,167,229 | ) | (920,290 | ) | (14,029,231 | ) | (29,241,447 | ) | ||||||||||||
| Net increase (decrease) from | ||||||||||||||||||||||||
| capital share transactions | (12,044,094 | ) | (12,124,234 | ) | 3,042,519 | — | 40,843,496 | (1,486,170 | ) | |||||||||||||||
| Total increase (decrease) in | ||||||||||||||||||||||||
| net assets | (11,942,502 | ) | (11,404,982 | ) | 2,963,353 | 339,773 | 42,902,337 | (6,045,778 | ) | |||||||||||||||
| Net Assets | ||||||||||||||||||||||||
| Beginning of year | 25,572,157 | 36,977,139 | 2,276,201 | 1,936,428 | 52,145,847 | 58,191,625 | ||||||||||||||||||
| End of year | $ | 13,629,655 | $ | 25,572,157 | $ | 5,239,554 | $ | 2,276,201 | $ | 95,048,184 | $ | 52,145,847 | ||||||||||||
| Including undistributed | ||||||||||||||||||||||||
| (accumulated) net investment | ||||||||||||||||||||||||
| income (loss) as follows: | $ | 49,653 | $ | 32,539 | $ | 9,580 | $ | (6,304 | ) | $ | 16,889 | $ | 2,019 | |||||||||||
| Changes in Shares Outstanding | ||||||||||||||||||||||||
| Shares outstanding, | ||||||||||||||||||||||||
| beginning of year | 950,000 | 1,400,000 | 100,000 | 100,000 | 2,050,000 | 2,150,000 | ||||||||||||||||||
| Shares created | 200,000 | 300,000 | 250,000 | 50,000 | 2,000,000 | 1,100,000 | ||||||||||||||||||
| Shares redeemed | (650,000 | ) | (750,000 | ) | (50,000 | ) | (50,000 | ) | (500,000 | ) | (1,200,000 | ) | ||||||||||||
| Shares outstanding, end of year | 500,000 | 950,000 | 300,000 | 100,000 | 3,550,000 | 2,050,000 | ||||||||||||||||||
See notes to financial statements.
| 86 |
| Financial Highlights |
| Selected Data for a Share of Capital Stock Outstanding |
| IQ Hedge Multi-Strategy Tracker ETF | IQ Hedge Macro Tracker ETF | |||||||||||||||||||||||||||||||||||||||
| For the Year Ended April 30, | For the Year Ended April 30, | |||||||||||||||||||||||||||||||||||||||
| 2015 | 2014 | 2013 | 2012 | 2011 | 2015 | 2014 | 2013 | 2012 | 2011 | |||||||||||||||||||||||||||||||
| Net asset value, | ||||||||||||||||||||||||||||||||||||||||
| beginning of year | $ | 29.26 | $ | 28.41 | $ | 27.66 | $ | 27.86 | $ | 27.21 | $ | 26.50 | $ | 26.90 | $ | 27.28 | $ | 28.30 | $ | 26.54 | ||||||||||||||||||||
| Income from Investment | ||||||||||||||||||||||||||||||||||||||||
| Operations | ||||||||||||||||||||||||||||||||||||||||
| Net investment income2* | 0.38 | 0.33 | 0.34 | 0.43 | 0.61 | 0.32 | 0.36 | 0.38 | 0.39 | 0.38 | ||||||||||||||||||||||||||||||
| Net realized and unrealized | ||||||||||||||||||||||||||||||||||||||||
| gain (loss) on investments | 0.74 | 0.88 | 0.69 | (0.27 | ) | 0.45 | (0.79 | ) | (0.62 | ) | (0.29 | ) | (1.14 | ) | 1.53 | |||||||||||||||||||||||||
| Distributions of net realized | ||||||||||||||||||||||||||||||||||||||||
| gains from investments | ||||||||||||||||||||||||||||||||||||||||
| in other investment | ||||||||||||||||||||||||||||||||||||||||
| companies | 0.02 | 0.01 | 0.03 | 0.01 | 0.00 | 3 | 0.00 | 3 | 0.02 | 0.01 | 0.00 | 3 | 0.00 | 3 | ||||||||||||||||||||||||||
| Net increase (decrease) in | ||||||||||||||||||||||||||||||||||||||||
| net assets resulting from | ||||||||||||||||||||||||||||||||||||||||
| investment operations | 1.14 | 1.22 | 1.06 | 0.17 | 1.06 | (0.47 | ) | (0.24 | ) | 0.10 | (0.75 | ) | 1.91 | |||||||||||||||||||||||||||
| Distributions from: | ||||||||||||||||||||||||||||||||||||||||
| Net investment income | (0.39 | ) | (0.37 | ) | (0.31 | ) | (0.37 | ) | (0.41 | ) | (0.34 | ) | (0.16 | ) | (0.48 | ) | (0.27 | ) | (0.15 | ) | ||||||||||||||||||||
| Total distributions from net | ||||||||||||||||||||||||||||||||||||||||
| investment income and | ||||||||||||||||||||||||||||||||||||||||
| realized gains | (0.39 | ) | (0.37 | ) | (0.31 | ) | (0.37 | ) | (0.41 | ) | (0.34 | ) | (0.16 | ) | (0.48 | ) | (0.27 | ) | (0.15 | ) | ||||||||||||||||||||
| Net asset value, end of year | $ | 30.01 | $ | 29.26 | $ | 28.41 | $ | 27.66 | $ | 27.86 | $ | 25.69 | $ | 26.50 | $ | 26.90 | $ | 27.28 | $ | 28.30 | ||||||||||||||||||||
| Market Price, end of year | $ | 30.00 | $ | 25.74 | ||||||||||||||||||||||||||||||||||||
| Total Return | ||||||||||||||||||||||||||||||||||||||||
| Total investment return based | ||||||||||||||||||||||||||||||||||||||||
| on net asset value5 | 3.93 | %6 | 4.30 | %6 | 3.85 | % | 0.65 | % | 3.95 | % | (1.77 | )% | (0.90 | )% | 0.36 | % | (2.61 | )% | 7.21 | % | ||||||||||||||||||||
| Total investment return based | ||||||||||||||||||||||||||||||||||||||||
| on Market Price | 3.79 | % | (1.47 | )% | ||||||||||||||||||||||||||||||||||||
| Ratios/Supplemental Data | ||||||||||||||||||||||||||||||||||||||||
| Net assets, end of year | ||||||||||||||||||||||||||||||||||||||||
| (000’s omitted) | $ | 1,000,840 | $ | 722,844 | $ | 383,501 | $ | 196,415 | $ | 131,077 | $ | 21,837 | $ | 26,504 | $ | 63,225 | $ | 50,476 | $ | 28,302 | ||||||||||||||||||||
| Ratio to average net assets of: | ||||||||||||||||||||||||||||||||||||||||
| Expenses8 | 0.76 | % | 0.75 | % | 0.75 | % | 0.75 | % | 0.77 | % | 0.75 | % | 0.75 | % | 0.75 | % | 0.75 | % | 0.77 | % | ||||||||||||||||||||
| Net investment | ||||||||||||||||||||||||||||||||||||||||
| income* | 1.27 | % | 1.16 | % | 1.22 | % | 1.57 | % | 2.23 | % | 1.23 | % | 1.37 | % | 1.39 | % | 1.44 | % | 1.41 | % | ||||||||||||||||||||
| Portfolio turnover rate9 | 81 | % | 119 | % | 159 | % | 90 | % | 145 | % | 101 | % | 58 | % | 146 | % | 108 | % | 54 | % | ||||||||||||||||||||
See footnotes on page 92
See notes to financial statements.
| 87 |
| Financial Highlights (continued) |
| Selected Data for a Share of Capital Stock Outstanding |
| IQ Hedge Market Neutral Tracker ETF | IQ Hedge Long/Short Tracker ETF | IQ Hedge Event-Driven Tracker ETF | ||||||||||||||||||
| For the Year Ended April 30, | For the Period October 4, 20121 to April 30, 2013 | For the Period March 24, 20151 to April 30, 2015 | For the Period March 24, 20151 to April 30, 2015 | |||||||||||||||||
| 2015 | 2014 | |||||||||||||||||||
| Net asset value, beginning of period | $ | 25.77 | $ | 25.69 | $ | 24.98 | $ | 20.00 | $ | 19.95 | ||||||||||
| Income from Investment Operations | ||||||||||||||||||||
| Net investment income2* | 0.16 | 0.16 | 0.06 | 0.04 | 0.02 | |||||||||||||||
| Net realized and unrealized gain (loss) on investments | (0.09 | ) | 0.12 | 0.68 | (0.11 | ) | 0.03 | |||||||||||||
| Distributions of net realized gains from investments | ||||||||||||||||||||
| in other investment companies | 0.03 | 0.02 | 0.03 | — | 0.01 | |||||||||||||||
| Net increase (decrease) in net assets resulting from | ||||||||||||||||||||
| investment operations | 0.10 | 0.30 | 0.77 | (0.07 | ) | 0.06 | ||||||||||||||
| Distributions from: | ||||||||||||||||||||
| Net investment income | (0.34 | ) | (0.22 | ) | (0.06 | ) | — | — | ||||||||||||
| Net realized gains | — | — | — | — | — | |||||||||||||||
| Total distributions from net investment | ||||||||||||||||||||
| income and realized gains | (0.34 | ) | (0.22 | ) | (0.06 | ) | — | — | ||||||||||||
| Net asset value, end of period | $ | 25.53 | $ | 25.77 | $ | 25.69 | $ | 19.93 | $ | 20.01 | ||||||||||
| Market Price, end of period | $ | 25.50 | $ | 20.79 | $ | 20.00 | ||||||||||||||
| Total Return | ||||||||||||||||||||
| Total investment return based on net asset value5 | 0.40 | % | 1.17 | % | 3.10 | % | (0.35 | )% | 0.30 | % | ||||||||||
| Total investment return based on Market Price | 0.43 | % | 3.95 | %10 | 0.25 | %10 | ||||||||||||||
| Ratios/Supplemental Data | ||||||||||||||||||||
| Net assets, end of period (000’s omitted) | $ | 12,766 | $ | 16,748 | $ | 5,137 | $ | 1,993 | $ | 2,001 | ||||||||||
| Ratio to average net assets of: | ||||||||||||||||||||
| Expenses8 | 0.76 | % | 0.75 | % | 0.76 | %7 | 0.75 | %7 | 0.75 | %7 | ||||||||||
| Net investment income* | 0.64 | % | 0.64 | % | 0.40 | %7 | 1.73 | %7 | 1.31 | %7 | ||||||||||
| Portfolio turnover rate9 | 101 | % | 51 | % | 29 | % | 4 | % | 6 | % | ||||||||||
See footnotes on page 92
See notes to financial statements.
| 88 |
| Financial Highlights (continued) |
| Selected Data for a Share of Capital Stock Outstanding |
| IQ Global Resources ETF | IQ Merger Arbitrage ETF | |||||||||||||||||||||||||||||||||||||||
| For the Year Ended April 30, | For the Year Ended April 30, | |||||||||||||||||||||||||||||||||||||||
| 2015 | 2014 | 2013 | 2012 | 2011 | 2015 | 2014 | 2013 | 2012 | 2011 | |||||||||||||||||||||||||||||||
| Net asset value, beginning | ||||||||||||||||||||||||||||||||||||||||
| of year | $ | 29.21 | $ | 28.50 | $ | 28.95 | $ | 33.27 | $ | 27.50 | $ | 27.09 | $ | 25.60 | $ | 26.02 | $ | 25.47 | $ | 26.34 | ||||||||||||||||||||
| Income from Investment | ||||||||||||||||||||||||||||||||||||||||
| Operations | ||||||||||||||||||||||||||||||||||||||||
| Net investment income | ||||||||||||||||||||||||||||||||||||||||
| (loss)2 | 0.37 | 0.41 | 0.40 | 0.39 | 0.29 | 0.04 | 0.03 | 0.09 | (0.03 | ) | 0.01 | |||||||||||||||||||||||||||||
| Net realized and unrealized | ||||||||||||||||||||||||||||||||||||||||
| gain (loss) on investments | (2.05 | ) | 0.61 | (0.48 | ) | (4.17 | ) | 5.78 | 1.79 | 1.72 | (0.46 | ) | 0.58 | (0.55 | ) | |||||||||||||||||||||||||
| Net increase (decrease) in | ||||||||||||||||||||||||||||||||||||||||
| net assets resulting from | ||||||||||||||||||||||||||||||||||||||||
| investment operations | (1.68 | ) | 1.02 | (0.08 | ) | (3.78 | ) | 6.07 | 1.83 | 1.75 | (0.37 | ) | 0.55 | (0.54 | ) | |||||||||||||||||||||||||
| Distributions from: | ||||||||||||||||||||||||||||||||||||||||
| Net investment income | (0.35 | ) | (0.31 | ) | (0.37 | ) | (0.20 | ) | (0.12 | ) | — | (0.26 | ) | (0.05 | ) | — | (0.01 | ) | ||||||||||||||||||||||
| Net realized gains | — | — | — | (0.34 | ) | (0.18 | ) | — | — | — | — | (0.32 | ) | |||||||||||||||||||||||||||
| Total distributions from net | ||||||||||||||||||||||||||||||||||||||||
| investment income and | ||||||||||||||||||||||||||||||||||||||||
| realized gains | (0.35 | ) | (0.31 | ) | (0.37 | ) | (0.54 | ) | (0.30 | ) | — | (0.26 | ) | (0.05 | ) | — | (0.33 | ) | ||||||||||||||||||||||
| Net asset value, end of year | $ | 27.18 | $ | 29.21 | $ | 28.50 | $ | 28.95 | $ | 33.27 | $ | 28.92 | $ | 27.09 | $ | 25.60 | $ | 26.02 | $ | 25.47 | ||||||||||||||||||||
| Market Price, end of year | $ | 27.18 | $ | 28.97 | ||||||||||||||||||||||||||||||||||||
| Total Return | ||||||||||||||||||||||||||||||||||||||||
| Total investment return based | ||||||||||||||||||||||||||||||||||||||||
| on net asset value5 | (5.75 | )%6 | 3.61 | %6 | (0.35 | )% | (11.30 | )% | 22.17 | % | 6.76 | % | 6.88 | % | (1.42 | )% | 2.16 | % | (2.03 | )% | ||||||||||||||||||||
| Total investment return based | ||||||||||||||||||||||||||||||||||||||||
| on Market Price | (5.97 | )% | 6.31 | % | ||||||||||||||||||||||||||||||||||||
| Ratios/Supplemental Data | ||||||||||||||||||||||||||||||||||||||||
| Net assets, end of year | ||||||||||||||||||||||||||||||||||||||||
| (000’s omitted) | $ | 66,587 | $ | 84,719 | $ | 85,511 | $ | 68,039 | $ | 79,854 | $ | 121,447 | $ | 33,862 | $ | 14,078 | $ | 26,019 | $ | 22,921 | ||||||||||||||||||||
| Ratio to average net assets of: | ||||||||||||||||||||||||||||||||||||||||
| Expenses8 | 0.75 | % | 0.75 | % | 0.76 | % | 0.75 | % | 0.76 | % | 0.76 | % | 0.75 | % | 0.76 | % | 0.75 | % | 0.76 | % | ||||||||||||||||||||
| Net investment income (loss) | 1.32 | % | 1.45 | % | 1.39 | % | 1.31 | % | 0.94 | % | 0.14 | % | 0.13 | % | 0.36 | % | (0.11 | )% | 0.04 | % | ||||||||||||||||||||
| Portfolio turnover rate9 | 182 | % | 116 | % | 119 | % | 178 | % | 117 | % | 447 | % | 353 | % | 374 | % | 365 | % | 365 | % | ||||||||||||||||||||
See footnotes on page 92
See notes to financial statements.
| 89 |
| Financial Highlights (continued) |
| Selected Data for a Share of Capital Stock Outstanding |
| IQ Real Return ETF | IQ Australia Small Cap ETF | |||||||||||||||||||||||||||||||||||||||
| For the Year Ended April 30, | For the Year Ended April 30, | |||||||||||||||||||||||||||||||||||||||
| 2015 | 2014 | 2013 | 2012 | 2011 | 2015 | 2014 | 2013 | 2012 | 2011 | |||||||||||||||||||||||||||||||
| Net asset value, | ||||||||||||||||||||||||||||||||||||||||
| beginning of year | $ | 26.33 | $ | 26.50 | $ | 26.23 | $ | 25.63 | $ | 24.99 | $ | 19.22 | $ | 21.34 | $ | 23.25 | $ | 30.94 | $ | 25.64 | ||||||||||||||||||||
| Income from Investment | ||||||||||||||||||||||||||||||||||||||||
| Operations | ||||||||||||||||||||||||||||||||||||||||
| Net investment income2 | 0.05 | 0.09 | 0.06 | (0.01 | ) | (0.08 | ) | 0.57 | 0.53 | 0.62 | 0.64 | 1.03 | ||||||||||||||||||||||||||||
| Net realized and unrealized | ||||||||||||||||||||||||||||||||||||||||
| gain (loss) on investments | 0.35 | (0.23 | ) | 0.23 | 0.66 | 0.72 | (2.60 | ) | (1.93 | ) | (2.14 | ) | (5.71 | ) | 4.76 | |||||||||||||||||||||||||
| Net increase (decrease) in | ||||||||||||||||||||||||||||||||||||||||
| net assets resulting from | ||||||||||||||||||||||||||||||||||||||||
| investment operations | 0.40 | (0.14 | ) | 0.29 | 0.65 | 0.64 | (2.03 | ) | (1.40 | ) | (1.52 | ) | (5.07 | ) | 5.79 | |||||||||||||||||||||||||
| Distributions from: | ||||||||||||||||||||||||||||||||||||||||
| Net investment income | (0.03 | ) | (0.03 | ) | (0.02 | ) | — | (0.00 | )4 | (0.88 | ) | (0.72 | ) | (0.39 | ) | (1.77 | ) | (0.45 | ) | |||||||||||||||||||||
| Net realized gains | — | — | — | (0.05 | ) | — | — | — | — | (0.85 | ) | (0.04 | ) | |||||||||||||||||||||||||||
| Total distributions from net | ||||||||||||||||||||||||||||||||||||||||
| investment income and | ||||||||||||||||||||||||||||||||||||||||
| realized gains | (0.03 | ) | (0.03 | ) | (0.02 | ) | (0.05 | ) | (0.00 | )4 | (0.88 | ) | (0.72 | ) | (0.39 | ) | (2.62 | ) | (0.49 | ) | ||||||||||||||||||||
| Net asset value, end of year | $ | 26.70 | $ | 26.33 | $ | 26.50 | $ | 26.23 | $ | 25.63 | $ | 16.31 | $ | 19.22 | $ | 21.34 | $ | 23.25 | $ | 30.94 | ||||||||||||||||||||
| Market Price, end of year | $ | 26.81 | $ | 16.42 | ||||||||||||||||||||||||||||||||||||
| Total Return | ||||||||||||||||||||||||||||||||||||||||
| Total investment return based | ||||||||||||||||||||||||||||||||||||||||
| on net asset value5 | 1.50 | % | (0.54 | )% | 1.09 | % | 2.56 | % | 2.58 | % | (10.43 | )% | (6.32 | )% | (6.51 | )% | (15.08 | )% | 22.71 | % | ||||||||||||||||||||
| Total investment return based | ||||||||||||||||||||||||||||||||||||||||
| on Market Price | 1.96 | % | (9.84 | )% | ||||||||||||||||||||||||||||||||||||
| Ratios/Supplemental Data | ||||||||||||||||||||||||||||||||||||||||
| Net assets, end of year | ||||||||||||||||||||||||||||||||||||||||
| (000’s omitted) | $ | 28,031 | $ | 26,329 | $ | 60,954 | $ | 27,543 | $ | 12,815 | $ | 5,708 | $ | 8,649 | $ | 13,870 | $ | 16,277 | $ | 43,323 | ||||||||||||||||||||
| Ratio to average net assets of: | ||||||||||||||||||||||||||||||||||||||||
| Expenses8 | 0.48 | % | 0.48 | % | 0.48 | % | 0.48 | % | 0.49 | % | 0.70 | % | 0.69 | % | 0.69 | % | 0.69 | % | 0.69 | % | ||||||||||||||||||||
| Net investment income (loss) | 0.18 | % | 0.36 | % | 0.23 | % | (0.05 | )% | (0.32 | )% | 3.22 | % | 2.84 | % | 2.98 | % | 2.49 | % | 3.72 | % | ||||||||||||||||||||
| Portfolio turnover rate9 | 91 | % | 45 | % | 72 | % | 62 | % | 52 | % | 36 | % | 31 | % | 29 | % | 42 | % | 49 | % | ||||||||||||||||||||
See footnotes on page 92
See notes to financial statements.
| 90 |
| Financial Highlights (continued) |
| Selected Data for a Share of Capital Stock Outstanding |
| IQ Canada Small Cap ETF | IQ Global Agribusiness Small Cap ETF | |||||||||||||||||||||||||||||||||||||||
| For the Year Ended April 30, | For the Year Ended April 30, | For the Period March 21, 20111 to April 30, 2011 | ||||||||||||||||||||||||||||||||||||||
| 2015 | 2014 | 2013 | 2012 | 2011 | 2015 | 2014 | 2013 | 2012 | ||||||||||||||||||||||||||||||||
| Net asset value, | ||||||||||||||||||||||||||||||||||||||||
| beginning of period | $ | 23.80 | $ | 21.31 | $ | 26.17 | $ | 35.44 | $ | 26.02 | $ | 26.92 | $ | 26.41 | $ | 24.82 | $ | 27.42 | $ | 25.40 | ||||||||||||||||||||
| Income from Investment | ||||||||||||||||||||||||||||||||||||||||
| Operations | ||||||||||||||||||||||||||||||||||||||||
| Net investment income2 | 0.27 | 0.29 | 0.28 | 0.16 | 0.14 | 0.31 | 0.35 | 0.31 | 0.22 | 0.06 | ||||||||||||||||||||||||||||||
| Net realized and unrealized gain | ||||||||||||||||||||||||||||||||||||||||
| (loss) on investments | (5.22 | ) | 2.51 | (4.27 | ) | (9.12 | ) | 9.75 | 0.44 | 0.58 | 1.64 | (2.61 | ) | 1.96 | ||||||||||||||||||||||||||
| Net increase (decrease) in | ||||||||||||||||||||||||||||||||||||||||
| net assets resulting from | ||||||||||||||||||||||||||||||||||||||||
| investment operations | (4.95 | ) | 2.80 | (3.99 | ) | (8.96 | ) | 9.89 | 0.75 | 0.93 | 1.95 | (2.39 | ) | 2.02 | ||||||||||||||||||||||||||
| Distributions from: | ||||||||||||||||||||||||||||||||||||||||
| Net investment income | (0.18 | ) | (0.31 | ) | (0.87 | ) | (0.31 | ) | (0.47 | ) | (0.41 | ) | (0.42 | ) | (0.36 | ) | (0.21 | ) | — | |||||||||||||||||||||
| Net realized gains | — | — | — | — | — | — | — | — | — | — | ||||||||||||||||||||||||||||||
| Total distributions from net | ||||||||||||||||||||||||||||||||||||||||
| investment income and | ||||||||||||||||||||||||||||||||||||||||
| realized gains | (0.18 | ) | (0.31 | ) | (0.87 | ) | (0.31 | ) | (0.47 | ) | (0.41 | ) | (0.42 | ) | (0.36 | ) | (0.21 | ) | — | |||||||||||||||||||||
| Net asset value, end of period | $ | 18.67 | $ | 23.80 | $ | 21.31 | $ | 26.17 | $ | 35.44 | $ | 27.26 | $ | 26.92 | $ | 26.41 | $ | 24.82 | $ | 27.42 | ||||||||||||||||||||
| Market Price, end of period | $ | 18.63 | $ | 27.27 | ||||||||||||||||||||||||||||||||||||
| Total Return | ||||||||||||||||||||||||||||||||||||||||
| Total investment return based | ||||||||||||||||||||||||||||||||||||||||
| on net asset value5 | (20.81 | )% | 13.32 | % | (15.49 | )% | (25.24 | )% | 38.15 | % | 2.92 | % | 3.50 | % | 7.91 | % | (8.64 | )% | 7.95 | % | ||||||||||||||||||||
| Total investment return based | ||||||||||||||||||||||||||||||||||||||||
| on Market Price | (20.71 | )% | 3.15 | % | ||||||||||||||||||||||||||||||||||||
| Ratios/Supplemental Data | ||||||||||||||||||||||||||||||||||||||||
| Net assets, end of period | ||||||||||||||||||||||||||||||||||||||||
| (000’s omitted) | $ | 10,270 | $ | 16,663 | $ | 15,981 | $ | 31,409 | $ | 120,492 | $ | 13,630 | $ | 25,572 | $ | 36,977 | $ | 39,709 | $ | 54,839 | ||||||||||||||||||||
| Ratio to average net assets of: | ||||||||||||||||||||||||||||||||||||||||
| Expenses8 | 0.69 | % | 0.69 | % | 0.70 | % | 0.69 | % | 0.69 | % | 0.76 | % | 0.75 | % | 0.75 | % | 0.75 | % | 0.75 | %7 | ||||||||||||||||||||
| Net investment income | 1.25 | % | 1.37 | % | 1.21 | % | 0.55 | % | 0.44 | % | 1.16 | % | 1.29 | % | 1.24 | % | 0.89 | % | 1.96 | %7 | ||||||||||||||||||||
| Portfolio turnover rate9 | 33 | % | 38 | % | 41 | % | 37 | % | 52 | % | 33 | % | 25 | % | 17 | % | 26 | % | 0 | % | ||||||||||||||||||||
See footnotes on page 92
See notes to financial statements.
| 91 |
| Financial Highlights (continued) |
| Selected Data for a Share of Capital Stock Outstanding |
| IQ Global Oil Small Cap ETF | IQ U.S. Real Estate Small Cap ETF | |||||||||||||||||||||||||||||||
| For the Year Ended April 30, | For the Period May 4, 20111 to April 30, 2012 | For the Year Ended April 30, | For the Period June 13, 20111 to April 30, 2012 | |||||||||||||||||||||||||||||
| 2015 | 2014 | 2013 | 2015 | 2014 | 2013 | |||||||||||||||||||||||||||
| Net asset value, | ||||||||||||||||||||||||||||||||
| beginning of period | $ | 22.76 | $ | 19.36 | $ | 17.58 | $ | 19.56 | $ | 25.44 | $ | 27.07 | $ | 20.42 | $ | 19.91 | ||||||||||||||||
| Income from Investment Operations | ||||||||||||||||||||||||||||||||
| Net investment income2 | 0.25 | 0.19 | 0.15 | 0.21 | 1.07 | 1.22 | 0.83 | 0.73 | ||||||||||||||||||||||||
| Net realized and unrealized | ||||||||||||||||||||||||||||||||
| gain (loss) on investments | (5.25 | ) | 3.36 | 1.93 | (2.07 | ) | 1.57 | (0.96 | ) | 7.00 | 0.37 | |||||||||||||||||||||
| Net increase in net assets resulting | ||||||||||||||||||||||||||||||||
| from investment operations | (5.00 | ) | 3.55 | 2.08 | (1.86 | ) | 2.64 | 0.26 | 7.83 | 1.10 | ||||||||||||||||||||||
| Distributions from: | ||||||||||||||||||||||||||||||||
| Net investment income | (0.29 | ) | (0.15 | ) | (0.30 | ) | (0.12 | ) | (1.04 | ) | (1.24 | ) | (1.18 | ) | (0.59 | ) | ||||||||||||||||
| Net realized gains | — | — | — | — | — | — | — | — | ||||||||||||||||||||||||
| Return of capital | (0.27 | ) | (0.65 | ) | — | — | ||||||||||||||||||||||||||
| Total distributions from net | ||||||||||||||||||||||||||||||||
| investment income and | ||||||||||||||||||||||||||||||||
| realized gains | (0.29 | ) | (0.15 | ) | (0.30 | ) | (0.12 | ) | (1.31 | ) | (1.89 | ) | (1.18 | ) | (0.59 | ) | ||||||||||||||||
| Net asset value, end of period | $ | 17.47 | $ | 22.76 | $ | 19.36 | $ | 17.58 | $ | 26.77 | $ | 25.44 | $ | 27.07 | $ | 20.42 | ||||||||||||||||
| Market Price, end of period | $ | 17.42 | $ | 26.82 | ||||||||||||||||||||||||||||
| Total Return | ||||||||||||||||||||||||||||||||
| Total investment return based | ||||||||||||||||||||||||||||||||
| on net asset value5 | (21.80 | )% | 18.44 | % | 12.09 | % | (9.40 | )% | 10.44 | % | 1.65 | % | 39.85 | % | 6.05 | % | ||||||||||||||||
| Total investment return based | ||||||||||||||||||||||||||||||||
| on Market Price | (21.58 | )% | 10.51 | % | ||||||||||||||||||||||||||||
| Ratios/Supplemental Data | ||||||||||||||||||||||||||||||||
| Net assets, end of period | ||||||||||||||||||||||||||||||||
| (000’s omitted) | $ | 5,240 | $ | 2,276 | $ | 1,936 | $ | 2,637 | $ | 95,048 | $ | 52,146 | $ | 58,192 | $ | 32,669 | ||||||||||||||||
| Ratio to average net assets of: | ||||||||||||||||||||||||||||||||
| Expenses8 | 0.76 | % | 0.76 | % | 0.76 | % | 0.75 | %7 | 0.69 | % | 0.69 | % | 0.69 | % | 0.69 | %7 | ||||||||||||||||
| Net investment income | 1.41 | % | 0.93 | % | 0.86 | % | 1.22 | %7 | 3.97 | % | 4.91 | % | 3.70 | % | 4.43 | %7 | ||||||||||||||||
| Portfolio turnover rate9 | 58 | % | 42 | % | 30 | % | 10 | % | 17 | % | 35 | % | 16 | % | 11 | % | ||||||||||||||||
| * | Recognition of net investment income by the Fund is affected by the timing of the declaration of dividends by the investment companies in which the Fund invests. |
| 1 | Commencement of operations. |
| 2 | Based on average shares outstanding. |
| 3 | Less than $0.005 per share. |
| 4 | Greater than $(0.005) per share. |
| 5 | Total investment return is calculated assuming an initial investment made at the net asset value at the beginning of the period, reinvestment of all dividends and distributions, if any, at net asset value during the period, and redemption on the last day of the period. Total return calculated for a period less than one year is not annualized. |
| 6 | Includes adjustments in accordance with accounting principles generally accepted in the United States of America and as such, the net asset values for financial reporting purposes and the returns based upon those net asset values may differ from the net asset values and returns for shareholder transactions. |
| 7 | Annualized. |
| 8 | Excludes expenses incurred by the underlying investments in other funds. |
| 9 | Portfolio turnover rate is not annualized and excludes the value of portfolio securities received or delivered as in-kind creations or redemptions of the Fund’s capital share transactions. Portfolio turnover rate does not include the impact of the derivative transactions. |
| 10 | Since the shares of the Funds did not trade in the secondary market until the day after the Fund’s inception, for the period from inception to the first day of secondary market trading, the NAV is used as a proxy for the secondary market trading price to calculate market returns. |
See notes to financial statements.
| 92 |
| Notes to Financial Statements |
| April 30, 2015 |
1. ORGANIZATION
IndexIQ ETF Trust (the “Trust”) was organized as a Delaware statutory trust on July 1, 2008 and is registered with the Securities and Exchange Commission (“SEC”) as a diversified, open-end, management investment company, as defined by the Investment Company Act of 1940, as amended (the “1940 Act”), except for the IQ Merger Arbitrage ETF, IQ Australia Small Cap ETF, IQ Canada Small Cap ETF, IQ Global Agribusiness Small Cap ETF, IQ Global Oil Small Cap ETF, and the IQ U.S. Real Estate Small Cap ETF which are classified as a “non-diversified”, open-end investment companies under the 1940 Act. The Trust is currently comprised of thirteen operational funds (collectively, the “Funds” and each individually, a “Fund”). The Funds are exchange-traded funds (“ETFs”), whose shares are listed on a stock exchange and traded like equity securities at market prices.
| Funds | Commencement of Operation Date | |
| IQ Hedge Multi-Strategy Tracker ETF | March 24, 2009 | |
| IQ Hedge Macro Tracker ETF | June 8, 2009 | |
| IQ Hedge Market Neutral Tracker ETF | October 4, 2012 | |
| IQ Hedge Long/Short Tracker ETF and IQ Hedge Event-Driven Tracker ETF | March 24, 2015 | |
| IQ Real Return ETF and IQ Global Resources ETF | October 26, 2009 | |
| IQ Merger Arbitrage ETF | November 16, 2009 | |
| IQ Australia Small Cap ETF and IQ Canada Small Cap ETF | March 22, 2010 | |
| IQ Global Agribusiness Small Cap ETF | March 21, 2011 | |
| IQ Global Oil Small Cap ETF | May 4, 2011 | |
| IQ U.S. Real Estate Small Cap ETF | June 13, 2011 |
On April 15, 2015, New York Life Investment Management (“NYLIM”), completed its acquisition of IndexIQ Advisors LLC (the “Advisor”), the Funds’ investment advisor. Effective April 15, 2015 the Funds entered into a new advisory agreement. The terms of the Advisory Agreement are substantially identical to the prior investment advisory agreement between the Trust and the investment advisor.
Each Fund’s investment objective is to seek daily investment results, before fees and expenses that correspond to the performance of a particular index (the Underlying Index). The underlying indices for the Funds are listed below:
| Funds | Underlying Index | |
| IQ Hedge Multi-Strategy Tracker ETF | IQ Hedge Multi-Strategy Index | |
| IQ Hedge Macro Tracker ETF | IQ Hedge Macro Index | |
| IQ Hedge Market Neutral Tracker ETF | IQ Hedge Market Neutral Index | |
| IQ Hedge Long/Short Tracker ETF | IQ Hedge Long/Short Index | |
| IQ Hedge Event-Driven Tracker ETF | IQ Hedge Event-Driven Index | |
| IQ Global Resources ETF | IQ Global Resources Index | |
| IQ Merger Arbitrage ETF | IQ Merger Arbitrage Index | |
| IQ Real Return ETF | IQ Real Return Index | |
| IQ Australia Small Cap ETF | IQ Australia Small Cap Index | |
| IQ Canada Small Cap ETF | IQ Canada Small Cap Index | |
| IQ Global Agribusiness Small Cap ETF | IQ Global Agribusiness Small Cap Index | |
| IQ Global Oil Small Cap ETF | IQ Global Oil Small Cap Index | |
| IQ U.S. Real Estate Small Cap ETF | IQ U.S. Real Estate Small Cap Index |
Investors may find the financial statements of any issuer whose securities represent a significant amount of a Fund’s assets on the SEC’s website (www.sec.gov).
2. SIGNIFICANT ACCOUNTING POLICIES
Each Fund is an investment company and accordingly follows the investment company accounting and reporting guidance of the Financial Account Standards Board (FASB) Accounting Standard Codification Topic 946 Financial Services — Investment Companies. Each Fund prepares its financial statements in accordance with generally accepted accounting principles (“GAAP”) in the United States of America and follows the significant accounting policies described below.
| 93 |
| Notes to Financial Statements (continued) |
| April 30, 2015 |
Use of Estimates
Management makes certain estimates and assumptions that affect the reported amounts of assets and liabilities and disclosure of contingent assets and liabilities at the date of the financial statements and reported amounts of increases and decreases in the net assets from operations during the reporting period. Actual results could differ from those estimates.
Indemnification
In the normal course of business, the Funds may enter into contracts that contain a variety of representations which provide general indemnifications for certain liabilities. Each Fund’s maximum exposure under these arrangements is unknown as this would involve future claims that may be made against the Funds that have not yet occurred. However, the Funds have not had prior claims or losses pursuant to these contracts and expect the risk of loss to be remote. Under the Trust’s organizational documents, its officers and trustees are indemnified against certain liabilities that may arise out of performance of their duties to the Trust. Additionally, in the normal course of business, the Funds enter into contracts with third party service providers that contain a variety of representations and warranties and which may provide general indemnifications.
Investment Valuation
Each Fund issues and redeems Shares on a continuous basis at NAV only in large blocks of shares called “Creation Units.” A Creation Unit consists of 50,000 Shares. According to the Registration Statement, the net asset value (“NAV”) of the Shares of the Fund will be equal to the Fund’s total assets minus the Fund’s total liabilities divided by the total number of shares outstanding. The NAV that is published will be rounded to the nearest cent; however, for purposes of determining the price of Creation Units, the NAV will be calculated to five decimal places. For purposes of calculating NAV, portfolio securities and other assets for which market quotations are readily available will be valued at market value. Market value will generally be determined on the basis of last reported sales prices, or if no sales are reported, based on quotes obtained from a quotation reporting system, established market makers, or pricing services.
In calculating NAV, the Fund’s exchange-traded Equity Securities will be valued at market value, which will generally be determined using the last reported official closing or last trading price on the exchange or market on which the security is primarily traded at the time of valuation or, if no sale has occurred, at the last quoted mid-price on the primary market or exchange on which they are traded. Investment company securities (other than ETFs) will be valued at NAV.
Securities listed on the NASDAQ Stock Market LLC are generally valued at the NASDAQ official closing price.
Unsponsored depositary receipts will be valued at the last quoted mid-price. Debt Securities will be valued using market quotations when available or other equivalent indications of value provided by an independent third-party pricing service. Short-term Debt Instruments having a remaining maturity of 60 days or less are generally valued at amortized cost, which approximates market value.
A swap on an exchange-listed security or securities is valued at the last reported sale price of the swap’s underlying security or securities on the exchange where the security or securities is primarily traded, or if no sale price is available, at the mid-price of the security or securities underlying the swap on the exchange where the security is primarily traded. A swap on an index is valued based on the publicly available index price. The index price, in turn, is determined by the applicable index calculation agent, which generally values the securities underlying the index at the last reported sale price.
Futures contracts generally will be valued at the settlement or closing price determined by the applicable exchange. Exchange-traded option contracts, including options futures and swaps, will be valued at their most recent sale price. If no such sales are reported, these contracts will be valued at their last traded price.
Over-the counter (“OTC”) traded Financial Instruments, including OTC-traded options, forwards and currency-related derivatives, will normally be valued on the basis of quotes obtained from a third party broker-dealer who makes markets in such securities or on the basis of quotes obtained from an independent third-party pricing service.
| 94 |
| Notes to Financial Statements (continued) |
| April 30, 2015 |
Foreign securities and instruments will be valued in their local currency following the methodologies described above. Foreign securities, instruments and currencies will be translated to U.S. dollars, based on foreign currency exchange rate quotations supplied by the London Stock Exchange.
When market quotations are not readily available, or deemed unreliable or do not reflect material events occurring between the close of local markets and the time of valuation, investments will be valued using fair value pricing as determined in good faith by the Advisor under procedures established by and under the general supervision and responsibility of the Trust’s Board of Trustees. According to the Registration Statement, the NAV will be calculated by the Administrator and determined each Business Day as of the close of regular trading on the Exchange (ordinarily 4:00 p.m., Eastern Time). The Shares of the Fund will not be priced on days on which the Exchange is closed for trading.
The Fund automatically sweeps un-invested cash balances into a money market fund, the Morgan Stanley Institutional Liquidity Funds — Treasury Portfolio — Institutional Class. The Morgan Stanley Institutional Liquidity Funds — Treasury Portfolio seeks preservation of capital, daily liquidity and maximum current income. Morgan Stanley Institutional Liquidity Funds — Treasury Portfolio has no redemption restriction and is valued at the daily NAV.
Under normal conditions, each Fund invests cash collateral from securities lending activities into Dreyfus Government Cash Management Fund. The Dreyfus Government Cash Management’s investment objective is to maximize current income to the extent consistent with the preservation of capital and the maintenance of liquidity. Dreyfus Government Cash Management has no redemption restrictions and is valued at the daily NAV.
Due to the inherent uncertainty of valuations, fair values may differ significantly from the values that would have been used had an active market existed. Fair valuation could result in a different NAV than a NAV determined by using market quotes.
Fair Value Measurement
Accounting Standards Codification (“ASC”) Topic 820, Fair Value Measurements and Disclosures defines fair value, establishes a framework for measuring fair value in accordance with U.S. GAAP, and requires disclosure about fair value measurements. It also provides guidance on determining when there has been a significant decrease in the volume and level of activity for an asset or liability, when a transaction is not orderly, and how that information must be incorporated into fair value measurement. Under ASC 820, various inputs are used in determining the value of the Funds’ investments. These inputs are summarized in the following hierarchy:
| • | Level 1 — Unadjusted quoted prices in active markets for identical assets or liabilities that the Funds have the ability to access. |
| • | Level 2 — Observable inputs other than quoted prices included in Level 1 that are observable for the asset or liability, either directly or indirectly. These inputs may include quoted prices for the identical instrument on an inactive market, prices for similar securities, interest rates, prepayment speeds, credit risk, yield curves, default rates and similar data. |
| • | Level 3 — Unobservable inputs for the asset or liability, to the extent relevant observable inputs are not available; representing the Funds’ own assumptions about the assumptions a market participant would use in valuing the asset or liability, and would be based on the best information available. |
A financial instrument’s level within the fair value hierarchy is based on the lowest level of any input that is significant to the fair value measurement. The inputs or methodology used for valuing instruments are not necessarily an indication of the risk associated with investing in those instruments.
The availability of observable inputs can vary from security to security and is affected by a wide variety of factors, including, for example, the type of security, whether the security is new and not yet established in the marketplace, the liquidity of markets, and other characteristics particular to the security. To the extent that valuation is based on models or inputs that are less observable or unobservable in the market, the determination of fair value requires more judgment. Accordingly, the degree of judgment exercised in determining fair value is greatest for instruments categorized in Level 3. With respect to the valuation of Level 3 securities, the Advisor may employ a market-based valuation approach which may use related or comparable securities, recent transactions, market multiples, book values, and other relevant information to determine fair value. The Advisor may also use an income-based valuation approach in which anticipated future cash flows of the financial
| 95 |
| Notes to Financial Statements (continued) |
| April 30, 2015 |
instrument are discounted to calculate fair value. The Advisor representatives meet regularly to review and discuss the appropriateness of such fair values using more current information such as, recent security news, recent market transactions, updated corporate action information and/or other macro or security specific events.
All other securities and investments for which market values are not readily available, including restricted securities, and those securities for which it is inappropriate to determine prices in accordance with the aforementioned procedures, are valued at fair value as determined in good faith under procedures adopted by the Board, although the actual calculations may be done by others. Factors considered in making this determination may include, but are not limited to, information obtained by contacting the issuer, analysts, or the appropriate stock exchange (for exchange-traded securities), analysis of the issuer’s financial statements or other available documents and, if necessary, available information concerning other securities in similar circumstances.
The inputs or methodology used for valuing securities are not necessarily an indication of the risk associated with investing in those securities. The hierarchy classification of inputs used to value each Fund’s investments at April 30, 2015 is disclosed at the end of each Fund’s Schedule of Investments.
Tax Information, Dividends and Distributions to Shareholders and Uncertain Tax Positions
Each Fund is treated as a separate entity for federal income tax purposes. Each Fund’s policy is to comply with the requirements of the Internal Revenue Code of 1986, as amended (the “Internal Revenue Code”), applicable to regulated investment companies and to distribute all of the taxable income to the shareholders of the Fund within the allowable time limits. Distributions to Shareholders are recorded on the ex-dividend date. In addition, the Funds may determine to distribute at least annually amounts representing the full dividend yield net of expenses on the underlying investment securities, as if the Funds owned the underlying investment securities for the entire dividend period in which case some portion of each distribution may result in a return of capital. The amount of dividends and distributions from net investment income and net realized capital gains are determined in accordance with Federal income tax regulations which may differ from GAAP. These “book/tax” differences are either considered temporary or permanent in nature. To the extent these differences are permanent in nature, such amounts are reclassified within the components of net assets based on their Federal tax basis treatment; temporary differences do not require reclassification. Dividends and distributions, which exceed that earnings and profit for tax purposes are reported as a tax return of capital. Therefore, no federal, state and local income tax provisions are required.
Management evaluates the Fund’s tax positions to determine if the tax positions taken meet the minimum recognition threshold in connection with accounting for uncertainties in income tax positions taken or expected to be taken for the purposes of measuring and recognizing tax liabilities in the financial statements. Recognition of tax benefits of an uncertain tax position is required only when the position is “more likely than not” to be sustained assuming examination by taxing authorities. Management has analyzed the Fund’s tax positions taken on federal, state and local income tax returns for all open tax years (for up to three tax years), and has concluded that no provisions for federal, state and local income tax are required in the Fund’s financial statements. The Fund’s federal, state and local income and federal excise tax returns for tax years for which the applicable statutes of limitations have not expired are subject to examination by the Internal Revenue Service and state and local departments of revenue.
Foreign Taxes
The Funds may be subject to foreign taxes on income and other transaction-based taxes imposed by certain countries in which they invest. A portion of the taxes on gains on investments or currency purchases/repatriation may be recoverable. The Funds will accrue such taxes and recoveries as applicable, based upon their current interpretation of tax rules and regulations that exist in the markets in which they invest.
The Funds may be subject to taxation on realized capital gains, repatriation proceeds and other transaction-based taxes imposed by certain countries in which they invest. The Funds will accrue the unrecoverable portion of such taxes as applicable based upon their current interpretation of tax rules and regulations that exist in the market in which they invests. Capital gains taxes relating to positions still held are reflected as a liability on the Statement of Assets and Liabilities, as well as an adjustment to the Funds’ net unrealized appreciation (depreciation). Taxes related to capital gains realized during the year ended April 30, 2015, if any, are reflected as part of net realized
| 96 |
| Notes to Financial Statements (continued) |
| April 30, 2015 |
gain (loss) in the Statement of Operations. Changes in tax liabilities related to capital gains taxes on unrealized investment gains, if any, are reflected as part of the change in net unrealized appreciation (depreciation) on investments in the Statement of Operations. Transaction-based charges are generally assessed as a percentage of the transaction amount.
Cash Equivalents
Cash equivalents consist of highly liquid investments, with maturities of three months or less when acquired, and are disclosed as Short-Term Investments in the Schedules of Investments.
Security Transactions
Security transactions are recorded as of the trade date. Realized gains and losses on sales of investment securities are calculated using the identified cost method.
Foreign Currency Translation
The books and records of the Funds are maintained in U.S. dollars. Foreign currency amounts are translated into U.S. dollars at the prevailing exchange rates of such currencies against the U.S. dollar. The market value of investment securities and other assets and liabilities are translated at the exchange rate as of the valuation date. Purchases and sales of investment securities, income and expenses are translated at the exchange rate prevailing on the respective dates of such transactions.
Although the net assets of the Funds are presented at the foreign exchange rates and market values at the close of the period, the Funds do not isolate that portion of the results of operations arising as a result of changes in the foreign exchange rates from the fluctuations arising from changes in the market prices of securities held or sold during the period. Accordingly, such foreign currency gains/(losses) are included in the reported net realized and unrealized gains/(losses) on investment transactions.
Reported realized foreign currency gains or losses arise from the disposition of foreign currency, currency gains or losses realized between the trade and settlement dates on securities transactions, and the difference between the amounts of dividends, interest and foreign withholding taxes recorded on each Fund’s books on the transaction date and the U.S. dollar equivalent of the amounts actually received or paid. Unrealized foreign exchange gains and losses arise from changes (due to the changes in the exchange rate) in the value of foreign currency and other assets and liabilities denominated in foreign currencies, which are held at period end.
Securities Lending
The Bank of New York Mellon serves as the Funds’ securities lending agent. The Funds may lend portfolio securities to certain creditworthy borrowers, including the Funds’ securities lending agent. It is the Funds’ policy that, at origination, all loans are secured by collateral of at least 102% of the value of U.S. securities loaned and 105% of the value of foreign securities loaned. Collateral in the form of cash and /or high grade debt obligations, equivalent to at least 100% of the market value of securities loaned, is maintained at all times. Cash collateral can be invested in certain money market mutual funds which also have exposure to the fluctuations of the market. Each Fund receives compensation for lending its securities from interest or dividends earned on the cash or U.S. government securities held as collateral, net of fee rebates paid to the borrower plus reasonable administrative and custody fees. The dividend and interest income earned on the securities loaned is accounted for in the same manner as other dividend and interest income. The borrower pays to the Funds an amount equal to any dividends or interest received on loaned securities. Lending portfolio securities could result in a loss or delay in recovering the Funds’ securities if the borrower defaults.
The Bank of New York Mellon will manage the Funds’ cash collateral in accordance with the securities lending agreement between the Funds and the Bank of New York Mellon, and indemnify the Funds’ portfolio against counterparty risk.
The securities lending income earned by each Fund is disclosed on the Statements of Operations. The value of loaned securities and related collateral outstanding at April 30, 2015 are shown on a gross basis in the Schedules of Investments and Statements of Assets and Liabilities.
| 97 |
| Notes to Financial Statements (continued) |
| April 30, 2015 |
Master Netting Arrangements
Accounting Standards Update No. 2011-11 “Disclosures about Offsetting Assets and Liabilities” (“ASU 2011-11”), as clarified by ASU 2013-1 which requires entities to disclose (i) gross and net information about both instruments and transactions eligible for offset in the financial statements, and (ii) instruments and transactions subject to an agreement similar to a master netting agreement. ASU 2011-11, is limited in scope to the following financial instruments, to the extent they are offset in the financial statements or subject to an enforceable master netting arrangement or similar agreement: (i) recognized securities lending and derivative instruments accounted for under ASC 815 (Derivatives and Hedging).
In order to better define its contractual rights and to secure rights that will help a Fund mitigate its counterparty risk, a Fund may enter into an International Swaps and Derivatives Association, Inc. Master Agreement (“ISDA Master Agreement”) or similar agreement with its counterparties. An ISDA Master Agreement is a bilateral agreement between a Fund and a counterparty that governs over-the-counter derivatives (“OTC”), including Forward Contracts, and typically contains, among other things, collateral posting terms, netting and rights of set-off provisions in the event of a default and/or termination event. Generally, the amount of collateral due from or to counterparty must exceed a minimum transfer amount threshold before a transfer is required to be made. To the extent amounts due to a Fund from its derivatives counterparties are not fully collateralized, contractually or otherwise, the Fund bears the risk of loss from counterparty non-performance.
For financial reporting purposes, the Funds do not offset assets and liabilities subject to master netting arrangements or similar arrangements in the Statements of Assets and Liabilities. Therefore, all qualifying transactions are presented on a gross basis in the Statements of Assets and Liabilities.
Total Return Swap contracts are valued at the unrealized appreciation/depreciation of the instrument. Securities segregated as collateral for swap contracts are footnoted within each Fund’s schedule of investments and the cash collateral is noted at the end of each Fund’s swap table.
At April 30, 2015 the unrealized appreciation/depreciation for the following funds were zero, reflecting a reset date at period end based on the contractual agreement with Morgan Stanley & Co. LLC, each Fund’s counterparty.
IQ Hedge Multi-Strategy Tracker ETF
IQ Hedge Macro Tracker ETF
IQ Hedge Market Neutral Tracker ETF
IQ Hedge Long/Short Tracker ETF
IQ Hedge Event-Driven Tracker ETF
IQ Merger Arbitrage ETF
A Fund’s security lending activities are governed by a Securities Lending Authorization Agreement (“Lending Agreement”) between the Fund and the lending agent. The Lending Agreement authorizes the lending agent to lend qualifying U.S. and foreign securities held by a Fund to approved borrowers (each a “Borrower”). To mitigate borrower risk, a Fund typically receives from a Borrower, collateral in the form of U.S. dollar cash and/or securities issued or guaranteed by the U.S. Government or its agencies in excess of the market value of the securities loaned. Under the provisions of the Lending Agreement, a Fund shall have, as to the collateral, all of the rights and remedies of a secured party under applicable law. A Fund is exposed to risk of loss if a Borrower defaults on its obligation to return borrowed securities and the value of the collateral a Fund received is insufficient to cover the market value of the securities loaned. Also, the lending agent is permitted to invest the cash collateral it receives from a Borrower into a money market fund which is subject to market fluctuation. Therefore, a Fund is exposed to risk of loss if the value of invested cash collateral is insufficient to satisfy the Fund’s obligation to return the full amount owed to such Borrower.
| 98 |
| Notes to Financial Statements (continued) |
| April 30, 2015 |
As of April 30, 2015, the impact of netting of assets and liabilities and offsetting of collateral pledged or received based on contractual netting provisions in the Lending Agreement are detailed in the following table:
| Assets | Liabilities | |||||||||||||||||||||||
| Fund | Gross Amounts Presented in Statements of Assets and Liabilities | Collateral Received | Net Amount | Gross Amounts Presented in Statements of Assets and Liabilities | Collateral Pledged | Net Amount | ||||||||||||||||||
| IQ Hedge Multi-Strategy | ||||||||||||||||||||||||
| Tracker ETF | $ | 89,389,461 | $ | (89,389,461 | )1 | $ | — | $ | — | $ | — | $ | — | |||||||||||
| IQ Hedge Macro | ||||||||||||||||||||||||
| Tracker ETF | 4,622,477 | (4,622,477 | )1 | — | — | — | — | |||||||||||||||||
| IQ Hedge Market | ||||||||||||||||||||||||
| Neutral Tracker ETF | 420,118 | (420,118 | )1 | — | — | — | — | |||||||||||||||||
| IQ Hedge Long/Short | ||||||||||||||||||||||||
| Tracker ETF | 588 | (588 | )1 | — | — | — | — | |||||||||||||||||
| IQ Global | ||||||||||||||||||||||||
| Resources ETF | 3,899,829 | (3,899,829 | )1 | — | — | — | — | |||||||||||||||||
| IQ Merger Arbitrage ETF | 3,211,970 | (3,211,970 | )1 | — | — | — | — | |||||||||||||||||
| IQ Real Return ETF | 4,197,868 | (4,197,868 | )1 | — | — | — | — | |||||||||||||||||
| IQ Australia | ||||||||||||||||||||||||
| Small Cap ETF | 864,341 | (864,341 | )1 | — | — | — | — | |||||||||||||||||
| IQ Canada | ||||||||||||||||||||||||
| Small Cap ETF | 1,842,394 | (1,842,394 | )1 | — | — | — | — | |||||||||||||||||
| IQ Global Agribusiness | ||||||||||||||||||||||||
| Small Cap ETF | 2,463,889 | (2,463,889 | )1 | — | — | — | — | |||||||||||||||||
| IQ Global Oil Small | ||||||||||||||||||||||||
| Cap ETF | 1,025,116 | (1,025,116 | )1 | — | — | — | — | |||||||||||||||||
| IQ U.S. Real Estate | ||||||||||||||||||||||||
| Small Cap ETF | 3,449,950 | (3,449,950 | )1 | — | — | — | — | |||||||||||||||||
| 1 | The amount of collateral presented is limited such that the net amount cannot be less than zero. |
Investment Income and Expenses
Dividend income is recognized on the ex-dividend date. Interest income is accrued daily. Distributions of realized capital gains by underlying Funds are recorded as realized capital gains on the ex-date. Expenses of the Trust arising in connection with a specific Fund are allocated to that Fund. Other Trust expenses which cannot be directly attributed to a fund are apportioned among the funds in the Trust based upon the relative net assets or other appropriate measures. The Funds distribute substantially all their net investment income to shareholders in the form of dividends. Net investment income and net capital gains are typically distributed to shareholders at least annually; the IQ U.S. Real Estate Small Cap ETF distributes income quarterly. Dividends may be declared and paid more frequently to comply with the distribution requirements of the Internal Revenue Code. The expenses of the investment companies in which a Fund invests are not included in the amounts shown as expenses on the Statements of Operations or in the expense ratios included in the financial highlights.
3. INVESTMENT MANAGEMENT AND OTHER AGREEMENTS
Advisory Agreement
Under an Investment Advisory Agreement between the Trusts, on behalf of each Fund, the Adviser provides a continuous investment program for each Fund’s assets in accordance with its investment objectives, policies and limitations, and oversees the day-to-day operations of a Fund, subject to the supervision of the Trustees. Pursuant
| 99 |
| Notes to Financial Statements (continued) |
| April 30, 2015 |
to the Advisory Agreement, The Funds pays the Advisor an advisory fee, based on the average daily net assets of each Fund, at the following annual rates:
| Fund | Rate |
| IQ Hedge Multi-Strategy Tracker ETF | 0.75% |
| IQ Hedge Macro Tracker ETF | 0.75% |
| IQ Hedge Market Neutral Tracker ETF | 0.75% |
| IQ Hedge Long/Short Tracker ETF | 0.75% |
| IQ Hedge Event-Driven Tracker ETF | 0.75% |
| IQ Global Resources ETF | 0.75% |
| IQ Merger Arbitrage ETF | 0.75% |
| IQ Real Return ETF | 0.48% |
| IQ Australia Small Cap ETF | 0.69% |
| IQ Canada Small Cap ETF | 0.69% |
| IQ Global Agribusiness Small Cap ETF | 0.75% |
| IQ Global Oil Small Cap ETF | 0.75% |
| IQ U.S. Real Estate Small Cap ETF | 0.69% |
Such fee is accrued daily and paid monthly.
The Advisor has agreed to pay all expenses of the Funds, except brokerage and other transaction expenses; extraordinary legal fees or expenses, such as those for litigation or arbitration; compensation and expenses of the Independent Trustees, counsel to the Independent Trustees, and the Funds’ chief compliance officer; extraordinary expenses; distribution fees and expenses paid by the Funds under any distribution plan adopted pursuant to Rule 12b-1 under the 1940 Act; and the advisory fee payable to the Advisor hereunder.
Distribution (12b-1 Fees)
ALPS Distributors, Inc. serves as the Funds’ distributor (the “Distributor”) pursuant to a Distribution Services Agreement. The Board has adopted a Distribution and Service Plan pursuant to Rule 12b-1 under the 1940 Act (“Rule 12b-1 Plan”). In accordance with the Rule 12b-1 Plan, the Funds are authorized to pay an amount up to 0.10% of each Fund’s average daily net assets each year for certain distribution-related activities. As authorized by the Board, no Rule 12b-1 fees are currently paid by the Funds and there are no plans to impose these fees. However, in the event Rule 12b-1 fees are charged in the future, they will be paid out of each Fund’s assets. The Advisor and its affiliates may, out of their own resources, pay amounts to third parties for distribution or marketing services on behalf of the Funds.
Administrator, Custodian and Transfer Agent
The Bank of New York Mellon (in each capacity, the “Administrator,” “Custodian” or “Transfer Agent”) serves as the Funds’ Administrator, Custodian and Transfer Agent pursuant to the Fund Administration and Accounting Agreement. Under the terms of this agreement, the Advisor pays the Funds’ Administrative, Custody and Transfer Agency fees. The Bank of New York Mellon is a subsidiary of The Bank of New York Mellon Corporation, a financial holding company.
As described in Note 4 below, the Distributor has entered into Participant Agreements with certain broker-dealers and others that allow those parties to be “Authorized Participants” and to subscribe for and redeem shares of the Funds, also as described in Note 4 below. Such Authorized Participants may from time to time hold, of record or beneficially, a substantial percentage of the Funds’ shares outstanding, act as executing or clearing broker for investment transactions on behalf of the Fund and/or serve as counterparty to derivative transactions with the Fund.
4. CAPITAL SHARE TRANSACTIONS
As of April 30, 2015, there were an unlimited number of no par value shares of beneficial interest authorized by the Trust. Shares are created and redeemed on a continuous basis at NAV only in groups of 50,000 shares called Creation Units. Except when aggregated in Creation Units, shares are not redeemable. Transactions in shares of the Funds are disclosed in detail in the Statements of Changes in Net Assets. Only “Authorized Participants” may purchase or redeem shares directly from the Funds. An Authorized Participant is either (i) a broker-dealer or other participant in the clearing process through the Continuous Net Settlement System of National Securities Clearing
| 100 |
| Notes to Financial Statements (continued) |
| April 30, 2015 |
Corporation or (ii) a Depository Trust Company (“DTC”) participant and, in each case, must have executed a Participant Agreement with the Distributor. Most retail investors will not qualify as Authorized Participants or have the resources to create and redeem whole Creation Units. Therefore, they will be unable to purchase or redeem the shares directly from the Funds. Rather, most retail investors will purchase shares in the secondary market with the assistance of a broker and will be subject to customary brokerage commissions or fees. Securities received or delivered in connection with in-kind creates and redeems are valued as of the close of business on the effective date of the creation or redemption.
5. FEDERAL INCOME TAX
At April 30, 2015, the cost of investments on a tax basis including the adjustments for financial reporting purposes as of the most recently completed Federal income tax reporting year was as follows:
| Fund | Cost | Gross Unrealized Appreciation | Gross Unrealized Depreciation | Net Unrealized Appreciation/ (Depreciation) | ||||||||||||
| IQ Hedge Multi-Strategy Tracker ETF | $ | 1,076,879,663 | $ | 10,526,490 | $ | (2,520,775 | ) | $ | 8,005,715 | |||||||
| IQ Hedge Macro Tracker ETF | 26,737,333 | 46,297 | (175,612 | ) | (129,315 | ) | ||||||||||
| IQ Hedge Market Neutral Tracker ETF | 13,030,536 | 7,731,505 | (7,532,442 | ) | 199,063 | |||||||||||
| IQ Hedge Long/Short Tracker ETF | 2,002,612 | 1,174,457 | (1,192,407 | ) | (17,950 | ) | ||||||||||
| IQ Hedge Event-Driven Tracker ETF | 2,000,244 | 425,652 | (427,030 | ) | (1,378 | ) | ||||||||||
| IQ Global Resources ETF | 71,906,994 | 1,094,193 | (4,140,544 | ) | (3,046,351 | ) | ||||||||||
| IQ Merger Arbitrage ETF | 122,083,699 | 40,141,907 | (38,571,743 | ) | 1,570,164 | |||||||||||
| IQ Real Return ETF | 32,122,954 | 337,024 | (114,917 | ) | 222,107 | |||||||||||
| IQ Australia Small Cap ETF | 7,673,498 | 600,736 | (1,596,196 | ) | (995,460 | ) | ||||||||||
| IQ Canada Small Cap ETF | 14,913,907 | 747,671 | (3,459,453 | ) | (2,711,782 | ) | ||||||||||
| IQ Global Agribusiness Small Cap ETF | 18,194,368 | 741,820 | (3,004,081 | ) | (2,262,261 | ) | ||||||||||
| IQ Global Oil Small Cap ETF | 5,989,826 | 462,924 | (151,418 | ) | 311,506 | |||||||||||
| IQ U.S. Real Estate Small Cap ETF | 98,426,783 | 6,949,527 | (6,744,773 | ) | 204,754 | |||||||||||
The differences between book and tax basis cost of investments and net unrealized appreciation (depreciation) are primarily attributable to wash sale loss deferrals, pass through investments and the realization for tax purposes of unrealized gains on investments in passive foreign investment companies held at April 30, 2015.
At April 30, 2015, the Components of Undistributed (Accumulated) Earnings (Losses) on a tax-basis were as follows:
| Fund | Ordinary Income (Loss)1 | Net Capital Gain (Losses)2 | Net Unrealized Appreciation/ (Depreciation) | Total Earnings/ (Losses) | ||||||||||||
| IQ Hedge Multi-Strategy Tracker ETF | $ | 1,880,555 | $ | (37,648,091 | ) | $ | 8,005,715 | $ | (27,761,821 | ) | ||||||
| IQ Hedge Macro Tracker ETF | (289,215 | ) | (5,381,280 | ) | (129,315 | ) | (5,799,810 | ) | ||||||||
| IQ Hedge Market Neutral Tracker ETF | (7,962 | ) | (416,775 | ) | 199,063 | (225,674 | ) | |||||||||
| IQ Hedge Long/Short Tracker ETF | 11,705 | (714 | ) | (17,950 | ) | (6,959 | ) | |||||||||
| IQ Hedge Event-Driven Tracker ETF | 7,394 | 70 | (1,378 | ) | 6,086 | |||||||||||
| IQ Global Resources ETF | 1,098,135 | (38,825,552 | ) | (3,044,998 | ) | (40,772,415 | ) | |||||||||
| IQ Merger Arbitrage ETF | (995,469 | ) | — | 1,570,599 | 575,130 | |||||||||||
| IQ Real Return ETF | 2,300 | (1,960,011 | ) | 222,107 | (1,735,604 | ) | ||||||||||
| IQ Australia Small Cap ETF | 225,046 | (8,037,363 | ) | (995,450 | ) | (8,807,767 | ) | |||||||||
| IQ Canada Small Cap ETF | 148,997 | (17,967,191 | ) | (2,710,780 | ) | (20,528,974 | ) | |||||||||
| IQ Global Agribusiness Small Cap ETF | 52,998 | (5,999,074 | ) | (2,263,865 | ) | (8,209,941 | ) | |||||||||
| IQ Global Oil Small Cap ETF | 17,081 | (609,010 | ) | 311,992 | (279,937 | ) | ||||||||||
| IQ U.S. Real Estate Small Cap ETF | — | (1,541,023 | ) | 204,754 | (1,336,269 | ) | ||||||||||
| 1 | Includes late year ordinary losses, if any. |
| 2 | Amounts include the deferral of post October losses, if any. |
The differences between book and tax basis components of net assets are primarily attributable to wash sale loss deferrals and other book and tax differences including foreign currency contracts, swap contracts, post-October and late year losses.
| 101 |
| Notes to Financial Statements (continued) |
| April 30, 2015 |
At April 30, 2015, the effect of permanent book/tax reclassifications resulted in increases (decreases) to the components of net assets were as follows:
| Fund | Undistributed Net Investment Income/ (Accumulated Net Investment Loss) | Accumulated Net Realized Gain/(Loss) on Investments | Paid-in Capital | |||||||||
| IQ Hedge Multi-Strategy Tracker ETF | $ | (3,587,594 | ) | $ | (31,494,579 | ) | $ | 35,082,173 | ||||
| IQ Hedge Macro Tracker ETF | (390,948 | ) | 345,380 | 45,568 | ||||||||
| IQ Hedge Market Neutral Tracker ETF | (111,024 | ) | 272,533 | (161,509 | ) | |||||||
| IQ Hedge Long/Short Tracker ETF | 8,095 | (8,095 | ) | — | ||||||||
| IQ Hedge Event-Driven Tracker ETF | 1,090 | (1,090 | ) | — | ||||||||
| IQ Global Resources ETF | (101,623 | ) | (4,975,955 | ) | 5,077,578 | |||||||
| IQ Merger Arbitrage ETF | (1,073,087 | ) | (973,907 | ) | 2,046,994 | |||||||
| IQ Real Return ETF | (23,268 | ) | (753,500 | ) | 776,768 | |||||||
| IQ Australia Small Cap ETF | 153,503 | (185,421 | ) | 31,918 | ||||||||
| IQ Canada Small Cap ETF | 209,880 | 51,901 | (261,781 | ) | ||||||||
| IQ Global Agribusiness Small Cap ETF | 66,784 | (1,681,279 | ) | 1,614,495 | ||||||||
| IQ Global Oil Small Cap ETF | 9,481 | (50,380 | ) | 40,899 | ||||||||
| IQ U.S. Real Estate Small Cap ETF | 762,824 | (3,011,680 | ) | 2,248,856 | ||||||||
For financial reporting purposes, capital accounts are adjusted to reflect the tax character of permanent book/tax differences. Reclassifications are primarily due to the tax treatment of foreign currency gains and losses, investments in passive foreign investment companies, publicly traded partnerships, grantors trusts, real estate investment trusts, regulated investment companies, swap, and redemptions in-kind.
The tax character of distributions paid during the years ended April 30, 2015 and 2014 were as follows:
| 2015 | 2014 | |||||||||||||||||||||||
| Fund | Ordinary Income | Long-Term Capital Gains | Tax Return of Capital | Ordinary Income | Long-Term Capital Gains | Tax Return of Capital | ||||||||||||||||||
| IQ Hedge Multi-Strategy | ||||||||||||||||||||||||
| Tracker ETF | $ | 13,005,300 | $ | — | $ | — | $ | 7,853,060 | $ | — | $ | — | ||||||||||||
| IQ Hedge Macro Tracker ETF | 304,929 | — | — | 203,047 | — | — | ||||||||||||||||||
| IQ Hedge Market Neutral | ||||||||||||||||||||||||
| Tracker ETF | 221,006 | — | — | 163,748 | — | — | ||||||||||||||||||
| IQ Hedge Long/Short | ||||||||||||||||||||||||
| Tracker ETF | — | — | — | — | — | — | ||||||||||||||||||
| IQ Hedge Event-Driven | ||||||||||||||||||||||||
| Tracker ETF | — | — | — | — | — | — | ||||||||||||||||||
| IQ Global Resources ETF | 1,147,080 | — | — | 881,676 | — | — | ||||||||||||||||||
| IQ Merger Arbitrage ETF | — | — | — | 237,312 | — | — | ||||||||||||||||||
| IQ Real Return ETF | 24,006 | — | — | 24,255 | — | — | ||||||||||||||||||
| IQ Australia Small Cap ETF | 351,608 | — | — | 359,750 | — | — | ||||||||||||||||||
| IQ Canada Small Cap ETF | 106,182 | — | — | 232,680 | — | — | ||||||||||||||||||
| IQ Global Agribusiness | ||||||||||||||||||||||||
| Small Cap ETF | 267,937 | — | — | 569,025 | — | — | ||||||||||||||||||
| IQ Global Oil Small Cap ETF | 28,982 | — | — | 15,442 | — | — | ||||||||||||||||||
| IQ U.S. Real Estate | ||||||||||||||||||||||||
| Small Cap ETF | 2,917,585 | — | 787,254 | 2,286,196 | — | 1,208,211 | ||||||||||||||||||
| 102 |
| Notes to Financial Statements (continued) |
| April 30, 2015 |
Capital losses incurred after October 31 (“Post-October Losses”) and certain late year ordinary income losses within the taxable year can be deemed to arise on the first business day of the Funds’ next taxable year. For the year ended April 30, 2015, the Funds incurred and elected to defer to May 1, 2015 post-October losses and late year ordinary losses of:
| Fund | Late Year Ordinary Losses | Short-Term Post October Losses | Long-Term Post October Losses | |||||||||
| IQ Hedge Multi-Strategy Tracker ETF | $ | — | $ | 9,490,238 | $ | — | ||||||
| IQ Hedge Macro Tracker ETF | 289,215 | 154,820 | 324,258 | |||||||||
| IQ Hedge Market Neutral Tracker ETF | 7,962 | 8,003 | 757 | |||||||||
| IQ Hedge Long/Short Tracker ETF | — | 714 | — | |||||||||
| IQ Hedge Event-Driven Tracker ETF | — | — | — | |||||||||
| IQ Global Resources ETF | — | 5,250,707 | 1,701,536 | |||||||||
| IQ Merger Arbitrage ETF | 995,469 | — | — | |||||||||
| IQ Real Return ETF | — | 14,451 | 199,984 | |||||||||
| IQ Australia Small Cap ETF | — | — | 629,927 | |||||||||
| IQ Canada Small Cap ETF | — | 633,571 | 1,893,406 | |||||||||
| IQ Global Agribusiness Small Cap ETF | — | — | — | |||||||||
| IQ Global Oil Small Cap ETF | — | 81,555 | 224,790 | |||||||||
| IQ U.S. Real Estate Small Cap ETF | — | — | — | |||||||||
On December 22, 2010, the Regulated Investment Company (“RIC”) Modernization Act of 2010 (the “Act”) was enacted. The Act modernizes several of the federal income and excise tax provisions related to RICs, and, with certain exceptions, are effective for taxable years beginning after December 22, 2010. Among the changes made are changes to the capital loss carryforward rules allowing for RICs to carry forward capital losses indefinitely and to retain the character of capital loss carryforwards as short-term or long-term. Rules in effect previously limited the carryforward period to eight years and all carryforwards were considered short-term in character. Capital loss carryforwards generated in taxable years beginning after the effective date of the Act must be fully used before capital loss carryforwards generated in taxable years prior to the effective date of the Act; therefore, under certain circumstances, capital loss carryforwards available as of the report date, if any, may expire unused.
At April 30, 2015, the Funds listed below had net capital loss carryforwards for Federal income tax purposes which are available for offset against future taxable net capital gains. The amounts were determined after adjustments for certain differences between financial reporting and tax purposes, such as wash sale losses. Accordingly, no capital gain distributions are expected to be paid to shareholders of these Funds until future net capital gains have been realized in excess of the available capital loss carryforwards. There is no assurance that any Fund will be able to utilize all of its capital loss carryforwards before they expire. These loss carryforwards expire in amounts and fiscal years as follows:
| Fund | Short-Term Expiring April 30, 2018 | Short-Term Expiring April 30, 2019 | Utilized in Current Year | Short-Term With No Expiration | Long-Term With No Expiration | |||||||||||||||
| IQ Hedge Multi-Strategy Tracker ETF | $ | 841,667 | $ | 5,603,304 | $ | — | $ | 21,712,882 | $ | — | ||||||||||
| IQ Hedge Macro Tracker ETF | 80,017 | 531,209 | — | 3,792,588 | 498,387 | |||||||||||||||
| IQ Hedge Market Neutral Tracker ETF | — | — | — | 348,275 | 59,743 | |||||||||||||||
| IQ Hedge Long/Short Tracker ETF | — | — | — | — | — | |||||||||||||||
| IQ Hedge Event-Driven Tracker ETF | — | — | — | — | — | |||||||||||||||
| IQ Global Resources ETF | — | — | — | 21,220,902 | 10,652,408 | |||||||||||||||
| IQ Merger Arbitrage ETF | — | — | 971,183 | — | — | |||||||||||||||
| IQ Real Return ETF | — | — | — | 518,849 | 1,226,727 | |||||||||||||||
| IQ Australia Small Cap ETF | — | — | — | 2,649,888 | 4,757,548 | |||||||||||||||
| IQ Canada Small Cap ETF | — | 161,421 | — | 8,080,768 | 7,198,026 | |||||||||||||||
| IQ Global Agribusiness Small Cap ETF | — | — | — | 2,661,135 | 3,337,939 | |||||||||||||||
| IQ Global Oil Small Cap ETF | — | — | — | 103,446 | 199,219 | |||||||||||||||
| IQ U.S. Real Estate Small Cap ETF | — | — | 259,739 | 1,470,803 | 70,220 | |||||||||||||||
| 103 |
| Notes to Financial Statements (continued) |
| April 30, 2015 |
6. OTHER AFFILIATED PARTIES AND TRANSACTIONS
An issuer which is under common control with a fund may be considered an affiliate. For the purposes of the financial statements, the Funds assume the following to be affiliated issuers. As of April 30, 2015, New York Life Insurance & Annuity Corporation was known to own beneficially greater than 5% of the shares outstanding of the IQ Merger Arbitrage ETF.
| Fund | Affiliated Fund Name | Value April 30, 2014 | Purchases at Cost | Proceeds from Sales | Change in Unrealized Appreciation (Depreciation) | Realized Gain (Loss) | Value April 30, 2015 | Dividend Income | ||||||||||||||||||||||
| IQ Real Return ETF | CurrencyShares | |||||||||||||||||||||||||||||
| British Pound | ||||||||||||||||||||||||||||||
| Sterling Trust | $ | — | $ | 2,802,535 | $ | — | $ | 74,016 | $ | — | $ | 2,876,551 | $ | — | ||||||||||||||||
| IQ Hedge | CurrencyShares | |||||||||||||||||||||||||||||
| Multi-Strategy | Japanese | |||||||||||||||||||||||||||||
| Tracker ETF | Yen Trust | $ | 1,547,846 | $ | 16,949,886 | $ | (2,815,038 | ) | $ | (167,345 | ) | $ | 2,515 | $ | 15,517,864 | — | ||||||||||||||
| IQ Hedge | ||||||||||||||||||||||||||||||
| Multi-Strategy | CurrencyShares | |||||||||||||||||||||||||||||
| Tracker ETF | Euro Trust | — | 25,303,546 | (3,965,189 | ) | 287,071 | (49,528 | ) | 21,575,900 | — | ||||||||||||||||||||
| IQ Hedge | PowerShares DB | |||||||||||||||||||||||||||||
| Multi-Strategy | G10 Currency | |||||||||||||||||||||||||||||
| Tracker ETF | Harvest Fund | — | 56,396,210 | (2,986,913 | ) | (403,727 | ) | (59,811 | ) | 52,945,759 | — | |||||||||||||||||||
| Total | $ | 1,547,846 | $ | 98,649,642 | $ | (9,767,140 | ) | $ | (284,001 | ) | $ | (106,824 | ) | $ | 90,039,523 | — | ||||||||||||||
7. INVESTMENT TRANSACTIONS
Purchases and sales of investments (excluding short-term investments) for the year ended April 30, 2015 are as follows:
| Fund | Purchases | Sales | Purchases In-Kind | Sales In-Kind | ||||||||||||
| IQ Hedge Multi-Strategy Tracker ETF | $ | 1,100,757,496 | $ | 701,135,548 | $ | 383,597,810 | $ | 527,564,274 | ||||||||
| IQ Hedge Macro Tracker ETF | 23,972,303 | 23,814,943 | 1,247,592 | 5,129,642 | ||||||||||||
| IQ Hedge Market Neutral Tracker ETF | 15,876,217 | 17,770,098 | 3,479,621 | 5,372,911 | ||||||||||||
| IQ Hedge Long/Short Tracker ETF | 78,115 | 78,199 | 1,995,928 | — | ||||||||||||
| IQ Hedge Event-Driven Tracker ETF | 126,139 | 127,417 | 1,991,495 | — | ||||||||||||
| IQ Global Resources ETF | 170,737,029 | 137,386,268 | 29,402,902 | 72,292,936 | ||||||||||||
| IQ Merger Arbitrage ETF | 293,978,145 | 250,962,660 | 73,434,523 | 29,408,193 | ||||||||||||
| IQ Real Return ETF | 29,885,134 | 23,482,797 | 5,590,451 | 10,573,508 | ||||||||||||
| IQ Australia Small Cap ETF | 3,483,679 | 2,593,243 | — | 2,570,255 | ||||||||||||
| IQ Canada Small Cap ETF | 4,974,764 | 4,843,917 | 5,216,603 | 7,339,962 | ||||||||||||
| IQ Global Agribusiness Small Cap ETF | 10,686,001 | 6,221,777 | — | 16,505,423 | ||||||||||||
| IQ Global Oil Small Cap ETF | 1,693,694 | 1,492,513 | 2,999,186 | 138,979 | ||||||||||||
| IQ U.S. Real Estate Small Cap ETF | 26,423,951 | 12,531,120 | 40,729,512 | 12,372,538 | ||||||||||||
8. DERIVATIVE FINANCIAL INSTRUMENTS
Futures Contracts
Certain Funds may invest in futures contracts (“futures”) in order to replicate exposures to their respective underlying index components. Investments in futures may increase or leverage exposure to a particular market risk, thereby increasing price volatility of derivative instruments a Fund holds. No price is paid or received by a Fund upon the purchase of a futures contract.
Upon entering into a futures contract, the Funds are required to deposit with the broker, cash or securities in an amount equal to a certain percentage of the contract amount, which is referred to as the initial margin deposit. Subsequent payments, referred to as variation margin, are made or received by the Funds periodically and are based on changes in the market value of open futures contracts. Changes in the market value of open futures contracts are recorded as change in net unrealized appreciation/depreciation in the Statements of Operations. Realized gains or losses, representing the difference between the value of the contract at the time it was opened
| 104 |
| Notes to Financial Statements (continued) |
| April 30, 2015 |
and the value at the time it was closed, are reported in the Statements of Operations at the closing or expiration of the futures contract. Securities deposited as initial margin are designated in the Schedules of Investments and cash deposited is recorded on the Statements of Assets and Liabilities. A receivable from and/or a payable to brokers for the daily variation margin is also recorded on the Statements of Assets and Liabilities
During the year ended April 30, 2015, IQ Hedge Multi-Strategy Tracker ETF utilized futures contracts to effect short exposure to emerging markets equity returns, currency returns and commodity returns, the IQ Hedge Macro Tracker ETF utilized futures contracts to effect short exposure to currency returns and commodity returns, and the IQ Hedge Market Neutral Tracker ETF utilized futures contracts to effect short exposure to emerging markets equity returns and currency returns. In addition, the IQ Merger Arbitrage ETF and IQ Global Resources ETF both utilized futures contracts to affect short exposure to domestic and international equity returns.
The open futures contracts at April 30, 2015 are listed in the Schedules of Investments. The variation margin receivable or payable, as applicable, is included in the Statements of Assets and Liabilities.
Swap Transactions
A swap agreement is an agreement between two parties pursuant to which the parties exchange payments at specified dates on the basis of a specified notional amount, with the payments calculated by reference to specified securities, indexes, reference rates, currencies or other instruments. Most swap agreements provide that when the period payment dates for both parties are the same, the payments are made on a net basis (i.e., the two payment streams are netted out, with only the net amount paid by one party to the other). The Funds’ obligations or rights under a swap agreement entered into on a net basis will generally be equal only to the net amount to be paid or received under the agreement, based on the relative values of the positions held by each counterparty. Swap agreements are not entered into or traded on exchanges and there is no central clearing or guaranty function for total return swaps. Total return swaps give the Fund the right to receive the appreciation in the value of a specified security, index or other instrument in return for a fee paid to the counterparty, which will typically be an agreed upon interest rate. Total return swaps can also be used to replicate an exposure to a short position in an asset class where the Fund has the right to receive the depreciation in value of a specified security, index or other instrument (“inverse swaps”). If the underlying asset in a total return swap declines in value (or increases in value, if an inverse swap) over the term of the swap, the Fund may also be required to pay the dollar value of that decline (or increase, if an inverse swap) to the counterparty. Therefore, swaps are subject to credit risk or the risk of default or non-performance by the counterparty. Swaps could result in losses if interest rate or foreign currency exchange rates or credit quality changes are not correctly anticipated by the Funds or if the reference index, security or investments do not perform as expected.
The value of a total return swap agreement is recorded as either an asset or a liability on the Statements of Assets and Liabilities at the beginning of the measurement period. Segregated securities are designated on the Schedules of Investments and cash deposited is recorded on the Statements of Assets and Liabilities. Daily changes in valuation of total return swaps, if any, are recorded as a unrealized appreciation or depreciation on the Statements of Assets and Liabilities. The change in the value of swaps, including accruals of periodic amounts of interest to be paid or received on swaps, is reported as change in net unrealized appreciation/depreciation in the Statements of Operations. A realized gain or loss is recorded upon payment or receipt of a periodic payment or payment made upon termination of a swap agreement.
During the year ended April 30, 2015, IQ Hedge Multi-Strategy Tracker ETF utilized swaps to effect long exposure to convertible bond returns and currency returns, and short exposure to several asset classes, including, among others, U.S. real estate returns, volatility returns, domestic and international equity returns, corporate bonds, and short-term U.S. Treasury bonds. IQ Hedge Macro Tracker ETF utilized swaps to effect long exposure to mid-term volatility returns, convertible bond returns and corporate bond returns, and short exposure to several asset classes, including, among others, currency returns, and domestic and international equity returns, and domestic and international real estate returns. IQ Hedge Market Neutral Tracker ETF utilized swaps to effect long exposure to convertible bond returns and international equity returns, and short exposure to several asset classes, including, among others, domestic and international equity returns, currency returns, and corporate bond returns. IQ Hedge Event Driven Tracker ETF utilized swaps to effect long exposure to the aggregate U.S bond market; convertible bond securities; and domestic small and large capitalization equities, and short exposure to principally investment grade corporate bonds. IQ Hedge Long/Short Tracker ETF utilized swaps to effect long
| 105 |
| Notes to Financial Statements (continued) |
| April 30, 2015 |
exposure to investment grade corporate bonds; domestic senior bank loans; domestic small and large capitalization equities; and equities listed in developed countries. The short exposures included all of the Underlying Index positions, including principally domestic small capitalization equities. IQ Merger Arbitrage ETF utilized swaps to effect short exposure to global equities as a partial equity market hedge, the Funds’ swap exposures were consistent with the exposure of the Funds’ underlying indexes. At April 30, 2015, the IQ Hedge Multi-Strategy Tracker ETF and IQ Hedge Macro Tracker ETF posted $3,379,724 and $113,760, respectively, as collateral for swaps.
Pursuant to documentation governing the Funds’ swap transactions with Morgan Stanley Capital Services Inc. (“Morgan Stanley”), Morgan Stanley has the right to terminate the swaps early in the event that the net assets of the given Fund decline below specific levels set forth in the documentation (“net asset contingent features”). In the event of early termination, Morgan Stanley may require the Funds to pay or receive a settlement amount in connection with the terminated swap transaction. As of April 30, 2015, the Funds have not triggered the conditions under such documentation that will give the counterparty the right to call for an early termination. As of such date, the settlement values of these contracts were approximately equal to the fair value of such contracts.
At April 30, 2015, the fair values of derivative instruments reflected on the Statements of Assets and Liabilities were as follows:
Liability Derivatives
| Equity Risk | ||||
| IQ Global Resources ETF | ||||
| Unrealized depreciation on futures contracts1 | (352,790 | ) | ||
1 Includes cumulative appreciation (depreciation) of futures contracts as reported in the Schedules of Investments. Only unsettled variation margin is reported within the Statements of Assets and Liabilities.
Transactions in derivative instruments reflected on the Statements of Operations during the year ended April 30, 2015 as follows:
| Equity Risk | ||||
| IQ Hedge Multi-Strategy Tracker ETF | ||||
| Realized gain (loss) | ||||
| Swap transactions | $ | (4,879,049 | ) | |
| IQ Hedge Macro Tracker ETF | ||||
| Realized gain (loss) | ||||
| Swap transactions | $ | (33,385 | ) | |
| IQ Hedge Market Neutral Tracker ETF | ||||
| Realized gain (loss) | ||||
| Swap transactions | $ | (422,607 | ) | |
| IQ Hedge Long/Short Tracker ETF | ||||
| Realized gain (loss) | ||||
| Swap transactions | $ | 8,250 | ||
| IQ Hedge Event-Driven Tracker ETF | ||||
| Realized gain (loss) | ||||
| Swap transactions | $ | 2,707 | ||
| IQ Global Resources ETF | ||||
| Realized gain (loss) | ||||
| Futures contracts | $ | (818,805 | ) | |
| Change in Unrealized appreciation (depreciation) | ||||
| Futures contracts | $ | (139,947 | ) | |
| IQ Merger Arbitrage ETF | ||||
| Realized gain (loss) | ||||
| Futures contracts | $ | 541,489 | ||
| Swap transactions | $ | (2,398,186 | ) | |
| Change in Unrealized appreciation (depreciation) | ||||
| Futures contracts | $ | 152,139 | ||
| 106 |
| Notes to Financial Statements (continued) |
| April 30, 2015 |
For the year ended April 30, 2015, the monthly average volume of the derivatives held by the Funds was as follows:
| Average Notional Value | ||||||||||||||||||||||||||||||
| IQ Hedge Multi-Strategy Tracker ETF | IQ Hedge Macro Tracker ETF | IQ Hedge Market Neutral Tracker ETF | IQ Hedge Long/Short Tracker ETF | IQ Hedge Event-Driven Tracker ETF | IQ Global Resources ETF | IQ Merger Arbitrage ETF | ||||||||||||||||||||||||
| Short | ||||||||||||||||||||||||||||||
| Swaps | $ | 249,878,038 | $ | 1,801,712 | $ | 4,295,350 | $ | 91,610 | $ | 44,821 | $ | — | $ | 9,206,832 | ||||||||||||||||
| Long | ||||||||||||||||||||||||||||||
| Futures | $ | — | $ | — | $ | — | $ | — | $ | — | $ | 16,702,447 | $ | 12,421,458 | ||||||||||||||||
| Swaps | 272,772,226 | 2,294,974 | 4,544,592 | 92,323 | 45,042 | — | — | |||||||||||||||||||||||
9. RISKS INVOLVED WITH INVESTING IN THE FUNDS
The Funds are subject to the principal risks described below, some or all of these risks may adversely affect a Fund’s NAV, trading price, yield, total return and ability to meet its investment objective. As with any investment, an investment in a Fund could result in a loss or the performance of a Fund could be inferior to that of other investments.
Fund of Funds Risk*
Certain of the Funds’ investment performance, because they are funds of funds, depend on the investment performance of the underlying ETFs in which they invest. An investment in any such Fund is subject to the risks associated with the underlying ETFs that comprise its underlying Index. Such a Fund will indirectly pay a proportional share of the asset-based fees, if any, of the underlying ETFs in which it invests.
Exchange Traded Vehicle Risk*
Unlike an investment in a mutual fund, the value of the Funds’ investments in ETFs, exchange-traded vehicles (“ETVs”) and exchange-traded notes (“ETNs”) is based on stock market prices and the Fund could lose money due to stock market developments, the failure of an active trading market to develop, or exchange trading halts or de-listings. Federal law prohibits the Funds from acquiring investment company shares, including shares of ETFs, in excess of specific thresholds unless exempted by rule, regulation or exemptive order. These prohibitions may prevent the Funds from allocating their investments to ETFs in an optimal manner.
Index Risk
The Funds’ underlying indexes and the Funds rebalance only on a monthly or quarterly basis, which may cause the performance of the underlying indexes and the Funds to deviate from that of the market exposure that they are trying to achieve.
Industry Concentration Risk
A Fund will not invest 25% or more of the value of the Fund’s total assets in the securities of one or more issuers conducting their principal business activities in the same industry or group of industries; except that, to the extent that the underlying Index is concentrated in a particular industry, the Fund also will be concentrated in that industry. The risk of concentrating Fund investments in a limited number of issuers conducting business in the same industry or group of industries will subject the Fund to a greater risk of loss as a result of adverse economic, business or other developments than if its investments were diversified across different industry sectors.
Tracking Error Risk
Each Fund’s performance may not match its underlying Index during any period of time. Although each Fund attempts to track the performance of its underlying Index, a Fund may not be able to duplicate its exact composition or return for any number of reasons, including but not limited to risk that the strategies used by the Advisor to match the performance of the underlying Indexes may fail to produce the intended results, liquidity risk and new fund risk, as well as the incurring of Fund expenses, which the underlying Index does not incur.
| 107 |
| Notes to Financial Statements (continued) |
| April 30, 2015 |
Foreign Securities Risk
Certain of the Funds invest directly or indirectly (through underlying ETFs) in the securities of non-U.S. issuers, which involves risks beyond those associated with investments in U.S. securities. These additional risks include greater market volatility, the availability of less reliable financial information, higher transactional and custody costs, taxation by foreign governments, decreased market liquidity and political instability.
Small Capitalization Companies Risk**
Certain of the Funds invest primarily in the stocks of small capitalization companies, which may be more volatile than those of larger companies. Stock prices of small capitalization companies are also more vulnerable than those of large capitalization companies to adverse business and economic developments, and the stocks of small capitalization companies may be thinly traded, making it difficult to buy and sell them.
Total Return Swap Risk*
Certain of the Funds intend to use total return swaps in several ways to replicate the performance of the Index. Risks may arise as a result of the failure of the counterparty to the swap contract to comply with the terms of the swap contract. Therefore the Funds consider the creditworthiness of the counterparty to a swap contract in evaluating potential credit risk. Additionally, risks may arise from unanticipated movements in interest rates or in the value of the underlying instruments.
Futures Risk*
Certain Funds may be subject to the risk that the change in the value of the futures contract may not correlate perfectly with the underlying instrument. Use of long futures contracts subjects the Funds to risk of loss in excess of the amounts shown on the Statements of Assets and Liabilities, up to the notional amount of the futures contracts. Use of short futures contracts subjects the Funds to unlimited risk of loss. The Funds may enter into futures contracts only on exchanges or boards of trade. The exchange or board of trade acts as the counterparty to each futures transaction; therefore, the Funds’ credit risk is limited to failure of the exchange or board of trade. Under some circumstances, futures exchanges may establish daily limits on the amount that the price of a futures contract can vary from the previous day’s settlement price, which could effectively prevent liquidation of positions.
New Fund Risk
The IQ Hedge Long/Short Tracker ETF and IQ Hedge Event-Driven Tracker ETF are new funds. As new funds, there can be no assurance that the Funds will grow to or maintain an economically viable size, in which case the Funds may experience greater tracking error to their Underlying Indices than they otherwise would be at higher asset levels or they could ultimately liquidate.
| * | Applies to IQ Hedge Multi-Strategy Tracker ETF, IQ Hedge Macro Tracker ETF, IQ Hedge Market Neutral Tracker ETF, IQ Hedge Long/Short Tracker ETF, IQ Hedge Event-Driven Tracker ETF and IQ Real Return ETF. |
| ** | Applies to IQ Australia Small Cap ETF, IQ Canada Small Cap ETF, IQ Global Agribusiness Small Cap ETF, IQ Global Oil Small Cap ETF and IQ U.S. Real Estate Small Cap ETF. |
| 108 |
| Notes to Financial Statements (continued) |
| April 30, 2015 |
10. CHANGE IN INDEPENDENT REGISTERED PUBLIC ACCOUNTING FIRM
Effective April 15, 2015, PricewaterhouseCoopers LLP was appointed as the Funds’ independent registered public accounting firm for the 2015 fiscal year. The selection of PricewaterhouseCoopers LLP was recommended by the Trust’s Audit Committee, comprised of all non-interested Trustees, and was approved by the Board.
Ernst & Young LLP, the predecessor independent registered public accounting firm, of the financial statements of the Funds, serves as the paid tax preparer to the Trust and accordingly will prepare the Funds’ federal, state and excise tax returns, and advise the Trust on matters of accounting and federal and state income taxation.
11. CHANGE IN BOARD COMPOSITION
Effective April 15, 2015, the composition of the Board changed. The number of seats on the Board increased from three to four and Gene Chao resigned his position as an Independent Trustee of the Board. At the special meeting of shareholders of the Trust on March 16, 2015, the Trust’s shareholders elected two new Independent Trustees to the Board: Michael A. Pignataro and Paul D. Schaeffer, effective as of the closing of April 15, 2015. The Board now consists of three Trustees who are Independent Trustees and one Trustee who is considered to be an “interested person” of the Trust, as defined in the 1940 Act.
12. SUBSEQUENT EVENTS
In the preparation of the financial statements, the Funds’ management has evaluated events and transactions for potential recognition or disclosure through the date the financial statements were issued.
At the meeting held on May 21, 2015, the shareholders of each of the IQ Canada Small Cap ETF, IQ Global Agribusiness Small Cap ETF and IQ Global Oil Small Cap ETF approved a new investment advisory agreement between the Trust, on behalf of its Funds, and the Investment Advisor (the “Investment Advisory Agreement”). The terms of the Investment Advisory Agreement are substantially identical to the prior investment advisory agreement. The approval of and entry into the Investment Advisory Agreement resulted in the automatic termination of the interim investment advisory agreement under which the Funds were operating.
On June 24, 2015 IQ U.S. Real Estate Small Cap ETF declared a regularly scheduled distribution in the amount of $0.32763 per share to shareholders of record as of June 26, 2015.
| 109 |
| Report of Independent Registered Public Accounting Firm |
To the Board of Trustees and Shareholders of IndexIQ ETF Trust:
In our opinion, the accompanying statements of assets and liabilities, including the schedules of investments, as of April 30, 2015, and the related statements of operations and of changes in net assets and the financial highlights of each of the portfolios of the IndexIQ ETF Trust (IQ Hedge Multi-Strategy Tracker ETF, IQ Hedge Macro Tracker ETF, IQ Hedge Market Neutral Tracker ETF, IQ Global Resources ETF, IQ Merger Arbitrage ETF, IQ Real Return ETF, IQ Australia Small Cap ETF, IQ Canada Small Cap ETF, IQ Global Agribusiness Small Cap ETF, IQ Global Oil Small Cap ETF, and IQ U.S. Real Estate Small Cap ETF, each for the year ended April 30, 2015, and IQ Hedge Long/Short Tracker ETF and IQ Hedge Event-Driven Tracker ETF, each for the period March 24, 2015 to April 30, 2015)(collectively referred to as the “Funds”) present fairly, in all material respects, the financial position of each of the portfolios of the IndexIQ ETF Trust at April 30, 2015, and the results of each of their operations, the changes in each of their net assets and each of their financial highlights for the year then ended or the period from March 24, 2015 to April 30, 2015 as indicated above, in conformity with accounting principles generally accepted in the United States of America. These financial statements and financial highlights (hereafter referred to as “financial statements”) are the responsibility of the Funds’ management. Our responsibility is to express an opinion on these financial statements based on our audit. We conducted our audit of these financial statements in accordance with the standards of the Public Company Accounting Oversight Board (United States). Those standards require that we plan and perform the audit to obtain reasonable assurance about whether the financial statements are free of material misstatement. An audit includes examining, on a test basis, evidence supporting the amounts and disclosures in the financial statements, assessing the accounting principles used and significant estimates made by management, and evaluating the overall financial statement presentation. We believe that our audit, which included confirmation of securities at April 30, 2015 by correspondence with the custodian and brokers, and the application of alternative auditing procedures where confirmations for securities purchased had not been received, provides a reasonable basis for our opinion.
The financial statements of the Funds as of and for periods ended on or before April 30, 2014 were audited by other auditors whose report dated June 27, 2014 expressed an unqualified opinion on those statements.

PricewaterhouseCoopers LLP
New York, New York
June 29, 2015
| 110 |
| Supplemental Information (unaudited) |
Federal Tax Status of Dividends Declared During the Tax Year
Qualified Dividend Income — Certain dividends paid by the fund may be subject to a maximum tax rate of 15%, as provided for by the Jobs and Growth Tax Relief Reconciliation Act of 2003. The percentage of ordinary income distributions for the fiscal year ended April 30, 2015 taxed at a maximum rate of 15% is as follows:
| IQ Hedge Multi-Strategy Tracker ETF | 32.46% |
| IQ Hedge Macro Tracker ETF | 8.87% |
| IQ Hedge Market Neutral Tracker ETF | 24.35% |
| IQ Hedge Long/Short Tracker ETF | 0.00% |
| IQ Hedge Event-Driven Tracker ETF | 0.00% |
| IQ Global Resources ETF | 69.76% |
| IQ Merger Arbitrage ETF | 0.00% |
| IQ Real Return ETF | 100.00% |
| IQ Australia Small Cap ETF | 100.00% |
| IQ Canada Small Cap ETF | 70.38% |
| IQ Global Agribusiness Small Cap ETF | 84.95% |
| IQ Global Oil Small Cap ETF | 86.42% |
| IQ U.S. Real Estate Small Cap ETF | 0.47% |
Dividends Received Deduction — For corporate shareholders, the percentage of ordinary income distributions for the year ended April 30, 2015 that qualifies for the dividends received deduction is as follows:
| IQ Hedge Multi-Strategy Tracker ETF | 10.10% |
| IQ Hedge Macro Tracker ETF | 0.40% |
| IQ Hedge Market Neutral Tracker ETF | 0.14% |
| IQ Hedge Long/Short Tracker ETF | 0.00% |
| IQ Hedge Event-Driven Tracker ETF | 0.00% |
| IQ Global Resources ETF | 45.32% |
| IQ Merger Arbitrage ETF | 0.00% |
| IQ Real Return ETF | 100.00% |
| IQ Australia Small Cap ETF | 0.00% |
| IQ Canada Small Cap ETF | 0.00% |
| IQ Global Agribusiness Small Cap ETF | 6.47% |
| IQ Global Oil Small Cap ETF | 31.62% |
| IQ U.S. Real Estate Small Cap ETF | 0.47% |
Foreign Taxes Paid — The following Funds elect under the Internal Revenue Code Section 853 to pass through foreign taxes paid to its shareholders. The total amount of foreign taxes passed through to shareholders on a per share basis for the year ended April 30, 2015, are as follows:
| Foreign Taxes | Income | |||||||
| Fund | Per Share | Per Share | ||||||
| IQ Hedge Multi-Strategy Tracker ETF | — | — | ||||||
| IQ Hedge Macro Tracker ETF | — | — | ||||||
| IQ Hedge Market Neutral Tracker ETF | — | — | ||||||
| IQ Hedge Long/Short Tracker ETF | — | — | ||||||
| IQ Hedge Event-Driven Tracker ETF | — | — | ||||||
| IQ Real Return ETF | — | — | ||||||
| IQ Global Resources ETF | 0.0166 | 0.3780 | ||||||
| IQ Merger Arbitrage ETF | — | — | ||||||
| IQ Australia Small Cap ETF | — | — | ||||||
| IQ Canada Small Cap ETF | 0.0507 | 0.3347 | ||||||
| IQ Global Agribusiness Small Cap ETF | 0.0847 | 0.5172 | ||||||
| IQ Global Oil Small Cap ETF | — | — | ||||||
| IQ U.S. Real Estate Small Cap ETF | — | — | ||||||
In January 2016, you will be advised on IRS Form 1099 DIV as to the Federal tax status of the distributions received by you in calendar year 2015.
| 111 |
| Board Review of Investment Advisory Agreement (unaudited) |
The Board (the members of which are referred to as “Trustees”) of the Trust met in person on April 7, 2015, to consider the approval of the Advisory Agreement between the Trust, on behalf of the Funds, and the Advisor. In accordance with Section 15(c) of the Investment Company Act of 1940, as amended (“1940 Act”), the Board requested, reviewed and considered materials furnished by the Advisor relevant to the Board’s consideration of whether to approve the Advisory Agreement. In connection with considering approval of the Advisory Agreement, the Trustees who are not “interested persons” of the Trust, as that term is defined in the 1940 Act (the “Independent Trustees”), met in executive session with counsel to the Trust, who provided assistance and advice. The consideration of the Advisory Agreement was conducted by both the full Board and the Independent Trustees, who also voted separately.
During their review and consideration, the Board and the Independent Trustees focused on and analyzed the factors they deemed relevant, including: (1) the nature, extent and quality of the services provided by the Advisor; (2) the investment performance of the Funds; (3) the costs of the services to be provided and profits to be realized by the Advisor and their affiliates from the relationship with the Trust; (4) the extent to which economies of scale would be realized as the Funds grow; (5) any benefits derived or to be derived by the Advisor from the relationship with the Trust; (6) potential conflicts of interest; and (7) the change in control of the Advisor relating to the acquisition of the Advisor’s parent entity by New York Life Investment Management Holdings LLC (“NYLIM”).
In reviewing such factors, the Board relied on certain information, including (1) a copy of the Advisory Agreement; (2) information describing the Advisor and the services provided thereby; (3) information regarding the compliance program of the Advisor; (4) copies of the Form ADV for the Advisor; and (5) memoranda and guidance from Katten Muchin Rosenman LLP on the fiduciary responsibilities of trustees, including Independent Trustees, in considering advisory and distribution agreements under the 1940 Act. In addition, the Board was provided data comparing the advisory fees and expected expenses of the Funds with expenses and performance of other registered investment companies with similar investment objectives and policies. The Trustees also considered their personal experiences as Trustees and participants in the exchange-traded fund (“ETF”) and mutual fund industry, as applicable.
In particular, the Trustees including the Independent Trustees, considered and discussed the following with respect to the Funds:
1. The nature, extent and quality of the facilities and services provided by the Advisor. The Board reviewed the services that IndexIQ provides to the Funds. The Board noted the responsibilities that IndexIQ has as the Funds’ investment adviser, including overall supervisory responsibility for the general management and investment of each Fund’s securities portfolio, monitoring Fund compliance with regulatory requirements and Fund objectives and policies, daily monitoring of the portfolio, overseeing Fund service providers, providing officers for the Funds, ongoing reporting to the Board, and the implementation of Board directives as they relate to the Funds.
The Board reviewed the experience, resources, and strengths of IndexIQ in managing the Funds, the IndexIQ Trust’s mutual fund, as well as separately managed accounts. Based on their consideration and review of the foregoing information, the Board determined that the Funds were likely to continue to benefit from the nature, quality, and extent of these services, as well as IndexIQ’s ability to render such services based on its personnel, experience, operations, and resources.
2. Comparison of services provided and fees charged by IndexIQ and other investment advisers to similar clients, and the cost of the services provided and profits realized by IndexIQ from its relationship with the Funds. The Board then compared both the services rendered and the fees paid pursuant to the Advisory Agreement to contracts of other registered investment advisers providing services to similar ETFs. In particular, the Board compared each Fund’s advisory fee and expense ratio to other investment companies considered to be in each such Fund’s peer group.
After comparing each Fund’s fees with those of other investment companies in the Fund’s peer group, and in light of the nature, quality, and extent of services provided by IndexIQ and the costs incurred by IndexIQ in rendering those services, the Board concluded that the level of fees paid to IndexIQ with respect to each Fund were fair and reasonable.
| 112 |
| Board Review of Investment Advisory Agreement (unaudited) (continued) |
3. IndexIQ’s profitability and the extent to which economies of scale would be realized as the Funds grow and whether fee levels would reflect such economies of scale. The Board discussed with the Advisor the costs and profitability of the Advisor in connection with its serving as investment adviser to each Fund, including operational costs. It determined that the expense ratios of the Funds were well suited in light of expectations for asset accumulation and projected growth therefrom.
4. Change in Control of the Advisor. After considering the acquisition of control of the Advisor by NYLIM, the Board determined that it was unlikely that the change in control of the Advisor would adversely impact the services provided to the Funds by the Advisor, and that the acquisition may result in enhanced resources available to the Advisor and Funds. In this determination, the Board considered information relating to the change in control presented at prior meetings.
5. Investment performance of IndexIQ and the Funds. The Board considered the investment performance of the Funds, including tracking error. In particular, the Board considered the investment performance of the Funds relative to their stated objectives and the success of IndexIQ in reaching such objectives. The Board considered each Fund’s investment performance compared to the underlying index that each Fund seeks to track and includes in its prospectus and shareholder reports. The Board also considered each Fund’s investment performance compared to the respective Fund’s peer group.
The Board also received and considered information about the premium/discount history of the Funds, which illustrated the number of times that the market price of the Funds trading on the secondary market closed above or below the NAV of the Funds, and by how much, measured in basis points.
Based on the foregoing and such other matters as were deemed relevant, and while no single factor was determinative in the decision, all of the Trustees, including the Independent Trustees, concluded that the advisory fee rates and total expense ratios are reasonable in relation to the services provided by the Advisor to the Funds, as well as the costs incurred and the benefits gained by the Advisor in providing such services. The Board also found the investment advisory fees paid to the Advisor to be reasonable in comparison to the fees charged by advisers to other comparable funds of similar anticipated size. As a result, all of the Board members, including the Independent Trustees, determined that the continuation of the Advisory Agreement with IndexIQ was in the best interests of each Fund and its shareholders. The Board and the Independent Trustees, voting separately, approved the Advisory Agreement and instructed the officers of the Trust to submit the Advisory Agreement to a vote of the shareholders of the Funds.
| 113 |
| Board of Trustees and Officers (unaudited) |
The business of the Trust is managed under the direction of the Trust’s Board of Trustees. The Board elects the officers of the Trust who are responsible for administering the Trust’s day-to-day operations. Each Trustee serves until his or her successor is duly elected or appointed and qualified.
The name, year of birth, address and principal occupations during the past five years for each Trustee and Officer of the Trust is set forth below, along with the other public directorships held by the Trustees.
| Independent Trustees |
| Name and Year of Birth1 | Position(s) Held with Trust | Term of Office and Length of Time Served2 | Principal Occupation(s) During Past 5 Years3 | Number of Portfolios in Fund Complex Overseen by Trustee4 | Other Directorships Held by Trustee During Past 5 Years | |||||
| Reena Aggarwal, | Trustee | Since | Robert E. McDonough Professor (2003 to present) | 14 | FBR & Co. | |||||
| 1957 | August | and Professor of Finance (2000 to 2003), | (2011 to | |||||||
| 2008 | McDonough School of Business, Georgetown | present) | ||||||||
| University (2000 to present); Co-Chair of Board, | Hennessy | |||||||||
| Social Innovations and Public Service Fund, | Funds Trust | |||||||||
| Georgetown University (2012 to present); and | (fka The FBR | |||||||||
| Director, Brightwood Capital Advisors, L.P. (2013 | Funds) (2006 | |||||||||
| to present). | to 2011) | |||||||||
| Michael A. Pignataro, | Trustee | Since | Proprietor, Countless Collectables LLC (online | 14 | None | |||||
| 1959 | April 2015 | retailer) (2009 to present); Director, Credit Suisse | ||||||||
| Asset Management (2001 to 2013); and Chief | ||||||||||
| Financial Officer, Credit Suisse Funds (1996 to 2013). | ||||||||||
| Paul D. Schaeffer, | Trustee | Since | President, AlphaHut (dba Aspiring Solution | 14 | Context | |||||
| 1951 | April 2015 | Partners) (financial services consulting) (2013 to | Capital Funds | |||||||
| present); Managing Director, Forward | (mutual fund | |||||||||
| Management LLC (asset management) (2010 to | trust) (2014 to | |||||||||
| 2013); and President, Reflow Management | present); | |||||||||
| (mutual fund service provider (2008 to 2010). | PopTech! | |||||||||
| (conference | ||||||||||
| operator) | ||||||||||
| (2012 to present) | ||||||||||
| Interested Trustee5 | ||||||||||
| Adam S. Patti, | Chairman | Since | Chairman, Trustee, President and Principal | 14 | None | |||||
| 1970 | and Trustee | November | Executive, IndexIQ Trust (2008 to present); and | |||||||
| President | 2008 | Chief Executive Officer, the Advisor (2007 to | ||||||||
| and | Since | present); and Chief Executive Officer, IndexIQ | ||||||||
| Principal | July 2008 | (2006 to present). | ||||||||
| Executive | ||||||||||
Officers of the Trust
| Name and Year of Birth1 | Position(s) Held with Trust | Term of Office and Length of Time Served2 | Principal Occupation(s) During Past 5 Years | |||
| David L. Fogel | Treasurer, | Since | Executive Vice President, IndexIQ Trust (2011 to present); Treasurer, | |||
| 1971 | Principal | October 2008 | Principal Financial Officer and Chief Compliance Officer, IndexIQ Trust | |||
| Financial | (2008 to present); and President (2013 to present) and Executive Vice | |||||
| Officer and | President (2006 to 2013), IndexIQ. | |||||
| Chief | ||||||
| Compliance | ||||||
| Officer | ||||||
| Executive Vice | Since | |||||
| President | June 2011 | |||||
| 1 | The address of each Trustee or Officer is c/o IndexIQ, 800 Westchester Avenue, Suite S-710, Rye Brook, New York 10573. |
| 2 | Trustees and Officers serve until their successors are duly elected and qualified. |
| 3 | Principal occupations(s) of the Trustees may cover more than the past five years. |
| 4 | The Funds are part of a “fund complex” as defined in the 1940 Act. The fund complex includes all open-end funds (including all of their portfolios) advised by the Advisor and any funds that have an investment advisor that is an affiliated person of the Advisor. |
| 5 | Mr. Patti is an “interested person” of the Trust (as that term is defined in the 1940 Act) because of his affiliations with the Advisor. |
| 114 |

| 115 |
ANNUAL REPORT | APRIL 30, 2015
IndexIQ ETF Trust

IQ Hedge Multi-Strategy Tracker ETF
IQ Hedge Macro Tracker ETF
IQ Hedge Market Neutral Tracker ETF
IQ Hedge Long/Short Tracker ETF
IQ Hedge Event-Driven Tracker ETF
IQ Global Resources ETF
IQ Merger Arbitrage ETF
IQ Real Return ETF
IQ Australia Small Cap ETF
IQ Canada Small Cap ETF
IQ Global Agribusiness Small Cap ETF
IQ Global Oil Small Cap ETF
IQ U.S. Real Estate Small Cap ETF
Investment Advisor
IndexIQ Advisors LLC
800 Westchester Avenue
Suite S-710
Rye Brook, NY 10573
Distributor
ALPS Distributors, Inc.
1290 Broadway, Suite 1100
Denver, CO 80203
Custodian/Fund Administrator/Transfer Agent
The Bank of New York Mellon
One Wall Street
New York, NY 10286
Legal Counsel
Katten Muchin Rosenman, LLP
575 Madison Avenue
New York, New York 10022
Independent Registered Public Accounting Firm
PricewaterhouseCoopers LLP
300 Madison Avenue
New York, NY 10017
Item 2. Code of Ethics.
| (a) | The registrant, as of the end of the period covered by this report, has adopted a code of ethics that applies to the registrant’s principal executive officer, principal financial officer, principal accounting officer or controller, or persons performing similar functions, regardless of whether these individuals are employed by the registrant or a third party. |
| (c) | There have been no amendments, during the period covered by this report, to a provision of the code of ethics that applies to the registrant’s principal executive officer, principal financial officer, principal accounting officer or controller, or persons performing similar functions, regardless of whether these individuals are employed by the registrant or a third party, and that relates to any element of the code of ethics description. |
| (d) | The registrant has not granted any waivers, including an implicit waiver, from a provision of the code of ethics that applies to the registrant’s principal executive officer, principal financial officer, principal accounting officer or controller, or persons performing similar functions, regardless of whether these individuals are employed by the registrant or a third party, that relates to one or more of the items set forth in paragraph (b) of this item’s instructions. |
Item 3. Audit Committee Financial Expert.
The Registrant’s Board of Trustees has one audit committee financial expert serving on its audit committee, an “independent” Trustee, Reena Aggarwal. Under applicable securities laws, a person who is determined to be an audit committee financial expert will not be deemed an “expert” for any purpose, including without limitation for the purposes of Section 11 of the Securities Act of 1933, as a result of being designated or identified as an audit committee financial expert. The designation or identification of a person as an audit committee financial expert does not impose on such person any duties, obligations, or liabilities that are greater than the duties, obligations, and liabilities imposed on such person as a member of the audit committee and Board of Trustees in the absence of such designation or identification.
Item 4. Principal Accountant Fees and Services.
Audit Fees
| (a) | The aggregate fees billed for each of the last two fiscal years for professional services rendered by the principal accountant for the audit of the registrant's annual financial statements or services that are normally provided by the accountant in connection with statutory and regulatory filings or engagements for those fiscal years are $226,000 for 2015 and $206,000 for 2014. |
Audit-Related Fees
| (b) | The aggregate fees billed in each of the last two fiscal years for assurance and related services by the principal accountant that are reasonably related to the performance of the audit of the registrant's financial statements and are not reported under paragraph (a) of this Item are $0 for 2015 and $0 for 2014. |
Tax Fees
| (c) | The aggregate fees billed in each of the last two fiscal years for professional services rendered by the principal accountant for tax compliance, tax advice, and tax planning are $0 for 2015 and $56,000 for 2014. |
All Other Fees
| (d) | The aggregate fees billed in each of the last two fiscal years for products and services provided by the principal accountant, other than the services reported in paragraphs (a) through (c) of this Item are $0 for 2015 and $0 for 2014. |
| (e)(1) | Per Rule 2-01(c)(7)(A), the Audit Committee pre-approves all of the Audit, Audit-Related, Tax and Other Fees of the Registrant. |
| (e)(2) | 100% of services described in each of Items 4(b) through (d) were approved by the audit committee pursuant to paragraph (c)(7)(A) of Rule 2-01 of Regulation S-X. |
| (f) | No response required |
| (g) | The aggregate non-audit fees billed by the principal accountant for services rendered to the registrant’s investment adviser (not including any subadvisor whose role is primarily portfolio management and is subcontracted with or overseen by another investment adviser), and any entity controlling, controlled by, or under common control with the adviser that provides ongoing services to the registrant were (i) approximately $3,771,000 for the fiscal year ended April 30, 2015, and (ii) $2,876,000 for the fiscal year ended April 30, 2014. |
| (h) | The registrant’s Audit Committee has determined that the non-audit services rendered by the principal accountant for the fiscal year ended April 30, 2015 to the registrant’s investment adviser and any entity controlling, controlled by, or under common control with the registrant’s investment adviser that provides ongoing services to the registrant that were not required to be pre-approved by the Audit Committee because they did not relate directly to the operations and financial reporting of the registrant were compatible with maintaining the respective independence of the principal accountant during the relevant time period. |
Item 5. Audit Committee of Listed Registrants.
| (a) | The Fund has a designated Audit Committee in accordance with Section 3(a)(58)(A) of the Securities and Exchange Act of 1934 (the “Exchange Act”) and the members of such committee are Reena Aggarwal, Michael Pignataro, and Paul Shaeffer. |
| (b) | Not applicable. |
Item 6. Investments.
| (a) | Schedule of Investments in securities of unaffiliated issuers as of the close of the reporting period is included as part of the report to shareholders filed under Item 1 of this form. |
| (b) | Not applicable. |
Item 7. Disclosure of Proxy Voting Policies and Procedures for Closed-End Management Investment Companies.
Not applicable.
Item 8. Portfolio Managers of Closed-End Management Investment Companies.
Not applicable.
Item 9. Purchases of Equity Securities by Closed-End Management Investment Company and Affiliated Purchasers.
Not applicable.
Item 10. Submission of Matters to a Vote of Security Holders.
There have been no material changes to the procedures by which the shareholders may recommend nominees to the registrant’s board of trustees, where those changes were implemented after the registrant last provided disclosure in response to the requirements of Item 407(c)(2)(iv) of Regulation S-K (17 CFR 229.407) (as required by Item 22(b)(15) of Schedule 14A (17 CFR 240.14a-101)), or this Item.
Item 11. Controls and Procedures.
| (a) | The registrant’s principal executive and principal financial officers, or persons performing similar functions, have concluded that the registrant’s disclosure controls and procedures (as defined in Rule 30a-3(c) under the Investment Company Act of 1940, as amended (the “1940 Act”) (17 CFR 270.30a-3(c))) are effective, as of a date within 90 days of the filing date of the report that includes the disclosure required by this paragraph, based on their evaluation of these controls and procedures required by Rule 30a-3(b) under the 1940 Act (17 CFR 270.30a-3(b)) and Rules 13a-15(b) or 15d-15(b) under the Securities Exchange Act of 1934, as amended (17 CFR 240.13a-15(b) or 240.15d-15(b)). |
| (b) | There were no changes in the registrant’s internal control over financial reporting (as defined in Rule 30a-3(d) under the 1940 Act (17 CFR 270.30a-3(d)) that occurred during the registrant’s second fiscal quarter of the period covered by this report that has materially affected, or is reasonably likely to materially affect, the registrant’s internal control over financial reporting. |
Item 12. Exhibits.
| (a)(1) | Code of ethics that is the subject of disclosure required by Item 2 is attached hereto. |
| (a)(2) | Certifications pursuant to Rule 30a-2(a) under the 1940 Act and Section 302 of the Sarbanes-Oxley Act of 2002 are attached hereto. |
(a)(3) Not applicable.
| (b) | Certifications pursuant to Rule 30a-2(b) under the 1940 Act and Section 906 of the Sarbanes-Oxley Act of 2002 are attached hereto. |
SIGNATURES
Pursuant to the requirements of the Securities Exchange Act of 1934 and the Investment Company Act of 1940, the registrant has duly caused this report to be signed on its behalf by the undersigned, thereunto duly authorized.
| (Registrant) | IndexIQ ETF Trust |
| By (Signature and Title)* | /s/ Adam S. Patti |
| Adam S. Patti | |
| (Principal Executive Officer) |
| Date | July 1, 2015 |
Pursuant to the requirements of the Securities Exchange Act of 1934 and the Investment Company Act of 1940, this report has been signed below by the following persons on behalf of the registrant and in the capacities and on the dates indicated.
| By (Signature and Title)* | /s/ Adam S. Patti |
| Adam S. Patti | |
| (Principal Executive Officer) |
| Date | July 1, 2015 |
| By (Signature and Title)* | /s/ David L. Fogel |
| David L. Fogel | |
| (Principal Financial Officer) |
| Date | July 1, 2015 |
* Print the name and title of each signing officer under his or her signature.