UNITED STATES
SECURITIES AND EXCHANGE COMMISSION
Washington, D.C. 20549
FORM N-CSR
CERTIFIED SHAREHOLDER REPORT OF REGISTERED MANAGEMENT
INVESTMENT COMPANIES
Investment Company Act file number 811-22227
IndexIQ ETF Trust
(Exact name of registrant as specified in charter)
800 Westchester Ave., Suite S-710
Rye Brook, NY 10573
(Address of principal executive offices) (Zip code)
Adam S. Patti
IndexIQ Advisors LLC
800 Westchester Ave., Suite S-710
Rye Brook, NY 10573
(Name and address of agent for service)
Registrant's telephone number, including area code: 1-888-934-0777
Date of fiscal year end: April 30
Date of reporting period: April 30, 2016
Form N-CSR is to be used by management investment companies to file reports with the Commission not later than 10 days after the transmission to stockholders of any report that is required to be transmitted to stockholders under Rule 30e-1 under the Investment Company Act of 1940 (17 CFR 270.30e-1). The Commission may use the information provided on Form N-CSR in its regulatory, disclosure review, inspection, and policymaking roles.
A registrant is required to disclose the information specified by Form N-CSR, and the Commission will make this information public. A registrant is not required to respond to the collection of information contained in Form N-CSR unless the Form displays a currently valid Office of Management and Budget ("OMB") control number. Please direct comments concerning the accuracy of the information collection burden estimate and any suggestions for reducing the burden to Secretary, Securities and Exchange Commission, 100 F Street, NE, Washington, DC 20549. The OMB has reviewed this collection of information under the clearance requirements of 44 U.S.C. § 3507.
Item 1. Reports to Stockholders.
The Report to Shareholders is attached herewith.
ANNUAL REPORT | APRIL 30, 2016
IndexIQ ETF Trust

IQ Hedge Multi-Strategy Tracker ETF (QAI)
IQ Hedge Macro Tracker ETF (MCRO)
IQ Hedge Market Neutral Tracker ETF (QMN)
IQ Hedge Long/Short Tracker ETF (QLS)
IQ Hedge Event-Driven Tracker ETF (QED)
IQ Global Resources ETF (GRES)
IQ Merger Arbitrage ETF (MNA)
IQ Real Return ETF (CPI)
IQ Australia Small Cap ETF (KROO)
IQ Canada Small Cap ETF (CNDA)
IQ Global Agribusiness Small Cap ETF (CROP)
IQ Global Oil Small Cap ETF (IOIL)
IQ U.S. Real Estate Small Cap ETF (ROOF)
IQ 50 Percent Hedged FTSE International ETF (HFXI)
IQ 50 Percent Hedged FTSE Europe ETF (HFXE)
IQ 50 Percent Hedged FTSE Japan ETF (HFXJ)
IQ Leaders GTAA Tracker ETF (QGTA)

The investment return and value of each of the Funds’ shares will fluctuate so that an investor’s shares, when sold, may be worth more or less than their original cost. Performance may be lower or higher than performance data quoted. Consider the Funds’ investment objectives, risks, charges and expenses carefully before investing. The prospectus and the statement of additional information include this and other relevant information about the Funds and are available by visiting www.IQetfs.com or by calling 1-888-934-0777. Read the prospectus carefully before investing.
Each of the Funds’ performance that is current to the most recent month-end is available by visiting www.IQetfs.com or by calling 1-888-934-0777.
You may obtain a description of the IndexIQ ETF Trust proxy voting, policies, procedures and information regarding how each Fund voted proxies relating to portfolio securities during the 12-month period ending June 30 (available by August 31) without charge, upon request, by calling 1-888-934-0777 or by accessing the SEC’s website at www.sec.gov. Such reports may be reviewed and copied at the SEC’s Public Reference Room in Washington, DC. Information on the operation of the Public Reference Room may be obtained by calling 800.SEC.0330.
The Funds file their complete schedules of portfolio holdings with the Commission for the first and third quarters of each fiscal year on Form N-Q. The Funds’ Forms N-Q are available on the Commission’s web site at www.sec.gov. The Funds’ Forms N-Q also may be reviewed and copied at the Commission’s Public Reference Room in Washington, DC; information on the operation of the Public Reference Room may be obtained by calling 1-800-SEC-0330.
Each Funds’ premium/discount information is available, free of charge, on the Funds’ website, www.IQetfs.com or by calling 1-888-934-0777.
The Funds are distributed by ALPS Distributors, Inc., which is not affiliated with IndexIQ or the Funds’ investment advisor.
IndexIQ® and IQ® are registered service marks of IndexIQ.
Help Preserve the Environment — Go Green!
With e-Delivery, you can:
| • | Receive email notifications when your most recent shareholder communications are available for review. |
| • | Access prospectuses, annual reports and semiannual reports online. |
It’s easy to enroll:
| 1. | Visit https://www.icsdelivery.com/live/ |
| 2. | Follow the simple enrollment instructions |
If you have questions about IndexIQ e-Delivery services, contact a representative at 888-934-0777.

| Shareholder Letter | 5 |
| Management’s Discussion of Fund Performance | 6 |
| Fund Expenses | 40 |
| Portfolio Summaries | 42 |
| Schedules of Investments | |
| IQ Hedge Multi-Strategy Tracker ETF | 46 |
| IQ Hedge Macro Tracker ETF | 50 |
| IQ Hedge Market Neutral Tracker ETF | 53 |
| IQ Hedge Long/Short Tracker ETF | 56 |
| IQ Hedge Event-Driven Tracker ETF | 58 |
| IQ Global Resources ETF | 60 |
| IQ Merger Arbitrage ETF | 64 |
| IQ Real Return ETF | 67 |
| IQ Australia Small Cap ETF | 68 |
| IQ Canada Small Cap ETF | 70 |
| IQ Global Agribusiness Small Cap ETF | 73 |
| IQ Global Oil Small Cap ETF | 75 |
| IQ U.S. Real Estate Small Cap ETF | 77 |
| IQ 50 Percent Hedged FTSE International ETF | 79 |
| IQ 50 Percent Hedged FTSE Europe ETF | 89 |
| IQ 50 Percent Hedged FTSE Japan ETF | 96 |
| IQ Leaders GTAA Tracker ETF | 102 |
| Statements of Assets and Liabilities | 104 |
| Statements of Operations | 107 |
| Statements of Changes in Net Assets | 110 |
| Financial Highlights | 115 |
| Notes to Financial Statements | 123 |
| Report of Independent Registered Public Accounting Firm | 141 |
| Supplemental Information | 142 |
| Board Review of Investment Advisory Agreement | 144 |
| Board of Trustees and Officers | 146 |
| Shareholder Letter (unaudited) |
Dear Shareholder:
We are pleased to present you with the annual report for IndexIQ ETF Trust for the 12 months ended April 30, 2016 (the “Reporting Period”).
It was a challenging Reporting Period for investors, as high levels of volatility and disparity were evident in the returns of various global asset classes. Indeed, the Reporting Period was marked by numerous global cross currents. The Chinese economic growth rate slowed, and this put pressure on China’s equity prices as well as on global commodity prices, specifically, oil and industrial metals. Greece was on the brink of defaulting on its debt obligations, but a last minute agreement allowed the nation to avert a default. The U.S. dollar gained strength through the first three quarters of the Reporting Period but then began to lose ground to other major currencies as it became more clear that the U.S. Federal Reserve would be unable to implement its intended schedule to increase interest rates. Overall, this was a turbulent Reporting Period, wherein U.S. large-cap equities were barely able to stay above water, and investment-grade bonds had solid results, but many other asset classes did not.
On the following pages, you will find a detailed discussion of the key factors influencing performance of each of the ETFs in the IndexIQ ETF Trust during the Reporting Period. You will also find a schedule of investments and financial statements for each.
Despite the macro challenges of the Reporting Period, we believe that the solutions provided by the ETFs of the IndexIQ ETF Trust give investors the opportunity to enhance portfolio construction in a liquid and transparent manner relative to typical alternative asset strategies, and we look forward to adding more new and innovative ETF solutions in the future.
We thank you for choosing the IndexIQ ETFs, and we honor the responsibility you have placed on us. For more information on our broad array of alternative investment solutions, please visit us at www.indexiq.com or call us at 888-934-0777.
Adam S. Patti
Chief Executive Officer
Registered Representative of NYLIFE Distributors LLC
| Management’s Discussion of Fund Performance (unaudited) |
IQ Hedge Multi-Strategy Tracker ETF
How did IQ Hedge Multi-Strategy Tracker ETF (the “Fund”) perform during the 12 months ended April 30, 2016?
For the 12 months ended April 30, 2016, IQ the Fund returned –2.80% at NAV (net asset value) and –2.67% at market price.1 To compare, the Fund’s Underlying Index, the IQ Hedge Multi-Strategy Index,2 returned –1.50% for the same time period. The HFRI Fund of Funds Composite Index2 and S&P 500® Index2 returned –5.52% and 0.55%, respectively, for the same period.
What factors affected the Fund’s performance during the reporting period?
The Fund’s position in investment grade bonds, particularly investment grade corporate bonds, aggregate bonds and short-term Treasury bonds, via underlying ETFs, was the primary positive contributor to returns. The Fund’s short exposure to Brazil, via an underlying ETF, was also beneficial, as oil prices plummeted. However, losses on the Fund’s long exposure to China, via an underlying ETF, largely offset those gains. Similarly, via underlying ETFs, gains from short positions in Asia ex Japan equities were negated by losses from long positions in Emerging Small Cap equities. The Fund’s results were boosted by positions in U.S. large-capitalization value stock ETFs but gave back most of that from its positions in U.S. large-cap growth stock ETFs and U.S. small-capitalization value stock ETFs.
The Fund’s position in convertible bond ETFs detracted from its performance during the reporting period as did the Fund’s holding in a currency carry strategy ETF. Implemented via underlying ETFs, positions in emerging market equities in general were a net detractor from performance. The Fund’s position in a volatility-oriented ETP also dampened relative results.
During the reporting period, how was the Fund’s performance materially affected by investments in derivatives?
The Fund used derivatives to obtain exposure to long and short positions of the Underlying Index. The long exposures included certain Underlying Index positions, such as investment grade corporate, sovereign, and local authority bonds; short term Treasury securities; equity volatility; and domestic small capitalization stocks. The short exposures included all of the Underlying Index positions, including principally iShares iBoxx $ Investment Grade Corporate Bond ETF, iShares Russell 2000 Value ETF, and the Vanguard Small-Cap Value ETF.
How were the Fund’s assets allocated during the reporting period and why?
The Fund’s allocations are driven by quantitative models that determine the weights across the various hedge fund strategies represented in the Fund as well as the weights of the assets within these strategies. Given the rules-based nature of the process, there is no subjectivity involved in the allocation decision process.
During the reporting period, the Fund had positive, or long, allocations to the following hedge fund strategies: Long/Short Equity, Equity Market Neutral, Event Driven and Fixed Income Arbitrage. The Fund had negative, or short, allocations to the following hedge fund strategies: Emerging Markets and Global Macro. These allocations are driven by a proprietary model that overweights strategies with high price momentum, high correlation to the broad hedge fund universe and low total variance. The Fund underweights strategies with the opposite characteristics.
At the asset class level, the Fund was net long in bonds, particularly convertible bonds, aggregate bonds, short-term bonds and floating rate bank loans. The Fund was also net long in equities, particularly U.S. value-oriented equities, as well as real estate investment trusts (REITs). The Fund was net short volatility and currencies, especially the U.S. dollar, during the reporting period.
How did the Fund’s allocations change over the course of the reporting period?
Based on our proprietary quantitative models and via shifts in its underlying ETF positions, the Fund’s total bond exposure was relatively unchanged, however the allocation within fixed income changed, as the Fund gradually decreased its exposure to aggregate bonds and convertible bonds and increased its exposure to investment grade corporate bonds and Treasury inflation-protect securities (TIPS).
Via underlying ETFs, the Fund’s currency position shifted from long the euro and yen to small short exposures. The Fund’s equity allocation, implemented via underlying ETFs, increased in broad international, Japan and U.S. large-capitalization value equities. The Fund’s net real estate position went from a small positive to a small negative, via underlying ETFs.
| 1 | The price used to calculate the market price returns is determined by using the closing price listed on the NYSE Arca and does not represent returns an investor would receive if shares were traded at other times. |
| 2 | See page 7 for more information on this index. |
| Management’s Discussion of Fund Performance (unaudited) (continued) |
During the reporting period, which underlying ETFs had the highest total returns and which underlying ETFs had the lowest total returns?
In terms of total return, the best-performing underlying ETFs in the Fund were CurrencyShares Japanese Yen Trust (FXY) and iShares Silver Trust (SLV). During the reporting period, iShares China Large-Cap ETF (FXI) and iShares MSCI China ETF (MCHI) recorded the lowest total returns.
Which underlying ETFs were the strongest positive contributors to the Fund’s performance and which underlying ETFs were particularly weak?
On the basis of impact, which takes weightings and total returns into consideration, the underlying ETFs that made the greatest positive contributions to the Fund’s performance during the reporting period were iShares iBoxx USD Investment Grade Corporate Bond ETF (LQD) and iShares Core U.C. Aggregate Bond ETF (AGG). The weakest contributors were SPDR Barclays Convertible Securities ETF (CWB) and SPDR S&P Emerging Markets Small Cap ETF (EWX).
The opinions expressed are those of the portfolio managers as of the date of this report and are subject to change. There is no guarantee that any forecast made will come to pass. This material does not constitute investment advice and is not intended as an endorsement of any specific investment.
Hypothetical Growth of a $10,000 Investment
(Since Inception Through 4/30/2016)
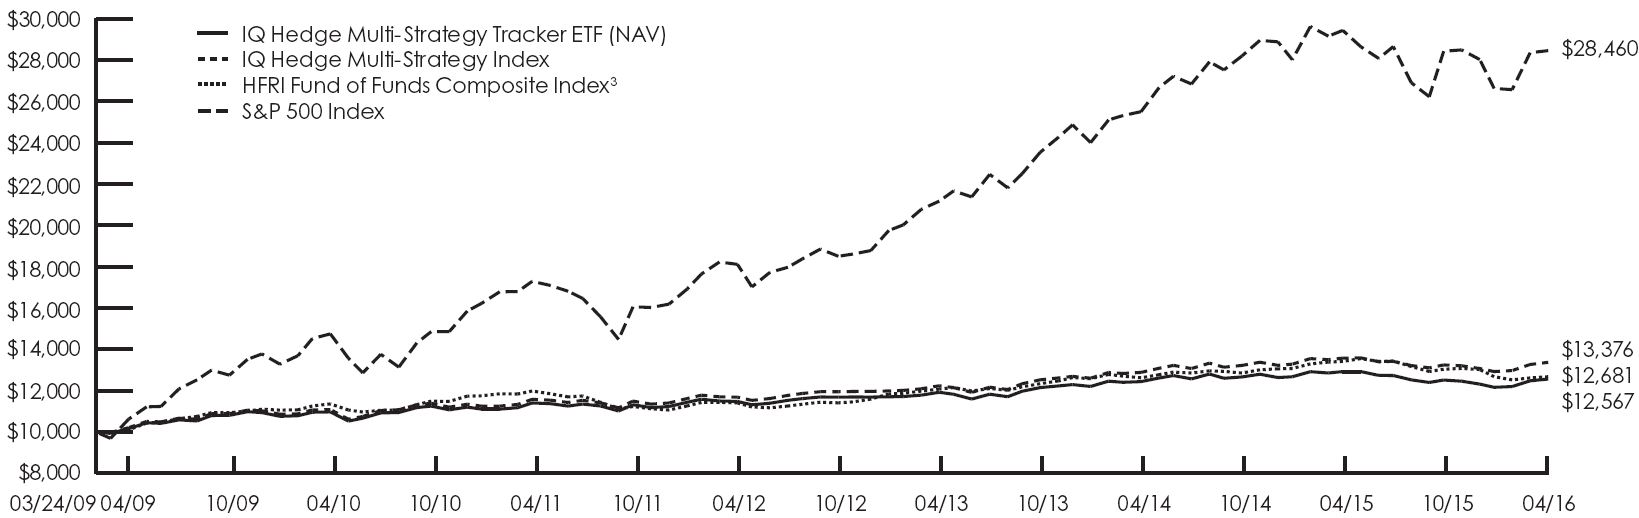
This chart illustrates the performance of a hypothetical $10,000 investment made on the Fund’s inception, and is not intended to imply any future performance.
Fund Performance History
IQ Hedge Multi-Strategy Tracker ETF
(as of April 30, 2016)
| | | 1 Year | | 3 Year | | 5 Year | | Since Inception1 |
| | | Average
Annual | | Average
Annual | | Average
Annual | | Average
Annual | | Cumulative |
| IQ Hedge Multi-Strategy Tracker ETF Market Price2 | | –2.67 | % | | 1.76 | % | | 1.98 | % | | 3.28 | % | | 25.77 | % |
| IQ Hedge Multi-Strategy Tracker ETF NAV | | –2.80 | % | | 1.76 | % | | 1.95 | % | | 3.27 | % | | 25.67 | % |
| IQ Hedge Multi-Strategy Index | | –1.50 | % | | 2.99 | % | | 2.91 | % | | 4.18 | % | | 33.76 | % |
| HFRI Fund of Funds Composite Index3 | | –5.52 | % | | 1.63 | % | | 1.13 | % | | 3.41 | % | | 26.81 | % |
| S&P 500 Index | | 0.55 | % | | 10.55 | % | | 10.30 | % | | 15.85 | % | | 184.60 | % |
| 1 | Fund Inception Date: 3/24/2009. |
| 2 | The price used to calculate the Market Price returns is determined by using the closing price listed on the NYSE Arca and does not represent returns an investor would receive if shares were traded at other times. |
| 3 | Data shown above for the HFRI Fund of Funds Composite Index is from 3/31/2009 to 4/30/2016. |
| Management’s Discussion of Fund Performance (unaudited) (continued) |
IQ Hedge Macro Tracker ETF
How did IQ Hedge Macro Tracker ETF (the “Fund”) perform during the 12 months ended April 30, 2016?
For the 12 months ended April 30, 2016, the Fund returned –2.97% at NAV (net asset value) and –2.60% at market price.1 To compare, the Fund’s Underlying Index, the IQ Hedge Macro Index,2 returned –2.35% for the same time period. The HFRI Fund of Funds Composite Index and the MSCI® World Index2 returned –5.52% and –3.61%, respectively, for the same period.
What factors affected the Fund’s performance during the reporting period?
The Fund’s positions in investment grade bond ETFs, particularly those focused on investment grade corporate bonds and short-term Treasury bonds, were the primary positive contributors to returns. The Fund’s short exposure to Brazil and Russia, via underlying ETFs, were also beneficial, as oil prices plummeted. However, the losses on the Fund’s long exposure to China largely offset those gains.
The Fund benefited from its short exposure to commodities during the reporting period. However, its short position in the Japanese yen, via an underlying ETF, detracted from Fund performance. Also implemented via underlying ETFs, the Fund’s long positions in U.S. and emerging market small-capitalization equities detracted from performance as did exposure to an emerging market bond ETF.
During the reporting period, how was the Fund’s performance materially affected by investments in derivatives?
The Fund used derivatives to obtain exposure to long and short positions of the Underlying Index. The long exposures included certain Underlying Index positions, such as investment grade corporate, sovereign, and local authority bonds; short term Treasury securities; equity volatility; and domestic small capitalization stocks. The short exposures included all of the Underlying Index positions, including principally SPDR Dow Jones International Real Estate ETF, CurrencyShares Euro Trust, and the CurrencyShares Japanese Yen Trust.
How were the Fund’s assets allocated during the reporting period and why?
The Fund’s allocations are driven by quantitative models that determine the weights across the various hedge fund strategies represented in the Fund, as well as the weights of the assets within these strategies. Given the rules-based nature of the process, there is no subjectivity involved in the allocation decision process.
During the reporting period, the Fund had an overweight relative to the Underlying Index in the Emerging Markets hedge fund strategy and a proportionate underweight in the Global Macro hedge fund strategy. These allocations are driven by a proprietary quantitative model that overweights strategies with high price momentum, high correlation to the broad hedge fund universe and low total variance. The Fund underweights strategies with the opposite characteristics.
At the asset class level, the Fund was net long in bonds, particularly short-term U.S. Treasury bonds, investment grade U.S. corporate bonds and international bonds. The Fund was also net long in equities, particularly small-capitalization equities and emerging market equities. Amongst currencies, the Fund was long the euro and short the yen for a net short position in the U.S. dollar.
How did the Fund’s allocations change over the course of the reporting period?
Based on our proprietary quantitative models, the Fund’s total bond exposure was increased, and there was a change in the composition of underlying ETFs as well. Via underlying ETFs, the Fund reduced its exposure to international bonds and corporate bonds and increased its holdings in short-term U.S. Treasuries. The Fund’s currency position shifted from long the euro to a small short exposure. The Fund’s equity allocation, implemented via underlying ETFs, increased in emerging market small-capitalization equities, Japan equities and U.S. large-cap value equities. The Fund’s net real estate position drifted from a small negative to a larger negative.
| 1 | The price used to calculate the market price returns is determined by using the closing price listed on the NYSE Arca and does not represent returns an investor would receive if shares were traded at other times. |
| 2 | See page 9 for more information on this index. |
| Management’s Discussion of Fund Performance (unaudited) (continued) |
During the reporting period, which underlying ETFs had the highest total returns and which underlying ETFs had the lowest total returns?
In terms of total return, the best-performing underlying ETFs in the Fund were CurrencyShares Japanese Yen Trust (FXY) and iShares Silver Trust (SLV). During the reporting period, iShares China Large-Cap ETF (FXI) and iShares MSCI China ETF (MCHI) recorded the lowest total returns.
Which underlying ETFs were the strongest positive contributors to the Fund’s performance and which underlying ETFs were particularly weak?
On the basis of impact, which takes weightings and total returns into consideration, the underlying ETFs that made the greatest positive contributions to the Fund’s performance during the reporting period were iShares iBoxx USD Investment Grade Corporate Bond ETF (LQD) and Power Shares DB Commodity Index Tracking fund (DBC). The weakest contributors were iShares China Large-Cap ETF (FXI) and SPDR S&P Emerging Markets Small Cap ETF (EWX).
The opinions expressed are those of the portfolio managers as of the date of this report and are subject to change. There is no guarantee that any forecast made will come to pass. This material does not constitute investment advice and is not intended as an endorsement of any specific investment.
Hypothetical Growth of a $10,000 Investment
(Since Inception Through 4/30/2016)
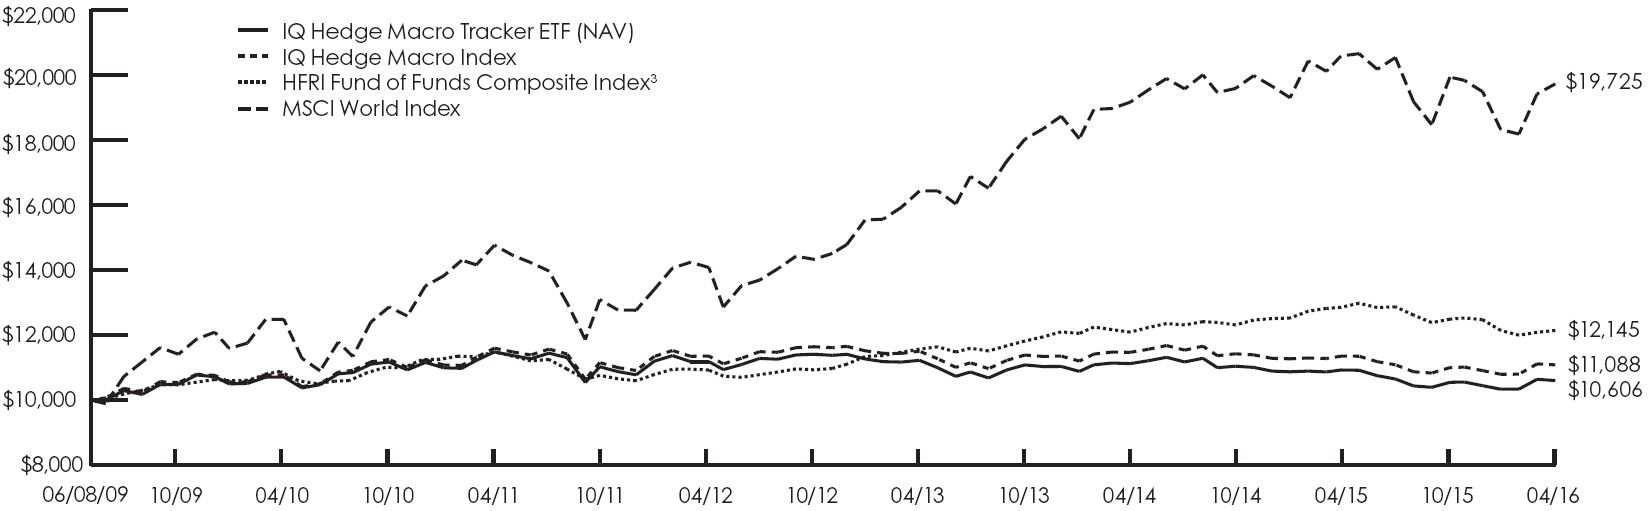
This chart illustrates the performance of a hypothetical $10,000 investment made on the Fund’s inception, and is not intended to imply any future performance.
Fund Performance History
IQ Hedge Macro Tracker ETF
(as of April 30, 2016)
| | | 1 Year | | 3 Year | | 5 Year | | Since Inception1 |
| | | Average
Annual | | Average
Annual | | Average
Annual | | Average
Annual | | Cumulative |
| IQ Hedge Macro Tracker ETF Market Price2 | | –2.60 | % | | –1.72 | % | | –1.52 | % | | 0.94 | % | | 6.65 | % |
| IQ Hedge Macro Tracker ETF NAV | | –2.97 | % | | –1.88 | % | | –1.59 | % | | 0.86 | % | | 6.06 | % |
| IQ Hedge Macro Index | | –2.35 | % | | –1.23 | % | | –0.90 | % | | 1.51 | % | | 10.88 | % |
| HFRI Fund of Funds Composite Index3 | | –5.52 | % | | 1.63 | % | | 1.13 | % | | 2.85 | % | | 21.45 | % |
| MSCI World Index | | –3.61 | % | | 6.86 | % | | 6.56 | % | | 10.35 | % | | 97.25 | % |
| 1 | Fund Inception Date: 6/08/2009. |
| 2 | The price used to calculate the Market Price returns is determined by using the closing price listed on the NYSE Arca and does not represent returns an investor would receive if shares were traded at other times. |
| 3 | Data shown above for the HFRI Fund of Funds Composite Index is from 5/31/2009 to 4/30/2016. |
| Management’s Discussion of Fund Performance (unaudited) (continued) |
IQ Hedge Market Neutral Tracker ETF
How did IQ Hedge Market Neutral Tracker ETF (the “Fund”) perform during the 12 months ended April 30, 2016?
For the 12 months ended April 30, 2016, the Fund returned –0.15% at NAV (net asset value) and –0.27% at market price.1 To compare, the Fund’s Underlying Index, the IQ Hedge Market Neutral Index,2 returned 1.17% for the same time period. The HFRI Equity Market Neutral Index2 and the Barclays Capital U.S. Short Term Treasury Bond Index2 returned 2.11% and 0.29%, respectively, for the same period.
What factors affected the Fund’s performance during the reporting period?
The Fund’s position in investment grade bonds, particularly investment grade corporate bonds, aggregate bonds and short-term Treasury bonds, via underlying ETFs, were the primary positive contributors to returns. The Fund’s short exposure to international bonds was also beneficial, as turbulence overseas led to bond price drops.
Gains from the Fund’s currency positions via underlying ETFs — long the euro and short the U.S. Dollar — were offset by its long exposure to a currency carry strategy. Similarly, gains from short positions in Asia ex Japan equity ETFs were negated by losses from long positions in international, European and emerging market equity ETFs. The Fund benefited from positions in U.S. large-capitalization value equity ETFs, but this was virtually offset by positions in U.S. small-cap value equity ETFs.
During the reporting period, how was the Fund’s performance materially affected by investments in derivatives?
The Fund used derivatives to obtain exposure to long and short positions of the Underlying Index. The long exposures included certain Underlying Index positions, such as investment grade corporate, sovereign, and local authority bonds; short term Treasury securities; equity volatility; and domestic small capitalization stocks. The short exposures included all of the Underlying Index positions, including principally Vanguard FTSE Pacific ETF, iShares MSCI All Country Asia ex Japan ETF, and the iShares Russell 1000 Growth ETF.
How were the Fund’s assets allocated during the reporting period and why?
The Fund’s allocations are driven by quantitative models that determine the weights across the various hedge fund strategies represented in the Fund as well as the weights of the assets within these strategies. Given the rules-based nature of the process, there is no subjectivity involved in the allocation decision process.
During the reporting period, the Fund had an overweight relative to the Underlying Index in the Equity Market Neutral hedge fund strategy and a proportionate underweight in the Fixed Income Arbitrage hedge fund strategy. These allocations are driven by a proprietary quantitative model that overweights strategies with high price momentum, high correlation to the broad hedge fund universe and low total variance. The Fund underweights strategies with the opposite characteristics.
At the asset class level, the Fund was net long in bonds, particularly U.S. short-term Treasury bonds. The Fund was slightly net long in equities, with long positions in U.S. large-capitalization value equities and U.S. small-cap growth equities with a partial hedge in U.S. small-capitalization value equities. Internationally, the Fund was long Europe, short Asia ex Japan and long emerging markets equities with a short position in developed international equities.
How did the Fund’s allocations change over the course of the reporting period?
Based on our proprietary quantitative models, the Fund’s overall bond allocation was little changed over the course of the reporting period, but, within that, some of the Fund’s allocation from aggregate bonds and short-term U.S. Treasury bonds was moved into investment grade corporate bonds. The Fund’s overall equity allocation declined, as emerging markets went from a small positive to a small negative. The Fund also went more short in U.S. large-capitalization growth equities and less short in U.S. small-capitalization value equities.
| 1 | The price used to calculate the market price returns is determined by using the closing price listed on the NYSE Arca and does not represent returns an investor would receive if shares were traded at other times. |
| 2 | See page 11 for more information on this index. |
| Management’s Discussion of Fund Performance (unaudited) (continued) |
During the reporting period, which underlying ETFs had the highest total returns and which underlying ETFs had the lowest total returns?
In terms of total return, the best-performing underlying ETFs in the Fund were Guggenheim S&P 500 Pure Value ETF (RPV) and iShares MSCI Japan ETF (EWJ). During the reporting period, iShares MSCI All Country Asia ex Japan ETF (AAXJ) and Vanguard FTSE Emerging Markets ETF (VWO) recorded the lowest total returns.
Which underlying ETFs were the strongest positive contributors to the Fund’s performance and which underlying ETFs were particularly weak?
On the basis of impact, which takes weightings and total returns into consideration, the underlying ETFs that made the greatest positive contributions to the Fund’s performance during the reporting period were iShares MSCI All Country Asia ex Japan ETF (AAXJ) and iShares iBoxx USD Investment Grade Corporate Bond ETF (LQD). The weakest contributors were iShares MSCI EAFE ETF (EFA) and Vanguard Small Cap Value Index Fund (VBR).
The opinions expressed are those of the portfolio managers as of the date of this report and are subject to change. There is no guarantee that any forecast made will come to pass. This material does not constitute investment advice and is not intended as an endorsement of any specific investment.
Hypothetical Growth of a $10,000 Investment (Since Inception Through 4/30/2016)

This chart illustrates the performance of a hypothetical $10,000 investment made on the Fund’s inception, and is not intended to imply any future performance.
Fund Performance History
IQ Hedge Market Neutral Tracker ETF
(as of April 30, 2016)
| | | 1 Year | | 3 Year | | Since Inception1 |
| | | Average
Annual | | Average
Annual | | Average
Annual | | Cumulative |
| IQ Hedge Market Neutral Tracker ETF Market Price2 | | –0.27 | % | | 0.35 | % | | 1.19 | % | | 4.31 | % |
| IQ Hedge Market Neutral Tracker ETF NAV | | –0.15 | % | | 0.47 | % | | 1.26 | % | | 4.56 | % |
| IQ Hedge Market Neutral Index | | 1.17 | % | | 1.66 | % | | 2.37 | % | | 8.75 | % |
| HFRI Equity Market Neutral Index3 | | 2.11 | % | | 3.62 | % | | 3.98 | % | | 14.99 | % |
| Barclays Capital U.S. Short Term Treasury Bond Index | | 0.29 | % | | 0.18 | % | | 0.18 | % | | 0.64 | % |
| 1 | Fund Inception Date: 10/04/2012. |
| 2 | The price used to calculate the Market Price returns is determined by using the closing price listed on the NYSE Arca and does not represent returns an investor would receive if shares were traded at other times. |
| 3 | Data shown above for the HFRI Equity Market Neutral Index is from 9/30/2012 to 4/30/2016. |
| Management’s Discussion of Fund Performance (unaudited) (continued) |
IQ Hedge Long/Short Tracker ETF
How did IQ Hedge Long/Short Tracker ETF (the “Fund”) perform during the 12 months ended April 30, 2016?
For the 12 months ended April 30, 2016, the Fund returned –3.46% at NAV (net asset value) and –8.23% at market price.1 To compare, the Fund’s Underlying Index, the IQ Hedge Long/Short Index,2 returned –2.10% for the same time period. The HFRI Equity Hedge Index2 and the Barclays Capital U.S. Short Term Treasury Bond Index2 returned –5.17% and 0.29%, respectively, for the same period.
What factors affected the Fund’s performance during the reporting period?
The Fund’s position in investment grade bond ETFs was the primary positive contributor to returns. The Fund’s exposure to floating rate senior loans, via an underlying ETF, detracted, largely offsetting those gains.
Similarly, gains from short positions in U.S. small-capitalization equities and long positions in U.S. large-capitalization value equities, via underlying ETFs, were negated by losses from long positions in U.S. small-capitalization growth equity ETFs. Emerging markets in general were a net detractor from Fund performance as was the Fund’s position in a volatility-oriented ETF.
During the reporting period, how was the Fund’s performance materially affected by investments in derivatives?
The Fund used derivatives to obtain exposure to long and short positions of the Underlying Index. The long exposures included certain Underlying Index positions, such as investment grade corporate, sovereign, and local authority bonds; short term Treasury securities; equity volatility; and domestic small capitalization stocks. The short exposures included all of the Underlying Index positions, including principally iShares Russell 2000 Value ETF, Vanguard Small-Cap Value ETF, and the iShares S&P Small-Cap 600 Value ETF.
How were the Fund’s assets allocated during the reporting period and why?
The Fund’s allocations are driven by quantitative models that determine the weights across the various hedge fund strategies represented in the Fund as well as the weights of the assets within these strategies. Given the rules-based nature of the process, there is no subjectivity involved in the allocation decision process.
At the asset class level, the Fund was net long in bonds, particularly investment grade bonds and floating rate senior loans. The Fund was also net long in equities, with long positions in U.S. growth-oriented equities and international equities. The Fund was short U.S. small-capitalization value-oriented equities.
How did the Fund’s allocations change over the course of the reporting period?
Based on our proprietary quantitative models and via shifts in its underlying ETF positions, the Fund’s total bond exposure was reduced, largely due to the reduction in the allocation to floating rate senior loans. Some of this reduction was absorbed by an increase in exposure to investment grade corporate bonds. The remaining weight was moved into equities, primarily in a core international equity ETF. The Fund’s allocation to U.S. large-capitalization value equities also increased.
During the reporting period, which underlying ETFs had the highest total returns and which underlying ETFs had the lowest total returns?
In terms of total return, the best-performing underlying ETFs in the Fund were Energy Select Sector SPDR Fund (XLE) and Financial Select Sector SPDR Fund (XLF). During the reporting period, Vanguard FTSE Emerging Markets ETF (VWO) and iShares MSCI Emerging Markets ETF (EEM) recorded the lowest total returns.
| 1 | The price used to calculate the market price returns is determined by using the closing price listed on the NYSE Arca and does not represent returns an investor would receive if shares were traded at other times. |
| 2 | See page 13 for more information on this index. |
| Management’s Discussion of Fund Performance (unaudited) (continued) |
Which underlying ETFs were the strongest positive contributors to the Fund’s performance and which underlying ETFs were particularly weak?
On the basis of impact, which takes weightings and total returns into consideration, the underlying ETFs that made the greatest positive contributions to the Fund’s performance during the reporting period were iShares iBoxx USD Investment Grade Corporate Bond ETF (LQD) and Financial Select Sector SPDR Fund (XLF). The weakest contributors were iShares Russell 2000 Growth ETF (IWO) and PowerShares Senior Loan Portfolio (BKLN).
The opinions expressed are those of the portfolio managers as of the date of this report and are subject to change. There is no guarantee that any forecast made will come to pass. This material does not constitute investment advice and is not intended as an endorsement of any specific investment.
Hypothetical Growth of a $10,000 Investment
(Since Inception Through 4/30/2016)
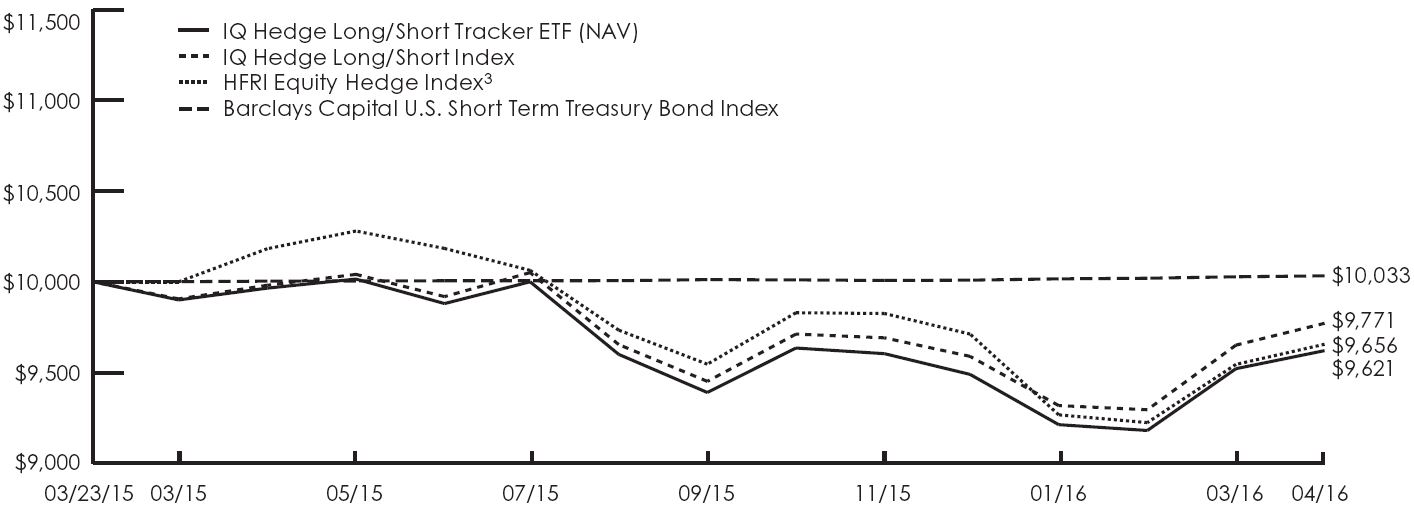
This chart illustrates the performance of a hypothetical $10,000 investment made on the Fund’s inception, and is not intended to imply any future performance.
Fund Performance History
IQ Hedge Long/Short Tracker ETF
(as of April 30, 2016)
| | | 1 Year | | Since Inception1 |
| | | Average
Annual | | Average
Annual | | Cumulative |
| IQ Hedge Long/Short Tracker ETF Market Price2 | | –8.23 | % | | –4.18 | % | | –4.60 | % |
| IQ Hedge Long/Short Tracker ETF NAV | | –3.46 | % | | –3.44 | % | | –3.79 | % |
| IQ Hedge Long/Short Index | | –2.10 | % | | –2.07 | % | | –2.28 | % |
| HFRI Equity Hedge Index3 | | –5.17 | % | | –3.18 | % | | –3.44 | % |
| Barclays Capital U.S. Short Term Treasury Bond Index | | 0.29 | % | | 0.30 | % | | 0.33 | % |
| 1 | Fund Inception Date: 3/23/2015. |
| 2 | The price used to calculate the Market Price returns is determined by using the closing price listed on the NYSE Arca and does not represent returns an investor would receive if shares were traded at other times. |
| 3 | Data shown above for the HFRI Equity Hedge Index is from 3/31/2015 to 4/30/2016. |
| Management’s Discussion of Fund Performance (unaudited) (continued) |
IQ Hedge Event-Driven Tracker ETF
How did IQ Hedge Event-Driven Tracker ETF (the “Fund”) perform during the 12 months ended April 30, 2016?
For the 12 months ended April 30, 2016, the Fund returned –1.26% at NAV (net asset value) and –1.04% at market price.1 To compare, the Fund’s Underlying Index, the IQ Hedge Event-Driven Index,2 returned –0.63% for the same time period. The HFRI Event-Driven Index2 and the Barclays Capital U.S. Short Term Treasury Bond Index2 returned –5.22%, and 0.29%, respectively, for the same period.
What factors affected the Fund’s performance during the reporting period?
The Fund’s position in aggregate bonds, via underlying ETFs, was the primary positive contributor to returns. A short position in investment grade corporate bonds and a long position in convertible bonds, via underlying ETFs, detracted from the Fund’s performance. The Fund’s positions in equity ETFs had a small net negative contribution.
During the reporting period, how was the Fund’s performance materially affected by investments in derivatives?
The Fund used derivatives to obtain exposure to long and short positions of the Underlying Index. The long exposures included certain Underlying Index positions, such as investment grade corporate, sovereign, and local authority bonds; short term Treasury securities; equity volatility; and domestic small capitalization stocks. The short exposures included all of the Underlying Index positions, including principally iShares iBoxx $ Investment Grade Corporate Bond ETF, Vanguard FTSE Emerging Markets ETF, and the iShares MSCI Emerging Markets ETF.
How were the Fund’s assets allocated during the reporting period and why?
The Fund’s allocations are driven by quantitative models that determine the weights across the various hedge fund strategies represented in the Fund as well as the weights of the assets within these strategies. Given the rules-based nature of the process, there is no subjectivity involved in the allocation decision process.
At the asset class level, the Fund was net long in bonds, particularly convertible bonds and aggregate bonds, but had a short position in investment grade corporate bonds. The Fund was also net long equities, with long positions in U.S. growth-oriented equities and emerging markets equities.
How did the Fund’s allocations change over the course of the reporting period?
During the reporting period, the Fund’s allocations did not change significantly. The Fund had a small decrease in exposure to U.S. large-capitalization growth equities and an offsetting reduction in its short position in investment grade corporate bonds, via underlying ETFs.
During the reporting period, which underlying ETFs had the highest total returns and which underlying ETFs had the lowest total returns?
In terms of total return, the best-performing underlying ETFs in the Fund were iShares iBoxx USD Investment Grade Corporate Bond ETF (LQD) and iShares Core U.S. Credit Bond ETF (CRED). During the reporting period, Vanguard FTSE Emerging Markets ETF (EEM) and iShares MSCI Emerging Markets ETF (VWO) recorded the lowest total returns.
| 1 | The price used to calculate the market price returns is determined by using the closing price listed on the NYSE Arca and does not represent returns an investor would receive if shares were traded at other times. |
| 2 | See page 15 for more information on this index. |
| Management’s Discussion of Fund Performance (unaudited) (continued) |
Which underlying ETFs were the strongest positive contributors to the Fund’s performance and which underlying ETFs were particularly weak?
On the basis of impact, which takes weightings and total returns into consideration, the underlying ETFs that made the greatest positive contributions to the Fund’s performance during the reporting period were iShares Core U.S. Aggregate Bond ETF (AGG) and Vanguard Total Bond Market Index Fund (BND). The weakest contributors were SPDR Barclays Convertible Securities ETF (CWB) and iShares iBoxx USD Investment Grade Corporate Bond ETF (LQD).
The opinions expressed are those of the portfolio managers as of the date of this report and are subject to change. There is no guarantee that any forecast made will come to pass. This material does not constitute investment advice and is not intended as an endorsement of any specific investment.
Hypothetical Growth of a $10,000 Investment
(Since Inception Through 4/30/2016)

This chart illustrates the performance of a hypothetical $10,000 investment made on the Fund’s inception, and is not intended to imply any future performance.
Fund Performance History
IQ Hedge Event-Driven Tracker ETF
(as of April 30, 2016)
| | | 1 Year | | Since Inception1 |
| | | Average
Annual | | Average
Annual | | Cumulative |
| IQ Hedge Event-Driven Tracker ETF Market Price2 | | –1.04 | % | | –0.72 | % | | –0.79 | % |
| IQ Hedge Event-Driven Tracker ETF NAV | | –1.26 | % | | –0.87 | % | | –0.96 | % |
| IQ Hedge Event-Driven Index | | –0.63 | % | | –0.21 | % | | –0.23 | % |
| HFRI Event-Driven Index3 | | –5.22 | % | | –3.72 | % | | –4.03 | % |
| Barclays Capital U.S. Short Term Treasury Bond Index | | 0.29 | % | | 0.30 | % | | 0.33 | % |
| 1 | Fund Inception Date: 3/23/2015. |
| 2 | The price used to calculate the Market Price returns is determined by using the closing price listed on the NYSE Arca and does not represent returns an investor would receive if shares were traded at other times. |
| 3 | Data shown above for the HFRI Event-Driven Index is from 3/31/2015 to 4/30/2016. |
| Management’s Discussion of Fund Performance (unaudited) (continued) |
IQ Global Resources ETF
How did IQ Global Resources ETF (the “Fund”) perform during the 12 months ended April 30, 2016?
For the 12 months ended April 30, 2016, the Fund returned –6.78% at NAV (net asset value) and –6.41% at market price.1 To compare, the Fund’s Underlying Index, the IQ Global Resources Index,2 returned –4.75% for the same time period. The MSCI® World Index2 and the Bloomberg Commodity Index2 returned –4.17% and –17.45%, respectively, during the same period.
The Fund invests in a representative sample of securities included in the Index that collectively has an investment profile similar to the Underlying Index. Due to the use of representative sampling, the Fund may or may not hold all of the securities that are included in the Underlying Index.
What factors affected the Fund’s performance during the reporting period?
The Fund seeks to invest in small-, mid- and large-capitalization significant exposure to global commodities and resources. During the first three fiscal quarters of the reporting period, the U.S. dollar strengthened relative to other global currencies, while global commodities prices, most notably oil prices, declined. These trends started to reverse during the fourth fiscal quarter, helping to recover from the drawdown earlier in the reporting period.
The Fund has exposure to 11 global currencies, and, in aggregate, the currency effect detracted from performance, with exposure to the British pound, Australian dollar and Canadian dollar detracting the most. The Fund maintained exposure to the U.S. dollar, euro and Japanese yen, which contributed positively to performance, helping dampen the overall currency effect.
From a sector and industry perspective, the Fund’s largest detractors from performance were industrial metals and precious metals. While the energy sector overall performed negatively for most of the reporting period, primarily due to the decline in oil prices, the Fund managed to generate positive returns in the energy sector. The Fund’s exposure to livestock generated the greatest positive sector return.
The Fund also utilizes U.S. and international equity market hedges, which, in aggregate, contributed positively to performance during the reporting period.
During the reporting period, how was the Fund’s performance materially affected by investments in derivatives?
The Fund used derivatives to obtain exposure to long and short positions of the Underlying Index. The long exposures included certain Underlying Index positions, such as investment grade corporate, sovereign, and local authority bonds; short term Treasury securities; equity volatility; and domestic small capitalization stocks. The short exposures included all of the Underlying Index positions, including principally E-mini S&P 500 Future, and the Mini MSCI EAFE Index Future.
During the reporting period, which industries had the highest total returns and which industries had the lowest total returns?
In terms of total return, the best-performing industries in the Underlying Index were precious metals, livestock grains, food and fiber. During the reporting period, coal, industrial metals and timber recorded the lowest total returns.
During the reporting period, which industries made the strongest contributions to the Fund’s absolute performance and which industries made the weakest contributions?
On the basis of impact, which takes weightings and total returns into account, the industries that made the strongest positive contributions to the Fund’s absolute performance were livestock, energy and water. The industries that made the weakest contributions to the Fund’s absolute performance were industrial metals, precious metals and timber.
During the reporting period, which individual stocks had the highest total returns and which stocks had the lowest total returns?
Within the Underlying Index, the stocks with the highest total return during the reporting period were Kinross Gold, Detour Gold and First Quantum Minerals. Both Kinross Gold and Detour Gold operate in precious metals mining, while First Quantum Minerals is a copper miner.
| 1 | The price used to calculate the market price returns is determined by using the closing price listed on the NYSE Arca and does not represent returns an investor would receive if shares were traded at other times. |
| 2 | See page 17 for more information on this index. |
| Management’s Discussion of Fund Performance (unaudited) (continued) |
The Underlying Index components with the lowest total returns for the reporting period were Horsehead Holding, Peabody Energy and Lonmin. Horsehead Holding operates in zinc mining; Peabody Energy operates in coal; and Lonmin is a precious metals miner.
Which individual stocks made the strongest contributions to the Fund’s absolute performance during the reporting period and which stocks made the weakest contributions?
On the basis of impact, which takes weightings and total returns into consideration, the stocks that made the strongest contributions to the Fund’s absolute performance during the reporting period were Hormel Foods and Tyson Foods, which are each meat and poultry producers; and Sandvik, which is a mining machinery company. The weakest contributors were BHP Billiton, an industrial metals company, as well as Glencore and Rio Tinto, which are each base metals companies.
Were there any changes in the Underlying Index during the reporting period?
The Underlying Index is reconstituted annually with periodic monthly rebalances. In turn, the Fund rebalances its sector weights each month according to a proprietary rotation methodology that overweights sectors with high price momentum and low valuation and underweights sectors with the opposite characteristics.
The opinions expressed are those of the portfolio managers as of the date of this report and are subject to change. There is no guarantee that any forecast made will come to pass. This material does not constitute investment advice and is not intended as an endorsement of any specific investment.
Hypothetical Growth of a $10,000 Investment (Since Inception Through 4/30/2016)

This chart illustrates the performance of a hypothetical $10,000 investment made on the Fund’s inception, and is not intended to imply any future performance.
Fund Performance History
IQ Global Resources ETF
(as of April 30, 2016)
| | | 1 Year | | 3 Year | | 5 Year | | Since Inception1 |
| | | Average
Annual | | Average
Annual | | Average
Annual | | Average
Annual | | Cumulative |
| IQ Global Resources ETF Market Price2 | | –6.41 | % | | –2.75 | % | | –4.21 | % | | 1.29 | % | | 8.73 | % |
| IQ Global Resources ETF NAV | | –6.78 | % | | –3.06 | % | | –4.24 | % | | 1.25 | % | | 8.39 | % |
| IQ Global Resources Index | | –4.75 | % | | –2.20 | % | | –3.39 | % | | 2.21 | % | | 15.30 | % |
| MSCI World Index | | –4.17 | % | | 6.28 | % | | 5.96 | % | | 8.26 | % | | 67.73 | % |
| Bloomberg Commodity Index | | –17.45 | % | | –13.76 | % | | –13.32 | % | | –6.70 | % | | –36.38 | % |
| 1 | Fund Inception Date: 10/26/2009. |
| 2 | The price used to calculate the Market Price returns is determined by using the closing price listed on the NYSE Arca and does not represent returns an investor would receive if shares were traded at other times. |
| Management’s Discussion of Fund Performance (unaudited) (continued) |
IQ Merger Arbitrage ETF
How did IQ Merger Arbitrage ETF (the “Fund”) perform during the 12 months ended April 30, 2016?
For the 12 months ended April 30, 2016, the Fund returned –0.79% at NAV (net asset value) and –0.73% at market price.1 To compare, the Fund’s Underlying Index, the IQ Merger Arbitrage Index,2 returned 0.25% for the same time period. The S&P 500® Index2 and the MSCI® World Index2 returned 0.55% and –4.17%, respectively, for the same period.
What factors affected the Fund’s performance during the reporting period?
The Underlying Index seeks to capture the premium discount of merger targets. Through a proprietary merger selection process, the Underlying Index will select target companies satisfying all required selection criteria and will hold securities until the premium has been realized through a successful merger or when any of the selection criteria are violated during the monthly reconstitution.
Key risks of the strategy include potential withdrawal or cancellation of a pending merger, the failure to meet selection criteria pertaining to liquidity, deal age or size requirements, and the risks associated with deal payment through the use of the acquiring company’s stock. Any or all of these conditions can result in under-realization of the deal premium. During the reporting period, global merger and acquisition activity exceeded $7.2 trillion, with 44% completing successfully and 29% remaining open. The remaining deals were either terminated/withdrawn or did not progress past proposal. During the reporting period, less than 10% of Underlying Index constituents failed to complete the intended merger successfully. Close to 25% were removed due to failing to meet criteria necessary to remain in the Underlying Index. The majority of deals completed successfully.
Regulatory risks related to tax inversion deals persisted during the reporting period, most notably affecting the Allergan/Pfizer merger. (A tax inversion is a transaction used by a company whereby it becomes a subsidiary of a new parent company in another country for the purpose of falling under beneficial tax laws.)
During the reporting period, how was the Fund’s performance materially affected by investments in derivatives?
The Fund used derivatives to obtain exposure to long and short positions of the Underlying Index. The long exposures included certain Underlying Index positions, such as investment grade corporate, sovereign, and local authority bonds; short term Treasury securities; equity volatility; and domestic small capitalization stocks. The short exposures included all of the Underlying Index positions, including principally Energy Select Sector SPDR Fund, Consumer Discretionary Select Sector SPDR Fund, and the Health Care Select Sector SPDR Fund.
During the reporting period, which sectors had the highest total returns and which sectors had the lowest total returns?
In terms of total return, the best-performing sectors in the Underlying Index were consumer staples, industrials and utilities. During the reporting period, energy, health care and materials recorded the lowest total returns.
During the reporting period, which sectors made the strongest contributions to the Fund’s absolute performance and which sectors made the weakest contributions?
On the basis of impact, which takes weightings and total returns into account, the sectors that made the strongest positive contributions to the Fund’s absolute performance were consumer discretionary, industrials and information technology. The sectors that made the weakest contributions to the Fund’s absolute performance were health care, energy and materials.
During the reporting period, which individual stocks had the highest total returns and which stocks had the lowest total returns?
Within the Underlying Index, the stocks with the highest total returns during the reporting period were Starwood Hotels, Integrated Silicon Solutions and Pep-Boys. Starwood Hotels operated in the hotels and hospitality industry. Integrated Silicon Solutions operated in semiconductors. Pep-Boys operated in automobile parts and retail.
The Underlying Index components with the lowest total returns for the reporting period were K+S, Allergan and Alere. K+S operates in agricultural chemicals. Allergan and Alere operate in biotechnology.
| 1 | The price used to calculate the market price returns is determined by using the closing price listed on the NYSE Arca and does not represent returns an investor would receive if shares were traded at other times. |
| 2 | See page 19 for more information on this index. |
| Management’s Discussion of Fund Performance (unaudited) (continued) |
Which individual stocks made the strongest contributions to the Fund’s absolute performance during the reporting period and which stocks made the weakest contributions?
On the basis of impact, which takes weightings and total returns into consideration, the stocks that made the strongest contributions to the Fund’s absolute performance during the reporting period were Time Warner, Baxalta and Starwood Hotels, the latter mentioned earlier. Time Warner operates in media services. Baxalta is a pharmaceutical company.
The weakest contributors were Allergan, mentioned earlier, Baker-Hughes and Office Depot. Baker-Hughes is an oil and gas services company. Office Depot is an office supply retailer.
Were there any changes in the Underlying Index during the reporting period?
The Underlying Index is reconstituted and rebalanced monthly. Intra-month removal of deals occurs only for completed transactions. All other deals are removed at the monthly rebalance. The timing of the rebalance can have both positive and potentially adverse effects, depending on the circumstance of the deal, the number of competing offers, and if new acquirers attempt to acquire existing targets. The Fund’s hedges are also reset at this time.
The opinions expressed are those of the portfolio managers as of the date of this report and are subject to change. There is no guarantee that any forecast made will come to pass. This material does not constitute investment advice and is not intended as an endorsement of any specific investment.
Hypothetical Growth of a $10,000 Investment
(Since Inception Through 4/30/2016)
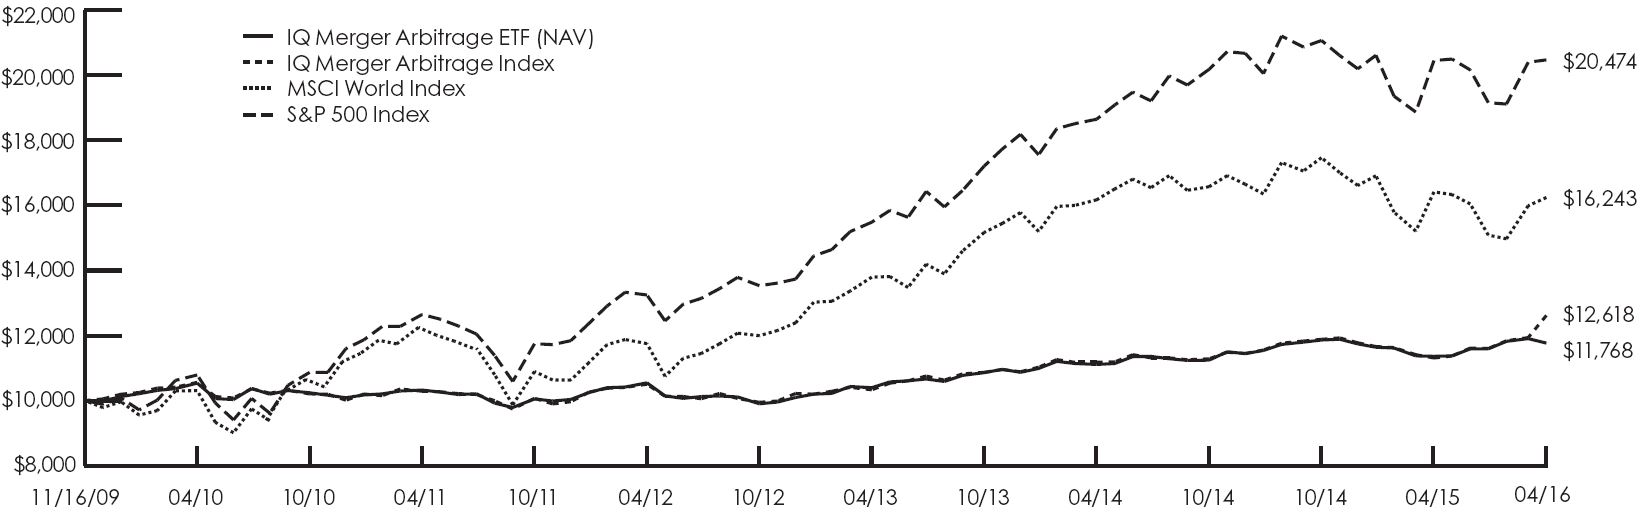
This chart illustrates the performance of a hypothetical $10,000 investment made on the Fund’s inception, and is not intended to imply any future performance.
Fund Performance History
IQ Merger Arbitrage ETF
(as of April 30, 2016)
| | | 1 Year | | 3 Year | | 5 Year | | Since Inception1 |
| | | Average
Annual | | Average
Annual | | Average
Annual | | Average
Annual | | Cumulative |
| IQ Merger Arbitrage ETF Market Price2 | | –0.73 | % | | 4.52 | % | | 2.78 | % | | 2.60 | % | | 17.97 | % |
| IQ Merger Arbitrage ETF NAV | | –0.79 | % | | 4.22 | % | | 2.65 | % | | 2.56 | % | | 17.68 | % |
| IQ Merger Arbitrage Index | | 0.25 | % | | 5.23 | % | | 3.71 | % | | 3.67 | % | | 26.18 | % |
| MSCI World Index | | –4.17 | % | | 6.28 | % | | 5.96 | % | | 7.80 | % | | 62.43 | % |
| S&P 500 Index | | 0.55 | % | | 10.55 | % | | 10.33 | % | | 11.74 | % | | 104.74 | % |
| 1 | Fund Inception Date: 11/16/2009. |
| 2 | The price used to calculate the Market Price returns is determined by using the closing price listed on the NYSE Arca and does not represent returns an investor would receive if shares were traded at other times. |
| Management’s Discussion of Fund Performance (unaudited) (continued) |
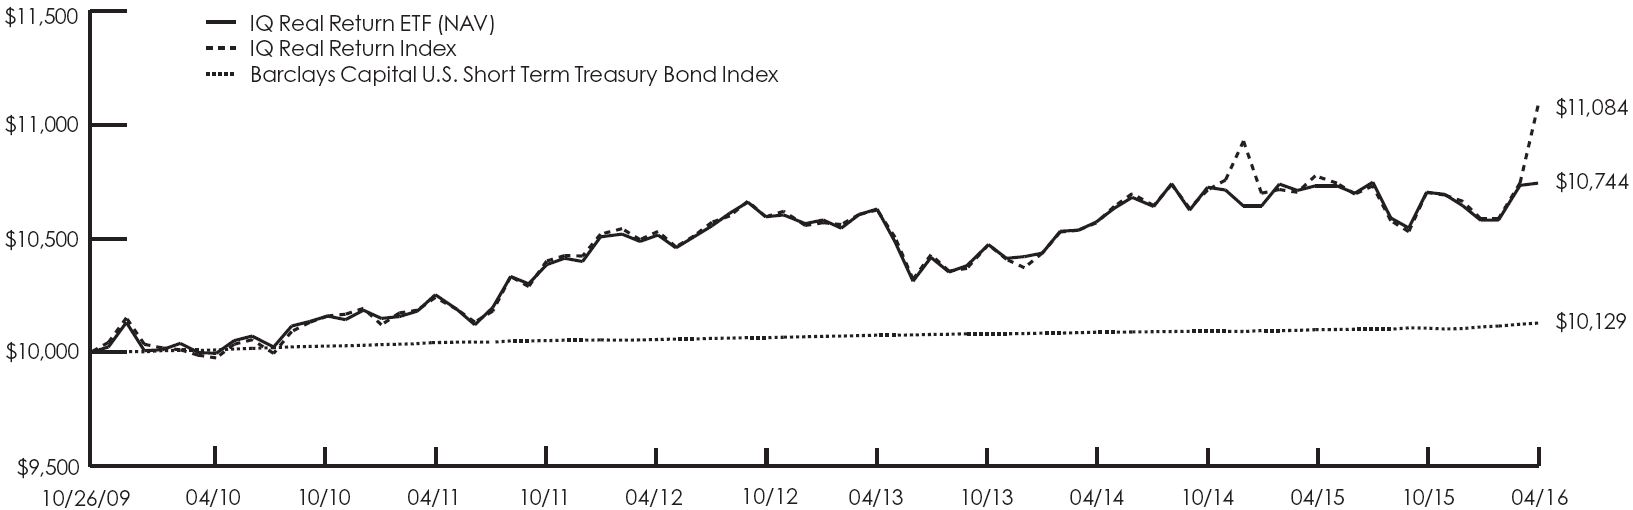
IQ Real Return ETF
How did IQ Real Return ETF (the “Fund”) perform during the 12 months ended April 30, 2016?
For the 12 months ended April 30, 2016, the Fund returned 0.11% at NAV (net asset value) and –0.32% at market price.1 To compare, the Fund’s Underlying Index, the IQ Real Return Index,2 returned 0.49% for the same time period. The Barclays Capital U.S. Short Term Treasury Bond Index2 returned 0.29% for the same period.
What factors affected the Fund’s performance during the reporting period?
The Fund’s position in intermediate-term and long-term U.S. Treasury bonds, via underlying ETFs, was the primary positive contributor to returns. Also contributing positively were positions, via underlying ETFs, in U.S. small-capitalization equities and real estate investment trusts (REITs). The only detractor of note during the reporting period was the Fund’s position in a currency ETF focused on the British pound, as the currency declined on anxiety about the possible exit of Britain from the European Union.
During the reporting period, how was the Fund’s performance materially affected by investments in derivatives?
The Fund did not use derivatives during the reporting period.
How were the Fund’s assets allocated during the reporting period and why?
The Fund’s allocations are driven by quantitative models that determine the weights across the various hedge fund strategies represented in the Fund as well as the weights of the assets within these strategies. Given the rules-based nature of the process, there is no subjectivity involved in the allocation decision process.
During the reporting period, the Fund had a core position in a short-term U.S. Treasury bond ETF that ranged in allocation from 65% to 70% of Fund assets. The Fund’s next largest allocation was to equities, via underlying ETFs, with a weight that ranged from 12% to 15% of Fund assets. The Fund also held ETFs focused on intermediate-term and long-term U.S. Treasuries, REITs and the British pound.
How did the Fund’s allocations change over the course of the reporting period?
Based on our proprietary quantitative models and via shifts in its underlying ETF positions, the Fund’s short-term U.S. Treasury bond allocation decreased and its equity allocation increased during the reporting period. Via changes in its underlying ETF positions, the Fund’s allocation to intermediate-term U.S. Treasuries increased through the reporting period, absorbing the proceeds from the reduction in long-term U.S. Treasury bonds. The Fund’s position in the British pound ETF was reduced to zero by the end of the reporting period.
During the reporting period, which underlying ETFs had the highest total returns and which underlying ETFs had the lowest total returns?
In terms of total return, the best-performing underlying ETFs in the Fund were Vanguard REIT Index Fund (VNQ) and SPDR Dow Jones REIT ETF (RWR). During the reporting period, CurrencyShares British Pound Sterling (FXB) and iShares Russell 2000 ETF (IWM) recorded the lowest total returns.
| 1 | The price used to calculate the market price returns is determined by using the closing price listed on the NYSE Arca and does not represent returns an investor would receive if shares were traded at other times. |
| 2 | See page 21 for more information on this index. |
| Management’s Discussion of Fund Performance (unaudited) (continued) |
Which underlying ETFs were the strongest positive contributors to the Fund’s performance and which underlying ETFs were particularly weak?
On the basis of impact, which takes weightings and total returns into consideration, the underlying ETFs that made the greatest positive contributions to the Fund’s performance during the reporting period were Vanguard REIT Index Fund (VNQ) and iShares 7-10 Year Treasury Bond ETF (IEF). The weakest contributors were CurrencyShares British Pound Sterling (FXB) and iShares 1-3 Year Treasury Bond ETF (SHY).
The opinions expressed are those of the portfolio managers as of the date of this report and are subject to change. There is no guarantee that any forecast made will come to pass. This material does not constitute investment advice and is not intended as an endorsement of any specific investment.
Hypothetical Growth of a $10,000 Investment (Since Inception Through 4/30/2016)
This chart illustrates the performance of a hypothetical $10,000 investment made on the Fund’s inception, and is not intended to imply any future performance.
Fund Performance History
IQ Real Return ETF
(as of April 30, 2016)
| | | 1 Year | | 3 Year | | 5 Year | | Since Inception1 |
| | | Average
Annual | | Average
Annual | | Average
Annual | | Average
Annual | | Cumulative |
| IQ Real Return ETF Market Price2 | | –0.32 | % | | 0.36 | % | | 0.96 | % | | 1.10 | % | | 7.41 | % |
| IQ Real Return ETF NAV | | 0.11 | % | | 0.36 | % | | 0.94 | % | | 1.11 | % | | 7.44 | % |
| IQ Real Return Index | | 0.49 | % | | 0.76 | % | | 1.38 | % | | 1.59 | % | | 10.84 | % |
| Barclays Capital U.S. Short Term Treasury Bond Index | | 0.29 | % | | 0.18 | % | | 0.17 | % | | 0.20 | % | | 1.29 | % |
| 1 | Fund Inception Date: 10/26/2009. |
| 2 | The price used to calculate the Market Price returns is determined by using the closing price listed on the NYSE Arca and does not represent returns an investor would receive if shares were traded at other times. |
| Management’s Discussion of Fund Performance (unaudited) (continued) |
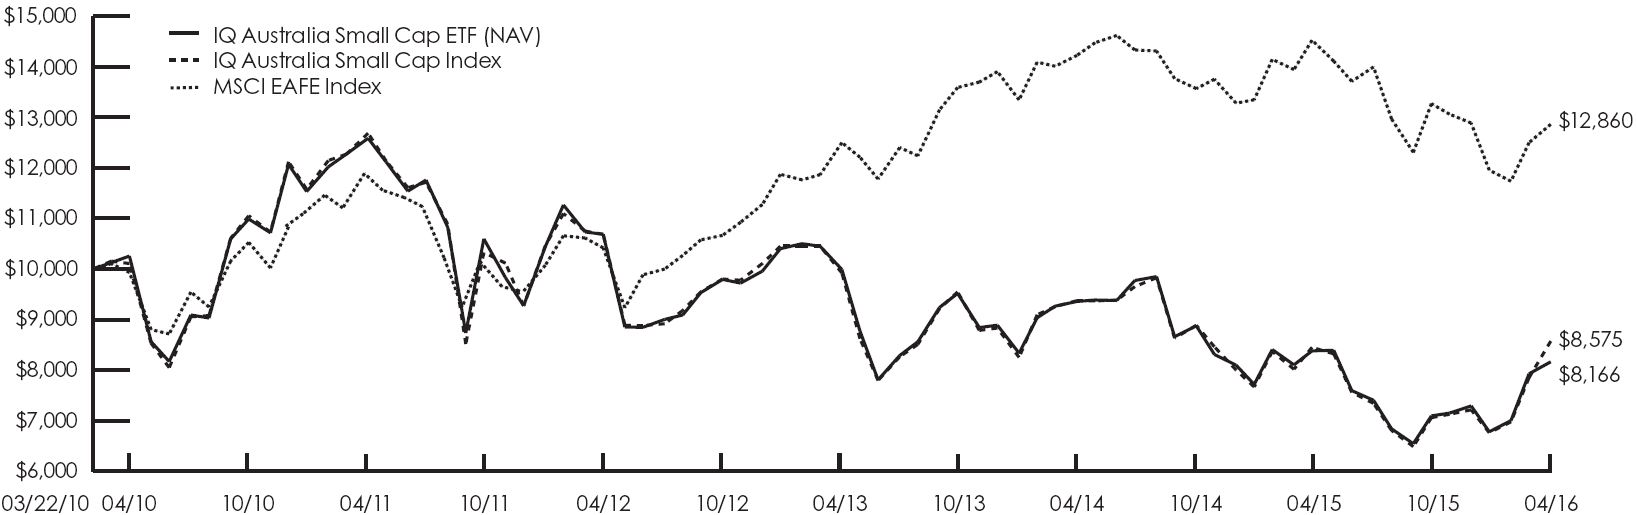
IQ Australia Small Cap ETF
How did IQ Australia Small Cap ETF (the “Fund”) perform during the 12 months ended April 30, 2016?
For the 12 months ended April 30, 2016, the Fund returned –2.59% at NAV (net asset value) and –3.70% at market price.1 To compare, the Fund’s Underlying Index, the IQ Australia Small Cap Index,2 returned –1.70% for the same time period. The MSCI® EAFE Index2 returned –9.32% for the same period.
What factors affected the Fund’s performance during the reporting period?
The Underlying Index seeks to capture the performance of the small-capitalization Australian equity market. The investable universe is limited to the 100 companies that satisfy the market capitalization and liquidity requirements of the Underlying Index selection criteria, and Underlying Index components are weighted by their float-adjusted market capitalization.
During the first three fiscal quarters of the reporting period, the Australian dollar depreciated versus the U.S. dollar. In the fourth fiscal quarter, the Australian dollar appreciated versus the U.S. dollar.
From a sector perspective, the Underlying Index was heavily weighted in materials, consumer discretionary and industrials, which accounted for approximately 50% of the weight of the Underlying Index during the Reporting Period. Although energy accounted for a smaller weighting in the Underlying Index, it was a key negative contributor to both the Underlying Index’s and the Fund’s overall performance, thus mirroring the impact the energy sector has had on the global economy. The effect of the negative total return of the energy sector was somewhat mitigated by the positive contribution made by exposure to the materials sector.
During the reporting period, how was the Fund’s performance materially affected by investments in derivatives?
The Fund did not use derivatives during the reporting period.
During the reporting period, which sectors had the highest total returns and which sectors had the lowest total returns?
In terms of total return, the best-performing sectors in the Underlying Index were telecommunication services, materials and information technology. During the reporting period, energy, utilities and consumer staples recorded the lowest total returns.
During the reporting period, which sectors made the strongest contributions to the Fund’s absolute performance and which sectors made the weakest contributions?
On the basis of impact, which takes weightings and total returns into account, the sectors that made the strongest positive contributions to the Fund’s absolute performance were materials, information technology and financials. The sectors that made the weakest contributions to the Fund’s absolute performance were energy, consumer discretionary and health care.
During the reporting period, which individual stocks had the highest total returns and which stocks had the lowest total returns?
Within the Underlying Index, the stocks with the highest total returns during the reporting period were Regis Resources and Evolution Mining, each a precious metals mining company, and APN Outdoor Group, an advertising and marketing firm.
The Underlying Index components with the lowest total returns for the reporting period were Slater & Gordon, a professional services firm; Liquefied Natural Gas, a midstream oil and gas company; and Dick Smith Holdings, a consumer electronics and appliances company.
| 1 | The price used to calculate the market price returns is determined by using the closing price listed on the NYSE Arca and does not represent returns an investor would receive if shares were traded at other times. |
| 2 | See page 23 for more information on this index. |
| Management’s Discussion of Fund Performance (unaudited) (continued) |
Which individual stocks made the strongest contributions to the Fund’s absolute performance during the reporting period and which stocks made the weakest contributions?
On the basis of impact, which takes weightings and total returns into consideration, the stocks that made the strongest contributions to the Fund’s absolute performance during the reporting period were steel producer Bluescope Steel and precious metals companies Northern Star Resources and Evolution Mining. The weakest contributors were Slater & Gordon and Liquefied Natural Gas, each mentioned earlier, and Ansell, a health and safety protection solutions provider.
Were there any changes in the Underlying Index during the reporting period?
The Underlying Index is reconstituted and rebalanced quarterly, with weights reflecting the then-current float-adjusted market capitalizations. During the reporting period, PanAust, iiNET, Veda Group, iProperty Group and Recall Holdings were removed from the Underlying Index in connection with their acquisition by other companies. Additionally, Underlying Index constituents that were acquired by other Underlying Index constituents include Amcom Telecommunications and M2Group, which were each acquired by Vocus Communications, as well as Sirius Resources, which was acquired by Independence Group.
The opinions expressed are those of the portfolio managers as of the date of this report and are subject to change. There is no guarantee that any forecast made will come to pass. This material does not constitute investment advice and is not intended as an endorsement of any specific investment.
Hypothetical Growth of a $10,000 Investment
(Since Inception Through 4/30/2016)
This chart illustrates the performance of a hypothetical $10,000 investment made on the Fund’s inception, and is not intended to imply any future performance.
Fund Performance History
IQ Australia Small Cap ETF
(as of April 30, 2016)
| | | 1 Year | | 3 Year | | 5 Year | | Since Inception1 |
| | | Average
Annual | | Average
Annual | | Average
Annual | | Average
Annual | | Cumulative |
| IQ Australia Small Cap ETF Market Price2 | | –3.70 | % | | –6.39 | % | | –8.49 | % | | –3.32 | % | | –18.61 | % |
| IQ Australia Small Cap ETF NAV | | –2.59 | % | | –6.50 | % | | –8.29 | % | | –3.26 | % | | –18.34 | % |
| IQ Australia Small Cap Index | | –1.70 | % | | –5.72 | % | | –7.63 | % | | –2.48 | % | | –14.25 | % |
| MSCI EAFE Index | | –9.32 | % | | 1.48 | % | | 1.69 | % | | 4.20 | % | | 28.60 | % |
| 1 | Fund Inception Date: 3/22/2010. |
| 2 | The price used to calculate the Market Price returns is determined by using the closing price listed on the NYSE Arca and does not represent returns an investor would receive if shares were traded at other times. |
| Management’s Discussion of Fund Performance (unaudited) (continued) |
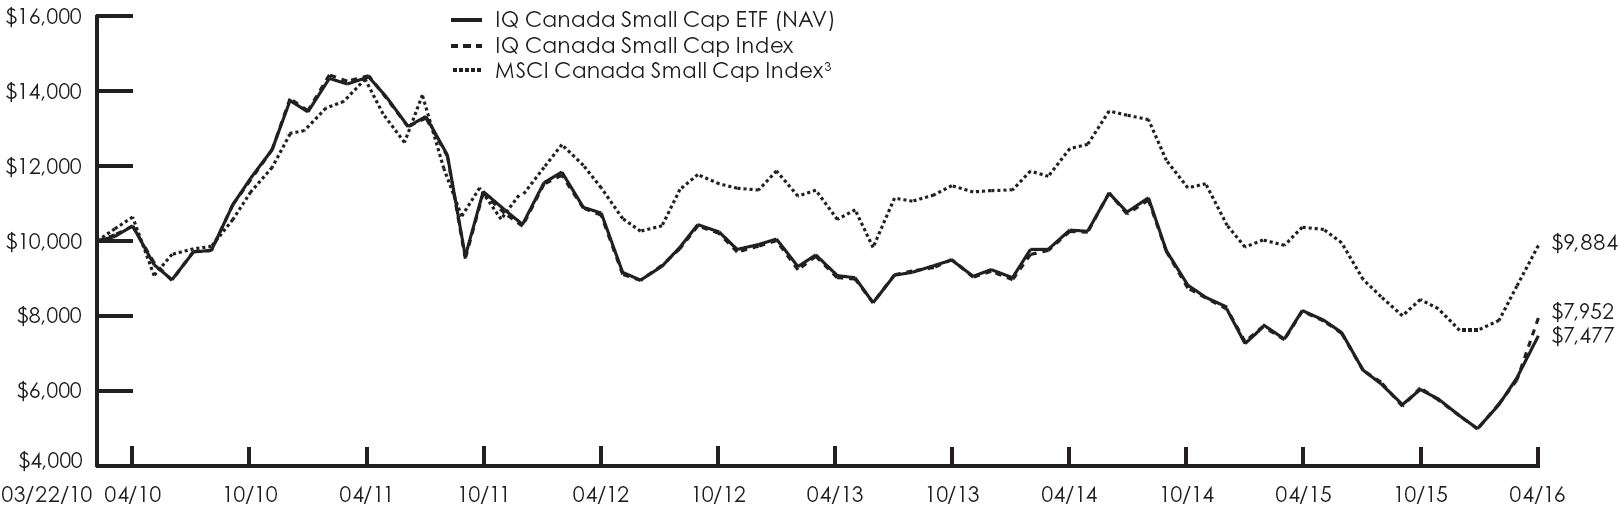
IQ Canada Small Cap ETF
How did IQ Canada Small Cap ETF (the “Fund”) perform during the 12 months ended April 30, 2016?
For the 12 months ended April 30, 2016, the Fund returned –8.29% at NAV (net asset value) and –10.39% at market price.1 To compare, the Fund’s Underlying Index, the IQ Canada Small Cap Index,2 returned –7.43% for the same time period. The MSCI Canada Small Cap Index2 returned –7.38% for the same period.
What factors affected the Fund’s performance during the reporting period?
The Underlying Index seeks to capture the performance of the small-capitalization Canadian equity market. The investable universe is limited to the 100 companies that satisfy the market capitalization and liquidity requirements of the Underlying Index selection criteria, and Underlying Index components are weighted by their float-adjusted market capitalization.
The Canadian dollar depreciated versus the U.S. dollar during the first three quarters of the reporting period but reversed and appreciated versus the U.S. dollar during the fourth quarter of the reporting period. Overall, the lack of relative currency strength, negatively impacted the Underlying Index’s returns when presented in U.S. dollar terms. Also, the Underlying Index has a large weighting in energy, the weakest performing sector during the reporting period, impacted by the decline in oil prices. That said, the materials sector, also a large weighting in the Underlying Index, performed strongly during the reporting period. The Fund’s exposure to the materials sector contributed positively to relative results, nearly offsetting the detracting effect of exposure to the energy sector.
During the reporting period, how was the Fund’s performance materially affected by investments in derivatives?
The Fund did not use derivatives during the reporting period.
During the reporting period, which sectors had the highest total returns and which sectors had the lowest total returns?
In terms of total return, the best-performing sectors in the Underlying Index were materials, telecommunication services and financials. During the reporting period, energy, health care and information technology recorded the lowest total returns.
During the reporting period, which sectors made the strongest contributions to the Fund’s absolute performance and which sectors made the weakest contributions?
On the basis of impact, which takes weightings and total returns into account, the sectors that made the strongest positive contributions to the Fund’s absolute performance were materials, telecommunication services and consumer staples. The sectors that made the weakest contributions to the Fund’s absolute performance were energy, consumer discretionary and health care.
During the reporting period, which individual stocks had the highest total returns and which stocks had the lowest total returns?
Within the Underlying Index, the stocks with the highest total returns during the reporting period were Kinross Gold, Yamana Gold and First Majestic Silver, each precious metals miners. Kinross Gold is involved in the exploration, development and production of gold. Yamana Gold is an intermediate gold producer. First Majestic Silver is a silver producing mining company.
The Underlying Index components with the lowest total returns for the reporting period were Pacific Exploration and Production, Calfrac Well Services and Sherritt International. Pacific Exploration and Production provides oilfield services. The company focuses on exploration, development and production of natural gas and crude oil. Calfrac Well Services provides specialized oilfield services. Sherritt International owns an interest in a nickel/cobalt metals business. The company also owns assets that provide for the input requirements of the metals refinery and also produce fertilizer.
| 1 | The price used to calculate the market price returns is determined by using the closing price listed on the NYSE Arca and does not represent returns an investor would receive if shares were traded at other times. |
| 2 | See page 25 for more information on this index. |
| Management’s Discussion of Fund Performance (unaudited) (continued) |
Which individual stocks made the strongest contributions to the Fund’s absolute performance during the reporting period and which stocks made the weakest contributions?
On the basis of impact, which takes weightings and total returns into consideration, the stocks that made the strongest contributions to the Fund’s absolute performance during the reporting period were Kinross Gold and Yamana Gold, mentioned above as well as Detour Gold, which explores for and produces gold in Canada. The weakest contributors were Veresen, a midstream oil and gas services company; Concordia Healthcare, a biotechnology and pharmaceuticals firm; and HudBay Minerals, a base and precious metals mining company.
Were there any changes in the Underlying Index during the reporting period?
The Underlying Index is reconstituted and rebalanced quarterly, with weights reflecting the then-current float-adjusted market capitalization. During the reporting period, precious metals mining companies AuRico Gold and Alamos Gold merged to form Alamos Gold and precious metals mining company Lake Shore Gold was acquired by Tahoe Resources. In turn, AuRico Gold and Lake Shore Gold were subsequently removed from the Underlying Index.
The opinions expressed are those of the portfolio managers as of the date of this report and are subject to change. There is no guarantee that any forecast made will come to pass. This material does not constitute investment advice and is not intended as an endorsement of any specific investment.
Hypothetical Growth of a $10,000 Investment
(Since Inception Through 4/30/2016)
This chart illustrates the performance of a hypothetical $10,000 investment made on the Fund’s inception, and is not intended to imply any future performance.
Fund Performance History
IQ Canada Small Cap ETF
(as of April 30, 2016)
| | | 1 Year | | 3 Year | | 5 Year | | Since Inception1 |
| | | Average
Annual | | Average
Annual | | Average
Annual | | Average
Annual | | Cumulative |
| IQ Canada Small Cap ETF Market Price2 | | –10.39 | % | | –6.88 | % | | –12.74 | % | | –5.04 | % | | –27.10 | % |
| IQ Canada Small Cap ETF NAV | | –8.29 | % | | –6.29 | % | | –12.26 | % | | –4.65 | % | | –25.23 | % |
| IQ Canada Small Cap Index | | –7.43 | % | | –5.21 | % | | –11.33 | % | | –3.68 | % | | –20.48 | % |
| MSCI Canada Small Cap Index3 | | –7.38 | % | | –4.01 | % | | –7.18 | % | | –0.19 | % | | –1.16 | % |
| 1 | Fund Inception Date: 3/22/2010. |
| 2 | The price used to calculate the Market Price returns is determined by using the closing price listed on the NYSE Arca and does not represent returns an investor would receive if shares were traded at other times. |
| 3 | The MSCI Canada Small Cap Index has replaced the MSCI EAFE Index as the Fund’s benchmark index. The new index more closely aligns with the Fund’s investment strategies. |
| Management’s Discussion of Fund Performance (unaudited) (continued) |
IQ Global Agribusiness Small Cap ETF
How did IQ Global Agribusiness Small Cap ETF (the “Fund”) perform during the 12 months ended April 30, 2016?
For the 12 months ended April 30, 2016, the Fund returned 11.93% at NAV (net asset value) and 9.66% at market price.1 To compare, the Fund’s Underlying Index, the IQ Global Agribusiness Small Cap Index,2 returned 12.39% for the same time period. The Russell Global Small Cap Agriculture Fishing & Ranching Index and the MSCI World Small Cap Index2 returned 3.46% and –2.56%, respectively, during the same period.
What factors affected the Fund’s performance during the reporting period?
The Underlying Index applies size, liquidity and business operations rules to select small capitalization agribusiness companies and uses a float-adjusted market capitalization weighting methodology.
The Fund focuses on global, small capitalization stocks. Global investing also exposes the strategy to currency fluctuations. During the reporting period, the Underlying Index’s and the Fund’s overall performance benefited from both local equity market appreciation and currency returns. The Underlying Index’s and Fund’s currency exposure to the yen was an especially strong source of performance. From a local equity market perspective, the Underlying Index’s and the Fund’s exposure to Japan provided the greatest contribution to overall return, followed by exposure to the equity markets of Indonesia and the U.S. The Underlying Index’s largest sector —crop production and farming — also performed positively during the reporting period.
During the reporting period, how was the Fund’s performance materially affected by investments in derivatives?
The Fund did not use derivatives during the reporting period.
During the reporting period, which sectors had the highest total returns and which sectors had the lowest total returns?
The Underlying Index is organized into five sectors. In terms of total return, the best-performing sectors in the Underlying Index were livestock operations, crop production and farming, and agricultural machinery. During the reporting period, agricultural chemicals and agricultural supplies and logistics were the two weakest sectors.
During the reporting period, which sectors made the strongest contributions to the Fund’s absolute performance and which sectors made the weakest contributions?
On the basis of impact, which takes weightings and total returns into account, the sectors that made the strongest positive contributions to the Fund’s absolute performance were crop production and farming as well as livestock operations. The sectors that made the weakest contributions were agricultural chemicals, agricultural machinery and agricultural supplies and logistics.
During the reporting period, which individual stocks had the highest total returns and which stocks had the lowest total returns?
Within the Underlying Index, the stocks with the highest total returns during the reporting period were PC Charoen Pokphand, China Huishan Dairy Holdings and Nichirei Corporation. PT Charoen Pokphand manufactures and distributes animal feeds, poultry equipment and poultry processing services and operates poultry farms through its subsidiaries. China Huishan Dairy Holdings operates dairy farms and produces dairy products. Nichirie Corporation produces and distributes frozen foods and meat products.
The Underlying Index components with the lowest total returns for the reporting period were Shenguan Holdings, China Modern Dairy Holdings and Select Harvests. Shenguan Holdings manufactures sausage casings. China Modern Dairy Holdings is an industrialized agricultural company focusing on dairy farms and raw milk. Select Harvests grows, processes, packages and distributes almonds and edible nuts.
| 1 | The price used to calculate the market price returns is determined by using the closing price listed on the NYSE Arca and does not represent returns an investor would receive if shares were traded at other times. |
| 2 | See page 27 for more information on this index. |
| Management’s Discussion of Fund Performance (unaudited) (continued) |
Which individual stocks made the strongest contributions to the Fund’s absolute performance during the reporting period and which stocks made the weakest contributions?
On the basis of impact, which takes weightings and total returns into consideration, the stocks that made the strongest contributions to the Fund’s absolute performance during the reporting period were Nisshin Seifun Group, which is a flour milling and food processing company, and PT Charoen Pokphand and Nichirie Corporation, each mentioned above. The weakest contributors were China Modern Dairy Holdings and Select Harvests, each mentioned earlier, as well as China BlueChemical, which is a mineral fertilizers and chemicals producer.
Were there any changes in the Underlying Index during the reporting period?
The Underlying Index is reconstituted and rebalanced quarterly in accordance with the rules of the Underlying Index. During the reporting period, no significant corporate actions occurred.
The opinions expressed are those of the portfolio managers as of the date of this report and are subject to change. There is no guarantee that any forecast made will come to pass. This material does not constitute investment advice and is not intended as an endorsement of any specific investment.
Hypothetical Growth of a $10,000 Investment
(Since Inception Through 4/30/2016)

This chart illustrates the performance of a hypothetical $10,000 investment made on the Fund’s inception, and is not intended to imply any future performance.
Fund Performance History
IQ Global Agribusiness Small Cap ETF
(as of April 30, 2016)
| | | 1 Year | | 3 Year | | 5 Year | | Since Inception1 |
| | | Average
Annual | | Average
Annual | | Average
Annual | | Average
Annual | | Cumulative |
| IQ Global Agribusiness Small Cap ETF Market Price2 | | 9.66 | % | | 5.40 | % | | 2.76 | % | | 4.36 | % | | 24.38 | % |
| IQ Global Agribusiness Small Cap ETF NAV | | 11.93 | % | | 6.04 | % | | 3.29 | % | | 4.77 | % | | 26.90 | % |
| IQ Global Agribusiness Small Cap Index | | 12.39 | % | | 6.66 | % | | 3.95 | % | | 5.46 | % | | 31.25 | % |
| Russell Global Small Cap Agriculture | | | | | | | | | | | | | | | |
| Fishing & Ranching Index | | 3.46 | % | | 3.44 | % | | 0.87 | % | | 2.23 | % | | 11.96 | % |
| MSCI World Small Cap Index | | –2.56 | % | | 7.44 | % | | 6.08 | % | | 7.38 | % | | 43.92 | % |
| 1 | Fund Inception Date: 3/21/2011. |
| 2 | The price used to calculate the Market Price returns is determined by using the closing price listed on the NYSE Arca and does not represent returns an investor would receive if shares were traded at other times. |
| Management’s Discussion of Fund Performance (unaudited) (continued) |
IQ Global Oil Small Cap ETF
How did IQ Global Oil Small Cap ETF (the “Fund”) perform during the 12 months ended April 30, 2016?
For the 12 months ended April 30, 2016, the Fund returned –30.69% at NAV (net asset value) and –29.39% at market price.1 To compare, the Fund’s Underlying Index, the IQ Global Oil Small Cap Index,2 returned –30.25% for the same time period. The MSCI World Small Cap Index2 and the Russell Global Small Cap Energy Index returned –2.56% and –35.34%, respectively, during the same period.
What factors affected the Fund’s performance during the reporting period?
The Underlying Index applies size and liquidity rules to select small capitalization pure-oil companies and uses a float-adjusted market capitalization weighting methodology.
The global price of oil was the dominant theme during the reporting period that impacted the energy sector as a whole and oil companies in particular. As a global strategy, the Underlying Index was also subject to currency risks. The U.S. dollar performed strongly during the first three fiscal quarters of the reporting period. The combination of the drop in oil prices and the strengthening U.S. dollar negatively affected U.S.-based companies operating in the oil industry. The final fiscal quarter of the reporting period saw a depreciating U.S. dollar and an increase in oil prices, which helped mitigate the downward trending performance.
The Fund’s sector exposure also contributed negatively to its performance, with all three sectors in which the Underlying Index and the Fund invest posting negative absolute returns.
During the reporting period, how was the Fund’s performance materially affected by investments in derivatives?
The Fund did not use derivatives during the reporting period.
During the reporting period, which industries had the highest total returns and which industries had the lowest total returns?
The Underlying Index is organized into three sectors. All three sectors posted negative total returns during the reporting period. The industries in order of descending total return were refining and marketing; equipment, services and drilling; and exploration and production.
During the reporting period, which industries made the strongest contributions to the Fund’s absolute performance and which industries made the weakest contributions?
On the basis of impact, which takes weightings and total returns into account, all three industries in which the Underlying Index and the Fund invest detracted from performance. The industries in order of descending contribution to return were equipment, services and drilling; refining and marketing; and exploration and production.
During the reporting period, which individual stocks had the highest total returns and which stocks had the lowest total returns?
Within the Underlying Index, the stocks with the highest total returns during the reporting period were Seven Generations Energy, Baytex Energy and Tullow Oil, each an oil exploration and production company.
The Underlying Index components with the lowest total returns for the reporting period were Stone Energy, Legacy Reserves and Linn Energy, each also an oil exploration and production company.
| 1 | The price used to calculate the market price returns is determined by using the closing price listed on the NYSE Arca and does not represent returns an investor would receive if shares were traded at other times. |
| 2 | See page 29 for more information on this index. |
| Management’s Discussion of Fund Performance (unaudited) (continued) |
Which individual stocks made the strongest contributions to the Fund’s absolute performance during the reporting period and which stocks made the weakest contributions?
On the basis of impact, which takes weightings and total returns into consideration, the stocks that made the strongest contributions to the Fund’s absolute performance during the reporting period were Seven Generations Energy, Tullow Oil and Baytex Energy, each mentioned earlier. The weakest contributors were SemGroup, a midstream oil and gas company; and California Resources and SM Energy, each an oil exploration and production company.
Were there any changes in the Underlying Index during the reporting period?
The Underlying Index is reconstituted and rebalanced quarterly. During the reporting period, Dragon Oil was acquired in an all-cash acquisition and thus removed from the Underlying Index in September 2015. Pacific Exploration and Production was removed from the Underlying Index during the reporting period in connection with a capital restructuring and trading suspension on its primary exchange.
The opinions expressed are those of the portfolio managers as of the date of this report and are subject to change. There is no guarantee that any forecast made will come to pass. This material does not constitute investment advice and is not intended as an endorsement of any specific investment.
Hypothetical Growth of a $10,000 Investment
(Since Inception Through 4/30/2016)
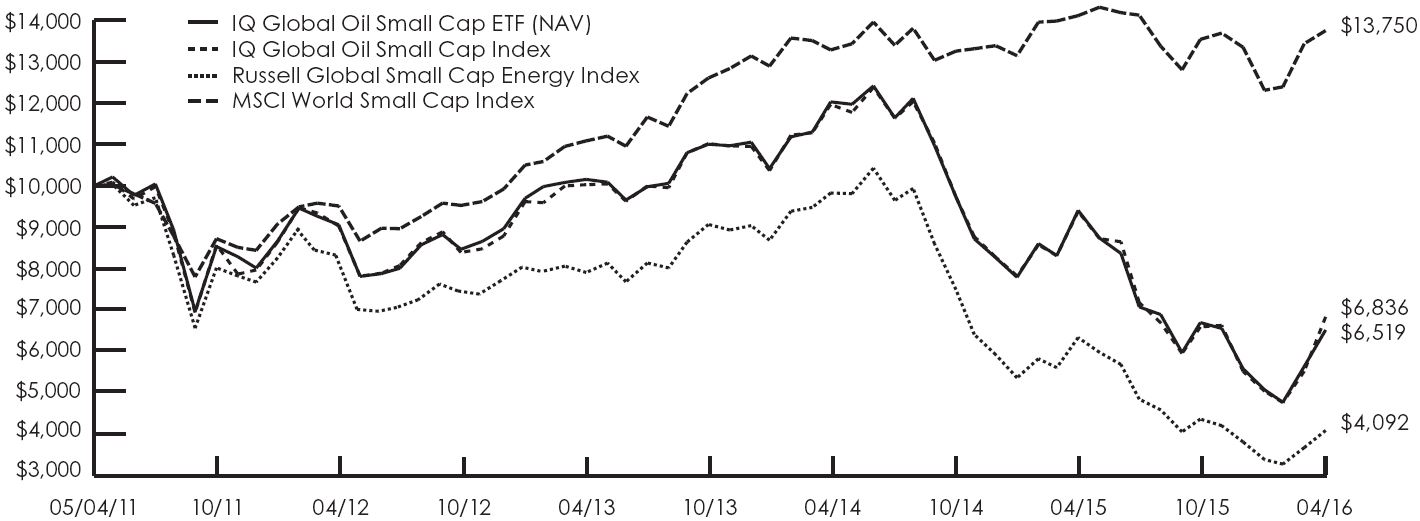
This chart illustrates the performance of a hypothetical $10,000 investment made on the Fund’s inception, and is not intended to imply any future performance.
Fund Performance History
IQ Global Oil Small Cap ETF
(as of April 30, 2016)
| | | 1 Year | | 3 Year | | Since Inception1 |
| | | Average
Annual | | Average
Annual | | Average
Annual | | Cumulative |
| IQ Global Oil Small Cap ETF Market Price2 | | –29.39 | % | | –12.91 | % | | –7.92 | % | | –33.75 | % |
| IQ Global Oil Small Cap ETF NAV | | –30.69 | % | | –13.74 | % | | –8.21 | % | | –34.81 | % |
| IQ Global Oil Small Cap Index | | –30.25 | % | | –12.93 | % | | –7.33 | % | | –31.64 | % |
| Russell Global Small Cap Energy Index | | –35.34 | % | | –19.70 | % | | –16.38 | % | | –59.08 | % |
| MSCI World Small Cap Index | | –2.56 | % | | 7.44 | % | | 6.58 | % | | 37.50 | % |
| 1 | Fund Inception Date: 5/4/2011. |
| 2 | The price used to calculate the Market Price returns is determined by using the closing price listed on the NYSE Arca and does not represent returns an investor would receive if shares were traded at other times. |
| Management’s Discussion of Fund Performance (unaudited) (continued) |
IQ U.S. Real Estate Small Cap ETF
How did IQ U.S. Real Estate Small Cap ETF (the “Fund”) perform during the 12 months ended April 30, 2016?
For the 12 months ended April 30, 2016, the Fund returned –0.51% at NAV (net asset value) and –0.83% at market price.1 To compare, the Fund’s Underlying Index, the IQ U.S. Real Estate Small Cap Index,2 returned 0.23% for the same time period. The Dow Jones U.S. Real Estate Index2 returned 6.40% for the same period.
What factors affected the Fund’s performance during the reporting period?
The Underlying Index seeks to capture the performance of the small-capitalization U.S. real estate equity market. The investable universe is limited to, at most, 100 companies that satisfy the market capitalization and liquidity requirements of the Underlying Index selection criteria, and Underlying Index components are weighted by their float-adjusted market capitalization.
The Underlying Index classifies real estate investment trusts (REITs) as residential, hotel, retail, office, diversified, specialized or mortgage REITs. Over time, mortgage REITs have shown interest rate sensitivity. Office REITs and retail REITs are affected by the overall economic environment. Virtually all publicly-traded U.S. REITs exhibit sensitivity to the broad U.S. equity market. Other factors that affect REITs are the metropolitan markets in which they operate and the various types of properties that comprise the REIT’s portfolio.
During the reporting period, the Underlying Index’s mortgage REIT sector underperformed the other REIT sectors, posting the largest negative contribution to return. Retail and office REITs posted positive contributions.
During the reporting period, how was the Fund’s performance materially affected by investments in derivatives?
The Fund did not use derivatives during the reporting period.
During the reporting period, which sectors had the highest total returns and which sectors had the lowest total returns?
In terms of total return, the best-performing sectors in the Underlying Index were retail, residential and office. During the reporting period, hotel, mortgage and diversified recorded the lowest total returns.
During the reporting period, which sectors made the strongest contributions to the Fund’s absolute performance and which sectors made the weakest contributions?
On the basis of impact, which takes weightings and total returns into account, the sectors that made the strongest positive contributions to the Fund’s absolute performance were retail, office and specialized. The sectors that made the weakest contributions to the Fund’s absolute performance were mortgage, hotel and diversified.
During the reporting period, which individual stocks had the highest total returns and which stocks had the lowest total returns?
Within the Underlying Index, the stocks with the highest total returns during the reporting period were National Storage Affiliates, a specialty REIT focused on self-storage; Mack-Cali Realty, an office REIT focused on the Northeast; and CyrusOne, a specialty REIT focused on industrial data centers.
The Underlying Index components with the lowest total returns for the reporting period were RAIT Financial Trust, a mortgage REIT; InfraREIT, a specialized REIT focused on electricity infrastructure; and FelCor Lodging Trust, a hotel REIT.
| 1 | The price used to calculate the market price returns is determined by using the closing price listed on the NYSE Arca and does not represent returns an investor would receive if shares were traded at other times. |
| 2 | See page 31 for more information on this index. |
| Management’s Discussion of Fund Performance (unaudited) (continued) |
Which individual stocks made the strongest contributions to the Fund’s absolute performance during the reporting period and which stocks made the weakest contributions?
On the basis of impact, which takes weightings and total returns into consideration, the stocks that made the strongest contributions to the Fund’s absolute performance during the reporting period were CyrusOne and Mack-Cali Realty, each mentioned earlier, and Education Realty Trust, a residential REIT. The weakest contributors were Colony Capital and New Residential Investment, each a mortgage finance company, and Sabra Health Care, a specialized REIT.
Were there any changes in the Underlying Index during the reporting period?
The Underlying Index is reconstituted and rebalanced quarterly, with weights reflecting the then-current float-adjusted market capitalizations.
During the reporting period, several Underlying Index constituents were removed as a result of merger activity. These included Inland Real Estate, American Residential Properties, Campus Credit Communities, BioMed Realty Trust, Associated Estates Realty and Excel Trust. Two Underlying Index constituents, Chambers Street Properties and Gramercy Property Trust, merged together.
The opinions expressed are those of the portfolio managers as of the date of this report and are subject to change. There is no guarantee that any forecast made will come to pass. This material does not constitute investment advice and is not intended as an endorsement of any specific investment.
Hypothetical Growth of a $10,000 Investment
(Since Inception Through 4/30/2016)
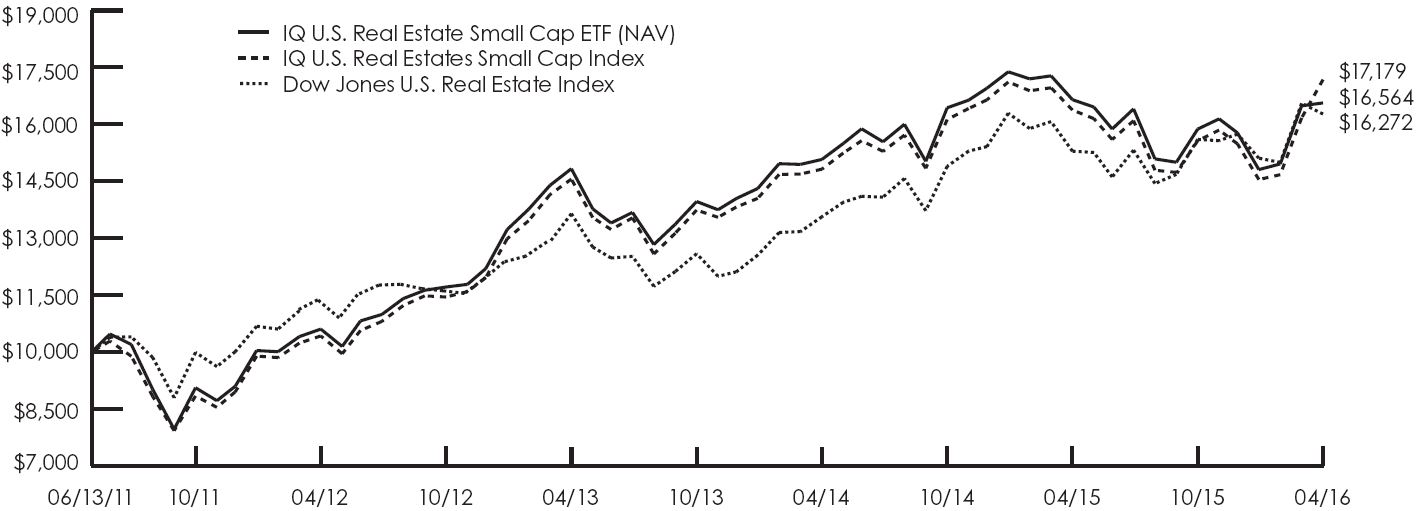
This chart illustrates the performance of a hypothetical $10,000 investment made on the Fund’s inception, and is not intended to imply any future performance.
Fund Performance History
IQ U.S. Real Estate Small Cap ETF
(as of April 30, 2016)
| | | 1 Year | | 3 Year | | Since Inception1 |
| | | Average
Annual | | Average
Annual | | Average
Annual | | Cumulative |
| IQ U.S. Real Estate Small Cap ETF Market Price2 | | –0.83 | % | | 3.72 | % | | 10.44 | % | | 62.41 | % |
| IQ U.S. Real Estate Small Cap ETF NAV | | –0.51 | % | | 3.75 | % | | 10.89 | % | | 65.65 | % |
| IQ U.S. Real Estate Small Cap Index | | 0.23 | % | | 4.46 | % | | 14.90 | % | | 71.79 | % |
| Dow Jones U.S. Real Estate Index | | 6.40 | % | | 6.04 | % | | 10.48 | % | | 62.72 | % |
| 1 | Fund Inception Date: 6/13/2011. |
| 2 | The price used to calculate the Market Price returns is determined by using the closing price listed on the NYSE Arca and does not represent returns an investor would receive if shares were traded at other times. |
| Management’s Discussion of Fund Performance (unaudited) (continued) |
IQ 50 Percent Hedged FTSE International ETF
How did IQ 50 Percent Hedged FTSE International ETF (the “Fund”) perform from its inception on July 22, 2015 through April 30, 2016?
From its inception on July 22, 2015 through April 30, 2016 (the “reporting period”), the Fund returned –10.33% at NAV (net asset value) and –10.77% at market price.1 To compare, the Fund’s Underlying Index, the FTSE Developed ex North America 50% Hedged to USD Index2, returned –9.65% for the same time period. The FTSE Developed ex North America Index2 returned –7.96% for the same period.
The Fund invests in a representative sample of securities included in the Underlying Index that collectively has an investment profile similar to the Underlying Index. Due to the use of representative sampling, the Fund may or may not hold all of the securities that are included in the Underlying Index.
What factors affected the Fund’s performance during the reporting period?
The Fund was impacted during the reporting period by the currency effect of investing in international developed equity markets and then hedging 50% of its foreign currency exposure back to U.S. dollars. The Fund’s strategy is meant to track the FTSE Developed ex North America Index with a 50% currency hedge to the U.S. dollar. During the reporting period as a whole, most currencies of major developed nations depreciated against the U.S. dollar, although the U.S. dollar weakened in the last months of the reporting period.
Local market economies were also a primary influence on the negative performance of the local international developed equity markets as were broader concerns regarding a global economic slowdown. Local market monetary and interest rate policies also had a negative influence.
During the reporting period, how was the Fund’s performance materially affected by investments in derivatives?
The Fund uses currency forwards to hedge 50% of its respective currency exposure of the component securities of the Underlying Index. The hedge is reset monthly using 30-day forward contracts.
During the reporting period, which sectors had the highest total returns and which sectors had the lowest total returns?
In terms of total return, the best-performing sectors in the Underlying Index were consumer goods, oil & gas and utilities. During the reporting period, financials, basic materials and telecommunications recorded the lowest total returns.
During the reporting period, which sectors made the strongest contributions to the Fund’s absolute performance and which sectors made the weakest contributions?
On the basis of impact, which takes weightings and total returns into account, the sectors that made the strongest positive contributions to the Fund’s absolute performance were oil & gas, utilities and technology. The sectors that made the weakest contributions to the Fund’s absolute performance were financials, health care and basic materials.
During the reporting period, which individual stocks had the highest total returns and which stocks had the lowest total returns?
Within the Underlying Index, the stocks with the highest total returns during the reporting period were Goldin Financial, a Hong Kong-based diversified investment company; Fortescue Metals Group, an Australian iron ore exploration and production company; and Ono Pharmaceuticals, a Japanese specialty pharmaceuticals company that researches and develops prescription drugs.
The Underlying Index constituents with the lowest total returns for the reporting period were Piraeus Bank, a full service bank based in Greece; National Bank of Greece, a retail and corporate bank in Greece; and Saipem SpA, an Italian oilfield services company.
| 1 | The price used to calculate the market price returns is determined by using the closing price listed on the NYSE Arca and does not represent returns an investor would receive if shares were traded at other times. |
| 2 | See page 33 for more information on this index. |
| Management’s Discussion of Fund Performance (unaudited) (continued) |
Which individual stocks made the strongest contributions to the Fund’s absolute performance during the reporting period and which stocks made the weakest contributions?
On the basis of impact, which takes weightings and total returns into consideration, the stocks that made the strongest contributions to the Fund’s absolute performance during the reporting period were British American Tobacco, a U.K.-based international tobacco company; Adidas, a German-based apparel and footwear company; and Ono Pharmaceuticals, mentioned earlier. The weakest contributors were Novartis, a Switzerland-based large pharmaceuticals company; HSBC Holdings, a U.K.-based diversified bank; and Toyota Motor, a Japan-based automobile manufacturer and retailer.
Were there any changes in the Underlying Index during the reporting period?
The Underlying Index was reconstituted by FTSE in September 2015 and March 2016. Also during the reporting period, FTSE removed Greece from the investable universe of the Underlying Index. Throughout the reporting period, FTSE made incremental adjustments to underlying constituent weights based on company shares in issue updates or float factors.
The opinions expressed are those of the portfolio managers as of the date of this report and are subject to change. There is no guarantee that any forecast made will come to pass. This material does not constitute investment advice and is not intended as an endorsement of any specific investment.
Hypothetical Growth of a $10,000 Investment
(Since Inception Through 4/30/2016)

This chart illustrates the performance of a hypothetical $10,000 investment made on the Fund’s inception, and is not intended to imply any future performance.
Fund Performance History
IQ 50 Percent Hedged FTSE International ETF
(as of April 30, 2016)
| | | Since Inception1,3 |
| | | Cumulative |
| IQ 50 Percent Hedged FTSE International ETF Market Price2 | | –10.77 | % |
| IQ 50 Percent Hedged FTSE International ETF NAV | | –10.33 | % |
| FTSE Developed ex North America 50% Hedged to USD Index | | –9.65 | % |
| FTSE Developed ex North America Index | | –7.96 | % |
| 1 | Fund Inception Date: 7/22/2015. |
| 2 | The price used to calculate the Market Price returns is determined by using the closing price listed on the NYSE Arca and does not represent returns an investor would receive if shares were traded at other times. |
| 3 | Total return calculated for a period of less than one year is not annualized. |
| Management’s Discussion of Fund Performance (unaudited) (continued) |
IQ 50 Percent Hedged FTSE Europe ETF
How did IQ 50 Percent Hedged FTSE Europe ETF (the “Fund”) perform from its inception on July 22, 2015 through April 30, 2016?
From its inception on July 22, 2015 through April 30, 2016 (the “reporting period”), the Fund returned –10.33% at NAV (net asset value) and –9.38% at market price.1 To compare, the Fund’s Underlying Index, the FTSE Developed Europe 50% Hedged to USD Index2, returned –9.43% for the same time period. The FTSE Developed Europe Index2 returned –9.43% for the same period.
The Fund invests in a representative sample of securities included in the Underlying Index that collectively has an investment profile similar to the Underlying Index. Due to the use of representative sampling, the Fund may or may not hold all of the securities that are included in the Underlying Index.
What factors affected the Fund’s performance during the reporting period?
The Fund was impacted during the reporting period by the currency effect of investing in developed European equity markets and then hedging 50% of its foreign currency exposure back to U.S. dollars. The Fund’s strategy is meant to track the FTSE Developed Europe Index with a 50% currency hedge to the U.S. dollar. During the reporting period as a whole, most currencies of major developed European nations depreciated against the U.S. dollar, although the U.S. dollar weakened in the last months of the reporting period.
Local market economies were also a primary influence on the positive performance of the local developed European equity markets as were broader concerns regarding a global economic slowdown. Local market monetary and interest rate policies also had a positive influence.
During the reporting period, how was the Fund’s performance materially affected by investments in derivatives?
The Fund uses currency forwards to hedge 50% of its respective currency exposure of the component securities of the Underlying Index. The hedge is reset monthly using 30-day forward contracts.
During the reporting period, which sectors had the highest total returns and which sectors had the lowest total returns?
In terms of total return, the best-performing sectors in the Underlying Index were consumer goods, industrials and oil & gas. During the reporting period, financials, telecommunications and basic materials recorded the lowest total returns.
During the reporting period, which sectors made the strongest contributions to the Fund’s absolute performance and which sectors made the weakest contributions?
On the basis of impact, which takes weightings and total returns into account, the sectors that made the strongest positive contributions to the Fund’s absolute performance were oil & gas, consumer goods and utilities. The sectors that made the weakest contributions to the Fund’s absolute performance were financials, health care and basic materials.
During the reporting period, which individual stocks had the highest total returns and which stocks had the lowest total returns?
Within the Underlying Index, the stocks with the highest total returns during the reporting period were Adidas, a German-based apparel and footwear company; Randgold Resources, a Jersey-based, Africa-focused precious metals mining and exploration company; and Fresnillo, a Mexico-based precious metals mining and exploration company.
The Underlying Index constituents with the lowest total returns for the reporting period were Piraeus Bank, a full service bank based in Greece; National Bank of Greece, a retail and corporate bank in Greece; and Saipem SpA, an Italian oilfield services company.
| 1 | The price used to calculate the market price returns is determined by using the closing price listed on the NYSE Arca and does not represent returns an investor would receive if shares were traded at other times. |
| 2 | See page 35 for more information on this index. |
| Management’s Discussion of Fund Performance (unaudited) (continued) |
Which individual stocks made the strongest contributions to the Fund’s absolute performance during the reporting period and which stocks made the weakest contributions?
On the basis of impact, which takes weightings and total returns into consideration, the stocks that made the strongest contributions to the Fund’s absolute performance during the reporting period were British American Tobacco, a U.K.-based international tobacco company; Adidas, mentioned earlier; and Total, a France-based integrated oil company. The weakest contributors were Novartis, a Switzerland-based large pharmaceuticals company, as well as HSBC Holdings and Barclays, each a U.K.-based diversified bank.
Were there any changes in the Underlying Index during the reporting period?
The Underlying Index was reconstituted by FTSE in September 2015 and March 2016. Also during the reporting period, FTSE removed Greece from the investable universe of the Underlying Index. Throughout the reporting period, FTSE made incremental adjustments to underlying constituent weights based on company shares in issue updates or float factors.
The opinions expressed are those of the portfolio managers as of the date of this report and are subject to change. There is no guarantee that any forecast made will come to pass. This material does not constitute investment advice and is not intended as an endorsement of any specific investment.
Hypothetical Growth of a $10,000 Investment
(Since Inception Through 4/30/2016)
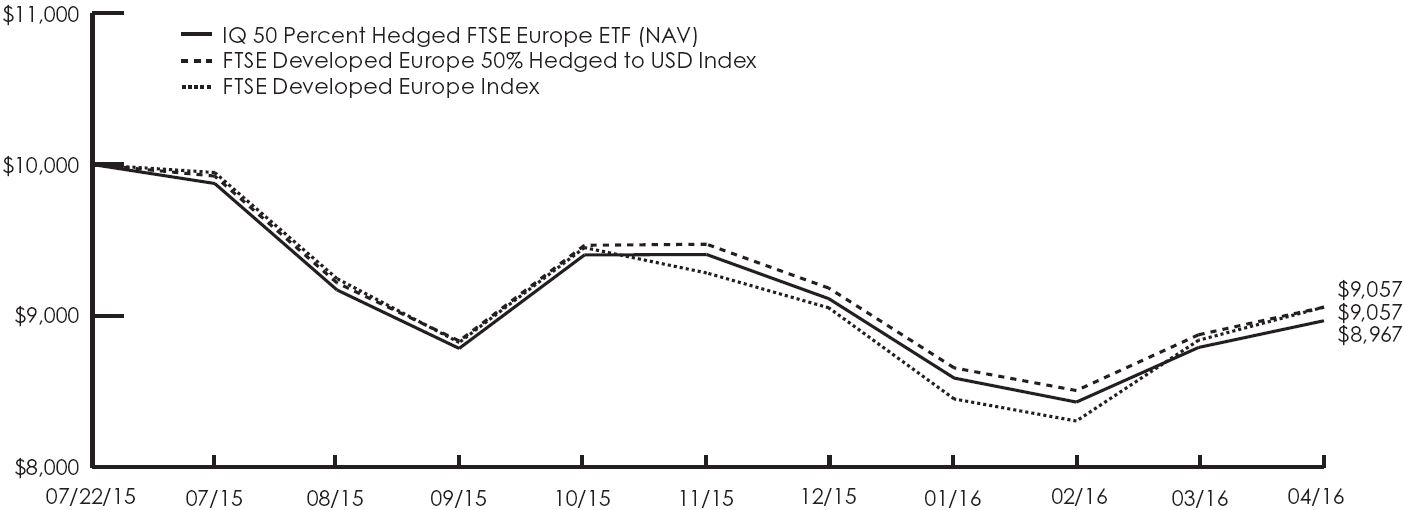
This chart illustrates the performance of a hypothetical $10,000 investment made on the Fund’s inception, and is not intended to imply any future performance.
Fund Performance History
IQ 50 Percent Hedged FTSE Europe ETF
(as of April 30, 2016)
| | | Since Inception1,3 |
| | | Cumulative |
| IQ 50 Percent Hedged FTSE Europe ETF Market Price2 | | –9.38 | % |
| IQ 50 Percent Hedged FTSE Europe ETF NAV | | –10.33 | % |
| FTSE Developed Europe 50% Hedged to USD Index | | –9.43 | % |
| FTSE Developed Europe Index | | –9.43 | % |
| 1 | Fund Inception Date: 7/22/2015. |
| 2 | The price used to calculate the Market Price returns is determined by using the closing price listed on the NYSE Arca and does not represent returns an investor would receive if shares were traded at other times. |
| 3 | Total return calculated for a period of less than one year is not annualized. |
| Management’s Discussion of Fund Performance (unaudited) (continued) |
IQ 50 Percent Hedged FTSE Japan ETF
How did IQ 50 Percent Hedged FTSE Japan ETF (the “Fund”) perform from its inception on July 22, 2015 through April 30, 2016?
From its inception on July 22, 2015 through April 30, 2016 (the “reporting period”), the Fund returned –14.05% at NAV (net asset value) and –11.56% at market price.1 To compare, the Fund’s Underlying Index, the FTSE Japan 50% Hedged to USD Index2, returned –13.57% for the same time period. The FTSE Japan Index2 returned –6.88% for the same period.
The Fund invests in a representative sample of securities included in the Underlying Index that collectively has an investment profile similar to the Underlying Index. Due to the use of representative sampling, the Fund may or may not hold all of the securities that are included in the Underlying Index.
What factors affected the Fund’s performance during the reporting period?
The Fund was impacted during the reporting period by the currency effect of investing in the Japanese equity market and then hedging 50% of its foreign currency exposure back to U.S. dollars. The Fund’s strategy is meant to track the FTSE Japan Index with a 50% currency hedge to the U.S. dollar. During the reporting period as a whole, the yen depreciated against the U.S. dollar, although the U.S. dollar weakened in the last months of the reporting period.
Local market economies were also a primary influence on the negative performance of the local Japanese equity market as were broader concerns regarding a global economic slowdown. Local market monetary and interest rate policies also had an negative influence.
During the reporting period, how was the Fund’s performance materially affected by investments in derivatives?
The Fund uses currency forwards to hedge 50% of its respective currency exposure of the component securities of the Underlying Index. The hedge is reset monthly using 30-day forward contracts.
During the reporting period, which sectors had the highest total returns and which sectors had the lowest total returns?
In terms of total return, the best-performing sectors in the Underlying Index were telecommunications, health care and technology. During the reporting period, financials, utilities and basic materials recorded the lowest total returns.
During the reporting period, which sectors made the strongest contributions to the Fund’s absolute performance and which sectors made the weakest contributions?
On the basis of impact, which takes weightings and total returns into account, the sectors that made the strongest positive contributions to the Fund’s absolute performance were health care, telecommunications and oil & gas. The sectors that made the weakest contributions to the Fund’s absolute performance were financials, consumer goods and industrials.
During the reporting period, which individual stocks had the highest total returns and which stocks had the lowest total returns?
Within the Underlying Index, the stocks with the highest total returns during the reporting period were Ono Pharmaceuticals, a specialty pharmaceuticals company that researches and develops prescription drugs; Park24, an automated parking garage operator; and Konami Holdings, an application software company offering digital entertainment and health and fitness gaming products.
The Underlying Index constituents with the lowest total returns for the reporting period were Laox, a specialized retailer in household appliances and computers; Mitsubishi Motors, an automobile manufacturer and retailer; and IHI, a heavy machinery manufacturer focusing on aircraft parts, petroleum refineries and nuclear power plants.
| 1 | The price used to calculate the market price returns is determined by using the closing price listed on the NYSE Arca and does not represent returns an investor would receive if shares were traded at other times. |
| 2 | See page 37 for more information on this index. |
| Management’s Discussion of Fund Performance (unaudited) (continued) |
Which individual stocks made the strongest contributions to the Fund’s absolute performance during the reporting period and which stocks made the weakest contributions?
On the basis of impact, which takes weightings and total returns into consideration, the stocks that made the strongest contributions to the Fund’s absolute performance during the reporting period were Ono Pharmaceuticals, already mentioned, as well as KDDI and NTT DoCoMo, each a mobile telecommunications carrier. The weakest contributors were Toyota Motor, an automobile manufacturer and retailer; Mitsubishi UFJ Financial Group, a holding company operating as a diversified bank formed in the merger between Mitsubishi Tokyo Financial Group and UFJ Holdings; and Sumitomo Mitsui Financial Group, another holding company operating as a diversified bank.
Were there any changes in the Underlying Index during the reporting period?
The Underlying Index was reconstituted by FTSE in September 2015 and March 2016.
The opinions expressed are those of the portfolio managers as of the date of this report and are subject to change. There is no guarantee that any forecast made will come to pass. This material does not constitute investment advice and is not intended as an endorsement of any specific investment.
Hypothetical Growth of a $10,000 Investment
(Since Inception Through 4/30/2016)
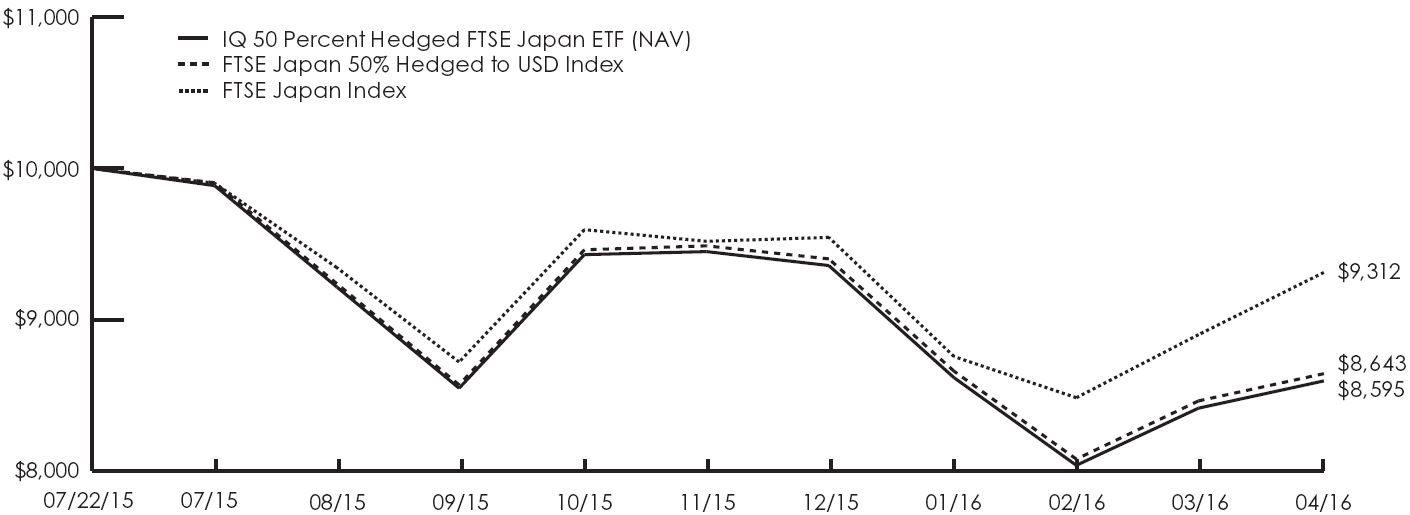
This chart illustrates the performance of a hypothetical $10,000 investment made on the Fund’s inception, and is not intended to imply any future performance.
Fund Performance History
IQ 50 Percent Hedged FTSE Japan ETF
(as of April 30, 2016)
| | | Since Inception1,3 |
| | | Cumulative |
| IQ 50 Percent Hedged FTSE Japan ETF Market Price2 | | –11.56 | % |
| IQ 50 Percent Hedged FTSE Japan ETF NAV | | –14.05 | % |
| FTSE Japan 50% Hedged to USD Index | | –13.57 | % |
| FTSE Japan Index | | –6.88 | % |
| 1 | Fund Inception Date: 7/22/2015. |
| 2 | The price used to calculate the Market Price returns is determined by using the closing price listed on the NYSE Arca and does not represent returns an investor would receive if shares were traded at other times. |
| 3 | Total return calculated for a period of less than one year is not annualized. |
| Management’s Discussion of Fund Performance (unaudited) (continued) |
IQ Leaders GTAA Tracker ETF
How did IQ Leaders GTAA Tracker ETF (the “Fund”) perform from its inception on September 30, 2015 through April 30, 2016?
From its inception on September 30, 2015 through April 30, 2016 (the “reporting period”), the Fund returned 5.50% at NAV (net asset value) and 1.72% at market price.1 To compare, the Fund’s Underlying Index, the IQ Leaders GTAA Index2, returned 5.99% for the same time period. The MSCI All Cap World Index (Net)2 returned 9.00% for the same period.
What factors affected the Fund’s performance during the reporting period?
The Fund’s short positions in the utilities, industrials and consumer discretionary sectors, via underlying ETFs, detracted from its performance as did its long position in convertible bonds. Conversely, the Fund’s long positions in equities, specifically U.S. large-capitalization core equity sectors and core international equities, via underlying ETFs, were the primary positive contributors to returns. The materials and information technology sectors had the biggest positive effects. The Fund’s weighting in a U.S. small-capitalization equity ETF also made a positive contribution. The Fund was also aided during the reporting period by its positions in aggregate bonds and high yield corporate bonds, via underlying ETFs.
During the reporting period, how was the Fund’s performance materially affected by investments in derivatives?
The Fund used derivatives to obtain exposure to long and short positions of the Underlying Index. The long exposures included certain Underlying Index positions, such as investment grade corporate, sovereign, and local authority bonds; short term Treasury securities; equity volatility; and domestic small capitalization stocks. The short exposures included all of the Underlying Index positions, including principally Consumer Staples Select Sector SPDR Fund, Utilities Select Sector SPDR Fund, and the iShares 7-10 Year Treasury Bond ETF.
How were the Fund’s assets allocated during the reporting period and why?
The Fund’s allocations are driven by quantitative models that determine the weights across the various hedge fund strategies represented in the Fund as well as the weights of the assets within these strategies. Given the rules-based nature of the process, there is no subjectivity involved in the allocation decision process.
At the asset class level, the Fund was allocated approximately 60% in equities and 40% in bonds. Within fixed income, aggregate bonds were the largest position, followed by high yield corporate bonds. In equities, the Fund had approximately half of its weighting in core international equities. The materials and information technology sectors were the largest equity sector allocations. The Fund also had approximately 7.5% of its assets in U.S. small-capitalization equities.
How did the Fund’s allocations change over the course of the reporting period?
Based on our proprietary quantitative models, the Fund’s overall bond allocation declined somewhat during the reporting period, but, within that, the Fund’s allocation changed even more, as the Fund shifted its exposure away from investment grade corporate bonds and convertible bonds and toward intermediate-term U.S. Treasury bonds and high yield corporate bonds. The Fund’s equity allocation to the consumer discretionary and health care sectors increased.
During the reporting period, which underlying ETFs had the highest total returns and which underlying ETFs had the lowest total returns?
In terms of total return, the best-performing underlying ETFs in the Fund were Vanguard Materials Index Fund (VAW) and Materials Select Sector SPDR Fund (XLB). During the reporting period, Vanguard Health Care Index Fund (VHT) and Vanguard Financials Index Fund (VFH) recorded the lowest total returns.
| 1 | The price used to calculate the market price returns is determined by using the closing price listed on the NYSE Arca and does not represent returns an investor would receive if shares were traded at other times. |
| 2 | See page 39 for more information on this index. |
| Management’s Discussion of Fund Performance (unaudited) (continued) |
Which underlying ETFs were the strongest positive contributors to the Fund’s performance and which underlying ETFs were particularly weak?
On the basis of impact, which takes weightings and total returns into consideration, the underlying ETFs that made the greatest positive contributions to the Fund’s performance during the reporting period were Materials Select Sector SPDR Fund (XLB) and Technology Select Sector SPDR Fund (XLK). The weakest contributors were Utilities Select Sector SPDR Fund (XLU) and SPDR Barclays Convertible Securities ETF (CWB).
The opinions expressed are those of the portfolio managers as of the date of this report and are subject to change. There is no guarantee that any forecast made will come to pass. This material does not constitute investment advice and is not intended as an endorsement of any specific investment.
Hypothetical Growth of a $10,000 Investment
(Since Inception Through 4/30/2016)
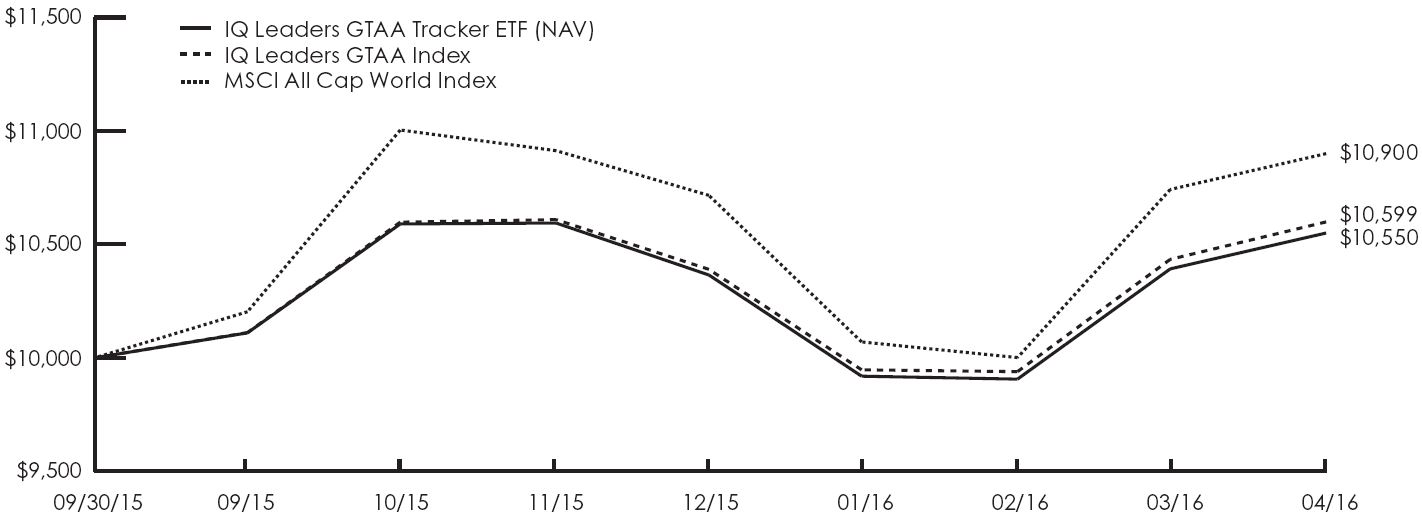
This chart illustrates the performance of a hypothetical $10,000 investment made on the Fund’s inception, and is not intended to imply any future performance.
Fund Performance History
IQ Leaders GTAA Tracker ETF
(as of April 30, 2016)
| | | Since Inception1,3 |
| | | Cumulative |
| IQ Leaders GTAA Tracker ETF Market Price2 | | 1.72 | % |
| IQ Leaders GTAA Tracker ETF NAV | | 5.50 | % |
| IQ Leaders GTAA Index | | 5.99 | % |
| MSCI All Cap World Index | | 9.00 | % |
| 1 | Fund Inception Date: 9/30/2015. |
| 2 | The price used to calculate the Market Price returns is determined by using the closing price listed on the NYSE Arca and does not represent returns an investor would receive if shares were traded at other times. |
| 3 | Total return calculated for a period of less than one year is not annualized. |
| Fund Expenses (unaudited) |
As a shareholder of a Fund, you incur two types of costs: (1) transaction costs on purchases and sales and (2) ongoing costs, including Advisory fees and other Fund expenses. This example is intended to help you understand your ongoing costs (in dollars) of investing in a Fund and to compare these costs with the ongoing costs of investing in other funds. Shareholders may pay brokerage commissions on their purchase and sale of the Fund, which are not reflected in the example.
The examples are based on an investment of $1,000 invested at the beginning of the period and held for the entire period as indicated below.
Actual Expenses
The first line of the table below provides information about actual account values and actual expenses. You may use the information together with the amount you invested, in a particular Fund, to estimate the expenses that you paid over the period. Simply divide your account value by $1,000 (for example, an $8,600 account value divided by $1,000 = 8.6), then multiply the result by the number in the first line under the heading entitled “Expenses Paid for Period 11/01/15 to 4/30/16” to estimate the expenses you paid on your account during this period. Each Fund will indirectly bear its pro rata share of the expenses incurred by the underlying ETF investments in which each Fund invests. These expenses are not included in the table.
Hypothetical Example for Comparison Purposes
The second line of the table below also provides information about hypothetical account values and hypothetical expenses based on each Fund’s actual expense ratio and an assumed annual rate of return of 5% before expenses, which are not the Funds’ actual returns. The hypothetical account values and expenses may not be used to estimate the actual ending account balance or expenses you paid for the period. You may use this information to compare the ongoing costs of investing in the Fund and other funds. To do so, compare this 5% hypothetical example with the 5% hypothetical examples that appear in the shareholder reports of other funds. The Funds will indirectly bear their pro rata share of the expenses incurred by the underlying fund investments in which the Funds invest. These expenses are not included in the table.
Please note that the expenses shown in the table are meant to highlight your ongoing costs only and do not reflect any transactional costs. Therefore, the hypothetical example is useful in comparing ongoing costs only, and will not help you determine the relative total costs of owning different funds. In addition, if these transactional costs were included, your costs would have been higher.
| Fund Expenses (unaudited) (continued) |
| | | Beginning
Account
Value | | Ending
Account
Value
04/30/16 | | Annualized
Expense
Ratios for the
Period 11/01/15
to 04/30/16 | | Expenses1
Paid for
Period
11/01/15 to
04/30/16 |
| IQ Hedge Multi-Strategy Tracker ETF | | | | | | | | |
| Actual | | $1,000.00 | | $ | 1,003.80 | | 0.76% | | $3.79 |
| Hypothetical (assuming a 5% return before expenses) | | $1,000.00 | | $ | 1,021.08 | | 0.76% | | $3.82 |
| IQ Hedge Macro Tracker ETF | | | | | | | | |
| Actual | | $1,000.00 | | $ | 1,005.20 | | 0.76% | | $3.79 |
| Hypothetical (assuming a 5% return before expenses) | | $1,000.00 | | $ | 1,021.08 | | 0.76% | | $3.82 |
| IQ Hedge Market Neutral Tracker ETF | | | | | | | | |
| Actual | | $1,000.00 | | $ | 1,011.50 | | 0.76% | | $3.80 |
| Hypothetical (assuming a 5% return before expenses) | | $1,000.00 | | $ | 1,021.08 | | 0.76% | | $3.82 |
| IQ Hedge Long/Short Tracker ETF | | | | | | | | |
| Actual | | $1,000.00 | | $ | 998.50 | | 0.77% | | $3.83 |
| Hypothetical (assuming a 5% return before expenses) | | $1,000.00 | | $ | 1,021.03 | | 0.77% | | $3.87 |
| IQ Hedge Event-Driven Tracker ETF | | | | | | | | |
| Actual | | $1,000.00 | | $ | 1,003.00 | | 0.78% | | $3.88 |
| Hypothetical (assuming a 5% return before expenses) | | $1,000.00 | | $ | 1,020.98 | | 0.78% | | $3.92 |
| IQ Global Resources ETF | | | | | | | | |
| Actual | | $1,000.00 | | $ | 1,129.00 | | 0.76% | | $4.02 |
| Hypothetical (assuming a 5% return before expenses) | | $1,000.00 | | $ | 1,021.08 | | 0.76% | | $3.82 |
| IQ Merger Arbitrage ETF | | | | | | | | |
| Actual | | $1,000.00 | | $ | 1,035.80 | | 0.76% | | $3.85 |
| Hypothetical (assuming a 5% return before expenses) | | $1,000.00 | | $ | 1,021.08 | | 0.76% | | $3.82 |
| IQ Real Return ETF | | | | | | | | |
| Actual | | $1,000.00 | | $ | 1,003.80 | | 0.49% | | $2.44 |
| Hypothetical (assuming a 5% return before expenses) | | $1,000.00 | | $ | 1,022.43 | | 0.49% | | $2.46 |
| IQ Australia Small Cap ETF | | | | | | | | |
| Actual | | $1,000.00 | | $ | 1,150.40 | | 0.70% | | $3.74 |
| Hypothetical (assuming a 5% return before expenses) | | $1,000.00 | | $ | 1,021.38 | | 0.70% | | $3.52 |
| IQ Canada Small Cap ETF | | | | | | | | |
| Actual | | $1,000.00 | | $ | 1,236.30 | | 0.70% | | $3.89 |
| Hypothetical (assuming a 5% return before expenses) | | $1,000.00 | | $ | 1,021.38 | | 0.70% | | $3.52 |
| IQ Global Agribusiness Small Cap ETF | | | | | | | | |
| Actual | | $1,000.00 | | $ | 1,111.60 | | 0.77% | | $4.04 |
| Hypothetical (assuming a 5% return before expenses) | | $1,000.00 | | $ | 1,021.03 | | 0.77% | | $3.87 |
| IQ Global Oil Small Cap ETF | | | | | | | | |
| Actual | | $1,000.00 | | $ | 973.30 | | 0.86% | | $4.22 |
| Hypothetical (assuming a 5% return before expenses) | | $1,000.00 | | $ | 1,020.59 | | 0.86% | | $4.32 |
| IQ U.S. Real Estate Small Cap ETF | | | | | | | | |
| Actual | | $1,000.00 | | $ | 1,043.40 | | 0.70% | | $3.56 |
| Hypothetical (assuming a 5% return before expenses) | | $1,000.00 | | $ | 1,021.38 | | 0.70% | | $3.52 |
| IQ 50 Percent Hedged FTSE International ETF | | | | | | | | |
| Actual | | $1,000.00 | | $ | 953.10 | | 0.36% | | $1.75 |
| Hypothetical (assuming a 5% return before expenses) | | $1,000.00 | | $ | 1,023.07 | | 0.36% | | $1.81 |
| IQ 50 Percent Hedged FTSE Europe ETF | | | | | | | | |
| Actual | | $1,000.00 | | $ | 953.70 | | 0.46% | | $2.23 |
| Hypothetical (assuming a 5% return before expenses) | | $1,000.00 | | $ | 1,022.58 | | 0.46% | | $2.31 |
| IQ 50 Percent Hedged FTSE Japan ETF | | | | | | | | |
| Actual | | $1,000.00 | | $ | 911.50 | | 0.46% | | $2.19 |
| Hypothetical (assuming a 5% return before expenses) | | $1,000.00 | | $ | 1,022.58 | | 0.46% | | $2.31 |
| IQ Leaders GTAA Tracker ETF | | | | | | | | |
| Actual | | $1,000.00 | | $ | 996.20 | | 0.46% | | $2.28 |
| Hypothetical (assuming a 5% return before expenses) | | $1,000.00 | | $ | 1,022.58 | | 0.46% | | $2.31 |
| 1 | Unless otherwise indicated, expenses are calculated using the Fund’s annualized expense ratio, multiplied by the average account value for the period, multiplied by 182/366 (to reflect the six-month period). |
| Portfolio Summaries (unaudited) |
| April 30, 2016 |
SCHEDULES OF INVESTMENTS SUMMARY TABLE
IQ Hedge Multi-Strategy Tracker ETF
Net Assets ($ mil): $1,074.1
| Industry | | % of
Net Assets |
| U.S. Short Term Treasury Bond Funds | | | 24.2 | % |
| Investment Grade Corporate Bond Funds | | | 23.9 | |
| Money Market Fund | | | 12.0 | |
| Aggregate Bond Funds | | | 10.3 | |
| U.S. Large Cap Value Funds | | | 9.3 | |
| U.S. Small Cap Growth Funds | | | 6.3 | |
| Treasury Inflation-Protected Securities | | | | |
| Bond Fund | | | 4.5 | |
| Floating Rate Funds | | | 3.2 | |
| Europe Equity Funds | | | 3.1 | |
| International Equity Core Funds | | | 3.1 | |
| Convertible Bonds Fund | | | 2.8 | |
| U.S. Large Cap Growth Funds | | | 2.7 | |
| U.S. Large Cap Core Fund | | | 2.3 | |
| Japan Equity Fund | | | 1.6 | |
| Volatility Fund | | | 0.9 | |
| Silver Fund | | | 0.9 | |
| U.S. Low Volatility Funds | | | 0.4 | |
| U.S. Preferred Fund | | | 0.3 | |
| BRIC Equity Funds | | | 0.3 | |
| Emerging Small Cap Equity Fund | | | 0.1 | |
| International Bond Funds | | | 0.1 | |
| International Small Cap Equity Funds | | | 0.1 | |
| U.S. Small Cap Core Fund | | | 0.0 | (a) |
| Total Investments | | | 112.4 | |
| Liabilities in Excess of Other Assets | | | (12.4 | ) |
| Total Net Assets | | | 100.0 | % |
(a) Less than 0.05%.
IQ Hedge Macro Tracker ETF
Net Assets ($ mil): $14.8
| Industry | | % of
Net Assets |
| U.S. Short Term Treasury Bond Funds | | | 52.0 | % |
| Money Market Fund | | | 21.9 | |
| Investment Grade Corporate Bond Funds | | | 12.2 | |
| International Bond Funds | | | 9.3 | |
| Emerging Small Cap Equity Fund | | | 6.1 | |
| International Small Cap Equity Funds | | | 6.1 | |
| BRIC Equity Funds | | | 6.0 | |
| Treasury Inflation-Protected Securities | | | | |
| Bond Fund | | | 4.0 | |
| U.S. Small Cap Core Fund | | | 1.9 | |
| U.S. Large Cap Growth Funds | | | 1.0 | |
| Silver Fund | | | 0.8 | |
| Japan Equity Fund | | | 0.7 | |
| Emerging Equity Funds | | | 0.7 | |
| Volatility Fund | | | 0.1 | |
| U.S. Large Cap Value Fund | | | 0.0 | (a) |
| Total Investments | | | 122.8 | |
| Liabilities in Excess of Other Assets | | | (22.8 | ) |
| Total Net Assets | | | 100.0 | % |
IQ Hedge Market Neutral Tracker ETF
Net Assets ($ mil): $15.3
| Industry | | % of
Net Assets |
| U.S. Short Term Treasury Bond Funds | | | 38.2 | % |
| Investment Grade Corporate Bond Funds | | | 16.1 | |
| Aggregate Bond Funds | | | 12.1 | |
| U.S. Large Cap Value Funds | | | 9.7 | |
| Floating Rate Funds | | | 4.6 | |
| U.S. Small Cap Growth Funds | | | 4.6 | |
| Convertible Bonds Fund | | | 3.3 | |
| Europe Equity Funds | | | 3.1 | |
| Japan Equity Fund | | | 2.9 | |
| Euro Fund | | | 2.3 | |
| Currency Strategy Fund | | | 1.8 | |
| U.S. Low Volatility Funds | | | 1.2 | |
| Money Market Fund | | | 0.5 | |
| Total Investments | | | 100.4 | |
| Liabilities in Excess of Other Assets | | | (0.4 | ) |
| Total Net Assets | | | 100.0 | % |
See notes to financial statements.
| Portfolio Summaries (unaudited) (continued) |
| April 30, 2016 |
IQ Hedge Long/Short Tracker ETF
Net Assets ($ mil): $1.9
| Industry | | % of
Net Assets |
| Investment Grade Corporate | | | | |
| Bond Funds | | | 20.6 | % |
| U.S. Large Cap Value Funds | | | 19.8 | |
| U.S. Small Cap Growth Funds | | | 18.6 | |
| International Equity Core Funds | | | 11.7 | |
| Money Market Funds | | | 11.1 | |
| U.S. Large Cap Growth Funds | | | 10.2 | |
| U.S. Large Cap Core Fund | | | 8.8 | |
| Floating Rate Funds | | | 6.7 | |
| Volatility Fund | | | 2.6 | |
| U.S. Preferred Fund | | | 1.3 | |
| Total Investments | | | 111.4 | |
| Liabilities in Excess of Other Assets | | | (11.4 | ) |
| Total Net Assets | | | 100.0 | % |
IQ Hedge Event-Driven Tracker ETF
Net Assets ($ mil): $1.9
| Industry | | % of
Net Assets |
| Convertible Bonds Fund | | | 45.9 | % |
| Aggregate Bond Funds | | | 45.8 | |
| U.S. Large Cap Growth Funds | | | 7.5 | |
| Emerging Equity Funds | | | 0.8 | |
| Money Market Fund | | | 0.2 | |
| Total Investments | | | 100.2 | |
| Liabilities in Excess of Other Assets | | | (0.2 | ) |
| Total Net Assets | | | 100.0 | % |
IQ Global Resources ETF
Net Assets ($ mil): $67.9
| Industry | | % of
Net Assets |
| Energy | | | 18.7 | % |
| Water | | | 18.4 | |
| Money Market Fund | | | 14.8 | |
| Grains Food Fiber | | | 14.5 | |
| Timber | | | 14.3 | |
| Coal | | | 13.7 | |
| Precious Metals | | | 4.4 | |
| Livestock | | | 3.4 | |
| Industrial Metals | | | 2.6 | |
| Total Investments | | | 104.8 | |
| Liabilities in Excess of Other Assets | | | (4.8 | ) |
| Total Net Assets | | | 100.0 | % |
IQ Merger Arbitrage ETF
Net Assets ($ mil): $139.4
| Industry | | % of
Net Assets |
| Information Technology | | | 18.8 | % |
| Health Care | | | 17.5 | |
| Materials | | | 14.9 | |
| Industrials | | | 11.0 | |
| Energy | | | 10.5 | |
| Utilities | | | 10.1 | |
| Consumer Staples | | | 6.0 | |
| Money Market Fund | | | 4.8 | |
| Financials | | | 4.0 | |
| Consumer Discretionary | | | 3.6 | |
| Total Investments | | | 101.2 | |
| Liabilities in Excess of Other Assets | | | (1.2 | ) |
| Total Net Assets | | | 100.0 | % |
IQ Real Return ETF
Net Assets ($ mil): $26.7
| Industry | | % of
Net Assets |
| U.S. Short Term Treasury Bond Funds | | | 71.1 | % |
| Money Market Fund | | | 12.5 | |
| U.S. Large Cap Core Funds | | | 9.9 | |
| U.S. Medium Term Treasury Bond Funds | | | 8.0 | |
| U.S. Small Cap Core Fund | | | 6.5 | |
| U.S. REITS Funds | | | 4.2 | |
| Total Investments | | | 112.2 | |
| Liabilities in Excess of Other Assets | | | (12.2 | ) |
| Total Net Assets | | | 100.0 | % |
IQ Australia Small Cap ETF
Net Assets ($ mil): $6.8
| Industry | | % of
Net Assets |
| Materials | | | 28.3 | % |
| Consumer Discretionary | | | 21.9 | |
| Industrials | | | 12.0 | |
| Health Care | | | 11.9 | |
| Financials | | | 8.0 | |
| Consumer Staples | | | 7.1 | |
| Information Technology | | | 7.1 | |
| Money Market Fund | | | 7.0 | |
| Energy | | | 3.2 | |
| Total Investments | | | 106.5 | |
| Liabilities in Excess of Other Assets | | | (6.5 | ) |
| Total Net Assets | | | 100.0 | % |
See notes to financial statements.
| Portfolio Summaries (unaudited) (continued) |
| April 30, 2016 |
IQ Canada Small Cap ETF
Net Assets ($ mil): $10.8
| Industry | | % of
Net Assets |
| Materials | | | 37.0 | % |
| Energy | | | 19.5 | |
| Industrials | | | 14.2 | |
| Money Market Fund | | | 13.6 | |
| Consumer Discretionary | | | 8.7 | |
| Utilities | | | 6.5 | |
| Financials | | | 3.4 | |
| Consumer Staples | | | 3.4 | |
| Health Care | | | 2.8 | |
| Information Technology | | | 2.4 | |
| Telecommunication Services | | | 1.5 | |
| Total Investments | | | 113.0 | |
| Liabilities in Excess of Other Assets | | | (13.0 | ) |
| Total Net Assets | | | 100.0 | % |
IQ Global Agribusiness Small Cap ETF
Net Assets ($ mil): $12.0
| Industry | | % of
Net Assets |
| Crop Production and Farming | | | 68.2 | % |
| Livestock Operations | | | 13.1 | |
| Agricultural Chemicals | | | 9.3 | |
| Agricultural Supplies and Logistics | | | 5.9 | |
| Money Market Fund | | | 5.5 | |
| Agricultural Machinery | | | 2.6 | |
| Total Investments | | | 104.6 | |
| Liabilities in Excess of Other Assets | | | (4.6 | ) |
| Total Net Assets | | | 100.0 | % |
IQ Global Oil Small Cap ETF
Net Assets ($ mil): $2.9
| Industry | | % of
Net Assets |
| Exploration & Production | | | 42.4 | % |
| Equipment, Services & Drilling | | | 33.8 | |
| Money Market Fund | | | 25.4 | |
| Refining & Marketing | | | 23.3 | |
| Total Investments | | | 124.9 | |
| Liabilities in Excess of Other Assets | | | (24.9 | ) |
| Total Net Assets | | | 100.0 | % |
IQ U.S. Real Estate Small Cap ETF
Net Assets ($ mil): $76.7
| Industry | | % of
Net Assets |
| Office REITs | | | 21.2 | % |
| Mortgage REITs | | | 16.2 | |
| Specialized REITs | | | 16.2 | |
| Diversified REITs | | | 16.2 | |
| Retail REITs | | | 15.8 | |
| Money Market Fund | | | 7.7 | |
| Hotel REITs | | | 7.3 | |
| Residential REITs | | | 5.7 | |
| Total Investments | | | 106.3 | |
| Liabilities in Excess of Other Assets | | | (6.3 | ) |
| Total Net Assets | | | 100.0 | % |
IQ 50 Percent Hedged FTSE International ETF
Net Assets ($ mil): $76.0
| Industry | | % of
Net Assets |
| Financials | | | 23.3 | % |
| Industrials | | | 13.9 | |
| Consumer Discretionary | | | 12.9 | |
| Consumer Staples | | | 12.1 | |
| Health Care | | | 11.1 | |
| Materials | | | 7.7 | |
| Information Technology | | | 6.2 | |
| Energy | | | 4.6 | |
| Telecommunication Services | | | 4.5 | |
| Utilities | | | 3.7 | |
| Money Market Fund | | | 2.2 | |
| Total Investments | | | 102.2 | |
| Liabilities in Excess of Other Assets | | | (2.2 | ) |
| Total Net Assets | | | 100.0 | % |
IQ 50 Percent Hedged FTSE Europe ETF
Net Assets ($ mil): $46.7
| Industry | | % of
Net Assets |
| Financials | | | 21.0 | % |
| Consumer Staples | | | 15.1 | |
| Health Care | | | 13.4 | |
| Industrials | | | 12.0 | |
| Consumer Discretionary | | | 11.5 | |
| Materials | | | 7.5 | |
| Energy | | | 6.6 | |
| Telecommunication Services | | | 4.7 | |
| Utilities | | | 4.2 | |
| Information Technology | | | 3.9 | |
| Money Market Fund | | | 3.1 | |
| Total Investments | | | 103.0 | |
| Liabilities in Excess of Other Assets | | | (3.0 | ) |
| Total Net Assets | | | 100.0 | % |
See notes to financial statements.
| Portfolio Summaries (unaudited) (continued) |
| April 30, 2016 |
IQ 50 Percent Hedged FTSE Japan ETF
Net Assets ($ mil): $25.1
| Industry | | % of
Net Assets |
| Consumer Discretionary | | | 21.0 | % |
| Industrials | | | 21.0 | |
| Financials | | | 16.7 | |
| Information Technology | | | 10.3 | |
| Consumer Staples | | | 9.2 | |
| Health Care | | | 9.0 | |
| Materials | | | 6.4 | |
| Telecommunication Services | | | 5.4 | |
| Utilities | | | 2.4 | |
| Energy | | | 0.9 | |
| Money Market Fund | | | 0.3 | |
| Total Investments | | | 102.6 | |
| Liabilities in Excess of Other Assets | | | (2.6 | ) |
| Total Net Assets | | | 100.0 | % |
IQ Leaders GTAA Tracker ETF
Net Assets ($ mil): $2.1
| Industry | | % of
Net Assets |
| International Equity Core Funds | | | 24.6 | % |
| High Yield Corporate Bond Funds | | | 22.5 | |
| U.S. Large Cap Core Funds | | | 18.8 | |
| Aggregate Bond Funds | | | 17.3 | |
| Money Market Fund | | | 10.3 | |
| U.S. Medium Term Treasury Bond Funds | | | 8.2 | |
| U.S. Small Cap Core Fund | | | 4.2 | |
| Emerging Equity Funds | | | 4.1 | |
| Total Investments | | | 110.0 | |
| Liabilities in Excess of Other Assets | | | (10.0 | ) |
| Total Net Assets | | | 100.0 | % |
See notes to financial statements.
| Schedules of Investments — IQ Hedge Multi-Strategy Tracker ETF |
| April 30, 2016 |
| | | Shares | | Value |
| Exchange Traded Note — 0.9% | | | | |
| Volatility Fund — 0.9% | | | | |
| iPATH S&P 500 VIX Short-Term | | | | |
| Futures ETN*(a) | | | | |
| (Cost $10,000,511) | | | 538,165 | | | $ | 9,046,554 | |
| |
| Investment Companies — 99.5% | | | | | | | | |
| Aggregate Bond Funds — 10.3% | | | | | | | | |
| iShares Core U.S. Aggregate | | | | | | | | |
| Bond ETF(b) | | | 531,460 | | | | 58,933,600 | |
| SPDR Barclays Aggregate | | | | | | | | |
| Bond ETF(a) | | | 35,417 | | | | 2,075,436 | |
| Vanguard Total Bond | | | | | | | | |
| Market ETF(a)(b) | | | 595,254 | | | | 49,388,224 | |
| Total Aggregate Bond Funds | | | | | | | 110,397,260 | |
| |
| BRIC Equity Funds — 0.3% | | | | | | | | |
| iShares China Large-Cap ETF(a) | | | 12,689 | | | | 425,462 | |
| iShares India 50 ETF | | | 17,632 | | | | 476,770 | |
| iShares MSCI China ETF(a) | | | 4,163 | | | | 176,053 | |
| iShares MSCI India ETF | | | 85,336 | | | | 2,309,192 | |
| SPDR S&P China ETF | | | 929 | | | | 64,482 | |
| Total BRIC Equity Funds | | | | | | | 3,451,959 | |
| |
| Convertible Bonds Fund — 2.8% | | | | | | | | |
| SPDR Barclays Convertible | | | | | | | | |
| Securities ETF(a) | | | 685,713 | | | | 29,787,373 | |
| |
| Emerging Small Cap Equity Fund — 0.1% | | | | | | | | |
| SPDR S&P Emerging Markets | | | | | | | | |
| SmallCap ETF(a) | | | 17,230 | | | | 676,277 | |
| |
| Europe Equity Funds — 3.1% | | | | | | | | |
| iShares Europe ETF | | | 77,186 | | | | 3,111,368 | |
| iShares MSCI Eurozone ETF | | | 412,919 | | | | 14,563,653 | |
| Vanguard FTSE Europe ETF | | | 314,117 | | | | 15,661,873 | |
| Total Europe Equity Funds | | | | | | | 33,336,894 | |
| |
| Floating Rate Funds — 3.2% | | | | | | | | |
| PowerShares Senior Loan Portfolio(a) | | | 1,229,930 | | | | 28,399,084 | |
| SPDR Blackstone / GSO Senior | | | | | | | | |
| Loan ETF | | | 120,382 | | | | 5,636,285 | |
| Total Floating Rate Funds | | | | | | | 34,035,369 | |
| |
| International Bond Funds — 0.1% | | | | | | | | |
| VanEck Vectors J.P. Morgan EM | | | | | | | | |
| Local Currency Bond ETF(a) | | | 41,681 | | | | 789,855 | |
| WisdomTree Emerging Markets | | | | | | | | |
| Local Debt Fund(a) | | | 6,259 | | | | 235,088 | |
| Total International Bond Funds | | | | | | | 1,024,943 | |
| |
| International Equity Core Funds — 3.1% | | | | | | | | |
| iShares MSCI EAFE ETF | | | 376,450 | | | | 21,995,973 | |
| Vanguard FTSE Developed | | | | | | | | |
| Markets ETF(a) | | | 319,281 | | | | 11,720,806 | |
| Total International Equity | | | | | | | | |
| Core Funds | | | | | | | 33,716,779 | |
| |
| International Small Cap Equity Funds — 0.1% | | | | |
| iShares MSCI EAFE Small-Cap ETF(a) | | | 10,244 | | | | 516,195 | |
| SPDR S&P International Small | | | | | | | | |
| Cap ETF | | | 1,986 | | | | 58,428 | |
| | | Shares | | Value |
| Investment Companies (continued) | | | | |
| International Small Cap Equity Funds | | | | |
| (continued) | | | | |
| WisdomTree International SmallCap | | | | |
| Dividend Fund(a) | | | 1,703 | | | $ | 101,312 | |
| Total International Small Cap | | | | | | | | |
| Equity Funds | | | | | | | 675,935 | |
| |
| Investment Grade Corporate | | | | | | | | |
| Bond Funds — 23.9% | | | | | | | | |
| iShares Core U.S. Credit Bond ETF | | | 63,471 | | | | 7,070,035 | |
| iShares iBoxx $ Investment Grade | | | | | | | | |
| Corporate Bond ETF(b) | | | 2,075,573 | | | | 249,753,699 | |
| Total Investment Grade Corporate | | | | | | | | |
| Bond Funds | | | | | | | 256,823,734 | |
| |
| Japan Equity Fund — 1.6% | | | | | | | | |
| iShares MSCI Japan ETF | | | 1,541,467 | | | | 17,603,553 | |
| |
| Silver Fund — 0.9% | | | | | | | | |
| iShares Silver Trust*(a) | | | 570,942 | | | | 9,694,595 | |
| |
| Treasury Inflation-Protected Securities | | | | | | | | |
| Bond Fund — 4.5% | | | | | | | | |
| iShares TIPS Bond ETF | | | 418,729 | | | | 48,103,588 | |
| |
| U.S. Large Cap Core Fund — 2.3% | | | | | | | | |
| Financial Select Sector SPDR Fund | | | 1,085,528 | | | | 25,303,658 | |
| |
| U.S. Large Cap Growth Funds — 2.7% | | | | | | | | |
| Guggenheim S&P 500 Pure | | | | | | | | |
| Growth ETF | | | 10,814 | | | | 851,062 | |
| iShares Russell 1000 Growth ETF(a) | | | 131,893 | | | | 13,037,623 | |
| iShares S&P 500 Growth ETF(a) | | | 52,519 | | | | 6,014,476 | |
| Vanguard Growth ETF(a) | | | 85,566 | | | | 9,036,625 | |
| Total U.S. Large Cap Growth Funds | | | | | | | 28,939,786 | |
| |
| U.S. Large Cap Value Funds — 9.3% | | | | | | | | |
| Guggenheim S&P 500 Pure | | | | | | | | |
| Value ETF(a) | | | 24,688 | | | | 1,281,801 | |
| iShares Russell 1000 Value ETF | | | 460,781 | | | | 46,488,195 | |
| iShares S&P 500 Value ETF(a) | | | 186,024 | | | | 17,062,121 | |
| Vanguard Value ETF(a) | | | 415,817 | | | | 34,778,934 | |
| Total U.S. Large Cap Value Funds | | | | | | | 99,611,051 | |
| |
| U.S. Low Volatility Funds — 0.4% | | | | | | | | |
| iShares Edge MSCI Min Vol USA ETF(a) | | | 57,019 | | | | 2,495,722 | |
| PowerShares S&P 500 Low | | | | | | | | |
| Volatility Portfolio(a) | | | 36,908 | | | | 1,474,105 | |
| Total U.S. Low Volatility Funds | | | | | | | 3,969,827 | |
| |
| U.S. Preferred Fund — 0.3% | | | | | | | | |
| iShares U.S. Preferred Stock ETF(a) | | | 97,130 | | | | 3,805,553 | |
| |
| U.S. Short Term Treasury Bond | | | | | | | | |
| Funds — 24.2% | | | | | | | | |
| iShares 1-3 Year Treasury Bond ETF(a) | | | 564,539 | | | | 47,991,461 | |
| iShares Short Treasury Bond ETF(a) | | | 295,935 | | | | 32,671,224 | |
| SPDR Barclays 1-3 Month T-Bill ETF*(a) | | | 467,231 | | | | 21,357,129 | |
| Vanguard Short-Term Bond ETF(a) | | | 1,959,748 | | | | 157,975,286 | |
| Total U.S. Short Term Treasury | | | | | | | | |
| Bond Funds | | | | | | | 259,995,100 | |
See notes to financial statements.
| Schedules of Investments — IQ Hedge Multi-Strategy Tracker ETF (continued) |
| April 30, 2016 |
| | | Shares | | Value |
| Investment Companies (continued) | | | | |
| U.S. Small Cap Core Fund — 0.0%(c) | | | | |
| iShares Russell 2000 ETF(a) | | | 867 | | | $ | 97,416 | |
| |
| U.S. Small Cap Growth Funds — 6.3% | | | | | | | | |
| iShares Russell 2000 Growth ETF(a)(b) | | | 226,493 | | | | 30,365,916 | |
| iShares S&P Small-Cap 600 | | | | | | | | |
| Growth ETF(a) | | | 128,867 | | | | 16,052,962 | |
| Vanguard Small-Cap Growth ETF(a) | | | 178,335 | | | | 21,505,418 | |
| Total U.S. Small Cap Growth Funds | | | | | | | 67,924,296 | |
| Total Investment Companies | | | | | | | | |
| (Cost $1,046,299,310) | | | | | | | 1,068,974,946 | |
| |
| Investment of Cash Collateral | | | | | | | | |
| For Securities Loaned — 12.0% | | | | | | | | |
| Money Market Fund — 12.0% | | | | | | | | |
| Dreyfus Government Cash | | | | | | | | |
| Management Fund, | | | | | | | | |
| Institutional Shares, 0.20%(d) | | | | | | | | |
| (Cost $128,792,461) | | | 128,792,461 | | | | 128,792,461 | |
| | | Value |
| Total Investments — 112.4% | | | | |
| (Cost $1,185,092,282) | | $ | 1,206,813,961 | |
| Liabilities in Excess of | | | | |
| Other Assets — (12.4)% | | | (132,693,789 | ) |
| Net Assets — 100.0% | | $ | 1,074,120,172 | |
| * | Non-income producing securities. |
| (a) | All or a portion of the security was on loan. In addition, “Other Assets and Liabilities, Net” may include pending sales that are also on loan. The aggregate market value of securities on loan was $125,659,626; total market value of collateral held by the Fund was $128,792,461. |
| (b) | All or a portion of these securities have been segregated as collateral for swap contracts. The total value of securities segregated amounted to $225,030,302. |
| (d) | Rate shown reflects the 1-day yield at April 30, 2016. |
BRIC — Brazil, Russia, India and China
ETF — Exchange Traded Fund
ETN — Exchange Traded Note
TIPS — Treasury Inflation Protected Security
Total return swap contracts outstanding at April 30, 2016:
| Total Return Benchmark | | Annual
Financing Rate
(Received) Paid % | | Expiration
Date | | Notional
Amount
Long (Short) | | Unrealized
Appreciation
(Depreciation)1 |
| CurrencyShares Euro Trust | | | (2.10 | ) | | | 5/19/2016 | | | $ | (3,923,235 | ) | | $ | — | |
| CurrencyShares Japanese Yen Trust | | | (1.84 | ) | | | 5/19/2016 | | | | (29,955,434 | ) | | | — | |
| Energy Select Sector SPDR Fund | | | (0.50 | ) | | | 5/19/2016 | | | | (11,270,659 | ) | | | — | |
| Financial Select Sector SPDR Fund | | | 1.37 | | | | 5/19/2016 | | | | 7,663,535 | | | | — | |
| Guggenheim S&P 500 Pure Growth ETF | | | 1.33 | | | | 5/19/2016 | | | | 257,664 | | | | — | |
| Guggenheim S&P 500 Pure Value ETF | | | 1.37 | | | | 5/19/2016 | | | | 388,258 | | | | — | |
| Health Care Select Sector SPDR Fund | | | (0.50 | ) | | | 5/19/2016 | | | | (12,961,189 | ) | | | — | |
| iPath Bloomberg Commodity Index Total Return | | | (2.34 | ) | | | 5/19/2016 | | | | (44,708 | ) | | | — | |
| iPATH S&P 500 VIX Short-Term Futures | | | 1.37 | | | | 5/19/2016 | | | | 2,739,896 | | | | — | |
| iShares 1-3 Year Treasury Bond ETF | | | 1.37 | | | | 5/19/2016 | | | | 14,534,840 | | | | — | |
| iShares China Large-Cap ETF | | | 1.37 | | | | 5/19/2016 | | | | 128,856 | | | | — | |
| iShares Core U.S. Aggregate Bond ETF | | | 1.25 | | | | 5/19/2016 | | | | 17,848,854 | | | | — | |
| iShares Core U.S. Credit Bond ETF | | | 1.36 | | | | 5/19/2016 | | | | 2,141,361 | | | | — | |
| iShares Europe ETF | | | 1.37 | | | | 5/19/2016 | | | | 942,287 | | | | — | |
| iShares iBoxx $ High Yield Corporate Bond ETF | | | (1.22 | ) | | | 5/19/2016 | | | | (41,319,435 | ) | | | — | |
| iShares iBoxx $ Investment Grade Corporate Bond ETF | | | 1.36 | | | | 5/19/2016 | | | | 75,641,363 | | | | — | |
| iShares India 50 ETF | | | 1.37 | | | | 5/19/2016 | | | | 144,367 | | | | — | |
| iShares MSCI All Country Asia ex Japan ETF | | | (4.03 | ) | | | 5/19/2016 | | | | (8,239,766 | ) | | | — | |
| iShares MSCI Brazil Capped ETF | | | (1.59 | ) | | | 5/19/2016 | | | | (428,367 | ) | | | — | |
| iShares MSCI China ETF | | | 1.37 | | | | 5/19/2016 | | | | 53,260 | | | | — | |
| iShares MSCI EAFE ETF | | | 1.37 | | | | 5/19/2016 | | | | 6,661,721 | | | | — | |
| iShares MSCI EAFE Small-Cap ETF | | | 1.37 | | | | 5/19/2016 | | | | 156,310 | | | | — | |
| iShares MSCI Emerging Markets ETF | | | (1.07 | ) | | | 5/19/2016 | | | | (5,919,448 | ) | | | — | |
| iShares MSCI Eurozone ETF | | | 1.37 | | | | 5/19/2016 | | | | 4,410,796 | | | | — | |
| iShares MSCI India ETF | | | 1.37 | | | | 5/19/2016 | | | | 699,366 | | | | — | |
| iShares MSCI Japan ETF | | | 1.37 | | | | 5/19/2016 | | | | 5,331,461 | | | | — | |
| iShares MSCI Pacific ex Japan ETF | | | (4.14 | ) | | | 5/19/2016 | | | | (7,019,455 | ) | | | — | |
| iShares MSCI Russia Capped ETF | | | (2.84 | ) | | | 5/19/2016 | | | | (1,167 | ) | | | — | |
| iShares MSCI USA Minimum Volatility ETF | | | 1.37 | | | | 5/19/2016 | | | | 755,820 | | | | — | |
| iShares Russell 1000 Growth ETF | | | 1.33 | | | | 5/19/2016 | | | | 3,948,464 | | | | — | |
| iShares Russell 1000 Value ETF | | | 1.37 | | | | 5/19/2016 | | | | 14,079,603 | | | | — | |
| iShares Russell 2000 ETF | | | 1.36 | | | | 5/19/2016 | | | | 36,854 | | | | — | |
| iShares Russell 2000 Growth ETF | | | 1.37 | | | | 5/19/2016 | | | | 9,297,620 | | | | — | |
| iShares Russell 2000 Value ETF | | | (1.53 | ) | | | 5/19/2016 | | | | (30,588,473 | ) | | | — | |
| iShares S&P 500 Growth ETF | | | 1.33 | | | | 5/19/2016 | | | | 1,821,441 | | | | — | |
See notes to financial statements.
| Schedules of Investments — IQ Hedge Multi-Strategy Tracker ETF (continued) |
| April 30, 2016 |
Total return swap contracts outstanding at April 30, 2016 (continued):
| Total Return Benchmark | | Annual
Financing Rate
(Received) Paid % | | Expiration
Date | | Notional
Amount
Long (Short) | | Unrealized
Appreciation
(Depreciation)1 |
| iShares S&P 500 Value ETF | | | 1.37 | | | | 5/19/2016 | | | $ 5,167,505 | | | | | $ | — | |
| iShares S&P Small-Cap 600 Growth ETF | | | 1.37 | | | | 5/19/2016 | | | 4,861,843 | | | | — | |
| iShares S&P Small-Cap 600 Value ETF | | | (3.03 | ) | | | 5/19/2016 | | | (18,107,694 | ) | | | — | |
| iShares Short Treasury Bond ETF | | | 1.37 | | | | 5/19/2016 | | | 9,895,042 | | | | — | |
| iShares Silver Trust | | | 1.37 | | | | 5/19/2016 | | | 2,936,165 | | | | — | |
| iShares TIPS Bond ETF | | | 1.37 | | | | 5/19/2016 | | | 14,568,737 | | | | — | |
| iShares U.S. Preferred Stock ETF | | | 1.37 | | | | 5/19/2016 | | | 1,152,519 | | | | — | |
| iShares U.S. Real Estate ETF | | | (0.90 | ) | | | 5/19/2016 | | | (2,779,671 | ) | | | — | |
| PowerShares DB Commodity Index Tracking Fund | | | (1.09 | ) | | | 5/19/2016 | | | (177,118 | ) | | | — | |
| PowerShares DB G10 Currency Harvest Fund | | | (4.58 | ) | | | 5/19/2016 | | | (2,638,858 | ) | | | — | |
| PowerShares DB Gold Fund | | | (0.99 | ) | | | 5/19/2016 | | | (821,255 | ) | | | — | |
| PowerShares DB U.S. Dollar Index Bullish Fund | | | (3.01 | ) | | | 5/19/2016 | | | (25,046,865 | ) | | | — | |
| PowerShares S&P 500 Low Volatility Portfolio | | | 1.37 | | | | 5/19/2016 | | | 446,409 | | | | — | |
| PowerShares Senior Loan Portfolio | | | 1.37 | | | | 5/19/2016 | | | 8,601,071 | | | | — | |
| SPDR Barclays 1-3 Month T-Bill ETF | | | 1.37 | | | | 5/19/2016 | | | 6,468,285 | | | | — | |
| SPDR Barclays Aggregate Bond ETF | | | 1.25 | | | | 5/19/2016 | | | 628,485 | | | | — | |
| SPDR Barclays Convertible Securities ETF | | | 1.36 | | | | 5/19/2016 | | | 9,021,445 | | | | — | |
| SPDR Barclays High Yield Bond ETF | | | (0.92 | ) | | | 5/19/2016 | | | (29,724,577 | ) | | | — | |
| SPDR Blackstone / GSO Senior Loan ETF | | | 1.37 | | | | 5/19/2016 | | | 1,707,057 | | | | — | |
| SPDR Dow Jones International Real Estate ETF | | | (2.09 | ) | | | 5/19/2016 | | | (451,303 | ) | | | — | |
| SPDR Dow Jones REIT ETF | | | (1.35 | ) | | | 5/19/2016 | | | (2,064,499 | ) | | | — | |
| SPDR S&P China ETF | | | 1.37 | | | | 5/19/2016 | | | 19,574 | | | | — | |
| SPDR S&P Emerging Markets SmallCap ETF | | | 1.37 | | | | 5/19/2016 | | | 204,846 | | | | — | |
| SPDR S&P International Small Cap ETF | | | 1.37 | | | | 5/19/2016 | | | 18,652 | | | | — | |
| Technology Select Sector SPDR Fund | | | (0.15 | ) | | | 5/19/2016 | | | (7,739,997 | ) | | | — | |
| VanEck Vectors J.P. Morgan EM Local Currency Bond ETF | | | 1.37 | | | | 5/19/2016 | | | 239,225 | | | | — | |
| VanEck Vectors Russia ETF | | | (0.36 | ) | | | 5/19/2016 | | | (8,604 | ) | | | — | |
| Vanguard FTSE Europe ETF | | | 1.37 | | | | 5/19/2016 | | | 4,743,381 | | | | — | |
| Vanguard FTSE Pacific ETF | | | (0.93 | ) | | | 5/19/2016 | | | (9,787,385 | ) | | | — | |
| Vanguard Growth ETF | | | 1.33 | | | | 5/19/2016 | | | 2,736,989 | | | | — | |
| Vanguard REIT ETF | | | (0.85 | ) | | | 5/19/2016 | | | (17,651,631 | ) | | | — | |
| Vanguard Short-Term Bond ETF | | | 1.37 | | | | 5/19/2016 | | | 47,844,856 | | | | — | |
| Vanguard Small-Cap Growth ETF | | | 1.37 | | | | 5/19/2016 | | | 6,513,186 | | | | — | |
| Vanguard Small-Cap Value ETF | | | (3.03 | ) | | | 5/19/2016 | | | (32,523,517 | ) | | | — | |
| Vanguard Total Bond Market ETF | | | 1.25 | | | | 5/19/2016 | | | 14,957,915 | | | | — | |
| Vanguard Value ETF | | | 1.37 | | | | 5/19/2016 | | | 10,533,203 | | | | — | |
| WisdomTree Emerging Markets Local Debt Fund | | | 1.37 | | | | 5/19/2016 | | | 71,251 | | | | — | |
| WisdomTree International SmallCap Dividend Fund | | | 1.37 | | | | 5/19/2016 | | | 30,697 | | | | — | |
| | | | | | | | | | | | | | | $ | — | |
Morgan Stanley acts as the counterparty to the total return swap contracts listed above. The Fund either receives from, or pays to, the counterparty, depending upon the total return of the benchmark and the agreed-upon financing rate.
| 1 | Reflects a reset date of April 30, 2016. |
See notes to financial statements.
| Schedules of Investments — IQ Hedge Multi-Strategy Tracker ETF (continued) |
| April 30, 2016 |
The following is a summary of the fair valuations according to the inputs used as of April 30, 2016 for valuing the Fund’s assets and liabilities. For more information on the valuation techniques, and their aggregation into the levels used in the table below, please refer to Note 2.
Asset Valuation Inputs
| Description | | Level 1 | | Level 2 | | Level 3 | | Total |
| Investments in Securities:(a) | | | | | | | | | | | | | | | | |
| Exchange Traded Notes | | $ | 9,046,554 | | | $ | — | | | $ | — | | | $ | 9,046,554 | |
| Investment Companies | | | 1,068,974,946 | | | | — | | | | — | | | | 1,068,974,946 | |
| Investment of Cash Collateral for Securities Loaned: | | | | | | | | | | | | | | | | |
| Money Market Fund | | | 128,792,461 | | | | — | | | | — | | | | 128,792,461 | |
| Total Investments in Securities | | | 1,206,813,961 | | | | — | | | | — | | | | 1,206,813,961 | |
| Other Financial Instruments: | | | | | | | | | | | | | | | | |
| Swap Contracts | | | — | | | | — | (b) | | | — | | | | — | |
| Total Investments in Securities and Other Financial Instruments | | $ | 1,206,813,961 | | | $ | — | | | $ | — | | | $ | 1,206,813,961 | |
Liability Valuation Inputs
| Description | | | Level 1 | | | | Level 2 | | | | Level 3 | | | | Total | |
| Other Financial Instruments: | | | | | | | | | | | | | | | | |
| Swap Contracts | | $ | — | | | $ | — | (b) | | $ | — | | | $ | — | |
| Total Other Financial Instruments | | $ | — | | | $ | — | | | $ | — | | | $ | — | |
| (a) | For a complete listing of investments and their industries, see the Schedules of Investments. |
| (b) | Reflects the unrealized appreciation (depreciation) of the instruments. |
The Fund recognizes transfers between the levels as of the beginning of the period.
For the year ended April 30, 2016, the Fund did not have any transfers between any levels within the fair value hierarchy. (See Note 2)
The Fund did not hold any level 3 securities as of April 30, 2016.
See notes to financial statements.
| Schedules of Investments — IQ Hedge Macro Tracker ETF |
| April 30, 2016 |
| | | Shares | | Value |
| Exchange Traded Notes — 0.1% | | | | |
| Volatility Fund — 0.1% | | | | |
| iPATH S&P 500 VIX Short-Term | | | | |
| Futures ETN*(a) | | | | |
| (Cost $23,156) | | | 1,243 | | | $ | 20,895 | |
| |
| Investment Companies — 100.8% | | | | | | | | |
| BRIC Equity Funds — 6.0% | | | | | | | | |
| iShares China Large-Cap ETF(a) | | | 16,926 | | | | 567,529 | |
| iShares MSCI China ETF(a) | | | 5,548 | | | | 234,625 | |
| SPDR S&P China ETF | | | 1,242 | | | | 86,207 | |
| Total BRIC Equity Funds | | | | | | | 888,361 | |
| |
| Emerging Equity Funds — 0.7% | | | | | | | | |
| iShares MSCI Emerging Markets ETF | | | 1,229 | | | | 42,266 | |
| Vanguard FTSE Emerging | | | | | | | | |
| Markets ETF | | | 1,698 | | | | 59,311 | |
| Total Emerging Equity Funds | | | | | | | 101,577 | |
| |
| Emerging Small Cap Equity Fund — 6.1% | | | | | | | | |
| SPDR S&P Emerging Markets | | | | | | | | |
| SmallCap ETF(a) | | | 22,986 | | | | 902,200 | |
| |
| International Bond Funds — 9.3% | | | | | | | | |
| VanEck Vectors J.P. Morgan EM | | | | | | | | |
| Local Currency Bond ETF(a) | | | 55,600 | | | | 1,053,620 | |
| WisdomTree Emerging Markets Local | | | | | | | | |
| Debt Fund(a) | | | 8,355 | | | | 313,814 | |
| Total International Bond Funds | | | | | | | 1,367,434 | |
| |
| International Small Cap Equity | | | | | | | | |
| Funds — 6.1% | | | | | | | | |
| iShares MSCI EAFE Small-Cap ETF | | | 13,662 | | | | 688,428 | |
| SPDR S&P International Small | | | | | | | | |
| Cap ETF | | | 2,793 | | | | 82,170 | |
| WisdomTree International SmallCap | | | | | | | | |
| Dividend Fund(a) | | | 2,275 | | | | 135,340 | |
| Total International Small Cap | | | | | | | | |
| Equity Funds | | | | | | | 905,938 | |
| |
| Investment Grade Corporate Bond | | | | | | | | |
| Funds — 12.2% | | | | | | | | |
| iShares Core U.S. Credit Bond ETF | | | 448 | | | | 49,903 | |
| iShares iBoxx $ Investment Grade | | | | | | | | |
| Corporate Bond ETF(b) | | | 14,635 | | | | 1,761,029 | |
| Total Investment Grade Corporate | | | | | | | | |
| Bond Funds | | | | | | | 1,810,932 | |
| |
| Japan Equity Fund — 0.7% | | | | | | | | |
| iShares MSCI Japan ETF | | | 8,908 | | | | 101,729 | |
| |
| Silver Fund — 0.8% | | | | | | | | |
| iShares Silver Trust* | | | 6,801 | | | | 115,481 | |
| |
| Treasury Inflation-Protected Securities | | | | | | | | |
| Bond Fund — 4.0% | | | | | | | | |
| iShares TIPS Bond Fund | | | 5,200 | | | | 597,376 | |
| |
| U.S. Large Cap Growth Funds — 1.0% | | | | | | | | |
| Guggenheim S&P 500 Pure | | | | | | | | |
| Growth ETF | | | 115 | | | | 9,050 | |
| iShares Russell 1000 Growth ETF | | | 1,407 | | | | 139,082 | |
| Total U.S. Large Cap Growth Funds | | | | | | | 148,132 | |
| | | Shares | | Value |
| Investment Companies (continued) | | | | |
| U.S. Large Cap Value Fund — 0.0%(c) | | | | |
| Guggenheim S&P 500 Pure | | | | |
| Value ETF | | | 35 | | | $ | 1,817 | |
| |
| U.S. Short Term Treasury Bond Funds — 52.0% | | | | |
| iShares 1-3 Year Treasury Bond ETF(a) | | | 7,010 | | | | 595,920 | |
| iShares Short Treasury Bond ETF | | | 9,900 | | | | 1,092,960 | |
| SPDR Barclays 1-3 Month T-Bill ETF*(a) | | | 15,631 | | | | 714,493 | |
| Vanguard Short-Term Bond ETF(b) | | | 65,561 | | | | 5,284,872 | |
| Total U.S. Short Term Treasury | | | | | | | | |
| Bond Funds | | | | | | | 7,688,245 | |
| |
| U.S. Small Cap Core Fund — 1.9% | | | | | | | | |
| iShares Russell 2000 ETF(a) | | | 2,485 | | | | 279,215 | |
| Total Investment Companies | | | | | | | | |
| (Cost $15,255,954) | | | | | | | 14,908,437 | |
| |
| Investment of Cash Collateral For | | | | | | | | |
| Securities Loaned — 21.9% | | | | | | | | |
| Money Market Fund — 21.9% | | | | | | | | |
| Dreyfus Government Cash | | | | | | | | |
| Management Fund, | | | | | | | | |
| Institutional Shares, 0.20%(d) | | | | | | | | |
| (Cost $3,240,904) | | | 3,240,904 | | | | 3,240,904 | |
| Total Investments — 122.8% | | | | | | | | |
| (Cost $18,520,014) | | | | | | | 18,170,236 | |
| Liabilities in Excess of | | | | | | | | |
| Other Assets — (22.8)% | | | | | | | (3,375,870 | ) |
| Net Assets — 100.0% | | | | | | $ | 14,794,366 | |
| * | Non-income producing securities. |
| (a) | All or a portion of the security was on loan. In addition, “Other Assets and Liabilities, Net” may include pending sales that are also on loan. The aggregate market value of securities on loan was $3,132,960; total market value of collateral held by the Fund was $3,240,904. |
| (b) | All or a portion of these securities have been segregated as collateral for swap contracts. The total value of securities segregated amounted to $3,051,434. |
| (d) | Rate shown reflects the 1-day yield at April 30, 2016. |
BRIC — Brazil, Russia, India and China
ETF — Exchange Traded Fund
ETN — Exchange Traded Note
TIPS — Treasury Inflation Protected Security
See notes to financial statements.
| Schedules of Investments — IQ Hedge Macro Tracker ETF (continued) |
| April 30, 2016 |
Total return swap contracts outstanding at April 30, 2016:
| Total Return Benchmark | | Annual
Financing Rate
(Received) Paid % | | Expiration
Date | | Notional
Amount
Long (Short) | | Unrealized
Appreciation
(Depreciation)1 |
| CurrencyShares Euro Trust | | | (2.10 | ) | | | 4/09/2018 | | | $ | (586,265 | ) | | $ | — | |
| CurrencyShares Japanese Yen Trust | | | (1.85 | ) | | | 4/09/2018 | | | | (411,913 | ) | | | — | |
| Guggenheim S&P 500 Pure Growth ETF | | | 1.37 | | | | 5/19/2016 | | | | 2,361 | | | | — | |
| Guggenheim S&P 500 Pure Value ETF | | | 1.37 | | | | 5/19/2016 | | | | 467 | | | | — | |
| iPath Bloomberg Commodity Index Total Return | | | (2.35 | ) | | | 4/09/2018 | | | | (66,022 | ) | | | — | |
| iPATH S&P 500 VIX Short-Term Futures | | | 1.37 | | | | 5/19/2016 | | | | 5,514 | | | | — | |
| iShares 1-3 Year Treasury Bond ETF | | | 0.96 | | | | 5/19/2016 | | | | 157,439 | | | | — | |
| iShares China Large-Cap ETF | | | 0.99 | | | | 5/19/2016 | | | | 149,913 | | | | — | |
| iShares Core U.S. Credit Bond ETF | | | 1.37 | | | | 5/19/2016 | | | | 13,144 | | | | — | |
| iShares iBoxx $ High Yield Corporate Bond ETF | | | (1.10 | ) | | | 4/09/2018 | | | | (349,487 | ) | | | — | |
| iShares iBoxx $ Investment Grade Corporate Bond ETF | | | 1.37 | | | | 5/19/2016 | | | | 465,196 | | | | — | |
| iShares India 50 ETF | | | (4.10 | ) | | | 4/09/2018 | | | | (20,442 | ) | | | — | |
| iShares MSCI Brazil Capped ETF | | | (1.23 | ) | | | 4/09/2018 | | | | (524,658 | ) | | | — | |
| iShares MSCI China ETF | | | 1.06 | | | | 5/19/2016 | | | | 61,968 | | | | — | |
| iShares MSCI EAFE Small-Cap ETF | | | 1.37 | | | | 5/19/2016 | | | | 181,858 | | | | — | |
| iShares MSCI Emerging Markets ETF | | | 1.37 | | | | 5/19/2016 | | | | 11,177 | | | | — | |
| iShares MSCI India ETF | | | (1.35 | ) | | | 4/09/2018 | | | | (99,013 | ) | | | — | |
| iShares MSCI Japan ETF | | | 1.37 | | | | 5/19/2016 | | | | 26,871 | | | | — | |
| iShares MSCI Russia Capped ETF | | | (2.85 | ) | | | 4/09/2018 | | | | (1,715 | ) | | | — | |
| iShares Russell 1000 Growth ETF | | | 1.37 | | | | 5/19/2016 | | | | 36,772 | | | | — | |
| iShares Russell 2000 ETF | | | 1.37 | | | | 5/19/2016 | | | | 73,708 | | | | — | |
| iShares Short Treasury Bond ETF | | | 1.19 | | | | 5/19/2016 | | | | 288,696 | | | | — | |
| iShares Silver Trust | | | 1.37 | | | | 5/19/2016 | | | | 30,496 | | | | — | |
| iShares TIPS Bond ETF | | | 1.37 | | | | 5/19/2016 | | | | 157,730 | | | | — | |
| iShares U.S. Real Estate ETF | | | (0.90 | ) | | | 4/09/2018 | | | | (38,258 | ) | | | — | |
| PowerShares DB Commodity Index Tracking Fund | | | (1.10 | ) | | | 4/09/2018 | | | | (261,609 | ) | | | — | |
| PowerShares DB G10 Currency Harvest Fund | | | (2.10 | ) | | | 4/09/2018 | | | | (260,776 | ) | | | — | |
| PowerShares DB Gold Fund | | | (1.10 | ) | | | 4/09/2018 | | | | (245,509 | ) | | | — | |
| SPDR Barclays 1-3 Month T-Bill ETF | | | 1.37 | | | | 5/19/2016 | | | | 188,737 | | | | — | |
| SPDR Barclays High Yield Bond ETF | | | (0.98 | ) | | | 4/09/2018 | | | | (251,442 | ) | | | — | |
| SPDR Dow Jones International Real Estate ETF | | | (2.10 | ) | | | 4/09/2018 | | | | (666,535 | ) | | | — | |
| SPDR Dow Jones REIT ETF | | | (1.35 | ) | | | 4/09/2018 | | | | (28,345 | ) | | | — | |
| SPDR S&P China ETF | | | 1.00 | | | | 5/19/2016 | | | | 22,766 | | | | — | |
| SPDR S&P Emerging Markets SmallCap ETF | | | 1.00 | | | | 5/19/2016 | | | | 238,287 | | | | — | |
| SPDR S&P International Small Cap ETF | | | 0.99 | | | | 5/19/2016 | | | | 21,712 | | | | — | |
| VanEck Vectors J.P. Morgan EM Local Currency Bond ETF | | | 0.99 | | | | 5/19/2016 | | | | 278,300 | | | | — | |
| VanEck Vectors Russia ETF | | | (0.35 | ) | | | 4/09/2018 | | | | (12,702 | ) | | | — | |
| Vanguard REIT ETF | | | (0.85 | ) | | | 4/09/2018 | | | | (242,708 | ) | | | — | |
| Vanguard Short-Term Bond ETF | | | 1.22 | | | | 5/19/2016 | | | | 1,395,923 | | | | — | |
| WisdomTree Emerging Markets Local Debt Fund | | | 0.99 | | | | 5/19/2016 | | | | 82,895 | | | | — | |
| WisdomTree International SmallCap Dividend Fund | | | 1.00 | | | | 5/19/2016 | | | | 35,753 | | | | — | |
| | | | | | | | | | | | | | | $ | — | |
Cash posted has been segregated as collateral for swaps in the amount of $113,760 at April 30, 2016.
Morgan Stanley acts as the counterparty to the total return swap contracts listed above. The Fund either receives from, or pays to, the counterparty, depending upon the total return of the benchmark and the agreed-upon financing rate.
| 1 | Reflects a reset date of April 30, 2016. |
See notes to financial statements.
| Schedules of Investments — IQ Hedge Macro Tracker ETF (continued) |
| April 30, 2016 |
The following is a summary of the fair valuations according to the inputs used as of April 30, 2016 for valuing the Fund’s assets and liabilities. For more information on the valuation techniques, and their aggregation into the levels used in the table below, please refer to Note 2.
Asset Valuation Inputs
| Description | | Level 1 | | Level 2 | | Level 3 | | Total |
| Investments in Securities:(a) | | | | | | | | | | | | | | | | |
| Exchange Traded Notes | | $ | 20,895 | | | $ | — | | | $ | — | | | $ | 20,895 | |
| Investment Companies | | | 14,908,437 | | | | — | | | | — | | | | 14,908,437 | |
| Investment of Cash Collateral for Securities Loaned: | | | | | | | | | | | | | | | | |
| Money Market Fund | | | 3,240,904 | | | | — | | | | — | | | | 3,240,904 | |
| Total Investments in Securities | | | 18,170,236 | | | | — | | | | — | | | | 18,170,236 | |
| Other Financial Instruments: | | | | | | | | | | | | | | | | |
| Swap Contracts | | | — | | | | — | (b) | | | — | | | | — | |
| Total Investments in Securities and Other Financial Instruments | | $ | 18,170,236 | | | $ | — | | | $ | — | | | $ | 18,170,236 | |
Liability Valuation Inputs
| Description | | | Level 1 | | | | Level 2 | | | | Level 3 | | | | Total | |
| Other Financial Instruments: | | | | | | | | | | | | | | | | |
| Swap Contracts | | $ | — | | | $ | — | (b) | | $ | — | | | $ | — | |
| Total Other Financial Instruments | | $ | — | | | $ | — | | | $ | — | | | $ | — | |
| (a) | For a complete listing of investments and their industries, see the Schedules of Investments. |
| (b) | Reflects the unrealized appreciation (depreciation) of the instruments. |
The Fund recognizes transfers between the levels as of the beginning of the period.
For the year ended April 30, 2016, the Fund did not have any transfers between any levels within the fair value hierarchy. (See Note 2)
The Fund did not hold any level 3 securities as of April 30, 2016.
See notes to financial statements.
| Schedules of Investments — IQ Hedge Market Neutral Tracker ETF |
| April 30, 2016 |
| | | Shares | | Value |
| Investment Companies — 99.9% | | | | | | | | |
| Aggregate Bond Funds — 12.1% | | | | | | | | |
| iShares Core U.S. Aggregate | | | | | | | | |
| Bond ETF | | | 8,932 | | | $ | 990,469 | |
| SPDR Barclays Aggregate Bond ETF | | | 595 | | | | 34,867 | |
| Vanguard Total Bond Market ETF(a) | | | 10,004 | | | | 830,032 | |
| Total Aggregate Bond Funds | | | | | | | 1,855,368 | |
| |
| Convertible Bonds Fund — 3.3% | | | | | | | | |
| SPDR Barclays Convertible | | | | | | | | |
| Securities ETF | | | 11,396 | | | | 495,042 | |
| |
| Currency Strategy Fund — 1.8% | | | | | | | | |
| PowerShares DB G10 Currency | | | | | | | | |
| Harvest Fund*(b) | | | 11,607 | | | | 273,229 | |
| |
| Euro Fund — 2.3% | | | | | | | | |
| CurrencyShares Euro Trust* | | | 3,158 | | | | 353,191 | |
| |
| Europe Equity Funds — 3.1% | | | | | | | | |
| iShares Europe ETF | | | 1,093 | | | | 44,059 | |
| iShares MSCI Eurozone ETF | | | 5,847 | | | | 206,224 | |
| Vanguard FTSE Europe ETF | | | 4,448 | | | | 221,777 | |
| Total Europe Equity Funds | | | | | | | 472,060 | |
| |
| Floating Rate Funds — 4.6% | | | | | | | | |
| PowerShares Senior Loan Portfolio | | | 25,503 | | | | 588,864 | |
| SPDR Blackstone / GSO Senior | | | | | | | | |
| Loan ETF | | | 2,496 | | | | 116,863 | |
| Total Floating Rate Funds | | | | | | | 705,727 | |
| |
| Investment Grade Corporate Bond | | | | | | | | |
| Funds — 16.1% | | | | | | | | |
| iShares Core U.S. Credit Bond ETF | | | 609 | | | | 67,836 | |
| iShares iBoxx $ Investment Grade | | | | | | | | |
| Corporate Bond ETF | | | 19,905 | | | | 2,395,169 | |
| Total Investment Grade Corporate | | | | | | | | |
| Bond Funds | | | | | | | 2,463,005 | |
| |
| Japan Equity Fund — 2.9% | | | | | | | | |
| iShares MSCI Japan ETF | | | 38,978 | | | | 445,129 | |
| |
| U.S. Large Cap Value Funds — 9.7% | | | | | | | | |
| Guggenheim S&P 500 Pure | | | | | | | | |
| Value ETF | | | 367 | | | | 19,055 | |
| iShares Russell 1000 Value ETF | | | 6,858 | | | | 691,903 | |
| iShares S&P 500 Value ETF | | | 2,769 | | | | 253,973 | |
| Vanguard Value ETF | | | 6,189 | | | | 517,648 | |
| Total U.S. Large Cap Value Funds | | | | | | | 1,482,579 | |
| |
| U.S. Low Volatility Funds — 1.2% | | | | | | | | |
| iShares Edge MSCI Min Vol USA ETF | | | 2,697 | | | | 118,048 | |
| PowerShares S&P 500 Low | | | | | | | | |
| Volatility Portfolio | | | 1,745 | | | | 69,695 | |
| Total U.S. Low Volatility Funds | | | | | | | 187,743 | |
| |
| U.S. Short Term Treasury Bond | | | | | | | | |
| Funds — 38.2% | | | | | | | | |
| iShares Short Treasury Bond ETF(a) | | | 8,158 | | | | 900,643 | |
| SPDR Barclays 1-3 Month T-Bill ETF* | | | 12,880 | | | | 588,745 | |
| Vanguard Short-Term Bond ETF(a) | | | 54,025 | | | | 4,354,955 | |
| Total U.S. Short Term Treasury | | | | | | | | |
| Bond Funds | | | | | | | 5,844,343 | |
| | | Shares | | Value |
| Investment Companies (continued) | | | | | | | | |
| U.S. Small Cap Growth Funds — 4.6% | | | | | | | | |
| iShares Russell 2000 Growth ETF | | | 2,355 | | | $ | 315,735 | |
| iShares S&P Small-Cap 600 | | | | | | | | |
| Growth ETF | | | 1,325 | | | | 165,055 | |
| Vanguard Small-Cap Growth ETF | | | 1,834 | | | | 221,162 | |
| Total U.S. Small Cap Growth Funds | | | | | | | 701,952 | |
| Total Investment Companies | | | | | | | | |
| (Cost $14,948,158) | | | | | | | 15,279,368 | |
| |
| Short-Term Investment — 0.3% | | | | | | | | |
| Money Market Fund — 0.3% | | | | | | | | |
| Morgan Stanley Institutional Liquidity | | | | | | | | |
| Funds Treasury Portfolio — | | | | | | | | |
| Institutional Class, 0.22%(c) | | | | | | | | |
| (Cost $43,734) | | | 43,734 | | | | 43,734 | |
| |
| Investment of Cash Collateral For | | | | | | | | |
| Securities Loaned — 0.2% | | | | | | | | |
| Money Market Fund — 0.2% | | | | | | | | |
| Dreyfus Government Cash | | | | | | | | |
| Management Fund, | | | | | | | | |
| Institutional Shares, 0.20%(d) | | | | | | | | |
| (Cost $31,330) | | | 31,330 | | | | 31,330 | |
| Total Investments — 100.4% | | | | | | | | |
| (Cost $15,023,222) | | | | | | | 15,354,432 | |
| Liabilities in Excess of | | | | | | | | |
| Other Assets — (0.4)% | | | | | | | (60,088 | ) |
| Net Assets — 100.0% | | | | | | $ | 15,294,344 | |
| * | Non-income producing securities. |
| (a) | All or a portion of these securities have been segregated as collateral for swap contracts. The total value of securities segregated amounted to $3,492,849. |
| (b) | All or a portion of the security was on loan. In addition, “Other Assets and Liabilities, Net” may include pending sales that are also on loan. The aggregate market value of securities on loan was $30,602; total market value of collateral held by the Fund was $31,330. |
| (c) | Rate shown reflects the 7-day yield at April 30, 2016. |
| (d) | Rate shown reflects the 1-day yield at April 30, 2016. |
ETF — Exchange Traded Fund
ETN — Exchange Traded Note
See notes to financial statements.
| Schedules of Investments — IQ Hedge Market Neutral Tracker ETF (continued) |
| April 30, 2016 |
Total return swap contracts outstanding at April 30, 2016:
| Total Return Benchmark | | Annual
Financing Rate
(Received) Paid % | | Expiration
Date | | Notional
Amount
Long (Short) | | Unrealized
Appreciation
(Depreciation)1 |
| CurrencyShares Euro Trust | | | 1.06 | | | 5/19/2016 | | $ | 106,024 | | | $ | — | |
| Guggenheim S&P 500 Pure Value ETF | | | 1.37 | | | 5/19/2016 | | | 5,711 | | | | — | |
| iShares Core U.S. Aggregate Bond ETF | | | 1.22 | | | 5/19/2016 | | | 297,407 | | | | — | |
| iShares Core U.S. Credit Bond ETF | | | 1.24 | | | 5/19/2016 | | | 20,384 | | | | — | |
| iShares Europe ETF | | | 1.37 | | | 5/19/2016 | | | 13,222 | | | | — | |
| iShares iBoxx $ High Yield Corporate Bond ETF | | | (1.10 | ) | | 4/09/2018 | | | (279,807 | ) | | | — | |
| iShares iBoxx $ Investment Grade Corporate Bond ETF | | | 1.31 | | | 5/19/2016 | | | 719,212 | | | | — | |
| iShares MSCI All Country Asia ex Japan ETF | | | (4.10 | ) | | 4/09/2018 | | | (406,371 | ) | | | — | |
| iShares MSCI Emerging Markets ETF | | | (0.85 | ) | | 4/09/2018 | | | (244,891 | ) | | | — | |
| iShares MSCI Eurozone ETF | | | 1.37 | | | 5/19/2016 | | | 61,934 | | | | — | |
| iShares MSCI Japan ETF | | | 1.37 | | | 5/19/2016 | | | 133,648 | | | | — | |
| iShares MSCI Pacific ex Japan ETF | | | (4.10 | ) | | 4/09/2018 | | | (346,207 | ) | | | — | |
| iShares MSCI USA Minimum Volatility ETF | | | 1.37 | | | 5/19/2016 | | | 35,454 | | | | — | |
| iShares Russell 1000 Growth ETF | | | (0.73 | ) | | 4/09/2018 | | | (680,780 | ) | | | — | |
| iShares Russell 1000 Value ETF | | | 1.37 | | | 5/19/2016 | | | 207,733 | | | | — | |
| iShares Russell 2000 Growth ETF | | | 1.37 | | | 5/19/2016 | | | 94,788 | | | | — | |
| iShares Russell 2000 Value ETF | | | (1.60 | ) | | 4/09/2018 | | | (172,942 | ) | | | — | |
| iShares S&P 500 Growth ETF | | | (1.60 | ) | | 4/09/2018 | | | (314,014 | ) | | | — | |
| iShares S&P 500 Value ETF | | | 1.37 | | | 5/19/2016 | | | 76,219 | | | | — | |
| iShares S&P Small-Cap 600 Growth ETF | | | 1.37 | | | 5/19/2016 | | | 49,579 | | | | — | |
| iShares S&P Small-Cap 600 Value ETF | | | (3.10 | ) | | 4/09/2018 | | | (102,421 | ) | | | — | |
| iShares Short Treasury Bond ETF | | | 1.16 | | | 5/19/2016 | | | 270,480 | | | | — | |
| PowerShares DB G10 Currency Harvest Fund | | | 1.02 | | | 5/19/2016 | | | 82,037 | | | | — | |
| PowerShares DB U.S. Dollar Index Bullish Fund | | | (3.10 | ) | | 4/09/2018 | | | (336,099 | ) | | | — | |
| PowerShares S&P 500 Low Volatility Portfolio | | | 1.37 | | | 5/19/2016 | | | 20,929 | | | | — | |
| PowerShares Senior Loan Portfolio | | | 1.02 | | | 5/19/2016 | | | 176,800 | | | | — | |
| SPDR Barclays 1-3 Month T-Bill ETF | | | 1.11 | | | 5/19/2016 | | | 176,761 | | | | — | |
| SPDR Barclays Aggregate Bond ETF | | | 1.00 | | | 5/19/2016 | | | 10,489 | | | | — | |
| SPDR Barclays Convertible Securities ETF | | | 1.25 | | | 5/19/2016 | | | 148,652 | | | | — | |
| SPDR Barclays High Yield Bond ETF | | | (0.98 | ) | | 4/09/2018 | | | (201,281 | ) | | | — | |
| SPDR Blackstone / GSO Senior Loan ETF | | | 1.10 | | | 5/19/2016 | | | 35,068 | | | | — | |
| Vanguard FTSE Emerging Markets ETF | | | (0.60 | ) | | 4/09/2018 | | | (343,571 | ) | | | — | |
| Vanguard FTSE Europe ETF | | | 1.37 | | | 5/19/2016 | | | 66,613 | | | | — | |
| Vanguard FTSE Pacific ETF | | | (0.98 | ) | | 4/09/2018 | | | (482,722 | ) | | | — | |
| Vanguard Growth ETF | | | (0.85 | ) | | 4/09/2018 | | | (471,971 | ) | | | — | |
| Vanguard Short-Term Bond ETF | | | 1.15 | | | 5/19/2016 | | | 1,307,575 | | | | — | |
| Vanguard Small-Cap Growth ETF | | | 1.37 | | | 5/19/2016 | | | 66,445 | | | | — | |
| Vanguard Small-Cap Value ETF | | | (3.10 | ) | | 4/09/2018 | | | (183,907 | ) | | | — | |
| Vanguard Total Bond Market ETF | | | 0.96 | | | 5/19/2016 | | | 249,242 | | | | — | |
| Vanguard Value ETF | | | 1.37 | | | 5/19/2016 | | | 155,403 | | | | — | |
| | | | | | | | | | | | | $ | — | |
Morgan Stanley acts as the counterparty to the total return swap contracts listed above. The Fund either receives from, or pays to, the counterparty, depending upon the total return of the benchmark and the agreed-upon financing rate.
| 1 | Reflects a reset date of April 30, 2016. |
See notes to financial statements.
| Schedules of Investments — IQ Hedge Market Neutral Tracker ETF (continued) |
| April 30, 2016 |
The following is a summary of the fair valuations according to the inputs used as of April 30, 2016 for valuing the Fund’s assets and liabilities. For more information on the valuation techniques, and their aggregation into the levels used in the table below, please refer to Note 2.
Asset Valuation Inputs
| Description | | Level 1 | | Level 2 | | Level 3 | | Total |
| Investments in Securities:(a) | | | | | | | | | | | | | | | | |
| Investment Companies | | $ | 15,279,368 | | | $ | — | | | $ | — | | | $ | 15,279,368 | |
| Short-Term Investment: | | | | | | | | | | | | | | | | |
| Money Market Fund | | | 43,734 | | | | — | | | | — | | | | 43,734 | |
| Investment of Cash Collateral for Securities Loaned: | | | | | | | | | | | | | | | | |
| Money Market Fund | | | 31,330 | | | | — | | | | — | | | | 31,330 | |
| Total Investments in Securities | | | 15,354,432 | | | | — | | | | — | | | | 15,354,432 | |
| Other Financial Instruments: | | | | | | | | | | | | | | | | |
| Swap Contracts | | | — | | | | — | (b) | | | — | | | | — | |
| Total Investments in Securities and Other Financial Instruments | | $ | 15,354,432 | | | $ | — | | | $ | — | | | $ | 15,354,432 | |
Liability Valuation Inputs
| Description | | | Level 1 | | | | Level 2 | | | Level 3 | | | | Total | |
| Other Financial Instruments: | | | | | | | | | | | | | | | | |
| Swap Contracts | | $ | — | | | $ | — | (b) | | $ | — | | | $ | — | |
| Total Other Financial Instruments | | $ | — | | | $ | — | | | $ | — | | | $ | — | |
| (a) | For a complete listing of investments and their industries, see the Schedules of Investments. |
| (b) | Reflects the unrealized appreciation (depreciation) of the instruments. |
The Fund recognizes transfers between the levels as of the beginning of the period.
For the year ended April 30, 2016, the Fund did not have any transfers between any levels within the fair value hierarchy. (See Note 2)
The Fund did not hold any level 3 securities as of April 30, 2016.
See notes to financial statements.
| Schedules of Investments — IQ Hedge Long/Short Tracker ETF |
| April 30, 2016 |
| | | Shares | | Value |
| Exchange Traded Notes — 2.6% | | | | |
| Volatility Fund — 2.6% | | | | |
| iPATH S&P 500 VIX Short-Term | | | | |
| Futures ETN*(a) | | | | |
| (Cost $53,689) | | | 2,882 | | | $ | 48,446 | |
| |
| Investment Companies — 97.7% | | | | | | | | |
| Floating Rate Funds — 6.7% | | | | | | | | |
| PowerShares Senior Loan Portfolio(b) | | | 4,544 | | | | 104,921 | |
| SPDR Blackstone / GSO Senior | | | | | | | | |
| Loan ETF | | | 445 | | | | 20,835 | |
| Total Floating Rate Funds | | | | | | | 125,756 | |
| |
| International Equity Core Funds — 11.7% | | | | | | | | |
| iShares MSCI EAFE ETF | | | 2,476 | | | | 144,673 | |
| Vanguard FTSE Developed | | | | | | | | |
| Markets ETF | | | 2,100 | | | | 77,091 | |
| Total International Equity | | | | | | | | |
| Core Funds | | | | | | | 221,764 | |
| |
| Investment Grade Corporate Bond | | | | | | | | |
| Funds — 20.6% | | | | | | | | |
| iShares Core U.S. Credit Bond ETF | | | 96 | | | | 10,694 | |
| iShares iBoxx $ Investment Grade | | | | | | | | |
| Corporate Bond ETF(b) | | | 3,137 | | | | 377,475 | |
| Total Investment Grade Corporate | | | | | | | | |
| Bond Funds | | | | | | | 388,169 | |
| |
| U.S. Large Cap Core Fund — 8.8% | | | | | | | | |
| Financial Select Sector SPDR Fund | | | 7,141 | | | | 166,457 | |
| |
| U.S. Large Cap Growth Funds — 10.2% | | | | | | | | |
| Guggenheim S&P 500 Pure | | | | | | | | |
| Growth ETF | | | 72 | | | | 5,666 | |
| iShares Russell 1000 Growth ETF | | | 875 | | | | 86,494 | |
| iShares S&P 500 Growth ETF | | | 349 | | | | 39,968 | |
| Vanguard Growth ETF | | | 568 | | | | 59,986 | |
| Total U.S. Large Cap Growth Funds | | | | | | | 192,114 | |
| |
| U.S. Large Cap Value Funds — 19.8% | | | | | | | | |
| Guggenheim S&P 500 Pure Value ETF | | | 93 | | | | 4,829 | |
| iShares Russell 1000 Value ETF | | | 1,732 | | | | 174,742 | |
| iShares S&P 500 Value ETF | | | 699 | | | | 64,112 | |
| Vanguard Value ETF | | | 1,563 | | | | 130,729 | |
| Total U.S. Large Cap Value Funds | | | | | | | 374,412 | |
| |
| U.S. Preferred Fund — 1.3% | | | | | | | | |
| iShares U.S. Preferred Stock ETF | | | 639 | | | | 25,036 | |
| |
| U.S. Small Cap Growth Funds — 18.6% | | | | | | | | |
| iShares Russell 2000 Growth ETF(a) | | | 1,179 | | | | 158,068 | |
| iShares S&P Small-Cap 600 | | | | | | | | |
| Growth ETF | | | 663 | | | | 82,590 | |
| Vanguard Small-Cap Growth ETF | | | 918 | | | | 110,702 | |
| Total U.S. Small Cap Growth Funds | | | | | | | 351,360 | |
| Total Investment Companies | | | | | | | | |
| (Cost $1,841,525) | | | | | | | 1,845,068 | |
| | | Shares | | Value |
| Short-Term Investment — 0.1% | | | | |
| Money Market Fund — 0.1% | | | | |
| Morgan Stanley Institutional | | | | |
| Liquidity Funds Treasury Portfolio — | | | | |
| Institutional Class, 0.22%(c) | | | | |
| (Cost $2,681) | | | 2,681 | | | $ | 2,681 | |
| |
| Investment of Cash Collateral For | | | | | | | | |
| Securities Loaned — 11.0% | | | | | | | | |
| Money Market Fund — 11.0% | | | | | | | | |
| Dreyfus Government Cash | | | | | | | | |
| Management Fund, | | | | | | | | |
| Institutional Shares, 0.20%(d) | | | | | | | | |
| (Cost $207,270) | | | 207,270 | | | | 207,270 | |
| Total Investments — 111.4% | | | | | | | | |
| (Cost $2,105,165) | | | | | | | 2,103,465 | |
| Liabilities in Excess of | | | | | | | | |
| Other Assets — (11.4)% | | | | | | | (215,535 | ) |
| Net Assets — 100.0% | | | | | | $ | 1,887,930 | |
| * | Non-income producing securities. |
| (a) | All or a portion of the security was on loan. In addition, “Other Assets and Liabilities, Net” may include pending sales that are also on loan. The aggregate market value of securities on loan was $202,322; total market value of collateral held by the Fund was $207,270. |
| (b) | All or a portion of these securities have been segregated as collateral for swap contracts. The total value of securities segregated amounted to $405,746. |
| (c) | Rate shown reflects the 7-day yield at April 30, 2016. |
| (d) | Rate shown reflects the 1-day yield at April 30, 2016. |
ETF — Exchange Traded Fund
ETN — Exchange Traded Note
See notes to financial statements.
| Schedules of Investments — IQ Hedge Long/Short Tracker ETF (continued) |
| April 30, 2016 |
Total return swap contracts outstanding at April 30, 2016:
| Total Return Benchmark | | Annual
Financing Rate
(Received) Paid % | | Expiration
Date | | Notional
Amount
Long (Short) | | Unrealized
Appreciation
(Depreciation)1 |
| Energy Select Sector SPDR Fund | | | (0.50 | ) | | | 3/28/2017 | | | $ (55,763 | ) | | | $ | — | |
| Financial Select Sector SPDR Fund | | | 1.37 | | | | 3/28/2017 | | | 49,907 | | | | — | |
| Guggenheim S&P 500 Pure Growth ETF | | | 1.18 | | | | 3/28/2017 | | | 1,731 | | | | — | |
| Guggenheim S&P 500 Pure Value ETF | | | 1.36 | | | | 3/28/2017 | | | 1,454 | | | | — | |
| Health Care Select Sector SPDR Fund | | | (0.50 | ) | | | 3/28/2017 | | | (64,137 | ) | | | — | |
| iPATH S&P 500 VIX Short-Term Futures | | | 1.37 | | | | 3/28/2017 | | | 14,524 | | | | — | |
| iShares Core U.S. Credit Bond ETF | | | 1.36 | | | | 3/28/2017 | | | 3,230 | | | | — | |
| iShares iBoxx $ Investment Grade Corporate Bond ETF | | | 1.33 | | | | 3/28/2017 | | | 113,231 | | | | — | |
| iShares MSCI EAFE ETF | | | 1.37 | | | | 3/28/2017 | | | 43,413 | | | | — | |
| iShares MSCI Emerging Markets ETF | | | (0.85 | ) | | | 3/28/2017 | | | (24,623 | ) | | | — | |
| iShares Russell 1000 Growth ETF | | | 1.20 | | | | 3/28/2017 | | | 25,899 | | | | — | |
| iShares Russell 1000 Value ETF | | | 1.36 | | | | 3/28/2017 | | | 52,362 | | | | — | |
| iShares Russell 2000 Growth ETF | | | 1.37 | | | | 3/28/2017 | | | 47,327 | | | | — | |
| iShares Russell 2000 Value ETF | | | (1.30 | ) | | | 3/28/2017 | | | (134,013 | ) | | | — | |
| iShares S&P 500 Growth ETF | | | 1.20 | | | | 3/28/2017 | | | 12,025 | | | | — | |
| iShares S&P 500 Value ETF | | | 1.36 | | | | 3/28/2017 | | | 19,261 | | | | — | |
| iShares S&P Small-Cap 600 Growth ETF | | | 1.37 | | | | 3/28/2017 | | | 24,789 | | | | — | |
| iShares S&P Small-Cap 600 Value ETF | | | (3.01 | ) | | | 3/28/2017 | | | (79,275 | ) | | | — | |
| iShares U.S. Preferred Stock ETF | | | 1.37 | | | | 3/28/2017 | | | 7,523 | | | | — | |
| PowerShares Senior Loan Portfolio | | | 1.36 | | | | 3/28/2017 | | | 31,472 | | | | — | |
| SPDR Blackstone / GSO Senior Loan ETF | | | 1.34 | | | | 3/28/2017 | | | 6,227 | | | | — | |
| Technology Select Sector SPDR Fund | | | (0.15 | ) | | | 3/28/2017 | | | (38,296 | ) | | | — | |
| Vanguard FTSE Developed Markets ETF | | | 1.37 | | | | 3/28/2017 | | | 23,127 | | | | — | |
| Vanguard FTSE Emerging Markets ETF | | | (0.60 | ) | | | 3/28/2017 | | | (34,546 | ) | | | — | |
| Vanguard Growth ETF | | | 1.20 | | | | 3/28/2017 | | | 17,954 | | | | — | |
| Vanguard Small-Cap Growth ETF | | | 1.37 | | | | 3/28/2017 | | | 33,162 | | | | — | |
| Vanguard Small-Cap Value ETF | | | (2.80 | ) | | | 3/28/2017 | | | (142,507 | ) | | | — | |
| Vanguard Value ETF | | | 1.36 | | | | 3/28/2017 | | | 39,227 | | | | — | |
| | | | | | | | | | | | | | | $ | — | |
Morgan Stanley acts as the counterparty to the total return swap contracts listed above. The Fund either receives from, or pays to, the counterparty, depending upon the total return of the benchmark and the agreed-upon financing rate.
| 1 | Reflects a reset date of April 30, 2016. |
The following is a summary of the fair valuations according to the inputs used as of April 30, 2016 for valuing the Fund’s assets and liabilities. For more information on the valuation techniques, and their aggregation into the levels used in the table below, please refer to Note 2.
Asset Valuation Inputs
| Description | | Level 1 | | Level 2 | | Level 3 | | Total |
| Investments in Securities:(a) | | | | | | | | | | | | | | | | |
| Exchange Traded Notes | | $ | 48,446 | | | $ | — | | | $ | — | | | $ | 48,446 | |
| Investment Companies | | | 1,845,068 | | | | — | | | | — | | | | 1,845,068 | |
| Short-Term Investment: | | | | | | | | | | | | | | | | |
| Money Market Fund | | | 2,681 | | | | — | | | | — | | | | 2,681 | |
| Investment of Cash Collateral for Securities Loaned: | | | | | | | | | | | | | | | | |
| Money Market Fund | | | 207,270 | | | | — | | | | — | | | | 207,270 | |
| Total Investments in Securities | | | 2,103,465 | | | | — | | | | — | | | | 2,103,465 | |
| Other Financial Instruments: | | | | | | | | | | | | | | | | |
| Swap Contracts | | | — | | | | — | (b) | | | — | | | | — | |
| Total Investments in Securities and Other Financial Instruments | | $ | 2,103,465 | | | $ | — | | | $ | — | | | $ | 2,103,465 | |
Liability Valuation Inputs
| Description | | | Level 1 | | | | Level 2 | | | | Level 3 | | | | Total | |
| Other Financial Instruments: | | | | | | | | | | | | | | | | |
| Swap Contracts | | $ | — | | | $ | — | (b) | | $ | — | | | $ | — | |
| Total Other Financial Instruments | | $ | — | | | $ | — | | | $ | — | | | $ | — | |
| (a) | For a complete listing of investments and their industries, see the Schedules of Investments. |
| (b) | Reflects the unrealized appreciation (depreciation) of the instruments. |
The Fund recognizes transfers between the levels as of the beginning of the period.
For the year ended April 30, 2016, the Fund did not have any transfers between any levels within the fair value hierarchy. (See Note 2)
The Fund did not hold any level 3 securities as of April 30, 2016.
See notes to financial statements.
| Schedules of Investments — IQ Hedge Event-Driven Tracker ETF |
| April 30, 2016 |
| | | Shares | | Value |
| Investment Companies — 100.0% | | | | | | | | |
| Aggregate Bond Funds — 45.8% | | | | | | | | |
| iShares Core U.S. Aggregate | | | | | | | | |
| Bond ETF | | | 4,273 | | | $ | 473,833 | |
| SPDR Barclays Aggregate Bond ETF | | | 285 | | | | 16,701 | |
| Vanguard Total Bond Market ETF | | | 4,786 | | | | 397,094 | |
| Total Aggregate Bond Funds | | | | | | | 887,628 | |
| |
| Convertible Bonds Fund — 45.9% | | | | | | | | |
| SPDR Barclays Convertible | | | | | | | | |
| Securities ETF | | | 20,520 | | | | 891,389 | |
| |
| Emerging Equity Funds — 0.8% | | | | | | | | |
| iShares MSCI Emerging Markets ETF | | | 195 | | | | 6,706 | |
| Vanguard FTSE Emerging Markets ETF | | | 269 | | | | 9,396 | |
| Total Emerging Equity Funds | | | | | | | 16,102 | |
| |
| U.S. Large Cap Growth Funds — 7.5% | | | | | | | | |
| Guggenheim S&P 500 Pure | | | | | | | | |
| Growth ETF | | | 54 | | | | 4,250 | |
| iShares Russell 1000 Growth ETF | | | 663 | | | | 65,538 | |
| iShares S&P 500 Growth ETF | | | 264 | | | | 30,233 | |
| Vanguard Growth ETF | | | 430 | | | | 45,412 | |
| Total U.S. Large Cap Growth Funds | | | | | | | 145,433 | |
| Total Investment Companies | | | | | | | | |
| (Cost $2,023,694) | | | | | | | 1,940,552 | |
| | | Shares | | Value |
| Short-Term Investment — 0.2% | | | | |
| Money Market Fund — 0.2% | | | | |
| Morgan Stanley Institutional Liquidity | | | | |
| Funds Treasury Portfolio — | | | | |
| Institutional Class, 0.22%(a) | | | | |
| (Cost $3,057) | | | 3,057 | | | $ | 3,057 | |
| Total Investments — 100.2% | | | | | | | | |
| (Cost $2,026,751) | | | | | | | 1,943,609 | |
| Liabilities in Excess of | | | | | | | | |
| Other Assets — (0.2)% | | | | | | | (3,492 | ) |
| Net Assets — 100.0% | | | | | | $ | 1,940,117 | |
| (a) | Rate shown reflects the 7-day yield at April 30, 2016. |
ETF — Exchange Traded Fund
Total return swap contracts outstanding at April 30, 2016:
| Total Return Benchmark | | Annual
Financing Rate
(Received) Paid % | | Expiration
Date | | Notional
Amount
Long (Short) | | Unrealized
Appreciation
(Depreciation)1 |
| Guggenheim S&P 500 Pure Growth ETF | | | 1.26 | | | 3/28/2017 | | $ | 394 | | | $ | — | |
| iShares Core U.S. Aggregate Bond ETF | | | 1.30 | | | 3/28/2017 | | | 43,580 | | | | — | |
| iShares Core U.S. Credit Bond ETF | | | (4.85 | ) | | 3/28/2017 | | | (4,901 | ) | | | — | |
| iShares iBoxx $ Investment Grade Corporate Bond ETF | | | (0.32 | ) | | 3/28/2017 | | | (175,080 | ) | | | — | |
| iShares MSCI Emerging Markets ETF | | | 1.37 | | | 3/28/2017 | | | 619 | | | | — | |
| iShares Russell 1000 Growth ETF | | | 1.29 | | | 3/28/2017 | | | 6,030 | | | | — | |
| iShares S&P 500 Growth ETF | | | 1.29 | | | 3/28/2017 | | | 2,748 | | | | — | |
| SPDR Barclays Aggregate Bond ETF | | | 1.30 | | | 3/28/2017 | | | 1,524 | | | | — | |
| SPDR Barclays Convertible Securities ETF | | | 1.31 | | | 3/28/2017 | | | 81,928 | | | | — | |
| Vanguard FTSE Emerging Markets ETF | | | 1.37 | | | 3/28/2017 | | | 873 | | | | — | |
| Vanguard Growth ETF | | | 1.29 | | | 3/28/2017 | | | 4,224 | | | | — | |
| Vanguard Total Bond Market ETF | | | 1.30 | | | 3/28/2017 | | | 36,507 | | | | — | |
| | | | | | | | | | | | | $ | — | |
Morgan Stanley acts as the counterparty to the total return swap contracts listed above. The Fund either receives from, or pays to, the counterparty, depending upon the total return of the benchmark and the agreed-upon financing rate.
| 1 | Reflects a reset date of April 30, 2016. |
See notes to financial statements.
| Schedules of Investments — IQ Hedge Event-Driven Tracker ETF (continued) |
| April 30, 2016 |
The following is a summary of the fair valuations according to the inputs used as of April 30, 2016 for valuing the Fund’s assets and liabilities. For more information on the valuation techniques, and their aggregation into the levels used in the table below, please refer to Note 2.
Asset Valuation Inputs
| Description | | Level 1 | | Level 2 | | Level 3 | | Total |
| Investments in Securities:(a) | | | | | | | | | | | | | | | | |
| Investment Companies | | $ | 1,940,552 | | | $ | — | | | $ | — | | | $ | 1,940,552 | |
| Short-Term Investment: | | | | | | | | | | | | | | | | |
| Money Market Fund | | | 3,057 | | | | — | | | | — | | | | 3,057 | |
| Total Investments in Securities | | | 1,943,609 | | | | — | | | | — | | | | 1,943,609 | |
| Other Financial Instruments: | | | | | | | | | | | | | | | | |
| Swap Contracts | | | — | | | | — | (b) | | | — | | | | — | |
| Total Investments in Securities and Other Financial Instruments | | $ | 1,943,609 | | | $ | — | | | $ | — | | | $ | 1,943,609 | |
Liability Valuation Inputs
| Description | | | Level 1 | | | | Level 2 | | | Level 3 | | | | Total | |
| Other Financial Instruments: | | | | | | | | | | | | | | | | |
| Swap Contracts | | $ | — | | | $ | — | (b) | | $ | — | | | $ | — | |
| Total Other Financial Instruments | | $ | — | | | $ | — | | | $ | — | | | $ | — | |
| (a) | For a complete listing of investments and their industries, see the Schedules of Investments. |
| (b) | Reflects the unrealized appreciation (depreciation) of the instruments. |
The Fund recognizes transfers between the levels as of the beginning of the period.
For the year ended April 30, 2016, the Fund did not have any transfers between any levels within the fair value hierarchy. (See Note 2)
The Fund did not hold any level 3 securities as of April 30, 2016.
See notes to financial statements.
| Schedules of Investments — IQ Global Resources ETF |
| April 30, 2016 |
| | | Shares | | Value |
| Common Stocks — 90.0% | | | | | | | | |
| Australia — 1.7% | | | | | | | | |
| BHP Billiton Ltd. | | | 26,493 | | | $ | 418,111 | |
| Evolution Mining Ltd. | | | 24,133 | | | | 36,097 | |
| Fortescue Metals Group Ltd.(a) | | | 15,567 | | | | 40,511 | |
| Newcrest Mining Ltd.* | | | 12,431 | | | | 179,963 | |
| Northern Star Resources Ltd. | | | 10,049 | | | | 29,679 | |
| OceanaGold Corp. | | | 10,597 | | | | 37,985 | |
| South32 Ltd.* | | | 26,733 | | | | 33,866 | |
| Washington H Soul Pattinson & | | | | | | | | |
| Co., Ltd. | | | 27,811 | | | | 344,890 | |
| Total Australia | | | | | | | 1,121,102 | |
| |
| Canada — 8.0% | | | | | | | | |
| Agnico Eagle Mines Ltd. | | | 3,856 | | | | 182,580 | |
| Alamos Gold, Inc., Class A | | | 4,560 | | | | 32,946 | |
| B2Gold Corp.*(a) | | | 16,403 | | | | 36,536 | |
| Barrick Gold Corp. | | | 20,416 | | | | 395,900 | |
| Canadian Natural Resources Ltd. | | | 6,428 | | | | 193,363 | |
| Canfor Corp.* | | | 28,557 | | | | 312,791 | |
| Detour Gold Corp.* | | | 2,905 | | | | 62,409 | |
| Eldorado Gold Corp. | | | 12,214 | | | | 51,582 | |
| Enbridge, Inc. | | | 5,296 | | | | 220,364 | |
| First Quantum Minerals Ltd. | | | 3,485 | | | | 29,742 | |
| Goldcorp, Inc. | | | 14,250 | | | | 287,594 | |
| HudBay Minerals, Inc. | | | 32,283 | | | | 161,338 | |
| Imperial Oil Ltd. | | | 4,999 | | | | 166,061 | |
| Kinross Gold Corp.* | | | 20,845 | | | | 118,986 | |
| Lundin Mining Corp.* | | | 3,675 | | | | 14,464 | |
| Maple Leaf Foods, Inc. | | | 4,417 | | | | 91,612 | |
| New Gold, Inc.* | | | 8,894 | | | | 41,893 | |
| Norbord, Inc. | | | 18,526 | | | | 369,899 | |
| Pan American Silver Corp. | | | 2,635 | | | | 41,378 | |
| Silver Wheaton Corp. | | | 7,308 | | | | 153,383 | |
| Stella-Jones, Inc. | | | 15,173 | | | | 581,070 | |
| Suncor Energy, Inc. | | | 9,041 | | | | 265,831 | |
| Teck Resources Ltd., Class B | | | 2,839 | | | | 34,813 | |
| TransCanada Corp. | | | 4,022 | | | | 167,289 | |
| Turquoise Hill Resources Ltd.* | | | 255,863 | | | | 762,472 | |
| West Fraser Timber Co., Ltd. | | | 17,948 | | | | 592,344 | |
| Yamana Gold, Inc. | | | 16,394 | | | | 81,407 | |
| Total Canada | | | | | | | 5,450,047 | |
| |
| Chile — 0.0%(b) | | | | | | | | |
| Antofagasta PLC | | | 4,832 | | | | 34,203 | |
| |
| China — 12.4% | | | | | | | | |
| Aluminum Corp. of China Ltd., | | | | | | | | |
| Class H* | | | 76,379 | | | | 25,600 | |
| Beijing Enterprises Water | | | | | | | | |
| Group Ltd.*(a) | | | 988,400 | | | | 592,490 | |
| China Coal Energy Co. Ltd., | | | | | | | | |
| Class H(a) | | | 1,594,166 | | | | 756,269 | |
| China Petroleum & Chemical Corp., | | | | | | | | |
| Class H | | | 674,407 | | | | 480,775 | |
| China Resources Power Holdings | | | | | | | | |
| Co., Ltd. | | | 541,965 | | | | 918,040 | |
| China Shenhua Energy Co. Ltd., | | | | | | | | |
| Class H | | | 2,368,947 | | | | 4,006,676 | |
| CNOOC Ltd. | | | 263,214 | | | | 327,779 | |
| Jiangxi Copper Co. Ltd., Class H | | | 17,873 | | | | 21,865 | |
| PetroChina Co. Ltd., Class H | | | 1,063,206 | | | | 782,616 | |
| Yanzhou Coal Mining Co. Ltd., | | | | | | | | |
| Class H(a) | | | 573,212 | | | | 326,612 | |
| | | Shares | | Value |
| Common Stocks (continued) | | | | | | | | |
| China (continued) | | | | | | | | |
| Zhaojin Mining Industry Co. Ltd., | | | | | | | | |
| Class H | | | 50,438 | | | $ | 43,109 | |
| Zijin Mining Group Co. Ltd., Class H | | | 366,081 | | | | 121,285 | |
| Total China | | | | | | | 8,403,116 | |
| |
| Finland — 6.1% | | | | | | | | |
| Stora Enso OYJ, Class R | | | 170,717 | | | | 1,489,943 | |
| UPM-Kymmene OYJ | | | 118,714 | | | | 2,267,963 | |
| Valmet OYJ | | | 31,340 | | | | 393,053 | |
| Total Finland | | | | | | | 4,150,959 | |
| |
| France — 5.2% | | | | | | | | |
| Suez | | | 64,902 | | | | 1,196,801 | |
| TOTAL SA | | | 13,795 | | | | 694,098 | |
| Veolia Environnement SA | | | 65,829 | | | | 1,617,647 | |
| Total France | | | | | | | 3,508,546 | |
| |
| Germany — 0.2% | | | | | | | | |
| Suedzucker AG(a) | | | 9,534 | | | | 168,164 | |
| |
| Hong Kong — 0.7% | | | | | | | | |
| C.P. Pokphand Co., Ltd. | | | 802,709 | | | | 85,887 | |
| Hong Kong & China Gas Co., Ltd. | | | 67,247 | | | | 125,527 | |
| Noble Group Ltd.* | | | 786,029 | | | | 269,018 | |
| Total Hong Kong | | | | | | | 480,432 | |
| |
| Indonesia — 0.1% | | | | | | | | |
| Sakari Resources Ltd.*(c)(d) | | | 240,456 | | | | 64,406 | |
| |
| Italy — 0.7% | | | | | | | | |
| Eni SpA | | | 20,999 | | | | 341,527 | |
| Snam SpA | | | 20,145 | | | | 122,979 | |
| Total Italy | | | | | | | 464,506 | |
| |
| Japan — 4.2% | | | | | | | | |
| Fuji Oil Holdings, Inc. | | | 4,464 | | | | 85,237 | |
| Kurita Water Industries Ltd. | | | 14,672 | | | | 362,292 | |
| Mitsubishi Materials Corp. | | | 5,943 | | | | 19,607 | |
| Mitsui & Co., Ltd. | | | 10,994 | | | | 137,843 | |
| NH Foods Ltd. | | | 5,935 | | | | 134,847 | |
| Nichirei Corp. | | | 11,920 | | | | 106,951 | |
| Nippon Paper Industries Co., Ltd. | | | 26,742 | | | | 526,367 | |
| Nisshin Seifun Group, Inc. | | | 15,773 | | | | 265,205 | |
| Oji Holdings Corp. | | | 226,123 | | | | 957,369 | |
| Sumitomo Metal Mining Co., Ltd. | | | 2,554 | | | | 29,886 | |
| Yamazaki Baking Co., Ltd. | | | 9,293 | | | | 226,864 | |
| Total Japan | | | | | | | 2,852,468 | |
| |
| Jersey — 0.3% | | | | | | | | |
| Centamin PLC | | | 18,602 | | | | 32,945 | |
| Randgold Resources Ltd. | | | 1,563 | | | | 155,009 | |
| Total Jersey | | | | | | | 187,954 | |
| |
| Mexico — 0.3% | | | | | | | | |
| Fresnillo PLC | | | 12,033 | | | | 196,190 | |
| |
| Netherlands — 1.8% | | | | | | | | |
| Royal Dutch Shell PLC, Class B | | | 46,912 | | | | 1,227,365 | |
| |
| Norway — 0.5% | | | | | | | | |
| Norsk Hydro ASA(a) | | | 9,699 | | | | 42,194 | |
| Statoil ASA(a) | | | 18,059 | | | | 319,136 | |
| Total Norway | | | | | | | 361,330 | |
| |
| Peru — 0.2% | | | | | | | | |
| Southern Copper Corp. | | | 4,027 | | | | 119,481 | |
See notes to financial statements.
| Schedules of Investments — IQ Global Resources ETF (continued) |
| April 30, 2016 |
| | | Shares | | Value |
| Common Stocks (continued) | | | | |
| Portugal — 0.8% | | | | |
| Navigator Co. SA (The) | | | 160,501 | | | $ | 572,630 | |
| |
| Russia — 0.1% | | | | | | | | |
| Polymetal International PLC | | | 7,030 | | | | 73,015 | |
| |
| Singapore — 1.7% | | | | | | | | |
| First Resources Ltd. | | | 77,245 | | | | 109,484 | |
| Golden Agri-Resources Ltd. | | | 607,248 | | | | 180,722 | |
| Wilmar International Ltd. | | | 307,976 | | | | 850,110 | |
| Total Singapore | | | | | | | 1,140,316 | |
| |
| Spain — 0.2% | | | | | | | | |
| Ebro Foods SA | | | 7,444 | | | | 168,729 | |
| |
| Sweden — 3.4% | | | | | | | | |
| AAK AB | | | 1,993 | | | | 150,672 | |
| Boliden AB | | | 1,321 | | | | 23,053 | |
| Holmen AB, B Shares | | | 17,939 | | | | 618,952 | |
| Sandvik AB(a) | | | 145,156 | | | | 1,490,923 | |
| Total Sweden | | | | | | | 2,283,600 | |
| |
| Switzerland — 0.3% | | | | | | | | |
| Bell AG | | | 110 | | | | 43,610 | |
| Glencore PLC* | | | 66,660 | | | | 159,072 | |
| Total Switzerland | | | | | | | 202,682 | |
| |
| United Kingdom — 7.8% | | | | | | | | |
| Acacia Mining PLC | | | 6,489 | | | | 33,441 | |
| Anglo American PLC | | | 6,164 | | | | 68,932 | |
| BP PLC | | | 109,768 | | | | 600,987 | |
| Johnson Matthey PLC | | | 3,224 | | | | 136,348 | |
| Pennon Group PLC | | | 51,313 | | | | 610,368 | |
| Pentair PLC(a) | | | 21,961 | | | | 1,275,495 | |
| Rio Tinto PLC | | | 8,681 | | | | 292,550 | |
| Severn Trent PLC | | | 28,677 | | | | 935,540 | |
| Tate & Lyle PLC | | | 22,435 | | | | 193,247 | |
| United Utilities Group PLC | | | 83,389 | | | | 1,147,662 | |
| Total United Kingdom | | | | | | | 5,294,570 | |
| |
| United States — 33.3% | | | | | | | | |
| Alcoa, Inc. | | | 6,812 | | | | 76,090 | |
| American Water Works Co., Inc. | | | 21,911 | | | | 1,594,244 | |
| Anadarko Petroleum Corp. | | | 3,078 | | | | 162,395 | |
| Apache Corp. | | | 2,260 | | | | 122,944 | |
| Aqua America, Inc. | | | 22,232 | | | | 703,865 | |
| Archer-Daniels-Midland Co. | | | 29,223 | | | | 1,167,167 | |
| Bunge Ltd. | | | 6,941 | | | | 433,813 | |
| Chevron Corp. | | | 11,308 | | | | 1,155,451 | |
| ConAgra Foods, Inc. | | | 21,192 | | | | 944,316 | |
| ConocoPhillips | | | 7,308 | | | | 349,249 | |
| CONSOL Energy, Inc.(a) | | | 26,822 | | | | 403,671 | |
| Domtar Corp. | | | 13,160 | | | | 508,502 | |
| EOG Resources, Inc. | | | 3,430 | | | | 283,387 | |
| Exxon Mobil Corp.(e) | | | 25,232 | | | | 2,230,509 | |
| Flowserve Corp.(a) | | | 15,959 | | | | 778,959 | |
| Freeport-McMoRan, Inc.(a) | | | 6,265 | | | | 87,710 | |
| Fresh Del Monte Produce, Inc. | | | 2,548 | | | | 110,226 | |
| General Mills, Inc. | | | 28,946 | | | | 1,775,548 | |
| Hain Celestial Group, Inc. (The)* | | | 5,099 | | | | 213,444 | |
| Halliburton Co. | | | 5,056 | | | | 208,863 | |
| Hormel Foods Corp. | | | 18,149 | | | | 699,644 | |
| IDEX Corp. | | | 9,461 | | | | 774,856 | |
| Ingredion, Inc. | | | 3,520 | | | | 405,117 | |
| JM Smucker Co. (The) | | | 5,875 | | | | 746,008 | |
| Kellogg Co. | | | 17,275 | | | | 1,326,893 | |
| Kinder Morgan, Inc. | | | 13,251 | | | | 235,338 | |
| Louisiana-Pacific Corp.* | | | 31,242 | | | | 531,114 | |
| | | Shares | | Value |
| Common Stocks (continued) | | | | |
| |
| United States (continued) | | | | | | | | |
| Marathon Petroleum Corp. | | | 3,135 | | | $ | 122,516 | |
| Newmont Mining Corp. | | | 9,193 | | | | 321,479 | |
| Occidental Petroleum Corp. | | | 4,556 | | | | 349,217 | |
| Phillips 66(a) | | | 3,192 | | | | 262,095 | |
| Pilgrim’s Pride Corp.*(a) | | | 8,355 | | | | 224,833 | |
| Pioneer Natural Resources Co.(a) | | | 977 | | | | 162,280 | |
| Post Holdings, Inc.*(a) | | | 3,206 | | | | 230,319 | |
| Royal Gold, Inc. | | | 1,138 | | | | 71,262 | |
| Sanderson Farms, Inc. | | | 754 | | | | 69,172 | |
| Schlumberger Ltd. | | | 7,448 | | | | 598,372 | |
| Seaboard Corp.* | | | 40 | | | | 120,120 | |
| Spectra Energy Corp. | | | 3,970 | | | | 124,142 | |
| Tahoe Resources, Inc. | | | 4,181 | | | | 59,147 | |
| Tyson Foods, Inc., Class A | | | 12,303 | | | | 809,783 | |
| Valero Energy Corp. | | | 2,874 | | | | 169,192 | |
| Xylem, Inc. | | | 21,899 | | | | 914,940 | |
| Total United States | | | | | | | 22,638,192 | |
| Total Common Stocks | | | | | | | | |
| (Cost $55,179,170) | | | | | | | 61,164,003 | |
| Short-Term Investment — 10.3% | | | | | | | | |
| Money Market Fund — 10.3% | | | | | | | | |
| Morgan Stanley Institutional Liquidity | | | | | | | | |
| Funds Treasury Portfolio — | | | | | | | | |
| Institutional Class, 0.22%(f) | | | | | | | | |
| (Cost $6,988,535) | | | 6,988,535 | | | | 6,988,535 | |
| |
| Investment of Cash Collateral For | | | | | | | | |
| Securities Loaned — 4.5% | | | | | | | | |
| Money Market Fund — 4.5% | | | | | | | | |
| Dreyfus Government Cash | | | | | | | | |
| Management Fund, | | | | | | | | |
| Institutional Shares, 0.20%(g) | | | | | | | | |
| (Cost $3,024,500) | | | 3,024,500 | | | | 3,024,500 | |
| Total Investments — 104.8% | | | | | | | | |
| (Cost $65,192,205) | | | | | | | 71,177,038 | |
| Liabilities in Excess of | | | | | | | | |
| Other Assets — (4.8)% | | | | | | | (3,252,543 | ) |
| Net Assets — 100.0% | | | | | | $ | 67,924,495 | |
| * | Non-income producing securities. |
| (a) | All or a portion of the security was on loan. In addition, “Other Assets and Liabilities, Net” may include pending sales that are also on loan. The aggregate market value of securities on loan was $4,588,057; total market value of collateral held by the Fund was $4,772,827. Market value of the collateral held includes non-cash U.S. Treasury securities collateral having a value of $1,748,327. |
| (c) | Security has been deemed illiquid because it may not be able to be sold within seven days at approximate value shown. At April 30, 2016, the value of this security was $64,406. |
| (d) | Security fair valued as determined in good faith in accordance with the procedures established by the Board of Trustees. |
| (e) | All or a portion of this security have been segregated as collateral for swap contracts. The total value of security segregated amounted to $1,476,280. |
| (f) | Rate shown reflects the 7-day yield at April 30, 2016 |
| (g) | Rate shown reflects the 1-day yield at April 30, 2016. |
AB — Aktiebolag (stock company)
AG — Aktiengesellschaft (public limited company)
ASA — Allmeennaksjeselskap (stock company)
OYJ — Osakeyhtiö(stock company)
PLC — Public Limited Company
SA — Société Anonyme (corporation)
SpA — Societa per azioni (public company)
See notes to financial statements.
| Schedules of Investments — IQ Global Resources ETF (continued) |
| April 30, 2016 |
Total return swap contracts outstanding at April 30, 2016:
| Total Return Benchmark | | Annual
Financing Rate
(Received) Paid % | | Expiration
Date | | Notional
Amount
Long (short) | | Unrealized
Appreciation
(Depreciation)1 |
| iShares MSCI EAFE ETF | | | (0.75 | ) | | 4/10/2018 | | $ | (6,658,449 | ) | | $ | — | |
| SPDR S&P 500 ETF Trust | | | (0.13 | ) | | 4/10/2018 | | | (6,538,472 | ) | | | — | |
| | | | | | | | | | | | | $ | — | |
Morgan Stanley acts as the counterparty to the total return swap contracts listed above. The Fund either receives from, or pays to, the counterparty, depending upon the total return of the benchmark and the agreed-upon financing rate.
| 1 | Reflects a reset date of April 30, 2016. |
The following is a summary of the fair valuations according to the inputs used as of April 30, 2016 for valuing the Fund’s assets and liabilities. For more information on the valuation techniques, and their aggregation into the levels used in the table below, please refer to Note 2.
Asset Valuation Inputs
| Description | | Level 1 | | Level 2 | | Level 3 | | Total |
| Investments in Securities:(a) | | | | | | | | | | | | | | | | |
| Common Stocks | | $ | 61,099,597 | | | $ | — | | | $ | 64,406 | (b) | | $ | 61,164,003 | |
| Short-Term Investment: | | | | | | | | | | | | | | | | |
| Money Market Fund | | | 6,988,535 | | | | — | | | | — | | | | 6,988,535 | |
| Investment of Cash Collateral for Securities Loaned: | | | | | | | | | | | | | | | | |
| Money Market Fund | | | 3,024,500 | | | | — | | | | — | | | | 3,024,500 | |
| Total Investments in Securities | | | 71,112,632 | | | | — | | | | 64,406 | | | | 71,177,038 | |
| Other Financial Instruments: | | | | | | | | | | | | | | | | |
| Swap Contracts | | | — | | | | — | (c) | | | — | | | | — | |
| Total Investments in Securities and Other Financial Instruments | | $ | 71,112,632 | | | $ | — | | | $ | 64,406 | | | $ | 71,177,038 | |
Liability Valuation Inputs
| Description | | | Level 1 | | | | Level 2 | | | | Level 3 | | | | Total | |
| Other Financial Instruments | | | | | | | | | | | | | | | | |
| Swap Contracts | | $ | — | | | $ | — | (c) | | $ | — | | | $ | — | |
| Total Other Financial Instruments | | $ | — | | | $ | — | | | $ | — | | | $ | — | |
| (a) | For a complete listing of investments and their countries, see the Schedules of Investments. |
| (b) | The Level 3 security valued at $64,406 has been deemed illiquid in good faith in accordance with procedures established by the Board of Trustees. |
| (c) | The value listed for these securities reflects the unrealized appreciation (depreciation) of the instruments. |
The Fund recognizes transfers between the levels as of the beginning of the period.
For the year ended April 30, 2016, the Fund did not have any transfers between any levels within the fair value hierarchy. (See Note 2)
See notes to financial statements.
| Schedules of Investments — IQ Global Resources ETF (continued) |
| April 30, 2016 |
The following is a reconciliation of investments in which significant unobservable inputs (Level 3) were used in determining value:
Investments in
Securities | | Balance as of
April 30, 2015 | | Accrued
Discounts
(Premiums) | | Realized
Gain
(Loss) | | Change in
Unrealized
Appreciation
(Depreciation) | | Purchases | | Sales | | Transfers
into
Level 3 | | Transfers
out of
Level 3 | | Balance as of
April 30, 2016 | | Change in
Unrealized
Appreciation
(Depreciation)
from
Investments
Still Held at
April 30, 2016(a) |
| Common Stock | | | | | | | | | | | | | | | | | | | | |
| Sakari Resources Ltd.(b) | | $ | 98,030 | | | $ | — | | | $ | — | | | $ | (33,624 | ) | | $ | — | | | $ | — | | | $ | — | | | $ | — | | | $ | 64,406 | | | $ | (33,624 | ) |
|
| Total | | $ | 98,030 | | | $ | — | | | $ | — | | | $ | (33,624 | ) | | $ | — | | | $ | — | | | $ | — | | | $ | — | | | $ | 64,406 | | | $ | (33,624 | ) |
| (a) | Included in “Net change in unrealized appreciation (depreciation) on investments” in the Statements of Operations. |
| (b) | Security has been deemed illiquid in good faith in accordance with procedures established by the Board of Trustees. |
Information about Level 3 fair value measurements as of April 30, 2016.
| Security Type | | Fair Value | | Valuation Technique | | Unobservable Inputs |
| Common Stock | | | $64,406 | | | Peer Analysis | | Comparable Securities |
See notes to financial statements.
| Schedules of Investments — IQ Merger Arbitrage ETF |
| April 30, 2016 |
| | | Shares | | Value |
| Common Stocks — 96.4% | | | | | | | | |
| Consumer Discretionary — 3.6% | | | | | | | | |
| Amaya, Inc.*(a) | | | 35,436 | | | $ | 481,212 | |
| Apollo Education Group, Inc.* | | | 69,025 | | | | 538,395 | |
| Cablevision Systems Corp., Class A | | | 97,717 | | | | 3,262,771 | |
| Tumi Holdings, Inc.* | | | 28,966 | | | | 772,813 | |
| Total Consumer Discretionary | | | | | | | 5,055,191 | |
| |
| Consumer Staples — 6.0% | | | | | | | | |
| Rite Aid Corp.* | | | 694,271 | | | | 5,588,881 | |
| SABMiller PLC | | | 45,161 | | | | 2,768,645 | |
| Total Consumer Staples | | | | | | | 8,357,526 | |
| |
| Energy — 10.5% | | | | | | | | |
| Columbia Pipeline Group, Inc.(b) | | | 542,509 | | | | 13,899,080 | |
| Sakari Resources Ltd.*(c)(d) | | | 425 | | | | 114 | |
| Santos Ltd. | | | 208,487 | | | | 763,713 | |
| Total Energy | | | | | | | 14,662,907 | |
| |
| Financials — 4.0% | | | | | | | | |
| Astoria Financial Corp. | | | 24,192 | | | | 363,848 | |
| First Niagara Financial Group, Inc. | | | 83,642 | | | | 883,259 | |
| Firstmerit Corp. | | | 153,850 | | | | 3,409,316 | |
| London Stock Exchange Group PLC | | | 23,392 | | | | 929,663 | |
| Total Financials | | | | | | | 5,586,086 | |
| |
| Health Care — 17.5% | | | | | | | | |
| Alere, Inc.* | | | 42,889 | | | | 1,672,671 | |
| Allergan PLC* | | | 46,944 | | | | 10,166,193 | |
| Baxalta, Inc.(b) | | | 299,156 | | | | 12,549,594 | |
| Total Health Care | | | | | | | 24,388,458 | |
| |
| Industrials — 11.0% | | | | | | | | |
| ADT Corp. (The) | | | 123,113 | | | | 5,168,284 | |
| Asciano Ltd. | | | 371,082 | | | | 2,500,580 | |
| IHS, Inc., Class A* | | | 7,740 | | | | 953,413 | |
| Norfolk Southern Corp. | | | 49,329 | | | | 4,445,036 | |
| Progressive Waste Solutions Ltd. | | | 14,881 | | | | 479,718 | |
| Terex Corp. | | | 76,534 | | | | 1,828,397 | |
| Total Industrials | | | | | | | 15,375,428 | |
| |
| Information Technology — 18.8% | | | | | | | | |
| EMC Corp.(b) | | | 373,283 | | | | 9,746,419 | |
| Fairchild Semiconductor | | | | | | | | |
| International, Inc.* | | | 42,864 | | | | 857,280 | |
| Ingram Micro, Inc., Class A | | | 67,777 | | | | 2,368,806 | |
| KLA-Tencor Corp. | | | 41,685 | | | | 2,915,449 | |
| Newport Corp.* | | | 27,377 | | | | 629,397 | |
| Rofin-Sinar Technologies, Inc.* | | | 14,178 | | | | 456,390 | |
| SanDisk Corp. | | | 121,783 | | | | 9,149,557 | |
| Total Information Technology | | | | | | | 26,123,298 | |
| |
| Materials — 14.9% | | | | | | | | |
| Airgas, Inc. | | | 24,113 | | | | 3,434,656 | |
| E.I. du Pont de Nemours & Co. | | | 142,738 | | | | 9,407,862 | |
| Italcementi SpA | | | 64,731 | | | | 768,086 | |
| Syngenta AG | | | 3,969 | | | | 1,590,085 | |
| Valspar Corp. (The) | | | 51,760 | | | | 5,522,274 | |
| Total Materials | | | | | | | 20,722,963 | |
| | | Shares | | Value |
| Common Stocks (continued) | | | | | | | | |
| Utilities — 10.1% | | | | | | | | |
| AGL Resources, Inc.(b) | | | 65,742 | | | $ | 4,329,768 | |
| Empire District Electric Co. (The)(a) | | | 14,766 | | | | 497,171 | |
| ITC Holdings Corp. | | | 53,268 | | | | 2,347,521 | |
| Piedmont Natural Gas Co., Inc. | | | 28,619 | | | | 1,711,416 | |
| Questar Corp. | | | 86,925 | | | | 2,179,210 | |
| TECO Energy, Inc. | | | 109,860 | | | | 3,050,812 | |
| Total Utilities | | | | | | | 14,115,898 | |
| Total Common Stocks | | | | | | | | |
| (Cost $133,999,400) | | | | | | | 134,387,755 | |
| |
| Right — 0.0%(e) | | | | | | | | |
| Health Care — 0.0%(e) | | | | | | | | |
| Dyax Corp. CVR*(c)(d) | | | 23,351 | | | | 25,920 | |
| Trius Therapeutics CVR*(c)(d) | | | 6,177 | | | | — | |
| Total Right | | | | | | | | |
| (Cost $0) | | | | | | | 25,920 | |
| |
| Short-Term Investment — 3.7% | | | | | | | | |
| Money Market Fund — 3.7% | | | | | | | | |
| Morgan Stanley Institutional Liquidity | | | | | | | | |
| Funds Treasury Portfolio — | | | | | | | | |
| Institutional Class, 0.22%(f) | | | | | | | | |
| (Cost $5,147,877) | | | 5,147,877 | | | | 5,147,877 | |
| |
| Investment of Cash Collateral For | | | | | | | | |
| Securities Loaned — 1.1% | | | | | | | | |
| Money Market Fund — 1.1% | | | | | | | | |
| Dreyfus Government Cash | | | | | | | | |
| Management Fund, | | | | | | | | |
| Institutional Shares, 0.20%(g) | | | | | | | | |
| (Cost $1,534,625) | | | 1,534,625 | | | | 1,534,625 | |
| Total Investments — 101.2% | | | | | | | | |
| (Cost $140,681,902) | | | | | | | 141,096,177 | |
| Liabilities in Excess of | | | | | | | | |
| Other Assets — (1.2)% | | | | | | | (1,729,272 | ) |
| Net Assets — 100.0% | | | | | | $ | 139,366,905 | |
| * | Non-income producing securities. |
| (a) | All or a portion of the security was on loan. In addition, “Other Assets and Liabilities, Net” may include pending sales that are also on loan. The aggregate market value of securities on loan was $1,446,739; total market value of collateral held by the Fund was $1,534,625. |
| (b) | All or a portion of these securities have been segregated as collateral for swap contracts. The total value of securities segregated amounted to $17,329,510. |
| (c) | Security has been deemed illiquid because it may not be able to be sold within seven days at approximate value shown. At April 30, 2016, the value of these securities was $26,034. |
| (d) | Security fair valued as determined in good faith in accordance with the procedures established by the Board of Trustees. |
| (f) | Rate shown reflects the 7-day yield at April 30, 2016. |
| (g) | Rate shown reflects the 1-day yield at April 30, 2016. |
AG — Aktiengesellschaft (public limited company)
CVR — Contingent Value Right
PLC — Public Limited Company
SpA — Societa per azioni (public company)
See notes to financial statements.
| Schedules of Investments — IQ Merger Arbitrage ETF (continued) |
| April 30, 2016 |
Total return swap contracts outstanding at April 30, 2016:
| Total Return Benchmark | | Annual
Financing Rate
(Received) Paid % | | Expiration
Date | | Notional
Amount
Long (Short) | | Unrealized
Appreciation
(Depreciation)1 |
| Energy Select Sector SPDR Fund | | | (0.50 | ) | | 1/11/2017 | | $ | (1,056,126 | ) | | $ | — | |
| Financial Select Sector SPDR Fund | | | (0.12 | ) | | 1/11/2017 | | | (3,585,381 | ) | | | — | |
| Health Care Select Sector SPDR Fund | | | (0.43 | ) | | 1/11/2017 | | | (12,955,955 | ) | | | — | |
| Industrial Select Sector SPDR Fund | | | (0.42 | ) | | 1/11/2017 | | | (3,142,208 | ) | | | — | |
| Materials Select Sector SPDR Fund | | | (0.15 | ) | | 1/11/2017 | | | (9,501,295 | ) | | | — | |
| Technology Select Sector SPDR Fund | | | (0.14 | ) | | 1/11/2017 | | | (5,852,405 | ) | | | — | |
| Utilities Select Sector SPDR Fund | | | (0.53 | ) | | 1/11/2017 | | | (1,125,136 | ) | | | — | |
| Vanguard FTSE Europe ETF | | | (0.42 | ) | | 1/11/2017 | | | (8,501,379 | ) | | | — | |
| | | | | | | | | | | | | $ | — | |
Morgan Stanley acts as the counterparty to the total return swap contracts listed above. The Fund either receives from, or pays to, the counterparty, depending upon the total return of the benchmark and the agreed-upon financing rate.
| 1 | Reflects a reset date of April 30, 2016. |
The following is a summary of the fair valuations according to the inputs used as of April 30, 2016 for valuing the Fund’s assets and liabilities.
For more information on the valuation techniques, and their aggregation into the levels used in the table below, please refer to Note 2.
Asset Valuation Inputs
| Description | | Level 1 | | Level 2 | | Level 3 | | Total |
| Investments in Securities:(a) | | | | | | | | | | | | | | | | |
| Common Stocks | | $ | 134,387,641 | | | $ | — | | | $ | 114 | (b) | | $ | 134,387,755 | |
| Rights | | | — | | | | — | | | | 25,920 | (b) | | | 25,920 | |
| Short-Term Investment: | | | | | | | | | | | | | | | | |
| Money Market Fund | | | 5,147,877 | | | | — | | | | — | | | | 5,147,877 | |
| Investment of Cash Collateral for Securities Loaned: | | | | | | | | | | | | | | | | |
| Money Market Fund | | | 1,534,625 | | | | — | | | | — | | | | 1,534,625 | |
| Total Investments in Securities | | | 141,070,143 | | | | — | | | | 26,034 | * | | | 141,096,177 | |
| Other Financial Instruments: | | | | | | | | | | | | | | | | |
| Swap Contracts | | | — | | | | — | (c) | | | — | | | | — | |
| Total Investments in Securities and Other Financial Instruments | | $ | 141,070,143 | | | $ | — | | | $ | 26,034 | | | $ | 141,096,177 | |
Liability Valuation Inputs
| Description | | | Level 1 | | | | Level 2 | | | | Level 3 | | | | Total | |
| Other Financial Instruments: | | | | | | | | | | | | | | | | |
| Swap Contracts | | $ | — | | | $ | — | (c) | | $ | — | | | $ | — | |
| Total Other Financial Instruments | | $ | — | | | $ | — | | | $ | — | | | $ | — | |
| (a) | For a complete listing of investments and their industries, see the Schedules of Investments. |
| (b) | The Level 3 securities valued at $26,034 have been deemed illiquid in good faith in accordance with procedures established by the Board of Trustees. |
| (c) | The value listed for these securities reflects the unrealized appreciation (depreciation) of the instruments. |
The Fund recognizes transfers between the levels as of the beginning of the period.
For the year ended April 30, 2016, the Fund did not have any transfers between any levels within the fair value hierarchy. (See Note 2)
See notes to financial statements.
| Schedules of Investments — IQ Merger Arbitrage ETF (continued) |
| April 30, 2016 |
Investments in
Securities | | Balance as of
April 30, 2015 | | Accrued
Discounts
(Premiums) | | Realized
Gain
(Loss) | | Change in
Unrealized
Appreciation
(Depreciation) | | Purchases | | Sales | | Transfers
into
Level 3 | | Transfers
out of
Level 3 | | Balance as of
April 30, 2016 | | Change in
Unrealized
Appreciation
(Depreciation)
from
Investments
Still Held at
April 30, 2016(a) |
| Common Stock | | | | | | | | | | | | | | | | | | | | | | | | | | | | | | | | | | | | | | | | |
| Sakari Resources Ltd. | | $ | 173 | | | $ | — | | | $ | — | | | $ | (59 | ) | | $ | — | | | $ | — | | | $ | — | | | $ | — | | | $ | 114 | | | $ | (59 | ) |
| Rights | | | | | | | | | | | | | | | | | | | | | | | | | | | | | | | | | | | | | | | | |
| Dyax Corp. CVR | | | — | | | | — | | | | — | | | | 25,920 | | | | 0 | ** | | | — | | | | — | | | | — | | | | 25,920 | | | | 25,920 | |
| Trius Therapeutics CVR | | | — | (b) | | | — | | | | — | | | | — | | | | — | | | | — | | | | — | | | | — | | | | — | (b) | | | — | |
| Total | | $ | 173 | | | $ | — | | | $ | — | | | $ | 25,861 | | | $ | — | | | $ | — | | | $ | — | | | $ | — | | | $ | 26,034 | | | $ | 25,861 | |
| ** | Amount is less than $0.50. |
| (a) | Included in “Net change in unrealized appreciation (depreciation) on investments” in the Statements of Operations. |
| (b) | Includes a level 3 security valued at $—. |
Information about Level 3 fair value measurements as of April 30, 2016.
| Security Type | | Fair Value | | Valuation Technique | | Unobservable Inputs |
| Common Stock | | $ | 114 | | | Peer Analysis | | Comparable Securities |
| Rights | | $ | 25,920 | | | Issuer Specific Facts | | Contingent Payment Terms |
| Rights | | $ | — | | | Issuer Specific Facts | | Contingent Payment Terms |
See notes to financial statements.
| Schedules of Investments — IQ Real Return ETF |
| April 30, 2016 |
| | | Shares | | Value |
| Investment Companies — 99.7% | | | | | | | | |
| U.S. Large Cap Core Funds — 9.9% | | | | | | | | |
| iShares Core S&P 500 ETF | | | 25 | | | $ | 5,184 | |
| SPDR S&P 500 ETF Trust | | | 12,810 | | | | 2,642,703 | |
| Total U.S. Large Cap Core Funds | | | | | | | 2,647,887 | |
| |
| U.S. Medium Term Treasury Bond Funds — 8.0% | | | | |
| iShares 3-7 Year Treasury Bond ETF | | | 15,911 | | | | 1,998,899 | |
| iShares 7-10 Year Treasury Bond ETF(a) | | | 1,233 | | | | 135,630 | |
| Total U.S. Medium Term Treasury | | | | | | | | |
| Bond Funds | | | | | | | 2,134,529 | |
| |
| U.S. REITs Funds — 4.2% | | | | | | | | |
| iShares U.S. Real Estate ETF(a) | | | 1,728 | | | | 132,486 | |
| SPDR Dow Jones REIT ETF(a) | | | 1,123 | | | | 103,687 | |
| Vanguard REIT ETF | | | 10,827 | | | | 885,973 | |
| Total U.S. REITs Funds | | | | | | | 1,122,146 | |
| |
| U.S. Short Term Treasury Bond Funds — 71.1% | | | | |
| iShares 1-3 Year Treasury Bond ETF | | | 6,252 | | | | 531,482 | |
| iShares Short Treasury Bond ETF | | | 100,394 | | | | 11,083,498 | |
| SPDR Barclays 1-3 Month T-Bill ETF*(a) | | | 161,742 | | | | 7,393,227 | |
| Total U.S. Short Term Treasury | | | | | | | | |
| Bond Funds | | | | | | | 19,008,207 | |
| |
| U.S. Small Cap Core Fund — 6.5% | | | | | | | | |
| iShares Russell 2000 ETF(a) | | | 15,550 | | | | 1,747,198 | |
| Total Investment Companies | | | | | | | | |
| (Cost $26,407,203) | | | | | | | 26,659,967 | |
| | | Shares | | Value |
| Short-Term Investment — 0.3% | | | | |
| Money Market Fund — 0.3% | | | | |
| Morgan Stanley Institutional | | | | |
| Liquidity Funds Treasury Portfolio — | | | | |
| Institutional Class, 0.22%(b) | | | | |
| (Cost $74,449) | | | 74,449 | | | $ | 74,449 | |
| |
| Investment of Cash Collateral For | | | | | | | | |
| Securities Loaned — 12.2% | | | | | | | | |
| Money Market Fund — 12.2% | | | | | | | | |
| Dreyfus Government Cash | | | | | | | | |
| Management Fund, | | | | | | | | |
| Institutional Shares, 0.20%(c) | | | | | | | | |
| (Cost $3,273,756) | | | 3,273,756 | | | | 3,273,756 | |
| Total Investments — 112.2% | | | | | | | | |
| (Cost $29,755,408) | | | | | | | 30,008,172 | |
| Liabilities in Excess of | | | | | | | | |
| Other Assets — (12.2)% | | | | | | | (3,280,975 | ) |
| Net Assets — 100.0% | | | | | | $ | 26,727,197 | |
| * | Non-income producing securities. |
| (a) | All or a portion of the security was on loan. In addition, “Other Assets and Liabilities, Net” may include pending sales that are also on loan. The aggregate market value of securities on loan was $3,184,369; total market value of collateral held by the Fund was $3,273,756. |
| (b) | Rate shown reflects the 7-day yield at April 30, 2016. |
| (c) | Rate shown reflects the 1-day yield at April 30, 2016. |
ETF — Exchange Traded Fund
REIT — Real Estate Investment Trust
The following is a summary of the fair valuations according to the inputs used as of April 30, 2016 for valuing the Fund’s assets and liabilities. For more information on the valuation techniques, and their aggregation into the levels used in the table below, please refer to Note 2.
Asset Valuation Inputs
| Description | | Level 1 | | Level 2 | | Level 3 | | Total |
| Investments in Securities:(a) | | | | | | | | | | | | | | | | |
| Investment Companies | | $ | 26,659,967 | | | $ | — | | | $ | — | | | $ | 26,659,967 | |
| Short-Term Investment: | | | | | | | | | | | | | | | | |
| Money Market Fund | | | 74,449 | | | | — | | | | — | | | | 74,449 | |
| Investment of Cash Collateral for Securities Loaned: | | | | | | | | | | | | | | | | |
| Money Market Fund | | | 3,273,756 | | | | — | | | | — | | | | 3,273,756 | |
| Total Investments in Securities | | $ | 30,008,172 | | | $ | — | | | $ | — | | | $ | 30,008,172 | |
| (a) | For a complete listing of investments and their industries, see the Schedules of Investments. |
The Fund recognizes transfers between the levels as of the beginning of the period.
For the year ended April 30, 2016, the Fund did not have any transfers between any levels within the fair value hierarchy. (See Note 2)
The Fund did not hold any level 3 securities as of April 30, 2016.
See notes to financial statements.
| Schedules of Investments — IQ Australia Small Cap ETF |
| April 30, 2016 |
| | | Shares | | Value |
| Common Stocks — 99.5% | | | | | | | | |
| Consumer Discretionary — 21.9% | | | | | | | | |
| Ainsworth Game Technology Ltd. | | | 8,877 | | | $ | 15,785 | |
| APN News & Media Ltd.*(a) | | | 51,211 | | | | 24,231 | |
| APN Outdoor Group Ltd. | | | 14,047 | | | | 67,643 | |
| Automotive Holdings Group Ltd. | | | 17,301 | | | | 51,757 | |
| Breville Group Ltd. | | | 10,621 | | | | 66,708 | |
| Burson Group Ltd. | | | 16,183 | | | | 61,503 | |
| Collins Foods Ltd. | | | 7,066 | | | | 21,678 | |
| Corporate Travel Management Ltd. | | | 5,060 | | | | 55,066 | |
| Fairfax Media Ltd. | | | 195,814 | | | | 118,801 | |
| G8 Education Ltd. | | | 25,890 | | | | 77,649 | |
| Greencross Ltd. (a) | | | 7,004 | | | | 38,004 | |
| IDP Education Ltd.* | | | 10,449 | | | | 33,252 | |
| InvoCare Ltd. | | | 9,114 | | | | 85,273 | |
| JB Hi-Fi Ltd.(a) | | | 8,411 | | | | 141,022 | |
| Mantra Group Ltd. | | | 19,718 | | | | 55,677 | |
| Myer Holdings Ltd. | | | 69,147 | | | | 54,616 | |
| Navitas Ltd. | | | 21,026 | | | | 82,155 | |
| Nine Entertainment Co. Holdings Ltd. | | | 66,257 | | | | 57,137 | |
| oOh!media Ltd. | | | 8,024 | | | | 28,536 | |
| Pacific Brands Ltd. | | | 77,758 | | | | 67,945 | |
| RCG Corp., Ltd. | | | 27,035 | | | | 28,265 | |
| Retail Food Group Ltd.(a) | | | 11,078 | | | | 46,498 | |
| Seven West Media Ltd. | | | 75,613 | | | | 61,166 | |
| Southern Cross Media Group Ltd. | | | 64,490 | | | | 53,153 | |
| Super Retail Group Ltd.(a) | | | 11,845 | | | | 76,474 | |
| Village Roadshow Ltd. | | | 6,411 | | | | 25,735 | |
| Total Consumer Discretionary | | | | | | | 1,495,729 | |
| |
| Consumer Staples — 7.1% | | | | | | | | |
| Asaleo Care Ltd. | | | 28,069 | | | | 42,199 | |
| Australian Agricultural Co., Ltd.*(a) | | | 17,017 | | | | 18,636 | |
| Bega Cheese Ltd. | | | 10,466 | | | | 49,121 | |
| Bellamy’s Australia Ltd.(a) | | | 6,509 | | | | 50,021 | |
| Costa Group Holdings Ltd. | | | 25,218 | | | | 57,158 | |
| GrainCorp Ltd., Class A | | | 15,426 | | | | 96,415 | |
| Metcash Ltd.*(a) | | | 79,613 | | | | 106,932 | |
| Select Harvests Ltd.(a) | | | 6,018 | | | | 23,101 | |
| Tassal Group Ltd. | | | 12,404 | | | | 36,918 | |
| Total Consumer Staples | | | | | | | 480,501 | |
| |
| Energy — 3.2% | | | | | | | | |
| Beach Energy Ltd. | | | 139,909 | | | | 79,011 | |
| Karoon Gas Australia Ltd.* | | | 19,356 | | | | 21,567 | |
| Liquefied Natural Gas Ltd.*(a) | | | 39,216 | | | | 18,256 | |
| Whitehaven Coal Ltd.* | | | 43,198 | | | | 25,384 | |
| WorleyParsons Ltd. | | | 14,228 | | | | 75,898 | |
| Total Energy | | | | | | | 220,116 | |
| |
| Financials — 8.0% | | | | | | | | |
| Cover-More Group Ltd. | | | 20,485 | | | | 21,886 | |
| Eclipx Group Ltd. | | | 13,924 | | | | 31,453 | |
| FlexiGroup Ltd. | | | 23,945 | | | | 43,674 | |
| Genworth Mortgage Insurance | | | | | | | | |
| Australia Ltd.(a) | | | 22,091 | | | | 40,293 | |
| IOOF Holdings Ltd.(a) | | | 24,633 | | | | 168,060 | |
| nib holdings Ltd. | | | 37,180 | | | | 129,385 | |
| OzForex Group Ltd. | | | 18,766 | | | | 30,934 | |
| Steadfast Group Ltd. | | | 57,319 | | | | 82,237 | |
| Total Financials | | | | | | | 547,922 | |
| | | Shares | | Value |
| Common Stocks (continued) | | | | | | | | |
| Health Care — 11.9% | | | | | | | | |
| Ansell Ltd. | | | 12,674 | | | $ | 192,766 | |
| Australian Pharmaceutical | | | | | | | | |
| Industries Ltd. | | | 30,117 | | | | 45,048 | |
| Estia Health Ltd. | | | 14,513 | | | | 64,017 | |
| Japara Healthcare Ltd.(a) | | | 18,395 | | | | 39,728 | |
| Mayne Pharma Group Ltd.* | | | 59,408 | | | | 63,245 | |
| Mesoblast Ltd.*(a) | | | 20,720 | | | | 34,629 | |
| Primary Health Care Ltd.(a) | | | 43,222 | | | | 114,458 | |
| Regis Healthcare Ltd. | | | 11,420 | | | | 44,447 | |
| Sigma Pharmaceuticals Ltd. | | | 87,984 | | | | 73,860 | |
| Sirtex Medical Ltd. | | | 4,762 | | | | 108,079 | |
| Virtus Health Ltd. | | | 6,362 | | | | 32,821 | |
| Total Health Care | | | | | | | 813,098 | |
| |
| Industrials — 12.0% | | | | | | | | |
| ALS Ltd. | | | 41,807 | | | | 149,316 | |
| Austal Ltd. | | | 23,591 | | | | 28,085 | |
| Broadspectrum Ltd.* | | | 38,849 | | | | 43,879 | |
| Cleanaway Waste Management Ltd. | | | 124,385 | | | | 74,990 | |
| Downer EDI Ltd. | | | 35,510 | | | | 100,810 | |
| GWA Group Ltd. | | | 16,571 | | | | 29,213 | |
| IPH Ltd. | | | 13,083 | | | | 69,091 | |
| McMillan Shakespeare Ltd. | | | 5,733 | | | | 53,727 | |
| Mineral Resources Ltd. | | | 11,507 | | | | 65,071 | |
| Monadelphous Group Ltd.(a) | | | 7,337 | | | | 42,666 | |
| Programmed Maintenance | | | | | | | | |
| Services Ltd. | | | 20,876 | | | | 23,340 | |
| SAI Global Ltd. | | | 18,129 | | | | 50,498 | |
| Spotless Group Holdings Ltd. | | | 85,977 | | | | 84,969 | |
| Total Industrials | | | | | | | 815,655 | |
| |
| Information Technology — 7.1% | | | | | | | | |
| 1-Page Ltd.* | | | 8,182 | | | | 6,026 | |
| Aconex Ltd.* | | | 10,527 | | | | 53,745 | |
| Altium Ltd. | | | 7,995 | | | | 37,524 | |
| carsales.com Ltd. | | | 16,351 | | | | 146,744 | |
| IRESS Ltd. | | | 8,831 | | | | 78,446 | |
| iSentia Group Ltd. | | | 15,964 | | | | 44,224 | |
| MYOB Group Ltd. | | | 18,582 | | | | 48,215 | |
| Technology One Ltd. | | | 19,419 | | | | 72,320 | |
| Total Information Technology | | | | | | | 487,244 | |
| |
| Materials — 28.3% | | | | | | | | |
| Adelaide Brighton Ltd. | | | 36,601 | | | | 144,409 | |
| BlueScope Steel Ltd. | | | 48,717 | | | | 240,544 | |
| CSR Ltd. | | | 42,836 | | | | 111,801 | |
| DuluxGroup Ltd. | | | 32,877 | | | | 160,577 | |
| Evolution Mining Ltd. | | | 85,334 | | | | 127,640 | |
| Independence Group NL | | | 27,047 | | | | 63,161 | |
| Jacana Minerals Ltd.*(b)(c) | | | 2,006 | | | | 201 | |
| Northern Star Resources Ltd. | | | 48,980 | | | | 144,657 | |
| Nufarm Ltd. | | | 16,611 | | | | 88,990 | |
| Orora Ltd. | | | 103,326 | | | | 208,173 | |
| OZ Minerals Ltd. | | | 25,559 | | | | 114,692 | |
| Pact Group Holdings Ltd. | | | 14,607 | | | | 57,743 | |
| Regis Resources Ltd. | | | 30,077 | | | | 66,565 | |
| Sandfire Resources NL | | | 12,417 | | | | 56,193 | |
| Saracen Mineral Holdings Ltd.* | | | 61,145 | | | | 49,463 | |
| Sims Metal Management Ltd. | | | 14,109 | | | | 102,074 | |
| St. Barbara Ltd.* | | | 41,238 | | | | 73,012 | |
See notes to financial statements.
| Schedules of Investments — IQ Australia Small Cap ETF (continued) |
| April 30, 2016 |
| | | Shares | | Value |
| Common Stocks (continued) | | | | | | | | |
| Materials (continued) | | | | | | | | |
| Syrah Resources Ltd.* | | | 16,271 | | | $ | 58,733 | |
| TFS Corp., Ltd. | | | 23,519 | | | | 28,000 | |
| Western Areas Ltd. | | | 16,900 | | | | 32,243 | |
| Total Materials | | | | | | | 1,928,871 | |
| Total Common Stocks | | | | | | | | |
| (Cost $7,305,821) | | | | | | | 6,789,136 | |
| |
| Short-Term Investment — 0.3% | | | | | | | | |
| Money Market Fund — 0.3% | | | | | | | | |
| Morgan Stanley Institutional Liquidity | | | | | | | | |
| Funds Treasury Portfolio — | | | | | | | | |
| Institutional Class, 0.22%(d) | | | | | | | | |
| (Cost $18,305) | | | 18,305 | | | | 18,305 | |
| |
| Investment of Cash Collateral For | | | | | | | | |
| Securities Loaned — 6.7% | | | | | | | | |
| Money Market Fund — 6.7% | | | | | | | | |
| Dreyfus Government Cash | | | | | | | | |
| Management Fund, | | | | | | | | |
| Institutional Shares, 0.20%(e) | | | | | | | | |
| (Cost $455,831) | | | 455,831 | | | | 455,831 | |
| | | Value |
| Total Investments — 106.5% | | | | |
| (Cost $7,779,957) | | $ | 7,263,272 | |
| Liabilities in Excess of | | | | |
| Other Assets — (6.5)% | | | (437,658 | ) |
| Net Assets — 100.0% | | $ | 6,825,614 | |
| * | Non-income producing securities. |
| (a) | All or a portion of the security was on loan. In addition, “Other Assets and Liabilities, Net” may include pending sales that are also on loan. The aggregate market value of securities on loan was $531,074; total market value of collateral held by the Fund was $564,675. Market value of the collateral held includes non-cash U.S. Treasury securities collateral having a value of $108,844. |
| (b) | Security has been deemed illiquid because it may not be able to be sold within seven days at approximate value shown. At April 30, 2016, the value of this security was $201. |
| (c) | Security fair valued as determined in good faith in accordance with the procedures established by the Board of Trustees. |
| (d) | Rate shown reflects the 7-day yield at April 30, 2016. |
| (e) | Rate shown reflects the 1-day yield at April 30, 2016. |
The following is a summary of the fair valuations according to the inputs used as of April 30, 2016 for valuing the Fund’s assets and liabilities. For more information on the valuation techniques, and their aggregation into the levels used in the table below, please refer to Note 2.
Asset Valuation Inputs
| Description | | Level 1 | | Level 2 | | Level 3 | | Total |
| Investments in Securities:(a) | | | | | | | | | | | | | | | | |
| Common Stocks | | $ | 6,788,935 | | | $ | — | | | $ | 201 | (b) | | $ | 6,789,136 | |
| Short-Term Investment: | | | | | | | | | | | | | | | | |
| Money Market Fund | | | 18,305 | | | | — | | | | — | | | | 18,305 | |
| Investment of Cash Collateral for Securities Loaned: | | | | | | | | | | | | | | | | |
| Money Market Fund | | | 455,831 | | | | — | | | | — | | | | 455,831 | |
| Total Investments in Securities | | | 7,263,071 | | | | — | | | | 201 | | | | 7,263,272 | |
| Total Investments in Securities and Other Financial Instruments | | $ | 7,263,071 | | | $ | — | | | $ | 201 | | | $ | 7,263,272 | |
| (a) | For a complete listing of investments and their industries, see the Schedules of Investments. |
| (b) | The Level 3 security valued at $201 has been deemed illiquid in good faith in accordance with procedures established by the Board of Trustees. |
The Fund recognizes transfers between the levels as of the beginning of the period.
For the year ended April 30, 2016, the Fund did not have any transfers between any levels within the fair value hierarchy. (See Note 2)
Investments in
Securities | | Balance as of
April 30, 2015 | | Accrued
Discounts
(Premiums) | | Realized
Gain
(Loss) | | Change in
Unrealized
Appreciation
(Depreciation) | | Purchases | | Sales | | Transfers
into
Level 3 | | Transfers
out of
Level 3 | | Balance as of
April 30, 2016 | | Change in
Unrealized
Appreciation
(Depreciation)
from
Investments
Still Held at
April 30, 2016(a) |
| Common Stock | | | | | | | | | | | | | | | | | | | | |
| Jacana Minerals Ltd.(b) | | $ | 224 | | | $ | — | | | $ | — | | | $ | (23 | ) | | $ | — | | | $ | — | | | $ | — | | | $ | — | | | $ | 201 | | | $ | (23 | ) |
|
| Total | | $ | 224 | | | $ | — | | | $ | — | | | $ | (23 | ) | | $ | — | | | $ | — | | | $ | — | | | $ | — | | | $ | 201 | | | $ | (23 | ) |
| (a) | Included in “Net change in unrealized appreciation (depreciation) on investments” in the Statements of Operations. |
| (b) | Security has been deemed illiquid in good faith in accordance with procedures established by the Board of Trustees. |
Information about Level 3 fair value measurements as of April 30, 2016.
| Security Type | | Fair Value | | Valuation Technique | | Unobservable Inputs |
| Common Stock | | | $201 | | | Peer Analysis | | Comparable Securities |
See notes to financial statements.
| Schedules of Investments — IQ Canada Small Cap ETF |
| April 30, 2016 |
| | | Shares | | Value |
| Common Stocks — 99.4% | | | | | | | | |
| Consumer Discretionary — 8.7% | | | | | | | | |
| Aimia, Inc. | | | 12,149 | | | $ | 83,024 | |
| Amaya, Inc.*(a) | | | 8,634 | | | | 117,248 | |
| Corus Entertainment, Inc., Class B | | | 6,169 | | | | 61,611 | |
| DHX Media Ltd. | | | 6,768 | | | | 41,172 | |
| EnerCare, Inc. | | | 6,945 | | | | 88,157 | |
| Hudson’s Bay Co. | | | 8,767 | | | | 116,744 | |
| Intertain Group Ltd. (The)* | | | 4,830 | | | | 43,110 | |
| Martinrea International, Inc. | | | 6,794 | | | | 51,473 | |
| Quebecor, Inc., Class B | | | 6,614 | | | | 177,204 | |
| RONA, Inc. | | | 8,486 | | | | 161,780 | |
| Total Consumer Discretionary | | | | | | | 941,523 | |
| |
| Consumer Staples — 3.4% | | | | | | | | |
| Cott Corp. | | | 9,608 | | | | 127,560 | |
| Jean Coutu Group (PJC), Inc. | | | | | | | | |
| The), Class A | | | 6,251 | | | | 95,217 | |
| Maple Leaf Foods, Inc. | | | 6,902 | | | | 143,153 | |
| Total Consumer Staples | | | | | | | 365,930 | |
| |
| Energy — 19.5% | | | | | | | | |
| Advantage Oil & Gas Ltd.* | | | 14,491 | | | | 83,179 | |
| Athabasca Oil Corp.* | | | 31,968 | | | | 34,199 | |
| Baytex Energy Corp. | | | 16,510 | | | | 84,619 | |
| Birchcliff Energy Ltd.* | | | 8,243 | | | | 34,351 | |
| Canadian Energy Services & | | | | | | | | |
| Technology Corp. | | | 15,518 | | | | 47,448 | |
| Cardinal Energy Ltd. | | | 4,867 | | | | 36,563 | |
| Crew Energy, Inc.* | | | 10,825 | | | | 43,902 | |
| Ensign Energy Services, Inc. | | | 9,903 | | | | 60,085 | |
| Freehold Royalties Ltd.(a) | | | 5,848 | | | | 58,452 | |
| Gibson Energy, Inc. | | | 9,973 | | | | 148,488 | |
| Kelt Exploration Ltd.* | | | 10,995 | | | | 42,484 | |
| MEG Energy Corp.* | | | 12,425 | | | | 65,964 | |
| Mullen Group Ltd.(a) | | | 7,016 | | | | 81,833 | |
| NuVista Energy Ltd.*(a) | | | 11,642 | | | | 55,208 | |
| Paramount Resources Ltd., Class A* | | | 4,664 | | | | 33,995 | |
| Parex Resources, Inc.* | | | 11,365 | | | | 114,049 | |
| Parkland Fuel Corp. | | | 7,408 | | | | 141,524 | |
| Pengrowth Energy Corp. | | | 42,972 | | | | 70,671 | |
| Penn West Petroleum Ltd. | | | 37,872 | | | | 43,236 | |
| Poseidon Concepts Corp.*(b)(c) | | | 13,377 | | | | — | |
| Precision Drilling Corp. | | | 22,968 | | | | 119,369 | |
| Raging River Exploration, Inc.* | | | 15,943 | | | | 129,443 | |
| Secure Energy Services, Inc.(a) | | | 10,570 | | | | 76,199 | |
| Spartan Energy Corp.* | | | 18,634 | | | | 42,695 | |
| Surge Energy, Inc.(a) | | | 17,025 | | | | 33,436 | |
| TORC Oil & Gas Ltd.(a) | | | 12,275 | | | | 82,905 | |
| Veresen, Inc.(a) | | | 23,777 | | | | 172,358 | |
| Whitecap Resources, Inc.(a) | | | 23,417 | | | | 175,917 | |
| Total Energy | | | | | | | 2,112,572 | |
| |
| Financials — 3.4% | | | | | | | | |
| Canadian Western Bank(a) | | | 6,126 | | | | 135,372 | |
| Genworth MI Canada, Inc. | | | 3,109 | | | | 80,617 | |
| Home Capital Group, Inc. | | | 5,137 | | | | 154,159 | |
| Total Financials | | | | | | | 370,148 | |
| |
| Health Care — 2.8% | | | | | | | | |
| Concordia Healthcare Corp. | | | 3,494 | | | | 101,757 | |
| Extendicare, Inc. | | | 6,984 | | | | 51,574 | |
| Knight Therapeutics, Inc.* | | | 5,846 | | | | 37,757 | |
| | | Shares | | Value |
| Common Stocks (continued) | | | | |
| Health Care (continued) | | | | |
| ProMetic Life Sciences, Inc.* | | | 44,032 | | | $ | 114,949 | |
| Total Health Care | | | | | | | 306,037 | |
| |
| Industrials — 14.2% | | | | | | | | |
| Aecon Group, Inc. | | | 4,399 | | | | 58,754 | |
| Air Canada* | | | 18,954 | | | | 141,179 | |
| ATS Automation Tooling | | | | | | | | |
| Systems, Inc.* | | | 5,899 | | | | 54,676 | |
| Bombardier, Inc. Class B* | | | 151,412 | | | | 228,460 | |
| CAE, Inc. | | | 21,461 | | | | 254,256 | |
| Chorus Aviation, Inc. | | | 7,843 | | | | 39,697 | |
| DIRTT Environmental Solutions* | | | 6,466 | | | | 27,978 | |
| Progressive Waste Solutions Ltd. | | | 8,662 | | | | 279,236 | |
| Russel Metals, Inc.(a) | | | 4,873 | | | | 86,910 | |
| TransForce, Inc. | | | 7,407 | | | | 140,027 | |
| WestJet Airlines Ltd. | | | 9,538 | | | | 159,906 | |
| Westshore Terminals Investment | | | | | | | | |
| Corp. | | | 4,497 | | | | 65,843 | |
| Total Industrials | | | | | | | 1,536,922 | |
| |
| Information Technology — 2.4% | | | | | | | | |
| Avigilon Corp.* | | | 2,744 | | | | 35,313 | |
| DH Corp. | | | 8,415 | | | | 218,806 | |
| Total Information Technology | | | | | | | 254,119 | |
| |
| Materials — 37.0% | | | | | | | | |
| Alacer Gold Corp.* | | | 23,063 | | | | 62,601 | |
| Alamos Gold, Inc., Class A | | | 20,860 | | | | 150,713 | |
| B2Gold Corp.*(a) | | | 71,036 | | | | 158,223 | |
| Canfor Corp.* | | | 5,850 | | | | 64,076 | |
| Centerra Gold, Inc. | | | 12,870 | | | | 71,306 | |
| Detour Gold Corp.* | | | 13,619 | | | | 292,581 | |
| Dominion Diamond Corp. | | | 6,419 | | | | 73,845 | |
| First Majestic Silver Corp.* | | | 12,001 | | | | 128,000 | |
| Fortuna Silver Mines, Inc.* | | | 10,213 | | | | 65,472 | |
| HudBay Minerals, Inc. | | | 18,689 | | | | 93,400 | |
| IAMGOLD Corp.* | | | 31,014 | | | | 105,724 | |
| Interfor Corp.* | | | 5,520 | | | | 48,079 | |
| Intertape Polymer Group, Inc. | | | 4,183 | | | | 65,887 | |
| Kinross Gold Corp.* | | | 97,657 | | | | 557,439 | |
| Kirkland Lake Gold, Inc.*(a) | | | 7,945 | | | | 60,701 | |
| Labrador Iron Ore Royalty Corp.(a) | | | 4,592 | | | | 53,890 | |
| Lundin Mining Corp.* | | | 49,605 | | | | 195,236 | |
| Nevsun Resources Ltd. | | | 15,634 | | | | 58,537 | |
| New Gold, Inc.* | | | 39,336 | | | | 185,280 | |
| Norbord, Inc. | | | 3,170 | | | | 63,294 | |
| Novagold Resources, Inc.* | | | 18,416 | | | | 119,823 | |
| Pan American Silver Corp. | | | 11,843 | | | | 185,975 | |
| Pretium Resources, Inc.* | | | 9,794 | | | | 80,770 | |
| Primero Mining Corp.* | | | 12,933 | | | | 24,367 | |
| SEMAFO, Inc.* | | | 23,389 | | | | 104,378 | |
| Silver Standard Resources, Inc.*(a) | | | 6,416 | | | | 60,339 | |
| Tahoe Resources, Inc. | | | 22,917 | | | | 324,197 | |
| Torex Gold Resources, Inc.* | | | 62,366 | | | | 111,030 | |
| Western Forest Products, Inc. | | | 31,385 | | | | 56,376 | |
| Yamana Gold, Inc. | | | 75,137 | | | | 373,106 | |
| Total Materials | | | | | | | 3,994,645 | |
| |
| Telecommunication Services — 1.5% | | | | | | | | |
| Manitoba Telecom Services, Inc. | | | 6,303 | | | | 165,249 | |
See notes to financial statements.
| Schedules of Investments — IQ Canada Small Cap ETF (continued) |
| April 30, 2016 |
| | | Shares | | Value |
| Common Stocks (continued) | | | | | | | | |
| Utilities — 6.5% | | | | | | | | |
| Algonquin Power & Utilities Corp. | | | 16,004 | | | $ | 140,032 | |
| Capital Power Corp. | | | 6,897 | | | | 97,844 | |
| Just Energy Group, Inc. | | | 7,604 | | | | 48,504 | |
| Northland Power, Inc.(a) | | | 8,754 | | | | 145,434 | |
| Superior Plus Corp.(a) | | | 11,120 | | | | 96,943 | |
| TransAlta Corp. | | | 22,881 | | | | 119,830 | |
| TransAlta Renewables, Inc. | | | 5,521 | | | | 54,566 | |
| Total Utilities | | | | | | | 703,153 | |
| Total Common Stocks | | | | | | | | |
| (Cost $11,537,472) | | | | | | | 10,750,298 | |
| |
| Short-Term Investment — 0.2% | | | | | | | | |
| Money Market Fund — 0.2% | | | | | | | | |
| Morgan Stanley Institutional Liquidity | | | | | | | | |
| Funds Treasury Portfolio — | | | | | | | | |
| Institutional Class, 0.22%(d) | | | | | | | | |
| (Cost $23,380) | | | 23,380 | | | | 23,380 | |
| |
| Investment of Cash Collateral For | | | | | | | | |
| Securities Loaned — 13.4% | | | | | | | | |
| Money Market Fund — 13.4% | | | | | | | | |
| Dreyfus Government Cash | | | | | | | | |
| Management Fund, | | | | | | | | |
| Institutional Shares, 0.20%(e) | | | | | | | | |
| (Cost $1,454,269) | | | 1,454,269 | | | | 1,454,269 | |
| | | Value |
| Total Investments — 113.0% | | | | |
| (Cost $13,015,121) | | $ | 12,227,947 | |
| Liabilities in Excess of | | | | |
| Other Assets — (13.0)% | | | (1,413,559 | ) |
| Net Assets — 100.0% | | $ | 10,814,388 | |
| * | Non-income producing securities. |
| (a) | All or a portion of the security was on loan. In addition, “Other Assets and Liabilities, Net” may include pending sales that are also on loan. The aggregate market value of securities on loan was $1,395,867; total market value of collateral held by the Fund was $1,454,269. |
| (b) | Security has been deemed illiquid because it may not be able to be resold within seven days. At April 30, 2016, the value of this security was $0. |
| (c) | Security fair valued as determined in good faith in accordance with the procedures established by the Board of Trustees. |
| (d) | Rate shown reflects the 7-day yield at April 30, 2016. |
| (e) | Rate shown reflects the 1-day yield at April 30, 2016. |
The following is a summary of the fair valuations according to the inputs used as of April 30, 2016 for valuing the Fund’s assets and liabilities.
For more information on the valuation techniques, and their aggregation into the levels used in the table below, please refer to Note 2.
Asset Valuation Inputs
| Description | | Level 1 | | Level 2 | | Level 3 | | Total |
| Investments in Securities:(a) | | | | | | | | | | | | | | | | |
| Common Stocks | | $ | 10,750,298 | | | $ | — | | | $ | — | (b) | | $ | 10,750,298 | |
| Short-Term Investment: | | | | | | | | | | | | | | | | |
| Money Market Fund | | | 23,380 | | | | — | | | | — | | | | 23,380 | |
| Investment of Cash Collateral for Securities Loaned: | | | | | | | | | | | | | | | | |
| Money Market Fund | | | 1,454,269 | | | | — | | | | — | | | | 1,454,269 | |
| Total Investments in Securities | | $ | 12,227,947 | | | $ | — | | | $ | — | | | $ | 12,227,947 | |
| (a) | For a complete listing of investments and their industries, see the Schedules of Investments. |
| (b) | The Level 3 Security, valued at $0, has been deemed illiquid in good faith in accordance with procedures established by the Board of Trustees. |
See notes to financial statements.
| Schedules of Investments — IQ Canada Small Cap ETF (continued) |
| April 30, 2016 |
The Fund recognizes transfers between the levels as of the beginning of the period.
For the year ended April 30, 2016, the Fund did not have any transfers between any levels within the fair value hierarchy. (See Note 2)
The following is a reconciliation of investments in which significant unobservable inputs (Level 3) were used in determining value:
Investments in
Securities | | | Balance as of
April 30, 2015 | | | | Accrued
Discounts
(Premiums) | | | | Realized
Gain
(Loss) | | | | Change in
Unrealized
Appreciation
(Depreciation) | | | | Purchases | | | | Sales | | | | Transfers
into
Level 3 | | | | Transfers
out of
Level 3 | | | | Balance as of
April 30, 2016 | | | | Change in
Unrealized
Appreciation
(Depreciation)
from Investments
Still Held at
April 30, 2016(a) | |
| Common Stock | | | | | | | | | | | | | | | | | | | | | | | | | | | | | | | | | | | | | | | | |
| Poseidon Concepts | | | | | | | | | | | | | | | | | | | | | | | | | | | | | | | | | | | | | | | | |
|
| Corp.(b) | | $ | —* | | | $ | — | | | $ | — | | | $ | — | | | $ | — | | | $ | — | | | $ | — | | | $ | — | | | $ | —* | | | $ | — | |
|
| Total | | $ | —* | | | $ | — | | | $ | — | | | $ | — | | | $ | — | | | $ | — | | | $ | — | | | $ | — | | | $ | —* | | | $ | — | |
| * | Includes a level 3 security valued at $0. |
| (a) | Included in “Net change in unrealized appreciation (depreciation) on investments” in the Statements of Operations. |
| (b) | Security has been deemed illiquid in good faith in accordance with procedures established by the Board of Trustees. |
Information about Level 3 fair value measurements as of April 30, 2016.
| Security Type | | | Fair Value | | | Valuation Technique | | Unobservable Inputs |
| Common Stock | | | $ — | | | Issue Specific Facts | | Bankruptcy |
See notes to financial statements.
| Schedules of Investments — IQ Global Agribusiness Small Cap ETF |
| April 30, 2016 |
| | | Shares | | Value |
| Common Stocks — 99.1% | | | | | | | | |
| Australia — 11.3% | | | | | | | | |
| Australian Agricultural Co. Ltd.*(a) | | | 65,635 | | | $ | 71,878 | |
| Bega Cheese Ltd. | | | 40,367 | | | | 189,457 | |
| Costa Group Holdings Ltd. | | | 97,268 | | | | 220,463 | |
| Elders Ltd.* | | | 26,549 | | | | 69,090 | |
| GrainCorp Ltd., Class A | | | 59,500 | | | | 371,887 | |
| Nufarm Ltd. | | | 64,067 | | | | 343,227 | |
| Select Harvests Ltd.(a) | | | 23,212 | | | | 89,103 | |
| Total Australia | | | | | | | 1,355,105 | |
| |
| Canada — 4.9% | | | | | | | | |
| Maple Leaf Foods, Inc. | | | 28,710 | | | | 595,470 | |
| |
| China — 8.2% | | | | | | | | |
| China BlueChemical Ltd., Class H | | | 586,442 | | | | 136,080 | |
| China Huishan Dairy Holdings | | | | | | | | |
| Co., Ltd.(a) | | | 967,199 | | | | 361,584 | |
| China Modern Dairy Holdings Ltd.(a) | | | 629,163 | | | | 115,983 | |
| China Yurun Food Group Ltd.*(a) | | | 447,656 | | | | 76,752 | |
| First Tractor Co., Ltd., Class H | | | 132,873 | | | | 74,854 | |
| Leyou Technologies Holdings Ltd.*(a) | | | 767,698 | | | | 103,914 | |
| Shenguan Holdings Group Ltd. | | | 334,765 | | | | 34,524 | |
| Sinofert Holdings Ltd. | | | 583,622 | | | | 79,750 | |
| Total China | | | | | | | 983,441 | |
| |
| Indonesia — 8.5% | | | | | | | | |
| PT Astra Agro Lestari Tbk* | | | 105,935 | | | | 129,326 | |
| PT Charoen Pokphand | | | | | | | | |
| Indonesia Tbk | | | 2,414,359 | | | | 680,114 | |
| PT Perusahaan Perkebunan London | | | | | | | | |
| Sumatra Indonesia Tbk | | | 912,899 | | | | 106,256 | |
| PT Sawit Sumbermas Sarana Tbk* | | | 788,518 | | | | 110,911 | |
| Total Indonesia | | | | | | | 1,026,607 | |
| |
| Japan — 38.8% | | | | | | | | |
| Fuji Oil Holdings, Inc. | | | 19,931 | | | | 380,569 | |
| Iseki & Co., Ltd.(a) | | | 64,424 | | | | 140,896 | |
| Itoham Yonekyu Holdings, Inc.* | | | 38,685 | | | | 292,501 | |
| J-Oil Mills, Inc. | | | 29,971 | | | | 98,041 | |
| Kumiai Chemical Industry Co., Ltd.(a) | | | 24,054 | | | | 213,798 | |
| Megmilk Snow Brand Co., Ltd. | | | 16,352 | | | | 388,340 | |
| Mitsui Sugar Co., Ltd. | | | 26,391 | | | | 121,355 | |
| Morinaga Milk Industry Co., Ltd. | | | 67,745 | | | | 364,067 | |
| Nichirei Corp. | | | 87,400 | | | | 784,186 | |
| Nihon Nohyaku Co., Ltd.(a) | | | 15,997 | | | | 86,717 | |
| Nippon Flour Mills Co., Ltd. | | | 38,672 | | | | 304,692 | |
| Nisshin Oillio Group Ltd. (The) | | | 43,442 | | | | 187,581 | |
| Nisshin Seifun Group, Inc. | | | 69,831 | | | | 1,174,129 | |
| Prima Meat Packers Ltd. | | | 46,239 | | | | 130,945 | |
| Total Japan | | | | | | | 4,667,817 | |
| |
| Luxembourg — 2.7% | | | | | | | | |
| Adecoagro SA* | | | 30,651 | | | | 326,740 | |
| |
| Singapore — 8.9% | | | | | | | | |
| First Resources Ltd. | | | 164,312 | | | | 232,889 | |
| Golden Agri-Resources Ltd. | | | 2,093,164 | | | | 622,942 | |
| Olam International Ltd. | | | 177,169 | | | | 217,499 | |
| Total Singapore | | | | | | | 1,073,330 | |
| |
| Spain — 4.1% | | | | | | | | |
| Ebro Foods SA | | | 21,789 | | | | 493,880 | |
| | | Shares | | Value |
| Common Stocks (continued) | | | | | | | | |
| Thailand — 0.5% | | | | | | | | |
| Buriram Sugar PCL | | | 30,595 | | | $ | 11,299 | |
| Thai Vegetable Oil PCL | | | 72,707 | | | | 53,599 | |
| Total Thailand | | | | | | | 64,898 | |
| |
| United Arab Emirates — 0.3% | | | | | | | | |
| Amira Nature Foods Ltd.*(a) | | | 5,559 | | | | 40,303 | |
| |
| United Kingdom — 3.1% | | | | | | | | |
| Dairy Crest Group PLC | | | 44,854 | | | | 371,243 | |
| |
| United States — 7.8% | | | | | | | | |
| American Vanguard Corp.* | | | 9,192 | | | | 152,128 | |
| CVR Partners LP(a) | | | 11,266 | | | | 98,014 | |
| Sanderson Farms, Inc. | | | 6,506 | | | | 596,860 | |
| Titan International, Inc.(a) | | | 14,351 | | | | 95,147 | |
| Total United States | | | | | | | 942,149 | |
| Total Common Stocks | | | | | | | | |
| (Cost $12,017,228) | | | | | | | 11,940,983 | |
| |
| Short-Term Investment — 0.3% | | | | | | | | |
| Money Market Fund — 0.3% | | | | | | | | |
| Morgan Stanley Institutional Liquidity | | | | | | | | |
| Funds Treasury Portfolio — | | | | | | | | |
| Institutional Class, 0.22%(b) | | | | | | | | |
| (Cost $39,890) | | | 39,890 | | | | 39,890 | |
| |
| Investment of Cash Collateral For | | | | | | | | |
| Securities Loaned — 5.2% | | | | | | | | |
| Money Market Fund — 5.2% | | | | | | | | |
| Dreyfus Government Cash | | | | | | | | |
| Management Fund, | | | | | | | | |
| Institutional Shares, 0.20%(c) | | | | | | | | |
| (Cost $628,836) | | | 628,836 | | | | 628,836 | |
| Total Investments — 104.6% | | | | | | | | |
| (Cost $12,685,954) | | | | | | | 12,609,709 | |
| Liabilities in Excess of | | | | | | | | |
| Other Assets — (4.6)% | | | | | | | (562,500 | ) |
| Net Assets — 100.0% | | | | | | $ | 12,047,209 | |
| * | Non-income producing securities. |
| (a) | All or a portion of the security was on loan. In addition, “Other Assets and Liabilities, Net” may include pending sales that are also on loan. The aggregate market value of securities on loan was $1,123,060; total market value of collateral held by the Fund was $1,214,231. Market value of the collateral held includes non-cash U.S. Treasury securities collateral having a value of $585,395. |
| (b) | Rate shown reflects the 7-day yield at April 30, 2016. |
| (c) | Rate shown reflects the 1-day yield at April 30, 2016. |
LP — Limited Partnership
PCL — Public Company Limited
PLC — Public Limited Company
PT — Perseroan Terbatas (Limited Liability Company)
SA — Société Anonyme (Corporation)
Tbk — Perseroan Terbuka (Public Traded Company)
See notes to financial statements.
| Schedules of Investments — IQ Global Agribusiness Small Cap ETF (continued) |
| April 30, 2016 |
The following is a summary of the fair valuations according to the inputs used as of April 30, 2016 for valuing the Fund’s assets and liabilities.
For more information on the valuation techniques, and their aggregation into the levels used in the table below, please refer to Note 2.
Asset Valuation Inputs
| Description | | Level 1 | | Level 2 | | Level 3 | | Total |
| Investments in Securities:(a) | | | | | | | | | | | | | | | | |
| Common Stocks | | $ | 11,940,983 | | | $ | — | | | $ | — | | | $ | 11,940,983 | |
| Short-Term Investment: | | | | | | | | | | | | | | | | |
| Money Market Fund | | | 39,890 | | | | — | | | | — | | | | 39,890 | |
| Investment of Cash Collateral for Securities Loaned: | | | | | | | | | | | | | | | | |
| Money Market Fund | | | 628,836 | | | | — | | | | — | | | | 628,836 | |
| Total Investments in Securities | | | 12,609,709 | | | | — | | | | — | | | | 12,609,709 | |
| Total Investments in Securities and Other Financial Instruments | | $ | 12,609,709 | | | $ | — | | | $ | — | | | $ | 12,609,709 | |
| (a) | For a complete listing of investments and their countries, see the Schedules of Investments. |
The Fund recognizes transfers between the levels as of the beginning of the period.
For the year ended April 30, 2016, the Fund did not have any transfers between any levels within the fair value hierarchy. (See Note 2)
The Fund did not hold any level 3 securities as of April 30, 2016.
See notes to financial statements.
| Schedules of Investments — IQ Global Oil Small Cap ETF |
| April 30, 2016 |
| | | Shares | | Value |
| Common Stocks — 99.5% | | | | | | | | |
| Canada — 19.8% | | | | | | | | |
| Baytex Energy Corp. | | | 9,620 | | | $ | 49,306 | |
| Canadian Energy Services & | | | | | | | | |
| Technology Corp. | | | 9,070 | | | | 27,733 | |
| Canyon Services Group, Inc.(a) | | | 3,084 | | | | 12,015 | |
| Cardinal Energy Ltd. | | | 2,829 | | | | 21,252 | |
| Ensign Energy Services, Inc. | | | 5,788 | | | | 35,118 | |
| Gibson Energy, Inc., | | | 5,829 | | | | 86,788 | |
| MEG Energy Corp.* | | | 7,262 | | | | 38,554 | |
| Mullen Group Ltd.(a) | | | 4,100 | | | | 47,821 | |
| Pengrowth Energy Corp. | | | 25,116 | | | | 41,305 | |
| Penn West Petroleum Ltd. | | | 22,136 | | | | 25,271 | |
| Seven Generations Energy Ltd., | | | | | | | | |
| Class A* | | | 8,156 | | | | 143,899 | |
| Sunshine Oilsands Ltd.* | | | 92,347 | | | | 3,809 | |
| TORC Oil & Gas Ltd.(a) | | | 7,175 | | | | 48,460 | |
| Total Canada | | | | | | | 581,331 | |
| |
| China — 5.1% | | | | | | | | |
| China Oilfield Services Ltd., Class H | | | 83,269 | | | | 72,457 | |
| Sinopec Shanghai Petrochemical | | | | | | | | |
| Co., Ltd., Class H* | | | 160,306 | | | | 78,942 | |
| Total China | | | | | | | 151,399 | |
| |
| Colombia — 0.0% | | | | | | | | |
| Pacific Exploration and Production | | | | | | | | |
| Corp.*(b)(c) | | | 7,216 | | | | — | |
| |
| Cyprus — 0.3% | | | | | | | | |
| Ocean Rig UDW, Inc. | | | 3,526 | | | | 7,405 | |
| |
| France — 1.0% | | | | | | | | |
| Etablissements Maurel et Prom*(a) | | | 7,419 | | | | 29,826 | |
| |
| Indonesia — 0.2% | | | | | | | | |
| PT Elnusa Tbk | | | 138,406 | | | | 5,174 | |
| |
| Italy — 0.9% | | | | | | | | |
| Saras SpA* | | | 15,780 | | | | 27,472 | |
| |
| Japan — 5.0% | | | | | | | | |
| Cosmo Energy Holdings Co. Ltd. | | | 3,796 | | | | 49,776 | |
| Fuji Oil Co. Ltd. | | | 1,800 | | | | 5,737 | |
| Showa Shell Sekiyu K.K. | | | 8,448 | | | | 90,642 | |
| Total Japan | | | | | | | 146,155 | |
| |
| Norway — 2.7% | | | | | | | | |
| BW Offshore Ltd. | | | 15,298 | | | | 3,344 | |
| Det Norske Oljeselskap ASA*(a) | | | 4,072 | | | | 36,359 | |
| DNO ASA*(a) | | | 29,422 | | | | 33,962 | |
| Fred Olsen Energy ASA* | | | 1,379 | | | | 5,977 | |
| Total Norway | | | | | | | 79,642 | |
| |
| Thailand — 6.2% | | | | | | | | |
| Bangchak Petroleum PCL (The) | | | 42,777 | | | | 37,964 | |
| IRPC PCL | | | 450,995 | | | | 65,848 | |
| Star Petroleum Refining PCL*(d) | | | 60,000 | | | | 18,895 | |
| Thai Oil PCL | | | 32,009 | | | | 60,481 | |
| Total Thailand | | | | | | | 183,188 | |
| | | Shares | | Value |
| Common Stocks (continued) | | | | | | | | |
| United Kingdom — 11.9% | | | | | | | | |
| Genel Energy PLC*(a) | | | 5,739 | | | $ | 11,097 | |
| Rockhopper Exploration PLC* | | | 20,901 | | | | 11,635 | |
| Seadrill Ltd.*(a) | | | 13,440 | | | | 64,243 | |
| Subsea 7 SA*(a) | | | 9,897 | | | | 91,075 | |
| Tullow Oil PLC* | | | 41,989 | | | | 172,043 | |
| Total United Kingdom | | | | | | | 350,093 | |
| |
| United States — 46.4% | | | | | | | | |
| Alon USA Energy, Inc.(a) | | | 1,150 | | | | 12,075 | |
| Alon USA Partners LP | | | 415 | | | | 4,150 | |
| Bonanza Creek Energy, Inc.*(a) | | | 1,500 | | | | 5,820 | |
| Breitburn Energy Partners LP | | | 7,731 | | | | 2,552 | |
| California Resources Corp. | | | 11,433 | | | | 25,152 | |
| Cobalt International Energy, Inc.* | | | 13,412 | | | | 43,321 | |
| CVR Energy, Inc. | | | 581 | | | | 14,107 | |
| CVR Refining LP | | | 1,643 | | | | 19,256 | |
| Denbury Resources, Inc.(a) | | | 12,765 | | | | 49,273 | |
| Diamond Offshore Drilling, Inc.(a) | | | 2,376 | | | | 57,642 | |
| EP Energy Corp., Class A* | | | 1,301 | | | | 6,388 | |
| GulfMark Offshore, Inc., Class A*(a) | | | 717 | | | | 4,861 | |
| Gulfport Energy Corp.* | | | 4,557 | | | | 142,634 | |
| Kosmos Energy Ltd.* | | | 5,175 | | | | 33,534 | |
| Linn Energy LLC | | | 8,236 | | | | 3,047 | |
| Northern Tier Energy LP(a) | | | 2,114 | | | | 48,305 | |
| NOW, Inc.* | | | 3,851 | | | | 69,549 | |
| Oasis Petroleum, Inc.*(a) | | | 6,497 | | | | 62,956 | |
| Oil States International, Inc.* | | | 1,870 | | | | 64,777 | |
| PBF Energy, Inc., Class A | | | 3,614 | | | | 116,298 | |
| Pioneer Energy Services Corp.* | | | 2,307 | | | | 7,175 | |
| Rowan Cos. PLC, Class A | | | 4,571 | | | | 85,980 | |
| RPC, Inc.(a) | | | 2,224 | | | | 33,627 | |
| Sanchez Energy Corp.*(a) | | | 1,933 | | | | 17,378 | |
| SemGroup Corp., Class A | | | 1,611 | | | | 49,393 | |
| SM Energy Co.(a) | | | 2,486 | | | | 77,464 | |
| Stone Energy Corp.*(a) | | | 2,023 | | | | 1,983 | |
| Superior Energy Services, Inc. | | | 5,553 | | | | 93,623 | |
| Synergy Resources Corp.* | | | 4,041 | | | | 29,176 | |
| Tesco Corp. | | | 1,347 | | | | 12,743 | |
| Tesoro Logistics LP | | | 2,263 | | | | 104,641 | |
| Western Refining, Inc.(a) | | | 2,479 | | | | 66,338 | |
| Total United States | | | | | | | 1,365,218 | |
| Total Common Stocks | | | | | | | | |
| (Cost $3,237,327) | | | | | | | 2,926,903 | |
| |
| Short-Term Investment — 0.1% | | | | | | | | |
| Money Market Fund — 0.1% | | | | | | | | |
| Morgan Stanley Institutional Liquidity | | | | | | | | |
| Funds Treasury Portfolio, 0.22%(e) | | | | | | | | |
| (Cost $3,440) | | | 3,440 | | | | 3,440 | |
See notes to financial statements.
| Schedules of Investments — IQ Global Oil Small Cap ETF (continued) |
| April 30, 2016 |
| | | Shares | | Value |
| Investment of Cash Collateral For | | | | |
| Securities Loaned — 25.3% | | | | |
| Money Market Fund — 25.3% | | | | |
| Dreyfus Government Cash | | | | |
| Management Fund, | | | | |
| Institutional Shares, 0.20%(f) | | | | |
| (Cost $744,175) | | | 744,175 | | | $ | 744,175 | |
| Total Investments — 124.9% | | | | | | | | |
| (Cost $3,984,942) | | | | | | | 3,674,518 | |
| Liabilities in Excess of | | | | | | | | |
| Other Assets — (24.9)% | | | | | | | (731,523 | ) |
| Net Assets — 100.0% | | | | | | $ | 2,942,995 | |
| * | Non-income producing securities. |
| (a) | All or a portion of the security was on loan. In addition, “Other Assets and Liabilities, Net” may include pending sales that are also on loan. The aggregate market value of securities on loan was $716,728; total market value of collateral held by the Fund was $744,175. |
| (b) | Security has been deemed illiquid because it may not be able to be resold within seven days at approximately the price shown. At April 30, 2016, the value of this security was $0. |
| (c) | Security fair valued as determined in good faith in accordance with the procedures established by the Board of Trustee. |
| (d) | Security was purchased pursuant to Rule 144A under the Securities Act of 1933 and may not be resold subject to that rule except to qualified institutional buyers. Unless otherwise noted, 144A securities are deemed to be liquid. |
| (e) | Rate shown reflects the 7-day yield at April 30, 2016. |
| (f) | Rate shown reflects the 1-day yield at April 30, 2016. |
ASA — Allmeennaksjeselskap (stock company)
K.K. — Kabushiki Kaisha
LP — Limited Partnership
PCL — Public Company Limited
PLC — Public Limited Company
PT — Perseroan Terbatas (Limited Liability Company)
SA — Société Anonyme (corporation)
SpA — Societa per azioni (public company)
Tbk — Perseroan Terbuka (Public Traded Company)
The following is a summary of the fair valuations according to the inputs used as of April 30, 2016 for valuing the Fund’s assets and liabilities.
For more information on the valuation techniques, and their aggregation into the levels used in the table below, please refer to Note 2.
Asset Valuation Inputs
| Description | | Level 1 | | Level 2 | | Level 3 | | Total |
| Investments in Securities:(a) | | | | | | | | | | | | | | | | |
| Common Stocks | | $ | 2,926,903 | | | $ | — | | | | $ — | (b) | | $ | 2,926,903 | |
| Short-Term Investment: | | | | | | | | | | | | | | | | |
| Money Market Fund | | | 3,440 | | | | — | | | | — | | | | 3,440 | |
| Investment of Cash Collateral for Securities Loaned: | | | | | | | | | | | | | | | | |
| Money Market Fund | | | 744,175 | | | | — | | | | — | | | | 744,175 | |
| Total Investments in Securities | | | 3,674,518 | | | | — | | | | — | | | | 3,674,518 | |
| Total Investments in Securities and Other Financial Instruments | | $ | 3,674,518 | | | $ | — | | | $ | — | | | $ | 3,674,518 | |
The Fund recognizes transfers between the levels as of the beginning of the period.
For the year ended April 30, 2016, the amount of transfers between Level 1 and Level 3 was $70,400. Investments were transferred from Level 1 to Level 3 as a result of bankruptcy proceedings. (See Note 2)
The following is a reconciliation of investments in which significant unobservable inputs (Level 3) were used in determining value:
Investments in
Securities | | Balance as of
April 30, 2015 | | Accrued
Discounts
(Premiums) | | Realized
Gain
(Loss) | | Change in
Unrealized
Appreciation
(Depreciation) | | Purchases | | Sales | | Transfers
into
Level 3 | | Transfers
out of
Level 3 | | Balance as of
April 30, 2016 | | Change in
Unrealized
Appreciation
(Depreciation)
from Investments
Still Held at
April 30, 2016(a) |
| Common Stock | | | | | | | | | | | | | | | | | | | | |
| Pacific Exploration | | | | | | | | | | | | | | | | | | | | |
| and Production | | | | | | | | | | | | | | | | | | | | |
| Corp.(b) | | $ | — | | | $ | — | | | $ | 9,053 | | | $ | (37,692 | ) | | $ | 2,496 | | | $ | (44,257 | ) | | $ | 70,400 | | | $ | — | | | $ | — | | | $ | (37,692 | ) |
| Total | | $ | — | | | $ | — | | | $ | 9,053 | | | $ | (37,692 | ) | | $ | 2,496 | | | $ | (44,257 | ) | | $ | 70,400 | | | $ | — | | | $ | — | | | $ | (37,692 | ) |
Information about Level 3 fair value measurements as of April 30, 2016.
| Security Type | | | Fair Value | | | Valuation Technique | | Unobservable Inputs |
| Common Stock | | | $ — | | | Issuer Specific Facts | | Company Announcement |
| (a) | For a complete listing of investments and their countries, see the Schedules of Investments. |
| (b) | The Level 3 security valued at $0 has been deemed illiquid in good faith in accordance with procedures established by the Board of Trustees. |
See notes to financial statements.
| Schedules of Investments — IQ U.S. Real Estate Small Cap ETF |
| April 30, 2016 |
| | | Shares | | Value |
| Common Stocks — 98.6% | | | | | | | | |
| Diversified REITs — 16.2% | | | | | | | | |
| Cousins Properties, Inc. | | | 184,510 | | | $ | 1,909,679 | |
| Empire State Realty Trust, Inc., | | | | | | | | |
| Class A | | | 106,159 | | | | 1,965,003 | |
| Investors Real Estate Trust(a) | | | 105,903 | | | | 637,536 | |
| Kennedy-Wilson Holdings, Inc. | | | 82,874 | | | | 1,790,907 | |
| Monmouth Real Estate | | | | | | | | |
| Investment Corp. | | | 52,331 | | | | 601,807 | |
| New Senior Investment Group, Inc. | | | 71,373 | | | | 770,828 | |
| New York REIT, Inc. | | | 145,409 | | | | 1,429,370 | |
| Redwood Trust, Inc. | | | 67,155 | | | | 870,329 | |
| Resource Capital Corp. | | | 26,891 | | | | 319,465 | |
| Washington Real Estate | | | | | | | | |
| Investment Trust | | | 59,984 | | | | 1,719,741 | |
| Winthrop Realty Trust* | | | 29,155 | | | | 370,852 | |
| Total Diversified REITs | | | | | | | 12,385,517 | |
| |
| Hotel REITs — 7.3% | | | | | | | | |
| Ashford Hospitality Trust, Inc. | | | 80,021 | | | | 447,317 | |
| Chesapeake Lodging Trust | | | 52,140 | | | | 1,284,208 | |
| FelCor Lodging Trust, Inc. | | | 115,073 | | | | 823,923 | |
| Hersha Hospitality Trust | | | 38,214 | | | | 737,148 | |
| Summit Hotel Properties, Inc. | | | 74,427 | | | | 848,468 | |
| Xenia Hotels & Resorts, Inc.(a) | | | 96,666 | | | | 1,486,723 | |
| Total Hotel REITs | | | | | | | 5,627,787 | |
| |
| Mortgage REITs — 16.2% | | | | | | | | |
| AG Mortgage Investment Trust, Inc. | | | 24,765 | | | | 331,603 | |
| Altisource Residential Corp.(a) | | | 47,347 | | | | 550,172 | |
| American Capital Mortgage | | | | | | | | |
| Investment Corp. | | | 41,659 | | | | 617,803 | |
| Anworth Mortgage Asset Corp. | | | 84,715 | | | | 399,855 | |
| Apollo Commercial Real Estate | | | | | | | | |
| Finance, Inc.(a) | | | 51,368 | | | | 818,292 | |
| Apollo Residential Mortgage, Inc. | | | 27,954 | | | | 379,056 | |
| Ares Commercial Real Estate Corp. | | | 22,988 | | | | 275,856 | |
| ARMOUR Residential REIT, Inc.(a) | | | 31,752 | | | | 675,683 | |
| Capstead Mortgage Corp. | | | 83,688 | | | | 813,447 | |
| Colony Capital, Inc., Class A | | | 96,760 | | | | 1,710,717 | |
| Dynex Capital, Inc.(a) | | | 39,770 | | | | 258,505 | |
| Hatteras Financial Corp. | | | 82,593 | | | | 1,312,403 | |
| Invesco Mortgage Capital, Inc. | | | 100,558 | | | | 1,292,170 | |
| iStar, Inc.*(a) | | | 64,506 | | | | 632,159 | |
| New York Mortgage Trust, Inc.(a) | | | 96,473 | | | | 501,660 | |
| Newcastle Investment Corp. | | | 51,123 | | | | 221,874 | |
| Orchid Island Capital, Inc.(a) | | | 17,943 | | | | 173,688 | |
| PennyMac Mortgage | | | | | | | | |
| Investment Trust | | | 61,497 | | | | 835,744 | |
| RAIT Financial Trust(a) | | | 80,201 | | | | 243,811 | |
| Western Asset Mortgage | | | | | | | | |
| Capital Corp.(a) | | | 35,884 | | | | 357,764 | |
| Total Mortgage REITs | | | | | | | 12,402,262 | |
| | | Shares | | Value |
| Common Stocks (continued) | | | | | | | | |
| Office REITs — 21.2% | | | | | | | | |
| Brandywine Realty Trust | | | 152,500 | | | $ | 2,279,875 | |
| First Industrial Realty Trust, Inc. | | | 96,926 | | | | 2,223,483 | |
| First Potomac Realty Trust | | | 50,126 | | | | 421,560 | |
| Franklin Street Properties Corp. | | | 83,890 | | | | 890,912 | |
| Global Net Lease, Inc. | | | 149,805 | | | | 1,268,848 | |
| Government Properties Income | | | | | | | | |
| Trust(a) | | | 61,507 | | | | 1,163,712 | |
| Hudson Pacific Properties, Inc. | | | 67,420 | | | | 1,972,035 | |
| Lexington Realty Trust | | | 163,439 | | | | 1,434,994 | |
| Mack-Cali Realty Corp. | | | 71,825 | | | | 1,835,847 | |
| Parkway Properties, Inc. | | | 74,445 | | | | 1,224,620 | |
| Rexford Industrial Realty, Inc. | | | 48,860 | | | | 917,102 | |
| Tier REIT, Inc. | | | 41,881 | | | | 631,566 | |
| Total Office REITs | | | | | | | 16,264,554 | |
| |
| Residential REITs — 5.7% | | | | | | | | |
| Education Realty Trust, Inc. | | | 55,765 | | | | 2,217,774 | |
| Independence Realty Trust, Inc. | | | 35,393 | | | | 253,768 | |
| Monogram Residential Trust, Inc.(a) | | | 146,887 | | | | 1,487,965 | |
| Silver Bay Realty Trust Corp. | | | 29,027 | | | | 423,794 | |
| Total Residential REITs | | | | | | | 4,383,301 | |
| |
| Retail REITs — 15.8% | | | | | | | | |
| Acadia Realty Trust | | | 62,041 | | | | 2,090,782 | |
| Cedar Realty Trust, Inc. | | | 71,481 | | | | 494,649 | |
| Four Corners Property Trust, Inc. | | | 53,106 | | | | 942,632 | |
| Kite Realty Group Trust | | | 73,594 | | | | 2,003,965 | |
| Pennsylvania Real Estate | | | | | | | | |
| Investment Trust | | | 59,317 | | | | 1,360,732 | |
| Ramco-Gershenson | | | | | | | | |
| Properties Trust | | | 68,744 | | | | 1,217,456 | |
| Retail Opportunity | | | | | | | | |
| Investments Corp.(a) | | | 86,475 | | | | 1,700,963 | |
| Rouse Properties, Inc.(a) | | | 33,452 | | | | 617,858 | |
| WP Glimcher, Inc. | | | 163,362 | | | | 1,713,667 | |
| Total Retail REITs | | | | | | | 12,142,704 | |
| |
| Specialized REITs — 16.2% | | | | | | | | |
| CareTrust REIT, Inc. | | | 40,842 | | | | 519,510 | |
| CyrusOne, Inc. | | | 56,420 | | | | 2,489,815 | |
| InfraREIT, Inc.(a) | | | 27,805 | | | | 461,007 | |
| Medical Properties Trust, Inc.(a) | | | 206,417 | | | | 2,747,410 | |
| National Storage Affiliates Trust | | | 20,125 | | | | 392,840 | |
| Physicians Realty Trust | | | 95,591 | | | | 1,733,065 | |
| QTS Realty Trust, Inc., Class A | | | 34,380 | | | | 1,664,680 | |
| Sabra Health Care REIT, Inc. | | | 56,382 | | | | 1,189,096 | |
| STAG Industrial, Inc. | | | 60,268 | | | | 1,202,949 | |
| Total Specialized REITs | | | | | | | 12,400,372 | |
| Total Common Stocks | | | | | | | | |
| (Cost $78,398,085) | | | | | | | 75,606,497 | |
See notes to financial statements.
| Schedules of Investments — IQ U.S. Real Estate Small Cap ETF (continued) |
| April 30, 2016 |
| | | Shares | | Value |
| Short-Term Investment — 1.3% | | | | |
| Money Market Fund — 1.3% | | | | |
| Morgan Stanley Institutional Liquidity | | | | |
| Funds Treasury Portfolio — | | | | |
| Institutional Class, 0.22%(b) | | | | |
| (Cost $1,025,445) | | | 1,025,445 | | | $ | 1,025,445 | |
| |
| Investment of Cash Collateral For | | | | | | | | |
| Securities Loaned — 6.4% | | | | | | | | |
| Money Market Fund — 6.4% | | | | | | | | |
| Dreyfus Government Cash | | | | | | | | |
| Management Fund, | | | | | | | | |
| Institutional Shares, 0.20%(c) | | | | | | | | |
| (Cost $4,900,443) | | | 4,900,443 | | | | 4,900,443 | |
| | | Value |
| Total Investments — 106.3% | | | | |
| (Cost $84,323,973) | | $ | 81,532,385 | |
| Liabilities in Excess of | | | | |
| Other Assets — (6.3)% | | | (4,869,467 | ) |
| Net Assets — 100.0% | | $ | 76,662,918 | |
| * | Non-income producing securities. |
| (a) | All or a portion of the security was on loan. In addition, “Other Assets and Liabilities, Net” may include pending sales that are also on loan. The aggregate market value of securities on loan was $9,383,983; total market value of collateral held by the Fund was $9,690,290. Market value of the collateral held includes non-cash U.S. Treasury securities collateral having a value of $4,789,847. |
| (b) | Rate shown reflects the 7-day yield at April 30, 2016. |
| (c) | Rate shown reflects the 1-day yield at April 30, 2016. |
REIT — Real Estate Investment Trust.
The following is a summary of the fair valuations according to the inputs used as of April 30, 2016 for valuing the Fund’s assets and liabilities.
For more information on the valuation techniques, and their aggregation into the levels used in the table below, please refer to Note 2.
| Asset Valuation Inputs | | | | | | | | |
| Description | | Level 1 | | Level 2 | | Level 3 | | Total |
| Investments in Securities:(a) | | | | | | | | | | | | | | | | |
| Common Stocks | | $ | 75,606,497 | | | $ | — | | | $ | — | | | $ | 75,606,497 | |
| Short-Term Investment: | | | | | | | | | | | | | | | | |
| Money Market Fund | | | 1,025,445 | | | | — | | | | — | | | | 1,025,445 | |
| Investment of Cash Collateral for Securities Loaned: | | | | | | | | | | | | | | | | |
| Money Market Fund | | | 4,900,443 | | | | — | | | | — | | | | 4,900,443 | |
| Total Investments in Securities | | | 81,532,385 | | | | — | | | | — | | | | 81,532,385 | |
| Total Investments in Securities and Other Financial Instruments | | $ | 81,532,385 | | | $ | — | | | $ | — | | | $ | 81,532,385 | |
| (a) | For a complete listing of investments and their industries, see the Schedules of Investments. |
The Fund recognizes transfers between the levels as of the beginning of the period.
For the year ended April 30, 2016, the Fund did not have any transfers between any levels within the fair value hierarchy. (See Note 2)
The Fund did not hold any level 3 securities as of April 30, 2016.
See notes to financial statements.
| Schedules of Investments — IQ 50 Percent Hedged FTSE International ETF |
| April 30, 2016 |
| | | Shares | | Value |
| Common Stocks — 99.4% | | | | | | | | |
| Australia — 7.0% | | | | | | | | |
| AGL Energy Ltd. | | | 4,236 | | | $ | 59,126 | |
| Alumina Ltd. | | | 27,356 | | | | 31,211 | |
| Amcor Ltd. | | | 7,616 | | | | 89,507 | |
| AMP Ltd. | | | 18,324 | | | | 82,226 | |
| APA Group | | | 7,500 | | | | 50,082 | |
| Aristocrat Leisure Ltd. | | | 5,099 | | | | 38,913 | |
| Asciano Ltd. | | | 5,230 | | | | 35,243 | |
| ASX Ltd. | | | 1,855 | | | | 61,906 | |
| Aurizon Holdings Ltd. | | | 13,788 | | | | 44,930 | |
| Australia & New Zealand Banking | | | | | | | | |
| Group Ltd. | | | 16,189 | | | | 299,847 | |
| Bank of Queensland Ltd. | | | 3,890 | | | | 33,397 | |
| Bendigo & Adelaide Bank Ltd. | | | 4,050 | | | | 28,806 | |
| BHP Billiton Ltd. | | | 18,764 | | | | 296,132 | |
| BHP Billiton PLC | | | 12,408 | | | | 169,605 | |
| Boral Ltd. | | | 7,516 | | | | 36,939 | |
| Brambles Ltd. | | | 10,103 | | | | 96,222 | |
| Caltex Australia Ltd. | | | 1,989 | | | | 49,332 | |
| Challenger Ltd. | | | 5,695 | | | | 38,941 | |
| Coca-Cola Amatil Ltd. | | | 5,535 | | | | 36,327 | |
| Commonwealth Bank of Australia | | | 9,661 | | | | 544,776 | |
| Computershare Ltd. | | | 4,244 | | | | 32,744 | |
| CSL Ltd. | | | 2,770 | | | | 222,343 | |
| Dexus Property Group | | | 7,865 | | | | 50,538 | |
| Goodman Group | | | 11,787 | | | | 61,977 | |
| GPT Group (The) | | | 14,050 | | | | 53,933 | |
| Incitec Pivot Ltd. | | | 13,692 | | | | 33,646 | |
| Insurance Australia Group Ltd. | | | 17,034 | | | | 75,007 | |
| Macquarie Group Ltd. | | | 1,851 | | | | 89,700 | |
| Medibank Pvt Ltd. | | | 25,245 | | | | 60,494 | |
| Mirvac Group | | | 29,432 | | | | 42,002 | |
| National Australia Bank Ltd. | | | 14,881 | | | | 308,782 | |
| Newcrest Mining Ltd.* | | | 5,256 | | | | 76,091 | |
| Oil Search Ltd. | | | 9,569 | | | | 51,337 | |
| Orica Ltd. | | | 2,870 | | | | 33,511 | |
| Origin Energy Ltd. | | | 12,395 | | | | 51,931 | |
| QBE Insurance Group Ltd. | | | 8,543 | | | | 72,693 | |
| Ramsay Health Care Ltd. | | | 897 | | | | 44,461 | |
| Santos Ltd. | | | 12,429 | | | | 45,529 | |
| Scentre Group | | | 30,887 | | | | 110,550 | |
| SEEK Ltd. | | | 3,214 | | | | 40,152 | |
| Sonic Healthcare Ltd. | | | 3,109 | | | | 46,077 | |
| South32 Ltd.* | | | 36,291 | | | | 45,974 | |
| Stockland | | | 17,054 | | | | 56,875 | |
| Suncorp Group Ltd. | | | 8,473 | | | | 80,827 | |
| Sydney Airport | | | 8,780 | | | | 45,630 | |
| Tatts Group Ltd. | | | 11,737 | | | | 33,768 | |
| Telstra Corp. Ltd. | | | 23,678 | | | | 96,855 | |
| Transurban Group | | | 12,323 | | | | 108,902 | |
| Treasury Wine Estates Ltd. | | | 5,848 | | | | 41,594 | |
| Vicinity Centres | | | 21,718 | | | | 55,026 | |
| Wesfarmers Ltd. | | | 6,398 | | | | 208,830 | |
| Westfield Corp. | | | 12,240 | | | | 94,344 | |
| Westpac Banking Corp. | | | 18,787 | | | | 445,173 | |
| Woodside Petroleum Ltd. | | | 4,918 | | | | 106,365 | |
| Woolworths Ltd. | | | 7,671 | | | | 129,435 | |
| Total Australia | | | | | | | 5,276,564 | |
| | | Shares | | Value |
| Common Stocks (continued) | | | | | | | | |
| Austria — 0.2% | | | | | | | | |
| ANDRITZ AG(a) | | | 706 | | | $ | 39,549 | |
| Erste Group Bank AG* | | | 2,103 | | | | 60,506 | |
| OMV AG | | | 1,312 | | | | 39,386 | |
| Total Austria | | | | | | | 139,441 | |
| |
| Belgium — 1.3% | | | | | | | | |
| Ageas | | | 1,398 | | | | 54,857 | |
| Anheuser-Busch InBev NV | | | 4,496 | | | | 556,660 | |
| Delhaize Group | | | 639 | | | | 66,989 | |
| Groupe Bruxelles Lambert SA | | | 638 | | | | 56,361 | |
| KBC Groep NV | | | 1,647 | | | | 92,490 | |
| Proximus SA(a) | | | 1,056 | | | | 35,529 | |
| Solvay SA | | | 475 | | | | 48,017 | |
| UCB SA(a) | | | 801 | | | | 59,954 | |
| Umicore SA(a) | | | 818 | | | | 40,778 | |
| Total Belgium | | | | | | | 1,011,635 | |
| |
| China — 0.1% | | | | | | | | |
| AAC Technologies Holdings, Inc. | | | 5,943 | | | | 41,333 | |
| China Mengniu Dairy Co. Ltd.(a) | | | 13,174 | | | | 22,383 | |
| Want Want China Holdings Ltd.(a) | | | 49,225 | | | | 37,947 | |
| Total China | | | | | | | 101,663 | |
| |
| Denmark — 1.8% | | | | | | | | |
| AP Moeller — Maersk A/S, Class A | | | 26 | | | | 35,409 | |
| AP Moeller — Maersk A/S, Class B | | | 38 | | | | 53,448 | |
| Carlsberg A/S, Class B | | | 689 | | | | 67,115 | |
| Chr Hansen Holding A/S | | | 724 | | | | 45,067 | |
| Coloplast A/S, Class B | | | 707 | | | | 53,028 | |
| Danske Bank A/S | | | 4,509 | | | | 127,534 | |
| DSV A/S | | | 1,241 | | | | 52,231 | |
| Genmab A/S* | | | 359 | | | | 53,201 | |
| ISS A/S | | | 1,211 | | | | 45,993 | |
| Novo Nordisk A/S, Class B | | | 10,515 | | | | 587,214 | |
| Novozymes A/S, Class B | | | 1,418 | | | | 67,973 | |
| Pandora A/S | | | 691 | | | | 89,747 | |
| Vestas Wind Systems A/S | | | 1,394 | | | | 99,751 | |
| Total Denmark | | | | | | | 1,377,711 | |
| |
| Finland — 1.0% | | | | | | | | |
| Elisa OYJ | | | 982 | | | | 36,678 | |
| Fortum OYJ | | | 2,756 | | | | 41,541 | |
| Kone OYJ, Class B | | | 2,172 | | | | 99,110 | |
| Nokia OYJ | | | 34,694 | | | | 204,644 | |
| Nokian Renkaat OYJ | | | 1,122 | | | | 41,405 | |
| Orion OYJ, Class B | | | 799 | | | | 27,875 | |
| Sampo OYJ, Class A | | | 2,687 | | | | 117,347 | |
| Stora Enso OYJ, Class R | | | 4,055 | | | | 35,390 | |
| UPM-Kymmene OYJ | | | 3,474 | | | | 66,369 | |
| Wartsila OYJ Abp | | | 1,070 | | | | 45,884 | |
| Total Finland | | | | | | | 716,243 | |
| |
| France — 8.8% | | | | | | | | |
| Accor SA(a) | | | 1,317 | | | �� | 58,353 | |
| Air Liquide SA | | | 1,996 | | | | 226,326 | |
| Airbus Group SE | | | 3,215 | | | | 201,090 | |
| Alstom SA* | | | 1,150 | | | | 29,399 | |
| Arkema SA | | | 535 | | | | 42,697 | |
| Atos SE | | | 611 | | | | 54,368 | |
| AXA SA | | | 10,699 | | | | 269,774 | |
| BNP Paribas SA | | | 5,609 | | | | 297,058 | |
| Bollore SA | | | 6,477 | | | | 25,668 | |
See notes to financial statements.
| Schedules of Investments — IQ 50 Percent Hedged FTSE International ETF (continued) |
| April 30, 2016 |
| | | Shares | | Value |
| Common Stocks (continued) | | | | | | | | |
| France (continued) | | | | | | | | |
| Bouygues SA | | | 1,317 | | | $ | 43,925 | |
| Bureau Veritas SA | | | 1,985 | | | | 47,062 | |
| Capgemini SA | | | 897 | | | | 83,762 | |
| Carrefour SA | | | 3,215 | | | | 91,119 | |
| Casino Guichard Perrachon SA | | | 432 | | | | 25,709 | |
| Christian Dior SE | | | 277 | | | | 48,652 | |
| Cie de Saint-Gobain | | | 2,692 | | | | 123,316 | |
| Cie Generale des Etablissements | | | | | | | | |
| Michelin | | | 1,147 | | | | 119,745 | |
| Credit Agricole SA | | | 6,192 | | | | 68,502 | |
| Danone SA | | | 3,142 | | | | 220,132 | |
| Dassault Systemes | | | 809 | | | | 63,286 | |
| Edenred | | | 1,821 | | | | 35,915 | |
| Engie | | | 8,118 | | | | 133,890 | |
| Essilor International SA | | | 1,157 | | | | 149,810 | |
| Eutelsat Communications SA | | | 1,400 | | | | 43,495 | |
| Groupe Eurotunnel SE | | | 3,275 | | | | 41,824 | |
| Hermes International | | | 147 | | | | 52,362 | |
| Iliad SA | | | 168 | | | | 36,723 | |
| Ingenico Group | | | 369 | | | | 43,531 | |
| JCDecaux SA | | | 621 | | | | 27,437 | |
| Kering | | | 469 | | | | 80,387 | |
| Klepierre | | | 1,381 | | | | 64,970 | |
| Legrand SA | | | 1,736 | | | | 98,899 | |
| L’Oreal SA | | | 1,341 | | | | 243,366 | |
| LVMH Moet Hennessy Louis | | | | | | | | |
| Vuitton SE | | | 1,438 | | | | 238,982 | |
| Natixis SA | | | 5,705 | | | | 31,475 | |
| Numericable-SFR SA | | | 646 | | | | 21,150 | |
| Orange SA | | | 10,610 | | | | 175,963 | |
| Pernod Ricard SA | | | 1,151 | | | | 124,289 | |
| Peugeot SA* | | | 2,410 | | | | 38,796 | |
| Publicis Groupe SA | | | 1,213 | | | | 89,791 | |
| Renault SA | | | 1,040 | | | | 100,391 | |
| Rexel SA | | | 2,504 | | | | 37,943 | |
| Safran SA | | | 1,659 | | | | 114,331 | |
| Sanofi | | | 6,546 | | | | 540,642 | |
| Schneider Electric SE* | | | 3,277 | | | | 213,338 | |
| SCOR SE | | | 1,231 | | | | 41,924 | |
| Societe BIC SA | | | 197 | | | | 27,967 | |
| Societe Generale SA | | | 4,218 | | | | 165,465 | |
| Sodexo SA | | | 468 | | | | 47,272 | |
| Suez | | | 2,068 | | | | 38,134 | |
| Technip SA* | | | 878 | | | | 51,397 | |
| Teleperformance | | | 346 | | | | 31,069 | |
| Thales SA | | | 698 | | | | 60,359 | |
| TOTAL SA | | | 12,224 | | | | 615,053 | |
| Unibail-Rodamco SE | | | 586 | | | | 157,055 | |
| Valeo SA | | | 503 | | | | 79,763 | |
| Veolia Environnement SA | | | 2,766 | | | | 67,970 | |
| Vinci SA | | | 2,756 | | | | 205,936 | |
| Vivendi SA | | | 6,799 | | | | 130,514 | |
| Zodiac Aerospace | | | 1,406 | | | | 32,972 | |
| Total France | | | | | | | 6,672,493 | |
| |
| Germany — 7.8% | | | | | | | | |
| adidas AG | | | 1,296 | | | | 167,140 | |
| Allianz SE | | | 2,507 | | | | 425,684 | |
| BASF SE | | | 5,351 | | | | 442,190 | |
| Bayer AG | | | 4,764 | | | | 549,737 | |
| Bayerische Motoren Werke AG | | | 1,983 | | | | 182,834 | |
| | | Shares | | Value |
| Common Stocks (continued) | | | | | | | | |
| Germany (continued) | | | | | | | | |
| Beiersdorf AG | | | 692 | | | $ | 62,107 | |
| Brenntag AG | | | 1,053 | | | | 61,762 | |
| Commerzbank AG | | | 6,381 | | | | 59,637 | |
| Continental AG | | | 623 | | | | 136,859 | |
| Daimler AG | | | 5,449 | | | | 378,767 | |
| Deutsche Bank AG | | | 8,032 | | | | 151,515 | |
| Deutsche Boerse AG | | | 1,062 | | | | 87,201 | |
| Deutsche Post AG | | | 5,364 | | | | 157,523 | |
| Deutsche Telekom AG | | | 18,092 | | | | 316,731 | |
| Deutsche Wohnen AG | | | 2,187 | | | | 66,993 | |
| E.ON SE | | | 10,792 | | | | 111,357 | |
| Fresenius Medical Care AG & | | | | | | | | |
| Co. KGaA | | | 1,224 | | | | 106,195 | |
| Fresenius SE & Co. KGaA | | | 2,257 | | | | 164,203 | |
| GEA Group AG | | | 1,250 | | | | 57,969 | |
| Hannover Rueck SE | | | 375 | | | | 42,770 | |
| HeidelbergCement AG | | | 898 | | | | 79,803 | |
| Henkel AG & Co. KGaA | | | 605 | | | | 61,484 | |
| HUGO BOSS AG | | | 470 | | | | 29,979 | |
| Infineon Technologies AG | | | 7,225 | | | | 102,819 | |
| K+S AG(a) | | | 1,299 | | | | 32,404 | |
| LANXESS AG | | | 708 | | | | 37,030 | |
| LEG Immobilien AG* | | | 286 | | | | 26,471 | |
| Linde AG | | | 1,093 | | | | 166,999 | |
| Merck KGaA* | | | 764 | | | | 71,815 | |
| METRO AG | | | 1,139 | | | | 36,201 | |
| MTU Aero Engines AG | | | 393 | | | | 37,099 | |
| Muenchener Rueckversicherungs- | | | | | | | | |
| Gesellschaft AG | | | 792 | | | | 146,908 | |
| OSRAM Licht AG | | | 629 | | | | 32,833 | |
| ProSiebenSat.1 Media SE | | | 1,416 | | | | 72,203 | |
| RWE AG* | | | 3,195 | | | | 47,737 | |
| SAP SE | | | 5,121 | | | | 400,720 | |
| Siemens AG | | | 4,402 | | | | 459,411 | |
| Symrise AG | | | 893 | | | | 59,179 | |
| thyssenkrupp AG | | | 2,767 | | | | 64,366 | |
| TUI AG | | | 2,787 | | | | 40,459 | |
| United Internet AG | | | 814 | | | | 39,749 | |
| Volkswagen AG | | | 158 | | | | 25,037 | |
| Vonovia SE | | | 2,601 | | | | 87,540 | |
| Wirecard AG(a) | | | 886 | | | | 38,272 | |
| Zalando SE*‡ | | | 792 | | | | 26,252 | |
| Total Germany | | | | | | | 5,951,944 | |
| |
| Hong Kong — 3.3% | | | | | | | | |
| AIA Group Ltd. | | | 70,612 | | | | 425,099 | |
| Bank of East Asia Ltd. (The) | | | 10,836 | | | | 39,462 | |
| BOC Hong Kong Holdings Ltd. | | | 23,781 | | | | 71,277 | |
| Cheung Kong Infrastructure | | | | | | | | |
| Holdings Ltd. | | | 4,925 | | | | 46,570 | |
| Cheung Kong Property | | | | | | | | |
| Holdings Ltd. | | | 17,116 | | | | 117,494 | |
| CK Hutchison Holdings Ltd. | | | 17,132 | | | | 205,393 | |
| CLP Holdings Ltd. | | | 9,999 | | | | 92,486 | |
| Galaxy Entertainment Group Ltd.(a) | | | 13,862 | | | | 46,819 | |
| Hang Lung Properties Ltd. | | | 17,400 | | | | 34,723 | |
| Hang Seng Bank Ltd. | | | 5,106 | | | | 92,810 | |
| Henderson Land Development | | | | | | | | |
| Co. Ltd. | | | 7,512 | | | | 46,967 | |
| Hong Kong & China Gas Co., Ltd. | | | 44,659 | | | | 83,363 | |
See notes to financial statements.
| Schedules of Investments — IQ 50 Percent Hedged FTSE International ETF (continued) |
| April 30, 2016 |
| | | Shares | | Value |
| Common Stocks (continued) | | | | | | | | |
| Hong Kong (continued) | | | | | | | | |
| Hong Kong Exchanges and | | | | | | | | |
| Clearing Ltd. | | | 7,164 | | | $ | 181,289 | |
| Hongkong Land Holdings Ltd. | | | 8,363 | | | | 53,105 | |
| Hopewell Holdings Ltd. | | | 11,301 | | | | 38,169 | |
| Hysan Development Co. Ltd. | | | 8,192 | | | | 36,275 | |
| Jardine Matheson Holdings Ltd. | | | 1,504 | | | | 83,171 | |
| Jardine Strategic Holdings Ltd. | | | 1,511 | | | | 43,744 | |
| Li & Fung Ltd. | | | 46,901 | | | | 29,082 | |
| Link REIT (The) | | | 15,683 | | | | 95,325 | |
| MTR Corp. Ltd. | | | 11,024 | | | | 54,571 | |
| New World Development Co. Ltd. | | | 41,536 | | | | 41,444 | |
| Power Assets Holdings Ltd. | | | 9,048 | | | | 86,255 | |
| Sands China Ltd. | | | 15,832 | | | | 56,738 | |
| Sino Land Co. Ltd. | | | 26,617 | | | | 41,930 | |
| Sun Hung Kai Properties Ltd. | | | 10,182 | | | | 128,699 | |
| Swire Pacific Ltd., Class A | | | 4,567 | | | | 49,661 | |
| Techtronic Industries Co. Ltd. | | | 11,625 | | | | 43,684 | |
| Wharf Holdings Ltd. (The) | | | 9,654 | | | | 52,394 | |
| Wheelock & Co. Ltd. | | | 6,476 | | | | 30,054 | |
| Yue Yuen Industrial Holdings Ltd. | | | 9,066 | | | | 33,075 | |
| Total Hong Kong | | | | | | | 2,481,128 | |
| |
| Ireland — 0.7% | | | | | | | | |
| Bank of Ireland* | | | 163,318 | | | | 49,570 | |
| CRH PLC | | | 4,747 | | | | 138,243 | |
| Experian PLC | | | 5,630 | | | | 103,175 | |
| James Hardie Industries PLC | | | 2,871 | | | | 40,599 | |
| Kerry Group PLC, Class A | | | 821 | | | | 73,224 | |
| Paddy Power Betfair PLC | | | 465 | | | | 62,328 | |
| Ryanair Holdings PLC | | | 1,316 | | | | 19,874 | |
| Smurfit Kappa Group PLC | | | 1,465 | | | | 38,844 | |
| Total Ireland | | | | | | | 525,857 | |
| |
| Israel — 0.7% | | | | | | | | |
| Bank Hapoalim BM | | | 12,747 | | | | 65,639 | |
| Bank Leumi Le-Israel BM* | | | 14,740 | | | | 54,340 | |
| Bezeq The Israeli Telecommunication | | | | | | | | |
| Corp. Ltd. | | | 20,916 | | | | 44,662 | |
| NICE-Systems Ltd. | | | 470 | | | | 30,271 | |
| Teva Pharmaceutical Industries Ltd. | | | 6,038 | | | | 339,875 | |
| Total Israel | | | | | | | 534,787 | |
| |
| Italy — 2.0% | | | | | | | | |
| Assicurazioni Generali SpA | | | 7,328 | | | | 111,796 | |
| Atlantia SpA | | | 3,274 | | | | 91,197 | |
| Enel SpA | | | 44,356 | | | | 201,079 | |
| Eni SpA | | | 15,168 | | | | 246,692 | |
| EXOR SpA | | | 875 | | | | 32,871 | |
| Ferrari NV* | | | 789 | | | | 35,533 | |
| Intesa Sanpaolo SpA | | | 74,490 | | | | 206,467 | |
| Leonardo-Finmeccanica SpA*(a) | | | 3,091 | | | | 39,049 | |
| Luxottica Group SpA | | | 1,129 | | | | 61,513 | |
| Mediobanca SpA | | | 5,323 | | | | 43,744 | |
| Prysmian SpA | | | 2,086 | | | | 49,194 | |
| Snam SpA | | | 16,285 | | | | 99,415 | |
| Telecom Italia SpA* | | | 56,008 | | | | 54,526 | |
| Telecom Italia SpA-RSP | | | 38,179 | | | | 29,954 | |
| Terna Rete Elettrica Nazionale SpA | | | 10,849 | | | | 61,185 | |
| UniCredit SpA | | | 29,351 | | | | 113,424 | |
| Unione di Banche Italiane SpA | | | 6,213 | | | | 26,344 | |
| Total Italy | | | | | | | 1,503,983 | |
| | | Shares | | Value |
| Common Stocks (continued) | | | | | | | | |
| Japan — 23.1% | | | | | | | | |
| Aeon Co., Ltd. | | | 4,590 | | | $ | 70,505 | |
| Air Water, Inc. | | | 1,990 | | | | 30,986 | |
| Aisin Seiki Co., Ltd. | | | 1,387 | | | | 56,131 | |
| Ajinomoto Co., Inc. | | | 3,541 | | | | 84,558 | |
| Alfresa Holdings Corp. | | | 1,660 | | | | 33,171 | |
| Alps Electric Co., Ltd. | | | 1,307 | | | | 24,309 | |
| Amada Holdings Co., Ltd. | | | 3,800 | | | | 39,529 | |
| Aozora Bank Ltd. | | | 12,050 | | | | 44,035 | |
| Asahi Glass Co., Ltd. | | | 7,785 | | | | 47,222 | |
| Asahi Group Holdings Ltd. | | | 2,586 | | | | 84,810 | |
| Asahi Intecc Co. Ltd. | | | 390 | | | | 19,355 | |
| Asahi Kasei Corp. | | | 9,225 | | | | 65,501 | |
| Asics Corp. | | | 1,473 | | | | 30,439 | |
| Astellas Pharma, Inc. | | | 13,278 | | | | 185,777 | |
| Bandai Namco Holdings, Inc. | | | 1,646 | | | | 35,998 | |
| Bridgestone Corp. | | | 3,917 | | | | 150,683 | |
| Brother Industries Ltd. | | | 2,413 | | | | 28,799 | |
| Canon, Inc. | | | 6,321 | | | | 183,849 | |
| Casio Computer Co., Ltd. | | | 1,904 | | | | 37,637 | |
| Central Japan Railway Co., | | | 1,066 | | | | 193,633 | |
| Chiba Bank Ltd. (The) | | | 5,772 | | | | 30,426 | |
| Chubu Electric Power Co., Inc. | | | 4,405 | | | | 59,717 | |
| Chugai Pharmaceutical Co., Ltd. | | | 1,498 | | | | 52,642 | |
| Chugoku Electric Power Co., | | | | | | | | |
| Inc. (The) | | | 2,255 | | | | 30,054 | |
| Concordia Financial Group Ltd.* | | | 8,711 | | | | 41,717 | |
| Credit Saison Co., Ltd. | | | 1,512 | | | | 28,800 | |
| Dai Nippon Printing Co., Ltd. | | | 4,920 | | | | 47,869 | |
| Daicel Corp. | | | 3,043 | | | | 39,390 | |
| Daihatsu Motor Co., Ltd. | | | 2,241 | | | | 31,417 | |
| Dai-ichi Life Insurance Co., | | | | | | | | |
| Ltd. (The) | | | 6,813 | | | | 87,172 | |
| Daiichi Sankyo Co., Ltd. | | | 4,502 | | | | 109,442 | |
| Daikin Industries Ltd. | | | 1,672 | | | | 138,829 | |
| Daito Trust Construction Co., Ltd. | | | 520 | | | | 75,306 | |
| Daiwa House Industry Co., Ltd. | | | 3,987 | | | | 110,412 | |
| Daiwa Securities Group, Inc. | | | 11,820 | | | | 71,387 | |
| Denso Corp. | | | 2,934 | | | | 116,570 | |
| Dentsu, Inc. | | | 1,423 | | | | 75,409 | |
| Don Quijote Holdings Co., Ltd. | | | 864 | | | | 32,099 | |
| East Japan Railway Co., | | | 2,195 | | | | 201,539 | |
| Eisai Co., Ltd. | | | 1,675 | | | | 107,001 | |
| Electric Power Development | | | | | | | | |
| Co., Ltd. | | | 1,235 | | | | 38,264 | |
| FANUC Corp. | | | 1,159 | | | | 178,787 | |
| Fast Retailing Co., Ltd. | | | 289 | | | | 78,830 | |
| Fuji Heavy Industries Ltd. | | | 3,825 | | | | 132,845 | |
| FUJIFILM Holdings Corp. | | | 2,604 | | | | 111,198 | |
| Fujitsu Ltd. | | | 11,653 | | | | 42,563 | |
| Fukuoka Financial Group, Inc. | | | 6,905 | | | | 24,395 | |
| Gunma Bank Ltd. (The) | | | 4,485 | | | | 18,402 | |
| Hankyu Hanshin Holdings, Inc. | | | 8,706 | | | | 56,551 | |
| Hino Motors Ltd. | | | 2,762 | | | | 27,931 | |
| Hirose Electric Co., Ltd. | | | 283 | | | | 35,734 | |
| Hiroshima Bank Ltd. (The) | | | 5,429 | | | | 20,398 | |
| Hitachi Ltd. | | | 28,055 | | | | 135,195 | |
| Honda Motor Co., Ltd.(b) | | | 10,429 | | | | 291,684 | |
| Hoya Corp. | | | 2,712 | | | | 108,003 | |
| IHI Corp. | | | 11,615 | | | | 26,596 | |
| Inpex Corp. | | | 6,535 | | | | 54,249 | |
See notes to financial statements.
| Schedules of Investments — IQ 50 Percent Hedged FTSE International ETF (continued) |
| April 30, 2016 |
| | | Shares | | Value |
| Common Stocks (continued) | | | | | | | | |
| Japan (continued) | | | | | | | | |
| Isetan Mitsukoshi Holdings Ltd. | | | 2,586 | | | $ | 28,617 | |
| Isuzu Motors Ltd. | | | 4,398 | | | | 49,141 | |
| ITOCHU Corp. | | | 9,160 | | | | 121,140 | |
| Iyo Bank Ltd. (The) | | | 2,588 | | | | 17,706 | |
| J Front Retailing Co., Ltd. | | | 1,989 | | | | 24,929 | |
| Japan Airlines Co., Ltd. | | | 636 | | | | 23,497 | |
| Japan Exchange Group, Inc. | | | 3,661 | | | | 57,347 | |
| Japan Tobacco, Inc.(b) | | | 6,237 | | | | 264,065 | |
| JFE Holdings, Inc. | | | 3,477 | | | | 51,329 | |
| JGC Corp. | | | 2,238 | | | | 39,407 | |
| Joyo Bank Ltd. (The) | | | 6,648 | | | | 24,046 | |
| JTEKT Corp. | | | 1,984 | | | | 26,535 | |
| JX Holdings, Inc. | | | 17,714 | | | | 77,912 | |
| Kansai Electric Power Co., | | | | | | | | |
| Inc. (The)* | | | 4,663 | | | | 42,588 | |
| Kansai Paint Co., Ltd. | | | 2,106 | | | | 38,225 | |
| Kao Corp. | | | 3,144 | | | | 179,716 | |
| Kawasaki Heavy Industries Ltd. | | | 11,796 | | | | 34,838 | |
| KDDI Corp. | | | 10,954 | | | | 324,438 | |
| Keikyu Corp. | | | 4,406 | | | | 40,891 | |
| Keio Corp. | | | 5,022 | | | | 45,529 | |
| Keisei Electric Railway Co., Ltd. | | | 2,585 | | | | 36,796 | |
| Keyence Corp. | | | 272 | | | | 170,732 | |
| Kikkoman Corp. | | | 1,412 | | | | 46,651 | |
| Kintetsu Group Holdings Co., Ltd. | | | 13,072 | | | | 54,978 | |
| Kirin Holdings Co., Ltd. | | | 5,694 | | | | 84,696 | |
| Kobe Steel Ltd. | | | 25,206 | | | | 25,443 | |
| Koito Manufacturing Co., Ltd. | | | 984 | | | | 44,512 | |
| Komatsu Ltd. | | | 6,290 | | | | 112,079 | |
| Konica Minolta, Inc. | | | 3,788 | | | | 34,271 | |
| Kubota Corp. | | | 7,328 | | | | 113,658 | |
| Kuraray Co., Ltd. | | | 3,354 | | | | 44,074 | |
| Kurita Water Industries Ltd. | | | 1,465 | | | | 36,175 | |
| Kyocera Corp. | | | 2,074 | | | | 106,089 | |
| Kyowa Hakko Kirin Co., Ltd. | | | 2,165 | | | | 40,145 | |
| Kyushu Electric Power Co., Inc. | | | 3,109 | | | | 32,312 | |
| Lawson, Inc. | | | 608 | | | | 48,301 | |
| Lion Corp. | | | 1,729 | | | | 21,783 | |
| LIXIL Group Corp. | | | 2,092 | | | | 45,009 | |
| M3, Inc. | | | 1,639 | | | | 46,109 | |
| Mabuchi Motor Co., Ltd. | | | 533 | | | | 27,996 | |
| Makita Corp. | | | 955 | | | | 61,765 | |
| Marubeni Corp. | | | 11,870 | | | | 65,022 | |
| Marui Group Co., Ltd. | | | 2,026 | | | | 32,058 | |
| Mazda Motor Corp. | | | 3,651 | | | | 59,528 | |
| MEIJI Holdings Co., Ltd. | | | 907 | | | | 72,733 | |
| Miraca Holdings, Inc. | | | 642 | | | | 28,231 | |
| MISUMI Group, Inc. | | | 2,325 | | | | 33,768 | |
| Mitsubishi Chemical Holdings Corp. | | | 9,060 | | | | 49,265 | |
| Mitsubishi Corp. | | | 8,429 | | | | 146,766 | |
| Mitsubishi Electric Corp. | | | 12,154 | | | | 136,086 | |
| Mitsubishi Estate Co., Ltd. | | | 7,668 | | | | 152,006 | |
| Mitsubishi Heavy Industries Ltd. | | | 20,235 | | | | 75,176 | |
| Mitsubishi Materials Corp. | | | 10,593 | | | | 34,949 | |
| Mitsubishi Motors Corp. | | | 4,988 | | | | 20,932 | |
| Mitsubishi UFJ Financial | | | | | | | | |
| Group, Inc.(b) | | | 81,373 | | | | 395,552 | |
| Mitsubishi UFJ Lease & Finance | | | | | | | | |
| Co., Ltd. | | | 5,514 | | | | 25,046 | |
| Mitsui & Co., Ltd. | | | 10,525 | | | | 131,962 | |
| | | Shares | | Value |
| Common Stocks (continued) | | | | | | | | |
| Japan (continued) | | | | | | | | |
| Mitsui Fudosan Co., Ltd. | | | 5,715 | | | $ | 145,552 | |
| Mitsui OSK Lines Ltd. | | | 10,753 | | | | 23,819 | |
| Mizuho Financial Group, Inc. | | | 139,664 | | | | 219,035 | |
| MS&AD Insurance Group | | | | | | | | |
| Holdings, Inc. | | | 3,359 | | | | 93,193 | |
| Murata Manufacturing Co., Ltd. | | | 1,144 | | | | 158,189 | |
| Nabtesco Corp. | | | 1,410 | | | | 33,051 | |
| NEC Corp. | | | 18,707 | | | | 47,207 | |
| NGK Insulators Ltd. | | | 2,157 | | | | 46,650 | |
| NGK Spark Plug Co., Ltd. | | | 1,681 | | | | 35,365 | |
| NH Foods Ltd. | | | 1,821 | | | | 41,374 | |
| Nidec Corp. | | | 1,475 | | | | 112,836 | |
| Nikon Corp. | | | 3,045 | | | | 45,848 | |
| Nintendo Co., Ltd. | | | 641 | | | | 90,793 | |
| Nippon Express Co., Ltd. | | | 6,372 | | | | 30,313 | |
| Nippon Paint Holdings Co., Ltd. | | | 1,300 | | | | 35,867 | |
| Nippon Steel & Sumitomo | | | | | | | | |
| Metal Corp. | | | 5,179 | | | | 113,217 | |
| Nippon Telegraph & | | | | | | | | |
| Telephone Corp. | | | 2,761 | | | | 125,515 | |
| Nippon Yusen K.K. | | | 13,679 | | | | 27,743 | |
| Nissan Chemical Industries Ltd. | | | 1,512 | | | | 41,773 | |
| Nissan Motor Co., Ltd. | | | 13,850 | | | | 129,445 | |
| Nisshin Seifun Group, Inc. | | | 2,671 | | | | 44,910 | |
| Nissin Foods Holdings Co., Ltd. | | | 793 | | | | 37,651 | |
| Nitori Holdings Co., Ltd. | | | 543 | | | | 52,171 | |
| Nitto Denko Corp. | | | 1,070 | | | | 60,363 | |
| Nomura Holdings, Inc. | | | 21,757 | | | | 97,382 | |
| Nomura Research Institute Ltd. | | | 952 | | | | 34,612 | |
| NSK Ltd. | | | 3,625 | | | | 33,406 | |
| NTT Data Corp. | | | 952 | | | | 51,072 | |
| NTT DOCOMO, Inc. | | | 8,129 | | | | 197,308 | |
| Obayashi Corp. | | | 5,445 | | | | 55,012 | |
| Obic Co., Ltd. | | | 616 | | | | 33,450 | |
| Odakyu Electric Railway Co., Ltd. | | | 4,824 | | | | 53,788 | |
| Oji Holdings Corp. | | | 7,846 | | | | 33,219 | |
| Olympus Corp. | | | 2,155 | | | | 87,513 | |
| Omron Corp. | | | 1,415 | | | | 47,081 | |
| Ono Pharmaceutical Co., Ltd. | | | 3,026 | | | | 140,786 | |
| Oriental Land Co., Ltd. | | | 1,294 | | | | 91,915 | |
| ORIX Corp. | | | 8,209 | | | | 121,721 | |
| Osaka Gas Co., Ltd. | | | 12,928 | | | | 47,945 | |
| Otsuka Holdings Co., Ltd. | | | 2,447 | | | | 98,251 | |
| Panasonic Corp. | | | 12,771 | | | | 118,692 | |
| Rakuten, Inc. | | | 5,019 | | | | 57,252 | |
| Recruit Holdings Co., Ltd. | | | 2,184 | | | | 69,708 | |
| Resona Holdings, Inc. | | | 15,330 | | | | 56,337 | |
| Ricoh Co., Ltd. | | | 5,171 | | | | 54,806 | |
| Rohm Co., Ltd. | | | 728 | | | | 33,340 | |
| Ryohin Keikaku Co., Ltd. | | | 183 | | | | 42,195 | |
| Santen Pharmaceutical Co., Ltd. | | | 3,130 | | | | 46,689 | |
| SBI Holdings, Inc. | | | 2,171 | | | | 23,578 | |
| Secom Co., Ltd. | | | 1,319 | | | | 104,107 | |
| Seibu Holdings, Inc. | | | 1,653 | | | | 36,090 | |
| Seiko Epson Corp. | | | 2,252 | | | | 38,854 | |
| Sekisui Chemical Co., Ltd. | | | 3,362 | | | | 43,582 | |
| Sekisui House Ltd. | | | 4,047 | | | | 73,057 | |
| Seven & i Holdings Co., Ltd. | | | 4,644 | | | | 197,184 | |
| Seven Bank Ltd. | | | 7,077 | | | | 31,153 | |
| Shimadzu Corp. | | | 2,368 | | | | 37,491 | |
See notes to financial statements.
| Schedules of Investments — IQ 50 Percent Hedged FTSE International ETF (continued) |
| April 30, 2016 |
| | | Shares | | Value |
| Common Stocks (continued) | | | | | | | | |
| Japan (continued) | | | | | | | | |
| Shimano, Inc. | | | 527 | | | $ | 79,201 | |
| Shimizu Corp. | | | 4,763 | | | | 43,759 | |
| Shin-Etsu Chemical Co., Ltd. | | | 2,591 | | | | 150,212 | |
| Shinsei Bank Ltd. | | | 15,249 | | | | 22,233 | |
| Shionogi & Co., Ltd. | | | 1,991 | | | | 105,007 | |
| Shiseido Co., Ltd. | | | 2,704 | | | | 62,801 | |
| Shizuoka Bank Ltd. (The) | | | 4,397 | | | | 33,904 | |
| SMC Corp. | | | 375 | | | | 95,840 | |
| SoftBank Group Corp. | | | 5,437 | | | | 304,283 | |
| Sompo Japan Nipponkoa | | | | | | | | |
| Holdings, Inc. | | | 2,453 | | | | 67,415 | |
| Sony Corp. | | | 7,436 | | | | 193,067 | |
| Sotetsu Holdings, Inc. | | | 4,749 | | | | 31,203 | |
| Stanley Electric Co., Ltd. | | | 1,582 | | | | 33,889 | |
| Sumitomo Chemical Co., Ltd. | | | 10,587 | | | | 50,068 | |
| Sumitomo Corp. | | | 7,667 | | | | 83,839 | |
| Sumitomo Electric Industries Ltd. | | | 5,178 | | | | 65,091 | |
| Sumitomo Metal Mining Co., Ltd. | | | 3,811 | | | | 44,594 | |
| Sumitomo Mitsui Financial | | | | | | | | |
| Group, Inc. | | | 7,695 | | | | 245,460 | |
| Sumitomo Mitsui Trust Holdings, Inc. | | | 24,122 | | | | 77,690 | |
| Sumitomo Realty & Development | | | | | | | | |
| Co., Ltd. | | | 2,764 | | | | 83,828 | |
| Suntory Beverage & Food Ltd. | | | 976 | | | | 43,694 | |
| Suruga Bank Ltd. | | | 1,725 | | | | 34,824 | |
| Suzuki Motor Corp. | | | 2,619 | | | | 75,269 | |
| Sysmex Corp. | | | 968 | | | | 63,330 | |
| T&D Holdings, Inc. | | | 4,643 | | | | 46,931 | |
| Taiheiyo Cement Corp. | | | 11,791 | | | | 32,179 | |
| Taisei Corp. | | | 8,465 | | | | 59,179 | |
| Taisho Pharmaceutical Holdings | | | | | | | | |
| Co., Ltd. | | | 446 | | | | 37,516 | |
| Takashimaya Co., Ltd. | | | 3,199 | | | | 24,128 | |
| Takeda Pharmaceutical Co., Ltd. | | | 4,654 | | | | 228,883 | |
| TDK Corp. | | | 821 | | | | 50,490 | |
| Teijin Ltd. | | | 8,882 | | | | 32,956 | |
| Terumo Corp. | | | 2,350 | | | | 92,796 | |
| Tobu Railway Co., Ltd. | | | 8,524 | | | | 44,773 | |
| Toho Co., Ltd. | | | 1,241 | | | | 32,592 | |
| Toho Gas Co., Ltd. | | | 2,425 | | | | 16,998 | |
| Tohoku Electric Power Co., Inc. | | | 3,185 | | | | 41,913 | |
| Tokio Marine Holdings, Inc. | | | 4,311 | | | | 148,636 | |
| Tokyo Electric Power Co. | | | | | | | | |
| Holdings, Inc.* | | | 9,721 | | | | 53,604 | |
| Tokyo Electron Ltd. | | | 1,122 | | | | 77,715 | |
| Tokyo Gas Co., Ltd. | | | 14,475 | | | | 65,628 | |
| Tokyu Corp. | | | 7,837 | | | | 69,511 | |
| Tokyu Fudosan Holdings Corp. | | | 3,983 | | | | 28,217 | |
| TonenGeneral Sekiyu K.K. | | | 4,228 | | | | 41,373 | |
| Toppan Printing Co., Ltd. | | | 4,516 | | | | 39,971 | |
| Toray Industries, Inc. | | | 10,108 | | | | 87,547 | |
| Toshiba Corp.* | | | 25,463 | | | | 55,926 | |
| TOTO Ltd. | | | 1,237 | | | | 43,991 | |
| Toyo Suisan Kaisha Ltd. | | | 962 | | | | 35,065 | |
| Toyota Industries Corp. | | | 1,143 | | | | 51,972 | |
| Toyota Motor Corp.(b) | | | 15,736 | | | | 831,547 | |
| Toyota Tsusho Corp. | | | 1,723 | | | | 40,581 | |
| Tsuruha Holdings, Inc. | | | 298 | | | | 29,411 | |
| Unicharm Corp. | | | 2,442 | | | | 52,323 | |
| USS Co., Ltd. | | | 2,070 | | | | 33,934 | |
| | | Shares | | Value |
| Common Stocks (continued) | | | | | | | | |
| Japan (continued) | | | | | | | | |
| West Japan Railway Co., | | | 1,158 | | | $ | 72,276 | |
| Yahoo Japan Corp. | | | 10,157 | | | | 47,085 | |
| Yakult Honsha Co., Ltd. | | | 809 | | | | 41,662 | |
| Yamaguchi Financial Group, Inc. | | | 2,594 | | | | 24,850 | |
| Yamaha Corp. | | | 1,072 | | | | 32,061 | |
| Yamaha Motor Co., Ltd. | | | 2,067 | | | | 35,759 | |
| Yamato Holdings Co., Ltd. | | | 2,599 | | | | 54,144 | |
| Yamazaki Baking Co., Ltd. | | | 889 | | | | 21,703 | |
| Total Japan | | | | | | | 17,549,083 | |
| |
| Jersey — 0.1% | | | | | | | | |
| Randgold Resources Ltd. | | | 689 | | | | 68,331 | |
| |
| Jordan — 0.0%(c) | | | | | | | | |
| Hikma Pharmaceuticals PLC | | | 949 | | | | 30,640 | |
| |
| Luxembourg — 0.3% | | | | | | | | |
| ArcelorMittal | | | 9,329 | | | | 52,698 | |
| RTL Group SA(a) | | | 294 | | | | 24,568 | |
| SES SA | | | 2,019 | | | | 55,095 | |
| Tenaris SA | | | 3,820 | | | | 51,540 | |
| Total Luxembourg | | | | | | | 183,901 | |
| |
| Macau — 0.0%(c) | | | | | | | | |
| MGM China Holdings Ltd. | | | 17,830 | | | | 25,054 | |
| |
| Netherlands — 3.5% | | | | | | | | |
| Aegon NV | | | 11,486 | | | | 65,935 | |
| Akzo Nobel NV | | | 1,492 | | | | 105,761 | |
| Altice NV, Class A*(a) | | | 2,865 | | | | 43,479 | |
| ASML Holding NV* | | | 1,920 | | | | 185,602 | |
| Gemalto NV(a) | | | 547 | | | | 35,585 | |
| Heineken Holding NV | | | 565 | | | | 46,651 | |
| Heineken NV | | | 1,241 | | | | 116,340 | |
| ING Groep NV | | | 22,147 | | | | 271,290 | |
| Koninklijke Ahold NV | | | 5,019 | | | | 109,222 | |
| Koninklijke DSM NV | | | 1,244 | | | | 76,313 | |
| Koninklijke KPN NV | | | 19,609 | | | | 77,147 | |
| Koninklijke Philips NV | | | 5,524 | | | | 151,846 | |
| NN Group NV | | | 2,139 | | | | 74,134 | |
| Randstad Holding NV | | | 719 | | | | 38,627 | |
| Royal Dutch Shell PLC, Class A(b) | | | 23,575 | | | | 614,551 | |
| Royal Dutch Shell PLC, Class B(b) | | | 22,022 | | | | 576,164 | |
| TNT Express NV* | | | 1,831 | | | | 16,624 | |
| Wolters Kluwer NV | | | 2,114 | | | | 80,471 | |
| Total Netherlands | | | | | | | 2,685,742 | |
| |
| New Zealand — 0.2% | | | | | | | | |
| Auckland International Airport Ltd. | | | 9,882 | | | | 42,497 | |
| Fisher & Paykel Healthcare | | | | | | | | |
| Corp. Ltd. | | | 6,800 | | | | 43,507 | |
| Fletcher Building Ltd. | | | 9,040 | | | | 52,719 | |
| Spark New Zealand Ltd. | | | 17,044 | | | | 44,216 | |
| Total New Zealand | | | | | | | 182,939 | |
| |
| Norway — 0.6% | | | | | | | | |
| DNB ASA | | | 6,719 | | | | 86,028 | |
| Norsk Hydro ASA(a) | | | 9,483 | | | | 41,254 | |
| Orkla ASA | | | 6,059 | | | | 52,897 | |
| Schibsted ASA, Class A | | | 1,155 | | | | 33,693 | |
| Statoil ASA | | | 5,709 | | | | 100,889 | |
| Telenor ASA | | | 4,235 | | | | 72,894 | |
See notes to financial statements.
| Schedules of Investments — IQ 50 Percent Hedged FTSE International ETF (continued) |
| April 30, 2016 |
| | | Shares | | Value |
| Common Stocks (continued) | | | | |
| Norway (continued) | | | | |
| Yara International ASA | | | 1,153 | | | $ | 46,164 | |
| Total Norway | | | | | | | 433,819 | |
| |
| Portugal — 0.1% | | | | | | | | |
| EDP — Energias de Portugal SA | | | 16,445 | | | | 58,465 | |
| Jeronimo Martins SGPS SA | | | 2,595 | | | | 42,472 | |
| Total Portugal | | | | | | | 100,937 | |
| |
| Russia — 0.0%(c) | | | | | | | | |
| Polymetal International PLC | | | 2,024 | | | | 21,022 | |
| |
| Singapore — 1.3% | | | | | | | | |
| Ascendas Real Estate | | | | | | | | |
| Investment Trust | | | 25,845 | | | | 47,304 | |
| CapitaLand Commercial Trust | | | 37,946 | | | | 40,373 | |
| CapitaLand Ltd. | | | 18,006 | | | | 41,664 | |
| CapitaLand Mall Trust | | | 29,532 | | | | 45,483 | |
| City Developments Ltd. | | | 4,913 | | | | 30,486 | |
| ComfortDelGro Corp. Ltd. | | | 19,739 | | | | 42,443 | |
| DBS Group Holdings Ltd. | | | 10,150 | | | | 115,392 | |
| Genting Singapore PLC | | | 51,808 | | | | 31,415 | |
| Global Logistic Properties Ltd. | | | 23,817 | | | | 33,934 | |
| Keppel Corp. Ltd. | | | 11,311 | | | | 45,444 | |
| Oversea-Chinese Banking | | | | | | | | |
| Corp. Ltd. | | | 18,408 | | | | 120,113 | |
| Singapore Exchange Ltd. | | | 9,312 | | | | 52,170 | |
| Singapore Press Holdings Ltd.(a) | | | 18,246 | | | | 55,116 | |
| Singapore Technologies | | | | | | | | |
| Engineering Ltd. | | | 17,223 | | | | 41,262 | |
| Singapore Telecommunications Ltd. | | | 42,819 | | | | 122,973 | |
| United Overseas Bank Ltd. | | | 7,256 | | | | 100,414 | |
| Total Singapore | | | | | | | 965,986 | |
| |
| South Africa — 0.1% | | | | | | | | |
| Investec PLC | | | 3,040 | | | | 23,291 | |
| Mondi PLC | | | 2,241 | | | | 42,939 | |
| Total South Africa | | | | | | | 66,230 | |
| |
| South Korea — 4.1% | | | | | | | | |
| Amorepacific Corp. | | | 231 | | | | 82,616 | |
| AMOREPACIFIC Group | | | 218 | | | | 32,143 | |
| BNK Financial Group, Inc. | | | 3,386 | | | | 27,608 | |
| Celltrion, Inc.* | | | 525 | | | | 46,353 | |
| Coway Co. Ltd. | | | 591 | | | | 51,143 | |
| Dongbu Insurance Co., Ltd. | | | 544 | | | | 33,469 | |
| E-Mart Co. Ltd. | | | 188 | | | | 30,277 | |
| Hana Financial Group, Inc. | | | 2,245 | | | | 50,539 | |
| Hankook Tire Co. Ltd. | | | 799 | | | | 37,236 | |
| Hanmi Pharm Co. Ltd. | | | 44 | | | | 23,054 | |
| Hyosung Corp. | | | 177 | | | | 19,030 | |
| Hyundai Heavy Industries Co. Ltd.* | | | 352 | | | | 35,836 | |
| Hyundai Mobis Co. Ltd. | | | 455 | | | | 104,026 | |
| Hyundai Motor Co. | | | 1,069 | | | | 134,634 | |
| Hyundai Steel Co. | | | 688 | | | | 37,981 | |
| Industrial Bank of Korea | | | 2,412 | | | | 25,720 | |
| Kakao Corp. | | | 262 | | | | 23,110 | |
| Kangwon Land, Inc. | | | 1,322 | | | | 49,485 | |
| KB Financial Group, Inc. | | | 2,768 | | | | 84,541 | |
| Kia Motors Corp. | | | 1,848 | | | | 77,689 | |
| Korea Aerospace Industries Ltd. | | | 557 | | | | 33,144 | |
| Korea Electric Power Corp. | | | 1,680 | | | | 91,122 | |
| Korea Zinc Co. Ltd. | | | 104 | | | | 45,227 | |
| | | Shares | | Value |
| Common Stocks (continued) | | | | | | | | |
| South Korea (continued) | | | | | | | | |
| KT&G Corp. | | | 885 | | | $ | 95,537 | |
| LG Chem Ltd. | | | 310 | | | | 80,806 | |
| LG Corp. | | | 812 | | | | 48,532 | |
| LG Display Co. Ltd. | | | 1,834 | | | | 38,470 | |
| LG Electronics, Inc. | | | 906 | | | | 46,278 | |
| LG Household & Health Care Ltd. | | | 71 | | | | 62,750 | |
| Lotte Chemical Corp. | | | 108 | | | | 27,725 | |
| NAVER Corp. | | | 175 | | | | 103,980 | |
| NCSoft Corp. | | | 127 | | | | 25,525 | |
| Orion Corp. | | | 37 | | | | 30,200 | |
| POSCO | | | 453 | | | | 95,618 | |
| Samsung C&T Corp. | | | 456 | | | | 52,428 | |
| Samsung Electro-Mechanics | | | | | | | | |
| Co. Ltd. | | | 365 | | | | 16,690 | |
| Samsung Electronics Co. Ltd. | | | 623 | | | | 680,740 | |
| Samsung Fire & Marine Insurance | | | | | | | | |
| Co. Ltd. | | | 265 | | | | 68,494 | |
| Samsung Life Insurance Co. Ltd. | | | 637 | | | | 61,218 | |
| Samsung SDI Co. Ltd. | | | 444 | | | | 44,423 | |
| Samsung SDS Co. Ltd. | | | 189 | | | | 28,282 | |
| Shinhan Financial Group Co. Ltd. | | | 3,096 | | | | 113,580 | |
| SK Holdings Co. Ltd. | | | 253 | | | | 49,739 | |
| SK Hynix, Inc. | | | 3,444 | | | | 85,087 | |
| SK Innovation Co. Ltd. | | | 444 | | | | 60,400 | |
| SK Telecom Co. Ltd. | | | 203 | | | | 36,702 | |
| Total South Korea | | | | | | | 3,129,187 | |
| |
| Spain — 3.0% | | | | | | | | |
| Abertis Infraestructuras SA | | | 3,302 | | | | 55,689 | |
| ACS Actividades de Construccion y | | | | | | | | |
| Servicios SA | | | 1,166 | | | | 38,562 | |
| Aena SA*‡ | | | 416 | | | | 59,344 | |
| Amadeus IT Holding SA, Class A | | | 2,600 | | | | 118,342 | |
| Banco Bilbao Vizcaya | | | | | | | | |
| Argentaria SA | | | 36,322 | | | | 248,901 | |
| Banco de Sabadell SA* | | | 488 | | | | 933 | |
| Banco de Sabadell SA | | | 29,508 | | | | 56,407 | |
| Banco Popular Espanol SA | | | 10,673 | | | | 29,033 | |
| Banco Santander SA(a) | | | 82,472 | | | | 417,604 | |
| Bankia SA | | | 32,209 | | | | 29,992 | |
| Bankinter SA | | | 5,340 | | | | 40,709 | |
| CaixaBank SA | | | 13,979 | | | | 42,093 | |
| Distribuidora Internacional de | | | | | | | | |
| Alimentacion SA* | | | 4,746 | | | | 26,342 | |
| Enagas SA | | | 1,637 | | | | 49,883 | |
| Endesa SA | | | 1,931 | | | | 40,551 | |
| Ferrovial SA | | | 3,104 | | | | 66,802 | |
| Gamesa Corp. Tecnologica SA | | | 1,150 | | | | 22,648 | |
| Gas Natural SDG SA | | | 1,839 | | | | 38,261 | |
| Grifols SA | | | 3,190 | | | | 69,401 | |
| Iberdrola SA | | | 30,198 | | | | 214,579 | |
| Industria de Diseno Textil SA | | | 6,149 | | | | 197,444 | |
| Red Electrica Corp. SA | | | 703 | | | | 62,780 | |
| Repsol SA | | | 6,473 | | | | 84,851 | |
| Telefonica SA | | | 24,338 | | | | 265,431 | |
| Total Spain | | | | | | | 2,276,582 | |
See notes to financial statements.
| Schedules of Investments — IQ 50 Percent Hedged FTSE International ETF (continued) |
| April 30, 2016 |
| | | Shares | | Value |
| Common Stocks (continued) | | | | | | | | |
| Sweden — 2.7% | | | | | | | | |
| Alfa Laval AB | | | 2,270 | | | $ | 35,822 | |
| Assa Abloy AB, B Shares | | | 5,347 | | | | 112,239 | |
| Atlas Copco AB, A Shares | | | 3,557 | | | | 92,134 | |
| Atlas Copco AB, B Shares | | | 2,239 | | | | 53,781 | |
| Boliden AB | | | 1,989 | | | | 34,710 | |
| Electrolux AB | | | 1,410 | | | | 40,951 | |
| Getinge AB, B Shares | | | 1,384 | | | | 29,293 | |
| Hennes & Mauritz AB, B Shares* | | | 5,183 | | | | 184,451 | |
| Hexagon AB, B Shares | | | 1,657 | | | | 66,136 | |
| Industrivarden AB, A Shares | | | 2,498 | | | | 49,104 | |
| Investment AB Kinnevik, B Shares | | | 1,550 | | | | 44,631 | |
| Investor AB, B Shares | | | 2,602 | | | | 95,583 | |
| Meda AB, A Shares(a) | | | 1,989 | | | | 36,718 | |
| Nordea Bank AB | | | 16,870 | | | | 163,917 | |
| Sandvik AB(a) | | | 6,913 | | | | 71,005 | |
| Securitas AB, B Shares | | | 2,160 | | | | 34,140 | |
| Skandinaviska Enskilda Banken AB, | | | | | | | | |
| A Shares | | | 8,045 | | | | 76,916 | |
| Skanska AB, B Shares | | | 2,240 | | | | 49,310 | |
| SKF AB, B Shares | | | 2,679 | | | | 49,389 | |
| Svenska Cellulosa AB SCA, B Shares | | | 3,478 | | | | 109,641 | |
| Svenska Handelsbanken AB, | | | | | | | | |
| A Shares | | | 7,785 | | | | 103,736 | |
| Swedbank AB, A Shares | | | 5,794 | | | | 125,089 | |
| Swedish Match AB | | | 1,408 | | | | 44,702 | |
| Telefonaktiebolaget LM Ericsson, | | | | | | | | |
| B Shares | | | 16,891 | | | | 136,855 | |
| Telia Co. AB | | | 13,521 | | | | 64,635 | |
| Trelleborg AB, B Shares | | | 2,085 | | | | 38,023 | |
| Volvo AB, B Shares | | | 8,965 | | | | 105,044 | |
| Total Sweden | | | | | | | 2,047,955 | |
| |
| Switzerland — 8.7% | | | | | | | | |
| ABB Ltd.* | | | 11,888 | | | | 251,527 | |
| Actelion Ltd.* | | | 622 | | | | 100,584 | |
| Adecco SA | | | 984 | | | | 63,393 | |
| Aryzta AG* | | | 689 | | | | 26,776 | |
| Baloise Holding AG | | | 325 | | | | 40,248 | |
| Chocoladefabriken Lindt & | | | | | | | | |
| Sprungli AG | | | 7 | | | | 42,869 | |
| Cie Financiere Richemont SA | | | 3,024 | | | | 201,284 | |
| Clariant AG* | | | 2,275 | | | | 43,079 | |
| Coca-Cola HBC AG*(a) | | | 1,396 | | | | 28,630 | |
| Credit Suisse Group AG* | | | 10,846 | | | | 164,868 | |
| Dufry AG* | | | 360 | | | | 47,399 | |
| EMS-Chemie Holding AG | | | 67 | | | | 33,150 | |
| Galenica AG | | | 37 | | | | 54,120 | |
| Geberit AG | | | 258 | | | | 99,135 | |
| Givaudan SA | | | 64 | | | | 126,197 | |
| Glencore PLC* | | | 67,683 | | | | 161,514 | |
| Julius Baer Group Ltd.* | | | 1,336 | | | | 57,162 | |
| Kuehne + Nagel International AG | | | 251 | | | | 36,190 | |
| LafargeHolcim Ltd.* | | | 2,497 | | | | 126,530 | |
| Lonza Group AG* | | | 350 | | | | 58,279 | |
| Nestle SA | | | 17,818 | | | | 1,329,147 | |
| Novartis AG | | | 12,079 | | | | 922,465 | |
| Partners Group Holding AG | | | 149 | | | | 61,403 | |
| PSP Swiss Property AG | | | 371 | | | | 35,765 | |
| Roche Holding AG | | | 3,989 | | | | 1,009,215 | |
| Schindler Holding AG — | | | | | | | | |
| Participating Certificate | | | 362 | | | | 65,980 | |
| | | Shares | | Value |
| Common Stocks (continued) | | | | | | | | |
| Switzerland (continued) | | | | | | | | |
| SGS SA | | | 37 | | | $ | 81,489 | |
| Sika AG | | | 17 | | | | 72,416 | |
| Sonova Holding AG | | | 364 | | | | 48,685 | |
| STMicroelectronics NV | | | 4,497 | | | | 27,628 | |
| Swatch Group AG (The) — Bearer | | | 205 | | | | 70,066 | |
| Swiss Life Holding AG* | | | 211 | | | | 53,295 | |
| Swiss Prime Site AG* | | | 472 | | | | 41,389 | |
| Swiss Re AG | | | 1,836 | | | | 163,008 | |
| Swisscom AG | | | 134 | | | | 68,014 | |
| Syngenta AG | | | 546 | | | | 218,742 | |
| UBS Group AG | | | 20,292 | | | | 351,432 | |
| Wolseley PLC | | | 1,413 | | | | 79,091 | |
| Zurich Insurance Group AG* | | | 793 | | | | 177,629 | |
| Total Switzerland | | | | | | | 6,639,793 | |
| |
| United Kingdom — 16.5% | | | | | | | | |
| 3i Group PLC | | | 6,555 | | | | 45,477 | |
| Aberdeen Asset Management PLC | | | 7,431 | | | | 32,516 | |
| Admiral Group PLC | | | 1,750 | | | | 47,606 | |
| Aggreko PLC | | | 1,819 | | | | 28,965 | |
| Anglo American PLC | | | 8,025 | | | | 89,744 | |
| ARM Holdings PLC | | | 8,637 | | | | 118,616 | |
| Ashtead Group PLC | | | 3,357 | | | | 44,628 | |
| Associated British Foods PLC | | | 2,085 | | | | 93,584 | |
| AstraZeneca PLC(b) | | | 7,271 | | | | 418,383 | |
| Auto Trader Group PLC‡ | | | 6,370 | | | | 34,993 | |
| Aviva PLC | | | 22,828 | | | | 144,598 | |
| BAE Systems PLC | | | 17,583 | | | | 122,940 | |
| Barclays PLC(b) | | | 95,965 | | | | 241,093 | |
| Barratt Developments PLC | | | 6,226 | | | | 48,566 | |
| Berkeley Group Holdings PLC | | | 821 | | | | 36,020 | |
| BP PLC(b) | | | 105,458 | | | | 577,390 | |
| British American Tobacco PLC(b) | | | 10,603 | | | | 647,699 | |
| British Land Co. PLC (The) | | | 6,217 | | | | 65,481 | |
| BT Group PLC(b) | | | 48,264 | | | | 313,351 | |
| Bunzl PLC | | | 2,184 | | | | 65,235 | |
| Burberry Group PLC | | | 2,868 | | | | 49,954 | |
| Capita PLC | | | 4,000 | | | | 58,655 | |
| Centrica PLC | | | 29,419 | | | | 102,741 | |
| CNH Industrial NV | | | 4,603 | | | | 35,323 | |
| Cobham PLC(a) | | | 10,020 | | | | 22,605 | |
| Compass Group PLC | | | 9,146 | | | | 163,321 | |
| Croda International PLC* | | | 1,065 | | | | 46,975 | |
| DCC PLC | | | 523 | | | | 46,428 | |
| Derwent London PLC | | | 689 | | | | 33,146 | |
| Diageo PLC(b) | | | 14,540 | | | | 393,192 | |
| Direct Line Insurance Group PLC | | | 9,467 | | | | 50,189 | |
| Dixons Carphone PLC | | | 6,398 | | | | 39,852 | |
| DS Smith PLC | | | 6,724 | | | | 37,558 | |
| easyJet PLC | | | 1,403 | | | | 30,274 | |
| Fiat Chrysler Automobiles NV | | | 4,582 | | | | 36,788 | |
| G4S PLC | | | 10,795 | | | | 29,793 | |
| GKN PLC | | | 11,454 | | | | 46,763 | |
| GlaxoSmithKline PLC(b) | | | 27,811 | | | | 594,402 | |
| Hammerson PLC | | | 5,350 | | | | 45,809 | |
| Hargreaves Lansdown PLC | | | 1,729 | | | | 32,572 | |
| HSBC Holdings PLC(b) | | | 110,593 | | | | 733,085 | |
| ICAP PLC | | | 4,050 | | | | 27,795 | |
| IMI PLC | | | 2,254 | | | | 30,873 | |
| Imperial Brands PLC (b) | | | 5,511 | | | | 300,197 | |
| Inchcape PLC | | | 3,206 | | | | 31,819 | |
See notes to financial statements.
| Schedules of Investments — IQ 50 Percent Hedged FTSE International ETF (continued) |
| April 30, 2016 |
| | | Shares | | Value |
| Common Stocks (continued) | | | | | | | | |
| United Kingdom (continued) | | | | | | | | |
| Informa PLC | | | 5,280 | | | $ | 50,623 | |
| Inmarsat PLC | | | 3,219 | | | | 43,831 | |
| InterContinental Hotels Group PLC | | | 1,496 | | | | 59,806 | |
| International Consolidated Airlines | | | | | | | | |
| Group SA | | | 6,155 | | | | 47,336 | |
| Intertek Group PLC | | | 1,206 | | | | 57,540 | |
| Intu Properties PLC | | | 6,830 | | | | 30,446 | |
| ITV PLC | | | 22,481 | | | | 74,164 | |
| J Sainsbury PLC | | | 9,677 | | | | 40,954 | |
| Johnson Matthey PLC | | | 1,293 | | | | 54,683 | |
| Kingfisher PLC | | | 14,555 | | | | 77,589 | |
| Land Securities Group PLC | | | 4,600 | | | | 76,280 | |
| Legal & General Group PLC | | | 32,100 | | | | 104,909 | |
| Lloyds Banking Group PLC(b) | | | 342,363 | | | | 336,375 | |
| London Stock Exchange | | | | | | | | |
| Group PLC | | | 1,761 | | | | 69,987 | |
| Marks & Spencer Group PLC | | | 10,238 | | | | 63,515 | |
| Meggitt PLC | | | 6,056 | | | | 36,435 | |
| Merlin Entertainments PLC‡ | | | 4,933 | | | | 31,182 | |
| National Grid PLC(b) | | | 21,154 | | | | 302,076 | |
| Next PLC | | | 881 | | | | 65,626 | |
| Old Mutual PLC | | | 29,089 | | | | 79,046 | |
| Pearson PLC | | | 5,007 | | | | 59,045 | |
| Persimmon PLC | | | 1,942 | | | | 56,527 | |
| Petrofac Ltd.(a) | | | 2,184 | | | | 27,034 | |
| Provident Financial PLC | | | 1,070 | | | | 45,675 | |
| Prudential PLC(b) | | | 14,142 | | | | 279,157 | |
| Reckitt Benckiser Group PLC(b) | | | 3,630 | | | | 353,832 | |
| RELX NV | | | 5,295 | | | | 88,877 | |
| RELX PLC | | | 6,381 | | | | 113,105 | |
| Rexam PLC | | | 5,188 | | | | 47,499 | |
| Rightmove PLC | | | 552 | | | | 31,197 | |
| Rio Tinto Ltd. | | | 2,411 | | | | 94,850 | |
| Rio Tinto PLC | | | 7,077 | | | | 238,495 | |
| Rolls-Royce Holdings PLC* | | | 11,052 | | | | 108,393 | |
| Rolls-Royce Holdings PLC — | | | | | | | | |
| Entitlement* | | | 784,692 | | | | 1,149 | |
| Royal Bank of Scotland | | | | | | | | |
| Group PLC* | | | 18,177 | | | | 61,243 | |
| Royal Mail PLC | | | 5,703 | | | | 40,677 | |
| RSA Insurance Group PLC | | | 7,336 | | | | 49,337 | |
| SABMiller PLC(b) | | | 5,428 | | | | 332,770 | |
| Sage Group PLC (The) | | | 7,075 | | | | 61,356 | |
| Schroders PLC | | | 779 | | | | 28,689 | |
| Severn Trent PLC | | | 1,487 | | | | 48,511 | |
| Sky PLC | | | 5,723 | | | | 78,680 | |
| Smith & Nephew PLC | | | 5,603 | | | | 94,883 | |
| Smiths Group PLC | | | 2,934 | | | | 47,622 | |
| SSE PLC | | | 5,590 | | | | 123,651 | |
| St James’s Place PLC | | | 3,376 | | | | 42,878 | |
| Standard Chartered PLC | | | 16,032 | | | | 129,662 | |
| Standard Life PLC | | | 11,311 | | | | 54,033 | |
| Tate & Lyle PLC | | | 4,240 | | | | 36,522 | |
| Taylor Wimpey PLC | | | 20,340 | | | | 54,914 | |
| | | Shares | | Value |
| Common Stocks (continued) | | | | | | | | |
| United Kingdom (continued) | | | | | | | | |
| Tesco PLC* | | | 48,528 | | | $ | 122,344 | |
| Travis Perkins PLC | | | 1,499 | | | | 40,580 | |
| Unilever NV | | | 8,820 | | | | 387,563 | |
| Unilever PLC(b) | | | 6,841 | | | | 306,103 | |
| United Utilities Group PLC | | | 4,238 | | | | 58,326 | |
| Vodafone Group PLC(b) | | | 152,729 | | | | 490,422 | |
| Weir Group PLC (The)(a) | | | 1,559 | | | | 27,405 | |
| Whitbread PLC | | | 1,051 | | | | 59,614 | |
| William Hill PLC | | | 6,041 | | | | 27,672 | |
| Wm Morrison Supermarkets PLC | | | 15,353 | | | | 42,980 | |
| WPP PLC | | | 7,520 | | | | 175,816 | |
| Total United Kingdom | | | | | | | 12,508,485 | |
| |
| United States — 0.4% | | | | | | | | |
| Carnival PLC | | | 1,100 | | | | 54,739 | |
| QIAGEN NV* | | | 1,579 | | | | 35,393 | |
| Samsonite International SA | | | 9,741 | | | | 31,456 | |
| Shire PLC | | | 3,384 | | | | 211,227 | |
| Total United States | | | | | | | 332,815 | |
| Total Common Stocks | | | | | | | | |
| (Cost $75,691,510) | | | | | | | 75,541,950 | |
| |
| Preferred Stocks — 0.6% | | | | | | | | |
| Germany — 0.5% | | | | | | | | |
| FUCHS PETROLUB SE | | | 895 | | | | 38,292 | |
| Henkel AG & Co. KGaA | | | 1,064 | | | | 121,475 | |
| Porsche Automobil Holding SE | | | 1,043 | | | | 58,213 | |
| Volkswagen AG | | | 1,048 | | | | 151,781 | |
| Total Germany | | | | | | | 369,761 | |
| |
| South Korea — 0.1% | | | | | | | | |
| Samsung Electronics Co. Ltd. | | | 83 | | | | 75,978 | |
| Total Preferred Stocks | | | | | | | | |
| (Cost $448,491) | | | | | | | 445,739 | |
| |
| Short-Term Investment — 1.0% | | | | | | | | |
| Money Market Fund — 1.0% | | | | | | | | |
| Morgan Stanley Institutional Liquidity | | | | | | | | |
| Funds Treasury Portfolio — | | | | | | | | |
| Institutional Class, 0.22%(d) | | | | | | | | |
| (Cost $782,161) | | | 782,161 | | | | 782,161 | |
| |
| Investment of Cash Collateral For | | | | | | | | |
| Securities Loaned — 1.2% | | | | | | | | |
| Money Market Fund — 1.2% | | | | | | | | |
| Dreyfus Government Cash | | | | | | | | |
| Management Fund, | | | | | | | | |
| Institutional Shares, 0.20%(e) | | | | | | | | |
| (Cost $913,399) | | | 913,399 | | | | 913,399 | |
See notes to financial statements.
| Schedules of Investments — IQ 50 Percent Hedged FTSE International ETF (continued) |
| April 30, 2016 |
| | | Value |
| Total Investments — 102.2% | | | | |
| (Cost $77,835,561) | | $ | 77,683,249 | |
| Liabilities in Excess of | | | | |
| Other Assets — (2.2)% | | | (1,672,946 | ) |
| Net Assets — 100.0% | | $ | 76,010,303 | |
| * | Non-income producing securities. |
| ‡ | Security was purchased pursuant to Rule 144A under the Securities Act of 1933 and may not be resold subject to that rule except to qualified institutional buyers. Unless otherwise noted, 144A securities are deemed to be liquid. |
| (a) | All or a portion of the security was on loan. In addition, “Other Assets and Liabilities, Net” may include pending sales that are also on loan. The aggregate market value of securities on loan was $852,868; total market value of collateral held by the Fund was $913,399. |
| (b) | All or a portion of these securities have been segregated as collateral for forward currency contracts. The total value of securities segregated amounted to $4,526,714. |
| (d) | Rate shown reflects the 7-day yield at April 30, 2016. |
| (e) | Rate shown reflects the 1-day yield at April 30, 2016. |
AB — Aktiebolag (stock company)
AG — Aktiengesellschaft (public limited company)
A/S — Aktieselskab (joint stock company)
ASA — Allmeennaksjeselskap (stock company)
KGaA — Kommanditgesellschaft auf Aktien (partnership limited by shares)
K.K. — Kabushiki Kaisha
NV — Naamloze Vennootschap (public company)
OYJ — Osakeyhtiö (stock company)
PLC — Public Limited Company
REIT — Real Estate Investment Trust
RSP — Risparmio Italian Savings Shares
SA — Société Anonyme (corporation)
SE — Societas Europaea (public company)
SpA — Societa per azioni (public company)
Forward Exchange Contracts Outstanding as of April 30, 2016:
| Purchase Contracts | | Counterparty | | Currency | | Currency
Amount
Purchased | | Value at
Settlement
Date | | Value at
April 30, 2016) | | Unrealized
Appreciation
(Depreciation |
| Australian Dollar Expiring 05/10/16 | | Morgan Stanley | | | AUD | | | | 3,303,970 | | | $ | 2,520,469 | | | $ | 2,520,357 | | | $ | (112 | ) |
| Swiss Franc Expiring 05/10/16 | | Morgan Stanley | | | CHF | | | | 2,867,941 | | | | 2,991,892 | | | | 2,993,416 | | | | 1,524 | |
| Danish Krone Expiring 05/10/16 | | Morgan Stanley | | | DKK | | | | 4,282,505 | | | | 659,047 | | | | 659,215 | | | | 168 | |
| Euro Expiring 05/10/16 | | Morgan Stanley | | | EUR | | | | 9,127,353 | | | | 10,455,348 | | | | 10,457,116 | | | | 1,768 | |
| British Pound Expiring 05/10/16 | | Morgan Stanley | | | GBP | | | | 4,831,327 | | | | 7,077,021 | | | | 7,077,609 | | | | 588 | |
| Hong Kong Dollar Expiring 05/10/16 | | Morgan Stanley | | | HKD | | | | 9,449,144 | | | | 1,218,151 | | | | 1,218,244 | | | | 93 | |
| Israeli Shekel Expiring 05/10/16 | | Morgan Stanley | | | ILS | | | | 982,424 | | | | 262,940 | | | | 263,246 | | | | 306 | |
| Japanese Yen Expiring 05/10/16 | | Morgan Stanley | | | JPY | | | | 941,933,119 | | | | 8,804,129 | | | | 8,805,583 | | | | 1,454 | |
| South Korean Won Expiring 05/10/16 | | Morgan Stanley | | | KRW | | | | 1,759,053,850 | | | | 1,540,327 | | | | 1,543,617 | | | | 3,290 | |
| Norwegian Krone Expiring 05/10/16 | | Morgan Stanley | | | NOK | | | | 1,692,104 | | | | 209,977 | | | | 210,128 | | | | 151 | |
| New Zealand Dollar Expiring 05/10/16 | | Morgan Stanley | | | NZD | | | | 130,372 | | | | 91,078 | | | | 91,112 | | | | 34 | |
| Swedish Krona Expiring 05/10/16 | | Morgan Stanley | | | SEK | | | | 8,297,125 | | | | 1,034,684 | | | | 1,034,610 | | | | (74 | ) |
| Singapore Dollar Expiring 05/10/16 | | Morgan Stanley | | | SGD | | | | 651,485 | | | | 484,654 | | | | 484,582 | | | | (72 | ) |
| | | | | | | | | | | | | $ | 37,349,717 | | | $ | 37,358,835 | | | $ | 9,118 | |
| Sales Contracts | | Counterparty | | Currency | | Currency
Amount Sold | | Value at
Settlement
Date | | Value at
April 30, 2016 | | Unrealized
Appreciation
(Depreciation) |
| Australian Dollar Expiring 05/10/16 | | Morgan Stanley | | | AUD | | | | (2,079,319 | ) | | $ | (1,596,447 | ) | | $ | (1,586,160 | ) | | $ | 10,287 | |
| Australian Dollar Expiring 05/10/16 | | Morgan Stanley | | | AUD | | | | (1,224,651 | ) | | | (929,517 | ) | | | (934,197 | ) | | | (4,680 | ) |
| Australian Dollar Expiring 06/07/16 | | Morgan Stanley | | | AUD | | | | (3,434,716 | ) | | | (2,617,140 | ) | | | (2,616,956 | ) | | | 184 | |
| Swiss Franc Expiring 05/10/16 | | Morgan Stanley | | | CHF | | | | (2,710,906 | ) | | | (2,839,932 | ) | | | (2,829,511 | ) | | | 10,421 | |
| Swiss Franc Expiring 05/10/16 | | Morgan Stanley | | | CHF | | | | (157,035 | ) | | | (161,887 | ) | | | (163,905 | ) | | | (2,018 | ) |
| Swiss Franc Expiring 06/07/16 | | Morgan Stanley | | | CHF | | | | (3,051,384 | ) | | | (3,186,952 | ) | | | (3,188,910 | ) | | | (1,958 | ) |
| Danish Krone Expiring 05/10/16 | | Morgan Stanley | | | DKK | | | | (4,282,505 | ) | | | (656,275 | ) | | | (659,215 | ) | | | (2,940 | ) |
| Danish Krone Expiring 06/07/16 | | Morgan Stanley | | | DKK | | | | (4,483,484 | ) | | | (690,504 | ) | | | (690,752 | ) | | | (248 | ) |
| Euro Expiring 05/10/16 | | Morgan Stanley | | | EUR | | | | (9,127,353 | ) | | | (10,415,944 | ) | | | (10,457,116 | ) | | | (41,172 | ) |
| Euro Expiring 06/07/16 | | Morgan Stanley | | | EUR | | | | (9,314,155 | ) | | | (10,677,905 | ) | | | (10,680,483 | ) | | | (2,578 | ) |
| British Pound Expiring 05/10/16 | | Morgan Stanley | | | GBP | | | | (4,831,328 | ) | | | (6,920,984 | ) | | | (7,077,611 | ) | | | (156,627 | ) |
| British Pound Expiring 06/07/16 | | Morgan Stanley | | | GBP | | | | (4,909,181 | ) | | | (7,191,503 | ) | | | (7,192,265 | ) | | | (762 | ) |
| Hong Kong Dollar Expiring 05/10/16 | | Morgan Stanley | | | HKD | | | | (9,010,517 | ) | | | (1,161,922 | ) | | | (1,161,693 | ) | | | 229 | |
| Hong Kong Dollar Expiring 05/10/16 | | Morgan Stanley | | | HKD | | | | (438,627 | ) | | | (56,549 | ) | | | (56,550 | ) | | | (1 | ) |
| Hong Kong Dollar Expiring 06/07/16 | | Morgan Stanley | | | HKD | | | | (9,538,572 | ) | | | (1,229,928 | ) | | | (1,230,107 | ) | | | (179 | ) |
| Israeli Shekel Expiring 05/10/16 | | Morgan Stanley | | | ILS | | | | (982,424 | ) | | | (261,275 | ) | | | (263,246 | ) | | | (1,971 | ) |
| Israeli Shekel Expiring 06/07/16 | | Morgan Stanley | | | ILS | | | | (1,019,610 | ) | | | (273,000 | ) | | | (273,346 | ) | | | (346 | ) |
| Japanese Yen Expiring 05/10/16 | | Morgan Stanley | | | JPY | | | | (941,933,119 | ) | | | (8,529,655 | ) | | | (8,805,583 | ) | | | (275,928 | ) |
| Japanese Yen Expiring 06/07/16 | | Morgan Stanley | | | JPY | | | | (941,675,648 | ) | | | (8,807,360 | ) | | | (8,809,859 | ) | | | (2,499 | ) |
| South Korean Won Expiring 05/10/16 | | Morgan Stanley | | | KRW | | | | (56,915,935 | ) | | | (50,037 | ) | | | (49,945 | ) | | | 92 | |
| South Korean Won Expiring 05/10/16 | | Morgan Stanley | | | KRW | | | | (1,702,137,916 | ) | | | (1,490,018 | ) | | | (1,493,672 | ) | | | (3,654 | ) |
| South Korean Won Expiring 06/07/16 | | Morgan Stanley | | | KRW | | | | (1,825,982,245 | ) | | | (1,594,995 | ) | | | (1,601,655 | ) | | | (6,660 | ) |
| Norwegian Krone Expiring 05/10/16 | | Morgan Stanley | | | NOK | | | | (1,692,104 | ) | | | (205,254 | ) | | | (210,128 | ) | | | (4,874 | ) |
| Norwegian Krone Expiring 06/07/16 | | Morgan Stanley | | | NOK | | | | (1,746,632 | ) | | | (216,709 | ) | | | (216,868 | ) | | | (159 | ) |
See notes to financial statements.
| Schedules of Investments — IQ 50 Percent Hedged FTSE International ETF (continued) |
| April 30, 2016 |
Forward Exchange Contracts Outstanding as of April 30, 2016 (continued):
| Sales Contracts | | Counterparty | | Currency | | Currency
Amount Sold | | Value at
Settlement
Date | | Value at
April 30, 2016 | | Unrealized
Appreciation
(Depreciation) |
| New Zealand Dollar Expiring 05/10/16 | | Morgan Stanley | | | NZD | | | | (130,372 | ) | | $ | (89,867 | ) | | $ | (91,112 | ) | | $ | (1,245 | ) |
| New Zealand Dollar Expiring 06/07/16 | | Morgan Stanley | | | NZD | | | | (130,810 | ) | | | (91,246 | ) | | | (91,278 | ) | | | (32 | ) |
| Swedish Krona Expiring 05/10/16 | | Morgan Stanley | | | SEK | | | | (8,297,125 | ) | | | (1,024,479 | ) | | | (1,034,610 | ) | | | (10,131 | ) |
| Swedish Krona Expiring 06/07/16 | | Morgan Stanley | | | SEK | | | | (8,231,776 | ) | | | (1,027,535 | ) | | | (1,027,528 | ) | | | 7 | |
| Singapore Dollar Expiring 05/10/16 | | Morgan Stanley | | | SGD | | | | (226,969 | ) | | | (168,857 | ) | | | (168,822 | ) | | | 35 | |
| Singapore Dollar Expiring 05/10/16 | | Morgan Stanley | | | SGD | | | | (424,516 | ) | | | (315,050 | ) | | | (315,760 | ) | | | (710 | ) |
| Singapore Dollar Expiring 06/07/16 | | Morgan Stanley | | | SGD | | | | (649,166 | ) | | | (482,554 | ) | | | (482,539 | ) | | | 15 | |
| | | | | | | | | | | | | $ | (74,961,280 | ) | | $ | (75,461,382 | ) | | $ | (500,102 | ) |
|
| Net Unrealized Appreciation (Depreciation) | | | | | | | | | | | | | | | | | | $ | (490,984 | ) |
The following is a summary of the fair valuations according to the inputs used as of April 30, 2016 for valuing the Fund’s assets and liabilities. For more information on the valuation techniques, and their aggregation into the levels used in the table below, please refer to Note 2.
Asset Valuation Inputs
| Description | | Level 1 | | Level 2 | | Level 3 | | Total |
| Investments in Securities:(a) | | | | | | | | | | | | | | | | |
| Common Stocks | | $ | 75,540,801 | | | $ | 1,149 | | | $ | — | | | $ | 75,541,950 | |
| Preferred Stocks | | | 445,739 | | | | — | | | | — | | | | 445,739 | |
| Short-Term Investment: | | | | | | | | | | | | | | | | |
| Money Market Fund | | | 782,161 | | | | — | | | | — | | | | 782,161 | |
| Investment of Cash Collateral for Securities Loaned: | | | | | | | | | | | | | | | | |
| Money Market Fund | | | 913,399 | | | | — | | | | — | | | | 913,399 | |
| Total Investments in Securities | | | 77,682,100 | | | | 1,149 | | | | — | | | | 77,683,249 | |
| Other Financial Instruments: | | | | | | | | | | | | | | | | |
| Forward Exchange Contracts | | | — | | | | 30,646 | (b) | | | — | | | | 30,646 | |
| Total Investments in Securities and Other Financial Instruments | | $ | 77,682,100 | | | $ | 31,795 | | | $ | — | | | $ | 77,713,895 | |
Liability Valuation Inputs
| Description | | Level 1 | | Level 2 | | Level 3 | | Total |
| Other Financial Instruments: | | | | | | | | |
| Forward Exchange Contracts | | $ | — | | | $ | 521,630 | (b) | | $ | — | | | $ | 521,630 | |
| Total Other Financial Instruments | | $ | — | | | $ | 521,630 | | | $ | — | | | $ | 521,630 | |
| (a) | For a complete listing of investments and their industries, see the Schedules of Investments. |
| (b) | The value listed for these securities reflects the unrealized appreciation (depreciation) of the instruments. |
The Fund recognizes transfers between the levels as of the beginning of the period.
For the year ended April 30, 2016, the Fund did not have any transfers between any levels within the fair value hierarchy. (See Note 2)
The Fund did not hold any level 3 securities as of April 30, 2016.
See notes to financial statements.
| Schedules of Investments — IQ 50 Percent Hedged FTSE Europe ETF |
| April 30, 2016 |
| | | Shares | | Value |
| Common Stocks — 98.9% | | | | |
| Australia — 0.4% | | | | |
| BHP Billiton PLC | | | 12,346 | | | $ | 168,757 | |
| |
| Austria — 0.3% | | | | | | | | |
| ANDRITZ AG(a) | | | 427 | | | | 23,920 | |
| Erste Group Bank AG* | | | 1,664 | | | | 47,875 | |
| OMV AG | | | 851 | | | | 25,547 | |
| Raiffeisen Bank International AG* | | | 692 | | | | 11,060 | |
| Telekom Austria AG | | | 443 | | | | 2,782 | |
| Vienna Insurance Group AG | | | | | | | | |
| Wiener Versicherung Gruppe | | | 218 | | | | 4,921 | |
| voestalpine AG | | | 661 | | | | 23,833 | |
| Total Austria | | | | | | | 139,938 | |
| |
| Belgium — 2.2% | | | | | | | | |
| Ackermans & van Haaren NV | | | 145 | | | | 18,883 | |
| Ageas | | | 1,192 | | | | 46,774 | |
| Anheuser-Busch InBev NV | | | 4,663 | | | | 577,337 | |
| bpost SA | | | 587 | | | | 16,563 | |
| Colruyt SA | | | 368 | | | | 21,192 | |
| Delhaize Group | | | 593 | | | | 62,166 | |
| Groupe Bruxelles Lambert SA | | | 453 | | | | 40,018 | |
| KBC Groep NV | | | 1,601 | | | | 89,907 | |
| Proximus SA(a) | | | 819 | | | | 27,555 | |
| Solvay SA | | | 412 | | | | 41,648 | |
| Telenet Group Holding NV* | | | 280 | | | | 13,918 | |
| UCB SA(a) | | | 703 | | | | 52,619 | |
| Umicore SA(a) | | | 540 | | | | 26,920 | |
| Total Belgium | | | | | | | 1,035,500 | |
| |
| Chile — 0.0%(b) | | | | | | | | |
| Antofagasta PLC | | | 2,083 | | | | 14,744 | |
| |
| Denmark — 3.0% | | | | | | | | |
| AP Moeller — Maersk A/S, Class A | | | 26 | | | | 35,409 | |
| AP Moeller — Maersk A/S, Class B | | | 37 | | | | 52,041 | |
| Carlsberg A/S, Class B | | | 618 | | | | 60,199 | |
| Chr Hansen Holding A/S | | | 504 | | | | 31,373 | |
| Coloplast A/S, Class B | | | 585 | | | | 43,877 | |
| Danske Bank A/S | | | 4,450 | | | | 125,865 | |
| DSV A/S | | | 1,069 | | | | 44,992 | |
| Genmab A/S* | | | 316 | | | | 46,829 | |
| H Lundbeck A/S* | | | 341 | | | | 11,392 | |
| ISS A/S | | | 1,072 | | | | 40,714 | |
| Jyske Bank A/S | | | 399 | | | | 16,339 | |
| Novo Nordisk A/S, Class B | | | 10,775 | | | | 601,734 | |
| Novozymes A/S, Class B | | | 1,297 | | | | 62,172 | |
| Pandora A/S | | | 658 | | | | 85,461 | |
| TDC A/S | | | 4,731 | | | | 24,215 | |
| Tryg A/S(a) | | | 653 | | | | 12,330 | |
| Vestas Wind Systems A/S | | | 1,277 | | | | 91,379 | |
| William Demant Holding A/S* | | | 138 | | | | 14,186 | |
| Total Denmark | | | | | | | 1,400,507 | |
| |
| Finland — 1.6% | | | | | | | | |
| Elisa OYJ | | | 920 | | | | 34,362 | |
| Fortum OYJ | | | 2,601 | | | | 39,204 | |
| Kesko OYJ, Class B | | | 390 | | | | 15,585 | |
| Kone OYJ, Class B | | | 2,202 | | | | 100,479 | |
| Metso OYJ | | | 798 | | | | 19,185 | |
| Neste Oyj(a) | | | 750 | | | | 24,001 | |
| Nokia OYJ | | | 33,419 | | | | 197,124 | |
| Nokian Renkaat OYJ | | | 770 | | | | 28,415 | |
| | | Shares | | Value |
| Common Stocks (continued) | | | | | | | | |
| Finland (continued) | | | | | | | | |
| Orion OYJ, Class B | | | 599 | | | $ | 20,898 | |
| Sampo OYJ, Class A | | | 2,732 | | | | 119,312 | |
| Stora Enso OYJ, Class R | | | 3,401 | | | | 29,682 | |
| UPM-Kymmene OYJ | | | 3,096 | | | | 59,147 | |
| Wartsila OYJ Abp | | | 907 | | | | 38,894 | |
| Total Finland | | | | | | | 726,288 | |
| |
| France — 14.6% | | | | | | | | |
| Accor SA(a) | | | 1,185 | | | | 52,505 | |
| Aeroports de Paris | | | 166 | | | | 20,895 | |
| Air Liquide SA | | | 2,000 | | | | 226,779 | |
| Airbus Group SE | | | 3,236 | | | | 202,404 | |
| Alstom SA* | | | 878 | | | | 22,445 | |
| Arkema SA | | | 407 | | | | 32,482 | |
| Atos SE | | | 517 | | | | 46,004 | |
| AXA SA | | | 11,250 | | | | 283,667 | |
| BioMerieux | | | 83 | | | | 10,709 | |
| BNP Paribas SA | | | 5,694 | | | | 301,560 | |
| Bollore SA | | | 5,832 | | | | 23,112 | |
| Bouygues SA | | | 1,115 | | | | 37,188 | |
| Bureau Veritas SA | | | 1,498 | | | | 35,516 | |
| Capgemini SA | | | 929 | | | | 86,750 | |
| Carrefour SA | | | 3,178 | | | | 90,070 | |
| Casino Guichard Perrachon SA | | | 335 | | | | 19,937 | |
| Christian Dior SE | | | 303 | | | | 53,219 | |
| Cie de Saint-Gobain | | | 2,653 | | | | 121,529 | |
| Cie Generale des Etablissements | | | | | | | | |
| Michelin | | | 1,056 | | | | 110,245 | |
| CNP Assurances | | | 964 | | | | 16,413 | |
| Credit Agricole SA | | | 6,154 | | | | 68,081 | |
| Danone SA | | | 3,309 | | | | 231,832 | |
| Dassault Systemes | | | 740 | | | | 57,888 | |
| Edenred | | | 1,179 | | | | 23,253 | |
| Eiffage SA | | | 372 | | | | 29,582 | |
| Electricite de France SA | | | 1,541 | | | | 22,142 | |
| Engie SA | | | 8,317 | | | | 137,173 | |
| Essilor International SA | | | 1,165 | | | | 150,846 | |
| Euler Hermes Group | | | 68 | | | | 6,464 | |
| Eurazeo SA | | | 223 | | | | 15,708 | |
| Eutelsat Communications SA | | | 956 | | | | 29,701 | |
| Faurecia | | | 437 | | | | 18,054 | |
| Fonciere Des Regions* | | | 209 | | | | 19,782 | |
| Gecina SA | | | 234 | | | | 33,850 | |
| Groupe Eurotunnel SE | | | 2,715 | | | | 34,672 | |
| Hermes International | | | 140 | | | | 49,868 | |
| ICADE | | | 206 | | | | 16,221 | |
| Iliad SA | | | 137 | | | | 29,947 | |
| Imerys SA | | | 213 | | | | 15,726 | |
| Ingenico Group SA | | | 319 | | | | 37,633 | |
| Ipsen SA | | | 202 | | | | 12,227 | |
| JCDecaux SA | | | 401 | | | | 17,717 | |
| Kering | | | 431 | | | | 73,874 | |
| Klepierre | | | 1,187 | | | | 55,843 | |
| Lagardere SCA | | | 663 | | | | 17,595 | |
| Legrand SA | | | 1,546 | | | | 88,075 | |
| L’Oreal SA | | | 1,384 | | | | 251,169 | |
| LVMH Moet Hennessy Louis | | | | | | | | |
| Vuitton SE | | | 1,463 | | | | 243,136 | |
| Natixis SA | | | 5,563 | | | | 30,692 | |
| Numericable-SFR SAS | | | 537 | | | | 17,581 | |
| Orange SA | | | 11,139 | | | | 184,736 | |
See notes to financial statements.
| Schedules of Investments — IQ 50 Percent Hedged FTSE Europe ETF (continued) |
| April 30, 2016 |
| | | Shares | | Value |
| Common Stocks (continued) | | | | | | | | |
| France (continued) | | | | | | | | |
| Orpea | | | 235 | | | $ | 19,382 | |
| Pernod Ricard SA | | | 1,232 | | | | 133,036 | |
| Peugeot SA* | | | 2,253 | | | | 36,269 | |
| Publicis Groupe SA | | | 1,107 | | | | 81,944 | |
| Remy Cointreau SA | | | 138 | | | | 11,456 | |
| Renault SA | | | 1,005 | | | | 97,013 | |
| Rexel SA | | | 1,752 | | | | 26,548 | |
| Safran SA | | | 1,716 | | | | 118,259 | |
| Sanofi | | | 6,590 | | | | 544,276 | |
| Sartorius Stedim Biotech* | | | 23 | | | | 8,785 | |
| Schneider Electric SE* | | | 3,231 | | | | 210,343 | |
| SCOR SE | | | 911 | | | | 31,026 | |
| SEB SA | | | 161 | | | | 18,047 | |
| Societe BIC SA | | | 160 | | | | 22,715 | |
| Societe Generale SA | | | 4,267 | | | | 167,387 | |
| Sodexo SA | | | 533 | | | | 53,837 | |
| Suez | | | 1,913 | | | | 35,276 | |
| Technip SA* | | | 652 | | | | 38,167 | |
| Teleperformance | | | 331 | | | | 29,722 | |
| Thales SA | | | 602 | | | | 52,057 | |
| TOTAL SA | | | 12,233 | | | | 615,506 | |
| Unibail-Rodamco SE | | | 575 | | | | 154,107 | |
| Valeo SA | | | 454 | | | | 71,992 | |
| Veolia Environnement SA | | | 2,715 | | | | 66,717 | |
| Vinci SA | | | 2,716 | | | | 202,947 | |
| Vivendi SA | | | 6,860 | | | | 131,685 | |
| Wendel SA | | | 171 | | | | 19,762 | |
| Zodiac Aerospace | | | 1,124 | | | | 26,359 | |
| Total France | | | | | | | 6,839,117 | |
| |
| Germany — 13.0% | | | | | | | | |
| adidas AG | | | 1,169 | | | | 150,762 | |
| Allianz SE | | | 2,657 | | | | 451,153 | |
| Axel Springer SE | | | 265 | | | | 14,800 | |
| BASF SE | | | 5,392 | | | | 445,578 | |
| Bayer AG | | | 4,829 | | | | 557,237 | |
| Bayerische Motoren Werke AG | | | 1,899 | | | | 175,089 | |
| Beiersdorf AG | | | 583 | | | | 52,324 | |
| Brenntag AG | | | 902 | | | | 52,905 | |
| Commerzbank AG | | | 6,063 | | | | 56,665 | |
| Continental AG | | | 631 | | | | 138,617 | |
| Daimler AG | | | 5,576 | | | | 387,595 | |
| Deutsche Bank AG | | | 8,059 | | | | 152,024 | |
| Deutsche Boerse AG | | | 1,091 | | | | 89,582 | |
| Deutsche Lufthansa AG(a) | | | 1,348 | | | | 20,936 | |
| Deutsche Post AG | | | 5,560 | | | | 163,279 | |
| Deutsche Telekom AG | | | 18,500 | | | | 323,873 | |
| Deutsche Wohnen AG | | | 1,966 | | | | 60,223 | |
| E.ON SE | | | 10,940 | | | | 112,884 | |
| Evonik Industries AG | | | 764 | | | | 24,208 | |
| Fielmann AG | | | 147 | | | | 10,841 | |
| Fraport AG Frankfurt Airport | | | | | | | | |
| Services Worldwide | | | 215 | | | | 13,017 | |
| Fresenius Medical Care | | | | | | | | |
| AG & Co. KGaA | | | 1,236 | | | | 107,236 | |
| Fresenius SE & Co. KGaA | | | 2,287 | | | | 166,385 | |
| FUCHS PETROLUB SE | | | 184 | | | | 6,786 | |
| GEA Group AG | | | 1,024 | | | | 47,488 | |
| Hannover Rueck SE | | | 352 | | | | 40,147 | |
| HeidelbergCement AG | | | 812 | | | | 72,161 | |
| Hella KGaA Hueck & Co. | | | 169 | | | | 6,460 | |
| | | Shares | | Value |
| Common Stocks (continued) | | | | | | | | |
| Germany (continued) | | | | | | | | |
| Henkel AG & Co. KGaA | | | 683 | | | $ | 69,411 | |
| HOCHTIEF AG | | | 114 | | | | 14,617 | |
| HUGO BOSS AG | | | 375 | | | | 23,919 | |
| Infineon Technologies AG | | | 6,541 | | | | 93,085 | |
| K+S AG(a) | | | 1,131 | | | | 28,214 | |
| KION Group AG* | | | 385 | | | | 20,981 | |
| LANXESS AG | | | 535 | | | | 27,982 | |
| LEG Immobilien AG* | | | 367 | | | | 33,968 | |
| Linde AG | | | 1,081 | | | | 165,166 | |
| MAN SE | | | 206 | | | | 22,356 | |
| Merck KGaA* | | | 750 | | | | 70,499 | |
| METRO AG | | | 965 | | | | 30,671 | |
| MTU Aero Engines AG | | | 297 | | | | 28,037 | |
| Muenchener Rueckversicherungs- | | | | | | | | |
| Gesellschaft AG | | | 853 | | | | 158,222 | |
| OSRAM Licht AG | | | 494 | | | | 25,786 | |
| ProSiebenSat.1 Media SE | | | 1,235 | | | | 62,974 | |
| Rational AG* | | | 24 | | | | 12,187 | |
| RWE AG* | | | 2,820 | | | | 42,134 | |
| SAP SE | | | 5,213 | | | | 407,919 | |
| Siemens AG | | | 4,440 | | | | 463,377 | |
| Suedzucker AG | | | 438 | | | | 7,726 | |
| Symrise AG | | | 702 | | | | 46,521 | |
| Talanx AG | | | 216 | | | | 7,168 | |
| Telefonica Deutschland Holding AG | | | 3,990 | | | | 20,263 | |
| thyssenkrupp AG | | | 2,465 | | | | 57,341 | |
| TUI AG | | | 2,755 | | | | 39,995 | |
| United Internet AG | | | 690 | | | | 33,694 | |
| Volkswagen AG | | | 168 | | | | 26,621 | |
| Vonovia SE | | | 2,716 | | | | 91,410 | |
| Wacker Chemie AG | | | 87 | | | | 8,343 | |
| Wirecard AG(a) | | | 658 | | | | 28,424 | |
| Zalando SE*(c) | | | 609 | | | | 20,186 | |
| Total Germany | | | | | | | 6,089,452 | |
| |
| Ireland — 1.1% | | | | | | | | |
| Bank of Ireland* | | | 160,843 | | | | 48,819 | |
| CRH PLC(d) | | | 4,745 | | | | 138,185 | |
| Experian PLC | | | 5,613 | | | | 102,863 | |
| Glanbia PLC | | | 1,015 | | | | 19,135 | |
| Kerry Group PLC, Class A | | | 850 | | | | 75,810 | |
| Paddy Power Betfair PLC | | | 478 | | | | 64,070 | |
| Ryanair Holdings PLC | | | 1,399 | | | | 21,127 | |
| Smurfit Kappa Group PLC | | | 1,384 | | | | 36,697 | |
| Total Ireland | | | | | | | 506,706 | |
| |
| Italy — 3.3% | | | | | | | | |
| Assicurazioni Generali SpA | | | 7,368 | | | | 112,407 | |
| Atlantia SpA | | | 2,777 | | | | 77,353 | |
| Banca Mediolanum SpA | | | 1,500 | | | | 12,344 | |
| Banca Monte dei Paschi | | | | | | | | |
| di Siena SpA*(a) | | | 14,370 | | | | 11,628 | |
| Banco Popolare SC | | | 2,129 | | | | 15,033 | |
| Davide Campari-Milano SpA | | | 1,657 | | | | 15,999 | |
| Enel SpA | | | 44,610 | | | | 202,230 | |
| Eni SpA | | | 14,404 | | | | 234,266 | |
| EXOR SpA | | | 604 | | | | 22,691 | |
| Ferrari NV* | | | 766 | | | | 34,497 | |
| FinecoBank Banca Fineco SpA(a) | | | 1,244 | | | | 9,988 | |
| Finmeccanica SpA*(a) | | | 2,241 | | | | 28,311 | |
| Intesa Sanpaolo SpA | | | 70,386 | | | | 195,092 | |
See notes to financial statements.
| Schedules of Investments — IQ 50 Percent Hedged FTSE Europe ETF (continued) |
| April 30, 2016 |
| | | Shares | | Value |
| Common Stocks (continued) | | | | | | | | |
| Italy (continued) | | | | | | | | |
| Intesa Sanpaolo SpA-RSP(a) | | | 5,456 | | | $ | 14,348 | |
| Luxottica Group SpA | | | 1,019 | | | | 55,519 | |
| Mediaset SpA | | | 4,459 | | | | 20,071 | |
| Mediobanca SpA | | | 3,243 | | | | 26,651 | |
| Parmalat SpA | | | 1,816 | | | | 5,067 | |
| Prysmian SpA | | | 1,187 | | | | 27,993 | |
| Recordati SpA | | | 597 | | | | 15,173 | |
| Saipem SpA* | | | 32,995 | | | | 15,796 | |
| Salvatore Ferragamo SpA | | | 271 | | | | 6,273 | |
| Snam SpA | | | 14,309 | | | | 87,352 | |
| Telecom Italia SpA* | | | 57,101 | | | | 55,590 | |
| Telecom Italia SpA-RSP | | | 35,229 | | | | 27,639 | |
| Terna Rete Elettrica Nazionale SpA | | | 8,333 | | | | 46,996 | |
| UniCredit SpA | | | 28,606 | | | | 110,545 | |
| Unione di Banche Italiane SpA | | | 5,143 | | | | 21,807 | |
| UnipolSai SpA | | | 6,044 | | | | 14,108 | |
| Total Italy | | | | | | | 1,522,767 | |
| |
| Jersey — 0.1% | | | | | | | | |
| Randgold Resources Ltd. | | | 538 | | | | 53,356 | |
| |
| Jordan — 0.1% | | | | | | | | |
| Hikma Pharmaceuticals PLC | | | 797 | | | | 25,732 | |
| |
| Luxembourg — 0.4% | | | | | | | | |
| ArcelorMittal | | | 9,921 | | | | 56,042 | |
| Eurofins Scientific SE | | | 49 | | | | 18,186 | |
| RTL Group SA(a) | | | 223 | | | | 18,635 | |
| SES SA | | | 1,721 | | | | 46,963 | |
| Tenaris SA | | | 2,758 | | | | 37,212 | |
| Total Luxembourg | | | | | | | 177,038 | |
| |
| Mexico — 0.0%(b) | | | | | | | | |
| Fresnillo PLC | | | 1,011 | | | | 16,484 | |
| |
| Netherlands — 5.9% | | | | | | | | |
| ABN AMRO Group NV*(c) | | | 1,247 | | | | 26,665 | |
| Aegon NV | | | 11,121 | | | | 63,840 | |
| Akzo Nobel NV | | | 1,441 | | | | 102,146 | |
| Altice NV, Class A*(a) | | | 2,242 | | | | 34,024 | |
| Altice NV, Class B* | | | 697 | | | | 10,653 | |
| ASML Holding NV* | | | 1,868 | | | | 180,575 | |
| Boskalis Westminster NV(a) | | | 447 | | | | 18,638 | |
| Gemalto NV(a) | | | 469 | | | | 30,511 | |
| GrandVision NV(c) | | | 279 | | | | 7,669 | |
| Heineken Holding NV | | | 572 | | | | 47,229 | |
| Heineken NV | | | 1,276 | | | | 119,621 | |
| ING Groep NV | | | 22,573 | | | | 276,508 | |
| Koninklijke Ahold NV | | | 4,876 | | | | 106,110 | |
| Koninklijke DSM NV | | | 1,016 | | | | 62,326 | |
| Koninklijke KPN NV | | | 18,142 | | | | 71,376 | |
| Koninklijke Philips NV | | | 5,407 | | | | 148,630 | |
| Koninklijke Vopak NV | | | 389 | | | | 21,139 | |
| NN Group NV | | | 1,948 | | | | 67,514 | |
| OCI NV*(a) | | | 481 | | | | 9,512 | |
| Randstad Holding NV | | | 639 | | | | 34,329 | |
| Royal Dutch Shell PLC, Class A(d) | | | 24,599 | | | | 641,245 | |
| Royal Dutch Shell PLC, Class B | | | 21,890 | | | | 572,711 | |
| TNT Express NV* | | | 2,761 | | | | 25,068 | |
| Wolters Kluwer NV | | | 1,715 | | | | 65,283 | |
| Total Netherlands | | | | | | | 2,743,322 | |
| | | Shares | | Value |
| Common Stocks (continued) | | | | | | | | |
| Norway — 0.9% | | | | | | | | |
| DNB ASA | | | 6,256 | | | $ | 80,100 | |
| Gjensidige Forsikring ASA | | | 1,013 | | | | 17,348 | |
| Marine Harvest ASA* | | | 2,179 | | | | 33,907 | |
| Norsk Hydro ASA(a) | | | 7,956 | | | | 34,611 | |
| Orkla ASA | | | 4,561 | | | | 39,819 | |
| Schibsted ASA, Class A | | | 479 | | | | 13,973 | |
| Schibsted ASA, Class B* | | | 533 | | | | 15,151 | |
| Statoil ASA | | | 5,581 | | | | 98,627 | |
| Telenor ASA | | | 4,046 | | | | 69,641 | |
| Yara International ASA | | | 1,020 | | | | 40,839 | |
| Total Norway | | | | | | | 444,016 | |
| |
| Portugal — 0.2% | | | | | | | | |
| Banco Comercial Portugues SA, | | | | | | | | |
| Class R*(a) | | | 245,012 | | | | 10,860 | |
| EDP — Energias de Portugal SA | | | 11,244 | | | | 39,975 | |
| Galp Energia SGPS SA | | | 2,780 | | | | 38,193 | |
| Jeronimo Martins SGPS SA | | | 1,442 | | | | 23,601 | |
| Total Portugal | | | | | | | 112,629 | |
| |
| Russia — 0.0%(b) | | | | | | | | |
| Polymetal International PLC | | | 1,492 | | | | 15,496 | |
| | | | | | | | | |
| South Africa — 0.1% | | | | | | | | |
| Investec PLC | | | 3,026 | | | | 23,183 | |
| Mondi PLC | | | 2,136 | | | | 40,928 | |
| Total South Africa | | | | | | | 64,111 | |
| |
| Spain — 4.9% | | | | | | | | |
| Abertis Infraestructuras SA | | | 2,875 | | | | 48,488 | |
| Acciona SA | | | 151 | | | | 12,096 | |
| Acerinox SA | | | 800 | | | | 9,451 | |
| ACS Actividades de Construccion y | | | | | | | | |
| Servicios SA | | | 974 | | | | 32,212 | |
| Aena SA*(c) | | | 375 | | | | 53,495 | |
| Amadeus IT Holding SA, Class A | | | 2,393 | | | | 108,920 | |
| Banco Bilbao Vizcaya | | | | | | | | |
| Argentaria SA | | | 37,178 | | | | 254,767 | |
| Banco de Sabadell SA* | | | 505 | | | | 965 | |
| Banco de Sabadell SA | | | 27,813 | | | | 53,167 | |
| Banco Popular Espanol SA | | | 9,331 | | | | 25,382 | |
| Banco Santander SA(a) | | | 84,217 | | | | 426,440 | |
| Bankia SA | | | 26,924 | | | | 25,071 | |
| Bankinter SA | | | 4,092 | | | | 31,195 | |
| CaixaBank SA | | | 14,961 | | | | 45,049 | |
| Corp. Financiera Alba SA | | | 110 | | | | 4,513 | |
| Distribuidora Internacional de | | | | | | | | |
| Alimentacion SA* | | | 3,572 | | | | 19,826 | |
| EDP Renovaveis SA | | | 1,176 | | | | 9,173 | |
| Enagas SA | | | 1,325 | | | | 40,376 | |
| Endesa SA | | | 1,856 | | | | 38,976 | |
| Ferrovial SA | | | 2,772 | | | | 59,657 | |
| Gamesa Corp. Tecnologica SA | | | 1,327 | | | | 26,134 | |
| Gas Natural SDG SA | | | 1,811 | | | | 37,678 | |
| Grifols SA | | | 1,929 | | | | 41,967 | |
| Iberdrola SA | | | 32,963 | | | | 234,227 | |
| Industria de Diseno Textil SA | | | 6,196 | | | | 198,953 | |
| Mapfre SA | | | 6,046 | | | | 15,338 | |
| Mediaset Espana | | | | | | | | |
| Comunicacion SA | | | 1,132 | | | | 14,703 | |
| Red Electrica Corp. SA | | | 632 | | | | 56,440 | |
| Repsol SA | | | 6,317 | | | | 82,807 | |
See notes to financial statements.
| Schedules of Investments — IQ 50 Percent Hedged FTSE Europe ETF (continued) |
| April 30, 2016 |
| | | Shares | | Value |
| Common Stocks (continued) | | | | | | | | |
| Spain (continued) | | | | | | | | |
| Telefonica SA | | | 25,022 | | | $ | 272,890 | |
| Zardoya Otis SA(a) | | | 1,066 | | | | 11,318 | |
| Total Spain | | | | | | | 2,291,674 | |
| |
| Sweden — 4.5% | | | | | | | | |
| Alfa Laval AB | | | 1,818 | | | | 28,689 | |
| Assa Abloy AB, B Shares | | | 5,477 | | | | 114,968 | |
| Atlas Copco AB, A Shares | | | 3,614 | | | | 93,611 | |
| Atlas Copco AB, B Shares | | | 2,280 | | | | 54,766 | |
| Boliden AB | | | 1,603 | | | | 27,974 | |
| Electrolux AB | | | 1,289 | | | | 37,437 | |
| Getinge AB, B Shares | | | 1,069 | | | | 22,626 | |
| Hennes & Mauritz AB, B Shares* | | | 5,535 | | | | 196,977 | |
| Hexagon AB, B Shares | | | 1,492 | | | | 59,550 | |
| Husqvarna AB, B Shares | | | 2,232 | | | | 17,806 | |
| Industrivarden AB, A Shares | | | 1,127 | | | | 22,154 | |
| Industrivarden AB, C Shares | | | 961 | | | | 17,513 | |
| Investment AB Kinnevik, B Shares | | | 1,185 | | | | 34,121 | |
| Investment AB Latour, B Shares(a) | | | 175 | | | | 7,489 | |
| Investor AB, B Shares | | | 2,626 | | | | 96,465 | |
| Lundin Petroleum AB* | | | 1,031 | | | | 19,329 | |
| Meda AB, A Shares | | | 1,597 | | | | 29,482 | |
| Melker Schorling AB | | | 57 | | | | 3,791 | |
| Nordea Bank AB | | | 18,559 | | | | 180,328 | |
| Sandvik AB(a) | | | 6,306 | | | | 64,770 | |
| Securitas AB, B Shares | | | 1,809 | | | | 28,592 | |
| Skandinaviska Enskilda Banken | | | | | | | | |
| AB, A Shares | | | 8,491 | | | | 81,180 | |
| Skanska AB, B Shares | | | 2,090 | | | | 46,008 | |
| SKF AB, A Shares | | | 83 | | | | 1,525 | |
| SKF AB, B Shares | | | 2,197 | | | | 40,503 | |
| Svenska Cellulosa AB SCA, B Shares | | | 3,470 | | | | 109,388 | |
| Svenska Handelsbanken AB, | | | | | | | | |
| A Shares | | | 8,422 | | | | 112,224 | |
| Svenska Handelsbanken AB, | | | | | | | | |
| B Shares(a) | | | 186 | | | | 2,585 | |
| Swedbank AB, A Shares | | | 6,099 | | | | 131,674 | |
| Swedish Match AB | | | 1,118 | | | | 35,495 | |
| Tele2 AB, B Shares | | | 1,816 | | | | 17,340 | |
| Telefonaktiebolaget LM Ericsson, | | | | | | | | |
| B Shares | | | 17,426 | | | | 141,190 | |
| Telia Co. AB | | | 15,174 | | | | 72,537 | |
| Trelleborg AB, B Shares | | | 1,435 | | | | 26,169 | |
| Volvo AB, B Shares | | | 9,020 | | | | 105,688 | |
| Total Sweden | | | | | | | 2,081,944 | |
| |
| Switzerland — 14.5% | | | | | | | | |
| ABB Ltd.* | | | 11,518 | | | | 243,698 | |
| Actelion Ltd.* | | | 575 | | | | 92,984 | |
| Adecco SA | | | 943 | | | | 60,751 | |
| Aryzta AG* | | | 484 | | | | 18,810 | |
| Baloise Holding AG | | | 270 | | | | 33,437 | |
| Banque Cantonale Vaudoise | | | 17 | | | | 11,732 | |
| Barry Callebaut AG* | | | 11 | | | | 12,934 | |
| Chocoladefabriken Lindt & | | | | | | | | |
| Spruengli AG | | | 1 | | | | 73,229 | |
| Chocoladefabriken Lindt & | | | | | | | | |
| Spruengli AG | | | 6 | | | | 36,745 | |
| Cie Financiere Richemont SA | | | 2,978 | | | | 198,223 | |
| Clariant AG* | | | 1,595 | | | | 30,203 | |
| Coca-Cola HBC AG*(a) | | | 1,131 | | | | 23,195 | |
| | | Shares | | Value |
| Common Stocks (continued) | | | | | | | | |
| Switzerland (continued) | | | | | | | | |
| Credit Suisse Group AG* | | | 11,397 | | | $ | 173,244 | |
| DKSH Holding AG | | | 160 | | | | 10,466 | |
| Dufry AG* | | | 274 | | | | 36,076 | |
| EMS-Chemie Holding AG | | | 42 | | | | 20,781 | |
| Galenica AG | | | 28 | | | | 40,956 | |
| GAM Holding AG* | | | 911 | | | | 11,881 | |
| Geberit AG | | | 220 | | | | 84,534 | |
| Givaudan SA | | | 54 | | | | 106,479 | |
| Glencore PLC* | | | 68,169 | | | | 162,673 | |
| Helvetia Holding AG | | | 35 | | | | 18,842 | |
| Julius Baer Group Ltd.* | | | 1,274 | | | | 54,509 | |
| Kuehne + Nagel International AG | | | 294 | | | | 42,390 | |
| LafargeHolcim Ltd.* | | | 2,821 | | | | 142,948 | |
| Lonza Group AG* | | | 303 | | | | 50,453 | |
| Nestle SA | | | 18,297 | | | | 1,364,878 | |
| Novartis AG | | | 12,460 | | | | 951,562 | |
| Pargesa Holding SA | | | 163 | | | | 11,334 | |
| Partners Group Holding AG | | | 106 | | | | 43,683 | |
| PSP Swiss Property AG | | | 225 | | | | 21,690 | |
| Roche Holding AG | | | 4,104 | | | | 1,038,310 | |
| Roche Holding AG | | | 159 | | | | 40,725 | |
| Schindler Holding AG — Participating | | | | | | | | |
| Certificate | | | 236 | | | | 43,014 | |
| Schindler Holding AG — Registered | | | 121 | | | | 22,256 | |
| SGS SA | | | 30 | | | | 66,072 | |
| Sika AG | | | 12 | | | | 51,117 | |
| Sonova Holding AG | | | 303 | | | | 40,526 | |
| STMicroelectronics NV | | | 3,617 | | | | 22,222 | |
| Straumann Holding AG | | | 56 | | | | 19,426 | |
| Sulzer AG(a) | | | 66 | | | | 6,028 | |
| Swatch Group AG (The) — Bearer | | | 177 | | | | 60,496 | |
| Swatch Group AG (The) — | | | | | | | | |
| Registered | | | 279 | | | | 18,658 | |
| Swiss Life Holding AG* | | | 187 | | | | 47,233 | |
| Swiss Prime Site AG* | | | 371 | | | | 32,533 | |
| Swiss Re AG | | | 1,999 | | | | 177,480 | |
| Swisscom AG | | | 133 | | | | 67,506 | |
| Syngenta AG | | | 534 | | | | 213,934 | |
| UBS Group AG | | | 20,522 | | | | 355,415 | |
| Wolseley PLC | | | 1,489 | | | | 83,345 | |
| Zurich Insurance Group AG* | | | 871 | | | | 195,100 | |
| Total Switzerland | | | | | | | 6,786,716 | |
| |
| United Kingdom — 27.1% | | | | | | | | |
| 3i Group PLC | | | 5,627 | | | | 39,039 | |
| Aberdeen Asset Management PLC | | | 5,777 | | | | 25,278 | |
| Admiral Group PLC | | | 1,170 | | | | 31,828 | |
| Aggreko PLC | | | 1,396 | | | | 22,229 | |
| Anglo American PLC | | | 7,635 | | | | 85,383 | |
| ARM Holdings PLC | | | 8,236 | | | | 113,109 | |
| Ashmore Group PLC | | | 2,293 | | | | 10,316 | |
| Ashtead Group PLC | | | 2,977 | | | | 39,576 | |
| Associated British Foods PLC | | | 2,028 | | | | 91,026 | |
| AstraZeneca PLC(d) | | | 7,372 | | | | 424,195 | |
| Auto Trader Group PLC(c) | | | 5,745 | | | | 31,559 | |
| Aviva PLC(d) | | | 23,641 | | | | 149,748 | |
| Babcock International Group PLC | | | 1,487 | | | | 20,639 | |
| BAE Systems PLC | | | 18,490 | | | | 129,282 | |
| Barclays PLC | | | 97,921 | | | | 246,007 | |
| Barratt Developments PLC | | | 5,804 | | | | 45,275 | |
| Bellway PLC | | | 712 | | | | 25,522 | |
See notes to financial statements.
| Schedules of Investments — IQ 50 Percent Hedged FTSE Europe ETF (continued) |
| April 30, 2016 |
| | | Shares | | Value |
| Common Stocks (continued) | | | | | | | | |
| United Kingdom (continued) | | | | | | | | |
| Berkeley Group Holdings PLC | | | 744 | | | $ | 32,642 | |
| Booker Group PLC | | | 9,751 | | | | 23,141 | |
| BP PLC(d) | | | 108,085 | | | | 591,773 | |
| British American Tobacco PLC(d) | | | 10,883 | | | | 664,803 | |
| British Land Co. PLC (The) | | | 5,987 | | | | 63,059 | |
| BT Group PLC | | | 48,931 | | | | 317,682 | |
| Bunzl PLC | | | 1,928 | | | | 57,588 | |
| Burberry Group PLC | | | 2,572 | | | | 44,798 | |
| Capita PLC | | | 3,869 | | | | 56,734 | |
| Capital & Counties Properties PLC | | | 4,304 | | | | 22,288 | |
| Centrica PLC | | | 29,524 | | | | 103,107 | |
| CNH Industrial NV | | | 5,358 | | | | 41,116 | |
| Cobham PLC(a) | | | 6,747 | | | | 15,221 | |
| Compass Group PLC | | | 9,616 | | | | 171,714 | |
| Croda International PLC* | | | 797 | | | | 35,154 | |
| CYBG PLC* | | | 5,088 | | | | 16,528 | |
| Daily Mail & General Trust PLC, | | | | | | | | |
| Class A | | | 1,551 | | | | 15,859 | |
| DCC PLC | | | 515 | | | | 45,718 | |
| Derwent London PLC | | | 586 | | | | 28,191 | |
| Diageo PLC(d) | | | 14,726 | | | | 398,222 | |
| Direct Line Insurance Group PLC | | | 8,024 | | | | 42,539 | |
| Dixons Carphone PLC | | | 5,800 | | | | 36,127 | |
| DS Smith PLC | | | 5,478 | | | | 30,598 | |
| easyJet PLC | | | 1,278 | | | | 27,577 | |
| Fiat Chrysler Automobiles NV | | | 5,105 | | | | 40,988 | |
| G4S PLC | | | 9,227 | | | | 25,465 | |
| GKN PLC | | | 10,016 | | | | 40,892 | |
| GlaxoSmithKline PLC(d) | | | 28,412 | | | | 607,247 | |
| Halma PLC | | | 2,231 | | | | 29,152 | |
| Hammerson PLC | | | 4,574 | | | | 39,164 | |
| Hargreaves Lansdown PLC | | | 1,281 | | | | 24,132 | |
| Henderson Group PLC | | | 6,259 | | | | 23,436 | |
| Howden Joinery Group PLC | | | 3,618 | | | | 26,182 | |
| HSBC Holdings PLC(d) | | | 114,118 | | | | 756,451 | |
| ICAP PLC | | | 3,188 | | | | 21,879 | |
| IMI PLC | | | 1,602 | | | | 21,942 | |
| Imperial Brands PLC | | | 5,626 | | | | 306,461 | |
| Inchcape PLC | | | 2,516 | | | | 24,971 | |
| Informa PLC | | | 3,833 | | | | 36,750 | |
| Inmarsat PLC | | | 2,655 | | | | 36,151 | |
| InterContinental Hotels Group PLC | | | 1,380 | | | | 55,168 | |
| International Consolidated | | | | | | | | |
| Airlines Group SA | | | 5,944 | | | | 45,714 | |
| Intertek Group PLC | | | 925 | | | | 44,133 | |
| Intu Properties PLC | | | 5,587 | | | | 24,905 | |
| ITV PLC | | | 21,883 | | | | 72,191 | |
| J Sainsbury PLC | | | 8,380 | | | | 35,465 | |
| John Wood Group PLC | | | 2,177 | | | | 19,916 | |
| Johnson Matthey PLC | | | 1,124 | | | | 47,536 | |
| Just Eat PLC* | | | 2,716 | | | | 15,258 | |
| Kingfisher PLC | | | 13,320 | | | | 71,006 | |
| Land Securities Group PLC | | | 4,583 | | | | 75,998 | |
| Legal & General Group PLC(d) | | | 34,707 | | | | 113,429 | |
| Lloyds Banking Group PLC | | | 374,277 | | | | 367,731 | |
| London Stock Exchange Group PLC | | | 1,815 | | | | 72,133 | |
| Marks & Spencer Group PLC | | | 9,479 | | | | 58,806 | |
| Meggitt PLC | | | 4,532 | | | | 27,266 | |
| Melrose Industries PLC | | | 856 | | | | 4,681 | |
| Merlin Entertainments PLC(c) | | | 4,200 | | | | 26,548 | |
| | | Shares | | Value |
| Common Stocks (continued) | | | | | | | | |
| United Kingdom (continued) | | | | | | | | |
| Micro Focus International PLC | | | 1,116 | | | $ | 24,997 | |
| National Grid PLC | | | 22,046 | | | | 314,814 | |
| Next PLC | | | 845 | | | | 62,944 | |
| Old Mutual PLC | | | 28,564 | | | | 77,620 | |
| Pearson PLC | | | 4,831 | | | | 56,969 | |
| Pennon Group PLC | | | 2,445 | | | | 29,083 | |
| Persimmon PLC | | | 1,773 | | | | 51,608 | |
| Petrofac Ltd.(a) | | | 1,543 | | | | 19,100 | |
| Provident Financial PLC | | | 852 | | | | 36,370 | |
| Prudential PLC | | | 14,905 | | | | 294,218 | |
| Reckitt Benckiser Group PLC(d) | | | 3,668 | | | | 357,537 | |
| RELX NV | | | 5,418 | | | | 90,942 | |
| RELX PLC | | | 6,531 | | | | 115,764 | |
| Rentokil Initial PLC | | | 10,756 | | | | 27,747 | |
| Rexam PLC | | | 4,088 | | | | 37,428 | |
| Rightmove PLC | | | 528 | | | | 29,840 | |
| Rio Tinto PLC | | | 7,060 | | | | 237,922 | |
| Rolls-Royce Holdings PLC* | | | 10,751 | | | | 105,441 | |
| Rolls-Royce Holdings PLC — | | | | | | | | |
| Entitlement* | | | 763,321 | | | | 1,118 | |
| Royal Bank of Scotland Group PLC* | | | 18,933 | | | | 63,790 | |
| Royal Mail PLC | | | 5,311 | | | | 37,881 | |
| RSA Insurance Group PLC | | | 5,936 | | | | 39,922 | |
| SABMiller PLC | | | 5,579 | | | | 342,027 | |
| Sage Group PLC (The) | | | 6,279 | | | | 54,453 | |
| Schroders PLC | | | 651 | | | | 23,975 | |
| Segro PLC | | | 4,407 | | | | 26,966 | |
| Severn Trent PLC | | | 1,356 | | | | 44,237 | |
| Sky PLC | | | 6,116 | | | | 84,083 | |
| Smith & Nephew PLC | | | 5,243 | | | | 88,786 | |
| Smiths Group PLC | | | 2,287 | | | | 37,121 | |
| Sports Direct International PLC* | | | 1,488 | | | | 8,397 | |
| SSE PLC | | | 5,895 | | | | 130,397 | |
| St James’s Place PLC | | | 3,026 | | | | 38,432 | |
| Standard Chartered PLC | | | 15,688 | | | | 126,880 | |
| Standard Life PLC | | | 11,438 | | | | 54,640 | |
| TalkTalk Telecom Group PLC | | | 3,128 | | | | 12,253 | |
| Tate & Lyle PLC | | | 2,761 | | | | 23,782 | |
| Taylor Wimpey PLC | | | 18,876 | | | | 50,962 | |
| Tesco PLC* | | | 47,499 | | | | 119,749 | |
| Travis Perkins PLC | | | 1,456 | | | | 39,416 | |
| Unilever NV | | | 9,084 | | | | 399,163 | |
| Unilever PLC | | | 7,050 | | | | 315,455 | |
| United Utilities Group PLC | | | 3,981 | | | | 54,790 | |
| Vodafone Group PLC(d) | | | 155,334 | | | | 498,787 | |
| Weir Group PLC (The)(a) | | | 1,236 | | | | 21,727 | |
| Whitbread PLC | | | 1,064 | | | | 60,351 | |
| William Hill PLC | | | 5,248 | | | | 24,040 | |
| Wm Morrison Supermarkets PLC | | | 12,656 | | | | 35,430 | |
| WPP PLC | | | 7,576 | | | | 177,126 | |
| Total United Kingdom | | | | | | | 12,657,817 | |
| |
| United States — 0.7% | | | | | | | | |
| Cable & Wireless | | | | | | | | |
| Communications PLC | | | 16,483 | | | | 17,771 | |
| Carnival PLC | | | 1,064 | | | | 52,948 | |
| QIAGEN NV* | | | 1,302 | | | | 29,184 | |
| Shire PLC | | | 3,419 | | | | 213,412 | |
| Total United States | | | | | | | 313,315 | |
| Total Common Stocks | | | | | | | | |
| (Cost $47,578,078) | | | | | | | 46,227,426 | |
See notes to financial statements.
| Schedules of Investments — IQ 50 Percent Hedged FTSE Europe ETF (continued) |
| April 30, 2016 |
| | | Shares | | Value |
| Preferred Stocks — 0.9% | | | | | | | | |
| Germany — 0.8% | | | | | | | | |
| Bayerische Motoren Werke AG | | | 318 | | | $ | 25,259 | |
| FUCHS PETROLUB SE | | | 393 | | | | 16,814 | |
| Henkel AG & Co. KGaA | | | 1,012 | | | | 115,538 | |
| Porsche Automobil Holding SE | | | 894 | | | | 49,897 | |
| RWE AG | | | 213 | | | | 2,331 | |
| Sartorius AG | | | 50 | | | | 12,338 | |
| Volkswagen AG | | | 1,068 | | | | 154,678 | |
| Total Germany | | | | | | | 376,855 | |
| |
| Spain — 0.1% | | | | | | | | |
| Grifols SA, Class B | | | 1,510 | | | | 23,789 | |
| Total Preferred Stocks | | | | | | | | |
| (Cost $421,544) | | | | | | | 400,644 | |
| |
| Short-Term Investment — 1.0% | | | | | | | | |
| Money Market Fund — 1.0% | | | | | | | | |
| Morgan Stanley Institutional Liquidity | | | | | | | | |
| Funds Treasury Portfolio — | | | | | | | | |
| Institutional Class, 0.22%(e) | | | | | | | | |
| (Cost $460,087) | | | 460,087 | | | | 460,087 | |
| |
| Investment of Cash Collateral | | | | | | | | |
| For Securities Loaned — 2.2% | | | | | | | | |
| Money Market Fund — 2.2% | | | | | | | | |
| Dreyfus Government Cash | | | | | | | | |
| Management Fund, | | | | | | | | |
| Institutional Shares, 0.20%(f) | | | | | | | | |
| (Cost $1,006,432) | | | 1,006,432 | | | | 1,006,432 | |
| | | Value |
| Total Investments — 103.0% | | | | |
| (Cost $49,466,141) | | $ | 48,094,589 | |
| Liabilities in Excess of | | | | |
| Other Assets — (3.0)% | | | (1,371,067 | ) |
| Net Assets — 100.0% | | $ | 46,723,522 | |
| * | Non-income producing securities. |
| (a) | All or a portion of the security was on loan. In addition, “Other Assets and Liabilities, Net” may include pending sales that are also on loan. The aggregate market value of securities on loan was $936,945; total market value of collateral held by the Fund was $1,006,432. |
| (c) | Security was purchased pursuant to Rule 144A under the Securities Act of 1933 and may not be resold subject to that rule except to qualified institutional buyers. Unless otherwise noted, 144A securities are deemed to be liquid. |
| (d) | All or a portion of these securities have been segregated as collateral for forward foreign currency contracts. The total value of securities segregated amounted to $2,523,424. |
| (e) | Rate shown reflects the 7-day yield at April 30, 2016. |
| (f) | Rate shown reflects the 1-day yield at April 30, 2016. |
AG — Aktiengesellschaft (public limited company)
A/S — Aktieselskab (joint stock company)
ASA — Allmeennaksjeselskap (stock company)
KGaA — Kommanditgesellschaft auf Aktien (partnership limited by shares)
NV — Naamloze Vennootschap (public company)
OYJ — Osakeyhtiö (stock company)
PLC — Public Limited Company
RSP — Risparmio Italian Savings Shares
SA — Société Anonyme (corporation)
SE — Societas Europaea (public company)
SpA — Societa per azioni (public company)
See notes to financial statements.
| Schedules of Investments — IQ 50 Percent Hedged FTSE Europe ETF (continued) |
| April 30, 2016 |
Forward Exchange Contracts Outstanding as of April 30, 2016:
| Purchase Contracts | | Counterparty | | Currency | | Currency
Amount
Purchased | | Value at
Settlement
Date | | Value at
April 30, 2016 | | Unrealized
Appreciation
(Depreciation) |
| Swiss Franc Expiring 05/10/16 | | Morgan Stanley | | | CHF | | | | 2,965,796 | | | $ | 3,093,976 | | | $ | 3,095,552 | | | $ | 1,576 | |
| Danish Krone Expiring 05/10/16 | | Morgan Stanley | | | DKK | | | | 4,377,421 | | | | 673,654 | | | | 673,826 | | | | 172 | |
| Euro Expiring 05/10/16 | | Morgan Stanley | | | EUR | | | | 9,334,199 | | | | 10,692,289 | | | | 10,694,098 | | | | 1,809 | |
| British Pound Expiring 05/10/16 | | Morgan Stanley | | | GBP | | | | 4,918,021 | | | | 7,204,012 | | | | 7,204,611 | | | | 599 | |
| Norwegian Krone Expiring 05/10/16 | | Morgan Stanley | | | NOK | | | | 1,735,190 | | | | 215,324 | | | | 215,478 | | | | 154 | |
| Swedish Krona Expiring 05/10/16 | | Morgan Stanley | | | SEK | | | | 8,421,156 | | | | 1,050,151 | | | | 1,050,076 | | | | (74 | ) |
| | | | | | | | | | | | | $ | 22,929,406 | | | $ | 22,933,641 | | | $ | 4,236 | |
| Sales Contracts | | Counterparty | | Currency | | Currency
Amount Sold | | Value at
Settlement
Date | | Value at
April 30, 2016 | | Unrealized
Appreciation
(Depreciation) |
| Swiss Franc Expiring 05/10/16 | | Morgan Stanley | | | CHF | | | | (2,965,797 | ) | | $ | (3,105,274 | ) | | $ | (3,095,554 | ) | | $ | 9,720 | |
| Swiss Franc Expiring 06/07/16 | | Morgan Stanley | | | CHF | | | | (3,118,319 | ) | | | (3,256,861 | ) | | | (3,258,862 | ) | | | (2,001 | ) |
| Danish Krone Expiring 05/10/16 | | Morgan Stanley | | | DKK | | | | (4,377,422 | ) | | | (670,564 | ) | | | (673,826 | ) | | | (3,262 | ) |
| Danish Krone Expiring 06/07/16 | | Morgan Stanley | | | DKK | | | | (4,557,742 | ) | | | (701,941 | ) | | | (702,192 | ) | | | (251 | ) |
| Euro Expiring 05/10/16 | | Morgan Stanley | | | EUR | | | | (9,334,199 | ) | | | (10,647,326 | ) | | | (10,694,098 | ) | | | (46,772 | ) |
| Euro Expiring 06/07/16 | | Morgan Stanley | | | EUR | | | | (9,487,510 | ) | | | (10,876,642 | ) | | | (10,879,268 | ) | | | (2,626 | ) |
| British Pound Expiring 05/10/16 | | Morgan Stanley | | | GBP | | | | (4,918,021 | ) | | | (7,020,462 | ) | | | (7,204,611 | ) | | | (184,149 | ) |
| British Pound Expiring 06/07/16 | | Morgan Stanley | | | GBP | | | | (4,997,529 | ) | | | (7,320,925 | ) | | | (7,321,700 | ) | | | (775 | ) |
| Norwegian Krone Expiring 05/10/16 | | Morgan Stanley | | | NOK | | | | (1,735,190 | ) | | | (210,249 | ) | | | (215,478 | ) | | | (5,229 | ) |
| Norwegian Krone Expiring 06/07/16 | | Morgan Stanley | | | NOK | | | | (1,787,686 | ) | | | (221,803 | ) | | | (221,966 | ) | | | (163 | ) |
| Swedish Krona Expiring 05/10/16 | | Morgan Stanley | | | SEK | | | | (8,421,157 | ) | | | (1,038,567 | ) | | | (1,050,076 | ) | | | (11,510 | ) |
| Swedish Krona Expiring 06/07/16 | | Morgan Stanley | | | SEK | | | | (8,364,879 | ) | | | (1,044,149 | ) | | | (1,044,142 | ) | | | 7 | |
| | | | | | | | | | | | | $ | (46,114,763 | ) | | $ | (46,361,773 | ) | | $ | (247,011 | ) |
|
| Net Unrealized Appreciation (Depreciation) | | | | | | | | | | | | | | | | | | | | $ | (242,775 | ) |
The following is a summary of the fair valuations according to the inputs used as of April 30, 2016 for valuing the Fund’s assets and liabilities.
For more information on the valuation techniques, and their aggregation into the levels used in the table below, please refer to Note 2.
Asset Valuation Inputs
| Description | | Level 1 | | Level 2 | | Level 3 | | Total |
| Investments in Securities:(a) | | | | | | | | | | | | | | | | |
| Common Stocks | | $ | 46,226,308 | | | $ | 1,118 | | | $ | — | | | $ | 46,227,426 | |
| Preferred Stocks | | | 400,644 | | | | — | | | | — | | | | 400,644 | |
| Short-Term Investment: | | | | | | | | | | | | | | | | |
| Money Market Fund | | | 460,087 | | | | — | | | | — | | | | 460,087 | |
| Investment of Cash Collateral for Securities Loaned: | | | | | | | | | | | | | | | | |
| Money Market Fund | | | 1,006,432 | | | | — | | | | — | | | | 1,006,432 | |
| Total Investments in Securities | | | 48,093,471 | | | | 1,118 | | | | — | | | | 48,094,589 | |
| Other Financial Instruments: | | | | | | | | | | | | | | | | |
| Forward Exchange Contracts | | | — | | | | 14,037 | (b) | | | — | | | | 14,037 | |
| Total Investments in Securities and Other Financial Instruments | | $ | 48,093,471 | | | $ | 15,155 | | | $ | — | | | $ | 48,108,626 | |
Liability Valuation Inputs
| Description | | Level 1 | | Level 2 | | Level 3 | | Total |
| Other Financial Instruments: | | | | | | | | |
| Forward Exchange Contracts | | $ | — | | | $ | 256,812 | (b) | | $ | — | | | $ | 256,812 | |
| Total Other Financial Instruments | | $ | — | | | $ | 256,812 | | | $ | — | | | $ | 256,812 | |
| (a) | For a complete listing of investments and their countries, see the Schedules of Investments. |
| (b) | Reflects the unrealized appreciation (depreciation) of the instruments. |
The Fund recognizes transfers between the levels as of the beginning of the period.
For the year ended April 30, 2016, the Fund did not have any transfers between any levels within the fair value hierarchy. (See Note 2)
The Fund did not hold any level 3 securities as of April 30, 2016.
See notes to financial statements.
| Schedules of Investments — IQ 50 Percent Hedged FTSE Japan ETF |
| April 30, 2016 |
| | | Shares | | Value |
| Common Stocks — 102.3% | | | | | | | | |
| Consumer Discretionary — 21.0% | | | | | | | | |
| ABC-Mart, Inc. | | | 209 | | | $ | 13,986 | |
| Aisin Seiki Co., Ltd. | | | 1,583 | | | | 64,063 | |
| Aoyama Trading Co., Ltd. | | | 412 | | | | 15,865 | |
| Asics Corp. | | | 1,474 | | | | 30,459 | |
| ASKUL Corp. | | | 173 | | | | 7,001 | |
| Autobacs Seven Co., Ltd. | | | 620 | | | | 10,952 | |
| Bandai Namco Holdings, Inc. | | | 1,632 | | | | 35,692 | |
| Benesse Holdings, Inc. | | | 586 | | | | 17,006 | |
| Bic Camera, Inc. | | | 1,282 | | | | 12,952 | |
| Bridgestone Corp. | | | 5,382 | | | | 207,041 | |
| Calsonic Kansei Corp. | | | 1,320 | | | | 9,462 | |
| Canon Marketing Japan, Inc. | | | 379 | | | | 6,992 | |
| Casio Computer Co., Ltd. | | | 1,920 | | | | 37,953 | |
| CyberAgent, Inc. | | | 401 | | | | 19,489 | |
| Daihatsu Motor Co., Ltd. | | | 1,747 | | | | 24,492 | |
| Denso Corp. | | | 4,212 | | | | 167,346 | |
| Dentsu, Inc. | | | 1,857 | | | | 98,408 | |
| Don Quijote Holdings Co., Ltd. | | | 976 | | | | 36,260 | |
| Exedy Corp. | | | 241 | | | | 5,847 | |
| Fast Retailing Co., Ltd. | | | 427 | | | | 116,473 | |
| Fuji Heavy Industries Ltd. | | | 5,248 | | | | 182,266 | |
| Fuji Media Holdings, Inc. | | | 237 | | | | 2,760 | |
| H2O Retailing Corp. | | | 724 | | | | 12,322 | |
| Hakuhodo DY Holdings, Inc. | | | 1,991 | | | | 23,409 | |
| Haseko Corp. | | | 2,335 | | | | 22,260 | |
| Heiwa Corp. | | | 445 | | | | 9,587 | |
| Hikari Tsushin, Inc. | | | 195 | | | | 15,018 | |
| HIS Co., Ltd. | | | 307 | | | | 7,819 | |
| Honda Motor Co., Ltd. | | | 15,028 | | | | 420,312 | |
| Iida Group Holdings Co., Ltd. | | | 1,324 | | | | 25,875 | |
| Isetan Mitsukoshi Holdings Ltd. | | | 3,031 | | | | 33,541 | |
| Isuzu Motors Ltd. | | | 4,622 | | | | 51,644 | |
| Izumi Co., Ltd. | | | 328 | | | | 13,151 | |
| J Front Retailing Co., Ltd. | | | 2,073 | | | | 25,982 | |
| Koito Manufacturing Co., Ltd. | | | 955 | | | | 43,200 | |
| Komeri Co., Ltd. | | | 233 | | | | 5,997 | |
| K’s Holdings Corp. | | | 332 | | | | 11,465 | |
| Laox Co., Ltd.* | | | 2,212 | | | | 2,419 | |
| Marui Group Co., Ltd. | | | 1,963 | | | | 31,061 | |
| Mazda Motor Corp. | | | 4,741 | | | | 77,300 | |
| Mitsubishi Motors Corp. | | | 5,172 | | | | 21,704 | |
| NGK Spark Plug Co., Ltd. | | | 1,635 | | | | 34,398 | |
| NHK Spring Co., Ltd. | | | 1,389 | | | | 12,800 | |
| Nifco, Inc. | | | 350 | | | | 17,337 | |
| Nikon Corp. | | | 2,939 | | | | 44,252 | |
| Nippon Television Holdings, Inc. | | | 260 | | | | 4,355 | |
| Nissan Motor Co., Ltd. | | | 21,074 | | | | 196,962 | |
| Nissan Shatai Co., Ltd. | | | 638 | | | | 6,523 | |
| Nitori Holdings Co., Ltd. | | | 618 | | | | 59,377 | |
| NOK Corp. | | | 951 | | | | 16,585 | |
| Oriental Land Co., Ltd. | | | 1,624 | | | | 115,355 | |
| PanaHome Corp. | | | 635 | | | | 5,116 | |
| Panasonic Corp. | | | 17,827 | | | | 165,682 | |
| Rakuten, Inc. | | | 7,014 | | | | 80,009 | |
| Resorttrust, Inc. | | | 546 | | | | 11,752 | |
| Rinnai Corp. | | | 313 | | | | 28,581 | |
| Ryohin Keikaku Co., Ltd. | | | 200 | | | | 46,114 | |
| Sankyo Co., Ltd. | | | 427 | | | | 16,642 | |
| Sanrio Co., Ltd. | | | 496 | | | | 10,041 | |
| Sega Sammy Holdings, Inc. | | | 1,667 | | | | 18,727 | |
| Sekisui Chemical Co., Ltd. | | | 3,095 | | | | 40,121 | |
| | | Shares | | Value |
| Common Stocks (continued) | | | | | | | | |
| Consumer Discretionary (continued) | | | | | | | | |
| Sekisui House Ltd. | | | 4,906 | | | $ | 88,564 | |
| Sharp Corp.* | | | 11,857 | | | | 16,401 | |
| Shimachu Co., Ltd. | | | 416 | | | | 9,988 | |
| Shimamura Co., Ltd. | | | 183 | | | | 25,365 | |
| Shimano, Inc. | | | 660 | | | | 99,190 | |
| Shochiku Co., Ltd. | | | 983 | | | | 9,996 | |
| SKY Perfect JSAT Holdings, Inc. | | | 1,086 | | | | 5,938 | |
| Skylark Co., Ltd. | | | 816 | | | | 10,685 | |
| Sony Corp. | | | 10,527 | | | | 273,321 | |
| Stanley Electric Co., Ltd. | | | 1,254 | | | | 26,863 | |
| Start Today Co., Ltd. | | | 408 | | | | 17,694 | |
| Sumitomo Electric Industries Ltd. | | | 6,393 | | | | 80,364 | |
| Sumitomo Forestry Co., Ltd. | | | 1,139 | | | | 13,669 | |
| Sumitomo Rubber Industries Ltd. | | | 1,493 | | | | 23,722 | |
| Suzuki Motor Corp. | | | 3,425 | | | | 98,433 | |
| Takashimaya Co., Ltd. | | | 2,516 | | | | 18,977 | |
| Toho Co., Ltd. | | | 971 | | | | 25,501 | |
| Tokai Rika Co., Ltd. | | | 411 | | | | 7,986 | |
| Tokyo Broadcasting System | | | | | | | | |
| Holdings, Inc. | | | 291 | | | | 4,158 | |
| Toyo Tire & Rubber Co., Ltd. | | | 839 | | | | 13,182 | |
| Toyoda Gosei Co., Ltd. | | | 619 | | | | 11,866 | |
| Toyota Boshoku Corp. | | | 522 | | | | 10,109 | |
| Toyota Industries Corp. | | | 1,364 | | | | 62,020 | |
| Toyota Motor Corp. | | | 23,082 | | | | 1,219,736 | |
| TS Tech Co., Ltd. | | | 434 | | | | 10,372 | |
| TV Asahi Holdings Corp. | | | 183 | | | | 3,142 | |
| USS Co., Ltd. | | | 1,835 | | | | 30,082 | |
| Wacoal Holdings Corp. | | | 1,065 | | | | 13,238 | |
| Yamada Denki Co., Ltd. | | | 5,962 | | | | 30,647 | |
| Yamaha Corp. | | | 1,439 | | | | 43,038 | |
| Yamaha Motor Co., Ltd. | | | 2,336 | | | | 40,412 | |
| Yokohama Rubber Co., Ltd. (The) | | | 870 | | | | 15,287 | |
| Total Consumer Discretionary | | | | | | | 5,267,506 | |
| |
| Consumer Staples — 9.2% | | | | | | | | |
| Aeon Co., Ltd. | | | 5,791 | | | | 88,953 | |
| Ajinomoto Co., Inc. | | | 4,334 | | | | 103,494 | |
| Asahi Group Holdings Ltd. | | | 3,185 | | | | 104,455 | |
| Calbee, Inc. | | | 624 | | | | 25,224 | |
| Coca-Cola East Japan Co., Ltd. | | | 633 | | | | 11,939 | |
| Coca-Cola West Co., Ltd. | | | 528 | | | | 14,755 | |
| Cosmos Pharmaceutical Corp. | | | 75 | | | | 12,968 | |
| Ezaki Glico Co., Ltd. | | | 432 | | | | 22,570 | |
| FamilyMart Co., Ltd. | | | 507 | | | | 27,436 | |
| House Foods Group, Inc. | | | 618 | | | | 12,176 | |
| Ito En Ltd. | | | 473 | | | | 14,854 | |
| Japan Tobacco, Inc. | | | 8,703 | | | | 368,471 | |
| Kagome Co., Ltd. | | | 632 | | | | 13,786 | |
| Kao Corp. | | | 4,202 | | | | 240,193 | |
| Kewpie Corp. | | | 951 | | | | 25,696 | |
| Kikkoman Corp. | | | 1,484 | | | | 49,030 | |
| Kirin Holdings Co., Ltd. | | | 7,035 | | | | 104,642 | |
| Kobayashi Pharmaceutical | | | | | | | | |
| Co., Ltd. | | | 265 | | | | 21,845 | |
| Kose Corp. | | | 243 | | | | 23,302 | |
| Lawson, Inc. | | | 549 | | | | 43,614 | |
| Lion Corp. | | | 2,087 | | | | 26,293 | |
| Matsumotokiyoshi Holdings | | | | | | | | |
| Co., Ltd. | | | 331 | | | | 16,860 | |
| MEIJI Holdings Co., Ltd. | | | 1,143 | | | | 91,658 | |
See notes to financial statements.
| Schedules of Investments — IQ 50 Percent Hedged FTSE Japan ETF (continued) |
| April 30, 2016 |
| | | Shares | | Value |
| Common Stocks (continued) | | | | | | | | |
| Consumer Staples (continued) | | | | | | | | |
| Mitsubishi Shokuhin Co., Ltd. | | | 121 | | | $ | 3,182 | |
| NH Foods Ltd. | | | 1,632 | | | | 37,080 | |
| Nichirei Corp. | | | 1,909 | | | | 17,128 | |
| Nisshin Seifun Group, Inc. | | | 2,211 | | | | 37,175 | |
| Nissin Foods Holdings Co., Ltd. | | | 617 | | | | 29,294 | |
| Pigeon Corp. | | | 900 | | | | 24,638 | |
| Pola Orbis Holdings, Inc. | | | 162 | | | | 13,309 | |
| Sapporo Holdings Ltd. | | | 2,830 | | | | 15,579 | |
| Seven & i Holdings Co., Ltd. | | | 6,537 | | | | 277,561 | |
| Shiseido Co., Ltd. | | | 3,273 | | | | 76,017 | |
| Sugi Holdings Co., Ltd. | | | 301 | | | | 14,966 | |
| Sundrug Co., Ltd. | | | 288 | | | | 21,211 | |
| Suntory Beverage & Food Ltd. | | | 1,058 | | | | 47,365 | |
| Takara Holdings, Inc. | | | 1,478 | | | | 12,916 | |
| Toyo Suisan Kaisha Ltd. | | | 759 | | | | 27,666 | |
| Tsuruha Holdings, Inc. | | | 296 | | | | 29,214 | |
| Unicharm Corp. | | | 2,860 | | | | 61,279 | |
| UNY Group Holdings Co., Ltd. | | | 1,786 | | | | 13,354 | |
| Welcia Holdings Co., Ltd. | | | 218 | | | | 11,858 | |
| Yakult Honsha Co., Ltd. | | | 855 | | | | 44,031 | |
| Yamazaki Baking Co., Ltd. | | | 1,214 | | | | 29,637 | |
| Total Consumer Staples | | | | | | | 2,308,674 | |
| |
| Energy — 0.9% | | | | | | | | |
| Cosmo Energy Holdings Co., Ltd. | | | 555 | | | | 7,278 | |
| Idemitsu Kosan Co., Ltd. | | | 842 | | | | 18,541 | |
| Inpex Corp. | | | 7,691 | | | | 63,845 | |
| Japan Petroleum Exploration | | | | | | | | |
| Co., Ltd. | | | 261 | | | | 6,267 | |
| JX Holdings, Inc. | | | 20,208 | | | | 88,881 | |
| Showa Shell Sekiyu K.K. | | | 1,605 | | | | 17,221 | |
| TonenGeneral Sekiyu K.K. | | | 2,494 | | | | 24,405 | |
| Total Energy | | | | | | | 226,438 | |
| |
| Financials — 16.7% | | | | | | | | |
| 77 Bank Ltd. (The) | | | 2,999 | | | | 10,903 | |
| Acom Co., Ltd.*(a) | | | 3,270 | | | | 17,787 | |
| AEON Financial Service Co., Ltd. | | | 896 | | | | 20,735 | |
| Aeon Mall Co., Ltd. | | | 1,011 | | | | 14,467 | |
| Aiful Corp.* | | | 2,457 | | | | 8,841 | |
| Aozora Bank Ltd. | | | 9,738 | | | | 35,586 | |
| Aplus Financial Co., Ltd.* | | | 793 | | | | 756 | |
| Awa Bank Ltd. (The) | | | 1,900 | | | | 9,998 | |
| Bank of Kyoto Ltd. (The) | | | 3,039 | | | | 21,246 | |
| Century Tokyo Leasing Corp. | | | 388 | | | | 13,689 | |
| Chiba Bank Ltd. (The) | | | 5,624 | | | | 29,646 | |
| Chugoku Bank Ltd. (The) | | | 1,517 | | | | 16,277 | |
| Concordia Financial Group Ltd.* | | | 9,478 | | | | 45,390 | |
| Credit Saison Co., Ltd. | | | 1,337 | | | | 25,467 | |
| Dai-ichi Life Insurance Co., | | | | | | | | |
| Ltd. (The) | | | 9,471 | | | | 121,181 | |
| Daikyo, Inc. | | | 2,547 | | | | 4,190 | |
| Daishi Bank Ltd. (The) | | | 2,734 | | | | 9,812 | |
| Daito Trust Construction Co., Ltd. | | | 618 | | | | 89,499 | |
| Daiwa House Industry Co., Ltd. | | | 5,413 | | | | 149,902 | |
| Daiwa Securities Group, Inc. | | | 14,270 | | | | 86,184 | |
| Fukuoka Financial Group, Inc. | | | 6,116 | | | | 21,607 | |
| Gunma Bank Ltd. (The) | | | 3,674 | | | | 15,074 | |
| Hachijuni Bank Ltd. (The) | | | 3,390 | | | | 15,367 | |
| Hiroshima Bank Ltd. (The) | | | 4,884 | | | | 18,350 | |
| Hitachi Capital Corp. | | | 372 | | | | 8,330 | |
| | | Shares | | Value |
| Common Stocks (continued) | | | | | | | | |
| Financials (continued) | | | | | | | | |
| Hokuhoku Financial Group, Inc. | | | 10,852 | | | $ | 14,200 | |
| Hulic Co., Ltd. | | | 2,970 | | | | 30,534 | |
| Hyakugo Bank Ltd. (The) | | | 1,730 | | | | 6,613 | |
| Hyakujushi Bank Ltd. (The) | | | 2,288 | | | | 6,779 | |
| Iyo Bank Ltd. (The) | | | 2,269 | | | | 15,523 | |
| Jafco Co., Ltd. | | | 265 | | | | 7,703 | |
| Japan Exchange Group, Inc. | | | 4,584 | | | | 71,805 | |
| Japan Post Bank Co., Ltd. | | | 3,443 | | | | 43,281 | |
| Japan Post Holdings Co., Ltd. | | | 3,790 | | | | 52,602 | |
| Japan Post Insurance Co., Ltd. | | | 551 | | | | 12,993 | |
| Joyo Bank Ltd. (The) | | | 5,696 | | | | 20,602 | |
| Juroku Bank Ltd. (The) | | | 3,017 | | | | 9,192 | |
| Keiyo Bank Ltd. (The) | | | 2,037 | | | | 7,711 | |
| Kyushu Financial Group, Inc. | | | 3,300 | | | | 17,950 | |
| Matsui Securities Co., Ltd. | | | 857 | | | | 7,633 | |
| Mitsubishi Estate Co., Ltd. | | | 10,603 | | | | 210,187 | |
| Mitsubishi UFJ Financial Group, Inc. | | | 116,547 | | | | 566,532 | |
| Mitsubishi UFJ Lease & | | | | | | | | |
| Finance Co., Ltd. | | | 3,673 | | | | 16,684 | |
| Mitsui Fudosan Co., Ltd. | | | 7,950 | | | | 202,474 | |
| Mizuho Financial Group, Inc. | | | 207,476 | | | | 325,384 | |
| MS&AD Insurance Group | | | | | | | | |
| Holdings, Inc. | | | 4,324 | | | | 119,966 | |
| Musashino Bank Ltd. (The) | | | 282 | | | | 7,390 | |
| Nihon M&A Center, Inc. | | | 264 | | | | 15,643 | |
| Nishi-Nippon City Bank Ltd. (The) | | | 6,109 | | | | 11,419 | |
| Nomura Holdings, Inc. | | | 28,614 | | | | 128,074 | |
| Nomura Real Estate Holdings, Inc. | | | 1,001 | | | | 18,936 | |
| North Pacific Bank Ltd. | | | 2,346 | | | | 6,161 | |
| NTT Urban Development Corp. | | | 929 | | | | 9,065 | |
| Okasan Securities Group, Inc. | | | 1,537 | | | | 8,461 | |
| Orient Corp.* | | | 3,179 | | | | 6,626 | |
| ORIX Corp. | | | 10,988 | | | | 162,928 | |
| Resona Holdings, Inc. | | | 18,275 | | | | 67,160 | |
| San-In Godo Bank Ltd. (The) | | | 1,331 | | | | 8,907 | |
| SBI Holdings, Inc. | | | 1,672 | | | | 18,158 | |
| Senshu Ikeda Holdings, Inc. | | | 2,328 | | | | 9,030 | |
| Seven Bank Ltd. | | | 5,468 | | | | 24,071 | |
| Shiga Bank Ltd. (The) | | | 2,140 | | | | 9,640 | |
| Shinsei Bank Ltd. | | | 14,214 | | | | 20,724 | |
| Shizuoka Bank Ltd. (The) | | | 4,493 | | | | 34,644 | |
| Sompo Japan Nipponkoa | | | | | | | | |
| Holdings, Inc. | | | 3,138 | | | | 86,240 | |
| Sony Financial Holdings, Inc. | | | 1,453 | | | | 18,876 | |
| Sumitomo Mitsui Financial | | | | | | | | |
| Group, Inc. | | | 10,885 | | | | 347,217 | |
| Sumitomo Mitsui Trust Holdings, Inc. | | | 31,586 | | | | 101,729 | |
| Sumitomo Real Estate Sales | | | | | | | | |
| Co., Ltd. | | | 124 | | | | 2,574 | |
| Sumitomo Realty & Development | | | | | | | | |
| Co., Ltd. | | | 3,631 | | | | 110,123 | |
| Suruga Bank Ltd. | | | 1,449 | | | | 29,252 | |
| T&D Holdings, Inc. | | | 5,253 | | | | 53,097 | |
| Tokai Tokyo Financial Holdings, Inc. | | | 1,917 | | | | 10,374 | |
| Tokio Marine Holdings, Inc. | | | 5,882 | | | | 202,801 | |
| Tokyo Tatemono Co., Ltd. | | | 1,717 | | | | 23,397 | |
| Tokyu Fudosan Holdings Corp. | | | 4,330 | | | | 30,676 | |
| Yamaguchi Financial Group, Inc. | | | 1,891 | | | | 18,116 | |
| Zenkoku Hosho Co., Ltd. | | | 420 | | | | 15,466 | |
| Total Financials | | | | | | | 4,193,607 | |
See notes to financial statements.
| Schedules of Investments — IQ 50 Percent Hedged FTSE Japan ETF (continued) |
| April 30, 2016 |
| | | Shares | | Value |
| Common Stocks (continued) | | | | | | | | |
| Health Care — 9.0% | | | | | | | | |
| Alfresa Holdings Corp. | | | 1,501 | | | $ | 29,993 | |
| Asahi Intecc Co., Ltd. | | | 408 | | | | 20,248 | |
| Astellas Pharma, Inc. | | | 17,825 | | | | 249,395 | |
| Chugai Pharmaceutical Co., Ltd. | | | 1,823 | | | | 64,064 | |
| Daiichi Sankyo Co., Ltd. | | | 5,661 | | | | 137,616 | |
| Eisai Co., Ltd. | | | 2,227 | | | | 142,264 | |
| Hisamitsu Pharmaceutical Co., Inc. | | | 608 | | | | 29,720 | |
| Hoya Corp. | | | 3,372 | | | | 134,288 | |
| Kaken Pharmaceutical Co., Ltd. | | | 297 | | | | 16,849 | |
| Kissei Pharmaceutical Co., Ltd. | | | 270 | | | | 6,442 | |
| KYORIN Holdings, Inc. | | | 387 | | | | 7,900 | |
| Kyowa Hakko Kirin Co., Ltd. | | | 2,147 | | | | 39,812 | |
| M3, Inc. | | | 1,513 | | | | 42,564 | |
| Medipal Holdings Corp. | | | 1,323 | | | | 21,750 | |
| Miraca Holdings, Inc. | | | 475 | | | | 20,888 | |
| Mitsubishi Tanabe Pharma Corp. | | | 1,875 | | | | 34,400 | |
| Mochida Pharmaceutical Co., Ltd. | | | 114 | | | | 8,694 | |
| Nihon Kohden Corp. | | | 637 | | | | 16,604 | |
| Nippon Shinyaku Co., Ltd. | | | 439 | | | | 20,494 | |
| Nipro Corp. | | | 1,005 | | | | 10,088 | |
| Olympus Corp. | | | 2,696 | | | | 109,483 | |
| Ono Pharmaceutical Co., Ltd. | | | 3,820 | | | | 177,728 | |
| Otsuka Holdings Co., Ltd. | | | 3,133 | | | | 125,794 | |
| Rohto Pharmaceutical Co., Ltd. | | | 806 | | | | 14,253 | |
| Santen Pharmaceutical Co., Ltd. | | | 3,333 | | | | 49,717 | |
| Sawai Pharmaceutical Co., Ltd. | | | 270 | | | | 17,866 | |
| Shionogi & Co., Ltd. | | | 2,483 | | | | 130,955 | |
| Sumitomo Dainippon | | | | | | | | |
| Pharma Co., Ltd.(a) | | | 1,329 | | | | 17,675 | |
| Suzuken Co., Ltd. | | | 695 | | | | 24,846 | |
| Sysmex Corp. | | | 1,196 | | | | 78,247 | |
| Taisho Pharmaceutical | | | | | | | | |
| Holdings Co., Ltd. | | | 386 | | | | 32,469 | |
| Takeda Pharmaceutical Co., Ltd. | | | 6,485 | | | | 318,931 | |
| Terumo Corp. | | | 2,703 | | | | 106,736 | |
| Tsumura & Co., | | | 582 | | | | 15,383 | |
| Total Health Care | | | | | | | 2,274,156 | |
| |
| Industrials — 21.0% | | | | | | | | |
| Amada Holdings Co., Ltd. | | | 2,987 | | | | 31,072 | |
| ANA Holdings, Inc. | | | 9,770 | | | | 28,124 | |
| Asahi Glass Co., Ltd. | | | 8,009 | | | | 48,580 | |
| Central Japan Railway Co., | | | 1,517 | | | | 275,554 | |
| Chiyoda Corp. | | | 1,285 | | | | 10,160 | |
| COMSYS Holdings Corp. | | | 962 | | | | 14,889 | |
| Dai Nippon Printing Co., Ltd. | | | 5,152 | | | | 50,126 | |
| Daikin Industries Ltd. | | | 2,235 | | | | 185,576 | |
| DMG Mori Co., Ltd. | | | 890 | | | | 10,606 | |
| East Japan Railway Co. | | | 3,181 | | | | 292,071 | |
| Ebara Corp. | | | 3,761 | | | | 17,751 | |
| FANUC Corp. | | | 1,640 | | | | 252,986 | |
| Fuji Electric Co., Ltd. | | | 4,771 | | | | 21,181 | |
| Fujikura Ltd. | | | 2,447 | | | | 12,419 | |
| Fukuyama Transporting Co., Ltd. | | | 1,193 | | | | 6,222 | |
| Furukawa Electric Co., Ltd. | | | 5,125 | | | | 12,885 | |
| Glory Ltd. | | | 472 | | | | 16,013 | |
| GS Yuasa Corp. | | | 3,294 | | | | 13,977 | |
| Hankyu Hanshin Holdings, Inc. | | | 10,550 | | | | 68,529 | |
| Hino Motors Ltd. | | | 2,255 | | | | 22,804 | |
| Hitachi Construction Machinery | | | | | | | | |
| Co., Ltd. | | | 890 | | | | 14,707 | |
| | | Shares | | Value |
| Common Stocks (continued) | | | | | | | | |
| Industrials (continued) | | | | | | | | |
| Hitachi Transport System Ltd. | | | 375 | | | $ | 6,498 | |
| Hoshizaki Electric Co., Ltd. | | | 331 | | | | 28,678 | |
| IHI Corp. | | | 12,499 | | | | 28,621 | |
| ITOCHU Corp. | | | 12,052 | | | | 159,387 | |
| Japan Airlines Co., Ltd. | | | 662 | | | | 24,458 | |
| Japan Airport Terminal Co., Ltd.(a) | | | 468 | | | | 17,562 | |
| Japan Steel Works Ltd. (The) | | | 2,981 | | | | 11,952 | |
| JGC Corp. | | | 1,812 | | | | 31,906 | |
| JTEKT Corp. | | | 1,885 | | | | 25,211 | |
| Kajima Corp. | | | 7,021 | | | | 44,950 | |
| Kamigumi Co., Ltd. | | | 1,812 | | | | 16,902 | |
| Kandenko Co., Ltd. | | | 894 | | | | 6,517 | |
| Kawasaki Heavy Industries Ltd. | | | 12,054 | | | | 35,600 | |
| Kawasaki Kisen Kaisha Ltd.(a) | | | 6,918 | | | | 15,259 | |
| Keihan Holdings Co., Ltd. | | | 4,299 | | | | 31,822 | |
| Keikyu Corp. | | | 4,144 | | | | 38,460 | |
| Keio Corp. | | | 4,792 | | | | 43,444 | |
| Keisei Electric Railway Co., Ltd. | | | 2,346 | | | | 33,394 | |
| Kinden Corp. | | | 1,088 | | | | 13,097 | |
| Kintetsu Group Holdings Co., Ltd. | | | 15,079 | | | | 63,419 | |
| Komatsu Ltd. | | | 7,898 | | | | 140,731 | |
| Kubota Corp. | | | 9,426 | | | | 146,198 | |
| Kurita Water Industries Ltd. | | | 951 | | | | 23,483 | |
| LIXIL Group Corp. | | | 2,175 | | | | 46,795 | |
| Mabuchi Motor Co., Ltd. | | | 447 | | | | 23,479 | |
| Maeda Road Construction | | | | | | | | |
| Co., Ltd. | | | 496 | | | | 9,239 | |
| Makita Corp. | | | 1,020 | | | | 65,969 | |
| Marubeni Corp. | | | 13,905 | | | | 76,169 | |
| Minebea Co., Ltd. | | | 2,747 | | | | 23,595 | |
| MISUMI Group, Inc. | | | 2,243 | | | | 32,577 | |
| Mitsubishi Corp. | | | 11,544 | | | | 201,004 | |
| Mitsubishi Electric Corp. | | | 16,554 | | | | 185,352 | |
| Mitsubishi Heavy Industries Ltd. | | | 26,853 | | | | 99,762 | |
| Mitsubishi Logistics Corp. | | | 1,134 | | | | 16,078 | |
| Mitsui & Co., Ltd. | | | 14,270 | | | | 178,917 | |
| Mitsui Engineering & | | | | | | | | |
| Shipbuilding Co., Ltd. | | | 6,338 | | | | 10,248 | |
| Mitsui OSK Lines Ltd. | | | 9,359 | | | | 20,731 | |
| MonotaRO Co., Ltd. | | | 497 | | | | 15,584 | |
| Nabtesco Corp. | | | 974 | | | | 22,831 | |
| Nagase & Co., Ltd. | | | 948 | | | | 10,951 | |
| Nagoya Railroad Co., Ltd. | | | 7,600 | | | | 39,209 | |
| Nankai Electric Railway Co., Ltd. | | | 4,544 | | | | 24,675 | |
| NGK Insulators Ltd. | | | 2,263 | | | | 48,942 | |
| Nidec Corp. | | | 2,031 | | | | 155,369 | |
| Nippo Corp. | | | 436 | | | | 7,351 | |
| Nippon Express Co., Ltd. | | | 6,355 | | | | 30,232 | |
| Nippon Yusen K.K. | | | 13,487 | | | | 27,353 | |
| Nishi-Nippon Railroad Co., Ltd. | | | 3,180 | | | | 19,824 | |
| Nisshinbo Holdings, Inc. | | | 1,060 | | | | 11,938 | |
| NSK Ltd. | | | 3,887 | | | | 35,820 | |
| NTN Corp. | | | 3,556 | | | | 11,632 | |
| Obayashi Corp. | | | 5,662 | | | | 57,205 | |
| Odakyu Electric Railway Co., Ltd. | | | 5,117 | | | | 57,055 | |
| OKUMA Corp. | | | 1,310 | | | | 10,774 | |
| OSG Corp. | | | 644 | | | | 12,279 | |
| Park24 Co., Ltd. | | | 860 | | | | 24,797 | |
| Recruit Holdings Co., Ltd. | | | 2,200 | | | | 70,218 | |
| Sanwa Holdings Corp. | | | 1,768 | | | | 14,178 | |
See notes to financial statements.
| Schedules of Investments — IQ 50 Percent Hedged FTSE Japan ETF (continued) |
| April 30, 2016 |
| | | Shares | | Value |
| Common Stocks (continued) | | | | | | | | |
| Industrials (continued) | | | | | | | | |
| Secom Co., Ltd. | | | 1,628 | | | $ | 128,496 | |
| Seibu Holdings, Inc. | | | 1,770 | | | | 38,644 | |
| Seino Holdings Co., Ltd. | | | 1,280 | | | | 13,506 | |
| Shimizu Corp. | | | 4,740 | | | | 43,548 | |
| SMC Corp. | | | 490 | | | | 125,231 | |
| Sohgo Security Services Co., Ltd. | | | 567 | | | | 32,538 | |
| Sojitz Corp. | | | 10,448 | | | | 21,776 | |
| Sotetsu Holdings, Inc. | | | 3,687 | | | | 24,225 | |
| Sumitomo Corp. | | | 9,397 | | | | 102,757 | |
| Sumitomo Heavy Industries Ltd. | | | 4,720 | | | | 20,866 | |
| Tadano Ltd. | | | 979 | | | | 9,818 | |
| Taisei Corp. | | | 9,084 | | | | 63,506 | |
| Temp Holdings Co., Ltd. | | | 1,212 | | | | 18,917 | |
| THK Co., Ltd. | | | 951 | | | | 19,474 | |
| Tobu Railway Co., Ltd. | | | 8,440 | | | | 44,332 | |
| Toda Corp. | | | 1,979 | | | | 9,526 | |
| Tokyu Corp. | | | 9,496 | | | | 84,226 | |
| Toppan Forms Co., Ltd. | | | 351 | | | | 3,989 | |
| Toppan Printing Co., Ltd. | | | 4,330 | | | | 38,324 | |
| Toshiba Corp.* | | | 31,840 | | | | 69,932 | |
| TOTO Ltd. | | | 1,194 | | | | 42,462 | |
| Toyota Tsusho Corp. | | | 1,883 | | | | 44,349 | |
| Ushio, Inc. | | | 994 | | | | 14,056 | |
| West Japan Railway Co., | | | 1,535 | | | | 95,806 | |
| Yamato Holdings Co., Ltd. | | | 3,065 | | | | 63,852 | |
| Total Industrials | | | | | | | 5,266,069 | |
| |
| Information Technology — 10.3% | | | | | | | | |
| Advantest Corp. | | | 1,416 | | | | 14,028 | |
| Alps Electric Co., Ltd. | | | 1,540 | | | | 28,642 | |
| Azbil Corp. | | | 593 | | | | 15,690 | |
| Brother Industries Ltd. | | | 1,972 | | | | 23,536 | |
| Canon, Inc. | | | 8,785 | | | | 255,516 | |
| Capcom Co., Ltd. | | | 430 | | | | 10,184 | |
| Citizen Holdings Co., Ltd. | | | 2,471 | | | | 14,411 | |
| COLOPL, Inc. | | | 387 | | | | 7,925 | |
| COOKPAD, Inc. | | | 375 | | | | 5,597 | |
| DeNA Co., Ltd. | | | 882 | | | | 15,366 | |
| Disco Corp. | | | 230 | | | | 20,336 | |
| FUJIFILM Holdings Corp. | | | 3,375 | | | | 144,122 | |
| Fujitsu Ltd. | | | 14,862 | | | | 54,284 | |
| Gree, Inc.* | | | 790 | | | | 4,541 | |
| GungHo Online Entertainment, Inc. | | | 2,891 | | | | 7,782 | |
| Hamamatsu Photonics K.K. | | | 1,114 | | | | 32,120 | |
| Hirose Electric Co., Ltd. | | | 273 | | | | 34,471 | |
| Hitachi High-Technologies Corp. | | | 540 | | | | 15,242 | |
| Hitachi Ltd. | | | 38,862 | | | | 187,273 | |
| Ibiden Co., Ltd. | | | 888 | | | | 11,569 | |
| IT Holdings Corp. | | | 691 | | | | 16,966 | |
| Itochu Techno-Solutions Corp. | | | 401 | | | | 8,095 | |
| Japan Aviation Electronics | | | | | | | | |
| Industry Ltd. | | | 579 | | | | 8,123 | |
| Japan Display, Inc.* | | | 3,066 | | | | 6,190 | |
| Kakaku.com, Inc.(a) | | | 1,158 | | | | 21,570 | |
| Keyence Corp. | | | 382 | | | | 239,779 | |
| Konami Holdings Corp. | | | 810 | | | | 26,005 | |
| Konica Minolta, Inc. | | | 3,763 | | | | 34,044 | |
| Kyocera Corp. | | | 2,613 | | | | 133,660 | |
| Murata Manufacturing Co., Ltd. | | | 1,579 | | | | 218,340 | |
| NEC Corp. | | | 21,745 | | | | 54,873 | |
| Nexon Co., Ltd. | | | 1,112 | | | | 17,294 | |
| | | Shares | | Value |
| Common Stocks (continued) | | | | | | | | |
| Information Technology (continued) | | | | | | | | |
| Nintendo Co., Ltd. | | | 906 | | | $ | 128,328 | |
| Nippon Electric Glass Co., Ltd. | | | 3,448 | | | | 18,852 | |
| Nomura Research Institute Ltd. | | | 841 | | | | 30,576 | |
| NS Solutions Corp. | | | 276 | | | | 4,966 | |
| NTT Data Corp. | | | 1,054 | | | | 56,544 | |
| OBIC Business Consultants Co., Ltd. | | | 63 | | | | 2,729 | |
| Obic Co., Ltd. | | | 565 | | | | 30,680 | |
| Omron Corp. | | | 1,669 | | | | 55,532 | |
| Oracle Corp. Japan | | | 278 | | | | 15,356 | |
| Otsuka Corp. | | | 428 | | | | 21,281 | |
| Ricoh Co., Ltd. | | | 5,689 | | | | 60,296 | |
| Rohm Co., Ltd. | | | 742 | | | | 33,981 | |
| SCREEN Holdings Co., Ltd. | | | 1,713 | | | | 13,897 | |
| SCSK Corp. | | | 355 | | | | 13,321 | |
| Seiko Epson Corp. | | | 2,360 | | | | 40,717 | |
| Shimadzu Corp. | | | 2,249 | | | | 35,607 | |
| Square Enix Holdings Co., Ltd. | | | 662 | | | | 17,566 | |
| Sumco Corp. | | | 1,563 | | | | 10,591 | |
| Taiyo Yuden Co., Ltd. | | | 959 | | | | 10,128 | |
| TDK Corp. | | | 1,000 | | | | 61,498 | |
| Tokyo Electron Ltd. | | | 1,303 | | | | 90,252 | |
| Topcon Corp. | | | 904 | | | | 11,558 | |
| Trend Micro, Inc. | | | 853 | | | | 33,364 | |
| Yahoo Japan Corp. | | | 10,930 | | | | 50,669 | |
| Yaskawa Electric Corp. | | | 2,216 | | | | 27,152 | |
| Yokogawa Electric Corp. | | | 2,041 | | | | 23,005 | |
| Total Information Technology | | | | | | | 2,586,020 | |
| |
| Materials — 6.4% | | | | | | | | |
| Air Water, Inc. | | | 1,278 | | | | 19,900 | |
| Asahi Kasei Corp. | | | 11,124 | | | | 78,984 | |
| Daicel Corp. | | | 2,522 | | | | 32,646 | |
| Daido Steel Co., Ltd. | | | 2,962 | | | | 10,326 | |
| Denka Co., Ltd. | | | 3,764 | | | | 16,394 | |
| DIC Corp. | | | 6,906 | | | | 16,588 | |
| Dowa Holdings Co., Ltd. | | | 1,972 | | | | 12,883 | |
| FP Corp. | | | 199 | | | | 8,993 | |
| Hitachi Chemical Co., Ltd. | | | 865 | | | | 15,166 | |
| Hitachi Metals Ltd. | | | 1,642 | | | | 17,495 | |
| JFE Holdings, Inc. | | | 4,291 | | | | 63,345 | |
| JSR Corp. | | | 1,582 | | | | 22,489 | |
| Kaneka Corp. | | | 2,700 | | | | 23,519 | |
| Kansai Paint Co., Ltd. | | | 1,668 | | | | 30,275 | |
| Kobe Steel Ltd. | | | 24,812 | | | | 25,045 | |
| Kuraray Co., Ltd. | | | 2,936 | | | | 38,581 | |
| Lintec Corp. | | | 433 | | | | 8,612 | |
| Maruichi Steel Tube Ltd. | | | 518 | | | | 15,541 | |
| Mitsubishi Chemical Holdings Corp. | | | 11,006 | | | | 59,847 | |
| Mitsubishi Gas Chemical Co., Inc. | | | 3,208 | | | | 18,199 | |
| Mitsubishi Materials Corp. | | | 10,428 | | | | 34,404 | |
| Mitsui Chemicals, Inc. | | | 7,603 | | | | 26,434 | |
| Mitsui Mining & Smelting Co., Ltd. | | | 4,752 | | | | 9,238 | |
| Nippon Kayaku Co., Ltd. | | | 1,441 | | | | 16,040 | |
| Nippon Paint Holdings Co., Ltd. | | | 1,499 | | | | 41,358 | |
| Nippon Paper Industries Co., Ltd. | | | 786 | | | | 15,471 | |
| Nippon Shokubai Co., Ltd. | | | 271 | | | | 14,665 | |
| Nippon Steel & Sumitomo | | | | | | | | |
| Metal Corp. | | | 6,881 | | | | 150,424 | |
| Nissan Chemical Industries Ltd. | | | 1,194 | | | | 32,987 | |
| Nisshin Steel Co., Ltd. | | | 798 | | | | 11,143 | |
| Nitto Denko Corp. | | | 1,310 | | | | 73,902 | |
See notes to financial statements.
| Schedules of Investments — IQ 50 Percent Hedged FTSE Japan ETF (continued) |
| April 30, 2016 |
| | | Shares | | Value |
| Common Stocks (continued) | | | | | | | | |
| Materials (continued) | | | | | | | | |
| Oji Holdings Corp. | | | 7,343 | | | $ | 31,089 | |
| Rengo Co., Ltd. | | | 1,805 | | | | 10,088 | |
| Shin-Etsu Chemical Co., Ltd. | | | 3,453 | | | | 200,187 | |
| Showa Denko K.K. | | | 12,270 | | | | 13,188 | |
| Sumitomo Chemical Co., Ltd. | | | 12,689 | | | | 60,009 | |
| Sumitomo Metal Mining Co., Ltd. | | | 3,961 | | | | 46,350 | |
| Sumitomo Osaka Cement Co., Ltd. | | | 3,127 | | | | 13,736 | |
| Taiheiyo Cement Corp. | | | 10,049 | | | | 27,425 | |
| Taiyo Nippon Sanso Corp. | | | 1,227 | | | | 11,777 | |
| Teijin Ltd. | | | 7,419 | | | | 27,528 | |
| Toray Industries, Inc. | | | 12,727 | | | | 110,230 | |
| Tosoh Corp. | | | 5,415 | | | | 25,811 | |
| Toyo Seikan Group Holdings Ltd. | | | 1,338 | | | | 27,449 | |
| Toyobo Co., Ltd. | | | 7,568 | | | | 13,227 | |
| Ube Industries Ltd. | | | 8,835 | | | | 17,341 | |
| Yamato Kogyo Co., Ltd. | | | 368 | | | | 8,894 | |
| Zeon Corp. | | | 1,285 | | | | 9,476 | |
| Total Materials | | | | | | | 1,614,699 | |
| |
| Telecommunication Services — 5.4% | | | | | | | | |
| KDDI Corp. | | | 15,744 | | | | 466,309 | |
| Nippon Telegraph & | | | | | | | | |
| Telephone Corp. | | | 3,880 | | | | 176,385 | |
| NTT DOCOMO, Inc. | | | 11,385 | | | | 276,339 | |
| SoftBank Group Corp. | | | 7,770 | | | | 434,850 | |
| Total Telecommunication Services | | | | | | | 1,353,883 | |
| |
| Utilities — 2.4% | | | | | | | | |
| Chubu Electric Power Co., Inc. | | | 5,924 | | | | 80,310 | |
| Chugoku Electric Power Co., | | | | | | | | |
| Inc. (The) | | | 2,541 | | | | 33,866 | |
| Electric Power Development | | | | | | | | |
| Co., Ltd. | | | 1,498 | | | | 46,412 | |
| Hokkaido Electric Power Co., Inc. | | | 1,518 | | | | 14,216 | |
| Hokuriku Electric Power Co., | | | 1,563 | | | | 20,977 | |
| | | Shares | | Value |
| Common Stocks (continued) | | | | | | | | |
| Utilities (continued) | | | | | | | | |
| Kansai Electric Power Co., | | | | | | | | |
| Inc. (The)* | | | 6,117 | | | $ | 55,867 | |
| Kyushu Electric Power Co., Inc. | | | 3,880 | | | | 40,325 | |
| Osaka Gas Co., Ltd. | | | 16,524 | | | | 61,281 | |
| Shikoku Electric Power Co., Inc. | | | 1,290 | | | | 16,385 | |
| Toho Gas Co., Ltd. | | | 3,838 | | | | 26,903 | |
| Tohoku Electric Power Co., Inc. | | | 3,988 | | | | 52,480 | |
| Tokyo Electric Power Co. | | | | | | | | |
| Holdings, Inc.* | | | 13,014 | | | | 71,763 | |
| Tokyo Gas Co., Ltd. | | | 19,356 | | | | 87,757 | |
| Total Utilities | | | | | | | 608,542 | |
| Total Common Stocks | | | | | | | | |
| (Cost $26,729,088) | | | | | | | 25,699,594 | |
| |
| Investment of Cash Collateral | | | | | | | | |
| For Securities Loaned — 0.3% | | | | | | | | |
| | | | | | | | | |
| Money Market Fund — 0.3% | | | | | | | | |
| Dreyfus Government Cash | | | | | | | | |
| Management Fund, 0.20%(b) | | | | | | | | |
| (Cost $66,761) | | | 66,761 | | | | 66,761 | |
| Total Investments — 102.6% | | | | | | | | |
| (Cost $26,795,849) | | | | | | | 25,766,355 | |
| Liabilities in Excess of | | | | | | | | |
| Other Assets — (2.6)% | | | | | | | (641,040 | ) |
| Net Assets — 100.0% | | | | | | $ | 25,125,315 | |
| * | Non-income producing securities. |
| (a) | All or a portion of the security was on loan. In addition, “Other Assets and Liabilities, Net” may include pending sales that are also on loan. The aggregate market value of securities on loan was $79,034; total market value of collateral held by the Fund was $82,087. Market value of the collateral held includes non-cash U.S. Treasury securities collateral having a value of $15,326. |
| (b) | Rate shown reflects the 1-day yield at April 30, 2016. |
K.K. — Kabushiki Kaisha
See notes to financial statements.
| Schedules of Investments — IQ 50 Percent Hedged FTSE Japan ETF (continued) |
| April 30, 2016 |
Forward Exchange Contracts Outstanding as of April 30, 2016:
| Purchase Contracts | | Counterparty | | Currency | | Currency
Amount
Purchased | | Value at
Settlement
Date | | Value at
April 30, 2016 | | Unrealized
Appreciation
(Depreciation) |
| Japanese Yen Expiring 05/10/16 | | Merrill Lynch | | | JPY | | | | 1,380,651,955 | | | $ | 12,906,824 | | | $ | 12,906,909 | | | $ | 85 | |
| | | | | | | | | | | | | $ | 12,906,824 | | | $ | 12,906,909 | | | $ | 85 | |
| Sales Contracts | | Counterparty | | Currency | | Currency
Amount Sold | | Value at
Settlement
Date | | Value at
April 30, 2016 | | Unrealized
Appreciation
(Depreciation) |
| Japanese Yen Expiring 05/10/16 | | Merrill Lynch | | | JPY | | | | (1,380,651,955 | ) | | $ | (12,288,245 | ) | | $ | (12,906,909 | ) | | $ | (618,664 | ) |
| Japanese Yen Expiring 06/07/16 | | Merrill Lynch | | | JPY | | | | (1,374,938,200 | ) | | | (12,861,212 | ) | | | (12,863,252 | ) | | | (2,040 | ) |
| | | | | | | | | | | | | $ | (25,149,457 | ) | | $ | (25,770,161 | ) | | $ | (620,704 | ) |
|
| Net Unrealized Appreciation (Depreciation) | | | | | | | | | | | | | | | | $ | (620,619 | ) |
The following is a summary of the fair valuations according to the inputs used as of April 30, 2016 for valuing the Fund’s assets and liabilities.
For more information on the valuation techniques, and their aggregation into the levels used in the table below, please refer to Note 2.
Asset Valuation Inputs
| Description | | Level 1 | | Level 2 | | Level 3 | | Total |
| Investments in Securities:(a) | | | | | | | | | | | | | | | | |
| Common Stocks | | $ | 25,699,594 | | | $ | — | | | $ | — | | | $ | 25,699,594 | |
| Investment of Cash Collateral for Securities Loaned: | | | | | | | | | | | | | | | | |
| Money Market Fund | | | 66,761 | | | | — | | | | — | | | | 66,761 | |
| Total Investments in Securities | | | 25,766,355 | | | | — | | | | — | | | | 25,766,355 | |
| Other Financial Instruments: | | | | | | | | | | | | | | | | |
| Forward Exchange Contracts | | | — | | | | 85 | (b) | | | — | | | | 85 | |
| Total Investments in Securities and Other Financial Instruments | | $ | 25,766,355 | | | $ | 85 | | | $ | — | | | $ | 25,766,440 | |
| Liability Valuation Inputs | | | | | | | | |
| Description | | Level 1 | | Level 2 | | Level 3 | | Total |
| Other Financial Instruments: | | | | | | | | |
| Forward Exchange Contracts | | $ | — | | | $ | 620,704 | (b) | | $ | — | | | $ | 620,704 | |
| Total Other Financial Instruments | | $ | — | | | $ | 620,704 | | | $ | — | | | $ | 620,704 | |
| (a) | For a complete listing of investments and their industries, see the Schedules of Investments. |
| (b) | Reflects the unrealized appreciation (depreciation) of the instruments. |
The Fund recognizes transfers between the levels as of the beginning of the period.
For the year ended April 30, 2016, the Fund did not have any transfers between any levels within the fair value hierarchy. (See Note 2)
The Fund did not hold any level 3 securities as of April 30, 2016.
See notes to financial statements.
| Schedules of Investments — IQ Leaders GTAA Tracker ETF |
| April 30, 2016 |
| | | Shares | | Value |
| Investment Companies — 99.7% | | | | | | | | |
| Aggregate Bond Funds — 17.3% | | | | | | | | |
| iShares Core U.S. Aggregate | | | | | | | | |
| Bond ETF | | | 1,747 | | | $ | 193,725 | |
| SPDR Barclays Aggregate Bond ETF | | | 117 | | | | 6,856 | |
| Vanguard Total Bond | | | | | | | | |
| Market ETF | | | 1,955 | | | | 162,206 | |
| Total Aggregate Bond Funds | | | | | | | 362,787 | |
| |
| Emerging Equity Funds — 4.1% | | | | | | | | |
| iShares Core MSCI Emerging | | | | | | | | |
| Markets ETF | | | 301 | | | | 12,618 | |
| iShares MSCI Emerging Markets ETF | | | 895 | | | | 30,779 | |
| Vanguard FTSE Emerging | | | | | | | | |
| Markets ETF | | | 1,235 | | | | 43,138 | |
| Total Emerging Equity Funds | | | | | | | 86,535 | |
| |
| High Yield Corporate | | | | | | | | |
| Bond Funds — 22.5% | | | | | | | | |
| iShares iBoxx $ High Yield Corporate | | | | | | | | |
| Bond Fund | | | 3,272 | | | | 274,357 | |
| SPDR Barclays High Yield Bond ETF | | | 5,598 | | | | 197,610 | |
| Total High Yield Corporate | | | | | | | | |
| Bond Funds | | | | | | | 471,967 | |
| |
| International Equity | | | | | | | | |
| Core Funds — 24.6% | | | | | | | | |
| iShares Core MSCI EAFE ETF | | | 1,005 | | | | 54,471 | |
| iShares MSCI EAFE ETF | | | 5,138 | | | | 300,214 | |
| Vanguard FTSE Developed | | | | | | | | |
| Markets ETF(a) | | | 4,358 | | | | 159,982 | |
| Total International Equity | | | | | | | | |
| Core Funds | | | | | | | 514,667 | |
| |
| U.S. Large Cap Core Funds — 18.8% | | | | | | | | |
| Consumer Discretionary Select | | | | | | | | |
| Sector SPDR Fund | | | 663 | | | | 52,477 | |
| Financial Select Sector SPDR Fund | | | 2,768 | | | | 64,522 | |
| Health Care Select Sector | | | | | | | | |
| SPDR Fund | | | 365 | | | | 25,473 | |
| Materials Select Sector SPDR Fund | | | 1,144 | | | | 53,882 | |
| Technology Select Sector | | | | | | | | |
| SPDR Fund | | | 1,992 | | | | 83,923 | |
| Vanguard Consumer | | | | | | | | |
| Discretionary ETF | | | 73 | | | | 9,048 | |
| Vanguard Financials ETF | | | 293 | | | | 13,970 | |
| Vanguard Health Care ETF | | | 91 | | | | 11,563 | |
| | | Shares | | Value |
| Investment Companies (continued) | | | | | | | | |
| U.S. Large Cap Core Funds (continued) | | | | | | | | |
| Vanguard Information | | | | | | | | |
| Technology ETF | | | 518 | | | $ | 54,084 | |
| Vanguard Materials ETF(a) | | | 244 | | | | 25,242 | |
| Total U.S. Large Cap Core Funds | | | | | | | 394,184 | |
| |
| U.S. Medium Term Treasury | | | | | | | | |
| Bond Funds — 8.2% | | | | | | | | |
| iShares 7-10 Year Treasury | | | | | | | | |
| Bond ETF(a) | | | 1,554 | | | | 170,940 | |
| |
| U.S. Small Cap Core Fund — 4.2% | | | | | | | | |
| iShares Russell 2000 ETF | | | 767 | | | | 86,180 | |
| Vanguard Russell 2000 | | | 21 | | | | 1,893 | |
| Total U.S. Small Cap Core Fund | | | | | | | 88,073 | |
| Total Investment Companies | | | | | | | | |
| (Cost $2,031,527) | | | | | | | 2,089,153 | |
| |
| Short-Term Investment — 0.2% | | | | | | | | |
| Money Market Fund — 0.2% | | | | | | | | |
| Morgan Stanley Institutional Liquidity | | | | | | | | |
| Funds Treasury Portfolio — | | | | | | | | |
| Institutional Class, 0.22%(b) | | | | | | | | |
| (Cost $3,168) | | | 3,168 | | | | 3,168 | |
| |
| Investment of Cash Collateral | | | | | | | | |
| For Securities Loaned — 10.1% | | | | | | | | |
| | | | | | | | | |
| Money Market Fund — 10.1% | | | | | | | | |
| Dreyfus Government Cash | | | | | | | | |
| Management Fund, | | | | | | | | |
| Institutional Shares, 0.20%(c) | | | | | | | | |
| (Cost $212,194) | | | 212,194 | | | | 212,194 | |
| Total Investments — 110.0% | | | | | | | | |
| (Cost $2,246,889) | | | | | | | 2,304,515 | |
| Liabilities in Excess of | | | | | | | | |
| Other Assets — (10.0)% | | | | | | | (208,451 | ) |
| Net Assets — 100.0% | | | | | | $ | 2,096,064 | |
| (a) | All or a portion of the security was on loan. In addition, “Other Assets and Liabilities, Net” may include pending sales that are also on loan. The aggregate market value of securities on loan was $206,608; total market value of collateral held by the Fund was $212,194. |
| (b) | Rate shown reflects the 7-day yield at April 30, 2016. |
| (c) | Rate shown reflects the 1-day yield at April 30, 2016. |
ETF — Exchange Traded Fund
See notes to financial statements.
| Schedules of Investments — IQ Leaders GTAA Tracker ETF (continued) |
| April 30, 2016 |
Total return swap contracts outstanding at April 30, 2016:
| | | | | | | | | | | | | | | | |
| Total Return Benchmark | | Annual
Financing Rate
(Received) Paid % | | Expiration
Date | | Notional
Amount
Long (Short) | | Unrealized
Appreciation
(Depreciation)1 |
| Consumer Discretionary Select Sector SPDR Fund | | | 1.37 | | | | 10/04/2017 | | | $ | 10,685 | | | | $ | — | |
| Consumer Staples Select Sector SPDR Fund | | | (0.48 | ) | | | 10/04/2017 | | | (101,776 | ) | | | — | |
| Energy Select Sector SPDR Fund | | | (0.50 | ) | | | 10/04/2017 | | | (945 | ) | | | — | |
| Financial Select Sector SPDR Fund | | | 1.37 | | | | 10/04/2017 | | | 13,170 | | | | — | |
| Health Care Select Sector SPDR Fund | | | 1.37 | | | | 10/04/2017 | | | 5,164 | | | | — | |
| Industrial Select Sector SPDR Fund | | | (0.45 | ) | | | 10/04/2017 | | | (35,268 | ) | | | — | |
| iShares 7-10 Year Treasury Bond ETF | | | 1.37 | | | | 10/04/2017 | | | 34,870 | | | | — | |
| iShares Core MSCI EAFE ETF | | | 1.37 | | | | 10/04/2017 | | | 11,111 | | | | — | |
| iShares Core MSCI Emerging Markets ETF | | | 1.37 | | | | 10/04/2017 | | | 2,557 | | | | — | |
| iShares Core U.S. Aggregate Bond ETF | | | 1.37 | | | | 10/04/2017 | | | 39,588 | | | | — | |
| iShares iBoxx $ High Yield Corporate Bond ETF | | | 1.37 | | | | 10/04/2017 | | | 56,012 | | | | — | |
| iShares iBoxx $ Investment Grade Corporate Bond ETF | | | (0.73 | ) | | | 10/04/2017 | | | (104,567 | ) | | | — | |
| iShares MSCI EAFE ETF | | | 1.37 | | | | 10/04/2017 | | | 61,235 | | | | — | |
| iShares MSCI Emerging Markets ETF | | | 1.37 | | | | 10/04/2017 | | | 6,293 | | | | — | |
| iShares Russell 2000 ETF | | | 1.37 | | | | 10/04/2017 | | | 17,528 | | | | — | |
| Materials Select Sector SPDR Fund | | | 1.37 | | | | 10/04/2017 | | | 10,974 | | | | — | |
| SPDR Barclays Aggregate Bond ETF | | | 1.37 | | | | 10/04/2017 | | | 1,406 | | | | — | |
| SPDR Barclays Convertible Securities ETF | | | (1.60 | ) | | | 10/04/2017 | | | (85,794 | ) | | | — | |
| SPDR Barclays High Yield Bond ETF | | | 1.37 | | | | 10/04/2017 | | | 40,313 | | | | — | |
| Technology Select Sector SPDR Fund | | | 1.37 | | | | 10/04/2017 | | | 17,105 | | | | — | |
| Utilities Select Sector SPDR Fund | | | (0.51 | ) | | | 10/04/2017 | | | (88,609 | ) | | | — | |
| Vanguard Consumer Discretionary ETF | | | 1.37 | | | | 10/04/2017 | | | 1,859 | | | | — | |
| Vanguard Financials ETF | | | 1.37 | | | | 10/04/2017 | | | 2,861 | | | | — | |
| Vanguard FTSE Developed Markets ETF | | | 1.37 | | | | 10/04/2017 | | | 32,635 | | | | — | |
| Vanguard FTSE Emerging Markets ETF | | | 1.37 | | | | 10/04/2017 | | | 8,802 | | | | — | |
| Vanguard Health Care ETF | | | 1.37 | | | | 10/04/2017 | | | 2,414 | | | | — | |
| Vanguard Information Technology ETF | | | 1.37 | | | | 10/04/2017 | | | 11,067 | | | | — | |
| Vanguard Materials ETF | | | 1.37 | | | | 10/04/2017 | | | 5,173 | | | | — | |
| Vanguard Russell 2000 | | | 1.37 | | | | 10/04/2017 | | | 360 | | | | — | |
| Vanguard Total Bond Market ETF | | | 1.37 | | | | 10/04/2017 | | | 33,105 | | | | — | |
| | | | | | | | | | | | | | | $ | — | |
Morgan Stanley acts as the counterparty to the total return swap contracts listed above. The Fund either receives from, or pays to, the counterparty, depending upon the total return of the benchmark and the agreed-upon financing rate.
| 1 | Reflects a reset date of April 30, 2016. |
The following is a summary of the fair valuations according to the inputs used as of April 30, 2016 for valuing the Fund’s assets and liabilities.
For more information on the valuation techniques, and their aggregation into the levels used in the table below, please refer to Note 2.
Asset Valuation Inputs
| Description | | Level 1 | | Level 2 | | Level 3 | | Total |
| Investments in Securities:(a) | | | | | | | | | | | | | | | | |
| Investment Companies | | $ | 2,089,153 | | | $ | — | | | $ | — | | | $ | 2,089,153 | |
| Short-Term Investment: | | | | | | | | | | | | | | | | |
| Money Market Fund | | | 3,168 | | | | — | | | | — | | | | 3,168 | |
| Investment of Cash Collateral for Securities Loaned: | | | | | | | | | | | | | | | | |
| Money Market Fund | | | 212,194 | | | | — | | | | — | | | | 212,194 | |
| Total Investments in Securities | | | 2,304,515 | | | | — | | | | — | | | | 2,304,515 | |
| Other Financial Instruments: | | | | | | | | | | | | | | | | |
| Swap Contracts | | | — | | | | — | (b) | | | — | | | | — | (b) |
| Total Investments in Securities and Other Financial Instruments | | $ | 2,304,515 | | | $ | — | | | $ | — | | | $ | 2,304,515 | |
Liability Valuation Inputs
| Description | | | Level 1 | | | | Level 2 | | | | Level 3 | | | | Total | |
| Other Financial Instruments: | | | | | | | | | | | | | | | | |
| Swap Contracts | | $ | — | | | $ | — | (b) | | $ | — | | | $ | — | (b) |
| Total Other Financial Instruments | | $ | — | | | $ | — | | | $ | — | | | $ | — | |
| (a) | For a complete listing of investments and their industries, see the Schedules of Investments. |
| (b) | Reflects the unrealized appreciation (depreciation) of the instruments. |
The Fund recognizes transfers between the levels as of the beginning of the period.
For the year ended April 30, 2016, the Fund did not have any transfers between any levels within the fair value hierarchy. (See Note 2)
The Fund did not hold any level 3 securities as of April 30, 2016.
See notes to financial statements.
| Statements of Assets and Liabilities |
| April 30, 2016 |
| | | IQ Hedge | | IQ Hedge | | IQ Hedge | | IQ Hedge | | IQ Hedge | | |
| | | Multi-Strategy | | Macro | | Market Neutral | | Long/Short | | Event-Driven | | IQ Global |
| | | Tracker ETF | | Tracker ETF | | Tracker ETF | | Tracker ETF | | Tracker ETF | | Resources ETF |
| Assets | | | | | | | | | | | | | | | | | | | | | | | | |
| Investments, at value (including | | | | | | | | | | | | | | | | | | | | | | | | |
| securities on loan)1 | | $ | 1,206,813,961 | | | $ | 18,170,236 | | | $ | 15,354,432 | | | $ | 2,103,465 | | | $ | 1,943,609 | | | $ | 71,177,038 | |
| Cash | | | — | | | | — | | | | — | | | | 409 | | | | — | | | | — | |
| Foreign currency2 | | | — | | | | — | | | | — | | | | — | | | | — | | | | 1,075 | |
| Cash deposited at broker for | | | | | | | | | | | | | | | | | | | | | | | | |
| swap collateral | | | — | | | | 113,760 | | | | — | | | | — | | | | — | | | | — | |
| Due from broker | | | 4,807,022 | | | | 32,795 | | | | 62,116 | | | | 12,784 | | | | 696 | | | | — | |
| Dividend, interest, reclaims | | | | | | | | | | | | | | | | | | | | | | | | |
| receivable and security lending | | | | | | | | | | | | | | | | | | | | | | | | |
| income | | | 106,915 | | | | 6,765 | | | | 338 | | | | 122 | | | | 23 | | | | 203,949 | |
| Litigation income receivable | | | — | | | | — | | | | — | | | | — | | | | — | | | | 20,758 | |
| Total Assets | | | 1,211,727,898 | | | | 18,323,556 | | | | 15,416,886 | | | | 2,116,780 | | | | 1,944,328 | | | | 71,402,820 | |
| Liabilities | | | | | | | | | | | | | | | | | | | | | | | | |
| Collateral for securities on loan3 | | | 128,792,461 | | | | 3,240,904 | | | | 31,330 | | | | 207,270 | | | | — | | | | 3,024,500 | |
| Due to broker | | | 7,919,617 | | | | 206,662 | | | | 81,778 | | | | 20,365 | | | | 2,531 | | | | 415,349 | |
| Advisory fees payable | | | 651,855 | | | | 9,123 | | | | 9,359 | | | | 1,158 | | | | 1,193 | | | | 38,307 | |
| Due to custodian | | | 242,515 | | | | 72,403 | | | | — | | | | — | | | | — | | | | — | |
| Accrued expenses and other | | | | | | | | | | | | | | | | | | | | | | | | |
| liabilities | | | 1,278 | | | | 98 | | | | 75 | | | | 57 | | | | 487 | | | | 169 | |
| Total Liabilities | | | 137,607,726 | | | | 3,529,190 | | | | 122,542 | | | | 228,850 | | | | 4,211 | | | | 3,478,325 | |
| Net Assets | | $ | 1,074,120,172 | | | $ | 14,794,366 | | | $ | 15,294,344 | | | $ | 1,887,930 | | | $ | 1,940,117 | | | $ | 67,924,495 | |
| Composition of Net Assets | | | | | | | | | | | | | | | | | | | | | | | | |
| Paid-in capital | | $ | 1,144,593,186 | | | $ | 21,454,036 | | | $ | 15,666,544 | | | $ | 1,999,620 | | | $ | 1,995,348 | | | $ | 114,157,441 | |
| Undistributed (accumulated) net | | | | | | | | | | | | | | | | | | | | | | | | |
| investment income (loss) | | | (2,211,670 | ) | | | (244,181 | ) | | | 188,313 | | | | (7,433 | ) | | | 29,292 | | | | 675,490 | |
| Undistributed (accumulated) net | | | | | | | | | | | | | | | | | | | | | | | | |
| realized gain (loss) on | | | | | | | | | | | | | | | | | | | | | | | | |
| investments, swap transactions, | | | | | | | | | | | | | | | | | | | | | | | | |
| futures contracts and foreign | | | | | | | | | | | | | | | | | | | | | | | | |
| currency translations | | | (89,983,023 | ) | | | (6,065,711 | ) | | | (891,723 | ) | | | (102,557 | ) | | | (1,381 | ) | | | (52,895,389 | ) |
| Net unrealized appreciation | | | | | | | | | | | | | | | | | | | | | | | | |
| (depreciation) on investments, | | | | | | | | | | | | | | | | | | | | | | | | |
| swap transactions, futures | | | | | | | | | | | | | | | | | | | | | | | | |
| contracts and foreign | | | | | | | | | | | | | | | | | | | | | | | | |
| currency translations | | | 21,721,679 | | | | (349,778 | ) | | | 331,210 | | | | (1,700 | ) | | | (83,142 | ) | | | 5,986,953 | |
| Net Assets | | $ | 1,074,120,172 | | | $ | 14,794,366 | | | $ | 15,294,344 | | | $ | 1,887,930 | | | $ | 1,940,117 | | | $ | 67,924,495 | |
| NET ASSET VALUE PER SHARE | | | | | | | | | | | | | | | | | | | | | | | | |
| Shares Outstanding (no par value, | | | | | | | | | | | | | | | | | | | | | | | | |
| unlimited shares authorized) | | | 37,000,000 | | | | 600,000 | | | | 600,000 | | | | 100,001 | | | | 100,001 | | | | 2,750,000 | |
| Net Asset Value | | $ | 29.03 | | | $ | 24.66 | | | $ | 25.49 | | | $ | 18.88 | | | $ | 19.40 | | | $ | 24.70 | |
| Investments, at cost: | | $ | 1,185,092,282 | | | $ | 18,520,014 | | | $ | 15,023,222 | | | $ | 2,105,165 | | | $ | 2,026,751 | | | $ | 65,192,205 | |
| | | | | | | | | | | | | | | | | | | | | | | | | |
|
| 1 Market value of securities | | | | | | | | | | | | | | | | | | | | | | | | |
| on loan: | | $ | 125,659,626 | | | $ | 3,132,960 | | | $ | 30,602 | | | $ | 202,322 | | | $ | — | | | $ | 4,588,057 | |
| 2 Cost of foreign currency: | | $ | — | | | $ | — | | | $ | — | | | $ | — | | | $ | — | | | $ | 1,038 | |
| 3 Non-cash collateral for securities | | | | | | | | | | | | | | | | | | | | | | | | |
| on loan: | | $ | — | | | $ | — | | | $ | — | | | $ | — | | | $ | — | | | $ | 1,748,327 | |
See notes to financial statements.
| Statements of Assets and Liabilities (continued) |
| April 30, 2016 |
| | | | | | | | | | | IQ Global | | IQ Global |
| | | IQ Merger | | IQ Real | | IQ Australia | | IQ Canada | | Agribusiness | | Oil Small |
| | | Arbitrage ETF | | Return ETF | | Small Cap ETF | | Small Cap ETF | | Small Cap ETF | | Cap ETF |
| Assets | | | | | | | | | | | | | | | | | | | | | | | | |
| Investments, at value (including | | | | | | | | | | | | | | | | | | | | | | | | |
| securities on loan)1 | | $ | 141,096,177 | | | $ | 30,008,172 | | | $ | 7,263,272 | | | $ | 12,227,947 | | | $ | 12,609,709 | | | $ | 3,674,518 | |
| Cash | | | 632,416 | | | | — | | | | — | | | | — | | | | — | | | | — | |
| Foreign currency2 | | | 13,777 | | | | — | | | | 8,952 | | | | 19,872 | | | | 380 | | | | 11,274 | |
| Due from broker | | | 326,094 | | | | — | | | | — | | | | — | | | | — | | | | — | |
| Dividend, interest, reclaims | | | | | | | | | | | | | | | | | | | | | | | | |
| receivable and security | | | | | | | | | | | | | | | | | | | | | | | | |
| lending income | | | 127,094 | | | | 3,398 | | | | 3,106 | | | | 6,303 | | | | 64,913 | | | | 3,430 | |
| Receivable for investments sold | | | — | | | | — | | | | — | | | | — | | | | — | | | | 1,833 | |
| Litigation income receivable | | | 10,220 | | | | — | | | | 9,251 | | | | 19,920 | | | | 8,863 | | | | 293 | |
| Prepaid expenses | | | — | | | | — | | | | — | | | | — | | | | — | | | | 41 | |
| Total Assets | | | 142,205,778 | | | | 30,011,570 | | | | 7,284,581 | | | | 12,274,042 | | | | 12,683,865 | | | | 3,691,389 | |
| | | | | | | | | | | | | | | | | | | | | | | | | |
| Liabilities | | | | | | | | | | | | | | | | | | | | | | | | |
| Collateral for securities on loan3 | | | 1,534,625 | | | | 3,273,756 | | | | 455,831 | | | | 1,454,269 | | | | 628,836 | | | | 744,175 | |
| Due to broker | | | 1,223,781 | | | | — | | | | — | | | | — | | | | — | | | | — | |
| Advisory fees payable | | | 80,090 | | | | 10,531 | | | | 3,072 | | | | 5,315 | | | | 7,322 | | | | 1,642 | |
| Accrued expenses and other | | | | | | | | | | | | | | | | | | | | | | | | |
| liabilities | | | 377 | | | | 86 | | | | 64 | | | | 70 | | | | 498 | | | | 2,577 | |
| Total Liabilities | | | 2,838,873 | | | | 3,284,373 | | | | 458,967 | | | | 1,459,654 | | | | 636,656 | | | | 748,394 | |
| Net Assets | | $ | 139,366,905 | | | $ | 26,727,197 | | | $ | 6,825,614 | | | $ | 10,814,388 | | | $ | 12,047,209 | | | $ | 2,942,995 | |
| Composition of Net Assets | | | | | | | | | | | | | | | | | | | | | | | | |
| Paid-in capital | | $ | 144,406,830 | | | $ | 28,772,181 | | | $ | 16,038,242 | | | $ | 32,072,764 | | | $ | 19,393,857 | | | $ | 4,823,414 | |
| Undistributed (accumulated) net | | | | | | | | | | | | | | | | | | | | | | | | |
| investment income (loss) | | | (110,786 | ) | | | (73,665 | ) | | | 116,307 | | | | 24,695 | | | | 92,321 | | | | 30,508 | |
| Undistributed (accumulated) net | | | | | | | | | | | | | | | | | | | | | | | | |
| realized gain (loss) on | | | | | | | | | | | | | | | | | | | | | | | | |
| investments, swap transactions, | | | | | | | | | | | | | | | | | | | | | | | | |
| futures contracts and foreign | | | | | | | | | | | | | | | | | | | | | | | | |
| currency translations | | | (5,343,857 | ) | | | (2,224,083 | ) | | | (8,812,181 | ) | | | (20,496,537 | ) | | | (7,364,197 | ) | | | (1,600,773 | ) |
| Net unrealized appreciation | | | | | | | | | | | | | | | | | | | | | | | | |
| (depreciation) on investments, | | | | | | | �� | | | | | | | | | | | | | | | | | |
| swap transactions and foreign | | | | | | | | | | | | | | | | | | | | | | | | |
| currency translations | | | 414,718 | | | | 252,764 | | | | (516,754 | ) | | | (786,534 | ) | | | (74,772 | ) | | | (310,154 | ) |
| Net Assets | | $ | 139,366,905 | | | $ | 26,727,197 | | | $ | 6,825,614 | | | $ | 10,814,388 | | | $ | 12,047,209 | | | $ | 2,942,995 | |
| NET ASSET VALUE PER SHARE | | | | | | | | | | | | | | | | | | | | | | | | |
| Shares Outstanding (no par value, | | | | | | | | | | | | | | | | | | | | | | | | |
| unlimited shares authorized) | | | 4,900,000 | | | | 1,000,000 | | | | 450,000 | | | | 650,000 | | | | 400,000 | | | | 250,000 | |
| Net Asset Value | | $ | 28.44 | | | $ | 26.73 | | | $ | 15.17 | | | $ | 16.64 | | | $ | 30.12 | | | $ | 11.77 | |
| Investments, at cost: | | $ | 140,681,902 | | | $ | 29,755,408 | | | $ | 7,779,957 | | | $ | 13,015,121 | | | $ | 12,685,954 | | | $ | 3,984,942 | |
| | | | | | | | | | | | | | | | | | | | | | | | | |
|
| 1 Market value of securities | | | | | | | | | | | | | | | | | | | | | | | | |
| on loan: | | $ | 1,449,066 | | | $ | 3,184,369 | | | $ | 531,074 | | | $ | 1,395,867 | | | $ | 1,123,060 | | | $ | 716,728 | |
| 2 Cost of foreign currency: | | $ | 13,767 | | | $ | — | | | $ | 9,072 | | | $ | 19,295 | | | $ | 376 | | | $ | 11,076 | |
| 3 Non-cash collateral for | | | | | | | | | | | | | | | | | | | | | | | | |
| securities on loan: | | $ | — | | | $ | — | | | $ | 108,844 | | | $ | — | | | $ | 585,395 | | | $ | — | |
See notes to financial statements.
| Statements of Assets and Liabilities (continued) |
| April 30, 2016 |
| | | IQ U.S | | IQ 50 Percent | | IQ 50 Percent | | IQ 50 Percent | | IQ Leaders |
| | | Real Estate | | Hedged FTSE | | Hedged FTSE | | Hedged FTSE | | GTAA |
| | | Small Cap ETF | | International ETF | | Europe ETF | | Japan ETF | | Tracker ETF |
| Assets | | | | | | | | | | | | | | | | | | | | |
| Investments, at value (including | | | | | | | | | | | | | | | | | | | | |
| securities on loan)1 | | $ | 81,532,385 | | | $ | 77,683,249 | | | $ | 48,094,589 | | | $ | 25,766,355 | | | $ | 2,304,515 | |
| Foreign currency2 | | | — | | | | 59,480 | | | | 53,409 | | | | 1,333 | | | | — | |
| Dividend, interest, reclaims receivable | | | | | | | | | | | | | | | | | | | | |
| and security lending income | | | 74,425 | | | | 273,368 | | | | 180,696 | | | | 235,204 | | | | 72 | |
| Due from broker | | | — | | | | — | | | | — | | | | — | | | | 9,794 | |
| Unrealized appreciation on forward | | | | | | | | | | | | | | | | | | | | |
| foreign currency contracts | | | — | | | | 30,646 | | | | 14,037 | | | | 85 | | | | — | |
| Total Assets | | | 81,606,810 | | | | 78,046,743 | | | | 48,342,731 | | | | 26,002,977 | | | | 2,314,381 | |
| Liabilities | | | | | | | | | | | | | | | | | | | | |
| Collateral for securities on loan3 | | | 4,900,443 | | | | 913,399 | | | | 1,006,432 | | | | 66,761 | | | | 212,194 | |
| Advisory fees payable | | | 43,214 | | | | 18,019 | | | | 14,972 | | | | 9,132 | | | | 768 | |
| Payable for investments purchased | | | — | | | | 583,120 | | | | 340,715 | | | | — | | | | — | |
| Due to broker | | | — | | | | — | | | | — | | | | — | | | | 5,226 | |
| Due to custodian | | | — | | | | — | | | | — | | | | 180,822 | | | | 52 | |
| Unrealized depreciation on forward | | | | | | | | | | | | | | | | | | | | |
| foreign currency contracts | | | — | | | | 521,630 | | | | 256,812 | | | | 620,704 | | | | — | |
| Accrued expenses and other | | | | | | | | | | | | | | | | | | | | |
| liabilities | | | 235 | | | | 272 | | | | 278 | | | | 243 | | | | 77 | |
| Total Liabilities | | | 4,943,892 | | | | 2,036,440 | | | | 1,619,209 | | | | 877,662 | | | | 218,317 | |
| Net Assets | | $ | 76,662,918 | | | $ | 76,010,303 | | | $ | 46,723,522 | | | $ | 25,125,315 | | | $ | 2,096,064 | |
| Composition of Net Assets | | | | | | | | | | | | | | | | | | | | |
| Paid-in capital | | $ | 82,912,219 | | | $ | 77,022,070 | | | $ | 48,162,417 | | | $ | 27,830,914 | | | $ | 2,099,852 | |
| Undistributed (accumulated) net | | | | | | | | | | | | | | | | | | | | |
| investment income (loss) | | | 55,101 | | | | 608,564 | | | | 670,698 | | | | 355,358 | | | | (380 | ) |
| Undistributed (accumulated) | | | | | | | | | | | | | | | | | | | | |
| net realized gain (loss) on investments, | | | | | | | | | | | | | | | | | | | | |
| swap transactions and foreign | | | | | | | | | | | | | | | | | | | | |
| currency translations | | | (3,512,814 | ) | | | (985,195 | ) | | | (498,316 | ) | | | (1,424,217 | ) | | | (61,034 | ) |
| Net unrealized appreciation | | | | | | | | | | | | | | | | | | | | |
| (depreciation) on investments, | | | | | | | | | | | | | | | | | | | | |
| swap transactions, futures contracts | | | | | | | | | | | | | | | | | | | | |
| and foreign currency translations | | | (2,791,588 | ) | | | (635,136 | ) | | | (1,611,277 | ) | | | (1,636,740 | ) | | | 57,626 | |
| Net Assets | | $ | 76,662,918 | | | $ | 76,010,303 | | | $ | 46,723,522 | | | $ | 25,125,315 | | | $ | 2,096,064 | |
| NET ASSET VALUE PER SHARE | | | | | | | | | | | | | | | | | | | | |
| Shares Outstanding (no par value, | | | | | | | | | | | | | | | | | | | | |
| unlimited shares authorized) | | | 3,050,000 | | | | 4,300,001 | | | | 2,650,001 | | | | 1,450,001 | | | | 100,001 | |
| Net Asset Value | | $ | 25.14 | | �� | $ | 17.68 | | | $ | 17.63 | | | $ | 17.33 | | | $ | 20.96 | |
| Investments, at cost: | | $ | 84,323,973 | | | $ | 77,835,561 | | | $ | 49,466,141 | | | $ | 26,795,849 | | | $ | 2,246,889 | |
| | | | | | | | | | | | | | | | | | | | | |
|
| 1 Market value of securities on loan: | | $ | 9,383,983 | | | $ | 852,868 | | | $ | 936,945 | | | $ | 79,034 | | | $ | 206,608 | |
| 2 Cost of foreign currency: | | $ | — | | | $ | 58,386 | | | $ | 52,734 | | | $ | 1,338 | | | $ | — | |
| 3 Non-cash collateral for | | | | | | | | | | | | | | | | | | | | |
| securities on loan: | | $ | 4,789,847 | | | $ | — | | | $ | — | | | $ | 15,326 | | | $ | — | |
See notes to financial statements.
| Statements of Operations |
| For the year ended April 30, 2016 |
| | | IQ Hedge | | IQ Hedge | | IQ Hedge | | IQ Hedge | | IQ Hedge | | |
| | | Multi-Strategy | | Macro | | Market Neutral | | Long/Short | | Event-Driven | | IQ Global |
| | | Tracker ETF | | Tracker ETF | | Tracker ETF | | Tracker ETF | | Tracker ETF | | Resources ETF |
| Investment Income | | | | | | | | | | | | | | | | | | | | | | | | |
| Dividend income* | | $ | 22,260,859 | | | $ | 358,219 | | | $ | 256,553 | | | $ | 52,536 | | | $ | 68,965 | | | $ | 1,614,664 | |
| Interest income | | | — | | | | — | | | | — | | | | — | | | | — | | | | 291 | |
| Securities lending income, net | | | 1,497,898 | | | | 111,726 | | | | 14,011 | | | | 3,092 | | | | 754 | | | | 21,173 | |
| Litigation income | | | — | | | | — | | | | — | | | | — | | | | — | | | | 20,758 | |
| Total investment income | | | 23,758,757 | | | | 469,945 | | | | 270,564 | | | | 55,628 | | | | 69,719 | | | | 1,656,886 | |
| Expenses | | | | | | | | | | | | | | | | | | | | | | | | |
| Advisory fees | | | 7,952,984 | | | | 134,461 | | | | 109,944 | | | | 14,332 | | | | 14,559 | | | | 394,073 | |
| Trustee fees | | | 62,811 | | | | 1,224 | | | | 881 | | | | 121 | | | | 122 | | | | 3,610 | |
| Legal fees | | | 17,312 | | | | 335 | | | | 223 | | | | 33 | | | | 33 | | | | 1,004 | |
| Compliance fees | | | 14,299 | | | | 224 | | | | 188 | | | | 26 | | | | 26 | | | | 662 | |
| Excise tax fees | | | — | | | | — | | | | — | | | | — | | | | 483 | | | | — | |
| Miscellaneous | | | 23 | | | | 54 | | | | 54 | | | | 82 | | | | 28 | | | | 54 | |
| Total expenses | | | 8,047,429 | | | | 136,298 | | | | 111,290 | | | | 14,594 | | | | 15,251 | | | | 399,403 | |
| Net investment income (loss) | | | 15,711,328 | | | | 333,647 | | | | 159,274 | | | | 41,034 | | | | 54,468 | | | | 1,257,483 | |
| Realized and Unrealized Gain | | | | | | | | | | | | | | | | | | | | | | | | |
| (Loss) on Investments, Swap | | | | | | | | | | | | | | | | | | | | | | | | |
| Transactions, Futures Contracts | | | | | | | | | | | | | | | | | | | | | | | | |
| and Foreign Currency | | | | | | | | | | | | | | | | | | | | | | | | |
| Translations | | | | | | | | | | | | | | | | | | | | | | | | |
| Net realized gain (loss) from: | | | | | | | | | | | | | | | | | | | | | | | | |
| Investment securities | | | (52,030,298 | ) | | | (685,335 | ) | | | (441,414 | ) | | | (106,269 | ) | | | (14,389 | ) | | | (14,402,634 | ) |
| Investments in Affiliates | | | (1,407,734 | ) | | | — | | | | — | | | | — | | | | — | | | | — | |
| In-Kind redemptions | | | 7,582,432 | | | | 37,422 | | | | 147,627 | | | | — | | | | — | | | | 139,525 | |
| Affiliates In-Kind redemptions | | | 232,425 | | | | — | | | | — | | | | — | | | | — | | | | — | |
| Swap transactions | | | (14,768,117 | ) | | | 3,947 | | | | (17,962 | ) | | | (19,765 | ) | | | (7,229 | ) | | | (415,349 | ) |
| Distributions by other investment | | | | | | | | | | | | | | | | | | | | | | | | |
| companies | | | 1,189,845 | | | | 36,808 | | | | 12,841 | | | | — | | | | 22,848 | | | | — | |
| Futures contracts | | | — | | | | — | | | | — | | | | — | | | | — | | | | 291,556 | |
| Foreign currency translation | | | — | | | | — | | | | — | | | | — | | | | — | | | | (166,637 | ) |
| Net realized gain (loss) | | | (59,201,447 | ) | | | (607,158 | ) | | | (298,908 | ) | | | (126,034 | ) | | | 1,230 | | | | (14,553,539 | ) |
| Net change in net unrealized | | | | | | | | | | | | | | | | | | | | | | | | |
| appreciation (depreciation) | | | | | | | | | | | | | | | | | | | | | | | | |
| Investment securities | | | 13,020,643 | | | | (389,428 | ) | | | 129,751 | | | | 16,183 | | | | (81,764 | ) | | | 8,255,643 | |
| Futures contracts | | | — | | | | — | | | | — | | | | — | | | | — | | | | 352,790 | |
| Foreign currency translation | | | — | | | | — | | | | — | | | | — | | | | — | | | | 767 | |
| Net change in net unrealized | | | | | | | | | | | | | | | | | | | | | | | | |
| appreciation (depreciation) | | | 13,020,643 | | | | (389,428 | ) | | | 129,751 | | | | 16,183 | | | | (81,764 | ) | | | 8,609,200 | |
| Net realized and unrealized | | | | | | | | | | | | | | | | | | | | | | | | |
| gain (loss) | | | (46,180,804 | ) | | | (996,586 | ) | | | (169,157 | ) | | | (109,851 | ) | | | (80,534 | ) | | | (5,944,339 | ) |
| Net Increase (Decrease) in | | | | | | | | | | | | | | | | | | | | | | | | |
| Net Assets Resulting from | | | | | | | | | | | | �� | | | | | | | | | | | | |
| Operations | | $ | (30,469,476 | ) | | $ | (662,939 | ) | | $ | (9,883 | ) | | $ | (68,817 | ) | | $ | (26,066 | ) | | $ | (4,686,856 | ) |
| * Net of foreign taxes | | | | | | | | | | | | | | | | | | | | | | | | |
| withheld of: | | $ | — | | | $ | — | | | $ | — | | | $ | — | | | $ | — | | | $ | 99,804 | |
See notes to financial statements.
| Statements of Operations (continued) |
| For the year ended April 30, 2016 |
| | | | | | | | | | | IQ Global | | IQ Global |
| | | IQ Merger | | IQ Real | | IQ Australia | | IQ Canada | | Agribusiness | | Oil Small |
| | | Arbitrage ETF | | Return ETF | | Small Cap ETF | | Small Cap ETF | | Small Cap ETF | | Cap ETF |
| Investment Income | | | | | | | | | | | | | | | | | | | | | | | | |
| Dividend income* | | $ | 1,060,787 | | | $ | 165,730 | | | $ | 170,872 | | | $ | 186,173 | | | $ | 201,551 | | | $ | 60,306 | |
| Securities lending income, net | | | 23,615 | | | | 47,127 | | | | 4,771 | | | | 10,446 | | | | 84,788 | | | | 10,994 | |
| Litigation income | | | 10,220 | | | | — | | | | 9,251 | | | | 19,920 | | | | 8,863 | | | | 293 | |
| Total investment income | | | 1,094,622 | | | | 212,857 | | | | 184,894 | | | | 216,539 | | | | 295,202 | | | | 71,593 | |
| Expenses | | | | | | | | | | | | | | | | | | | | | | | | |
| Advisory fees | | | 971,583 | | | | 125,211 | | | | 33,879 | | | | 55,830 | | | | 98,594 | | | | 24,627 | |
| Trustee fees | | | 7,724 | | | | 1,595 | | | | 304 | | | | 527 | | | | 761 | | | | 227 | |
| Legal fees | | | 2,276 | | | | 438 | | | | 87 | | | | 152 | | | | 240 | | | | 73 | |
| Compliance fees | | | 1,768 | | | | 304 | | | | 43 | | | | 78 | | | | 42 | | | | 45 | |
| Excise tax fees | | | — | | | | — | | | | — | | | | — | | | | 462 | | | | 2,577 | |
| Miscellaneous | | | 54 | | | | 54 | | | | 54 | | | | 54 | | | | — | | | | 126 | |
| Total expenses | | | 983,405 | | | | 127,602 | | | | 34,367 | | | | 56,641 | | | | 100,099 | | | | 27,675 | |
| Net investment income (loss) | | | 111,217 | | | | 85,255 | | | | 150,527 | | | | 159,898 | | | | 195,103 | | | | 43,918 | |
| Realized and Unrealized Gain | | | | | | | | | | | | | | | | | | | | | | | | |
| (Loss) on Investments, Swap | | | | | | | | | | | | | | | | | | | | | | | | |
| Transactions, Futures Contracts | | | | | | | | | | | | | | | | | | | | | | | | |
| and Foreign Currency | | | | | | | | | | | | | | | | | | | | | | | | |
| Translations | | | | | | | | | | | | | | | | | | | | | | �� | | |
| Net realized gain (loss) from: | | | | | | | | | | | | | | | | | | | | | | | | |
| Investment securities | | | (4,805,140 | ) | | | (421,952 | ) | | | (791,836 | ) | | | (2,474,078 | ) | | | (1,331,958 | ) | | | (780,537 | ) |
| In-Kind redemptions | | | 2,094,208 | | | | 345,994 | | | | 40,222 | | | | — | | | | 201,123 | | | | (113,242 | ) |
| Swap transactions | | | 1,290,289 | | | | — | | | | — | | | | — | | | | — | | | | — | |
| Foreign currency translation | | | (51,913 | ) | | | — | | | | (4,376 | ) | | | (19,796 | ) | | | (2,413 | ) | | | 1,048 | |
| Net realized gain (loss) | | | (1,472,556 | ) | | | (75,958 | ) | | | (755,990 | ) | | | (2,493,874 | ) | | | (1,133,248 | ) | | | (892,731 | ) |
| Net change in net unrealized | | | | | | | | | | | | | | | | | | | | | | | | |
| appreciation (depreciation) | | | | | | | | | | | | | | | | | | | | | | | | |
| Investment securities | | | (1,169,283 | ) | | | 29,675 | | | | 433,847 | | | | 1,797,859 | | | | 2,151,183 | | | | (812,390 | ) |
| Foreign currency translation | | | 8 | | | | — | | | | (79 | ) | | | (362 | ) | | | 3,077 | | | | (216 | ) |
| Net change in net unrealized | | | | | | | | | | | | | | | | | | | | | | | | |
| appreciation (depreciation) | | | (1,169,275 | ) | | | 29,675 | | | | 433,768 | | | | 1,797,497 | | | | 2,154,260 | | | | (812,606 | ) |
| Net realized and unrealized | | | | | | | | | | | | | | | | | | | | | | | | |
| gain (loss) | | | (2,641,831 | ) | | | (46,283 | ) | | | (322,222 | ) | | | (696,377 | ) | | | 1,021,012 | | | | (1,705,337 | ) |
| Net Increase (Decrease) in | | | | | | | | | | | | | | | | | | | | | | | | |
| Net Assets Resulting from | | | | | | | | | | | | | | | | | | | | | | | | |
| Operations | | $ | (2,530,614 | ) | | $ | 38,972 | | | $ | (171,695 | ) | | $ | (536,479 | ) | | $ | 1,216,115 | | | $ | (1,661,419 | ) |
| * Net of foreign taxes | | | | | | | | | | | | | | | | | | | | | | | | |
| withheld of: | | $ | 11,831 | | | $ | — | | | $ | 2,906 | | | $ | 31,844 | | | $ | 16,669 | | | $ | 4,886 | |
See notes to financial statements.
| Statements of Operations (continued) |
| For the year ended April 30, 2016 |
| | | IQ U.S.
Real Estate
Small Cap ETF | | IQ 50 Percent
Hedged FTSE
International
ETF** | | IQ 50 Percent
Hedged FTSE
Europe ETF** | | IQ 50 Percent
Hedged FTSE
Japan ETF** | | IQ Leaders
GTAA
Tracker ETF*** |
| Investment Income | | | | | | | | | | | | | | | | | | | | |
| Dividend income* | | $ | 3,609,480 | | | $ | 888,120 | | | $ | 705,544 | | | $ | 423,483 | | | $ | 31,296 | |
| Interest income | | | — | | | | — | | | | 170 | | | | — | | | | | |
| Securities lending income, net | | | 30,077 | | | | 2,697 | | | | 1,933 | | | | 211 | | | | 494 | |
| Total investment income | | | 3,639,557 | | | | 890,817 | | | | 707,647 | | | | 423,694 | | | | 31,790 | |
| | | | | | | | | | | | | | | | | | | | | |
| Expenses | | | | | | | | | | | | | | | | | | | | |
| Advisory fees | | | 581,840 | | | | 101,493 | | | | 102,514 | | | | 82,459 | | | | 5,408 | |
| Trustee fees | | | 5,463 | | | | 1,186 | | | | 1,062 | | | | 878 | | | | 58 | |
| Legal fees | | | 1,534 | | | | 380 | | | | 343 | | | | 299 | | | | 32 | |
| Compliance fees | | | 1,163 | | | | 325 | | | | 271 | | | | 227 | | | | 16 | |
| Miscellaneous | | | 54 | | | | 347 | | | | 347 | | | | 347 | | | | 54 | |
| Total expenses | | | 590,054 | | | | 103,731 | | | | 104,537 | | | | 84,210 | | | | 5,568 | |
| Net investment income (loss) | | | 3,049,503 | | | | 787,086 | | | | 603,110 | | | | 339,484 | | | | 26,222 | |
| | | | | | | | | | | | | | | | | | | | | |
| Realized and Unrealized Gain (Loss) on | | | | | | | | | | | | | | | | | | | | |
| Investments, Swap Transactions, Futures | | | | | | | | | | | | | | | | | | | | |
| Contracts and Forward Foreign Currency | | | | | | | | | | | | | | | | | | | | |
| Contracts and Translations | | | | | | | | | | | | | | | | | | | | |
| Net realized gain (loss) from: | | | | | | | | | | | | | | | | | | | | |
| Investment securities | | | (1,960,813 | ) | | | (363,540 | ) | | | (307,405 | ) | | | (318,169 | ) | | | (56,093 | ) |
| In-Kind redemptions | | | (92,900 | ) | | | 122,685 | | | | 35,323 | | | | — | | | | 85,744 | |
| Swap transactions | | | — | | | | — | | | | — | | | | — | | | | (23,724 | ) |
| Distributions by other investment companies | | | — | | | | — | | | | — | | | | — | | | | 5,991 | |
| Forward foreign currency contracts and | | | | | | | | | | | | | | | | | | | | |
| translation | | | — | | | | (364,161 | ) | | | 186,571 | | | | (1,090,174 | ) | | | — | |
| Net realized gain (loss) | | | (2,053,713 | ) | | | (605,016 | ) | | | (85,511 | ) | | | (1,408,343 | ) | | | 11,918 | |
| Net change in net unrealized appreciation | | | | | | | | | | | | | | | | | | | | |
| (depreciation) | | | | | | | | | | | | | | | | | | | | |
| Investment securities | | | (3,107,461 | ) | | | (152,312 | ) | | | (1,371,552 | ) | | | (1,029,494 | ) | | | 57,626 | |
| Forward foreign currency contracts and | | | | | | | | | | | | | | | | | | | | |
| translation | | | — | | | | (482,824 | ) | | | (239,725 | ) | | | (607,246 | ) | | | — | |
| Net change in net unrealized appreciation | | | | | | | | | | | | | | | | | | | | |
| (depreciation) | | | (3,107,461 | ) | | | (635,136 | ) | | | (1,611,277 | ) | | | (1,636,740 | ) | | | 57,626 | |
| Net realized and unrealized gain (loss) | | | (5,161,174 | ) | | | (1,240,152 | ) | | | (1,696,788 | ) | | | (3,045,083 | ) | | | 69,544 | |
| Net Increase (Decrease) in Net Assets Resulting | | | | | | | | | | | | | | | | | | | | |
| from Operations | | $ | (2,111,671 | ) | | $ | (453,066 | ) | | $ | (1,093,678 | ) | | $ | (2,705,599 | ) | | $ | 95,766 | |
| | | | | | | | | | | | | | | | | | | | | |
| * Net of foreign taxes withheld of: | | $ | — | | | $ | 85,103 | | | $ | 68,361 | | | $ | 54,971 | | | $ | — | |
| ** | Commencement of operations July 22, 2015. |
| *** | Commencement of operations September 30, 2015. |
See notes to financial statements.
| Statements of Changes in Net Assets |
| | | IQ Hedge
Multi-Strategy Tracker ETF | | IQ Hedge
Macro Tracker ETF | | IQ Hedge Market
Neutral Tracker ETF |
| | | For the Year Ended April 30, | | For the Year Ended April 30, | | For the Year Ended April 30, |
| | | 2016 | | 2015 | | 2016 | | 2015 | | 2016 | | 2015 |
| Increase (Decrease) in Net | | | | | | | | | | | | | | | | | | | | | | | | |
| Assets from Operations | | | | | | | | | | | | | | | | | | | | | | | | |
| Net investment income | | $ | 15,711,328 | | | $ | 11,288,991 | | | $ | 333,647 | | | $ | 298,927 | | | $ | 159,274 | | | $ | 102,998 | |
| Net realized gain (loss) | | | (59,201,447 | ) | | | 21,282,118 | | | | (607,158 | ) | | | (940,305 | ) | | | (298,908 | ) | | | (289,990 | ) |
| Net change in net unrealized | | | | | | | | | | | | | | | | | | | | | | | | |
| appreciation (depreciation) | | | 13,020,643 | | | | 1,680,999 | | | | (389,428 | ) | | | 242,089 | | | | 129,751 | | | | 238,845 | |
| Net increase (decrease) in net | | | | | | | | | | | | | | | | | | | | | | | | |
| assets resulting from operations | | | (30,469,476 | ) | | | 34,252,108 | | | | (662,939 | ) | | | (399,289 | ) | | | (9,883 | ) | | | 51,853 | |
| Dividends and Distributions to | | | | | | | | | | | | | | | | | | | | | | | | |
| Shareholders from: | | | | | | | | | | | | | | | | | | | | | | | | |
| Net investment income | | | (5,414,930 | ) | | | (13,005,300 | ) | | | (186,676 | ) | | | (304,929 | ) | | | — | | | | (221,006 | ) |
| Total dividends and distributions | | | | | | | | | | | | | | | | | | | | | | | | |
| to shareholders | | | (5,414,930 | ) | | | (13,005,300 | ) | | | (186,676 | ) | | | (304,929 | ) | | | — | | | | (221,006 | ) |
| Capital Share Transactions | | | | | | | | | | | | | | | | | | | | | | | | |
| Proceeds from shares created | | | 464,603,240 | | | | 792,465,144 | | | | — | | | | 1,260,589 | | | | 11,333,780 | | | | 3,851,427 | |
| Cost of shares redeemed | | | (355,438,803 | ) | | | (535,715,447 | ) | | | (6,192,864 | ) | | | (5,223,810 | ) | | | (8,795,969 | ) | | | (7,664,158 | ) |
| Net increase (decrease) from | | | | | | | | | | | | | | | | | | | | | | | | |
| capital share transactions | | | 109,164,437 | | | | 256,749,697 | | | | (6,192,864 | ) | | | (3,963,221 | ) | | | 2,537,811 | | | | (3,812,731 | ) |
| Total increase (decrease) in | | | | | | | | | | | | | | | | | | | | | | | | |
| net assets | | | 73,280,031 | | | | 277,996,505 | | | | (7,042,479 | ) | | | (4,667,439 | ) | | | 2,527,928 | | | | (3,981,884 | ) |
| Net Assets | | | | | | | | | | | | | | | | | | | | | | | | |
| Beginning of year | | | 1,000,840,141 | | | | 722,843,636 | | | | 21,836,845 | | | | 26,504,284 | | | | 12,766,416 | | | | 16,748,300 | |
| End of year | | $ | 1,074,120,172 | | | $ | 1,000,840,141 | | | $ | 14,794,366 | | | $ | 21,836,845 | | | $ | 15,294,344 | | | $ | 12,766,416 | |
| Including undistributed | | | | | | | | | | | | | | | | | | | | | | | | |
| (accumulated) net investment | | | | | | | | | | | | | | | | | | | | | | | | |
| income (loss) as follows: | | $ | (2,211,670 | ) | | $ | 1,939,577 | | | $ | (244,181 | ) | | $ | (350,908 | ) | | $ | 188,313 | | | $ | (7,962 | ) |
| Changes in Shares Outstanding | | | | | | | | | | | | | | | | | | | | | | | | |
| Shares outstanding, beginning | | | | | | | | | | | | | | | | | | | | | | | | |
| of year | | | 33,350,000 | | | | 24,700,000 | | | | 850,000 | | | | 1,000,000 | | | | 500,000 | | | | 650,000 | |
| Shares created | | | 15,900,000 | | | | 26,600,000 | | | | — | | | | 50,000 | | | | 450,000 | | | | 150,000 | |
| Shares redeemed | | | (12,250,000 | ) | | | (17,950,000 | ) | | | (250,000 | ) | | | (200,000 | ) | | | (350,000 | ) | | | (300,000 | ) |
| Shares outstanding, end of year | | | 37,000,000 | | | | 33,350,000 | | | | 600,000 | | | | 850,000 | | | | 600,000 | | | | 500,000 | |
See notes to financial statements.
| Statements of Changes in Net Assets (continued) |
| | | IQ Hedge
Long/Short Tracker ETF | | IQ Hedge
Event-Driven Tracker ETF | | IQ Global
Resources ETF For the Year Ended April 30, |
| | | For the Year
Ended April 30, | | For the Period
March 24, 2015*
to April 30, | | For the Year
Ended April 30, | | For the Period
March 24, 2015*
to April 30, | |
| | | 2016 | | 2015 | | 2016 | | 2015 | | 2016 | | 2015 |
| Increase (Decrease) in Net | | | | | | | | | | | | | | | | | | | | | | | | |
| Assets from Operations | | | | | | | | | | | | | | | | | | | | | | | | |
| Net investment income | | $ | 41,034 | | | $ | 3,610 | | | $ | 54,468 | | | $ | 2,724 | | | $ | 1,257,483 | | | $ | 1,118,184 | |
| Net realized gain (loss) | | | (126,034 | ) | | | 7,314 | | | | 1,230 | | | | 4,740 | | | | (14,553,539 | ) | | | (6,814,121 | ) |
| Net change in net unrealized | | | | | | | | | | | | | | | | | | | | | | | | |
| appreciation (depreciation) | | | 16,183 | | | | (17,883 | ) | | | (81,764 | ) | | | (1,378 | ) | | | 8,609,200 | | | | (558,600 | ) |
| Net increase (decrease) in net | | | | | | | | | | | | | | | | | | | | | | | | |
| assets resulting from operations | | | (68,817 | ) | | | (6,959 | ) | | | (26,066 | ) | | | 6,086 | | | | (4,686,856 | ) | | | (6,254,537 | ) |
|
| Dividends and Distributions to | | | | | | | | | | | | | | | | | | | | | | | | |
| Shareholders from: | | | | | | | | | | | | | | | | | | | | | | | | |
| Net investment income | | | (35,914 | ) | | | — | | | | (35,251 | ) | | | — | | | | (1,098,143 | ) | | | (1,147,080 | ) |
| Total dividends and distributions | | | | | | | | | | | | | | | | | | | | | | | | |
| to shareholders | | | (35,914 | ) | | | — | | | | (35,251 | ) | | | — | | | | (1,098,143 | ) | | | (1,147,080 | ) |
|
| Capital Share Transactions | | | | | | | | | | | | | | | | | | | | | | | | |
| Proceeds from shares created | | | — | | | | 1,999,620 | | | | — | | | | 1,995,348 | | | | 20,271,481 | | | | 66,327,418 | |
| Cost of shares redeemed | | | — | | | | — | | | | — | | | | — | | | | (13,149,347 | ) | | | (77,057,048 | ) |
| Net increase (decrease) from | | | | | | | | | | | | | | | | | | | | | | | | |
| capital share transactions | | | — | | | | 1,999,620 | | | | — | | | | 1,995,348 | | | | 7,122,134 | | | | (10,729,630 | ) |
| Total increase (decrease) in net | | | | | | | | | | | | | | | | | | | | | | | | |
| assets | | | (104,731 | ) | | | 1,992,661 | | | | (61,317 | ) | | | 2,001,434 | | | | 1,337,135 | | | | (18,131,247 | ) |
|
| Net Assets | | | | | | | | | | | | | | | | | | | | | | | | |
| Beginning of year | | | 1,992,661 | | | | — | | | | 2,001,434 | | | | — | | | | 66,587,360 | | | | 84,718,607 | |
| End of year | | $ | 1,887,930 | | | $ | 1,992,661 | | | $ | 1,940,117 | | | $ | 2,001,434 | | | $ | 67,924,495 | | | $ | 66,587,360 | |
| Including undistributed | | | | | | | | | | | | | | | | | | | | | | | | |
| (accumulated) net investment | | | | | | | | | | | | | | | | | | | | | | | | |
| income (loss) as follows: | | $ | (7,433 | ) | | $ | 11,705 | | | $ | 29,292 | | | $ | 3,814 | | | $ | 675,490 | | | $ | 1,008,848 | |
|
| Changes in Shares Outstanding | | | | | | | | | | | | | | | | | | | | | | | | |
| Shares outstanding, | | | | | | | | | | | | | | | | | | | | | | | | |
| beginning of year | | | 100,001 | | | | — | | | | 100,001 | | | | — | | | | 2,450,000 | | | | 2,900,000 | |
| Shares created | | | — | | | | 100,001 | | | | — | | | | 100,001 | | | | 900,000 | | | | 2,350,000 | |
| Shares redeemed | | | — | | | | — | | | | — | | | | — | | | | (600,000 | ) | | | (2,800,000 | ) |
| Shares outstanding, end of year | | | 100,001 | | | | 100,001 | | | | 100,001 | | | | 100,001 | | | | 2,750,000 | | | | 2,450,000 | |
| * | Commencement of operations. |
See notes to financial statements.
| Statements of Changes in Net Assets (continued) |
| | | IQ Merger Arbitrage ETF | | IQ Real Return ETF | | IQ Australia
Small Cap ETF |
| | | For the Year Ended April 30, | | For the Year Ended April 30, | | For the Year Ended April 30, |
| | | 2016 | | 2015 | | 2016 | | 2015 | | 2016 | | 2015 |
| Increase (Decrease) in Net | | | | | | | | | | | | | | | | | | | | | | | | |
| Assets from Operations | | | | | | | | | | | | | | | | | | | | | | | | |
| Net investment income | | $ | 111,217 | | | $ | 99,623 | | | $ | 85,255 | | | $ | 45,990 | | | $ | 150,527 | | | $ | 232,796 | |
| Net realized gain (loss) | | | (1,472,556 | ) | | | 3,434,625 | | | | (75,958 | ) | | | 500,473 | | | | (755,990 | ) | | | (829,562 | ) |
| Net change in net unrealized | | | | | | | | | | | | | | | | | | | | | | | | |
| appreciation (depreciation) | | | (1,169,275 | ) | | | 1,483,281 | | | | 29,675 | | | | (167,593 | ) | | | 433,768 | | | | (331,268 | ) |
| Net increase (decrease) in net | | | | | | | | | | | | | | | | | | | | | | | | |
| assets resulting from operations | | | (2,530,614 | ) | | | 5,017,529 | | | | 38,972 | | | | 378,870 | | | | (171,695 | ) | | | (928,034 | ) |
| Dividends and Distributions to | | | | | | | | | | | | | | | | | | | | | | | | |
| Shareholders from: | | | | | | | | | | | | | | | | | | | | | | | | |
| Net investment income | | | (992,736 | ) | | | — | | | | (2,630 | ) | | | (24,006 | ) | | | (225,046 | ) | | | (351,608 | ) |
| Total dividends and distributions | | | | | | | | | | | | | | | | | | | | | | | | |
| to shareholders | | | (992,736 | ) | | | — | | | | (2,630 | ) | | | (24,006 | ) | | | (225,046 | ) | | | (351,608 | ) |
| Capital Share Transactions | | | | | | | | | | | | | | | | | | | | | | | | |
| Proceeds from shares created | | | 84,329,157 | | | | 116,282,725 | | | | 6,628,991 | | | | 15,983,426 | | | | 2,216,487 | | | | 1,863,266 | |
| Cost of shares redeemed | | | (62,886,075 | ) | | | (33,715,417 | ) | | | (7,969,178 | ) | | | (14,636,254 | ) | | | (701,728 | ) | | | (3,524,767 | ) |
| Net increase (decrease) from | | | | | | | | | | | | | | | | | | | | | | | | |
| capital share transactions | | | 21,443,082 | | | | 82,567,308 | | | | (1,340,187 | ) | | | 1,347,172 | | | | 1,514,759 | | | | (1,661,501 | ) |
| Total increase (decrease) | | | | | | | | | | | | | | | | | | | | | | | | |
| in net assets | | | 17,919,732 | | | | 87,584,837 | | | | (1,303,845 | ) | | | 1,702,036 | | | | 1,118,018 | | | | (2,941,143 | ) |
| Net Assets | | | | | | | | | | | | | | | | | | | | | | | | |
| Beginning of year | | | 121,447,173 | | | | 33,862,336 | | | | 28,031,042 | | | | 26,329,006 | | | | 5,707,596 | | | | 8,648,739 | |
| End of year | | $ | 139,366,905 | | | $ | 121,447,173 | | | $ | 26,727,197 | | | $ | 28,031,042 | | | $ | 6,825,614 | | | $ | 5,707,596 | |
| Including undistributed | | | | | | | | | | | | | | | | | | | | | | | | |
| (accumulated) net investment | | | | | | | | | | | | | | | | | | | | | | | | |
| income (loss) as follows: | | $ | (110,786 | ) | | $ | (995,469 | ) | | $ | (73,665 | ) | | $ | 2,300 | | | $ | 116,307 | | | $ | 191,951 | |
| Changes in Shares Outstanding | | | | | | | | | | | | | | | | | | | | | | | | |
| Shares outstanding, | | | | | | | | | | | | | | | | | | | | | | | | |
| beginning of year | | | 4,200,000 | | | | 1,250,000 | | | | 1,050,000 | | | | 1,000,000 | | | | 350,000 | | | | 450,000 | |
| Shares created | | | 2,950,000 | | | | 4,150,000 | | | | 250,000 | | | | 600,000 | | | | 150,000 | | | | 100,000 | |
| Shares redeemed | | | (2,250,000 | ) | | | (1,200,000 | ) | | | (300,000 | ) | | | (550,000 | ) | | | (50,000 | ) | | | (200,000 | ) |
| Shares outstanding, end of year | | | 4,900,000 | | | | 4,200,000 | | | | 1,000,000 | | | | 1,050,000 | | | | 450,000 | | | | 350,000 | |
See notes to financial statements.
| Statements of Changes in Net Assets (continued) |
| | | IQ Canada | | IQ Global | | IQ Global |
| | | Small Cap ETF | | Agribusiness Small Cap ETF | | Oil Small Cap ETF |
| | | For the Year Ended April 30, | | For the Year Ended April 30, | | For the Year Ended April 30, |
| | | 2016 | | 2015 | | 2016 | | 2015 | | 2016 | | 2015 |
| Increase (Decrease) in Net | | | | | | | | | | | | | | | | | | | | | | | | |
| Assets from Operations | | | | | | | | | | | | | | | | | | | | | | | | |
| Net investment income | | $ | 159,898 | | | $ | 188,021 | | | $ | 195,103 | | | $ | 218,267 | | | $ | 43,918 | | | $ | 35,385 | |
| Net realized gain (loss) | | | (2,493,874 | ) | | | (3,231,159 | ) | | | (1,133,248 | ) | | | 1,635,741 | | | | (892,731 | ) | | | (463,934 | ) |
| Net change in net unrealized | | | | | | | | | | | | | | | | | | | | | | | | |
| appreciation (depreciation) | | | 1,797,497 | | | | (1,058,823 | ) | | | 2,154,260 | | | | (1,484,479 | ) | | | (812,606 | ) | | | 378,365 | |
| Net increase (decrease) in net | | | | | | | | | | | | | | | | | | | | | | | | |
| assets resulting from operations | | | (536,479 | ) | | | (4,101,961 | ) | | | 1,216,115 | | | | 369,529 | | | | (1,661,419 | ) | | | (50,184 | ) |
| Dividends and Distributions to | | | | | | | | | | | | | | | | | | | | | | | | |
| Shareholders from: | | | | | | | | | | | | | | | | | | | | | | | | |
| Net investment income | | | (192,923 | ) | | | (106,182 | ) | | | (166,361 | ) | | | (267,937 | ) | | | (72,240 | ) | | | (28,982 | ) |
| Total dividends and distributions | | | | | | | | | | | | | | | | | | | | | | | | |
| to shareholders | | | (192,923 | ) | | | (106,182 | ) | | | (166,361 | ) | | | (267,937 | ) | | | (72,240 | ) | | | (28,982 | ) |
| Capital Share Transactions | | | | | | | | | | | | | | | | | | | | | | | | |
| Proceeds from shares created | | | 1,273,711 | | | | 5,232,999 | | | | 1,360,942 | | | | 5,217,969 | | | | — | | | | 4,209,748 | |
| Cost of shares redeemed | | | — | | | | (7,417,277 | ) | | | (3,993,142 | ) | | | (17,262,063 | ) | | | (562,900 | ) | | | (1,167,229 | ) |
| Net increase (decrease) from | | | | | | | | | | | | | | | | | | | | | | | | |
| capital share transactions | | | 1,273,711 | | | | (2,184,278 | ) | | | (2,632,200 | ) | | | (12,044,094 | ) | | | (562,900 | ) | | | 3,042,519 | |
| Total increase (decrease) in | | | | | | | | | | | | | | | | | | | | | | | | |
| net assets | | | 544,309 | | | | (6,392,421 | ) | | | (1,582,446 | ) | | | (11,942,502 | ) | | | (2,296,559 | ) | | | 2,963,353 | |
| Net Assets | | | | | | | | | | | | | | | | | | | | | | | | |
| Beginning of year | | | 10,270,079 | | | | 16,662,500 | | | | 13,629,655 | | | | 25,572,157 | | | | 5,239,554 | | | | 2,276,201 | |
| End of year | | $ | 10,814,388 | | | $ | 10,270,079 | | | $ | 12,047,209 | | | $ | 13,629,655 | | | $ | 2,942,995 | | | $ | 5,239,554 | |
| Including undistributed | | | | | | | | | | | | | | | | | | | | | | | | |
| (accumulated) net investment | | | | | | | | | | | | | | | | | | | | | | | | |
| income (loss) as follows: | | $ | 24,695 | | | $ | 31,556 | | | $ | 92,321 | | | $ | 49,653 | | | $ | 30,508 | | | $ | 9,580 | |
| Changes in Shares Outstanding | | | | | | | | | | | | | | | | | | | | | | | | |
| Shares outstanding, | | | | | | | | | | | | | | | | | | | | | | | | |
| beginning of year | | | 550,000 | | | | 700,000 | | | | 500,000 | | | | 950,000 | | | | 300,000 | | | | 100,000 | |
| Shares created | | | 100,000 | | | | 200,000 | | | | 50,000 | | | | 200,000 | | | | — | | | | 250,000 | |
| Shares redeemed | | | — | | | | (350,000 | ) | | | (150,000 | ) | | | (650,000 | ) | | | (50,000 | ) | | | (50,000 | ) |
| Shares outstanding, end of year | | | 650,000 | | | | 550,000 | | | | 400,000 | | | | 500,000 | | | | 250,000 | | | | 300,000 | |
See notes to financial statements.
| Statements of Changes in Net Assets (continued) |
| | | | | | | IQ 50
Percent
Hedged FTSE
International
ETF | | IQ 50
Percent
Hedged FTSE
Europe ETF | | IQ 50
Percent
Hedged FTSE
Japan ETF | | IQ Leaders
GTAA
Tracker ETF |
| | | IQ U.S. Real Estate
Small Cap ETF | | For the
Period
July 22,
2015* to | | For the
Period
July 22,
2015* to | | For the
Period
July 22,
2015* to | | For the
Period
September 30,
2015* to |
| | | For the Year Ended April 30, | | April 30, | | April 30, | | April 30, | | April 30, |
| | | 2016 | | 2015 | | 2016 | | 2016 | | 2016 | | 2016 |
| Increase (Decrease) in Net | | | | | | | | | | | | | | | | | | | | | | | | |
| Assets from Operations | | | | | | | | | | | | | | | | | | | | | | | | |
| Net investment income | | $ | 3,049,503 | | | $ | 2,956,885 | | | $ | 787,086 | | | $ | 603,110 | | | $ | 339,484 | | | $ | 26,222 | |
| Net realized gain (loss) | | | (2,053,713 | ) | | | 3,247,369 | | | | (605,016 | ) | | | (85,511 | ) | | | (1,408,343 | ) | | | 11,918 | |
| Net change in net unrealized | | | | | | | | | | | | | | | | | | | | | | | | |
| appreciation (depreciation) | | | (3,107,461 | ) | | | (440,574 | ) | | | (635,136 | ) | | | (1,611,277 | ) | | | (1,636,740 | ) | | | 57,626 | |
| Net increase (decrease) in net | | | | | | | | | | | | | | | | | | | | | | | | |
| assets resulting from operations | | | (2,111,671 | ) | | | 5,763,680 | | | | (453,066 | ) | | | (1,093,678 | ) | | | (2,705,599 | ) | | | 95,766 | |
| Dividends and Distributions to | | | | | | | | | | | | | | | | | | | | | | | | |
| Shareholders from: | | | | | | | | | | | | | | | | | | | | | | | | |
| Net investment income | | | (3,031,724 | ) | | | (2,917,585 | ) | | | (446,626 | ) | | | (331,580 | ) | | | — | | | | (13,810 | ) |
| Return of Capital | | | (1,905,746 | ) | | | (787,254 | ) | | | — | | | | — | | | | | | | | | |
| Total dividends and distributions | | | | | | | | | | | | | | | | | | | | | | | | |
| to shareholders | | | (4,937,470 | ) | | | (3,704,839 | ) | | | (446,626 | ) | | | (331,580 | ) | | | — | | | | (13,810 | ) |
| Capital Share Transactions | | | | | | | | | | | | | | | | | | | | | | | | |
| Proceeds from shares created | | | 1,324,154 | | | | 54,872,727 | | | | 80,525,000 | | | | 58,757,517 | | | | 27,830,914 | | | | 4,099,527 | |
| Cost of shares redeemed | | | (12,660,279 | ) | | | (14,029,231 | ) | | | (3,615,005 | ) | | | (10,608,737 | ) | | | — | | | | (2,085,419 | ) |
| Net increase (decrease) from | | | | | | | | | | | | | | | | | | | | | | | | |
| capital share transactions | | | (11,336,125 | ) | | | 40,843,496 | | | | 76,909,995 | | | | 48,148,780 | | | | 27,830,914 | | | | 2,014,108 | |
| Total increase (decrease) in | | | | | | | | | | | | | | | | | | | | | | | | |
| net assets | | | (18,385,266 | ) | | | 42,902,337 | | | | 76,010,303 | | | | 46,723,522 | | | | 25,125,315 | | | | 2,096,064 | |
| Net Assets | | | | | | | | | | | | | | | | | | | | | | | | |
| Beginning of period | | | 95,048,184 | | | | 52,145,847 | | | | — | | | | — | | | | — | | | | — | |
| End of period | | $ | 76,662,918 | | | $ | 95,048,184 | | | $ | 76,010,303 | | | $ | 46,723,522 | | | $ | 25,125,315 | | | $ | 2,096,064 | |
| Including undistributed | | | | | | | | | | | | | | | | | | | | | | | | |
| (accumulated) net investment | | | | | | | | | | | | | | | | | | | | | | | | |
| income (loss) as follows: | | $ | 55,101 | | | $ | 16,889 | | | $ | 608,564 | | | $ | 670,698 | | | $ | 355,358 | | | $ | (380 | ) |
| Changes in Shares Outstanding | | | | | | | | | | | | | | | | | | | | | | | | |
| Shares outstanding, | | | | | | | | | | | | | | | | | | | | | | | | |
| beginning of period | | | 3,550,000 | | | | 2,050,000 | | | | — | | | | — | | | | — | | | | — | |
| Shares created | | | 50,000 | | | | 2,000,000 | | | | 4,500,001 | | | | 3,250,001 | | | | 1,450,001 | | | | 200,001 | |
| Shares redeemed | | | (550,000 | ) | | | (500,000 | ) | | | (200,000 | ) | | | (600,000 | ) | | | — | | | | (100,000 | ) |
| Shares outstanding, end of period | | | 3,050,000 | | | | 3,550,000 | | | | 4,300,001 | | | | 2,650,001 | | | | 1,450,001 | | | | 100,001 | |
| * | Commencement of operations. |
See notes to financial statements.
| Financial Highlights |
| Selected Data for a Share of Capital Stock Outstanding |
| | | IQ Hedge Multi-Strategy Tracker ETF | | IQ Hedge Macro Tracker ETF |
| | | For the Year Ended April 30, | | For the Year Ended April 30, |
| | | 2016 | | 2015 | | 2014 | | 2013 | | 2012 | | 2016 | | 2015 | | 2014 | | 2013 | | 2012 |
| Net asset value, | | | | | | | | | | | | | | | | | | | | | | | | | | | | | | | | | | | | | | | | |
| beginning of period | | $ | 30.01 | | | $ | 29.26 | | | $ | 28.41 | | | $ | 27.66 | | | $ | 27.86 | | | $ | 25.69 | | | $ | 26.50 | | | $ | 26.90 | | | $ | 27.28 | | | $ | 28.30 | |
|
| | | | | | | | | | | | | | | | | | | | | | | | | | | | | | | | | | | | | | | | | |
| Income from Investment | | | | | | | | | | | | | | | | | | | | | | | | | | | | | | | | | | | | | | | | |
| Operations | | | | | | | | | | | | | | | | | | | | | | | | | | | | | | | | | | | | | | | | |
| Net investment | | | | | | | | | | | | | | | | | | | | | | | | | | | | | | | | | | | | | | | | |
| income (loss)2 | | | 0.43 | | | | 0.38 | | | | 0.33 | | | | 0.34 | | | | 0.43 | | | | 0.46 | | | | 0.32 | | | | 0.36 | | | | 0.38 | | | | 0.39 | |
| Net realized and unrealized | | | | | | | | | | | | | | | | | | | | | | | | | | | | | | | | | | | | | | | | |
| gain (loss) on investments | | | (1.30 | ) | | | 0.74 | | | | 0.88 | | | | 0.69 | | | | (0.27 | ) | | | (1.27 | ) | | | (0.79 | ) | | | (0.62 | ) | | | (0.29 | ) | | | (1.14 | ) |
| Distributions of net realized | | | | | | | | | | | | | | | | | | | | | | | | | | | | | | | | | | | | | | | | |
| gains from investments | | | | | | | | | | | | | | | | | | | | | | | | | | | | | | | | | | | | | | | | |
| in other investment | | | | | | | | | | | | | | | | | | | | | | | | | | | | | | | | | | | | | | | | |
| companies | | | 0.03 | | | | 0.02 | | | | 0.01 | | | | 0.03 | | | | 0.01 | | | | 0.05 | | | | 0.00 | 3 | | | 0.02 | | | | 0.01 | | | | 0.00 | 3 |
| Net increase (decrease) in | | | | | | | | | | | | | | | | | | | | | | | | | | | | | | | | | | | | | | | | |
| net assets resulting from | | | | | | | | | | | | | | | | | | | | | | | | | | | | | | | | | | | | | | | | |
| investment operations | | | (0.84 | ) | | | 1.14 | | | | 1.22 | | | | 1.06 | | | | 0.17 | | | | (0.76 | ) | | | (0.47 | ) | | | (0.24 | ) | | | 0.10 | | | | (0.75 | ) |
|
| Distributions from: | | | | | | | | | | | | | | | | | | | | | | | | | | | | | | | | | | | | | | | | |
| Net investment income | | | (0.14 | ) | | | (0.39 | ) | | | (0.37 | ) | | | (0.31 | ) | | | (0.37 | ) | | | (0.27 | ) | | | (0.34 | ) | | | (0.16 | ) | | | (0.48 | ) | | | (0.27 | ) |
| Total distributions from net | | | | | | | | | | | | | | | | | | | | | | | | | | | | | | | | | | | | | | | | |
| investment income | | | (0.14 | ) | | | (0.39 | ) | | | (0.37 | ) | | | (0.31 | ) | | | (0.37 | ) | | | (0.27 | ) | | | (0.34 | ) | | | (0.16 | ) | | | (0.48 | ) | | | (0.27 | ) |
|
| Net end asset of period value, | | $ | 29.03 | | | $ | 30.01 | | | $ | 29.26 | | | $ | 28.41 | | | $ | 27.66 | | | $ | 24.66 | | | $ | 25.69 | | | $ | 26.50 | | | $ | 26.90 | | | $ | 27.28 | |
| Market Price, end of period | | $ | 29.06 | | | $ | 30.00 | | | | | | | | | | | | | | | $ | 24.80 | | | $ | 25.74 | | | | | | | | | | | | | |
|
| Total Return | | | | | | | | | | | | | | | | | | | | | | | | | | | | | | | | | | | | | | | | |
| Total investment return based | | | | | | | | | | | | | | | | | | | | | | | | | | | | | | | | | | | | | | | | |
| on net asset value5 | | | (2.80 | )% | | | 3.93 | %6 | | | 4.30 | %6 | | | 3.85 | % | | | 0.65 | % | | | (2.97 | )% | | | (1.77 | )% | | | (0.90 | )% | | | 0.36 | % | | | (2.61 | )% |
| Total investment return based | | | | | | | | | | | | | | | | | | | | | | | | | | | | | | | | | | | | | | | | |
| on Market Price | | | (2.67 | )% | | | 3.79 | % | | | | | | | | | | | | | | | (2.60 | )% | | | (1.47 | )% | | | | | | | | | | | | |
|
| Ratios/Supplemental Data | | | | | | | | | | | | | | | | | | | | | | | | | | | | | | | | | | | | | | | | |
| Net assets, end of period | | | | | | | | | | | | | | | | | | | | | | | | | | | | | | | | | | | | | | | | |
| (000’s omitted) | | $ | 1,074,120 | | | $ | 1,000,840 | | | $ | 722,844 | | | $ | 383,501 | | | $ | 196,415 | | | $ | 14,794 | | | $ | 21,837 | | | $ | 26,504 | | | $ | 63,225 | | | $ | 50,476 | |
| Ratio to average net assets of: | | | | | | | | | | | | | | | | | | | | | | | | | | | | | | | | | | | | | | | | |
| Expenses7 | | | 0.76 | % | | | 0.76 | % | | | 0.75 | % | | | 0.75 | % | | | 0.75 | % | | | 0.76 | % | | | 0.75 | % | | | 0.75 | % | | | 0.75 | % | | | 0.75 | % |
| Net investment | | | | | | | | | | | | | | | | | | | | | | | | | | | | | | | | | | | | | | | | |
| income (loss) | | | 1.48 | % | | | 1.27 | % | | | 1.16 | % | | | 1.22 | % | | | 1.57 | % | | | 1.86 | % | | | 1.23 | % | | | 1.37 | % | | | 1.39 | % | | | 1.44 | % |
| Portfolio turnover rate9 | | | 312 | % | | | 81 | % | | | 119 | % | | | 159 | % | | | 90 | % | | | 99 | % | | | 101 | % | | | 58 | % | | | 146 | % | | | 108 | % |
See footnotes on page 122.
See notes to financial statements.
| Financial Highlights (continued) |
| Selected Data for a Share of Capital Stock Outstanding |
| | | IQ Hedge Market Neutral Tracker ETF | | IQ Hedge Long/Short Tracker ETF |
| | | For the Year Ended April 30, | | For the Period
October 4, 20121 | | For the
Year Ended | | For the Period
March 24, 20151 |
| | | 2016 | | 2015 | | 2014 | | to April 30, 2013 | | April 30, 2016 | | to April 30, 2015 |
| Net asset value, beginning of period | | $ | 25.53 | | | $ | 25.77 | | | $ | 25.69 | | | $ | 24.98 | | | $ | 19.93 | | | $ | 20.00 | |
|
| Income from Investment Operations | | | | | | | | | | | | | | | | | | | | | | | | |
| Net investment income (loss)2 | | | 0.27 | | | | 0.16 | | | | 0.16 | | | | 0.06 | | | | 0.41 | | | | 0.04 | |
| Net realized and unrealized gain (loss) | | | | | | | | | | | | | | | | | | | | | | | | |
| on investments | | | (0.33 | ) | | | (0.09 | ) | | | 0.12 | | | | 0.68 | | | | (1.10 | ) | | | (0.11 | ) |
| Distributions of net realized gains from | | | | | | | | | | | | | | | | | | | | | | | | |
| investments in other investment companies | | | 0.02 | | | | 0.03 | | | | 0.02 | | | | 0.03 | | | | — | | | | — | |
| Net increase (decrease) in net assets resulting | | | | | | | | | | | | | | | | | | | | | | | | |
| from investment operations | | | (0.04 | ) | | | 0.10 | | | | 0.30 | | | | 0.77 | | | | (0.69 | ) | | | (0.07 | ) |
|
| Distributions from: | | | | | | | | | | | | | | | | | | | | | | | | |
| Net investment income | | | — | | | | (0.34 | ) | | | (0.22 | ) | | | (0.06 | ) | | | (0.36 | ) | | | — | |
| Total distributions from net investment income | | | — | | | | (0.34 | ) | | | (0.22 | ) | | | (0.06 | ) | | | (0.36 | ) | | | — | |
| Net asset value, end of period | | $ | 25.49 | | | $ | 25.53 | | | $ | 25.77 | | | $ | 25.69 | | | $ | 18.88 | | | $ | 19.93 | |
| Market Price, end of period | | $ | 25.43 | | | $ | 25.50 | | | | | | | | | | | $ | 18.72 | | | $ | 20.79 | |
|
| Total Return | | | | | | | | | | | | | | | | | | | | | | | | |
| Total investment return based on net | | | | | | | | | | | | | | | | | | | | | | | | |
| asset value5 | | | (0.15 | )% | | | 0.40 | % | | | 1.17 | % | | | 3.10 | % | | | (3.46 | )% | | | (0.35 | )% |
| Total investment return based on Market Price | | | (0.27 | )% | | | 0.43 | % | | | | | | | | | | | (8.23 | )% | | | 3.95 | %10 |
| Ratios/Supplemental Data | | | | | | | | | | | | | | | | | | | | | | | | |
| Net assets, end of period (000’s omitted) | | $ | 15,294 | | | $ | 12,766 | | | $ | 16,748 | | | $ | 5,137 | | | $ | 1,888 | | | $ | 1,993 | |
| Ratio to average net assets of: | | | | | | | | | | | | | | | | | | | | | | | | |
| Expenses7 | | | 0.76 | % | | | 0.76 | % | | | 0.75 | % | | | 0.76 | %8 | | | 0.76 | % | | | 0.75 | %8 |
| Net investment income (loss) | | | 1.09 | % | | | 0.64 | % | | | 0.64 | % | | | 0.40 | %8 | | | 2.15 | % | | | 1.73 | %8 |
| Portfolio turnover rate9 | | | 135 | % | | | 101 | % | | | 51 | % | | | 29 | % | | | 94 | % | | | 4 | % |
See footnotes on page 122.
See notes to financial statements.
| Financial Highlights (continued) |
| Selected Data for a Share of Capital Stock Outstanding |
| | | IQ Hedge Event-Driven Tracker ETF | | IQ Global Resources ETF
For the Year Ended April 30, |
| | | For the
Year Ended
April 30, 2016 | | For the Period
March 24, 20151
to April 30, 2015 | | | | | | | | | | |
| | | | | For the Year Ended April 30, |
| | | | | 2016 | | 2015 | | 2014 | | 2013 | | 2012 |
| Net asset value, beginning of period | | $ | 20.01 | | | $ | 19.95 | | | $ | 27.18 | | | $ | 29.21 | | | $ | 28.50 | | | $ | 28.95 | | | $ | 33.27 | |
|
| Income from Investment Operations | | | | | | | | | | | | | | | | | | | | | | | | | | | | |
| Net investment income (loss)2 | | | 0.54 | | | | 0.02 | | | | 0.56 | | | | 0.37 | | | | 0.41 | | | | 0.40 | | | | 0.39 | |
| Net realized and unrealized gain (loss) | | | | | | | | | | | | | | | | | | | | | | | | | | | | |
| on investments | | | (1.03 | ) | | | 0.03 | | | | (2.48 | ) | | | (2.05 | ) | | | 0.61 | | | | (0.48 | ) | | | (4.17 | ) |
| Distributions of net realized gains | | | | | | | | | | | | | | | | | | | | | | | | | | | | |
| from investments in other | | | | | | | | | | | | | | | | | | | | | | | | | | | | |
| investment companies | | | 0.23 | | | | 0.01 | | | | — | | | | — | | | | — | | | | — | | | | — | |
| Net increase (decrease) in net assets resulting | | | | | | | | | | | | | | | | | | | | | | | | | | | | |
| from investment operations | | | (0.26 | ) | | | 0.06 | | | | (1.92 | ) | | | (1.68 | ) | | | 1.02 | | | | (0.08 | ) | | | (3.78 | ) |
|
| Distributions from: | | | | | | | | | | | | | | | | | | | | | | | | | | | | |
| Net investment income | | | (0.35 | ) | | | — | | | | (0.56 | ) | | | (0.35 | ) | | | (0.31 | ) | | | (0.37 | ) | | | (0.20 | ) |
| Net realized (loss) | | | — | | | | — | | | | — | | | | — | | | | — | | | | — | | | | (0.34 | ) |
| Total distributions from net investment | | | | | | | | | | | | | | | | | | | | | | | | | | | | |
| income | | | (0.35 | ) | | | — | | | | (0.56 | ) | | | (0.35 | ) | | | (0.31 | ) | | | (0.37 | ) | | | (0.54 | ) |
| Net asset value, end of period | | $ | 19.40 | | | $ | 20.01 | | | $ | 24.70 | | | $ | 27.18 | | | $ | 29.21 | | | $ | 28.50 | | | $ | 28.95 | |
| Market Price, end of period | | $ | 19.43 | | | $ | 20.00 | | | $ | 24.78 | | | $ | 27.18 | | | | | | | | | | | | | |
|
| Total Return | | | | | | | | | | | | | | | | | | | | | | | | | | | | |
| Total investment return based on net | | | | | | | | | | | | | | | | | | | | | | | | | | | | |
| asset value5 | | | (1.26 | )% | | | 0.30 | % | | | (6.71 | )%6 | | | (5.75 | )%6 | | | 3.61 | %6 | | | (0.35 | )% | | | (11.30 | )% |
| Total investment return based on | | | | | | | | | | | | | | | | | | | | | | | | | | | | |
| Market Price | | | (1.04 | )% | | | 0.25 | %10 | | | (6.41 | )% | | | (5.97 | )% | | | | | | | | | | | | |
|
| Ratios/Supplemental Data | | | | | | | | | | | | | | | | | | | | | | | | | | | | |
| Net assets, end of period (000’s omitted) | | $ | 1,940 | | | $ | 2,001 | | | $ | 67,924 | | | $ | 66,587 | | | $ | 84,719 | | | $ | 85,511 | | | $ | 68,039 | |
| Ratio to average net assets of: | | | | | | | | | | | | | | | | | | | | | | | | | | | | |
| Expenses7 | | | 0.79 | % | | | 0.75 | %8 | | | 0.76 | % | | | 0.75 | % | | | 0.75 | % | | | 0.76 | % | | | 0.75 | % |
| Net investment income (loss) | | | 2.81 | % | | | 1.31 | %8 | | | 2.39 | % | | | 1.32 | % | | | 1.45 | % | | | 1.39 | % | | | 1.31 | % |
| Portfolio turnover rate9 | | | 16 | % | | | 6 | % | | | 325 | % | | | 182 | % | | | 116 | % | | | 119 | % | | | 178 | % |
See footnotes on page 122.
See notes to financial statements.
| Financial Highlights (continued) |
| Selected Data for a Share of Capital Stock Outstanding |
| | | IQ Merger Arbitrage ETF | | IQ Real Return ETF |
| | | For the Year Ended April 30, | | For the Year Ended April 30, |
| | | 2016 | | 2015 | | 2014 | | 2013 | | 2012 | | 2016 | | 2015 | | 2014 | | 2013 | | 2012 |
| Net asset value, | | | | | | | | | | | | | | | | | | | | | | | | | | | | | | | | | | | | | | | | |
| beginning of period | | $ | 28.92 | | | $ | 27.09 | | | $ | 25.60 | | | $ | 26.02 | | | $ | 25.47 | | | $ | 26.70 | | | $ | 26.33 | | | $ | 26.50 | | | $ | 26.23 | | | $ | 25.63 | |
|
| Income from Investment | | | | | | | | | | | | | | | | | | | | | | | | | | | | | | | | | | | | | | | | |
| Operations | | | | | | | | | | | | | | | | | | | | | | | | | | | | | | | | | | | | | | | | |
| Net investment income (loss)2 | | | 0.02 | | | | 0.04 | | | | 0.03 | | | | 0.09 | | | | (0.03 | ) | | | 0.09 | | | | 0.05 | | | | 0.09 | | | | 0.06 | | | | (0.01 | ) |
| Net realized and unrealized | | | | | | | | | | | | | | | | | | | | | | | | | | | | | | | | | | | | | | | | |
| gain (loss) on investments | | | (0.25 | ) | | | 1.79 | | | | 1.72 | | | | (0.46 | ) | | | 0.58 | | | | (0.06 | ) | | | 0.35 | | | | (0.23 | ) | | | 0.23 | | | | 0.66 | |
| Net increase (decrease) in | | | | | | | | | | | | | | | | | | | | | | | | | | | | | | | | | | | | | | | | |
| net assets resulting from | | | | | | | | | | | | | | | | | | | | | | | | | | | | | | | | | | | | | | | | |
| investment operations | | | (0.23 | ) | | | 1.83 | | | | 1.75 | | | | (0.37 | ) | | | 0.55 | | | | 0.03 | | | | 0.40 | | | | (0.14 | ) | | | 0.29 | | | | 0.65 | |
|
| Distributions from: | | | | | | | | | | | | | | | | | | | | | | | | | | | | | | | | | | | | | | | | |
| Net investment income | | | (0.25 | ) | | | — | | | | (0.26 | ) | | | (0.05 | ) | | | — | | | | (0.00 | )4 | | | (0.03 | ) | | | (0.03 | ) | | | (0.02 | ) | | | — | |
| Net realized (loss) | | | — | | | | — | | | | — | | | | — | | | | — | | | | — | | | | — | | | | — | | | | — | | | | (0.05 | ) |
| Total distributions from net | | | | | | | | | | | | | | | | | | | | | | | | | | | | | | | | | | | | | | | | |
| investment income and | | | | | | | | | | | | | | | | | | | | | | | | | | | | | | | | | | | | | | | | |
| realized gains | | | (0.25 | ) | | | — | | | | (0.26 | ) | | | (0.05 | ) | | | — | | | | (0.00 | )4 | | | (0.03 | ) | | | (0.03 | ) | | | (0.02 | ) | | | (0.05 | ) |
| Net asset value, end of period | | $ | 28.44 | | | $ | 28.92 | | | $ | 27.09 | | | $ | 25.60 | | | $ | 26.02 | | | $ | 26.73 | | | $ | 26.70 | | | $ | 26.33 | | | $ | 26.50 | | | $ | 26.23 | |
| Market Price, end of period | | $ | 28.51 | | | $ | 28.97 | | | | | | | | | | | | | | | $ | 26.72 | | | $ | 26.81 | | | | | | | | | | | | | |
|
| Total Return | | | | | | | | | | | | | | | | | | | | | | | | | | | | | | | | | | | | | | | | |
| Total investment return based | | | | | | | | | | | | | | | | | | | | | | | | | | | | | | | | | | | | | | | | |
| on net asset value5 | | | (0.79 | )% | | | 6.76 | % | | | 6.88 | % | | | (1.42 | )% | | | 2.16 | % | | | 0.11 | % | | | 1.50 | % | | | (0.54 | )% | | | 1.09 | % | | | 2.56 | % |
| Total investment return based | | | | | | | | | | | | | | | | | | | | | | | | | | | | | | | | | | | | | | | | |
| on Market Price | | | (0.73 | )% | | | 6.31 | % | | | | | | | | | | | | | | | (0.32 | )% | | | 1.96 | % | | | | | | | | | | | | |
|
| Ratios/Supplemental Data | | | | | | | | | | | | | | | | | | | | | | | | | | | | | | | | | | | | | | | | |
| Net assets, end of period | | | | | | | | | | | | | | | | | | | | | | | | | | | | | | | | | | | | | | | | |
| (000’s omitted) | | $ | 139,367 | | | $ | 121,447 | | | $ | 33,862 | | | $ | 14,078 | | | $ | 26,019 | | | $ | 26,727 | | | $ | 28,031 | | | $ | 26,329 | | | $ | 60,954 | | | $ | 27,543 | |
| Ratio to average net assets of: | | | | | | | | | | | | | | | | | | | | | | | | | | | | | | | | | | | | | | | | |
| Expenses7 | | | 0.76 | % | | | 0.76 | % | | | 0.75 | % | | | 0.76 | % | | | 0.75 | % | | | 0.49 | % | | | 0.48 | % | | | 0.48 | % | | | 0.48 | % | | | 0.48 | % |
| Net investment income (loss) | | | 0.09 | % | | | 0.14 | % | | | 0.13 | % | | | 0.36 | % | | | (0.11 | )% | | | 0.33 | % | | | 0.18 | % | | | 0.36 | % | | | 0.23 | % | | | (0.05 | )% |
| Portfolio turnover rate9 | | | 272 | % | | | 447 | % | | | 353 | % | | | 374 | % | | | 365 | % | | | 109 | % | | | 91 | % | | | 45 | % | | | 72 | % | | | 62 | % |
See footnotes on page 122.
See notes to financial statements.
| Financial Highlights (continued) |
| Selected Data for a Share of Capital Stock Outstanding |
| | | IQ Australia Small Cap ETF | | IQ Canada Small Cap ETF |
| | | For the Year Ended April 30, | | For the Year Ended April 30, |
| | | 2016 | | 2015 | | 2014 | | 2013 | | 2012 | | 2016 | | 2015 | | 2014 | | 2013 | | 2012 |
| Net asset value, | | | | | | | | | | | | | | | | | | | | | | | | | | | | | | | | | | | | | | | | |
| beginning of period | | $ | 16.31 | | | $ | 19.22 | | | $ | 21.34 | | | $ | 23.25 | | | $ | 30.94 | | | $ | 18.67 | | | $ | 23.80 | | | $ | 21.31 | | | $ | 26.17 | | | $ | 35.44 | |
|
| Income from Investment | | | | | | | | | | | | | | | | | | | | | | | | | | | | | | | | | | | | | | | | |
| Operations | | | | | | | | | | | | | | | | | | | | | | | | | | | | | | | | | | | | | | | | |
| Net investment income (loss)2 | | | 0.43 | | | | 0.57 | | | | 0.53 | | | | 0.62 | | | | 0.64 | | | | 0.28 | | | | 0.27 | | | | 0.29 | | | | 0.28 | | | | 0.16 | |
| Net realized and unrealized | | | | | | | | | | | | | | | | | | | | | | | | | | | | | | | | | | | | | | | | |
| gain (loss) on investments | | | (0.93 | ) | | | (2.60 | ) | | | (1.93 | ) | | | (2.14 | ) | | | (5.71 | ) | | | (1.96 | ) | | | (5.22 | ) | | | 2.51 | | | | (4.27 | ) | | | (9.12 | ) |
| Net increase (decrease) in | | | | | | | | | | | | | | | | | | | | | | | | | | | | | | | | | | | | | | | | |
| net assets resulting from | | | | | | | | | | | | | | | | | | | | | | | | | | | | | | | | | | | | | | | | |
| investment operations | | | (0.50 | ) | | | (2.03 | ) | | | (1.40 | ) | | | (1.52 | ) | | | (5.07 | ) | | | (1.68 | ) | | | (4.95 | ) | | | 2.80 | | | | (3.99 | ) | | | (8.96 | ) |
|
| Distributions from: | | | | | | | | | | | | | | | | | | | | | | | | | | | | | | | | | | | | | | | | |
| Net investment income | | | (0.64 | ) | | | (0.88 | ) | | | (0.72 | ) | | | (0.39 | ) | | | (1.77 | ) | | | (0.35 | ) | | | (0.18 | ) | | | (0.31 | ) | | | (0.87 | ) | | | (0.31 | ) |
| Net realized (loss) | | | — | | | | — | | | | — | | | | — | | | | (0.85 | ) | | | — | | | | — | | | | — | | | | — | | | | — | |
| Total distributions from net | | | | | | | | | | | | | | | | | | | | | | | | | | | | | | | | | | | | | | | | |
| investment income and | | | | | | | | | | | | | | | | | | | | | | | | | | | | | | | | | | | | | | | | |
| realized gains | | | (0.64 | ) | | | (0.88 | ) | | | (0.72 | ) | | | (0.39 | ) | | | (2.62 | ) | | | (0.35 | ) | | | (0.18 | ) | | | (0.31 | ) | | | (0.87 | ) | | | (0.31 | ) |
| Net asset value, end of period | | $ | 15.17 | | | $ | 16.31 | | | $ | 19.22 | | | $ | 21.34 | | | $ | 23.25 | | | $ | 16.64 | | | $ | 18.67 | | | $ | 23.80 | | | $ | 21.31 | | | $ | 26.17 | |
| Market Price, end of period | | $ | 15.10 | | | $ | 16.42 | | | | | | | | | | | | | | | $ | 16.22 | | | $ | 18.63 | | | | | | | | | | | | | |
|
| Total Return | | | | | | | | | | | | | | | | | | | | | | | | | | | | | | | | | | | | | | | | |
| Total investment return based | | | | | | | | | | | | | | | | | | | | | | | | | | | | | | | | | | | | | | | | |
| on net asset value5 | | | (2.59 | )% | | | (10.43 | )% | | | (6.32 | )% | | | (6.51 | )% | | | (15.08 | )% | | | (8.29 | )% | | | (20.81 | )% | | | 13.32 | % | | | (15.49 | )% | | | (25.24 | )% |
| Total investment return based | | | | | | | | | | | | | | | | | | | | | | | | | | | | | | | | | | | | | | | | |
| on Market Price | | | (3.70 | )% | | | (9.84 | )% | | | | | | | | | | | | | | | (10.39 | )% | | | (20.71 | )% | | | | | | | | | | | | |
|
| Ratios/Supplemental Data | | | | | | | | | | | | | | | | | | | | | | | | | | | | | | | | | | | | | | | | |
| Net assets, end of period | | | | | | | | | | | | | | | | | | | | | | | | | | | | | | | | | | | | | | | | |
| (000’s omitted) | | $ | 6,826 | | | $ | 5,708 | | | $ | 8,649 | | | $ | 13,870 | | | $ | 16,277 | | | $ | 10,814 | | | $ | 10,270 | | | $ | 16,663 | | | $ | 15,981 | | | $ | 31,409 | |
| Ratio to average net assets of: | | | | | | | | | | | | | | | | | | | | | | | | | | | | | | | | | | | | | | | | |
| Expenses7 | | | 0.70 | % | | | 0.70 | % | | | 0.69 | % | | | 0.69 | % | | | 0.69 | % | | | 0.70 | % | | | 0.69 | % | | | 0.69 | % | | | 0.70 | % | | | 0.69 | % |
| Net investment income (loss) | | | 3.08 | % | | | 3.22 | % | | | 2.84 | % | | | 2.98 | % | | | 2.49 | % | | | 1.98 | % | | | 1.25 | % | | | 1.37 | % | | | 1.21 | % | | | 0.55 | % |
| Portfolio turnover rate9 | | | 40 | % | | | 36 | % | | | 31 | % | | | 29 | % | | | 42 | % | | | 27 | % | | | 33 | % | | | 38 | % | | | 41 | % | | | 37 | % |
See footnotes on page 122.
See notes to financial statements.
| Financial Highlights (continued) |
| Selected Data for a Share of Capital Stock Outstanding |
| | | IQ Global Agribusiness Small Cap ETF | | IQ Global Oil Small Cap ETF |
| | |
For the Year Ended April 30, | | For the Year Ended April 30, | | For the
Period
May 4,
20111 to
April 30,
2012 |
| | | 2016 | | 2015 | | 2014 | | 2013 | | 2012 | | 2016 | | 2015 | | 2014 | | 2013 | |
| Net asset value, | | | | | | | | | | | | | | | | | | | | |
| beginning of period | | $ | 27.26 | | | $ | 26.92 | | | $ | 26.41 | | | $ | 24.82 | | | $ | 27.42 | | | $ | 17.47 | | | $ | 22.76 | | | $ | 19.36 | | | $ | 17.58 | | | $ | 19.56 | |
|
| Income from Investment | | | | | | | | | | | | | | | | | | | | | | | | | | | | | | | | | | | | | | | | |
| Operations | | | | | | | | | | | | | | | | | | | | | | | | | | | | | | | | | | | | | | | | |
| Net investment income (loss)2 | | | 0.41 | | | | 0.31 | | | | 0.35 | | | | 0.31 | | | | 0.22 | | | | 0.17 | | | | 0.25 | | | | 0.19 | | | | 0.15 | | | | 0.21 | |
| Net realized and unrealized | | | | | | | | | | | | | | | | | | | | | | | | | | | | | | | | | | | | | | | | |
| gain (loss) on investments | | | 2.82 | | | | 0.44 | | | | 0.58 | | | | 1.64 | | | | (2.61 | ) | | | (5.58 | ) | | | (5.25 | ) | | | 3.36 | | | | 1.93 | | | | (2.07 | ) |
| Net increase (decrease) in | | | | | | | | | | | | | | | | | | | | | | | | | | | | | | | | | | | | | | | | |
| net assets resulting from | | | | | | | | | | | | | | | | | | | | | | | | | | | | | | | | | | | | | | | | |
| investment operations | | | 3.23 | | | | 0.75 | | | | 0.93 | | | | 1.95 | | | | (2.39 | ) | | | (5.41 | ) | | | (5.00 | ) | | | 3.55 | | | | 2.08 | | | | (1.86 | ) |
|
| Distributions from: | | | | | | | | | | | | | | | | | | | | | | | | | | | | | | | | | | | | | | | | |
| Net investment income | | | (0.37 | ) | | | (0.41 | ) | | | (0.42 | ) | | | (0.36 | ) | | | (0.21 | ) | | | (0.29 | ) | | | (0.29 | ) | | | (0.15 | ) | | | (0.30 | ) | | | (0.12 | ) |
| Total distributions from net | | | | | | | | | | | | | | | | | | | | | | | | | | | | | | | | | | | | | | | | |
| investment income | | | (0.37 | ) | | | (0.41 | ) | | | (0.42 | ) | | | (0.36 | ) | | | (0.21 | ) | | | (0.29 | ) | | | (0.29 | ) | | | (0.15 | ) | | | (0.30 | ) | | | (0.12 | ) |
| Net asset value, end of period | | $ | 30.12 | | | $ | 27.26 | | | $ | 26.92 | | | $ | 26.41 | | | $ | 24.82 | | | $ | 11.77 | | | $ | 17.47 | | | $ | 22.76 | | | $ | 19.36 | | | $ | 17.58 | |
| Market Price, end of period | | $ | 29.52 | | | $ | 27.27 | | | | | | | | | | | | | | | $ | 11.96 | | | $ | 17.42 | | | | | | | | | | | | | |
|
| Total Return | | | | | | | | | | | | | | | | | | | | | | | | | | | | | | | | | | | | | | | | |
| Total investment return based | | | | | | | | | | | | | | | | | | | | | | | | | | | | | | | | | | | | | | | | |
| on net asset value5 | | | 11.93 | % | | | 2.92 | % | | | 3.50 | % | | | 7.91 | % | | | (8.64 | )% | | | (30.69 | )% | | | (21.80 | )% | | | 18.44 | % | | | 12.09 | % | | | (9.40 | )% |
| Total investment return based | | | | | | | | | | | | | | | | | | | | | | | | | | | | | | | | | | | | | | | | |
| on Market Price | | | 9.66 | % | | | 3.15 | % | | | | | | | | | | | | | | | (29.39 | )% | | | (21.58 | )% | | | | | | | | | | | | |
|
| Ratios/Supplemental Data | | | | | | | | | | | | | | | | | | | | | | | | | | | | | | | | | | | | | | | | |
| Net assets, end of period | | | | | | | | | | | | | | | | | | | | | | | | | | | | | | | | | | | | | | | | |
| (000’s omitted) | | $ | 12,047 | | | $ | 13,630 | | | $ | 25,572 | | | $ | 36,977 | | | $ | 39,709 | | | $ | 2,943 | | | $ | 5,240 | | | $ | 2,276 | | | $ | 1,936 | | | $ | 2,637 | |
| Ratio to average net assets of: | | | | | | | | | | | | | | | | | | | | | | | | | | | | | | | | | | | | | | | | |
| Expenses7 | | | 0.76 | % | | | 0.76 | % | | | 0.75 | % | | | 0.75 | % | | | 0.75 | % | | | 0.84 | % | | | 0.76 | % | | | 0.76 | % | | | 0.76 | % | | | 0.75 | %8 |
| Net investment income (loss) | | | 1.48 | % | | | 1.16 | % | | | 1.29 | % | | | 1.24 | % | | | 0.89 | % | | | 1.34 | % | | | 1.41 | % | | | 0.93 | % | | | 0.86 | % | | | 1.22 | %8 |
| Portfolio turnover rate9 | | | 31 | % | | | 33 | % | | | 25 | % | | | 17 | % | | | 26 | % | | | 52 | % | | | 58 | % | | | 42 | % | | | 30 | % | | | 10 | % |
See footnotes on page 122.
See notes to financial statements.
| Financial Highlights (continued) |
| Selected Data for a Share of Capital Stock Outstanding |
| | | IQ U.S. Real Estate Small Cap ETF |
| | | For the Year Ended April 30, | | For the Period
June 13, 20111
to April 30, 2012 |
| | | 2016 | | 2015 | | 2014 | | 2013 | |
| Net asset value, beginning of period | | $ | 26.77 | | | $ | 25.44 | | | $ | 27.07 | | | $ | 20.42 | | | $ | 19.91 | |
|
| Income from Investment Operations | | | | | | | | | | | | | | | | | | | | |
| Net investment income (loss)2 | | | 0.90 | | | | 1.07 | | | | 1.22 | | | | 0.83 | | | | 0.73 | |
Net realized and unrealized gain (loss)
on investments | | | (1.09 | ) | | | 1.57 | | | | (0.96 | ) | | | 7.00 | | | | 0.37 | |
Net increase (decrease) in net assets
resulting from investment operations | | | (0.19 | ) | | | 2.64 | | | | 0.26 | | | | 7.83 | | | | 1.10 | |
|
| Distributions from: | | | | | | | | | | | | | | | | | | | | |
| Net investment income | | | (0.88 | ) | | | (1.04 | ) | | | (1.24 | ) | | | (1.18 | ) | | | (0.59 | ) |
| Return of capital | | | (0.56 | ) | | | (0.27 | ) | | | (0.65 | ) | | | — | | | | — | |
Total distributions from net investment
income and return of capital | | | (1.44 | ) | | | (1.31 | ) | | | (1.89 | ) | | | (1.18 | ) | | | (0.59 | ) |
| Net asset value, end of period | | $ | 25.14 | | | $ | 26.77 | | | $ | 25.44 | | | $ | 27.07 | | | $ | 20.42 | |
| Market Price, end of period | | $ | 25.10 | | | $ | 26.82 | | | | | | | | | | | | | |
|
| Total Return | | | | | | | | | | | | | | | | | | | | |
Total investment return based on net
asset value5 | | | (0.51 | )% | | | 10.44 | % | | | 1.65 | % | | | 39.85 | % | | | 6.05 | % |
Total investment return based on
Market Price | | | (0.83 | )% | | | 10.51 | % | | | | | | | | | | | | |
|
| Ratios/Supplemental Data | | | | | | | | | | | | | | | | | | | | |
| Net assets, end of period (000’s omitted) | | $ | 76,663 | | | $ | 95,048 | | | $ | 52,146 | | | $ | 58,192 | | | $ | 32,669 | |
| Ratio to average net assets of: | | | | | | | | | | | | | | | | | | | | |
| Expenses7 | | | 0.70 | % | | | 0.69 | % | | | 0.69 | % | | | 0.69 | % | | | 0.69 | %8 |
| Net investment income (loss) | | | 3.62 | % | | | 3.97 | % | | | 4.91 | % | | | 3.70 | % | | | 4.43 | %8 |
| Portfolio turnover rate9 | | | 28 | % | | | 17 | % | | | 35 | % | | | 16 | % | | | 11 | % |
See footnotes on page 122.
See notes to financial statements.
| Financial Highlights (continued) |
| Selected Data for a Share of Capital Stock Outstanding |
| | | IQ 50 Percent
Hedged FTSE
International ETF | | IQ 50 Percent
Hedged FTSE
Europe ETF | | IQ 50 Percent
Hedged FTSE
Japan ETF | | IQ Leaders GTAA
Tracker ETF |
| | | For the Period
July 22, 20151
to April 30, 2016 | | For the Period
July 22, 20151
to April 30, 2016 | | For the Period
July 22, 20151
to April 30, 2016 | | For the Period
September 30, 20151
to April 30, 2016 |
| Net asset value, beginning of period | | $ | 19.94 | | | $ | 19.90 | | | $ | 20.16 | | | $ | 20.00 | |
|
| Income from Investment Operations | | | | | | | | | | | | | | | | |
| Net investment income (loss)2 | | | 0.37 | | | | 0.36 | | | | 0.27 | | | | 0.26 | |
| Net realized and unrealized gain (loss) on investments | | | (2.42 | ) | | | (2.41 | ) | | | (3.10 | ) | | | 0.78 | |
| Distributions of net realized gains from investments in | | | | | | | | | | | | | | | | |
| other investment companies | | | — | | | | — | | | | — | | | | 0.06 | |
| Net increase (decrease) in net assets resulting from | | | | | | | | | | | | | | | | |
| investment operations | | | (2.05 | ) | | | (2.05 | ) | | | (2.83 | ) | | | 1.10 | |
|
| Distributions from: | | | | | | | | | | | | | | | | |
| Net investment income | | | (0.21 | ) | | | (0.22 | ) | | | — | | | | (0.14 | ) |
| Total distributions from net investment income | | | (0.21 | ) | | | (0.22 | ) | | | — | | | | (0.14 | ) |
| Net asset value, end of period | | $ | 17.68 | | | $ | 17.63 | | | $ | 17.33 | | | $ | 20.96 | |
| Market Price, end of period | | $ | 17.59 | | | $ | 17.82 | | | $ | 17.83 | | | $ | 20.21 | |
|
| Total Return | | | | | | | | | | | | | | | | |
| Total investment return based on net asset value5 | | | (10.33 | )% | | | (10.33 | )% | | | (14.05 | )% | | | 5.50 | % |
| Total investment return based on Market Price | | | (10.77 | )%10 | | | (9.38 | )%10 | | | (11.56 | )%10 | | | 1.72 | %10 |
|
| Ratios/Supplemental Data | | | | | | | | | | | | | | | | |
| Net assets, end of period (000’s omitted) | | $ | 76,010 | | | $ | 46,724 | | | $ | 25,125 | | | $ | 2,096 | |
| Ratio to average net assets of: | | | | | | | | | | | | | | | | |
| Expenses7 | | | 0.36 | %8 | | | 0.46 | %8 | | | 0.46 | %8 | | | 0.46 | %8 |
| Net investment income (loss) | | | 2.71 | %8 | | | 2.65 | %8 | | | 1.85 | %8 | | | 2.18 | %8 |
| Portfolio turnover rate9 | | | 7 | % | | | 10 | % | | | 11 | % | | | 116 | % |
| 1 | Commencement of operations. |
| 2 | Based on average shares outstanding. |
| 3 | Less than $0.005 per share. |
| 4 | Greater than $(0.005) per share. |
| 5 | Total investment return is calculated assuming an initial investment made at the net asset value at the beginning of the period, reinvestment of all dividends and distributions, if any, at net asset value during the period, and redemption on the last day of the period. Total return calculated for a period less than one year is not annualized. |
| 6 | Includes adjustments in accordance with accounting principles generally accepted in the United States of America and as such, the net asset values for financial reporting purposes and the returns based upon those net asset values may differ from the net asset values and returns for shareholder transactions. |
| 7 | Excludes expenses incurred by the underlying investments in other funds. |
| 9 | Portfolio turnover rate is not annualized and excludes the value of portfolio securities received or delivered as in-kind creations or redemptions in connection with the Fund’s capital share transactions. |
| 10 | Since the shares of the Funds did not trade in the secondary market until the day after the Fund’s inception, for the period from inception to the first day of secondary market trading, the NAV is used as a proxy for the secondary market trading price to calculate market returns. |
See notes to financial statements.
| Notes to Financial Statements |
| April 30, 2016 |
1. ORGANIZATION
IndexIQ ETF Trust (the “Trust”) was organized as a Delaware statutory trust on July 1, 2008 and is registered with the Securities and Exchange Commission (“SEC”) as an open-end, management investment company, as defined by the Investment Company Act of 1940, as amended (the “1940 Act”). The Trust is currently comprised of seventeen operational funds (collectively, the “Funds” and each individually, a “Fund”). Each Fund is classified as diversified under the 1940 Act, except for the IQ Merger Arbitrage ETF, IQ Global Resources ETF, IQ Australia Small Cap ETF, IQ Canada Small Cap ETF, IQ Global Agribusiness Small Cap ETF, IQ Global Oil Small Cap ETF, IQ U.S. Real Estate Small Cap ETF, IQ 50 Percent Hedged FTSE International ETF, IQ 50 Percent Hedged FTSE Europe ETF, IQ 50 Percent Hedged FTSE Japan ETF and the IQ Leaders GTAA Tracker ETF which are classified as a “non-diversified”. The Funds are exchange-traded funds (“ETFs”), whose shares are listed on a stock exchange and traded like equity securities at market prices.
| Funds | Commencement of
Operation Date |
| IQ Hedge Multi-Strategy Tracker ETF | March 24, 2009 |
| IQ Hedge Macro Tracker ETF | June 8, 2009 |
| IQ Hedge Market Neutral Tracker ETF | October 4, 2012 |
| IQ Hedge Long/Short Tracker ETF and IQ Hedge Event-Driven Tracker ETF | March 24, 2015 |
| IQ Real Return ETF and IQ Global Resources ETF | October 26, 2009 |
| IQ Merger Arbitrage ETF | November 16, 2009 |
| IQ Australia Small Cap ETF and IQ Canada Small Cap ETF | March 22, 2010 |
| IQ Global Agribusiness Small Cap ETF | March 21, 2011 |
| IQ Global Oil Small Cap ETF | May 4, 2011 |
| IQ U.S. Real Estate Small Cap ETF | June 13, 2011 |
| IQ 50 Percent Hedged FTSE International ETF, IQ 50 Percent Hedged FTSE Europe ETF, | |
| and IQ 50 Percent Hedged FTSE Japan ETF | July 22, 2015 |
| IQ Leaders GTAA Tracker ETF | September 30, 2015 |
Each Fund’s investment objective is to seek daily investment results, before fees and expenses that correspond to the performance of a particular index (the Underlying Index). The underlying indices for the Funds are listed below:
| Funds | Underlying Index |
| IQ Hedge Multi-Strategy Tracker ETF | IQ Hedge Multi-Strategy Index |
| IQ Hedge Macro Tracker ETF | IQ Hedge Macro Index |
| IQ Hedge Market Neutral Tracker ETF | IQ Hedge Market Neutral Index |
| IQ Hedge Long/Short Tracker ETF | IQ Hedge Long/Short Index |
| IQ Hedge Event-Driven Tracker ETF | IQ Hedge Event-Driven Index |
| IQ Global Resources ETF | IQ Global Resources Index |
| IQ Merger Arbitrage ETF | IQ Merger Arbitrage Index |
| IQ Real Return ETF | IQ Real Return Index |
| IQ Australia Small Cap ETF | IQ Australia Small Cap Index |
| IQ Canada Small Cap ETF | IQ Canada Small Cap Index |
| IQ Global Agribusiness Small Cap ETF | IQ Global Agribusiness Small Cap Index |
| IQ Global Oil Small Cap ETF | IQ Global Oil Small Cap Index |
| IQ U.S. Real Estate Small Cap ETF | IQ U.S. Real Estate Small Cap Index |
| IQ 50 Percent Hedged FTSE International ETF | FTSE Developed ex North America 50% Hedged to USD Index |
| IQ 50 Percent Hedged FTSE Europe ETF | FTSE Developed Europe 50% Hedged to USD Index |
| IQ 50 Percent Hedged FTSE Japan ETF | FTSE Japan 50% Hedged to USD Index |
| IQ Leaders GTAA Tracker ETF | IQ Leaders GTAA Index |
2. SIGNIFICANT ACCOUNTING POLICIES
Each Fund is an investment company and accordingly follows the investment company accounting and reporting guidance of the Financial Account Standards Board (FASB) Accounting Standard Codification Topic 946 Financial Services — Investment Companies. Each Fund prepares its financial statements in accordance with generally accepted accounting principles (“GAAP”) in the United States of America and follows the significant accounting policies described below.
| Notes to Financial Statements (continued) |
| April 30, 2016 |
Use of Estimates
Management makes certain estimates and assumptions that affect the reported amounts of assets and liabilities and disclosure of contingent assets and liabilities at the date of the financial statements and reported amounts of increases and decreases in the net assets from operations during the reporting period. Actual results could differ from those estimates.
Indemnification
In the normal course of business, the Funds may enter into contracts that contain a variety of representations which provide general indemnifications for certain liabilities. Each Fund’s maximum exposure under these arrangements is unknown as this would involve future claims that may be made against the Funds that have not yet occurred. However, the Funds have not had prior claims or losses pursuant to these contracts and expect the risk of loss to be remote. Under the Trust’s organizational documents, its officers and trustees are indemnified against certain liabilities that may arise out of performance of their duties to the Trust. Additionally, in the normal course of business, the Funds enter into contracts with third party service providers that contain a variety of representations and warranties and which may provide general indemnifications.
Investment Valuation
Each Fund issues and redeems Shares on a continuous basis at NAV only in large blocks of shares called “Creation Units.” A Creation Unit consists of 50,000 Shares. The net asset value (“NAV”) of the Shares of the Fund will be equal to the Fund’s total assets minus the Fund’s total liabilities divided by the total number of shares outstanding. The NAV that is published will be rounded to the nearest cent; however, for purposes of determining the price of Creation Units, the NAV will be calculated to five decimal places. For purposes of calculating NAV, portfolio securities and other assets for which market quotations are readily available will be valued at market value. Market value will generally be determined on the basis of last reported sales prices, or if no sales are reported, based on quotes obtained from a quotation reporting system, established market makers, or pricing services.
In calculating NAV, the Fund’s exchange-traded Equity Securities will be valued at market value, which will generally be determined using the last reported official closing or last trading price on the exchange or market on which the security is primarily traded at the time of valuation or, if no sale has occurred, at the last quoted mid-price on the primary market or exchange on which they are traded. Investment company securities (other than ETFs) will be valued at NAV.
Securities listed on the NASDAQ Stock Market, Inc. are generally valued at the NASDAQ official closing price.
Unsponsored depositary receipts will be valued at the last quoted mid-price. Debt Securities will be valued using market quotations when available or other equivalent indications of value provided by an independent third-party pricing service. Short-term Debt Instruments having a remaining maturity of 60 days or less are generally valued at amortized cost, which approximates market value. Due to the inherent uncertainty of valuations, fair values may differ significantly from the values that would have been used had an active market existed. Fair valuation could result in a different NAV than a NAV determined by using market quotes.
A swap on an exchange-listed security or securities is valued based on the last reported sale price of the swap’s underlying security or securities on the exchange where the security or securities is primarily traded, or if no sale price is available, at the mid-price of the security or securities underlying the swap on the exchange where the security is primarily traded. A swap on an index is valued based on the publicly available index price. The index price, in turn, is determined by the applicable index calculation agent, which generally values the securities underlying the index at the last reported sale price.
Futures contracts generally will be valued at the settlement or closing price determined by the applicable exchange. Exchange-traded option contracts, including options, futures and swaps, will be valued at their most recent sale price. If no such sales are reported, these contracts will be valued at their last traded price.
Over-the counter (“OTC”) traded Financial Instruments, including OTC-traded options, forwards and currency-related derivatives, will normally be valued on the basis of quotes obtained from a third party broker-dealer who makes markets in such securities or on the basis of quotes obtained from an independent third-party pricing service.
Foreign securities and instruments will be valued in their local currency following the methodologies described above. Foreign securities, instruments and currencies will be translated to U.S. dollars, based on foreign currency exchange rate quotations supplied by the London Stock Exchange.
| Notes to Financial Statements (continued) |
| April 30, 2016 |
When market quotations are not readily available, or deemed unreliable or do not reflect material events occurring between the close of local markets and the time of valuation, investments will be valued using fair value pricing as determined in good faith by the Advisor under procedures established by and under the general supervision and responsibility of the Trust’s Board of Trustees (the “Board”). According to the Registration Statement, the NAV will be calculated by The Bank of New York Mellon the (“Administrator”) and determined each Business Day as of the close of regular trading on the Exchange (ordinarily 4:00 PM, Eastern Time). The Shares of the Fund will not be priced on days on which the Exchange is closed for trading.
Each Fund automatically sweeps uninvested cash balances into a money market fund, the Morgan Stanley Institutional Liquidity Funds — Treasury Portfolio — Institutional Class. The Morgan Stanley Institutional Liquidity Funds — Treasury Portfolio seeks preservation of capital, daily liquidity and maximum current income. The Morgan Stanley Institutional Liquidity Funds — Treasury Portfolio has no redemption restriction and is valued at the daily NAV.
Under normal conditions, each Fund invests cash collateral from securities lending activities into Dreyfus Government Cash Management Fund. The Dreyfus Government Cash Management’s investment objective is to maximize current income to the extent consistent with the preservation of capital and the maintenance of liquidity. Dreyfus Government Cash Management has no redemption restrictions and is valued at the daily NAV.
Fair Value Measurement
Accounting Standards Codification (“ASC”) Topic 820, Fair Value Measurements and Disclosures defines fair value, establishes a framework for measuring fair value in accordance with U.S. GAAP, and requires disclosure about fair value measurements. It also provides guidance on determining when there has been a significant decrease in the volume and level of activity for an asset or liability, when a transaction is not orderly, and how that information must be incorporated into fair value measurement. Under ASC 820, various inputs are used in determining the value of the Funds’ investments. These inputs are summarized in the following hierarchy:
| • | | Level 1 — Unadjusted quoted prices in active markets for identical assets or liabilities that the Funds have the ability to access. |
| • | | Level 2 — Observable inputs other than quoted prices included in Level 1 that are observable for the asset or liability, either directly or indirectly. These inputs may include quoted prices for the identical instrument on an inactive market, prices for similar securities, interest rates, prepayment speeds, credit risk, yield curves, default rates and similar data. |
| • | | Level 3 — Unobservable inputs for the asset or liability, to the extent relevant observable inputs are not available; representing the Funds’ own assumptions about the assumptions a market participant would use in valuing the asset or liability, and would be based on the best information available. |
A financial instrument’s level within the fair value hierarchy is based on the lowest level of any input that is significant to the fair value measurement. The inputs or methodology used for valuing instruments are not necessarily an indication of the risk associated with investing in those instruments.
The availability of observable inputs can vary from security to security and is affected by a wide variety of factors, including, for example, the type of security, whether the security is new and not yet established in the marketplace, the liquidity of markets, and other characteristics particular to the security. To the extent that valuation is based on models or inputs that are less observable or unobservable in the market, the determination of fair value requires more judgment. Accordingly, the degree of judgment exercised in determining fair value is greatest for instruments categorized in Level 3. With respect to the valuation of Level 3 securities, IndexIQ Advisors LLC (the “Advisor”) may employ a market-based valuation approach which may use related or comparable securities, recent transactions, market multiples, book values, and other relevant information to determine fair value. The Advisor may also use an income-based valuation approach in which anticipated future cash flows of the financial instrument are discounted to calculate fair value. The Advisor representatives meet regularly to review and discuss the appropriateness of such fair values using more current information such as, recent security news, recent market transactions, updated corporate action information and/or other macro or security specific events.
All other securities and investments for which market values are not readily available, including restricted securities, and those securities for which it is inappropriate to determine prices in accordance with the aforementioned procedures, are valued at fair value as determined in good faith under procedures adopted
| Notes to Financial Statements (continued) |
| April 30, 2016 |
by the Board, although the actual calculations may be done by others. Factors considered in making this determination may include, but are not limited to, information obtained by contacting the issuer, analysts, or the appropriate stock exchange (for exchange-traded securities), analysis of the issuer’s financial statements or other available documents and, if necessary, available information concerning other securities in similar circumstances.
The inputs or methodology used for valuing securities are not necessarily an indication of the risk associated with investing in those securities. The hierarchy classification of inputs used to value each Fund’s investments at April 30, 2016 is disclosed at the end of each Fund’s Schedule of Investments.
Tax Information, Dividends and Distributions to Shareholders and Uncertain Tax Positions
Each Fund is treated as a separate entity for federal income tax purposes. Each Fund’s policy is to comply with the requirements of the Internal Revenue Code of 1986, as amended (the “Internal Revenue Code”), applicable to regulated investment companies and to distribute all of the taxable income to the shareholders of the Fund within the allowable time limits. Distributions to Shareholders are recorded on the ex-dividend date. In addition, the Funds may determine to distribute at least annually amounts representing the full dividend yield net of expenses on the underlying investment securities, as if the Funds owned the underlying investment securities for the entire dividend period in which case some portion of each distribution may result in a return of capital. The amount of dividends and distributions from net investment income and net realized capital gains are determined in accordance with Federal income tax regulations which may differ from GAAP. These “book/tax” differences are either considered temporary or permanent in nature. To the extent these differences are permanent in nature, such amounts are reclassified within the components of net assets based on their Federal tax basis treatment; temporary differences do not require reclassification. Dividends and distributions, which exceed that earnings and profit for tax purposes are reported as a tax return of capital. Therefore, no federal, state and local income tax provisions are required.
Management evaluates each Fund’s tax positions to determine if the tax positions taken meet the minimum recognition threshold in connection with accounting for uncertainties in income tax positions taken or expected to be taken for the purposes of measuring and recognizing tax liabilities in the financial statements. Recognition of tax benefits of an uncertain tax position is required only when the position is “more likely than not” to be sustained assuming examination by taxing authorities. Management has analyzed each Fund’s tax positions taken on federal, state and local income tax returns for all open tax years (for up to three tax years), and has concluded that no provisions for federal, state and local income tax are required in each Fund’s financial statements. Each Fund’s federal, state and local income and federal excise tax returns for tax years for which the applicable statutes of limitations have not expired are subject to examination by the Internal Revenue Service and state and local departments of revenue.
Foreign Taxes
The Funds may be subject to foreign taxes on income and other transaction-based taxes imposed by certain countries in which they invest. A portion of the taxes on gains on investments or currency purchases/repatriation may be recoverable. The Funds will accrue such taxes and recoveries as applicable, based upon their current interpretation of tax rules and regulations that exist in the markets in which they invest.
The Funds may be subject to taxation on realized capital gains, repatriation proceeds and other transaction-based taxes imposed by certain countries in which they invest. The Funds will accrue the unrecoverable portion of such taxes as applicable based upon their current interpretation of tax rules and regulations that exist in the market in which they invests. Capital gains taxes relating to positions still held are reflected as a liability on the Statement of Assets and Liabilities, as well as an adjustment to the Funds’ net unrealized appreciation (depreciation). Taxes related to capital gains realized during the year ended April 30, 2016, if any, are reflected as part of net realized gain (loss) in the Statement of Operations. Changes in tax liabilities related to capital gains taxes on unrealized investment gains, if any, are reflected as part of the change in net unrealized appreciation (depreciation) on investments in the Statement of Operations. Transaction-based charges are generally assessed as a percentage of the transaction amount.
| Notes to Financial Statements (continued) |
| April 30, 2016 |
Cash Equivalents
Cash equivalents consist of highly liquid investments, with maturities of three months or less when acquired, and are disclosed as Short-Term Investments in the Schedules of Investments.
Security Transactions
Security transactions are recorded as of the trade date. Realized gains and losses on sales of investment securities are calculated using the identified cost method.
Foreign Currency Translation
The books and records of the Funds are maintained in U.S. dollars. Foreign currency amounts are translated into U.S. dollars at the prevailing exchange rates of such currencies against the U.S. dollar. The market value of investment securities and other assets and liabilities are translated at the exchange rate as of the valuation date. Purchases and sales of investment securities, income and expenses are translated at the exchange rate prevailing on the respective dates of such transactions.
Although the net assets of the Funds are presented at the foreign exchange rates and market values at the close of the period, the Funds do not isolate that portion of the results of operations arising as a result of changes in the foreign exchange rates from the fluctuations arising from changes in the market prices of securities held or sold during the period. Accordingly, such foreign currency gains/(losses) are included in the reported net realized and unrealized gains/(losses) on investment transactions.
Reported realized foreign currency gains or losses arise from the disposition of foreign currency, currency gains or losses realized between the trade and settlement dates on securities transactions, and the difference between the amounts of dividends, interest and foreign withholding taxes recorded on each Fund’s books on the transaction date and the U.S. dollar equivalent of the amounts actually received or paid. Unrealized foreign exchange gains and losses arise from changes (due to the changes in the exchange rate) in the value of foreign currency and other assets and liabilities denominated in foreign currencies, which are held at period end.
Securities Lending
The Bank of New York Mellon serves as the Funds’ securities lending agent. The Funds may lend portfolio securities to certain creditworthy borrowers, including the Funds’ securities lending agent. It is the Funds’ policy that, at origination, all loans are secured by collateral of at least 102% of the value of U.S. securities loaned and 105% of the value of foreign securities loaned. Collateral in the form of cash and/or high grade debt obligations, equivalent to at least 100% of the market value of securities loaned, is maintained at all times. Cash collateral can be invested in certain money market mutual funds which also have exposure to the fluctuations of the market. Each Fund receives compensation for lending its securities from interest or dividends earned on the cash or U.S. government securities held as collateral, net of fee rebates paid to the borrower plus reasonable administrative and custody fees. The dividend and interest income earned on the securities loaned is accounted for in the same manner as other dividend and interest income. The borrower pays to the Funds an amount equal to any dividends or interest received on loaned securities. Lending portfolio securities could result in a loss or delay in recovering the Funds’ securities if the borrower defaults.
A Fund’s security lending activities are governed by a Securities Lending Authorization Agreement (“Lending Agreement”) between the Fund and the lending agent. The Lending Agreement authorizes the lending agent to lend qualifying U.S. and foreign securities held by a Fund to approved borrowers (each a “Borrower”). To mitigate borrower risk, a Fund typically receives from a Borrower, collateral in the form of U.S. dollar cash and/or securities issued or guaranteed by the U.S. Government or its agencies in excess of the market value of the securities loaned. Under the provisions of the Lending Agreement, a Fund shall have, as to the collateral, all of the rights and remedies of a secured party under applicable law. A Fund is exposed to risk of loss if a Borrower defaults on its obligation to return borrowed securities and the value of the collateral a Fund received is insufficient to cover the market value of the securities loaned. Also, the lending agent is permitted to invest the cash collateral it receives from a Borrower into a money market fund which is subject to market fluctuation. Therefore, a Fund is exposed to risk of loss if the value of invested cash collateral is insufficient to satisfy the Fund’s obligation to return the full amount owed to such Borrower.
In accordance with the securities lending agreement between the Funds and the Bank of New York Mellon, the Funds will be the indemnified by the Bank of New York Mellon in the event of default of a Borrower.
| Notes to Financial Statements (continued) |
| April 30, 2016 |
The securities lending income earned by each Fund is disclosed on the Statements of Operations. The value of loaned securities and related collateral outstanding at April 30, 2016 are shown on a gross basis in the Schedules of Investments and Statements of Assets and Liabilities.
Master Netting Arrangements
In order to better define its contractual rights and to secure rights that will help a Fund mitigate its counterparty risk, a Fund may enter into an International Swaps and Derivatives Association, Inc. Master Agreement (“ISDA Master Agreement”) or similar agreement with its counterparties. An ISDA Master Agreement is a bilateral agreement between a Fund and a counterparty that governs over-the-counter derivatives (“OTC”), including Forward Contracts, and typically contains, among other things, collateral posting terms, netting and rights of set-off provisions in the event of a default and/or termination event. Generally, the amount of collateral due from or to counterparty must exceed a minimum transfer amount threshold before a transfer is required to be made. To the extent amounts due to a Fund from its derivatives counterparties are not fully collateralized, contractually or otherwise, the Fund bears the risk of loss from counterparty non-performance.
For financial reporting purposes, the Funds do not offset assets and liabilities subject to master netting arrangements or similar arrangements in the Statements of Assets and Liabilities. Therefore, all qualifying transactions are presented on a gross basis in the Statements of Assets and Liabilities.
Total Return Swap contracts are valued at the unrealized appreciation/depreciation on total return swap contracts of the instrument. Securities segregated as collateral for swap contracts are footnoted within each Fund’s Schedule of Investments and the cash collateral is noted at the end of each Fund’s swap table.
At April 30, 2016 the unrealized appreciation/depreciation on total return swap contracts for the following funds were zero, reflecting a reset date at period end based on the contractual agreement with Morgan Stanley Capital Service LLC (“Morgan Stanley”), each Fund’s counterparty.
IQ Hedge Multi-Strategy Tracker ETF
IQ Hedge Macro Tracker ETF
IQ Hedge Market Neutral Tracker ETF
IQ Hedge Long/Short Tracker ETF
IQ Hedge Event-Driven Tracker ETF
IQ Global Resources ETF
IQ Merger Arbitrage ETF
IQ Leaders GTAA Tracker ETF
| Notes to Financial Statements (continued) |
| April 30, 2016 |
As of April 30, 2016, the impact of netting of assets and liabilities and offsetting of collateral pledged or received based on contractual netting provisions in the Lending Agreement with the Bank of New York Mellon are detailed in the following table:
| | | Assets | | Liabilities |
| | | Gross Amounts | | | | | | Gross Amounts | | | | |
| | | Presented in | | | | | | Presented in | | | | |
| | | Statements of | | | | | | Statements of | | | | |
| | | Assets and | | Collateral | | | | Assets and | | Collateral | | |
| Fund | | Liabilities | | Received | | Net Amount | | Liabilities | | Pledged | | Net Amount |
| IQ Hedge Multi-Strategy | | | | | | | | | | | | | | | | | | | | | | | | |
| Tracker ETF | | $ | 125,659,626 | | | $ | (125,659,626 | )1 | | $ | — | | | $ | — | | | $ | — | | | $ | — | |
| IQ Hedge Macro | | | | | | | | | | | | | | | | | | | | | | | | |
| Tracker ETF | | | 3,132,960 | | | | (3,132,960 | )1 | | | — | | | | — | | | | — | | | | — | |
| IQ Hedge Market Neutral | | | | | | | | | | | | | | | | | | | | | | | | |
| Tracker ETF | | | 30,602 | | | | (30,602 | )1 | | | — | | | | — | | | | — | | | | — | |
| IQ Hedge Long/Short | | | | | | | | | | | | | | | | | | | | | | | | |
| Tracker ETF | | | 202,322 | | | | (202,322 | )1 | | | — | | | | — | | | | — | | | | — | |
| IQ Global Resources ETF | | | 4,588,057 | | | | (4,588,057 | )1 | | | — | | | | — | | | | — | | | | — | |
| IQ Merger Arbitrage ETF | | | 1,446,739 | | | | (1,446,739 | )1 | | | — | | | | — | | | | — | | | | — | |
| IQ Real Return ETF | | | 3,184,369 | | | | (3,184,369 | )1 | | | — | | | | — | | | | — | | | | — | |
| IQ Australia Small | | | | | | | | | | | | | | | | | | | | | | | | |
| Cap ETF | | | 531,074 | | | | (531,074 | )1 | | | — | | | | — | | | | — | | | | — | |
| IQ Canada Small | | | | | | | | | | | | | | | | | | | | | | | | |
| Cap ETF | | | 1,395,867 | | | | (1,395,867 | )1 | | | — | | | | — | | | | — | | | | — | |
| IQ Global Agribusiness | | | | | | | | | | | | | | | | | | | | | | | | |
| Small Cap ETF | | | 1,123,060 | | | | (1,123,060 | )1 | | | — | | | | — | | | | — | | | | — | |
| IQ Global Oil Small | | | | | | | | | | | | | | | | | | | | | | | | |
| Cap ETF | | | 716,728 | | | | (716,728 | )1 | | | — | | | | — | | | | — | | | | — | |
| IQ U.S. Real Estate | | | | | | | | | | | | | | | | | | | | | | | | |
| Small Cap ETF | | | 9,383,983 | | | | (9,383,983 | )1 | | | — | | | | — | | | | — | | | | — | |
| IQ 50 Percent Hedged | | | | | | | | | | | | | | | | | | | | | | | | |
| FTSE International ETF | | | 852,868 | | | | (852,868 | )1 | | | — | | | | — | | | | — | | | | — | |
| IQ 50 Percent Hedged | | | | | | | | | | | | | | | | | | | | | | | | |
| FTSE Europe ETF | | | 936,945 | | | | (936,945 | )1 | | | — | | | | — | | | | — | | | | — | |
| IQ 50 Percent Hedged | | | | | | | | | | | | | | | | | | | | | | | | |
| FTSE Japan ETF | | | 79,034 | | | | (79,034 | )1 | | | — | | | | — | | | | — | | | | — | |
| IQ Leaders GTAA | | | | | | | | | | | | | | | | | | | | | | | | |
| Tracker ETF | | | 206,608 | | | | (206,608 | )1 | | | — | | | | — | | | | — | | | | — | |
| 1 | The amount of collateral presented is limited such that the net amount cannot be less than zero. |
At April 30, 2016 the Fund's OTC derivative assets, which may be offset against the Fund’s OTC derivative liabilities and collateral received from the counterparty, are as follows:
| | | Gross Amounts | | | | | | Gross Amounts | | | | |
| | | of Assets | | Financial | | | | of Liabilities | | Financial | | |
| | | Presented in | | Instruments | | | | Presented in | | Instruments | | |
| | | the Statement | | and Derivatives | | Net Amount | | the Statement | | and Derivatives | | Net Amount |
| | | of Assets | | Available | | of Derivatives | | of Assets | | Available | | of Derivatives |
| Fund | | and Liabilities | | for Offset | | Assets | | and Liabilities | | for Offset | | Liabilities |
| IQ 50 Percent Hedged | | | | | | | | | | | | | | | | | | | | |
| FTSE International ETF | | | | | | | | | | | | | | | | | | | | |
| Morgan Stanley | | $30,646 | | $ | (30,646 | ) | | $ | — | | | $521,630 | | $ | (30,646 | ) | | $ | 490,984 | |
| IQ 50 Percent Hedged | | | | | | | | | | | | | | | | | | | | |
| FTSE Europe ETF | | | | | | | | | | | | | | | | | | | | |
| Morgan Stanley | | $14,037 | | $ | (14,037 | ) | | $ | — | | | $256,812 | | $ | (14,037 | ) | | $ | 242,775 | |
| IQ 50 Percent Hedged | | | | | | | | | | | | | | | | | | | | |
| FTSE Japan ETF | | | | | | | | | | | | | | | | | | | | |
| Merrill Lynch | | $ 85 | | $ | (85 | ) | | $ | — | | | $620,704 | | $ | (85 | ) | | $ | 620,619 | |
| Notes to Financial Statements (continued) |
| April 30, 2016 |
Investment Income and Expenses
Dividend income is recognized on the ex-dividend date. Interest income is accrued daily. Distributions of realized capital gains by underlying funds are recorded as realized capital gains on the ex-date. Expenses of the Trust arising in connection with a specific Fund are allocated to that Fund. Other Trust expenses which cannot be directly attributed to a Fund are apportioned among the Funds in the Trust based upon the relative net assets or other appropriate measures. The Funds distribute substantially all their net investment income to shareholders in the form of dividends. Net investment income and net capital gains are typically distributed to shareholders at least annually; the IQ U.S. Real Estate Small Cap ETF distributes income quarterly. Dividends may be declared and paid more frequently to comply with the distribution requirements of the Internal Revenue Code. The expenses of the investment companies in which a Fund invests are not included in the amounts shown as expenses on the Statements of Operations or in the expense ratios included in the financial highlights.
3. INVESTMENT MANAGEMENT AND OTHER AGREEMENTS
Investment Advisory Agreement
Under an Investment Advisory Agreement (“Advisory Agreement”) between the Trusts, on behalf of each Fund, the Advisor provides a continuous investment program for each Fund’s assets in accordance with its investment objectives, policies and limitations, and oversees the day-to-day operations of a Fund, subject to the supervision of the Independent Trustees of the Trust (“Independent Trustees”). Pursuant to the Advisory Agreement, the Funds pay the Advisor an advisory fee, based on the average daily net assets of each Fund, at the following annual rates:
| Fund | Rate |
| IQ Hedge Multi-Strategy Tracker ETF | 0.75% |
| IQ Hedge Macro Tracker ETF | 0.75% |
| IQ Hedge Market Neutral Tracker ETF | 0.75% |
| IQ Hedge Long/Short Tracker ETF | 0.75% |
| IQ Hedge Event-Driven Tracker ETF | 0.75% |
| IQ Global Resources ETF | 0.75% |
| IQ Merger Arbitrage ETF | 0.75% |
| IQ Real Return ETF | 0.48% |
| IQ Australia Small Cap ETF | 0.69% |
| IQ Canada Small Cap ETF | 0.69% |
| IQ Global Agribusiness Small Cap ETF | 0.75% |
| IQ Global Oil Small Cap ETF | 0.75% |
| IQ U.S. Real Estate Small Cap ETF | 0.69% |
| IQ 50 Percent Hedged FTSE International ETF | 0.35% |
| IQ 50 Percent Hedged FTSE Europe ETF | 0.45% |
| IQ 50 Percent Hedged FTSE Japan ETF | 0.45% |
| IQ Leaders GTAA Tracker ETF | 0.45% |
Such fee is accrued daily and paid monthly.
The Advisor has agreed to pay all expenses of the Funds, except brokerage and other transaction expenses; extraordinary legal fees or expenses, such as those for litigation or arbitration; compensation and expenses of the Independent Trustees, counsel to the Independent Trustees, and the Funds’ chief compliance officer; extraordinary expenses; distribution fees and expenses paid by the Funds under any distribution plan adopted pursuant to Rule 12b-1 under the 1940 Act; and the advisory fee payable to the Advisor hereunder.
Distribution (12b-1 Fees)
ALPS Distributors, Inc. serves as the Funds’ distributor (the “Distributor”) pursuant to a Distribution Services Agreement. The Board has adopted a Distribution and Service Plan pursuant to Rule 12b-1 under the 1940 Act (“Rule 12b-1 Plan”). In accordance with the Rule 12b-1 Plan, the Funds are authorized to pay an amount up to 0.10% of each Fund’s average daily net assets each year for certain distribution-related activities. As authorized by the Board, no Rule 12b-1 fees are currently paid by the Funds and there are no plans to impose these fees. However, in the event Rule 12b-1 fees are charged in the future, they will be paid out of each Fund’s assets. The Advisor and its affiliates may, out of their own resources, pay amounts to third parties for distribution or marketing services on behalf of the Funds.
| Notes to Financial Statements (continued) |
| April 30, 2016 |
Administrator, Custodian and Transfer Agent
The Bank of New York Mellon (in each capacity, the “Administrator,” “Custodian” or “Transfer Agent”) serves as the Funds’ Administrator, Custodian and Transfer Agent pursuant to the Fund Administration and Accounting Agreement. Under the terms of this agreement, the Advisor pays the Funds’ Administrative, Custody and Transfer Agency fees. The Bank of New York Mellon is a subsidiary of The Bank of New York Mellon Corporation, a financial holding company.
As described in Note 4 below, the Distributor has entered into Participant Agreements with certain broker-dealers and others that allow those parties to be “Authorized Participants” and to subscribe for and redeem shares of the Funds, also as described in Note 4 below. Such Authorized Participants may from time to time hold, of record or beneficially, a substantial percentage of the Funds’ shares outstanding, act as executing or clearing broker for investment transactions on behalf of the Funds and/or serve as counterparty to derivative transactions with each Fund.
4. CAPITAL SHARE TRANSACTIONS
As of April 30, 2016, there were an unlimited number of no par value shares of beneficial interest authorized by the Trust. Shares are created and redeemed on a continuous basis at NAV only in groups of 50,000 shares called Creation Units. Except when aggregated in Creation Units, shares are not redeemable. Transactions in shares of the Funds are disclosed in detail in the Statements of Changes in Net Assets. Only “Authorized Participants” may purchase or redeem shares directly from the Funds. An Authorized Participant is either (i) a broker-dealer or other participant in the clearing process through the Continuous Net Settlement System of National Securities Clearing Corporation or (ii) a Depository Trust Company (“DTC”) participant and, in each case, must have executed a Participant Agreement with the Distributor. Most retail investors will not qualify as Authorized Participants or have the resources to create and redeem whole Creation Units. Therefore, they will be unable to purchase or redeem the shares directly from the Funds. Rather, most retail investors will purchase shares in the secondary market with the assistance of a broker and will be subject to customary brokerage commissions or fees. Securities received or delivered in connection with in-kind creates and redeems are valued as of the close of business on the effective date of the creation or redemption.
5. FEDERAL INCOME TAX
At April 30, 2016, the cost of investments on a tax basis including the adjustments for financial reporting purposes as of the most recently completed Federal income tax reporting year was as follows:
| | | | | Gross | | Gross | | Net Unrealized |
| | | | | Unrealized | | Unrealized | | Appreciation/ |
| Fund | | Cost | | Appreciation | | Depreciation | | (Depreciation) |
| IQ Hedge Multi-Strategy Tracker ETF | | $ | 1,188,912,522 | | | $ | 19,272,358 | | | $ | (1,370,919 | ) | | $ | 17,901,439 | |
| IQ Hedge Macro Tracker ETF | | | 18,566,678 | | | | 90,524 | | | | (486,966 | ) | | | (396,442 | ) |
| IQ Hedge Market Neutral Tracker ETF | | | 15,022,983 | | | | 353,864 | | | | (22,415 | ) | | | 331,449 | |
| IQ Hedge Long/Short Tracker ETF | | | 2,116,522 | | | | 23,288 | | | | (36,345 | ) | | | (13,057 | ) |
| IQ Hedge Event-Driven Tracker ETF | | | 2,031,665 | | | | 947 | | | | (89,003 | ) | | | (88,056 | ) |
| IQ Global Resources ETF | | | 66,645,356 | | | | 18,184,991 | | | | (13,653,309 | ) | | | 4,531,682 | |
| IQ Merger Arbitrage ETF | | | 140,760,393 | | | | 3,783,767 | | | | (3,447,983 | ) | | | 335,784 | |
| IQ Real Return ETF | | | 29,766,300 | | | | 242,791 | | | | (919 | ) | | | 241,872 | |
| IQ Australia Small Cap ETF | | | 7,941,596 | | | | 455,670 | | | | (1,133,994 | ) | | | (678,324 | ) |
| IQ Canada Small Cap ETF | | | 13,123,110 | | | | 1,672,683 | | | | (2,567,846 | ) | | | (895,163 | ) |
| IQ Global Agribusiness Small Cap ETF | | | 12,696,206 | | | | 2,348,469 | | | | (2,434,966 | ) | | | (86,497 | ) |
| IQ Global Oil Small Cap ETF | | | 4,186,776 | | | | 156,939 | | | | (669,197 | ) | | | (512,258 | ) |
| IQ U.S. Real Estate Small Cap ETF | | | 84,372,074 | | | | 6,931,541 | | | | (9,771,230 | ) | | | (2,839,689 | ) |
| IQ 50 Percent Hedged FTSE International ETF | | | 78,009,797 | | | | 2,198,978 | | | | (2,525,526 | ) | | | (326,548 | ) |
| IQ 50 Percent Hedged FTSE Europe ETF | | | 49,541,561 | | | | 930,931 | | | | (2,377,903 | ) | | | (1,446,972 | ) |
| IQ 50 Percent Hedged FTSE Japan ETF | | | 26,925,574 | | | | 1,271,114 | | | | (2,430,333 | ) | | | (1,159,219 | ) |
| IQ Leaders GTAA Tracker ETF | | | 2,257,180 | | | | 52,004 | | | | (4,669 | ) | | | 47,335 | |
The differences between book and tax basis cost of investments and net unrealized appreciation (depreciation) are primarily attributable to wash sale loss deferrals, pass through investments and the realization for tax purposes of unrealized gains on investments in passive foreign investment companies held at April 30, 2016.
| Notes to Financial Statements (continued) |
| April 30, 2016 |
At April 30, 2016, the Components of Undistributed (Accumulated) Earnings (Losses) on a tax-basis were as follows:
| Fund | | Ordinary
Income (Loss)1 | | Net
Capital
Gain (Losses)2 | | Net Unrealized
Appreciation/
Depreciation | | Total
Earnings/(Losses) |
| IQ Hedge Multi-Strategy Tracker ETF | | $ | (2,222,384 | ) | | $ | (86,152,070 | ) | | $ | 17,901,439 | | | $ | (70,473,014 | ) |
| IQ Hedge Macro Tracker ETF | | | (244,695 | ) | | | (6,018,533 | ) | | | (396,442 | ) | | | (6,659,670 | ) |
| IQ Hedge Market Neutral Tracker ETF | | | 173,904 | | | | (877,553 | ) | | | 331,449 | | | | (372,200 | ) |
| IQ Hedge Long/Short Tracker ETF | | | (7,435 | ) | | | (91,198 | ) | | | (13,057 | ) | | | (111,690 | ) |
| IQ Hedge Event-Driven Tracker ETF | | | 29,292 | | | | 3,533 | | | | (88,056 | ) | | | (55,231 | ) |
| IQ Global Resources ETF | | | 676,497 | | | | (51,443,245 | ) | | | 4,533,802 | | | | (46,232,946 | ) |
| IQ Merger Arbitrage ETF | | | (110,785 | ) | | | (5,265,366 | ) | | | 336,226 | | | | (5,039,925 | ) |
| IQ Real Return ETF | | | (76,129 | ) | | | (2,210,727 | ) | | | 241,872 | | | | (2,044,984 | ) |
| IQ Australia Small Cap ETF | | | 154,748 | | | | (8,688,984 | ) | | | (678,392 | ) | | | (9,212,628 | ) |
| IQ Canada Small Cap ETF | | | 119,430 | | | | (20,483,284 | ) | | | (894,522 | ) | | | (21,258,376 | ) |
| IQ Global Agribusiness Small Cap ETF | | | 98,000 | | | | (7,359,624 | ) | | | (85,024 | ) | | | (7,346,648 | ) |
| IQ Global Oil Small Cap ETF | | | 96,479 | | | | (1,464,910 | ) | | | (511,988 | ) | | | (1,880,419 | ) |
| IQ U.S. Real Estate Small Cap ETF | | | — | | | | (3,409,612 | ) | | | (2,839,689 | ) | | | (6,249,301 | ) |
| IQ 50 Percent Hedged FTSE International ETF | | | 718,957 | | | | (1,408,725 | ) | | | (321,999 | ) | | | (1,011,767 | ) |
| IQ 50 Percent Hedged FTSE Europe ETF | | | 679,095 | | | | (670,726 | ) | | | (1,447,264 | ) | | | (1,438,895 | ) |
| IQ 50 Percent Hedged FTSE Japan ETF | | | 381,554 | | | | (1,941,307 | ) | | | (1,145,846 | ) | | | (2,705,599 | ) |
| IQ Leaders GTAA Tracker ETF | | | (381 | ) | | | (50,742 | ) | | | 47,335 | | | | (3,789 | ) |
| 1 | Includes late year ordinary loss, if any. |
| 2 | Amount includes the deferral of post October losses, if any. |
The differences between book and tax basis components of net assets are primarily attributable to wash sale loss deferrals and other book and tax differences including foreign currency contracts, swap contracts, post-October and late year losses.
At April 30, 2016, the effect of permanent book/tax reclassifications resulted in increases (decreases) to the components of net assets were as follows:
| | | Undistributed | | | | |
| | | Net Investment | | Accumulated | | |
| | | Income/ | | Net Realized | | |
| | | (Accumulated Net | | Gain/(Loss) | | Paid-in |
| Fund | | Investment Loss) | | on Investments | | Capital |
| IQ Hedge Multi-Strategy Tracker ETF | | $ | (14,447,645 | ) | | $ | 7,620,858 | | | $ | 6,826,787 | |
| IQ Hedge Macro Tracker ETF | | | (40,244 | ) | | | 29,999 | | | | 10,245 | |
| IQ Hedge Market Neutral Tracker ETF | | | 37,001 | | | | (173,641 | ) | | | 136,640 | |
| IQ Hedge Long/Short Tracker ETF | | | (24,258 | ) | | | 24,258 | | | | — | |
| IQ Hedge Event-Driven Tracker ETF | | | 6,261 | | | | (6,261 | ) | | | — | |
| IQ Global Resources ETF | | | (492,698 | ) | | | 817,166 | | | | (324,468 | ) |
| IQ Merger Arbitrage ETF | | | 1,766,202 | | | | (3,857,907 | ) | | | 2,091,705 | |
| IQ Real Return ETF | | | (158,590 | ) | | | (187,132 | ) | | | 345,722 | |
| IQ Australia Small Cap ETF | | | (1,125 | ) | | | (6,995 | ) | | | 8,120 | |
| IQ Canada Small Cap ETF | | | 26,164 | | | | (26,164 | ) | | | — | |
| IQ Global Agribusiness Small Cap ETF | | | 13,926 | | | | (200,387 | ) | | | 186,461 | |
| IQ Global Oil Small Cap ETF | | | 49,250 | | | | 83,927 | | | | (133,177 | ) |
| IQ U.S. Real Estate Small Cap ETF | | | 1,926,179 | | | | 209,930 | | | | (2,136,109 | ) |
| IQ 50 Percent Hedged FTSE International ETF | | | 268,104 | | | | (380,179 | ) | | | 112,075 | |
| IQ 50 Percent Hedged FTSE Europe ETF | | | 399,168 | | | | (412,805 | ) | | | 13,637 | |
| IQ 50 Percent Hedged FTSE Japan ETF | | | 15,874 | | | | (15,874 | ) | | | — | |
| IQ Leaders GTAA Tracker ETF | | | (12,792 | ) | | | (72,952 | ) | | | 85,744 | |
For financial reporting purposes, capital accounts are adjusted to reflect the tax character of permanent book/tax differences. Reclassifications are primarily due to the tax treatment of foreign currency gains and losses, investments in passive foreign investment companies, publicly traded partnerships, grantors trusts, real estate investment trusts, regulated investment companies, swaps, and redemptions in-kind.
| Notes to Financial Statements (continued) |
| April 30, 2016 |
The tax character of distributions paid during the years ended April 30, 2016 and 2015 were as follows:
| | | 2016 | | 2015 |
| Fund | | Ordinary
Income | | Long-Term
Capital Gains | | Tax Return
of Capital | | Ordinary
Income | | Long-Term
Capital Gains | | Tax Return
of Capital |
| IQ Hedge Multi-Strategy | | | | | | | | | | | | | | | | | | | | | | | | |
| Tracker ETF | | $ | 5,414,930 | | | $ | — | | | $ | — | | | $ | 13,005,300 | | | $ | — | | | $ | — | |
| IQ Hedge Macro Tracker ETF | | | 186,676 | | | | — | | | | — | | | | 304,929 | | | | — | | | | — | |
| IQ Hedge Market Neutral | | | | | | | | | | | | | | | | | | | | | | | | |
| Tracker ETF | | | — | | | | — | | | | — | | | | 221,006 | | | | — | | | | — | |
| IQ Hedge Long/Short | | | | | | | | | | | | | | | | | | | | | | | | |
| Tracker ETF | | | 35,914 | | | | — | | | | — | | | | — | | | | — | | | | — | |
| IQ Hedge Event-Driven | | | | | | | | | | | | | | | | | | | | | | | | |
| Tracker ETF | | | 35,251 | | | | — | | | | — | | | | — | | | | — | | | | — | |
| IQ Global Resources ETF | | | 1,098,143 | | | | — | | | | — | | | | 1,147,080 | | | | — | | | | — | |
| IQ Merger Arbitrage ETF | | | 992,736 | | | | — | | | | — | | | | — | | | | — | | | | — | |
| IQ Real Return ETF | | | 2,630 | | | | — | | | | — | | | | 24,006 | | | | — | | | | — | |
| IQ Australia Small Cap ETF | | | 225,046 | | | | — | | | | — | | | | 351,608 | | | | — | | | | — | |
| IQ Canada Small Cap ETF | | | 192,923 | | | | — | | | | — | | | | 106,182 | | | | — | | | | — | |
| IQ Global Agribusiness Small | | | | | | | | | | | | | | | | | | | | | | | | |
| Cap ETF | | | 166,361 | | | | — | | | | — | | | | 267,937 | | | | — | | | | — | |
| IQ Global Oil Small Cap ETF | | | 72,240 | | | | — | | | | — | | | | 28,982 | | | | — | | | | — | |
| IQ U.S. Real Estate Small | | | | | | | | | | | | | | | | | | | | | | | | |
| Cap ETF | | | 3,031,724 | | | | — | | | | 1,905,746 | | | | 2,917,585 | | | | — | | | | 787,254 | |
| IQ 50 Percent Hedged | | | | | | | | | | | | | | | | | | | | | | | | |
| FTSE International ETF | | | 446,626 | | | | — | | | | — | | | | — | | | | — | | | | — | |
| IQ 50 Percent Hedged | | | | | | | | | | | | | | | | | | | | | | | | |
| FTSE Europe ETF | | | 331,580 | | | | — | | | | — | | | | — | | | | — | | | | — | |
| IQ 50 Percent Hedged | | | | | | | | | | | | | | | | | | | | | | | | |
| FTSE Japan ETF | | | — | | | | — | | | | — | | | | — | | | | — | | | | — | |
| IQ Leaders GTAA Tracker ETF | | | 13,810 | | | | — | | | | — | | | | — | | | | — | | | | — | |
Capital losses incurred after October 31 (“Post-October Losses”) and certain late year ordinary income losses within the taxable year can be deemed to arise on the first business day of the Funds’ next taxable year. For the year ended April 30, 2016, the Funds incurred and elected to defer to May 1, 2016 post-October losses and late year ordinary losses of:
| | | | | Short-Term | | Long-Term |
| | | Late Year | | Post October | | Post October |
| Fund | | Ordinary Losses | | Losses | | Losses |
| IQ Hedge Multi-Strategy Tracker ETF | | $ | (2,222,384 | ) | | $ | 16,554,763 | | | $ | 1,161,391 | |
| IQ Hedge Macro Tracker ETF | | | (244,695 | ) | | | (278,796 | ) | | | (198,244 | ) |
| IQ Hedge Market Neutral Tracker ETF | | | — | | | | (274,244 | ) | | | (2,857 | ) |
| IQ Hedge Long/Short Tracker ETF | | | (7,435 | ) | | | (29,729 | ) | | | (40,869 | ) |
| IQ Hedge Event-Driven Tracker ETF | | | — | | | | — | | | | — | |
| IQ Global Resources ETF | | | — | | | | (730,589 | ) | | | (5,836,857 | ) |
| IQ Merger Arbitrage ETF | | | (110,785 | ) | | | (92,458 | ) | | | (18,189 | ) |
| IQ Real Return ETF | | | (76,129 | ) | | | (151,730 | ) | | | (17,201 | ) |
| IQ Australia Small Cap ETF | | | — | | | | (49,382 | ) | | | (182,458 | ) |
| IQ Canada Small Cap ETF | | | — | | | | (117,515 | ) | | | (1,159,651 | ) |
| IQ Global Agribusiness Small Cap ETF | | | — | | | | (99,230 | ) | | | (48,986 | ) |
| IQ Global Oil Small Cap ETF | | | — | | | | (339,032 | ) | | | (224,123 | ) |
| IQ U.S. Real Estate Small Cap ETF | | | — | | | | (238,517 | ) | | | (1,793,108 | ) |
| IQ 50 Percent Hedged FTSE International ETF | | | — | | | | (731,070 | ) | | | (656,428 | ) |
| IQ 50 Percent Hedged FTSE Europe ETF | | | — | | | | (386,190 | ) | | | (259,386 | ) |
| IQ 50 Percent Hedged FTSE Japan ETF | | | — | | | | (855,184 | ) | | | (1,035,572 | ) |
| IQ Leaders GTAA Tracker ETF | | | (381 | ) | | | — | | | | — | |
| Notes to Financial Statements (continued) |
| April 30, 2016 |
On December 22, 2010, the Regulated Investment Company (“RIC”) Modernization Act of 2010 (the “Act”) was enacted. The Act modernizes several of the federal income and excise tax provisions related to RICs, and, with certain exceptions, are effective for taxable years beginning after December 22, 2010. Among the changes made are changes to the capital loss carryforward rules allowing for RICs to carry forward capital losses indefinitely and to retain the character of capital loss carryforwards as short-term or long-term. Rules in effect previously limited the carryforward period to eight years and all carryforwards were considered short-term in character. Capital loss carryforwards generated in taxable years beginning after the effective date of the Act must be fully used before capital loss carryforwards generated in taxable years prior to the effective date of the Act; therefore, under certain circumstances, capital loss carryforwards available as of the report date, if any, may expire unused.
At April 30, 2016, the Funds listed below had net capital loss carryforwards for Federal income tax purposes which are available for offset against future taxable net capital gains. The amounts were determined after adjustments for certain differences between financial reporting and tax purposes, such as wash sale losses. Accordingly, no capital gain distributions are expected to be paid to shareholders of these Funds until future net capital gains have been realized in excess of the available capital loss carryforwards. There is no assurance that any Fund will be able to utilize all of its capital loss carryforwards before they expire. These loss carryforwards expire in amounts and fiscal years as follows:
| | | Short-Term | | Short-Term | | | | Short-Term | | Long-Term |
| | | Expiring | | Expiring | | Utilized in | | With | | With |
| Fund | | April 30, 2018 | | April 30, 2019 | | Current Year | | No Expiration | | No Expiration |
| IQ Hedge Multi-Strategy Tracker ETF | | $ | 841,667 | | | $ | 5,603,304 | | | $ | — | | | $ | 60,335,430 | | | $ | 1,655,515 | |
| IQ Hedge Macro Tracker ETF | | | 80,017 | | | | 531,209 | | | | — | | | | 4,052,532 | | | | 877,735 | |
| IQ Hedge Market Neutral Tracker ETF | | | — | | | | — | | | | — | | | | 526,705 | | | | 73,748 | |
| IQ Hedge Long/Short Tracker ETF | | | — | | | | — | | | | — | | | | 20,600 | | | | — | |
| IQ Hedge Event-Driven Tracker ETF | | | — | | | | — | | | | — | | | | — | | | | — | |
| IQ Global Resources ETF | | | — | | | | — | | | | — | | | | 32,544,718 | | | | 12,331,081 | |
| IQ Merger Arbitrage ETF | | | — | | | | — | | | | — | | | | 5,154,719 | | | | — | |
| IQ Real Return ETF | | | — | | | | — | | | | — | | | | 614,180 | | | | 1,427,616 | |
| IQ Australia Small Cap ETF | | | — | | | | — | | | | — | | | | 2,738,011 | | | | 5,719,133 | |
| IQ Canada Small Cap ETF | | | — | | | | 161,421 | | | | — | | | | 8,855,107 | | | | 10,189,590 | |
| IQ Global Agribusiness Small Cap ETF | | | — | | | | — | | | | — | | | | 2,938,779 | | | | 4,272,629 | |
| IQ Global Oil Small Cap ETF | | | — | | | | — | | | | — | | | | 280,442 | | | | 621,313 | |
| IQ U.S. Real Estate Small Cap ETF | | | — | | | | — | | | | — | | | | 1,377,987 | | | | — | |
| IQ 50 Percent Hedged | | | | | | | | | | | | | | | | | | | | |
| FTSE International ETF | | | — | | | | — | | | | — | | | | 21,227 | | | | — | |
| IQ 50 Percent Hedged | | | | | | | | | | | | | | | | | | | | |
| FTSE Europe ETF | | | — | | | | — | | | | — | | | | 25,150 | | | | — | |
| IQ 50 Percent Hedged | | | �� | | | | | | | | | | | | | | | | | |
| FTSE Japan ETF | | | — | | | | — | | | | — | | | | 50,551 | | | | — | |
| IQ Leaders GTAA Tracker ETF | | | — | | | | — | | | | — | | | | 50,742 | | | | — | |
6. OTHER AFFILIATED PARTIES AND TRANSACTIONS
An issuer which is under common control with a fund may be considered an affiliate. For the purposes of the financial statements, the Funds assume the following to be affiliated issuers. As of April 30, 2016, New York Life Insurance & Annuity Corporation was known to own beneficially greater than 5% of the shares outstanding of the following funds:
| Fund | % Ownership |
| IQ 50 Percent Hedged FTSE Europe ETF | 51.82% |
| IQ 50 Percent Hedged FTSE International ETF | 31.32% |
| IQ 50 Percent Hedged FTSE Japan ETF | 91.54% |
| IQ Hedge Event-Driven Tracker ETF | 80.00% |
| IQ Hedge Long/Short Tracker ETF | 80.00% |
| IQ Leaders GTAA Tracker ETF | 90.00% |
| Notes to Financial Statements (continued) |
| April 30, 2016 |
7. INVESTMENT TRANSACTIONS
Purchases and sales of investments (excluding short-term investments) for the year ended April 30, 2016 are as follows:
| | | | | | | Purchases | | |
| Fund | | Purchases | | Sales | | In-Kind | | Sales In-Kind |
| IQ Hedge Multi-Strategy Tracker ETF | | $ | 3,401,917,426 | | | $ | 3,263,037,428 | | | $ | 338,951,471 | | | $ | 349,456,774 | |
| IQ Hedge Macro Tracker ETF | | | 17,871,675 | | | | 17,535,906 | | | | — | | | | 6,192,906 | |
| IQ Hedge Market Neutral Tracker ETF | | | 20,457,236 | | | | 19,753,682 | | | | 10,143,457 | | | | 8,127,844 | |
| IQ Hedge Long/Short Tracker ETF | | | 1,797,896 | | | | 1,791,321 | | | | — | | | | — | |
| IQ Hedge Event-Driven Tracker ETF | | | 353,443 | | | | 307,480 | | | | — | | | | — | |
| IQ Global Resources ETF | | | 156,400,381 | | | | 156,155,486 | | | | 17,801,985 | | | | 11,691,090 | |
| IQ Merger Arbitrage ETF | | | 318,521,552 | | | | 318,009,220 | | | | 79,738,771 | | | | 60,221,168 | |
| IQ Real Return ETF | | | 28,376,819 | | | | 29,263,599 | | | | 6,628,583 | | | | 6,982,785 | |
| IQ Australia Small Cap ETF | | | 1,990,527 | | | | 2,108,209 | | | | 2,206,067 | | | | 692,156 | |
| IQ Canada Small Cap ETF | | | 2,217,225 | | | | 2,299,937 | | | | 1,270,170 | | | | — | |
| IQ Global Agribusiness Small Cap ETF | | | 4,065,755 | | | | 4,021,621 | | | | 1,338,506 | | | | 3,953,671 | |
| IQ Global Oil Small Cap ETF | | | 1,716,387 | | | | 1,722,339 | | | | — | | | | 552,974 | |
| IQ U.S. Real Estate Small Cap ETF | | | 23,194,691 | | | | 24,254,091 | | | | 1,324,216 | | | | 12,658,026 | |
| IQ 50 Percent Hedged FTSE International ETF | | | 8,726,251 | | | | 2,657,713 | | | | 73,748,046 | | | | 3,425,854 | |
| IQ 50 Percent Hedged FTSE Europe ETF | | | 5,904,492 | | | | 2,711,730 | | | | 55,635,605 | | | | 10,546,509 | |
| IQ 50 Percent Hedged FTSE Japan ETF | | | 3,616,835 | | | | 2,423,493 | | | | 25,853,915 | | | | — | |
| IQ Leaders GTAA Tracker ETF | | | 2,381,106 | | | | 2,595,538 | | | | 4,099,974 | | | | 1,883,667 | |
8. DERIVATIVE FINANCIAL INSTRUMENTS
Swap Transactions
A swap agreement is an agreement between two parties pursuant to which the parties exchange payments at specified dates on the basis of a specified notional amount, with the payments calculated by reference to specified securities, indexes, reference rates, currencies or other instruments. Most swap agreements provide that when the period payment dates for both parties are the same, the payments are made on a net basis (i.e., the two payment streams are netted out, with only the net amount paid by one party to the other). The Funds’ obligations or rights under a swap agreement entered into on a net basis will generally be equal only to the net amount to be paid or received under the agreement, based on the relative values of the positions held by each counterparty. Swap agreements are not entered into or traded on exchanges and there is no central clearing or guaranty function for total return swaps. Swaps could result in losses if interest rate or foreign currency exchange rates or credit quality changes are not correctly anticipated by the Funds or if the reference index, security or investments do not perform as expected.
The value of a total return swap agreement is recorded as either an asset or a liability on the Statements of Assets and Liabilities at the beginning of the measurement period. Segregated securities are designated on the Schedules of Investments and cash deposited is recorded on the Statements of Assets and Liabilities. Daily changes in valuation of total return swaps, if any, are recorded as unrealized appreciation or depreciation on the Statements of Assets and Liabilities. The change in the value of swaps, including accruals of periodic amounts of interest to be paid or received on swaps, is reported as change in net unrealized appreciation/depreciation in the Statements of Operations. A realized gain or loss is recorded upon payment or receipt of a periodic payment or payment made upon termination of a swap agreement.
When the Funds have an unrealized loss on a swap agreement, the Funds have instructed the custodian to pledge cash or liquid securities as collateral with a value at least equal to the amount of the unrealized loss. Collateral pledges are monitored and subsequently adjusted with the fluctuations of the swap value.
Certain of the Funds intend to use total return swaps in several ways to replicate the performance of the Index. Risks may arise as a result of the failure of the counterparty to the swap contract to comply with the terms of the swap contract. Therefore the Funds consider the creditworthiness of the counterparty to a swap contract in evaluating potential credit risk. Additionally, risks may arise from unanticipated movements in interest rates or in the value of the underlying instruments.
| Notes to Financial Statements (continued) |
| April 30, 2016 |
Pursuant to documentation governing the Funds’ swap transactions with Morgan Stanley, Morgan Stanley has the right to terminate the swaps early in the event that the net assets of the given Fund decline below specific levels set forth in the documentation (“net asset contingent features”). In the event of early termination, Morgan Stanley may require the Funds to pay or receive a settlement amount in connection with the terminated swap transaction. IQ Leaders GTAA Tracker ETF utilized swaps to effect both long and short exposure to several asset classes and market segments, including long exposure to convertible bonds, corporate bonds, government bonds, and domestic and international equities; and short exposure to domestic consumer equities, domestic energy related equities, high yield bonds, and intermediate term treasury notes. As of April 30, 2016, the Funds have not triggered the conditions under such documentation that will give the counterparty the right to call for an early termination. As of such date, the settlement values of these contracts were approximately equal to the fair value of such contracts.
Futures Contracts
Certain Funds may invest in futures contracts (“futures”) in order to replicate exposures to their respective underlying index components. Investments in futures may increase or leverage exposure to a particular market risk, thereby increasing price volatility of derivative instruments a Fund holds. No price is paid or received by a Fund upon the purchase of a futures contract.
Upon entering into a futures contract, the Funds are required to deposit with the broker, cash or securities in an amount equal to a certain percentage of the contract amount, which is referred to as the initial margin deposit. Subsequent payments, referred to as variation margin, are made or received by the Funds periodically and are based on changes in the market value of open futures contracts. Changes in the market value of open futures contracts are recorded as change in net unrealized appreciation/depreciation in the Statements of Operations. Realized gains or losses, representing the difference between the value of the contract at the time it was opened and the value at the time it was closed, are reported in the Statements of Operations at the closing or expiration of the futures contract. Securities deposited as initial margin are designated in the Schedules of Investments and cash deposited is recorded on the Statements of Assets and Liabilities. A receivable from and/or a payable to brokers for the daily variation margin is also recorded on the Statements of Assets and Liabilities.
During the year ended April 30, 2016, IQ Global Resources ETF utilized futures contracts to affect short exposure to domestic and international equity returns.
At April 30, 2016, there were no open futures contracts.
Forward Foreign Currency Exchange Contracts
Certain Funds may enter into foreign currency transactions to seek a closer correlation between the Funds’ overall currency exposures and the currency exposures of the Underlying Index as a part of its principal investment strategy.
The Fund may enter into forward foreign currency exchange contracts for hedging purposes, to seek to protect against anticipated changes in future foreign currency exchange rates. A forward foreign currency exchange contract involves an obligation to purchase or sell a specific currency at a future date, which may be any fixed number of days from the date of the contract agreed upon by the parties, at a price set at the time of the contract. These contracts are traded in the interbank market between currency traders (usually large commercial banks) and their customers. A forward contract generally has no deposit requirement, and no commissions are generally charged at any stage for trades.
Upon entering into a forward foreign currency contract a Fund is required to segregate permissible liquid assets, or engage in other measures approved by the SEC to “cover” the Fund’s obligations relating to its transactions in derivatives. Fluctuations in the value of open forward contracts are recorded for book purposes as unrealized gains or losses on forward contracts by the Funds. Realized gains and losses on forward contracts include net gains or losses recognized by the Funds on contracts which have matured or were sold.
The open forward foreign currency contracts at April 30, 2016, are listed in the Schedules of Investments. The unrealized appreciation/depreciation, as applicable, is included in the Statements of Assets and Liabilities.
| Notes to Financial Statements (continued) |
| April 30, 2016 |
Total Return Swaps reflects a reset date as of April 30, 2016, therefore, there is no unrealized appreciation (depreciation) reflected on the Statements of Assets and Liabilities.
At April 30, 2016, the fair values of derivative instruments reflected on the Statements of Assets and Liabilities were as follows:
Asset Derivatives
| | | Currency Risk | | Equity Risk | | Total |
| IQ 50 Percent Hedged FTSE International ETF | | | | | | | | | | | | |
| Unrealized appreciation on forward foreign currency contracts | | $ | 30,646 | | | $ | — | | | $ | 30,646 | |
| IQ 50 Percent Hedged FTSE Europe ETF | | | | | | | | | | | | |
| Unrealized appreciation on forward foreign currency contracts | | | 14,037 | | | | — | | | | 14,037 | |
| IQ 50 Percent Hedged FTSE Japan ETF | | | | | | | | | | | | |
| Unrealized appreciation on forward foreign currency contracts | | | 85 | | | | — | | | | 85 | |
Liability Derivatives
| | | Currency Risk | | Equity Risk | | Total |
| IQ 50 Percent Hedged FTSE International ETF | | | | | | | | | | | | |
| Unrealized depreciation on forward foreign currency contracts | | $ | (521,630 | ) | | $ | — | | | $ | (521,630 | ) |
| IQ 50 Percent Hedged FTSE Europe ETF | | | | | | | | | | | | |
| Unrealized depreciation on forward foreign currency contracts | | | (256,812 | ) | | | — | | | | (256,812 | ) |
| IQ 50 Percent Hedged FTSE Japan ETF | | | | | | | | | | | | |
| Unrealized depreciation on forward foreign currency contracts | | | (620,704 | ) | | | — | | | | (620,704 | ) |
| Notes to Financial Statements (continued) |
| April 30, 2016 |
Transactions in derivative instruments reflected on the Statements of Operations during the year ended April 30, 2016 as follows:
| | | Currency Risk | | Equity Risk |
| IQ Hedge Multi-Strategy Tracker ETF | | | | | | | | |
| Realized gain (loss) | | | | | | | | |
| Swap transactions | | | | | | $ | (14,768,117 | ) |
| IQ Hedge Macro Tracker ETF | | | | | | | | |
| Realized gain (loss) | | | | | | | | |
| Swap transactions | | | | | | $ | 3,947 | |
| IQ Hedge Market Neutral Tracker ETF | | | | | | | | |
| Realized gain (loss) | | | | | | | | |
| Swap transactions | | | | | | $ | (17,962 | ) |
| IQ Hedge Long/Short Tracker ETF | | | | | | | | |
| Realized gain (loss) | | | | | | | | |
| Swap transactions | | | | | | $ | (19,765 | ) |
| IQ Hedge Event-Driven Tracker ETF | | | | | | | | |
| Realized gain (loss) | | | | | | | | |
| Swap contracts | | | | | | $ | (7,229 | ) |
| IQ Global Resources ETF | | | | | | | | |
| Realized gain (loss) | | | | | | | | |
| Futures contracts | | | | | | $ | 291,556 | |
| Swaps | | | | | | $ | (415,349 | ) |
| Change in Unrealized appreciation (depreciation) | | | | | | | | |
| Futures contracts | | | | | | $ | 352,790 | |
| IQ Merger Arbitrage ETF | | | | | | | | |
| Realized gain (loss) | | | | | | | | |
| Swap contracts | | | | | | $ | 1,290,289 | |
| IQ 50 Percent Hedged FTSE International ETF(a) | | | | | | | | |
| Realized gain (loss) | | | | | | | | |
| Forward foreign currency contracts | | $ | (346,274 | ) | | | | |
| Change in Unrealized appreciation (depreciation) | | | | | | | | |
| Forward foreign currency contracts | | $ | (490,984 | ) | | | | |
| IQ 50 Percent Hedged FTSE Europe ETF(a) | | | | | | | | |
| Realized gain (loss) | | | | | | | | |
| Forward foreign currency contracts | | $ | 204,645 | | | | | |
| Change in Unrealized appreciation (depreciation) | | | | | | | | |
| Forward foreign currency contracts | | $ | (242,775 | ) | | | | |
| IQ 50 Percent Hedged FTSE Japan ETF(a) | | | | | | | | |
| Realized gain (loss) | | | | | | | | |
| Forward foreign currency contracts | | $ | (1,082,011 | ) | | | | |
| Change in Unrealized appreciation (depreciation) | | | | | | | | |
| Forward foreign currency contracts | | $ | (620,619 | ) | | | | |
| IQ Leaders GTAA Tracker ETF | | | | | | | | |
| Realized gain (loss) | | | | | | | | |
| Swap contracts | | | | | | $ | (23,724 | ) |
| (a) | Forward foreign currency contracts are included in net realized gain (loss) from forward foreign currency contracts and translation & net change in unrealized appreciation (depreciation) of forward foreign currency contracts are included in forward foreign currency contracts and translation in the Statements of Operations. |
| Notes to Financial Statements (continued) |
| April 30, 2016 |
For the year ended April 30, 2016, the monthly average volume of the derivatives held by the Funds was as follows:
| | | Average Notional Value |
| | | | | | | | | | | | | | | | | | | IQ 50 | | IQ 50 | | IQ 50 |
| | | | | | | IQ Hedge | | | | | | | | | | | | Percent | | Percent | | Percent |
| | | IQ Hedge | | IQ Hedge | | Market | | IQ Hedge | | IQ Hedge | | IQ Global | | IQ Merger | | IQ Leaders | | Hedged | | Hedged | | Hedged |
| | | Multi-Strategy | | Macro | | Neutral | | Long/Short | | Event-Driven | | Resources | | Arbitrage | | GTAA | | International | | FTSE | | FTSE |
| | | Tracker ETF | | Tracker ETF | | Tracker ETF | | Tracker ETF | | Tracker ETF | | ETF | | ETF | | Tracker ETF | | ETF | | Europe ETF | | Japan ETF |
| Asset | | | | | | | | | | | | | | | | | | | | | | | | | | | | | | | | | | | | | | | | | | | | |
| Futures | | $ | — | | | $ | — | | | $ | — | | | $ | — | | | $ | — | | | $ | — | | | $ | — | | | $ | — | | | $ | — | | | $ | — | | | $ | — | |
| Swaps | | | 273,928,178 | | | | 3,808,152 | | | | 3,878,418 | | | | 560,517 | | | | 174,435 | | | | 1,015,148 | | | | 43,397,826 | | | | 379,362 | | | | — | | | | — | | | | — | |
| Forwards | | | — | | | | — | | | | — | | | | — | | | | — | | | | — | | | | — | | | | — | | | | 58,923,116 | | | | 46,063,269 | | | | 36,766,541 | |
| Liability | | | | | | | | | | | | | | | | | | | | | | | | | | | | | | | | | | | | | | | | | | | | |
| Futures | | $ | — | | | $ | — | | | $ | — | | | $ | — | | | $ | — | | | | (9,892,473 | ) | | $ | — | | | $ | — | | | $ | — | | | $ | — | | | $ | — | |
| Swaps | | | (303,433,364 | ) | | | (3,874,670 | ) | | | (4,057,360 | ) | | | (560,653 | ) | | | (174,390 | ) | | | — | | | | — | | | | (380,268 | ) | | | — | | | | — | | | | — | |
| Forwards | | | — | | | | — | | | | — | | | | — | | | | — | | | | — | | | | — | | | | — | | | | (59,009,511 | ) | | | (46,067,948 | ) | | | (36,932,220 | ) |
9. RISKS INVOLVED WITH INVESTING IN THE FUNDS
The Funds are subject to the principal risks described below, some or all of these risks may adversely affect a Fund’s NAV, trading price, yield, total return and ability to meet its investment objective. As with any investment, an investment in a Fund could result in a loss or the performance of a Fund could be inferior to that of other investments.
Currency Risk*
Certain Funds will invest in securities denominated in currencies other than U.S. dollars (foreign currencies) and much of the income received by the Fund will be in foreign currencies, but the Underlying Index and the Fund’s NAV will be calculated in U.S. dollars. Furthermore a Fund may convert cash in U.S. dollars to foreign currencies to purchase securities. Both the Fund’s ability to track the Underlying Index and Fund returns in general may be adversely impacted by changes in currency exchange rates, which can occur quickly and without warning.
Currency Hedging Risk**
Certain Funds uses various strategies to attempt to reduce the impact of changes in the value of a foreign currency against the U.S. dollar. These strategies may not be successful. Currency exchange rates can be very volatile and can change quickly and unpredictably. Therefore, the value of an investment in a Fund may also go up or down quickly and unpredictably and investors may lose money.
Fund of Funds Risk***
Certain Funds’ investment performance, because they are funds of funds, depend on the investment performance of the underlying ETFs in which they invest. An investment in any such Fund is subject to the risks associated with the underlying ETFs that comprise its Underlying Index. Such a Fund will indirectly pay a proportional share of the asset-based fees, if any, of the underlying ETFs in which it invests.
Exchange Traded Vehicle Risk***
Unlike an investment in a mutual fund, the value of the Funds’ investments in ETFs, exchange-traded vehicles (“ETVs”) and exchange-traded notes (“ETNs”) is based on stock market prices and the Funds could lose money due to stock market developments, the failure of an active trading market to develop, or exchange trading halts or de-listings. Federal law prohibits the Funds from acquiring investment company shares, including shares of ETFs, in excess of specific thresholds unless exempted by rule, regulation or exemptive order. These prohibitions may prevent the Funds from allocating their investments to ETFs in an optimal manner.
Index Risk
The Funds’ Underlying Indexes and the Funds rebalance only on a monthly or quarterly basis, which may cause the performance of the Underlying Indexes and the Funds to deviate from that of the market exposure that they are trying to achieve.
Industry Concentration Risk
A Fund will not invest 25% or more of the value of the Fund’s total assets in the securities of one or more issuers conducting their principal business activities in the same industry or group of industries; except that, to the extent that the Underlying Index is concentrated in a particular industry, the Fund also will be concentrated in that
| Notes to Financial Statements (continued) |
| April 30, 2016 |
industry. The risk of concentrating Fund investments in a limited number of issuers conducting business in the same industry or group of industries will subject the Fund to a greater risk of loss as a result of adverse economic, business or other developments than if its investments were diversified across different industry sectors.
Tracking Error Risk
Each Fund’s performance may not match its Underlying Index during any period of time. Although each Fund attempts to track the performance of its Underlying Index, a Fund may not be able to duplicate its exact composition or return for any number of reasons, including but not limited to risk that the strategies used by the Advisor to match the performance of the Underlying Indexes may fail to produce the intended results, liquidity risk and new fund risk, as well as the incurring of Fund expenses, which the Underlying Index does not incur.
Foreign Securities Risk
Certain Funds invest directly or indirectly (through underlying ETFs) in the securities of non-U.S. issuers, which involves risks beyond those associated with investments in U.S. securities. These additional risks include greater market volatility, the availability of less reliable financial information, higher transactional and custody costs, taxation by foreign governments, decreased market liquidity and political instability.
Total Return Swap Risk****
Total return swaps give the Funds the right to receive the appreciation in the value of a specified security, index or other instrument in return for a fee paid to the counterparty, which will typically be an agreed upon interest rate. Total return swaps can also be used to replicate an exposure to a short position in an asset class where the Funds have the right to receive the depreciation in value of a specified security, index or other instrument (“inverse swaps”). If the underlying asset in a total return swap declines in value (or increases in value, if an inverse swap) over the term of the swap, the Funds may also be required to pay the dollar value of that decline (or increase, if an inverse swap) to the counterparty. Therefore, swaps are subject to credit risk or the risk of default or non-performance by the counterparty.
Futures Risk*****
Certain Funds may be subject to the risk that the change in the value of the futures contract may not correlate perfectly with the underlying instrument. Use of long futures contracts subjects the Funds to risk of loss in excess of the amounts shown on the Statements of Assets and Liabilities, up to the notional amount of the futures contracts. Use of short futures contracts subjects the Funds to unlimited risk of loss. The Funds may enter into futures contracts only on exchanges or boards of trade. The exchange or board of trade acts as the counterparty to each futures transaction; therefore, the Funds’ credit risk is limited to failure of the exchange or board of trade. Under some circumstances, futures exchanges may establish daily limits on the amount that the price of a futures contract can vary from the previous day’s settlement price, which could effectively prevent liquidation of positions.
Small Capitalization Companies Risk******
Certain Funds invest primarily in the stocks of small capitalization companies, which may be more volatile than those of larger companies. Stock prices of small capitalization companies are also more vulnerable than those of large capitalization companies to adverse business and economic developments, and the stocks of small capitalization companies may be thinly traded, making it difficult to buy and sell them.
| * | Applies to IQ Australia Small Cap ETF, IQ Canada Small Cap ETF, IQ Global Agribusiness Small Cap ETF, IQ Global Oil Small Cap ETF, IQ 50 Percent Hedged FTSE International ETF, IQ 50 Percent Hedged FTSE Europe ETF, and IQ 50 Percent Hedged FTSE Japan ETF. |
| ** | Applies to IQ 50 Percent Hedged FTSE International ETF, IQ 50 Percent Hedged FTSE Europe ETF, and IQ 50 Percent Hedged FTSE Japan ETF. |
| *** | Applies to IQ Hedge Multi-Strategy Tracker ETF, IQ Hedge Macro Tracker ETF, IQ Hedge Market Neutral Tracker ETF, IQ Hedge Long/Short Tracker ETF, IQ Hedge Event-Driven Tracker ETF, IQ Real Return ETF and GTAA Tracker. |
| **** | Applies to IQ Multi-Strategy Tracker ETF, IQ Hedge Macro Tracker ETF, IQ Hedge Market Neutral Tracker ETF, IQ Hedge Long/Short Tracker ETF, IQ Hedge Event-Driven ETF, IQ Merger Arbitrage ETF and IQ GTAA Tracker ETF. |
| ***** | Applies to IQ Global Resources. |
| ****** | Applies to IQ Australia Small Cap ETF, IQ Canada Small Cap ETF, IQ Global Agribusiness Small Cap ETF, IQ Global Oil Small Cap ETF and IQ U.S. Real Estate Small Cap ETF. |
10. SUBSEQUENT EVENTS
In the preparation of the financial statements, the Funds’ management has evaluated events and transactions for potential recognition or disclosure through the date the financial statements were issued.
| Report of Independent Registered Public Accounting Firm |
To the Board of Trustees and Shareholders of IndexIQ ETF Trust:
In our opinion, the accompanying statements of assets and liabilities, including the schedules of investments, as of April 30, 2016, and the related statements of operations and of changes in net assets and the financial highlights, present fairly, in all material respects, the financial position of each of the portfolios comprising the IndexIQ ETF Trust indicated in the table below (collectively referred to as the “Funds”) at April 30, 2016, and the results of each of their operations, the changes in each of their net assets and each of their financial highlights for each of the periods indicated in the table below, in conformity with accounting principles generally accepted in the United States of America. These financial statements and financial highlights (hereafter referred to as “financial statements”) are the responsibility of the Funds’ management. Our responsibility is to express an opinion on these financial statements based on our audits. We conducted our audit of these financial statements in accordance with the standards of the Public Company Accounting Oversight Board (United States). Those standards require that we plan and perform the audit to obtain reasonable assurance about whether the financial statements are free of material misstatement. An audit includes examining, on a test basis, evidence supporting the amounts and disclosures in the financial statements, assessing the accounting principles used and significant estimates made by management, and evaluating the overall financial statement presentation. We believe that our audits, which included confirmation of securities at April 30, 2016 by correspondence with the custodian and brokers, provide a reasonable basis for our opinion.
The financial statements of the Funds as of and for periods ended on or before April 30, 2014 were audited by other auditors whose report dated June 27, 2014 expressed an unqualified opinion on those statements.
| | Periods audited by PricewaterhouseCoopers LLP |
| Individual portfolio comprising the IndexIQ ETF Trust | Statement of operations | Statements of changes in net assets
and the financial highlights |
IQ Hedge Multi-Strategy Tracker ETF
IQ Hedge Macro Tracker ETF
IQ Global Resources ETF
IQ Merger Arbitrage ETF
IQ Real Return ETF
IQ Australia Small Cap ETF
IQ Canada Small Cap ETF
IQ Global Agribusiness Small Cap ETF
IQ Global Oil Small Cap ETF
IQ U.S. Real Estate Small Cap ETF
IQ Hedge Market Neutral Tracker ETF | For the year ended
April 30, 2016 | For the years ended
April 30, 2016 and 2015 |
|
IQ Hedge Long/Short Tracker ETF
IQ Hedge Event-Driven Tracker ETF | For the year ended
April 30, 2016 | For the year ended April 30,
2016 and the period from
March 24, 2015 (Inception)
through April 30, 2015 |
|
IQ 50 Percent Hedged FTSE International ETF
IQ 50 Percent Hedged FTSE Europe ETF
IQ 50 Percent Hedged FTSE Japan ETF | For the period from July 22, 2015 (Inception)
through April 30, 2016. |
| IQ Leaders GTAA Tracker ETF | For the period from September 30, 2015 (Inception)
through April 30, 2016. |

New York, New York
June 28, 2016
| Supplemental Information (unaudited) |
Federal Tax Status of Dividends Declared During the Tax Year
Qualified Dividend Income — For the fiscal year ended April 30, 2016, the Funds reporting 15% as ordinary income dividends, or maximum amount allowable, as qualifying for the reduced tax rate under the Jobs and Growth Tax Relief Reconciliation Act of 2003. The percentage of distributions are listed as follows:
| IQ Hedge Multi-Strategy Tracker ETF | 38.62% |
| IQ Hedge Macro Tracker ETF | 3.71% |
| IQ Hedge Market Neutral Tracker ETF | 0.00% |
| IQ Hedge Long/Short Tracker ETF | 4.81% |
| IQ Hedge Event-Driven Tracker ETF | 9.23% |
| IQ Global Resources ETF | 100.00% |
| IQ Merger Arbitrage ETF | 89.10% |
| IQ Real Return ETF | 100.00% |
| IQ Australia Small Cap ETF | 100.00% |
| IQ Canada Small Cap ETF | 66.70% |
| IQ Global Agribusiness Small Cap ETF | 62.58% |
| IQ Global Oil Small Cap ETF | 33.37% |
| IQ U.S. Real Estate Small Cap ETF | 0.26% |
| IQ 50 Percent Hedged FTSE International ETF | 60.45% |
| IQ 50 Percent Hedged FTSE Europe ETF | 55.11% |
| IQ 50 Percent Hedged FTSE Japan ETF | 100.00% |
| IQ Leaders GTAA Tracker ETF | 51.84% |
Dividends Received Deduction — Corporate shareholders are generally entitled to take the dividend received deduction on the portion of the Fund’s dividend distribution that qualifies under the tax law. The percentage for the Funds’ ordinary income dividend that qualifies for the corporate dividend received deductions for the fiscal year ended April 30, 2016 are listed as follows:
| IQ Hedge Multi-Strategy Tracker ETF | 16.54% |
| IQ Hedge Macro Tracker ETF | 0.04% |
| IQ Hedge Market Neutral Tracker ETF | 0.00% |
| IQ Hedge Long/Short Tracker ETF | 20.65% |
| IQ Hedge Event-Driven Tracker ETF | 5.47% |
| IQ Global Resources ETF | 44.58% |
| IQ Merger Arbitrage ETF | 76.19% |
| IQ Real Return ETF | 100.00% |
| IQ Australia Small Cap ETF | 0.00% |
| IQ Canada Small Cap ETF | 0.00% |
| IQ Global Agribusiness Small Cap ETF | 2.87% |
| IQ Global Oil Small Cap ETF | 7.71% |
| IQ U.S. Real Estate Small Cap ETF | 0.26% |
| IQ 50 Percent Hedged FTSE International ETF | 0.00% |
| IQ 50 Percent Hedged FTSE Europe ETF | 0.00% |
| IQ 50 Percent Hedged FTSE Japan ETF | 0.00% |
| IQ Leaders GTAA Tracker ETF | 19.03% |
| Supplemental Information (unaudited)(continued) |
Foreign Taxes Paid — The following Funds elect under the Internal Revenue Code Section 853 to pass through foreign taxes paid to its shareholders. The total amount of foreign taxes passed through to shareholders on a per share basis for the year ended April 30, 2016, are as follows:
| | | Foreign Taxes | | Foreign Income |
| Fund | | Per Share | | Per Share |
| IQ Hedge Multi-Strategy Tracker ETF | | — | | | — | |
| IQ Hedge Macro Tracker ETF | | — | | | — | |
| IQ Hedge Market Neutral Tracker ETF | | — | | | — | |
| IQ Hedge Long/Short Tracker ETF | | — | | | — | |
| IQ Hedge Event-Driven Tracker ETF | | — | | | — | |
| IQ Global Resources ETF | | 0.0294 | | | 0.4709 | |
| IQ Merger Arbitrage ETF | | — | | | — | |
| IQ Real Return ETF | | — | | | — | |
| IQ Australia Small Cap ETF | | — | | | — | |
| IQ Canada Small Cap ETF | | 0.0230 | | | 0.1619 | |
| IQ Global Agribusiness Small Cap ETF | | 0.0338 | | | 0.4013 | |
| IQ Global Oil Small Cap ETF | | 0.0133 | | | 0.1225 | |
| IQ U.S. Real Estate Small Cap ETF | | — | | | — | |
| IQ 50 Percent Hedged FTSE International ETF | | 0.0186 | | | 0.2173 | |
| IQ 50 Percent Hedged FTSE Europe ETF | | 0.0223 | | | 0.2718 | |
| IQ 50 Percent Hedged FTSE Japan ETF | | 0.0378 | | | 0.3285 | |
| IQ Leaders GTAA Tracker ETF | | — | | | — | |
In January 2017, you will be advised on IRS Form 1099 DIV as to the Federal tax status of the distributions received by you in calendar year 2016.
| Board Review of Investment Advisory Agreement (unaudited) |
The Board (the members of which are referred to as “Trustees”) of the Trust met in person on March 28, 2016, to consider the approval of an amendment to the Advisory Agreement between the Trust, on behalf of its funds, and the Advisor, to apply such Advisory Agreement to the IQ Enhanced Core Bond U.S. Fixed Income ETF, IQ Enhanced Core Plus Bond U.S. Fixed Income ETF, IQ Candriam Sustainable US Equity ETF, IQ Candriam Sustainable World Equity ETF, IQ Candriam Sustainable International Equity ETF, IQ Candriam Sustainable European Equity ETF, and IQ Candriam Sustainable Asia Pacific Equity ETF (together, the “New Funds”). The Trustees also considered the continuation, for an additional year, of the Advisory Agreement with respect to the existing series of the Trust for which the Advisory Agreement applies (together with the “New Funds”, the “Funds”).
In accordance with Section 15(c) of the Investment Company Act of 1940, as amended (“1940 Act”), the Board requested, reviewed and considered materials furnished by the Advisor relevant to the Board’s consideration of whether to approve the amendment to the Advisory Agreement to apply such agreement to the New Funds, as well as the continuation of the Advisory Agreement with respect to the existing Funds. In connection with considering approval of the amendment to and continuation of the Advisory Agreement, the Trustees who are not “interested persons” of the Trust, as that term is defined in the 1940 Act (the “Independent Trustees”), met in executive session with counsel to the Trust and counsel to the Independent Trustees, who provided assistance and advice. The consideration of the both the amendment to and the continuation of the Advisory Agreement was conducted by both the full Board and the Independent Trustees, who also voted separately.
During their review and consideration, the Board and the Independent Trustees focused on and analyzed the factors they deemed relevant, including: (1) the nature, extent and quality of the services provided by the Advisor, both for the Trust’s existing Funds and the proposed New Funds, and the fees to be charged by the Advisor; (2) information concerning business and operations, compliance program and portfolio management team of the Advisor, (3) the investment performance of the existing Funds; (3) the costs of the services to be provided and profits to be realized by the Advisor and their affiliates from the relationship with the Trust; (4) the extent to which economies of scale would be realized as the Funds grow; (5) any benefits derived or to be derived by the Advisor from the relationship with the Trust; and (6) potential conflicts of interest.
In reviewing such factors, the Board relied on certain information, including (1) a copy of the amendment to the Advisory Agreement and of the Advisory Agreement, itself; (2) information describing the Advisor and the services provided thereby; (3) information regarding the compliance program and portfolio management team of the Advisor; (4) copies of the Form ADV for the Advisor; (5) memoranda and guidance from Drinker Biddle & Reath LLP on the fiduciary responsibilities of trustees, including Independent Trustees, in considering advisory and distribution agreements under the 1940 Act; and (6) materials provided by the Advisor in response to a 15(c) request for information from Drinker Biddle & Reath LLP. In addition, the Board was provided data comparing the advisory fees and operating expenses (including acquired fund fees and expenses) of the Funds with expenses and performance of other registered investment companies with similar investment objectives and policies. The Trustees also considered their personal experiences as Trustees and participants in the exchange-traded fund (“ETF”) and mutual fund industry, as applicable.
In particular, the Trustees including the Independent Trustees, considered and discussed the following with respect to the Funds:
| 1. | | The nature, extent and quality of the facilities and services provided by the Advisor. The Board noted the responsibilities that Advisor has as the Funds’ investment adviser, including overall supervisory responsibility for the general management and investment of each Fund’s securities portfolio, monitoring Fund compliance with regulatory requirements and Fund objectives and policies, daily monitoring of the portfolio, overseeing Fund service providers, obtaining licenses for use of indexes tracked by the Funds, providing officers for the Funds, ongoing reporting to the Board, and the implementation of Board directives as they relate to the Funds. For the New Funds, the Board considered the services rendered in respect of the existing Funds in assessing services expected to be provided to the New Funds. |
The Board reviewed the experience, resources, and strengths of the Advisor in managing the existing Funds of the Trust, the IndexIQ Trust’s mutual fund, as well as separately managed accounts. Based on their consideration and review of the foregoing information, and based on the performance of the existing Funds of the Trust, the Board determined that the Funds, including the New Funds, were likely to benefit from the nature, quality, and extent of these services, as well as the Advisor’s ability to render such services based on its personnel, experience, operations, and resources.
| Board Review of Investment Advisory Agreement (unaudited)(continued) |
| 2. | | Comparison of services provided and fees charged by the Advisor and other investment advisers to similar clients, and the cost of the services provided and profits to be realized by the Advisor from its relationship with the Funds. The Board then compared both the services rendered and the fees paid with respect to the Funds (and those proposed to be paid in respect of the New Funds) pursuant to the Advisory Agreement to contracts of other registered investment advisers providing services to similar ETFs. In particular, the Board compared each Fund’s advisory fee and expense ratio (including acquired fund fees and expenses) to other investment companies considered to be in each such Fund’s peer group. |
After comparing each Fund’s fees with those of other investment companies in the Fund’s peer group, and in light of the nature, quality, and extent of services provided by the Advisor (and those proposed to be provided in respect of the New Funds) and the costs incurred by the Advisor in rendering those services, the Board concluded that the level of fees paid (or proposed to be paid) to the Advisor with respect to each Fund is fair and reasonable.
| 3. | | The Advisor’s profitability and the extent to which economies of scale would be realized as the Funds grow and whether fee levels would reflect such economies of scale. The Board discussed with the Advisor the costs and profitability of the Advisor in connection with its serving as investment adviser to each Fund, including operational costs. |
| 4. | | Investment performance of the Funds. The Board considered the investment performance of the existing Funds, including tracking error. In particular, the Board considered the investment performance of the Funds relative to their stated objectives and the success of the Advisor in reaching such objectives. The Board considered each Fund’s investment performance compared to the underlying index that each Fund seeks to track and includes in its prospectus and shareholder reports. The Board also considered each Fund’s investment performance compared to the respective Fund’s peer group. In respect of the New Funds, the Board considered that the New Funds had not yet commenced operations, and therefore had no performance or operational history to consider. |
Based on the foregoing and such other matters as were deemed relevant, and while no single factor was determinative in the decision, the Independent Trustees concluded that the terms of the Advisory Agreement with the Advisor were reasonable and fair to the Funds and to recommend to the Board the approval of the Advisory Agreement. As a result, all of the Board members, including the Independent Trustees, determined that (i) the amendment of the Advisory Agreement to apply such agreement to the New Funds and (ii) the continuation of the Advisory Agreement with IndexIQ was in the best interests of each Fund and its shareholders. The Board and the Independent Trustees, voting separately, approved the amendment to the Advisory Agreement and the continuation of the Advisory Agreement for an additional one-year period.
| Board of Trustees and Officers (unaudited) |
Name and
Year of Birth1 | | Position(s)
Held with
Trust | | Term of
Office and
Length of
Time Served2 | | Principal Occupation(s) During Past 5 Years | | Number of
Portfolios
in Fund
Complex
Overseen
by Trustee3 | | Other
Directorships
Held by
Trustee
During Past
5 Years |
| |
Reena Aggarwal,
1957 | | Trustee | | Since
August
2008 | | Robert E. McDonough Professor (2003 to present) and Professor of Finance (2000 to 2003), McDonough School of Business, Georgetown University (2000 to present); Co-Chair of Board, Social Innovations and Public Service Fund, Georgetown University (2012 to present); and Director, Brightwood Capital Advisors, L.P. (2013 to present). | | 18 | | FBR & Co.
(2011 to
present)
Hennessy
Funds Trust
(fka The FBR
Funds) (2006
to 2011) |
| |
Michael A. Pignataro,
1959 | | Trustee | | Since
April 2015 | | Proprietor, Countless Collectables LLC (online retailer) (2009 to present); Director, Credit Suisse Asset Management (2001 to 2013); and Chief Financial Officer, Credit Suisse Funds (1996 to 2013). | | 18 | | The New
Ireland
Fund, Inc.
(closed-end
fund) (2015
to present) |
| |
Paul D. Schaeffer,
1951 | | Trustee | | Since
April 2015 | | President, AlphaHut (dba Aspiring Solution Partners) (financial services consulting) (2013 to present); Managing Director, Forward Management LLC (asset management) (2010 to 2013); and President, Reflow) Management (mutual fund service provider (2008 to 2010). | | 18 | | Context
Capital Funds
(mutual fund
trust) (2014 to
present);
PopTech!
(conference
operator)
(2012 to
present) |
| |
| Interested Trustee |
| |
Adam S. Patti,4
1970 | | Chairman
and Trustee | | Since
November
2008
Since
July 2008 | | Chairman, Trustee, President and Principal Executive, IndexIQ Trust (2008 to present); Chief Executive Officer, the Advisor (2007 to present); and Chief Executive Officer, IndexIQ (2006 to
present). | | 18 | | None |
| | | President
and
Principal
Executive
Officer | | | | | | | | |
Other Officers
Name and
Year of Birth1 | | Position(s)
Held with
Trust | | Term of Office
and Length of
Time Served2 | | Principal Occupation(s) During Past 5 Years |
| |
Matthew V. Curtin,
1982 | | Secretary,
Chief
Compliance
Officer | | Since
June 2015 | | Chief Compliance Officer, IndexIQ (since June 2015); Associate General Counsel, New York Life Insurance Company (since February 2015); Associate, Dechert LLP (2007 to 2015) |
| |
David L. Fogel,
1971 | | Treasurer,
Principal
Financial
Officer | | Since
October 2008 | | Treasurer, Principal Financial Officer, IndexIQ Trust (2008 to present); Executive Vice President, IndexIQ Trust (2011 to present); President (2013 to present) and Executive Vice President (2006 to 2013), IndexIQ; and formerly, Chief Compliance Officer, IndexIQ Trust (2008-2015). |
| | | Executive Vice
President | | Since
June 2011 | | |
| 1 | The address of each Trustee or officer is c/o IndexIQ, 800 Westchester Avenue, Suite S-710, Rye Brook, New York 10573. |
| 2 | Trustees and Officers serve until their successors are duly elected and qualified. |
| 3 | The Funds are part of a “fund complex” as defined in the 1940 Act. The fund complex includes all open-end funds (including all of their portfolios) advised by the Advisor and any funds that have an investment advisor that is an affiliated person of the Advisor. As of the date of this SAI, the fund complex consists of the Trust’s Funds and the one fund of the IndexIQ Trust advised by the Advisor. |
| 4 | Mr. Patti is an “interested person” of the Trust (as that term is defined in the 1940 Act) because of his affiliations with the Advisor. |

ANNUAL REPORT | APRIL 30, 2016
IndexIQ ETF Trust

IQ Hedge Multi-Strategy Tracker ETF
IQ Hedge Macro Tracker ETF
IQ Hedge Market Neutral Tracker ETF
IQ Hedge Long/Short Tracker ETF
IQ Hedge Event-Driven Tracker ETF
IQ Global Resources ETF
IQ Merger Arbitrage ETF
IQ Real Return ETF
IQ Australia Small Cap ETF
IQ Canada Small Cap ETF
IQ Global Agribusiness Small Cap ETF
IQ Global Oil Small Cap ETF
IQ U.S. Real Estate Small Cap ETF
IQ 50 Percent Hedged FTSE International ETF
IQ 50 Percent Hedged FTSE Europe ETF
IQ 50 Percent Hedged FTSE Japan ETF
IQ Leaders GTAA Tracker ETF
Investment Advisor
IndexIQ Advisors LLC
800 Westchester Avenue
Suite S-710
Rye Brook, NY 10573
Distributor
ALPS Distributors, Inc.
1290 Broadway, Suite 1100
Denver, CO 80203
Custodian/Fund Administrator/Transfer Agent
The Bank of New York Mellon
101 Barclay Street
New York, NY 10286
Legal Counsel
Kaye Scholer, LLP
250 West 55th Street
New York, New York 10019
Independent Registered Public Accounting Firm
PricewaterhouseCoopers LLP
300 Madison Avenue
New York, NY 10017
MEIQH11-06/16 1698564
ME11-06/16 1698567
Item 2. Code of Ethics.
| (a) | The registrant, as of the end of the period covered by this report, has adopted a code of ethics that applies to the registrant’s principal executive officer, principal financial officer, principal accounting officer or controller, or persons performing similar functions, regardless of whether these individuals are employed by the registrant or a third party. |
| (c) | There have been no amendments, during the period covered by this report, to a provision of the code of ethics that applies to the registrant’s principal executive officer, principal financial officer, principal accounting officer or controller, or persons performing similar functions, regardless of whether these individuals are employed by the registrant or a third party, and that relates to any element of the code of ethics description. |
| (d) | The registrant has not granted any waivers, including an implicit waiver, from a provision of the code of ethics that applies to the registrant’s principal executive officer, principal financial officer, principal accounting officer or controller, or persons performing similar functions, regardless of whether these individuals are employed by the registrant or a third party, that relates to one or more of the items set forth in paragraph (b) of this item’s instructions. |
Item 3. Audit Committee Financial Expert.
The Registrant’s Board of Trustees has two audit committee financial experts serving on its audit committee, an “independent” Trustee, Reena Aggarwal and Michael Pignataro. Under applicable securities laws, a person who is determined to be an audit committee financial expert will not be deemed an “expert” for any purpose, including without limitation for the purposes of Section 11 of the Securities Act of 1933, as a result of being designated or identified as an audit committee financial expert. The designation or identification of a person as an audit committee financial expert does not impose on such person any duties, obligations, or liabilities that are greater than the duties, obligations, and liabilities imposed on such person as a member of the audit committee and Board of Trustees in the absence of such designation or identification.
Item 4. Principal Accountant Fees and Services.
Audit Fees
| (a) | The aggregate fees billed for each of the last two fiscal years for professional services rendered by the principal accountant for the audit of the registrant's annual financial statements or services that are normally provided by the accountant in connection with statutory and regulatory filings or engagements for those fiscal years are $302,500 for 2016 and $226,000 for 2015. |
Audit-Related Fees
| (b) | The aggregate fees billed in each of the last two fiscal years for assurance and related services by the principal accountant that are reasonably related to the performance of the audit of the registrant's financial statements and are not reported under paragraph (a) of this Item are $0 for 2016 and $0 for 2015. |
Tax Fees
| (c) | The aggregate fees billed in each of the last two fiscal years for professional services rendered by the principal accountant for tax compliance, tax advice, and tax planning are $0 for 2016 and $0 for 2015. |
All Other Fees
| (d) | The aggregate fees billed in each of the last two fiscal years for products and services provided by the principal accountant, other than the services reported in paragraphs (a) through (c) of this Item are $0 for 2016 and $0 for 2015. |
| (e)(1) | Per Rule 2-01(c)(7)(A), the Audit Committee pre-approves all of the Audit, Audit-Related, Tax and Other Fees of the Registrant. |
| (e)(2) | 100% of services described in each of Items 4(b) through (d) were approved by the audit committee pursuant to paragraph (c)(7)(A) of Rule 2-01 of Regulation S-X. |
| (g) | The aggregate non-audit fees billed by the principal accountant for services rendered to the registrant's investment adviser (not including any subadvisor whose role is primarily portfolio management and is subcontracted with or overseen by another investment adviser), and any entity controlling, controlled by, or under common control with the adviser that provides ongoing services to the registrant were (i) approximately $5,300,000 for the fiscal year ended April 30, 2016, and (ii) $3,771,000 for the fiscal year ended April 30, 2015. |
| (h) | The registrant’s Audit Committee has determined that the non-audit services rendered by the principal accountant for the fiscal year ended April 30, 2016 to the registrant’s investment adviser and any entity controlling, controlled by, or under common control with the registrant’s investment adviser that provides ongoing services to the registrant that were not required to be pre-approved by the Audit Committee because they did not relate directly to the operations and financial reporting of the registrant were compatible with maintaining the respective independence of the principal accountant during the relevant time period. |
Item 5. Audit Committee of Listed Registrants.
| (a) | The Fund has a designated Audit Committee in accordance with Section 3(a)(58)(A) of the Securities and Exchange Act of 1934 (the “Exchange Act”) and the members of such committee are Reena Aggarwal, Michael Pignataro, and Paul Schaeffer. |
Item 6. Investments.
| (a) | Schedule of Investments in securities of unaffiliated issuers as of the close of the reporting period is included as part of the report to shareholders filed under Item 1 of this form. |
Item 7. Disclosure of Proxy Voting Policies and Procedures for Closed-End Management Investment Companies.
Not applicable.
Item 8. Portfolio Managers of Closed-End Management Investment Companies.
Not applicable.
Item 9. Purchases of Equity Securities by Closed-End Management Investment Company and Affiliated Purchasers.
Not applicable.
Item 10. Submission of Matters to a Vote of Security Holders.
There have been no material changes to the procedures by which the shareholders may recommend nominees to the registrant’s board of trustees, where those changes were implemented after the registrant last provided disclosure in response to the requirements of Item 407(c)(2)(iv) of Regulation S-K (17 CFR 229.407) (as required by Item 22(b)(15) of Schedule 14A (17 CFR 240.14a-101)), or this Item.
Item 11. Controls and Procedures.
| (a) | The registrant’s principal executive and principal financial officers, or persons performing similar functions, have concluded that the registrant’s disclosure controls and procedures (as defined in Rule 30a-3(c) under the Investment Company Act of 1940, as amended (the “1940 Act”) (17 CFR 270.30a-3(c))) are effective, as of a date within 90 days of the filing date of the report that includes the disclosure required by this paragraph, based on their evaluation of these controls and procedures required by Rule 30a-3(b) under the 1940 Act (17 CFR 270.30a-3(b)) and Rules 13a-15(b) or 15d-15(b) under the Securities Exchange Act of 1934, as amended (17 CFR 240.13a-15(b) or 240.15d-15(b)). |
| (b) | There were no changes in the registrant’s internal control over financial reporting (as defined in Rule 30a-3(d) under the 1940 Act (17 CFR 270.30a-3(d))) that occurred during the registrant’s second fiscal quarter of the period covered by this report that has materially affected, or is reasonably likely to materially affect, the registrant’s internal control over financial reporting. |
Item 12. Exhibits.
| (a)(1) | Code of ethics that is the subject of disclosure required by Item 2 is attached hereto. |
| (a)(2) | Certifications pursuant to Rule 30a-2(a) under the 1940 Act and Section 302 of the Sarbanes-Oxley Act of 2002 are attached hereto. |
| (b) | Certifications pursuant to Rule 30a-2(b) under the 1940 Act and Section 906 of the Sarbanes-Oxley Act of 2002 are attached hereto. |
SIGNATURES
Pursuant to the requirements of the Securities Exchange Act of 1934 and the Investment Company Act of 1940, the registrant has duly caused this report to be signed on its behalf by the undersigned, thereunto duly authorized.
| (Registrant) | IndexIQ ETF Trust |
| By (Signature and Title)* | /s/ Adam S. Patti |
| | Adam S. Patti |
| | (Principal Executive Officer) |
Pursuant to the requirements of the Securities Exchange Act of 1934 and the Investment Company Act of 1940, this report has been signed below by the following persons on behalf of the registrant and in the capacities and on the dates indicated.
| By (Signature and Title)* | /s/ Adam S. Patti |
| | Adam S. Patti |
| | (Principal Executive Officer) |
| By (Signature and Title)* | /s/ David L. Fogel |
| | David L. Fogel |
| | (Principal Financial Officer) |
* Print the name and title of each signing officer under his or her signature.