Kirk C. Lehneis
IndexIQ Advisors LLC
51 Madison Avenue
New York, NY 10010
(Name and address of agent for service)
Form N-CSR is to be used by management investment companies to file reports with the Commission not later than 10 days after the transmission to stockholders of any report that is required to be transmitted to stockholders under Rule 30e-1 under the Investment Company Act of 1940 (17 CFR 270.30e-1). The Commission may use the information provided on Form N-CSR in its regulatory, disclosure review, inspection, and policymaking roles.
A registrant is required to disclose the information specified by Form N-CSR, and the Commission will make this information public. A registrant is not required to respond to the collection of information contained in Form N-CSR unless the Form displays a currently valid Office of Management and Budget ("OMB") control number. Please direct comments concerning the accuracy of the information collection burden estimate and any suggestions for reducing the burden to Secretary, Securities and Exchange Commission, 450 Fifth Street, NW, Washington, DC 20549-0609. The OMB has reviewed this collection of information under the clearance requirements of 44 U.S.C. § 3507.
Item 1. Reports to Stockholders.
The Report to Shareholders is attached herewith.
Beginning on January 1, 2021, as permitted by regulations adopted by the Securities and Exchange Commission, paper copies of the Funds’ shareholder reports will no longer be sent by mail, unless you specifically request paper copies of the reports from your financial intermediary, such as a broker-dealer or bank. Instead, the reports will be made available on a website, and you will be notified by mail each time a report is posted and provided with a website link to access the report.
The investment return and value of each of the Funds’ shares will fluctuate so that an investor’s shares, when sold, may be worth more or less than their original cost. Performance may be lower or higher than performance data quoted. Consider the Funds’ investment objectives, risks, charges and expenses carefully before investing. The prospectus and the statement of additional information include this and other relevant information about the Funds and are available by visitingnylinvestments.com/etfs or by calling 1-888-474-7725. Read the prospectus carefully before investing.
Each of the Funds’ performance that is current to the most recent month-end is available by visitingnylinvestments.com/etfs or by calling 1-888-474-7725.
You may obtain a description of the IndexIQ ETF Trust proxy voting policies, procedures and information regarding how each Fund voted proxies relating to portfolio securities during the 12-month period ending June 30 (available by August 31) without charge, upon request, by calling 1-888-474-7725 or by accessing the SEC’s website atsec.gov.
The Funds file their complete schedules of portfolio holdings with the Commission for the first and third quarters of each fiscal year on Form N-Q. The Funds’ Forms N-Q are available on the Commission’s website atsec.gov. Each Funds’ premium/discount information is available, free of charge, on the Funds’ websitenylinvestments.com/etfs or by calling 1-888-474-7725.
New York Life Investments is a service mark and name under which New York Life Investment Management LLC does business. New York Life Investments, an indirect subsidiary of New York Life Insurance Company, 51 Madison Avenue, New York, NY 10010, provides investment advisory products and services. IndexIQ® is an indirect wholly owned subsidiary of New York Life Investment Management Holdings LLC. ALPS Distributors, Inc. (”ALPS“) is the principal underwriter of the ETFs, and NYLIFE Distributors LLC is a distributor of the ETFs. NYLIFE Distributors LLC is located at 30 Hudson Street, Jersey City, NJ 07302. ALPS Distributors, Inc. is not affiliated with NYLIFE Distributors LLC. NYLIFE Distributors LLC is a Member FINRA/SIPC.
If you have questions about IndexIQ e-Delivery services, contact a representative at 1-888-474-7725.
We are pleased to present you with this annual report for IndexIQ ETF Trust for the 12 months ended April 30, 2019.
The annual reporting period ended April 30, 2019 saw dramatic shifts in sentiment driven by geopolitical and macroeconomic developments. U.S. equities plunged in late 2018 in response to high stock valuations and possible indications of slowing economic growth, along with concerns that the Federal Reserve (Fed) was raising rates too aggressively and that trade conflicts between the U.S. and China could prove more difficult to resolve than previously expected. Market sentiment turned positive again in the last week of December after the Fed signaled that it may put additional rate hikes on hold. During the rest of the reporting period, many investors looked beyond ongoing concerns regarding mounting trade tensions between the U.S. and China and an increasingly unclear global economic picture, focusing instead on continued U.S. economic growth, low unemployment, restrained inflation and better than expected corporate earnings. By April 30, 2019, most U.S.-based equity and fixed-income sectors had climbed back into positive territory compared to their levels a year before, with some areas of the domestic market recording impressive gains.
International equity markets followed a similar V-shaped pattern in response to many of the same economic and political developments. However, the recovery in the rest of the world generally lagged the United States as economic growth in most other developed nations proved less robust.
U.S. fixed-income instruments generally traded in a narrower range than equities. For the most part, corporate bonds suffered relatively mild declines in late 2018 and recovered along with their equity counterparts through April 30, 2019. Most other bond sectors produced comparatively steady positive performance throughout the reporting period, with lower-credit quality, higher-yielding, longer-duration securities generally leading the group’s advance.
On the following pages, you will find detailed discussion of the key factors influencing performance of each of the IndexIQ ETFs for the period ended April 30, 2019. You will also find a schedule of investments and the financial statements for each ETF.
The heightened volatility of the last 12 months makes the importance of broad diversification across geography and asset class clearer than ever. We believe the solutions provided by the IndexIQ ETFs give investors the opportunity to enhance portfolio construction in a liquid and transparent manner relative to typical alternative asset strategies, to build a portfolio that best meets their specific objectives. If you have any questions or would like more information about IndexIQ ETFs, we invite you to visit us at nylinvestments.com/etfs or call us at 1-888-474-7725.
Sincerely,
Kirk C. Lehneis
President
The opinions expressed are as of the date of this report and are subject to change. There is no guarantee that any forecast made will come to pass. This material does not constitute investment advice and is not intended as an endorsement of any specific investment. Past performance is no guarantee of future results.
5
Management’s Discussion of Fund Performance
(unaudited)
How did IQ Hedge Multi-Strategy Tracker ETF perform during the 12 months ended April 30, 2019?
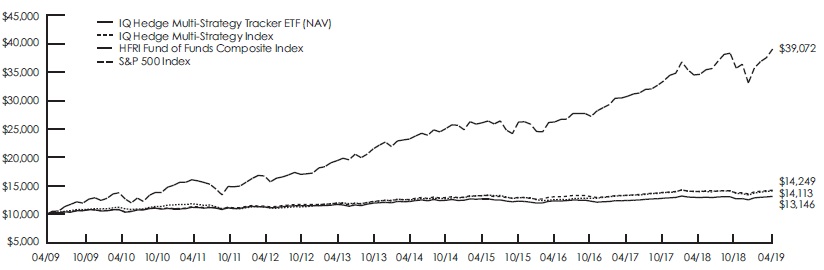
For the 12 months ended April 30, 2019 (the “reporting period”), the IQ Hedge Multi-Strategy Tracker ETF returned 1.56% at NAV (net asset value) and 1.56% at market price.1 To compare, the Fund’s Underlying Index, the IQ Hedge Multi-Strategy Index,2 returned 1.87% for the same period. The HFRI Fund of Funds Composite Index2 and S&P 500 Index2 returned 0.58% and 12.82%, respectively, for the same period.
What factors affected the Fund’s performance during the reporting period?
The Fund employs a 110/10 long/short strategy in line with its Underlying Index. This approach calls for the simultaneous holding of both long and short positions on different securities. The “110” portion stands for 110% exposure to its long portfolio and the “10” portion stands for 10% exposure to its short portfolio, for a net exposure of 100%.
The Fund is a “fund of funds,” meaning that it seeks to achieve its investment objective by investing primarily in underlying exchange-traded funds (“ETFs”). During the reporting period, the long positions that added to the Fund’s total return were bonds, equities and real estate. Commodities, volatility and currencies detracted from the Fund’s total return. Among the Fund’s short positions, equities, real estate, currencies and bonds provided positive returns, while commodities proved negative. The Fund’s total asset class performance was positive for bonds, real estate and equities, and negative for volatility, commodities and currencies.
During the reporting period, how was the Fund’s performance materially affected by investments in derivatives?
The Fund used derivative positions where necessary to help it track the IQ Hedge Multi-Strategy Index, which contained both long and short positions. The Fund’s derivatives positions were primarily total return swaps on the ETFs at the weights in which they were included in the Underlying Index. Derivatives were not used to gain leverage beyond the index positioning; rather, they were used exclusively to enable the Fund to track its Underlying Index.
How were the Fund’s assets allocated during the reporting period and why?
The positions in the Fund’s Underlying Index were driven by quantitative models that determined the weights across the various hedge fund strategies represented in the Fund, as well as the weights of the assets within these strategies. Given the rules-based nature of this approach, there was no subjectivity involved in the allocation decision process.
How did the Fund’s allocations change over the course of the reporting period?
On average, the Fund’s allocations to bonds accounted for approximately 75% of assets, while equities accounted for approximately 22%. Allocations to bonds remained stable during the reporting period, while equity allocations fluctuated around the average for the asset class. Allocations to the alternative asset classes of real estate, volatility, currencies and commodities moved within -3 and +3% in aggregate.
During the reporting period, which underlying ETFs had the highest total returns and which underlying ETFs had the lowest total returns?
In terms of total return, the best-performing underlying ETFs in the Fund during the reporting period were Technology Select Sector SPDR Fund (XLK), iShares U.S. Real Estate ETF (IYR) and Vanguard Real Estate Index Fund ETF (VNQ). During the same period, iPath Series B S&P 500 VIX Short-Term Futures ETN (VXX), SPDR S&P International Small Cap ETF (GWX) and SPDR S&P Emerging Markets Small Cap ETF (EWX) recorded the lowest returns.
1 | | The price used to calculate the market price returns is determined by using the closing price listed on the NYSE Arca and does not represent returns an investor would receive if shares were traded at other times. |
2 | | See page 7 for more information on this index. |
6
Management’s Discussion of Fund Performance(unaudited) (continued)
Which underlying ETFs made the strongest contributions to the Fund’s performance during the reporting period and which underlying ETFs made the weakest contributions?
On the basis of impact, which takes weightings and total returns into consideration, the underlying ETFs that made the greatest positive contributions to the Fund’s performance during the reporting period were iShares iBoxx $ Investment Grade Corporate Bond ETF (LQD), iShares Russell 1000 Growth ETF (IWF) and Vanguard Growth ETF (VUG). The weakest contributors were iShares MSCI EAFE Small-Cap ETF (SCZ), Vanguard FTSE All-World ex-US Small-Cap ETF (VSS) and iShares Edge MSCI Min Vol USA ETF (USMV).
The opinions expressed are those of the portfolio managers as of the date of this report and are subject to change. There is no guarantee that any forecasts will come to pass. This material does not constitute investment advice and is not intended as an endorsement of any specific investment.
Hypothetical Growth of a $10,000 Investment
(From 4/30/2009 Through 4/30/2019)
Fund Performance History
IQ Hedge Multi-Strategy Tracker ETF
(as of April 30, 2019)
| | | | 1 Year
| | 5 Year
| | 10 Year
|
| | | | Average
Annual
| | Average
Annual
| | Average
Annual
|
IQ Hedge Multi-Strategy Tracker ETF Market Price1 | | | | | 1.56 | % | | | 1.41 | % | | | 2.74 | % |
IQ Hedge Multi-Strategy Tracker ETF NAV | | | | | 1.56 | % | | | 1.43 | % | | | 2.77 | % |
IQ Hedge Multi-Strategy Index | | | | | 1.87 | % | | | 2.46 | % | | | 3.60 | % |
HFRI Fund of Funds Composite Index2 | | | | | 0.58 | % | | | 2.46 | % | | | 3.51 | % |
S&P 500 Index | | | | | 12.82 | % | | | 10.94 | % | | | 14.60 | % |
1 | | Beginning on May 31, 2016, the price used to calculate the Market Price returns is the mean between the day’s last bid and ask prices. Prior to May 31, 2016, market price returns were calculated using the day’s NYSE Arca closing price. The market price returns do not represent returns an investor would receive if shares were traded at other times. |
7
Management’s Discussion of Fund Performance(unaudited) (continued)
How did IQ Hedge Macro Tracker ETF perform during the 12 months ended April 30, 2019?
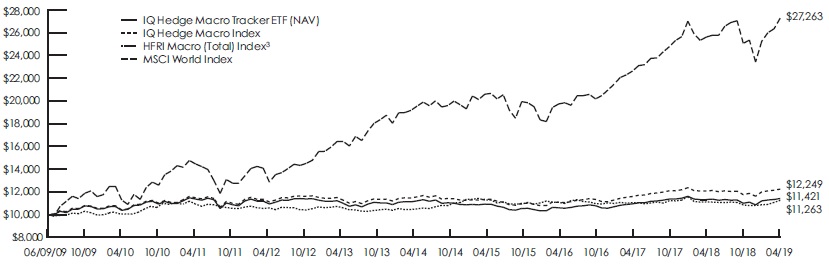
For the 12 months ended April 30, 2019 (the “reporting period”), the IQ Hedge Macro Tracker ETF returned 0.77% at NAV (net asset value) and 0.74% at market price.1 To compare, the Fund’s Underlying Index, the IQ Hedge Macro Index2 returned 1.36% for the same period. The HFRI Macro (Total) Index2 and the MSCI World Index2 returned 1.21% and 6.48%. respectively, for the same period.
What factors affected the Fund’s performance during the reporting period?
The Fund employs a 110/10 strategy in line with its Underlying Index. This approach calls for the simultaneous holding of both long and short positions on different securities. The “110” portion stands for 110% exposure to its long portfolio and the “10” portion stands for 10% exposure to its short portfolio, for a net exposure of 100%.
The Fund is a “fund of funds,” meaning that it seeks to achieve its investment objective by investing primarily in underlying exchange-traded funds (“ETFs”). During the reporting period, the Fund maintained allocations to bonds, equities, currencies, real estate and commodities. Allocations to bonds remained at consistent levels, while the weight to equities decreased below its average level with an offset to currencies. Real estate was held short.
During the reporting period, how was the Fund’s performance materially affected by investments in derivatives?
The Fund used derivative positions where necessary to help it track the IQ Hedge Macro Index, which contained both long and short positions. The Fund’s derivatives positions were primarily total return swaps on the ETFs at the weights in which they were included in the Underlying Index. Derivatives were not used to gain leverage beyond the index positioning; rather, they were used exclusively to enable the Fund to track its index.
How were the Fund’s assets allocated during the reporting period and why?
The positions in the Fund’s Underlying Index are driven by quantitative models that determine the weights across the various hedge fund strategies represented in the Fund as well as the weights of the assets within these strategies. Given the rules-based nature of the process, there is no subjectivity involved in the allocation decision process.
How did the Fund’s allocations change over the course of the reporting period?
The Fund’s asset class allocations were adjusted as determined by the Underlying Index’s proprietary quantitative models. During the reporting period, total bond exposure remained constant at approximately 63%. Exposure to equities stood below its annual average as of April 30, 2019 due to a reduction in the Fund’s overall long allocation, which was offset by increased exposure to currencies. Real estate exposure remained short during the reporting period.
During the reporting period, which underlying ETFs had the highest total returns and which underlying ETFs had the lowest total returns?
In terms of total return, the best-performing underlying ETFs in the Fund during the reporting period were SPDR Portfolio S&P 500 Growth ETF (SPYG), Vanguard Growth ETF (VUG) and iShares Russell 1000 Growth ETF (IWF). During the same period, SPDR S&P International Small Cap ETF (GWX), SPDR S&P Emerging Markets Small Cap ETF (EWX) and iShares Silver Trust (SLV) recorded the lowest returns.
Which underlying ETFs made the strongest contributions to the Fund’s performance during the reporting period and which underlying ETFs made the weakest contributions?
On the basis of impact, which takes weightings and total returns into consideration, the underlying ETFs that made the greatest positive contributions to the Fund’s performance during the reporting period were Vanguard Total Stock Market ETF (VTI), Vanguard FTSE Emerging Markets ETF (VWO) and iShares Core MSCI Emerging Markets ETF (IEMG). The weakest contributors were iShares MSCI EAFE Small-Cap ETF (SCZ), iShares MSCI China ETF (MCHI) and SPDR S&P Emerging Markets Small Cap ETF (EWX).
1 | | The price used to calculate the market price returns is determined by using the closing price listed on the NYSE Arca and does not represent returns an investor would receive if shares were traded at other times. |
2 | | See page 9 for more information on this index. |
8
Management’s Discussion of Fund Performance(unaudited) (continued)
The opinions expressed are those of the portfolio managers as of the date of this report and are subject to change. There is no guarantee that any forecasts will come to pass. This material does not constitute investment advice and is not intended as an endorsement of any specific investment.
Hypothetical Growth of a $10,000 Investment
(Since Inception Through 4/30/2019)
Fund Performance History
IQ Hedge Macro Tracker ETF
(as of April 30, 2019)
| | | | 1 Year
| | 3 Year
| | 5 Year
| | Since Inception1
| |
| | | | Average
Annual
| | Average
Annual
| | Average
Annual
| | Average
Annual
| | Cumulative
|
IQ Hedge Macro Tracker ETF Market Price2 | | | | | 0.74 | % | | | 2.28 | % | | | 0.53 | % | | | 1.34 | % | | | 14.12 | % |
IQ Hedge Macro Tracker ETF NAV | | | | | 0.77 | % | | | 2.50 | % | | | 0.52 | % | | | 1.35 | % | | | 14.21 | % |
IQ Hedge Macro Index | | | | | 1.36 | % | | | 3.38 | % | | | 1.32 | % | | | 2.07 | % | | | 22.49 | % |
HFRI Macro (Total) Index3 | | | | | 1.21 | % | | | 0.53 | % | | | 1.50 | % | | | 1.21 | % | | | 12.63 | % |
MSCI World Index | | | | | 6.48 | % | | | 11.39 | % | | | 7.31 | % | | | 10.66 | % | | | 172.63 | % |
1 | | Fund Inception Date: 6/09/2009. |
2 | | Beginning on May 31, 2016, the price used to calculate the Market Price returns is the mean between the day’s last bid and ask prices. Prior to May 31, 2016, market price returns were calculated using the day’s NYSE Arca closing price. The market price returns do not represent returns an investor would receive if shares were traded at other times. |
3 | | Data shown above for the HFRI Macro (Total) Index is from 5/31/2009 to 4/30/2019. |
9
Management’s Discussion of Fund Performance(unaudited) (continued)
How did IQ Hedge Market Neutral Tracker ETF perform during the 12 months ended April 30, 2019?
For the 12 months ended April 30, 2019 (the “reporting period”), the IQ Hedge Market Neutral Tracker ETF returned 2.56% at NAV (net asset value) and 2.54% at market price.1 To compare, the Fund’s Underlying Index, IQ Hedge Market Neutral Index.2 returned 3.16% for the same period. The HFRI Equity Market Neutral Index2 and the Bloomberg Barclays U.S. Short Treasury Bond Index2 returned -0.51% and 2.29%, respectively, for the same period.
What factors affected the Fund’s performance during the reporting period?
The Fund employs a 110/10 long/short strategy in line with its Underlying Index. This approach calls for the simultaneous holding of both long and short positions on different securities. The “110” portion stands for 110% exposure to its long portfolio and the “10” portion stands for 10% exposure to its short portfolio, for a net exposure of 100%.
The Fund is a “fund of funds,” meaning that it seeks to achieve its investment objective by investing primarily in underlying exchange-traded funds (“ETFs”). During the reporting period, the long portion of the Fund’s strategy produced positive returns, while the short portion of the strategy detracted from returns. On an asset class basis, the Fund held exposure to equities, bonds and currencies, with currencies as the only negative performing holdings. Most of the Fund’s assets were invested in bonds.
During the reporting period, how was the Fund’s performance materially affected by investments in derivatives?
The Fund used derivative positions where necessary to help it track the IQ Hedge Market Neutral Tracker ETF, which contained both long and short positions. The Fund’s derivatives positions were primarily total return swaps on the ETFs at the weights in which they were included in the Underlying Index. Derivatives were not used to gain leverage beyond the index positioning; rather, they were used exclusively to enable the Fund to track its Underlying Index.
How were the Fund’s assets allocated during the reporting period and why?
The positions in the Fund’s Underlying Index were driven by quantitative models that determined the weights across the various hedge fund strategies represented in the Fund, as well as the weights of the assets within these strategies. Given the rules-based nature of the process, there was no subjectivity involved in the allocation decision process.
How did the ETF’s allocations change over the course of the reporting period?
During the reporting period, the Fund maintained allocations to bonds, equities and currencies. On a net basis, bonds represented the Fund’s largest average exposure, followed by equities. As of April 30, 2019, the Fund’s bond allocation stood below the annual average while equities had increased.
During the reporting period, which underlying ETFs had the highest total returns and which underlying ETFs had the lowest total returns?
In terms of total return, the best-performing underlying ETFs in the Fund during the reporting period were Invesco S&P 500 Low Volatility ETF (SPLV), iShares Edge MSCI Min Vol USA ETF (USMV) and SPDR Portfolio S&P 500 Growth ETF (SPYG). During the same period, SPDR S&P International Small Cap ETF (GWX), Vanguard FTSE All-World ex-US Small-Cap ETF (VSS) and iShares MSCI EAFE Small-Cap ETF (SCZ) recorded the lowest returns.
Which underlying ETFs made the strongest contributions to the Fund’s performance during the reporting period and which underlying ETFs made the weakest contributions?
On the basis of impact, which takes weightings and total returns into consideration, the underlying ETFs that made the greatest positive contributions to the Fund’s performance during the reporting period were iShares iBoxx $ Investment Grade Corporate Bond ETF (LQD), Invesco Senior Loan ETF (BKLN) and iShares Russell 1000 Growth ETF (IWF). The weakest contributors were iShares MSCI EAFE Small-Cap ETF (SCZ), Invesco CurrencyShares Euro Trust (FXE) and iShares Edge MSCI Min Vol USA ETF (USMV).
1 | | The price used to calculate the market price returns is determined by using the closing price listed on the NYSE Arca and does not represent returns an investor would receive if shares were traded at other times. |
2 | | See page 11 for more information on this index. |
10
Management’s Discussion of Fund Performance(unaudited) (continued)
The opinions expressed are those of the portfolio managers as of the date of this report and are subject to change. There is no guarantee that any forecasts will come to pass. This material does not constitute investment advice and is not intended as an endorsement of any specific investment.
Hypothetical Growth of a $10,000 Investment
(Since Inception Through 4/30/2019)
Fund Performance History
IQ Hedge Market Neutral Tracker ETF
(as of April 30, 2019)
| | | | 1 Year
| | 3 Year
| | 5 Year
| | Since Inception1
|
| | | | Average
Annual
| | Average
Annual
| | Average
Annual
| | Average
Annual
| | Cumulative
|
IQ Hedge Market Neutral Tracker ETF Market Price2 | | | | | 2.54 | % | | | 1.50 | % | | | 0.93 | % | | | 1.33 | % | | | 9.08 | % |
IQ Hedge Market Neutral Tracker ETF NAV | | | | | 2.56 | % | | | 1.43 | % | | | 0.90 | % | | | 1.33 | % | | | 9.11 | % |
IQ Hedge Market Neutral Index | | | | | 3.16 | % | | | 2.23 | % | | | 1.93 | % | | | 2.31 | % | | | 16.20 | % |
HFRI Equity Market Neutral Index3 | | | | | -0.51 | % | | | 2.52 | % | | | 2.58 | % | | | 3.30 | % | | | 23.82 | % |
Bloomberg Barclays U.S. Short Treasury Bond Index | | | | | 2.29 | % | | | 1.28 | % | | | 0.85 | % | | | 0.68 | % | | | 4.55 | % |
1 | | Fund Inception Date: 10/04/2012. |
2 | | Beginning on May 31, 2016, the price used to calculate the Market Price returns is the mean between the day’s last bid and ask prices. Prior to May 31, 2016, market price returns were calculated using the day’s NYSE Arca closing price. The market price returns do not represent returns an investor would receive if shares were traded at other times. |
3 | | Data shown above for the HFRI Equity Market Neutral Index is from 9/30/2012 to 4/30/2019. |
11
Management’s Discussion of Fund Performance(unaudited) (continued)
How did IQ Hedge Long/Short Tracker ETF perform during the 12 months ended April 30, 2019?
For the 12 months ended April 30, 2019 (the “reporting period”), the IQ Hedge Long/Short Tracker ETF returned 3.07% at NAV (net asset value) and 2.91% at market price.1 To compare, the Fund’s Underlying Index, IQ Hedge Long/Short Index2 returned 3.79% for the same period. The HFRI Equity Hedge Index2 and the MSCI World Index2 returned 0.99% and 6.48%, respectively, for the same period.
What factors affected the Fund’s performance during the reporting period?
The Fund employs a 110/10 strategy in line with its Underlying Index. This approach calls for the simultaneous holding of both long and short positions on different securities. The “110” portion stands for 110% exposure to its long portfolio, and the “10” portion stands for 10% exposure to its short portfolio, for a net exposure of 100%.
The Fund is a “fund of funds,” meaning that it seeks to achieve its investment objective by investing primarily in underlying exchange-traded funds (“ETFs”). During the reporting period, the Fund maintained allocations to bonds, equities, currencies, real estate and volatility, with volatility constrained to long allocations only. While the Fund’s overall long allocation contributed positively to returns, short exposure detracted from performance.
During the reporting period, how was the Fund’s performance materially affected by investments in derivatives?
The Fund used derivative positions where necessary to help it track the IQ Hedge Long/Short Index, which contained both long and short positions. The Fund’s derivatives positions were primarily total return swaps on the ETFs at the weights in which they were included in the Underlying Index. Derivatives were not used to gain leverage beyond the index positioning; rather, they were used exclusively to enable the Fund to track its Underlying Index.
How were the Fund’s assets allocated during the reporting period and why?
The positions in the Underlying Index were driven by quantitative models that determined the weights across the various hedge fund strategies represented in the Fund as well as the weights of the assets within these strategies. Given the rules-based nature of the process, there was no subjectivity involved in the allocation decision process.
How did the Fund’s allocations change over the course of the reporting period?
The Fund maintained its largest core allocations to equities, followed by bonds. Equity allocations averaged 60% during the reporting period, but stood below this average at the beginning and end of the same period. Volatility, as mentioned earlier, was constrained to long-only exposure, while the Fund’s real estate exposure remained short throughout the reporting period.
During the reporting period, which underlying ETFs had the highest total returns and which underlying ETFs had the lowest total returns?
In terms of total return, the best-performing underlying ETFs in the Fund during the reporting period were the Technology Select Sector SPDR Fund (XLK), iShares U.S. Real Estate ETF (IYR) and Vanguard Real Estate ETF (VNQ). During the same period, iPath Series B S&P 500 VIX Short-Term Futures ETN (VXX), SPDR S&P International Small Cap ETF (GWX) and Vanguard FTSE All-World ex-US Small-Cap ETF (VSS) recorded the lowest returns.
Which underlying ETFs made the strongest contributions to the Fund’s performance during the reporting period and which underlying ETFs made the weakest contributions?
On the basis of impact, which takes weightings and total returns into consideration, the underlying ETFs that made the greatest positive contributions to the Fund’s performance during the reporting period were iShares iBoxx $ Investment Grade Corporate Bond ETF (LQD), Xtrackers MSCI EAFE Hedged Equity ETF (DBEF) and Vanguard Intermediate-Term Corporate Bond ETF (VCIT). The weakest contributors were iShares MSCI EAFE Small-Cap ETF (SCZ), iPath Series B S&P 500 VIX Short-Term Futures ETN (VXX) and Vanguard FTSE All-World ex-US Small-Cap ETF (VSS).
1 | | The price used to calculate the market price returns is determined by using the closing price listed on the NYSE Arca and does not represent returns an investor would receive if shares were traded at other times. |
2 | | See page 13 for more information on this index. |
12
Management’s Discussion of Fund Performance(unaudited) (continued)
The opinions expressed are those of the portfolio managers as of the date of this report and are subject to change. There is no guarantee that any forecasts will come to pass. This material does not constitute investment advice and is not intended as an endorsement of any specific investment.
Hypothetical Growth of a $10,000 Investment
(Since Inception Through 4/30/2019)
Fund Performance History
IQ Hedge Long/Short Tracker ETF
(as of April 30, 2019)
| | | | 1 Year
| | 3 Year
| | Since Inception1
| |
| | | | Average
Annual
| | Average
Annual
| | Average
Annual
| | Cumulative
|
IQ Hedge Long/Short Tracker ETF Market Price2 | | | | | 2.91 | % | | | 6.67 | % | | | 3.64 | % | | | 15.79 | % |
IQ Hedge Long/Short Tracker ETF NAV | | | | | 3.07 | % | | | 6.39 | % | | | 3.66 | % | | | 15.87 | % |
IQ Hedge Long/Short Index | | | | | 3.79 | % | | | 7.40 | % | | | 4.76 | % | | | 21.06 | % |
HFRI Equity Hedge Index3 | | | | | 0.99 | % | | | 6.92 | % | | | 4.12 | % | | | 17.94 | % |
MSCI World Index | | | | | 6.48 | % | | | 11.39 | % | | | 7.16 | % | | | 32.85 | % |
1 | | Fund Inception Date: 3/24/2015. |
2 | | Beginning on May 31, 2016, the price used to calculate the Market Price returns is the mean between the day’s last bid and ask prices. Prior to May 31, 2016, market price returns were calculated using the day’s NYSE Arca closing price. The market price returns do not represent returns an investor would receive if shares were traded at other times. |
3 | | Data shown above for the HFRI Equity Hedge Index is from 3/31/2015 to 4/30/2019. |
13
Management’s Discussion of Fund Performance(unaudited) (continued)
How did IQ Hedge Event-Driven Tracker ETF perform during the 12 months ended April 30, 2019?
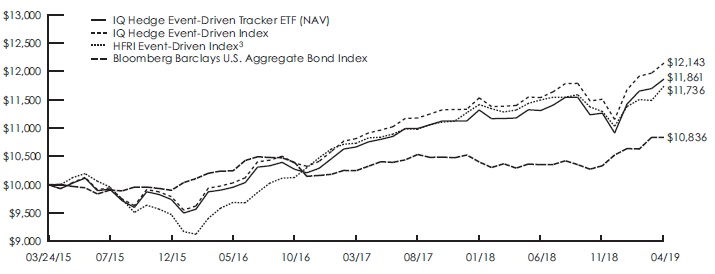
For the 12 months ended April 30, 2019 (the “reporting period”), the IQ Hedge Event-Driven Tracker ETF returned 6.12% at NAV (net asset value) and 6.13% at market price.1 To compare, the Fund’s Underlying Index, IQ Hedge Event-Driven Index.2 returned 6.55% for the same period. The HFRI Event-Driven (Total) Index2 and the Bloomberg Barclays U.S. Aggregate Bond Index2 returned 3.71% and 5.29%, respectively, for the same period.
What factors affected the Fund’s performance during the reporting period?
The Fund employs a long/short net 100% strategy, which calls for the simultaneous holding of both long and short positions on different securities.
The Fund is a “fund of funds,” meaning that it seeks to achieve its investment objective by investing primarily in underlying exchange-traded funds (“ETFs”). On average during the reporting period, the Fund’s overall long allocation was 102%, with the long position exceeding 100% funded with the proceeds from an average 2% short position. During the same period, the Fund maintained long-only bond exposures, and both long and short equity exposures.
During the reporting period, how was the Fund’s performance materially affected by investments in derivatives?
The Fund used derivative positions where necessary to help it track the IQ Hedge Event-Driven Index, which contained both long and short weights. Primarily, the Fund used total return swaps on the ETFs at the weights in which they were included in the Underlying Index. Derivatives were not used to gain leverage beyond the index positioning; rather, they were used exclusively to enable the Fund to track its Underlying Index.
How were the Fund’s assets allocated during the reporting period and why?
The positions in the Fund’s Underlying Index were driven by quantitative models that determined the weights across the various hedge fund strategies represented in the Fund as well as the weights of the assets within these strategies. Given the rules-based nature of the process, there was no subjectivity involved in the allocation decision process.
How did the Fund’s allocations change over the course of the reporting period?
The strategy allocation was dominated by its holdings to bonds with the remainder in equity, with the average allocation at about 95% to 5%. Allocations to high yield bonds increased over the period while convertible bonds were reduced by a similar level. Allocations to investment grade bonds and bank loans were relatively stable.
The equity allocation during the reporting period was long small-cap growth stocks and short preferred stocks.
During the reporting period, which underlying ETFs had the highest total returns and which underlying ETFs had the lowest total returns?
In terms of total return, the best-performing underlying ETFs in the Fund during the reporting period were Vanguard Small-Cap Growth ETF (VBK), SPDR Bloomberg Barclays Convertible Securities ETF (CWB) and Xtrackers USD High Yield Corporate Bond ETF (HYLB). During the same period, Invesco Treasury Collateral ETF (CLTL), Goldman Sachs Access Treasury 0-1 Year ETF (GBIL) and SPDR Blackstone / GSO Senior Loan ETF (SRLN) recorded the lowest returns.
Which underlying ETFs made the strongest contributions to the Fund’s performance during the reporting period and which underlying ETFs made the weakest contributions?
On the basis of impact, which takes weightings and total returns into consideration, the underlying ETFs that made the greatest positive contributions to the Fund’s performance during the reporting period were SPDR Bloomberg Barclays Convertible Securities ETF (CWB), iShares iBoxx $ High Yield Corporate Bond ETF (HYG) and Vanguard Short-Term Corporate Bond ETF (VCSH). The weakest contributors were iShares Preferred and Income Securities ETF (PFF), Invesco Preferred ETF (PGX) and Invesco Treasury Collateral ETF (CLTL).
1 | | The price used to calculate the market price returns is determined by using the closing price listed on the NYSE Arca and does not represent returns an investor would receive if shares were traded at other times. |
2 | | See page 15 for more information on this index. |
14
Management’s Discussion of Fund Performance(unaudited) (continued)
The opinions expressed are those of the portfolio managers as of the date of this report and are subject to change. There is no guarantee that any forecasts will come to pass. This material does not constitute investment advice and is not intended as an endorsement of any specific investment.
Hypothetical Growth of a $10,000 Investment
(Since Inception Through 4/30/2019)
Fund Performance History
IQ Hedge Event-Driven Tracker ETF
(as of April 30, 2019)
| | | | 1 Year
| | 3 Year
| | Since Inception1
| |
| | | | Average
Annual
| | Average
Annual
| | Average
Annual
| | Cumulative
|
IQ Hedge Event-Driven Tracker ETF Market Price2 | | | | | 6.13 | % | | | 6.15 | % | | | 4.26 | % | | | 18.67 | % |
IQ Hedge Event-Driven Tracker ETF NAV | | | | | 6.12 | % | | | 6.19 | % | | | 4.25 | % | | | 18.61 | % |
IQ Hedge Event-Driven Index | | | | | 6.55 | % | | | 6.77 | % | | | 4.84 | % | | | 21.43 | % |
HFRI Event-Driven (Total) Index3 | | | | | 3.71 | % | | | 6.98 | % | | | 4.00 | % | | | 17.36 | % |
Bloomberg Barclays U.S. Aggregate Bond Index | | | | | 5.29 | % | | | 1.90 | % | | | 1.97 | % | | | 8.36 | % |
1 | | Fund Inception Date: 3/24/2015. |
2 | | Beginning on May 31, 2016, the price used to calculate the Market Price returns is the mean between the day’s last bid and ask prices. Prior to May 31, 2016, market price returns were calculated using the day’s NYSE Arca closing price. The market price returns do not represent returns an investor would receive if shares were traded at other times. |
3 | | Data shown above for the HFRI Event-Driven (Total) Index is from 3/31/2015 to 4/30/2019. |
15
Management’s Discussion of Fund Performance(unaudited) (continued)
How did IQ Real Return ETF perform during the 12 months ended April 30, 2019?
For the 12 months ended April 30, 2019 (the “reporting period”), the IQ Real Return ETF returned 2.64% at NAV (net asset value) and 2.53% at market price.1 To compare, the Fund’s Underlying Index, the IQ Real Return Index2 returned 3.00% for the same period. The Bloomberg Barclays U.S. Short Treasury Bond Index2 returned 2.29% for the same period.
What factors affected the Fund’s performance during the reporting period?
The Fund is a “fund of funds,” meaning that it seeks to achieve its investment objective by investing primarily in underlying exchange-traded funds (“ETFs”). Exposure to short-term U.S. Treasury bonds accounted for nearly three-quarters of the Fund’s overall allocation and produced slightly over half of the Fund’s total gains during the reporting period. The Fund’s exposure to equities, considered inflation-sensitive assets, provided another dominant source of positive performance at a time of rising interest rates. Intermediate-term Treasury bonds produced additional positive performance for the Fund. On the other hand, commodities, which tend to move inversely to the performance of the U.S. dollar, detracted from the Fund’s returns.
During the reporting period, how was the Fund’s performance materially affected by investments in derivatives?
The Fund did not use derivatives during the reporting period.
How were the Fund’s assets allocated during the reporting period and why?
The positions in the Fund’s Underlying Index are driven by quantitative models that determine the weights across asset classes whose returns incorporate inflation expectations. Given the rules-based nature of the process, there is no subjectivity involved in the allocation decision process.
How did the Fund’s allocations change over the course of the reporting period?
The Fund maintained its core allocation to short-term Treasury bonds during the reporting period, as well as a dominant satellite allocation to equities. Other satellite positions accounted for the Fund’s relatively small remaining allocations. Annual turnover was approximately 97% for the reporting period as a whole.
During the reporting period, which underlying ETFs had the highest total returns and which underlying ETFs had the lowest total returns?
In terms of total return, the best-performing underlying ETFs in the Fund during the reporting period were iShares Core S&P 500 ETF (IVV), SPDR S&P 500 ETF Trust (SPY) and Vanguard FTSE Emerging Markets ETF (VWO). During the same period, Invesco DB Oil Fund (DBO), Invesco DB Gold Fund (DGL) and Vanguard FTSE Developed Markets ETF (VEA) recorded the lowest total returns.
Which underlying ETFs were the strongest positive contributors to the Fund’s performance and which underlying ETFs were particularly weak?
On the basis of impact, which takes weightings and total returns into consideration, the underlying ETFs that made the greatest positive contributions to the Fund’s performance during the reporting period were SPDR S&P 500 ETF Trust (SPY), iShares Core S&P 500 ETF (IVV) and PIMCO Enhanced Short Maturity Active ETF (MINT). The weakest contributors were Invesco DB Gold Fund (DGL), Invesco DB Oil Fund (DBO) and iShares MSCI EAFE ETF (EFA).
1 | | The price used to calculate the market price returns is determined by using the closing price listed on the NYSE Arca and does not represent returns an investor would receive if shares were traded at other times. |
2 | | See page 17 for more information on this index. |
16
Management’s Discussion of Fund Performance(unaudited) (continued)
The opinions expressed are those of the portfolio managers as of the date of this report and are subject to change. There is no guarantee that any forecasts will come to pass. This material does not constitute investment advice and is not intended as an endorsement of any specific investment.
Hypothetical Growth of a $10,000 Investment
(Since Inception Through 4/30/2019)
Fund Performance History
IQ Real Return ETF
(as of April 30, 2019)
| | | | 1 Year
| | 3 Year
| | 5 Year
| | Since Inception1
| |
| | | | Average
Annual
| | Average
Annual
| | Average
Annual
| | Average
Annual
| | Cumulative
|
IQ Real Return ETF Market Price2 | | | | | 2.53 | % | | | 2.13 | % | | | 1.60 | % | | | 1.43 | % | | | 14.42 | % |
IQ Real Return ETF NAV | | | | | 2.64 | % | | | 2.16 | % | | | 1.61 | % | | | 1.44 | % | | | 14.53 | % |
IQ Real Return Index | | | | | 3.00 | % | | | 2.41 | % | | | 1.93 | % | | | 1.85 | % | | | 19.06 | % |
Bloomberg Barclays U.S. Short Treasury Bond Index | | | | | 2.29 | % | | | 1.28 | % | | | 0.85 | % | | | 0.54 | % | | | 5.23 | % |
1 | | Fund Inception Date: 10/27/2009. |
2 | | Beginning on May 31, 2016, the price used to calculate the Market Price returns is the mean between the day’s last bid and ask prices. Prior to May 31, 2016, market price returns were calculated using the day’s NYSE Arca closing price. The market price returns do not represent returns an investor would receive if shares were traded at other times. |
17
Management’s Discussion of Fund Performance(unaudited) (continued)
How did IQ Leaders GTAA Tracker perform during the 12 months ended April 30, 2019?
For the 12 months ended April 30, 2019 (the “reporting period”), the IQ Leaders GTAA Tracker returned 3.74% at NAV (net asset value) and 3.61% at market price.1 To compare, the Fund’s Underlying Index, IQ Leaders GTAA Tracker Index2 returned 3.93% for the same time period. The MSCI All Country World Index2 returned 5.06% for the same period.
What factors affected the Fund’s performance during the reporting period?
The Fund is a “fund of funds,” meaning that it seeks to achieve its investment objective by investing primarily in underlying exchange-traded funds (“ETFs”). The Fund’s assets were allocated primarily to U.S. large-cap equities, international equities and U.S. aggregate bonds during the reporting period. Of these, U.S. large-cap equities and U.S. aggregate bonds produced positive returns, contributing strongly to the Fund’s performance. While international equities produced negative returns, the sector’s weighted return was not as significant of a detractor from performance as compared to the Fund’s approximately 4% short exposure to real estate equities, which suffered when the asset class performed positively. The Fund’s allocation to intermediate-term U.S. Treasury bonds, which shifted from a long to short position during the reporting period, also detracted from strategy performance.
During the reporting period, how was the Fund’s performance materially affected by investments in derivatives?
The Fund uses derivative positions where necessary to help it track its Underlying Index, which contains both long and short positions. The derivatives positions are primarily total return swaps on the ETFs at the weights in which they are included in the Underlying Index. Derivatives are not used to gain leverage beyond the positions in the Underlying Index; rather, they are used exclusively to enable the Fund to track its Underlying Index.
How were the Fund’s assets allocated during the reporting period and why?
The positions in the Fund’s Underlying Index are driven by quantitative models. Given the rules-based nature of this approach, there is no subjectivity involved in the allocation decision process.
How did the Fund’s allocations change over the course of the reporting period?
As mentioned earlier, the Fund’s allocation to intermediate-term U.S. Treasury bonds moved from a long position to a short position during the reporting period, averaging as a short position for the reporting period as a whole. Otherwise, the Fund maintained core long allocations to U.S. large-cap equities, international equities and U.S. aggregate bonds. Smaller positions included short allocations to U.S. small-cap stocks and real estate equities, and long exposures to emerging market equities, investment grade corporate bonds, high yield bonds and convertible bonds.
During the reporting period, which underlying ETFs had the highest total returns and which underlying ETFs had the lowest total returns?
In terms of total return, the best-performing underlying ETFs in the Fund during the reporting period were Technology Select Sector SPDR Fund (XLK), Vanguard Information Technology ETF (VGT) and Vanguard Real Estate ETF (VNQ). During the same period, Vanguard Materials ETF, Vanguard Energy ETF and Energy Select Sector SPDR Fund (XLE) recorded the lowest total returns.
Which underlying ETFs were the strongest positive contributors to the Fund’s performance and which underlying ETFs were particularly weak?
On the basis of impact, which takes weightings and total returns into consideration, the underlying ETFs that made the greatest positive contributions to the Fund’s performance during the reporting period were Consumer Discretionary Select Sector SPDR Fund (XLY), iShares Core U.S. Aggregate Bond ETF (AGG) and iShares iBoxx $ High Yield Corporate Bond ETF (HYG). The weakest contributors included Vanguard Real Estate ETF (VNQ), Energy Select Sector SPDR Fund (XLE) and Vanguard FTSE Developed Markets ETF (VEA).
1 | | The price used to calculate the market price returns is determined by using the closing price listed on the NYSE Arca and does not represent returns an investor would receive if shares were traded at other times. |
2 | | See page 19 for more information on this index. |
18
Management’s Discussion of Fund Performance(unaudited) (continued)
The opinions expressed are those of the portfolio managers as of the date of this report and are subject to change. There is no guarantee that any forecasts will come to pass. This material does not constitute investment advice and is not intended as an endorsement of any specific investment.
Hypothetical Growth of a $10,000 Investment
(Since Inception Through 4/30/2019)
Fund Performance History
IQ Leaders GTAA Tracker ETF
(as of April 30, 2019)
| | | | 1 Year
| | 3 Year
| | Since Inception1
| |
| | | | Average
Annual
| | Average
Annual
| | Average
Annual
| | Cumulative
|
IQ Leaders GTAA Tracker ETF Market Price2 | | | | | 3.61 | % | | | 8.96 | % | | | 7.96 | % | | | 31.59 | % |
IQ Leaders GTAA Tracker ETF NAV | | | | | 3.74 | % | | | 7.68 | % | | | 7.98 | % | | | 31.72 | % |
IQ Leaders GTAA Tracker Index | | | | | 3.93 | % | | | 8.11 | % | | | 8.49 | % | | | 33.92 | % |
MSCI All Country World Index | | | | | 5.06 | % | | | 11.36 | % | | | 12.08 | % | | | 50.53 | % |
1 | | Fund Inception Date: 9/30/2015. |
2 | | Beginning on May 31, 2016, the price used to calculate the Market Price returns is the mean between the day’s last bid and ask prices. Prior to May 31, 2016, market price returns were calculated using the day’s NYSE Arca closing price. The market price returns do not represent returns an investor would receive if shares were traded at other times. |
19
Management’s Discussion of Fund Performance(unaudited) (continued)
How did IQ Enhanced Core Bond U.S. ETF perform during the 12 months ended April 30, 2019?
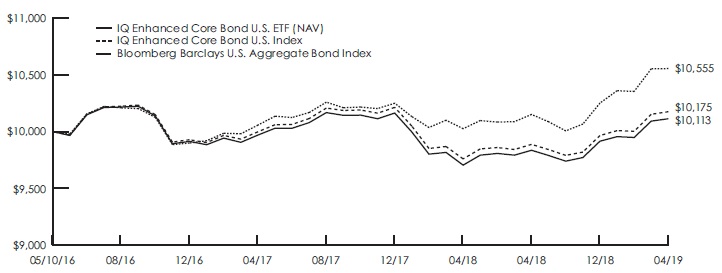
For the 12 months ended April 30, 2019 (the “reporting period”), the IQ Enhanced Core Bond U.S. ETF returned 4.21% at NAV (net asset value) and 4.20% at market price.1 To compare, the Fund’s Underlying Index, the IQ Enhanced Core Bond U.S. Index2 returned 4.26% for the same period. The Bloomberg Barclays U.S. Aggregate Bond Index2 returned 5.29% for the same period.
What factors affected the Fund’s performance during the reporting period?
The Fund’s underlying strategy rotates among five fixed income sectors: investment grade corporate bonds; mortgage-backed securities; long-term U.S. Treasury bonds; intermediate-term U.S. Treasury bonds; and short-term U.S. Treasury bonds.
The Fund is a “fund of funds,” meaning that it seeks to achieve its investment objective by investing primarily in underlying exchange-traded funds (“ETFs”). Over the reporting period, the Fund generated most of its performance from its core allocation to short-term Treasury bonds. During the first quarter of the reporting period, the Fund also added to returns by reducing its exposure to long-term Treasury bonds, and then, during the remainder of the period, rotating in and out of smaller long-term Treasury allocations. The Fund approached intermediate-term Treasury securities in a tactical manner as well, ranging in weight from 0% to 31% during the reporting period. Additionally, the Fund’s performance benefited from its allocation to short-term investment grade corporate bonds, which were introduced in the September 2018 rebalance of the Underlying Index to reduce the impact of duration on investment-grade holdings.
During the reporting period, how was the Fund’s performance materially affected by investments in derivatives?
The Fund did not use derivatives during the reporting period.
How were the Fund’s assets allocated during the reporting period and why?
The positions in the Fund’s Underlying Index are driven by quantitative models that determine the weights across the various aggregate bond sectors based on short- and long-term momentum signals. The Underlying Index’s maximum and minimum allocations to individual sectors varies based on the sector’s weight within the broad U.S. bond market. Given the rules-based nature of the process, there is no subjectivity involved in the allocation decision process.
How did the Fund’s allocations change over the course of the reporting period?
As mentioned earlier, the Fund first began investing in short-term investment grade corporate bonds during the reporting period. The Fund also adjusted its weighting algorithm to allocate to similar exposures based on asset size rather than fees. These changes were introduced in the September 2018 rebalance.
For the entire reporting period, the Fund’s turnover was 286%. The allocation to short-term Treasury bonds remained consistently at or near its maximum 50% allowable allocation. Allocations to intermediate- and long-term Treasury bonds adjusted relative to each other with long-term Treasuries overweight and intermediate treasuries underweight at the beginning of the reporting period. As the period progressed, their relative weights reversed.
The Fund’s investment-grade corporate bond exposures rotated from 0% to its maximum 50% allowable allocation during the reporting period. Generally, the Fund maintained greater exposure to longer-duration investment-grade corporates than their short-term investment-grade counterparts.
On an active weight basis, the Fund held underweight average exposure to investment-grade corporate bonds and overweight average exposure to short-term Treasury bonds.
1 | | The price used to calculate the market price returns is determined by using the closing price listed on the NYSE Arca and does not represent returns an investor would receive if shares were traded at other times. |
2 | | See page 21 for more information on this index. |
20
Management’s Discussion of Fund Performance(unaudited) (continued)
During the reporting period, which underlying ETFs had the highest total returns and which underlying ETFs had the lowest total returns?
In terms of total return, the best-performing underlying ETFs in the Fund during the reporting period were iShares 20+ Year Treasury Bond ETF (TLT), Vanguard Long-Term Treasury ETF (VGLT) and SPDR Portfolio Long Term Treasury ETF (SPTL). During the same period, iShares iBoxx $ Investment Grade Corporate Bond ETF (LQD), iShares 3-7 Year Treasury Bond ETF (IEI) and iShares 1-3 Year Treasury Bond ETF (SHY) recorded the lowest total returns.
Which underlying ETFs were the strongest positive contributors to the Fund’s performance and which underlying ETFs were particularly weak?
On the basis of impact, which takes weightings and total returns into consideration, the underlying ETFs that made the greatest positive contributions to the Fund’s performance during the reporting period were Schwab Short-Term U.S. Treasury ETF (SCHO), Vanguard Short-Term Treasury ETF (VGSH) and SPDR Portfolio Long Term Treasury ETF (SPTL). The weakest contributors were iShares iBoxx $ Investment Grade Corporate Bond ETF (LQD), iShares 7-10 Year Treasury Bond ETF (IEF) and iShares 3-7 Year Treasury Bond ETF (IEI).
The opinions expressed are those of the portfolio managers as of the date of this report and are subject to change. There is no guarantee that any forecasts will come to pass. This material does not constitute investment advice and is not intended as an endorsement of any specific investment.
Hypothetical Growth of a $10,000 Investment
(Since Inception Through 4/30/2019)
Fund Performance History
IQ Enhanced Core Bond U.S. ETF
(as of April 30, 2019)
| | | | 1 Year
| | Since Inception1
| |
| | | | Average
Annual
| | Average
Annual
| | Cumulative
|
IQ Enhanced Core Bond U.S. ETF Market Price2 | | | | | 4.20 | % | | | 0.36 | % | | | 1.08 | % |
IQ Enhanced Core Bond U.S. ETF NAV | | | | | 4.21 | % | | | 0.38 | % | | | 1.13 | % |
IQ Enhanced Core Bond U.S. Index | | | | | 4.26 | % | | | 0.58 | % | | | 1.75 | % |
Bloomberg Barclays U.S. Aggregate Bond Index | | | | | 5.29 | % | | | 1.83 | % | | | 5.55 | % |
1 | | Fund Inception Date: 5/10/2016. |
2 | | Beginning on May 31, 2016, the price used to calculate the Market Price returns is the mean between the day’s last bid and ask prices. Prior to May 31, 2016, market price returns were calculated using the day’s NYSE Arca closing price. The market price returns do not represent returns an investor would receive if shares were traded at other times. |
21
Management’s Discussion of Fund Performance(unaudited) (continued)
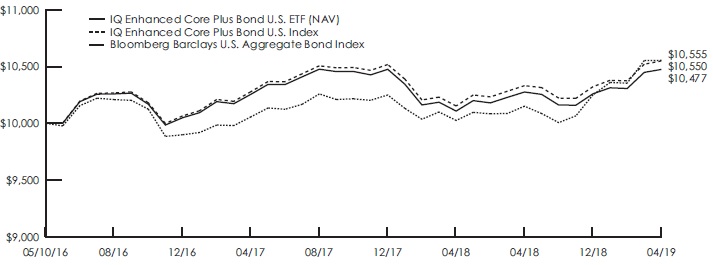
How did IQ Enhanced Core Plus Bond U.S. ETF perform during the 12 months ended April 30, 2019?
For the 12 months ended April 30, 2019 (the “reporting period”), the IQ Enhanced Core Plus Bond U.S. ETF returned 3.63% at NAV (net asset value) and 3.59% at market price.1 To compare, the Fund’s Underlying Index, IQ Enhanced Core Plus Bond U.S. Index,2 returned 3.91% for the same time period. The Bloomberg Barclays U.S. Aggregate Bond Index2 returned 5.29% for the same period.
What factors affected the Fund’s performance during the reporting period?
The Fund’s long-only strategy rotates among seven bond sectors: high yield corporate bonds; U.S. dollar-denominated emerging markets debt; investment grade corporate bonds; mortgage-backed securities; long-term U.S. Treasury bonds; intermediate-term U.S. Treasury bonds; and short-term U.S. Treasury bonds.
The Fund is a “fund of funds,” meaning that it seeks to achieve its investment objective by investing primarily in underlying exchange-traded funds (“ETFs”). The sector making the largest contribution to the Fund’s positive performance during the reporting period was short-term Treasury bonds. During the first half of the reporting period, the Fund also added to returns by rotating away from long-term Treasury bonds, and then, during the remainder of the period, rotating in and out of smaller long-term Treasury allocations. The Fund approached intermediate-term Treasury securities in a tactical manner as well, ranging in weight from 0% to 29% during the reporting period. Additionally, the Fund’s performance benefited from its allocation to short-term investment grade corporate bonds, which were introduced in September 2018 to reduce the impact of duration on investment grade holdings. The only sector to detract from the Fund’s performance during the reporting period was high yield corporate bonds.
During the reporting period, how was the Fund’s performance materially affected by investments in derivatives?
The Fund did not use derivatives during the reporting period.
How were the Fund’s assets allocated during the reporting period and why?
The positions in the Fund’s Underlying Index are driven by quantitative models that determine the weights across the various aggregate bond sectors based on short-term and long-term momentum signals. The Underlying Index’s maximum and minimum allocations to individual sectors varies based on the sector’s weight within the broad U.S. bond market. Given the rules-based nature of the process, there is no subjectivity involved in the allocation decision process.
How did the Fund’s allocations change over the course of the reporting period?
During the reporting period, the Fund’s primary allocation was to short-term Treasury bonds, with exposure ranging between 23% and 50%. Further along the yield curve, the Fund rotated exposures between long-term U.S. Treasury bonds and intermediate-term U.S. Treasury bonds. The Fund’s exposure to mortgage-backed securities fluctuated from 0% to 34%, averaging approximately 18% during the period. The Fund also allocated assets to high yield corporate bonds and U.S. dollar-denominated emerging markets debt during the reporting period. High yield credit averaged 11.49% over the period with exposures declining during the latter portion of the period. Emerging market credit allocations averaged 1.17% during the reporting period, and there were several periods when the model called for 0% allocations to the sector.
During the reporting period, which underlying ETFs had the highest total returns and which underlying ETFs had the lowest total returns?
In terms of total return, the best-performing underlying ETFs in the Fund during the reporting period were iShares 20+ Year Treasury Bond ETF (TLT), Vanguard Long-Term Treasury ETF (VGLT) and SPDR Portfolio Long Term Treasury ETF (SPTL). During the same period, Xtrackers USD High Yield Corporate Bond ETF (HYLB), iShares 7-10 Year Treasury Bond ETF (IEF) and iShares 3-7 Year Treasury Bond ETF (IEI) recorded the lowest total returns.
1 | | The price used to calculate the market price returns is determined by using the closing price listed on the NYSE Arca and does not represent returns an investor would receive if shares were traded at other times. |
2 | | See page 23 for more information on this index. |
22
Management’s Discussion of Fund Performance(unaudited) (continued)
Which underlying ETFs were the strongest positive contributors to the Fund’s performance and which underlying ETFs were particularly weak?
On the basis of impact, which takes weightings and total returns into consideration, the underlying ETFs that made the greatest positive contributions to the Fund’s performance during the reporting period were Schwab Short-Term U.S. Treasury ETF (SCHO), Vanguard Short-Term Treasury ETF (VGSH) and SPDR Portfolio Long Term Treasury ETF (SPTL). The weakest contributors were iShares iBoxx $ High Yield Corporate Bond ETF (HYG), iShares iBoxx $ Investment Grade Corporate Bond ETF (LQD) and Xtrackers USD High Yield Corporate Bond ETF (HYLB).
The opinions expressed are those of the portfolio managers as of the date of this report and are subject to change. There is no guarantee that any forecasts will come to pass. This material does not constitute investment advice and is not intended as an endorsement of any specific investment.
Hypothetical Growth of a $10,000 Investment
(Since Inception Through 4/30/2019)
Fund Performance History
IQ Enhanced Core Plus Bond U.S. ETF
(as of April 30, 2019)
| | | | 1 Year
| | Since Inception1
| |
| | | | Average
Annual
| | Average
Annual
| | Cumulative
|
IQ Enhanced Core Plus Bond U.S. ETF Market Price2 | | | | | 3.59 | % | | | 1.54 | % | | | 4.64 | % |
IQ Enhanced Core Plus Bond U.S. ETF NAV | | | | | 3.63 | % | | | 1.58 | % | | | 4.77 | % |
IQ Enhanced Core Plus Bond U.S. Index | | | | | 3.91 | % | | | 1.82 | % | | | 5.50 | % |
Bloomberg Barclays U.S. Aggregate Bond Index | | | | | 5.29 | % | | | 1.83 | % | | | 5.55 | % |
1 | | Fund Inception Date: 5/10/2016. |
2 | | Beginning on May 31, 2016, the price used to calculate the Market Price returns is the mean between the day’s last bid and ask prices. Prior to May 31, 2016, market price returns were calculated using the day’s NYSE Arca closing price. The market price returns do not represent returns an investor would receive if shares were traded at other times. |
23
Management’s Discussion of Fund Performance(unaudited) (continued)
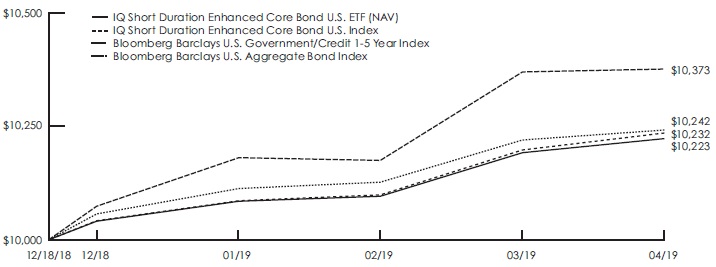
How did IQ Short Duration Enhanced Core Bond U.S. ETF perform during the period since its inception on December 18, 2018 through April 30, 2019 (the “reporting period”)?
Since its inception the IQ Short Duration Enhanced Core Bond U.S. ETF returned 2.23% at NAV (net asset value) and 2.20% at market price.1 To compare, the Fund’s Underlying Index, IQ Short Duration Enhanced Core Bond U.S. Index2 returned 2.32% for the same time period. The Bloomberg Barclays U.S. Government/Credit 1-5 Year Index2 and the Bloomberg Barclays U.S. Aggregate Bond Index2 returned 2.42% and 3.73%, respectively, for the same period.
What factors affected the Fund’s performance during the reporting period?
The Fund is a “fund of funds,” meaning that it seeks to achieve its investment objective by investing primarily in underlying exchange-traded funds (“ETFs”). During the reporting period, the Fund’s exposure to short-maturity investment grade corporate bonds provided the strongest source of returns due to the sector’s compression of credit spreads and minimized duration risk. The Fund’s exposure to short-maturity Treasury securities also contributed positively to performance in an environment of rising interest rates. Exposure to high yield corporate bonds provided further gains as that sector’s spreads also compressed.
During the reporting period, how was the Fund’s performance materially affected by investments in derivatives?
The Fund did not use derivatives during the reporting period.
How were the Fund’s assets allocated during the reporting period and why?
The positions in the Fund’s Underlying Index are driven by quantitative models that determine the weights across the various aggregate bond sectors based on short-term and long-term momentum signals. The Underlying Index’s maximum and minimum allocations to individual sectors varies based on the sector’s weight within the broad U.S. bond market. Given the rules-based nature of the process, there is no subjectivity involved in the allocation decision process.
How did the Fund’s allocations change over the course of the reporting period?
At the beginning of the reporting period, the Fund established core allocations to short-term Treasury securities and short-term investment grade corporate bonds. As the reporting period progressed, the Fund’s emphasis shifted away from Treasury bonds. Allocations to the investment grade corporate sector increased, and the Fund initiated a position in the short-term high yield corporate bond sector. By the end of the reporting period, the Fund’s largest allocations were to investment grade and high yield corporate securities. The Fund also maintained an allocation to investment grade corporate floating-rate bonds but reduced its exposure given the lower overall total-return momentum from the asset type.
During the reporting period, which underlying ETFs had the highest total returns and which underlying ETFs had the lowest total returns?
All underlying ETFs posted positive total returns during the reporting period. The Fund’s best-performing ETFs were Vanguard Short-Term Corporate Bond ETF (VCSH), iShares 0-5 Year Investment Grade Corporate Bond ETF (SLQD) and Vanguard Short-Term Treasury ETF (VGSH). During the same period, iShares 0-5 Year High Yield Corporate Bond ETF (SHYG), iShares Floating Rate Bond ETF (FLOT) and SPDR Bloomberg Barclays Investment Grade Floating Rate ETF (FLRN) recorded the lowest total returns.
1 | | The price used to calculate the market price returns is determined by using the closing price listed on the NYSE Arca and does not represent returns an investor would receive if shares were traded at other times. |
2 | | See page 25 for more information on this index. |
24
Management’s Discussion of Fund Performance(unaudited) (continued)
Which underlying ETFs were the strongest positive contributors to the Fund’s performance and which underlying ETFs were particularly weak?
On the basis of impact, which takes weightings and total returns into consideration, the underlying ETFs that made the greatest positive contributions to the Fund’s performance during the reporting period were Vanguard Short-Term Corporate Bond ETF (VCSH), Vanguard Short-Term Treasury ETF (VGSH) and Schwab Short-Term U.S. Treasury ETF (SCHO). The weakest contributors included iShares 0-5 Year Investment Grade Corporate Bond ETF (SLQD), iShares Floating Rate Bond ETF (FLOT) and SPDR Bloomberg Barclays Investment Grade Floating Rate ETF (FLRN).
The opinions expressed are those of the portfolio managers as of the date of this report and are subject to change. There is no guarantee that any forecasts will come to pass. This material does not constitute investment advice and is not intended as an endorsement of any specific investment.
Hypothetical Growth of a $10,000 Investment
(Since Inception Through 4/30/2019)
Fund Performance History
IQ Short Duration Enhanced Core Bond U.S. ETF
(as of April 30, 2019)
| | | | Since Inception1
|
| | | | Cumulative
|
IQ Short Duration Enhanced Core Bond U.S. ETF Market Price2 | | | | | 2.20 | % |
IQ Short Duration Enhanced Core Bond U.S. ETF NAV | | | | | 2.23 | % |
IQ Short Duration Enhanced Core Bond U.S. Index | | | | | 2.32 | % |
Bloomberg Barclays U.S. Government/Credit 1-5 Year Index | | | | | 2.42 | % |
Bloomberg Barclays U.S. Aggregate Bond Index | | | | | 3.73 | % |
1 | | Fund Inception Date: 12/18/2018. |
2 | | The price used to calculate the Market Price returns is determined by using the mid price between bid and ask price listed on the NYSE Arca and does not represent returns an investor would receive. |
25
Management’s Discussion of Fund Performance(unaudited) (continued)
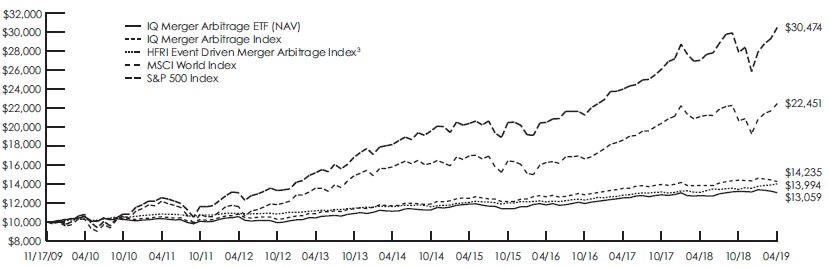
How did IQ Merger Arbitrage ETF perform during the 12 months ended April 30, 2019?
For the 12 months ended April 30, 2019 (the “reporting period”), the IQ Merger Arbitrage ETF returned 2.52% at NAV (net asset value) and 2.37% at market price.1 To compare, the Fund’s Underlying Index, IQ Merger Arbitrage Index returned 2.93% for the same period. The HFRI Event Driven Merger Arbitrage Index2, MSCI World Index2 and the S&P 500® Index2 returned 6.82%, 6.48% and 12.82%, respectively, for the same period.
What were the most significant factors and risks that influenced the markets in which the Fund invested during the reporting period?
The Underlying Index seeks to capture the takeover premium of merger targets. Through a proprietary merger selection process, the Underlying Index will select target companies satisfying all required selection criteria and will hold securities until the premium has been realized through a successful merger or until any of the selection criteria are violated prior to the monthly reconstitution resulting in the security being dropped from the index. Key risks of the strategy include potential withdrawal or cancellation of a pending merger, the failure to meet selection criteria pertaining to liquidity, deal age or size requirements, and the risks associated with deal payment through the use of the acquiring company’s stock. Any or all of these conditions can result in under-realization of the deal premium.
What factors affected the Fund’s performance during the reporting period?
During the reporting period, the number of global mergers and acquisitions remained consistent, although average deal size decreased. The embedded premium, however, remained steady. Of the total components held by the Underlying Index during the reporting period, 16% remained open while 67% completed successfully. Of the remaining components, 15% were removed for failing established holding period rules set forth by the index methodology and 3% were removed following deal cancellation. The holding period rules are in place to address extension risk from regulatory or other factors that may delay deal completion, or minimum weight rules, which signal a decline in the overall liquidity of the component.
The Fund also employed a hedging methodology primarily using U.S. large-cap equity sectors. During the reporting period, these hedges contributed positively to the Fund’s performance.
During the reporting period, how was the Fund’s performance materially affected by investments in derivatives?
The Fund uses hedges to dampen potential downward price performance of the acquiring company’s stock in stock-based transactions through the use of sector- or region-based short positions. In cases when the acquiring company’s economic sector or region performs positively, the hedge detracts from performance; when the acquiring company’s economic sector or region performs negatively, the hedge contributes positively to performance. The Fund only hedges its exposure to stock-based transactions.
During the reporting period, which sectors had the highest total returns and which sectors had the lowest total returns?
In terms of total return, the best-performing sectors in the Underlying Index were communication services, consumer discretionary and information technology. Energy, financials and consumer staples recorded the lowest total returns.
During the reporting period, which sectors made the strongest contributions to the Fund’s performance and which sectors made the weakest contributions?
On the basis of impact, which takes weightings and total returns into account, the sectors that provided the strongest positive contributions to the Fund’s absolute performance were health care, information technology and industrials. The sectors providing the weakest contributions to the Fund’s absolute performance were energy, financials and consumer staples.
1 | | The price used to calculate the market price returns is determined by using the closing price listed on the NYSE Arca and does not represent returns an investor would receive if shares were traded at other times. |
2 | | See page 27 for more information on this index. |
26
Management’s Discussion of Fund Performance(unaudited) (continued)
Which individual stocks made the strongest contributions to the Fund’s performance during the reporting period and which stocks made the weakest contributions?
On the basis of impact, which takes weightings and total returns into consideration, the stocks making the strongest contributions to the Fund’s absolute performance during the reporting period were Express Scripts, mentioned earlier, logistics and refining company Andeavor, and aerospace and defense contractor L3 Technologies. The weakest contributors during the same period were medical cannabis producer Aphria, drug store chain Rite Aid and offshore drilling services provider Rowan.
Were there any changes in the Underlying Index during the reporting period?
The Underlying Index is reconstituted and rebalanced monthly. Intra-month removal of deals occurs only for completed transactions. All other deals are removed at the monthly rebalance. The timing of the rebalance can have both positive and potentially adverse effects, depending on the circumstance of the deal, the number of competing offers and if new acquirers attempt to acquire existing targets. The Fund’s hedges are also reset at this time.
The opinions expressed are those of the portfolio managers as of the date of this report and are subject to change. There is no guarantee that any forecasts will come to pass. This material does not constitute investment advice and is not intended as an endorsement of any specific investment.
Hypothetical Growth of a $10,000 Investment
(Since Inception Through 4/30/2019)
Fund Performance History
IQ Merger Arbitrage ETF
(as of April 30, 2019)
| | | | 1 Year
| | 3 Year
| | 5 Year
| | Since Inception1
| |
| | | | Average
Annual
| | Average
Annual
| | Average
Annual
| | Average
Annual
| | Cumulative
|
| |
IQ Merger Arbitrage ETF Market Price2 | | | | | 2.37 | % | | | 3.43 | % | | | 3.15 | % | | | 2.86 | % | | | 30.54 | % |
IQ Merger Arbitrage ETF NAV | | | | | 2.52 | % | | | 3.53 | % | | | 3.28 | % | | | 2.86 | % | | | 30.59 | % |
IQ Merger Arbitrage Index | | | | | 2.93 | % | | | 4.10 | % | | | 4.04 | % | | | 3.80 | % | | | 42.35 | % |
HFRI Event Driven: Merger Arbitrage Index3 | | | | | 6.82 | % | | | 5.04 | % | | | 3.83 | % | | | 3.63 | % | | | 39.94 | % |
MSCI World Index | | | | | 6.48 | % | | | 11.39 | % | | | 7.31 | % | | | 8.93 | % | | | 124.51 | % |
S&P 500 Index | | | | | 12.82 | % | | | 14.18 | % | | | 10.94 | % | | | 12.50 | % | | | 204.74 | % |
1 | | Fund Inception Date: 11/17/2009. |
2 | | Beginning on May 31, 2016, the price used to calculate the Market Price returns is the mean between the day’s last bid and ask prices. Prior to May 31, 2016, market price returns were calculated using the day’s NYSE Arca closing price. The market price returns do not represent returns an investor would receive if shares were traded at other times. |
3 | | Data shown above for the HFRI Event Driven: Merger Arbitrage Index is from 11/30/2009 to 4/30/2019. |
27
Management’s Discussion of Fund Performance(unaudited) (continued)
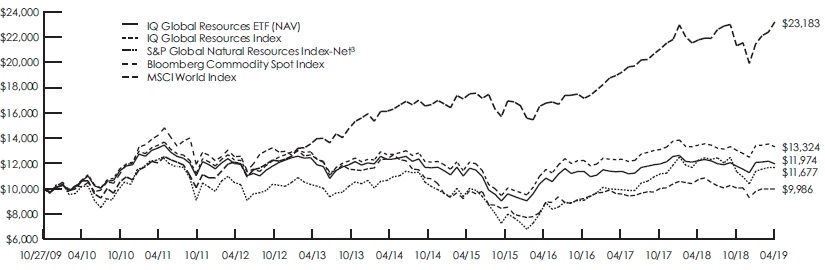
How did IQ Global Resources ETF perform during the 12 months ended April 30, 2019?
For the 12 months ended April 30, 2019 (the “reporting period”), the IQ Global Resources ETF returned -2.08% at NAV (net asset value) and -1.38% at market price.1 To compare, the Fund’s Underlying Index, IQ Global Resources Index2 returned -0.99% for the same time period. The S&P Global Natural Resources Index-Net,2 Bloomberg Commodity Spot Index2 and the MSCI® World Index2 returned -4.82%, -7.00% and -6.48%, respectively, during the same period.
What were the most significant factors and risks that influenced the markets in which the Fund invested during the reporting period?
The Fund seeks to invest in large-, mid- and small-cap equities with significant exposure to global commodities and resources.
What factors affected the Fund’s performance during the reporting period?
During the reporting period, the U.S. dollar appreciated relative to other global currencies, and global commodity prices, including oil prices, came down slightly from the previous year. The Fund employs U.S. and international equity market hedges, which, in aggregate, contributed positively to performance during the reporting period.
During the reporting period, how was the Fund’s performance materially affected by investments in derivatives?
The Fund used derivatives, primarily total return swaps, in limited quantities and solely to replicate the economic exposures that were reflected in the Underlying Index. The use of derivatives had a positive impact on the Fund’s performance during the reporting period.
During the reporting period, which sectors had the highest total returns and which sectors had the lowest total returns?
In terms of total return, the best-performing sectors during the reporting period in the Underlying Index included water, livestock and grains, food & fiber. The timber, precious metals and energy sectors recorded the lowest total returns during the same period.
During the reporting period, which sectors made the strongest contributions to the ETF’s performance and which sectors made the weakest contributions?
On the basis of impact, which takes weightings and total returns into account, the sectors making the strongest positive contributions to the Fund’s absolute performance included water; grains, food & fiber; and energy. The industrial metals, timber and coal sectors provided the weakest contributions to the Fund’s absolute performance.
During the reporting period, which securities had the highest total returns and which securities had the lowest total returns?
Within the Underlying Index, the stocks with the highest total returns during the reporting period were gold mining and exploration company Kirkland Lake Gold, steel making and mining firm Evraz and iron ore producer Fortescue Metals Group. The Underlying Index constituents with the lowest total returns for the reporting period were coal mining company Cloud Peak Energy, silicon and specialty metals producer Ferroglobe and gold and mineral developer New Gold.
Which securities made the strongest contributions to the Fund’s performance during the reporting period and which securities made the weakest contributions?
On the basis of impact, which takes weightings and total returns into consideration, the stocks that made the strongest contributions to the Fund’s absolute performance during the reporting period were packaged foods producer Hormel Foods, water utility American Water Works and branded consumer foods company General Mills. The weakest contributors to the Fund’s absolute performance during the same period were paper and pulp manufacturer Stora Enso, commodity trading and mining company Glencor and minerals mining and refining firm Southern Copper.
1 | | The price used to calculate the market price returns is determined by using the closing price listed on the NYSE Arca and does not represent returns an investor would receive if shares were traded at other times. |
2 | | See page 29 for more information on this index. |
28
Management’s Discussion of Fund Performance(unaudited) (continued)
Were there any changes in the Underlying Index during the reporting period?
The Underlying Index is reconstituted annually with monthly reweights. In turn, the Fund rebalances its sector weights each month according to a proprietary rotation methodology that overweights sectors with high price momentum and low valuation and underweights sectors with the opposite characteristics. The adjusted minimum and maximum weights for individual sectors are based on their model output scores.
The opinions expressed are those of the portfolio managers as of the date of this report and are subject to change. There is no guarantee that any forecasts will come to pass. This material does not constitute investment advice and is not intended as an endorsement of any specific investment.
Hypothetical Growth of a $10,000 Investment
(Since Inception Through 4/30/2019)
Fund Performance History
IQ Global Resources ETF
(as of April 30, 2019)
| | | | 1 Year
| | 3 Year
| | 5 Year
| | Since Inception1
| |
| | | | Average
Annual
| | Average
Annual
| | Average
Annual
| | Average
Annual
| | Cumulative
|
| |
IQ Global Resources ETF Market Price2 | | | | | –1.38 | % | | | 3.38 | % | | | –0.56 | % | | | 1.95 | % | | | 20.12 | % |
IQ Global Resources ETF NAV | | | | | –2.08 | % | | | 3.37 | % | | | –0.61 | % | | | 1.91 | % | | | 19.74 | % |
IQ Global Resources Index | | | | | –0.99 | % | | | 4.94 | % | | | 0.92 | % | | | 3.06 | % | | | 33.24 | % |
S&P Global Natural Resources Index-Net3 | | | | | –4.82 | % | | | 9.49 | % | | | 1.29 | % | | | 1.64 | % | | | 16.77 | % |
Bloomberg Commodity Spot Index | | | | | –7.00 | % | | | 3.72 | % | | | –4.66 | % | | | –0.01 | % | | | –0.14 | % |
MSCI World Index | | | | | –6.48 | % | | | 11.39 | % | | | 7.31 | % | | | 9.24 | % | | | 131.83 | % |
1 | | Fund Inception Date: 10/27/2009. |
2 | | Beginning on May 31, 2016, the price used to calculate the Market Price returns is the mean between the day’s last bid and ask prices. Prior to May 31, 2016, market price returns were calculated using the day’s NYSE Arca closing price. The market price returns do not represent returns an investor would receive if shares were traded at other times. |
3 | | The S&P Global Natural Resources Index-Net has replaced the Bloomberg Commodity Spot Index as the Fund’s benchmark index. The new index more closely aligns with the Fund’s investment Strategy. |
29
Management’s Discussion of Fund Performance(unaudited) (continued)
How did IQ Global Agribusiness Small Cap ETF perform during the 12 months ended April 30, 2019?
For the 12 months ended April 30, 2019 (the “reporting period”), the IQ Global Agribusiness Small Cap ETF returned -2.16% at NAV (net asset value) and -2.04% at market price.1 To compare, the Fund’s Underlying Index, the IQ Global Agribusiness Small Cap Index returned -1.65% for the same period. The MSCI World Small Cap Index2 and the MSCI ACWI Select Agriculture Producers IMI Index2 returned 0.65% and 2.29%, respectively, for the same period.
What were the most significant factors and risks that influenced the markets in which the Fund invested during the reporting period?
The Underlying Index applies size, liquidity and business operations rules to select small-capitalization agribusiness companies and uses a float-adjusted market capitalization weighting methodology.
The Fund focuses on global, small-capitalization stocks. The selection of small-cap stocks focuses on potential capital appreciation of the underlying equity. Global investing also exposes the strategy to currency fluctuations.
What factors affected the Fund’s performance during the reporting period?
During the reporting period, the Underlying Index’s livestock operations sector outperformed its other sectors, posting the largest positive contribution to return. The crop production & farming sector posted the largest negative contributions for the period.
During the reporting period, how was the Fund’s performance materially affected by investments in derivatives?
The Fund did not use derivatives during the reporting period.
During the reporting period, which sectors had the highest total returns and which sectors had the lowest total returns?
The Underlying Index is organized into five sectors. In terms of total return, the best-performing sectors in the Underlying Index during the reporting period were livestock operations and agricultural machinery. During the same period, crop production & farming, agricultural supplies & logistics and agricultural chemicals posted the lowest total returns.
During the reporting period, which sectors made the strongest contributions to the Fund’s absolute performance and which sectors made the weakest contributions?
On the basis of impact, which takes weightings and total returns into account, the sectors that made the strongest positive contributions to the Fund’s absolute performance were livestock operations and agricultural machinery. The sectors that made the weakest contributions to the Fund’s absolute performance were agricultural supplies & logistics, crop production & farming, and agricultural chemicals.
During the reporting period, which individual stocks had the highest total returns and which stocks had the lowest total returns?
Within the Underlying Index, the stocks with the highest total returns during the reporting period were agricultural greenhouse operator and manager Village Farms International, poultry processing company PT Charoen Pokphand Indonesia and dairy and nutritional products producer Ausnutria Diary. The Underlying Index constituents with the lowest total returns for the reporting period were crop protection products maker Nufarm, meat and processed food producer Prima Meat Packers and animal feed and grain producer ForFarmers.
Which individual stocks made the strongest contributions to the Fund’s performance during the reporting period and which stocks made the weakest contributions?
On the basis of impact, which takes weightings and total returns into consideration, the stocks that made the strongest contributions to the Fund’s absolute performance during the reporting period were PT Charoen Pokphand Indonesia, mentioned above, poultry processing company Sanderson Farms and agricultural equipment manufacturer AGCO. The weakest contributors to the Fund’s absolute performance were Nufarm, mentioned above, frozen foods and cold storage company Nichirei and horticultural company and food supplier Costa Group.
1 | | The price used to calculate the market price returns is determined by using the closing price listed on the NYSE Arca and does not represent returns an investor would receive if shares were traded at other times. |
2 | | See page 31 for more information on this index. |
30
Management’s Discussion of Fund Performance(unaudited) (continued)
Were there any changes in the Underlying Index during the reporting period?
The Underlying Index is reconstituted, meaning that components are added or removed, and rebalanced quarterly in accordance with the rules of the Underlying Index.
The opinions expressed are those of the portfolio managers as of the date of this report and are subject to change. There is no guarantee that any forecasts will come to pass. This material does not constitute investment advice and is not intended as an endorsement of any specific investment.
Hypothetical Growth of a $10,000 Investment
(Since Inception Through 4/30/2019)
Fund Performance History
IQ Global Agribusiness Small Cap ETF
(as of April 30, 2019)
| | | | 1 Year
| | 3 Year
| | 5 Year
| | Since Inception1
| |
| | | | Average
Annual
| | Average
Annual
| | Average
Annual
| | Average
Annual
| | Cumulative
|
IQ Global Agribusiness Small Cap ETF Market Price2 | | | | | –2.04 | % | | | 4.67 | % | | | 5.34 | % | | | 4.48 | % | | | 42.63 | % |
IQ Global Agribusiness Small Cap ETF NAV | | | | | –2.16 | % | | | 4.02 | % | | | 5.33 | % | | | 4.49 | % | | | 42.81 | % |
IQ Global Agribusiness Small Cap Index | | | | | –1.65 | % | | | 4.84 | % | | | 6.04 | % | | | 5.11 | % | | | 49.87 | % |
MSCI World Small Cap Index | | | | | 0.65 | % | | | 10.67 | % | | | 7.01 | % | | | 8.56 | % | | | 94.69 | % |
MSCI ACWI Select Agriculture Producers IMI Index3 | | | | | 2.29 | % | | | 9.33 | % | | | 3.12 | % | | | 2.55 | % | | | 22.67 | % |
1 | | Fund Inception Date: 3/22/2011. |
2 | | Beginning on May 31, 2016, the price used to calculate the Market Price returns is the mean between the day’s last bid and ask prices. Prior to May 31, 2016, market price returns were calculated using the day’s NYSE Arca closing price. The market price returns do not represent returns an investor would receive if shares were traded at other times. |
3 | | The MSCI ACWI Select Agriculture Producers IMI Index has replaced the Russell Global Small Cap Agriculture Fishing & Ranching Index (“Russell Index”) as the Fund’s benchmark index, due to the termination of the Russell Index on December 31, 2018. |
31
Management’s Discussion of Fund Performance(unaudited) (continued)
How did IQ U.S. Real Estate Small Cap ETF perform during the 12 months ended April 30, 2019?
For the 12 months ended April 30, 2019 (the “reporting period”), the IQ U.S. Real Estate Small Cap ETF returned 11.16% at NAV (net asset value) and 11.24% at market price.1 To compare, the Fund’s Underlying Index, the IQ U.S. Real Estate Small Cap Index,2 returned 11.84% for the same time period. The Dow Jones U.S. Real Estate Index2 returned 19.06% for the same period.
What were the most significant factors and risks that influenced the markets in which the Fund invested during the reporting period?
The Underlying Index seeks to capture the performance of the small-cap U.S. real estate equity market. The investable universe is limited to, at most, 100 companies that satisfy the market capitalization and liquidity requirements of the Underlying Index selection criteria. Underlying Index components are weighted by their float-adjusted market capitalization.
The Underlying Index classifies real estate investment trusts (REITs) as residential, hotel, retail, office, diversified, specialized or mortgage REITs. Over time, mortgage REITs have shown interest rate sensitivity. Office REITs and retail REITs are affected by the overall economic environment. Virtually all publicly traded U.S. REITs exhibit sensitivity to the broad U.S. equity market. Other factors that affect REITs are the metropolitan markets in which they operate and the various types of properties that make up the REITs’ portfolios.
What factors affected the Fund’s performance during the reporting period?
During the reporting period, the Underlying Index’s specialized REIT sector was the highest contributor, while hotel REITs provided the weakest, yet positive, contribution for the same period. Residential REIT holdings had the highest total return, but their contribution was limited due to its lower weight relative to the other sectors.
During the reporting period, how was the Fund’s performance materially affected by investments in derivatives?
The Fund did not use derivatives during the reporting period.
During the reporting period, which sectors had the highest total returns and which sectors had the lowest total returns?
In terms of total return, the best-performing sectors in the Underlying Index were mortgage REITs, specialized REITs and residential REITs. During the reporting period, hotel REITs, retail REITs and diversified REITs recorded the lowest total returns.
During the reporting period, which sectors made the strongest contributions to the Fund’s performance and which sectors made the weakest contributions?
On the basis of impact, which takes weightings and total returns into account, the sectors that made the strongest positive contributions to the Fund’s absolute performance were specialized REITs, office REITs and mortgage REITs. The sectors that made the weakest contributions to the Fund’s absolute performance were hotel REITs, residential REITs and retail REITs.
During the reporting period, which individual stocks had the highest total returns and which stocks had the lowest total returns?
Within the Underlying Index, the stocks providing the highest total returns during the reporting period were CareTrust REIT, a specialized REIT focused on healthcare and senior living properties; Arbor Reality Trust, a mortgage REIT focused on bridge and mezzanine loads; and Tier REIT, Inc., an office REIT focused on commercial office real estate. The Underlying Index constituents with the lowest total returns for the reporting period included three retail REITs with national portfolios of properties: CBL & Associates Properties, Office Properties Income Trust and American Finance Trust, Inc.
1 | | The price used to calculate the market price returns is determined by using the closing price listed on the NYSE Arca and does not represent returns an investor would receive if shares were traded at other times. |
2 | | See page 33 for more information on this index. |
32
Management’s Discussion of Fund Performance(unaudited) (continued)
Which individual stocks made the strongest contributions to the Fund’s absolute performance during the reporting period and which stocks made the weakest contributions?
On the basis of impact, which takes weightings and total returns into consideration, the stocks that made the strongest contributions to the Fund’s absolute performance during the reporting period included two specialized REITs, CareTrust REIT and Physicians Realty Trust, and office REIT Rexford Industrial Reality Inc. The weakest contributors were Office Properties Income Trust, CBL & Associates Properties and Pebblebrook Hotel Trust.
Were there any changes in the Underlying Index during the reporting period?
The Underlying Index is reconstituted and rebalanced quarterly, with weights reflecting the then-current float-adjusted market capitalizations.
During the reporting period, several Underlying Index constituents were removed due to merger activity. These included Select Income REIT, Education Realty Trust and MTGE Investment.
The opinions expressed are those of the portfolio managers as of the date of this report and are subject to change. There is no guarantee that any forecasts will come to pass. This material does not constitute investment advice and is not intended as an endorsement of any specific investment.
Hypothetical Growth of a $10,000 Investment
(Since Inception Through 4/30/2019)
Fund Performance History
IQ U.S. Real Estate Small Cap ETF
(as of April 30, 2019)
| | | | 1 Year
| | 3 Year
| | 5 Year
| | Since Inception1
| |
| | | | Average
Annual
| | Average
Annual
| | Average
Annual
| | Average
Annual
| | Cumulative
|
IQ U.S. Real Estate Small Cap ETF Market Price2 | | | | | 11.24 | % | | | 6.09 | % | | | 5.53 | % | | | 8.77 | % | | | 93.94 | % |
IQ U.S. Real Estate Small Cap ETF NAV | | | | | 11.16 | % | | | 6.05 | % | | | 5.56 | % | | | 9.02 | % | | | 97.58 | % |
IQ U.S. Real Estate Small Cap Index | | | | | 11.84 | % | | | 6.85 | % | | | 6.37 | % | | | 9.84 | % | | | 109.55 | % |
Dow Jones U.S. Real Estate Index | | | | | 19.06 | % | | | 8.69 | % | | | 9.02 | % | | | 9.79 | % | | | 108.92 | % |
1 | | Fund Inception Date: 6/14/2011. |
2 | | Beginning on May 31, 2016, the price used to calculate the Market Price returns is the mean between the day’s last bid and ask prices. Prior to May 31, 2016, market price returns were calculated using the day’s NYSE Arca closing price. The market price returns do not represent returns an investor would receive if shares were traded at other times. |
33
Management’s Discussion of Fund Performance(unaudited) (continued)
How did the IQ S&P High Yield Low Volatility Bond ETF perform during the 12 months ended April 30, 2019?
For the 12 months ending April 30, 2019 (the “reporting period”), the total return for the IQ S&P High Yield Low Volatility Bond ETF was 6.31% at NAV (net asset value) and 6.56% at market price.1 To compare, the Fund’s Underlying Index, the S&P U.S. High Yield Low Volatility Corporate Bond Index,2 returned 6.41% for the same time period. The ICE BofAML U.S. High Yield Index2 returned 6.71% for the same period.
What were the most significant factors and risks that influenced the markets in which the Fund invested during the reporting period?
The Fund seeks investment results that track the price and yield performance of its Underlying Index, the S&P U.S. High Yield Low Volatility Corporate Bond Index. The Underlying Index is made up of U.S. dollar-denominated high yield corporate bonds that have been selected in accordance with a rules-based methodology. This methodology is based on the concept that duration3 times spread4 (DTS) is an effective volatility measure of credit risk for corporate bonds. Overlaying the marginal contribution to risk (MCR) approach on the DTS of a corporate bond portfolio and measuring the credit risk of individual bonds in a portfolio context allows for a meaningful way to screen out riskier bonds. As such, the total return volatility for bonds in the S&P U.S. High Yield Low Volatility Corporate Bond Index is, in the aggregate, expected to be lower relative to the aggregate group of bonds in the broad U.S. dollar-denominated high yield corporate bond market.
Between April 30, 2018 and April 30, 2019, the Federal Reserve (Fed) raised the targeted federal funds rate by 0.25% three times. The spread between the target range of the lower and upper bound of the federal funds rate is 0.25%. On April 30, 2018 the upper bound of the federal funds rate was 1.75% and on April 30, 2019 it was 2.5%.
Over the reporting period, the U.S. Treasury yield curve5 inverted at the front end. While the upper bound of the Fed funds rate increased from 1.75% to 2.5%, the two-year Treasury yield decreased from 2.65% to 2.27%. During the same period, rates on longer-dated bonds also declined, with the 10-year Treasury moving from 2.95% to 2.5%.
As mentioned, the Fed raised its target rate three times during the reporting period and accelerated its balance sheet reduction as the U.S. economy expanded, unemployment fell and inflation measures remained benign. The U.S. Treasury yield curve flattened and even inverted along the front-end by the end of 2018. The Fed adopted a dovish stance during its latest testimony in March 2019. Chairman Powell cited the risks of a slowing economy over the next few years and waning fiscal stimulus from tax cuts. Forward guidance from the Fed suggested a target rate of 2.9% by the end of 2020, 50 basis points lower than previously communicated. (A basis point is one one-hundredth of a percentage point.) The Fed also removed the prospects for additional rate hikes in 2019 and outlined plans to slow the pace of quantitative tightening, with a complete end to the reduction of the Fed’s balance sheet by September 2019. Lastly, the Fed stated that portfolio run-off, which typically includes coupons paid and principal pay-downs, would be reinvested into shorter-term US Treasury securities in an effort to lower the average maturity of the portfolio holdings.
1 | | The price used to calculate the market price returns is the mean between the day’s last bid and ask prices and does not represent returns an investor would receive if shares were traded at other times. |
2 | | See page 36 for more information on this index. |
34
Management’s Discussion of Fund Performance(unaudited) (continued)
The option-adjusted spread (OAS)3 of the overall U.S. high yield corporate bond market, as represented by the ICE BofAML U.S. High Yield Index4, increased by 27 basis points and had an excess return5 over similar duration-matched Treasury securities of 2.12%. During the reporting period, relatively high quality bonds rated “BB” to “B” experienced a 16 basis point increase change in spreads, while lower-quality bonds rated “CCC” experienced a 101 basis point increase in spreads6. In line with the Fund’s underlying strategy, lower-quality bonds had a smaller weight in the Fund relative to the ICE BofAML U.S. High Yield Index.
What factors affected the Fund’s performance during the reporting period?
The Fund underperformed the S&P U.S. High Yield Low Volatility Corporate Bond Index by ten basis points during the reporting period, reflecting the Fund’s optimization process and bond market structure.
During the reporting period, how was the Fund’s performance materially affected by investments in derivatives?
The Fund did not use derivatives during the reporting period.
During the reporting period, which sectors had the highest total returns and which sectors had the lowest total returns?
In terms of total return, the best-performing sectors in the Underlying Index during the reporting period included financials, and information technology. The sectors recording the lowest total returns over the same period included consumer discretionary and industrials.
During the reporting period, which sectors made the strongest contributions to the Fund’s absolute performance and which sectors made the weakest contributions?
On the basis of impact, which takes weightings and total returns into account, the sectors that made the strongest positive contributions to the Fund’s absolute performance included media, health care and energy. The sectors making the weakest contributions to the Fund’s absolute performance over the reporting period were consumer discretionary and industrials.
During the reporting period, which individual securities had the highest total returns and which securities had the lowest total returns?
In the Underlying Index, the securities providing the highest total returns during the reporting period included high yield bonds issued by clean power generation company TerraForm Power, hospital operator HCA Healthcare, and storage & information management company Iron Mountain. The Underlying Index components with the lowest total returns for the same period included high yield bonds issued by the telecommunications company Telecom Italia, real estate investment trust Commscope and specialty retailer Rite Aid.
3 | | Option-adjusted spread (OAS) is the measurement of the spread of a fixed income security rate and the risk-free rate of return, which is adjusted to take into account an embedded option. Typically, an analyst uses the Treasury securities yield for the risk-free rate. The spread is added to the fixed income security price to make the risk-free bond price the same as the bond. |
4 | | See page 36 for more information on this index. |
5 | | The expression “excess return” may refer to the return that a security or portfolio provides above (or below) an investment with the lowest perceived risk, such as comparable U.S. Treasury securities. The expression may also refer to the return that a security or portfolio provides above (or below) an index or other benchmark. |
6 | | An obligation rated ‘BB’ by Standard & Poor’s (“S&P”) is deemed by S&P to be less vulnerable to nonpayment than other speculative issues. In the opinion of S&P, however, the obligor faces major ongoing uncertainties or exposure to adverse business, financial or economic conditions which could lead to the obligor’s inadequate capacity to meet its financial commitment on the obligation. An obligation rated ‘B’ by S&P is deemed by S&P to be more vulnerable to nonpayment than obligations rated ‘BB’, but in the opinion of S&P, the obligor currently has the capacity to meet its financial commitment on the obligation. It is the opinion of S&P that adverse business, financial, or economic conditions will likely impair the obligor’s capacity or willingness to meet its financial commitment on the obligation. An obligation rated ‘CCC’ by S&P is deemed by S&P to be currently vulnerable to nonpayment and is dependent upon favorable business, financial and economic conditions for the obligor to meet its financial commitment on the obligation. It is the opinion of S&P that in the event of adverse business, financial or economic conditions, the obligor is not likely to have the capacity to meet its financial commitment on the obligation. When applied to Fund holdings, ratings are based solely on the creditworthiness of the bonds in the portfolio and are not meant to represent the security or safety of the Fund. |
35
Management’s Discussion of Fund Performance(unaudited) (continued)
Which individual securities made the strongest contributions to the Fund’s absolute performance during the reporting period and which securities made the weakest contributions?
On the basis of impact, which takes weightings and total returns into consideration, the securities that made the strongest contributions to the Fund’s absolute performance during the reporting period included finance company, Ally Financial, real estate investment trust Starwood, and midstream natural gas & natural gas services company Targa Resources. The weakest contributors were issued by specialty retailer Rite Aid, computer hardware maker Western Digital and real estate investment trust Commscope.
Were there any changes in the Underlying Index during the reporting period?
The security selection process of the Underlying Index is designed to measure the performance of U.S. high yield bonds that exhibit low volatility characteristics, as measured by marginal contribution to risk (MCR), and that meet both liquidity and maturity criteria. Bonds that meet the criteria of the S&P U.S. High Yield Low Volatility Corporate Bond Index are market value weighted, subject to an issuer weight cap, whereby any issuer that exceeds 3% of the market value weight of the index is capped at 3%. The excess market value over the 3% cap is redistributed on a pro-rata basis to all other index constituents of issuers that are below the 3% cap. This process is then repeated until no issuer exceeds the 3% limit.
The opinions expressed are those of the portfolio managers as of the date of this report and are subject to change. There is no guarantee that any forecasts will come to pass. This material does not constitute investment advice and is not intended as an endorsement of any specific investment.
Hypothetical Growth of a $10,000 Investment
(Since Inception Through 4/30/2019)
Fund Performance History
IQ S&P High Yield Low Volatility Bond ETF
(as of April 30, 2019)
| | | | 1 Year
| | Since Inception1
|
| | | | Average
Annual
| | Average
Annual
| | Cumulative
|
IQ S&P U.S. High Yield Low Volatility Bond ETF Market Price2 | | | | | 6.56 | % | | | 3.65 | % | | | 8.23 | % |
IQ S&P U.S. High Yield Low Volatility Bond ETF NAV | | | | | 6.31 | % | | | 3.65 | % | | | 8.22 | % |
S&P U.S. High Yield Low Volatility Corporate Bond Index | | | | | 6.41 | % | | | 3.92 | % | | | 8.86 | % |
ICE BofAML U.S. High Yield Index (previously named
Merrill Lynch U.S. High Yield Master II Index) | | | | | 6.71 | % | | | 5.31 | % | | | 12.08 | % |
1 | | Fund Inception Date: 2/15/2017. |
2 | | The price used to calculate the Market Price returns is determined by using the mid price between bid and ask price listed on the NYSE Arca and does not represent returns an investor would receive. |
36
Management’s Discussion of Fund Performance(unaudited) (continued)
How did IQ 500 International ETF perform during the period since its inception on December 13, 2018 through April 30, 2019 (the “reporting period”)?
For the reporting period, IQ 500 International ETF returned 8.47% at NAV (net asset value) and 8.52% at market price.1 To compare, the Fund’s Underlying Index, the IQ 500 International Index, returned 8.53% for the same time period. The MSCI EAFE NR Index2 and the FTSE Developed ex U.S. Index2 returned 9.65% and 9.53%, respectively, for the same period.
What were the most significant factors and risks that influenced the markets in which the Fund invested during the reporting period?
The Underlying Index seeks to capture the equity performance of the 500 highest ranked international companies according to a fundamental composite rank composed of revenue, market share and operating margin growth. The Fund focuses on large capitalization stocks in developed markets outside the United States that exhibit dominant market share and strong operating efficiency. International investing exposes the Fund to currency fluctuations and local trends in international developed market economies.
What factors affected the Fund’s performance during the reporting period?
During the reporting period, the Fund’s European holdings outperformed holdings in other regions, posting the largest positive contribution to return. North American holdings provided the weakest contribution to the Fund’s performance for the same period.
During the reporting period, how was the Fund’s performance materially affected by investments in derivatives?
The Fund did not use derivatives during the reporting period.
During the reporting period, which sectors had the highest total returns and which sectors had the lowest total returns?
In terms of total return, the Fund’s best performing sectors during the reporting period were information technology, industrials and financials. During the same period, telecommunication services, utilities and health care provided the weakest total returns.
During the reporting period, which sectors made the strongest contributions to the Fund’s performance and which sectors made the weakest contributions?
On the basis of impact, which takes weightings and total returns into account, the sectors providing the strongest positive contributions to the Fund’s absolute performance were industrials, consumer discretionary and financials. The sectors that made the weakest contributions to the Fund’s absolute performance were real estate, telecommunication services and health care.
During the reporting period, which individual stocks had the highest total returns and which stocks had the lowest total returns?
Within the Underlying Index, the stocks with the highest total returns during the reporting period were precision machinery and instrument manufacturer Olympus, consumer electronics retailer CECONOMY and business support services provider SPIE. The Underlying Index constituents with the lowest total returns for the same period were bread makers Yamazaki Baking, engineering and construction services provider SNC-Lavalin and convenience store franchise chain FamilyMart.
Which individual stocks made the strongest contributions to the Fund’s performance during the reporting period and which stocks made the weakest contributions?
On the basis of impact, which takes weightings and total returns into consideration, the stocks that posted the strongest contributions to the Fund’s absolute performance during the reporting period were multinational conglomerate SoftBank, aeronautics company Airbus and luxury goods conglomerate LVMH. The weakest contributors to the Fund’s absolute performance during the same period were supermarket and shopping center operator AEON, diversified retailer Seven & I and industrial conglomerate Thyssenkrupp.
1 | | The price used to calculate the market price returns is determined by using the closing price listed on the NYSE Arca and does not represent returns an investor would receive if shares were traded at other times. |
2 | | See page 38 for more information on this index. |
37
Management’s Discussion of Fund Performance(unaudited) (continued)
Were there any changes in the Underlying Index during the reporting period?
The Underlying Index is reconstituted annually and reviewed quarterly in accordance with the rules of the Underlying Index. During the quarterly review, the Underlying Index is reweighted, if necessary, so that no single component has a weight of greater than 5% of the Index.
The opinions expressed are those of the portfolio managers as of the date of this report and are subject to change. There is no guarantee that any forecasts will come to pass. This material does not constitute investment advice and is not intended as an endorsement of any specific investment.
Hypothetical Growth of a $10,000 Investment
(Since Inception Through 4/30/2019)
Fund Performance History
IQ 500 International ETF
(as of April 30, 2019)
| | | | Since Inception1
|
| | | | Cumulative
|
IQ 500 International ETF Market Price2 | | | | | 8.52 | % |
IQ 500 International ETF NAV | | | | | 8.47 | % |
IQ 500 International Index | | | | | 8.53 | % |
MSCI EAFE NR Index | | | | | 9.65 | % |
FTSE Developed ex U.S. Index | | | | | 9.53 | % |
1 | | Fund Inception Date: 12/13/2018. |
2 | | The price used to calculate the Market Price returns is determined by using the mid price between bid and ask price listed on the NYSE Arca and does not represent returns an investor would receive. |
38
Management’s Discussion of Fund Performance(unaudited) (continued)
How did IQ 50 Percent Hedged FTSE International ETF perform during the 12 months ended April 30, 2019?
For the 12-month period ended April 30, 2019 (the “reporting period”), IQ 50 Percent Hedged FTSE International ETF returned -0.42% at NAV (net asset value) and -0.03% at market price.1 To compare, the Fund’s Underlying Index, FTSE Developed ex North America 50% Hedged to USD Index,2 returned -0.51% for the same period. The FTSE Developed ex North America Index Local Currency2 and the FTSE Developed ex North America Index2 returned 3.28% and -4.20%, respectively, for the same period.
The Fund invests in a representative sample of securities included in the Underlying Index that collectively has an investment profile similar to the Underlying Index. Due to the use of representative sampling, the Fund may or may not hold all of the securities that are included in the Underlying Index.
What were the most significant factors and risks that influenced the markets in which the Fund invested during the reporting period?
The Fund was affected during the reporting period by the currency effect of investing in international developed equity markets and then converting back to U.S. dollars. The Fund’s strategy is meant to track the FTSE Developed ex North America Index with a 50% currency hedge to the U.S. dollar.
The strategy offers broad exposure to developed country equity markets. In additional to the risks of investing in equity securities, including loss of initial value and performance volatility, local economic risks and broad geo-political risks also exist. The strategy’s exposure to local currency effects also introduces further risks in cases where a local currency depreciates relative to the U.S. dollar.
What factors affected the Fund’s performance during the reporting period?
During the reporting period, most currencies of major developed nations depreciated against the U.S. dollar. Of the 14 currency exposures in the Underlying Index, only the Hong Kong Dollar and Israel New Shekel appreciated against the U.S. dollar. The total currency effect of the Underlying Index was negative. Use of the Fund’s 50% currency hedge offset some of the negative currency impact. While local equity performance was positive for the Underlying Index, the local equity returns were offset by a greater margin from both the 50% and unhedged currency overlay.
Local equity performance are affected by systematic risks of the local market economies. Both long-term and short-term influences impact currency returns, such as local monetary policy, changes in interest rate differentials and geopolitical risks.
During the reporting period, how was the Fund’s performance materially affected by investments in derivatives?
The Underlying Index uses currency forwards to hedge 50% of its respective currency exposure of its underlying constituents. The hedge is reset monthly using 30-day forward contracts.
During the reporting period, which sectors had the highest total returns and which sectors had the lowest total returns?
In terms of total return, on a USD basis, the best-performing sectors in the Underlying Index during the reporting period were health care, technology, and utilities. During the same period, the consumer goods, financials and communication services sectors recorded the lowest total returns.
During the reporting period, which sectors made the strongest contributions to the Fund’s performance and which sectors made the weakest contributions?
On the basis of impact, which takes weightings and total returns on a USD basis into account, the sectors that made the strongest positive contributions to the Underlying Index’s absolute performance were health care, information technology and utilities. The sectors that made the weakest contributions to the Underlying Index’s absolute performance were financials, consumer goods and industrials.
1 | | The price used to calculate the market price returns is determined by using the closing price listed on the NYSE Arca and does not represent returns an investor would receive if shares were traded at other times. |
2 | | See page 41 for more information on this index. |
39
Management’s Discussion of Fund Performance(unaudited) (continued)
During the reporting period, which individual stocks had the highest total returns and which stocks had the lowest total returns?
Within the Underlying Index, the stocks with the highest total returns during the reporting period included Fortescue Metals Group, a developer of iron ore deposits; GMO Payment Gateway, an ecommerce transaction service; Magellan Financial Group, a global investment management group. GMO Payments and Magellan Financial were not included in the representative sample of securities held by the Fund.
The Underlying Index constituents producing the lowest total returns for the reporting period included Leopalace21, a real estate developer; Chiyoda Corp, a plant construction firm; Brightoil Petroleum, a petroleum refining and marking company. All three components were not included in the representative sample of securities held by the Fund.
Which individual stocks made the strongest contributions to the Fund’s performance during the reporting period and which stocks made the weakest contributions?
On the basis of impact, which takes weightings and total returns on a USD basis into consideration, the stocks that made the strongest contributions to the Fund’s absolute performance during the reporting period included Nestle, a food and beverage maker; Novartis, a holding company that develops, manufactures and markets health care products; and Roche Holding a health care research company.
The weakest contributors to the Fund’s absolute performance during the reporting were Bayer, a maker of pharmaceutical, agricultural and health products; Samsung Electronics, which manufactures and sells electronics and computer peripherals; and British American Tobacco, a holding company engaged in the manufacture and distribution of tobacco products.
Were there any changes in the Underlying Index during the reporting period?
The Underlying Index was reconstituted, meaning that components were added to or removed from the Underlying Index, by FTSE in September 2018 and March 2019. Throughout the reporting period, FTSE made incremental adjustments to underlying constituent weights based on company shares available for purchase by investors.
The Underlying Index added Poland as a new country.
40
Management’s Discussion of Fund Performance(unaudited) (continued)
The opinions expressed are those of the portfolio managers as of the date of this report and are subject to change. There is no guarantee that any forecasts will come to pass. This material does not constitute investment advice and is not intended as an endorsement of any specific investment.
Hypothetical Growth of a $10,000 Investment
(Since Inception Through 4/30/2019)
Fund Performance History
IQ 50 Percent Hedged FTSE International ETF
(as of April 30, 2019)
| | | | 1 Year
| | 3 Year
| | Since Inception1
| |
| | | | Average
Annual
| | Average
Annual
| | Average
Annual
| | Cumulative
|
IQ 50 Percent Hedged FTSE International ETF Market Price2 | | | | | –0.03 | % | | | 9.29 | % | | | 4.12 | % | | | 16.46 | % |
IQ 50 Percent Hedged FTSE International ETF NAV | | | | | –0.42 | % | | | 9.01 | % | | | 4.04 | % | | | 16.16 | % |
FTSE Developed ex North America 50% Hedged to USD Index | | | | | –0.51 | % | | | 9.44 | % | | | 4.58 | % | | | 18.44 | % |
FTSE Developed ex North America Index Local Currency | | | | | 3.28 | % | | | 11.28 | % | | | 5.43 | % | | | 22.11 | % |
FTSE Developed ex North America Index | | | | | –4.20 | % | | | 7.57 | % | | | 3.66 | % | | | 14.55 | % |
1 | | Fund Inception Date: 7/22/2015. |
2 | | Beginning on May 31, 2016, the price used to calculate the Market Price returns is the mean between the day’s last bid and ask prices. Prior to May 31, 2016, market price returns were calculated using the day’s NYSE Arca closing price. The market price returns do not represent returns an investor would receive if shares were traded at other times. |
41
Management’s Discussion of Fund Performance(unaudited) (continued)
How did IQ 50 Percent Hedged FTSE Europe ETF perform during the 12 months ended April 30, 2019?
For the 12 months ended April 30, 2019 (the “reporting period”), IQ 50 Percent Hedged FTSE Europe ETF returned 1.45% at NAV (net asset value) and 1.90% at market price.1 To compare, the Fund’s Underlying Index, the FTSE Developed Europe 50% Hedged to USD Index,2 returned 1.71% for the same period. The FTSE Developed Europe Index Hedged2 and the FTSE Developed Europe Index2 returned 6.47% and -2.89%, respectively, for the same period.
What were the most significant factors and risks that influenced the markets in which the Fund invested during the reporting period?
The Fund was affected during the reporting period by the currency effect of investing in developed European equity markets and then converting back to U.S. dollars. The Fund’s strategy is meant to track the FTSE Developed Europe Index with a 50% currency hedge to the U.S. dollar.
The strategy offers broad exposure to developed European equity markets. In additional to the risks of investing in equity securities including loss of initial value and performance volatility, local economic risks and broad geopolitical risks also exist. The strategy’s exposure to local currency effects also introduces further risks in cases where a local currency depreciates relative to the U.S. dollar.
What factors affected the Fund’s performance during the reporting period?
During the reporting period, the underlying equities contributed positively to the Underlying Index on a local currency basis. However, the 7 currency exposures of the Underlying Index depreciated against the U.S. Dollar. Given the negative currency effect, the Fund’s 50% currency hedge mitigated some of the negative currency impact. Local equity performance are affected by systematic risks of the local market economies. Both long-term and short-term influences impact currency returns, such as local monetary policy, changes in interest rate differentials, and geopolitical risks.
During the reporting period, how was the Fund’s performance materially affected by investments in derivatives?
The Underlying Index uses currency forwards to hedge 50% of its respective currency exposure of its underlying constituents. The hedge is reset monthly using 30-day forward contracts.
During the reporting period, which sectors had the highest total returns and which sectors had the lowest total returns?
In terms of total return, on a USD basis, the best-performing sectors in the Underlying Index included technology, health care and utilities. During the reporting period, the telecommunications, financials and basic materials sectors recorded the lowest total returns.
During the reporting period, which sectors made the strongest contributions to the Fund’s performance and which sectors made the weakest contributions?
On the basis of impact, which takes weightings and total returns on a USD basis into account, the sectors that made the strongest positive contributions to the Fund’s absolute performance were utilities, health care and information technology. The sectors that produced the weakest contributions to the Fund’s absolute performance were financials, energy and telecommunications.
During the reporting period, which individual stocks had the highest total returns and which securities had the lowest total returns?
Within the Underlying Index, the stocks with the highest total returns on a USD basis during the reporting period included enterprise application management solutions provider Micro Focus International, steel making and mining company Evraz, and digital auto marketplace platform Auto Trader Group. The Underlying Index constituents producing the lowest total returns for the reporting period included semiconductor manufacturer AMS, jewelry designer and maker Pandora and postal and delivery services provider Royal Mail.
1 | | The price used to calculate the market price returns is determined by using the closing price listed on the NYSE Arca and does not represent returns an investor would receive if shares were traded at other times. |
2 | | See page 43 for more information on this index. |
42
Management’s Discussion of Fund Performance(unaudited) (continued)
Which individual stocks made the strongest contributions to the Fund’s performance during the reporting period and which securities made the weakest contributions?
On the basis of impact, which takes weightings and total returns into consideration, the stocks that made the strongest contributions to the Fund’s absolute performance during the reporting period included food and beverage company Nestle, health care products producer Novartis and health care research company Roche Holding. The weakest contributors were health care and nutrition product maker Bayer; tobacco product manufacturer and distributor British American Tobacco and telecommunication services provider Vodafone Group.
Were there any changes in the Underlying Index during the reporting period?
The Underlying Index was reconstituted, meaning that components were added to or removed from the Underlying Index, by FTSE in September 2018 and March 2019. Throughout the reporting period, FTSE made incremental adjustments to underlying constituent weights based on company shares available for purchase by investors.
Poland was introduced to the Underlying Index in the September 2018 reconstitution.
The opinions expressed are those of the portfolio managers as of the date of this report and are subject to change. There is no guarantee that any forecasts will come to pass. This material does not constitute investment advice and is not intended as an endorsement of any specific investment.
Hypothetical Growth of a $10,000 Investment
(Since Inception Through 4/30/2019)
Fund Performance History
IQ 50 Percent Hedged FTSE Europe ETF
(as of April 30, 2019)
| | | | 1 Year
| | 3 Year
| | Since Inception1
| |
| | | | Average
Annual
| | Average
Annual
| | Average
Annual
| | Cumulative
|
IQ 50 Percent Hedged FTSE Europe ETF Market Price2 | | | | | 1.90 | % | | | 8.63 | % | | | 4.05 | % | | | 16.17 | % |
IQ 50 Percent Hedged FTSE Europe ETF NAV | | | | | 1.45 | % | | | 9.01 | % | | | 4.05 | % | | | 16.17 | % |
FTSE Developed Europe 50% Hedged to USD Index | | | | | 1.71 | % | | | 9.51 | % | | | 4.70 | % | | | 18.94 | % |
FTSE Developed Europe Index Hedged | | | | | 6.47 | % | | | 11.75 | % | | | 6.37 | % | | | 26.27 | % |
FTSE Developed Europe Index | | | | | –2.89 | % | | | 7.22 | % | | | 2.96 | % | | | 11.63 | % |
1 | | Fund Inception Date: 7/22/2015. |
2 | | Beginning on May 31, 2016, the price used to calculate the Market Price returns is the mean between the day’s last bid and ask prices. Prior to May 31, 2016, market price returns were calculated using the day’s NYSE Arca closing price. The market price returns do not represent returns an investor would receive if shares were traded at other times. |
43
Management’s Discussion of Fund Performance(unaudited) (continued)
How did IQ 50 Percent Hedged FTSE Japan ETF perform during the 12 months ended April 30, 2019?
For the 12-month period ended April 30, 2019, the Fund returned -5.96% at NAV (net asset value) and -5.71% at market price.1 To compare, the Fund’s Underlying Index, the FTSE Japan 50% Hedged to USD Index,2 returned -5.70% for the same period. The FTSE Japan Index Hedged2 and the FTSE Japan Index2 returned -3.85% and -7.59%, respectively, for the same period.
What were the most significant factors and risks that influenced the markets in which the Fund invested during the reporting period?
The Fund was affected during the reporting period by the currency effect of investing in the Japanese equity markets and then converting back to U.S. dollars. The Fund’s strategy is meant to track the FTSE Japan Index with a 50% currency hedge to the U.S. dollar.
What factors affected the Fund’s performance during the reporting period?
During the reporting period, the yen remained stagnant against the U.S. dollar. Developments in local market economies were the primary influence on the performance of the local Japanese equity market.
During the reporting period, how was the Fund’s performance materially affected by investments in derivatives?
The Underlying Index uses currency forwards to hedge 50% of its respective currency exposure of its underlying constituents. During the reporting period, the hedge added 1.68% to Fund performance. The hedge is reset monthly using 30-day forward contracts.
During the reporting period, which sectors had the highest total returns and which sectors had the lowest total returns?
In terms of total return, the best-performing sectors in the Underlying Index during the reporting period were communication services, health care and information technology. During the same period energy, financials and materials recorded the lowest total returns.
During the reporting period, which sectors made the strongest contributions to the Fund’s performance and which sectors made the weakest contributions?
On the basis of impact, which takes weightings and total returns into account, the sectors that made the strongest positive contributions to the Fund’s absolute performance were communication services, health care and utilities. The sectors that produced the weakest contributions to the Fund’s absolute performance were financials, consumer discretionary and industrials.
During the reporting period, which dual stocks had the highest total returns and which stocks had the lowest total returns?
Within the Underlying Index, the stocks with the highest total returns during the reporting period were GMO Payment Gateway, a provider of payment-related services and other financial services; Rakuten, an internet services provider; and Daiichi Sankyo, which develops, manufactures and sells pharmaceutical products.
The Underlying Index constituents with the lowest total returns for the reporting period were Leopalace21, a leasing and construction business; Chiyoda, an engineering services provider; and Suruga Bank, which provides banking and other financial services.
Which securities made the strongest contributions to the Fund’s performance during the reporting period and which securities made the weakest contributions?
On the basis of impact, which takes weightings and total returns into consideration, the stocks that made the strongest contributions to the Fund’s absolute performance during the reporting period were SoftBank Group, a telecommunications services provider; Daiichi Sankyo, a pharmaceutical company; and Recruit Holdings, which provides integrated human resource services.
The weakest contributors were Mitsubishi UFJ Financial Group, a financial services provider; Panasonic, which manufactures electrical products; and Honda Motor, an automobile, motorcycle and power products company.
1 | | The price used to calculate the market price returns is determined by using the closing price listed on the NYSE Arca and does not represent returns an investor would receive if shares were traded at other times. . The price used to calculate the market price returns is determined by using the closing price listed on the NYSE Arca and does not represent returns an investor would receive if shares were traded at other times. |
2 | | See page 45 for more information on this index. |
44
Management’s Discussion of Fund Performance(unaudited) (continued)
Were there any changes in the Underlying Index during the reporting period?
The Underlying Index was reconstituted, meaning that components were added to or removed from the Underlying Index, by FTSE in September 2018 and March 2019. Throughout the reporting period, FTSE made incremental adjustments to underlying constituent weights based on company shares available for purchase by investors.
The opinions expressed are those of the portfolio managers as of the date of this report and are subject to change. There is no guarantee that any forecasts will come to pass. This material does not constitute investment advice and is not intended as an endorsement of any specific investment.
Hypothetical Growth of a $10,000 Investment
(Since Inception Through 4/30/2019)
Fund Performance History
IQ 50 Percent Hedged FTSE Japan ETF
(as of April 30, 2019)
| | | | 1 Year
| | 3 Year
| | Since Inception1
| |
| | | | Average
Annual
| | Average
Annual
| | Average
Annual
| | Cumulative
|
IQ 50 Percent Hedged FTSE Japan ETF Market Price2 | | | | | –5.71 | % | | | 7.11 | % | | | 2.23 | % | | | 8.67 | % |
IQ 50 Percent Hedged FTSE Japan ETF NAV | | | | | –5.96 | % | | | 8.22 | % | | | 2.30 | % | | | 8.95 | % |
FTSE Japan 50% Hedged to USD Index | | | | | –5.70 | % | | | 8.74 | % | | | 2.84 | % | | | 11.14 | % |
FTSE Japan Index Hedged | | | | | –3.85 | % | | | 10.00 | % | | | 1.68 | % | | | 6.51 | % |
FTSE Japan Index | | | | | –7.59 | % | | | 7.27 | % | | | 3.76 | % | | | 14.95 | % |
1 | | Fund Inception Date: 7/22/2015. |
2 | | Beginning on May 31, 2016, the price used to calculate the Market Price returns is the mean between the day’s last bid and ask prices. Prior to May 31, 2016, market price returns were calculated using the day’s NYSE Arca closing price. The market price returns do not represent returns an investor would receive if shares were traded at other times. |
45
Management’s Discussion of Fund Performance(unaudited) (continued)
How did IQ Chaikin U.S. Small Cap ETF perform during the 12 months ended April 30, 2019?
For the 12 months ended April 30, 2019 (the “reporting period”), the Fund returned -4.10% at NAV (net asset value) and -4.14% at market price.1 In comparison to the Fund’s Underlying Index, NASDAQ Chaikin Power U.S. Small Cap Index,2 returned -3.71% for the same period. The Russell 2000 Index2 and the NASDAQ US 1500 Index2 returned 4.61% and 4.69%, respectively, for the same period.
What were the most significant factors and risks that influenced the markets in which the Fund invested during the reporting period?
The Underlying Index seeks to capture the performance of the U.S. small-cap universe by selecting stocks that have a probability of outperforming peers, based on Chaikin Power Gauge stock ratings. The Chaikin Power Gauge is a proprietary, 20-factor quantitative stock selection model that combines value, growth, technical and sentiment indicators.
During the reporting period, the U.S. small-cap universe performed positively. U.S. small-cap companies are generally more domestically focused compared to U.S. large-cap companies. These companies also generally maintain a higher effective tax rate relative to large-cap companies. During the period, small-cap companies reported slightly lower returns than large-cap companies but reported stronger earnings following passage of the Tax Cuts and Jobs Act of 2017. While the U.S. Federal Reserve has been raising short-term rates, the U.S. economy has been growing at higher rates relative to other developed market countries. Improving GDP growth has also shown that the U.S. is in an environment of continued economic growth. With lower than expected inflation, input prices didn’t grow by a substantial amount. The labor market has also been tight with more muted wage inflation, helping to reduce overall operating costs to corporations.
What factors affected the Fund’s performance during the reporting period?
Some major themes affecting the U.S. markets over the reporting period included corporate tax reform, rising interest rates, muted but rising inflation, an increase in market volatility, political uncertainty surrounding tariffs and the uncertainty of a trade war with China.
The strategy utilizes the Chaikin Power Gauge ranking as selection overlay versus a U.S. small-cap universe. The selected securities are equal-weighted in the final construction creating greater active share compared to a market weighted index. Sector distribution is determined as a result of final security selection, possibly resulting in the exclusion of certain sectors.
During the reporting period, how was the Fund’s performance materially affected by investments in derivatives?
The Fund did not use derivatives during the reporting period.
During the reporting period, which sectors had the highest total returns and which sectors had the lowest total returns?
In terms of total return, the best-performing sectors in the Underlying Index during the reporting period included communication services, information technology and consumer staples. During the same period, real estate, materials and energy recorded the lowest total returns.
During the reporting period, which sectors made the strongest contributions to the Fund’s absolute performance and which sectors made the weakest contributions?
On the basis of impact, which takes weightings and total returns into account, the sectors that made the strongest positive contributions to the Fund’s absolute performance were information technology, health care and communication services. The sectors that made the weakest contributions to the Fund’s absolute performance were financials, industrials and materials.
During the reporting period, which individual stocks had the highest total returns and which stocks had the lowest total returns?
Within the Underlying Index, the stocks generating the highest total returns during the reporting period were workplace essentials supplier Essendant, biofuel and renewable chemical producer Renewable Energy Group and online travel company Liberty TripAdvisor Holdings.
1 | | The price used to calculate the market price returns is determined by using the closing price listed on the NASDAQ and does not represent returns an investor would receive if shares were traded at other times. |
2 | | See page 47 for more information on this index. |
46
Management’s Discussion of Fund Performance(unaudited) (continued)
The Underlying Index constituents with the lowest total returns for the reporting period were pharmaceuticals and chemicals manufacturer Aceto, reinsurer Maiden Holdings and metal fabrication company NCI Building Systems.
Which individual stocks made the strongest contributions to the Fund’s performance during the reporting period and which stocks made the weakest contributions?
On the basis of impact, which takes weightings and total returns into consideration, the stocks that made the strongest contributions to the Fund’s absolute performance during the reporting period were banking services provider First Bancorp, Essendant, mentioned above, and social game developer Zynga. The weakest contributors to the Fund’s absolute performance were Maiden Holdings and NCI Buildings Systems, both mentioned above, and outdoor recreation products maker Vista Outdoors.
Were there any changes in the Underlying Index during the reporting period?
In accordance with its rules, the Underlying Index was rebalanced and reconstituted, meaning that components were added to or removed from the Underlying Index, in April 2019.
The opinions expressed are those of the portfolio managers as of the date of this report and are subject to change. There is no guarantee that any forecasts will come to pass. This material does not constitute investment advice and is not intended as an endorsement of any specific investment.
Hypothetical Growth of a $10,000 Investment
(Since Inception Through 4/30/2019)
Fund Performance History
IQ Chaikin U.S. Small Cap ETF
(as of April 30, 2019)
| | | | 1 Year
| | Since Inception1
| |
| | | | Average
Annual
| | Average
Annual
| | Cumulative
|
IQ Chaikin U.S. Small Cap ETF Market Price2 | | | | | –4.14 | % | | | 1.96 | % | | | 3.88 | % |
IQ Chaikin U.S. Small Cap ETF NAV | | | | | –4.10 | % | | | 1.97 | % | | | 3.89 | % |
NASDAQ Chaikin Power U.S. Small Cap Index | | | | | –3.71 | % | | | 2.52 | % | | | 5.00 | % |
Russell 2000 Index | | | | | 4.61 | % | | | 8.42 | % | | | 17.16 | % |
NASDAQ US 1500 Index | | | | | 4.69 | % | | | 8.70 | % | | | 17.75 | % |
1 | | Fund Inception Date: 5/16/2017. |
2 | | The price used to calculate the Market Price returns is determined by using the mid price between bid and ask price listed on the NASDAQ and does not represent returns an investor would receive. |
47
Management’s Discussion of Fund Performance(unaudited) (continued)
How did IQ Chaikin U.S. Large Cap ETF perform during the 12 months ended April 30, 2019?
Over the 12 months ending April 30, 2019 (the “reporting period”), IQ Chaikin U.S. Large Cap ETF returned -0.13% at NAV (net asset value) and -0.13% at market price.1 To compare, the Fund’s Underlying Index, the NASDAQ Chaikin Power U.S. Large Cap Index, returned 0.09% for the same period. The S&P 500 Index2 and the NASDAQ US 300 Total Return Index2 returned 12.82% and 13.96%, respectively, for the same period.
What were the most significant factors and risks that influenced the markets in which the Fund invested during the reporting period?
The Underlying Index seeks to capture the performance of the U.S. large-cap universe by selecting stocks that have a probability of outperforming peers based on Chaikin Power Gauge stock ratings. The Chaikin Power Gauge is a proprietary, 20-factor quantitative stock selection model that combines value, growth, technical and sentiment indicators.
The Underlying Index seeks exposure to the U.S. large-cap universe. During the reporting period, the U.S. large-cap universe performed positively. Large Cap companies frequently have more global operations than smaller companies. During the period, large-cap companies reported stronger earnings following passage of the Tax Cuts and Jobs Act in late 2017. While the U.S. Federal Reserve has been raising short-term rates, the U.S. economy has been growing at higher rates relative to other developed market countries. Improving GDP growth has also shown the US is in an environment of continued economic growth. With lower than expected inflation, input prices didn’t grow by a substantial amount. The labor market has also been tight with more muted wage inflation, helping to reduce overall operating costs to corporations.
What factors affected the Fund’s performance during the reporting period?
The strategy utilizes the Chaikin Power Gauge ranking as selection overlay versus a U.S. large-cap universe. The selected securities are equal-weighted in the final construction creating greater active share compared to a market weighted index. Sector distribution is determined as a result of final security selection possibly resulting in the exclusion of certain sectors.
During the reporting period, how was the Fund’s performance materially affected by investments in derivatives?
The Fund did not use derivatives during the reporting period.
During the reporting period, which sectors had the highest total returns and which sectors had the lowest total returns?
In terms of total return, the best-performing sectors in the Underlying Index during the reporting period were industrials, health care and information technology. During the same period, utilities, materials and energy recorded the lowest total returns.
During the reporting period, which sectors made the strongest contributions to the Fund’s absolute performance and which sectors made the weakest contributions?
On the basis of impact, which takes weightings and total returns into account, the sectors that made the strongest positive contributions to the Fund’s absolute performance were information technology, industrials and financials. The sectors that made the weakest contributions to the Fund’s absolute performance were utilities, energy and consumer staples.
During the reporting period, which individual stocks had the highest total returns and which stocks had the lowest total returns?
Within the Underlying Index, the stocks generating the highest total returns during the reporting period were health care provider HCA Healthcare, insurer Progressive, and rail transportation company Norfolk Southern Corporation. The Underlying Index constituents with the lowest total returns for the reporting period were energy provider PG&E, financial holding company State Street and technology consulting and support services provider DXC Technology.
1 | | The price used to calculate the market price returns is determined by using the closing price listed on the NASDAQ and does not represent returns an investor would receive if shares were traded at other times. |
2 | | See page 49 for more information on this index. |
48
Management’s Discussion of Fund Performance(unaudited) (continued)
Which securities made the strongest contributions to the Fund’s performance during the reporting period and which securities made the weakest contributions?
On the basis of impact, which takes weightings and total returns into consideration, the stocks that made the strongest contributions to the Fund’s absolute performance during the reporting period were Norfolk Southern and HCA Healthcare, both mentioned earlier, and power utility Exelon. The weakest contributors to the Fund’s absolute performance were PG&E and State Street, both mentioned earlier, and shipping and logistics company FedEx.
Were there any changes in the Underlying Index during the reporting period?
The Underlying Index was reconstituted, meaning that components were added to or removed from the Underlying Index, in April 2019.
The opinions expressed are those of the portfolio managers as of the date of this report and are subject to change. There is no guarantee that any forecasts will come to pass. This material does not constitute investment advice and is not intended as an endorsement of any specific investment.
Hypothetical Growth of a $10,000 Investment
(Since Inception Through 4/30/2019)
Fund Performance History
IQ Chaikin U.S. Large Cap ETF
(as of April 30, 2019)
| | | | 1 Year
| | Since Inception1
| |
| | | | Average
Annual
| | Average
Annual
| | Cumulative
|
IQ Chaikin U.S. Large Cap ETF Market Price2 | | | | | –0.13 | % | | | 0.86 | % | | | 1.19 | % |
IQ Chaikin U.S. Large Cap ETF NAV | | | | | –0.13 | % | | | 0.85 | % | | | 1.18 | % |
NASDAQ Chaikin Power U.S. Large Cap Index | | | | | 0.09 | % | | | 1.10 | % | | | 1.53 | % |
S&P 500 Index | | | | | 12.82 | % | | | 9.01 | % | | | 12.66 | % |
NASDAQ US 300 Total Return Index | | | | | 13.96 | % | | | 9.82 | % | | | 13.81 | % |
1 | | Fund Inception Date: 12/13/2017. |
2 | | The price used to calculate the Market Price returns is determined by using the mid price between bid and ask price listed on the NASDAQ and does not represent returns an investor would receive if shares were traded at other times. |
49
As a shareholder of a fund, you incur two types of costs: (1) transaction costs on purchases and sales and (2) ongoing costs, including Advisory fees and other fund expenses. This example is intended to help you understand your ongoing costs (in dollars) of investing in a fund and to compare these costs with the ongoing costs of investing in other funds. Shareholders may pay brokerage commissions on their purchase and sale of the Fund, which are not reflected in the example.
The examples are based on an investment of $1,000 invested at the beginning of the period and held for the entire period as indicated below.
Actual Expenses
The first line of the table below provides information about actual account values and actual expenses. You may use the information together with the amount you invested, in a particular fund, to estimate the expenses that you paid over the period. Simply divide your account value by $1,000 (for example, an $8,600 account value divided by $1,000 = 8.6), then multiply the result by the number in the first line under the heading entitled “Expenses Paid During the Period 11/01/2018 to 04/30/2019” to estimate the expenses you paid on your account during this period. Each Fund will indirectly bear its pro rata share of the expenses incurred by the underlying ETF investments in which each Fund invests. These expenses are not included in the table.
Hypothetical Example for Comparison Purposes
The second line of the table below also provides information about hypothetical account values and hypothetical expenses based on each Fund’s actual expense ratio and an assumed annual rate of return of 5% before expenses, which are not the Funds’ actual returns. The hypothetical account values and expenses may not be used to estimate the actual ending account balance or expenses you paid for the period. You may use this information to compare the ongoing costs of investing in a fund and other funds. To do so, compare this 5% hypothetical example with the 5% hypothetical examples that appear in the shareholder reports of other funds. The Funds will indirectly bear their pro rata share of the expenses incurred by the underlying fund investments in which the Funds invest. These expenses are not included in the table.
Please note that the expenses shown in the table are meant to highlight your ongoing costs only and do not reflect any transactional costs. Therefore, the hypothetical example is useful in comparing ongoing costs only, and will not help you determine the relative total costs of owning different funds. In addition, if these transactional costs were included, your costs would have been higher.
50
Fund Expenses(unaudited) (continued)
| | | | Beginning
Account
Value
11/01/18
| | Ending
Account
Value
04/30/19
| | Annualized
Expense
Ratios for the
Period 11/01/18
to 04/30/19
| | Expenses1
Paid During
the Period
11/01/18 to
04/30/19
|
IQ Hedge Multi-Strategy Tracker ETF | | | | | | | | | | | | | | | | | | |
Actual | | | | $ | 1,000.00 | | | $ | 1,033.70 | | | | 0.54 | % | | $ | 2.72 | |
Hypothetical (assuming a 5% return before expenses) | | | | $ | 1,000.00 | | | $ | 1,022.12 | | | | 0.54 | % | | $ | 2.71 | |
IQ Hedge Macro Tracker ETF | | | | | | | | | | | | | | | | | | |
Actual | | | | $ | 1,000.00 | | | $ | 1,037.90 | | | | 0.76 | % | | $ | 3.84 | |
Hypothetical (assuming a 5% return before expenses) | | | | $ | 1,000.00 | | | $ | 1,021.03 | | | | 0.76 | % | | $ | 3.81 | |
IQ Hedge Market Neutral Tracker ETF | | | | | | | | | | | | | | | | | | |
Actual | | | | $ | 1,000.00 | | | $ | 1,025.60 | | | | 0.76 | % | | $ | 3.82 | |
Hypothetical (assuming a 5% return before expenses) | | | | $ | 1,000.00 | | | $ | 1,021.03 | | | | 0.76 | % | | $ | 3.81 | |
IQ Hedge Long/Short Tracker ETF | | | | | | | | | | | | | | | | | | |
Actual | | | | $ | 1,000.00 | | | $ | 1,059.60 | | | | 0.76 | % | | $ | 3.88 | |
Hypothetical (assuming a 5% return before expenses) | | | | $ | 1,000.00 | | | $ | 1,021.03 | | | | 0.76 | % | | $ | 3.81 | |
IQ Hedge Event-Driven Tracker ETF | | | | | | | | | | | | | | | | | | |
Actual | | | | $ | 1,000.00 | | | $ | 1,055.80 | | | | 0.76 | % | | $ | 3.87 | |
Hypothetical (assuming a 5% return before expenses) | | | | $ | 1,000.00 | | | $ | 1,021.03 | | | | 0.76 | % | | $ | 3.81 | |
IQ Real Return ETF | | | | | | | | | | | | | | | | | | |
Actual | | | | $ | 1,000.00 | | | $ | 1,025.40 | | | | 0.27 | % | | $ | 1.36 | |
Hypothetical (assuming a 5% return before expenses) | | | | $ | 1,000.00 | | | $ | 1,023.46 | | | | 0.27 | % | | $ | 1.35 | |
IQ Leaders GTAA Tracker ETF | | | | | | | | | | | | | | | | | | |
Actual | | | | $ | 1,000.00 | | | $ | 1,082.80 | | | | 0.28 | % | | $ | 1.45 | |
Hypothetical (assuming a 5% return before expenses) | | | | $ | 1,000.00 | | | $ | 1,023.41 | | | | 0.28 | % | | $ | 1.40 | |
IQ Enhanced Core Bond U.S. ETF | | | | | | | | | | | | | | | | | | |
Actual | | | | $ | 1,000.00 | | | $ | 1,038.30 | | | | 0.21 | % | | $ | 1.06 | |
Hypothetical (assuming a 5% return before expenses) | | | | $ | 1,000.00 | | | $ | 1,023.75 | | | | 0.21 | % | | $ | 1.05 | |
IQ Enhanced Core Plus Bond U.S. ETF | | | | | | | | | | | | | | | | | | |
Actual | | | | $ | 1,000.00 | | | $ | 1,030.90 | | | | 0.21 | % | | $ | 1.06 | |
Hypothetical (assuming a 5% return before expenses) | | | | $ | 1,000.00 | | | $ | 1,023.75 | | | | 0.21 | % | | $ | 1.05 | |
IQ Short Duration Enhanced Core Bond U.S. ETF * | | | | | | | | | | | | | | | | | | |
Actual | | | | $ | 1,000.00 | | | $ | 1,022.30 | | | | 0.20 | % | | $ | 0.74 | |
Hypothetical (assuming a 5% return before expenses) | | | | $ | 1,000.00 | | | $ | 1,023.80 | | | | 0.20 | % | | $ | 1.00 | |
IQ Merger Arbitrage ETF | | | | | | | | | | | | | | | | | | |
Actual | | | | $ | 1,000.00 | | | $ | 990.00 | | | | 0.76 | % | | $ | 3.75 | |
Hypothetical (assuming a 5% return before expenses) | | | | $ | 1,000.00 | | | $ | 1,021.03 | | | | 0.76 | % | | $ | 3.81 | |
IQ Global Resources ETF | | | | | | | | | | | | | | | | | | |
Actual | | | | $ | 1,000.00 | | | $ | 1,015.90 | | | | 0.76 | % | | $ | 3.80 | |
Hypothetical (assuming a 5% return before expenses) | | | | $ | 1,000.00 | | | $ | 1,021.03 | | | | 0.76 | % | | $ | 3.81 | |
IQ Global Agribusiness Small Cap ETF | | | | | | | | | | | | | | | | | | |
Actual | | | | $ | 1,000.00 | | | $ | 1,119.50 | | | | 0.76 | % | | $ | 3.99 | |
Hypothetical (assuming a 5% return before expenses) | | | | $ | 1,000.00 | | | $ | 1,021.03 | | | | 0.76 | % | | $ | 3.81 | |
IQ U.S. Real Estate Small Cap ETF | | | | | | | | | | | | | | | | | | |
Actual | | | | $ | 1,000.00 | | | $ | 1,066.20 | | | | 0.70 | % | | $ | 3.59 | |
Hypothetical (assuming a 5% return before expenses) | | | | $ | 1,000.00 | | | $ | 1,021.32 | | | | 0.70 | % | | $ | 3.51 | |
IQ S&P High Yield Low Volatility Bond ETF | | | | | | | | | | | | | | | | | | |
Actual | | | | $ | 1,000.00 | | | $ | 1,059.50 | | | | 0.40 | % | | $ | 2.04 | |
Hypothetical (assuming a 5% return before expenses) | | | | $ | 1,000.00 | | | $ | 1,022.81 | | | | 0.40 | % | | $ | 2.01 | |
IQ 500 International ETF ** | | | | | | | | | | | | | | | | | | |
Actual | | | | $ | 1,000.00 | | | $ | 1,084.70 | | | | 0.25 | % | | $ | 0.99 | |
Hypothetical (assuming a 5% return before expenses) | | | | $ | 1,000.00 | | | $ | 1,023.55 | | | | 0.25 | % | | $ | 1.25 | |
IQ 50 Percent Hedged FTSE International ETF | | | | | | | | | | | | | | | | | | |
Actual | | | | $ | 1,000.00 | | | $ | 1,079.30 | | | | 0.20 | % | | $ | 1.03 | |
Hypothetical (assuming a 5% return before expenses) | | | | $ | 1,000.00 | | | $ | 1,023.80 | | | | 0.20 | % | | $ | 1.00 | |
51
Fund Expenses(unaudited) (continued)
| | | | Beginning
Account
Value
11/01/18
| | Ending
Account
Value
04/30/19
| | Annualized
Expense
Ratios for the
Period 11/01/18
to 04/30/19
| | Expenses1
Paid During
the Period
11/01/18 to
04/30/19
|
IQ 50 Percent Hedged FTSE Europe ETF
| | | | | | | | | | | | | | | | | | |
Actual | | | | $ | 1,000.00 | | | $ | 1,097.00 | | | | 0.30 | % | | $ | 1.56 | |
Hypothetical (assuming a 5% return before expenses) | | | | $ | 1,000.00 | | | $ | 1,023.31 | | | | 0.30 | % | | $ | 1.51 | |
IQ 50 Percent Hedged FTSE Japan ETF | | | | | | | | | | | | | | | | | | |
Actual | | | | $ | 1,000.00 | | | $ | 1,011.90 | | | | 0.30 | % | | $ | 1.50 | |
Hypothetical (assuming a 5% return before expenses) | | | | $ | 1,000.00 | | | $ | 1,023.31 | | | | 0.30 | % | | $ | 1.51 | |
IQ Chaikin U.S. Small Cap ETF | | | | | | | | | | | | | | | | | | |
Actual | | | | $ | 1,000.00 | | | $ | 1,026.90 | | | | 0.35 | % | | $ | 1.76 | |
Hypothetical (assuming a 5% return before expenses) | | | | $ | 1,000.00 | | | $ | 1,023.06 | | | | 0.35 | % | | $ | 1.76 | |
IQ Chaikin U.S. Large Cap ETF | | | | | | | | | | | | | | | | | | |
Actual | | | | $ | 1,000.00 | | | $ | 1,036.40 | | | | 0.25 | % | | $ | 1.26 | |
Hypothetical (assuming a 5% return before expenses) | | | | $ | 1,000.00 | | | $ | 1,023.55 | | | | 0.25 | % | | $ | 1.25 | |
| * | | Fund commenced operations on December 18, 2018. Expenses are calculated using the Fund’s annualized expense ratio, multiplied by the ending value for the period, multiplied by 134/365 (to reflect commencement of operation). |
| ** | | Fund commenced operations on December 13, 2018. Expenses are calculated using the Fund’s annualized expense ratio, multiplied by the ending value for the period, multiplied by 139/365 (to reflect commencement of operation). |
| 1 | | Unless otherwise indicated, expenses are calculated using the Fund’s annualized expense ratio, multiplied by the average account value for the period, multiplied by 181/365. |
52
Portfolio Summaries*
(unaudited)
April 30, 2019IQ Hedge Multi-Strategy Tracker ETF
Net Assets ($ mil): $993.4
Asset Class
| | | | % of
Net Assets
|
U.S. Ultra Short Term Treasury Bond Funds | | | | | 28.6 | % |
Floating Rate — Investment Grade Funds | | | | | 10.5 | |
Investment Grade Corporate Bond Funds | | | | | 9.3 | |
Money Market Fund | | | | | 9.0 | |
Bank Loan Funds | | | | | 8.5 | |
International Small Cap Equity Funds | | | | | 5.2 | |
BRIC Equity Funds | | | | | 3.7 | |
Mortgage Backed Securities Funds | | | | | 3.7 | |
Europe Equity Funds | | | | | 3.2 | |
Euro Fund | | | | | 2.5 | |
Japan Equity Funds | | | | | 2.3 | |
Emerging Markets Small Cap Equity Fund | | | | | 2.3 | |
U.S. Small Cap Growth Funds | | | | | 2.1 | |
Emerging Bonds — USD Funds | | | | | 2.1 | |
Emerging Bonds — Local Currency Funds | | | | | 2.0 | |
U.S. Medium Term Treasury Bond Funds | | | | | 1.9 | |
High Yield Corporate Bond Funds | | | | | 1.8 | |
U.S. Large Cap Growth Funds | | | | | 1.8 | |
Japanese Yen Fund | | | | | 1.4 | |
Asia ex Japan Equity Funds | | | | | 1.4 | |
U.S. Large Cap Core Funds | | | | | 1.3 | |
U.S. Dollar Fund | | | | | 1.3 | |
Silver Fund | | | | | 0.8 | |
U.S. Small Cap Core Funds | | | | | 0.8 | |
Municipal Bond Fund | | | | | 0.4 | |
International Equity Core Funds | | | | | 0.3 | |
U.S. REITS Funds | | | | | 0.3 | |
Broad Fund | | | | | 0.3 | |
Convertible Bond Fund | | | | | 0.1 | |
Total Investments | | | | | 108.9 | |
Other Assets and Liabilites, Net | | | | | (8.9 | ) |
Total Net Assets | | | | | 100.0 | % |
IQ Hedge Macro Tracker ETF
Net Assets ($ mil): $5.3
Asset Class
| | | | % of
Net Assets
|
U.S. Ultra Short Term Treasury Bond Funds | | | | | 28.9 | % |
Money Market Funds | | | | | 19.1 | |
Floating Rate — Investment Grade Funds | | | | | 14.6 | |
BRIC Equity Funds | | | | | 9.5 | |
International Small Cap Equity Funds | | | | | 6.0 | |
Investment Grade Corporate Bond Funds | | | | | 5.7 | |
U.S. Medium Term Treasury Bond Funds | | | | | 5.6 | |
Europe Equity Fund | | | | | 4.4 | |
Japan Equity Fund | | | | | 3.8 | |
Emerging Small Cap Equity Fund | | | | | 2.6 | |
U.S. Dollar Fund | | | | | 2.6 | |
Emerging Bonds — USD Funds | | | | | 2.6 | |
Japanese Yen Fund | | | | | 2.5 | |
Emerging Bonds — Local Currency Funds | | | | | 2.5 | |
U.S. Small Cap Core Funds | | | | | 2.1 | |
Euro Fund | | | | | 2.0 | |
Silver Fund | | | | | 1.6 | |
U.S. Large Cap Growth Funds | | | | | 1.2 | |
U.S. Large Cap Core Fund | | | | | 1.0 | |
Broad Fund | | | | | 0.7 | |
Total Investments | | | | | 119.0 | |
Other Assets and Liabilites, Net | | | | | (19.0 | ) |
Total Net Assets | | | | | 100.0 | % |
IQ Hedge Market Neutral Tracker ETF
Net Assets ($ mil): $15.7
Asset Class
| | | | % of
Net Assets
|
U.S. Ultra Short Term Treasury Bond Funds | | | | | 41.8 | % |
Money Market Fund | | | | | 16.8 | |
Investment Grade Corporate Bond Funds | | | | | 12.3 | |
Bank Loan Funds | | | | | 11.2 | |
International Small Cap Equity Funds | | | | | 7.4 | |
Floating Rate — Investment Grade Funds | | | | | 5.6 | |
Mortgage Backed Securities Funds | | | | | 4.2 | |
U.S. Small Cap Growth Funds | | | | | 3.0 | |
Europe Equity Funds | | | | | 3.0 | |
Euro Fund | | | | | 2.5 | |
Asia ex Japan Equity Funds | | | | | 2.4 | |
High Yield Corporate Bond Funds | | | | | 2.1 | |
Japan Equity Fund | | | | | 1.9 | |
U.S. Large Cap Growth Funds | | | | | 1.5 | |
U.S. Large Cap Core Funds | | | | | 0.6 | |
Municipal Bond | | | | | 0.5 | |
Total Investments | | | | | 116.8 | |
Other Assets and Liabilites, Net | | | | | (16.8 | ) |
Total Net Assets | | | | | 100.0 | % |
See notes to financial statements.
53
Portfolio Summaries*(unaudited) (continued)
April 30, 2019IQ Hedge Long/Short Tracker ETF
Net Assets ($ mil): $6.5
Asset Class
| | | | % of
Net Assets
|
U.S. Ultra Short Term Treasury Bond Funds | | | | | 17.1 | % |
International Equity Core Fund | | | | | 16.0 | |
Investment Grade Corporate Bond Funds | | | | | 15.5 | |
U.S. Large Cap Core Funds | | | | | 14.7 | |
International Small Cap Equity Funds | | | | | 12.7 | |
Money Market Fund | | | | | 12.5 | |
U.S. Momentum Fund | | | | | 6.3 | |
Bank Loan Funds | | | | | 6.3 | |
International Large Cap Growth Fund | | | | | 5.8 | |
U.S. Long Term Treasury Bond Funds | | | | | 3.0 | |
U.S. Small Cap Value Funds | | | | | 1.4 | |
Volatility Note | | | | | 0.9 | |
U.S. Preferred Funds | | | | | 0.1 | |
Total Investments | | | | | 112.3 | |
Other Assets and Liabilites, Net | | | | | (12.3 | ) |
Total Net Assets | | | | | 100.0 | % |
IQ Hedge Event-Driven Tracker ETF
Net Assets ($ mil): $4.3
Asset Class
| | | | % of
Net Assets
|
High Yield Corporate Bond Funds | | | | | 31.4 | % |
Investment Grade Corporate Bond Funds | | | | | 24.6 | |
Bank Loan Funds | | | | | 23.8 | |
Convertible Bond Fund | | | | | 10.2 | |
U.S. Small Cap Growth Funds | | | | | 9.7 | |
Money Market Fund | | | | | 4.3 | |
U.S. Ultra Short Term Treasury Bond Funds | | | | | 0.1 | |
Total Investments | | | | | 104.1 | |
Other Assets and Liabilites, Net | | | | | (4.1 | ) |
Total Net Assets | | | | | 100.0 | % |
IQ Real Return ETF
Net Assets ($ mil): $57.0
Asset Class
| | | | % of
Net Assets
|
U.S. Ultra Short Term Treasury Bond Funds | | | | | 51.5 | % |
U.S. Short Term Investment Grade Fund | | | | | 24.9 | |
Money Market Fund | | | | | 17.8 | |
U.S. Large Cap Core Funds | | | | | 10.2 | |
Oil Fund | | | | | 4.2 | |
U.S. Small Cap Core Fund | | | | | 4.0 | |
Euro Fund | | | | | 3.4 | |
Emerging Equity Funds | | | | | 0.9 | |
Japanese Yen Fund | | | | | 0.8 | |
Total Investments | | | | | 117.7 | |
Other Assets and Liabilities, Net | | | | | (17.7 | ) |
Total Net Assets | | | | | 100.0 | % |
IQ Leaders GTAA Tracker ETF
Net Assets ($ mil): $43.7
Asset Class
| | | | % of
Net Assets
|
International Equity Core Funds | | | | | 24.2 | % |
U.S. Large Cap Core Funds | | | | | 21.3 | |
Aggregate Bond Funds | | | | | 19.9 | |
High Yield Corporate Bond Funds | | | | | 18.9 | |
Money Market Fund | | | | | 9.4 | |
Emerging Equity Funds | | | | | 8.0 | |
Convertible Bond Fund | | | | | 6.9 | |
Investment Grade Corporate Bond Funds | | | | | 0.6 | |
Total Investments | | | | | 109.2 | |
Other Assets and Liabilites, Net | | | | | (9.2 | ) |
Total Net Assets | | | | | 100.0 | % |
IQ Enhanced Core Bond U.S. ETF
Net Assets ($ mil): $88.6
Asset Class
| | | | % of
Net Assets
|
U.S. Short Term Treasury Bond Funds | | | | | 50.0 | % |
Investment Grade Corporate Bond Funds | | | | | 36.1 | |
Short Maturity Investment Grade Corporate Bond Fund | | | | | 13.9 | |
Money Market Fund | | | | | 0.0 | (a) |
Total Investments | | | | | 100.0 | |
Other Assets and Liabilites, Net | | | | | (0.0) | (a) |
Total Net Assets | | | | | 100.0 | % |
IQ Enhanced Core Plus Bond U.S. ETF
Net Assets ($ mil): $156.5
Asset Class
| | | | % of
Net Assets
|
U.S. Short Term Treasury Bond Funds | | | | | 49.2 | % |
Investment Grade Corporate Bond Funds | | | | | 30.3 | |
Short Maturity Investment Grade Corporate Bond Fund | | | | | 11.7 | |
High Yield Corporate Bond Funds | | | | | 5.9 | |
Emerging Market Bond Funds | | | | | 2.8 | |
Money Market Fund | | | | | 0.8 | |
Total Investments | | | | | 100.7 | |
Other Assets and Liabilites, Net | | | | | (0.7 | ) |
Total Net Assets | | | | | 100.0 | % |
See notes to financial statements.
54
Portfolio Summaries*(unaudited) (continued)
April 30, 2019IQ Short Duration Enhanced Core Bond U.S. ETF
Net Assets ($ mil): $3.8
Asset Class
| | | | % of
Net Assets
|
Short Maturity Investment Grade Corp Bond Fund | | | | | 60.7 | % |
High Yield Corporate Bond Funds | | | | | 25.0 | |
Floating Rate — Investment Grade Funds | | | | | 5.7 | |
U.S. Short Term Treasury Bond Funds | | | | | 4.4 | |
Investment Grade Corporate Bond Fund | | | | | 4.1 | |
Money Market Fund | | | | | 2.5 | |
Total Investments | | | | | 102.4 | |
Other Assets and Liabilites, Net | | | | | (2.4 | ) |
Total Net Assets | | | | | 100.0 | % |
IQ Merger Arbitrage ETF
Net Assets ($ mil): $985.8
Industry
| | | | % of
Net Assets
|
Information Technology | | | | | 36.3 | % |
Health Care | | | | | 22.5 | |
Money Market Fund | | | | | 18.2 | |
Industrials | | | | | 11.4 | |
Financials | | | | | 9.4 | |
Communication Services | | | | | 4.1 | |
Materials | | | | | 1.6 | |
Real Estate | | | | | 0.5 | |
Total Investments | | | | | 104.0 | |
Other Assets and Liabilites, Net | | | | | (4.0 | ) |
Total Net Assets | | | | | 100.0 | % |
IQ Global Resources ETF
Net Assets ($ mil): $175.3
Industry
| | | | % of
Net Assets
|
Energy | | | | | 16.1 | % |
Timber | | | | | 15.9 | |
Industrial Metals | | | | | 14.4 | |
Coal | | | | | 11.3 | |
Money Market Fund | | | | | 10.9 | |
Precious Metals | | | | | 9.8 | |
Water | | | | | 9.3 | |
Grains Food Fiber | | | | | 7.1 | |
Livestock | | | | | 7.0 | |
Total Investments | | | | | 101.8 | |
Other Assets and Liabilities, Net | | | | | (1.8 | ) |
Total Net Assets | | | | | 100.0 | % |
IQ Global Agribusiness Small Cap ETF
Net Assets ($ mil): $9.9
Industry
| | | | % of
Net Assets
|
Crop Production and Farming | | | | | 47.1 | % |
Livestock Operations | | | | | 20.0 | |
Agricultural Chemicals | | | | | 13.2 | |
Agricultural Machinery | | | | | 11.1 | |
Agricultural Supplies and Logistics | | | | | 8.4 | |
Money Market Fund | | | | | 6.0 | |
Total Investments | | | | | 105.8 | |
Other Assets and Liabilites, Net | | | | | (5.8 | ) |
Total Net Assets | | | | | 100.0 | % |
IQ U.S. Real Estate Small Cap ETF
Net Assets ($ mil): $71.6
Industry
| | | | % of
Net Assets
|
Specialized REITs | | | | | 20.4 | % |
Retail REITs | | | | | 19.5 | |
Diversified REITs | | | | | 16.8 | |
Office REITs | | | | | 16.4 | |
Mortgage REITs | | | | | 13.2 | |
Hotel REITs | | | | | 12.5 | |
Money Market Fund | | | | | 4.8 | |
Residential REIT | | | | | 0.9 | |
Total Investments | | | | | 104.5 | |
Other Assets and Liabilites, Net | | | | | (4.5 | ) |
Total Net Assets | | | | | 100.0 | % |
IQ S&P High Yield Low Volatility Bond ETF
Net Assets ($ mil): $65.6
Industry
| | | | % of
Net Assets
|
Media | | | | | 13.3 | % |
Health Care | | | | | 12.1 | |
Consumer Discretionary | | | | | 11.8 | |
Energy | | | | | 10.7 | |
Materials | | | | | 10.4 | |
Industrials | | | | | 9.3 | |
Telecommunication Services | | | | | 8.5 | |
Information Technology | | | | | 7.5 | |
Financials | | | | | 6.6 | |
Utilities | | | | | 3.6 | |
Consumer Staples | | | | | 3.2 | |
Money Market Fund | | | | | 3.1 | |
Real Estate | | | | | 1.0 | |
Transportation | | | | | 0.1 | |
Total Investments | | | | | 101.2 | |
Other Assets and Liabilites, Net | | | | | (1.2 | ) |
Total Net Assets | | | | | 100.0 | % |
See notes to financial statements.
55
Portfolio Summaries*(unaudited) (continued)
April 30, 2019IQ 500 International ETF
Net Assets ($ mil): $85.7
Industry
| | | | % of
Net Assets
|
Industrials | | | | | 21.6 | % |
Consumer Discretionary | | | | | 14.8 | |
Consumer Staples | | | | | 11.9 | |
Financials | | | | | 10.0 | |
Materials | | | | | 9.4 | |
Communication Services | | | | | 7.4 | |
Energy | | | | | 6.9 | |
Utilities | | | | | 6.5 | |
Health Care | | | | | 5.9 | |
Information Technology | | | | | 5.0 | |
Money Market Fund | | | | | 3.8 | |
Total Investments | | | | | 103.2 | |
Other Assets and Liabilites, Net | | | | | (3.2 | ) |
Total Net Assets | | | | | 100.0 | % |
IQ 50 Percent Hedged FTSE International ETF
Net Assets ($ mil): $281.1
Industry
| | | | % of
Net Assets
|
Financials | | | | | 19.2 | % |
Industrials | | | | | 14.9 | |
Consumer Staples | | | | | 11.1 | |
Consumer Discretionary | | | | | 11.0 | |
Health Care | | | | | 10.5 | |
Information Technology | | | | | 7.9 | |
Materials | | | | | 7.8 | |
Energy | | | | | 5.6 | |
Communication Services | | | | | 5.3 | |
Money Market Fund | | | | | 3.6 | |
Utilities | | | | | 3.3 | |
Real Estate | | | | | 3.3 | |
Total Investments | | | | | 103.5 | |
Other Assets and Liabilites, Net | | | | | (3.5 | ) |
Total Net Assets | | | | | 100.0 | % |
IQ 50 Percent Hedged FTSE Europe ETF
Net Assets ($ mil): $8.9
Industry
| | | | % of
Net Assets
|
Financials | | | | | 19.2 | % |
Industrials | | | | | 13.6 | |
Consumer Staples | | | | | 13.5 | |
Health Care | | | | | 12.4 | |
Consumer Discretionary | | | | | 9.4 | |
Energy | | | | | 8.1 | |
Money Market Fund | | | | | 7.8 | |
Materials | | | | | 7.7 | |
Information Technology | | | | | 5.3 | |
Communication Services | | | | | 4.8 | |
Utilities | | | | | 4.0 | |
Real Estate | | | | | 1.8 | |
Total Investments | | | | | 107.6 | |
Other Assets and Liabilites, Net | | | | | (7.6 | ) |
Total Net Assets | | | | | 100.0 | % |
IQ 50 Percent Hedged FTSE Japan ETF
Net Assets ($ mil): $6.2
Industry
| | | | % of
Net Assets
|
Industrials | | | | | 22.3 | % |
Consumer Discretionary | | | | | 18.3 | |
Information Technology | | | | | 10.9 | |
Financials | | | | | 10.9 | |
Consumer Staples | | | | | 8.9 | |
Health Care | | | | | 8.8 | |
Communication Services | | | | | 8.0 | |
Materials | | | | | 6.2 | |
Real Estate | | | | | 2.8 | |
Utilities | | | | | 1.9 | |
Energy | | | | | 0.9 | |
Money Market Fund | | | | | 0.6 | |
Total Investments | | | | | 100.5 | |
Other Assets and Liabilites, Net | | | | | (0.5 | ) |
Total Net Assets | | | | | 100.0 | % |
See notes to financial statements.
56
Portfolio Summaries*(unaudited) (continued)
April 30, 2019IQ Chaikin U.S. Small Cap ETF
Net Assets ($ mil): $348.6
Industry
| | | | % of
Net Assets
|
Industrials | | | | | 30.1 | % |
Financials | | | | | 24.7 | |
Technology | | | | | 12.7 | |
Consumer Services | | | | | 10.6 | |
Consumer Goods | | | | | 9.6 | |
Basic Materials | | | | | 8.4 | |
Health Care | | | | | 3.1 | |
Money Market Fund | | | | | 1.5 | |
Utilities | | | | | 0.4 | |
Oil & Gas | | | | | 0.4 | |
Total Investments | | | | | 101.5 | |
Other Assets and Liabilites, Net | | | | | (1.5 | ) |
Total Net Assets | | | | | 100.0 | % |
IQ Chaikin U.S. Large Cap ETF
Net Assets ($ mil): $278.4
Industry
| | | | % of
Net Assets
|
Financials | | | | | 34.3 | % |
Health Care | | | | | 15.5 | |
Technology | | | | | 14.8 | |
Industrials | | | | | 12.0 | |
Consumer Services | | | | | 10.1 | |
Consumer Goods | | | | | 5.8 | |
Utilities | | | | | 2.9 | |
Oil & Gas | | | | | 2.9 | |
Basic Materials | | | | | 1.5 | |
Money Market Fund | | | | | 0.1 | |
Total Investments | | | | | 99.9 | |
Other Assets and Liabilites, Net | | | | | 0.1 | |
Total Net Assets | | | | | 100.0 | % |
* | | Each Fund’s portfolio is subject to change. |
See notes to financial statements.
57
Schedules of Investments — IQ Hedge Multi-Strategy Tracker ETF
April 30, 2019 | | | | Shares
| | Value
|
| | | | | | | | | | |
Exchange Traded Vehicles — 6.0% | | | | | | | | | | |
| | | | | | | | | | | |
Euro Fund — 2.5% | | | | | | | | | | |
Invesco CurrencyShares Euro Currency Trust*(a) | | | | | 229,476 | | | $ | 24,528,690 | |
| | | | | | | | | | | |
Japanese Yen Fund — 1.4% | | | | | | | | | | |
Invesco CurrencyShares Japanese Yen Trust*(a) | | | | | 169,259 | | | | 14,475,030 | |
| | | | | | | | | | | |
Silver Fund — 0.8% | | | | | | | | | | |
iShares Silver Trust*(a) | | | | | 594,877 | | | | 8,340,175 | |
| | | | | | | | | | | |
U.S. Dollar Fund — 1.3% | | | | | | | | | | |
Invesco DB U.S. Dollar Index Bullish Fund(a) | | | | | 482,897 | | | | 12,637,414 | |
| | | | | | | | | | | |
Total Exchange Traded Vehicles
(Cost $60,660,980) | | | | | | | | | 59,981,309 | |
| | | | | | | | | | | |
Investment Companies — 93.9% | | | | | | | | | | |
| | | | | | | | | | | |
Asia ex Japan Equity Funds — 1.4% | | | | | | | | | | |
iShares Core MSCI Pacific ETF(a) | | | | | 103,057 | | | | 5,802,109 | |
iShares MSCI All Country Asia ex Japan ETF(a) | | | | | 89,260 | | | | 6,449,928 | |
Vanguard FTSE Pacific ETF | | | | | 22,042 | | | | 1,469,540 | |
Total Asia ex Japan Equity Funds | | | | | | | | | 13,721,577 | |
| | | | | | | | | | | |
Bank Loan Funds — 8.5% | | | | | | | | | | |
Invesco Senior Loan ETF(a) | | | | | 2,639,356 | | | | 60,626,007 | |
SPDR Blackstone / GSO Senior Loan ETF(a) | | | | | 509,669 | | | | 23,877,993 | |
Total Bank Loan Funds | | | | | | | | | 84,504,000 | |
| | | | | | | | | | | |
BRIC Equity Funds — 3.7% | | | | | | | | | | |
iShares China Large-Cap ETF | | | | | 417,238 | | | | 18,562,919 | |
iShares MSCI China ETF(a) | | | | | 212,830 | | | | 13,518,962 | |
SPDR S&P China ETF(a) | | | | | 41,975 | | | | 4,278,931 | |
Total BRIC Equity Funds | | | | | | | | | 36,360,812 | |
| | | | | | | | | | | |
Broad Fund — 0.3% | | | | | | | | | | |
FlexShares Global Upstream Natural Resources Index Fund | | | | | 78,868 | | | | 2,592,391 | |
| | | | | | | | | | | |
Convertible Bond Fund — 0.1% | | | | | | | | | | |
SPDR Bloomberg Barclays Convertible Securities ETF | | | | | 15,828 | | | | 846,798 | |
| | | | | | | | | | | |
Emerging Bonds — USD Funds — 2.1% | | | | | | | | | | |
iShares J.P. Morgan USD Emerging Markets Bond ETF | | | | | 176,488 | | | | 19,378,382 | |
Vanguard Emerging Markets Government Bonds ETF(a) | | | | | 17,701 | | | | 1,382,979 | |
Total Emerging Bond — USD Funds | | | | | | | | | 20,761,361 | |
| | | | | | | | | | | |
Emerging Bonds — Local Currency Funds — 2.0% | | | | | | | | | | |
SPDR Bloomberg Barclays Emerging Markets Local Bond ETF | | | | | 89,486 | | | | 2,390,171 | |
VanEck Vectors J.P. Morgan EM Local Currency Bond ETF | | | | | 518,007 | | | | 17,156,392 | |
WisdomTree Emerging Markets Local Debt Fund | | | | | 17,704 | | | | 603,529 | |
Total Emerging Bonds — Local Currency Funds | | | | | | | | | 20,150,092 | |
| | | | | | | | | | |
| | | | Shares
| | Value
|
| | | | | | | | | | | |
Investment Companies (continued) | | | | | | | | | | |
| | | | | | | | | | | |
Emerging Markets Small Cap Equity Fund — 2.3% | | | | | | | | | | |
SPDR S&P Emerging Markets SmallCap ETF | | | | | 497,144 | | | $ | 22,386,394 | |
| | | | | | | | | | | |
Europe Equity Funds — 3.2% | | | | | | | | | | |
iShares Core MSCI Europe ETF | | | | | 26,577 | | | | 1,267,723 | |
iShares MSCI Eurozone ETF(a) | | | | | 63,478 | | | | 2,572,763 | |
Vanguard FTSE Europe ETF | | | | | 92,584 | | | | 5,157,855 | |
Xtrackers MSCI Europe Hedged Equity ETF | | | | | 776,373 | | | | 22,957,349 | |
Total Europe Equity Funds | | | | | | | | | 31,955,690 | |
| | | | | | | | | | | |
Floating Rate — Investment Grade Funds — 10.5% | | | | | | | | | | |
iShares Floating Rate Bond ETF(a) | | | | | 1,473,046 | | | | 75,066,424 | |
SPDR Bloomberg Barclays Investment Grade Floating Rate ETF | | | | | 943,209 | | | | 28,975,381 | |
Total Floating Rate — Investment Grade Funds | | | | | | | | | 104,041,805 | |
| | | | | | | | | | | |
High Yield Corporate Bond
Funds — 1.8% | | | | | | | | | | |
iShares 0-5 Year High Yield Corporate Bond ETF | | | | | 169,831 | | | | 7,958,281 | |
SPDR Bloomberg Barclays Short Term High Yield Bond ETF | | | | | 365,431 | | | | 9,998,192 | |
Total High Yield Corporate Bond Funds | | | | | | | | | 17,956,473 | |
| | | | | | | | | | | |
International Equity Core
Funds — 0.3% | | | | | | | | | | |
iShares Core MSCI EAFE ETF | | | | | 22,004 | | | | 1,376,570 | |
Vanguard FTSE Developed Markets ETF(a) | | | | | 38,183 | | | | 1,604,832 | |
Total International Equity Core Funds | | | | | | | | | 2,981,402 | |
| | | | | | | | | | | |
International Small Cap Equity
Funds — 5.2% | | | | | | | | | | |
Schwab International Small-Cap Equity ETF(a) | | | | | 442,300 | | | | 14,684,360 | |
Vanguard FTSE All World ex-U.S. Small-Cap ETF(a) | | | | | 350,774 | | | | 37,431,094 | |
Total International Small Cap Equity Funds | | | | | | | | | 52,115,454 | |
| | | | | | | | | | | |
Investment Grade Corporate Bond Funds — 9.3% | | | | | | | | | | |
iShares Broad USD Investment Grade Corporate Bond ETF | | | | | 46,544 | | | | 2,574,349 | |
SPDR Portfolio Short Term Corporate Bond ETF | | | | | 217,762 | | | | 6,654,807 | |
Vanguard Intermediate-Term Corporate Bond ETF | | | | | 598,388 | | | | 52,053,772 | |
Vanguard Short-Term Corporate Bond ETF | | | | | 389,655 | | | | 31,067,193 | |
Total Investment Grade Corporate Bond Funds | | | | | | | | | 92,350,121 | |
See notes to financial statements.
58
Schedules of Investments — IQ Hedge Multi-Strategy Tracker ETF(continued)
April 30, 2019 | | | | Shares
| | Value
|
Investment Companies (continued) | | | | | | | | | | |
| | | | | | | | | | | |
Japan Equity Funds — 2.3% | | | | | | | | | | |
iShares MSCI Japan ETF | | | | | 55,151 | | | $ | 3,056,469 | |
Xtrackers MSCI Japan Hedged Equity ETF(a) | | | | | 486,313 | | | | 19,763,760 | |
Total Japan Equity Funds | | | | | | | | | 22,820,229 | |
| | | | | | | | | | | |
Mortgage Backed Securities
Funds — 3.7% | | | | | | | | | | |
iShares MBS ETF | | | | | 223,369 | | | | 23,674,880 | |
Vanguard Mortgage-Backed Securities ETF | | | | | 242,607 | | | | 12,654,381 | |
Total Mortgage Backed Securities Funds | | | | | | | | | 36,329,261 | |
| | | | | | | | | | | |
Municipal Bond Fund — 0.4% | | | | | | | | | | |
Vaneck Vectors High-Yield Municipal Index ETF(a) | | | | | 65,395 | | | | 4,109,422 | |
| | | | | | | | | | | |
U.S. Large Cap Core Funds — 1.3% | | | | | | | | | | |
Energy Select Sector SPDR Fund(a) | | | | | 122,982 | | | | 8,130,340 | |
Invesco KBW Bank ETF | | | | | 18,740 | | | | 987,036 | |
SPDR S&P Bank ETF(a) | | | | | 84,541 | | | | 3,845,770 | |
Total U.S. Large Cap Core Funds | | | | | | | | | 12,963,146 | |
| | | | | | | | | | | |
U.S. Large Cap Growth Funds — 1.8% | | | | | | | | | | |
iShares Core S&P U.S. Growth ETF(a) | | | | | 29,841 | | | | 1,869,240 | |
Schwab U.S. Large-Cap Growth ETF(a) | | | | | 27,045 | | | | 2,245,817 | |
SPDR Portfolio S&P 500 Growth ETF(a) | | | | | 36,593 | | | | 1,415,417 | |
Vanguard Growth ETF(a) | | | | | 73,547 | | | | 12,045,528 | |
Total U.S. Large Cap Growth Funds | | | | | | | | | 17,576,002 | |
| | | | | | | | | | | |
U.S. Medium Term Treasury Bond Funds — 1.9% | | | | | | | | | | |
iShares 3-7 Year Treasury Bond ETF(a) | | | | | 77,369 | | | | 9,509,424 | |
Schwab Intermediate-Term U.S. Treasury ETF | | | | | 95,012 | | | | 5,090,743 | |
Vanguard Intermediate-Term Treasury ETF(a) | | | | | 74,458 | | | | 4,785,415 | |
Total U.S. Medium Term Treasury Bond Funds | | | | | | | | | 19,385,582 | |
| | | | | | | | | | | |
U.S. REITS Funds — 0.3% | | | | | | | | | | |
iShares Core U.S. REIT ETF | | | | | 1,680 | | | | 86,671 | |
Schwab U.S. REIT ETF(a) | | | | | 8,596 | | | | 381,147 | |
Vanguard Real Estate ETF | | | | | 27,949 | | | | 2,425,135 | |
Total U.S. REITS Funds | | | | | | | | | 2,892,953 | |
| | | | | | | | | | | |
U.S. Small Cap Core Funds — 0.8% | | | | | | | | | | |
iShares Russell 2000 ETF(a) | | | | | 29,347 | | | | 4,645,337 | |
Schwab U.S. Small-Cap ETF(a) | | | | | 11,761 | | | | 852,320 | |
Vanguard Small-Cap ETF | | | | | 16,519 | | | | 2,614,627 | |
Total U.S. Small Cap Core Funds | | | | | | | | | 8,112,284 | |
| | | | | | | | | | | |
U.S. Small Cap Growth Funds — 2.1% | | | | | | | | | | |
iShares Russell 2000 Growth ETF(a) | | | | | 41,190 | | | | 8,339,739 | |
iShares S&P Small-Cap 600 Growth ETF(a) | | | | | 27,592 | | | | 5,091,276 | |
Vanguard Small-Cap Growth ETF(a) | | | | | 42,579 | | | | 7,902,662 | |
Total U.S. Small Cap Growth Funds | | | | | | | | | 21,333,677 | |
| | | | | | | | | | | |
| | | | Shares
| | Value
|
| | | | | | | | | | | |
Investment Companies (continued) | | | | | | | | | | |
| | | | | | | | | | | |
U.S. Ultra Short Term Treasury Bond Funds — 28.6% | | | | | | | | | | |
Goldman Sachs Access Treasury 0-1 Year ETF(a) | | | | | 285,234 | | | $ | 28,606,118 | |
Invesco Treasury Collateral ETF | | | | | 46,369 | | | | 4,892,161 | |
iShares Short Treasury Bond ETF(a)(b) | | | | | 1,603,699 | | | | 177,304,962 | |
SPDR Bloomberg Barclays 1-3 Month T-Bill ETF(a) | | | | | 803,629 | | | | 73,612,416 | |
Total U.S. Ultra Short Term Treasury Bond Funds | | | | | | | | | 284,415,657 | |
| | | | | | | | | | | |
Total Investment Companies
(Cost $916,367,686) | | | | | | | | | 932,662,583 | |
| | | | | | | | | | | |
Short-Term Investment — 0.2% | | | | | | | | | | |
| | | | | | | | | | | |
Money Market Fund — 0.2% | | | | | | | | | | |
Morgan Stanley Institutional Liquidity Funds Treasury Portfolio — Institutional Class, 2.32%(c) | | | | | | | | | | |
(Cost $2,205,013) | | | | | 2,205,013 | | | | 2,205,013 | |
| | | | | | | | | | | |
Investment of Cash Collateral For Securities Loaned — 8.8% | | | | | | | | | | |
| | | | | | | | | | | |
Money Market Fund — 8.8% | | | | | | | | | | |
Dreyfus Government Cash Management Fund, Institutional Shares, 2.45%(c) | | | | | | | | | | |
(Cost $86,985,349) | | | | | 86,985,349 | | | | 86,985,349 | |
| | | | | | | | | | | |
Total Investments — 108.9% | | | | | | | | | | |
(Cost $1,066,219,028) | | | | | | | | | 1,081,834,254 | |
| | | | | | | | | | | |
Other Assets and Liabilities,
Net — (8.9)% | | | | | | | | | (88,412,182 | ) |
| | | | | | | | | | | |
Net Assets — 100.0% | | | | | | | | $ | 993,422,072 | |
* | | Non-income producing securities. |
(a) | | All or a portion of the security was on loan. In addition, “Other Assets and Liabilities, Net” may include pending sales that are also on loan. The aggregate market value of securities on loan was $169,075,017; total market value of collateral held by the Fund was $172,575,536. Market value of the collateral held includes non-cash U.S. Treasury securities collateral having a value of $85,590,187. |
(b) | | All or a portion of these securities have been segregated as collateral for swap contracts. The total value of securities segregated amounted to $1,304,490. |
(c) | | Reflects the 1-day yield at April 30, 2019. |
See notes to financial statements.
59
Schedules of Investments — IQ Hedge Multi-Strategy Tracker ETF(continued)
April 30, 2019Total Return Swap contracts outstanding at April 30, 2019:
| | | | | | | | | | | | | |
Total Return Benchmark
| | Counterparties
| | Annual
Financing
Rate
Received
(Paid)%
| | Expiration
Date
| | Payment
Frequency
Received/
(Paid)
| | Notional
Amount
Long
(Short)
| | Value/
Unrealized
Appreciation/
(Depreciation)(d)
|
| Consumer Discretionary Select Sector SPDR Fund | | Morgan Stanley | | | 2.10 | | | 7/02/2020 | | Monthly | | $ | (1,436,758 | ) | | $ | — | |
| Consumer Discretionary Select Sector SPDR Fund | | Bank of America
Merrill Lynch | | | 2.99 | | | 9/30/2020 | | Monthly | | | (1,436,758 | ) | | | — | |
| Energy Select Sector SPDR Fund | | Morgan Stanley | | | 2.95 | | | 7/02/2020 | | Monthly | | | 411,799 | | | | — | |
| Energy Select Sector SPDR Fund | | Bank of America Merrill Lynch | | | 2.99 | | | 9/30/2020 | | Monthly | | | 411,799 | | | | — | |
| Financial Select Sector SPDR Fund | | Morgan Stanley | | | 2.10 | | | 7/02/2020 | | Monthly | | | (3,120,139 | ) | | | — | |
| FlexShares Global Upstream Natural Resources Index Fund | | Morgan Stanley | | | 2.95 | | | 7/02/2020 | | Monthly | | | 131,283 | | | | — | |
| FlexShares Global Upstream Natural Resources Index Fund | | Bank of America Merrill Lynch | | | 2.99 | | | 9/30/2020 | | Monthly | | | 131,283 | | | | — | |
| Goldman Sachs Access Treasury 0-1 Year ETF | | Morgan Stanley | | | 2.95 | | | 7/02/2020 | | Monthly | | | 1,448,789 | | | | — | |
| Goldman Sachs Access Treasury 0-1 Year ETF | | Bank of America Merrill Lynch | | | 2.99 | | | 9/30/2020 | | Monthly | | | 1,448,789 | | | | — | |
| Graniteshares Gold Trust | | Morgan Stanley | | | (6.14 | ) | | 7/02/2020 | | Monthly | | | (15,885 | ) | | | — | |
| Graniteshares Gold Trust | | Bank of America Merrill Lynch | | | 2.99 | | | 9/30/2020 | | Monthly | | | (15,885 | ) | | | — | |
| Health Care Select Sector SPDR Fund | | Morgan Stanley | | | 2.10 | | | 7/02/2020 | | Monthly | | | (1,231,788 | ) | | | — | |
| Invesco CurrencyShares Australian Dollar Trust | | Morgan Stanley | | | (2.89 | ) | | 7/02/2020 | | Monthly | | | (1,238,016 | ) | | | — | |
| Invesco CurrencyShares Australian Dollar Trust | | Bank of America Merrill Lynch | | | 2.99 | | | 9/30/2020 | | Monthly | | | (1,238,016 | ) | | | — | |
| Invesco CurrencyShares British Pound Sterling Trust | | Morgan Stanley | | | (4.49 | ) | | 7/02/2020 | | Monthly | | | (18,215 | ) | | | — | |
| Invesco CurrencyShares British Pound Sterling Trust | | Bank of America Merrill Lynch | | | 2.99 | | | 9/30/2020 | | Monthly | | | (18,215 | ) | | | — | |
| Invesco CurrencyShares Euro Currency Trust | | Morgan Stanley | | | 2.95 | | | 7/02/2020 | | Monthly | | | 1,242,276 | | | | — | |
| Invesco CurrencyShares Euro Currency Trust | | Bank of America Merrill Lynch | | | 2.99 | | | 9/30/2020 | | Monthly | | | 1,242,276 | | | | — | |
| Invesco CurrencyShares Japanese Yen Trust | | Morgan Stanley | | | 2.95 | | | 7/02/2020 | | Monthly | | | 733,163 | | | | — | |
| Invesco CurrencyShares Japanese Yen Trust | | Bank of America Merrill Lynch | | | 2.99 | | | 9/30/2020 | | Monthly | | | 733,163 | | | | — | |
Invesco DB U.S. Dollar Index
Bullish Fund | | Morgan Stanley | | | 2.95 | | | 7/02/2020 | | Monthly | | | 640,066 | | | | — | |
Invesco DB U.S. Dollar Index
Bullish Fund | | Bank of America Merrill Lynch | | | 2.99 | | | 9/30/2020 | | Monthly | | | 640,066 | | | | — | |
| Invesco KBW Bank ETF | | Morgan Stanley | | | 2.95 | | | 7/02/2020 | | Monthly | | | 49,984 | | | | — | |
| Invesco KBW Bank ETF | | Bank of America Merrill Lynch | | | 2.99 | | | 9/30/2020 | | Monthly | | | 49,984 | | | | — | |
| Invesco Preferred ETF | | Morgan Stanley | | | 2.10 | | | 7/02/2020 | | Monthly | | | (300,883 | ) | | | — | |
| Invesco Preferred ETF | | Bank of America Merrill Lynch | | | 2.99 | | | 9/30/2020 | | Monthly | | | (300,883 | ) | | | — | |
Invesco S&P 500 Low
Volatility ETF | | Morgan Stanley | | | (0.24 | ) | | 7/02/2020 | | Monthly | | | (1,928,784 | ) | | | — | |
Invesco S&P 500 Low
Volatility ETF | | Bank of America Merrill Lynch | | | 2.99 | | | 9/30/2020 | | Monthly | | | (1,928,784 | ) | | | — | |
| Invesco Senior Loan ETF | | Morgan Stanley | | | 2.95 | | | 7/02/2020 | | Monthly | | | 3,070,538 | | | | — | |
| Invesco Senior Loan ETF | | Bank of America Merrill Lynch | | | 2.99 | | | 9/30/2020 | | Monthly | | | 3,070,538 | | | | — | |
| Invesco Treasury Collateral ETF | | Morgan Stanley | | | 2.95 | | | 7/02/2020 | | Monthly | | | 247,726 | | | | — | |
| Invesco Treasury Collateral ETF | | Bank of America Merrill Lynch | | | 2.99 | | | 9/30/2020 | | Monthly | | | 247,726 | | | | — | |
| iShares 0-5 Year High Yield Corporate Bond ETF | | Morgan Stanley | | | 2.95 | | | 7/02/2020 | | Monthly | | | 403,043 | | | | — | |
| iShares 0-5 Year High Yield Corporate Bond ETF | | Bank of America Merrill Lynch | | | 2.99 | | | 9/30/2020 | | Monthly | | | 403,043 | | | | — | |
See notes to financial statements.
60
Schedules of Investments — IQ Hedge Multi-Strategy Tracker ETF(continued)
April 30, 2019Total Return Swap contracts outstanding at April 30, 2019(continued):
| | | | | | | | | | | | | |
Total Return Benchmark
| | Counterparties
| | Annual
Financing
Rate
Received
(Paid)%
| | Expiration
Date
| | Payment
Frequency
Received/
(Paid)
| | Notional
Amount
Long
(Short)
| | Value/
Unrealized
Appreciation/
(Depreciation)(d)
|
iShares 20+ Year Treasury
Bond ETF | | Morgan Stanley | | | 1.76 | | | 7/02/2020 | | Monthly | | $ | (2,121,587 | ) | | $ | — | |
iShares 20+ Year Treasury
Bond ETF | | Bank of America
Merrill Lynch | | | 2.99 | | | 9/30/2020 | | Monthly | | | (2,121,587 | ) | | | — | |
iShares 3-7 Year Treasury
Bond ETF | | Morgan Stanley | | | 2.95 | | | 7/02/2020 | | Monthly | | | 481,684 | | | | — | |
iShares 3-7 Year Treasury
Bond ETF | | Bank of America Merrill Lynch | | | 2.99 | | | 9/30/2020 | | Monthly | | | 481,684 | | | | — | |
| iShares Broad USD Investment Grade Corporate Bond ETF | | Morgan Stanley | | | 2.95 | | | 7/02/2020 | | Monthly | | | 130,366 | | | | — | |
| iShares Broad USD Investment Grade Corporate Bond ETF | | Bank of America Merrill Lynch | | | 2.99 | | | 9/30/2020 | | Monthly | | | 130,366 | | | | — | |
| iShares China Large-Cap ETF | | Morgan Stanley | | | 2.95 | | | 7/02/2020 | | Monthly | | | 1,880,325 | | | | — | |
| iShares Core MSCI EAFE ETF | | Morgan Stanley | | | 2.95 | | | 7/02/2020 | | Monthly | | | 69,692 | | | | — | |
| iShares Core MSCI EAFE ETF | | Bank of America Merrill Lynch | | | 2.99 | | | 9/30/2020 | | Monthly | | | 69,692 | | | | — | |
| iShares Core MSCI Emerging Markets ETF | | Morgan Stanley | | | 2.10 | | | 7/02/2020 | | Monthly | | | (3,209,871 | ) | | | — | |
| iShares Core MSCI Emerging Markets ETF | | Bank of America Merrill Lynch | | | 2.99 | | | 9/30/2020 | | Monthly | | | (3,209,871 | ) | | | — | |
| iShares Core MSCI Europe ETF | | Morgan Stanley | | | 2.95 | | | 7/02/2020 | | Monthly | | | 64,204 | | | | — | |
| iShares Core MSCI Europe ETF | | Bank of America Merrill Lynch | | | 2.99 | | | 9/30/2020 | | Monthly | | | 64,204 | | | | — | |
| iShares Core MSCI Pacific ETF | | Morgan Stanley | | | 2.95 | | | 7/02/2020 | | Monthly | | | 293,886 | | | | — | |
| iShares Core MSCI Pacific ETF | | Bank of America Merrill Lynch | | | 2.99 | | | 9/30/2020 | | Monthly | | | 293,886 | | | | — | |
iShares Core S&P U.S.
Growth ETF | | Morgan Stanley | | | 2.95 | | | 7/02/2020 | | Monthly | | | 94,649 | | | | — | |
iShares Core S&P U.S.
Growth ETF | | Bank of America Merrill Lynch | | | 2.99 | | | 9/30/2020 | | Monthly | | | 94,649 | | | | — | |
| iShares Core S&P U.S. Value ETF | | Morgan Stanley | | | (2.44 | ) | | 7/02/2020 | | Monthly | | | (591,260 | ) | | | — | |
| iShares Core S&P U.S. Value ETF | | Bank of America Merrill Lynch | | | 2.99 | | | 9/30/2020 | | Monthly | | | (590,846 | ) | | | — | |
| iShares Core U.S. REIT ETF | | Morgan Stanley | | | 2.95 | | | 7/02/2020 | | Monthly | | | 4,385 | | | | — | |
| iShares Core U.S. REIT ETF | | Bank of America Merrill Lynch | | | 2.99 | | | 9/30/2020 | | Monthly | | | 4,385 | | | | — | |
| iShares Edge MSCI Min Vol Emerging Markets ETF | | Morgan Stanley | | | 2.10 | | | 7/02/2020 | | Monthly | | | (1,850,415 | ) | | | — | |
| iShares Edge MSCI Min Vol Emerging Markets ETF | | Bank of America Merrill Lynch | | | 2.99 | | | 9/30/2020 | | Monthly | | | (1,850,415 | ) | | | — | |
| iShares Edge MSCI Min Vol USA ETF | | Morgan Stanley | | | 1.76 | | | 7/02/2020 | | Monthly | | | (4,739,531 | ) | | | — | |
| iShares Edge MSCI Min Vol USA ETF | | Bank of America Merrill Lynch | | | 2.99 | | | 9/30/2020 | | Monthly | | | (4,739,531 | ) | | | — | |
| iShares Edge MSCI USA Momentum Factor ETF | | Morgan Stanley | | | 1.39 | | | 7/02/2020 | | Monthly | | | (1,602,613 | ) | | | — | |
| iShares Edge MSCI USA Momentum Factor ETF | | Bank of America Merrill Lynch | | | 2.99 | | | 9/30/2020 | | Monthly | | | (1,602,613 | ) | | | — | |
| iShares Floating Rate Bond ETF | | Morgan Stanley | | | 2.95 | | | 7/02/2020 | | Monthly | | | 3,801,922 | | | | — | |
| iShares Floating Rate Bond ETF | | Bank of America Merrill Lynch | | | 2.99 | | | 9/30/2020 | | Monthly | | | 3,801,922 | | | | — | |
| iShares iBoxx High Yield Corporate Bond ETF | | Morgan Stanley | | | 1.26 | | | 7/02/2020 | | Monthly | | | (956,601 | ) | | | — | |
| iShares iBoxx High Yield Corporate Bond ETF | | Bank of America Merrill Lynch | | | 2.99 | | | 9/30/2020 | | Monthly | | | (956,601 | ) | | | — | |
| iShares J.P. Morgan USD Emerging Markets Bond ETF | | Morgan Stanley | | | 2.95 | | | 7/02/2020 | | Monthly | | | 981,502 | | | | — | |
| iShares J.P. Morgan USD Emerging Markets Bond ETF | | Bank of America Merrill Lynch | | | 2.99 | | | 9/30/2020 | | Monthly | | | 981,502 | | | | — | |
| iShares MBS ETF | | Morgan Stanley | | | 2.95 | | | 7/02/2020 | | Monthly | | | 1,199,065 | | | | — | |
| iShares MBS ETF | | Bank of America Merrill Lynch | | | 2.99 | | | 9/30/2020 | | Monthly | | | 1,199,065 | | | | — | �� |
| iShares MSCI All Country Asia ex Japan ETF | | Morgan Stanley | | | 2.95 | | | 7/02/2020 | | Monthly | | | 326,687 | | | | — | |
| iShares MSCI All Country Asia ex Japan ETF | | Bank of America Merrill Lynch | | | 2.99 | | | 9/30/2020 | | Monthly | | | 326,687 | | | | — | |
See notes to financial statements.
61
Schedules of Investments — IQ Hedge Multi-Strategy Tracker ETF(continued)
April 30, 2019Total Return Swap contracts outstanding at April 30, 2019 (continued):
| | | | | | | | | | | | | |
Total Return Benchmark
| | Counterparties
| | Annual
Financing
Rate
Received
(Paid)%
| | Expiration
Date
| | Payment
Frequency
Received/
(Paid)
| | Notional
Amount
Long
(Short)
| | Value/
Unrealized
Appreciation/
(Depreciation)(d)
|
| iShares MSCI China ETF | | Morgan Stanley | | | 2.95 | | | 7/02/2020 | | Monthly | | $ | 1,369,428 | | | $ | — | |
| iShares MSCI EAFE Growth ETF | | Morgan Stanley | | | (6.49 | ) | | 7/02/2020 | | Monthly | | | (1,464,844 | ) | | | — | |
| iShares MSCI EAFE Growth ETF | | Bank of America Merrill Lynch | | | 2.99 | | | 9/30/2020 | | Monthly | | | (1,464,844 | ) | | | — | |
| iShares MSCI Eurozone ETF | | Morgan Stanley | | | 2.95 | | | 7/02/2020 | | Monthly | | | 130,304 | | | | — | |
| iShares MSCI Eurozone ETF | | Bank of America Merrill Lynch | | | 2.99 | | | 9/30/2020 | | Monthly | | | 130,304 | | | | — | |
| iShares MSCI Japan ETF | | Morgan Stanley | | | 2.95 | | | 7/02/2020 | | Monthly | | | 154,788 | | | | — | |
| iShares MSCI Japan ETF | | Bank of America Merrill Lynch | | | 2.99 | | | 9/30/2020 | | Monthly | | | 154,788 | | | | — | |
| iShares Preferred & Income Securities ETF | | Morgan Stanley | | | 1.76 | | | 7/02/2020 | | Monthly | | | (905,173 | ) | | | — | |
| iShares Preferred & Income Securities ETF | | Bank of America Merrill Lynch | | | 2.99 | | | 9/30/2020 | | Monthly | | | (905,173 | ) | | | — | |
| iShares Russell 2000 ETF | | Morgan Stanley | | | 2.95 | | | 7/02/2020 | | Monthly | | | 235,219 | | | | — | |
| iShares Russell 2000 ETF | | Bank of America Merrill Lynch | | | 2.99 | | | 9/30/2020 | | Monthly | | | 235,219 | | | | — | |
| iShares Russell 2000 Growth ETF | | Morgan Stanley | | | 2.95 | | | 7/02/2020 | | Monthly | | | 422,352 | | | | — | |
| iShares Russell 2000 Growth ETF | | Bank of America Merrill Lynch | | | 2.99 | | | 9/30/2020 | | Monthly | | | 422,352 | | | | — | |
| iShares Russell 2000 Value ETF | | Morgan Stanley | | | 1.64 | | | 7/02/2020 | | Monthly | | | (2,173,661 | ) | | | — | |
| iShares Russell 2000 Value ETF | | Bank of America Merrill Lynch | | | 2.99 | | | 9/30/2020 | | Monthly | | | (2,173,661 | ) | | | — | |
| iShares S&P Small-Cap 600 Growth ETF | | Morgan Stanley | | | 2.95 | | | 7/02/2020 | | Monthly | | | 257,774 | | | | — | |
| iShares S&P Small-Cap 600 Growth ETF | | Bank of America Merrill Lynch | | | 2.99 | | | 9/30/2020 | | Monthly | | | 257,774 | | | | — | |
| iShares S&P Small-Cap 600 Value ETF | | Morgan Stanley | | | 2.10 | | | 7/02/2020 | | Monthly | | | (1,476,459 | ) | | | — | |
| iShares S&P Small-Cap 600 Value ETF | | Bank of America Merrill Lynch | | | 2.99 | | | 9/30/2020 | | Monthly | | | (1,476,459 | ) | | | — | |
| iShares Short Treasury Bond ETF | | Morgan Stanley | | | 2.95 | | | 7/02/2020 | | Monthly | | | 8,980,015 | | | | — | |
| iShares Short Treasury Bond ETF | | Bank of America Merrill Lynch | | | 2.99 | | | 9/30/2020 | | Monthly | | | 8,980,015 | | | | — | |
| iShares Silver Trust | | Morgan Stanley | | | 2.95 | | | 7/02/2020 | | Monthly | | | 422,409 | | | | — | |
| iShares Silver Trust | | Bank of America Merrill Lynch | | | 2.99 | | | 9/30/2020 | | Monthly | | | 422,409 | | | | — | |
| Schwab Intermediate-Term U.S. Treasury ETF | | Morgan Stanley | | | 2.95 | | | 7/02/2020 | | Monthly | | | 257,827 | | | | — | |
| Schwab Intermediate-Term U.S. Treasury ETF | | Bank of America Merrill Lynch | | | 2.99 | | | 9/30/2020 | | Monthly | | | 257,827 | | | | — | |
| Schwab International Small-Cap Equity ETF | | Morgan Stanley | | | 2.95 | | | 7/02/2020 | | Monthly | | | 743,713 | | | | — | |
| Schwab International Small-Cap Equity ETF | | Bank of America Merrill Lynch | | | 2.99 | | | 9/30/2020 | | Monthly | | | 743,713 | | | | — | |
Schwab U.S. Large-Cap
Growth ETF | | Morgan Stanley | | | 2.95 | | | 7/02/2020 | | Monthly | | | 113,765 | | | | — | |
Schwab U.S. Large-Cap
Growth ETF | | Bank of America Merrill Lynch | | | 2.99 | | | 9/30/2020 | | Monthly | | | 113,765 | | | | — | |
Schwab U.S. Large-Cap
Value ETF | | Morgan Stanley | | | (2.19 | ) | | 7/02/2020 | | Monthly | | | (654,286 | ) | | | — | |
Schwab U.S. Large-Cap
Value ETF | | Bank of America Merrill Lynch | | | 2.99 | | | 9/30/2020 | | Monthly | | | (654,286 | ) | | | — | |
| Schwab U.S. REIT ETF | | Morgan Stanley | | | 2.95 | | | 7/02/2020 | | Monthly | | | 19,288 | | | | — | |
| Schwab U.S. REIT ETF | | Bank of America Merrill Lynch | | | 2.99 | | | 9/30/2020 | | Monthly | | | 19,288 | | | | — | |
| Schwab U.S. Small-Cap ETF | | Morgan Stanley | | | 2.95 | | | 7/02/2020 | | Monthly | | | 43,192 | | | | — | |
| Schwab U.S. Small-Cap ETF | | Bank of America Merrill Lynch | | | 2.99 | | | 9/30/2020 | | Monthly | | | 43,192 | | | | — | |
| SPDR Blackstone / GSO Senior Loan ETF | | Morgan Stanley | | | 2.95 | | | 7/02/2020 | | Monthly | | | 1,209,339 | | | | — | |
| SPDR Blackstone / GSO Senior Loan ETF | | Bank of America
Merrill Lynch | | | 2.99 | | | 9/30/2020 | | Monthly | | | 1,209,339 | | | | — | |
SPDR Bloomberg Barclays
1-3 Month T-Bill ETF | | Morgan Stanley | | | 2.95 | | | 7/02/2020 | | Monthly | | | 3,728,303 | | | | — | |
SPDR Bloomberg Barclays
1-3 Month T-Bill ETF | | Bank of America Merrill Lynch | | | 2.99 | | | 9/30/2020 | | Monthly | | | 3,728,303 | | | | — | |
| SPDR Bloomberg Barclays Convertible Securities ETF | | Morgan Stanley | | | 2.95 | | | 7/02/2020 | | Monthly | | | 42,907 | | | | — | |
See notes to financial statements.
62
Schedules of Investments — IQ Hedge Multi-Strategy Tracker ETF(continued)
April 30, 2019Total Return Swap contracts outstanding at April 30, 2019 (continued):
| | | | | | | | | | | | | |
Total Return Benchmark
| | Counterparties
| | Annual
Financing
Rate
Received
(Paid)%
| | Expiration
Date
| | Payment
Frequency
Received/
(Paid)
| | Notional
Amount
Long
(Short)
| | Value/
Unrealized
Appreciation/
(Depreciation)(d)
|
| SPDR Bloomberg Barclays Convertible Securities ETF | | Bank of America
Merrill Lynch | | | 2.99 | | | 9/30/2020 | | Monthly | | $ | 42,907 | | | $ | — | |
| SPDR Bloomberg Barclays Emerging Markets Local Bond ETF | | Morgan Stanley | | | 2.95 | | | 7/02/2020 | | Monthly | | | 121,050 | | | | — | |
| SPDR Bloomberg Barclays Emerging Markets Local Bond ETF | | Bank of America Merrill Lynch | | | 2.99 | | | 9/30/2020 | | Monthly | | | 121,050 | | | | — | |
| SPDR Bloomberg Barclays High Yield Bond ETF | | Morgan Stanley | | | 1.26 | | | 7/02/2020 | | Monthly | | | (555,983 | ) | | | — | |
| SPDR Bloomberg Barclays High Yield Bond ETF | | Bank of America Merrill Lynch | | | 2.99 | | | 9/30/2020 | | Monthly | | | (555,983 | ) | | | — | |
| SPDR Bloomberg Barclays Investment Grade Floating Rate ETF | | Morgan Stanley | | | 2.95 | | | 7/02/2020 | | Monthly | | | 1,467,525 | | | | — | |
| SPDR Bloomberg Barclays Investment Grade Floating Rate ETF | | Bank of America Merrill Lynch | | | 2.99 | | | 9/30/2020 | | Monthly | | | 1,467,525 | | | | — | |
| SPDR Bloomberg Barclays Short Term High Yield Bond ETF | | Morgan Stanley | | | 2.95 | | | 7/02/2020 | | Monthly | | | 506,379 | | | | — | |
| SPDR Bloomberg Barclays Short Term High Yield Bond ETF | | Bank of America Merrill Lynch | | | 2.99 | | | 9/30/2020 | | Monthly | | | 506,379 | | | | — | |
| SPDR Dow Jones International Real Estate ETF | | Morgan Stanley | | | 1.71 | | | 7/02/2020 | | Monthly | | | (2,942,767 | ) | | | — | |
| SPDR Dow Jones International Real Estate ETF | | Bank of America Merrill Lynch | | | 2.99 | | | 9/30/2020 | | Monthly | | | (2,942,767 | ) | | | — | |
| SPDR Gold MiniShares Trust | | Morgan Stanley | | | 1.96 | | | 7/02/2020 | | Monthly | | | (22,256 | ) | | | — | |
| SPDR Gold MiniShares Trust | | Bank of America Merrill Lynch | | | 2.99 | | | 9/30/2020 | | Monthly | | | (22,256 | ) | | | — | |
| SPDR Gold Shares | | Morgan Stanley | | | 2.10 | | | 7/02/2020 | | Monthly | | | (1,123,160 | ) | | | — | |
| SPDR Gold Shares | | Bank of America Merrill Lynch | | | 2.99 | | | 9/30/2020 | | Monthly | | | (1,123,160 | ) | | | — | |
| SPDR Portfolio Long Term Treasury ETF | | Morgan Stanley | | | (0.99 | ) | | 7/02/2020 | | Monthly | | | (362,143 | ) | | | — | |
| SPDR Portfolio Long Term Treasury ETF | | Bank of America Merrill Lynch | | | 2.99 | | | 9/30/2020 | | Monthly | | | (362,143 | ) | | | — | |
SPDR Portfolio S&P 500
Growth ETF | | Morgan Stanley | | | 2.95 | | | 7/02/2020 | | Monthly | | | 71,674 | | | | — | |
SPDR Portfolio S&P 500
Growth ETF | | Bank of America Merrill Lynch | | | 2.99 | | | 9/30/2020 | | Monthly | | | 71,674 | | | | — | |
SPDR Portfolio S&P 500
Value ETF | | Morgan Stanley | | | (7.49 | ) | | 7/02/2020 | | Monthly | | | (285,355 | ) | | | — | |
SPDR Portfolio S&P 500
Value ETF | | Bank of America Merrill Lynch | | | 2.99 | | | 9/30/2020 | | Monthly | | | (285,355 | ) | | | — | |
| SPDR Portfolio Short Term Corporate Bond ETF | | Morgan Stanley | | | 2.95 | | | 7/02/2020 | | Monthly | | | 337,046 | | | | — | |
| SPDR Portfolio Short Term Corporate Bond ETF | | Bank of America Merrill Lynch | | | 2.99 | | | 9/30/2020 | | Monthly | | | 337,046 | | | | — | |
| SPDR S&P Bank ETF | | Morgan Stanley | | | 2.95 | | | 7/02/2020 | | Monthly | | | 194,788 | | | | — | |
| SPDR S&P Bank ETF | | Bank of America Merrill Lynch | | | 2.99 | | | 9/30/2020 | | Monthly | | | 194,788 | | | | — | |
| SPDR S&P China ETF | | Morgan Stanley | | | 2.95 | | | 7/02/2020 | | Monthly | | | 433,449 | | | | — | |
| SPDR S&P Emerging Markets SmallCap ETF | | Morgan Stanley | | | 2.95 | | | 7/02/2020 | | Monthly | | | 1,133,810 | | | | — | |
| SPDR S&P Emerging Markets SmallCap ETF | | Bank of America Merrill Lynch | | | 2.99 | | | 9/30/2020 | | Monthly | | | 1,133,810 | | | | — | |
| Technology Select Sector SPDR Fund | | Morgan Stanley | | | 2.10 | | | 7/02/2020 | | Monthly | | | (201,261 | ) | | | — | |
| VanEck Vectors High-Yield Municipal Index ETF | | Morgan Stanley | | | 2.95 | | | 7/02/2020 | | Monthly | | | 208,126 | | | | — | |
| VanEck Vectors High-Yield Municipal Index ETF | | Bank of America Merrill Lynch | | | 2.99 | | | 9/30/2020 | | Monthly | | | 208,126 | | | | — | |
See notes to financial statements.
63
Schedules of Investments — IQ Hedge Multi-Strategy Tracker ETF(continued)
April 30, 2019Total Return Swap contracts outstanding at April 30, 2019 (continued):
| | | | | | | | | | | | | |
Total Return Benchmark
| | Counterparties
| | Annual
Financing
Rate
Received
(Paid)%
| | Expiration
Date
| | Payment
Frequency
Received/
(Paid)
| | Notional
Amount
Long
(Short)
| | Value/
Unrealized
Appreciation/
(Depreciation)(d)
|
| VanEck Vectors J.P. Morgan EM Local Currency Bond ETF | | Morgan Stanley | | | 2.95 | | | 7/02/2020 | | Monthly | | $ | 868,936 | | | $ | — | |
| VanEck Vectors J.P. Morgan EM Local Currency Bond ETF | | Bank of America
Merrill Lynch | | | 2.99 | | | 9/30/2020 | | Monthly | | | 868,936 | | | | — | |
| Vanguard Emerging Markets Government Bond ETF | | Morgan Stanley | | | 2.95 | | | 7/02/2020 | | Monthly | | | 70,083 | | | | — | |
| Vanguard Emerging Markets Government Bond ETF | | Bank of America Merrill Lynch | | | 2.99 | | | 9/30/2020 | | Monthly | | | 70,083 | | | | — | |
| Vanguard FTSE All World ex-U.S. Small-Cap ETF | | Morgan Stanley | | | 2.95 | | | 7/02/2020 | | Monthly | | | 1,895,810 | | | | — | |
| Vanguard FTSE All World ex-U.S. Small-Cap ETF | | Bank of America Merrill Lynch | | | 2.99 | | | 9/30/2020 | | Monthly | | | 1,895,810 | | | | — | |
| Vanguard FTSE Developed Markets ETF | | Morgan Stanley | | | 2.95 | | | 7/02/2020 | | Monthly | | | 81,286 | | | | — | |
| Vanguard FTSE Developed Markets ETF | | Bank of America Merrill Lynch | | | 2.99 | | | 9/30/2020 | | Monthly | | | 81,286 | | | | — | |
Vanguard FTSE Emerging
Markets ETF | | Morgan Stanley | | | 2.10 | | | 7/02/2020 | | Monthly | | | (3,458,084 | ) | | | — | |
Vanguard FTSE Emerging
Markets ETF | | Bank of America Merrill Lynch | | | 2.99 | | | 9/30/2020 | | Monthly | | | (3,458,084 | ) | | | — | |
| Vanguard FTSE Europe ETF | | Morgan Stanley | | | 2.95 | | | 7/02/2020 | | Monthly | | | 261,224 | | | | — | |
| Vanguard FTSE Europe ETF | | Bank of America Merrill Lynch | | | 2.99 | | | 9/30/2020 | | Monthly | | | 261,224 | | | | — | |
| Vanguard FTSE Pacific ETF | | Morgan Stanley | | | 2.95 | | | 7/02/2020 | | Monthly | | | 74,404 | | | | — | |
| Vanguard FTSE Pacific ETF | | Bank of America Merrill Lynch | | | 2.99 | | | 9/30/2020 | | Monthly | | | 74,404 | | | | — | |
| Vanguard Growth ETF | | Morgan Stanley | | | 2.95 | | | 7/02/2020 | | Monthly | | | 610,081 | | | | — | |
| Vanguard Growth ETF | | Bank of America Merrill Lynch | | | 2.99 | | | 9/30/2020 | | Monthly | | | 610,081 | | | | — | |
| Vanguard Intermediate-Term Corporate Bond ETF | | Morgan Stanley | | | 2.95 | | | 7/02/2020 | | Monthly | | | 2,637,537 | | | | — | |
| Vanguard Intermediate-Term Corporate Bond ETF | | Bank of America Merrill Lynch | | | 2.99 | | | 9/30/2020 | | Monthly | | | 2,637,537 | | | | — | |
| Vanguard Intermediate-Term Treasury ETF | | Morgan Stanley | | | 2.95 | | | 7/02/2020 | | Monthly | | | 242,362 | | | | — | |
| Vanguard Intermediate-Term Treasury ETF | | Bank of America Merrill Lynch | | | 2.99 | | | 9/30/2020 | | Monthly | | | 242,362 | | | | — | |
Vanguard Long-Term
Treasury ETF | | Morgan Stanley | | | 2.10 | | | 7/02/2020 | | Monthly | | | (191,595 | ) | | | — | |
Vanguard Long-Term
Treasury ETF | | Bank of America Merrill Lynch | | | 2.99 | | | 9/30/2020 | | Monthly | | | (191,595 | ) | | | — | |
| Vanguard Mortgage-Backed Securities ETF | | Morgan Stanley | | | 2.95 | | | 7/02/2020 | | Monthly | | | 640,890 | | | | — | |
| Vanguard Mortgage-Backed Securities ETF | | Bank of America Merrill Lynch | | | 2.99 | | | 9/30/2020 | | Monthly | | | 640,890 | | | | — | |
| Vanguard Real Estate ETF | | Morgan Stanley | | | 2.95 | | | 7/02/2020 | | Monthly | | | 122,780 | | | | — | |
| Vanguard Real Estate ETF | | Bank of America Merrill Lynch | | | 2.99 | | | 9/30/2020 | | Monthly | | | 122,780 | | | | — | |
| Vanguard Short-Term Corporate Bond ETF | | Morgan Stanley | | | 2.95 | | | 7/02/2020 | | Monthly | | | 1,573,472 | | | | — | |
| Vanguard Short-Term Corporate Bond ETF | | Bank of America Merrill Lynch | | | 2.99 | | | 9/30/2020 | | Monthly | | | 1,573,472 | | | | — | |
| Vanguard Small-Cap ETF | | Morgan Stanley | | | 2.95 | | | 7/02/2020 | | Monthly | | | 132,480 | | | | — | |
| Vanguard Small-Cap ETF | | Bank of America Merrill Lynch | | | 2.99 | | | 9/30/2020 | | Monthly | | | 132,480 | | | | — | |
Vanguard Small-Cap
Growth ETF | | Morgan Stanley | | | 2.95 | | | 7/02/2020 | | Monthly | | | 400,154 | | | | — | |
Vanguard Small-Cap
Growth ETF | | Bank of America Merrill Lynch | | | 2.99 | | | 9/30/2020 | | Monthly | | | 400,154 | | | | — | |
Vanguard Small-Cap
Value ETF | | Morgan Stanley | | | 1.01 | | | 7/02/2020 | | Monthly | | | (3,133,060 | ) | | | — | |
Vanguard Small-Cap
Value ETF | | Bank of America Merrill Lynch | | | 2.99 | | | 9/30/2020 | | Monthly | | | (3,133,060 | ) | | | — | |
| Vanguard Value ETF | | Morgan Stanley | | | 1.51 | | | 7/02/2020 | | Monthly | | | (5,221,630 | ) | | | — | |
| Vanguard Value ETF | | Bank of America Merrill Lynch | | | 2.99 | | | 9/30/2020 | | Monthly | | | (5,221,630 | ) | | | — | |
See notes to financial statements.
64
Schedules of Investments — IQ Hedge Multi-Strategy Tracker ETF(continued)
April 30, 2019Total Return Swap contracts outstanding at April 30, 2019 (continued):
| | | | | | | | | | | | | |
Total Return Benchmark
| | Counterparties
| | Annual
Financing
Rate
Received
(Paid)%
| | Expiration
Date
| | Payment
Frequency
Received/
(Paid)
| | Notional
Amount
Long
(Short)
| | Value/
Unrealized
Appreciation/
(Depreciation)(d)
|
| WisdomTree Emerging Markets Local Debt Fund | | Morgan Stanley | | | 2.95 | | | 7/02/2020 | | Monthly | | $ | 30,579 | | | $ | — | |
| WisdomTree Emerging Markets Local Debt Fund | | Bank of America
Merrill Lynch | | | 2.99 | | | 9/30/2020 | | Monthly | | | 30,579 | | | | — | |
| Xtrackers MSCI EAFE Hedged Equity ETF | | Morgan Stanley | | | (0.24 | ) | | 7/02/2020 | | Monthly | | | (4,057,544 | ) | | | — | |
| Xtrackers MSCI EAFE Hedged Equity ETF | | Bank of America Merrill Lynch | | | 2.99 | | | 9/30/2020 | | Monthly | | | (4,057,544 | ) | | | — | |
| Xtrackers MSCI Europe Hedged Equity ETF | | Morgan Stanley | | | 2.95 | | | 7/02/2020 | | Monthly | | | 1,162,722 | | | | — | |
| Xtrackers MSCI Europe Hedged Equity ETF | | Bank of America Merrill Lynch | | | 2.99 | | | 9/30/2020 | | Monthly | | | 1,162,722 | | | | — | |
| Xtrackers MSCI Japan Hedged Equity ETF | | Morgan Stanley | | | 2.95 | | | 7/02/2020 | | Monthly | | | 1,001,004 | | | | — | |
| Xtrackers MSCI Japan Hedged Equity ETF | | Bank of America Merrill Lynch | | | 2.99 | | | 9/30/2020 | | Monthly | | | 1,001,004 | | | | — | |
| Xtrackers USD High Yield Corporate Bond ETF | | Morgan Stanley | | | 2.10 | | | 7/02/2020 | | Monthly | | | (161,089 | ) | | | — | |
| Xtrackers USD High Yield Corporate Bond ETF | | Bank of America Merrill Lynch | | | 2.99 | | | 9/30/2020 | | Monthly | | | (161,089 | ) | | | — | |
| | | | | | | | | | | | | | | | | $ | — | |
Cash posted has been segregated as collateral for swaps (counterparty Bank of America Merrill Lynch) in the amount of $410,000 at April 30, 2019.
The total value of securities segregated as collateral for swap contracts with counterparty Morgan Stanley amounted to $1,304,490 and with Bank of America Merrill Lynch amounted to $ — at April 30, 2019. The Fund either receives fees from, or pays to the counterparty, the total return of the benchmark and the agreed-upon financing rate.
(d) | | Reflects the value at reset date of April 30, 2019. |
The following is a summary of the inputs used to value the Fund’s investments as of April 30, 2019. For more information on the valuation techniques, and their aggregation into the levels used in the table below, please refer to Note 2.
Asset Valuation Inputs
Description
| | | | Level 1
| | Level 2
| | Level 3
| | Total
|
Investments in Securities:(e) | | | | | | | | | | | | | | | | | | |
Exchange Traded Vehicles | | | | $ | 59,981,309 | | | $ | — | | | $ | — | | | $ | 59,981,309 | |
Investment Companies | | | | | 932,662,583 | | | | — | | | | — | | | | 932,662,583 | |
Short-Term Investment: | | | | | | | | | | | | | | | | | | |
Money Market Fund | | | | | 2,205,013 | | | | — | | | | — | | | | 2,205,013 | |
Investment of Cash Collateral for Securities Loaned: | | | | | | | | | | | | | | | | | | |
Money Market Fund | | | | | 86,985,349 | | | | — | | | | — | | | | 86,985,349 | |
Total Investments in Securities | | | | | 1,081,834,254 | | | | — | | | | — | | | | 1,081,834,254 | |
Other Financial Instruments:(f) | | | | | | | | | | | | | | | | | | |
Swap Contracts | | | | | — | | | | — | | | | — | | | | — | |
Total Investments in Securities and Other Financial Instruments | | | | $ | 1,081,834,254 | | | $ | — | | | $ | — | | | $ | 1,081,834,254 | |
| | | | | | | | | | | | | | | | | | | |
| Liability Valuation Inputs | | | | | | | | | | | | | | | | | | |
| | | | | | | | | | | | | | | | | | | |
Description
| | | | Level 1
| | Level 2
| | Level 3
| | Total
|
Other Financial Instruments:(f) | | | | | | | | | | | | | | | | | | |
Swap Contracts | | | | $ | — | | | $ | — | | | $ | — | | | $ | — | |
(e) | | For a complete listing of investments and their industries, see the Schedules of Investments. |
(f) | | Reflects the unrealized appreciation (depreciation) of the instruments. |
For the year ended April 30, 2019, the Fund did not have any transfers into or out of Level 3 within the fair value hierarchy. (See Note 2)
See notes to financial statements.
65
Schedules of Investments — IQ Hedge Macro Tracker ETF
April 30, 2019 | | | | Shares
| | Value
|
| | | | | | | | | | |
Exchange Traded Vehicles — 8.7% | | | | | | | | | | |
| | | | | | | | | | | |
Euro Fund — 2.0% | | | | | | | | | | |
Invesco CurrencyShares Euro Currency Trust*(a) | | | | | 975 | | | $ | 104,218 | |
| | | | | | | | | | | |
Japanese Yen Fund — 2.5% | | | | | | | | | | |
Invesco CurrencyShares Japanese Yen Trust* | | | | | 1,577 | | | | 134,865 | |
| | | | | | | | | | | |
Silver Fund — 1.6% | | | | | | | | | | |
iShares Silver Trust*(a) | | | | | 5,926 | | | | 83,082 | |
| | | | | | | | | | | |
U.S. Dollar Fund — 2.6% | | | | | | | | | | |
Invesco DB U.S. Dollar Index Bullish Fund | | | | | 5,216 | | | | 136,503 | |
| | | | | | | | | | | |
Total Exchange Traded Vehicles | | | | | | | | | | |
(Cost $463,671) | | | | | | | | | 458,668 | |
| | | | | | | | | | | |
Investment Companies — 91.2% | | | | | | | | | | |
| | | | | | | | | | | |
BRIC Equity Funds — 9.5% | | | | | | | | | | |
iShares China Large-Cap ETF | | | | | 5,739 | | | | 255,328 | |
iShares MSCI China ETF(a) | | | | | 2,927 | | | | 185,923 | |
SPDR S&P China ETF(a) | | | | | 577 | | | | 58,820 | |
Total BRIC Equity Funds | | | | | | | | | 500,071 | |
| | | | | | | | | | | |
Broad Fund — 0.7% | | | | | | | | | | |
FlexShares Global Upstream Natural Resources Index Fund | | | | | 1,085 | | | | 35,664 | |
| | | | | | | | | | | |
Emerging Bonds — USD Funds — 2.6% | | | | | | | | | | |
iShares J.P. Morgan USD Emerging Markets Bond ETF | | | | | 1,151 | | | | 126,380 | |
Vanguard Emerging Markets Government Bond ETF | | | | | 115 | | | | 8,985 | |
Total Emerging Bond —
USD Funds | | | | | | | | | 135,365 | |
| | | | | | | | | | | |
Emerging Bonds — Local Currency Funds — 2.5% | | | | | | | | | | |
SPDR Bloomberg Barclays Emerging Markets Local Bond ETF | | | | | 599 | | | | 15,999 | |
VanEck Vectors J.P. Morgan EM Local Currency Bond ETF | | | | | 3,465 | | | | 114,761 | |
WisdomTree Emerging Markets Local Debt Fund | | | | | 118 | | | | 4,023 | |
Total Emerging Bonds Local Currency Funds | | | | | | | | | 134,783 | |
| | | | | | | | | | | |
Emerging Small Cap Equity
Fund — 2.6% | | | | | | | | | | |
SPDR S&P Emerging Markets SmallCap ETF | | | | | 3,046 | | | | 137,161 | |
| | | | | | | | | | | |
Europe Equity Fund — 4.4% | | | | | | | | | | |
Xtrackers MSCI Europe Hedged Equity ETF | | | | | 7,871 | | | | 232,746 | |
| | | | | | | | | | | |
Floating Rate — Investment Grade Funds — 14.6% | | | | | | | | | | |
SPDR Bloomberg Barclays Investment Grade Floating Rate ETF(a) | | | | | 6,914 | | | | 212,398 | |
iShares Floating Rate Bond ETF(a) | | | | | 10,797 | | | | 550,215 | |
Total Floating Rate — Investment Grade Funds | | | | | | | | | 762,613 | |
| | | | | | | | | | |
| | | | Shares
| | Value
|
| | | | | | | | | | | |
Investment Companies (continued) | | | | | | | | | | |
| | | | | | | | | | | |
International Small Cap Equity
Funds — 6.0% | | | | | | | | | | |
Schwab International Small-Cap Equity ETF | | | | | 2,654 | | | $ | 88,113 | |
Vanguard FTSE All World ex-U.S. Small-Cap ETF | | | | | 2,105 | | | | 224,624 | |
Total International Small Cap Equity Funds | | | | | | | | | 312,737 | |
| | | | | | | | | | | |
Investment Grade Corporate Bond Funds — 5.7% | | | | | | | | | | |
iShares Broad USD Investment Grade Corporate Bond ETF(a) | | | | | 4 | | | | 221 | |
iShares iBoxx $ Investment Grade Corporate Bond ETF | | | | | 20 | | | | 2,385 | |
SPDR Portfolio Short Term Corporate Bond ETF | | | | | 1,706 | | | | 52,135 | |
Vanguard Intermediate-Term Corporate Bond ETF(a) | | | | | 18 | | | | 1,566 | |
Vanguard Short-Term Corporate Bond ETF(a) | | | | | 3,052 | | | | 243,336 | |
Total Investment Grade Corporate Bond Funds | | | | | | | | | 299,643 | |
| | | | | | | | | | | |
Japan Equity Fund — 3.8% | | | | | | | | | | |
Xtrackers MSCI Japan Hedged Equity ETF | | | | | 4,930 | | | | 200,355 | |
| | | | | | | | | | | |
U.S. Large Cap Core Fund — 1.0% | | | | | | | | | | |
Energy Select Sector SPDR Fund(a) | | | | | 802 | | | | 53,020 | |
| | | | | | | | | | | |
U.S. Large Cap Growth Funds — 1.2% | | | | | | | | | | |
iShares Core S&P U.S. Growth ETF(a) | | | | | 106 | | | | 6,640 | |
Schwab U.S. Large-Cap Growth ETF | | | | | 96 | | | | 7,972 | |
SPDR Portfolio S&P 500 Growth ETF | | | | | 130 | | | | 5,028 | |
Vanguard Growth ETF | | | | | 261 | | | | 42,747 | |
Total U.S. Large Cap Growth Funds | | | | | | | | | 62,387 | |
| | | | | | | | | | | |
U.S. Medium Term Treasury Bond Funds — 5.6% | | | | | | | | | | |
iShares 3-7 Year Treasury Bond ETF | | | | | 1,176 | | | | 144,542 | |
Schwab Intermediate-Term U.S. Treasury ETF(a) | | | | | 1,444 | | | | 77,369 | |
Vanguard Intermediate-Term Treasury ETF(a) | | | | | 1,132 | | | | 72,754 | |
Total U.S. Medium Term Treasury Bond Fund | | | | | | | | | 294,665 | |
| | | | | | | | | | | |
U.S. Ultra Short Term Treasury Bond
Funds — 28.9% | | | | | | | | | | |
Goldman Sachs Access Treasury 0-1 Year ETF(a) | | | | | 1,520 | | | | 152,441 | |
Invesco Treasury Collateral ETF | | | | | 247 | | | | 26,059 | |
iShares Short Treasury Bond ETF(b) | | | | | 8,546 | | | | 944,846 | |
SPDR Bloomberg Barclays 1-3 Month T-Bill ETF(a) | | | | | 4,283 | | | | 392,323 | |
Total U.S. Short Term Treasury Bond Funds | | | | | | | | | 1,515,669 | |
See notes to financial statements.
66
Schedules of Investments — IQ Hedge Macro Tracker ETF(continued)
April 30, 2019 | | | | Shares
| | Value
|
| | | | | | | | | | |
Investment Companies (continued) | | | | | | | | | | |
| | | | | | | | | | | |
U.S. Small Cap Core Funds — 2.1% | | | | | | | | | | |
iShares Russell 2000 ETF(a) | | | | | 404 | | | $ | 63,949 | |
Schwab U.S. Small-Cap ETF | | | | | 162 | | | | 11,740 | |
Vanguard Small-Cap ETF | | | | | 227 | | | | 35,930 | |
Total U.S. Small Cap Core Funds | | | | | | | | | 111,619 | |
| | | | | | | | | | | |
Total Investment Companies | | | | | | | | | | |
(Cost $4,729,843) | | | | | | | | | 4,788,498 | |
| | | | | | | | | | | |
Short-Term Investment — 0.2% | | | | | | | | | | |
| | | | | | | | | | | |
Money Market Fund — 0.2% | | | | | | | | | | |
Morgan Stanley Institutional Liquidity Funds Treasury Portfolio — Institutional Class, 2.32%(c) | | | | | | | | | | |
(Cost $8,347) | | | | | 8,347 | | | | 8,347 | |
| | | | | | | | | | | |
Investment of Cash Collateral For Securities Loaned — 18.9% | | | | | | | | | | |
| | | | | | | | | | | |
Money Market Fund — 18.9% | | | | | | | | | | |
Dreyfus Government Cash Management Fund, Institutional Shares, 2.45%(c) | | | | | | | | | | |
(Cost $991,018) | | | | | 991,018 | | | | 991,018 | |
| | | | | | | | | | | |
Total Investments — 119.0% | | | | | | | | | | |
(Cost $6,192,879) | | | | | | | | | 6,246,531 | |
| | | | | | | | | | | |
Other Assets and Liabilities,
Net — (19.0)% | | | | | | | | | (995,067 | ) |
| | | | | | | | | | | |
Net Assets — 100.0% | | | | | | | | $ | 5,251,464 | |
* | | Non-income producing securities. |
(a) | | All or a portion of the security was on loan. In addition, “Other Assets and Liabilities, Net” may include pending sales that are also on loan. The aggregate market value of securities on loan was $1,199,595; total market value of collateral held by the Fund was $1,224,694. Market value of the collateral held includes non-cash U.S. Treasury securities collateral having a value of $233,676. |
(b) | | All or a portion of these securities have been segregated as collateral for swap contracts. The total value of securities segregated amounted to $262,004. |
(c) | | Reflects the 1-day yield at April 30, 2019. |
See notes to financial statements.
67
Schedules of Investments — IQ Hedge Macro Tracker ETF(continued)
April 30, 2019Total Return Swap contracts outstanding at April 30, 2019:
| | | | | | | | | | | | | |
Total Return Benchmark
| | Counterparty
| | Annual
Financing
Rate
Received
(Paid)%
| | Expiration
Date
| | Payment
Frequency
Received/
(Paid)
| | Notional
Amount
Long
(Short)
| | Value/
Unrealized
Appreciation/
(Depreciation)(d)
|
| Energy Select Sector SPDR Fund | | Morgan Stanley | | | 2.95 | | | 7/02/2020 | | Monthly | | $ | 5,289 | | | $ | — | |
| FlexShares Global Upstream Natural Resources Index Fund | | Morgan Stanley | | | 2.95 | | | 7/02/2020 | | Monthly | | | 3,583 | | | | — | |
| Goldman Sachs Access Treasury 0-1 Year ETF | | Morgan Stanley | | | 2.95 | | | 7/02/2020 | | Monthly | | | 15,244 | | | | — | |
| Graniteshares Gold Trust | | Morgan Stanley | | | (6.14 | ) | | 5/04/2020 | | Monthly | | | (422 | ) | | | — | |
| Invesco CurrencyShares Euro Currency Trust | | Morgan Stanley | | | 2.95 | | | 7/02/2020 | | Monthly | | | 10,475 | | | | — | |
| Invesco CurrencyShares Japanese Yen Trust | | Morgan Stanley | | | 2.95 | | | 7/02/2020 | | Monthly | | | 13,512 | | | | — | |
| Invesco DB US Dollar Index Bullish Fund | | Morgan Stanley | | | 2.95 | | | 7/02/2020 | | Monthly | | | 13,687 | | | | — | |
| Invesco Treasury Collateral ETF | | Morgan Stanley | | | 2.95 | | | 7/02/2020 | | Monthly | | | 2,638 | | | | — | |
iShares 20+ Year Treasury
Bond ETF | | Morgan Stanley | | | 1.76 | | | 5/04/2020 | | Monthly | | | (41,052 | ) | | | — | |
iShares 3-7 Year Treasury
Bond ETF | | Morgan Stanley | | | 2.95 | | | 7/02/2020 | | Monthly | | | 14,503 | | | | — | |
| iShares China Large-Cap ETF | | Morgan Stanley | | | 2.95 | | | 7/02/2020 | | Monthly | | | 25,582 | | | | — | |
| iShares Core MSCI Emerging Markets ETF | | Morgan Stanley | | | 2.10 | | | 5/04/2020 | | Monthly | | | (29,802 | ) | | | — | |
| iShares Core MSCI Europe ETF | | Morgan Stanley | | | 2.10 | | | 5/04/2020 | | Monthly | | | (7,775 | ) | | | — | |
iShares Core S&P U.S.
Growth ETF | | Morgan Stanley | | | 2.95 | | | 7/02/2020 | | Monthly | | | 689 | | | | — | |
| iShares Core S&P U.S. Value ETF | | Morgan Stanley | | | (2.44 | ) | | 5/04/2020 | | Monthly | | | (3,883 | ) | | | — | |
| iShares Edge MSCI Min Vol Emerging Markets ETF | | Morgan Stanley | | | 2.10 | | | 5/04/2020 | | Monthly | | | (78,728 | ) | | | — | |
| iShares Floating Rate Bond ETF | | Morgan Stanley | | | 2.95 | | | 7/02/2020 | | Monthly | | | 55,139 | | | | — | |
| iShares iBoxx $ High Yield Corporate Bond ETF | | Morgan Stanley | | | 1.26 | | | 5/04/2020 | | Monthly | | | (30,429 | ) | | | — | |
| iShares iBoxx $ Investment Grade Corporate Bond ETF | | Morgan Stanley | | | 2.95 | | | 7/02/2020 | | Monthly | | | 238 | | | | — | |
| iShares J.P. Morgan USD Emerging Markets Bond ETF | | Morgan Stanley | | | 2.95 | | | 7/02/2020 | | Monthly | | | 12,627 | | | | — | |
| iShares MSCI China ETF | | Morgan Stanley | | | 2.95 | | | 7/02/2020 | | Monthly | | | 18,611 | | | | — | |
| iShares MSCI Eurozone ETF | | Morgan Stanley | | | 1.14 | | | 5/04/2020 | | Monthly | | | (15,766 | ) | | | — | |
| iShares MSCI Japan ETF | | Morgan Stanley | | | 2.10 | | | 5/04/2020 | | Monthly | | | (53,647 | ) | | | — | |
| iShares Russell 2000 ETF | | Morgan Stanley | | | 2.95 | | | 7/02/2020 | | Monthly | | | 6,332 | | | | — | |
| iShares Short Treasury Bond ETF | | Morgan Stanley | | | 2.95 | | | 7/02/2020 | | Monthly | | | 94,639 | | | | — | |
| iShares Silver Trust | | Morgan Stanley | | | 2.95 | | | 7/02/2020 | | Monthly | | | 8,328 | | | | — | |
| Schwab Intermediate-Term U.S. Treasury ETF | | Morgan Stanley | | | 2.95 | | | 7/02/2020 | | Monthly | | | 7,769 | | | | — | |
| Schwab International Small-Cap Equity ETF | | Morgan Stanley | | | 2.95 | | | 7/02/2020 | | Monthly | | | 8,831 | | | | — | |
| Schwab U.S. Large-Cap Growth ETF | | Morgan Stanley | | | 2.95 | | | 7/02/2020 | | Monthly | | | 830 | | | | — | |
| Schwab U.S. Large-Cap Value ETF | | Morgan Stanley | | | (2.19 | ) | | 5/04/2020 | | Monthly | | | (4,242 | ) | | | — | |
| Schwab U.S. Small-Cap ETF | | Morgan Stanley | | | 2.95 | | | 7/02/2020 | | Monthly | | | 1,160 | | | | — | |
| SPDR Bloomberg Barclays 1-3 Month T-Bill ETF | | Morgan Stanley | | | 2.95 | | | 7/02/2020 | | Monthly | | | 39,296 | | | | — | |
| SPDR Bloomberg Barclays Emerging Markets Local Bond ETF | | Morgan Stanley | | | 2.95 | | | 7/02/2020 | | Monthly | | | 1,603 | | | | — | |
| SPDR Bloomberg Barclays High Yield Bond ETF | | Morgan Stanley | | | 1.26 | | | 5/04/2020 | | Monthly | | | (17,700 | ) | | | — | |
| SPDR Bloomberg Barclays Investment Grade Floating Rate ETF | | Morgan Stanley | | | 2.95 | | | 7/02/2020 | | Monthly | | | 21,289 | | | | — | |
See notes to financial statements.
68
Schedules of Investments — IQ Hedge Macro Tracker ETF(continued)
April 30, 2019Total Return Swap contracts outstanding at April 30, 2019 (continued):
| | | | | | | | | | | | | |
Total Return Benchmark
| | Counterparty
| | Annual
Financing
Rate
Received
(Paid) %
| | Expiration
Date
| | Payment
Frequency
Received/
(Paid)
| | Notional
Amount
Long
(Short)
| | Value/
Unrealized
Appreciation/
(Depreciation)(d)
|
| SPDR Dow Jones International Real Estate ETF | | Morgan Stanley | | | 1.71 | | | 5/04/2020 | | Monthly | | $ | (95,563 | ) | | $ | — | |
| SPDR Gold Shares | | Morgan Stanley | | | 2.10 | | | 5/04/2020 | | Monthly | | | (30,179 | ) | | | — | |
SPDR Portfolio Long Term
Treasury ETF | | Morgan Stanley | | | (0.99 | ) | | 5/04/2020 | | Monthly | | | (7,019 | ) | | | — | |
SPDR Portfolio S&P 500
Growth ETF | | Morgan Stanley | | | 2.95 | | | 7/02/2020 | | Monthly | | | 503 | | | | — | |
| SPDR Portfolio S&P 500 Value ETF | | Morgan Stanley | | | (7.49 | ) | | 5/04/2020 | | Monthly | | | (1,859 | ) | | | — | |
| SPDR Portfolio Short Term Corporate Bond ETF | | Morgan Stanley | | | 2.95 | | | 7/02/2020 | | Monthly | | | 5,226 | | | | — | |
| SPDR S&P China ETF | | Morgan Stanley | | | 2.95 | | | 7/02/2020 | | Monthly | | | 5,913 | | | | — | |
| SPDR S&P Emerging Markets SmallCap ETF | | Morgan Stanley | | | 2.95 | | | 7/02/2020 | | Monthly | | | 13,734 | | | | — | |
| VanEck Vectors J.P. Morgan EM Local Currency Bond ETF | | Morgan Stanley | | | 2.95 | | | 7/02/2020 | | Monthly | | | 11,493 | | | | — | |
| Vanguard Emerging Markets Government Bond ETF | | Morgan Stanley | | | 2.95 | | | 7/02/2020 | | Monthly | | | 938 | | | | — | |
| Vanguard FTSE All World ex-U.S. Small-Cap ETF | | Morgan Stanley | | | 2.95 | | | 7/02/2020 | | Monthly | | | 22,516 | | | | — | |
Vanguard FTSE Emerging
Markets ETF | | Morgan Stanley | | | 2.10 | | | 5/04/2020 | | Monthly | | | (32,123 | ) | | | — | |
| Vanguard FTSE Europe ETF | | Morgan Stanley | | | 1.96 | | | 5/04/2020 | | Monthly | | | (31,588 | ) | | | — | |
| Vanguard Growth ETF | | Morgan Stanley | | | 2.95 | | | 7/02/2020 | | Monthly | | | 4,258 | | | | — | |
| Vanguard Intermediate-Term Corporate Bond ETF | | Morgan Stanley | | | 2.95 | | | 7/02/2020 | | Monthly | | | 174 | | | | — | |
| Vanguard Intermediate-Term Treasury ETF | | Morgan Stanley | | | 2.95 | | | 7/02/2020 | | Monthly | | | 7,263 | | | | — | |
Vanguard Long-Term
Treasury ETF | | Morgan Stanley | | | 2.10 | | | 5/04/2020 | | Monthly | | | (3,728 | ) | | | — | |
| Vanguard Short-Term Corporate Bond ETF | | Morgan Stanley | | | 2.95 | | | 7/02/2020 | | Monthly | | | 24,397 | | | | — | |
| Vanguard Small-Cap ETF | | Morgan Stanley | | | 2.95 | | | 7/02/2020 | | Monthly | | | 3,640 | | | | — | |
| Vanguard Value ETF | | Morgan Stanley | | | 1.51 | | | 5/04/2020 | | Monthly | | | (34,043 | ) | | | — | |
| WisdomTree Emerging Markets Local Debt Fund | | Morgan Stanley | | | 2.95 | | | 7/02/2020 | | Monthly | | | 409 | | | | — | |
| Xtrackers MSCI Europe Hedged Equity ETF | | Morgan Stanley | | | 2.95 | | | 7/02/2020 | | Monthly | | | 23,331 | | | | — | |
| Xtrackers MSCI Japan Hedged Equity ETF | | Morgan Stanley | | | 2.95 | | | 7/02/2020 | | Monthly | | | 20,076 | | | | — | |
| Xtrackers USD High Yield Corporate Bond ETF | | Morgan Stanley | | | 2.10 | | | 5/04/2020 | | Monthly | | | (5,109 | ) | | | — | |
| | | | | | | | | | | | | | | | | $ | — | |
The total value of securities segregated as collateral for swap contracts with counterparty Morgan Stanley amounted to $262,004 at April 30, 2019. The Fund either receives fees from, or pays to the counterparty, the total return of the benchmark and the agreed-upon financing rate.
(d) | | Reflects the value at reset date of April 30, 2019. |
See notes to financial statements.
69
Schedules of Investments — IQ Hedge Macro Tracker ETF(continued)
April 30, 2019The following is a summary of the inputs used to value the Fund’s investments as of April 30, 2019. For more information on the valuation techniques, and their aggregation into the levels used in the table below, please refer to Note 2.
Asset Valuation Inputs
Description
| | | | Level 1
| | | Level 2
| | | Level 3
| | | Total
| |
Investments in Securities:(e) | | | | | | | | | | | | | | | | | | |
Exchange Traded Vehicles | | | | $ | 458,668 | | | $ | — | | | $ | — | | | $ | 458,668 | |
Investment Companies | | | | | 4,788,498 | | | | — | | | | — | | | | 4,788,498 | |
Short-Term Investment: | | | | | | | | | | | | | | | | | | |
Money Market Fund | | | | | 8,347 | | | | — | | | | — | | | | 8,347 | |
Investment of Cash Collateral for Securities Loaned: | | | | | | | | | | | | | | | | | | |
Money Market Fund | | | | | 991,018 | | | | — | | | | — | | | | 991,018 | |
Total Investments in Securities | | | | | 6,246,531 | | | | — | | | | — | | | | 6,246,531 | |
Other Financial Instruments:(f) | | | | | | | | | | | | | | | | | | |
Swap Contracts | | | | | — | | | | — | | | | — | | | | — | |
Total Investments in Securities and Other Financial Instruments | | | | $ | 6,246,531 | | | $ | — | | | $ | — | | | $ | 6,246,531 | |
| | | | | | | | | | | |
| Liability Valuation Inputs | | | | | | | | | | |
| | | | | | | | | | | |
Description
| | | | Level 1
| | | Level 2
| | | Level 3
| | | Total
| |
| Other Financial Instruments:(f) | | | | | | | | | | | | | | | | | | |
| Swap Contracts | | | | $ | — | | | $ | — | | | $ | — | | | $ | — | |
(e) | | For a complete listing of investments and their industries, see the Schedules of Investments. |
(f) | | Reflects the unrealized appreciation (depreciation) of the instruments. |
For the year ended April 30, 2019, the Fund did not have any transfers into or out of Level 3 within the fair value hierarchy. (See Note 2)
See notes to financial statements.
70
Schedules of Investments — IQ Hedge Market Neutral Tracker ETF
April 30, 2019 | | | | Shares
| | Value
|
| | | | | | | | | | |
Exchange Traded Vehicle — 2.5% | | | | | | | | | | |
| | | | | | | | | | | |
Euro Fund — 2.5% | | | | | | | | | | |
Invesco CurrencyShares Euro Currency Trust*(a) | | | | | | | | | | |
(Cost $395,792) | | | | | 3,652 | | | $ | 390,362 | |
| | | | | | | | | | | |
Investment Companies — 97.5% | | | | | | | | | | |
| | | | | | | | | | | |
Asia ex Japan Equity Funds — 2.4% | | | | | | | | | | |
iShares Core MSCI Pacific ETF(a) | | | | | 2,903 | | | | 163,439 | |
iShares MSCI All Country Asia ex Japan ETF | | | | | 2,514 | | | | 181,662 | |
Vanguard FTSE Pacific ETF | | | | | 621 | | | | 41,402 | |
Total Asia ex Japan Equity Funds | | | | | | | | | 386,503 | |
| | | | | | | | | | | |
Bank Loan Funds — 11.2% | | | | | | | | | | |
Invesco Senior Loan ETF(a) | | | | | 55,240 | | | | 1,268,863 | |
SPDR Blackstone / GSO Senior Loan ETF(a) | | | | | 10,667 | | | | 499,749 | |
Total Bank Loan Funds | | | | | | | | | 1,768,612 | |
| | | | | | | | | | | |
Europe Equity Funds — 3.0% | | | | | | | | | | |
iShares Core MSCI Europe ETF | | | | | 1,380 | | | | 65,826 | |
iShares MSCI Eurozone ETF(a) | | | | | 3,295 | | | | 133,546 | |
Vanguard FTSE Europe ETF | | | | | 4,806 | | | | 267,742 | |
Total Europe Equity Funds | | | | | | | | | 467,114 | |
| | | | | | | | | | | |
Floating Rate — Investment Grade
Funds — 5.6% | | | | | | | | | | |
iShares Floating Rate Bond ETF(a) | | | | | 12,564 | | | | 640,262 | |
SPDR Bloomberg Barclays Investment Grade Floating Rate ETF(a) | | | | | 8,045 | | | | 247,142 | |
Total Floating Rate — Investment Grade Funds | | | | | | | | | 887,404 | |
| | | | | | | | | | | |
High Yield Corporate Bond
Funds — 2.1% | | | | | | | | | | |
iShares 0-5 Year High Yield Corporate Bond ETF | | | | | 3,101 | | | | 145,313 | |
SPDR Bloomberg Barclays Short Term High Yield Bond ETF(a) | | | | | 6,673 | | | | 182,573 | |
Total High Yield Corporate Bond Funds | | | | | | | | | 327,886 | |
| | | | | | | | | | | |
International Small Cap Equity
Funds — 7.4% | | | | | | | | | | |
Schwab International Small-Cap Equity ETF | | | | | 9,866 | | | | 327,551 | |
Vanguard FTSE All World ex-U.S. Small-Cap ETF | | | | | 7,824 | | | | 834,899 | |
Total International Small Cap Equity Funds | | | | | | | | | 1,162,450 | |
| | | | | | | | | | | |
Investment Grade Corporate Bond Funds — 12.3% | | | | | �� | | | | | |
iShares Broad USD Investment Grade Corporate Bond ETF(a) | | | | | 1,649 | | | | 91,206 | |
iShares iBoxx $ Investment Grade Corporate Bond ETF | | | | | 9,208 | | | | 1,097,778 | |
Vanguard Intermediate-Term Corporate Bond ETF(a) | | | | | 8,580 | | | | 746,374 | |
Total Investment Grade Corporate Bond Funds | | | | | | | | | 1,935,358 | |
| | | | | | | | | | | |
Japan Equity Fund — 1.9% | | | | | | | | | | |
iShares MSCI Japan ETF | | | | | 5,305 | | | | 294,003 | |
| | | | | | | | | | | |
| | | | Shares
| | Value
|
Investment Companies (continued) | | | | | | | | | | |
| | | | | | | | | | |
Mortgage Backed Securities
Funds — 4.2% | | | | | | | | | | |
iShares MBS ETF | | | | | 4,079 | | | $ | 432,333 | |
Vanguard Mortgage-Backed Securities ETF | | | | | 4,430 | | | | 231,069 | |
Total Mortgage Backed Securities Funds | | | | | | | | | 663,402 | |
| | | | | | | | | | | |
Municipal Bond — 0.5% | | | | | | | | | | |
Vaneck Vectors High-Yield Municipal Index ETF | | | | | 1,194 | | | | 75,031 | |
| | | | | | | | | | | |
U.S. Large Cap Core Funds — 0.6% | | | | | | | | | | |
Invesco KBW Bank ETF | | | | | 342 | | | | 18,013 | |
SPDR S&P Bank ETF | | | | | 1,544 | | | | 70,237 | |
Total U.S. Large Cap Core Funds | | | | | | | | | 88,250 | |
| | | | | | | | | | | |
U.S. Large Cap Growth Funds — 1.5% | | | | | | | | | | |
iShares Core S&P U.S. Growth ETF(a) | | | | | 402 | | | | 25,181 | |
Schwab U.S. Large-Cap Growth ETF | | | | | 364 | | | | 30,227 | |
SPDR Portfolio S&P 500 Growth ETF | | | | | 493 | | | | 19,069 | |
Vanguard Growth ETF | | | | | 991 | | | | 162,306 | |
Total U.S. Large Cap Growth Funds | | | | | | | | | 236,783 | |
| | | | | | | | | | | |
U.S. Small Cap Growth Funds — 3.0% | | | | | | | | | | |
iShares Russell 2000 Growth ETF(a) | | | | | 910 | | | | 184,248 | |
iShares S&P Small-Cap 600 Growth ETF | | | | | 609 | | | | 112,372 | |
Vanguard Small-Cap Growth ETF | | | | | 940 | | | | 174,464 | |
Total U.S. Small Cap Growth Funds | | | | | | | | | 471,084 | |
| | | | | | | | | | | |
U.S. Ultra Short Term Treasury Bond Funds — 41.8% | | | | | | | | | | |
Goldman Sachs Access Treasury 0-1 Year ETF | | | | | 6,598 | | | | 661,713 | |
Invesco Treasury Collateral ETF | | | | | 1,073 | | | | 113,207 | |
iShares Short Treasury Bond ETF | | | | | 37,099 | | | | 4,101,666 | |
SPDR Bloomberg Barclays 1-3 Month T-Bill ETF(a) | | | | | 18,590 | | | | 1,702,844 | |
Total U.S. Ultra Short Term Treasury Bond Funds | | | | | | | | | 6,579,430 | |
| | | | | | | | | | | |
Total Investment Companies | | | | | | | | | | |
(Cost $15,109,629) | | | | | | | | | 15,343,310 | |
| | | | | | | | | | | |
Short-Term Investment — 0.2% | | | | | | | | | | |
| | | | | | | | | | | |
Money Market Fund — 0.2% | | | | | | | | | | |
Morgan Stanley Institutional Liquidity Funds Treasury Portfolio — Institutional Class, 2.32%(b) | | | | | | | | | | |
(Cost $37,847) | | | | | 37,847 | | | | 37,847 | |
See notes to financial statements.
71
Schedules of Investments — IQ Hedge Market Neutral Tracker ETF(continued)
April 30, 2019 | | | | Shares
| | Value
|
Investment of Cash Collateral For Securities Loaned — 16.6% | | | | | | | | | | |
| | | | | | | | | | | |
Money Market Fund — 16.6% | | | | | | | | | | |
Dreyfus Government Cash Management Fund, Institutional Shares, 2.45%(b) | | | | | | | | | | |
(Cost $2,613,985) | | | | | 2,613,985 | | | $ | 2,613,985 | |
| | | | | | | | | | |
Total Investments — 116.8% | | | | | | | | | | |
(Cost $18,157,253) | | | | | | | | | 18,385,504 | |
| | | | | | | | | | | |
Other Assets and Liabilities,
Net — (16.8)% | | | | | | | | | (2,644,898 | ) |
| | | | | | | | | | | |
Net Assets — 100.0% | | | | | | | | $ | 15,740,606 | |
* | | Non-income producing securities. |
(a) | | All or a portion of the security was on loan. In addition, “Other Assets and Liabilities, Net” may include pending sales that are also on loan. The aggregate market value of securities on loan was $4,535,071; total market value of collateral held by the Fund was $4,628,711. Market value of the collateral held includes non-cash U.S. Treasury securities collateral having a value of $2,014,726. |
(b) | | Reflects the 1-day yield at April 30, 2019. |
See notes to financial statements.
72
Schedules of Investments — IQ Hedge Market Neutral Tracker ETF(continued)
April 30, 2019Total Return Swap contracts outstanding at April 30, 2019:
| | | | | | | | | | | | | |
Total Return Benchmark
| | Counterparty
| | Annual
Financing
Rate
Received
(Paid)%
| | Expiration
Date
| | Payment
Frequency
Received/
(Paid)
| | Notional
Amount
Long
(Short)
| | Value/
Unrealized
Appreciation/
(Depreciation)(c)
|
| Goldman Sachs Access Treasury 0-1 Year ETF | | Morgan Stanley | | | 2.95 | | | 7/02/2020 | | Monthly | | $ | 66,593 | | | $ | — | |
| Invesco CurrencyShares Australian Dollar Trust | | Morgan Stanley | | | (2.89 | ) | | 5/04/2020 | | Monthly | | | (59,282 | ) | | | — | |
| Invesco CurrencyShares British Pound Sterling Trust | | Morgan Stanley | | | (4.49 | ) | | 5/04/2020 | | Monthly | | | (885 | ) | | | — | |
| Invesco CurrencyShares Euro Currency Trust | | Morgan Stanley | | | 2.95 | | | 7/02/2020 | | Monthly | | | 39,336 | | | | — | |
| Invesco DB U.S. Dollar Index Bullish Fund | | Morgan Stanley | | | (3.89 | ) | | 5/04/2020 | | Monthly | | | (237,336 | ) | | | — | |
| Invesco KBW Bank ETF | | Morgan Stanley | | | 2.95 | | | 7/02/2020 | | Monthly | | | 1,791 | | | | — | |
| Invesco Preferred ETF | | Morgan Stanley | | | 2.10 | | | 5/04/2020 | | Monthly | | | (8,973 | ) | | | — | |
Invesco S&P 500 Low
Volatility ETF | | Morgan Stanley | | | (0.24 | ) | | 5/04/2020 | | Monthly | | | (69,740 | ) | | | — | |
| Invesco Senior Loan ETF | | Morgan Stanley | | | 2.95 | | | 7/02/2020 | | Monthly | | | 127,690 | | | | — | |
| Invesco Treasury Collateral ETF | | Morgan Stanley | | | 2.95 | | | 7/02/2020 | | Monthly | | | 11,395 | | | | — | |
| iShares 0-5 Year High Yield Corporate Bond ETF | | Morgan Stanley | | | 2.95 | | | 7/02/2020 | | Monthly | | | 14,620 | | | | — | |
iShares 3-7 Year Treasury
Bond ETF | | Morgan Stanley | | | 1.51 | | | 5/04/2020 | | Monthly | | | (61,455 | ) | | | — | |
| iShares Broad USD Investment Grade Corporate Bond ETF | | Morgan Stanley | | | 2.95 | | | 7/02/2020 | | Monthly | | | 9,181 | | | | — | |
| iShares Core MSCI Emerging Markets ETF | | Morgan Stanley | | | 2.10 | | | 5/04/2020 | | Monthly | | | (116,089 | ) | | | — | |
| iShares Core MSCI Europe ETF | | Morgan Stanley | | | 2.95 | | | 7/02/2020 | | Monthly | | | 6,630 | | | | — | |
| iShares Core MSCI Pacific ETF | | Morgan Stanley | | | 2.95 | | | 7/02/2020 | | Monthly | | | 16,440 | | | | — | |
iShares Core S&P U.S.
Growth ETF | | Morgan Stanley | | | 2.95 | | | 7/02/2020 | | Monthly | | | 2,506 | | | | — | |
| iShares Core S&P U.S. Value ETF | | Morgan Stanley | | | (2.44 | ) | | 5/04/2020 | | Monthly | | | (21,359 | ) | | | — | |
| iShares Edge MSCI Min Vol USA ETF | | Morgan Stanley | | | 1.76 | | | 5/04/2020 | | Monthly | | | (171,408 | ) | | | — | |
| iShares Floating Rate Bond ETF | | Morgan Stanley | | | 2.95 | | | 7/02/2020 | | Monthly | | | 64,413 | | | | — | |
| iShares iBoxx $ High Yield Corporate Bond ETF | | Morgan Stanley | | | 1.26 | | | 5/04/2020 | | Monthly | | | (72,334 | ) | | | — | |
| iShares iBoxx $ Investment Grade Corporate Bond ETF | | Morgan Stanley | | | 2.95 | | | 7/02/2020 | | Monthly | | | 110,517 | | | | — | |
| iShares MBS ETF | | Morgan Stanley | | | 2.95 | | | 7/02/2020 | | Monthly | | | 43,456 | | | | — | |
| iShares MSCI All Country Asia ex Japan ETF | | Morgan Stanley | | | 2.95 | | | 7/02/2020 | | Monthly | | | 18,282 | | | | — | |
| iShares MSCI Eurozone ETF | | Morgan Stanley | | | 2.95 | | | 7/02/2020 | | Monthly | | | 13,456 | | | | — | |
| iShares MSCI Japan ETF | | Morgan Stanley | | | 2.95 | | | 7/02/2020 | | Monthly | | | 29,594 | | | | — | |
| iShares Preferred & Income Securities ETF | | Morgan Stanley | | | 1.76 | | | 5/04/2020 | | Monthly | | | (26,989 | ) | | | — | |
| iShares Russell 2000 Growth ETF | | Morgan Stanley | | | 2.95 | | | 7/02/2020 | | Monthly | | | 18,627 | | | | — | |
| iShares Russell 2000 Value ETF | | Morgan Stanley | | | 1.64 | | | 5/04/2020 | | Monthly | | | (78,577 | ) | | | — | |
iShares S&P Small-Cap 600
Growth ETF | | Morgan Stanley | | | 2.95 | | | 7/02/2020 | | Monthly | | | 11,256 | | | | — | |
| iShares S&P Small-Cap 600 Value ETF | | Morgan Stanley | | | 2.10 | | | 5/04/2020 | | Monthly | | | (53,407 | ) | | | — | |
| iShares Short Treasury Bond ETF | | Morgan Stanley | | | 2.95 | | | 7/02/2020 | | Monthly | | | 412,720 | | | | — | |
| Schwab Intermediate-Term U.S. Treasury ETF | | Morgan Stanley | | | (0.64 | ) | | 5/04/2020 | | Monthly | | | (32,898 | ) | | | — | |
| Schwab International Small-Cap Equity ETF | | Morgan Stanley | | | 2.95 | | | 7/02/2020 | | Monthly | | | 32,968 | | | | — | |
Schwab U.S. Large-Cap
Growth ETF | | Morgan Stanley | | | 2.95 | | | 7/02/2020 | | Monthly | | | 3,072 | | | | — | |
| Schwab U.S. Large-Cap Value ETF | | Morgan Stanley | | | (2.19 | ) | | 5/04/2020 | | Monthly | | | (23,642 | ) | | | — | |
| SPDR Blackstone / GSO Senior Loan ETF | | Morgan Stanley | | | 2.95 | | | 7/02/2020 | | Monthly | | | 50,317 | | | | — | |
See notes to financial statements.
73
Schedules of Investments — IQ Hedge Market Neutral Tracker ETF(continued)
April 30, 2019Total Return Swap contracts outstanding at April 30, 2019 (continued):
| | | | | | | | | | | | | |
Total Return Benchmark
| | Counterparty
| | Annual
Financing
Rate
Received
(Paid) %
| | Expiration
Date
| | Payment
Frequency
Received/
(Paid)
| | Notional
Amount
Long
(Short)
| | Value/
Unrealized
Appreciation/
(Depreciation)(c)
|
SPDR Bloomberg Barclays
1-3 Month T-Bill ETF | | Morgan Stanley | | | 2.95 | | | 7/02/2020 | | Monthly | | $ | 171,384 | | | $ | — | |
| SPDR Bloomberg Barclays Convertible Securities ETF | | Morgan Stanley | | | 2.10 | | | 5/04/2020 | | Monthly | | | (34,936 | ) | | | — | |
| SPDR Bloomberg Barclays High Yield Bond ETF | | Morgan Stanley | | | 1.26 | | | 5/04/2020 | | Monthly | | | (42,037 | ) | | | — | |
| SPDR Bloomberg Barclays Investment Grade Floating Rate ETF | | Morgan Stanley | | | 2.95 | | | 7/02/2020 | | Monthly | | | 24,883 | | | | — | |
| SPDR Bloomberg Barclays Short Term High Yield Bond ETF | | Morgan Stanley | | | 2.95 | | | 7/02/2020 | | Monthly | | | 18,386 | | | | — | |
SPDR Portfolio S&P 500
Growth ETF | | Morgan Stanley | | | 2.95 | | | 7/02/2020 | | Monthly | | | 1,934 | | | | — | |
SPDR Portfolio S&P 500
Value ETF | | Morgan Stanley | | | (7.49 | ) | | 5/04/2020 | | Monthly | | | (10,335 | ) | | | — | |
| SPDR S&P Bank ETF | | Morgan Stanley | | | 2.95 | | | 7/02/2020 | | Monthly | | | 7,051 | | | | — | |
| VanEck Vectors High-Yield Municipal Index ETF | | Morgan Stanley | | | 2.95 | | | 7/02/2020 | | Monthly | | | 7,541 | | | | — | |
| Vanguard FTSE All World ex-U.S. Small-Cap ETF | | Morgan Stanley | | | 2.95 | | | 7/02/2020 | | Monthly | | | 83,981 | | | | — | |
Vanguard FTSE Emerging
Markets ETF | | Morgan Stanley | | | 2.10 | | | 5/04/2020 | | Monthly | | | (125,064 | ) | | | — | |
| Vanguard FTSE Europe ETF | | Morgan Stanley | | | 2.95 | | | 7/02/2020 | | Monthly | | | 26,964 | | | | — | |
| Vanguard FTSE Pacific ETF | | Morgan Stanley | | | 2.95 | | | 7/02/2020 | | Monthly | | | 4,134 | | | | — | |
| Vanguard Growth ETF | | Morgan Stanley | | | 2.95 | | | 7/02/2020 | | Monthly | | | 16,378 | | | | — | |
| Vanguard Intermediate-Term Corporate Bond ETF | | Morgan Stanley | | | 2.95 | | | 7/02/2020 | | Monthly | | | 75,159 | | | | — | |
| Vanguard Intermediate-Term Treasury ETF | | Morgan Stanley | | | 2.10 | | | 5/04/2020 | | Monthly | | | (30,914 | ) | | | — | |
| Vanguard Mortgage-Backed Securities ETF | | Morgan Stanley | | | 2.95 | | | 7/02/2020 | | Monthly | | | 23,263 | | | | — | |
| Vanguard Small-Cap Growth ETF | | Morgan Stanley | | | 2.95 | | | 7/02/2020 | | Monthly | | | 17,632 | | | | — | |
| Vanguard Small-Cap Value ETF | | Morgan Stanley | | | 1.01 | | | 5/04/2020 | | Monthly | | | (113,295 | ) | | | — | |
| Vanguard Value ETF | | Morgan Stanley | | | 1.51 | | | 5/04/2020 | | Monthly | | | (188,903 | ) | | | — | |
| Xtrackers USD High Yield Corporate Bond ETF | | Morgan Stanley | | | 2.10 | | | 5/04/2020 | | Monthly | | | (12,172 | ) | | | — | |
| | | | | | | | | | | | | | | | | $ | — | |
At April 30, 2019 there was no collateral held or posted. The Fund either receives fees from, or pays to the counterparty, the total return of the benchmark and the agreed-upon financing rate.
(c) | | Reflects the value at reset date of April 30, 2019. |
See notes to financial statements.
74
Schedules of Investments — IQ Hedge Market Neutral Tracker ETF(continued)
April 30, 2019The following is a summary of the inputs used to value the Fund’s investments as of April 30, 2019. For more information on the valuation techniques, and their aggregation into the levels used in the table below, please refer to Note 2.
Asset Valuation Inputs
Description
| | | | Level 1
| | | Level 2
| | | Level 3
| | | Total
| |
Investments in Securities:(d) | | | | | | | | | | | | | | | | | | |
Exchange Traded Vehicle | | | | $ | 390,362 | | | $ | — | | | $ | — | | | $ | 390,362 | |
Investment Companies | | | | | 15,343,310 | | | | — | | | | — | | | | 15,343,310 | |
Short-Term Investment: | | | | | | | | | | | | | | | | | | |
Money Market Fund | | | | | 37,847 | | | | — | | | | — | | | | 37,847 | |
Investment of Cash Collateral for Securities Loaned: | | | | | | | | | | | | | | |
Money Market Fund | | | | | 2,613,985 | | | | — | | | | — | | | | 2,613,985 | |
Total Investments in Securities | | | | $ | 18,385,504 | | | $ | — | | | $ | — | | | $ | 18,385,504 | |
Other Financial Instruments:(e) | | | | | | | | | | | | | | | | | | |
Swap Contracts | | | | | — | | | | — | | | | — | | | | — | |
Total Investments in Securities and Other Financial Instruments | | | | $ | 18,385,504 | | | $ | — | | | $ | — | | | $ | 18,385,504 | |
| | | | | | | | | | | |
| | | | | | | | | | | |
| Liability Valuation Inputs | | | | | | | | | | |
| | | | | | | | | | | |
Description
| | | | Level 1
| | | Level 2
| | | Level 3
| | | Total
| |
Other Financial Instruments:(e) | | | | | | | | | | | | | | | | | | |
| Swap Contracts | | | | $ | — | | | $ | — | | | $ | — | | | $ | — | |
(d) | | For a complete listing of investments and their industries, see the Schedules of Investments. |
(e) | | Reflects the unrealized appreciation (depreciation) of the instruments. |
For the year ended April 30, 2019, the Fund did not have any transfers in and out of level 3 within the fair value hierarchy. (See Note 2)
See notes to financial statements.
75
Schedules of Investments — IQ Hedge Long/Short Tracker ETF
April 30, 2019 | | | | Shares
| | Value
|
| | | | | | | | | | |
Exchange Traded Note — 0.9% | | | | | | | | | | |
| | | | | | | | | | | |
Volatility Note — 0.9% | | | | | | | | | | |
iPath Series B S&P 500 VIX Short-Term Futures ETN* | | | | | | | | | | |
(Cost $75,138) | | | | | 2,261 | | | $ | 58,063 | |
| | | | | | | | | | | |
Investment Companies — 98.9% | | | | | | | | | | |
| | | | | | | | | | | |
Bank Loan Funds — 6.3% | | | | | | | | | | |
Invesco Senior Loan ETF(a) | | | | | 12,688 | | | | 291,443 | |
SPDR Blackstone / GSO Senior Loan ETF | | | | | 2,450 | | | | 114,783 | |
Total Bank Loan Funds | | | | | | | | | 406,226 | |
| | | | | | | | | | | |
International Equity Core
Fund — 16.0% | | | | | | | | | | |
Xtrackers MSCI EAFE Hedged Equity ETF(a)(b) | | | | | 32,038 | | | | 1,035,789 | |
| | | | | | | | | | | |
International Large Cap Growth
Fund — 5.8% | | | | | | | | | | |
iShares MSCI EAFE Growth ETF(a) | | | | | 4,665 | | | | 373,946 | |
| | | | | | | | | | | |
International Small Cap Equity
Funds — 12.7% | | | | | | | | | | |
Schwab International Small-Cap Equity ETF | | | | | 6,968 | | | | 231,338 | |
Vanguard FTSE All World ex-U.S. Small-Cap ETF | | | | | 5,526 | | | | 589,679 | |
Total International Small Cap Equity Funds | | | | | | | | | 821,017 | |
| | | | | | | | | | | |
Investment Grade Corporate Bond Funds — 15.5% | | | | | | | | | | |
iShares Broad USD Investment Grade Corporate Bond ETF(a) | | | | | 853 | | | | 47,179 | |
iShares iBoxx $ Investment Grade Corporate Bond ETF | | | | | 4,765 | | | | 568,083 | |
Vanguard Intermediate-Term Corporate Bond ETF(a) | | | | | 4,440 | | | | 386,236 | |
Total Investment Grade Corporate Bond Funds | | | | | | | | | 1,001,498 | |
| | | | | | | | | | | |
U.S. Large Cap Core Funds — 14.7% | | | | | | | | | | |
Consumer Discretionary Select Sector SPDR Fund | | | | | 3,055 | | | | 366,814 | |
Financial Select Sector SPDR Fund | | | | | 14,213 | | | | 398,248 | |
Health Care Select Sector SPDR Fund | | | | | 1,761 | | | | 157,187 | |
Technology Select Sector SPDR Fund(a) | | | | | 326 | | | | 25,659 | |
Total U.S. Large Cap Core Funds | | | | | | | | | 947,908 | |
| | | | | | | | | | | |
U.S. Long Term Treasury Bond
Funds — 3.0% | | | | | | | | | | |
iShares 20+ Year Treasury Bond ETF | | | | | 1,226 | | | | 151,595 | |
SPDR Portfolio Long Term Treasury ETF | | | | | 726 | | | | 25,867 | |
Vanguard Long-Term Treasury ETF | | | | | 180 | | | | 13,696 | |
Total U.S. Long Term Treasury Bond Funds | | | | | | | | | 191,158 | |
| | | | | | | | | | | |
U.S. Momentum Fund — 6.3% | | | | | | | | | | |
iShares Edge MSCI USA Momentum Factor ETF | | | | | 3,567 | | | | 409,171 | |
| | | | | | | | | | |
| | | | Shares
| | Value
|
| | | | | | | | | | | |
Investment Companies (continued) | | | | | | | | | | |
| | | | | | | | | | | |
U.S. Preferred Funds — 0.1% | | | | | | | | | | |
Invesco Preferred ETF | | | | | 50 | | | $ | 726 | |
iShares Preferred & Income Securities ETF | | | | | 59 | | | | 2,161 | |
Total U.S. Preferred Funds | | | | | | | | | 2,887 | |
| | | | | | | | | | | |
U.S. Small Cap Value Funds — 1.4% | | | | | | | | | | |
iShares Russell 2000 Value ETF | | | | | 234 | | | | 29,093 | |
iShares S&P Small-Cap 600 Value ETF | | | | | 129 | | | | 19,854 | |
Vanguard Small-Cap Value ETF | | | | | 314 | | | | 42,001 | |
Total U.S. Small Cap Value Funds | | | | | | | | | 90,948 | |
| | | | | | | | | | | |
U.S. Ultra Short Term Treasury Bond Funds — 17.1% | | | | | | | | | | |
Goldman Sachs Access Treasury 0-1 Year ETF | | | | | 1,108 | | | | 111,121 | |
Invesco Treasury Collateral ETF | | | | | 180 | | | | 18,991 | |
iShares Short Treasury Bond ETF | | | | | 6,231 | | | | 688,900 | |
SPDR Bloomberg Barclays 1-3 Month T-Bill ETF(a) | | | | | 3,122 | | | | 285,975 | |
Total U.S. Ultra Short Term Treasury Bond Funds | | | | | | | | | 1,104,987 | |
| | | | | | | | | | | |
Total Investment Companies | | | | | | | | | | |
(Cost $6,264,341) | | | | | | | | | 6,385,535 | |
| | | | | | | | | | | |
Short-Term Investment — 0.3% | | | | | | | | | | |
| | | | | | | | | | | |
Money Market Fund — 0.3% | | | | | | | | | | |
Morgan Stanley Institutional Liquidity Funds Treasury Portfolio — Institutional Class, 2.32%(c) | | | | | | | | | | |
(Cost $18,351) | | | | | 18,351 | | | | 18,351 | |
| | | | | | | | | | | |
Investment of Cash Collateral For Securities Loaned — 12.2% | | | | | | | | | | |
| | | | | | | | | | | |
Money Market Fund — 12.2% | | | | | | | | | | |
Dreyfus Government Cash Management Fund, Institutional Shares, 2.45%(c) | | | | | | | | | | |
(Cost $789,998) | | | | | 789,998 | | | | 789,998 | |
| | | | | | | | | | | |
Total Investments — 112.3% | | | | | | | | | | |
(Cost $7,147,828) | | | | | | | | | 7,251,947 | |
| | | | | | | | | | | |
Other Assets and Liabilities,
Net — (12.3)% | | | | | | | | | (792,750 | ) |
| | | | | | | | | | | |
Net Assets — 100.0% | | | | | | | | $ | 6,459,197 | |
* | | Non-income producing securities. |
(a) | | All or a portion of the security was on loan. In addition, “Other Assets and Liabilities, Net” may include pending sales that are also on loan. The aggregate market value of securities on loan was $1,462,836; total market value of collateral held by the Fund was $1,493,505. Market value of the collateral held includes non-cash U.S. Treasury securities collateral having a value of $703,507. |
(b) | | All or a portion of these securities have been segregated as collateral for swap contracts. The total value of securities segregated amounted to $39,928. |
(c) | | Reflects the 1-day yield at April 30, 2019. |
See notes to financial statements.
76
Schedules of Investments — IQ Hedge Long/Short Tracker ETF(continued)
April 30, 2019Total Return Swap contracts outstanding at April 30, 2019:
| | | | | | | | | | | | | |
Total Return Benchmark
| | Counterparty
| | Annual
Financing
Rate
Received
(Paid)%
| | Expiration
Date
| | Payment
Frequency
Received/
(Paid)
| | Notional
Amount
Long
(Short)
| | Value/
Unrealized
Appreciation/
(Depreciation)(d)
|
| Consumer Discretionary Select Sector SPDR Fund | | Morgan Stanley | | | 2.94 | | | 3/30/2021 | | Monthly | | $ | 36,861 | | | $ | — | |
| Energy Select Sector SPDR Fund | | Morgan Stanley | | | 2.09 | | | 3/30/2021 | | Monthly | | | (94,537 | ) | | | — | |
Financial Select Sector
SPDR Fund | | Morgan Stanley | | | 2.94 | | | 3/30/2021 | | Monthly | | | 40,069 | | | | — | |
| Goldman Sachs Access Treasury 0-1 Year ETF | | Morgan Stanley | | | 2.94 | | | 3/30/2021 | | Monthly | | | 11,232 | | | | — | |
Health Care Select Sector
SPDR Fund | | Morgan Stanley | | | 2.94 | | | 3/30/2021 | | Monthly | | | 15,799 | | | | — | |
| Invesco Preferred ETF | | Morgan Stanley | | | 2.94 | | | 3/30/2021 | | Monthly | | | 73 | | | | — | |
| Invesco Senior Loan ETF | | Morgan Stanley | | | 2.94 | | | 3/30/2021 | | Monthly | | | 29,333 | | | | — | |
| Invesco Treasury Collateral ETF | | Morgan Stanley | | | 2.94 | | | 3/30/2021 | | Monthly | | | 1,899 | | | | — | |
iPath Series B S&P 500 VIX
Short-Term Futures ETN | | Morgan Stanley | | | 2.94 | | | 3/30/2021 | | Monthly | | | 5,855 | | | | — | |
iShares 20+ Year Treasury
Bond ETF | | Morgan Stanley | | | 2.94 | | | 3/30/2021 | | Monthly | | | 15,209 | | | | — | |
| iShares Broad USD Investment Grade Corporate Bond ETF | | Morgan Stanley | | | 2.94 | | | 3/30/2021 | | Monthly | | | 4,757 | | | | — | |
| iShares Core MSCI EAFE ETF | | Morgan Stanley | | | 2.09 | | | 3/30/2021 | | Monthly | | | (44,918 | ) | | | — | |
| iShares Core MSCI Emerging Markets ETF | | Morgan Stanley | | | 2.09 | | | 3/30/2021 | | Monthly | | | (46,499 | ) | | | — | |
| iShares Core S&P U.S. Growth ETF | | Morgan Stanley | | | (1.35 | ) | | 3/30/2021 | | Monthly | | | (10,524 | ) | | | — | |
| iShares Core S&P U.S. Value ETF | | Morgan Stanley | | | (2.45 | ) | | 3/30/2021 | | Monthly | | | (8,567 | ) | | | — | |
| iShares Core U.S. REIT ETF | | Morgan Stanley | | | (5.25 | ) | | 3/30/2021 | | Monthly | | | (2,837 | ) | | | — | |
| iShares Edge MSCI USA Momentum Factor ETF | | Morgan Stanley | | | 2.94 | | | 3/30/2021 | | Monthly | | | 41,181 | | | | — | |
| iShares iBoxx $ Investment Grade Corporate Bond ETF | | Morgan Stanley | | | 2.94 | | | 3/30/2021 | | Monthly | | | 57,226 | | | | — | |
| iShares MSCI EAFE Growth ETF | | Morgan Stanley | | | 2.94 | | | 3/30/2021 | | Monthly | | | 37,595 | | | | — | |
| iShares Preferred & Income Securities ETF | | Morgan Stanley | | | 2.94 | | | 3/30/2021 | | Monthly | | | 220 | | | | — | |
| iShares Russell 2000 Growth ETF | | Morgan Stanley | | | 1.25 | | | 3/30/2021 | | Monthly | | | (26,119 | ) | | | — | |
| iShares Russell 2000 Value ETF | | Morgan Stanley | | | 2.94 | | | 3/30/2021 | | Monthly | | | 2,984 | | | | — | |
iShares S&P Small-Cap 600
Growth ETF | | Morgan Stanley | | | (1.75 | ) | | 3/30/2021 | | Monthly | | | (16,053 | ) | | | — | |
| iShares S&P Small-Cap 600 Value ETF | | Morgan Stanley | | | 2.94 | | | 3/30/2021 | | Monthly | | | 2,001 | | | | — | |
| iShares Short Treasury Bond ETF | | Morgan Stanley | | | 2.94 | | | 3/30/2021 | | Monthly | | | 69,321 | | | | — | |
| Schwab International Small-Cap Equity ETF | | Morgan Stanley | | | 2.94 | | | 3/30/2021 | | Monthly | | | 23,273 | | | | — | |
| Schwab U.S. Large-Cap Growth ETF | | Morgan Stanley | | | (2.05 | ) | | 3/30/2021 | | Monthly | | | (12,622 | ) | | | — | |
Schwab U.S. Large-Cap
Value ETF | | Morgan Stanley | | | (2.20 | ) | | 3/30/2021 | | Monthly | | | (9,502 | ) | | | — | |
| Schwab U.S. REIT ETF | | Morgan Stanley | | | (1.05 | ) | | 3/30/2021 | | Monthly | | | (12,460 | ) | | | — | |
| SPDR Blackstone / GSO Senior Loan ETF | | Morgan Stanley | | | 2.94 | | | 3/30/2021 | | Monthly | | | 11,572 | | | | — | |
SPDR Bloomberg Barclays
1-3 Month T-Bill ETF | | Morgan Stanley | | | 2.94 | | | 3/30/2021 | | Monthly | | | 28,762 | | | | — | |
SPDR Portfolio Long Term
Treasury ETF | | Morgan Stanley | | | 2.94 | | | 3/30/2021 | | Monthly | | | 2,601 | | | | — | |
SPDR Portfolio S&P 500
Growth ETF | | Morgan Stanley | | | (0.10 | ) | | 3/30/2021 | | Monthly | | | (7,968 | ) | | | — | |
SPDR Portfolio S&P 500
Value ETF | | Morgan Stanley | | | (7.50 | ) | | 3/30/2021 | | Monthly | | | (4,128 | ) | | | — | |
| Technology Select Sector SPDR Fund | | Morgan Stanley | | | 2.94 | | | 3/30/2021 | | Monthly | | | 2,597 | | | | — | |
Vanguard FTSE All World
ex-U.S. Small-Cap ETF | | Morgan Stanley | | | 2.94 | | | 3/30/2021 | | Monthly | | | 59,331 | | | | — | |
See notes to financial statements.
77
Schedules of Investments — IQ Hedge Long/Short Tracker ETF(continued)
April 30, 2019Total Return Swap contracts outstanding at April 30, 2019 (continued):
| | | | | | | | | | | | | |
Total Return Benchmark
| | Counterparty
| | Annual
Financing
Rate
Received
(Paid) %
| | Expiration
Date
| | Payment
Frequency
Received/
(Paid)
| | Notional
Amount
Long
(Short)
| | Value/
Unrealized
Appreciation/
(Depreciation)(d)
|
| Vanguard FTSE Developed Markets ETF | | Morgan Stanley | | | 1.90 | | | 3/30/2021 | | Monthly | | $ | (52,369 | ) | | $ | — | |
| Vanguard FTSE Emerging Markets ETF | | Morgan Stanley | | | 2.09 | | | 3/30/2021 | | Monthly | | | (50,095 | ) | | | — | |
| Vanguard Growth ETF | | Morgan Stanley | | | 1.38 | | | 3/30/2021 | | Monthly | | | (67,805 | ) | | | — | |
| Vanguard Intermediate-Term Corporate Bond ETF | | Morgan Stanley | | | 2.94 | | | 3/30/2021 | | Monthly | | | 38,885 | | | | — | |
| Vanguard Long-Term Treasury ETF | | Morgan Stanley | | | 2.94 | | | 3/30/2021 | | Monthly | | | 1,370 | | | | — | |
| Vanguard Real Estate ETF | | Morgan Stanley | | | 2.09 | | | 3/30/2021 | | Monthly | | | (79,134 | ) | | | — | |
| Vanguard Small-Cap Growth ETF | | Morgan Stanley | | | 0.80 | | | 3/30/2021 | | Monthly | | | (24,685 | ) | | | — | |
| Vanguard Small-Cap Value ETF | | Morgan Stanley | | | 2.94 | | | 3/30/2021 | | Monthly | | | 4,280 | | | | — | |
| Vanguard Value ETF | | Morgan Stanley | | | 1.50 | | | 3/30/2021 | | Monthly | | | (75,650 | ) | | | — | |
| Xtrackers MSCI EAFE Hedged Equity ETF | | Morgan Stanley | | | 2.94 | | | 3/30/2021 | | Monthly | | | 104,232 | | | | — | |
| | | | | | | | | | | | | | | | | $ | — | |
The total value of securities segregated as collateral for swap contracts with counterparty Morgan Stanley amounted to $39,928 at April 30, 2019. The Fund either receives fees from, or pays to the counterparty, the total return of the benchmark and the agreed-upon financing rate.
(d) | | Reflects the value at reset date of April 30, 2019. |
The following is a summary of the inputs used to value the Fund’s investments as of April 30, 2019. For more information on the valuation techniques, and their aggregation into the levels used in the table below, please refer to Note 2.
Asset Valuation Inputs
Description
| | | | Level 1
| | | Level 2
| | | Level 3
| | | Total
| |
Investments in Securities:(e) | | | | | | | | | | | | | | | | | | |
Exchange Traded Note | | | | $ | 58,063 | | | $ | — | | | $ | — | | | $ | 58,063 | |
Investment Companies | | | | | 6,385,535 | | | | — | | | | — | | | | 6,385,535 | |
Short-Term Investment: | | | | | | | | | | | | | | | | | | |
Money Market Fund | | | | | 18,351 | | | | — | | | | — | | | | 18,351 | |
Investment of Cash Collateral for Securities Loaned: | | | | | | | | | | | | | | | | | | |
Money Market Fund | | | | | 789,998 | | | | — | | | | — | | | | 789,998 | |
Total Investments in Securities | | | | | 7,251,947 | | | | — | | | | — | | | | 7,251,947 | |
Other Financial Instruments:(f) | | | | | | | | | | | | | | | | | | |
Swap Contracts | | | | | — | | | | — | | | | — | | | | — | |
Total Investments in Securities and Other Financial Instruments | | | | $ | 7,251,947 | | | $ | — | | | $ | — | | | $ | 7,251,947 | |
Liability Valuation Inputs
Description
| | | | Level 1
| | | Level 2
| | | Level 3
| | | Total
| |
Other Financial Instruments:(f) | | | | | | | | | | | | | | | | | | |
| Swap Contracts | | | | $ | — | | | $ | — | | | $ | — | | | $ | — | |
(e) | | For a complete listing of investments and their industries, see the Schedules of Investments. |
(f) | | Reflects the unrealized appreciation (depreciation) of the instruments. |
For the year ended April 30, 2019, the Fund did not have any transfers into or out of Level 3 within the fair value hierarchy. (See Note 2)
See notes to financial statements.
78
Schedules of Investments — IQ Hedge Event-Driven Tracker ETF
April 30, 2019 | | | | Shares
| | Value
|
| | | | | | | | | | |
Investment Companies — 99.8% | | | | | | | | | | |
| | | | | | | | | | | |
Bank Loan Funds — 23.8% | | | | | | | | | | |
Invesco Senior Loan ETF(a) | | | | | 31,681 | | | $ | 727,713 | |
SPDR Blackstone / GSO Senior Loan ETF | | | | | 6,118 | | | | 286,628 | |
Total Bank Loan Funds | | | | | | | | | 1,014,341 | |
| | | | | | | | | | | |
Convertible Bond Fund — 10.2% | | | | | | | | | | |
SPDR Bloomberg Barclays Convertible Securities ETF(b) | | | | | 8,099 | | | | 433,296 | |
| | | | | | | | | | | |
High Yield Corporate Bond
Funds — 31.4% | | | | | | | | | | |
iShares iBoxx High Yield Corporate Bond ETF(a) | | | | | 8,774 | | | | 762,812 | |
SPDR Bloomberg Barclays High Yield Bond ETF(a) | | | | | 12,224 | | | | 443,364 | |
Xtrackers USD High Yield Corporate Bond ETF | | | | | 2,564 | | | | 128,431 | |
Total High Yield Corporate Bond Funds | | | | | | | | | 1,334,607 | |
| | | | | | | | | | | |
Investment Grade Corporate Bond Funds — 24.6% | | | | | | | | | | |
SPDR Portfolio Short Term Corporate Bond ETF | | | | | 6,049 | | | | 184,857 | |
Vanguard Short-Term Corporate Bond ETF | | | | | 10,824 | | | | 862,997 | |
Total Investment Grade Corporate Bond Funds | | | | | | | | | 1,047,854 | |
| | | | | | | | | | | |
U.S. Small Cap Growth Funds — 9.7% | | | | | | | | | | |
iShares Russell 2000 Growth ETF(a) | | | | | 796 | | | | 161,166 | |
iShares S&P Small-Cap 600 Growth ETF | | | | | 533 | | | | 98,349 | |
Vanguard Small-Cap Growth ETF | | | | | 823 | | | | 152,749 | |
Total U.S. Small Cap Growth Funds | | | | | | | | | 412,264 | |
| | | | | | | | | | | |
U.S. Ultra Short Term Treasury Bond Funds — 0.1% | | | | | | | | | | |
Goldman Sachs Access Treasury 0-1 Year ETF | | | | | 2 | | | | 201 | |
iShares Short Treasury Bond ETF | | | | | 14 | | | | 1,548 | |
SPDR Bloomberg Barclays 1-3 Month T-Bill ETF(a) | | | | | 7 | | | | 641 | |
Total U.S. Ultra Short Term Treasury Bond Funds | | | | | | | | | 2,390 | |
| | | | | | | | | | | |
Total Investment Companies | | | | | | | | | | |
(Cost $4,166,265) | | | | | | | | | 4,244,752 | |
| | | | | | | | | | |
| | | | Shares
| | Value
|
Investment Companies (continued) | | | | | | | | | | |
| | | | | | | | | | | |
Short-Term Investment — 0.2% | | | | | | | | | | |
| | | | | | | | | | | |
Money Market Fund — 0.2% | | | | | | | | | | |
Morgan Stanley Institutional Liquidity Funds Treasury Portfolio — Institutional Class, 2.32%(c) | | | | | | | | | | |
(Cost $9,700) | | | | | 9,700 | | | $ | 9,700 | |
| | | | | | | | | | | |
Investment of Cash Collateral For Securities Loaned — 4.1% | | | | | | | | | | |
| | | | | | | | | | | |
Money Market Fund — 4.1% | | | | | | | | | | |
Dreyfus Government Cash Management Fund, Institutional Shares, 2.45%(c) | | | | | | | | | | |
(Cost $175,698) | | | | | 175,698 | | | | 175,698 | |
| | | | | | | | | | | |
Total Investments — 104.1% | | | | | | | | | | |
(Cost $4,351,663) | | | | | | | | $ | 4,430,150 | |
| | | | | | | | | | | |
Other Assets and Liabilities,
Net — (4.1)% | | | | | | | | | (177,158 | ) |
| | | | | | | | | | | |
Net Assets — 100.0% | | | | | | | | $ | 4,252,992 | |
(a) | | All or a portion of the security was on loan. In addition, ″Other Assets and Liabilities, Net″ may include pending sales that are also on loan. The aggregate market value of securities on loan was $1,116,268; total market value of collateral held by the Fund was $1,140,092. Market value of the collateral held includes non-cash U.S. Treasury securities collateral having a value of $964,394. |
(b) | | All or a portion of these securities have been segregated as collateral for swap contracts. The total value of securities segregated amounted to $5,350. |
(c) | | Reflects the 1-day yield at April 30, 2019. |
See notes to financial statements.
79
Schedules of Investments — IQ Hedge Event-Driven Tracker ETF(continued)
April 30, 2019Total Return Swap contracts outstanding at April 30, 2019:
| | | | | | | | | | | | | |
Total Return Benchmark
| | Counterparty
| | Annual
Financing
Rate
Received
(Paid)%
| | Expiration
Date
| | Payment
Frequency
Received/
(Paid)
| | Notional
Amount
Long
(Short)
| | Value/
Unrealized
Appreciation/
(Depreciation)(d)
|
| Invesco Preferred ETF | | Morgan Stanley | | | 2.09 | | | 3/30/2021 | | Monthly | | $ | (31,479 | ) | | $ | — | |
| Invesco Senior Loan ETF | | Morgan Stanley | | | 2.94 | | | 3/30/2021 | | Monthly | | | 21,913 | | | | — | |
| iShares iBoxx High Yield Corporate Bond ETF | | Morgan Stanley | | | 2.94 | | | 3/30/2021 | | Monthly | | | 22,952 | | | | — | |
| iShares Preferred & Income Securities ETF | | Morgan Stanley | | | 1.75 | | | 3/30/2021 | | Monthly | | | (94,699 | ) | | | — | |
| iShares Russell 2000 Growth ETF | | Morgan Stanley | | | 2.94 | | | 3/30/2021 | | Monthly | | | 4,859 | | | | — | |
iShares S&P Small-Cap 600
Growth ETF | | Morgan Stanley | | | 2.94 | | | 3/30/2021 | | Monthly | | | 2,952 | | | | — | |
| SPDR Blackstone / GSO Senior Loan ETF | | Morgan Stanley | | | 2.94 | | | 3/30/2021 | | Monthly | | | 8,620 | | | | — | |
| SPDR Bloomberg Barclays Convertible Securities ETF | | Morgan Stanley | | | 2.94 | | | 3/30/2021 | | Monthly | | | 13,054 | | | | — | |
| SPDR Bloomberg Barclays High Yield Bond ETF | | Morgan Stanley | | | 2.94 | | | 3/30/2021 | | Monthly | | | 13,347 | | | | — | |
| SPDR Portfolio Short Term Corporate Bond ETF | | Morgan Stanley | | | 2.94 | | | 3/30/2021 | | Monthly | | | 5,562 | | | | — | |
| Vanguard Short-Term Corporate Bond ETF | | Morgan Stanley | | | 2.94 | | | 3/30/2021 | | Monthly | | | 25,992 | | | | — | |
Vanguard Small-Cap
Growth ETF | | Morgan Stanley | | | 2.94 | | | 3/30/2021 | | Monthly | | | 4,640 | | | | — | |
| Xtrackers USD High Yield Corporate Bond ETF | | Morgan Stanley | | | 2.94 | | | 3/30/2021 | | Monthly | | | 3,857 | | | | — | |
| | | | | | | | | | | | | | | | | $ | — | |
The total value of securities segregated as collateral for swap contracts with counterparty Morgan Stanley amounted to $5,350 at April 30, 2019. The Fund either receives fees from, or pays to the counterparty, the total return of the benchmark and the agreed-upon financing rate.
(d) | | Reflects the value at reset date of April 30, 2019. |
The following is a summary of the inputs used to value the Fund’s investments as of April 30, 2019. For more information on the valuation techniques, and their aggregation into the levels used in the table below, please refer to Note 2.
Asset Valuation Inputs
Description
| | | | Level 1
| | Level 2
| | Level 3
| | Total
|
Investments in Securities:(e) | | | | | | | | | | | | | | | | | | |
Investment Companies | | | | $ | 4,244,752 | | | $ | — | | | $ | — | | | $ | 4,244,752 | |
Short-Term Investment: | | | | | | | | | | | | | | | | | | |
Money Market Fund | | | | | 9,700 | | | | — | | | | — | | | | 9,700 | |
Investment of Cash Collateral for Securities Loaned: | | | | | | | | | | | | | | | | | | |
Money Market Fund | | | | | 175,698 | | | | — | | | | — | | | | 175,698 | |
Total Investments in Securities | | | | | 4,430,150 | | | | — | | | | — | | | | 4,430,150 | |
Other Financial Instruments:(f) | | | | | | | | | | | | | | | | | | |
Swap Contracts | | | | | — | | | | — | | | | — | | | | — | |
Total Investments in Securities and Other Financial Instruments | | | | $ | 4,430,150 | | | $ | — | | | $ | — | | | $ | 4,430,150 | |
Liability Valuation Inputs
Description
| | | | Level 1
| | Level 2
| | Level 3
| | Total
|
Other Financial Instruments:(f) | | | | | | | | | | | | | | | | | | |
| Swap Contracts | | | | $ | — | | | $ | — | | | $ | — | | | $ | — | |
(e) | | For a complete listing of investments and their industries, see the Schedules of Investments. |
(f) | | Reflects the unrealized appreciation (depreciation) of the instruments. |
For the year ended April 30, 2019, the Fund did not have any transfers into or out of Level 3 within the fair value hierarchy. (See Note 2)
See notes to financial statements.
80
Schedules of Investments — IQ Real Return ETF
April 30, 2019 | | | | Shares
| | Value
|
| | | | | | | | | | |
Exchange Traded Vehicles — 4.2% | | | | | | | | | | |
| | | | | | | | | | | |
Euro Fund — 3.4% | | | | | | | | | | |
Invesco CurrencyShares Euro Currency Trust*(a) | | | | | 18,264 | | | $ | 1,952,239 | |
| | | | | | | | | | | |
Japanese Yen Fund — 0.8% | | | | | | | | | | |
Invesco CurrencyShares Japanese Yen Trust* | | | | | 5,389 | | | | 460,867 | |
| | | | | | | | | | | |
Total Exchange Traded Vehicles | | | | | | | | | | |
(Cost $2,429,199) | | | | | | | | | 2,413,106 | |
| | | | | | | | | | | |
Investment Companies — 95.7% | | | | | | | | | | |
| | | | | | | | | | | |
Emerging Equity Funds — 0.9% | | | | | | | | | | |
iShares MSCI Emerging Markets ETF | | | | | 4,078 | | | | 179,147 | |
Vanguard FTSE Emerging Markets ETF | | | | | 7,611 | | | | 330,393 | |
Total Emerging Equity Funds | | | | | | | | | 509,540 | |
| | | | | | | | | | | |
Oil Fund — 4.2% | | | | | | | | | | |
Invesco DB Oil Fund | | | | | 219,492 | | | | 2,396,853 | |
| | | | | | | | | | | |
U.S. Large Cap Core Funds — 10.2% | | | | | | | | | | |
iShares Core S&P 500 ETF | | | | | 7,448 | | | | 2,204,161 | |
SPDR S&P 500 ETF Trust(a) | | | | | 12,247 | | | | 3,600,863 | |
Total U.S. Large Cap Core Funds | | | | | | | | | 5,805,024 | |
| | | | | | | | | | | |
U.S. Short Term Investment Grade Fund — 24.9% | | | | | | | | | | |
PIMCO Enhanced Short Maturity Active Exchange-Traded Fund | | | | | 139,829 | | | | 14,215,016 | |
| | | | | | | | | | | |
U.S. Small Cap Core Fund — 4.0% | | | | | | | | | | |
iShares Russell 2000 ETF(a) | | | | | 14,256 | | | | 2,256,583 | |
| | | | | | | | | | | |
U.S. Ultra Short Term Treasury Bond Funds — 51.5% | | | | | | | | | | |
Goldman Sachs Access Treasury 0-1 Year ETF | | | | | 31,744 | | | | 3,183,606 | |
Invesco Treasury Collateral ETF | | | | | 5,150 | | | | 543,351 | |
iShares Short Treasury Bond ETF | | | | | 128,468 | | | | 14,203,422 | |
| | | | | | | | | | | |
| | | | Shares
| | Value
|
| | | | | | | | | | | |
Investment Companies (continued) | | | | | | | | | | |
| | | | | | | | | | | |
U.S. Ultra Short Term Treasury Bond Funds (continued) | | | | | | | | | | |
SPDR Bloomberg Barclays 1-3 Month T-Bill ETF(a) | | | | | 125,051 | | | $ | 11,454,671 | |
Total U.S. Ultra Short Term Treasury Bond Funds | | | | | | | | | 29,385,050 | |
| | | | | | | | | | | |
Total Investment Companies | | | | | | | | | | |
(Cost $53,867,362) | | | | | | | | | 54,568,066 | |
| | | | | | | | | | | |
Short-Term Investment — 0.1% | | | | | | | | | | |
| | | | | | | | | | | |
Money Market Fund — 0.1% | | | | | | | | | | |
Morgan Stanley Institutional Liquidity Funds Treasury Portfolio — Institutional Class, 2.32%(b) | | | | | | | | | | |
(Cost $71,289) | | | | | 71,289 | | | | 71,289 | |
| | | | | | | | | | | |
Investment of Cash Collateral For Securities Loaned — 17.7% | | | | | | | | | | |
| | | | | | | | | | | |
Money Market Fund — 17.7% | | | | | | | | | | |
Dreyfus Government Cash Management Fund, Institutional Shares, 2.45%(b) | | | | | | | | | | |
(Cost $10,081,653) | | | | | 10,081,653 | | | | 10,081,653 | |
| | | | | | | | | | | |
Total Investments — 117.7% | | | | | | | | | | |
(Cost $66,449,503) | | | | | | | | | 67,134,114 | |
| | | | | | | | | | | |
Other Assets and Liabilities,
Net — (17.7)% | | | | | | | | | (10,088,211 | ) |
| | | | | | | | | | | |
Net Assets — 100.0% | | | | | | | | $ | 57,045,903 | |
* | | Non-income producing securities. |
(a) | | All or a portion of the security was on loan. In addition, “Other Assets and Liabilities, Net” may include pending sales that are also on loan. The aggregate market value of securities on loan was $15,618,184; total market value of collateral held by the Fund was $15,950,261. Market value of the collateral held includes non-cash U.S. Treasury securities collateral having a value of $5,868,608. |
(b) | | Reflects the 1-day yield at April 30, 2019. |
The following is a summary of the inputs used to value the Fund’s investments as of April 30, 2019. For more information on the valuation techniques, and their aggregation into the levels used in the table below, please refer to Note 2.
Asset Valuation Inputs
Description
| | | | Level 1
| | Level 2
| | Level 3
| | Total
|
Investments in Securities:(c) | | | | | | | | | | | | | | | | | | |
Exchange Traded Vehicles | | | | $ | 2,413,106 | | | $ | — | | | $ | — | | | $ | 2,413,106 | |
Investment Companies | | | | | 54,568,066 | | | | — | | | | — | | | | 54,568,066 | |
Short-Term Investment: | | | | | | | | | | | | | | | | | | |
Money Market Fund | | | | | 71,289 | | | | — | | | | — | | | | 71,289 | |
Investment of Cash Collateral for Securities Loaned: | | | | | | | | | | | | | | | | | | |
Money Market Fund | | | | | 10,081,653 | | | | — | | | | — | | | | 10,081,653 | |
Total Investments in Securities | | | | $ | 67,134,114 | | | $ | — | | | $ | — | | | $ | 67,134,114 | |
(c) | | For a complete listing of investments and their industries, see the Schedules of Investments. |
For the year ended April 30, 2019, the Fund did not have any transfers into or out of Level 3 within the fair value hierarchy. (See Note 2)
See notes to financial statements.
81
Schedules of Investments — IQ Leaders GTAA Tracker ETF
April 30, 2019 | | | | Shares
| | Value
|
| | | | | | | | | | |
Investment Companies — 99.8% | | | | | | | | | | |
| | | | | | | | | | | |
Aggregate Bond Funds — 19.9% | | | | | | | | | | |
iShares Core U.S. Aggregate Bond ETF(a) | | | | | 46,728 | | | $ | 5,074,194 | |
SPDR Portfolio Aggregate Bond ETF(b) | | | | | 11,123 | | | | 316,338 | |
Vanguard Total Bond Market ETF | | | | | 40,550 | | | | 3,282,928 | |
Total Aggregate Bond Funds | | | | | | | | | 8,673,460 | |
| | | | | | | | | | | |
Convertible Bond Fund — 6.9% | | | | | | | | | | |
SPDR Bloomberg Barclays Convertible Securities ETF | | | | | 56,472 | | | | 3,021,252 | |
| | | | | | | | | | | |
Emerging Equity Funds — 8.0% | | | | | | | | | | |
iShares Core MSCI Emerging Markets ETF | | | | | 31,747 | | | | 1,677,512 | |
Vanguard FTSE Emerging Markets ETF | | | | | 41,632 | | | | 1,807,245 | |
Total Emerging Equity Funds | | | | | | | | | 3,484,757 | |
| | | | | | | | | | | |
High Yield Corporate Bond
Funds — 18.9% | | | | | | | | | | |
iShares iBoxx High Yield Corporate Bond ETF(b) | | | | | 59,991 | | | | 5,215,618 | |
SPDR Bloomberg Barclays High Yield Bond ETF(b) | | | | | 83,578 | | | | 3,031,374 | |
Total High Yield Corporate Bond Funds | | | | | | | | | 8,246,992 | |
| | | | | | | | | | | |
International Equity Core
Funds — 24.2% | | | | | | | | | | |
iShares Core MSCI EAFE ETF | | | | | 78,093 | | | | 4,885,498 | |
Vanguard FTSE Developed Markets ETF | | | | | 135,523 | | | | 5,696,032 | |
Total International Equity Core Funds | | | | | | | | | 10,581,530 | |
| | | | | | | | | | | |
Investment Grade Corporate Bond Funds — 0.6% | | | | | | | | | | |
iShares Broad USD Investment Grade Corporate Bond ETF | | | | | 356 | | | | 19,690 | |
iShares iBoxx $ Investment Grade Corporate Bond ETF | | | | | 1,991 | | | | 237,367 | |
Total Investment Grade Corporate Bond Funds | | | | | | | | | 257,057 | |
| | | | | | | | | | | |
U.S. Large Cap Core Funds — 21.3% | | | | | | | | | | |
Consumer Discretionary Select Sector SPDR Fund | | | | | 14,608 | | | | 1,753,983 | |
Consumer Staples Select Sector SPDR Fund | | | | | 1,800 | | | | 103,878 | |
Energy Select Sector SPDR Fund | | | | | 6,389 | | | | 422,377 | |
Financial Select Sector SPDR Fund | | | | | 67,333 | | | | 1,886,671 | |
Health Care Select Sector SPDR Fund | | | | | 297 | | | | 26,510 | |
Industrial Select Sector SPDR Fund(b) | | | | | 22,319 | | | | 1,741,105 | |
Utilities Select Sector SPDR Fund | | | | | 20,554 | | | | 1,206,725 | |
Vanguard Consumer Discretionary ETF(b) | | | | | 2,087 | | | | 378,185 | |
Vanguard Consumer Staples ETF(b) | | | | | 297 | | | | 44,220 | |
Vanguard Energy ETF | | | | | 1,271 | | | | 113,386 | |
Vanguard Financials ETF(b) | | | | | 8,299 | | | | 581,428 | |
| | | | | | | | | | | |
| | | | Shares
| | Value
|
| | | | | | | | | | | |
Investment Companies (continued) | | | | | | | | | | |
| | | | | | | | | | | |
U.S. Large Cap Core Funds (continued) | | | |
Vanguard Health Care ETF | | | | | 76 | | | $ | 12,755 | |
Vanguard Industrials ETF | | | | | 3,987 | | | | 583,218 | |
Vanguard Utilities ETF(b) | | | | | 3,561 | | | | 465,494 | |
Total U.S. Large Cap Core Funds | | | | | | | | | 9,319,935 | |
| | | | | | | | | | | |
Total Investment Companies | | | | | | | | | | |
(Cost $41,923,274) | | | | | | | | | 43,584,983 | |
| | | | | | | | | | | |
Short-Term Investment — 0.1% | | | | | | | | | | |
| | | | | | | | | | | |
Money Market Fund — 0.1% | | | | | | | | | | |
Morgan Stanley Institutional Liquidity Funds Treasury Portfolio — Institutional Class, 2.32%(c) | | | | | | | | | | |
(Cost $32,953) | | | | | 32,953 | | | | 32,953 | |
| | | | | | | | | | | |
Investment of Cash Collateral For Securities Loaned — 9.3% | | | | | | | | | | |
| | | | | | | | | | | |
Money Market Fund — 9.3% | | | | | | | | | | |
Dreyfus Government Cash Management Fund, Institutional Shares, 2.45%(c) | | | | | | | | | | |
(Cost $4,075,170) | | | | | 4,075,170 | | | | 4,075,170 | |
| | | | | | | | | | | |
Total Investments — 109.2% | | | | | | | | | | |
(Cost $46,031,397) | | | | | | | | | 47,693,106 | |
| | | | | | | | | | | |
Other Assets and Liabilities,
Net — (9.2)% | | | | | | | | | (4,017,689 | ) |
| | | | | | | | | | | |
Net Assets — 100.0% | | | | | | | | $ | 43,675,417 | |
(a) | | All or a portion of these securities have been segregated as collateral for swap contracts. The total value of securities segregated amounted to $235,640. |
(b) | | All or a portion of the security was on loan. In addition, “Other Assets and Liabilities, Net” may include pending sales that are also on loan. The aggregate market value of securities on loan was $6,257,252; total market value of collateral held by the Fund was $6,385,442. Market value of the collateral held includes non-cash U.S. Treasury securities collateral having a value of $2,310,272. |
(c) | | Reflects the 1-day yield at April 30, 2019. |
See notes to financial statements.
82
Schedules of Investments — IQ Leaders GTAA Tracker ETF(continued)
April 30, 2019Total Return Swap contracts outstanding at April 30, 2019:
| | | | | | | | | | | | | |
Total Return Benchmark
| | Counterparty
| | Annual
Financing
Rate
Received
(Paid)%
| | Expiration
Date
| | Payment
Frequency
Received/
(Paid)
| | Notional
Amount
Long
(Short)
| | Value/
Unrealized
Appreciation/
(Depreciation)(d)
|
| Consumer Discretionary Select Sector SPDR Fund | | Morgan Stanley | | | 2.94 | | | 10/03/2019 | | Monthly | | $ | 208,201 | | | $ | — | |
| Consumer Staples Select Sector SPDR Fund | | Morgan Stanley | | | 2.94 | | | 10/03/2019 | | Monthly | | | 12,350 | | | | — | |
| Energy Select Sector SPDR Fund | | Morgan Stanley | | | 2.94 | | | 10/03/2019 | | Monthly | | | 50,111 | | | | — | |
Financial Select Sector
SPDR Fund | | Morgan Stanley | | | 2.94 | | | 10/03/2019 | | Monthly | | | 223,880 | | | | — | |
Health Care Select Sector
SPDR Fund | | Morgan Stanley | | | 2.94 | | | 10/03/2019 | | Monthly | | | 3,124 | | | | — | |
Industrial Select Sector
SPDR Fund | | Morgan Stanley | | | 2.94 | | | 10/03/2019 | | Monthly | | | 206,648 | | | | — | |
iShares 7-10 Year Treasury
Bond ETF | | Morgan Stanley | | | 1.25 | | | 10/03/2019 | | Monthly | | | (2,095,549 | ) | | | — | |
| iShares Broad USD Investment Grade Corporate Bond ETF | | Morgan Stanley | | | 2.94 | | | 10/03/2019 | | Monthly | | | 2,323 | | | | — | |
| iShares Core MSCI EAFE ETF | | Morgan Stanley | | | 2.94 | | | 10/03/2019 | | Monthly | | | 579,744 | | | | — | |
| iShares Core MSCI Emerging Markets ETF | | Morgan Stanley | | | 2.94 | | | 10/03/2019 | | Monthly | | | 199,048 | | | | — | |
iShares Core U.S. Aggregate
Bond ETF | | Morgan Stanley | | | 2.94 | | | 10/03/2019 | | Monthly | | | 602,132 | | | | — | |
| iShares iBoxx $ Investment Grade Corporate Bond ETF | | Morgan Stanley | | | 2.94 | | | 10/03/2019 | | Monthly | | | 28,136 | | | | — | |
| iShares iBoxx High Yield Corporate Bond ETF | | Morgan Stanley | | | 2.94 | | | 10/03/2019 | | Monthly | | | 618,926 | | | | — | |
| iShares Russell 2000 ETF | | Morgan Stanley | | | 1.85 | | | 10/03/2019 | | Monthly | | | (732,883 | ) | | | — | |
| Materials Select Sector SPDR Fund | | Morgan Stanley | | | 2.09 | | | 10/03/2019 | | Monthly | | | (184,127 | ) | | | — | |
| SPDR Bloomberg Barclays Convertible Securities ETF | | Morgan Stanley | | | 2.94 | | | 10/03/2019 | | Monthly | | | 358,504 | | | | — | |
| SPDR Bloomberg Barclays High Yield Bond ETF | | Morgan Stanley | | | 2.94 | | | 10/03/2019 | | Monthly | | | 359,726 | | | | — | |
| SPDR Portfolio Aggregate Bond ETF | | Morgan Stanley | | | 2.94 | | | 10/03/2019 | | Monthly | | | 37,541 | | | | — | |
| Technology Select Sector SPDR Fund | | Morgan Stanley | | | 2.09 | | | 10/03/2019 | | Monthly | | | (14,325 | ) | | | — | |
| Utilities Select Sector SPDR Fund | | Morgan Stanley | | | 2.94 | | | 10/03/2019 | | Monthly | | | 143,194 | | | | — | |
Vanguard Consumer
Discretionary ETF | | Morgan Stanley | | | 2.94 | | | 10/03/2019 | | Monthly | | | 44,940 | | | | — | |
| Vanguard Consumer Staples ETF | | Morgan Stanley | | | 2.94 | | | 10/03/2019 | | Monthly | | | 5,211 | | | | — | |
| Vanguard Energy ETF | | Morgan Stanley | | | 2.94 | | | 10/03/2019 | | Monthly | | | 13,471 | | | | — | |
| Vanguard Financials ETF | | Morgan Stanley | | | 2.94 | | | 10/03/2019 | | Monthly | | | 69,009 | | | | — | |
| Vanguard FTSE Developed Markets ETF | | Morgan Stanley | | | 2.94 | | | 10/03/2019 | | Monthly | | | 675,926 | | | | — | |
Vanguard FTSE Emerging
Markets ETF | | Morgan Stanley | | | 2.94 | | | 10/03/2019 | | Monthly | | | 214,445 | | | | — | |
| Vanguard Health Care ETF | | Morgan Stanley | | | 2.94 | | | 10/03/2019 | | Monthly | | | 1,510 | | | | — | |
| Vanguard Industrials ETF | | Morgan Stanley | | | 2.94 | | | 10/03/2019 | | Monthly | | | 69,190 | | | | — | |
| Vanguard Real Estate ETF | | Morgan Stanley | | | 2.09 | | | 10/03/2019 | | Monthly | | | (2,084,302 | ) | | | — | |
| Vanguard Total Bond Market ETF | | Morgan Stanley | | | 2.94 | | | 10/03/2019 | | Monthly | | | 389,580 | | | | — | |
| Vanguard Utilities ETF | | Morgan Stanley | | | 2.94 | | | 10/03/2019 | | Monthly | | | 55,295 | | | | — | |
| | | | | | | | | | | | | | | | | $ | — | |
The total value of securities segregated as collateral for swap contracts with counterparty Morgan Stanley amounted to $235,640 at April 30, 2019. The Fund either receives fees from, or pays to the counterparty, the total return of the benchmark and the agreed-upon financing rate.
(d) | | Reflects the value at reset date of April 30, 2019. |
See notes to financial statements.
83
Schedules of Investments — IQ Leaders GTAA Tracker ETF(continued)
April 30, 2019The following is a summary of the inputs used to value the Fund’s investments as of April 30, 2019. For more information on the valuation techniques, and their aggregation into the levels used in the table below, please refer to Note 2.
Asset Valuation Inputs
Description
| | | | Level 1
| | | Level 2
| | | Level 3
| | | Total
| |
Investments in Securities:(e) | | | | | | | | | | | | | | | | | | |
Investment Companies | | | | $ | 43,584,983 | | | $ | — | | | $ | — | | | $ | 43,584,983 | |
Short-Term Investment: | | | | | | | | | | | | | | | | | | |
Money Market Fund | | | | | 32,953 | | | | — | | | | — | | | | 32,953 | |
Investment of Cash Collateral for Securities Loaned: | | | | | | | | | | | | | | | | | | |
Money Market Fund | | | | | 4,075,170 | | | | — | | | | — | | | | 4,075,170 | |
Total Investments in Securities | | | | | 47,693,106 | | | | — | | | | — | | | | 47,693,106 | |
Other Financial Instruments:(f) | | | | | | | | | | | | | | | | | | |
Swap Contracts | | | | | — | | | | — | | | | — | | | | — | |
Total Investments in Securities and Other Financial Instruments | | | | $ | 47,693,106 | | | $ | — | | | $ | — | | | $ | 47,693,106 | |
| | | | | | | | | | | |
| Liability Valuation Inputs | | | | | | | | | | |
| | | | | | | | | | | |
Description
| | | | Level 1
| | | Level 2
| | | Level 3
| | | Total
| |
Other Financial Instruments:(f) | | | | | | | | | | | | | | | | | | |
Swap Contracts | | | | $ | — | | | $ | — | | | $ | — | | | $ | — | |
(e) | | For a complete listing of investments and their industries, see the Schedules of Investments. |
(f) | | Reflects the unrealized appreciation (depreciation) of the instruments. |
For the year ended April 30, 2019, the Fund did not have any transfers into and out of Level 3 within the fair value hierarchy. (See Note 2)
See notes to financial statements.
84
Schedules of Investments — IQ Enhanced Core Bond U.S. ETF
April 30, 2019 | | | | Shares
| | Value
|
| | | | | | | | | | |
Investment Companies — 100.0% | | | | | | | | | | |
| | | | | | | | | | | |
Investment Grade Corporate Bond Funds — 36.1% | | | | | | | | | | |
iShares Broad USD Investment Grade Corporate Bond ETF | | | | | 98,545 | | | $ | 5,450,524 | |
SPDR Portfolio Intermediate Term Corporate Bond ETF | | | | | 117,221 | | | | 4,010,130 | |
SPDR Portfolio Long Term Corporate Bond ETF | | | | | 72,786 | | | | 1,979,051 | |
Vanguard Intermediate-Term Corporate Bond ETF(a) | | | | | 112,203 | | | | 9,760,539 | |
Vanguard Long-Term Corporate Bond ETF(a) | | | | | 117,836 | | | | 10,764,319 | |
Total Investment Grade Corporate Bond Funds | | | | | | | | | 31,964,563 | |
| | | | | | | | | | | |
Short Maturity Investment Grade Corporate Bond Fund — 13.9% | | | | | | | | | | |
Vanguard Short-Term Corporate Bond ETF | | | | | 154,590 | | | | 12,325,461 | |
| | | | | | | | | | | |
U.S. Short Term Treasury Bond Funds — 50.0% | | | | | | | | | | |
Schwab Short-Term U.S. Treasury ETF | | | | | 464,075 | | | | 23,282,643 | |
Vanguard Short-Term Treasury ETF | | | | | 347,542 | | | | 21,001,963 | |
Total U.S. Short Term Treasury Bond Funds | | | | | | | | | 44,284,606 | |
| | | | | | | | | | | |
Total Investment Companies | | | | | | | | | | |
(Cost $87,355,978) | | | | | | | | | 88,574,630 | |
| | | | | | | | | | |
| | | | Shares
| | Value
|
Short-Term Investment — 0.0%(b) | | | | | | | | | | |
| | | | | | | | | | | |
Money Market Fund — 0.0%(b) | | | | | | | | | | |
Morgan Stanley Institutional Liquidity Funds Treasury Portfolio — Institutional Class, 2.32%(c) | | | | | | | | | | |
(Cost $28,696) | | | | | 28,696 | | | $ | 28,696 | |
| | | | | | | | | | | |
Total Investments — 100.0% | | | | | | | | | | |
(Cost $87,384,674) | | | | | | | | | 88,603,326 | |
| | | | | | | | | | | |
Other Assets and Liabilities,
Net — (0.0)%(b) | | | | | | | | | (14,047 | ) |
| | | | | | | | | | | |
Net Assets — 100.0% | | | | | | | | $ | 88,589,279 | |
(a) | | All or a portion of the security was on loan. In addition, “Other Assets and Liabilities, Net” may include pending sales that are also on loan. The aggregate market value of securities on loan was $4,507,592; total market value of collateral held consisted of non-cash U.S. Treasury securities collateral having a value of $4,602,287. |
(c) | | Reflects the 1-day yield at April 30, 2019. |
The following is a summary of the inputs used to value the Fund’s investments as of April 30, 2019. For more information on the valuation techniques, and their aggregation into the levels used in the table below, please refer to Note 2.
Asset Valuation Inputs
Description
| | | | Level 1
| | Level 2
| | Level 3
| | Total
|
Investments in Securities:(d) | | | | | | | | | | | | | | | | | | |
Investment Companies | | | | $ | 88,574,630 | | | $ | — | | | $ | — | | | $ | 88,574,630 | |
Short-Term Investment: | | | | | | | | | | | | | | | | | | |
Money Market Fund | | | | | 28,696 | �� | | | — | | | | — | | | | 28,696 | |
Total Investments in Securities | | | | $ | 88,603,326 | | | $ | — | | | $ | — | | | $ | 88,603,326 | |
(d) | | For a complete listing of investments and their industries, see the Schedules of Investments. |
For the year ended April 30, 2019, the Fund did not have any transfers into or out of Level 3 within the fair value hierarchy. (See Note 2)
See notes to financial statements.
85
Schedules of Investments — IQ Enhanced Core Plus Bond U.S. ETF
April 30, 2019 | | | | Shares
| | Value
|
| | | | | | | | | | |
Investment Companies — 99.9% | | | | | | | | | | |
| | | | | | | | | | | |
Emerging Market Bond Funds — 2.8% | | | | | | | | | | |
iShares J.P. Morgan USD Emerging Markets Bond ETF | | | | | 37,141 | | | $ | 4,078,082 | |
Vanguard Emerging Markets Government Bond ETF(a) | | | | | 3,716 | | | | 290,331 | |
Total Emerging Market Bond Funds | | | | | | | | | 4,368,413 | |
| | | | | | | | | | | |
High Yield Corporate Bond
Funds — 5.9% | | | | | | | | | | |
iShares iBoxx High Yield Corporate Bond ETF(a) | | | | | 60,334 | | | | 5,245,438 | |
SPDR Bloomberg Barclays High Yield Bond ETF(a) | | | | | 85,965 | | | | 3,117,951 | |
Xtrackers USD High Yield Corporate Bond ETF | | | | | 17,249 | | | | 864,002 | |
Total High Yield Corporate Bond Funds | | | | | | | | | 9,227,391 | |
| | | | | | | | | | | |
Investment Grade Corporate Bond Funds — 30.3% | | | | | | | | | | |
iShares Broad USD Investment Grade Corporate Bond ETF | | | | | 146,328 | | | | 8,093,402 | |
SPDR Portfolio Intermediate Term Corporate Bond ETF(a) | | | | | 174,062 | | | | 5,954,661 | |
SPDR Portfolio Long Term Corporate Bond ETF | | | | | 108,079 | | | | 2,938,668 | |
Vanguard Intermediate-Term Corporate Bond ETF | | | | | 166,614 | | | | 14,493,752 | |
Vanguard Long-Term Corporate Bond ETF(a) | | | | | 174,981 | | | | 15,984,514 | |
Total Investment Grade Corporate Bond Funds | | | | | | | | | 47,464,997 | |
| | | | | | | | | | | |
Short Maturity Investment Grade Corporate Bond Fund — 11.7% | | | | | | | | | | |
Vanguard Short-Term Corporate Bond ETF | | | | | 229,550 | | | | 18,302,021 | |
| | | | | | | | | | |
| | | | Shares
| | Value
|
| | | | | | | | | | | |
Investment Companies (continued) | | | | | | | | | | |
| | | | | | | | | | | |
U.S. Short Term Treasury Bond
Funds — 49.2% | | | | | | | | | | |
Schwab Short-Term U.S. Treasury ETF | | | | | 806,983 | | | $ | 40,486,337 | |
Vanguard Short-Term Treasury ETF | | | | | 604,341 | | | | 36,520,327 | |
Total U.S. Short Term Treasury Bond Funds | | | | | | | | | 77,006,664 | |
| | | | | | | | | | | |
Total Investment Companies | | | | | | | | | | |
(Cost $154,094,559) | | | | | | | | | 156,369,486 | |
| | | | | | | | | | | |
Short-Term Investment — 0.1% | | | | | | | | | | |
| | | | | | | | | | | |
Money Market Fund — 0.1% | | | | | | | | | | |
Morgan Stanley Institutional Liquidity Funds Treasury Portfolio — Institutional Class, 2.32%(b) | | | | | | | | | | |
(Cost $149,802) | | | | | 149,802 | | | | 149,802 | |
| | | | | | | | | | | |
Investment of Cash Collateral For Securities Loaned — 0.7% | | | | | | | | | | |
| | | | | | | | | | | |
Money Market Fund — 0.7% | | | | | | | | | | |
Dreyfus Government Cash Management Fund, Institutional Shares, 2.45%(b) | | | | | | | | | | |
(Cost $1,116,868) | | | | | 1,116,868 | | | | 1,116,868 | |
| | | | | | | | | | | |
Total Investments — 100.7% | | | | | | | | | | |
(Cost $155,361,229) | | | | | | | | | 157,636,156 | |
| | | | | | | | | | | |
Other Assets and Liabilities,
Net — (0.7)% | | | | | | | | | (1,142,221 | ) |
| | | | | | | | | | | |
Net Assets — 100.0% | | | | | | | | $ | 156,493,935 | |
(a) | | All or a portion of the security was on loan. In addition, “Other Assets and Liabilities, Net” may include pending sales that are also on loan. The aggregate market value of securities on loan was $7,453,730; total market value of collateral held by the Fund was $7,616,686. Market value of the collateral held includes non-cash U.S. Treasury securities collateral having a value of $6,499,818. |
(b) | | Reflects the 1-day yield at April 30, 2019. |
The following is a summary of the inputs used to value the Fund’s investments as of April 30, 2019. For more information on the valuation techniques, and their aggregation into the levels used in the table below, please refer to Note 2.
Asset Valuation Inputs
Description
| | | | Level 1
| | Level 2
| | Level 3
| | Total
|
Investments in Securities:(c) | | | | | | | | | | | | | | | | | | |
Investment Companies | | | | $ | 156,369,486 | | | $ | — | | | $ | — | | | $ | 156,369,486 | |
Short-Term Investment: | | | | | | | | | | | | | | | | | | |
Money Market Fund | | | | | 149,802 | | | | — | | | | — | | | | 149,802 | |
Investment of Cash Collateral for Securities Loaned: | | | | | | | | | | | | | | | | | | |
Money Market Fund | | | | | 1,116,868 | | | | — | | | | — | | | | 1,116,868 | |
Total Investments in Securities | | | | $ | 157,636,156 | | | $ | — | | | $ | — | | | $ | 157,636,156 | |
(c) | | For a complete listing of investments and their industries, see the Schedules of Investments. |
For the year ended April 30, 2019, the Fund did not have any transfers into or out of Level 3 within the fair value hierarchy. (See Note 2)
See notes to financial statements.
86
Schedules of Investments — IQ Enhanced Core Plus Bond U.S. ETF(continued)
April 30, 2019A summary of the Fund’s transactions with affiliated funds during the year April 30, 2019 is as follows:
| | | | | | | | | | | | | | | | | | | | | | | |
Affiliated Holdings
| | | | Shares at
04/30/2018
| | Value Value
($) at
04/30/2018
| | Purchases
Cost
($)
| | Sales
Proceeds
($)
| | Net
Realized
Gain/(Loss)
($)
| | Net
Change in
Unrealized
Appreciation/
(Depreciation)
($)
| | Capital
Gain
Distributions
($)
| | Shares at
04/30/2019
| | Value
($) at
04/30/2019
| | Income
Distributions
($)
|
| SPDR Bloomberg Barclays Mortgage Backed Bond ETF | | | | | 520,339 | | | | 13,174,984 | | | | 28,235,817 | | | | (41,249,057 | ) | | | (310,932 | ) | | | 149,188 | | | | — | | | | — | | | | — | | | | 283,334 | |
| | | | | | 520,339 | | | | 13,174,984 | | | | 28,235,817 | | | | (41,249,057 | ) | | | (310,932 | ) | | | 149,188 | | | | — | | | | — | | | | — | | | | 283,334 | |
For more information on the determination, please refer to Note 6.
See notes to financial statements.
87
Schedules of Investments — IQ Short Duration Enhanced Core Bond U.S. ETF
April 30, 2019 | | | | Shares
| | Value
|
| | | | | | | | | | |
Investment Companies — 99.9% | | | | | | | | | | |
| | | | | | | | | | | |
Floating Rate — Investment Grade Funds — 5.7% | | | | | | | | | | |
iShares Floating Rate Bond ETF | | | | | 3,055 | | | $ | 155,683 | |
SPDR Bloomberg Barclays Investment Grade Floating Rate ETF | | | | | 1,973 | | | | 60,611 | |
Total Floating Rate — Investment Grade Funds | | | | | | | | | 216,294 | |
| | | | | | | | | | | |
High Yield Corporate Bond
Funds — 25.0% | | | | | | | | | | |
iShares 0-5 Year High Yield Corporate Bond ETF | | | | | 8,989 | | | | 421,225 | |
SPDR Bloomberg Barclays Short Term High Yield Bond ETF(a) | | | | | 19,426 | | | | 531,495 | |
Total High Yield Corporate Bond Fund | | | | | | | | | 952,720 | |
| | | | | | | | | | | |
Investment Grade Corporate Bond Fund — 4.1% | | | | | | | | | | |
iShares 0-5 Year Investment Grade Corporate Bond ETF | | | | | 3,069 | | | | 154,831 | |
| | | | | | | | | | | |
Short Maturity Investment Grade Corp Bond Fund — 60.7% | | | | | | | | | | |
Vanguard Short-Term Corporate Bond ETF(a) | | | | | 28,948 | | | | 2,308,024 | |
| | | | | | | | | | | |
U.S. Short Term Treasury Bond
Funds — 4.4% | | | | | | | | | | |
Schwab Short-Term U.S.
Treasury ETF | | | | | 1,759 | | | | 88,249 | |
Vanguard Short-Term Treasury ETF | | | | | 1,317 | | | | 79,586 | |
Total U.S. Short Term Treasury Bond Fund | | | | | | | | | 167,835 | |
| | | | | | | | | | | |
Total Investment Companies | | | | | | | | | | |
(Cost $3,765,937) | | | | | | | | | 3,799,704 | |
| | | | | | | | | | |
| | | | | | | | | | |
| | | | Shares
| | Value
|
Short-Term Investment — 0.2% | | | | | | | | | | |
| | | | | | | | | | | |
Money Market Fund — 0.2% | | | | | | | | | | |
Morgan Stanley Institutional Liquidity Funds Treasury Portfolio — Institutional Class, 2.32%(b) | | | | | | | | | | |
(Cost $6,063) | | | | | 6,063 | | | $ | 6,063 | |
| | | | | | | | | | | |
Investment of Cash Collateral For Securities Loaned — 2.3% | | | | | | | | | | |
| | | | | | | | | | | |
Money Market Fund — 2.3% | | | | | | | | | | |
Dreyfus Government Cash Management Fund, Institutional Shares, 2.45%(b) | | | | | | | | | | |
(Cost $85,755) | | | | | 85,755 | | | | 85,755 | |
| | | | | | | | | | | |
Total Investments — 102.4% | | | | | | | | | | |
(Cost $3,857,755) | | | | | | | | | 3,891,522 | |
| | | | | | | | | | | |
Other Assets and Liabilities,
Net — (2.4)% | | | | | | | | | (86,484 | ) |
| | | | | | | | | | | |
Net Assets — 100.0% | | | | | | | | $ | 3,805,038 | |
(a) | | All or a portion of the security was on loan. In addition, “Other Assets and Liabilities, Net” may include pending sales that are also on loan. The aggregate market value of securities on loan was $84,111; total market value of collateral held by the Fund was $85,755. |
(b) | | Reflects the 1-day yield at April 30, 2019. |
The following is a summary of the inputs used to value the Fund’s investments as of April 30, 2019. For more information on the valuation techniques, and their aggregation into the levels used in the table below, please refer to Note 2.
Asset Valuation Inputs
Description
| | | | Level 1
| | | Level 2
| | | Level 3
| | | Total
| |
Investments in Securities:(c) | | | | | | | | | | | | | | | | | | |
Investment Companies | | | | $ | 3,799,704 | | | $ | — | | | $ | — | | | $ | 3,799,704 | |
Short-Term Investment: | | | | | | | | | | | | | | | | | | |
Money Market Fund | | | | | 6,063 | | | | — | | | | — | | | | 6,063 | |
Investment of Cash Collateral for Securities Loaned: | | | | | | | | | | | | | | | | | | |
Money Market Fund | | | | | 85,755 | | | | — | | | | — | | | | 85,755 | |
Total Investments in Securities | | | | $ | 3,891,522 | | | $ | — | | | $ | — | | | $ | 3,891,522 | |
(c) | | For a complete listing of investments and their industries, see the Schedules of Investments. |
For the period ended April 30, 2019, the Fund did not have any transfers into or out of Level 3 within the fair value hierarchy. (See Note 2)
See notes to financial statements.
88
Schedules of Investments — IQ Merger Arbitrage ETF
April 30, 2019 | | | | Shares
| | Value
|
| | | | | | | | | | |
Common Stocks — 85.8% | | | | | | | | | | |
| | | | | | | | | | | |
Communication Services — 4.1% | | | | | | | | | | |
Inmarsat PLC | | | | | 469,042 | | | $ | 3,333,716 | |
Scout24 AG‡(a) | | | | | 91,430 | | | | 4,703,173 | |
Tribune Media Co., Class A | | | | | 698,718 | | | | 32,280,772 | |
Total Communication Services | | | | | | | | | 40,317,661 | |
| | | | | | | | | | | |
Financials — 9.4% | | | | | | | | | | |
Navigators Group, Inc. (The) | | | | | 132,329 | | | | 9,255,090 | |
Oaktree Capital Group LLC | | | | | 109,112 | | | | 5,523,250 | |
SunTrust Banks, Inc. | | | | | 1,122,069 | | | | 73,473,078 | |
TCF Financial Corp. | | | | | 187,907 | | | | 4,158,382 | |
Total Financials | | | | | | | | | 92,409,800 | |
| | | | | | | | | | | |
Health Care — 22.5% | | | | | | | | | | |
Aphria, Inc.*(a) | | | | | 1,983,663 | | | | 15,070,648 | |
BTG PLC* | | | | | 1,599,572 | | | | 17,422,533 | |
Celgene Corp.* | | | | | 769,711 | | | | 72,860,843 | |
Pacific Biosciences of California, Inc.* | | | | | 1,010,971 | | | | 7,471,076 | |
Spark Therapeutics, Inc.*(a) | | | | | 667,353 | | | | 71,199,891 | |
WellCare Health Plans, Inc.* | | | | | 144,894 | | | | 37,433,365 | |
Total Health Care | | | | | | | | | 221,458,356 | |
| | | | | | | | | | | |
Industrials — 11.4% | | | | | | | | | | |
Ceva Logistics AG*(a) | | | | | 446,833 | | | | 13,155,044 | |
L3 Technologies, Inc. | | | | | 329,921 | | | | 72,114,132 | |
Multi-Color Corp.(a) | | | | | 335,035 | | | | 16,718,247 | |
WABCO Holdings, Inc.* | | | | | 80,961 | | | | 10,722,475 | |
Total Industrials | | | | | | | | | 112,709,898 | |
| | | | | | | | | | | |
Information Technology — 36.3% | | | | | | | | | | |
Finisar Corp.*(a) | | | | | 1,758,991 | | | | 42,409,273 | |
First Data Corp., Class A* | | | | | 2,765,622 | | | | 71,518,985 | |
Luxoft Holding, Inc.*(a) | | | | | 173,280 | | | | 10,123,017 | |
Red Hat, Inc.*(b) | | | | | 479,750 | | | | 87,568,767 | |
Travelport Worldwide Ltd. | | | | | 1,278,923 | | | | 20,053,513 | |
Ultimate Software Group, Inc. (The)* | | | | | 162,758 | | | | 53,815,933 | |
Versum Materials, Inc. | | | | | 617,532 | | | | 32,222,820 | |
Worldpay, Inc., Class A* | | | | | 344,656 | | | | 40,397,130 | |
Total Information Technology | | | | | | | | | 358,109,438 | |
| | | | | | | | | | | |
Materials — 1.6% | | | | | | | | | | |
Bemis Co., Inc.(a) | | | | | 230,997 | | | | 13,263,848 | |
RPC Group PLC | | | | | 275,952 | | | | 2,838,387 | |
Total Materials | | | | | | | | | 16,102,235 | |
| | | | | | | | | | | |
Real Estate — 0.5% | | | | | | | | | | |
InfraREIT, Inc. | | | | | 237,148 | | | | 4,991,965 | |
| | | | | | | | | | | |
Total Common Stocks | | | | | | | | | | |
(Cost $828,429,578) | | | | | | | | | 846,099,353 | |
| | | | | | | | | | | |
Rights — 0.0%(c) | | | | | | | | | | |
| | | | | | | | | | | |
Materials — 0.0%(c) | | | | | | | | | | |
A. Schulman, Inc., Contingent Value Right (CVR) *(d)(e) | | | | | | | | | | |
(Cost $79,792) | | | | | 152,567 | | | | 66,061 | |
| | | | | | | | | | | |
| | | | Shares
| | Value
|
Short-Term Investment — 15.6% | | | | | | | | | | |
| | | | | | | | | | | |
Money Market Fund — 15.6% | | | | | | | | | | |
Morgan Stanley Institutional Liquidity Funds Treasury Portfolio — Institutional Class, 2.32%(f) | | | | | | | | | | |
(Cost $153,909,452) | | | | | 153,909,452 | | | $ | 153,909,452 | |
| | | | | | | | | | | |
Investment of Cash Collateral For Securities Loaned — 2.6% | | | | | | | | | | |
| | | | | | | | | | | |
Money Market Fund — 2.6% | | | | | | | | | | |
Dreyfus Government Cash Management Fund, Institutional Shares, 2.45%(f) | | | | | | | | | | |
(Cost $26,117,837) | | | | | 26,117,837 | | | | 26,117,837 | |
| | | | | | | | | | | |
Total Investments — 104.0% | | | | | | | | | | |
(Cost $1,008,536,659) | | | | | | | | | 1,026,192,703 | |
| | | | | | | | | | | |
Other Assets and Liabilities,
Net — (4.0)% | | | | | | | | | (40,393,156 | ) |
| | | | | | | | | | | |
Net Assets — 100.0% | | | | | | | | $ | 985,799,547 | |
‡ | | May be sold to institutional investors only under Rule 144A or securities offered pursuant to section 4(a)(2) of the Securities Act of 1933, as amended. |
* | | Non-income producing securities. |
(a) | | All or a portion of the security was on loan. In addition, “Other Assets and Liabilities, Net” may include pending sales that are also on loan. The aggregate market value of securities on loan was $30,647,713; total market value of collateral held by the Fund was $32,334,398. Market value of the collateral held includes non-cash U.S. Treasury securities collateral having a value of $6,216,561. |
(b) | | All or a portion of these securities have been segregated as collateral for swap contracts. The total value of securities segregated amounted to $27,808,405. |
(d) | | Security has been deemed illiquid because it may not be able to be resold within seven days at approximately the price shown. At April 30, 2019, the value of this security was $66,061. |
(e) | | Security fair valued as determined in good faith in accordance with the procedures established by the Board of Trustees. The security is fair valued using significant unobservable inputs. |
(f) | | Reflects the 1-day yield at April 30, 2019. |
See notes to financial statements.
89
Schedules of Investments — IQ Merger Arbitrage ETF(continued)
April 30, 2019Total Return Swap contracts outstanding at April 30, 2019:
| | | | | | | | | | | | | |
Total Return Benchmark
| | Counterparty
| | Annual
Financing
Rate
Received
(Paid) %
| | Expiration
Date
| | Payment
Frequency
Received/
(Paid)
| | Notional
Amount
Long
(Short)
| | Value/
Unrealized
Appreciation/
(Depreciation)(g)
|
| Financial Select Sector SPDR Fund | | Morgan Stanley | | | 2.09 | | | 1/10/2020 | | Monthly | | $ | (79,537,964 | ) | | $ | — | |
| Health Care Select Sector SPDR Fund | | Morgan Stanley | | | 2.09 | | | 1/10/2020 | | Monthly | | | (77,123,139 | ) | | | — | |
| Industrial Select Sector SPDR Fund | | Morgan Stanley | | | 2.09 | | | 1/10/2020 | | Monthly | | | (70,680,570 | ) | | | — | |
| iShares MSCI Pacific ex Japan ETF | | Morgan Stanley | | | 0.25 | | | 1/10/2020 | | Monthly | | | (13,027,296 | ) | | | — | |
| Technology Select Sector SPDR Fund | | Morgan Stanley | | | 2.09 | | | 1/10/2020 | | Monthly | | | (131,936,693 | ) | | | — | |
| | | | | | | | | | | | | | | | | $ | — | |
The total value of securities segregated as collateral for swap contracts with counterparty Morgan Stanley amounted to $27,808,405 at April 30, 2019. The Fund either receives fees from, or pays to the counterparty, the total return of the benchmark and the agreed-upon financing rate.
(g) | | Reflects the value at reset date of April 30, 2019. |
The following is a summary of the inputs used to value the Fund’s investments as of April 30, 2019. For more information on the valuation techniques, and their aggregation into the levels used in the table below, please refer to Note 2.
Asset Valuation Inputs
Description
| | | | Level 1
| | | Level 2
| | | Level 3
| | | Total
| |
Investments in Securities:(h) | | | | | | | | | | | | | | | | | | |
Common Stocks | | | | $ | 846,099,353 | | | $ | — | | | $ | — | | | $ | 846,099,353 | |
Rights | | | | | — | | | | — | | | | 66,061 | (i) | | | 66,061 | |
Short-Term Investment: | | | | | | | | | | | | | | | | | | |
Money Market Fund | | | | | 153,909,452 | | | | — | | | | — | | | | 153,909,452 | |
Investment of Cash Collateral for Securities Loaned: | | | | | | | | | | | | | | | �� | | | |
Money Market Fund | | | | | 26,117,837 | | | | — | | | | — | | | | 26,117,837 | |
Total Investments in Securities | | | | | 1,026,126,642 | | | | — | | | | 66,061 | | | | 1,026,192,703 | |
Other Financial Instruments:(j) | | | | | | | | | | | | | | | | | | |
Swap Contracts | | | | | — | | | | — | | | | — | | | | — | |
Total Investments in Securities and Other Financial Instruments | | | | $ | 1,026,126,642 | | | $ | — | | | $ | 66,061 | | | $ | 1,026,192,703 | |
| | | | | | | | | | | |
| Liability Valuation Inputs | | | | | | | | | | |
| | | | | | | | | | | |
Description
| | | | Level 1
| | | Level 2
| | | Level 3
| | | Total
| |
Other Financial Instruments:(j) | | | | | | | | | | | | | | | | | | |
Swap Contracts | | | | $ | — | | | $ | — | | | $ | — | | | $ | — | |
(h) | | For a complete listing of investments and their industries, see the Schedules of Investments. |
(i) | | The Level 3 security, valued at $66,061, has been deemed illiquid and has been fair valued in good faith in accordance with procedures established by the Board of Trustees. |
(j) | | Reflects the unrealized appreciation (depreciation) of the instruments. |
For the year ended April 30, 2019, the Fund did not have any transfers into or out of Level 3 within the fair value hierarchy. (See Note 2)
See notes to financial statements.
90
Schedules of Investments — IQ Merger Arbitrage ETF(continued)
April 30, 2019The following is a reconciliation of investments in which significant unobservable inputs (Level 3) were used in determining value:
| | | | | | | | | | | | | | | | | | | | | | | |
Investments in Securities
| | | | Balance
as of
April 30,
2018
| | Accrued
Discounts
(Premiums)
| | Realized
Gain
(Loss)
| | Change in
Unrealized
Appreciation
(Depreciation)
| | Purchases
| | Sales
| | Transfers
into
Level 3
| | Transfers
out of
Level 3
| | Balance
as of
April 30,
2019
| | Change in
Unrealized
Appreciation
(Depreciation)
from Investments
Still Held at
April 30,
2019(k)
|
Common Stock | | | | | | | | | | | | | | | | | | | | | | | | | | | | | | | | | | | | | | | | | | |
Sakari
Resources Ltd. | | | | $ | 379 | | | $ | — | | | $ | (449 | ) | | $ | 263 | | | $ | — | | | $ | (193 | ) | | $ | — | | | $ | — | | | $ | — | | | $ | — | |
Rights | | | | | | | | | | | | | | | | | | | | | | | | | | | | | | | | | | | | | | | | | | |
A. Schulman, Inc.(l) | | | | | — | | | | — | | | | — | | | | (13,731 | ) | | | 305,134 | | | | (225,342 | ) | | | — | | | | — | | | | 66,061 | | | | (13,731 | ) |
| Dyax Corp. CVR | | | | | 25,920 | | | | — | | | | 93,404 | | | | (25,920 | ) | | | — | | | | (93,404 | ) | | | — | | | | — | | | | — | | | | — | |
| Total | | | | $ | 26,299 | | | $ | — | | | $ | 92,955 | | | $ | (39,388 | ) | | $ | 305,134 | | | $ | (318,939 | ) | | $ | — | | | $ | — | | | $ | 66,061 | | | $ | (13,731 | ) |
(k) | | Included in “Net change in unrealized appreciation (depreciation) on investments” in the Statements of Operations. |
(l) | | Security has been deemed illiquid and has been fair valued in good faith in accordance with procedures established by the Board of Trustees. |
Information about Level 3 fair value measurements as of April 30, 2019.
Security Type
| | | | Fair Value
| | Valuation Technique
| | Unobservable Inputs
|
Rights | | | | $ 66,061 | | Issuer Specific Facts | | Contingent Payment Terms | |
See notes to financial statements.
91
Schedules of Investments — IQ Global Resources ETF
April 30, 2019 | | | | Shares
| | Value
|
| | | | | | | | | | |
Common Stocks — 90.9% | | | | | | | | | | |
| | | | | | | | | | | |
Argentina — 0.0%(a) | | | | | | | | | | |
Adecoagro SA* | | | | | 4,773 | | | $ | 32,456 | |
| | | | | | | | | | | |
Australia — 10.2% | | | | | | | | | | |
BHP Group Ltd. | | | | | 230,095 | | | | 6,057,020 | |
Evolution Mining Ltd. | | | | | 199,312 | | | | 447,512 | |
Fortescue Metals Group Ltd. | | | | | 140,006 | | | | 704,584 | |
GrainCorp Ltd., Class A | | | | | 9,357 | | | | 59,273 | |
Iluka Resources Ltd. | | | | | 19,186 | | | | 116,675 | |
Independence Group NL | | | | | 69,349 | | | | 217,698 | |
Mineral Resources Ltd. | | | | | 8,519 | | | | 93,479 | |
New Hope Corp. Ltd. | | | | | 190,749 | | | | 361,156 | |
Newcrest Mining Ltd. | | | | | 90,097 | | | | 1,586,004 | |
Northern Star Resources Ltd. | | | | | 75,101 | | | | 432,922 | |
OceanaGold Corp. | | | | | 72,654 | | | | 203,077 | |
OZ Minerals Ltd. | | | | | 14,734 | | | | 103,291 | |
Regis Resources Ltd. | | | | | 59,641 | | | | 201,076 | |
Resolute Mining Ltd. | | | | | 89,032 | | | | 70,812 | |
Rio Tinto PLC | | | | | 76,059 | | | | 4,427,241 | |
Sandfire Resources NL | | | | | 7,259 | | | | 35,969 | |
Saracen Mineral Holdings Ltd.* | | | | | 96,336 | | | | 189,179 | |
South32 Ltd. | | | | | 228,181 | | | | 536,421 | |
St. Barbara Ltd. | | | | | 61,307 | | | | 138,083 | |
Washington H Soul Pattinson & Co., Ltd. | | | | | 54,933 | | | | 888,899 | |
Whitehaven Coal Ltd. | | | | | 234,546 | | | | 693,358 | |
Woodside Petroleum Ltd. | | | | | 10,146 | | | | 252,729 | |
Total Australia | | | | | | | | | 17,816,458 | |
| | | | | | | | | | | |
Austria — 0.1% | | | | | | | | | | |
OMV AG | | | | | 3,545 | | | | 189,705 | |
| | | | | | | | | | | |
Brazil — 0.1% | | | | | | | | | | |
Yamana Gold, Inc. | | | | | 111,601 | | | | 243,909 | |
| | | | | | | | | | | |
Canada — 12.0% | | | | | | | | | | |
Agnico Eagle Mines Ltd. | | | | | 27,649 | | | | 1,140,326 | |
Alamos Gold, Inc., Class A | | | | | 45,663 | | | | 211,139 | |
B2Gold Corp.* | | | | | 117,980 | | | | 319,244 | |
Barrick Gold Corp. | | | | | 205,761 | | | | 2,604,899 | |
Canadian Natural Resources Ltd. | | | | | 13,019 | | | | 389,254 | |
Canfor Corp.* | | | | | 62,439 | | | | 650,290 | |
Canfor Pulp Products, Inc. | | | | | 32,552 | | | | 354,994 | |
Centerra Gold, Inc.* | | | | | 34,293 | | | | 173,861 | |
Detour Gold Corp.* | | | | | 20,642 | | | | 182,605 | |
Enbridge, Inc. | | | | | 21,947 | | | | 807,432 | |
First Majestic Silver Corp.* | | | | | 23,093 | | | | 141,284 | |
Fortuna Silver Mines, Inc.* | | | | | 18,784 | | | | 57,251 | |
Hudbay Minerals, Inc. | | | | | 11,886 | | | | 78,816 | |
IAMGOLD Corp.* | | | | | 54,961 | | | | 164,654 | |
Imperial Oil Ltd. | | | | | 8,437 | | | | 244,103 | |
Kinross Gold Corp.* | | | | | 146,841 | | | | 465,018 | |
Kirkland Lake Gold Ltd. | | | | | 24,643 | | | | 793,405 | |
Labrador Iron Ore Royalty Corp. | | | | | 2,912 | | | | 67,107 | |
Largo Resources Ltd.* | | | | | 24,070 | | | | 30,240 | |
Maple Leaf Foods, Inc. | | | | | 18,611 | | | | 432,486 | |
Mercer International, Inc.(b) | | | | | 32,512 | | | | 460,370 | |
New Gold, Inc.* | | | | | 68,013 | | | | 58,144 | |
Norbord, Inc. | | | | | 40,723 | | | | 1,032,909 | |
Nutrien Ltd. | | | | | 24,680 | | | | 1,333,072 | |
Osisko Gold Royalties Ltd. | | | | | 18,172 | | | | 204,523 | |
Pan American Silver Corp. | | | | | 24,597 | | | | 311,942 | |
Pembina Pipeline Corp. | | | | | 5,490 | | | | 195,488 | |
Pretium Resources, Inc.* | | | | | 21,632 | | | | 163,542 | |
| | | | | | | | | | |
| | | | Shares
| | Value
|
| | | | | | | | | | | |
Common Stocks (continued) | | | | | | | | | | |
| | | | | | | | | | | |
Canada (continued) | | | | | | | | | | |
SEMAFO, Inc.* | | | | | 38,233 | | | $ | 101,182 | |
SSR Mining, Inc.* | | | | | 14,224 | | | | 163,049 | |
Suncor Energy, Inc. | | | | | 17,143 | | | | 563,022 | |
Teck Resources Ltd., Class B | | | | | 130,092 | | | | 3,063,719 | |
Torex Gold Resources, Inc.* | | | | | 9,995 | | | | 95,180 | |
TransAlta Corp. | | | | | 65,315 | | | | 438,929 | |
TransCanada Corp. | | | | | 10,017 | | | | 476,128 | |
West Fraser Timber Co. Ltd. | | | | | 34,650 | | | | 1,776,547 | |
Westshore Terminals Investment Corp.(b) | | | | | 15,305 | | | | 239,155 | |
Wheaton Precious Metals Corp. | | | | | 52,185 | | | | 1,124,235 | |
Total Canada | | | | | | | | | 21,109,544 | |
| | | | | | | | | | | |
Chile — 0.4% | | | | | | | | | | |
Antofagasta PLC | | | | | 44,851 | | | | 530,908 | |
Lundin Mining Corp. | | | | | 33,478 | | | | 178,937 | |
Total Chile | | | | | | | | | 709,845 | |
| | | | | | | | | | | |
China — 10.5% | | | | | | | | | | |
Beijing Enterprises Water Group Ltd.* | | | | | 900,577 | | | | 559,030 | |
China Agri-Industries Holdings Ltd. | | | | | 215,374 | | | | 69,454 | |
China Coal Energy Co., Ltd., Class H | | | | | 3,042,431 | | | | 1,341,781 | |
China Modern Dairy Holdings Ltd.*(b) | | | | | 910,354 | | | | 136,923 | |
China Petroleum & Chemical Corp., Class H | | | | | 1,313,690 | | | | 1,009,706 | |
China Power International Development Ltd. | | | | | 2,250,358 | | | | 599,491 | |
China Shenhua Energy Co., Ltd., Class H | | | | | 4,564,011 | | | | 10,087,434 | |
CNOOC Ltd. | | | | | 484,450 | | | | 875,609 | |
Guangdong Investment Ltd. | | | | | 588,111 | | | | 1,101,949 | |
Jiangxi Copper Co., Ltd., Class H | | | | | 157,534 | | | | 208,830 | |
MMG Ltd.* | | | | | 366,317 | | | | 158,286 | |
PetroChina Co., Ltd., Class H | | | | | 1,985,877 | | | | 1,260,569 | |
Shougang Fushan Resources Group Ltd. | | | | | 1,216,592 | | | | 294,634 | |
Southern Energy Holdings
Group Ltd.* | | | | | 164,757 | | | | 321,307 | |
Zhaojin Mining Industry Co., Ltd., Class H | | | | | 378,255 | | | | 325,442 | |
Total China | | | | | | | | | 18,350,445 | |
| | | | | | | | | | | |
Egypt — 0.1% | | | | | | | | | | |
Centamin PLC | | | | | 135,516 | | | | 156,349 | |
| | | | | | | | | | | |
Finland — 8.4% | | | | | | | | | | |
Neste OYJ | | | | | 8,328 | | | | 274,769 | |
Stora Enso OYJ, Class R | | | | | 393,234 | | | | 4,876,319 | |
UPM-Kymmene OYJ | | | | | 265,934 | | | | 7,483,593 | |
Valmet OYJ | | | | | 74,605 | | | | 2,048,442 | |
Total Finland | | | | | | | | | 14,683,123 | |
| | | | | | | | | | | |
France — 2.0% | | | | | | | | | | |
Suez | | | | | 55,577 | | | | 780,122 | |
TOTAL SA | | | | | 28,313 | | | | 1,572,083 | |
Veolia Environnement SA | | | | | 49,753 | | | | 1,174,268 | |
Vilmorin & Cie SA | | | | | 938 | | | | 52,140 | |
Total France | | | | | | | | | 3,578,613 | |
See notes to financial statements.
92
Schedules of Investments — IQ Global Resources ETF(continued)
April 30, 2019 | | | | Shares
| | Value
|
| | | | | | | | | | |
Common Stocks (continued) | | | | | | | | | | |
| | | | | | | | | | | |
Germany — 0.2% | | | | | | | | | | |
Aurubis AG | | | | | 2,045 | | | $ | 99,511 | |
GEA Group AG | | | | | 7,392 | | | | 206,443 | |
Suedzucker AG(b) | | | | | 8,362 | | | | 128,387 | |
Total Germany | | | | | | | | | 434,341 | |
| | | | | | | | | | |
Hong Kong — 0.5% | | | | | | | | | | |
Agritrade Resources Ltd.(b) | | | | | 1,462,732 | | | | 238,649 | |
C.P. Pokphand Co., Ltd. | | | | | 3,790,839 | | | | 323,739 | |
Hong Kong & China Gas Co., Ltd. | | | | | 166,951 | | | | 398,364 | |
Total Hong Kong | | | | | | | | | 960,752 | |
| | | | | | | | | | | |
Italy — 0.5% | | | | | | | | | | |
Eni SpA | | | | | 39,074 | | | | 666,400 | |
Snam SpA | | | | | 35,816 | | | | 182,111 | |
Total Italy | | | | | | | | | 848,511 | |
| | | | | | | | | | | |
Ivory Coast — 0.1% | | | | | | | | | | |
Endeavour Mining Corp.* | | | | | 11,715 | | | | 165,640 | |
| | | | | | | | | | | |
Japan(c) — 3.2% | | | | | | | | | | |
Daio Paper Corp. | | | | | 74,841 | | | | 862,814 | |
Ebara Corp. | | | | | 9,000 | | | | 275,152 | |
Fuji Oil Holdings, Inc. | | | | | 3,520 | | | | 112,672 | |
Hokuto Corp. | | | | | 1,297 | | | | 22,289 | |
Itoham Yonekyu Holdings, Inc. | | | | | 44,202 | | | | 275,035 | |
Kewpie Corp. | | | | | 5,858 | | | | 134,964 | |
NH Foods Ltd.(b) | | | | | 15,407 | | | | 618,355 | |
Nichirei Corp. | | | | | 5,458 | | | | 125,552 | |
Nippon Flour Mills Co., Ltd. | | | | | 2,985 | | | | 50,253 | |
Nippon Paper Industries Co., Ltd. | | | | | 57,705 | | | | 1,141,924 | |
Nippon Steel Corp. | | | | | 40,153 | | | | 714,011 | |
Nisshin Oillio Group Ltd. (The) | | | | | 1,398 | | | | 39,853 | |
Nisshin Seifun Group, Inc. | | | | | 12,166 | | | | 282,262 | |
Prima Meat Packers Ltd.(b) | | | | | 7,522 | | | | 137,372 | |
S Foods, Inc. | | | | | 4,739 | | | | 162,966 | |
Sumitomo Metal Mining Co., Ltd. | | | | | 12,501 | | | | 390,491 | |
Toyo Suisan Kaisha Ltd. | | | | | 4,183 | | | | 159,057 | |
UACJ Corp.(b) | | | | | 2,194 | | | | 44,185 | |
Yamazaki Baking Co., Ltd. | | | | | 8,903 | | | | 132,056 | |
Total Japan | | | | | | | | | 5,681,263 | |
| | | | | | | | | | | |
Kazakhstan — 0.1% | | | | | | | | | | |
KAZ Minerals PLC | | | | | 21,408 | | | | 180,457 | |
| | | | | | | | | | | |
Luxembourg — 0.6% | | | | | | | | | | |
ArcelorMittal | | | | | 46,111 | | | | 998,806 | |
| | | | | | | | | | | |
Mexico — 0.5% | | | | | | | | | | |
Fresnillo PLC | | | | | 86,544 | | | | 844,819 | |
| | | | | | | | | | | |
Netherlands — 1.8% | | | | | | | | | | |
ForFarmers NV | | | | | 14,989 | | | | 128,002 | |
OCI NV* | | | | | 8,580 | | | | 248,564 | |
Royal Dutch Shell PLC, Class B | | | | | 88,958 | | | | 2,858,083 | |
Total Netherlands | | | | | | | | | 3,234,649 | |
| | | | | | | | | | | |
Norway — 1.0% | | | | | | | | | | |
Equinor ASA | | | | | 36,114 | | | | 803,717 | |
Norsk Hydro ASA | | | | | 93,095 | | | | 397,894 | |
Yara International ASA | | | | | 11,168 | | | | 502,511 | |
Total Norway | | | | | | | | | 1,704,122 | |
| | | | | | | | | | |
| | | | Shares
| | Value
|
| | | | | | | | | | | |
Common Stocks (continued) | | | | | | | | | | |
| | | | | | | | | | | |
Peru — 0.9% | | | | | | | | | | |
Hochschild Mining PLC | | | | | 60,063 | | | $ | 145,719 | |
Nexa Resources SA | | | | | 6,060 | | | | 71,750 | |
Southern Copper Corp. | | | | | 35,169 | | | | 1,351,193 | |
Total Peru | | | | | | | | | 1,568,662 | |
| | | | | | | | | | | |
Portugal — 1.4% | | | | | | | | | | |
Altri SGPS SA | | | | | 102,286 | | | | 800,704 | |
Navigator Co. SA (The) | | | | | 357,771 | | | | 1,579,760 | |
Total Portugal | | | | | | | | | 2,380,464 | |
| | | | | | | | | | | |
Singapore — 0.6% | | | | | | | | | | |
First Resources Ltd. | | | | | 64,873 | | | | 87,216 | |
Golden Agri-Resources Ltd. | | | | | 521,538 | | | | 111,112 | |
Olam International Ltd. | | | | | 130,333 | | | | 189,582 | |
Wilmar International Ltd. | | | | | 259,116 | | | | 692,905 | |
Total Singapore | | | | | | | | | 1,080,815 | |
| | | | | | | | | | | |
South Africa — 0.9% | | | | | | | | | | |
Anglo American PLC | | | | | 57,790 | | | | 1,492,746 | |
| | | | | | | | | | | |
Spain — 0.4% | | | | | | | | | | |
Ebro Foods SA | | | | | 6,301 | | | | 132,757 | |
Naturgy Energy Group SA | | | | | 10,706 | | | | 303,795 | |
Repsol SA | | | | | 16,499 | | | | 279,760 | |
Total Spain | | | | | | | | | 716,312 | |
| | | | | | | | | | | |
Sweden — 1.3% | | | | | | | | | | |
AAK AB | | | | | 10,391 | | | | 168,596 | |
Boliden AB*(b) | | | | | 12,443 | | | | 369,097 | |
Holmen AB, B Shares(b) | | | | | 83,767 | | | | 1,759,611 | |
Total Sweden | | | | | | | | | 2,297,304 | |
| | | | | | | | | | | |
Switzerland — 1.6% | | | | | | | | | | |
Bell Food Group AG* | | | | | 940 | | | | 270,285 | |
Glencore PLC* | | | | | 625,107 | | | | 2,480,211 | |
Total Switzerland | | | | | | | | | 2,750,496 | |
| | | | | | | | | | | |
Tanzania — 0.1% | | | | | | | | | | |
Acacia Mining PLC* | | | | | 48,162 | | | | 91,857 | |
| | | | | | | | | | | |
United Kingdom — 2.1% | | | | | | | | | | |
BP PLC | | | | | 219,711 | | | | 1,601,123 | |
Central Asia Metals PLC | | | | | 8,006 | | | | 23,849 | |
Cranswick PLC | | | | | 7,728 | | | | 291,962 | |
Pennon Group PLC | | | | | 37,827 | | | | 369,158 | |
Severn Trent PLC | | | | | 21,334 | | | | 566,254 | |
Tate & Lyle PLC | | | | | 18,951 | | | | 189,639 | |
United Utilities Group PLC | | | | | 61,339 | | | | 662,746 | |
Total United Kingdom | | | | | | | | | 3,704,731 | |
| | | | | | | | | | | |
United States — 29.1% | | | | | | | | | | |
AK Steel Holding Corp.*(b) | | | | | 14,390 | | | | 34,824 | |
Alcoa Corp.* | | | | | 8,440 | | | | 225,179 | |
American Water Works Co., Inc. | | | | | 16,238 | | | | 1,756,789 | |
Anadarko Petroleum Corp. | | | | | 5,421 | | | | 394,920 | |
Aqua America, Inc. | | | | | 16,045 | | | | 626,718 | |
Archer-Daniels-Midland Co. | | | | | 22,938 | | | | 1,023,035 | |
Bunge Ltd. | | | | | 5,779 | | | | 302,877 | |
Campbell Soup Co.(b) | | | | | 12,332 | | | | 477,125 | |
Carpenter Technology Corp. | | | | | 2,155 | | | | 107,039 | |
Century Aluminum Co.*(b) | | | | | 4,008 | | | | 33,707 | |
CF Industries Holdings, Inc. | | | | | 9,108 | | | | 407,856 | |
Chevron Corp. | | | | | 20,617 | | | | 2,475,277 | |
See notes to financial statements.
93
Schedules of Investments — IQ Global Resources ETF(continued)
April 30, 2019 | | | | Shares
| | Value
|
| | | | | | | | | | |
Common Stocks (continued) | | | | | | | | | | |
| | | | | | | | | | | |
United States (continued) | | | | | | | | | | |
Cleveland-Cliffs, Inc.(b) | | | | | 13,219 | | | $ | 132,058 | |
Coeur Mining, Inc.*(b) | | | | | 24,100 | | | | 87,001 | |
Commercial Metals Co. | | | | | 5,365 | | | | 92,761 | |
Conagra Brands, Inc. | | | | | 19,889 | | | | 612,183 | |
Concho Resources, Inc. | | | | | 2,177 | | | | 251,182 | |
ConocoPhillips | | | | | 12,309 | | | | 776,944 | |
CONSOL Energy, Inc.* | | | | | 6,335 | | | | 214,757 | |
Continental Resources, Inc.* | | | | | 4,080 | | | | 187,639 | |
Diamondback Energy, Inc. | | | | | 1,784 | | | | 189,800 | |
Domtar Corp. | | | | | 31,376 | | | | 1,534,286 | |
Ecolab, Inc. | | | | | 25,940 | | | | 4,775,035 | |
EOG Resources, Inc. | | | | | 6,294 | | | | 604,539 | |
Exxon Mobil Corp. | | | | | 45,974 | | | | 3,690,793 | |
Flowers Foods, Inc.(b) | | | | | 8,637 | | | | 187,768 | |
Flowserve Corp. | | | | | 11,783 | | | | 577,721 | |
FMC Corp. | | | | | 5,390 | | | | 426,133 | |
Freeport-McMoRan, Inc. | | | | | 65,924 | | | | 811,524 | |
Fresh Del Monte Produce, Inc. | | | | | 1,977 | | | | 58,341 | |
General Mills, Inc. | | | | | 24,523 | | | | 1,262,199 | |
Halliburton Co. | | | | | 9,468 | | | | 268,228 | |
Hecla Mining Co. | | | | | 56,724 | | | | 119,120 | |
Hess Corp. | | | | | 3,288 | | | | 210,827 | |
Hormel Foods Corp. | | | | | 80,159 | | | | 3,201,550 | |
IDEX Corp. | | | | | 6,818 | | | | 1,068,108 | |
Ingredion, Inc. | | | | | 2,730 | | | | 258,668 | |
John Bean Technologies Corp. | | | | | 1,291 | | | | 141,739 | |
Kellogg Co. | | | | | 14,077 | | | | 848,843 | |
Kinder Morgan, Inc. | | | | | 24,562 | | | | 488,047 | |
Lamb Weston Holdings, Inc. | | | | | 5,999 | | | | 420,230 | |
Louisiana-Pacific Corp. | | | | | 61,549 | | | | 1,541,802 | |
Marathon Petroleum Corp. | | | | | 7,299 | | | | 444,290 | |
McEwen Mining, Inc.(b) | | | | | 40,635 | | | | 56,076 | |
Mosaic Co. (The) | | | | | 15,787 | | | | 412,199 | |
Newmont Goldcorp Corp. | | | | | 96,099 | | | | 2,984,835 | |
Nucor Corp. | | | | | 13,866 | | | | 791,333 | |
Occidental Petroleum Corp. | | | | | 8,115 | | | | 477,811 | |
ONEOK, Inc. | | | | | 4,466 | | | | 303,375 | |
Peabody Energy Corp. | | | | | 24,831 | | | | 714,388 | |
Pentair PLC | | | | | 15,443 | | | | 602,123 | |
Phillips 66 | | | | | 4,948 | | | | 466,448 | |
Pilgrim’s Pride Corp.* | | | | | 37,255 | | | | 1,002,532 | |
Pioneer Natural Resources Co. | | | | | 1,827 | | | | 304,122 | |
Post Holdings, Inc.* | | | | | 2,723 | | | | 307,100 | |
Reliance Steel & Aluminum Co. | | | | | 3,052 | | | | 280,662 | |
Sanderson Farms, Inc. | | | | | 3,315 | | | | 502,653 | |
| | | | | | | | | | | |
| | | | Shares
| | Value
|
| | | | | | | | | | |
Common Stocks (continued) | | | | | | | | | | |
| | | | | | | | | | | |
United States (continued) | | | | | | | | | | |
Schlumberger Ltd. | | | | | 15,039 | | | $ | 641,865 | |
Seaboard Corp. | | | | | 175 | | | | 786,727 | |
Steel Dynamics, Inc. | | | | | 10,142 | | | | 321,299 | |
Tyson Foods, Inc., Class A | | | | | 53,611 | | | | 4,021,361 | |
United States Steel Corp.(b) | | | | | 7,886 | | | | 123,022 | |
Valero Energy Corp. | | | | | 4,531 | | | | 410,780 | |
Warrior Met Coal, Inc. | | | | | 11,830 | | | | 366,730 | |
Williams Cos., Inc. (The) | | | | | 13,148 | | | | 372,483 | |
Xylem, Inc.(b) | | | | | 16,152 | | | | 1,347,077 | |
Total United States | | | | | | | | | 50,946,463 | |
| | | | | | | | | | | |
Zambia — 0.2% | | | | | | | | | | |
First Quantum Minerals Ltd. | | | | | 31,363 | | | | 329,904 | |
| | | | | | | | | | | |
Total Common Stocks | | | | | | | | | | |
(Cost $157,346,691) | | | | | | | | | 159,283,561 | |
| | | | | | | | | | | |
Short-Term Investment — 8.9% | | | | | | | | | | |
| | | | | | | | | | | |
Money Market Fund — 8.9% | | | | | | | | | | |
Morgan Stanley Institutional Liquidity Funds Treasury Portfolio — Institutional Class, 2.32%(d) | | | | | | | | | | |
(Cost $15,589,427) | | | | | 15,589,427 | | | | 15,589,427 | |
| | | | | | | | | | | |
Investment of Cash Collateral For Securities Loaned — 2.0% | | | | | | | | | | |
| | | | | | | | | | | |
Money Market Fund — 2.0% | | | | | | | | | | |
Dreyfus Government Cash Management Fund, Institutional Shares, 2.45%(d) | | | | | | | | | | |
(Cost $3,586,080) | | | | | 3,586,080 | | | | 3,586,080 | |
| | | | | | | | | | | |
Total Investments — 101.8% | | | | | | | | | | |
(Cost $176,522,198) | | | | | | | | | 178,459,068 | |
| | | | | | | | | | | |
Other Assets and Liabilities,
Net — (1.8)% | | | | | | | | | (3,147,131 | ) |
| | | | | | | | | | | |
Net Assets — 100.0% | | | | | | | | $ | 175,311,937 | |
* | | Non-income producing securities. |
(b) | | All or a portion of the security was on loan. In addition, “Other Assets and Liabilities, Net” may include pending sales that are also on loan. The aggregate market value of securities on loan was $5,535,999; total market value of collateral held by the Fund was $5,807,103. Market value of the collateral held includes non-cash U.S. Treasury securities collateral having a value of $2,221,023. |
(c) | | These securities are deemed illiquid due to the extended closure of the Japanese market. |
(d) | | Reflects the 1-day yield at April 30, 2019. |
See notes to financial statements.
94
Schedules of Investments — IQ Global Resources ETF(continued)
April 30, 2019Total Return Swap contracts outstanding at April 30, 2019:
| | | | | | | | | | | | | |
Total Return Benchmark
| | Counterparty
| | Annual
Financing
Rate
Received
(Paid)%
| | Expiration
Date
| | Payment
Frequency
Received/
(Paid)
| | Notional
Amount
Long
(Short)
| | Value/
Unrealized
Appreciation/
(Depreciation)(e)
|
| iShares MSCI EAFE ETF | | Morgan Stanley | | | 2.10 | | | 5/04/2020 | | Monthly | | $ | (18,288,435 | ) | | $ | — | |
| SPDR S&P 500 ETF Trust | | Morgan Stanley | | | 2.10 | | | 5/04/2020 | | Monthly | | | (18,493,858 | ) | | | — | |
| | | | | | | | | | | | | | | | | $ | — | |
Cash posted has been segregated as collateral for swaps in the amount of $1,125,028 at April 30, 2019.
The Fund either receives fees from, or pays to the counterparty, the total return of the benchmark and the agreed-upon financing rate.
(e) | | Reflects the value at reset date of April 30, 2019. |
The following is a summary of the inputs used to value the Fund’s investments as of April 30, 2019. For more information on the valuation techniques, and their aggregation into the levels used in the table below, please refer to Note 2.
Asset Valuation Inputs
Description
| | | | Level 1
| | Level 2
| | Level 3
| | Total
|
Investments in Securities:(f) | | | | | | | | | | | | | | | | | | |
Common Stocks | | | | | | | | | | | | | | | | | | |
Argentina | | | | $ | 32,456 | | | $ | — | | | $ | — | | | $ | 32,456 | |
Australia | | | | | 17,816,458 | | | | — | | | | — | | | | 17,816,458 | |
Austria | | | | | 189,705 | | | | — | | | | — | | | | 189,705 | |
Brazil | | | | | 243,909 | | | | — | | | | — | | | | 243,909 | |
Canada | | | | | 21,109,544 | | | | — | | | | — | | | | 21,109,544 | |
Chile | | | | | 709,845 | | | | — | | | | — | | | | 709,845 | |
China | | | | | 18,350,445 | | | | — | | | | — | | | | 18,350,445 | |
Egypt | | | | | 156,349 | | | | — | | | | — | | | | 156,349 | |
Finland | | | | | 14,683,123 | | | | — | | | | — | | | | 14,683,123 | |
France | | | | | 3,578,613 | | | | — | | | | — | | | | 3,578,613 | |
Germany | | | | | 434,341 | | | | — | | | | — | | | | 434,341 | |
Hong Kong | | | | | 960,752 | | | | — | | | | — | | | | 960,752 | |
Italy | | | | | 848,511 | | | | — | | | | — | | | | 848,511 | |
Ivory Coast | | | | | 165,640 | | | | — | | | | — | | | | 165,640 | |
Japan | | | | | — | | | | 5,681,263 | | | | — | | | | 5,681,263 | |
Kazakhstan | | | | | 180,457 | | | | — | | | | — | | | | 180,457 | |
Luxembourg | | | | | 998,806 | | | | — | | | | — | | | | 998,806 | |
Mexico | | | | | 844,819 | | | | — | | | | — | | | | 844,819 | |
Netherlands | | | | | 3,234,649 | | | | — | | | | — | | | | 3,234,649 | |
Norway | | | | | 1,704,122 | | | | — | | | | — | | | | 1,704,122 | |
Peru | | | | | 1,568,662 | | | | — | | | | — | | | | 1,568,662 | |
Portugal | | | | | 2,380,464 | | | | — | | | | — | | | | 2,380,464 | |
Singapore | | | | �� | 1,080,815 | | | | — | | | | — | | | | 1,080,815 | |
South Africa | | | | | 1,492,746 | | | | — | | | | — | | | | 1,492,746 | |
Spain | | | | | 716,312 | | | | — | | | | — | | | | 716,312 | |
Sweden | | | | | 2,297,304 | | | | — | | | | — | | | | 2,297,304 | |
Switzerland | | | | | 2,750,496 | | | | — | | | | — | | | | 2,750,496 | |
Tanzania | | | | | 91,857 | | | | — | | | | — | | | | 91,857 | |
United Kingdom | | | | | 3,704,731 | | | | — | | | | — | | | | 3,704,731 | |
United States | | | | | 50,946,463 | | | | — | | | | — | | | | 50,946,463 | |
Zambia | | | | | 329,904 | | | | — | | | | — | | | | 329,904 | |
Total Common Stocks | | | | | 153,602,298 | | | | 5,681,263 | | | | — | | | | 159,283,561 | |
Short-Term Investment: | | | | | | | | | | | | | | | | | | |
Money Market Fund | | | | | 15,589,427 | | | | — | | | | — | | | | 15,589,427 | |
Investment of Cash Collateral for Securities Loaned: | | | | | | | | | | | | | | |
Money Market Fund | | | | | 3,586,080 | | | | — | | | | — | | | | 3,586,080 | |
Total Investments in Securities | | | | | 172,777,805 | | | | 5,681,263 | | | | — | | | | 178,459,068 | |
Other Financial Instruments:(g) | | | | | | | | | | | | | | | | | | |
Swap Contracts | | | | | — | | | | — | | | | — | | | | — | |
Total Investments in Securities and Other Financial Instruments | | | | $ | 172,777,805 | | | $ | 5,681,263 | | | $ | — | | | $ | 178,459,068 | |
See notes to financial statements.
95
Schedules of Investments — IQ Global Resources ETF(continued)
April 30, 2019
Liability Valuation Inputs
Description
| | | | Level 1
| | | Level 2
| | | Level 3
| | | Total
| |
Other Financial Instruments:(g) | | | | | | | | | | | | | | | | | | |
Swap Contracts | | | | $ | — | | | $ | — | | | $ | — | | | $ | — | |
(f) | | For a complete listing of investments and their countries, see the Schedules of Investments. |
(g) | | Reflects the unrealized appreciation (depreciation) of the instruments. |
For the year ended April 30, 2019, the Fund did not have any transfers into or out of Level 3 within the fair value hierarchy. (See Note 2)
The following is a reconciliation of investments in which significant unobservable inputs (Level 3) were used in determining value:
Investments in Securities
| | | | Balance
as of
April 30,
2018
| | Accrued
Discounts
(Premiums)
| | Realized
Gain
(Loss)
| | Change in
Unrealized
Appreciation
(Depreciation)
| | Purchases
| | Sales
| | Transfers
into
Level 3
| | Transfers
out of
Level 3
| | Balance
as of
April 30,
2019
| | Change in
Unrealized
Appreciation
(Depreciation)
from Investments
Still Held at
April 30,
2019(h)
|
Common Stock:
Sakari Resources Ltd. | | | | $ | 214,241 | | | $ | — | | | $ | (244,347 | ) | | $ | 139,499 | | | $ | — | | | $ | (109,393 | ) | | $ | — | | | $ | — | | | $ | — | | | $ | — | |
(h) | | Included in “Net change in unrealized appreciation (depreciation) on investments” in the Statements of Operations. |
See notes to financial statements.
96
Schedules of Investments — IQ Global Agribusiness Small Cap ETF
April 30, 2019 | | | | Shares
| | Value
|
| | | | | | | | | | |
Common Stocks — 99.8% | | | | | | | | | | |
| | | | | | | | | | | |
Argentina — 1.9% | | | | | | | | | | |
Adecoagro SA* | | | | | 27,120 | | | $ | 184,416 | |
| | | | | | | | | | | |
Australia — 15.0% | | | | | | | | | | |
Australian Agricultural Co., Ltd.*(a) | | | | | 73,087 | | | | 60,702 | |
Bega Cheese Ltd.(a) | | | | | 44,826 | | | | 159,647 | |
Costa Group Holdings Ltd. | | | | | 69,462 | | | | 277,211 | |
Elders Ltd. | | | | | 26,335 | | | | 111,957 | |
GrainCorp Ltd., Class A | | | | | 52,587 | | | | 333,120 | |
Inghams Group Ltd.(a) | | | | | 59,066 | | | | 185,003 | |
Nufarm Ltd.(a) | | | | | 72,451 | | | | 258,033 | |
Select Harvests Ltd. | | | | | 21,770 | | | | 98,066 | |
Total Australia | | | | | | | | | 1,483,739 | |
| | | | | | | | | | | |
Canada — 5.3% | | | | | | | | | | |
Maple Leaf Foods, Inc. | | | | | 17,619 | | | | 409,434 | |
Village Farms International, Inc.*(a) | | | | | 8,698 | | | | 107,787 | |
Total Canada | | | | | | | | | 517,221 | |
| | | | | | | | | | | |
China — 5.9% | | | | | | | | | | |
Ausnutria Dairy Corp., Ltd. | | | | | 108,766 | | | | 175,514 | |
China BlueChemical Ltd., Class H | | | | | 415,646 | | | | 141,456 | |
China Huishan Dairy Holdings Co., Ltd.*(b)(c) | | | | | 938,079 | | | | — | |
COFCO Meat Holdings Ltd.* | | | | | 294,051 | | | | 120,313 | |
Leyou Technologies Holdings Ltd.*(a) | | | | | 331,229 | | | | 94,994 | |
Sinofert Holdings Ltd.* | | | | | 412,168 | | | | 50,960 | |
Total China | | | | | | | | | 583,237 | |
| | | | | | | | | | | |
Indonesia — 3.0% | | | | | | | | | | |
PT Astra Agro Lestari Tbk | | | | | 91,767 | | | | 70,032 | |
PT Japfa Comfeed Indonesia Tbk | | | | | 988,491 | | | | 108,214 | |
PT Malindo Feedmill Tbk | | | | | 224,512 | | | | 18,985 | |
PT Perusahaan Perkebunan London Sumatra Indonesia Tbk | | | | | 647,026 | | | | 49,492 | |
PT Sawit Sumbermas Sarana Tbk | | | | | 699,602 | | | | 53,268 | |
Total Indonesia | | | | | | | | | 299,991 | |
| | | | | | | | | | | |
Japan(d) — 32.1% | | | | | | | | | | |
Feed One Co. Ltd. | | | | | 30,157 | | | | 46,302 | |
Fuji Oil Holdings, Inc. | | | | | 12,142 | | | | 388,653 | |
Itoham Yonekyu Holdings, Inc. | | | | | 34,831 | | | | 216,726 | |
Kumiai Chemical Industry Co., Ltd. | | | | | 25,998 | | | | 190,010 | |
Megmilk Snow Brand Co., Ltd. | | | | | 11,623 | | | | 255,993 | |
Morinaga Milk Industry Co., Ltd. | | | | | 9,658 | | | | 317,814 | |
NH Foods Ltd. | | | | | 23,317 | | | | 935,820 | |
Nichirei Corp. | | | | | 28,541 | | | | 656,539 | |
Nihon Nohyaku Co., Ltd. | | | | | 8,652 | | | | 36,667 | |
Prima Meat Packers Ltd. | | | | | 6,689 | | | | 122,159 | |
Total Japan | | | | | | | | | 3,166,683 | |
| | | | | | | | | | | |
Singapore — 5.5% | | | | | | | | | | |
Golden Agri-Resources Ltd. | | | | | 1,483,643 | | | | 316,086 | |
Japfa Ltd. | | | | | 85,439 | | | | 40,171 | |
Olam International Ltd. | | | | | 128,395 | | | | 186,763 | |
Total Singapore | | | | | | | | | 543,020 | |
| | | | | | | | | | | |
| | | | Shares
| | Value
|
| | | | | | | | | | |
Common Stocks (continued) | | | | | | | | | | |
| | | | | | | | | | | |
Spain — 2.7% | | | | | | | | | | |
Ebro Foods SA | | | | | 12,619 | | | $ | 265,872 | |
| | | | | | | | | | | |
Thailand — 2.2% | | | | | | | | | | |
GFPT PCL | | | | | 227,043 | | | | 110,232 | |
Thai Vegetable Oil PCL | | | | | 125,393 | | | | 106,049 | |
Total Thailand | | | | | | | | | 216,281 | |
| | | | | | | | | | | |
United States — 26.2% | | | | | | | | | | |
AGCO Corp. | | | | | 14,367 | | | | 1,016,896 | |
Cal-Maine Foods, Inc. | | | | | 5,309 | | | | 218,253 | |
CVR Partners LP | | | | | 17,374 | | | | 63,589 | |
Element Solutions, Inc.* | | | | | 51,928 | | | | 563,938 | |
Sanderson Farms, Inc. | | | | | 4,234 | | | | 642,001 | |
Titan International, Inc. | | | | | 11,651 | | | | 80,742 | |
Total United States | | | | | | | | | 2,585,419 | |
| | | | | | | | | | | |
Total Common Stocks | | | | | | | | | | |
(Cost $9,772,693) | | | | | | | | | 9,845,879 | |
| | | | | | | | | | | |
Investment of Cash Collateral For Securities Loaned — 6.0% | | | | | | | | | | |
| | | | | | | | | | | |
Money Market Fund — 6.0% | | | | | | | | | | |
Dreyfus Government Cash Management Fund, Institutional Shares, 2.45%(e) | | | | | | | | | | |
(Cost $594,995) | | | | | 594,995 | | | | 594,995 | |
| | | | | | | | | | | |
Total Investments — 105.8% | | | | | | | | | | |
(Cost $10,367,688) | | | | | | | | | 10,440,874 | |
| | | | | | | | | | �� | |
Other Assets and Liabilities,
Net — (5.8)% | | | | | | | | | (576,953 | ) |
| | | | | | | | | | | |
Net Assets — 100.0% | | | | | | | | $ | 9,863,921 | |
* | | Non-income producing securities. |
(a) | | All or a portion of the security was on loan. In addition, “Other Assets and Liabilities, Net” may include pending sales that are also on loan. The aggregate market value of securities on loan was $678,369; total market value of collateral held by the Fund was $729,484. Market value of the collateral held includes non-cash U.S. Treasury securities collateral having a value of $134,489. |
(b) | | Security has been deemed illiquid because it may not be able to be resold within seven days at approximately the price shown. At April 30, 2019, the value of this security was $ —. |
(c) | | Security is fair valued as determined in good faith in accordance with the procedures established by the Board of Trustees. The security is fair valued using significant unobservable inputs. |
(d) | | These securities are deemed illiquid due to the extended closure of the Japanese market. |
(e) | | Reflects the 1-day yield at April 30, 2019. |
See notes to financial statements.
97
Schedules of Investments — IQ Global Agribusiness Small Cap ETF(continued)
April 30, 2019The following is a summary of the inputs used to value the Fund’s investments as of April 30, 2019. For more information on the valuation techniques, and their aggregation into the levels used in the table below, please refer to Note 2.
Asset Valuation Inputs
Description
| | | | Level 1
| | Level 2
| | Level 3
| | Total
|
Investments in Securities:(f) | | | | | | | | | | | | | | | | | | |
| Common Stocks | | | | | | | | | | | | | | | | | | |
Argentina | | | | $ | 184,416 | | | $ | — | | | $ | — | | | $ | 184,416 | |
Australia | | | | | 1,483,739 | | | | — | | | | — | | | | 1,483,739 | |
Canada | | | | | 517,221 | | | | — | | | | — | | | | 517,221 | |
China | | | | | 583,237 | | | | — | | | | — | (g) | | | 583,237 | |
Indonesia | | | | | 299,991 | | | | — | | | | — | | | | 299,991 | |
Japan | | | | | — | | | | 3,166,683 | | | | — | | | | 3,166,683 | |
Singapore | | | | | 543,020 | | | | — | | | | — | | | | 543,020 | |
Spain | | | | | 265,872 | | | | — | | | | — | | | | 265,872 | |
Thailand | | | | | 216,281 | | | | — | | | | — | | | | 216,281 | |
United States | | | | | 2,585,419 | | | | — | | | | — | | | | 2,585,419 | |
Total Common Stocks | | | | | 6,679,196 | | | | 3,166,683 | | | | — | | | | 9,845,879 | |
Investment of Cash Collateral for Securities Loaned: | | | | | | | | | | | | | | | | | | |
Money Market Fund | | | | | 594,995 | | | | — | | | | — | | | | 594,995 | |
Total Investments in Securities | | | | $ | 7,274,191 | | | $ | 3,166,683 | | | $ | — | | | $ | 10,440,874 | |
(f) | | For a complete listing of investments and their countries, see the Schedules of Investments. |
(g) | | The Level 3 security, valued at $ — , has been deemed illiquid and has been fair valued in good faith in accordance with procedures established by the Board of Trustees. |
For the year ended April 30, 2019, the Fund did not have any transfers into or out of Level 3 within the fair value hierarchy. (See Note 2)
The following is a reconciliation of investments in which significant unobservable inputs (Level 3) were used in determining value:
Investments in Securities
| | | | Balance
as of
April 30,
2018
| | Accrued
Discounts
(Premiums)
| | Realized
Gain
(Loss)
| | Change in
Unrealized
Appreciation
(Depreciation)
| | Purchases
| | Sales
| | Transfers
into
Level 3
| | Transfers
out of
Level 3
| | Balance
as of
April 30,
2019
| | Change in
Unrealized
Appreciation
(Depreciation)
from Investments
Still Held at
April 30,
2019(h)
|
Common Stocks | | | | | | | | | | | | | | | | | | | | | | | | | | | | | | | | | | | | | | | | | | |
China Huishan
Dairy Holdings
Co., Ltd.(i) | | | | $ | — | (j) | | $ | — | | | $ | — | | | $ | — | | | $ | — | | | $ | — | | | $ | — | | | $ | — | | | $ | — | (j) | | $ | — | |
| | | | | | | | | | | | | | | | | | | | | | | | | | | | | | | | | | | | | | | | | | | |
Information about Level 3 fair value measurements as of April 30, 2019.
Security Type
| | | | Fair Value
| | Valuation Technique
| | Unobservable Inputs
|
Common Stock | | | $ — | | Issuer Specific | | Company Announcements |
(h) | | Included in “Net change in unrealized appreciation (depreciation) on investments” in the Statements of Operations. |
(i) | | Security has been deemed illiquid and has been fair valued in good faith in accordance with procedures established by the Board of Trustees. |
(j) | | Includes a level 3 security valued at $ —. |
See notes to financial statements.
98
Schedules of Investments — IQ U.S. Real Estate Small Cap ETF
April 30, 2019 | | | | Shares
| | Value
|
| | | | | | | | | | |
Common Stocks — 99.7% | | | | | | | | | | |
| | | | | | | | | | | |
Diversified REITs — 16.8% | | | | | | | | | | |
Alexander & Baldwin, Inc. | | | | | 46,848 | | | $ | 1,106,550 | |
American Assets Trust, Inc. | | | | | 26,227 | | | | 1,211,425 | |
Empire State Realty Trust, Inc., Class A | | | | | 121,320 | | | | 1,875,607 | |
Exantas Capital Corp. | | | | | 20,789 | | | | 227,640 | |
Granite Point Mortgage Trust, Inc.(a) | | | | | 34,811 | | | | 669,416 | |
Industrial Logistics Properties Trust | | | | | 45,096 | | | | 895,156 | |
Kennedy-Wilson Holdings, Inc.(a) | | | | | 82,722 | | | | 1,781,832 | |
Monmouth Real Estate Investment Corp. | | | | | 60,081 | | | | 825,513 | |
New Senior Investment Group, Inc. | | | | | 55,871 | | | | 312,319 | |
Preferred Apartment Communities, Inc., Class A(a) | | | | | 29,399 | | | | 459,800 | |
Redwood Trust, Inc.(a) | | | | | 65,912 | | | | 1,078,320 | |
Washington Real Estate Investment Trust(a) | | | | | 54,879 | | | | 1,549,783 | |
Winthrop Realty Trust*(a)(b)(c) | | | | | 29,107 | | | | 9,896 | |
Total Diversified REITs | | | | | | | | | 12,003,257 | |
| | | | | | | | | | | |
Hotel REITs — 12.5% | | | | | | | | | | |
Ashford Hospitality Trust, Inc. | | | | | 66,368 | | | | 365,688 | |
Braemar Hotels & Resorts, Inc. | | | | | 21,291 | | | | 295,945 | |
Chatham Lodging Trust | | | | | 31,536 | | | | 620,944 | |
Chesapeake Lodging Trust(a) | | | | | 41,025 | | | | 1,169,212 | |
DiamondRock Hospitality Co. | | | | | 137,028 | | | | 1,488,124 | |
Hersha Hospitality Trust | | | | | 26,174 | | | | 486,051 | |
MGM Growth Properties LLC, Class A | | | | | 62,468 | | | | 2,015,218 | |
Summit Hotel Properties, Inc.(a) | | | | | 70,838 | | | | 822,429 | |
Xenia Hotels & Resorts, Inc.(a) | | | | | 77,925 | | | | 1,687,076 | |
Total Hotel REITs | | | | | | | | | 8,950,687 | |
| | | | | | | | | | | |
Mortgage REITs — 13.2% | | | | | | | | | | |
AG Mortgage Investment
Trust, Inc. | | | | | 21,938 | | | | 375,359 | |
Anworth Mortgage Asset Corp. | | | | | 67,022 | | | | 280,822 | |
Apollo Commercial Real Estate Finance, Inc.(a) | | | | | 92,549 | | | | 1,734,368 | |
Arbor Realty Trust, Inc.(a) | | | | | 51,109 | | | | 698,149 | |
ARMOUR Residential REIT, Inc. | | | | | 40,924 | | | | 780,830 | |
Capstead Mortgage Corp.(a) | | | | | 58,149 | | | | 499,500 | |
Dynex Capital, Inc. | | | | | 47,841 | | | | 291,830 | |
Front Yard Residential Corp. | | | | | 33,670 | | | | 333,670 | |
Invesco Mortgage Capital, Inc. | | | | | 88,247 | | | | 1,440,191 | |
iStar, Inc.(a) | | | | | 44,817 | | | | 388,563 | |
KKR Real Estate Finance Trust, Inc. | | | | | 16,457 | | | | 331,938 | |
New York Mortgage Trust, Inc.(a) | | | | | 127,677 | | | | 804,365 | |
Orchid Island Capital, Inc. | | | | | 32,555 | | | | 213,886 | |
PennyMac Mortgage Investment Trust | | | | | 45,788 | | | | 961,548 | |
Western Asset Mortgage Capital Corp. | | | | | 32,251 | | | | 339,281 | |
Total Mortgage REITs | | | | | | | | | 9,474,300 | |
| | | | | | | | | | |
| | | | Shares
| | Value
|
| | | | | | | | | | | |
Common Stocks (continued) | | | | | | | | | | |
| | | | | | | | | | | |
Office REITs — 16.4% | | | | | | | | | | |
Brandywine Realty Trust | | | | | 120,244 | | | $ | 1,850,555 | |
City Office REIT, Inc.(a) | | | | | 25,945 | | | | 300,962 | |
Easterly Government Properties, Inc.(a) | | | | | 41,966 | | | | 755,388 | |
Franklin Street Properties Corp. | | | | | 71,355 | | | | 560,850 | |
Global Net Lease, Inc. | | | | | 58,006 | | | | 1,106,175 | |
Lexington Realty Trust | | | | | 158,374 | | | | 1,436,452 | |
Mack-Cali Realty Corp. | | | | | 55,349 | | | | 1,288,525 | |
Office Properties Income Trust | | | | | 32,663 | | | | 886,474 | |
Rexford Industrial Realty, Inc. | | | | | 66,881 | | | | 2,534,121 | |
Tier REIT, Inc. | | | | | 36,826 | | | | 1,043,649 | |
Total Office REITs | | | | | | | | | 11,763,151 | |
| | | | | | | | | | | |
Residential REIT — 0.9% | | | | | | | | | | |
Independence Realty Trust, Inc. | | | | | 61,482 | | | | 651,094 | |
| | | | | | | | | | | |
Retail REITs — 19.5% | | | | | | | | | | |
Acadia Realty Trust | | | | | 56,236 | | | | 1,588,105 | |
Agree Realty Corp.(a) | | | | | 25,182 | | | | 1,648,665 | |
Brookfield Property REIT, Inc., Class A | | | | | 69,242 | | | | 1,442,311 | |
CBL & Associates Properties,
Inc.(a) | | | | | 116,378 | | | | 117,542 | |
Cedar Realty Trust, Inc. | | | | | 58,968 | | | | 181,032 | |
Four Corners Property Trust, Inc.(a) | | | | | 47,043 | | | | 1,337,903 | |
Kite Realty Group Trust(a) | | | | | 57,690 | | | | 910,925 | |
Pennsylvania Real Estate Investment Trust(a) | | | | | 43,809 | | | | 263,730 | |
Retail Opportunity Investments Corp. | | | | | 77,193 | | | | 1,354,737 | |
RPT Realty(a) | | | | | 54,306 | | | | 658,732 | |
Seritage Growth Properties, Class A(a) | | | | | 22,419 | | | | 999,663 | |
Tanger Factory Outlet Centers, Inc. | | | | | 63,616 | | | | 1,148,905 | |
Urban Edge Properties | | | | | 75,575 | | | | 1,403,428 | |
Washington Prime Group, Inc.(a) | | | | | 128,251 | | | | 570,717 | |
Whitestone REIT | | | | | 26,235 | | | | 336,595 | |
Total Retail REITs | | | | | | | | | 13,962,990 | |
| | | | | | | | | | | |
Specialized REITs — 20.4% | | | | | | | | | | |
American Finance Trust, Inc. | | | | | 73,396 | | | | 720,015 | |
CareTrust REIT, Inc. | | | | | 60,599 | | | | 1,469,526 | |
CatchMark Timber Trust, Inc., Class A(a) | | | | | 33,640 | | | | 336,400 | |
InfraREIT, Inc. | | | | | 27,150 | | | | 571,507 | |
Innovative Industrial Properties, Inc.(a) | | | | | 6,388 | | | | 543,874 | |
LTC Properties, Inc. | | | | | 27,061 | | | | 1,219,369 | |
MedEquities Realty Trust, Inc. | | | | | 19,213 | | | | 205,771 | |
National Storage Affiliates Trust | | | | | 39,138 | | | | 1,145,178 | |
Physicians Realty Trust | | | | | 125,678 | | | | 2,269,745 | |
QTS Realty Trust, Inc., Class A(a) | | | | | 40,065 | | | | 1,816,948 | |
Spirit MTA REIT | | | | | 29,579 | | | | 199,362 | |
STAG Industrial, Inc. | | | | | 77,845 | | | | 2,240,379 | |
Terreno Realty Corp. | | | | | 41,308 | | | | 1,844,402 | |
Total Specialized REITs | | | | | | | | | 14,582,476 | |
| | | | | | | | | | | |
Total Common Stocks | | | | | | | | | | |
(Cost $74,739,746) | | | | | | | | | 71,387,955 | |
See notes to financial statements.
99
Schedules of Investments — IQ U.S. Real Estate Small Cap ETF(continued)
April 30, 2019 | | | | Shares
| | Value
|
Short-Term Investment — 0.3% | | | | | | | | | | |
| | | | | | | | | | | |
Money Market Fund — 0.3% | | | | | | | | | | |
Morgan Stanley Institutional Liquidity Funds Treasury Portfolio — Institutional Class, 2.32%(d) | | | | | | | | | | |
(Cost $181,070) | | | | | 181,070 | | | $ | 181,070 | |
| | | | | | | | | | | |
Investment of Cash Collateral For Securities Loaned — 4.5% | | | | | | | | | | |
| | | | | | | | | | | |
Money Market Fund — 4.5% | | | | | | | | | | |
Dreyfus Government Cash Management Fund, Institutional Shares, 2.45%(d) | | | | | | | | | | |
(Cost $3,241,315) | | | | | 3,241,315 | | | | 3,241,315 | |
| | | | | | | | | | | |
Total Investments — 104.5% | | | | | | | | | | |
(Cost $78,162,131) | | | | | | | | | 74,810,340 | |
| | | | | | | | | | | |
Other Assets and Liabilities,
Net — (4.5)% | | | | | | | | | (3,195,345 | ) |
| | | | | | | | | | | |
Net Assets — 100.0% | | | | | | | | $ | 71,614,995 | |
* | | Non-income producing securities. |
(a) | | All or a portion of the security was on loan. In addition, “Other Assets and Liabilities, Net” may include pending sales that are also on loan. The aggregate market value of securities on loan was $14,857,669; total market value of collateral held by the Fund was $15,222,033. Market value of the collateral held includes non-cash U.S. Treasury securities collateral having a value of $11,980,718. |
(b) | | Security has been deemed illiquid because it may not be able to be resold within seven days at approximately the price shown. At April 30, 2019, the value of this security was $9,896. |
(c) | | Security fair valued as determined in good faith in accordance with the procedures established by the Board of Trustees. The security is fair valued using significant unobservable inputs. |
(d) | | Reflects the 1-day yield at April 30, 2019. |
See notes to financial statements.
100
Schedules of Investments — IQ U.S. Real Estate Small Cap ETF(continued)
April 30, 2019The following is a summary of the inputs used to value the Fund’s investments as of April 30, 2019. For more information on the valuation techniques, and their aggregation into the levels used in the table below, please refer to Note 2.
Asset Valuation Inputs
Description
| | | | Level 1
| | Level 2
| | Level 3
| | Total
|
Investments in Securities:(e) | | | | | | | | | | | | | | | | | | |
Common Stocks | | | | | | | | | | | | | | | | | | |
Diversified REITs | | | | $ | 11,993,361 | | | $ | — | | | $ | 9,896 | (f) | | $ | 12,003,257 | |
Hotel REITs | | | | | 8,950,687 | | | | — | | | | — | | | | 8,950,687 | |
Mortgage REITs | | | | | 9,474,300 | | | | — | | | | — | | | | 9,474,300 | |
Office REITs | | | | | 11,763,151 | | | | — | | | | — | | | | 11,763,151 | |
Residential REITs | | | | | 651,094 | | | | — | | | | — | | | | 651,094 | |
Retail REITs | | | | | 13,962,990 | | | | — | | | | — | | | | 13,962,990 | |
Specialized REITs | | | | | 14,582,476 | | | | — | | | | — | | | | 14,582,476 | |
Total Common Stocks | | | | | 71,378,059 | | | | — | | | | 9,896 | | | | 71,387,955 | |
Short-Term Investment: | | | | | | | | | | | | | | | | | | |
Money Market Fund | | | | | 181,070 | | | | — | | | | — | | | | 181,070 | |
Investment of Cash Collateral for Securities Loaned: | | | | | | | | | | | | | | | | | | |
Money Market Fund | | | | | 3,241,315 | | | | — | | | | — | | | | 3,241,315 | |
Total Investments in Securities | | | | $ | 74,800,444 | | | $ | — | | | $ | 9,896 | | | $ | 74,810,340 | |
(e) | | For a complete listing of investments and their industries, see the Schedules of Investments. |
(f) | | The Level 3 security, valued at $9,896, has been deemed illiquid and has been fair valued in good faith in accordance with procedures established by the Board of Trustees. |
For the year ended April 30, 2019, the Fund did not have any transfers into or out of Level 3 within the fair value hierarchy. (See Note 2).
The following is a reconciliation of investments in which significant unobservable inputs (Level 3) were used in determining value:
Investments in Securities
| | | | Balance
as of
April 30,
2018
| | Accrued
Discounts
(Premiums)
| | Realized
Gain
(Loss)
| | Change in
Unrealized
Appreciation
(Depreciation)
| | Purchases
| | Sales
| | Transfers
into
Level 3
| | Transfers
out of
Level 3
| | Balance
as of
April 30,
2019
| | Change in
Unrealized
Appreciation
(Depreciation)
from Investments
Still Held at
April 30,
2019(g)
|
| Common Stock: | | | | | | | | | | | | | | | | | | | | | | | | | | | | | | | | | | | | | | | | | | |
Winthrop Realty
Trust(h) | | | | $ | 164,454 | | | $ | — | | | $ | — | | | $ | 21,539 | | | $ | — | | | $ | (176,097 | ) | | $ | — | | | $ | — | | | $ | 9,896 | | | $ | 21,539 | |
(g) | | Included in “Net change in unrealized appreciation (depreciation) on investments” in the Statement of Operations. |
(h) | | Security has been deemed illiquid and has been fair valued in good faith in accordance with procedures established by the Board of Trustees. |
Information about Level 3 fair value measurements as of April 30, 2019.
Security Type
| | | | Fair Value
| | Valuation Technique
| | Unobservable Inputs
|
Common Stock | | | | $ 9,896 | | Issuer Specific Facts | | Company Information | |
See notes to financial statements.
101
Schedules of Investments — IQ S&P High Yield Low Volatility Bond ETF
April 30, 2019 | | | | Principal
Amount
| | Value
|
| | | | | | | | | | |
Long-Term Bonds — 98.1%
| | | | | | | | | | |
| | | | | | | | | | | |
Corporate Bonds — 91.2% | | | | | | | | | | |
| | | | | | | | | | | |
Consumer Discretionary — 9.8% | | | | | | | | | | |
Allison Transmission, Inc. | | | | | | | | | | |
5.000%, due 10/1/24‡ | | | | $ | 155,000 | | | $ | 156,356 | |
5.875%, due 6/1/29‡ | | | | | 100,000 | | | | 102,875 | |
Boyd Gaming Corp. | | | | | | | | | | |
6.000%, due 8/15/26 | | | | | 125,000 | | | | 129,687 | |
6.375%, due 4/1/26 | | | | | 136,000 | | | | 142,800 | |
Churchill Downs, Inc. | | | | | | | | | | |
4.750%, due 1/15/28‡ | | | | | 55,000 | | | | 53,969 | |
5.500%, due 4/1/27‡ | | | | | 125,000 | | | | 128,125 | |
Dana, Inc. | | | | | | | | | | |
5.500%, due 12/15/24 | | | | | 76,000 | | | | 76,950 | |
Eldorado Resorts, Inc. | | | | | | | | | | |
6.000%, due 4/1/25 | | | | | 160,000 | | | | 165,000 | |
6.000%, due 9/15/26 | | | | | 120,000 | | | | 124,800 | |
ESH Hospitality, Inc. | | | | | | | | | �� | |
5.250%, due 5/1/25‡ | | | | | 205,000 | | | | 205,769 | |
Goodyear Tire & Rubber Co. (The) | | | | | | | | | | |
5.125%, due 11/15/23(a) | | | | | 155,000 | | | | 156,937 | |
Hanesbrands, Inc. | | | | | | | | | | |
4.625%, due 5/15/24‡ | | | | | 176,000 | | | | 176,880 | |
4.875%, due 5/15/26‡ | | | | | 154,000 | | | | 154,192 | |
Hilton Domestic Operating Co., Inc. | | | | | | | | | | |
4.250%, due 9/1/24 | | | | | 124,000 | | | | 124,000 | |
5.125%, due 5/1/26‡ | | | | | 285,000 | | | | 291,412 | |
Hilton Worldwide Finance LLC / Hilton Worldwide Finance Corp. | | | | | | | | | | |
4.625%, due 4/1/25 | | | | | 115,000 | | | | 116,294 | |
4.875%, due 4/1/27 | | | | | 134,000 | | | | 135,675 | |
International Game Technology PLC | | | | | | | | | | |
6.250%, due 2/15/22‡ | | | | | 303,000 | | | | 315,877 | |
6.250%, due 1/15/27‡ | | | | | 99,000 | | | | 103,826 | |
6.500%, due 2/15/25‡ | | | | | 203,000 | | | | 215,687 | |
KFC Holding Co./Pizza Hut Holdings LLC/Taco Bell of America LLC | | | | | | | | | | |
4.750%, due 6/1/27‡ | | | | | 119,000 | | | | 117,810 | |
5.000%, due 6/1/24‡ | | | | | 208,000 | | | | 212,680 | |
5.250%, due 6/1/26‡ | | | | | 202,000 | | | | 207,555 | |
MGM Growth Properties Operating Partnership LP / MGP Finance
Co-Issuer, Inc. | | | | | | | | | | |
4.500%, due 9/1/26 | | | | | 90,000 | | | | 88,988 | |
5.625%, due 5/1/24 | | | | | 149,000 | | | | 156,636 | |
5.750%, due 2/1/27‡ | | | | | 175,000 | | | | 183,750 | |
MGM Resorts International | | | | | | | | | | |
4.625%, due 9/1/26 | | | | | 129,000 | | | | 127,710 | |
5.500%, due 4/15/27 | | | | | 175,000 | | | | 180,469 | |
5.750%, due 6/15/25 | | | | | 175,000 | | | | 185,063 | |
6.000%, due 3/15/23 | | | | | 229,000 | | | | 243,885 | |
6.625%, due 12/15/21 | | | | | 218,000 | | | | 233,805 | |
7.750%, due 3/15/22 | | | | | 150,000 | | | | 165,750 | |
Panther BF Aggregator 2 LP / Panther Finance Co., Inc. | | | | | | | | | | |
6.250%, due 5/15/26‡ | | | | | 175,000 | | | | 182,000 | |
Penske Automotive Group, Inc. | | | | | | | | | | |
5.500%, due 5/15/26 | | | | | 77,000 | | | | 77,193 | |
QVC, Inc. | | | | | | | | | | |
4.450%, due 2/15/25 | | | | | 115,000 | | | | 114,781 | |
4.850%, due 4/1/24 | | | | | 75,000 | | | | 76,652 | |
Scientific Games International, Inc. | | | | | | | | | | |
5.000%, due 10/15/25‡ | | | | | 251,000 | | | | 249,118 | |
| | | | | | | | | | | |
| | | | Principal
Amount
| | Value
|
| | | | | | | | | | |
Corporate Bonds (continued) | | | | | | | | | | |
| | | | | | | | | | | |
Consumer Discretionary (continued) | | | | | | | | | | |
Six Flags Entertainment Corp. | | | | | | | | | | |
4.875%, due 7/31/24‡ | | | | $ | 99,000 | | | $ | 99,248 | |
5.500%, due 4/15/27‡ | | | | | 150,000 | | | | 152,250 | |
Wynn Las Vegas LLC / Wynn Las Vegas Capital Corp. | | | | | | | | | | |
5.500%, due 3/1/25‡ | | | | | 314,000 | | | | 316,355 | |
| | | | | | | | | 6,448,809 | |
Consumer Staples — 3.2% | | | | | | | | | | |
Energizer Holdings, Inc. | | | | | | | | | | |
5.500%, due 6/15/25‡ | | | | | 85,000 | | | | 85,637 | |
Lamb Weston Holdings, Inc. | | | | | | | | | | |
4.625%, due 11/1/24‡ | | | | | 167,000 | | | | 169,505 | |
4.875%, due 11/1/26‡ | | | | | 166,000 | | | | 168,490 | |
Pilgrim’s Pride Corp. | | | | | | | | | | |
5.750%, due 3/15/25‡ | | | | | 184,000 | | | | 188,370 | |
5.875%, due 9/30/27‡ | | | | | 150,000 | | | | 155,063 | |
Post Holdings, Inc. | | | | | | | | | | |
5.000%, due 8/15/26‡ | | | | | 350,000 | | | | 349,125 | |
5.500%, due 3/1/25‡ | | | | | 225,000 | | | | 229,500 | |
5.625%, due 1/15/28‡ | | | | | 136,000 | | | | 137,020 | |
5.750%, due 3/1/27‡ | | | | | 213,000 | | | | 218,591 | |
Spectrum Brands, Inc. | | | | | | | | | | |
5.750%, due 7/15/25 | | | | | 200,000 | | | | 204,750 | |
Tempur Sealy International, Inc. | | | | | | | | | | |
5.500%, due 6/15/26 | | | | | 99,000 | | | | 98,629 | |
5.625%, due 10/15/23 | | | | | 78,000 | | | | 78,975 | |
| | | | | | | | | 2,083,655 | |
Energy — 10.7% | | | | | | | | | | |
AmeriGas Partners LP / AmeriGas Finance Corp. | | | | | | | | | | |
5.500%, due 5/20/25 | | | | | 150,000 | | | | 153,562 | |
5.625%, due 5/20/24 | | | | | 150,000 | | | | 156,375 | |
5.750%, due 5/20/27 | | | | | 100,000 | | | | 103,250 | |
5.875%, due 8/20/26 | | | | | 78,000 | | | | 81,315 | |
Antero Midstream Partners LP / Antero Midstream Finance Corp. | | | | | | | | | | |
5.375%, due 9/15/24 | | | | | 81,000 | | | | 82,721 | |
5.750%, due 3/1/27‡ | | | | | 143,000 | | | | 145,681 | |
Antero Resources Corp. | | | | | | | | | | |
5.000%, due 3/1/25(a) | | | | | 115,000 | | | | 113,275 | |
5.125%, due 12/1/22 | | | | | 200,000 | | | | 200,750 | |
5.625%, due 6/1/23 | | | | | 132,000 | | | | 133,320 | |
Cheniere Corpus Christi Holdings LLC | | | | | | | | | | |
5.125%, due 6/30/27 | | | | | 243,000 | | | | 253,327 | |
5.875%, due 3/31/25 | | | | | 264,000 | | | | 284,460 | |
7.000%, due 6/30/24 | | | | | 280,000 | | | | 313,950 | |
Cheniere Energy Partners LP | | | | | | | | | | |
5.250%, due 10/1/25 | | | | | 237,000 | | | | 242,036 | |
5.625%, due 10/1/26‡ | | | | | 210,000 | | | | 216,562 | |
Crestwood Midstream Partners LP / Crestwood Midstream Finance Corp. | | | | | | | | | | |
5.750%, due 4/1/25(a) | | | | | 101,000 | | | | 103,146 | |
DCP Midstream Operating LP | | | | | | | | | | |
5.375%, due 7/15/25 | | | | | 143,000 | | | | 149,971 | |
Diamondback Energy, Inc. | | | | | | | | | | |
4.750%, due 11/1/24‡ | | | | | 142,000 | | | | 145,017 | |
5.375%, due 5/31/25 | | | | | 130,000 | | | | 135,688 | |
See notes to financial statements.
102
Schedules of Investments — IQ S&P High Yield Low Volatility Bond ETF(continued)
April 30, 2019 | | | | Principal
Amount
| | Value
|
| | | | | | | | | | |
Corporate Bonds (continued) | | | | | | | | | | |
| | | | | | | | | | | |
Energy (continued) | | | | | | | | | | |
Endeavor Energy Resources LP / EER Finance, Inc. | | | | | | | | | | |
5.500%, due 1/30/26‡ | | | | $ | 111,000 | | | $ | 116,273 | |
5.750%, due 1/30/28‡ | | | | | 80,000 | | | | 85,600 | |
EnLink Midstream Partners LP | | | | | | | | | | |
4.150%, due 6/1/25 | | | | | 150,000 | | | | 144,893 | |
4.850%, due 7/15/26 | | | | | 93,000 | | | | 92,266 | |
5.050%, due 4/1/45 | | | | | 80,000 | | | | 69,288 | |
Hilcorp Energy I LP / Hilcorp
Finance Co. | | | | | | | | | | |
5.000%, due 12/1/24‡ | | | | | 75,000 | | | | 74,250 | |
5.750%, due 10/1/25‡ | | | | | 85,000 | | | | 85,213 | |
Ladder Capital Finance Holdings LLLP / Ladder Capital Finance Corp. | | | | | | | | | | |
5.250%, due 3/15/22‡ | | | | | 64,000 | | | | 65,520 | |
Matador Resources Co. | | | | | | | | | | |
5.875%, due 9/15/26 | | | | | 176,000 | | | | 176,880 | |
Murphy Oil Corp. | | | | | | | | | | |
5.750%, due 8/15/25 | | | | | 125,000 | | | | 128,254 | |
NuStar Logistics LP | | | | | | | | | | |
5.625%, due 4/28/27 | | | | | 103,000 | | | | 103,000 | |
Parsley Energy LLC / Parsley Finance Corp. | | | | | | | | | | |
5.250%, due 8/15/25‡ | | | | | 70,000 | | | | 70,700 | |
5.375%, due 1/15/25‡ | | | | | 114,000 | | | | 115,995 | |
5.625%, due 10/15/27‡ | | | | | 131,000 | | | | 134,275 | |
Radian Group, Inc. | | | | | | | | | | |
4.500%, due 10/1/24 | | | | | 76,000 | | | | 75,810 | |
Range Resources Corp. | | | | | | | | | | |
5.750%, due 6/1/21 | | | | | 100,000 | | | | 102,500 | |
Springleaf Finance Corp. | | | | | | | | | | |
8.250%, due 12/15/20 | | | | | 199,000 | | | | 214,174 | |
Sunoco LP / Sunoco Finance Corp. | | | | | | | | | | |
4.875%, due 1/15/23 | | | | | 135,000 | | | | 137,025 | |
5.500%, due 2/15/26 | | | | | 180,000 | | | | 183,150 | |
6.000%, due 4/15/27‡ | | | | | 120,000 | | | | 124,500 | |
Tallgrass Energy Partners LP / Tallgrass Energy Finance Corp. | | | | | | | | | | |
4.750%, due 10/1/23‡(a) | | | | | 100,000 | | | | 101,500 | |
5.500%, due 9/15/24‡ | | | | | 160,000 | | | | 165,200 | |
5.500%, due 1/15/28‡ | | | | | 98,000 | | | | 99,838 | |
Targa Resources Partners LP / Targa Resources Partners Finance Corp. | | | | | | | | | | |
4.250%, due 11/15/23 | | | | | 75,000 | | | | 75,188 | |
5.000%, due 1/15/28 | | | | | 150,000 | | | | 147,188 | |
5.125%, due 2/1/25 | | | | | 50,000 | | | | 51,125 | |
5.375%, due 2/1/27 | | | | | 42,000 | | | | 42,788 | |
5.875%, due 4/15/26 | | | | | 200,000 | | | | 210,250 | |
6.500%, due 7/15/27‡ | | | | | 175,000 | | | | 187,250 | |
6.875%, due 1/15/29‡ | | | | | 159,000 | | | | 171,720 | |
Transocean Guardian Ltd. | | | | | | | | | | |
5.875%, due 1/15/24‡ | | | | | 133,245 | | | | 137,242 | |
WPX Energy, Inc. | | | | | | | | | | |
5.250%, due 9/15/24 | | | | | 125,000 | | | | 128,750 | |
5.750%, due 6/1/26 | | | | | 93,000 | | | | 95,790 | |
8.250%, due 8/1/23 | | | | | 90,000 | | | | 102,150 | |
| | | | | | | | | 7,029,951 | |
| | | | | | | | | | |
| | | | Principal
Amount
| | Value
|
| | | | | | | | | | | |
Corporate Bonds (continued) | | | | | | | | | | |
| | | | | | | | | | | |
Financials — 6.6% | | | | | | | | | | |
Ally Financial, Inc. | | | | | | | | | | |
3.750%, due 11/18/19 | | | | $ | 22,000 | | | $ | 22,027 | |
4.125%, due 3/30/20 | | | | | 145,000 | | | | 145,725 | |
4.125%, due 2/13/22 | | | | | 165,000 | | | | 167,062 | |
4.250%, due 4/15/21 | | | | | 103,000 | | | | 104,416 | |
4.625%, due 3/30/25 | | | | | 115,000 | | | | 118,594 | |
5.125%, due 9/30/24 | | | | | 158,000 | | | | 166,887 | |
8.000%, due 11/1/31 | | | | | 350,000 | | | | 448,875 | |
CIT Group, Inc. | | | | | | | | | | |
4.125%, due 3/9/21 | | | | | 91,000 | | | | 92,365 | |
4.750%, due 2/16/24 | | | | | 101,000 | | | | 104,283 | |
5.000%, due 8/15/22 | | | | | 188,000 | | | | 196,225 | |
5.250%, due 3/7/25 | | | | | 102,000 | | | | 108,503 | |
Icahn Enterprises LP / Icahn Enterprises Finance Corp. | | | | | | | | | | |
6.375%, due 12/15/25 | | | | | 155,000 | | | | 161,394 | |
6.750%, due 2/1/24 | | | | | 110,000 | | | | 114,950 | |
MSCI, Inc. | | | | | | | | | | |
4.750%, due 8/1/26‡ | | | | | 127,000 | | | | 130,016 | |
5.250%, due 11/15/24‡ | | | | | 180,000 | | | | 185,850 | |
5.375%, due 5/15/27‡ | | | | | 43,000 | | | | 45,311 | |
5.750%, due 8/15/25‡ | | | | | 160,000 | | | | 167,600 | |
Navient Corp. | | | | | | | | | | |
5.000%, due 10/26/20 | | | | | 100,000 | | | | 101,500 | |
5.500%, due 1/25/23 | | | | | 200,000 | | | | 203,750 | |
5.875%, due 3/25/21 | | | | | 63,000 | | | | 65,126 | |
6.500%, due 6/15/22 | | | | | 165,000 | | | | 173,869 | |
6.625%, due 7/26/21 | | | | | 165,000 | | | | 173,250 | |
7.250%, due 9/25/23 | | | | | 100,000 | | | | 108,250 | |
8.000%, due 3/25/20 | | | | | 300,000 | | | | 310,875 | |
Quicken Loans, Inc. | | | | | | | | | | |
5.750%, due 5/1/25‡ | | | | | 203,000 | | | | 206,219 | |
Springleaf Finance Corp. | | | | | | | | | | |
5.625%, due 3/15/23 | | | | | 165,000 | | | | 171,188 | |
6.125%, due 5/15/22 | | | | | 163,000 | | | | 172,169 | |
6.125%, due 3/15/24 | | | | | 175,000 | | | | 184,625 | |
| | | | | | | | | 4,350,904 | |
Health Care — 12.1% | | | | | | | | | | |
Acadia Healthcare Co., Inc. | | | | | | | | | | |
5.625%, due 2/15/23 | | | | | 90,000 | | | | 90,900 | |
Avantor, Inc. | | | | | | | | | | |
6.000%, due 10/1/24‡ | | | | | 247,000 | | | | 257,497 | |
Bausch Health Cos., Inc. | | | | | | | | | | |
5.500%, due 11/1/25‡ | | | | | 332,000 | | | | 341,130 | |
5.750%, due 8/15/27‡ | | | | | 68,000 | | | | 70,720 | |
7.000%, due 3/15/24‡ | | | | | 367,000 | | | | 386,726 | |
Centene Corp. | | | | | | | | | | |
4.750%, due 5/15/22 | | | | | 217,000 | | | | 221,340 | |
4.750%, due 1/15/25 | | | | | 180,000 | | | | 182,700 | |
5.375%, due 6/1/26‡ | | | | | 360,000 | | | | 374,850 | |
5.625%, due 2/15/21 | | | | | 204,000 | | | | 207,060 | |
6.125%, due 2/15/24 | | | | | 155,000 | | | | 162,362 | |
DaVita, Inc. | | | | | | | | | | |
5.125%, due 7/15/24 | | | | | 314,000 | | | | 314,000 | |
Elanco Animal Health, Inc. | | | | | | | | | | |
3.912%, due 8/27/21‡ | | | | | 87,000 | | | | 88,535 | |
4.272%, due 8/28/23‡ | | | | | 127,000 | | | | 131,822 | |
4.900%, due 8/28/28‡ | | | | | 128,000 | | | | 134,021 | |
See notes to financial statements.
103
Schedules of Investments — IQ S&P High Yield Low Volatility Bond ETF(continued)
April 30, 2019 | | | | Principal
Amount
| | Value
|
| | | | | | | | | | |
Corporate Bonds (continued) | | | | | | | | | | |
| | | | | | | | | | | |
Health Care (continued) | | | | | | | | | | |
Encompass Health Corp. | | | | | | | | | | |
5.750%, due 11/1/24 | | | | $ | 250,000 | | | $ | 253,125 | |
HCA Healthcare, Inc. | | | | | | | | | | |
6.250%, due 2/15/21 | | | | | 136,000 | | | | 142,630 | |
HCA, Inc. | | | | | | | | | | |
5.375%, due 2/1/25 | | | | | 348,000 | | | | 366,270 | |
5.375%, due 9/1/26 | | | | | 141,000 | | | | 148,050 | |
5.625%, due 9/1/28 | | | | | 252,000 | | | | 268,380 | |
5.875%, due 5/1/23 | | | | | 243,000 | | | | 260,314 | |
5.875%, due 2/15/26 | | | | | 208,000 | | | | 223,600 | |
5.875%, due 2/1/29 | | | | | 175,000 | | | | 188,562 | |
7.500%, due 2/15/22 | | | | | 330,000 | | | | 363,000 | |
Hologic, Inc. | | | | | | | | | | |
4.375%, due 10/15/25‡ | | | | | 168,000 | | | | 166,530 | |
IQVIA, Inc. | | | | | | | | | | |
4.875%, due 5/15/23‡ | | | | | 123,000 | | | | 124,691 | |
5.000%, due 10/15/26‡ | | | | | 223,000 | | | | 227,460 | |
MEDNAX, Inc. | | | | | | | | | | |
5.250%, due 12/1/23‡ | | | | | 151,000 | | | | 153,643 | |
Molina Healthcare, Inc. | | | | | | | | | | |
5.375%, due 11/15/22 | | | | | 103,000 | | | | 107,378 | |
Service Corp. International | | | | | | | | | | |
4.625%, due 12/15/27 | | | | | 100,000 | | | | 100,750 | |
Teleflex, Inc. | | | | | | | | | | |
4.625%, due 11/15/27 | | | | | 100,000 | | | | 99,625 | |
Tenet Healthcare Corp. | | | | | | | | | | |
4.375%, due 10/1/21 | | | | | 181,000 | | | | 183,263 | |
4.625%, due 7/15/24 | | | | | 369,000 | | | | 370,845 | |
5.125%, due 5/1/25 | | | | | 300,000 | | | | 302,250 | |
6.000%, due 10/1/20 | | | | | 280,000 | | | | 289,450 | |
6.250%, due 2/1/27‡ | | | | | 253,000 | | | | 263,753 | |
WellCare Health Plans, Inc. | | | | | | | | | | |
5.250%, due 4/1/25 | | | | | 229,000 | | | | 235,870 | |
5.375%, due 8/15/26‡ | | | | | 117,000 | | | | 122,265 | |
| | | | | | | | | 7,925,367 | |
Industrials — 9.0% | | | | | | | | | | |
ADT Security Corp. (The) | | | | | | | | | | |
3.500%, due 7/15/22 | | | | | 245,000 | | | | 237,650 | |
6.250%, due 10/15/21 | | | | | 120,000 | | | | 126,000 | |
AECOM | | | | | | | | | | |
5.125%, due 3/15/27 | | | | | 124,000 | | | | 124,310 | |
5.875%, due 10/15/24 | | | | | 184,000 | | | | 194,810 | |
Aramark Services, Inc. | | | | | | | | | | |
4.750%, due 6/1/26 | | | | | 83,000 | | | | 84,245 | |
5.000%, due 4/1/25‡ | | | | | 89,000 | | | | 91,447 | |
5.000%, due 2/1/28‡ | | | | | 202,000 | | | | 204,525 | |
5.125%, due 1/15/24 | | | | | 173,000 | | | | 178,622 | |
Colfax Corp. | | | | | | | | | | |
6.000%, due 2/15/24‡ | | | | | 126,000 | | | | 130,410 | |
Iron Mountain, Inc. | | | | | | | | | | |
4.375%, due 6/1/21‡ | | | | | 56,000 | | | | 56,420 | |
4.875%, due 9/15/27‡ | | | | | 195,000 | | | | 189,150 | |
5.250%, due 3/15/28‡ | | | | | 144,000 | | | | 141,660 | |
Lennar Corp. | | | | | | | | | | |
4.125%, due 1/15/22 | | | | | 105,000 | | | | 106,050 | |
4.500%, due 4/30/24 | | | | | 108,000 | | | | 110,025 | |
4.750%, due 4/1/21 | | | | | 77,000 | | | | 78,444 | |
4.750%, due 5/30/25 | | | | | 94,000 | | | | 96,585 | |
4.750%, due 11/29/27 | | | | | 175,000 | | | | 178,719 | |
5.875%, due 11/15/24 | | | | | 76,000 | | | | 81,510 | |
| | | | | | | | | | |
| | | | Principal
Amount
| | Value
|
| | | | | | | | | | | |
Corporate Bonds (continued) | | | | | | | | | | |
| | | | | | | | | | | |
Industrials (continued) | | | | | | | | | | |
Prime Security Services Borrower
LLC / Prime Finance, Inc. | | | | | | | | | | |
5.250%, due 4/15/24‡ | | | | $ | 150,000 | | | $ | 150,375 | |
PulteGroup, Inc. | | | | | | | | | | |
4.250%, due 3/1/21 | | | | | 73,000 | | | | 73,912 | |
5.000%, due 1/15/27 | | | | | 125,000 | | | | 126,875 | |
5.500%, due 3/1/26 | | | | | 147,000 | | | | 155,085 | |
Sabre GLBL, Inc. | | | | | | | | | | |
5.250%, due 11/15/23‡ | | | | | 75,000 | | | | 76,500 | |
5.375%, due 4/15/23‡ | | | | | 128,000 | | | | 130,560 | |
Standard Industries, Inc. | | | | | | | | | | |
4.750%, due 1/15/28‡ | | | | | 226,000 | | | | 216,112 | |
5.000%, due 2/15/27‡ | | | | | 100,000 | | | | 98,375 | |
5.375%, due 11/15/24‡ | | | | | 147,000 | | | | 149,940 | |
5.500%, due 2/15/23‡ | | | | | 78,000 | | | | 79,365 | |
6.000%, due 10/15/25‡ | | | | | 198,000 | | | | 206,415 | |
Toll Brothers Finance Corp. | | | | | | | | | | |
4.875%, due 3/15/27 | | | | | 75,000 | | | | 75,094 | |
Transdigm, Inc. | | | | | | | | | | |
6.250%, due 3/15/26‡ | | | | | 720,000 | | | | 747,900 | |
United Rentals North America, Inc. | | | | | | | | | | |
4.625%, due 10/15/25 | | | | | 172,000 | | | | 170,280 | |
4.875%, due 1/15/28 | | | | | 318,000 | | | | 316,013 | |
5.500%, due 7/15/25 | | | | | 143,000 | | | | 148,005 | |
5.500%, due 5/15/27 | | | | | 139,000 | | | | 143,170 | |
5.875%, due 9/15/26 | | | | | 135,000 | | | | 141,075 | |
6.500%, due 12/15/26 | | | | | 250,000 | | | | 267,188 | |
| | | | | | | | | 5,882,821 | |
Information Technology — 6.5% | | | | | | | | | | |
CDK Global, Inc. | | | | | | | | | | |
4.875%, due 6/1/27 | | | | | 109,000 | | | | 110,090 | |
5.000%, due 10/15/24 | | | | | 95,000 | | | | 98,087 | |
5.875%, due 6/15/26 | | | | | 75,000 | | | | 79,125 | |
CDW LLC / CDW Finance Corp. | | | | | | | | | | |
5.000%, due 9/1/23 | | | | | 102,000 | | | | 104,040 | |
5.000%, due 9/1/25 | | | | | 125,000 | | | | 128,125 | |
5.500%, due 12/1/24 | | | | | 85,000 | | | | 89,887 | |
CommScope, Inc. | | | | | | | | | | |
5.500%, due 3/1/24‡ | | | | | 187,000 | | | | 195,181 | |
5.500%, due 6/15/24‡ | | | | | 100,000 | | | | 100,750 | |
6.000%, due 3/1/26‡ | | | | | 318,000 | | | | 336,682 | |
EMC Corp. | | | | | | | | | | |
2.650%, due 6/1/20 | | | | | 373,000 | | | | 370,203 | |
3.375%, due 6/1/23(a) | | | | | 153,000 | | | | 149,366 | |
First Data Corp. | | | | | | | | | | |
5.000%, due 1/15/24‡ | | | | | 350,000 | | | | 358,750 | |
Match Group, Inc. | | | | | | | | | | |
5.000%, due 12/15/27‡ | | | | | 76,000 | | | | 76,380 | |
Pitney Bowes, Inc. | | | | | | | | | | |
3.875%, due 10/1/21 | | | | | 73,000 | | | | 72,179 | |
Qorvo, Inc. | | | | | | | | | | |
5.500%, due 7/15/26‡ | | | | | 175,000 | | | | 183,094 | |
Sensata Technologies BV | | | | | | | | | | |
5.000%, due 10/1/25‡ | | | | | 103,000 | | | | 105,446 | |
Sensata Technologies UK Financing Co. PLC | | | | | | | | | | |
6.250%, due 2/15/26‡ | | | | | 132,000 | | | | 140,250 | |
SS&C Technologies, Inc. | | | | | | | | | | |
5.500%, due 9/30/27‡ | | | | | 375,000 | | | | 384,375 | |
Symantec Corp. | | | | | | | | | | |
5.000%, due 4/15/25‡ | | | | | 218,000 | | | | 221,961 | |
See notes to financial statements.
104
Schedules of Investments — IQ S&P High Yield Low Volatility Bond ETF(continued)
April 30, 2019 | | | | Principal
Amount
| | Value
|
| | | | | | | | | | |
Corporate Bonds (continued) | | | | | | | | | | |
| | | | | | | | | | | |
Information Technology (continued) | | | | | | | | | | |
VeriSign, Inc. | | | | | | | | | | |
4.750%, due 7/15/27 | | | | $ | 131,000 | | | $ | 133,293 | |
5.250%, due 4/1/25 | | | | | 70,000 | | | | 74,288 | |
Western Digital Corp. | | | | | | | | | | |
4.750%, due 2/15/26(a) | | | | | 419,000 | | | | 403,811 | |
Xerox Corp. | | | | | | | | | | |
4.125%, due 3/15/23 | | | | | 193,000 | | | | 192,585 | |
4.500%, due 5/15/21 | | | | | 173,000 | | | | 175,193 | |
| | | | | | | | | 4,283,141 | |
Materials — 8.7% | | | | | | | | | | |
Alcoa Nederland Holding BV | | | | | | | | | | |
6.125%, due 5/15/28‡ | | | | | 100,000 | | | | 103,750 | |
6.750%, due 9/30/24‡ | | | | | 64,000 | | | | 67,680 | |
7.000%, due 9/30/26‡ | | | | | 140,000 | | | | 150,850 | |
Arconic, Inc. | | | | | | | | | | |
5.125%, due 10/1/24 | | | | | 255,000 | | | | 262,331 | |
5.400%, due 4/15/21 | | | | | 219,000 | | | | 224,749 | |
6.150%, due 8/15/20 | | | | | 159,000 | | | | 164,172 | |
Ashland LLC | | | | | | | | | | |
4.750%, due 8/15/22 | | | | | 182,000 | | | | 186,550 | |
Ball Corp. | | | | | | | | | | |
4.000%, due 11/15/23 | | | | | 211,000 | | | | 212,582 | |
4.375%, due 12/15/20 | | | | | 193,000 | | | | 196,136 | |
4.875%, due 3/15/26 | | | | | 120,000 | | | | 124,200 | |
5.250%, due 7/1/25 | | | | | 152,000 | | | | 161,120 | |
Berry Global, Inc. | | | | | | | | | | |
4.500%, due 2/15/26‡(a) | | | | | 100,000 | | | | 96,875 | |
5.125%, due 7/15/23 | | | | | 130,000 | | | | 131,950 | |
5.500%, due 5/15/22 | | | | | 75,000 | | | | 75,937 | |
Blue Cube Spinco LLC | | | | | | | | | | |
9.750%, due 10/15/23 | | | | | 185,000 | | | | 206,506 | |
10.000%, due 10/15/25 | | | | | 68,000 | | | | 77,520 | |
Chemours Co. (The) | | | | | | | | | | |
5.375%, due 5/15/27 | | | | | 125,000 | | | | 125,781 | |
7.000%, due 5/15/25 | | | | | 170,000 | | | | 179,350 | |
Crown Americas LLC / Crown Americas Capital Corp. IV | | | | | | | | | | |
4.500%, due 1/15/23 | | | | | 150,000 | | | | 153,187 | |
Crown Americas LLC / Crown Americas Capital Corp. VI | | | | | | | | | | |
4.750%, due 2/1/26 | | | | | 175,000 | | | | 177,625 | |
Freeport-McMoRan, Inc. | | | | | | | | | | |
3.550%, due 3/1/22 | | | | | 377,000 | | | | 373,230 | |
3.875%, due 3/15/23 | | | | | 322,000 | | | | 318,780 | |
4.000%, due 11/14/21 | | | | | 77,000 | | | | 77,770 | |
4.550%, due 11/14/24 | | | | | 132,000 | | | | 131,175 | |
5.400%, due 11/14/34 | | | | | 135,000 | | | | 126,900 | |
6.875%, due 2/15/23 | | | | | 200,000 | | | | 211,000 | |
Novelis Corp. | | | | | | | | | | |
5.875%, due 9/30/26‡ | | | | | 275,000 | | | | 279,469 | |
6.250%, due 8/15/24‡ | | | | | 200,000 | | | | 208,500 | |
Olin Corp. | | | | | | | | | | |
5.000%, due 2/1/30 | | | | | 94,000 | | | | 92,943 | |
5.125%, due 9/15/27 | | | | | 59,000 | | | | 60,032 | |
Owens-Brockway Glass
Container, Inc. | | | | | | | | | | |
5.000%, due 1/15/22‡ | | | | | 102,000 | | | | 104,423 | |
5.875%, due 8/15/23‡ | | | | | 110,000 | | | | 115,088 | |
| | | | | | | | | | |
| | | | Principal
Amount
| | Value
|
| | | | | | | | | | | |
Corporate Bonds (continued) | | | | | | | | | | |
| | | | | | | | | | | |
Materials (continued) | | | | | | | | | | |
Reynolds Group Issuer, Inc. / Reynolds Group Issuer LLC / Reynolds Group Issuer Lu | | | | | | | | | | |
5.125%, due 7/15/23‡ | | | | $ | 269,000 | | | $ | 272,363 | |
Sealed Air Corp. | | | | | | | | | | |
4.875%, due 12/1/22‡(a) | | | | | 111,000 | | | | 114,608 | |
5.125%, due 12/1/24‡ | | | | | 37,000 | | | | 38,434 | |
Steel Dynamics, Inc. | | | | | | | | | | |
5.500%, due 10/1/24 | | | | | 40,000 | | | | 41,300 | |
WR Grace & Co.-Conn. | | | | | | | | | | |
5.125%, due 10/1/21‡ | | | | | 94,000 | | | | 97,290 | |
| | | | | | | | | 5,742,156 | |
Media — 11.6% | | | | | | | | | | |
AMC Networks, Inc. | | | | | | | | | | |
4.750%, due 8/1/25 | | | | | 132,000 | | | | 131,340 | |
5.000%, due 4/1/24 | | | | | 192,000 | | | | 194,160 | |
CCO Holdings LLC / CCO Holdings Capital Corp. | | | | | | | | | | |
4.000%, due 3/1/23‡ | | | | | 75,000 | | | | 75,094 | |
5.000%, due 2/1/28‡ | | | | | 335,000 | | | | 334,162 | |
5.125%, due 5/1/23‡ | | | | | 145,000 | | | | 148,625 | |
5.125%, due 5/1/27‡ | | | | | 403,000 | | | | 409,045 | |
5.375%, due 5/1/25‡ | | | | | 50,000 | | | | 51,750 | |
5.500%, due 5/1/26‡ | | | | | 225,000 | | | | 232,312 | |
5.750%, due 2/15/26‡ | | | | | 269,000 | | | | 281,105 | |
5.875%, due 4/1/24‡ | | | | | 255,000 | | | | 265,837 | |
5.875%, due 5/1/27‡ | | | | | 127,000 | | | | 132,239 | |
CSC Holdings LLC | | | | | | | | | | |
5.250%, due 6/1/24 | | | | | 70,000 | | | | 71,487 | |
5.375%, due 7/15/23‡ | | | | | 272,000 | | | | 277,766 | |
5.375%, due 2/1/28‡ | | | | | 178,000 | | | | 181,115 | |
5.500%, due 5/15/26‡ | | | | | 275,000 | | | | 282,906 | |
5.500%, due 4/15/27‡ | | | | | 183,000 | | | | 188,261 | |
6.500%, due 2/1/29‡ | | | | | 325,000 | | | | 348,969 | |
6.625%, due 10/15/25‡ | | | | | 119,000 | | | | 126,437 | |
6.750%, due 11/15/21 | | | | | 83,000 | | | | 88,810 | |
10.875%, due 10/15/25‡ | | | | | 350,000 | | | | 402,500 | |
DISH DBS Corp. | | | | | | | | | | |
5.125%, due 5/1/20 | | | | | 210,000 | | | | 211,050 | |
Gray Television, Inc. | | | | | | | | | | |
5.125%, due 10/15/24‡ | | | | | 100,000 | | | | 101,500 | |
5.875%, due 7/15/26‡ | | | | | 108,000 | | | | 111,240 | |
7.000%, due 5/15/27‡ | | | | | 150,000 | | | | 162,000 | |
Lamar Media Corp. | | | | | | | | | | |
5.375%, due 1/15/24 | | | | | 94,000 | | | | 96,115 | |
Lions Gate Capital Holdings LLC | | | | | | | | | | |
5.875%, due 11/1/24‡ | | | | | 90,000 | | | | 91,800 | |
6.375%, due 2/1/24‡ | | | | | 76,000 | | | | 79,610 | |
Live Nation Entertainment, Inc. | | | | | | | | | | |
4.875%, due 11/1/24‡ | | | | | 107,000 | | | | 108,872 | |
Netflix, Inc. | | | | | | | | | | |
4.375%, due 11/15/26(a) | | | | | 158,000 | | | | 156,420 | |
4.875%, due 4/15/28 | | | | | 320,000 | | | | 317,200 | |
5.500%, due 2/15/22 | | | | | 153,000 | | | | 161,033 | |
5.875%, due 2/15/25 | | | | | 96,000 | | | | 103,560 | |
5.875%, due 11/15/28 | | | | | 350,000 | | | | 368,813 | |
6.375%, due 5/15/29‡ | | | | | 143,000 | | | | 156,228 | |
Nexstar Broadcasting, Inc. | | | | | | | | | | |
5.625%, due 8/1/24‡ | | | | | 133,000 | | | | 134,995 | |
| | | | | | | | | | |
See notes to financial statements.
105
Schedules of Investments — IQ S&P High Yield Low Volatility Bond ETF(continued)
April 30, 2019 | | | | Principal
Amount
| | | Value
| |
Corporate Bonds (continued) | | | | | | | | | | |
| | | | | | | | | | | |
Media (continued) | | | | | | | | | | |
Nielsen Co. Luxembourg SARL (The) | | | | | | | | | | |
5.000%, due 2/1/25‡(a) | | | | $ | 76,000 | | | $ | 74,860 | |
Sinclair Television Group, Inc. | | | | | | | | | | |
5.625%, due 8/1/24‡ | | | | | 93,000 | | | | 93,698 | |
Sirius XM Radio, Inc. | | | | | | | | | | |
3.875%, due 8/1/22‡ | | | | | 200,000 | | | | 199,750 | |
5.000%, due 8/1/27‡ | | | | | 280,000 | | | | 281,750 | |
5.375%, due 4/15/25‡ | | | | | 185,000 | | | | 190,088 | |
5.375%, due 7/15/26‡ | | | | | 162,000 | | | | 166,658 | |
| | | | | | | | | 7,591,160 | |
Real Estate — 1.0% | | | | | | | | | | |
Howard Hughes Corp. (The) | | | | | | | | | | |
5.375%, due 3/15/25‡ | | | | | 210,000 | | | | 211,575 | |
Realogy Group LLC / Realogy Co-Issuer Corp. | | | | | | | | | | |
5.250%, due 12/1/21‡ | | | | | 101,000 | | | | 101,884 | |
Starwood Property Trust, Inc. | | | | | | | | | | |
3.625%, due 2/1/21 | | | | | 85,000 | | | | 84,575 | |
4.750%, due 3/15/25 | | | | | 100,000 | | | | 100,125 | |
5.000%, due 12/15/21 | | | | | 141,000 | | | | 143,996 | |
| | | | | | | | | 642,155 | |
Telecommunication Services — 8.3% | | | | | | | | | | |
CenturyLink, Inc. | | | | | | | | | | |
5.625%, due 4/1/20 | | | | | 175,000 | | | | 178,062 | |
5.800%, due 3/15/22 | | | | | 350,000 | | | | 359,187 | |
6.450%, due 6/15/21 | | | | | 139,000 | | | | 144,734 | |
CyrusOne LP / CyrusOne
Finance Corp. | | | | | | | | | | |
5.000%, due 3/15/24 | | | | | 104,000 | | | | 106,340 | |
5.375%, due 3/15/27 | | | | | 101,000 | | | | 104,787 | |
Equinix, Inc. | | | | | | | | | | |
5.375%, due 1/1/22 | | | | | 140,000 | | | | 143,675 | |
5.375%, due 5/15/27 | | | | | 206,000 | | | | 218,102 | |
5.750%, due 1/1/25 | | | | | 98,000 | | | | 101,675 | |
5.875%, due 1/15/26 | | | | | 207,000 | | | | 218,385 | |
Hughes Satellite Systems Corp. | | | | | | | | | | |
5.250%, due 8/1/26 | | | | | 126,000 | | | | 126,788 | |
Level 3 Financing, Inc. | | | | | | | | | | |
5.125%, due 5/1/23 | | | | | 93,000 | | | | 93,930 | |
5.250%, due 3/15/26 | | | | | 175,000 | | | | 178,063 | |
5.375%, due 1/15/24 | | | | | 120,000 | | | | 121,800 | |
5.375%, due 5/1/25 | | | | | 168,000 | | | | 170,940 | |
5.625%, due 2/1/23 | | | | | 79,000 | | | | 79,790 | |
SBA Communications Corp. | | | | | | | | | | |
4.000%, due 10/1/22 | | | | | 120,000 | | | | 120,600 | |
4.875%, due 7/15/22 | | | | | 150,000 | | | | 151,875 | |
4.875%, due 9/1/24 | | | | | 210,000 | | | | 213,150 | |
Sprint Capital Corp. | | | | | | | | | | |
6.900%, due 5/1/19 | | | | | 24,000 | | | | 24,000 | |
Sprint Communications, Inc. | | | | | | | | | | |
7.000%, due 3/1/20‡ | | | | | 214,000 | | | | 219,618 | |
7.000%, due 8/15/20 | | | | | 218,000 | | | | 226,175 | |
Sprint Corp. | | | | | | | | | | |
7.250%, due 9/15/21 | | | | | 401,000 | | | | 419,546 | |
| | | | | | | | | | | |
| | | | Principal
Amount
| | Value
|
Corporate Bonds (continued) | | | | | | | | | | |
| | | | | | | | | | | |
Telecommunication Services (continued) |
T-Mobile USA, Inc. | | | | | | | | | | |
4.000%, due 4/15/22 | | | | $ | 63,000 | | | $ | 63,788 | |
4.500%, due 2/1/26 | | | | | 133,000 | | | | 133,665 | |
4.750%, due 2/1/28 | | | | | 277,000 | | | | 278,731 | |
5.125%, due 4/15/25 | | | | | 100,000 | | | | 102,750 | |
5.375%, due 4/15/27 | | | | | 112,000 | | | | 117,600 | |
6.000%, due 4/15/24 | | | | | 191,000 | | | | 199,356 | |
6.500%, due 1/15/26 | | | | | 385,000 | | | | 411,469 | |
ViaSat, Inc. | | | | | | | | | | |
5.625%, due 4/15/27‡ | | | | | 125,000 | | | | 128,125 | |
Zayo Group LLC / Zayo Capital, Inc. | | | | | | | | | | |
5.750%, due 1/15/27‡ | | | | | 301,000 | | | | 305,139 | |
| | | | | | | | | 5,461,845 | |
Transportation — 0.1% | | | | | | | | | | |
American Airlines Group, Inc. | | | | | | | | | | |
4.625%, due 3/1/20‡ | | | | | 90,000 | | | | 90,453 | |
| | | | | | | | | | | |
Utilities — 3.6% | | | | | | | | | | |
AES Corp. | | | | | | | | | | |
4.000%, due 3/15/21 | | | | | 100,000 | | | | 101,000 | |
4.500%, due 3/15/23 | | | | | 100,000 | | | | 101,375 | |
5.125%, due 9/1/27 | | | | | 100,000 | | | | 104,125 | |
5.500%, due 4/15/25 | | | | | 56,000 | | | | 57,960 | |
6.000%, due 5/15/26 | | | | | 136,000 | | | | 143,820 | |
Calpine Corp. | | | | | | | | | | |
5.250%, due 6/1/26‡ | | | | | 199,000 | | | | 199,497 | |
Clearway Energy Operating LLC | | | | | | | | | | |
5.375%, due 8/15/24 | | | | | 84,000 | | | | 85,260 | |
5.750%, due 10/15/25‡ | | | | | 125,000 | | | | 127,500 | |
NextEra Energy Operating Partners LP | | | | | | | | | | |
4.250%, due 9/15/24‡ | | | | | 94,000 | | | | 93,765 | |
4.500%, due 9/15/27‡ | | | | | 100,000 | | | | 98,250 | |
NRG Energy, Inc. | | | | | | | | | | |
5.750%, due 1/15/28(a) | | | | | 184,000 | | | | 194,580 | |
6.625%, due 1/15/27 | | | | | 186,000 | | | | 199,252 | |
7.250%, due 5/15/26 | | | | | 200,000 | | | | 218,000 | |
TerraForm Power Operating LLC | | | | | | | | | | |
4.250%, due 1/31/23‡ | | | | | 93,000 | | | | 91,838 | |
5.000%, due 1/31/28‡ | | | | | 115,000 | | | | 113,563 | |
Vistra Operations Co. LLC | | | | | | | | | | |
5.500%, due 9/1/26‡ | | | | | 200,000 | | | | 206,000 | |
5.625%, due 2/15/27‡ | | | | | 211,000 | | | | 217,066 | |
| | | | | | | | | 2,352,851 | |
Total Corporate Bonds | | | | | | | | | | |
(Cost $59,359,847) | | | | | | | | | 59,885,268 | |
| | | | | | | | | | | |
Foreign Bonds — 6.9% | | | | | | | | | | |
| | | | | | | | | | | |
Consumer Discretionary — 2.0% | | | | | | | | | | |
1011778 BC ULC / New Red Finance, Inc., (Canada) | | | | | | | | | | |
4.250%, due 5/15/24‡ | | | | | 305,000 | | | | 301,188 | |
5.000%, due 10/15/25‡ | | | | | 493,000 | | | | 489,303 | |
Fiat Chrysler Automobiles NV,
(United Kingdom) | | | | | | | | | | |
4.500%, due 4/15/20 | | | | | 255,000 | | | | 256,912 | |
5.250%, due 4/15/23 | | | | | 271,000 | | | | 282,517 | |
| | | | | | | | | 1,329,920 | |
See notes to financial statements.
106
Schedules of Investments — IQ S&P High Yield Low Volatility Bond ETF(continued)
April 30, 2019 | | | | Principal
Amount
| | Value
|
| | | | | | | | | | |
Foreign Bonds (continued) | | | | | | | | | | |
Industrials — 0.3% | | | | | | | | | | |
Bombardier, Inc., (Canada) | | | | | | | | | | |
8.750%, due 12/1/21‡ | | | | $ | 168,000 | | | $ | 185,640 | |
| | | | | | | | | | | |
Information Technology — 1.0% | | | | | | | | | | |
Nokia OYJ, (Finland) | | | | | | | | | | |
3.375%, due 6/12/22 | | | | | 75,000 | | | | 74,531 | |
4.375%, due 6/12/27 | | | | | 97,000 | | | | 97,060 | |
5.375%, due 5/15/19 | | | | | 3,000 | | | | 3,002 | |
Open Text Corp., (Canada) | | | | | | | | | | |
5.625%, due 1/15/23‡ | | | | | 123,000 | | | | 125,921 | |
5.875%, due 6/1/26‡ | | | | | 167,000 | | | | 175,141 | |
Telefonaktiebolaget LM Ericsson, (Sweden) | | | | | | | | | | |
4.125%, due 5/15/22 | | | | | 181,000 | | | | 183,737 | |
| | | | | | | | | 659,392 | |
Materials — 1.7% | | | | | | | | | | |
Ardagh Packaging Finance PLC / Ardagh Holdings USA, Inc., (Ireland) | | | | | | | | | | |
4.250%, due 9/15/22‡ | | | | | 200,000 | | | | 200,750 | |
4.625%, due 5/15/23‡ | | | | | 147,000 | | | | 148,102 | |
FMG Resources August 2006 Pty Ltd., (Australia) | | | | | | | | | | |
4.750%, due 5/15/22‡ | | | | | 159,000 | | | | 160,987 | |
5.125%, due 3/15/23‡(a) | | | | | 125,000 | | | | 127,813 | |
5.125%, due 5/15/24‡ | | | | | 118,000 | | | | 119,180 | |
NOVA Chemicals Corp., (Canada) | | | | | | | | | | |
4.875%, due 6/1/24‡ | | | | | 206,000 | | | | 203,487 | |
5.250%, due 6/1/27‡ | | | | | 180,000 | | | | 176,850 | |
| | | | | | | | | 1,137,169 | |
Media — 1.7% | | | | | | | | | | |
Telenet Finance Luxembourg Notes SARL, (Belgium) | | | | | | | | | | |
5.500%, due 3/1/28‡ | | | | | 200,000 | | | | 197,250 | |
Videotron Ltd., (Canada) | | | | | | | | | | |
5.125%, due 4/15/27‡ | | | | | 101,000 | | | | 102,894 | |
Virgin Media Finance PLC, (United Kingdom) | | | | | | | | | | |
6.000%, due 10/15/24‡ | | | | | 100,000 | | | | 103,250 | |
Virgin Media Secured Finance PLC, (United Kingdom) | | | | | | | | | | |
5.250%, due 1/15/26‡ | | | | | 174,000 | | | | 176,175 | |
5.500%, due 8/15/26‡ | | | | | 145,000 | | | | 148,444 | |
Ziggo BV, (Netherlands) | | | | | | | | | | |
5.500%, due 1/15/27‡ | | | | | 375,000 | | | | 374,531 | |
| | | | | | | | | 1,102,544 | |
Telecommunication Services — 0.2% | | | | | | | | | | |
Intelsat Jackson Holdings SA, (Luxembourg) | | | | | | | | | | |
9.500%, due 9/30/22‡ | | | | | 76,000 | | | | 87,780 | |
| | | | | | | | | | | |
Total Foreign Bonds | | | | | | | | | | |
(Cost $4,474,583) | | | | | | | | | 4,502,445 | |
| | | | Shares
| | Value
|
| | | | | | | | | | |
Short-Term Investment — 0.5% | | | | | | | | | | |
| | | | | | | | | | | |
Money Market Fund — 0.5% | | | | | | | | | | |
BlackRock Liquidity Funds Treasury Trust Fund Portfolio, Institutional Class, 2.28%(b) | | | | | | | | | | |
(Cost $331,001) | | | | | 331,001 | | | $ | 331,001 | |
| | | | | | | | | | | |
Investment of Cash Collateral For Securities Loaned — 2.6% | | | | | | | | | | |
| | | | | | | | | | | |
Money Market Fund — 2.6% | | | | | | | | | | |
Dreyfus Government Cash Management Fund, Institutional Shares, 2.45%(b) | | | | | | | | | | |
(Cost $1,729,250) | | | | | 1,729,250 | | | | 1,729,250 | |
| | | | | | | | | | | |
Total Investments — 101.2% | | | | | | | | | | |
(Cost $65,894,681) | | | | | | | | | 66,447,964 | |
| | | | | | | | | | | |
Other Assets and Liabilities,
Net — (1.2)% | | | | | | | | | (822,220 | ) |
| | | | | | | | | | | |
Net Assets — 100.0% | | | | | | | | $ | 65,625,744 | |
‡ | | May be sold to institutional investors only under Rule 144A or securities offered pursuant to section 4(a)(2) of the Securities Act of 1933, as amended. |
(a) | | All or a portion of the security was on loan. In addition, “Other Assets and Liabilities, Net” may include pending sales that are also on loan. The aggregate market value of securities on loan was $1,793,191; total market value of collateral held by the Fund was $1,860,014. Market value of the collateral held includes non-cash U.S. Treasury securities collateral having a value of $130,764. |
(b) | | Reflects the 1-day yield at April 30, 2019. |
See notes to financial statements.
107
Schedules of Investments — IQ S&P High Yield Low Volatility Bond ETF(continued)
April 30, 2019The following is a summary of the inputs used to value the Fund’s investments as of April 30, 2019. For more information on the valuation techniques, and their aggregation into the levels used in the table below, please refer to Note 2.
Asset Valuation Inputs
Description
| | | | Level 1
| | Level 2
| | Level 3
| | Total
|
Investments in Securities:(c) | | | | | | | | | | | | | | | | | | |
Corporate Bonds | | | | $ | — | | | $ | 59,885,268 | | | $ | — | | | $ | 59,885,268 | |
Foreign Bonds | | | | | — | | | | 4,502,445 | | | | — | | | | 4,502,445 | |
Short-Term Investment: | | | | | | | | | | | | | | | | | | |
Money Market Fund | | | | | 331,001 | | | | — | | | | — | | | | 331,001 | |
Investment of Cash Collateral for Securities Loaned: | | | | | | | | | | | | | | | | | | |
Money Market Fund | | | | | 1,729,250 | | | | — | | | | — | | | | 1,729,250 | |
Total Investments in Securities | | | | $ | 2,060,251 | | | $ | 64,387,713 | | | $ | — | | | $ | 66,447,964 | |
(c) | | For a complete listing of investments and their industries, see the Schedules of Investments. |
For the year ended April 30, 2019, the Fund did not have any transfers into or out of Level 3 within the fair value hierarchy. (See Note 2)
See notes to financial statements.
108
Schedules of Investments — IQ 500 International ETF
April 30, 2019 | | | | Shares
| | Value
|
| | | | | | | | | | |
Common Stocks — 98.2% | | | | | | | | | | |
| | | | | | | | | | | |
Australia — 3.5% | | | | | | | | | | |
AGL Energy Ltd. | | | | | 5,557 | | | $ | 86,948 | |
Amcor Ltd. | | | | | 7,963 | | | | 89,844 | |
Australia & New Zealand Banking Group Ltd. | | | | | 4,674 | | | | 89,482 | |
BHP Group Ltd. | | | | | 15,042 | | | | 395,965 | |
BlueScope Steel Ltd. | | | | | 6,842 | | | | 64,772 | |
Brambles Ltd. | | | | | 9,331 | | | | 79,140 | |
Caltex Australia Ltd. | | | | | 4,241 | | | | 81,223 | |
CIMIC Group Ltd. | | | | | 3,040 | | | | 108,248 | |
Commonwealth Bank of Australia | | | | | 1,988 | | | | 104,272 | |
CSL Ltd. | | | | | 613 | | | | 85,675 | |
Downer EDI Ltd. | | | | | 17,664 | | | | 96,230 | |
Metcash Ltd. | | | | | 43,079 | | | | 87,022 | |
National Australia Bank Ltd. | | | | | 4,436 | | | | 79,150 | |
Origin Energy Ltd. | | | | | 15,162 | | | | 78,651 | |
Qantas Airways Ltd. | | | | | 26,659 | | | | 105,266 | |
Ramsay Health Care Ltd. | | | | | 2,737 | | | | 125,835 | |
Rio Tinto PLC | | | | | 6,591 | | | | 383,649 | |
Sonic Healthcare Ltd. | | | | | 5,255 | | | | 94,872 | |
Telstra Corp. Ltd. | | | | | 62,450 | | | | 148,569 | |
Wesfarmers Ltd. | | | | | 9,075 | | | | 230,012 | |
Westpac Banking Corp. | | | | | 4,701 | | | | 91,025 | |
Woolworths Group Ltd. | | | | | 11,187 | | | | 250,786 | |
Total Australia | | | | | | | | | 2,956,636 | |
| | | | | | | | | | | |
Austria — 0.3% | | | | | | | | | | |
OMV AG | | | | | 2,388 | | | | 127,790 | |
voestalpine AG | | | | | 3,031 | | | | 97,252 | |
Total Austria | | | | | | | | | 225,042 | |
| | | | | | | | | | | |
Belgium — 0.9% | | | | | | | | | | |
Anheuser-Busch InBev SA/NV | | | | | 6,135 | | | | 544,952 | |
Colruyt SA | | | | | 1,131 | | | | 81,450 | |
Solvay SA | | | | | 865 | | | | 103,872 | |
Umicore SA(a) | | | | | 2,055 | | | | 79,455 | |
Total Belgium | | | | | | | | | 809,729 | |
| | | | | | | | | | | |
Canada — 5.7% | | | | | | | | | | |
Air Canada* | | | | | 5,653 | | | | 135,147 | |
Alimentation Couche-Tard, Inc., Class B | | | | | 6,826 | | | | 400,822 | |
Bank of Montreal | | | | | 985 | | | | 77,485 | |
Bank of Nova Scotia (The) | | | | | 1,667 | | | | 91,430 | |
Barrick Gold Corp. | | | | | 4,675 | | | | 59,185 | |
BCE, Inc. | | | | | 3,465 | | | | 154,395 | |
Bombardier, Inc., Class B* | | | | | 49,790 | | | | 84,760 | |
Brookfield Asset Management, Inc., Class A | | | | | 3,072 | | | | 147,503 | |
Canadian Imperial Bank of Commerce | | | | | 746 | | | | 62,560 | |
Canadian National Railway Co. | | | | | 1,068 | | | | 98,797 | |
Canadian Natural Resources Ltd. | | | | | 2,889 | | | | 86,378 | |
Canadian Tire Corp. Ltd., Class A | | | | | 613 | | | | 67,197 | |
Cenovus Energy, Inc. | | | | | 9,119 | | | | 90,024 | |
CGI, Inc.* | | | | | 1,732 | | | | 124,158 | |
Empire Co. Ltd., Class A | | | | | 5,484 | | | | 121,486 | |
Enbridge, Inc. | | | | | 10,415 | | | | 383,168 | |
George Weston Ltd. | | | | | 2,867 | | | | 213,192 | |
Great-West Lifeco, Inc. | | | | | 4,027 | | | | 100,795 | |
Husky Energy, Inc. | | | | | 6,066 | | | | 65,566 | |
Imperial Oil Ltd. | | | | | 3,694 | | | | 106,877 | |
Loblaw Cos. Ltd. | | | | | 3,810 | | | | 185,883 | |
| | | | Shares
| | Value
|
Common Stocks (continued) | | | | | | | | | | |
| | | | | | | | | | | |
Canada (continued) | | | | | | | | | | |
Magna International, Inc. | | | | | 3,948 | | | $ | 218,854 | |
Manulife Financial Corp. | | | | | 6,519 | | | | 119,554 | |
Metro, Inc. | | | | | 2,162 | | | | 77,949 | |
Onex Corp. | | | | | 1,113 | | | | 64,296 | |
Parkland Fuel Corp. | | | | | 2,437 | | | | 74,802 | |
Power Corp. of Canada | | | | | 4,878 | | | | 111,470 | |
Power Financial Corp. | | | | | 4,547 | | | | 107,929 | |
Restaurant Brands International, Inc. | | | | | 1,265 | | | | 82,227 | |
Rogers Communications, Inc., Class B | | | | | 1,760 | | | | 88,249 | |
Royal Bank of Canada | | | | | 1,731 | | | | 137,391 | |
Saputo, Inc. | | | | | 2,164 | | | | 73,694 | |
SNC-Lavalin Group, Inc. | | | | | 2,104 | | | | 52,240 | |
Sun Life Financial, Inc. | | | | | 1,880 | | | | 77,788 | |
Suncor Energy, Inc. | | | | | 4,095 | | | | 134,491 | |
Teck Resources Ltd., Class B | | | | | 3,906 | | | | 91,988 | |
TELUS Corp. | | | | | 2,411 | | | | 88,414 | |
Thomson Reuters Corp. | | | | | 1,640 | | | | 100,933 | |
Toronto-Dominion Bank (The) | | | | | 1,980 | | | | 112,483 | |
TransCanada Corp. | | | | | 2,618 | | | | 124,439 | |
WSP Global, Inc. | | | | | 1,184 | | | | 63,671 | |
Total Canada | | | | | | | | | 4,859,670 | |
| | | | | | | | | | | |
Denmark — 0.8% | | | | | | | | | | |
Carlsberg A/S, Class B | | | | | 625 | | | | 80,667 | |
Danske Bank A/S | | | | | 3,217 | | | | 57,008 | |
DSV A/S | | | | | 1,184 | | | | 109,306 | |
ISS A/S | | | | | 3,686 | | | | 114,536 | |
Novo Nordisk A/S, Class B | | | | | 3,641 | | | | 177,906 | |
Orsted A/S‡ | | | | | 1,111 | | | | 84,989 | |
Vestas Wind Systems A/S | | | | | 1,086 | | | | 98,140 | |
Total Denmark | | | | | | | | | 722,552 | |
| | | | | | | | | | | |
Finland — 0.8% | | | | | | | | | | |
Kesko OYJ, Class B | | | | | 1,236 | | | | 64,134 | |
Kone OYJ, Class B | | | | | 1,356 | | | | 74,251 | |
Neste OYJ | | | | | 3,192 | | | | 105,315 | |
Nokia OYJ | | | | | 32,914 | | | | 172,593 | |
Outokumpu OYJ(a) | | | | | 14,097 | | | | 53,699 | |
Stora Enso OYJ, Class R | | | | | 5,762 | | | | 71,452 | |
UPM-Kymmene OYJ | | | | | 2,856 | | | | 80,370 | |
Wartsila OYJ Abp | | | | | 3,795 | | | | 60,479 | |
Total Finland | | | | | | | | | 682,293 | |
| | | | | | | | | | | |
France —13.4% | | | | | | | | | | |
Air France-KLM* | | | | | 20,767 | | | | 239,718 | |
Air Liquide SA | | | | | 1,500 | | | | 199,289 | |
Airbus SE | | | | | 4,300 | | | | 587,341 | |
Arkema SA | | | | | 760 | | | | 77,899 | |
Atos SE | | | | | 1,760 | | | | 181,030 | |
AXA SA(a) | | | | | 12,988 | | | | 345,624 | |
BNP Paribas SA | | | | | 5,185 | | | | 275,724 | |
Bollore SA | | | | | 41,778 | | | | 198,332 | |
Bouygues SA(a) | | | | | 7,832 | | | | 294,392 | |
Bureau Veritas SA | | | | | 2,998 | | | | 75,866 | |
Capgemini SE | | | | | 1,294 | | | | 156,765 | |
Carrefour SA | | | | | 24,480 | | | | 476,542 | |
Casino Guichard Perrachon SA(a) | | | | | 5,070 | | | | 207,391 | |
Cie de Saint-Gobain | | | | | 6,481 | | | | 264,673 | |
Cie Generale des Etablissements Michelin | | | | | 1,111 | | | | 143,373 | |
Cie Plastic Omnium SA | | | | | 2,720 | | | | 82,274 | |
See notes to financial statements.
109
Schedules of Investments — IQ 500 International ETF(continued)
April 30, 2019 | | | | Shares
| | Value
|
| | | | | | | | | | |
Common Stocks (continued) | | | | | | | | | | |
| | | | | | | | | | | |
France (continued) | | | | | | | | | | |
CNP Assurances(a) | | | | | 6,650 | | | $ | 156,804 | |
Credit Agricole SA | | | | | 12,456 | | | | 170,724 | |
Danone SA | | | | | 2,597 | | | | 209,786 | |
Eiffage SA | | | | | 1,544 | | | | 161,097 | |
Electricite de France SA | | | | | 23,818 | | | | 342,736 | |
Elior Group SA‡ | | | | | 5,930 | | | | 82,009 | |
Engie SA | | | | | 32,473 | | | | 480,563 | |
EssilorLuxottica SA* | | | | | 556 | | | | 67,607 | |
Faurecia SA | | | | | 2,371 | | | | 120,317 | |
Kering SA | | | | | 269 | | | | 158,874 | |
L’Oreal SA(a) | | | | | 985 | | | | 270,563 | |
LVMH Moet Hennessy Louis Vuitton SE | | | | | 1,358 | | | | 531,223 | |
Natixis SA | | | | | 15,699 | | | | 92,333 | |
Orange SA | | | | | 20,388 | | | | 319,084 | |
Pernod Ricard SA | | | | | 502 | | | | 87,399 | |
Peugeot SA | | | | | 15,129 | | | | 396,071 | |
Publicis Groupe SA | | | | | 2,054 | | | | 121,725 | |
Renault SA | | | | | 3,644 | | | | 248,379 | |
Rexel SA | | | | | 9,409 | | | | 126,325 | |
Safran SA | | | | | 1,384 | | | | 201,481 | |
Sanofi(a) | | | | | 3,983 | | | | 345,896 | |
Schneider Electric SE | | | | | 2,300 | | | | 194,507 | |
Societe Generale SA | | | | | 3,986 | | | | 126,062 | |
Sodexo SA | | | | | 2,017 | | | | 231,131 | |
SPIE SA | | | | | 4,422 | | | | 85,239 | |
Suez | | | | | 8,461 | | | | 118,765 | |
Teleperformance* | | | | | 368 | | | | 70,647 | |
Thales SA | | | | | 1,069 | | | | 127,530 | |
TOTAL SA | | | | | 16,213 | | | | 900,229 | |
Valeo SA | | | | | 4,076 | | | | 147,865 | |
Veolia Environnement SA | | | | | 8,305 | | | | 196,014 | |
Vinci SA | | | | | 5,995 | | | | 604,808 | |
Vivendi SA(a) | | | | | 5,504 | | | | 159,575 | |
Total France | | | | | | | | | 11,459,601 | |
| | | | | | | | | | | |
Germany — 11.1% | | | | | | | | | | |
adidas AG | | | | | 646 | | | | 165,862 | |
Allianz SE | | | | | 1,497 | | | | 360,368 | |
Aurubis AG | | | | | 1,427 | | | | 69,439 | |
BASF SE | | | | | 10,269 | | | | 834,249 | |
Bayer AG | | | | | 4,346 | | | | 289,019 | |
Bayerische Motoren Werke AG | | | | | 5,898 | | | | 501,691 | |
Beiersdorf AG | | | | | 582 | | | | 63,555 | |
Brenntag AG | | | | | 2,172 | | | | 116,986 | |
CECONOMY AG* | | | | | 26,248 | | | | 175,909 | |
Continental AG | | | | | 1,875 | | | | 309,650 | |
Covestro AG‡ | | | | | 2,171 | | | | 118,611 | |
Daimler AG* | | | | | 11,485 | | | | 750,909 | |
Deutsche Bank AG | | | | | 11,501 | | | | 94,980 | |
Deutsche Lufthansa AG | | | | | 12,109 | | | | 292,039 | |
Deutsche Post AG* | | | | | 13,217 | | | | 457,700 | |
Deutsche Telekom AG | | | | | 31,161 | | | | 520,829 | |
E.ON SE | | | | | 23,169 | | | | 248,438 | |
Evonik Industries AG | | | | | 4,154 | | | | 123,647 | |
Fresenius Medical Care AG & Co. KGaA | | | | | 3,134 | | | | 263,280 | |
Fresenius SE & Co. KGaA | | | | | 4,343 | | | | 246,183 | |
Hannover Rueck SE | | | | | 507 | | | | 76,365 | |
HeidelbergCement AG | | | | | 2,062 | | | | 166,384 | |
Infineon Technologies AG | | | | | 4,208 | | | | 99,152 | |
LANXESS AG | | | | | 1,313 | | | | 75,781 | |
| | | | Shares
| | Value
|
Common Stocks (continued) | | | | | | | | | | |
| | | | | | | | | | | |
Germany (continued) | | | | | | | | | | |
Merck KGaA | | | | | 1,421 | | | $ | 151,098 | |
METRO AG | | | | | 17,587 | | | | 297,617 | |
Muenchener Rueckversicherungs-Gesellschaft AG* | | | | | 748 | | | | 186,937 | |
ProSiebenSat.1 Media SE | | | | | 2,845 | | | | 44,749 | |
RWE AG* | | | | | 11,857 | | | | 302,571 | |
Salzgitter AG | | | | | 1,854 | | | | 61,024 | |
SAP SE | | | | | 2,860 | | | | 367,252 | |
Siemens AG | | | | | 4,421 | | | | 528,856 | |
Siemens Healthineers AG‡ | | | | | 4,945 | | | | 210,702 | |
Talanx AG | | | | | 3,003 | | | | 119,878 | |
Telefonica Deutschland Holding AG | | | | | 16,014 | | | | 51,974 | |
thyssenkrupp AG(a) | | | | | 13,133 | | | | 184,492 | |
TUI AG | | | | | 11,803 | | | | 131,374 | |
Uniper SE | | | | | 13,711 | | | | 415,034 | |
United Internet AG | | | | | 1,857 | | | | 74,359 | |
Total Germany | | | | | | | | | 9,548,943 | |
| | | | | | | | | | | |
Hong Kong — 1.7% | | | | | | | | | | |
AIA Group Ltd. | | | | | 13,407 | | | | 136,626 | |
Cathay Pacific Airways Ltd. | | | | | 78,314 | | | | 131,764 | |
CK Hutchison Holdings Ltd. | | | | | 18,285 | | | | 192,047 | |
CLP Holdings Ltd. | | | | | 7,541 | | | | 85,499 | |
Dairy Farm International Holdings Ltd. | | | | | 7,735 | | | | 60,565 | |
Haier Electronics Group Co. Ltd.* | | | | | 28,046 | | | | 80,255 | |
Jardine Matheson Holdings Ltd. | | | | | 3,555 | | | | 233,919 | |
Li & Fung Ltd. | | | | | 480,851 | | | | 79,678 | |
Nine Dragons Paper Holdings Ltd.* | | | | | 71,832 | | | | 66,381 | |
Sun Art Retail Group Ltd. | | | | | 75,824 | | | | 66,204 | |
WH Group Ltd.‡ | | | | | 183,698 | | | | 217,757 | |
Yue Yuen Industrial Holdings Ltd. | | | | | 24,288 | | | | 78,479 | |
Total Hong Kong | | | | | | | | | 1,429,174 | |
| | | | | | | | | | | |
Ireland — 0.3% | | | | | | | | | | |
CRH PLC | | | | | 6,484 | | | | 216,393 | |
Smurfit Kappa Group PLC | | | | | 2,313 | | | | 67,695 | |
Total Ireland | | | | | | | | | 284,088 | |
| | | | | | | | | | | |
Israel — 0.2% | | | | | | | | | | |
Teva Pharmaceutical Industries Ltd.* | | | | | 8,582 | | | | 131,935 | |
| | | | | | | | | | | |
Italy — 3.2% | | | | | | | | | | |
Assicurazioni Generali SpA | | | | | 13,823 | | | | 268,002 | |
Atlantia SpA | | | | | 2,936 | | | | 80,022 | |
Autogrill SpA | | | | | 7,185 | | | | 69,773 | |
Enel SpA | | | | | 129,312 | | | | 817,204 | |
Eni SpA | | | | | 25,989 | | | | 443,238 | |
Intesa Sanpaolo SpA | | | | | 47,915 | | | | 125,493 | |
Leonardo SpA | | | | | 9,487 | | | | 109,457 | |
Poste Italiane SpA‡ | | | | | 31,514 | | | | 335,872 | |
Saipem SpA* | | | | | 15,630 | | | | 79,122 | |
Salini Impregilo SpA(a) | | | | | 29,332 | | | | 61,143 | |
Saras SpA | | | | | 35,177 | | | | 62,761 | |
Telecom Italia SpA* | | | | | 299,227 | | | | 167,202 | |
UniCredit SpA | | | | | 6,845 | | | | 94,586 | |
Total Italy | | | | | | | | | 2,713,875 | |
| | | | | | | | | | | |
Japan(b) — 28.7% | | | | | | | | | | |
Aeon Co., Ltd. | | | | | 15,134 | | | | 279,172 | |
AGC, Inc. | | | | | 2,725 | | | | 92,607 | |
Aisin Seiki Co., Ltd. | | | | | 4,045 | | | | 156,352 | |
Ajinomoto Co., Inc. | | | | | 4,322 | | | | 69,559 | |
Alfresa Holdings Corp. | | | | | 6,408 | | | | 178,072 | |
See notes to financial statements.
110
Schedules of Investments — IQ 500 International ETF(continued)
April 30, 2019 | | | | Shares
| | Value
|
| | | | | | | | | | |
Common Stocks (continued) | | | | | | | | | | �� |
| | | | | | | | | | | |
Japan(b) (continued) | | | | | | | | | | |
Alps Alpine Co., Ltd. | | | | | 2,996 | | | $ | 63,135 | |
ANA Holdings, Inc. | | | | | 3,973 | | | | 138,694 | |
Asahi Group Holdings Ltd. | | | | | 2,747 | | | | 119,105 | |
Asahi Kasei Corp. | | | | | 10,803 | | | | 110,867 | |
Astellas Pharma, Inc. | | | | | 6,635 | | | | 89,896 | |
Bridgestone Corp. | | | | | 3,659 | | | | 144,750 | |
Brother Industries Ltd. | | | | | 3,408 | | | | 66,798 | |
Canon, Inc. | | | | | 8,848 | | | | 245,400 | |
Central Japan Railway Co. | | | | | 678 | | | | 145,462 | |
Chubu Electric Power Co., Inc. | | | | | 10,164 | | | | 147,475 | |
Chugoku Electric Power Co., Inc. (The)(a) | | | | | 5,871 | | | | 69,951 | |
Coca-Cola Bottlers Japan Holdings, Inc. | | | | | 2,351 | | | | 57,775 | |
Cosmo Energy Holdings Co., Ltd. | | | | | 3,111 | | | | 64,161 | |
Dai Nippon Printing Co., Ltd. | | | | | 5,233 | | | | 123,713 | |
Dai-ichi Life Holdings, Inc. | | | | | 7,775 | | | | 111,346 | |
Daiichi Sankyo Co., Ltd. | | | | | 1,867 | | | | 91,879 | |
Daikin Industries Ltd. | | | | | 968 | | | | 122,548 | |
Denso Corp. | | | | | 5,049 | | | | 220,003 | |
Dentsu, Inc. | | | | | 1,979 | | | | 80,582 | |
East Japan Railway Co. | | | | | 2,535 | | | | 238,193 | |
FamilyMart UNY Holdings Co., Ltd. | | | | | 2,464 | | | | 65,662 | |
Fast Retailing Co., Ltd. | | | | | 219 | | | | 126,356 | |
Fuji Media Holdings, Inc. | | | | | 4,183 | | | | 56,111 | |
FUJIFILM Holdings Corp. | | | | | 2,069 | | | | 96,303 | |
Fujitsu Ltd. | | | | | 4,475 | | | | 326,861 | |
Hakuhodo DY Holdings, Inc. | | | | | 6,676 | | | | 112,271 | |
Hankyu Hanshin Holdings, Inc. | | | | | 1,916 | | | | 71,393 | |
Hanwa Co. Ltd. | | | | | 3,749 | | | | 107,547 | |
Haseko Corp. | | | | | 6,108 | | | | 73,543 | |
Hino Motors Ltd. | | | | | 8,897 | | | | 83,718 | |
HIS Co., Ltd. | | | | | 2,371 | | | | 75,361 | |
Hitachi Ltd. | | | | | 13,198 | | | | 437,149 | |
Honda Motor Co., Ltd. | | | | | 16,176 | | | | 450,386 | |
Idemitsu Kosan Co., Ltd. | | | | | 3,725 | | | | 120,571 | |
IHI Corp. | | | | | 1,920 | | | | 45,459 | |
Isetan Mitsukoshi Holdings Ltd. | | | | | 5,950 | | | | 56,575 | |
Isuzu Motors Ltd. | | | | | 6,258 | | | | 89,649 | |
ITOCHU Corp. | | | | | 31,784 | | | | 570,756 | |
Japan Airlines Co., Ltd. | | | | | 2,968 | | | | 99,373 | |
Japan Post Holdings Co., Ltd. | | | | | 21,901 | | | | 244,426 | |
Japan Post Insurance Co., Ltd. | | | | | 4,901 | | | | 98,790 | |
Japan Tobacco, Inc. | | | | | 5,036 | | | | 116,478 | |
JFE Holdings, Inc. | | | | | 9,832 | | | | 168,170 | |
JGC Corp. | | | | | 3,079 | | | | 43,901 | |
JTEKT Corp. | | | | | 5,495 | | | | 70,504 | |
JXTG Holdings, Inc. | | | | | 63,247 | | | | 307,050 | |
Kajima Corp. | | | | | 11,123 | | | | 164,286 | |
Kansai Electric Power Co., Inc. (The) | | | | | 11,006 | | | | 132,961 | |
Kao Corp. | | | | | 1,357 | | | | 104,259 | |
Kawasaki Heavy Industries Ltd. | | | | | 3,036 | | | | 70,492 | |
Kawasaki Kisen Kaisha Ltd.*(a) | | | | | 5,440 | | | | 78,639 | |
KDDI Corp. | | | | | 14,137 | | | | 322,470 | |
Kintetsu Group Holdings Co., Ltd. | | | | | 2,167 | | | | 96,019 | |
Kirin Holdings Co., Ltd. | | | | | 4,279 | | | | 96,799 | |
Kobe Steel Ltd. | | | | | 12,869 | | | | 98,099 | |
Komatsu Ltd. | | | | | 5,028 | | | | 128,753 | |
Konica Minolta, Inc. | | | | | 7,448 | | | | 74,497 | |
Kubota Corp. | | | | | 5,584 | | | | 84,380 | |
Kyocera Corp. | | | | | 2,108 | | | | 136,086 | |
Kyushu Electric Power Co., Inc. | | | | | 9,104 | | | | 88,036 | |
| | | | Shares
| | Value
|
Common Stocks (continued) | | | | | | | | | | |
| | | | | | | | | | | |
Japan(b) (continued) | | | | | | | | | | |
LIXIL Group Corp. | | | | | 4,704 | | | $ | 61,115 | |
Marubeni Corp. | | | | | 53,666 | | | | 383,119 | |
Mazda Motor Corp. | | | | | 11,007 | | | | 130,009 | |
Medipal Holdings Corp. | | | | | 9,187 | | | | 205,805 | |
MEIJI Holdings Co., Ltd. | | | | | 1,111 | | | | 87,284 | |
Mitsubishi Chemical Holdings Corp. | | | | | 30,021 | | | | 212,701 | |
Mitsubishi Corp. | | | | | 26,744 | | | | 733,824 | |
Mitsubishi Electric Corp. | | | | | 22,663 | | | | 321,911 | |
Mitsubishi Heavy Industries Ltd. | | | | | 4,384 | | | | 181,894 | |
Mitsubishi Materials Corp. | | | | | 2,785 | | | | 72,116 | |
Mitsubishi Motors Corp. | | | | | 13,960 | | | | 78,088 | |
Mitsubishi UFJ Financial Group, Inc. | | | | | 23,580 | | | | 116,423 | |
Mitsui & Co., Ltd. | | | | | 20,668 | | | | 332,915 | |
Mitsui Chemicals, Inc. | | | | | 4,002 | | | | 97,665 | |
Mitsui OSK Lines Ltd. | | | | | 4,233 | | | | 107,179 | |
Mizuho Financial Group, Inc. | | | | | 53,669 | | | | 83,606 | |
MS&AD Insurance Group Holdings, Inc. | | | | | 3,735 | | | | 115,295 | |
Murata Manufacturing Co., Ltd. | | | | | 2,397 | | | | 128,270 | |
NEC Corp. | | | | | 6,140 | | | | 206,458 | |
NH Foods Ltd. | | | | | 2,042 | | | | 81,955 | |
Nidec Corp. | | | | | 628 | | | | 89,005 | |
Nippon Express Co., Ltd. | | | | | 2,103 | | | | 115,181 | |
Nippon Paper Industries Co., Ltd. | | | | | 4,041 | | | | 79,967 | |
Nippon Steel Corp. | | | | | 15,632 | | | | 277,972 | |
Nippon Telegraph & Telephone Corp. | | | | | 18,118 | | | | 750,911 | |
Nippon Yusen K.K. | | | | | 7,809 | | | | 132,937 | |
Nissan Motor Co., Ltd. | | | | | 41,864 | | | | 335,777 | |
Nitto Denko Corp. | | | | | 1,047 | | | | 56,310 | |
Nomura Holdings, Inc. | | | | | 12,413 | | | | 46,565 | |
Nomura Research Institute Ltd. | | | | | 1,442 | | | | 70,304 | |
NTT Data Corp. | | | | | 13,216 | | | | 153,549 | |
NTT DOCOMO, Inc. | | | | | 12,685 | | | | 274,543 | |
Obayashi Corp. | | | | | 16,206 | | | | 158,459 | |
Oji Holdings Corp. | | | | | 13,971 | | | | 83,544 | |
Olympus Corp. | | | | | 7,811 | | | | 87,245 | |
Omron Corp. | | | | | 1,808 | | | | 96,589 | |
Oriental Land Co., Ltd. | | | | | 680 | | | | 74,914 | |
ORIX Corp. | | | | | 4,703 | | | | 66,359 | |
Osaka Gas Co., Ltd. | | | | | 4,132 | | | | 76,240 | |
Otsuka Corp. | | | | | 2,391 | | | | 93,815 | |
Otsuka Holdings Co., Ltd. | | | | | 1,942 | | | | 69,206 | |
PALTAC Corp. | | | | | 1,629 | | | | 89,366 | |
Panasonic Corp. | | | | | 23,472 | | | | 215,173 | |
Persol Holdings Co., Ltd. | | | | | 4,105 | | | | 76,811 | |
Rakuten, Inc. | | | | | 14,970 | | | | 165,997 | |
Recruit Holdings Co., Ltd. | | | | | 7,350 | | | | 219,692 | |
Renesas Electronics Corp.* | | | | | 13,258 | | | | 70,590 | |
Ricoh Co., Ltd. | | | | | 11,802 | | | | 119,000 | |
Secom Co., Ltd. | | | | | 1,183 | | | | 99,186 | |
Seibu Holdings, Inc. | | | | | 3,500 | | | | 56,786 | |
Seiko Epson Corp. | | | | | 4,793 | | | | 76,559 | |
Sekisui Chemical Co., Ltd. | | | | | 5,095 | | | | 81,474 | |
Sekisui House Ltd. | | | | | 4,343 | | | | 69,878 | |
Seven & i Holdings Co., Ltd. | | | | | 8,412 | | | | 291,465 | |
SG Holdings Co., Ltd. | | | | | 2,974 | | | | 79,440 | |
Sharp Corp.* | | | | | 5,792 | | | | 64,278 | |
Shimizu Corp. | | | | | 15,010 | | | | 127,897 | |
Shin-Etsu Chemical Co., Ltd. | | | | | 1,385 | | | | 129,702 | |
Shiseido Co., Ltd. | | | | | 1,077 | | | | 84,303 | |
Showa Denko K.K. | | | | | 1,561 | | | | 52,769 | |
| | | | | | | | | | |
See notes to financial statements.
111
Schedules of Investments — IQ 500 International ETF(continued)
April 30, 2019 | | | | Shares
| | Value
|
Common Stocks (continued) | | | | | | | | | | |
| | | | | | | | | | | |
Japan(b) (continued) | | | | | | | | | | |
SoftBank Group Corp. | | | | | 6,708 | | | $ | 695,946 | |
Sojitz Corp. | | | | | 36,187 | | | | 124,441 | |
Sompo Holdings, Inc. | | | | | 2,084 | | | | 77,859 | |
Sony Corp. | | | | | 5,830 | | | | 272,826 | |
Subaru Corp. | | | | | 4,553 | | | | 111,214 | |
Sumitomo Chemical Co., Ltd. | | | | | 26,059 | | | | 129,154 | |
Sumitomo Corp. | | | | | 21,807 | | | | 311,221 | |
Sumitomo Electric Industries Ltd. | | | | | 9,492 | | | | 125,665 | |
Sumitomo Metal Mining Co., Ltd. | | | | | 2,114 | | | | 66,035 | |
Sumitomo Mitsui Financial Group, Inc. | | | | | 3,641 | | | | 131,452 | |
Suntory Beverage & Food Ltd. | | | | | 1,825 | | | | 80,292 | |
Suzuken Co., Ltd. | | | | | 2,727 | | | | 156,703 | |
Suzuki Motor Corp. | | | | | 2,791 | | | | 126,926 | |
Taiheiyo Cement Corp. | | | | | 2,147 | | | | 68,820 | |
Taisei Corp. | | | | | 3,075 | | | | 134,596 | |
Takeda Pharmaceutical Co., Ltd. | | | | | 3,065 | | | | 113,161 | |
TDK Corp. | | | | | 1,167 | | | | 101,533 | |
Teijin Ltd. | | | | | 3,560 | | | | 60,956 | |
Tohoku Electric Power Co., Inc. | | | | | 8,910 | | | | 101,760 | |
Tokio Marine Holdings, Inc. | | | | | 2,560 | | | | 128,764 | |
Tokyo Electric Power Co., Holdings, Inc.* | | | | | 54,549 | | | | 307,580 | |
Tokyo Electron Ltd. | | | | | 741 | | | | 117,396 | |
Tokyo Gas Co., Ltd. | | | | | 3,875 | | | | 98,358 | |
Tokyu Corp. | | | | | 4,808 | | | | 78,223 | |
Toppan Printing Co., Ltd. | | | | | 8,549 | | | | 138,242 | |
Toray Industries, Inc. | | | | | 18,880 | | | | 128,494 | |
Toshiba Corp. | | | | | 4,724 | | | | 156,936 | |
Tosoh Corp. | | | | | 4,833 | | | | 77,458 | |
Toyota Boshoku Corp. | | | | | 3,732 | | | | 55,088 | |
Toyota Industries Corp. | | | | | 1,829 | | | | 103,459 | |
Toyota Motor Corp. | | | | | 18,005 | | | | 1,116,270 | |
Toyota Tsusho Corp. | | | | | 12,615 | | | | 416,819 | |
West Japan Railway Co. | | | | | 1,631 | | | | 120,991 | |
Yahoo Japan Corp. | | | | | 30,575 | | | | 81,259 | |
Yamada Denki Co., Ltd. | | | | | 17,205 | | | | 81,410 | |
Yamaha Motor Co., Ltd. | | | | | 2,968 | | | | 60,972 | |
Yamato Holdings Co., Ltd. | | | | | 3,567 | | | | 77,265 | |
Yamazaki Baking Co., Ltd. | | | | | 3,562 | | | | 52,834 | |
Zensho Holdings Co., Ltd. | | | | | 3,473 | | | | 78,082 | |
Total Japan | | | | | | | | | 24,581,484 | |
| | | | | | | | | | | |
Luxembourg — 0.6% | | | | | | | | | | |
ArcelorMittal | | | | | 19,423 | | | | 420,720 | |
RTL Group SA(a) | | | | | 1,420 | | | | 79,729 | |
Total Luxembourg | | | | | | | | | 500,449 | |
| | | | | | | | | | | |
Macau — 0.1% | | | | | | | | | | |
Galaxy Entertainment Group Ltd. | | | | | 16,463 | | | | 123,073 | |
| | | | | | | | | | | |
Netherlands — 4.0% | | | | | | | | | | |
Aegon NV | | | | | 15,050 | | | | 78,531 | |
Akzo Nobel NV | | | | | 871 | | | | 73,893 | |
Altice Europe NV* | | | | | 89,714 | | | | 283,530 | |
ASML Holding NV(a) | | | | | 618 | | | | 128,504 | |
EXOR NV | | | | | 5,959 | | | | 396,421 | |
Heineken Holding NV | | | | | 1,948 | | | | 197,682 | |
Heineken NV | | | | | 1,878 | | | | 202,554 | |
ING Groep NV(a) | | | | | 5,896 | | | | 75,037 | |
Koninklijke Ahold Delhaize NV | | | | | 15,904 | | | | 382,495 | |
Koninklijke DSM NV | | | | | 951 | | | | 108,550 | |
Koninklijke Philips NV | | | | | 4,204 | | | | 178,869 | |
| | | | Shares
| | Value
|
Common Stocks (continued) | | | | | | | | | | |
| | | | | | | | | | | |
Netherlands (continued) | | | | | | | | | | |
NN Group NV | | | | | 1,629 | | | $ | 70,871 | |
Randstad NV | | | | | 4,437 | | | | 253,202 | |
Royal Dutch Shell PLC, Class B | | | | | 28,455 | | | | 914,215 | |
Wolters Kluwer NV | | | | | 1,140 | | | | 79,441 | |
Total Netherlands | | | | | | | | | 3,423,795 | |
| | | | | | | | | | | |
Norway — 0.8% | | | | | | | | | | |
Equinor ASA | | | | | 17,258 | | | | 384,077 | |
Norsk Hydro ASA | | | | | 24,822 | | | | 106,091 | |
Telenor ASA | | | | | 6,031 | | | | 120,794 | |
Yara International ASA | | | | | 2,059 | | | | 92,646 | |
Total Norway | | | | | | | | | 703,608 | |
| | | | | | | | | | | |
Portugal — 0.4% | | | | | | | | | | |
EDP — Energias de Portugal SA* | | | | | 32,741 | | | | 123,985 | |
Galp Energia SGPS SA | | | | | 5,765 | | | | 96,719 | |
Jeronimo Martins SGPS SA(a) | | | | | 8,255 | | | | 134,330 | |
Total Portugal | | | | | | | | | 355,034 | |
| | | | | | | | | | | |
Singapore — 0.8% | | | | | | | | | | |
Jardine Cycle & Carriage Ltd. | | | | | 5,015 | | | | 130,865 | |
Oversea-Chinese Banking Corp. Ltd. | | | | | 8,861 | | | | 78,767 | |
Singapore Airlines Ltd. | | | | | 13,272 | | | | 94,382 | |
Singapore Telecommunications Ltd. | | | | | 42,073 | | | | 97,981 | |
Wilmar International Ltd. | | | | | 111,099 | | | | 297,091 | |
Total Singapore | | | | | | | | | 699,086 | |
| | | | | | | | | | | |
Spain — 3.1% | | | | | | | | | | |
Acciona SA | | | | | 925 | | | | 107,086 | |
ACS Actividades de Construccion y Servicios SA | | | | | 7,592 | | | | 348,247 | |
Amadeus IT Group SA | | | | | 956 | | | | 75,983 | |
Banco Bilbao Vizcaya Argentaria SA | | | | | 15,397 | | | | 93,490 | |
Banco Santander SA(a) | | | | | 55,238 | | | | 279,286 | |
Endesa SA | | | | | 6,556 | | | | 163,184 | |
Ferrovial SA | | | | | 4,991 | | | �� | 122,831 | |
Iberdrola SA | | | | | 34,689 | | | | 314,818 | |
Industria de Diseno Textil SA(a) | | | | | 6,956 | | | | 210,247 | |
Mapfre SA | | | | | 25,723 | | | | 77,114 | |
Naturgy Energy Group SA | | | | | 5,406 | | | | 153,401 | |
Repsol SA | | | | | 15,755 | | | | 267,145 | |
Telefonica SA | | | | | 49,231 | | | | 410,047 | |
Total Spain | | | | | | | | | 2,622,879 | |
| | | | | | | | | | | |
Sweden — 1.9% | | | | | | | | | | |
Assa Abloy AB, B Shares | | | | | 3,094 | | | | 65,936 | |
Atlas Copco AB, A Shares | | | | | 3,031 | | | | 94,117 | |
Electrolux AB | | | | | 3,426 | | | | 84,075 | |
Essity AB, B Shares | | | | | 3,701 | | | | 109,705 | |
Hennes & Mauritz AB, B Shares | | | | | 8,563 | | | | 149,142 | |
ICA Gruppen AB | | | | | 2,250 | | | | 81,297 | |
NCC AB, B Shares | | | | | 4,298 | | | | 70,979 | |
Sandvik AB(a) | | | | | 4,550 | | | | 84,067 | |
Securitas AB, B Shares | | | | | 6,460 | | | | 112,799 | |
Skanska AB, B Shares | | | | | 9,993 | | | | 173,754 | |
SKF AB, B Shares | | | | | 3,972 | | | | 73,429 | |
SSAB AB, A Shares(a) | | | | | 16,213 | | | | 61,105 | |
Telefonaktiebolaget LM Ericsson, B Shares | | | | | 18,608 | | | | 183,990 | |
Telia Co. AB | | | | | 17,540 | | | | 74,612 | |
Volvo AB, B Shares | | | | | 15,023 | | | | 240,196 | |
Total Sweden | | | | | | | | | 1,659,203 | |
| | | | | | | | | | |
See notes to financial statements.
112
Schedules of Investments — IQ 500 International ETF(continued)
April 30, 2019 | | | | Shares
| | Value
|
Common Stocks (continued) | | | | | | | | | | |
| | | | | | | | | | | |
Switzerland — 5.5% | | | | | | | | | | |
ABB Ltd.* | | | | | 8,949 | | | $ | 184,161 | |
Adecco Group AG | | | | | 4,801 | | | | 275,716 | |
Cie Financiere Richemont SA | | | | | 891 | | | | 65,142 | |
Credit Suisse Group AG* | | | | | 6,930 | | | | 92,491 | |
Glencore PLC* | | | | | 174,806 | | | | 693,571 | |
Kuehne + Nagel International AG | | | | | 1,047 | | | | 152,118 | |
LafargeHolcim Ltd.* | | | | | 3,499 | | | | 179,860 | |
Nestle SA | | | | | 10,508 | | | | 1,011,099 | |
Novartis AG | | | | | 5,296 | | | | 432,463 | |
Roche Holding AG | | | | | 2,927 | | | | 771,533 | |
Schindler Holding AG — Participating Certificate | | | | | 319 | | | | 68,809 | |
Sika AG | | | | | 494 | | | | 75,627 | |
STMicroelectronics NV | | | | | 5,584 | | | | 102,475 | |
Swiss Life Holding AG* | | | | | 182 | | | | 85,570 | |
Swiss Re AG | | | | | 1,245 | | | | 119,808 | |
Swisscom AG | | | | | 207 | | | | 96,431 | |
UBS Group AG* | | | | | 8,469 | | | | 113,571 | |
Zurich Insurance Group AG | | | | | 510 | | | | 162,609 | |
Total Switzerland | | | | | | | | | 4,683,054 | |
| | | | | | | | | | | |
United Kingdom — 10.2% | | | | | | | | | | |
Associated British Foods PLC | | | | | 4,023 | | | | 134,209 | |
AstraZeneca PLC | | | | | 2,328 | | | | 173,778 | |
Aviva PLC | | | | | 24,850 | | | | 139,140 | |
Babcock International Group PLC | | | | | 9,477 | | | | 64,862 | |
BAE Systems PLC | | | | | 24,915 | | | | 160,453 | |
Balfour Beatty PLC | | | | | 23,930 | | | | 78,365 | |
Barclays PLC | | | | | 38,078 | | | | 81,549 | |
BP PLC | | | | | 101,195 | | | | 737,449 | |
British American Tobacco PLC | | | | | 4,853 | | | | 189,166 | |
BT Group PLC | | | | | 77,862 | | | | 232,497 | |
Bunzl PLC | | | | | 3,331 | | | | 100,267 | |
Capita PLC* | | | | | 42,240 | | | | 70,182 | |
Centrica PLC | | | | | 109,751 | | | | 152,019 | |
Compass Group PLC | | | | | 13,138 | | | | 298,530 | |
DCC PLC | | | | | 1,110 | | | | 99,094 | |
Diageo PLC | | | | | 3,159 | | | | 133,163 | |
Dixons Carphone PLC | | | | | 39,002 | | | | 73,776 | |
DS Smith PLC | | | | | 13,072 | | | | 60,837 | |
easyJet PLC | | | | | 4,108 | | | | 62,310 | |
Experian PLC | | | | | 2,672 | | | | 77,505 | |
Fiat Chrysler Automobiles NV | | | | | 25,989 | | | | 400,015 | |
G4S PLC | | | | | 36,955 | | | | 104,157 | |
GlaxoSmithKline PLC | | | | | 17,703 | | | | 363,117 | |
Hays PLC | | | | | 40,049 | | | | 79,150 | |
HSBC Holdings PLC | | | | | 21,511 | | | | 187,074 | |
Imperial Brands PLC | | | | | 3,888 | | | | 123,471 | |
Inchcape PLC | | | | | 11,414 | | | | 91,437 | |
| | | | Shares
| | Value
|
Common Stocks (continued) | | | | | | | | | | |
| | | | | | | | | | | |
United Kingdom (continued) | | | | | | | | | | |
International Consolidated Airlines Group SA | | | | | 26,807 | | | $ | 188,853 | |
ITV PLC | | | | | 33,126 | | | | 59,012 | |
J Sainsbury PLC | | | | | 46,166 | | | | 133,910 | |
John Wood Group PLC(a) | | | | | 8,392 | | | | 51,474 | |
Johnson Matthey PLC | | | | | 3,216 | | | | 139,905 | |
Kingfisher PLC | | | | | 29,508 | | | | 101,594 | |
Legal & General Group PLC | | | | | 28,507 | | | | 103,388 | |
Linde PLC | | | | | 865 | | | | 155,493 | |
Lloyds Banking Group PLC | | | | | 197,310 | | | | 160,945 | |
Marks & Spencer Group PLC | | | | | 23,227 | | | | 86,570 | |
Mondi PLC | | | | | 3,118 | | | | 68,309 | |
National Grid PLC | | | | | 12,602 | | | | 137,360 | |
Pearson PLC | | | | | 6,111 | | | | 66,139 | |
Petrofac Ltd. | | | | | 8,685 | | | | 50,191 | |
Prudential PLC | | | | | 9,147 | | | | 206,890 | |
Reckitt Benckiser Group PLC | | | | | 1,338 | | | | 108,093 | |
RELX PLC | | | | | 5,368 | | | | 123,095 | |
Rolls-Royce Holdings PLC* | | | | | 14,330 | | | | 170,859 | |
Rolls-Royce Holdings PLC —Entitlement*(c)(d) | | | | | 1,017,430 | | | | 1,326 | |
Royal Bank of Scotland Group PLC | | | | | 22,909 | | | | 71,557 | |
Royal Mail PLC | | | | | 21,280 | | | | 70,131 | |
SSE PLC | | | | | 16,277 | | | | 242,857 | |
Standard Chartered PLC | | | | | 9,953 | | | | 90,827 | |
Tesco PLC | | | | | 135,670 | | | | 441,812 | |
Travis Perkins PLC | | | | | 5,914 | | | | 107,744 | |
Unilever NV | | | | | 8,430 | | | | 509,787 | |
Vodafone Group PLC | | | | | 168,481 | | | | 311,889 | |
Wm Morrison Supermarkets PLC | | | | | 38,801 | | | | 109,209 | |
WPP PLC | | | | | 17,209 | | | | 214,564 | |
Total United Kingdom | | | | | | | | | 8,751,355 | |
| | | | | | | | | | | |
United States — 0.2% | | | | | | | | | | |
Ferguson PLC | | | | | 2,561 | | | | 181,622 | |
| | | | | | | | | | | |
Total Common Stocks | | | | | | | | | | |
(Cost $78,873,364) | | | | | | | | | 84,108,180 | |
| | | | | | | | | | | |
Preferred Stocks — 1.2% | | | | | | | | | | |
| | | | | | | | | | | |
Germany — 1.2% | | | | | | | | | | |
Henkel AG & Co. KGaA, 2.05% | | | | | 1,439 | | | | 145,529 | |
Schaeffler AG, 7.25% | | | | | 9,149 | | | | 78,027 | |
Volkswagen AG, 2.54% | | | | | 4,649 | | | | 807,780 | |
Total Germany | | | | | | | | | 1,031,336 | |
| | | | | | | | | | | |
Total Preferred Stocks | | | | | | | | | | |
(Cost $989,541) | | | | | | | | | 1,031,336 | |
See notes to financial statements.
113
Schedules of Investments — IQ 500 International ETF(continued)
April 30, 2019 | | | | Shares
| | Value
|
Short-Term Investment — 0.0%(e) | | | | | | | | | | |
| | | | | | | | | | | |
Money Market Fund — 0.0%(e) | | | | | | | | | | |
Morgan Stanley Institutional Liquidity Funds Treasury Portfolio — Institutional Class, 2.32%(f) | | | | | | | | | | |
(Cost $30,797) | | | | | 30,797 | | | $ | 30,797 | |
| | | | | | | | | | | |
Investment of Cash Collateral For Securities Loaned — 3.8% | | | | | | | | | | |
| | | | | | | | | | | |
Money Market Fund — 3.8% | | | | | | | | | | |
Dreyfus Government Cash Management Fund, Institutional Shares, 2.45%(f) | | | | | | | | | | |
(Cost $3,265,837) | | | | | 3,265,837 | | | | 3,265,837 | |
| | | | | | | | | | | |
Total Investments — 103.2% | | | | | | | | | | |
(Cost $83,159,539) | | | | | | | | | 88,436,150 | |
| | | | | | | | | | | |
Other Assets and Liabilities, Net — (3.2)% | | | | | | | | | (2,761,572 | ) |
| | | | | | | | | | | |
Net Assets — 100.0% | | | | | | | | $ | 85,674,578 | |
‡ | | May be sold to institutional investors only under Rule 144A or securities offered pursuant to section 4(a)(2) of the Securities Act of 1933, as amended. |
* | | Non-income producing securities. |
(a) | | All or a portion of the security was on loan. In addition, “Other Assets and Liabilities, Net” may include pending sales that are also on loan. The aggregate market value of securities on loan was $3,158,681; total market value of collateral held by the Fund was $3,327,727. Market value of the collateral held includes non-cash U.S. Treasury securities collateral having a value of $61,890. |
(b) | | These securities are deemed illiquid due to the extended closure of the Japanese market. |
(c) | | Security has been deemed illiquid because it may not be able to be resold within seven days at approximately the price shown. At April 30, 2019, the value of this security was $1,326. |
(d) | | Security is fair valued as determined in good faith in accordance with the procedures established by the Board of Trustees. The Security is fair valued using significant unobservable inputs. |
(f) | | Reflects the 1-day yield at April 30, 2019. |
See notes to financial statements.
114
Schedules of Investments — IQ 500 International ETF(continued)
April 30, 2019The following is a summary of the inputs used to value the Fund’s investments as of April 30, 2019. For more information on the valuation techniques, and their aggregation into the levels used in the table below, please refer to Note 2.
Asset Valuation Inputs
Description
| | | | Level 1
| | Level 2
| | Level 3
| | Total
|
Investments in Securities:(g) | | | | | | | | | | | | | | | | | | |
Common Stocks | | | | | | | | | | | | | | | | | | |
Australia | | | | $ | 2,956,636 | | | $ | — | | | $ | — | | | $ | 2,956,636 | |
Austria | | | | | 225,042 | | | | — | | | | — | | | | 225,042 | |
Belgium | | | | | 809,729 | | | | — | | | | — | | | | 809,729 | |
Canada | | | | | 4,859,670 | | | | — | | | | — | | | | 4,859,670 | |
Denmark | | | | | 722,552 | | | | — | | | | — | | | | 722,552 | |
Finland | | | | | 682,293 | | | | — | | | | — | | | | 682,293 | |
France | | | | | 11,459,601 | | | | — | | | | — | | | | 11,459,601 | |
Germany | | | | | 9,548,943 | | | | — | | | | — | | | | 9,548,943 | |
Hong Kong | | | | | 1,429,174 | | | | — | | | | — | | | | 1,429,174 | |
Ireland | | | | | 284,088 | | | | — | | | | — | | | | 284,088 | |
Israel | | | | | 131,935 | | | | — | | | | — | | | | 131,935 | |
Italy | | | | | 2,713,875 | | | | — | | | | — | | | | 2,713,875 | |
Japan | | | | | — | | | | 24,581,484 | | | | — | | | | 24,581,484 | |
Luxembourg | | | | | 500,449 | | | | — | | | | — | | | | 500,449 | |
Macau | | | | | 123,073 | | | | — | | | | — | | | | 123,073 | |
Netherlands | | | | | 3,423,795 | | | | — | | | | — | | | | 3,423,795 | |
Norway | | | | | 703,608 | | | | — | | | | — | | | | 703,608 | |
Portugal | | | | | 355,034 | | | | — | | | | — | | | | 355,034 | |
Singapore | | | | | 699,086 | | | | — | | | | — | | | | 699,086 | |
Spain | | | | | 2,622,879 | | | | — | | | | — | | | | 2,622,879 | |
Sweden | | | | | 1,659,203 | | | | — | | | | — | | | | 1,659,203 | |
Switzerland | | | | | 4,683,054 | | | | — | | | | — | | | | 4,683,054 | |
United Kingdom | | | | | 8,750,029 | | | | — | | | | 1,326 | (h) | | | 8,751,355 | |
United States | | | | | 181,622 | | | | — | | | | — | | | | 181,622 | |
Total Common Stocks | | | | | 59,525,370 | | | | 24,581,484 | | | | 1,326 | | | | 84,108,180 | |
Preferred Stocks | | | | | | | | | | | | | | | | | | |
Germany | | | | | 1,031,336 | | | | — | | | | — | | | | 1,031,336 | |
Total Preferred Stocks | | | | | 1,031,336 | | | | — | | | | — | | | | 1,031,336 | |
Short-Term Investment: | | | | | | | | | | | | | | | | | | |
Money Market Fund | | | | | 30,797 | | | | — | | | | — | | | | 30,797 | |
Investment of Cash Collateral for Securities Loaned: | | | | | | | | | | | | | | | | | | |
Money Market Fund | | | | | 3,265,837 | | | | — | | | | — | | | | 3,265,837 | |
Total Investments in Securities | | | | $ | 63,853,340 | | | $ | 24,581,484 | | | $ | 1,326 | | | $ | 88,436,150 | |
(g) | | For a complete listing of investments and their countries, see the Schedules of Investments. |
(h) | | The Level 3 security, valued at $1,326, has been deemed illiquid and has been fair valued in good faith in accordance with procedures established by the Board of Trustees. |
For the period ended April 30, 2019, the Fund did not have any transfers into or out of Level 3 within the fair value hierarchy. (See Note 2)
See notes to financial statements.
115
Schedules of Investments — IQ 500 International ETF(continued)
April 30, 2019The following is a reconciliation of investments in which significant unobservable inputs (Level 3) were used in determining value:
Investments
in Securities
| | Balance
as of
December 13,
2018
| | Accrued
Discounts
(Premiums)
| | Realized
Gain
(Loss)
| | Change in
Unrealized
Appreciation
(Depreciation)
| | Purchases
| | Sales
| | Transfers
into
Level 3
| | Transfers
out of
Level 3
| | Balance
as of
April 30,
2019
| | Change in
Unrealized
Appreciation
(Depreciation)
from Investments
Still Held at
April 30,
2019(i)
|
Common Stock | | | | | | | | | | | | | | | | | | | | | | | | | | | | | | | | | | | | | | | | |
Rolls-Royce | | | | | | | | | | | | | | | | | | | | | | | | | | | | | | | | | | | | | | | | |
Holdings
PLC — Entitlement(j) | | $ | — | | | $ | — | | | $ | — | | | $ | 13 | | | $ | 1,313 | | | $ | — | | | $ | — | | | $ | — | | | $ | 1,326 | | | $ | 13 | |
Information about Level 3 fair value measurements as of April 30, 2019.
Security Type
| | | | Fair Value
| | Valuation Technique
| | Unobservable Inputs
|
| Common Stock | | | | $ | 1,326 | | | Peer Analysis | | Contingent Payment Terms |
(i) | | Included in “Net change in unrealized appreciation (depreciation) on investments” in the Statements of Operations. |
(j) | | Security has been deemed illiquid and has been fair valued in good faith in accordance with procedures established by the Board of Trustees. |
See notes to financial statements.
116
Schedules of Investments — IQ 50 Percent Hedged FTSE International ETF
April 30, 2019 | | | | Shares
| | Value
|
| | | | | | | | | | |
Common Stocks — 99.2% | | | | | | | | | | |
| | | | | | | | | | | |
Australia — 7.3% | | | | | | | | | | |
AGL Energy Ltd. | | | | | 13,979 | | | $ | 218,724 | |
Alumina Ltd. | | | | | 63,721 | | | | 100,464 | |
Amcor Ltd. | | | | | 24,101 | | | | 271,925 | |
AMP Ltd. | | | | | 65,666 | | | | 104,917 | |
APA Group | | | | | 26,003 | | | | 176,067 | |
Aristocrat Leisure Ltd. | | | | | 14,306 | | | | 262,607 | |
ASX Ltd. | | | | | 5,864 | | | | 307,490 | |
Aurizon Holdings Ltd. | | | | | 44,590 | | | | 149,391 | |
Australia & New Zealand Banking Group Ltd. | | | | | 52,907 | | | | 1,012,890 | |
Bendigo & Adelaide Bank Ltd. | | | | | 14,296 | | | | 103,641 | |
BHP Group Ltd. | | | | | 55,612 | | | | 1,463,930 | |
BHP Group PLC | | | | | 38,098 | | | | 898,665 | |
BlueScope Steel Ltd. | | | | | 10,758 | | | | 101,844 | |
Boral Ltd. | | | | | 32,059 | | | | 109,439 | |
Brambles Ltd. | | | | | 32,115 | | | | 272,380 | |
Caltex Australia Ltd. | | | | | 6,133 | | | | 117,458 | |
Coca-Cola Amatil Ltd. | | | | | 17,124 | | | | 106,064 | |
Coles Group Ltd.* | | | | | 21,136 | | | | 187,594 | |
Commonwealth Bank of Australia | | | | | 32,903 | | | | 1,725,792 | |
Computershare Ltd. | | | | | 13,864 | | | | 173,988 | |
CSL Ltd. | | | | | 8,456 | | | | 1,181,840 | |
Dexus | | | | | 26,846 | | | | 236,195 | |
Fortescue Metals Group Ltd. | | | | | 29,738 | | | | 149,657 | |
Goodman Group | | | | | 38,783 | | | | 359,234 | |
GPT Group (The) | | | | | 46,493 | | | | 187,509 | |
Incitec Pivot Ltd. | | | | | 43,502 | | | | 103,186 | |
Insurance Australia Group Ltd. | | | | | 52,249 | | | | 289,791 | |
Lendlease Group | | | | | 11,789 | | | | 110,359 | |
Macquarie Group Ltd. | | | | | 6,232 | | | | 590,847 | |
Medibank Pvt Ltd. | | | | | 68,591 | | | | 138,074 | |
Mirvac Group | | | | | 96,105 | | | | 191,431 | |
National Australia Bank Ltd. | | | | | 50,414 | | | | 899,517 | |
Newcrest Mining Ltd. | | | | | 14,784 | | | | 260,247 | |
Northern Star Resources Ltd. | | | | | 12,773 | | | | 73,630 | |
Oil Search Ltd. | | | | | 30,126 | | | | 164,969 | |
Orica Ltd. | | | | | 9,402 | | | | 123,087 | |
Origin Energy Ltd. | | | | | 37,677 | | | | 195,445 | |
QBE Insurance Group Ltd. | | | | | 26,928 | | | | 245,066 | |
Ramsay Health Care Ltd. | | | | | 2,932 | | | | 134,800 | |
Rio Tinto Ltd. | | | | | 6,896 | | | | 462,902 | |
Rio Tinto PLC | | | | | 20,562 | | | | 1,196,872 | |
Santos Ltd. | | | | | 38,533 | | | | 195,003 | |
Scentre Group | | | | | 101,561 | | | | 273,068 | |
SEEK Ltd. | | | | | 10,748 | | | | 137,758 | |
Sonic Healthcare Ltd. | | | | | 11,107 | | | | 200,523 | |
South32 Ltd. | | | | | 99,806 | | | | 234,630 | |
Stockland | | | | | 57,409 | | | | 152,336 | |
Suncorp Group Ltd. | | | | | 28,218 | | | | 263,559 | |
Sydney Airport | | | | | 28,282 | | | | 151,686 | |
Telstra Corp. Ltd. | | | | | 75,168 | | | | 178,826 | |
Transurban Group | | | | | 53,417 | | | | 505,311 | |
Treasury Wine Estates Ltd. | | | | | 16,676 | | | | 201,883 | |
Vicinity Centres | | | | | 68,854 | | | | 123,096 | |
Wesfarmers Ltd. | | | | | 21,255 | | | | 538,722 | |
Westpac Banking Corp. | | | | | 62,745 | | | | 1,214,926 | |
Woodside Petroleum Ltd. | | | | | 19,602 | | | | 488,271 | |
Woolworths Group Ltd. | | | | | 26,264 | | | | 588,777 | |
Total Australia | | | | | | | | | 20,608,303 | |
| | | | | | | | | | | |
Austria — 0.2% | | | | | | | | | | |
ANDRITZ AG | | | | | 2,295 | | | | 109,310 | |
| | | | Shares
| | Value
|
| | | | | | | | | | |
Common Stocks (continued) | | | | | | | | | | |
| | | | | | | | | | | |
Austria (continued) | | | | | | | | | | |
Erste Group Bank AG* | | | | | 6,775 | | | $ | 271,061 | |
OMV AG | | | | | 4,084 | | | | 218,549 | |
Verbund AG* | | | | | 1,377 | | | | 68,241 | |
Total Austria | | | | | | | | | 667,161 | |
| | | | | | | | | | | |
Belgium — 1.0% | | | | | | | | | | |
Ageas | | | | | 4,606 | | | | 242,611 | |
Anheuser-Busch InBev SA/NV | | | | | 14,147 | | | | 1,256,632 | |
Galapagos NV* | | | | | 1,044 | | | | 119,400 | |
Groupe Bruxelles Lambert SA | | | | | 1,987 | | | | 189,771 | |
KBC Group NV | | | | | 5,305 | | | | 392,510 | |
Solvay SA | | | | | 1,614 | | | | 193,814 | |
UCB SA | | | | | 2,621 | | | | 207,730 | |
Umicore SA(a) | | | | | 4,974 | | | | 192,315 | |
Total Belgium | | | | | | | | | 2,794,783 | |
| | | | | | | | | | | |
China — 0.3% | | | | | | | | | | |
AAC Technologies Holdings, Inc. | | | | | 15,021 | | | | 97,071 | |
BOC Hong Kong Holdings Ltd. | | | | | 75,757 | | | | 338,934 | |
China Mengniu Dairy Co., Ltd.* | | | | | 57,742 | | | | 213,439 | |
Lenovo Group Ltd. | | | | | 149,292 | | | | 138,343 | |
Want Want China Holdings Ltd. | | | | | 150,749 | | | | 119,517 | |
Total China | | | | | | | | | 907,304 | |
| | | | | | | | | | | |
Denmark — 1.6% | | | | | | | | | | |
Ambu A/S, Class B | | | | | 3,246 | | | | 93,044 | |
AP Moller — Maersk A/S, Class A | | | | | 118 | | | | 143,655 | |
AP Moller — Maersk A/S, Class B | | | | | 128 | | | | 166,628 | |
Carlsberg A/S, Class B | | | | | 2,227 | | | | 287,432 | |
Chr Hansen Holding A/S | | | | | 2,171 | | | | 221,283 | |
Coloplast A/S, Class B | | | | | 2,730 | | | | 294,324 | |
Danske Bank A/S | | | | | 12,248 | | | | 217,045 | |
Drilling Co. of 1972 A/S (The)* | | | | | 492 | | | | 37,740 | |
DSV A/S | | | | | 3,675 | | | | 339,274 | |
Genmab A/S* | | | | | 1,218 | | | | 202,036 | |
GN Store Nord A/S | | | | | 2,470 | | | | 126,324 | |
ISS A/S | | | | | 4,171 | | | | 129,607 | |
Novo Nordisk A/S, Class B | | | | | 31,238 | | | | 1,526,344 | |
Novozymes A/S, Class B | | | | | 4,344 | | | | 202,279 | |
Orsted A/S‡ | | | | | 2,290 | | | | 175,179 | |
Pandora A/S | | | | | 2,046 | | | | 85,751 | |
Vestas Wind Systems A/S | | | | | 3,938 | | | | 355,869 | |
Total Denmark | | | | | | | | | 4,603,814 | |
| | | | | | | | | | | |
Finland — 0.9% | | | | | | | | | | |
Elisa OYJ | | | | | 3,109 | | | | 131,809 | |
Fortum OYJ | | | | | 8,500 | | | | 179,469 | |
Kone OYJ, Class B | | | | | 7,211 | | | | 394,856 | |
Neste OYJ | | | | | 7,784 | | | | 256,821 | |
Nokia OYJ | | | | | 107,584 | | | | 564,144 | |
Nokian Renkaat OYJ | | | | | 3,198 | | | | 106,875 | |
Sampo OYJ, Class A | | | | | 9,144 | | | | 417,696 | |
Stora Enso OYJ, Class R | | | | | 12,685 | | | | 157,301 | |
UPM-Kymmene OYJ | | | | | 10,794 | | | | 303,752 | |
Wartsila OYJ Abp | | | | | 10,207 | | | | 162,662 | |
Total Finland | | | | | | | | | 2,675,385 | |
| | | | | | | | | | | |
France — 10.0% | | | | | | | | | | |
Accor SA | | | | | 4,630 | | | | 194,893 | |
Adevinta ASA, Class A* | | | | | 3,648 | | | | 36,710 | |
Aeroports de Paris | | | | | 524 | | | | 106,644 | |
Air Liquide SA | | | | | 8,140 | | | | 1,081,473 | |
Airbus SE | | | | | 10,385 | | | | 1,418,497 | |
See notes to financial statements.
117
Schedules of Investments — IQ 50 Percent Hedged FTSE International ETF(continued)
April 30, 2019 | | | | Shares
| | Value
|
| | | | | | | | | | |
Common Stocks (continued) | | | | | | | | | | |
| | | | | | | | | | | |
France (continued) | | | | | | | | | | |
Alstom SA | | | | | 3,737 | | | $ | 164,172 | |
Arkema SA | | | | | 1,790 | | | | 183,474 | |
Atos SE | | | | | 2,040 | | | | 209,830 | |
AXA SA(a) | | | | | 35,363 | | | | 941,046 | |
BNP Paribas SA | | | | | 20,572 | | | | 1,093,962 | |
Bouygues SA(a) | | | | | 4,295 | | | | 161,442 | |
Bureau Veritas SA | | | | | 6,903 | | | | 174,683 | |
Capgemini SE | | | | | 2,997 | | | | 363,080 | |
Carrefour SA | | | | | 11,042 | | | | 214,950 | |
Cie de Saint-Gobain | | | | | 9,657 | | | | 394,376 | |
Cie Generale des Etablissements Michelin | | | | | 3,683 | | | | 475,286 | |
Credit Agricole SA | | | | | 20,963 | | | | 287,322 | |
Danone SA | | | | | 10,518 | | | | 849,645 | |
Dassault Systemes SE | | | | | 2,781 | | | | 439,606 | |
Edenred | | | | | 5,379 | | | | 253,247 | |
Electricite de France SA | | | | | 7,773 | | | | 111,852 | |
Engie SA | | | | | 31,012 | | | | 458,942 | |
EssilorLuxottica SA* | | | | | 5,615 | | | | 682,762 | |
Eutelsat Communications SA | | | | | 4,823 | | | | 86,969 | |
Getlink SE | | | | | 10,580 | | | | 170,148 | |
Hermes International | | | | | 643 | | | | 451,967 | |
Ingenico Group SA | | | | | 1,400 | | | | 117,925 | |
Ipsen SA | | | | | 872 | | | | 101,732 | |
Kering SA | | | | | 1,403 | | | | 828,625 | |
Klepierre SA | | | | | 4,362 | | | | 154,819 | |
Legrand SA | | | | | 5,791 | | | | 425,223 | |
L’Oreal SA(a) | | | | | 4,504 | | | | 1,237,175 | |
LVMH Moet Hennessy Louis Vuitton SE | | | | | 4,652 | | | | 1,819,772 | |
Orange SA | | | | | 35,349 | | | | 553,232 | |
Orpea | | | | | 1,192 | | | | 145,210 | |
Pernod Ricard SA | | | | | 3,872 | | | | 674,118 | |
Peugeot SA | | | | | 10,177 | | | | 266,429 | |
Publicis Groupe SA | | | | | 4,221 | | | | 250,148 | |
Renault SA | | | | | 3,637 | | | | 247,901 | |
Rexel SA | | | | | 8,222 | | | | 110,388 | |
Rubis SCA | | | | | 2,299 | | | | 125,733 | |
Safran SA | | | | | 6,300 | | | | 917,148 | |
Sanofi(a) | | | | | 20,289 | | | | 1,761,959 | |
Schneider Electric SE | | | | | 10,041 | | | | 849,148 | |
SCOR SE(a) | | | | | 4,036 | | | | 164,462 | |
SEB SA | | | | | 539 | | | | 98,582 | |
Societe Generale SA | | | | | 13,971 | | | | 441,849 | |
Sodexo SA | | | | | 1,497 | | | | 171,544 | |
Teleperformance* | | | | | 1,228 | | | | 235,746 | |
Thales SA | | | | | 2,142 | | | | 255,537 | |
TOTAL SA | | | | | 46,472 | | | | 2,580,363 | |
Ubisoft Entertainment SA* | | | | | 1,625 | | | | 154,870 | |
Unibail-Rodamco-Westfield | | | | | 2,659 | | | | 456,676 | |
Valeo SA | | | | | 4,946 | | | | 179,426 | |
Veolia Environnement SA | | | | | 9,615 | | | | 226,933 | |
Vinci SA(a) | | | | | 9,010 | | | | 908,978 | |
Vivendi SA | | | | | 18,778 | | | | 544,422 | |
Total France | | | | | | | | | 28,013,051 | |
| | | | | | | | | | | |
Germany — 7.7% | | | | | | | | | | |
adidas AG | | | | | 3,669 | | | | 942,025 | |
Allianz SE | | | | | 7,937 | | | | 1,910,646 | |
BASF SE | | | | | 17,541 | | | | 1,425,024 | |
Bayer AG | | | | | 17,643 | | | | 1,173,301 | |
Bayerische Motoren Werke AG | | | | | 6,486 | | | | 551,707 | |
| | | | Shares
| | Value
|
| | | | | | | | | | |
Common Stocks (continued) | | | | | | | | | | |
| | | | | | | | | | | |
Germany (continued) | | | | | | | | | | |
Beiersdorf AG | | | | | 2,285 | | | $ | 249,524 | |
Brenntag AG | | | | | 3,428 | | | | 184,635 | |
Commerzbank AG* | | | | | 21,081 | | | | 189,287 | |
Continental AG | | | | | 2,052 | | | | 338,881 | |
Covestro AG‡ | | | | | 3,134 | | | | 171,223 | |
Daimler AG* | | | | | 15,994 | | | | 1,045,714 | |
Delivery Hero SE‡* | | | | | 2,364 | | | | 108,861 | |
Deutsche Bank AG | | | | | 39,156 | | | | 323,368 | |
Deutsche Boerse AG | | | | | 3,574 | | | | 476,240 | |
Deutsche Lufthansa AG | | | | | 4,692 | | | | 113,159 | |
Deutsche Post AG* | | | | | 17,941 | | | | 621,291 | |
Deutsche Telekom AG | | | | | 59,073 | | | | 987,354 | |
Deutsche Wohnen SE | | | | | 7,716 | | | | 346,498 | |
E.ON SE | | | | | 41,397 | | | | 443,894 | |
Fresenius Medical Care AG & Co. KGaA | | | | | 4,039 | | | | 339,307 | |
Fresenius SE & Co. KGaA | | | | | 8,040 | | | | 455,748 | |
GEA Group AG | | | | | 3,943 | | | | 110,120 | |
Hannover Rueck SE | | | | | 1,281 | | | | 192,947 | |
HeidelbergCement AG | | | | | 2,967 | | | | 239,409 | |
Henkel AG & Co. KGaA | | | | | 1,706 | | | | 162,417 | |
HUGO BOSS AG | | | | | 1,620 | | | | 112,854 | |
Infineon Technologies AG | | | | | 23,308 | | | | 549,200 | |
K+S AG | | | | | 4,473 | | | | 90,633 | |
KION Group AG | | | | | 1,509 | | | | 103,227 | |
LANXESS AG | | | | | 2,311 | | | | 133,382 | |
LEG Immobilien AG | | | | | 1,183 | | | | 137,551 | |
Merck KGaA | | | | | 2,502 | | | | 266,043 | |
MTU Aero Engines AG | | | | | 1,223 | | | | 287,418 | |
Muenchener Rueckversicherungs-Gesellschaft AG* | | | | | 2,664 | | | | 665,777 | |
OSRAM Licht AG | | | | | 2,318 | | | | 79,206 | |
ProSiebenSat.1 Media SE | | | | | 5,040 | | | | 79,274 | |
Rheinmetall AG | | | | | 862 | | | | 98,826 | |
RWE AG* | | | | | 11,433 | | | | 291,751 | |
SAP SE | | | | | 18,015 | | | | 2,313,304 | |
Scout24 AG‡(a) | | | | | 2,238 | | | | 115,123 | |
Siemens AG | | | | | 14,342 | | | | 1,715,641 | |
Symrise AG | | | | | 2,996 | | | | 287,748 | |
thyssenkrupp AG(a) | | | | | 9,681 | | | | 135,999 | |
TUI AG | | | | | 8,835 | | | | 98,339 | |
United Internet AG | | | | | 2,615 | | | | 104,712 | |
Vonovia SE | | | | | 9,014 | | | | 449,236 | |
Wirecard AG | | | | | 2,309 | | | | 345,975 | |
Zalando SE‡* | | | | | 3,294 | | | | 154,825 | |
Total Germany | | | | | | | | | 21,718,624 | |
| | | | | | | | | | | |
Hong Kong —3.4% | | | | | | | | | | |
AIA Group Ltd. | | | | | 229,283 | | | | 2,336,551 | |
ASM Pacific Technology Ltd. | | | | | 6,952 | | | | 80,504 | |
Bank of East Asia Ltd. (The) | | | | | 36,821 | | | | 116,160 | |
CK Asset Holdings Ltd. | | | | | 54,128 | | | | 434,658 | |
CK Hutchison Holdings Ltd. | | | | | 55,036 | | | | 578,042 | |
CK Infrastructure Holdings Ltd. | | | | | 16,330 | | | | 132,590 | |
CLP Holdings Ltd. | | | | | 32,301 | | | | 366,224 | |
Hang Lung Properties Ltd. | | | | | 50,902 | | | | 119,641 | |
Hang Seng Bank Ltd. | | | | | 15,143 | | | | 397,616 | |
Henderson Land Development Co., Ltd. | | | | | 27,973 | | | | 172,215 | |
Hong Kong & China Gas Co., Ltd. | | | | | 184,747 | | | | 440,827 | |
Hong Kong Exchanges and Clearing Ltd. | | | | | 24,198 | | | | 838,945 | |
| | | | | | | | | | |
See notes to financial statements.
118
Schedules of Investments — IQ 50 Percent Hedged FTSE International ETF(continued)
April 30, 2019 | | | | Shares
| | Value
|
Common Stocks (continued) | | | | | | | | | | |
| | | | | | | | | | | |
Hong Kong (continued) | | | | | | | | | | |
Hongkong Land Holdings Ltd. | | | | | 27,135 | | | $ | 189,131 | |
Hysan Development Co., Ltd. | | | | | 26,327 | | | | 147,316 | |
Jardine Matheson Holdings Ltd. | | | | | 4,176 | | | | 274,781 | |
Jardine Strategic Holdings Ltd. | | | | | 4,070 | | | | 153,927 | |
Link REIT | | | | | 42,703 | | | | 498,040 | |
MTR Corp. Ltd. | | | | | 32,334 | | | | 192,469 | |
New World Development Co., Ltd. | | | | | 136,959 | | | | 226,595 | |
Power Assets Holdings Ltd. | | | | | 29,304 | | | | 204,315 | |
Sino Land Co., Ltd. | | | | | 80,378 | | | | 141,384 | |
Sun Hung Kai Properties Ltd. | | | | | 28,181 | | | | 486,362 | |
Swire Pacific Ltd., Class A | | | | | 12,950 | | | | 163,909 | |
Techtronic Industries Co., Ltd. | | | | | 29,373 | | | | 212,284 | |
WH Group Ltd.‡ | | | | | 166,980 | | | | 197,939 | |
Wharf Real Estate Investment Co., Ltd. | | | | | 26,003 | | | | 199,197 | |
Wheelock & Co., Ltd. | | | | | 20,061 | | | | 142,811 | |
Total Hong Kong | | | | | | | | | 9,444,433 | |
| | | | | | | | | | | |
Ireland — 0.6% | | | | | | | | | | |
Bank of Ireland Group PLC* | | | | | 19,888 | | | | 126,822 | |
CRH PLC | | | | | 15,189 | | | | 506,909 | |
Glanbia PLC | | | | | 3,114 | | | | 57,199 | |
James Hardie Industries PLC | | | | | 9,961 | | | | 135,173 | |
Kerry Group PLC, Class A | | | | | 2,853 | | | | 319,096 | |
Kingspan Group PLC | | | | | 3,102 | | | | 162,974 | |
Paddy Power Betfair PLC | | | | | 1,486 | | | | 125,687 | |
Smurfit Kappa Group PLC | | | | | 4,562 | | | | 133,516 | |
Total Ireland | | | | | | | | | 1,567,376 | |
| | | | | | | | | | | |
Israel — 0.5% | | | | | | | | | | |
Bank Hapoalim BM | | | | | 42,665 | | | | 313,382 | |
Bank Leumi Le-Israel BM | | | | | 45,852 | | | | 313,363 | |
Bezeq The Israeli Telecommunication Corp. Ltd. | | | | | 91,238 | | | | 62,329 | |
Israel Discount Bank Ltd., Class A | | | | | 38,661 | | | | 150,521 | |
Nice Ltd.* | | | | | 2,033 | | | | 280,250 | |
Teva Pharmaceutical Industries Ltd.* | | | | | 18,800 | | | | 289,022 | |
Total Israel | | | | | | | | | 1,408,867 | |
| | | | | | | | | | | |
Italy — 2.0% | | | | | | | | | | |
Assicurazioni Generali SpA | | | | | 25,176 | | | | 488,115 | |
Atlantia SpA | | | | | 11,848 | | | | 322,922 | |
Enel SpA | | | | | 150,082 | | | | 948,463 | |
Eni SpA | | | | | 49,789 | | | | 849,143 | |
FinecoBank Banca Fineco SpA | | | | | 8,963 | | | | 117,876 | |
Intesa Sanpaolo SpA | | | | | 288,161 | | | | 754,716 | |
Leonardo SpA | | | | | 10,231 | | | | 118,041 | |
Mediobanca Banca di Credito Finanziario SpA | | | | | 18,833 | | | | 199,453 | |
Moncler SpA | | | | | 3,972 | | | | 162,789 | |
Prysmian SpA* | | | | | 8,134 | | | | 156,700 | |
Recordati SpA | | | | | 3,667 | | | | 147,905 | |
Snam SpA | | | | | 48,951 | | | | 248,897 | |
Telecom Italia SpA* | | | | | 323,609 | | | | 180,827 | |
Terna Rete Elettrica Nazionale SpA | | | | | 36,784 | | | | 220,053 | |
UniCredit SpA | | | | | 43,181 | | | | 596,685 | |
Unione di Banche Italiane SpA | | | | | 27,953 | | | | 87,089 | |
Total Italy | | | | | | | | | 5,599,674 | |
| | | | | | | | | | | |
Japan(b) — 24.0% | | | | | | | | | | |
Advantest Corp. | | | | | 4,250 | | | | 119,820 | |
Aeon Co., Ltd. | | | | | 14,961 | | | | 275,981 | |
AGC, Inc. | | | | | 5,044 | | | | 171,417 | |
| | | | Shares
| | Value
|
Common Stocks (continued) | | | | | | | | | | |
| | | | | | | | | | | |
Japan(b) (continued) | | | | | | | | | | |
Air Water, Inc. | | | | | 6,337 | | | $ | 96,271 | |
Aisin Seiki Co., Ltd. | | | | | 3,951 | | | | 152,719 | |
Ajinomoto Co., Inc. | | | | | 11,576 | | | | 186,307 | |
Alfresa Holdings Corp. | | | | | 5,493 | | | | 152,645 | |
Alps Alpine Co., Ltd. | | | | | 4,973 | | | | 104,796 | |
Amada Holdings Co., Ltd. | | | | | 12,133 | | | | 134,648 | |
Aozora Bank Ltd. | | | | | 4,846 | | | | 117,870 | |
Asahi Group Holdings Ltd. | | | | | 8,430 | | | | 365,508 | |
Asahi Kasei Corp. | | | | | 29,599 | | | | 303,764 | |
Astellas Pharma, Inc. | | | | | 39,709 | | | | 538,010 | |
Bandai Namco Holdings, Inc. | | | | | 5,118 | | | | 243,550 | |
Bank of Kyoto Ltd. (The) | | | | | 1,966 | | | | 84,730 | |
Bridgestone Corp. | | | | | 12,661 | | | | 500,870 | |
Brother Industries Ltd. | | | | | 6,912 | | | | 135,478 | |
Canon, Inc. | | | | | 20,820 | | | | 577,445 | |
Central Japan Railway Co. | | | | | 3,595 | | | | 771,291 | |
Chiba Bank Ltd. (The) | | | | | 17,415 | | | | 90,847 | |
Chubu Electric Power Co., Inc. | | | | | 14,306 | | | | 207,574 | |
Chugai Pharmaceutical Co., Ltd. | | | | | 5,004 | | | | 316,302 | |
Concordia Financial Group Ltd. | | | | | 28,429 | | | | 110,270 | |
Dai Nippon Printing Co., Ltd. | | | | | 8,041 | | | | 190,096 | |
Daifuku Co., Ltd. | | | | | 2,223 | | | | 135,326 | |
Dai-ichi Life Holdings, Inc. | | | | | 22,070 | | | | 316,064 | |
Daiichi Sankyo Co., Ltd. | | | | | 12,933 | | | | 636,460 | |
Daikin Industries Ltd. | | | | | 5,473 | | | | 692,878 | |
Daito Trust Construction Co., Ltd. | | | | | 1,610 | | | | 214,884 | |
Daiwa House Industry Co., Ltd. | | | | | 13,233 | | | | 369,633 | |
Daiwa Securities Group, Inc. | | | | | 36,935 | | | | 170,821 | |
Denso Corp. | | | | | 8,694 | | | | 378,828 | |
Dentsu, Inc. | | | | | 4,764 | | | | 193,982 | |
East Japan Railway Co. | | | | | 7,268 | | | | 682,915 | |
Eisai Co., Ltd. | | | | | 5,297 | | | | 306,953 | |
Electric Power Development Co., Ltd. | | | | | 3,960 | | | | 91,733 | |
FamilyMart UNY Holdings Co., Ltd. | | | | | 4,633 | | | | 123,463 | |
FANUC Corp. | | | | | 3,886 | | | | 724,863 | |
Fast Retailing Co., Ltd. | | | | | 1,023 | | | | 590,240 | |
FUJIFILM Holdings Corp. | | | | | 8,022 | | | | 373,388 | |
Fujitsu Ltd. | | | | | 4,040 | | | | 295,088 | |
Fukuoka Financial Group, Inc. | | | | | 5,073 | | | | 117,334 | |
Hamamatsu Photonics K.K. | | | | | 3,635 | | | | 147,032 | |
Hankyu Hanshin Holdings, Inc. | | | | | 5,590 | | | | 208,292 | |
Hino Motors Ltd. | | | | | 9,034 | | | | 85,007 | |
Hirose Electric Co., Ltd. | | | | | 960 | | | | 110,847 | |
Hisamitsu Pharmaceutical Co., Inc. | | | | | 1,831 | | | | 77,432 | |
Hitachi Ltd. | | | | | 18,492 | | | | 612,498 | |
Honda Motor Co., Ltd. | | | | | 33,893 | | | | 943,679 | |
Hoya Corp. | | | | | 7,898 | | | | 554,190 | |
Idemitsu Kosan Co., Ltd. | | | | | 4,408 | | | | 142,679 | |
IHI Corp. | | | | | 3,766 | | | | 89,167 | |
Inpex Corp. | | | | | 20,853 | | | | 202,398 | |
Isetan Mitsukoshi Holdings Ltd. | | | | | 8,319 | | | | 79,101 | |
Isuzu Motors Ltd. | | | | | 14,237 | | | | 203,952 | |
ITOCHU Corp. | | | | | 29,840 | | | | 535,847 | |
Japan Exchange Group, Inc. | | | | | 11,870 | | | | 192,691 | |
Japan Tobacco, Inc. | | | | | 23,858 | | | | 551,813 | |
JFE Holdings, Inc. | | | | | 11,305 | | | | 193,365 | |
JGC Corp. | | | | | 6,506 | | | | 92,763 | |
JXTG Holdings, Inc. | | | | | 67,962 | | | | 329,940 | |
Kajima Corp. | | | | | 9,930 | | | | 146,665 | |
Kansai Electric Power Co., Inc. (The) | | | | | 15,180 | | | | 183,387 | |
Kansai Paint Co., Ltd. | | | | | 6,718 | | | | 127,574 | |
| | | | | | | | | | |
See notes to financial statements.
119
Schedules of Investments — IQ 50 Percent Hedged FTSE International ETF(continued)
April 30, 2019 | | | | Shares
| | Value
|
Common Stocks (continued) | | | | | | | | | | |
| | | | | | | | | | | |
Japan(b) (continued) | | | | | | | | | | |
Kao Corp. | | | | | 9,538 | | | $ | 732,810 | |
KDDI Corp. | | | | | 34,415 | | | | 785,017 | |
Keikyu Corp. | | | | | 6,969 | | | | 118,637 | |
Keio Corp. | | | | | 3,260 | | | | 196,112 | |
Keisei Electric Railway Co., Ltd. | | | | | 4,170 | | | | 145,646 | |
Keyence Corp. | | | | | 1,764 | | | | 1,094,749 | |
Kikkoman Corp. | | | | | 4,652 | | | | 215,527 | |
Kintetsu Group Holdings Co., Ltd. | | | | | 4,223 | | | | 187,120 | |
Kirin Holdings Co., Ltd. | | | | | 17,415 | | | | 393,958 | |
Kobayashi Pharmaceutical Co., Ltd. | | | | | 1,324 | | | | 105,326 | |
Koito Manufacturing Co., Ltd. | | | | | 3,133 | | | | 186,222 | |
Komatsu Ltd. | | | | | 18,577 | | | | 475,705 | |
Konami Holdings Corp. | | | | | 2,135 | | | | 96,998 | |
Konica Minolta, Inc. | | | | | 12,147 | | | | 121,497 | |
Kose Corp. | | | | | 615 | | | | 115,131 | |
Kubota Corp. | | | | | 23,588 | | | | 356,441 | |
Kuraray Co., Ltd. | | | | | 10,744 | | | | 143,446 | |
Kurita Water Industries Ltd. | | | | | 4,770 | | | | 123,602 | |
Kyocera Corp. | | | | | 6,675 | | | | 430,916 | |
Kyowa Hakko Kirin Co., Ltd. | | | | | 6,990 | | | | 135,313 | |
Kyushu Electric Power Co., Inc. | | | | | 10,229 | | | | 98,915 | |
Lion Corp. | | | | | 5,860 | | | | 120,383 | |
LIXIL Group Corp. | | | | | 6,689 | | | | 86,904 | |
M3, Inc. | | | | | 9,657 | | | | 170,726 | |
Makita Corp. | | | | | 6,190 | | | | 225,091 | |
Marubeni Corp. | | | | | 38,645 | | | | 275,885 | |
Marui Group Co., Ltd. | | | | | 6,416 | | | | 130,019 | |
Matsumotokiyoshi Holdings Co., Ltd. | | | | | 2,042 | | | | 67,012 | |
Mazda Motor Corp. | | | | | 12,124 | | | | 143,202 | |
MEIJI Holdings Co., Ltd. | | | | | 3,026 | | | | 237,733 | |
MINEBEA MITSUMI, Inc. | | | | | 8,853 | | | | 156,592 | |
MISUMI Group, Inc. | | | | | 7,712 | | | | 199,283 | |
Mitsubishi Chemical Holdings Corp. | | | | | 29,055 | | | | 205,857 | |
Mitsubishi Corp. | | | | | 26,669 | | | | 731,766 | |
Mitsubishi Electric Corp. | | | | | 40,240 | | | | 571,580 | |
Mitsubishi Estate Co., Ltd. | | | | | 24,548 | | | | 413,376 | |
Mitsubishi Heavy Industries Ltd. | | | | | 6,485 | | | | 269,066 | |
Mitsubishi Materials Corp.(a) | | | | | 3,229 | | | | 83,613 | |
Mitsubishi Motors Corp. | | | | | 15,908 | | | | 88,985 | |
Mitsubishi UFJ Financial Group, Inc. | | | | | 245,857 | | | | 1,213,888 | |
Mitsui & Co., Ltd. | | | | | 35,176 | | | | 566,606 | |
Mitsui Chemicals, Inc. | | | | | 3,841 | | | | 93,736 | |
Mitsui Fudosan Co., Ltd. | | | | | 18,626 | | | | 429,297 | |
Mizuho Financial Group, Inc. | | | | | 467,031 | | | | 727,541 | |
MonotaRO Co., Ltd. | | | | | 2,909 | | | | 66,917 | |
MS&AD Insurance Group Holdings, Inc. | | | | | 10,501 | | | | 324,152 | |
Murata Manufacturing Co., Ltd. | | | | | 11,138 | | | | 596,027 | |
Nabtesco Corp. | | | | | 4,287 | | | | 130,486 | |
NEC Corp. | | | | | 5,781 | | | | 194,387 | |
Nexon Co., Ltd.* | | | | | 8,123 | | | | 116,402 | |
NGK Spark Plug Co., Ltd. | | | | | 5,585 | | | | 108,165 | |
NH Foods Ltd. | | | | | 3,136 | | | | 125,862 | |
Nichirei Corp. | | | | | 2,594 | | | | 59,671 | |
Nidec Corp. | | | | | 4,741 | | | | 671,934 | |
Nihon M&A Center, Inc. | | | | | 3,211 | | | | 90,816 | |
Nikon Corp. | | | | | 9,940 | | | | 138,334 | |
Nintendo Co., Ltd. | | | | | 2,080 | | | | 709,675 | |
Nippon Express Co., Ltd. | | | | | 2,038 | | | | 111,621 | |
Nippon Paint Holdings Co., Ltd. | | | | | 3,710 | | | | 140,405 | |
Nippon Shinyaku Co., Ltd. | | | | | 1,744 | | | | 119,947 | |
Nippon Steel Corp. | | | | | 16,481 | | | | 293,070 | |
| | | | Shares
| | Value
|
Common Stocks (continued) | | | | | | | | | | |
| | | | | | | | | | | |
Japan(b) (continued) | | | | | | | | | | |
Nippon Telegraph & Telephone Corp. | | | | | 12,960 | | | $ | 537,135 | |
Nissan Chemical Corp. | | | | | 4,688 | | | | 207,514 | |
Nissan Motor Co., Ltd. | | | | | 35,400 | | | | 283,931 | |
Nisshin Seifun Group, Inc. | | | | | 8,468 | | | | 196,465 | |
Nissin Foods Holdings Co., Ltd. | | | | | 2,543 | | | | 167,364 | |
Nitori Holdings Co., Ltd. | | | | | 1,751 | | | | 208,312 | |
Nitto Denko Corp. | | | | | 3,628 | | | | 195,122 | |
Nomura Holdings, Inc. | | | | | 68,610 | | | | 257,376 | |
Nomura Research Institute Ltd. | | | | | 3,121 | | | | 152,162 | |
NSK Ltd. | | | | | 11,491 | | | | 118,650 | |
NTT Data Corp. | | | | | 15,582 | | | | 181,038 | |
NTT DOCOMO, Inc. | | | | | 25,107 | | | | 543,393 | |
Obayashi Corp. | | | | | 17,573 | | | | 171,825 | |
Obic Co., Ltd. | | | | | 2,035 | | | | 234,973 | |
Odakyu Electric Railway Co., Ltd. | | | | | 7,771 | | | | 182,387 | |
Oji Holdings Corp. | | | | | 25,280 | | | | 151,169 | |
Olympus Corp. | | | | | 27,122 | | | | 302,938 | |
Omron Corp. | | | | | 4,711 | | | | 251,676 | |
Ono Pharmaceutical Co., Ltd. | | | | | 9,846 | | | | 183,836 | |
Oriental Land Co., Ltd. | | | | | 4,092 | | | | 450,809 | |
ORIX Corp. | | | | | 26,462 | | | | 373,379 | |
Osaka Gas Co., Ltd. | | | | | 8,473 | | | | 156,337 | |
Otsuka Corp. | | | | | 2,227 | | | | 87,380 | |
Otsuka Holdings Co., Ltd. | | | | | 9,021 | | | | 321,476 | |
Pan Pacific International Holdings Corp. | | | | | 2,860 | | | | 184,119 | |
Panasonic Corp. | | | | | 41,689 | | | | 382,173 | |
PeptiDream, Inc.* | | | | | 2,320 | | | | 124,775 | |
Pigeon Corp. | | | | | 2,441 | | | | 103,338 | |
Pola Orbis Holdings, Inc. | | | | | 1,901 | | | | 59,740 | |
Rakuten, Inc. | | | | | 15,962 | | | | 176,997 | |
Recruit Holdings Co., Ltd. | | | | | 23,333 | | | | 697,424 | |
Resona Holdings, Inc. | | | | | 50,265 | | | | 211,982 | |
Ricoh Co., Ltd. | | | | | 16,977 | | | | 171,180 | |
Rohm Co., Ltd. | | | | | 2,309 | | | | 168,964 | |
Ryohin Keikaku Co., Ltd. | | | | | 621 | | | | 117,872 | |
Santen Pharmaceutical Co., Ltd. | | | | | 10,222 | | | | 155,475 | |
SBI Holdings, Inc. | | | | | 6,718 | | | | 143,136 | |
Secom Co., Ltd. | | | | | 4,347 | | | | 364,465 | |
Seiko Epson Corp. | | | | | 7,157 | | | | 114,319 | |
Sekisui Chemical Co., Ltd. | | | | | 10,901 | | | | 174,318 | |
Sekisui House Ltd. | | | | | 13,233 | | | | 212,916 | |
Seven & i Holdings Co., Ltd. | | | | | 15,181 | | | | 526,002 | |
SG Holdings Co., Ltd. | | | | | 4,403 | | | | 117,611 | |
Sharp Corp.* | | | | | 2,956 | | | | 32,805 | |
Shimadzu Corp. | | | | | 7,267 | | | | 194,048 | |
Shimano, Inc. | | | | | 1,745 | | | | 255,228 | |
Shimizu Corp. | | | | | 15,144 | | | | 129,038 | |
Shin-Etsu Chemical Co., Ltd. | | | | | 8,289 | | | | 776,245 | |
Shionogi & Co., Ltd. | | | | | 6,390 | | | | 371,552 | |
Shiseido Co., Ltd. | | | | | 7,779 | | | | 608,910 | |
Shizuoka Bank Ltd. (The) | | | | | 14,865 | | | | 113,448 | |
Showa Denko K.K. | | | | | 3,222 | | | | 108,919 | |
SMC Corp. | | | | | 1,215 | | | | 502,473 | |
Softbank Corp.(a) | | | | | 28,857 | | | | 339,936 | |
SoftBank Group Corp. | | | | | 15,866 | | | | 1,646,075 | |
Sompo Holdings, Inc. | | | | | 7,848 | | | | 293,203 | |
Sony Corp. | | | | | 23,628 | | | | 1,105,716 | |
Sotetsu Holdings, Inc. | | | | | 3,401 | | | | 93,900 | |
Stanley Electric Co., Ltd. | | | | | 4,299 | | | | 116,184 | |
Subaru Corp. | | | | | 12,079 | | | | 295,048 | |
| | | | | | | | | | |
See notes to financial statements.
120
Schedules of Investments — IQ 50 Percent Hedged FTSE International ETF(continued)
April 30, 2019 | | | | Shares
| | Value
|
Common Stocks (continued) | | | | | | | | | | |
| | | | | | | | | | | |
Japan(b) (continued) | | | | | | | | | | |
SUMCO Corp. | | | | | 5,696 | | | $ | 74,668 | |
Sumitomo Chemical Co., Ltd. | | | | | 34,217 | | | | 169,587 | |
Sumitomo Corp. | | | | | 24,841 | | | | 354,521 | |
Sumitomo Dainippon Pharma Co., Ltd. | | | | | 3,418 | | | | 75,188 | |
Sumitomo Electric Industries Ltd. | | | | | 16,658 | | | | 220,536 | |
Sumitomo Metal Mining Co., Ltd. | | | | | 5,483 | | | | 171,271 | |
Sumitomo Mitsui Financial Group, Inc. | | | | | 26,268 | | | | 948,360 | |
Sumitomo Mitsui Trust Holdings, Inc. | | | | | 7,766 | | | | 269,431 | |
Sumitomo Realty & Development Co., Ltd. | | | | | 9,127 | | | | 336,234 | |
Suntory Beverage & Food Ltd. | | | | | 3,196 | | | | 140,610 | |
Suzuki Motor Corp. | | | | | 8,620 | | | | 392,012 | |
Sysmex Corp. | | | | | 4,228 | | | | 241,134 | |
T&D Holdings, Inc. | | | | | 13,995 | | | | 150,348 | |
Taiheiyo Cement Corp. | | | | | 3,813 | | | | 122,221 | |
Taisei Corp. | | | | | 5,484 | | | | 240,040 | |
Taisho Pharmaceutical Holdings Co., Ltd. | | | | | 1,391 | | | | 128,390 | |
Taiyo Yuden Co., Ltd. | | | | | 3,004 | | | | 72,474 | |
Takeda Pharmaceutical Co., Ltd. | | | | | 28,839 | | | | 1,064,745 | |
TDK Corp. | | | | | 2,700 | | | | 234,909 | |
Teijin Ltd. | | | | | 6,383 | | | | 109,292 | |
Terumo Corp. | | | | | 13,874 | | | | 416,936 | |
Tobu Railway Co., Ltd. | | | | | 5,597 | | | | 157,796 | |
Toho Co., Ltd. | | | | | 3,971 | | | | 165,971 | |
Toho Gas Co., Ltd. | | | | | 2,033 | | | | 83,602 | |
Tohoku Electric Power Co., Inc. | | | | | 10,240 | | | | 116,950 | |
Tokio Marine Holdings, Inc. | | | | | 13,566 | | | | 682,350 | |
Tokyo Electric Power Co., Holdings, Inc.* | | | | | 31,633 | | | | 178,366 | |
Tokyo Electron Ltd. | | | | | 3,166 | | | | 501,585 | |
Tokyo Gas Co., Ltd. | | | | | 9,957 | | | | 252,736 | |
Tokyu Corp. | | | | | 12,790 | | | | 208,085 | |
Toppan Printing Co., Ltd. | | | | | 7,417 | | | | 119,937 | |
Toray Industries, Inc. | | | | | 33,155 | | | | 225,648 | |
Toshiba Corp. | | | | | 10,495 | | | | 348,655 | |
TOTO Ltd. | | | | | 4,087 | | | | 172,104 | |
Toyo Suisan Kaisha Ltd. | | | | | 3,075 | | | | 116,926 | |
Toyota Industries Corp. | | | | | 3,654 | | | | 206,691 | |
Toyota Motor Corp. | | | | | 46,332 | | | | 2,872,480 | |
Toyota Tsusho Corp. | | | | | 5,514 | | | | 182,191 | |
Tsuruha Holdings, Inc. | | | | | 1,102 | | | | 93,701 | |
Unicharm Corp. | | | | | 8,835 | | | | 289,463 | |
USS Co., Ltd. | | | | | 7,225 | | | | 137,916 | |
West Japan Railway Co. | | | | | 3,945 | | | | 292,647 | |
Yahoo Japan Corp. | | | | | 59,036 | | | | 156,899 | |
Yakult Honsha Co., Ltd. | | | | | 3,183 | | | | 215,772 | |
Yamada Denki Co., Ltd. | | | | | 19,478 | | | | 92,165 | |
Yamaguchi Financial Group, Inc. | | | | | 11,171 | | | | 82,247 | |
Yamaha Corp. | | | | | 3,400 | | | | 175,533 | |
Yamaha Motor Co., Ltd. | | | | | 6,673 | | | | 137,085 | |
Yamato Holdings Co., Ltd. | | | | | 8,219 | | | | 178,032 | |
Yaskawa Electric Corp. | | | | | 5,577 | | | | 205,053 | |
ZOZO, Inc. | | | | | 3,912 | | | | 69,020 | |
Total Japan | | | | | | | | | 67,395,175 | |
| | | | | | | | | | | |
Luxembourg — 0.2% | | | | | | | | | | |
ArcelorMittal | | | | | 11,028 | | | | 238,876 | |
Eurofins Scientific SE(a) | | | | | 255 | | | | 116,598 | |
RTL Group SA(a) | | | | | 951 | | | | 53,396 | |
| | | | Shares
| | Value
|
Common Stocks (continued) | | | | | | | | | | |
| | | | | | | | | | | |
Luxembourg (continued) | | | | | | | | | | |
SES SA | | | | | 7,320 | | | $ | 124,448 | |
Tenaris SA | | | | | 10,974 | | | | 152,256 | |
Total Luxembourg | | | | | | | | | 685,574 | |
| | | | | | | | | | | |
Macau — 0.3% | | | | | | | | | | |
Galaxy Entertainment Group Ltd. | | | | | 43,526 | | | | 325,388 | |
Sands China Ltd. | | | | | 50,328 | | | | 276,485 | |
Wynn Macau Ltd. | | | | | 38,992 | | | | 111,826 | |
Total Macau | | | | | | | | | 713,699 | |
| | | | | | | | | | | |
Netherlands — 4.2% | | | | | | | | | | |
ABN AMRO Group NV‡(a) | | | | | 5,856 | | | | 137,622 | |
Adyen NV‡* | | | | | 166 | | | | 134,988 | |
Aegon NV | | | | | 34,645 | | | | 180,777 | |
Akzo Nobel NV | | | | | 4,445 | | | | 377,101 | |
ASML Holding NV | | | | | 7,165 | | | | 1,489,853 | |
ASR Nederland NV | | | | | 2,217 | | | | 98,390 | |
EXOR NV | | | | | 2,625 | | | | 174,627 | |
Heineken Holding NV | | | | | 2,258 | | | | 229,141 | |
Heineken NV | | | | | 4,439 | | | | 478,774 | |
ING Groep NV(a) | | | | | 73,904 | | | | 940,552 | |
Koninklijke Ahold Delhaize NV | | | | | 22,121 | | | | 532,015 | |
Koninklijke DSM NV | | | | | 3,828 | | | | 436,941 | |
Koninklijke KPN NV(a) | | | | | 69,428 | | | | 212,883 | |
Koninklijke Philips NV | | | | | 17,517 | | | | 745,303 | |
NN Group NV | | | | | 7,227 | | | | 314,415 | |
Randstad NV | | | | | 2,287 | | | | 130,510 | |
Royal Dutch Shell PLC, Class A | | | | | 80,895 | | | | 2,583,740 | |
Royal Dutch Shell PLC, Class B | | | | | 70,491 | | | | 2,264,767 | |
Wolters Kluwer NV | | | | | 5,449 | | | | 379,714 | |
Total Netherlands | | | | | | | | | 11,842,113 | |
| | | | | | | | | | | |
New Zealand — 0.3% | | | | | | | | | | |
a2 Milk Co., Ltd.* | | | | | 15,411 | | | | 172,355 | |
Auckland International Airport Ltd. | | | | | 34,121 | | | | 181,360 | |
Fisher & Paykel Healthcare Corp. Ltd. | | | | | 17,048 | | | | 179,749 | |
Fletcher Building Ltd. | | | | | 28,971 | | | | 99,695 | |
Spark New Zealand Ltd. | | | | | 56,325 | | | | 137,857 | |
Total New Zealand | | | | | | | | | 771,016 | |
| | | | | | | | | | | |
Norway — 0.7% | | | | | | | | | | |
Aker BP ASA | | | | | 2,196 | | | | 72,248 | |
DNB ASA*(a) | | | | | 22,233 | | | | 425,891 | |
Equinor ASA | | | | | 19,625 | | | | 436,754 | |
Mowi ASA | | | | | 6,940 | | | | 149,996 | |
Norsk Hydro ASA | | | | | 27,219 | | | | 116,336 | |
Orkla ASA | | | | | 19,577 | | | | 153,130 | |
Schibsted ASA, Class A | | | | | 3,648 | | | | 95,508 | |
Telenor ASA | | | | | 12,249 | | | | 245,334 | |
Yara International ASA | | | | | 3,653 | | | | 164,369 | |
Total Norway | | | | | | | | | 1,859,566 | |
| | | | | | | | | | | |
Poland — 0.3% | | | | | | | | | | |
Bank Polska Kasa Opieki SA | | | | | 6,215 | | | | 184,594 | |
CD Projekt SA* | | | | | 1,489 | | | | 83,589 | |
mBank SA | | | | | 965 | | | | 111,673 | |
Polski Koncern Naftowy ORLEN SA | | | | | 7,151 | | | | 182,917 | |
Powszechna Kasa Oszczednosci Bank Polski SA | | | | | 21,408 | | | | 219,443 | |
Powszechny Zaklad Ubezpieczen SA | | | | | 14,252 | | | | 156,366 | |
Total Poland | | | | | | | | | 938,582 | |
See notes to financial statements.
121
Schedules of Investments — IQ 50 Percent Hedged FTSE International ETF(continued)
April 30, 2019 | | | | Shares
| | Value
|
| | | | | | | | | | |
Common Stocks (continued) | | | | | | | | | | |
| | | | | | | | | | | |
Portugal — 0.1% | | | | | | | | | | |
EDP —Energias de Portugal SA* | | | | | 47,866 | | | $ | 181,261 | |
Galp Energia SGPS SA | | | | | 8,410 | | | | 141,094 | |
Jeronimo Martins SGPS SA | | | | | 5,861 | | | | 95,373 | |
Total Portugal | | | | | | | | | 417,728 | |
| | | | | | | | | | | |
Russia — 0.1% | | | | | | | | | | |
Polymetal International PLC | | | | | 14,022 | | | | 147,445 | |
VEON Ltd. | | | | | 25,710 | | | | 61,372 | |
Total Russia | | | | | | | | | 208,817 | |
| | | | | | | | | | | |
Singapore — 1.3% | | | | | | | | | | |
Ascendas Real Estate Investment Trust | | | | | 91,475 | | | | 201,605 | |
CapitaLand Commercial Trust | | | | | 122,924 | | | | 175,193 | |
CapitaLand Ltd. | | | | | 56,060 | | | | 145,380 | |
CapitaLand Mall Trust | | | | | 99,450 | | | | 176,807 | |
ComfortDelGro Corp. Ltd. | | | | | 66,718 | | | | 131,848 | |
DBS Group Holdings Ltd. | | | | | 34,073 | | | | 707,142 | |
Genting Singapore Ltd | | | | | 149,808 | | | | 108,405 | |
Keppel Corp. Ltd. | | | | | 37,706 | | | | 187,533 | |
Oversea-Chinese Banking Corp. Ltd. | | | | | 63,319 | | | | 562,856 | |
Singapore Exchange Ltd. | | | | | 29,594 | | | | 160,449 | |
Singapore Post Ltd. | | | | | 91,262 | | | | 69,727 | |
Singapore Press Holdings Ltd. | | | | | 57,677 | | | | 106,354 | |
Singapore Technologies Engineering Ltd. | | | | | 46,875 | | | | 136,369 | |
Singapore Telecommunications Ltd. | | | | | 140,007 | | | | 326,052 | |
United Overseas Bank Ltd. | | | | | 24,406 | | | | 498,986 | |
Total Singapore | | | | | | | | | 3,694,706 | |
| | | | | | | | | | | |
South Africa — 0.2% | | | | | | | | | | |
Anglo American PLC(a) | | | | | 20,159 | | | | 520,718 | |
| | | | | | | | | | | |
South Korea —4.3% | | | | | | | | | | |
Amorepacific Corp. | | | | | 771 | | | | 137,284 | |
Celltrion, Inc.* | | | | | 1,547 | | | | 280,755 | |
DB Insurance Co., Ltd. | | | | | 1,803 | | | | 105,573 | |
E-Mart Inc. | | | | | 668 | | | | 98,357 | |
GS Holdings Corp. | | | | | 2,207 | | | | 98,244 | |
Hana Financial Group, Inc. | | | | | 6,840 | | | | 215,479 | |
Hankook Tire Co., Ltd. | | | | | 2,320 | | | | 78,945 | |
Hanmi Pharm Co. Ltd. | | | | | 178 | | | | 66,208 | |
Helixmith Co. Ltd.* | | | | | 333 | | | | 74,203 | |
HLB, Inc.* | | | | | 811 | | | | 58,248 | |
Hotel Shilla Co., Ltd. | | | | | 927 | | | | 91,260 | |
Hyundai Engineering & Construction Co. Ltd. | | | | | 1,761 | | | | 79,144 | |
Hyundai Heavy Industries Co., Ltd.* | | | | | 947 | | | | 100,930 | |
Hyundai Heavy Industries Holdings Co., Ltd. | | | | | 258 | | | | 75,535 | |
Hyundai Mobis Co., Ltd. | | | | | 1,310 | | | | 260,733 | |
Hyundai Motor Co. | | | | | 3,460 | | | | 410,230 | |
Industrial Bank of Korea | | | | | 9,685 | | | | 117,316 | |
Kakao Corp. | | | | | 1,132 | | | | 116,286 | |
Kangwon Land, Inc. | | | | | 4,284 | | | | 124,689 | |
KB Financial Group, Inc. | | | | | 8,557 | | | | 338,427 | |
Kia Motors Corp. | | | | | 6,141 | | | | 237,881 | |
Korea Electric Power Corp.* | | | | | 5,584 | | | | 135,280 | |
Korea Zinc Co., Ltd. | | | | | 328 | | | | 127,056 | |
KT&G Corp. | | | | | 2,779 | | | | 242,655 | |
LG Chem Ltd. | | | | | 1,032 | | | | 318,925 | |
LG Corp. | | | | | 2,587 | | | | 161,667 | |
| | | | Shares
| | Value
|
Common Stocks (continued) | | | | | | | | | | |
| | | | | | | | | | | |
South Korea (continued) | | | | | | | | | | |
LG Display Co., Ltd.* | | | | | 5,206 | | | $ | 88,910 | |
LG Electronics, Inc. | | | | | 2,357 | | | | 152,943 | |
LG Household & Health Care Ltd. | | | | | 214 | | | | 260,504 | |
Lotte Chemical Corp. | | | | | 398 | | | | 91,480 | |
Medy-Tox, Inc. | | | | | 136 | | | | 65,092 | |
NAVER Corp. | | | | | 2,806 | | | | 287,050 | |
NCSoft Corp. | | | | | 400 | | | | 180,114 | |
POSCO | | | | | 1,419 | | | | 309,759 | |
Samsung Biologics Co., Ltd.‡* | | | | | 355 | | | | 103,326 | |
Samsung C&T Corp. | | | | | 1,743 | | | | 152,941 | |
Samsung Electro-Mechanics Co., Ltd. | | | | | 1,229 | | | | 114,152 | |
Samsung Electronics Co., Ltd. | | | | | 87,456 | | | | 3,432,656 | |
Samsung Fire & Marine Insurance Co., Ltd. | | | | | 867 | | | | 225,629 | |
Samsung Life Insurance Co., Ltd. | | | | | 1,855 | | | | 134,820 | |
Samsung SDI Co., Ltd. | | | | | 1,129 | | | | 228,574 | |
Samsung SDS Co., Ltd. | | | | | 700 | | | | 130,035 | |
Shinhan Financial Group Co., Ltd. | | | | | 10,212 | | | | 385,523 | |
SillaJen, Inc.* | | | | | 1,226 | | | | 68,639 | |
SK Holdings Co., Ltd. | | | | | 751 | | | | 164,903 | |
SK Hynix, Inc. | | | | | 9,795 | | | | 662,419 | |
SK Innovation Co., Ltd. | | | | | 1,394 | | | | 217,784 | |
SK Telecom Co., Ltd. | | | | | 793 | | | | 168,016 | |
S-Oil Corp. | | | | | 1,311 | | | | 103,475 | |
Woongjin Coway Co., Ltd. | | | | | 1,737 | | | | 130,556 | |
Woori Financial Group, Inc. | | | | | 12,530 | | | | 148,560 | |
Total South Korea | | | | | | | | | 12,159,170 | |
| | | | | | | | | | | |
Spain — 2.9% | | | | | | | | | | |
Abertis Infraestructuras SA*(c)(d) | | | | | 5,353 | | | | 44,573 | |
ACS Actividades de Construccion y Servicios SA | | | | | 5,970 | | | | 273,846 | |
Aena SME SA‡ | | | | | 1,322 | | | | 244,977 | |
Amadeus IT Group SA | | | | | 8,097 | | | | 643,550 | |
Banco Bilbao Vizcaya Argentaria SA | | | | | 125,736 | | | | 763,463 | |
Banco de Sabadell SA(a) | | | | | 124,004 | | | | 143,974 | |
Banco Santander SA(a) | | | | | 300,885 | | | | 1,521,287 | |
Bankinter SA | | | | | 18,933 | | | | 151,031 | |
CaixaBank SA | | | | | 70,147 | | | | 223,185 | |
Cellnex Telecom SA‡* | | | | | 4,197 | | | | 128,972 | |
Enagas SA | | | | | 5,815 | | | | 165,529 | |
Endesa SA | | | | | 6,244 | | | | 155,418 | |
Ferrovial SA | | | | | 11,031 | | | | 271,479 | |
Grifols SA | | | | | 11,091 | | | | 307,511 | |
Iberdrola SA | | | | | 112,113 | | | | 1,017,474 | |
Industria de Diseno Textil SA | | | | | 19,609 | | | | 592,688 | |
Naturgy Energy Group SA | | | | | 5,971 | | | | 169,434 | |
Red Electrica Corp. SA | | | | | 9,156 | | | | 189,677 | |
Repsol SA | | | | | 24,303 | | | | 412,087 | |
Telefonica SA | | | | | 83,038 | | | | 691,627 | |
Total Spain | | | | | | | | | 8,111,782 | |
| | | | | | | | | | | |
Sweden — 2.5% | | | | | | | | | | |
Alfa Laval AB(a) | | | | | 7,325 | | | | 169,818 | |
Assa Abloy AB, B Shares(a) | | | | | 17,168 | | | | 365,868 | |
Atlas Copco AB, A Shares | | | | | 11,692 | �� | | | 363,054 | |
Atlas Copco AB, B Shares | | | | | 7,107 | | | | 202,068 | |
Boliden AB*(a) | | | | | 5,599 | | | | 166,083 | |
Electrolux AB | | | | | 5,343 | | | | 131,119 | |
Epiroc AB, A Shares* | | | | | 11,317 | | | | 116,898 | |
Epiroc AB, B Shares* | | | | | 6,769 | | | | 66,894 | |
See notes to financial statements.
122
Schedules of Investments — IQ 50 Percent Hedged FTSE International ETF(continued)
April 30, 2019 | | | | Shares
| | Value
|
| | | | | | | | | | |
Common Stocks (continued) | | | | | | | | | | |
| | | | | | | | | | | |
Sweden (continued) | | | | | | | | | | |
Essity AB, B Shares | | | | | 11,559 | | | $ | 342,631 | |
Hennes & Mauritz AB, B Shares(a) | | | | | 16,560 | | | | 288,426 | |
Hexagon AB, B Shares | | | | | 4,835 | | | | 263,446 | |
Industrivarden AB, A Shares | | | | | 10,058 | | | | 232,544 | |
Investor AB, B Shares | | | | | 10,508 | | | | 500,376 | |
Kinnevik AB, B Shares | | | | | 6,538 | | | | 190,154 | |
Lundin Petroleum AB | | | | | 5,014 | | | | 163,920 | |
Sandvik AB(a) | | | | | 20,486 | | | | 378,504 | |
Securitas AB, B Shares | | | | | 7,063 | | | | 123,328 | |
Skandinaviska Enskilda Banken AB, A Shares | | | | | 27,224 | | | | 259,503 | |
Skanska AB, B Shares | | | | | 7,168 | | | | 124,634 | |
SKF AB, B Shares | | | | | 8,254 | | | | 152,590 | |
Svenska Cellulosa AB SCA, B Shares | | | | | 13,547 | | | | 118,017 | |
Svenska Handelsbanken AB, A Shares(a) | | | | | 27,660 | | | | 301,569 | |
Swedbank AB, A Shares | | | | | 18,796 | | | | 304,574 | |
Swedish Match AB | | | | | 4,232 | | | | 205,929 | |
Tele2 AB, B Shares | | | | | 11,047 | | | | 147,227 | |
Telefonaktiebolaget LM Ericsson, B Shares | | | | | 55,679 | | | | 550,535 | |
Telia Co. AB | | | | | 49,658 | | | | 211,235 | |
Trelleborg AB, B Shares | | | | | 6,711 | | | | 110,829 | |
Volvo AB, B Shares | | | | | 28,722 | | | | 459,223 | |
Total Sweden | | | | | | | | | 7,010,996 | |
| | | | | | | | | | | |
Switzerland — 8.5% | | | | | | | | | | |
ABB Ltd.* | | | | | 34,180 | | | | 703,390 | |
Adecco Group AG | | | | | 3,085 | | | | 177,168 | |
Alcon, Inc.* | | | | | 7,852 | | | | 452,164 | |
Baloise Holding AG | | | | | 1,076 | | | | 184,367 | |
Chocoladefabriken Lindt & Spruengli AG | | | | | 34 | | | | 226,055 | |
Cie Financiere Richemont SA | | | | | 9,790 | | | | 715,756 | |
Clariant AG* | | | | | 5,891 | | | | 121,057 | |
Coca-Cola HBC AG* | | | | | 4,494 | | | | 160,584 | |
Credit Suisse Group AG* | | | | | 45,054 | | | | 601,309 | |
Dufry AG* | | | | | 742 | | | | 72,482 | |
EMS-Chemie Holding AG | | | | | 217 | | | | 131,393 | |
Geberit AG | | | | | 801 | | | | 335,885 | |
Givaudan SA | | | | | 186 | | | | 481,702 | |
Glencore PLC* | | | | | 210,105 | | | | 833,625 | |
Julius Baer Group Ltd.* | | | | | 4,412 | | | | 212,677 | |
Kuehne + Nagel International AG | | | | | 805 | | | | 116,958 | |
LafargeHolcim Ltd.* | | | | | 8,199 | | | | 421,456 | |
Lonza Group AG* | | | | | 1,423 | | | | 439,468 | |
Mediclinic International PLC | | | | | 11,496 | | | | 51,420 | |
Nestle SA | | | | | 54,636 | | | | 5,257,173 | |
Novartis AG | | | | | 39,680 | | | | 3,240,209 | |
Partners Group Holding AG | | | | | 410 | | | | 308,848 | |
PSP Swiss Property AG | | | | | 1,227 | | | | 125,229 | |
Roche Holding AG | | | | | 13,167 | | | | 3,470,713 | |
Schindler Holding AG — Participating Certificate | | | | | 1,223 | | | | 263,803 | |
SGS SA | | | | | 127 | | | | 335,135 | |
Sika AG | | | | | 3,087 | | | | 472,593 | |
Sonova Holding AG | | | | | 1,173 | | | | 236,557 | |
Straumann Holding AG | | | | | 176 | | | | 142,078 | |
Swatch Group AG (The) | | | | | 674 | | | | 205,838 | |
Swiss Life Holding AG* | | | | | 705 | | | | 331,468 | |
Swiss Prime Site AG* | | | | | 1,872 | | | | 150,274 | |
Swiss Re AG | | | | | 5,882 | | | | 566,034 | |
| | | | Shares
| | Value
|
Common Stocks (continued) | | | | | | | | | | |
| | | | | | | | | | | |
Switzerland (continued) | | | | | | | | | | |
Swisscom AG | | | | | 496 | | | $ | 231,061 | |
Temenos AG* | | | | | 1,016 | | | | 168,901 | |
UBS Group AG* | | | | | 64,080 | | | | 859,326 | |
Vifor Pharma AG | | | | | 1,078 | | | | 140,912 | |
Zurich Insurance Group AG | | | | | 2,689 | | | | 857,366 | |
Total Switzerland | | | | | | | | | 23,802,434 | |
| | | | | | | | | | | |
United Arab Emirates — 0.0%(e) | | | | | | | | | | |
NMC Health PLC | | | | | 2,578 | | | | 94,842 | |
| | | | | | | | | | | |
United Kingdom — 13.6% | | | | | | | | | | |
3i Group PLC | | | | | 20,866 | | | | 291,197 | |
Admiral Group PLC | | | | | 5,830 | | | | 167,510 | |
Ashtead Group PLC | | | | | 10,207 | | | | 282,361 | |
Associated British Foods PLC | | | | | 6,763 | | | | 225,616 | |
AstraZeneca PLC | | | | | 24,391 | | | | 1,820,715 | |
Auto Trader Group PLC‡ | | | | | 18,364 | | | | 135,358 | |
Aviva PLC | | | | | 75,971 | | | | 425,375 | |
B&M European Value Retail SA | | | | | 16,590 | | | | 85,321 | |
BAE Systems PLC | | | | | 57,451 | | | | 369,986 | |
Barclays PLC | | | | | 319,757 | | | | 684,803 | |
Barratt Developments PLC | | | | | 20,472 | | | | 160,610 | |
Berkeley Group Holdings PLC | | | | | 2,585 | | | | 126,575 | |
BP PLC | | | | | 361,382 | | | | 2,633,537 | |
British American Tobacco PLC | | | | | 42,227 | | | | 1,645,972 | |
British Land Co. PLC (The) | | | | | 19,693 | | | | 152,496 | |
BT Group PLC | | | | | 159,054 | | | | 474,937 | |
Bunzl PLC | | | | | 7,033 | | | | 211,702 | |
Burberry Group PLC | | | | | 8,866 | | | | 233,128 | |
Centrica PLC | | | | | 102,560 | | | | 142,059 | |
Compass Group PLC | | | | | 29,097 | | | | 661,160 | |
Croda International PLC | | | | | 3,216 | | | | 217,215 | |
DCC PLC | | | | | 2,038 | | | | 181,940 | |
Diageo PLC | | | | | 44,111 | | | | 1,859,434 | |
Direct Line Insurance Group PLC | | | | | 31,460 | | | | 135,096 | |
DS Smith PLC | | | | | 31,155 | | | | 144,996 | |
Experian PLC | | | | | 18,213 | | | | 528,290 | |
G4S PLC | | | | | 35,200 | | | | 99,211 | |
GlaxoSmithKline PLC | | | | | 90,384 | | | | 1,853,923 | |
GVC Holdings PLC | | | | | 11,781 | | | | 100,259 | |
Hammerson PLC | | | | | 19,712 | | | | 82,720 | |
Hargreaves Lansdown PLC | | | | | 6,155 | | | | 181,101 | |
HSBC Holdings PLC | | | | | 369,969 | | | | 3,217,491 | |
IMI PLC | | | | | 7,201 | | | | 98,617 | |
Imperial Brands PLC | | | | | 17,968 | | | | 570,608 | |
Informa PLC | | | | | 27,398 | | | | 278,239 | |
InterContinental Hotels Group PLC | | | | | 3,684 | | | | 238,596 | |
International Consolidated Airlines Group SA | | | | | 21,590 | | | | 152,100 | |
Intertek Group PLC | | | | | 3,939 | | | | 274,727 | |
ITV PLC | | | | | 72,451 | | | | 129,067 | |
J Sainsbury PLC | | | | | 35,686 | | | | 103,512 | |
John Wood Group PLC | | | | | 13,944 | | | | 85,528 | |
Johnson Matthey PLC | | | | | 4,118 | | | | 179,145 | |
Just Eat PLC* | | | | | 11,835 | | | | 107,847 | |
Kingfisher PLC | | | | | 45,630 | | | | 157,101 | |
Land Securities Group PLC | | | | | 14,531 | | | | 174,847 | |
Legal & General Group PLC | | | | | 113,554 | | | | 411,833 | |
Lloyds Banking Group PLC | | | | | 1,331,682 | | | | 1,086,245 | |
London Stock Exchange Group PLC | | | | | 5,731 | | | | 374,607 | |
Marks & Spencer Group PLC | | | | | 33,392 | | | | 124,457 | |
Meggitt PLC | | | | | 19,475 | | | | 138,215 | |
See notes to financial statements.
123
Schedules of Investments — IQ 50 Percent Hedged FTSE International ETF(continued)
April 30, 2019 | | | | Shares
| | Value
|
| | | | | | | | | | |
Common Stocks (continued) | | | | | | | | | | |
| | | | | | | | | | | |
United Kingdom (continued) | | | | | | | | | | |
Melrose Industries PLC | | | | | 101,804 | | | $ | 268,353 | |
Micro Focus International PLC | | | | | 7,326 | | | | 185,070 | |
Mondi PLC | | | | | 8,812 | | | | 193,052 | |
National Grid PLC | | | | | 62,177 | | | | 677,718 | |
Next PLC | | | | | 2,842 | | | | 213,629 | |
Ocado Group PLC* | | | | | 9,177 | | | | 163,004 | |
Pearson PLC | | | | | 16,246 | | | | 175,829 | |
Persimmon PLC | | | | | 6,487 | | | | 189,094 | |
Prudential PLC | | | | | 48,139 | | | | 1,088,824 | |
Quilter PLC‡ | | | | | 34,473 | | | | 66,324 | |
Reckitt Benckiser Group PLC | | | | | 11,731 | | | | 947,715 | |
RELX PLC | | | | | 36,806 | | | | 844,006 | |
Rentokil Initial PLC | | | | | 34,143 | | | | 173,591 | |
Rolls-Royce Holdings PLC* | | | | | 31,278 | | | | 372,933 | |
Rolls-Royce Holdings PLC —Entitlement*(c)(d) | | | | | 2,220,738 | | | | 2,895 | |
Royal Bank of Scotland Group PLC | | | | | 84,603 | | | | 264,261 | |
RSA Insurance Group PLC | | | | | 23,859 | | | | 168,583 | |
Sage Group PLC (The) | | | | | 23,041 | | | | 217,891 | |
Schroders PLC | | | | | 2,580 | | | | 106,519 | |
Severn Trent PLC | | | | | 4,751 | | | | 126,103 | |
Smith & Nephew PLC | | | | | 17,711 | | | | 341,832 | |
Smiths Group PLC | | | | | 9,628 | | | | 191,097 | |
Spirax-Sarco Engineering PLC | | | | | 1,307 | | | | 140,569 | |
SSE PLC | | | | | 18,686 | | | | 278,800 | |
St James’s Place PLC | | | | | 11,600 | | | | 169,597 | |
Standard Chartered PLC | | | | | 52,919 | | | | 482,915 | |
Standard Life Aberdeen PLC | | | | | 47,149 | | | | 171,428 | |
Subsea 7 SA | | | | | 4,767 | | | | 60,418 | |
Tate & Lyle PLC | | | | | 13,765 | | | | 137,744 | |
Taylor Wimpey PLC | | | | | 65,844 | | | | 155,709 | |
Tesco PLC | | | | | 186,827 | | | | 608,405 | |
Unilever NV | | | | | 27,662 | | | | 1,672,804 | |
Unilever PLC | | | | | 20,022 | | | | 1,215,686 | |
United Utilities Group PLC | | | | | 13,774 | | | | 148,823 | |
Vodafone Group PLC | | | | | 504,217 | | | | 933,398 | |
Weir Group PLC (The) | | | | | 5,595 | | | | 121,043 | |
Whitbread PLC | | | | | 3,433 | | | | 199,604 | |
Wm Morrison Supermarkets PLC | | | | | 50,337 | | | | 141,678 | |
WPP PLC | | | | | 23,050 | | | | 287,390 | |
Total United Kingdom | | | | | | | | | 38,121,719 | |
| | | | | | | | | | | |
United States — 0.2% | | | | | | | | | | |
Carnival PLC | | | | | 3,461 | | | | 182,056 | |
Ferguson PLC | | | | | 4,381 | | | | 310,694 | |
OneMarket Ltd* | | | | | 1,920 | | | | 1,095 | |
Samsonite International SA‡* | | | | | 30,940 | | | | 88,734 | |
Total United States | | | | | | | | | 582,579 | |
| | | | | | | | | | | |
Total Common Stocks | | | | | | | | | | |
(Cost $299,531,144) | | | | | | | | | 278,939,991 | |
| | | | | | | | | | | |
Preferred Stocks — 0.7% | | | | | | | | | | |
| | | | | | | | | | | |
Germany — 0.5% | | | | | | | | | | |
FUCHS PETROLUB SE, 2.34% | | | | | 2,866 | | | $ | 124,558 | |
Henkel AG & Co. KGaA, 2.05% | | | | | 3,560 | | | | 360,030 | |
Porsche Automobil Holding SE, 2.85% | | | | | 3,380 | | | | 234,248 | |
Sartorius AG, 0.38% | | | | | 678 | | | | 124,005 | |
Volkswagen AG, 2.54% | | | | | 3,683 | | | | 639,934 | |
Total Germany | | | | | | | | | 1,482,775 | |
| | | | | | | | | | | |
South Korea — 0.2% | | | | | | | | | | |
Samsung Electronics Co., Ltd., 3.81% | | | | | 12,725 | | | | 405,231 | |
| | | | | | | | | | | |
Total Preferred Stocks | | | | | | | | | | |
(Cost $2,050,311) | | | | | | | | | 1,888,006 | |
| | | | | | | | | | | |
Investment of Cash Collateral For Securities Loaned — 3.6% | | | | | | | | | | |
| | | | | | | | | | | |
Money Market Fund — 3.6% | | | | | | | | | | |
Dreyfus Government Cash Management Fund, Institutional Shares, 2.45%(f) | | | | | | | | | | |
(Cost $9,981,686) | | | | | 9,981,686 | | | | 9,981,686 | |
| | | | | | | | | | | |
Total Investments — 103.5% | | | | | | | | | | |
(Cost $311,563,141) | | | | | | | | | 290,809,683 | |
| | | | | | | | | | | |
Other Assets and Liabilities, Net — (3.5)% | | | | | | | | | (9,730,778 | ) |
| | | | | | | | | | | |
Net Assets — 100.0% | | | | | | | | $ | 281,078,905 | |
* | | Non-income producing securities. |
‡ | | May be sold to institutional investors only under Rule 144A or securities offered pursuant to section 4(a)(2) of the Securities Act of 1933, as amended. |
(a) | | All or a portion of the security was on loan. In addition, “Other Assets and Liabilities, Net” may include pending sales that are also on loan. The aggregate market value of securities on loan was $10,204,882; total market value of collateral held by the Fund was $10,733,663. Market value of the collateral held includes non-cash U.S. Treasury securities collateral having a value of $751,977. |
(b) | | These securities are deemed illiquid due to the extended closure of the Japanese market. |
(c) | | Securities have been deemed illiquid because they may not be able to be resold within seven days at approximately the price shown. At April 30, 2019, the value of these securities was $47,468. |
(d) | | Securities are fair valued as determined in good faith in accordance with the procedures established by the Board of Trustees. The Securities are fair valued using significant unobservable inputs. |
(f) | | Reflects the 1-day yield at April 30, 2019. |
See notes to financial statements.
124
Schedules of Investments — IQ 50 Percent Hedged FTSE International ETF(continued)
April 30, 2019Forward Foreign Currency Contracts Outstanding as of April 30, 2019:
Purchased Contracts
| | Settlement Date
| | Counterparty
| | Currency
Amount
Purchased
| | Value at
Settlement
Date
| | Value at
April 30, 2019
| | Unrealized
Appreciation
|
Australian Dollar | | 05/07/19 | | Morgan Stanley | | | 12,848,057 | | | $ | 9,043,683 | | | $ | 9,044,786 | | | $ | 1,103 | |
Swiss Franc | | 05/07/19 | | Morgan Stanley | | | 12,642,650 | | | | 12,409,065 | | | | 12,415,638 | | | | 6,573 | |
Danish Krone | | 05/07/19 | | Morgan Stanley | | | 15,246,935 | | | | 2,289,584 | | | | 2,290,341 | | | | 757 | |
Euro | | 05/07/19 | | Morgan Stanley | | | 34,344,076 | | | | 38,500,945 | | | | 38,513,545 | | | | 12,600 | |
British Pound | | 05/07/19 | | Morgan Stanley | | | 19,685,732 | | | | 25,647,131 | | | | 25,673,464 | | | | 26,333 | |
Hong Kong Dollar | | 05/07/19 | | Morgan Stanley | | | 41,246,168 | | | | 5,257,398 | | | | 5,257,980 | | | | 582 | |
Israeli Shekel | | 05/07/19 | | Morgan Stanley | | | 2,684,414 | | | | 745,539 | | | | 745,827 | | | | 288 | |
Japanese Yen | | 05/07/19 | | Morgan Stanley | | | 4,193,896,854 | | | | 37,634,719 | | | | 37,678,636 | | | | 43,917 | |
Norwegian Krone | | 05/07/19 | | Morgan Stanley | | | 8,281,508 | | | | 957,748 | | | | 957,960 | | | | 212 | |
New Zealand Dollar | | 05/07/19 | | Morgan Stanley | | | 640,151 | | | | 426,712 | | | | 426,977 | | | | 265 | |
Polish Zloty | | 05/07/19 | | Morgan Stanley | | | 1,689,357 | | | | 441,271 | | | | 441,399 | | | | 128 | |
Swedish Krona | | 05/07/19 | | Morgan Stanley | | | 30,279,298 | | | | 3,185,756 | | | | 3,186,900 | | | | 1,144 | |
Singapore Dollar | | 05/07/19 | | Morgan Stanley | | | 2,341,329 | | | | 1,719,972 | | | | 1,720,251 | | | | 279 | |
Unrealized Appreciation | | | | | | | | | | $ | 138,259,523 | | | $ | 138,353,704 | | | $ | 94,181 | |
Sold Contracts
| | Settlement Date
| | Counterparty
| | Currency
Amount Sold
| | Value at
Settlement
Date
| | Value at
April 30, 2019
| | Unrealized
Appreciation
|
| Australian Dollar | | 05/07/19 | | Morgan Stanley | | | (14,644,858 | ) | | $ | (10,408,906 | ) | | $ | (10,309,700 | ) | | $ | 99,206 | |
Swiss Franc | | 05/07/19 | | Morgan Stanley | | | (12,642,650 | ) | | | (12,734,625 | ) | | | (12,415,638 | ) | | | 318,987 | |
Danish Krone | | 05/07/19 | | Morgan Stanley | | | (17,375,456 | ) | | | (2,621,316 | ) | | | (2,610,080 | ) | | | 11,236 | |
Euro | | 05/07/19 | | Morgan Stanley | | | (39,179,611 | ) | | | (44,115,713 | ) | | | (43,936,128 | ) | | | 179,585 | |
British Pound | | 05/07/19 | | Morgan Stanley | | | (19,685,732 | ) | | | (25,693,028 | ) | | | (25,673,464 | ) | | | 19,564 | |
Hong Kong Dollar | | 05/07/19 | | Morgan Stanley | | | (46,997,715 | ) | | | (5,992,830 | ) | | | (5,991,176 | ) | | | 1,654 | |
Japanese Yen | | 05/07/19 | | Morgan Stanley | | | (4,171,421,857 | ) | | | (37,787,666 | ) | | | (37,476,717 | ) | | | 310,949 | |
South Korean Won# | | 05/07/19 | | Morgan Stanley | | | (8,059,159,550 | ) | | | (7,091,022 | ) | | | (6,900,800 | ) | | | 190,222 | |
South Korean Won# | | 06/05/19 | | Morgan Stanley | | | (7,338,552,000 | ) | | | (6,295,944 | ) | | | (6,290,438 | ) | | | 5,506 | |
Norwegian Krone | | 05/07/19 | | Morgan Stanley | | | (9,444,267 | ) | | | (1,098,055 | ) | | | (1,092,462 | ) | | | 5,593 | |
New Zealand Dollar | | 05/07/19 | | Morgan Stanley | | | (640,151 | ) | | | (436,838 | ) | | | (426,976 | ) | | | 9,862 | |
Swedish Krona | | 05/07/19 | | Morgan Stanley | | | (34,508,257 | ) | | | (3,729,730 | ) | | | (3,631,998 | ) | | | 97,732 | |
Singapore Dollar | | 05/07/19 | | Morgan Stanley | | | (2,667,662 | ) | | | (1,970,371 | ) | | | (1,960,019 | ) | | | 10,352 | |
Unrealized Appreciation | | | | | | | | | | $ | (159,976,044 | ) | | $ | (158,715,596 | ) | | $ | 1,260,448 | |
| Total Unrealized Appreciation | $ | 1,354,629 | |
Purchased Contracts
| | Settlement Date
| | Counterparty
| | Currency
Amount Purchased
| | Value at
Settlement
Date
| | Value at
April 30, 2019
| | Unrealized
(Depreciation)
|
Australian Dollar | | 05/07/19 | | Morgan Stanley | | | 1,796,801 | | | $ | 1,274,729 | | | $ | 1,264,913 | | | $ | (9,816 | ) |
Danish Krone | | 05/07/19 | | Morgan Stanley | | | 2,128,521 | | | | 319,902 | | | | 319,739 | | | | (163 | ) |
Euro | | 05/07/19 | | Morgan Stanley | | | 4,835,535 | | | | 5,425,609 | | | | 5,422,583 | | | | (3,026 | ) |
Hong Kong Dollar | | 05/07/19 | | Morgan Stanley | | | 5,751,547 | | | | 733,453 | | | | 733,196 | | | | (257 | ) |
South Korean Won# | | 05/07/19 | | Morgan Stanley | | | 8,059,159,550 | | | | 6,925,766 | | | | 6,900,800 | | | | (24,966 | ) |
Norwegian Krone | | 05/07/19 | | Morgan Stanley | | | 1,162,759 | | | | 135,965 | | | | 134,502 | | | | (1,463 | ) |
Polish Zloty | | 05/07/19 | | Morgan Stanley | | | 237,451 | | | | 62,101 | | | | 62,042 | | | | (59 | ) |
Swedish Krona | | 05/07/19 | | Morgan Stanley | | | 4,228,959 | | | | 451,839 | | | | 445,098 | | | | (6,741 | ) |
Singapore Dollar | | 05/07/19 | | Morgan Stanley | | | 326,333 | | | | 240,458 | | | | 239,767 | | | | (691 | ) |
Unrealized Depreciation | | | | | | | | | | $ | 15,569,822 | | | $ | 15,522,640 | | | $ | (47,182 | ) |
Sold Contracts
| | Settlement Date
| | Counterparty
| | Currency
Amount Sold
| | Value at
Settlement
Date
| | Value at
April 30, 2019
| | Unrealized
Depreciation
|
Australian Dollar | | 06/04/19 | | Morgan Stanley | | | (13,247,872 | ) | | $ | (9,330,106 | ) | | $ | (9,332,976 | ) | | $ | (2,870 | ) |
Swiss Franc | | 06/04/19 | | Morgan Stanley | | | (11,596,828 | ) | | | (11,414,335 | ) | | | (11,420,434 | ) | | | (6,099 | ) |
Danish Krone | | 06/04/19 | | Morgan Stanley | | | (15,357,306 | ) | | | (2,311,787 | ) | | | (2,313,178 | ) | | | (1,391 | ) |
Euro | | 06/04/19 | | Morgan Stanley | | | (36,275,812 | ) | | | (40,761,088 | ) | | | (40,781,227 | ) | | | (20,139 | ) |
British Pound | | 06/04/19 | | Morgan Stanley | | | (17,831,496 | ) | | | (23,283,463 | ) | | | (23,291,494 | ) | | | (8,031 | ) |
Hong Kong Dollar | | 06/04/19 | | Morgan Stanley | | | (41,330,866 | ) | | | (5,269,708 | ) | | | (5,271,122 | ) | | | (1,414 | ) |
Israeli Shekel | | 05/07/19 | | Morgan Stanley | | | (2,684,414 | ) | | | (741,369 | ) | | | (745,826 | ) | | | (4,457 | ) |
See notes to financial statements.
125
Schedules of Investments — IQ 50 Percent Hedged FTSE International ETF(continued)
April 30, 2019Sold Contracts
| | Settlement Date
| | Counterparty
| | Currency
Amount Sold
| | Value at
Settlement
Date
| | Value at
April 30, 2019
| | Unrealized
Depreciation
|
Israeli Shekel | | 06/04/19 | | Morgan Stanley | | | (2,536,664 | ) | | $ | (705,762 | ) | | $ | (706,132 | ) | | $ | (370 | ) |
Japanese Yen | | 05/07/19 | | Morgan Stanley | | | (22,474,997 | ) | | | (201,428 | ) | | | (201,919 | ) | | | (491 | ) |
Japanese Yen | | 06/04/19 | | Morgan Stanley | | | (3,753,068,816 | ) | | | (33,768,144 | ) | | | (33,799,162 | ) | | | (31,018 | ) |
Norwegian Krone | | 06/04/19 | | Morgan Stanley | | | (8,460,253 | ) | | | (979,398 | ) | | | (979,775 | ) | | | (377 | ) |
New Zealand Dollar | | 06/04/19 | | Morgan Stanley | | | (578,059 | ) | | | (385,654 | ) | | | (385,773 | ) | | | (119 | ) |
Polish Zloty | | 05/07/19 | | Morgan Stanley | | | (1,926,808 | ) | | | (503,076 | ) | | | (503,441 | ) | | | (365 | ) |
Polish Zloty | | 06/04/19 | | Morgan Stanley | | | (1,792,493 | ) | | | (468,548 | ) | | | (468,753 | ) | | | (205 | ) |
Swedish Krona | | 06/04/19 | | Morgan Stanley | | | (33,357,625 | ) | | | (3,517,282 | ) | | | (3,519,118 | ) | | | (1,836 | ) |
Singapore Dollar | | 06/04/19 | | Morgan Stanley | | | (2,514,617 | ) | | | (1,847,781 | ) | | | (1,848,458 | ) | | | (677 | ) |
Unrealized Depreciation | | | | | | | | | | $ | (135,488,929 | ) | | $ | (135,568,788 | ) | | $ | (79,859 | ) |
| Total Unrealized Depreciation | $ | (127,041) | |
| | | | |
| Net Unrealized Appreciation (Depreciation) | $ | 1,227,588 | |
# | | Non-deliverable forward. |
As of April 30, 2019, there was no collateral segregated by the counterparty for forward foreign currency contracts.
The following is a summary of the inputs used to value the Fund’s investments as of April 30, 2019. For more information on the valuation techniques, and their aggregation into the levels used in the table below, please refer to Note 2.
Asset Valuation Inputs
Description
| | | | Level 1
| | Level 2
| | Level 3
| | Total
|
Investments in Securities:(g) | | | | | | | | | | | | | | | | | | |
Common Stocks | | | | | | | | | | | | | | | | | | |
Australia | | | | $ | 20,608,303 | | | $ | — | | | $ | — | | | $ | 20,608,303 | |
Austria | | | | | 667,161 | | | | — | | | | — | | | | 667,161 | |
Belgium | | | | | 2,794,783 | | | | — | | | | — | | | | 2,794,783 | |
China | | | | | 907,304 | | | | — | | | | — | | | | 907,304 | |
Denmark | | | | | 4,603,814 | | | | — | | | | — | | | | 4,603,814 | |
Finland | | | | | 2,675,385 | | | | — | | | | — | | | | 2,675,385 | |
France | | | | | 28,013,051 | | | | — | | | | — | | | | 28,013,051 | |
Germany | | | | | 21,718,624 | | | | — | | | | — | | | | 21,718,624 | |
Hong Kong | | | | | 9,444,433 | | | | — | | | | — | | | | 9,444,433 | |
Ireland | | | | | 1,567,376 | | | | — | | | | — | | | | 1,567,376 | |
Israel | | | | | 1,408,867 | | | | — | | | | — | | | | 1,408,867 | |
Italy | | | | | 5,599,674 | | | | — | | | | — | | | | 5,599,674 | |
Japan | | | | | — | | | | 67,395,175 | | | | — | | | | 67,395,175 | |
Luxembourg | | | | | 685,574 | | | | — | | | | — | | | | 685,574 | |
Macau | | | | | 713,699 | | | | — | | | | — | | | | 713,699 | |
Netherlands | | | | | 11,842,113 | | | | — | | | | — | | | | 11,842,113 | |
New Zealand | | | | | 771,016 | | | | — | | | | — | | | | 771,016 | |
Norway | | | | | 1,859,566 | | | | — | | | | — | | | | 1,859,566 | |
Poland | | | | | 938,582 | | | | — | | | | — | | | | 938,582 | |
Portugal | | | | | 417,728 | | | | — | | | | — | | | | 417,728 | |
Russia | | | | | 208,817 | | | | — | | | | — | | | | 208,817 | |
Singapore | | | | | 3,694,706 | | | | — | | | | — | | | | 3,694,706 | |
South Africa | | | | | 520,718 | | | | — | | | | — | | | | 520,718 | |
South Korea | | | | | 12,159,170 | | | | — | | | | — | | | | 12,159,170 | |
Spain | | | | | 8,067,209 | | | | — | | | | 44,573 | (h) | | | 8,111,782 | |
Sweden | | | | | 7,010,996 | | | | — | | | | — | | | | 7,010,996 | |
Switzerland | | | | | 23,802,434 | | | | — | | | | — | | | | 23,802,434 | |
United Arab Emirates | | | | | 94,842 | | | | — | | | | — | | | | 94,842 | |
United Kingdom | | | | | 38,118,824 | | | | — | | | | 2,895 | (h) | | | 38,121,719 | |
United States | | | | | 582,579 | | | | — | | | | — | | | | 582,579 | |
Total Common Stocks | | | | | 211,497,348 | | | | 67,395,175 | | | | 47,468 | | | | 278,939,991 | |
Preferred Stocks | | | | | | | | | | | | | | | | | | |
Germany | | | | | 1,482,775 | | | | — | | | | — | | | | 1,482,775 | |
South Korea | | | | | 405,231 | | | | — | | | | — | | | | 405,231 | |
Total Preferred Stocks | | | | | 1,888,006 | | | | — | | | | — | | | | 1,888,006 | |
Investment of Cash Collateral for Securities Loaned: | | | | | | | | | | | | | | | | | | |
Money Market Fund | | | | | 9,981,686 | | | | — | | | | — | | | | 9,981,686 | |
See notes to financial statements.
126
Schedules of Investments — IQ 50 Percent Hedged FTSE International ETF(continued)
April 30, 2019Description
| | | | Level 1
| | Level 2
| | Level 3
| | Total
|
Total Investments in Securities | | | | $ | 223,367,040 | | | $ | 67,395,175 | | | $ | 47,468 | | | $ | 290,809,683 | |
Other Financial Instruments:(i) | | | | | | | | | | | | | | | | | | |
Forward Foreign Currency Contracts | | | | | — | | | | 1,354,629 | | | | — | | | | 1,354,629 | |
Total Investments in Securities and Other Financial Instruments | | | | $ | 223,367,040 | | | $ | 68,749,804 | | | $ | 47,468 | | | $ | 292,164,312 | |
Liability Valuation Inputs
Description
| | | | Level 1
| | Level 2
| | Level 3
| | Total
|
| Other Financial Instruments:(i) | | | | | | | | | | | | | | | | | | |
Forward Foreign Currency Contracts | | | | $ | — | | | $ | 127,041 | | | $ | — | | | $ | 127,041 | |
(g) | | For a complete listing of investments and their countries, see the Schedules of Investments. |
(h) | | The Level 3 securities, valued in total at $47,468, have been deemed illiquid and have been fair valued in good faith in accordance with procedures established by the Board of Trustees. |
(i) | | Reflects the unrealized appreciation (depreciation) of the instruments. |
For the period ended April 30, 2019, the Fund transferred common stock valued at $615,985 from Level 1 to Level 3 as a result of halted trade.
The following is a reconciliation of investments in which significant unobservable inputs (Level 3) were used in determining value:
Investments in Securities
| | Balance
as of
April 30,
2018
| | Accrued
Discounts
(Premiums)
| | Realized
Gain
(Loss)
| | Change in
Unrealized
Appreciation
(Depreciation)
| | Purchases
| | Sales
| | Transfers
into
Level 3
| | Transfers
out of
Level 3
| | Balance
as of
April 30,
2019
| | Change in
Unrealized
Appreciation
(Depreciation)
from Investments
Still Held at
April 30,
2019(j)
|
Common Stocks | | | | | | | | | | | | | | | | | | | | | | | | | | | | | | | | | | | | | | | | |
Abertis
Infraestructuras SA(k) | | $ | — | | | $ | — | | | $ | 4,261 | | | $ | (89,507 | ) | | $ | 9,931 | | | $ | (496,097 | ) | | $ | 615,985 | | | $ | — | | | $ | 44,573 | | | $ | (89,507 | ) |
Rolls-Royce Holdings
PLC — Entitlement(k) | | | — | | | | — | | | | — | | | | 29 | | | | 2,866 | | | | — | | | | — | | | | — | | | | 2,895 | | | | 29 | |
| Rolls-Royce Holdings PLC, Class C | | | 5,687 | | | | — | | | | (272 | ) | | | 66 | | | | — | | | | (5,481 | ) | | | — | | | | — | | | | — | | | | — | |
Rights | | | | | | | | | | | | | | | | | | | | | | | | | | | | | | | | | | | | | | | | |
| Fletcher Building Ltd. | | | —(l) | | | | — | | | | 11,756 | | | | — | | | | — | | | | (11,756 | ) | | | — | | | | — | | | | — | | | | — | |
| Total | | $ | 5,687 | | | $ | — | | | $ | 15,745 | | | $ | (89,412 | ) | | $ | 12,797 | | | $ | (513,334 | ) | | $ | 615,985 | | | $ | — | | | $ | 47,468 | | | $ | (89,478 | ) |
(j) | | Included in “Net change in unrealized appreciation (depreciation) on investments” in the Statements of Operations. |
(k) | | Security has been deemed illiquid and has been fair valued in good faith in accordance with procedures established by the Board of Trustees. |
(l) | | Includes a Level 3 security valued at $ —. |
Information about Level 3 fair value measurements as of April 30, 2019.
Security Type
| | | | Fair Value
| | Valuation Technique
| | Unobservable Inputs
|
| Common Stock | | | | $ | 47,468 | | | Issuer Specific Facts | | Company Information |
See notes to financial statements.
127
Schedules of Investments — IQ 50 Percent Hedged FTSE Europe ETF
April 30, 2019 | | | | Shares
| | Value
|
| | | | | | | | | | |
Common Stocks — 98.9% | | | | | | | | | | |
| | | | | | | | | | | |
Australia — 1.3% | | | | | | | | | | |
BHP Group PLC | | | | | 2,033 | | | $ | 47,955 | |
Rio Tinto PLC | | | | | 1,085 | | | | 63,156 | |
Total Australia | | | | | | | | | 111,111 | |
| | | | | | | | | | | |
Austria — 0.4% | | | | | | | | | | |
ANDRITZ AG | | | | | 68 | | | | 3,239 | |
Erste Group Bank AG* | | | | | 280 | | | | 11,203 | |
OMV AG | | | | | 137 | | | | 7,331 | |
Raiffeisen Bank International AG | | | | | 124 | | | | 3,303 | |
Telekom Austria AG* | | | | | 133 | | | | 996 | |
Verbund AG* | | | | | 64 | | | | 3,172 | |
Vienna Insurance Group AG Wiener Versicherung Gruppe | | | | | 38 | | | | 1,056 | |
voestalpine AG | | | | | 110 | | | | 3,529 | |
Total Austria | | | | | | | | | 33,829 | |
| | | | | | | | | | | |
Belgium — 1.7% | | | | | | | | | | |
Ackermans & van Haaren NV | | | | | 22 | | | | 3,536 | |
Ageas | | | | | 179 | | | | 9,428 | |
Anheuser-Busch InBev SA/NV | | | | | 753 | | | | 66,886 | |
bpost SA | | | | | 97 | | | | 1,164 | |
Colruyt SA | | | | | 51 | | | | 3,673 | |
Galapagos NV* | | | | | 45 | | | | 5,147 | |
Groupe Bruxelles Lambert SA | | | | | 71 | | | | 6,781 | |
KBC Group NV | | | | | 266 | | | | 19,681 | |
Proximus SADP | | | | | 135 | | | | 3,775 | |
Sofina SA | | | | | 15 | | | | 3,083 | |
Solvay SA | | | | | 67 | | | | 8,046 | |
Telenet Group Holding NV | | | | | 47 | | | | 2,492 | |
UCB SA | | | | | 118 | | | | 9,352 | |
Umicore SA(a) | | | | | 196 | | | | 7,578 | |
Total Belgium | | | | | | | | | 150,622 | |
| | | | | | | | | | | |
Chile — 0.0%(b) | | | | | | | | | | |
Antofagasta PLC | | | | | 334 | | | | 3,954 | |
| | | | | | | | | | | |
Denmark — 2.7% | | | | | | | | | | |
Ambu A/S, Class B(a) | | | | | 158 | | | | 4,529 | |
AP Moller — Maersk A/S, Class A | | | | | 5 | | | | 6,087 | |
AP Moller — Maersk A/S, Class B | | | | | 6 | | | | 7,811 | |
Carlsberg A/S, Class B | | | | | 103 | | | | 13,294 | |
Chr Hansen Holding A/S | | | | | 94 | | | | 9,581 | |
Coloplast A/S, Class B | | | | | 129 | | | | 13,908 | |
Danske Bank A/S | | | | | 646 | | | | 11,448 | |
Drilling Co. of 1972 A/S (The)* | | | | | 22 | | | | 1,688 | |
DSV A/S | | | | | 173 | | | | 15,971 | |
Genmab A/S* | | | | | 53 | | | | 8,791 | |
GN Store Nord A/S | | | | | 129 | | | | 6,597 | |
H Lundbeck A/S | | | | | 57 | | | | 2,396 | |
ISS A/S | | | | | 178 | | | | 5,531 | |
Jyske Bank A/S | | | | | 62 | | | | 2,495 | |
Novo Nordisk A/S, Class B | | | | | 1,661 | | | | 81,159 | |
Novozymes A/S, Class B | | | | | 201 | | | | 9,360 | |
Orsted A/S‡ | | | | | 146 | | | | 11,169 | |
Pandora A/S | | | | | 97 | | | | 4,065 | |
Rockwool International A/S, Class B | | | | | 6 | | | | 1,601 | |
Tryg A/S | | | | | 117 | | | | 3,572 | |
Vestas Wind Systems A/S | | | | | 195 | | | | 17,622 | |
William Demant Holding A/S*(a) | | | | | 106 | | | | 3,342 | |
Total Denmark | | | | | | | | | 242,017 | |
| | | | Shares
| | Value
|
Common Stocks (continued) | | | | | | | | | | |
| | | | | | | | | | | |
Finland — 1.9% | | | | | | | | | | |
Elisa OYJ | | | | | 137 | | | $ | 5,808 | |
Fortum OYJ | | | | | 412 | | | | 8,699 | |
Huhtamaki OYJ(a) | | | | | 90 | | | | 3,430 | |
Kesko OYJ, Class B | | | | | 66 | | | | 3,425 | |
Kone OYJ, Class B | | | | | 381 | | | | 20,863 | |
Metso OYJ(a) | | | | | 103 | | | | 3,834 | |
Neste OYJ | | | | | 402 | | | | 13,263 | |
Nokia OYJ | | | | | 5,465 | | | | 28,657 | |
Nokian Renkaat OYJ | | | | | 130 | | | | 4,345 | |
Nordea Bank Abp* | | | | | 3,104 | | | | 25,074 | |
Orion OYJ, Class B(a) | | | | | 98 | | | | 3,254 | |
Sampo OYJ, Class A | | | | | 479 | | | | 21,881 | |
Stora Enso OYJ, Class R | | | | | 540 | | | | 6,696 | |
UPM-Kymmene OYJ | | | | | 521 | | | | 14,661 | |
Wartsila OYJ Abp | | | | | 438 | | | | 6,980 | |
Total Finland | | | | | | | | | 170,870 | |
| | | | | | | | | | | |
France — 16.8% | | | | | | | | | | |
Accor SA | | | | | 192 | | | | 8,082 | |
Adevinta ASA, Class A* | | | | | 76 | | | | 765 | |
Adevinta ASA, Class B* | | | | | 123 | | | | 1,207 | |
Aeroports de Paris | | | | | 27 | | | | 5,495 | |
Air France-KLM* | | | | | 208 | | | | 2,401 | |
Air Liquide SA | | | | | 410 | | | | 54,472 | |
Airbus SE | | | | | 537 | | | | 73,349 | |
ALD SA‡ | | | | | 78 | | | | 1,145 | |
Alstom SA | | | | | 147 | | | | 6,458 | |
Amundi SA‡ | | | | | 55 | | | | 3,948 | |
Arkema SA | | | | | 70 | | | | 7,175 | |
Atos SE | | | | | 89 | | | | 9,154 | |
AXA SA(a) | | | | | 1,878 | | | | 49,975 | |
BioMerieux | | | | | 39 | | | | 3,092 | |
BNP Paribas SA | | | | | 1,057 | | | | 56,208 | |
Bollore SA | | | | | 948 | | | | 4,500 | |
Bouygues SA(a) | | | | | 203 | | | | 7,630 | |
Bureau Veritas SA | | | | | 266 | | | | 6,731 | |
Capgemini SE | | | | | 153 | | | | 18,536 | |
Carrefour SA | | | | | 545 | | | | 10,609 | |
Casino Guichard Perrachon SA(a) | | | | | 52 | | | | 2,127 | |
Cie de Saint-Gobain | | | | | 470 | | | | 19,194 | |
Cie Generale des Etablissements Michelin | | | | | 172 | | | | 22,196 | |
Cie Plastic Omnium SA | | | | | 54 | | | | 1,633 | |
CNP Assurances | | | | | 153 | | | | 3,608 | |
Covivio | | | | | 42 | | | | 4,542 | |
Credit Agricole SA | | | | | 1,113 | | | | 15,255 | |
Danone SA | | | | | 584 | | | | 47,176 | |
Dassault Aviation SA | | | | | 2 | | | | 3,024 | |
Dassault Systemes SE | | | | | 129 | | | | 20,392 | |
Edenred | | | | | 232 | | | | 10,923 | |
Eiffage SA | | | | | 73 | | | | 7,617 | |
Electricite de France SA | | | | | 480 | | | | 6,907 | |
Elis SA | | | | | 183 | | | | 3,261 | |
Engie SA | | | | | 1,602 | | | | 23,708 | |
EssilorLuxottica SA* | | | | | 283 | | | | 34,412 | |
Eurazeo SE* | | | | | 46 | | | | 3,606 | |
Eutelsat Communications SA | | | | | 177 | | | | 3,192 | |
Faurecia SA | | | | | 70 | | | | 3,552 | |
Gecina SA | | | | | 51 | | | | 7,607 | |
Getlink SE | | | | | 434 | | | | 6,980 | |
Hermes International | | | | | 30 | | | | 21,087 | |
ICADE | | | | | 30 | | | | 2,562 | |
See notes to financial statements.
128
Schedules of Investments — IQ 50 Percent Hedged FTSE Europe ETF(continued)
April 30, 2019 | | | | Shares
| | Value
|
| | | | | | | | | | |
Common Stocks (continued) | | | | | | | | | | |
| | | | | | | | | | | |
France (continued) | | | | | | | | | | |
Iliad SA | | | | | 22 | | | $ | 2,236 | |
Imerys SA | | | | | 35 | | | | 1,862 | |
Ingenico Group SA | | | | | 60 | | | | 5,054 | |
Ipsen SA | | | | | 34 | | | | 3,967 | |
JCDecaux SA | | | | | 70 | | | | 2,291 | |
Kering SA | | | | | 72 | | | | 42,524 | |
Klepierre SA | | | | | 193 | | | | 6,850 | |
Lagardere SCA | | | | | 112 | | | | 3,045 | |
Legrand SA | | | | | 260 | | | | 19,091 | |
L’Oreal SA(a) | | | | | 235 | | | | 64,551 | |
LVMH Moet Hennessy Louis Vuitton SE | | | | | 243 | | | | 95,057 | |
Natixis SA | | | | | 804 | | | | 4,729 | |
Orange SA | | | | | 1,875 | | | | 29,345 | |
Orpea | | | | | 44 | | | | 5,360 | |
Pernod Ricard SA | | | | | 207 | | | | 36,039 | |
Peugeot SA | | | | | 531 | | | | 13,901 | |
Publicis Groupe SA | | | | | 205 | | | | 12,149 | |
Remy Cointreau SA | | | | | 23 | | | | 3,062 | |
Renault SA | | | | | 178 | | | | 12,133 | |
Rexel SA | | | | | 291 | | | | 3,907 | |
Rubis SCA(a) | | | | | 88 | | | | 4,813 | |
Safran SA | | | | | 319 | | | �� | 46,440 | |
Sanofi(a) | | | | | 1,060 | | | | 92,054 | |
Sartorius Stedim Biotech | | | | | 22 | | | | 2,983 | |
Schneider Electric SE | | | | | 500 | | | | 42,284 | |
SCOR SE(a) | | | | | 149 | | | | 6,071 | |
SEB SA | | | | | 26 | | | | 4,755 | |
Societe BIC SA | | | | | 24 | | | | 2,067 | |
Societe Generale SA | | | | | 706 | | | | 22,328 | |
Sodexo SA | | | | | 83 | | | | 9,511 | |
Suez | | | | | 353 | | | | 4,955 | |
Teleperformance* | | | | | 55 | | | | 10,559 | |
Thales SA | | | | | 97 | | | | 11,572 | |
TOTAL SA | | | | | 2,430 | | | | 134,926 | |
Ubisoft Entertainment SA* | | | | | 81 | | | | 7,720 | |
Unibail-Rodamco-Westfield | | | | | 132 | | | | 22,671 | |
Valeo SA(a) | | | | | 228 | | | | 8,271 | |
Veolia Environnement SA | | | | | 480 | | | | 11,329 | |
Vinci SA | | | | | 454 | | | | 45,802 | |
Vivendi SA | | | | | 937 | | | | 27,166 | |
Wendel SA | | | | | 27 | | | | 3,734 | |
Worldline SA‡*(a) | | | | | 39 | | | | 2,454 | |
Total France | | | | | | | | | 1,497,111 | |
| | | | | | | | | | | |
Germany — 13.2% | | | | | | | | | | |
1&1 Drillisch AG(a) | | | | | 45 | | | | 1,676 | |
adidas AG | | | | | 185 | | | | 47,499 | |
Allianz SE | | | | | 412 | | | | 99,179 | |
Aroundtown SA | | | | | 636 | | | | 5,150 | |
Axel Springer SE | | | | | 43 | | | | 2,434 | |
BASF SE | | | | | 895 | | | | 72,709 | |
Bayer AG | | | | | 912 | | | | 60,650 | |
Bayerische Motoren Werke AG | | | | | 314 | | | | 26,709 | |
Beiersdorf AG | | | | | 97 | | | | 10,592 | |
Brenntag AG | | | | | 148 | | | | 7,971 | |
Carl Zeiss Meditec AG | | | | | 35 | | | | 3,434 | |
CECONOMY AG* | | | | | 157 | | | | 1,052 | |
Commerzbank AG* | | | | | 1,002 | | | | 8,997 | |
Continental AG | | | | | 106 | | | | 17,506 | |
Covestro AG‡ | | | | | 167 | | | | 9,124 | |
Daimler AG* | | | | | 841 | | | | 54,986 | |
Delivery Hero SE‡* | | | | | 103 | | | | 4,743 | |
| | | | Shares
| | Value
|
Common Stocks (continued) | | | | | | | | | | |
| | | | | | | | | | | |
Germany (continued) | | | | | | | | | | |
Deutsche Bank AG | | | | | 2,000 | | | $ | 16,517 | |
Deutsche Boerse AG | | | | | 180 | | | | 23,985 | |
Deutsche Lufthansa AG | | | | | 228 | | | | 5,499 | |
Deutsche Post AG* | | | | | 949 | | | | 32,864 | |
Deutsche Telekom AG | | | | | 3,156 | | | | 52,750 | |
Deutsche Wohnen SE | | | | | 343 | | | | 15,403 | |
DWS Group GmbH & Co. KGaA‡* | | | | | 32 | | | | 1,175 | |
E.ON SE | | | | | 2,120 | | | | 22,732 | |
Evonik Industries AG | | | | | 157 | | | | 4,673 | |
Fielmann AG | | | | | 23 | | | | 1,632 | |
Fraport AG Frankfurt Airport Services Worldwide | | | | | 34 | | | | 2,814 | |
Fresenius Medical Care AG & Co. KGaA | | | | | 208 | | | | 17,474 | |
Fresenius SE & Co. KGaA | | | | | 396 | | | | 22,447 | |
FUCHS PETROLUB SE | | | | | 32 | | | | 1,273 | |
GEA Group AG | | | | | 160 | | | | 4,468 | |
GRENKE AG | | | | | 25 | | | | 2,652 | |
Hannover Rueck SE | | | | | 58 | | | | 8,736 | |
Hapag-Lloyd AG‡ | | | | | 25 | | | | 769 | |
HeidelbergCement AG | | | | | 143 | | | | 11,539 | |
Hella GmbH & Co. KGaA | | | | | 43 | | | | 2,335 | |
Henkel AG & Co. KGaA | | | | | 98 | | | | 9,330 | |
HOCHTIEF AG | | | | | 19 | | | | 2,832 | |
HUGO BOSS AG | | | | | 62 | | | | 4,319 | |
Infineon Technologies AG | | | | | 1,106 | | | | 26,060 | |
Innogy SE‡* | | | | | 121 | | | | 5,613 | |
K+S AG | | | | | 185 | | | | 3,749 | |
KION Group AG | | | | | 67 | | | | 4,583 | |
Knorr-Bremse AG* | | | | | 46 | | | | 4,983 | |
LANXESS AG | | | | | 88 | | | | 5,079 | |
LEG Immobilien AG | | | | | 62 | | | | 7,209 | |
Merck KGaA | | | | | 125 | | | | 13,291 | |
METRO AG | | | | | 164 | | | | 2,775 | |
MTU Aero Engines AG | | | | | 50 | | | | 11,751 | |
Muenchener Rueckversicherungs-Gesellschaft AG* | | | | | 146 | | | | 36,488 | |
OSRAM Licht AG(a) | | | | | 85 | | | | 2,904 | |
ProSiebenSat.1 Media SE | | | | | 220 | | | | 3,460 | |
Puma SE | | | | | 8 | | | | 4,945 | |
Rational AG | | | | | 4 | | | | 2,699 | |
Rheinmetall AG | | | | | 42 | | | | 4,815 | |
Rocket Internet SE‡* | | | | | 61 | | | | 1,607 | |
RWE AG* | | | | | 522 | | | | 13,321 | |
SAP SE | | | | | 947 | | | | 121,604 | |
Scout24 AG‡(a) | | | | | 103 | | | | 5,298 | |
Siemens AG | | | | | 750 | | | | 89,718 | |
Siemens Healthineers AG‡ | | | | | 124 | | | | 5,284 | |
Suedzucker AG(a) | | | | | 76 | | | | 1,167 | |
Symrise AG | | | | | 121 | | | | 11,621 | |
Talanx AG | | | | | 37 | | | | 1,477 | |
Telefonica Deutschland Holding AG | | | | | 647 | | | | 2,100 | |
thyssenkrupp AG(a) | | | | | 448 | | | | 6,293 | |
TUI AG | | | | | 418 | | | | 4,653 | |
Uniper SE | | | | | 188 | | | | 5,691 | |
United Internet AG | | | | | 111 | | | | 4,445 | |
Volkswagen AG | | | | | 31 | | | | 5,538 | |
Vonovia SE | | | | | 507 | | | | 25,268 | |
Wacker Chemie AG | | | | | 14 | | | | 1,224 | |
Wirecard AG(a) | | | | | 112 | | | | 16,782 | |
Zalando SE‡* | | | | | 130 | | | | 6,110 | |
Total Germany | | | | | | | | | 1,172,234 | |
See notes to financial statements.
129
Schedules of Investments — IQ 50 Percent Hedged FTSE Europe ETF(continued)
April 30, 2019 | | | | Shares
| | Value
|
| | | | | | | | | | |
Common Stocks (continued) | | | | | | | | | | |
| | | | | | | | | | | |
Ireland — 0.9% | | | | | | | | | | |
AIB Group PLC(a) | | | | | 756 | | | $ | 3,506 | |
Bank of Ireland Group PLC* | | | | | 885 | | | | 5,643 | |
CRH PLC | | | | | 801 | | | | 26,732 | |
Glanbia PLC | | | | | 190 | | | | 3,499 | |
Kerry Group PLC, Class A | | | | | 142 | | | | 15,882 | |
Kingspan Group PLC | | | | | 144 | | | | 7,566 | |
Paddy Power Betfair PLC | | | | | 76 | | | | 6,428 | |
Smurfit Kappa Group PLC | | | | | 228 | | | | 6,673 | |
Total Ireland | | | | | | | | | 75,929 | |
| | | | | | | | | | | |
Italy — 3.5% | | | | | | | | | | |
A2A SpA | | | | | 1,495 | | | | 2,496 | |
Assicurazioni Generali SpA | | | | | 1,267 | | | | 24,565 | |
Atlantia SpA | | | | | 520 | | | | 14,173 | |
Banca Mediolanum SpA | | | | | 277 | | | | 2,032 | |
Banco BPM SpA* | | | | | 1,468 | | | | 3,488 | |
Buzzi Unicem SpA | | | | | 69 | | | | 1,533 | |
Buzzi Unicem SpA-RSP | | | | | 40 | | | | 609 | |
Davide Campari-Milano SpA | | | | | 548 | | | | 5,518 | |
DiaSorin SpA | | | | | 21 | | | | 2,050 | |
Enel SpA | | | | | 7,601 | | | | 48,035 | |
Eni SpA | | | | | 2,446 | | | | 41,716 | |
Ferrari NV | | | | | 123 | | | | 16,645 | |
FinecoBank Banca Fineco SpA | | | | | 379 | | | | 4,984 | |
Hera SpA | | | | | 769 | | | | 2,735 | |
Intesa Sanpaolo SpA | | | | | 14,760 | | | | 38,658 | |
Italgas SpA | | | | | 473 | | | | 2,947 | |
Leonardo SpA | | | | | 372 | | | | 4,292 | |
Mediaset SpA*(a) | | | | | 291 | | | | 967 | |
Mediobanca Banca di Credito Finanziario SpA | | | | | 699 | | | | 7,403 | |
Moncler SpA | | | | | 177 | | | | 7,254 | |
Pirelli & C SpA‡* | | | | | 417 | | | | 3,041 | |
Poste Italiane SpA‡ | | | | | 444 | | | | 4,732 | |
Prysmian SpA* | | | | | 252 | | | | 4,855 | |
Recordati SpA | | | | | 93 | | | | 3,751 | |
Saipem SpA* | | | | | 528 | | | | 2,673 | |
Salvatore Ferragamo SpA | | | | | 65 | | | | 1,470 | |
Snam SpA | | | | | 2,216 | | | | 11,268 | |
Telecom Italia SpA* | | | | | 10,370 | | | | 5,795 | |
Telecom Italia SpA-RSP | | | | | 5,839 | | | | 3,042 | |
Terna Rete Elettrica Nazionale SpA | | | | | 1,360 | | | | 8,136 | |
UniCredit SpA | | | | | 2,182 | | | | 30,151 | |
Unione di Banche Italiane SpA | | | | | 983 | | | | 3,063 | |
UnipolSai Assicurazioni SpA(a) | | | | | 553 | | | | 1,513 | |
Total Italy | | | | | | | | | 315,590 | |
| | | | | | | | | | | |
Jordan — 0.0%(b) | | | | | | | | | | |
Hikma Pharmaceuticals PLC | | | | | 136 | | | | 3,130 | |
| | | | | | | | | | | |
Kazakhstan — 0.0%(b) | | | | | | | | | | |
KAZ Minerals PLC | | | | | 227 | | | | 1,913 | |
| | | | | | | | | | | |
Luxembourg — 0.4% | | | | | | | | | | |
ArcelorMittal | | | | | 590 | | | | 12,780 | |
Eurofins Scientific SE(a) | | | | | 11 | | | | 5,030 | |
RTL Group SA(a) | | | | | 36 | | | | 2,021 | |
SES SA | | | | | 337 | | | | 5,730 | |
Tenaris SA | | | | | 451 | | | | 6,257 | |
Total Luxembourg | | | | | | | | | 31,818 | |
| | | | | | | | | | | |
Mexico — 0.0%(b) | | | | | | | | | | |
Fresnillo PLC(a) | | | | | 179 | | | | 1,747 | |
| | | | Shares
| | Value
|
Common Stocks (continued) | | | | | | | | | | |
| | | | | | | | | | | |
Netherlands —7.0% | | | | | | | | | | |
Aalberts NV | | | | | 93 | | | $ | 3,648 | |
ABN AMRO Group NV‡(a) | | | | | 396 | | | | 9,306 | |
Adyen NV‡* | | | | | 8 | | | | 6,505 | |
Aegon NV | | | | | 1,688 | | | | 8,808 | |
Akzo Nobel NV | | | | | 223 | | | | 18,919 | |
Altice Europe NV* | | | | | 539 | | | | 1,703 | |
Altice Europe NV, Class B* | | | | | 55 | | | | 173 | |
ASML Holding NV(a) | | | | | 390 | | | | 81,095 | |
ASR Nederland NV | | | | | 127 | | | | 5,636 | |
Boskalis Westminster NV | | | | | 77 | | | | 2,105 | |
EXOR NV | | | | | 102 | | | | 6,786 | |
GrandVision NV‡ | | | | | 48 | | | | 1,079 | |
Heineken Holding NV | | | | | 101 | | | | 10,249 | |
Heineken NV | | | | | 231 | | | | 24,915 | |
ING Groep NV(a) | | | | | 3,806 | | | | 48,438 | |
Koninklijke Ahold Delhaize NV | | | | | 1,060 | | | | 25,493 | |
Koninklijke DSM NV | | | | | 171 | | | | 19,519 | |
Koninklijke KPN NV | | | | | 3,233 | | | | 9,913 | |
Koninklijke Philips NV | | | | | 891 | | | | 37,910 | |
Koninklijke Vopak NV | | | | | 64 | | | | 2,851 | |
NN Group NV | | | | | 333 | | | | 14,487 | |
OCI NV* | | | | | 94 | | | | 2,723 | |
Randstad NV | | | | | 105 | | | | 5,992 | |
Royal Dutch Shell PLC, Class A | | | | | 4,356 | | | | 139,128 | |
Royal Dutch Shell PLC, Class B | | | | | 3,664 | | | | 117,719 | |
Signify NV‡ | | | | | 103 | | | | 3,086 | |
Wolters Kluwer NV | | | | | 260 | | | | 18,118 | |
Total Netherlands | | | | | | | | | 626,304 | |
| | | | | | | | | | | |
Norway — 1.1% | | | | | | | | | | |
Aker ASA, Class A | | | | | 22 | | | | 1,501 | |
Aker BP ASA | | | | | 103 | | | | 3,389 | |
DNB ASA* | | | | | 1,036 | | | | 19,845 | |
Equinor ASA | | | | | 962 | | | | 21,409 | |
Gjensidige Forsikring ASA | | | | | 161 | | | | 3,120 | |
Leroy Seafood Group ASA | | | | | 246 | | | | 1,773 | |
Mowi ASA | | | | | 408 | | | | 8,818 | |
Norsk Hydro ASA | | | | | 1,286 | | | | 5,496 | |
Orkla ASA | | | | | 730 | | | | 5,710 | |
Salmar ASA | | | | | 50 | | | | 2,267 | |
Schibsted ASA, Class A | | | | | 76 | | | | 1,990 | |
Schibsted ASA, Class B | | | | | 93 | | | | 2,220 | |
Telenor ASA | | | | | 651 | | | | 13,039 | |
Yara International ASA | | | | | 168 | | | | 7,559 | |
Total Norway | | | | | | | | | 98,136 | |
| | | | | | | | | | | |
Poland — 0.6% | | | | | | | | | | |
Bank Polska Kasa Opieki SA | | | | | 149 | | | | 4,426 | |
CD Projekt SA* | | | | | 59 | | | | 3,312 | |
Cyfrowy Polsat SA* | | | | | 256 | | | | 1,772 | |
Dino Polska SA‡* | | | | | 46 | | | | 1,526 | |
Grupa Lotos SA | | | | | 93 | | | | 2,020 | |
KGHM Polska Miedz SA* | | | | | 130 | | | | 3,493 | |
LPP SA | | | | | 1 | | | | 2,237 | |
mBank SA | | | | | 13 | | | | 1,504 | |
PGE Polska Grupa Energetyczna SA* | | | | | 698 | | | | 1,736 | |
Polski Koncern Naftowy ORLEN SA | | | | | 296 | | | | 7,571 | |
Polskie Gornictwo Naftowe I Gazownictwo SA | | | | | 1,659 | | | | 2,514 | |
Powszechna Kasa Oszczednosci Bank Polski SA | | | | | 813 | | | | 8,334 | |
Powszechny Zaklad Ubezpieczen SA | | | | | 534 | | | | 5,859 | |
See notes to financial statements.
130
Schedules of Investments — IQ 50 Percent Hedged FTSE Europe ETF(continued)
April 30, 2019 | | | | Shares
| | Value
|
| | | | | | | | | | |
Common Stocks (continued) | | | | | | | | | | |
| | | | | | | | | | | |
Poland (continued) | | | | | | | | | | |
Santander Bank Polska SA | | | | | 29 | | | $ | 3,006 | |
Total Poland | | | | | | | | | 49,310 | |
| | | | | | | | | | | |
Portugal — 0.2% | | | | | | | | | | |
EDP —Energias de Portugal SA* | | | | | 2,183 | | | | 8,267 | |
Galp Energia SGPS SA | | | | | 496 | | | | 8,321 | |
Jeronimo Martins SGPS SA | | | | | 236 | | | | 3,840 | |
Total Portugal | | | | | | | | | 20,428 | |
| | | | | | | | | | | |
Russia — 0.1% | | | | | | | | | | |
Evraz PLC | | | | | 489 | | | | 4,001 | |
Polymetal International PLC | | | | | 269 | | | | 2,829 | |
VEON Ltd. | | | | | 634 | | | | 1,513 | |
Total Russia | | | | | | | | | 8,343 | |
| | | | | | | | | | | |
South Africa — 0.3% | | | | | | | | | | |
Anglo American PLC | | | | | 965 | | | | 24,927 | |
Investec PLC | | | | | 618 | | | | 3,907 | |
Total South Africa | | | | | | | | | 28,834 | |
| | | | | | | | | | | |
Spain — 4.8% | | | | | | | | | | |
Acciona SA | | | | | 21 | | | | 2,431 | |
Acerinox SA | | | | | 166 | | | | 1,725 | |
ACS Actividades de Construccion y Servicios SA | | | | | 241 | | | | 11,055 | |
Aena SME SA‡ | | | | | 61 | | | | 11,304 | |
Amadeus IT Group SA | | | | | 404 | | | | 32,110 | |
Banco Bilbao Vizcaya Argentaria SA | | | | | 6,507 | | | | 39,510 | |
Banco de Sabadell SA(a) | | | | | 5,411 | | | | 6,282 | |
Banco Santander SA(a) | | | | | 15,715 | | | | 79,456 | |
Bankia SA | | | | | 1,169 | | | | 3,229 | |
Bankinter SA | | | | | 659 | | | | 5,257 | |
CaixaBank SA | | | | | 3,509 | | | | 11,164 | |
Cellnex Telecom SA‡* | | | | | 201 | | | | 6,177 | |
Corp. Financiera Alba SA | | | | | 20 | | | | 1,029 | |
EDP Renovaveis SA* | | | | | 147 | | | | 1,458 | |
Enagas SA | | | | | 219 | | | | 6,234 | |
Endesa SA | | | | | 305 | | | | 7,592 | |
Ferrovial SA | | | | | 466 | | | | 11,469 | |
Fomento de Construcciones y Contratas SA* | | | | | 66 | | | | 808 | |
Grifols SA | | | | | 316 | | | | 8,761 | |
Iberdrola SA | | | | | 5,985 | | | | 54,316 | |
Industria de Diseno Textil SA(a) | | | | | 1,027 | | | | 31,041 | |
Inmobiliaria Colonial Socimi SA | | | | | 293 | | | | 3,151 | |
Mapfre SA | | | | | 957 | | | | 2,869 | |
Merlin Properties Socimi SA | | | | | 323 | | | | 4,398 | |
Naturgy Energy Group SA | | | | | 298 | | | | 8,456 | |
Red Electrica Corp. SA | | | | | 412 | | | | 8,535 | |
Repsol SA | | | | | 1,324 | | | | 22,450 | |
Siemens Gamesa Renewable Energy SA | | | | | 217 | | | | 3,889 | |
Telefonica SA | | | | | 4,436 | | | | 36,948 | |
Zardoya Otis SA | | | | | 173 | | | | 1,396 | |
Total Spain | | | | | | | | | 424,500 | |
| | | | | | | | | | | |
Sweden — 4.2% | | | | | | | | | | |
Alfa Laval AB(a) | | | | | 301 | | | | 6,978 | |
Assa Abloy AB, B Shares(a) | | | | | 882 | | | | 18,796 | |
Atlas Copco AB, A Shares(a) | | | | | 607 | | | | 18,848 | |
Atlas Copco AB, B Shares(a) | | | | | 361 | | | | 10,264 | |
Boliden AB*(a) | | | | | 264 | | | | 7,831 | |
Castellum AB | | | | | 259 | | | | 4,652 | |
| | | | Shares
| | Value
|
Common Stocks (continued) | | | | | | | | | | |
| | | | | | | | | | | |
Sweden (continued) | | | | | | | | | | |
Electrolux AB | | | | | 229 | | | $ | 5,620 | |
Elekta AB, B Shares | | | | | 346 | | | | 4,095 | |
Epiroc AB, A Shares* | | | | | 600 | | | | 6,198 | |
Epiroc AB, B Shares* | | | | | 363 | | | | 3,587 | |
Essity AB, B Shares | | | | | 587 | | | | 17,400 | |
Fastighets AB Balder, B Shares* | | | | | 93 | | | | 2,937 | |
Hennes & Mauritz AB, B Shares(a) | | | | | 838 | | | | 14,596 | |
Hexagon AB, B Shares | | | | | 238 | | | | 12,968 | |
Husqvarna AB, B Shares | | | | | 387 | | | | 3,528 | |
ICA Gruppen AB | | | | | 76 | | | | 2,746 | |
Industrivarden AB, A Shares | | | | | 201 | | | | 4,647 | |
Industrivarden AB, C Shares | | | | | 161 | | | | 3,617 | |
Investment AB Latour, B Shares(a) | | | | | 117 | | | | 1,655 | |
Investor AB, A Shares | | | | | 128 | | | | 6,072 | |
Investor AB, B Shares | | | | | 434 | | | | 20,667 | |
Kinnevik AB, B Shares(a) | | | | | 230 | | | | 6,689 | |
L E Lundbergforetagen AB, B Shares | | | | | 72 | | | | 2,458 | |
Lundin Petroleum AB | | | | | 167 | | | | 5,460 | |
Nibe Industrier AB, B Shares | | | | | 290 | | | | 3,892 | |
Saab AB, B Shares | | | | | 90 | | | | 2,958 | |
Sandvik AB(a) | | | | | 1,041 | | | | 19,234 | |
Securitas AB, B Shares | | | | | 298 | | | | 5,203 | |
Skandinaviska Enskilda Banken AB, A Shares | | | | | 1,372 | | | | 13,078 | |
Skandinaviska Enskilda Banken AB, C Shares | | | | | 20 | | | | 194 | |
Skanska AB, B Shares | | | | | 342 | | | | 5,947 | |
SKF AB, B Shares | | | | | 366 | | | | 6,766 | |
Svenska Cellulosa AB SCA, A Shares | | | | | 21 | | | | 205 | |
Svenska Cellulosa AB SCA, B Shares | | | | | 571 | | | | 4,974 | |
Svenska Handelsbanken AB, A Shares(a) | | | | | 1,393 | | | | 15,188 | |
Svenska Handelsbanken AB, B Shares | | | | | 34 | | | | 369 | |
Swedbank AB, A Shares | | | | | 956 | | | | 15,491 | |
Swedish Match AB | | | | | 164 | | | | 7,980 | |
Swedish Orphan Biovitrum AB* | | | | | 169 | | | | 3,075 | |
Tele2 AB, B Shares | | | | | 508 | | | | 6,770 | |
Telefonaktiebolaget LM Ericsson, A Shares | | | | | 35 | | | | 348 | |
Telefonaktiebolaget LM Ericsson,B Shares | | | | | 2,854 | | | | 28,219 | |
Telia Co. AB | | | | | 2,563 | | | | 10,903 | |
Trelleborg AB, B Shares | | | | | 235 | | | | 3,881 | |
Volvo AB, B Shares | | | | | 1,436 | | | | 22,960 | |
Total Sweden | | | | | | | | | 369,944 | |
| | | | | | | | | | | |
Switzerland — 14.2% | | | | | | | | | | |
ABB Ltd.* | | | | | 1,742 | | | | 35,849 | |
Adecco Group AG | | | | | 147 | | | | 8,442 | |
Alcon, Inc.* | | | | | 426 | | | | 24,532 | |
Baloise Holding AG | | | | | 45 | | | | 7,710 | |
Banque Cantonale Vaudoise* | | | | | 3 | | | | 2,367 | |
Barry Callebaut AG | | | | | 2 | | | | 3,662 | |
Chocoladefabriken Lindt & Spruengli AG | | | | | 1 | | | | 6,649 | |
Cie Financiere Richemont SA | | | | | 498 | | | | 36,409 | |
Clariant AG* | | | | | 193 | | | | 3,966 | |
Coca-Cola HBC AG* | | | | | 190 | | | | 6,789 | |
See notes to financial statements.
131
Schedules of Investments — IQ 50 Percent Hedged FTSE Europe ETF(continued)
April 30, 2019 | | | | Shares
| | Value
|
| | | | | | | | | | |
Common Stocks (continued) | | | | | | | | | | |
| | | | | | | | | | | |
Switzerland (continued) | | | | | | | | | | |
Credit Suisse Group AG* | | | | | 2,483 | | | $ | 33,139 | |
DKSH Holding AG | | | | | 25 | | | | 1,535 | |
Dufry AG* | | | | | 29 | | | | 2,833 | |
EMS-Chemie Holding AG | | | | | 7 | | | | 4,238 | |
Flughafen Zurich AG | | | | | 18 | | | | 2,964 | |
Geberit AG | | | | | 35 | | | | 14,677 | |
Georg Fischer AG | | | | | 5 | | | | 4,858 | |
Givaudan SA | | | | | 9 | | | | 23,308 | |
Glencore PLC* | | | | | 11,032 | | | | 43,771 | |
Helvetia Holding AG* | | | | | 6 | | | | 3,813 | |
Julius Baer Group Ltd.* | | | | | 209 | | | | 10,075 | |
Kuehne + Nagel International AG | | | | | 49 | | | | 7,119 | |
LafargeHolcim Ltd.* | | | | | 463 | | | | 23,800 | |
Logitech International SA | | | | | 138 | | | | 5,395 | |
Lonza Group AG* | | | | | 72 | | | | 22,236 | |
Mediclinic International PLC | | | | | 381 | | | | 1,704 | |
Nestle SA | | | | | 2,943 | | | | 283,181 | |
Novartis AG | | | | | 2,128 | | | | 173,769 | |
OC Oerlikon Corp. AG | | | | | 182 | | | | 2,375 | |
Pargesa Holding SA | | | | | 37 | | | | 2,912 | |
Partners Group Holding AG | | | | | 16 | | | | 12,053 | |
PSP Swiss Property AG | | | | | 38 | | | | 3,878 | |
Roche Holding AG | | | | | 679 | | | | 178,979 | |
Roche Holding AG | | | | | 26 | | | | 6,802 | |
Schindler Holding AG | | | | | 40 | | | | 8,628 | |
Schindler Holding AG — Registered | | | | | 18 | | | | 3,823 | |
SGS SA | | | | | 5 | | | | 13,194 | |
Sika AG | | | | | 136 | | | | 20,820 | |
Sonova Holding AG | | | | | 49 | | | | 9,882 | |
STMicroelectronics NV | | | | | 611 | | | | 11,213 | |
Straumann Holding AG | | | | | 10 | | | | 8,073 | |
Sulzer AG | | | | | 17 | | | | 1,790 | |
Swatch Group AG (The) — Bearer | | | | | 29 | | | | 8,856 | |
Swatch Group AG (The) —Registered | | | | | 42 | | | | 2,465 | |
Swiss Life Holding AG* | | | | | 33 | | | | 15,515 | |
Swiss Prime Site AG* | | | | | 73 | | | | 5,860 | |
Swiss Re AG | | | | | 297 | | | | 28,581 | |
Swisscom AG | | | | | 25 | | | | 11,646 | |
Temenos AG* | | | | | 57 | | | | 9,476 | |
UBS Group AG* | | | | | 3,383 | | | | 45,367 | |
Vifor Pharma AG | | | | | 42 | | | | 5,490 | |
Zurich Insurance Group AG | | | | | 147 | | | | 46,870 | |
Total Switzerland | | | | | | | | | 1,263,338 | |
| | | | | | | | | | | |
United Arab Emirates — 0.0%(b) | | | | | | | | | | |
NMC Health PLC | | | | | 83 | | | | 3,053 | |
| | | | | | | | | | | |
United Kingdom — 23.2% | | | | | | | | | | |
3i Group PLC | | | | | 931 | | | | 12,993 | |
Admiral Group PLC | | | | | 196 | | | | 5,632 | |
Ashmore Group PLC(a) | | | | | 372 | | | | 2,226 | |
Ashtead Group PLC | | | | | 457 | | | | 12,642 | |
Associated British Foods PLC | | | | | 340 | | | | 11,343 | |
AstraZeneca PLC | | | | | 1,282 | | | | 95,697 | |
Auto Trader Group PLC‡ | | | | | 897 | | | | 6,612 | |
AVEVA Group PLC | | | | | 59 | | | | 2,572 | |
Aviva PLC | | | | | 3,831 | | | | 21,450 | |
B&M European Value Retail SA | | | | | 821 | | | | 4,222 | |
Babcock International Group PLC | | | | | 247 | | | | 1,691 | |
BAE Systems PLC | | | | | 3,120 | | | | 20,093 | |
Barclays PLC | | | | | 16,670 | | | | 35,701 | |
| | | | Shares
| | Value
|
Common Stocks (continued) | | | | | | | | | | |
| | | | | | | | | | | |
United Kingdom (continued) | | | | | | | | | | |
Barratt Developments PLC | | | | | 969 | | | $ | 7,602 | |
Bellway PLC | | | | | 119 | | | | 4,828 | |
Berkeley Group Holdings PLC | | | | | 114 | | | | 5,582 | |
BP PLC | | | | | 19,392 | | | | 141,317 | |
British American Tobacco PLC | | | | | 2,231 | | | | 86,962 | |
British Land Co. PLC (The) | | | | | 925 | | | | 7,163 | |
BT Group PLC | | | | | 8,154 | | | | 24,348 | |
Bunzl PLC | | | | | 328 | | | | 9,873 | |
Burberry Group PLC | | | | | 391 | | | | 10,281 | |
Capital & Counties Properties PLC | | | | | 711 | | | | 2,244 | |
Centrica PLC | | | | | 5,469 | | | | 7,575 | |
Cineworld Group PLC | | | | | 970 | | | | 4,021 | |
CNH Industrial NV(a) | | | | | 971 | | | | 10,521 | |
Cobham PLC* | | | | | 2,316 | | | | 3,481 | |
Compass Group PLC | | | | | 1,546 | | | | 35,129 | |
ConvaTec Group PLC‡ | | | | | 1,410 | | | | 2,547 | |
Croda International PLC | | | | | 124 | | | | 8,375 | |
CYBG PLC | | | | | 1,183 | | | | 3,134 | |
DCC PLC | | | | | 94 | | | | 8,392 | |
Derwent London PLC | | | | | 96 | | | | 3,967 | |
Diageo PLC | | | | | 2,319 | | | | 97,754 | |
Direct Line Insurance Group PLC | | | | | 1,325 | | | | 5,690 | |
DS Smith PLC | | | | | 1,225 | | | | 5,701 | |
easyJet PLC | | | | | 210 | | | | 3,185 | |
Experian PLC | | | | | 895 | | | | 25,961 | |
Fiat Chrysler Automobiles NV | | | | | 1,076 | | | | 16,561 | |
G4S PLC | | | | | 1,498 | | | | 4,222 | |
GlaxoSmithKline PLC | | | | | 4,764 | | | | 97,717 | |
GVC Holdings PLC | | | | | 553 | | | | 4,706 | |
Halma PLC | | | | | 364 | | | | 8,539 | |
Hammerson PLC | | | | | 751 | | | | 3,152 | |
Hargreaves Lansdown PLC(a) | | | | | 254 | | | | 7,474 | |
Hiscox Ltd. | | | | | 267 | | | | 5,827 | |
Howden Joinery Group PLC | | | | | 567 | | | | 3,755 | |
HSBC Holdings PLC | | | | | 19,645 | | | | 170,846 | |
IMI PLC | | | | | 258 | | | | 3,533 | |
Imperial Brands PLC | | | | | 928 | | | | 29,470 | |
Inchcape PLC | | | | | 390 | | | | 3,124 | |
Informa PLC | | | | | 1,217 | | | | 12,359 | |
InterContinental Hotels Group PLC | | | | | 174 | | | | 11,269 | |
International Consolidated Airlines Group SA | | | | | 947 | | | | 6,672 | |
Intertek Group PLC | | | | | 156 | | | | 10,880 | |
Intu Properties PLC(a) | | | | | 861 | | | | 1,058 | |
ITV PLC | | | | | 3,591 | | | | 6,397 | |
J Sainsbury PLC | | | | | 1,558 | | | | 4,519 | |
JD Sports Fashion PLC | | | | | 338 | | | | 2,773 | |
John Wood Group PLC(a) | | | | | 634 | | | | 3,889 | |
Johnson Matthey PLC | | | | | 184 | | | | 8,005 | |
Just Eat PLC* | | | | | 556 | | | | 5,067 | |
Kingfisher PLC | | | | | 2,073 | | | | 7,137 | |
Land Securities Group PLC | | | | | 687 | | | | 8,266 | |
Legal & General Group PLC | | | | | 5,785 | | | | 20,981 | |
Lloyds Banking Group PLC | | | | | 69,433 | | | | 56,636 | |
London Stock Exchange Group PLC | | | | | 305 | | | | 19,936 | |
Marks & Spencer Group PLC | | | | | 1,566 | | | | 5,837 | |
Meggitt PLC | | | | | 746 | | | | 5,294 | |
Melrose Industries PLC | | | | | 4,703 | | | | 12,397 | |
Merlin Entertainments PLC‡ | | | | | 682 | | | | 3,256 | |
Micro Focus International PLC | | | | | 330 | | | | 8,337 | |
See notes to financial statements.
132
Schedules of Investments — IQ 50 Percent Hedged FTSE Europe ETF(continued)
April 30, 2019 | | | | Shares
| | Value
|
| | | | | | | | | | |
Common Stocks (continued) | | | | | | | | | | |
| | | | | | | | | | | |
United Kingdom (continued) | | | | | | | | | | |
Mondi PLC | | | | | 350 | | | $ | 7,668 | |
National Grid PLC | | | | | 3,320 | | | | 36,187 | |
Next PLC | | | | | 128 | | | | 9,622 | |
Ocado Group PLC* | | | | | 435 | | | | 7,727 | |
Pearson PLC | | | | | 744 | | | | 8,052 | |
Pennon Group PLC | | | | | 403 | | | | 3,933 | |
Persimmon PLC | | | | | 301 | | | | 8,774 | |
Phoenix Group Holdings PLC | | | | | 502 | | | | 4,728 | |
Prudential PLC | | | | | 2,533 | | | | 57,292 | |
Quilter PLC‡ | | | | | 1,757 | | | | 3,380 | |
Reckitt Benckiser Group PLC | | | | | 612 | | | | 49,442 | |
RELX PLC | | | | | 1,839 | | | | 42,171 | |
Renishaw PLC | | | | | 31 | | | | 1,823 | |
Rentokil Initial PLC | | | | | 1,777 | | | | 9,035 | |
Rightmove PLC | | | | | 848 | | | | 5,976 | |
Rolls-Royce Holdings PLC* | | | | | 1,645 | | | | 19,614 | |
Rolls-Royce Holdings PLC —Entitlement*(c)(d) | | | | | 114,807 | | | | 150 | |
Royal Bank of Scotland Group PLC | | | | | 4,416 | | | | 13,794 | |
Royal Mail PLC | | | | | 886 | | | | 2,920 | |
RPC Group PLC | | | | | 385 | | | | 3,960 | |
RSA Insurance Group PLC | | | | | 987 | | | | 6,974 | |
Sage Group PLC (The) | | | | | 1,045 | | | | 9,882 | |
Schroders PLC | | | | | 108 | | | | 4,459 | |
Segro PLC | | | | | 1,038 | | | | 9,180 | |
Severn Trent PLC | | | | | 229 | | | | 6,078 | |
Smith & Nephew PLC | | | | | 846 | | | | 16,328 | |
Smiths Group PLC | | | | | 380 | | | | 7,542 | |
Spirax-Sarco Engineering PLC | | | | | 71 | | | | 7,636 | |
SSE PLC | | | | | 1,004 | | | | 14,980 | |
St James’s Place PLC | | | | | 503 | | | | 7,354 | |
Standard Chartered PLC | | | | | 2,643 | | | | 24,119 | |
Standard Life Aberdeen PLC | | | | | 2,413 | | | | 8,773 | |
Subsea 7 SA | | | | | 247 | | | | 3,131 | |
Tate & Lyle PLC | | | | | 448 | | | | 4,483 | |
Taylor Wimpey PLC | | | | | 3,135 | | | | 7,414 | |
TechnipFMC PLC | | | | | 448 | | | | 11,101 | |
Tesco PLC | | | | | 9,446 | | | | 30,761 | |
Travis Perkins PLC | | | | | 245 | | | | 4,464 | |
Unilever NV | | | | | 1,479 | | | | 89,440 | |
Unilever PLC | | | | | 1,068 | | | | 64,846 | |
United Utilities Group PLC | | | | | 658 | | | | 7,109 | |
Vodafone Group PLC | | | | | 26,095 | | | | 48,307 | |
Weir Group PLC (The) | | | | | 248 | | | | 5,365 | |
Whitbread PLC | | | | | 174 | | | | 10,117 | |
Wm Morrison Supermarkets PLC | | | | | 2,094 | | | | 5,894 | |
WPP PLC | | | | | 1,198 | | | | 14,937 | |
Total United Kingdom | | | | | | | | | 2,065,320 | |
| | | | | | | | | | | |
United States — 0.4% | | | | | | | | | | |
Carnival PLC | | | | | 156 | | | | 8,206 | |
Ferguson PLC | | | | | 224 | | | | 15,886 | |
QIAGEN NV* | | | | | 210 | | | | 8,103 | |
Total United States | | | | | | | | | 32,195 | |
| | | | | | | | | | | |
Total Common Stocks | | | | | | | | | | |
(Cost $9,880,937) | | | | | | | | | 8,801,580 | |
| | | | | | | | | | | |
Preferred Stocks — 0.9% | | | | | | | | | | |
| | | | | | | | | | | |
Germany — 0.8% | | | | | | | | | | |
Bayerische Motoren Werke AG, 6.05% | | | | | 52 | | | $ | 3,835 | |
FUCHS PETROLUB SE, 2.34% | | | | | 66 | | | | 2,868 | |
Henkel AG & Co. KGaA, 2.05% | | | | | 171 | | | | 17,293 | |
Porsche Automobil Holding SE, 2.85% | | | | | 147 | | | | 10,188 | |
RWE AG, 2.20% | | | | | 38 | | | | 969 | |
Sartorius AG, 0.38% | | | | | 32 | | | | 5,853 | |
Volkswagen AG, 2.54% | | | | | 179 | | | | 31,102 | |
Total Germany | | | | | | | | | 72,108 | |
| | | | | | | | | | | |
Spain — 0.1% | | | | | | | | | | |
Grifols SA, 2.41%, Class B | | | | | 254 | | | | 4,890 | |
| | | | | | | | | | | |
Total Preferred Stocks | | | | | | | | | | |
(Cost $89,868) | | | | | | | | | 76,998 | |
| | | | | | | | | | | |
Investment of Cash Collateral For Securities Loaned — 7.8% | | | | | | | | | | |
| | | | | | | | | | | |
Money Market Fund — 7.8% | | | | | | | | | | |
Dreyfus Government Cash Management Fund, Institutional Shares, 2.45%(e) | | | | | | | | | | |
(Cost $696,634) | | | | | 696,634 | | | | 696,634 | |
| | | | | | | | | | | |
Total Investments — 107.6% | | | | | | | | | | |
(Cost $10,667,439) | | | | | | | | | 9,575,212 | |
| | | | | | | | | | | |
Other Assets and Liabilities, Net — (7.6)% | | | | | | | | | (679,750 | ) |
| | | | | | | | | | | |
Net Assets — 100.0% | | | | | | | | $ | 8,895,462 | |
‡ | | May be sold to institutional investors only under Rule 144A or securities offered pursuant to section 4(a)(2) of the Securities Act of 1933, as amended. |
* | | Non-income producing securities. |
(a) | | All or a portion of the security was on loan. In addition, “Other Assets and Liabilities, Net” may include pending sales that are also on loan. The aggregate market value of securities on loan was $671,099; total market value of collateral held by the Fund was $704,064. Market value of the collateral held includes non-cash U.S. Treasury securities collateral having a value of $7,430. |
(c) | | Security has been deemed illiquid because it may not be able to be resold within seven days at approximately the price shown. At April 30, 2019, the value of this security was $150. |
(d) | | Securities are fair valued as determined in good faith in accordance with the procedures established by the Board of Trustees. The securities are fair valued using significant unobservable inputs. |
(e) | | Reflects the 1-day yield at April 30, 2019. |
See notes to financial statements.
133
Schedules of Investments — IQ 50 Percent Hedged FTSE Europe ETF(continued)
April 30, 2019Forward Foreign Currency Contracts Outstanding as of April 30, 2019:
Purchased Contracts
| | Settlement Date
| | Counterparty
| | Currency
Amount
Purchased
| | Value at
Settlement
Date
| | Value at
April 30, 2019
| | Unrealized
Appreciation
|
Swiss Franc | | 05/07/19 | | Morgan Stanley | | | 588,451 | | | $ | 577,679 | | | $ | 577,885 | | | $ | 206 | |
Danish Krone | | 05/07/19 | | Morgan Stanley | | | 796,688 | | | | 119,636 | | | | 119,676 | | | | 40 | |
Euro | | 05/07/19 | | Morgan Stanley | | | 1,875,794 | | | | 2,102,833 | | | | 2,103,521 | | | | 688 | |
British Pound | | 05/07/19 | | Morgan Stanley | | | 918,925 | | | | 1,198,218 | | | | 1,198,431 | | | | 213 | |
Norwegian Krone | | 05/07/19 | | Morgan Stanley | | | 434,681 | | | | 50,270 | | | | 50,281 | | | | 11 | |
Polish Zloty | | 05/07/19 | | Morgan Stanley | | | 93,019 | | | | 24,297 | | | | 24,304 | | | | 7 | |
Swedish Krona | | 05/07/19 | | Morgan Stanley | | | 1,640,615 | | | | 172,613 | | | | 172,675 | | | | 62 | |
Unrealized Appreciation | | | | | | | | | | $ | 4,245,546 | | | $ | 4,246,773 | | | $ | 1,227 | |
Sold Contracts
| | Settlement Date
| | Counterparty
| | Currency
Amount Sold
| | Value at
Settlement
Date
| | Value at
April 30, 2019
| | Unrealized
Appreciation
|
Swiss Franc | | 05/07/19 | | Morgan Stanley | | | (588,451 | ) | | $ | (592,732 | ) | | $ | (577,885 | ) | | $ | 14,847 | |
Danish Krone | | 05/07/19 | | Morgan Stanley | | | (796,688 | ) | | | (120,191 | ) | | | (119,676 | ) | | | 515 | |
Euro | | 05/07/19 | | Morgan Stanley | | | (1,875,794 | ) | | | (2,112,119 | ) | | | (2,103,521 | ) | | | 8,598 | |
British Pound | | 05/07/19 | | Morgan Stanley | | | (918,925 | ) | | | (1,199,344 | ) | | | (1,198,431 | ) | | | 913 | |
Norwegian Krone | | 05/07/19 | | Morgan Stanley | | | (434,681 | ) | | | (50,539 | ) | | | (50,281 | ) | | | 258 | |
Swedish Krona | | 05/07/19 | | Morgan Stanley | | | (1,640,615 | ) | | | (177,321 | ) | | | (172,675 | ) | | | 4,646 | |
Unrealized Appreciation | | | | | | | | | | $ | (4,252,246 | ) | | $ | (4,222,469 | ) | | $ | 29,777 | |
| Total Unrealized Appreciation | $ | 31,004 | |
Sold Contracts
| | Settlement Date
| | Counterparty
| | Currency
Amount Sold
| | Value at
Settlement
Date
| | Value at
April 30, 2019
| | Unrealized
Depreciation
|
Swiss Franc | | 06/04/19 | | Morgan Stanley | | | (611,455 | ) | | $ | (601,833 | ) | | $ | (602,154 | ) | | $ | (321 | ) |
Danish Krone | | 06/04/19 | | Morgan Stanley | | | (807,329 | ) | | | (121,530 | ) | | | (121,603 | ) | | | (73 | ) |
Euro | | 06/04/19 | | Morgan Stanley | | | (1,979,884 | ) | | | (2,224,684 | ) | | | (2,225,783 | ) | | | (1,099 | ) |
British Pound | | 06/04/19 | | Morgan Stanley | | | (948,286 | ) | | | (1,238,224 | ) | | | (1,238,651 | ) | | | (427 | ) |
Norwegian Krone | | 06/04/19 | | Morgan Stanley | | | (446,378 | ) | | | (51,675 | ) | | | (51,695 | ) | | | (20 | ) |
Polish Zloty | | 05/07/19 | | Morgan Stanley | | | (93,019 | ) | | | (24,286 | ) | | | (24,304 | ) | | | (18 | ) |
Polish Zloty | | 06/04/19 | | Morgan Stanley | | | (94,191 | ) | | | (24,621 | ) | | | (24,632 | ) | | | (11 | ) |
Swedish Krona | | 06/04/19 | | Morgan Stanley | | | (1,760,168 | ) | | | (185,595 | ) | | | (185,692 | ) | | | (97 | ) |
Unrealized Depreciation | | | | | | | | | | $ | (4,472,448 | ) | | $ | (4,474,514 | ) | | $ | (2,066 | ) |
| Total Unrealized Depreciation | $ | (2,066) | |
| | | | | | | | | | | | | | | | | |
| Net Unrealized Appreciation (Depreciation) | | | | | | | | | | | | | | $ | 28,938 | |
As of April 30, 2019, there was no collateral segregated by the counterparty for forward foreign currency contracts.
See notes to financial statements.
134
Schedules of Investments — IQ 50 Percent Hedged FTSE Europe ETF(continued)
April 30, 2019The following is a summary of the inputs used to value the Fund’s investments as of April 30, 2019. For more information on the valuation techniques, and their aggregation into the levels used in the table below, please refer to Note 2.
Asset Valuation Inputs
Description
| | | | Level 1
| | Level 2
| | Level 3
| | Total
|
Investments in Securities:(f) | | | | | | | | | | | | | | | | | | |
Common Stocks | | | | | | | | | | | | | | | | | | |
Australia | | | | $ | 111,111 | | | $ | — | | | $ | — | | | $ | 111,111 | |
Austria | | | | | 33,829 | | | | — | | | | — | | | | 33,829 | |
Belgium | | | | | 150,622 | | | | — | | | | — | | | | 150,622 | |
Chile | | | | | 3,954 | | | | — | | | | — | | | | 3,954 | |
Denmark | | | | | 242,017 | | | | — | | | | — | | | | 242,017 | |
Finland | | | | | 170,870 | | | | — | | | | — | | | | 170,870 | |
France | | | | | 1,497,111 | | | | — | | | | — | | | | 1,497,111 | |
Germany | | | | | 1,172,234 | | | | — | | | | — | | | | 1,172,234 | |
Ireland | | | | | 75,929 | | | | — | | | | — | | | | 75,929 | |
Italy | | | | | 315,590 | | | | — | | | | — | | | | 315,590 | |
Jordan | | | | | 3,130 | | | | — | | | | — | | | | 3,130 | |
Kazakhstan | | | | | 1,913 | | | | — | | | | — | | | | 1,913 | |
Luxembourg | | | | | 31,818 | | | | — | | | | — | | | | 31,818 | |
Mexico | | | | | 1,747 | | | | — | | | | — | | | | 1,747 | |
Netherlands | | | | | 626,304 | | | | — | | | | — | | | | 626,304 | |
Norway | | | | | 98,136 | | | | — | | | | — | | | | 98,136 | |
Poland | | | | | 49,310 | | | | — | | | | — | | | | 49,310 | |
Portugal | | | | | 20,428 | | | | — | | | | — | | | | 20,428 | |
Russia | | | | | 8,343 | | | | — | | | | — | | | | 8,343 | |
South Africa | | | | | 28,834 | | | | — | | | | — | | | | 28,834 | |
Spain | | | | | 424,500 | | | | — | | | | — | | | | 424,500 | |
Sweden | | | | | 369,944 | | | | — | | | | — | | | | 369,944 | |
Switzerland | | | | | 1,263,338 | | | | — | | | | — | | | | 1,263,338 | |
United Arab Emirates | | | | | 3,053 | | | | — | | | | — | | | | 3,053 | |
United Kingdom | | | | | 2,065,170 | | | | — | | | | 150 | (g) | | | 2,065,320 | |
United States | | | | | 32,195 | | | | — | | | | — | | | | 32,195 | |
Total Common Stocks | | | | | 8,801,430 | | | | — | | | | 150 | | | | 8,801,580 | |
Preferred Stocks | | | | | | | | | | | | | | | | | | |
Germany | | | | | 72,108 | | | | — | | | | — | | | | 72,108 | |
Spain | | | | | 4,890 | | | | — | | | | — | | | | 4,890 | |
Total Preferred Stocks | | | | | 76,998 | | | | — | | | | — | | | | 76,998 | |
Investment of Cash Collateral for Securities Loaned: | | | | | | | | | | | | | | | | | | |
Money Market Fund | | | | | 696,634 | | | | — | | | | — | | | | 696,634 | |
Total Investments in Securities | | | | | 9,575,062 | | | | — | | | | 150 | | | | 9,575,212 | |
Other Financial Instruments:(h) | | | | | | | | | | | | | | | | | | |
Forward Foreign Currency Contracts | | | | | — | | | | 31,004 | | | | — | | | | 31,004 | |
Total Investments in Securities and Other Financial Instruments | | | | $ | 9,575,062 | | | $ | 31,004 | | | $ | 150 | | | $ | 9,606,216 | |
Liability Valuation Inputs
Description
| | | | Level 1
| | Level 2
| | Level 3
| | Total
|
Other Financial Instruments:(h) | | | | | | | | | | | | | | | | | | |
| Forward Foreign Currency Contracts | | | | $ | — | | | $ | 2,066 | | | $ | — | | | $ | $2,066 | |
(f) | | For a complete listing of investments and their countries, see the Schedules of Investments. |
(g) | | The Level 3 security, valued at $150, has been deemed illiquid and has been fair valued in good faith in accordance with procedures established by the Board of Trustees. |
(h) | | Reflects the unrealized appreciation (depreciation) of the instruments. |
For the year ended April 30, 2019, the Fund did not have any transfers into or out of Level 3 within the fair value hierarchy. (See Note 2)
See notes to financial statements.
135
Schedules of Investments — IQ 50 Percent Hedged FTSE Europe ETF(continued)
April 30, 2019The following is a reconciliation of investments in which significant unobservable inputs (Level 3) were used in determining value:
Investments
in Securities
| | Balance
as of
April 30,
2018
| | Accrued
Discounts
(Premiums)
| | Realized
Gain
(Loss)
| | Change in
Unrealized
Appreciation
(Depreciation)
| | Purchases
| | Sales
| | Transfers
into
Level 3
| | Transfers
out of
Level 3
| | Balance
as of
April 30,
2019
| | Change in
Unrealized
Appreciation
(Depreciation)
from Investments
Still Held at
April 30,
2019(i)
|
Common Stocks | | | | | | | | | | | | | | | | | | | | | | | | | | | | | | | | | | | | | | | | |
Rolls-Royce Holdings PLC — Entitlement(j) | | $ | — | | | $ | — | | | $ | — | | | $ | 2 | | | $ | 148 | | | $ | — | | | $ | — | | | $ | — | | | $ | 150 | | | $ | 2 | |
| Rolls-Royce Holdings PLC, Class C | | | 2,740 | | | | — | | | | (131 | ) | | | 32 | | | | — | | | | (2,641 | ) | | | — | | | | — | | | | — | | | | — | |
| Total | | $ | 2,740 | | | $ | — | | | $ | (131 | ) | | $ | 34 | | | $ | 148 | | | $ | (2,641 | ) | | $ | — | | | $ | — | | | $ | 150 | | | $ | 2 | |
(i) | | Included in “Net change in unrealized appreciation (depreciation) on investments” in the Statement of Operations. |
(j) | | Security has been deemed illiquid and has been fair valued in good faith in accordance with procedures established by the Board of Trustees. |
Information about Level 3 fair value measurements as of April 30, 2019.
Security Type
| | | | Fair Value
| | Valuation Technique
| | Unobservable Inputs
|
| Common Stock | | | | $ | 150 | | | Issuer Specific Facts | | Comparable Information |
See notes to financial statements.
136
Schedules of Investments — IQ 50 Percent Hedged FTSE Japan ETF
April 30, 2019 | | | | Shares
| | Value
|
| | | | | | | | | | |
Common Stocks — 99.9% | | | | | | | | | | |
| | | | | | | | | | | |
Communication Services — 8.0% | | | | | | | | | | |
Capcom Co., Ltd.(a) | | | | | 160 | | | $ | 3,599 | |
CyberAgent, Inc.(a) | | | | | 160 | | | | 6,364 | |
Daiichikosho Co., Ltd.(a) | | | | | 71 | | | | 3,468 | |
DeNA Co., Ltd.(a) | | | | | 187 | | | | 2,913 | |
Dentsu, Inc.(a) | | | | | 373 | | | | 15,188 | |
Fuji Media Holdings, Inc.(a) | | | | | 76 | | | | 1,019 | |
GungHo Online Entertainment, Inc.(a) | | | | | 618 | | | | 1,925 | |
Hakuhodo DY Holdings, Inc.(a) | | | | | 403 | | | | 6,777 | |
Kakaku.com, Inc.(a) | | | | | 225 | | | | 4,606 | |
KDDI Corp.(a) | | | | | 2,972 | | | | 67,792 | |
Koei Tecmo Holdings Co., Ltd.(a) | | | | | 99 | | | | 1,797 | |
Konami Holdings Corp.(a) | | | | | 161 | | | | 7,315 | |
LINE Corp.*,(a)(b) | | | | | 89 | | | | 2,985 | |
Nexon Co., Ltd.*,(a) | | | | | 695 | | | | 9,959 | |
Nintendo Co., Ltd.(a) | | | | | 183 | | | | 62,438 | |
Nippon Telegraph & Telephone Corp.(a) | | | | | 1,089 | | | | 45,134 | |
Nippon Television Holdings, Inc.(a) | | | | | 84 | | | | 1,225 | |
NTT DOCOMO, Inc.(a) | | | | | 1,989 | | | | 43,048 | |
Shochiku Co., Ltd.(a) | | | | | 16 | | | | 1,918 | |
SKY Perfect JSAT Holdings, Inc.(a) | | | | | 199 | | | | 793 | |
Softbank Corp.(a) | | | | | 2,723 | | | | 32,077 | |
SoftBank Group Corp.(a) | | | | | 1,451 | | | | 150,539 | |
Square Enix Holdings Co., Ltd.(a) | | | | | 130 | | | | 4,471 | |
Toho Co., Ltd.(a) | | | | | 193 | | | | 8,067 | |
Tokyo Broadcasting System Holdings, Inc.(a) | | | | | 55 | | | | 1,042 | |
TV Asahi Holdings Corp.(a) | | | | | 33 | | | | 580 | |
Yahoo Japan Corp.(a) | | | | | 3,988 | | | | 10,599 | |
Total Communication Services | | | | | | | | | 497,638 | |
| | | | | | | | | | | |
Consumer Discretionary — 18.3% | | | | | | | | | | |
ABC-Mart, Inc.(a) | | | | | 45 | | | | 2,796 | |
Aisin Seiki Co., Ltd.(a) | | | | | 294 | | | | 11,364 | |
Aoyama Trading Co., Ltd.(a) | | | | | 73 | | | | 1,599 | |
Asics Corp.(a) | | | | | 291 | | | | 3,566 | |
ASKUL Corp.(a) | | | | | 31 | | | | 832 | |
Autobacs Seven Co., Ltd.(a) | | | | | 98 | | | | 1,707 | |
Bandai Namco Holdings, Inc.(a) | | | | | 330 | | | | 15,704 | |
Benesse Holdings, Inc.(a) | | | | | 119 | | | | 3,275 | |
Bic Camera, Inc.(a) | | | | | 249 | | | | 2,665 | |
Bridgestone Corp.(a) | | | | | 1,048 | | | | 41,459 | |
Canon Marketing Japan, Inc.(a) | | | | | 75 | | | | 1,618 | |
Casio Computer Co., Ltd.(a) | | | | | 360 | | | | 4,529 | |
Denso Corp.(a) | | | | | 779 | | | | 33,944 | |
Exedy Corp.(a) | | | | | 51 | | | | 1,162 | |
Fast Retailing Co., Ltd.(a) | | | | | 87 | | | | 50,196 | |
Fujitsu General Ltd.(a) | | | | | 93 | | | | 1,354 | |
Goldwin, Inc.(a) | | | | | 30 | | | | 4,773 | |
H2O Retailing Corp.(a) | | | | | 147 | | | | 1,865 | |
Haseko Corp.(a) | | | | | 471 | | | | 5,671 | |
Heiwa Corp.(a) | | | | | 85 | | | | 1,688 | |
Hikari Tsushin, Inc.(a) | | | | | 41 | | | | 7,561 | |
HIS Co., Ltd.(a) | | | | | 53 | | | | 1,685 | |
Honda Motor Co., Ltd.(a) | | | | | 2,965 | | | | 82,554 | |
Iida Group Holdings Co., Ltd.(a) | | | | | 235 | | | | 3,965 | |
Isetan Mitsukoshi Holdings Ltd.(a) | | | | | 607 | | | | 5,772 | |
Isuzu Motors Ltd.(a) | | | | | 864 | | | | 12,377 | |
Izumi Co., Ltd.(a) | | | | | 69 | | | | 3,005 | |
J Front Retailing Co., Ltd.(a) | | | | | 411 | | | | 5,000 | |
Koito Manufacturing Co., Ltd.(a) | | | | | 192 | | | | 11,412 | |
| | | | Shares
| | Value
|
Common Stocks (continued) | | | | | | | | | | |
| | | | | | | | | | | |
Consumer Discretionary (continued) | | | | | | | | | | |
Komeri Co., Ltd.(a) | | | | | 44 | | | $ | 926 | |
K’s Holdings Corp.(a) | | | | | 314 | | | | 2,800 | |
Kyoritsu Maintenance Co., Ltd.(a) | | | | | 40 | | | | 2,047 | |
Marui Group Co., Ltd.(a) | | | | | 354 | | | | 7,174 | |
Mazda Motor Corp.(a) | | | | | 967 | | | | 11,422 | |
Mitsubishi Motors Corp.(a) | | | | | 1,066 | | | | 5,963 | |
NGK Spark Plug Co., Ltd.(a) | | | | | 340 | | | | 6,585 | |
NHK Spring Co., Ltd.(a)(b) | | | | | 270 | | | | 2,424 | |
Nifco, Inc.(a) | | | | | 144 | | | | 4,047 | |
Nikon Corp.(a) | | | | | 590 | | | | 8,211 | |
Nissan Motor Co., Ltd.(a) | | | | | 3,271 | | | | 26,236 | |
Nissan Shatai Co., Ltd.(a) | | | | | 105 | | | | 962 | |
Nitori Holdings Co., Ltd.(a) | | | | | 126 | | | | 14,990 | |
NOK Corp.(a) | | | | | 189 | | | | 3,022 | |
Oriental Land Co., Ltd.(a) | | | | | 319 | | | | 35,144 | |
PALTAC Corp.(a) | | | | | 52 | | | | 2,853 | |
Pan Pacific International Holdings Corp.(a) | | | | | 216 | | | | 13,905 | |
Panasonic Corp.(a) | | | | | 3,614 | | | | 33,130 | |
Rakuten, Inc.(a) | | | | | 1,334 | | | | 14,792 | |
Resorttrust, Inc.(a) | | | | | 111 | | | | 1,545 | |
Rinnai Corp.(a) | | | | | 63 | | | | 4,231 | |
Ryohin Keikaku Co., Ltd.(a) | | | | | 40 | | | | 7,592 | |
Sankyo Co., Ltd.(a) | | | | | 89 | | | | 3,504 | |
Sanrio Co., Ltd.(a) | | | | | 101 | | | | 2,299 | |
Sega Sammy Holdings, Inc.(a) | | | | | 332 | | | | 4,185 | |
Sekisui Chemical Co., Ltd.(a) | | | | | 602 | | | | 9,627 | |
Sekisui House Ltd.(a) | | | | | 983 | | | | 15,816 | |
Sharp Corp.*,(a) | | | | | 258 | | | | 2,863 | |
Shimachu Co., Ltd.(a) | | | | | 75 | | | | 1,805 | |
Shimamura Co., Ltd.(a) | | | | | 40 | | | | 2,977 | |
Shimano, Inc.(a) | | | | | 133 | | | | 19,453 | |
Skylark Holdings Co., Ltd.(a) | | | | | 324 | | | | 5,332 | |
Sony Corp.(a) | | | | | 2,154 | | | | 100,800 | |
Stanley Electric Co., Ltd.(a) | | | | | 250 | | | | 6,756 | |
Subaru Corp.(a) | | | | | 1,039 | | | | 25,379 | |
Sumitomo Electric Industries Ltd.(a) | | | | | 1,276 | | | | 16,893 | |
Sumitomo Forestry Co., Ltd.(a) | | | | | 222 | | | | 3,044 | |
Sumitomo Rubber Industries Ltd.(a) | | | | | 300 | | | | 3,682 | |
Suzuki Motor Corp.(a) | | | | | 730 | | | | 33,198 | |
Takashimaya Co., Ltd.(a)(b) | | | | | 249 | | | | 2,792 | |
Tokai Rika Co., Ltd.(a) | | | | | 83 | | | | 1,438 | |
Toyo Tire Corp.(a) | | | | | 168 | | | | 1,959 | |
Toyoda Gosei Co., Ltd.(a) | | | | | 120 | | | | 2,489 | |
Toyota Boshoku Corp.(a) | | | | | 99 | | | | 1,461 | |
Toyota Industries Corp.(a) | | | | | 272 | | | | 15,386 | |
Toyota Motor Corp.(a) | | | | | 4,247 | | | | 263,304 | |
TS Tech Co., Ltd.(a) | | | | | 88 | | | | 2,627 | |
USS Co., Ltd.(a) | | | | | 365 | | | | 6,967 | |
Wacoal Holdings Corp.(a) | | | | | 97 | | | | 2,392 | |
Yamada Denki Co., Ltd.(a) | | | | | 1,230 | | | | 5,820 | |
Yamaha Corp.(a) | | | | | 274 | | | | 14,146 | |
Yamaha Motor Co., Ltd.(a) | | | | | 474 | | | | 9,738 | |
Yokohama Rubber Co., Ltd. (The)(a) | | | | | 178 | | | | 3,345 | |
Zensho Holdings Co., Ltd.(a) | | | | | 152 | | | | 3,417 | |
ZOZO, Inc.(a) | | | | | 291 | | | | 5,134 | |
Total Consumer Discretionary | | | | | | | | | 1,135,127 | |
| | | | | | | | | | | |
Consumer Staples — 8.9% | | | | | | | | | | |
Aeon Co., Ltd.(a) | | | | | 1,183 | | | | 21,822 | |
Ain Holdings, Inc.(a) | | | | | 47 | | | | 3,730 | |
See notes to financial statements.
137
Schedules of Investments — IQ 50 Percent Hedged FTSE Japan ETF(continued)
April 30, 2019 | | | | Shares
| | Value
|
| | | | | | | | | | |
Common Stocks (continued) | | | | | | | | | | |
| | | | | | | | | | | |
Consumer Staples (continued) | | | | | | | | | | |
Ajinomoto Co., Inc.(a) | | | | | 828 | | | $ | 13,326 | |
Ariake Japan Co., Ltd.(a) | | | | | 31 | | | | 1,798 | |
Asahi Group Holdings Ltd.(a) | | | | | 646 | | | | 28,009 | |
Calbee, Inc.(a) | | | | | 128 | | | | 3,517 | |
Coca-Cola Bottlers Japan Holdings, Inc.(a) | | | | | 243 | | | | 5,972 | |
Cosmos Pharmaceutical Corp.(a) | | | | | 15 | | | | 2,389 | |
Ezaki Glico Co., Ltd.(a) | | | | | 87 | | | | 4,578 | |
FamilyMart UNY Holdings Co., Ltd.(a) | | | | | 391 | | | | 10,420 | |
Fancl Corp.(a) | | | | | 120 | | | | 3,556 | |
Fuji Oil Holdings, Inc.(a) | | | | | 75 | | | | 2,401 | |
House Foods Group, Inc.(a) | | | | | 126 | | | | 5,057 | |
Ito En Ltd.(a) | | | | | 97 | | | | 4,816 | |
Itoham Yonekyu Holdings, Inc.(a) | | | | | 220 | | | | 1,369 | |
Japan Tobacco, Inc.(a) | | | | | 2,035 | | | | 47,068 | |
Kagome Co., Ltd.(a) | | | | | 133 | | | | 3,612 | |
Kao Corp.(a) | | | | | 809 | | | | 62,156 | |
Kewpie Corp.(a) | | | | | 183 | | | | 4,216 | |
Kikkoman Corp.(a) | | | | | 310 | | | | 14,362 | |
Kirin Holdings Co., Ltd.(a) | | | | | 1,366 | | | | 30,901 | |
Kobayashi Pharmaceutical Co., Ltd.(a) | | | | | 105 | | | | 8,353 | |
Kose Corp.(a) | | | | | 49 | | | | 9,173 | |
Kusuri no Aoki Holdings Co., Ltd.(a) | | | | | 28 | | | | 1,966 | |
Lawson, Inc.(a) | | | | | 81 | | | | 3,775 | |
Lion Corp.(a) | | | | | 428 | | | | 8,792 | |
Maruha Nichiro Corp.(a) | | | | | 62 | | | | 1,960 | |
Matsumotokiyoshi Holdings Co., Ltd.(a) | | | | | 129 | | | | 4,233 | |
Megmilk Snow Brand Co., Ltd.(a) | | | | | 67 | | | | 1,476 | |
MEIJI Holdings Co., Ltd.(a) | | | | | 228 | | | | 17,912 | |
Mitsubishi Shokuhin Co., Ltd.(a) | | | | | 20 | | | | 517 | |
Morinaga & Co., Ltd.(a) | | | | | 69 | | | | 2,865 | |
Morinaga Milk Industry Co., Ltd.(a) | | | | | 69 | | | | 2,271 | |
NH Foods Ltd.(a) | | | | | 169 | | | | 6,783 | |
Nichirei Corp.(a) | | | | | 182 | | | | 4,187 | |
Nisshin Seifun Group, Inc.(a) | | | | | 436 | | | | 10,116 | |
Nissin Foods Holdings Co., Ltd.(a) | | | | | 117 | | | | 7,700 | |
Noevir Holdings Co., Ltd.(a) | | | | | 28 | | | | 1,471 | |
Pigeon Corp.(a) | | | | | 183 | | | | 7,747 | |
Pola Orbis Holdings, Inc.(a) | | | | | 124 | | | | 3,897 | |
Sapporo Holdings Ltd.(a) | | | | | 104 | | | | 2,122 | |
Seven & i Holdings Co., Ltd.(a) | | | | | 1,312 | | | | 45,459 | |
Shiseido Co., Ltd.(a) | | | | | 661 | | | | 51,740 | |
Sugi Holdings Co., Ltd.(a) | | | | | 60 | | | | 3,022 | |
Sundrug Co., Ltd.(a) | | | | | 110 | | | | 2,939 | |
Suntory Beverage & Food Ltd.(a) | | | | | 213 | | | | 9,371 | |
Takara Holdings, Inc.(a) | | | | | 292 | | | | 3,393 | |
Toyo Suisan Kaisha Ltd.(a) | | | | | 153 | | | | 5,818 | |
Tsuruha Holdings, Inc.(a) | | | | | 61 | | | | 5,187 | |
Unicharm Corp.(a) | | | | | 657 | | | | 21,525 | |
Welcia Holdings Co., Ltd.(a) | | | | | 84 | | | | 3,300 | |
Yakult Honsha Co., Ltd.(a) | | | | | 208 | | | | 14,100 | |
Yamazaki Baking Co., Ltd.(a) | | | | | 213 | | | | 3,159 | |
Yaoko Co., Ltd.(a) | | | | | 35 | | | | 1,659 | |
Total Consumer Staples | | | | | | | | | 553,063 | |
| | | | | | | | | | | |
Energy — 0.9% | | | | | | | | | | |
Cosmo Energy Holdings Co., Ltd.(a) | | | | | 109 | | | | 2,248 | |
Idemitsu Kosan Co., Ltd.(a) | | | | | 328 | | | | 10,617 | |
Inpex Corp.(a) | | | | | 1,548 | | | | 15,025 | |
| | | | Shares
| | Value
|
Common Stocks (continued) | | | | | | | | | | |
| | | | | | | | | | | |
Energy (continued) | | | | | | | | | | |
Japan Petroleum Exploration Co., Ltd.(a) | | | | | 49 | | | $ | 1,063 | |
JXTG Holdings, Inc.(a) | | | | | 5,380 | | | | 26,119 | |
Total Energy | | | | | | | | | 55,072 | |
| | | | | | | | | | | |
Financials — 10.9% | | | | | | | | | | |
77 Bank Ltd. (The)(a) | | | | | 119 | | | | 1,696 | |
Acom Co., Ltd.(a)(b) | | | | | 641 | | | | 2,245 | |
AEON Financial Service Co., Ltd.(a) | | | | | 193 | | | | 3,984 | |
Aiful Corp.*,(a) | | | | | 481 | | | | 1,123 | |
Aozora Bank Ltd.(a) | | | | | 199 | | | | 4,840 | |
Aplus Financial Co., Ltd.*,(a) | | | | | 151 | | | | 117 | |
Awa Bank Ltd. (The)(a) | | | | | 61 | | | | 1,527 | |
Bank of Kyoto Ltd. (The)(a) | | | | | 120 | | | | 5,172 | |
Chiba Bank Ltd. (The)(a) | | | | | 1,049 | | | | 5,472 | |
Chugoku Bank Ltd. (The)(a) | | | | | 291 | | | | 2,803 | |
Concordia Financial Group Ltd.(a) | | | | | 1,928 | | | | 7,478 | |
Credit Saison Co., Ltd.(a) | | | | | 273 | | | | 3,471 | |
Dai-ichi Life Holdings, Inc.(a) | | | | | 1,863 | | | | 26,680 | |
Daishi Hokuetsu Financial Group, Inc.(a) | | | | | 73 | | | | 2,140 | |
Daiwa Securities Group, Inc.(a) | | | | | 2,603 | | | | 12,039 | |
Fukuoka Financial Group, Inc.(a) | | | | | 276 | | | | 6,384 | |
Fuyo General Lease Co., Ltd.(a) | | | | | 34 | | | | 1,688 | |
Gunma Bank Ltd. (The)(a) | | | | | 716 | | | | 2,822 | |
Hachijuni Bank Ltd. (The)(a) | | | | | 761 | | | | 3,047 | |
Hiroshima Bank Ltd. (The)(a) | | | | | 493 | | | | 2,647 | |
Hitachi Capital Corp.(a) | | | | | 68 | | | | 1,572 | |
Hokuhoku Financial Group, Inc.(a) | | | | | 214 | | | | 2,346 | |
Iyo Bank Ltd. (The)(a) | | | | | 456 | | | | 2,522 | |
Japan Exchange Group, Inc.(a) | | | | | 910 | | | | 14,772 | |
Japan Post Bank Co., Ltd.(a)(b) | | | | | 694 | | | | 7,621 | |
Japan Post Holdings Co., Ltd.(a) | | | | | 2,248 | | | | 25,089 | |
Japan Post Insurance Co., Ltd.(a) | | | | | 333 | | | | 6,712 | |
Kansai Mirai Financial Group, Inc.(a) | | | | | 304 | | | | 2,118 | |
Kyushu Financial Group, Inc.(a) | | | | | 656 | | | | 2,633 | |
Matsui Securities Co., Ltd.(a) | | | | | 171 | | | | 1,520 | |
Mebuki Financial Group, Inc.(a) | | | | | 1,689 | | | | 4,292 | |
Mitsubishi UFJ Financial Group, Inc.(a) | | | | | 21,238 | | | | 104,860 | |
Mitsubishi UFJ Lease & Finance Co., Ltd.(a) | | | | | 731 | | | | 3,702 | |
Mizuho Financial Group, Inc.(a) | | | | | 43,225 | | | | 67,336 | |
MS&AD Insurance Group Holdings, Inc.(a) | | | | | 834 | | | | 25,744 | |
Nishi-Nippon Financial Holdings, Inc.(a) | | | | | 256 | | | | 2,105 | |
Nomura Holdings, Inc.(a) | | | | | 5,592 | | | | 20,977 | |
North Pacific Bank Ltd.(a) | | | | | 464 | | | | 1,133 | |
Orient Corp.(a) | | | | | 933 | | | | 980 | |
ORIX Corp.(a) | | | | | 2,176 | | | | 30,703 | |
Resona Holdings, Inc.(a) | | | | | 3,695 | | | | 15,583 | |
San-In Godo Bank Ltd. (The)(a) | | | | | 253 | | | | 1,670 | |
SBI Holdings, Inc.(a) | | | | | 387 | | | | 8,246 | |
Seven Bank Ltd.(a) | | | | | 1,104 | | | | 2,994 | |
Shiga Bank Ltd. (The)(a) | | | | | 85 | | | | 2,024 | |
Shinsei Bank Ltd.(a) | | | | | 256 | | | | 3,544 | |
Shizuoka Bank Ltd. (The)(a) | | | | | 858 | | | | 6,548 | |
Sompo Holdings, Inc.(a) | | | | | 586 | | | | 21,893 | |
Sony Financial Holdings, Inc.(a) | | | | | 291 | | | | 5,923 | |
Sumitomo Mitsui Financial Group, Inc.(a) | | | | | 2,250 | | | | 81,232 | |
Sumitomo Mitsui Trust Holdings, Inc.(a) | | | | | 630 | | | | 21,857 | |
See notes to financial statements.
138
Schedules of Investments — IQ 50 Percent Hedged FTSE Japan ETF(continued)
April 30, 2019 | | | | Shares
| | Value
|
| | | | | | | | | | |
Common Stocks (continued) | | | | | | | | | | |
| | | | | | | | | | | |
Financials (continued) | | | | | | | | | | |
T&D Holdings, Inc.(a) | | | | | 945 | | | $ | 10,152 | |
Tokai Tokyo Financial Holdings, Inc.(a) | | | | | 374 | | | | 1,236 | |
Tokio Marine Holdings, Inc.(a) | | | | | 1,135 | | | | 57,089 | |
Tokyo Century Corp.(a) | | | | | 80 | | | | 3,678 | |
Yamaguchi Financial Group, Inc.(a) | | | | | 383 | | | | 2,820 | |
Zenkoku Hosho Co., Ltd.(a) | | | | | 87 | | | | 3,039 | |
Total Financials | | | | | | | | | 675,640 | |
| | | | | | | | | | | |
Health Care — 8.8% | | | | | | | | | | |
Alfresa Holdings Corp.(a) | | | | | 296 | | | | 8,226 | |
Asahi Intecc Co., Ltd.(a) | | | | | 170 | | | | 8,563 | |
Astellas Pharma, Inc.(a) | | | | | 3,273 | | | | 44,345 | |
Chugai Pharmaceutical Co., Ltd.(a) | | | | | 367 | | | | 23,198 | |
Daiichi Sankyo Co., Ltd.(a) | | | | | 1,081 | | | | 53,198 | |
Eisai Co., Ltd.(a) | | | | | 448 | | | | 25,961 | |
Hisamitsu Pharmaceutical Co., Inc.(a) | | | | | 123 | | | | 5,202 | |
Hoya Corp.(a) | | | | | 625 | | | | 43,855 | |
Kaken Pharmaceutical Co., Ltd.(a) | | | | | 58 | | | | 2,471 | |
Kissei Pharmaceutical Co., Ltd.(a) | | | | | 52 | | | | 1,284 | |
KYORIN Holdings, Inc.(a) | | | | | 64 | | | | 1,199 | |
Kyowa Hakko Kirin Co., Ltd.(a) | | | | | 421 | | | | 8,150 | |
M3, Inc.(a) | | | | | 682 | | | | 12,057 | |
Medipal Holdings Corp.(a) | | | | | 262 | | | | 5,869 | |
Miraca Holdings, Inc.(a) | | | | | 85 | | | | 2,170 | |
Mitsubishi Tanabe Pharma Corp.(a) | | | | | 369 | | | | 4,632 | |
Mochida Pharmaceutical Co., Ltd.(a) | | | | | 44 | | | | 2,038 | |
Nihon Kohden Corp.(a) | | | | | 124 | | | | 3,602 | |
Nippon Shinyaku Co., Ltd.(a) | | | | | 89 | | | | 6,121 | |
Nipro Corp.(a) | | | | | 192 | | | | 2,374 | |
Olympus Corp.(a) | | | | | 1,902 | | | | 21,244 | |
Ono Pharmaceutical Co., Ltd.(a) | | | | | 748 | | | | 13,966 | |
Otsuka Holdings Co., Ltd.(a) | | | | | 710 | | | | 25,302 | |
PeptiDream, Inc.*,(a) | | | | | 144 | | | | 7,745 | |
Rohto Pharmaceutical Co., Ltd.(a) | | | | | 166 | | | | 4,643 | |
Santen Pharmaceutical Co., Ltd.(a) | | | | | 617 | | | | 9,384 | |
Sawai Pharmaceutical Co., Ltd.(a) | | | | | 66 | | | | 3,532 | |
Shionogi & Co., Ltd.(a) | | | | | 477 | | | | 27,736 | |
Sumitomo Dainippon Pharma Co., Ltd.(a) | | | | | 283 | | | | 6,225 | |
Suzuken Co., Ltd.(a) | | | | | 132 | | | | 7,585 | |
Sysmex Corp.(a) | | | | | 321 | | | | 18,307 | |
Taisho Pharmaceutical Holdings Co., Ltd.(a) | | | | | 73 | | | | 6,738 | |
Takara Bio, Inc.(a) | | | | | 75 | | | | 1,638 | |
Takeda Pharmaceutical Co., Ltd.(a) | | | | | 2,579 | | | | 95,217 | |
Terumo Corp.(a) | | | | | 1,095 | | | | 32,907 | |
Tsumura & Co.(a) | | | | | 109 | | | | 3,342 | |
Total Health Care | | | | | | | | | 550,026 | |
| | | | | | | | | | | |
Industrials — 22.3% | | | | | | | | | | |
AGC, Inc.(a) | | | | | 313 | | | | 10,637 | |
Aica Kogyo Co., Ltd.(a) | | | | | 87 | | | | 3,000 | |
Amada Holdings Co., Ltd.(a) | | | | | 539 | | | | 5,982 | |
ANA Holdings, Inc.(a) | | | | | 190 | | | | 6,633 | |
Benefit One, Inc.(a) | | | | | 98 | | | | 2,033 | |
Central Japan Railway Co.(a) | | | | | 307 | | | | 65,865 | |
Chiyoda Corp.*,(a) | | | | | 252 | | | | 796 | |
COMSYS Holdings Corp.(a) | | | | | 195 | | | | 5,107 | |
Dai Nippon Printing Co., Ltd.(a) | | | | | 499 | | | | 11,797 | |
Daifuku Co., Ltd.(a) | | | | | 163 | | | | 9,923 | |
| | | | Shares
| | Value
|
Common Stocks (continued) | | | | | | | | | | |
| | | | | | | | | | | |
Industrials (continued) | | | | | | | | | | |
Daikin Industries Ltd.(a) | | | | | 451 | | | $ | 57,096 | |
DMG Mori Co., Ltd.(a)(b) | | | | | 165 | | | | 2,356 | |
East Japan Railway Co.(a) | | | | | 627 | | | | 58,914 | |
Ebara Corp.(a) | | | | | 170 | | | | 5,197 | |
FANUC Corp.(a) | | | | | 330 | | | | 61,556 | |
Fuji Electric Co., Ltd.(a) | | | | | 213 | | | | 7,506 | |
Fujikura Ltd.(a) | | | | | 462 | | | | 1,900 | |
Fukuyama Transporting Co., Ltd.(a) | | | | | 57 | | | | 2,185 | |
Furukawa Electric Co., Ltd.(a) | | | | | 104 | | | | 2,734 | |
Glory Ltd.(a) | | | | | 87 | | | | 2,187 | |
GS Yuasa Corp.(a) | | | | | 129 | | | | 2,579 | |
Hankyu Hanshin Holdings, Inc.(a) | | | | | 377 | | | | 14,048 | |
Hino Motors Ltd.(a) | | | | | 451 | | | | 4,244 | |
Hitachi Construction Machinery Co., Ltd.(a) | | | | | 177 | | | | 4,688 | |
Hitachi Transport System Ltd.(a) | | | | | 73 | | | | 2,019 | |
Hoshizaki Corp.(a) | | | | | 87 | | | | 5,624 | |
IHI Corp.(a) | | | | | 221 | | | | 5,233 | |
ITOCHU Corp.(a) | | | | | 2,404 | | | | 43,169 | |
Japan Airlines Co., Ltd.(a) | | | | | 199 | | | | 6,663 | |
Japan Airport Terminal Co., Ltd.(a) | | | | | 81 | | | | 3,407 | |
Japan Steel Works Ltd. (The)(a) | | | | | 105 | | | | 2,014 | |
JGC Corp.(a) | | | | | 366 | | | | 5,219 | |
JTEKT Corp.(a) | | | | | 378 | | | | 4,850 | |
Kajima Corp.(a) | | | | | 778 | | | | 11,491 | |
Kamigumi Co., Ltd.(a) | | | | | 172 | | | | 4,096 | |
Kandenko Co., Ltd.(a) | | | | | 169 | | | | 1,419 | |
Kawasaki Heavy Industries Ltd.(a) | | | | | 243 | | | | 5,642 | |
Kawasaki Kisen Kaisha Ltd.*,(a)(b) | | | | | 139 | | | | 2,009 | |
Keihan Holdings Co., Ltd.(a) | | | | | 164 | | | | 6,958 | |
Keikyu Corp.(a) | | | | | 422 | | | | 7,184 | |
Keio Corp.(a) | | | | | 196 | | | | 11,791 | |
Keisei Electric Railway Co., Ltd.(a) | | | | | 237 | | | | 8,278 | |
Kinden Corp.(a) | | | | | 219 | | | | 3,506 | |
Kintetsu Group Holdings Co., Ltd.(a) | | | | | 304 | | | | 13,470 | |
Kokuyo Co., Ltd.(a) | | | | | 142 | | | | 1,800 | |
Komatsu Ltd.(a) | | | | | 1,550 | | | | 39,691 | |
Kubota Corp.(a) | | | | | 1,885 | | | | 28,484 | |
Kurita Water Industries Ltd.(a) | | | | | 184 | | | | 4,768 | |
Kyowa Exeo Corp.(a) | | | | | 172 | | | | 4,679 | |
Kyudenko Corp.(a) | | | | | 68 | | | | 1,929 | |
Kyushu Railway Co.(a) | | | | | 272 | | | | 8,841 | |
LIXIL Group Corp.(a) | | | | | 446 | | | | 5,795 | |
Mabuchi Motor Co., Ltd.(a) | | | | | 88 | | | | 3,247 | |
Maeda Corp.(a) | | | | | 223 | | | | 2,206 | |
Maeda Road Construction Co., Ltd.(a) | | | | | 95 | | | | 1,877 | |
Makita Corp.(a) | | | | | 415 | | | | 15,091 | |
Marubeni Corp.(a) | | | | | 2,652 | | | | 18,932 | |
MINEBEA MITSUMI, Inc.(a) | | | | | 705 | | | | 12,470 | |
MISUMI Group, Inc.(a) | | | | | 470 | | | | 12,145 | |
Mitsubishi Corp.(a) | | | | | 2,189 | | | | 60,064 | |
Mitsubishi Electric Corp.(a) | | | | | 3,362 | | | | 47,755 | |
Mitsubishi Heavy Industries Ltd.(a) | | | | | 485 | | | | 20,123 | |
Mitsubishi Logistics Corp.(a)(b) | | | | | 116 | | | | 3,091 | |
Mitsui & Co., Ltd.(a) | | | | | 2,878 | | | | 46,358 | |
Mitsui OSK Lines Ltd.(a) | | | | | 185 | | | | 4,684 | |
Miura Co., Ltd.(a) | | | | | 164 | | | | 4,157 | |
MonotaRO Co., Ltd.(a) | | | | | 199 | | | | 4,578 | |
Nabtesco Corp.(a) | | | | | 196 | | | | 5,966 | |
Nagase & Co., Ltd.(a) | | | | | 183 | | | | 2,778 | |
See notes to financial statements.
139
Schedules of Investments — IQ 50 Percent Hedged FTSE Japan ETF(continued)
April 30, 2019 | | | | Shares
| | Value
|
| | | | | | | | | | |
Common Stocks (continued) | | | | | | | | | | |
| | | | | | | | | | | |
Industrials (continued) | | | | | | | | | | |
Nagoya Railroad Co., Ltd.(a) | | | | | 316 | | | $ | 8,540 | |
Nankai Electric Railway Co., Ltd.(a) | | | | | 180 | | | | 4,897 | |
NGK Insulators Ltd.(a) | | | | | 450 | | | | 6,642 | |
Nidec Corp.(a) | | | | | 398 | | | | 56,408 | |
Nihon M&A Center, Inc.(a) | | | | | 213 | | | | 6,024 | |
Nippo Corp.(a) | | | | | 83 | | | | 1,681 | |
Nippon Express Co., Ltd.(a) | | | | | 122 | | | | 6,682 | |
Nippon Yusen K.K.(a)(b) | | | | | 270 | | | | 4,596 | |
Nishi-Nippon Railroad Co., Ltd.(a) | | | | | 127 | | | | 2,980 | |
Nisshinbo Holdings, Inc.(a) | | | | | 232 | | | | 2,052 | |
NSK Ltd.(a) | | | | | 750 | | | | 7,744 | |
NTN Corp.(a) | | | | | 713 | | | | 2,337 | |
Obayashi Corp.(a) | | | | | 1,141 | | | | 11,156 | |
Odakyu Electric Railway Co., Ltd.(a) | | | | | 517 | | | | 12,134 | |
OKUMA Corp.(a) | | | | | 50 | | | | 2,923 | |
OSG Corp.(a) | | | | | 128 | | | | 2,562 | |
Park24 Co., Ltd.(a) | | | | | 182 | | | | 3,812 | |
Penta-Ocean Construction Co., Ltd.(a) | | | | | 477 | | | | 2,180 | |
Persol Holdings Co., Ltd.(a) | | | | | 283 | | | | 5,295 | |
Pilot Corp.(a) | | | | | 42 | | | | 1,735 | |
Recruit Holdings Co., Ltd.(a) | | | | | 2,035 | | | | 60,826 | |
Sankyu, Inc.(a) | | | | | 83 | | | | 3,965 | |
Sanwa Holdings Corp.(a) | | | | | 332 | | | | 3,977 | |
Secom Co., Ltd.(a) | | | | | 330 | | | | 27,668 | |
Seibu Holdings, Inc.(a) | | | | | 356 | | | | 5,776 | |
Seino Holdings Co., Ltd.(a) | | | | | 258 | | | | 3,496 | |
SG Holdings Co., Ltd.(a) | | | | | 359 | | | | 9,589 | |
Shima Seiki Manufacturing Ltd.(a) | | | | | 50 | | | | 1,672 | |
Shimizu Corp.(a) | | | | | 959 | | | | 8,171 | |
SHO-BOND Holdings Co., Ltd.(a) | | | | | 38 | | | | 2,607 | |
SMC Corp.(a) | | | | | 99 | | | | 40,942 | |
Sohgo Security Services Co., Ltd.(a) | | | | | 113 | | | | 5,027 | |
Sojitz Corp.(a) | | | | | 2,130 | | | | 7,325 | |
Sotetsu Holdings, Inc.(a) | | | | | 132 | | | | 3,644 | |
Sumitomo Corp.(a) | | | | | 1,900 | | | | 27,116 | |
Sumitomo Heavy Industries Ltd.(a) | | | | | 192 | | | | 6,766 | |
Tadano Ltd.(a) | | | | | 193 | | | | 2,024 | |
Taisei Corp.(a) | | | | | 355 | | | | 15,539 | |
TechnoPro Holdings, Inc.(a) | | | | | 64 | | | | 3,821 | |
THK Co., Ltd.(a) | | | | | 191 | | | | 4,984 | |
Tobu Railway Co., Ltd.(a) | | | | | 348 | | | | 9,811 | |
Toda Corp.(a) | | | | | 391 | | | | 2,405 | |
Tokyu Corp.(a) | | | | | 838 | | | | 13,634 | |
Toppan Forms Co., Ltd.(a) | | | | | 62 | | | | 565 | |
Toppan Printing Co., Ltd.(a) | | | | | 444 | | | | 7,180 | |
Toshiba Corp.(a) | | | | | 924 | | | | 30,696 | |
Toshiba Plant Systems & Services Corp.(a) | | | | | 63 | | | | 1,127 | |
TOTO Ltd.(a) | | | | | 244 | | | | 10,275 | |
Toyota Tsusho Corp.(a) | | | | | 378 | | | | 12,490 | |
Ushio, Inc.(a) | | | | | 198 | | | | 2,396 | |
West Japan Railway Co.(a) | | | | | 311 | | | | 23,071 | |
Yamato Holdings Co., Ltd.(a) | | | | | 603 | | | | 13,062 | |
Total Industrials | | | | | | | | | 1,388,541 | |
| | | | | | | | | | | |
Information Technology — 10.9% | | | | | | | | | | |
Advantest Corp.(a) | | | | | 330 | | | | 9,304 | |
Alps Alpine Co., Ltd.(a) | | | | | 360 | | | | 7,586 | |
Azbil Corp.(a) | | | | | 224 | | | | 5,364 | |
| | | | Shares
| | Value
|
| | | | | | | | | | |
Common Stocks (continued) | | | | | | | | | | |
| | | | | | | | | | | |
Information Technology (continued) | | | | | | | | | | |
Brother Industries Ltd.(a) | | | | | 401 | | | $ | 7,860 | |
Canon, Inc.(a) | | | | | 1,749 | | | | 48,509 | |
Citizen Watch Co., Ltd.(a) | | | | | 456 | | | | 2,555 | |
Disco Corp.(a) | | | | | 47 | | | | 8,052 | |
FUJIFILM Holdings Corp.(a) | | | | | 623 | | | | 28,998 | |
Fujitsu Ltd.(a) | | | | | 326 | | | | 23,812 | |
GMO internet, Inc.(a) | | | | | 106 | | | | 1,636 | |
GMO Payment Gateway, Inc.(a) | | | | | 67 | | | | 5,276 | |
Hamamatsu Photonics K.K.(a) | | | | | 217 | | | | 8,777 | |
Hirose Electric Co., Ltd.(a) | | | | | 56 | | | | 6,466 | |
Hitachi High-Technologies Corp.(a) | | | | | 108 | | | | 4,800 | |
Hitachi Ltd.(a) | | | | | 1,573 | | | | 52,101 | |
Horiba Ltd.(a) | | | | | 64 | | | | 3,850 | |
Ibiden Co., Ltd.(a) | | | | | 181 | | | | 3,232 | |
Itochu Techno-Solutions Corp.(a) | | | | | 165 | | | | 4,031 | |
Japan Aviation Electronics Industry Ltd.(a) | | | | | 75 | | | | 1,208 | |
Keyence Corp.(a) | | | | | 153 | | | | 94,953 | |
Konica Minolta, Inc.(a) | | | | | 767 | | | | 7,672 | |
Kyocera Corp.(a) | | | | | 520 | | | | 33,569 | |
Murata Manufacturing Co., Ltd.(a) | | | | | 970 | | | | 51,907 | |
NEC Corp.(a) | | | | | 422 | | | | 14,190 | |
Nihon Unisys Ltd.(a) | | | | | 110 | | | | 2,808 | |
Nippon Electric Glass Co., Ltd.(a) | | | | | 133 | | | | 3,642 | |
Nomura Research Institute Ltd.(a) | | | | | 171 | | | | 8,337 | |
NS Solutions Corp.(a) | | | | | 54 | | | | 1,448 | |
NTT Data Corp.(a) | | | | | 1,067 | | | | 12,397 | |
OBIC Business Consultants Co., Ltd.(a) | | | | | 26 | | | | 1,040 | |
Obic Co., Ltd.(a) | | | | | 114 | | | | 13,163 | |
Omron Corp.(a) | | | | | 323 | | | | 17,256 | |
Oracle Corp. Japan(a) | | | | | 57 | | | | 3,895 | |
Otsuka Corp.(a) | | | | | 172 | | | | 6,749 | |
Renesas Electronics Corp.*,(a) | | | | | 1,185 | | | | 6,309 | |
Ricoh Co., Ltd.(a) | | | | | 1,152 | | | | 11,616 | |
Rohm Co., Ltd.(a) | | | | | 149 | | | | 10,903 | |
SCREEN Holdings Co., Ltd.(a) | | | | | 67 | | | | 3,212 | |
SCSK Corp.(a) | | | | | 71 | | | | 3,360 | |
Seiko Epson Corp.(a) | | | | | 468 | | | | 7,475 | |
Shimadzu Corp.(a) | | | | | 455 | | | | 12,150 | |
SUMCO Corp.(a) | | | | | 393 | | | | 5,152 | |
Taiyo Yuden Co., Ltd.(a) | | | | | 212 | | | | 5,115 | |
TDK Corp.(a) | | | | | 204 | | | | 17,749 | |
TIS, Inc.(a) | | | | | 133 | | | | 6,042 | |
Tokyo Electron Ltd.(a) | | | | | 265 | | | | 41,984 | |
Topcon Corp.(a) | | | | | 176 | | | | 2,125 | |
Trend Micro, Inc.(a) | | | | | 198 | | | | 9,884 | |
Ulvac, Inc.(a) | | | | | 81 | | | | 2,705 | |
Yaskawa Electric Corp.(a)(b) | | | | | 442 | | | | 16,251 | |
Yokogawa Electric Corp.(a) | | | | | 412 | | | | 8,575 | |
Total Information Technology | | | | | | | | | 677,050 | |
| | | | | | | | | | | |
Materials — 6.2% | | | | | | | | | | |
Air Water, Inc.(a) | | | | | 253 | | | | 3,844 | |
Asahi Kasei Corp.(a) | | | | | 2,110 | | | | 21,654 | |
Daicel Corp.(a) | | | | | 478 | | | | 5,330 | |
Daido Steel Co., Ltd.(a) | | | | | 57 | | | | 2,308 | |
Denka Co., Ltd.(a) | | | | | 146 | | | | 4,378 | |
DIC Corp.(a) | | | | | 136 | | | | 3,975 | |
Dowa Holdings Co., Ltd.(a) | | | | | 77 | | | | 2,499 | |
FP Corp.(a) | | | | | 38 | | | | 2,303 | |
Fuji Seal International, Inc.(a) | | | | | 71 | | | | 2,473 | |
Hitachi Chemical Co., Ltd.(a) | | | | | 165 | | | | 4,370 | |
See notes to financial statements.
140
Schedules of Investments — IQ 50 Percent Hedged FTSE Japan ETF(continued)
April 30, 2019 | | | | Shares
| | Value
|
| | | | | | | | | | |
Common Stocks (continued) | | | | | | | | | | |
| | | | | | | | | | | |
Materials (continued) | | | | | | | | | | |
Hitachi Metals Ltd.(a) | | | | | 330 | | | $ | 3,796 | |
JFE Holdings, Inc.(a) | | | | | 871 | | | | 14,898 | |
JSR Corp.(a) | | | | | 310 | | | | 4,698 | |
Kaneka Corp.(a) | | | | | 97 | | | | 3,728 | |
Kansai Paint Co., Ltd.(a) | | | | | 329 | | | | 6,248 | |
Kobe Steel Ltd.(a) | | | | | 497 | | | | 3,789 | |
Kuraray Co., Ltd.(a) | | | | | 598 | | | | 7,984 | |
Lintec Corp.(a) | | | | | 86 | | | | 1,852 | |
Maruichi Steel Tube Ltd.(a) | | | | | 105 | | | | 2,894 | |
Mitsubishi Chemical Holdings Corp.(a) | | | | | 2,159 | | | | 15,297 | |
Mitsubishi Gas Chemical Co., Inc.(a) | | | | | 307 | | | | 4,576 | |
Mitsubishi Materials Corp.(a)(b) | | | | | 212 | | | | 5,490 | |
Mitsui Chemicals, Inc.(a) | | | | | 293 | | | | 7,150 | |
Mitsui Mining & Smelting Co., Ltd.(a) | | | | | 94 | | | | 2,427 | |
Nippon Kayaku Co., Ltd.(a) | | | | | 283 | | | | 3,313 | |
Nippon Paint Holdings Co., Ltd.(a) | | | | | 261 | | | | 9,878 | |
Nippon Paper Industries Co., Ltd.(a) | | | | | 159 | | | | 3,146 | |
Nippon Shokubai Co., Ltd.(a) | | | | | 54 | | | | 3,733 | |
Nippon Steel Corp.(a) | | | | | 1,375 | | | | 24,451 | |
Nissan Chemical Corp.(a) | | | | | 236 | | | | 10,446 | |
Nitto Denko Corp.(a) | | | | | 263 | | | | 14,145 | |
NOF Corp.(a) | | | | | 115 | | | | 4,084 | |
Oji Holdings Corp.(a) | | | | | 1,491 | | | | 8,916 | |
Rengo Co., Ltd.(a) | | | | | 349 | | | | 3,061 | |
Shin-Etsu Chemical Co., Ltd.(a) | | | | | 694 | | | | 64,991 | |
Showa Denko K.K.(a) | | | | | 241 | | | | 8,147 | |
Sumitomo Bakelite Co., Ltd.(a) | | | | | 53 | | | | 2,061 | |
Sumitomo Chemical Co., Ltd.(a) | | | | | 2,555 | | | | 12,663 | |
Sumitomo Metal Mining Co., Ltd.(a) | | | | | 403 | | | | 12,588 | |
Sumitomo Osaka Cement Co., Ltd.(a) | | | | | 58 | | | | 2,354 | |
Taiheiyo Cement Corp.(a) | | | | | 206 | | | | 6,603 | |
Taiyo Nippon Sanso Corp.(a) | | | | | 236 | | | | 3,918 | |
Teijin Ltd.(a) | | | | | 307 | | | | 5,257 | |
Tokai Carbon Co., Ltd.(a)(b) | | | | | 326 | | | | 3,744 | |
Tokuyama Corp.(a) | | | | | 117 | | | | 2,889 | |
Toray Industries, Inc.(a) | | | | | 2,577 | | | | 17,539 | |
Tosoh Corp.(a) | | | | | 483 | | | | 7,741 | |
Toyo Seikan Group Holdings Ltd.(a) | | | | | 254 | | | | 5,061 | |
Toyobo Co., Ltd.(a) | | | | | 146 | | | | 1,902 | |
Ube Industries Ltd.(a) | | | | | 175 | | | | 3,724 | |
Yamato Kogyo Co., Ltd.(a) | | | | | 56 | | | | 1,546 | |
Zeon Corp.(a) | | | | | 240 | | | | 2,334 | |
Total Materials | | | | | | | | | 388,196 | |
| | | | | | | | | | | |
Real Estate — 2.8% | | | | | | | | | | |
Aeon Mall Co., Ltd.(a) | | | | | 201 | | | | 3,075 | |
Daito Trust Construction Co., Ltd.(a) | | | | | 118 | | | | 15,749 | |
Daiwa House Industry Co., Ltd.(a) | | | | | 1,102 | | | | 30,782 | |
Hulic Co., Ltd.(a) | | | | | 605 | | | | 5,204 | |
Ichigo, Inc.(a) | | | | | 337 | | | | 1,083 | |
Leopalace21 Corp.*,(a)(b) | | | | | 390 | | | | 658 | |
Mitsubishi Estate Co., Ltd.(a) | | | | | 2,003 | | | | 33,730 | |
Mitsui Fudosan Co., Ltd.(a) | | | | | 1,609 | | | | 37,085 | |
Nomura Real Estate Holdings, Inc.(a) | | | | | 195 | | | | 4,123 | |
Open House Co., Ltd.(a) | | | | | 52 | | | | 1,898 | |
Relo Group, Inc.(a) | | | | | 175 | | | | 4,761 | |
Sumitomo Realty & Development Co., Ltd.(a) | | | | | 670 | | | | 24,682 | |
| | | | Shares
| | Value
|
| | | | | | | | | | |
Common Stocks (continued) | | | | | | | | | | |
| | | | | | | | | | | |
Real Estate (continued) | | | | | | | | | | |
Tokyo Tatemono Co., Ltd.(a) | | | | | 344 | | | $ | 3,864 | |
Tokyu Fudosan Holdings Corp.(a) | | | | | 1,015 | | | | 5,705 | |
Total Real Estate | | | | | | | | | 172,399 | |
| | | | | | | | | | | |
Utilities — 1.9% | | | | | | | | | | |
Chubu Electric Power Co., Inc.(a) | | | | | 1,185 | | | | 17,194 | |
Chugoku Electric Power Co., Inc. (The)(a) | | | | | 490 | | | | 5,838 | |
Electric Power Development Co., Ltd.(a) | | | | | 281 | | | | 6,509 | |
Hokkaido Electric Power Co., Inc.(a) | | | | | 298 | | | | 1,667 | |
Hokuriku Electric Power Co.*,(a) | | | | | 284 | | | | 2,106 | |
Kansai Electric Power Co., Inc. (The)(a) | | | | | 1,232 | | | | 14,884 | |
Kyushu Electric Power Co., Inc.(a) | | | | | 786 | | | | 7,601 | |
Nippon Gas Co., Ltd.(a) | | | | | 65 | | | | 1,705 | |
Osaka Gas Co., Ltd.(a) | | | | | 669 | | | | 12,344 | |
Shikoku Electric Power Co., Inc.(a) | | | | | 253 | | | | 2,549 | |
Toho Gas Co., Ltd.(a) | | | | | 150 | | | | 6,168 | |
Tohoku Electric Power Co., Inc.(a) | | | | | 799 | | | | 9,125 | |
Tokyo Electric Power Co., Holdings, Inc.*,(a) | | | | | 2,649 | | | | 14,937 | |
Tokyo Gas Co., Ltd.(a) | | | | | 733 | | | | 18,605 | |
Total Utilities | | | | | | | | | 121,232 | |
| | | | | | | | | | | |
Total Common Stocks | | | | | | | | | | |
(Cost $6,214,769) | | | | | | | | | 6,213,984 | |
| | | | | | | | | | | |
Investment of Cash Collateral For Securities Loaned — 0.6% | | | | | | | | | | |
| | | | | | | | | | | |
Money Market Fund — 0.6% | | | | | | | | | | |
Dreyfus Government Cash Management Fund, Institutional Shares, 2.45%(c) | | | | | | | | | | |
(Cost $36,999) | | | | | 36,999 | | | | 36,999 | |
| | | | | | | | | | | |
Total Investments — 100.5% | | | | | | | | | | |
(Cost $6,251,768) | | | | | | | | | 6,250,983 | |
| | | | | | | | | | | |
Other Assets and Liabilities, Net — (0.5)% | | | | | | | | | (33,105 | ) |
| | | | | | | | | | | |
Net Assets — 100.0% | | | | | | | | $ | 6,217,878 | |
* | | Non-income producing securities. |
(a) | | These securities are deemed illiquid due to the extended closure of the Japanese market. |
(b) | | All or a portion of the security was on loan. In addition, “Other Assets and Liabilities, Net” may include pending sales that are also on loan. The aggregate market value of securities on loan was $52,929; total market value of collateral held by the Fund was $56,367. Market value of the collateral held includes non-cash U.S. Treasury securities collateral having a value of $19,368. |
(c) | | Reflects the 1-day yield at April 30, 2019. |
See notes to financial statements.
141
Schedules of Investments — IQ 50 Percent Hedged FTSE Japan ETF(continued)
April 30, 2019Forward Foreign Currency Contracts Outstanding as of April 30, 2019:
Purchased Contracts
| | | | Settlement Date
| | Counterparty
| | Currency
Amount
Purchased
| | Value at
Settlement
Date
| | Value at
April 30, 2019
| | Unrealized
Appreciation
|
Japanese Yen | | | | 05/07/19 | | Merrill Lynch | | | 339,348,549 | | | $ | 3,046,455 | | | $ | 3,048,762 | | | $ | 2,307 | |
Unrealized Appreciation | | | | | | | | | | | | $ | 3,046,455 | | | $ | 3,048,762 | | | $ | 2,307 | |
Sold Contracts
| | | | Settlement Date
| | Counterparty
| | Currency
Amount Sold
| | Value at
Settlement
Date
| | Value at
April 30, 2019
| | Unrealized
Appreciation
|
Japanese Yen | | | | 05/07/19 | | Merrill Lynch | | | (337,864,323 | ) | | $ | (3,060,845 | ) | | $ | (3,035,427 | ) | | $ | 25,418 | |
Unrealized Appreciation | | | | | | | | | | | | $ | (3,060,845 | ) | | $ | (3,035,427 | ) | | $ | 25,418 | |
| Total Unrealized Appreciation | $ | 27,725 | |
Sold Contracts
| | | | Settlement Date
| | Counterparty
| | Currency
Amount Sold
| | Value at
Settlement
Date
| | Value at
April 30, 2019
| | Unrealized
Depreciation
|
Japanese Yen | | | | 05/07/19 | | Merrill Lynch | | | (1,484,226 | ) | | $ | (13,302 | ) | | $ | (13,334 | ) | | $ | (32 | ) |
Japanese Yen | | | | 06/04/19 | | Merrill Lynch | | | (346,041,254 | ) | | | (3,113,582 | ) | | | (3,116,358 | ) | | | (2,776 | ) |
Unrealized Depreciation | | | | | | | | | | | | $ | (3,126,884 | ) | | $ | (3,129,692 | ) | | $ | (2,808 | ) |
| Total Unrealized Depreciation | $ | (2,808 | ) |
| | | | |
| Net Unrealized Appreciation (Depreciation) | $ | 24,917 | |
As of April 30, 2019, there was no collateral segregated by the counterparty for forward foreign currency contracts.
The following is a summary of the inputs used to value the Fund’s investments as of April 30, 2019. For more information on the valuation techniques, and their aggregation into the levels used in the table below, please refer to Note 2.
Asset Valuation Inputs
Description
| | | | Level 1
| | Level 2
| | Level 3
| | Total
|
Investments in Securities:(d) | | | | | | | | | | | | | | | | | | |
Common Stocks | | | | $ | — | | | $ | 6,213,984 | | | $ | — | | | $ | 6,213,984 | |
Investment of Cash Collateral for Securities Loaned: | | | | | | | | | | | | | | | | | | |
Money Market Fund | | | | | 36,999 | | | | — | | | | — | | | | 36,999 | |
Total Investments in Securities | | | | | 36,999 | | | | 6,213,984 | | | | — | | | | 6,250,983 | |
Other Financial Instruments:(e) | | | | | | | | | | | | | | | | | | |
Forward Foreign Currency Contracts | | | | | — | | | | 27,725 | | | | — | | | | 27,725 | |
Total Investments in Securities and Other Financial Instruments | | | | $ | 36,999 | | | $ | 6,241,709 | | | $ | — | | | $ | 6,278,708 | |
| | | | | | | | | | | |
| | | | | | | | | | | |
| Liability Valuation Inputs | | | | | | | | | | |
| | | | | | | | | | | |
Description
| | | | Level 1
| | Level 2
| | Level 3
| | Total
|
Other Financial Instruments:(e) | | | | | | | | | | | | | | | | | | |
Forward Foreign Currency Contracts | | | | $ | — | | | $ | 2,808 | | | $ | — | | | $ | 2,808 | |
(d) | | For a complete listing of investments and their industries, see the Schedules of Investments. |
(e) | | Reflects the unrealized appreciation (depreciation) of the instruments. |
For the year ended April 30, 2019, the Fund did not have any transfers into or out of Level 3 within the fair value hierarchy. (See Note 2)
See notes to financial statements.
142
Schedules of Investments — IQ Chaikin U.S. Small Cap ETF
April 30, 2019 | | | | Shares
| | Value
|
| | | | | | | | | | |
Common Stocks — 100.0% | | | | | | | | | | |
| | | | | | | | | | | |
Basic Materials — 8.4% | | | | | | | | | | |
AdvanSix, Inc.* | | | | | 54,839 | | | $ | 1,657,783 | |
Arch Coal, Inc., Class A(a) | | | | | 17,166 | | | | 1,664,759 | |
Commercial Metals Co. | | | | | 91,730 | | | | 1,586,012 | |
Encore Wire Corp. | | | | | 27,381 | | | | 1,623,419 | |
Global Brass & Copper Holdings, Inc. | | | | | 45,492 | | | | 1,973,898 | |
Innophos Holdings, Inc. | | | | | 51,982 | | | | 1,673,301 | |
Insteel Industries, Inc.(a) | | | | | 74,893 | | | | 1,568,259 | |
Kraton Corp.* | | | | | 48,687 | | | | 1,597,907 | |
Landec Corp.*(a) | | | | | 127,585 | | | | 1,340,918 | |
Materion Corp. | | | | | 27,458 | | | | 1,593,388 | |
Mueller Industries, Inc. | | | | | 49,992 | | | | 1,458,267 | |
OMNOVA Solutions, Inc.* | | | | | 223,183 | | | | 1,651,554 | |
Schnitzer Steel Industries, Inc., Class A | | | | | 65,281 | | | | 1,548,465 | |
SunCoke Energy, Inc.* | | | | | 184,541 | | | | 1,588,898 | |
Universal Forest Products, Inc. | | | | | 52,418 | | | | 1,936,845 | |
Verso Corp., Class A* | | | | | 73,144 | | | | 1,632,574 | |
Warrior Met Coal, Inc. | | | | | 51,538 | | | | 1,597,678 | |
ZAGG, Inc.* | | | | | 172,740 | | | | 1,423,378 | |
Total Basic Materials | | | | | | | | | 29,117,303 | |
| | | | | | | | | | | |
Consumer Goods — 9.6% | | | | | | | | | | |
ACCO Brands Corp. | | | | | 183,032 | | | | 1,672,912 | |
Beazer Homes USA, Inc.*(a) | | | | | 136,121 | | | | 1,809,048 | |
Central Garden & Pet Co., Class A* | | | | | 67,387 | | | | 1,649,634 | |
Century Communities, Inc.*(a) | | | | | 65,363 | | | | 1,662,181 | |
Dana, Inc. | | | | | 88,317 | | | | 1,722,181 | |
Edgewell Personal Care Co.* | | | | | 35,697 | | | | 1,471,787 | |
Fitbit, Inc., Class A* | | | | | 264,653 | | | | 1,397,368 | |
Fresh Del Monte Produce, Inc. | | | | | 57,963 | | | | 1,710,488 | |
Herman Miller, Inc. | | | | | 44,536 | | | | 1,728,888 | |
Hooker Furniture Corp. | | | | | 54,344 | | | | 1,619,995 | |
Knoll, Inc. | | | | | 82,853 | | | | 1,809,509 | |
M/I Homes, Inc.* | | | | | 58,856 | | | | 1,657,974 | |
Meritor, Inc.* | | | | | 76,990 | | | | 1,867,777 | |
Modine Manufacturing Co.* | | | | | 112,959 | | | | 1,670,664 | |
REV Group, Inc. | | | | | 143,082 | | | | 1,815,711 | |
Taylor Morrison Home Corp., Class A* | | | | | 88,267 | | | | 1,708,849 | |
Tower International, Inc. | | | | | 74,501 | | | | 1,738,853 | |
Unifi, Inc.* | | | | | 80,969 | | | | 1,635,574 | |
Universal Electronics, Inc.* | | | | | 42,173 | | | | 1,604,683 | |
USANA Health Sciences, Inc.* | | | | | 18,681 | | | | 1,559,116 | |
Total Consumer Goods | | | | | | | | | 33,513,192 | |
| | | | | | | | | | | |
Consumer Services — 10.6% | | | | | | | | | | |
Abercrombie & Fitch Co., Class A(a) | | | | | 57,160 | | | | 1,708,513 | |
Bloomin’ Brands, Inc. | | | | | 76,613 | | | | 1,531,494 | |
Career Education Corp.* | | | | | 94,840 | | | | 1,721,346 | |
Carrols Restaurant Group, Inc.* | | | | | 157,146 | | | | 1,541,602 | |
Central European Media Enterprises Ltd., Class A* | | | | | 393,655 | | | | 1,558,874 | |
Envestnet, Inc.* | | | | | 23,960 | | | | 1,700,920 | |
Gray Television, Inc.* | | | | | 73,349 | | | | 1,718,567 | |
Group 1 Automotive, Inc. | | | | | 24,216 | | | | 1,896,355 | |
Houghton Mifflin Harcourt Co.* | | | | | 215,509 | | | | 1,536,579 | |
J. Jill, Inc.(a) | | | | | 285,382 | | | | 1,600,993 | |
JC Penney Co., Inc.*(a) | | | | | 1,051,509 | | | | 1,440,567 | |
K12, Inc.* | | | | | 45,906 | | | | 1,382,689 | |
Liberty TripAdvisor Holdings, Inc., Class A* | | | | | 110,413 | | | | 1,627,488 | |
| | | | Shares
| | Value
|
Common Stocks (continued) | | | | | | | | | | |
| | | | | | | | | | | |
Consumer Services (continued) | | | | | | | | | | |
Lithia Motors, Inc., Class A | | | | | 16,893 | | | $ | 1,917,693 | |
Marcus Corp. (The) | | | | | 39,120 | | | | 1,471,694 | |
MarineMax, Inc.*(a) | | | | | 81,772 | | | | 1,413,838 | |
Meredith Corp. | | | | | 28,352 | | | | 1,672,768 | |
Nexstar Media Group, Inc., Class A(a) | | | | | 14,458 | | | | 1,692,309 | |
Office Depot, Inc. | | | | | 431,611 | | | | 1,035,866 | |
Sinclair Broadcast Group, Inc., Class A | | | | | 40,716 | | | | 1,864,386 | |
TEGNA, Inc.(a) | | | | | 111,117 | | | | 1,768,983 | |
Titan Machinery, Inc.* | | | | | 100,690 | | | | 1,731,868 | |
Tribune Publishing Co.* | | | | | 132,888 | | | | 1,429,875 | |
Total Consumer Services | | | | | | | | | 36,965,267 | |
| | | | | | | | | | | |
Financials — 24.7% | | | | | | | | | | |
Alexander & Baldwin, Inc. | | | | | 61,586 | | | | 1,454,661 | |
Altisource Portfolio Solutions SA* | | | | | 66,192 | | | | 1,566,765 | |
Ashford Hospitality Trust, Inc. | | | | | 329,842 | | | | 1,817,429 | |
B. Riley Financial, Inc.(a) | | | | | 93,874 | | | | 1,701,936 | |
Bancorp, Inc. (The)* | | | | | 193,904 | | | | 1,979,760 | |
BBX Capital Corp. | | | | | 264,653 | | | | 1,466,178 | |
Braemar Hotels & Resorts, Inc. | | | | | 128,316 | | | | 1,783,592 | |
Byline Bancorp, Inc.* | | | | | 84,781 | | | | 1,697,316 | |
Camden National Corp. | | | | | 37,553 | | | | 1,651,581 | |
Capstead Mortgage Corp. | | | | | 182,392 | | | | 1,566,747 | |
CBL & Associates Properties, Inc.(a) | | | | | 1,010,806 | | | | 1,020,914 | |
CNO Financial Group, Inc. | | | | | 96,833 | | | | 1,602,586 | |
Community Trust Bancorp, Inc. | | | | | 38,157 | | | | 1,612,133 | |
CorePoint Lodging, Inc. | | | | | 140,264 | | | | 1,753,300 | |
Cowen, Inc.*(a) | | | | | 108,126 | | | | 1,811,110 | |
Enova International, Inc.* | | | | | 68,657 | | | | 1,883,262 | |
EZCORP, Inc., Class A*(a) | | | | | 168,106 | | | | 1,827,312 | |
First Busey Corp. | | | | | 64,211 | | | | 1,659,212 | |
First Commonwealth Financial Corp. | | | | | 124,345 | | | | 1,692,335 | |
First Defiance Financial Corp. | | | | | 54,515 | | | | 1,608,738 | |
First Financial Corp. | | | | | 37,303 | | | | 1,535,765 | |
First Foundation, Inc. | | | | | 115,457 | | | | 1,640,644 | |
First Midwest Bancorp, Inc. | | | | | 76,576 | | | | 1,644,087 | |
Flagstar Bancorp, Inc.(a) | | | | | 47,592 | | | | 1,701,414 | |
Great Southern Bancorp, Inc. | | | | | 30,188 | | | | 1,749,395 | |
Great Western Bancorp, Inc. | | | | | 49,596 | | | | 1,744,291 | |
Heritage Insurance Holdings, Inc. | | | | | 107,312 | | | | 1,463,736 | |
Hertz Global Holdings, Inc.* | | | | | 90,198 | | | | 1,639,800 | |
Hilltop Holdings, Inc. | | | | | 85,849 | | | | 1,805,404 | |
Independent Bank Corp. | | | | | 72,872 | | | | 1,568,934 | |
INTL. FCStone, Inc.* | | | | | 40,422 | | | | 1,639,516 | |
iStar, Inc. | | | | | 186,074 | | | | 1,613,262 | |
Mercury General Corp.(a) | | | | | 31,292 | | | | 1,682,884 | |
Meta Financial Group, Inc.(a) | | | | | 79,611 | | | | 2,050,779 | |
National General Holdings Corp. | | | | | 66,024 | | | | 1,627,492 | |
New Senior Investment Group, Inc. | | | | | 287,477 | | | | 1,606,996 | |
Oppenheimer Holdings, Inc., Class A | | | | | 60,213 | | | | 1,580,591 | |
Orchid Island Capital, Inc. | | | | | 238,107 | | | | 1,564,363 | |
Outfront Media, Inc. | | | | | 66,955 | | | | 1,595,538 | |
Pacific Premier Bancorp, Inc. | | | | | 59,056 | | | | 1,716,758 | |
PennyMac Financial Services, Inc. | | | | | 70,447 | | | | 1,570,968 | |
Peoples Bancorp, Inc. | | | | | 50,589 | | | | 1,653,249 | |
Piper Jaffray Cos. | | | | | 21,513 | | | | 1,733,948 | |
QCR Holdings, Inc. | | | | | 46,190 | | | | 1,580,160 | |
See notes to financial statements.
143
Schedules of Investments — IQ Chaikin U.S. Small Cap ETF(continued)
April 30, 2019 | | | | Shares
| | Value
|
| | | | | | | | | | |
Common Stocks (continued) | | | | | | | | | | |
| | | | | | | | | | | |
Financials (continued) | | | | | | | | | | |
Simmons First National Corp., Class A(a) | | | | | 64,001 | | | $ | 1,624,985 | |
South State Corp. | | | | | 22,925 | | | | 1,734,506 | |
TriState Capital Holdings, Inc.* | | | | | 76,689 | | | | 1,783,786 | |
United Community Financial Corp. | | | | | 167,567 | | | | 1,543,292 | |
United Financial Bancorp, Inc. | | | | | 109,181 | | | | 1,440,097 | |
Univest Financial Corp. | | | | | 64,054 | | | | 1,615,442 | |
Veritex Holdings, Inc. | | | | | 64,688 | | | | 1,714,879 | |
Walker & Dunlop, Inc. | | | | | 30,774 | | | | 1,691,031 | |
Total Financials | | | | | | | | | 86,014,859 | |
| | | | | | | | | | | |
Health Care — 3.1% | | | | | | | | | | |
Akebia Therapeutics, Inc.*(a) | | | | | 191,300 | | | | 1,155,452 | |
Assertio Therapeutics, Inc.*(a) | | | | | 309,024 | | | | 1,288,630 | |
Eagle Pharmaceuticals, Inc.* | | | | | 31,030 | | | | 1,595,253 | |
Lannett Co., Inc.*(a) | | | | | 199,078 | | | | 1,530,910 | |
Lantheus Holdings, Inc.* | | | | | 64,001 | | | | 1,546,264 | |
Tivity Health, Inc.*(a) | | | | | 89,223 | | | | 1,929,001 | |
Triple-S Management Corp., Class B* | | | | | 68,657 | | | | 1,559,887 | |
Total Health Care | | | | | | | | | 10,605,397 | |
| | | | | | | | | | | |
Industrials — 30.1% | | | | | | | | | | |
AAR Corp. | | | | | 48,193 | | | | 1,627,478 | |
ABM Industries, Inc.(a) | | | | | 43,102 | | | | 1,636,583 | |
Alamo Group, Inc. | | | | | 15,677 | | | | 1,624,764 | |
American Woodmark Corp.*(a) | | | | | 18,961 | | | | 1,705,163 | |
Anixter International, Inc.* | | | | | 27,923 | | | | 1,755,519 | |
Astec Industries, Inc. | | | | | 41,492 | | | | 1,398,695 | |
Atkore International Group, Inc.* | | | | | 72,770 | | | | 1,801,785 | |
Atlas Air Worldwide Holdings, Inc.* | | | | | 30,988 | | | | 1,496,411 | |
Barrett Business Services, Inc. | | | | | 20,260 | | | | 1,476,144 | |
Benchmark Electronics, Inc. | | | | | 59,686 | | | | 1,613,313 | |
Blue Bird Corp.* | | | | | 92,542 | | | | 1,601,902 | |
BMC Stock Holdings, Inc.* | | | | | 88,667 | | | | 1,824,767 | |
Builders FirstSource, Inc.* | | | | | 117,448 | | | | 1,618,433 | |
CBIZ, Inc.* | | | | | 77,408 | | | | 1,494,748 | |
Core-Mark Holding Co., Inc. | | | | | 42,196 | | | | 1,533,825 | |
CRA International, Inc. | | | | | 31,001 | | | | 1,614,532 | |
CSG Systems International, Inc. | | | | | 37,039 | | | | 1,653,791 | |
Daseke, Inc.*(a) | | | | | 307,809 | | | | 1,588,294 | |
Ducommun, Inc.* | | | | | 36,001 | | | | 1,460,921 | |
Echo Global Logistics, Inc.* | | | | | 63,227 | | | | 1,450,427 | |
EnerSys | | | | | 24,044 | | | | 1,663,604 | |
Federal Signal Corp. | | | | | 60,283 | | | | 1,734,342 | |
GMS, Inc.* | | | | | 103,621 | | | | 1,825,802 | |
Greif, Inc., Class A | | | | | 37,982 | | | | 1,501,049 | |
Griffon Corp.(a) | | | | | 84,781 | | | | 1,663,403 | |
Hackett Group, Inc. (The) | | | | | 99,161 | | | | 1,522,121 | |
Hawkins, Inc. | | | | | 42,540 | | | | 1,570,151 | |
Heidrick & Struggles International, Inc. | | | | | 40,875 | | | | 1,462,507 | |
Integer Holdings Corp.* | | | | | 20,773 | | | | 1,435,207 | |
JELD-WEN Holding, Inc.* | | | | | 88,718 | | | | 1,752,181 | |
Kelly Services, Inc., Class A | | | | | 71,022 | | | | 1,580,950 | |
Kforce, Inc. | | | | | 44,611 | | | | 1,606,888 | |
Kimball Electronics, Inc.* | | | | | 101,146 | | | | 1,530,339 | |
Kimball International, Inc., Class B | | | | | 110,803 | | | | 1,735,175 | |
Manitowoc Co., Inc. (The)* | | | | | 95,476 | | | | 1,705,201 | |
ManTech International Corp., Class A | �� | | | | 29,003 | | | | 1,797,896 | |
Methode Electronics, Inc. | | | | | 54,439 | | | | 1,606,495 | |
| | | | Shares
| | Value
|
Common Stocks (continued) | | | | | | | | | | |
| | | | | | | | | | | |
Industrials (continued) | | | | | | | | | | |
MYR Group, Inc.* | | | | | 45,242 | | | $ | 1,635,498 | |
NCI Building Systems, Inc.* | | | | | 254,342 | | | | 1,454,836 | |
Patrick Industries, Inc.*(a) | | | | | 34,570 | | | | 1,724,006 | |
Perficient, Inc.* | | | | | 57,202 | | | | 1,684,027 | |
Providence Service Corp. (The)* | | | | | 23,517 | | | | 1,559,883 | |
Quanex Building Products Corp. | | | | | 98,600 | | | | 1,648,592 | |
Resources Connection, Inc. | | | | | 94,724 | | | | 1,521,267 | |
Rush Enterprises, Inc., Class A | | | | | 37,473 | | | | 1,589,230 | |
Sanmina Corp.* | | | | | 54,307 | | | | 1,842,093 | |
Silgan Holdings, Inc. | | | | | 52,877 | | | | 1,583,137 | |
SP Plus Corp.* | | | | | 45,919 | | | | 1,585,124 | |
Spartan Motors, Inc. | | | | | 177,435 | | | | 1,650,146 | |
SPX Corp.* | | | | | 45,035 | | | | 1,643,778 | |
Sterling Construction Co., Inc.* | | | | | 125,139 | | | | 1,696,885 | |
SunPower Corp.*(a) | | | | | 240,668 | | | | 1,737,623 | |
Sykes Enterprises, Inc.* | | | | | 55,402 | | | | 1,537,406 | |
Titan International, Inc. | | | | | 262,436 | | | | 1,818,681 | |
TrueBlue, Inc.* | | | | | 66,275 | | | | 1,601,204 | |
TTEC Holdings, Inc. | | | | | 43,244 | | | | 1,576,676 | |
TTM Technologies, Inc.*(a) | | | | | 133,568 | | | | 1,768,440 | |
Tutor Perini Corp.*(a) | | | | | 91,515 | | | | 1,827,555 | |
Universal Logistics Holdings, Inc. | | | | | 79,611 | | | | 1,944,101 | |
Vectrus, Inc.* | | | | | 58,923 | | | | 2,389,328 | |
Vishay Intertechnology, Inc. | | | | | 84,827 | | | | 1,680,423 | |
Werner Enterprises, Inc.(a) | | | | | 45,879 | | | | 1,536,947 | |
Wesco Aircraft Holdings, Inc.* | | | | | 178,242 | | | | 1,504,362 | |
YRC Worldwide, Inc.*(a) | | | | | 234,193 | | | | 1,594,854 | |
Total Industrials | | | | | | | | | 105,006,908 | |
| | | | | | | | | | | |
Oil & Gas — 0.4% | | | | | | | | | | |
Select Energy Services, Inc., Class A*(a) | | | | | 130,345 | | | | 1,501,574 | |
| | | | | | | | | | | |
Technology — 12.7% | | | | | | | | | | |
A10 Networks, Inc.* | | | | | 220,980 | | | | 1,427,531 | |
Amkor Technology, Inc.* | | | | | 183,460 | | | | 1,662,148 | |
Avaya Holdings Corp.*(a) | | | | | 93,092 | | | | 1,776,195 | |
Calix, Inc.* | | | | | 203,474 | | | | 1,393,797 | |
Carbonite, Inc.*(a) | | | | | 63,150 | | | | 1,549,069 | |
ChannelAdvisor Corp.* | | | | | 128,633 | | | | 1,511,438 | |
Computer Programs & Systems, Inc. | | | | | 52,770 | | | | 1,603,680 | |
Comtech Telecommunications Corp. | �� | | �� | | 67,474 | | | | 1,587,663 | |
Endurance International Group Holdings, Inc.* | | | | | 216,103 | | | | 1,195,050 | |
ePlus, Inc.* | | | | | 17,696 | | | | 1,668,556 | |
Insight Enterprises, Inc.* | | | | | 28,455 | | | | 1,609,984 | |
Limelight Networks, Inc.* | | | | | 485,062 | | | | 1,440,634 | |
MagnaChip Semiconductor Corp.* | | | | | 211,723 | | | | 1,873,749 | |
MobileIron, Inc.* | | | | | 286,426 | | | | 1,698,506 | |
Monotype Imaging Holdings, Inc. | | | | | 78,770 | | | | 1,357,995 | |
Nanometrics, Inc.* | | | | | 50,737 | | | | 1,511,455 | |
OneSpan, Inc.* | | | | | 81,516 | | | | 1,511,307 | |
PC Connection, Inc. | | | | | 42,725 | | | | 1,587,661 | |
Photronics, Inc.* | | | | | 165,793 | | | | 1,548,507 | |
Presidio, Inc. | | | | | 105,861 | | | | 1,590,032 | |
Progress Software Corp. | | | | | 35,311 | | | | 1,610,535 | |
Rambus, Inc.* | | | | | 149,928 | | | | 1,718,175 | |
Ribbon Communications, Inc.* | | | | | 304,223 | | | | 1,630,635 | |
ScanSource, Inc.* | | | | | 43,740 | | | | 1,646,811 | |
SMART Global Holdings, Inc.*(a) | | | | | 81,602 | | | | 1,774,027 | |
Tech Data Corp.* | | | | | 15,299 | | | | 1,631,026 | |
See notes to financial statements.
144
Schedules of Investments — IQ Chaikin U.S. Small Cap ETF(continued)
April 30, 2019 | | | | Shares
| | Value
|
| | | | | | | | | | |
Common Stocks (continued) | | | | | | | | | | |
| | | | | | | | | | | |
Technology (continued) | | | | | | | | | | |
Unisys Corp.* | | | | | 134,255 | | | $ | 1,504,999 | |
Verint Systems, Inc.* | | | | | 26,173 | | | | 1,580,587 | |
Total Technology | | | | | | | | | 44,201,752 | |
| | | | | | | | | | | |
Utilities — 0.4% | | | | | | | | | | |
Black Hills Corp. | | | | | 21,152 | | | | 1,539,019 | |
| | | | | | | | | | | |
Total Common Stocks | | | | | | | | | | |
(Cost $349,870,502) | | | | | | | | | 348,465,271 | |
| | | | | | | | | | | |
Short-Term Investment — 0.0%(b) | | | | | | | | | | |
| | | | | | | | | | | |
Money Market Fund — 0.0%(b) | | | | | | | | | | |
Morgan Stanley Institutional Liquidity Funds Treasury Portfolio — Institutional Class, 2.32%(c) | | | | | | | | | | |
(Cost $91,353) | | | | | 91,353 | | | | 91,353 | |
| | | | | | | | | | | |
Investment of Cash Collateral For Securities Loaned — 1.5% | | | | | | | | | | |
| | | | | | | | | | | |
Money Market Fund — 1.5% | | | | | | | | | | |
Dreyfus Government Cash Management Fund, Institutional Shares, 2.45%(c) | | | | | | | | | | |
(Cost $5,238,855) | | | | | 5,238,855 | | | | 5,238,855 | |
| | | | | | | | | | | |
| | | | Shares
| | Value
|
Total Investments — 101.5% | | | | | | | | | | |
(Cost $355,200,710) | | | | | | | | $ | 353,795,479 | |
| | | | | | | | | | | |
Other Assets and Liabilities, Net — (1.5)% | | | | | | | | | (5,240,757 | ) |
| | | | | | | | | | | |
Net Assets — 100.0% | | | | | | | | $ | 348,554,722 | |
* | | Non-income producing securities. |
(a) | | All or a portion of the security was on loan. In addition, “Other Assets and Liabilities, Net” may include pending sales that are also on loan. The aggregate market value of securities on loan was $36,791,699; total market value of collateral held by the Fund was $38,108,611. Market value of the collateral held includes non-cash U.S. Treasury securities collateral having a value of $32,869,756. |
(c) | | Reflects the 1-day yield at April 30, 2019. |
The following is a summary of the inputs used to value the Fund’s investments as of April 30, 2019. For more information on the valuation techniques, and their aggregation into the levels used in the table below, please refer to Note 2.
Asset Valuation Inputs
Description
| | | | Level 1
| | Level 2
| | Level 3
| | Total
|
Investments in Securities:(d) | | | | | | | | | | | | | | | | | | |
Common Stocks | | | | $ | 348,465,271 | | | $ | — | | | $ | — | | | $ | 348,465,271 | |
Short-Term Investment: | | | | | | | | | | | | | | | | | | |
Money Market Fund | | | | | 91,353 | | | | — | | | | — | | | | 91,353 | |
Investment of Cash Collateral for Securities Loaned: | | | | | | | | | | | | | | | | | | |
Money Market Fund | | | | | 5,238,855 | | | | — | | | | — | | | | 5,238,855 | |
Total Investments in Securities | | | | $ | 353,795,479 | | | $ | — | | | $ | — | | | $ | 353,795,479 | |
(d) | | For a complete listing of investments and their industries, see the Schedules of Investments. |
For the year ended April 30, 2019, the Fund did not have any transfers into or out of Level 3 within the fair value hierarchy. (See Note 2)
See notes to financial statements.
145
Schedules of Investments — IQ Chaikin U.S. Large Cap ETF
April 30, 2019 | | | | Shares
| | Value
|
| | | | | | | | | | |
Common Stocks — 99.8% | | | | | | | | | | |
| | | | | | | | | | | |
Basic Materials — 1.5% | | | | | | | | | | |
DowDuPont, Inc. | | | | | 110,656 | | | $ | 4,254,723 | |
| | | | | | | | | | | |
Consumer Goods — 5.8% | | | | | | | | | | |
Archer-Daniels-Midland Co. | | | | | 92,208 | | | | 4,112,477 | |
General Motors Co. | | | | | 106,280 | | | | 4,139,606 | |
Kimberly-Clark Corp. | | | | | 31,801 | | | | 4,082,612 | |
Philip Morris International, Inc. | | | | | 45,123 | | | | 3,905,847 | |
Total Consumer Goods | | | | | | | | | 16,240,542 | |
| | | | | | | | | | | |
Consumer Services — 10.1% | | | | | | | | | | |
AutoZone, Inc.* | | | | | 3,880 | | | | 3,989,843 | |
Carnival Corp. | | | | | 78,249 | | | | 4,292,740 | |
CVS Health Corp. | | | | | 73,800 | | | | 4,013,244 | |
Expedia Group, Inc. | | | | | 33,089 | | | | 4,296,276 | |
McKesson Corp. | | | | | 34,165 | | | | 4,074,176 | |
Starbucks Corp. | | | | | 53,255 | | | | 4,136,848 | |
Walgreens Boots Alliance, Inc. | | | | | 63,022 | | | | 3,376,089 | |
Total Consumer Services | | | | | | | | | 28,179,216 | |
| | | | | | | | | | | |
Financials — 34.3% | | | | | | | | | | |
Allstate Corp. (The) | | | | | 41,917 | | | | 4,152,298 | |
Ameriprise Financial, Inc. | | | | | 31,017 | | | | 4,552,365 | |
Bank of America Corp. | | | | | 144,102 | | | | 4,406,639 | |
Bank of New York Mellon Corp. (The) | | | | | 78,161 | | | | 3,881,475 | |
BB&T Corp.(a) | | | | | 85,038 | | | | 4,353,946 | |
Capital One Financial Corp. | | | | | 48,636 | | | | 4,514,880 | |
Citigroup, Inc. | | | | | 63,543 | | | | 4,492,490 | |
Citizens Financial Group, Inc. | | | | | 121,440 | | | | 4,396,128 | |
Fifth Third Bancorp | | | | | 157,282 | | | | 4,532,867 | |
Hartford Financial Services Group, Inc. (The) | | | | | 79,800 | | | | 4,174,338 | |
KeyCorp(a) | | | | | 250,861 | | | | 4,402,611 | |
M&T Bank Corp. | | | | | 25,034 | | | | 4,257,532 | |
MetLife, Inc. | | | | | 92,734 | | | | 4,277,819 | |
Morgan Stanley | | | | | 93,938 | | | | 4,532,509 | |
Northern Trust Corp. | | | | | 43,719 | | | | 4,308,508 | |
PNC Financial Services Group, Inc. (The) | | | | | 32,049 | | | | 4,388,470 | |
Progressive Corp. (The) | | | | | 55,020 | | | | 4,299,813 | |
Prudential Financial, Inc. | | | | | 42,962 | | | | 4,541,513 | |
Regions Financial Corp. | | | | | 277,965 | | | | 4,316,796 | |
SunTrust Banks, Inc. | | | | | 66,774 | | | | 4,372,362 | |
Synchrony Financial | | | | | 123,735 | | | | 4,289,892 | |
Wells Fargo & Co. | | | | | 82,101 | | | | 3,974,509 | |
Total Financials | | | | | | | | | 95,419,760 | |
| | | | | | | | | | | |
Health Care — 15.5% | | | | | | | | | | |
AbbVie, Inc. | | | | | 49,265 | | | | 3,911,148 | |
Allergan PLC | | | | | 27,080 | | | | 3,980,760 | |
Baxter International, Inc. | | | | | 48,788 | | | | 3,722,525 | |
Biogen, Inc.* | | | | | 16,926 | | | | 3,880,116 | |
Boston Scientific Corp.* | | | | | 103,878 | | | | 3,855,951 | |
Centene Corp.* | | | | | 74,565 | | | | 3,844,571 | |
Cigna Corp. | | | | | 24,658 | | | | 3,916,677 | |
IDEXX Laboratories, Inc.* | | | | | 17,872 | | | | 4,146,304 | |
Medtronic PLC | | | | | 43,779 | | | | 3,888,013 | |
Thermo Fisher Scientific, Inc. | | | | | 14,567 | | | | 4,041,614 | |
Zimmer Biomet Holdings, Inc. | | | | | 31,025 | | | | 3,821,039 | |
Total Health Care | | | | | | | | | 43,008,718 | |
| | | | Shares
| | Value
|
Common Stocks (continued) | | | | | | | | | | |
| | | | | | | | | | | |
Industrials — 12.0% | | | | | | | | | | |
Accenture PLC, Class A | | | | | 22,495 | | | $ | 4,109,162 | |
Agilent Technologies, Inc. | | | | | 49,418 | | | | 3,879,313 | |
Cummins, Inc. | | | | | 25,261 | | | | 4,200,652 | |
Danaher Corp. | | | | | 30,336 | | | | 4,017,700 | |
Fidelity National Information Services, Inc. | | | | | 35,075 | | | | 4,066,245 | |
Honeywell International, Inc. | | | | | 24,831 | | | | 4,311,406 | |
TE Connectivity Ltd. | | | | | 49,231 | | | | 4,708,945 | |
TransDigm Group, Inc.* | | | | | 8,770 | | | | 4,231,700 | |
Total Industrials | | | | | | | | | 33,525,123 | |
| | | | | | | | | | | |
Oil & Gas — 2.9% | | | | | | | | | | |
Marathon Petroleum Corp. | | | | | 66,276 | | | | 4,034,220 | |
Phillips 66 | | | | | 41,665 | | | | 3,927,760 | |
Total Oil & Gas | | | | | | | | | 7,961,980 | |
| | | | | | | | | | | |
Technology — 14.8% | | | | | | | | | | |
Applied Materials, Inc. | | | | | 100,020 | | | | 4,407,881 | |
Broadcom, Inc. | | | | | 13,159 | | | | 4,189,826 | |
Cognizant Technology Solutions Corp., Class A | | | | | 55,023 | | | | 4,014,478 | |
DXC Technology Co. | | | | | 61,234 | | | | 4,025,523 | |
HP, Inc. | | | | | 204,139 | | | | 4,072,573 | |
Intel Corp. | | | | | 74,164 | | | | 3,785,331 | |
Micron Technology, Inc.* | | | | | 95,979 | | | | 4,036,877 | |
Microsoft Corp. | | | | | 33,682 | | | | 4,398,869 | |
Motorola Solutions, Inc. | | | | | 28,296 | | | | 4,100,373 | |
Oracle Corp. | | | | | 74,038 | | | | 4,096,523 | |
Total Technology | | | | | | | | | 41,128,254 | |
| | | | | | | | | | | |
Utilities — 2.9% | | | | | | | | | | |
Duke Energy Corp. | | | | | 44,071 | | | | 4,015,750 | |
Edison International | | | | | 64,064 | | | | 4,085,361 | |
Total Utilities | | | | | | | | | 8,101,111 | |
| | | | | | | | | | | |
Total Common Stocks | | | | | | | | | | |
(Cost $285,107,179) | | | | | | | | | 277,819,427 | |
| | | | | | | | | | | |
Short-Term Investment — 0.1% | | | | | | | | | | |
| | | | | | | | | | | |
Money Market Fund — 0.1% | | | | | | | | | | |
Morgan Stanley Institutional Liquidity Funds Treasury Portfolio — Institutional Class, 2.32%(b) | | | | | | | | | | |
(Cost $398,968) | | | | | 398,968 | | | | 398,968 | |
| | | | | | | | | | | |
Total Investments — 99.9% | | | | | | | | | | |
(Cost $285,506,147) | | | | | | | | | 278,218,395 | |
| | | | | | | | | | | |
Other Assets and Liabilities, Net — 0.1% | | | | | | | | | 193,195 | |
| | | | | | | | | | | |
Net Assets — 100.0% | | | | | | | | $ | 278,411,590 | |
* | | Non-income producing securities. |
(a) | | All or a portion of the security was on loan. In addition, “Other Assets and Liabilities, Net” may include pending sales that are also on loan. The aggregate market value of securities on loan was $8,581,399; total market value of collateral held consisted of non-cash U.S. Treasury securities collateral having a value of $8,764,057. |
(b) | | Reflects the 1-day yield at April 30, 2019. |
See notes to financial statements.
146
Schedules of Investments — IQ Chaikin U.S. Large Cap ETF(continued)
April 30, 2019The following is a summary of the inputs used to value the Fund’s investments as of April 30, 2019. For more information on the valuation techniques, and their aggregation into the levels used in the table below, please refer to Note 2.
Asset Valuation Inputs
Description
| | | | Level 1
| | Level 2
| | Level 3
| | Total
|
Investments in Securities:(c) | | | | | | | | | | | | | | | | | | |
Common Stocks | | | | $ | 277,819,427 | | | $ | — | | | $ | — | | | $ | 277,819,427 | |
Short-Term Investment: | | | | | | | | | | | | | | | | | | |
Money Market Fund | | | | | 398,968 | | | | — | | | | — | | | | 398,968 | |
Total Investments in Securities | | | | $ | 278,218,395 | | | $ | — | | | $ | — | | | $ | 278,218,395 | |
(c) | | For a complete listing of investments and their industries, see the Schedules of Investments. |
For the year ended April 30, 2019, the Fund did not have any transfers into or out of Level 3 within the fair value hierarchy. (See Note 2)
See notes to financial statements.
147
Statements of Assets and Liabilities
April 30, 2019 | | | | IQ Hedge
Multi-Strategy
Tracker ETF
| | IQ Hedge
Macro
Tracker ETF
| | IQ Hedge
Market Neutral
Tracker ETF
| | IQ Hedge
Long/Short
Tracker ETF
|
Assets | | | | | | | | | | | | | | | | | | |
Investments, at value (including securities on loan)(a) | | | | $ | 1,081,834,254 | | | $ | 6,246,531 | | | $ | 18,385,504 | | | $ | 7,251,947 | |
Cash | | | | | 4,384 | | | | — | | | | — | | | | — | |
Cash deposited at broker for swap collateral | | | | | 410,000 | | | | — | | | | — | | | | — | |
Due from broker | | | | | 1,006,789 | | | | 5,871 | | | | 11,041 | | | | 13,232 | |
Securities lending income receivable | | | | | 87,997 | | | | 682 | | | | 1,819 | | | | 1,541 | |
Dividend receivable | | | | | 3,416 | | | | 11 | | | | 59 | | | | 30 | |
Total Assets | | | | | 1,083,346,840 | | | | 6,253,095 | | | | 18,398,423 | | | | 7,266,750 | |
Liabilities | | | | | | | | | | | | | | | | | | |
Collateral for investments on loan | | | | | 86,985,349 | | | | 991,018 | | | | 2,613,985 | | | | 789,998 | |
Due to broker | | | | | 2,493,710 | | | | 7,216 | | | | 33,870 | | | | 13,414 | |
Advisory fees payable | | | | | 430,536 | | | | 3,238 | | | | 9,677 | | | | 3,990 | |
Trustee fees payable | | | | | 4,599 | | | | 15 | | | | 74 | | | | 31 | |
Compliance fees payable | | | | | 109 | | | | 1 | | | | 4 | | | | 2 | |
Accrued expenses and other liabilities | | | | | 10,465 | | | | 143 | | | | 207 | | | | 118 | |
Total Liabilities | | | | | 89,924,768 | | | | 1,001,631 | | | | 2,657,817 | | | | 807,553 | |
Net Assets | | | | $ | 993,422,072 | | | $ | 5,251,464 | | | $ | 15,740,606 | | | $ | 6,459,197 | |
Composition of Net Assets | | | | | | | | | | | | | | | | | | |
Paid-in capital | | | | $ | 1,023,809,230 | | | $ | 10,631,662 | | | $ | 15,756,105 | | | $ | 6,729,719 | |
Total distributable earnings/
(accumulated loss)(b) | | | | | (30,387,158 | ) | | | (5,380,198 | ) | | | (15,499 | ) | | | (270,522 | ) |
Net Assets | | | | $ | 993,422,072 | | | $ | 5,251,464 | | | $ | 15,740,606 | | | $ | 6,459,197 | |
NET ASSET VALUE PER SHARE | | | | | | | | | | | | | | | | | | |
Shares Outstanding (no par value, unlimited shares authorized) . | | | | | 32,800,000 | | | | 200,000 | | | | 600,000 | | | | 300,000 | |
Net Asset Value Per Share | | | | $ | 30.29 | | | $ | 26.26 | | | $ | 26.23 | | | $ | 21.53 | |
Investments, at cost | | | | $ | 1,066,219,028 | | | $ | 6,192,879 | | | $ | 18,157,253 | | | $ | 7,147,828 | |
(a) Market value of securities on loan | | | | $ | 169,075,017 | | | $ | 1,199,595 | | | $ | 4,535,071 | | | $ | 1,462,836 | |
| (b) | Total distributable earnings has been aggregated to conform to the current presentation requirements per the adoption of the SEC’s Disclosure Update and Simplification. (See Note 10) |
See notes to financial statements.
148
Statements of Assets and Liabilities(continued)
April 30, 2019 | | | | IQ Hedge
Event-Driven
Tracker ETF
| | IQ Real
Return ETF
| | IQ Leaders
GTAA
Tracker ETF
| | IQ Enhanced
Core Bond
U.S. ETF
|
Assets | | | | | | | | | | | | | | | | | | |
Investments, at value (including securities on loan)(a) | | | | $ | 4,430,150 | | | $ | 67,134,114 | | | $ | 47,693,106 | | | $ | 88,603,326 | |
Cash | | | | | — | | | | — | | | | 1,730 | | | | — | |
Due from broker | | | | | 1,605 | | | | — | | | | 103,094 | | | | — | |
Securities lending income receivable | | | | | 181 | | | | 3,802 | | | | 1,348 | | | | 1,604 | |
Dividend receivable | | | | | 13 | | | | 205 | | | | 1,146 | | | | 171 | |
Total Assets | | | | | 4,431,949 | | | | 67,138,121 | | | | 47,800,424 | | | | 88,605,101 | |
Liabilities | | | | | | | | | | | | | | | | | | |
Collateral for investments on loan | | | | | 175,698 | | | | 10,081,653 | | | | 4,075,170 | | | | — | |
Advisory fees payable | | | | | 2,605 | | | | 9,350 | | | | 7,937 | | | | 14,653 | |
Due to broker | | | | | 534 | | | | — | | | | 41,200 | | | | — | |
Trustee fees payable | | | | | 20 | | | | 266 | | | | 208 | | | | 335 | |
Compliance fees payable | | | | | 2 | | | | 13 | | | | 12 | | | | 21 | |
Accrued expenses and other liabilities | | | | | 98 | | | | 936 | | | | 480 | | | | 813 | |
Total Liabilities | | | | | 178,957 | | | | 10,092,218 | | | | 4,125,007 | | | | 15,822 | |
Net Assets | | | | $ | 4,252,992 | | | $ | 57,045,903 | | | $ | 43,675,417 | | | $ | 88,589,279 | |
Composition of Net Assets | | | | | | | | | | | | | | | | | | |
Paid-in capital | | | | $ | 4,239,373 | | | $ | 57,911,715 | | | $ | 44,501,063 | | | $ | 92,812,958 | |
Total distributable earnings/
(accumulated loss)(b) | | | | | 13,619 | | | | (865,812 | ) | | | (825,646 | ) | | | (4,223,679 | ) |
Net Assets | | | | $ | 4,252,992 | | | $ | 57,045,903 | | | $ | 43,675,417 | | | $ | 88,589,279 | |
NET ASSET VALUE PER SHARE | | | | | | | | | | | | | | | | | | |
Shares Outstanding (no par value, unlimited shares authorized) | | | | | 200,000 | | | | 2,050,000 | | | | 1,800,000 | | | | 4,700,000 | |
Net Asset Value Per Share | | | | $ | 21.26 | | | $ | 27.83 | | | $ | 24.26 | | | $ | 18.85 | |
Investments, at cost | | | | $ | 4,351,663 | | | $ | 66,449,503 | | | $ | 46,031,397 | | | $ | 87,384,674 | |
(a) Market value of securities on loan | | | | $ | 1,116,268 | | | $ | 15,618,184 | | | $ | 6,257,252 | | | $ | 4,507,592 | |
| (b) | | Total distributable earnings has been aggregated to conform to the current presentation requirements per the adoption of the SEC’s Disclosure Update and Simplification. (See Note 10) |
See notes to financial statements.
149
Statements of Assets and Liabilities(continued)
April 30, 2019 | | | | IQ Enhanced
Core Plus
Bond U.S. ETF
| | IQ Short Duration
Enhanced Core
Bond U.S. ETF
| | IQ Merger
Arbitrage ETF
| | IQ Global
Resources ETF
|
Assets | | | | | | | | | | | | | | | | | | |
Investments, at value (including securities on loan)(a) | | | | $ | 157,636,156 | | | $ | 3,891,522 | | | $ | 1,026,192,703 | | | $ | 178,459,068 | |
Cash | | | | | — | | | | — | | | | 558,512 | | | | — | |
Cash deposited at broker for swap collateral | | | | | — | | | | — | | | | — | | | | 1,125,028 | |
Securities lending income receivable | | | | | 1,027 | | | | 81 | | | | 136,355 | | | | 17,460 | |
Dividend receivable | | | | | 491 | | | | 14 | | | | 304,072 | | | | 365,797 | |
Prepaid expenses | | | | | 91 | | | | — | | | | — | | | | — | |
Receivable for capital shares transactions | | | | | — | | | | — | | | | — | | | | 1,231 | |
Due from broker | | | | | — | | | | — | | | | 2,679,477 | | | | 121,701 | |
Reclaims receivable | | | | | — | | | | — | | | | 13,588 | | | | 198,415 | |
Total Assets | | | | | 157,637,765 | | | | 3,891,617 | | | | 1,029,884,707 | | | | 180,288,700 | |
Liabilities | | | | | | | | | | | | | | | | | | |
Collateral for investments on loan | | | | | 1,116,868 | | | | 85,755 | | | | 26,117,837 | | | | 3,586,080 | |
Advisory fees payable | | | | | 26,110 | | | | 500 | | | | 612,583 | | | | 109,941 | |
Trustee fees payable | | | | | 759 | | | | 18 | | | | 4,690 | | | | 853 | |
Due to broker | | | | | — | | | | — | | | | 17,274,379 | | | | 1,269,480 | |
Foreign currency due to custodian(b) | | | | | — | | | | — | | | | 65,707 | | | | 8,586 | |
Compliance fees payable | | | | | 36 | | | | 1 | | | | 300 | | | | 46 | |
Accrued expenses and other liabilities | | | | | 57 | | | | 305 | | | | 9,664 | | | | 1,777 | |
Total Liabilities | | | | | 1,143,830 | | | | 86,579 | | | | 44,085,160 | | | | 4,976,763 | |
Net Assets | | | | $ | 156,493,935 | | | $ | 3,805,038 | | | $ | 985,799,547 | | | $ | 175,311,937 | |
Composition of Net Assets | | | | | | | | | | | | | | | | | | |
Paid-in capital | | | | $ | 174,290,200 | | | $ | 3,772,539 | | | $ | 1,005,308,523 | | | $ | 227,150,651 | |
Total distributable earnings/(accumulated loss) | | | | | (17,796,265 | )(c) | | | 32,499 | | | | (19,508,976 | )(c) | | | (51,838,714 | )(c) |
Net Assets | | | | $ | 156,493,935 | | | $ | 3,805,038 | | | $ | 985,799,547 | | | $ | 175,311,937 | |
NET ASSET VALUE PER SHARE | | | | | | | | | | | | | | | | | | |
Shares Outstanding (no par value, unlimited shares authorized) . | | | | | 8,150,000 | | | | 150,000 | | | | 31,300,000 | | | | 6,500,000 | |
Net Asset Value Per Share | | | | $ | 19.20 | | | $ | 25.37 | | | $ | 31.50 | | | $ | 26.97 | |
Investments, at cost | | | | $ | 155,361,229 | | | $ | 3,857,755 | | | $ | 1,008,536,659 | | | $ | 176,522,198 | |
(a) Market value of securities on loan | | | | $ | 7,453,730 | | | $ | 84,111 | | | $ | 30,647,713 | | | $ | 5,535,999 | |
(b) Cost of foreign currency | | | | $ | — | | | $ | — | | | $ | (43,453 | ) | | $ | (8,496 | ) |
| (c) | | Total distributable earnings has been aggregated to conform to the current presentation requirements per the adoption of the SEC’s Disclosure Update and Simplification. (See Note 10) |
See notes to financial statements.
150
Statements of Assets and Liabilities(continued)
April 30, 2019 | | | | IQ Global
Agribusiness
Small Cap ETF
| | IQ U.S. Real
Estate Small Cap
ETF
| | IQ S&P High
Yield Low
Volatility Bond
ETF
| | IQ 500
International ETF
|
Investments, at value (including securities on loan)(a) | | | | $ | 10,440,874 | | | $ | 74,810,340 | | | $ | 66,447,964 | | | $ | 88,436,150 | |
Cash | | | | | — | | | | 4,650 | | | | — | | | | — | |
Foreign currency(b) | | | | | — | | | | — | | | | — | | | | 29,339 | |
Dividend receivable | | | | | 55,474 | | | | 80,111 | | | | — | | | | 442,413 | |
Securities lending income receivable | | | | | 1,458 | | | | 2,834 | | | | 684 | | | | 2,666 | |
Reclaims receivable | | | | | 107 | | | | — | | | | — | | | | 47,840 | |
Receivable for investments sold | | | | | — | | | | — | | | | 4,590,668 | | | | — | |
Interest receivable | | | | | — | | | | — | | | | 875,498 | | | | — | |
Total Assets | | | | | 10,497,913 | | | | 74,897,935 | | | | 71,914,814 | | | | 88,958,408 | |
Liabilities | | | | | | | | | | | | | | | | | | |
Collateral for investments on loan | | | | | 594,995 | | | | 3,241,315 | | | | 1,729,250 | | | | 3,265,837 | |
Cash due to custodian | | | | | 32,770 | | | | — | | | | — | | | | — | |
Advisory fees payable | | | | | 6,027 | | | | 40,528 | | | | 23,274 | | | | 16,611 | |
Trustee fees payable | | | | | 49 | | | | 337 | | | | 347 | | | | 404 | |
Payable for investments purchased | | | | | — | | | | — | | | | 4,534,936 | | | | — | |
Compliance fees payable | | | | | 2 | | | | 17 | | | | 11 | | | | 37 | |
Accrued expenses and other liabilities | | | | | 149 | | | | 743 | | | | 1,252 | | | | 941 | |
Total Liabilities | | | | | 633,992 | | | | 3,282,940 | | | | 6,289,070 | | | | 3,283,830 | |
Net Assets | | | | $ | 9,863,921 | | | $ | 71,614,995 | | | $ | 65,625,744 | | | $ | 85,674,578 | |
Composition of Net Assets | | �� | | | | | | | | | | | | | | | | |
Paid-in capital | | | | $ | 17,166,235 | | | $ | 79,611,394 | | | $ | 67,824,948 | | | $ | 79,513,105 | |
Total distributable earnings/(accumulated loss) | | | | | (7,302,314 | )(c) | | | (7,996,399 | )(c) | | | (2,199,204 | )(c) | | | 6,161,473 | |
Net Assets | | | | $ | 9,863,921 | | | $ | 71,614,995 | | | $ | 65,625,744 | | | $ | 85,674,578 | |
NET ASSET VALUE PER SHARE | | | | | | | | | | | | | | | | | | |
Shares Outstanding (no par value, unlimited shares authorized) | | | | | 300,000 | | | | 2,850,000 | | | | 2,650,000 | | | | 3,100,000 | |
Net Asset Value Per Share | | | | $ | 32.88 | | | $ | 25.13 | | | $ | 24.76 | | | $ | 27.64 | |
Investments, at cost | | | | $ | 10,367,688 | | | $ | 78,162,131 | | | $ | 65,894,681 | | | $ | 83,159,539 | |
(a) Market value of securities on loan | | | | $ | 678,369 | | | $ | 14,857,669 | | | $ | 1,793,191 | | | $ | 3,158,681 | |
(b) Cost of foreign currency | | | | $ | — | | | $ | — | | | $ | — | | | $ | 29,409 | |
| (c) | | Total distributable earnings has been aggregated to conform to the current presentation requirements per the adoption of the SEC’s Disclosure Update and Simplification. (See Note 10) |
See notes to financial statements.
151
Statements of Assets and Liabilities(continued)
April 30, 2019 | | | | IQ 50 Percent
Hedged FTSE
International ETF
| | IQ 50 Percent
Hedged FTSE
Europe ETF
| | IQ 50 Percent
Hedged FTSE
Japan ETF
| | IQ Chaikin U.S.
Small Cap ETF
|
Assets | | | | | | | | | | | | | | | | | | |
Investments, at value (including securities on loan)(a) | | | | $ | 290,809,683 | | | $ | 9,575,212 | | | $ | 6,250,983 | | | $ | 353,795,479 | |
Foreign currency(b) | | | | | 67,135 | | | | 5,192 | | | | 1,017 | | | | — | |
Dividend receivable | | | | | 1,390,895 | | | | 28,715 | | | | 61,498 | | | | 87,656 | |
Unrealized appreciation on forward foreign currency contracts . | | | | | 1,354,629 | | | | 31,004 | | | | 27,725 | | | | — | |
Reclaims receivable | | | | | 840,887 | | | | 324,563 | | | | 3,655 | | | | — | |
Securities lending income receivable | | | | | 6,179 | | | | 268 | | | | 53 | | | | 11,560 | |
Total Assets | | | | | 294,469,408 | | | | 9,964,954 | | | | 6,344,931 | | | | 353,894,695 | |
Liabilities | | | | | | | | | | | | | | | | | | |
Collateral for investments on loan | | | | | 9,981,686 | | | | 696,634 | | | | 36,999 | | | | 5,238,855 | |
Payable for investments purchased | | | | | 2,625,146 | | | | 83,730 | | | | 27,179 | | | | — | |
Cash due to custodian | | | | | 603,592 | | | | 282,101 | | | | 58,514 | | | | — | |
Unrealized depreciation on forward foreign currency contracts . | | | | | 127,041 | | | | 2,066 | | | | 2,808 | | | | — | |
Advisory fees payable | | | | | 48,398 | | | | 2,119 | | | | 1,409 | | | | 96,127 | |
Trustee fees payable | | | | | 1,487 | | | | 2,531 | | | | 28 | | | | 1,585 | |
Compliance fees payable | | | | | 56 | | | | 121 | | | | 1 | | | | 57 | |
Accrued expenses and other liabilities | | | | | 3,097 | | | | 190 | | | | 115 | | | | 3,349 | |
Total Liabilities | | | | | 13,390,503 | | | | 1,069,492 | | | | 127,053 | | | | 5,339,973 | |
Net Assets | | | | $ | 281,078,905 | | | $ | 8,895,462 | | | $ | 6,217,878 | | | $ | 348,554,722 | |
Composition of Net Assets | | | | | | | | | | | | | | | | | | |
Paid-in capital | | | | $ | 304,873,817 | | | $ | 12,283,472 | | | $ | 7,725,011 | | | $ | 390,530,319 | |
Total distributable earnings/
(accumulated loss)(c) | | | | | (23,794,912 | ) | | | (3,388,010 | ) | | | (1,507,133 | ) | | | (41,975,597 | ) |
Net Assets | | | | $ | 281,078,905 | | | $ | 8,895,462 | | | $ | 6,217,878 | | | $ | 348,554,722 | |
NET ASSET VALUE PER SHARE | | | | | | | | | | | | | | | | | | |
Shares Outstanding (no par value, unlimited shares authorized) . | | | | | 13,650,000 | | | | 450,000 | | | | 300,000 | | | | 13,550,000 | |
Net Asset Value Per Share | | | | $ | 20.59 | | | $ | 19.77 | | | $ | 20.73 | | | $ | 25.72 | |
Investments, at cost | | | | $ | 311,563,141 | | | $ | 10,667,439 | | | $ | 6,251,768 | | | $ | 355,200,710 | |
(a) Market value of securities on loan | | | | $ | 10,204,882 | | | $ | 671,099 | | | $ | 52,929 | | | $ | 36,791,699 | |
(b) Cost of foreign currency | | | | $ | 66,942 | | | $ | 5,167 | | | $ | 1,014 | | | $ | — | |
| (c) | | Total distributable earnings has been aggregated to conform to the current presentation requirements per the adoption of the SEC’s Disclosure Update and Simplification. (See Note 10) |
See notes to financial statements.
152
Statements of Assets and Liabilities(continued)
April 30, 2019 | | | | IQ Chaikin U.S.
Large Cap ETF
|
Assets
| | | | |
Investments, at value (including securities on loan)(a) | | | | $ | 278,218,395 | |
Cash | | | | | 271 | |
Dividend receivable | | | | | 252,582 | |
Securities lending income receivable | | | | | 370 | |
Total Assets | | | | | 278,471,618 | |
| | | | | | | |
Liabilities | | | | | | |
Advisory fees payable | | | | | 55,541 | |
Trustee fees payable | | | | | 1,427 | |
Compliance fees payable | | | | | 53 | |
Accrued expenses and other liabilities | | | | | 3,007 | |
Total Liabilities | | | | | 60,028 | |
Net Assets | | | | $ | 278,411,590 | |
| | | | | | | |
Composition of Net Assets | | | | | | |
Paid-in capital | | | | $ | 306,415,357 | |
Total distributable earnings/(accumulated loss)(b) | | | | | (28,003,767 | ) |
Net Assets | | | | $ | 278,411,590 | |
| | | | | | | |
NET ASSET VALUE PER SHARE | | | | | | |
Shares Outstanding (no par value, unlimited shares authorized) . | | | | | 11,250,000 | |
Net Asset Value Per Share | | | | $ | 24.75 | |
Investments, at cost | | | | $ | 285,506,147 | |
(a) Market value of securities on loan | | | | $ | 8,581,399 | |
(b) Total distributable earnings has been aggregated to conform to the current presentation requirements per the adoption of the SEC’s Disclosure Update and Simplification. (See Note 10) |
See notes to financial statements.
153
Statements of Operations
For the year ended April 30, 2019 | | | | IQ Hedge
Multi-Strategy
Tracker ETF
| | IQ Hedge
Macro
Tracker ETF
| | IQ Hedge
Market Neutral
Tracker ETF
| | IQ Hedge
Long/Short
Tracker ETF
|
Investment Income | | | | | | | | | | | | | | | | | | |
Dividend income | | | | $ | 31,584,200 | | | $ | 141,048 | | | $ | 384,655 | | | $ | 180,924 | |
Securities lending income, net of borrower rebates | | | | | 2,029,415 | | | | 13,964 | | | | 19,161 | | | | 7,736 | |
Total investment income | | | | | 33,613,615 | | | | 155,012 | | | | 403,816 | | | | 188,660 | |
Expenses | | | | | | | | | | | | | | | | | | |
Advisory fees (See Note 3) | | | | | 8,587,212 | | | | 47,173 | | | | 104,012 | | | | 50,223 | |
Trustee fees | | | | | 62,009 | | | | 329 | | | | 758 | | | | 358 | |
Legal fees | | | | | 37,265 | | | | 205 | | | | 465 | | | | 234 | |
Compliance fees | | | | | 3,709 | | | | 21 | | | | 47 | | | | 23 | |
Miscellaneous | | | | | 1,144 | | | | 95 | | | | 57 | | | | 57 | |
Total expenses | | | | | 8,691,339 | | | | 47,823 | | | | 105,339 | | | | 50,895 | |
Waivers/Reimbursement (See Note 3) | | | | | (2,522,422 | ) | | | — | | | | — | | | | — | |
Net expenses | | | | | 6,168,917 | | | | 47,823 | | | | 105,339 | | | | 50,895 | |
Net investment income | | | | | 27,444,698 | | | | 107,189 | | | | 298,477 | | | | 137,765 | |
Realized and Unrealized Gain (Loss) on Investments
and Swap Transactions | | | | | | | | | | | | | | | | | | |
Net realized gain (loss) from: | | | | | | | | | | | | | | | | | | |
Investment securities | | | | | (759,829 | ) | | | 4,734 | | | | (21,202 | ) | | | (193,171 | ) |
In-Kind redemptions | | | | | 12,493,366 | | | | 36,235 | | | | 130,090 | | | | 481,991 | |
Swap transactions | | | | | (5,312,617 | ) | | | (779 | ) | | | (61,510 | ) | | | (36,091 | ) |
Net realized gain (loss) | | | | | 6,420,920 | | | | 40,190 | | | | 47,378 | | | | 252,729 | |
Net change in net unrealized appreciation (depreciation) on: | | | | | | | | | | | | | | | | | | |
Investment securities | | | | | (14,845,687 | ) | | | (113,656 | ) | | | 75,237 | | | | (1,818 | ) |
Net change in net unrealized appreciation (depreciation) | | | | | (14,845,687 | ) | | | (113,656 | ) | | | 75,237 | | | | (1,818 | ) |
Net realized and unrealized gain (loss) | | | | | (8,424,767 | ) | | | (73,466 | ) | | | 122,615 | | | | 250,911 | |
Net Increase (Decrease) in Net Assets Resulting
from Operations | | | | $ | 19,019,931 | | | $ | 33,723 | | | $ | 421,092 | | | $ | 388,676 | |
See notes to financial statements.
154
Statements of Operations(continued)
For the year ended April 30, 2019 | | | | IQ Hedge
Event-Driven
Tracker ETF
| | IQ Real
Return ETF
| | IQ Leaders
GTAA
Tracker ETF
| | IQ Enhanced
Core Bond
U.S. ETF
|
Investment Income | | | | | | | | | | | | | | | | | | |
Dividend income | | | | $ | 135,764 | | | $ | 1,086,078 | | | $ | 1,354,428 | | | $ | 1,577,443 | |
Securities lending income, net of borrower rebates | | | | | 7,075 | | | | 42,327 | | | | 58,785 | | | | 168,343 | |
Total investment income | | | | | 142,839 | | | | 1,128,405 | | | | 1,413,213 | | | | 1,745,786 | |
Expenses | | | | | | | | | | | | | | | | | | |
Advisory fees (See Note 3) | | | | | 24,917 | | | | 253,347 | | | | 200,435 | | | | 158,801 | |
Trustee fees | | | | | 182 | | | | 2,915 | | | | 2,427 | | | | 3,420 | |
Legal fees | | | | | 116 | | | | 1,721 | | | | 1,494 | | | | 2,102 | |
Compliance fees | | | | | 12 | | | | 172 | | | | 152 | | | | 212 | |
Miscellaneous | | | | | 57 | | | | 240 | | | | 57 | | | | 57 | |
Total expenses | | | | | 25,284 | | | | 258,395 | | | | 204,565 | | | | 164,592 | |
Waivers/Reimbursement (See Note 3) | | | | | — | | | | (62,966 | ) | | | (39,242 | ) | | | (31,911 | ) |
Net expenses | | | | | 25,284 | | | | 195,429 | | | | 165,323 | | | | 132,681 | |
Net investment income | | | | | 117,555 | | | | 932,976 | | | | 1,247,890 | | | | 1,613,105 | |
Realized and Unrealized Gain (Loss) on Investments and Swap Transactions | | | | | | | | | | | | | | | | | | |
Net realized gain (loss) from: | | | | | | | | | | | | | | | | | | |
Investment securities | | | | | (51,183 | ) | | | (439,788 | ) | | | (1,420,694 | ) | | | (1,316,647 | ) |
In-Kind redemptions | | | | | 104,199 | | | | 27,767 | | | | 799,598 | | | | (147,508 | ) |
Swap transactions | | | | | 444 | | | | — | | | | (328,489 | ) | | | — | |
Net realized gain (loss) | | | | | 53,460 | | | | (412,021 | ) | | | (949,585 | ) | | | (1,464,155 | ) |
Net change in net unrealized appreciation
(depreciation) on: | | | | | | | | | | | | | | | | | | |
Investment securities | | | | | 31,980 | | | | 791,516 | | | | 1,222,240 | | | | 2,739,537 | |
Net change in net unrealized appreciation (depreciation) | | | | | 31,980 | | | | 791,516 | | | | 1,222,240 | | | | 2,739,537 | |
Net realized and unrealized gain (loss) | | | | | 85,440 | | | | 379,495 | | | | 272,655 | | | | 1,275,382 | |
Net Increase (Decrease) in Net Assets Resulting from Operations | | | | $ | 202,995 | | | $ | 1,312,471 | | | $ | 1,520,545 | | | $ | 2,888,487 | |
See notes to financial statements.
155
Statements of Operations(continued)
For the year ended April 30, 2019 | | | | IQ Enhanced
Core Plus Bond
U.S. ETF
| | IQ Short
Duration
Enhanced Core
Bond U.S. ETF**
| | IQ Merger
Arbitrage ETF
| | IQ Global
Resources ETF
|
Investment Income | | | | | | | | | | | | | | | | | | |
Dividend income* | | | | $ | 6,694,391 | | | $ | 30,088 | | | $ | 6,053,708 | | | $ | 6,881,702 | |
Securities lending income, net of borrower rebates | | | | | 347,136 | | | | 755 | | | | 1,042,507 | | | | 63,470 | |
Dividend income from affiliates* | | | | | 283,334 | | | | — | | | | — | | | | — | |
Total investment income | | | | | 7,324,861 | | | | 30,843 | | | | 7,096,215 | | | | 6,945,172 | |
Expenses | | | | | | | | | | | | | | | | | | |
Advisory fees (See Note 3) | | | | | 572,525 | | | | 2,643 | | | | 5,468,960 | | | | 1,663,902 | |
Trustee fees | | | | | 12,423 | | | | 82 | | | | 40,234 | | | | 11,980 | |
Legal fees | | | | | 6,036 | | | | 254 | | | | 24,675 | | | | 7,513 | |
Compliance fees | | | | | 801 | | | | 5 | | | | 2,429 | | | | 758 | |
Miscellaneous | | | | | 57 | | | | 65 | | | | 57 | | | | 57 | |
Total expenses | | | | | 591,842 | | | | 3,049 | | | | 5,536,355 | | | | 1,684,210 | |
Waivers/Reimbursement (See Note 3) | | | | | (115,208 | ) | | | (406 | ) | | | — | | | | — | |
Net expenses | | | | | 476,634 | | | | 2,643 | | | | 5,536,355 | | | | 1,684,210 | |
Net investment income | | | | | 6,848,227 | | | | 28,200 | | | | 1,559,860 | | | | 5,260,962 | |
Realized and Unrealized Gain (Loss) on Investments, Swap transactions and Forward foreign currency contracts and translation | | | | | | | | | | | | | | | | | | |
Net realized gain (loss) from: | | | | | | | | | | | | | | | | | | |
Investment securities | | | | | (8,926,552 | ) | | | (2,263 | ) | | | (3,996,393 | ) | | | (15,106,942 | ) |
Investment in affiliates | | | | | (304,337 | ) | | | — | | | | — | | | | — | |
In-Kind redemptions | | | | | (202,454 | ) | | | 19,115 | | | | 20,569,693 | | | | 9,465,273 | |
Affiliates In-Kind redemptions | | | | | (6,595 | ) | | | — | | | | — | | | | — | |
Swap transactions | | | | | — | | | | — | | | | (26,863,752 | ) | | | (994,330 | ) |
Forward foreign currency contracts | | | | | — | | | | — | | | | (5,150 | ) | | | 54 | |
Foreign currency transactions | | | | | — | | | | — | | | | (995,827 | ) | | | (105,662 | ) |
Net realized gain (loss) | | | | | (9,439,938 | ) | | | 16,852 | | | | (11,291,429 | ) | | | (6,741,607 | ) |
Net change in net unrealized appreciation
(depreciation) on: | | | | | | | | | | | | | | | | | | |
Investment securities | | | | | 9,889,834 | | | | 33,767 | | | | 20,509,066 | | | | (6,406,019 | ) |
Investment in affiliates | | | | | 149,188 | | | | — | | | | — | | | | — | |
Foreign currency translations | | | | | — | | | | — | | | | (12,417 | ) | | | (4,515 | ) |
Net change in net unrealized appreciation
(depreciation) | | | | | 10,039,022 | | | | 33,767 | | | | 20,496,649 | | | | (6,410,534 | ) |
Net realized and unrealized gain (loss) | | | | | 599,084 | | | | 50,619 | | | | 9,205,220 | | | | (13,152,141 | ) |
Net Increase (Decrease) in Net Assets Resulting from Operations | | | | $ | 7,447,311 | | | $ | 78,819 | | | $ | 10,765,080 | | | $ | (7,891,179 | ) |
* Net of foreign taxes withheld of: | | | | $ | — | | | $ | — | | | $ | 23,763 | | | $ | 440,301 | |
** | | Commencement of operations December 18, 2018. |
See notes to financial statements.
156
Statements of Operations(continued)
For the year ended April 30, 2019 | | | | IQ Global
Agribusiness
Small Cap ETF
| | IQ U.S. Real
Estate Small
Cap ETF
| | IQ S&P High Yield
Low Volatility
Bond ETF
| | IQ 500
International ETF**
|
Investment Income | | | | | | | | | | | | | | | | | | |
Dividend income* | | | | $ | 183,824 | | | $ | 2,960,528 | | | $ | — | | | $ | 951,970 | |
Interest income | | | | | — | | | | — | | | | 4,138,152 | | | | — | |
Securities lending income, net of borrower rebates | | | | | 9,883 | | | | 34,674 | | | | 2,500 | | | | 4,469 | |
Total investment income | | | | | 193,707 | | | | 2,995,202 | | | | 4,140,652 |
| | | 956,439 | |
Expenses | | | | | | | | | | | | | | | | | | |
Advisory fees (See Note 3) | | | | | 80,875 | | | | 542,471 | | | | 343,624 | | | | 57,555 | |
Trustee fees | | | | | 584 | | | | 4,252 | | | | 4,670 | | | | 1,361 | |
Legal fees | | | | | 361 | | | | 2,667 | | | | 2,923 | | | | 1,009 | |
Compliance fees | | | | | 36 | | | | 263 | | | | 287 | | | | 89 | |
Miscellaneous | | | | | 57 | | | | 57 | | | | 838 | | | | 57 | |
Total expenses | | | | | 81,913 | | | | 549,710 | | | | 352,342 | | | | 60,071 | |
Waivers/Reimbursement (See Note 3) | | | | | — | | | | — | | | | (8,720 | ) | | | (2,515 | ) |
Net expenses | | | | | 81,913 | | | | 549,710 | | | | 343,622 | | | | 57,556 | |
Net investment income | | | | | 111,794 | | | | 2,445,492 | | | | 3,797,030 | | | | 898,883 | |
Realized and Unrealized Gain (Loss) on Investments and Forward foreign currency translation | | | | | | | | | | | | | | | | | | |
Net realized gain (loss) from: | | | | | | | | | | | | | | | | | | |
Investment securities | | | | | 1,224,758 | | | | (956,529 | ) | | | (1,761,134 | ) | | | 6,155 | |
In-Kind redemptions | | | | | 354,979 | | | | 541,900 | | | | (188,326 | ) | | | — | |
Foreign currency transactions | | | | | (2,539 | ) | | | — | | | | — | | | | (1,815 | ) |
Net realized gain (loss) | | | | | 1,577,198 | | | | (414,629 | ) | | | (1,949,460 | ) | | | 4,340 | |
Net change in net unrealized appreciation
(depreciation) on: | | | | | | | | | | | | | | | | | | |
Investment securities | | | | | (1,979,040 | ) | | | 6,056,098 | | | | 3,236,523 | | | | 5,276,611 | |
Foreign currency translations | | | | | 1,037 | | | | — | | | | — | | | | (3,017 | ) |
Net change in net unrealized appreciation
(depreciation) | | | | | (1,978,003 | ) | | | 6,056,098 | | | | 3,236,523 | | | | 5,273,594 | |
Net realized and unrealized gain (loss) | | | | | (400,805 | ) | | | 5,641,469 | | | | 1,287,063 | | | | 5,277,934 | |
Net Increase (Decrease) in Net Assets Resulting
from Operations | | | | $ | (289,011 | ) | | $ | 8,086,961 | | | $ | 5,084,093 | | | $ | 6,176,817 | |
* Net of foreign taxes withheld of: | | | | $ | 12,896 | | | $ | — | | | $ | — | | | $ | 109,011 | |
** | | Commencement of operations December 13, 2018. |
See notes to financial statements.
157
Statements of Operations(continued)
For the year ended April 30, 2019 | | | | IQ 50 Percent
Hedged FTSE
International ETF
| | IQ 50 Percent
Hedged FTSE
Europe ETF
| | IQ 50 Percent
Hedged FTSE
Japan ETF
| | IQ Chaikin
U.S. Small
Cap ETF
|
Investment Income | | | | | | | | | | | | | | | | | | |
Dividend income* | | | | $ | 14,501,609 | | | $ | 1,676,854 | | | $ | 425,858 | | | $ | 5,971,876 | |
Securities lending income, net of borrower rebates | | | | | 41,638 | | | | 4,946 | | | | 3,609 | | | | 54,609 | |
Total investment income | | | | | 14,543,247 | | | | 1,681,800 | | | | 429,467 | | | | 6,026,485 | |
Expenses | | | | | | | | | | | | | | | | | | |
Advisory fees (See Note 3) | | | | | 1,576,189 | | | | 107,449 | | | | 114,345 | | | | 1,545,749 | |
Trustee fees | | | | | 24,176 | | | | 3,674 | | | | 1,358 | | | | 23,894 | |
Legal fees | | | | | 15,001 | | | | 1,445 | | | | 819 | | | | 16,564 | |
Compliance fees | | | | | 1,530 | | | | 234 | | | | 87 | | | | 1,467 | |
Miscellaneous | | | | | — | | | | 43 | | | | 57 | | | | 57 | |
Total expenses | | | | | 1,616,896 | | | | 112,845 | | | | 116,666 | | | | 1,587,731 | |
Waivers/Reimbursement (See Note 3) | | | | | (716,212 | ) | | | (41,212 | ) | | | (40,436 | ) | | | (41,982 | ) |
Net expenses | | | | | 900,684 | | | | 71,633 | | | | 76,230 | | | | 1,545,749 | |
Net investment income | | | | | 13,642,563 | | | | 1,610,167 | | | | 353,237 | | | | 4,480,736 | |
Realized and Unrealized Gain (Loss) on Investments, Swap transactions and Forward foreign currency contracts and translation | | | | | | | | | | | | | | | | | | |
Net realized gain (loss) from: | | | | | | | | | | | | | | | | | | |
Investment securities | | | | | (8,984,314 | ) | | | (80,675 | ) | | | (249,709 | ) | | | (32,925,984 | ) |
In-Kind redemptions | | | | | 7,157,285 | | | | 12,747,491 | | | | 2,630,764 | | | | 7,093,159 | |
Swap transactions | | | | | (58,365 | ) | | | (1,757 | ) | | | — | | | | — | |
Forward foreign currency contracts | | | | | 23,209,042 | | | | 4,377,403 | | | | 798,491 | | | | — | |
Foreign currency transactions | | | | | (317,132 | ) | | | (49,788 | ) | | | (17,009 | ) | | | — | |
Net realized gain (loss) | | | | | 21,006,516 | | | | 16,992,674 | | | | 3,162,537 | | | | (25,832,825 | ) |
Net change in net unrealized appreciation
(depreciation) on: | | | | | | | | | | | | | | | | | | |
Investment securities | | | | | (48,574,841 | ) | | | (16,900,860 | ) | | | (6,410,965 | ) | | | (4,926,146 | ) |
Forward foreign currency contracts | | | | | (4,876,917 | ) | | | (1,771,299 | ) | | | (476,184 | ) | | | — | |
Foreign currency translations | | | | | 10,772 | | | | (2,204 | ) | | | 8,124 | | | | — | |
Net change in net unrealized appreciation
(depreciation) | | | | | (53,440,986 | ) | | | (18,674,363 | ) | | | (6,879,025 | ) | | | (4,926,146 | ) |
Net realized and unrealized gain (loss) | | | | | (32,434,470 | ) | | | (1,681,689 | ) | | | (3,716,488 | ) | | | (30,758,971 | ) |
Net Increase (Decrease) in Net Assets Resulting from Operations | | | | $ | (18,791,907 | ) | | $ | (71,522 | ) | | $ | (3,363,251 | ) | | $ | (26,278,235 | ) |
* Net of foreign taxes withheld of: | | | | $ | 1,287,812 | | | $ | 204,729 | | | $ | 59,180 | | | $ | 2,109 | |
See notes to financial statements.
158
Statements of Operations(continued)
For the year ended April 30, 2019 | | | | IQ Chaikin U.S.
Large Cap ETF
|
Investment Income | | | | | | |
Dividend income* | | | | $ | 8,092,540 | |
Securities lending income, net of borrower rebates | | | | | 2,507 | |
Total investment income | | | | | 8,095,047 | |
| | | | | | | |
Expenses | | | | | | |
Advisory fees (See Note 3) | | | | | 912,282 | |
Trustee fees | | | | | 19,127 | |
Legal fees | | | | | 13,034 | |
Compliance fees | | | | | 1,126 | |
Miscellaneous | | | | | 621 | |
Total expenses | | | | | 946,190 | |
Waivers/Reimbursement (See Note 3) | | | | | (33,909 | ) |
Net expenses | | | | | 912,281 | |
Net investment income | | | | | 7,182,766 | |
| | | | | | | |
Realized and Unrealized Gain (Loss) on Investments | | | | | | |
Net realized gain (loss) from: | | | | | | |
Investment securities | | | | | (16,319,373 | ) |
In-Kind redemptions | | | | | 21,793,312 | |
Net realized gain (loss) | | | | | 5,473,939 | |
Net change in net unrealized appreciation (depreciation) on: | | | | | | |
Investment securities | | | | | (10,090,415 | ) |
Net change in net unrealized appreciation (depreciation) | | | | | (10,090,415 | ) |
Net realized and unrealized gain (loss) | | | | | (4,616,476 | ) |
| | | | | | | |
Net Increase (Decrease) in Net Assets Resulting from Operations | | | | $ | 2,566,290 | |
* Net of foreign taxes withheld of: | | | | $ | 21,186 | |
See notes to financial statements.
159
Statements of Changes in Net Assets
| | | | IQ Hedge Multi-Strategy Tracker ETF
| | IQ Hedge Macro Tracker ETF
| |
| | | | For the Year Ended April 30,
| | For the Year Ended April 30,
| |
| | | | 2019
| | 2018
| | 2019
| | 2018
|
Increase (Decrease) in Net Assets from Operations
| | | | | | | | | | | | | | | | | | |
Net investment income | | | | $ | 27,444,698 | | | $ | 20,581,898 | | | $ | 107,189 | | | $ | 96,282 | |
Net realized gain (loss) | | | | | 6,420,920 | | | | 9,264,374 | | | | 40,190 | | | | (70,917 | ) |
Net change in net unrealized appreciation (depreciation) | | | | | (14,845,687 | ) | | | 15,463,404 | | | | (113,656 | ) | | | 197,348 | |
Net increase (decrease) in net assets resulting from operations | | | | | 19,019,931 | | | | 45,309,676 | | | | 33,723 | | | | 222,713 | |
Distributions to Shareholders | | | | | (24,498,116 | ) | | | —* | | | | (69,928 | ) | | | —* | |
Capital Share Transactions | | | | | | | | | | | | | | | | | | |
Proceeds from shares created | | | | | 331,859,370 | | | | 125,582,960 | | | | — | | | | — | |
Cost of shares redeemed | | | | | (457,237,241 | ) | | | (109,193,905 | ) | | | (1,299,990 | ) | | | — | |
Net increase (decrease) from capital share transactions | | | | | (125,377,871 | ) | | | 16,389,055 | | | | (1,299,990 | ) | | | — | |
Total increase (decrease) in net assets | | | | | (130,856,056 | ) | | | 61,698,731 | | | | (1,336,195 | ) | | | 222,713 | |
Net Assets | | | | | | | | | | | | | | | | | | |
Beginning of year | | | | | 1,124,278,128 | | | | 1,062,579,397 | | | | 6,587,659 | | | | 6,364,946 | |
End of year | | | | $ | 993,422,072 | | | $ | 1,124,278,128 | * | | $ | 5,251,464 | | | $ | 6,587,659 | * |
Changes in Shares Outstanding | | | | | | | | | | | | | | | | | | |
Shares outstanding, beginning of year | | | | | 37,000,000 | | | | 36,450,000 | | | | 250,000 | | | | 250,000 | |
Shares created | | | | | 11,150,000 | | | | 4,150,000 | | | | — | | | | — | |
Shares redeemed | | | | | (15,350,000 | ) | | | (3,600,000 | ) | | | (50,000 | ) | | | — | |
Shares outstanding, end of year | | | | | 32,800,000 | | | | 37,000,000 | | | | 200,000 | | | | 250,000 | |
* | | For the year ended April 30, 2019, the requirement to disclose dividends and distributions paid to shareholders from net investment income and or net realized gain (loss) on investments was modified and now presented together as Distributions to Shareholders. End of period net assets included undistributed net investment income of $10,278,887 and $24,981 respectively at April 30, 2018. (See Note 10.) See Note 5 for tax basis of distributable earnings. |
See notes to financial statements.
160
Statements of Changes in Net Assets(continued)
| | | | IQ Hedge Market Neutral Tracker ETF
| | IQ Hedge Long/Short Tracker ETF
| |
| | | | For the Year Ended April 30,
| | For the Year Ended April 30,
| |
| | | | 2019
| | 2018
| | 2019
| | 2018
|
Increase (Decrease) in Net Assets from Operations | | | | | | | | | | | | | | | | | | |
Net investment income | | | | $ | 298,477 | | | $ | 189,743 | | | $ | 137,765 | | | $ | 103,075 | |
Net realized gain (loss) | | | | | 47,378 | | | | (53,261 | ) | | | 252,729 | | | | 16,362 | |
Net change in net unrealized appreciation (depreciation) | | | | | 75,237 | | | | 13,566 | | | | (1,818 | ) | | | 56,690 | |
Net increase (decrease) in net assets resulting
from operations | | | | | 421,092 | | | | 150,048 | | | | 388,676 | | | | 176,127 | |
Distributions to Shareholders | | | | | — | | | | —* | | | | (190,276 | ) | | | (16,706 | )* |
Capital Share Transactions | | | | | | | | | | | | | | | | | | |
Proceeds from shares created | | | | | 3,815,609 | | | | 1,276,132 | | | | 6,294,199 | | | | 5,621,040 | |
Cost of shares redeemed | | | | | (1,286,386 | ) | | | — | | | | (8,797,572 | ) | | | (1,088,637 | ) |
Net increase (decrease) from capital share transactions | | | | | 2,529,223 | | | | 1,276,132 | | | | (2,503,373 | ) | | | 4,532,403 | |
Total increase (decrease) in net assets | | | | | 2,950,315 | | | | 1,426,180 | | | | (2,304,973 | ) | | | 4,691,824 | |
Net Assets | | | | | | | | | | | | | | | | | | |
Beginning of year | | | | | 12,790,291 | | | | 11,364,111 | | | | 8,764,170 | | | | 4,072,346 | |
End of year | | | | $ | 15,740,606 | | | $ | 12,790,291 | * | | $ | 6,459,197 | | | $ | 8,764,170 | * |
Changes in Shares Outstanding | | | | | | | | | | | | | | | | | | |
Shares outstanding, beginning of year | | | | | 500,000 | | | | 450,000 | | | | 400,001 | | | | 200,001 | |
Shares created | | | | | 150,000 | | | | 50,000 | | | | 300,000 | | | | 250,000 | |
Shares redeemed | | | | | (50,000 | ) | | | — | | | | (400,001 | ) | | | (50,000 | ) |
Shares outstanding, end of year | | | | | 600,000 | | | | 500,000 | | | | 300,000 | | | | 400,001 | |
* | | For the year ended April 30, 2019, the requirement to disclose dividends and distributions paid to shareholders from net investment income and or net realized gain (loss) on investments was modified and now presented together as Distributions to Shareholders. End of period net assets included undistributed net investment income of $2,372 and $80,533 respectively at April 30, 2018. (See Note 10.) See Note 5 for tax basis of distributable earnings. |
See notes to financial statements.
161
Statements of Changes in Net Assets(continued)
| | | | IQ Hedge Event-Driven Tracker ETF
| | IQ Real Return ETF
| |
| | | | For the Year Ended April 30,
| | For the Year Ended April 30,
| |
| | | | 2019
| | 2018
| | 2019
| | 2018
|
Increase (Decrease) in Net Assets from Operations | | | | | | | | | | | | | | | | | | |
Net investment income | | | | $ | 117,555 | | | $ | 83,106 | | | $ | 932,976 | | | $ | 330,098 | |
Net realized gain (loss) | | | | | 53,460 | | | | 24,172 | | | | (412,021 | ) | | | 628,896 | |
Net change in net unrealized appreciation (depreciation) | | | | | 31,980 | | | | 13,877 | | | | 791,516 | | | | (487,900 | ) |
Net increase (decrease) in net assets resulting
from operations | | | | | 202,995 | | | | 121,155 | | | | 1,312,471 | | | | 471,094 | |
Distributions to Shareholders | | | | | (129,849 | ) | | | (70,341 | )* | | | (730,380 | ) | | | (308,837 | )* |
Capital Share Transactions | | | | | | | | | | | | | | | | | | |
Proceeds from shares created | | | | | 3,148,412 | | | | — | | | | 13,889,918 | | | | 16,549,415 | |
Cost of shares redeemed | | | | | (2,107,542 | ) | | | — | | | | (2,745,538 | ) | | | — | |
Net increase from capital share transactions | | | | | 1,040,870 | | | | — | | | | 11,144,380 | | | | 16,549,415 | |
Total increase in net assets | | | | | 1,114,016 | | | | 50,814 | | | | 11,726,471 | | | | 16,711,672 | |
Net Assets | | | | | | | | | | | | | | | | | | |
Beginning of year | | | | | 3,138,976 | | | | 3,088,162 | | | | 45,319,432 | | | | 28,607,760 | |
End of year | | | | $ | 4,252,992 | | | $ | 3,138,976 | * | | $ | 57,045,903 | | | $ | 45,319,432 | * |
Changes in Shares Outstanding | | | | | | | | | | | | | | | | | | |
Shares outstanding, beginning of year | | | | | 150,001 | | | | 150,001 | | | | 1,650,000 | | | | 1,050,000 | |
Shares created | | | | | 150,000 | | | | — | | | | 500,000 | | | | 600,000 | |
Shares redeemed | | | | | (100,001 | ) | | | — | | | | (100,000 | ) | | | — | |
Shares outstanding, end of year | | | | | 200,000 | | | | 150,001 | | | | 2,050,000 | | | | 1,650,000 | |
* | | For the year ended April 30, 2019, the requirement to disclose dividends and distributions paid to shareholders from net investment income and or net realized gain (loss) on investments was modified and now presented together as Distributions to Shareholders. End of period net assets included undistributed net investment income of $45,908 and $172,756 respectively at April 30, 2018. (See Note 10.) See Note 5 for tax basis of distributable earnings. |
See notes to financial statements.
162
Statements of Changes in Net Assets(continued)
| | | | IQ Leaders GTAA Tracker ETF
| | IQ Enhanced Core Bond U.S. ETF
| |
| | | | For the Year Ended April 30,
| | For the Year Ended April 30,
| |
| | | | 2019
| | 2018
| | 2019
| | 2018
|
Increase (Decrease) in Net Assets from Operations | | | | | | | | | | | | | | | | | | |
Net investment income | | | | $ | 1,247,890 | | | $ | 981,659 | | | $ | 1,613,105 | | | $ | 1,570,301 | |
Net realized gain (loss) | | | | | (949,585 | ) | | | 3,277,365 | | | | (1,464,155 | ) | | | (1,981,229 | ) |
Net change in net unrealized appreciation (depreciation) | | | | | 1,222,240 | | | | (1,384,243 | ) | | | 2,739,537 | | | | (1,002,008 | ) |
Net increase (decrease) in net assets resulting from operations | | | | | 1,520,545 | | | | 2,874,781 | | | | 2,888,487 | | | | (1,412,936 | ) |
Distributions to Shareholders | | | | | (1,367,155 | ) | | | (1,005,870 | )* | | | (1,624,788 | ) | | | (1,575,071 | )* |
Capital Share Transactions | | | | | | | | | | | | | | | | | | |
Proceeds from shares created | | | | | 7,161,649 | | | | 45,790,546 | | | | 97,133,380 | | | | 7,640,257 | |
Cost of shares redeemed | | | | | (13,112,399 | ) | | | (32,426,450 | ) | | | (60,889,657 | ) | | | (27,802,367 | ) |
Net increase (decrease) from capital share transactions | | | | | (5,950,750 | ) | | | 13,364,096 | | | | 36,243,723 | | | | (20,162,110 | ) |
Total increase (decrease) in net assets | | | | | (5,797,360 | ) | | | 15,233,007 | | | | 37,507,422 | | | | (23,150,117 | ) |
Net Assets | | | | | | | | | | | | | | | | | | |
Beginning of year | | | | | 49,472,777 | | | | 34,239,770 | | | | 51,081,857 | | | | 74,231,974 | |
End of year | | | | $ | 43,675,417 | | | $ | 49,472,777 | * | | $ | 88,589,279 | | | $ | 51,081,857 | * |
Changes in Shares Outstanding | | | | | | | | | | | | | | | | | | |
Shares outstanding, beginning of year | | | | | 2,050,001 | | | | 1,500,001 | | | | 2,750,001 | | | | 3,800,001 | |
Shares created | | | | | 300,000 | | | | 1,900,000 | | | | 5,250,000 | | | | 400,000 | |
Shares redeemed | | | | | (550,001 | ) | | | (1,350,000 | ) | | | (3,300,001 | ) | | | (1,450,000 | ) |
Shares outstanding, end of year | | | | | 1,800,000 | | | | 2,050,001 | | | | 4,700,000 | | | | 2,750,001 | |
* | | For the year ended April 30, 2019, the requirement to disclose dividends and distributions paid to shareholders from net investment income and or net realized gain (loss) on investments was modified and now presented together as Distributions to Shareholders. End of period net assets included undistributed net investment income of $202,093 and $— respectively at April 30, 2018. (See Note 10.) See Note 5 for tax basis of distributable earnings. |
See notes to financial statements.
163
Statements of Changes in Net Assets(continued)
| | | | IQ Enhanced Core Plus Bond U.S. ETF
| | IQ Short Duration Enhanced
Core Bond U.S. ETF
| |
| | | | For the Year Ended April 30,
| |
| | | | 2019
| | 2018
| | For the Period
December 18, 2018*
to April 30,
2019
|
Increase (Decrease) in Net Assets from Operations | | | | | | | | | | | | | | |
Net investment income | | | | $ | 6,848,227 | | | $ | 9,279,494 | | | $ | 28,200 | |
Net realized gain (loss) | | | | | (9,439,938 | ) | | | (7,606,571 | ) | | | 16,852 | |
Net change in net unrealized appreciation (depreciation) | | | | | 10,039,022 | | | | (8,187,023 | | | | 33,767 | |
Net increase (decrease) in net assets resulting from operations | | | | | 7,447,311 | | | | (6,514,100 | ) | | | 78,819 | |
Distributions to Shareholders | | | | | (6,882,062 | ) | | | (9,263,899 | )† | | | (28,586 | ) |
| | | | | | | | | | | | | | | |
Capital Share Transactions | | | | | | | | | | | | | | |
Proceeds from shares created | | | | | 25,593,390 | | | | 221,440,893 | | | | 8,792,823 | |
Cost of shares redeemed | | | | | (203,654,352 | ) | | | (102,460,425 | ) | | | (5,038,018 | ) |
Net increase (decrease) from capital share transactions | | | | | (178,060,962 | ) | | | 118,980,468 | | | | 3,754,805 | |
Total increase (decrease) in net assets | | | | | (177,495,713 | ) | | | 103,202,469 | | | | 3,805,038 | |
| | | | | | | | | | | | | | | |
Net Assets | | | | | | | | | | | | | | |
Beginning of period | | | | | 333,989,648 | | | | 230,787,179 | | | | — | |
End of period | | | | $ | 156,493,935 | | | $ | 333,989,648 | † | | $ | 3,805,038 | |
| | | | | | | | | | | | | | | |
Changes in Shares Outstanding | | | | | | | | | | | | | | |
Shares outstanding, beginning of period | | | | | 17,500,001 | | | | 11,550,001 | | | | — | |
Shares created | | | | | 1,350,000 | | | | 11,200,000 | | | | 350,000 | |
Shares redeemed | | | | | (10,700,001 | ) | | | (5,250,000 | ) | | | (200,000 | ) |
Shares outstanding, end of period | | | | | 8,150,000 | | | | 17,500,001 | | | | 150,000 | |
* | | Commencement of operations. |
† | | For the year ended April 30, 2019, the requirement to disclose dividends and distributions paid to shareholders from net investment income and or net realized gain (loss) on investments was modified and now presented together as Distributions to Shareholders. End of period net assets included undistributed net investment income of $14,785 at April 30, 2018. (See Note 10.) See Note 5 for tax basis of distributable earnings. |
See notes to financial statements.
164
Statements of Changes in Net Assets(continued)
| | | | IQ Merger Arbitrage ETF
| | IQ Global Resources ETF
| |
| | | | For the Year Ended April 30,
| | For the Year Ended April 30,
| |
| | | | 2019
| | 2018
| | 2019
| | 2018
|
Increase (Decrease) in Net Assets from Operations | | | | | | | | | | | | | | | | | | |
Net investment income | | | | $ | 1,559,860 | | | $ | 1,126,792 | | | $ | 5,260,962 | | | $ | 5,135,314 | |
Net realized gain (loss) | | | | | (11,291,429 | ) | | | 6,943,944 | | | | (6,741,607 | ) | | | (1,714,686 | ) |
Net change in net unrealized appreciation (depreciation) | | | | | 20,496,649 | | | | (7,222,718 | ) | | | (6,410,534 | ) | | | 9,685,770 | |
Net increase (decrease) in net assets resulting from operations | | | | | 10,765,080 | | | | 848,018 | | | | (7,891,179 | ) | | | 13,106,398 | |
Distributions to Shareholders | | | | | — | | | | —* | | | | (1,346,949 | ) | | | —* | |
Capital Share Transactions | | | | | | | | | | | | | | | | | | |
Proceeds from shares created | | | | | 628,333,768 | | | | 590,741,873 | | | | 69,696,407 | | | | 59,545,258 | |
Cost of shares redeemed | | | | | (178,685,181 | ) | | | (255,037,093 | ) | | | (123,858,817 | ) | | | (13,389,404 | ) |
Net increase (decrease) from capital share transactions | | | | | 449,648,587 | | | | 335,704,780 | | | | (54,162,410 | ) | | | 46,155,854 | |
Total increase (decrease) in net assets | | | | | 460,413,667 | | | | 336,552,798 | | | | (63,400,538 | ) | | | 59,262,252 | |
Net Assets | | | | | | | | | | | | | | | | | | |
Beginning of year | | | | | 525,385,880 | | | | 188,833,082 | | | | 238,712,475 | | | | 179,450,223 | |
End of year | | | | $ | 985,799,547 | | | $ | 525,385,880 | * | | $ | 175,311,937 | | | $ | 238,712,475 | * |
Changes in Shares Outstanding | | | | | | | | | | | | | | | | | | |
Shares outstanding, beginning of year | | | | | 17,100,000 | | | | 6,250,000 | | | | 8,600,000 | | | | 6,950,000 | |
Shares created | | | | | 19,850,000 | | | | 19,150,000 | | | | 2,500,000 | | | | 2,150,000 | |
Shares redeemed | | | | | (5,650,000 | ) | | | (8,300,000 | ) | | | (4,600,000 | ) | | | (500,000 | ) |
Shares outstanding, end of year | | | | | 31,300,000 | | | | 17,100,000 | | | | 6,500,000 | | | | 8,600,000 | |
* | | For the year ended April 30, 2019, the requirement to disclose dividends and distributions paid to shareholders from net investment income and/or net realized gain (loss) on investments was modified and now presented together as Distributions to Shareholders. End of period net assets included overdistributed net investment income of $120,110 and $69,350 respectively at April 30, 2018. (See Note 10.) See Note 5 for taxbasis of distributable earnings. |
See notes to financial statements.
165
Statements of Changes in Net Assets(continued)
| | | | IQ Global Agribusiness Small Cap ETF
| | IQ U.S. Real Estate Small Cap ETF
| |
| | | | For the Year Ended April 30,
| | For the Year Ended April 30,
| |
| | | | 2019
| | 2018
| | 2019
| | 2018
|
Increase (Decrease) in Net Assets from Operations | | | | | | | | | | | | | | | | | | |
Net investment income | | | | $ | 111,794 | | | $ | 98,074 | | | $ | 2,445,492 | | | $ | 3,630,933 | |
Net realized gain (loss) | | | | | 1,577,198 | | | | 292,890 | | | | (414,629 | ) | | | 2,784,023 | |
Net change in net unrealized appreciation (depreciation) | | | | | (1,978,003 | ) | | | 109,259 | | | | 6,056,098 | | | | (13,108,294 | ) |
Net increase (decrease) in net assets resulting from operations | | | | | (289,011 | ) | | | 500,223 | | | | 8,086,961 | | | | (6,693,338 | ) |
Distributions to Shareholders | | | | | (98,945 | ) | | | (109,575 | )* | | | (2,374,318 | ) | | | (3,563,539 | )* |
Distributions to Shareholders from Return of Capital | | | | | — | | | | — | | | | (2,583,466 | ) | | | (2,075,765 | ) |
Total distributions to shareholders | | | | | (98,945 | ) | | | (109,575 | ) | | | (4,957,784 | ) | | | (5,639,304 | ) |
Capital Share Transactions | | | | | | | | | | | | | | | | | | |
Proceeds from shares created | | | | | — | | | | — | | | | 1,351,055 | | | | 6,779,681 | |
Cost of shares redeemed | | | | | (1,620,848 | ) | | | (1,713,338 | ) | | | (14,954,392 | ) | | | (26,358,606 | ) |
Net increase (decrease) from capital share transactions | | | | | (1,620,848 | ) | | | (1,713,338 | ) | | | (13,603,337 | ) | | | (19,578,925 | ) |
Total increase (decrease) in net assets | | | | | (2,008,804 | ) | | | (1,322,690 | ) | | | (10,474,160 | ) | | | (31,911,567 | ) |
Net Assets | | | | | | | | | | | | | | | | | | |
Beginning of year | | | | | 11,872,725 | | | | 13,195,415 | | | | 82,089,155 | | | | 114,000,722 | |
End of year | | | | $ | 9,863,921 | | | $ | 11,872,725 | * | | $ | 71,614,995 | | | $ | 82,089,155 | * |
Changes in Shares Outstanding | | | | | | | | | | | | | | | | | | |
Shares outstanding, beginning of year | | | | | 350,000 | | | | 400,000 | | | | 3,400,000 | | | | 4,200,000 | |
Shares created | | | | | — | | | | — | | | | 50,000 | | | | 250,000 | |
Shares redeemed | | | | | (50,000 | ) | | | (50,000 | ) | | | (600,000 | ) | | | (1,050,000 | ) |
Shares outstanding, end of year | | | | | 300,000 | | | | 350,000 | | | | 2,850,000 | | | | 3,400,000 | |
* | | For the year ended April 30, 2019, the requirement to disclose dividends and distributions paid to shareholders from net investment income and or net realized gain (loss) on investments was modified and now presented together as Distributions to Shareholders. End of period net assets included undistributed net investment income of $44,699 and $94,696 respectively at April 30, 2018. (See Note 10.) See Note 5 for tax basis of distributable earnings. |
See notes to financial statements.
166
Statements of Changes in Net Assets(continued)
| | | | IQ S&P High Yield Low
Volatility Bond ETF
| | IQ 500
International ETF
| |
| | | | For the Year Ended April 30,
| |
| | | | 2019
| | 2018
| | For the Period
December 13, 2018*
to April 30,
2019
|
Increase (Decrease) in Net Assets from Operations | | | | | | | | | | | | | | |
Net investment income | | | | $ | 3,797,030 | | | $ | 3,762,027 | | | $ | 898,883 | |
Net realized gain (loss) | | | | | (1,949,460 | ) | | | (1,255,059 | ) | | | 4,340 | |
Net change in net unrealized appreciation (depreciation) | | | | | 3,236,523 | | | | (2,962,912 | ) | | | 5,273,594 | |
Net increase (decrease) in net assets resulting from operations | | | | | 5,084,093 | | | | (455,944 | ) | | | 6,176,817 | |
Distributions to Shareholders | | | | | (3,901,103 | ) | | | (3,536,709 | )† | | | (15,344 | ) |
| | | | | | | | | | | | | | | |
Capital Share Transactions | | | | | | | | | | | | | | |
Proceeds from shares created | | | | | 3,699,667 | | | | 64,577,677 | | | | 79,513,130 | |
Cost of shares redeemed | | | | | (46,449,379 | ) | | | (2,537,164 | ) | | | (25 | ) |
Net increase (decrease) from capital share transactions | | | | | (42,749,712 | ) | | | 62,040,513 | | | | 79,513,105 | |
Total increase (decrease) in net assets | | | | | (41,566,722 | ) | | | 58,047,860 | | | | 85,674,578 | |
| | | | | | | | | | | | | | | |
Net Assets | | | | | | | | | | | | | | |
Beginning of period | | | | | 107,192,466 | | | | 49,144,606 | | | | — | |
End of period | | | | $ | 65,625,744 | | | $ | 107,192,466 | † | | $ | 85,674,578 | |
| | | | | | | | | | | | | | | |
Changes in Shares Outstanding | | | | | | | | | | | | | | |
Shares outstanding, beginning of period | | | | | 4,400,001 | | | | 1,950,001 | | | | — | |
Shares created | | | | | 150,000 | | | | 2,550,000 | | | | 3,100,001 | |
Shares redeemed | | | | | (1,900,001 | ) | | | (100,000 | ) | | | (1 | ) |
Shares outstanding, end of period | | | | | 2,650,000 | | | | 4,400,001 | | | | 3,100,000 | |
* | | Commencement of operations. |
† | | For the year ended April 30, 2019, the requirement to disclose dividends and distributions paid to shareholders from net investment income and or net realized gain (loss) on investments was modified and now presented together as Distributions to Shareholders. End of period net assets included undistributed net investment income of $368,463 at April 30, 2018. (See Note 10.) See Note 5 for tax basis of distributable earnings. |
See notes to financial statements.
167
Statements of Changes in Net Assets(continued)
| | | | IQ 50 Percent Hedged FTSE
International ETF
| | IQ 50 Percent Hedged FTSE
Europe ETF
| |
| | | | For the year ended April 30,
| | For the year ended April 30,
| |
| | | | 2019
| | 2018
| | 2019
| | 2018
|
Increase (Decrease) in Net Assets from Operations | | | | | | | | | | | | | | | | | | |
Net investment income | | | | $ | 13,642,563 | | | $ | 11,415,421 | | | $ | 1,610,167 | | | $ | 4,056,247 | |
Net realized gain (loss) | | | | | 21,006,516 | | | | 8,788,328 | | | | 16,992,674 | | | | (7,096,132 | ) |
Net change in net unrealized appreciation (depreciation) | | | | | (53,440,986 | ) | | | 16,871,161 | | | | (18,674,363 | ) | | | 16,070,128 | |
Net increase (decrease) in net assets resulting from operations | | | | | (18,791,907 | ) | | | 37,074,910 | | | | (71,522 | ) | | | 13,030,243 | |
Distributions to Shareholders | | | | | (19,464,426 | ) | | | (8,843,710 | )* | | | (417,662 | ) | | | (3,305,273 | )* |
Capital Share Transactions | | | | | | | | | | | | | | | | | | |
Proceeds from shares created | | | | | 30,368,545 | | | | 465,488,096 | | | | — | | | | 77,166,966 | |
Cost of shares redeemed | | | | | (289,550,341 | ) | | | (123,797,011 | ) | | | (159,352,565 | ) | | | — | |
Net increase (decrease) from capital share transactions | | | | | (259,181,796 | ) | | | 341,691,085 | | | | (159,352,565 | ) | | | 77,166,966 | |
Total increase (decrease) in net assets | | | | | (297,438,129 | ) | | | 369,922,285 | | | | (159,841,749 | ) | | | 86,891,936 | |
Net Assets | | | | | | | | | | | | | | | | | | |
Beginning of year | | | | | 578,517,034 | | | | 208,594,749 | | | | 168,737,211 | | | | 81,845,275 | |
End of year | | | | $ | 281,078,905 | | | $ | 578,517,034 | * | | $ | 8,895,462 | | | $ | 168,737,211 | * |
Changes in Shares Outstanding | | | | | | | | | | | | | | | | | | |
Shares outstanding, beginning of year | | | | | 26,750,001 | | | | 10,600,001 | | | | 8,300,001 | | | | 4,350,001 | |
Shares created | | | | | 1,450,000 | | | | 22,150,000 | | | | — | | | | 3,950,000 | |
Shares redeemed | | | | | (14,550,001 | ) | | | (6,000,000 | ) | | | (7,850,001 | ) | | | — | |
Shares outstanding, end of year | | | | | 13,650,000 | | | | 26,750,001 | | | | 450,000 | | | | 8,300,001 | |
* | | For the year ended April 30, 2019, the requirement to disclose dividends and distributions paid to shareholders from net investment income and or net realized gain (loss) on investments was modified and now presented together as Distributions to Shareholders. End of period net assets included undistributed net investment income of $3,645,338 and $1,142,504 respectively at April 30, 2018. (See Note 10.) See Note 5 for tax basis of distributable earnings. |
See notes to financial statements.
168
Statements of Changes in Net Assets(continued)
| | | | IQ 50 Percent Hedged FTSE
Japan ETF
| | IQ Chaikin U.S. Small Cap ETF
| |
| | | | For the Year Ended April 30,
| |
| | | | 2019
| | 2018
| | For the Year Ended
April 30,
2019
| | For the Period
May 16, 2017*
to April 30,
2018
|
Increase (Decrease) in Net Assets from Operations | | | | | | | | | | | | | | | | | | |
Net investment income | | | | $ | 353,237 | | | $ | 524,704 | | | $ | 4,480,736 | | | $ | 1,598,588 | |
Net realized gain (loss) | | | | | 3,162,537 | | | | (319,584 | ) | | | (25,832,825 | ) | | | 5,038,942 | |
Net change in net unrealized appreciation (depreciation) | | | | | (6,879,025 | ) | | | 5,261,020 | | | | (4,926,146 | ) | | | 3,520,915 | |
Net increase (decrease) in net assets resulting from operations | | | | | (3,363,251 | ) | | | 5,466,140 | | | | (26,278,235 | ) | | | 10,158,445 | |
Distributions to Shareholders | | | | | (545,585 | ) | | | (544,769 | )† | | | (4,624,785 | ) | | | (1,436,366 | )† |
Capital Share Transactions | | | | | | | | | | | | | | | | | | |
Proceeds from shares created | | | | | — | | | | 3,191,034 | | | | 94,020,959 | | | | 514,484,818 | |
Cost of shares redeemed | | | | | (24,619,769 | ) | | | (1,105,653 | ) | | | (179,909,783 | ) | | | (57,860,331 | ) |
Net increase (decrease) from capital share transactions | | | | | (24,619,769 | ) | | | 2,085,381 | | | | (85,888,824 | ) | | | 456,624,487 | |
Total increase (decrease) in net assets | | | | | (28,528,605 | ) | | | 7,006,752 | | | | (116,791,844 | ) | | | 465,346,566 | |
Net Assets | | | | | | | | | | | | | | | | | | |
Beginning of period | | | | | 34,746,483 | | | | 27,739,731 | | | | 465,346,566 | | | | — | |
End of period | | | | $ | 6,217,878 | | | $ | 34,746,483 | † | | $ | 348,554,722 | | | $ | 465,346,566 | † |
Changes in Shares Outstanding | | | | | | | | | | | | | | | | | | |
Shares outstanding, beginning of period | | | | | 1,550,001 | | | | 1,450,001 | | | | 17,150,001 | | | | — | |
Shares created | | | | | — | | | | 150,000 | | | | 3,400,000 | | | | 19,250,001 | |
Shares redeemed | | | | | (1,250,001 | ) | | | (50,000 | ) | | | (7,000,001 | ) | | | (2,100,000 | ) |
Shares outstanding, end of period | | | | | 300,000 | | | | 1,550,001 | | | | 13,550,000 | | | | 17,150,001 | |
* | | Commencement of operations. |
† | | For the year ended April 30, 2019, the requirement to disclose dividends and distributions paid to shareholders from net investment income and or net realized gain (loss) on investments was modified and now presented together as Distributions to Shareholders. End of period net assets included undistributed net investment income of $94,474 and $144,782 respectively at April 30, 2018. (See Note 10.) See Note 5 for tax basis of distributable earnings. |
See notes to financial statements.
169
Statements of Changes in Net Assets(continued)
| | | | IQ Chaikin U.S. Large Cap ETF
| |
| | | | For the
Year Ended
April 30, 2019
| | For the Period
December 13, 2017* to
April 30, 2018
|
Increase (Decrease) in Net Assets from Operations | | | | | | | | | | |
Net investment income | | | | $ | 7,182,766 | | | $ | 1,162,151 | |
Net realized gain (loss) | | | | | 5,473,939 | | | | (5,212,594 | ) |
Net change in net unrealized appreciation (depreciation) | | | | | (10,090,415 | ) | | | 2,802,663 | |
Net increase (decrease) in net assets resulting from operations | | | | | 2,566,290 | | | | (1,247,780 | ) |
Distributions to Shareholders | | | | | (7,178,905 | ) | | | (916,233 | )† |
| | | | | | | | | | | |
Capital Share Transactions | | | | | | | | | | |
Proceeds from shares created | | | | | 609,684,554 | | | | 324,739,089 | |
Cost of shares redeemed | | | | | (646,660,428 | ) | | | (2,574,997 | ) |
Net increase (decrease) from capital share transactions | | | | | (36,975,874 | ) | | | 322,164,092 | |
Total increase (decrease) in net assets | | | | | (41,588,489 | ) | | | 320,000,079 | |
| | | | | | | | | | | |
Net Assets | | | | | | | | | | |
Beginning of period | | | | | 320,000,079 | | | | — | |
End of period | | | | $ | 278,411,590 | | | $ | 320,000,079 | † |
| | | | | | | | | | | |
Changes in Shares Outstanding | | | | | | | | | | |
Shares outstanding, beginning of period | | | | | 12,650,001 | | | | — | |
Shares created | | | | | 24,850,000 | | | | 12,750,001 | |
Shares redeemed | | | | | (26,250,001 | ) | | | (100,000 | ) |
Shares outstanding, end of period | | | | | 11,250,000 | | | | 12,650,001 | |
* | | Commencement of operations. |
† | | For the year ended April 30, 2019, the requirement to disclose dividends and distributions paid to shareholders from net investment income and or net realized gain (loss) on investments was modified and now presented together as Distributions to Shareholders. End of period net assets included undistributed net investment income of $245,918 at April 30, 2018. (See Note 10.) See Note 5 for tax basis of distributable earnings. |
See notes to financial statements.
170
Financial Highlights
Selected Data for a Share of Capital Stock Outstanding | | | | IQ Hedge Multi-Strategy Tracker ETF
| |
| | | | For the Year Ended April 30,
| |
| | | | 2019
| | 2018
| | 2017
| | 2016
| | 2015
|
Net asset value, beginning of year | | | | $ | 30.39 | | | $ | 29.15 | | | $ | 29.03 | | | $ | 30.01 | | | $ | 29.26 | |
| | | | | | | | | | | | | | | | | | | | | | | |
Income from Investment Operations | | | | | | | | | | | | | | | | | | | | | | |
Net investment income(a)(b) | | | | | 0.72 | | | | 0.56 | | | | 0.50 | | | | 0.43 | | | | 0.38 | |
Net realized and unrealized gain (loss) | | | | | (0.27 | ) | | | 0.68 | | | | (0.38 | ) | | | (1.30 | ) | | | 0.74 | |
Distributions of net realized gains from investments in other investment companies | | | | | — | | | | 0.00 | (c) | | | 0.00 | (c) | | | 0.03 | | | | 0.02 | |
Net increase (decrease) in net assets resulting from investment operations | | | | | 0.45 | | | | 1.24 | | | | 0.12 | | | | (0.84 | ) | | | 1.14 | |
| | | | | | | | | | | | | | | | | | | | | | | |
Distributions from: | | | | | | | | | | | | | | | | | | | | | | |
Net investment income | | | | | (0.55 | ) | | | — | | | | (0.00 | )(d) | | | (0.14 | ) | | | (0.39 | ) |
Net asset value, end of year | | | | $ | 30.29 | | | $ | 30.39 | | | $ | 29.15 | | | $ | 29.03 | | | $ | 30.01 | |
Market price, end of year | | | | $ | 30.28 | | | $ | 30.38 | | | $ | 29.15 | | | $ | 29.06 | | | $ | 30.00 | |
| | | | | | | | | | | | | | | | | | | | | | | |
Total Return | | | | | | | | | | | | | | | | | | | | | | |
Total investment return based on net asset value(e) | | | | | 1.56 | % | | | 4.24 | % | | | 0.42 | % | | | (2.80 | )% | | | 3.93 | %(f) |
Total investment return based on market price(g) | | | | | 1.56 | % | | | 4.22 | % | | | 0.31 | % | | | (2.67 | )% | | | 3.79 | % |
| | | | | | | | | | | | | | | | | | | | | | | |
Ratios/Supplemental Data | | | | | | | | | | | | | | | | | | | | | | |
Net assets, end of year (000’s omitted) | | | | $ | 993,422 | | | $ | 1,124,278 | | | $ | 1,062,579 | | | $ | 1,074,120 | | | $ | 1,000,840 | |
Ratio to average net assets of: | | | | | | | | | | | | | | | | | | | | | | |
Expenses net of waivers/reimbursements(h) | | | | | 0.54 | % | | | 0.64 | % | | | 0.76 | % | | | 0.76 | % | | | 0.76 | % |
Expenses excluding waivers/reimbursements(h) | | | | | 0.76 | % | | | 0.76 | % | | | 0.76 | % | | | 0.76 | % | | | 0.76 | % |
Net investment income (loss)(b) | | | | | 2.40 | % | | | 1.87 | % | | | 1.72 | % | | | 1.48 | % | | | 1.27 | % |
Portfolio turnover rate(i) | | | | | 137 | % | | | 164 | % | | | 285 | % | | | 312 | % | | | 81 | % |
(a) | | Based on average shares outstanding. |
(b) | | Recognition of net investment income by the Fund is affected by the timing of the declaration of dividends by the investment companies in which the Fund invests. |
(c) | | Less than $0.005 per share. |
(d) | | Greater than $(0.005) per share. |
(e) | | Total investment return is calculated assuming an initial investment made at the net asset value at the beginning of the period, reinvestment of all dividends and distributions, if any, at net asset value during the period, and redemption on the last day of the period. Total return calculated for a period less than one year is not annualized. |
(f) | | Includes adjustments in accordance with accounting principles generally accepted in the United States of America and as such, the net asset values for financial reporting purposes and the returns based upon those net asset values may differ from the net asset values and returns for shareholder transactions. |
(g) | | The market price returns are calculated using the mean between the last bid and ask prices. Prior to May 31, 2016, the closing price listed on the NYSE Arca was used. |
(h) | | In addition to the fees and expenses which the Fund bears directly, the Fund indirectly bears a prorated share of the fees and expenses of the underlying funds in which it invests. Such indirect expenses are not included in the above expense ratios. |
(i) | | Portfolio turnover rate is not annualized and excludes the value of portfolio securities received or delivered as in-kind creations or redemptions in connection with the Fund’s capital share transactions. |
See notes to financial statements.
171
Financial Highlights(continued)
Selected Data for a Share of Capital Stock Outstanding | | | | IQ Hedge Macro Tracker ETF
| |
| | | | For the Year Ended April 30,
| |
| | | | 2019
| | 2018
| | 2017
| | 2016
| | 2015
|
Net asset value, beginning of year | | | | $ | 26.35 | | | $ | 25.46 | | | $ | 24.66 | | | $ | 25.69 | | | $ | 26.50 | |
| | | | | | | | | | | | | | | | | | | | | | | |
Income from Investment Operations | | | | | | | | | | | | | | | | | | | | | | |
Net investment income(a)(b) | | | | | 0.44 | | | | 0.39 | | | | 0.37 | | | | 0.46 | | | | 0.32 | |
Net realized and unrealized gain (loss) | | | | | (0.25 | ) | | | 0.50 | | | | 0.43 | | | | (1.27 | ) | | | (0.79 | ) |
Distributions of net realized gains from investments in other investment companies | | | | | — | | | | 0.00 | (c) | | | 0.00 | (c) | | | 0.05 | | | | 0.00 | (c) |
Net increase (decrease) in net assets resulting from investment operations | | | | | 0.19 | | | | 0.89 | | | | 0.80 | | | | (0.76 | ) | | | (0.47 | ) |
| | | | | | | | | | | | | | | | | | | | | | | |
Distributions from: | | | | | | | | | | | | | | | | | | | | | | |
Net investment income | | | | | (0.28 | ) | | | — | | | | — | | | | (0.27 | ) | | | (0.34 | ) |
Net asset value, end of year | | | | $ | 26.26 | | | $ | 26.35 | | | $ | 25.46 | | | $ | 24.66 | | | $ | 25.69 | |
Market price, end of year | | | | $ | 26.24 | | | $ | 26.34 | | | $ | 25.44 | | | $ | 24.80 | | | $ | 25.74 | |
| | | | | | | | | | | | | | | | | | | | | | | |
Total Return | | | | | | | | | | | | | | | | | | | | | | |
Total investment return based on net asset value(d) | | | | | 0.77 | % | | | 3.50 | % | | | 3.25 | % | | | (2.97 | )% | | | (1.77 | )% |
Total investment return based on market price(e) | | | | | 0.74 | % | | | 3.54 | % | | | 2.58 | % | | | (2.60 | )% | | | (1.47 | )% |
| | | | | | | | | | | | | | | | | | | | | | | |
Ratios/Supplemental Data | | | | | | | | | | | | | | | | | | | | | | |
Net assets, end of year (000’s omitted) | | | | $ | 5,251 | | | $ | 6,588 | | | $ | 6,365 | | | $ | 14,794 | | | $ | 21,837 | |
Ratio to average net assets of: | | | | | | | | | | | | | | | | | | | | | | |
Expenses(f) | | | | | 0.76 | % | | | 0.75 | % | | | 0.76 | % | | | 0.76 | % | | | 0.75 | % |
Net investment income (loss)(b) | | | | | 1.70 | % | | | 1.47 | % | | | 1.50 | % | | | 1.86 | % | | | 1.23 | % |
Portfolio turnover rate(g) | | | | | 82 | % | | | 152 | % | | | 68 | % | | | 99 | % | | | 101 | % |
(a) | | Based on average shares outstanding. |
(b) | | Recognition of net investment income by the Fund is affected by the timing of the declaration of dividends by the investment companies in which the Fund invests. |
(c) | | Less than $0.005 per share. |
(d) | | Total investment return is calculated assuming an initial investment made at the net asset value at the beginning of the period, reinvestment of all dividends and distributions, if any, at net asset value during the period, and redemption on the last day of the period. |
(e) | | The market price returns are calculated using the mean between the last bid and ask prices. Prior to May 31, 2016, the closing price listed on the NYSE Arca was used. |
(f) | | In addition to the fees and expenses which the Fund bears directly, the Fund indirectly bears a prorated share of the fees and expenses of the underlying funds in which it invests. Such indirect expenses are not included in the above expense ratios. |
(g) | | Portfolio turnover rate is not annualized and excludes the value of portfolio securities received or delivered as in-kind creations or redemptions in connection with the Fund’s capital share transactions. |
See notes to financial statements.
172
Financial Highlights(continued)
Selected Data for a Share of Capital Stock Outstanding | | | | IQ Hedge Market Neutral Tracker ETF
| |
| | | | For the Year Ended April 30,
| |
| | | | 2019
| | 2018
| | 2017
| | 2016
| | 2015
|
Net asset value, beginning of year | | | | $ | 25.58 | | | $ | 25.25 | | | $ | 25.49 | | | $ | 25.53 | | | $ | 25.77 | |
| | | | | | | | | | | | | | | | | | | | | | | |
Income from Investment Operations | | | | | | | | | | | | | | | | | | | | | | |
Net investment income(a)(b) | | | | | 0.55 | | | | 0.41 | | | | 0.36 | | | | 0.27 | | | | 0.16 | |
Net realized and unrealized gain (loss) | | | | | 0.10 | | | | (0.08 | ) | | | (0.25 | ) | | | (0.33 | ) | | | (0.09 | ) |
Distributions of net realized gains from investments in other investment companies | | | | | — | | | | — | | | | 0.00 | (c) | | | 0.02 | | | | 0.03 | |
Net increase (decrease) in net assets resulting from investment operations | | | | | 0.65 | | | | 0.33 | | | | 0.11 | | | | (0.04 | ) | | | 0.10 | |
| | | | | | | | | | | | | | | | | | | | | | | |
Distributions from: | | | | | | | | | | | | | | | | | | | | | | |
Net investment income | | | | | — | | | | — | | | | (0.35 | ) | | | — | | | | (0.34 | ) |
Net asset value, end of year | | | | $ | 26.23 | | | $ | 25.58 | | | $ | 25.25 | | | $ | 25.49 | | | $ | 25.53 | |
Market price, end of year | | | | $ | 26.23 | | | $ | 25.58 | | | $ | 25.25 | | | $ | 25.43 | | | $ | 25.50 | |
| | | | | | | | | | | | | | | | | | | | | | | |
Total Return | | | | | | | | | | | | | | | | | | | | | | |
Total investment return based on net asset value(d) | | | | | 2.56 | % | | | 1.29 | % | | | 0.44 | % | | | (0.15 | )% | | | 0.40 | % |
Total investment return based on market price(e) | | | | | 2.54 | % | | | 1.31 | % | | | 0.67 | % | | | 0.27 | % | | | 0.43 | % |
| | | | | | | | | | | | | | | | | | | | | | | |
Ratios/Supplemental Data | | | | | | | | | | | | | | | | | | | | | | |
Net assets, end of year (000’s omitted) | | | | $ | 15,741 | | | $ | 12,790 | | | $ | 11,364 | | | $ | 15,294 | | | $ | 12,766 | |
Ratio to average net assets of: | | | | | | | | | | | | | | | | | | | | | | |
Expenses(f) | | | | | 0.76 | % | | | 0.76 | % | | | 0.76 | % | | | 0.76 | % | | | 0.76 | % |
Net investment income (loss)(b) | | | | | 2.15 | % | | | 1.61 | % | | | 1.40 | % | | | 1.09 | % | | | 0.64 | % |
Portfolio turnover rate(g) | | | | | 107 | % | | | 165 | % | | | 99 | % | | | 135 | % | | | 101 | % |
(a) | | Based on average shares outstanding. |
(b) | | Recognition of net investment income by the Fund is affected by the timing of the declaration of dividends by the investment companies in which the Fund invests. |
(c) | | Less than $0.005 per share. |
(d) | | Total investment return is calculated assuming an initial investment made at the net asset value at the beginning of the period, reinvestment of all dividends and distributions, if any, at net asset value during the period, and redemption on the last day of the period. |
(e) | | The market price returns are calculated using the mean between the last bid and ask prices. Prior to May 31, 2016, the closing price listed on the NYSE Arca was used. |
(f) | | In addition to the fees and expenses which the Fund bears directly, the Fund indirectly bears a prorated share of the fees and expenses of the underlying funds in which it invests. Such indirect expenses are not included in the above expense ratios. |
(g) | | Portfolio turnover rate is not annualized and excludes the value of portfolio securities received or delivered as in-kind creations or redemptions in connection with the Fund’s capital share transactions. |
See notes to financial statements.
173
Financial Highlights(continued)
Selected Data for a Share of Capital Stock Outstanding | | | | IQ Hedge Long/Short Tracker ETF
|
| | | |
For the Year Ended April 30,
| For the
Period
March 24,
2015(a)
to
April 30,
2015
|
| | | | 2019
| | 2018
| | 2017
| | 2016
| |
Net asset value, beginning of period | | | | $ | 21.91 | | | $ | 20.36 | | | $ | 18.88 | | | $ | 19.93 | | | | $ | 20.00 | |
| | | | | | | | | | | | | | | | | | | | | | | | |
| Income from Investment Operations | | | | | | | | | | | | | | | | | | | | | | | |
Net investment income(b)(c) | | | | | 0.44 | | | | 0.41 | | | | 0.35 | | | | 0.41 | | | | | 0.04 | |
Net realized and unrealized gain (loss) | | | | | 0.13 | | | | 1.22 | | | | 1.19 | | | | (1.10 | ) | | | | (0.11 | ) |
Distributions of net realized gains from investments in other investment companies | | | | | — | | | | 0.00 | (d) | | | 0.00 | (d) | | | — | | | | | — | |
Net increase (decrease) in net assets resulting from investment operations | | | | | 0.57 | | | | 1.63 | | | | 1.54 | | | | (0.69 | ) | | | | (0.07 | ) |
| | | | | | | | | | | | | | | | | | | | | | | | |
Distributions from: | | | | | | | | | | | | | | | | | | | | | | | |
Net investment income | | | | | (0.95 | ) | | | (0.08 | ) | | | (0.06 | ) | | | (0.36 | ) | | | | — | |
Net asset value, end of period | | | | $ | 21.53 | | | $ | 21.91 | | | $ | 20.36 | | | $ | 18.88 | | | | $ | 19.93 | |
Market price, end of period | | | | $ | 21.54 | | | $ | 21.93 | | | $ | 20.34 | | | $ | 18.72 | | | | $ | 20.79 | |
| | | | | | | | | | | | | | | | | | | | | | | | |
Total Return | | | | | | | | | | | | | | | | | | | | | | | |
Total investment return based on net asset value(e) | | | | | 3.07 | % | | | 8.02 | % | | | 8.18 | % | | | (3.46 | )% | | | | (0.35 | )% |
Total investment return based on market price(f) | | | | | 2.91 | % | | | 8.23 | % | | | 8.98 | % | | | (8.23 | )% | | | | 3.95 | %(g) |
| | | | | | | | | | | | | | | | | | | | | | | | |
Ratios/Supplemental Data | | | | | | | | | | | | | | | | | | | | | | | |
Net assets, end of period (000’s omitted) | | | | $ | 6,459 | | | $ | 8,764 | | | $ | 4,072 | | | $ | 1,888 | | | | $ | 1,993 | |
Ratio to average net assets of: | | | | | | | | | | | | | | | | | | | | | | | |
Expenses(h) | | | | | 0.76 | % | | | 0.76 | % | | | 0.77 | % | | | 0.76 | % | | | | 0.75 | %(i) |
Net investment income (loss)(c) | | | | | 2.06 | % | | | 1.89 | % | | | 1.78 | % | | | 2.15 | % | | | | 1.73 | %(i) |
Portfolio turnover rate(j) | | | | | 95 | % | | | 77 | % | | | 147 | % | | | 94 | % | | | | 4 | % |
(a) | | Commencement of operations. |
(b) | | Based on average shares outstanding. |
(c) | | Recognition of net investment income by the Fund is affected by the timing of the declaration of dividends by the investment companies in which the Fund invests. |
(d) | | Less than $0.005 per share. |
(e) | | Total investment return is calculated assuming an initial investment made at the net asset value at the beginning of the period, reinvestment of all dividends and distributions, if any, at net asset value during the period, and redemption on the last day of the period. Total return calculated for a period less than one year is not annualized. |
(f) | | The market price returns are calculated using the mean between the last bid and ask prices. Prior to May 31, 2016, the closing price listed on the NYSE Arca was used. |
(g) | | Since the Shares of the Funds did not trade in the secondary market until the day after the Fund’s inception, for the period from the inception to the first day of the secondary market trading, the NAV is used as a proxy for the secondary market trading price to calculate the market returns. |
(h) | | In addition to the fees and expenses which the Fund bears directly, the Fund indirectly bears a prorated share of the fees and expenses of the underlying funds in which it invests. Such indirect expenses are not included in the above expense ratios. |
(j) | | Portfolio turnover rate is not annualized and excludes the value of portfolio securities received or delivered as in-kind creations or redemptions in connection with the Fund’s capital share transactions. |
See notes to financial statements.
174
Financial Highlights(continued)
Selected Data for a Share of Capital Stock Outstanding | | | | IQ Hedge Event-Driven Tracker ETF
|
| | | |
For the Year Ended April 30,
| For the
Period
March 24,
2015(a)
to
April 30,
2015
|
| | | | 2019
| | 2018
| | 2017
| | 2016
| |
Net asset value, beginning of period | | | | $ | 20.93 | | | $ | 20.59 | | | $ | 19.40 | | | $ | 20.01 | | | | $ | 19.95 | |
| | | | | | | | | | | | | | | | | | | | | | | | |
| Income from Investment Operations | | | | | | | | | | | | | | | | | | | | | | | |
Net investment income(b)(c) | | | | | 0.74 | | | | 0.55 | | | | 0.56 | | | | 0.54 | | | | | 0.02 | |
Net realized and unrealized gain (loss) | | | | | 0.46 | | | | 0.26 | | | | 1.09 | | | | (1.03 | ) | | | | 0.03 | |
Distributions of net realized gains from investments in other investment companies | | | | | — | | | | — | | | | 0.00 | (d) | | | 0.23 | | | | | 0.01 | |
Net increase (decrease) in net assets resulting from investment operations | | | | | 1.20 | | | | 0.81 | | | | 1.65 | | | | (0.26 | ) | | | | 0.06 | |
| | | | | | | | | | | | | | | | | | | | | | | | |
Distributions from: | | | | | | | | | | | | | | | | | | | | | | | |
Net investment income | | | | | (0.87 | ) | | | (0.47 | ) | | | (0.46 | ) | | | (0.35 | ) | | | | — | |
Net asset value, end of period | | | | $ | 21.26 | | | $ | 20.93 | | | $ | 20.59 | | | $ | 19.40 | | | | $ | 20.01 | |
Market price, end of period | | | | $ | 21.27 | | | $ | 20.93 | | | $ | 20.59 | | | $ | 19.43 | | | | $ | 20.00 | |
| | | | | | | | | | | | | | | | | | | | | | | | |
Total Return | | | | | | | | | | | | | | | | | | | | | | | |
Total investment return based on net asset value(e) | | | | | 6.12 | % | | | 3.93 | % | | | 8.58 | % | | | (1.26 | )% | | | | 0.30 | % |
Total investment return based on market price(f) | | | | | 6.13 | % | | | 3.94 | % | | | 8.44 | % | | | (1.04 | )% | | | | 0.25 | %(g) |
| | | | | | | | | | | | | | | | | | | | | | | | |
Ratios/Supplemental Data | | | | | | | | | | | | | | | | | | | | | | | |
Net assets, end of period (000’s omitted) | | | | $ | 4,253 | | | $ | 3,139 | | | $ | 3,088 | | | $ | 1,940 | | | | $ | 2,001 | |
Ratio to average net assets of: | | | | | | | | | | | | | | | | | | | | | | | |
Expenses(h) | | | | | 0.76 | % | | | 0.76 | % | | | 0.76 | % | | | 0.79 | % | | | | 0.75 | %(i) |
Net investment income (loss)(c) | | | | | 3.54 | % | | | 2.64 | % | | | 2.80 | % | | | 2.81 | % | | | | 1.31 | %(i) |
Portfolio turnover rate(j) | | | | | 34 | % | | | 41 | % | | | 68 | % | | | 16 | % | | | | 6 | % |
(a) | | Commencement of operations. |
(b) | | Based on average shares outstanding. |
(c) | | Recognition of net investment income by the Fund is affected by the timing of the declaration of dividends by the investment companies in which the Fund invests. |
(d) | | Less than $0.005 per share. |
(e) | | Total investment return is calculated assuming an initial investment made at the net asset value at the beginning of the period, reinvestment of all dividends and distributions, if any, at net asset value during the period, and redemption on the last day of the period. Total return calculated for a period less than one year is not annualized. |
(f) | | The market price returns are calculated using the mean between the last bid and ask prices. Prior to May 31, 2016, the closing price listed on the NYSE Arca was used. |
(g) | | Since the Shares of the Funds did not trade in the secondary market until the day after the Fund’s inception, for the period from the inception to the first day of the secondary market trading, the NAV is used as a proxy for the secondary market trading price to calculate the market returns. |
(h) | | In addition to the fees and expenses which the Fund bears directly, the Fund indirectly bears a prorated share of the fees and expenses of the underlying funds in which it invests. Such indirect expenses are not included in the above expense ratios. |
(j) | | Portfolio turnover rate is not annualized and excludes the value of portfolio securities received or delivered as in-kind creations or redemptions in connection with the Fund’s capital share transactions. |
See notes to financial statements.
175
Financial Highlights(continued)
Selected Data for a Share of Capital Stock Outstanding | | | | IQ Real Return ETF
|
| | | | For the Year Ended April 30,
|
| | | | 2019
| | 2018
| | 2017
| | 2016
| | 2015
|
Net asset value, beginning of year | | | | $ | 27.47 | | | $ | 27.25 | | | $ | 26.73 | | | $ | 26.70 | | | $ | 26.33 | |
| | | | | | | | | | | | | | | | | | | | | | | |
Income from Investment Operations | | | | | | | | | | | | | | | | | | | | | | |
Net investment income(a)(b) | | | | | 0.49 | | | | 0.30 | | | | 0.22 | | | | 0.09 | | | | 0.05 | |
Net realized and unrealized gain (loss) | | | | | 0.22 | | | | 0.21 | | | | 0.30 | | | | (0.06 | ) | | | 0.35 | |
Distributions of net realized gains from investments in other investment companies | | | | | — | | | | 0.00 | (c) | | | 0.0 | 0(c) | | | — | | | | — | |
Net increase (decrease) in net assets resulting from investment operations | | | | | 0.71 | | | | 0.51 | | | | 0.52 | | | | 0.03 | | | | 0.40 | |
| | | | | | | | | | | | | | | | | | | | | | | |
Distributions from: | | | | | | | | | | | | | | | | | | | | | | |
Net investment income | | | | | (0.35 | ) | | | (0.29 | ) | | | — | | | | (0.00 | )(d) | | | (0.03 | ) |
Net asset value, end of year | | | | $ | 27.83 | | | $ | 27.47 | | | $ | 27.25 | | | $ | 26.73 | | | $ | 26.70 | |
Market price, end of year | | | | $ | 27.80 | | | $ | 27.47 | | | $ | 27.27 | | | $ | 26.72 | | | $ | 26.81 | |
| | | | | | | | | | | | | | | | | | | | | | | |
Total Return | | | | | | | | | | | | | | | | | | | | | | |
Total investment return based on net asset value(e) | | | | | 2.64 | % | | | 1.89 | % | | | 1.94 | % | | | 0.11 | % | | | 1.50 | % |
Total investment return based on market price(f) | | | | | 2.53 | % | | | 1.81 | % | | | 2.06 | % | | | (0.32 | )% | | | 1.96 | % |
| | | | | | | | | | | | | | | | | | | | | | | |
Ratios/Supplemental Data | | | | | | | | | | | | | | | | | | | | | | |
Net assets, end of year (000’s omitted) | | | | $ | 57,046 | | | $ | 45,319 | | | $ | 28,608 | | | $ | 26,727 | | | $ | 28,031 | |
Ratio to average net assets of: | | | | | | | | | | | | | | | | | | | | | | |
Expenses net of waivers/reimbursements(g) | | | | | 0.37 | % | | | 0.49 | % | | | 0.49 | % | | | 0.49 | % | | | 0.48 | % |
Expenses excluding waivers/reimbursements(g) | | | | | 0.49 | % | | | 0.49 | % | | | 0.49 | % | | | 0.49 | % | | | 0.48 | % |
Net investment income (loss)(b) | | | | | 1.77 | % | | | 1.10 | % | | | 0.82 | % | | | 0.33 | % | | | 0.18 | % |
Portfolio turnover rate(h) | | | | | 97 | % | | | 101 | % | | | 71 | % | | | 109 | % | | | 91 | % |
(a) | | Based on average shares outstanding. |
(b) | | Recognition of net investment income by the Fund is affected by the timing of the declaration of dividends by the investment companies in which the Fund invests. |
(c) | | Less than $0.005 per share. |
(d) | | Greater than $(0.005) per share. |
(e) | | Total investment return is calculated assuming an initial investment made at the net asset value at the beginning of the period, reinvestment of all dividends and distributions, if any, at net asset value during the period, and redemption on the last day of the period. |
(f) | | The market price returns are calculated using the mean between the last bid and ask prices. Prior to May 31, 2016, the closing price listed on the NYSE Arca was used. |
(g) | | In addition to the fees and expenses which the Fund bears directly, the Fund indirectly bears a prorated share of the fees and expenses of the underlying funds in which it invests. Such indirect expenses are not included in the above expense ratios. |
(h) | | Portfolio turnover rate is not annualized and excludes the value of portfolio securities received or delivered as in-kind creations or redemptions in connection with the Fund’s capital share transactions. |
See notes to financial statements.
176
Financial Highlights(continued)
Selected Data for a Share of Capital Stock Outstanding| | | | | IQ Leaders GTAA Tracker ETF
|
| | | | For the Year Ended April 30,
| | For the Period
September 30, 2015(a)
to April 30,
2016
|
| | | | 2019
| | 2018
| | 2017
| | | | |
Net asset value, beginning of period | | | | $ | 24.13 | | | $ | 22.83 | | | $ | 20.96 | | | $ | 20.00 | |
| | | | | | | | | | | | | | | | | | | |
Income from Investment Operations
| | | | | | | | | | | | | | | | | | |
Net investment income(b)(c) | | | | | 0.66 | | | | 0.58 | | | | 0.48 | | | | 0.26 | |
Net realized and unrealized gain (loss) | | | | | 0.20 | | | | 1.32 | | | | 1.80 | | | | 0.78 | |
Distributions of net realized gains from investments in other investment companies | | | | | — | | | | 0.00 | (d) | | | 0.00 | (d) | | | 0.06 | |
Net increase (decrease) in net assets resulting from investment operations | | | | | 0.86 | | | | 1.90 | | | | 2.28 | | | | 1.10 | |
| | | | | | | | | | | | | | | | | | | |
Distributions from: | | | | | | | | | | | | | | | | | | |
Net investment income | | | | | (0.73 | ) | | | (0.60 | ) | | | (0.41 | ) | | | (0.14 | ) |
Net asset value, end of period | | | | $ | 24.26 | | | $ | 24.13 | | | $ | 22.83 | | | $ | 20.96 | |
Market price, end of period | | | | $ | 24.24 | | | $ | 24.14 | | | $ | 22.84 | | | $ | 20.21 | |
| | | | | | | | | | | | | | | | | | | |
Total Return | | | | | | | | | | | | | | | | | | |
Total investment return based on net asset value(e) | | | | | 3.74 | % | | | 8.43 | % | | | 10.99 | % | | | 5.50 | % |
Total investment return based on market price(f) | | | | | 3.61 | % | | | 8.40 | % | | | 15.18 | % | | | 1.72 | %(g) |
| | | | | | | | | | | | | | | | | | | |
Ratios/Supplemental Data | | | | | | | | | | | | | | | | | | |
Net assets, end of period (000’s omitted) | | | | $ | 43,675 | | | $ | 49,473 | | | $ | 34,240 | | | $ | 2,096 | |
Ratio to average net assets of: | | | | | | | | | | | | | | | | | | |
Expenses net of waivers/reimbursements(h) | | | | | 0.37 | % | | | 0.46 | % | | | 0.46 | % | | | 0.46 | %(i) |
Expenses excluding waivers/reimbursements(h) | | | | | 0.46 | % | | | —% | | | | —% | | | | —%(i) | |
Net investment income (loss)(c) | | | | | 2.80 | % | | | 2.43 | % | | | 2.23 | % | | | 2.18 | %(i) |
Portfolio turnover rate(j) | | | | | 174 | % | | | 145 | % | | | 105 | % | | | 116 | % |
(a) | | Commencement of operations. |
(b) | | Based on average shares outstanding. |
(c) | | Recognition of net investment income by the Fund is affected by the timing of the declaration of dividends by the investment companies in which the Fund invests. |
(d) | | Less than $0.005 per share. |
(e) | | Total investment return is calculated assuming an initial investment made at the net asset value at the beginning of the period, reinvestment of all dividends and distributions, if any, at net asset value during the period, and redemption on the last day of the period. Total return calculated for a period less than one year is not annualized. |
(f) | | The market price returns are calculated using the mean between the last bid and ask prices. Prior to May 31, 2016, the closing price listed on the NYSE Arca was used. |
(g) | | Since the Shares of the Funds did not trade in the secondary market until the day after the Fund’s inception, for the period from the inception to the first day of the secondary market trading, the NAV is used as a proxy for the secondary market trading price to calculate the market returns. |
(h) | | In addition to the fees and expenses which the Fund bears directly, the Fund indirectly bears a prorated share of the fees and expenses of the underlying funds in which it invests. Such indirect expenses are not included in the above expense ratios. |
(j) | | Portfolio turnover rate is not annualized and excludes the value of portfolio securities received or delivered as in-kind creations or redemptions in connection with the Fund’s capital share transactions. |
See notes to financial statements.
177
Financial Highlights(continued)
Selected Data for a Share of Capital Stock Outstanding | | | | IQ Enhanced Core Bond U.S. ETF
|
| | | | For the Year Ended April 30,
| | For the Period
May 10, 2016(a)
to April 30,
2017
|
| | | | 2019
| | 2018
| |
| Net asset value, beginning of period | | | | $ | 18.58 | | | $ | 19.53 | | | $ | 20.00 | |
| | | | | | | | | | | | | | | |
Income from Investment Operations
| | | | | | | | | | | | | | |
Net investment income(b)(c) | | | | | 0.47 | | | | 0.45 | | | | 0.41 | |
Net realized and unrealized gain (loss) | | | | | 0.29 | | | | (0.95 | ) | | | (0.49 | ) |
Distributions of net realized gains from investments in other investment companies | | | | | — | | | | — | | | | 0.01 | |
Net increase (decrease) in net assets resulting from investment operations | | | | | 0.76 | | | | (0.50 | ) | | | (0.07 | ) |
| | | | | | | | | | | | | | | |
Distributions from: | | | | | | | | | | | | | | |
Net investment income | | | | | (0.49 | ) | | | (0.45 | ) | | | (0.40 | ) |
Net asset value, end of period | | | | $ | 18.85 | | | $ | 18.58 | | | $ | 19.53 | |
Market price, end of period | | | | $ | 18.84 | | | $ | 18.57 | | | $ | 19.54 | |
| | | | | | | | | | | | | | | |
Total Return | | | | | | | | | | | | | | |
Total investment return based on net asset value(d) | | | | | 4.21 | % | | | (2.66 | )% | | | (0.31 | )% |
Total investment return based on market price(e) | | | | | 4.20 | % | | | (2.71 | )% | | | (0.29 | )%(f) |
| | | | | | | | | | | | | | | |
Ratios/Supplemental Data | | | | | | | | | | | | | | |
Net assets, end of period (000’s omitted) | | | | $ | 88,589 | | | $ | 51,082 | | | $ | 74,232 | |
Ratio to average net assets of: | | | | | | | | | | | | | | |
Expenses net of waivers/reimbursements(g) | | | | | 0.21 | % | | | 0.21 | % | | | 0.20 | %(h) |
Expenses excluding waivers/reimbursements(g) | | | | | 0.26 | % | | | 0.26 | % | | | 0.25 | %(h) |
Net investment income (loss)(c) | | | | | 2.54 | % | | | 2.32 | % | | | 2.14 | %(h) |
Portfolio turnover rate(i) | | | | | 286 | % | | | 264 | % | | | 265 | % |
(a) | | Commencement of operations. |
(b) | | Based on average shares outstanding. |
(c) | | Recognition of net investment income by the Fund is affected by the timing of the declaration of dividends by the investment companies in which the Fund invests. |
(d) | | Total investment return is calculated assuming an initial investment made at the net asset value at the beginning of the period, reinvestment of all dividends and distributions, if any, at net asset value during the period, and redemption on the last day of the period. Total return calculated for a period less than one year is not annualized. |
(e) | | The market price returns are calculated using the mean between the last bid and ask prices. |
(f) | | Since the Shares of the Funds did not trade in the secondary market until the day after the Fund’s inception, for the period from the inception to the first day of the secondary market trading, the NAV is used as a proxy for the secondary market trading price to calculate the market returns. |
(g) | | In addition to the fees and expenses which the Fund bears directly, the Fund indirectly bears a prorated share of the fees and expenses of the underlying funds in which it invests. Such indirect expenses are not included in the above expense ratios. |
(i) | | Portfolio turnover rate is not annualized and excludes the value of portfolio securities received or delivered as in-kind creations or redemptions in connection with the Fund’s capital share transactions. |
See notes to financial statements.
178
Financial Highlights(continued)
Selected Data for a Share of Capital Stock Outstanding | | | | IQ Enhanced Core Plus Bond U.S. ETF
|
| | | | For the Year Ended April 30,
| | For the Period
May 10, 2016(a)
to April 30,
2017
|
| | | | 2019
| | 2018
| |
| Net asset value, beginning of period | | | | $ | 19.09 | | | $ | 19.98 | | | $ | 20.00 | |
| | | | | | | | | | | | | | | |
Income from Investment Operations
| | | | | | | | | | | | | | |
Net investment income(b)(c) | | | | | 0.57 | | | | 0.61 | | | | 0.53 | |
Net realized and unrealized gain (loss) | | | | | 0.10 | | | | (0.88 | ) | | | (0.03 | ) |
Distributions of net realized gains from investments in other investment companies | | | | | — | | | | — | | | | 0.01 | |
Net increase (decrease) in net assets resulting from investment operations | | | | | 0.67 | | | | (0.27 | ) | | | 0.51 | |
| | | | | | | | | | | | | | | |
Distributions from: | | | | | | | | | | | | | | |
Net investment income | | | | | (0.56 | ) | | | (0.62 | ) | | | (0.53 | ) |
Net asset value, end of period | | | | $ | 19.20 | | | $ | 19.09 | | | $ | 19.98 | |
Market price, end of period | | | | $ | 19.18 | | | $ | 19.07 | | | $ | 19.99 | |
| | | | | | | | | | | | | | | |
Total Return | | | | | | | | | | | | | | |
Total investment return based on net asset value(d) | | | | | 3.63 | % | | | (1.44 | )% | | | 2.57 | % |
Total investment return based on market price(e) | | | | | 3.59 | % | | | (1.56 | )% | | | 2.61 | %(f) |
| | | | | | | | | | | | | | | |
Ratios/Supplemental Data | | | | | | | | | | | | | | |
Net assets, end of period (000’s omitted) | | | | $ | 156,494 | | | $ | 333,990 | | | $ | 230,787 | |
Ratio to average net assets of: | | | | | | | | | | | | | | |
Expenses net of waivers/reimbursements(g) | | | | | 0.21 | % | | | 0.21 | % | | | 0.20 | %(h) |
Expenses excluding waivers/reimbursements(g) | | | | | 0.26 | % | | | 0.26 | % | | | 0.25 | %(h) |
Net investment income (loss)(c) | | | | | 2.99 | % | | | 3.09 | % | | | 2.73 | %(h) |
Portfolio turnover rate(i) | | | | | 411 | % | | | 269 | % | | | 147 | % |
(a) | | Commencement of operations. |
(b) | | Based on average shares outstanding. |
(c) | | Recognition of net investment income by the Fund is affected by the timing of the declaration of dividends by the investment companies in which the Fund invests. |
(d) | | Total investment return is calculated assuming an initial investment made at the net asset value at the beginning of the period, reinvestment of all dividends and distributions, if any, at net asset value during the period, and redemption on the last day of the period. Total return calculated for a period less than one year is not annualized. |
(e) | | The market price returns are calculated using the mean between the last bid and ask prices. |
(f) | | Since the Shares of the Funds did not trade in the secondary market until the day after the Fund’s inception, for the period from the inception to the first day of the secondary market trading, the NAV is used as a proxy for the secondary market trading price to calculate the market returns. |
(g) | | In addition to the fees and expenses which the Fund bears directly, the Fund indirectly bears a prorated share of the fees and expenses of the underlying funds in which it invests. Such indirect expenses are not included in the above expense ratios. |
(i) | | Portfolio turnover rate is not annualized and excludes the value of portfolio securities received or delivered as in-kind creations or redemptions in connection with the Fund’s capital share transactions. |
See notes to financial statements.
179
Financial Highlights(continued)
Selected Data for a Share of Capital Stock Outstanding | | | | IQ Short Duration Enhanced
Core Bond U.S. ETF
|
| | | | For the Period
December 18, 2018(a)
to April 30, 2019
|
Net asset value, beginning of period | | | | $ | 25.02 | |
| | | | | | | |
Income from Investment Operations | | | | | | |
Net investment income(b)(c) | | | | | 0.20 | |
Net realized and unrealized gain (loss) | | | | | 0.36 | |
Net increase (decrease) in net assets resulting from investment operations | | | | | 0.56 | |
| | | | | | | |
Distributions from: | | | | | | |
Net investment income | | | | | (0.21 | ) |
Net asset value, end of period | | | | $ | 25.37 | |
Market price, end of period | | | | $ | 25.36 | |
| | | | | | | |
Total Return | | | | | | |
Total investment return based on net asset value(d) | | | | | 2.23 | % |
Total investment return based on market price(e) | | | | | 2.20 | %(f) |
| | | | | | | |
Ratios/Supplemental Data | | | | | | |
Net assets, end of period (000’s omitted) | | | | $ | 3,805 | |
Ratio to average net assets of: | | | | | | |
Expenses net of waivers/reimbursements(g) | | | | | 0.20 | %(h) |
Expenses excluding waivers/reimbursements(g) | | | | | 0.23 | %(h) |
Net investment income (loss)(c) | | | | | 2.13 | %(h) |
Portfolio turnover rate(i) | | | | | 78 | % |
(a) | | Commencement of operations. |
(b) | | Based on average shares outstanding. |
(c) | | Recognition of net investment income by the Fund is affected by the timing of the declaration of dividends by the investment companies in which the Fund invests. |
(d) | | Total investment return is calculated assuming an initial investment made at the net asset value at the beginning of the period, reinvestment of all dividends and distributions, if any, at net asset value during the period, and redemption on the last day of the period. Total return calculated for a period less than one year is not annualized. |
(e) | | The market price returns are calculated using the mean between the last bid and ask prices. |
(f) | | Since the Shares of the Funds did not trade in the secondary market until the day after the Fund’s inception, for the period from the inception to the first day of the secondary market trading, the NAV is used as a proxy for the secondary market trading price to calculate the market returns. |
(g) | | In addition to the fees and expenses which the Fund bears directly, the Fund indirectly bears a prorated share of the fees and expenses of the underlying funds in which it invests. Such indirect expenses are not included in the above expense ratios. |
(i) | | Portfolio turnover rate is not annualized and excludes the value of portfolio securities received or delivered as in-kind creations or redemptions in connection with the Fund’s capital share transactions. |
See notes to financial statements.
180
Financial Highlights(continued)
Selected Data for a Share of Capital Stock Outstanding | | | | IQ Merger Arbitrage ETF
| |
| | | | For the Year Ended April 30,
| |
| | | | 2019
| | 2018
| | 2017
| | 2016
| | 2015
|
Net asset value, beginning of year | | | | $ | 30.72 | | | $ | 30.21 | | | $ | 28.44 | | | $ | 28.92 | | | $ | 27.09 | |
| | | | | | | | | | | | | | | | | | | | | | | |
Income from Investment Operations | | | | | | | | | | | | | | | | | | | | | | |
Net investment income(a)(b) | | | | | 0.07 | | | | 0.10 | | | | 0.24 | (c) | | | 0.02 | | | | 0.04 | |
Net realized and unrealized gain (loss) | | | | | 0.71 | | | | 0.41 | (d) | | | 1.59 | | | | (0.25 | ) | | | 1.79 | |
Net increase (decrease) in net assets resulting from investment operations | | | | | 0.78 | | | | 0.51 | | | | 1.83 | | | | (0.23 | ) | | | 1.83 | |
| | | | | | | | | | | | | | | | | | | | | | | |
Distributions from: | | | | | | | | | | | | | | | | | | | | | | |
Net investment income | | | | | — | | | | — | | | | (0.06 | ) | | | (0.25 | ) | | | — | |
Net asset value, end of year | | | | $ | 31.50 | | | $ | 30.72 | | | $ | 30.21 | | | $ | 28.44 | | | $ | 28.92 | |
Market price, end of year | | | | $ | 31.48 | | | $ | 30.75 | | | $ | 30.27 | | | $ | 28.51 | | | $ | 28.97 | |
| | | | | | | | | | | | | | | | | | | | | | | |
Total Return | | | | | | | | | | | | | | | | | | | | | | |
Total investment return based on net asset value(e) | | | | | 2.52 | % | | | 1.69 | % | | | 6.45 | % | | | (0.79 | )% | | | 6.76 | % |
Total investment return based on market price(f) | | | | | 2.37 | % | | | 1.59 | % | | | 6.39 | % | | | (0.73 | )% | | | 6.31 | % |
| | | | | | | | | | | | | | | | | | | | | | | |
Ratios/Supplemental Data | | | | | | | | | | | | | | | | | | | | | | |
Net assets, end of year (000’s omitted) | | | | $ | 985,800 | | | $ | 525,386 | | | $ | 188,833 | | | $ | 139,367 | | | $ | 121,447 | |
Ratio to average net assets of: | | | | | | | | | | | | | | | | | | | | | | |
Expenses(g) | | | | | 0.76 | % | | | 0.76 | % | | | 0.76 | % | | | 0.76 | % | | | 0.76 | % |
Net investment income (loss)(b) | | | | | 0.21 | % | | | 0.34 | % | | | 0.82 | %(c) | | | 0.09 | % | | | 0.14 | % |
Portfolio turnover rate(h) | | | | | 337 | % | | | 329 | % | | | 268 | % | | | 272 | % | | | 447 | % |
(a) | | Based on average shares outstanding. |
(b) | | Recognition of net investment income by the Fund is affected by the timing of the declaration of dividends by the investment companies in which the Fund invests. |
(c) | | Net investment income per share and ratio of net investment income to average net assets include a special cash dividend received of $0.14 per share owned of Calsonic Kansei Corp. on February 17, 2017. Net investment income per share and the net investment income to average net assets excluding the special dividend are $0.10 and 0.34% respectively. |
(d) | | Calculation of the net realized and unrealized gain (loss) per share does not correlate with the Fund’s net realized and unrealized gain (loss) presented on the Statements of Changes in Net Assets due to the timing of creation of Fund shares in relation to fluctuating market values. |
(e) | | Total investment return is calculated assuming an initial investment made at the net asset value at the beginning of the period, reinvestment of all dividends and distributions, if any, at net asset value during the period, and redemption on the last day of the period. |
(f) | | The market price returns are calculated using the mean between the last bid and ask prices. Prior to May 31, 2016, the closing price listed on the NYSE Arca was used. |
(g) | | In addition to the fees and expenses which the Fund bears directly, the Fund indirectly bears a prorated share of the fees and expenses of the underlying funds in which it invests. Such indirect expenses are not included in the above expense ratios. |
(h) | | Portfolio turnover rate is not annualized and excludes the value of portfolio securities received or delivered as in-kind creations or redemptions in connection with the Fund’s capital share transactions. |
See notes to financial statements.
181
Financial Highlights(continued)
Selected Data for a Share of Capital Stock Outstanding | | | | IQ Global Resources ETF
| |
| | | | For the Year Ended April 30,
| |
| | | | 2019
| | 2018
| | 2017
| | 2016
| | 2015
|
Net asset value, beginning of year | | | | $ | 27.76 | | | $ | 25.82 | | | $ | 24.70 | | | $ | 27.18 | | | $ | 29.21 | |
| | | | | | | | | | | | | | | | | | | | | | | |
Income from Investment Operations | | | | | | | | | | | | | | | | | | | | | | |
Net investment income(a)(b) | | | | | 0.65 | | | | 0.68 | | | | 0.33 | | | | 0.56 | | | | 0.37 | |
Net realized and unrealized gain (loss) | | | | | (1.24 | ) | | | 1.26 | | | | 0.89 | | | | (2.48 | ) | | | (2.05 | ) |
Net increase (decrease) in net assets resulting from investment operations | | | | | (0.59 | ) | | | 1.94 | | | | 1.22 | | | | (1.92 | ) | | | (1.68 | ) |
| | | | | | | | | | | | | | | | | | | | | | | |
Distributions from: | | | | | | | | | | | | | | | | | | | | | | |
Net investment income | | | | | (0.20 | ) | | | — | | | | (0.10 | ) | | | (0.56 | ) | | | (0.35 | ) |
Net asset value, end of year | | | | $ | 26.97 | | | $ | 27.76 | | | $ | 25.82 | | | $ | 24.70 | | | $ | 27.18 | |
Market price, end of year | | | | $ | 27.06 | | | $ | 27.65 | | | $ | 25.95 | | | $ | 24.78 | | | $ | 27.18 | |
| | | | | | | | | | | | | | | | | | | | | | | |
Total Return | | | | | | | | | | | | | | | | | | | | | | |
Total investment return based on net asset value(c) | | | | | (2.08 | )% | | | 7.50 | % | | | 4.94 | % | | | (6.71 | )%(d) | | | (5.75 | )%(d) |
Total investment return based on market price(e) | | | | | (1.38 | )% | | | 6.55 | % | | | 5.13 | % | | | (6.41 | )% | | | (5.97 | )% |
| | | | | | | | | | | | | | | | | | | | | | | |
Ratios/Supplemental Data | | | | | | | | | | | | | | | | | | | | | | |
Net assets, end of year (000’s omitted) | | | | $ | 175,312 | | | $ | 238,712 | | | $ | 179,450 | | | $ | 67,924 | | | $ | 66,587 | |
Ratio to average net assets of: | | | | | | | | | | | | | | | | | | | | | | |
Expenses(f) | | | | | 0.76 | % | | | 0.76 | % | | | 0.75 | % | | | 0.76 | % | | | 0.75 | %�� |
Net investment income (loss)(b) | | | | | 2.37 | % | | | 2.51 | % | | | 1.29 | % | | | 2.39 | % | | | 1.32 | % |
Portfolio turnover rate(g) | | | | | 132 | % | | | 235 | % | | | 199 | % | | | 325 | % | | | 182 | % |
(a) | | Based on average shares outstanding. |
(b) | | Recognition of net investment income by the Fund is affected by the timing of the declaration of dividends by the investment companies in which the Fund invests. |
(c) | | Total investment return is calculated assuming an initial investment made at the net asset value at the beginning of the period, reinvestment of all dividends and distributions, if any, at net asset value during the period, and redemption on the last day of the period. |
(d) | | Includes adjustments in accordance with accounting principles generally accepted in the United States of America and as such, the net asset values for financial reporting purposes and the returns based upon those net asset values may differ from the net asset values and returns for shareholder transactions. |
(e) | | The market price returns are calculated using the mean between the last bid and ask prices. Prior to May 31, 2016, the closing price listed on the NYSE Arca was used. |
(f) | | In addition to the fees and expenses which the Fund bears directly, the Fund indirectly bears a prorated share of the fees and expenses of the underlying funds in which it invests. Such indirect expenses are not included in the above expense ratios. |
(g) | | Portfolio turnover rate is not annualized and excludes the value of portfolio securities received or delivered as in-kind creations or redemptions in connection with the Fund’s capital share transactions. |
See notes to financial statements.
182
Financial Highlights(continued)
Selected Data for a Share of Capital Stock Outstanding | | | | IQ Global Agribusiness Small Cap ETF
| |
| | | | For the Year Ended April 30,
| |
| | | | 2019
| | 2018
| | 2017
| | 2016
| | 2015
|
Net asset value, beginning of year | | | | $ | 33.92 | | | $ | 32.99 | | | $ | 30.12 | | | $ | 27.26 | | | $ | 26.92 | |
| | | | | | | | | | | | | | | | | | | | | | | |
Income from Investment Operations | | | | | | | | | | | | | | | | | | | | | | |
Net investment income(a)(b) | | | | | 0.33 | | | | 0.27 | | | | 0.31 | | | | 0.41 | | | | 0.31 | |
Net realized and unrealized gain (loss) | | | | | (1.09 | ) | | | 0.97 | | | | 2.94 | | | | 2.82 | | | | 0.44 | |
Net increase (decrease) in net assets resulting from investment operations | | | | | (0.76 | ) | | | 1.24 | | | | 3.25 | | | | 3.23 | | | | 0.75 | |
| | | | | | | | | | | | | | | | | | | | | | | |
Distributions from: | | | | | | | | | | | | | | | | | | | | | | |
Net investment income | | | | | (0.28 | ) | | | (0.31 | ) | | | (0.38 | ) | | | (0.37 | ) | | | (0.41 | ) |
Net asset value, end of year | | | | $ | 32.88 | | | $ | 33.92 | | | $ | 32.99 | | | $ | 30.12 | | | $ | 27.26 | |
Market price, end of year | | | | $ | 32.84 | | | $ | 33.84 | | | $ | 33.05 | | | $ | 29.52 | | | $ | 27.27 | |
| | | | | | | | | | | | | | | | | | | | | | | |
Total Return | | | | | | | | | | | | | | | | | | | | | | |
Total investment return based on net asset value(c) | | | | | (2.16 | )% | | | 3.75 | % | | | 10.86 | % | | | 11.93 | % | | | 2.92 | % |
Total investment return based on market price(d) | | | | | (2.04 | )% | | | 3.30 | % | | | 13.32 | % | | | 9.66 | % | | | 3.15 | % |
| | | | | | | | | | | | | | | | | | | | | | | |
Ratios/Supplemental Data | | | | | | | | | | | | | | | | | | | | | | |
Net assets, end of year (000’s omitted) | | | | $ | 9,864 | | | $ | 11,873 | | | $ | 13,195 | | | $ | 12,047 | | | $ | 13,630 | |
Ratio to average net assets of: | | | | | | | | | | | | | | | | | | | | | | |
Expenses(e) | | | | | 0.76 | % | | | 0.76 | % | | | 0.76 | % | | | 0.76 | % | | | 0.76 | % |
Net investment income (loss)(b) | | | | | 1.04 | % | | | 0.79 | % | | | 0.99 | % | | | 1.48 | % | | | 1.16 | % |
Portfolio turnover rate(f) | | | | | 32 | % | | | 11 | % | | | 35 | % | | | 31 | % | | | 33 | % |
(a) | | Based on average shares outstanding. |
(b) | | Recognition of net investment income by the Fund is affected by the timing of the declaration of dividends by the investment companies in which the Fund invests. |
(c) | | Total investment return is calculated assuming an initial investment made at the net asset value at the beginning of the period, reinvestment of all dividends and distributions, if any, at net asset value during the period, and redemption on the last day of the period. |
(d) | | The market price returns are calculated using the mean between the last bid and ask prices. Prior to May 31, 2016, the closing price listed on the NYSE Arca was used. |
(e) | | In addition to the fees and expenses which the Fund bears directly, the Fund indirectly bears a prorated share of the fees and expenses of the underlying funds in which it invests. Such indirect expenses are not included in the above expense ratios. |
(f) | | Portfolio turnover rate is not annualized and excludes the value of portfolio securities received or delivered as in-kind creations or redemptions in connection with the Fund’s capital share transactions. |
See notes to financial statements.
183
Financial Highlights(continued)
Selected Data for a Share of Capital Stock Outstanding | | | | IQ U.S. Real Estate Small Cap ETF
| |
| | | | For the Year Ended April 30,
| |
| | | | 2019
| | 2018
| | 2017
| | 2016
| | 2015
|
Net asset value, beginning of year | | | | $ | 24.14 | | | $ | 27.14 | | | $ | 25.14 | | | $ | 26.77 | | | $ | 25.44 | |
| | | | | | | | | | | | | | | | | | | | | | | |
Income from Investment Operations | | | | | | | | | | | | | | | | | | | | | | |
Net investment income(a)(b) | | | | | 0.79 | | | | 0.88 | | | | 0.71 | | | | 0.90 | | | | 1.07 | |
Net realized and unrealized gain (loss) | | | | | 1.81 | | | | (2.53 | ) | | | 2.88 | | | | (1.09 | ) | | | 1.57 | |
Distributions of net realized gains from investments in other investment companies | | | | | — | | | | — | | | | 0.00 | (c) | | | — | | | | — | |
Net increase (decrease) in net assets resulting from investment operations | | | | | 2.60 | | | | (1.65 | ) | | | 3.59 | | | | (0.19 | ) | | | 2.64 | |
| | | | | | | | | | | | | | | | | | | | | | | |
Distributions from: | | | | | | | | | | | | | | | | | | | | | | |
Net investment income | | | | | (0.78 | ) | | | (0.85 | ) | | | (0.71 | ) | | | (0.88 | ) | | | (1.04 | ) |
Return of capital | | | | | (0.83 | ) | | | (0.50 | ) | | | (0.88 | ) | | | (0.56 | ) | | | (0.27 | ) |
Total distributions from net investment income and return of capital | | | | | (1.61 | ) | | | (1.35 | ) | | | (1.59 | ) | | | (1.44 | ) | | | (1.31 | ) |
Net asset value, end of year | | | | $ | 25.13 | | | $ | 24.14 | | | $ | 27.14 | | | $ | 25.14 | | | $ | 26.77 | |
Market price, end of year | | | | $ | 25.12 | | | $ | 24.12 | | | $ | 27.15 | | | $ | 25.10 | | | $ | 26.82 | |
| | | | | | | | | | | | | | | | | | | | | | | |
Total Return | | | | | | | | | | | | | | | | | | | | | | |
Total investment return based on net asset value(d) | | | | | 11.16 | % | | | (6.37 | )% | | | 14.60 | % | | | (0.51 | )% | | | 10.44 | % |
Total investment return based on market price(e) | | | | | 11.24 | % | | | (6.49 | )% | | | 14.79 | % | | | (0.83 | )% | | | 10.51 | % |
| | | | | | | | | | | | | | | | | | | | | | | |
Ratios/Supplemental Data | | | | | | | | | | | | | | | | | | | | | | |
Net assets, end of year (000’s omitted) | | | | $ | 71,615 | | | $ | 82,089 | | | $ | 114,001 | | | $ | 76,663 | | | $ | 95,048 | |
Ratio to average net assets of: | | | | | | | | | | | | | | | | | | | | | | |
Expenses(f) | | | | | 0.70 | % | | | 0.70 | % | | | 0.70 | % | | | 0.70 | % | | | 0.69 | % |
Net investment income (loss)(b) | | | | | 3.11 | % | | | 3.36 | % | | | 2.64 | % | | | 3.62 | % | | | 3.97 | % |
Portfolio turnover rate(g) | | | | | 26 | % | | | 27 | % | | | 28 | % | | | 28 | % | | | 17 | % |
(a) | | Based on average shares outstanding. |
(b) | | Recognition of net investment income by the Fund is affected by the timing of the declaration of dividends by the investment companies in which the Fund invests. |
(c) | | Less than $0.005 per share. |
(d) | | Total investment return is calculated assuming an initial investment made at the net asset value at the beginning of the period, reinvestment of all dividends and distributions, if any, at net asset value during the period, and redemption on the last day of the period. |
(e) | | The market price returns are calculated using the mean between the last bid and ask prices. Prior to May 31, 2016, the closing price listed on the NYSE Arca was used. |
(f) | | In addition to the fees and expenses which the Fund bears directly, the Fund indirectly bears a prorated share of the fees and expenses of the underlying funds in which it invests. Such indirect expenses are not included in the above expense ratios. |
(g) | | Portfolio turnover rate is not annualized and excludes the value of portfolio securities received or delivered as in-kind creations or redemptions in connection with the Fund’s capital share transactions. |
See notes to financial statements.
184
Financial Highlights(continued)
Selected Data for a Share of Capital Stock Outstanding | | | | IQ S&P High Yield Low Volatility Bond ETF
|
| | | | For the Year Ended April 30,
| | For the Period
February 15, 2017(a)
to April 30,
2017
|
| | | | 2019
| | 2018
| |
| Net asset value, beginning of period | | | | $ | 24.36 | | | $ | 25.20 | | | $ | 25.00 | |
| | | | | | | | | | | | | | | |
Income from Investment Operations
| | | | | | | | | | | | | | |
Net investment income(b)(c) | | | | | 1.07 | | | | 0.99 | | | | 0.20 | |
Net realized and unrealized gain (loss) | | | | | 0.41 | | | | (0.88 | ) | | | 0.10 | |
Net increase (decrease) in net assets resulting from investment operations | | | | | 1.48 | | | | 0.11 | | | | 0.30 | |
| | | | | | | | | | | | | | | |
Distributions from: | | | | | | | | | | | | | | |
Net investment income | | | | | (1.08 | ) | | | (0.95 | ) | | | (0.10 | ) |
Net asset value, end of period | | | | $ | 24.76 | | | $ | 24.36 | | | $ | 25.20 | |
Market price, end of period | | | | $ | 24.78 | | | $ | 24.32 | | | $ | 25.34 | |
| | | | | | | | | | | | | | | |
Total Return | | | | | | | | | | | | | | |
Total investment return based on net asset value(d) | | | | | 6.31 | % | | | 0.39 | % | | | 1.40 | % |
Total investment return based on market price(e) | | | | | 6.56 | % | | | (0.36 | )% | | | 1.93 | %(f) |
| | | | | | | | | | | | | | | |
Ratios/Supplemental Data | | | | | | | | | | | | | | |
Net assets, end of period (000’s omitted) | | | | $ | 65,626 | | | $ | 107,192 | | | $ | 49,145 | |
Ratio to average net assets of: | | | | | | | | | | | | | | |
Expenses net of waivers/reimbursements(g) | | | | | 0.40 | % | | | 0.40 | % | | | 0.40 | %(h) |
Expenses excluding waivers/reimbursements(g) | | | | | 0.41 | % | | | 0.41 | % | | | 0.41 | %(h) |
Net investment income (loss)(c) | | | | | 4.42 | % | | | 3.97 | % | | | 4.05 | %(h) |
Portfolio turnover rate(i) | | | | | 83 | % | | | 75 | % | | | 15 | % |
(a) | | Commencement of operations. |
(b) | | Based on average shares outstanding. |
(c) | | Recognition of net investment income by the Fund is affected by the timing of the declaration of dividends by the investment companies in which the Fund invests. |
(d) | | Total investment return is calculated assuming an initial investment made at the net asset value at the beginning of the period, reinvestment of all dividends and distributions, if any, at net asset value during the period, and redemption on the last day of the period. Total return calculated for a period less than one year is not annualized. |
(e) | | The market price returns are calculated using the mean between the last bid and ask prices. |
(f) | | Since the Shares of the Funds did not trade in the secondary market until the day after the Fund’s inception, for the period from the inception to the first day of the secondary market trading, the NAV is used as a proxy for the secondary market trading price to calculate the market returns. |
(g) | | In addition to the fees and expenses which the Fund bears directly, the Fund indirectly bears a prorated share of the fees and expenses of the underlying funds in which it invests. Such indirect expenses are not included in the above expense ratios. |
(i) | | Portfolio turnover rate is not annualized and excludes the value of portfolio securities received or delivered as in-kind creations or redemptions in connection with the Fund’s capital share transactions. |
See notes to financial statements.
185
Financial Highlights(continued)
Selected Data for a Share of Capital Stock Outstanding | | | | IQ 500 International ETF
|
| | | | For the Period
December 13, 2018(a)
to April 30, 2019
|
Net asset value, beginning of period | | | | $ | 25.50 | |
| | | | | | | |
Income from Investment Operations | | | | | | |
Net investment income(b)(c) | | | | | 0.39 | |
Net realized and unrealized gain (loss) | | | | | 1.77 | |
Net increase (decrease) in net assets resulting from investment operations | | | | | 2.16 | |
| | | | | | | |
Distributions from: | | | | | | |
Net investment income | | | | | (0.02 | ) |
Net asset value, end of period | | | | $ | 27.64 | |
Market price, end of period | | | | $ | 27.65 | |
| | | | | | | |
Total Return | | | | | | |
Total investment return based on net asset value(d) | | | | | 8.47 | % |
Total investment return based on market price(e) | | | | | 8.52 | % |
| | | | | | | |
Ratios/Supplemental Data | | | | | | |
Net assets, end of period (000’s omitted) | | | | $ | 85,675 | |
Ratio to average net assets of: | | | | | | |
Expenses net of waivers/reimbursements(f) | | | | | 0.25 | %(g) |
Expenses excluding waivers/reimbursements(f) | | | | | 0.26 | %(g) |
Net investment income (loss)(c) | | | | | 3.90 | %(g) |
Portfolio turnover rate(h) | | | | | 0 | % |
(a) | | Commencement of operations. |
(b) | | Based on average shares outstanding. |
(c) | | Recognition of net investment income by the Fund is affected by the timing of the declaration of dividends by the investment companies in which the Fund invests. |
(d) | | Total investment return is calculated assuming an initial investment made at the net asset value at the beginning of the period, reinvestment of all dividends and distributions, if any, at net asset value during the period, and redemption on the last day of the period. Total return calculated for a period less than one year is not annualized. |
(e) | | The market price returns are calculated using the mean between the last bid and ask prices. |
(f) | | In addition to the fees and expenses which the Fund bears directly, the Fund indirectly bears a prorated share of the fees and expenses of the underlying funds in which it invests. Such indirect expenses are not included in the above expense ratios. |
(h) | | Portfolio turnover rate is not annualized and excludes the value of portfolio securities received or delivered as in-kind creations or redemptions in connection with the Fund’s capital share transactions. |
See notes to financial statements.
186
Financial Highlights(continued)
Selected Data for a Share of Capital Stock Outstanding | | | | IQ 50 Percent Hedged FTSE International ETF
|
| | | | For the Year Ended April 30,
| | For the Period
July 22, 2015(a)
to April 30,
2016
|
| | | | 2019
| | 2018
| | 2017
| |
Net asset value, beginning of period | | | | $ | 21.63 | | | $ | 19.68 | | | $ | 17.68 | | | $ | 19.94 | |
| | | | | | | | | | | | | | | | | | | |
Income from Investment Operations
| | | | | | | | | | | | | | | | | | |
Net investment income(b)(c) | | | | | 0.62 | | | | 0.60 | | | | 0.46 | | | | 0.37 | |
Net realized and unrealized gain (loss) | | | | | (0.77 | ) | | | 1.89 | | | | 2.18 | | | | (2.42 | ) |
Net increase (decrease) in net assets resulting from investment operations | | | | | (0.15 | ) | | | 2.49 | | | | 2.64 | | | | (2.05 | ) |
| | | | | | | | | | | | | | | | | | | |
Distributions from: | | | | | | | | | | | | | | | | | | |
Net investment income | | | | | (0.70 | ) | | | (0.54 | ) | | | (0.44 | ) | | | (0.21 | ) |
Net realized gain | | | | | (0.19 | ) | | | 0.00 | (d) | | | (0.20 | ) | | | — | |
Total distributions from net investment income and realized gains | | | | | (0.89 | ) | | | (0.54 | ) | | | (0.64 | ) | | | (0.21 | ) |
Net asset value, end of period | | | | $ | 20.59 | | | $ | 21.63 | | | $ | 19.68 | | | $ | 17.68 | |
Market price, end of period | | | | $ | 20.65 | | | $ | 21.60 | | | $ | 19.75 | | | $ | 17.59 | |
| | | | | | | | | | | | | | | | | | | |
Total Return | | | | | | | | | | | | | | | | | | |
Total investment return based on net asset value(e) | | | | | (0.42 | )% | | | 12.84 | % | | | 15.29 | % | | | (10.33 | )% |
Total investment return based on market price(f) | | | | | (0.03 | )% | | | 12.28 | % | | | 16.28 | % | | | (10.77 | )%(g) |
| | | | | | | | | | | | | | | | | | | |
Ratios/Supplemental Data | | | | | | | | | | | | | | | | | | |
Net assets, end of period (000’s omitted) | | | | $ | 281,079 | | | $ | 578,517 | | | $ | 208,595 | | | $ | 76,010 | |
Ratio to average net assets of: | | | | | | | | | | | | | | | | | | |
Expenses net of waivers/reimbursements(h) | | | | | 0.20 | % | | | 0.22 | % | | | 0.36 | % | | | 0.36 | %(i) |
Expenses excluding waivers/reimbursements(h) | | | | | 0.36 | % | | | 0.36 | % | | | 0.36 | % | | | 0.36 | %(i) |
Net investment income (loss)(c) | | | | | 3.03 | % | | | 2.87 | % | | | 2.55 | % | | | 2.71 | %(i) |
Portfolio turnover rate(j) | | | | | 13 | % | | | 10 | % | | | 8 | % | | | 7 | % |
(a) | | Commencement of operations. |
(b) | | Based on average shares outstanding. |
(c) | | Recognition of net investment income by the Fund is affected by the timing of the declaration of dividends by the investment companies in which the Fund invests. |
(d) | | Less than $0.005 per share. |
(e) | | Total investment return is calculated assuming an initial investment made at the net asset value at the beginning of the period, reinvestment of all dividends and distributions, if any, at net asset value during the period, and redemption on the last day of the period. Total return calculated for a period less than one year is not annualized. |
(f) | | The market price returns are calculated using the mean between the last bid and ask prices. Prior to May 31, 2016, the closing price listed on the NYSE Arca was used. |
(g) | | Since the Shares of the Funds did not trade in the secondary market until the day after the Fund’s inception, for the period from the inception to the first day of the secondary market trading, the NAV is used as a proxy for the secondary market trading price to calculate the market returns. |
(h) | | In addition to the fees and expenses which the Fund bears directly, the Fund indirectly bears a prorated share of the fees and expenses of the underlying funds in which it invests. Such indirect expenses are not included in the above expense ratios. |
(j) | | Portfolio turnover rate is not annualized and excludes the value of portfolio securities received or delivered as in-kind creations or redemptions in connection with the Fund’s capital share transactions. |
See notes to financial statements.
187
Financial Highlights(continued)
Selected Data for a Share of Capital Stock Outstanding | | | | IQ 50 Percent Hedged FTSE Europe ETF
|
| | | | For the Year Ended April 30,
| | For the Period
July 22, 2015(a)
to April 30,
2016
|
| | | | 2019
| | 2018
| | 2017
| |
Net asset value, beginning of period | | | | $ | 20.33 | | | $ | 18.82 | | | $ | 17.63 | | | $ | 19.90 | |
| | | | | | | | | | | | | | | | | | | |
Income from Investment Operations
| | | | | | | | | | | | | | | | | | |
Net investment income(b)(c) | | | | | 1.37 | | | | 0.53 | | | | 0.62 | | | | 0.36 | |
Net realized and unrealized gain (loss) | | | | | (1.15 | ) | | | 1.43 | | | | 1.96 | | | | (2.41 | ) |
Net increase (decrease) in net assets resulting from investment operations | | | | | 0.22 | | | | 1.96 | | | | 2.58 | | | | (2.05 | ) |
| | | | | | | | | | | | | | | | | | | |
Distributions from: | | | | | | | | | | | | | | | | | | |
Net investment income | | | | | (0.78 | ) | | | (0.45 | ) | | | (0.63 | ) | | | (0.22 | ) |
Net realized gain | | | | | — | | | | — | | | | (0.76 | ) | | | — | |
Total distributions from net investment income and realized gains | | | | | (0.78 | ) | | | (0.45 | ) | | | (1.39 | ) | | | (0.22 | ) |
Net asset value, end of period | | | | $ | 19.77 | | | $ | 20.33 | | | $ | 18.82 | | | $ | 17.63 | |
Market price, end of period | | | | $ | 19.77 | | | $ | 20.24 | | | $ | 18.90 | | | $ | 17.82 | |
| | | | | | | | | | | | | | | | | | | |
Total Return | | | | | | | | | | | | | | | | | | |
Total investment return based on net asset value(d) | | | | | 1.45 | % | | | 10.58 | % | | | 15.48 | % | | | (10.33 | )% |
Total investment return based on market price(e) | | | | | 1.90 | % | | | 9.59 | % | | | 14.78 | % | | | (9.38 | )%(f) |
| | | | | | | | | | | | | | | | | | | |
Ratios/Supplemental Data | | | | | | | | | | | | | | | | | | |
Net assets, end of period (000’s omitted) | | | | $ | 8,895 | | | $ | 168,737 | | | $ | 81,845 | | | $ | 46,724 | |
Ratio to average net assets of: | | | | | | | | | | | | | | | | | | |
Expenses net of waivers/reimbursements(g) | | | | | 0.30 | % | | | 0.32 | % | | | 0.46 | % | | | 0.46 | %(h) |
Expenses excluding waivers/reimbursements(g) | | | | | 0.47 | % | | | 0.46 | % | | | 0.46 | % | | | 0.46 | %(h) |
Net investment income (loss)(c) | | | | | 6.74 | % | | | 2.68 | % | | | 3.52 | % | | | 2.65 | %(h) |
Portfolio turnover rate(i) | | | | | 10 | % | | | 10 | % | | | 14 | % | | | 10 | % |
(a) | | Commencement of operations. |
(b) | | Based on average shares outstanding. |
(c) | | Recognition of net investment income by the Fund is affected by the timing of the declaration of dividends by the investment companies in which the Fund invests. |
(d) | | Total investment return is calculated assuming an initial investment made at the net asset value at the beginning of the period, reinvestment of all dividends and distributions, if any, at net asset value during the period, and redemption on the last day of the period. Total return calculated for a period less than one year is not annualized. |
(e) | | The market price returns are calculated using the mean between the last bid and ask prices. Prior to May 31, 2016, the closing price listed on the NYSE Arca was used. |
(f) | | Since the Shares of the Funds did not trade in the secondary market until the day after the Fund’s inception, for the period from the inception to the first day of the secondary market trading, the NAV is used as a proxy for the secondary market trading price to calculate the market returns. |
(g) | | In addition to the fees and expenses which the Fund bears directly, the Fund indirectly bears a prorated share of the fees and expenses of the underlying funds in which it invests. Such indirect expenses are not included in the above expense ratios. |
(i) | | Portfolio turnover rate is not annualized and excludes the value of portfolio securities received or delivered as in-kind creations or redemptions in connection with the Fund’s capital share transactions. |
See notes to financial statements.
188
Financial Highlights(continued)
Selected Data for a Share of Capital Stock Outstanding | | | | IQ 50 Percent Hedged FTSE Japan ETF
|
| | | | For the Year Ended April 30,
| | For the Period
July 22, 2015(a)
to April 30,
2016
|
| | | | 2019
| | 2018
| | 2017
| |
Net asset value, beginning of period | | | | $ | 22.42 | | | $ | 19.13 | | | $ | 17.33 | | | $ | 20.16 | |
| | | | | | | | | | | | | | | | | | | |
Income from Investment Operations
| | | | | | | | | | | | | | | | | | |
Net investment income(b)(c) | | | | | 0.30 | | | | 0.34 | | | | 0.27 | | | | 0.27 | |
Net realized and unrealized gain (loss) | | | | | (1.64 | ) | | | 3.30 | | | | 1.95 | | | | (3.10 | ) |
Net increase (decrease) in net assets resulting from investment operations | | | | | (1.34 | ) | | | 3.64 | | | | 2.22 | | | | (2.83 | ) |
| | | | | | | | | | | | | | | | | | | |
Distributions from: | | | | | | | | | | | | | | | | | | |
Net investment income | | | | | (0.35 | ) | | | (0.35 | ) | | | (0.42 | ) | | | — | |
Net asset value, end of period | | | | $ | 20.73 | | | $ | 22.42 | | | $ | 19.13 | | | $ | 17.33 | |
Market price, end of period | | | | $ | 20.67 | | | $ | 22.30 | | | $ | 19.16 | | | $ | 17.83 | |
| | | | | | | | | | | | | | | | | | | |
Total Return | | | | | | | | | | | | | | | | | | |
Total investment return based on net asset value(d) | | | | | (5.96 | )% | | | 19.11 | % | | | 13.18 | % | | | (14.05 | )% |
Total investment return based on market price(e) | | | | | (5.71 | )% | | | 18.29 | % | | | 10.17 | % | | | (11.56 | )%(f) |
| | | | | | | | | | | | | | | | | | | |
Ratios/Supplemental Data | | | | | | | | | | | | | | | | | | |
Net assets, end of period (000’s omitted) | | | | $ | 6,218 | | | $ | 34,746 | | | $ | 27,740 | | | $ | 25,125 | |
Ratio to average net assets of: | | | | | | | | | | | | | | | | | | |
Expenses net of waivers/reimbursements(g) | | | | | 0.30 | % | | | 0.33 | % | | | 0.46 | % | | | 0.46 | %(h) |
Expenses excluding waivers/reimbursements(g) | | | | | 0.46 | % | | | 0.46 | % | | | —% | | | | —%(h) | |
Net investment income (loss)(c) | | | | | 1.39 | % | | | 1.61 | % | | | 1.53 | % | | | 1.85 | %(h) |
Portfolio turnover rate(i) | | | | | 7 | % | | | 6 | % | | | 15 | % | | | 11 | % |
(a) | | Commencement of operations. |
(b) | | Based on average shares outstanding. |
(c) | | Recognition of net investment income by the Fund is affected by the timing of the declaration of dividends by the investment companies in which the Fund invests. |
(d) | | Total investment return is calculated assuming an initial investment made at the net asset value at the beginning of the period, reinvestment of all dividends and distributions, if any, at net asset value during the period, and redemption on the last day of the period. Total return calculated for a period less than one year is not annualized. |
(e) | | The market price returns are calculated using the mean between the last bid and ask prices. Prior to May 31, 2016, the closing price listed on the NYSE Arca was used. |
(f) | | Since the Shares of the Funds did not trade in the secondary market until the day after the Fund’s inception, for the period from the inception to the first day of the secondary market trading, the NAV is used as a proxy for the secondary market trading price to calculate the market returns. |
(g) | | In addition to the fees and expenses which the Fund bears directly, the Fund indirectly bears a prorated share of the fees and expenses of the underlying funds in which it invests. Such indirect expenses are not included in the above expense ratios. |
(i) | | Portfolio turnover rate is not annualized and excludes the value of portfolio securities received or delivered as in-kind creations or redemptions in connection with the Fund’s capital share transactions. |
See notes to financial statements.
189
Financial Highlights(continued)
Selected Data for a Share of Capital Stock Outstanding | | | | IQ Chaikin U.S. Small Cap ETF
| |
| | | | For the
Year Ended
April 30, 2019
| | For the Period
May 16, 2017(a)
to April 30, 2018
|
Net asset value, beginning of period | | | | $ | 27.13 | | | $ | 25.16 | |
| | | | | | | | | | | |
Income from Investment Operations | | | | | | | | | | |
Net investment income(b)(c) | | | | | 0.27 | | | | 0.16 | |
Net realized and unrealized gain (loss) | | | | | (1.39 | ) | | | 1.93 | |
Net increase (decrease) in net assets resulting from investment operations | | | | | (1.12 | ) | | | 2.09 | |
| | | | | | | | | | | |
Distributions from: | | | | | | | | | | |
Net investment income | | | | | (0.29 | ) | | | (0.12 | ) |
Net asset value, end of period | | | | $ | 25.72 | | | $ | 27.13 | |
Market price, end of period | | | | $ | 25.72 | | | $ | 27.14 | |
| | | | | | | | | | | |
Total Return | | | | | | | | | | |
Total investment return based on net asset value(d) | | | | | (4.10 | )% | | | 8.33 | % |
Total investment return based on market price(e) | | | | | (4.14 | )% | | | 8.36 | %(f) |
| | | | | | | | | | | |
Ratios/Supplemental Data | | | | | | | | | | |
Net assets, end of period (000’s omitted) | | | | $ | 348,555 | | | $ | 465,347 | |
Ratio to average net assets of: | | | | | | | | | | |
Expenses net of waivers/reimbursements(g) | | | | | 0.35 | % | | | 0.35 | %(h) |
Expenses excluding waivers/reimbursements(g) | | | | | 0.36 | % | | | 0.36 | %(h) |
Net investment income (loss)(c) | | | | | 1.01 | % | | | 0.61 | %(h) |
Portfolio turnover rate(i) | | | | | 57 | % | | | 106 | % |
(a) | | Commencement of operations. |
(b) | | Based on average shares outstanding. |
(c) | | Recognition of net investment income by the Fund is affected by the timing of the declaration of dividends by the investment companies in which the Fund invests. |
(d) | | Total investment return is calculated assuming an initial investment made at the net asset value at the beginning of the period, reinvestment of all dividends and distributions, if any, at net asset value during the period, and redemption on the last day of the period. Total return calculated for a period less than one year is not annualized. |
(e) | | The market price returns are calculated using the mean between the last bid and ask prices. |
(f) | | Since the Shares of the Funds did not trade in the secondary market until the day after the Fund’s inception, for the period from the inception to the first day of the secondary market trading, the NAV is used as a proxy for the secondary market trading price to calculate the market returns. |
(g) | | In addition to the fees and expenses which the Fund bears directly, the Fund indirectly bears a prorated share of the fees and expenses of the underlying funds in which it invests. Such indirect expenses are not included in the above expense ratios. |
(i) | | Portfolio turnover rate is not annualized and excludes the value of portfolio securities received or delivered as in-kind creations or redemptions in connection with the Fund’s capital share transactions. |
See notes to financial statements.
190
Financial Highlights(continued)
Selected Data for a Share of Capital Stock Outstanding | | | | IQ Chaikin U.S. Large Cap ETF
| |
| | | | For the
Year Ended
April 30, 2019
| | For the Period
December 13, 2017(a)
to April 30, 2018
|
Net asset value, beginning of period | | | | $ | 25.30 | | | $ | 25.05 | |
| | | | | | | | | | | |
Income from Investment Operations | | | | | | | | | | |
Net investment income(b)(c) | | | | | 0.48 | | | | 0.15 | |
Net realized and unrealized gain (loss) | | | | | (0.53 | ) | | | 0.18 | (d) |
Net increase (decrease) in net assets resulting from investment operations | | | | | (0.05 | ) | | | 0.33 | |
| | | | | | | | | | | |
Distributions from: | | | | | | | | | | |
Net investment income | | | | | (0.50 | ) | | | (0.08 | ) |
Net asset value, end of period | | | | $ | 24.75 | | | $ | 25.30 | |
Market price, end of period | | | | $ | 24.75 | | | $ | 25.30 | |
| | | | | | | | | | | |
Total Return | | | | | | | | | | |
Total investment return based on net asset value(e) | | | | | (0.13 | )% | | | 1.31 | % |
Total investment return based on market price(f) | | | | | (0.13 | )% | | | 1.32 | %(g) |
| | | | | | | | | | | |
Ratios/Supplemental Data | | | | | | | | | | |
Net assets, end of period (000’s omitted) | | | | $ | 278,412 | | | $ | 320,000 | |
Ratio to average net assets of: | | | | | | | | | | |
Expenses net of waivers/reimbursements(h) | | | | | 0.25 | % | | | 0.25 | %(i) |
Expenses excluding waivers/reimbursements(h) | | | | | 0.26 | % | | | 0.26 | %(i) |
Net investment income (loss)(c) | | | | | 1.97 | % | | | 1.59 | %(i) |
Portfolio turnover rate(j) | | | | | 52 | % | | | 94 | % |
(a) | | Commencement of operations. |
(b) | | Based on average shares outstanding. |
(c) | | Recognition of net investment income by the Fund is affected by the timing of the declaration of dividends by the investment companies in which the Fund invests. |
(d) | | Calculation of the net realized and unrealized gain (loss) per share does not correlate with the Fund’s net realized and unrealized gain (loss) presented on the Statements of Changes in Net Assets due to the timing of creation of Fund shares in relation to fluctuating market values. |
(e) | | Total investment return is calculated assuming an initial investment made at the net asset value at the beginning of the period, reinvestment of all dividends and distributions, if any, at net asset value during the period, and redemption on the last day of the period. Total return calculated for a period less than one year is not annualized. |
(f) | | The market price returns are calculated using the mean between the last bid and ask prices. |
(g) | | Since the Shares of the Funds did not trade in the secondary market until the day after the Fund’s inception, for the period from the inception to the first day of the secondary market trading, the NAV is used as a proxy for the secondary market trading price to calculate the market returns. |
(h) | | In addition to the fees and expenses which the Fund bears directly, the Fund indirectly bears a prorated share of the fees and expenses of the underlying funds in which it invests. Such indirect expenses are not included in the above expense ratios. |
(j) | | Portfolio turnover rate is not annualized and excludes the value of portfolio securities received or delivered as in-kind creations or redemptions in connection with the Fund’s capital share transactions. |
See notes to financial statements.
191
Notes to Financial Statements
April 30, 20191. ORGANIZATION
IndexIQ ETF Trust (the “Trust”) was organized as a Delaware statutory trust on July 1, 2008 and is registered with the Securities and Exchange Commission (“SEC”) as an open-end, management investment company, as defined by the Investment Company Act of 1940, as amended (the “1940 Act”). The Trust is currently comprised of twenty-one operational funds (collectively, the “Funds” and each individually, a “Fund”). The Funds are exchange-traded funds (“ETFs”), whose shares are listed on a stock exchange and traded like equity securities at market prices.
Investors may find the financial statements of any issuer whose securities represent a significant amount of the Fund’s assets on the SEC’s website (www.sec.gov).
Funds
| | Diversification Policy
| | Commencement of
Operations Date
|
IQ Hedge Multi-Strategy Tracker ETF* | | Diversified | | March 25, 2009 |
IQ Hedge Macro Tracker ETF* | | Diversified | | June 9, 2009 |
IQ Hedge Market Neutral Tracker ETF* | | Diversified | | October 4, 2012 |
IQ Hedge Long/Short Tracker ETF* | | Diversified | | March 24, 2015 |
IQ Hedge Event-Driven Tracker ETF* | | Diversified | | March 24, 2015 |
IQ Real Return ETF* | | Non-diversified | | October 27, 2009 |
IQ Leaders GTAA Tracker ETF* | | Diversified | | September 30, 2015 |
IQ Enhanced Core Bond U.S. ETF* | | Non-diversified | | May 10, 2016 |
IQ Enhanced Core Plus Bond U.S. ETF* | | Non-diversified | | May 10, 2016 |
IQ Short Duration Enhanced Core Bond U.S. ETF* | | Diversified | | December 18, 2018 |
IQ Merger Arbitrage ETF | | Non-diversified | | November 17, 2009 |
IQ Global Resources ETF | | Non-diversified | | October 27, 2009 |
IQ Global Agribusiness Small Cap ETF | | Non-diversified | | March 22, 2011 |
IQ U.S. Real Estate Small Cap ETF | | Non-diversified | | June 14, 2011 |
IQ S&P High Yield Low Volatility Bond ETF | | Diversified | | February 15, 2017 |
IQ 500 International ETF | | Diversified | | December 13, 2018 |
IQ 50 Percent Hedged FTSE International ETF | | Non-diversified | | July 22, 2015 |
IQ 50 Percent Hedged FTSE Europe ETF | | Non-diversified | | July 22, 2015 |
IQ 50 Percent Hedged FTSE Japan ETF | | Non-diversified | | July 22, 2015 |
IQ Chaikin U.S. Small Cap ETF | | Diversified | | May 16, 2017 |
IQ Chaikin U.S. Large Cap ETF | | Diversified | | December 13, 2017 |
* | | Funds are “fund of funds”, meaning that they seek to achieve their investment objective by investing primarily in underlying funds, including ETFs, exchange-traded notes (“ETNs”), and other exchange-traded vehicles issuing equity securities organized in the U.S., such as exchange traded commodity pools (“ETVs”). Such ETFs, ETVs and ETNs are referred to collectively as exchange-traded products (“ETPs”). |
Each Fund’s investment objective is to seek daily investment results, before fees and expenses that correspond to the performance of a particular index (the “Underlying Index”). The underlying indices for the Funds are listed below:
Fund
| | Underlying Index
|
IQ Hedge Multi-Strategy Tracker ETF | | IQ Hedge Multi-Strategy Index |
IQ Hedge Macro Tracker ETF | | IQ Hedge Macro Index |
IQ Hedge Market Neutral Tracker ETF | | IQ Hedge Market Neutral Index |
IQ Hedge Long/Short Tracker ETF | | IQ Hedge Long/Short Index |
IQ Hedge Event-Driven Tracker ETF | | IQ Hedge Event-Driven Index |
IQ Real Return ETF | | IQ Real Return Index |
IQ Leaders GTAA Tracker ETF | | IQ Leaders GTAA Index |
IQ Enhanced Core Bond U.S. ETF | | IQ Enhanced Core Bond U.S. Index |
IQ Enhanced Core Plus Bond U.S. ETF | | IQ Enhanced Core Plus Bond U.S. Index |
IQ Short Duration Enhanced Core Bond U.S. ETF | | IQ Short Duration Enhanced Core Bond U.S. Index |
IQ Merger Arbitrage ETF | | IQ Merger Arbitrage Index |
IQ Global Resources ETF | | IQ Global Resources Index |
IQ Global Agribusiness Small Cap ETF | | IQ Global Agribusiness Small Cap Index |
IQ U.S. Real Estate Small Cap ETF | | IQ U.S. Real Estate Small Cap Index |
IQ S&P High Yield Low Volatility Bond ETF | | S&P U.S. High Yield Low Volatility Corporate Bond Index |
IQ 500 International ETF | | IQ 500 International Index |
IQ 50 Percent Hedged FTSE International ETF | | FTSE Developed ex North America 50% Hedged to USD Index |
IQ 50 Percent Hedged FTSE Europe ETF | | FTSE Developed Europe 50% Hedged to USD Index |
IQ 50 Percent Hedged FTSE Japan ETF | | FTSE Japan 50% Hedged to USD Index |
IQ Chaikin U.S. Small Cap ETF | | NASDAQ Chaikin Power U.S. Small Cap Index |
IQ Chaikin U.S. Large Cap ETF | | NASDAQ Chaikin Power U.S. Large Cap Index |
192
Notes to Financial Statements (continued)
April 30, 20192. SIGNIFICANT ACCOUNTING POLICIES
Each Fund is an investment company and accordingly follows the investment company accounting and reporting guidance of the Financial Account Standards Board (“FASB”) Accounting Standard Codification Topic 946 Financial Services — Investment Companies. Each Fund prepares its financial statements in accordance with generally accepted accounting principles (“GAAP”) in the United States of America and follows the significant accounting policies described below.
Use of Estimates
Management makes certain estimates and assumptions that affect the reported amounts of assets and liabilities and disclosure of contingent assets and liabilities at the date of the financial statements and reported amounts of increases and decreases in the net assets from operations during the reporting period. Actual results could differ from those estimates.
Indemnification
In the normal course of business, the Funds may enter into contracts that contain a variety of representations and warranties and which may provide general indemnifications for certain liabilities. Under the Trust’s organizational documents, its officers and trustees are indemnified against certain liabilities that may arise out of performance of their duties to the Trust. The Funds’ maximum exposure under these arrangements is unknown, as this would involve future claims that may be made against the Funds that have not yet occurred. Based on experience, management is of the view that the risk of loss in connection with these potential indemnification obligations is remote. However, there can be no assurance that material liabilities related to such obligations will not arise in the future, which could adversely impact the Funds.
Investment Valuation
Each Fund issues and redeems shares on a continuous basis at Net Asset Value (“NAV”) only in large blocks of shares called “Creation Units.” A Creation Unit consists of 50,000 shares. The NAV is determined as of the close of trading (generally, 4:00 PM Eastern Time) on each day the New York Stock Exchange (“NYSE”) is open for trading. The NAV of the shares of each Fund will be equal to each Fund’s total assets minus each Fund’s total liabilities divided by the total number of shares outstanding. The NAV that is published will be rounded to the nearest cent; however, for purposes of determining the price of Creation Units, the NAV will be calculated to five decimal places. The consideration for purchase of a Creation Unit of shares of each Fund consist of in-kind deposits; however, the Funds reserve the rights to permit cash payments.
In calculating NAV, each Fund’s investments are valued using market quotations when available. Equity securities are generally valued at the closing price of the security on the security’s primary exchange. The primary exchanges for a fund’s foreign equity securities may close for trading at various times prior to close of regular trading on the NYSE Arca, and the value of such securities used in computing the Fund’s NAV are generally determined as of such times.
A fund typically values fixed-income portfolio securities using last available bid prices or current market quotations provided by dealers or prices (including evaluated prices) supplied by the Fund’s approved independent third-party pricing services. Pricing services may use matrix pricing or valuation models that utilize certain inputs and assumptions to derive values. Pricing services generally value fixed-income securities assuming orderly transactions of an institutional round lot size, but a fund may hold or transact in such securities in smaller odd lot sizes. Odd lots often trade at different prices that may be above or below the price at which the pricing service has valued the security. Amortized cost is used as the method of valuation with respect to debt obligations with sixty days or less remaining to maturity unless IndexIQ Advisors LLC (the “Advisor”) determines in good faith that such method does not represent fair value.
A swap on an exchange-listed security or securities is valued based on the last reported sale price of the swap’s underlying security or securities on the exchange where the security or securities is primarily traded, or if no sale price is available, at the mid-price of the security or securities underlying the swap on the exchange where the security is primarily traded. A swap on an index is valued based on the publicly available index price. The index price, in turn, is determined by the applicable index calculation agent, which generally values the securities underlying the index at the last reported sale price.
193
Notes to Financial Statements(continued)
April 30, 2019Over-the counter (“OTC”) traded financial Instruments, including OTC-traded options, forward foreign currency contracts and currency-related derivatives, are normally valued on the basis of quotes obtained from a third party broker-dealer who makes markets in such securities or on the basis of quotes obtained from an independent third-party pricing service. At April 30, 2019 there were no open OTC-traded options.
If a fund invests in open-end management investment companies (other than ETFs) registered under the 1940 Act, it may rely on the NAVs of those companies to value the shares they hold of them. Those companies may also use fair value pricing under some circumstances.
When market quotations or prices are not readily available or are deemed unreliable or not representative of an investment’s fair value, investments are valued using fair value pricing as determined in good faith by the Advisor, under procedures established by and under the general supervision and responsibility of the Trust’s Board of Trustees. The Advisor may conclude that a market quotation is not readily available or is unreliable if a security or other asset or liability does not have a price source due to its lack of liquidity or other reason, if a market quotation differs significantly from recent price quotations or otherwise no longer appears to reflect fair value, where the security or other asset or liability is thinly traded, or if the trading market on which a security is listed is suspended or closed and no appropriate alternative trading market is available. The frequency with which a fund’s investments are valued using fair value pricing is primarily a function of the types of securities and other assets in which the Fund invests pursuant to its investment objective, strategies and limitations.
A fund may automatically sweep uninvested cash balances into a money market fund, either the Morgan Stanley Institutional Liquidity Funds Treasury Portfolio — Institutional Class or the BlackRock Liquidity Funds Treasury Trust Fund Portfolio, Institutional Class. The Morgan Stanley Institutional Liquidity Funds Treasury Portfolio and the BlackRock Liquidity Funds Treasury Trust Fund Portfolio seek preservation of capital, daily liquidity and maximum current income. The Morgan Stanley Institutional Liquidity Funds Treasury Portfolio and the BlackRock Liquidity Funds Treasury Trust Fund Portfolio have no redemption restriction and are valued at the daily NAV.
Under normal conditions, each Fund invests cash collateral from securities lending activities into the Dreyfus Government Cash Management Fund, Institutional Shares. The Dreyfus Government Cash Management Fund’s investment objective is to maximize current income to the extent consistent with the preservation of capital and the maintenance of liquidity. The Dreyfus Government Cash Management Fund has no redemption restrictions and is valued at the daily NAV.
Fair Value Measurement
Accounting Standards Codification (“ASC”) Topic 820, Fair Value Measurements and Disclosures defines fair value, establishes a framework for measuring fair value in accordance with GAAP, and requires disclosure about fair value measurements. It also provides guidance on determining when there has been a significant decrease in the volume and level of activity for an asset or liability, when a transaction is not orderly, and how that information must be incorporated into fair value measurement. Under ASC 820, various inputs are used in determining the value of the Funds’ investments. These inputs are summarized in the following hierarchy:
• | | Level 1 — Unadjusted quoted prices in active markets for identical assets or liabilities that the Funds have the ability to access. |
• | | Level 2 — Observable inputs other than quoted prices included in Level 1 that are observable for the asset or liability, either directly or indirectly. These inputs may include quoted prices for the identical instrument on an inactive market, prices for similar securities, interest rates, prepayment speeds, credit risk, yield curves, default rates and similar data. |
• | | Level 3 — Unobservable inputs for the asset or liability, to the extent relevant observable inputs are not available; representing the Funds’ own assumptions about the assumptions a market participant would use in valuing the asset or liability, and would be based on the best information available. |
A financial instrument’s level within the fair value hierarchy is based on the lowest level of any input that is significant to the fair value measurement. The inputs or methodology used for valuing instruments are not necessarily an indication of the risk associated with investing in those instruments.
194
Notes to Financial Statements(continued)
April 30, 2019The availability of observable inputs can vary from security to security and are affected by a wide variety of factors, including, for example, the type of security, whether the security is new and not yet established in the marketplace, the liquidity of markets, and other characteristics particular to the security. To the extent that valuation is based on models or inputs that are less observable or unobservable in the market, the determination of fair value requires more judgment. Accordingly, the degree of judgment exercised in determining fair value is greatest for instruments categorized in Level 3. With respect to the valuation of Level 3 securities, the Advisor may employ a market-based valuation approach which may use related or comparable securities, recent transactions, market multiples, book values, and other relevant information to determine fair value. The Advisor may also use an income-based valuation approach in which anticipated future cash flows of the financial instrument are discounted to calculate fair value. The Advisor representatives meet regularly to review and discuss the appropriateness of such fair values using more current information, such as recent security news, recent market transactions, updated corporate action information and/or other macro or security specific events.
All other securities and investments for which market values are not readily available, including restricted securities, and those securities for which it is inappropriate to determine prices in accordance with the aforementioned procedures, are valued at fair value as determined in good faith under procedures adopted by the Board, although the actual calculations may be done by others. Factors considered in making this determination may include, but are not limited to, information obtained by contacting the issuer, analysts, or the appropriate stock exchange (for exchange-traded securities), analysis of the issuer’s financial statements or other available documents and, if necessary, available information concerning other securities in similar circumstances.
The inputs or methodology used for valuing securities are not necessarily an indication of the risk associated with investing in those securities. The hierarchy classification of inputs used to value each Fund’s investments at April 30, 2019 is disclosed at the end of each Fund’s Schedule of Investments.
Foreign Currency Translation — Assets and liabilities denominated in foreign currencies are translated into U.S. dollars using the current exchange rates at the close of each business day. The effect of changes in foreign currency exchange rates on investments is included within net realized and unrealized gain (loss) on investments. Changes in the value of other assets and liabilities as a result of fluctuations in foreign exchange rates are included on the Statements of Operations within net change in unrealized appreciation/depreciation on foreign currency translations. Transactions denominated in foreign currencies are translated into U.S. dollars on the date the transaction occurred, the effects of which are included within net realized gain (loss) on foreign currency transactions.
Foreign securities and instruments are valued in their local currency following the methodologies described above. Foreign securities, instruments and currencies will be translated to U.S. dollars, based on foreign currency exchange rate quotations supplied by the London Stock Exchange.
Tax Information and Uncertain Tax Positions
Each Fund is treated as a separate entity for federal income tax purposes. Each Fund’s policy is to comply with the requirements of the Internal Revenue Code of 1986, as amended (the “Internal Revenue Code”), applicable to regulated investment companies and to distribute all of the taxable income to the shareholders of the Funds within the allowable time limits.
Management evaluates each Fund’s tax positions to determine if the tax positions taken meet the minimum recognition threshold in connection with accounting for uncertainties in income tax positions taken or expected to be taken for the purposes of measuring and recognizing tax liabilities in the financial statements. Recognition of tax benefits of an uncertain tax position is required only when the position is “more likely than not” to be sustained assuming examination by taxing authorities. Management has analyzed each Fund’s tax positions taken on federal, state and local income tax returns for all open tax years (for up to three tax years), and has concluded that no provisions for federal, state and local income tax are required in each Fund’s financial statements. Each Fund’s federal, state and local income and federal excise tax returns for tax years for which the applicable statutes of limitations have not expired are subject to examination by the Internal Revenue Service and state and local departments of revenue.
195
Notes to Financial Statements(continued)
April 30, 2019The Funds have concluded that there is no tax liability resulting from uncertain income tax positions taken or expected to be taken.
Dividends and Distributions to Shareholders
Distributions to Shareholders are recorded on the ex-dividend date. In addition, the Funds may determine to distribute at least annually amounts representing the full dividend yield net of expenses on the underlying investment securities, as if the Funds owned the underlying investment securities for the entire dividend period in which case some portion of each distribution may result in a return of capital. The amount of dividends and distributions from net investment income and net realized capital gains are determined in accordance with federal income tax regulations which may differ from GAAP. These “book/tax” differences are either considered temporary or permanent in nature. To the extent these differences are permanent in nature, such amounts are reclassified within the components of net assets based on their federal tax basis treatment; temporary differences do not require reclassification. Dividends and distributions, which exceed earnings and profit for tax purposes, are reported as a tax return of capital. Therefore, no federal, state and local income tax provisions are required.
Foreign Taxes
The Funds may be subject to foreign taxes on income and other transaction-based taxes imposed by certain countries in which they invest. A portion of the taxes on gains on investments or currency purchases/repatriation may be recoverable. The Funds will accrue such taxes and recoveries as applicable, based upon their current interpretation of tax rules and regulations that exist in the markets in which they invest.
The Funds may be subject to taxation on realized capital gains, repatriation proceeds and other transaction-based taxes imposed by certain countries in which they invest. The Funds will accrue the unrecoverable portion of such taxes as applicable based upon their current interpretation of tax rules and regulations that exist in the market in which they invests. Capital gains taxes relating to positions still held are reflected as a liability on the Statements of Assets and Liabilities, as well as an adjustment to the Funds’ net unrealized appreciation/depreciation. Taxes related to capital gains realized during the year ended April 30, 2019, if any, are reflected as part of net realized gain (loss) on the Statements of Operations. Changes in tax liabilities related to capital gains taxes on unrealized investment gains, if any, are reflected as part of the change in net unrealized appreciation/depreciation on investments on the Statements of Operations. Transaction-based charges are generally assessed as a percentage of the transaction amount.
Cash Equivalents
Cash equivalents consist of highly liquid investments, with maturities of three months or less when acquired and are disclosed as “Short-Term Investments” in the Schedules of Investments.
Security Transactions
Security transactions are recorded as of the trade date. Realized gains and losses on sales of investment securities are calculated using the identified cost method.
Investment Income and Expenses
Dividend income is recognized on the ex-date. Interest income is accrued daily. Distributions of realized capital gains by underlying funds are recorded as realized capital gains on the ex-date. Expenses of the Trust arising in connection with a specific Fund are allocated to that Fund. Other Trust expenses which cannot be directly attributed to a fund are apportioned among the Funds in the Trust based upon the relative net assets or other appropriate measures. The Funds distribute substantially all their net investment income to shareholders in the form of dividends. Net investment income and capital gains are typically distributed to shareholders at least annually; except that IQ U.S. Real Estate Small Cap ETF typically distributes income quarterly, and IQ Enhanced Core Bond U.S. ETF, IQ Enhanced Core Plus Bond U.S. ETF, IQ Short Duration Enhanced Core Bond U.S. ETF and IQ S&P High Yield Low Volatility Bond ETF typically distribute income monthly. Dividends may be declared and paid more frequently to comply with the distribution requirements of the Internal Revenue Code. Distributions received from the IQ U.S. Real Estate Small Cap ETF investments in U.S. real estate investment trusts (“REITs”) may be characterized as ordinary income, net capital gain or a return of capital. A return of capital is recorded by
196
Notes to Financial Statements(continued)
April 30, 2019
the Funds as a reduction to the cost basis of the REIT. The expenses of the investment companies in which the Funds invest are not included in the amounts shown as expenses on the Statements of Operations or in the expense ratios included in the Financial Highlights.
Discounts and premiums on securities purchased, other than Short-Term Investments, for the Funds are accreted and amortized, respectively, on the effective interest rate method over the life of the respective securities. Discounts and premiums on Short-Term Investments are accreted and amortized, respectively, on the straight-line method. The straight-line method approximates the effective interest method for Short-Term Investments. Income from payment-in-kind securities is accreted daily based on the effective interest method.
Securities Lending
The Bank of New York Mellon (“BNY Mellon”) serves as the Funds’ securities lending agent. The Funds may lend portfolio securities to certain creditworthy borrowers, including the Funds’ securities lending agent. It is the Funds’ policy that, at origination, all loans are secured by collateral of at least 102% of the value of U.S. securities loaned and 105% of the value of foreign securities loaned. Collateral in the form of cash and/or high grade debt obligations, is maintained at all times. Cash collateral can be invested in certain money market mutual funds which also have exposure to the fluctuations of the market. Each Fund receives compensation for lending its securities from fees paid by the borrowers of securities, net of fee rebates paid to the borrower plus reasonable administrative and custody fees. Each Fund will continue to receive dividend and interest income on securities loaned, any gain or loss in the market price of securities on loan will be accounted for by each Fund. Lending portfolio securities could result in a delay in recovering the Funds’ securities if the borrower defaults.
A fund’s security lending activities are governed by a Securities Lending Authorization Agreement (“Lending Agreement”) between each Fund and the lending agent. The Lending Agreement authorizes the lending agent to lend qualifying U.S. and foreign securities held by a fund to approved borrowers (each a “Borrower”). To mitigate borrower risk, a fund typically receives from a Borrower, collateral in the form of U.S. dollar cash and/or securities issued or guaranteed by the U.S. Government or its agencies in excess of the market value of the securities loaned. Under the provisions of the Lending Agreement, each Fund shall have, as to the collateral, all of the rights and remedies of a secured party under applicable law. The lending agent is permitted to invest the cash collateral it receives from a Borrower into a money market fund which is subject to market fluctuation. Therefore, a fund is exposed to risk of loss if the value of invested cash collateral is insufficient to satisfy the fund’s obligation to return the full amount owed to such Borrower.
In accordance with the securities lending agreement between the Funds and the BNY Mellon, the Funds will be indemnified by the BNY Mellon in the event of default of a third party Borrower.
The securities lending income earned by each Fund is disclosed on the Statements of Operations. The value of loaned securities and related collateral are shown on a gross basis in the Schedules of Investments and Statements of Assets and Liabilities. As of April 30, 2019, the cash collateral consisted of an institutional money market fund and non-cash collateral consisted of U.S. Treasury Bills, Notes, Bonds, Separate Trading of Registered Interest (“STRIPs”) and Principal of Securities and U.S. Treasury Inflation Indexed Notes and Bonds with the following maturities:
197
Notes to Financial Statements(continued)
April 30, 2019 | | | | Money Market
Mutual Fund
| | U.S. Government Securities
|
Fund
| | | | Overnight and
Continuous
| | <30 Days
| | Between 30 & 90 Days
| | >90 Days
| | Total
|
IQ Hedge Multi-Strategy Tracker ETF | | | | $ | 86,985,349 | | | $ | 13,826 | | | $ | 35,480 | | | $ | 85,540,881 | | | $ | 172,575,536 | |
IQ Hedge Macro Tracker ETF | | | | | 991,018 | | | | — | | | | — | | | | 233,676 | | | | 1,224,694 | |
IQ Hedge Market Neutral Tracker ETF | | | | | 2,613,985 | | | | — | | | | — | | | | 2,014,726 | | | | 4,628,711 | |
IQ Hedge Long/Short Tracker ETF | | | | | 789,998 | | | | 389 | | | | — | | | | 703,118 | | | | 1,493,505 | |
IQ Hedge Event-Driven Tracker ETF | | | | | 175,698 | | | | — | | | | — | | | | 964,394 | | | | 1,140,092 | |
IQ Real Return ETF | | | | | 10,081,653 | | | | 166,475 | | | | — | | | | 5,702,133 | | | | 15,950,261 | |
IQ Leaders GTAA Tracker ETF | | | | | 4,075,170 | | | | — | | | | 21,892 | | | | 2,288,380 | | | | 6,385,442 | |
IQ Enhanced Core Bond U.S. ETF | | | | | — | | | | 39,371 | | | | — | | | | 4,562,916 | | | | 4,602,287 | |
IQ Enhanced Core Plus Bond U.S. ETF | | | | | 1,116,868 | | | | — | | | | — | | | | 6,499,818 | | | | 7,616,686 | |
IQ Short Duration Enhanced Core Bond U.S. ETF | | | | | 85,755 | | | | — | | | | — | | | | — | | | | 85,755 | |
IQ Merger Arbitrage ETF | | | | | 26,117,837 | | | | 134 | | | | — | | | | 6,216,427 | | | | 32,334,398 | |
IQ Global Resources ETF | | | | | 3,586,080 | | | | 65,216 | | | | 3,893 | | | | 2,151,914 | | | | 5,807,103 | |
IQ Global Agribusiness Small Cap ETF | | | | | 594,995 | | | | 3,084 | | | | 22,093 | | | | 109,312 | | | | 729,484 | |
IQ U.S. Real Estate Small Cap ETF | | | | | 3,241,315 | | | | 88,074 | | | | 143,713 | | | | 11,748,931 | | | | 15,222,033 | |
IQ S&P High Yield Low Volatility Bond ETF | | | | | 1,729,250 | | | | — | | | | 4,007 | | | | 126,757 | | | | 1,860,014 | |
IQ 500 International ETF | | | | | 3,265,837 | | | | — | | | | — | | | | 61,890 | | | | 3,327,727 | |
IQ 50 Percent Hedged FTSE International ETF | | | | | 9,981,686 | | | | — | | | | 3,088 | | | | 748,889 | | | | 10,733,663 | |
IQ 50 Percent Hedged FTSE Europe ETF | | | | | 696,634 | | | | — | | | | 133 | | | | 7,297 | | | | 704,064 | |
IQ 50 Percent Hedged FTSE Japan ETF | | | | | 36,999 | | | | 632 | | | | — | | | | 18,736 | | | | 56,367 | |
IQ Chaikin U.S. Small Cap ETF | | | | | 5,238,855 | | | | 245,540 | | | | 198,506 | | | | 32,425,710 | | | | 38,108,611 | |
IQ Chaikin U.S. Large Cap ETF | | | | | — | | | | 122,388 | | | | 21,746 | | | | 8,619,923 | | | | 8,764,057 | |
The collateral amount presented is in excess of the securities on loan.
Master Netting Arrangements
In order to better define its contractual rights and to secure rights that will help a fund mitigate its counterparty risk, a fund may enter into an International Swaps and Derivatives Association, Inc. Master Agreement (“ISDA Master Agreement”) or similar agreement with its counterparties. An ISDA Master Agreement is a bilateral agreement between a fund and a counterparty that governs OTC derivatives, including forward foreign currency contracts, and typically contains, among other things, collateral posting terms, netting and rights of offset provisions in the event of a default and/or termination event. Generally, the amount of collateral due from or to a counterparty must exceed a minimum transfer amount threshold before a transfer is required to be made. To the extent amounts due to a fund from its derivatives counterparties are not fully collateralized, contractually or otherwise, the Fund bears the risk of loss from counterparty non-performance.
For financial reporting purposes, the Funds do not offset assets and liabilities subject to master netting arrangements or similar arrangements on the Statements of Assets and Liabilities. Therefore, all qualifying transactions are presented on a gross basis on the Statements of Assets and Liabilities.
Total return swap contracts are valued at the unrealized appreciation/depreciation on Total Return Swap contracts of the instrument. Securities segregated as collateral for swap contracts are footnoted within each Fund’s Schedule of Investments and the cash collateral is noted at the end of each Fund’s swap table.
198
Notes to Financial Statements(continued)
April 30, 2019At April 30, 2019, the unrealized appreciation/depreciation on total return swap contracts for the following Funds was zero, reflecting a reset date at period end based on the contractual agreements with Bank of America Merrill Lynch (“Merrill Lynch”) and Morgan Stanley Capital Service LLC (“Morgan Stanley”), as counterparties to the following Funds:
| | IQ Hedge Multi-Strategy Tracker ETF
IQ Hedge Macro Tracker ETF
IQ Hedge Market Neutral Tracker ETF
IQ Hedge Long/Short Tracker ETF
IQ Hedge Event-Driven Tracker ETF
IQ Leaders GTAA Tracker ETF
IQ Merger Arbitrage ETF
IQ Global Resources ETF
|
As of April 30, 2019, the impact of netting of assets and liabilities and offsetting of collateral pledged or received based on contractual netting provisions in the Lending Agreement with BNY Mellon are detailed in the following table:
| | | | Assets
| | Liabilities
|
Fund
| | | | Gross Amounts
Presented in
Statements of
Assets and
Liabilities
| | Collateral
Received(1)
| | Net
Amount
| | Gross Amounts
Presented in
Statements of
Assets and
Liabilities
| | Collateral
Pledged
| | Net
Amount
|
IQ Hedge Multi-Strategy Tracker ETF | | | | $ | 169,075,017 | | | $ | (169,075,017 | ) | | $ | — | | | $ | — | | | $ | — | | | $ | — | |
IQ Hedge Macro Tracker ETF | | | | | 1,199,595 | | | | (1,199,595 | ) | | | — | | | | — | | | | — | | | | — | |
IQ Hedge Market Neutral Tracker ETF | | | | | 4,535,071 | | | | (4,535,071 | ) | | | — | | | | — | | | | — | | | | — | |
IQ Hedge Long/Short Tracker ETF | | | | | 1,462,836 | | | | (1,462,836 | ) | | | — | | | | — | | | | — | | | | — | �� |
IQ Hedge Event-Driven Tracker ETF | | | | | 1,116,268 | | | | (1,116,268 | ) | | | — | | | | — | | | | — | | | | — | |
IQ Real Return ETF | | | | | 15,618,184 | | | | (15,618,184 | ) | | | — | | | | — | | | | — | | | | — | |
IQ Leaders GTAA Tracker ETF | | | | | 6,257,252 | | | | (6,257,252 | ) | | | — | | | | — | | | | — | | | | — | |
IQ Enhanced Core Bond U.S. ETF | | | | | 4,507,592 | | | | (4,507,592 | ) | | | — | | | | — | | | | — | | | | — | |
IQ Enhanced Core Plus Bond U.S. ETF | | | | | 7,453,730 | | | | (7,453,730 | ) | | | — | | | | — | | | | — | | | | — | |
IQ Short Duration Enhanced Core
Bond U.S. ETF | | | | | 84,111 | | | | (84,111 | ) | | | — | | | | — | | | | — | | | | — | |
IQ Merger Arbitrage ETF | | | | | 30,647,713 | | | | (30,647,713 | ) | | | — | | | | — | | | | — | | | | — | |
IQ Global Resources ETF | | | | | 5,535,999 | | | | (5,535,999 | ) | | | — | | | | — | | | | — | | | | — | |
IQ Global Agribusiness Small Cap ETF | | | | | 678,369 | | | | (678,369 | ) | | | — | | | | — | | | | — | | | | — | |
IQ U.S. Real Estate Small Cap ETF | | | | | 14,857,669 | | | | (14,857,669 | ) | | | — | | | | — | | | | — | | | | — | |
IQ S&P High Yield Low Volatility
Bond ETF | | | | | 1,793,191 | | | | (1,793,191 | ) | | | — | | | | — | | | | — | | | | — | |
IQ 500 International ETF | | | | | 3,158,681 | | | | (3,158,681 | ) | | | — | | | | — | | | | — | | | | — | |
IQ 50 Percent Hedged FTSE
International ETF | | | | | 10,204,882 | | | | (10,204,882 | ) | | | — | | | | — | | | | — | | | | — | |
IQ 50 Percent Hedged FTSE Europe ETF | | | | | 671,099 | | | | (671,099 | ) | | | — | | | | — | | | | — | | | | — | |
IQ 50 Percent Hedged FTSE Japan ETF | | | | | 52,929 | | | | (52,929 | ) | | | — | | | | — | | | | — | | | | — | |
IQ Chaikin U.S. Small Cap ETF | | | | | 36,791,699 | | | | (36,791,699 | ) | | | — | | | | — | | | | — | | | | — | |
IQ Chaikin U.S. Large Cap ETF | | | | | 8,581,399 | | | | (8,581,399 | ) | | | — | | | | — | | | | — | | | | — | |
| 1 | | The amount of collateral presented is limited such that the net amount cannot be less than $0. |
199
Notes to Financial Statements(continued)
April 30, 2019As of April 30, 2019, each Fund’s OTC derivative assets, which may be offset against each Fund’s OTC derivative liabilities and collateral received from the counterparty, are as follows:
Fund
| | | | Gross Amounts
of Assets
Presented in
Statements of
Assets and
Liabilities
| | Financial
Instruments and
Derivatives
Available
for Offset
| | Net Amount
of Derivatives
Assets
| | Gross Amounts
of Liabilities
Presented in
Statements of
Assets and
Liabilities
| | Financial
Instruments and
Derivatives
Available
for Offset
| | Net Amount
of Derivatives
Liabilities
|
IQ 50 Percent Hedged FTSE International ETF | | | | | | | | | | | | | | | | | | | | | | | | | | |
Morgan Stanley | | | | $ | 1,354,629 | | | $ | (127,041 | ) | | $ | 1,227,588 | | | $ | 127,041 | | | $ | (127,041 | ) | | $ | — | |
IQ 50 Percent Hedged FTSE Europe ETF | | | | | | | | | | | | | | | | | | | | | | | | | | |
Morgan Stanley | | | | | 31,004 | | | | (2,066 | ) | | | 28,938 | | | | 2,066 | | | | (2,066 | ) | | | — | |
IQ 50 Percent Hedged FTSE Japan ETF | | | | | | | | | | | | | | | | | | | | | | | | | | |
Merrill Lynch | | | | | 27,725 | | | | (2,808 | ) | | | 24,917 | | | | 2,808 | | | | (2,808 | ) | | | — | |
3. INVESTMENT MANAGEMENT AND OTHER AGREEMENTS
Investment Advisory Agreement
The Advisor serves as the investment advisor to each series of the Trust and is an indirect wholly-owned subsidiary of New York Life Investment Management Holdings LLC. Under an Investment Advisory Agreement (“Advisory Agreement”) between the Advisor and the Trust on behalf of each Fund, the Advisor provides a continuous investment program for each Fund’s assets in accordance with its investment objectives, policies and limitations, and oversees the day-to-day operations of each Fund (including arranging for sub-advisory services, as applicable) subject to the supervision of the Board of Trustees. The Advisor is responsible for the supervision of MacKay Shields LLC (“MacKay Shields” or the “Sub-Advisor”), the sub-advisor to IQ S&P High Yield Low Volatility ETF, and its management of the Fund.
The Advisor also: (i) supervises all non-advisory operations of the Funds; (ii) provides personnel to perform such executive, administrative and clerical services as are reasonably necessary to provide effective administration of the Funds and the other series of the Trust; (iii) arranges for (a) the preparation of all required tax returns, (b) the preparation and submission of reports to existing shareholders, (c) the periodic updating of prospectuses and statements of additional information and (d) the preparation of reports to be filed with the SEC and other regulatory authorities; (iv) maintains the records of the Funds and the other series of the Trust; and (v) provides office space and all necessary office equipment and services. The Funds reimburse the Advisor in an amount equal to a portion of the compensation of the Chief Compliance Officer attributable to each Fund.
The Advisory Agreement will continue in effect with respect to the Funds from year to year provided such continuance is specifically approved at least annually by a majority of the Trustees that are not interested persons of the Trust (“Independent Trustees”).
200
Notes to Financial Statements(continued)
April 30, 2019Pursuant to the Advisory Agreement, the Funds pay the Advisor a fee, which is accrued daily and paid monthly, for the services performed and the facilities furnished at an annual rate of each Fund’s average daily net assets per the table below.
Fund
| | | | Rate
|
IQ Hedge Multi-Strategy Tracker ETF | | | | 0.75% |
IQ Hedge Macro Tracker ETF | | | | 0.75 |
IQ Hedge Market Neutral Tracker ETF | | | | 0.75 |
IQ Hedge Long/Short Tracker ETF | | | | 0.75 |
IQ Hedge Event-Driven Tracker ETF | | | | 0.75 |
IQ Real Return ETF | | | | 0.48 |
IQ Leaders GTAA Tracker ETF | | | | 0.45 |
IQ Enhanced Core Bond U.S. ETF | | | | 0.25 |
IQ Enhanced Core Plus Bond U.S. ETF | | | | 0.25 |
IQ Short Duration Enhanced Core Bond U.S. ETF | | | | 0.20 |
IQ Merger Arbitrage ETF | | | | 0.75 |
IQ Global Resources ETF | | | | 0.75 |
IQ Global Agribusiness Small Cap ETF | | | | 0.75 |
IQ U.S. Real Estate Small Cap ETF | | | | 0.69 |
IQ S&P High Yield Low Volatility Bond ETF | | | | 0.40 |
IQ 500 International ETF | | | | 0.25 |
IQ 50 Percent Hedged FTSE International ETF | | | | 0.35 |
IQ 50 Percent Hedged FTSE Europe ETF | | | | 0.45 |
IQ 50 Percent Hedged FTSE Japan ETF | | | | 0.45 |
IQ Chaikin U.S. Small Cap ETF | | | | 0.35 |
IQ Chaikin U.S. Large Cap ETF | | | | 0.25 |
The Advisor has agreed to pay all expenses of the Funds, except: brokerage and other transaction expenses; extraordinary legal fees or expenses, such as those for litigation or arbitration; compensation and expenses of the Independent Trustees, counsel to the Independent Trustee, and the Chief Compliance Officer; extraordinary expenses; distribution fees and expenses paid by the Funds under any distribution plan adopted pursuant to Rule 12b-1 under the 1940 Act; and the advisory fee payable to the Advisor.
The Advisor has entered into a Fee Waiver Agreement with each Fund under which it has contractually agreed to waive a portion of its management fee equal to a specific percentage of the average daily net assets as follows:
Fund
| | | | Rate
| | Expires
|
IQ Hedge Multi-Strategy Tracker ETF | | | | | 0.22 | % | | | 8/31/2019 | |
IQ Real Return ETF | | | | | 0.28 | | | | 8/31/2020 | |
IQ 50 Percent Hedged FTSE International ETF | | | | | 0.20 | | | | 8/31/2019 | |
IQ 50 Percent Hedged FTSE Europe ETF | | | | | 0.30 | | | | 8/31/2019 | |
IQ 50 Percent Hedged FTSE Japan ETF | | | | | 0.30 | | | | 8/31/2019 | |
IQ Leaders GTAA Tracker ETF | | | | | 0.23 | | | | 8/31/2020 | |
IQ Enhanced Core Bond U.S. ETF | | | | | 0.05 | | | | 8/31/2019 | |
IQ Enhanced Core Plus Bond U.S. ETF | | | | | 0.05 | | | | 8/31/2019 | |
The Advisor has entered into an Expense Limitation Agreement with each Fund under which it has contractually agreed, to waive a portion of its management fee and/or reimburse expenses of the Fund in an amount that limits the Fund’s total annual operating expenses (exclusive of interest, taxes, brokerage fees and commissions, dividends paid on short sale, acquired fund fees and expenses, and extraordinary expenses) to not more than a specific percentage of the average daily net assets as follows:
Fund
| | | | Rate
| | Expires
|
IQ Short Duration Enhanced Core Bond U.S. ETF | | | | | 0.20 | % | | | 8/31/2020 | |
IQ S&P High Yield Low Volatility Bond ETF | | | | | 0.40 | | | | 8/31/2019 | |
IQ 500 International ETF | | | | | 0.25 | | | | 8/31/2020 | |
IQ Chaikin U.S. Small Cap ETF | | | | | 0.35 | | | | 8/31/2019 | |
IQ Chaikin U.S. Large Cap ETF | | | | | 0.25 | | | | 8/31/2019 | |
201
Notes to Financial Statements(continued)
April 30, 2019Investment Sub-Advisory Agreement
The Sub-Advisor is a registered investment adviser and an indirect, wholly-owned subsidiary of New York Life, and is responsible for the day-to-day portfolio management of IQ S&P High Yield Low Volatility Bond ETF. Pursuant to the terms of the Subadvisory Agreement (“Subadvisory Agreement”) between the Advisor and the Sub-Advisor, the Advisor pays for the services of the Sub-Advisor. The Sub-Advisor acts as portfolio manager for the Fund subject to the supervision of the Advisor and the Board of Trustees.
Distribution (12b-1 Fees)
ALPS Distributors, Inc. serves as the Funds’ distributor (the “Distributor”) pursuant to a Distribution Agreement. NYLIFE Distributors LLC has entered into a Service Agreement with the Distributor to market the Funds. The Board has adopted a Distribution and Service Plan pursuant to Rule 12b-1 under the 1940 Act (“Rule 12b-1 Plan”). In accordance with the Rule 12b-1 Plan, the Funds are authorized to pay an amount up to 0.25% of each Fund’s average daily net assets each year for certain distribution-related activities. As authorized by the Board of Trustees, no Rule 12b-1 fees are currently paid by the Funds and there are no plans to impose these fees. However, in the event Rule 12b-1 fees are charged in the future, they will be paid out of each respective Fund’s assets. The Advisor and its affiliates may, out of their own resources, pay amounts to third parties for distribution or marketing services on behalf of the Funds.
As described in Note 4 below, the Distributor has entered into Participant Agreements with certain broker-dealers and others that allow those parties to be Authorized Participants and to subscribe for and redeem shares of the Funds. As described in Note 4 below, such Authorized Participants may from time to time hold, of record or beneficially, a substantial percentage of the Funds’ shares outstanding, act as executing or clearing broker for investment transactions on behalf of the Funds and/or serve as counterparty to derivative transactions with each Fund.
Administrator, Custodian and Transfer Agent
BNY Mellon (in each capacity, the “Administrator,” “Custodian” or “Transfer Agent”) serves as the Funds’ Administrator, Custodian and Transfer Agent pursuant to the Fund Administration and Accounting Agreement. Under the terms of this agreement, the Advisor pays the Funds’ Administrative, Custody and Transfer Agency fees. Pursuant to these agreements, BNY Mellon provides necessary administrative, custody, transfer agency, tax, accounting services and financial reporting for the maintenance and operations of the Trust and the Funds. BNY Mellon is responsible for maintaining the books and records and calculating the daily NAV of the Funds. BNY Mellon is a subsidiary of The Bank of New York Mellon Corporation, a financial holding company.
4. CAPITAL SHARE TRANSACTIONS
Shares are created and redeemed on a continuous basis at NAV only in groups of 50,000 shares called Creation Units. Except when aggregated in Creation Units, shares are not redeemable. Transactions in shares of the Funds are disclosed in detail on the Statements of Changes in Net Assets. Only Authorized Participants may purchase or redeem shares directly from the Funds. An Authorized Participant is either (i) a broker-dealer or other participant in the clearing process through the Continuous Net Settlement System of National Securities Clearing Corporation or (ii) a Depository Trust Company (“DTC”) participant and, in each case, must have executed a Participant Agreement with the Distributor. Most retail investors will not qualify as Authorized Participants or have the resources to create and redeem whole Creation Units. Therefore, they will be unable to purchase or redeem the shares directly from the Funds. Rather, most retail investors will purchase shares in the secondary market with the assistance of a broker and will be subject to customary brokerage commissions or fees. Securities received or delivered in connection with in-kind creates and redeems are valued as of the close of business on the effective date of the creation or redemption.
202
Notes to Financial Statements(continued)
April 30, 20195. FEDERAL INCOME TAX
At April 30, 2019, the cost and unrealized appreciation/depreciation of investments, including applicable derivative contracts and other financial instruments, as determined on a federal income tax basis, were as follows:
Fund
| | Cost
| | Gross
Unrealized
Appreciation
| | Gross
Unrealized
Depreciation
| | Net Unrealized
Appreciation/
(Depreciation)
|
IQ Hedge Multi-Strategy Tracker ETF | | $ | 1,069,613,744 | | | $ | 14,187,665 | | | $ | (1,967,155 | ) | | | 12,220,510 | |
IQ Hedge Macro Tracker ETF | | | 6,205,029 | | | | 88,181 | | | | (46,679 | ) | | | 41,502 | |
IQ Hedge Market Neutral Tracker ETF | | | 18,188,170 | | | | 218,444 | | | | (21,110 | ) | | | 197,334 | |
IQ Hedge Long/Short Tracker ETF | | | 7,203,800 | | | | 89,855 | | | | (41,708 | ) | | | 48,147 | |
IQ Hedge Event-Driven Tracker ETF | | | 4,368,620 | | | | 65,847 | | | | (4,317 | ) | | | 61,530 | |
IQ Real Return ETF | | | 65,984,571 | | | | 1,338,593 | | | | (189,050 | ) | | | 1,149,543 | |
IQ Leaders GTAA Tracker ETF | | | 46,562,719 | | | | 1,175,355 | | | | (44,968 | ) | | | 1,130,387 | |
IQ Enhanced Core Bond U.S. ETF | | | 87,392,471 | | | | 1,210,855 | | | | — | | | | 1,210,855 | |
IQ Enhanced Core Plus Bond U.S. ETF | | | 155,361,330 | | | | 2,275,646 | | | | (820 | ) | | | 2,274,826 | |
IQ Short Duration Enhanced Core Bond U.S. ETF | | | 3,858,426 | | | | 33,096 | | | | — | | | | 33,096 | |
IQ Merger Arbitrage ETF | | | 1,009,069,367 | | | | 32,227,473 | | | | (15,104,137 | ) | | | 17,123,336 | |
IQ Global Resources ETF | | | 179,720,118 | | | | 6,668,918 | | | | (7,929,968 | ) | | | (1,261,050 | ) |
IQ Global Agribusiness Small Cap ETF | | | 10,365,824 | | | | 1,702,713 | | | | (1,627,663 | ) | | | 75,050 | |
IQ U.S. Real Estate Small Cap ETF | | | 78,538,778 | | | | 7,399,154 | | | | (11,127,592 | ) | | | (3,728,438 | ) |
IQ S&P High Yield Low Volatility Bond ETF | | | 65,958,004 | | | | 764,762 | | | | (274,802 | ) | | | 489,960 | |
IQ 500 International ETF | | | 83,210,956 | | | | 6,604,366 | | | | (1,379,172 | ) | | | 5,225,194 | |
IQ 50 Percent Hedged FTSE International ETF | | | 312,937,405 | | | | 14,993,267 | | | | (37,100,720 | ) | | | (22,107,453 | ) |
IQ 50 Percent Hedged FTSE Europe ETF | | | 10,703,663 | | | | 332,885 | | | | (1,460,854 | ) | | | (1,127,969 | ) |
IQ 50 Percent Hedged FTSE Japan ETF | | | 6,296,578 | | | | 702,825 | | | | (748,420 | ) | | | (45,595 | ) |
IQ Chaikin U.S. Small Cap ETF | | | 355,481,813 | | | | 20,232,870 | | | | (21,919,204 | ) | | | (1,686,334 | ) |
IQ Chaikin U.S. Large Cap ETF | | | 285,517,438 | | | | 8,356,315 | | | | (15,655,358 | ) | | | (7,299,043 | ) |
The differences between book and tax basis cost of investments and net unrealized appreciation (depreciation) are primarily attributable to wash sale loss deferrals, pass through investments, distributions from underlying Funds and the realization for tax purposes of unrealized gains on investments in passive foreign investment companies held at April 30, 2019.
203
Notes to Financial Statements(continued)
April 30, 2019At April 30, 2019, the components of undistributed or accumulated earnings/losses on a tax-basis were as follows:
Fund
| | | | Ordinary
Income (Loss)1
| | Net Capital Gain
(Losses)2
| | Net Unrealized
Appreciation/
Depreciation
| | Total
Earnings/
(Losses)
|
IQ Hedge Multi-Strategy Tracker ETF | | | | $ | 9,104,193 | | | $ | (51,711,861 | ) | | $ | 12,220,510 | | | $ | (30,387,158 | ) |
IQ Hedge Macro Tracker ETF | | | | | 53,004 | | | | (5,474,704 | ) | | | 41,502 | | | | (5,380,198 | ) |
IQ Hedge Market Neutral Tracker ETF | | | | | 239,942 | | | | (452,775 | ) | | | 197,334 | | | | (15,499 | ) |
IQ Hedge Long/Short Tracker ETF | | | | | 675 | | | | (319,344 | ) | | | 48,147 | | | | (270,522 | ) |
IQ Hedge Event-Driven Tracker ETF | | | | | 34,885 | | | | (82,796 | ) | | | 61,530 | | | | 13,619 | |
IQ Real Return ETF | | | | | 335,111 | | | | (2,350,466 | ) | | | 1,149,543 | | | | (865,812 | ) |
IQ Leaders GTAA Tracker ETF | | | | | — | | | | (1,956,033 | ) | | | 1,130,387 | | | | (825,646 | ) |
IQ Enhanced Core Bond U.S. ETF | | | | | — | | | | (5,434,534 | ) | | | 1,210,855 | | | | (4,223,679 | ) |
IQ Enhanced Core Plus Bond U.S. ETF | | | | | — | | | | (20,071,091 | ) | | | 2,274,826 | | | | (17,796,265 | ) |
IQ Short Duration Enhanced Core Bond U.S. ETF | | | | | — | | | | (597 | ) | | | 33,096 | | | | 32,499 | |
IQ Merger Arbitrage ETF | | | | | (23,678,582 | ) | | | (12,930,826 | ) | | | 17,100,432 | | | | (19,508,976 | ) |
IQ Global Resources ETF | | | | | 2,545,700 | | | | (53,116,840 | ) | | | (1,267,574 | ) | | | (51,838,714 | ) |
IQ Global Agribusiness Small Cap ETF | | | | | 52,708 | | | | (7,429,693 | ) | | | 74,671 | | | | (7,302,314 | ) |
IQ U.S. Real Estate Small Cap ETF | | | | | — | | | | (4,267,961 | ) | | | (3,728,438 | ) | | | (7,996,399 | ) |
IQ S&P High Yield Low Volatility Bond ETF | | | | | 264,390 | | | | (2,953,554 | ) | | | 489,960 | | | | (2,199,204 | ) |
IQ 500 International ETF | | | | | 939,296 | | | | — | | | | 5,222,177 | | | | 6,161,473 | |
IQ 50 Percent Hedged FTSE International ETF | | | | | 1,940,768 | | | | (3,582,397 | ) | | | (22,153,283 | ) | | | (23,794,912 | ) |
IQ 50 Percent Hedged FTSE Europe ETF | | | | | — | | | | (2,246,140 | ) | | | (1,141,870 | ) | | | (3,388,010 | ) |
IQ 50 Percent Hedged FTSE Japan ETF | | | | | 122,520 | | | | (1,583,845 | ) | | | (45,808 | ) | | | (1,507,133 | ) |
IQ Chaikin U.S. Small Cap ETF | | | | | — | | | | (40,289,263 | ) | | | (1,686,334 | ) | | | (41,975,597 | ) |
IQ Chaikin U.S. Large Cap ETF | | | | | 250,370 | | | | (20,955,094 | ) | | | (7,299,043 | ) | | | (28,003,767 | ) |
| 1 | | Includes late year ordinary loss, if any. |
| 2 | | Amount includes the deferral of post-October losses, if any. |
The differences between book and tax basis components of net assets are primarily attributable to wash sale loss deferrals and other book and tax differences including foreign currency contracts, swap contracts, post-October and late year losses.
204
Notes to Financial Statements(continued)
April 30, 2019At April 30, 2019, the effect of permanent book/tax reclassifications resulted in increases (decreases) to the components of net assets were as follows:
Fund
| | | | Total distributable
earnings/
(accumulated loss)
| | Paid-in capital
| |
IQ Hedge Multi-Strategy Tracker ETF | | | | $ | (1,824,572 | ) | | $ | 1,824,572 | | |
IQ Hedge Macro Tracker ETF | | | | | 505,750 | | | | (505,750 | ) | |
IQ Hedge Market Neutral Tracker ETF | | | | | (129,443 | ) | | | 129,443 | | |
IQ Hedge Long/Short Tracker ETF | | | | | (421,926 | ) | | | 421,926 | | |
IQ Hedge Event-Driven Tracker ETF | | | | | (100,963 | ) | | | 100,963 | | |
IQ Real Return ETF | | | | | (31,473 | ) | | | 31,473 | | |
IQ Leaders GTAA Tracker ETF | | | | | (502,583 | ) | | | 502,583 | | |
IQ Enhanced Core Bond U.S. ETF | | | | | 288,892 | | | | (288,892 | ) | |
IQ Enhanced Core Plus Bond U.S. ETF | | | | | 567,348 | | | | (567,348 | ) | |
IQ Short Duration Enhanced Core Bond U.S. ETF | | | | | (17,734 | ) | | | 17,734 | | |
IQ Merger Arbitrage ETF | | | | | (20,329,648 | ) | | | 20,329,648 | | |
IQ Global Resources ETF | | | | | (6,289,844 | ) | | | 6,289,844 | | |
IQ Global Agribusiness Small Cap ETF | | | | | (355,678 | ) | | | 355,678 | | |
IQ U.S. Real Estate Small Cap ETF | | | | | 2,216,913 | | | | (2,216,913 | ) | |
IQ S&P High Yield Low Volatility Bond ETF | | | | | 244,609 | | | | (244,609 | ) | |
IQ 500 International ETF | | | | | — | | | | — | | |
IQ 50 Percent Hedged FTSE International ETF | | | | | (8,532,492 | ) | | | 8,532,492 | | |
IQ 50 Percent Hedged FTSE Europe ETF | | | | | (14,651,728 | ) | | | 14,651,728 | | |
IQ 50 Percent Hedged FTSE Japan ETF | | | | | (2,129,421 | ) | | | 2,129,421 | | |
IQ Chaikin U.S. Small Cap ETF | | | | | (6,663,256 | ) | | | 6,663,256 | | |
IQ Chaikin U.S. Large Cap ETF | | | | | (21,098,890 | ) | | | 21,098,890 | | |
For financial reporting purposes, capital accounts are adjusted to reflect the tax character of permanent book/ tax differences. Reclassifications are primarily due to the tax treatment of redemptions in-kind, the expiration of capital loss carryforwards, nondeductible expenses and capital share redemptions utilized as distributions for tax purposes.
205
Notes to Financial Statements(continued)
April 30, 2019The tax character of distributions paid during the years ended April 30, 2019 and 2018 were as follows:
| | | | 2019
| | 2018
|
Fund
| | | | Ordinary
Income
| | Long-Term
Capital Gains
| | Tax Return
of Capital
| | Ordinary
Income
| | Long-Term
Capital Gains
| | Tax Return
of Capital
|
IQ Hedge Multi-Strategy Tracker ETF | | | | $ | 24,498,116 | | | $ | — | | | $ | — | | | $ | — | | | $ | — | | | $ | — | |
IQ Hedge Macro Tracker ETF | | | | | 69,928 | | | | — | | | | — | | | | — | | | | — | | | | — | |
IQ Hedge Market Neutral
Tracker ETF | | | | | — | | | | — | | | | — | | | | — | | | | — | | | | — | |
IQ Hedge Long/Short Tracker ETF | | | | | 190,276 | | | | — | | | | — | | | | 16,706 | | | | — | | | | — | |
IQ Hedge Event-Driven Tracker ETF | | | | | 129,849 | | | | — | | | | — | | | | 70,341 | | | | — | | | | — | |
IQ Real Return ETF | | | | | 730,380 | | | | — | | | | — | | | | 308,837 | | | | — | | | | — | |
IQ Leaders GTAA Tracker ETF | | | | | 1,367,155 | | | | — | | | | — | | | | 1,005,870 | | | �� | — | | | | — | |
IQ Enhanced Core Bond U.S. ETF | | | | | 1,624,788 | | | | — | | | | — | | | | 1,575,071 | | | | — | | | | — | |
IQ Enhanced Core Plus
Bond U.S. ETF | | | | | 6,882,062 | | | | — | | | | — | | | | 9,263,899 | | | | — | | | | — | |
IQ Short Duration Enhanced Core Bond U.S. ETF | | | | | 28,586 | | | | — | | | | — | | | | — | | | | — | | | | — | |
IQ Merger Arbitrage ETF | | | | | — | | | | — | | | | — | | | | — | | | | — | | | | — | |
IQ Global Resources ETF | | | | | 1,346,949 | | | | — | | | | — | | | | — | | | | — | | | | — | |
IQ Global Agribusiness Small
Cap ETF | | | | | 98,945 | | | | — | | | | — | | | | 109,575 | | | | — | | | | — | |
IQ U.S. Real Estate Small Cap ETF | | | | | 2,374,318 | | | | — | | | | 2,583,466 | | | | 3,563,539 | | | | — | | | | 2,075,765 | |
IQ S&P High Yield Low Volatility Bond ETF | | | | | 3,901,103 | | | | — | | | | — | | | | 3,536,709 | | | | — | | | | — | |
IQ 500 International ETF | | | | | 15,344 | | | | — | | | | — | | | | — | | | | — | | | | — | |
IQ 50 Percent Hedged FTSE International ETF | | | | | 18,743,014 | | | | 721,412 | | | | — | | | | 8,843,710 | | | | — | | | | — | |
IQ 50 Percent Hedged FTSE
Europe ETF | | | | | 417,662 | | | | — | | | | — | | | | 3,305,273 | | | | — | | | | — | |
IQ 50 Percent Hedged FTSE
Japan ETF | | | | | 545,585 | | | | — | | | | — | | | | 544,769 | | | | — | | | | — | |
IQ Chaikin U.S. Small Cap ETF | | | | | 4,624,785 | | | | — | | | | — | | | | 1,436,366 | | | | — | | | | — | |
IQ Chaikin U.S. Large Cap ETF | | | | | 7,178,905 | | | | — | | | | — | | | | 916,233 | | | | — | | | | — | |
206
Notes to Financial Statements(continued)
April 30, 2019Capital losses incurred after October 31 (“Post-October Losses”) and certain late year ordinary income losses within the taxable year can be deemed to arise on the first business day of the Funds’ next taxable year. For the year ended April 30, 2019, the Funds incurred and elected to defer to May 1, 2019 Post-October Losses and late year ordinary losses of:
Fund
| | | | Late Year
Ordinary Losses
| | Short-Term
Post-October
Losses
| | Long-Term
Post-October
Losses
|
IQ Hedge Multi-Strategy Tracker ETF | | | | $ | — | | | $ | — | | | $ | — | |
IQ Hedge Macro Tracker ETF | | | | | — | | | | — | | | | — | |
IQ Hedge Market Neutral Tracker ETF | | | | | — | | | | — | | | | — | |
IQ Hedge Long/Short Tracker ETF | | | | | — | | | | — | | | | — | |
IQ Hedge Event-Driven Tracker ETF | | | | | — | | | | — | | | | — | |
IQ Real Return ETF | | | | | — | | | | — | | | | — | |
IQ Leaders GTAA Tracker ETF | | | | | — | | | | 592,857 | | | | 27,452 | |
IQ Enhanced Core Bond U.S. ETF | | | | | — | | | | — | | | | — | |
IQ Enhanced Core Plus Bond U.S. ETF | | | | | — | | | | — | | | | — | |
IQ Short Duration Enhanced Core Bond U.S. ETF | | | | | — | | | | — | | | | — | |
IQ Merger Arbitrage ETF | | | | | 23,678,582 | | | | — | | | | — | |
IQ Global Resources ETF | | | | | — | | | | — | | | | — | |
IQ Global Agribusiness Small Cap ETF | | | | | — | | | | — | | | | — | |
IQ U.S. Real Estate Small Cap ETF | | | | | — | | | | — | | | | — | |
IQ S&P High Yield Low Volatility Bond ETF | | | | | — | | | | — | | | | — | |
IQ 500 International ETF | | | | | — | | | | — | | | | — | |
IQ 50 Percent Hedged FTSE International ETF | | | | | — | | | | 1,282,778 | | | | 2,299,619 | |
IQ 50 Percent Hedged FTSE Europe ETF | | | | | — | | | | — | | | | — | |
IQ 50 Percent Hedged FTSE Japan ETF | | | | | — | | | | — | | | | — | |
IQ Chaikin U.S. Small Cap ETF | | | | | — | | | | 25,812,206 | | | | 8,678,233 | |
IQ Chaikin U.S. Large Cap ETF | | | | | — | | | | — | | | | — | |
On December 22, 2010, the Regulated Investment Company (“RIC”) Modernization Act of 2010 (the “Act”) was enacted. The Act modernizes several of the federal income and excise tax provisions related to RICs, and, with certain exceptions, are effective for taxable years beginning after December 22, 2010. Among the changes made are changes to the capital loss carryforward rules allowing for RICs to carry forward capital losses indefinitely and to retain the character of capital loss carryforwards as short-term or long-term. Rules in effect previously limited the carryforward period to eight years and all carryforwards were considered short-term in character. Capital loss carryforwards generated in taxable years beginning after the effective date of the Act must be fully used before capital loss carryforwards generated in taxable years prior to the effective date of the Act; therefore, under certain circumstances, capital loss carryforwards available as of the report date, if any, may expire unused.
207
Notes to Financial Statements(continued)
April 30, 2019As of April 30, 2019, the Funds listed below had net capital loss carryforwards for Federal income tax purposes which are available for offset against future taxable net capital gains. The amounts were determined after adjustments for certain differences between financial reporting and tax purposes, such as wash sale losses. Accordingly, no capital gain distributions are expected to be paid to shareholders of these Funds until future net capital gains have been realized in excess of the available capital loss carryforwards. There is no assurance that any Fund will be able to utilize all of its capital loss carryforwards before they expire. These loss carryforwards expire in amounts and fiscal years as follows:
Fund
| | | | Expired
Current Year
| | Utilized on
Current Year
| | Short-Term
With
No Expiration
| | Long-Term
With
No Expiration
|
IQ Hedge Multi-Strategy Tracker ETF | | | | $ | 5,603,304 | | | $ | 3,957,181 | | | $ | 51,711,861 | | | $ | — | |
IQ Hedge Macro Tracker ETF | | | | | 531,209 | | | | 27,218 | | | | 4,279,620 | | | | 1,195,084 | |
IQ Hedge Market Neutral Tracker ETF | | | | | — | | | | — | | | | 425,001 | | | | 27,774 | |
IQ Hedge Long/Short Tracker ETF | | | | | — | | | | — | | | | 187,592 | | | | 131,752 | |
IQ Hedge Event-Driven Tracker ETF | | | | | — | | | | — | | | | 45,993 | | | | 36,803 | |
IQ Real Return ETF | | | | | — | | | | — | | | | 1,079,470 | | | | 1,270,996 | |
IQ Leaders GTAA Tracker ETF | | | | | — | | | | — | | | | 1,212,750 | | | | 122,974 | |
IQ Enhanced Core Bond U.S. ETF | | | | | — | | | | — | | | | 4,053,878 | | | | 1,380,656 | |
IQ Enhanced Core Plus Bond U.S. ETF | | | | | — | | | | — | | | | 18,916,701 | | | | 1,154,390 | |
IQ Short Duration Enhanced Core
Bond U.S. ETF | | | | | — | | | | — | | | | 597 | | | | — | |
IQ Merger Arbitrage ETF | | | | | — | | | | — | | | | 12,930,826 | | | | — | |
IQ Global Resources ETF | | | | | — | | | | — | | | | 28,802,974 | | | | 24,313,866 | |
IQ Global Agribusiness Small Cap ETF | | | | | — | | | | 1,224,465 | | | | 2,742,804 | | | | 4,686,889 | |
IQ U.S. Real Estate Small Cap ETF | | | | | — | | | | — | | | | 1,196,038 | | | | 3,071,923 | |
IQ S&P High Yield Low Volatility Bond ETF | | | | | — | | | | — | | | | 2,314,674 | | | | 638,880 | |
IQ 500 International ETF | | | | | — | | | | — | | | | — | | | | — | |
IQ 50 Percent Hedged FTSE International ETF | | | | | — | | | | 7,719,162 | | | | — | | | | — | |
IQ 50 Percent Hedged FTSE Europe ETF | | | | | — | | | | 2,508,944 | | | | — | | | | 2,246,140 | * |
IQ 50 Percent Hedged FTSE Japan ETF | | | | | — | | | | 130,332 | | | | 782,534 | | | | 801,311 | |
IQ Chaikin U.S. Small Cap ETF | | | | | — | | | | 1,796,558 | | | | 5,798,824 | | | | — | |
IQ Chaikin U.S. Large Cap ETF | | | | | — | | | | — | | | | 17,886,687 | | | | 3,068,407 | |
* | | Subject to annual limitation on utilization. |
6. OTHER AFFILIATED PARTIES AND TRANSACTIONS
For the purposes of the financial statements, the Funds assume the following to be affiliated issuers. As of April 30, 2019, affiliated transactions, if any, are listed at the end of the Fund’s respective Schedule of Investments.
The Advisor is an affiliate and subsidiary of New York Life Investment Management LLC (“NYLIM”) and of New York Life Insurance & Annuity Corporation (“NYLife”). As of April 30, 2019, NYLIM and NYLife were not known to own beneficially greater than 5% of the shares of any Fund except as set forth below. NYLIM and NYLife own shares of the Funds on their own behalf or on behalf of funds or accounts managed by NYLIM or NYLife.
New York Life Insurance & Annuity Corporation
Fund
| | | | % Ownership
|
IQ Hedge Long/Short Tracker ETF | | | | | 26.7 | % |
IQ Hedge Event-Driven Tracker ETF | | | | | 40.0 | |
IQ Leaders GTAA Tracker ETF | | | | | 67.6 | |
IQ Short Duration Enhanced Core Bond U.S. ETF | | | | | 80.0 | |
IQ S&P High Yield Low Volatility Bond ETF | | | �� | | 43.6 | |
IQ 500 International ETF | | | | | 6.5 | |
IQ 50 Percent Hedged FTSE Japan ETF | | | | | 34.4 | |
IQ Chaikin U.S. Small Cap ETF | | | | | 11.9 | |
208
Notes to Financial Statements(continued)
April 30, 2019New York Life Investment Management LLC
Fund
| | | | % Ownership
|
IQ Enhanced Core Bond U.S. ETF | | | | | 90.1 | % |
IQ Enhanced Core Plus Bond U.S. ETF | | | | | 37.1 | |
IQ Global Resources ETF | | | | | 71.7 | |
IQ S&P High Yield Low Volatility Bond ETF | | | | | 41.0 | |
IQ 500 International ETF | | | | | 89.2 | |
IQ 50 Percent Hedged FTSE International ETF | | | | | 72.5 | |
IQ Chaikin U.S. Small Cap ETF | | | | | 73.6 | |
IQ Chaikin U.S. Large Cap ETF | | | | | 93.3 | |
7. INVESTMENT TRANSACTIONS
Purchases and sales of investments (excluding short-term investments) for the year ended April 30, 2019 are as follows:
Fund
| | | | Purchases
| | Sales
| | Purchases
In-Kind
| | Sales
In-Kind
|
IQ Hedge Multi-Strategy Tracker ETF | | | | $ | 1,562,701,080 | | | $ | 1,564,531,808 | | | $ | 330,392,037 | | | $ | 456,729,461 | |
IQ Hedge Macro Tracker ETF | | | | | 5,197,144 | | | | 5,164,365 | | | | — | | | | 1,296,043 | |
IQ Hedge Market Neutral Tracker ETF | | | | | 14,926,833 | | | | 15,137,570 | | | | 3,804,824 | | | | 832,044 | |
IQ Hedge Long/Short Tracker ETF | | | | | 6,190,362 | | | | 6,528,113 | | | | 6,282,748 | | | | 8,558,748 | |
IQ Hedge Event-Driven Tracker ETF | | | | | 1,136,970 | | | | 2,098,064 | | | | 3,144,074 | | | | 1,154,114 | |
IQ Real Return ETF | | | | | 51,317,330 | | | | 51,125,352 | | | | 13,889,997 | | | | 2,743,139 | |
IQ Leaders GTAA Tracker ETF | | | | | 77,538,696 | | | | 78,045,193 | | | | 7,152,986 | | | | 13,085,309 | |
IQ Enhanced Core Bond U.S. ETF | | | | | 183,095,341 | | | | 183,003,327 | | | | 97,129,653 | | | | 60,881,881 | |
IQ Enhanced Core Plus Bond U.S. ETF | | | | | 943,374,271 | | | | 943,010,495 | | | | 25,593,812 | | | | 203,642,246 | |
IQ Short Duration Enhanced Core Bond
U.S. ETF | | | | | 2,622,500 | | | | 2,626,991 | | | | 8,792,798 | | | | 5,039,222 | |
IQ Merger Arbitrage ETF | | | | | 2,134,942,056 | | | | 2,130,371,218 | | | | 552,961,151 | | | | 172,152,406 | |
IQ Global Resources ETF | | | | | 268,923,864 | | | | 259,168,760 | | | | 56,082,261 | | | | 109,483,522 | |
IQ Global Agribusiness Small Cap ETF | | | | | 3,524,387 | | | | 3,441,696 | | | | — | | | | 1,619,169 | |
IQ U.S. Real Estate Small Cap ETF | | | | | 20,095,010 | | | | 20,386,095 | | | | 1,349,902 | | | | 14,954,730 | |
IQ S&P High Yield Low Volatility Bond ETF | | | | | 70,758,604 | | | | 69,601,374 | | | | — | | | | 42,256,981 | |
IQ 500 International ETF | | | | | 2,193,861 | | | | 68,409 | | | | 77,731,283 | | | | — | |
IQ 50 Percent Hedged FTSE International ETF | | | | | 56,576,129 | | | | 58,480,954 | | | | 27,563,511 | | | | 269,443,313 | |
IQ 50 Percent Hedged FTSE Europe ETF | | | | | 5,749,568 | | | | 3,123,640 | | | | — | | | | 158,025,822 | |
IQ 50 Percent Hedged FTSE Japan ETF | | | | | 2,438,287 | | | | 1,748,100 | | | | — | | | | 24,753,955 | |
IQ Chaikin U.S. Small Cap ETF | | | | | 249,626,978 | | | | 249,309,408 | | | | 93,706,101 | | | | 179,766,753 | |
IQ Chaikin U.S. Large Cap ETF | | | | | 183,097,522 | | | | 183,400,508 | | | | 609,012,569 | | | | 646,141,846 | |
8. DERIVATIVE FINANCIAL INSTRUMENTS
Swap Transactions
A swap agreement is an agreement between two parties pursuant to which the parties exchange payments at specified dates based on a specified notional amount, with the payments calculated by reference to specified securities, indexes, reference rates, currencies or other instruments. Most swap agreements provide that when the period payment dates for both parties are the same, the payments are made on a net basis (i.e., the two payment streams are netted out, with only the net amount paid by one party to the other). The Funds’ obligations or rights under a swap agreement entered into on a net basis will generally be equal only to the net amount to be paid or received under the agreement, based on the relative values of the positions held by each counterparty. Swap agreements are not entered into or traded on exchanges and there is no central clearing or guaranty function for total return swaps. Swaps could result in losses if interest rates or foreign currency exchange rates or credit quality changes are not correctly anticipated by the Funds or if the reference index, security or investments do not perform as expected.
209
Notes to Financial Statements(continued)
April 30, 2019The value of a total return swap agreement is recorded as either an asset or a liability on the Statements of Assets and Liabilities at the beginning of the measurement period. Segregated securities are designated on the Schedules of Investments and cash deposited is recorded on the Statements of Assets and Liabilities. Daily changes in valuation of Total Return Swaps, if any, are recorded as unrealized appreciation or depreciation on the Statements of Assets and Liabilities. The change in the value of swaps, including accruals of periodic amounts of interest to be paid or received on swaps, is reported as a change in net unrealized appreciation depreciation on the Statements of Operations. A realized gain or loss is recorded upon payment or receipt of a periodic payment or payment made upon termination of a swap agreement.
When the Funds have an unrealized loss on a swap agreement, the Funds have instructed the Custodian to pledge cash or liquid securities as collateral with a value at least equal to the amount of the unrealized loss. Collateral pledges are monitored and subsequently adjusted with the fluctuations of the swap value.
Some of the Funds intend to use Total Return Swaps in several ways to replicate the performance of the Index. Risks may arise as a result of the failure of the counterparty to the swap contract to comply with the terms of the swap contract. Therefore, the Funds consider the creditworthiness of the counterparty to a swap contract in evaluating potential credit risk. Additionally, risks may arise from unanticipated movements in interest rates or in the value of the underlying instruments.
Pursuant to documentation governing the Funds’ swap transactions with Merrill Lynch and Morgan Stanley, Merrill Lynch and Morgan Stanley have the right to terminate the swaps early in the event that the net assets of the given Fund decline below specific levels set forth in the documentation (“net asset contingent features”). In the event of early termination, Merrill Lynch and Morgan Stanley may require the Funds to pay or receive a settlement amount in connection with the terminated swap transaction. The Funds utilized swaps to affect both long and short exposure to several asset classes and market segments, including, among others, real estate, domestic equity, international equity, emerging markets equities, investment grade corporate bonds, high yield corporate bonds, convertible bonds, preferred securities, emerging market-debt, mortgage-backed securities, floating rate notes, developed markets currencies, broad commodity indices, precious metals, equity market volatility, and U.S. Treasury bonds. As of April 30, 2019, the Funds have not triggered the conditions under such documentation that will give the counterparty the right to call for an early termination. As of such date, the settlement values of these contracts were approximately equal to the fair value of such contracts. As of April 30, 2019, open swap transactions, if any, are listed at the end of the Funds’ respective Schedule of Investments.
Futures Contracts
Certain Funds may invest in futures contracts (“futures”) in order to replicate exposures to their respective underlying index components. Investments in futures may increase or leverage exposure to a particular market risk, thereby increasing price volatility of derivative instruments a fund holds. No price is paid or received by the Funds upon the purchase of a futures.
Upon entering into a futures, the Funds are required to deposit with the broker, cash or securities in an amount equal to a certain percentage of the contract amount, which is referred to as the initial margin deposit. Subsequent payments, referred to as variation margin, are made or received by the Funds periodically and are based on changes in the market value of open futures. Changes in the market value of open futures are recorded as change in net unrealized appreciation/depreciation on the Statements of Operations. Realized gains or losses, representing the difference between the value of the contract at the time it was opened and the value at the time it was closed, are reported on the Statements of Operations at the closing or expiration of the futures. Securities deposited as initial margin are designated in the Schedules of Investments and cash deposited is recorded on the Statements of Assets and Liabilities. A receivable from and/or a payable to brokers for the daily variation margin is also recorded on the Statements of Assets and Liabilities.
As of April 30, 2019, there were no open futures contracts.
210
Notes to Financial Statements(continued)
April 30, 2019Forward Foreign Currency Contracts
Certain Funds may enter into forward foreign currency transactions to seek a closer correlation between the Funds’ overall currency exposures and the currency exposures of the Underlying Index as a part of its principal investment strategy.
The Funds may enter into forward foreign currency contracts for hedging purposes, to seek to protect against anticipated changes in future foreign currency exchange rates. A forward foreign currency contract involves an obligation to purchase or sell a specific currency at a future date, which may be any fixed number of days from the date of the contract agreed upon by the parties, at a price set at the time of the contract. A non-deliverable forward currency contract does not require physical delivery of the underlying currencies and the contract is settled based on the difference between the contracted price and the prevailing spot price of the agreed upon notional amount. These contracts are traded in the interbank market between currency traders (usually large commercial banks) and their customers. A forward foreign currency contract generally has no deposit requirement, and no commissions are generally charged at any stage for trades.
Upon entering into a forward foreign currency contract, a fund is required to segregate permissible liquid assets or engage in other measures approved by the SEC to “cover” the Fund’s obligations relating to its transactions in derivatives. Fluctuations in the value of open forward foreign currency contracts are recorded for book purposes as unrealized gains or losses on forward foreign currency contracts by the Funds. Realized gains and losses on forward foreign currency contracts include net gains or losses recognized by the Funds on contracts which have matured or were sold. At April 30, 2019, open forward foreign currency contracts, if any, are listed at the end of the Funds’ respective Schedule of Investments.
Quantitative Disclosure of Derivative Holding
The following tables show additional disclosures related to each Fund’s derivative and holding activities, including how such activities are accounted for and their effect in each Fund’s financial positions, performance and cash flows.
The fair value of derivative instruments reflected on the Statements of Assets and Liabilities were as follows:
Asset Derivatives
| | | | Currency Risk
|
IQ 50 Percent Hedged FTSE International ETF | | | | | | |
Unrealized appreciation on forward foreign currency contracts | | | | $ | 1,354,629 | |
IQ 50 Percent Hedged FTSE Europe ETF | | | | | | |
Unrealized appreciation on forward foreign currency contracts | | | | | 31,004 | |
IQ 50 Percent Hedged FTSE Japan ETF | | | | | | |
Unrealized appreciation on forward foreign currency contracts | | | | | 27,725 | |
Liability Derivatives
| | | | Currency Risk
|
IQ 50 Percent Hedged FTSE International ETF | | | | | | |
Unrealized depreciation on forward foreign currency contracts | | | | $ | 127,041 | |
IQ 50 Percent Hedged FTSE Europe ETF | | | | | | |
Unrealized depreciation on forward foreign currency contracts | | | | | 2,066 | |
IQ 50 Percent Hedged FTSE Japan ETF | | | | | | |
Unrealized depreciation on forward foreign currency contracts | | | | | 2,808 | |
211
Notes to Financial Statements(continued)
April 30, 2019Total return swaps reflect a reset date as of April 30, 2019; therefore, there is no unrealized appreciation/depreciation reflected on the Statements of Assets and Liabilities.
Transactions in derivative instruments reflected on the Statements of Operations during the year ended April 30, 2019 were as follows:
Fund
| | | | Currency Risk
| | Equity Risk
|
IQ Hedge Multi-Strategy Tracker ETF | | | | | | | | | | |
Realized gain (loss) | | | | | | | | | | |
Swap transactions | | | | | | | | $ | (5,312,617 | ) |
IQ Hedge Macro Tracker ETF | | | | | | | | | | |
Realized gain (loss) | | | | | | | | | | |
Swap transactions | | | | | | | | | (779 | ) |
IQ Hedge Market Neutral Tracker ETF | | | | | | | | | | |
Realized gain (loss) | | | | | | | | | | |
Swap transactions | | | | | | | | | (61,510 | ) |
IQ Hedge Long/Short Tracker ETF | | | | | | | | | | |
Realized gain (loss) | | | | | | | | | | |
Swap transactions | | | | | | | | | (36,091 | ) |
IQ Hedge Event-Driven Tracker ETF | | | | | | | | | | |
Realized gain (loss) | | | | | | | | | | |
Swap transactions | | | | | | | | | 444 | |
IQ Leaders GTAA Tracker ETF | | | | | | | | | | |
Realized gain (loss) | | | | | | | | | | |
Swap transactions | | | | | | | | | (328,489 | ) |
IQ Merger Arbitrage ETF | | | | | | | | | | |
Realized gain (loss) | | | | | | | | | | |
Swap transactions | | | | | | | | | (26,863,752 | ) |
Forward foreign currency contracts | | | | $ | (5,150 | ) | | �� | | |
IQ Global Resources ETF | | | | | | | | | | |
Realized gain (loss) | | | | | | | | | | |
Swap transactions | | | | | | | | | (994,330 | ) |
Forward foreign currency contracts | | | | | 54 | | | | | |
IQ 50 Percent Hedged FTSE International ETF | | | | | | | | | | |
Realized gain (loss) | | | | | | | | | | |
Swap transactions | | | | | | | | | (58,365 | ) |
Forward foreign currency contracts | | | | | 23,209,042 | | | | | |
Change in unrealized appreciation (depreciation) | | | | | | | | | | |
Forward foreign currency contracts | | | | | (4,876,917 | ) | | | | |
IQ 50 Percent Hedged FTSE Europe ETF | | | | | | | | | | |
Realized gain (loss) | | | | | | | | | | |
Swap transactions | | | | | | | | | (1,757 | ) |
Forward foreign currency contracts | | | | | 4,377,403 | | | | | |
Change in unrealized appreciation (depreciation) | | | | | | | | | | |
Forward foreign currency contracts | | | | | (1,771,299 | ) | | | | |
IQ 50 Percent Hedged FTSE Japan ETF | | | | | | | | | | |
Realized gain (loss) | | | | | | | | | | |
Forward foreign currency contracts | | | | | 798,491 | | | | | |
Change in unrealized appreciation (depreciation) | | | | | | | | | | |
Forward foreign currency contracts | | | | | (476,184 | ) | | | | |
212
Notes to Financial Statements(continued)
April 30, 2019For the year ended April 30, 2019, the monthly average notional value of the derivatives held by the Funds were as follows:
| | | | Average Notional Value
|
| | | | IQ Hedge
Multi-Strategy
Tracker ETF
| | IQ Hedge
Macro
Tracker ETF
| | IQ Hedge
Market Neutral
Tracker ETF
| | IQ Hedge
Long/Short
Tracker ETF
| | IQ Hedge
Event-Driven
Tracker ETF
| | IQ Leaders
GTAA
Tracker ETF
|
| Asset Derivatives | | | | | | | | | | | | | | | | | | | | | | | | | |
| Swap contracts | | | $ | 114,732,796 | | | $ | 624,201 | | | $ | 1,387,801 | | | $ | 653,470 | | | $ | 97,875 | | | $ | 5,415,803 | |
| Forward foreign currency contracts | | | | — | | | | — | | | | — | | | | — | | | | — | | | | — | |
| Liability Derivatives | | | | | | | | | | | | | | | | | | | | | | | | | |
| Swap contracts | | | $ | (115,117,144 | ) | | $ | (625,998 | ) | | $ | (1,390,308 | ) | | $ | (657,254 | ) | | $ | (97,781 | ) | | $ | (5,417,907 | ) |
| Forward foreign currency contracts | | | | — | | | | — | | | | — | | | | — | | | | — | | | | — | |
| | | | Average Notional Value
|
| | | | IQ Merger
Arbitrage ETF*
| | IQ Global
Resources ETF*
| | IQ 50 Percent
Hedged FTSE
International ETF
| | IQ 50 Percent
Hedged FTSE
Europe ETF
| | IQ 50 Percent
Hedged FTSE
Japan ETF
|
| Asset Derivatives | | | | | | | | | | | | | | | | | | | | | |
| Swap contracts | | | $ | — | | | $ | — | | | $ | 248,218 | | | $ | 8,673 | | | $ | — | |
| Forward foreign currency contracts | | | | — | | | | — | | | | 697,961,838 | | | | 60,022,837 | | | | 39,693,033 | |
| Liability Derivatives | | | | | | | | | | | | | | | | | | | | | |
| Swap contracts | | | $ | (226,463,038 | ) | | $ | (44,197,935 | ) | | $ | — | | | $ | — | | | $ | — | |
| Forward foreign currency contracts | | | | — | | | | — | | | | (696,182,190 | ) | | | (59,691,660 | ) | | | (39,635,417 | ) |
* | | The Fund had derivative activity during the year but did not have open positions at any month-end during the period. |
9. RISKS INVOLVED WITH INVESTING IN THE FUNDS
The Funds are subject to the principal risks described below, some or all of these risks may adversely affect a fund’s NAV, trading price, yield, total return and ability to meet its investment objective. As with any investment, an investment in a fund could result in a loss or the performance of a fund could be inferior to that of other investments.
Currency Risk
Certain Funds will invest in securities denominated in currencies other than U.S. dollars (foreign currencies). Therefore, while much of the income received by a fund may be denominated in foreign currency, the Underlying Index and the Fund’s NAV will be calculated in U.S. dollars. Furthermore a fund may convert cash in U.S. dollars to foreign currencies to purchase securities. Both a fund’s ability to track the Underlying Index, and Fund returns in general, may be adversely impacted by changes in currency exchange rates, which can occur quickly and without warning.
Currency Hedging Risk1
Certain Funds use various strategies to attempt to reduce the impact of changes in the value of a foreign currency against the U.S. dollar. These strategies may not be successful. Currency exchange rates can be very volatile and can change quickly and unpredictably. Therefore, the value of an investment in a fund may also go up or down quickly and unpredictably and investors may lose money.
Fund of Funds Risk2
Certain Funds’ investment performance, because they are fund of funds, depend on the investment performance of the underlying ETFs in which they invest. An investment in any such Fund is subject to the risks associated with the underlying ETFs that comprise its Underlying Index. Such a fund will indirectly pay a proportional share of the asset-based fees of the underlying ETFs in which it invests.
Exchange Traded Vehicle Risk2
Unlike an investment in a mutual fund, the value of the Funds’ investments in ETFs, ETVs and ETNs is based on stock market prices and the Funds could lose money due to stock market developments, the failure of an active trading market to develop, or exchange trading halts or de-listings. Federal law prohibits the Funds from acquiring investment company shares, including shares of ETFs, in excess of specific thresholds unless exempted by rule, regulation or exemptive order. These prohibitions may prevent the Funds from allocating their investments to ETFs in an optimal manner.
213
Notes to Financial Statements(continued)
April 30, 2019Index Risk
The Funds’ Underlying Indexes and the Funds rebalance only on a monthly, quarterly or annual basis, which may cause the performance of the Underlying Indexes and the Funds to deviate from that of the market exposure that they are trying to achieve.
Industry Concentration Risk
To the extent that a fund’s Underlying Index is concentrated in a particular industry, the Fund also will be concentrated in that industry. The risk of concentrating fund investments in a limited number of issuers conducting business in the same industry or group of industries will subject a fund to a greater risk of loss as a result of adverse economic, business or other developments than if its investments were diversified across different industry sectors.
Tracking Error Risk
Each Fund’s performance may not match its Underlying Index during any period of time. Although each Fund attempts to track the performance of its Underlying Index, a fund may not be able to duplicate its exact composition or return for a number of reasons, including that the strategies used by the Advisor to match the performance of the Underlying Indexes were unsuccessful and because a fund incurs expenses, which an Underlying Index does not incur.
Counterparty Risk
Many of the protections afforded to participants on some organized exchanges, such as the performance guarantee of an exchange clearing house, are not available in connection with OTC derivatives transactions. In those instances, an underlying ETP utilizing such deliverables will be subject to the risk that its direct counterparty will not perform its obligations under the transactions and that the underlying ETP will sustain losses.
Foreign Securities Risk
Certain Funds invest directly or indirectly (through underlying ETFs) in the securities of non-U.S. issuers, which involves risks beyond those associated with investments in U.S. securities. These additional risks include greater market volatility, the availability of less reliable financial information, higher transactional and custody costs, taxation by foreign governments, decreased market liquidity and political instability.
Total Return Swap Risk3
Total return swaps give a fund the right to receive the appreciation in the value of a specified security, index or other instrument in return for a fee paid to the counterparty, which will typically be an agreed upon interest rate. Total return swaps can also be used to replicate an exposure to a short position in an asset class where a fund has the right to receive the depreciation in value of a specified security, index or other instrument (“inverse swaps”). If the underlying asset in a total return swap declines in value (or increases in value, if an inverse swap) over the term of the swap, a fund may also be required to pay the dollar value of that decline (or, if an inverse swap, increase, if an inverse swap) to the counterparty. Therefore, swaps are subject to credit risk or the risk of default or non-performance by the counterparty.
Small Capitalization Companies Risk4
Certain Funds invest primarily in the stocks of small capitalization companies, which may be more volatile than those of larger companies. Stock prices of small capitalization companies are also more vulnerable than those of large capitalization companies to adverse business and economic developments. Additionally, the stocks of small capitalization companies may be thinly traded, making it difficult to buy and sell them.
High Yield Securities Risk5
High yield securities generally offer a higher current yield than the yield available from higher grade issues, but typically involve greater risk. Securities rated below investment grade are commonly referred to as “junk bonds.”
Market Risk
The market price of investments owned by a fund may go up or down, sometimes rapidly or unpredictably.
214
Notes to Financial Statements(continued)
April 30, 2019Investments may decline in value due to factors affecting fixed income securities markets generally or particular segments of the market.
Long/Short Risk
There is no guarantee that the returns on a fund’s long or short positions, if any, will produce positive returns, and the Fund could lose money if either or both positions produce negative returns. In addition, a fund may gain enhanced long exposure to certain securities (i.e., obtain investment exposure that exceeds the amount directly invested in those assets, a form of leverage) and, as a result, suffer losses that exceed the amount invested in those assets.
Equity Securities Risk
The prices of equity securities are responsive to many factors, including the historical and prospective earnings of the issuer, the value of its assets, general economic, stock market, industry and company conditions and the risk inherent in the portfolio manager’s ability to anticipate such changes that can adversely affect the value of a fund’s holdings. Opportunity for greater gain may come with greater risk of loss.
Passive Management Risk
Unlike many investment companies, each Fund seeks to track its Underlying Index and is not “actively” managed. Therefore, a fund would not generally sell a security because the security’s issuer was in financial trouble unless that security is removed from (or was no longer useful in tracking a component of) its Underlying Index.
Debt Investments Risk
Debt investments are subject to many risks, including, but not limited to, interest rate risk, credit risk, market risk, regulatory risk, price volatility and liquidity risk. There is a risk that an issuer or guarantor of a debt investment might be unable or unwilling to meet its financial obligations and might not make interest or principal payments on an instrument when those payments are due (“default”). Defaults may potentially reduce a fund’s income or ability to recover amounts due, and may reduce the value of the debt investment, sometimes dramatically. Certain debt investments may be difficult to value, purchase, or sell, particularly during adverse market conditions, because there is a limited market for the investment or there are restrictions on resale.
Debt investments most frequently trade in institutional round lot size transactions. Until a fund grows significantly in size, a fund may purchase a significant number of bonds in amounts less than the institutional round lot size, which are frequently referred to as “odd” lots. Odd lot size positions may have more price volatility than institutional round lot size positions. The Funds use a third-party pricing service to value bond holdings and the pricing service values bonds assuming orderly transactions of an institutional round lot size.
Income Risk5
The income of a fund receives from investments in debt securities may decline when interest rates fall. This decline can occur because a fund may subsequently invest in lower-yielding bonds when bonds in its portfolio mature or the Fund needs to purchase additional bonds.
Call Risk5
During periods of falling interest rates, an issuer of a callable bond held by a fund may “call” or repay the security before its stated maturity, and the Fund may have to reinvest the proceeds at lower interest rates, resulting in a decline in the Fund’s income.
Credit Risk5
Debt issuers and other counterparties may not honor their obligations or may have their debt downgraded by ratings agencies. The financial condition of an issuer of a debt security or other instrument may cause such issuer to default on its obligations or cause such issuer to be perceived (whether by market participants, rating agencies, pricing services or otherwise) as being in default.
215
Notes to Financial Statements(continued)
April 30, 2019Interest Rate Risk5
An increase in interest rates may cause the value of debt securities held by a fund to decline. Interest rates in the United States are near historic lows, which may increase a fund’s exposure to risks associated with rising interest rates. Interest rates may rise significantly and/or rapidly. Rising interest rates or lack of market participants may lead to decreased liquidity and increased volatility in the bond markets, making it more difficult for a fund to sell its bond holdings at a time when the Fund might wish to sell.
New Fund Risk6
Certain Funds are new funds. There can be no assurance that they will grow to or maintain an economically viable size, in which case they may experience greater tracking error to their Underlying Indexes or ultimately liquidate.
Trading Price Risk
Although it is expected that generally the market price of a fund’s Shares will approximate the Fund’s NAV, there may be times when market price in the Secondary Market and the NAV vary significantly.
Large Transaction Risks
From time to time, a fund may receive large purchase or redemption orders from affiliated or unaffiliated funds or other investors. Such large transactions could have adverse effects on a fund’s performance if the Fund were required to sell securities or invest cash at times when it otherwise would not do so. This activity could also accelerate the realization of capital gains and increase a fund’s transaction costs.
1 | | Applies to IQ 50 Percent Hedged FTSE International ETF, IQ 50 Percent Hedged FTSE Europe ETF and IQ 50 Percent Hedged FTSE Japan ETF. |
2 | | Applies to IQ Hedge Multi-Strategy Tracker ETF, IQ Hedge Macro Tracker ETF, IQ Hedge Market Neutral Tracker ETF, IQ Hedge Long/Short Tracker ETF, IQ Hedge Event-Driven Tracker ETF, IQ Real Return ETF, IQ Leaders GTAA Tracker, IQ Enhanced Core Bond U.S. ETF, IQ Enhanced Core Plus Bond U.S. ETF and IQ Short Duration Enhanced Core Bond U.S. ETF. |
3 | | Applies to IQ Hedge Multi-Strategy Tracker ETF, IQ Hedge Macro Tracker ETF, IQ Hedge Market Neutral Tracker ETF, IQ Hedge Long/Short Tracker ETF, IQ Hedge Event-Driven Tracker ETF, IQ Global Resources ETF, IQ Merger Arbitrage ETF and IQ Leaders GTAA Tracker ETF. |
4 | | Applies to IQ Global Agribusiness Small Cap ETF, IQ U.S. Real Estate Small Cap ETF, and IQ Chaikin U.S. Small Cap ETF. |
5 | | Applies to IQ Enhanced Core Bond U.S. ETF, IQ Enhanced Core Plus Bond U.S. ETF, IQ Short Duration Enhanced Core Bond U.S. ETF and IQ S&P High Yield Low Volatility Bond ETF. |
6 | | Applies to IQ Short Duration Enhanced Core Bond U.S. ETF and IQ 500 International ETF. |
10. NEW ACCOUNTING PRONOUNCEMENTS
Effective April 30, 2019, the Portfolio has adopted disclosure requirements conforming to SEC Rule 6-04.17 of Regulation S-X that simplifies the reporting of information by registered investment companies in financial statements. The amendments require presentation of the total, rather than the components, of distributable earnings on the Statements of Assets and Liabilities and also require presentation of the total, rather than the components, of distributions to shareholders, except for tax return of capital distributions, if any, on the Statements of Changes in Net Assets. The amendments also removed the requirement for parenthetical disclosure of undistributed net investment income on the Statements of Changes in Net Assets. These Regulation S-X amendments are reflected in the Portfolio’s financial statements for the year ended April 30, 2019.
To improve the effectiveness of fair value disclosure requirements, the Financial Accounting Standards Board recently issued Accounting Standard Update (ASU) 2018-13, Fair Value Measurement Disclosure Framework — Changes to the Disclosure Requirements for Fair Value Measurement (ASU 2018-13), which adds, removes, and modifies certain aspects relating to fair value disclosure. ASU 2018-13 is effective for interim and annual reporting periods beginning after December 15, 2019; early adoption of the additions relating to ASU 2018-13 is not required. Management has evaluated the implications of certain other provisions of the ASU and has determined to early adopt aspects related to the removal and modifications of certain fair value measurement disclosures under the ASU effective immediately. At this time, management is evaluating the implications of certain other provisions of the ASU related to new disclosure requirements and any impact on the financial statement disclosures has not yet been determined.
11. SUBSEQUENT EVENTS
In the preparation of the financial statements, the Funds’ management has evaluated events and transactions for potential recognition or disclosure through the date the financial statements were issued and has determined that there are no material subsequent events that would require disclosure.
216
Report of Independent Registered Public Accounting Firm
April 30, 2019
To the Board of Trustees of IndexIQ ETF Trust and Shareholders of each of the twenty-one funds indicated in the table below
Opinions on the Financial Statements
We have audited the accompanying statements of assets and liabilities, including the schedules of investments, of each of the funds indicated in the table below (twenty-one of the funds constituting IndexIQ ETF Trust, hereafter collectively referred to as the “Funds”) as of April 30, 2019, the related statements of operations and of changes in net assets for each of the periods indicated in the table below, including the related notes, and the financial highlights for each of the periods indicated in the table below (collectively referred to as the “financial statements”). In our opinion, the financial statements present fairly, in all material respects, the financial position of each of the Funds as of April 30, 2019, the results of each of their operations, the changes in each of their net assets, and each of the financial highlights for each of the periods indicated in the table below, in conformity with accounting principles generally accepted in the United States of America.
Individual Fund Comprising the IndexIQ ETF Trust
|
| Statement
of Operations
|
| Statements of
Changes in Net Assets
|
| Financial Highlights
|
IQ Hedge Multi-Strategy Tracker ETF
IQ Hedge Macro Tracker ETF
IQ Hedge Market Neutral Tracker ETF
IQ Global Resources ETF
IQ Merger Arbitrage ETF
IQ Real Return ETF
IQ Global Agribusiness Small Cap ETF
IQ U.S. Real Estate Small Cap ETF | | For the year ended April 30, 2019 | | For the years ended April 30, 2019 and 2018 | | For the years ended April 30, 2019, 2018, 2017, 2016 and 2015 |
IQ Hedge Event-Driven Tracker ETF
IQ Hedge Long/Short Tracker ETF | | For the year ended April 30, 2019 | | For the years ended April 30, 2019 and 2018 | | For the years ended April 30, 2019, 2018, 2017 and 2016, and the period from March 24, 2015 (commencement of operations) through April 30, 2015 |
IQ 50 Percent Hedged FTSE International ETF
IQ 50 Percent Hedged FTSE Europe ETF
IQ 50 Percent Hedged FTSE Japan ETF | | For the year ended April 30, 2019 | | For the years ended April 30, 2019 and 2018 | | For the years ended April 30, 2019, 2018 and 2017, and the period from
July 22, 2015 (commencement of operations) through April 30, 2016 |
IQ Leaders GTAA Tracker ETF | | For the year ended April 30, 2019 | | For the years ended April 30, 2019 and 2018 | | For the years ended April 30, 2019, 2018 and 2017, and the period from September 30, 2015 (commencement of operations) through April 30, 2016 |
217
Report of Independent Registered Public Accounting Firm
April 30, 2019Individual Fund Comprising the IndexIQ ETF Trust
|
| Statement
of Operations
|
| Statements of
Changes in Net Assets
|
| Financial Highlights
|
IQ Enhanced Core Bond U.S. ETF
IQ Enhanced Core Plus Bond U.S. ETF | | For the year ended April 30, 2019 | | For the years ended April 30, 2019 and 2018 | | For the years ended April 30, 2019 and 2018, and the period from May 10, 2016 (commencement of operations) through April 30, 2017 |
IQ S&P High Yield Low Volatility Bond ETF | | For the year ended April 30, 2019 | | For the years ended April 30, 2019 and 2018 | | For the years ended April 30, 2019 and 2018, and the period from February 15, 2017 (commencement of operations) through April 30, 2017 |
IQ Chaikin U.S. Small Cap ETF | | For the year ended April 30, 2019 | | For the year ended April 30, 2019 and the period from May 16, 2017 (commencement of operations) through April 30, 2018 |
IQ Chaikin U.S. Large Cap ETF | | For the year ended April 30, 2019 | | For the year ended April 30, 2019 and the period from December 13, 2017 (commencement of operations) through April 30, 2018 |
IQ 500 International ETF | | For the period December 13, 2018 (commencement of operations) through April 30, 2019 |
IQ Short Duration Enhanced Core
Bond U.S. ETF | | For the period December 18, 2018 (commencement of operations) through April 30, 2019 |
Basis for Opinions
These financial statements are the responsibility of the Funds’ management. Our responsibility is to express an opinion on the Funds’ financial statements based on our audits. We are a public accounting firm registered with the Public Company Accounting Oversight Board (United States) (PCAOB) and are required to be independent with respect to the Funds in accordance with the U.S. federal securities laws and the applicable rules and regulations of the Securities and Exchange Commission and the PCAOB.
We conducted our audits of these financial statements in accordance with the standards of the PCAOB. Those standards require that we plan and perform the audit to obtain reasonable assurance about whether the financial statements are free of material misstatement, whether due to error or fraud.
Our audits included performing procedures to assess the risks of material misstatement of the financial statements, whether due to error or fraud, and performing procedures that respond to those risks. Such procedures included examining, on a test basis, evidence regarding the amounts and disclosures in the financial statements. Our audits also included evaluating the accounting principles used and significant estimates made by management, as well as evaluating the overall presentation of the financial statements. Our procedures included confirmation of securities owned as of April 30, 2019 by correspondence with the custodian, transfer agent and brokers; when replies were not received from brokers, we performed other auditing procedures. We believe that our audits provide a reasonable basis for our opinions.
/s/PricewaterhouseCoopers LLP
New York, New York
June 27, 2019
We have served as the auditor of one or more investment companies in the IndexIQ Complex since 2015.
218
Supplemental Information
(unaudited)
April 30, 2019Federal Tax Status of Dividends Declared During the Tax Year
IQ U.S. Real Estate Small Cap ETF designates 99% as Qualified Business Income.
Qualified Dividend Income — Certain dividends paid by the Fund may be subject to a maximum tax rate of 15%, as provided for by the Jobs and Growth Tax Relief Reconciliation Act of 2003. The percentage of ordinary income distributions for the fiscal year ended April 30, 2019 taxed at a maximum rate of 15% is as follows:
IQ Hedge Multi-Strategy Tracker ETF | | | | | 28.71 | % |
IQ Hedge Macro Tracker ETF | | | | | 40.35 | |
IQ Hedge Market Neutral Tracker ETF | | | | | 0.00 | |
IQ Hedge Long/Short Tracker ETF | | | | | 50.19 | |
IQ Hedge Event-Driven Tracker ETF | | | | | 9.54 | |
IQ Real Return ETF | | | | | 5.29 | |
IQ Leaders GTAA Tracker ETF | | | | | 41.44 | |
IQ Enhanced Core Bond U.S. ETF | | | | | 0.00 | |
IQ Enhanced Core Plus Bond U.S. ETF | | | | | 0.00 | |
IQ Short Duration Enhanced Core Bond U.S. ETF | | | | | 0.00 | |
IQ Merger Arbitrage ETF | | | | | 0.00 | |
IQ Global Resources ETF | | | | | 100.00 | |
IQ Global Agribusiness Small Cap ETF | | | | | 100.00 | |
IQ U.S. Real Estate Small Cap ETF | | | | | 0.89 | |
IQ S&P High Yield Low Volatility Bond ETF | | | | | 0.00 | |
IQ 500 International ETF | | | | | 83.75 | |
IQ 50 Percent Hedged FTSE International ETF | | | | | 72.92 | |
IQ 50 Percent Hedged FTSE Europe ETF | | | | | 82.62 | |
IQ 50 Percent Hedged FTSE Japan ETF | | | | | 91.91 | |
IQ Chaikin U.S. Small Cap ETF | | | | | 100.00 | |
IQ Chaikin U.S. Large Cap ETF | | | | | 100.00 | |
Dividends Received Deduction — For corporate shareholders, the percentage of ordinary income distributions for the year ended April 30, 2019 that qualifies for the dividends received deduction is as follows:
IQ Hedge Multi-Strategy Tracker ETF | | | | | 6.24 | % |
IQ Hedge Macro Tracker ETF | | | | | 3.74 | |
IQ Hedge Market Neutral Tracker ETF | | | | | 0.00 | |
IQ Hedge Long/Short Tracker ETF | | | | | 14.11 | |
IQ Hedge Event-Driven Tracker ETF | | | | | 7.71 | |
IQ Real Return ETF | | | | | 3.32 | |
IQ Leaders GTAA Tracker ETF | | | | | 14.45 | |
IQ Enhanced Core Bond U.S. ETF | | | | | 0.00 | |
IQ Enhanced Core Plus Bond U.S. ETF | | | | | 0.00 | |
IQ Short Duration Enhanced Core Bond U.S. ETF | | | | | 0.00 | |
IQ Merger Arbitrage ETF | | | | | 0.00 | |
IQ Global Resources ETF | | | | | 36.59 | |
IQ Global Agribusiness Small Cap ETF | | | | | 16.38 | |
IQ U.S. Real Estate Small Cap ETF | | | | | 0.00 | |
IQ S&P High Yield Low Volatility Bond ETF | | | | | 0.00 | |
IQ 500 International ETF | | | | | 0.00 | |
IQ 50 Percent Hedged FTSE International ETF | | | | | 0.00 | |
IQ 50 Percent Hedged FTSE Europe ETF | | | | | 0.00 | |
IQ 50 Percent Hedged FTSE Japan ETF | | | | | 0.00 | |
IQ Chaikin U.S. Small Cap ETF | | | | | 100.00 | |
IQ Chaikin U.S. Large Cap ETF | | | | | 97.79 | |
219
Supplemental Information(unaudited) (continued)
April 30, 2019Foreign Taxes Paid — The following Funds elect under the Internal Revenue Code Section 853 to pass through foreign taxes paid to its shareholders. The total amount of foreign taxes passed through to shareholders on a per share basis for the year ended April 30, 2019, are as follows:
Fund
| | | | Foreign Taxes
Per Shares
| | Foreign Income
Per Shares
|
IQ Hedge Multi-Strategy Tracker ETF | | | | | — | | | | — | |
IQ Hedge Macro Tracker ETF | | | | | — | | | | — | |
IQ Hedge Market Neutral Tracker ETF | | | | | — | | | | — | |
IQ Hedge Long/Short Tracker ETF | | | | | — | | | | — | |
IQ Hedge Event-Driven Tracker ETF | | | | | — | | | | — | |
IQ Real Return ETF | | | | | — | | | | — | |
IQ Leaders GTAA Tracker ETF | | | | | — | | | | — | |
IQ Enhanced Core Bond U.S. ETF | | | | | — | | | | — | |
IQ Enhanced Core Plus Bond U.S. ETF | | | | | — | | | | — | |
IQ Short Duration Enhanced Core Bond U.S. ETF | | | | | — | | | | — | |
IQ Merger Arbitrage ETF | | | | | — | | | | — | |
IQ Global Resources ETF | | | | | 0.0492 | | | | 0.6740 | |
IQ Global Agribusiness Small Cap ETF | | | | | 0.0380 | | | | 0.5038 | |
IQ U.S. Real Estate Small Cap ETF | | | | | — | | | | — | |
IQ S&P High Yield Low Volatility Bond ETF | | | | | — | | | | — | |
IQ 500 International ETF | | | | | 0.0325 | | | | 0.3174 | |
IQ 50 Percent Hedged FTSE International ETF | | | | | 0.0770 | | | | 0.9858 | |
IQ 50 Percent Hedged FTSE Europe ETF | | | | | 0.3422 | | | | 3.2142 | |
IQ 50 Percent Hedged FTSE Japan ETF | | | | | 0.1847 | | | | 1.4814 | |
IQ Chaikin U.S. Small Cap ETF | | | | | — | | | | — | |
IQ Chaikin U.S. Large Cap ETF | | | | | — | | | | — | |
In January 2020, you will be advised on IRS Form 1099-DIV as to the federal tax status of the distributions received by you in calendar year 2019.
220
Board Review of Investment Advisory Agreement(unaudited)
April 30, 2019Approval Relating to IQ S&P U.S. Preferred Stock Low Volatility High Dividend ETF
The Board of Trustees (the “Board”, and the members of which are referred to as “Trustees”) met in person on June 26, 2018 to consider the approval of an amendment to the Advisory Agreement between the Trust, on behalf of its series, and the Advisor to apply such Advisory Agreement to the IQ S&P U.S. Preferred Stock Low Volatility High Dividend ETF (“PRHD”).
In accordance with Section 15(c) of the 1940 Act, the Board requested, reviewed and considered materials furnished by the Advisor relevant to the Board’s consideration of whether to approve the amendment to the Advisory Agreement to apply such agreement to PRHD. In connection with considering approval of the amendment to the Advisory Agreement, the Trustees who are not “interested persons” of the Trust, as that term is defined in the 1940 Act (the “Independent Trustees”), met in executive session with counsel to the Trust and counsel to the Independent Trustees, who provided assistance and advice. The consideration of the amendment to the Advisory Agreement was conducted by both the full Board and the Independent Trustees, who also voted separately.
During their review and consideration, the Board and the Independent Trustees focused on and analyzed the factors they deemed relevant, including: (1) information describing the nature, quality and extent of the services that IndexIQ will provide to the PRHD, and the fees that the Advisor will charge to PRHD; (2) information concerning the business and operations, compliance program and portfolio management team of the Advisor; (3) information describing PRHD’s anticipated operating expenses; (4) memoranda and guidance from legal counsel to the Independent Trustees on the fiduciary responsibilities of trustees, including the Independent Trustees, in considering investment advisory and distribution arrangements under the 1940 Act; and (5) materials provided by the Advisor in response to a section 15(c) request for information from legal counsel to the Independent Trustees. In addition, the Independent Trustees received data comparing PRHD’s proposed advisory fee rate and expected expense ratio against the advisory fees and expense ratios of other mutual funds or ETFs with similar investment objectives and policies. During their review of this information, the Independent Trustees focused on and analyzed the factors that the Independent Trustees deemed relevant, including: the nature, quality, and extent of the services to be provided to PRHD by the Advisor; the personnel and operations of the Advisor; PRHD’s proposed expense levels; any “fall-out” benefits to the Advisor (i.e., the ancillary benefits realized due to a relationship with the Trust); and possible conflicts of interest.
In reviewing such factors, the Board relied on certain information, including (1) a copy of the amendment to the Advisory Agreement and of the Advisory Agreement, itself; (2) a copy of the expense limitation agreement; (3) information describing the Advisor and the services provided thereby; (4) information regarding the respective compliance program and portfolio management teams of the Advisor; (5) a copy of the Form ADV for the Advisor; (6) memoranda and guidance from legal counsel to the Independent Trustees on the fiduciary responsibilities of trustees, including Independent Trustees, in considering advisory and distribution agreements under the 1940 Act; (7) materials provided by the Advisor in response to a section 15(c) request for information from legal counsel to the Independent Trustees; and (8) an in-person presentation by personnel of the Advisor. In addition, the Board was provided data comparing the proposed advisory fees and operating expenses (including acquired fund fees and expenses, as applicable) of PRHD with expenses and performance of other registered investment companies with similar investment objectives and policies, and a presentation regarding PRHD, its index, and the proposed marketing and launch strategy relating to PRHD. The Trustees also considered their personal experiences as Trustees and participants in the ETF and mutual fund industry, as applicable, including their experiences with the Advisor in respect of series of the Trust and IndexIQ Active ETF Trust.
In particular, the Trustees including the Independent Trustees, considered and discussed the following with respect to the PRHD:
1. | | The nature, extent and quality of the facilities and services provided by the Advisor. The Independent Trustees reviewed the services that the Advisor would provide to PRHD. In connection with the investment advisory services to be provided to PRHD, the Independent Trustees noted the responsibilities that the Advisor would have as the PRHD’s investment adviser, including overall supervisory responsibility for the general |
221
Board Review of Investment Advisory Agreement(unaudited) (continued)
April 30, 2019 | | management and investment of PRHD’s securities portfolio ultimate responsibility, subject to oversight by the Board, for daily monitoring of tracking error and quarterly reporting to the Board, and the implementation of Board directives as they relate to PRHD. |
| | The Board reviewed the Advisor’s experience, resources, and strengths in managing other mutual funds and ETFs. The Independent Trustees considered the Advisor’s performance in managing the existing Funds of the Trust. Based on their consideration and review of the foregoing information, the Independent Trustees determined that PRHD would be likely to benefit from the nature, quality and extent of these services, as well as the Advisor’s ability to render such services based on its experience, operations and resources. The Board noted the responsibilities that the Advisor would have as PRHD’s investment adviser and do have as the existing Funds’ investment adviser, including overall supervisory responsibility for the general management and investment of PRHD’s securities portfolio, monitoring PRHD’s compliance with regulatory requirements and fund objectives and policies, daily monitoring of the portfolio, overseeing Fund service providers, obtaining licenses from S&P for use of the index, providing officers for PRHD, ongoing reporting to the Board and the implementation of Board directives as they relate to PRHD. The Board considered the services rendered in respect of the existing Funds in assessing services expected to be provided to PRHD. |
| | The Board reviewed the Advisor’s experience, resources and strengths in managing other ETFs, including the Advisor’s management of the existing Funds and the funds of the IndexIQ Active ETF Trust. The Board also noted and discussed with the Advisor the resources and additional support and personnel from its parent, New York Life Investment Management (“NYLIM”) that enhance and support the work of the Advisor’s officers and staff. The Board also considered the tenure and experience of the personnel at the Advisor providing management and administrative services to the Funds, and noted the discussion of personnel matters presented at the March 2018 meeting of the Board. In addition, the Board considered the ongoing expansion of compliance and distribution/sales personnel that support the Funds and the funds of the IndexIQ Active ETF Trust. |
2. | | Comparison of services provided and fees charged by the Advisor and other investment advisers to similar clients, and the cost of the services provided and profits realized by the Advisor from its relationship with PRHD. The Independent Trustees then compared both the services to be rendered and the proposed fees to be paid pursuant to the Advisory Agreement with the Advisor and to contracts of other investment advisers with respect to similar mutual funds and ETFs, as well as the Trust’s operational ETFs. In particular, the Independent Trustees compared PRHD’s proposed advisory fees and projected expense ratios for its first year of operations to other ETFs in PRHD’s peer group. The Independent Trustees also considered that the Advisor had proposed an expense limitation agreement to limit the total operating expenses of PRHD for a period of at least one year. |
| | After comparing PRHD’s proposed fees with those of other funds in PRHD’s peer group, and in light of the nature, quality and extent of services proposed to be provided by the Advisor, and the costs expected to be incurred by the Advisor in rendering those services, the Independent Trustees concluded that the fees proposed to be paid to the Advisor with respect to PRHD were fair and reasonable. |
3. | | The Advisor’s profitability and the extent to which economies of scale would be realized as PRHD grows and whether fee levels would reflect such economies of scale. The Independent Trustees next considered potential economies of scale and the anticipated costs and projected profitability of the Advisor in connection with its serving as investment adviser to PRHD, including operational costs. Due to the fact that PRHD had no assets at the time, the Independent Trustees made no determination with respect to economies of scale or the impact of PRHD on the Advisor’s profitability. |
4. | | Investment performance of the Funds. Because PRHD has not commenced operations, the Independent Trustees could not consider the investment performance of PRHD, but did take into account the experience of the Advisor, the investment performance of other strategies managed by Advisor and peer performance. |
No single factor was determinative to the decision of the Independent Trustees. Based on the foregoing and such other matters as were deemed relevant, the Independent Trustees concluded that the terms of the Investment Advisory Agreement with the Advisor were reasonable and fair to PRHD and to recommend to the
222
Board Review of Investment Advisory Agreement(unaudited) (continued)
April 30, 2019
Board the approval of the amendment to the Advisory Agreement. As a result, all of the Board members, including the Independent Trustees, determined that the Advisory Agreement was in the best interests of PRHD. The Board and the Independent Trustees, voting separately, approved the amendment to the Advisory Agreement to apply such agreement to PRHD.
Approval Relating to IQ Short Duration Enhanced Core Bond U.S. ETF, IQ 500 ETF and IQ 500 International ETF
The Board met in person on December 6, 2018 to consider the approval of an amendment to the Advisory Agreement between the Trust, on behalf of its series, and the Advisor to apply the Advisory Agreement to the IQ Short Duration Enhanced Core Bond U.S. ETF (“SDAG”). In addition, the Board considered the approval of an amendment to the Advisory Agreement to increase the fees applicable to IQ 500 ETF (“IQUS”) and IQ 500 International ETF (“IQIN” and, collectively with SDAG and IQUS, the “New Funds”), both of which were Funds approved at the March 2018 meeting of the Board, but which had not yet commenced operations.
In accordance with Section 15(c) of the 1940 Act, the Board requested, reviewed and considered materials furnished by the Advisor relevant to the Board’s consideration of whether to approve the amendment to the Advisory Agreement to apply such agreement to SDAG and to alter the fees applicable to IQUS and IQIN. In connection with considering approval of the amendment to the Advisory Agreement, the Independent Trustees met in executive session with counsel to the Trust and counsel to the Independent Trustees, who provided assistance and advice. The consideration of the amendment to the Advisory Agreement was conducted by both the full Board and the Independent Trustees, who also voted separately.
During their review and consideration, the Board and the Independent Trustees focused on and analyzed the factors they deemed relevant, including: (1) the nature, extent and quality of the services provided by the Advisor, both for the existing Funds (including IQUS and IQIN) and the proposed SDAG, and the fees to be charged by the Advisor; (2) information concerning the business and operations, compliance program and portfolio management team of the Advisor; (3) the anticipated expense levels of SDAG (including with respect to acquired fund fees and expenses), IQUS and IQIN; (4) the investment performance of the existing Funds; (5) the costs of the services to be provided and profits to be realized by the Advisor and its affiliates from the relationship with the Trust, including a proposed expense limitation agreement between the Advisor and the Trust in respect of the New Funds; (6) the extent to which economies of scale would be realized as the New Funds grow; (7) any benefits derived or to be derived by the Advisor from its relationship with the Trust; and (8) potential conflicts of interest. The Board considered that each New Fund was proposed to be a passively managed ETF, and that each was designed to track an index created by an affiliate of the Advisor.
In reviewing such factors, the Board relied on certain information, including (1) a copy of the amendment to the Advisory Agreement and of the Advisory Agreement, itself; (2) a copy of the expense limitation agreement; (3) information describing the Advisor and the services provided thereby; (4) information regarding the respective compliance program and portfolio management teams of the Advisor; (5) a copy of the Form ADV for the Advisor; (6) memoranda and guidance from legal counsel to the Independent Trustees on the fiduciary responsibilities of trustees, including Independent Trustees, in considering advisory and distribution agreements under the 1940 Act; (7) materials provided by the Advisor in response to a section 15(c) request for information from legal counsel to the Independent Trustees; and (8) an in-person presentation by personnel of the Advisor. In addition, the Board was provided data comparing the proposed advisory fees and operating expenses (including acquired fund fees and expenses, as applicable) of each New Fund with expenses and performance of other registered investment companies with similar investment objectives and policies, and a presentation regarding SDAG, its index and the proposed marketing and launch strategy relating to SDAG. The Board also considered that IQUS and IQIN had previously been approved at the March 2018 meeting of the Board, and that the material information presented at such meeting had not changed, with the exception of a new presentation detailing the proposed fee changes, an updated peer group analysis and a new competitive landscape analysis. The Trustees also considered their personal experiences as Trustees and participants in the ETF and mutual fund industry, as applicable, including their experiences with the Advisor with respect to existing series of the Trust and IndexIQ Active ETF Trust.
223
Board Review of Investment Advisory Agreement(unaudited) (continued)
April 30, 2019In particular, the Trustees including the Independent Trustees, considered and discussed the following with respect to the New Funds:
1. | | The nature, extent and quality of the facilities and services provided by the Advisor. The Board reviewed the services that the Advisor provides to the existing Funds, noting that they had continually reviewed and overseen such services, including at the Trust’s general section 15(c) meeting in March 2018. The Board noted the responsibilities that the Advisor would have as the New Funds’ investment adviser and do have as the existing Funds’ investment adviser, including overall supervisory responsibility for the general management and investment of the securities portfolio of each of the New Funds, and monitoring each New Fund’s compliance with regulatory requirements and fund objectives and policies, daily monitoring of the portfolio, overseeing Fund service providers, obtaining licenses for use of the index, providing officers for the New Funds, ongoing reporting to the Board, and the implementation of Board directives as they relate to the New Funds. The Board considered the services rendered in respect of the existing Funds in assessing services expected to be provided to for the New Funds. |
| | The Board considered similarities between SDAG and the IQ Enhanced Core Bond U.S. ETF (“AGGE”) and IQ Enhanced Core Plus Bond U.S. ETF (“AGGP”), each an existing Fund managed by the Advisor. In addition, they considered the structure of IQUS and IQIN and the history of the underlying indexes. |
| | The Board reviewed the Advisor’s experience, resources and strengths in managing other ETFs, including the Advisor’s management of the existing Funds and the funds of the IndexIQ Active ETF Trust. The Board also noted and discussed with the Advisor the resources and additional support and personnel from its parent NYLIM, that enhance and support the work of the Advisor’s officers and staff. The Board also considered the tenure and experience of the personnel at the Advisor providing management and administrative services to the New Funds. |
| | Based on their consideration and review of the foregoing information, the Board concluded that each of the New Funds was likely to benefit from the nature, quality, and extent of these services, as well as the Advisor’s ability to render such services based on its personnel, experience, operations and resources. |
2. | | Comparison of services provided and fees charged by the Advisor and other investment advisers to similar clients, and the cost of the services provided and profits realized by the Advisor from its relationship with the New Funds. The Board then compared both the services proposed to be rendered and the fees proposed to be paid with respect to the New Funds pursuant to the Advisory Agreement to contracts of other registered investment advisers providing services to similar ETFs. |
| | In particular, the Board compared each proposed New Fund’s advisory fee and expense ratio to other investment companies considered to be in its respective peer group. The Advisor presented information on how the peer group was selected for SDAG, and noted how the Fund differed in structure and strategy from its peers. The Board considered the unique characteristics of SDAG relative to its peer group, including that SDAG is a fund of funds. In addition, the Advisor reviewed the peer groups for IQUS and IQIN, and each such Fund’s respective position relative to its peers. |
| | The Board considered a presentation on the rationale for the increase in management fees applicable to IQUS and IQIN, as against the amount originally approved at the March 2018 meeting. In particular, the Board noted that the new fee levels remained below the median net expense ratios of the U.S. large-cap and foreign large-cap peers. |
| | The Board considered that the Advisor had proposed an expense limitation agreement whereby the Advisor would reimburse expenses and/or waives fees to limit the impact above set thresholds of certain expenses on shareholders. The Board noted that such expense limitation agreements were reflected in the peer group analysis provided by the Advisor, which showed each new Fund’s position both with and without the expense limitation and with acquired fund fees and expenses. |
224
Board Review of Investment Advisory Agreement(unaudited) (continued)
April 30, 2019 | | After comparing the fees applicable to each New Fund with those of other investment companies in its respective peer group, and in light of the distinctions between SDAG and its peers, the nature, quality and extent of services proposed to be provided by the Advisor and the costs incurred by the Advisor in rendering those services, the Board concluded that the level of fees proposed to be paid to the Advisor is fair and reasonable in respect of each New Fund. |
3. | | The Advisor’s profitability and the extent to which economies of scale would be realized as each New Fund grows and whether fee levels would reflect such economies of scale. The Board discussed with the Advisor the costs and profitability of the Advisor in connection with its serving as investment adviser to the New Funds and the existing Funds, including operational costs. The Board also discussed additional resources that have been made available to the Advisor by its parent entity, NYLIM. The Board also noted the proposed expense limitation agreement and its impacts on costs to shareholders of each New Fund. The Board considered that the New Funds had not yet commenced operations and therefore no direct historical profitability data was available for consideration. |
| | Due to the fact that each New Fund had no assets and was not yet operational, the Independent Trustees made no determination with respect to economies of scale or the impact of the New Funds on the Advisor’s profitability. |
4. | | Investment performance of the Funds. Because the New Funds have not commenced operations, the Independent Trustees could not consider the investment performance of the New Funds, but did take into account the experience of the Advisor, the investment performance of other strategies managed by Advisor and peer performance. With respect to SDAG, the Board considered, in particular, the Advisor’s provision of services to AGGE and AGGP. |
The Board agreed that it had been furnished with sufficient information, both at the meeting and in its ongoing oversight of the existing Funds, to make an informed business decision with respect to applying the Advisory Agreement to the New Funds. Based on the foregoing and such other matters as were deemed relevant, the Independent Trustees concluded that the terms of the Advisory Agreement were reasonable and fair to the New Funds and to recommend to the Board the approval of the application of the Advisory Agreement to the New Funds. As a result, all of the Board members, including the Independent Trustees, determined that the Advisory Agreement was in the best interests of the New Funds and their shareholders. The Board and the Independent Trustees, voting separately, approved the application of the Advisory Agreement to SDAG and the amendment to the Advisory Agreement relating to IQUS and IQIN.
Approval Relating To Annual Continuation of the Advisory Agreement and Sub-Advisory Agreement
The Board met in person on March 28, 2019 to consider the approval of the continuation, for an additional year, of the Advisory Agreement with respect to the existing series of the Trust for which the agreements apply. The Board noted that the Advisory Agreement was between the Trust and the Advisor. In addition, the (the “Funds”) Board considered the continuation of the Sub-Advisory Agreement between the Advisor and MacKay Shields LLC (“MacKay”) with respect to the IQ S&P High Yield Low Volatility Bond ETF (“HYLV”).
In accordance with Section 15(c) of the 1940 Act, the Board requested, reviewed and considered materials furnished by the Advisor relevant to the Board’s consideration of whether to approve the continuation of the Advisory Agreement with respect to the existing Funds, and from MacKay and the Advisor relevant to the Board’s consideration of whether to approve the continuation of the Sub-Advisory Agreement only as it relates to HYLV. In connection with considering approval of the continuation of the Advisory Agreement and Sub-Advisory Agreement, the Independent Trustees met in executive session with counsel to the Trust and counsel to the Independent Trustees, who provided assistance and advice. The consideration of the continuation of the Advisory Agreement and Sub-Advisory Agreement was conducted by both the full Board and the Independent Trustees, who also voted separately.
During their review and consideration, the Board and the Independent Trustees focused on and analyzed the factors they deemed relevant, including: (1) the nature, extent and quality of the services provided by the Advisor, and by MacKay with respect to HYLV, and the fees to be charged by the Advisor and MacKay; (2) information concerning the business and operations, compliance program and portfolio management team
225
Board Review of Investment Advisory Agreement(unaudited) (continued)
April 30, 2019
of the Advisor and MacKay; (3) the expense levels of each Fund; (4) the investment performance of the Funds; (5) the costs of the services to be provided and profits to be realized by the Advisor and its affiliates from the relationship with the Trust, including expense limitation agreements and fee waiver agreements between the Advisor and certain Funds; (6) the extent to which economies of scale would be realized as the Funds grow; (7) any “fall-out” benefits derived or to be derived by the Advisor or MacKay from its relationship with the Trust; and (8) potential conflicts of interest. The Board considered that the Funds were passively managed ETFs and that several of the Funds were designed to track indexes created by an affiliate of the Advisor.
In reviewing such factors, the Board relied on certain information, including (1) a copy of the Advisory Agreement; (2) a copy of the Sub-Advisory Agreement; (3) information about applicable expense limitation and fee waiver agreements; (4) information describing the Advisor and MacKay and the services provided thereby; (5) information regarding the respective compliance program and portfolio management teams of the Advisor and MacKay; (6) copies of the Form ADV for each of the Advisor and MacKay; (7) memoranda and guidance from legal counsel to the Independent Trustees on the fiduciary responsibilities of trustees, including Independent Trustees, in considering advisory and distribution agreements under the 1940 Act; (8) materials provided by each of the Advisor and MacKay in response to a section15(c) request for information from legal counsel to the Independent Trustees; and (9) an in-person presentation by personnel of the Advisor. In addition, the Board was provided data comparing the advisory fees and operating expenses (including acquired fund fees and expenses, as applicable) of the Funds with expenses and performance of other registered investment companies with similar investment objectives and policies. The Trustees also considered their personal experiences as Trustees and participants in the ETF and mutual fund industry, as applicable, including their experiences with the Advisor in respect of series of the Trust and IndexIQ Active ETF Trust.
In particular, the Trustees including the Independent Trustees, considered and discussed the following with respect to the Funds:
1. | | The nature, extent and quality of the facilities and services provided by the Advisor and MacKay. The Board reviewed the services that the Advisor and MacKay provide to the respective Funds, noting that they had continually reviewed and overseen such services throughout the past year. The Board noted the responsibilities that the Advisor and MacKay have as the Funds’ investment adviser and sub-advisor, respectively, including overall supervisory responsibility for the general management and investment of each Fund’s securities portfolio, monitoring Fund compliance with regulatory requirements and Fund objectives and policies, daily monitoring of the portfolio, overseeing Fund service providers, obtaining licenses for use of indexes tracked by the Funds, providing officers for the Funds, ongoing reporting to the Board and the implementation of Board directives as they relate to the Funds. For Funds that were not yet operational, the Board considered the services rendered in respect of the existing Funds in assessing services expected to be provided to non-operational Funds. |
| | The Board reviewed the Advisor’s and MacKay’s experience, resources and strengths in managing mutual funds and ETFs, including the Advisor’s management of the Funds and the funds of the IndexIQ Active ETF Trust. The Board also considered the experience of MacKay’s team in managing strategies and asset classes similar to HYLV and their tenure in managing the portfolio of HYLV. The Board also noted and discussed with the Advisor the resources and additional support and personnel from its parent, NYLIM, that enhance and support the work of the Advisor’s officers and staff. The Board also considered the tenure and experience of the personnel at the Advisor providing management and administrative services to the Funds. The Board also considered a presentation on marketing and distribution strategy that described the services engaged by the Advisor in seeking to market and grow assets in the Funds and a discussion regarding the relocation of the Advisor’s team to NYLIM’s New York City offices. |
| | Based on their consideration and review of the foregoing information, the Board concluded that each Fund was likely to continue to benefit from the nature, quality and extent of these services, as well as the Advisor’s and MacKay’s ability to render such services based on its personnel, experience, operations and resources. |
2. | | Comparison of services provided and fees charged by the Advisor and MacKay and other investment advisers to similar clients, and the cost of the services provided and profits realized by the Advisor and MacKay from its relationship with the Funds. The Board then compared both the services rendered and the |
226
Board Review of Investment Advisory Agreement(unaudited) (continued)
April 30, 2019 | | fees paid with respect to the Funds pursuant to the Advisory Agreement and Sub-Advisory Agreement to contracts of other registered investment advisers providing services to similar ETFs. The Board also considered that the Advisor is responsible for payment of the sub-advisory fee to MacKay pursuant to the Sub-Advisory Agreement and that HYLV shareholders do not directly pay the sub-advisory fee. |
| | In particular, the Board compared each Fund’s advisory fee and expense ratio (including acquired fund fees and expenses, as applicable) to other investment companies considered to be in each such Fund’s peer group. The Advisor presented information on how peer groups were selected for the Funds, which generally are differentiated from broad Morningstar categorization based on distinguishing characteristics of many Funds’ core strategies, several of which are unique indexes designed by an affiliate of the Advisor. The Advisor explained that peer groups were selected using objective methodology by a NYLIM team. |
| | The Board noted that certain Funds had peer groups of limited size and, in certain cases, with substantial differences in portfolio management and operational costs. The Board was presented with a dashboard view describing Fund performance and fees, with information relative to peer groups. The Board considered unique characteristics of certain Funds relative to peer groups, particularly where such Funds had fee or total expense rates that diverged from the median levels of the applicable peer group. The Board also discussed price pressure in the general ETF marketplace and the impact of market pressures on the price levels for relatively unique investment strategies such as those implemented by several of the Funds. |
| | Additionally, the Trustees considered that the Advisor had put in place expense limitation or fee waiver agreements whereby the Advisor reimburses expenses and/or waives fees to limit the impact above set thresholds of certain expenses on shareholders of certain Funds. The Board noted that such expense limitation and fee waiver agreements were reflected, where applicable, in the peer group analysis provided by the Advisor. |
| | After comparing each Fund’s fees with those of other investment companies in the Fund’s peer group, and in light of the nature, quality and extent of services provided by the Advisor and MacKay, and the costs incurred by the Advisor and MacKay in rendering those services, the Board concluded that the level of fees paid (or proposed to be paid) to the Advisor and Sub-Advisor with respect to each Fund, and MacKay with respect to HYLV, is fair and reasonable. |
3. | | The Advisor’s and MacKay’s profitability and the extent to which economies of scale would be realized as the Funds grow and whether fee levels would reflect such economies of scale. The Board discussed with the Advisor the costs and profitability of the Advisor in connection with its serving as investment adviser to each Fund, including operational costs. The Board also discussed additional resources that have been made available to the Advisor following its acquisition by NYLIM, including the investment of financial and human resources by NYLIM into the Advisor and additional support to market and distribute the Funds. |
| | The Board considered information regarding the strategy of the Advisor to grow assets in the Funds during the calendar year, including the marketing and distribution presentation. The Board reviewed the net asset levels of the Funds and the impact of both high and low asset levels on such Funds. The Advisor presented to the Board information on the operating profits on a year over year basis. |
| | The Board also considered the impact of future asset growth on the services required and fees paid to MacKay, noting again that such fees were paid by the Advisor out of its management fees. The Board considered whether the continued operation of certain Funds that had not attracted significant assets under management would be profitable to the Advisor under the unitary fee arrangement of the Advisory Agreement, and determined to continue to review the asset levels of the Funds in relation to the Advisor’s profitability. The Board also noted the existence of expense limitation agreements and fee waiver agreements applicable to certain of the Funds, and their respective impacts on costs to shareholders and profitability of the Advisor. |
| | The Board noted that certain Funds had not yet commenced operations, and therefore no direct historical profitability data was available for consideration for such Funds. |
227
Board Review of Investment Advisory Agreement(unaudited) (continued)
April 30, 2019 | | The Board concluded that the fees paid to the Advisor and MacKay were reasonable when considering the relative asset levels and profitability of the Funds to the Advisor and MacKay. |
4. | | Investment performance of the Funds. The Board considered the investment performance of the existing Funds, including tracking error. In particular, the Board considered the investment performance of the Funds relative to their stated objectives and the success of the Advisor and MacKay in reaching such objectives. The Board considered each Fund’s investment performance compared to the underlying index that each Fund seeks to track and includes in its prospectus and shareholder reports. The Board also considered each Fund’s investment performance compared to the respective Fund’s peer group. The Board considered that certain Funds had not yet commenced operations, and therefore had no performance or operational history to consider. |
| | The Board concluded that the investment performance of the Funds, particularly in the context of tracking error as against each Fund’s underlying index and in succeeding in satisfying their stated investment objective, supported the approval of the Advisory Agreement and Sub-Advisory Agreement. |
The Board agreed that it had been furnished with sufficient information, both at the meeting and in its ongoing oversight of the Funds, to make an informed business decision with respect to the Advisory Agreement for the Funds and, with respect to HYLV, the Sub-Advisory Agreement. Based on the foregoing and such other matters as were deemed relevant, and while no single factor was determinative in the decision, the Independent Trustees concluded that the terms of the Advisory Agreement with the Advisor and the Sub-Advisory Agreement between the Advisor and MacKay were reasonable and fair to the Funds and to recommend to the Board the approval of the Advisory Agreement and Sub-Advisory Agreement. As a result, all of the Board members, including the Independent Trustees, determined that the continuation of the Advisory Agreement with the Advisor and continuation of the Sub-Advisory Agreement with MacKay was in the best interests of each applicable Fund and its shareholders. The Board and the Independent Trustees, voting separately, approved the continuation of the Advisory Agreement and Sub-Advisory Agreement for an additional one-year period.
228
Board of Trustees and Officers(unaudited)
Name and
Year of Birth(1)
| | Position(s)
Held with
Trust
| | Term of
Office and
Length of
Time Served(2)
| | Principal Occupation(s) During
Past 5 Years
| | Number of Portfolios
in Fund
Complex
Overseen
by Trustee(3)
| | Other
Directorships
Held by
Trustee
During Past
5 Years
|
Reena Aggarwal,
1957 | | Trustee
Chair | | Since
August
2008
January 2018 | | Vice Provost of Faculty (2016 to present), Georgetown University, Robert E. McDonough Professor (2003 to present) and Professor of Finance, McDonough School of Business, Georgetown University (2000 to present); Director, Georgetown Center for Financial Markets and Policy (2010 to present); Co-Chair of Board, Social Innovations and Public Service Fund, Georgetown University (2012 to 2014). | | 23 | | Chair of Board, IndexIQ Active ETF Trust (2018 to present); Trustee, IndexIQ Active ETF Trust (2008 to present); Trustee, IndexIQ Trust (2008 to 2018); FBR & Co. (investment banking) (2011 to 2017); Cohen & Steers (asset management) (2017 to present); Director, Brightwood Capital Advisors, L.P. (private equity investment) (2013 to present). |
Michael A.
Pignataro,
1959 | | Trustee | | Since
April
2015 | | Director, Credit Suisse Asset Management (2001 to 2012); and Chief Financial Officer, Credit Suisse Funds (1996 to 2013). | | 23 | | Trustee, IndexIQ Active ETF Trust (2015 to present); Trustee, IndexIQ Trust (2015 to 2018); The New Ireland Fund, Inc. (closed-end fund) (2015 to present). |
229
Board of Trustees and Officers (unaudited) (continued)
Name and
Year of Birth(1)
| | Position(s)
Held with
Trust
| | Term of
Office and
Length of
Time Served(2)
| | Principal Occupation(s) During
Past 5 Years
| | Number of Portfolios
in Fund
Complex
Overseen
by Trustee(3)
| | Other
Directorships
Held by
Trustee
During Past
5 Years
|
Paul D. Schaeffer,
1951 | | Trustee | | Since
April
2015 | | President, ASP (dba Aspiring Solution Partners) (financial services consulting) (2013 to present); Executive Advisor, Aquiline Capital Partners LLC (private equity investment) (2014 to present). | | 23 | | Trustee, Active IndexIQ ETF Trust (2015 to present); Management Board Member, RIA in a Box LLC (financial services consulting) (2018 to present); Trustee, IndexIQ Trust (2015 to 2018); Context Capital Funds (mutual fund trust) (2 Portfolios) (2014 to 2018); Management Board Member, Altegris Investments, LLC (registered broker-dealer) (2016 to 2018); Management Board Member, AssetMark Inc. (financial services consulting) (2016 to 2017); PopTech! (conference operator) (2012 to 2016). |
Interested Trustee
Kirk C. Lehneis,
1974(4) | | Trustee, President and Principal Executive Officer | | Since
January
2018 | | Chief Operating Officer and Senior Managing Director (2016 to present), New York Life Investment Management LLC; Chairman of the Board (2017 to present), NYLIFE Distributors LLC; Chairman of the Board, NYLIM Service Company LLC (2017 to present); President, MainStay MacKay DefinedTerm Municipal Opportunities Fund, The MainStay Funds, MainStay Funds Trust, and MainStay VP Funds Trust (2017 to present); Chief Executive Officer, IndexIQ Advisors LLC (2018 to present); Trustee, President and Principal Executive Officer, IndexIQ Active ETF Trust (2018 to present). | | 23 | | None. |
230
Board of Trustees and Officers (unaudited) (continued)
Other Officers
Name and
Year of Birth(1)
| | Position(s)
Held with
Trust
| | Term of Office
and Length of
Time Served(2)
| | Principal Occupation(s) During Past 5 Years
|
Jonathan
Zimmerman,
1982 | | Executive Vice President | | Since April 2018 | | Chief Operating Officer, IndexIQ Advisors LLC (2018 to present); Managing Director, New York Life Investments LLC (2018 to present); Director, New York Life Investment Management LLC (2015 to 2018); Vice President, Morgan Stanley (2007 to 2015). |
Adefolahan Oyefeso,
1974 | | Treasurer, Principal Financial Officer and Principal Accounting Officer | | Since April 2018 | | Vice President of Operations & Finance, IndexIQ Advisors LLC (2015 to present); Director of the Fund Administration Client Service Department at The Bank of New York Mellon (2007 to 2015). |
Matthew V. Curtin,
1982 | | Secretary and Chief Legal Officer | | Since June 2015 | | Chief Legal Officer, IndexIQ Advisors LLC (2015 to present), Chief Compliance Officer, IndexIQ Advisors LLC, IndexIQ ETF Trust and IndexIQ Active ETF Trust (2015 to 2017); Associate General Counsel, New York Life Insurance Company (2015 to present); Associate, Dechert LLP (2007 to 2015). |
Kevin M. Bopp,
1969 | | Chief Compliance Officer | | Since January
2017 | | Chief Compliance Officer, IndexIQ Advisors LLC and IndexIQ ETF Trust (2017 to present); Chief Compliance Officer, New York Life Investment Management LLC, The MainStay Funds, MainStay Funds Trust, MainStay VP Funds Trust and MainStay MacKay DefinedTerm Municipal Opportunities Fund (2014 to present); Director and Associate General Counsel and Assistant Secretary, The MainStay Funds, MainStay Funds Trust, MainStay VP Funds Trust and MainStay MacKay DefinedTerm Municipal Opportunities Fund (2011 to 2014) and Vice President and Assistant General Counsel, New York Life Investment Management LLC (2010 to 2011). |
(1) | | The address of each Trustee or officer is c/o IndexIQ, 51 Madison Avenue, New York, New York 10010.
|
(2) | | Trustees and Officers serve until their successors are duly elected and qualified.
|
(3) | | The Fund is part of a “fund complex”. The fund complex includes all open-end funds (including all of their portfolios) advised by the Advisor. As of the date of this SAI, the fund complex consists of the Trust’s funds and the funds of IndexIQ Active ETF Trust.
|
(4) | | Mr. Lehneis is an “interested person” of the Trust (as that term is defined in the 1940 Act) because of his affiliations with the Advisor. |
231
| IndexIQ ETF Trust | |
| ANNUAL REPORT | APRIL 30, 2019 | |
| IQ Hedge Multi-Strategy Tracker ETF | |
| IQ Hedge Macro Tracker ETF | |
| IQ Hedge Market Neutral Tracker ETF | |
| IQ Hedge Long/Short Tracker ETF | |
| IQ Hedge Event-Driven Tracker ETF | |
| IQ Real Return ETF | |
| IQ Leaders GTAA Tracker ETF | |
| IQ Enhanced Core Bond U.S. ETF |
| IQ Enhanced Core Plus Bond U.S. ETF | |
| IQ Short Duration Enhanced Core Bond U.S. ETF | |
| IQ Merger Arbitrage ETF | |
| IQ Global Resources ETF | |
| IQ Global Agribusiness Small Cap ETF | |
| IQ U.S. Real Estate Small Cap ETF | |
| IQ S&P High Yield Low Volatility Bond ETF | |
| IQ 500 International ETF | |
| IQ 50 Percent Hedged FTSE International ETF | |
| IQ 50 Percent Hedged FTSE Europe ETF | |
| IQ 50 Percent Hedged FTSE Japan ETF | |
| IQ Chaikin U.S. Small Cap ETF | |
IQ Chaikin U.S. Large Cap ETF
| |
| Investment Advisor | |
| IndexIQ Advisors LLC | |
| 51 Madison Avenue | |
| New York, NY 10010 | |
| Distributor | |
| ALPS Distributors, Inc. | |
| 1290 Broadway, Suite 1100 | |
| Denver, CO 80203 | |
| Custodian/Fund Administrator/Transfer Agent | |
| The Bank of New York Mellon | |
| 240 Greenwich Street | |
| New York, NY 10286 | |
| Legal Counsel | |
| Chapman and Cutler LLP | |
| 1270 Avenue of the Americas | |
| New York, NY 10020 | |
| Independent Registered Public Accounting Firm | |
| PricewaterhouseCoopers LLP | |
| 300 Madison Avenue | |
| New York, NY 10017 | |
| | |
| | |
| | |
| | |
| | |
| | |
| | |
| | |
The Registrant’s Board of Trustees has two audit committee financial experts serving on its Audit Committee, each an “independent” Trustee, Reena Aggarwal and Michael Pignataro. Under applicable securities laws, a person who is determined to be an audit committee financial expert will not be deemed an “expert” for any purpose, including without limitation for the purposes of Section 11 of the Securities Act of 1933, as a result of being designated or identified as an audit committee financial expert. The designation or identification of a person as an audit committee financial expert does not impose on such person any duties, obligations, or liabilities that are greater than the duties, obligations, and liabilities imposed on such person as a member of the Audit Committee and Board of Trustees in the absence of such designation or identification.
Not applicable.
Not applicable.
Not applicable.
There have been no material changes to the procedures by which the shareholders may recommend nominees to the registrant’s board of trustees, where those changes were implemented after the registrant last provided disclosure in response to the requirements of Item 407(c)(2)(iv) of Regulation S-K (17 CFR 229.407) (as required by Item 22(b)(15) of Schedule 14A (17 CFR 240.14a-101)), or this Item.
Not applicable.
Pursuant to the requirements of the Securities Exchange Act of 1934 and the Investment Company Act of 1940, the registrant has duly caused this report to be signed on its behalf by the undersigned, thereunto duly authorized.
Pursuant to the requirements of the Securities Exchange Act of 1934 and the Investment Company Act of 1940, this report has been signed below by the following persons on behalf of the registrant and in the capacities and on the dates indicated.