Filed Pursuant to Rule 424(b)(3)
Registration No. 333-147414
SUPPLEMENT NO. 7 DATED MARCH 18, 2010
TO PROSPECTUS DATED SEPTEMBER 21, 2009
APPLE REIT NINE, INC.
The following information supplements the prospectus of Apple REIT Nine, Inc. dated September 21, 2009 and is part of the prospectus. This Supplement updates the information presented in the prospectus.Prospective investors should carefully review the prospectus and this Supplement No. 7 (which is cumulative and replaces all prior Supplements).
TABLE OF CONTENTS
Status of the Offering | S-3 | |
Summary Overview | S-5 | |
Summary of Contracts for Our Recently Purchased Properties | S-10 | |
Financial and Operating Information for Our Purchased Properties | S-12 | |
Selected Financial Data | S-17 | |
Management's Discussion and Analysis of Financial Condition and Results of Operations | S-19 | |
Experts | S-34 | |
Experience of Prior Programs | S-34 | |
Index to Financial Statements | F-1 |
Certain forward-looking statements are included in the prospectus and this supplement. These forward-looking statements may involve our plans and objectives for future operations, including future growth and availability of funds. These forward-looking statements are based on current expectations, which are subject to numerous risks and uncertainties. Assumptions relating to these statements involve judgments with respect to, among other things, the continuation of our offering of Units, future economic, competitive and market conditions and future business decisions, together with local, national and international events (including, without limitation, acts of terrorism or war, and their direct and indirect effects on travel and the economy). All of these matters are difficult or impossible to predict accurately and many of them are beyond our control. Although we believe the assumptions relating to the forward-looking statements, and the statements themselves, are reasonable, any of the assumptions could be inaccurate and, therefore, there can be no assurance that these forward-looking statements will prove to be accurate. In light of the significant uncertainties inherent in these forward-looking statements, the inclusion of this information should not be regarded as a representation by us or any other person that our objectives and plans, which we consider to be reasonable, will be achieved.
S-1
"Courtyard by Marriott," "Fairfield Inn," "Fairfield Inn & Suites," "TownePlace Suites," "Marriott," "SpringHill Suites" and "Residence Inn" are each a registered trademark of Marriott International, Inc. or one of its affiliates. All references below to "Marriott" mean Marriott International, Inc. and all of its affiliates and subsidiaries, and their respective officers, directors, agents, employees, accountants and attorneys. Marriott is not responsible for the content of this prospectus supplement, whether relating to hotel information, operating information, financial information, Marriott's relationship with Apple REIT Nine, Inc., or otherwise. Marriott is not involved in any way, whether as an "issuer" or "underwriter" or otherwise, in the offering by Apple REIT Nine, Inc. and receives no proceeds from the offering. Marriott has not expressed any approval or disapproval regarding this prospectus supplement or the offering related to this prospectus supplement, and the grant by Marriott of any franchise or other rights to Apple REIT Nine, Inc. shall not be construed as any expression of approval or disapproval. Marriott has not assumed, and shall not have, any liability in connection with this prospectus supplement or the offering related to this prospectus supplement.
"Hampton Inn," "Hampton Inn & Suites," "Homewood Suites," "Embassy Suites" and "Hilton Garden Inn" are each a registered trademark of Hilton Worldwide or one of its affiliates. All references below to "Hilton" mean Hilton Worldwide and all of its affiliates and subsidiaries, and their respective officers, directors, agents, employees, accountants and attorneys. Hilton is not responsible for the content of this prospectus supplement, whether relating to hotel information, operating information, financial information, Hilton's relationship with Apple REIT Nine, Inc., or otherwise. Hilton is not involved in any way, whether as an "issuer" or "underwriter" or otherwise, in the offering by Apple REIT Nine, Inc. and receives no proceeds from the offering. Hilton has not expressed any approval or disapproval regarding this prospectus supplement or the offering related to this prospectus supplement, and the grant by Hilton of any franchise or other rights to Apple REIT Nine, Inc. shall not be construed as any expression of approval or disapproval. Hilton has not assumed, and shall not have, any liability in connection with this prospectus supplement or the offering related to this prospectus supplement.
S-2
We completed the minimum offering of Units (with each Unit consisting of one Common Share and one Series A Preferred Share) at $10.50 per Unit on May 14, 2008. We are continuing the offering at $11 per Unit in accordance with the prospectus. We registered to sell a total of 182,251,082 Units. As of February 26, 2010, 72,964,668 Units remained unsold. Our offering of Units expires on April 25, 2010, unless it is extended for one additional year. We plan to extend the offering for one additional year until April 25, 2011, provided that the offering will be terminated if all of the Units are sold before then.
As of February 26, 2010, we had closed on the following sales of Units in the offering:
Price Per Unit | Number of Units Sold | Gross Proceeds | Proceeds Net of Selling Commissions and Marketing Expense Allowance | |||||||||
|---|---|---|---|---|---|---|---|---|---|---|---|---|
$10.50 | 9,523,810 | $ | 100,000,000 | $ | 90,000,000 | |||||||
$11.00 | 99,762,604 | 1,097,388,650 | 987,649,786 | |||||||||
Total | 109,286,414 | $ | 1,197,388,650 | $ | 1,077,649,786 | |||||||
Our distributions since the initial capitalization through December 31, 2009 totaled approximately $70.3 million of which approximately $44.2 million was used to purchase additional Units under the Company's best-efforts offering. Thus the net cash distributions were $26.1 million. Our distributions were paid at a monthly rate of $0.073334 per common share beginning in June 2008. For the same period our net cash generated from operations, from our Consolidated Statements of Cash Flows, was approximately $32.5 million, which exceeded the net cash distributions. The following is a summary of the distributions and cash generated by operations.
| | Total Distributions Declared and Paid per Share | | | | | |||||||||||
|---|---|---|---|---|---|---|---|---|---|---|---|---|---|---|---|---|
| | Total Declared and Paid | | ||||||||||||||
| | Net Cash From Operations(1) | |||||||||||||||
| | Cash | Reinvested | Total | |||||||||||||
2nd Quarter 2008 | $ | 0.07 | $ | 300,000 | $ | 593,000 | $ | 893,000 | $ | 323,000 | ||||||
3rd Quarter 2008 | 0.22 | 1,694,000 | 3,094,000 | 4,788,000 | 966,000 | |||||||||||
4th Quarter 2008 | 0.22 | 2,582,000 | 4,749,000 | 7,331,000 | 2,047,000 | |||||||||||
1st Quarter 2009 | 0.22 | 3,624,000 | 6,265,000 | 9,889,000 | 2,204,000 | |||||||||||
2nd Quarter 2009 | 0.22 | 4,728,000 | 7,897,000 | 12,625,000 | 8,888,000 | |||||||||||
3rd Quarter 2009 | 0.22 | 5,956,000 | 9,790,000 | 15,746,000 | 8,908,000 | |||||||||||
4th Quarter 2009 | 0.22 | 7,240,000 | 11,830,000 | 19,070,000 | 9,137,000 | |||||||||||
| $ | 1.39 | $ | 26,124,000 | $ | 44,218,000 | $ | 70,342,000 | $ | 32,473,000 | |||||||
- (1)
- See complete consolidated statement of cash flows for the twelve months ended December 31, 2009 included in our audited financial statements for the year ended December 31, 2009 on page F-6.
During the initial phase of our operations, we may, due to the inherent delay between raising capital and investing that same capital in income producing real estate, have a portion of our distributions funded from offering proceeds. Our objective in setting a distribution rate is to project a rate that will provide consistency over the life of the Company, taking into account acquisitions and capital improvements, ramp up of new properties and varying economic cycles. We anticipate that we may need to utilize debt, offering proceeds and cash from operations to meet this objective. We evaluate the distribution rate on an ongoing basis and may make changes at any time if we feel the rate
S-3
is not appropriate based on available cash resources. In May 2008, our Board of Directors established a policy for an annualized dividend rate of $0.88 per common share, payable in monthly distributions. Since there can be no assurance of our ability to acquire properties that provide income at this level, or that the properties already acquired will provide income at this level, there can be no assurance as to the classification or duration of distributions at the current rate.
For the year ended December 31, 2009, as stated in Note 1 to our consolidated financial statements for that period, 53% of distributions made to investors represented a return of capital and the remaining 47% represented ordinary income. Proceeds of the offering which are distributed are not available for investment in properties. See "Risk Factors"—"We may be unable to make distributions to our shareholders," on page 28 of the prospectus, and "Our distributions to our shareholders may not be sourced from operating cash flow but instead from offering proceeds or indebtedness, which (to the extent it occurs) will decrease our distributions in the future," on page 16 of the prospectus.
For the year ended December 31, 2009, we received requests to redeem approximately 252,000 Units pursuant to our Unit Redemption Program for a total of $2.6 million. Through our last scheduled quarterly redemption date in 2009, October 20, 2009, we redeemed 100% of the redemption requests for the year ended December 31, 2009 at an average per Unit redemption price of $10.32. We funded Unit redemptions for the periods noted above from the proceeds of dividends used to purchase additional Units under the Company's best efforts offering of Units.
(Remainder of Page Intentionally Left Blank)
S-4
Summary of Real Estate Investments
Since our prospectus dated September 21, 2009, we have purchased seven additional hotels. Currently, through our subsidiaries, we own a total of 38 hotels. These hotels contain a total of 4,465 guest rooms. They were purchased for an aggregate gross purchase price of $616.3 million. Financial and operating information about our purchased hotels is provided in another section below.
In addition, we currently own, through one of our subsidiaries, approximately 410 acres of land and land improvements located on 111 individual sites in the Ft. Worth, Texas area. The purchase price for this land was approximately $145 million. The land is leased to Chesapeake Energy Corporation for the production of natural gas. Under the ground lease, we receive monthly rental payments.
Description of Real Estate Owned
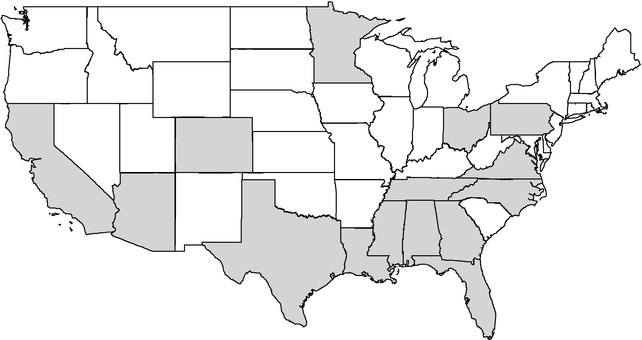
The map below shows the states in which our hotels are located, and the following charts summarize our room and franchise information.
States in which Our Hotels are Located
S-5
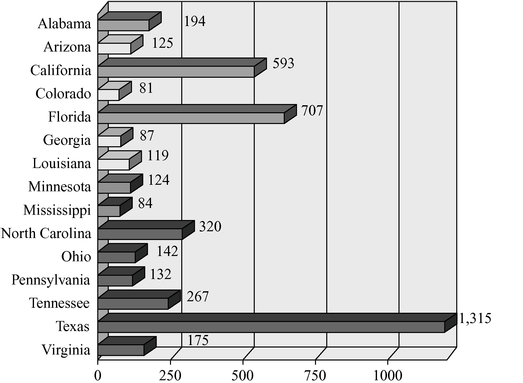
Number of Guest Rooms by State
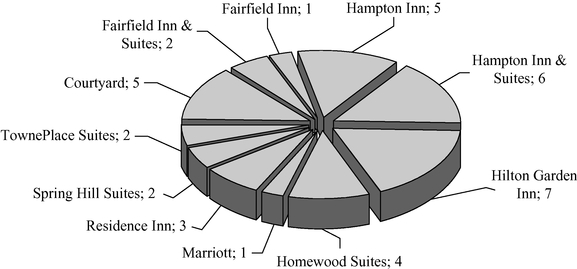
Type and Number of Hotel Franchises
S-6
Summary of Potential Acquisitions
We have entered into, or caused one of our indirect wholly-owned subsidiaries to enter into, purchase contracts for five other hotels. These contracts are for direct hotel purchases. The following table summarizes the hotel and contract information:
Hotel Location | Franchise | Date of Purchase Contract | Number of Rooms | Gross Purchase Price | |||||||||||
|---|---|---|---|---|---|---|---|---|---|---|---|---|---|---|---|
1. | Holly Springs, North Carolina(a) | Hampton Inn | January 6, 2009 | 124 | $ | 14,880,000 | |||||||||
2. | Fort Worth, Texas(a)(b) | TownePlace Suites | May 7, 2009 | 140 | 18,460,000 | ||||||||||
3. | Jacksonville, North Carolina | Fairfield Inn & Suites | December 11, 2009 | 79 | 7,800,000 | ||||||||||
4. | Santa Ana, California(a) | Courtyard | February 1, 2010 | 155 | 24,800,000 | ||||||||||
5. | Miami, Florida | Hampton Inn & Suites | March 1, 2010 | 121 | 11,900,000 | ||||||||||
6. | Boise, Idaho(c) | Hampton Inn & Suites | March 16, 2010 | 186 | 22,370,000 | ||||||||||
7. | Rogers, Arkansas(c)(d) | Hampton Inn | March 16, 2010 | 122 | 8,500,000 | ||||||||||
8. | Rogers, Arkansas(c) | Homewood Suites | March 16, 2010 | 126 | 12,000,000 | ||||||||||
9. | St. Louis, Missouri(c)(d) | Hampton Inn | March 16, 2010 | 190 | 23,000,000 | ||||||||||
10. | St. Louis, Missouri(c) | Hampton Inn & Suites | March 16, 2010 | 126 | 16,000,000 | ||||||||||
11. | Kansas City, Missouri(c)(d) | Hampton Inn | March 16, 2010 | 122 | 10,130,000 | ||||||||||
12. | Oklahoma City, Oklahoma(c)(d) | Hampton Inn & Suites | March 16, 2010 | 200 | 32,000,000 | ||||||||||
13. | Anchorage, Alaska | Embassy Suites | March 16, 2010 | 169 | 42,000,000 | ||||||||||
| Total | 1,860 | $ | 243,840,000 | ||||||||||||
Notes for Table:
- (a)
- The indicated hotels are currently under construction. The table shows the expected number of rooms upon hotel completion and the expected franchise.
- (b)
- If the seller meets all of the conditions to closing, we are obligated to specifically perform under the purchase contract. As the properties are under construction at this time, the seller has not met all conditions to closing.
- (c)
- Sellers of properties are affiliated with each other, but not the Company.
- (d)
- Purchase contract for these hotels requires the assumption of loans secured by the hotels. Total outstanding principal is approximately $49.5 million. The loans have current interest rates varying from 2.0% - 5.5%, maturity dates from November 2011 to October 2015, and require monthly payments of principal and interest on an amortized basis.
In general, each purchase contract listed above required a deposit upon (or shortly after) execution. An additional deposit is typically due upon the expiration of the contract review period. Additionally, for the Santa Ana Courtyard, upon the issuance of the building permit by the City of Santa Ana, the Company will be required to fund an additional deposit of $6 million. If a closing occurs under a purchase contract, the initial and additional deposits are credited toward the purchase price. If a closing does not occur because the seller fails to satisfy a condition to closing or breaches the purchase contract, the applicable deposits would be refunded to us. The total of both the initial and additional deposits for the purchase contracts listed above is $9.3 million.
For each purchase contract listed above, there are material conditions to closing that presently remain unsatisfied. Accordingly, there can be no assurance at this time that a closing will occur under any of these purchase contracts.
On October 14, 2009, through one of our indirect wholly-owned subsidiaries, we entered into a ground lease for approximately one acre of land located in downtown Richmond, Virginia. The lease terminates on December 31, 2098, subject to our right to exercise two renewal periods of ten years each. We intend to use the land to build two nationally recognized brand hotels. Under the terms of
S-7
the lease we have a six month "Study Period" to determine the viability of the hotels. We can terminate the lease for any reason during the Study Period, which ends on April 14, 2010. After the Study Period, the lease continues to be subject to various conditions, including but not limited to obtaining various permits, licenses, zoning variances and franchise approvals. If any of these conditions are not met we have the right to terminate the lease at any time. Rent payments are not required until we decide to begin construction on the hotels. Annual rent under the lease is $300,000 with adjustments throughout the lease term based on the Consumer Price Index. As there are many conditions to beginning construction on the hotels, there are no assurances that we will construct the hotels or continue the lease.
Recent Terminations
In December 2009 the Company terminated two contracts for hotels in Hillsboro, Oregon. The contracts were initially entered into in October 2008. The seller was not able to begin construction of the hotels, and as a result the contracts were terminated by the Company and the initial aggregate deposit of $200,000 was returned to the Company.
Source of Funds and Related Party Payments
David Lerner Associates, Inc., Apple Suites Realty Group, Inc. and Apple Nine Advisors, Inc. earned the compensation and expense reimbursements shown below in connection with their services from inception through the period ending December 31, 2009 relating to our offering phase, acquisition phase and operations phase.
David Lerner Associates, Inc. is not related to Apple Suites Realty Group, Inc. or Apple Nine Advisors, Inc.
As described on page 41 of our prospectus under the heading "Compensation" and as shown below, we pay certain fees and expenses as they are incurred, while others accrue and will be paid in future periods, subject in some cases to the achievement of performance criteria. We did not incur any amounts in connection with our disposition phase through December 31, 2009.
Cumulative through December 31, 2009
Offering Phase | Incurred | Paid | Accrued | |||||||
|---|---|---|---|---|---|---|---|---|---|---|
Selling commissions paid to David Lerner Associates, Inc. in connection with the offering | $ | 81,122,000 | $ | 81,122,000 | $ | — | ||||
Marketing expense allowance paid to David Lerner Associates, Inc. in connection with the offering | 27,040,000 | 27,040,000 | — | |||||||
| 108,162,000 | 108,162,000 | — | ||||||||
Acquisition Phase | ||||||||||
Acquisition commission paid to Apple Suites Realty Group, Inc. | 13,554,000 | 13,554,000 | — | |||||||
Operations Phase | ||||||||||
Asset management fee paid to Apple Nine Advisors, Inc. | 893,000 | 893,000 | — | |||||||
Reimbursement of costs paid to Apple Nine Advisors, Inc. | 2,269,000 | 2,269,000 | — | |||||||
S-8
Amendment to Our Unit Redemption Program
On October 8, 2009, our Board of Directors adopted a resolution amending our Unit redemption program. The first full paragraph on page 128 of our prospectus describing the Unit redemption program is amended as follows:
"If funds available for our Unit redemption program are not sufficient to accommodate all requests, Units will be redeemed as follows: first, pro rata as to redemptions upon the death or disability of a shareholder; next pro rata as to redemptions to shareholders who demonstrate, in the discretion of our board of directors, another involuntary exigent circumstance, such as bankruptcy; next pro rata as to redemptions to shareholders subject to a mandatory distribution requirement under such shareholder's IRA; pro rata as to shareholders seeking redemption of all Units owned by them who beneficially or of record fewer than 100 Units; and, finally, pro rata as to other redemption requests. The board of directors, in its sole discretion, may choose to suspend or terminate the Unit redemption program or to reduce the number of Units purchased under the Unit redemption program if it determines the funds otherwise available to fund our Unit redemption program are needed for other purposes."
S-9
SUMMARY OF CONTRACTS
FOR OUR RECENTLY PURCHASED
PROPERTIES
The following information updates the contract information included in our prospectus dated September 21, 2009 for our recently purchased hotels. These recent hotel purchases were funded by the proceeds from our ongoing best-efforts offering of Units.
Ownership, Leasing and Management Summary
Each of our recently purchased hotels has been leased to one of our indirect wholly-owned subsidiaries, as the lessee, under a separate hotel lease agreement. For simplicity, the applicable lessee will be referred to below as the "lessee."
Each hotel is managed under a separate management agreement between the applicable lessee and the manager. For simplicity, the applicable manager will be referred to below as the "manager."
The hotel lease agreements and the management agreements are among the contracts described in another section below. The table below specifies the franchise, hotel owner, lessee and manager for the hotels we have purchased since our prospectus dated September 21, 2009:
Hotel Location | Franchise(a) | Hotel Owner/Lessor | Lessee | Manager | ||||
|---|---|---|---|---|---|---|---|---|
1. Baton Rouge, Louisiana | SpringHill Suites | Apple Nine Hospitality Ownership, Inc. | Apple Nine Hospitality Management, Inc. | Dimension Development Two, LLC | ||||
2. Johnson City, Tennessee | Courtyard | Sunbelt-CJT, L.L.C. | Apple Nine | LBAM-Investor | ||||
3. Houston, Texas | Marriott | Apple Nine | Apple Nine | Texas Western | ||||
4. Albany, Georgia | Fairfield Inn & Suites | Sunbelt-RAG, L.L.C. | Apple Nine | LBAM-Investor | ||||
5. Panama City, Florida | TownePlace Suites | Sunbelt-RPC, L.L.C. | Apple Nine | LBAM-Investor | ||||
6. Clovis, California | Homewood Suites | Apple Nine | Apple Nine | Dimension Development Two, LLC | ||||
7. Jacksonville, North Carolina | TownePlace Suites | Apple Nine | Apple Nine | LBAM-Investor |
Notes for Table:
- (a)
- All brand and trade names, logos or trademarks contained, or referred to, in this prospectus supplement are the properties of their respective owners. These references shall not in any way be construed as participation by, or endorsement of, our offering by any of our franchisors or managers.
- (b)
- The hotel specified was purchased from an affiliate of the indicated manager.
We have no material relationship or affiliation with the hotel sellers or managers, except for the relationship resulting from our purchases, our management agreements for the hotels we own and any related documents.
S-10
Hotel Lease Agreements
Each of our recently purchased hotels is covered by a separate hotel lease agreement between the owner (one of our indirect wholly-owned subsidiaries) and the applicable lessee (another one of our indirect wholly-owned subsidiaries, as specified in a previous section). Each lease provides for an initial term of 10 years. The applicable lessee has the option to extend its lease term for two additional five-year periods, provided it is not in default at the end of the prior term or at the time the option is exercised.
Each lease provides for annual base rent and percentage rent. The annual base rent is payable in advance in equal monthly installments and will be adjusted each year in proportion to the Consumer Price Index (based on the U.S. City Average). Shown below are the annual base rent and the lease commencement date for the hotels we have purchased since our prospectus dated September 21, 2009:
Hotel Location | Franchise | Annual Base Rent | Date of Lease Commencement | ||||
|---|---|---|---|---|---|---|---|
1. Baton Rouge, Louisiana | SpringHill Suites | $ | 974,274 | September 25, 2009 | |||
2. Johnson City, Tennessee | Courtyard | 723,153 | September 25, 2009 | ||||
3. Houston, Texas | Marriott | 2,367,460 | January 8, 2010 | ||||
4. Albany, Georgia | Fairfield Inn & Suites | 698,338 | January 14, 2010 | ||||
5. Panama City, Florida | TownePlace Suites | 695,825 | January 19, 2010 | ||||
6. Clovis, California | Homewood Suites | 546,980 | February 2, 2010 | ||||
7. Jacksonville, North Carolina | TownePlace Suites | 1,046,227 | February 16, 2010 | ||||
The annual percentage rent depends on a formula that compares fixed "suite revenue breakpoints" with a portion of "suite revenue," which is equal to gross revenue from guest rentals less sales and room taxes and credit card fees. The suite revenue breakpoints will be adjusted each year in proportion to the Consumer Price Index (based on the U.S. City Average). Specifically, the annual percentage rent is equal to the sum of (a) 17% of all suite revenue for the year, up to the applicable suite revenue breakpoint; plus (b) 55% of the suite revenue for the year in excess of the applicable suite revenue breakpoint, as reduced by base rent paid for the year.
Management Agreements
Each of our hotels is being managed by the manager under a separate management agreement between the manager and the applicable lessee (which is one of our indirect wholly-owned subsidiaries, as specified in the previous section). The manager is responsible for managing and supervising the daily operations of the hotel and for collecting revenues for the benefit of the applicable lessee. The fees and other terms of these agreements are the result of commercial negotiations between otherwise unrelated parties. We believe that such fees and terms are appropriate for the hotels and the markets in which they operate.
Franchise Agreements
In general, for our hotels franchised by Marriott International, Inc. or one of its affiliates, there is a relicensing franchise agreement between the applicable lessee (as specified in a previous section) and Marriott International, Inc. or an affiliate. Each relicensing franchise agreement provides for the payment of royalty fees and marketing contributions to the franchisor. A percentage of gross room revenues is used to determine these payments. In addition, we have caused Apple Nine Hospitality, Inc. or another one of our subsidiaries to provide a separate guaranty of the payment and performance of the applicable lessee under the relicensing franchise agreement.
For the hotel franchised by Hilton Worldwide or one of its affiliates, there is a franchise license agreement between the lessee and Hilton Worldwide or an affiliate. The franchise license agreement
S-11
provides for the payment of royalty fees and program fees to the franchisor. A percentage of gross room revenues is used to determine these payments. Apple Nine Hospitality, Inc. or another one of our subsidiaries has guaranteed the payment and performance of the lessee under the franchise license agreement.
The fees and other terms of these agreements are the result of commercial negotiations between otherwise unrelated parties, and we believe that such fees and terms are appropriate for the hotels and the markets in which they operate. These agreements may be terminated for various reasons, including failure by the applicable lessee to operate in accordance with the standards, procedures and requirements established by the franchisors.
FINANCIAL AND OPERATING INFORMATION
FOR OUR PURCHASED PROPERTIES
Our hotels offer guest rooms and suites, together with related amenities, that are consistent with their operations. The hotels are located in developed or developing areas and in competitive markets. We believe the hotels are well-positioned to compete in their markets based on location, amenities, rate structure and franchise affiliation. In the opinion of management, each hotel is adequately covered by insurance. The following tables present further information about the hotels we have purchased:
Hotel Location | Franchise | Number of Rooms/ Suites | Gross Purchase Price | Average Daily Rate (Price) per Room/ Suite(a) | Federal Income Tax Basis for Depreciable Real Property Component Of Hotel(b) | Purchase Date | ||||||||||
|---|---|---|---|---|---|---|---|---|---|---|---|---|---|---|---|---|
1. Tucson, Arizona | Hilton Garden Inn | 125 | $ | 18,375,000 | $ | 120-149 | $ | 17,397,150 | July 31, 2008 | |||||||
2. Charlotte, North Carolina | Homewood Suites | 112 | 5,750,000 | 129-189 | 4,729,410 | September 24, 2008 | ||||||||||
3. Santa Clarita, California | Courtyard | 140 | 22,700,000 | 129-209 | 18,243,805 | September 24, 2008 | ||||||||||
4. Allen, Texas | Hampton Inn & Suites | 103 | 12,500,000 | 144-159 | 11,100,086 | September 26, 2008 | ||||||||||
5. Twinsburg, Ohio | Hilton Garden Inn | 142 | 17,792,440 | 134-161 | 16,387,690 | October 7, 2008 | ||||||||||
6. Lewisville, Texas | Hilton Garden Inn | 165 | 28,000,000 | 149-176 | 24,529,875 | October 16, 2008 | ||||||||||
7. Duncanville, Texas | Hilton Garden Inn | 142 | 19,500,000 | 143-199 | 17,779,620 | October 21, 2008 | ||||||||||
8. Santa Clarita, California | Hampton Inn | 128 | 17,129,348 | 109 | 15,358,348 | October 29, 2008 | ||||||||||
9. Santa Clarita, California | Residence Inn | 90 | 16,599,578 | 139-199 | 14,118,232 | October 29, 2008 | ||||||||||
10. Santa Clarita, California | Fairfield Inn | 66 | 9,337,262 | 89-119 | 7,517,608 | October 29, 2008 | ||||||||||
11. Beaumont, Texas(c) | Residence Inn | 133 | 16,900,000 | 159-179 | 15,752,641 | October 29, 2008 | ||||||||||
12. Pueblo, Colorado | Hampton Inn & Suites | 81 | 8,025,000 | 149-199 | 7,157,264 | October 31, 2008 | ||||||||||
13. Allen, Texas | Hilton Garden Inn | 150 | 18,500,000 | 129-149 | 16,405,653 | October 31, 2008 | ||||||||||
14. Bristol, Virginia | Courtyard | 175 | 18,650,000 | 119-189 | 17,115,637 | November 7, 2008 | ||||||||||
15. Durham, North Carolina | Homewood Suites | 122 | 19,050,000 | 144-209 | 17,846,600 | December 4, 2008 | ||||||||||
16. Hattiesburg, Mississippi(c) | Residence Inn | 84 | 9,793,028 | 139-149 | 8,910,083 | December 11, 2008 | ||||||||||
17. Jackson, Tennessee | Courtyard | 94 | 15,200,000 | 129-139 | 14,240,000 | December 16, 2008 | ||||||||||
18. Jackson, Tennessee | Hampton Inn & Suites | 83 | 12,600,000 | 119-149 | 11,926,000 | December 30, 2008 | ||||||||||
19. Fort Lauderdale, Florida | Hampton Inn | 109 | 19,290,434 | 149-169 | 18,080,922 | December 31, 2008 | ||||||||||
20. Pittsburgh, Pennsylvania | Hampton Inn | 132 | 20,457,777 | 129-159 | 18,019,257 | December 31, 2008 | ||||||||||
21. Frisco, Texas(c) | Hilton Garden Inn | 102 | 15,050,000 | 99-209 | 12,608,112 | December 31, 2008 | ||||||||||
22. Round Rock, Texas | Hampton Inn | 93 | 11,500,000 | 119-139 | 10,658,652 | March 6, 2009 | ||||||||||
23. Panama City, Florida(c) | Hampton Inn & Suites | 95 | 11,600,000 | 159-189 | 9,995,450 | March 12, 2009 | ||||||||||
24. Austin, Texas | Homewood Suites | 97 | 17,700,000 | 149-189 | 15,866,419 | April 14, 2009 | ||||||||||
25. Austin, Texas | Hampton Inn | 124 | 18,000,000 | 129-149 | 16,587,854 | April 14, 2009 | ||||||||||
26. Dothan, Alabama(c) | Hilton Garden Inn | 104 | 11,600,836 | 119-169 | 10,564,205 | June 1, 2009 | ||||||||||
27. Troy, Alabama(c) | Courtyard | 90 | 8,696,456 | 109-159 | 8,129,696 | June 18, 2009 | ||||||||||
28. Orlando, Florida(c) | Fairfield Inn & Suites | 200 | 25,800,000 | 89-109 | 22,650,000 | July 1, 2009 | ||||||||||
29. Orlando, Florida(c) | SpringHill Suites | 200 | 29,000,000 | 94-109 | 25,850,000 | July 1, 2009 | ||||||||||
S-12
Hotel Location | Franchise | Number of Rooms/ Suites | Gross Purchase Price | Average Daily Rate (Price) per Room/ Suite(a) | Federal Income Tax Basis for Depreciable Real Property Component Of Hotel(b) | Purchase Date | ||||||||||
|---|---|---|---|---|---|---|---|---|---|---|---|---|---|---|---|---|
30. Clovis, California(c) | Hampton Inn & Suites | 86 | 11,150,000 | 99-139 | 9,860,000 | July 31, 2009 | ||||||||||
31. Rochester, Minnesota(c) | Hampton Inn & Suites | 124 | 14,136,000 | 109-119 | 13,219,780 | August 3, 2009 | ||||||||||
32. Baton Rouge, Louisiana(c) | SpringHill Suites | 119 | 15,100,000 | 99-134 | 13,820,000 | September 25, 2009 | ||||||||||
33. Johnson City, Tennessee(c) | Courtyard | 90 | 9,879,788 | 119-169 | 8,774,788 | September 25, 2009 | ||||||||||
34. Houston, Texas(c) | Marriott | 206 | 50,750,000 | 199-279 | 46,605,026 | January 8, 2010 | ||||||||||
35. Albany, Georgia(c) | Fairfield Inn & Suites | 87 | 7,919,790 | 109 | 7,070,116 | January 14, 2010 | ||||||||||
36. Panama City, Florida(c) | TownePlace Suites | 103 | 10,640,346 | 84-99 | 9,732,274 | January 19, 2010 | ||||||||||
37. Clovis, California(c) | Homewood Suites | 83 | 12,435,000 | 119-139 | 10,932,060 | February 2, 2010 | ||||||||||
38. Jacksonville, North Carolina | TownePlace Suites | 86 | 9,200,000 | 119-129 | 8,568,200 | February 16, 2010 | ||||||||||
| Total | 4,465 | $ | 616,308,083 | |||||||||||||
Notes for Table 1:
- (a)
- The amounts shown are subject to change, and exclude discounts that may be offered to corporate, frequent and other select customers.
- (b)
- The depreciable life is 39 years (or less, as may be permitted by federal tax laws) using the straight-line method. The modified accelerated cost recovery system will be used for the hotel's personal property component.
- (c)
- The date that the hotel was acquired was the date the hotel began operations.
Table 2. Loan Information(a)
Hotel | Franchise | Assumed Principal Balance of Loan | Annual Interest Rate | Maturity Date | ||||||
|---|---|---|---|---|---|---|---|---|---|---|
1. Allen, Texas | Hilton Garden Inn | $ | 10,786,698 | 5.37 | % | October 2015 | ||||
2. Bristol, Virginia | Courtyard | 9,767,131 | 6.59 | % | August 2016 | |||||
3. Duncanville, Texas | Hilton Garden Inn | 13,965,858 | 5.88 | % | May 2017 | |||||
4. Round Rock, Texas | Hampton Inn | 4,175,225 | 5.95 | % | May 2016 | |||||
5. Austin, Texas | Homewood Suites | 7,555,797 | 5.99 | % | March 2016 | |||||
6. Austin, Texas | Hampton Inn | 7,553,015 | 5.95 | % | March 2016 | |||||
| $ | 53,803,724 | |||||||||
Note for Table 2:
- (a)
- This table summarizes loans that (i) pre-dated our purchase, (ii) are secured by our hotels, and (iii) were assumed by our purchasing subsidiary. Each loan provides for monthly payments of principal and interest on an amortized basis.
S-13
Table 3. Operating Information(a)
| | | Avg. Daily Occupancy Rates (%) | ||||||||||||||||
|---|---|---|---|---|---|---|---|---|---|---|---|---|---|---|---|---|---|---|
| PART A | Franchise | 2005 | 2006 | 2007 | 2008 | 2009 | ||||||||||||
Hotel Location | ||||||||||||||||||
1. Tucson, Arizona | Hilton Garden Inn | — | — | — | 61 | % | 68 | % | ||||||||||
2. Charlotte, North Carolina | Homewood Suites | 78 | % | 76 | % | 71 | % | 53 | % | 52 | % | |||||||
3. Santa Clarita, California | Courtyard | — | — | 51 | % | 61 | % | 66 | % | |||||||||
4. Allen, Texas | Hampton Inn & Suites | — | 51 | % | 68 | % | 69 | % | 60 | % | ||||||||
5. Twinsburg, Ohio | Hilton Garden Inn | 64 | % | 63 | % | 66 | % | 66 | % | 62 | % | |||||||
6. Lewisville, Texas | Hilton Garden Inn | — | — | 42 | % | 63 | % | 61 | % | |||||||||
7. Duncanville, Texas | Hilton Garden Inn | 59 | % | 64 | % | 65 | % | 66 | % | 58 | % | |||||||
8. Santa Clarita, California | Hampton Inn | 83 | % | 82 | % | 78 | % | 70 | % | 63 | % | |||||||
9. Santa Clarita, California | Residence Inn | 91 | % | 91 | % | 89 | % | 85 | % | 76 | % | |||||||
10. Santa Clarita, California | Fairfield Inn | 89 | % | 88 | % | 83 | % | 81 | % | 79 | % | |||||||
11. Beaumont, Texas | Residence Inn | — | — | — | 85 | % | 76 | % | ||||||||||
12. Pueblo, Colorado | Hampton Inn & Suites | 61 | % | 67 | % | 74 | % | 70 | % | 60 | % | |||||||
13. Allen, Texas | Hilton Garden Inn | 73 | % | 73 | % | 68 | % | 65 | % | 53 | % | |||||||
14. Bristol, Virginia | Courtyard | 54 | % | 65 | % | 67 | % | 57 | % | 61 | % | |||||||
15. Durham, North Carolina | Homewood Suites | 67 | % | 73 | % | 73 | % | 69 | % | 59 | % | |||||||
16. Hattiesburg, Mississippi | Residence Inn | — | — | — | — | 75 | % | |||||||||||
17. Jackson, Tennessee | Courtyard | — | — | — | 52 | % | 67 | % | ||||||||||
18. Jackson, Tennessee | Hampton Inn & Suites | — | — | 80 | % | 87 | % | 80 | % | |||||||||
19. Fort Lauderdale, Florida | Hampton Inn | 85 | % | 85 | % | 89 | % | 85 | % | 73 | % | |||||||
20. Pittsburgh, Pennsylvania | Hampton Inn | 76 | % | 73 | % | 80 | % | 81 | % | 73 | % | |||||||
21. Frisco, Texas | Hilton Garden Inn | — | — | — | — | 45 | % | |||||||||||
22. Round Rock, Texas | Hampton Inn | 73 | % | 81 | % | 85 | % | 80 | % | 72 | % | |||||||
23. Panama City, Florida | Hampton Inn & Suites | — | — | — | — | 44 | % | |||||||||||
24. Austin, Texas | Homewood Suites | 82 | % | 89 | % | 80 | % | 81 | % | 77 | % | |||||||
25. Austin, Texas | Hampton Inn | 76 | % | 82 | % | 80 | % | 77 | % | 70 | % | |||||||
26. Dothan, Alabama | Hilton Garden Inn | — | — | — | — | 46 | % | |||||||||||
27. Troy, Alabama | Courtyard | — | — | — | — | 36 | % | |||||||||||
28. Orlando, Florida | Fairfield Inn & Suites | — | — | — | — | 56 | % | |||||||||||
29. Orlando, Florida | SpringHill Suites | — | — | — | — | 65 | % | |||||||||||
30. Clovis, California | Hampton Inn & Suites | — | — | — | — | 36 | % | |||||||||||
31. Rochester, Minnesota | Hampton Inn & Suites | — | — | — | — | 28 | % | |||||||||||
32. Baton Rouge, Louisiana | SpringHill Suites | — | — | — | — | 32 | % | |||||||||||
33. Johnson City, Tennessee | Courtyard | — | — | — | — | 49 | % | |||||||||||
34. Houston, Texas | Marriott | — | — | — | — | — | ||||||||||||
35. Albany, Georgia | Fairfield Inn & Suites | — | — | — | — | — | ||||||||||||
36. Panama City, Florida | TownePlace Suites | — | — | — | — | — | ||||||||||||
37. Clovis, California | Homewood Suites | — | — | — | — | — | ||||||||||||
38. Jacksonville, North Carolina | TownePlace Suites | — | — | — | 83 | % | 90 | % | ||||||||||
S-14
| | | Revenue per Available Room/Suite ($) | ||||||||||||||||
|---|---|---|---|---|---|---|---|---|---|---|---|---|---|---|---|---|---|---|
| PART B | Franchise | 2005 | 2006 | 2007 | 2008 | 2009 | ||||||||||||
Hotel Location | ||||||||||||||||||
1. Tucson, Arizona | Hilton Garden Inn | — | — | — | $ | 65 | $ | 73 | ||||||||||
2. Charlotte, North Carolina | Homewood Suites | $ | 55 | $ | 62 | $ | 67 | $ | 51 | $ | 46 | |||||||
3. Santa Clarita, California | Courtyard | — | — | $ | 59 | $ | 70 | $ | 68 | |||||||||
4. Allen, Texas | Hampton Inn & Suites | — | $ | 53 | $ | 76 | $ | 79 | $ | 63 | ||||||||
5. Twinsburg, Ohio | Hilton Garden Inn | $ | 62 | $ | 64 | $ | 69 | $ | 71 | $ | 63 | |||||||
6. Lewisville, Texas | Hilton Garden Inn | — | — | $ | 50 | $ | 72 | $ | 65 | |||||||||
7. Duncanville, Texas | Hilton Garden Inn | $ | 56 | $ | 66 | $ | 73 | $ | 75 | $ | 59 | |||||||
8. Santa Clarita, California | Hampton Inn | $ | 83 | $ | 91 | $ | 86 | $ | 72 | $ | 60 | |||||||
9. Santa Clarita, California | Residence Inn | $ | 110 | $ | 120 | $ | 120 | $ | 110 | $ | 89 | |||||||
10. Santa Clarita, California | Fairfield Inn | $ | 82 | $ | 95 | $ | 88 | $ | 78 | $ | 68 | |||||||
11. Beaumont, Texas | Residence Inn | — | — | — | $ | 133 | $ | 91 | ||||||||||
12. Pueblo, Colorado | Hampton Inn & Suites | $ | 42 | $ | 51 | $ | 70 | $ | 72 | $ | 54 | |||||||
13. Allen, Texas | Hilton Garden Inn | $ | 72 | $ | 77 | $ | 76 | $ | 74 | $ | 58 | |||||||
14. Bristol, Virginia | Courtyard | $ | 50 | $ | 58 | $ | 66 | $ | 66 | $ | 65 | |||||||
15. Durham, North Carolina | Homewood Suites | $ | 71 | $ | 81 | $ | 88 | $ | 85 | $ | 65 | |||||||
16. Hattiesburg, Mississippi | Residence Inn | — | — | — | — | $ | 71 | |||||||||||
17. Jackson, Tennessee | Courtyard | — | — | — | $ | 58 | $ | 71 | ||||||||||
18. Jackson, Tennessee | Hampton Inn & Suites | — | — | $ | 92 | $ | 105 | $ | 95 | |||||||||
19. Fort Lauderdale, Florida | Hampton Inn | $ | 90 | $ | 102 | $ | 112 | $ | 105 | $ | 85 | |||||||
20. Pittsburgh, Pennsylvania | Hampton Inn | $ | 71 | $ | 75 | $ | 90 | $ | 101 | $ | 94 | |||||||
21. Frisco, Texas | Hilton Garden Inn | — | — | — | — | $ | 47 | |||||||||||
22. Round Rock, Texas | Hampton Inn | $ | 61 | $ | 72 | $ | 81 | $ | 85 | $ | 73 | |||||||
23. Panama City, Florida | Hampton Inn & Suites | — | — | — | — | $ | 42 | |||||||||||
24. Austin, Texas | Homewood Suites | $ | 79 | $ | 96 | $ | 103 | $ | 110 | $ | 97 | |||||||
25. Austin, Texas | Hampton Inn | $ | 63 | $ | 74 | $ | 83 | $ | 93 | $ | 75 | |||||||
26. Dothan, Alabama | Hilton Garden Inn | — | — | — | — | $ | 47 | |||||||||||
27. Troy, Alabama | Courtyard | — | — | — | — | $ | 30 | |||||||||||
28. Orlando, Florida | Fairfield Inn & Suites | — | — | — | — | $ | 37 | |||||||||||
29. Orlando, Florida | SpringHill Suites | — | — | — | — | $ | 48 | |||||||||||
30. Clovis, California | Hampton Inn & Suites | — | — | — | — | $ | 35 | |||||||||||
31. Rochester, Minnesota | Hampton Inn & Suites | — | — | — | — | $ | 23 | |||||||||||
32. Baton Rouge, Louisiana | SpringHill Suites | — | — | — | — | $ | 27 | |||||||||||
33. Johnson City, Tennessee | Courtyard | — | — | — | — | $ | 42 | |||||||||||
34. Houston, Texas | Marriott | — | — | — | — | — | ||||||||||||
35. Albany, Georgia | Fairfield Inn & Suites | — | — | — | — | — | ||||||||||||
36. Panama City, Florida | TownePlace Suites | — | — | — | — | — | ||||||||||||
37. Clovis, California | Homewood Suites | — | — | — | — | — | ||||||||||||
38. Jacksonville, North Carolina | TownePlace Suites | — | — | — | $ | 79 | $ | 88 | ||||||||||
Note for Table 3
- (a)
- Operating data is presented for the last five years (or since the beginning of hotel operations). Hotels with no data for a period were under construction and not open at that time. The first year of data for a hotel reflects results only for the period of time open and may not be a reflection of results once established in its market. See Table 1. General Information on page S-12 for the date the hotel was acquired.
S-15
Table 4. Tax and Related Information
Hotel Location | Franchise | Tax Year | Real Property Tax Rate(e) | Real Property Tax | |||||||
|---|---|---|---|---|---|---|---|---|---|---|---|
1. Tucson, Arizona | Hilton Garden Inn | 2009(a) | 3.0% | $ | 182,214 | ||||||
2. Charlotte, North Carolina | Homewood Suites | 2009(a) | 1.3% | 75,716 | |||||||
3. Santa Clarita, California | Courtyard | 2009(b) | 1.2% | 244,355 | |||||||
4. Allen, Texas | Hampton Inn & Suites | 2009(a) | 2.4% | 165,942 | |||||||
5. Twinsburg, Ohio | Hilton Garden Inn | 2009(a) | 2.0% | 206,372 | |||||||
6. Lewisville, Texas | Hilton Garden Inn | 2009(a) | 2.3% | 173,620 | |||||||
7. Duncanville, Texas | Hilton Garden Inn | 2009(a) | 2.7% | 264,406 | |||||||
8. Santa Clarita, California | Hampton Inn | 2009(b) | 1.3% | 204,837 | |||||||
9. Santa Clarita, California | Residence Inn | 2009(b) | 1.3% | 140,814 | |||||||
10. Santa Clarita, California | Fairfield Inn | 2009(b) | 1.3% | 103,264 | |||||||
11. Beaumont, Texas | Residence Inn | 2009(a) | 2.6% | 266,990 | |||||||
12. Pueblo, Colorado | Hampton Inn & Suites | 2009(a) | 2.6% | 68,945 | |||||||
13. Allen Texas | Hilton Garden Inn | 2009(a) | 2.4% | 245,621 | |||||||
14. Bristol, Virginia | Courtyard | 2009(a) | 0.9% | 61,125 | |||||||
15. Durham, North Carolina | Homewood Suites | 2009(a) | 1.2% | 135,546 | |||||||
16. Hattiesburg, Mississippi | Residence Inn | 2009(a) | 2.3% | 119,504 | |||||||
17. Jackson, Tennessee | Courtyard | 2009(a) | 1.8% | 102,240 | |||||||
18. Jackson, Tennessee | Hampton Inn & Suites | 2009(a) | 1.8% | 78,504 | |||||||
19. Fort Lauderdale, Florida | Hampton Inn | 2009(a) | 2.0% | 208,760 | |||||||
20. Pittsburgh, Pennsylvania | Hampton Inn | 2009(a) | 2.9% | 229,625 | |||||||
21. Frisco, Texas | Hilton Garden Inn | 2009(a) | 2.2% | 249,005 | |||||||
22. Round Rock, Texas | Hampton Inn | 2009(a) | 2.4% | 148,293 | |||||||
23. Panama City, Florida | Hampton Inn & Suites | 2009(a)(d) | 1.1% | 8,211 | |||||||
24. Austin, Texas | Homewood Suites | 2009(a) | 2.2% | 210,672 | |||||||
25. Austin, Texas | Hampton Inn | 2009 (a) | 2.2% | 226,426 | |||||||
26. Dothan, Alabama | Hilton Garden Inn | 2009(c)(d) | 3.3% | 6,831 | |||||||
27. Troy, Alabama | Courtyard | 2009(c)(d) | 4.1% | 3,663 | |||||||
28. Orlando, Florida | Fairfield Inn & Suites | 2009(a)(d) | 1.7% | 63,806 | |||||||
29. Orlando, Florida | SpringHill Suites | 2009(a)(d) | 3.2% | 8,360 | |||||||
30. Clovis, California | Hampton Inn & Suites | 2009(b)(d) | 1.2% | 40,312 | |||||||
31. Rochester, Minnesota | Hampton Inn & Suites | 2009(a)(d) | 1.5% | 2,088 | |||||||
32. Baton Rouge, Louisiana | SpringHill Suites | 2009(a)(d) | 10.7% | 22,454 | |||||||
33. Johnson City, Tennessee | Courtyard | 2009(a)(d) | 1.4% | 14,962 | |||||||
34. Houston, Texas | Marriott | 2009(a)(d) | 2.8% | 200,498 | |||||||
35. Albany, Georgia | Fairfield Inn & Suites | 2009(a)(d) | 4.0% | 15,302 | |||||||
36. Panama City, Florida | TownePlace Suites | 2009(a)(d) | 1.5% | 5,719 | |||||||
37. Clovis, California | Homewood Suites | 2009(b)(d) | 1.2% | 12,458 | |||||||
38. Jacksonville, North Carolina | TownePlace Suites | 2009(a) | 1.2% | 42,741 | |||||||
Notes for Table 4:
- (a)
- Represents calendar year.
- (b)
- Represents 12-month period from July 1, 2009 through June 30, 2010.
- (c)
- Represents 12-month period from October 1, 2008 through September 30, 2009.
- (d)
- The hotel property consisted of undeveloped land for a portion of the tax year, and the real property tax is not necessarily indicative of property taxes expected for the hotel in the future.
- (e)
- Property tax rate is an aggregate figure for county, city and other local taxing authorities (to the extent applicable).
S-16
The following table sets forth selected financial data for the years ended December 31, 2009 and 2008 and for the period November 9, 2007 (initial capitalization) through December 31, 2007. Certain information in the table has been derived from the Company's audited financial statements and notes thereto. This data should be read in conjunction with Management's Discussion and Analysis of Financial Condition and Results of Operations, and the Consolidated Financial Statements and Notes thereto, appearing elsewhere in this Supplement. During the period from the Company's initial capitalization on November 9, 2007 to July 30, 2008, the Company owned no properties, had no revenue exclusive of interest income, and was primarily engaged in capital formation activities. Operations commenced on July 31, 2008 with the Company's first property acquisition.
(in thousands except per share and statistical data) | Year Ended December 31, 2009 | Year Ended December 31, 2008 | For the period November 9, 2007 (initial capitalization) through December 31, 2007 | ||||||||||
|---|---|---|---|---|---|---|---|---|---|---|---|---|---|
Revenues: | |||||||||||||
Room revenue | $ | 76,163 | $ | 9,501 | $ | — | |||||||
Other revenue | 9,043 | 2,023 | — | ||||||||||
Total hotel revenue | 85,206 | 11,524 | — | ||||||||||
Rental revenue | 15,961 | — | — | ||||||||||
Total revenue | 101,167 | 11,524 | — | ||||||||||
Expenses: | |||||||||||||
Hotel operating expenses | 52,297 | 7,422 | — | ||||||||||
Taxes, insurance and other | 6,032 | 731 | — | ||||||||||
General and administrative | 4,079 | 1,288 | 15 | ||||||||||
Acquisition related costs | 4,951 | — | — | ||||||||||
Depreciation | 15,936 | 2,277 | — | ||||||||||
Interest (income) expense, net | 1,018 | (2,346 | ) | 2 | |||||||||
Total expenses | 84,313 | 9,372 | 17 | ||||||||||
Net income (loss) | $ | 16,854 | $ | 2,152 | $ | (17 | ) | ||||||
Per Share: | |||||||||||||
Net income (loss) per common share | $ | 0.26 | $ | 0.14 | $ | (1,684.60 | ) | ||||||
Distributions declared and paid per common share | $ | 0.88 | $ | 0.51 | $ | — | |||||||
Weighted-average common shares outstanding—basic and diluted | 66,041 | 15,852 | — | ||||||||||
Balance Sheet Data (at end of period): | |||||||||||||
Cash and cash equivalents | $ | 272,913 | $ | 75,193 | $ | 20 | |||||||
Investment in real estate, net | $ | 687,509 | $ | 346,423 | $ | — | |||||||
Total assets | $ | 982,513 | $ | 431,619 | $ | 337 | |||||||
Notes payable | $ | 58,688 | $ | 38,647 | $ | 151 | |||||||
Shareholders' equity | $ | 917,405 | $ | 389,740 | $ | 31 | |||||||
Net book value per share | $ | 9.31 | $ | 9.50 | $ | — | |||||||
Other Data: | |||||||||||||
Cash Flow From (Used In): | |||||||||||||
Operating activities | $ | 29,137 | $ | 3,317 | $ | (2 | ) | ||||||
Investing activities | $ | (341,131 | ) | $ | (315,322 | ) | $ | — | |||||
Financing activities | $ | 509,714 | $ | 387,178 | $ | (26 | ) | ||||||
Number of hotels owned at end of period | 33 | 21 | — | ||||||||||
Average Daily Rate (ADR) (a) | $ | 104 | $ | 110 | $ | — | |||||||
Occupancy | 62 | % | 59 | % | — | ||||||||
Revenue Per Available Room (RevPAR)(b) | $ | 64 | $ | 65 | $ | — | |||||||
S-17
(in thousands except per share and statistical data) | Year Ended December 31, 2009 | Year Ended December 31, 2008 | For the period November 9, 2007 (initial capitalization) through December 31, 2007 | ||||||||||
|---|---|---|---|---|---|---|---|---|---|---|---|---|---|
Funds From Operations Calculation(c): | |||||||||||||
Net income (loss) | $ | 16,854 | $ | 2,152 | $ | (17 | ) | ||||||
Depreciation of real estate owned | 15,936 | 2,277 | — | ||||||||||
Acquisition related costs | 4,951 | — | — | ||||||||||
Funds from operations | 37,741 | 4,429 | (17 | ) | |||||||||
Straight-line rental income | 4,618 | — | — | ||||||||||
Modified funds from operations | $ | 33,123 | $ | 4,429 | $ | (17 | ) | ||||||
- (a)
- Total room revenue divided by number of rooms sold.
- (b)
- ADR multiplied by occupancy percentage.
- (c)
- Funds from operations (FFO) is defined as net income (loss) (computed in accordance with generally accepted accounting principals—GAAP) excluding gains and losses from sales of depreciable property, plus depreciation and amortization, plus costs associated with the acquisition of real estate. Modified FFO (MFFO) excludes rental revenue earned, but not received during the period or straight-line rental income. The Company considers FFO and MFFO in evaluating property acquisitions and its operating performance and believes that FFO and MFFO should be considered along with, but not as an alternative to, net income and cash flows as a measure of the Company's activities in accordance with GAAP. FFO and MFFO are not necessarily indicative of cash available to fund cash needs.
S-18
MANAGEMENT'S DISCUSSION AND ANALYSIS
OF FINANCIAL CONDITION AND RESULTS OF OPERATIONS
(for the year ended December 31, 2009)
General
The Company is a Virginia corporation that has elected to be treated as a real estate investment trust ("REIT") for federal income tax purposes. The Company, which has limited operating history, was formed to invest in hotels, residential apartment communities and other income-producing real estate in selected metropolitan areas in the United States. The Company was initially capitalized November 9, 2007, with its first investor closing on May 14, 2008. Prior to the Company's first hotel acquisition on July 31, 2008, the Company had no revenue, exclusive of interest income. As of December 31, 2009, the Company owned 33 hotels (21 of which were purchased during 2008 and 12 which were acquired during 2009). Also, in April 2009, the Company purchased 417 acres of land and improvements located on 113 sites in the Ft. Worth, Texas area and simultaneously entered into a long-term, triple net lease with one of the nation's largest producers of natural gas. Accordingly, the results of operations include only results from the date of ownership of the properties.
Hotel Operations
Although hotel performance can be influenced by many factors including local competition, local and general economic conditions in the United States and the performance of individual managers assigned to each hotel, performance of the hotels within their respective local markets, in general, has met the Company's expectations for the period owned. With the significant decline in economic conditions throughout the United States, overall performance of the Company's hotels has not met expectations. Although there is no way to predict general economic conditions, many industry analysts believe the hotel industry will see flat to single digit declines in hotel revenues in 2010 as compared to 2009. In evaluating financial condition and operating performance, the most important matters on which the Company focuses are revenue measurements, such as average occupancy, average daily rate ("ADR") and revenue per available room ("RevPAR"), and expenses, such as hotel operating expenses, general and administrative and property taxes and insurance.
Hotels Owned
As noted above, the Company commenced operations in July 2008 upon the purchase of its first hotel property. The following table summarizes the location, brand, manager, gross purchase price,
S-19
number of hotel rooms and date of purchase for each of the 33 hotels the Company owned as of December 31, 2009. All dollar amounts are in thousands.
Location | Brand | Manager | Gross Purchase Price | Rooms | Date of Purchase | ||||||||||
|---|---|---|---|---|---|---|---|---|---|---|---|---|---|---|---|
Tucson, AZ | Hilton Garden Inn | Western | $ | 18,375 | 125 | 7/31/2008 | |||||||||
Santa Clarita, CA | Courtyard | Dimension | 22,700 | 140 | 9/24/2008 | ||||||||||
Charlotte, NC | Homewood Suites | McKibbon | 5,750 | 112 | 9/24/2008 | ||||||||||
Allen, TX | Hampton Inn & Suites | Gateway | 12,500 | 103 | 9/26/2008 | ||||||||||
Twinsburg, OH | Hilton Garden Inn | Gateway | 17,792 | 142 | 10/7/2008 | ||||||||||
Lewisville, TX | Hilton Garden Inn | Gateway | 28,000 | 165 | 10/16/2008 | ||||||||||
Duncanville, TX | Hilton Garden Inn | Gateway | 19,500 | 142 | 10/21/2008 | ||||||||||
Santa Clarita, CA | Hampton Inn | Dimension | 17,129 | 128 | 10/29/2008 | ||||||||||
Santa Clarita, CA | Residence Inn | Dimension | 16,600 | 90 | 10/29/2008 | ||||||||||
Santa Clarita, CA | Fairfield Inn | Dimension | 9,337 | 66 | 10/29/2008 | ||||||||||
Beaumont, TX | Residence Inn | Western | 16,900 | 133 | 10/29/2008 | ||||||||||
Pueblo, CO | Hampton Inn & Suites | Dimension | 8,025 | 81 | 10/31/2008 | ||||||||||
Allen, TX | Hilton Garden Inn | Gateway | 18,500 | 150 | 10/31/2008 | ||||||||||
Bristol, VA | Courtyard | LBA | 18,650 | 175 | 11/7/2008 | ||||||||||
Durham, NC | Homewood Suites | McKibbon | 19,050 | 122 | 12/4/2008 | ||||||||||
Hattiesburg, MS | Residence Inn | LBA | 9,793 | 84 | 12/11/2008 | ||||||||||
Jackson, TN | Courtyard | Vista | 15,200 | 94 | 12/16/2008 | ||||||||||
Jackson, TN | Hampton Inn & Suites | Vista | 12,600 | 83 | 12/30/2008 | ||||||||||
Pittsburgh, PA | Hampton Inn | Vista | 20,458 | 132 | 12/31/2008 | ||||||||||
Fort Lauderdale, FL | Hampton Inn | Vista | 19,290 | 109 | 12/31/2008 | ||||||||||
Frisco, TX | Hilton Garden Inn | Western | 15,050 | 102 | 12/31/2008 | ||||||||||
Round Rock, TX | Hampton Inn | Vista | 11,500 | 93 | 3/6/2009 | ||||||||||
Panama City, FL | Hampton Inn & Suites | LBA | 11,600 | 95 | 3/12/2009 | ||||||||||
Austin, TX | Homewood Suites | Vista | 17,700 | 97 | 4/14/2009 | ||||||||||
Austin, TX | Hampton Inn | Vista | 18,000 | 124 | 4/14/2009 | ||||||||||
Dothan, AL | Hilton Garden Inn | LBA | 11,601 | 104 | 6/1/2009 | ||||||||||
Troy, AL | Courtyard | LBA | 8,696 | 90 | 6/18/2009 | ||||||||||
Orlando, FL | Fairfield Inn & Suites | Marriott | 25,800 | 200 | 7/1/2009 | ||||||||||
Orlando, FL | SpringHill Suites | Marriott | 29,000 | 200 | 7/1/2009 | ||||||||||
Clovis, CA | Hampton Inn & Suites | Dimension | 11,150 | 86 | 7/31/2009 | ||||||||||
Rochester, MN | Hampton Inn & Suites | White | 14,136 | 124 | 8/3/2009 | ||||||||||
Johnson City, TN | Courtyard | LBA | 9,880 | 90 | 9/25/2009 | ||||||||||
Baton Rouge, LA | SpringHill Suites | Dimension | 15,100 | 119 | 9/25/2009 | ||||||||||
Total | $ | 525,362 | 3,900 | ||||||||||||
The Company also acquired during 2009, land for the planned construction of a SpringHill Suites hotel to be completed over the next 15 months. The purchase price for the land was $5.1 million. Upon completion, it is expected that the hotel will contain approximately 152 guest rooms and will be managed by Marriott. To date the Company has incurred $1.8 million in construction costs and anticipates the total construction costs to be approximately $20-$25 million.
The purchase price for these properties, net of debt assumed, was funded primarily by the Company's on-going best-efforts offering of Units. The Company assumed approximately $53.8 million of debt secured by six of its hotel properties and $3.8 million of unsecured debt in connection with one of its hotel properties. The following table summarizes the hotel location, interest rate, maturity date
S-20
and the principal amount assumed associated with each note payable outstanding as of December 31, 2009. All dollar amounts are in thousands.
Location | Brand | Interest Rate(1) | Maturity Date | Principal Assumed | Outstanding balance as of December 31, 2009 | ||||||||||
|---|---|---|---|---|---|---|---|---|---|---|---|---|---|---|---|
Lewisville, TX | Hilton Garden Inn | 0.00 | % | 12/31/2016 | $ | 3,750 | $ | 3,750 | |||||||
Duncanville, TX | Hilton Garden Inn | 5.88 | % | 5/11/2017 | 13,966 | 13,754 | |||||||||
Allen, TX | Hilton Garden Inn | 5.37 | % | 10/11/2015 | 10,787 | 10,585 | |||||||||
Bristol, VA | Courtyard | 6.59 | % | 8/1/2016 | 9,767 | 9,640 | |||||||||
Round Rock, TX | Hampton Inn | 5.95 | % | 5/1/2016 | 4,175 | 4,110 | |||||||||
Austin, TX | Homewood Suites | 5.99 | % | 3/1/2016 | 7,556 | 7,448 | |||||||||
Austin, TX | Hampton Inn | 5.95 | % | 3/1/2016 | 7,553 | 7,445 | |||||||||
| $ | 57,554 | $ | 56,732 | ||||||||||||
- (1)
- At acquisition, the Company adjusted the interest rates on these loans to market rates and is amortizing the adjustments to interest expense over the life of the loan.
The Company leases all of its hotels to its wholly-owned taxable REIT subsidiary (or a subsidiary thereof) under master hotel lease agreements. The Company also used the proceeds of its on-going best-efforts offering to pay approximately $10.6 million, representing 2% of the gross purchase price for these properties, as a brokerage commission to Apple Suites Realty Group, Inc. ("ASRG"), 100% owned by Glade M. Knight, the Company's Chairman and Chief Executive.
No goodwill was recorded in connection with any of the acquisitions.
Management and Franchise Agreements
Each of the Company's 33 hotels are operated and managed, under separate management agreements, by affiliates of one of the following companies: Dimension Development Two, LLC ("Dimension"), Gateway Hospitality Group, Inc. ("Gateway"), LBAM-Investor Group, L.L.C. ("LBA"), Fairfield FMC, LLC and SpringHill SMC, LLC, subsidiaries of Marriott International ("Marriott"), MHH Management, LLC ("McKibbon"), Vista Host, Inc. ("Vista"), Texas Western Management Partners, L.P. ("Western") and White Lodging Services Corporation ("White"). The agreements provide for initial terms of one to 30 years. Fees associated with the agreements generally include the payment of base management fees, incentive management fees, accounting fees, and other fees for centralized services which are allocated among all of the hotels that receive the benefit of such services. Base management fees are calculated as a percentage of gross revenues. Incentive management fees are calculated as a percentage of operating profit in excess of a priority return to the Company, as defined in the management agreements. The Company has the option to terminate the management agreements if specified performance thresholds are not satisfied. For the years ended December 31, 2009 and 2008, the Company incurred approximately $2.6 million and $441,000 in management fees.
Dimension, Gateway, LBA, McKibbon, Vista, Western and White are not affiliated with either Marriott or Hilton, and as a result, the hotels they manage were required to obtain separate franchise agreements with each respective franchisor. The Hilton franchise agreements generally provide for a term of 10 to 20 years. Fees associated with the agreements generally include the payment of royalty fees and program fees. The Marriott franchise agreements generally provide for initial terms of 13 to 20 years. Fees associated with the agreements generally include the payment of royalty fees, marketing fees, reservation fees and a communications support fee based on room revenues. For the years ended December 31, 2009 and 2008, the Company incurred approximately $3.4 million and $468,000 in franchise fees.
S-21
Land and Improvements and Lease
On April 7, 2009, the Company completed the preliminary closing with a subsidiary of Chesapeake Energy Corporation under the terms of the purchase and sale contract dated January 21, 2009, as amended, for the purchase of approximately 417 acres of land and improvements located on 113 sites in the Ft. Worth, Texas area. The purchase price for the land and improvements was approximately $147 million. The preliminary closing provided equitable title to the Company. Subsequent to the preliminary closing, the recorded fee simple title was completed for 111 sites and conveyed to the Company. Each of the 113 individual sites is between approximately two and eleven acres in size. Simultaneous with the preliminary closing, the Company entered into a ground lease for this real estate (the "Lease"). The Lease is with a subsidiary of Chesapeake Energy Corporation, Chesapeake Operating, Inc. (the "Tenant"). Chesapeake Energy Corporation is a guarantor of the Lease. The Lease has an initial term of 40 years with five renewal options of five years each, and annual rent ranging from approximately $15.5 million to $27.4 million with the average annual rent over the initial term being $21.8 million. Payments under the Lease are required to be made monthly in advance. Currently, the Tenant is producing natural gas or is in the process of developing the sites for the production of natural gas on over 70% of the 113 sites, and anticipates using substantially all of the remaining land for natural gas production. Under the Lease, the Tenant is responsible for all operating costs associated with the real estate including, maintenance, insurance, property taxes, environmental, zoning, permitting, etc. and the Tenant is required to maintain the real estate in good condition. During the term of the Lease, the Tenant has the option to purchase up to 30 sites (no more than 10 producing natural gas) for $1.4 million per site in years 1-5 of the Lease and $1.9 million for the remainder of the Lease. For any sites purchased, the annual rent will be reduced proportionately to the remaining sites.
The purchase price for the 417 acres of land and improvements was funded primarily by the Company's on-going best-efforts offering of Units. The Company also used the proceeds of its on-going best-efforts offering to pay approximately $4.1 million in closing costs, including $2.9 million, representing 2% of the gross purchase price, as a brokerage commission to ASRG. The Company capitalized the commission as well as the other closing costs as part of the acquisition cost of the land and improvements. Of the total purchase price and associated closing costs, $53 million is included in land and $98 million in land improvements on the Company's consolidated balance sheets.
Results of Operations
The following is a summary of the Company's consolidated financial results for the years ended December 31, 2009 and 2008:
(in thousands) | Year Ended December 31, 2009 | Year Ended December 31, 2008 | ||||||
|---|---|---|---|---|---|---|---|---|
Revenues: | ||||||||
Hotel revenue | $ | 85,206 | $ | 11,524 | ||||
Rental revenue | 15,961 | — | ||||||
Expenses: | ||||||||
Hotel direct expenses | 52,297 | 7,422 | ||||||
Taxes, insurance and other expense | 6,032 | 731 | ||||||
General and administrative expenses | 4,079 | 1,288 | ||||||
Acquisition related costs | 4,951 | — | ||||||
Depreciation | 15,936 | 2,277 | ||||||
Interest income (expense), net | (1,018 | ) | 2,346 | |||||
During the period from the Company's initial capitalization on November 9, 2007 to July 30, 2008, the Company owned no properties, had no revenue, exclusive of interest income and was primarily
S-22
engaged in capital formation activities. During this period, the Company incurred miscellaneous start-up costs and interest expense related to an unsecured line of credit. The Company began operations on July 31, 2008 when it purchased its first hotel. During the remainder of 2008, the Company purchased an additional 20 hotel properties. With the purchase of an additional 12 hotels in 2009, the Company owned 33 hotels as of December 31, 2009, compared to 21 hotels at December 31, 2008. In April 2009, the Company purchased 417 acres of land and improvements located on 113 sites in the Ft. Worth, Texas area and simultaneously entered into a long-term, triple net lease with one of the nation's largest producers of natural gas. Due to the Company's limited operating history, a comparison of operating results for the year ended December 31, 2009 to prior year results is not meaningful.
Hotel Performance
The following is summary of the operating results of the 33 hotels acquired through December 31, 2009 and their respective periods of ownership by the Company:
(in thousands) | Year Ended December 31, 2009 | % of Hotel Revenue | Year Ended December 31, 2008 | % of Hotel Revenue | ||||||||||
|---|---|---|---|---|---|---|---|---|---|---|---|---|---|---|
Hotel Revenue: | ||||||||||||||
Room revenue | $ | 76,163 | $ | 9,501 | ||||||||||
Other revenue | 9,043 | 2,023 | ||||||||||||
| 85,206 | 11,524 | |||||||||||||
Hotel Operating Expenses: | ||||||||||||||
Hotel direct expenses | 52,297 | 61 | % | 7,422 | 64 | % | ||||||||
Taxes, insurance and other expense | 5,953 | 7 | % | 731 | 6 | % | ||||||||
Hotel Operating Statistics: | ||||||||||||||
Number of hotels | 33 | 21 | ||||||||||||
ADR | $ | 104 | $ | 110 | ||||||||||
Occupancy | 62 | % | 59 | % | ||||||||||
RevPAR | $ | 64 | $ | 65 | ||||||||||
Hotel performance is impacted by many factors including the economic conditions in the United States as well as each locality. During the past several quarters, the overall weakness in the U.S. economy has had a considerable negative impact on both consumer and business travel. As a result, lodging demand in most markets in the United States has declined. The Company expects demand for the industry to continue to be below pre-recession levels until general economic conditions improve. The Company's hotels have shown results consistent with industry and brand averages for the short period of ownership.
Hotel Revenues
The Company's principal source of revenue is hotel revenue consisting of room and other related revenue. For the year ended December 31, 2009, the Company had hotel revenue of $85.2 million. This revenue reflects hotel operations for the 33 hotels acquired through December 31, 2009 for their respective periods of ownership by the Company. For the year ended December 31, 2009, the hotels achieved combined average occupancy of approximately 62%, ADR of $104 and RevPAR of $64. ADR is calculated as room revenue divided by the number of rooms sold, and RevPAR is calculated as occupancy multiplied by ADR.
Due to industry wide hotel demand declines from a general weakening economy, the Company's hotel revenue has been lower than anticipated. While reflecting the impact of declining economic
S-23
activity, the Company's hotels continue to lead their respective markets. The Company's average RevPAR index was 128 for 2009. The RevPAR index is a measure of each hotel's RevPAR compared to the average in the market, with 100 being the average and is provided by Smith Travel Research, Inc.®, an independent company that tracks historical hotel performance in most markets throughout the world. Although it is not possible to predict when economic conditions will improve or their impact on the hotel industry, many industry analysts forecast a 0-5% decline in RevPAR for 2010. The Company will continue to pursue market opportunities to improve revenue.
Hotel Operating Expenses
Hotel operating expenses relate to the 33 hotels acquired through December 31, 2009 for their respective periods owned and consist of direct room expenses, hotel administrative expense, sales and marketing expense, utilities expense, repair and maintenance expense, franchise fees and management fees. For the year ended December 31, 2009, hotel operating expenses totaled $52.3 million or 61% of hotel revenue. Nine of the 12 hotels acquired in 2009 are new hotels and as a result, hotel operating expenses as a percentage of hotel revenue for these hotels are higher than is expected once the properties have established themselves within their markets. With weakened economic conditions the Company will continue to work with its management companies to reduce costs as aggressively as possible, however it is not anticipated that these reductions will offset revenue declines.
Taxes, insurance, and other expense for the year ended December 31, 2009 totaled $6.0 million.
Rental Revenue
The Company generates rental revenue from its purchase and leaseback transaction completed during the second quarter of 2009. As noted above, during April 2009, the Company purchased 417 acres of land and improvements located on 113 sites in the Ft. Worth, Texas area and simultaneously entered into a long-term, triple net lease with one of the nation's largest producers of natural gas. Rental payments are fixed and have determinable rent increases during the initial lease term. The lease is classified as an operating lease and rental income is recognized on a straight line basis over the initial term of the lease. Rental income for the year ended December 31, 2009 was $16 million, and includes $4.6 million of adjustments necessary to record rent on the straight line basis.
Other Expenses
General and administrative expense for the year ended December 31, 2009 was $4.1 million. The principal components of general and administrative expense are advisory fees, legal fees, accounting fees, the Company's share of the loss in its investment in Apple Air Holding, LLC, and reporting expenses.
Acquisition related costs for the year ended December 31, 2009 were $5.0 million. In accordance with the Accounting Standards Codification on business combinations, the Company has expensed as incurred all transaction costs associated with the acquisitions of existing businesses that occurred on or after January 1, 2009, including title, legal, accounting and other related costs, as well as the brokerage commission paid to ASRG, owned 100% by Glade M. Knight, Chairman and Chief Executive Officer of the Company. Also, included in acquisition related costs for the year ended December 31, 2009 is $293,000 in transaction costs related to potential acquisitions as of December 31, 2008. These costs were incurred during 2008 and were recorded as deferred costs and included in other assets, net in the Company's consolidated balance sheet as of December 31, 2008. For acquisitions that occurred prior to January 1, 2009, these costs were capitalized as part of the cost of the acquisition.
Depreciation expense for the year ended December 31, 2009 was $15.9 million. Depreciation expense primarily represents expense of the Company's 33 hotel buildings and related improvements, and associated personal property (furniture, fixtures, and equipment) for their respective periods
S-24
owned. Also, included in depreciation expense is the depreciation of the Company's land improvements located on 113 sites in Fort Worth, Texas which is leased to one of the nation's largest producers of natural gas.
Interest expense for the year ended December 31, 2009 was $2.3 million and is net of approximately $400,000 of interest capitalized associated with renovation and construction projects. Interest expense primarily arose from debt assumed with the acquisition of seven of the Company's hotels (four loan assumptions during 2008 and three in 2009). During the year ended December 31, 2009, the Company also recognized $1.3 million in interest income, representing interest on excess cash invested in short-term money market instruments and certificates of deposit.
Related Parties
The Company has significant transactions with related parties. These transactions cannot be construed to be at arm's length and the results of the Company's operations may be different than if conducted with non-related parties.
The Company has a contract with ASRG, to acquire and dispose of real estate assets for the Company. A fee of 2% of the gross purchase price or gross sale price in addition to certain reimbursable expenses is paid to ASRG for these services. As of December 31, 2009, payments to ASRG for services under the terms of this contract have totaled approximately $13.6 million since inception.
The Company is party to an advisory agreement with Apple Nine Advisors, Inc. ("A9A") to provide management services to the Company. An annual fee ranging from 0.1% to 0.25% of total equity proceeds received by the Company, in addition to certain reimbursable expenses, are payable for these services. A9A has entered into an agreement with Apple REIT Six, Inc. ("AR6") to provide certain management services to the Company. The Company will reimburse A9A for the cost of the services provided by AR6. A9A will in turn reimburse AR6. Total advisory fees and reimbursable expenses incurred by the Company under the advisory agreement are included in general and administrative expenses and totaled approximately $2.4 million and $766,000 for the years ended December 31, 2009 and 2008, respectively and $15,000 for the period November 9, 2007 (initial capitalization) through December 31, 2007. Of this total expense, $722,000, $171,000 and $— were fees paid to A9A and $1.7 million, $595,000 and $15,000 were expenses reimbursed by A9A to AR6 for the years ended December 31, 2009 and 2008 and the period November 9, 2007 through December 31, 2007.
ASRG and A9A are 100% owned by Glade M. Knight, Chairman and Chief Executive Officer of the Company.
Mr. Knight is also Chairman and Chief Executive Officer of AR6, Apple REIT Seven, Inc. and Apple REIT Eight, Inc. Members of the Company's Board of Directors are also on the Board of Directors of AR6, Apple REIT Seven, Inc. and Apple REIT Eight, Inc.
In January 2009, the Company purchased a 24% ownership interest in Apple Air Holding, LLC ("Apple Air"), for $3.2 million in cash. The Company has recorded its share of income and losses of the entity under the equity method of accounting and adjusted its investment in Apple Air accordingly. The Company incurred approximately $460,000 of expense related to its ownership in Apple Air during 2009. The other members of Apple Air are AR6, Apple REIT Seven, Inc. and Apple REIT Eight, Inc. The interest was purchased to allow the Company access to two Lear jets for acquisition, asset management and renovation purposes.
During the fourth quarter of 2008, the Company entered into a series of assignment of contracts with Apple REIT Eight, Inc. ("AR8") to become the purchaser under three purchase contracts for four hotels which at the time of the assignment were under construction: a Fairfield Inn & Suites and SpringHill Suites, both 200 room hotels located in Orlando, Florida, with a combined purchase price of
S-25
$54.8 million, a 119 room SpringHill Suites hotel in Baton Rouge, Louisiana with a purchase price of $15.1 million and a 124 room Hampton Inn & Suites hotel in Rochester, Minnesota with a purchase price of $14.1 million. Under the terms and conditions of the contracts, AR8 assigned to the Company all of its rights and obligations under these purchase contracts. No consideration or fees was paid to AR8 for the assignment of the purchase contracts except for the reimbursement payment of the following: (i) initial deposits totaling $1.2 million made by AR8; and (ii) other costs totaling approximately $64,000 paid by AR8 to third parties. These reimbursement payments did not constitute or result in a profit for AR8. The Company acquired these newly constructed hotels during 2009.
Series B Convertible Preferred Stock
The Company has issued 480,000 Series B convertible preferred shares to Glade M. Knight, Chairman and Chief Executive Officer of the Company, in exchange for the payment by him of $0.10 per Series B convertible preferred share, or an aggregate of $48,000. The Series B convertible preferred shares are convertible into common shares pursuant to the formula and on the terms and conditions set forth below.
There are no dividends payable on the Series B convertible preferred shares. Holders of more than two-thirds of the Series B convertible preferred shares must approve any proposed amendment to the articles of incorporation that would adversely affect the Series B convertible preferred shares.
Upon the Company's liquidation, the holder of the Series B convertible preferred shares is entitled to a priority liquidation payment before any distribution of liquidation proceeds to the holders of the common shares. However, the priority liquidation payment of the holder of the Series B convertible preferred shares is junior to the holders of the Series A preferred shares distribution rights. The holder of a Series B convertible preferred share is entitled to a liquidation payment of $11 per number of common shares each Series B convertible preferred share would be convertible into according to the formula described below. In the event that the liquidation of the Company's assets results in proceeds that exceed the distribution rights of the Series A preferred shares and the Series B convertible preferred shares, the remaining proceeds will be distributed between the common shares and the Series B convertible preferred shares, on an as converted basis.
Each holder of outstanding Series B convertible preferred shares shall have the right to convert any of such shares into common shares of the Company upon and for 180 days following the occurrence of any of the following events:
- (1)
- substantially all of the Company's assets, stock or business is sold or transferred through exchange, merger, consolidation, lease, share exchange, sale or otherwise, other than a sale of assets in liquidation, dissolution or winding up of the Company;
- (2)
- the termination or expiration without renewal of the advisory agreement with A9A, or if the Company ceases to use ASRG to provide property acquisition and disposition services; or
- (3)
- the Company's common shares are listed on any securities exchange or quotation system or in any established market.
S-26
Upon the occurrence of any conversion event, each Series B convertible preferred share may be converted into a number of common shares based upon the gross proceeds raised through the date of conversion in the Company's $2 billion offering according to the following table:
Gross Proceeds Raised from Sales of Units through Date of Conversion | Number of Common Shares through Conversion of One Series B Convertible Preferred Share | |||
|---|---|---|---|---|
$1 billion | 12.11423 | |||
$1.1 billion | 13.31991 | |||
$1.2 billion | 14.52559 | |||
$1.3 billion | 15.73128 | |||
$1.4 billion | 16.93696 | |||
$1.5 billion | 18.14264 | |||
$1.6 billion | 19.34832 | |||
$1.7 billion | 20.55400 | |||
$1.8 billion | 21.75968 | |||
$1.9 billion | 22.96537 | |||
$2 billion | 24.17104 | |||
In the event that after raising gross proceeds of $2 billion, the Company raises additional gross proceeds in a subsequent public offering, each Series B convertible preferred share may be converted into an additional number of common shares based on the additional gross proceeds raised through the date of conversion in a subsequent public offering according to the following formula: (X/100 million) × 1.20568, where X is the additional gross proceeds rounded down to the nearest 100 million.
No additional consideration is due upon the conversion of the Series B convertible preferred shares. The conversion into common shares of the Series B convertible preferred shares will result in dilution of the shareholders' interests.
Expense related to the issuance of 480,000 Series B convertible preferred shares to Mr. Knight will be recognized at such time when the number of common shares to be issued for conversion of the Series B shares can be reasonably estimated and the event triggering the conversion of the Series B shares to common shares occurs. The expense will be measured as the difference between the fair value of the common stock for which the Series B shares can be converted and the amounts paid for the Series B shares. Although the fair market value cannot be determined at this time, expense if the maximum offering is achieved could range from $0 to in excess of $127 million (assumes $11 per unit fair market value). Based on equity raised through December 31, 2009, if a triggering event had occurred, expense would have ranged from $0 to $64.0 million (assumes $11 per unit fair market value) and approximately 5.8 million common shares would have been issued.
Liquidity and Capital Resources
The following is a summary of the Company's significant contractual obligations as of December 31, 2009:
| | | Amount of Commitments Expiring per Period | ||||||||||||||
|---|---|---|---|---|---|---|---|---|---|---|---|---|---|---|---|---|
(000's) | Total | Less than 1 Year | 2-3 Years | 4-5 Years | Over 5 Years | |||||||||||
Property Purchase Commitments | $ | 132,085 | $ | 132,085 | $ | — | $ | — | $ | — | ||||||
Debt (including interest of $19.7 million) | 76,391 | 4,101 | 9,952 | 8,202 | 54,136 | |||||||||||
| $ | 208,476 | $ | 136,186 | $ | 9,952 | $ | 8,202 | $ | 54,136 | |||||||
S-27
The Company was initially capitalized on November 9, 2007, with its first investor closing on May 14, 2008. The Company's principal source of liquidity is cash on hand, the proceeds of its on-going best-efforts offering and the cash flow generated from properties the Company has or will acquire and any short term investments. In addition, the Company may borrow funds, subject to the approval of the Company's board of directors.
The Company anticipates that cash flow, and cash on hand, will be adequate to cover its operating expenses and to permit the Company to meet its anticipated liquidity requirements, including debt service, capital improvements and anticipated distributions to shareholders. The Company intends to use the proceeds from the Company's on-going best-efforts offering, and cash on hand, to purchase income producing real estate.
The Company is raising capital through a best-efforts offering of Units (each Unit consists of one common share and one Series A preferred share) by David Lerner Associates, Inc., the managing dealer, which receives selling commissions and a marketing expense allowance based on proceeds of the Units sold. The minimum offering of 9,523,810 Units at $10.50 per Unit was sold as of May 14, 2008, with proceeds net of commissions and marketing expenses totaling $90 million. Subsequent to the minimum offering and through December 31, 2009, an additional 89.2 million Units, at $11 per Unit, were sold, with the Company receiving proceeds, net of commissions, marketing expenses and other offering costs of approximately $881.3 million. The Company is continuing its offering at $11.00 per Unit. The offering expires on April 25, 2010. The Company plans on extending the offering for one year to April 25, 2011. As of December 31, 2009, 83,488,971 Units remained unsold.
To maintain its REIT status the Company is required to distribute at least 90% of its ordinary income. Distributions during 2009 totaled approximately $57.3 million of which approximately $35.8 million was used to purchase additional Units under the Company's best-efforts offering. Thus the net cash distributions were $21.5 million. The distributions were paid at a monthly rate of $0.073334 per common share. For the same period the Company's net cash generated from operations was approximately $29.1 million, which exceeded the net cash distributions. During the initial phase of the Company's operations, the Company may, due to the inherent delay between raising capital and investing that same capital in income producing real estate, have a portion of its distributions funded from offering proceeds. The portion of the distributions funded from offering proceeds is expected to be treated as a return of capital for federal income tax purposes. In May, 2008, the Company's Board of Directors established a policy for an annualized dividend rate of $0.88 per common share, payable in monthly distributions. The Company intends to continue paying dividends on a monthly basis, consistent with the annualized dividend rate established by its Board of Directors. The Company's Board of Directors, upon the recommendation of the Audit Committee, may amend or establish a new annualized dividend rate and may change the timing of when distributions are paid. The Company's objective in setting a distribution rate is to project a rate that will provide consistency over the life of the Company taking into account acquisitions and capital improvements, ramp up of new properties and varying economic cycles. To meet this objective, the Company may require the use of debt or offering proceeds in addition to cash from operations. Since a portion of distributions has to date been funded with proceeds from the offering of Units, the Company's ability to maintain its current intended rate of distribution will be based on its ability to fully invest its offering proceeds and thereby increase its cash generated from operations. As there can be no assurance of the Company's ability to acquire properties that provide income at this level, or that the properties already acquired will provide income at this level, there can be no assurance as to the classification or duration of distributions at the current rate. Proceeds of the offering which are distributed are not available for investment in properties.
The Company has a Unit Redemption Program to provide limited interim liquidity to its shareholders who have held their Units for at least one year. Shareholders may request redemption of Units for a purchase price equal to 92% of the price paid per Unit if the Units have been owned for less than three years, or 100% of the price paid per Unit if the Units have been owned more than
S-28
three years. The maximum number of Units that may be redeemed in any given year will be three percent of the weighted average number of Units outstanding during the 12-month period immediately prior to the date of redemption. The Company reserves the right to change the purchase price of redemptions, reject any request for redemption, or otherwise amend the terms of, suspend, or terminate the Unit Redemption Program. During 2009, the Company redeemed 252,471 Units in the amount of $2.6 million under the program.
The Company has on-going capital commitments to fund its capital improvements. The Company is required, under all of the hotel management agreements and certain loan agreements, to make available, for the repair, replacement, refurbishing of furniture, fixtures, and equipment, a percentage of gross revenues provided that such amount may be used for the Company's capital expenditures with respect to the hotels. As of December 31, 2009, the Company held with various lenders $6.3 million in reserves for capital expenditures. As of December 31, 2009, the Company had four major renovations in progress, which will be completed during the first quarter of 2010. Total capital expenditures on properties owned at December 31, 2009 are anticipated to be approximately $13 million in 2010. Additionally, the Company is in the process of constructing a SpringHill Suites hotel in Alexandria, Virginia. The total construction costs are expected to be approximately $20-$25 million and will be completed over the next 15 months.
As of December 31, 2009, the Company had outstanding contracts for the potential purchase of eight additional hotels for a total purchase price of $132.1 million. Six of these hotels are under construction and are expected to be completed over the next 12 months. Although the Company is working towards acquiring these hotels, there are many conditions to closing that have not yet been satisfied and there can be no assurance that closings will occur under the outstanding purchase contracts. It is anticipated that the purchase price for the outstanding contracts will be funded from the proceeds of the Company's on-going best-efforts offering of Units and cash on hand.
On October 14, 2009, the Company entered into a ground lease for approximately one acre of land located in downtown Richmond, Virginia. The lease terminates on December 31, 2098, subject to the Company's right to exercise two renewal periods of ten years each. The Company intends to use the land to build two nationally recognized brand hotels. Under the terms of the lease the Company has a six month "Study Period" to determine the viability of the hotels. The Company can terminate the lease for any reason during the Study Period, which ends on April 14, 2010. After the Study Period, the lease continues to be subject to various conditions, including but not limited to obtaining various permits, licenses, zoning variances and franchise approvals. If any of these conditions are not met the Company has the right to terminate the lease at any time. Rent payments are not required until the Company decides to begin construction on the hotels. Annual rent under the lease is $300,000 with adjustments throughout the lease term based on the Consumer Price Index. As there are many conditions to beginning construction on the hotels, there are no assurances that the Company will construct the hotels or continue the lease.
Subsequent Events
In January 2010, the Company declared and paid approximately $7.2 million in dividend distributions to its common shareholders, or $0.073334 per outstanding common share. The Company also closed on the issuance of 5.3 million Units through its on-going best-efforts offering, representing gross proceeds to the Company of $58.4 million and proceeds net of selling and marketing costs of $52.5 million.
In January 2010, the Company redeemed 120,742 Units in the amount of $1.25 million under its Unit Redemption Program.
In February 2010, the Company declared and paid approximately $7.6 million in dividend distributions to its common shareholders, or $0.073334 per outstanding common share. The Company
S-29
also closed on the issuance of 5.2 million Units through its on-going best-efforts offering, representing gross proceeds to the Company of $57.4 million and proceeds net of selling and marketing costs of $51.6 million.
On February 1, 2010, the Company entered into a purchase contract for the potential acquisition of a Courtyard in Santa Ana, California. The gross purchase price for the 155 room hotel is $24.8 million, and a refundable deposit of $100,000 was paid by the Company in connection with the contract. The hotel is currently under construction. The number of rooms refers to the expected number of rooms upon completion.
In February 2010, the Company agreed to sell back to Chesapeake Energy Corporation (Chesapeake) two of the 113 sites originally purchased from Chesapeake and release Chesapeake from their associated lease obligation. The sales price for the two sites was equal to the Company's original purchase price, approximately $2.6 million. The Company did earn and receive rental income for the period held totaling approximately $240,000.
Subsequent to December 31, 2009, the Company closed on the purchase of five hotels. The following table summarizes the hotel information. All dollar amounts are in thousands.
Location | Brand | Gross Purchase Price | Rooms | Date of Purchase | ||||||||
|---|---|---|---|---|---|---|---|---|---|---|---|---|
Houston, TX | Marriott | $ | 50,750 | 206 | 1/8/2010 | |||||||
Albany, GA | Fairfield Inn & Suites | 7,920 | 87 | 1/14/2010 | ||||||||
Panama City, FL | TownePlace Suites | 10,640 | 103 | 1/19/2010 | ||||||||
Clovis, CA | Homewood Suites | 12,435 | 83 | 2/2/2010 | ||||||||
Jacksonville, NC | TownePlace Suites | 9,200 | 86 | 2/16/2010 | ||||||||
| $ | 90,945 | 565 | ||||||||||
Impact of Inflation
Operators of hotels, in general, possess the ability to adjust room rates daily to reflect the effects of inflation. Competitive pressures may, however, limit the operators' ability to raise room rates. Currently the Company is not experiencing any material impact from inflation.
Business Interruption
Being in the real estate industry, the Company is exposed to natural disasters on both a local and national scale. Although management believes there is adequate insurance to cover this exposure, there can be no assurance that such events will not have a material adverse effect on the Company's financial position or results of operations.
Seasonality
The hotel industry historically has been seasonal in nature. Seasonal variations in occupancy at the Company's hotels may cause quarterly fluctuations in its revenues. To the extent that cash flow from operations is insufficient during any quarter, due to temporary or seasonal fluctuations in revenue, the Company expects to utilize cash on hand to make distributions.
Critical Accounting Policies
The following contains a discussion of what the Company believes to be critical accounting policies. These items should be read to gain a further understanding of the principles used to prepare the Company's financial statements. These principles include application of judgment; therefore,
S-30
changes in judgments may have a significant impact on the Company's reported results of operations and financial condition.
Investment Policy
Upon acquisition of real estate properties, the Company estimates the fair value of acquired tangible assets (consisting of land, land improvements, buildings and improvements) and identified intangible assets and liabilities, in-place leases and assumed debt based on evaluation of information and estimates available at that date. Generally, the Company does not acquire hotel properties that have significant in-place leases as lease terms for hotel properties are very short term in nature. The Company has not assigned any value to intangible assets such as management contracts and franchise agreements as such contracts are generally at current market rates and any other value attributable to these contracts is not considered material. Beginning January 1, 2009, the Company has expensed as incurred all transaction costs associated with the acquisitions of existing businesses, including title, legal, accounting and other related costs, as well as the brokerage commission paid to ASRG, owned 100% by Glade M. Knight, Chairman and Chief Executive Officer of the Company. For acquisitions of existing businesses prior to January 1, 2009, these costs were capitalized as part of the cost of the acquisition.
Capitalization Policy
The Company considers expenditures to be capital in nature based on the following criteria: (1) for a single asset, the cost must be at least $500, including all normal and necessary costs to place the asset in service, and the useful life must be at least one year; (2) for group purchases of 10 or more identical assets, the unit cost for each asset must be at least $50, including all normal and necessary costs to place the asset in service, and the useful life must be at least one year; (3) for major repairs to a single asset, the repair must be at least $2,500 and the useful life of the asset must be substantially extended.
Impairment Losses Policy
The Company records impairment losses on hotel properties used in operations if indicators of impairment are present, and the sum of the undiscounted cash flows estimated to be generated by the respective properties, based on historical and industry information, is less than the properties' carrying amount. Impairment losses are measured as the difference between the asset's fair value less cost to sell, and its carrying value. No impairment losses have been recorded to date.
Recent Accounting Pronouncements
Accounting Standards Codification
In June 2009, the Financial Accounting Standards Board ("FASB") issued a pronouncement establishing the FASB Accounting Standards Codification™ as the source of authoritative accounting principles recognized by the FASB to be applied in the preparation of financial statements in conformity with United States generally accepted accounting principles ("GAAP"). The standard explicitly recognizes rules and interpretive releases of the Securities and Exchange Commission ("SEC") under federal securities laws as authoritative GAAP for SEC registrants. This standard is effective for financial statements issued for interim and annual periods ending after September 15, 2009. The adoption of this standard did not have a material impact on the Company's consolidated financial statements.
S-31
Noncontrolling Interests
In June 2009, the FASB issued a pronouncement which amends its guidance surrounding a company's analysis to determine whether any of its variable interests constitute controlling financial interests in a variable interest entity. This analysis identifies the primary beneficiary of a variable interest entity as the enterprise that has both of the following characteristics: (a) the power to direct the activities of a variable interest entity that most significantly impact the entity's economic performance, and (b) the obligation to absorb losses of the entity that could potentially be significant to the variable interest entity or the right to receive benefits from the entity that could potentially be significant to the variable interest entity. Additionally, an enterprise is required to assess whether it has an implicit financial responsibility to ensure that a variable interest entity operates as designed when determining whether it has the power to direct the activities of the variable interest entity that most significantly impact the entity's economic performance. The new pronouncement also requires ongoing assessments of whether an enterprise is the primary beneficiary of a variable interest entity and enhanced disclosure about an enterprise's involvement with a variable interest entity. This pronouncement is effective for interim and annual reporting periods beginning after November 15, 2009. The adoption of this standard is not anticipated to have a material impact on the Company's consolidated financial statements.
Subsequent Events
In May 2009, the FASB issued a pronouncement which sets forth general standards of accounting for and disclosure of events that occur after the balance sheet date but before financial statements are issued or available to be issued. Although there is new terminology, this pronouncement is based on the same principles as those that previously existed in the auditing standards. This pronouncement was effective for the Company beginning June 30, 2009. The adoption of this standard did not have a material impact on the Company's consolidated financial statements.
Assets Acquired or Liabilities Assumed in a Business Combination
In April 2009, the FASB issued a pronouncement which amends its guidance for all assets acquired and all liabilities assumed in a business combination that arise from contingencies. This pronouncement states that the acquirer will recognize such an asset or liability if the acquisition-date fair value of that asset or liability can be determined during the measurement period. If it cannot be determined during the measurement period, then the asset or liability should be recognized as of the acquisition date if the following criteria are met: (1) information available before the end of the measurement period indicates that it is probable that an asset existed or that a liability had been incurred at the acquisition date, and (2) the amount of the asset or liability can be reasonably estimated. This pronouncement was adopted by the Company in the first quarter of 2009. The adoption of this standard did not have a material impact on the Company's consolidated financial statements.
Business Combinations
In December 2007, the FASB issued a pronouncement which amends its guidance for business combinations by requiring an acquirer to recognize the assets of existing businesses acquired, the liabilities assumed, and any noncontrolling interest in the acquiree at the acquisition date, measured at their fair values as of that date, with limited exceptions. This method replaces the cost-allocation process, which required the cost of an acquisition of an existing business to be allocated to the individual assets acquired and liabilities assumed based on their estimated fair values. A significant change included in the new pronouncement is the requirement that costs incurred to effect an acquisition of an existing business, must be accounted for separately as expenses. Such costs include title, legal, accounting and other related costs, as well as commissions including the commission paid to ASRG, a related party 100% owned by Glade M. Knight, Chairman and CEO of the Company. This
S-32
pronouncement was effective January 1, 2009. For acquisitions of existing businesses prior to January 1, 2009, these costs were capitalized as part of the cost of the acquisition. During 2009, the Company expensed $5.0 million in acquisition related costs. Included in this amount is $293,000 in transaction costs related to potential acquisitions as of December 31, 2008. These costs were incurred during 2008 and recorded as deferred acquisition costs and included in other assets, net in the Company's consolidated balance sheet as of December 31, 2008. In accordance with this pronouncement, these costs were expensed on January 1, 2009. The adoption of this standard has had a material impact on the Company's financial position and results of operations and will continue to have a material impact on the Company's consolidated financial statements as it acquires other operating businesses.
S-33
Set forth below are the audited consolidated financial statements of the Company as of December 31, 2009 and 2008, and the related consolidated statements of operations, shareholders' equity, and cash flows for the years ended December 31, 2009 and December 31, 2008 and for the period November 9, 2007 (initial capitalization) through December 31, 2007. These financial statements have been included herein in reliance on the report, also set forth below, of Ernst & Young LLP, an independent registered public accounting firm, and upon the authority of that firm as an expert in accounting and auditing.
The tables following this introduction set forth information with respect to certain of the prior real estate programs sponsored by Glade M. Knight, who is sometimes referred to as the "prior program sponsor." These tables provide information for use in evaluating the programs, the results of the operations of the programs, and compensation paid by the programs. Information in the tables is current as of December 31, 2009. The tables are furnished solely to provide prospective investors with information concerning the past performance of entities formed by Glade M. Knight. Regulatory filings and annual reports of Cornerstone, Apple REIT Eight, Apple REIT Seven, Apple REIT Six, Apple Hospitality Five and Apple Hospitality Two will be provided upon request for no cost (except for exhibits, for which there is a minimal charge). In addition, Table VI of this Supplement contains detailed information on the property acquisitions of Apple REIT Six, Apple REIT Seven and Apple REIT Eight and is available without charge upon request of any investor or prospective investor. Please send all requests to Apple REIT Nine, Inc., 814 East Main Street, Richmond, VA 23219, Attn: Kelly Clarke; telephone: 804-344-8121.
In the five years ending December 31, 2009, Glade M. Knight sponsored only Cornerstone, Apple Hospitality Two, Apple Hospitality Five, Apple REIT Six, Apple REIT Seven and Apple REIT Eight, which have investment objectives similar to ours. Cornerstone, Apple Hospitality Two, Apple Hospitality Five, Apple REIT Six, Apple REIT Seven and Apple REIT Eight were formed to invest in existing residential rental properties and/or extended-stay and select-service hotels and possibly other properties for the purpose of providing regular monthly or quarterly distributions to shareholders and the possibility of long-term appreciation in the value of properties and shares.
On May 23, 2007, Apple Hospitality Two merged with and into an affiliate managed by ING Clarion Partners, LLC. Pursuant to the terms and conditions of the Agreement and Plan of Merger, dated as of February 15, 2007, upon the completion of the merger, the separate corporate existence of Apple Hospitality Two ceased. Each shareholder of Apple Hospitality Two received approximately $11.20 for each outstanding unit (consisting of one common share together with one Series A preferred share).
On October 5, 2007, Apple Hospitality Five merged with and into a subsidiary of Inland American Real Estate Trust, Inc. Pursuant to the terms and conditions of the Agreement and Plan of Merger, dated as of July 25, 2007, upon the completion of the merger, the separate corporate existence of Apple Hospitality Five ceased. Each shareholder of Apple Hospitality Five received approximately $14.05 for each outstanding unit (consisting of one common share together with one Series A preferred share).
The information in the following tables should not be considered as indicative of our capitalization or operations. Also past performance of prior programs is not necessarily indicative of our future results. Purchasers of Units offered by our offering will not have any interest in the entities referred to in the following tables or in any of the properties owned by those entities as a result of the acquisition of Units in us.
S-34
See, "Apple Nine Advisors and Apple Suites Realty—Prior Performance of Programs Sponsored by Glade M. Knight" in the prospectus for additional information on certain prior real estate programs sponsored by Mr. Knight, including a description of the investment objectives which are deemed by Mr. Knight to be similar and dissimilar to those of the Company.
The following tables use certain financial terms. The following paragraphs briefly describe the meanings of these terms.
- •
- "Acquisition Costs" means fees related to the purchase of property, cash down payments, acquisition fees, and legal and other costs related to property acquisitions.
- •
- "Cash Generated From Operations" means the excess (or the deficiency in the case of a negative number) of operating cash receipts, including interest on investments, over operating cash expenditures, including debt service payments.
- •
- "GAAP" refers to "Generally Accepted Accounting Principles" in the United States.
- •
- "Recapture" means the portion of taxable income from property sales or other dispositions that is taxed as ordinary income.
- •
- "Reserves" refers to offering proceeds designated for repairs and renovations to properties and offering proceeds not committed for expenditure and held for potential unforeseen cash requirements.
- •
- "Return of Capital" refers to distributions to investors in excess of net income.
S-35
TABLE I: EXPERIENCE IN RAISING AND INVESTING FUNDS
Table I presents a summary of the funds raised and the use of those funds by Apple REIT Eight and Apple REIT Seven whose investment objectives are similar to those of Apple REIT Nine, and whose offering closed or was in progress within the three years ending December 31, 2009.
| | Apple REIT Eight | Apple REIT Seven | ||||||
|---|---|---|---|---|---|---|---|---|
Dollar Amount Offered | $ | 1,000,000,000 | $ | 1,000,000,000 | ||||
Dollar Amount Raised | 1,000,000,000 | 1,000,000,000 | ||||||
LESS OFFERING EXPENSES: | ||||||||
Selling Commissions and Discounts | 10.00% | 10.00% | ||||||
Organizational Expenses | 0.15% | 0.19% | ||||||
Other | 0.00% | 0.00% | ||||||
Reserves | 0.50% | 0.50% | ||||||
Percent Available from Investment | 89.35% | 89.31% | ||||||
ACQUISITION COSTS: | ||||||||
Prepaid items and fees to purchase property(1) | 87.35% | 87.31% | ||||||
Cash down payment | 0.00% | 0.00% | ||||||
Acquisition fees(2) | 2.00% | 2.00% | ||||||
Other | 0.00% | 0.00% | ||||||
Total Acquisition Costs | 89.35% | 89.31% | ||||||
Percentage Leverage (excluding unsecured debt) | 12.89% | 11.06% | ||||||
Date Offering Began | July 2007 | March 2006 | ||||||
Length of offering (in months) | 9 | 17 | ||||||
Months to invest 90% of amount available for investment (measured from beginning of offering) | 11 | 22 | ||||||
- (1)
- This line item includes the contracted purchase price plus any additional closing costs such as transfer taxes, title insurance and legal fees.
- (2)
- Substantially all of the acquisition fees were paid to the sponsor or affiliates of the sponsor. The acquisition fees include real estate commissions paid on the acquisition.
Information on prior programs is not indicative of our capitalization or operations and is not necessarily indicative of our future results.
Purchasers of Units in our offering will own no interest in these prior programs.
S-36
TABLE II: COMPENSATION TO SPONSOR AND ITS AFFILIATES
Table II summarizes the compensation paid to the Prior Program Sponsor and its Affiliates, and employee cost reimbursements to related entities (i) by programs organized by it and closed within three years ended December 31, 2009, and (ii) by all other programs during the three years ended December 31, 2009.
| | Apple REIT Eight | Apple REIT Seven | Apple REIT Six | Apple Hospitality Five(4) | Apple Hospitality Two(3) | ||||||||||||
|---|---|---|---|---|---|---|---|---|---|---|---|---|---|---|---|---|---|
Date offering commenced | July 2007 | March 2006 | April 2004 | January 2003 | May 2001 | ||||||||||||
Dollar amount raised | $ | 1,000,000,000 | $ | 1,000,000,000 | $ | 1,000,000,000 | $ | 500,000,000 | $ | 300,000,000 | |||||||
Amounts Paid to Prior Program Sponsor from Proceeds of Offering: | |||||||||||||||||
Acquisition fees | — | — | — | — | — | ||||||||||||
Real Estate commission | 19,011,000 | 18,032,000 | 16,906,642 | 8,200,000 | 8,247,000 | ||||||||||||
Advisory Fees(2) | 2,135,000 | 3,882,000 | 9,646,000 | 3,315,000 | 749,000 | ||||||||||||
Other | — | — | — | — | — | ||||||||||||
Employee payroll and benefits(5) | 3,555,000 | 4,837,000 | 7,089,000 | 2,754,135 | 4,378,624 | ||||||||||||
Cash generated from operations before deducting payments to Prior Program Sponsor | 93,151,000 | 183,482,000 | 367,444,000 | 167,383,000 | 203,609,000 | ||||||||||||
Management and Accounting Fees | — | — | — | — | — | ||||||||||||
Reimbursements | — | — | — | — | 423,000 | ||||||||||||
Leasing Fees | — | — | — | — | — | ||||||||||||
Other Fees | — | — | — | — | 15,700,000 | (1) | |||||||||||
| |||||||||||||||||
- (1)
- Effective January 31, 2003, Apple Hospitality Two acquired all shares of Apple Suites Advisors (previously owned by Mr. Glade Knight). As a result of this transaction, Mr. Knight received $2 million in cash and a note due in 2007 in the amount of $3.5 million. Additionally as the result of this transaction, Apple Hospitality Two's Series B Preferred Shares were converted into approximately 1.3 million Series C Preferred Shares. The Series C Preferred Shares were valued at $10.2 million.
- (2)
- Effective February 1, 2003, Apple Hospitality Five advisory fees and related expenses were paid to Apple Hospitality Two.
- (3)
- On May 23, 2007, Apple Hospitality Two merged with and into an affiliate managed by ING Clarion Partners, LLC.
- (4)
- On October 5, 2007, Apple Hospitality Five merged with and into a subsidiary of Inland American Real Estate Trust, Inc.
- (5)
- Represents payroll and benefits expenses either directly incurred, or reimbursements to, Apple Fund Management (a subsidiary of Apple REIT Six and indirectly controlled by the Prior Performance Sponsor) or a prior related REIT organized and indirectly controlled by the Prior Program Sponsor.
Information on prior programs is not indicative of our capitalization or operations and is not necessarily indicative of our future results.
Purchasers of Units in our offering will own no interest in these prior programs.
S-37
TABLE III: OPERATING RESULTS OF PRIOR PROGRAMS*
Table III presents a summary of the annual operating results for Apple REIT Eight, Apple REIT Seven and Apple REIT Six, whose offerings closed or were in progress in the five year period ending December 31, 2009. Table III is shown on both an income tax basis as well as in accordance with generally accepted accounting principles, the only significant difference being the methods of calculating depreciation.
| | 2009 Apple REIT Eight | 2009 Apple REIT Seven | 2009 Apple REIT Six | 2008 Apple REIT Eight | 2008 Apple REIT Seven | 2008 Apple REIT Six | 2007 Apple REIT Eight | 2007 Apple REIT Seven | 2007 Apple REIT Six | 2006 Apple REIT Seven | 2006 Apple REIT Six | 2005 Apple REIT Six | ||||||||||||||||||||||||||
|---|---|---|---|---|---|---|---|---|---|---|---|---|---|---|---|---|---|---|---|---|---|---|---|---|---|---|---|---|---|---|---|---|---|---|---|---|---|---|
Gross revenues | $ | 170,885,000 | $ | 191,715,000 | $ | 219,689,000 | $ | 133,284,000 | $ | 214,291,000 | $ | 264,302,000 | $ | 1,485,000 | $ | 138,564,000 | $ | 257,934,000 | $ | 20,345,000 | $ | 235,875,000 | $ | 101,790,000 | ||||||||||||||
Profit on sale of properties | — | — | — | — | — | — | — | — | — | — | — | — | ||||||||||||||||||||||||||
Less Operating expenses | 126,178,000 | 132,285,000 | 153,060,000 | 95,047,000 | 144,028,000 | 173,098,000 | 2,097,000 | 89,338,000 | 165,059,000 | 15,689,000 | 154,424,000 | 68,733,000 | ||||||||||||||||||||||||||
Interest income (expense) | (6,295,000 | ) | (6,292,000 | ) | (2,312,000 | ) | (1,928,000 | ) | (3,766,000 | ) | (1,784,000 | ) | 6,343,000 | 997,000 | (1,853,000 | ) | 1,855,000 | (1,809,000 | ) | 2,126,000 | ||||||||||||||||||
Depreciation | 32,907,000 | 32,425,000 | 30,938,000 | 22,044,000 | 28,434,000 | 30,918,000 | 333,000 | 16,990,000 | 27,694,000 | 3,073,000 | 25,529,000 | 11,366,000 | ||||||||||||||||||||||||||
Net income (loss) GAAP basis | 5,505,000 | 20,713,000 | 33,379,000 | 14,265,000 | 38,063,000 | 58,502,000 | 5,398,000 | 33,233,000 | 63,328,000 | 3,438,000 | 54,113,000 | 23,817,000 | ||||||||||||||||||||||||||
Taxable income | — | — | — | — | — | — | — | — | — | — | — | — | ||||||||||||||||||||||||||
Cash generated from operations | 45,739,000 | 55,460,000 | 66,029,000 | 39,714,000 | 69,025,000 | 88,747,000 | 5,563,000 | 49,957,000 | 89,848,000 | 5,158,000 | 81,363,000 | 28,907,000 | ||||||||||||||||||||||||||
Cash generated from sales | — | — | — | — | — | — | — | — | — | — | — | — | ||||||||||||||||||||||||||
Cash generated from refinancing | — | — | — | — | — | — | — | — | — | — | — | — | ||||||||||||||||||||||||||
Less cash distributions to investors | 74,924,000 | 75,380,000 | 82,215,000 | 76,378,000 | 81,440,000 | 81,746,000 | 14,464,000 | 60,234,000 | 78,834,000 | 12,526,000 | 77,997,000 | 48,865,000 | ||||||||||||||||||||||||||
Cash generated after cash distribution | (29,185,000 | ) | (19,920,000 | ) | (16,186,000 | ) | (36,664,000 | ) | (12,415,000 | ) | 7,001,000 | (8,901,000 | ) | (10,277,000 | ) | 11,014,000 | (7,368,000 | ) | 3,366,000 | (19,958,000 | ) | |||||||||||||||||
Less Special items | — | — | — | — | — | — | — | — | — | — | — | — | ||||||||||||||||||||||||||
Cash generated after cash distributions and special items | (29,185,000 | ) | (19,920,000 | ) | (16,186,000 | ) | (36,664,000 | ) | (12,415,000 | ) | 7,001,000 | (8,901,000 | ) | (10,277,000 | ) | 11,014,000 | (7,368,000 | ) | 3,366,000 | (19,958,000 | ) | |||||||||||||||||
Capital contributions, net | 13,692,000 | 1,171,000 | (3,149,000 | ) | 234,054,000 | 20,599,000 | 16,325,000 | 679,435,000 | 541,410,000 | 13,159,000 | 363,640,000 | 78,026,000 | 471,784,000 | |||||||||||||||||||||||||
Fixed asset additions | 29,923,000 | 13,777,000 | 9,155,000 | 759,346,000 | 129,589,000 | 33,434,000 | 87,643,000 | 391,227,000 | 15,635,000 | 318,157,000 | 62,075,000 | 570,034,000 | ||||||||||||||||||||||||||
Line of credit-change in(1) | 48,090,000 | 11,510,000 | 25,940,000 | 10,258,000 | — | — | — | (18,000,000 | ) | — | 18,000,000 | (28,000,000 | ) | 28,000,000 | ||||||||||||||||||||||||
S-38
TABLE III: OPERATING RESULTS OF PRIOR PROGRAMS*—(Continued)
| | 2009 Apple REIT Eight | 2009 Apple REIT Seven | 2009 Apple REIT Six | 2008 Apple REIT Eight | 2008 Apple REIT Seven | 2008 Apple REIT Six | 2007 Apple REIT Eight | 2007 Apple REIT Seven | 2007 Apple REIT Six | 2006 Apple REIT Seven | 2006 Apple REIT Six | 2005 Apple REIT Six | ||||||||||||||||||||||||||
|---|---|---|---|---|---|---|---|---|---|---|---|---|---|---|---|---|---|---|---|---|---|---|---|---|---|---|---|---|---|---|---|---|---|---|---|---|---|---|
Cash generated(2) | — | (20,609,000 | ) | (935,000 | ) | (562,009,000 | ) | (121,828,000 | ) | (32,326,000 | ) | 561,985,000 | 97,833,000 | 7,101,000 | 44,554,000 | (9,788,000 | ) | (106,842,000 | ) | |||||||||||||||||||
End of period cash | — | — | — | — | 20,609,000 | 935,000 | 562,009,000 | 142,437,000 | 33,261,000 | 44,604,000 | 26,160,000 | 35,948,000 | ||||||||||||||||||||||||||
Tax and distribution data per $1,000 invested | ||||||||||||||||||||||||||||||||||||||
Federal income tax results | ||||||||||||||||||||||||||||||||||||||
Ordinary income | 24 | 35 | 51 | 42 | 45 | 70 | 11 | 50 | 72 | 38 | 66 | 50 | ||||||||||||||||||||||||||
Capital gain | — | — | — | — | — | — | — | — | — | — | — | — | ||||||||||||||||||||||||||
Cash distributions to investors Source (on GAAP basis) | ||||||||||||||||||||||||||||||||||||||
Investment income | 24 | 35 | 51 | 42 | 45 | 70 | 11 | 50 | 72 | 38 | 66 | 50 | ||||||||||||||||||||||||||
Long-term capital gain | — | — | — | — | — | — | — | — | — | — | — | — | ||||||||||||||||||||||||||
Return of capital | 50 | 39 | 31 | 38 | 35 | 12 | 25 | 30 | 8 | 22 | 14 | 30 | ||||||||||||||||||||||||||
Source (on Cash basis) | ||||||||||||||||||||||||||||||||||||||
Sales | — | — | — | — | — | — | — | — | — | — | — | — | ||||||||||||||||||||||||||
Refinancings | — | — | — | — | — | — | — | — | — | — | — | — | ||||||||||||||||||||||||||
Operations | 74 | 74 | 82 | 80 | 80 | 82 | 36 | 80 | 80 | 60 | 80 | 80 | ||||||||||||||||||||||||||
Other | — | — | — | — | — | — | — | — | — | — | — | — | ||||||||||||||||||||||||||
Amount (in percentage terms) remaining invested in program properties at the end of the last year reported in the Table (original total acquisition cost of properties retained divided by original total acquisition cost of all properties in program) | 100 | % | 100 | % | 100 | % | ||||||||||||||||||||||||||||||||
- *
- Any rows not reflected from SEC Industry Guide 5 are not applicable to the programs.
- (1)
- Amount reflects change in Company's short term credit facilities.
- (2)
- Amount reflects the net change in Company's cash balance during the year.
Information on prior programs is not indicative of our capitalization or operations and is not necessarily indicative of our future results.
Purchasers of Units in our offering will own no interest in these prior programs.
S-39
TABLE IV: RESULTS OF COMPLETED PROGRAMS
Table IV shows the aggregate results during the period of operation for Cornerstone Realty, Apple Hospitality Two and Apple Hospitality Five, each of which completed operations within the five year period ending December 31, 2009. Cornerstone Realty merged into Colonial Properties Trust on April 1, 2005. Apple Hospitality Two merged with and into an affiliate managed by ING Clarion Partners, LLC on May 23, 2007. Apple Hospitality Five merged with and into a subsidiary of Inland American Real Estate Trust, Inc. on October 5, 2007.
| | Apple Hospitality Two | Apple Hospitality Five | Cornerstone Realty(1) | |||||||||
|---|---|---|---|---|---|---|---|---|---|---|---|---|
Dollar Amount Raised | $ | 300,000,000 | $ | 500,000,000 | $ | 432,309,000 | ||||||
Number of Properties Purchased | 66 | 28 | 107 | |||||||||
Date of Closing of Offering | 11/26/02 | 3/18/04 | 12/01/01 | |||||||||
Date of First Sale of Property | 3/24/06 | 8/10/07 | 3/10/00 | |||||||||
Date of Final Sale of Property | 5/23/07 | 10/5/07 | 4/01/05 | |||||||||
Tax and Distribution Data per $1,000 Investment through: | ||||||||||||
Federal Income Tax Results: | ||||||||||||
Ordinary income (loss) | ||||||||||||
—from operations | $ | 429 | $ | 235 | $ | 688 | ||||||
—from recapture/return capital | $ | 1,000 | $ | 1,000 | $ | 407 | ||||||
Capital Gain (loss) | $ | 288 | $ | 426 | $ | 28 | ||||||
Deferred Gain | ||||||||||||
—Capital | $ | — | $ | — | $ | — | ||||||
—Ordinary | $ | — | $ | — | $ | — | ||||||
Cash Distributions to Investors | $ | 1,717 | $ | 1,661 | $ | 1,123 | ||||||
Source (on GAAP basis) | ||||||||||||
—Investment income | $ | 717 | $ | 661 | $ | 716 | ||||||
—Return of Capital | $ | 1,000 | $ | 1,000 | $ | 407 | ||||||
Source (on cash basis) | ||||||||||||
—Sales | $ | 1,120 | $ | 1,277 | $ | 7 | ||||||
—Refinancing | $ | — | $ | — | $ | — | ||||||
—Operations | $ | 597 | $ | 384 | $ | 1,116 | ||||||
—Other | $ | — | $ | — | $ | — | ||||||
Receivable on Net Purchase Money Financing | $ | — | $ | — | $ | — | ||||||
- (1)
- Merged into a subsidiary of Colonial Properties Trust on April 1, 2005. In connection with the merger, the aggregate value of the stock consideration issued by Colonial Properties Trust was approximately $595 million.
Information on prior programs is not indicative of our capitalization or operations and is not necessarily indicative of our future results.
Purchasers of Units in our offering will own no interest in these prior programs.
S-40
TABLE V: SALES OR DISPOSALS OF PROPERTIES
On May 23, 2007, Apple Hospitality Two merged with and into an affiliate managed by ING Clarion Partners, LLC. Prior to the merger, Apple Hospitality Two owned 63 hotels.
On October 5, 2007, Apple Hospitality Five merged with and into a subsidiary of Inland American Real Estate Trust, Inc. Prior to the merger, Apple Hospitality Five owned 27 hotels.
Selling Price, Net of Closing Costs and GAAP Adjustments
Property | Date Acquired | Date of Sale | Cash Received Net of Closing Costs | Mortgage Balance at Time of Sale | Purchase Money Mortgage Taken Back by Program | Adjustments Resulting from Application of GAAP | Total | Original Mortgage Financing | Total Acquisition Cost, Capital Improvements, Closing and Soft Costs | Total | Excess (Deficiency) of Property Operating Cash Receipts Over Cash Expenditures | |||||||||||||||||||||
|---|---|---|---|---|---|---|---|---|---|---|---|---|---|---|---|---|---|---|---|---|---|---|---|---|---|---|---|---|---|---|---|---|
Sale of two hotels in 2006 Apple Hospitality Two, Inc. | ||||||||||||||||||||||||||||||||
Charlotte | Aug 02 | Mar 06 | $ | 3,700,000 | — | — | — | $ | 3,700,000 | — | $ | 5,833,000 | $ | 5,833,000 | $ | 452,000 | ||||||||||||||||
Spartanburg | Aug 02 | Mar 06 | 1,900,000 | — | — | — | 1,900,000 | — | 3,202,000 | 3,202,000 | 343,000 | |||||||||||||||||||||
| $ | 5,600,000 | $ | 5,600,000 | $ | 9,035,000 | $ | 9,035,000 | $ | 795,000 | |||||||||||||||||||||||
Information on prior programs is not indicative of our capitalization or operations and is not necessarily indicative of our future results.
Purchasers of Units in our offering will own no interest in these prior programs.
S-41
TABLE VI: ACQUISITIONS OF PROPERTIES BY PROGRAMS
The following is a summary of acquisitions by Apple REIT Eight, Apple REIT Seven and Apple REIT Six at December 31, 2009, each of which acquired hotels, which are named according to their location and franchise (as shown below). Purchasers of our units will not have any interest in these properties.
Apple REIT Six
(dollars in thousands)
City | State | Brand | Encumbrances | Initial Investment | Total Investment | Date of Construction | Date Acquired | # of Rooms | |||||||||||||
|---|---|---|---|---|---|---|---|---|---|---|---|---|---|---|---|---|---|---|---|---|---|
Birmingham | Alabama | Fairfield Inn | $ | — | $ | 2,411 | $ | 2,544 | 1995 | Aug-05 | 63 | ||||||||||
Dothan | Alabama | Courtyard | — | 8,412 | 9,326 | 1996 | Aug-05 | 78 | |||||||||||||
Dothan | Alabama | Hampton Inn & Suites | — | 8,971 | 9,042 | 2004 | Jun-05 | 85 | |||||||||||||
Huntsville | Alabama | Fairfield Inn | 2,760 | 5,319 | 5,496 | 1999 | Sep-05 | 79 | |||||||||||||
Huntsville | Alabama | Residence Inn | — | 8,579 | 10,114 | 2002 | Jun-05 | 78 | |||||||||||||
Montgomery | Alabama | SpringHill Suites | 3,451 | 7,290 | 7,493 | 1998 | Sep-05 | 79 | |||||||||||||
Tuscaloosa | Alabama | Courtyard | — | 7,953 | 8,853 | 1996 | Aug-05 | 78 | |||||||||||||
Tuscaloosa | Alabama | Fairfield Inn | — | 4,240 | 4,397 | 1996 | Aug-05 | 63 | |||||||||||||
Anchorage | Alaska | Hampton Inn | — | 11,721 | 13,801 | 1997 | Mar-05 | 101 | |||||||||||||
Anchorage | Alaska | Hilton Garden Inn | — | 19,018 | 20,886 | 2002 | Oct-04 | 125 | |||||||||||||
Anchorage | Alaska | Homewood Suites | — | 12,849 | 12,974 | 2004 | Oct-04 | 122 | |||||||||||||
Phoenix | Arizona | Hampton Inn | — | 6,630 | 7,450 | 1998 | Oct-04 | 99 | |||||||||||||
Tempe | Arizona | SpringHill Suites | — | 8,329 | 8,446 | 1998 | Jun-05 | 121 | |||||||||||||
Tempe | Arizona | TownePlace Suites | — | 8,395 | 8,537 | 1998 | Jun-05 | 119 | |||||||||||||
Arcadia | California | Hilton Garden Inn | — | 11,913 | 14,264 | 1999 | Oct-04 | 124 | |||||||||||||
Arcadia | California | SpringHill Suites | — | 8,092 | 8,926 | 1999 | Oct-04 | 86 | |||||||||||||
Bakersfield | California | Hilton Garden Inn | — | 11,731 | 11,942 | 2004 | Mar-05 | 120 | |||||||||||||
Folsom | California | Hilton Garden Inn | — | 18,510 | 19,713 | 1999 | Nov-05 | 100 | |||||||||||||
Foothill Ranch | California | Hampton Inn | 4,094 | 7,555 | 8,386 | 1998 | Apr-05 | 84 | |||||||||||||
Lake Forest | California | Hilton Garden Inn | — | 10,966 | 11,201 | 2004 | Oct-04 | 103 | |||||||||||||
Milpitas | California | Hilton Garden Inn | — | 19,099 | 21,032 | 1999 | Nov-05 | 161 | |||||||||||||
Roseville | California | Hilton Garden Inn | — | 21,299 | 22,899 | 1999 | Nov-05 | 131 | |||||||||||||
San Francisco | California | Hilton Garden Inn | — | 11,552 | 13,658 | 1999 | Jan-06 | 169 | |||||||||||||
Boulder | Colorado | Marriott | — | 30,891 | 33,022 | 1997 | May-05 | 157 | |||||||||||||
Glendale | Colorado | Hampton Inn & Suites | 5,483 | 14,862 | 16,138 | 1999 | Oct-04 | 133 | |||||||||||||
Lakewood | Colorado | Hampton Inn | — | 10,598 | 11,070 | 2003 | Oct-04 | 170 | |||||||||||||
Farmington | Connecticut | Courtyard | — | 17,228 | 17,240 | 2005 | Oct-05 | 119 | |||||||||||||
Rocky Hill | Connecticut | Residence Inn | — | 12,756 | 12,763 | 2005 | Aug-05 | 96 | |||||||||||||
Wallingford | Connecticut | Homewood Suites | — | 13,491 | 13,665 | 2005 | Jul-05 | 104 | |||||||||||||
Clearwater | Florida | SpringHill Suites | — | 7,214 | 7,215 | 2006 | Feb-06 | 79 | |||||||||||||
Lake Mary | Florida | Courtyard | — | 6,258 | 8,073 | 1995 | Mar-05 | 86 | |||||||||||||
Lakeland | Florida | Residence Inn | — | 10,219 | 11,515 | 2001 | Jun-05 | 78 | |||||||||||||
Orange Park | Florida | Fairfield Inn | 2,933 | 7,834 | 8,038 | 1998 | Nov-05 | 83 | |||||||||||||
Panama City | Florida | Courtyard | — | 9,624 | 9,676 | 2006 | Mar-06 | 84 | |||||||||||||
Pensacola | Florida | Courtyard | — | 11,914 | 12,283 | 1997 | Aug-05 | 90 | |||||||||||||
Pensacola | Florida | Fairfield Inn | — | 5,173 | 5,349 | 1995 | Aug-05 | 63 | |||||||||||||
Pensacola | Florida | Hampton Inn & Suites | — | 9,602 | 9,613 | 2005 | Jul-05 | 85 | |||||||||||||
Tallahassee | Florida | Hilton Garden Inn | — | 11,233 | 12,037 | 1997 | Mar-05 | 99 | |||||||||||||
Albany | Georgia | Courtyard | — | 8,911 | 8,999 | 2004 | Jun-05 | 84 | |||||||||||||
Columbus | Georgia | Residence Inn | — | 8,184 | 8,288 | 2003 | Jun-05 | 78 | |||||||||||||
Savannah | Georgia | SpringHill Suites | 2,795 | 5,792 | 5,979 | 1999 | Sep-05 | 79 | |||||||||||||
Valdosta | Georgia | Courtyard | — | 8,565 | 9,337 | 2002 | Oct-05 | 84 | |||||||||||||
Mt. Olive | New Jersey | Residence Inn | — | 12,741 | 12,820 | 2005 | Sep-05 | 123 | |||||||||||||
Somerset | New Jersey | Homewood Suites | — | 18,614 | 18,814 | 2005 | Aug-05 | 123 | |||||||||||||
Saratoga Springs | New York | Hilton Garden Inn | — | 18,284 | 19,790 | 1999 | Sep-05 | 112 | |||||||||||||
Roanoke Rapids | North Carolina | Hilton Garden Inn | — | 18,171 | 18,177 | 2008 | Mar-08 | 147 | |||||||||||||
Hillsboro | Oregon | Courtyard | 6,185 | 11,363 | 11,635 | 1996 | Mar-06 | 155 | |||||||||||||
Hillsboro | Oregon | Residence Inn | — | 15,960 | 16,263 | 1994 | Mar-06 | 122 | |||||||||||||
Hillsboro | Oregon | TownePlace Suites | — | 11,865 | 13,100 | 1999 | Dec-05 | 136 | |||||||||||||
Portland | Oregon | Residence Inn | — | 43,087 | 46,320 | 2001 | Dec-05 | 258 | |||||||||||||
Pittsburgh | Pennsylvania | Residence Inn | — | 11,428 | 13,109 | 1998 | Sep-05 | 156 | |||||||||||||
Myrtle Beach | South Carolina | Courtyard | — | 9,488 | 10,530 | 1999 | Jun-04 | 135 | |||||||||||||
Nashville | Tennessee | Homewood Suites | — | 8,347 | 8,865 | 1999 | May-05 | 121 | |||||||||||||
S-42
City | State | Brand | Encumbrances | Initial Investment | Total Investment | Date of Construction | Date Acquired | # of Rooms | |||||||||||||
|---|---|---|---|---|---|---|---|---|---|---|---|---|---|---|---|---|---|---|---|---|---|
Arlington | Texas | SpringHill Suites | $ | — | $ | 7,771 | $ | 7,886 | 1998 | Jun-05 | 122 | ||||||||||
Arlington | Texas | TownePlace Suites | — | 7,406 | 7,566 | 1999 | Jun-05 | 95 | |||||||||||||
Dallas | Texas | SpringHill Suites | — | 20,109 | 20,618 | 1997 | Dec-05 | 147 | |||||||||||||
Fort Worth | Texas | Homewood Suites | — | 9,362 | 11,549 | 1999 | May-05 | 137 | |||||||||||||
Fort Worth | Texas | Residence Inn | — | 17,459 | 17,478 | 2005 | May-05 | 149 | |||||||||||||
Fort Worth | Texas | SpringHill Suites | — | 13,744 | 13,800 | 2004 | May-04 | 145 | |||||||||||||
Laredo | Texas | Homewood Suites | — | 10,899 | 10,954 | 2005 | Nov-05 | 106 | |||||||||||||
Laredo | Texas | Residence Inn | — | 11,871 | 11,890 | 2005 | Sep-05 | 109 | |||||||||||||
Las Colinas | Texas | TownePlace Suites | — | 7,461 | 7,600 | 1998 | Jun-05 | 136 | |||||||||||||
McAllen | Texas | Hilton Garden Inn | — | 9,321 | 10,922 | 2000 | Jul-05 | 104 | |||||||||||||
Fredericksburg | Virginia | Hilton Garden Inn | — | 17,184 | 17,329 | 2005 | Dec-05 | 148 | |||||||||||||
Richmond | Virginia | Corporate Office | — | 1,419 | 5,170 | 1893 | Jun-04 | N/A | |||||||||||||
Kent | Washington | TownePlace Suites | — | 12,562 | 13,990 | 1999 | Dec-05 | 152 | |||||||||||||
Mukilteo | Washington | TownePlace Suites | — | 12,560 | 13,794 | 1999 | Dec-05 | 128 | |||||||||||||
Redmond | Washington | Marriott | — | 65,672 | 66,971 | 2004 | Jul-04 | 262 | |||||||||||||
Renton | Washington | Hilton Garden Inn | — | 15,951 | 17,920 | 1998 | Nov-05 | 150 | |||||||||||||
Deposits on Construction in Progress | — | — | 49 | ||||||||||||||||||
| $ | 27,701 | $ | 871,282 | $ | 926,589 | 7,897 | |||||||||||||||
S-43
Apple REIT Seven
(dollars in thousands)
City | State | Brand | Encumbrances | Initial Investment | Total Investment | Date of Construction | Date Acquired | # of Rooms | |||||||||||||
|---|---|---|---|---|---|---|---|---|---|---|---|---|---|---|---|---|---|---|---|---|---|
Montgomery | AL | Homewood Suites | $ | — | $ | 11,010 | $ | 11,278 | 2004 | Aug-06 | 91 | ||||||||||
Montgomery | AL | Hilton Garden Inn | — | 10,725 | 11,184 | 2003 | Aug-06 | 97 | |||||||||||||
Troy | AL | Hampton Inn | — | 6,369 | 6,465 | 2003 | Aug-06 | 82 | |||||||||||||
Auburn | AL | Hilton Garden Inn | — | 10,522 | 11,959 | 2001 | Aug-06 | 101 | |||||||||||||
Huntsville | AL | Hilton Garden Inn | — | 10,627 | 10,721 | 2005 | Aug-06 | 101 | |||||||||||||
Huntsville | AL | Homewood Suites | — | 11,981 | 12,022 | 2006 | Oct-06 | 107 | |||||||||||||
Prattville | AL | Courtyard | — | 9,577 | 9,582 | 2007 | Apr-07 | 84 | |||||||||||||
Dothan | AL | Fairfield Inn | — | 4,813 | 4,843 | 1993 | May-07 | 63 | |||||||||||||
Trussville | AL | Courtyard | — | 9,832 | 9,833 | 2007 | Oct-07 | 84 | |||||||||||||
Huntsville | AL | TownePlace Suites | — | 9,188 | 9,190 | 2007 | Dec-07 | 86 | |||||||||||||
Dothan | AL | Residence Inn | — | 9,918 | 9,918 | 2008 | Apr-08 | 84 | |||||||||||||
Tucson | AZ | Residence Inn | — | 16,958 | 16,958 | 2008 | Jan-08 | 124 | |||||||||||||
San Diego | CA | Hilton Garden Inn | — | 35,366 | 35,858 | 2004 | May-06 | 200 | |||||||||||||
Rancho Bernardo | CA | Courtyard | — | 36,940 | 37,142 | 1987 | Dec-06 | 210 | |||||||||||||
Agoura Hills | CA | Homewood Suites | — | 25,945 | 25,977 | 2007 | May-07 | 125 | |||||||||||||
San Diego | CA | Residence Inn | 14,898 | 33,569 | 33,836 | 1999 | Jun-07 | 121 | |||||||||||||
San Diego | CA | Hampton Inn | — | 43,632 | 45,771 | 2001 | Jul-07 | 177 | |||||||||||||
Highlands Ranch | CO | Residence Inn | 11,203 | 19,678 | 20,165 | 1996 | Feb-07 | 117 | |||||||||||||
Highlands Ranch | CO | Hilton Garden Inn | — | 21,063 | 21,145 | 2007 | Mar-07 | 128 | |||||||||||||
Sarasota | FL | Homewood Suites | — | 14,062 | 14,395 | 2005 | Sep-06 | 100 | |||||||||||||
Miami | FL | Homewood Suites | 9,199 | 25,367 | 27,339 | 2000 | Feb-07 | 159 | |||||||||||||
Tallahassee | FL | Fairfield Inn | 3,285 | 7,112 | 7,250 | 2000 | Apr-07 | 79 | |||||||||||||
Lakeland | FL | Courtyard | 3,957 | 10,393 | 10,540 | 2000 | Apr-07 | 78 | |||||||||||||
Miami | FL | Courtyard | — | 15,463 | 15,545 | 2008 | Sep-08 | 118 | |||||||||||||
Columbus | GA | Fairfield Inn | — | 7,620 | 7,636 | 2003 | Apr-07 | 79 | |||||||||||||
Macon | GA | Hilton Garden Inn | — | 10,115 | 10,140 | 2007 | Jun-07 | 101 | |||||||||||||
Columbus | GA | SpringHill Suites | — | 9,946 | 9,952 | 2008 | Mar-08 | 85 | |||||||||||||
Columbus | GA | TownePlace Suites | — | 8,643 | 8,653 | 2008 | May-08 | 86 | |||||||||||||
Boise | ID | SpringHill Suites | — | 21,604 | 22,009 | 1992 | Sep-07 | 230 | |||||||||||||
New Orleans | LA | Homewood Suites | 16,109 | 44,086 | 45,176 | 2002 | Dec-06 | 166 | |||||||||||||
Hattiesburg | MS | Courtyard | — | 9,791 | 9,793 | 2006 | Oct-06 | 84 | |||||||||||||
Tupelo | MS | Hampton Inn | 3,754 | 5,264 | 6,456 | 1994 | Jan-07 | 96 | |||||||||||||
Omaha | NE | Courtyard | 11,868 | 22,229 | 25,373 | 1999 | Nov-06 | 181 | |||||||||||||
Cranford | NJ | Homewood Suites | — | 13,982 | 15,842 | 2000 | Mar-07 | 108 | |||||||||||||
Mahwah | NJ | Homewood Suites | — | 20,146 | 22,294 | 2001 | Mar-07 | 110 | |||||||||||||
Ronkonkoma | NY | Hilton Garden Inn | — | 27,581 | 28,073 | 2003 | Dec-06 | 164 | |||||||||||||
Cincinnati | OH | Homewood Suites | — | 7,373 | 7,474 | 2005 | Dec-06 | 76 | |||||||||||||
Memphis | TN | Homewood Suites | — | 11,469 | 13,501 | 1989 | May-07 | 140 | |||||||||||||
Houston | TX | Residence Inn | — | 14,147 | 14,206 | 2006 | Apr-06 | 129 | |||||||||||||
Brownsville | TX | Courtyard | — | 8,874 | 8,882 | 2006 | Jun-06 | 90 | |||||||||||||
Stafford | TX | Homewood Suites | — | 8,076 | 8,137 | 2006 | Aug-06 | 78 | |||||||||||||
San Antonio | TX | TownePlace Suites | — | 12,225 | 12,225 | 2007 | Jun-07 | 106 | |||||||||||||
Addison | TX | SpringHill Suites | — | 12,857 | 12,922 | 2003 | Aug-07 | 159 | |||||||||||||
San Antonio | TX | TownePlace Suites | — | 14,219 | 14,219 | 2007 | Sep-07 | 123 | |||||||||||||
El Paso | TX | Homewood Suites | — | 15,825 | 15,831 | 2008 | Apr-08 | 114 | |||||||||||||
Provo | UT | Residence Inn | 5,234 | 11,746 | 14,507 | 1996 | Jun-07 | 114 | |||||||||||||
Alexandria | VA | Courtyard | — | 36,842 | 40,895 | 1987 | Jul-07 | 176 | |||||||||||||
Richmond | VA | Marriott | 24,276 | 59,614 | 74,429 | 1984 | Jan-08 | 410 | |||||||||||||
Seattle | WA | Residence Inn | — | 60,489 | 67,173 | 1991 | Sep-06 | 234 | |||||||||||||
Vancouver | WA | SpringHill Suites | — | 16,436 | 16,456 | 2007 | Jun-07 | 119 | |||||||||||||
Kirkland | WA | Courtyard | — | 32,014 | 32,046 | 2006 | Oct-07 | 150 | |||||||||||||
| $ | 103,783 | $ | 933,323 | $ | 983,216 | 6,424 | |||||||||||||||
S-44
Apple REIT Eight
(dollars in thousands)
City | State | Brand | Encumbrances | Initial Investment | Total Investment | Date of Construction | Date Acquired | # of Rooms | |||||||||||||
|---|---|---|---|---|---|---|---|---|---|---|---|---|---|---|---|---|---|---|---|---|---|
Birmingham | AL | Homewood Suites | $ | 11,596 | $ | 17,093 | $ | 17,388 | 2005 | May-08 | 95 | ||||||||||
Rogers | AR | Fairfield Inn & Suites | — | 8,275 | 9,432 | 2002 | February-08 | 99 | |||||||||||||
Rogers | AR | Residence Inn | — | 12,107 | 12,318 | 2003 | February-08 | 88 | |||||||||||||
Springdale | AR | Residence Inn | — | 5,830 | 7,243 | 2001 | March-08 | 72 | |||||||||||||
Burbank | CA | Residence Inn | — | 51,429 | 51,452 | 2007 | May-08 | 166 | |||||||||||||
Cypress | CA | Courtyard | — | 31,922 | 32,485 | 1988 | April-08 | 180 | |||||||||||||
Oceanside | CA | Residence Inn | — | 29,276 | 29,302 | 2007 | May-08 | 125 | |||||||||||||
Sacramento | CA | Hilton Garden Inn | — | 28,308 | 30,075 | 1999 | March-08 | 154 | |||||||||||||
San Jose | CA | Homewood Suites | — | 22,424 | 23,200 | 1991 | July-08 | 140 | |||||||||||||
Tulare | CA | Hampton Inn & Suites | — | 10,595 | 10,598 | 2008 | June-08 | 86 | |||||||||||||
Jacksonville | FL | Homewood Suites | 16,856 | 23,916 | 24,492 | 2005 | June-08 | 119 | |||||||||||||
Sanford | FL | SpringHill Suites | — | 11,542 | 11,752 | 2000 | March-08 | 105 | |||||||||||||
Tallahassee | FL | Hilton Garden Inn | — | 13,580 | 13,617 | 2006 | January-08 | 85 | |||||||||||||
Tampa | FL | TownePlace Suites | 8,124 | 11,651 | 11,912 | 1999 | June-08 | 95 | |||||||||||||
Port Wentworth | GA | Hampton Inn | — | 11,125 | 11,245 | 1997 | January-08 | 106 | |||||||||||||
Savannah | GA | Hilton Garden Inn | 5,523 | 15,119 | 15,360 | 2004 | July-08 | 105 | |||||||||||||
Overland Park | KS | Fairfield Inn & Suites | — | 12,446 | 12,446 | 2008 | August-08 | 110 | |||||||||||||
Overland Park | KS | Residence Inn | 6,812 | 16,153 | 16,535 | 2000 | April-08 | 120 | |||||||||||||
Overland Park | KS | SpringHill Suites | — | 9,153 | 9,618 | 1999 | March-08 | 102 | |||||||||||||
Wichita | KS | Courtyard | — | 9,190 | 9,404 | 2000 | June-08 | 90 | |||||||||||||
Bowling Green | KY | Hampton Inn | — | 19,371 | 19,440 | 1989 | December-07 | 131 | |||||||||||||
Marlborough | MA | Residence Inn | — | 20,703 | 20,884 | 2006 | January-08 | 112 | |||||||||||||
Westford | MA | Hampton Inn & Suites | — | 15,692 | 15,758 | 2007 | March-08 | 110 | |||||||||||||
Westford | MA | Residence Inn | 6,923 | 15,079 | 15,745 | 2000 | April-08 | 108 | |||||||||||||
Annapolis | MD | Hilton Garden Inn | — | 25,782 | 25,820 | 2007 | January-08 | 126 | |||||||||||||
Kansas City | MO | Residence Inn | 11,382 | 17,330 | 18,329 | 1968 | April-08 | 106 | |||||||||||||
Carolina Beach | NC | Courtyard | — | 24,861 | 25,458 | 2003 | June-08 | 144 | |||||||||||||
Concord | NC | Hampton Inn | 5,033 | 9,607 | 9,704 | 1996 | March-08 | 101 | |||||||||||||
Dunn | NC | Hampton Inn | — | 13,087 | 13,140 | 2006 | January-08 | 120 | |||||||||||||
Fayetteville | NC | Residence Inn | 7,038 | 13,238 | 13,375 | 2006 | May-08 | 92 | |||||||||||||
Greensboro | NC | SpringHill Suites | — | 8,297 | 8,353 | 2004 | November-07 | 82 | |||||||||||||
Matthews | NC | Hampton Inn | — | 11,072 | 11,588 | 1995 | January-08 | 92 | |||||||||||||
Wilmington | NC | Fairfield Inn & Suites | — | 15,316 | 15,316 | 2008 | December-08 | 122 | |||||||||||||
Winston-Salem | NC | Courtyard | 7,907 | 13,896 | 13,920 | 1998 | May-08 | 122 | |||||||||||||
Somerset | NJ | Courtyard | — | 16,504 | 16,612 | 2001 | November-07 | 162 | |||||||||||||
New York | NY | Renaissance | — | 111,870 | 132,258 | 1916 | January-08 | 200 | |||||||||||||
Tulsa | OK | Hampton Inn & Suites | — | 10,839 | 10,889 | 2007 | December-07 | 102 | |||||||||||||
Columbia | SC | Hilton Garden Inn | 11,101 | 21,884 | 21,888 | 2006 | September-08 | 143 | |||||||||||||
Greenville | SC | Residence Inn | 6,391 | 9,064 | 9,226 | 1998 | May-08 | 78 | |||||||||||||
Hilton Head | SC | Hilton Garden Inn | 6,176 | 14,208 | 15,392 | 2001 | May-08 | 104 | |||||||||||||
Chattanooga | TN | Homewood Suites | — | 8,899 | 10,960 | 1997 | December-07 | 76 | |||||||||||||
Texarkana | TX | Courtyard | — | 13,334 | 13,482 | 2003 | March-08 | 90 | |||||||||||||
Texarkana | TX | TownePlace Suites | — | 9,357 | 9,640 | 2006 | March-08 | 85 | |||||||||||||
Charlottesville | VA | Courtyard | — | 28,748 | 28,791 | 2000 | June-08 | 137 | |||||||||||||
Chesapeake | VA | Marriott Full Service | — | 39,640 | 39,643 | 2008 | October-08 | 226 | |||||||||||||
Harrisonburg | VA | Courtyard | — | 23,821 | 23,907 | 1999 | November-07 | 125 | |||||||||||||
Suffolk | VA | Courtyard | 8,406 | 12,652 | 12,652 | 2007 | July-08 | 92 | |||||||||||||
Suffolk | VA | TownePlace Suites | 6,448 | 10,140 | 10,140 | 2007 | July-08 | 72 | |||||||||||||
Virginia Beach | VA | Courtyard | — | 27,828 | 27,923 | 1999 | June-08 | 141 | |||||||||||||
Virginia Beach | VA | Courtyard | — | 40,859 | 42,197 | 2002 | June-08 | 160 | |||||||||||||
Tukwila | WA | Homewood Suites | — | 16,144 | 17,504 | 1991 | July-08 | 106 | |||||||||||||
Construction in Progress | — | — | 247 | ||||||||||||||||||
| $ | 125,716 | $ | 990,256 | $ | 1,030,055 | 5,909 | |||||||||||||||
Information on prior programs is not indicative of our capitalization or operations and is not necessarily indicative of our future results.
Purchasers of Units in our offering will own no interest in these prior programs.
S-45
Financial Statements of Company
Apple REIT Nine, Inc.
Report of Independent Registered Public Accounting Firm | F-2 | |||
Consolidated Balance Sheets—December 31, 2009 and December 31, 2008 | F-3 | |||
Consolidated Statements of Operations—Years Ended December 31, 2009 and December 31, 2008 and For the Period November 9, 2007 (initial capitalization) through December 31, 2007 | F-4 | |||
Consolidated Statements of Shareholders' Equity—Years Ended December 31, 2009 and December 31, 2008 and For the Period November 9, 2007 (initial capitalization) through December 31, 2007 | F-5 | |||
Consolidated Statements of Cash Flows—Years Ended December 31, 2009 and December 31, 2008 and For the Period November 9, 2007 (initial capitalization) through December 31, 2007 | F-6 | |||
Notes to Consolidated Financial Statements | F-7 |
F-1
Report of Independent Registered Public Accounting Firm
The Board of Directors and Shareholders of
Apple REIT Nine, Inc.
We have audited the accompanying consolidated balance sheets of Apple REIT Nine, Inc. as of December 31, 2009 and 2008, and the related consolidated statements of operations, shareholders' equity, and cash flows for years ended December 31, 2009 and 2008 and for the period November 9, 2007 (initial capitalization) through December 31, 2007. Our audits also included the financial statement schedule listed in the index at Item 15(2). These financial statements and schedule are the responsibility of the Company's management. Our responsibility is to express an opinion on these financial statements and schedule based on our audits.
We conducted our audits in accordance with the standards of the Public Company Accounting Oversight Board (United States). Those standards require that we plan and perform the audit to obtain reasonable assurance about whether the financial statements are free of material misstatement. An audit includes examining, on a test basis, evidence supporting the amounts and disclosures in the financial statements. An audit also includes assessing the accounting principles used and significant estimates made by management, as well as evaluating the overall financial statement presentation. We believe that our audits provide a reasonable basis for our opinion.
In our opinion, the financial statements referred to above present fairly, in all material respects, the consolidated financial position of Apple REIT Nine, Inc. at December 31, 2009 and 2008, and the consolidated results of its operations and its cash flows for the years ended December 31, 2009 and 2008 and for the period from November 9, 2007 (initial capitalization) through December 31, 2007, in conformity with U.S. generally accepted accounting principles. Also, in our opinion, the related financial statement schedule, when considered in relation to the basic financial statements taken as a whole, presents fairly in all material respects, the information set forth therein.
As discussed in Note 1 to the Consolidated Financial Statements, the Company adopted new accounting pronouncements related to business combinations on January 1, 2009.
We also have audited, in accordance with the standards of the Public Company Accounting Oversight Board (United States), Apple REIT Nine, Inc.'s internal control over financial reporting as of December 31, 2009, based on criteria established in Internal Control-Integrated Framework issued by the Committee of Sponsoring Organizations of the Treadway Commission and our report dated March 5, 2010 expressed an unqualified opinion thereon.
/s/ ERNST & YOUNG LLP
Richmond, Virginia
March 5, 2010
F-2
Apple REIT Nine, Inc.
Consolidated Balance Sheets
(in thousands, except share data)
| | December 31, 2009 | December 31, 2008 | ||||||
|---|---|---|---|---|---|---|---|---|
Assets | ||||||||
Investment in real estate, net of accumulated depreciation of $18,213 and $2,277, respectively | $ | 687,509 | $ | 346,423 | ||||
Cash and cash equivalents | 272,913 | 75,193 | ||||||
Due from third party managers, net | 2,591 | 1,775 | ||||||
Other assets, net | 19,500 | 8,228 | ||||||
Total Assets | $ | 982,513 | $ | 431,619 | ||||
Liabilities | ||||||||
Notes payable | $ | 58,688 | $ | 38,647 | ||||
Accounts payable and accrued expenses | 6,420 | 3,232 | ||||||
Total Liabilities | 65,108 | 41,879 | ||||||
Shareholders' Equity | ||||||||
Preferred stock, authorized 30,000,000 shares; none issued and outstanding | — | — | ||||||
Series A preferred stock, no par value, authorized 400,000,000 shares; issued and outstanding 98,509,650 and 41,013,517 shares, respectively | — | — | ||||||
Series B convertible preferred stock, no par value, authorized 480,000 shares; issued and outstanding 480,000 shares, respectively | 48 | 48 | ||||||
Common stock, no par value, authorized 400,000,000 shares; issued and outstanding 98,509,650 and 41,013,517 shares, respectively | 968,710 | 400,569 | ||||||
Distributions greater than net income | (51,353 | ) | (10,877 | ) | ||||
Total Shareholders' Equity | 917,405 | 389,740 | ||||||
Total Liabilities and Shareholders' Equity | $ | 982,513 | $ | 431,619 | ||||
See accompanying notes to consolidated financial statements.
The Company was initially capitalized on November 9, 2007 and commenced operations on July 31, 2008.
F-3
Apple REIT Nine, Inc.
Consolidated Statements of Operations
(in thousands, except per share data)
| | Year Ended December 31, 2009 | Year Ended December 31, 2008 | For the period November 9, 2007 (initial capitalization) through December 31, 2007 | |||||||||
|---|---|---|---|---|---|---|---|---|---|---|---|---|
Revenues: | ||||||||||||
Room revenue | $ | 76,163 | $ | 9,501 | $ | — | ||||||
Other revenue | 9,043 | 2,023 | — | |||||||||
Total hotel revenue | 85,206 | 11,524 | — | |||||||||
Rental revenue | 15,961 | — | — | |||||||||
Total revenue | 101,167 | 11,524 | — | |||||||||
Expenses: | ||||||||||||
Operating expense | 23,454 | 3,381 | — | |||||||||
Hotel administrative expense | 6,945 | 883 | — | |||||||||
Sales and marketing | 7,674 | 1,066 | — | |||||||||
Utilities | 4,245 | 546 | — | |||||||||
Repair and maintenance | 3,924 | 637 | — | |||||||||
Franchise fees | 3,445 | 468 | — | |||||||||
Management fees | 2,610 | 441 | — | |||||||||
Taxes, insurance and other | 6,032 | 731 | — | |||||||||
General and administrative | 4,079 | 1,288 | 15 | |||||||||
Acquisition related costs | 4,951 | — | — | |||||||||
Depreciation expense | 15,936 | 2,277 | — | |||||||||
Total expenses | 83,295 | 11,718 | 15 | |||||||||
Operating income (loss) | 17,872 | (194 | ) | (15 | ) | |||||||
Interest income (expense), net | (1,018 | ) | 2,346 | (2 | ) | |||||||
Net income (loss) | $ | 16,854 | $ | 2,152 | $ | (17 | ) | |||||
Basic and diluted net income (loss) per common share | $ | 0.26 | $ | 0.14 | $ | (1,684.60 | ) | |||||
Weighted average common shares outstanding—basic and diluted | 66,041 | 15,852 | — | |||||||||
Distributions declared and paid per common share | $ | 0.88 | $ | 0.51 | $ | — | ||||||
See accompanying notes to consolidated financial statements.
The Company was initially capitalized on November 9, 2007 and commenced operations on July 31, 2008.
F-4
Apple REIT Nine, Inc.
Consolidated Statements of Shareholders' Equity
(in thousands, except per share data)
| | Common Stock | Class B Convertible Preferred Stock | | | |||||||||||||||
|---|---|---|---|---|---|---|---|---|---|---|---|---|---|---|---|---|---|---|---|
| | Number of Shares | Amount | Number of Shares | Amount | Distributions Greater Than Net Income | Total | |||||||||||||
Initial capitalization November 9, 2007 | — | $ | — | 480 | $ | 48 | $ | — | $ | 48 | |||||||||
Offering costs | — | — | — | — | — | — | |||||||||||||
Net loss | — | — | — | — | (17 | ) | (17 | ) | |||||||||||
Balance at December 31, 2007 | — | — | 480 | 48 | (17 | ) | 31 | ||||||||||||
Net proceeds from the sale of common shares | 41,014 | 400,543 | — | — | — | 400,543 | |||||||||||||
Stock options granted | — | 26 | — | — | — | 26 | |||||||||||||
Net income | — | — | — | — | 2,152 | 2,152 | |||||||||||||
Cash distributions declared and paid to shareholders ($0.51 per share) | — | — | — | — | (13,012 | ) | (13,012 | ) | |||||||||||
Balance at December 31, 2008 | 41,014 | 400,569 | 480 | 48 | (10,877 | ) | 389,740 | ||||||||||||
Net proceeds from the sale of common shares | 57,748 | 570,681 | — | — | — | 570,681 | |||||||||||||
Common shares redeemed | (252 | ) | (2,605 | ) | (2,605 | ) | |||||||||||||
Stock options granted | — | 65 | — | — | — | 65 | |||||||||||||
Net income | — | — | — | — | 16,854 | 16,854 | |||||||||||||
Cash distributions declared and paid to shareholders ($0.88 per share) | — | — | — | — | (57,330 | ) | (57,330 | ) | |||||||||||
Balance at December 31, 2009 | 98,510 | $ | 968,710 | 480 | $ | 48 | $ | (51,353 | ) | $ | 917,405 | ||||||||
See accompanying notes to consolidated financial statements.
The Company was initially capitalized on November 9, 2007 and commenced operations on July 31, 2008.
F-5
Apple REIT Nine, Inc.
Consolidated Statements of Cash Flows
(in thousands)
| | Year Ended December 31, 2009 | Year Ended December 31, 2008 | For the period November 9, 2007 (initial capitalization) through December 31, 2007 | ||||||||||
|---|---|---|---|---|---|---|---|---|---|---|---|---|---|
Cash flows from operating activities: | |||||||||||||
Net income (loss) | $ | 16,854 | $ | 2,152 | $ | (17 | ) | ||||||
Adjustments to reconcile net income (loss) to cash provided by (used in) operating activities: | |||||||||||||
Depreciation | 15,936 | 2,277 | — | ||||||||||
Amortization of deferred financing costs, fair value adjustments and other non-cash expenses, net | 206 | 36 | — | ||||||||||
Straight-line rental income | (4,618 | ) | — | — | |||||||||
Changes in operating assets and liabilities: | |||||||||||||
Increase in funds due from third party managers, net | (574 | ) | (1,680 | ) | — | ||||||||
(Increase) decrease in other assets, net | (1,317 | ) | 336 | — | |||||||||
Increase in accounts payable and accrued expenses | 2,650 | 196 | 15 | ||||||||||
Net cash provided by (used in) operating activities | 29,137 | 3,317 | (2 | ) | |||||||||
Cash flows used in investing activities: | |||||||||||||
Cash paid for acquisitions | (325,085 | ) | (311,052 | ) | — | ||||||||
Deposits and other disbursements for potential acquisitions, net | (238 | ) | (4,176 | ) | — | ||||||||
Capital improvements | (11,736 | ) | (40 | ) | — | ||||||||
Increase in capital improvement reserves | (832 | ) | (54 | ) | — | ||||||||
Investment in other assets | (3,240 | ) | — | — | |||||||||
Net cash used in investing activities | (341,131 | ) | (315,322 | ) | — | ||||||||
Cash flows from financing activities: | |||||||||||||
Net proceeds (disbursements) related to issuance of common shares | 570,703 | 400,779 | (177 | ) | |||||||||
Redeemptions of common stock | (2,605 | ) | — | — | |||||||||
Distributions paid to common shareholders | (57,330 | ) | (13,012 | ) | — | ||||||||
Payments of notes payable | (754 | ) | (67 | ) | — | ||||||||
Deferred financing costs | (300 | ) | (371 | ) | — | ||||||||
Borrowings from (payments on) line of credit | — | (151 | ) | 151 | |||||||||
Net cash provided by (used in) financing activities | 509,714 | 387,178 | (26 | ) | |||||||||
Increase (decrease) in cash and cash equivalents | 197,720 | 75,173 | (28 | ) | |||||||||
Cash and cash equivalents, beginning of period | 75,193 | 20 | 48 | ||||||||||
Cash and cash equivalents, end of period | $ | 272,913 | $ | 75,193 | $ | 20 | |||||||
Supplemental information: | |||||||||||||
Interest paid | $ | 2,835 | $ | 229 | $ | 2 | |||||||
Non-cash transactions: | |||||||||||||
Notes payable assumed in acquisitions | $ | 19,284 | $ | 38,270 | $ | — | |||||||
Other assets assumed in acquisitions | $ | 210 | $ | 2,795 | $ | — | |||||||
Other liabilities assumed in acquisitions | $ | 2,209 | $ | 3,303 | $ | — | |||||||
See accompanying notes to consolidated financial statements.
The Company was initially capitalized on November 9, 2007 and commenced operations on July 31, 2008.
F-6
Notes to Consolidated Financial Statements
Note 1
General Information and Summary of Significant Accounting Policies
Organization
Apple REIT Nine, Inc. together with its wholly owned subsidiaries (the "Company") is a Virginia corporation formed to invest in hotels, residential apartment communities and other income-producing real estate in selected metropolitan areas in the United States. Initial capitalization occurred on November 9, 2007, when 10 Units, each Unit consisting of one common share and one Series A preferred share, were purchased by Apple Nine Advisors, Inc. ("A9A") and 480,000 Series B convertible preferred shares were purchased by Glade M. Knight, the Company's Chairman and Chief Executive Officer. The Company began operations on July 31, 2008 when it purchased its first hotel. The Company's fiscal year end is December 31. The Company has no foreign operations or assets and its operating structure includes two segments, hotels and a ground lease. The consolidated financial statements include the accounts of the Company and its subsidiaries. All intercompany accounts and transactions have been eliminated. Although the Company has an interest in several variable interest entities through its purchase commitments, it is not the primary beneficiary and therefore does not consolidate any of these entities.
The Company has elected to be treated as a real estate investment trust ("REIT") for federal income tax purposes. The REIT Modernization Act, effective January 1, 2001, permits real estate investment trusts to establish taxable businesses to conduct certain previously disallowed business activities. The Company has a wholly-owned taxable REIT subsidiary (or subsidiary thereof) (collectively, the "Lessee"), which leases all of the Company's hotels.
Cash and Cash Equivalents
Cash and cash equivalents consist of highly liquid investments with original maturities of three months or less. The fair market value of cash and cash equivalents approximates their carrying value. As of December 31, 2009, all cash and cash equivalents were held at two institutions, Wachovia Bank, N.A. (a subsidiary of Wells Fargo & Company) and BB&T Corporation. Cash balances may at times exceed federal depository insurance limits.
Investment in Real Estate and Related Depreciation
Real estate is stated at cost, net of depreciation. Repair and maintenance costs are expensed as incurred while significant improvements, renovations, and replacements are capitalized. Depreciation is computed using the straight-line method over estimated useful lives of the assets, which are 40 years for land improvements, 39 years for buildings, ten years for major improvements and three to seven years for furniture and equipment.
The Company considers expenditures to be capital in nature based on the following criteria: (1) for a single asset, the cost must be at least $500, including all normal and necessary costs to place the asset in service, and the useful life must be at least one year; (2) for group purchases of 10 or more identical assets, the unit cost for each asset must be at least $50, including all normal and necessary costs to place the asset in service, and the useful life must be at least one year; (3) for major repairs to a single asset, the repair must be at least $2,500 and the useful life of the asset must be substantially extended.
Upon acquisition of real estate properties, the Company estimates the fair value of acquired tangible assets (consisting of land, land improvements, buildings and improvements) and identified intangible assets and liabilities, in-place leases and assumed debt based on evaluation of information
F-7
Notes to Consolidated Financial Statements (Continued)
Note 1 (Continued)
and estimates available at that date. Generally, the Company does not acquire hotel properties that have significant in-place leases as lease terms for hotel properties are very short term in nature. Other than the leases discussed in Note 2, the Company has not assigned any value to intangible assets such as management contracts and franchise agreements as such contracts are generally at current market rates and any other value attributable to these contracts is not considered material. Beginning January 1, 2009, the Company has expensed as incurred all transaction costs associated with the acquisitions of existing businesses, including title, legal, accounting and other related costs, as well as the brokerage commission paid to Apple Suites Realty Group, Inc. ("ASRG"), a related party 100% owned by Glade M. Knight, Chairman and Chief Executive Officer of the Company. For acquisitions of existing businesses prior to January 1, 2009, these costs were capitalized as part of the cost of the acquisition.
The Company records impairment losses on hotel properties used in operations if indicators of impairment are present, and the sum of the undiscounted cash flows estimated to be generated by the respective properties, based on historical and industry information, is less than the properties' carrying amount. Impairment losses are measured as the difference between the asset's fair value less cost to sell, and its carrying value. No impairment losses have been recorded to date.
Other Assets
Included in other assets, net as of December 31, 2009 on the Company's consolidated balance sheet is a 24% ownership interest in Apple Air Holding, LLC ("Apple Air"), purchased by the Company for $3.2 million in cash in January 2009. The other members of Apple Air are Apple REIT Six, Inc., Apple REIT Seven, Inc. and Apple REIT Eight, Inc. The interest was purchased to allow the Company access to two Lear jets for acquisition, asset management and renovation purposes. The Company has recorded its share of income and losses of the entity under the equity method of accounting and adjusted its investment in Apple Air accordingly. The Company's ownership interest was $2.8 million at December 31, 2009. The Company recorded a $460,000 loss as its share of the 2009 net loss of Apple Air, which primarily relates to the depreciation of the aircraft.
Revenue Recognition
Hotel revenue is recognized as earned, which is generally defined as the date upon which a guest occupies a room or utilizes the hotel's services.
On April 7, 2009, the Company entered into a ground lease with a subsidiary of Chesapeake Energy Corporation, the largest independent producer of natural gas in the United States and guarantor of the lease. The lease has an initial term of 40 years with five renewal options of five years each, exercisable by the tenant. Rental payments are fixed and have determinable rent increases during the initial lease term and reset to market during the first year of the renewal period. Rental payments are required to be made monthly in advance. Under the lease, the tenant is responsible for all operating costs associated with the real estate including, maintenance, insurance, property taxes, environmental, zoning, permitting, etc. and the tenant is required to maintain the real estate in good condition. The lease is classified as an operating lease and rental revenue is recognized on a straight line basis over the initial term of the lease. Rental revenue includes $4.6 million of adjustments to record rent on the straight line basis for the year ended December 31, 2009. Straight line rental receivable is included in other assets, net in the Company's consolidated balance sheet and totaled $4.6 million as of December 31, 2009. Management assesses the realizability of this receivable on an
F-8
Notes to Consolidated Financial Statements (Continued)
Note 1 (Continued)
ongoing basis to determine if any allowance is warranted. As of December 31, 2009, no allowance was recorded.
Offering Costs
The Company is raising capital through a best-efforts offering of Units by David Lerner Associates, Inc., the managing underwriter, which receives a selling commission and a marketing expense allowance based on proceeds of the Units sold. Additionally, the Company has incurred other offering costs including legal, accounting and reporting services. These offering costs are recorded by the Company as a reduction of shareholders' equity. Prior to the commencement of the Company's offering, these costs were deferred and recorded as prepaid expense. As of December 31, 2009, the Company had sold 98.8 million Units for gross proceeds of $1.1 billion and proceeds net of offering costs of $971.3 million. The offering expires on April 25, 2010. The Company plans to extend the offering for one year to April 25, 2011.
Comprehensive Income
The Company recorded no comprehensive income (loss) other than net income (loss) for the periods reported.
Earnings Per Common Share
Basic earnings per common share is computed as net income (loss) divided by the weighted average number of common shares outstanding during the year. Diluted earnings per share is calculated after giving effect to all potential common shares that were dilutive and outstanding for the year. There were no shares with a dilutive effect for the years ended December 31, 2009 and 2008 or for the period from November 9, 2007 (initial capitalization) through December 31, 2007. As a result, basic and dilutive outstanding shares were the same. Series B convertible preferred shares are not included in earnings per common share calculations until such time that such shares are converted to common shares.
Federal Income Taxes
The Company is operated as, and has elected to be taxed as, a REIT under Sections 856 to 860 of the Internal Revenue Code. Earnings and profits, which will determine the taxability of distributions to shareholders, will differ from income reported for financial reporting purposes primarily due to the differences for federal income tax purposes in the estimated useful lives used to compute depreciation and straight line rent. The characterization of 2009 distributions of $0.88 per share for tax purposes was 47% ordinary income and 53% return of capital (unaudited). The characterization of 2008 distributions of $0.51 per share for tax purposes was 42% ordinary income and 58% return of capital (unaudited).
The Lessee, as a taxable REIT subsidiary of the Company, is subject to federal and state income taxes. The taxable REIT subsidiary incurred a loss for the years ended December 31, 2009 and 2008, and therefore did not have any tax expense. No operating loss benefit has been recorded in the consolidated balance sheet since realization is uncertain. Total net operating loss carry forward for federal income tax purposes was approximately $8.6 million as of December 31, 2009. The net operating loss carry forward will expire beginning in 2028. There are no material differences between the book and tax cost basis of the Company's assets.
F-9
Notes to Consolidated Financial Statements (Continued)
Note 1 (Continued)
Sales and Marketing Costs
Sales and marketing costs are expensed when incurred. These costs represent the expense for franchise advertising and reservation systems under the terms of the hotel management and franchise agreements and general and administrative expenses that are directly attributable to advertising and promotion.
Use of Estimates
The preparation of the financial statements in conformity with United States generally accepted accounting principles requires management to make estimates and assumptions that affect the amounts reported in the consolidated financial statements and accompanying notes. Actual results could differ from those estimates.
Recent Accounting Pronouncements
Accounting Standards Codification
In June 2009, the Financial Accounting Standards Board ("FASB") issued a pronouncement establishing the FASB Accounting Standards Codification™ as the source of authoritative accounting principles recognized by the FASB to be applied in the preparation of financial statements in conformity with United States generally accepted accounting principles ("GAAP"). The standard explicitly recognizes rules and interpretive releases of the Securities and Exchange Commission ("SEC") under federal securities laws as authoritative GAAP for SEC registrants. This standard is effective for financial statements issued for interim and annual periods ending after September 15, 2009. The adoption of this standard did not have a material impact on the Company's consolidated financial statements.
Noncontrolling Interests
In June 2009, the FASB issued a pronouncement which amends its guidance surrounding a company's analysis to determine whether any of its variable interests constitute controlling financial interests in a variable interest entity. This analysis identifies the primary beneficiary of a variable interest entity as the enterprise that has both of the following characteristics: (a) the power to direct the activities of a variable interest entity that most significantly impact the entity's economic performance, and (b) the obligation to absorb losses of the entity that could potentially be significant to the variable interest entity or the right to receive benefits from the entity that could potentially be significant to the variable interest entity. Additionally, an enterprise is required to assess whether it has an implicit financial responsibility to ensure that a variable interest entity operates as designed when determining whether it has the power to direct the activities of the variable interest entity that most significantly impact the entity's economic performance. The new pronouncement also requires ongoing assessments of whether an enterprise is the primary beneficiary of a variable interest entity and enhanced disclosure about an enterprise's involvement with a variable interest entity. This pronouncement is effective for interim and annual reporting periods beginning after November 15, 2009. The adoption of this standard is not anticipated to have a material impact on the Company's consolidated financial statements.
F-10
Notes to Consolidated Financial Statements (Continued)
Note 1 (Continued)
Subsequent Events
In May 2009, the FASB issued a pronouncement which sets forth general standards of accounting for and disclosure of events that occur after the balance sheet date but before financial statements are issued or available to be issued. Although there is new terminology, this pronouncement is based on the same principles as those that previously existed in the auditing standards. This pronouncement was effective for the Company beginning June 30, 2009. The adoption of this standard did not have a material impact on the Company's consolidated financial statements.
Assets Acquired or Liabilities Assumed in a Business Combination
In April 2009, the FASB issued a pronouncement which amends its guidance for all assets acquired and all liabilities assumed in a business combination that arise from contingencies. This pronouncement states that the acquirer will recognize such an asset or liability if the acquisition-date fair value of that asset or liability can be determined during the measurement period. If it cannot be determined during the measurement period, then the asset or liability should be recognized as of the acquisition date if the following criteria are met: (1) information available before the end of the measurement period indicates that it is probable that an asset existed or that a liability had been incurred at the acquisition date, and (2) the amount of the asset or liability can be reasonably estimated. This pronouncement was adopted by the Company in the first quarter of 2009. The adoption of this standard did not have a material impact on the Company's consolidated financial statements.
Business Combinations
In December 2007, the FASB issued a pronouncement which amends its guidance for business combinations by requiring an acquirer to recognize the assets of existing businesses acquired, the liabilities assumed, and any noncontrolling interest in the acquiree at the acquisition date, measured at their fair values as of that date, with limited exceptions. This method replaces the cost-allocation process, which required the cost of an acquisition of an existing business to be allocated to the individual assets acquired and liabilities assumed based on their estimated fair values. A significant change included in the new pronouncement is the requirement that costs incurred to effect an acquisition of an existing business, must be accounted for separately as expenses. Such costs include title, legal, accounting and other related costs, as well as commissions including the commission paid to ASRG, a related party 100% owned by Glade M. Knight, Chairman and CEO of the Company. This pronouncement was effective January 1, 2009. For acquisitions of existing businesses prior to January 1, 2009, these costs were capitalized as part of the cost of the acquisition. During 2009, the Company expensed $5.0 million in acquisition related costs. Included in this amount is $293,000 in transaction costs related to potential acquisitions as of December 31, 2008. These costs were incurred during 2008 and recorded as deferred acquisition costs and included in other assets, net in the Company's consolidated balance sheet as of December 31, 2008. In accordance with this pronouncement, these costs were expensed on January 1, 2009. The adoption of this standard has had a material impact on the Company's financial position and results of operations and will continue to have a material impact on the Company's consolidated financial statements as it acquires other operating businesses.
F-11
Notes to Consolidated Financial Statements (Continued)
Note 2
Investments in Real Estate
The Company's investment in real estate consisted of the following (in thousands):
| | December 31, 2009 | December 31, 2008 | |||||
|---|---|---|---|---|---|---|---|
Land | $ | 115,989 | $ | 38,549 | |||
Land Improvements | 98,164 | — | |||||
Building and Improvements | 450,602 | 289,672 | |||||
Furniture, Fixtures and Equipment | 39,135 | 20,479 | |||||
Construction in Progress | 1,832 | — | |||||
| 705,722 | 348,700 | ||||||
Less Accumulated Depreciation | (18,213 | ) | (2,277 | ) | |||
Investment in real estate, net | $ | 687,509 | $ | 346,423 | |||
Hotels Owned
As of December 31, 2009, the Company owned 33 hotels, located in 14 states with an aggregate of 3,900 rooms and consisted of the following: seven Hilton Garden Inn hotels, three Homewood Suites hotels, 11 Hampton Inn hotels, five Courtyard hotels, three Residence Inn hotels, two SpringHill Suites hotels and two Fairfield Inn hotels.
F-12
Notes to Consolidated Financial Statements (Continued)
Note 2 (Continued)
The following table summarizes the location, brand, manager, gross purchase price, number of hotel rooms and date of purchase by the Company for each of the 33 hotels. All dollar amounts are in thousands.
Location | Brand | Manager | Gross Purchase Price | Rooms | Date of Purchase | ||||||||||
|---|---|---|---|---|---|---|---|---|---|---|---|---|---|---|---|
Tucson, AZ | Hilton Garden Inn | Western | $ | 18,375 | 125 | 7/31/2008 | |||||||||
Santa Clarita, CA | Courtyard | Dimension | 22,700 | 140 | 9/24/2008 | ||||||||||
Charlotte, NC | Homewood Suites | McKibbon | 5,750 | 112 | 9/24/2008 | ||||||||||
Allen, TX | Hampton Inn & Suites | Gateway | 12,500 | 103 | 9/26/2008 | ||||||||||
Twinsburg, OH | Hilton Garden Inn | Gateway | 17,792 | 142 | 10/7/2008 | ||||||||||
Lewisville, TX | Hilton Garden Inn | Gateway | 28,000 | 165 | 10/16/2008 | ||||||||||
Duncanville, TX | Hilton Garden Inn | Gateway | 19,500 | 142 | 10/21/2008 | ||||||||||
Santa Clarita, CA | Hampton Inn | Dimension | 17,129 | 128 | 10/29/2008 | ||||||||||
Santa Clarita, CA | Residence Inn | Dimension | 16,600 | 90 | 10/29/2008 | ||||||||||
Santa Clarita, CA | Fairfield Inn | Dimension | 9,337 | 66 | 10/29/2008 | ||||||||||
Beaumont, TX | Residence Inn | Western | 16,900 | 133 | 10/29/2008 | ||||||||||
Pueblo, CO | Hampton Inn & Suites | Dimension | 8,025 | 81 | 10/31/2008 | ||||||||||
Allen, TX | Hilton Garden Inn | Gateway | 18,500 | 150 | 10/31/2008 | ||||||||||
Bristol, VA | Courtyard | LBA | 18,650 | 175 | 11/7/2008 | ||||||||||
Durham, NC | Homewood Suites | McKibbon | 19,050 | 122 | 12/4/2008 | ||||||||||
Hattiesburg, MS | Residence Inn | LBA | 9,793 | 84 | 12/11/2008 | ||||||||||
Jackson, TN | Courtyard | Vista | 15,200 | 94 | 12/16/2008 | ||||||||||
Jackson, TN | Hampton Inn & Suites | Vista | 12,600 | 83 | 12/30/2008 | ||||||||||
Pittsburgh, PA | Hampton Inn | Vista | 20,458 | 132 | 12/31/2008 | ||||||||||
Fort Lauderdale, FL | Hampton Inn | Vista | 19,290 | 109 | 12/31/2008 | ||||||||||
Frisco, TX | Hilton Garden Inn | Western | 15,050 | 102 | 12/31/2008 | ||||||||||
Round Rock, TX | Hampton Inn | Vista | 11,500 | 93 | 3/6/2009 | ||||||||||
Panama City, FL | Hampton Inn & Suites | LBA | 11,600 | 95 | 3/12/2009 | ||||||||||
Austin, TX | Homewood Suites | Vista | 17,700 | 97 | 4/14/2009 | ||||||||||
Austin, TX | Hampton Inn | Vista | 18,000 | 124 | 4/14/2009 | ||||||||||
Dothan, AL | Hilton Garden Inn | LBA | 11,601 | 104 | 6/1/2009 | ||||||||||
Troy, AL | Courtyard | LBA | 8,696 | 90 | 6/18/2009 | ||||||||||
Orlando, FL | Fairfield Inn & Suites | Marriott | 25,800 | 200 | 7/1/2009 | ||||||||||
Orlando, FL | SpringHill Suites | Marriott | 29,000 | 200 | 7/1/2009 | ||||||||||
Clovis, CA | Hampton Inn & Suites | Dimension | 11,150 | 86 | 7/31/2009 | ||||||||||
Rochester, MN | Hampton Inn & Suites | White | 14,136 | 124 | 8/3/2009 | ||||||||||
Johnson City, TN | Courtyard | LBA | 9,880 | 90 | 9/25/2009 | ||||||||||
Baton Rouge, LA | SpringHill Suites | Dimension | 15,100 | 119 | 9/25/2009 | ||||||||||
Total | $ | 525,362 | 3,900 | ||||||||||||
F-13
Notes to Consolidated Financial Statements (Continued)
Note 2 (Continued)
Of the Company's 33 hotels owned at December 31, 2009, 21 were purchased during 2008 and 12 were acquired during 2009. For the 12 hotels acquired during 2009, the amount of revenue and operating income (excluding acquisition related costs totaling $4.6 million) included in the Company's consolidated income statement from the acquisition date to the period ending December 31, 2009 was approximately $14.7 million and $500,000, respectively. The Company also acquired during 2009, land for the planned construction of a SpringHill Suites hotel to be completed over the next 15 months. The purchase price for the land was $5.1 million. Upon completion, it is expected that the hotel will contain approximately 152 guest rooms and will be managed by Marriott. To date the Company has incurred $1.8 million in construction costs and anticipates the total construction costs to be approximately $20-$25 million.
The purchase price for these properties, net of debt assumed, was funded primarily by the Company's on-going best-efforts offering of Units. The Company assumed approximately $53.8 million of debt secured by six of its hotel properties and $3.8 million of unsecured debt in connection with one of its hotel properties. The Company also used the proceeds of its on-going best-efforts offering to pay approximately $14.9 million in acquisition related costs, including $10.6 million, representing 2% of the gross purchase price for these properties, as a brokerage commission to ASRG, 100% owned by Glade M. Knight, the Company's Chairman and Chief Executive and approximately $4.3 million in other acquisition related costs, including title, legal and other related costs. In accordance with the Accounting Standards Codification on business combinations, the Company has expensed $5.0 million in acquisition related costs associated with acquiring existing businesses, the execution of new contracts and contract terminations that occurred on or after January 1, 2009. These costs are included in acquisition related costs in the Company's consolidated statements of operations for the year ended December 31, 2009. For acquisitions that occurred prior to January 1, 2009, acquisition related costs totaling $9.9 million were capitalized as part of the cost of the acquisition and included in investment in real estate, net in the Company's consolidated balance sheets.
In connection with the acquisitions of the Duncanville, Texas, Allen, Texas and Lewisville, Texas Hilton Garden Inn hotels, the Company assumed agreements with the various localities for the use of the hotel's banquet and meeting facilities. These agreements were at above market rates and as a result the Company recorded an asset of approximately $2.1 million associated with these agreements, which is included in other assets, net in the Company's consolidated balance sheets. These amounts are being amortized over the remaining terms (average of approximately 7 years) of the respective agreements, and the unamortized balance totaled approximately $1.7 million and $2.0 million as of December 31, 2009 and 2008.
No goodwill was recorded in connection with any of the acquisitions.
Land and Improvements and Lease
On April 7, 2009, the Company completed the preliminary closing with a subsidiary of Chesapeake Energy Corporation under the terms of the purchase and sale contract dated January 21, 2009, as amended, for the purchase of approximately 417 acres of land and improvements located on 113 sites in the Ft. Worth, Texas area. The purchase price for the land and improvements was approximately $147 million. The preliminary closing provided equitable title to the Company. Subsequent to the preliminary closing, the recorded fee simple title was completed for 111 sites and conveyed to the Company. Each of the 113 individual sites is between approximately two and eleven acres in size. Simultaneous with the preliminary closing, the Company entered into a ground lease for this real estate
F-14
Notes to Consolidated Financial Statements (Continued)
Note 2 (Continued)
(the "Lease"). The Lease is with a subsidiary of Chesapeake Energy Corporation, Chesapeake Operating, Inc. (the "Tenant"). Chesapeake Energy Corporation is a guarantor of the Lease. The Lease has an initial term of 40 years with five renewal options of five years each, and annual rent ranging from approximately $15.5 million to $27.4 million with the average annual rent over the initial term being $21.8 million. Payments under the Lease are required to be made monthly in advance. Currently, the Tenant is producing natural gas or is in the process of developing the sites for the production of natural gas on over 70% of the 113 sites, and anticipates using substantially all of the remaining land for natural gas production. Under the Lease, the Tenant is responsible for all operating costs associated with the real estate including, maintenance, insurance, property taxes, environmental, zoning, permitting, etc. and the Tenant is required to maintain the real estate in good condition. During the term of the Lease, the Tenant has the option to purchase up to 30 sites (no more than 10 producing natural gas) for $1.4 million per site in years 1-5 of the Lease and $1.9 million for the remainder of the Lease. For any sites purchased, the annual rent will be reduced proportionately to the remaining sites.
Chesapeake Energy Corporation is a publicly held company that is traded on the New York Stock Exchange. Chesapeake Energy Corporation is the second-largest independent producer of natural gas in the United States with interests in approximately 36,000 net drill sites.
The purchase price for the 417 acres of land and improvements was funded primarily by the Company's on-going best-efforts offering of Units. The Company also used the proceeds of its on-going best-efforts offering to pay approximately $4.1 million in closing costs, including $2.9 million, representing 2% of the gross purchase price, as a brokerage commission to ASRG. The Company capitalized the commission as well as other closing costs as part of the acquisition cost of the land and improvements. Of the total purchase price and associated closing costs, $53 million was recorded to land and $98 million was allocated to land improvements on the Company's consolidated balance sheets.
Note 3
Notes Payable
In conjunction with the acquisition of seven hotel properties, the Company assumed approximately $57.6 million in debt. During 2009, the Company assumed approximately $19.3 million of debt secured by first mortgage notes on three of its hotel properties (Round Rock, Texas Hampton Inn, Austin, Texas Homewood Suites and Austin, Texas Hampton Inn). During 2008, the Company assumed approximately $34.5 million of debt secured by first mortgage notes on three of its hotel properties. In addition, the Company assumed a non-mortgage note payable of $3.8 million in connection with the Lewisville, Texas Hilton Garden Inn hotel. The following table summarizes the hotel location, interest
F-15
Notes to Consolidated Financial Statements (Continued)
Note 3 (Continued)
rate, maturity date and the principal amount assumed associated with each note payable outstanding as of December 31, 2009 and 2008. All dollar amounts are in thousands.
Location | Brand | Interest Rate | Maturity Date | Principal Assumed | Outstanding balance as of December 31, 2009 | Outstanding balance as of December 31, 2008 | ||||||||||||
|---|---|---|---|---|---|---|---|---|---|---|---|---|---|---|---|---|---|---|
Lewisville, TX | Hilton Garden Inn | 0.00 | % | 12/31/2016 | $ | 3,750 | $ | 3,750 | $ | 3,750 | ||||||||
Duncanville, TX | Hilton Garden Inn | 5.88 | % | 5/11/2017 | 13,966 | 13,754 | 13,937 | |||||||||||
Allen, TX | Hilton Garden Inn | 5.37 | % | 10/11/2015 | 10,787 | 10,585 | 10,759 | |||||||||||
Bristol, VA | Courtyard | 6.59 | % | 8/1/2016 | 9,767 | 9,640 | 9,757 | |||||||||||
Round Rock, TX | Hampton Inn | 5.95 | % | 5/1/2016 | 4,175 | 4,110 | — | |||||||||||
Austin, TX | Homewood Suites | 5.99 | % | 3/1/2016 | 7,556 | 7,448 | — | |||||||||||
Austin, TX | Hampton Inn | 5.95 | % | 3/1/2016 | 7,553 | 7,445 | — | |||||||||||
| $ | 57,554 | $ | 56,732 | $ | 38,203 | |||||||||||||
The aggregate amounts of principal payable under the Company's debt obligations, for the five years subsequent to December 31, 2009 and thereafter are as follows (in thousands):
2010 | $ | 938 | ||
2011 | 996 | |||
2012 | 2,798 | |||
2013 | 1,122 | |||
2014 | 1,191 | |||
Thereafter | 49,687 | |||
| 56,732 | ||||
Fair Value Adjustment of Assumed Debt | 1,956 | |||
Total | $ | 58,688 | ||
A fair value adjustment was recorded upon the assumption of five above market rate mortgage loans (premium), one below market rate mortgage loan (discount) and one below market rate unsecured loan (discount) in connection with the Company's hotel acquisitions. These fair value adjustments will be amortized into interest expense over the remaining term of the related indebtedness using a method approximating the effective interest rate method. The effective interest rates on the applicable debt obligations assumed ranged from 3.9% to 6.5% at the date of assumption. The total adjustment to interest expense was a decrease of $281,500 and an increase of $1,500 for the years ended December 31, 2009 and 2008, respectively.
The Company estimates the fair value of its debt by discounting the future cash flows of each instrument at estimated market rates consistent with the maturity of the debt obligation with similar credit policies. Market rates take into consideration general market conditions and maturity. As of December 31, 2009, the carrying value and estimated fair value of the Company's debt was $58.7 million and $56.7 million. As of December 31, 2008, the carrying value and estimated fair value of the Company's debt was $38.6 million and $40.4 million.
The Company incurred loan origination costs related to the assumption of the mortgage obligations on purchased hotels, totaling $671,000. Such costs are amortized over the period to maturity
F-16
Notes to Consolidated Financial Statements (Continued)
Note 3 (Continued)
of the applicable mortgage loan, as an addition to interest expense. Amortization of such costs totaled $81,000 and $8,000 for the years ended December 31, 2009 and 2008, respectively.
The Company's interest expense in 2009 is net of interest capitalized in conjunction with hotel renovations and construction totaling $400,000.
Prior to the commencement of the Company's best-efforts offering, the Company obtained an unsecured line of credit in a principal amount of $400,000 to fund certain start-up costs and offering expenses. The lender was Wachovia Bank, N.A. The line of credit bore interest at a variable rate based on the London Interbank Borrowing Rate (LIBOR). The line of credit was fully paid during May 2008 with net proceeds from the Company's best-efforts offering.
Note 4
Shareholders' Equity
Best-efforts Offering
The Company is currently conducting an on-going best-efforts offering. The Company registered its Units on Registration Statement Form S-11 (File No. 333-147414) filed on April 23, 2008 and was declared effective by the Securities and Exchange Commission on April 25, 2008. The Company began its best-efforts offering of Units the same day the registration statement was declared effective. Each Unit consists of one common share and one Series A preferred share. The minimum offering of 9,523,810 Units at $10.50 per Unit was sold as of May 14, 2008, with proceeds, net of commissions and marketing expenses totaling $90 million. The Offering is continuing as of the date of filing this annual report on Form 10-K. The managing underwriter is David Lerner Associates, Inc. and all of the Units are being sold for the Company's account. The Company will offer Units until April 25, 2010, unless the offering is extended, or terminated if all of the Units are sold before then. As of December 31, 2009, 83,488,971 Units remained unsold.
Series A Preferred Shares
The Series A preferred shares have no voting rights and no conversion rights. In addition, the Series A preferred shares are not separately tradable from the common shares to which they relate. The Series A preferred shares do not have any distribution rights except a priority distribution upon the sale of the Company's assets. The priority distribution ("Priority Distribution") will be equal to $11.00 per Series A preferred share, and will be paid before any distribution will be made to the holders of any other shares. Upon the Priority Distribution the Series A preferred shares will have no other distribution rights.
Series B Convertible Preferred Stock
The Company has issued 480,000 Series B convertible preferred shares to Glade M. Knight, Chairman and Chief Executive Officer of the Company, in exchange for the payment by him of $0.10 per Series B convertible preferred share, or an aggregate of $48,000. The Series B convertible preferred shares are convertible into common shares pursuant to the formula and on the terms and conditions set forth below.
F-17
Notes to Consolidated Financial Statements (Continued)
Note 4 (Continued)
There are no dividends payable on the Series B convertible preferred shares. Holders of more than two-thirds of the Series B convertible preferred shares must approve any proposed amendment to the articles of incorporation that would adversely affect the Series B convertible preferred shares.
Upon the Company's liquidation, the holder of the Series B convertible preferred shares is entitled to a priority liquidation payment before any distribution of liquidation proceeds to the holders of the common shares. However, the priority liquidation payment of the holder of the Series B convertible preferred shares is junior to the holders of the Series A preferred shares distribution rights. The holder of a Series B convertible preferred share is entitled to a liquidation payment of $11 per number of common shares each Series B convertible preferred share would be convertible into according to the formula described below. In the event that the liquidation of the Company's assets results in proceeds that exceed the distribution rights of the Series A preferred shares and the Series B convertible preferred shares, the remaining proceeds will be distributed between the common shares and the Series B convertible preferred shares, on an as converted basis.
Each holder of outstanding Series B convertible preferred shares shall have the right to convert any of such shares into common shares of the Company upon and for 180 days following the occurrence of any of the following events:
(1) substantially all of the Company's assets, stock or business is sold or transferred through exchange, merger, consolidation, lease, share exchange, sale or otherwise, other than a sale of assets in liquidation, dissolution or winding up of the Company;
(2) the termination or expiration without renewal of the advisory agreement with A9A, or if the Company ceases to use ASRG to provide property acquisition and disposition services; or
(3) the Company's common shares are listed on any securities exchange or quotation system or in any established market.
Upon the occurrence of any conversion event, each Series B convertible preferred share may be converted into a number of common shares based upon the gross proceeds raised through the date of conversion in the Company's $2 billion offering according to the following table:
Gross Proceeds Raised from Sales of Units through Date of Conversion | Number of Common Shares through Conversion of One Series B Convertible Preferred Share | |||
|---|---|---|---|---|
$1 billion | 12.11423 | |||
$1.1 billion | 13.31991 | |||
$1.2 billion | 14.52559 | |||
$1.3 billion | 15.73128 | |||
$1.4 billion | 16.93696 | |||
$1.5 billion | 18.14264 | |||
$1.6 billion | 19.34832 | |||
$1.7 billion | 20.55400 | |||
$1.8 billion | 21.75968 | |||
$1.9 billion | 22.96537 | |||
$2 billion | 24.17104 | |||
In the event that after raising gross proceeds of $2 billion, the Company raises additional gross proceeds in a subsequent public offering, each Series B convertible preferred share may be converted
F-18
Notes to Consolidated Financial Statements (Continued)
Note 4 (Continued)
into an additional number of common shares based on the additional gross proceeds raised through the date of conversion in a subsequent public offering according to the following formula: (X/100 million) × 1.20568, where X is the additional gross proceeds rounded down to the nearest 100 million.
No additional consideration is due upon the conversion of the Series B convertible preferred shares. The conversion into common shares of the Series B convertible preferred shares will result in dilution of the shareholders' interests.
Expense related to the issuance of 480,000 Series B convertible preferred shares to Mr. Knight will be recognized at such time when the number of common shares to be issued for conversion of the Series B shares can be reasonably estimated and the event triggering the conversion of the Series B shares to common shares occurs. The expense will be measured as the difference between the fair value of the common stock for which the Series B shares can be converted and the amounts paid for the Series B shares. Although the fair market value cannot be determined at this time, expense if the maximum offering is achieved could range from $0 to in excess of $127 million (assumes $11 per unit fair market value). Based on equity raised through December 31, 2009, if a triggering event had occurred, expense would have ranged from $0 to $64.0 million (assumes $11 per unit fair market value) and approximately 5.8 million common shares would have been issued.
Preferred Shares
The Company's articles of incorporation authorize issuance of up to 30 million additional preferred shares. No preferred shares other than the Series A preferred shares and the Series B convertible preferred shares (discussed above) have been issued. The Company believes that the authorization to issue additional preferred shares benefits the Company and its shareholders by permitting flexibility in financing additional growth, giving the Company additional financing options in corporate planning and in responding to developments in business, including financing of additional acquisitions and other general corporate purposes. Having authorized preferred shares available for issuance in the future gives the Company the ability to respond to future developments and allows preferred shares to be issued without the expense and delay of a special shareholders' meeting. At present, the Company has no specific financing or acquisition plans involving the issuance of additional preferred shares and the Company does not propose to fix the characteristics of any series of preferred shares in anticipation of issuing preferred shares other than the Series A preferred shares and Series B convertible preferred shares discussed above. The Company cannot now predict whether or to what extent, if any, additional preferred shares will be used or if so used what the characteristics of a particular series may be. The voting rights and rights to distributions of the holders of common shares will be subject to the prior rights of the holders of any subsequently-issued preferred shares. Unless otherwise required by applicable law or regulation, the preferred shares would be issuable without further authorization by holders of the common shares and on such terms and for such consideration as may be determined by the Board of Directors. The preferred shares could be issued in one or more series having varying voting rights, redemption and conversion features, distribution (including liquidating distribution) rights and preferences, and other rights, including rights of approval of specified transactions. A series of preferred shares could be given rights that are superior to rights of holders of common shares and a series having preferential distribution rights could limit common share distributions and reduce the amount holders of common shares would otherwise receive on dissolution.
F-19
Notes to Consolidated Financial Statements (Continued)
Note 4 (Continued)
Unit Redemption Program
The Company has a Unit Redemption Program to provide limited interim liquidity to its shareholders who have held their Units for at least one year. Shareholders may request redemption of Units for a purchase price equal to 92% of the price paid per Unit if the Units have been owned for less than three years, or 100% of the price paid per Unit if the Units have been owned more than three years. The maximum number of Units that may be redeemed in any given year will be three percent of the weighted average number of Units outstanding during the 12-month period immediately prior to the date of redemption. The Company reserves the right to change the purchase price of redemptions, reject any request for redemption, or otherwise amend the terms of, suspend, or terminate the Unit Redemption Program. During 2009, the Company redeemed 252,471 Units in the amount of $2.6 million under the program.
Note 5
Stock Option Plan
During 2008, the Company adopted a non-employee directors' stock option plan (the "Directors' Plan") to provide incentives to attract and retain directors. The Directors' Plan provides for an automatic grant of options to purchase a specified number of Units to directors, who are not employees of the Company. A Compensation Committee ("Committee") was established to administer the Directors' Plan. The Committee is responsible for granting Options and for establishing the exercise price of Options. Under the Directors Plan, the number of Units authorized for issuance is equal to 45,000 plus 1.8% of the number of Units sold in excess of the minimum offering of 9,523,810 Units. This plan currently relates to the initial public offering of 182,251,082 Units. Therefore, the maximum number of Units authorized under the Directors' Plan is currently 1,651,289 based on the number of Units issued as of December 31, 2009.
The Directors' Plan generally provides, among other things, that options be granted at exercise prices not lower than the market value of the Units on the date of grant. The options are 100% vested upon issuance and are exercisable six months after the date of grant and will expire 10 years from the date of grant. During 2009 and 2008, the Company granted options to purchase 49,864 and 31,744 Units under the Directors' Plan and recorded compensation expense totaling $65,000 in 2009 and $26,000 in 2008. All of the options issued have an exercise price of $11 per Unit. Activity in the Company Directors' Plan during 2009 and 2008 is summarized in the following table:
| | 2009 | 2008 | ||||||
|---|---|---|---|---|---|---|---|---|
Outstanding, beginning of year: | 31,744 | — | ||||||
Granted | 49,864 | 31,744 | ||||||
Exercised | — | — | ||||||
Expired or canceled | — | — | ||||||
Outstanding, end of year: | 81,608 | 31,744 | ||||||
Exercisable, end of year: | 81,608 | 31,744 | ||||||
The weighted-average exercise price: | $ | 11.00 | $ | 11.00 | ||||
F-20
Notes to Consolidated Financial Statements (Continued)
Note 6
Management and Franchise Agreements
Each of the Company's 33 hotels are operated and managed, under separate management agreements, by affiliates of one of the following companies (indicates the number of hotels managed): Dimension Development Two, LLC ("Dimension") (7), Gateway Hospitality Group, Inc. ("Gateway") (5), LBAM-Investor Group, L.L.C. ("LBA") (6), Fairfield FMC, LLC and SpringHill SMC, LLC, subsidiaries of Marriott International ("Marriott") (2), MHH Management, LLC ("McKibbon") (2), Vista Host, Inc. ("Vista") (7), Texas Western Management Partners, L.P. ("Western") (3) and White Lodging Services Corporation ("White") (1). The agreements provide for initial terms of one to 30 years. Fees associated with the agreements generally include the payment of base management fees, incentive management fees, accounting fees, and other fees for centralized services which are allocated among all of the hotels that receive the benefit of such services. Base management fees are calculated as a percentage of gross revenues. Incentive management fees are calculated as a percentage of operating profit in excess of a priority return to the Company, as defined in the management agreements. The Company has the option to terminate the management agreements if specified performance thresholds are not satisfied. For the years ended December 31, 2009 and 2008, the Company incurred approximately $2.6 million and $441,000 in management fees.
Dimension, Gateway, LBA, McKibbon, Vista, Western and White are not affiliated with either Marriott or Hilton, and as a result, the hotels they manage were required to obtain separate franchise agreements with each respective franchisor. The Hilton franchise agreements generally provide for a term of 10 to 20 years. Fees associated with the agreements generally include the payment of royalty fees and program fees. The Marriott franchise agreements generally provide for initial terms of 13 to 20 years. Fees associated with the agreements generally include the payment of royalty fees, marketing fees, reservation fees and a communications support fee based on room revenues. For the years ended December 31, 2009 and 2008, the Company incurred approximately $3.4 million and $468,000 in franchise fees.
Note 7
Related Parties
The Company has significant transactions with related parties. These transactions cannot be construed to be at arm's length and the results of the Company's operations may be different than if conducted with non-related parties.
The Company has a contract with ASRG, to acquire and dispose of real estate assets for the Company. A fee of 2% of the gross purchase price or gross sale price in addition to certain reimbursable expenses is paid to ASRG for these services. As of December 31, 2009, payments to ASRG for services under the terms of this contract have totaled approximately $13.6 million since inception.
The Company is party to an advisory agreement with A9A to provide management services to the Company. An annual fee ranging from 0.1% to 0.25% of total equity proceeds received by the Company, in addition to certain reimbursable expenses, are payable for these services. A9A has entered into an agreement with Apple REIT Six, Inc. ("AR6") to provide certain management services to the Company. The Company will reimburse A9A for the cost of the services provided by AR6. A9A will in turn reimburse AR6. Total advisory fees and reimbursable expenses incurred by the Company under the advisory agreement are included in general and administrative expenses and totaled approximately
F-21
Notes to Consolidated Financial Statements (Continued)
Note 7 (Continued)
$2.4 million and $766,000 for the years ended December 31, 2009 and 2008, respectively and $15,000 for the period November 9, 2007 (initial capitalization) through December 31, 2007. Of this total expense, $722,000, $171,000 and $— were fees paid to A9A and $1.7 million, $595,000 and $15,000 were expenses reimbursed by A9A to AR6 for the years ended December 31, 2009 and 2008 and the period November 9, 2007 through December 31, 2007.
ASRG and A9A are 100% owned by Glade M. Knight, Chairman and Chief Executive Officer of the Company.
Mr. Knight is also Chairman and Chief Executive Officer of AR6, Apple REIT Seven, Inc. and Apple REIT Eight, Inc. Members of the Company's Board of Directors are also on the Board of Directors of AR6, Apple REIT Seven, Inc. and Apple REIT Eight, Inc.
During the fourth quarter of 2008, the Company entered into a series of assignment of contracts with Apple REIT Eight, Inc. ("AR8") to become the purchaser under three purchase contracts for four hotels which at the time of the assignment were under construction: a Fairfield Inn & Suites and SpringHill Suites, both 200 room hotels located in Orlando, Florida, with a combined purchase price of $54.8 million, a 119 room SpringHill Suites hotel in Baton Rouge, Louisiana with a purchase price of $15.1 million and a 124 room Hampton Inn & Suites hotel in Rochester, Minnesota with a purchase price of $14.1 million. Under the terms and conditions of the contracts, AR8 assigned to the Company all of its rights and obligations under these purchase contracts. No consideration or fees was paid to AR8 for the assignment of the purchase contracts except for the reimbursement payment of the following: (i) initial deposits totaling $1.2 million made by AR8; and (ii) other costs totaling approximately $64,000 paid by AR8 to third parties. These reimbursement payments did not constitute or result in a profit for AR8. The Company acquired these newly constructed hotels during 2009.
Note 8
Leases
On April 7, 2009, the Company entered into a ground lease with a subsidiary of Chesapeake Energy Corporation, the largest independent producer of natural gas in the United States and guarantor of the lease. The lease has an initial term of 40 years with five renewal options of five years each, exercisable by the tenant. Rental payments are fixed and have determinable rent increases during the initial lease term and reset to market during the first year of the renewal period. Rental payments are required to be made monthly in advance. Under the lease, the tenant is responsible for all operating costs associated with the real estate including, maintenance, insurance, property taxes, environmental, zoning, permitting, etc. and the tenant is required to maintain the real estate in good condition. Future minimum rental payments to be received from the tenant for the five years subsequent to December 31, 2009 and thereafter are as follows (in thousands):
2010 | $ | 15,458 | |||
2011 | 15,458 | ||||
2012 | 15,458 | ||||
2013 | 15,458 | ||||
2014 | 16,592 | ||||
Thereafter | 780,450 | ||||
Total | $ | 858,874 | |||
F-22
Notes to Consolidated Financial Statements (Continued)
Note 9
Pro Forma Information (Unaudited)
The following unaudited pro forma information for the years ended December 31, 2009 and 2008 is presented as if the acquisitions of the Company's 33 hotels owned at December 31, 2009 had occurred on the latter of January 1, 2008 or the opening date of the hotel. The pro forma information does not purport to represent what the Company's results of operations would actually have been if such transactions, in fact, had occurred on these applicable dates, nor does it purport to represent the results of operations for future periods. Amounts are in thousands, except per share data.
| | Year Ended December 31, 2009 | Year Ended December 31, 2008 | |||||
|---|---|---|---|---|---|---|---|
Total revenues | $ | 103,976 | $ | 81,088 | |||
Net income | 18,812 | 11,836 | |||||
Net income per share—basic and diluted | $ | 0.28 | $ | 0.37 | |||
The pro forma information reflects adjustments for actual revenues and expenses of the 33 hotels acquired during 2008 and 2009 for the respective period owned prior to acquisition by the Company. Net income has been adjusted as follows: (1) interest income and expense have been adjusted to reflect the reduction in cash and cash equivalents required to fund the acquisitions; (2) interest expense related to prior owners' debt which was not assumed has been eliminated; (3) depreciation has been adjusted based on the Company's basis in the hotels; and (4) transaction costs have been adjusted for the acquisition of existing businesses that occurred on or after January 1, 2009.
Note 10
Industry Segments
The Company has two reportable segments: hotel investments and real estate leased under a long-term triple-net lease. The Company owns extended-stay and limited service hotel properties throughout the United States that generate rental and other property related income. The Company separately evaluates the performance of each of its hotel properties. However, because each of the hotels has similar economic characteristics, facilities, and services, and each hotel is not individually significant, the properties have been aggregated into a single operating segment. During the second quarter of 2009, the Company closed on the acquisition of 417 acres of land and improvements located on 113 sites in the Ft. Worth area and simultaneously entered into a long-term ground lease with a tenant that will use the land for natural gas production. Prior to this acquisition, the Company's only reportable segment was hotel investments. The Company does not allocate corporate-level accounts to its operating segments, including corporate general and administrative expenses, non-operating interest
F-23
Notes to Consolidated Financial Statements (Continued)
Note 10 (Continued)
income and interest expense. The following table summarizes the results of operations and assets for each segment for the year ending December 31, 2009. Dollar amounts are in thousands.
| | For the year ended December 31, 2009 | ||||||||||||
|---|---|---|---|---|---|---|---|---|---|---|---|---|---|
| | Hotels | Ground Lease | Corporate | Consolidated | |||||||||
Total revenue | $ | 85,206 | $ | 15,961 | $ | — | $ | 101,167 | |||||
Operating expenses | 58,250 | 79 | — | 58,329 | |||||||||
Acquisition related costs | 4,951 | — | — | 4,951 | |||||||||
Depreciation expense | 14,095 | 1,841 | — | 15,936 | |||||||||
General and administrative | — | — | 4,079 | 4,079 | |||||||||
Operating income/(loss) | 7,910 | 14,041 | (4,079 | ) | 17,872 | ||||||||
Interest income | — | — | 1,282 | 1,282 | |||||||||
Interest expense | (2,300 | ) | — | — | (2,300 | ) | |||||||
Net income/(loss) | $ | 5,610 | $ | 14,041 | $ | (2,797 | ) | $ | 16,854 | ||||
Total assets as of December 31, 2009 | $ | 550,163 | $ | 154,078 | $ | 278,272 | $ | 982,513 | |||||
Note 11
Significant Tenant
Chesapeake Energy Corporation leases properties with carrying values that represent approximately 16% of the Company's total assets, at cost, as of December 31, 2009. The following table presents summary financial information for Chesapeake Energy Corporation as of December 31, 2009 and 2008, and for the years ended December 31, 2009 and 2008, as reported in its December 31, 2009 Form 10-K furnished with the Securities and Exchange Commission (the "SEC").
Chesapeake Energy Corporation
Selected Financial Data
(In millions)
Consolidated Balance Sheet Data:
| | December 31, 2009 | December 31, 2008 | |||||
|---|---|---|---|---|---|---|---|
Current assets | $ | 2,446 | $ | 4,292 | |||
Noncurrent assets | 27,468 | 34,301 | |||||
Current liabilities | 2,688 | 3,621 | |||||
Noncurrent liabilities | 14,885 | 17,955 | |||||
Total equity | 12,341 | 17,017 | |||||
F-24
Notes to Consolidated Financial Statements (Continued)
Note 11 (Continued)
Consolidated Statements of Income Data:
| | Year Ended December 31, 2009 | Year Ended December 31, 2008 | |||||
|---|---|---|---|---|---|---|---|
Total revenues | $ | 7,702 | $ | 11,629 | |||
Total operating costs | 16,647 | 10,172 | |||||
Operating income (loss) | (8,945 | ) | 1,457 | ||||
Net income (loss) | (5,805 | ) | 604 | ||||
Consolidated Statements of Cash Flows Data:
| | Year Ended December 31, 2009 | Year Ended December 31, 2008 | |||||
|---|---|---|---|---|---|---|---|
Cash provided by operating activities | $ | 4,356 | $ | 5,357 | |||
Cash used in investing activities | (5,462 | ) | (9,965 | ) | |||
Cash (used in) provided by financing activities | (336 | ) | 6,356 | ||||
Net increase (decrease) in cash and cash equivalents | (1,442 | ) | 1,748 | ||||
Cash and cash equivalents, beginning of period | 1,749 | 1 | |||||
Cash and cash equivalents, end of period | 307 | 1,749 | |||||
The summary financial information of Chesapeake Energy Corporation is presented to comply with applicable accounting regulations of the SEC. References in these financials statements to the financial statements furnished with the SEC for Chesapeake Energy Corporation are included as textual references only, and the information in Chesapeake Energy Corporation's filing is not incorporated by reference into these financial statements.
Note 12
Commitments
As of December 31, 2009, the Company had outstanding contracts for the potential purchase of eight additional hotels for a total purchase price of $132.1 million. Six of these hotels are under construction and are expected to be completed over the next 12 months. Although the Company is working towards acquiring these hotels, there are many conditions to closing that have not yet been satisfied and there can be no assurance that closings will occur under the outstanding purchase contracts. The following table summarizes the location, brand, number of rooms, refundable (if the
F-25
Notes to Consolidated Financial Statements (Continued)
Note 12 (Continued)
seller does not meet its obligations under the contract) contract deposits paid, and gross purchase price for each of the contracts. All dollar amounts are in thousands.
Location | Brand | Rooms | Deposits Paid | Gross Purchase Price | ||||||||
|---|---|---|---|---|---|---|---|---|---|---|---|---|
Clovis, CA | Homewood Suites | 83 | $ | 55 | $ | 12,435 | (a) | |||||
Albany, GA | Fairfield Inn & Suites | 87 | 5 | 7,920 | (a)/(b) | |||||||
Panama City, FL | TownePlace Suites | 103 | 5 | 10,640 | (a)/(b) | |||||||
Houston, TX | Marriott | 206 | 200 | 50,750 | (a)/(b) | |||||||
Holly Springs, NC | Hampton Inn | 124 | 100 | 14,880 | (a) | |||||||
Ft. Worth, TX | TownePlace Suites | 140 | 500 | 18,460 | (a)/(b) | |||||||
Jacksonville, NC | Fairfield Inn & Suites | 79 | 125 | 7,800 | ||||||||
Jacksonville, NC | TownePlace Suites | 86 | 125 | 9,200 | ||||||||
| 908 | $ | 1,115 | $ | 132,085 | ||||||||
- (a)
- The hotels are currently under construction. The table shows the expected number of rooms upon hotel completion and the expected franchise.
- (b)
- If the seller meets all of the conditions to closing, the Company is obligated to specifically perform under the contract. As the properties are under construction, at this time, the seller has not met all of the conditions to closing.
As there can be no assurance that all conditions to closing will be satisfied, the Company includes deposits paid for hotels under contract in other assets, net in the Company's consolidated balance sheets, and in deposits and other disbursements for potential acquisitions in the Company's consolidated statements of cash flows. It is anticipated that the purchase price for the outstanding contracts will be funded from the proceeds of the Company's on-going best-efforts offering of Units and cash on hand if a closing occurs.
On October 14, 2009, the Company entered into a ground lease for approximately one acre of land located in downtown Richmond, Virginia. The lease terminates on December 31, 2098, subject to the Company's right to exercise two renewal periods of ten years each. The Company intends to use the land to build two nationally recognized brand hotels. Under the terms of the lease the Company has a six month "Study Period" to determine the viability of the hotels. The Company can terminate the lease for any reason during the Study Period, which ends on April 14, 2010. After the Study Period, the lease continues to be subject to various conditions, including but not limited to obtaining various permits, licenses, zoning variances and franchise approvals. If any of these conditions are not met the Company has the right to terminate the lease at any time. Rent payments are not required until the Company decides to begin construction on the hotels. Annual rent under the lease is $300,000 with adjustments throughout the lease term based on the Consumer Price Index. As there are many conditions to beginning construction on the hotels, there are no assurances that the Company will construct the hotels or continue the lease.
On December 22, 2009, the Company terminated two separate purchase contracts for two hotels to be constructed in Hillsboro, Oregon. The hotels had a combined purchase price of $47.0 million. In connection with the termination of these contracts, the initial deposits of $100,000 each were repaid to the Company.
F-26
Notes to Consolidated Financial Statements (Continued)
Note 13
Quarterly Financial Data (Unaudited)
The following is a summary of quarterly results of operations for the years ended December 31, 2009 and 2008. Income per share for the four quarters in 2009 and 2008 are non-additive in comparison to income per share for the period ended December 31, 2009 and 2008, respectively due to the timing and size of the Company's Unit issuances.
2009 (in thousands except per share data) | First Quarter | Second Quarter | Third Quarter | Fourth Quarter | |||||||||
|---|---|---|---|---|---|---|---|---|---|---|---|---|---|
Revenues | $ | 18,683 | $ | 26,584 | $ | 28,101 | $ | 27,799 | |||||
Net income | $ | 1,550 | $ | 5,733 | $ | 4,085 | $ | 5,486 | |||||
Basic and diluted net income per common share | $ | 0.03 | $ | 0.10 | $ | 0.06 | $ | 0.06 | |||||
Distributions declared and paid per common share | $ | 0.22 | $ | 0.22 | $ | 0.22 | $ | 0.22 | |||||
2008 (in thousands except per share data) | First Quarter | Second Quarter | Third Quarter | Fourth Quarter | |||||||||
|---|---|---|---|---|---|---|---|---|---|---|---|---|---|
Revenues | $ | — | $ | — | $ | 719 | $ | 10,805 | |||||
Net income (loss) | $ | (20 | ) | $ | 294 | $ | 988 | $ | 890 | ||||
Basic and diluted net income (loss) per common share | $ | (1,985.20 | ) | $ | 0.05 | $ | 0.04 | $ | 0.03 | ||||
Distributions declared and paid per common share | $ | — | $ | 0.07 | $ | 0.22 | $ | 0.22 | |||||
Upon completion of the purchase price allocation for the land and land improvements acquired on April 7, 2009, the Company calculated and recorded depreciation expense related to land improvements of $1.8 million of which $614,000 relates to the second quarter and $614,000 relates to the third quarter of 2009. Previously reported amounts have been adjusted to reflect this expense in the quarter to which it relates.
Note 14
Subsequent Events
In January 2010, the Company declared and paid approximately $7.2 million in dividend distributions to its common shareholders, or $0.073334 per outstanding common share. The Company also closed on the issuance of 5.3 million Units through its on-going best-efforts offering, representing gross proceeds to the Company of $58.4 million and proceeds net of selling and marketing costs of $52.5 million.
In January 2010, the Company redeemed 120,742 Units in the amount of $1.25 million under its Unit Redemption Program.
In February 2010, the Company declared and paid approximately $7.6 million in dividend distributions to its common shareholders, or $0.073334 per outstanding common share. The Company also closed on the issuance of 5.2 million Units through its on-going best-efforts offering, representing gross proceeds to the Company of $57.4 million and proceeds net of selling and marketing costs of $51.6 million.
On February 1, 2010, the Company entered into a purchase contract for the potential acquisition of a Courtyard in Santa Ana, California. The gross purchase price for the 155 room hotel is $24.8 million, and a refundable deposit of $100,000 was paid by the Company in connection with the
F-27
Notes to Consolidated Financial Statements (Continued)
Note 14 (Continued)
contract. The hotel is currently under construction. The number of rooms refers to the expected number of rooms upon completion.
In February 2010, the Company agreed to sell back to Chesapeake Energy Corporation (Chesapeake) two of the 113 sites originally purchased from Chesapeake and release Chesapeake from their associated lease obligation. The sales price for the two sites was equal to the Company's original purchase price, approximately $2.6 million. The Company did earn and receive rental income for the period held totaling approximately $240,000.
Subsequent to December 31, 2009, the Company closed on the purchase of five hotels. The following table summarizes the hotel information. All dollar amounts are in thousands.
Location | Brand | Gross Purchase Price | Rooms | Date of Purchase | ||||||||
|---|---|---|---|---|---|---|---|---|---|---|---|---|
Houston, TX | Marriott | $ | 50,750 | 206 | 1/8/2010 | |||||||
Albany, GA | Fairfield Inn & Suites | 7,920 | 87 | 1/14/2010 | ||||||||
Panama City, FL | TownePlace Suites | 10,640 | 103 | 1/19/2010 | ||||||||
Clovis, CA | Homewood Suites | 12,435 | 83 | 2/2/2010 | ||||||||
Jacksonville, NC | TownePlace Suites | 9,200 | 86 | 2/16/2010 | ||||||||
| $ | 90,945 | 565 | ||||||||||
F-28