Use these links to rapidly review the document
TABLE OF CONTENTS
Filed pursuant to rule 424(b)(3)
Registration No.: 333-147414
SUPPLEMENT NO. 8 DATED APRIL 21, 2010
TO PROSPECTUS DATED SEPTEMBER 21, 2009
APPLE REIT NINE, INC.
The following information supplements the prospectus of Apple REIT Nine, Inc. dated September 21, 2009 and is part of the prospectus. This Supplement updates the information presented in the prospectus.Prospective investors should carefully review the prospectus and this Supplement No. 8 (which is cumulative and replaces all prior Supplements).
Status of the Offering | S-3 | |
Incorporation by Reference | S-5 | |
Summary Overview | S-7 | |
Summary of Contracts for Our Recently Purchased Properties | S-12 | |
Financial and Operating Information for Our Purchased Properties | S-14 | |
Management | S-19 | |
Selected Financial Data | S-24 | |
Management's Discussion and Analysis of Financial Condition and Results of Operations | S-26 | |
Experts | S-27 | |
Experience of Prior Programs | S-29 | |
Index to Financial Statements | F-1 |
Certain forward-looking statements are included in the prospectus and this supplement. These forward-looking statements may involve our plans and objectives for future operations, including future growth and availability of funds. These forward-looking statements are based on current expectations, which are subject to numerous risks and uncertainties. Assumptions relating to these statements involve judgments with respect to, among other things, the continuation of our offering of Units, future economic, competitive and market conditions and future business decisions, together with local, national and international events (including, without limitation, acts of terrorism or war, and their direct and indirect effects on travel and the economy). All of these matters are difficult or impossible to predict accurately and many of them are beyond our control. Although we believe the assumptions relating to the forward-looking statements, and the statements themselves, are reasonable, any of the assumptions could be inaccurate and, therefore, there can be no assurance that these forward-looking statements will prove to be accurate. In light of the significant uncertainties inherent in these forward-looking statements, the inclusion of this information should not be regarded as a representation by us or any other person that our objectives and plans, which we consider to be reasonable, will be achieved.
S-1
"Courtyard by Marriott," "Fairfield Inn," "Fairfield Inn & Suites," "TownePlace Suites," "Marriott," "SpringHill Suites" and "Residence Inn" are each a registered trademark of Marriott International, Inc. or one of its affiliates. All references below to "Marriott" mean Marriott International, Inc. and all of its affiliates and subsidiaries, and their respective officers, directors, agents, employees, accountants and attorneys. Marriott is not responsible for the content of this prospectus supplement, whether relating to hotel information, operating information, financial information, Marriott's relationship with Apple REIT Nine, Inc., or otherwise. Marriott is not involved in any way, whether as an "issuer" or "underwriter" or otherwise, in the offering by Apple REIT Nine, Inc. and receives no proceeds from the offering. Marriott has not expressed any approval or disapproval regarding this prospectus supplement or the offering related to this prospectus supplement, and the grant by Marriott of any franchise or other rights to Apple REIT Nine, Inc. shall not be construed as any expression of approval or disapproval. Marriott has not assumed, and shall not have, any liability in connection with this prospectus supplement or the offering related to this prospectus supplement.
"Hampton Inn," "Hampton Inn & Suites," "Homewood Suites," "Embassy Suites" and "Hilton Garden Inn" are each a registered trademark of Hilton Worldwide or one of its affiliates. All references below to "Hilton" mean Hilton Worldwide and all of its affiliates and subsidiaries, and their respective officers, directors, agents, employees, accountants and attorneys. Hilton is not responsible for the content of this prospectus supplement, whether relating to hotel information, operating information, financial information, Hilton's relationship with Apple REIT Nine, Inc., or otherwise. Hilton is not involved in any way, whether as an "issuer" or "underwriter" or otherwise, in the offering by Apple REIT Nine, Inc. and receives no proceeds from the offering. Hilton has not expressed any approval or disapproval regarding this prospectus supplement or the offering related to this prospectus supplement, and the grant by Hilton of any franchise or other rights to Apple REIT Nine, Inc. shall not be construed as any expression of approval or disapproval. Hilton has not assumed, and shall not have, any liability in connection with this prospectus supplement or the offering related to this prospectus supplement.
S-2
We completed the minimum offering of Units (with each Unit consisting of one Common Share and one Series A Preferred Share) at $10.50 per Unit on May 14, 2008. We are continuing the offering at $11 per Unit in accordance with the prospectus. We registered to sell a total of 182,251,082 Units. As of March 31, 2010, 67,029,405 Units remained unsold. Our offering of Units expires on April 25, 2011, provided that the offering will be terminated if all of the Units are sold before then.
As of March 31, 2010, we had closed on the following sales of Units in the offering:
Price Per Unit | Number of Units Sold | Gross Proceeds | Proceeds Net of Selling Commissions and Marketing Expense Allowance | |||||||||
|---|---|---|---|---|---|---|---|---|---|---|---|---|
$10.50 | 9,523,810 | $ | 100,000,000 | $ | 90,000,000 | |||||||
$11.00 | 105,697,867 | 1,162,676,547 | 1,046,408,892 | |||||||||
Total | 115,221,677 | $ | 1,262,676,547 | $ | 1,136,408,892 | |||||||
Our distributions since the initial capitalization through December 31, 2009 totaled approximately $70.3 million of which approximately $44.2 million was used to purchase additional Units under the Company's best-efforts offering. Thus the net cash distributions were $26.1 million. Our distributions were paid at a monthly rate of $0.073334 per common share beginning in June 2008. For the same period our net cash generated from operations, from our Consolidated Statements of Cash Flows, was approximately $32.5 million, which exceeded the net cash distributions. The following is a summary of the distributions and cash generated by operations.
| | Total Distributions Declared and Paid per Share | Total Declared and Paid | | |||||||||||||
|---|---|---|---|---|---|---|---|---|---|---|---|---|---|---|---|---|
| | Net Cash From Operations(1) | |||||||||||||||
| | Cash | Reinvested | Total | |||||||||||||
2nd Quarter 2008 | $ | 0.07 | $ | 300,000 | $ | 593,000 | $ | 893,000 | $ | 323,000 | ||||||
3rd Quarter 2008 | 0.22 | 1,694,000 | 3,094,000 | 4,788,000 | 966,000 | |||||||||||
4th Quarter 2008 | 0.22 | 2,582,000 | 4,749,000 | 7,331,000 | 2,047,000 | |||||||||||
1st Quarter 2009 | 0.22 | 3,624,000 | 6,265,000 | 9,889,000 | 2,204,000 | |||||||||||
2nd Quarter 2009 | 0.22 | 4,728,000 | 7,897,000 | 12,625,000 | 8,888,000 | |||||||||||
3rd Quarter 2009 | 0.22 | 5,956,000 | 9,790,000 | 15,746,000 | 8,908,000 | |||||||||||
4th Quarter 2009 | 0.22 | 7,240,000 | 11,830,000 | 19,070,000 | 9,137,000 | |||||||||||
| $ | 1.39 | $ | 26,124,000 | $ | 44,218,000 | $ | 70,342,000 | $ | 32,473,000 | |||||||
- (1)
- See complete consolidated statement of cash flows for the twelve months ended December 31, 2009 included in our audited financial statements in our most recent Form 10-K for the year ended December 31, 2009, incorporated by reference herein. See "Incorporation by Reference" on page S-5 of this Supplement.
During the initial phase of our operations, we may, due to the inherent delay between raising capital and investing that same capital in income producing real estate, have a portion of our distributions funded from offering proceeds. Our objective in setting a distribution rate is to project a rate that will provide consistency over the life of the Company, taking into account acquisitions and capital improvements, ramp up of new properties and varying economic cycles. We anticipate that we may need to utilize debt, offering proceeds and cash from operations to meet this objective. We evaluate the distribution rate on an ongoing basis and may make changes at any time if we feel the rate is not appropriate based on available cash resources. In May 2008, our Board of Directors established a policy for an annualized dividend rate of $0.88 per common share, payable in monthly distributions. Since there can be no assurance of our ability to acquire properties that provide income at this level, or
S-3
that the properties already acquired will provide income at this level, there can be no assurance as to the classification or duration of distributions at the current rate.
For the year ended December 31, 2009, as stated in Note 1 to our consolidated financial statements for that period, 53% of distributions made to investors represented a return of capital and the remaining 47% represented ordinary income. Proceeds of the offering which are distributed are not available for investment in properties. See "Risk Factors"—"We may be unable to make distributions to our shareholders," on page 28 of the prospectus, and "Our distributions to our shareholders may not be sourced from operating cash flow but instead from offering proceeds or indebtedness, which (to the extent it occurs) will decrease our distributions in the future," on page 16 of the prospectus.
For the year ended December 31, 2009, we received requests to redeem approximately 252,000 Units pursuant to our Unit Redemption Program for a total of $2.6 million. Through our last scheduled quarterly redemption date in 2009, October 20, 2009, we redeemed 100% of the redemption requests for the year ended December 31, 2009 at an average per Unit redemption price of $10.32. We funded Unit redemptions for the periods noted above from the proceeds of dividends used to purchase additional Units under the Company's best efforts offering of Units.
Extension of Best-Efforts Offering
On April 15, 2010, our Board of Directors unanimously approved a resolution extending our offering of Units until April 25, 2011. Our best-efforts offering will continue until all of the Units offered under this prospectus have been sold or until April 25, 2011.
(Remainder of Page Intentionally Left Blank)
S-4
INCORPORATION BY REFERENCE
We have elected to "incorporate by reference" certain information into this prospectus. By incorporating by reference, we are disclosing important information to you by referring you to documents we have filed separately with the Securities and Exchange Commission, or "SEC." The following documents filed with the SEC are incorporated by reference in this prospectus (Commission File No. 333-147414), except for any document or portion thereof deemed to be "furnished" and not filed in accordance with SEC rules:
- •
- Annual Report on Form 10-K for the fiscal year ended December 31, 2009 filed with the SEC on March 5, 2010;
- •
- Definitive Proxy Statement filed on Schedule 14A filed with the SEC on April 2, 2010;
- •
- Current Report on Form 8-K/A filed with the SEC on October 10, 2008; includes the financial statements for the Tucson, Arizona Hilton Garden Inn Hotel and the required pro forma financial information;
- •
- Current Report on Form 8-K filed with the SEC on October 22, 2008; includes the financial statements for SCI Lewisville Hotel, Ltd. (previous owner of the Lewisville, Texas Hilton Garden Inn); SCI Duncanville Hotel, Ltd. (previous owner of the Duncanville, Texas Hilton Garden Inn) and the required pro forma financial information;
- •
- Current Report on Form 8-K/A filed with the SEC on October 24, 2008; includes the financial statements for RSV Twinsburg Hotel, Ltd (previous owner of the Twinsburg, Ohio Hilton Garden Inn) and the required pro forma financial information;
- •
- Current Report on Form 8-K/A filed with the SEC on October 24, 2008; includes the financial statements for Charlotte Lakeside Hotel, L.P. (previous owner of the Charlotte, North Carolina Homewood Suites); Santa Clarita Courtyard; Allen Stacy Hotel, Ltd. (previous owner of the Allen, Texas Hampton Inn & Suites) and the required pro forma financial information;
- •
- Current Report on Form 8-K/A filed with the SEC on January 12, 2009; includes the financial statements for the Beaumont, Texas—Residence Inn by Marriott; Santa Clarita Hotels Portfolio; SCI Allen Hotel, Ltd. (previous owner of the Allen, Texas Hilton Garden Inn); Pueblo, Colorado Hampton Inn & Suites and the required pro forma financial information;
- •
- Current Report on Form 8-K/A filed with the SEC on January 12, 2009; includes the financial statements for the Bristol, Virginia—Courtyard Marriott and the required pro forma financial information;
- •
- Current Report on Form 8-K/A filed with the SEC on January 27, 2009; includes the financial statements for the Durham, North Carolina—Homewood Suites and the required pro forma financial information;
- •
- Current Report on Form 8-K/A filed with the SEC on January 27, 2009; includes the financial statements for RMRVH Jackson, LLC, CYRMR Jackson, LLC and VH Fort Lauderdale Investment Ltd (previous owners of the Jackson, Tennessee Courtyard; Jackson, Tennessee Hampton Inn & Suites and Fort Lauderdale, Florida Hampton Inn) and the required pro forma financial information;
- •
- Current Report on Form 8-K/A filed with the SEC on January 27, 2009; includes the financial statements for RMRVH Jackson, LLC, CYRMR Jackson, LLC and VH Fort Lauderdale Investment Ltd (previous owners of the Jackson, Tennessee Courtyard; Jackson, Tennessee Hampton Inn & Suites and Fort Lauderdale, Florida Hampton Inn); Playhouse Square Hotel Associates and Playhouse Parking Associates, L.P. (previous owners of the Pittsburgh, Pennsylvania Hampton Inn) and the required pro forma financial information;
S-5
- •
- Current Report on Form 8-K filed with the SEC on April 15, 2009; includes the financial statements for Austin FRH, LTD, FRH Braker, LTD and RR Hotel Investment, LTD (previous owners of Round Rock, Texas Hampton Inn; Austin, Texas Homewood Suites and Austin, Texas Hampton Inn) and the required pro forma financial information;
- •
- Current Report on Form 8-K/A filed with the SEC on April 15, 2009; includes the financial statements for Austin FRH, LTD, FRH Braker, LTD and RR Hotel Investment, LTD (previous owners of Round Rock, Texas Hampton Inn; Austin, Texas Homewood Suites and Austin, Texas Hampton Inn) and the required pro forma financial information;
- •
- Current Report on Form 8-K/A filed with the SEC on September 1, 2009; includes the financial statements for Grove Street Orlando, LLC (previous owner of Orlando, Florida Fairfield Inn & Suites and Orlando, Florida SpringHill Suites) and the required pro forma financial information;
- •
- Current Report on Form 8-K/A filed with the SEC on March 22, 2010; includes the financial statements for the Houston, Texas—Marriott Hotel and the required pro forma financial information;
- •
- The description of our Units contained in our Registration Statement filed on Form 8-A (File No. 000-53603), filed with the SEC on March 27, 2009; and
- •
- Current Reports on Form 8-K filed with the SEC on January 2, 2009, January 7, 2009, January 8, 2009, January 22, 2009, February 3, 2009, February 6, 2009, February 17, 2009, March 10, 2009, March 16, 2009, April 10, 2009, May 26, 2009, June 3, 2009, June 18, 2009, July 2, 2009, August 21, 2009, September 28, 2009, November 20, 2009, January 12, 2010, January 20, 2010, March 19, 2010 and April 16, 2010.
All of the documents that we have incorporated by reference into this prospectus are available on the SEC's website, www.sec.gov. In addition, these documents can be inspected and copied at the Public Reference Room maintained by the SEC at 100 F Street, NE, Washington, D.C. 20549. Copies also can be obtained by mail from the Public Reference Room at prescribed rates. Please call the SEC at (800) SEC-0330 for further information on the operation of the Public Reference Room.
In addition, we will provide to each person, including any beneficial owner of our common shares, to whom this prospectus is delivered, a copy of any or all of the information that we have incorporated by reference into this prospectus, as supplemented, but not delivered with this prospectus. To receive a free copy of any of the documents incorporated by reference in this prospectus, other than exhibits, unless they are specifically incorporated by reference in those documents, call or write us at 814 East Main Street, Richmond, Virginia 23219, Attention: Kelly Clarke, (804) 344-8121. The documents also may be accessed on our website at www.applereitnine.com. The information relating to us contained in this prospectus does not purport to be comprehensive and should be read together with the information contained in the documents incorporated or deemed to be incorporated by reference in this prospectus.
S-6
Summary of Real Estate Investments
Since our prospectus dated September 21, 2009, we have purchased eight additional hotels. Currently, through our subsidiaries, we own a total of 39 hotels. These hotels contain a total of 4,586 guest rooms. They were purchased for an aggregate gross purchase price of $628.2 million. Financial and operating information about our purchased hotels is provided in another section below.
In addition, we currently own, through one of our subsidiaries, approximately 410 acres of land and land improvements located on 111 individual sites in the Ft. Worth, Texas area. The purchase price for this land was approximately $145 million. The land is leased to Chesapeake Energy Corporation for the production of natural gas. Under the ground lease, we receive monthly rental payments.
Description of Real Estate Owned
The map below shows the states in which our hotels are located, and the following charts summarize our room and franchise information.
States in which Our Hotels are Located
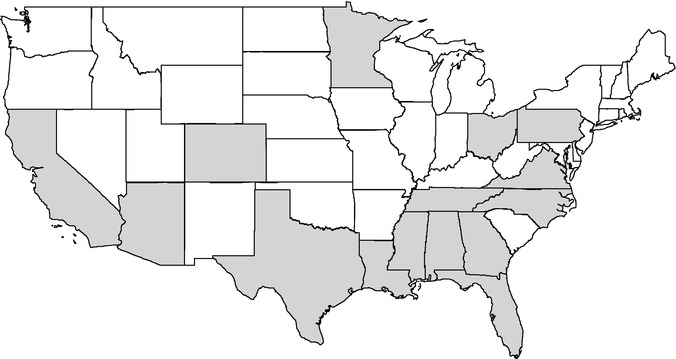
S-7
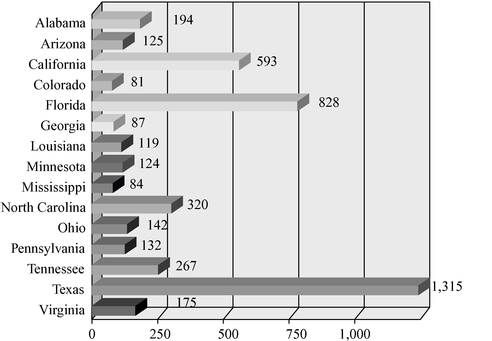
Number of Guest Rooms by State
Type and Number of Hotel Franchises
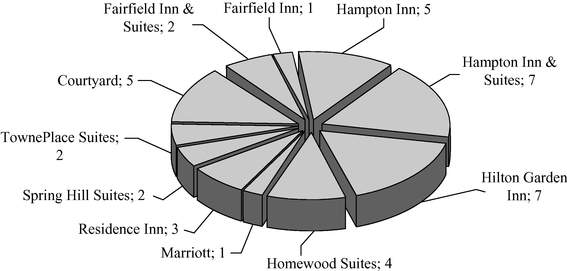
S-8
Summary of Potential Acquisitions
We have entered into, or caused one of our indirect wholly-owned subsidiaries to enter into, purchase contracts for 13 other hotels. These contracts are for direct hotel purchases. The following table summarizes the hotel and contract information:
| | Hotel Location | Franchise | Date of Purchase Contract | Number of Rooms | Gross Purchase Price | ||||||||
|---|---|---|---|---|---|---|---|---|---|---|---|---|---|
| 1. | Holly Springs, North Carolina(a) | Hampton Inn | January 6, 2009 | 124 | $ | 14,880,000 | |||||||
| 2. | Fort Worth, Texas(a)(b) | TownePlace Suites | May 7, 2009 | 140 | 18,460,000 | ||||||||
| 3. | Jacksonville, North Carolina | Fairfield Inn & Suites | December 11, 2009 | 79 | 7,800,000 | ||||||||
| 4. | Santa Ana, California(a) | Courtyard | February 1, 2010 | 155 | 24,800,000 | ||||||||
| 5. | Boise, Idaho(c) | Hampton Inn & Suites | March 16, 2010 | 186 | 22,370,000 | ||||||||
| 6. | Rogers, Arkansas(c)(d) | Hampton Inn | March 16, 2010 | 122 | 8,500,000 | ||||||||
| 7. | Rogers, Arkansas(c) | Homewood Suites | March 16, 2010 | 126 | 12,000,000 | ||||||||
| 8. | St. Louis, Missouri(c)(d) | Hampton Inn | March 16, 2010 | 190 | 23,000,000 | ||||||||
| 9. | St. Louis, Missouri(c) | Hampton Inn & Suites | March 16, 2010 | 126 | 16,000,000 | ||||||||
| 10. | Kansas City, Missouri(c)(d) | Hampton Inn | March 16, 2010 | 122 | 10,130,000 | ||||||||
| 11. | Oklahoma City, Oklahoma(c)(d) | Hampton Inn & Suites | March 16, 2010 | 200 | 32,000,000 | ||||||||
| 12. | Anchorage, Alaska | Embassy Suites | March 16, 2010 | 169 | 42,000,000 | ||||||||
| 13. | Lafayette, Louisiana(a)(b) | SpringHill Suites | March 29, 2010 | 103 | 10,232,110 | ||||||||
| Total | 1,842 | $ | 242,172,110 | ||||||||||
Notes for Table:
- (a)
- The indicated hotels are currently under construction. The table shows the expected number of rooms upon hotel completion and the expected franchise.
- (b)
- If the seller meets all of the conditions to closing, we are obligated to specifically perform under the purchase contract. As the properties are under construction at this time, the seller has not met all conditions to closing.
- (c)
- Sellers of properties are affiliated with each other, but not the Company.
- (d)
- Purchase contract for these hotels requires the assumption of loans secured by the hotels. Total outstanding principal is approximately $49.5 million. The loans have current interest rates varying from 2.0%—5.5% maturity dates from November 2011 to October 2015, and require monthly payments of principal and interest on an amortized basis.
In general, each purchase contract listed above required a deposit upon (or shortly after) execution. An additional deposit is typically due upon the expiration of the contract review period. Additionally, for the Santa Ana Courtyard, upon the issuance of the building permit by the City of Santa Ana, the Company will be required to fund an additional deposit of $6 million. If a closing occurs under a purchase contract, the initial and additional deposits are credited toward the purchase price. If a closing does not occur because the seller fails to satisfy a condition to closing or breaches the purchase contract, the applicable deposits would be refunded to us. The total of both the initial and additional deposits for the purchase contracts listed above is $9.0 million.
For each purchase contract listed above, there are material conditions to closing that presently remain unsatisfied. Accordingly, there can be no assurance at this time that a closing will occur under any of these purchase contracts.
On October 14, 2009, through one of our indirect wholly-owned subsidiaries, we entered into a ground lease for approximately one acre of land located in downtown Richmond, Virginia. The lease terminates on December 31, 2098, subject to our right to exercise two renewal periods of ten years
S-9
each. We intend to use the land to build two nationally recognized brand hotels. Under the terms of the lease we have a "Study Period" to determine the viability of the hotels. We can terminate the lease for any reason during the Study Period, which originally ended on April 14, 2010. The Study Period was extended for six months to October 14, 2010, in April 2010. After the Study Period, the lease continues to be subject to various conditions, including but not limited to obtaining various permits, licenses, zoning variances and franchise approvals. If any of these conditions are not met we have the right to terminate the lease at any time. Rent payments are not required until we decide to begin construction on the hotels. Annual rent under the lease is $300,000 with adjustments throughout the lease term based on the Consumer Price Index. As there are many conditions to beginning construction on the hotels, there are no assurances that we will construct the hotels or continue the lease.
Recent Terminations
In December 2009 the Company terminated two purchase contracts for hotels in Hillsboro, Oregon. The contracts were initially entered into in October 2008. The seller was not able to begin construction of the hotels, and as a result the contracts were terminated by the Company and the initial aggregate deposit of $200,000 was returned to the Company.
Source of Funds and Related Party Payments
David Lerner Associates, Inc., Apple Suites Realty Group, Inc. and Apple Nine Advisors, Inc. earned the compensation and expense reimbursements shown below in connection with their services from inception through the period ending December 31, 2009 relating to our offering phase, acquisition phase and operations phase.
David Lerner Associates, Inc. is not related to Apple Suites Realty Group, Inc. or Apple Nine Advisors, Inc. Apple Suites Realty Group, Inc. and Apple Nine Advisors, Inc. are owned by Glade M. Knight, our Chairman and Chief Executive Officer.
As described on page 41 of our prospectus under the heading "Compensation" and as shown below, we pay certain fees and expenses as they are incurred, while others accrue and will be paid in future periods, subject in some cases to the achievement of performance criteria. We did not incur any amounts in connection with our disposition phase through December 31, 2009.
Cumulative through December 31, 2009
| | Incurred | Paid | Accrued | |||||||
|---|---|---|---|---|---|---|---|---|---|---|
Offering Phase | ||||||||||
Selling commissions paid to David Lerner Associates, Inc. in connection with the offering | $ | 81,122,000 | $ | 81,122,000 | $ | — | ||||
Marketing expense allowance paid to David Lerner Associates, Inc. in connection with the offering | 27,040,000 | 27,040,000 | — | |||||||
| 108,162,000 | 108,162,000 | — | ||||||||
Acquisition Phase | ||||||||||
Acquisition commission paid to Apple Suites Realty Group, Inc. | 13,554,000 | 13,554,000 | — | |||||||
Operations Phase | ||||||||||
Asset management fee paid to Apple Nine Advisors, Inc. | 893,000 | 893,000 | — | |||||||
Reimbursement of costs paid to Apple Nine Advisors, Inc. | 2,269,000 | 2,269,000 | — | |||||||
S-10
Amendment to Our Unit Redemption Program
On October 8, 2009, our Board of Directors adopted a resolution amending our Unit redemption program. The first full paragraph on page 128 of our prospectus describing the Unit redemption program is amended as follows:
"If funds available for our Unit redemption program are not sufficient to accommodate all requests, Units will be redeemed as follows: first, pro rata as to redemptions upon the death or disability of a shareholder; next pro rata as to redemptions to shareholders who demonstrate, in the discretion of our board of directors, another involuntary exigent circumstance, such as bankruptcy; next pro rata as to redemptions to shareholders subject to a mandatory distribution requirement under such shareholder's IRA; pro rata as to shareholders seeking redemption of all Units owned by them who beneficially or of record fewer than 100 Units; and, finally, pro rata as to other redemption requests. The board of directors, in its sole discretion, may choose to suspend or terminate the Unit redemption program or to reduce the number of Units purchased under the Unit redemption program if it determines the funds otherwise available to fund our Unit redemption program are needed for other purposes."
(Remainder of Page Intentionally Left Blank)
S-11
SUMMARY OF CONTRACTS
FOR OUR RECENTLY PURCHASED PROPERTIES
The following information updates the contract information included in our prospectus dated September 21, 2009 for our recently purchased hotels. These recent hotel purchases were funded by the proceeds from our ongoing best-efforts offering of Units.
Ownership, Leasing and Management Summary
Each of our recently purchased hotels has been leased to one of our indirect wholly-owned subsidiaries, as the lessee, under a separate hotel lease agreement. For simplicity, the applicable lessee will be referred to below as the "lessee."
Each hotel is managed under a separate management agreement between the applicable lessee and the manager. For simplicity, the applicable manager will be referred to below as the "manager."
The hotel lease agreements and the management agreements are among the contracts described in another section below. The table below specifies the franchise, hotel owner, lessee and manager for the hotels we have purchased since our prospectus dated September 21, 2009:
| | Hotel Location | Franchise(a) | Hotel Owner/Lessor | Lessee | Manager | |||||
|---|---|---|---|---|---|---|---|---|---|---|
| 1. | Baton Rouge, Louisiana | SpringHill Suites | Apple Nine Hospitality Ownership, Inc. | Apple Nine Hospitality Management, Inc. | Dimension Development Two, LLC | |||||
| 2. | Johnson City, Tennessee | Courtyard | Sunbelt-CJT, L.L.C. | Apple Nine Hospitality Management, Inc. | LBAM-Investor Group, L.L.C.(b) | |||||
| 3. | Houston, Texas | Marriott | Apple Nine Hospitality Ownership, Inc. | Apple Nine Hospitality Texas Services II, Inc. | Texas Western Management Partners, L.P.(b) | |||||
| 4. | Albany, Georgia | Fairfield Inn & Suites | Sunbelt-RAG, L.L.C. | Apple Nine Hospitality Management, Inc. | LBAM-Investor Group, L.L.C.(b) | |||||
| 5. | Panama City, Florida | TownePlace Suites | Sunbelt-RPC, L.L.C. | Apple Nine Hospitality Management, Inc. | LBAM-Investor Group, L.L.C.(b) | |||||
| 6. | Clovis, California | Homewood Suites | Apple Nine Hospitality Ownership, Inc. | Apple Nine Hospitality Management, Inc. | Dimension Development Two, LLC | |||||
| 7. | Jacksonville, North Carolina | TownePlace Suites | Apple Nine North Carolina, L.P. | Apple Nine Hospitality Management, Inc. | LBAM-Investor Group, L.L.C. | |||||
| 8. | Miami, Florida | Hampton Inn & Suites | Apple Nine Hospitality Ownership, Inc. | Apple Nine Hospitality Management, Inc. | Dimension Development Two, LLC |
Notes for Table:
- (a)
- All brand and trade names, logos or trademarks contained, or referred to, in this prospectus supplement are the properties of their respective owners. These references shall not in any way be construed as participation by, or endorsement of, our offering by any of our franchisors or managers.
- (b)
- The hotel specified was purchased from an affiliate of the indicated manager.
S-12
We have no material relationship or affiliation with the hotel sellers or managers, except for the relationship resulting from our purchases, our management agreements for the hotels we own and any related documents.
Hotel Lease Agreements
Each of our recently purchased hotels is covered by a separate hotel lease agreement between the owner (one of our indirect wholly-owned subsidiaries) and the applicable lessee (another one of our indirect wholly-owned subsidiaries, as specified in a previous section). Each lease provides for an initial term of 10 years. The applicable lessee has the option to extend its lease term for two additional five-year periods, provided it is not in default at the end of the prior term or at the time the option is exercised.
Each lease provides for annual base rent and percentage rent. The annual base rent is payable in advance in equal monthly installments and will be adjusted each year in proportion to the Consumer Price Index (based on the U.S. City Average). Shown below are the annual base rent and the lease commencement date for the hotels we have purchased since our prospectus dated September 21, 2009:
| | Hotel Location | Franchise | Annual Base Rent | Date of Lease Commencement | |||||
|---|---|---|---|---|---|---|---|---|---|
| 1. | Baton Rouge, Louisiana | SpringHill Suites | $ | 974,274 | September 25, 2009 | ||||
2. | Johnson City, Tennessee | Courtyard | 723,153 | September 25, 2009 | |||||
3. | Houston, Texas | Marriott | 2,367,460 | January 8, 2010 | |||||
4. | Albany, Georgia | Fairfield Inn & Suites | 698,338 | January 14, 2010 | |||||
5. | Panama City, Florida | TownePlace Suites | 695,825 | January 19, 2010 | |||||
6. | Clovis, California | Homewood Suites | 546,980 | February 2, 2010 | |||||
7. | Jacksonville, North Carolina | TownePlace Suites | 1,046,227 | February 16, 2010 | |||||
8. | Miami, Florida | Hampton Inn & Suites | 1,188,311 | April 9, 2010 | |||||
The annual percentage rent depends on a formula that compares fixed "suite revenue breakpoints" with a portion of "suite revenue," which is equal to gross revenue from guest rentals less sales and room taxes and credit card fees. The suite revenue breakpoints will be adjusted each year in proportion to the Consumer Price Index (based on the U.S. City Average). Specifically, the annual percentage rent is equal to the sum of (a) 17% of all suite revenue for the year, up to the applicable suite revenue breakpoint; plus (b) 55% of the suite revenue for the year in excess of the applicable suite revenue breakpoint, as reduced by base rent paid for the year.
Management Agreements
Each of our hotels is being managed by the manager under a separate management agreement between the manager and the applicable lessee (which is one of our indirect wholly-owned subsidiaries, as specified in the previous section). The manager is responsible for managing and supervising the daily operations of the hotel and for collecting revenues for the benefit of the applicable lessee. The fees and other terms of these agreements are the result of commercial negotiations between otherwise unrelated parties. We believe that such fees and terms are appropriate for the hotels and the markets in which they operate.
S-13
Franchise Agreements
In general, for our hotels franchised by Marriott International, Inc. or one of its affiliates, there is a relicensing franchise agreement between the applicable lessee (as specified in a previous section) and Marriott International, Inc. or an affiliate. Each relicensing franchise agreement provides for the payment of royalty fees and marketing contributions to the franchisor. A percentage of gross room revenues is used to determine these payments. In addition, we have caused Apple Nine Hospitality, Inc. or another one of our subsidiaries to provide a separate guaranty of the payment and performance of the applicable lessee under the relicensing franchise agreement.
For the hotels franchised by Hilton Worldwide or one of its affiliates, there is a franchise license agreement between the applicable lessee and Hilton Worldwide or an affiliate. Each franchise license agreement provides for the payment of royalty fees and program fees to the franchisor. A percentage of gross room revenues is used to determine these payments. Apple Nine Hospitality, Inc. or another one of our subsidiaries has guaranteed the payment and performance of the lessee under the applicable franchise license agreement.
The fees and other terms of these agreements are the result of commercial negotiations between otherwise unrelated parties, and we believe that such fees and terms are appropriate for the hotels and the markets in which they operate. These agreements may be terminated for various reasons, including failure by the applicable lessee to operate in accordance with the standards, procedures and requirements established by the franchisors.
FINANCIAL AND OPERATING INFORMATION
FOR OUR PURCHASED
PROPERTIES
Our hotels offer guest rooms and suites, together with related amenities, that are consistent with their operations. The hotels are located in developed or developing areas and in competitive markets. We believe the hotels are well-positioned to compete in their markets based on location, amenities, rate structure and franchise affiliation. In the opinion of management, each hotel is adequately covered by insurance. The following tables present further information about the hotels we have purchased:
| | Hotel Location | Franchise | Number of Rooms/ Suites | Gross Purchase Price | Average Daily Rate (Price) per Room/ Suite(a) | Federal Income Tax Basis for Depreciable Real Property Component of Hotel(b) | Purchase Date | |||||||||||
|---|---|---|---|---|---|---|---|---|---|---|---|---|---|---|---|---|---|---|
| 1. | Tucson, Arizona | Hilton Garden Inn | 125 | $ | 18,375,000 | $ | 120-149 | $ | 17,397,150 | July 31, 2008 | ||||||||
| 2. | Charlotte, North Carolina | Homewood Suites | 112 | 5,750,000 | 129-189 | 4,729,410 | September 24, 2008 | |||||||||||
| 3. | Santa Clarita, California | Courtyard | 140 | 22,700,000 | 129-209 | 18,243,805 | September 24, 2008 | |||||||||||
| 4. | Allen, Texas | Hampton Inn & Suites | 103 | 12,500,000 | 144-159 | 11,100,086 | September 26, 2008 | |||||||||||
| 5. | Twinsburg, Ohio | Hilton Garden Inn | 142 | 17,792,440 | 134-161 | 16,387,690 | October 7, 2008 | |||||||||||
| 6. | Lewisville, Texas | Hilton Garden Inn | 165 | 28,000,000 | 149-176 | 24,529,875 | October 16, 2008 | |||||||||||
| 7. | Duncanville, Texas | Hilton Garden Inn | 142 | 19,500,000 | 143-199 | 17,779,620 | October 21, 2008 | |||||||||||
| 8. | Santa Clarita, California | Hampton Inn | 128 | 17,129,348 | 109 | 15,358,348 | October 29, 2008 | |||||||||||
| 9. | Santa Clarita, California | Residence Inn | 90 | 16,599,578 | 139-199 | 14,118,232 | October 29, 2008 | |||||||||||
| 10. | Santa Clarita, California | Fairfield Inn | 66 | 9,337,262 | 89-119 | 7,517,608 | October 29, 2008 | |||||||||||
| 11. | Beaumont, Texas(c) | Residence Inn | 133 | 16,900,000 | 159-179 | 15,752,641 | October 29, 2008 | |||||||||||
| 12. | Pueblo, Colorado | Hampton Inn & Suites | 81 | 8,025,000 | 149-199 | 7,157,264 | October 31, 2008 | |||||||||||
| 13. | Allen, Texas | Hilton Garden Inn | 150 | 18,500,000 | 129-149 | 16,405,653 | October 31, 2008 | |||||||||||
| 14. | Bristol, Virginia | Courtyard | 175 | 18,650,000 | 119-189 | 17,115,637 | November 7, 2008 | |||||||||||
| 15. | Durham, North Carolina | Homewood Suites | 122 | 19,050,000 | 144-209 | 17,846,600 | December 4, 2008 | |||||||||||
S-14
| | Hotel Location | Franchise | Number of Rooms/ Suites | Gross Purchase Price | Average Daily Rate (Price) per Room/ Suite(a) | Federal Income Tax Basis for Depreciable Real Property Component of Hotel(b) | Purchase Date | |||||||||||
|---|---|---|---|---|---|---|---|---|---|---|---|---|---|---|---|---|---|---|
| 16. | Hattiesburg, Mississippi(c) | Residence Inn | 84 | $ | 9,793,028 | $ | 139-149 | $ | 8,910,083 | December 11, 2008 | ||||||||
| 17. | Jackson, Tennessee | Courtyard | 94 | 15,200,000 | 129-139 | 14,240,000 | December 16, 2008 | |||||||||||
| 18. | Jackson, Tennessee | Hampton Inn & Suites | 83 | 12,600,000 | 119-149 | 11,926,000 | December 30, 2008 | |||||||||||
| 19. | Fort Lauderdale, Florida | Hampton Inn | 109 | 19,290,434 | 149-169 | 18,080,922 | December 31, 2008 | |||||||||||
| 20. | Pittsburgh, Pennsylvania | Hampton Inn | 132 | 20,457,777 | 129-159 | 18,019,257 | December 31, 2008 | |||||||||||
| 21. | Frisco, Texas(c) | Hilton Garden Inn | 102 | 15,050,000 | 99-209 | 12,608,112 | December 31, 2008 | |||||||||||
| 22. | Round Rock, Texas | Hampton Inn | 93 | 11,500,000 | 119-139 | 10,658,652 | March 6, 2009 | |||||||||||
| 23. | Panama City, Florida(c) | Hampton Inn & Suites | 95 | 11,600,000 | 159-189 | 9,995,450 | March 12, 2009 | |||||||||||
| 24. | Austin, Texas | Homewood Suites | 97 | 17,700,000 | 149-189 | 15,866,419 | April 14, 2009 | |||||||||||
| 25. | Austin, Texas | Hampton Inn | 124 | 18,000,000 | 129-149 | 16,587,854 | April 14, 2009 | |||||||||||
| 26. | Dothan, Alabama(c) | Hilton Garden Inn | 104 | 11,600,836 | 119-169 | 10,564,205 | June 1, 2009 | |||||||||||
| 27. | Troy, Alabama(c) | Courtyard | 90 | 8,696,456 | 109-159 | 8,129,696 | June 18, 2009 | |||||||||||
| 28. | Orlando, Florida(c) | Fairfield Inn & Suites | 200 | 25,800,000 | 89-109 | 22,650,000 | July 1, 2009 | |||||||||||
| 29. | Orlando, Florida(c) | SpringHill Suites | 200 | 29,000,000 | 94-109 | 25,850,000 | July 1, 2009 | |||||||||||
| 30. | Clovis, California(c) | Hampton Inn & Suites | 86 | 11,150,000 | 99-139 | 9,860,000 | July 31, 2009 | |||||||||||
| 31. | Rochester, Minnesota(c) | Hampton Inn & Suites | 124 | 14,136,000 | 109-119 | 13,219,780 | August 3, 2009 | |||||||||||
| 32. | Baton Rouge, Louisiana(c) | SpringHill Suites | 119 | 15,100,000 | 99-134 | 13,820,000 | September 25, 2009 | |||||||||||
| 33. | Johnson City, Tennessee(c) | Courtyard | 90 | 9,879,788 | 119-169 | 8,774,788 | September 25, 2009 | |||||||||||
| 34. | Houston, Texas(c) | Marriott | 206 | 50,750,000 | 199-279 | 46,605,026 | January 8, 2010 | |||||||||||
| 35. | Albany, Georgia(c) | Fairfield Inn & Suites | 87 | 7,919,790 | 109 | 7,070,116 | January 14, 2010 | |||||||||||
| 36. | Panama City, Florida(c) | TownePlace Suites | 103 | 10,640,346 | 84-99 | 9,732,274 | January 19, 2010 | |||||||||||
| 37. | Clovis, California(c) | Homewood Suites | 83 | 12,435,000 | 119-139 | 10,932,060 | February 2, 2010 | |||||||||||
| 38. | Jacksonville, North Carolina | TownePlace Suites | 86 | 9,200,000 | 119-129 | 8,568,200 | February 16, 2010 | |||||||||||
| 39. | Miami, Florida | Hampton Inn & Suites | 121 | 11,900,000 | 139-159 | 9,927,800 | April 9, 2010 | |||||||||||
| Total | 4,586 | $ | 628,208,083 | |||||||||||||||
Notes for Table 1:
- (a)
- The amounts shown are subject to change, and exclude discounts that may be offered to corporate, frequent and other select customers.
- (b)
- The depreciable life is 39 years (or less, as may be permitted by federal tax laws) using the straight-line method. The modified accelerated cost recovery system will be used for the hotel's personal property component.
- (c)
- The date that the hotel was acquired was the date the hotel began operations.
| | Hotel | Franchise | Assumed Principal Balance of Loan | Annual Interest Rate | Maturity Date | |||||||
|---|---|---|---|---|---|---|---|---|---|---|---|---|
| 1. | Allen, Texas | Hilton Garden Inn | $ | 10,786,698 | 5.37 | % | October 2015 | |||||
| 2. | Bristol, Virginia | Courtyard | 9,767,131 | 6.59 | % | August 2016 | ||||||
| 3. | Duncanville, Texas | Hilton Garden Inn | 13,965,858 | 5.88 | % | May 2017 | ||||||
| 4. | Round Rock, Texas | Hampton Inn | 4,175,225 | 5.95 | % | May 2016 | ||||||
| 5. | Austin, Texas | Homewood Suites | 7,555,797 | 5.99 | % | March 2016 | ||||||
| 6. | Austin, Texas | Hampton Inn | 7,553,015 | 5.95 | % | March 2016 | ||||||
| $ | 53,803,724 | |||||||||||
Note for Table 2:
- (a)
- This table summarizes loans that (i) pre-dated our purchase, (ii) are secured by our hotels, and (iii) were assumed by our purchasing subsidiary. Each loan provides for monthly payments of principal and interest on an amortized basis.
S-15
Table 3. Operating Information(a)
PART A
| | | | Avg. Daily Occupancy Rates (%) | |||||||||||||||||
|---|---|---|---|---|---|---|---|---|---|---|---|---|---|---|---|---|---|---|---|---|
| | Hotel Location | Franchise | 2005 | 2006 | 2007 | 2008 | 2009 | |||||||||||||
| 1. | Tucson, Arizona | Hilton Garden Inn | — | — | — | 61 | % | 68 | % | |||||||||||
| 2. | Charlotte, North Carolina | Homewood Suites | 78 | % | 76 | % | 71 | % | 53 | % | 52 | % | ||||||||
| 3. | Santa Clarita, California | Courtyard | — | — | 51 | % | 61 | % | 66 | % | ||||||||||
| 4. | Allen, Texas | Hampton Inn & Suites | — | 51 | % | 68 | % | 69 | % | 60 | % | |||||||||
| 5. | Twinsburg, Ohio | Hilton Garden Inn | 64 | % | 63 | % | 66 | % | 66 | % | 62 | % | ||||||||
| 6. | Lewisville, Texas | Hilton Garden Inn | — | — | 42 | % | 63 | % | 61 | % | ||||||||||
| 7. | Duncanville, Texas | Hilton Garden Inn | 59 | % | 64 | % | 65 | % | 66 | % | 58 | % | ||||||||
| 8. | Santa Clarita, California | Hampton Inn | 83 | % | 82 | % | 78 | % | 70 | % | 63 | % | ||||||||
| 9. | Santa Clarita, California | Residence Inn | 91 | % | 91 | % | 89 | % | 85 | % | 76 | % | ||||||||
| 10. | Santa Clarita, California | Fairfield Inn | 89 | % | 88 | % | 83 | % | 81 | % | 79 | % | ||||||||
| 11. | Beaumont, Texas | Residence Inn | — | — | — | 85 | % | 76 | % | |||||||||||
| 12. | Pueblo, Colorado | Hampton Inn & Suites | 61 | % | 67 | % | 74 | % | 70 | % | 60 | % | ||||||||
| 13. | Allen, Texas | Hilton Garden Inn | 73 | % | 73 | % | 68 | % | 65 | % | 53 | % | ||||||||
| 14. | Bristol, Virginia | Courtyard | 54 | % | 65 | % | 67 | % | 57 | % | 61 | % | ||||||||
| 15. | Durham, North Carolina | Homewood Suites | 67 | % | 73 | % | 73 | % | 69 | % | 59 | % | ||||||||
| 16. | Hattiesburg, Mississippi | Residence Inn | — | — | — | — | 75 | % | ||||||||||||
| 17. | Jackson, Tennessee | Courtyard | — | — | — | 52 | % | 67 | % | |||||||||||
| 18. | Jackson, Tennessee | Hampton Inn & Suites | — | — | 80 | % | 87 | % | 80 | % | ||||||||||
| 19. | Fort Lauderdale, Florida | Hampton Inn | 85 | % | 85 | % | 89 | % | 85 | % | 73 | % | ||||||||
| 20. | Pittsburgh, Pennsylvania | Hampton Inn | 76 | % | 73 | % | 80 | % | 81 | % | 73 | % | ||||||||
| 21. | Frisco, Texas | Hilton Garden Inn | — | — | — | — | 45 | % | ||||||||||||
| 22. | Round Rock, Texas | Hampton Inn | 73 | % | 81 | % | 85 | % | 80 | % | 72 | % | ||||||||
| 23. | Panama City, Florida | Hampton Inn & Suites | — | — | — | — | 44 | % | ||||||||||||
| 24. | Austin, Texas | Homewood Suites | 82 | % | 89 | % | 80 | % | 81 | % | 77 | % | ||||||||
| 25. | Austin, Texas | Hampton Inn | 76 | % | 82 | % | 80 | % | 77 | % | 70 | % | ||||||||
| 26. | Dothan, Alabama | Hilton Garden Inn | — | — | — | — | 46 | % | ||||||||||||
| 27. | Troy, Alabama | Courtyard | — | — | — | — | 36 | % | ||||||||||||
| 28. | Orlando, Florida | Fairfield Inn & Suites | — | — | — | — | 56 | % | ||||||||||||
| 29. | Orlando, Florida | SpringHill Suites | — | — | — | — | 65 | % | ||||||||||||
| 30. | Clovis, California | Hampton Inn & Suites | — | — | — | — | 36 | % | ||||||||||||
| 31. | Rochester, Minnesota | Hampton Inn & Suites | — | — | — | — | 28 | % | ||||||||||||
| 32. | Baton Rouge, Louisiana | SpringHill Suites | — | — | — | — | 32 | % | ||||||||||||
| 33. | Johnson City, Tennessee | Courtyard | — | — | — | — | 49 | % | ||||||||||||
| 34. | Houston, Texas | Marriott | — | — | — | — | — | |||||||||||||
| 35. | Albany, Georgia | Fairfield Inn & Suites | — | — | — | — | — | |||||||||||||
| 36. | Panama City, Florida | TownePlace Suites | — | — | — | — | — | |||||||||||||
| 37. | Clovis, California | Homewood Suites | — | — | — | — | — | |||||||||||||
| 38. | Jacksonville, North Carolina | TownePlace Suites | — | — | — | 83 | % | 90 | % | |||||||||||
| 39. | Miami, Florida | Hampton Inn & Suites | 87 | % | 83 | % | 86 | % | 85 | % | 77 | % | ||||||||
S-16
PART B
| | | | Revenue per Available Room/Suite ($) | |||||||||||||||||
|---|---|---|---|---|---|---|---|---|---|---|---|---|---|---|---|---|---|---|---|---|
| | Hotel Location | Franchise | 2005 | 2006 | 2007 | 2008 | 2009 | |||||||||||||
| 1. | Tucson, Arizona | Hilton Garden Inn | — | — | — | $ | 65 | $ | 73 | |||||||||||
| 2. | Charlotte, North Carolina | Homewood Suites | $ | 55 | $ | 62 | $ | 67 | $ | 51 | $ | 46 | ||||||||
| 3. | Santa Clarita, California | Courtyard | — | — | $ | 59 | $ | 70 | $ | 68 | ||||||||||
| 4. | Allen, Texas | Hampton Inn & Suites | — | $ | 53 | $ | 76 | $ | 79 | $ | 63 | |||||||||
| 5. | Twinsburg, Ohio | Hilton Garden Inn | $ | 62 | $ | 64 | $ | 69 | $ | 71 | $ | 63 | ||||||||
| 6. | Lewisville, Texas | Hilton Garden Inn | — | — | $ | 50 | $ | 72 | $ | 65 | ||||||||||
| 7. | Duncanville, Texas | Hilton Garden Inn | $ | 56 | $ | 66 | $ | 73 | $ | 75 | $ | 59 | ||||||||
| 8. | Santa Clarita, California | Hampton Inn | $ | 83 | $ | 91 | $ | 86 | $ | 72 | $ | 60 | ||||||||
| 9. | Santa Clarita, California | Residence Inn | $ | 110 | $ | 120 | $ | 120 | $ | 110 | $ | 89 | ||||||||
| 10. | Santa Clarita, California | Fairfield Inn | $ | 82 | $ | 95 | $ | 88 | $ | 78 | $ | 68 | ||||||||
| 11. | Beaumont, Texas | Residence Inn | — | — | — | $ | 133 | $ | 91 | |||||||||||
| 12. | Pueblo, Colorado | Hampton Inn & Suites | $ | 42 | $ | 51 | $ | 70 | $ | 72 | $ | 54 | ||||||||
| 13. | Allen, Texas | Hilton Garden Inn | $ | 72 | $ | 77 | $ | 76 | $ | 74 | $ | 58 | ||||||||
| 14. | Bristol, Virginia | Courtyard | $ | 50 | $ | 58 | $ | 66 | $ | 66 | $ | 65 | ||||||||
| 15. | Durham, North Carolina | Homewood Suites | $ | 71 | $ | 81 | $ | 88 | $ | 85 | $ | 65 | ||||||||
| 16. | Hattiesburg, Mississippi | Residence Inn | — | — | — | — | $ | 71 | ||||||||||||
| 17. | Jackson, Tennessee | Courtyard | — | — | — | $ | 58 | $ | 71 | |||||||||||
| 18. | Jackson, Tennessee | Hampton Inn & Suites | — | — | $ | 92 | $ | 105 | $ | 95 | ||||||||||
| 19. | Fort Lauderdale, Florida | Hampton Inn | $ | 90 | $ | 102 | $ | 112 | $ | 105 | $ | 85 | ||||||||
| 20. | Pittsburgh, Pennsylvania | Hampton Inn | $ | 71 | $ | 75 | $ | 90 | $ | 101 | $ | 94 | ||||||||
| 21. | Frisco, Texas | Hilton Garden Inn | — | — | — | — | $ | 47 | ||||||||||||
| 22. | Round Rock, Texas | Hampton Inn | $ | 61 | $ | 72 | $ | 81 | $ | 85 | $ | 73 | ||||||||
| 23. | Panama City, Florida | Hampton Inn & Suites | — | — | — | — | $ | 42 | ||||||||||||
| 24. | Austin, Texas | Homewood Suites | $ | 79 | $ | 96 | $ | 103 | $ | 110 | $ | 97 | ||||||||
| 25. | Austin, Texas | Hampton Inn | $ | 63 | $ | 74 | $ | 83 | $ | 93 | $ | 75 | ||||||||
| 26. | Dothan, Alabama | Hilton Garden Inn | — | — | — | — | $ | 47 | ||||||||||||
| 27. | Troy, Alabama | Courtyard | — | — | — | — | $ | 30 | ||||||||||||
| 28. | Orlando, Florida | Fairfield Inn & Suites | — | — | — | — | $ | 37 | ||||||||||||
| 29. | Orlando, Florida | SpringHill Suites | — | — | — | — | $ | 48 | ||||||||||||
| 30. | Clovis, California | Hampton Inn & Suites | — | — | — | — | $ | 35 | ||||||||||||
| 31. | Rochester, Minnesota | Hampton Inn & Suites | — | — | — | — | $ | 23 | ||||||||||||
| 32. | Baton Rouge, Louisiana | SpringHill Suites | — | — | — | — | $ | 27 | ||||||||||||
| 33. | Johnson City, Tennessee | Courtyard | — | — | — | — | $ | 42 | ||||||||||||
| 34. | Houston, Texas | Marriott | — | — | — | — | — | |||||||||||||
| 35. | Albany, Georgia | Fairfield Inn & Suites | — | — | — | — | — | |||||||||||||
| 36. | Panama City, Florida | TownePlace Suites | — | — | — | — | — | |||||||||||||
| 37. | Clovis, California | Homewood Suites | — | — | — | — | — | |||||||||||||
| 38. | Jacksonville, North Carolina | TownePlace Suites | — | — | — | $ | 79 | $ | 88 | |||||||||||
| 39. | Miami, Florida | Hampton Inn & Suites | $ | 79 | $ | 92 | $ | 108 | $ | 105 | $ | 80 | ||||||||
Note for Table 3
- (a)
- Operating data is presented for the last five years (or since the beginning of hotel operations). Hotels with no data for a period were under construction and not open at that time. The first year of data for a hotel reflects results only for the period of time open and may not be a reflection of results once established in its market. See Table 1. General Information on page S-14 for the date the hotel was acquired.
S-17
Table 4. Tax and Related Information
| | Hotel Location | Franchise | Tax Year | Real Property Tax Rate(e) | Real Property Tax | ||||||||
|---|---|---|---|---|---|---|---|---|---|---|---|---|---|
1. | Tucson, Arizona | Hilton Garden Inn | 2009 | (a) | 3.0 | % | $ | 182,214 | |||||
2. | Charlotte, North Carolina | Homewood Suites | 2009 | (a) | 1.3 | % | 75,716 | ||||||
3. | Santa Clarita, California | Courtyard | 2009 | (b) | 1.2 | % | 244,355 | ||||||
4. | Allen, Texas | Hampton Inn & Suites | 2009 | (a) | 2.4 | % | 165,942 | ||||||
5. | Twinsburg, Ohio | Hilton Garden Inn | 2009 | (a) | 2.0 | % | 206,372 | ||||||
6. | Lewisville, Texas | Hilton Garden Inn | 2009 | (a) | 2.3 | % | 173,620 | ||||||
7. | Duncanville, Texas | Hilton Garden Inn | 2009 | (a) | 2.7 | % | 264,406 | ||||||
8. | Santa Clarita, California | Hampton Inn | 2009 | (b) | 1.3 | % | 204,837 | ||||||
9. | Santa Clarita, California | Residence Inn | 2009 | (b) | 1.3 | % | 140,814 | ||||||
10. | Santa Clarita, California | Fairfield Inn | 2009 | (b) | 1.3 | % | 103,264 | ||||||
11. | Beaumont, Texas | Residence Inn | 2009 | (a) | 2.6 | % | 266,990 | ||||||
12. | Pueblo, Colorado | Hampton Inn & Suites | 2009 | (a) | 2.6 | % | 68,945 | ||||||
13. | Allen Texas | Hilton Garden Inn | 2009 | (a) | 2.4 | % | 245,621 | ||||||
14. | Bristol, Virginia | Courtyard | 2009 | (a) | 0.9 | % | 61,125 | ||||||
15. | Durham, North Carolina | Homewood Suites | 2009 | (a) | 1.2 | % | 135,546 | ||||||
16. | Hattiesburg, Mississippi | Residence Inn | 2009 | (a) | 2.3 | % | 119,504 | ||||||
17. | Jackson, Tennessee | Courtyard | 2009 | (a) | 1.8 | % | 102,240 | ||||||
18. | Jackson, Tennessee | Hampton Inn & Suites | 2009 | (a) | 1.8 | % | 78,504 | ||||||
19. | Fort Lauderdale, Florida | Hampton Inn | 2009 | (a) | 2.0 | % | 208,760 | ||||||
20. | Pittsburgh, Pennsylvania | Hampton Inn | 2009 | (a) | 2.9 | % | 229,625 | ||||||
21. | Frisco, Texas | Hilton Garden Inn | 2009 | (a) | 2.2 | % | 249,005 | ||||||
22. | Round Rock, Texas | Hampton Inn | 2009 | (a) | 2.4 | % | 148,293 | ||||||
23. | Panama City, Florida | Hampton Inn & Suites | 2009 | (a)(d) | 1.1 | % | 8,211 | ||||||
24. | Austin, Texas | Homewood Suites | 2009 | (a) | 2.2 | % | 210,672 | ||||||
25. | Austin, Texas | Hampton Inn | 2009 | (a) | 2.2 | % | 226,426 | ||||||
26. | Dothan, Alabama | Hilton Garden Inn | 2009 | (c)(d) | 3.3 | % | 6,831 | ||||||
27. | Troy, Alabama | Courtyard | 2009 | (c)(d) | 4.1 | % | 3,663 | ||||||
28. | Orlando, Florida | Fairfield Inn & Suites | 2009 | (a)(d) | 1.7 | % | 63,806 | ||||||
29. | Orlando, Florida | SpringHill Suites | 2009 | (a)(d) | 3.2 | % | 8,360 | ||||||
30. | Clovis, California | Hampton Inn & Suites | 2009 | (b)(d) | 1.2 | % | 40,312 | ||||||
31. | Rochester, Minnesota | Hampton Inn & Suites | 2009 | (a)(d) | 1.5 | % | 2,088 | ||||||
32. | Baton Rouge, Louisiana | SpringHill Suites | 2009 | (a)(d) | 10.7 | % | 22,454 | ||||||
33. | Johnson City, Tennessee | Courtyard | 2009 | (a)(d) | 1.4 | % | 14,962 | ||||||
34. | Houston, Texas | Marriott | 2009 | (a)(d) | 2.8 | % | 200,498 | ||||||
35. | Albany, Georgia | Fairfield Inn & Suites | 2009 | (a)(d) | 4.0 | % | 15,302 | ||||||
36. | Panama City, Florida | TownePlace Suites | 2009 | (a)(d) | 1.5 | % | 5,719 | ||||||
37. | Clovis, California | Homewood Suites | 2009 | (b)(d) | 1.2 | % | 12,458 | ||||||
38. | Jacksonville, North Carolina | �� | TownePlace Suites | 2009 | (a) | 1.2 | % | 42,741 | |||||
39. | Miami, Florida | Hampton Inn & Suites | 2009 | (a) | 1.9 | % | 165,510 | ||||||
Notes for Table 4:
- (a)
- Represents calendar year.
- (b)
- Represents 12-month period from July 1, 2009 through June 30, 2010.
- (c)
- Represents 12-month period from October 1, 2008 through September 30, 2009.
- (d)
- The hotel property consisted of undeveloped land for a portion of the tax year, and the real property tax is not necessarily indicative of property taxes expected for the hotel in the future.
- (e)
- Property tax rate is an aggregate figure for county, city and other local taxing authorities (to the extent applicable).
S-18
We are expanding our discussion in the prospectus to include the subsections and information below.
Ownership of Equity Securities by Management
The determination of "beneficial ownership" for purposes of this Supplement has been based on information reported to the Company and the rules and regulations of the Securities and Exchange Commission. References below to "beneficial ownership" by a particular person, and similar references, should not be construed as an admission or determination by the Company that Common Shares in fact are beneficially owned by such person.
As of March 19, 2010, the Company had a total of 109,363,945 issued and outstanding Common Shares. There are no shareholders known to the Company who beneficially owned more than 5% of its outstanding voting securities on such date. The following table sets forth the beneficial ownership of the Company's securities by its directors and executive officers as of such date:
Title of Class(1) | Name of Beneficial Owner | Amount and Nature of Beneficial Ownership(2) | Percent of Class | ||||
|---|---|---|---|---|---|---|---|
Common Shares | Lisa B. Kern | 20,402 | * | ||||
(voting) | Bruce H. Matson | 20,402 | * | ||||
| Michael S. Waters | 20,402 | * | |||||
| Robert M. Wily | 20,402 | * | |||||
| Glade M. Knight | 10 | * | |||||
| Above directors and executive officers as a group | 81,618 | * | |||||
Series A | Lisa B. Kern | 20,402 | * | ||||
Preferred Shares | Bruce H. Matson | 20,402 | * | ||||
(non-voting) | Michael S. Waters | 20,402 | * | ||||
| Robert M. Wily | 20,402 | * | |||||
| Glade M. Knight | 10 | * | |||||
| Above directors and executive officers as a group | 81,618 | * | |||||
Series B Convertible | Glade M. Knight | 480,000 | 100% | ||||
Preferred Shares | |||||||
(non-voting) | |||||||
- *
- Less than one percent of class.
- (1)
- Executive officers not listed above for a particular class of securities hold no securities of such class. The Series A Preferred Shares are being issued as part of the Company's best efforts offering of Units. Each Unit consists of one Common Share and one Series A Preferred Share. The Series A Preferred Shares have no voting rights and are not separately tradable from the Common Shares to which they relate.
- (2)
- Amounts shown for individuals other than Glade M. Knight consist entirely of securities that may be acquired upon the exercise of options, although no options have been exercised to date. The Series B Convertible Preferred Shares are convertible into Common Shares upon the occurrence of certain events, under a formula which is based on the gross proceeds raised by the Company during its best-efforts offering of Units.
S-19
Information regarding the Company's equity compensation plan is set forth in note 5 to the Company's audited consolidated financial statements, which are incorporated by reference into this Supplement.
Corporate Governance
Board of Directors
The Company's Board of Directors has determined that all of the Company's directors, except Mr. Knight, are "independent" within the meaning of the rules of the New York Stock Exchange (which the Company, although not listed on a national exchange, has adopted for purposes of determining such independence). In making this determination, the Board considered all relationships between the director and the Company, including commercial, industrial, banking, consulting, legal, accounting, charitable and familial relationships.
The Board has adopted a categorical standard that a director is not independent (a) if he or she receives any personal financial benefit from, on account of or in connection with a relationship between the Company and the director (excluding directors fees and options), (b) if he or she is a partner, officer, employee or managing member of an entity that has a business or professional relationship with, and that receives compensation from, the Company, or (c) if he or she is a non-managing member or shareholder of such an entity and owns 10% or more of the membership interests or common stock of that entity. The Board may determine that a director with a business or other relationship that does not fit within the categorical standard described in the immediately preceding sentence is nonetheless independent, but in that event, the Board is required to disclose the basis for its determination in the Company's then current annual proxy statement. In addition, the Board has voluntarily adopted, based on rules of the New York Stock Exchange, certain conditions that prevent a director from being considered independent while the condition lasts and then for three years thereafter.
Compensation of Directors
During 2009, the directors of the Company were compensated as follows:
All Directors in 2009. All directors were reimbursed by the Company for travel and other out-of-pocket expenses incurred by them to attend meetings of the directors or a committee and in conducting the business of the Company.
Independent Directors in 2009. The independent directors (classified by the Company as all directors other than Mr. Knight) received annual directors' fees of $15,000, plus $1,000 for each meeting of the Board attended and $1,000 for each committee meeting attended. Additionally, the Chair of the Audit Committee receives an additional fee of $2,500 per year and the Chair of the Compensation Committee receives an additional fee of $1,500 per year. Under the Company's Non-Employee Directors' Stock Option Plan, each non-employee director received options to purchase 12,466 Units, exercisable at $11 per Unit.
Non-Independent Director in 2009. Mr. Knight received no compensation from the Company for his services as a director.
S-20
Director Summary Compensation
Director | Year | Fees Earned | Option Awards(1) | Total | |||||||||
|---|---|---|---|---|---|---|---|---|---|---|---|---|---|
Lisa B. Kern | 2009 | $ | 25,500 | $ | 16,198 | $ | 41,698 | ||||||
Bruce H. Matson | 2009 | 20,500 | 16,198 | 36,698 | |||||||||
Michael S. Waters | 2009 | 23,000 | 16,198 | 39,198 | |||||||||
Robert M. Wily | 2009 | 23,000 | 16,198 | 39,198 | |||||||||
Glade M. Knight | 2009 | — | — | — | |||||||||
- (1)
- The amounts in this column reflect the grant date fair value determined in accordance with FASB ASC Topic 718.
Stock Option Grants in Last Fiscal Year
In 2008, the Company adopted a Non-Employee Directors' Stock Option Plan (the "Directors' Plan"). The Directors' Plan provides for automatic grants of options to acquire Units. The Directors' Plan applies to directors of the Company who are not employees of the Company.
Since adoption of the Directors' Plan, none of the participants have exercised any of their options to acquire Units. The following table shows the options to acquire Units that were granted under the Directors Plan in 2009:
Option Grants in Last Fiscal Year
Name(1) | Number of Units Underlying Options Granted in 2009(2) | |||
|---|---|---|---|---|
Glade M. Knight | — | |||
Lisa B. Kern | 12,466 | |||
Bruce H. Matson | 12,466 | |||
Michael S. Waters | 12,466 | |||
Robert M. Wily | 12,466 | |||
- (1)
- Glade M. Knight is not eligible under the Directors' Plan.
- (2)
- Options granted in 2009 are exercisable for ten years from the date of grant at an exercise price of $11 per Unit.
Certain Relationships and Agreements
The Company has significant transactions with related parties. These transactions may not have arms-length terms, and the results of the Company's operations might be different if these transactions had been conducted with unrelated parties. The Company's independent members of the Board of Directors oversee the existing related party relationships and are required to approve any material modifications to the existing contracts. At least one member of the Company's senior management team approves each related party transaction.
S-21
The Company has contracted with Apple Suites Realty Group, Inc. ("ASRG") to provide brokerage services for the acquisition and disposition of real estate assets. ASRG is wholly-owned by Glade M. Knight, the Company's Chairman and Chief Executive Officer. In accordance with the contract, ASRG is paid a fee equal to 2% of the gross purchase or sales price (as applicable) of any acquisitions or dispositions of real estate investments, subject to certain conditions. Total amounts earned and paid to date through December 31, 2009 to ASRG for services under the terms of this contract were approximately $13.6 million. Amounts earned in 2009 were approximately $6.7 million.
The Company also has contracted with Apple Nine Advisors, Inc. ("A9A"), a company wholly-owned by Glade M. Knight to advise the Company and provide day-to-day management services and due-diligence services on acquisitions. In accordance with the contract, the Company pays A9A a fee equal to 0.1% to 0.25% of the total equity contributions to the Company, in addition to certain reimbursable expenses. The aggregate amount paid by the Company to A9A in 2009 was approximately $2.4 million. This amount includes a fee of $.7 million and costs of $1.7 million which were reimbursed by A9A to Apple REIT Six, Inc. who provides the resources for these services.
Compensation Discussion and Analysis
General Philosophy
The Company's executive compensation philosophy is to attract, motivate and retain a superior management team. The Company's compensation program rewards each senior manager for their contribution to the Company. In addition, the Company uses annual incentive benefits that are designed to be competitive with comparable employers and to align management's incentives with the interests of the Company and its shareholders.
With the exception of the Company's Chief Executive Officer, the Company compensates its senior management through a mix of base salary and bonus designed to be competitive with comparable employers. The Company has not utilized stock based awards or long term compensation for senior management. The Company believes that a simplistic approach to compensation better matches the objectives of all stakeholders. Each member of the senior management team performs similar functions for Apple REIT Six, Inc. ("A6"), Apple REIT Seven, Inc. ("A7"), Apple REIT Eight, Inc. ("A8"), ASRG, Apple Six Advisors, Inc. ("A6A"), Apple Seven Advisors, Inc. ("A7A"), Apple Eight Advisors, Inc. ("A8A") and Apple Nine Advisors, Inc. ("A9A"). As a result each senior manager's total compensation paid by the Company is proportionate to the estimated amount of time devoted to activities associated with the Company. The Chief Executive Officer is Chairman of the Board of Directors, Chief Executive Officer and majority shareholder of ASRG, A6A, A7A, A8A and A9A, each of which has various agreements with the Company and A6, A7 and A8. During 2009, ASRG, A6A, A7A, A8A and A9A received fees of approximately $11.0 million from A6, A7, A8 and A9. The Compensation Committee of the Board of Directors considers these agreements when developing the Chief Executive Officer's compensation. As a result, the Company's Chief Executive Officer has historically been compensated a minimal amount by the Company. Annually, the Chairman of the Board of Directors develops the compensation targets of senior management (as well as goals and objectives) with input from other members of senior management and reviews these items with the Compensation Committee of the Board of Directors.
Base and Incentive Salaries
The process of establishing each senior manager's compensation involves establishing an overall targeted amount and allocating that total between base and incentive compensation. The overall target is developed using comparisons to compensation paid by other public hospitality REITs, and consideration of each individual's experience in their position and the industry, the risks and deterrents associated with their position and the anticipated difficulty to replace the individual. It is the
S-22
Company's intention to set this overall target sufficiently high to attract and retain a strong and motivated leadership team, but not so high that it creates a negative perception with our other stakeholders. Once the overall target is established, approximately 75% of that number is allocated to base salary and the remaining 25% is allocated to incentive compensation. The incentive compensation is then allocated 50% to Company overall performance (typically Funds From Operations (FFO) targets) and 50% to each individual's subjective performance objectives.
Perquisites and Other Benefits
Senior management may participate in the Company's other benefit plans on the same terms as other employees. These plans include medical and dental insurance, life insurance and 401K plan. As noted in the Summary Compensation Table below, the Company provides limited perquisites to its senior managers.
Summary Compensation Table
Name | Position | Year | Salary | Bonus | All Other Compensation(1) | Total(2) | ||||||||||||
|---|---|---|---|---|---|---|---|---|---|---|---|---|---|---|---|---|---|---|
Glade Knight | Chief Executive Officer | 2009 | $ | 12,500 | $ | — | $ | 4,278 | $ | 16,778 | ||||||||
| 2008 | 12,500 | 203 | 3,525 | 16,228 | ||||||||||||||
Justin Knight | President | 2009 | 86,625 | 12,504 | 9,120 | 108,249 | ||||||||||||
| 2008 | 85,750 | 12,431 | 7,017 | 105,198 | ||||||||||||||
David McKenney | President, Capital Markets | 2009 | 86,625 | 12,504 | 9,509 | 108,638 | ||||||||||||
| 2008 | 85,750 | 12,431 | 6,616 | 104,797 | ||||||||||||||
David Buckley | Executive Vice President, | 2009 | 59,375 | 27,674 | 7,543 | 94,592 | ||||||||||||
| Chief Legal Counsel | ||||||||||||||||||
Kristian Gathright | Executive Vice President, | 2009 | 61,875 | 12,504 | 7,790 | 82,169 | ||||||||||||
| Chief Operating Officer | 2008 | 61,250 | 12,431 | 6,916 | 80,597 | |||||||||||||
Bryan Peery | Executive Vice President, | 2009 | 50,000 | 10,104 | 5,741 | 65,845 | ||||||||||||
| Chief Financial Officer | 2008 | 47,500 | 9,640 | 4,651 | 61,791 | |||||||||||||
- (1)
- Includes portion of health insurance, life insurance, parking and 401K match paid by the company.
- (2)
- As described above, represents Apple REIT Nine's allocated share of each officer's total compensation.
S-23
The following table sets forth selected financial data for the years ended December 31, 2009 and 2008 and for the period November 9, 2007 (initial capitalization) through December 31, 2007. Certain information in the table has been derived from the Company's audited financial statements and notes thereto. This data should be read in conjunction with Management's Discussion and Analysis of Financial Condition and Results of Operations, and the Consolidated Financial Statements and Notes thereto, included in our Annual Report on Form 10-K for the year ended December 31, 2009, incorporated by reference herein. See "Incorporation by Reference" on page S-5 of this Supplement. During the period from the Company's initial capitalization on November 9, 2007 to July 30, 2008, the Company owned no properties, had no revenue exclusive of interest income, and was primarily engaged in capital formation activities. Operations commenced on July 31, 2008 with the Company's first property acquisition.
(in thousands except per share and statistical data) | Year Ended December 31, 2009 | Year Ended December 31, 2008 | For the period November 9, 2007 (initial capitalization) through December 31, 2007 | ||||||||||
|---|---|---|---|---|---|---|---|---|---|---|---|---|---|
Revenues: | |||||||||||||
Room revenue | $ | 76,163 | $ | 9,501 | $ | — | |||||||
Other revenue | 9,043 | 2,023 | — | ||||||||||
Total hotel revenue | 85,206 | 11,524 | — | ||||||||||
Rental revenue | 15,961 | — | — | ||||||||||
Total revenue | 101,167 | 11,524 | — | ||||||||||
Expenses: | |||||||||||||
Hotel operating expenses | 52,297 | 7,422 | — | ||||||||||
Taxes, insurance and other | 6,032 | 731 | — | ||||||||||
General and administrative | 4,079 | 1,288 | 15 | ||||||||||
Acquisition related costs | 4,951 | — | — | ||||||||||
Depreciation | 15,936 | 2,277 | — | ||||||||||
Interest (income) expense, net | 1,018 | (2,346 | ) | 2 | |||||||||
Total expenses | 84,313 | 9,372 | 17 | ||||||||||
Net income (loss) | $ | 16,854 | $ | 2,152 | $ | (17 | ) | ||||||
Per Share: | |||||||||||||
Net income (loss) per common share | $ | 0.26 | $ | 0.14 | $ | (1,684.60 | ) | ||||||
Distributions declared and paid per common share | $ | 0.88 | $ | 0.51 | $ | — | |||||||
Weighted-average common shares outstanding—basic and diluted | 66,041 | 15,852 | — | ||||||||||
Balance Sheet Data (at end of period): | |||||||||||||
Cash and cash equivalents | $ | 272,913 | $ | 75,193 | $ | 20 | |||||||
Investment in real estate, net | $ | 687,509 | $ | 346,423 | $ | — | |||||||
Total assets | $ | 982,513 | $ | 431,619 | $ | 337 | |||||||
Notes payable | $ | 58,688 | $ | 38,647 | $ | 151 | |||||||
Shareholders' equity | $ | 917,405 | $ | 389,740 | $ | 31 | |||||||
Net book value per share | $ | 9.31 | $ | 9.50 | $ | — | |||||||
Other Data: | |||||||||||||
Cash Flow From (Used In): | |||||||||||||
Operating activities | $ | 29,137 | $ | 3,317 | $ | (2 | ) | ||||||
Investing activities | $ | (341,131 | ) | $ | (315,322 | ) | $ | — | |||||
Financing activities | $ | 509,714 | $ | 387,178 | $ | (26 | ) | ||||||
Number of hotels owned at end of period | 33 | 21 | — | ||||||||||
Average Daily Rate (ADR) (a) | $ | 104 | $ | 110 | $ | — | |||||||
Occupancy | 62 | % | 59 | % | — | ||||||||
Revenue Per Available Room (RevPAR)(b) | $ | 64 | $ | 65 | $ | — | |||||||
S-24
(in thousands except per share and statistical data) | Year Ended December 31, 2009 | Year Ended December 31, 2008 | For the period November 9, 2007 (initial capitalization) through December 31, 2007 | ||||||||||
|---|---|---|---|---|---|---|---|---|---|---|---|---|---|
Funds From Operations Calculation(c): | |||||||||||||
Net income (loss) | $ | 16,854 | $ | 2,152 | $ | (17 | ) | ||||||
Depreciation of real estate owned | 15,936 | 2,277 | — | ||||||||||
Acquisition related costs | 4,951 | — | — | ||||||||||
Funds from operations | 37,741 | 4,429 | (17 | ) | |||||||||
Straight-line rental income | 4,618 | — | — | ||||||||||
Modified funds from operations | $ | 33,123 | $ | 4,429 | $ | (17 | ) | ||||||
- (a)
- Total room revenue divided by number of rooms sold.
- (b)
- ADR multiplied by occupancy percentage.
- (c)
- Funds from operations (FFO) is defined as net income (loss) (computed in accordance with generally accepted accounting principals—GAAP) excluding gains and losses from sales of depreciable property, plus depreciation and amortization, plus costs associated with the acquisition of real estate. Modified FFO (MFFO) excludes rental revenue earned, but not received during the period or straight-line rental income. The Company considers FFO and MFFO in evaluating property acquisitions and its operating performance and believes that FFO and MFFO should be considered along with, but not as an alternative to, net income and cash flows as a measure of the Company's activities in accordance with GAAP. FFO and MFFO are not necessarily indicative of cash available to fund cash needs.
(Remainder of Page Intentionally Left Blank)
S-25
MANAGEMENT'S DISCUSSION AND ANALYSIS
OF FINANCIAL CONDITION AND RESULTS OF OPERATIONS
(for the year ended December 31, 2009)
Our Management's Discussion and Analysis of Financial Condition and Results of Operations from our Annual Report on Form 10-K for the year ended December 31, 2009 has been incorporated by reference herein. See "Incorporation by Reference" on page S-5 of this Supplement.
(Remainder of Page Intentionally Left Blank)
S-26
The consolidated financial statements and financial statement schedule listed in the Index at Item 15(2) of Apple REIT Nine, Inc. appearing in Apple REIT Nine, Inc.'s Annual Report (Form 10-K) at December 31, 2009 and 2008 and for the years ended December 31, 2009 and 2008, and the period from November 9, 2007 (initial capitalization) through December 31, 2007, and the effectiveness of Apple REIT Nine, Inc.'s internal control over financial reporting as of December 31, 2009, have been audited by Ernst & Young LLP, independent registered public accounting firm, as set forth in their reports thereon, included therein, and incorporated herein by reference. Such consolidated financial statements and schedule are incorporated herein by reference in reliance upon such report given on the authority of such firm as experts in accounting and auditing.
The separate audited financial statements of (i) the Tucson, Arizona—Hilton Garden Inn and (ii) the Bristol, Virginia—Courtyard Marriott Hotel have been incorporated by reference herein. These financial statements have been audited by Ernst & Young LLP, independent registered public accounting firm, as set forth in their reports thereon, and are incorporated herein by reference in reliance upon such reports given on the authority of such firm as experts in accounting and auditing.
The audited financial statements of Charlotte Lakeside Hotel, L.P. (previous owner of the Charlotte, North Carolina Homewood Suites) have been incorporated by reference herein. These financial statements have been incorporated herein in reliance on the report of Schneider & Company Certified Public Accountants, PC, an independent certified public accounting firm, and upon the authority of that firm as an expert in accounting and auditing.
The separate audited financial statements of (i) the Santa Clarita, California Courtyard by Marriott Hotel, (ii) Beaumont, Texas-Residence Inn by Marriott Hotel, (iii) Durham, North Carolina—Homewood Suites and (iv) Houston, Texas-Marriott Hotel, have been incorporated by reference herein. These financial statements have been incorporated herein in reliance on the reports of L.P. Martin & Company, P.C., an independent certified public accounting firm, and upon the authority of that firm as an expert in accounting and auditing.
The separate audited financial statements of (i) Allen Stacy Hotel, Ltd. (previous owner of the Allen, Texas Hampton Inn & Suites), (ii) RSV Twinsburg Hotel, Ltd. (previous owner of the Twinsburg, Ohio Hilton Garden Inn), (iii) SCI Lewisville Hotel, Ltd. (previous owner of the Lewisville, Texas Hilton Garden Inn), (iv) SCI Duncanville Hotel, Ltd. (previous owner of the Duncanville, Texas Hilton Garden Inn) and (v) SCI Allen Hotel, Ltd. (previous owner of the Allen, Texas Hilton Garden Inn) have been incorporated by reference herein. These financial statements have been incorporated herein in reliance on the reports of Novogradac & Company LLP, an independent certified public accounting firm, and upon the authority of that firm as an expert in accounting and auditing.
The audited financial statements of the Santa Clarita Hotels Portfolio have been incorporated by reference herein. These financial statements have been incorporated herein in reliance on the report of Wilson, Price, Barranco, Blankenship & Billingsley, P.C., an independent certified public accounting firm, and upon the authority of that firm as an expert in accounting and auditing.
The financial statements of the Hampton Inn & Suites, located in Pueblo, Colorado, as of and for the years ended December 31, 2007 and 2006 have been incorporated by reference herein in reliance upon the report of KPMG LLP, independent auditors, and upon the authority of said firm as experts in accounting and auditing.
The audited financial statements of RMRVH Jackson, LLC, CYRMR Jackson, LLC and VH Fort Lauderdale Investment, Ltd (previous owners of Jackson, Tennessee Courtyard, Jackson, Tennessee Hampton Inn & Suites and Fort Lauderdale, Florida Hampton Inn) have been incorporated by reference herein. These financial statements have been incorporated herein in reliance on the report of
S-27
Pannell Kerr Forster of Texas, P.C., an independent certified public accounting firm, and upon the authority of that firm as an expert in accounting and auditing.
The audited financial statements of Playhouse Square Hotel Associates and Playhouse Parking Associates, L.P. (previous owners of Pittsburgh, Pennsylvania Hampton Inn) as of and for the year ended December 31, 2007 have been incorporated by reference herein. The 2007 financial statements have been incorporated herein in reliance on the report of Dauby O'Connor & Zaleski, LLC, an independent certified public accounting firm, and upon the authority of that firm as an expert in accounting and auditing.
The audited financial statements of Playhouse Square Hotel Associates and Playhouse Parking Associates, L.P. (previous owners of Pittsburgh, Pennsylvania Hampton Inn) as of and for the year ended December 31, 2006 have been incorporated by reference herein. The 2006 financial statements have been incorporated herein in reliance on the report of Deloitte & Touche LLP, independent auditors, and upon the authority of that firm as an expert in accounting and auditing.
The audited financial statements of Austin FRH, LTD, FRH Braker, LTD and RR Hotel Investment, LTD (previous owners of Round Rock, Texas Hampton Inn, Austin, Texas Homewood Suites and Austin, Texas Hampton Inn) have been incorporated by reference herein. These financial statements have been incorporated herein in reliance on the report of Pannell Kerr Forster of Texas, P.C., an independent certified public accounting firm, and upon the authority of that firm as an expert in accounting and auditing.
The audited financial statements of Grove Street Orlando, LLC (previous owner of Orlando, Florida Fairfield Inn & Suites and Orlando, Florida SpringHill Suites) have been incorporated by reference herein. These financial statements have been incorporated herein in reliance on the report of Frazier & Deeter, LLC, an independent certified public accounting firm, and upon the authority of that firm as an expert in accounting and auditing.
(Remainder of Page Intentionally Left Blank)
S-28
The tables following this introduction set forth information with respect to certain of the prior real estate programs sponsored by Glade M. Knight, who is sometimes referred to as the "prior program sponsor." These tables provide information for use in evaluating the programs, the results of the operations of the programs, and compensation paid by the programs. Information in the tables is current as of December 31, 2009. The tables are furnished solely to provide prospective investors with information concerning the past performance of entities formed by Glade M. Knight. Regulatory filings and annual reports of Cornerstone, Apple REIT Eight, Apple REIT Seven, Apple REIT Six, Apple Hospitality Five and Apple Hospitality Two will be provided upon request for no cost (except for exhibits, for which there is a minimal charge). In addition, Table VI of this Supplement contains detailed information on the property acquisitions of Apple REIT Six, Apple REIT Seven and Apple REIT Eight and is available without charge upon request of any investor or prospective investor. Please send all requests to Apple REIT Nine, Inc., 814 East Main Street, Richmond, VA 23219, Attn: Kelly Clarke; telephone: 804-344-8121.
In the five years ending December 31, 2009, Glade M. Knight sponsored only Cornerstone, Apple Hospitality Two, Apple Hospitality Five, Apple REIT Six, Apple REIT Seven and Apple REIT Eight, which have investment objectives similar to ours. Cornerstone, Apple Hospitality Two, Apple Hospitality Five, Apple REIT Six, Apple REIT Seven and Apple REIT Eight were formed to invest in existing residential rental properties and/or extended-stay and select-service hotels and possibly other properties for the purpose of providing regular monthly or quarterly distributions to shareholders and the possibility of long-term appreciation in the value of properties and shares.
On May 23, 2007, Apple Hospitality Two merged with and into an affiliate managed by ING Clarion Partners, LLC. Pursuant to the terms and conditions of the Agreement and Plan of Merger, dated as of February 15, 2007, upon the completion of the merger, the separate corporate existence of Apple Hospitality Two ceased. Each shareholder of Apple Hospitality Two received approximately $11.20 for each outstanding unit (consisting of one common share together with one Series A preferred share).
On October 5, 2007, Apple Hospitality Five merged with and into a subsidiary of Inland American Real Estate Trust, Inc. Pursuant to the terms and conditions of the Agreement and Plan of Merger, dated as of July 25, 2007, upon the completion of the merger, the separate corporate existence of Apple Hospitality Five ceased. Each shareholder of Apple Hospitality Five received approximately $14.05 for each outstanding unit (consisting of one common share together with one Series A preferred share).
The information in the following tables should not be considered as indicative of our capitalization or operations. Also past performance of prior programs is not necessarily indicative of our future results. Purchasers of Units offered by our offering will not have any interest in the entities referred to in the following tables or in any of the properties owned by those entities as a result of the acquisition of Units in us.
See, "Apple Nine Advisors and Apple Suites Realty—Prior Performance of Programs Sponsored by Glade M. Knight" in the prospectus for additional information on certain prior real estate programs sponsored by Mr. Knight, including a description of the investment objectives which are deemed by Mr. Knight to be similar and dissimilar to those of the Company.
The following tables use certain financial terms. The following paragraphs briefly describe the meanings of these terms.
- •
- "Acquisition Costs" means fees related to the purchase of property, cash down payments, acquisition fees, and legal and other costs related to property acquisitions.
S-29
- •
- "Cash Generated From Operations" means the excess (or the deficiency in the case of a negative number) of operating cash receipts, including interest on investments, over operating cash expenditures, including debt service payments.
- •
- "GAAP" refers to "Generally Accepted Accounting Principles" in the United States.
- •
- "Recapture" means the portion of taxable income from property sales or other dispositions that is taxed as ordinary income.
- •
- "Reserves" refers to offering proceeds designated for repairs and renovations to properties and offering proceeds not committed for expenditure and held for potential unforeseen cash requirements.
- •
- "Return of Capital" refers to distributions to investors in excess of net income.
(Remainder of Page Intentionally Left Blank)
S-30
TABLE I: EXPERIENCE IN RAISING AND INVESTING FUNDS
Table I presents a summary of the funds raised and the use of those funds by Apple REIT Eight and Apple REIT Seven whose investment objectives are similar to those of Apple REIT Nine, and whose offering closed or was in progress within the three years ending December 31, 2009.
| | Apple REIT Eight | Apple REIT Seven | ||||||
|---|---|---|---|---|---|---|---|---|
Dollar Amount Offered | $ | 1,000,000,000 | $ | 1,000,000,000 | ||||
Dollar Amount Raised | 1,000,000,000 | 1,000,000,000 | ||||||
LESS OFFERING EXPENSES: | ||||||||
Selling Commissions and Discounts | 10.00 | % | 10.00 | % | ||||
Organizational Expenses | 0.15 | % | 0.19 | % | ||||
Other | 0.00 | % | 0.00 | % | ||||
Reserves | 0.50 | % | 0.50 | % | ||||
Percent Available from Investment | 89.35 | % | 89.31 | % | ||||
ACQUISITION COSTS: | ||||||||
Prepaid items and fees to purchase property(1) | 87.35 | % | 87.31 | % | ||||
Cash down payment | 0.00 | % | 0.00 | % | ||||
Acquisition fees(2) | 2.00 | % | 2.00 | % | ||||
Other | 0.00 | % | 0.00 | % | ||||
Total Acquisition Costs | 89.35 | % | 89.31 | % | ||||
Percentage Leverage (excluding unsecured debt) | 12.89 | % | 11.06 | % | ||||
Date Offering Began | July 2007 | March 2006 | ||||||
Length of offering (in months) | 9 | 17 | ||||||
Months to invest 90% of amount available for investment (measured from beginning of offering) | 11 | 22 | ||||||
- (1)
- This line item includes the contracted purchase price plus any additional closing costs such as transfer taxes, title insurance and legal fees.
- (2)
- Substantially all of the acquisition fees were paid to the sponsor or affiliates of the sponsor. The acquisition fees include real estate commissions paid on the acquisition.
Information on prior programs is not indicative of our capitalization or operations and is not necessarily indicative of our future results.
Purchasers of Units in our offering will own no interest in these prior programs.
S-31
TABLE II: COMPENSATION TO SPONSOR AND ITS AFFILIATES
Table II summarizes the compensation paid to the Prior Program Sponsor and its Affiliates, and employee cost reimbursements to related entities (i) by programs organized by it and closed within three years ended December 31, 2009, and (ii) by all other programs during the three years ended December 31, 2009.
| | Apple REIT Eight | Apple REIT Seven | Apple REIT Six | Apple Hospitality Five(4) | Apple Hospitality Two(3) | ||||||||||||
|---|---|---|---|---|---|---|---|---|---|---|---|---|---|---|---|---|---|
Date offering commenced | July 2007 | March 2006 | April 2004 | January 2003 | May 2001 | ||||||||||||
Dollar amount raised | $ | 1,000,000,000 | $ | 1,000,000,000 | $ | 1,000,000,000 | $ | 500,000,000 | $ | 300,000,000 | |||||||
Amounts Paid to Prior Program Sponsor from Proceeds of Offering: | |||||||||||||||||
Acquisition fees | — | — | — | — | — | ||||||||||||
Real Estate commission | 19,011,000 | 18,032,000 | 16,906,642 | 8,200,000 | 8,247,000 | ||||||||||||
Advisory Fees(2) | 2,135,000 | 3,882,000 | 9,646,000 | 3,315,000 | 749,000 | ||||||||||||
Other | — | — | — | — | — | ||||||||||||
Employee payroll and benefits(5) | 3,555,000 | 4,837,000 | 7,089,000 | 2,754,135 | 4,378,624 | ||||||||||||
Cash generated from operations before deducting payments to Prior Program Sponsor | 93,151,000 | 183,482,000 | 367,444,000 | 167,383,000 | 203,609,000 | ||||||||||||
Management and Accounting Fees | — | — | — | — | — | ||||||||||||
Reimbursements | — | — | — | — | 423,000 | ||||||||||||
Leasing Fees | — | — | — | — | — | ||||||||||||
Other Fees | — | — | — | — | 15,700,000 | (1) | |||||||||||
| |||||||||||||||||
- (1)
- Effective January 31, 2003, Apple Hospitality Two acquired all shares of Apple Suites Advisors (previously owned by Mr. Glade Knight). As a result of this transaction, Mr. Knight received $2 million in cash and a note due in 2007 in the amount of $3.5 million. Additionally as the result of this transaction, Apple Hospitality Two's Series B Preferred Shares were converted into approximately 1.3 million Series C Preferred Shares. The Series C Preferred Shares were valued at $10.2 million.
- (2)
- Effective February 1, 2003, Apple Hospitality Five advisory fees and related expenses were paid to Apple Hospitality Two.
- (3)
- On May 23, 2007, Apple Hospitality Two merged with and into an affiliate managed by ING Clarion Partners, LLC.
- (4)
- On October 5, 2007, Apple Hospitality Five merged with and into a subsidiary of Inland American Real Estate Trust, Inc.
- (5)
- Represents payroll and benefits expenses either directly incurred, or reimbursements to, Apple Fund Management (a subsidiary of Apple REIT Six and indirectly controlled by the Prior Performance Sponsor) or a prior related REIT organized and indirectly controlled by the Prior Program Sponsor.
Information on prior programs is not indicative of our capitalization or operations and is not necessarily indicative of our future results.
Purchasers of Units in our offering will own no interest in these prior programs.
S-32
TABLE III: OPERATING RESULTS OF PRIOR PROGRAMS*
Table III presents a summary of the annual operating results for Apple REIT Eight, Apple REIT Seven and Apple REIT Six, whose offerings closed or were in progress in the five year period ending December 31, 2009. Table III is shown on both an income tax basis as well as in accordance with generally accepted accounting principles, the only significant difference being the methods of calculating depreciation.
| | 2009 Apple REIT Eight | 2009 Apple REIT Seven | 2009 Apple REIT Six | 2008 Apple REIT Eight | 2008 Apple REIT Seven | 2008 Apple REIT Six | 2007 Apple REIT Eight | 2007 Apple REIT Seven | 2007 Apple REIT Six | 2006 Apple REIT Seven | 2006 Apple REIT Six | 2005 Apple REIT Six | ||||||||||||||||||||||||||
|---|---|---|---|---|---|---|---|---|---|---|---|---|---|---|---|---|---|---|---|---|---|---|---|---|---|---|---|---|---|---|---|---|---|---|---|---|---|---|
Gross revenues | $ | 170,885,000 | $ | 191,715,000 | $ | 219,689,000 | $ | 133,284,000 | $ | 214,291,000 | $ | 264,302,000 | $ | 1,485,000 | $ | 138,564,000 | $ | 257,934,000 | $ | 20,345,000 | $ | 235,875,000 | $ | 101,790,000 | ||||||||||||||
Profit on sale of properties | — | — | — | — | — | — | — | — | — | — | — | — | ||||||||||||||||||||||||||
Less Operating expenses | 126,178,000 | 132,285,000 | 153,060,000 | 95,047,000 | 144,028,000 | 173,098,000 | 2,097,000 | 89,338,000 | 165,059,000 | 15,689,000 | 154,424,000 | 68,733,000 | ||||||||||||||||||||||||||
Interest income (expense) | (6,295,000 | ) | (6,292,000 | ) | (2,312,000 | ) | (1,928,000 | ) | (3,766,000 | ) | (1,784,000 | ) | 6,343,000 | 997,000 | (1,853,000 | ) | 1,855,000 | (1,809,000 | ) | 2,126,000 | ||||||||||||||||||
Depreciation | 32,907,000 | 32,425,000 | 30,938,000 | 22,044,000 | 28,434,000 | 30,918,000 | 333,000 | 16,990,000 | 27,694,000 | 3,073,000 | 25,529,000 | 11,366,000 | ||||||||||||||||||||||||||
Net income (loss) GAAP basis | 5,505,000 | 20,713,000 | 33,379,000 | 14,265,000 | 38,063,000 | 58,502,000 | 5,398,000 | 33,233,000 | 63,328,000 | 3,438,000 | 54,113,000 | 23,817,000 | ||||||||||||||||||||||||||
Taxable income | — | — | — | — | — | — | — | — | — | — | — | — | ||||||||||||||||||||||||||
Cash generated from operations | 45,739,000 | 55,460,000 | 66,029,000 | 39,714,000 | 69,025,000 | 88,747,000 | 5,563,000 | 49,957,000 | 89,848,000 | 5,158,000 | 81,363,000 | 28,907,000 | ||||||||||||||||||||||||||
Cash generated from sales | — | — | — | — | — | — | — | — | — | — | — | — | ||||||||||||||||||||||||||
Cash generated from refinancing | — | — | — | — | — | — | — | — | — | — | — | — | ||||||||||||||||||||||||||
Less cash distributions to investors | 74,924,000 | 75,380,000 | 82,215,000 | 76,378,000 | 81,440,000 | 81,746,000 | 14,464,000 | 60,234,000 | 78,834,000 | 12,526,000 | 77,997,000 | 48,865,000 | ||||||||||||||||||||||||||
Cash generated after cash distribution | (29,185,000 | ) | (19,920,000 | ) | (16,186,000 | ) | (36,664,000 | ) | (12,415,000 | ) | 7,001,000 | (8,901,000 | ) | (10,277,000 | ) | 11,014,000 | (7,368,000 | ) | 3,366,000 | (19,958,000 | ) | |||||||||||||||||
Less Special items | — | — | — | — | — | — | — | — | — | — | — | — | ||||||||||||||||||||||||||
Cash generated after cash distributions and special items | (29,185,000 | ) | (19,920,000 | ) | (16,186,000 | ) | (36,664,000 | ) | (12,415,000 | ) | 7,001,000 | (8,901,000 | ) | (10,277,000 | ) | 11,014,000 | (7,368,000 | ) | 3,366,000 | (19,958,000 | ) | |||||||||||||||||
Capital contributions, net | 13,692,000 | 1,171,000 | (3,149,000 | ) | 234,054,000 | 20,599,000 | 16,325,000 | 679,435,000 | 541,410,000 | 13,159,000 | 363,640,000 | 78,026,000 | 471,784,000 | |||||||||||||||||||||||||
Fixed asset additions | 29,923,000 | 13,777,000 | 9,155,000 | 759,346,000 | 129,589,000 | 33,434,000 | 87,643,000 | 391,227,000 | 15,635,000 | 318,157,000 | 62,075,000 | 570,034,000 | ||||||||||||||||||||||||||
Line of credit-change in(1) | 48,090,000 | 11,510,000 | 25,940,000 | 10,258,000 | — | — | — | (18,000,000 | ) | — | 18,000,000 | (28,000,000 | ) | 28,000,000 | ||||||||||||||||||||||||
S-33
TABLE III: OPERATING RESULTS OF PRIOR PROGRAMS*—(Continued)
| | 2009 Apple REIT Eight | 2009 Apple REIT Seven | 2009 Apple REIT Six | 2008 Apple REIT Eight | 2008 Apple REIT Seven | 2008 Apple REIT Six | 2007 Apple REIT Eight | 2007 Apple REIT Seven | 2007 Apple REIT Six | 2006 Apple REIT Seven | 2006 Apple REIT Six | 2005 Apple REIT Six | ||||||||||||||||||||||||||
|---|---|---|---|---|---|---|---|---|---|---|---|---|---|---|---|---|---|---|---|---|---|---|---|---|---|---|---|---|---|---|---|---|---|---|---|---|---|---|
Cash generated(2) | — | (20,609,000 | ) | (935,000 | ) | (562,009,000 | ) | (121,828,000 | ) | (32,326,000 | ) | 561,985,000 | 97,833,000 | 7,101,000 | 44,554,000 | (9,788,000 | ) | (106,842,000 | ) | |||||||||||||||||||
End of period cash | — | — | — | — | 20,609,000 | 935,000 | 562,009,000 | 142,437,000 | 33,261,000 | 44,604,000 | 26,160,000 | 35,948,000 | ||||||||||||||||||||||||||
Tax and distribution data per $1,000 invested | ||||||||||||||||||||||||||||||||||||||
Federal income tax results | ||||||||||||||||||||||||||||||||||||||
Ordinary income | 24 | 35 | 51 | 42 | 45 | 70 | 11 | 50 | 72 | 38 | 66 | 50 | ||||||||||||||||||||||||||
Capital gain | — | — | — | — | — | — | — | — | — | — | — | — | ||||||||||||||||||||||||||
Cash distributions to investors Source (on GAAP basis) | ||||||||||||||||||||||||||||||||||||||
Investment income | 24 | 35 | 51 | 42 | 45 | 70 | 11 | 50 | 72 | 38 | 66 | 50 | ||||||||||||||||||||||||||
Long-term capital gain | — | — | — | — | — | — | — | — | — | — | — | — | ||||||||||||||||||||||||||
Return of capital | 50 | 39 | 31 | 38 | 35 | 12 | 25 | 30 | 8 | 22 | 14 | 30 | ||||||||||||||||||||||||||
Source (on Cash basis) | ||||||||||||||||||||||||||||||||||||||
Sales | — | — | — | — | — | — | — | — | — | — | — | — | ||||||||||||||||||||||||||
Refinancings | — | — | — | — | — | — | — | — | — | — | — | — | ||||||||||||||||||||||||||
Operations | 74 | 74 | 82 | 80 | 80 | 82 | 36 | 80 | 80 | 60 | 80 | 80 | ||||||||||||||||||||||||||
Other | — | — | — | — | — | — | — | — | — | — | — | — | ||||||||||||||||||||||||||
Amount (in percentage terms) remaining invested in program properties at the end of the last year reported in the Table (original total acquisition cost of properties retained divided by original total acquisition cost of all properties in program) | 100 | % | 100 | % % | 100 | % % | ||||||||||||||||||||||||||||||||
- *
- Any rows not reflected from SEC Industry Guide 5 are not applicable to the programs.
- (1)
- Amount reflects change in Company's short term credit facilities.
- (2)
- Amount reflects the net change in Company's cash balance during the year.
Information on prior programs is not indicative of our capitalization or operations and is not necessarily indicative of our future results.
Purchasers of Units in our offering will own no interest in these prior programs.
S-34
TABLE IV: RESULTS OF COMPLETED PROGRAMS
Table IV shows the aggregate results during the period of operation for Cornerstone Realty, Apple Hospitality Two and Apple Hospitality Five, each of which completed operations within the five year period ending December 31, 2009. Cornerstone Realty merged into Colonial Properties Trust on April 1, 2005. Apple Hospitality Two merged with and into an affiliate managed by ING Clarion Partners, LLC on May 23, 2007. Apple Hospitality Five merged with and into a subsidiary of Inland American Real Estate Trust, Inc. on October 5, 2007.
| | Apple Hospitality Two | Apple Hospitality Five | Cornerstone Realty(1) | |||||||||
|---|---|---|---|---|---|---|---|---|---|---|---|---|
Dollar Amount Raised | $ | 300,000,000 | $ | 500,000,000 | $ | 432,309,000 | ||||||
Number of Properties Purchased | 66 | 28 | 107 | |||||||||
Date of Closing of Offering | 11/26/02 | 3/18/04 | 12/01/01 | |||||||||
Date of First Sale of Property | 3/24/06 | 8/10/07 | 3/10/00 | |||||||||
Date of Final Sale of Property | 5/23/07 | 10/5/07 | 4/01/05 | |||||||||
Tax and Distribution Data per $1,000 Investment through: | ||||||||||||
Federal Income Tax Results: | ||||||||||||
Ordinary income (loss) | ||||||||||||
—from operations | $ | 429 | $ | 235 | $ | 688 | ||||||
—from recapture/return capital | $ | 1,000 | $ | 1,000 | $ | 407 | ||||||
Capital Gain (loss) | $ | 288 | $ | 426 | $ | 28 | ||||||
Deferred Gain | ||||||||||||
—Capital | $ | — | $ | — | $ | — | ||||||
—Ordinary | $ | — | $ | — | $ | — | ||||||
Cash Distributions to Investors | $ | 1,717 | $ | 1,661 | $ | 1,123 | ||||||
Source (on GAAP basis) | ||||||||||||
—Investment income | $ | 717 | $ | 661 | $ | 716 | ||||||
—Return of Capital | $ | 1,000 | $ | 1,000 | $ | 407 | ||||||
Source (on cash basis) | ||||||||||||
—Sales | $ | 1,120 | $ | 1,277 | $ | 7 | ||||||
—Refinancing | $ | — | $ | — | $ | — | ||||||
—Operations | $ | 597 | $ | 384 | $ | 1,116 | ||||||
—Other | $ | — | $ | — | $ | — | ||||||
Receivable on Net Purchase Money Financing | $ | — | $ | — | $ | — | ||||||
- (1)
- Merged into a subsidiary of Colonial Properties Trust on April 1, 2005. In connection with the merger, the aggregate value of the stock consideration issued by Colonial Properties Trust was approximately $595 million.
Information on prior programs is not indicative of our capitalization or operations and is not necessarily indicative of our future results.
Purchasers of Units in our offering will own no interest in these prior programs.
S-35
TABLE V: SALES OR DISPOSALS OF PROPERTIES
On May 23, 2007, Apple Hospitality Two merged with and into an affiliate managed by ING Clarion Partners, LLC. Prior to the merger, Apple Hospitality Two owned 63 hotels.
On October 5, 2007, Apple Hospitality Five merged with and into a subsidiary of Inland American Real Estate Trust, Inc. Prior to the merger, Apple Hospitality Five owned 27 hotels.
Selling Price, Net of Closing Costs and GAAP Adjustments
Property | Date Acquired | Date of Sale | Cash Received Net of Closing Costs | Mortgage Balance at Time of Sale | Purchase Money Mortgage Taken Back by Program | Adjustments Resulting from Application of GAAP | Total | Original Mortgage Financing | Total Acquisition Cost, Capital Improvements, Closing and Soft Costs | Total | Excess (Deficiency) of Property Operating Cash Receipts Over Cash Expenditures | |||||||||||||||||||||
|---|---|---|---|---|---|---|---|---|---|---|---|---|---|---|---|---|---|---|---|---|---|---|---|---|---|---|---|---|---|---|---|---|
Sale of two hotels in 2006 Apple Hospitality Two, Inc. | ||||||||||||||||||||||||||||||||
Charlotte | Aug 02 | Mar 06 | $ | 3,700,000 | — | — | — | $ | 3,700,000 | — | $ | 5,833,000 | $ | 5,833,000 | $ | 452,000 | ||||||||||||||||
Spartanburg | Aug 02 | Mar 06 | 1,900,000 | — | — | — | 1,900,000 | — | 3,202,000 | 3,202,000 | 343,000 | |||||||||||||||||||||
| $ | 5,600,000 | $ | 5,600,000 | $ | 9,035,000 | $ | 9,035,000 | $ | 795,000 | |||||||||||||||||||||||
Information on prior programs is not indicative of our capitalization or operations and is not necessarily indicative of our future results.
Purchasers of Units in our offering will own no interest in these prior programs.
(Remainder of Page Intentionally Left Blank)
S-36
Financial Statements of Company
Apple REIT Nine, Inc. | ||||
(Audited) | ||||
Report of Independent Registered Public Accounting Firm | * | |||
Consolidated Balance Sheets—December 31, 2009 and December 31, 2008 | * | |||
Consolidated Statements of Operations—Years Ended December 31, 2009 and December 31, 2008 and For the Period November 9, 2007 (initial capitalization) through December 31, 2007 | * | |||
Consolidated Statements of Shareholders' Equity—Years Ended December 31, 2009 and December 31, 2008 and For the Period November 9, 2007 (initial capitalization) through December 31, 2007 | * | |||
Consolidated Statements of Cash Flows—Years Ended December 31, 2009 and December 31, 2008 and For the Period November 9, 2007 (initial capitalization) through December 31, 2007 | * | |||
Notes to Consolidated Financial Statements | * | |||
Financial Statement Schedule | * | |||
Financial Statements of Businesses Acquired | ||||
Tucson, Arizona—Hilton Garden Inn Hotel | ||||
(Audited) | ||||
Independent Auditors' Report | * | |||
Balance Sheet—December 31, 2007 | * | |||
Statement of Operations—Year Ended December 31, 2007 | * | |||
Statement of Owners' Equity—Year Ended December 31, 2007 | * | |||
Statement of Cash Flows—Year Ended December 31, 2007 | * | |||
Notes to Financial Statements | * | |||
(Unaudited) | ||||
Balance Sheets—June 30, 2008 and December 31, 2007 | * | |||
Statements of Operations—Six Months Ended June 30, 2008 and 2007 | * | |||
Statements of Cash Flows—Six Months Ended June 30, 2008 and 2007 | * | |||
Charlotte Lakeside Hotel, L.P.(previous owner of Charlotte, North Carolina Homewood Suites) | ||||
(Audited) | ||||
Independent Auditors' Report | * | |||
Balance Sheets—December 31, 2007 and 2006 | * | |||
Statements of Operations and Partners' Deficit—Years Ended | ||||
December 31, 2007 and 2006 | * | |||
Statements of Cash Flows—Years Ended December 31, 2007 and 2006 | * | |||
Notes to Financial Statements | * | |||
(Unaudited) | ||||
Balance Sheets—June 30, 2008 and 2007 | * | |||
Statements of Income and Partners' Deficit—Six Months Ended June 30, 2008 and 2007 | * | |||
Statements of Cash Flows—Six Months Ended June 30, 2008 and 2007 | * | |||
F-1
Santa Clarita—Courtyard by Marriott Hotel | ||||
(Audited) | ||||
Independent Auditors' Report | * | |||
Balance Sheets—December 31, 2007 and 2006 | * | |||
Statements of Members' Equity—Years Ended December 31, 2007 and 2006 | * | |||
Statements of Operations—Years Ended December 31, 2007 and 2006 | * | |||
Statements of Cash Flows—Years Ended December 31, 2007 and 2006 | * | |||
Notes to the Financial Statements | * | |||
(Unaudited) | ||||
Balance Sheets—June 30, 2008 and 2007 | * | |||
Statements of Members' Equity—June 30, 2008 and 2007 | * | |||
Statements of Operations—Six month periods ended June 30, 2008 and 2007 | * | |||
Statements of Cash Flows—Six month periods ended June 30, 2008 and 2007 | * | |||
Allen Stacy Hotel, Ltd.(previous owner of Allen, Texas Hampton Inn & Suites) | ||||
(Audited) | ||||
Independent Auditors' Report | * | |||
Balance Sheets—December 31, 2007 and 2006 | * | |||
Statements of Operations—Years Ended December 31, 2007 and 2006 | * | |||
Statements of Changes in Partners' Capital—Years Ended December 31, 2007 and 2006 | * | |||
Statements of Cash Flows—Years Ended December 31, 2007 and 2006 | * | |||
Notes to Financial Statements | * | |||
(Unaudited) | ||||
Balance Sheets—June 30, 2008 and 2007 | * | |||
Statements of Operations—Six months ended June 30, 2008 and 2007 | * | |||
Statements of Cash Flows—Six months ended June 30, 2008 and 2007 | * | |||
RSV Twinsburg Hotel, Ltd.previous owner of Twinsburg, Ohio Hilton Garden Inn) | ||||
(Audited) | ||||
Independent Auditors' Report | * | |||
Balance Sheets—December 31, 2007 and 2006 | * | |||
Statements of Operations—Years Ended December 31, 2007 and 2006 | * | |||
Statements of Changes in Partners' Capital—Years Ended December 31, 2007 and 2006 | * | |||
Statements of Cash Flows—Years Ended December 31, 2007 and 2006 | * | |||
Notes to Financial Statements | * | |||
(Unaudited) | ||||
Balance Sheets—June 30, 2008 and 2007 | * | |||
Statements of Operations—Six months ended June 30, 2008 and 2007 | * | |||
Statements of Cash Flows—Six months ended June 30, 2008 and 2007 | * | |||
F-2
SCI Lewisville Hotel, Ltd.(previous owner of Lewisville, Texas Hilton Garden Inn) | ||||
(Audited) | ||||
Independent Auditors' Report | * | |||
Balance Sheets—December 31, 2007 and 2006 | * | |||
Statements of Operations—Years Ended December 31, 2007 and 2006 | * | |||
Statements of Changes in Partners' Capital—Years Ended December 31, 2007 and 2006 | * | |||
Statements of Cash Flows—Years Ended December 31, 2007 and 2006 | * | |||
Notes to Financial Statements | * | |||
(Unaudited) | ||||
Balance Sheets—June 30, 2008 and 2007 | * | |||
Statements of Operations—Six months ended June 30, 2008 and 2007 | * | |||
Statements of Cash Flows—Six months ended June 30, 2008 and 2007 | * | |||
SCI Duncanville Hotel, Ltd.(previous owner of Duncanville, Texas Hilton Garden Inn) | ||||
(Audited) | ||||
Independent Auditors' Report | * | |||
Balance Sheets—December 31, 2007 and 2006 | * | |||
Statements of Operations—Years Ended December 31, 2007 and 2006 | * | |||
Statements of Changes in Partners' Capital—Years Ended December 31, 2007 and 2006 | * | |||
Statements of Cash Flows—Years Ended December 31, 2007 and 2006 | * | |||
Notes to Financial Statements | * | |||
(Unaudited) | ||||
Balance Sheets—June 30, 2008 and 2007 | * | |||
Statements of Operations—Six months ended June 30, 2008 and 2007 | * | |||
Statements of Cash Flows—Six months ended June 30, 2008 and 2007 | * | |||
Bristol, Virginia—Courtyard Marriott | ||||
(Audited) | ||||
Report of Independent Auditors | * | |||
Balance Sheets—December 31, 2007 and 2006 | * | |||
Statements of Operations—Years Ended December 31, 2007 and 2006 | * | |||
Statements of Cash Flows—Years Ended December 31, 2007 and 2006 | * | |||
Statements of Owner's Equity—Years Ended December 31, 2007 and 2006 | * | |||
Notes to Financial Statements | * | |||
(Unaudited) | ||||
Balance Sheets—September 30, 2008 and December 30, 2007 | * | |||
Statements of Operations—Nine Months Ended September 30, 2008 and 2007 | * | |||
Statements of Cash Flows—Nine Months Ended September 30, 2008 and 2007 | * | |||
F-3
Beaumont, Texas—Residence Inn by Marriott | ||||
(Audited) | ||||
Independent Auditors' Report | * | |||
Balance Sheet—December 31, 2007 | * | |||
Statement of Operations—Year Ended December 31, 2007 | * | |||
Statement of Partners' Equity—Year Ended December 31, 2007 | * | |||
Statement of Cash Flows—Year Ended December 31, 2007 | * | |||
Notes to Financial Statements | * | |||
(Unaudited) | ||||
Balance Sheets—September 30, 2008 and December 30, 2007 | * | |||
Statements of Operations—Nine Months Ended September 30, 2008 and 2007 | * | |||
Statements of Cash Flows—Nine Months Ended September 30, 2008 and 2007 | * | |||
Santa Clarita Hotels Portfolio | ||||
(Audited) | ||||
Independent Auditors' Report | * | |||
Combined Balance Sheets—December 31, 2007 and 2006 | * | |||
Combined Statements of Income—Years Ended December 31, 2007 and 2006 | * | |||
Combined Statements of Cash Flows—Years Ended December 31, 2007 and 2006 | * | |||
Notes to Financial Statements | * | |||
(Unaudited) | ||||
Combined Balance Sheets—September 30, 2008 and 2007 | * | |||
Combined Statements of Income—Nine Months Ended September 30, 2008 and 2007 | * | |||
Combined Statements of Cash Flows—Nine Months Ended September 30, 2008 and 2007 | * | |||
SCI Allen Hotel, Ltd.(previous owner of Allen, Texas Hilton Garden Inn) | ||||
(Audited) | ||||
Independent Auditors' Report | * | |||
Balance Sheets—December 31, 2007 and 2006 | * | |||
Statements of Operations—Years Ended December 31, 2007 and 2006 | * | |||
Statements of Changes in Partners' Capital—Years Ended December 31, 2007 and 2006 | * | |||
Statements of Cash Flows—Years Ended December 31, 2007 and 2006 | * | |||
Notes to Financial Statements | * | |||
(Unaudited) | ||||
Balance Sheets—September 30, 2008 and 2007 | * | |||
Statements of Operations—Nine Months Ended September 30, 2008 and 2007 | * | |||
Statements of Cash Flows—Nine Months Ended September 30, 2008 and 2007 | * | |||
F-4
Pueblo, Colorado—Hampton Inn & Suites | ||||
(Audited) | ||||
Independent Auditors' Report | * | |||
Balance Sheets—December 31, 2007 and 2006 | * | |||
Statements of Income—Years Ended December 31, 2007 and 2006 | * | |||
Statements of Owner's Equity—Years Ended December 31, 2007 and 2006 | * | |||
Statements of Cash Flows—Years Ended December 31, 2007 and 2006 | * | |||
Notes to Financial Statements | * | |||
(Unaudited) | ||||
Balance Sheets—September 30, 2008 and 2007 | * | |||
Statements of Income—Nine Months Ended September 30, 2008 and 2007 | * | |||
Statements of Cash Flows—Nine Months Ended September 30, 2008 and 2007 | * | |||
Durham, North Carolina—Homewood Suites | ||||
(Audited) | ||||
Independent Auditors' Report | * | |||
Balance Sheets—December 31, 2007 and 2006 | * | |||
Statements of Members' Deficit—Years Ended December 31, 2007 and 2006 | * | |||
Statements of Operations—Years Ended December 31, 2007 and 2006 | * | |||
Statements of Cash Flows—Years Ended December 31, 2007 and 2006 | * | |||
Notes to Financial Statements | * | |||
(Unaudited) | ||||
Balance Sheets—September 30, 2008 and 2007 | * | |||
Statements of Members' Deficit—Nine Months Ended September 30, 2008 and 2007 | * | |||
Statements of Operations—Nine Months Ended September 30, 2008 and 2007 | * | |||
Statements of Cash Flows—Nine Months Ended September 30, 2008 and 2007 | * | |||
RMRVH Jackson, LLC, CYRMR Jackson, LLC and VH Fort Lauderdale Investment Ltd.(previous owners of Jackson, Tennessee Courtyard, Jackson, Tennessee Hampton Inn & Suites and Fort Lauderdale, Florida Hampton Inn) | ||||
(Audited) | ||||
Independent Auditors' Report | * | |||
Combined Balance Sheets—December 30, 2007 and December 31, 2006 | * | |||
Combined Statements of Income—Years Ended December 30, 2007 and | ||||
December 31, 2006 | * | |||
Combined Statements of Owners' Equity—Years Ended December 30, 2007 and | ||||
December 31, 2006 | * | |||
Combined Statements of Cash Flows—Years Ended December 30, 2007 and | ||||
December 31, 2006 | * | |||
Notes to Combined Financial Statements | * | |||
F-5
(Unaudited) | ||||
Combined Balance Sheets—September 28, 2008 and September 30, 2007 | * | |||
Combined Statements of Income—Nine Months Ended September 28, 2008 and | ||||
September 30, 2007 | * | |||
Combined Statements of Cash Flows—Nine Months Ended September 28, 2008 and | ||||
September 30, 2007 | * | |||
Playhouse Square Hotel Associates and Playhouse Parking Associates, L.P. | ||||
(previous owners of Pittsburgh, Pennsylvania Hampton Inn) | ||||
(Audited) | ||||
Independent Auditors' Report | * | |||
Combined Balance Sheets—December 31, 2007 and 2006 | * | |||
Combined Statements of Income—Years Ended December 31, 2007 and 2006 | * | |||
Combined Statements of Changes in Partners' Deficit—Years Ended | ||||
December 31, 2007 and 2006 | * | |||
Combined Statements of Cash Flows—Years Ended December 31, 2007 and 2006 | * | |||
Schedule of General and Unapplied Expenses—Years Ended | ||||
December 31, 2007 and 2006 | * | |||
Notes to Combined Financial Statements | * | |||
(Unaudited) | ||||
Combined Balance Sheets—September 28, 2008 and September 30, 2007 | * | |||
Combined Statements of Income—Nine Months Ended September 28, 2008 and | ||||
September 30, 2007 | * | |||
Combined Statements of Changes in Partners' Equity—Nine Months Ended | ||||
September 28, 2008 and September 30, 2007 | * | |||
Combined Statements of Cash Flows—Nine Months Ended September 28, 2008 and | ||||
September 30, 2007 | * | |||
Austin FRH, LTD, FRH Braker, LTD and RR Hotel Investment, LTD | ||||
(Audited) | ||||
Independent Auditors' Report | * | |||
Combined Balance Sheets—December 28, 2008 and December 30, 2007 | * | |||
Combined Statements of Income—Years Ended December 28, 2008 and December 30, 2007 | * | |||
Combined Statements of Owners' Deficit—December 28, 2008, December 30, 2007 and | ||||
December 31, 2006 | * | |||
Combined Statements of Cash Flows—Years Ended December 28, 2008 and | ||||
December 30, 2007 | * | |||
Notes to Combined Financial Statements | * | |||
F-6
Grove Street Orlando, LLC | |||
(Audited) | |||
Independent Auditors' Report | * | ||
Balance Sheet as of December 31, 2008 | * | ||
Statement of Cash Flows for the Year Ended December 31, 2008 | * | ||
Notes to Financial Statements | * | ||
(Unaudited) | |||
Balance Sheets as of June 30, 2009 and 2008 | * | ||
Statements of Operations and Members' Equity for the Six Months Ended June 30, 2009 and 2008 | * | ||
Statements of Cash Flows for the Six Months Ended June 30, 2009 and 2008 | * | ||
Houston, Texas—Marriott Hotel | |||
(Audited) | |||
Independent Auditors' Report | * | ||
Balance Sheet as of December 31, 2009 | * | ||
Statement of Partners' Equity—Year Ended December 31, 2009 | * | ||
Statement of Operations—Year Ended December 31, 2009 | * | ||
Statement of Cash Flows—Year Ended December 31, 2009 | * | ||
Notes to Financial Statements | * | ||
Pro Forma Financial Information | |||
Apple REIT Nine, Inc. | |||
(Unaudited) | |||
Pro Forma Condensed Consolidated Balance Sheet as of December 31, 2009 | * | ||
Notes to Pro Forma Condensed Consolidated Balance Sheet | * | ||
Pro Forma Condensed Consolidated Statement of Operations for the | |||
Year Ended December 31, 2009 | * | ||
Notes to Pro Forma Condensed Consolidated Statement of Operations | * | ||
- *
- Incorporated by reference herein. See "Incorporation by Reference" on page S-5 of this Supplement.
F-7