Filed Pursuant to Rule 424(b)(3)
Registration No. 333-147414
SUPPLEMENT NO. 9 DATED MAY 20, 2010
TO PROSPECTUS DATED SEPTEMBER 21, 2009
APPLE REIT NINE, INC.
The following information supplements the prospectus of Apple REIT Nine, Inc. dated September 21, 2009 and is part of the prospectus. This Supplement updates the information presented in the prospectus.Prospective investors should carefully review the prospectus, Supplement No. 8 (which is cumulative and replaces all prior Supplements) and this Supplement No. 9.
TABLE OF CONTENTS
Certain forward-looking statements are included in the prospectus and this supplement. These forward-looking statements may involve our plans and objectives for future operations, including future growth and availability of funds. These forward-looking statements are based on current expectations, which are subject to numerous risks and uncertainties. Assumptions relating to these statements involve judgments with respect to, among other things, the continuation of our offering of Units, future economic, competitive and market conditions and future business decisions, together with local, national and international events (including, without limitation, acts of terrorism or war, and their direct and indirect effects on travel and the economy). All of these matters are difficult or impossible to predict accurately and many of them are beyond our control. Although we believe the assumptions relating to the forward-looking statements, and the statements themselves, are reasonable, any of the assumptions could be inaccurate and, therefore, there can be no assurance that these forward-looking statements will prove to be accurate. In light of the significant uncertainties inherent in these forward-looking statements, the inclusion of this information should not be regarded as a representation by us or any other person that our objectives and plans, which we consider to be reasonable, will be achieved.
S-1
"Courtyard by Marriott," "Fairfield Inn," "Fairfield Inn & Suites," "TownePlace Suites," "Marriott," "SpringHill Suites" and "Residence Inn" are each a registered trademark of Marriott International, Inc. or one of its affiliates. All references below to "Marriott" mean Marriott International, Inc. and all of its affiliates and subsidiaries, and their respective officers, directors, agents, employees, accountants and attorneys. Marriott is not responsible for the content of this prospectus supplement, whether relating to hotel information, operating information, financial information, Marriott's relationship with Apple REIT Nine, Inc., or otherwise. Marriott is not involved in any way, whether as an "issuer" or "underwriter" or otherwise, in the offering by Apple REIT Nine, Inc. and receives no proceeds from the offering. Marriott has not expressed any approval or disapproval regarding this prospectus supplement or the offering related to this prospectus supplement, and the grant by Marriott of any franchise or other rights to Apple REIT Nine, Inc. shall not be construed as any expression of approval or disapproval. Marriott has not assumed, and shall not have, any liability in connection with this prospectus supplement or the offering related to this prospectus supplement.
"Hampton Inn," "Hampton Inn & Suites," "Homewood Suites," "Embassy Suites" and "Hilton Garden Inn" are each a registered trademark of Hilton Worldwide or one of its affiliates. All references below to "Hilton" mean Hilton Worldwide and all of its affiliates and subsidiaries, and their respective officers, directors, agents, employees, accountants and attorneys. Hilton is not responsible for the content of this prospectus supplement, whether relating to hotel information, operating information, financial information, Hilton's relationship with Apple REIT Nine, Inc., or otherwise. Hilton is not involved in any way, whether as an "issuer" or "underwriter" or otherwise, in the offering by Apple REIT Nine, Inc. and receives no proceeds from the offering. Hilton has not expressed any approval or disapproval regarding this prospectus supplement or the offering related to this prospectus supplement, and the grant by Hilton of any franchise or other rights to Apple REIT Nine, Inc. shall not be construed as any expression of approval or disapproval. Hilton has not assumed, and shall not have, any liability in connection with this prospectus supplement or the offering related to this prospectus supplement.
S-2
We completed the minimum offering of Units (with each Unit consisting of one Common Share and one Series A Preferred Share) at $10.50 per Unit on May 14, 2008. We are continuing the offering at $11 per Unit in accordance with the prospectus. We registered to sell a total of 182,251,082 Units. As of April 30, 2010, 59,737,402 Units remained unsold. Our offering of Units expires on April 25, 2011, provided that the offering will be terminated if all of the Units are sold before then.
As of April 30, 2010, we had closed on the following sales of Units in the offering:
Price Per Unit | Number of Units Sold | Gross Proceeds | Proceeds Net of Selling Commissions and Marketing Expense Allowance | |||||||||
|---|---|---|---|---|---|---|---|---|---|---|---|---|
$10.50 | 9,523,810 | $ | 100,000,000 | $ | 90,000,000 | |||||||
$11.00 | 112,989,870 | 1,242,888,573 | 1,118,599,716 | |||||||||
Total | 122,513,680 | $ | 1,342,888,573 | $ | 1,208,599,716 | |||||||
Our distributions since the initial capitalization through March 31, 2010 totaled approximately $93.2 million of which approximately $58.4 million was used to purchase additional Units under the Company's best-efforts offering. In 2008 and 2009, our initial years of operations, over half of the $70.3 million in total distributions represented a return of capital (specifically, 53% and 58% in 2009 and 2008, respectively), as detailed below. Our distributions were paid at a monthly rate of $0.073334 per common share beginning in June 2008. For the same period our net cash generated from operations, from our Consolidated Statements of Cash Flows, was approximately $36.4 million, which exceeded the net cash distributions. The following is a summary of the distributions and cash generated by operations.
| | Total Distributions Declared and Paid per Share | | | | | |||||||||||
|---|---|---|---|---|---|---|---|---|---|---|---|---|---|---|---|---|
| | Total Declared and Paid | | ||||||||||||||
| | Net Cash From Operations(1) | |||||||||||||||
| | Cash | Reinvested | Total | |||||||||||||
2nd Quarter 2008 | $ | 0.07 | $ | 300,000 | $ | 593,000 | $ | 893,000 | $ | 323,000 | ||||||
3rd Quarter 2008 | 0.22 | 1,694,000 | 3,094,000 | 4,788,000 | 966,000 | |||||||||||
4th Quarter 2008 | 0.22 | 2,582,000 | 4,749,000 | 7,331,000 | 2,047,000 | |||||||||||
1st Quarter 2009 | 0.22 | 3,624,000 | 6,265,000 | 9,889,000 | 2,204,000 | |||||||||||
2nd Quarter 2009 | 0.22 | 4,728,000 | 7,897,000 | 12,625,000 | 8,888,000 | |||||||||||
3rd Quarter 2009 | 0.22 | 5,956,000 | 9,790,000 | 15,746,000 | 8,908,000 | |||||||||||
4th Quarter 2009 | 0.22 | 7,240,000 | 11,830,000 | 19,070,000 | 9,137,000 | |||||||||||
1st Quarter 2010 | 0.22 | 8,656,000 | 14,160,000 | 22,816,000 | 3,963,000 | |||||||||||
| $ | 1.61 | $ | 34,780,000 | $ | 58,378,000 | $ | 93,158,000 | $ | 36,436,000 | |||||||
- (1)
- See complete consolidated statement of cash flows for the three months ended March 31, 2010 on page F-4.
S-3
The following table shows the amount of annual distributions per share to investors and the percentage that represented a return of capital and the percentage representing ordinary income as included in Note 1 to our audited consolidated financial statements in our most recent Form 10-K.
Year | Distributions per Share | Percentage of Distributions Classified as Ordinary Income(1) | Percentage of Distributions Classified as Return of Capital(1) | |||||||
|---|---|---|---|---|---|---|---|---|---|---|
2009 | $ | 0.88 | 47 | % | 53 | % | ||||
2008 | $ | 0.51 | 42 | % | 58 | % | ||||
- (1)
- Percentages are based on earnings and profits of the Company as determined by federal income tax regulations.
As shown in the table above, for the years ended December 31, 2009 and 2008, 53% and 58%, respectively, of distributions made to investors represented a return of capital. The historical percentages may not be indicative of future return of capital percentages. We may use an unlimited amount of the offering proceeds to fund distributions in the future. Proceeds of the offering which are distributed are not available for investment in properties. Further, the payment of distributions from sources other than operating cash flow will decrease the cash available to invest in properties and will reduce the amount of distributions we may make in the future. See "Risk Factors"—"We may be unable to make distributions to our shareholders," on page 28 of the prospectus, and "Our distributions to our shareholders have been sourced from operating cash flow and offering proceeds, and in the future we may fund distributions from offering proceeds or indebtedness, which (to the extent it occurs) will decrease our distributions in the future," on page 16 of the prospectus.
During the initial phase of our operations, we have had and may continue to have, due to the inherent delay between raising capital and investing that same capital in income producing real estate, a portion of our distributions funded from offering proceeds. Our objective in setting a distribution rate is to project a rate that will provide consistency over the life of the Company, taking into account acquisitions and capital improvements, ramp up of new properties and varying economic cycles. We anticipate that we may need to continue to use offering proceeds and cash from operations, and also utilize debt, to meet this objective. We evaluate the distribution rate on an ongoing basis and may make changes at any time if we feel the rate is not appropriate based on available cash resources. In May 2008, our Board of Directors established a policy for an annualized dividend rate of $0.88 per common share, payable in monthly distributions. Since there can be no assurance of our ability to acquire properties that provide income at this level, or that the properties already acquired will provide income at this level, there can be no assurance as to the classification or duration of distributions at the current rate.
For the year ended December 31, 2009, as stated in Note 1 to our consolidated financial statements for that period, 53% of distributions made to investors represented a return of capital and the remaining 47% represented ordinary income. Proceeds of the offering which are distributed are not available for investment in properties. See "Risk Factors"—"We may be unable to make distributions to our shareholders," on page 28 of the prospectus, and "Our distributions to our shareholders have been sourced from operating cash flow and offering proceeds, and in the future we may fund distributions from offering proceeds or indebtedness, which (to the extent it occurs) will decrease our distributions in the future," on page 16 of the prospectus.
Through April 30, 2010, we have received requests to redeem approximately 559,000 Units pursuant to our Unit Redemption Program for a total of $5.7 million. Through our last scheduled quarterly redemption date in 2010, April 20, 2010, we redeemed 100% of the redemption requests at an average per Unit redemption price of $10.28. We funded Unit redemptions for the periods noted
S-4
above from the proceeds of dividends used to purchase additional Units under the Company's best efforts offering of Units.
Updated Risk Factor
The following updated risk factor amends and replaces the current risk factor found on page 16 of our prospectus dated September 21, 2009.
Our distributions to our shareholders have been sourced from operating cash flow and offering proceeds, and in the future we may fund distributions from offering proceeds or indebtedness, which (to the extent it occurs) will decrease our distributions in the future.
Since we completed our minimum offering in May 2008 the Company has made monthly distributions to shareholders. We plan to continue to make such regular distributions. As a result, we have had, and early in our operations are more likely to have, a return of capital as a part of distributions to shareholders. This is because as proceeds are raised in the offering, it is not always possible immediately to invest them in real estate properties that generate our desired return on investment. There may be a "lag" or delay between the raising of offering proceeds and their investment in real estate properties. Persons who acquire Units relatively early in our offering, as compared with later investors, may receive a greater return of offering proceeds as part of the earlier distributions. In fiscal years 2009 and 2008, over half of our distributions to shareholders represented a return of capital. If investors receive different amounts of returns of offering proceeds as distributions based upon when they acquire Units, the investors will experience different rates of return on their invested capital and some investors may have less net cash per Unit invested after distributions than other investors. Further, offering proceeds that are returned to investors as part of distributions to them will not be available for investments in properties. The payment of distributions from sources other than operating cash flow will decrease the cash available to invest in properties and will reduce the amount of distributions we may make in the future. See "Plan of Distribution."
(Remainder of Page Intentionally Left Blank)
S-5
Recent Purchases
On April 30, 2010, through one of our indirect wholly-owned subsidiaries, we closed on the purchase of four hotels located in Anchorage, Alaska, Boise, Idaho, Rogers, Arkansas and St. Louis, Missouri. The aggregate gross purchase price for these hotels, which contain a total of 607 guest rooms, was $91,270,000.
Further information about our recently purchased hotels is provided in other sections below.
Source of Funds and Related Party Payments
Our recent purchases, which resulted in our ownership of four additional hotels, were funded by the proceeds from our ongoing offering of Units.
We have entered into a property acquisition and disposition agreement with Apple Suites Realty Group, Inc. to acquire and dispose of our real estate assets. A fee of 2% of the gross purchase price or gross sale price in addition to certain reimbursable expenses will be payable for these services. This entity is owned by Glade M. Knight, who is our Chairman and Chief Executive Officer. We used our offering proceeds to pay $1,825,400 to Apple Suites Realty Group, Inc., representing 2% of the gross purchase price for our recent purchases on April 30, 2010.
Source of Funds and Related Party Payments
David Lerner Associates, Inc., Apple Suites Realty Group, Inc. and Apple Nine Advisors, Inc. earned the compensation and expense reimbursements shown below in connection with their services from inception through the period ending March 31, 2010 relating to our offering phase, acquisition phase and operations phase.
David Lerner Associates, Inc. is not related to Apple Suites Realty Group, Inc. or Apple Nine Advisors, Inc. Apple Suites Realty Group, Inc. and Apple Nine Advisors, Inc. are owned by Glade M. Knight, our Chairman and Chief Executive Officer.
As described on page 41 of our prospectus under the heading "Compensation" and as shown below, we pay certain fees and expenses as they are incurred, while others accrue and will be paid in future periods, subject in some cases to the achievement of performance criteria. We did not incur any amounts in connection with our disposition phase through March 31, 2010.
S-6
Cumulative through March 31, 2010
| | Incurred | Paid | Accrued | |||||||
|---|---|---|---|---|---|---|---|---|---|---|
Offering Phase | ||||||||||
Selling commissions paid to David Lerner Associates, Inc. in connection with the offering | $ | 94,701,000 | $ | 94,701,000 | $ | — | ||||
Marketing expense allowance paid to David Lerner Associates, Inc. in connection with the offering | 31,567,000 | 31,567,000 | — | |||||||
| 126,268,000 | 126,268,000 | — | ||||||||
Acquisition Phase | ||||||||||
Acquisition commission paid to Apple Suites Realty Group, Inc. | 15,321,000 | 15,321,000 | — | |||||||
Operations Phase | ||||||||||
Asset management fee paid to Apple Nine Advisors, Inc. | 1,179,000 | 1,179,000 | — | |||||||
Reimbursement of costs paid to Apple Nine Advisors, Inc. | 2,792,000 | 2,792,000 | — | |||||||
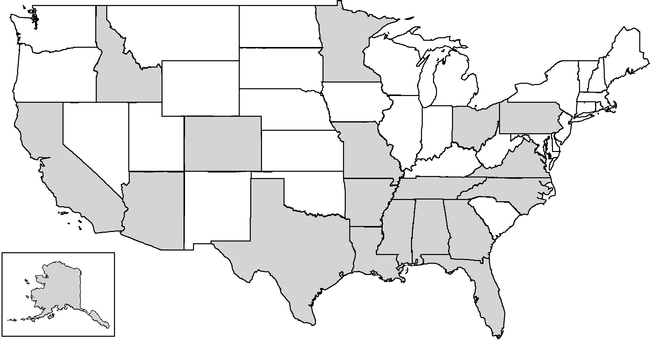
Overview of Owned Hotels
As a result of our recent purchases, we currently own 43 hotels, which are located in the states indicated in the map below:
States in which Our Hotels are Located
S-7
ACQUISITIONS AND RELATED MATTERS
Each of our recently purchased hotels has been leased to one of our indirect wholly-owned subsidiaries, as the lessee, under a separate hotel lease agreement. For simplicity, the applicable lessee will be referred to below as the "lessee."
Each hotel is managed under a separate management agreement between the applicable lessee and the manager. For simplicity, the applicable manager will be referred to below as the "manager."
The hotel lease agreements and the management agreements are among the contracts described in another section below. The table below specifies the franchise, hotel owner, lessee and manager for our recently purchased hotels:
Hotel Location | Franchise(a) | Hotel Owner/Lessor | Lessee | Manager | |||||
|---|---|---|---|---|---|---|---|---|---|
1. Anchorage, Alaska | Embassy Suites | Apple Nine Hospitality Ownership, Inc. | Apple Nine Hospitality Management, Inc. | Stonebridge Realty Advisors, Inc.(b) | |||||
2. Boise, Idaho | Hampton Inn & Suites | Apple Nine Hospitality Ownership, Inc. | Apple Nine Hospitality Management, Inc. | Raymond Management Company, Inc.(b) | |||||
3. Rogers, Arkansas | Homewood Suites | Apple Nine Hospitality Ownership, Inc. | Apple Nine Hospitality Management, Inc. | Raymond Management Company, Inc.(b) | |||||
4. St. Louis, Missouri | Hampton Inn & Suites | Apple Nine Missouri, LLC | Apple Nine Hospitality Management, Inc. | Raymond Management Company, Inc.(b) |
Notes for Table:
- (a)
- All brand and trade names, logos or trademarks contained, or referred to, in this prospectus supplement are the properties of their respective owners. These references shall not in any way be construed as participation by, or endorsement of, our offering by any of our franchisors or managers.
- (b)
- The hotel specified was purchased from an affiliate of the indicated manager.
We have no material relationship or affiliation with the sellers or managers, except for the relationship resulting from our purchases, our management agreements for the hotels we own and any related documents.
S-8
SUMMARY OF CONTRACTS FOR OUR
RECENTLY PURCHASED PROPERTIES
Hotel Lease Agreements
Each of our recently purchased hotels is covered by a separate hotel lease agreement between the owner (one of our indirect wholly-owned subsidiaries) and the applicable lessee (another one of our indirect wholly-owned subsidiaries, as specified in the previous section). Each lease provides for an initial term of 10 years. The applicable lessee has the option to extend its lease term for two additional five-year periods, provided it is not in default at the end of the prior term or at the time the option is exercised.
Each lease provides for annual base rent and percentage rent. The annual base rent is payable in advance in equal monthly installments and will be adjusted each year in proportion to the Consumer Price Index (based on the U.S. City Average). Shown below is the annual base rent and the lease commencement date for our recently purchased hotels:
Hotel Location | Franchise | Annual Base Rent | Date of Lease Commencement | ||||
|---|---|---|---|---|---|---|---|
1. Anchorage, Alaska | Embassy Suites | $ | 3,065,571 | April 30, 2010 | |||
2. Boise, Idaho | Hampton Inn & Suites | 1,769,990 | April 30, 2010 | ||||
3. Rogers, Arkansas | Homewood Suites | 722,695 | April 30, 2010 | ||||
4. St. Louis, Missouri | Hampton Inn & Suites | 1,309,803 | April 30, 2010 | ||||
The annual percentage rent depends on a formula that compares fixed "suite revenue breakpoints" with a portion of "suite revenue," which is equal to gross revenue from guest rentals less sales and room taxes and credit card fees. The suite revenue breakpoints will be adjusted each year in proportion to the Consumer Price Index (based on the U.S. City Average). Specifically, the annual percentage rent is equal to the sum of (a) 17% of all suite revenue for the year, up to the applicable suite revenue breakpoint; plus (b) 55% of the suite revenue for the year in excess of the applicable suite revenue breakpoint, as reduced by base rent paid for the year.
Management Agreements
Each of our hotels is being managed by the manager under a separate management agreement between the manager and the applicable lessee (which is one of our indirect wholly-owned subsidiaries, as specified in the previous section). The manager is responsible for managing and supervising the daily operations of the hotel and for collecting revenues for the benefit of the applicable lessee. The fees and other terms of these agreements are the result of commercial negotiations between otherwise unrelated parties. We believe that such fees and terms are appropriate for the hotels and the markets in which they operate.
Franchise Agreements
The recently purchased hotels are franchised by Hilton Worldwide or one of its affiliates, and there is a franchise license agreement between the lessee and Hilton Worldwide or an affiliate. The franchise license agreement provides for the payment of royalty fees and program fees to the franchisor. A percentage of gross room revenues is used to determine these payments. Apple Nine Hospitality, Inc. or another one of our subsidiaries has guaranteed the payment and performance of the lessee under the franchise license agreement.
The fees and other terms of these agreements are the result of commercial negotiations between otherwise unrelated parties, and we believe that such fees and terms are appropriate for the hotels and the markets in which they operate. These agreements may be terminated for various reasons, including failure by the applicable lessee to operate in accordance with the standards, procedures and requirements established by the franchisor.
S-9
FINANCIAL AND OPERATING INFORMATION
FOR OUR RECENTLY PURCHASED PROPERTIES
Our hotels offer guest rooms and suites, together with related amenities, that are consistent with their operations. The hotels are located in developed or developing areas and in competitive markets. We believe the hotels are well-positioned to compete in their markets based on location, amenities, rate structure and franchise affiliation. In the opinion of management, each hotel is adequately covered by insurance. The following tables present further information about our hotels:
Hotel Location | Franchise | Number of Rooms/ Suites | Gross Purchase Price | Average Daily Rate (Price) per Room/ Suite(a) | Federal Income Tax Basis for Depreciable Real Property Component of Hotel(b) | Purchase Date | ||||||||||
|---|---|---|---|---|---|---|---|---|---|---|---|---|---|---|---|---|
1. Anchorage, Alaska | Embassy Suites | 169 | $ | 42,000,000 | $ | 174-299 | $ | 39,040,017 | April 30, 2010 | |||||||
2. Boise, Idaho | Hampton Inn & Suites | 186 | 22,370,000 | 119-179 | 21,034,240 | April 30, 2010 | ||||||||||
3. Rogers, Arkansas | Homewood Suites | 126 | 10,900,000 | 109-139 | 9,514,300 | April 30, 2010 | ||||||||||
4. St. Louis, Missouri | Hampton Inn & Suites | 126 | 16,000,000 | 139-149 | 15,240,730 | April 30, 2010 | ||||||||||
| Total | 607 | $ | 91,270,000 | |||||||||||||
Notes for Table 1:
- (a)
- The amounts shown are subject to change, and exclude discounts that may be offered to corporate, frequent and other select customers.
- (b)
- The depreciable life is 39 years (or less, as may be permitted by federal tax laws) using the straight-line method. The modified accelerated cost recovery system will be used for the hotel's personal property component.
Table 2. Operating Information(a)
| | | Avg. Daily Occupancy Rates (%) | ||||||||||||||||
|---|---|---|---|---|---|---|---|---|---|---|---|---|---|---|---|---|---|---|
| PART A | Franchise | 2005 | 2006 | 2007 | 2008 | 2009 | ||||||||||||
Hotel Location | ||||||||||||||||||
1. Anchorage, Alaska | Embassy Suites | — | — | — | 69 | % | 72 | % | ||||||||||
2. Boise, Idaho | Hampton Inn & Suites | — | — | 64 | % | 71 | % | 73 | % | |||||||||
3. Rogers, Arkansas | Homewood Suites | — | 15 | % | 51 | % | 64 | % | 58 | % | ||||||||
4. St. Louis, Missouri | Hampton Inn & Suites | — | 72 | % | 76 | % | 74 | % | 75 | % | ||||||||
| | | Revenue per Available Room/Suite ($) | ||||||||||||||||
|---|---|---|---|---|---|---|---|---|---|---|---|---|---|---|---|---|---|---|
| PART B | Franchise | 2005 | 2006 | 2007 | 2008 | 2009 | ||||||||||||
Hotel Location | ||||||||||||||||||
1. Anchorage, Alaska | Embassy Suites | — | — | — | $ | 122 | $ | 111 | ||||||||||
2. Boise, Idaho | Hampton Inn & Suites | — | — | $ | 65 | $ | 76 | $ | 72 | |||||||||
3. Rogers, Arkansas | Homewood Suites | — | $ | 17 | $ | 59 | $ | 58 | $ | 53 | ||||||||
4. St. Louis, Missouri | Hampton Inn & Suites | — | $ | 76 | $ | 90 | $ | 86 | $ | 79 | ||||||||
Note for Table 2
- (a)
- Operating data is presented for the last five years (or since the beginning of hotel operations). Hotels with no data for a period were under construction and not open at that time. The first year of data for a hotel reflects results only for the period of time open and may not be a reflection of results once established in its market. See Table 1. General Information above for the date the hotel was acquired.
S-10
Table 3. Tax and Related Information
Hotel Location | Franchise | Tax Year(a) | Real Property Tax Rate(b) | Real Property Tax | ||||||
|---|---|---|---|---|---|---|---|---|---|---|
1. Anchorage, Alaska | Embassy Suites | 2009 | 1.3% | $ | 328,298 | |||||
2. Boise, Idaho | Hampton Inn & Suites | 2009 | 1.5% | 167,968 | ||||||
3. Rogers, Arkansas | Homewood Suites | 2009 | 5.3% | 88,545 | ||||||
4. St. Louis, Missouri | Hampton Inn & Suites | 2009 | 8.3% | 245,869 | ||||||
Notes for Table 3:
- (a)
- Represents a calendar year.
- (b)
- Property tax rate is an aggregate figure for county, city and other local taxing authorities (to the extent applicable).
(Remainder of Page Intentionally Left Blank)
S-11
(in thousands except per share and statistical data) | Three Months Ended March 31, 2010 | Year Ended December 31, 2009 | Year Ended December 31, 2008 | For the period November 9, 2007 (initial capitalization) through December 31, 2007 | ||||||||||||
|---|---|---|---|---|---|---|---|---|---|---|---|---|---|---|---|---|
Revenues: | ||||||||||||||||
Room revenue | $ | 24,093 | $ | 76,163 | $ | 9,501 | $ | — | ||||||||
Other revenue | 2,383 | 9,043 | 2,023 | — | ||||||||||||
Total hotel revenue | 26,476 | 85,206 | 11,524 | — | ||||||||||||
Rental revenue | 5,297 | 15,961 | — | — | ||||||||||||
Total revenue | 31,773 | 101,167 | 11,524 | — | ||||||||||||
Expenses: | ||||||||||||||||
Hotel operating expenses | 16,619 | 52,297 | 7,422 | — | ||||||||||||
Taxes, insurance and other | 2,130 | 6,032 | 731 | — | ||||||||||||
General and administrative | 1,310 | 4,079 | 1,288 | 15 | ||||||||||||
Acquisition related costs | 2,151 | 4,951 | — | — | ||||||||||||
Depreciation | 5,698 | 15,936 | 2,277 | — | ||||||||||||
Interest (income) expense, net | 84 | 1,018 | (2,346 | ) | 2 | |||||||||||
Total expenses | 27,992 | 84,313 | 9,372 | 17 | ||||||||||||
Net income (loss) | $ | 3,781 | $ | 16,854 | $ | 2,152 | $ | (17 | ) | |||||||
Per Share: | ||||||||||||||||
Net income (loss) per common share | $ | 0.04 | $ | 0.26 | $ | 0.14 | $ | (1,684.60 | ) | |||||||
Distributions declared and paid per common share | $ | 0.22 | $ | 0.88 | $ | 0.51 | $ | — | ||||||||
Weighted-average common shares outstanding—basic and diluted | 104,768 | 66,041 | 15,852 | — | ||||||||||||
Balance Sheet Data (at end of period): | ||||||||||||||||
Cash and cash equivalents | $ | 319,827 | $ | 272,913 | $ | 75,193 | $ | 20 | ||||||||
Investment in real estate, net | $ | 774,470 | $ | 687,509 | $ | 346,423 | $ | — | ||||||||
Total assets | $ | 1,121,628 | $ | 982,513 | $ | 431,619 | $ | 337 | ||||||||
Notes payable | $ | 58,367 | $ | 58,688 | $ | 38,647 | $ | 151 | ||||||||
Shareholders' equity | $ | 1,060,029 | $ | 917,405 | $ | 389,740 | $ | 31 | ||||||||
Net book value per share | $ | 9.23 | $ | 9.31 | $ | 9.50 | $ | — | ||||||||
Other Data: | ||||||||||||||||
Cash Flow From (Used In): | ||||||||||||||||
Operating activities | $ | 3,963 | $ | 29,137 | $ | 3,317 | $ | (2 | ) | |||||||
Investing activities | $ | (95,586 | ) | $ | (341,131 | ) | $ | (315,322 | ) | $ | — | |||||
Financing activities | $ | 138,537 | $ | 509,714 | $ | 387,178 | $ | (26 | ) | |||||||
Number of hotels owned at end of period | 38 | 33 | 21 | — | ||||||||||||
Average Daily Rate (ADR)(a) | $ | 102 | $ | 104 | $ | 110 | $ | — | ||||||||
Occupancy | 61 | % | 62 | % | 59 | % | — | |||||||||
Revenue Per Available Room (RevPAR)(b) | $ | 61 | $ | 64 | $ | 65 | $ | — | ||||||||
S-12
(in thousands except per share and statistical data) | Three Months Ended March 31, 2010 | Year Ended December 31, 2009 | Year Ended December 31, 2008 | For the period November 9, 2007 (initial capitalization) through December 31, 2007 | ||||||||||||
|---|---|---|---|---|---|---|---|---|---|---|---|---|---|---|---|---|
Funds From Operations Calculation(c): | ||||||||||||||||
Net income (loss) | $ | 3,781 | $ | 16,854 | $ | 2,152 | $ | (17 | ) | |||||||
Depreciation of real estate owned | 5,698 | 15,936 | 2,277 | — | ||||||||||||
Acquisition related costs | 2,151 | 4,951 | — | — | ||||||||||||
Funds from operations | 11,630 | 37,741 | 4,429 | (17 | ) | |||||||||||
Straight-line rental income | 1,465 | 4,618 | — | — | ||||||||||||
Modified funds from operations | $ | 10,165 | $ | 33,123 | $ | 4,429 | $ | (17 | ) | |||||||
- (a)
- Total room revenue divided by number of rooms sold.
- (b)
- ADR multiplied by occupancy percentage.
- (c)
- Funds from operations (FFO) is defined as net income (loss) (computed in accordance with generally accepted accounting principals—GAAP) excluding gains and losses from sales of depreciable property, plus depreciation and amortization, plus costs associated with the acquisition of real estate. Modified FFO (MFFO) excludes rental revenue earned, but not received during the period or straight-line rental income. The Company considers FFO and MFFO in evaluating property acquisitions and its operating performance and believes that FFO and MFFO should be considered along with, but not as an alternative to, net income and cash flows as a measure of the Company's activities in accordance with GAAP. FFO and MFFO are not necessarily indicative of cash available to fund cash needs.
S-13
MANAGEMENT'S DISCUSSION AND ANALYSIS
OF FINANCIAL CONDITION AND RESULTS OF OPERATIONS
(for the three months ended March 31, 2010)
General
The Company is a Virginia corporation that has elected to be treated as a real estate investment trust ("REIT") for federal income tax purposes. The Company, which has limited operating history, was formed to invest in hotels, residential apartment communities and other income-producing real estate in selected metropolitan areas in the United States. The Company was initially capitalized November 9, 2007, with its first investor closing on May 14, 2008. Prior to the Company's first hotel acquisition on July 31, 2008, the Company had no revenue, exclusive of interest income. As of March 31, 2010, the Company owned 38 hotels (five purchased during the first quarter of 2010, 12 acquired in 2009 and 21 acquired during 2008). The Company's real estate portfolio also includes approximately 410 acres of land and improvements located on 111 sites in the Ft. Worth, Texas area (acquired in April 2009) that are being leased to a subsidiary of Chesapeake Energy Corporation ("Chesapeake") for the production of natural gas. Accordingly, the results of operations include only results from the date of ownership of the properties.
Hotel Operations
Although hotel performance can be influenced by many factors including local competition, local and general economic conditions in the United States and the performance of individual managers assigned to each hotel, performance of the hotels within their respective local markets, in general, has met the Company's expectations for the period owned. With the significant decline in economic conditions throughout the United States, overall performance of the Company's hotels have not met expectations. Although there is no way to predict general economic conditions, many industry analysts believe that the hotel industry revenues are stabilizing and will be flat in 2010 as compared to 2009. In evaluating financial condition and operating performance, the most important matters on which the Company focuses are revenue measurements, such as average occupancy, average daily rate ("ADR") and revenue per available room ("RevPAR"), and expenses, such as hotel operating expenses, general and administrative and property taxes and insurance.
Hotels Owned
As noted above, the Company commenced operations in July 2008 upon the purchase of its first hotel property. The following table summarizes the location, brand, manager, gross purchase price,
S-14
number of hotel rooms and date of purchase for each of the 38 hotels the Company owned as of March 31, 2010. All dollar amounts are in thousands.
Location | Brand | Manager | Gross Purchase Price | Rooms | Date of Purchase | ||||||||||
|---|---|---|---|---|---|---|---|---|---|---|---|---|---|---|---|
Tucson, AZ | Hilton Garden Inn | Western | $ | 18,375 | 125 | 7/31/2008 | |||||||||
Santa Clarita, CA | Courtyard | Dimension | 22,700 | 140 | 9/24/2008 | ||||||||||
Charlotte, NC | Homewood Suites | McKibbon | 5,750 | 112 | 9/24/2008 | ||||||||||
Allen, TX | Hampton Inn & Suites | Gateway | 12,500 | 103 | 9/26/2008 | ||||||||||
Twinsburg, OH | Hilton Garden Inn | Gateway | 17,792 | 142 | 10/7/2008 | ||||||||||
Lewisville, TX | Hilton Garden Inn | Gateway | 28,000 | 165 | 10/16/2008 | ||||||||||
Duncanville, TX | Hilton Garden Inn | Gateway | 19,500 | 142 | 10/21/2008 | ||||||||||
Santa Clarita, CA | Hampton Inn | Dimension | 17,129 | 128 | 10/29/2008 | ||||||||||
Santa Clarita, CA | Residence Inn | Dimension | 16,600 | 90 | 10/29/2008 | ||||||||||
Santa Clarita, CA | Fairfield Inn | Dimension | 9,337 | 66 | 10/29/2008 | ||||||||||
Beaumont, TX | Residence Inn | Western | 16,900 | 133 | 10/29/2008 | ||||||||||
Pueblo, CO | Hampton Inn & Suites | Dimension | 8,025 | 81 | 10/31/2008 | ||||||||||
Allen, TX | Hilton Garden Inn | Gateway | 18,500 | 150 | 10/31/2008 | ||||||||||
Bristol, VA | Courtyard | LBA | 18,650 | 175 | 11/7/2008 | ||||||||||
Durham, NC | Homewood Suites | McKibbon | 19,050 | 122 | 12/4/2008 | ||||||||||
Hattiesburg, MS | Residence Inn | LBA | 9,793 | 84 | 12/11/2008 | ||||||||||
Jackson, TN | Courtyard | Vista | 15,200 | 94 | 12/16/2008 | ||||||||||
Jackson, TN | Hampton Inn & Suites | Vista | 12,600 | 83 | 12/30/2008 | ||||||||||
Pittsburgh, PA | Hampton Inn | Vista | 20,458 | 132 | 12/31/2008 | ||||||||||
Fort Lauderdale, FL | Hampton Inn | Vista | 19,290 | 109 | 12/31/2008 | ||||||||||
Frisco, TX | Hilton Garden Inn | Western | 15,050 | 102 | 12/31/2008 | ||||||||||
Round Rock, TX | Hampton Inn | Vista | 11,500 | 93 | 3/6/2009 | ||||||||||
Panama City, FL | Hampton Inn & Suites | LBA | 11,600 | 95 | 3/12/2009 | ||||||||||
Austin, TX | Homewood Suites | Vista | 17,700 | 97 | 4/14/2009 | ||||||||||
Austin, TX | Hampton Inn | Vista | 18,000 | 124 | 4/14/2009 | ||||||||||
Dothan, AL | Hilton Garden Inn | LBA | 11,601 | 104 | 6/1/2009 | ||||||||||
Troy, AL | Courtyard | LBA | 8,696 | 90 | 6/18/2009 | ||||||||||
Orlando, FL | Fairfield Inn & Suites | Marriott | 25,800 | 200 | 7/1/2009 | ||||||||||
Orlando, FL | SpringHill Suites | Marriott | 29,000 | 200 | 7/1/2009 | ||||||||||
Clovis, CA | Hampton Inn & Suites | Dimension | 11,150 | 86 | 7/31/2009 | ||||||||||
Rochester, MN | Hampton Inn & Suites | White | 14,136 | 124 | 8/3/2009 | ||||||||||
Johnson City, TN | Courtyard | LBA | 9,880 | 90 | 9/25/2009 | ||||||||||
Baton Rouge, LA | SpringHill Suites | Dimension | 15,100 | 119 | 9/25/2009 | ||||||||||
Houston, TX | Marriott | Western | 50,750 | 206 | 1/8/2010 | ||||||||||
Albany, GA | Fairfield Inn & Suites | LBA | 7,920 | 87 | 1/14/2010 | ||||||||||
Panama City, FL | TownePlace Suites | LBA | 10,640 | 103 | 1/19/2010 | ||||||||||
Clovis, CA | Homewood Suites | Dimension | 12,435 | 83 | 2/2/2010 | ||||||||||
Jacksonville, NC | TownePlace Suites | LBA | 9,200 | 86 | 2/16/2010 | ||||||||||
Total | $ | 616,307 | 4,465 | ||||||||||||
Of the Company's 38 hotels owned at March 31, 2010, five were purchased during the first three months of 2010. The total gross purchase price for these five hotels, with a total of 565 rooms, was $90.9 million.
During 2009, the Company acquired land in Alexandria, Virginia totaling $5.1 million, for the planned construction of a SpringHill Suites hotel to be completed over the next 12 months. Upon
S-15
completion, it is expected that the hotel will contain approximately 152 guest rooms and will be managed by Marriott. To date the Company has incurred $2.5 million in construction costs and anticipates the total construction costs to be approximately $20-$25 million.
The purchase price for these properties, net of debt assumed, was funded primarily by the Company's on-going best-efforts offering of Units. The Company assumed approximately $53.8 million of debt secured by six of its hotel properties and $3.8 million of unsecured debt in connection with one of its hotel properties. The following table summarizes the hotel location, interest rate, maturity date and the principal amount assumed associated with each note payable outstanding as of March 31, 2010. All dollar amounts are in thousands.
Location | Brand | Interest Rate(1) | Maturity Date | Principal Assumed | Outstanding balance as of March 31, 2010 | ||||||||||
|---|---|---|---|---|---|---|---|---|---|---|---|---|---|---|---|
Lewisville, TX | Hilton Garden Inn | 0.00 | % | 12/31/2016 | $ | 3,750 | $ | 3,750 | |||||||
Duncanville, TX | Hilton Garden Inn | 5.88 | % | 5/11/2017 | 13,966 | 13,704 | |||||||||
Allen, TX | Hilton Garden Inn | 5.37 | % | 10/11/2015 | 10,787 | 10,538 | |||||||||
Bristol, VA | Courtyard | 6.59 | % | 8/1/2016 | 9,767 | 9,607 | |||||||||
Round Rock, TX | Hampton Inn | 5.95 | % | 5/1/2016 | 4,175 | 4,085 | |||||||||
Austin, TX | Homewood Suites | 5.99 | % | 3/1/2016 | 7,556 | 7,406 | |||||||||
Austin, TX | Hampton Inn | 5.95 | % | 3/1/2016 | 7,553 | 7,402 | |||||||||
| $ | 57,554 | $ | 56,492 | ||||||||||||
- (1)
- At acquisition, the Company adjusted the interest rates on these loans to market rates and is amortizing the adjustments to interest expense over the life of the loan.
Land and Improvements and Lease
In April 2009, the Company acquired approximately 417 acres of land on 113 sites in the Ft. Worth, Texas area for approximately $147 million from Chesapeake. Simultaneous to the closing, the Company entered into a ground lease with Chesapeake for the 113 sites. Chesapeake is using the land for natural gas production. In February 2010, the Company agreed to sell back to Chesapeake two of the 113 sites originally purchased from Chesapeake in April 2009 and release Chesapeake from their associated lease obligation. The sales price for the two sites was equal to the Company's original purchase price, approximately $2.6 million. The Company earned and received rental income for the period held totaling approximately $240,000. The lease has an initial term of 40 years and annual rent ranging from $15.2 million to $26.9 million with the average annual rent being $21.4 million. Under the lease, Chesapeake is responsible for all operating costs of the real estate.
Chesapeake is a publicly held company that is traded on the New York Stock Exchange. Chesapeake is the second-largest independent producer of natural gas in the United States with interests in approximately 38,000 net drill sites.
S-16
Results of Operations
The following is a summary of the Company's consolidated financial results for the three months ended March 31, 2010 and 2009:
| | Three Months Ended | |||||||
|---|---|---|---|---|---|---|---|---|
(in thousands) | March 31, 2010 | March 31, 2009 | ||||||
Revenues: | ||||||||
Hotel revenue | $ | 26,476 | $ | 18,683 | ||||
Rental revenue | 5,297 | — | ||||||
Expenses: | ||||||||
Hotel direct expenses | 16,619 | 11,186 | ||||||
Taxes, insurance and other expense | 2,130 | 1,345 | ||||||
General and administrative expenses | 1,310 | 839 | ||||||
Acquisition related costs | 2,151 | 1,028 | ||||||
Depreciation | 5,698 | 2,652 | ||||||
Interest expense, net | (84 | ) | (83 | ) | ||||
During the period from the Company's initial capitalization on November 9, 2007 to July 30, 2008, the Company owned no properties, had no revenue, exclusive of interest income and was primarily engaged in capital formation activities. The Company began operations on July 31, 2008 when it purchased its first hotel. As of March 31, 2010, the Company owned 38 hotels (of which five were acquired during 2010) with 4,465 rooms as compared to 23 hotels, with a total of 2,666 rooms as of March 31, 2009. The Company's real estate portfolio also includes approximately 410 acres of land and improvements located on 111 sites in the Ft. Worth, Texas area (acquired in April 2009) that are being leased to Chesapeake for the production of natural gas. As a result of the acquisition activity during 2009 and 2010, a comparison of operations for 2010 to prior periods is not representative of the results that would have occurred if all properties had been owned for the entire periods presented.
Hotel Performance
The following is summary of the operating results of the 38 hotels acquired through March 31, 2010 for their respective periods of ownership by the Company:
(in thousands) | Three Months Ended March 31, 2010 | % of Hotel Revenue | Three Months Ended March 31, 2009 | % of Hotel Revenue | ||||||||||
|---|---|---|---|---|---|---|---|---|---|---|---|---|---|---|
Hotel Revenue: | ||||||||||||||
Room revenue | $ | 24,093 | $ | 16,637 | ||||||||||
Other revenue | 2,383 | 2,046 | ||||||||||||
| 26,476 | 18,683 | |||||||||||||
Hotel Operating Expenses: | ||||||||||||||
Hotel direct expenses | 16,619 | 63 | % | 11,186 | 60 | % | ||||||||
Taxes, insurance and other expense | 2,103 | 8 | % | 1,345 | 7 | % | ||||||||
Hotel Operating Statistics: | ||||||||||||||
Number of hotels | 38 | 23 | ||||||||||||
ADR | $ | 102 | $ | 114 | ||||||||||
Occupancy | 61 | % | 64 | % | ||||||||||
RevPAR | $ | 61 | $ | 73 | ||||||||||
S-17
Hotel performance is impacted by many factors including the economic conditions in the United States as well as each locality. During the past two years, the overall weakness in the U.S. economy has had a considerable negative impact on both consumer and business travel. As a result, lodging demand in most markets in the United States has declined. Although economic conditions appear to be stabilizing, the Company expects demand for the industry to continue to be below pre-recession levels until general economic conditions improve. The Company's hotels have shown results consistent with industry and brand averages for the period of ownership.
Hotel Revenues
The Company's principal source of revenue is hotel revenue consisting of room and other related revenue. For the three months ended March 31, 2010 and 2009, the Company had hotel revenue of $26.5 million and $18.7 million, respectively. This revenue reflects hotel operations for the 38 hotels acquired through March 31, 2010 for their respective periods of ownership by the Company. For the three months ended March 31, 2010, the hotels achieved combined average occupancy of approximately 61%, ADR of $102 and RevPAR of $61. For the three months ended March 31, 2009, the hotels achieved combined average occupancy of approximately 64%, ADR of $114 and RevPAR of $73. ADR is calculated as room revenue divided by the number of rooms sold, and RevPAR is calculated as occupancy multiplied by ADR.
The overall decline in occupancy, ADR and RevPAR is due to several factors. General economic conditions in the United States have caused industry declines. In addition, of the 15 hotels acquired by the Company since March 31, 2009, 12 were newly constructed. Generally, newly constructed hotels require 12-24 months to establish themselves in their respective markets. Therefore, revenue is below anticipated or market levels for this period of time. Lastly, many of the 15 hotels acquired by the Company since March 31, 2009 have been in markets with ADR below the average of the markets of the first 23 hotels acquired by the Company, thus reducing the overall average.
Due to industry-wide hotel demand declines from a general weakening economy, the Company's hotel revenue has been lower than anticipated. While reflecting the impact of declining economic activity, the Company's hotels continue to lead their respective markets. The Company's average RevPAR index was 134 for the first quarter of 2010 (the index excludes hotels under renovation or open less than two years). The RevPAR index is a measure of each hotel's RevPAR compared to the average in the market, with 100 being the average, and is provided by Smith Travel Research, Inc.®, an independent company that tracks historical hotel performance in most markets throughout the world. Although it is not possible to predict when economic conditions will improve or their impact on the hotel industry, many industry analysts are forecasting RevPAR for 2010 to be flat as compared to 2009. The Company will continue to pursue market opportunities to improve revenue.
Hotel Operating Expenses
Hotel operating expenses relate to the 38 hotels acquired through March 31, 2010 for their respective periods owned and consist of direct room expenses, hotel administrative expense, sales and marketing expense, utilities expense, repair and maintenance expense, franchise fees and management fees. For the three months ended March 31, 2010, hotel operating expenses totaled $16.6 million or 63% of hotel revenue. For the three months ended March 31, 2009, hotel operating expenses totaled $11.2 million or 60% of hotel revenue. Nine of the 12 hotels acquired in 2009 and four of the five hotels acquired in 2010 are new hotels and as a result, hotel operating expenses as a percentage of hotel revenue for these hotels are higher than is expected once the properties have established themselves within their markets. In addition, operating expenses were impacted by several hotel renovations, with approximately 9,200 room nights out of service during the first quarter of 2010 due to such renovations. While weakened economic conditions persist, the Company will continue to work
S-18
with its management companies to reduce costs as aggressively as possible, however it is not anticipated that these reductions will offset any future revenue declines.
Taxes, insurance, and other expense for the three months ended March 31, 2010 and 2009 totaled $2.1 million or 8% of hotel revenue and $1.3 million or 7% of hotel revenue.
Rental Revenue
The Company generates rental revenue from its purchase and leaseback transaction completed during the second quarter of 2009. In April 2009, the Company purchased 417 acres of land located on 113 sites in the Ft. Worth, Texas area and simultaneously entered into a long-term, triple net lease with Chesapeake, one of the nation's largest producers of natural gas. In February 2010, the Company agreed to sell back to Chesapeake two of the 113 sites originally purchased and release Chesapeake from their associated lease obligations. Rental payments are fixed and have determinable rent increases during the initial lease term. The lease is classified as an operating lease and rental income is recognized on a straight line basis over the initial term of the lease. Rental income for the three months ended March 31, 2010 and 2009 was $5.3 million and $—, respectively and includes $1.5 million and $— of adjustments to record rent on the straight line basis.
Other Expenses
General and administrative expense for the three months ended March 31, 2010 and 2009 was $1.3 million and $839,000, respectively. The principal components of general and administrative expense are advisory fees, legal fees, accounting fees, the Company's share of the loss in its investment in Apple Air Holding, LLC, and reporting expenses.
Acquisition related costs for the three months ended March 31, 2010 and 2009 were $2.2 million and $1.0 million, respectively. In accordance with the Accounting Standards Codification on business combinations, the Company has expensed as incurred all transaction costs associated with the acquisitions of existing businesses that occurred on or after January 1, 2009, including title, legal, accounting and other related costs, as well as the brokerage commission paid to Apple Suites Realty Group, Inc. ("ASRG"), owned 100% by Glade M. Knight, Chairman and Chief Executive Officer of the Company. For acquisitions that occurred prior to January 1, 2009, these costs were capitalized as part of the cost of the acquisition.
Depreciation expense for the three months ended March 31, 2010 and 2009 was $5.7 million and $2.7 million, respectively. Depreciation expense primarily represents expense of the Company's 38 hotel buildings and related improvements, and associated personal property (furniture, fixtures, and equipment) for their respective periods owned. Also, included in depreciation expense for the three months ended March 31, 2010 is the depreciation of the Company's land improvements (acquired in April 2009) located on 111 sites in Fort Worth, Texas which is leased to one of the nation's largest producers of natural gas.
Interest expense for the three months ended March 31, 2010 and 2009 was $520,000 and $523,000, respectively and is net of approximately $206,000 and $— of interest capitalized associated with renovation and construction projects. Interest expense primarily arose from debt assumed with the acquisition of seven of the Company's hotels (four loan assumptions during 2008 and three in 2009). During the three months ended March 31, 2010 and 2009, the Company also recognized $436,000 and $440,000 in interest income, representing interest on excess cash invested in short-term money market instruments and certificates of deposit.
S-19
Related Parties
The Company has significant transactions with related parties. These transactions cannot be construed to be at arm's length and the results of the Company's operations may be different than if conducted with non-related parties.
The Company has a contract with ASRG, to acquire and dispose of real estate assets for the Company. A fee of 2% of the gross purchase price or gross sale price in addition to certain reimbursable expenses is paid to ASRG for these services. As of March 31, 2010, payments to ASRG for services under the terms of this contract have totaled approximately $15.3 million since inception.
The Company is party to an advisory agreement with A9A to provide management services to the Company. An annual fee ranging from 0.1% to 0.25% of total equity proceeds received by the Company, in addition to certain reimbursable expenses, are payable for these services. A9A has entered into an agreement with Apple REIT Six, Inc. ("AR6") to provide certain management services to the Company. The Company will reimburse A9A for the cost of the services provided by AR6. A9A will in turn reimburse AR6. Total advisory fees and reimbursable expenses incurred by the Company under the advisory agreement are included in general and administrative expenses and totaled approximately $810,000 and $460,000 for the three months ended March 31, 2010 and 2009. Of this total expense, $287,000 and $124,000 were fees paid to A9A and $523,000 and $336,000 were expenses reimbursed by A9A to AR6 for the three months ended March 31, 2010 and 2009.
ASRG and A9A are 100% owned by Glade M. Knight, Chairman and Chief Executive Officer of the Company.
Mr. Knight is also Chairman and Chief Executive Officer of AR6, Apple REIT Seven, Inc. and Apple REIT Eight, Inc. Members of the Company's Board of Directors are also on the Board of Directors of AR6, Apple REIT Seven, Inc. and Apple REIT Eight, Inc.
Series B Convertible Preferred Stock
The Company has issued 480,000 Series B convertible preferred shares to Glade M. Knight, Chairman and Chief Executive Officer of the Company, in exchange for the payment by him of $0.10 per Series B convertible preferred share, or an aggregate of $48,000. The Series B convertible preferred shares are convertible into common shares pursuant to the formula and on the terms and conditions set forth below.
There are no dividends payable on the Series B convertible preferred shares. Holders of more than two-thirds of the Series B convertible preferred shares must approve any proposed amendment to the articles of incorporation that would adversely affect the Series B convertible preferred shares.
Upon the Company's liquidation, the holder of the Series B convertible preferred shares is entitled to a priority liquidation payment before any distribution of liquidation proceeds to the holders of the common shares. However, the priority liquidation payment of the holder of the Series B convertible preferred shares is junior to the holders of the Series A preferred shares distribution rights. The holder of a Series B convertible preferred share is entitled to a liquidation payment of $11 per number of common shares each Series B convertible preferred share would be convertible into according to the formula described below. In the event that the liquidation of the Company's assets results in proceeds that exceed the distribution rights of the Series A preferred shares and the Series B convertible preferred shares, the remaining proceeds will be distributed between the common shares and the Series B convertible preferred shares, on an as converted basis.
S-20
Each holder of outstanding Series B convertible preferred shares shall have the right to convert any of such shares into common shares of the Company upon and for 180 days following the occurrence of any of the following events:
- (1)
- substantially all of the Company's assets, stock or business is sold or transferred through exchange, merger, consolidation, lease, share exchange, sale or otherwise, other than a sale of assets in liquidation, dissolution or winding up of the Company;
- (2)
- the termination or expiration without renewal of the advisory agreement with A9A, or if the Company ceases to use ASRG to provide property acquisition and disposition services; or
- (3)
- the Company's common shares are listed on any securities exchange or quotation system or in any established market.
Upon the occurrence of any conversion event, each Series B convertible preferred share may be converted into a number of common shares based upon the gross proceeds raised through the date of conversion in the Company's $2 billion offering according to the following table:
Gross Proceeds Raised from Sales of Units through Date of Conversion | Number of Common Shares through Conversion of One Series B Convertible Preferred Share | |||
|---|---|---|---|---|
$1.2 billion | 14.52559 | |||
$1.3 billion | 15.73128 | |||
$1.4 billion | 16.93696 | |||
$1.5 billion | 18.14264 | |||
$1.6 billion | 19.34832 | |||
$1.7 billion | 20.55400 | |||
$1.8 billion | 21.75968 | |||
$1.9 billion | 22.96537 | |||
$2 billion | 24.17104 | |||
In the event that after raising gross proceeds of $2 billion, the Company raises additional gross proceeds in a subsequent public offering, each Series B convertible preferred share may be converted into an additional number of common shares based on the additional gross proceeds raised through the date of conversion in a subsequent public offering according to the following formula: (X/100 million) × 1.20568, where X is the additional gross proceeds rounded down to the nearest 100 million.
No additional consideration is due upon the conversion of the Series B convertible preferred shares. The conversion into common shares of the Series B convertible preferred shares will result in dilution of the shareholders' interests.
Expense related to the issuance of 480,000 Series B convertible preferred shares to Mr. Knight will be recognized at such time when the number of common shares to be issued for conversion of the Series B shares can be reasonably estimated and the event triggering the conversion of the Series B shares to common shares occurs. The expense will be measured as the difference between the fair value of the common stock for which the Series B shares can be converted and the amounts paid for the Series B shares. Although the fair market value cannot be determined at this time, expense if the maximum offering is achieved could range from $0 to in excess of $127 million (assumes $11 per unit fair market value). Based on equity raised through March 31, 2010, if a triggering event had occurred, expense would have ranged from $0 to $76.7 million (assumes $11 per unit fair market value) and approximately 7.0 million common shares would have been issued.
S-21
Liquidity and Capital Resources
The Company was initially capitalized on November 9, 2007, with its first investor closing on May 14, 2008. The Company's principal source of liquidity is cash on hand, the proceeds of its on-going best-efforts offering and the cash flow generated from properties the Company has or will acquire and any short term investments. In addition, the Company may borrow funds, subject to the approval of the Company's board of directors.
The Company anticipates that cash flow, and cash on hand, will be adequate to cover its operating expenses and to permit the Company to meet its anticipated liquidity requirements, including debt service, capital improvements and anticipated distributions to shareholders. The Company intends to use the proceeds from the Company's on-going best-efforts offering, and cash on hand, to purchase income producing real estate.
The Company is raising capital through a best-efforts offering of Units (each Unit consists of one common share and one Series A preferred share) by David Lerner Associates, Inc., the managing dealer, which receives selling commissions and a marketing expense allowance based on proceeds of the Units sold. The minimum offering of 9,523,810 Units at $10.50 per Unit was sold as of May 14, 2008, with proceeds net of commissions and marketing expenses totaling $90 million. Subsequent to the minimum offering and through March 31, 2010, an additional 105.7 million Units, at $11 per Unit, were sold, with the Company receiving proceeds, net of commissions, marketing expenses and other offering costs of approximately $1.0 billion. On April 25, 2010, the offering was extended for one additional year. The offering expires on April 25, 2011, provided that the offering will be terminated if all of the Units are sold before then. As of March 31, 2010, 67,029,405 Units remained unsold.
To maintain its REIT status the Company is required to distribute at least 90% of its ordinary income. Distributions during the first three months of 2010 totaled approximately $22.8 million of which approximately $14.2 million was used to purchase additional Units under the Company's best-efforts offering. Thus the net cash distributions were $8.6 million. The distributions were paid at a monthly rate of $0.073334 per common share. For the same period the Company's net cash generated from operations was approximately $4.0 million. During the initial phase of the Company's operations, the Company may, due to the inherent delay between raising capital and investing that same capital in income producing real estate, have a portion of its distributions funded from offering proceeds. The portion of the distributions funded from offering proceeds is expected to be treated as a return of capital for federal income tax purposes. In May 2008, the Company's Board of Directors established a policy for an annualized dividend rate of $0.88 per common share, payable in monthly distributions. The Company intends to continue paying dividends on a monthly basis, consistent with the annualized dividend rate established by its Board of Directors. The Company's Board of Directors, upon the recommendation of the Audit Committee, may amend or establish a new annualized dividend rate and may change the timing of when distributions are paid. The Company's objective in setting a distribution rate is to project a rate that will provide consistency over the life of the Company taking into account acquisitions and capital improvements, ramp up of new properties and varying economic cycles. To meet this objective, the Company may require the use of debt or offering proceeds in addition to cash from operations. Since a portion of distributions has to date been funded with proceeds from the offering of Units, the Company's ability to maintain its current intended rate of distribution will be based on its ability to fully invest its offering proceeds and thereby increase its cash generated from operations. As there can be no assurance of the Company's ability to acquire properties that provide income at this level, or that the properties already acquired will provide income at this level, there can be no assurance as to the classification or duration of distributions at the current rate. Proceeds of the offering which are distributed are not available for investment in properties.
The Company has a Unit Redemption Program to provide limited interim liquidity to its shareholders who have held their Units for at least one year. Shareholders may request redemption of
S-22
Units for a purchase price equal to 92% of the price paid per Unit if the Units have been owned for less than three years, or 100% of the price paid per Unit if the Units have been owned more than three years. The maximum number of Units that may be redeemed in any given year will be three percent of the weighted average number of Units outstanding during the 12-month period immediately prior to the date of redemption. The Company reserves the right to change the purchase price of redemptions, reject any request for redemption, or otherwise amend the terms of, suspend, or terminate the Unit Redemption Program. During the three months ended March 31, 2010, the Company redeemed 120,742 Units in the amount of $1.3 million under the program. There were no redemptions for the first quarter of 2009.
The Company has on-going capital commitments to fund its capital improvements. The Company is required, under all of the hotel management agreements and certain loan agreements, to make available, for the repair, replacement, refurbishing of furniture, fixtures, and equipment, a percentage of gross revenues provided that such amount may be used for the Company's capital expenditures with respect to the hotels. As of March 31, 2010, the Company held with various lenders $6.2 million in reserves for capital expenditures. As of March 31, 2010, the Company had six major renovations scheduled to be completed in 2010. Total capital expenditures on properties owned at March 31, 2010 are anticipated to be approximately $10 million for the remainder of 2010. Additionally, the Company is in the process of constructing a SpringHill Suites hotel in Alexandria, Virginia which is expected to be completed over the next 12 months. To date the Company has incurred $2.5 million in construction costs and anticipates the total construction costs to be approximately $20-$25 million.
As of March 31, 2010, the Company had outstanding contracts for the potential purchase of 14 additional hotels for a total purchase price of $254.1 million. Of these 14 hotels, four are under construction and should be completed over the next 12 months. The other 10 hotels are expected to close within the next six months. Although the Company is working towards acquiring these hotels, there are many conditions to closing that have not yet been satisfied and there can be no assurance that closings will occur under the outstanding purchase contracts. The following table summarizes the location, brand, number of rooms, refundable (if the seller does not meet its obligations under the contract) contract deposits paid, and gross purchase price for each of the contracts. All dollar amounts are in thousands.
(Remainder of Page Intentionally Left Blank)
S-23
Location | Brand | Rooms | Deposits Paid | Gross Purchase Price | ||||||||
|---|---|---|---|---|---|---|---|---|---|---|---|---|
Holly Springs, NC | Hampton Inn | 124 | $ | 100 | $ | 14,880 | (a) | |||||
Ft. Worth, TX | TownePlace Suites | 140 | 500 | 18,460 | (a)/(b) | |||||||
Jacksonville, NC | Fairfield Inn & Suites | 79 | 125 | 7,800 | ||||||||
Santa Ana, CA | Courtyard | 155 | 100 | 24,800 | (a) | |||||||
Miami, FL | Hampton Inn & Suites | 121 | 150 | 11,900 | ||||||||
Boise, ID | Hampton Inn & Suites | 186 | 125 | 22,370 | ||||||||
Rogers, AR | Hampton Inn | 122 | 125 | 9,600 | ||||||||
Rogers, AR | Homewood Suites | 126 | 125 | 10,900 | ||||||||
St. Louis, MO | Hampton Inn | 190 | 125 | 23,000 | ||||||||
St. Louis, MO | Hampton Inn & Suites | 126 | 125 | 16,000 | ||||||||
Kansas City, MO | Hampton Inn | 122 | 125 | 10,130 | ||||||||
Oklahoma City, OK | Hampton Inn & Suites | 200 | 125 | 32,000 | ||||||||
Anchorage, AK | Embassy Suites | 169 | 50 | 42,000 | ||||||||
Lafayette, LA | SpringHill Suites | 103 | 3 | 10,232 | (a)/(b) | |||||||
| 1,963 | $ | 1,903 | $ | 254,072 | ||||||||
- (a)
- The hotels are currently under construction. The table shows the expected number of rooms upon hotel completion and the expected franchise.
- (b)
- If the seller meets all of the conditions to closing, the Company is obligated to specifically perform under the contract. As the properties are under construction, at this time, the seller has not met all of the conditions to closing.
Four of the hotels under contract require the Company to assume approximately $49.5 million in mortgage debt. Each of these loans provide for monthly payments of principal and interest on an amortized basis.
As there can be no assurance that all conditions to closing will be satisfied, the Company includes deposits paid for hotels under contract in other assets, net in the Company's consolidated balance sheets, and in deposits and other disbursements for potential acquisitions in the Company's consolidated statements of cash flows. It is anticipated that the purchase price (less any debt assumed) for the outstanding contracts will be funded from the proceeds of the Company's on-going best-efforts offering of Units and cash on hand if a closing occurs.
On October 14, 2009, the Company entered into a ground lease for approximately one acre of land located in downtown Richmond, Virginia. The lease terminates on December 31, 2098, subject to the Company's right to exercise two renewal periods of ten years each. The Company intends to use the land to build two nationally recognized brand hotels. Under the terms of the lease the Company has a "Study Period" to determine the viability of the hotels. The Company can terminate the lease for any reason during the Study Period, which originally ended on April 14, 2010, and was extended for six months to October 14, 2010. After the Study Period, the lease continues to be subject to various conditions, including but not limited to obtaining various permits, licenses, zoning variances and franchise approvals. If any of these conditions are not met the Company has the right to terminate the lease at any time. Rent payments are not required until the Company decides to begin construction on the hotels. Annual rent under the lease is $300,000 with adjustments throughout the lease term based on the Consumer Price Index. As there are many conditions to beginning construction on the hotels, there are no assurances that the Company will construct the hotels or continue the lease.
S-24
Impact of Inflation
Operators of hotels, in general, possess the ability to adjust room rates daily to reflect the effects of inflation. Competitive pressures may, however, limit the operators' ability to raise room rates. Currently the Company is not experiencing any material impact from inflation.
Business Interruption
Being in the real estate industry, the Company is exposed to natural disasters on both a local and national scale. Although management believes there is adequate insurance to cover this exposure, there can be no assurance that such events will not have a material adverse effect on the Company's financial position or results of operations.
Seasonality
The hotel industry historically has been seasonal in nature. Seasonal variations in occupancy at the Company's hotels may cause quarterly fluctuations in its revenues. To the extent that cash flow from operations is insufficient during any quarter, due to temporary or seasonal fluctuations in revenue, the Company expects to utilize cash on hand to make distributions.
Recent Accounting Pronouncements
In June 2009, the Financial Accounting Standards Board ("FASB") issued a pronouncement (Accounting Standards Update No. 2009-17) which amends its guidance surrounding a company's analysis to determine whether any of its variable interests constitute controlling financial interests in a variable interest entity. This analysis identifies the primary beneficiary of a variable interest entity as the enterprise that has both of the following characteristics: (a) the power to direct the activities of a variable interest entity that most significantly impact the entity's economic performance, and (b) the obligation to absorb losses of the entity that could potentially be significant to the variable interest entity or the right to receive benefits from the entity that could potentially be significant to the variable interest entity. Additionally, an enterprise is required to assess whether it has an implicit financial responsibility to ensure that a variable interest entity operates as designed when determining whether it has the power to direct the activities of the variable interest entity that most significantly impact the entity's economic performance. The new pronouncement also requires ongoing assessments of whether an enterprise is the primary beneficiary of a variable interest entity and enhanced disclosure about an enterprise's involvement with a variable interest entity. This pronouncement was adopted by the Company in the first quarter of 2010. The adoption of this standard did not have a material impact on the Company's consolidated financial statements.
Subsequent Events
In April 2010, the Company declared and paid approximately $8.4 million in dividend distributions to its common shareholders, or $0.073334 per outstanding common share.
During April 2010, the Company closed on the issuance of 7.3 million Units through its ongoing best-efforts offering, representing gross proceeds to the Company of $80.2 million and proceeds net of selling and marketing costs of $72.2 million.
In April 2010, the Company redeemed 186,011 Units in the amount of $1.9 million under its Unit Redemption Program.
S-25
Subsequent to March 31, 2010, the Company closed on the purchase of five hotels. The following table summarizes the hotel information. All dollar amounts are in thousands.
Location | Brand | Gross Purchase Price | Rooms | Date of Purchase | ||||||||
|---|---|---|---|---|---|---|---|---|---|---|---|---|
Miami, FL | Hampton Inn & Suites | $ | 11,900 | 121 | 4/9/2010 | |||||||
Anchorage, AK | Embassy Suites | 42,000 | 169 | 4/30/2010 | ||||||||
Boise, ID | Hampton Inn & Suites | 22,370 | 186 | 4/30/2010 | ||||||||
Rogers, AR | Homewood Suites | 10,900 | 126 | 4/30/2010 | ||||||||
St. Louis, MO | Hampton Inn & Suites | 16,000 | 126 | 4/30/2010 | ||||||||
| $ | 103,170 | 728 | ||||||||||
(Remainder of Page Intentionally Left Blank)
S-26
Financial Statements of Company
Apple REIT Nine, Inc.
F-1
Apple REIT Nine, Inc.
Consolidated Balance Sheets
(in thousands, except share data)
| | March 31, 2010 | December 31, 2009 | |||||||
|---|---|---|---|---|---|---|---|---|---|
| | (unaudited) | | |||||||
Assets | |||||||||
Investment in real estate, net of accumulated depreciation of $23,911 and $18,213, respectively | $ | 774,470 | $ | 687,509 | |||||
Cash and cash equivalents | 319,827 | 272,913 | |||||||
Due from third party managers, net | 5,249 | 2,591 | |||||||
Other assets, net | 22,082 | 19,500 | |||||||
Total Assets | $ | 1,121,628 | $ | 982,513 | |||||
Liabilities | |||||||||
Notes payable | $ | 58,367 | $ | 58,688 | |||||
Accounts payable and accrued expenses | 3,232 | 6,420 | |||||||
Total Liabilities | 61,599 | 65,108 | |||||||
Shareholders' Equity | |||||||||
Preferred stock, authorized 30,000,000 shares; none issued and outstanding | — | — | |||||||
Series A preferred stock, no par value, authorized 400,000,000 shares; issued and outstanding 114,848,474 and 98,509,650 shares, respectively | — | — | |||||||
Series B convertible preferred stock, no par value, authorized 480,000 shares; issued and outstanding 480,000 shares, respectively | 48 | 48 | |||||||
Common stock, no par value, authorized 400,000,000 shares; issued and outstanding 114,848,474 and 98,509,650 shares, respectively | 1,130,369 | 968,710 | |||||||
Distributions greater than net income | (70,388 | ) | (51,353 | ) | |||||
Total Shareholders' Equity | 1,060,029 | 917,405 | |||||||
Total Liabilities and Shareholders' Equity | $ | 1,121,628 | $ | 982,513 | |||||
See accompanying notes to consolidated financial statements.
The Company was initially capitalized on November 9, 2007 and commenced operations on July 31, 2008.
F-2
Apple REIT Nine, Inc.
Consolidated Statements of Operations
(Unaudited)
(in thousands, except per share data)
| | Three Months Ended March 31, 2010 | Three Months Ended March 31, 2009 | |||||||
|---|---|---|---|---|---|---|---|---|---|
Revenues: | |||||||||
Room revenue | $ | 24,093 | $ | 16,637 | |||||
Other revenue | 2,383 | 2,046 | |||||||
Total hotel revenue | 26,476 | 18,683 | |||||||
Rental revenue | 5,297 | — | |||||||
Total revenue | 31,773 | 18,683 | |||||||
Expenses: | |||||||||
Operating expense | 7,589 | 4,854 | |||||||
Hotel administrative expense | 2,184 | 1,408 | |||||||
Sales and marketing | 2,397 | 1,685 | |||||||
Utilities | 1,395 | 868 | |||||||
Repair and maintenance | 1,232 | 912 | |||||||
Franchise fees | 1,004 | 788 | |||||||
Management fees | 818 | 671 | |||||||
Taxes, insurance and other | 2,130 | 1,345 | |||||||
General and administrative | 1,310 | 839 | |||||||
Acquisition related costs | 2,151 | 1,028 | |||||||
Depreciation expense | 5,698 | 2,652 | |||||||
Total expenses | 27,908 | 17,050 | |||||||
Operating income | 3,865 | 1,633 | |||||||
Interest expense, net | (84 | ) | (83 | ) | |||||
Net income | $ | 3,781 | $ | 1,550 | |||||
Basic and diluted net income per common share | $ | 0.04 | $ | 0.03 | |||||
Weighted average common shares outstanding—basic and diluted | 104,768 | 45,554 | |||||||
Distributions declared and paid per common share | $ | 0.22 | $ | 0.22 | |||||
See accompanying notes to consolidated financial statements.
The Company was initially capitalized on November 9, 2007 and commenced operations on July 31, 2008.
F-3
Apple REIT Nine, Inc.
Consolidated Statements of Cash Flows
(Unaudited)
(in thousands)
| | Three Months Ended March 31, 2010 | Three Months Ended March 31, 2009 | ||||||||
|---|---|---|---|---|---|---|---|---|---|---|
Cash flows from operating activities: | ||||||||||
Net income | $ | 3,781 | $ | 1,550 | ||||||
Adjustments to reconcile net income to cash provided by operating activities: | ||||||||||
Depreciation | 5,698 | 2,652 | ||||||||
Amortization of deferred financing costs, fair value adjustments and other non-cash expenses, net | 27 | 81 | ||||||||
Straight-line rental income | (1,465 | ) | — | |||||||
Changes in operating assets and liabilities: | ||||||||||
Increase in funds due from third party managers, net | (2,635 | ) | (1,503 | ) | ||||||
(Increase) decrease in other assets, net | 507 | (386 | ) | |||||||
Decrease in accounts payable and accrued expenses | (1,950 | ) | (190 | ) | ||||||
Net cash provided by operating activities | 3,963 | 2,204 | ||||||||
Cash flows used in investing activities: | ||||||||||
Cash paid for acquisitions, net | (88,409 | ) | (25,963 | ) | ||||||
Deposits and other disbursements for potential acquisitions, net | (1,918 | ) | (153 | ) | ||||||
Capital improvements | (5,391 | ) | (233 | ) | ||||||
Decrease (increase) in capital improvement reserves | 132 | (100 | ) | |||||||
Investment in other assets | — | (3,240 | ) | |||||||
Net cash used in investing activities | (95,586 | ) | (29,689 | ) | ||||||
Cash flows from financing activities: | ||||||||||
Net proceeds related to issuance of common shares | 162,845 | 118,135 | ||||||||
Redemptions of common stock | (1,252 | ) | — | |||||||
Distributions paid to common shareholders | (22,816 | ) | (9,889 | ) | ||||||
Payments of notes payable | (240 | ) | (123 | ) | ||||||
Deferred financing costs | — | (64 | ) | |||||||
Net cash provided by financing activities | 138,537 | 108,059 | ||||||||
Increase in cash and cash equivalents | 46,914 | 80,574 | ||||||||
Cash and cash equivalents, beginning of period | 272,913 | 75,193 | ||||||||
Cash and cash equivalents, end of period | $ | 319,827 | $ | 155,767 | ||||||
Non-cash transactions: | ||||||||||
Notes payable assumed in acquisitions | $ | — | $ | 4,175 | ||||||
See accompanying notes to consolidated financial statements.
The Company was initially capitalized on November 9, 2007 and commenced operations on July 31, 2008.
F-4
Apple REIT Nine, Inc.
Notes to Consolidated Financial Statements
1. Basis of Presentation
The accompanying unaudited consolidated financial statements have been prepared in accordance with the rules and regulations for reporting on Form 10-Q. Accordingly, they do not include all of the information required by accounting principles generally accepted in the United States for complete financial statements. In the opinion of management, all adjustments (consisting of normal recurring accruals) considered necessary for a fair presentation have been included. These unaudited financial statements should be read in conjunction with the Company's audited consolidated financial statements included in its 2009 Annual Report on Form 10-K. Operating results for the three months ended March 31, 2010 are not necessarily indicative of the results that may be expected for the twelve month period ending December 31, 2010.
2. General Information and Summary of Significant Accounting Policies
Organization
Apple REIT Nine, Inc. together with its wholly owned subsidiaries (the "Company") is a Virginia corporation that has elected to be treated as a real estate investment trust ("REIT") for federal income tax purposes. The Company was formed to invest in hotels, residential apartment communities and other income-producing real estate in selected metropolitan areas in the United States. Initial capitalization occurred on November 9, 2007, when 10 Units, each Unit consisting of one common share and one Series A preferred share, were purchased by Apple Nine Advisors, Inc. ("A9A") and 480,000 Series B convertible preferred shares were purchased by Glade M. Knight, the Company's Chairman and Chief Executive Officer. The Company began operations on July 31, 2008 when it purchased its first hotel. The Company's fiscal year end is December 31. The Company has no foreign operations or assets and its operating structure includes two segments, hotels and a ground lease. The consolidated financial statements include the accounts of the Company and its subsidiaries. All intercompany accounts and transactions have been eliminated.
As of March 31, 2010, the Company owned 38 hotels (five purchased during the first quarter of 2010, 12 acquired in 2009 and 21 acquired during 2008). The Company's real estate portfolio also includes approximately 410 acres of land and improvements located on 111 sites in the Ft. Worth, Texas area (acquired in April 2009) that are being leased to a subsidiary of Chesapeake Energy Corporation ("Chesapeake") for the production of natural gas.
Significant Accounting Policies
Use of Estimates
The preparation of the financial statements in conformity with generally accepted accounting principles requires management to make estimates and assumptions that affect the amounts reported in the consolidated financial statements and accompanying notes. Actual results could differ from those estimates.
Other Assets
Included in other assets, net on the Company's consolidated balance sheet is a 24% ownership interest in Apple Air Holding, LLC ("Apple Air"), purchased by the Company for $3.2 million in cash in January 2009. The other members of Apple Air are Apple REIT Six, Inc., Apple REIT Seven, Inc. and Apple REIT Eight, Inc. The interest was purchased to allow the Company access to two Lear jets
F-5
Apple REIT Nine, Inc.
Notes to Consolidated Financial Statements (Continued)
2. General Information and Summary of Significant Accounting Policies (Continued)
for acquisition, asset management and renovation purposes. The Company has recorded its share of income and losses of the entity under the equity method of accounting and adjusted its investment in Apple Air accordingly. The Company's ownership interest was approximately $2.7 million and $2.8 million at March 31, 2010 and December 31, 2009, respectively. For the three months ended March 31, 2010 and 2009, the Company recorded a loss of approximately $110,000 and $100,000, respectively, as its share of the net loss of Apple Air, which primarily relates to the deprecation of the aircraft. The loss is included in general and administrative expense in the Company's consolidated statements of operations.
Offering Costs
The Company is raising capital through a best-efforts offering of its Units by David Lerner Associates, Inc., the managing underwriter, which receives a selling commission and a marketing expense allowance based on proceeds of the Units sold. Additionally, the Company has incurred other offering costs including legal, accounting and reporting services. These offering costs are recorded by the Company as a reduction of shareholders' equity. As of March 31, 2010, the Company had sold 115.2 million Units for gross proceeds of $1.3 billion and proceeds net of offering costs of $1.1 billion. On April 15, 2010, the Company extended its best-efforts offering until April 25, 2011. As a result, the offering will continue until all Units have been sold or until April 25, 2011, whichever occurs sooner.
Rental Income
During April 2009, the Company entered into a ground lease with a subsidiary of Chesapeake, the second-largest independent producer of natural gas in the United States and guarantor of the lease. The lease has an initial term of 40 years with five renewal options of five years each, exercisable by the tenant. Rental payments are fixed and have determinable rent increases during the initial lease term and reset to market during the first year of the renewal period. Rental payments are required to be made monthly in advance. Under the lease, the tenant is responsible for all operating costs associated with the land including, maintenance, insurance, property taxes, environmental, zoning, permitting, etc. and the tenant is required to maintain the land in good condition. The lease is classified as an operating lease and rental income is recognized on a straight line basis over the initial term of the lease. Rental revenue includes $1.5 million of adjustments to record rent on the straight line basis for the three months ended March 31, 2010. Straight line rental receivable is included in other assets, net in the Company's consolidated balance sheet and totaled $6.1 million and $— as of March 31, 2010 and 2009.
Earnings Per Common Share
Basic earnings per common share is computed as net income divided by the weighted average number of common shares outstanding during the period. Diluted earnings per share is calculated after giving effect to all potential common shares that were dilutive and outstanding for the period. There were no shares with a dilutive effect for the three months ended March 31, 2010 or 2009. As a result, basic and dilutive outstanding shares were the same. Series B convertible preferred shares are not included in earnings per common share calculations until such time that such shares are converted to common shares.
F-6
Apple REIT Nine, Inc.
Notes to Consolidated Financial Statements (Continued)
2. General Information and Summary of Significant Accounting Policies (Continued)
Recent Accounting Pronouncements
In June 2009, the Financial Accounting Standards Board ("FASB") issued a pronouncement (Accounting Standards Update No. 2009-17) which amends its guidance surrounding a company's analysis to determine whether any of its variable interests constitute controlling financial interests in a variable interest entity. This analysis identifies the primary beneficiary of a variable interest entity as the enterprise that has both of the following characteristics: (a) the power to direct the activities of a variable interest entity that most significantly impact the entity's economic performance, and (b) the obligation to absorb losses of the entity that could potentially be significant to the variable interest entity or the right to receive benefits from the entity that could potentially be significant to the variable interest entity. Additionally, an enterprise is required to assess whether it has an implicit financial responsibility to ensure that a variable interest entity operates as designed when determining whether it has the power to direct the activities of the variable interest entity that most significantly impact the entity's economic performance. The new pronouncement also requires ongoing assessments of whether an enterprise is the primary beneficiary of a variable interest entity and enhanced disclosure about an enterprise's involvement with a variable interest entity. This pronouncement was adopted by the Company in the first quarter of 2010. The adoption of this standard did not have a material impact on the Company's consolidated financial statements.
3. Real Estate Investments
Hotel Acquisitions
The Company acquired five hotels during the first three months of 2010. The following table sets forth the location, brand, manager, gross purchase price, number of hotel rooms and date of purchase by the Company for each property. All dollar amounts are in thousands.
Location | Brand | Manager | Gross Purchase Price | Rooms | Date of Purchase | ||||||||||
|---|---|---|---|---|---|---|---|---|---|---|---|---|---|---|---|
Houston, TX | Marriott | Western | $ | 50,750 | 206 | 1/8/2010 | |||||||||
Albany, GA | Fairfield Inn & Suites | LBA | 7,920 | 87 | 1/14/2010 | (a) | |||||||||
Panama City, FL | TownePlace Suites | LBA | 10,640 | 103 | 1/19/2010 | ||||||||||
Clovis, CA | Homewood Suites | Dimension | 12,435 | 83 | 2/2/2010 | ||||||||||
Jacksonville, NC | TownePlace Suites | LBA | 9,200 | 86 | 2/16/2010 | ||||||||||
Total | $ | 90,945 | 565 | ||||||||||||
- (a)
- Purchase contract includes a provision for an additional $500,000 to be paid to the seller if certain earnings targets are met over the 15 months subsequent to acquisition.
The purchase price for these properties was funded primarily by the Company's on-going best-efforts offering of Units. The Company also used the proceeds of its on-going best-efforts offering to pay approximately $2.2 million in acquisition related costs, including $1.8 million, representing 2% of the gross purchase price for these properties, as a brokerage commission to Apple Suites Realty Group, Inc. ("ASRG"), 100% owned by Glade M. Knight, the Company's Chairman and Chief Executive Officer, and approximately $400,000 in other acquisition related costs, including title, legal
F-7
Apple REIT Nine, Inc.
Notes to Consolidated Financial Statements (Continued)
3. Real Estate Investments (Continued)
and other related costs. These costs are included in acquisition related costs in the Company's consolidated statements of operations for the three months ended March 31, 2010.
The Company leases all of its hotels to its wholly-owned taxable REIT subsidiary (or a subsidiary thereof) under master hotel lease agreements.
No goodwill was recorded in connection with any of the acquisitions.
As of March 31, 2010, the Company owned 38 hotels, located in 15 states with an aggregate of 4,465 rooms and consisted of the following: seven Hilton Garden Inn hotels, four Homewood Suites hotels, 11 Hampton Inn hotels, five Courtyard hotels, three Residence Inn hotels, two SpringHill Suites hotels, three Fairfield Inn hotels, two TownePlace Suites hotels and one full service Marriott hotel. Additionally, the Company is in the process of constructing a SpringHill Suites hotel in Alexandria, Virginia which is expected to be completed over the next 12 months. Upon completion, it is expected that the hotel will contain approximately 152 guest rooms and will be managed by Marriott. To date the Company has incurred $2.5 million in construction costs and anticipates the total construction costs to be approximately $20-$25 million.
Land and Land Improvements
In February 2010, the Company agreed to sell back to Chesapeake two of the 113 sites originally purchased from Chesapeake in April 2009 and release Chesapeake from their associated lease obligation. The sales price for the two sites was equal to the Company's original purchase price, approximately $2.6 million. The Company earned and received rental income for the period held totaling approximately $240,000.
As of March 31, 2010, the Company owned approximately 410 acres of land and land improvements located on 111 sites in the Ft. Worth, Texas area that are being leased to Chesapeake for the production of natural gas. Chesapeake is a publicly held company that is traded on the New York Stock Exchange. Chesapeake is the second-largest independent producer of natural gas in the United States with interests in approximately 38,000 net drill sites.
Total Real Estate Investments
At March 31, 2010, the Company's investment in real estate consisted of the following (in thousands):
Land | $ | 123,636 | ||
Land Improvements | 95,940 | |||
Building and Improvements | 529,382 | |||
Furniture, Fixtures and Equipment | 46,934 | |||
Construction in Progress | 2,489 | |||
| 798,381 | ||||
Less Accumulated Depreciation | (23,911 | ) | ||
Investment in real estate, net | $ | 774,470 | ||
F-8
Apple REIT Nine, Inc.
Notes to Consolidated Financial Statements (Continued)
3. Real Estate Investments (Continued)
As of March 31, 2010, the Company had outstanding contracts for the potential purchase of 14 additional hotels for a total purchase price of $254.1 million. Of these 14 hotels, four are under construction and should be completed over the next 12 months. The other 10 hotels are expected to close within the next six months. Although the Company is working towards acquiring these hotels, there are many conditions to closing that have not yet been satisfied and there can be no assurance that closings will occur under the outstanding purchase contracts. The following table summarizes the location, brand, number of rooms, refundable (if the seller does not meet its obligations under the contract) contract deposits paid, and gross purchase price for each of the contracts. All dollar amounts are in thousands.
Location | Brand | Rooms | Deposits Paid | Gross Purchase Price | ||||||||
|---|---|---|---|---|---|---|---|---|---|---|---|---|
Holly Springs, NC | Hampton Inn | 124 | $ | 100 | $ | 14,880 | (a) | |||||
Ft. Worth, TX | TownePlace Suites | 140 | 500 | 18,460 | (a)/(b) | |||||||
Jacksonville, NC | Fairfield Inn & Suites | 79 | 125 | 7,800 | ||||||||
Santa Ana, CA | Courtyard | 155 | 100 | 24,800 | (a) | |||||||
Miami, FL | Hampton Inn & Suites | 121 | 150 | 11,900 | ||||||||
Boise, ID | Hampton Inn & Suites | 186 | 125 | 22,370 | ||||||||
Rogers, AR | Hampton Inn | 122 | 125 | 9,600 | ||||||||
Rogers, AR | Homewood Suites | 126 | 125 | 10,900 | ||||||||
St. Louis, MO | Hampton Inn | 190 | 125 | 23,000 | ||||||||
St. Louis, MO | Hampton Inn & Suites | 126 | 125 | 16,000 | ||||||||
Kansas City, MO | Hampton Inn | 122 | 125 | 10,130 | ||||||||
Oklahoma City, OK | Hampton Inn & Suites | 200 | 125 | 32,000 | ||||||||
Anchorage, AK | Embassy Suites | 169 | 50 | 42,000 | ||||||||
Lafayette, LA | SpringHill Suites | 103 | 3 | 10,232 | (a)/(b) | |||||||
| 1,963 | $ | 1,903 | $ | 254,072 | ||||||||
- (a)
- The hotels are currently under construction. The table shows the expected number of rooms upon hotel completion and the expected franchise.
- (b)
- If the seller meets all of the conditions to closing, the Company is obligated to specifically perform under the contract. As the properties are under construction, at this time, the seller has not met all of the conditions to closing.
Four of the hotels under contract require the Company to assume approximately $49.5 million in mortgage debt. Each of these loans provide for monthly payments of principal and interest on an amortized basis.
As there can be no assurance that all conditions to closing will be satisfied, the Company includes deposits paid for hotels under contract in other assets, net in the Company's consolidated balance sheets, and in deposits and other disbursements for potential acquisitions in the Company's consolidated statements of cash flows. It is anticipated that the purchase price (less any debt assumed) for the outstanding contracts will be funded from the proceeds of the Company's on-going best-efforts offering of Units and cash on hand if a closing occurs.
F-9
Apple REIT Nine, Inc.
Notes to Consolidated Financial Statements (Continued)
3. Real Estate Investments (Continued)
On October 14, 2009, the Company entered into a ground lease for approximately one acre of land located in downtown Richmond, Virginia. The lease terminates on December 31, 2098, subject to the Company's right to exercise two renewal periods of ten years each. The Company intends to use the land to build two nationally recognized brand hotels. Under the terms of the lease the Company has a "Study Period" to determine the viability of the hotels. The Company can terminate the lease for any reason during the Study Period, which originally ended on April 14, 2010, and was extended for six months to October 14, 2010. After the Study Period, the lease continues to be subject to various conditions, including but not limited to obtaining various permits, licenses, zoning variances and franchise approvals. If any of these conditions are not met the Company has the right to terminate the lease at any time. Rent payments are not required until the Company decides to begin construction on the hotels. Annual rent under the lease is $300,000 with adjustments throughout the lease term based on the Consumer Price Index. As there are many conditions to beginning construction on the hotels, there are no assurances that the Company will construct the hotels or continue the lease.
4. Notes Payable
In conjunction with the acquisition of seven hotel properties, the Company assumed approximately $57.6 million in debt. The following table summarizes the hotel location, interest rate, maturity date and the principal amount assumed associated with each note payable outstanding as of March 31, 2010 and December 31, 2009. All dollar amounts are in thousands.
Location | Brand | Interest Rate(1) | Maturity Date | Principal Assumed | Outstanding balance as of March 31, 2010 | Outstanding balance as of December 31, 2009 | ||||||||||||
|---|---|---|---|---|---|---|---|---|---|---|---|---|---|---|---|---|---|---|
Lewisville, TX | Hilton Garden Inn | 0.00 | % | 12/31/2016 | $ | 3,750 | $ | 3,750 | $ | 3,750 | ||||||||
Duncanville, TX | Hilton Garden Inn | 5.88 | % | 5/11/2017 | 13,966 | 13,704 | 13,754 | |||||||||||
Allen, TX | Hilton Garden Inn | 5.37 | % | 10/11/2015 | 10,787 | 10,538 | 10,585 | |||||||||||
Bristol, VA | Courtyard | 6.59 | % | 8/1/2016 | 9,767 | 9,607 | 9,640 | |||||||||||
Round Rock, TX | Hampton Inn | 5.95 | % | 5/1/2016 | 4,175 | 4,085 | 4,110 | |||||||||||
Austin, TX | Homewood Suites | 5.99 | % | 3/1/2016 | 7,556 | 7,406 | 7,448 | |||||||||||
Austin, TX | Hampton Inn | 5.95 | % | 3/1/2016 | 7,553 | 7,402 | 7,445 | |||||||||||
| $ | 57,554 | $ | 56,492 | $ | 56,732 | |||||||||||||
- (1)
- At acquisition, the Company adjusted the interest rates on these loans to market rates and is amortizing the adjustments to interest expense over the life of the loan.
The Company estimates the fair value of its debt by discounting the future cash flows of each instrument at estimated market rates consistent with the maturity of the debt obligation with similar credit policies. Market rates take into consideration general market conditions and maturity. As of March 31, 2010, the carrying value and estimated fair value of the Company's debt was $58.4 million and $54.3 million. As of December 31, 2009, the carrying value and estimated fair value of the Company's debt was $58.7 million and $56.7 million. The carrying value of the Company's other financial instruments approximates fair value due to the short-term nature of these financial instruments.
F-10
Apple REIT Nine, Inc.
Notes to Consolidated Financial Statements (Continued)
5. Related Parties
The Company has significant transactions with related parties. These transactions cannot be construed to be at arm's length and the results of the Company's operations may be different than if conducted with non-related parties.
The Company has a contract with ASRG, to acquire and dispose of real estate assets for the Company. A fee of 2% of the gross purchase price or gross sale price in addition to certain reimbursable expenses is paid to ASRG for these services. As of March 31, 2010, payments to ASRG for services under the terms of this contract have totaled approximately $15.3 million since inception.
The Company is party to an advisory agreement with A9A to provide management services to the Company. An annual fee ranging from 0.1% to 0.25% of total equity proceeds received by the Company, in addition to certain reimbursable expenses, are payable for these services. A9A has entered into an agreement with Apple REIT Six, Inc. ("AR6") to provide certain management services to the Company. The Company will reimburse A9A for the cost of the services provided by AR6. A9A will in turn reimburse AR6. Total advisory fees and reimbursable expenses incurred by the Company under the advisory agreement are included in general and administrative expenses and totaled approximately $810,000 and $460,000 for the three months ended March 31, 2010 and 2009. Of this total expense, $287,000 and $124,000 were fees paid to A9A and $523,000 and $336,000 were expenses reimbursed by A9A to AR6 for the three months ended March 31, 2010 and 2009.
ASRG and A9A are 100% owned by Glade M. Knight, Chairman and Chief Executive Officer of the Company.
Mr. Knight is also Chairman and Chief Executive Officer of AR6, Apple REIT Seven, Inc. and Apple REIT Eight, Inc. Members of the Company's Board of Directors are also on the Board of Directors of AR6, Apple REIT Seven, Inc. and Apple REIT Eight, Inc.
6. Shareholders' Equity
The Company has a Unit Redemption Program to provide limited interim liquidity to its shareholders who have held their Units for at least one year. Shareholders may request redemption of Units for a purchase price equal to 92% of the price paid per Unit if the Units have been owned for less than three years, or 100% of the price paid per Unit if the Units have been owned more than three years. The maximum number of Units that may be redeemed in any given year will be three percent of the weighted average number of Units outstanding during the 12-month period immediately prior to the date of redemption. The Company reserves the right to change the purchase price of redemptions, reject any request for redemption, or otherwise amend the terms of, suspend, or terminate the Unit Redemption Program. During the three months ended March 31, 2010, the Company redeemed 120,742 Units in the amount of $1.3 million under the program. There were no redemptions in the first quarter of 2009.
7. Series B Convertible Preferred Stock
The Company has issued 480,000 Series B convertible preferred shares to Glade M. Knight, Chairman and Chief Executive Officer of the Company, in exchange for the payment by him of $0.10 per Series B convertible preferred share, or an aggregate of $48,000. The Series B convertible preferred shares are convertible into common shares pursuant to the formula and on the terms and conditions set forth below.
F-11
Apple REIT Nine, Inc.
Notes to Consolidated Financial Statements (Continued)
7. Series B Convertible Preferred Stock (Continued)
There are no dividends payable on the Series B convertible preferred shares. Holders of more than two-thirds of the Series B convertible preferred shares must approve any proposed amendment to the articles of incorporation that would adversely affect the Series B convertible preferred shares.
Upon the Company's liquidation, the holder of the Series B convertible preferred shares is entitled to a priority liquidation payment before any distribution of liquidation proceeds to the holders of the common shares. However, the priority liquidation payment of the holder of the Series B convertible preferred shares is junior to the holders of the Series A preferred shares distribution rights. The holder of a Series B convertible preferred share is entitled to a liquidation payment of $11 per number of common shares each Series B convertible preferred share would be convertible into according to the formula described below. In the event that the liquidation of the Company's assets results in proceeds that exceed the distribution rights of the Series A preferred shares and the Series B convertible preferred shares, the remaining proceeds will be distributed between the common shares and the Series B convertible preferred shares, on an as converted basis.
Each holder of outstanding Series B convertible preferred shares shall have the right to convert any of such shares into common shares of the Company upon and for 180 days following the occurrence of any of the following events:
(1) substantially all of the Company's assets, stock or business is sold or transferred through exchange, merger, consolidation, lease, share exchange, sale or otherwise, other than a sale of assets in liquidation, dissolution or winding up of the Company;
(2) the termination or expiration without renewal of the advisory agreement with A9A, or if the Company ceases to use ASRG to provide property acquisition and disposition services; or
(3) the Company's common shares are listed on any securities exchange or quotation system or in any established market.
Upon the occurrence of any conversion event, each Series B convertible preferred share may be converted into a number of common shares based upon the gross proceeds raised through the date of conversion in the Company's $2 billion offering according to the following table:
Gross Proceeds Raised from Sales of Units through Date of Conversion | Number of Common Shares through Conversion of One Series B Convertible Preferred Share | |||
|---|---|---|---|---|
$1.2 billion | 14.52559 | |||
$1.3 billion | 15.73128 | |||
$1.4 billion | 16.93696 | |||
$1.5 billion | 18.14264 | |||
$1.6 billion | 19.34832 | |||
$1.7 billion | 20.55400 | |||
$1.8 billion | 21.75968 | |||
$1.9 billion | 22.96537 | |||
$2 billion | 24.17104 | |||
In the event that after raising gross proceeds of $2 billion, the Company raises additional gross proceeds in a subsequent public offering, each Series B convertible preferred share may be converted into an additional number of common shares based on the additional gross proceeds raised through the
F-12
Apple REIT Nine, Inc.
Notes to Consolidated Financial Statements (Continued)
7. Series B Convertible Preferred Stock (Continued)
date of conversion in a subsequent public offering according to the following formula: (X/100 million) × 1.20568, where X is the additional gross proceeds rounded down to the nearest 100 million.
No additional consideration is due upon the conversion of the Series B convertible preferred shares. The conversion into common shares of the Series B convertible preferred shares will result in dilution of the shareholders' interests.
Expense related to the issuance of 480,000 Series B convertible preferred shares to Mr. Knight will be recognized at such time when the number of common shares to be issued for conversion of the Series B shares can be reasonably estimated and the event triggering the conversion of the Series B shares to common shares occurs. The expense will be measured as the difference between the fair value of the common stock for which the Series B shares can be converted and the amounts paid for the Series B shares. Although the fair market value cannot be determined at this time, expense if the maximum offering is achieved could range from $0 to in excess of $127 million (assumes $11 per unit fair market value). Based on equity raised through March 31, 2010, if a triggering event had occurred, expense would have ranged from $0 to $76.7 million (assumes $11 per unit fair market value) and approximately 7.0 million common shares would have been issued.
8. Industry Segments
The Company has two reportable segments: hotel investments and real estate leased under a long-term triple-net lease. The Company owns extended-stay and limited service hotel properties throughout the United States that generate rental and other property related income. The Company separately evaluates the performance of each of its hotel properties. However, because each of the hotels has similar economic characteristics, facilities, and services, and each hotel is not individually significant, the properties have been aggregated into a single operating segment. In addition, the Company owns approximately 410 acres of land and land improvements on 111 sites in the Ft. Worth, Texas area (acquired in April 2009) that is leased to a tenant for the production of natural gas. Under the ground lease, the Company receives monthly rental payments. Prior to the acquisition of the land in Ft. Worth, Texas, the Company's only reportable segment was hotel investments. The Company does not allocate corporate-level accounts to its operating segments, including corporate general and administrative expenses, non-operating interest income and interest expense. The following table
F-13
Apple REIT Nine, Inc.
Notes to Consolidated Financial Statements (Continued)
8. Industry Segments (Continued)
summarizes the results of operations and assets for each segment for the three months ending March 31, 2010. Dollar amounts are in thousands.
| | Hotels | Ground Lease | Corporate | Consolidated | |||||||||
|---|---|---|---|---|---|---|---|---|---|---|---|---|---|
Total revenue | $ | 26,476 | $ | 5,297 | $ | — | $ | 31,773 | |||||
Operating expenses | 18,722 | 27 | — | 18,749 | |||||||||
Acquisition related costs | 2,151 | — | — | 2,151 | |||||||||
Depreciation expense | 5,140 | 558 | — | 5,698 | |||||||||
General and administrative | — | — | 1,310 | 1,310 | |||||||||
Operating income/(loss) | 463 | 4,712 | (1,310 | ) | 3,865 | ||||||||
Interest income | — | — | 436 | 436 | |||||||||
Interest expense | (520 | ) | — | — | (520 | ) | |||||||
Net income/(loss) | $ | (57 | ) | $ | 4,712 | $ | (874 | ) | $ | 3,781 | |||
Total assets as of March 31, 2010 | $ | 642,831 | $ | 152,326 | $ | 326,471 | $ | 1,121,628 | |||||
9. Significant Tenant
A subsidiary of Chesapeake Energy Corporation leases properties with carrying values that represent approximately 14% of the Company's total assets, at cost, as of March 31, 2010. The following table presents summary financial information for Chesapeake Energy Corporation as of March 31, 2010 and December 31, 2009, and for the three months ended March 31, 2010 and 2009, as reported in its March 31, 2010 Earnings Release on Form 8-K furnished with the Securities and Exchange Commission (the "SEC").
Chesapeake Energy Corporation
Selected Financial Data
(In millions)
Consolidated Balance Sheet Data:
| | March 31, 2010 | December 31, 2009 | |||||
|---|---|---|---|---|---|---|---|
Current assets | $ | 3,335 | $ | 2,446 | |||
Noncurrent assets | 26,953 | 27,468 | |||||
Current liabilities | 3,123 | 2,688 | |||||
Noncurrent liabilities | 14,949 | 14,885 | |||||
Total equity | 12,216 | 12,341 | |||||
F-14
Apple REIT Nine, Inc.
Notes to Consolidated Financial Statements (Continued)
9. Significant Tenant (Continued)
Consolidated Statements of Income Data:
| | Three Months Ended | ||||||
|---|---|---|---|---|---|---|---|
| | March 31, 2010 | March 31, 2009 | |||||
Total revenues | $ | 2,798 | $ | 1,995 | |||
Total operating costs | 1,586 | 11,048 | |||||
Operating income/(loss) | 1,212 | (9,053 | ) | ||||
Net income/(loss) | 596 | (5,740 | ) | ||||
Consolidated Statements of Cash Flows Data:
| | Three Months Ended | ||||||
|---|---|---|---|---|---|---|---|
| | March 31, 2010 | March 31, 2009 | |||||
Cash provided by operating activities | $ | 1,183 | $ | 1,261 | |||
Cash used in investing activities | (1,014 | ) | (2,367 | ) | |||
Cash provided by (used in) financing activities | 40 | (560 | ) | ||||
Net increase (decrease) in cash and cash equivalents | 209 | (1,666 | ) | ||||
Cash and cash equivalents, beginning of period | 307 | 1,749 | |||||
Cash and cash equivalents, end of period | 516 | 83 | |||||
The summary financial information of Chesapeake Energy Corporation is presented to comply with applicable accounting regulations of the SEC. References in these financials statements to the financial statements furnished with the SEC for Chesapeake Energy Corporation are included as textual references only, and the information in Chesapeake Energy Corporation's filing is not incorporated by reference into these financial statements.
10. Pro Forma Information (unaudited)
The following unaudited pro forma information for the three months ended March 31, 2009 is presented as if the acquisitions of the Company's hotels acquired after December 31, 2008, and considered significant to the Company's results of operations, had occurred on the latter of January 1, 2009 or the opening date of the hotel. The five hotels acquired by the Company in the first three months of 2010 did not have significant results of operations for the period not owned by the Company. The pro forma information does not purport to represent what the Company's results of operations would actually have been if such transactions, in fact, had occurred on these applicable dates, nor does it purport to represent the results of operations for future periods. Amounts are in thousands, except per share data.
| | Three Months Ended March 31, 2009 | |||
|---|---|---|---|---|
Total revenues | $ | 21,233 | ||
Net income | 1,081 | |||
Net income per share—basic and diluted | $ | 0.02 | ||
F-15
Apple REIT Nine, Inc.
Notes to Consolidated Financial Statements (Continued)
10. Pro Forma Information (unaudited) (Continued)
The pro forma information reflects adjustments for actual revenues and expenses of the hotels acquired during 2009 for the respective period prior to acquisition by the Company. Net income has been adjusted as follows: (1) interest income and expense have been adjusted to reflect the reduction in cash and cash equivalents required to fund the acquisitions; (2) interest expense related to prior owners' debt which was not assumed has been eliminated; (3) depreciation has been adjusted based on the Company's basis in the hotels; and (4) transaction costs have been adjusted for the acquisition of existing businesses.
11. Subsequent Events
In April 2010, the Company declared and paid approximately $8.4 million in dividend distributions to its common shareholders, or $0.073334 per outstanding common share.
During April 2010, the Company closed on the issuance of 7.3 million Units through its ongoing best-efforts offering, representing gross proceeds to the Company of $80.2 million and proceeds net of selling and marketing costs of $72.2 million.
In April 2010, the Company redeemed 186,011 Units in the amount of $1.9 million under its Unit Redemption Program.
Subsequent to March 31, 2010, the Company closed on the purchase of five hotels. The following table summarizes the hotel information. All dollar amounts are in thousands.
Location | Brand | Gross Purchase Price | Rooms | Date of Purchase | ||||||||
|---|---|---|---|---|---|---|---|---|---|---|---|---|
Miami, FL | Hampton Inn & Suites | $ | 11,900 | 121 | 4/9/2010 | |||||||
Anchorage, AK | Embassy Suites | 42,000 | 169 | 4/30/2010 | ||||||||
Boise, ID | Hampton Inn & Suites | 22,370 | 186 | 4/30/2010 | ||||||||
Rogers, AR | Homewood Suites | 10,900 | 126 | 4/30/2010 | ||||||||
St. Louis, MO | Hampton Inn & Suites | 16,000 | 126 | 4/30/2010 | ||||||||
| $ | 103,170 | 728 | ||||||||||
F-16