UNITED STATES
SECURITIES AND EXCHANGE COMMISSION
Washington, D.C. 20549
FORM N-CSR
CERTIFIED SHAREHOLDER REPORT OF REGISTERED
MANAGEMENT INVESTMENT COMPANIES
Investment Company Act file number | 811-22148 | ||||||||
| |||||||||
PowerShares Actively Managed Exchange-Traded Fund Trust | |||||||||
(Exact name of registrant as specified in charter) | |||||||||
| |||||||||
301 W. Roosevelt Road |
| 60187 | |||||||
(Address of principal executive offices) |
| (Zip code) | |||||||
| |||||||||
H. Bruce Bond | |||||||||
(Name and address of agent for service) | |||||||||
| |||||||||
Registrant’s telephone number, including area code: | 800-983-0903 |
| |||||||
| |||||||||
Date of fiscal year end: | October 31 |
| |||||||
| |||||||||
Date of reporting period: | October 31, 2008 |
| |||||||
Item 1. Reports to Stockholders.
The Registrant’s annual report transmitted to shareholders pursuant to Rule 30e-1 under the Investment Company Act of 1940 is as follows:


2008 Annual Report to Shareholders
October 31, 2008
PowerShares Active AlphaQ Fund
PowerShares Active Alpha Multi-Cap Fund
PowerShares Active Low Duration Fund
PowerShares Active Mega Cap Fund

Table of Contents
| The Market Environment | 2 | ||||||
| Manager's Analysis | 3 | ||||||
| Frequency Distribution of Discounts & Premiums | 12 | ||||||
| Fees and Expenses | 14 | ||||||
| Schedules of Investments | |||||||
| PowerShares Active AlphaQ Fund | 16 | ||||||
| PowerShares Active Alpha Multi-Cap Fund | 17 | ||||||
| PowerShares Active Low Duration Fund | 18 | ||||||
| PowerShares Active Mega Cap Fund | 19 | ||||||
| Statements of Assets and Liabilities | 20 | ||||||
| Statements of Operations | 21 | ||||||
| Statements of Changes in Net Assets | 22 | ||||||
| Financial Highlights | 23 | ||||||
| Notes to Financial Statements | 25 | ||||||
| Report of Independent Registered Public Accounting Firm | 33 | ||||||
| Supplemental Information | 34 | ||||||
The Market Environment
After capitulating in early October 2007, U.S. equities proceeded to plunge into their worst bear market since the Great Depression. Over the one year period ending October 31, 2008, the S&P 500 Index returned -36.1% while volatility (as measured by the Chicago Board Options Exchange S&P 500 Volatility index) rose a staggering 223.2%. As the U.S. credit crunch spread to a global scale, few markets remained unscathed. By the end of the reporting period, most developed equity markets had dropped to multi-year lows given economic contraction while developing markets were decimated by the swift drop in commodity prices (Deutsche Bank Liquid Commodity Index returned -14.8%).
By September 2008, the governments of many developed nations and the United States began to provide emergency funding and lending facilities to financial institutions. By mid-September, the U.S. government had seized control of the two largest mortgage companies Fannie Mae and Freddie Mac and took over the largest U.S. insurance company, AIG. On October 8, 2008, central banks worldwide embarked on a coordinated easing of interest rates in an effort to restore liquidity and increase overall market stability. Unfortunately bonds were not their usual safe haven this time around: the Lehman Brothers U.S. Aggregate Total Return Bond Index was up a meager 0.3% in the year ended October 31, 2008. Only government-owned debt experienced any flight-to-quality in the fixed income asset class, with the Merrill Lynch U.S. Treasury Master Index returning +7.8% over the reporting period. Another benefactor of the global interest rate cuts was the U.S. dollar, as the FINEX-ICE U.S. Dollar Index rose 12.9%.
2
Manager's Analysis
PowerShares Active AlphaQ Fund (ticker: PQY)
The Sub-Adviser of the PowerShares Active AlphaQ Fund (the "Fund") is AER Advisors, Inc. The objective of the Fund is long-term capital appreciation. The Fund's portfolio generally consists of 50 Nasdaq–listed securities selected using a unique stock-screening methodology developed by AER Advisors, Inc. The Fund rates the stocks of companies with more than $400 million market cap (about 3,000 stocks) that are traded in the United States. Weekly, the Fund's Sub-Adviser generates a master stock list that ranks these stocks, segmented by market cap, based on its proprietary stock-ranking methodology. Stocks are selected based on factors such as strong earnings growth, low valuations and positive money flow. Fund managers then define their universe as the 100 largest Nasdaq-listed Global Market Securities from their master stock list. The Fund then generally selects and purchases approximately 50 stocks.
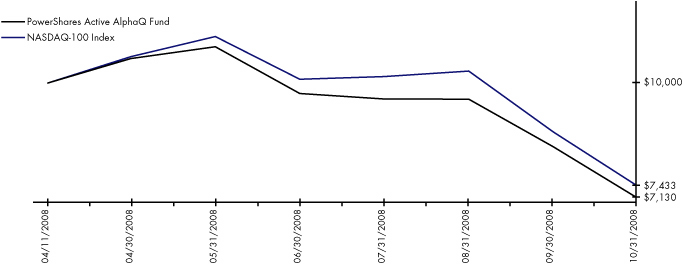
From inception (04/11/2008) through October 31, 2008 the Fund declined -28.70%. This decline is 100 bps more than the decline in the NASDAQ-100 Index. Information technology, which constitutes 35% of the portfolio, had the greatest contribution to the Fund's negative performance. When comparing to the NASDAQ-100 Index, overweight positions in Steel Dynamics and SunPower had the greatest impact on a relative basis. Underweight positions in Celgene and QUALCOMM, which are no longer held in the fund, also had a significant impact on the Fund's relative performance.
Sector Breakdown (% of the Fund's
Net Assets) as of October 31, 2008
| Information Technology | 34.9 | ||||||
| Financial | 25.6 | ||||||
| Health Care | 18.7 | ||||||
| Consumer Discretionary | 12.0 | ||||||
| Industrials | 5.3 | ||||||
| Consumer Staples | 1.8 | ||||||
| Telecommunication Services | 1.7 | ||||||
Style Allocation (% of the Fund's
Net Assets) as of October 31, 2008
| Mid-Cap Growth | 51.9 | ||||||
| Large-Cap Growth | 35.8 | ||||||
| Mid-Cap Value | 9.7 | ||||||
| Large-Cap Value | 2.6 | ||||||
Top Ten Fund Holdings (% of the Fund's
Net Assets) as of October 31, 2008
| Security | |||||||
| Hudson City Bancorp, Inc. | 3.0 | ||||||
| Oracle Corp. | 2.6 | ||||||
| Amgen, Inc. | 2.6 | ||||||
| QUALCOMM, Inc. | 2.6 | ||||||
| Intuit, Inc. | 2.6 | ||||||
| NASDAQ OMX (The) Group, Inc. | 2.5 | ||||||
| DENTSPLY International, Inc. | 2.4 | ||||||
| Northern Trust Corp. | 2.4 | ||||||
| People's United Financial, Inc. | 2.3 | ||||||
| Genzyme Corp. | 2.2 | ||||||
| Total | 25.2 | ||||||
3
Manager's Analysis (Continued)
PowerShares Active AlphaQ Fund (ticker: PQY)
Growth of a $10,000 Investment Since Inception†
| Fund Performance History (%) | As of October 31, 2008 | ||||||
| Fund Inception Cumulative† | |||||||
| Index | |||||||
| NASDAQ-100 Index | -25.67 | ||||||
| Fund | |||||||
| NAV Return | -28.70 | ||||||
| Share Price Return | -28.69 | ||||||
Fund Inception: April 11, 2008
Performance data quoted represents past performance. Past performance is not a guarantee of future results, current performance may be higher or lower than performance quoted. Investment returns and principal value will fluctuate and shares, when redeemed, may be worth more or less than their original cost. According to the Fund's current prospectus, the expense ratio of 0.75% is expressed as a unitary fee to cover operating expenses and expenses incurred in connection with managing the portfolio. NAV and Share Price returns assume that dividends and capital gain distributions have been reinvested in the Fund at NAV and Share Price, respectively. The returns shown in the table above do not reflect the deduction of taxes that a shareholder would pay on Fund distributions or the redemption or sale of Fund Shares. See invescopowershares.com to find the most recent month-end performance numbers.
The Index performance results are hypothetical. Index returns do not represent Fund returns. An investor cannot invest directly in an index. The Index does not charge management fees or brokerage expenses, and no such fees or expenses were deducted from the hypothetical performance shown. In addition, the results actual investors might have achieved would have differed from those shown because of differences in the timing, amounts of their investments, and fees and expenses associated with an investment in the Fund.
The NASDAQ-100 Index (the "Benchmark Index") is an unmanaged index used as a measurement of change in stock market conditions based on the average performance of approximately 100 common stocks.
† Fund returns are based on the inception date of the Fund. Returns for the Benchmark Index are based on the closest month end to the Fund's inception date.
4
Manager's Analysis
PowerShares Active Alpha Multi-Cap Fund (ticker: PQZ)
The Sub-Adviser of the PowerShares Active Multi-Cap Fund (the "Fund") is AER Advisors, Inc. The objective of the Fund is long-term capital appreciation. The Fund's portfolio generally consists of 50 securities selected using a unique stock-screening methodology developed by AER Advisors, Inc. The Fund rates the stocks of companies with more than $400 million market cap (about 3,000 stocks) that are traded in the United States. Weekly, the Fund's Sub-Adviser generates a master stock list that ranks these stocks, segmented by market cap, based on its proprietary stock-ranking methodology. Stocks are selected based on factors such as strong earnings growth, low valuations and positive money flow. Fund managers then define their universe as the 2,000 largest stocks of companies with varying capitalizations from their master list. The Fund then generally selects and purchases approximately 50 stocks.
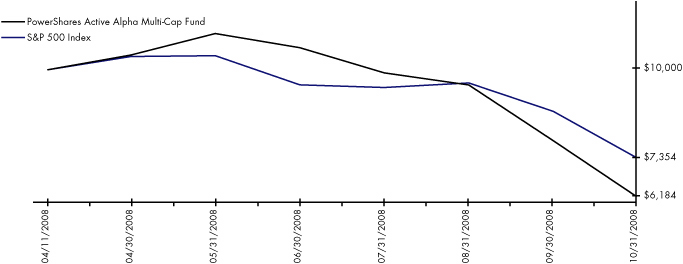
From inception (04/11/2008) through October 31, 2008 the Fund declined -38.16%. This decline is 11.8% more than the decline in the S&P 500 Index for this period. The Fund had a heavier weighting to small and mid cap companies which adversely affected its performance relative to the S&P 500 Index. Overweight allocations to energy and materials and an underweight allocation to consumer staples also hurt the Fund's relative performance. Overweight positions in Gerdau and CF Industries, which are no longer held by the fund, and Pioneer Natural Resources, and LDK Solar were the greatest contributors to the Fund's relative underperformance.
Sector Breakdown (% of the Fund's
Net Assets) as of October 31, 2008
| Financials | 26.8 | ||||||
| Information Technology | 26.3 | ||||||
| Energy | 17.4 | ||||||
| Health Care | 15.5 | ||||||
| Telecommunication Services | 8.1 | ||||||
| Materials | 2.7 | ||||||
| Consumer Discretionary | 1.8 | ||||||
| Consumer Staples | 1.6 | ||||||
| Other | (0.2 | ) | |||||
Style Allocation (% of the Fund's
Net Assets) as of October 31, 2008
| Mid-Cap Growth | 38.0 | ||||||
| Large-Cap Value | 15.4 | ||||||
| Large-Cap Growth | 14.6 | ||||||
| Small-Cap Value | 13.7 | ||||||
| Small-Cap Growth | 12.4 | ||||||
| Mid-Cap Value | 5.9 | ||||||
Top Ten Fund Holdings (% of the Fund's
Net Assets) as of October 31, 2008
| Security | |||||||
| NetEase.com, Inc. ADR (China) | 2.8 | ||||||
| Olin Corp. | 2.7 | ||||||
| Lincare Holdings, Inc. | 2.7 | ||||||
| Whiting Petroleum Corp. | 2.6 | ||||||
| Open Text Corp. (Canada) | 2.6 | ||||||
| HealthSpring, Inc. | 2.5 | ||||||
| Digital Realty Trust REIT, Inc. | 2.5 | ||||||
| Devon Energy Corp. | 2.4 | ||||||
| Community Health Systems, Inc. | 2.3 | ||||||
| OSI Pharmaceuticals, Inc. | 2.3 | ||||||
| Total | 25.4 | ||||||
5
Manager's Analysis (Continued)
PowerShares Active Alpha Multi-Cap Fund (ticker: PQZ)
Growth of a $10,000 Investment Since Inception†
| Fund Performance History (%) | As of October 31, 2008 | ||||||
| Fund Inception Cumulative† | |||||||
| Index | |||||||
| S&P 500 Index | -26.46 | ||||||
| Fund | |||||||
| NAV Return | -38.16 | ||||||
| Share Price Return | -38.37 | ||||||
Fund Inception: April 11, 2008
Performance data quoted represents past performance. Past performance is not a guarantee of future results, current performance may be higher or lower than performance quoted. Investment returns and principal value will fluctuate and shares, when redeemed, may be worth more or less than their original cost. According to the Fund's current prospectus, the expense ratio of 0.75% is expressed as a unitary fee to cover operating expenses and expenses incurred in connection with managing the portfolio. NAV and Share Price returns assume that dividends and capital gain distributions have been reinvested in the Fund at NAV and Share Price, respectively. The returns shown in the table above do not reflect the deduction of taxes that a shareholder would pay on Fund distributions or the redemption or sale of Fund Shares. See invescopowershares.com to find the most recent month-end performance numbers.
The Index performance results are hypothetical. Index returns do not represent Fund returns. An investor cannot invest directly in an index. The Index does not charge management fees or brokerage expenses, and no such fees or expenses were deducted from the hypothetical performance shown nor does the index lend securities, and no revenues from securities lending were added to the performance shown. In addition, the results actual investors might have achieved would have differed from those shown because of differences in the timing, amounts of their investments, and fees and expenses associated with an investment in the Fund.
The S&P 500 Index (the "Benchmark Index") is an unmanaged index used as a measurement of change in stock market conditions based on the average performance of approximately 500 common stocks.
† Fund returns are based on the inception date of the Fund. Returns for the Benchmark Index are based on the closest month end to the Fund's inception date.
6
Manager's Analysis
PowerShares Active Low Duration Fund (ticker: PLK)
PowerShares Active Low Duration Fund (the "Fund") seeks to provide total return by investing in a portfolio of U.S. government, corporate and agency debt securities selected by Invesco World-Wide Fixed Income. The Fund seeks to outperform its benchmark, Lehman Brothers 1-3 Year U.S. Treasury Index, by applying an actively managed, top-down portfolio construction and bottom-up security selection total return strategy. Brendan Gau and Scot Johnson, who have more than 25 years of investment experience between them, serve as portfolio managers for the Fund.
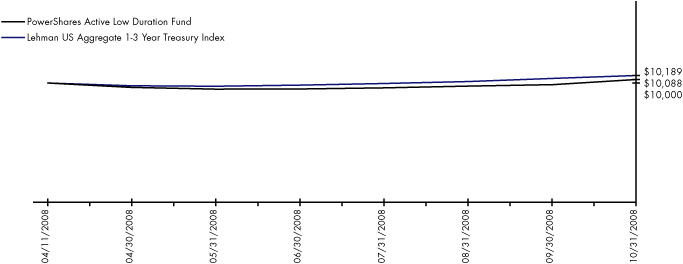
From inception (04/11/2008) through October 31, 2008 period, the Fund was +0.88% on a total return basis. Over this same period the Lehman Brothers 1-3 Year U.S. Treasury Index returned +1.89% while the Fund's peer group, the Lipper Short US Treasury Funds Category Average, was +1.28%. The Fund's performance differential versus the Lehman Brothers 1-3 Year U.S. Treasury Index, beyond regular fund expenses, can mainly be attributed to unfavorable movements of the treasury yield curve.
Duration Breakdown (% of the Fund's
Net Assets) as of October 31, 2008
| Maturing in less than 1 year | 42.7 | ||||||
| Maturing in 1 to 5 Years | 58.8 | ||||||
| Maturing in 6 to 10 Years | 4.5 | ||||||
| Other | (6.0 | ) | |||||
Top Ten Fund Holdings (% of the Fund's
Net Assets) as of October 31, 2008
| Security | |||||||
| Federal Home Loan Bank 5.250%, 11/14/08 | 13.0 | ||||||
| Federal National Mortgage Association 1.251%, 11/04/08 | 8.5 | ||||||
| United States Treasury Note 2.750%, 07/31/10 | 7.7 | ||||||
| United States Treasury Note 2.875%, 06/30/10 | 7.5 | ||||||
| United States Treasury Note 2.625%, 05/31/10 | 7.3 | ||||||
| United States Treasury Note 3.250%, 12/31/09 | 6.3 | ||||||
| United States Treasury Note 2.125%, 01/31/10 | 6.0 | ||||||
| Federal Home Loan Bank 5.000%, 11/21/08 | 5.8 | ||||||
| United States Treasury Note 4.750%, 3/31/11 | 5.7 | ||||||
| United States Treasury Note 4.000%, 9/30/09 | 5.2 | ||||||
| Total | 73.0 | ||||||
7
Manager's Analysis (Continued)
PowerShares Active Low Duration Fund (ticker: PLK)
Growth of a $10,000 Investment Since Inception†
| Fund Performance History (%) | As of October 31, 2008 | ||||||
| Fund Inception Cumulative† | |||||||
| Index | |||||||
| Lehman US Aggregate 1-3 Year Treasury Index | 1.89 | ||||||
| Fund | |||||||
| NAV Return | 0.88 | ||||||
| Share Price Return | -0.89 | ||||||
Fund Inception: April 11, 2008
Performance data quoted represents past performance. Past performance is not a guarantee of future results, current performance may be higher or lower than performance quoted. Investment returns and principal value will fluctuate and shares, when redeemed, may be worth more or less than their original cost. According to the Fund's current prospectus, the expense ratio of 0.29% is expressed as a unitary fee to cover operating expenses and expenses incurred in connection with managing. NAV and Share Price returns assume that dividends and capital gain distributions have been reinvested in the Fund at NAV and Share Price, respectively. The returns shown in the table above do not reflect the deduction of taxes that a shareholder would pay on Fund distributions or the redemption or sale of Fund Shares. See invescopowershares.com to find the most recent month-end performance numbers.
The Index performance results are hypothetical. Index returns do not represent Fund returns. An investor cannot invest directly in an index. The Index does not charge management fees or brokerage expenses, and no such fees or expenses were deducted from the hypothetical performance shown. In addition, the results actual investors might have achieved would have differed from those shown because of differences in the timing, amounts of their investments, and fees and expenses associated with an investment in the Fund.
The Lehman US Aggregate 1-3 Year Treasury Index (the "Benchmark Index") is an unmanaged index used as a measurement of change in bonds market conditions based on the average performance of approximately 100 bonds.
† Fund returns are based on the inception date of the Fund. Returns for the Benchmark Index are based on the closest month end to the Fund's inception date.
8
Manager's Analysis
PowerShares Active Mega Cap Fund (ticker: PMA)
The Sub-Adviser of the PowerShares Active Mega Cap Fund ("the Fund") is Invesco Institutional (N.A.), Inc. ("Invesco Institional"). The objective of the Fund is long-term growth of capital. The Fund's universe includes the holdings of the Russell Top 200® Index as well as other mega-cap stocks that meet certain liquidity requirements. All stocks in the universe are evaluated by Invesco Institutional's proprietary stock selection model. The model is based on several factors relating to four main concepts: earnings momentum, price trend, management action and relative value. Each stock is ranked by this model, and the result is a "weight-of-the-evidence" forecast of the expected annual forecasted excess return for each stock compared to other stocks within their respective industry for the next month. Additionally, each stock is evaluated for risk using at least 17 variables.
From inception (04/11/2008) through October 31, 2008 the Fund declined -26.27%. Information technology and health care allocations, which make up 60% of the Fund, made the greatest contributions to the negative performance. Consumer staples was the best performing sector, down 4.14% on average, but only comprised 2.9% of the total weight in the Fund. ConocoPhillips, Mosaic Co., and Eli Lilly & Co. were the largest negative contributors to the Fund's performance.
Industry Breakdown (% of the Fund's
Net Assets) as of October 31, 2008
| Health Care | 31.1 | ||||||
| Information Technology | 29.0 | ||||||
| Energy | 16.8 | ||||||
| Consumer Staples | 8.8 | ||||||
| Consumer Discretionary | 5.9 | ||||||
| Telecommunication Services | 5.0 | ||||||
| Industrials | 2.7 | ||||||
| Materials | 1.0 | ||||||
| Other | (0.3 | ) | |||||
Style Allocation (% of the Fund's
Net Assets) as of October 31, 2008
| Large-Cap Value | 54.6 | ||||||
| Large-Cap Growth | 45.4 | ||||||
Top Ten Fund Holdings (% of the Fund's
Net Assets) as of October 31, 2008
| Security | |||||||
| Exxon Mobil Corp. | 9.9 | ||||||
| Pfizer, Inc. | 8.5 | ||||||
| Eli Lilly & Co. | 5.6 | ||||||
| Microsoft Corp., Class A | 5.0 | ||||||
| Verizon Communications, Inc. | 5.0 | ||||||
| Merck & Co., Inc. | 4.7 | ||||||
| DIRECTV (The) Group Inc. | 4.6 | ||||||
| International Business Machines Corp. | 4.6 | ||||||
| Wal-Mart Stores, Inc. | 4.4 | ||||||
| Symantec Corp | 4.3 | ||||||
| Total | 56.6 | ||||||
9
Manager's Analysis (Continued)
PowerShares Active Mega Cap Fund (ticker: PMA)
Growth of a $10,000 Investment Since Inception†

| Fund Performance History (%) | As of October 31, 2008 | ||||||
| Fund Inception Cumulative† | |||||||
| Index | |||||||
| Russell Top 200 Index | -25.46 | ||||||
| Fund | |||||||
| NAV Return | -26.27 | ||||||
| Share Price Return | -26.31 | ||||||
Fund Inception: April 11, 2008
Performance data quoted represents past performance. Past performance is not a guarantee of future results, current performance may be higher or lower than performance quoted. Investment returns and principal value will fluctuate and shares, when redeemed, may be worth more or less than their original cost. According to the Fund's current prospectus, the 0.75% is expressed as a unitary fee to cover operating expenses and expenses incurred in connection with managing. NAV and Share Price returns assume that dividends and capital gain distributions have been reinvested in the Fund at NAV and Share Price, respectively. The returns shown in the table above do not reflect the deduction of taxes that a shareholder would pay on Fund distributions or the redemption or sale of Fund Shares. See invescopowershares.com to find the most recent month-end performance numbers.
The Index performance results are hypothetical. Index returns do not represent Fund returns. An investor cannot invest directly in an index. The Index does not charge management fees or brokerage expenses, and no such fees or expenses were deducted from the hypothetical performance shown nor does the index lend securities, and no revenues from securities lending were added to the performance shown. In addition, the results actual investors might have achieved would have differed from those shown because of differences in the timing, amounts of their investments, and fees and expenses associated with an investment in the Fund.
The Russell Top 200 Index (the "Benchmark Index") is an unmanaged index used as a measurement of change in stock market conditions based on the average performance of approximately 200 common stocks.
† Fund returns are based on the inception date of the Fund. Returns for the Benchmark Index are based on the closest month end to the Fund's inception date.
10
This page intentionally left blank
Frequency Distribution of Discounts & Premiums
Since Inception through October 31, 2008
| Closing Price Above NAV (bps) | |||||||||||||||||||||||||||||||||||||||
| Ticker | Fund Name | Inception | Days | 0-24 | 25-49 | 50-99 | 100-149 | 150-199 | 200+ | ||||||||||||||||||||||||||||||
| PQY | PowerShares Active AlphaQ Fund | 4/11/08 | 143 | 59 | 11 | 7 | 5 | 4 | 5 | ||||||||||||||||||||||||||||||
| PQZ | PowerShares Active Alpha Multi Cap Fund | 4/11/08 | 143 | 64 | 15 | 9 | 3 | 4 | 7 | ||||||||||||||||||||||||||||||
| PLK | PowerShares Active Low Duration Fund | 4/11/08 | 143 | 51 | 18 | 12 | 5 | 1 | 9 | ||||||||||||||||||||||||||||||
| PMA | PowerShares Active Mega Cap Fund | 4/11/08 | 143 | 71 | 10 | 7 | 5 | 6 | 6 | ||||||||||||||||||||||||||||||
12
| Closing Price Below NAV (bps) | |||||||||||||||||||||||||||
| Ticker | -0-24 | -25-49 | -50-99 | -100-149 | -150-199 | -200+ | |||||||||||||||||||||
| PQY | 39 | 6 | 7 | 0 | 0 | 0 | |||||||||||||||||||||
| PQZ | 25 | 7 | 3 | 1 | 2 | 3 | |||||||||||||||||||||
| PLK | 24 | 6 | 6 | 4 | 4 | 3 | |||||||||||||||||||||
| PMA | 31 | 4 | 2 | 0 | 0 | 1 | |||||||||||||||||||||
13
Fees and Expenses
As a shareholder of a Fund of the PowerShares Actively Managed Exchange-Traded Fund Trust, you incur a unitary management fee. The expense examples below are intended to help you understand your ongoing costs (in dollars) of investing in the Funds and to compare these costs with the ongoing costs of investing in other funds.
The example is based on an investment of $1,000 invested at the beginning of the period and held through the six-month period ended October 31, 2008.
Actual Expenses
The first line in the following table provides information about actual account values and actual expenses. You may use the information in this line, together with the amount you invested, to estimate the expenses that you paid over the period. Simply divide your account value by $1,000 (for example, an $8,600 account value divided by $1,000 = 8.6), then multiply the result by the number in the first line under the heading "Expenses Paid During Period" to estimate the expenses you paid on your account during this period.
Hypothetical Example for Comparison Purposes
The second line in the following table provides information about hypothetical account values and hypothetical expenses based on the each Fund's actual expense ratio and an assumed annualized rate of return of 5% per year before expenses, which is not the Fund's actual return. The hypothetical account values and expenses may not be used to estimate the actual ending account balance or expenses you paid for the period. You may use this information to compare the ongoing costs of investing in the Funds and other funds. To do so, compare this 5% hypothetical example with the 5% hypothetical examples that appear in the shareholder reports of the other funds.
Please note that the expenses shown in the table are meant to highlight your ongoing costs only, and do not reflect any transactional costs such as sales charges and brokerage commissions. Therefore the second line in the table is useful in comparing ongoing costs only, and will not help you determine the relative total costs of owning different funds. In addition, if these transactional costs were included, your costs would have been higher.
| Beginning Account Value May 1, 2008 | Ending Account Value October 31, 2008 | Annualized Expense Ratio based on Six-Month Period | Expenses Paid During the Six-Month Period (1) | ||||||||||||||||
| PowerShares Active AlphaQ Fund Actual | $ | 1,000.00 | $ | 671.78 | 0.75 | % | $ | 3.15 | |||||||||||
| Hypothetical (5% return before expenses) | $ | 1,000.00 | $ | 1,021.37 | 0.75 | % | $ | 3.81 | |||||||||||
| PowerShares Active Alpha Multi-Cap Fund Actual | $ | 1,000.00 | $ | 592.13 | 0.75 | % | $ | 3.00 | |||||||||||
| Hypothetical (5% return before expenses) | $ | 1,000.00 | $ | 1,021.37 | 0.75 | % | $ | 3.81 | |||||||||||
14
Fees and Expenses (Continued)
| Beginning Account Value May 1, 2008 | Ending Account Value October 31, 2008 | Annualized Expense Ratio based on Six-Month Period | Expenses Paid During the Six-Month Period (1) | ||||||||||||||||
| PowerShares Active Low Duration Fund Actual | $ | 1,000.00 | $ | 1,019.80 | 0.29 | % | $ | 1.47 | |||||||||||
| Hypothetical (5% return before expenses) | $ | 1,000.00 | $ | 1,023.68 | 0.29 | % | $ | 1.48 | |||||||||||
| PowerShares Active Mega Cap Fund Actual | $ | 1,000.00 | $ | 713.33 | 0.75 | % | $ | 3.23 | |||||||||||
| Hypothetical (5% return before expenses) | $ | 1,000.00 | $ | 1,021.37 | 0.75 | % | $ | 3.81 | |||||||||||
(1) Expenses are calculated using the annualized expense ratio, which represents the ongoing expenses as a percentage of net assets for the six-month period ended October 31, 2008. Expenses are calculated by multiplying the Fund's annualized expense ratio by the average account value for the period; then multiplying the result by 184 and then dividing the result by 366. Expense ratios for the most recent half-year may differ from expense ratios based on the annualized data in the Financial Highlights.
15
Schedule of Investments
PowerShares Active AlphaQ Fund
October 31, 2008
| Number of Shares | Value | ||||||||||
| Common Stocks—100.0% | |||||||||||
| Consumer Discretionary—12.0% | |||||||||||
| 995 | Apollo Group, Inc., Class A* | $ | 69,162 | ||||||||
| 2,724 | Bed Bath & Beyond, Inc.* | 70,197 | |||||||||
| 3,464 | DIRECTV (The) Group, Inc.* | 75,828 | |||||||||
| 1,895 | Dollar Tree, Inc.* | 72,048 | |||||||||
| 1,961 | Ross Stores, Inc. | 64,105 | |||||||||
| 3,154 | Urban Outfitters, Inc.* | 68,568 | |||||||||
| 419,908 | |||||||||||
| Consumer Staples—1.8% | |||||||||||
| 1,095 | Costco Wholesale Corp. | 62,426 | |||||||||
| Financials—25.6% | |||||||||||
| 1,565 | Capitol Federal Financial | 72,788 | |||||||||
| 3,323 | Charles Schwab (The) Corp. | 63,536 | |||||||||
| 160 | CME Group, Inc. | 45,144 | |||||||||
| 6,357 | Fifth Third Bancorp | 68,973 | |||||||||
| 5,640 | Hudson City Bancorp, Inc. | 106,088 | |||||||||
| 2,665 | NASDAQ OMX (The) Group, Inc.* | 86,506 | |||||||||
| 1,466 | Northern Trust Corp. | 82,550 | |||||||||
| 4,610 | People's United Financial, Inc. | 80,675 | |||||||||
| 1,851 | T. Rowe Price Group, Inc. | 73,189 | |||||||||
| 5,757 | TD Ameritrade Holding Corp.* | 76,511 | |||||||||
| 5,326 | TFS Financial Corp. | 69,611 | |||||||||
| 1,921 | Zions Bancorporation | 73,209 | |||||||||
| 898,780 | |||||||||||
| Health Care—18.7% | |||||||||||
| 1,517 | Amgen, Inc.* | 90,853 | |||||||||
| 783 | Cephalon, Inc.* | 56,157 | |||||||||
| 2,749 | DENTSPLY International, Inc. | 83,515 | |||||||||
| 1,175 | Express Scripts, Inc.* | 71,217 | |||||||||
| 1,066 | Genzyme Corp.* | 77,690 | |||||||||
| 1,599 | Gilead Sciences, Inc.* | 73,314 | |||||||||
| 1,647 | Henry Schein, Inc.* | 77,096 | |||||||||
| 1,363 | Shire PLC ADR | 53,770 | |||||||||
| 1,732 | Teva Pharmaceutical Industries Ltd. ADR (Israel) | 74,268 | |||||||||
| 657,880 | |||||||||||
| Industrials—5.3% | |||||||||||
| 3,001 | Cintas Corp. | 71,124 | |||||||||
| 1,312 | Stericycle, Inc.* | 76,660 | |||||||||
| 985 | Sunpower Corp., Class A* | 38,474 | |||||||||
| 186,258 | |||||||||||
| Information Technology—34.9% | |||||||||||
| 4,512 | Activision Blizzard, Inc.* | 56,220 | |||||||||
| 2,741 | Adobe Systems, Inc.* | 73,020 | |||||||||
| 3,654 | Altera Corp. | 63,397 | |||||||||
| 2,755 | Autodesk, Inc.* | 58,709 | |||||||||
| 231 | Baidu.com ADR (China)* | 47,586 | |||||||||
| 3,987 | Broadcom Corp., Class A* | 68,098 | |||||||||
| Number of Shares | Value | ||||||||||
| Common Stocks (Continued) | |||||||||||
| 3,550 | Check Point Software Technologies Ltd. (Israel)* | $ | 71,781 | ||||||||
| 3,057 | Cisco Systems, Inc.* | 54,323 | |||||||||
| 1,865 | Fiserv, Inc.* | 62,216 | |||||||||
| 1,757 | FLIR Systems, Inc.* | 56,400 | |||||||||
| 213 | Google, Inc., Class A* | 76,544 | |||||||||
| 3,616 | Intuit, Inc.* | 90,617 | |||||||||
| 3,182 | Linear Technology Corp. | 72,168 | |||||||||
| 2,529 | Microchip Technology, Inc. | 62,289 | |||||||||
| 3,327 | NetEase.com, Inc. ADR (China)* | 74,858 | |||||||||
| 5,005 | Oracle Corp.* | 91,540 | |||||||||
| 2,369 | QUALCOMM, Inc. | 90,638 | |||||||||
| 1,090 | Research In Motion Ltd. (Canada)* | 54,969 | |||||||||
| 1,225,373 | |||||||||||
| Telecommunication Services—1.7% | |||||||||||
| 2,370 | NII Holdings, Inc., Class B* | 61,051 | |||||||||
| Total Investments (Cost $4,342,695)—100.0% | 3,511,676 | ||||||||||
| Other assets less liabilities—0.0% | 149 | ||||||||||
| Net Assets—100.0% | $ | 3,511,825 | |||||||||
ADR American Depositary Receipt
* Non-income producing security.
See Notes to Financial Statements.
16
Schedule of Investments
PowerShares Active Alpha Multi-Cap Fund
October 31, 2008
| Number of Shares | Value | ||||||||||
| Common Stocks and Other Equity Interests—100.2% | |||||||||||
| Consumer Discretionary—1.8% | |||||||||||
| 5,952 | Focus Media Holding Ltd. ADR (China)* | $ | 110,291 | ||||||||
| Consumer Staples—1.6% | |||||||||||
| 3,860 | Hansen Natural Corp.* | 97,735 | |||||||||
| Energy—17.4% | |||||||||||
| 1,556 | Apache Corp. | 128,106 | |||||||||
| 3,555 | Continental Resources, Inc.* | 115,146 | |||||||||
| 1,836 | Devon Energy Corp. | 148,460 | |||||||||
| 2,124 | ENSCO International, Inc. | 80,733 | |||||||||
| 2,335 | Murphy Oil Corp. | 118,244 | |||||||||
| 10,641 | PetroQuest Energy, Inc.* | 105,878 | |||||||||
| 3,635 | Pioneer Natural Resources Co. | 101,162 | |||||||||
| 5,291 | W&T Offshore, Inc. | 101,429 | |||||||||
| 3,058 | Whiting Petroleum Corp.* | 158,986 | |||||||||
| 1,058,144 | |||||||||||
| Financials—26.8% | |||||||||||
| 8,385 | Annaly Capital Management REIT, Inc. | 116,552 | |||||||||
| 322 | CME Group, Inc. | 90,852 | |||||||||
| 2,645 | Credicorp Ltd. (Peru) | 103,869 | |||||||||
| 4,555 | Digital Realty Trust REIT, Inc. | 152,500 | |||||||||
| 6,919 | Hudson City Bancorp, Inc. | 130,146 | |||||||||
| 1,262 | IntercontinentalExchange, Inc.* | 107,977 | |||||||||
| 2,792 | JPMorgan Chase & Co. | 115,170 | |||||||||
| 3,811 | NASDAQ OMX (The) Group, Inc.* | 123,705 | |||||||||
| 4,295 | Pinnacle Financial Partners, Inc.* | 125,672 | |||||||||
| 1,792 | PNC Financial Services Group, Inc. | 119,473 | |||||||||
| 2,006 | State Street Corp. | 86,960 | |||||||||
| 8,991 | TD Ameritrade Holding Corp.* | 119,490 | |||||||||
| 3,833 | U.S. Bancorp | 114,262 | |||||||||
| 3,552 | Wells Fargo & Co. | 120,946 | |||||||||
| 1,627,574 | |||||||||||
| Health Care—15.5% | |||||||||||
| 2,166 | Amedisys, Inc.* | 122,184 | |||||||||
| 3,908 | China Medical Technologies, Inc. ADR (China) | 95,238 | |||||||||
| 6,874 | Community Health Systems, Inc.* | 140,917 | |||||||||
| 5,041 | Cubist Pharmaceuticals, Inc.* | 127,991 | |||||||||
| 9,351 | Healthspring, Inc.* | 154,479 | |||||||||
| 6,218 | Lincare Holdings, Inc.* | 163,844 | |||||||||
| 3,651 | OSI Pharmaceuticals, Inc.* | 138,555 | |||||||||
| 943,208 | |||||||||||
| Information Technology—26.3% | |||||||||||
| 4,931 | Adobe Systems, Inc.* | 131,362 | |||||||||
| 4,611 | Autodesk, Inc.* | 98,260 | |||||||||
| 6,367 | Check Point Software Technologies Ltd. (Israel)* | 128,741 | |||||||||
| 2,980 | Global Payments, Inc. | 120,720 | |||||||||
| Number of Shares | Value | ||||||||||
| Common Stocks and Other Equity Interests (Continued) | |||||||||||
| 6,234 | LDK Solar Co., Ltd. ADR (China)* | $ | 113,209 | ||||||||
| 7,494 | NetEase.com, Inc. ADR (China)* | 168,616 | |||||||||
| 7,137 | Nokia Oyj ADR (Finland) | 108,340 | |||||||||
| 5,973 | Open Text Corp. (Canada)* | 154,999 | |||||||||
| 3,004 | QUALCOMM, Inc. | 114,933 | |||||||||
| 1,638 | Research In Motion Ltd. (Canada)* | 82,604 | |||||||||
| 4,959 | Sybase, Inc.* | 132,058 | |||||||||
| 3,964 | Synaptics, Inc.* | 122,448 | |||||||||
| 6,198 | Websense, Inc.* | 120,985 | |||||||||
| 1,597,275 | |||||||||||
| Materials—2.7% | |||||||||||
| 9,081 | Olin Corp. | 164,911 | |||||||||
| Telecommunication Services—8.1% | |||||||||||
| 3,286 | Mobile TeleSystems OJSC ADR (Russia) | 128,647 | |||||||||
| 6,779 | Neutral Tandem, Inc.* | 118,090 | |||||||||
| 4,803 | NII Holdings, Inc.* | 123,725 | |||||||||
| 6,568 | Syniverse Holdings, Inc.* | 123,478 | |||||||||
| 493,940 | |||||||||||
| Total Investments (Cost $8,419,684)—100.2% | 6,093,078 | ||||||||||
| Liabilities in excess of other assets—(0.2%) | (13,563 | ) | |||||||||
| Net Assets—100.0% | $ | 6,079,515 | |||||||||
ADR American Depositary Receipt
REIT Real Estate Investment Trust
* Non-income producing security.
See Notes to Financial Statements.
17
Schedule of Investments
PowerShares Active Low Duration Fund
October 31, 2008
| Principal Amount | Value | ||||||||||
| Long-Term Investments —63.3% | |||||||||||
| United States Government Obligations | |||||||||||
| United States Treasury Notes | |||||||||||
| $ | 148,000 | 2.125%, 01/31/10 | $ | 149,226 | |||||||
| 179,000 | 2.625%, 05/31/10 | 182,300 | |||||||||
| 189,000 | 2.750%, 07/31/10 | 193,401 | |||||||||
| 85,000 | 2.750%, 10/31/13 | 84,741 | |||||||||
| 183,000 | 2.875%, 06/30/10 | 187,246 | |||||||||
| 102,000 | 3.125%, 09/30/13 | 103,689 | |||||||||
| 153,000 | 3.250%, 12/31/09 | 156,108 | |||||||||
| 83,000 | 4.000%, 04/15/10 | 86,054 | |||||||||
| 112,000 | 4.000%, 08/15/18 | 112,184 | |||||||||
| 76,000 | 4.375%, 12/15/10 | 80,655 | |||||||||
| 131,000 | 4.750%, 03/31/11 | 141,286 | |||||||||
| 96,000 | 4.875%, 05/31/11 | 104,010 | |||||||||
| Total Long-Term Investments (Cost $1,565,157) | 1,580,900 | ||||||||||
| Short-Term Investments—42.7% | |||||||||||
| Certificate of Deposit—4.0% | |||||||||||
| 100,000 | BNP Paribas 2.700%, 11/12/08 | 99,965 | |||||||||
| Sovereign Debt Obligations—0.5% | |||||||||||
| 14,000 | Tennessee Valley Authority 5.375%, 11/13/08 | 14,013 | |||||||||
| United States Government Agency Obligations—29.4% | |||||||||||
| 50,000 | Federal Home Loan Bank 3.625%, 11/14/08 | 50,023 | |||||||||
| 145,000 | Federal Home Loan Bank 5.000%, 11/21/08 | 145,260 | |||||||||
| 325,000 | Federal Home Loan Bank 5.250%, 11/14/08 | 325,447 | |||||||||
| 213,000 | Federal National Mortgage Association 1.251%, 11/04/08(a) | 212,972 | |||||||||
| 733,702 | |||||||||||
| United States Government Obligations—5.2% | |||||||||||
| 126,000 | United States Treasury Note 4.000%, 09/30/09 | 128,953 | |||||||||
| Shares | |||||||||||
| Money Market Fund—3.6% | |||||||||||
| 90,698 | Goldman Sachs Financial Square Prime Obligations Institutional Share Class | 90,698 | |||||||||
| Total Short-Term Investments (Cost $1,067,706) | 1,067,331 | ||||||||||
| Total Investments (Cost $2,632,863)—106.0% | 2,648,231 | ||||||||||
| Liabilities in excess of other assets—(6.0%) | (149,856 | ) | |||||||||
| Net Assets—100.0% | $ | 2,498,375 | |||||||||
(a) Rate shown is the effective yield at purchase date.
See Notes to Financial Statements.
18
Schedule of Investments
PowerShares Active Mega Cap Fund
October 31, 2008
| Number of Shares | Value | ||||||||||
| Common Stocks—100.3% | |||||||||||
| Consumer Discretionary—5.9% | |||||||||||
| 868 | Best Buy Co., Inc. | $ | 23,271 | ||||||||
| 3,831 | DIRECTV (The) Group, Inc.* | 83,861 | |||||||||
| 107,132 | |||||||||||
| Consumer Staples—8.8% | |||||||||||
| 643 | General Mills, Inc. | 43,556 | |||||||||
| 555 | Philip Morris International, Inc. | 24,126 | |||||||||
| 194 | Procter & Gamble (The) Co. | 12,521 | |||||||||
| 1,447 | Wal-Mart Stores, Inc. | 80,757 | |||||||||
| 160,960 | |||||||||||
| Energy—16.8% | |||||||||||
| 1,180 | ConocoPhillips | 61,384 | |||||||||
| 2,435 | Exxon Mobil Corp. | 180,482 | |||||||||
| 1,148 | Occidental Petroleum Corp. | 63,760 | |||||||||
| 305,626 | |||||||||||
| Health Care—31.1% | |||||||||||
| 545 | Aetna, Inc. | 13,554 | |||||||||
| 1,670 | Biogen Idec, Inc.* | 71,059 | |||||||||
| 7,001 | Boston Scientific Corp.* | 63,219 | |||||||||
| 3,025 | Eli Lilly & Co. | 102,305 | |||||||||
| 170 | Johnson & Johnson | 10,428 | |||||||||
| 1,325 | Medco Health Solutions, Inc.* | 50,284 | |||||||||
| 347 | Medtronic, Inc | 13,995 | |||||||||
| 2,776 | Merck & Co., Inc. | 85,917 | |||||||||
| 8,802 | Pfizer, Inc. | 155,882 | |||||||||
| 566,643 | |||||||||||
| Industrials—2.7% | |||||||||||
| 95 | First Solar, Inc.* | 13,652 | |||||||||
| 704 | Raytheon Co. | 35,981 | |||||||||
| 49,633 | |||||||||||
| Information Technology—29.0% | |||||||||||
| 720 | Adobe Systems, Inc.* | 19,181 | |||||||||
| 1,899 | Applied Materials, Inc. | 24,516 | |||||||||
| 361 | Automatic Data Processing, Inc. | 12,617 | |||||||||
| 927 | Dell, Inc.* | 11,263 | |||||||||
| 3,398 | eBay, Inc.* | 51,887 | |||||||||
| 1,359 | Hewlett-Packard Co. | 52,023 | |||||||||
| 2,953 | Intel Corp. | 47,248 | |||||||||
| 902 | International Business Machines Corp. | 83,859 | |||||||||
| 185 | MasterCard, Inc. | 27,347 | |||||||||
| 4,075 | Microsoft Corp., Class A | 90,994 | |||||||||
| 6,272 | Symantec Corp.* | 78,902 | |||||||||
| 1,459 | Texas Instruments, Inc. | 28,538 | |||||||||
| 87 | Western Union Co. | 1,328 | |||||||||
| 529,703 | |||||||||||
| Number of Shares | Value | ||||||||||
| Common Stocks (Continued) | |||||||||||
| Materials—1.0% | |||||||||||
| 458 | Mosaic (The) Co. | $ | 18,050 | ||||||||
| Telecommunication Services—5.0% | |||||||||||
| 3,065 | Verizon Communications, Inc. | 90,939 | |||||||||
| Total Investments (Cost $2,380,774)—100.3% | 1,828,686 | ||||||||||
| Liabilities in excess of other assets—(0.3%) | (5,153 | ) | |||||||||
| Net Assets—100.0% | $ | 1,823,533 | |||||||||
* Non-income producing security.
See Notes to Financial Statements.
19
Statements of Assets and Liabilities
October 31, 2008
| PowerShares Active AlphaQ Fund | PowerShares Active Alpha Multi-Cap Fund | PowerShares Active Low Duration Fund | PowerShares Active Mega Cap Fund | ||||||||||||||||
| ASSETS: | |||||||||||||||||||
| Investments at value | $ | 3,511,676 | $ | 6,093,078 | $ | 2,648,231 | $ | 1,828,686 | |||||||||||
| Cash | 5,813 | 10,092 | — | — | |||||||||||||||
| Receivables: | |||||||||||||||||||
| Dividends and interest | 692 | 233 | 26,947 | 2,566 | |||||||||||||||
| Investments sold | 242,323 | 451,137 | — | 174,768 | |||||||||||||||
| Total Assets | 3,760,504 | 6,554,540 | 2,675,178 | 2,006,020 | |||||||||||||||
| LIABILITIES: | |||||||||||||||||||
| Due to custodian | — | — | 74,903 | 8,861 | |||||||||||||||
| Payables: | |||||||||||||||||||
| Investments purchased | 246,442 | 471,143 | 101,286 | 172,461 | |||||||||||||||
| Accrued unitary management fees | 2,237 | 3,882 | 614 | 1,165 | |||||||||||||||
| Total Liabilities | 248,679 | 475,025 | 176,803 | 182,487 | |||||||||||||||
| NET ASSETS | $ | 3,511,825 | $ | 6,079,515 | $ | 2,498,375 | $ | 1,823,533 | |||||||||||
| NET ASSETS CONSIST OF: | |||||||||||||||||||
| Shares of beneficial interest | $ | 5,058,423 | $ | 10,148,737 | $ | 2,499,115 | $ | 2,531,286 | |||||||||||
| Undistributed net investment income | — | 1,831 | — | 17,219 | |||||||||||||||
| Accumulated net realized gain on investments | (715,579 | ) | (1,744,447 | ) | (16,108 | ) | (172,884 | ) | |||||||||||
| Net unrealized appreciation (depreciation) on investments | (831,019 | ) | (2,326,606 | ) | 15,368 | (552,088 | ) | ||||||||||||
| Net Assets | $ | 3,511,825 | $ | 6,079,515 | $ | 2,498,375 | $ | 1,823,533 | |||||||||||
| Shares outstanding (unlimited amount authorized, $0.01 par value) | 200,000 | 400,000 | 100,000 | 100,000 | |||||||||||||||
| Net asset value | $ | 17.56 | $ | 15.20 | $ | 24.98 | $ | 18.24 | |||||||||||
| Share Price | $ | 17.57 | $ | 15.15 | $ | 24.60 | $ | 18.23 | |||||||||||
| Investments at cost | $ | 4,342,695 | $ | 8,419,684 | $ | 2,632,863 | $ | 2,380,774 | |||||||||||
See Notes to Financial Statements.
20
Statement of Operations
For the Period April 8, 2008* through October 31, 2008
| PowerShares Active AlphaQ Fund | PowerShares Active Alpha Multi-Cap Fund | PowerShares Active Low Duration Fund | PowerShares Active Mega Cap Fund | ||||||||||||||||
| INVESTMENT INCOME: | |||||||||||||||||||
| Dividend income | $ | 12,155 | $ | 28,380 | $ | — | $ | 27,130 | |||||||||||
| Interest income | — | — | 31,687 | — | |||||||||||||||
| Foreign withholding taxes | (25 | ) | (1,362 | ) | — | — | |||||||||||||
| Total Income | 12,130 | 27,018 | 31,687 | 27,130 | |||||||||||||||
| EXPENSES: | |||||||||||||||||||
| Unitary management fees | 14,870 | 25,187 | 4,029 | 9,911 | |||||||||||||||
| Net Investment Income (Loss) | (2,740 | ) | 1,831 | 27,658 | 17,219 | ||||||||||||||
| REALIZED AND UNREALIZED GAIN (LOSS) ON INVESTMENTS: | |||||||||||||||||||
| Net realized gain (loss) from: | |||||||||||||||||||
| Investments | (715,579 | ) | (1,744,447 | ) | (16,108 | ) | (172,884 | ) | |||||||||||
| In-kind redemptions | 27,683 | — | — | 27,825 | |||||||||||||||
| Net realized loss | (687,896 | ) | (1,744,447 | ) | (16,108 | ) | (145,059 | ) | |||||||||||
| Net unrealized appreciation/(depreciation) on investments | (831,019 | ) | (2,326,606 | ) | 15,368 | (552,088 | ) | ||||||||||||
| Net realized and unrealized loss on investments | (1,518,915 | ) | (4,071,053 | ) | (740 | ) | (697,147 | ) | |||||||||||
| Net increase (decrease) in net assets resulting from operations | $ | (1,521,655 | ) | $ | (4,069,222 | ) | $ | 26,918 | $ | (679,928 | ) | ||||||||
* Commencement of Investment Operations.
See Notes to Financial Statements.
21
Statement of Changes in Net Assets
For the Period April 8, 2008* through October 31, 2008
| PowerShares Active AlphaQ Fund | PowerShares Active Alpha Multi-Cap Fund | PowerShares Active Low Duration Fund | PowerShares Active Mega Cap Fund | ||||||||||||||||
| OPERATIONS: | |||||||||||||||||||
| Net investment income (loss) | $ | (2,740 | ) | $ | 1,831 | $ | 27,658 | $ | 17,219 | ||||||||||
| Net realized loss on investments | (687,896 | ) | (1,744,447 | ) | (16,108 | ) | (145,059 | ) | |||||||||||
| Net unrealized appreciation/(depreciation) on investments | (831,019 | ) | (2,326,606 | ) | 15,368 | (552,088 | ) | ||||||||||||
| Net increase (decrease) in net assets resulting from operations | (1,521,655 | ) | (4,069,222 | ) | 26,918 | (679,928 | ) | ||||||||||||
| Undistributed net investment income (loss) included in the price of units issued and redeemed | 1,374 | 11,003 | 30 | (150 | ) | ||||||||||||||
| DISTRIBUTIONS TO SHAREHOLDERS FROM: | |||||||||||||||||||
| Net investment income | �� | — | — | (27,658 | ) | — | |||||||||||||
| Return of capital | — | — | (1,121 | ) | — | ||||||||||||||
| Total distributions to shareholders | — | — | (28,779 | ) | — | ||||||||||||||
| SHAREHOLDER TRANSACTIONS: | |||||||||||||||||||
| Proceeds from shares sold | 7,492,592 | 10,147,242 | 2,500,000 | 5,087,520 | |||||||||||||||
| Value of shares repurchased | (2,484,112 | ) | (23,505 | ) | (24,764 | ) | (2,609,059 | ) | |||||||||||
| Net income equalization | (1,374 | ) | (11,003 | ) | (30 | ) | 150 | ||||||||||||
| Net increase in net assets resulting from shares transactions | 5,007,106 | 10,112,734 | 2,475,206 | 2,478,611 | |||||||||||||||
| Increase in Net Assets | 3,486,825 | 6,054,515 | 2,473,375 | 1,798,533 | |||||||||||||||
| NET ASSETS: | |||||||||||||||||||
| Beginning of period | 25,000 | 25,000 | 25,000 | 25,000 | |||||||||||||||
| End of period | $ | 3,511,825 | $ | 6,079,515 | $ | 2,498,375 | $ | 1,823,533 | |||||||||||
| Undistributed net investment income at end of period | $ | — | $ | 1,831 | $ | — | $ | 17,219 | |||||||||||
| CHANGES IN SHARES OUTSTANDING: | |||||||||||||||||||
| Shares sold | 300,000 | 400,000 | 100,000 | 200,000 | |||||||||||||||
| Shares repurchased | (101,000 | ) | (1,000 | ) | (1,000 | ) | (101,000 | ) | |||||||||||
| Shares outstanding, beginning of period | 1,000 | 1,000 | 1,000 | 1,000 | |||||||||||||||
| Shares outstanding, end of period | 200,000 | 400,000 | 100,000 | 100,000 | |||||||||||||||
* Commencement of Investment Operations.
See Notes to Financial Statements.
22
Financial Highlights
PowerShares Active AlphaQ Fund
| For the Period April 8, 2008* through October 31, 2008 | |||||||
| PER SHARE OPERATING PERFORMANCE: | |||||||
| Net asset value at beginning of period | $ | 25.00 | |||||
| Net investment loss** | (0.02 | ) | |||||
| Net realized and unrealized loss on investments | (7.42 | ) | |||||
| Total from operations | (7.44 | ) | |||||
| Net asset value at end of period | $ | 17.56 | |||||
| Share price at end of period*** | $ | 17.57 | |||||
| NET ASSET VALUE, TOTAL RETURN**** | (29.76 | )%(a) | |||||
| SHARE PRICE TOTAL RETURN**** | (29.72 | )%(a) | |||||
| RATIOS/SUPPLEMENTAL DATA: | |||||||
| Net assets at end of period (000's omitted) | $ | 3,512 | |||||
| Ratio to average net assets of: | |||||||
| Expenses | 0.75 | %† | |||||
| Net investment loss | (0.14 | )%† | |||||
| Portfolio turnover rate †† | 90 | % | |||||
| Undistributed net investment income (loss) included in price of units issued and redeemed# | $ | 0.01 | |||||
PowerShares Active Alpha Multi-Cap Fund
| For the Period April 8, 2008* through October 31, 2008 | |||||||
| PER SHARE OPERATING PERFORMANCE: | |||||||
| Net asset value at beginning of period | $ | 25.00 | |||||
| Net investment income** | 0.01 | ||||||
| Net realized and unrealized loss on investments | (9.81 | ) | |||||
| Total from operations | (9.80 | ) | |||||
| Net asset value at end of period | $ | 15.20 | |||||
| Share price at end of period*** | $ | 15.15 | |||||
| NET ASSET VALUE, TOTAL RETURN**** | (39.20 | )%(b) | |||||
| SHARE PRICE TOTAL RETURN**** | (39.40 | )%(b) | |||||
| RATIOS/SUPPLEMENTAL DATA: | |||||||
| Net assets at end of period (000's omitted) | $ | 6,080 | |||||
| Ratio to average net assets of: | |||||||
| Expenses | 0.75 | %† | |||||
| Net investment income | 0.05 | %† | |||||
| Portfolio turnover rate †† | 89 | % | |||||
| Undistributed net investment income (loss) included in price of units issued and redeemed# | $ | 0.04 | |||||
* Commencement of Investment Operations.
** Based on average shares outstanding.
*** The mean between the last bid and ask prices.
**** Net asset value total return is calculated assuming an initial investment made at the net asset value at the beginning of the period, reinvestment of all dividends and distributions at net asset value during the period, and redemption on the last day of the period. Share price total return is calculated assuming an initial investment made at the share price at the beginning of the period, reinvestment of all dividends and distributions at share price during the period, and the sale at the share price on the last day of the period. Total investment returns calculated for a period of less than one year are not annualized.
† Annualized.
†† Portfolio turnover rate is not annualized and does not include securities received or delivered from processing creations or redemptions.
# The per share amount of equalization is presented to show the impact of equalization on distributable earnings per share. In prior periods, this amount has been included in the "Per Share Operating Performance" below the "Total from operations", with an offsetting amount included in "Net realized and unrealized gain (loss) on investments". The Fund's use of equalization does not affect net asset value per share, total return or the ratio of average net assets and the presentation has been revised accordingly.
(a) The net asset value total return from Fund Inception (April 11, 2008, first day of trading on the Exchange) to October 31, 2008 was (28.70)%. The share price total return from Fund inception to October 31, 2008 was (28.69)%.
(b) The net asset value total return from Fund Inception (April 11, 2008, first day of trading on the Exchange) to October 31, 2008 was (38.16)%. The share price total return from Fund inception to October 31, 2008 was (38.37)%.
See Notes to Financial Statements.
23
Financial Highlights (Continued)
PowerShares Active Low Duration Fund
| For the Period April 8, 2008* through October 31, 2008 | |||||||
| PER SHARE OPERATING PERFORMANCE: | |||||||
| Net asset value at beginning of period | $ | 25.00 | |||||
| Net investment income** | 0.28 | ||||||
| Net realized and unrealized loss on investments | (0.01 | ) | |||||
| Total from operations | 0.27 | ||||||
| Distribution to shareholders from: | |||||||
| Net investment income | (0.28 | ) | |||||
| Return of capital | (0.01 | ) | |||||
| Total distributions | (0.29 | ) | |||||
| Net asset value at end of period | $ | 24.98 | |||||
| Share price at end of period*** | $ | 24.60 | |||||
| NET ASSET VALUE, TOTAL RETURN**** | 1.08 | %(a) | |||||
| SHARE PRICE TOTAL RETURN**** | (0.45 | )%(a) | |||||
| RATIOS/SUPPLEMENTAL DATA: | |||||||
| Net assets at end of period (000's omitted) | $ | 2,498 | |||||
| Ratio to average net assets of: | |||||||
| Expenses | 0.29 | %† | |||||
| Net investment income | 1.99 | %† | |||||
| Portfolio turnover rate †† | 296 | % | |||||
| Undistributed net investment income (loss) included in price of units issued and redeemed | $ | — | (b) | ||||
PowerShares Active Mega Cap Fund
| For the Period April 8, 2008* through October 31, 2008 | |||||||
| PER SHARE OPERATING PERFORMANCE: | |||||||
| Net asset value at beginning of period | $ | 25.00 | |||||
| Net investment income** | 0.17 | ||||||
| Net realized and unrealized loss on investments | (6.93 | ) | |||||
| Total from operations | (6.76 | ) | |||||
| Net asset value at end of period | $ | 18.24 | |||||
| Share price at end of period*** | $ | 18.23 | |||||
| NET ASSET VALUE, TOTAL RETURN**** | (27.04 | )%(c) | |||||
| SHARE PRICE TOTAL RETURN**** | (27.08 | )%(c) | |||||
| RATIOS/SUPPLEMENTAL DATA: | |||||||
| Net assets at end of period (000's omitted) | $ | 1,824 | |||||
| Ratio to average net assets of: | |||||||
| Expenses | 0.75 | %† | |||||
| Net investment income | 1.30 | %† | |||||
| Portfolio turnover rate †† | 41 | % | |||||
| Undistributed net investment income (loss) included in price of units issued and redeemed | $ | — | (b) | ||||
* Commencement of Investment Operations.
** Based on average shares outstanding.
*** The mean between the last bid and ask price.
**** Net asset value total return is calculated assuming an initial investment made at the net asset value at the beginning of the period, reinvestment of all dividends and distributions at net asset value during the period, and the redemption on the last day of the period. Share price total return is calculated assuming an initial investment made at the share price at the beginning of the period, reinvestment of all dividends and distributions at share price during the period, and sale at the share price on the last day of the period. Total investment returns calculated for a period of less than one year are not annualized.
† Annualized.
†† Portfolio turnover rate is not annualized and does not include securities received or delivered from processing creations or redemptions.
# The per share amount of equalization is presented to show the impact of equalization on distributable earnings per share. In prior periods, this amount has been included in the "Per Share Operating Performance" below the "Total from operations", with an offsetting amount included in "Net realized and unrealized gain (loss) on investments". The Fund's use of equalization does not affect net asset value per share, total return or the ratio of average net assets and the presentation has been revised accordingly.
(a) The net asset value total return from Fund Inception (April 11, 2008, first day of trading on the Exchange) to October 31, 2008 was 0.88%. The share price total return from Fund inception to October 31, 2008 was (0.89)%.
(b) Amount represents less than $0.005
(c) The net asset value total return from Fund Inception (April 11, 2008, first day of trading on the Exchange) to October 31, 2008 was (26.27)%. The share price total return from Fund inception to December 31, 2008 was (26.31)%.
See Notes to Financial Statements.
24
Notes to Financial Statements
PowerShares Actively Managed Exchange-Traded Fund Trust
October 31, 2008
Note 1. Organization
PowerShares Actively Managed Exchange-Traded Fund Trust (the "Trust") was organized as a Delaware statutory trust on November 6, 2007 and is authorized to have multiple series or portfolios. The Trust is an open-end management investment company, registered under the Investment Company Act of 1940, as amended (the "1940 Act"). As of the period end, the Trust offered four portfolios. This report includes the following portfolios:
| Full Name | Short Name | ||||||
| PowerShares Active AlphaQ Fund | "Active AlphaQ Fund" | ||||||
| PowerShares Active Alpha Multi-Cap Fund | "Active Alpha Multi-Cap Fund" | ||||||
| PowerShares Active Low Duration Fund | "Active Low Duration Fund" | ||||||
| PowerShares Active Mega Cap Fund | "Active Mega Cap Fund" | ||||||
Each portfolio (the "Fund" or collectively the "Funds") represents a separate series of the Trust. All of the Funds, except for the Active AlphaQ Fund and Active Alpha Multi-Cap Fund, are "non-diversified" and, as such, such Funds' investments are not required to meet certain diversification requirements under the 1940 Act. The shares of the Funds are referred to herein as "Shares" or "Fund Shares." Each Fund's Shares are listed and traded on the New York Stock Exchange Arca, Inc. ("NYSE Arca").
The Funds' market prices may differ to some degree from the net asset value of the Shares of each Fund. Unlike conventional mutual funds, each Fund issues and redeems Shares on a continuous basis, at net asset value, only in a large specified number of Shares, each called a "Creation Unit." Creation Units are issued and redeemed principally in-kind for securities included in the relevant index. Except when aggregated in Creation Units by Authorized Participants, Shares are not individually redeemable securities of the Funds. The investment objective for the Active AlphaQ Fund, Active Alpha Multi-Cap Fund and Active Mega Cap Fund is long-term capital appreciation. The Active Low Duration Fund's investment objective is total return.
Note 2. Significant Accounting Policies
The preparation of the financial statements in accordance with accounting principles generally accepted in the United States of America requires management to make estimates and assumptions that affect the reported amounts and disclosures in the financial statements, including estimates and assumptions related to taxation. Actual results could differ from these estimates.
A. Security Valuation
Securities, including restricted securities, are valued according to the following policies.
A security listed or traded on an exchange (except convertible bonds) is valued at its last sales price or official closing price as of the close of the customary trading session on the exchange where the security is principally traded, or lacking any sales or official closing price on a particular day, the security may be valued at the closing bid price on that day. Securities traded in the over-the-counter market are valued based on prices furnished by independent pricing services or market makers. Listed options, if no closing price is available, are valued at the mean between the last bid and ask prices from the exchange on which they are principally traded. Options not listed on an exchange are valued by an independent source at the mean between the last bid and ask prices.
25
Notes to Financial Statements (Continued)
PowerShares Actively Managed Exchange-Traded Fund Trust
October 31, 2008
Investments in open-end registered investment companies not traded on an exchange are valued at the end of day net asset value per share.
Debt obligations (including convertible bonds) and unlisted equities are fair valued using an evaluated quote provided by an independent pricing service. Evaluated quotes provided by the pricing service may be determined without exclusive reliance on quoted prices, and may reflect appropriate factors such as institution-size trading in similar groups of securities, developments related to specific securities, dividend rate, yield, quality, type of issue, coupon rate, maturity, individual trading characteristics and other market data. Short-term obligations, including commercial paper, having 60 days or less to maturity are recorded at amortized cost which approximates value. Debt securities are subject to interest rate and credit risks. In addition, all debt securities involve some risk of default with respect to interest and/or principal payments.
Foreign securities (including foreign exchange contracts) are converted into U.S. dollar amounts using the applicable exchange rates as of the close of the London world markets. If market quotations are available and reliable for foreign exchange traded equity securities, the securities will be valued at the market quotations. Because trading hours for certain foreign securities end before the close of the New York Stock Exchange ("NYSE"), closing market quotations may become unreliable. If between the time trading ends on a particular security and the close of the customary trading session on the NYSE, events occur that are significant and may make the closing price unreliable, the Fund may fair value the security. If the event is likely to have affected the closing price of the security, the security will be valued at fair value in good faith using procedures approved by the Board of Trustees. Adjustments to closing prices to reflect fair value may also be based on a screening process of an independent pricing service to indicate the degree of certainty, based on historical data, that the closing price in the principal market where a foreign security trades is not the current value as of the close of the NYSE. Foreign securities meeting the approved degree of certainty that the price is not reflective of current value will be priced at the indication of fair value from the independent pricing service. Multiple factors may be considered by the independent pricing service in determining adjustments to reflect fair value and may include information relating to sector indices, ADRs and domestic and foreign index futures. Foreign securities may have additional risks including exchange rate changes, potential for sharply devalued currencies and high inflation, political and economic upheaval, the relative lack of issuer information, relatively low market liquidity and the potential lack of strict financial and accounting controls and s tandards.
Securities for which market prices are not provided by any of the above methods may be valued based upon quotes furnished by independent sources.
Securities for which market quotations are not readily available or are unreliable are valued at fair value as determined in good faith by or under the supervision of the Trust's officers following procedures approved by the Board of Trustees. Issuer specific events, market trends, bid/ask quotes of brokers and information providers and other market data may be reviewed in the course of making a good faith determination of a security's fair value.
Valuations change in response to many factors including the historical and prospective earnings of the issuer, the value of the issuer's assets, general economic conditions, interest rates, investor perceptions and market liquidity. Because of the inherent uncertainties of valuation, the values reflected in the financial statements may materially differ from the value received upon actual sale of those investments.
26
Notes to Financial Statements (Continued)
PowerShares Actively Managed Exchange-Traded Fund Trust
October 31, 2008
B. Other Risks
The Funds may invest a large percentage of assets in securities of a limited number of companies, such that each investment may have a greater effect on the Fund's overall performance, and any change in the value of those securities could significantly affect the value of your investment in the Fund.
The Funds may concentrate investments in a comparatively narrow segment of the economy. Consequently, such Fund may tend to be more volatile than other funds, and the value of investments may tend to rise and fall more rapidly.
Investments in obligations issued by agencies and instrumentalities of the U.S. Government may vary in the level of support they receive from the government. The government may choose not to provide financial support to government sponsored agencies or instrumentalities if it is not legally obligated to do so. In this case, if the issuer defaulted, the underlying fund holding securities of such issuer might not be able to recover its investment from the U.S. Government.
C. Federal Income Taxes
Each Fund intends to comply with the provisions of the Internal Revenue Code applicable to regulated investment companies and will distribute substantially all of the Fund's taxable earnings to its shareholders. As such, the Funds will not be subject to Federal income taxes on otherwise taxable income (including net realized gains) that is distributed to the shareholders. Therefore, no provision for Federal income taxes is included.
Income and capital gain distributions are determined in accordance with Federal income tax regulations, which may differ from accounting principles generally accepted in the United States of America. These differences are primarily due to differing book and tax treatments for in-kind transactions, losses deferred due to wash sales, and Passive Foreign Investment Company adjustments, if any.
The Funds file tax returns in the United States Federal jurisdiction and certain other jurisdictions. Generally a Fund is subject to examinations by such taxing authorities for up to three years after the filing of the returns for the tax period.
D. Investment Income and Investment Transactions
Dividend income is recorded on the ex-dividend date net of foreign taxes withheld. Interest income is recorded on the accrual basis. Investment transactions are recorded on the trade date. Realized gains and losses from the sale or disposition of securities are calculated on the specific identified cost basis. Dividends and interest received by a Fund may give rise to withholding and other taxes imposed by foreign countries. Corporate actions (including cash dividends) are recorded net of non-reclaimable foreign tax withholdings on the ex-dividend date. Tax conventions between certain countries and the United States may reduce or eliminate such taxes.
E. Expenses
Each Fund has agreed to pay an annual unitary management fee to Invesco PowerShares Capital Management LLC (the "Adviser"). The Adviser has agreed to pay for substantially all expenses of the Funds, including the cost of transfer agency, custody, fund administration, legal, audit and other services, except for advisory fees, distribution fees, if any, brokerage expenses, taxes, interest and other extraordinary expenses.
27
Notes to Financial Statements (Continued)
PowerShares Actively Managed Exchange-Traded Fund Trust
October 31, 2008
F. Dividends and Distributions to Shareholders
Each Fund (except for the Active Low Duration Fund, which declares and pays dividends monthly) declares and pays dividends in cash from net investment income, if any, to its shareholders quarterly and distributes net realized taxable capital gains, if any, generally annually. Such distributions on a tax basis are determined in conformity with income tax regulations which may differ from accounting principles generally accepted in the United States of America. Distributions in excess of tax basis earnings and profits, if any, are reported in such Fund's financial statements as a tax return of capital at fiscal period end.
G. Equalization
All Funds use the accounting practice of equalization. This accounting method is used to keep the continuing shareholders' per share equity in undistributed net investment income from being affected by the continuous sales and redemptions of capital shares. Equalization is calculated on a per share basis whereby a portion of the proceeds from the sales and cost of repurchases of capital shares is applied to undistributed net investment income. The amount of equalization is disclosed in the Statement of Changes in Net Assets as undistributed net investment income included in the price of capital shares issued or redeemed. The distributions to shareholders of amounts so applied may be deemed to be a return of capital for tax purposes to the extent that such distributions exceed taxable income.
Note 3. Investment Advisory Agreement and Other Agreements
The Trust has entered into an Investment Advisory Agreement with the Adviser under which the Adviser has overall responsibility as the Funds' investment adviser for the selection and ongoing monitoring of the Funds' investments, managing the Funds' business affairs providing certain clerical, bookkeeping and other administrative services and oversight of AER Advisors, Inc. ("AER") and Invesco Institutional (N.A.), Inc. ("Invesco Institutional") collectively the ("Sub-Advisers"). As compensation for its services, each Fund has agreed to pay an annual unitary management fee and the Adviser has agreed to pay for substantially all expenses of the Funds, including payments to the Sub-Advisers, the cost of transfer agency, custody, fund administration, legal, audit and other services, except for advisory fees, distribution fees, if any, brokerage expenses, taxes, interest and other extraordinary expenses. The unitary management fee is paid by each Fund to the Adviser at the following annual rates:
| % of Average Daily Net Assets | |||||||
| Active AlphaQ Fund | 0.75 | % | |||||
| Active Alpha Multi-Cap Fund | 0.75 | % | |||||
| Active Low Duration Fund | 0.29 | % | |||||
| Active Mega Cap Fund | 0.75 | % | |||||
The Adviser has entered into an Investment Sub-Advisory Agreement with AER, the investment Sub-Adviser for the Active AlphaQ Fund and Active Alpha Multi-Cap Fund and an Investment Sub-Advisory Agreement with Invesco Institutional, the investment Sub-Adviser for the Active Mega Cap Fund and Active Low Duration Fund. The sub-advisory fee is paid by the Adviser to the Sub-Advisers at the following annual rates:
| Sub-adviser/Fund | Sub-advisory fee | ||||||
| AER Advisors/Active AlphaQ Fund and Active Multi-Cap Fund | 0.20% of the Fund's average daily net assets. | ||||||
| Invesco Institutional/ Active Low Duration Fund and Active Mega Cap Fund | 40% of the Adviser's compensation of the sub-advised assets. | ||||||
28
Notes to Financial Statements (Continued)
PowerShares Actively Managed Exchange-Traded Fund Trust
October 31, 2008
The Trust has entered into a Distribution Agreement with Invesco Aim Distributors, Inc. (the "Distributor"), which serves as the Distributor of Creation Units for each Fund. The Distributor does not maintain a secondary market in Shares.
The Trust has entered into service agreements whereby The Bank of New York Mellon, a wholly-owned subsidiary of The Bank of New York Mellon Corporation, serves as the administrator, custodian, fund accounting and transfer agent for each Fund.
The custodian has agreed to provide overdraft protection to the Funds according to the terms of the service agreement.
Note 4. Federal Income Taxes
At October 31, 2008, costs of investments on a tax basis including the adjustments for financial reporting completed purposes as of the most recently Federal income tax reporting period were as follows:
| Active AlphaQ Fund | $ | 4,342,695 | |||||
| Active Alpha Multi-Cap Fund | 8,420,802 | ||||||
| Active Low Duration Fund | 2,634,556 | ||||||
| Active Mega Cap Fund | 2,427,883 | ||||||
At October 31, 2008, the components of accumulated earnings/loss on a tax basis were as follows:
| Accumulated Earnings | Net Accumulated Capital and other Losses | Net Unrealized Appreciation/ Depreciation | Gross Unrealized Appreciation | Gross Unrealized Depreciation | Total Accumulated Earnings/Loss | ||||||||||||||||||||||
| Active AlphaQ Fund | $ | — | $ | (715,579 | ) | $ | (831,019 | ) | $ | 139,562 | $ | (970,581 | ) | $ | (1,546,598 | ) | |||||||||||
| Active Alpha Multi-Cap Fund | 1,519 | (1,743,017 | ) | (2,327,724 | ) | 289,734 | (2,617,458 | ) | (4,069,222 | ) | |||||||||||||||||
| Active Low Duration Fund | — | (14,415 | ) | 13,675 | 18,384 | (4,709 | ) | (740 | ) | ||||||||||||||||||
| Active Mega Cap Fund | 17,219 | (125,775 | ) | (599,197 | ) | — | (599,197 | ) | (707,753 | ) | |||||||||||||||||
Distributions to Shareholders:
The tax character of distributions paid was as follows:
| Period ended October 31, 2008 | |||||||
| Distributions paid from Ordinary Income | |||||||
| Active AlphaQ Fund | $ | — | |||||
| Active Alpha Multi-Cap Fund | — | ||||||
| Active Low Duration Fund | 27,658 | ||||||
| Active Mega Cap Fund | — | ||||||
29
Notes to Financial Statements (Continued)
PowerShares Actively Managed Exchange-Traded Fund Trust
October 31, 2008
| Period ended October 31, 2008 | |||||||
| Distributions paid from Return of Capital | |||||||
| Active AlphaQ Fund | $ | — | |||||
| Active Alpha Multi-Cap Fund | — | ||||||
| Active Low Duration Fund | 1,121 | ||||||
| Active Mega Cap Fund | — | ||||||
At October 31, 2008, for Federal income tax purposes, the Funds have capital loss carryforwards available as shown in the table below, to the extent provided by the regulations, to offset future capital gains through the years indicated. To the extent that these loss carryforwards are used to offset future capital gains, it is probable that the capital gains so offset will not be distributed to shareholders. The use of some portion of the capital loss carryforwards by any one fund may be limited by Federal tax rules. These rules limit the use of the carryfowards when there has been a greater than fifty percent change in ownership of a fund.
| Year of Expiration 2016 | |||||||
| Active AlphaQ Fund | $ | 715,579 | |||||
| Active Alpha Multi-Cap Fund | 1,743,017 | ||||||
| Active Low Duration Fund | 14,415 | ||||||
| Active Mega Cap Fund | 125,775 | ||||||
In order to present shares of beneficial interest and accumulated net realized gains or losses on the Statements of Assets and Liabilities that more closely represent their tax character, certain adjustments have been made to shares of beneficial interest, undistributed net investment income or loss and accumulated net realized gain or loss on investments. These differences are primarily due to redemptions-in-kind, investments in partnerships, wash sales, book equalization, and net operating losses, if any. These adjustments have no effect on net assets. For the period ended October 31, 2008, the adjustments were as follows:
| Undistributed Net Investment Income (Loss) | Accumulated Net Realized Loss | Shares of Beneficial Interest | |||||||||||||
| Active AlphaQ Fund | $ | 1,366 | $ | (27,683 | ) | $ | 26,317 | ||||||||
| Active Alpha Multi-Cap Fund | (11,003 | ) | — | 11,003 | |||||||||||
| Active Low Duration Fund | 1,091 | — | (1,091 | ) | |||||||||||
| Active Mega Cap Fund | 150 | (27,825 | ) | 27,675 | |||||||||||
30
Notes to Financial Statements (Continued)
PowerShares Actively Managed Exchange-Traded Fund Trust
October 31, 2008
Note 5. Investment Transactions
For the period ended October 31, 2008, the cost of securities purchased and proceeds from sales of securities, excluding short-term securities, U.S. Government securities, money market funds and in-kind transactions, were as follows:
| Purchases | Sales | ||||||||||
| Active AlphaQ Fund | $ | 3,250,954 | $ | 3,440,060 | |||||||
| Active Alpha Multi-Cap Fund | 5,591,627 | 5,568,260 | |||||||||
| Active Low Duration Fund | 104,892 | 105,164 | |||||||||
| Active Mega Cap Fund | 962,673 | 1,008,063 | |||||||||
For the period ended October 31, 2008, the cost of securities purchased and the proceeds from sales of U.S. Government securities for the Active Low Duration Fund amounted to $7,360,105 and $5,763,069, respectively.
For the period ended October 31, 2008, in-kind transactions associated with creations and redemptions were as follows:
| Securities Received | Securities Delivered | ||||||||||
| Active AlphaQ Fund | $ | 5,334,240 | $ | 118,661 | |||||||
| Active Alpha Multi-Cap Fund | 10,140,764 | — | |||||||||
| Active Low Duration Fund | — | — | |||||||||
| Active Mega Cap Fund | 2,910,845 | 339,624 | |||||||||
Gains on in-kind transactions are generally not considered taxable gains for Federal income tax purposes.
Note 6. Trustees' Fees
The Funds compensate each Trustee on behalf of the Trust who is not an employee of the Adviser or its affiliates. The Adviser, as a result of the unitary management fee, pays for such compensation. The "Interested" Trustee and officers of the Trust do not receive any Trustees' fees.
The Trust has adopted a deferred compensation plan (the "Plan"). Under the Plan, a Trustee who is not an "interested person" (as defined in the 1940 Act) (an "Independent Trustee") and has executed a Deferred Fee Agreement (a "Participating Trustee") may defer receipt of all or a portion of his compensation ("Deferral Fees"). Such Deferral Fees are deemed to be invested in selected PowerShares Funds. The Deferral Fees payable to the Participating Trustee are valued as of the date such Fees would have been paid to the Participating Trustee. The value increases with contributions or with increases in the value of the shares selected, and the value decreases with distributions or with declines in the value of the shares selected.
Note 7. Capital
Shares are created and redeemed by the Trust only in Creation Unit size aggregations of 50,000. Only Authorized Participants are permitted to purchase or redeem Creation Units from the Funds. Such transactions are generally permitted on an in-kind basis, with a balancing cash component to equate the transaction to the net asset value per unit of each Fund of the Trust on the transaction date. Cash may be
31
Notes to Financial Statements (Continued)
PowerShares Actively Managed Exchange-Traded Fund Trust
October 31, 2008
substituted equivalent to the value of certain securities generally when they are not available in sufficient quantity for delivery, not eligible for trading by the Authorized Participant or as a result of other market circumstances.
Note 8. Indemnifications
Under the Trust's organizational documents, its officers and Trustees are indemnified against certain liability arising out of the performance of their duties to the Trust. Each Independent Trustee is also indemnified against certain liabilities arising out of the performance of his duties to the Trust pursuant to an Indemnification Agreement between the Independent Trustee and the Trust. Additionally, in the normal course of business, the Trust enters into contracts with service providers that contain general indemnification clauses. The Trust's maximum exposure under these arrangements is unknown, as this would involve future claims that may be made against the Trust that have not yet occurred. However, based on experience, the Trust believes the risk of loss to be remote.
32
Report of Independent Registered Public Accounting Firm
To the Board of Trustees and Shareholders of PowerShares Actively Managed Exchange-Traded Fund Trust:
In our opinion, the accompanying statements of assets and liabilities, including the schedules of investments, and the related statements of operations and of changes in net assets and the financial highlights present fairly, in all material respects, the financial position of each of the portfolios indicated in Note 1 of the financial statements (each a portfolio of PowerShares Actively Managed Exchange-Traded Fund Trust, hereafter referred to as the "Trust") at October 31, 2008, and the results of each of their operations, the changes in each of their net assets, and the financial highlights for the period April 8, 2008 (commencement of operations) through October 31, 2008, in conformity with accounting principles generally accepted in the United States of America. These financial statements and financial highlights (hereafter referred to as "financial statements") are the responsibility of the Trust's management; our responsi bility is to express an opinion on these financial statements based on our audit. We conducted our audit of these financial statements in accordance with the standards of the Public Company Accounting Oversight Board (United States). Those standards require that we plan and perform the audit to obtain reasonable assurance about whether the financial statements are free of material misstatement. An audit includes examining, on a test basis, evidence supporting the amounts and disclosures in the financial statements, assessing the accounting principles used and significant estimates made by management, and evaluating the overall financial statement presentation. We believe that our audit, which included confirmation of securities at October 31, 2008 by correspondence with the custodian and brokers, provides a reasonable basis for our opinion.
PricewaterhouseCoopers LLP
New York, NY
December 23, 2008
33
Supplemental Information
Trustees and Officers
The Independent Trustees and the Trustee who is affiliated with the Adviser and the executive officers of the Trust, their term of office and length of time served, their principal business occupations during at least the past five years, the number of portfolios in the Fund Complex overseen by each Trustee and the other directorships, if any, held by a Trustee, are shown below.
| Name, Address and Age of Independent Trustees | Position(s) with Trust | Length of Time Served* | Principal Occupation(s) During Past 5 Years | Number of Portfolios in Fund Complex** Overseen by Trustees | Other Directorships Held by Trustees | ||||||||||||||||||
| Ronn R. Bagge (50) YQA Capital Management LLC 1755 S. Naperville Rd. Suite 100 Wheaton, IL 60187 | Trustee | Since 2008 | YQA Capital Management, LLC (July 1998-Present); formerly Owner/CEO of Electronic Dynamic Balancing Co., Inc. (high-speed rotating equipment service provider) | 118 | None | ||||||||||||||||||
* This is the date the Trustee began serving the Trust. Each Trustee serves an indefinite term until his successor is elected.
** Fund Complex includes all open-end funds (including all of their portfolios) advised by the Adviser. At October 31, 2008, the Fund Complex consists of the Trust's four portfolios and three other exchange-traded fund trusts with 114 portfolios advised by the Adviser.
34
Supplemental Information (Continued)
Trustees and Officers (Continued)
| Name, Address and Age of Independent Trustees | Position(s) with Trust | Length of Time Served* | Principal Occupation(s) During Past 5 Years | Number of Portfolios in Fund Complex** Overseen by Trustees | Other Directorships Held by Trustees | ||||||||||||||||||
| Marc M. Kole (48) c/o Invesco PowerShares Capital Management LLC 301 W. Roosevelt Road Wheaton, IL 60187 | Trustee | Since 2008 | Vice President of Finance and Accounting, Hope Network (social services) (November 2008-Present); formerly Assistant Vice President and Controller, Priority Health (health insurance) (September 2005-April 2008); Senior Vice President of Finance, United Healthcare (health insurance) (July 2004-July 2005); Senior Vice President of Finance, Oxford Health Plans (June 2000-July 2004) | 118 | None | ||||||||||||||||||
| D. Mark McMillan (45) c/o Invesco PowerShares Capital Management LLC 301 W. Roosevelt Road Wheaton, IL 60187 | Trustee | Since 2008 | Partner, Bell, Boyd & Lloyd LLP (1989-Present) | 118 | None | ||||||||||||||||||
* This is the date the Trustee began serving the Trust. Each Trustee serves an indefinite term until his successor is elected.
** Fund Complex includes all open-end funds (including all of their portfolios) advised by the Adviser. At October 31, 2008, the Fund Complex consists of the Trust's four portfolios and three other exchange-traded fund trusts with 114 portfolios advised by the Adviser.
35
Supplemental Information (Continued)
Trustees and Officers (Continued)
| Name, Address and Age of Independent Trustees | Position(s) with Trust | Length of Time Served* | Principal Occupation(s) During Past 5 Years | Number of Portfolios in Fund Complex** Overseen by Trustees | Other Directorships Held by Trustees | ||||||||||||||||||
| Philip M. Nussbaum (46) c/o Invesco PowerShares Capital Management LLC 301 W. Roosevelt Road Wheaton, IL 60187 | Trustee | Since 2008 | Chairman, Performance Trust Capital Partners (formerly Betzold, Berg, Nussbaum & Heitman, Inc.) (November 2004- Present); formerly Managing Director, Communication Institute (May 2002-August 2003); formerly Executive Vice President of Finance, Betzold, Berg, Nussbaum & Heitman, Inc. (March 1994-1999) | 118 | None | ||||||||||||||||||
* This is the date the Trustee began serving the Trust. Each Trustee serves an indefinite term until his successor is elected.
** Fund Complex includes all open-end funds (including all of their portfolios) advised by the Adviser. At October 31, 2008, the Fund Complex consists of the Trust's four portfolios and three other exchange-traded fund trusts with 114 portfolios advised by the Adviser.
36
Supplemental Information (Continued)
Trustees and Officers (Continued)
| Name, Address and Age of Independent Trustees | Position(s) with Trust | Length of Time Served* | Principal Occupation(s) During Past 5 Years | Number of Portfolios in Fund Complex** Overseen by Trustees | Other Directorships Held by Trustees | ||||||||||||||||||
| Donald H. Wilson (48) c/o Invesco PowerShares Capital Management LLC 301 W. Roosevelt Road Wheaton, IL 60187 | Trustee | Since 2008 | President, Chief Operating Officer and Chief Financial Officer, AMCORE Financial, Inc. (bank holding company) (August 2007-Present); formerly Executive Vice President and Chief Financial Officer, AMCORE Financial, Inc. (February 2006- August 2007); Senior Vice President and Treasurer, Marshall & Ilsley Corp. (bank holding company) (May 1995- February 2006) | 118 | None | ||||||||||||||||||
* This is the date the Trustee began serving the Trust. Each Trustee serves an indefinite term until his successor is elected.
** Fund Complex includes all open-end funds (including all of their portfolios) advised by the Adviser. At October 31, 2008, the Fund Complex consists of the Trust's four portfolios and three other exchange-traded fund trusts with 114 portfolios advised by the Adviser.
37
Supplemental Information (Continued)
Trustees and Officers (Continued)
| Name, Address and Age of Management Trustee | Position(s) with Trust | Length of Time Served* | Principal Occupation(s) During Past 5 Years | Number of Portfolios in Fund Complex*** Overseen by Trustee | Other Directorships Held by Trustee | ||||||||||||||||||
| H. Bruce Bond** (45) Invesco PowerShares Capital Management LLC 301 W. Roosevelt Road Wheaton, IL 60187 | Chairman of the Board, Trustee and Chief Executive Officer | Since 2007 | Managing Director, Invesco PowerShares Capital Management LLC (August 2002-Present); formerly Manager, Nuveen Investments (April 1998-August 2002) | 118 | None | ||||||||||||||||||
Availability of Additional Information About the Trustees
The Statement of Additional Information includes additional information about the Trustees and is available, without charge, upon request at 800.337.4246.
* This is the date the Management Trustee began serving the Trust. Each Trustee serves an indefinite term until his successor is elected.
** "Interested person" as defined in Section 2(a)(19) of the 1940 Act.
*** Fund Complex includes all open-end funds (including all of their portfolios) advised by the Adviser. At October 31, 2008, the Fund Complex consists of the Trust's four portfolios and three other exchange-traded fund trusts with 114 portfolios advised by the Adviser.
38
Supplemental Information (Continued)
Trustees and Officers (Continued)
| Name, Address and Age of Officers | Position(s) with Trust | Length of Time Served* | Principal Occupation(s) During Past 5 Years | ||||||||||||
| Bruce T. Duncan (54) Invesco PowerShares Capital Management LLC 301 W. Roosevelt Road Wheaton, IL 60187 | Chief Financial Officer, Treasurer and Secretary | Since 2008 | Senior Vice President of Finance, Invesco PowerShares Capital Management LLC (September 2005-Present); Private Practice Attorney (2000-2005); Vice President of Investor Relations, The ServiceMaster Company (1994-2000); Vice President of Taxes, The ServiceMaster Company (1990-2000) | ||||||||||||
| Kevin R. Gustafson (42) Invesco PowerShares Capital Management LLC 301 W. Roosevelt Road Wheaton, IL 60187 | Chief Compliance Officer | Since 2008 | General Counsel, Invesco PowerShares Capital Management LLC (September 2004-Present); Chief Compliance Officer, Invesco PowerShares Capital Management LLC (September 2004-April 2008); Attorney, Nyberg & Gustafson (2001-2004); Attorney, Burke, Warren, McKay & Serritella, P.C. (1997-2000) | ||||||||||||
* This is the period for which the officers began serving the Trust. Each officer serves until his successor is elected.
39
This page intentionally left blank
PROXY VOTING POLICIES AND PROCEDURES
A description of the Funds' proxy voting policies and procedures that the Funds use to determine how to vote proxies relating to portfolio securities is available, without charge and upon request, by calling (800) 337-4246. This information is also available on the Securities and Exchange Commission's ("Commission") website at www.sec.gov.
Information regarding how the Funds voted proxies for portfolio securities, if applicable, during the most recent 12-month period ended June 30, is also available, without charge and upon request, by (i) calling (800) 337-4246; or (ii) accessing the Trust's Form N-PX on the Commission's website at www.sec.gov.
QUARTERLY PORTFOLIOS
The Funds file their complete schedules of portfolio holdings with the Commission for the first and third quarters of each fiscal year on Form N-Q. The Trust's Forms N-Q are available on the Commission's website at www.sec.gov. The Trust's Forms N-Q may also be reviewed and copied at the Commission's Public Reference Room in Washington, DC; information on the operation of the Public Reference Room may be obtained by calling (800) SEC-0330.
There are risks involved in investing in Exchange Traded Funds ("ETFs"), including possible loss of money. Investing in securities of small and medium sized companies involves greater risk than is customarily associated with investing in more established companies, and investments in concentrated industry sectors involve greater risks than investments that are more diversified. Index-based ETFs are not actively managed. Actively managed ETF's do not necessarily seek to replicate the performance of a specific index. Both index-based and actively managed ETFs are subject to risks similar to stocks, including those related to short selling and margin maintenance. PowerShares ETFs are not FDIC insured, may lose value and have no bank guarantee. PowerShares is a registered trademark of Invesco PowerShares Capital Management LLC. Past performance is not a guarantee of future results.
Invesco Aim Distributors, Inc. is the distributor of the PowerShares Actively Managed Exchange-Traded Fund Trust.
An investor should consider each ETF's investment objective, risks, charges and expenses carefully before investing. For more complete information about PowerShares ETFs call Invesco Aim Distributors, Inc. at (800) 337-4246 or visit invescopowershares.com for a prospectus. Please read the prospectus carefully before investing.


301 West Roosevelt Road
Wheaton, IL 60187
800.983.0903
www.invescopowershares.com
© 2008 Invesco PowerShares Capital Management LLC P-PS-AR-10
Item 2. Code of Ethics.
The Registrant has adopted a Code of Ethics that applies to the Registrant’s principal executive officer and principal financial officer. This Code is filed as an exhibit to this report on Form N-CSR under Item 12(a)(1).
Item 3. Audit Committee Financial Expert.
The Registrant’s Board of Trustees has determined that the Registrant has three “audit committee financial experts” serving on its audit committee: Mr. Philip M. Nussbaum, Mr. Marc M. Kole, and Mr. Donald H. Wilson. Each of these audit committee members is “independent,” meaning that he is not an “interested person” of the Registrant (as that term is defined in Section 2(a)(19) of the Investment Company Act of 1940) and he does not accept any consulting, advisory, or other compensatory fee from the Registrant (except in the capacity as a Board or committee member).
An “audit committee financial expert” is not an “expert” for any purpose, including for purposes of Section 11 of the Securities Act of 1933, as a result of being designated as an “audit committee financial expert.” Further, the designation of a person as an “audit committee financial expert” does not mean that the person has any greater duties, obligations, or liability than those imposed on the person without the “audit committee financial expert” designation. Similarly, the designation of a person as an “audit committee financial expert” does not affect the duties, obligations, or liability of any other member of the audit committee or board of trustees.
Item 4. Principal Accountant Fees and Services.
(a) Audit Fees. The aggregate fees billed for the Registrant’s fiscal period ended October 31, 2008 for professional services rendered by the principal accountant for the audit of the Registrant’s annual financial statements or services that are normally provided by the accountant in connection with statutory and regulatory filings or engagements for such fiscal year were $90,000.
(b) Audit-Related Fees. The aggregate fees billed for the Registrant’s fiscal period ended October 31, 2008 for assurance and related services by the principal accountant that are reasonably related to the performance of the audit of the Registrant’s financial statements and are not reported above in Item 4(a) were $3,000. These fees related to reviews of the Registrant’s Registration Statement.
(c) Tax Fees. The aggregate fees billed for the Registrant’s fiscal period ended October 31, 2008 for professional services rendered by the principal accountant for tax return reviews were $13,000.
(d) All Other Fees. All other aggregate fees billed for the Registrant’s fiscal period ended October 31, 2008 were $0.
(e) Audit Committee Pre-Approval Policies and Procedures. In accordance with Rule 2-01(c)(7) the Audit Committee pre-approves the engagement of the auditor, including the fees to be paid to the auditor, to provide any audit or non-audit services to the Registrant and any non-audit services to the Registrant’s investment adviser or any entity controlling, controlled by or under common control with the investment adviser that provides on-going services to the Registrant if the engagement relates directly to the operations and financial reporting of the Registrant. The Chairman of the Audit Committee may pre-approve certain services to be provided by the auditor to the Registrant. All such delegated pre-approvals shall be presented to the Audit Committee no later than the next Audit Committee meeting.
No services described in paragraphs (b) and (c) above were approved by the Audit Committee in accordance with paragraph (c)(7)(i)(C) of Rule 2-01 of Regulation S-X.
(g) Aggregate fees billed to the Registrant for non-audit services for the fiscal year ended October 31, 2008 were $16,000. The aggregate fees billed by the auditor for non-audit services rendered to the Registrant’s investment adviser (not including any subadviser whose role is primarily portfolio management and is subcontracted with or overseen by another investment adviser), and any entity controlling, controlled by, or under common control with the adviser that provides ongoing services to the Registrant were $0 for the fiscal year ended October 31, 2008.
(h) There were no non-audit services rendered to the Registrant’s investment adviser (not including any subadviser whose role is primarily portfolio management and is subcontracted with or overseen by another investment adviser), and any entity controlling, controlled by, or under common control with the adviser that provide on-going services to the Registrant.
PwC advised the Registrant’s Audit Committee that PwC had identified two matters that required further consideration under the SEC’s auditor independence rules.
First, PwC was engaged to perform services to an affiliate of the Registrant’s investment adviser, including (a) consulting with respect to the acquisition by the affiliate of certain assets from a third party; and (b) providing expert testimony in connection with any arbitration proceeding or litigation arising from or relating to the transaction. SEC rules provide that an accountant is not independent if, at any point during the audit and professional engagement period, the accountant provides expert services unrelated to the audit to an audit client. Specifically, PwC would not be permitted to provide expert testimony nor perform other services in support of the client or its counsel in connection with a proceeding. Within days of being engaged to provide the services, PwC determined that some of the services contemplated in the engagement terms would be inconsistent with the SEC’s auditor independence rules. A review of the services performed pursuant to the original agreement was conducted. Following the review, the initial engagement terms were modified to limit PwC’s services to those permitted under the rules. Although PwC concluded that the services performed were not inconsistent with the SEC’s independence rules, because PwC and an affiliate of the Registrant’s investment adviser entered into an agreement that would have permitted PwC to provide an impermissible service in violation of Rule 2-01(c)(4)(x) of Regulation S-X, PwC reported this independence exception to the Audit Committee.
Second, an employee of PwC served as a nominee shareholder (effectively equivalent to a Trustee) of various companies or trusts since 2001. Some of these companies held shares of INVESCO Nippon Warrants Fund (the “Investment”), an affiliate of Invesco Ltd., which owns the Registrant’s investment adviser and is part of the Investment Company Complex. The Investment, which consisted of 2,070 shares, was initially entered into during July 1, 2001 - December 31, 2005. PwC informed the Audit Committee that the second matter could have constituted an investment in an affiliate of an audit client in violation of Rule 2-01(c)(1) of Regulation S-X.
PwC advised the Audit Committee that it believes its independence had not been adversely affected as it related to the audit of the Registrant. In reaching this conclusion, PwC noted that during the time of its audit, the engagement team was not aware of the Investment, as it relates to the second matter, and that PwC did not believe either of these situations affected PwC’s ability to act objectively and impartially and to issue a report on financial statements as the Registrant’s independent auditor. Based upon PwC’s review and discussion, the Audit Committee concurred with PwC’s conclusions in relation to its independence.
Item 5. Audit Committee of Listed Registrants.
The Registrant has a separately designated Audit Committee established in accordance with Section 3(a)(58)(A) of the Securities Exchange Act of 1934, as amended, which consists of the independent trustees. The Audit Committee members are Philip M. Nussbaum, D. Mark McMillan, Ronn R. Bagge, Marc M. Kole and Donald H. Wilson.
Items 6. Schedule of Investments.
The Schedules of Investments are included as a part of the report to shareholders filed under Item 1 of this Form.
Item 7. Disclosure of Proxy Voting Policies and Procedures for Closed-End Management Investment Companies.
Not applicable.
Item 8. Portfolio Managers of Closed-End Management Investment Companies.
Not applicable.
Item 9. Purchases of Equity Securities by Closed-End Management Investment Company and Affiliated Purchasers.
Not applicable.
Item 10. Submission of Matters to a Vote of Security Holders.
There have been no changes to the procedures by which shareholders may recommend nominees to the Registrant’s Board of Trustees that would require disclosure herein.
Item 11. Controls and Procedures.
a) Based on their evaluation of the Registrant’s disclosure controls and procedures (as defined in Rule 30a-3-(c) under the Investment Company Act of 1940) as of a date within 90 days of the filing date of this report, the Registrant’s President (principal executive officer) and Chief Financial Officer (principal financial officer) have concluded that such disclosure controls and procedures are effective.
b) There were no significant changes in the Registrant’s internal controls over financial reporting (as defined in Rule 30a-3(d) under the Investment Company Act of 1940) that occurred during the fourth fiscal quarter of the period covered by this report that have materially affected, or are reasonably likely to materially affect, the Registrant’s internal control over financial reporting.
Item 12. Exhibits.
(a)(1) Code of Ethics.
(a)(2) Certifications of the Registrant’s Chief Executive Officer and Chief Financial Officer pursuant to Section 302 of the Sarbanes-Oxley Act of 2002 are attached as Exhibit 99.CERT.
(b) Certifications of the Registrant’s Chief Executive Officer and Chief Financial Officer pursuant to Section 906 of the Sarbanes-Oxley Act of 2002 is attached as Exhibit 99.906CERT.
SIGNATURES
Pursuant to the requirements of the Securities Exchange Act of 1934 and the Investment Company Act of 1940, the Registrant has duly caused this report to be signed on its behalf by the undersigned, thereunto duly authorized.
(Registrant) PowerShares Actively Managed Exchange-Traded Fund Trust
By: | /s/ H. Bruce Bond |
| |
|
| ||
Name: | H. Bruce Bond | ||
| |||
Title: | Chief Executive Officer | ||
| |||
Date: | January 9, 2009 | ||
Pursuant to the requirements of the Securities Exchange Act of 1934 and the Investment Company Act of 1940, this report has been signed by the following persons on behalf of the Registrant and in the capacities and on the dates indicated.
By: | /s/ H. Bruce Bond |
| |||
|
| ||||
Name: | H. Bruce Bond |
| |||
|
| ||||
Title: | Chief Executive Officer |
| |||
|
|
| |||
Date: | January 9, 2009 |
| |||
|
| ||||
By: | /s/ Bruce T. Duncan |
| |||
|
| ||||
Name: | Bruce T. Duncan |
| |||
|
|
| |||
Title: | Chief Financial Officer |
| |||
|
|
| |||
Date: | January 9, 2009 |
| |||