UNITED STATES
SECURITIES AND EXCHANGE COMMISSION
Washington, D.C. 20549
FORM N-CSR
CERTIFIED SHAREHOLDER REPORT OF REGISTERED
MANAGEMENT INVESTMENT COMPANIES
Investment Company Act file number | 811-22148 | |||||||
| ||||||||
PowerShares Actively Managed Exchange-Traded Fund Trust | ||||||||
(Exact name of registrant as specified in charter) | ||||||||
| ||||||||
301 W. Roosevelt Road |
| 60187 | ||||||
(Address of principal executive offices) |
| (Zip code) | ||||||
| ||||||||
Andrew Schlossberg | ||||||||
(Name and address of agent for service) | ||||||||
| ||||||||
Registrant’s telephone number, including area code: | 800-983-0903 |
| ||||||
| ||||||||
Date of fiscal year end: | October 31 |
| ||||||
| ||||||||
Date of reporting period: | October 31, 2009 |
| ||||||
Item 1. Reports to Stockholders.
The Registrant’s annual report transmitted to shareholders pursuant to Rule 30e-1 under the Investment Company Act of 1940 is as follows:


2009 Annual Report to Shareholders
October 31, 2009
PowerShares Active AlphaQ Fund
PowerShares Active Alpha Multi-Cap Fund
PowerShares Active Low Duration Fund
PowerShares Active Mega Cap Fund
PowerShares Active U.S. Real Estate Fund

Table of Contents
| The Market Environment | 3 | ||||||
| Manager's Analysis | 4 | ||||||
| Frequency Distribution of Discounts & Premiums | 16 | ||||||
| Fees and Expenses | 18 | ||||||
| Schedules of Investments | |||||||
| PowerShares Active AlphaQ Fund | 20 | ||||||
| PowerShares Active Alpha Multi-Cap Fund | 21 | ||||||
| PowerShares Active Low Duration Fund | 22 | ||||||
| PowerShares Active Mega Cap Fund | 23 | ||||||
| PowerShares Active U.S. Real Estate Fund | 24 | ||||||
| Statements of Assets and Liabilities | 26 | ||||||
| Statements of Operations | 27 | ||||||
| Statements of Changes in Net Assets | 28 | ||||||
| Financial Highlights | 30 | ||||||
| Notes to Financial Statements | 33 | ||||||
| Report of Independent Registered Public Accounting Firm | 44 | ||||||
| Supplemental Information | 45 | ||||||
This page intentionally left blank
The Market Environment
For the year ended October 31, 2009, the global economic situation saw signs of recovery. Global markets continued their decline during the last two months of 2008, but experienced a significant rally after the equity markets bottomed in the early months of 2009. International markets saw a steep rebound, while the U.S. markets experienced a milder upswing. Volatility returned closer to its historic average during the year. Emerging markets had the strongest recovery with the benchmark MSCI Emerging Markets Index returning 64.13%. Developed international markets also posted strong returns with the benchmark MSCI EAFE Index returning 27.71%. The U.S. market had the lowest equity returns over the reporting period with the S&P 500® Index returning 9.80%. Fixed income markets trended higher over the year with the Barclays Aggregate Bond Index returning 13.79%.
3
Manager's Analysis
PowerShares Active AlphaQ Fund (ticker: PQY)
The sub-adviser of the PowerShares Active AlphaQ Fund (the "Fund") is AER Advisors, Inc (the "Sub-Adviser"). The investment objective of the Fund is long-term capital appreciation. The Fund's portfolio generally consists of 50 Nasdaq-listed securities selected using a unique stock-screening methodology developed by AER Advisors, Inc. The Sub-Adviser rates the stocks of companies with more than $400 million market cap that are traded in the United States. The Sub-Adviser generates a master stock list on a weekly basis that ranks these stocks (approximately 3,000 stocks), segmented by market capitalization, based on its proprietary stock-ranking methodology. Stocks are selected based on factors such as strong earnings growth, low valuations and positive money flow. The Sub-Adviser then narrows its universe to the 100 largest NASDAQ-listed Global Market Securities from their master stock list. The Fund then generally selects and pu rchases approximately 50 stocks.
The Fund returned 14.38% for the year ended October 31, 2009 underperforming the NASDAQ 100 by 11.45%. The information technology sector, which constitutes more than 35.8% of the portfolio, had the greatest contribution to the Fund's performance. The largest detractor on an individual security basis, came from holdings of Fifth Third Bancorp., while the greatest positive performance came from Priceline.com Inc. The health care sector also contributed positively to the Fund's performance, mainly due to superior stock selection in the sector.
Sector Breakdown (% of the Fund's
Net Assets) as of October 31, 2009
| Information Technology | 35.8 | ||||||
| Consumer Discretionary | 23.8 | ||||||
| Health Care | 18.5 | ||||||
| Financials | 9.7 | ||||||
| Industrials | 4.5 | ||||||
| Telecommunication Services | 4.1 | ||||||
| Materials | 1.9 | ||||||
| Consumer Staples | 1.7 | ||||||
| Money Market Fund | 0.1 | ||||||
| Other | (0.1 | ) | |||||
Style Allocation (% of the Fund's Total
Investments) as of October 31, 2009
| Mid-Cap Growth | 56.5 | ||||||
| Large-Cap Growth | 22.5 | ||||||
| Large-Cap Value | 9.1 | ||||||
| Mid-Cap Value | 7.5 | ||||||
| Small-Cap Value | 4.4 | ||||||
Top Ten Fund Holdings (% of the Fund's
Net Assets) as of October 31, 2009
| Security | |||||||
| Citrix Systems, Inc. | 2.7 | ||||||
| NetApp, Inc. | 2.7 | ||||||
| Life Technologies Corp. | 2.6 | ||||||
| Liberty Media Corp.-Entertainment Class A | 2.6 | ||||||
| AsiaInfo Holdings, Inc. | 2.6 | ||||||
| Bucyrus International, Inc. | 2.5 | ||||||
| eBay, Inc. | 2.5 | ||||||
| Millicom International Cellular SA | 2.4 | ||||||
| Warner Chilcott PLC Class A | 2.4 | ||||||
| Express Scripts, Inc. | 2.3 | ||||||
| Total | 25.3 | ||||||
4
Manager's Analysis (Continued)
PowerShares Active AlphaQ Fund (ticker: PQY)
Growth of a $10,000 Investment Since Inception†
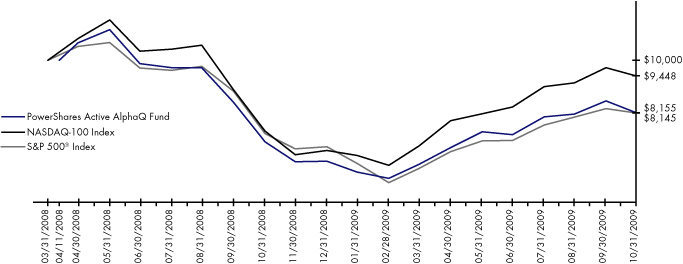
| Fund Performance History (%) | As of October 31, 2009 | ||||||||||||||
| Avg Ann†† | Fund Inception† | ||||||||||||||
| 1 Year | Avg Ann†† | Cumulative | |||||||||||||
| Index | |||||||||||||||
| NASDAQ 100 Index | 25.83 | -3.53 | -5.52 | ||||||||||||
| S&P 500® Index | 9.80 | -12.16 | -18.55 | ||||||||||||
| Fund | |||||||||||||||
| NAV | 14.38 | -12.28 | -18.45 | ||||||||||||
| Share Price Return | 14.15 | -12.39 | -18.60 | ||||||||||||
Fund Inception: April 11, 2008
Performance quoted represents past performance. Past performance is not a guarantee of future results and current performance may be higher or lower than performance quoted. Investment returns and principal value will fluctuate and shares, when redeemed, may be worth more or less than their original cost. According to the Fund's current prospectus, the expense ratio of 0.75% is expressed as a unitary fee to cover operating expenses and expenses incurred in connection with managing the portfolio. NAV and Share Price returns assume that dividends and capital gain distributions have been reinvested in the Fund at NAV and Share Price, respectively. The returns shown in the table above do not reflect the deduction of taxes that a shareholder would pay on Fund distributions or the redemption or sale of Fund Shares. See invescopowershares.com to find the most recent month-end performance numbers.
Index performance results are based upon a hypothetical investment in its constituent securities. Index returns do not represent Fund returns. An investor cannot invest directly in an index. The Index does not charge management fees or brokerage expenses, and no such fees or expenses were deducted from the hypothetical performance shown. In addition, the results actual investors might have achieved would have differed from those shown because of differences in the timing, amounts of their investments, and fees and expenses associated with an investment in the Fund.
The NASDAQ 100 Index and S&P 500® Index (the "Benchmark Indices") are unmanaged indices used as a measurement of change in stock market conditions based on the average performance of approximately 100 and 500 common stocks, respectively.
† Fund returns are based on the inception date of the Fund. Returns for the Benchmark Indices are based on the closest month-end to the Fund's inception date.
†† Average annualized.
5
Manager's Analysis
PowerShares Active Alpha Multi-Cap Fund (ticker: PQZ)
The sub-adviser of the PowerShares Active Alpha Multi-Cap Fund (the "Fund") is AER Advisors, Inc (the "Sub-Adviser"). The investment objective of the Fund is long-term capital appreciation. The Fund's portfolio generally consists of 50 securities selected using a unique stock-screening methodology developed by AER Advisors, Inc. The Sub-Adviser rates the stocks of companies with more than $400 million market capitalization that are traded in the United States. Weekly, the Sub-Adviser generates a master stock list that ranks these stocks (approximately 3,000 stocks), segmented by market capitalization, based on its proprietary stock-ranking methodology. Stocks are selected based on factors such as strong earnings growth, low valuations and positive money flow. The Sub-Advisers then narrows its universe to the 2,000 largest stocks of companies with varying capitalizations from their master list. The Fund then generally selects and purchases approximately 50 stocks.
The Fund returned 2.49% for the year ended October 31, 2009 underperforming the S&P 500® Index by 7.31%. The information technology sector, which constitutes more than 24% of the portfolio, had the greatest positive contribution to the Fund's performance, due to superior stock selection. IAMGOLD Corp. was the largest individual positive contributor to the Fund. Health care companies, specifically China Medical Technologies and Community Health Systems, which are no longer held by the Fund, were the greatest detractors to the Fund.
Sector Breakdown (% of the Fund's
Net Assets) as of October 31, 2009
| Information Technology | 24.1 | ||||||
| Financials | 21.0 | ||||||
| Energy | 17.1 | ||||||
| Health Care | 13.9 | ||||||
| Consumer Discretionary | 8.4 | ||||||
| Consumer Staples | 8.3 | ||||||
| Materials | 4.4 | ||||||
| Industrials | 1.5 | ||||||
| Utilities | 1.2 | ||||||
| Other | 0.1 | ||||||
Style Allocation (% of the Fund's Total
Investments) as of October 31, 2009
| Mid-Cap Growth | 33.8 | ||||||
| Small-Cap Growth | 32.5 | ||||||
| Small-Cap Value | 12.7 | ||||||
| Mid-Cap Value | 10.9 | ||||||
| Large-Cap Growth | 7.9 | ||||||
| Large-Cap Value | 2.2 | ||||||
Top Ten Fund Holdings (% of the Fund's
Net Assets) as of October 31, 2009
| Security | |||||||
| Hansen Natural Corp. | 2.9 | ||||||
| Amedisys, Inc. | 2.7 | ||||||
| Cognizant Technology Solutions Corp. Class A | 2.6 | ||||||
| Petroleo Brasileiro SA | 2.6 | ||||||
| CNinsure, Inc. | 2.6 | ||||||
| Perfect World Co. Ltd. | 2.6 | ||||||
| Atwood Oceanics, Inc. | 2.5 | ||||||
| VistaPrint NV | 2.5 | ||||||
| IAMGOLD Corp. | 2.5 | ||||||
| Longtop Financial Technologies Ltd. | 2.4 | ||||||
| Total | 25.9 | ||||||
6
Manager's Analysis (Continued)
PowerShares Active Alpha Multi-Cap Fund (ticker: PQZ)
Growth of a $10,000 Investment Since Inception†
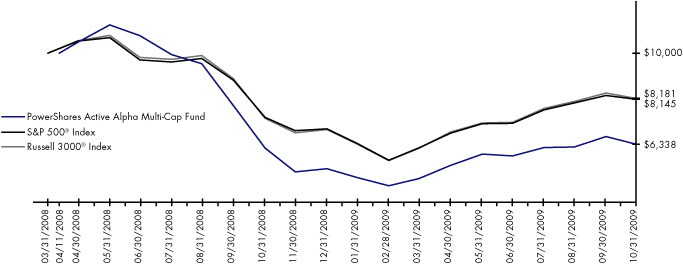
| Fund Performance History (%) | As of October 31, 2009 | ||||||||||||||
| Avg Ann†† | Fund Inception† | ||||||||||||||
| 1 Year | Avg Ann†† | Cumulative | |||||||||||||
| Index | |||||||||||||||
| S&P 500® Index | 9.80 | -12.16 | -18.55 | ||||||||||||
| Russell 3000® Index | 10.83 | -11.91 | -18.19 | ||||||||||||
| Fund | |||||||||||||||
| NAV | 2.49 | -25.40 | -36.62 | ||||||||||||
| Share Price Return | 2.82 | -25.40 | -36.62 | ||||||||||||
Fund Inception: April 11, 2008
Performance quoted represents past performance. Past performance is not a guarantee of future results and current performance may be higher or lower than performance quoted. Investment returns and principal value will fluctuate and shares, when redeemed, may be worth more or less than their original cost. According to the Fund's current prospectus, the expense ratio of 0.75% is expressed as a unitary fee to cover operating expenses and expenses incurred in connection with managing the portfolio. NAV and Share Price returns assume that dividends and capital gain distributions have been reinvested in the Fund at NAV and Share Price, respectively. The returns shown in the table above do not reflect the deduction of taxes that a shareholder would pay on Fund distributions or the redemption or sale of Fund Shares. See invescopowershares.com to find the most recent month-end performance numbers.
Index performance results are based upon a hypothetical investment in its constituent securities. Index returns do not represent Fund returns. An investor cannot invest directly in an index. The Index does not charge management fees or brokerage expenses, and no such fees or expenses were deducted from the hypothetical performance shown. In addition, the results actual investors might have achieved would have differed from those shown because of differences in the timing, amounts of their investments, and fees and expenses associated with an investment in the Fund.
The S&P 500® Index and Russell 3000® Index (the "Benchmark Indices") are unmanaged indices used as a measurement of change in stock market conditions based on the average performance of approximately 500 and 2956 common stocks, respectively.
† Fund returns are based on the inception date of the Fund. Returns for the Benchmark Indices are based on the closest month-end to the Fund's inception date.
†† Average annualized.
7
Manager's Analysis
PowerShares Active Low Duration Fund (ticker: PLK)
The sub-adviser of the PowerShares Active Low Duration Fund (the "Fund") is Invesco Institutional (N.A.), Inc. The investment objective of the Fund is to provide total return. The Fund seeks to achieve its objective by investing in a portfolio of U.S. government, corporate and agency debt securities selected by Invesco World-Wide Fixed Income management team. The Fund seeks to outperform its benchmark, Barclays Capital 1-3 Year U.S. Treasury Index ("The Index"), by applying an actively-managed, top-down portfolio construction and bottom-up security selection total return strategy.
For the year ended October 31, 2009, the Fund returned 3.27% while the Index returned 2.80%. The Fund's performance differential versus the Index, beyond regular fund expenses, can mainly be attributed to modest portfolio positions, added earlier in the year, in agency debentures, FDIC guaranteed bank debt and high grade corporate securities.
Duration Breakdown (% of the Fund's
Net Assets) as of October 31, 2009
| Maturing in less than 1 year | 33.7 | ||||||
| Maturing in 1 to 5 Years | 66.9 | ||||||
| Maturing in 6 to 10 Years | 2.1 | ||||||
| Other | (2.7 | ) | |||||
Top Ten Holdings (% of the Fund's
Net Assets) as of October 31, 2009
| United States Treasury Notes 4.375%, 12/15/2010 | 18.9 | ||||||
| United States Treasury Notes 4.125%, 08/15/2010 | 14.9 | ||||||
| United States Treasury Notes 1.875%, 06/15/2012 | 9.3 | ||||||
| United States Treasury Notes 2.750%, 07/31/2010 | 8.4 | ||||||
| United States Treasury Notes 1.375%, 05/15/2012 | 5.1 | ||||||
| United States Treasury Notes 0.875%, 02/28/2011 | 4.8 | ||||||
| United States Treasury Notes 1.375%, 03/15/2012 | 4.5 | ||||||
| United States Treasury Notes 4.250%, 10/15/2010 | 3.4 | ||||||
| United States Treasury Notes 0.875%, 03/31/2011 | 2.6 | ||||||
| United States Treasury Notes 1.500%, 07/15/2012 | 2.6 | ||||||
| Total | 74.5 | ||||||
8
Manager's Analysis (Continued)
PowerShares Active Low Duration Fund (ticker: PLK)
Growth of a $10,000 Investment Since Inception†
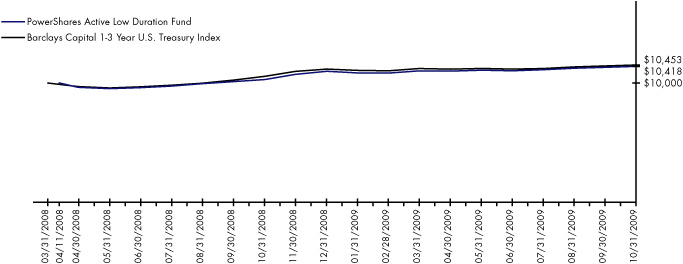
| Fund Performance History (%) | As of October 31, 2009 | ||||||||||||||
| Avg Ann†† | Fund Inception† | ||||||||||||||
| 1 Year | Avg Ann†† | Cumulative | |||||||||||||
| Index | |||||||||||||||
| Barclays Capital 1-3 Year US Treasury Index | 2.80 | 2.84 | 4.53 | ||||||||||||
| Fund | |||||||||||||||
| NAV | 3.27 | 2.66 | 4.18 | ||||||||||||
| Share Price Return | 4.20 | 2.09 | 3.27 | ||||||||||||
Fund Inception: April 11, 2008
Performance quoted represents past performance. Past performance is not a guarantee of future results and current performance may be higher or lower than performance quoted. Investment returns and principal value will fluctuate and shares, when redeemed, may be worth more or less than their original cost. According to the Fund's current prospectus, the expense ratio of 0.30%1 is expressed as a unitary fee to cover operating expenses and expenses incurred in connection with managing the portfolio. NAV and Share Price returns assume that dividends and capital gain distributions have been reinvested in the Fund at NAV and Share Price, respectively. The returns shown in the table above do not reflect the deduction of taxes that a shareholder would pay on Fund distributions or the redemption or sale of Fund Shares. See invescopowershares.com to find the most recent month-end performance numbers.
Index performance results are based upon a hypothetical investment in its constituent securities. Index returns do not represent Fund returns. An investor cannot invest directly in an index. The Index does not charge management fees or brokerage expenses, and no such fees or expenses were deducted from the hypothetical performance shown. In addition, the results actual investors might have achieved would have differed from those shown because of differences in the timing, amounts of their investments, and fees and expenses associated with an investment in the Fund.
The Barclays Capital 1-3 Year U.S. Treasury Index (the "Benchmark Index") is an unmanaged index used as a measurement of change in stock market conditions based on the average performance of approximately 20 treasury securities.
† Fund returns are based on the inception date of the Fund. Returns for the Benchmark Index are based on the closest month-end to the Fund's inception date.
†† Average annualized.
1 The expense ratio includes estimated acquired fund fees and expenses of the acquired funds in which the Fund invests of 0.01%.
9
Manager's Analysis
PowerShares Active Mega Cap Fund (ticker: PMA)
The sub-adviser of the PowerShares Active Mega Cap Fund ("the Fund") is Invesco Institutional (N.A.), Inc. ("Invesco Institutional"). The investment objective of the Fund is long-term growth of capital. The Fund's universe may include securities in the Russell Top 200® Index (the "Index") as well as other mega-capitalization stocks. All stocks in the universe are evaluated by Invesco Institutional's proprietary stock selection model. The model is based on several factors relating to four main concepts: earnings momentum, price trend, management action and relative value. Each stock is ranked by this model, and the result is a "weight-of-the-evidence" forecast of the expected excess return for each stock compared to other stocks within their respective industry. Additionally, each stock is evaluated for risk along multiple dimensions.
For the year ended October 31, 2009, the Fund returned 17.37%, while its benchmark, the Index returned 8.52%. The Fund benefited from stock selection in the financial and energy sectors. In particular, the avoidance of exposure to Citigroup and Bank of America over the last year proved advantageous. An underweight to financials during this period also helped the Fund.
Sector Breakdown (% of the Fund's
Net Assets) as of October 31, 2009
| Information Technology | 24.2 | ||||||
| Health Care | 22.9 | ||||||
| Energy | 15.6 | ||||||
| Financials | 14.0 | ||||||
| Consumer Discretionary | 12.4 | ||||||
| Telecommunication Services | 4.4 | ||||||
| Industrials | 3.5 | ||||||
| Consumer Staples | 2.0 | ||||||
| Money Market Fund | 0.8 | ||||||
| Materials | 0.7 | ||||||
| Other | (0.5 | ) | |||||
Style Allocation (% of the Fund's Total
Investments) as of October 31, 2009
| Large-Cap Value | 50.1 | ||||||
| Large-Cap Growth | 40.6 | ||||||
| Mid-Cap Value | 7.2 | ||||||
| Mid-Cap Growth | 2.1 | ||||||
Top Ten Fund Holdings (% of the Fund's
Net Assets) as of October 31, 2009
| Security | |||||||
| Exxon Mobil Corp. | 9.8 | ||||||
| Texas Instruments, Inc. | 5.4 | ||||||
| International Business Machines Corp. | 5.3 | ||||||
| Home Depot (The), Inc. | 5.3 | ||||||
| UnitedHealth Group, Inc. | 5.3 | ||||||
| Eli Lilly & Co. | 4.5 | ||||||
| Goldman Sachs Group (The), Inc. | 4.4 | ||||||
| Occidental Petroleum Corp. | 4.0 | ||||||
| Apple, Inc. | 3.9 | ||||||
| Microsoft Corp. | 3.8 | ||||||
| Total | 51.7 | ||||||
10
Manager's Analysis (Continued)
PowerShares Active Mega Cap Fund (ticker: PMA)
Growth of a $10,000 Investment Since Inception†
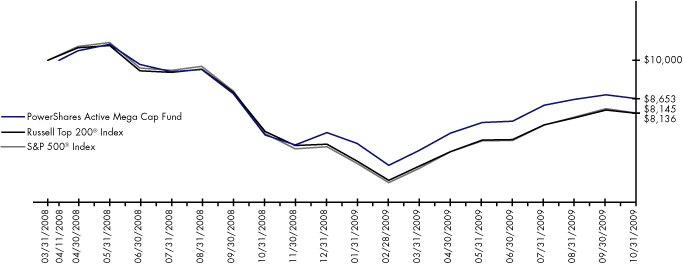
| Fund Performance History (%) | As of October 31, 2009 | ||||||||||||||
| Avg Ann†† | Fund Inception† | ||||||||||||||
| 1 Year | Avg Ann†† | Cumulative | |||||||||||||
| Index | |||||||||||||||
| Russell Top 200® Index | 8.52 | -12.22 | -18.64 | ||||||||||||
| S&P 500® Index | 9.80 | -12.16 | -18.55 | ||||||||||||
| Fund | |||||||||||||||
| NAV | 17.37 | -8.88 | -13.47 | ||||||||||||
| Share Price Return | 17.29 | -8.95 | -13.58 | ||||||||||||
Fund Inception: April 11, 2008
Performance quoted represents past performance. Past performance is not a guarantee of future results and current performance may be higher or lower than performance quoted. Investment returns and principal value will fluctuate and shares, when redeemed, may be worth more or less than their original cost. According to the Fund's current prospectus, the expense ratio of 0.75% is expressed as a unitary fee to cover operating expenses and expenses incurred in connection with managing the portfolio. NAV and Share Price returns assume that dividends and capital gain distributions have been reinvested in the Fund at NAV and Share Price, respectively. The returns shown in the table above do not reflect the deduction of taxes that a shareholder would pay on Fund distributions or the redemption or sale of Fund Shares. See invescopowershares.com to find the most recent month-end performance numbers.
Index performance results are based upon a hypothetical investment in its constituent securities. Index returns do not represent Fund returns. An investor cannot invest directly in an index. The Index does not charge management fees or brokerage expenses, and no such fees or expenses were deducted from the hypothetical performance shown. In addition, the results actual investors might have achieved would have differed from those shown because of differences in the timing, amounts of their investments, and fees and expenses associated with an investment in the Fund.
The Russell Top 200® Index and S&P 500® Index (the "Benchmark Indices") are unmanaged indices used as a measurement of change in stock market conditions based on the average performance of approximately 191 and 500 common stocks, respectively.
† Fund returns are based on the inception date of the Fund. Returns for the Benchmark Indices are based on the closest month-end to the Fund's inception date.
†† Average annualized.
11
Manager's Analysis
PowerShares Active U.S. Real Estate Fund (ticker: PSR)
The sub-adviser of the PowerShares Active U.S. Real Estate Fund, (the "Fund") is Invesco Institutional (N.A.) Inc. ("Invesco Institutional") and its affiliated sub-advisers. The Fund seeks high total return through growth of capital and current income. The Fund structures and selects its investments primarily from a universe of securities that are included within the FTSE NAREIT Equity REITs Index at the time of purchase. The selection methodology uses quantitative and statistical metrics to identify attractively priced securities and manage risk. The Fund will invest principally in equity real estate investment trusts ("REITs").
Despite the uncertainty, a significant stock market rally began late in the first quarter of 2009 which has persisted year-to-date. Strained credit markets materially affected real estate markets, with the effects being slowing property sales and lower property valuations. Towards the end of the fiscal year, modest improvements in credit markets and increased access to capital through debt refinancing and secondary equity offerings benefited the U.S. real estate investment trust ("REIT") market. In this volatile environment, the Fund reported positive returns of 67.47% since inception on November 20, 2008. While some REITs have raised capital to target new investment opportunities, it appears likely that a large volume of transactions are unlikely to occur over the near term as bid-ask spreads remain wide for most assets. As a result, these recent capital increases are likely to prove dilutive to earnings until the proceeds can be invested. Despite the recovery in REIT shares during most of 2009, relatively weak real estate fundamentals are likely to weigh on company earnings reports for at least the next few quarters. In addition, earnings are also likely to be negatively pressured as lower cost debt is refinanced at higher rates over the next 2-3 years.
12
Manager's Analysis (Continued)
PowerShares Active U.S. Real Estate Fund (ticker: PSR)
Property Type and Industry Breakdown
(% of the Fund's Net Assets) as of
October 31, 2009
| Health Care | 19.9 | ||||||
| Office Property | 16.1 | ||||||
| Apartments | 13.2 | ||||||
| Regional Malls | 11.2 | ||||||
| Diversified | 8.5 | ||||||
| Shopping Centers | 7.4 | ||||||
| Storage | 7.4 | ||||||
| Warehouse/Industrial | 4.4 | ||||||
| Hotels | 4.3 | ||||||
| Forestry | 2.4 | ||||||
| Paper & Related Products | 1.5 | ||||||
| Single Tenant | 1.1 | ||||||
| Manufactured Homes | 1.0 | ||||||
| Money Market | 0.0 | ||||||
| Other | 1.6 | ||||||
Style Allocation (% of the Fund's Total
Investments) as of October 31, 2009
| Mid-Cap Growth | 36.1 | ||||||
| Mid-Cap Value | 27.6 | ||||||
| Small-Cap Value | 17.3 | ||||||
| Small-Cap Growth | 12.4 | ||||||
| Large-Cap Growth | 6.6 | ||||||
Top Ten Fund Holdings (% of the Fund's
Net Assets) as of October 31, 2009
| Security | |||||||
| Simon Property Group, Inc. | 11.2 | ||||||
| Public Storage | 6.5 | ||||||
| HCP, Inc. | 6.1 | ||||||
| Boston Properties, Inc. | 5.8 | ||||||
| Equity Residential | 5.6 | ||||||
| Ventas, Inc. | 4.5 | ||||||
| Health Care, Inc. | 3.9 | ||||||
| Federal Realty Investment Trust | 2.6 | ||||||
| Vornado Realty Trust | 2.5 | ||||||
| Plum Creek Timber Co., Inc. | 2.4 | ||||||
| Total | 51.1 | ||||||
13
Manager's Analysis (Continued)
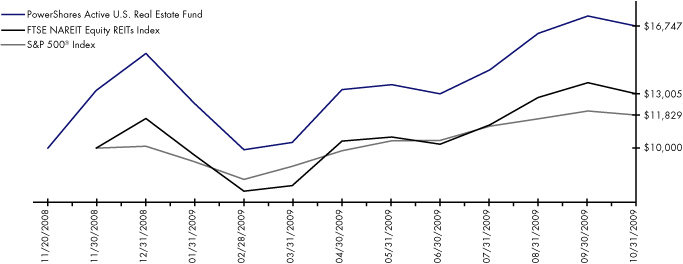
PowerShares Active U.S. Real Estate Fund (ticker: PSR)
Growth of a $10,000 Investment Since Inception†
| Fund Performance History (%) | As of October 31, 2009 | ||||||
| Fund Inception Cumulative† | |||||||
| Index | |||||||
| FTSE NAREIT Equity REITs Index | 30.05 | ||||||
| S&P 500® Index | 18.29 | ||||||
| Fund | |||||||
| NAV | 67.47 | ||||||
| Share Price Return | 68.71 | ||||||
Fund Inception: November 20, 2008
Performance quoted represents past performance. Past performance is not a guarantee of future results and current performance may be higher or lower than performance quoted. Investment returns and principal value will fluctuate and shares, when redeemed, may be worth more or less than their original cost. According to the Fund's current prospectus, the expense ratio of 0.80% is expressed as a unitary fee to cover operating expenses and expenses incurred in connection with managing the portfolio. NAV and Share Price returns assume that dividends and capital gain distributions have been reinvested in the Fund at NAV and Share Price, respectively. The returns shown in the table above do not reflect the deduction of taxes that a shareholder would pay on Fund distributions or the redemption or sale of Fund Shares. See invescopowershares.com to find the most recent month-end performance numbers.
Index performance results are based upon a hypothetical investment in its constituent securities. Index returns do not represent Fund returns. An investor cannot invest directly in an index. The Index does not charge management fees or brokerage expenses, and no such fees or expenses were deducted from the hypothetical performance shown. In addition, the results actual investors might have achieved would have differed from those shown because of differences in the timing, amounts of their investments, and fees and expenses associated with an investment in the Fund.
The FTSE NAREIT Equity REITs Index and S&P 500® Index (the "Benchmark Indices") are unmanaged indices used as a measurement of change in stock market conditions based on the average performance of approximately 99 and 500 common stocks, respectively.
† Fund returns are based on the inception date of the Fund. Returns for the Benchmark Indices are based on the closest month-end to the Fund's inception date.
14
This page intentionally left blank
Frequency Distribution of Discounts & Premiums
Since Inception through October 31, 2009
| Closing Price Above NAV (bps) | |||||||||||||||||||||||||||||||||||||||
| Ticker | Fund Name | Inception | Trading Days | 0-24 | 25-49 | 50-99 | 100-149 | 150-199 | 200+ | ||||||||||||||||||||||||||||||
| PQY | PowerShares Active AlphaQ Fund | 4/11/08 | 393 | 114 | 18 | 10 | 13 | 7 | 35 | ||||||||||||||||||||||||||||||
| PQZ | PowerShares Active Alpha Multi-Cap Fund | 4/11/08 | 393 | 122 | 24 | 15 | 6 | 6 | 14 | ||||||||||||||||||||||||||||||
| PLK | PowerShares Active Low Duration Fund | 4/11/08 | 393 | 82 | 44 | 49 | 8 | 6 | 20 | ||||||||||||||||||||||||||||||
| PMA | PowerShares Active Mega Cap Fund | 4/11/08 | 393 | 151 | 13 | 10 | 7 | 6 | 11 | ||||||||||||||||||||||||||||||
| PSR | PowerShares Active U.S. Real Estate Fund | 11/20/08 | 237 | 55 | 10 | 10 | 7 | 5 | 54 | ||||||||||||||||||||||||||||||
16
| Closing Price Below NAV (bps) | |||||||||||||||||||||||||||
| Ticker | -0-24 | -25-49 | -50-99 | -100-149 | -150-199 | -200+ | |||||||||||||||||||||
| PQY | 150 | 16 | 15 | 5 | 1 | 9 | |||||||||||||||||||||
| PQZ | 177 | 13 | 4 | 3 | 3 | 6 | |||||||||||||||||||||
| PLK | 69 | 27 | 47 | 12 | 12 | 17 | |||||||||||||||||||||
| PMA | 165 | 11 | 7 | 5 | 1 | 6 | |||||||||||||||||||||
| PSR | 64 | 12 | 4 | 4 | 3 | 9 | |||||||||||||||||||||
17
Fees and Expenses
As a shareholder of a Fund of the PowerShares Actively Managed Exchange-Traded Fund Trust, you incur a unitary management fee. The expense examples below are intended to help you understand your ongoing costs (in dollars) of investing in the Funds and to compare these costs with the ongoing costs of investing in other funds.
The example is based on an investment of $1,000 invested at the beginning of the period and held through the six-month period ended October 31, 2009.
Actual Expenses
The first line in the following table provides information about actual account values and actual expenses. You may use the information in this line, together with the amount you invested, to estimate the expenses that you paid over the period. Simply divide your account value by $1,000 (for example, an $8,600 account value divided by $1,000 = 8.6), then multiply the result by the number in the first line under the heading "Expenses Paid During Period" to estimate the expenses you paid on your account during this period.
Hypothetical Example for Comparison Purposes
The second line in the following table provides information about hypothetical account values and hypothetical expenses based on the each Fund's actual expense ratio and an assumed annualized rate of return of 5% per year before expenses, which is not the Fund's actual return. The hypothetical account values and expenses may not be used to estimate the actual ending account balance or expenses you paid for the period. You may use this information to compare the ongoing costs of investing in the Funds and other funds. To do so, compare this 5% hypothetical example with the 5% hypothetical examples that appear in the shareholder reports of the other funds.
Please note that the expenses shown in the table are meant to highlight your ongoing costs only, and do not reflect any transactional costs such as sales charges and brokerage commissions. Therefore the second line in the table is useful in comparing ongoing costs only, and will not help you determine the relative total costs of owning different funds. In addition, if these transactional costs were included, your costs would have been higher.
| Beginning Account Value May 1, 2009 | Ending Account Value October 31, 2009 | Annualized Expense Ratio based on Number of Days in the Period | Expenses Paid During the Six-Month Period (1) | ||||||||||||||||
| PowerShares Active AlphaQ Fund Actual | $ | 1,000.00 | $ | 1,177.13 | 0.75 | % | $ | 4.12 | |||||||||||
| Hypothetical (5% return before expenses) | $ | 1,000.00 | $ | 1,021.42 | 0.75 | % | $ | 3.82 | |||||||||||
| PowerShares Active Alpha Multi-Cap Fund Actual | $ | 1,000.00 | $ | 1,154.53 | 0.75 | % | $ | 4.07 | |||||||||||
| Hypothetical (5% return before expenses) | $ | 1,000.00 | $ | 1,021.42 | 0.75 | % | $ | 3.82 | |||||||||||
| PowerShares Active Low Duration Fund Actual | $ | 1,000.00 | $ | 1,019.80 | 0.29 | % | $ | 1.47 | |||||||||||
| Hypothetical (5% return before expenses) | $ | 1,000.00 | $ | 1,023.74 | 0.29 | % | $ | 1.48 | |||||||||||
18
Fees and Expenses (Continued)
| Beginning Account Value May 1, 2009 | Ending Account Value October 31, 2009 | Annualized Expense Ratio based on Number of Days in the Period | Expenses Paid During the Six-Month Period (1) | ||||||||||||||||
| PowerShares Active Mega Cap Fund Actual | $ | 1,000.00 | $ | 1,163.10 | 0.75 | % | $ | 4.09 | |||||||||||
| Hypothetical (5% return before expenses) | $ | 1,000.00 | $ | 1,021.42 | 0.75 | % | $ | 3.82 | |||||||||||
| PowerShares Active U.S. Real Estate Fund Actual | $ | 1,000.00 | $ | 1,265.27 | 0.80 | % | $ | 4.57 | |||||||||||
| Hypothetical (5% return before expenses) | $ | 1,000.00 | $ | 1,021.17 | 0.80 | % | $ | 4.08 | |||||||||||
(1) Expenses are calculated using the annualized expense ratio, which represents the ongoing expenses as a percentage of net assets for the six-month period ended October 31, 2009. Expenses are calculated by multiplying the Fund's annualized expense ratio by the average account value for the period; then multiplying the result by 184 and then dividing the result by 365. Expense ratios for the most recent half year may differ from expense ratios based on the one year data in the Financial Highlights.
19
Schedule of Investments
PowerShares Active AlphaQ Fund
October 31, 2009
| Number of Shares | Value | ||||||||||
| Common Stocks and Other Equity Interests—100.0% | |||||||||||
| Consumer Discretionary—23.8% | |||||||||||
| 1,165 | Apollo Group, Inc., Class A* | $ | 66,522 | ||||||||
| 1,725 | Bed Bath & Beyond, Inc.* | 60,737 | |||||||||
| 4,400 | Comcast Corp., Class A | 63,800 | |||||||||
| 2,587 | Discovery Communications, Inc., Class A* | 71,143 | |||||||||
| 4,292 | DISH Network Corp., Class A* | 74,681 | |||||||||
| 1,578 | Dollar Tree, Inc.* | 71,215 | |||||||||
| 3,641 | Expedia, Inc.* | 82,541 | |||||||||
| 2,030 | Garmin Ltd. | 61,428 | |||||||||
| 3,370 | Liberty Media Corp. - Entertainment, Class A* | 103,862 | |||||||||
| 1,150 | Netflix, Inc.* | 61,468 | |||||||||
| 534 | Priceline.com, Inc.* | 84,260 | |||||||||
| 1,567 | Ross Stores, Inc. | 68,964 | |||||||||
| 2,690 | Urban Outfitters, Inc.* | 84,412 | |||||||||
| 955,033 | |||||||||||
| Consumer Staples—1.7% | |||||||||||
| 1,860 | Hansen Natural Corp.* | 67,239 | |||||||||
| Financials—9.7% | |||||||||||
| 1,316 | Arch Capital Group Ltd.* | 88,659 | |||||||||
| 7,992 | Fifth Third Bancorp | 71,448 | |||||||||
| 5,213 | Hudson City Bancorp, Inc. | 68,499 | |||||||||
| 1,647 | T. Rowe Price Group, Inc. | 80,258 | |||||||||
| 4,095 | TD Ameritrade Holding Corp.* | 79,034 | |||||||||
| 387,898 | |||||||||||
| Health Care—18.5% | |||||||||||
| 1,300 | Celgene Corp.* | 66,365 | |||||||||
| 1,180 | Express Scripts, Inc.* | 94,306 | |||||||||
| 1,550 | Gilead Sciences, Inc.* | 65,953 | |||||||||
| 2,253 | Life Technologies Corp.* | 106,274 | |||||||||
| 4,924 | Mylan, Inc.* | 79,966 | |||||||||
| 2,407 | Perrigo Co. | 89,516 | |||||||||
| 3,256 | QIAGEN NV (Netherlands)* | 67,822 | |||||||||
| 1,563 | Teva Pharmaceutical Industries Ltd. ADR (Israel) | 78,900 | |||||||||
| 4,300 | Warner Chilcott PLC, Class A (Ireland)* | 95,245 | |||||||||
| 744,347 | |||||||||||
| Industrials—4.5% | |||||||||||
| 2,300 | Bucyrus International, Inc. | 102,166 | |||||||||
| 1,550 | Joy Global, Inc. | 78,136 | |||||||||
| 180,302 | |||||||||||
| Information Technology—35.8% | |||||||||||
| 4,657 | AsiaInfo Holdings, Inc.* | 102,733 | |||||||||
| 2,830 | ASML Holding NV (Netherlands) | 76,240 | |||||||||
| 227 | Baidu, Inc. ADR (China)* | 85,788 | |||||||||
| 2,874 | Check Point Software Technologies Ltd. (Israel)* | 89,295 | |||||||||
| 2,920 | Citrix Systems, Inc.* | 107,340 | |||||||||
| Number of Shares | Value | ||||||||||
| Common Stocks and Other Equity Interests (Continued) | |||||||||||
| 2,019 | Cognizant Technology Solutions Corp., Class A* | $ | 78,034 | ||||||||
| 4,471 | eBay, Inc.* | 99,569 | |||||||||
| 1,846 | Fiserv, Inc.* | 84,676 | |||||||||
| 164 | Google, Inc., Class A* | 87,924 | |||||||||
| 1,460 | Infosys Technologies Ltd. ADR (India) | 67,160 | |||||||||
| 6,639 | Marvell Technology Group Ltd. (Bermuda)* | 91,087 | |||||||||
| 3,958 | NetApp, Inc.* | 107,064 | |||||||||
| 6,201 | Nuance Communications, Inc.* | 81,295 | |||||||||
| 1,200 | Research In Motion Ltd. (Canada)* | 70,476 | |||||||||
| 3,630 | SanDisk Corp.* | 74,342 | |||||||||
| 7,157 | Telefonaktiebolaget LM Ericsson ADR (Sweden) | 74,433 | |||||||||
| 2,720 | Xilinx, Inc. | 59,160 | |||||||||
| 1,436,616 | |||||||||||
| Materials—1.9% | |||||||||||
| 1,515 | Sigma-Aldrich Corp. | 78,674 | |||||||||
| Telecommunication Services—4.1% | |||||||||||
| 1,523 | Millicom International Cellular SA (Luxembourg)* | 95,431 | |||||||||
| 2,630 | NII Holdings, Inc.* | 70,826 | |||||||||
| 166,257 | |||||||||||
| Total Common Stocks and Other Equity Interests (Cost $3,383,618) | 4,016,366 | ||||||||||
| Money Market Fund—0.1% | |||||||||||
| 3,719 | Goldman Sachs Financial Square Prime Obligations Institutional Share Class (Cost $3,719) | 3,719 | |||||||||
| Total Investments (Cost $3,387,337)—100.1% | 4,020,085 | ||||||||||
| Liabilities in excess of other assets—(0.1%) | (5,466 | ) | |||||||||
| Net Assets—100.0% | $ | 4,014,619 | |||||||||
ADR American Depositary Receipt
* Non-income producing security.
See Notes to Financial Statements.
20
Schedule of Investments
PowerShares Active Alpha Multi-Cap Fund
October 31, 2009
| Number of Shares | Value | ||||||||||
| Common Stocks and Other Equity Interests—99.9% | |||||||||||
| Consumer Discretionary—8.4% | |||||||||||
| 2,155 | Aeropostale, Inc.* | $ | 80,877 | ||||||||
| 4,185 | Bridgepoint Education, Inc.* | 59,343 | |||||||||
| 1,760 | DeVry, Inc. | 97,310 | |||||||||
| 845 | ITT Educational Services, Inc.* | 76,346 | |||||||||
| 3,830 | Lincoln Educational Services Corp.* | 75,911 | |||||||||
| 389,787 | |||||||||||
| Consumer Staples—8.3% | |||||||||||
| 3,160 | American Italian Pasta Co., Class A* | 85,857 | |||||||||
| 7,450 | Cresud S.A.C.I.F.yA. ADR (Argentina) | 91,783 | |||||||||
| 3,791 | Hansen Natural Corp.* | 137,045 | |||||||||
| 1,385 | Ralcorp Holdings, Inc.* | 74,375 | |||||||||
| 389,060 | |||||||||||
| Energy—17.1% | |||||||||||
| 3,340 | Atwood Oceanics, Inc.* | 118,537 | |||||||||
| 8,200 | Cheniere Energy Partners LP | 87,576 | |||||||||
| 2,429 | CONSOL Energy, Inc. | 103,985 | |||||||||
| 906 | Diamond Offshore Drilling, Inc. | 86,297 | |||||||||
| 3,484 | Dresser-Rand Group, Inc.* | 102,673 | |||||||||
| 3,100 | Linn Energy LLC | 75,950 | |||||||||
| 2,603 | Petroleo Brasileiro SA ADR (Brazil) | 120,311 | |||||||||
| 3,449 | Pride International, Inc.* | 101,952 | |||||||||
| 797,281 | |||||||||||
| Financials—21.0% | |||||||||||
| 5,081 | Assured Guaranty Ltd. (Bermuda) | 84,243 | |||||||||
| 5,900 | CNinsure, Inc. ADR (Cayman Islands) | 119,592 | |||||||||
| 6,800 | EZCORP, Inc., Class A* | 88,196 | |||||||||
| 4,681 | Greenlight Capital Re Ltd., Class A (Cayman Islands)* | 87,347 | |||||||||
| 3,027 | Hatteras Financial Corp. REIT | 85,059 | |||||||||
| 9,700 | Maiden Holdings Ltd. (Bermuda) | 67,221 | |||||||||
| 9,250 | MFA Financial, Inc. REIT | 68,635 | |||||||||
| 2,866 | Prosperity Bancshares, Inc. | 102,574 | |||||||||
| 1,737 | RenaissanceRe Holdings Ltd. (Bermuda) | 91,193 | |||||||||
| 3,377 | Tower Group, Inc. | 83,007 | |||||||||
| 3,657 | Wells Fargo & Co. | 100,641 | |||||||||
| 977,708 | |||||||||||
| Health Care—13.9% | |||||||||||
| 3,104 | Amedisys, Inc.* | 123,509 | |||||||||
| 3,150 | Endo Pharmaceuticals Holdings, Inc.* | 70,560 | |||||||||
| 2,136 | Inverness Medical Innovations, Inc.* | 81,189 | |||||||||
| 3,785 | LHC Group, Inc.* | 105,639 | |||||||||
| 6,300 | Mylan, Inc.* | 102,312 | |||||||||
| 4,560 | Par Pharmaceutical Cos., Inc.* | 95,623 | |||||||||
| 2,450 | Valeant Pharmaceuticals International* | 72,030 | |||||||||
| 650,862 | |||||||||||
| Number of Shares | Value | ||||||||||
| Common Stocks and Other Equity Interests (Continued) | |||||||||||
| Industrials—1.5% | |||||||||||
| 1,050 | American Science & Engineering, Inc. | $ | 69,426 | ||||||||
| Information Technology—24.1% | |||||||||||
| 4,862 | AsiaInfo Holdings, Inc.* | 107,256 | |||||||||
| 3,123 | Cognizant Technology Solutions Corp., Class A* | 120,704 | |||||||||
| 1,810 | Ebix, Inc.* | 111,496 | |||||||||
| 4,200 | InterDigital, Inc.* | 86,352 | |||||||||
| 4,215 | Longtop Financial Technologies Ltd. ADR (Cayman Islands)* | 111,698 | |||||||||
| 415 | MasterCard, Inc., Class A | 90,893 | |||||||||
| 2,717 | Perfect World Co. Ltd. ADR (Cayman Islands)* | 119,576 | |||||||||
| 3,766 | Red Hat, Inc.* | 97,200 | |||||||||
| 1,165 | Research In Motion Ltd. (Canada)* | 68,420 | |||||||||
| 11,810 | United Online, Inc. | 94,480 | |||||||||
| 2,300 | VistaPrint NV (Netherlands)* | 117,416 | |||||||||
| 1,125,491 | |||||||||||
| Materials—4.4% | |||||||||||
| 9,100 | Harmony Gold Mining Co. Ltd. ADR (South Africa) | 90,636 | |||||||||
| 8,769 | IAMGOLD Corp. (Canada) | 115,312 | |||||||||
| 205,948 | |||||||||||
| Utilities—1.2% | |||||||||||
| 2,100 | Spectra Energy Partners LP | 53,655 | |||||||||
| Total Investments (Cost $3,926,925)—99.9% | 4,659,218 | ||||||||||
| Other assets less liabilities—0.1% | 3,631 | ||||||||||
| Net Assets—100.0% | $ | 4,662,849 | |||||||||
ADR American Depositary Receipt
REIT Real Estate Investment Trust
* Non-income producing security.
See Notes to Financial Statements.
21
Schedule of Investments
PowerShares Active Low Duration Fund
October 31, 2009
| Principal Amount | Value | ||||||||||
| Long-Term Investments—69.0% | |||||||||||
| Corporate Bonds—10.0% | |||||||||||
| $ | 50,000 | AutoZone, Inc. 5.750%, 01/15/15 | $ | 53,608 | |||||||
| 30,000 | Bank of New York Mellon Corp. (The) 4.300%, 05/15/14 | 31,650 | |||||||||
| 100,000 | Citibank NA 1.500%, 07/12/11 | 100,970 | |||||||||
| 100,000 | Citigroup Funding, Inc. 1.875%, 10/22/12 | 100,406 | |||||||||
| 80,000 | Citigroup Funding, Inc. 2.250%, 12/10/12 | 81,298 | |||||||||
| 30,000 | Goldman Sachs Group, Inc. (The) 3.625%, 08/01/12 | 30,929 | |||||||||
| 10,000 | Goldman Sachs Group, Inc. (The) 6.000%, 05/01/14 | 11,005 | |||||||||
| 70,000 | JPMorgan Chase & Co. 4.650%, 06/01/14 | 73,917 | |||||||||
| 40,000 | MetLife, Inc. 6.750%, 06/01/16 | 44,790 | |||||||||
| 50,000 | Morgan Stanley 2.250%, 03/13/12 | 51,066 | |||||||||
| 15,000 | Northern Trust Corp. 4.625%, 05/01/14 | 16,115 | |||||||||
| 25,000 | Southern Co. 4.150%, 05/15/14 | 26,033 | |||||||||
| 25,000 | State Street Corp. 4.300%, 05/30/14 | 26,307 | |||||||||
| 60,000 | TJX Cos, Inc. 4.200%, 08/15/15 | 62,381 | |||||||||
| 50,000 | Wells Fargo & Co. 2.125%, 06/15/12 | 50,936 | |||||||||
| 761,411 | |||||||||||
| United States Government Agencies Obligations—5.6% | |||||||||||
| 75,000 | Federal Home Loan Bank 1.625%, 09/26/12 | 75,180 | |||||||||
| 100,000 | Federal Home Loan Bank 1.625%, 11/21/12 | 99,999 | |||||||||
| 100,000 | Federal Home Loan Bank 1.750%, 08/22/12 | 100,732 | |||||||||
| 50,000 | Federal Home Loan Mortgage Corp. 2.125%, 09/21/12 | 50,865 | |||||||||
| 100,000 | Federal National Mortgage Association 1.000%, 11/23/11 | 100,013 | |||||||||
| 426,789 | |||||||||||
| United States Government Obligations—53.4% | |||||||||||
| United States Treasury Notes | |||||||||||
| 360,000 | 0.875%, 02/28/11 | 361,758 | |||||||||
| 200,000 | 0.875%, 03/31/11 | 200,953 | |||||||||
| 340,000 | 1.375%, 03/15/12 | 342,152 | |||||||||
| 385,000 | 1.375%, 05/15/12 | 386,805 | |||||||||
| 195,000 | 1.500%, 07/15/12 | 196,310 | |||||||||
| Principal Amount | Value | ||||||||||
| Long-Term Investments (Continued) | |||||||||||
| $ | 700,000 | 1.875%, 06/15/12 | $ | 711,649 | |||||||
| 183,000 | 4.250%, 01/15/11 | 191,378 | |||||||||
| 1,376,000 | 4.375%, 12/15/10 | 1,436,470 | |||||||||
| 131,000 | 4.750%, 03/31/11 | 138,788 | |||||||||
| 96,000 | 4.875%, 05/31/11 | 102,431 | |||||||||
| 4,068,694 | |||||||||||
| Total Long-Term Investments (Cost $5,194,139) | 5,256,894 | ||||||||||
| Short-Term Investments—33.7% | |||||||||||
| United States Government Obligations—29.1% | |||||||||||
| United States Treasury Notes | |||||||||||
| 179,000 | 2.625%, 05/31/10(a) | 181,538 | |||||||||
| 629,000 | 2.750%, 07/31/10 | 640,696 | |||||||||
| 1,100,000 | 4.125%, 08/15/10 | 1,133,001 | |||||||||
| 250,000 | 4.250%, 10/15/10 | 259,239 | |||||||||
| 2,214,474 | |||||||||||
| Number of Shares | |||||||||||
| Money Market Fund—4.6% | |||||||||||
| 353,004 | Goldman Sachs Financial Square Prime Obligations Institutional Share Class | 353,004 | |||||||||
| Total Short-Term Investments (Cost $2,559,796) | 2,567,478 | ||||||||||
| Total Investments (Cost $7,753,935)—102.7% | 7,824,372 | ||||||||||
| Liabilities in excess of other assets—(2.7%) | (206,646 | ) | |||||||||
| Net Assets—100.0% | $ | 7,617,726 | |||||||||
(a) All or a portion of the value was pledged as collateral to cover margin requirements for open futures contracts. See Note 5.
See Notes to Financial Statements.
22
Schedule of Investments
PowerShares Active Mega Cap Fund
October 31, 2009
| Number of Shares | Value | ||||||||||
| Common Stocks—99.7% | |||||||||||
| Consumer Discretionary—12.4% | |||||||||||
| 9,072 | Ford Motor Co.* | $ | 63,504 | ||||||||
| 4,707 | Gap, Inc. (The) | 100,447 | |||||||||
| 6,669 | Home Depot, Inc. (The) | 167,325 | |||||||||
| 2,006 | Time Warner, Inc. | 60,421 | |||||||||
| 391,697 | |||||||||||
| Consumer Staples—2.0% | |||||||||||
| 465 | Archer-Daniels-Midland Co. | 14,006 | |||||||||
| 1,003 | Wal-Mart Stores, Inc. | 49,829 | |||||||||
| 63,835 | |||||||||||
| Energy—15.6% | |||||||||||
| 761 | Chevron Corp. | 58,247 | |||||||||
| 4,297 | Exxon Mobil Corp. | 307,965 | |||||||||
| 1,679 | Occidental Petroleum Corp. | 127,403 | |||||||||
| 493,615 | |||||||||||
| Financials—14.0% | |||||||||||
| 1,184 | Aflac, Inc. | 49,124 | |||||||||
| 1,523 | American Express Co. | 53,061 | |||||||||
| 933 | Chubb Corp. (The) | 45,269 | |||||||||
| 817 | Goldman Sachs Group, Inc. (The) | 139,029 | |||||||||
| 1,119 | Morgan Stanley* | 35,942 | |||||||||
| 1,605 | Prudential Financial, Inc. | 72,595 | |||||||||
| 940 | Travelers Cos., Inc. (The) | 46,803 | |||||||||
| 441,823 | |||||||||||
| Health Care—22.9% | |||||||||||
| 171 | Abbott Laboratories | 8,647 | |||||||||
| 2,116 | Amgen, Inc.* | 113,693 | |||||||||
| 592 | Biogen Idec, Inc.* | 24,941 | |||||||||
| 5,402 | Boston Scientific Corp.* | 43,864 | |||||||||
| 1,468 | Bristol-Myers Squibb Co. | 32,002 | |||||||||
| 4,209 | Eli Lilly & Co. | 143,148 | |||||||||
| 250 | Johnson & Johnson | 14,763 | |||||||||
| 890 | Merck & Co., Inc. | 27,528 | |||||||||
| 3,410 | Pfizer, Inc. | 58,072 | |||||||||
| 706 | Schering-Plough Corp. | 19,909 | |||||||||
| 6,430 | UnitedHealth Group, Inc. | 166,858 | |||||||||
| 1,429 | WellPoint, Inc.* | 66,820 | |||||||||
| 720,245 | |||||||||||
| Industrials—3.5% | |||||||||||
| 4,514 | General Electric Co. | 64,369 | |||||||||
| 1,024 | Raytheon Co. | 46,367 | |||||||||
| 110,736 | |||||||||||
| Information Technology—24.2% | |||||||||||
| 646 | Apple, Inc.* | 121,771 | |||||||||
| 827 | Corning, Inc. | 12,082 | |||||||||
| Number of Shares | Value | ||||||||||
| Common Stocks (Continued) | |||||||||||
| 2,173 | Dell, Inc.* | $ | 31,487 | ||||||||
| 1,241 | EMC Corp.* | 20,439 | |||||||||
| 135 | Hewlett-Packard Co. | 6,407 | |||||||||
| 1,395 | International Business Machines Corp. | 168,252 | |||||||||
| 4,374 | Microsoft Corp. | 121,292 | |||||||||
| 201 | Oracle Corp. | 4,241 | |||||||||
| 5,986 | Symantec Corp.* | 105,234 | |||||||||
| 7,291 | Texas Instruments, Inc. | 170,974 | |||||||||
| 762,179 | |||||||||||
| Materials—0.7% | |||||||||||
| 218 | Freeport-McMoRan Copper & Gold, Inc.* | 15,992 | |||||||||
| 227 | Southern Copper Corp. | 7,151 | |||||||||
| 23,143 | |||||||||||
| Telecommunication Services—4.4% | |||||||||||
| 3,808 | AT&T, Inc. | 97,751 | |||||||||
| 14,300 | Sprint Nextel Corp.* | 42,328 | |||||||||
| 140,079 | |||||||||||
| Total Common Stocks (Cost $3,070,178) | 3,147,352 | ||||||||||
| Money Market Fund—0.8% | |||||||||||
| 25,899 | Goldman Sachs Financial Square Prime Obligations Institutional Share Class (Cost $25,899) | 25,899 | |||||||||
| Total Investments (Cost $3,096,077)—100.5% | 3,173,251 | ||||||||||
| Liabilities in excess of other assets—(0.5%) | (14,863 | ) | |||||||||
| Net Assets—100.0% | $ | 3,158,388 | |||||||||
* Non-income producing security.
See Notes to Financial Statements.
23
Schedule of Investments
PowerShares Active U.S. Real Estate Fund
October 31, 2009
| Number of Shares | Value | ||||||||||
| Real Estate Investment Trust, Common Stocks and Other Equity Interests—98.4% | |||||||||||
| Apartments—13.2% | |||||||||||
| 2,405 | AvalonBay Communities, Inc. | $ | 165,416 | ||||||||
| 3,655 | BRE Properties, Inc. | 99,526 | |||||||||
| 16,000 | Equity Residential | 462,080 | |||||||||
| 1,650 | Essex Property Trust, Inc. | 124,047 | |||||||||
| 1,630 | Mid-America Apartment Communities, Inc. | 71,426 | |||||||||
| 2,477 | Post Properties, Inc. | 40,846 | |||||||||
| 8,511 | UDR, Inc. | 122,388 | |||||||||
| 1,085,729 | |||||||||||
| Diversified—8.5% | |||||||||||
| 2,950 | Colonial Properties Trust | 31,064 | |||||||||
| 4,450 | Digital Realty Trust, Inc. | 200,828 | |||||||||
| 5,506 | Liberty Property Trust | 161,711 | |||||||||
| 1,580 | Potlatch Corp. | 44,098 | |||||||||
| 1,107 | PS Business Parks, Inc. | 54,210 | |||||||||
| 3,465 | Vornado Realty Trust | 206,375 | |||||||||
| 698,286 | |||||||||||
| Forestry—2.4% | |||||||||||
| 6,450 | Plum Creek Timber Co., Inc. | 201,820 | |||||||||
| Health Care—19.9% | |||||||||||
| 17,159 | HCP, Inc. | 507,735 | |||||||||
| 7,250 | Health Care REIT, Inc. | 321,682 | |||||||||
| 3,450 | Healthcare Realty Trust, Inc. | 71,864 | |||||||||
| 4,720 | Medical Properties Trust, Inc. | 37,760 | |||||||||
| 6,250 | Nationwide Health Properties, Inc. | 201,563 | |||||||||
| 6,854 | Senior Housing Properties Trust | 132,145 | |||||||||
| 9,170 | Ventas, Inc. | 367,992 | |||||||||
| 1,640,741 | |||||||||||
| Hotels—4.3% | |||||||||||
| 7,160 | Hospitality Properties Trust | 138,260 | |||||||||
| 11,962 | Host Hotels & Resorts, Inc. | 120,936 | |||||||||
| 3,720 | LaSalle Hotel Properties | 63,835 | |||||||||
| 4,450 | Sunstone Hotel Investors, Inc. | 33,597 | |||||||||
| 356,628 | |||||||||||
| Manufactured Homes—1.0% | |||||||||||
| 1,738 | Equity Lifestyle Properties, Inc. | 80,730 | |||||||||
| Office Property—16.1% | |||||||||||
| 2,202 | Alexandria Real Estate Equities, Inc. | 119,282 | |||||||||
| 5,711 | BioMed Realty Trust, Inc. | 77,498 | |||||||||
| 7,928 | Boston Properties, Inc. | 481,785 | |||||||||
| 7,071 | Brandywine Realty Trust | 67,599 | |||||||||
| 3,451 | Corporate Office Properties Trust | 114,539 | |||||||||
| 5,234 | Douglas Emmett, Inc. | 61,761 | |||||||||
| 4,074 | Highwoods Properties, Inc. | 112,116 | |||||||||
| 13,021 | HRPT Properties Trust | 91,538 | |||||||||
| Number of Shares | Value | ||||||||||
| Real Estate Investment Trust, Common Stocks and Other Equity Interests (Continued) | |||||||||||
| 2,451 | Kilroy Realty Corp. | $ | 67,697 | ||||||||
| 4,401 | Mack-Cali Realty Corp. | 136,211 | |||||||||
| 1,330,026 | |||||||||||
| Paper & Related Products—1.5% | |||||||||||
| 3,267 | Rayonier, Inc. | 126,041 | |||||||||
| Regional Malls—11.2% | |||||||||||
| 13,643 | Simon Property Group, Inc. | 926,223 | |||||||||
| Shopping Centers—7.4% | |||||||||||
| 2,310 | Acadia Realty Trust | 36,729 | |||||||||
| 3,620 | Federal Realty Investment Trust | 213,688 | |||||||||
| 9,340 | Kimco Realty Corp. | 118,058 | |||||||||
| 4,583 | Regency Centers Corp. | 153,760 | |||||||||
| 2,356 | Tanger Factory Outlet Centers, Inc. | 89,693 | |||||||||
| 611,928 | |||||||||||
| Single Tenant—1.1% | |||||||||||
| 4,690 | National Retail Properties, Inc. | 90,892 | |||||||||
| Storage—7.4% | |||||||||||
| 7,260 | Public Storage | 534,336 | |||||||||
| 1,370 | Sovran Self Storage, Inc. | 41,237 | |||||||||
| 5,465 | U-Store-It Trust | 31,150 | |||||||||
| 606,723 | |||||||||||
| Warehouse/Industrial—4.4% | |||||||||||
| 8,570 | AMB Property Corp. | 188,369 | |||||||||
| 12,000 | DCT Industrial Trust, Inc. | 54,360 | |||||||||
| 10,819 | ProLogis | 122,579 | |||||||||
| 365,308 | |||||||||||
| Total Real Estate Investment Trust, Common Stocks and Other Equity Interests (Cost $7,497,693) | 8,121,075 | ||||||||||
| Money Market Fund—0.0% | |||||||||||
| 478 | Goldman Sachs Financial Square Prime Obligations Institutional Share Class (Cost $478) | 478 | |||||||||
| Total Investments (Cost $7,498,171)—98.4% | 8,121,553 | ||||||||||
| Other assets less liabilities—1.6% | 131,731 | ||||||||||
| Net Assets—100.0% | $ | 8,253,284 | |||||||||
REIT Real Estate Investment Trust
See Notes to Financial Statements.
24
This page intentionally left blank
Statements of Assets and Liabilities
October 31, 2009
| PowerShares Active AlphaQ Fund | PowerShares Active Alpha Multi-Cap Fund | PowerShares Active Low Duration Fund | PowerShares Active Mega Cap Fund | PowerShares Active U.S. Real Estate Fund | |||||||||||||||||||
| ASSETS: | |||||||||||||||||||||||
| Investments, at value | $ | 4,020,085 | $ | 4,659,218 | $ | 7,824,372 | $ | 3,173,251 | $ | 8,121,553 | |||||||||||||
| Cash | — | 57,573 | — | — | 4,317 | ||||||||||||||||||
| Receivables: | |||||||||||||||||||||||
| Dividends and interest | — | 3,039 | 63,313 | 2,183 | 8,224 | ||||||||||||||||||
| Variation margin | — | — | 881 | — | — | ||||||||||||||||||
| Shares sold | — | — | — | 192,585 | — | ||||||||||||||||||
| Investments sold | 60,856 | 79,784 | — | — | 124,916 | �� | |||||||||||||||||
| Total Assets | 4,080,941 | 4,799,614 | 7,888,566 | 3,368,019 | 8,259,010 | ||||||||||||||||||
| LIABILITIES: | |||||||||||||||||||||||
| Due to custodian | — | — | 9,370 | — | — | ||||||||||||||||||
| Payables: | |||||||||||||||||||||||
| Investments purchased | 63,629 | 133,624 | 259,716 | 207,744 | — | ||||||||||||||||||
| Accrued unitary management fees | 2,693 | 3,141 | 1,754 | 1,887 | 5,726 | ||||||||||||||||||
| Total Liabilities | 66,322 | 136,765 | 270,840 | 209,631 | 5,726 | ||||||||||||||||||
| NET ASSETS | $ | 4,014,619 | $ | 4,662,849 | $ | 7,617,726 | $ | 3,158,388 | $ | 8,253,284 | |||||||||||||
| NET ASSETS CONSIST OF: | |||||||||||||||||||||||
| Shares of beneficial interest | $ | 5,127,013 | $ | 9,087,893 | $ | 7,559,961 | $ | 3,644,520 | $ | 7,650,794 | |||||||||||||
| Undistributed net investment income | — | 5,154 | — | 14,256 | 22,443 | ||||||||||||||||||
| Accumulated net realized loss on investments | (1,745,142 | ) | (5,162,491 | ) | (20,529 | ) | (577,562 | ) | (43,335 | ) | |||||||||||||
| Net unrealized appreciation on investments | 632,748 | 732,293 | 78,294 | 77,174 | 623,382 | ||||||||||||||||||
| Net Assets | $ | 4,014,619 | $ | 4,662,849 | $ | 7,617,726 | $ | 3,158,388 | $ | 8,253,284 | |||||||||||||
| Shares outstanding (unlimited amount authorized, $0.01 par value) | 200,000 | 300,000 | 300,000 | 150,000 | 250,000 | ||||||||||||||||||
| Net asset value | $ | 20.07 | $ | 15.54 | $ | 25.39 | $ | 21.06 | $ | 33.01 | |||||||||||||
| Share Price | $ | 20.04 | $ | 15.54 | $ | 25.23 | $ | 21.04 | $ | 33.05 | |||||||||||||
| Investments, at cost | $ | 3,387,337 | $ | 3,926,925 | $ | 7,753,935 | $ | 3,096,077 | $ | 7,498,171 | |||||||||||||
See Notes to Financial Statements.
26
Statements of Operations
| PowerShares Active AlphaQ Fund | PowerShares Active Alpha Multi-Cap Fund | PowerShares Active Low Duration Fund | PowerShares Active Mega Cap Fund | PowerShares Active U.S. Real Estate Fund | |||||||||||||||||||
| Year Ended October 31, 2009 | Year Ended October 31, 2009 | Year Ended October 31, 2009 | Year Ended October 31, 2009 | For the Period November 19, 2008* Through October 31, 2009 | |||||||||||||||||||
| INVESTMENT INCOME: | |||||||||||||||||||||||
| Dividend income | $ | 21,083 | $ | 55,088 | $ | — | $ | 41,281 | $ | 114,754 | |||||||||||||
| Interest income | — | — | 80,298 | — | — | ||||||||||||||||||
| Foreign withholding taxes | (503 | ) | (950 | ) | — | — | — | ||||||||||||||||
| Total Income | 20,580 | 54,138 | 80,298 | 41,281 | 114,754 | ||||||||||||||||||
| EXPENSES: | |||||||||||||||||||||||
| Unitary management fees | 26,607 | 38,103 | 15,907 | 14,521 | 25,299 | ||||||||||||||||||
| Net Investment Income (Loss) | (6,027 | ) | 16,035 | 64,391 | 26,760 | 89,455 | |||||||||||||||||
| REALIZED AND UNREALIZED GAIN (LOSS) ON INVESTMENTS: | |||||||||||||||||||||||
| Net realized gain (loss) from: | |||||||||||||||||||||||
| Investments | (1,051,001 | ) | (3,421,046 | ) | 569 | (466,613 | ) | (46,912 | ) | ||||||||||||||
| In-kind redemptions | 190,831 | 422,406 | 14,322 | 108,162 | 483,980 | ||||||||||||||||||
| Futures contracts | — | — | (6,402 | ) | — | — | |||||||||||||||||
| Net realized gain (loss) | (860,170 | ) | (2,998,640 | ) | 8,489 | (358,451 | ) | 437,068 | |||||||||||||||
| Net change in unrealized appreciation on: | |||||||||||||||||||||||
| Investments | 1,463,767 | 3,058,899 | 55,069 | 629,262 | 623,382 | ||||||||||||||||||
| Futures contracts | — | — | 7,857 | — | — | ||||||||||||||||||
| Net realized and unrealized gain on investments and futures contracts | 603,597 | 60,259 | 71,415 | 270,811 | 1,060,450 | ||||||||||||||||||
| Net increase in net assets resulting from operations | $ | 597,570 | $ | 76,294 | $ | 135,806 | $ | 297,571 | $ | 1,149,905 | |||||||||||||
* Commencement of Investment Operations.
See Notes to Financial Statements.
27
Statements of Changes in Net Assets
| PowerShares Active AlphaQ Fund | PowerShares Active Alpha Multi-Cap Fund | ||||||||||||||||||
| Year Ended October 31, 2009 | For the Period April 8, 2008* Through October 31, 2008 | Year Ended October 31, 2009 | For the Period April 8, 2008* Through October 31, 2008 | ||||||||||||||||
| OPERATIONS: | |||||||||||||||||||
| Net investment income (loss) | $ | (6,027 | ) | $ | (2,740 | ) | $ | 16,035 | $ | 1,831 | |||||||||
| Net realized gain (loss) on investments | (860,170 | ) | (687,896 | ) | (2,998,640 | ) | (1,744,447 | ) | |||||||||||
| Net change in unrealized appreciation (depreciation) on investments | 1,463,767 | (831,019 | ) | 3,058,899 | (2,326,606 | ) | |||||||||||||
| Net increase (decerase) in net assets resulting from operations | 597,570 | (1,521,655 | ) | 76,294 | (4,069,222 | ) | |||||||||||||
| Undistributed net investment income (loss) included in the price of units issued and redeemed | (182 | ) | 1,374 | (2,751 | ) | 11,003 | |||||||||||||
| DISTRIBUTIONS TO SHAREHOLDERS FROM: | |||||||||||||||||||
| Net investment income | — | — | (12,784 | ) | — | ||||||||||||||
| Return of capital | (2,478 | ) | — | — | — | ||||||||||||||
| Total distributions to shareholders | (2,478 | ) | — | (12,784 | ) | — | |||||||||||||
| SHAREHOLDER TRANSACTIONS: | |||||||||||||||||||
| Proceeds from shares sold | 3,223,926 | 7,492,592 | 669,186 | 10,147,242 | |||||||||||||||
| Value of shares repurchased | (3,316,224 | ) | (2,484,112 | ) | (2,149,362 | ) | (23,505 | ) | |||||||||||
| Net income equalization | 182 | (1,374 | ) | 2,751 | (11,003 | ) | |||||||||||||
| Net increase (decrease) in net assets resulting from shares transactions | (92,116 | ) | 5,007,106 | (1,477,425 | ) | 10,112,734 | |||||||||||||
| Increase (Decrease) in Net Assets | 502,794 | 3,486,825 | (1,416,666 | ) | 6,054,515 | ||||||||||||||
| NET ASSETS: | |||||||||||||||||||
| Beginning of period | 3,511,825 | 25,000 | 6,079,515 | 25,000 | |||||||||||||||
| End of period | $ | 4,014,619 | $ | 3,511,825 | $ | 4,662,849 | $ | 6,079,515 | |||||||||||
| Undistributed net investment income at end of period | $ | — | $ | — | $ | 5,154 | $ | 1,831 | |||||||||||
| CHANGES IN SHARES OUTSTANDING: | |||||||||||||||||||
| Shares sold | 200,000 | 300,000 | 50,000 | 400,000 | |||||||||||||||
| Shares repurchased | (200,000 | ) | (101,000 | ) | (150,000 | ) | (1,000 | ) | |||||||||||
| Shares outstanding, beginning of period | 200,000 | 1,000 | 400,000 | 1,000 | |||||||||||||||
| Shares outstanding, end of period | 200,000 | 200,000 | 300,000 | 400,000 | |||||||||||||||
* Commencement of Investment Operations.
See Notes to Financial Statements.
28
| PowerShares Active Low Duration Fund | PowerShares Active Mega Cap Fund | PowerShares Active U.S. Real Estate Fund | |||||||||||||||||||||
| Year Ended October 31, 2009 | For the Period April 8, 2008* Through October 31, 2008 | Year Ended October 31, 2009 | For the Period April 8, 2008* Through October 31, 2008 | For the Period November 19, 2008* Through October 31, 2009 | |||||||||||||||||||
| OPERATIONS: | |||||||||||||||||||||||
| Net investment income (loss) | $ | 64,391 | $ | 27,658 | $ | 26,760 | $ | 17,219 | $ | 89,455 | |||||||||||||
| Net realized gain (loss) on investments | 8,489 | (16,108 | ) | (358,451 | ) | (145,059 | ) | 437,068 | |||||||||||||||
| Net change in unrealized appreciation (depreciation) on investments | 62,926 | 15,368 | 629,262 | (552,088 | ) | 623,382 | |||||||||||||||||
| Net increase (decerase) in net assets resulting from operations | 135,806 | 26,918 | 297,571 | (679,928 | ) | 1,149,905 | |||||||||||||||||
| Undistributed net investment income (loss) included in the price of units issued and redeemed | (5,852 | ) | 30 | 7,014 | (150 | ) | 88,841 | ||||||||||||||||
| DISTRIBUTIONS TO SHAREHOLDERS FROM: | |||||||||||||||||||||||
| Net investment income | (68,278 | ) | (27,658 | ) | (29,723 | ) | — | (67,012 | ) | ||||||||||||||
| Return of capital | (11,881 | ) | (1,121 | ) | — | — | — | ||||||||||||||||
| Total distributions to shareholders | (80,159 | ) | (28,779 | ) | (29,723 | ) | — | (67,012 | ) | ||||||||||||||
| SHAREHOLDER TRANSACTIONS: | |||||||||||||||||||||||
| Proceeds from shares sold | 12,643,122 | 2,500,000 | 7,472,575 | 5,087,520 | 25,601,869 | ||||||||||||||||||
| Value of shares repurchased | (7,579,418 | ) | (24,764 | ) | (6,405,568 | ) | (2,609,059 | ) | (18,431,478 | ) | |||||||||||||
| Net income equalization | 5,852 | (30 | ) | (7,014 | ) | 150 | (88,841 | ) | |||||||||||||||
| Net increase (decrease) in net assets resulting from shares transactions | 5,069,556 | 2,475,206 | 1,059,993 | 2,478,611 | 7,081,550 | ||||||||||||||||||
| Increase (Decrease) in Net Assets | 5,119,351 | 2,473,375 | 1,334,855 | 1,798,533 | 8,253,284 | ||||||||||||||||||
| NET ASSETS: | |||||||||||||||||||||||
| Beginning of period | 2,498,375 | 25,000 | 1,823,533 | 25,000 | — | ||||||||||||||||||
| End of period | $ | 7,617,726 | $ | 2,498,375 | $ | 3,158,388 | $ | 1,823,533 | $ | 8,253,284 | |||||||||||||
| Undistributed net investment income at end of period | $ | — | $ | — | $ | 14,256 | $ | 17,219 | $ | 22,443 | |||||||||||||
| CHANGES IN SHARES OUTSTANDING: | |||||||||||||||||||||||
| Shares sold | 500,000 | 100,000 | 400,000 | 200,000 | 900,000 | ||||||||||||||||||
| Shares repurchased | (300,000 | ) | (1,000 | ) | (350,000 | ) | (101,000 | ) | (650,000 | ) | |||||||||||||
| Shares outstanding, beginning of period | 100,000 | 1,000 | 100,000 | 1,000 | — | ||||||||||||||||||
| Shares outstanding, end of period | 300,000 | 100,000 | 150,000 | 100,000 | 250,000 | ||||||||||||||||||
29
Financial Highlights
PowerShares Active AlphaQ Fund
| Year Ended October 31, 2009 | For the Period April 8, 2008* through October 31, 2008 | ||||||||||
| PER SHARE OPERATING PERFORMANCE: | |||||||||||
| Net asset value at beginning of period | $ | 17.56 | $ | 25.00 | |||||||
| Net investment income (loss)** | (0.03 | ) | (0.02 | ) | |||||||
| Net realized and unrealized gain (loss) on investments | 2.55 | (7.42 | ) | ||||||||
| Total from investment operations | 2.52 | (7.44 | ) | ||||||||
| Distributions to shareholders from: | |||||||||||
| Return of capital | (0.01 | ) | — | ||||||||
| Net asset value at end of period | $ | 20.07 | $ | 17.56 | |||||||
| Share price at end of period*** | $ | 20.04 | $ | 17.57 | |||||||
| NET ASSET VALUE, TOTAL RETURN**** | 14.38 | % | (29.76 | )%(a) | |||||||
| SHARE PRICE TOTAL RETURN**** | 14.15 | % | (29.72 | )%(a) | |||||||
| RATIOS/SUPPLEMENTAL DATA: | |||||||||||
| Net assets at end of period (000's omitted) | $ | 4,015 | $ | 3,512 | |||||||
| Ratio to average net assets of: | |||||||||||
| Expenses | 0.75 | % | 0.75 | %† | |||||||
| Net investment income (loss) | (0.17 | )% | (0.14 | )%† | |||||||
| Portfolio turnover rate †† | 153 | % | 90 | % | |||||||
| Undistributed net investment income (loss) included in price of units issued and redeemed# | $ | (0.00 | )(b) | $ | 0.01 | ||||||
PowerShares Active Alpha Multi-Cap Fund
| Year Ended October 31, 2009 | For the Period April 8, 2008* through October 31, 2008 | ||||||||||
| PER SHARE OPERATING PERFORMANCE: | |||||||||||
| Net asset value at beginning of period | $ | 15.20 | $ | 25.00 | |||||||
| Net investment income** | 0.04 | 0.01 | |||||||||
| Net realized and unrealized gain (loss) on investments | 0.33 | (9.81 | ) | ||||||||
| Total from investment operations | 0.37 | (9.80 | ) | ||||||||
| Distributions to shareholders from: | |||||||||||
| Net investment income | (0.03 | ) | — | ||||||||
| Net asset value at end of period | $ | 15.54 | $ | 15.20 | |||||||
| Share price at end of period*** | $ | 15.54 | $ | 15.15 | |||||||
| NET ASSET VALUE, TOTAL RETURN**** | 2.49 | % | (39.20 | )%(c) | |||||||
| SHARE PRICE TOTAL RETURN**** | 2.82 | % | (39.40 | )%(c) | |||||||
| RATIOS/SUPPLEMENTAL DATA: | |||||||||||
| Net assets at end of period (000's omitted) | $ | 4,663 | $ | 6,080 | |||||||
| Ratio to average net assets of: | |||||||||||
| Expenses | 0.75 | % | 0.75 | %† | |||||||
| Net investment income | 0.32 | % | 0.05 | %† | |||||||
| Portfolio turnover rate †† | 197 | % | 89 | % | |||||||
| Undistributed net investment income (loss) included in price of units issued and redeemed# | $ | (0.01 | ) | $ | 0.04 | ||||||
* Commencement of Investment Operations.
** Based on average shares outstanding.
*** The mean between the last bid and ask prices.
**** Net asset value total return is calculated assuming an initial investment made at the net asset value at the beginning of the period, reinvestment of all dividends and distributions at net asset value during the period, and redemption on the last day of the period. Share price total return is calculated assuming an initial investment made at the share price at the beginning of the period, reinvestment of all dividends and distributions at share price during the period, and the sale at the share price on the last day of the period. Total investment returns calculated for a period of less than one year are not annualized.
† Annualized.
†† Portfolio turnover rate is not annualized and does not include securities received or delivered from processing creations or redemptions.
# The per share amount of equalization is presented to show the impact of equalization on distributable earnings per share.
(a) The net asset value total return from Fund Inception (April 11, 2008, first day of trading on the exchange) to October 31, 2008 was (28.70)%. The share price total return from Fund inception to October 31, 2008 was (28.69)%.
(b) Amount represents less than $0.005.
(c) The net asset value total return from Fund Inception (April 11, 2008, first day of trading on the exchange) to October 31, 2008 was (38.16)%. The share price total return from Fund inception to October 31, 2008 was (38.37)%.
See Notes to Financial Statements.
30
Financial Highlights (Continued)
PowerShares Active Low Duration Fund
| Year Ended October 31, 2009 | For the Period April 8, 2008* through October 31, 2008 | ||||||||||
| PER SHARE OPERATING PERFORMANCE: | |||||||||||
| Net asset value at beginning of period | $ | 24.98 | $ | 25.00 | |||||||
| Net investment income** | 0.29 | 0.28 | |||||||||
| Net realized and unrealized gain (loss) on investments | 0.52 | (0.01 | ) | ||||||||
| Total from investment operations | 0.81 | 0.27 | |||||||||
| Distribution to shareholders from: | |||||||||||
| Net investment income | (0.35 | ) | (0.28 | ) | |||||||
| Return of capital | (0.05 | ) | (0.01 | ) | |||||||
| Total distributions | (0.40 | ) | (0.29 | ) | |||||||
| Net asset value at end of period | $ | 25.39 | $ | 24.98 | |||||||
| Share price at end of period*** | $ | 25.23 | $ | 24.60 | |||||||
| NET ASSET VALUE, TOTAL RETURN**** | 3.27 | % | 1.08 | %(a) | |||||||
| SHARE PRICE TOTAL RETURN**** | 4.20 | % | (0.45 | )%(a) | |||||||
| RATIOS/SUPPLEMENTAL DATA: | |||||||||||
| Net assets at end of period (000's omitted) | $ | 7,618 | $ | 2,498 | |||||||
| Ratio to average net assets of: | |||||||||||
| Expenses | 0.29 | % | 0.29 | %† | |||||||
| Net investment income | 1.17 | % | 1.99 | %† | |||||||
| Portfolio turnover rate †† | 295 | % | 296 | % | |||||||
| Undistributed net investment income (loss) included in price of units issued and redeemed# | $ | (0.03 | ) | $ | 0.00 | (b) | |||||
PowerShares Active Mega Cap Fund
| Year Ended October 31, 2009 | For the Period April 8, 2008* through October 31, 2008 | ||||||||||
| PER SHARE OPERATING PERFORMANCE: | |||||||||||
| Net asset value at beginning of period | $ | 18.24 | $ | 25.00 | |||||||
| Net investment income** | 0.26 | 0.17 | |||||||||
| Net realized and unrealized gain (loss) on investments | 2.86 | (6.93 | ) | ||||||||
| Total from investment operations | 3.12 | (6.76 | ) | ||||||||
| Distributions to shareholders from: | |||||||||||
| Net investment income | (0.30 | ) | — | ||||||||
| Net asset value at end of period | $ | 21.06 | $ | 18.24 | |||||||
| Share price at end of period*** | $ | 21.04 | $ | 18.23 | |||||||
| NET ASSET VALUE, TOTAL RETURN**** | 17.37 | % | (27.04 | )%(c) | |||||||
| SHARE PRICE TOTAL RETURN**** | 17.29 | % | (27.08 | )%(c) | |||||||
| RATIOS/SUPPLEMENTAL DATA: | |||||||||||
| Net assets at end of period (000's omitted) | $ | 3,158 | $ | 1,824 | |||||||
| Ratio to average net assets of: | |||||||||||
| Expenses | 0.75 | % | 0.75 | %† | |||||||
| Net investment income | 1.38 | % | 1.30 | %† | |||||||
| Portfolio turnover rate †† | 87 | % | 41 | % | |||||||
| Undistributed net investment income (loss) included in price of units issued and redeemed# | $ | 0.07 | $ | (0.00 | )(b) | ||||||
* Commencement of Investment Operations.
** Based on average shares outstanding.
*** The mean between the last bid and ask price.
**** Net asset value total return is calculated assuming an initial investment made at the net asset value at the beginning of the period, reinvestment of all dividends and distributions at net asset value during the period, and the redemption on the last day of the period. Share price total return is calculated assuming an initial investment made at the share price at the beginning of the period, reinvestment of all dividends and distributions at share price during the period, and sale at the share price on the last day of the period. Total investment returns calculated for a period of less than one year are not annualized.
† Annualized.
†† Portfolio turnover rate is not annualized and does not include securities received or delivered from processing creations or redemptions.
# The per share amount of equalization is presented to show the impact of equalization on distributable earnings per share.
(a) The net asset value total return from Fund Inception (April 11, 2008, first day of trading on the exchange) to October 31, 2008 was 0.88%. The share price total return from Fund inception to October 31, 2008 was (0.89)%.
(b) Amount represents less than $0.005
(c) The net asset value total return from Fund Inception (April 11, 2008, first day of trading on the exchange) to October 31, 2008 was (26.27)%. The share price total return from Fund inception to October 31, 2008 was (26.31)%.
See Notes to Financial Statements.
31
Financial Highlights (Continued)
PowerShares Active U.S. Real Estate Fund
| For Period November 19, 2008* through October 31, 2009 | |||||||
| PER SHARE OPERATING PERFORMANCE: | |||||||
| Net asset value at beginning of period | $ | 21.66 | |||||
| Net investment income** | 0.72 | ||||||
| Net realized and unrealized gain (loss) on investments | 11.21 | ||||||
| Total from investment operations | 11.93 | ||||||
| Distribution to shareholders from: | |||||||
| Net investment income | (0.58 | ) | |||||
| Net asset value at end of period | $ | 33.01 | |||||
| Share price at end of period*** | $ | 33.05 | |||||
| NET ASSET VALUE, TOTAL RETURN**** | 55.56 | %(a) | |||||
| SHARE PRICE TOTAL RETURN**** | 55.70 | %(a) | |||||
| RATIOS/SUPPLEMENTAL DATA: | |||||||
| Net assets at end of period (000's omitted) | $ | 8,253 | |||||
| Ratio to average net assets of: | |||||||
| Expenses | 0.80 | %† | |||||
| Net investment income | 2.83 | %† | |||||
| Portfolio turnover rate †† | 46 | % | |||||
| Undistributed net investment income (loss) included in price of units issued and redeemed# | $ | 0.71 | |||||
* Commencement of Investment Operations.
** Based on average shares outstanding.
*** The mean between the last bid and ask price.
**** Net asset value total return is calculated assuming an initial investment made at the net asset value at the beginning of the period, reinvestment of all dividends and distributions at net asset value during the period, and the redemption on the last day of the period. Share price total return is calculated assuming an initial investment made at the share price at the beginning of the period, reinvestment of all dividends and distributions at share price during the period, and sale at the share price on the last day of the period. Total investment returns calculated for a period of less than one year are not annualized.
† Annualized.
†† Portfolio turnover rate is not annualized and does not include securities received or delivered from processing creations or redemptions.
# The per share amount of equalization is presented to show the impact of equalization on distributable earnings per share.
(a) The net asset value total return from Fund Inception (November 20, 2008, first day of trading on the exchange) to October 31, 2009 was 67.47%. The share price total return from Fund Inception to October 31, 2009 was 68.71%.
See Notes to Financial Statements.
32
Notes to Financial Statements
PowerShares Actively Managed Exchange-Traded Fund Trust
October 31, 2009
Note 1. Organization
PowerShares Actively Managed Exchange-Traded Fund Trust (the "Trust") was organized as a Delaware statutory trust on November 6, 2007 and is authorized to have multiple series of portfolios. The Trust is an open-end management investment company registered under the Investment Company Act of 1940, as amended (the "1940 Act"). As of the fiscal year end, the Trust offered five portfolios. This report includes the following portfolios:
| Full Name | Short Name | ||||||
| PowerShares Active AlphaQ Fund | "Active AlphaQ Fund" | ||||||
| PowerShares Active Alpha Multi-Cap Fund | "Active Alpha Multi-Cap Fund" | ||||||
| PowerShares Active Low Duration Fund | "Active Low Duration Fund" | ||||||
| PowerShares Active Mega Cap Fund | "Active Mega Cap Fund" | ||||||
| PowerShares Active U.S. Real Estate Fund | "Active U.S. Real Estate Fund" | ||||||
Each portfolio (the "Fund" and collectively the "Funds") represents a separate series of the Trust. The shares of the Funds are referred to herein as "Shares" or "Fund's Shares." Each Fund's Shares are listed and traded on the NYSE Arca, Inc.
The Funds' market prices may differ to some degree from the net asset value ("NAV") of the Shares of each Fund. Unlike conventional mutual funds, each Fund issues and redeems Shares on a continuous basis, at NAV, only in a large specified number of Shares, each called a "Creation Unit." Creation Units are issued and redeemed generally in-kind for securities included in the relevant index, except with respect to Active Low Duration Fund for which Creation Units are issued and redeemed partially for cash and partially in-kind for securities included in a specified universe. Except when aggregated in Creation Units by Authorized Participants, the Shares are not individually redeemable securities of the Funds.
The investment objective for the Active AlphaQ Fund and Active Alpha Multi-Cap Fund is long-term capital appreciation. The investment objective for the Active Low Duration Fund is total return. Active Mega Cap Fund's investment objective is long-term growth of capital. The investment objective of Active U.S. Real Estate Fund is high total return through growth of capital and current income.
Note 2. Significant Accounting Policies
The preparation of the financial statements in accordance with accounting principles generally accepted in the United States of America requires management to make estimates and assumptions that affect the reported amounts and disclosures in the financial statements, including estimates and assumptions related to taxation. Actual results could differ from these estimates. In addition, the Funds monitor for material events or transactions that may occur or become known after the period-end date and before the date the financial statements are released to print, which is generally 45 days from the period-end date.
A. Security Valuation
Securities, including restricted securities, are valued according to the following policies.
A security listed or traded on an exchange (except convertible bonds) is valued at its last sales price or official closing price as of the close of the customary trading session on the exchange where the security is principally traded, or lacking any sales or official closing price on a particular day, the security may be
33
Notes to Financial Statements (Continued)
PowerShares Actively Managed Exchange-Traded Fund Trust
October 31, 2009
valued at the closing bid price on that day. Securities traded in the over-the-counter market are valued based on prices furnished by independent pricing services or market makers. Listed options, if no closing price is available, are valued at the mean between the last bid and ask prices from the exchange on which they are principally traded. Options not listed on an exchange are valued by an independent source at the mean between the last bid and ask prices. Investments in open-end registered investment companies not traded on an exchange are valued at the end of day NAV per share.
Debt obligations (including convertible bonds) and unlisted equities are fair valued using an evaluated quote provided by an independent pricing service. Evaluated quotes provided by the pricing service may be determined without exclusive reliance on quoted prices, and may reflect appropriate factors such as institution-size trading in similar groups of securities, developments related to specific securities, dividend rate, yield, quality, type of issue, coupon rate, maturity, individual trading characteristics and other market data. Short-term obligations, including commercial paper, having 60 days or less to maturity are recorded at amortized cost which approximates value. Debt securities are subject to interest rate and credit risks. In addition, all debt securities involve some risk of default with respect to interest and/or principal payments.
Foreign securities (including foreign exchange contracts) are converted into U.S. dollar amounts using the applicable exchange rates as of the close of the London world markets. If market quotations are available and reliable for foreign exchange traded equity securities, the securities will be valued at the market quotations. Because trading hours for certain foreign securities end before the close of the New York Stock Exchange ("NYSE"), closing market quotations may become unreliable. If between the time trading ends on a particular security and the close of the customary trading session on the NYSE, events occur that are significant and make the closing price unreliable, the Fund may fair value the security. If the event is likely to have affected the closing price of the security, the security will be valued at fair value in good faith using procedures approved by the Board of Trustees. Adjustments to closing prices to refl ect fair value may also be based on a screening process of an independent pricing service to indicate the degree of certainty, based on historical data, that the closing price in the principal market where a foreign security trades is not the current value as of the close of the NYSE. Foreign securities meeting the approved degree of certainty that the price is not reflective of current value will be priced at the indication of fair value from the independent pricing service. Multiple factors may be considered by the independent pricing service in determining adjustments to reflect fair value and may include information relating to sector indices, American Depositary Receipts and domestic and foreign index futures. Foreign securities may have additional risks including exchange rate changes, potential for sharply devalued currencies and high inflation, political and economic upheaval, the relative lack of issuer information, relatively low market liquidity and the potential lack of strict financial and accou nting controls and standards.
Securities for which market prices are not provided by any of the above methods may be valued based upon quotes furnished by independent sources.
Securities for which market quotations are not readily available or are unreliable are valued at fair value as determined in good faith by or under the supervision of the Trust's officers following procedures approved by the Board of Trustees. Issuer specific events, market trends, bid/ask quotes of brokers and information providers and other market data may be reviewed in the course of making a good faith determination of a security's fair value.
34
Notes to Financial Statements (Continued)
PowerShares Actively Managed Exchange-Traded Fund Trust
October 31, 2009
Valuations change in response to many factors, including the historical and prospective earnings of the issuer, the value of the issuer's assets, general economic conditions, interest rates, investor perceptions and market liquidity. Because of the inherent uncertainties of valuation, the values reflected in the financial statements may materially differ from the value received upon actual sale of those investments.
B. Other Risks
A Fund may concentrate investments in a comparatively narrow segment of the economy. Consequently, such Fund may tend to be more volatile than other funds, and the value of investments may tend to rise and fall more rapidly.
All of the funds, except for Active AlphaQ and Active MultiCap, are considered non-diversified and can invest a greater portion of assets in securities of individual issuers than a diversified fund. As a result, changes in the market value of a single investment could cause greater fluctuations in share price than would occur in a diversified fund.
Active Low Duration Fund holds investments in obligations issued by agencies and instrumentalities of the U.S. Government, which may vary in the level of support they receive from the government. The government may choose not to provide financial support to government sponsored agencies or instrumentalities if it is not legally obligated to do so. In this case, if the issuer defaulted, the underlying fund holding securities of such issuer might not be able to recover its investment from the U.S. Government.
C. Federal Income Taxes
Each Fund intends to comply with the provisions of the Internal Revenue Code applicable to regulated investment companies and to distribute substantially all of the Fund's taxable earnings to its shareholders. As such, the Funds will not be subject to Federal income taxes on otherwise taxable income (including net realized gains) that is distributed to the shareholders. Therefore, no provision for Federal income taxes is recorded in the financial statements.
Income and capital gain distributions are determined in accordance with Federal income tax regulations, which may differ from accounting principles generally accepted in the United States of America. These differences are primarily due to differing book and tax treatments for in-kind transactions, losses deferred due to wash sales, and passive foreign investment company adjustments, if any.
The Funds file tax returns in the United States Federal jurisdiction and certain other jurisdictions. Generally, a Fund is subject to examinations by such taxing authorities for up to three years after the filing of the returns for the tax period.
D. Investment Income and Investment Transactions
Dividend income is recorded on the ex-dividend date net of foreign taxes withheld. Interest income is recorded on the accrual basis. Investment transactions are recorded on the trade date. Realized gains and losses from the sale or disposition of securities are calculated on the specific identified cost basis. Dividends and interest received by a Fund may give rise to withholding and other taxes imposed by foreign countries. Corporate actions (including cash dividends) are recorded net of non-reclaimable foreign tax withholdings on the ex-dividend date. Tax conventions between certain countries and the United States may reduce or eliminate such taxes.
35
Notes to Financial Statements (Continued)
PowerShares Actively Managed Exchange-Traded Fund Trust
October 31, 2009
E. Expenses
Each Fund has agreed to pay an annual unitary management fee to Invesco PowerShares Capital Management LLC (the "Adviser"). The Adviser has agreed to pay for substantially all expenses of the Funds, including payments to the Sub-Advisers (as defined below) and the cost of transfer agency, custody, fund administration, legal, audit and other services, except for advisory fees, distribution fees, if any, brokerage expenses, taxes, interest and other extraordinary expenses.
F. Dividends and Distributions to Shareholders
Each Fund (except for the Active Low Duration Fund, which declares and pays dividends monthly) declares and pays dividends from net investment income, if any, to its shareholders quarterly and records on ex-dividend date. Each Fund distributes net realized taxable capital gains, if any, generally annually in cash and records on ex-dividend date. Such distributions on a tax basis are determined in conformity with income tax regulations which may differ from accounting principles generally accepted in the United States of America. Distributions in excess of tax basis earnings and profits, if any, are reported in such Fund's financial statements as a tax return of capital at fiscal period-end.
G. Equalization
All Funds use the accounting practice of equalization. This accounting method is used to keep the continuing shareholders' per share equity in undistributed net investment income from being affected by the continuous sales and redemptions of capital shares. Equalization is calculated on a per share basis whereby a portion of the proceeds from the sales and cost of repurchases of capital shares is applied to undistributed net investment income. The amount of equalization is disclosed in the Statement of Changes in Net Assets as undistributed net investment income included in the price of capital shares issued or redeemed. The distributions to shareholders of amounts so applied may be deemed to be a return of capital for tax purposes to the extent that such distributions exceed taxable income.
H. Futures Contracts
Each Fund may enter into U.S. futures contracts to simulate full investment in securities or an Underlying Index, to facilitate trading or to reduce transaction costs. With respect to the Active Low Duration Fund, the Fund may invest in futures contracts on U.S. Treasury securities to manage interest rate risk and may do so with respect to the entire portfolio. A futures contract is an agreement between two parties to purchase or sell a specified underlying security or index for a specified price at a future date. The Funds will only enter into futures contracts that are traded on a U.S. exchange and they are standardized as to maturity date and underlying financial instrument. Initial margin deposits required upon entering into futures contracts are satisfied by the segregation of specific securities or cash as collateral at the futures commission merchant (broker). During the period the futures contracts are open, changes in t he value of the contracts are recognized as unrealized gains or losses by recalculating the value of the contracts on a daily basis. Subsequent or variation margin payments are received or made depending upon whether unrealized gains or losses are incurred. These amounts are reflected as a receivable or payable on the Statement of Assets and Liabilities. When the contracts are closed or expire, the Fund recognizes a realized gain or loss equal to the difference between the proceeds from, or cost of, the closing transaction and the Fund's basis in the contract. The net realized gain (loss) and the change in unrealized gain (loss) on futures contracts held during the period is included on the Statement of Operations. The primary risks associated
36
Notes to Financial Statements (Continued)
PowerShares Actively Managed Exchange-Traded Fund Trust
October 31, 2009
with futures contracts are market risk, leverage risk and the absence of a liquid secondary market. If the Fund were unable to liquidate a futures contract and/or enter into an offsetting closing transaction, the Fund would continue to be subject to market risk with respect to the value of the contracts and may be required to continue to maintain the margin deposits on the futures contracts until the position expired or matured. With respect to futures on U.S. Treasury securities, the Fund could experience losses if the U.S. Treasury securities underlying futures contracts are not closely correlated with the securities held by the Fund. Futures contracts have minimal counterparty risk since the exchange's clearinghouse, as counterparty to all exchange traded futures, guarantees the futures against default. Risks may exceed amounts recognized in the Statement of Assets and Liabilities.
Note 3. Investment Advisory Agreement and Other Agreements
The Trust has entered into an Investment Advisory Agreement with the Adviser under which the Adviser has overall responsibility as the Funds' investment adviser for the selection and ongoing monitoring of the Funds' investments, managing the Funds' business affairs, providing certain clerical, bookkeeping and other administrative services and oversight of AER Advisors, Inc. ("AER") and Invesco Institutional (N.A.), Inc. ("Invesco Institutional"), Invesco Aim Advisors, Inc. ("Invesco Aim"), Invesco Asset Management Deutschland GmbH ("Invesco Deutschland"), Invesco Asset Management Limited ("Invesco Asset Management"), Invesco Asset Management (Japan) Limited ("Invesco Japan"), Invesco Australia Limited ("Invesco Australia"), Invesco Global Asset Management (N.A.), Inc. ("Invesco Global"), Invesco Hong Kong Limited ("Invesco Hong Kong"), Invesco Senior Secured Management, Inc. ("Invesco Senior Secured") and Invesco Trimark Ltd. (" Invesco Trimark"), collectively the ("Sub-Advisers"). Except for AER, all other Sub-Advisers are affiliates of the Adviser. As compensation for its services, each Fund has agreed to pay the Adviser an annual unitary management fee and the Adviser has agreed to pay for substantially all expenses of the Funds, including payments to the Sub-Advisers and the cost of transfer agency, custody, fund administration, legal, audit and other services, except for advisory fees, distribution fees, if any, brokerage expenses, taxes, interest and other extraordinary expenses. The unitary management fee is paid by each Fund to the Adviser at the following annual rates:
| % of Average Daily Net Assets | |||||||
| Active AlphaQ Fund | 0.75 | % | |||||
| Active Alpha Multi-Cap Fund | 0.75 | % | |||||
| Active Low Duration Fund | 0.29 | % | |||||
| Active Mega Cap Fund | 0.75 | % | |||||
| Active U.S. Real Estate Fund | 0.80 | % | |||||
The Adviser has entered into an Investment Sub-Advisory Agreement with AER, the investment Sub-Adviser for the Active AlphaQ Fund and Active Alpha Multi-Cap Fund, and an Investment Sub-Advisory Agreement with Invesco Institutional, the Sub-Adviser for the Active Mega Cap Fund, Active Low Duration Fund and the primary Sub-Adviser for Active U.S. Real Estate Fund. Invesco Aim, Invesco Deutschland, Invesco Asset Management, Invesco Japan, Invesco Australia, Invesco Global, Invesco Hong Kong, Invesco Senior Secured and Invesco Trimark also serve as Sub-Advisers for the Active U.S. Real
37
Notes to Financial Statements (Continued)
PowerShares Actively Managed Exchange-Traded Fund Trust
October 31, 2009
Estate Fund pursuant to an Investment Sub-Advisory Agreement with the Adviser. The sub-advisory fee is paid by the Adviser to the Sub-Advisers at the following annual rates:
| Sub-adviser/Fund | Sub-advisory fee | ||||||
| AER/Active AlphaQ Fund and Active Alpha Multi-Cap Fund | 0.20% of the Fund's average daily net assets. | ||||||
| Invesco Institutional/Active Low Duration Fund, Active Mega Cap Fund and Active U.S. Real Estate Fund | 40% of the Adviser's compensation of the sub-advised assets. | ||||||
| Invesco Aim, Invesco Deutschland, Invesco Asset Management, Invesco Japan, Invesco Australia, Invesco Global, Invesco Hong Kong, Invesco Senior Secured and Invesco Trimark/Active U.S. Real Estate Fund | 40% of the Adviser's compensation of the sub-advised assets. | ||||||
The Trust has entered into a Distribution Agreement with Invesco Aim Distributors, Inc. (the "Distributor"), which serves as the distributor of Creation Units for each Fund. The Distributor does not maintain a secondary market in the Shares.
The Trust has entered into service agreements whereby The Bank of New York Mellon, a wholly-owned subsidiary of The Bank of New York Mellon Corporation, serves as the administrator, custodian, fund accountant and transfer agent for each Fund.
Note 4. Additional Valuation Information
Generally Accepted Accounting Principles ("GAAP") defines fair value as the price that would be received to sell an asset or paid to transfer a liability in an orderly transaction between market participants at the measurement date, under current market conditions. GAAP establishes a hierarchy that prioritizes the inputs to valuation methods giving the highest priority to readily available unadjusted quoted prices in an active market for identical assets (Level 1) and the lowest priority to significant unobservable inputs (Level 3) generally when market prices are not readily available or are unreliable. Based on the valuation inputs, the securities or other investments are tiered into one of three levels. Changes in valuation methods may result in transfers in or out of an investment's assigned level:
Level 1 – Prices are determined using quoted prices in an active market for identical assets.
Level 2 – Prices are determined using other significant observable inputs. Observable inputs are inputs that other market participants may use in pricing a security. These may include quoted prices for similar securities, interest rates, prepayment speeds, credit risk and others.
Level 3 – Prices are determined using significant unobservable inputs. In situations where quoted prices or observable inputs are unavailable (for example, when there is little or no market activity for an investment at the end of the period), unobservable inputs may be used. Unobservable inputs reflect the Fund's own assumptions about the factors market participants would use in determining fair value of the securities or instruments and would be based on the best available information.
38
Notes to Financial Statements (Continued)
PowerShares Actively Managed Exchange-Traded Fund Trust
October 31, 2009
The following is a summary of the tiered valuation input levels, as of October 31, 2009. The level assigned to the securities valuations may not be an indication of the risk or liquidity associated with investing in those securities. Because of the inherent uncertainties of valuation, the values reflected in the financial statements may materially differ from the value received upon actual sale of those investments.
| Investment in Securities | |||||||||||||||||||
| Level 1 | Level 2 | Level 3 | Total | ||||||||||||||||
| Active AlphaQ Fund | |||||||||||||||||||
| Equity Securities | $ | 4,016,366 | $ | — | $ | — | $ | 4,016,366 | |||||||||||
| Money Market Fund | 3,719 | — | — | 3,719 | |||||||||||||||
| Total Investments | 4,020,085 | — | — | 4,020,085 | |||||||||||||||
| Active Alpha Multi-Cap Fund | |||||||||||||||||||
| Equity Securities | 4,659,218 | — | — | 4,659,218 | |||||||||||||||
| Active Low Duration Fund | |||||||||||||||||||
| Corporate Debt Securities | — | 761,411 | — | 761,411 | |||||||||||||||
| U.S. Government Sponsored Agency Securities | — | 426,789 | — | 426,789 | |||||||||||||||
| U.S. Treasury Securities | — | 6,283,168 | — | 6,283,168 | |||||||||||||||
| Money Market Fund | 353,004 | — | — | 353,004 | |||||||||||||||
| Other Investments* | 7,857 | — | — | 7,857 | |||||||||||||||
| Total Investments | 360,861 | 7,471,368 | — | 7,832,229 | |||||||||||||||
| Active Mega Cap Fund | |||||||||||||||||||
| Equity Securities | 3,147,352 | — | — | 3,147,352 | |||||||||||||||
| Money Market Fund | 25,899 | — | — | 25,899 | |||||||||||||||
| Total Investments | 3,173,251 | — | — | 3,173,251 | |||||||||||||||
| Active U.S. Real Estate Fund | |||||||||||||||||||
| Equity Securities | 8,121,075 | — | — | 8,121,075 | |||||||||||||||
| Money Market Fund | 478 | — | — | 478 | |||||||||||||||
| Total Investments | 8,121,553 | — | — | 8,121,553 | |||||||||||||||
* Other Investments include futures which are included at unrealized appreciation (depreciation).
Note 5. Derivative Investments
Effective May 1, 2009, each Fund has implemented new required Disclosures about Derivative Instruments and Hedging Activities in accordance with Generally Accepted Accounting Principles. GAAP has intended to improve financial reporting about derivative instruments and hedging activities by requiring enhanced disclosures to enable investors to better understand their effects on an entity's financial position and financial performance. The enhanced disclosure has no impact on the results of operations reported in the financial statements.
39
Notes to Financial Statements (Continued)
PowerShares Actively Managed Exchange-Traded Fund Trust
October 31, 2009
Value of Derivative Instruments at Period-End
The Table below summarizes the value of the Fund's derivative instruments, detailed by primary risk exposure, held as of October 31, 2009:
| Value | |||||||||||
| Risk Exposure/Derivative Type | Assets | Liabilities | |||||||||
| Active Low Duration Fund | |||||||||||
| Interest rate risk | |||||||||||
| Futures contracts(a) | $ | 9,996 | $ | (2,139 | ) | ||||||
(a) Includes cumulative appreciation (depreciation) of futures contracts. Only current day's variation margin receivable (payable) is reported within the Statement of Assets and Liabilities.
Effect of Derivative Instruments for the six months ended October 31, 2009
The table below summarizes the gains (losses) on derivative instruments, detailed by primary risk exposure, recognized in earnings during the period:
| Location of Gain (Loss) on Statement of Operations | |||||||
| Futures | |||||||
| Active Low Duration Fund* | |||||||
| Realized Gain (Loss) | |||||||
| Interest rate risk | $ | (6,402 | ) | ||||
| Change in Unrealized Appreciation (Depreciation) | |||||||
| Interest rate risk | 7,857 | ||||||
| Total | $ | 1,455 | |||||
* The average value of outstanding futures during the period was $1,523,758.
| Open Futures Contracts | |||||||||||||||||||
| Active Low Duration Fund Contract | Number of Contracts | Expiration Date/Commitment | Value | Unrealized Appreciation/ (Depreciation) | |||||||||||||||
| U.S. Treasury 2 Year Notes | 9 | December-2009/Long | $ | 1,958,484 | $ | 9,996 | |||||||||||||
| U.S. Treasury 5 Year Notes | 3 | December-2009/Short | (349,359 | ) | (2,139 | ) | |||||||||||||
| Total Futures Contracts | $ | 1,609,125 | $ | 7,857 | |||||||||||||||
Note 6. Distributions to Shareholders and Tax Components of Net Assets
Tax Character of Distributions to Shareholders Paid During the Years Ended October 31, 2009 and 2008:
| 2009 | 2008 | ||||||||||||||||||
| Ordinary Income | Return of Capital | Ordinary Income | Return of Capital | ||||||||||||||||
| Active AlphaQ Fund | $ | — | $ | 2,478 | $ | — | $ | — | |||||||||||
| Active Alpha Multi-Cap Fund | 12,784 | — | — | — | |||||||||||||||
| Active Low Duration Fund | 68,278 | 11,881 | 27,658 | 1,121 | |||||||||||||||
| Active Mega Cap Fund | 29,723 | — | — | — | |||||||||||||||
| Active U.S. Real Estate Fund | 67,012 | — | — | — | |||||||||||||||
40
Notes to Financial Statements (Continued)
PowerShares Actively Managed Exchange-Traded Fund Trust
October 31, 2009
Tax Components of Net Assets at October 31, 2009:
Undistributed Ordinary Income | Net Unrealized Gains (Losses) | Capital Loss Carryforward | Shares of Beneficial Interest | Total Net Assets | |||||||||||||||||||
| Active AlphaQ Fund | $ | — | $ | 610,687 | $ | (1,723,081 | ) | $ | 5,127,013 | $ | 4,014,619 | ||||||||||||
| Active Alpha Multi-Cap Fund | 5,154 | 732,287 | (5,162,485 | ) | 9,087,893 | 4,662,849 | |||||||||||||||||
| Active Low Duration Fund | — | 68,293 | (10,528 | ) | 7,559,961 | 7,617,726 | |||||||||||||||||
| Active Mega Cap Fund | 14,256 | 38,981 | (539,369 | ) | 3,644,520 | 3,158,388 | |||||||||||||||||
| Active U.S. Real Estate Fund | 22,443 | 590,730 | (10,683 | ) | 7,650,794 | 8,253,284 | |||||||||||||||||
Capital loss carryforward is calculated and reported as of a specific date. Results of transactions and other activity after that date may affect the amount of capital loss carryforward actually available for the Funds to utilize. The ability to utilize capital loss carryforward in the future may be limited under Internal Revenue Code rules and related regulations based on the results of future transactions.
The following Funds have capital loss carryforward amounts as of October 31, 2009, which expire on October 31 of each year listed below:
| 2016 | 2017 | Total* | |||||||||||||
| Active AlphaQ Fund | $ | 715,579 | $ | 1,007,502 | $ | 1,723,081 | |||||||||
| Active Alpha Multi-Cap Fund | 1,743,017 | 3,419,468 | 5,162,485 | ||||||||||||
| Active Low Duration Fund | 10,528 | — | 10,528 | ||||||||||||
| Active Mega Cap Fund | 125,775 | 413,594 | 539,369 | ||||||||||||
| Active U.S. Real Estate Fund | — | 10,683 | 10,683 | ||||||||||||
* Capital loss carryforward as of the date listed above is reduced for limitations, if any, to the extent required by the Internal Revenue Code.
Note 7. Investment Transactions
For the year ended October 31, 2009, the cost of securities purchased and proceeds from sales of securities, excluding short-term securities, U.S. Government securities, money market funds and in-kind transactions, were as follows:
| Purchases | Sales | ||||||||||
| Active AlphaQ Fund | $ | 5,670,287 | $ | 5,622,042 | |||||||
| Active Alpha Multi-Cap Fund | 10,181,433 | 10,196,717 | |||||||||
| Active Low Duration Fund | 2,312,300 | 1,605,754 | |||||||||
| Active Mega Cap Fund | 1,708,458 | 1,718,458 | |||||||||
| Active U.S. Real Estate Fund | 1,594,745 | 1,612,377 | |||||||||
For the year ended October 31, 2009, the cost of securities purchased and the proceeds from sales of U.S. Government securities for the Active Low Duration Fund amounted to $16,365,311 and $11,944,287, respectively.
41
Notes to Financial Statements (Continued)
PowerShares Actively Managed Exchange-Traded Fund Trust
October 31, 2009
For the year ended October 31, 2009, in-kind transactions associated with creations and redemptions were as follows:
| Securities Received | Securities Delivered | ||||||||||
| Active AlphaQ Fund | $ | 3,150,927 | $ | 3,298,078 | |||||||
| Active Alpha Multi-Cap Fund | 668,697 | 2,147,532 | |||||||||
| Active Low Duration Fund | — | 793,662 | |||||||||
| Active Mega Cap Fund | 6,654,629 | 5,596,774 | |||||||||
| Active U.S. Real Estate Fund | 10,064,068 | 2,985,811 | |||||||||
Gains on in-kind transactions are generally not considered taxable gains for Federal income tax purposes.
At October 31, 2009, the aggregate cost and the net unrealized appreciation (depreciation) of Investments for tax purposes were as follows:
| Cost* | Net Unrealized Appreciation | Gross Unrealized Appreciation | Gross Unrealized (Depreciation) | ||||||||||||||||
| Active AlphaQ Fund | $ | 3,409,398 | $ | 610,687 | $ | 724,856 | $ | (114,169 | ) | ||||||||||
| Active Alpha Multi-Cap Fund | 3,926,931 | 732,287 | 890,502 | (158,215 | ) | ||||||||||||||
| Active Low Duration Fund | 7,756,079 | 68,293 | 68,293 | — | |||||||||||||||
| Active Mega Cap Fund | 3,134,270 | 38,981 | 197,822 | (158,841 | ) | ||||||||||||||
| Active U.S. Real Estate Fund | 7,530,823 | 590,730 | 651,710 | (60,980 | ) | ||||||||||||||
* Cost of investments on a tax basis, includes the adjustments for financial reporting purposes, as of the most recently completed Federal income tax reporting period-end.
Note 8. Reclassification of Permanent Differences
Primarily as a result of differing book/tax treatment of investment activity, on October 31, 2009, amounts were reclassified between undistributed net investment income (loss), undistributed net realized gain (loss) and shares of beneficial interest. These reclassifications had no effect on the net assets of each Fund. For the year ended October 31, 2009, the reclassifications were as follows:
| Undistributed Net Investment Income (Loss) | Undistributed Net Realized Gain (Loss) | Shares of Beneficial Interest | |||||||||||||
| Active AlphaQ Fund | $ | 8,687 | $ | (169,393 | ) | $ | 160,706 | ||||||||
| Active Alpha Multi-Cap Fund | 2,823 | (419,404 | ) | 416,581 | |||||||||||
| Active Low Duration Fund | 21,620 | (12,910 | ) | (8,710 | ) | ||||||||||
| Active Mega Cap Fund | (7,014 | ) | (46,227 | ) | 53,241 | ||||||||||
| Active U.S. Real Estate Fund | (88,841 | ) | (480,403 | ) | 569,244 | ||||||||||
42
Notes to Financial Statements (Continued)
PowerShares Actively Managed Exchange-Traded Fund Trust
October 31, 2009
Note 9. Trustees' Fees
The Funds compensate each Trustee who is not an employee of the Adviser or its affiliates. The Adviser, as a result of the unitary management fee, pays for such compensation. The "Interested" Trustee of the Trust does not receive any Trustees' fees.
The Trust has adopted a deferred compensation plan (the "Plan"). Under the Plan, a Trustee who is not an interested person" (as defined in the 1940 Act) (an "Independent Trustee") and has executed a Deferred Fee Agreement (a "Participating Trustee") may defer receipt of all or a portion of his compensation ("Deferral Fees"). Such Deferral Fees are deemed to be invested in selected PowerShares Funds. The Deferral Fees payable to the Participating Trustee are valued as of the date such Deferral Fees would have been paid to the Participating Trustee. The value increases with contributions or with increases in the value of the Shares selected, and the value decreases with distributions or with declines in the value of the Shares selected.
Note 10. Capital
Shares are created and redeemed by the Trust only in Creation Unit size aggregations of 50,000 Shares. Only Authorized Participants are permitted to purchase or redeem Creation Units from the Funds. Except for Active Low Duration Fund, such transactions are generally permitted on an in-kind basis, with a balancing cash component to equate the transaction to the NAV per share of each Fund of the Trust on the transaction date. Cash may be substituted equivalent to the value of certain securities generally when they are not available in sufficient quantity for delivery, not eligible for trading by the Authorized Participant or as a result of other market circumstances. Active Low Duration Fund issues and redeems Shares partially for cash and partially in-kind for securities included in a specified universe.
Active Low Duration Fund (the "Fund") currently intends to effect redemptions partially for cash and partially in-kind, rather than primarily in-kind redemptions, because of the nature of the Fund's investments. The Fund may be required to sell portfolio securities in order to obtain the cash needed to distribute redemption proceeds. The Fund may recognize a capital gain on these sales that might not have been incurred if the Fund had made a redemption entirely in-kind, which may decrease the tax efficiency of the Fund compared to ETFs that utilize an entirely in-kind redemption process.
Note 11. Indemnifications
Under the Trust's organizational documents, its officers and Trustees are indemnified against certain liability arising out of the performance of their duties to the Trust. Each Independent Trustee is also indemnified against certain liabilities arising out of the performance of his duties to the Trust pursuant to an Indemnification Agreement between the Independent Trustee and the Trust. Additionally, in the normal course of business, the Trust enters into contracts with service providers that contain general indemnification clauses. The Trust's maximum exposure under these arrangements is unknown, as this would involve future claims that may be made against the Trust that have not yet occurred. However, based on experience, the Trust believes the risk of loss to be remote.
43
Report of Independent Registered Public Accounting Firm
To the Board of Trustees and Shareholders of PowerShares Actively Managed Exchange-Traded Fund Trust:
In our opinion, the accompanying statements of assets and liabilities, including the schedules of investments, and the related statements of operations and of changes in net assets and the financial highlights present fairly, in all material respects, the financial position of each of the portfolios indicated in Note 1 of the financial statements (each a portfolio of PowerShares Actively Managed Exchange-Traded Fund Trust, hereafter referred to as the "Trust") at October 31, 2009, and the results of each of their operations, the changes in each of their net assets, and the financial highlights for each of the periods presented, in conformity with accounting principles generally accepted in the United States of America. These financial statements and financial highlights (hereafter referred to as "financial statements") are the responsibility of the Trust's management; our responsibility is to express an opinion on these financia l statements based on our audits. We conducted our audits of these financial statements in accordance with the standards of the Public Company Accounting Oversight Board (United States). Those standards require that we plan and perform the audits to obtain reasonable assurance about whether the financial statements are free of material misstatement. An audit includes examining, on a test basis, evidence supporting the amounts and disclosures in the financial statements, assessing the accounting principles used and significant estimates made by management, and evaluating the overall financial statement presentation. We believe that our audits, which included confirmation of securities at October 31, 2009 by correspondence with the custodian and brokers, provide a reasonable basis for our opinion.
/s/ PricewaterhouseCoopers LLP
New York, New York
December 23, 2009
44
Supplemental Information
Tax Information
Form 1099-DIV, Form 1042-S and other year-end tax information provide shareholders with actual calendar year amounts that should be included in their tax returns. Shareholders should consult their tax advisers.
The following distribution information is being provided as required by the Internal Revenue Code or to meet a specific state's requirement.
Each Fund designates the following amounts or, if subsequently determined to be different, the maximum amount allowable for its fiscal year ended October 31, 2009:
Federal Income Tax Information
| Qualified dividend income | Dividends-received deduction | ||||||||||
| Active AlphaQ Fund | 0 | % | 0 | % | |||||||
| Active Alpha Multi-Cap Fund | 100 | % | 100 | % | |||||||
| Active Low Duration Fund | 0 | % | 0 | % | |||||||
| Active Mega Cap Fund | 100 | % | 100 | % | |||||||
| Active U.S. Real Estate Fund | 2 | % | 2 | % | |||||||
45
Supplemental Information (Continued)
Trustees and Officers
The Independent Trustees, the Trustee who is affiliated with the Adviser (the "Management Trustee") and the executive officers of the Trust, their term of office and length of time served, their principal business occupations during at least the past five years, the number of portfolios in the Fund Complex overseen by each Trustee and the other directorships, if any, held by a Trustee, are shown below.
The Trustees and Officers information is current as of December 18, 2009.
Name, Address and Age of Independent Trustees | Position(s) with Trust | Length of Time Served* | Principal Occupation(s) During Past 5 Years | Number of Portfolios in Fund Complex** Overseen by Independent Trustees | Other Directorships Held by Independent Trustees | ||||||||||||||||||
| Ronn R. Bagge (51) YQA Capital Management LLC 1755 S. Naperville Rd. Suite 100 Wheaton, IL 60187 | Trustee | Since 2008 | YQA Capital Management, LLC (July 1998-Present); formerly Owner/CEO of Electronic Dynamic Balancing Co., Inc. (high-speed rotating equipment service provider) | 101 | None | ||||||||||||||||||
* This is the date the Trustee began serving the Trust. Each Trustee serves an indefinite term until his successor is elected.
** Fund Complex includes all open-end funds (including all of their portfolios) advised by the Adviser. At December 18, 2009, the Fund Complex consists of the Trust's five portfolios and three other exchange-traded fund trusts with 96 portfolios advised by the Adviser.
46
Supplemental Information (Continued)
Trustees and Officers (Continued)
Name, Address and Age of Independent Trustees | Position(s) with Trust | Length of Time Served* | Principal Occupation(s) During Past 5 Years | Number of Portfolios in Fund Complex** Overseen by Independent Trustees | Other Directorships Held by Independent Trustees | ||||||||||||||||||
| Marc M. Kole (49) c/o Invesco PowerShares Capital Management LLC 301 W. Roosevelt Road Wheaton, IL 60187 | Trustee | Since 2008 | Vice President of Finance and Accounting, Hope Network (social services) (November 2008-Present); formerly Assistant Vice President and Controller, Priority Health (health insurance) (September 2005-April 2008); Senior Vice President of Finance, United Healthcare (health insurance) (July 2004-July 2005); Senior Vice President of Finance, Oxford Health Plans (June 2000-July 2004) | 101 | None | ||||||||||||||||||
* This is the date the Trustee began serving the Trust. Each Trustee serves an indefinite term until his successor is elected.
** Fund Complex includes all open-end funds (including all of their portfolios) advised by the Adviser. At December 18, 2009, the Fund Complex consists of the Trust's five portfolios and three other exchange-traded fund trusts with 96 portfolios advised by the Adviser.
47
Supplemental Information (Continued)
Trustees and Officers (Continued)
Name, Address and Age of Independent Trustees | Position(s) with Trust | Length of Time Served* | Principal Occupation(s) During Past 5 Years | Number of Portfolios in Fund Complex** Overseen by Independent Trustees | Other Directorships Held by Independent Trustees | ||||||||||||||||||
| Philip M. Nussbaum (47) c/o Invesco PowerShares Capital Management LLC 301 W. Roosevelt Road Wheaton, IL 60187 | Trustee | Since 2008 | Chairman, Performance Trust Capital Partners (formerly Betzold, Berg, Nussbaum & Heitman, Inc.) (November 2004- Present); formerly Managing Director, Communication Institute (May 2002-August 2003); Executive Vice President of Finance, Betzold, Berg, Nussbaum & Heitman, Inc. (March 1994-1999) | 101 | None | ||||||||||||||||||
* This is the date the Trustee began serving the Trust. Each Trustee serves an indefinite term until his successor is elected.
** Fund Complex includes all open-end funds (including all of their portfolios) advised by the Adviser. At December 18, 2009, the Fund Complex consists of the Trust's five portfolios and three other exchange-traded fund trusts with 96 portfolios advised by the Adviser.
48
Supplemental Information (Continued)
Trustees and Officers (Continued)
Name, Address and Age of Independent Trustees | Position(s) with Trust | Length of Time Served* | Principal Occupation(s) During Past 5 Years | Number of Portfolios in Fund Complex** Overseen by Independent Trustees | Other Directorships Held by Independent Trustees | ||||||||||||||||||
| Donald H. Wilson (49) c/o Invesco PowerShares Capital Management LLC 301 W. Roosevelt Road Wheaton, IL 60187 | Trustee | Since 2008 | President and Chief Operating Officer, AMCORE Financial, Inc. (bank holding company) (August 2007-April 2009); formerly Executive Vice President and Chief Financial Officer, AMCORE Financial, Inc. (February 2006- August 2007); Senior Vice President and Treasurer, Marshall & Ilsley Corp. (bank holding company) (May 1995- February 2006) | 101 | None | ||||||||||||||||||
* This is the date the Trustee began serving the Trust. Each Trustee serves an indefinite term until his successor is elected.
** Fund Complex includes all open-end funds (including all of their portfolios) advised by the Adviser. At December 18, 2009, the Fund Complex consists of the Trust's five portfolios and three other exchange-traded fund trusts with 96 portfolios advised by the Adviser.
49
Supplemental Information (Continued)
Trustees and Officers (Continued)
Name, Address and Age of Management Trustee | Position(s) with Trust | Length of Time Served* | Principal Occupation(s) During Past 5 Years | Number of Portfolios in Fund Complex** Overseen by Management Trustee | Other Directorships Held by Management Trustee | ||||||||||||||||||
| H. Bruce Bond (46) Invesco PowerShares Capital Management LLC 301 W. Roosevelt Road Wheaton, IL 60187 | Chairman of the Board and Trustee | Since 2007 | Managing Director, Invesco PowerShares Capital Management LLC (August 2002-Present); formerly Manager, Nuveen Investments (April 1998-August 2002) | 101 | None | ||||||||||||||||||
Availability of Additional Information About the Trustees
The Statement of Additional Information includes additional information about the Trustees and is available, without charge, upon request at 800.337.4246.
* This is the date the Management Trustee began serving the Trust. Each Trustee serves an indefinite term until his successor is elected. Each Officer serves until his successor is elected.
** Fund Complex includes all open-end funds (including all of their portfolios) advised by the Adviser. At December 18, 2009, the Fund Complex consists of the Trust's five portfolios and three other exchange-traded fund trusts with 96 portfolios advised by the Adviser.
50
Supplemental Information (Continued)
Trustees and Officers (Continued)
| Name, Address and Age of Officers | Position(s) with Trust | Length of Time Served* | Principal Occupation(s) During Past 5 Years | ||||||||||||
| Andrew Schlossberg (35) Invesco Aim Management Group Inc. 11 Greenway Plaza Suite 100 Houston, Texas 77046 | President | Since 2009 | Managing Director, U.S. head of business strategy and chief marketing officer for Invesco Ltd. in the United States (January 2008-Present); formerly, Mr. Schlossberg served in multiple roles within Invesco, including head of corporate development, as well as global leadership roles in strategy and product development in the company's North American Institutional and Retirement divisions (July 2002-December 2007) | ||||||||||||
| Bruce T. Duncan (55) Invesco PowerShares Capital Management LLC 301 W. Roosevelt Road Wheaton, IL 60187 | Chief Financial Officer, Treasurer and Secretary | Since 2008 | Senior Vice President of Finance, Invesco PowerShares Capital Management LLC (September 2005-Present); Private Practice Attorney (2000-2005); Vice President of Investor Relations, The ServiceMaster Company (1994-2000); Vice President of Taxes, The ServiceMaster Company (1990-2000) | ||||||||||||
| Kevin R. Gustafson (43) Invesco PowerShares Capital Management LLC 301 W. Roosevelt Road Wheaton, IL 60187 | Chief Compliance Officer | Since 2008 | General Counsel, Invesco PowerShares Capital Management LLC (September 2004-Present); Chief Compliance Officer, Invesco PowerShares Capital Management LLC (September 2004-April 2008) | ||||||||||||
* This is the period for which the Officers began serving the Trust. Each Officer serves until his successor is elected.
51
This page intentionally left blank
PROXY VOTING POLICIES AND PROCEDURES
A description of the Funds' proxy voting policies and procedures that the Funds use to determine how to vote proxies relating to portfolio securities is available, without charge and upon request, by calling (800) 337-4246. This information is also available on the Securities and Exchange Commission's ("Commission") website at www.sec.gov.
Information regarding how the Funds voted proxies for portfolio securities, if applicable, during the most recent 12-month period ended June 30, is also available, without charge and upon request, by (i) calling (800) 337-4246; or (ii) accessing the Trust's Form N-PX on the Commission's website at www.sec.gov.
QUARTERLY PORTFOLIOS
The Funds file their complete schedules of portfolio holdings with the Commission for the first and third quarters of each fiscal year on Form N-Q. The Trust's Form N-Qs are available on the Commission's website at www.sec.gov. The Trust's Form N-Qs may also be reviewed and copied at the Commission's Public Reference Room in Washington, DC; information on the operation of the Public Reference Room may be obtained by calling (800) SEC-0330.


301 West Roosevelt Road
Wheaton, IL 60187
800.983.0903
www.invescopowershares.com
© 2009 Invesco PowerShares Capital Management LLC P-PS-AR-10
Item 2. Code of Ethics.
The Registrant has adopted a Code of Ethics that applies to the Registrant’s principal executive officer and principal financial officer. This Code is filed as an exhibit to this report on Form N-CSR under Item 12(a)(1).
Item 3. Audit Committee Financial Expert.
The Registrant’s Board of Trustees has determined that the Registrant has three “audit committee financial experts” serving on its audit committee: Mr. Marc M. Kole, Mr. Philip M. Nussbaum, and Mr. Donald H. Wilson. Each of these audit committee members is “independent,” meaning that he is not an “interested person” of the Registrant (as that term is defined in Section 2(a)(19) of the Investment Company Act of 1940) and he does not accept any consulting, advisory, or other compensatory fee from the Registrant (except in the capacity as a Board or committee member).
An “audit committee financial expert” is not an “expert” for any purpose, including for purposes of Section 11 of the Securities Act of 1933, as a result of being designated as an “audit committee financial expert.” Further, the designation of a person as an “audit committee financial expert” does not mean that the person has any greater duties, obligations, or liability than those imposed on the person without the “audit committee financial expert” designation. Similarly, the designation of a person as an “audit committee financial expert” does not affect the duties, obligations, or liability of any other member of the audit committee or board of trustees.
Item 4. Principal Accountant Fees and Services.
PricewaterhouseCoopers (“PWC”) billed the Registrant aggregate fees for services rendered to the Registrant for the last two fiscal years as follows:
|
| Fees Billed by |
| Percentage of |
| Fees Billed by |
| Percentage of |
| ||
|
|
|
|
|
|
|
|
|
| ||
Audit Fees |
| $ | 100,000 |
| N/A |
| $ | 90,000 |
| N/A |
|
Audit-Related Fees(2) |
| $ | 0 |
| 0% |
| $ | 3,000 |
| 0% |
|
Tax Fees(3) |
| $ | 41,525 |
| 0% |
| $ | 13,000 |
| 0% |
|
All Other Fees |
| $ | 0 |
| 0% |
| $ | 0 |
| 0% |
|
Total Fees |
| $ | 141,525 |
| 0% |
| $ | 106,000 |
| 0% |
|
PWC billed the Registrant aggregate fees of $ 41,525 for the fiscal year ended 2009 and $ 16,000 for the fiscal year ended 2008, for non-audit services rendered to the Registrant.
(1) For the provision of non-audit services, the pre-approval requirement is waived pursuant to a de minimis exception if (i) such services were not recognized as non-audit services by the Registrant at the time of engagement, (ii) the aggregate amount of all such services provided is no more than 5% of the aggregate audit and non-audit fees paid by the Registrant during the fiscal year in which the services are provided; and (iii) such services are promptly brought to the attention of the Registrant’s Audit Committee and approved by the Registrant’s Audit Committee prior to the completion of the audit.
(2) Audit-Related Fees for the fiscal year ended October 31, 2008 includes fees billed for reviewing certain registration statements.
(3) Tax fees for the fiscal year ended October 31, 2009 includes fees billed for reviewing tax returns and for providing tax consultation services. Tax fees for fiscal year ended October 31, 2008 includes fees billed for reviewing tax returns and providing tax consultation services.
PWC did not bill any fees for non-audit services rendered to the Registrant’s investment adviser (not including any sub adviser whose role is primarily portfolio management and is subcontracted with or overseen by another investment adviser) or any entity controlling, controlled by or under common control with the Registrant’s investment adviser that provides ongoing services to the Registrant for the fiscal years ended October 31, 2009 and October 31, 2008.
Audit Committee Pre Approval Policies and Procedures
PRE-APPROVAL OF AUDIT AND NON-AUDIT SERVICES
POLICIES AND PROCEDURES
As adopted by the Audit Committee of
the PowerShares Funds (the “Funds”)
June 26, 2009
Statement of Principles
Under the Sarbanes-Oxley Act of 2002 and rules adopted by the Securities and Exchange Commission (“SEC”) (“Rules”), the Audit Committee of the Funds’ (the “Audit Committee”) Board of Trustees (the “Board”) is responsible for the appointment, compensation and oversight of the work of independent accountants (an “Auditor”). As part of this responsibility and to assure that the Auditor’s independence is not impaired, the Audit Committee pre-approves the audit and non-audit services provided to the Funds by each Auditor, as well as all non-audit services provided by the Auditor to the Funds’ investment adviser and to affiliates of the adviser that provide ongoing services to the Funds (“Service Affiliates”) if the services directly impact the Funds’ operations or financial reporting. The SEC Rules also specify the types of services that an Auditor may not provide to its audit client. The following policies and procedures comply with the requirements for pre-approval and provide a mechanism by which management of the Funds may request and secure pre-approval of audit and non-audit services in an orderly manner with minimal disruption to normal business operations.
Proposed services either may be pre-approved without consideration of specific case-by-case services by the Audit Committee (“general pre-approval”) or require the specific pre-approval of the Audit Committee (“specific pre-approval”). As set forth in these policies and procedures, unless a type of service has received general pre-approval, it will require specific pre-approval by the Audit Committee. Additionally, any fees exceeding 110% of estimated pre-approved fee levels provided at the time the service was pre-approved will also require specific approval by the Audit Committee before payment is made. The Audit Committee will also consider the impact of additional fees on the Auditor’s independence when determining whether to approve any additional fees for previously pre-approved services.
The Audit Committee will annually review and generally pre-approve the services that may be provided by each Auditor without obtaining specific pre-approval from the Audit Committee. The term of any general pre-approval runs from the date of such pre-approval through June 30th of the following year, unless the Audit Committee considers a different period and states otherwise. The Audit Committee will add to or subtract from the list of general pre-approved services from time to time, based on subsequent determinations.
The purpose of these policies and procedures is to set forth the guidelines to assist the Audit Committee in fulfilling its responsibilities.
Delegation
The Chairman of the Audit Committee (or, in his or her absence, any member of the Audit Committee) may grant specific pre-approval for non-prohibited services for engagements of less than $20,000. All such delegated pre-approvals shall be presented to the Audit Committee no later than the next Audit Committee meeting.
Audit Services
The annual audit services engagement terms will be subject to specific pre-approval of the Audit Committee. Audit services include the annual financial statement audit and other procedures such as tax provision work that is required to be performed by the independent auditor to be able to form an opinion on the Funds’ financial statements. The Audit Committee will obtain, review and consider sufficient information concerning the proposed Auditor to make a reasonable evaluation of the Auditor’s qualifications and independence.
In addition to the annual Audit services engagement, the Audit Committee may grant either general or specific pre-approval of other Audit services, which are those services that only the independent auditor reasonably can provide. Other Audit services may include services such as issuing consents for the inclusion of audited financial statements with SEC registration statements, periodic reports and other documents filed with the SEC or other documents issued in connection with securities offerings.
Non-Audit Services
The Audit Committee may provide either general or specific pre-approval of any non-audit services to the Funds and its Service Affiliates if the Audit Committee believes that the provision of the service will not impair the independence of the Auditor, is consistent with the SEC’s Rules on auditor independence, and otherwise conforms to the Audit Committee’s general principles and policies as set forth herein.
Audit-Related Services
“Audit-related services” are assurance and related services that are reasonably related to the performance of the audit or review of the Funds’ financial statements or that are traditionally performed by the independent auditor. Audit-related services include, among others, accounting consultations related to accounting, financial reporting or disclosure matters not classified as “Audit services”; and assistance with understanding and implementing new accounting and financial reporting guidance from rulemaking authorities.
Tax Services
“Tax services” include, but are not limited to, the review and signing of the Funds’ federal tax returns, the review of required distributions by the Funds and consultations regarding tax matters such as the tax treatment of new investments or the impact of new regulations. The Audit Committee will scrutinize carefully the retention of the Auditor in connection with a transaction initially recommended by the Auditor, the major business purpose of which may be tax avoidance or the tax treatment of which may not be supported in the Internal Revenue Code and related regulations. The Audit Committee will consult with the Funds’ Treasurer (or his or her designee) and may consult with outside counsel or advisors as necessary to ensure the consistency of Tax services rendered by the Auditor with the foregoing policy.
No Auditor shall represent any Fund or any Service Affiliate before a tax court, district court or federal court of claims.
Under rules adopted by the Public Company Accounting Oversight Board and approved by the SEC, in connection with seeking Audit Committee pre-approval of permissible Tax services, the Auditor shall:
1. Describe in writing to the Audit Committee, which writing may be in the form of the proposed engagement letter:
a. The scope of the service, the fee structure for the engagement, and any side letter or amendment to the engagement letter, or any other agreement between the Auditor and the Fund, relating to the service; and
b. Any compensation arrangement or other agreement, such as a referral agreement, a referral fee or fee-sharing arrangement, between the Auditor and any person (other than the Fund) with respect to the promoting, marketing, or recommending of a transaction covered by the service;
2. Discuss with the Audit Committee the potential effects of the services on the independence of the Auditor; and
3. Document the substance of its discussion with the Audit Committee.
All Other Auditor Services
The Audit Committee may pre-approve non-audit services classified as “All other services” that are not categorically prohibited by the SEC, as listed in Exhibit 1 to this policy.
Pre-Approval Fee Levels or Established Amounts
Pre-approval of estimated fees or established amounts for services to be provided by the Auditor under general or specific pre-approval policies will be set periodically by the Audit Committee. Any proposed fees exceeding 110% of the maximum estimated pre-approved fees or established amounts for pre-approved audit and non-audit services will be reported to the Audit Committee at the quarterly Audit Committee meeting and will require specific approval by the Audit Committee before payment is made. The Audit Committee will always factor in the overall relationship of fees for audit and non-audit services in determining whether to pre-approve any such services and in determining whether to approve any additional fees exceeding 110% of the maximum pre-approved fees or established amounts for previously pre-approved services.
Procedures
On an annual basis, the Auditor will submit to the Audit Committee for general pre-approval, a list of non-audit services that the Funds or Service Affiliates of the Funds may request from the Auditor. The list will describe the non-audit services in reasonable detail and will include an estimated range of fees and such other information as the Audit Committee may request.
Each request for services to be provided by the Auditor under the general pre-approval of the Audit Committee will be submitted to the Funds’ Treasurer (or his or her designee) and must include a detailed description of the services to be rendered. The Treasurer or his or her designee will ensure that such services are included within the list of services that have received the general pre-approval of the Audit Committee. The Audit Committee will be informed at the next quarterly scheduled Audit Committee meeting of any such services for which the Auditor rendered an invoice and whether such services and fees had been pre-approved and if so, by what means.
Each request to provide services that require specific approval by the Audit Committee shall be submitted to the Audit Committee jointly by the Funds’ Treasurer or his or her designee and the Auditor, and must include a joint statement that, in their view, such request is consistent with the pre-approval policies and procedures and the SEC Rules.
Each request to provide Tax services under either the general or specific pre-approval of the Audit Committee will describe in writing: (i) the scope of the service, the fee structure for the engagement, and any side letter or amendment to the engagement letter, or any other agreement between the Auditor and the audit client, relating to the service; and (ii) any compensation arrangement or other agreement between the Auditor and any person (other than the audit client) with respect to the promoting, marketing, or recommending of a transaction covered by the service. The Auditor will discuss with the Audit Committee the potential effects of the services on the Auditor’s independence and will document the substance of the discussion.
Non-audit services pursuant to the de minimis exception provided by the SEC Rules will be promptly brought to the attention of the Audit Committee for approval, including documentation that each of the conditions for this exception, as set forth in the SEC Rules, has been satisfied.
On at least an annual basis, the Auditor will prepare a summary of all the services provided to any entity in the investment company complex as defined in section 2-01(f)(14) of Regulation S-X in sufficient detail as to the nature of the engagement and the fees associated with those services.
The Audit Committee has designated the Funds’ Treasurer to monitor the performance of all services provided by the Auditor and to ensure such services are in compliance with these policies and procedures. The Funds’ Treasurer will report to the Audit Committee on a periodic basis as to the results of such monitoring. Both the Funds’ Treasurer and management will immediately report to the Chairman of the Audit Committee any breach of these policies and procedures that comes to the attention of the Funds’ Treasurer or senior management.
Exhibit 1 to Pre-Approval of Audit and Non-Audit Services Policies and Procedures
Conditionally Prohibited Non-Audit Services (not prohibited if the Fund can reasonably conclude that the results of the service would not be subject to audit procedures in connection with the audit of the Fund’s financial statements)
· Bookkeeping or other services related to the accounting records or financial statements of the audit client
· Financial information systems design and implementation
· Appraisal or valuation services, fairness opinions, or contribution-in-kind reports
· Actuarial services
· �� Internal audit outsourcing services
Categorically Prohibited Non-Audit Services
· Management functions
· Human resources
· Broker-dealer, investment adviser, or investment banking services
· Legal services
· Expert services unrelated to the audit
· Any service or product provided for a contingent fee or a commission
· Services related to marketing, planning, or opining in favor of the tax treatment of confidential transactions or aggressive tax position transactions, a significant purpose of which is tax avoidance
· Tax services for persons in financial reporting oversight roles at the Fund
· Any other service that the Public Company Oversight Board determines by regulation is impermissible.
PwC Matter
PwC advised the Registrant’s Audit Committee that PwC identified the following matter for consideration under the SEC’s auditor independence rules.
PwC became aware that certain aspects of investment advisory services provided by a PwC network member firm’s Wealth Advisory Practice to its clients (generally high net worth individuals not associated with the Registrant or its affiliates) were inconsistent with [Rule 2-01(c)(4)(viii) and (c)(5) of Regulation S-X]. The violations occurred as a result of professionals of the Wealth Advisory Practice making a single recommendation of a product of an affiliate of the Registrant’s investment adviser to its clients rather than also identifying one or more suitable alternatives for the Wealth Advisory Practice’s client to consider. The Wealth Advisory Practice also received commissions from the affiliate of the Registrant’s investment adviser. With respect to the affiliates of the Registrant’s investment adviser, there were 33 cases of single product recommendation and 20 cases of commissions received totaling approximately £7,000. These violations occurred over a two year period and ended in November 2007. PwC represented that at no time did the Wealth Advisory Practice recommend products on behalf the affiliates of the Registrant’s investment adviser. Additionally, members of the audit engagement team were not aware of these violations or services; the advice provided was based on an understanding of the investment objectives of the clients of the Wealth Advisory Practice and not to promote the affiliates of the Registrant’s investment adviser, and the volume and nature of the violations were insignificant. PwC derived no economic benefit from the commissions, since any commissions received were deducted from the time-based fees charged to the Wealth Advisory Practice client and created no incentive for PwC to recommend the investment.
PwC advised the Audit Committee that it believes its independence had not been adversely affected as it related to the audits of the Registrant by this matter. In reaching this conclusion, PwC noted that during the time of its audits, the engagement team was not aware of the services provided and noted the insignificance of the services provided. Based on the foregoing, PwC did not believe this matter affected PwC’s ability to act objectively and impartially and to issue a report on financial statements as the Registrant’s independent auditor, and believes that a reasonable investor with knowledge of all the facts would agree with this conclusion.
Item 5. Audit Committee of Listed Registrants.
The Registrant has a separately designated Audit Committee established in accordance with Section 3(a)(58)(A) of the Securities Exchange Act of 1934, as amended, which consists of the independent trustees. The Audit Committee members are Ronn R. Bagge, Marc M. Kole, Philip M. Nussbaum, and Donald H. Wilson.
Item 6. Schedule of Investments.
The Schedules of Investments are included as a part of the report to shareholders filed under Item 1 of this Form N-CSR.
Item 7. Disclosure of Proxy Voting Policies and Procedures for Closed-End Management Investment Companies.
Not applicable.
Item 8. Portfolio Managers of Closed-End Management Investment Companies.
Not applicable.
Item 9. Purchases of Equity Securities by Closed-End Management Investment Company and Affiliated Purchasers.
Not applicable.
Item 10. Submission of Matters to a Vote of Security Holders.
There have been no changes to the procedures by which shareholders may recommend nominees to the Registrant’s Board of Trustees that would require disclosure herein.
Item 11. Controls and Procedures.
a) Based on their evaluation of the Registrant’s disclosure controls and procedures (as defined in Rule 30a-3(c) under the Investment Company Act of 1940) as of a date within 90 days of the filing date of this report, the Registrant’s President (principal executive officer) and Treasurer (principal financial officer) have concluded that such disclosure controls and procedures are effective.
b) There were no significant changes in the Registrant’s internal control over financial reporting (as defined in Rule 30a-3(d) under the Investment Company Act of 1940) that occurred during the fourth fiscal quarter of the period covered by this report that have materially affected, or are reasonably likely to materially affect, the Registrant’s internal control over financial reporting.
Item 12. Exhibits.
(a)(1) Code of Ethics.
(a)(2) Certifications of the Registrant’s President and Treasurer pursuant to Section 302 of the Sarbanes-Oxley Act of 2002 are attached as Exhibit 99.CERT.
(b) Certifications of the Registrant’s President and Treasurer pursuant to Section 906 of the Sarbanes-Oxley Act of 2002 are attached as Exhibit 99.906CERT.
SIGNATURES
Pursuant to the requirements of the Securities Exchange Act of 1934 and the Investment Company Act of 1940, the Registrant has duly caused this report to be signed on its behalf by the undersigned, thereunto duly authorized.
(Registrant) PowerShares Actively Managed Exchange-Traded Fund Trust
By: | /s/ Andrew Schlossberg |
| |
|
| ||
Name: | Andrew Schlossberg |
| |
Title: | President |
| |
|
|
| |
Date: | January 4, 2010 |
| |
Pursuant to the requirements of the Securities Exchange Act of 1934 and the Investment Company Act of 1940, this report has been signed below by the following persons on behalf of the Registrant and in the capacities and on the dates indicated.
By: | /s/Andrew Schlossberg |
| |
|
| ||
Name: | Andrew Schlossberg |
| |
Title: | President |
| |
|
|
| |
Date: | January 4, 2010 |
| |
|
| ||
By: | /s/ Bruce T. Duncan |
| |
|
| ||
Name: | Bruce T. Duncan |
| |
Title: | Treasurer |
| |
|
|
| |
Date: | January 4, 2010 |
| |