UNITED STATES
SECURITIES AND EXCHANGE COMMISSION
Washington, D.C. 20549
FORM N-CSR
CERTIFIED SHAREHOLDER REPORT OF REGISTERED MANAGEMENT
INVESTMENT COMPANIES
Investment Company Act file number 811-22148
Invesco Actively Managed Exchange-Traded Fund Trust
(Exact name of registrant as specified in charter)
3500 Lacey Road
Downers Grove, IL 60515
(Address of principal executive offices) (Zip code)
Anna Paglia
President
3500 Lacey Road
Downers Grove, IL 60515
(Name and address of agent for service)
Registrant’s telephone number, including area code: 800-983-0903
Date of fiscal year end: October 31
Date of reporting period: October 31, 2020
Form N-CSR is to be used by management investment companies to file reports with the Commission not later than 10 days after the transmission to stockholders of any report that is required to be transmitted to stockholders under Rule 30e-1 under the Investment Company Act of 1940 (17 CFR 270.30e-1). The Commission may use the information provided on Form N-CSR in its regulatory, disclosure review, inspection, and policymaking roles.
A registrant is required to disclose the information specified by Form N-CSR, and the Commission will make this information public. A registrant is not required to respond to the collection of information contained in Form N-CSR unless the Form displays a currently valid Office of Management and Budget (“OMB”) control number. Please direct comments concerning the accuracy of the information collection burden estimate and any suggestions for reducing the burden to Secretary, Securities and Exchange Commission, 450 Fifth Street, NW, Washington, DC 20549-0609. The OMB has reviewed this collection of information under the clearance requirements of 44 U.S.C. § 3507.
Item 1. Reports to Stockholders.
The Registrant’s annual report transmitted to shareholders pursuant to Rule 30e-1 under the Investment Company Act of 1940 is as follows:

Invesco Annual Report to Shareholders
October 31, 2020
| | |
| |
| PSR | | Invesco Active U.S. Real Estate ETF |
| |
| PSMB | | Invesco Balanced Multi-Asset Allocation ETF |
| |
| PSMC | | Invesco Conservative Multi-Asset Allocation ETF |
| |
| PSMG | | Invesco Growth Multi-Asset Allocation ETF |
| |
| PSMM | | Invesco Moderately Conservative Multi-Asset Allocation ETF |
| |
| PHDG | | Invesco S&P 500® Downside Hedged ETF |
| |
| GTO | | Invesco Total Return Bond ETF |
| |
| GSY | | Invesco Ultra Short Duration ETF |
| |
| VRIG | | Invesco Variable Rate Investment Grade ETF |
Beginning on January 1, 2021, as permitted by regulations adopted by the Securities and Exchange Commission, paper copies of the Funds’ shareholder reports will no longer be sent by mail, unless you specifically request paper copies of the reports from your financial intermediary, such as a broker-dealer or bank. Instead, the reports will be made available on a website, and you will be notified by mail each time a report is posted and provided with a website link to access the report.
If you already elected to receive shareholder reports electronically, you will not be affected by this change and you need not take any action. If you hold accounts through a financial intermediary, you may contact your financial intermediary to enroll in electronic delivery. Please note that not all financial intermediaries may offer this service.
You may elect to receive all future reports in paper free of charge. If you hold accounts through a financial intermediary, you can follow the instructions included with this disclosure, if applicable, or contact your financial intermediary to request that you continue to receive paper copies of your shareholder reports. Please note that not all financial intermediaries may offer this service. Your election to receive reports in paper will apply to all funds held with your financial intermediary.
Table of Contents
The Market Environment
Domestic Equity
At the outset of the fiscal year, improving economic conditions during the fourth quarter of 2019 provided the backdrop for strong equity market returns. Investors were encouraged by a resilient US economy and corporate earnings, putting the US equity market on track for its largest annual rise since 2013.
During the first quarter of 2020, as the spread of the new coronavirus (COVID-19) disrupted travel and suppressed consumer activity, investors became increasingly concerned about the global economy. At the same time, oil prices fell sharply as a price war between Saudi Arabia and Russia threatened to boost supply even as demand was falling. Beginning in late February, equity markets declined sharply and quickly, ushering in the first bear market since the financial crisis of 2008. Though the equity market stabilized somewhat toward the end of March, all sectors declined during the downturn. In response to the major collapse in demand and to help facilitate liquidity, the US Federal Reserve (“the Fed”) cut interest rates two times in March by 0.50% and 1.00%, ending with a target range of 0.00% to 0.25%.1
In April, US unemployment numbers continued to climb and the initial gross domestic product (GDP) estimates for the first quarter of 2020 saw the economy shrink by 5%, the sharpest drop since the 2008 financial crisis.2 However, during the second and into the third quarter of 2020, US stocks largely shrugged off economic uncertainty, social unrest and a resurgence in coronavirus infections to rally from the market bottom. The rally followed a sharp economic decline caused by global shutdowns to slow the spread of COVID-19. Investor sentiment improved in response to trillions of dollars in economic stimulus, progress on a coronavirus vaccine and re-openings in many US regions. After oil futures contracts turned negative in early April, oil prices doubled in June, which supported struggling energy companies and millions of energy sector employees. In July, the Fed extended its emergency stimulus programs, originally scheduled to end in September, to year-end, which provided support to equities. In late August, revised second quarter GDP fell by 31.40%2, a record decline. Despite the extreme drop in the economy, the S&P 500 Index not only erased all its losses from the first quarter but reached record highs by the end of August.
Despite a September selloff, US equity markets posted gains in the third quarter as the Fed extended its emergency stimulus programs and changed its inflation target policy, both of which supported equities. Activity was better than expected across many areas of the economy. Data for both manufacturing and services indicated expansion, a reversal from significant declines earlier in the year. Corporate earnings were also better than anticipated and a gradual decline in new COVID-19 infections in many regions, combined with optimism about progress on a coronavirus vaccine, further boosted stocks. October saw increased volatility as COVID-19 infection rates rose to record highs in the US and in Europe. Investors also became concerned about delayed results from the US presidential election and the real possibility of a contested election, further delaying a clear winner. Despite October posting negative returns for the major stock indices in the US and globally, the S&P 500 Index returned 9.71% for the fiscal year.
| 1 | Source: US Federal Reserve |
| 2 | Source: US Bureau of Economic Analysis |
Fixed Income
At the start of the fiscal year, US economic data remained supportive of continued economic expansion as fourth quarter 2019 GDP grew 2.40%.1 The US economy continued to add jobs, pushing the unemployment rate to 3.50% at the close of the 2019 calendar year, while inflation remained subdued.2 However, initial optimism in 2020 was dampened by the outbreak of the novel coronavirus (COVID-19) that swiftly spread from China to other global regions. Global equity markets fell sharply as the human and economic cost of the COVID-19 pandemic mounted. At the same time, oil prices fell sharply as a price war between Saudi Arabia and Russia threatened to boost supply even as demand was falling. The US bull market ended abruptly, while global equity markets also fell sharply.
As market panic set in, central banks around the world took aggressive action to support both local markets and the global economy. In the US, the Fed accomplished this with one 0.25% rate cut on March 3, followed by a 1.00% rate cut on March 16, bringing the target Fed Funds range of 0.00% to 0.25%.3 Second quarter GDP fell by an annualized rate of 31.40%,1 and unemployment in the US rose to 14.70%2 in April, a rate not seen since 1940.
The 10-year US Treasury yield reached a high of 1.94%4 in November of 2019 due to the continued strength of the global economy. However, a severe risk-off tone drove US Treasury yields sharply lower in mid-February as COVID-19 began its spread through Europe before falling sharply to a level of 0.54%4 in February of 2020 amid COVID-19 concerns. Throughout the remainder of the fiscal year, US Treasury yields remained comparatively low, as the Fed prolonged its accommodative stance and continued geoeconomic uncertainty forced investors to seek higher quality fixed income instruments. The 10-year US Treasury yield ended the fiscal year at 0.87%, 82 basis points lower than at the beginning of the fiscal year.4 (A basis point is one one-hundredth of a percentage point.)
The broader bond market, as represented by the Bloomberg Barclays US Aggregate Bond Index, gained 6.19% for the fiscal year. Positive performance for the index was largely attributable to the sharp decline in US Treasury yields. The four primary sectors of the Bloomberg Barclays US Aggregate Bond Index—government-related, corporate, securitized and treasury—posted positive returns for the fiscal year. Out-of-index exposure, such as high yield and US dollar-denominated emerging market (EM) corporate debt, experienced small gains despite longer-term economic concerns stemming from the COVID-19 pandemic. Helping to support returns in high yield was the Fed’s corporate bond purchase program, while US dollar-denominated EM corporate debt was buoyed by very accommodative central bank policies.
| 1 | Source: Bureau of Economic Analysis |
| 2 | Source: Bureau of Labor Statistics |
| 3 | Source: US Federal Reserve |
| 4 | Source: US Treasury Department |
The Market Environment (continued)
Global Equity
At the start of the fiscal year, macroeconomic and geopolitical issues mostly abated providing a favorable backdrop for global equity returns. Central banks maintained accommodative policies and better economic data and signs of progress in US and China trade talks also supported global equities.
Global equity markets started 2020 buoyed by positive economic data and the signing of the phase one US-China trade deal. However, initial optimism was dampened by the outbreak of the new coronavirus (COVID-19) that swiftly spread from China to other global regions. Global equity markets fell sharply as the human and economic cost of the COVID-19 pandemic mounted. At the same time, oil prices fell sharply as a price war between Saudi Arabia and Russia threatened to boost supply even as demand was falling. The US bull market came to an abrupt end, while global equity markets also fell sharply. As fear of a worldwide recession increased, central banks around the world took aggressive action to support both local markets and the global economy.
Despite the continuing global spread of COVID-19, many countries achieved some success in controlling the spread and were able to slowly re-open their economies. Global equity markets benefited from government policy responses to the crisis, which were swift and encouraging. Many economies received fiscal stimulus and very significant monetary stimulus. The massive monetary policy response created an environment in which investors embraced risk, and stocks rose globally after a deep rout in the first quarter.
Despite a correction in September, global equity stocks finished the third quarter in positive territory after posting strong gains in July and August. Building on progress made in the latter part of the second quarter, many countries were able to continue reducing pandemic-related stringency protocols. As a result, the “green shoots” we saw at the end of the second quarter grew and flourished into the third quarter, as many countries experienced a strong economic rebound.
At the end of the fiscal year, economic growth began to slow. This coincided with a resurgence in global infections with record highs in the US and in Europe. Investors also became concerned about delayed results from the US presidential election and the real possibility of a contested election, further delaying a clear winner. Global equity markets ended the fiscal year mixed, with emerging markets faring better than developed markets.
| | |
| PSR | | Management’s Discussion of Fund Performance |
| | Invesco Active U.S. Real Estate ETF (PSR) |
The Invesco Active U.S. Real Estate ETF (the “Fund”) is an actively managed exchange-traded fund whose investment objective is to achieve high total return through growth of capital and current income. The Fund seeks to achieve its investment objective by investing, under normal market conditions, at least 80% of its assets in securities of companies that are principally engaged in the U.S. real estate industry and included within the FTSE NAREIT All Equity REITs Index (the “Benchmark Index”). The Fund considers a company to be principally engaged in the U.S. real estate industry if it: (i) derives 50% of its revenues or profits from the ownership, leasing, management, construction, financing or sale of U.S. real estate; or (ii) has at least 50% of the value of its assets invested in U.S. real estate. The Fund plans to invest principally in equity real estate investment trusts (“REITs”). Equity REITs pool investors’ funds for investments primarily in real estate properties or real estate-related loans (such as mortgages). The Fund also may invest in real estate operating companies (“REOCs”), as well as securities of other companies principally engaged in the U.S. real estate industry. REOCs are similar to REITs, except that REOCs reinvest their earnings into the business, rather than distributing them to unitholders like REITs.
For the fiscal year ended October 31, 2020, on a market price basis, the Fund returned (16.52)%. On a net asset value (“NAV”) basis, the Fund returned (16.56)%. During the same time period, the Benchmark Index returned (16.01)%.
The Fund’s underperformance relative to the Benchmark Index during the period is primarily the result of security selection. In particular, security selection in the Specialty REITs was a key detractor from the Fund’s relative performance. Within the Specialty REITs, holdings in EPR properties and Outfront Media were the main detractors from the Fund’s performance. Additionally, overweight exposure to underperforming Lodging and Office REITs detracted from the Fund’s relative performance given the extent to which they were impacted by COVID-19. Underweight exposure to outperforming Data Center and Self-Storage REITs also detracted from the Fund’s performance as investor focus shifted to stability of operations and income during a period of economic shock.
Key contributors to the Fund’s relative return included overweight exposure to Infrastructure and Health Care REITs. Infrastructure REITs, comprised of cell tower companies, benefited from fundamental tailwinds from strong data demand, with future demand potential from 5G expansion. The Fund’s underweight exposure to Retail REITs also proved beneficial given the structural headwinds facing the sector, particularly focused on the malls segment.
| | | | |
Property Type and Sub-Industry Breakdown
(% of the Fund’s Net Assets)
as of October 31, 2020 | |
| Infrastructure REITs | | | 19.48 | |
| Industrial | | | 12.23 | |
| Data Centers | | | 11.15 | |
| Health Care | | | 9.94 | |
| Apartments | | | 9.29 | |
| Self Storage | | | 6.52 | |
| Office | | | 6.28 | |
| Free Standing | | | 4.15 | |
| Diversified | | | 3.49 | |
| Shopping Centers | | | 3.37 | |
| Timber REITs | | | 3.08 | |
| Specialty | | | 2.96 | |
| Single Family Homes | | | 2.48 | |
| Manufactured Homes | | | 2.34 | |
| Lodging Resorts | | | 1.98 | |
| Regional Malls | | | 1.24 | |
| Money Market Funds Plus Other Assets Less Liabilities | | | 0.02 | |
|
Top Ten Fund Holdings*
(% of the Fund’s Net Assets)
as of October 31, 2020 | |
| Security | | | | |
| American Tower Corp. | | | 9.50 | |
| Prologis, Inc. | | | 7.15 | |
| Crown Castle International Corp. | | | 6.27 | |
| Equinix, Inc. | | | 4.37 | |
| Digital Realty Trust, Inc. | | | 4.33 | |
| SBA Communications Corp., Class A | | | 3.71 | |
| Public Storage | | | 3.31 | |
| Welltower, Inc. | | | 2.37 | |
| Weyerhaeuser Co. | | | 2.25 | |
| Realty Income Corp. | | | 2.05 | |
| Total | | | 45.31 | |
| * | Excluding money market fund holdings. |
Invesco Active U.S. Real Estate ETF (PSR) (continued)
Growth of a $10,000 Investment
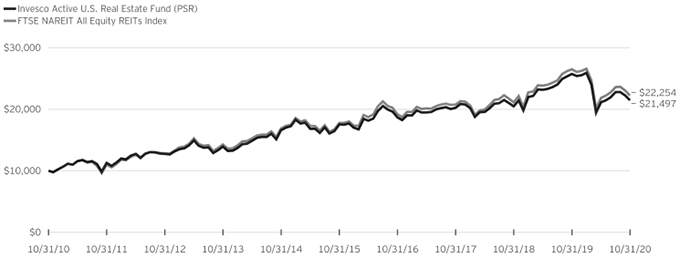
Fund Performance History as of October 31, 2020
| | | | | | | | | | | | | | | | | | | | | | | | | | | | | | | | | | | | | | | | |
| | | 1 Year | | | 3 Years Average
Annualized | | | 3 Years Cumulative | | | 5 Years Average
Annualized | | | 5 Years Cumulative | | | 10 Years Average
Annualized | | | 10 Years Cumulative | | | | | | Fund Inception | |
| Index | | | | | Average
Annualized | | | Cumulative | |
| FTSE NAREIT All Equity REITs Index | | | (16.01 | )% | | | 2.33 | % | | | 7.14 | % | | | 4.56 | % | | | 24.98 | % | | | 8.33 | % | | | 122.54 | % | | | | | | | 15.25 | % | | | 444.66 | % |
| Fund | | | | | | | | | | | | | | | | | | | | | | | | | | | | | | | | | | | | | | | | |
| NAV Return | | | (16.56 | ) | | | 1.98 | | | | 6.05 | | | | 4.16 | | | | 22.58 | | | | 7.95 | | | | 114.97 | | | | | | | | 14.51 | | | | 404.53 | |
| Market Price Return | | | (16.52 | ) | | | 1.97 | | | | 6.03 | | | | 4.12 | | | | 22.39 | | | | 7.95 | | | | 114.85 | | | | | | | | 14.57 | | | | 407.46 | |
Fund Inception: November 20, 2008
Performance quoted above represents past performance. Past performance is not a guarantee of future results and current performance may be higher or lower than performance quoted. Investment returns and principal value will fluctuate, and shares of the Fund (“Fund Shares”), when redeemed or sold, may be worth more or less than their original cost. Fund performance reflects any applicable fee waivers and/or expense reimbursements. Had the adviser not waived fees and/or reimbursed expenses currently or in the past, returns would have been lower. See the current prospectus for more information. According to the Fund’s current prospectus, as supplemented to date, the Fund’s expense ratio of 0.35% is expressed as a unitary management fee to cover operating expenses and expenses incurred in connection with managing the portfolio. NAV and Market Price returns assume that dividends and capital gain distributions have been reinvested in the Fund at NAV and Market Price, respectively. The returns shown in the table above do not reflect the deduction of taxes
that a shareholder would pay on Fund distributions or the redemption or sale of Fund Shares. See invesco.com/ETFs to find the most recent month-end performance numbers.
Benchmark Index performance results are based upon a hypothetical investment in their respective constituent securities. Benchmark Index returns do not represent Fund returns. An investor cannot invest directly in an index. The Benchmark Index does not charge management fees or brokerage expenses, and no such fees or expenses were deducted from the hypothetical performance shown. In addition, the results actual investors might have achieved would have differed from those shown because of differences in the timing, amounts of their investments, and fees and expenses associated with an investment in the Fund.
Notes Regarding Index and Fund Performance History:
| - | Average Annualized and Cumulative Inception returns for the Fund and Benchmark Index are based on the inception date of the Fund. |
| | |
| PSMB | | Management’s Discussion of Fund Performance |
| | Invesco Balanced Multi-Asset Allocation ETF (PSMB) |
The Invesco Balanced Multi-Asset Allocation ETF (the “Fund”) is an actively managed exchange-traded fund (“ETF”) which seeks to provide current income and capital appreciation. The Fund is a “fund of funds,” meaning that it invests its assets primarily in other ETFs (“Underlying ETFs”), rather than in securities of individual companies. Under normal circumstances, most of those Underlying ETFs will be ETFs that are advised by the Fund’s adviser or one of its affiliates (the “Invesco ETFs”). However, at times the Fund also may invest a portion of its assets in Underlying ETFs that are advised by unaffiliated advisers. The Fund and the Invesco ETFs are part of the same group of investment companies. The Fund seeks to achieve its investment objective by allocating its assets using a balanced investment style that seeks to maximize the benefits of diversification, which focuses on investing portions of the Fund’s assets both in Underlying ETFs that invest primarily in fixed-income securities (“Fixed Income ETFs”) as well as in Underlying ETFs that invest primarily in equity securities (“Equity ETFs”).
Invesco Advisers, Inc., the Fund’s sub-adviser, uses the following investment process to construct the Fund’s portfolio: (1) a strategic allocation across broad asset classes (i.e., equities and fixed income securities) and particular investment factors within those classes (e.g., for fixed income securities, exposure to domestic, international, corporate, government, high-yield and investment grade bonds; for equity securities, exposure to domestic and international issuers); (2) selection of Underlying ETFs that best represent those broad asset classes and factor exposures, based on a comprehensive quantitative and qualitative criteria (such as management experience and structure, investment process, performance and risk metrics); (3) determination by the Fund’s sub-adviser of target weightings in each Underlying ETF in a manner that seeks to manage the amount of active risk contributed by each Underlying ETF; and (4) ongoing monitoring of the Fund’s performance and risk. The Fund typically holds a limited number of securities (generally 10-20).
For the fiscal year ended October 31, 2020, on a market price basis, the Fund returned 1.49%. On a net asset value (“NAV”) basis, the Fund returned 1.86%. During the same time period, the Custom Invesco Balanced Allocation ETF Index (the “Benchmark Index”) returned 6.03%, while the S&P 500® Index returned 9.71%.
The Fund’s performance (NAV basis) was less than the return of the Benchmark Index during the period primarily because of the Fund’s higher relative exposures to variable rate fixed income securities. Exposure to low volatility U.S. and international equities and high yield securities also detracted from the Fund’s relative performance. During the same time period, the Benchmark Index posted a positive return driven by a larger allocation to growth-oriented equities and investment grade securities.
For the fiscal year ended October 31, 2020, from an asset class perspective, exposure to U.S. equities through Underlying ETFs were the largest contributors to the Fund’s absolute returns, followed by investment grade fixed income securities. In contrast, diversification in international developed equities and U.S. low volatility equities detracted from the Fund’s performance.
Positions that contributed most significantly to the Fund’s absolute return included the Invesco S&P 500® Pure Growth ETF (portfolio average weight of 10.96%), the Invesco RAFI™ Strategic US ETF (portfolio average weight of 12.13%) and Invesco Russell 1000 Dynamic Multifactor ETF (portfolio average weight of 3.47%). Positions that detracted most significantly from the Fund’s absolute return included the Invesco S&P International Developed Low Volatility ETF (portfolio average weight of 5.32%) and the Invesco S&P 500® Low Volatility ETF (portfolio average weight of 6.97%).
| | | | |
Market Segment Breakdown
(% of the Fund’s Net Assets)*
as of October 31, 2020 | |
| U.S. Equities | | | 50.97 | |
| Fixed Income | | | 38.31 | |
| International and Developed Equities | | | 8.70 | |
| Emerging Markets Equities | | | 2.00 | |
| Money Market Funds Plus Other Assets Less Liabilities | | | 0.02 | |
| * | Reflects exposure achieved through investments in underlying funds. |
| | | | |
Top Ten Fund Holdings*
(% of the Fund’s Net Assets)
as of October 31, 2020 | |
| Security | | | | |
| Invesco Variable Rate Investment Grade ETF | | | 9.85 | |
| Invesco Russell 1000 Dynamic Multifactor ETF | | | 9.43 | |
| Invesco S&P 500® Pure Growth ETF | | | 8.93 | |
| Invesco RAFI™ Strategic US ETF | | | 8.73 | |
| Invesco Investment Grade Defensive ETF | | | 7.96 | |
| Invesco RAFI™ Strategic US Small Company ETF | | | 7.74 | |
| Invesco 1-30 Laddered Treasury ETF | | | 6.13 | |
| Invesco S&P 500® Low Volatility ETF | | | 5.85 | |
| Invesco Taxable Municipal Bond ETF | | | 5.21 | |
| Invesco S&P International Developed Low Volatility ETF | | | 4.70 | |
| Total | | | 74.53 | |
| * | Excluding money market fund holdings. |
Invesco Balanced Multi-Asset Allocation ETF (PSMB) (continued)
Growth of a $10,000 Investment Since Inception
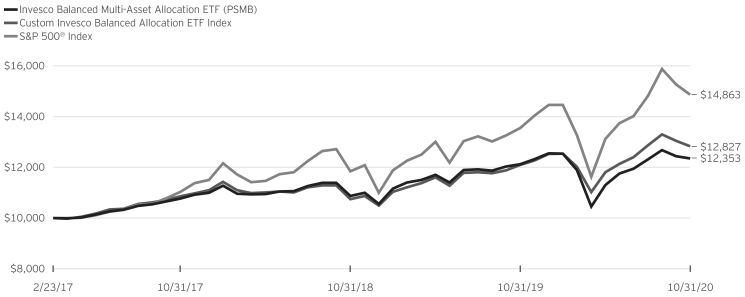
Fund Performance History as of October 31, 2020
| | | | | | | | | | | | | | | | | | | | | | | | |
| | | 1 Year | | | 3 Years Average
Annualized | | | 3 Years
Cumulative | | | | | | Fund Inception | |
| Index | | | | | Average
Annualized | | | Cumulative | |
| Custom Invesco Balanced Allocation ETF Index | | | 6.03 | % | | | 5.71 | % | | | 18.14 | % | | | | | | | 7.00 | % | | | 28.27 | % |
| S&P 500® Index | | | 9.71 | | | | 10.42 | | | | 34.64 | | | | | | | | 11.36 | | | | 48.63 | |
| Fund | | | | | | | | | | | | | | | | | | | | | | | | |
| NAV Return | | | 1.86 | | | | 4.66 | | | | 14.66 | | | | | | | | 5.91 | | | | 23.53 | |
| Market Price Return | | | 1.49 | | | | 4.55 | | | | 14.29 | | | | | | | | 5.79 | | | | 23.03 | |
Fund Inception: February 23, 2017
Performance quoted above represents past performance. Past performance is not a guarantee of future results and current performance may be higher or lower than performance quoted. Investment returns and principal value will fluctuate, and shares of the Fund (“Fund Shares”), when redeemed or sold, may be worth more or less than their original cost. Fund performance reflects any applicable fee waivers and/or expense reimbursements. Had the adviser not waived fees and/or reimbursed expenses currently or in the past, returns would have been lower. See the current prospectus for more information. According to the Fund’s current prospectus, the Fund’s expense ratio of 0.35% includes the unitary management fee of 0.05% and acquired fund fees and expenses of 0.30%. NAV and Market Price returns assume that dividends and capital gain distributions have been reinvested in the Fund at NAV and Market Price, respectively. The returns shown in the table above do not reflect the deduction of taxes that a shareholder would pay on Fund distributions or the redemption or sale of Fund Shares. See invesco.com/ETFs to find the most recent month-end performance numbers.
Benchmark Index performance results are based upon a hypothetical investment in their respective constituent securities. Benchmark Index returns do not represent Fund returns. An investor cannot invest directly in an index. The Benchmark Index does not charge management fees or brokerage expenses, and no such fees or expenses were deducted from the hypothetical performance shown. In addition, the results actual investors might have achieved would have differed from those shown because of differences in the timing, amounts of their investments, and fees and expenses associated with an investment in the Fund.
Notes Regarding Indexes and Fund Performance History:
| - | Average Annualized and Cumulative Inception returns for the Fund and Benchmark Index are based on the inception date of the Fund. |
| - | The Benchmark Index is a custom benchmark that consists of 60% MSCI ACWI Index and 40% Bloomberg Barclays U.S. Aggregate Bond Index. |
| | |
| PSMC | | Management’s Discussion of Fund Performance |
| | Invesco Conservative Multi-Asset Allocation ETF (PSMC) |
The Invesco Conservative Multi-Asset Allocation ETF (the “Fund”) is an actively managed exchange-traded fund (“ETF”) which seeks total return consistent with a lower level of risk relative to the broad stock market. The Fund is a “fund of funds,” meaning that it invests its assets primarily in other ETFs (“Underlying ETFs”), rather than in securities of individual companies. Under normal circumstances, most of those Underlying ETFs will be ETFs that are advised by the Fund’s adviser or one of its affiliates (the “Invesco ETFs”). However, at times the Fund also may invest a portion of its assets in Underlying ETFs that are advised by unaffiliated advisers. The Fund and the Invesco ETFs are part of the same group of investment companies. The Fund seeks to achieve its investment objective by allocating its assets using a conservative investment style that seeks to maximize the benefits of diversification, which focuses on investing a greater portion of the Fund’s assets in Underlying ETFs that invest primarily in fixed-income securities (“Fixed Income ETFs”), but also provides some exposure to Underlying ETFs that invest primarily in equity securities (“Equity ETFs”).
Invesco Advisers, Inc., the Fund’s sub-adviser, uses the following investment process to construct the Fund’s portfolio: (1) a strategic allocation across broad asset classes (i.e., equities and fixed income securities) and particular investment factors within those classes (e.g., for fixed income securities, exposure to domestic, international, corporate, government, high-yield and investment grade bonds; for equity securities, exposure to domestic and international issuers); (2) selection of Underlying ETFs that best represent those broad asset classes and factor exposures, based on comprehensive quantitative and qualitative criteria (such as management experience and structure, investment process, performance and risk metrics); (3) determination by the Fund’s sub-adviser of target weightings in each Underlying ETF in a manner that seeks to manage the amount of active risk contributed by each Underlying ETF; and (4) ongoing monitoring of the Fund’s performance and risk. The Fund typically holds a limited number of securities (generally 10-20).
For the fiscal year ended October 31, 2020, on a market price basis, the Fund returned 3.51%. On a net asset value (“NAV”) basis, the Fund returned 3.84%. During the same time period, the Custom Invesco Conservative Allocation ETF Index (the “Benchmark Index”) returned 6.34%, while the S&P 500® Index returned 9.71%.
The Fund’s performance (NAV basis) was less than the return of the Benchmark Index during the period primarily because of the Fund’s higher relative exposures to variable rate fixed income securities and high yield securities. Exposure to low volatility U.S. and international equities detracted from the Fund’s relative performance. During the same time period, the Benchmark Index posted a positive return driven by a larger allocation to investment grade fixed income securities and growth-oriented equities.
For the fiscal year ended October 31, 2020, from an asset class perspective, exposure to U.S. equities through Underlying ETFs were the largest contributors to the Fund’s absolute returns, followed by investment grade fixed income securities. In contrast, diversification in international developed equities and U.S. low volatility equities, along with high yield fixed income, detracted from the Fund’s performance.
Positions that contributed most significantly to the Fund’s absolute return included the Invesco S&P 500® Pure Growth ETF (portfolio average weight of 5.96%) and the Invesco RAFI™ Strategic US ETF (portfolio average weight of 6.14%). Positions that detracted most significantly from the Fund’s return included the Invesco S&P International Developed Low Volatility ETF (portfolio average weight of 1.62%), and the Invesco Fundamental High Yield® Corporate Bond ETF (portfolio average weight of 6.43%).
| | | | |
Market Segment Breakdown
(% of the Fund’s Net Assets)*
as of October 31, 2020 | |
| Fixed Income | | | 74.66 | |
| U.S. Equities | | | 23.39 | |
| International and Developed Equities | | | 1.94 | |
| Money Market Funds Plus Other Assets Less Liabilities | | | 0.01 | |
| * | Reflects exposure achieved through investments in underlying funds. |
| | | | |
Top Ten Fund Holdings*
(% of the Fund’s Net Assets) as of October 31, 2020 | |
| Security | | | | |
| Invesco Variable Rate Investment Grade ETF | | | 16.31 | |
| Invesco Investment Grade Defensive ETF | | | 13.00 | |
| Invesco Taxable Municipal Bond ETF | | | 8.63 | |
| Invesco Fundamental High Yield® Corporate Bond ETF | | | 7.76 | |
| Invesco Emerging Markets Sovereign Debt ETF | | | 7.66 | |
| Invesco Investment Grade Value ETF | | | 6.97 | |
| Invesco Senior Loan ETF | | | 6.25 | |
| Invesco Preferred ETF | | | 6.11 | |
| Invesco S&P 500® Pure Growth ETF | | | 5.72 | |
| Invesco RAFI™ Strategic US ETF | | | 4.77 | |
| Total | | | 83.18 | |
| * | Excluding money market fund holdings. |
Invesco Conservative Multi-Asset Allocation ETF (PSMC) (continued)
Growth of a $10,000 Investment Since Inception
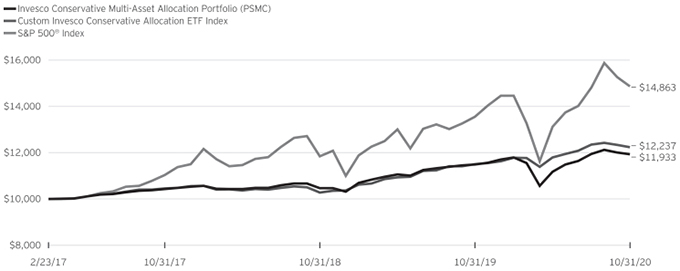
Fund Performance History as of October 31, 2020
| | | | | | | | | | | | | | | | | | | | | | | | |
| | | 1 Year | | | 3 Years
Average
Annualized | | | 3 Years
Cumulative | | | | | | Fund Inception | |
| Index | | | | | Average
Annualized | | | Cumulative | |
| Custom Invesco Conservative Allocation ETF Index | | | 6.34 | % | | | 5.40 | % | | | 17.10 | % | | | | | | | 5.64 | % | | | 22.37 | % |
| S&P 500® Index | | | 9.71 | | | | 10.42 | | | | 34.64 | | | | | | | | 11.36 | | | | 48.63 | |
| Fund | | | | | | | | | | | | | | | | | | | | | | | | |
| NAV Return | | | 3.84 | | | | 4.60 | | | | 14.46 | | | | | | | | 4.92 | | | | 19.33 | |
| Market Price Return | | | 3.51 | | | | 4.52 | | | | 14.17 | | | | | | | | 4.82 | | | | 18.93 | |
Fund Inception: February 23, 2017
Performance quoted above represents past performance. Past performance is not a guarantee of future results and current performance may be higher or lower than performance quoted. Investment returns and principal value will fluctuate, and shares of the Fund (“Fund Shares”), when redeemed or sold, may be worth more or less than their original cost. Fund performance reflects any applicable fee waivers and/or expense reimbursements. Had the adviser not waived fees and/or reimbursed expenses currently or in the past, returns would have been lower. See the current prospectus for more information. According to the Fund’s current prospectus, the Fund’s expense ratio of 0.39% includes the unitary management fee of 0.05% and acquired fund fees and expenses of 0.34%. NAV and Market Price returns assume that dividends and capital gain distributions have been reinvested in the Fund at NAV and Market Price, respectively. The returns shown in the table above do not reflect the deduction of taxes that a shareholder would pay on Fund distributions or the redemption or sale of Fund Shares. See invesco.com/ETFs to find the most recent month-end performance numbers.
Benchmark Index performance results are based upon a hypothetical investment in their respective constituent securities. Benchmark Index returns do not represent Fund returns. An investor cannot invest directly in an index. The Benchmark Index does not charge management fees or brokerage expenses, and no such fees or expenses were deducted from the hypothetical performance shown. In addition, the results actual investors might have achieved would have differed from those shown because of differences in the timing, amounts of their investments, and fees and expenses associated with an investment in the Fund.
Notes Regarding Indexes and Fund Performance History:
| - | Average Annualized and Cumulative Inception returns for the Fund and Benchmark Index are based on the inception date of the Fund. |
| - | The Benchmark Index is a custom benchmark that consists of 20% MSCI ACWI Index and 80% Bloomberg Barclays U.S. Aggregate Bond Index. |
| | |
| PSMG | | Management’s Discussion of Fund Performance |
| | Invesco Growth Multi-Asset Allocation ETF (PSMG) |
The Invesco Growth Multi-Asset Allocation ETF (the “Fund”) is an actively managed exchange-traded fund (“ETF”) which seeks to provide long-term capital appreciation. The Fund is a “fund of funds,” meaning that it invests its assets primarily in other ETFs (“Underlying ETFs”), rather than in securities of individual companies. Under normal circumstances, most of those Underlying ETFs will be ETFs that are advised by the Fund’s adviser or one of its affiliates (the “Invesco ETFs”). However, at times the Fund also may invest a portion of its assets in Underlying ETFs that are advised by unaffiliated advisers. The Fund and the Invesco ETFs are part of the same group of investment companies. The Fund seeks to achieve its investment objective by allocating its assets using a growth investment style that seeks to maximize the benefits of diversification, which focuses on investing a greater portion of Fund assets in Underlying ETFs that invest primarily in equity securities (“Equity ETFs”), but also provides some exposure to Underlying ETFs that invest primarily in fixed-income securities (“Fixed Income ETFs”).
Invesco Advisers, Inc., the Fund’s sub-adviser, uses the following investment process to construct the Fund’s portfolio: (1) a strategic allocation across broad asset classes (i.e., equities and fixed income securities) and particular investment factors within those classes (e.g., for fixed income securities, exposure to domestic, international, corporate, government, high-yield and investment grade bonds; for equity securities, exposure to domestic and international stocks); (2) selection of Underlying ETFs that best represent those broad asset classes and factor exposures, based on comprehensive quantitative and qualitative criteria (such as management experience and structure, investment process, performance and risk metrics); (3) determination by the Fund’s sub-adviser of target weightings in each Underlying ETF in a manner that seeks to manage the amount of active risk contributed by each Underlying ETF; and (4) ongoing monitoring of the Fund’s performance and risk. The Fund typically holds a limited number of securities (generally 10-20).
For the fiscal year ended October 31, 2020, on a market price basis, the Fund returned (0.52)%. On a net asset value (“NAV”) basis, the Fund returned (0.45)%. During the same time period, the Custom Invesco Growth Allocation ETF Index (the “Benchmark Index”) returned 5.56%, while the S&P 500® Index returned 9.71%.
The Fund’s performance (NAV basis) was less than from the return of the Benchmark Index during the period primarily because of the Fund’s higher relative exposure to variable rate fixed income securities. Exposure to low volatility U.S. and international equities along with exposure to treasury inflation-protected securities (“TIPS”) detracted from the Fund’s relative performance. During the same time period, the Benchmark Index posted a positive return driven by a larger allocation to investment grade fixed income securities and growth-oriented equities.
For the fiscal year ended October 31, 2020, from an asset class perspective, exposure in U.S. equities through Underlying ETFs were the largest contributors to the Fund’s absolute returns, followed by investment grade fixed income securities. In contrast, diversification in international developed equities and U.S. low volatility equities detracted from the Fund’s performance.
Positions that contributed most significantly to the Fund’s absolute return included the Invesco S&P 500® Pure Growth ETF (portfolio average weight of 13.88%) and the Invesco RAFI™ Strategic US ETF (portfolio average weight of 14.66%). Positions that detracted most significantly from the Fund’s absolute return included the Invesco S&P International Developed Low Volatility ETF (portfolio average weight of 7.60%) and the Invesco S&P SmallCap Low Volatility ETF (portfolio average weight of 4.08%).
| | | | |
Market Segment Breakdown
(% of the Fund’s Net Assets)*
as of October 31, 2020 | |
| U.S. Equities | | | 63.18 | |
| Fixed Income | | | 20.77 | |
| International and Developed Equities | | | 12.47 | |
| Emerging Markets Equities | | | 3.56 | |
| Money Market Funds Plus Other Assets Less Liabilities | | | 0.02 | |
| * | Reflects exposure achieved through investments in underlying funds. |
| | | | |
Top Ten Fund Holdings*
(% of the Fund’s Net Assets) as of October 31, 2020 | �� |
| Security | | | | |
| Invesco Russell 1000 Dynamic Multifactor ETF | | | 12.52 | |
| Invesco S&P 500® Pure Growth ETF | | | 11.26 | |
| Invesco RAFI™ Strategic US ETF | | | 11.26 | |
| Invesco RAFI™ Strategic US Small Company ETF | | | 9.76 | |
| Invesco S&P 500® Low Volatility ETF | | | 7.87 | |
| Invesco S&P International Developed Low Volatility ETF | | | 6.86 | |
| Invesco Investment Grade Defensive ETF | | | 6.78 | |
| Invesco RAFI™ Strategic Developed ex-US ETF | | | 5.61 | |
| Invesco S&P SmallCap Low Volatility ETF | | | 5.54 | |
| Invesco S&P MidCap Low Volatility ETF | | | 4.98 | |
| Total | | | 82.44 | |
| * | Excluding money market fund holdings. |
Invesco Growth Multi-Asset Allocation ETF (PSMG) (continued)
Growth of a $10,000 Investment Since Inception
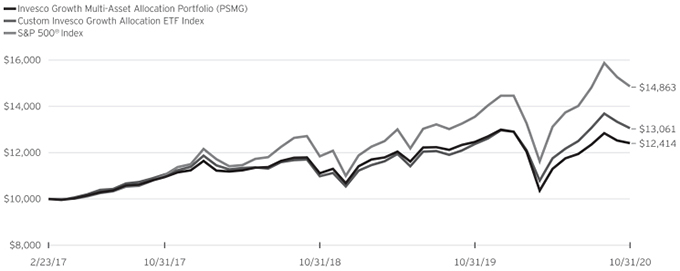
Fund Performance History as of October 31, 2020
| | | | | | | | | | | | | | | | | | | | | | | | |
| | | 1 Year | | | 3 Years
Average
Annualized | | | 3 Years
Cumulative | | | | | | Fund Inception | |
| Index | | | | | Average
Annualized | | | Cumulative | |
| Custom Invesco Growth Allocation ETF Index | | | 5.56 | % | | | 5.68 | % | | | 18.03 | % | | | | | | | 7.52 | % | | | 30.61 | % |
| S&P 500® Index | | | 9.71 | | | | 10.42 | | | | 34.64 | | | | | | | | 11.36 | | | | 48.63 | |
| Fund | | | | | | | | | | | | | | | | | | | | | | | | |
| NAV Return | | | (0.45 | ) | | | 4.26 | | | | 13.34 | | | | | | | | 6.05 | | | | 24.14 | |
| Market Price Return | | | (0.52 | ) | | | 4.20 | | | | 13.15 | | | | | | | | 6.04 | | | | 24.11 | |
Fund Inception: February 23, 2017
Performance quoted above represents past performance. Past performance is not a guarantee of future results and current performance may be higher or lower than performance quoted. Investment returns and principal value will fluctuate, and shares of the Fund (“Fund Shares”), when redeemed or sold, may be worth more or less than their original cost. Fund performance reflects any applicable fee waivers and/or expense reimbursements. Had the adviser not waived fees and/or reimbursed expenses currently or in the past, returns would have been lower. See the current prospectus for more information. According to the Fund’s current prospectus, the Fund’s expense ratio of 0.36% includes the unitary management fee of 0.05% and acquired fund fees and expenses of 0.31%. NAV and Market Price returns assume that dividends and capital gain distributions have been reinvested in the Fund at NAV and Market Price, respectively. The returns shown in the table above do not reflect the deduction of taxes that a shareholder would pay on Fund distributions or the redemption or sale of Fund Shares. See invesco.com/ETFs to find the most recent month-end performance numbers.
Benchmark Index performance results are based upon a hypothetical investment in their respective constituent securities. Benchmark Index returns do not represent Fund returns. An investor cannot invest directly in an index. The Benchmark Index does not charge management fees or brokerage expenses, and no such fees or expenses were deducted from the hypothetical performance shown. In addition, the results actual investors might have achieved would have differed from those shown because of differences in the timing, amounts of their investments, and fees and expenses associated with an investment in the Fund.
Notes Regarding Indexes and Fund Performance History:
| - | Average Annualized and Cumulative Inception returns for the Fund and Benchmark Index are based on the inception date of the Fund. |
| - | The Benchmark Index is a custom benchmark that consists of 80% MSCI ACWI Index and 20% Bloomberg Barclays U.S. Aggregate Bond Index. |
| | |
| PSMM | | Management’s Discussion of Fund Performance |
| | Invesco Moderately Conservative Multi-Asset Allocation ETF (PSMM) |
The Invesco Moderately Conservative Multi-Asset Allocation ETF (the “Fund”) is an actively managed exchange-traded fund (“ETF”) which seeks to provide current income and some capital appreciation. The Fund is a “fund of funds,” meaning that it invests its assets primarily in other ETFs (“Underlying ETFs”), rather than in securities of individual companies. Under normal circumstances, most of those Underlying ETFs will be ETFs that are advised by the Fund’s adviser or one of its affiliates (the “Invesco ETFs”). However, at times the Fund also may invest a portion of its assets in Underlying ETFs that are advised by unaffiliated advisers. The Fund and the Invesco ETFs are part of the same group of investment companies. The Fund seeks to achieve its investment objective by allocating its assets using a moderately conservative investment style that seeks to maximize the benefits of diversification, which focuses on investing portions of the Fund’s assets in Underlying ETFs that invest primarily in equity securities (“Equity ETFs”), as well as in Underlying ETFs that invest primarily in fixed-income securities (“Fixed Income ETFs”).
Invesco Advisers, Inc., the Fund’s sub-adviser uses the following investment process to construct the Fund’s portfolio: (1) a strategic allocation across broad asset classes (i.e., equities and fixed income securities) and particular investment factors within those classes (e.g., for fixed income securities, exposure to domestic, international, corporate, government, high-yield and investment grade bonds; for equity securities, exposure to domestic and international stocks); (2) selection of Underlying ETFs that best represent those broad asset classes and factor exposures, based on comprehensive quantitative and qualitative criteria (such as management experience and structure, investment process, performance and risk metrics); (3) determination by the Fund’s sub-adviser of target weightings in each Underlying ETF in a manner that seeks to manage the amount of active risk contributed by each Underlying ETF; and (4) ongoing monitoring of the Fund’s performance and risk. The Fund typically holds a limited number of securities (generally 10-20).
For the fiscal year ended October 31, 2020, on a market price basis, the Fund returned 2.25%. On a net asset value (“NAV”) basis, the Fund returned 2.55%. During the same time period, the Custom Invesco Moderately Conservative Allocation ETF Index (the “Benchmark Index”) returned 6.29%, while the S&P 500® Index returned 9.71%.
The Fund’s performance (NAV basis) was less than the return of the Benchmark Index during the period primarily because of the Fund’s higher relative exposure to variable rate fixed income securities and treasury inflation-protected securities (“TIPS”). Exposure to low volatility U.S. and international equities and high yield securities detracted from the Fund’s relative performance. During the same time period, the Benchmark Index posted a positive return driven by a larger allocation to growth-oriented equities and investment grade securities.
For the fiscal year ended October 31, 2020, from an asset class perspective, exposure to U.S. equities through Underlying ETFs were the largest contributors to the Fund’s absolute returns, followed by investment grade fixed income securities. In contrast, diversification in international developed equities and U.S. low volatility equities detracted from the Fund’s performance.
Positions that contributed most significantly to the Fund’s absolute return included the Invesco S&P 500® Pure Growth ETF (portfolio average weight of 8.63%) and the Invesco RAFI™ Strategic US ETF (portfolio average weight of 8.37%). Positions that detracted most significantly from the Fund’s absolute return included the Invesco S&P International Developed Low Volatility ETF (portfolio average weight of 4.24%) and the Invesco S&P 500® Low Volatility ETF (portfolio average weight of 4.64%).
| | | | |
Market Segment Breakdown
(% of the Fund’s Net Assets)*
as of October 31, 2020 | |
| Fixed Income | | | 57.10 | |
| U.S. Equities | | | 37.21 | |
| International and Developed Equities | | | 5.68 | |
| Money Market Funds Plus Other Assets Less Liabilities | | | 0.01 | |
| * | Reflects exposure achieved through investments in underlying funds. |
| | | | |
Top Ten Fund Holdings*
(% of the Fund’s Net Assets) as of October 31, 2020 | |
| Security | | | | |
| Invesco Variable Rate Investment Grade ETF | | | 12.34 | |
| Invesco Investment Grade Defensive ETF | | | 11.79 | |
| Invesco Taxable Municipal Bond ETF | | | 7.69 | |
| Invesco S&P 500® Pure Growth ETF | | | 7.51 | |
| Invesco Russell 1000 Dynamic Multifactor ETF | | | 6.40 | |
| Invesco Investment Grade Value ETF | | | 6.32 | |
| Invesco RAFI™ Strategic US ETF | | | 5.77 | |
| Invesco 1-30 Laddered Treasury ETF | | | 5.06 | |
| Invesco RAFI™ Strategic US Small Company ETF | | | 4.41 | |
| Invesco Emerging Markets Sovereign Debt ETF | | | 4.21 | |
| Total | | | 71.50 | |
| * | Excluding money market fund holdings. |
Invesco Moderately Conservative Multi-Asset Allocation ETF (PSMM) (continued)
Growth of a $10,000 Investment Since Inception
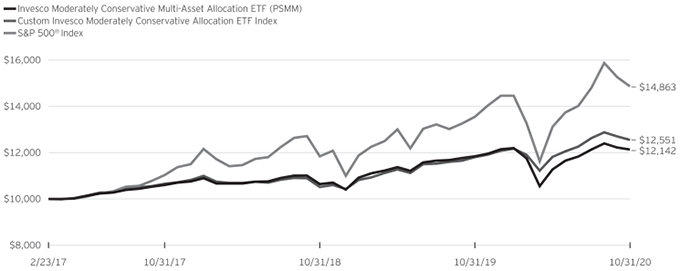
Fund Performance History as of October 31, 2020
| | | | | | | | | | | | | | | | | | | | | | | | |
| | | 1 Year | | | 3 Years
Average
Annualized | | | 3 Years
Cumulative | | | | | | Fund Inception | |
| Index | | | | | Average
Annualized | | | Cumulative | |
| Custom Invesco Moderately Conservative Allocation ETF Index | | | 6.29 | % | | | 5.62 | % | | | 17.83 | % | | | | | | | 6.37 | % | | | 25.51 | % |
| S&P 500® Index | | | 9.71 | | | | 10.42 | | | | 34.64 | | | | | | | | 11.36 | | | | 48.63 | |
| Fund | | | | | | | | | | | | | | | | | | | | | | | | |
| NAV Return | | | 2.55 | | | | 4.62 | | | | 14.52 | | | | | | | | 5.41 | | | | 21.42 | |
| Market Price Return | | | 2.25 | | | | 4.54 | | | | 14.25 | | | | | | | | 5.34 | | | | 21.12 | |
Fund Inception: February 23, 2017
Performance quoted above represents past performance. Past performance is not a guarantee of future results and current performance may be higher or lower than performance quoted. Investment returns and principal value will fluctuate, and shares of the Fund (“Fund Shares”), when redeemed or sold, may be worth more or less than their original cost. Fund performance reflects any applicable fee waivers and/or expense reimbursements. Had the adviser not waived fees and/or reimbursed expenses currently or in the past, returns would have been lower. See the current prospectus for more information. According to the Fund’s current prospectus, the Fund’s expense ratio of 0.37% includes the unitary management fee of 0.05% and acquired fund fees and expenses of 0.32%. NAV and Market Price returns assume that dividends and capital gain distributions have been reinvested in the Fund at NAV and Market Price, respectively. The returns shown in the table above do not reflect the deduction of taxes that a shareholder would pay on Fund distributions or the redemption or sale of Fund Shares. See invesco.com/ETFs to find the most recent month-end performance numbers.
Benchmark Index performance results are based upon a hypothetical investment in their respective constituent securities. Benchmark Index returns do not represent Fund returns. An investor cannot invest directly in an index. The Benchmark Index does not charge management fees or brokerage expenses, and no such fees or expenses were deducted from the hypothetical performance shown. In addition, the results actual investors might have achieved would have differed from those shown because of differences in the timing, amounts of their investments, and fees and expenses associated with an investment in the Fund.
Notes Regarding Indexes and Fund Performance History:
| - | Average Annualized and Cumulative Inception returns for the Fund and Benchmark Index are based on the inception date of the Fund. |
| - | The Benchmark Index is a custom benchmark that consists of 40% MSCI ACWI Index and 60% Bloomberg Barclays U.S. Aggregate Bond Index. |
| | |
| PHDG | | Management’s Discussion of Fund Performance |
| | Invesco S&P 500® Downside Hedged ETF (PHDG) |
The Invesco S&P 500® Downside Hedged ETF (the “Fund”) is an actively managed exchange-traded fund (“ETF”) that seeks to achieve positive total returns in rising or falling markets that are not directly correlated to broad equity or fixed income market returns. The Fund seeks to achieve its investment objective by using a quantitative, rules based strategy to allocate its assets among components of the S&P 500® Dynamic VEQTOR Index (the “Benchmark Index”) in a combination of (i) equity securities contained in the S&P 500® Index and that are listed on a U.S. securities exchange, (ii) Chicago Board Options Exchange (“CBOE”) Volatility Index (“VIX Index”) related instruments, such as listed VIX Index futures contracts that reflect exposure to the S&P 500® VIX Short Term Futures Index (“VIX Futures Index”), and (iii) money market instruments, cash and cash equivalents. However, the Fund’s allocations among its investments may not correspond to those of the Benchmark Index.
Rather than adhering to the Benchmark Index’s strategy allocation rules, the Adviser uses active management techniques in seeking to obtain returns that exceed the Benchmark Index by providing the Fund with higher or lower exposure to any component within the Benchmark Index at any time. In addition, the Fund may invest in other VIX Index related instruments, including ETFs and exchange-traded notes that are listed on a U.S. securities exchange and that provide exposure to the VIX Index and U.S. listed futures contracts that track the S&P 500® Index and are listed on the Chicago Mercantile Exchange. Consistent with its investment strategy, the Fund moves to a substantial cash position from time to time during periods of heightened volatility. In this regard, at the Fund’s fiscal year ended October 31, 2020, the Fund held primarily money market funds plus other assets.
For the fiscal year ended October 31, 2020, on a market price basis, the Fund returned 23.78%. On a net asset value (“NAV”) basis, the Fund returned 23.19%. During the same time period, the Benchmark Index returned 22.70%. The Fund’s performance (NAV basis) differed from the return of the Benchmark Index primarily due to active return generated on the Fund’s selection of VIX contracts that were partially offset by fees and transaction costs.
During this same time period, the S&P 500® Index returned 9.71% and the U.S. 3-Month Treasury Bill Index (the “T-Bill 3 Month Index”) returned 0.60% (these indexes, collectively with the Benchmark Index, are referred to as the “Indexes”). The Indexes were selected for their recognition in the marketplace. The S&P 500® Index was selected because its performance comparison is a useful measure for investors as a broad representation of the equity market. The T-Bill 3 Month Index was selected because its performance comparison is a useful measure for investors as a broad representation of the short-term U.S. fixed income market.
The Fund’s performance (NAV basis) differed from the return of the S&P 500® Index during the period primarily because of the Fund’s consistent allocation to VIX futures which have an inverse correlation to the S&P 500® Index. The Fund’s performance (NAV basis) differed from the return of the U.S. 3-month Treasury Bill Index during the period primarily because of the Fund’s consistent allocation to VIX Futures.
For the fiscal year ended October 31, 2020, the information technology sector contributed most significantly to the Fund’s return, followed by the fund’s VIX futures allocation. The energy sector detracted most significantly from the Fund’s return, followed by the real estate sector.
Positions that contributed most significantly to the Fund’s return included the CBOE VIX (CBF) March 2020, a VIX futures contract (portfolio average weight of 0.74%), and the CBOE VIX (CBF) April 2020, a VIX futures contract (portfolio average weight of 1.72%). The position that detracted most significantly from the Fund’s return was the CBOE VIX (CBF) May 2020, a VIX futures contract (portfolio average weight of 2.10%).
| | | | |
Sector Breakdown
(% of the Fund’s Net Assets)
as of October 31, 2020 | |
| Financials | | | 0.00* | |
| Money Market Funds Plus Other Assets Less Liabilities | | | 100.00 | |
| * | Amount is less than 0.005%. |
Invesco S&P 500® Downside Hedged ETF (PHDG) (continued)
Growth of a $10,000 Investment Since Inception
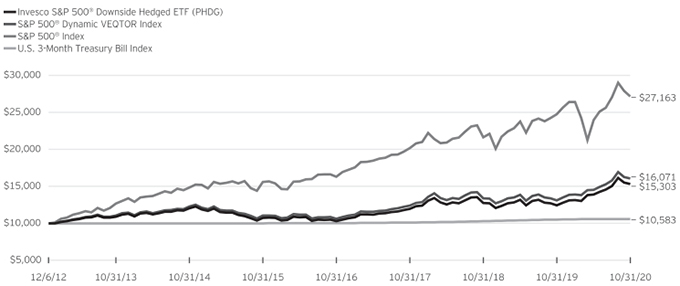
Fund Performance History as of October 31, 2020
| | | | | | | | | | | | | | | | | | | | | | | | | | | | | | | | |
| | | 1 Year | | | 3 Years Average
Annualized | | | 3 Years Cumulative | | | 5 Years Average
Annualized | | | 5 Years Cumulative | | | | | | Fund Inception | |
| Index | | | | | Average
Annualized | | | Cumulative | |
| S&P 500® Dynamic VEQTOR Index | | | 22.70 | % | | | 9.00 | % | | | 29.49 | % | | | 7.79 | % | | | 45.52 | % | | | | | | | 6.19 | % | | | 60.71 | % |
| S&P 500® Index | | | 9.71 | | | | 10.42 | | | | 34.64 | | | | 11.71 | | | | 73.97 | | | | | | | | 13.48 | | | | 171.63 | |
| U.S. 3 Month Treasury Bill Index | | | 0.60 | | | | 1.51 | | | | 4.60 | | | | 1.12 | | | | 5.71 | | | | | | | | 0.72 | | | | 5.83 | |
| Fund | | | | | | | | | | | | | | | | | | | | | | | | | | | | | | | | |
| NAV Return | | | 23.19 | | | | 8.51 | | | | 27.78 | | | | 7.34 | | | | 42.47 | | | | | | | | 5.53 | | | | 53.03 | |
| Market Price Return | | | 23.78 | | | | 8.58 | | | | 28.00 | | | | 7.36 | | | | 42.60 | | | | | | | | 5.55 | | | | 53.28 | |
Fund Inception: December 6, 2012
Performance quoted above represents past performance. Past performance is not a guarantee of future results and current performance may be higher or lower than performance quoted. Investment returns and principal value will fluctuate, and shares of the Fund (“Fund Shares”), when redeemed or sold, may be worth more or less than their original cost. Fund performance reflects any applicable fee waivers and/or expense reimbursements. Had the adviser not waived fees and/or reimbursed expenses currently or in the past, returns would have been lower. See the current prospectus for more information. According to the Fund’s current prospectus, the Fund’s expense ratio of 0.43% (0.39% after fee waiver) includes the unitary management fee of 0.39% and acquired fund fees and expenses of 0.04%. NAV and Market Price returns assume that dividends and capital gain distributions have been reinvested in the Fund at NAV and Market Price, respectively. The returns shown in the table above do not reflect the deduction of taxes that a shareholder would pay on Fund
distributions or the redemption or sale of Fund Shares. See invesco.com/ETFs to find the most recent month-end performance numbers.
The Indexes’ performance results are based upon a hypothetical investment in their respective constituent securities. The Indexes’ returns do not represent Fund returns. An investor cannot invest directly in an Index. The Indexes do not charge management fees or brokerage expenses, and no such fees or expenses were deducted from the hypothetical performance shown. In addition, the results actual investors might have achieved would have differed from those shown because of differences in the timing, amounts of their investments, and fees and expenses associated with an investment in the Fund.
Notes Regarding Indexes and Fund Performance History:
| - | Average Annualized and Cumulative Inception returns for the Fund and the Indexes’ are based on the inception date of the Fund. |
| | |
| GTO | | Management’s Discussion of Fund Performance |
| | Invesco Total Return Bond ETF (GTO) |
The Invesco Total Return Bond ETF (the “Fund”) is an actively managed exchange-traded fund (“ETF”) whose investment objective is to seek maximum total return, comprised of income and capital appreciation. The Fund will normally invest in a portfolio of fixed income instruments of varying maturities and of any credit quality. The Fund will normally invest at least 80% of its net assets (plus any borrowings for investment purposes) in fixed income instruments, which may be represented by certain derivative instruments as discussed below, and also include exchange-traded funds (“ETFs”) and closed-end funds (“CEFs”) that invest substantially all of their assets in fixed income instruments (which may include ETFs and CEFs affiliated with the Fund). The fixed income instruments in which the Fund will invest include corporate debt securities of U.S. and non-U.S. issuers, including corporate bonds, and other similar instruments, such as Treasury securities, collateralized loan obligations, mortgage-backed securities and asset-backed securities, issued by various U.S. and non-U.S. public- or private-sector entities, and municipal securities, which are debt securities issued by states or local governments and their agencies, authorities and other government sponsored enterprises.
For the fiscal year ended October 31, 2020, on a market price basis, the Fund returned 8.77%. On a net asset value (“NAV”) basis, the Fund returned 8.83%.
During this same time period, the Bloomberg Barclays U.S. Aggregate Bond Index (the “Benchmark Index”) returned 6.19%. The Benchmark Index is an unmanaged index weighted by market capitalization based on the average performance of approximately 11,570 securities. The Benchmark Index was selected for its recognition in the marketplace, and its performance comparison is a useful measure for investors as a broad representation of the U.S. bond market.
Relative to the Benchmark Index, the Fund was most overweight in the investment grade corporate debt sector and most underweight in the agency residential mortgage backed sector during the fiscal year ended October 31, 2020. The Fund’s performance (NAV basis) exceeded returns of the Benchmark Index during the period primarily because of the Fund’s slightly longer duration posture relative to the Benchmark Index as interest rates fell. Over this time frame, the yield on the 10-year U.S. Treasury bond fell approximately 85 basis points from 1.73% to 0.88%. Additionally, performance was positively impacted by security selection within the consumer cyclical, high yield independent, and technology media and telecommunication industries. Security selection within the energy sector detracted from performance relative to the Benchmark Index for the period.
Individual positions that contributed most significantly to the Fund’s return included a Corning, Inc. 60 Year Corporate Bond (portfolio average weight of 1.4%) and a 10 Year US Treasury Note (portfolio average weight of 1.2%). Positions that detracted
most significantly from the Fund’s return included a 10 Year US Treasury Note position (portfolio average weight of 1.3%) and a Continental Resources, Inc. 10 Year Corporate Note (portfolio average weight of 0.6%).
| | | | |
Asset Group
(% of the Fund’s Net Assets)
as of October 31, 2020 | |
| U.S. Dollar Denominated Bonds & Notes | | | 41.73 | |
| U.S. Treasury Securities | | | 25.76 | |
| U.S. Government Sponsored Agency Mortgage-Backed Securities | | | 16.73 | |
| Asset-Backed Securities | | | 11.10 | |
| U.S. Government Sponsored Agency Securities | | | 0.67 | |
| Municipal Obligations | | | 0.56 | |
| Agency Credit Risk Transfer Notes | | | 0.50 | |
| Non-U.S. Dollar Denominated Bonds & Notes | | | 0.21 | |
| Preferred Stocks | | | 0.08 | |
| Options Purchased | | | 0.04 | |
| Money Market Funds Plus Other Assets Less Liabilities | | | 2.62 | |
|
Top Ten Fund Holdings*
(% of the Fund’s Net Assets)
as of October 31, 2020 | |
| Security | | | | |
| U.S. Treasury Notes, 0.63%, 08/15/2030 | | | 9.39 | |
| U.S. Treasury Notes, 0.25%, 09/30/2025 | | | 6.66 | |
| U.S. Treasury Bonds, 1.25%, 05/15/2050 | | | 6.48 | |
| Uniform Mortgage-Backed Securities, TBA, 2.00%, 11/01/2050 | | | 3.62 | |
| U.S. Treasury Notes, 0.38%, 09/30/2027 | | | 2.46 | |
| Uniform Mortgage Backed Securities, TBA, 3.00%, 11/01/2050 | | | 2.15 | |
| Uniform Mortgage-Backed Securities, TBA, 2.50%, 11/01/2050 | | | 1.89 | |
| Federal Home Loan Mortgage Corp., 3.50%, 08/01/2049 | | | 1.14 | |
| Federal National Mortgage Association, 3.00%, 10/01/2049 | | | 0.96 | |
| Corning, Inc., 5.45%, 11/15/2079 | | | 0.87 | |
| Total | | | 35.62 | |
| * | Excluding money market fund holdings. |
Invesco Total Return Bond ETF (GTO) (continued)
Growth of a $10,000 Investment Since Inception
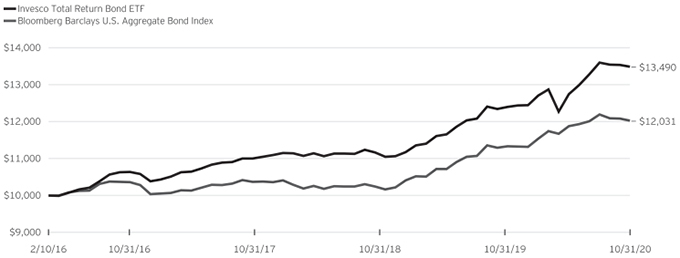
Fund Performance History as of October 31, 2020
| | | | | | | | | | | | | | | | | | | | | | | | |
| | | | | | 3 Years Average
Annualized | | | 3 Years Cumulative | | | | | | Fund Inception | |
| Index | | 1 Year | | | | | | Average
Annualized | | | Cumulative | |
| Bloomberg Barclays U.S. Aggregate Bond Index | | | 6.19 | % | | | 5.06 | % | | | 15.98 | % | | | | | | | 3.99 | % | | | 20.31 | % |
| Fund | | | | | | | | | | | | | | | | | | | | | | | | |
| NAV Return | | | 8.83 | | | | 6.88 | | | | 22.08 | | | | | | | | 6.55 | | | | 34.90 | |
| Market Price Return | | | 8.77 | | | | 6.80 | | | | 21.81 | | | | | | | | 6.54 | | | | 34.88 | |
Guggenheim Total Return Bond ETF (the “Predecessor Fund”)
Inception: February 10, 2016
Performance quoted above represents past performance. Past performance is not a guarantee of future results and current performance may be higher or lower than performance quoted. Investment returns and principal value will fluctuate, and shares of the Fund (“Fund Shares”), when redeemed or sold, may be worth more or less than their original cost. Fund performance reflects any applicable fee waivers and/or expense reimbursements. Had the adviser not waived fees and/or reimbursed expenses currently or in the past, returns would have been lower. See the current prospectus for more information. According to the Fund’s current prospectus, the Fund’s expense ratio of 0.50% is expressed as a unitary management fee to cover operating expenses and expenses incurred in connection with managing the portfolio. The Financial Highlights section of the Shareholder Report presents the expense ratios based on expenses incurred during the period covered by this report. NAV and Market Price returns assume that dividends and capital gain distributions have been reinvested in the Fund at NAV and Market Price, respectively. The returns shown in the table above do not reflect the deduction of taxes that a shareholder would pay
on Fund distributions or the redemption or sale of Fund Shares. See invesco.com/ETFs to find the most recent month-end performance numbers.
Benchmark Index performance results are based upon a hypothetical investment in their respective constituent securities. Benchmark Index returns do not represent Fund returns. An investor cannot invest directly in an index. The Benchmark Index does not charge management fees or brokerage expenses, and no such fees or expenses were deducted from the hypothetical performance shown. In addition, the results actual investors might have achieved would have differed from those shown because of differences in the timing, amounts of their investments, and fees and expenses associated with an investment in the Fund.
Notes Regarding Index and Fund Performance History:
| - | Average Annualized and Cumulative Inception returns for the Fund and Benchmark Index are based on the inception date of the Predecessor Fund. |
| - | Effective after the close of business on April 6, 2018, the Predecessor Fund was reorganized into the Fund. Fund returns shown are blended returns of the Predecessor Fund and the Fund. |
| | |
| GSY | | Management’s Discussion of Fund Performance |
| | Invesco Ultra Short Duration ETF (GSY) |
The Invesco Ultra Short Duration ETF (the “Fund”) is an actively managed exchange-traded fund (“ETF”) whose investment objective is to seek maximum current income, consistent with preservation of capital and daily liquidity. The Fund will invest at least 80% of its net assets (plus any borrowings for investment purposes) in fixed income securities and in exchange-traded funds (“ETFs”) and closed-end funds that invest substantially all of their assets in fixed income securities. The Fund uses a low duration strategy to seek to outperform the ICE BofA US Treasury Bill Index (the “Benchmark Index”) in addition to providing returns in excess of those available in U.S. Treasury bills, government repurchase agreements, and money market funds, while seeking to provide preservation of capital and daily liquidity. The Fund expects, under normal circumstances, to hold a diversified portfolio of fixed income instruments of varying maturities, but that have an average duration of less than one year.
The Fund is primarily invested in corporate bonds, commercial paper and asset-backed securities. The Fund’s high allocation to floating rate securities reduces interest rate risk while commercial paper helps the Fund manage its liquidity needs. The Fund’s focus on high-quality short maturity holdings helps the Fund manage credit risk. The Fund continues to maintain an average effective duration below one year. The portfolio management team believes the Fund is well positioned for interest rate volatility and broader financial market sell-offs overall and relative to other conservative ultra-short fixed income funds. The Fund’s significant holdings in high quality investment grade assets and money market securities continue to help reduce drawdown risks, while preserving capital
and maintaining a competitive yield.
For the fiscal year ended October 31, 2020, on a market price basis, the Fund returned 2.04%. On a net asset value (“NAV”) basis, the Fund returned 2.01%. During the same time period, the Benchmark Index returned 0.99%. The Fund’s performance (NAV basis) exceeded the return of the Benchmark Index during the year primarily due to the Fund maintaining an overweight position in short maturity investment grade credit securities.
Active positioning of investment grade corporate bonds of financial companies and cash securities were positive contributors to the Fund’s performance and specifically contributed to the Fund’s outperformance of the Benchmark Index. Investment grade corporate bonds benefitted from support from the U.S. Federal Reserve after spreads widened significantly earlier in the period due to the impact of the COVID-19 pandemic on the economy. The Fund’s overall duration and yield curve positioning, which was longer than that of the Benchmark Index, was also a positive contributor to relative performance as interest rates fell during the period. The shorter duration of cash securities was a detractor from the Fund’s performance relative to the Fund’s Benchmark Index.
| | | | |
Security Type Breakdown
(% of the Fund’s Net Assets)
as of October 31, 2020 | |
| U.S. Dollar Denominated Bonds & Notes | | | 46.03 | |
| Commercial Paper | | | 27.97 | |
| Asset-Backed Securities | | | 14.47 | |
| Repurchase Agreements | | | 6.15 | |
| U.S. Treasury Securities | | | 4.31 | |
| Certificate of Deposit | | | 0.83 | |
| Variable Rate Senior Loan Interests | | | 0.06 | |
| Money Market Funds Plus Other Assets Less Liabilities | | | 0.18 | |
|
Top Ten Fund Holdings* (% of the Fund’s Net Assets)
as of October 31, 2020 | |
| Security | | | | |
| ETP Legacy L.P., 0.60%, 11/02/2020 | | | 1.69 | |
| Citigroup Global Markets, Inc., joint open agreement dated 03/17/2020, 0.70% | | | 1.66 | |
| Societe Generale, joint term agreement dated 08/05/2020, 0.73%, 04/22/2021 | | | 1.66 | |
| U.S. Treasury Bills, 0.11%, 02/04/2021 | | | 1.55 | |
| Truist Securities, joint term agreement dated 10/13/2020, 0.50%, 11/06/2020 | | | 1.17 | |
| HSBC USA, Inc., 0.55%, 02/01/2021 | | | 1.16 | |
| Enable Midstream Partners L.P., 0.53%, 12/09/2020 | | | 1.16 | |
| Bayer US Finance II LLC, 3.88%, 12/15/2023 | | | 1.09 | |
| U.S. Treasury Bills, 0.14%, 07/15/2021 | | | 1.08 | |
| Motiva Enterprises LLC, 0.27%, 11/04/2020 | | | 1.04 | |
| Total | | | 13.26 | |
| * | Excluding money market fund holdings. |
Invesco Ultra Short Duration ETF (GSY) (continued)
Growth of a $10,000 Investment
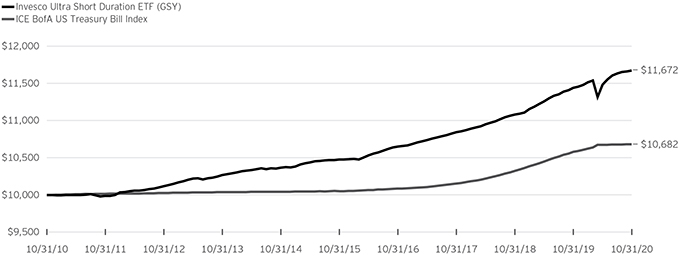
Fund Performance History as of October 31, 2020
| | | | | | | | | | | | | | | | | | | | | | | | | | | | | | | | | | | | | | | | |
| | | 1 Year | | | 3 Years Average
Annualized | | | 3 Years Cumulative | | | 5 Years Average
Annualized | | | 5 Years Cumulative | | | 10 Years Average
Annualized | | | 10 Years Cumulative | | | | | | Fund Inception | |
| Index | | | | | Average
Annualized | | | Cumulative | |
| ICE BofA US Treasury Bill Index | | | 0.99 | % | | | 1.70 | % | | | 5.20 | % | | | 1.22 | % | | | 6.28 | % | | | 0.66 | % | | | 6.82 | % | | | | | | | 0.71 | % | | | 9.42 | % |
| Fund | | | | | | | | | | | | | | | | | | | | | | | | | | | | | | | | | | | | | | | | |
| NAV Return | | | 2.01 | | | | 2.48 | | | | 7.64 | | | | 2.18 | | | | 11.38 | | | | 1.56 | | | | 16.72 | | | | | | | | 1.36 | | | | 18.71 | |
| Market Price Return | | | 2.04 | | | | 2.49 | | | | 7.67 | | | | 2.19 | | | | 11.44 | | | | 1.57 | | | | 16.85 | | | | | | | | 1.36 | | | | 18.73 | |
Guggenheim Ultra Short Duration ETF (the “Predecessor Fund”) Inception: February 12, 2008
Performance quoted above represents past performance. Past performance is not a guarantee of future results and current performance may be higher or lower than performance quoted. Investment returns and principal value will fluctuate, and shares of the Fund (“Fund Shares”), when redeemed or sold, may be worth more or less than their original cost. Fund performance reflects any applicable fee waivers and/or expense reimbursements. Had the adviser not waived fees and/or reimbursed expenses currently or in the past, returns would have been lower. See the current prospectus for more information. According to the Fund’s current prospectus, the total annual operating expense ratio was indicated as 0.23%. The Financial Highlights section of the Shareholder Report presents the expense ratios based on expenses incurred during the period covered by this report. NAV and Market Price returns assume that dividends and capital gain distributions have been reinvested in the Fund at NAV and Market Price, respectively. The returns shown in the table above do not reflect the deduction of taxes that a shareholder would pay on Fund distributions or the redemption or
sale of Fund Shares. See invesco.com/ETFs to find the most recent month-end performance numbers.
Benchmark Index performance results are based upon a hypothetical investment in their respective constituent securities. Benchmark Index returns do not represent Fund returns. An investor cannot invest directly in an index. The Benchmark Index does not charge management fees or brokerage expenses, and no such fees or expenses were deducted from the hypothetical performance shown. In addition, the results actual investors might have achieved would have differed from those shown because of differences in the timing, amounts of their investments, and fees and expenses associated with an investment in the Fund.
Notes Regarding Index and Fund Performance History:
| - | Average Annualized and Cumulative Inception returns for the Fund and Benchmark Index are based on the inception date of the Predecessor Fund. |
| - | Effective after the close of business on April 6, 2018, the Predecessor Fund was reorganized into the Fund. Fund returns shown are blended returns of the Predecessor Fund and the Fund. |
| | |
| VRIG | | Management’s Discussion of Fund Performance |
| | Invesco Variable Rate Investment Grade ETF (VRIG) |
The Invesco Variable Rate Investment Grade ETF (the “Fund”) is an actively managed exchange-traded fund (“ETF”) whose investment objectives are seeking to generate current income while maintaining low portfolio duration as a primary objective and capital appreciation as a secondary objective. The Fund seeks to achieve its investment objectives by investing, under normal market conditions, at least 80% of its net assets (plus any borrowings for investment purposes) in a portfolio of investment grade, variable rate or floating rate debt securities that are denominated in U.S. dollars and are issued by U.S. private sector entities or U.S. government agencies and instrumentalities.
Invesco Advisers, Inc., the sub-adviser to the Fund, selects the following types of securities for the Fund: (i) floating rate non-agency commercial mortgage-backed securities (“MBS”); variable rate non-agency residential MBS; variable rate agency MBS and floating rate non-agency asset-backed securities (“ABS”) (including floating rate non-agency commercial real estate collateralized loan obligations); (ii) floating rate corporate debt securities (comprised of corporate notes, bonds, debentures or privately issued securities offered pursuant to Rule 144A of the Securities Act of 1933, as amended); (iii) floating rate government sponsored enterprise credit risk transfers; (iv) floating rate U.S. Government securities (including floating rate agency debt securities); (v) variable rate preferred stock; and (vi) affiliated ETFs that invest primarily in any or all of the foregoing securities (collectively, “Variable Rate Instruments”), to the extent permitted by the Investment Company Act of 1940, as amended.
During the fiscal year ended October 31, 2020, on a market price basis, the Fund returned 1.72%. On a net asset value (“NAV”) basis, the Fund returned 1.75%. During the same time period, the Bloomberg Barclays US Floating Rate Note Index (the “Benchmark Index”) returned 1.62%.
The Fund’s outperformance relative to the Benchmark Index was driven largely by security selection within investment grade corporate bonds. The Fund’s allocation to high yield corporate bonds was also a positive contributor for the period. The Fund’s allocation to structured credit such as non-agency residential mortgage backed securities and commercial mortgage backed securities detracted from relative performance for the period.
Individual positions that contributed most significantly to the Fund’s return included the Fund’s allocation to US Treasury Bond, 0.25%, 01/31/22 (portfolio average weight of 1.6%) as well as its allocation to two agency credit risk transfer positions, Freddie Mac, Series 2017-DNA3, 2.65%, 03/25/2030 (portfolio average weight of 0.4%) and Fannie Mae Connecticut Avenue Securities, Series 2016-C04, Class 1M2, 4.40% , 01/25/2029 (portfolio average weight of 0.1%). The position that detracted most significantly from the Fund’s return was an agency credit risk transfer position, Fannie Mae Connecticut Avenue Securities,
Series 2014-C03, Class 1M2, 3.15%, 07/25/2024 (portfolio average weight of 1.2%).
| | | | |
Security Type Breakdown
(% of the Fund’s Net Assets)
as of October 31, 2020 | |
| U.S. Dollar Denominated Bonds & Notes | | | 47.78 | |
| Asset-Backed Securities | | | 17.52 | |
| Agency Credit Risk Transfer Notes | | | 15.08 | |
| U.S. Treasury Securities | | | 12.89 | |
| U.S. Government Sponsored Agency Mortgage-Backed Securities | | | 6.15 | |
| Exchange-Traded Funds | | | 0.38 | |
| Money Market Funds Plus Other Assets Less Liabilities | | | 0.20 | |
|
Top Ten Fund Holdings*
(% of the Fund’s Net Assets)
as of October 31, 2020 | |
| Security | | | | |
| U.S. Treasury Notes, 0.16%, 07/31/2022 | | | 12.89 | |
| Freddie Mac REMICs, Series 4750, Class CF, 0.50%, 01/15/2048 | | | 1.34 | |
| Invitation Homes Trust, Series 2017-SFR2, Class C, 1.60%, 12/17/2036 | | | 1.25 | |
| Freddie Mac, Series 2017-DNA3, Class M2, STACR®, 2.65%, 03/25/2030 | | | 1.22 | |
| Freddie Mac, Series 2018-HQA2, Class M2, STACR®, 2.45%, 10/25/2048 | | | 1.19 | |
| Athene Global Funding, 1.46%, 07/01/2022 | | | 1.18 | |
| Banco Santander S.A., 1.78%, 04/11/2022 | | | 1.16 | |
| Freddie Mac Multifamily Structured Pass-Through Ctfs., Series KF81, Class AS, 0.49%, 06/25/2027 | | | 1.11 | |
| CVS Health Corp., 0.96%, 03/09/2021 | | | 1.11 | |
| Sempra Energy, 0.70%, 03/15/2021 | | | 1.11 | |
| Total | | | 23.56 | |
| * | Excluding money market fund holdings. |
Invesco Variable Rate Investment Grade ETF (VRIG) (continued)
Growth of a $10,000 Investment Since Inception
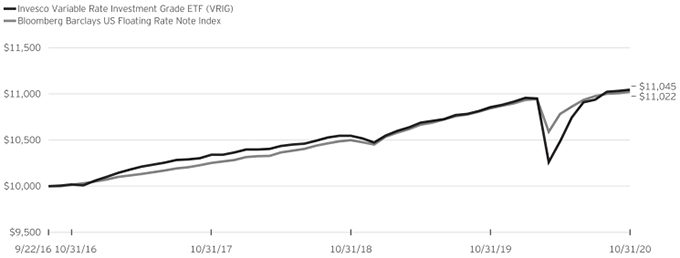
Fund Performance History as of October 31, 2020
| | | | | | | | | | | | | | | | | | | | | | | | |
| Index | | 1 Year | | | 3 Years
Average
Annualized | | | 3 Years
Cumulative | | | | | | Fund Inception | |
| | Average
Annualized | | | Cumulative | |
| Bloomberg Barclays US Floating Rate Note Index | | | 1.62 | % | | | 2.44 | % | | | 7.49 | % | | | | | | | 2.40 | % | | | 10.22 | % |
| Fund | | | | | | | | | | | | | | | | | | | | | | | | |
| NAV Return | | | 1.75 | | | | 2.23 | | | | 6.83 | | | | | | | | 2.45 | | | | 10.45 | |
| Market Price Return | | | 1.72 | | | | 2.20 | | | | 6.74 | | | | | | | | 2.40 | | | | 10.24 | |
Fund Inception: September 22, 2016
Performance quoted above represents past performance. Past performance is not a guarantee of future results and current performance may be higher or lower than performance quoted. Investment returns and principal value will fluctuate, and shares of the Fund (“Fund Shares”), when redeemed or sold, may be worth more or less than their original cost. Fund performance reflects any applicable fee waivers and/or expense reimbursements. Had the adviser not waived fees and/or reimbursed expenses currently or in the past, returns would have been lower. See the current prospectus for more information. According to the Fund’s current prospectus, the Fund’s expense ratio of 0.30% is expressed as a unitary management fee to cover operating expenses and expenses incurred in connection with managing the portfolio. NAV and Market Price returns assume that dividends and capital gain distributions have been reinvested in the Fund at NAV and Market Price, respectively. The returns shown in the table above do not reflect the deduction of taxes that a shareholder
would pay on Fund distributions or the redemption or sale of Fund Shares. See invesco.com/ETFs to find the most recent month-end performance numbers.
Benchmark Index performance results are based upon a hypothetical investment in their respective constituent securities. Benchmark Index returns do not represent Fund returns. An investor cannot invest directly in an index. The Benchmark Index does not charge management fees or brokerage expenses, and no such fees or expenses were deducted from the hypothetical performance shown. In addition, the results actual investors might have achieved would have differed from those shown because of differences in the timing, amounts of their investments, and fees and expenses associated with an investment in the Fund.
Notes Regarding Index and Fund Performance History:
| - | Average Annualized and Cumulative Inception returns for the Fund and Benchmark Index are based on the inception date of the Fund. |
Invesco Active U.S. Real Estate ETF (PSR)
October 31, 2020
Schedule of Investments(a)
| | | | | | | | | | |
| | | Shares | | Value |
| Common Stocks & Other Equity Interests-99.98% | |
Apartments-9.29% | | | | | | | | | | |
American Campus Communities, Inc. | | | | 12,204 | | | | $ | 457,162 | |
Apartment Investment & Management Co., Class A | | | | 14,846 | | | | | 473,587 | |
AvalonBay Communities, Inc. | | | | 10,906 | | | | | 1,517,352 | |
Camden Property Trust | | | | 6,977 | | | | | 643,558 | |
Equity Residential | | | | 29,611 | | | | | 1,391,125 | |
Essex Property Trust, Inc. | | | | 5,295 | | | | | 1,083,304 | |
Mid-America Apartment Communities, Inc. | | | | 8,379 | | | | | 977,243 | |
UDR, Inc. | | | | 23,296 | | | | | 727,767 | |
| | | | | | | | | | |
| | | | | | | | | 7,271,098 | |
| | | | | | | | | | |
| | |
Data Centers-11.15% | | | | | | | | | | |
CoreSite Realty Corp. | | | | 4,733 | | | | | 564,931 | |
CyrusOne, Inc. | | | | 11,932 | | | | | 847,768 | |
Digital Realty Trust, Inc. | | | | 23,479 | | | | | 3,388,020 | |
Equinix, Inc. | | | | 4,674 | | | | | 3,417,816 | |
QTS Realty Trust, Inc., Class A | | | | 8,251 | | | | | 507,519 | |
| | | | | | | | | | |
| | | | | | | | | 8,726,054 | |
| | | | | | | | | | |
| | |
Diversified-3.49% | | | | | | | | | | |
JBG SMITH Properties | | | | 13,104 | | | | | 305,978 | |
VEREIT, Inc. | | | | 103,237 | | | | | 640,070 | |
Vornado Realty Trust | | | | 19,400 | | | | | 596,162 | |
Washington REIT | | | | 13,552 | | | | | 236,889 | |
WP Carey, Inc. | | | | 15,189 | | | | | 950,983 | |
| | | | | | | | | | |
| | | | | | | | | 2,730,082 | |
| | | | | | | | | | |
| | |
Free Standing-4.15% | | | | | | | | | | |
Essential Properties Realty Trust, Inc. | | | | 12,955 | | | | | 214,017 | |
Four Corners Property Trust, Inc. | | | | 12,354 | | | | | 313,050 | |
National Retail Properties, Inc. | | | | 16,850 | | | | | 539,368 | |
Realty Income Corp. | | | | 27,699 | | | | | 1,602,664 | |
STORE Capital Corp. | | | | 22,574 | | | | | 580,152 | |
| | | | | | | | | | |
| | | | | | | | | 3,249,251 | |
| | | | | | | | | | |
| | |
Health Care-9.94% | | | | | | | | | | |
CareTrust REIT, Inc. | | | | 16,038 | | | | | 274,250 | |
Healthcare Realty Trust, Inc. | | | | 12,949 | | | | | 359,982 | |
Healthcare Trust of America, Inc., Class A | | | | 19,337 | | | | | 469,889 | |
Healthpeak Properties, Inc. | | | | 47,401 | | | | | 1,278,405 | |
Medical Properties Trust, Inc. | | | | 44,382 | | | | | 790,887 | |
Omega Healthcare Investors, Inc. | | | | 23,653 | | | | | 681,443 | |
Physicians Realty Trust | | | | 19,308 | | | | | 325,533 | |
Sabra Health Care REIT, Inc. | | | | 31,978 | | | | | 420,830 | |
Ventas, Inc. | | | | 33,433 | | | | | 1,319,601 | |
Welltower, Inc. | | | | 34,519 | | | | | 1,856,087 | |
| | | | | | | | | | |
| | | | | | | | | 7,776,907 | |
| | | | | | | | | | |
| | |
Industrial-12.23% | | | | | | | | | | |
Americold Realty Trust(b) | | | | 15,279 | | | | | 553,558 | |
Duke Realty Corp. | | | | 31,381 | | | | | 1,192,164 | |
EastGroup Properties, Inc. | | | | 3,692 | | | | | 491,331 | |
First Industrial Realty Trust, Inc. | | | | 11,869 | | | | | 472,505 | |
Prologis, Inc. | | | | 56,419 | | | | | 5,596,765 | |
Rexford Industrial Realty, Inc. | | | | 10,115 | | | | | 469,943 | |
STAG Industrial, Inc. | | | | 15,646 | | | | | 486,904 | |
Terreno Realty Corp. | | | | 5,564 | | | | | 313,142 | |
| | | | | | | | | | |
| | | | | | | | | 9,576,312 | |
| | | | | | | | | | |
| | | | | | | | | | |
| | | Shares | | Value |
Infrastructure REITs-19.48% | | | | | | | | | | |
American Tower Corp. | | | | 32,360 | | | | $ | 7,431,474 | |
Crown Castle International Corp. | | | | 31,435 | | | | | 4,910,147 | |
SBA Communications Corp., Class A | | | | 10,001 | | | | | 2,903,990 | |
| | | | | | | | | | |
| | | | | | | | | 15,245,611 | |
| | | | | | | | | | |
| | |
Lodging Resorts-1.98% | | | | | | | | | | |
Apple Hospitality REIT, Inc. | | | | 34,529 | | | | | 341,837 | |
Host Hotels & Resorts, Inc. | | | | 67,129 | | | | | 703,512 | |
RLJ Lodging Trust | | | | 30,790 | | | | | 251,862 | |
Sunstone Hotel Investors, Inc. | | | | 33,890 | | | | | 251,464 | |
| | | | | | | | | | |
| | | | | | | | | 1,548,675 | |
| | | | | | | | | | |
| | |
Manufactured Homes-2.34% | | | | | | | | | | |
Equity LifeStyle Properties, Inc. | | | | 13,430 | | | | | 794,922 | |
Sun Communities, Inc. | | | | 7,554 | | | | | 1,039,657 | |
| | | | | | | | | | |
| | | | | | | | | 1,834,579 | |
| | | | | | | | | | |
| | |
Office-6.28% | | | | | | | | | | |
Alexandria Real Estate Equities, Inc. | | | | 8,561 | | | | | 1,297,163 | |
Boston Properties, Inc. | | | | 13,510 | | | | | 978,259 | |
Brandywine Realty Trust | | | | 27,642 | | | | | 242,144 | |
Corporate Office Properties Trust | | | | 15,958 | | | | | 357,938 | |
Cousins Properties, Inc. | | | | 12,087 | | | | | 307,977 | |
Douglas Emmett, Inc. | | | | 16,431 | | | | | 387,772 | |
Highwoods Properties, Inc. | | | | 11,942 | | | | | 355,513 | |
Hudson Pacific Properties, Inc. | | | | 16,120 | | | | | 310,471 | |
Kilroy Realty Corp. | | | | 9,332 | | | | | 439,350 | |
Piedmont Office Realty Trust, Inc., Class A | | | | 21,046 | | | | | 240,345 | |
| | | | | | | | | | |
| | | | | | | | | 4,916,932 | |
| | | | | | | | | | |
| | |
Regional Malls-1.24% | | | | | | | | | | |
Simon Property Group, Inc. | | | | 15,517 | | | | | 974,623 | |
| | | | | | | | | | |
| | |
Self Storage-6.52% | | | | | | | | | | |
CubeSmart | | | | 16,123 | | | | | 547,053 | |
Extra Space Storage, Inc. | | | | 10,184 | | | | | 1,180,835 | |
Life Storage, Inc. | | | | 4,119 | | | | | 470,184 | |
National Storage Affiliates Trust | | | | 9,107 | | | | | 308,636 | |
Public Storage | | | | 11,319 | | | | | 2,592,843 | |
| | | | | | | | | | |
| | | | | | | | | 5,099,551 | |
| | | | | | | | | | |
| | |
Shopping Centers-3.37% | | | | | | | | | | |
Brixmor Property Group, Inc. | | | | 43,266 | | | | | 474,195 | |
Federal Realty Investment Trust | | | | 6,589 | | | | | 453,192 | |
Kimco Realty Corp. | | | | 51,978 | | | | | 533,294 | |
Regency Centers Corp. | | | | 16,812 | | | | | 598,339 | |
Retail Opportunity Investments Corp. | | | | 26,856 | | | | | 261,309 | |
Weingarten Realty Investors | | | | 19,901 | | | | | 315,630 | |
| | | | | | | | | | |
| | | | | | | | | 2,635,959 | |
| | | | | | | | | | |
| | |
Single Family Homes-2.48% | | | | | | | | | | |
American Homes 4 Rent, Class A | | | | 24,561 | | | | | 694,340 | |
Invitation Homes, Inc. | | | | 45,639 | | | | | 1,244,119 | |
| | | | | | | | | | |
| | | | | | | | | 1,938,459 | |
| | | | | | | | | | |
| | |
Specialty-2.96% | | | | | | | | | | |
Gaming and Leisure Properties, Inc. | | | | 20,951 | | | | | 761,569 | |
Lamar Advertising Co., Class A | | | | 8,611 | | | | | 533,538 | |
VICI Properties, Inc. | | | | 44,416 | | | | | 1,019,347 | |
| | | | | | | | | | |
| | | | | | | | | 2,314,454 | |
| | | | | | | | | | |
See accompanying Notes to Financial Statements which are an integral part of the financial statements.
Invesco Active U.S. Real Estate ETF (PSR)–(continued)
October 31, 2020
| | | | | | | | | | |
| | | Shares | | Value |
Timber REITs-3.08% | | | | | | | | | | |
PotlatchDeltic Corp. | | | | 8,385 | | | | $ | 348,397 | |
Rayonier, Inc. | | | | 12,079 | | | | | 306,565 | |
Weyerhaeuser Co. | | | | 64,438 | | | | | 1,758,513 | |
| | | | | | | | | | |
| | |
| | | | | | | | | 2,413,475 | |
| | | | | | | | | | |
| |
Total Common Stocks & Other Equity Interests
(Cost $87,111,177) | | | | | 78,252,022 | |
| | | | | | | | | | |
| | |
| Money Market Funds-0.00% | | | | | | | | | | |
Invesco Government & Agency Portfolio, Institutional Class, 0.01%(c)(d)
(Cost $185) | | | | 185 | | | | | 185 | |
| | | | | | | | | | |
| |
TOTAL INVESTMENTS IN SECURITIES
(excluding investments purchased with cash collateral from securities on loan)-99.98%
(Cost $87,111,362) | | | | | 78,252,207 | |
| | | | | | | | | | |
| | | | | | | | | | |
| | | Shares | | Value |
| Investments Purchased with Cash Collateral from Securities on Loan | | | | | | |
| Money Market Funds-0.63% | |
Invesco Private Government Fund, 0.04%(c)(d)(e) | | | | 197,061 | | | | $ | 197,061 | |
Invesco Private Prime Fund, 0.11%(c)(d)(e) | | | | 295,502 | | | | | 295,591 | |
| | | | | | | | | | |
| |
Total Investments Purchased with Cash Collateral from Securities on Loan
(Cost $492,652) | | | | | 492,652 | |
| | | | | | | | | | |
| |
TOTAL INVESTMENTS IN SECURITIES-100.61%
(Cost $87,604,014) | | | | | 78,744,859 | |
| |
OTHER ASSETS LESS LIABILITIES-(0.61)% | | | | | (475,264 | ) |
| | | | | | | | | | |
| | |
NET ASSETS-100.00% | | | | | | | | $ | 78,269,595 | |
| | | | | | | | | | |
Investment Abbreviations:
REIT-Real Estate Investment Trust
| Notes | to Schedule of Investments: |
| (a) | Property type classifications used in this report are generally according to FTSE National Association of Real Estate Investment Trusts (“NAREIT”) Equity REITs Index, which is exclusively owned by NAREIT. |
| (b) | All or a portion of this security was out on loan at October 31, 2020. |
| (c) | Affiliated issuer. The issuer and/or the Fund is a wholly-owned subsidiary of Invesco Ltd., or is affiliated by having an investment adviser that is under common control of Invesco Ltd. The table below shows the Fund’s transactions in, and earnings from, its investments in affiliates for the fiscal year ended October 31, 2020. |
| | | | | | | | | | | | | | | | | | | | | | | | | | | | | | | | | | | |
| | | Value
October 31, 2019 | | Purchases
at Cost | | Proceeds
from Sales | | Change in
Unrealized
Appreciation | | Realized
Gain
(Loss) | | Value
October 31, 2020 | | Dividend
Income |
| Investments in Affiliated Money Market Funds: | | | | | | | | | | | | | | | | | | | | | | | | | | | | | | | | | | | |
| | | | | | | |
| Invesco Government & Agency Portfolio, Institutional Class | | | $ | - | | | | $ | 987,200 | | | | $ | (987,015 | ) | | | $ | - | | | | $ | - | | | | $ | 185 | | | | $ | 1 | |
| | | | | | | |
| Invesco Premier U.S. Government Money Portfolio, Institutional Class | | | | 11,713 | | | | | 4,438,139 | | | | | (4,449,852 | ) | | | | - | | | | | - | | | | | - | | | | | 464 | |
| | | | | | | |
| Investments Purchased with Cash Collateral from Securities on Loan: | | | | | | | | | | | | | | | | | | | | | | | | | | | | | | | | | | | |
| | | | | | | |
| Invesco Government & Agency Portfolio, Institutional Class | | | | 935,723 | | | | | 11,727,641 | | | | | (12,663,364 | ) | | | | - | | | | | - | | | | | - | | | | | 2,028 | * |
| | | | | | | |
| Invesco Liquid Assets Portfolio, Institutional Class | | | | 311,908 | | | | | 2,610,152 | | | | | (2,921,834 | ) | | | | - | | | | | (226 | ) | | | | - | | | | | 824 | * |
| | | | | | | |
| Invesco Private Government Fund | | | | - | | | | | 3,086,261 | | | | | (2,889,200 | ) | | | | - | | | | | - | | | | | 197,061 | | | | | 12 | * |
| | | | | | | |
| Invesco Private Prime Fund | | | | - | | | | | 304,803 | | | | | (9,212 | ) | | | | - | | | | | - | | | | | 295,591 | | | | | 13 | * |
| | | | | | | | | | | | | | | | | | | | | | | | | | | | | | | | | | | |
| | | | | | | |
| Total | | | $ | 1,259,344 | | | | $ | 23,154,196 | | | | $ | (23,920,477 | ) | | | $ | - | | | | $ | (226 | ) | | | $ | 492,837 | | | | $ | 3,342 | |
| | | | | | | | | | | | | | | | | | | | | | | | | | | | | | | | | | | |
| * | Represents the income earned on the investment of cash collateral, which is included in securities lending income on the Statement of Operations. Does not include rebates and fees paid to lending agent or premiums received from borrowers, if any. |
| (d) | The rate shown is the 7-day SEC standardized yield as of October 31, 2020. |
| (e) | The security has been segregated to satisfy the commitment to return the cash collateral received in securities lending transactions upon the borrower’s return of the securities loaned. See Note 2N. |
See accompanying Notes to Financial Statements which are an integral part of the financial statements.
Invesco Balanced Multi-Asset Allocation ETF (PSMB)
October 31, 2020
Schedule of Investments
Schedule of Investments in Affiliated Issuers- 104.81%(a)
| | | | | | | | | | | | | | | | | | | | | | | | | | | | | | | | | | | | | | | | | | | | | |
| | | % of | | | | | | | | Change in | | | | | | | | |
| | | Net | | | | | | | | Unrealized | | Realized | | | | | | |
| | | Assets | | Value | | Purchases | | Proceeds | | Appreciation | | Gain | | Dividend | | Shares | | Value |
| | | 10/31/20 | | 10/31/19 | | at Cost | | from Sales | | (Depreciation) | | (Loss) | | Income | | 10/31/20 | | 10/31/20 |
Domestic Equity Funds-50.97% | | | | | | | | | | | | | | | | | | | | | | | | | | | | | | | | | | | | | | | | | | | | | |
Invesco Preferred ETF | | | | 2.85% | | | | $ | - | | | | $ | 229,800 | | | | $ | (1,726 | ) | | | $ | 4,614 | | | | $ | 44 | | | | $ | 3,743 | | | | | 15,897 | | | | $ | 232,732 | |
Invesco RAFI™ Strategic US ETF | | | | 8.73% | | | | | 596,435 | | | | | 568,543 | | | | | (453,379 | ) | | | | 26,412 | | | | | (25,573 | ) | | | | 15,054 | | | | | 27,017 | | | | | 712,438 | |
Invesco RAFI™ Strategic US Small Company ETF | | | | 7.74% | | | | | 319,581 | | | | | 397,871 | | | | | (106,110 | ) | | | | 33,427 | | | | | (13,573 | ) | | | | 5,012 | | | | | 27,892 | | | | | 631,196 | |
Invesco Russell 1000 Dynamic Multifactor ETF(b) | | | | 9.43% | | | | | - | | | | | 761,284 | | | | | (26,543 | ) | | | | 34,211 | | | | | 241 | | | | | 4,498 | | | | | 24,481 | | | | | 769,193 | |
Invesco S&P 500® Low Volatility ETF | | | | 5.85% | | | | | 319,168 | | | | | 351,961 | | | | | (160,262 | ) | | | | (12,538 | ) | | | | (20,902 | ) | | | | 9,743 | | | | | 9,176 | | | | | 477,427 | |
Invesco S&P 500® Pure Growth ETF | | | | 8.93% | | | | | 506,192 | | | | | 519,952 | | | | | (402,563 | ) | | | | 110,985 | | | | | (5,906 | ) | | | | 4,327 | | | | | 5,235 | | | | | 728,660 | |
Invesco S&P MidCap Low Volatility ETF | | | | 3.95% | | | | | 91,816 | | | | | 269,538 | | | | | (16,002 | ) | | | | (20,088 | ) | | | | (3,369 | ) | | | | 3,875 | | | | | 7,736 | | | | | 321,895 | |
Invesco S&P SmallCap Low Volatility ETF | | | | 3.49% | | | | | - | | | | | 288,049 | | | | | (7,605 | ) | | | | 4,281 | | | | | 222 | | | | | 1,584 | | | | | 8,408 | | | | | 284,947 | |
| | | | | | | | | | | | | | | | | | | | | | | | | | | | | | | | | | | | | | | | | | | | | |
Total Domestic Equity Funds | | | | | | | | | 1,833,192 | | | | | 3,386,998 | | | | | (1,174,190 | ) | | | | 181,304 | | | | | (68,816 | ) | | | | 47,836 | | | | | | | | | | 4,158,488 | |
| | | | | | | | | | | | | | | | | | | | | | | | | | | | | | | | | | | | | | | | | | | | | |
Fixed Income Funds-38.31% | | | | | | | | | | | | | | | | | | | | | | | | | | | | | | | | | | | | | | | | | | | | | |
Invesco 1-30 Laddered Treasury ETF | | | | 6.13% | | | | | - | | | | | 512,973 | | | | | - | | | | | (12,854 | ) | | | | - | | | | | 1,021 | | | | | 13,007 | | | | | 500,119 | |
Invesco Corporate Income Defensive ETF | | | | - | | | | | 122,030 | | | | | 43,237 | | | | | (165,391 | ) | | | | (212 | ) | | | | 857 | | | | | 1,388 | | | | | - | | | | | - | |
Invesco Corporate Income Value ETF | | | | - | | | | | 69,225 | | | | | 24,801 | | | | | (95,294 | ) | | | | 802 | | | | | 466 | | | | | 1,136 | | | | | - | | | | | - | |
Invesco Emerging Markets Sovereign Debt ETF | | | | - | | | | | 159,979 | | | | | 126,777 | | | | | (269,351 | ) | | | | 916 | | | | | (18,321 | ) | | | | 6,742 | | | | | - | | | | | - | |
Invesco Fundamental High Yield® Corporate Bond ETF | | | | 2.25% | | | | | - | | | | | 370,484 | | | | | (172,455 | ) | | | | (1,667 | ) | | | | (12,401 | ) | | | | 6,701 | | | | | 9,917 | | | | | 183,961 | |
Invesco Investment Grade Defensive ETF | | | | 7.96% | | | | | 257,289 | | | | | 472,189 | | | | | (85,368 | ) | | | | 9,340 | | | | | (3,788 | ) | | | | 7,298 | | | | | 23,789 | | | | | 649,440 | |
Invesco Investment Grade Value ETF | | | | 4.32% | | | | | 144,080 | | | | | 234,172 | | | | | (28,396 | ) | | | | 5,851 | | | | | (2,560 | ) | | | | 5,680 | | | | | 12,537 | | | | | 352,301 | |
Invesco PureBetaSM 0-5 Yr US TIPS ETF | | | | 2.59% | | | | | - | | | | | 210,586 | | | | | (1,856 | ) | | | | 2,222 | | | | | (4 | ) | | | | 664 | | | | | 8,192 | | | | | 210,948 | |
Invesco Senior Loan ETF | | | | - | | | | | 79,914 | | | | | 59,014 | | | | | (132,846 | ) | | | | 1,965 | | | | | (8,047 | ) | | | | 2,659 | | | | | - | | | | | - | |
Invesco Taxable Municipal Bond ETF(b) | | | | 5.21% | | | | | 282,660 | | | | | 295,768 | | | | | (149,569 | ) | | | | 4,876 | | | | | (8,795 | ) | | | | 11,539 | | | | | 13,055 | | | | | 424,940 | |
Invesco Variable Rate Investment Grade ETF | | | | 9.85% | | | | | 574,643 | | | | | 634,444 | | | | | (390,349 | ) | | | | 6,978 | | | | | (21,669 | ) | | | | 13,398 | | | | | 32,317 | | | | | 804,047 | |
| | | | | | | | | | | | | | | | | | | | | | | | | | | | | | | | | | | | | | | | | | | | | |
Total Fixed Income Funds | | | | | | | | | 1,689,820 | | | | | 2,984,445 | | | | | (1,490,875 | ) | | | | 18,217 | | | | | (74,262 | ) | | | | 58,226 | | | | | | | | | | 3,125,756 | |
| | | | | | | | | | | | | | | | | | | | | | | | | | | | | | | | | | | | | | | | | | | | | |
Foreign Equity Funds-10.70% | | | | | | | | | | | | | | | | | | | | | | | | | | | | | | | | | | | | | | | | | | | | | |
Invesco RAFI™ Strategic Developed ex-US ETF | | | | 4.00% | | | | | 338,025 | | | | | 351,644 | | | | | (305,625 | ) | | | | (12,960 | ) | | | | (44,800 | ) | | | | 10,383 | | | | | 15,176 | | | | | 326,284 | |
Invesco RAFI™ Strategic Emerging Markets ETF | | | | 2.00% | | | | | 89,460 | | | | | 113,601 | | | | | (25,671 | ) | | | | (10,426 | ) | | | | (3,512 | ) | | | | 4,022 | | | | | 7,226 | | | | | 163,452 | |
Invesco S&P Emerging Markets Low Volatility ETF | | | | - | | | | | 50,608 | | | | | 41,827 | | | | | (81,407 | ) | | | | 85 | | | | | (11,113 | ) | | | | 1,577 | | | | | - | | | | | - | |
Invesco S&P International Developed Low Volatility ETF(b) | | | | 4.70% | | | | | 243,857 | | | | | 280,377 | | | | | (73,499 | ) | | | | (49,920 | ) | | | | (17,291 | ) | | | | 14,801 | | | | | 13,987 | | | | | 383,524 | |
| | | | | | | | | | | | | | | | | | | | | | | | | | | | | | | | | | | | | | | | | | | | | |
Total Foreign Equity Funds | | | | | | | | | 721,950 | | | | | 787,449 | | | | | (486,202 | ) | | | | (73,221 | ) | | | | (76,716 | ) | | | | 30,783 | | | | | | | | | | 873,260 | |
| | | | | | | | | | | | | | | | | | | | | | | | | | | | | | | | | | | | | | | | | | | | | |
See accompanying Notes to Financial Statements which are an integral part of the financial statements.
Invesco Balanced Multi-Asset Allocation ETF (PSMB)–(continued)
October 31, 2020
Schedule of Investments in Affiliated Issuers- 104.81%(a)
| | | | | | | | | | | | | | | | | | | | | | | | | | | | | | | | | | | | | | | | | | | | | |
| | | % of | | | | | | | | Change in | | | | | | | | |
| | | Net | | | | | | | | Unrealized | | Realized | | | | | | |
| | | Assets | | Value | | Purchases | | Proceeds | | Appreciation | | Gain | | Dividend | | Shares | | Value |
| | | 10/31/20 | | 10/31/19 | | at Cost | | from Sales | | (Depreciation) | | (Loss) | | Income | | 10/31/20 | | 10/31/20 |
Money Market Funds-0.00% | | | | | | | | | | | | | | | | | | | | | | | | | | | | | | | | | | | | | | | | | | | | | |
Invesco Government & Agency Portfolio, Institutional Class, 0.01%(c) | | | | - | | | | $ | - | | | | $ | 11,036 | | | | $ | (11,036 | ) | | | $ | - | | | | $ | - | | | | $ | - | | | | | - | | | | $ | - | |
Invesco Premier U.S. Government Money Portfolio, Institutional Class, 0.01%(c) | | | | - | | | | | 1,464 | | | | | 193,329 | | | | | (194,793 | ) | | | | - | | | | | - | | | | | 45 | | | | | - | | | | | - | |
| | | | | | | | | | | | | | | | | | | | | | | | | | | | | | | | | | | | | | | | | | | | | |
| Total Money Market Funds | | | | | | | | | 1,464 | | | | | 204,365 | | | | | (205,829 | ) | | | | – | | | | | - | | | | | 45 | | | | | | | | | | - | |
| | | | | | | | | | | | | | | | | | | | | | | | | | | | | | | | | | | | | | | | | | | | | |
TOTAL INVESTMENTS IN AFFILIATED ISSUERS (excluding investments purchased with cash collateral from securities on loan)-99.98%
(Cost $7,996,559) | | | | 99.98% | | | | | 4,246,426 | | | | | 7,363,257 | | | | | (3,357,096 | ) | | | | 126,300 | | | | | (219,794 | ) | | | | 136,890 | | | | | | | | | | 8,157,504 | |
| | | | | | | | | | | | | | | | | | | | | | | | | | | | | | | | | | | | | | | | | | | | | |
| | | | | | | | | |
| Investments Purchased with Cash Collateral from Securities on Loan | | | | | | | | | | | | | | | | | | | | | | | | | | | | | | | | | | | | | | | | | | | | | |
| | | | | | | | | |
Money Market Funds-4.83% | | | | | | | | | | | | | | | | | | | | | | | | | | | | | | | | | | | | | | | | | | | | | |
| | | | | | | | | |
Invesco Government & Agency Portfolio, Institutional Class, 0.01%(c) | | | | - | | | | | 917,158 | | | | | 6,769,761 | | | | | (7,686,919 | ) | | | | - | | | | | - | | | | | 3,624 | * | | | | - | | | | | - | |
| | | | | | | | | |
Invesco Liquid Assets Portfolio, Institutional Class, 0.10%(c) | | | | - | | | | | 305,719 | | | | | 1,851,282 | | | | | (2,156,871 | ) | | | | (9 | ) | | | | (121 | ) | | | | 1,380 | * | | | | - | | | | | - | |
| | | | | | | | | |
Invesco Private Government Fund, 0.04%(c)(d) | | | | 1.93% | | | | | - | | | | | 8,337,474 | | | | | (8,179,783 | ) | | | | - | | | | | - | | | | | 103 | * | | | | 157,691 | | | | | 157,691 | |
| | | | | | | | | |
Invesco Private Prime Fund,
0.11%(c)(d) | | | | 2.90% | | | | | - | | | | | 2,845,111 | | | | | (2,608,595 | ) | | | | - | | | | | 21 | | | | | 103 | * | | | | 236,466 | | | | | 236,537 | |
| | | | | | | | | | | | | | | | | | | | | | | | | | | | | | | | | | | | | | | | | | | | | |
| | | | | | | | | |
Total Investments Purchased with Cash Collateral from Securities on Loan (Cost $394,228) | | | | 4.83% | | | | | 1,222,877 | | | | | 19,803,628 | | | | | (20,632,168 | ) | | | | (9 | ) | | | | (100 | ) | | | | 5,210 | | | | | | | | | | 394,228 | |
| | | | | | | | | | | | | | | | | | | | | | | | | | | | | | | | | | | | | | | | | | | | | |
| | | | | | | | | |
TOTAL INVESTMENTS IN AFFILIATED ISSUERS (Cost $8,390,787) | | | | 104.81% | | | | $ | 5,469,303 | | | | $ | 27,166,885 | | | | $ | (23,989,264 | ) | | | $ | 126,291 | | | | $ | (219,894 | )(e) | | | $ | 142,100 | | | | | | | | | $ | 8,551,732 | |
| | | | | | | | | | | | | | | | | | | | | | | | | | | | | | | | | | | | | | | | | | | | | |
| | | | | | | | | |
OTHER ASSETS LESS LIABILITIES | | | | (4.81)% | | | | | | | | | | | | | | | | | | | | | | | | | | | | | | | | | | | | | | | | (392,694 | ) |
| | | | | | | | | | | | | | | | | | | | | | | | | | | | | | | | | | | | | | | | | | | | | |
| | | | | | | | | |
NET ASSETS | | | | 100.00% | | | | | | | | | | | | | | | | | | | | | | | | | | | | | | | | | | | | | | | $ | 8,159,038 | |
| | | | | | | | | | | | | | | | | | | | | | | | | | | | | | | | | | | | | | | | | | | | | |
Investment Abbreviations:
ETF-Exchange-Traded Fund
See accompanying Notes to Financial Statements which are an integral part of the financial statements.
Invesco Balanced Multi-Asset Allocation ETF (PSMB)–(continued)
October 31, 2020
Notes to Schedule of Investments:
| (a) | Each underlying fund and the Fund are affiliated by either having the same investment adviser or an investment adviser under common control with the Fund’s investment adviser. |
| (b) | All or a portion of this security was out on loan at October 31, 2020. |
| (c) | The rate shown is the 7-day SEC standardized yield as of October 31, 2020. |
| (d) | The security has been segregated to satisfy the commitment to return the cash collateral received in securities lending transactions upon the borrower’s return of the securities loaned. See Note 2N. |
| (e) | Includes capital gains distributions from affiliated underlying funds as follows: |
| | | | |
| Fund Name | | Capital Gain | |
| |
Invesco Corporate Income Defensive ETF | | | $521 | |
| |
Invesco Investment Grade Defensive ETF | | | 222 | |
| |
Invesco Investment Grade Value ETF | | | 846 | |
| * | Represents the income earned on the investment of cash collateral, which is included in securities lending income on the Statement of Operations. Does not include rebates and fees paid to lending agent or premiums received from borrowers, if any. |
See accompanying Notes to Financial Statements which are an integral part of the financial statements.
Invesco Conservative Multi-Asset Allocation ETF (PSMC)
October 31, 2020
Schedule of Investments
Schedule of Investments in Affiliated Issuers- 114.64%(a)
| | | | | | | | | | | | | | | | | | | | | | | | | | | | | | | | | | | | | | | | | | | | | |
| | | % of | | | | | | | | Change in | | | | | | | | |
| | | Net | | | | | | | | Unrealized | | Realized | | | | | | |
| | | Assets | | Value | | Purchases | | Proceeds | | Appreciation | | Gain | | Dividend | | Shares | | Value |
| | | 10/31/20 | | 10/31/19 | | at Cost | | from Sales | | (Depreciation) | | (Loss) | | Income | | 10/31/20 | | 10/31/20 |
Domestic Equity Funds-23.39% | | | | | | | | | | | | | | | | | | | | | | | | | | | | | | | | | | | | | | | | | | | | | |
Invesco Preferred ETF | | | | 6.11% | | | | $ | 302,057 | | | | $ | 427,965 | | | | $ | (256,581 | ) | | | $ | (6,156 | ) | | | $ | 3,186 | | | | $ | 21,394 | | | | | 32,136 | | | | $ | 470,471 | |
Invesco RAFI™ Strategic US ETF | | | | 4.77% | | | | | 268,579 | | | | | 391,902 | | | | | (299,711 | ) | | | | 1,490 | | | | | 4,995 | | | | | 7,508 | | | | | 13,927 | | | | | 367,255 | |
Invesco Russell 1000 Dynamic Multifactor ETF(b) | | | | 4.39% | | | | | - | | | | | 400,413 | | | | | (77,209 | ) | | | | 12,402 | | | | | 2,473 | | | | | 2,000 | | | | | 10,760 | | | | | 338,079 | |
Invesco S&P 500® Low Volatility ETF | | | | 2.40% | | | | | 130,799 | | | | | 198,326 | | | | | (134,448 | ) | | | | (6,912 | ) | | | | (3,163 | ) | | | | 4,100 | | | | | 3,548 | | | | | 184,602 | |
Invesco S&P 500® Pure Growth ETF | | | | 5.72% | | | | | 230,813 | | | | | 367,056 | | | | | (222,575 | ) | | | | 39,438 | | | | | 26,222 | | | | | 2,195 | | | | | 3,168 | | | | | 440,954 | |
| | | | | | | | | | | | | | | | | | | | | | | | | | | | | | | | | | | | | | | | | | | | | |
Total Domestic Equity Funds | | | | | | | | | 932,248 | | | | | 1,785,662 | | | | | (990,524 | ) | | | | 40,262 | | | | | 33,713 | | | | | 37,197 | | | | | | | | | | 1,801,361 | |
| | | | | | | | | | | | | | | | | | | | | | | | | | | | | | | | | | | | | | | | | | | | | |
Fixed Income Funds-74.66% | | | | | | | | | | | | | | | | | | | | | | | | | | | | | | | | | | | | | | | | | | | | | |
Invesco 1-30 Laddered Treasury ETF | | | | 3.51% | | | | | - | | | | | 322,128 | | | | | (46,100 | ) | | | | (6,414 | ) | | | | 1,074 | | | | | 565 | | | | | 7,040 | | | | | 270,688 | |
Invesco Corporate Income Defensive ETF | | | | - | | | | | 213,772 | | | | | 71,803 | | | | | (285,972 | ) | | | | (2,249 | ) | | | | 3,547 | | | | | 2,410 | | | | | - | | | | | - | |
Invesco Corporate Income Value ETF | | | | - | | | | | 120,127 | | | | | 40,869 | | | | | (163,214 | ) | | | | 1,638 | | | | | 580 | | | | | 1,954 | | | | | - | | | | | - | |
Invesco Emerging Markets Sovereign Debt ETF(b) | | | | 7.66% | | | | | 227,496 | | | | | 514,457 | | | | | (134,819 | ) | | | | (28,287 | ) | | | | 10,807 | | | | | 17,680 | | | | | 22,002 | | | | | 589,654 | |
Invesco Fundamental High Yield® Corporate Bond ETF | | | | 7.76% | | | | | - | | | | | 795,428 | | | | | (182,723 | ) | | | | (15,563 | ) | | | | 279 | | | | | 16,074 | | | | | 32,206 | | | | | 597,421 | |
Invesco Investment Grade Defensive ETF | | | | 13.00% | | | | | 389,648 | | | | | 847,688 | | | | | (247,994 | ) | | | | 4,266 | | | | | 8,470 | | | | | 11,514 | | | | | 36,694 | | | | | 1,001,746 | |
Invesco Investment Grade Value ETF | | | | 6.97% | | | | | 219,220 | | | | | 417,045 | | | | | (109,704 | ) | | | | 3,270 | | | | | 8,475 | | | | | 8,963 | | | | | 19,111 | | | | | 537,036 | |
Invesco PureBetaSM 0-5 Yr US TIPS ETF | | | | 4.57% | | | | | 282,889 | | | | | 387,139 | | | | | (327,517 | ) | | | | 7,743 | | | | | 2,064 | | | | | 2,692 | | | | | 13,682 | | | | | 352,318 | |
Invesco Senior Loan ETF(b) | | | | 6.25% | | | | | 303,073 | | | | | 427,174 | | | | | (228,940 | ) | | | | (11,651 | ) | | | | (8,464 | ) | | | | 15,112 | | | | | 22,381 | | | | | 481,192 | |
Invesco Taxable Municipal Bond ETF | | | | 8.63% | | | | | 274,870 | | | | | 530,550 | | | | | (144,123 | ) | | | | (6,964 | ) | | | | 10,566 | | | | | 13,833 | | | | | 20,427 | | | | | 664,899 | |
Invesco Variable Rate Investment Grade ETF | | | | 16.31% | | | | | 784,587 | | | | | 1,097,554 | | | | | (615,637 | ) | | | | 3,676 | | | | | (13,665 | ) | | | | 19,331 | | | | | 50,503 | | | | | 1,256,515 | |
| | | | | | | | | | | | | | | | | | | | | | | | | | | | | | | | | | | | | | | | | | | | | |
Total Fixed Income Funds | | | | | | | | | 2,815,682 | | | | | 5,451,835 | | | | | (2,486,743 | ) | | | | (50,535 | ) | | | | 23,733 | | | | | 110,128 | | | | | | | | | | 5,751,469 | |
| | | | | | | | | | | | | | | | | | | | | | | | | | | | | | | | | | | | | | | | | | | | | |
Foreign Equity Funds-1.94% | | | | | | | | | | | | | | | | | | | | | | | | | | | | | | | | | | | | | | | | | | | | | |
Invesco RAFI™ Strategic Developed ex-US ETF | | | | 0.96% | | | | | 78,550 | | | | | 117,284 | | | | | (109,783 | ) | | | | (2,670 | ) | | | | (9,529 | ) | | | | 2,580 | | | | | 3,435 | | | | | 73,852 | |
Invesco S&P International Developed Low Volatility ETF | | | | 0.98% | | | | | 78,370 | | | | | 110,148 | | | | | (93,108 | ) | | | | (10,002 | ) | | | | (9,701 | ) | | | | 4,597 | | | | | 2,761 | | | | | 75,707 | |
| | | | | | | | | | | | | | | | | | | | | | | | | | | | | | | | | | | | | | | | | | | | | |
Total Foreign Equity Funds | | | | | | | | | 156,920 | | | | | 227,432 | | | | | (202,891 | ) | | | | (12,672 | ) | | | | (19,230 | ) | | | | 7,177 | | | | | | | | | | 149,559 | |
| | | | | | | | | | | | | | | | | | | | | | | | | | | | | | | | | | | | | | | | | | | | | |
Money Market Funds-0.00% | | | | | | | | | | | | | | | | | | | | | | | | | | | | | | | | | | | | | | | | | | | | | |
Invesco Government & Agency Portfolio, Institutional Class, 0.01%(c) | | | | - | | | | | - | | | | | 16,314 | | | | | (16,314 | ) | | | | - | | | | | - | | | | | - | | | | | - | | | | | - | |
Invesco Premier U.S. Government Money Portfolio, Institutional Class, 0.01%(c) | | | | - | | | | | 1,785 | | | | | 175,862 | | | | | (177,647 | ) | | | | - | | | | | - | | | | | 40 | | | | | - | | | | | - | |
| | | | | | | | | | | | | | | | | | | | | | | | | | | | | | | | | | | | | | | | | | | | | |
Total Money Market Funds | | | | | | | | | 1,785 | | | | | 192,176 | | | | | (193,961 | ) | | | | - | | | | | - | | | | | 40 | | | | | | | | | | - | |
| | | | | | | | | | | | | | | | | | | | | | | | | | | | | | | | | | | | | | | | | | | | | |
TOTAL INVESTMENTS IN AFFILIATED ISSUERS (excluding investments purchased with cash collateral from securities on loan)-99.99%
(Cost $7,641,473) | | | | 99.99% | | | | | 3,906,635 | | | | | 7,657,105 | | | | | (3,874,119 | ) | | | | (22,945 | ) | | | | 38,216 | | | | | 154,542 | | | | | | | | | | 7,702,389 | |
| | | | | | | | | | | | | | | | | | | | | | | | | | | | | | | | | | | | | | | | | | | | | |
See accompanying Notes to Financial Statements which are an integral part of the financial statements.
Invesco Conservative Multi-Asset Allocation ETF (PSMC)–(continued)
October 31, 2020
Schedule of Investments in Affiliated Issuers- 114.64%(a)
| | | | | | | | | | | | | | | | | | | | | | | | | | | | | | | | | | | | | | | | | | | | | |
| | | % of | | | | | | | | Change in | | | | | | | | |
| | | Net | | | | | | | | Unrealized | | Realized | | | | | | |
| | | Assets | | Value | | Purchases | | Proceeds | | Appreciation | | Gain | | Dividend | | Shares | | Value |
| | | 10/31/20 | | 10/31/19 | | at Cost | | from Sales | | (Depreciation) | | (Loss) | | Income | | 10/31/20 | | 10/31/20 |
| Investments Purchased with Cash Collateral from Securities on Loan | | | | | | | | | | | | | | | | | | | | | | | | | | | | | | | | | | | | | | | | | | | | | |
Money Market Funds-14.65% | | | | | | | | | | | | | | | | | | | | | | | | | | | | | | | | | | | | | | | | | | | | | |
Invesco Government & Agency Portfolio, Institutional Class, 0.01%(c) | | | | - | | | | $ | 817,399 | | | | $ | 7,593,858 | | | | $ | (8,411,257 | ) | | | $ | - | | | | $ | - | | | | $ | 3,529 | * | | | | - | | | | $ | - | |
Invesco Liquid Assets Portfolio, Institutional Class,
0.10%(c) | | | | - | | | | | 272,126 | | | | | 2,194,007 | | | | | (2,466,029 | ) | | | | - | | | | | (104 | ) | | | | 1,358 | * | | | | - | | | | | - | |
Invesco Private Government Fund, 0.04%(c)(d) | | | | 5.60% | | | | | - | | | | | 7,243,250 | | | | | (6,812,039 | ) | | | | - | | | | | - | | | | | 136 | * | | | | 431,211 | | | | | 431,211 | |
Invesco Private Prime Fund,
0.11%(c)(d) | | | | 9.05% | | | | | - | | | | | 2,423,096 | | | | | (1,725,875 | ) | | | | - | | | | | 92 | | | | | 136 | * | | | | 697,104 | | | | | 697,313 | |
| | | | | | | | | | | | | | | | | | | | | | | | | | | | | | | | | | | | | | | | | | | | | |
Total Investments Purchased with Cash Collateral from Securities on Loan (Cost $1,128,524) | | | | 14.65% | | | | | 1,089,525 | | | | | 19,454,211 | | | | | (19,415,200 | ) | | | | - | | | | | (12 | ) | | | | 5,159 | | | | | | | | | | 1,128,524 | |
| | | | | | | | | | | | | | | | | | | | | | | | | | | | | | | | | | | | | | | | | | | | | |
TOTAL INVESTMENTS IN AFFILIATED ISSUERS
(Cost $8,769,997) | | | | 114.64% | | | | $ | 4,996,160 | | | | $ | 27,111,316 | | | | $ | (23,289,319 | ) | | | $ | (22,945 | ) | | | $ | 38,204(e) | | | | $ | 159,701 | | | | | | | | | $ | 8,830,913 | |
| | | | | | | | | | | | | | | | | | | | | | | | | | | | | | | | | | | | | | | | | | | | | |
OTHER ASSETS LESS LIABILITIES | | | | (14.64)% | | | | | | | | | | | | | | | | | | | | | | | | | | | | | | | | | | | | | | | | (1,127,769 | ) |
| | | | | | | | | | | | | | | | | | | | | | | | | | | | | | | | | | | | | | | | | | | | | |
NET ASSETS | | | | 100.00% | | | | | | | | | | | | | | | | | | | | | | | | | | | | | | | | | | | | | | | $ | 7,703,144 | |
| | | | | | | | | | | | | | | | | | | | | | | | | | | | | | | | | | | | | | | | | | | | | |
Investment Abbreviations:
ETF-Exchange-Traded Fund
Notes to Schedule of Investments:
| (a) | Each underlying fund and the Fund are affiliated by either having the same investment adviser or an investment adviser under common control with the Fund’s investment adviser. |
| (b) | All or a portion of this security was out on loan at October 31, 2020. |
| (c) | The rate shown is the 7-day SEC standardized yield as of October 31, 2020. |
| (d) | The security has been segregated to satisfy the commitment to return the cash collateral received in securities lending transactions upon the borrower’s return of the securities loaned. See Note 2N. |
| (e) | Includes capital gains distributions from affiliated underlying funds as follows: |
| | | | |
| Fund Name | | Capital Gain | |
| |
Invesco Corporate Income Defensive ETF | | | $ 901 | |
| |
Invesco Investment Grade Defensive ETF | | | 332 | |
| |
Invesco Investment Grade Value ETF | | | 1,270 | |
| * | Represents the income earned on the investment of cash collateral, which is included in securities lending income on the Statement of Operations. Does not include rebates and fees paid to lending agent or premiums received from borrowers, if any. |
See accompanying Notes to Financial Statements which are an integral part of the financial statements.
Invesco Growth Multi-Asset Allocation ETF (PSMG)
October 31, 2020
Schedule of Investments
Schedule of Investments in Affiliated Issuers- 103.89%(a)
| | | | | | | | | | | | | | | | | | | | | | | | | | | | | | | | | | | | |
| | | % of | | | | | | | | | | | | Change in | | | | | | | | | | | | | |
| | | Net | | | | | | | | | | | | Unrealized | | | Realized | | | | | | | | | | |
| | | Assets | | | Value | | | Purchases | | | Proceeds | | | Appreciation | | | Gain | | | Dividend | | | Shares | | | Value | |
| | | 10/31/20 | | | 10/31/19 | | | at Cost | | | from Sales | | | (Depreciation) | | | (Loss) | | | Income | | | 10/31/20 | | | 10/31/20 | |
Domestic Equity Funds-63.18% | | | | | | | | | | | | | | | | | | | | | | | | | | | | | | | | | | | | |
Invesco RAFI™ Strategic US ETF | | | 11.26% | | | $ | 729,711 | | | $ | 999,366 | | | $ | (1,128,533 | ) | | $ | (10,679 | ) | | $ | 42,488 | | | $ | 19,837 | | | | 23,980 | | | $ | 632,353 | |
Invesco RAFI™ Strategic US Small Company ETF | | | 9.76% | | | | 363,625 | | | | 609,152 | | | | (457,796 | ) | | | 24,420 | | | | 8,675 | | | | 6,178 | | | | 24,219 | | | | 548,076 | |
Invesco Russell 1000 Dynamic Multifactor ETF | | | 12.52% | | | | - | | | | 686,240 | | | | (18,404 | ) | | | 34,671 | | | | 515 | | | | 4,094 | | | | 22,375 | | | | 703,022 | |
Invesco S&P 500® Low Volatility ETF | | | 7.87% | | | | 421,930 | | | | 629,890 | | | | (568,719 | ) | | | (94,625 | ) | | | 53,727 | | | | 11,781 | | | | 8,499 | | | | 442,203 | |
Invesco S&P 500® Pure Growth ETF | | | 11.26% | | | | 667,177 | | | | 932,590 | | | | (1,110,979 | ) | | | 87,009 | | | | 56,822 | | | | 6,653 | | | | 4,545 | | | | 632,619 | |
Invesco S&P MidCap Low Volatility ETF | | | 4.97% | | | | 97,150 | | | | 313,631 | | | | (109,200 | ) | | | (31,516 | ) | | | 9,429 | | | | 4,342 | | | | 6,717 | | | | 279,494 | |
Invesco S&P SmallCap Low Volatility ETF | | | 5.54% | | | | 146,684 | | | | 370,946 | | | | (156,321 | ) | | | (58,904 | ) | | | 8,603 | | | | 7,223 | | | | 9,177 | | | | 311,008 | |
| | | | | | | | | | | | | | | | | | | | | | | | | | | | | | | | | | | | |
Total Domestic Equity Funds | | | | | | | 2,426,277 | | | | 4,541,815 | | | | (3,549,952 | ) | | | (49,624 | ) | | | 180,259 | | | | 60,108 | | | | | | | | 3,548,775 | |
| | | | | | | | | | | | | | | | | | | | | | | | | | | | | | | | | | | | |
Fixed Income Funds-20.77% | | | | | | | | | | | | | | | | | | | | | | | | | | | | | | | | | | | | |
Invesco 1-30 Laddered Treasury ETF(b) | | | 2.06% | | | | - | | | | 118,452 | | | | - | | | | (2,640 | ) | | | - | | | | 244 | | | | 3,012 | | | | 115,812 | |
Invesco Emerging Markets Sovereign Debt ETF | | | - | | | | 78,387 | | | | 120,530 | | | | (190,678 | ) | | | (3,968 | ) | | | (4,271 | ) | | | 3,327 | | | | - | | | | - | |
Invesco Investment Grade Defensive ETF | | | 6.78% | | | | 176,715 | | | | 449,704 | | | | (247,679 | ) | | | 1,775 | | | | 626 | | | | 4,831 | | | | 13,950 | | | | 380,835 | |
Invesco Investment Grade Value ETF | | | 3.63% | | | | 98,627 | | | | 229,527 | | | | (123,972 | ) | | | (1,073 | ) | | | 1,982 | | | | 3,713 | | | | 7,257 | | | | 203,928 | |
Invesco PureBetaSM 0-5 Yr US TIPS ETF | | | 2.09% | | | | - | | | | 117,053 | | | | (1,160 | ) | | | 1,325 | | | | (2 | ) | | | 368 | | | | 4,552 | | | | 117,216 | |
Invesco Taxable Municipal Bond ETF | | | 4.12% | | | | 197,840 | | | | 307,550 | | | | (265,429 | ) | | | (7,895 | ) | | | (538 | ) | | | 7,699 | | | | 7,113 | | | | 231,528 | |
Invesco Variable Rate Investment Grade ETF | | | 2.09% | | | | 323,422 | | | | 509,807 | | | | (702,620 | ) | | | 2,673 | | | | (15,699 | ) | | | 6,941 | | | | 4,726 | | | | 117,583 | |
| | | | | | | | | | | | | | | | | | | | | | | | | | | | | | | | | | | | |
Total Fixed Income Funds | | | | | | | 874,991 | | | | 1,852,623 | | | | (1,531,538 | ) | | | (9,803 | ) | | | (17,902 | ) | | | 27,123 | | | | | | | | 1,166,902 | |
| | | | | | | | | | | | | | | | | | | | | | | | | | | | | | | | | | | | |
Foreign Equity Funds-16.03% | | | | | | | | | | | | | | | | | | | | | | | | | | | | | | | | | | | | |
Invesco RAFI™ Strategic Developed ex-US ETF | | | 5.61% | | | | 499,175 | | | | 745,990 | | | | (874,814 | ) | | | (25,403 | ) | | | (29,844 | ) | | | 16,380 | | | | 14,656 | | | | 315,104 | |
Invesco RAFI™ Strategic Emerging Markets ETF | | | 2.02% | | | | 154,229 | | | | 243,911 | | | | (275,316 | ) | | | 467 | | | | (9,761 | ) | | | 4,664 | | | | 5,019 | | | | 113,530 | |
Invesco S&P Emerging Markets Low Volatility ETF | | | 1.54% | | | | 87,246 | | | | 135,700 | | | | (123,265 | ) | | | (7,761 | ) | | | (5,791 | ) | | | 3,992 | | | | 4,339 | | | | 86,129 | |
Invesco S&P International Developed Low Volatility ETF(b) | | | 6.86% | | | | 357,558 | | | | 568,060 | | | | (441,409 | ) | | | (103,891 | ) | | | 5,125 | | | | 30,363 | | | | 14,057 | | | | 385,443 | |
| | | | | | | | | | | | | | | | | | | | | | | | | | | | | | | | | | | | |
Total Foreign Equity Funds | | | | | | | 1,098,208 | | | | 1,693,661 | | | | (1,714,804 | ) | | | (136,588 | ) | | | (40,271 | ) | | | 55,399 | | | | | | | | 900,206 | |
| | | | | | | | | | | | | | | | | | | | | | | | | | | | | | | | | | | | |
Money Market Funds-0.00% | | | | | | | | | | | | | | | | | | | | | | | | | | | | | | | | | | | | |
Invesco Government & Agency Portfolio, Institutional Class, 0.01%(c) | | | - | | | | - | | | | 11,191 | | | | (11,191 | ) | | | - | | | | - | | | | - | | | | - | | | | - | |
Invesco Premier U.S. Government Money Portfolio, Institutional Class, 0.01%(c) | | | - | | | | 1,261 | | | | 185,770 | | | | (187,031 | ) | | | - | | | | - | | | | 42 | | | | - | | | | - | |
| | | | | | | | | | | | | | | | | | | | | | | | | | | | | | | | | | | | |
Total Money Market Funds | | | | | | | 1,261 | | | | 196,961 | | | | (198,222 | ) | | | - | | | | - | | | | 42 | | | | | | | | - | |
| | | | | | | | | | | | | | | | | | | | | | | | | | | | | | | | | | | | |
TOTAL INVESTMENTS IN AFFILIATED ISSUERS
(excluding investments purchased with cash collateral from securities on loan)-99.98%
(Cost $5,665,715) | | | 99.98% | | | | 4,400,737 | | | | 8,285,060 | | | | (6,994,516 | ) | | | (196,015 | ) | | | 122,086 | | | | 142,672 | | | | | | | | 5,615,883 | |
| | | | | | | | | | | | | | | | | | | | | | | | | | | | | | | | | | | | |
See accompanying Notes to Financial Statements which are an integral part of the financial statements.
Invesco Growth Multi-Asset Allocation ETF (PSMG)–(continued)
October 31, 2020
Schedule of Investments in Affiliated Issuers- 103.89%(a)
| | | | | | | | | | | | | | | | | | | | | | | | | | | | | | | | | | | | | | | | | | | | | |
| | | % of | | | | | | | | Change in | | | | | | | | |
| | | Net | | | | | | | | Unrealized | | Realized | | | | | | |
| | | Assets | | Value | | Purchases | | Proceeds | | Appreciation | | Gain | | Dividend | | Shares | | Value |
| | | 10/31/20 | | 10/31/19 | | at Cost | | from Sales | | (Depreciation) | | (Loss) | | Income | | 10/31/20 | | 10/31/20 |
| Investments Purchased with Cash Collateral from Securities on Loan | | | | | | | | | | | | | | | | | | | | | | | | | | | | | | | | | | | | | | | | | | | | | |
Money Market Funds-3.91% | | | | | | | | | | | | | | | | | | | | | | | | | | | | | | | | | | | | | | | | | | | | | |
Invesco Government & Agency Portfolio, Institutional Class, 0.01%(c) | | | | - | | | | $ | 726,652 | | | | $ | 6,247,865 | | | | $ | (6,974,517 | ) | | | $ | - | | | | $ | - | | | | $ | 3,938 | * | | | | - | | | | $ | - | |
Invesco Liquid Assets Portfolio, Institutional Class, 0.10%(c) | | | | - | | | | | 241,033 | | | | | 1,703,219 | | | | | (1,944,133 | ) | | | | - | | | | | (119 | ) | | | | 1,510 | * | | | | - | | | | | - | |
Invesco Private Government Fund, 0.04%(c)(d) | | | | 1.56% | | | | | - | | | | | 7,215,334 | | | | | (7,127,476 | ) | | | | - | | | | | - | | | | | 67 | * | | | | 87,858 | | | | | 87,858 | |
Invesco Private Prime Fund,
0.11%(c)(d) | | | | 2.35% | | | | | - | | | | | 2,531,969 | | | | | (2,400,216 | ) | | | | - | | | | | 34 | | | | | 69 | * | | | | 131,747 | | | | | 131,787 | |
| | | | | | | | | | | | | | | | | | | | | | | | | | | | | | | | | | | | | | | | | | | | | |
Total Investments Purchased with Cash Collateral from Securities on Loan (Cost $219,645) | | | | 3.91% | | | | | 967,685 | | | | | 17,698,387 | | | | | (18,446,342 | ) | | | | - | | | | | (85 | ) | | | | 5,584 | | | | | | | | | | 219,645 | |
| | | | | | | | | | | | | | | | | | | | | | | | | | | | | | | | | | | | | | | | | | | | | |
TOTAL INVESTMENTS IN AFFILIATED ISSUERS
(Cost $5,885,360) | | | | 103.89% | | | | $ | 5,368,422 | | | | $ | 25,983,447 | | | | $ | (25,440,858 | ) | | | $ | (196,015 | ) | | | $ | 122,001(e) | | | | $ | 148,256 | | | | | | | | | $ | 5,835,528 | |
| | | | | | | | | | | | | | | | | | | | | | | | | | | | | | | | | | | | | | | | | | | | | |
OTHER ASSETS LESS LIABILITIES | | | | (3.89)% | | | | | | | | | | | | | | | | | | | | | | | | | | | | | | | | | | | | | | | | (218,557 | ) |
| | | | | | | | | | | | | | | | | | | | | | | | | | | | | | | | | | | | | | | | | | | | | |
NET ASSETS | | | | 100.00% | | | | | | | | | | | | | | | | | | | | | | | | | | | | | | | | | | | | | | | $ | 5,616,971 | |
| | | | | | | | | | | | | | | | | | | | | | | | | | | | | | | | | | | | | | | | | | | | | |
Investment Abbreviations:
ETF-Exchange-Traded Fund
Notes to Schedule of Investments:
| (a) | Each underlying fund and the Fund are affiliated by either having the same investment adviser or an investment adviser under common control with the Fund’s investment adviser. |
| (b) | All or a portion of this security was out on loan at October 31, 2020. |
| (c) | The rate shown is the 7-day SEC standardized yield as of October 31, 2020. |
| (d) | The security has been segregated to satisfy the commitment to return the cash collateral received in securities lending transactions upon the borrower’s return of the securities loaned. See Note 2N. |
| (e) | Includes capital gains distributions from affiliated underlying funds as follows: |
| | | | | |
| Fund Name | | Capital Gain |
| |
Invesco Investment Grade Defensive ETF | | | | $ 306 | |
| |
Invesco Investment Grade Value ETF | | | | 1,163 | |
| * | Represents the income earned on the investment of cash collateral, which is included in securities lending income on the Statement of Operations. Does not include rebates and fees paid to lending agent or premiums received from borrowers, if any. |
See accompanying Notes to Financial Statements which are an integral part of the financial statements.
Invesco Moderately Conservative Multi-Asset Allocation ETF (PSMM)
October 31, 2020
Schedule of Investments
Schedule of Investments in Affiliated Issuers- 107.15%(a)
| | | | | | | | | | | | | | | | | | | | | | | | | | | | | | | | | | | | |
| | | % of | | | | | | | | | | | | Change in | | | | | | | | | | | | | |
| | | Net | | | | | | | | | | | | Unrealized | | | Realized | | | | | | | | | | |
| | | Assets | | | Value | | | Purchases | | | Proceeds | | | Appreciation | | | Gain | | | Dividend | | | Shares | | | Value | |
| | | 10/31/20 | | | 10/31/19 | | | at Cost | | | from Sales | | | (Depreciation) | | | (Loss) | | | Income | | | 10/31/20 | | | 10/31/20 | |
Domestic Equity Funds-37.21% | | | | | | | | | | | | | | | | | | | | | | | | | | | | | | | | | | | | |
Invesco Preferred ETF | | | 4.04% | | | $ | 316,662 | | | $ | 247,672 | | | $ | (399,619 | ) | | $ | (18,074 | ) | | $ | 16,288 | | | $ | 16,026 | | | | 11,129 | | | $ | 162,929 | |
Invesco RAFI™ Strategic US ETF | | | 5.77% | | | | 542,907 | | | | 417,634 | | | | (769,207 | ) | | | (11,636 | ) | | | 53,070 | | | | 10,473 | | | | 8,827 | | | | 232,768 | |
Invesco RAFI™ Strategic US Small Company ETF | | | 4.41% | | | | 208,100 | | | | 237,798 | | | | (294,345 | ) | | | (8,603 | ) | | | 34,922 | | | | 2,513 | | | | 7,860 | | | | 177,872 | |
Invesco Russell 1000 Dynamic Multifactor ETF(b) | | | 6.40% | | | | - | | | | 425,722 | | | | (192,246 | ) | | | 12,743 | | | | 11,708 | | | | 1,522 | | | | 8,209 | | | | 257,927 | |
Invesco S&P 500® Low Volatility ETF(b) | | | 3.48% | | | | 289,059 | | | | 238,981 | | | | (381,655 | ) | | | (43,155 | ) | | | 37,147 | | | | 6,704 | | | | 2,698 | | | | 140,377 | |
Invesco S&P 500® Pure Growth ETF | | | 7.51% | | | | 500,710 | | | | 409,236 | | | | (735,342 | ) | | | 34,896 | | | | 93,238 | | | | 3,676 | | | | 2,175 | | | | 302,738 | |
Invesco S&P MidCap Low Volatility ETF | | | 2.93% | | | | 125,106 | | | | 167,826 | | | | (159,539 | ) | | | (32,516 | ) | | | 17,420 | | | | 3,519 | | | | 2,843 | | | | 118,297 | |
Invesco S&P SmallCap Low Volatility
ETF(b) | | | 2.67% | | | | - | | | | 180,114 | | | | (80,527 | ) | | | 2,114 | | | | 6,001 | | | | 604 | | | | 3,178 | | | | 107,702 | |
| | | | | | | | | | | | | | | | | | | | | | | | | | | | | | | | | | | | |
Total Domestic Equity Funds | | | | | | | 1,982,544 | | | | 2,324,983 | | | | (3,012,480 | ) | | | (64,231 | ) | | | 269,794 | | | | 45,037 | | | | | | | | 1,500,610 | |
| | | | | | | | | | | | | | | | | | | | | | | | | | | | | | | | | | | | |
Fixed Income Funds-57.10% | | | | | | | | | | | | | | | | | | | | | | | | | | | | | | | | | | | | |
Invesco 1-30 Laddered Treasury ETF(b) | | | 5.06% | | | | - | | | | 341,790 | | | | (135,868 | ) | | | (4,648 | ) | | | 2,972 | | | | 503 | | | | 5,312 | | | | 204,246 | |
Invesco Corporate Income Defensive ETF | | | - | | | | 243,853 | | | | 127,148 | | | | (371,737 | ) | | | (3,140 | ) | | | 5,427 | | | | 3,737 | | | | - | | | | - | |
Invesco Corporate Income Value ETF | | | - | | | | 136,588 | | | | 71,423 | | | | (211,836 | ) | | | 1,199 | | | | 2,626 | | | | 3,032 | | | | - | | | | - | |
Invesco Emerging Markets Sovereign Debt ETF(b) | | | 4.21% | | | | 318,005 | | | | 265,294 | | | | (402,898 | ) | | | (32,318 | ) | | | 21,775 | | | | 15,184 | | | | 6,338 | | | | 169,858 | |
Invesco Fundamental High Yield® Corporate Bond ETF | | | 3.76% | | | | - | | | | 649,931 | | | | (482,346 | ) | | | (5,901 | ) | | | (10,075 | ) | | | 8,687 | | | | 8,173 | | | | 151,609 | |
Invesco Investment Grade Defensive ETF | | | 11.79% | | | | 406,532 | | | | 660,936 | | | | (603,611 | ) | | | (8,935 | ) | | | 20,920 | | | | 9,221 | | | | 17,411 | | | | 475,320 | |
Invesco Investment Grade Value ETF | | | 6.32% | | | | 231,806 | | | | 324,220 | | | | (311,720 | ) | | | (5,657 | ) | | | 18,223 | | | | 7,118 | | | | 9,069 | | | | 254,847 | |
Invesco PureBetaSM 0-5 Yr US TIPS ETF | | | 4.10% | | | | 310,802 | | | | 266,291 | | | | (420,094 | ) | | | 1,627 | | | | 6,770 | | | | 2,877 | | | | 6,423 | | | | 165,396 | |
Invesco Senior Loan ETF(b) | | | 1.83% | | | | 238,285 | | | | 166,441 | | | | (321,122 | ) | | | 603 | | | | (10,419 | ) | | | 8,595 | | | | 3,432 | | | | 73,788 | |
Invesco Taxable Municipal Bond ETF | | | 7.69% | | | | 401,345 | | | | 356,606 | | | | (458,106 | ) | | | (14,914 | ) | | | 25,401 | | | | 14,092 | | | | 9,534 | | | | 310,332 | |
Invesco Variable Rate Investment Grade ETF | | | 12.34% | | | | 693,407 | | | | 617,523 | | | | (803,474 | ) | | | (1,639 | ) | | | (8,092 | ) | | | 15,057 | | | | 20,005 | | | | 497,725 | |
| | | | | | | | | | | | | | | | | | | | | | | | | | | | | | | | | | | | |
Total Fixed Income Funds | | | | | | | 2,980,623 | | | | 3,847,603 | | | | (4,522,812 | ) | | | (73,723 | ) | | | 75,528 | | | | 88,103 | | | | | | | | 2,303,121 | |
| | | | | | | | | | | | | | | | | | | | | | | | | | | | | | | | | | | | |
Foreign Equity Funds-5.68% | | | | | | | | | | | | | | | | | | | | | | | | | | | | | | | | | | | | |
Invesco RAFI™ Strategic Developed ex-US ETF | | | 2.71% | | | | 276,875 | | | | 228,316 | | | | (377,936 | ) | | | (21,914 | ) | | | 3,858 | | | | 6,673 | | | | 5,079 | | | | 109,199 | |
Invesco S&P International Developed Low Volatility ETF | | | 2.97% | | | | 276,180 | | | | 224,423 | | | | (331,050 | ) | | | (45,721 | ) | | | (3,870 | ) | | | 16,738 | | | | 4,375 | | | | 119,962 | |
| | | | | | | | | | | | | | | | | | | | | | | | | | | | | | | | | | | | |
Total Foreign Equity Funds | | | | | | | 553,055 | | | | 452,739 | | | | (708,986 | ) | | | (67,635 | ) | | | (12 | ) | | | 23,411 | | | | | | | | 229,161 | |
| | | | | | | | | | | | | | | | | | | | | | | | | | | | | | | | | | | | |
See accompanying Notes to Financial Statements which are an integral part of the financial statements.
Invesco Moderately Conservative Multi-Asset Allocation ETF (PSMM)–(continued)
October 31, 2020
Schedule of Investments in Affiliated Issuers- 107.15%(a)
| | | | | | | | | | | | | | | | | | | | | | | | | | | | | | | | | | | | |
| | | % of | | | | | | | | | | | | Change in | | | | | | | | | | | | | |
| | | Net | | | | | | | | | | | | Unrealized | | | Realized | | | | | | | | | | |
| | | Assets | | | Value | | | Purchases | | | Proceeds | | | Appreciation | | | Gain | | | Dividend | | | Shares | | | Value | |
| | | 10/31/20 | | | 10/31/19 | | | at Cost | | | from Sales | | | (Depreciation) | | | (Loss) | | | Income | | | 10/31/20 | | | 10/31/20 | |
Money Market Funds-0.00% | | | | | | | | | | | | | | | | | | | | | | | | | | | | | | | | | | | | |
Invesco Government & Agency Portfolio, Institutional Class,
0.01%(c) | | | - | | | $ | - | | | $ | 18,950 | | | $ | (18,892 | ) | | $ | - | | | $ | - | | | $ | - | | | | 58 | | | $ | 58 | |
Invesco Premier U.S. Government Money Portfolio, Institutional Class, 0.01%(c) | | | - | | | | 1,103 | | | | 248,594 | | | | (249,697 | ) | | | - | | | | - | | | | 56 | | | | - | | | | - | |
| | | | | | | | | | | | | | | | | | | | | | | | | | | | | | | | | | | | |
Total Money Market Funds | | | | | | | 1,103 | | | | 267,544 | | | | (268,589 | ) | | | - | | | | - | | | | 56 | | | | | | | | 58 | |
| | | | | | | | | | | | | | | | | | | | | | | | | | | | | | | | | | | | |
TOTAL INVESTMENTS IN AFFILIATED ISSUERS (excluding investments purchased with cash collateral from securities on loan)-99.99% (Cost $4,054,426) | | | 99.99% | | | | 5,517,325 | | | | 6,892,869 | | | | (8,512,867 | ) | | | (205,589 | ) | | | 345,310 | | | | 156,607 | | | | | | | | 4,032,950 | |
| | | | | | | | | | | | | | | | | | | | | | | | | | | | | | | | | | | | |
| | | | | | | | | |
| Investments Purchased with Cash Collateral from Securities on Loan | | | | | | | | | | | | | | | | | | | | | | | | | | | | | | | | | | | | |
Money Market Funds-7.16% | | | | | | | | | | | | | | | | | | | | | | | | | | | | | | | | | | | | |
Invesco Government & Agency Portfolio, Institutional Class,
0.01%(c) | | | - | | | | 786,816 | | | | 8,696,441 | | | | (9,483,257 | ) | | | - | | | | - | | | | 5,356 | * | | | - | | | | - | |
Invesco Liquid Assets Portfolio, Institutional Class, 0.10%(c) | | | - | | | | 262,272 | | | | 2,697,499 | | | | (2,959,737 | ) | | | - | | | | (34 | ) | | | 2,062 | * | | | - | | | | - | |
Invesco Private Government Fund, 0.04%(c)(d) | | | 2.22% | | | | - | | | | 5,806,467 | | | | (5,716,870 | ) | | | - | | | | - | | | | 70 | * | | | 89,597 | | | | 89,597 | |
Invesco Private Prime Fund,
0.11%(c)(d) | | | 4.94% | | | | - | | | | 1,852,792 | | | | (1,653,692 | ) | | | - | | | | (1 | ) | | | 62 | * | | | 199,040 | | | | 199,099 | |
| | | | | | | | | | | | | | | | | | | | | | | | | | | | | | | | | | | | |
Total Investments Purchased with Cash Collateral from Securities on Loan (Cost $288,696) | | | 7.16% | | | | 1,049,088 | | | | 19,053,199 | | | | (19,813,556 | ) | | | - | | | | (35 | ) | | | 7,550 | | | | | | | | 288,696 | |
| | | | | | | | | | | | | | | | | | | | | | | | | | | | | | | | | | | | |
TOTAL INVESTMENTS IN AFFILIATED ISSUERS (Cost $4,343,122) | | | 107.15% | | | $ | 6,566,413 | | | $ | 25,946,068 | | | $ | (28,326,423 | ) | | $ | (205,589 | ) | | $ | 345,275(e) | | | $ | 164,157 | | | | | | | $ | 4,321,646 | |
| | | | | | | | | | | | | | | | | | | | | | | | | | | | | | | | | | | | |
OTHER ASSETS LESS LIABILITIES | | | (7.15)% | | | | | | | | | | | | | | | | | | | | | | | | | | | | | | | | (288,430 | ) |
| | | | | | | | | | | | | | | | | | | | | | | | | | | | | | | | | | | | |
NET ASSETS | | | 100.00% | | | | | | | | | | | | | | | | | | | | | | | | | | | | | | | $ | 4,033,216 | |
| | | | | | | | | | | | | | | | | | | | | | | | | | | | | | | | | | | | |
Investment Abbreviations:
ETF-Exchange-Traded Fund
Notes to Schedule of Investments:
| (a) | Each underlying fund and the Fund are affiliated by either having the same investment adviser or an investment adviser under common control with the Fund’s investment adviser. |
| (b) | All or a portion of this security was out on loan at October 31, 2020. |
| (c) | The rate shown is the 7-day SEC standardized yield as of October 31, 2020. |
| (d) | The security has been segregated to satisfy the commitment to return the cash collateral received in securities lending transactions upon the borrower’s return of the securities loaned. See Note 2N. |
| (e) | Includes capital gains distributions from affiliated underlying funds as follows: |
| | | | | |
| Fund Name | | Capital Gain |
| |
Invesco Corporate Income Defensive ETF | | | $ | 1,551 | |
| |
Invesco Investment Grade Defensive ETF | | | | 522 | |
| |
Invesco Investment Grade Value ETF | | | | 2,025 | |
See accompanying Notes to Financial Statements which are an integral part of the financial statements.
Invesco Moderately Conservative Multi-Asset Allocation ETF (PSMM)–(continued)
October 31, 2020
| * | Represents the income earned on the investment of cash collateral, which is included in securities lending income on the Statement of Operations. Does not include rebates and fees paid to lending agent or premiums received from borrowers, if any. |
See accompanying Notes to Financial Statements which are an integral part of the financial statements.
Invesco S&P 500® Downside Hedged ETF (PHDG)
October 31, 2020
Schedule of Investments(a)
| | | | | | | | |
| | | Shares | | | Value | |
| Common Stocks & Other Equity Interests-0.00% | |
Financials-0.00% | | | | | | | | |
Invesco Ltd., (Acquired 02/03/2014; | | | | | | | | |
Cost $14,674)(b)(c) | | | | | | | | |
(Cost $14,674) | | | 460 | | | $ | 6,031 | |
| | | | | | | | |
| | |
| Money Market Funds-30.28% | | | | | | | | |
Invesco Government & Agency Portfolio, Institutional Class, 0.01%(b)(d)
(Cost $43,312,656) | | | 43,312,656 | | | | 43,312,656 | |
| | | | | | | | |
TOTAL INVESTMENTS IN SECURITIES-30.28%
(Cost $43,327,330) | | | | | | | 43,318,687 | |
OTHER ASSETS LESS
LIABILITIES-69.72% | | | | | | | 99,723,597 | |
| | | | | | | | |
NET ASSETS-100.00% | | | | | | $ | 143,042,284 | |
| | | | | | | | |
Notes to Schedule of Investments:
| (a) | Industry and/or sector classifications used in this report are generally according to the Global Industry Classification Standard, which was developed by and is the exclusive property and a service mark of MSCI Inc. and Standard & Poor’s. |
| (b) | Affiliated issuer. The issuer and/or the Fund is a wholly-owned subsidiary of Invesco Ltd., or is affiliated by having an investment adviser that is under common control of Invesco Ltd. The table below shows the Fund’s transactions in, and earnings from, its investments in affiliates for the fiscal year ended October 31, 2020. |
| | | | | | | | | | | | | | | | | | | | | | | | | | | | | | | | | | | |
| | | | | | | | | Change in | | | | | | |
| | | | | | | | | Unrealized | | Realized | | | | |
| | | Value | | Purchases | | Proceeds | | Appreciation | | Gain | | Value | | Dividend |
| | | October 31, 2019 | | at Cost | | from Sales | | (Depreciation) | | (Loss) | | October 31, 2020 | | Income |
| Invesco Ltd. | | | $ | 7,737 | | | | $ | - | | | | $ | - | | | | $ | (1,706 | ) | | | $ | - | | | | $ | 6,031 | | | | $ | 428 | |
| | | | | | | |
Investments in Affiliated Money
Market Funds: | | | | | | | | | | | | | | | | | | | | | | | | | | | | | | | | | | | |
| | | | | | | |
| Invesco Government & Agency Portfolio, Institutional Class | | | | - | | | | | 217,845,872 | | | | | (174,533,216 | ) | | | | - | | | | | - | | | | | 43,312,656 | | | | | 625 | |
| | | | | | | |
| Invesco Premier U.S. Government Money Portfolio, Institutional Class | | | | 1,833,025 | | | | | 225,446,269 | | | | | (227,279,294 | ) | | | | - | | | | | - | | | | | - | | | | | 21,545 | |
| | | | | | | |
| Investments Purchased with Cash Collateral from Securities on Loan: | | | | | | | | | | | | | | | | | | | | | | | | | | | | | | | | | | | |
| | | | | | | |
| Invesco Government & Agency Portfolio, Institutional Class | | | | 9,056 | | | | | 348,207 | | | | | (357,263 | ) | | | | - | | | | | - | | | | | - | | | | | 114 | * |
| | | | | | | |
| Invesco Liquid Assets Portfolio, Institutional Class | | | | 3,106 | | | | | 69,316 | | | | | (72,414 | ) | | | | - | | | | | (8 | ) | | | | - | | | | | 44 | * |
| | | | | | | |
| Invesco Private Government Fund | | | | - | | | | | 552,425 | | | | | (552,425 | ) | | | | - | | | | | - | | | | | - | | | | | 6 | * |
| | | | | | | |
| Invesco Private Prime Fund | | | | - | | | | | 152,042 | | | | | (152,044 | ) | | | | - | | | | | 2 | | | | | - | | | | | 6 | * |
| | | | | | | | | | | | | | | | | | | | | | | | | | | | | | | | | | | |
Total | | | $ | 1,852,924 | | | | $ | 444,414,131 | | | | $ | (402,946,656 | ) | | | $ | (1,706 | ) | | | $ | (6 | ) | | | $ | 43,318,687 | | | | $ | 22,768 | |
| | | | | | | | | | | | | | | | | | | | | | | | | | | | | | | | | | | |
| * | Represents the income earned on the investment of cash collateral, which is included in securities lending income on the Statement of Operations. Does not include rebates and fees paid to lending agent or premiums received from borrowers, if any. |
| (c) | Restricted security. The value of this security at October 31, 2020 represented less than 1% of the Fund’s Net Assets. |
| (d) | The rate shown is the 7-day SEC standardized yield as of October 31, 2020. |
See accompanying Notes to Financial Statements which are an integral part of the financial statements.
Invesco Total Return Bond ETF (GTO)
October 31, 2020
Schedule of Investments(a)
| | | | | | | | |
| | | Principal
Amount | | | Value | |
| U.S. Dollar Denominated Bonds & Notes-41.73% | |
Advertising-0.36% | |
Interpublic Group of Cos., Inc. (The), 4.75%, 03/30/2030 | | $ | 660,000 | | | $ | 795,604 | |
Lamar Media Corp.,
3.75%, 02/15/2028 . | | | 612,000 | | | | 610,675 | |
MDC Partners, Inc.,
6.50%, 05/01/2024(b) | | | 250,000 | | | | 239,582 | |
| | | | | | | | |
| | | | | | | 1,645,861 | |
| | | | | | | | |
|
Aerospace & Defense-0.51% | |
Boeing Co. (The) | | | | | | | | |
2.75%, 02/01/2026 | | | 1,758,000 | | | | 1,759,468 | |
3.63%, 02/01/2031 | | | 623,000 | | | | 622,478 | |
| | | | | | | | |
| | | | | | | 2,381,946 | |
| | | | | | | | |
|
Airlines-1.45% | |
American Airlines Pass-Through Trust, Series 2019-1, Class B, 3.85%, 02/15/2028 | | | 241,562 | | | | 152,277 | |
British Airways Pass-Through Trust (United Kingdom) | | | | | | | | |
Series 2019-1, Class A, 3.35%, 06/15/2029(b) | | | 315,119 | | | | 264,418 | |
Series 2019-1, Class AA, 3.30%, 12/15/2032(b) | | | 301,329 | | | | 281,723 | |
Delta Air Lines Pass-Through Trust, Series 2020-1, Class AA, 2.00%, 06/10/2028 | | | 1,398,000 | | | | 1,362,951 | |
Delta Air Lines, Inc./SkyMiles IP Ltd. | | | | | | | | |
4.50%, 10/20/2025(b) | | | 1,978,000 | | | | 2,009,217 | |
4.75%, 10/20/2028(b) | | | 1,181,000 | | | | 1,208,935 | |
United Airlines Pass-Through Trust, Series 2020-1 Class A, 5.88%, 10/15/2027 | | | 1,422,000 | | | | 1,430,102 | |
| | | | | | | | |
| | | | | | | 6,709,623 | |
| | | | | | | | |
| | |
Apparel Retail-0.90% | | | | | | | | |
Ross Stores, Inc. | | | | | | | | |
3.38%, 09/15/2024 | | | 1,471,000 | | | | 1,576,535 | |
4.60%, 04/15/2025 | | | 593,000 | | | | 685,356 | |
0.88%, 04/15/2026 | | | 1,121,000 | | | | 1,112,891 | |
4.70%, 04/15/2027 | | | 90,000 | | | | 105,751 | |
1.88%, 04/15/2031 | | | 712,000 | | | | 706,287 | |
| | | | | | | | |
| | | | | | | 4,186,820 | |
| | | | | | | | |
|
Asset Management & Custody Banks-0.64% | |
Ameriprise Financial, Inc.,
3.00%, 04/02/2025 | | | 450,000 | | | | 487,994 | |
Apollo Management Holdings L.P., 4.95%, 01/14/2050(b)(c) | | | 1,921,000 | | | | 1,923,947 | |
Bank of New York Mellon Corp. (The), Series G, 4.70%(c)(d) | | | 523,000 | | | | 560,918 | |
| | | | | | | | |
| | | | | | | 2,972,859 | |
| | | | | | | | |
|
Automobile Manufacturers-1.91% | |
Ford Motor Credit Co. LLC,
3.09%, 01/09/2023 | | | 1,446,000 | | | | 1,434,251 | |
| | | | | | | | |
| | | Principal
Amount | | | Value | |
Automobile Manufacturers-(continued) | |
Hyundai Capital America | | | | | | | | |
2.38%, 02/10/2023(b) | | $ | 361,000 | | | $ | 371,577 | |
5.75%, 04/06/2023(b) | | | 604,000 | | | | 669,927 | |
5.88%, 04/07/2025(b) | | | 334,000 | | | | 389,303 | |
Nissan Motor Co. Ltd. (Japan) | |
3.52%, 09/17/2025(b) | | | 1,309,000 | | | | 1,319,893 | |
4.35%, 09/17/2027(b) | | | 1,713,000 | | | | 1,720,807 | |
Toyota Motor Credit Corp.,
0.80%, 10/16/2025 | | | 2,927,000 | | | | 2,925,456 | |
| | | | | | | | |
| | | | | | | 8,831,214 | |
| | | | | | | | |
|
Automotive Retail-0.16% | |
Asbury Automotive Group, Inc. | |
4.50%, 03/01/2028(b) | | | 356,000 | | | | 362,898 | |
4.75%, 03/01/2030(b) | | | 356,000 | | | | 368,015 | |
| | | | | | | | |
| | | | | | | 730,913 | |
| | | | | | | | |
| | |
Biotechnology-0.29% | | | | | | | | |
AbbVie, Inc., 2.30%, 11/21/2022(b) | | | 1,317,000 | | | | 1,365,164 | |
| | | | | | | | |
| | |
Brewers-0.14% | | | | | | | | |
Anheuser-Busch InBev Worldwide, Inc. (Belgium) | | | | | | | | |
3.50%, 06/01/2030 | | | 251,000 | | | | 284,629 | |
4.50%, 06/01/2050 | | | 320,000 | | | | 379,318 | |
| | | | | | | | |
| | | | | | | 663,947 | |
| | | | | | | | |
| | |
Broadcasting-0.56% | | | | | | | | |
Discovery Communications LLC, 4.00%, 09/15/2055(b) | | | 2,015,000 | | | | 2,051,805 | |
Fox Corp. | | | | | | | | |
4.71%, 01/25/2029 | | | 330,000 | | | | 392,637 | |
3.50%, 04/08/2030 | | | 150,000 | | | | 168,234 | |
| | | | | | | | |
| | | | | | | 2,612,676 | |
| | | | | | | | |
| | |
Building Products-0.68% | | | | | | | | |
Carrier Global Corp. | | | | | | | | |
2.24%, 02/15/2025(b) | | | 1,026,000 | | | | 1,071,075 | |
2.72%, 02/15/2030(b) | | | 1,160,000 | | | | 1,212,653 | |
HP Communities LLC | | | | | | | | |
5.78%, 03/15/2046(b) | | | 150,000 | | | | 187,724 | |
5.86%, 09/15/2053(b) | | | 100,000 | | | | 133,253 | |
Standard Industries, Inc., 3.38%, 01/15/2031(b) | | | 543,000 | | | | 529,199 | |
| | | | | | | | |
| | | | | | | 3,133,904 | |
| | | | | | | | |
| | |
Cable & Satellite-1.14% | | | | | | | | |
CCO Holdings LLC/CCO Holdings Capital Corp. | | | | | | | | |
4.25%, 02/01/2031(b) | | | 193,000 | | | | 198,026 | |
4.50%, 05/01/2032(b) | | | 940,000 | | | | 972,900 | |
Charter Communications Operating LLC/ Charter Communications Operating Capital Corp.,
5.05%, 03/30/2029 | | | 343,000 | | | | 409,430 | |
See accompanying Notes to Financial Statements which are an integral part of the financial statements.
Invesco Total Return Bond ETF (GTO)–(continued)
October 31, 2020
| | | | | | | | |
| | | Principal
Amount | | | Value | |
Cable & Satellite-(continued) | |
Comcast Corp. | | | | | | | | |
3.95%, 10/15/2025 | | $ | 45,000 | | | $ | 51,596 | |
4.15%, 10/15/2028 | | | 220,000 | | | | 261,901 | |
4.60%, 10/15/2038 | | | 67,000 | | | | 85,495 | |
3.25%, 11/01/2039 | | | 1,129,000 | | | | 1,256,999 | |
3.45%, 02/01/2050 | | | 903,000 | | | | 1,009,869 | |
2.80%, 01/15/2051 | | | 434,000 | | | | 429,881 | |
4.95%, 10/15/2058 | | | 68,000 | | | | 98,341 | |
Cox Communications, Inc. | | | | | | | | |
1.80%, 10/01/2030(b) | | | 205,000 | | | | 201,356 | |
2.95%, 10/01/2050(b) | | | 326,000 | | | | 316,343 | |
| | | | | | | | |
| | | | | | | 5,292,137 | |
| | | | | | | | |
| | |
Casinos & Gaming-0.05% | | | | | | | | |
MGM China Holdings Ltd. (Macau), 5.38%, 05/15/2024(b) | | | 218,000 | | | | 218,503 | |
| | | | | | | | |
|
Construction & Engineering-0.09% | |
Shea Homes L.P./Shea Homes Funding Corp., 4.75%, 02/15/2028(b) | | | 421,000 | | | | 425,999 | |
| | | | | | | | |
|
Construction Machinery & Heavy Trucks-0.16% | |
Ashtead Capital, Inc. (United Kingdom), 4.00%, 05/01/2028(b) | | | 200,000 | | | | 209,000 | |
Cummins, Inc., 2.60%, 09/01/2050 | | | 574,000 | | | | 550,235 | |
| | | | | | | | |
| | | | | | | 759,235 | |
| | | | | | | | |
| | |
Copper-0.07% | | | | | | | | |
Freeport-McMoRan, Inc.,
4.38%, 08/01/2028 | | | 312,000 | | | | 326,235 | |
| | | | | | | | |
|
Data Processing & Outsourced Services-0.08% | |
PayPal Holdings, Inc. | | | | | | | | |
2.65%, 10/01/2026 | | | 195,000 | | | | 212,235 | |
2.85%, 10/01/2029 | | | 135,000 | | | | 147,575 | |
| | | | | | | | |
| | | | | | | 359,810 | |
| | | | | | | | |
| | |
Distillers & Vintners-0.04% | | | | | | | | |
Constellation Brands, Inc., 3.75%, 05/01/2050 | | | 164,000 | | | | 183,667 | |
| | | | | | | | |
| | |
Distributors-0.32% | | | | | | | | |
Genuine Parts Co., 1.88%, 11/01/2030 | | | 1,505,000 | | | | 1,475,498 | |
| | | | | | | | |
| | |
Diversified Banks-4.56% | | | | | | | | |
Africa Finance Corp. (Supranational),
4.38%, 04/17/2026(b) | | | 280,000 | | | | 301,327 | |
Banco del Estado de Chile (Chile), 2.70%, 01/09/2025(b) | | | 885,000 | | | | 932,024 | |
Banco Nacional de Panama (Panama), 2.50%, 08/11/2030(b) | | | 350,000 | | | | 348,177 | |
Bank of America Corp. | | | | | | | | |
2.59%, 04/29/2031(c) | | | 375,000 | | | | 392,245 | |
1.90%, 07/23/2031(c) | | | 1,062,000 | | | | 1,051,393 | |
1.92%, 10/24/2031(c) | | | 1,300,000 | | | | 1,291,562 | |
2.68%, 06/19/2041(c) | | | 1,860,000 | | | | 1,885,092 | |
BBVA Bancomer S.A. (Mexico), 1.88%, 09/18/2025(b) | | | 425,000 | | | | 421,838 | |
| | | | | | | | |
| | | Principal
Amount | | | Value | |
Diversified Banks-(continued) | | | | | | | | |
Citigroup, Inc. | | | | | | | | |
1.60% (3 mo. USD LIBOR + 1.38%), 03/30/2021(e) | | $ | 100,000 | | | $ | 100,542 | |
3.11%, 04/08/2026(c) | | | 513,000 | | | | 553,160 | |
3.98%, 03/20/2030(c) | | | 903,000 | | | | 1,036,606 | |
4.41%, 03/31/2031(c) | | | 427,000 | | | | 507,598 | |
2.57%, 06/03/2031(c) | | | 760,000 | | | | 792,999 | |
Series P, 5.95%(c)(d) | | | 390,000 | | | | 408,626 | |
Series U, 5.00%(c)(d) | | | 1,414,000 | | | | 1,420,576 | |
Credit Agricole S.A. (France), 1.91%, 06/16/2026(b)(c) | | | 250,000 | | | | 256,375 | |
Federation des Caisses Desjardins du Quebec (Canada), 2.05%,
02/10/2025(b)(f) | | | 662,000 | | | | 692,168 | |
HSBC Holdings PLC (United Kingdom), 1.65%, 04/18/2026(c) | | | 303,000 | | | | 304,344 | |
JPMorgan Chase & Co. | | | | | | | | |
1.10% (3 mo. USD LIBOR + 0.89%), 07/23/2024(e) | | | 205,000 | | | | 207,535 | |
2.08%, 04/22/2026(c) | | | 665,000 | | | | 696,109 | |
3.70%, 05/06/2030(c) | | | 903,000 | | | | 1,031,992 | |
2.74%, 10/15/2030(c) | | | 556,000 | | | | 595,357 | |
2.96%, 05/13/2031(c) | | | 427,000 | | | | 455,491 | |
Mizuho Financial Group, Inc. (Japan), 2.20%, 07/10/2031(c) | | | 907,000 | | | | 917,058 | |
Sumitomo Mitsui Financial Group, Inc. (Japan) | | | | | | | | |
1.47%, 07/08/2025 | | | 417,000 | | | | 424,870 | |
3.04%, 07/16/2029 | | | 205,000 | | | | 223,099 | |
2.13%, 07/08/2030 | | | 997,000 | | | | 1,013,973 | |
2.14%, 09/23/2030 | | | 1,186,000 | | | | 1,165,781 | |
U.S. Bancorp, 1.38%, 07/22/2030(f) | | | 430,000 | | | | 425,680 | |
Wells Fargo & Co. | | | | | | | | |
2.19%, 04/30/2026(c) | | | 195,000 | | | | 202,957 | |
4.15%, 01/24/2029 | | | 903,000 | | | | 1,052,769 | |
| | | | | | | | |
| | | | | | | 21,109,323 | |
| | | | | | | | |
| | |
Diversified Capital Markets-0.38% | | | | | | | | |
Credit Suisse Group AG (Switzerland) | | | | | | | | |
4.19%, 04/01/2031(b)(c) | | | 383,000 | | | | 439,962 | |
5.10%(b)(c)(d) | | | 492,000 | | | | 476,625 | |
5.25%(b)(c)(d) | | | 671,000 | | | | 677,240 | |
UBS Group AG (Switzerland), 2.00% (3 mo. USD LIBOR + 1.78%),
04/14/2021(b)(e) | | | 150,000 | | | | 151,125 | |
| | | | | | | | |
| | | | | | | 1,744,952 | |
| | | | | | | | |
| | |
Diversified Chemicals-0.09% | | | | | | | | |
OCP S.A. (Morocco), 5.63%, 04/25/2024(b) | | | 393,000 | | | | 428,131 | |
| | | | | | | | |
| | |
Diversified Metals & Mining-0.27% | | | | | | | | |
Anglo American Capital PLC (South Africa) | | | | | | | | |
5.38%, 04/01/2025(b) | | | 601,000 | | | | 693,395 | |
5.63%, 04/01/2030(b) | | | 319,000 | | | | 392,806 | |
BHP Billiton Finance USA Ltd. (Australia), 6.75%, 10/19/2075(b)(c) | | | 150,000 | | | | 181,012 | |
| | | | | | | | |
| | | | | | | 1,267,213 | |
| | | | | | | | |
See accompanying Notes to Financial Statements which are an integral part of the financial statements.
Invesco Total Return Bond ETF (GTO)–(continued)
October 31, 2020
| | | | | | | | |
| | | Principal
Amount | | | Value | |
Diversified REITs-0.76% | | | | | |
Atlantic Marine Corps Communities LLC,
5.34%, 12/01/2050(b) | | $ | 94,582 | | | $ | 112,958 | |
Brixmor Operating Partnership L.P., 4.05%, 07/01/2030 | | | 399,000 | | | | 431,920 | |
Fort Benning Family Communities LLC, 5.81%, 01/15/2051(b) | | | 200,000 | | | | 249,363 | |
iStar, Inc., 4.75%, 10/01/2024 | | | 603,000 | | | | 576,935 | |
Piedmont Operating Partnership L.P., 3.15%, 08/15/2030 | | | 362,000 | | | | 359,543 | |
Trust Fibra Uno (Mexico) | | | | | | | | |
4.87%, 01/15/2030(b) | | | 1,355,000 | | | | 1,411,232 | |
6.39%, 01/15/2050(b) | | | 385,000 | | | | 400,593 | |
| | | | | | | | |
| | | | | | | 3,542,544 | |
| | | | | | | | |
|
Diversified Support Services-0.30% | |
TransJamaican Highway Ltd. (Jamaica), 5.75%, 10/10/2036(b) | | | 1,375,000 | | | | 1,365,547 | |
| | | | | | | | |
| |
Electric Utilities-0.70% | | | | | |
Commonwealth Edison Co., Series 127, 3.20%, 11/15/2049 | | | 603,000 | | | | 657,538 | |
Drax Finco PLC (United Kingdom), 6.63%, 11/01/2025(b) | | | 200,000 | | | | 209,750 | |
Duke Energy Progress LLC, 2.50%, 08/15/2050 | | | 1,856,000 | | | | 1,788,620 | |
Eversource Energy, Series Q, 0.80%, 08/15/2025 | | | 98,000 | | | | 97,716 | |
NextEra Energy Capital Holdings, Inc., 2.75%, 05/01/2025 | | | 156,000 | | | | 168,243 | |
Southern Co. (The), Series A, 3.70%, 04/30/2030 | | | 298,000 | | | | 338,747 | |
| | | | | | | | |
| | | | | | | 3,260,614 | |
| | | | | | | | |
|
Electrical Components & Equipment-0.47% | |
Acuity Brands Lighting, Inc., 2.15%, 12/15/2030 | | | 2,236,000 | | | | 2,188,321 | |
| | | | | | | | |
| |
Electronic Components-0.87% | | | | | |
Corning, Inc., 5.45%, 11/15/2079 | | | 3,195,000 | | | | 4,038,017 | |
| | | | | | | | |
|
Electronic Manufacturing Services-0.13% | |
Jabil, Inc., 3.00%, 01/15/2031 | | | 582,000 | | | | 589,444 | |
| | | | | | | | |
|
Financial Exchanges & Data-0.38% | |
Intercontinental Exchange, Inc., 3.00%, 09/15/2060 | | | 543,000 | | | | 545,380 | |
Moody’s Corp. | | | | | | | | |
3.25%, 05/20/2050 | | | 167,000 | | | | 176,097 | |
2.55%, 08/18/2060 | | | 176,000 | | | | 158,196 | |
MSCI, Inc., 3.88%, 02/15/2031(b) | | | 334,000 | | | | 349,447 | |
S&P Global, Inc. | | | | | | | | |
1.25%, 08/15/2030 | | | 362,000 | | | | 353,205 | |
2.30%, 08/15/2060 | | | 194,000 | | | | 173,720 | |
| | | | | | | | |
| | | | | | | 1,756,045 | |
| | | | | | | | |
| |
Food Retail-0.13% | | | | | |
Albertsons Cos., Inc./Safeway, Inc./New Albertsons L.P./Albertson’s LLC, 3.50%, 02/15/2023(b) | | | 584,000 | | | | 593,869 | |
| | | | | | | | |
| | | | | | | | |
| | | Principal
Amount | | | Value | |
Gas Utilities-0.07% | | | | | |
East Ohio Gas Co. (The) | | | | | | | | |
1.30%, 06/15/2025(b) | | $ | 195,000 | | | $ | 198,817 | |
3.00%, 06/15/2050(b) | | | 101,000 | | | | 102,860 | |
| | | | | | | | |
| | | | | | | 301,677 | |
| | | | | | | | |
| |
Health Care Facilities-0.15% | | | | | |
CommonSpirit Health, 1.55%, 10/01/2025 | | | 292,000 | | | | 293,097 | |
Universal Health Services, Inc., 2.65%, 10/15/2030(b) | | | 421,000 | | | | 420,455 | |
| | | | | | | | |
| | | | | | | 713,552 | |
| | | | | | | | |
| |
Health Care REITs-0.30% | | | | | |
Healthcare Trust of America Holdings L.P., 2.00%, 03/15/2031 | | | 432,000 | | | | 418,388 | |
Healthpeak Properties, Inc., 2.88%, 01/15/2031 | | | 249,000 | | | | 261,864 | |
Omega Healthcare Investors, Inc., 3.38%, 02/01/2031 | | | 595,000 | | | | 574,831 | |
Welltower, Inc., 3.10%, 01/15/2030 | | | 111,000 | | | | 117,164 | |
| | | | | | | | |
| | | | | | | 1,372,247 | |
| | | | | | | | |
| |
Health Care Services-1.17% | | | | | |
Bon Secours Mercy Health, Inc. | | | | | | | | |
Series 20-2, 2.10%, 06/01/2031 | | | 215,000 | | | | 215,360 | |
Series 20-2, 3.21%, 06/01/2050 | | | 215,000 | | | | 217,395 | |
CVS Health Corp. | | | | | | | | |
1.30%, 08/21/2027 | | | 888,000 | | | | 873,812 | |
2.70%, 08/21/2040 | | | 700,000 | | | | 670,316 | |
DaVita, Inc., 3.75%, 02/15/2031(b) | | | 645,000 | | | | 621,216 | |
New York and Presbyterian Hospital (The) | | | | | | | | |
2.26%, 08/01/2040 | | | 265,000 | | | | 249,295 | |
2.61%, 08/01/2060 | | | 389,000 | | | | 361,959 | |
Sutter Health | | | | | | | | |
Series 20A, 3.16%, 08/15/2040 | | | 975,000 | | | | 981,271 | |
Series 20A, 3.36%, 08/15/2050 | | | 730,000 | | | | 728,755 | |
Texas Health Resources, 2.33%, 11/15/2050 | | | 545,000 | | | | 486,001 | |
| | | | | | | | |
| | | | | | | 5,405,380 | |
| | | | | | | | |
| |
Home Improvement Retail-0.16% | | | | | |
Lowe’s Cos., Inc.,
1.30%, 04/15/2028 | | | 736,000 | | | | 730,029 | |
| | | | | | | | |
| |
Homebuilding-0.65% | | | | | |
M.D.C. Holdings, Inc.,
3.85%, 01/15/2030 | | | 1,970,000 | | | | 2,085,679 | |
Mattamy Group Corp. (Canada) | | | | | | | | |
5.25%, 12/15/2027(b) | | | 698,000 | | | | 740,316 | |
4.63%, 03/01/2030(b) | | | 200,000 | | | | 203,344 | |
| | | | | | | | |
| | | | | | | 3,029,339 | |
| | | | | | | | |
| |
Hotel & Resort REITs-0.03% | | | | | |
Service Properties Trust,
5.25%, 02/15/2026 | | | 180,000 | | | | 157,050 | |
| | | | | | | | |
|
Hotels, Resorts & Cruise Lines-0.10% | |
Marriott Ownership Resorts, Inc., 4.75%, 01/15/2028 | | | 474,000 | | | | 453,172 | |
| | | | | | | | |
See accompanying Notes to Financial Statements which are an integral part of the financial statements.
Invesco Total Return Bond ETF (GTO)–(continued)
October 31, 2020
| | | | | | | | |
| | | Principal
Amount | | | Value | |
Industrial Conglomerates-0.15% | |
GE Capital International Funding Co. Unlimited Co.,
4.42%, 11/15/2035 | | $ | 273,000 | | | $ | 295,532 | |
General Electric Co.,
5.55%, 01/05/2026 | | | 349,000 | | | | 410,925 | |
| | | | | | | | |
| | | | | | | 706,457 | |
| | | | | | | | |
| |
Industrial Gases-0.06% | | | | | |
Linde, Inc., 2.00%, 08/10/2050 | | | 325,000 | | | | 286,153 | |
| | | | | | | | |
| |
Industrial REITs-0.51% | | | | | |
Duke Realty L.P., 2.88%, 11/15/2029 | | | 1,889,000 | | | | 2,063,886 | |
Lexington Realty Trust, 2.70%, 09/15/2030 | | | 222,000 | | | | 224,605 | |
Prologis L.P., 2.13%, 04/15/2027 | | | 68,000 | | | | 71,825 | |
| | | | | | | | |
| | | | | | | 2,360,316 | |
| | | | | | | | |
| |
Insurance Brokers-0.04% | | | | | |
Brown & Brown, Inc., 2.38%,
03/15/2031(f) | | | 167,000 | | | | 168,108 | |
| | | | | | | | |
| |
Integrated Oil & Gas-0.24% | | | | | |
Gray Oak Pipeline LLC, 2.60%, 10/15/2025(b) | | | 735,000 | | | | 735,177 | |
Saudi Arabian Oil Co. (Saudi Arabia), 2.88%, 04/16/2024(b) | | | 365,000 | | | | 382,908 | |
| | | | | | | | |
| | | | | | | 1,118,085 | |
| | | | | | | | |
|
Integrated Telecommunication Services-0.66% | |
AT&T, Inc. | | | | | | | | |
1.43% (3 mo. USD LIBOR + 1.18%), 06/12/2024(e) | | | 102,000 | | | | 104,360 | |
3.10%, 02/01/2043 | | | 674,000 | | | | 646,724 | |
3.50%, 09/15/2053(b) | | | 1,016,000 | | | | 975,981 | |
3.55%, 09/15/2055(b) | | | 434,000 | | | | 413,122 | |
3.50%, 02/01/2061 | | | 430,000 | | | | 400,852 | |
Verizon Communications, Inc., 3.88%, 02/08/2029 | | | 452,000 | | | | 529,741 | |
| | | | | | | | |
| | | | | | | 3,070,780 | |
| | | | | | | | |
|
Interactive Home Entertainment-0.46% | |
Activision Blizzard, Inc., 2.50%, 09/15/2050 | | | 678,000 | | | | 613,253 | |
WMG Acquisition Corp., 3.00%, 02/15/2031(b) | | | 1,576,000 | | | | 1,501,140 | |
| | | | | | | | |
| | | | | | | 2,114,393 | |
| | | | | | | | |
|
Interactive Media & Services-1.10% | |
Alphabet, Inc. | | | | | | | | |
1.90%, 08/15/2040 | | | 151,000 | | | | 142,882 | |
2.25%, 08/15/2060 | | | 586,000 | | | | 525,075 | |
Baidu, Inc. (China) | | | | | | | | |
3.08%, 04/07/2025 | | | 210,000 | | | | 222,940 | |
1.72%, 04/09/2026 | | | 235,000 | | | | 235,859 | |
3.43%, 04/07/2030 | | | 215,000 | | | | 236,957 | |
2.38%, 10/09/2030 | | | 215,000 | | | | 217,900 | |
Match Group Holdings II LLC | | | | | | | | |
4.63%, 06/01/2028(b) | | | 215,000 | | | | 223,003 | |
5.63%, 02/15/2029(b) | | | 339,000 | | | | 366,120 | |
| | | | | | | | |
| | | Principal
Amount | | | Value | |
Interactive Media & Services-(continued) | |
Tencent Holdings Ltd. (China) | | | | | | | | |
1.81%, 01/26/2026(b) | | $ | 200,000 | | | $ | 203,080 | |
2.39%, 06/03/2030(b) | | | 495,000 | | | | 501,734 | |
3.24%, 06/03/2050(b) | | | 200,000 | | | | 201,925 | |
3.29%, 06/03/2060(b) | | | 200,000 | | | | 200,849 | |
Twitter, Inc., 3.88%, 12/15/2027(b) | | | 1,746,000 | | | | 1,833,387 | |
| | | | | | | | |
| | | | | | | 5,111,711 | |
| | | | | | | | |
|
Internet & Direct Marketing Retail-1.12% | |
Alibaba Group Holding Ltd. (China), 4.20%, 12/06/2047 | | | 1,000,000 | | | | 1,239,650 | |
Expedia Group, Inc., 4.63%, 08/01/2027(b) | | | 1,198,000 | | | | 1,257,976 | |
Meituan (China) | | | | | | | | |
2.13%, 10/28/2025(b) | | | 870,000 | | | | 871,861 | |
3.05%, 10/28/2030(b) | | | 1,820,000 | | | | 1,826,863 | |
| | | | | | | | |
| | | | | | | 5,196,350 | |
| | | | | | | | |
|
Investment Banking & Brokerage-0.70% | |
Goldman Sachs Group, Inc. (The), 3.50%, 04/01/2025 | | | 446,000 | | | | 491,921 | |
Morgan Stanley | | | | | | | | |
2.19%, 04/28/2026(c) | | | 335,000 | | | | 351,262 | |
2.70%, 01/22/2031(c) | | | 1,753,000 | | | | 1,870,587 | |
National Securities Clearing Corp., 1.50%, 04/23/2025(b) | | | 265,000 | | | | 272,435 | |
Raymond James Financial, Inc., 4.65%, 04/01/2030 | | | 215,000 | | | | 260,676 | |
| | | | | | | | |
| | | | | | | 3,246,881 | |
| | | | | | | | |
| |
Life & Health Insurance-1.59% | | | | | |
AIA Group Ltd. (Hong Kong), 3.20%, 09/16/2040(b) | | | 305,000 | | | | 314,235 | |
American Equity Investment Life Holding Co., 5.00%, 06/15/2027 | | | 316,000 | | | | 353,391 | |
Athene Global Funding | | | | | | | | |
1.20%, 10/13/2023(b) | | | 904,000 | | | | 905,721 | |
2.50%, 01/14/2025(b) | | | 1,843,000 | | | | 1,901,490 | |
Athene Holding Ltd. | | | | | | | | |
6.15%, 04/03/2030 | | | 478,000 | | | | 572,294 | |
3.50%, 01/15/2031 | | | 242,000 | | | | 244,544 | |
Belrose Funding Trust, 2.33%,
08/15/2030(b) | | | 405,000 | | | | 404,412 | |
Brighthouse Financial, Inc., 4.70%, 06/22/2047 | | | 819,000 | | | | 798,260 | |
MetLife, Inc. | | | | | | | | |
9.25%, 04/08/2038(b) | | | 350,000 | | | | 505,305 | |
Series G, 3.85%(c)(d)(f) | | | 495,000 | | | | 497,653 | |
Nationwide Financial Services, Inc., 3.90%, 11/30/2049(b) | | | 275,000 | | | | 283,517 | |
Pacific LifeCorp, 3.35%, 09/15/2050(b) | | | 550,000 | | | | 565,507 | |
| | | | | | | | |
| | | | | | | 7,346,329 | |
| | | | | | | | |
| |
Managed Health Care-0.35% | | | | | |
Children’s Hospital, Series 2020, 2.93%, 07/15/2050 | | | 276,000 | | | | 256,834 | |
Community Health Network, Inc., Series 20-A, 3.10%, 05/01/2050 | | | 589,000 | | | | 539,162 | |
See accompanying Notes to Financial Statements which are an integral part of the financial statements.
Invesco Total Return Bond ETF (GTO)–(continued)
October 31, 2020
| | | | | | | | |
| | | Principal
Amount | | | Value | |
Managed Health Care-(continued) | |
Hackensack Meridian Health, Inc. | | | | | | | | |
Series 2020, 2.68%, 09/01/2041 | | $ | 257,000 | | | $ | 248,337 | |
Series 2020, 2.88%, 09/01/2050 | | | 248,000 | | | | 240,535 | |
MultiCare Health System, 2.80%, 08/15/2050 | | | 340,000 | | | | 326,994 | |
| | | | | | | | |
| | | | | | | 1,611,862 | |
| | | | | | | | |
|
Movies & Entertainment-0.20% | |
Netflix, Inc., 5.38%, 11/15/2029(b) | | | 68,000 | | | | 79,730 | |
Tencent Music Entertainment Group (China) | | | | | | | | |
1.38%, 09/03/2025 | | | 250,000 | | | | 250,208 | |
2.00%, 09/03/2030 | | | 590,000 | | | | 579,677 | |
| | | | | | | | |
| | | | | | | 909,615 | |
| | | | | | | | |
|
Multi-line Insurance-0.25% | |
American International Group, Inc., 3.40%, 06/30/2030 | | | 633,000 | | | | 704,960 | |
Fairfax Financial Holdings Ltd. (Canada), 4.63%, 04/29/2030 | | | 439,000 | | | | 470,503 | |
| | | | | | | | |
| | | | | | | 1,175,463 | |
| | | | | | | | |
| | |
Multi-Utilities-0.57% | | | | | | | | |
Dominion Energy, Inc., Series C, 3.38%, 04/01/2030 | | | 362,000 | | | | 409,053 | |
DTE Energy Co., Series H, 0.55%, 11/01/2022 | | | 290,000 | | | | 291,229 | |
WEC Energy Group, Inc. | | | | | | | | |
1.38%, 10/15/2027 | | | 998,000 | | | | 996,787 | |
1.80%, 10/15/2030 | | | 950,000 | | | | 942,194 | |
| | | | | | | | |
| | | | | | | 2,639,263 | |
| | | | | | | | |
| | |
Office REITs-0.40% | | | | | | | | |
Alexandria Real Estate Equities, Inc. | | | | | | | | |
3.38%, 08/15/2031 | | | 74,000 | | | | 83,198 | |
4.00%, 02/01/2050 | | | 115,000 | | | | 135,713 | |
Boston Properties L.P., 3.25%, 01/30/2031 | | | 269,000 | | | | 288,474 | |
Highwoods Realty L.P., 2.60%, 02/01/2031 | | | 478,000 | | | | 473,628 | |
Office Properties Income Trust, 4.50%, 02/01/2025 | | | 864,000 | | | | 876,651 | |
| | | | | | | | |
| | | | | | | 1,857,664 | |
| | | | | | | | |
|
Oil & Gas Exploration & Production-0.63% | |
Canadian Natural Resources Ltd. (Canada), 2.05%, 07/15/2025 | | | 688,000 | | | | 697,724 | |
Concho Resources, Inc., 2.40%, 02/15/2031 | | | 334,000 | | | | 337,645 | |
Continental Resources, Inc., 5.00%, 09/15/2022 | | | 725,000 | | | | 714,850 | |
Gazprom PJSC via Gaz Finance PLC (Russia), 4.60%(b)(c)(d) | | | 500,000 | | | | 499,650 | |
Pioneer Natural Resources Co., 1.90%, 08/15/2030 | | | 727,000 | | | | 681,990 | |
| | | | | | | | |
| | | | | | | 2,931,859 | |
| | | | | | | | |
|
Oil & Gas Refining & Marketing-0.06% | |
Petronas Capital Ltd. (Malaysia), 4.55%, 04/21/2050(b) | | | 210,000 | | | | 265,218 | |
| | | | | | | | |
| | | | | | | | |
| | | Principal
Amount | | | Value | |
Oil & Gas Storage & Transportation-1.71% | |
Energy Transfer Operating L.P. | | | | | | | | |
6.00%, 06/15/2048 | | $ | 63,000 | | | $ | 64,623 | |
Series 20Y, 5.80%, 06/15/2038 | | | 63,000 | | | | 64,374 | |
Kinder Morgan, Inc. | | | | | | | | |
2.00%, 02/15/2031 | | | 358,000 | | | | 340,829 | |
3.25%, 08/01/2050 | | | 758,000 | | | | 686,876 | |
MPLX L.P. | | | | | | | | |
1.34% (3 mo. USD LIBOR + 1.10%), 09/09/2022(e) | | | 379,000 | | | | 379,044 | |
1.75%, 03/01/2026 | | | 1,709,000 | | | | 1,701,722 | |
2.65%, 08/15/2030 | | | 635,000 | | | | 612,402 | |
NGPL PipeCo. LLC, 7.77%, 12/15/2037(b) | | | 1,129,000 | | | | 1,401,349 | |
ONEOK, Inc. | | | | | | | | |
5.85%, 01/15/2026 | | | 254,000 | | | | 289,169 | |
6.35%, 01/15/2031 | | | 1,118,000 | | | | 1,307,381 | |
Plains All American Pipeline L.P./PAA Finance Corp., 3.80%, 09/15/2030 | | | 224,000 | | | | 216,972 | |
Western Midstream Operating L.P., 2.07% (3 mo. USD LIBOR + 1.85%), 01/13/2023(e) | | | 917,000 | | | | 853,394 | |
| | | | | | | | |
| | | | | | | 7,918,135 | |
| | | | | | | | |
|
Other Diversified Financial Services-0.92% | |
AMC East Communities LLC, 6.01%, 01/15/2053(b) | | | 189,923 | | | | 235,622 | |
Ares Finance Co. LLC, 4.00%,
10/08/2024(b) | | | 147,000 | | | | 156,360 | |
Blackstone Holdings Finance Co. LLC | | | | | | | | |
1.60%, 03/30/2031(b) | | | 788,000 | | | | 772,866 | |
2.80%, 09/30/2050(b) | | | 364,000 | | | | 363,631 | |
Equitable Holdings, Inc., Series B,
4.95%(c)(d)(f) | | | 318,000 | | | | 329,985 | |
Fort Knox Military Housing Privatization Project, 0.49% (1 mo. USD LIBOR + 0.34%), 02/15/2052(b)(e) | | | 233,278 | | | | 135,972 | |
KKR Group Finance Co. VIII LLC, 3.50%, 08/25/2050(b) | | | 318,000 | | | | 322,672 | |
Mid-Atlantic Military Family Communities LLC, 5.30%, 08/01/2050(b) | | | 226,388 | | | | 256,946 | |
Pacific Beacon LLC | | | | | | | | |
5.38%, 07/15/2026(b) | | | 83,233 | | | | 92,934 | |
5.51%, 07/15/2036(b) | | | 500,000 | | | | 619,841 | |
Pershing Square Holdings Ltd. (Guernsey), 3.25%, 11/15/2030(b) | | | 1,000,000 | | | | 998,390 | |
| | | | | | | | |
| | | | | | | 4,285,219 | |
| | | | | | | | |
|
Packaged Foods & Meats-0.13% | |
BRF S.A. (Brazil), 5.75%, 09/21/2050(b) . | | | 627,000 | | | | 597,531 | |
| | | | | | | | |
|
Paper Packaging-0.08% | |
Cascades, Inc./Cascades USA, Inc. (Canada), 5.38%, 01/15/2028(b) | | | 362,000 | | | | 378,064 | |
| | | | | | | | |
|
Pharmaceuticals-0.52% | |
AstraZeneca PLC (United Kingdom) | | | | | | | | |
0.70%, 04/08/2026 | | | 914,000 | | | | 901,416 | |
1.38%, 08/06/2030 | | | 927,000 | | | | 904,133 | |
See accompanying Notes to Financial Statements which are an integral part of the financial statements.
Invesco Total Return Bond ETF (GTO)–(continued)
October 31, 2020
| | | | | | | | |
| | | Principal
Amount | | | Value | |
Pharmaceuticals-(continued) | | | | | |
Royalty Pharma PLC | | | | | | | | |
1.20%, 09/02/2025(b) | | $ | 203,000 | | | $ | 202,208 | |
1.75%, 09/02/2027(b) | | | 186,000 | | | | 184,799 | |
2.20%, 09/02/2030(b) | | | 225,000 | | | | 221,942 | |
| | | | | | | | |
| | | | | | | 2,414,498 | |
| | | | | | | | |
|
Property & Casualty Insurance-0.41% | |
Arch Capital Group Ltd., 3.64%, 06/30/2050 | | | 279,000 | | | | 300,686 | |
Fidelity National Financial, Inc. | | | | | | | | |
3.40%, 06/15/2030 | | | 337,000 | | | | 359,998 | |
2.45%, 03/15/2031 | | | 573,000 | | | | 564,261 | |
First American Financial Corp., 4.30%, 02/01/2023 | | | 295,000 | | | | 312,424 | |
W.R. Berkley Corp., 4.00%, 05/12/2050 | | | 296,000 | | | | 349,724 | |
| | | | | | | | |
| | | | | | | 1,887,093 | |
| | | | | | | | |
| |
Railroads-0.11% | | | | | |
Empresa de los Ferrocarriles del Estado (Chile), 3.07%, 08/18/2050(b) | | | 235,000 | | | | 218,990 | |
Norfolk Southern Corp., 2.55%, 11/01/2029 | | | 254,000 | | | | 273,189 | |
| | | | | | | | |
| | | | | | | 492,179 | |
| | | | | | | | |
| |
Regional Banks-0.58% | | | | | |
Citizens Bank N.A. | | | | | | | | |
1.04% (3 mo. USD LIBOR + 0.81%), 05/26/2022(e) | | | 250,000 | | | | 252,082 | |
2.25%, 04/28/2025 | | | 387,000 | | | | 409,573 | |
Citizens Financial Group, Inc. | | | | | | | | |
2.50%, 02/06/2030 | | | 393,000 | | | | 411,987 | |
3.25%, 04/30/2030 | | | 211,000 | | | | 230,597 | |
Fifth Third Bancorp | | | | | | | | |
2.38%, 01/28/2025 | | | 466,000 | | | | 492,315 | |
2.55%, 05/05/2027 | | | 285,000 | | | | 304,168 | |
KeyCorp, 2.25%, 04/06/2027 | | | 572,000 | | | | 601,424 | |
| | | | | | | | |
| | | | | | | 2,702,146 | |
| | | | | | | | |
| |
Reinsurance-0.27% | | | | | |
Berkshire Hathaway Finance Corp., 2.85%, 10/15/2050 | | | 577,000 | | | | 589,570 | |
Global Atlantic Fin Co., 4.40%, 10/15/2029(b) | | | 615,000 | | | | 643,509 | |
| | | | | | | | |
| | | | | | | 1,233,079 | |
| | | | | | | | |
| |
Renewable Electricity-0.08% | | | | | |
Northern States Power Co., 2.60%, 06/01/2051 | | | 379,000 | | | | 383,119 | |
| | | | | | | | |
| |
Residential REITs-0.30% | | | | | |
Camden Property Trust, 2.80%, 05/15/2030 | | | 188,000 | | | | 203,295 | |
Essex Portfolio L.P. | | | | | | | | |
1.65%, 01/15/2031 | | | 249,000 | | | | 240,743 | |
2.65%, 09/01/2050 | | | 444,000 | | | | 407,120 | |
Mid-America Apartments L.P., 1.70%, 02/15/2031 | | | 186,000 | | | | 180,737 | |
Spirit Realty L.P. | | | | | | | | |
4.00%, 07/15/2029 | | | 67,000 | | | | 70,348 | |
3.40%, 01/15/2030 | | | 302,000 | | | | 308,613 | |
| | | | | | | | |
| | | | | | | 1,410,856 | |
| | | | | | | | |
| | | | | | | | |
| | | Principal
Amount | | | Value | |
Restaurants-0.19% | | | | | |
1011778 BC ULC/New Red Finance, Inc. (Canada), 4.00%, 10/15/2030(b) | | $ | 882,000 | | | $ | 877,590 | |
| | | | | | | | |
| |
Retail REITs-0.76% | | | | | |
Kimco Realty Corp. | | | | | | | | |
1.90%, 03/01/2028 | | | 623,000 | | | | 614,706 | |
2.70%, 10/01/2030 | | | 323,000 | | | | 327,558 | |
Realty Income Corp., 3.25%, 01/15/2031 | | | 413,000 | | | | 452,535 | |
Retail Properties of America, Inc., 4.75%, 09/15/2030 | | | 357,000 | | | | 354,873 | |
Scentre Group Trust 2 (Australia) | | | | | | | | |
4.75%, 09/24/2080(b)(c) | | | 655,000 | | | | 647,590 | |
5.13%, 09/24/2080(b)(c) | | | 714,000 | | | | 703,362 | |
Simon Property Group L.P. | | | | | | | | |
3.50%, 09/01/2025 | | | 153,000 | | | | 167,573 | |
3.80%, 07/15/2050 | | | 260,000 | | | | 257,094 | |
| | | | | | | | |
| | | | | | | 3,525,291 | |
| | | | | | | | |
| |
Semiconductor Equipment-0.05% | | | | | |
NXP B.V./NXP Funding LLC/NXP USA, Inc. (Netherlands), 3.40%, 05/01/2030(b) | | | 219,000 | | | | 241,006 | |
| | | | | | | | |
|
Semiconductors-0.68% | |
Analog Devices, Inc., 2.95%, 04/01/2025 | | | 180,000 | | | | 195,691 | |
Broadcom, Inc. | | | | | | | | |
4.70%, 04/15/2025 | | | 1,070,000 | | | | 1,217,434 | |
5.00%, 04/15/2030 | | | 629,000 | | | | 741,003 | |
4.30%, 11/15/2032 | | | 585,000 | | | | 668,486 | |
Micron Technology, Inc. | | | | | | | | |
4.98%, 02/06/2026 | | | 54,000 | | | | 62,859 | |
4.19%, 02/15/2027 | | | 249,000 | | | | 281,471 | |
| | | | | | | | |
| | | | | | | 3,166,944 | |
| | | | | | | | |
| |
Soft Drinks-0.54% | | | | | |
Coca-Cola FEMSA S.A.B. de C.V. (Mexico), 1.85%, 09/01/2032 | | | 480,000 | | | | 480,977 | |
Fomento Economico Mexicano, S.A.B. de C.V. (Mexico), 3.50%, 01/16/2050 | | | 1,936,000 | | | | 2,020,935 | |
| | | | | | | | |
| | | | | | | 2,501,912 | |
| | | | | | | | |
| |
Sovereign Debt-0.58% | | | | | |
Abu Dhabi Government International Bond (United Arab Emirates), 3.88%, 04/16/2050(b) | | | 370,000 | | | | 440,348 | |
China Government International Bond (China), 2.25%, 10/21/2050(b) | | | 1,313,000 | | | | 1,280,293 | |
Egypt Government International Bond (Egypt), 5.25%, 10/06/2025(b) | | | 750,000 | | | | 746,250 | |
Qatar Government International Bond (Qatar), 3.38%, 03/14/2024(b) | | | 200,000 | | | | 215,958 | |
| | | | | | | | |
| | | | | | | 2,682,849 | |
| | | | | | | | |
| |
Specialized Finance-0.23% | | | | | |
Mitsubishi UFJ Lease & Finance Co. Ltd. (Japan), 3.64%, 04/13/2025(b) | | | 894,000 | | | | 981,563 | |
Park Aerospace Holdings Ltd. (Ireland), 5.25%, 08/15/2022(b) | | | 90,000 | | | | 92,722 | |
| | | | | | | | |
| | | | | | | 1,074,285 | |
| | | | | | | | |
See accompanying Notes to Financial Statements which are an integral part of the financial statements.
Invesco Total Return Bond ETF (GTO)–(continued)
October 31, 2020
| | | | | | | | |
| | | Principal
Amount | | | Value | |
Specialized REITs-0.87% | | | | | | | | |
Agree L.P., 2.90%, 10/01/2030 | | $ | 163,000 | | | $ | 167,962 | |
American Tower Corp., 3.10%, 06/15/2050 | | | 623,000 | | | | 610,795 | |
Crown Castle International Corp. | | | | | | | | |
4.15%, 07/01/2050 | | | 164,000 | | | | 188,334 | |
3.25%, 01/15/2051 | | | 721,000 | | | | 721,728 | |
Iron Mountain, Inc. | | | | | | | | |
5.25%, 07/15/2030(b) | | | 357,000 | | | | 366,818 | |
4.50%, 02/15/2031(b) | | | 364,000 | | | | 362,842 | |
Life Storage L.P., 2.20%, 10/15/2030 | | | 193,000 | | | | 192,977 | |
SBA Communications Corp., 3.88%, 02/15/2027(b) | | | 1,407,000 | | | | 1,431,622 | |
| | | | | | | | |
| | | | | | | 4,043,078 | |
| | | | | | | | |
| |
Specialty Chemicals-0.11% | | | | | |
Braskem Idesa S.A.P.I. (Mexico), 7.45%, 11/15/2029(b) | | | 515,000 | | | | 487,715 | |
| | | | | | | | |
| | |
Specialty Stores-0.07% | | | | | | | | |
Tractor Supply Co., 1.75%, 11/01/2030 | | | 306,000 | | | | 301,461 | |
| | | | | | | | |
| | |
Steel-0.44% | | | | | | | | |
POSCO (South Korea), 2.38%, 01/17/2023(b) | | | 2,006,000 | | | | 2,057,063 | |
| | | | | | | | |
| | |
Systems Software-0.38% | | | | | | | | |
Leidos, Inc., 2.30%, 02/15/2031(b) | | | 839,000 | | | | 833,274 | |
Oracle Corp., 3.60%, 04/01/2050 | | | 823,000 | | | | 906,902 | |
| | | | | | | | |
| | | | | | | 1,740,176 | |
| | | | | | | | |
|
Technology Hardware, Storage & Peripherals-0.29% | |
Apple, Inc., 2.65%, 05/11/2050 | | | 563,000 | | | | 570,208 | |
Dell International LLC/EMC Corp. | | | | | | | | |
5.85%, 07/15/2025(b) | | | 166,000 | | | | 195,266 | |
4.90%, 10/01/2026(b) | | | 64,000 | | | | 72,935 | |
Lenovo Group Ltd. (China), 3.42%, 11/02/2030(b) | | | 480,000 | | | | 487,832 | |
| | | | | | | | |
| | | | | | | 1,326,241 | |
| | | | | | | | |
| | |
Tobacco-0.51% | | | | | | | | |
BAT Capital Corp. (United Kingdom), 2.26%, 03/25/2028 | | | 488,000 | | | | 487,369 | |
Philip Morris International, Inc. | | | | | | | | |
1.50%, 05/01/2025 | | | 282,000 | | | | 290,939 | |
0.88%, 05/01/2026 | | | 1,609,000 | | | | 1,601,789 | |
| | | | | | | | |
| | | | | | | 2,380,097 | |
| | | | | | | | |
| |
Trading Companies & Distributors-0.24% | | | | | |
AerCap Ireland Capital DAC/AerCap Global Aviation Trust (Ireland), 4.50%, 09/15/2023 | | | 442,000 | | | | 459,319 | |
Aircastle Ltd., 4.40%, 09/25/2023 | | | 452,000 | | | | 455,272 | |
BOC Aviation Ltd. (Singapore), 1.36% (3 mo. USD LIBOR + 1.13%), 09/26/2023(b)(e) | | | 200,000 | | | | 196,517 | |
| | | | | | | | |
| | | | | | | 1,111,108 | |
| | | | | | | | |
| | |
Trucking-0.29% | | | | | | | | |
Aviation Capital Group LLC | | | | | | | | |
0.88% (3 mo. USD LIBOR + 0.67%), 07/30/2021(b)(e) | | | 69,000 | | | | 67,510 | |
4.13%, 08/01/2025(b) | | | 87,000 | | | | 85,056 | |
| | | | | | | | |
| | | Principal
Amount | | | Value | |
Trucking-(continued) | |
Penske Truck Leasing Co. L.P./PTL Finance Corp., 1.20%, 11/15/2025(b) | | $ | 992,000 | | | $ | 990,995 | |
SMBC Aviation Capital Finance DAC (Ireland), 4.13%, 07/15/2023(b) | | | 204,000 | | | | 216,618 | |
| | | | | | | | |
| | | | | | | 1,360,179 | |
| | | | | | | | |
|
Wireless Telecommunication Services-0.08% | |
Colombia Telecomunicaciones S.A. ESP (Colombia), 4.95%, 07/17/2030(b) | | | 365,000 | | | | 389,364 | |
| | | | | | | | |
Total U.S. Dollar Denominated Bonds & Notes
(Cost $188,041,680) | | | | | | | 193,407,262 | |
| | | | | | | | |
|
| U.S. Treasury Securities-25.76% | |
| | |
U.S. Treasury Bills-0.69% | | | | | | | | |
0.09%–0.12%, 02/04/2021(g)(h)(i) | | | 3,211,000 | | | | 3,210,266 | |
| | | | | | | | |
| | |
U.S. Treasury Bonds-6.48% | | | | | | | | |
1.25%, 05/15/2050(f) | | | 33,038,900 | | | | 30,024,101 | |
| | | | | | | | |
| | |
U.S. Treasury Notes-18.59% | | | | | | | | |
0.13%, 09/30/2022 | | | 259,900 | | | | 259,758 | |
0.13%, 10/15/2023 | | | 81,800 | | | | 81,637 | |
0.25%, 09/30/2025 | | | 31,075,600 | | | | 30,889,875 | |
0.38%, 09/30/2027 | | | 11,604,800 | | | | 11,410,782 | |
0.63%, 08/15/2030 | | | 44,486,900 | | | | 43,517,224 | |
| | | | | | | | |
| | | | | | | 86,159,276 | |
| | | | | | | | |
| | |
Total U.S. Treasury Securities
(Cost $121,179,388) | | | | | | | 119,393,643 | |
| | | | | | | | |
|
| U.S. Government Sponsored Agency Mortgage-Backed Securities-16.73% | |
Collateralized Mortgage Obligations-1.83% | |
Fannie Mae Multifamily Connecticut Avenue Securities, Series 2019-01, Class M7, 1.85% (1 mo. USD LIBOR + 1.70%), 10/15/2049(b)(e)(j) | | | 1,820,271 | | | | 1,749,371 | |
Freddie Mac Military Housing Bonds Resecuritization Trust Ctfs., Series 2015-R1, Class B1, 4.64%,
11/25/2055(b)(k) | | | 946,304 | | | | 1,112,075 | |
Freddie Mac Multifamily Structured Pass-Through Ctfs. | | | | | | | | |
Series 2013-K026, Class X1, IO, 0.96%, 11/25/2022(l) | | | 4,941,525 | | | | 76,255 | |
Series 2013-K035, Class X1, IO, 0.35%, 08/25/2023(l) | | | 7,925,276 | | | | 69,254 | |
Series 2014-K036, Class X1, IO, 0.89%, 10/25/2023(l) | | | 5,800,392 | | | | 109,931 | |
Series 2014-K037, Class X1, IO, 0.96%, 01/25/2024(l) | | | 6,170,725 | | | | 157,147 | |
Series 2015-K042, Class X1, IO, 1.04%, 12/25/2024(l) | | | 4,301,484 | | | | 159,510 | |
Series 2017-K066, Class AM, 3.20%, 06/25/2027 | | | 250,000 | | | | 284,159 | |
Series 2017-KGX1, Class AFX, 3.00%, 10/25/2027 | | | 1,000,000 | | | | 1,121,154 | |
Series 2018-K074, Class AM, 3.60%, 02/25/2028 | | | 1,000,000 | | | | 1,167,567 | |
See accompanying Notes to Financial Statements which are an integral part of the financial statements.
Invesco Total Return Bond ETF (GTO)–(continued)
October 31, 2020
| | | | | | | | |
| | | Principal
Amount | | | Value | |
Collateralized Mortgage Obligations-(continued) | |
Series 2018-K154, Class A3, 3.46%, 11/25/2032 | | $ | 1,000,000 | | | $ | 1,181,642 | |
Series K038, Class X1, IO, 1.12%, 03/25/2024(l) | | | 4,058,077 | | | | 129,154 | |
| Seasoned Credit Risk Transfer Trust | | | | | | | | |
Series 2017-3, Class HT, 3.25%, 07/25/2056(m) | | | 376,559 | | | | 413,825 | |
Series 2017-4, Class HT, 3.25%, 06/25/2057(m) | | | 675,026 | | | | 736,086 | |
| | | | | | | | |
| | | | | | | 8,467,130 | |
| | | | | | | | |
|
Federal Home Loan Mortgage Corp. (FHLMC)-1.64% | |
0.00%, 12/14/2029(n) | | | 150,000 | | | | 132,177 | |
3.55%, 10/01/2033 | | | 482,353 | | | | 550,392 | |
3.00%, 10/01/2034 | | | 739,845 | | | | 775,232 | |
4.00%, 11/01/2048 to 07/01/2049 | | | 774,727 | | | | 830,474 | |
3.50%, 08/01/2049 | | | 4,931,095 | | | | 5,292,950 | |
| | | | | | | | |
| | | | | | | 7,581,225 | |
| | | | | | | | |
|
Federal National Mortgage Association (FNMA)-4.31% | |
2.86%, 09/01/2029 | | | 500,000 | | | | 560,009 | |
2.99%, 09/01/2029 | | | 500,000 | | | | 550,687 | |
2.82%, 10/01/2029 | | | 500,000 | | | | 556,386 | |
3.05%, 10/01/2029 | | | 500,000 | | | | 546,625 | |
2.90%, 11/01/2029 | | | 500,000 | | | | 547,136 | |
3.08%, 10/01/2032 | | | 750,000 | | | | 845,121 | |
3.24%, 11/01/2032 | | | 475,471 | | | | 534,978 | |
3.31%, 01/01/2033 | | | 1,000,000 | | | | 1,163,640 | |
2.50%, 10/01/2034 to 12/01/2034 | | | 4,048,317 | | | | 4,257,924 | |
3.50%, 05/01/2047 to 06/01/2047 | | | 3,526,146 | | | | 3,823,650 | |
4.00%, 11/01/2047 | | | 262,860 | | | | 282,378 | |
3.00%, 09/01/2049 to 10/01/2049 | | | 5,875,431 | | | | 6,327,672 | |
| | | | | | | | |
| | | | | | | 19,996,206 | |
| | | | | | | | |
|
Government National Mortgage Association (GNMA)-0.24% | |
4.00%, 07/20/2049 | | | 183,072 | | | | 194,861 | |
TBA, 3.00%, 11/01/2050(o) | | | 865,000 | | | | 902,917 | |
| | | | | | | | |
| | | | | | | 1,097,778 | |
| | | | | | | | |
|
Uniform Mortgage-Backed Securities-8.71% | |
TBA, 2.00%, 11/01/2035 to 11/01/2050(o) | | | 19,906,850 | | | | 20,555,392 | |
TBA, 3.00%, 11/01/2035 to 11/01/2050(o) | | | 10,585,000 | | | | 11,065,805 | |
TBA, 2.50%, 11/01/2050(o) | | | 8,400,000 | | | | 8,754,047 | |
| | | | | | | | |
| | | | | | | 40,375,244 | |
| | | | | | | | |
Total U.S. Government Sponsored Agency Mortgage- Backed Securities
(Cost $75,275,702) | | | | | | | 77,517,583 | |
| | | | | | | | |
|
| Asset-Backed Securities-11.10% | |
Anchorage Credit Funding 4 Ltd. (Cayman Islands), Series 2016-4A, Class A, 3.50%, 02/15/2035(b) | | | 500,000 | | | | 502,728 | |
Angel Oak Mortgage Trust | | | | | | | | |
Series 2019-3, Class A1, 2.93%, 05/25/2059(b)(k) | | | 1,596,661 | | | | 1,619,248 | |
| | | | | | | | |
| | | Principal
Amount | | | Value | |
Series 2020-1, Class A1, 2.47%, 12/25/2059(b)(k) | | $ | 372,394 | | | $ | 376,075 | |
Series 2020-3, Class A1, 1.69%, 04/25/2065(b)(k) | | | 1,042,966 | | | | 1,049,865 | |
Angel Oak Mortgage Trust LLC, Series 2020-5, Class A1, 1.37%,
05/25/2065(b)(k) | | | 1,369,755 | | | | 1,372,543 | |
Bear Stearns Asset Backed Securities I Trust, Series 2006-HE9, Class 2A, 0.29% (1 mo. USD LIBOR + 0.14%), 11/25/2036(e) | | | 265,106 | | | | 255,311 | |
Benchmark Mortgage Trust | | | | | | | | |
Series 2019-B14, Class A5, 3.05%, 12/15/2062 | | | 2,000,000 | | | | 2,216,676 | |
Series 2019-B14, Class C, 3.78%, 12/15/2062(e)(k) | | | 930,000 | | | | 936,905 | |
Series 2019-B15, Class B, 3.56%, 12/15/2072 | | | 2,000,000 | | | | 2,166,525 | |
Chase Home Lending Mortgage Trust, Series 2019-ATR2, Class A3, 3.50%, 07/25/2049(b)(k) | | | 326,466 | | | | 335,609 | |
Citigroup Commercial Mortgage Trust, Series 2014-GC23, Class B, 4.18%, 07/10/2047(k) | | | 184,000 | | | | 197,185 | |
Citigroup Mortgage Loan Trust, Inc., Series 2019-IMC1, Class A1, 2.72%, 07/25/2049(b)(k) | | | 214,972 | | | | 218,943 | |
COLT Mortgage Loan Trust | | | | | | | | |
Series 2020-1, Class A1, 2.49%, 02/25/2050(b)(k) | | | 2,974,211 | | | | 3,005,211 | |
Series 2020-1R, Class A1, 1.26%, 09/25/2065(b)(k) | | | 504,262 | | | | 505,112 | |
Series 2020-2, Class A1, 1.85%, 03/25/2065(b)(k) | | | 499,833 | | | | 504,325 | |
Credit Suisse Mortgage Capital Ctfs., Series 2020-SPT1, Class A1, 1.70%, 04/25/2065(b)(m) | | | 906,360 | | | | 910,329 | |
CSAIL Commercial Mortgage Trust, Series 2020-C19, Class A3, 2.56%, 03/15/2053 | | | 1,459,000 | | | | 1,553,696 | |
Deephaven Residential Mortgage Trust, Series 2019-4A, Class A1, 2.79%, 10/25/2059(b)(k) | | | 2,041,952 | | | | 2,073,338 | |
Domino’s Pizza Master Issuer LLC | | | | | | | | |
Series 2017-1A, Class A2I, 1.47% (3 mo. USD LIBOR + 1.25%), 07/25/2047(b)(e) | | | 582,000 | | | | 585,429 | |
Series 2019-1A, Class A2, 3.67%, 10/25/2049(b) | | | 1,980,000 | | | | 2,095,643 | |
DT Auto Owner Trust | | | | | | | | |
Series 2019-3A, Class C, 2.74%, 04/15/2025(b) | | | 150,000 | | | | 153,170 | |
Series 2019-3A, Class D, 2.96%, 04/15/2025(b) | | | 214,000 | | | | 219,624 | |
Ellington Financial Mortgage Trust | | | | | | | | |
Series 2019-2, Class A1, 2.74%, 11/25/2059(b)(k) | | | 838,128 | | | | 857,210 | |
Series 2020-1, Class A1, 2.01%, 05/25/2065(b)(k) | | | 225,989 | | | | 228,982 | |
See accompanying Notes to Financial Statements which are an integral part of the financial statements.
Invesco Total Return Bond ETF (GTO)–(continued)
October 31, 2020
| | | | | | | | |
| | | Principal
Amount | | | Value | |
FREMF Mortgage Trust, Series 2013- K29, Class X2A, IO, 0.13%,
05/25/2046(b)(p) | | $ | 27,523,094 | | | $ | 61,594 | |
Galton Funding Mortgage Trust, Series 2019-H1, Class A1, 2.66%,
10/25/2059(b)(k) | | | 797,307 | | | | 814,460 | |
GCAT Trust | | | | | | | | |
Series 2019-NQM2, Class A1, 2.86%, 09/25/2059(b)(m) | | | 723,263 | | | | 738,324 | |
Series 2019-NQM3, Class A1, 2.69%, 11/25/2059(b)(k) | | | 1,154,351 | | | | 1,181,261 | |
Goldentree Loan Management US CLO 2 Ltd. (Cayman Islands), Series 2017-2A, Class A, 1.37% (3 mo. USD LIBOR + 1.15%), 11/28/2030(b)(e) | | | 2,000,000 | | | | 1,979,546 | |
Golub Capital Partners CLO 16 Ltd. (Cayman Islands), Series 2013-16A, Class A2R, 2.07% (3 mo. USD LIBOR + 1.85%), 07/25/2029(b)(e) | | | 300,000 | | | | 295,122 | |
Golub Capital Partners CLO 41(B) Ltd. (Cayman Islands), Series 2019-41A, Class A, 1.59% (3 mo. USD LIBOR + 1.37%), 04/20/2029(b)(e) | | | 427,000 | | | | 426,319 | |
GS Mortgage Securities Corp. Trust, Series 2017-STAY, Class C, 1.75% (1 mo. USD LIBOR + 1.35%),
07/15/2032(b)(e) | | | 500,000 | | | | 488,456 | |
GS Mortgage Securities Trust | | | | | | | | |
Series 2013-GC14, Class B, 4.74%, 08/10/2046(b)(k) | | | 325,000 | | | | 349,544 | |
Series 2020-GC45, Class A5, 2.91%, 02/13/2053 | | | 1,560,000 | | | | 1,713,703 | |
Series 2020-GC47, Class A5, 2.38%, 05/12/2053 | | | 545,000 | | | | 576,727 | |
Hertz Vehicle Financing II L.P., Series 2019-2A, Class A, 3.42%, 05/25/2025(b) | | | 93,078 | | | | 93,610 | |
MMAF Equipment Finance LLC, Series 2020-A, Class A5, 1.56%, 10/09/2042(b) | | | 1,500,000 | | | | 1,546,837 | |
Morgan Stanley BAML Trust, Series 2015-C25, Class B, 4.53%, 10/15/2048(k) | | | 1,032,000 | | | | 1,149,190 | |
Morgan Stanley Capital I Trust, Series 2019-L3, Class AS, 3.49%, 11/15/2052 | | | 1,580,000 | | | | 1,761,711 | |
New Residential Mortgage Loan Trust | | | | | | | | |
Series 2019-NQM4, Class A1, 2.49%, 09/25/2059(b)(k) | | | 754,966 | | | | 769,107 | |
Series 2020-NQM1, Series A1, 2.46%, 01/26/2060(b)(k) | | | 2,066,125 | | | | 2,102,370 | |
One Bryant Park Trust, Series 2019-OBP, Class A, 2.52%, 09/15/2054(b) | | | 457,000 | | | | 484,519 | |
PPM CLO 3 Ltd. (Cayman Islands), Series 2019-3A, Class A, 1.62% (3 mo. USD LIBOR + 1.40%), 07/17/2030(b)(e) | | | 250,000 | | | | 248,746 | |
Progress Residential Trust, Series 2020- SFR1, Class A, 1.73%, 04/17/2037(b) | | | 870,000 | | | | 881,417 | |
| | | | | | | | |
| | | Principal
Amount | | | Value | |
Race Point VIII CLO Ltd. (Cayman Islands), Series 2013-8A, Class AR2, 1.29% (3 mo. USD LIBOR + 1.04%), 02/20/2030(b)(e) | | $ | 672,370 | | | $ | 664,202 | |
Residential Mortgage Loan Trust | | | | | | | | |
Series 2019-3, Class A1, 2.63%, 09/25/2059(b)(k) | | | 134,579 | | | | 137,405 | |
Series 2020-1, Class A1, 2.38%, 02/25/2024(b)(k) | | | 278,242 | | | | 282,464 | |
Sonic Capital LLC, Series 2020-1A, Class A2I, 3.85%, 01/20/2050(b) | | | 1,617,147 | | | | 1,708,207 | |
Starwood Mortgage Residential Trust, Series 2020-1, Class A1, 2.28%, 02/25/2050(b)(k) | | | 362,503 | | | | 369,352 | |
Store Master Funding I-VII, Series 2016-1A, Class A2, 4.32%, 10/20/2046(b) | | | 467,580 | | | | 480,232 | |
Taco Bell Funding LLC, Series 2016-1A, Class A23, 4.97%, 05/25/2046(b) | | | 145,125 | | | | 157,630 | |
Taconic Park CLO Ltd. (Cayman Islands), Series 2016-1A, Class A1R, 1.22% (3 mo. USD LIBOR + 1.00%), 01/20/2029(b)(e) | | | 958,000 | | | | 947,243 | |
Tricon American Homes Trust, Series 2020-SFR2, Class A, 1.48%,
11/17/2039(b) | | | 1,145,000 | | | | 1,144,972 | |
Verus Securitization Trust, Series 2020- INV1, Class A1, 1.98%, 03/25/2060(b)(k) | | | 266,208 | | | | 269,478 | |
Wells Fargo Commercial Mortgage Trust, Series 2016-NXS5, Class XA, IO, 1.47%, 01/15/2059(p) | | | 1,582,961 | | | | 92,709 | |
Wendy’s Funding LLC | | | | | | | | |
Series 2015-1A, Class A23, 4.50%, 06/15/2045(b) | | | 2,185,000 | | | | 2,238,437 | |
Series 2019-1A, Class A2II, 4.08%, 06/15/2049(b) | | | 488,750 | | | | 521,360 | |
WFRBS Commercial Mortgage Trust, Series 2014-C23, Class B, 4.38%, 10/15/2057(k) | | | 307,000 | | | | 331,666 | |
Woodmont Trust, Series 2017-2A, Class A, 2.02% (3 mo. USD LIBOR + 1.80%), 07/18/2028(b)(e) | | | 500,000 | | | | 494,824 | |
| | | | | | | | |
Total Asset-Backed Securities (Cost $50,282,249) | | | | | | | 51,442,426 | |
| | | | | | | | |
|
| U.S. Government Sponsored Agency Securities-0.67% | |
Fannie Mae STRIPS | | | | | | | | |
0.00%, 05/15/2029(n) | | | 450,000 | | | | 403,417 | |
0.00%, 01/15/2030(n) | | | 1,300,000 | | | | 1,147,005 | |
0.00%, 05/15/2030(n) | | | 850,000 | | | | 744,801 | |
Freddie Mac STRIPS, 0.00%,
09/15/2030(n) | | | 350,000 | | | | 302,908 | |
Tennessee Valley Authority | | | | | | | | |
5.38%, 04/01/2056 | | | 100,000 | | | | 167,079 | |
4.25%, 09/15/2065 | | | 250,000 | | | | 367,100 | |
| | | | | | | | |
Total U.S. Government Sponsored Agency Securities
(Cost $2,462,024) | | | | | | | 3,132,310 | |
| | | | | | | | |
See accompanying Notes to Financial Statements which are an integral part of the financial statements.
Invesco Total Return Bond ETF (GTO)–(continued)
October 31, 2020
| | | | | | | | |
| | | Principal
Amount | | | Value | |
| Municipal Obligations-0.56% | |
Illinois (State of), Series 2010-1, GO Bonds, (INS -AGM), 6.63%, 02/01/2035(q) | | $ | 200,000 | | | $ | 243,528 | |
Los Angeles (City of), CA Department of Water & Power System, Series 2010, RB, 6.57%, 07/01/2045 | | | 255,000 | | | | 420,755 | |
Los Angeles Community College District | | | | | | | | |
1.81%, 08/01/2030 | | | 475,000 | | | | 473,969 | |
2.11%, 08/01/2032 | | | 380,000 | | | | 379,214 | |
Maryland (State of) Health & Higher Educational Facilities Authority (University of MD Medical System) | | | | | | | | |
Series 2020 D, Ref. RB, 3.05%, 07/01/2040 | | | 215,000 | | | | 213,250 | |
Series 2020 D, Ref. RB, 3.20%, 07/01/2050 | | | 290,000 | | | | 283,643 | |
Texas (State of) Transportation Commission (Central Texas Turnpike System), Series 2020 C, Ref. RB, 3.03%, 08/15/2041 | | | 580,000 | | | | 567,008 | |
| | | | | | | | |
Total Municipal Obligations
(Cost $2,537,776) | | | | | | | 2,581,367 | |
| | | | | | | | |
|
| Agency Credit Risk Transfer Notes-0.50% | |
Fannie Mae Connecticut Avenue Securities | | | | | | | | |
Series 2018-C05, Class 1M2, 2.50% (1 mo. USD LIBOR + 2.35%),
01/25/2031(e)(j) | | | 108,409 | | | | 106,322 | |
Series 2019-R03, Class 1M2, 2.30% (1 mo. USD LIBOR + 2.15%),
09/25/2031(b)(e)(j) | | | 162,511 | | | | 162,085 | |
Series 2019-R06, Class 2M2, 2.25% (1 mo. USD LIBOR + 2.10%),
09/25/2039(b)(e)(j) | | | 245,466 | | | | 243,978 | |
Freddie Mac | | | | | | | | |
Series 2016-DNA4, Class M3, STACR® , 3.95% (1 mo. USD LIBOR + 3.80%), 03/25/2029(e)(r) | | | 239,933 | | | | 249,901 | |
Series 2016-HQA4, Class M3, STACR® , 4.05% (1 mo. USD LIBOR + 3.90%), 04/25/2029(e)(r) | | | 249,625 | | | | 259,149 | |
Series 2020-DNA5, Class M1, STACR® , 1.39% (SOFR + 1.30%), 10/25/2050(b)(e)(r) | | | 355,000 | | | | 355,888 | |
Series 2020-DNA5, Class M2, STACR® , 2.89% (SOFR + 2.80%), 10/25/2050(b)(e)(r) | | | 942,000 | | | | 943,765 | |
| | | | | | | | |
Total Agency Credit Risk Transfer Notes
(Cost $2,334,660) | | | | | | | 2,321,088 | |
| | | | | | | | |
| | | | | | | | |
| | | Principal
Amount | | | Value | |
| Non-U.S. Dollar Denominated Bonds & Notes-0.21%(s) | |
Integrated Telecommunication Services-0.12% | |
AT&T, Inc., Series B, 2.88%, (c)(d) | | | EUR 500,000 | | | $ | 556,635 | |
| | | | | | | | |
| | |
Movies & Entertainment-0.03% | | | | | | | | |
Netflix, Inc., 3.88%, 11/15/2029(b) | | | EUR 100,000 | | | | 129,591 | |
| | | | | | | | |
| | |
Sovereign Debt-0.06% | | | | | | | | |
Ukraine Government International Bond (Ukraine), 4.38%, 01/27/2030(b) | | | EUR 309,000 | | | | 301,202 | |
| | | | | | | | |
Total Non-U.S. Dollar Denominated Bonds & Notes
(Cost $999,033) | | | | | | | 987,428 | |
| | | | | | | | |
| | |
| | | Shares | | | | |
| Preferred Stocks-0.08% | |
Diversified Banks-0.08% | | | | | | | | |
Wells Fargo & Co., Class A, Series L, Conv. Pfd., 7.50%,
(Cost $337,953) | | | 266 | | | | 358,770 | |
| | | | | | | | |
| | |
| Options Purchased-0.04% | | | | | | | | |
(Cost $274,638)† | | | | | | | 174,350 | |
| | | | | | | | |
TOTAL INVESTMENTS IN SECURITIES (excluding investments purchased with cash collateral from securities on loan)-97.38%
(Cost $443,725,103) | | | | | | | 451,316,227 | |
| | | | | | | | |
|
| Investments Purchased with Cash Collateral from Securities on Loan | |
|
| Money Market Funds-4.30% | |
Invesco Private Government Fund, 0.04%(t)(u)(v) | | | 7,969,602 | | | | 7,969,602 | |
Invesco Private Prime Fund,
0.11%(t)(u)(v) | | | 11,950,817 | | | | 11,954,402 | |
| | | | | | | | |
Total Investments Purchased with Cash Collateral from Securities on Loan
(Cost $19,924,004) | | | | | | | 19,924,004 | |
| | | | | | | | |
TOTAL INVESTMENTS IN SECURITIES-101.68%
(Cost $463,649,107) | | | | | | | 471,240,231 | |
OTHER ASSETS LESS LIABILITIES-(1.68)% | | | | | | | (7,783,399 | ) |
| | | | | | | | |
NET ASSETS-100.00%. | | | | | | $ | 463,456,832 | |
| | | | | | | | |
See accompanying Notes to Financial Statements which are an integral part of the financial statements.
Invesco Total Return Bond ETF (GTO)–(continued)
October 31, 2020
| | |
| Investment Abbreviations: |
| AGM | | -Assured Guaranty Municipal Corp. |
| CLO | | -Collateralized Loan Obligation |
| Conv. | | -Convertible |
| Ctfs. | | -Certificates |
| EUR | | -Euro |
| GO | | -General Obligation |
| INS | | -Insurer |
| IO | | -Interest Only |
| LIBOR | | -London Interbank Offered Rate |
| Pfd. | | -Preferred |
| RB | | -Revenue Bonds |
| Ref. | | -Refunding |
| REIT | | -Real Estate Investment Trust |
| SOFR | | -Secured Overnight Financing Rate |
| STACR® | | -Structured Agency Credit Risk |
| STRIPS | | -Separately Traded Registered Interest and Principal Security |
| TBA | | -To Be Announced |
| USD | | -U.S. Dollar |
See accompanying Notes to Financial Statements which are an integral part of the financial statements.
Invesco Total Return Bond ETF (GTO)–(continued)
October 31, 2020
Notes to Schedule of Investments:
| (a) | Industry and/or sector classifications used in this report are generally according to the Global Industry Classification Standard, which was developed by and is the exclusive property and a service mark of MSCI Inc. and Standard & Poor’s. |
| (b) | Security purchased or received in a transaction exempt from registration under the Securities Act of 1933, as amended (the “1933 Act”). The security may be resold pursuant to an exemption from registration under the 1933 Act, typically to qualified institutional buyers. The aggregate value of these securities at October 31, 2020 was $116,847,672, which represented 25.21% of the Fund’s Net Assets. |
| (c) | Security issued at a fixed rate for a specific period of time, after which it will convert to a variable rate. |
| (d) | Perpetual bond with no specified maturity date. |
| (e) | Interest or dividend rate is redetermined periodically. Rate shown is the rate in effect on October 31, 2020. |
| (f) | All or a portion of this security was out on loan at October 31, 2020. |
| (g) | $2,170,457 was pledged as collateral to cover margin requirements for open futures contracts. See Note 2Q. |
| (h) | $1,039,809 was pledged as collateral to cover margin requirements for open swap agreements. See Note 2T. |
| (i) | Security traded on a discount basis. The interest rate shown represents the discount rate at the time of purchase by the Fund. |
| (j) | CAS notes are bonds issued by Fannie Mae. The amount of periodic principal and ultimate principal paid by Fannie Mae is determined by the performance of a large and diverse reference pool. |
| (k) | Interest rate is redetermined periodically based on the cash flows generated by the pool of assets backing the security, less any applicable fees. The rate shown is the rate in effect on October 31, 2020. |
| (l) | Interest only security. Principal amount shown is the notional principal and does not reflect the maturity value of the security. |
| (m) | Step coupon bond. The interest rate represents the coupon rate at which the bond will accrue at a specified future date. |
| (n) | Denotes a zero coupon security issued at a substantial discount from its value at maturity. |
| (o) | Security purchased on a forward commitment basis. This security is subject to dollar roll transactions. See Note 2L. |
| (p) | Interest only security. Principal amount shown is the notional principal and does not reflect the maturity value of the security. Interest rate is redetermined periodically based on the cash flows generated by the pool of assets backing the security, less any applicable fees. The rate shown is the rate in effect on October 31, 2020. |
| (q) | Principal and/or interest payments are secured by the bond insurance company listed. |
| (r) | Principal payments are determined by the delinquency and principal payment experience on the STACR® reference pool. Freddie Mac transfers credit risk from the mortgages in the reference pool to credit investors who invest in the STACR® debt notes. |
| (s) | Foreign denominated security. Principal amount is denominated in the currency indicated. |
| (t) | Affiliated issuer. The issuer and/or the Fund is a wholly-owned subsidiary of Invesco Ltd., or is affiliated by having an investment adviser that is under common control of Invesco Ltd. The table below shows the Fund’s transactions in, and earnings from, its investments in affiliates for the fiscal year ended October 31, 2020. |
| | | | | | | | | | | | | | | | | | | | | | | | | | | | | | | | | | | |
| | | Value
October 31, 2019 | | Purchases
at Cost | | Proceeds
from Sales | | Change in
Unrealized
Appreciation | | Realized
Gain | | Value
October 31, 2020 | | Dividend
Income |
| Investments Purchased with Cash Collateral from Securities on Loan: | | | | | | | | | | | | | | | | | | | | | | | | | | | | | | | | | | | |
| | | | | | | |
| Invesco Private Government Fund | | | $ | - | | | | $ | 210,696,744 | | | | $ | (202,727,142 | ) | | | $ | - | | | | $ | - | | | | $ | 7,969,602 | | | | $ | 2,137 | * |
| | | | | | | |
| Invesco Private Prime Fund | | | | - | | | | | 93,657,094 | | | | | (81,703,426 | ) | | | | - | | | | | 734 | | | | | 11,954,402 | | | | | 2,676 | * |
| | | | | | | | | | | | | | | | | | | | | | | | | | | | | | | | | | | |
| | | | | | | |
Total | | | $ | - | | | | $ | 304,353,838 | | | | $ | (284,430,568 | ) | | | $ | - | | | | $ | 734 | | | | $ | 19,924,004 | | | | $ | 4,813 | |
| | | | | | | | | | | | | | | | | | | | | | | | | | | | | | | | | | | |
| * | Represents the income earned on the investment of cash collateral, which is included in securities lending income on the Statement of Operations. Does not include rebates and fees paid to lending agent or premiums received from borrowers, if any. |
| (u) | The rate shown is the 7-day SEC standardized yield as of October 31, 2020. |
| (v) | The security has been segregated to satisfy the commitment to return the cash collateral received in securities lending transactions upon the borrower’s return of the securities loaned. See Note 2N. |
| † | The table below details options purchased. |
| | | | | | | | | | | | | | | | | | | | | | | | | | | | | | |
| | | Open Exchange-Traded Index Options Purchased | | | | |
Description | | Type of
Contract | | Expiration Date | | Number of
Contracts | | Exercise Price | | Notional
Value* | | Value |
Equity Risk | | | | | | | | | | | | | | | | | | | | | | | | | | | | | | |
| | | | | | |
S&P 500 Index Option | | | | Call | | | | | 09/17/2021 | | | | | 11 | | | | $ | 3,525 | | | | $ | 3,877,500 | | | | $ | 174,350 | |
| * | Notional Value is calculated by multiplying the Number of Contracts by the Exercise Price by the multiplier. |
See accompanying Notes to Financial Statements which are an integral part of the financial statements.
Invesco Total Return Bond ETF (GTO)–(continued)
October 31, 2020
| | | | | | | | | | | | | | | | | | |
| Open Futures Contracts | |
Long Futures Contracts | | Number of
Contracts | | | Expiration
Month | | Notional
Value | | | Value | | | Unrealized
Appreciation
(Depreciation) | |
Interest Rate Risk | | | | | | | | | | | | | | | | | | |
| | | | | |
U.S. Treasury Long Bonds | | | 68 | | | December-2020 | | $ | 11,727,875 | | | $ | (280,620 | ) | | $ | (280,620 | ) |
| | | | | |
U.S. Treasury 2 Year Notes | | | 347 | | | December-2020 | | | 76,632,782 | | | | 3,612 | | | | 3,612 | |
| | | | | |
U.S. Treasury 5 Year Notes | | | 28 | | | December-2020 | | | 3,516,844 | | | | (7,057 | ) | | | (7,057 | ) |
| | | | | |
U.S. Treasury 10 Year Notes | | | 75 | | | December-2020 | | | 10,366,406 | | | | (49,348 | ) | | | (49,348 | ) |
| | | | | | | | | | | | | | | | | | |
| | | | | |
Subtotal–Long Futures Contracts | | | | | | | | | | | | | (333,413 | ) | | | (333,413 | ) |
| | | | | | | | | | | | | | | | | | |
| | | | | |
Short Futures Contracts | | | | | | | | | | | | | | | | | | |
Interest Rate Risk | | | | | | | | | | | | | | | | | | |
| | | | | |
U.S. Treasury 10 Year Ultra Bonds | | | 523 | | | December-2020 | | | (82,258,094 | ) | | | 1,122,935 | | | | 1,122,935 | |
| | | | | |
U.S. Treasury Ultra Bonds | | | 90 | | | December-2020 | | | (19,350,000 | ) | | | 477,229 | | | | 477,229 | |
| | | | | | | | | | | | | | | | | | |
| | | | | |
Subtotal–Short Futures Contracts | | | | | | | | | | | | | 1,600,164 | | | | 1,600,164 | |
| | | | | | | | | | | | | | | | | | |
| | | | | |
Total Futures Contracts | | | | | | | | | | | | $ | 1,266,751 | | | $ | 1,266,751 | |
| | | | | | | | | | | | | | | | | | |
| | | | | | | | | | | | | | | | | | | | | | | | | | | | | | | | | | | | | | | | | | | | | |
| Open Centrally Cleared Credit Default Swap Agreements(a) |
Reference Entity | | Buy/Sell
Protection | | (Pay)/
Receive
Fixed
Rate | | Payment
Frequency | | Maturity Date | | Implied
Credit
Spread(b) | | Notional Value | | Upfront
Payments
Paid
(Received) | | Value | | Unrealized
Appreciation |
Credit Risk | | | | | | | | | | | | | | | | | | | | | | | | | | | | | | | | | | | | | | | | | | | | | |
Markit CDX North | | | | | | | | | | | | | | | | | | | | | | | | | | | | | | | | | | | | | | | | | | | | | |
America High Yield | | | | | | | | | | | | | | | | | | | | | | | | | | | | | | | | | | | | | | | | | | | | | |
Index, Series 35, | | | | | | | | | | | | | | | | | | | | | | | | | | | | | | | | | | | | | | | | | | | | | |
Version 1 | | | | Sell | | | | | 5.00 | % | | | | Quarterly | | | | | 12/20/2025 | | | | | 4.2257 | % | | | | USD 14,624,100 | | | | $ | 581,961 | | | | $ | 593,820 | | | | $ | 11,859 | |
| | | | | | | | | | | | | | | | | | | | | | | | | | | | | | | | | | | | | | | | | | | | | |
| (a) | Centrally cleared swap agreements collateralized by $22,071 cash held with the broker. |
| (b) | Implied credit spreads represent the current level, as of October 31, 2020, at which protection could be bought or sold given the terms of the existing credit default swap agreement and serve as an indicator of the current status of the payment/performance risk of the credit default swap agreement. An implied credit spread that has widened or increased since entry into the initial agreement may indicate a deteriorating credit profile and increased risk of default for the reference entity. A declining or narrowing spread may indicate an improving credit profile or decreased risk of default for the reference entity. Alternatively, credit spreads may increase or decrease reflecting the general tolerance for risk in the credit markets generally. |
| | | | | | | | | | | | | | | | | | | | | | | | | | | |
| Open Forward Foreign Currency Contracts |
| | | | | | | | | | | | | Unrealized |
| | | | | Contract to | | Appreciation |
Settlement Date | | Counterparty | | Deliver | | Receive | | (Depreciation) |
Currency Risk | | | | | | | | | | | | | | | | | | | | | | | | | | | |
| | | | | | |
11/20/2020 | | Goldman Sachs & Co. | | | | CAD | | | | | 57,902 | | | | | USD | | | | | 43,759 | | | | $ | 330 | |
| | | | | | |
11/20/2020 | | Goldman Sachs & Co. | | | | EUR | | | | | 1,235,000 | | | | | USD | | | | | 1,459,225 | | | | | 20,001 | |
| | | | | | | | | | | | | | | | | | | | | | | | | | | |
| | | | | | |
Subtotal–Appreciation | | | | | | | | | | | | | | | | | | | | | | | | | | 20,331 | |
| | | | | | | | | | | | | | | | | | | | | | | | | | | |
| | | | | | |
Currency Risk | | | | | | | | | | | | | | | | | | | | | | | | | | | |
| | | | | | |
11/20/2020 | | Barclays Capital Inc. | | | | USD | | | | | 44,049 | | | | | CAD | | | | | 57,902 | | | | | (620 | ) |
| | | | | | | | | | | | | | | | | | | | | | | | | | | |
| | | | | | |
Subtotal–Depreciation | | | | | | | | | | | | | | | | | | | | | | | | | | (620 | ) |
| | | | | | | | | | | | | | | | | | | | | | | | | | | |
| | | | | | |
Total Forward Foreign Currency Contracts | | | | | | | | | | | | | | | | | | | | | | | | | $ | 19,711 | |
| | | | | | | | | | | | | | | | | | | | | | | | | | | |
Abbreviations:
CAD-Canadian Dollar
EUR -Euro
USD -U.S. Dollar
See accompanying Notes to Financial Statements which are an integral part of the financial statements.
Invesco Ultra Short Duration ETF (GSY)
October 31, 2020
Schedule of Investments(a)
| | | | | | | | |
| | | Principal
Amount | | | Value | |
| U.S. Dollar Denominated Bonds & Notes-46.03% | |
Aerospace & Defense-0.52% | | | | | | | | |
Raytheon Technologies Corp., 2.50%, 12/15/2022(b) | | $ | 15,000,000 | | | $ | 15,549,861 | |
| | | | | | | | |
|
Agricultural & Farm Machinery-0.85% | |
B.A.T. Capital Corp. (United Kingdom), 2.76%, 08/15/2022(c) | | | 12,685,000 | | | | 13,158,167 | |
John Deere Capital Corp. | | | | | | | | |
0.65% (3 mo. USD LIBOR + 0.40%), 06/07/2021(d) | | | 9,639,000 | | | | 9,660,730 | |
1.20%, 04/06/2023 | | | 2,687,000 | | | | 2,739,020 | |
| | | | | | | | |
| | | | | | | 25,557,917 | |
| | | | | | | | |
|
Apparel, Accessories & Luxury Goods-0.12% | |
Ralph Lauren Corp., 1.70%, 06/15/2022 | | | 3,519,000 | | | | 3,590,407 | |
| | | | | | | | |
|
Application Software-0.17% | |
Intuit, Inc., 0.65%, 07/15/2023 | | | 5,000,000 | | | | 5,038,038 | |
| | | | | | | | |
|
Automobile Manufacturers-5.76% | |
American Honda Finance Corp. | | | | | | | | |
0.70% (3 mo. USD LIBOR + 0.47%), 01/08/2021(c)(d) | | | 10,666,000 | | | | 10,675,405 | |
0.60% (3 mo. USD LIBOR + 0.35%), 06/11/2021(d) | | | 5,625,000 | | | | 5,636,293 | |
BMW US Capital LLC (Germany), 3.80%, 04/06/2023(b) | | | 10,000,000 | | | | 10,750,060 | |
Daimler Finance North America LLC (Germany) | | | | | | | | |
3.40%, 02/22/2022(b) | | | 22,290,000 | | | | 23,102,030 | |
2.55%, 08/15/2022(b) | | | 500,000 | | | | 515,234 | |
3.35%, 02/22/2023(b) | | | 21,462,000 | | | | 22,652,418 | |
Hyundai Capital America | | | | | | | | |
1.17% (3 mo. USD LIBOR + 0.94%), 07/08/2021(b)(d) | | | 10,000,000 | | | | 10,005,301 | |
1.25%, 09/18/2023(b) | | | 12,730,000 | | | | 12,768,801 | |
Toyota Motor Credit Corp. | | | | | | | | |
2.60%, 01/11/2022 | | | 6,000,000 | | | | 6,158,139 | |
0.68% (3 mo. USD LIBOR + 0.40%), 05/17/2022(c)(d) | | | 12,260,000 | | | | 12,310,713 | |
0.45%, 07/22/2022 | | | 6,800,000 | | | | 6,821,653 | |
0.50%, 08/14/2023 | | | 17,606,000 | | | | 17,719,190 | |
Volkswagen Group of America Finance LLC (Germany) | | | | | | | | |
1.02% (3 mo. USD LIBOR + 0.77%), 11/13/2020(b)(d) | | | 6,775,000 | | | | 6,776,356 | |
2.50%, 09/24/2021(b) | | | 15,455,000 | | | | 15,730,021 | |
2.70%, 09/26/2022(b) | | | 6,385,000 | | | | 6,619,891 | |
3.13%, 05/12/2023(b) | | | 5,091,000 | | | | 5,385,636 | |
| | | | | | | | |
| | | | | | | 173,627,141 | |
| | | | | | | | |
| | |
Biotechnology-1.88% | | | | | | | | |
AbbVie, Inc. | | | | | | | | |
0.73% (3 mo. USD LIBOR + 0.46%), 11/19/2021(b)(d) | | | 25,000,000 | | | | 25,061,525 | |
2.30%, 11/21/2022(b) | | | 8,000,000 | | | | 8,292,570 | |
Amgen, Inc., 2.65%, 05/11/2022 | | | 9,600,000 | | | | 9,919,371 | |
| | | | | | | | |
| | | Principal
Amount | | | Value | |
Biotechnology-(continued) | |
Gilead Sciences, Inc., 0.75%, 09/29/2023 | | $ | 10,000,000 | | | $ | 10,025,830 | |
Shire Acquisitions Investments Ireland DAC, 2.40%, 09/23/2021 | | | 3,274,000 | | | | 3,327,312 | |
| | | | | | | | |
| | | | | | | 56,626,608 | |
| | | | | | | | |
|
Cable & Satellite-0.67% | |
Comcast Corp., 0.67% (3 mo. USD LIBOR + 0.44%), 10/01/2021(c)(d) | | | 20,000,000 | | | | 20,080,616 | |
| | | | | | | | |
|
Construction Machinery & Heavy Trucks-0.16% | |
Caterpillar Financial Services Corp., 0.45% (3 mo. USD LIBOR + 0.22%), 01/06/2022(d) | | | 4,938,000 | | | | 4,944,512 | |
| | | | | | | | |
|
Consumer Finance-1.45% | |
Ally Financial, Inc., 1.45%, 10/02/2023 | | | 5,309,000 | | | | 5,357,864 | |
American Express Co. | | | | | | | | |
0.81% (3 mo. USD LIBOR + 0.53%), 05/17/2021(d) | | | 5,000,000 | | | | 5,011,673 | |
0.85% (3 mo. USD LIBOR + 0.60%), 11/05/2021(d) | | | 17,000,000 | | | | 17,080,964 | |
Capital One Financial Corp. | | | | | | | | |
1.19% (3 mo. USD LIBOR + 0.95%), 03/09/2022(d) | | | 10,000,000 | | | | 10,088,762 | |
2.60%, 05/11/2023 | | | 5,823,000 | | | | 6,105,597 | |
| | | | | | | | |
| | | | | | | 43,644,860 | |
| | | | | | | | |
|
Data Processing & Outsourced Services-0.67% | |
PayPal Holdings, Inc. | | | | | | | | |
2.20%, 09/26/2022 | | | 10,105,000 | | | | 10,448,229 | |
1.35%, 06/01/2023 | | | 9,688,000 | | | | 9,901,152 | |
| | | | | | | | |
| | | | | | | 20,349,381 | |
| | | | | | | | |
|
Diversified Banks-8.41% | |
ABN AMRO Bank N.V. (Netherlands), 0.82% (3 mo. USD LIBOR + 0.57%), 08/27/2021(b)(d) | | | 4,834,000 | | | | 4,856,709 | |
Australia & New Zealand Banking Group Ltd. (Australia), 0.74% (3 mo. USD LIBOR + 0.46%), 05/17/2021(b)(d) | | | 4,737,000 | | | | 4,748,796 | |
Bank of America Corp. | | | | | | | | |
0.88% (3 mo. USD LIBOR + 0.65%), 06/25/2022(d) | | | 12,000,000 | | | | 12,041,467 | |
3.30%, 01/11/2023 | | | 6,000,000 | | | | 6,363,069 | |
BPCE S.A. (France), 1.48% (3 mo. USD LIBOR + 1.22%), 05/22/2022(b)(d) | | | 12,000,000 | | | | 12,138,869 | |
Canadian Imperial Bank of Commerce (Canada), 0.95%, 06/23/2023(c) | | | 17,045,000 | | | | 17,246,205 | |
Credit Agricole Corporate & Investment Bank S.A. (France), 0.62% (3 mo. USD LIBOR + 0.40%), 05/03/2021(b)(d) | | | 10,000,000 | | | | 10,018,241 | |
Danske Bank A/S (Denmark), 2.70%, 03/02/2022(b) | | | 9,000,000 | | | | 9,264,852 | |
Lloyds Bank PLC (United Kingdom), 0.73% (3 mo. USD LIBOR + 0.49%), 05/07/2021(d) | | | 6,521,000 | | | | 6,534,915 | |
See accompanying Notes to Financial Statements which are an integral part of the financial statements.
Invesco Ultra Short Duration ETF (GSY)–(continued)
October 31, 2020
| | | | | | | | |
| | | Principal
Amount | | | Value | |
Diversified Banks-(continued) | | | | | | | | |
Mitsubishi UFJ Financial Group, Inc. (Japan) | | | | | | | | |
2.13% (3 mo. USD LIBOR + 1.88%), 03/01/2021(d) | | $ | 3,342,000 | | | $ | 3,362,289 | |
0.87% (3 mo. USD LIBOR + 0.65%), 07/26/2021(d) | | | 15,667,000 | | | | 15,733,648 | |
1.31% (3 mo. USD LIBOR + 1.06%), 09/13/2021(c)(d) | | | 5,000,000 | | | | 5,041,865 | |
Mizuho Financial Group, Inc. (Japan) | | | | | | | | |
1.39% (3 mo. USD LIBOR + 1.14%), 09/13/2021(d) | | | 6,850,000 | | | | 6,911,531 | |
2.60%, 09/11/2022 | | | 6,500,000 | | | | 6,751,908 | |
MUFG Union Bank N.A., 3.15%, 04/01/2022 | | | 7,500,000 | | | | 7,775,283 | |
National Australia Bank Ltd. (Australia), 0.93% (3 mo. USD LIBOR + 0.71%), 11/04/2021(b)(d) | | | 12,000,000 | | | | 12,074,776 | |
National Bank of Canada (Canada), 0.90%, 08/15/2023(c)(e) | | | 5,000,000 | | | | 5,031,624 | |
NatWest Markets PLC (United Kingdom), 3.63%, 09/29/2022(b) | | | 17,600,000 | | | | 18,535,864 | |
Nordea Bank Abp (Finland), 1.00%, 06/09/2023(b) | | | 7,407,000 | | | | 7,512,358 | |
Royal Bank of Canada (Canada), 0.60% (3 mo. USD LIBOR + 0.39%), 04/30/2021(d) | | | 10,000,000 | | | | 10,018,362 | |
Standard Chartered PLC (United Kingdom), 1.32%, 10/14/2023(b)(e) | | | 3,787,000 | | | | 3,807,450 | |
Sumitomo Mitsui Financial Group, Inc. (Japan) | | | | | | | | |
1.92% (3 mo. USD LIBOR + 1.68%), 03/09/2021(d) | | | 1,000,000 | | | | 1,005,455 | |
1.36% (3 mo. USD LIBOR + 1.14%), 10/19/2021(d) | | | 10,050,000 | | | | 10,148,508 | |
Sumitomo Mitsui Trust Bank Ltd. (Japan), 0.80%, 09/12/2023(b) | | | 11,102,000 | | | | 11,151,285 | |
Toronto-Dominion Bank (The) (Canada), 0.57% (3 mo. USD LIBOR + 0.35%), 07/22/2022(d) | | | 10,000,000 | | | | 10,033,863 | |
Truist Bank, 0.87% (3 mo. USD LIBOR + 0.59%), 05/17/2022(d) | | | 10,833,000 | | | | 10,897,936 | |
U.S. Bank N.A., 0.66% (3 mo. USD LIBOR + 0.38%), 11/16/2021(d) | | | 9,091,000 | | | | 9,120,023 | |
United Overseas Bank Ltd. (Singapore), 0.69% (3 mo. USD LIBOR + 0.48%), 04/23/2021(b)(d) | | | 2,500,000 | | | | 2,502,080 | |
Wells Fargo Bank N.A., 2.90%, 05/27/2022(e) | | | 12,500,000 | | | | 12,678,119 | |
| | | | | | | | |
| | | | | | | 253,307,350 | |
| | | | | | | | |
| |
Diversified Capital Markets-1.68% | | | | | |
Credit Suisse AG (Switzerland) | | | | | | | | |
0.56% (SOFR + 0.45%),
02/04/2022(d) | | | 15,000,000 | | | | 15,016,195 | |
1.00%, 05/05/2023 | | | 13,636,000 | | | | 13,809,576 | |
| | | | | | | | |
| | | Principal
Amount | | | Value | |
Diversified Capital Markets-(continued) | |
Macquarie Bank Ltd. (Australia), 2.85%, 01/15/2021(b)(c) | | $ | 13,000,000 | | | $ | 13,067,665 | |
UBS Group AG (Switzerland), 2.00% (3 mo. USD LIBOR + 1.78%),
04/14/2021(b)(d) | | | 8,550,000 | | | | 8,614,143 | |
| | | | | | | | |
| | | | | | | 50,507,579 | |
| | | | | | | | |
|
Diversified REITs-0.44% | |
Digital Realty Trust L.P., 2.75%, 02/01/2023 | | | 12,600,000 | | | | 13,185,311 | |
| | | | | | | | |
|
Electric Utilities-1.31% | |
Duke Energy Corp., 0.77% (3 mo. USD LIBOR + 0.50%), 05/14/2021(b)(d) | | | 17,300,000 | | | | 17,338,638 | |
Duke Energy Progress LLC, Series A, 0.43% (3 mo. USD LIBOR + 0.18%), 02/18/2022(d) | | | 9,756,000 | | | | 9,758,199 | |
NextEra Energy Capital Holdings, Inc., 0.70% (3 mo. USD LIBOR + 0.48%), 05/04/2021(d) | | | 8,000,000 | | | | 8,015,222 | |
Xcel Energy, Inc., 0.50%, 10/15/2023 | | | 4,372,000 | | | | 4,377,240 | |
| | | | | | | | |
| | | | | | | 39,489,299 | |
| | | | | | | | |
|
Fertilizers & Agricultural Chemicals-0.18% | |
Nutrien Ltd. (Canada), 1.90%, 05/13/2023 | | | 5,300,000 | | | | 5,471,586 | |
| | | | | | | | |
|
Financial Exchanges & Data-0.16% | |
Intercontinental Exchange, Inc., 0.70%, 06/15/2023 | | | 4,938,000 | | | | 4,971,457 | |
| | | | | | | | |
|
Health Care Distributors-0.12% | |
McKesson Corp., 3.65%, 11/30/2020 | | | 3,583,000 | | | | 3,592,173 | |
| | | | | | | | |
|
Health Care Equipment-0.15% | |
Zimmer Biomet Holdings, Inc., 0.98% (3 mo. USD LIBOR + 0.75%), 03/19/2021(d) | | | 4,450,000 | | | | 4,450,693 | |
| | | | | | | | |
|
Health Care Services-0.65% | |
CVS Health Corp. | | | | | | | | |
0.96% (3 mo. USD LIBOR + 0.72%), 03/09/2021(d) | | | 3,250,000 | | | | 3,256,596 | |
2.13%, 06/01/2021 | | | 5,483,000 | | | | 5,530,775 | |
Evernorth Health, Inc., 1.01% (3 mo. USD LIBOR + 0.75%), 11/30/2020(d) | | | 10,700,000 | | | | 10,702,366 | |
| | | | | | | | |
| | | | | | | 19,489,737 | |
| | | | | | | | |
|
Hotels, Resorts & Cruise Lines-0.67% | |
Marriott International, Inc. | | | | | | | | |
0.90% (3 mo. USD LIBOR + 0.65%), 03/08/2021(d) | | | 1,986,000 | | | | 1,981,419 | |
Series N, 3.13%, 10/15/2021(c) | | | 11,412,000 | | | | 11,572,443 | |
Series Y, 0.85% (3 mo. USD LIBOR + 0.60%), 12/01/2020(d) | | | 6,667,000 | | | | 6,663,185 | |
| | | | | | | | |
| | | | | | | 20,217,047 | |
| | | | | | | | |
|
Industrial Conglomerates-0.61% | |
General Electric Co., 4.63%, 01/07/2021(c) | | | 6,176,000 | | | | 6,220,568 | |
See accompanying Notes to Financial Statements which are an integral part of the financial statements.
Invesco Ultra Short Duration ETF (GSY)–(continued)
October 31, 2020
| | | | | | | | |
| | | Principal
Amount | | | Value | |
Industrial Conglomerates-(continued) | |
Honeywell International, Inc., 0.50% (3 mo. USD LIBOR + 0.23%), 08/19/2022(d) | | $ | 5,096,000 | | | $ | 5,103,173 | |
Siemens Financieringsmaatschappij N.V. (Germany), 1.70%, 09/15/2021(b) | | | 6,904,000 | | | | 6,995,391 | |
| | | | | | | | |
| | | | | | | 18,319,132 | |
| | | | | | | | |
|
Insurance Brokers-0.62% | |
Aon PLC, 2.80%, 03/15/2021 | | | 7,510,000 | | | | 7,563,558 | |
Marsh & McLennan Cos., Inc. | | | | | | | | |
3.50%, 12/29/2020 | | | 5,000,000 | | | | 5,025,533 | |
1.42% (3 mo. USD LIBOR + 1.20%), 12/29/2021(d) | | | 6,000,000 | | | | 6,005,335 | |
| | | | | | | | |
| | | | | | | 18,594,426 | |
| | | | | | | | |
|
Integrated Oil & Gas-1.13% | |
BP Capital Markets America, Inc., 3.22%, 11/28/2023 | | | 7,495,000 | | | | 8,038,563 | |
Exxon Mobil Corp., 1.57%, 04/15/2023 | | | 12,409,000 | | | | 12,758,124 | |
Shell International Finance B.V. (Netherlands), 0.38%, 09/15/2023 | | | 13,333,000 | | | | 13,316,373 | |
| | | | | | | | |
| | | | | | | 34,113,060 | |
| | | | | | | | |
|
Integrated Telecommunication Services-0.38% | |
AT&T, Inc., 1.19% (3 mo. USD LIBOR + 0.95%), 07/15/2021(d) | | | 11,315,000 | | | | 11,385,780 | |
| | | | | | | | |
|
Investment Banking & Brokerage-1.93% | |
Goldman Sachs Group, Inc. (The) | | | | | | | | |
2.88%, 02/25/2021 | | | 8,050,000 | | | | 8,097,813 | |
5.75%, 01/24/2022 | | | 15,517,000 | | | | 16,519,180 | |
Morgan Stanley | | | | | | | | |
0.92% (SOFR + 0.83%), 06/10/2022(d) | | | 18,000,000 | | | | 18,048,710 | |
3.13%, 01/23/2023 | | | 14,598,000 | | | | 15,436,017 | |
| | | | | | | | |
| | | | | | | 58,101,720 | |
| | | | | | | | |
|
IT Consulting & Other Services-0.33% | |
International Business Machines Corp., 0.65% (3 mo. USD LIBOR + 0.40%), 05/13/2021(d) | | | 10,000,000 | | | | 10,019,498 | |
| | | | | | | | |
|
Life & Health Insurance-4.76% | |
AIG Global Funding | | | | | | | | |
0.69% (3 mo. USD LIBOR + 0.46%), 06/25/2021(b)(d) | | | 4,000,000 | | | | 4,010,556 | |
2.30%, 07/01/2022(b) | | | 5,000,000 | | | | 5,164,075 | |
0.80%, 07/07/2023(b) | | | 7,317,000 | | | | 7,373,368 | |
Athene Global Funding | | | | | | | | |
2.80%, 05/26/2023(b) | | | 17,500,000 | | | | 18,255,441 | |
1.20%, 10/13/2023(b) | | | 14,974,000 | | | | 15,002,504 | |
Jackson National Life Global Funding | | | | | | | | |
3.30%, 02/01/2022(b) | | | 10,000,000 | | | | 10,367,992 | |
0.69% (SOFR + 0.60%),
01/06/2023(b)(d) | | | 10,000,000 | | | | 10,022,965 | |
MET Tower Global Funding, 0.64% (SOFR + 0.55%), 01/17/2023(b)(d) | | | 10,000,000 | | | | 10,047,984 | |
Metropolitan Life Global Funding I | | | | | | | | |
0.46% (3 mo. USD LIBOR + 0.23%), 01/08/2021(b)(d) | | | 16,100,000 | | | | 16,107,647 | |
0.66% (SOFR + 0.57%),
01/13/2023(b)(d) | | | 3,749,000 | | | | 3,765,731 | |
0.90%, 06/08/2023(b) | | | 9,524,000 | | | | 9,631,329 | |
| | | | | | | | |
| | | Principal
Amount | | | Value | |
Life & Health Insurance-(continued) | |
New York Life Global Funding | | | | | | | | |
0.50% (3 mo. USD LIBOR + 0.28%), 01/28/2021(b)(d) | | $ | 3,500,000 | | | $ | 3,502,157 | |
2.00%, 04/13/2021(b) | | | 5,000,000 | | | | 5,039,363 | |
0.57% (3 mo. USD LIBOR + 0.32%), 08/06/2021(b)(d) | | | 6,665,000 | | | | 6,678,886 | |
0.66% (3 mo. USD LIBOR + 0.44%), 07/12/2022(b)(d) | | | 7,407,000 | | | | 7,446,499 | |
1.10%, 05/05/2023(b) | | | 3,243,000 | | | | 3,295,649 | |
Principal Life Global Funding II, 2.63%, 11/19/2020(b) | | | 3,470,000 | | | | 3,475,847 | |
Protective Life Global Funding, 0.63%, 10/13/2023(b) | | | 4,192,000 | | | | 4,201,124 | |
| | | | | | | | |
| | | | | | | 143,389,117 | |
| | | | | | | | |
Managed Health Care-0.46% | |
Aetna, Inc., 4.13%, 06/01/2021 | | | 12,000,000 | | | | 12,140,823 | |
UnitedHealth Group, Inc., 2.13%, 03/15/2021 | | | 1,735,000 | | | | 1,746,897 | |
| | | | | | | | |
| | | | | | | 13,887,720 | |
| | | | | | | | |
Movies & Entertainment-0.16% | |
Walt Disney Co. (The), 0.50% (3 mo. USD LIBOR + 0.25%), 09/01/2021(d) | | | 4,762,000 | | | | 4,771,083 | |
| | | | | | | | |
Multi-line Insurance-0.27% | |
Assurant, Inc., 1.48% (3 mo. USD LIBOR + 1.25%), 03/26/2021(d) | | | 510,000 | | | | 509,875 | |
MassMutual Global Funding II, 2.50%, 04/13/2022(b) | | | 7,500,000 | | | | 7,740,418 | |
| | | | | | | | |
| | | | | | | 8,250,293 | |
| | | | | | | | |
Multi-Utilities-0.26% | |
Dominion Energy, Inc., Series D, 0.78% (3 mo. USD LIBOR + 0.53%), 09/15/2023(d) | | | 7,692,000 | | | | 7,714,593 | |
| | | | | | | | |
Oil & Gas Exploration & Production-0.39% | |
ConocoPhillips, 1.18% (3 mo. USD LIBOR + 0.90%), 05/15/2022(d) | | | 11,853,000 | | | | 11,925,730 | |
| | | | | | | | |
Oil & Gas Refining & Marketing-0.06% | |
Phillips 66, 0.83% (3 mo. USD LIBOR + 0.60%), 02/26/2021(d) | | | 1,900,000 | | | | 1,900,281 | |
| | | | | | | | |
Oil & Gas Storage & Transportation-1.05% | |
Enterprise Products Operating LLC, 2.80%, 02/15/2021 | | | 19,753,000 | | | | 19,900,383 | |
Kinder Morgan, Inc., 5.00%, 02/15/2021(b) | | | 8,794,000 | | | | 8,870,744 | |
MPLX L.P., 1.34% (3 mo. USD LIBOR + 1.10%), 09/09/2022(d) | | | 2,844,000 | | | | 2,844,332 | |
| | | | | | | | |
| | | | | | | 31,615,459 | |
| | | | | | | | |
Packaged Foods & Meats-1.39% | |
General Mills, Inc. | | | | | | | | |
0.77% (3 mo. USD LIBOR + 0.54%), 04/16/2021(d) | | | 8,100,000 | | | | 8,113,759 | |
3.20%, 04/16/2021 | | | 6,000,000 | | | | 6,081,234 | |
See accompanying Notes to Financial Statements which are an integral part of the financial statements.
Invesco Ultra Short Duration ETF (GSY)–(continued)
October 31, 2020
| | | | | | | | |
| | | Principal
Amount | | | Value | |
Packaged Foods & Meats-(continued) | | | | | |
Mondelez International Holdings Netherlands B.V. | | | | | | | | |
2.00%, 10/28/2021(b) | | $ | 18,052,000 | | | $ | 18,316,244 | |
2.13%, 09/19/2022(b) | | | 8,995,000 | | | | 9,270,905 | |
| | | | | | | | |
| | | | | | | 41,782,142 | |
| | | | | | | | |
| |
Personal Products-0.13% | | | | | |
Unilever Capital Corp. (United Kingdom), 0.38%, 09/14/2023 | | | 3,917,000 | | | | 3,933,000 | |
| | | | | | | | |
| |
Pharmaceuticals-2.52% | | | | | |
Bayer US Finance II LLC (Germany) 0.86% (3 mo. USD LIBOR + 0.63%), | | | | | | | | |
06/25/2021(b)(d) | | | 13,606,000 | | | | 13,636,977 | |
3.88%, 12/15/2023(b) | | | 30,000,000 | | | | 32,699,408 | |
Bristol-Myers Squibb Co., 0.48% (3 mo. USD LIBOR + 0.20%), 11/16/2020(c)(d) | | | 7,500,000 | | | | 7,500,772 | |
GlaxoSmithKline Capital PLC (United Kingdom), 0.62% (3 mo. USD LIBOR + 0.35%), 05/14/2021(d) | | | 6,757,000 | | | | 6,770,107 | |
Mylan N.V., 3.15%, 06/15/2021 | | | 15,000,000 | | | | 15,218,068 | |
| | | | | | | | |
| | | | | | | 75,825,332 | |
| | | | | | | | |
| |
Regional Banks-0.61% | | | | | |
Citizens Bank N.A., 3.25%, 02/14/2022 | | | 6,431,000 | | | | 6,649,567 | |
KeyBank N.A., 0.87% (3 mo. USD LIBOR + 0.66%), 02/01/2022(d) | | | 11,538,000 | | | | 11,606,512 | |
| | | | | | | | |
| | | | | | | 18,256,079 | |
| | | | | | | | |
| |
Restaurants-0.35% | | | | | |
McDonald’s Corp., 0.65% (3 mo. USD LIBOR + 0.43%), 10/28/2021(d) | | | 10,652,000 | | | | 10,689,933 | |
| | | | | | | | |
| |
Retail REITs-0.13% | | | | | |
Realty Income Corp., 3.25%, 10/15/2022 | | | 3,798,000 | | | | 3,977,036 | |
| | | | | | | | |
| |
Semiconductors-0.40% | | | | | |
Analog Devices, Inc., 2.50%, 12/05/2021 . | | | 11,789,000 | | | | 12,012,394 | |
| | | | | | | | |
| |
Soft Drinks-0.42% | | | | | |
Keurig Dr Pepper, Inc., 3.55%, 05/25/2021 | | | 12,500,000 | | | | 12,725,577 | |
| | | | | | | | |
| |
Specialized REITs-0.23% | | | | | |
American Tower Corp., 2.25%, 01/15/2022 | | | 6,747,000 | | | | 6,894,389 | |
| | | | | | | | |
| |
Technology Hardware, Storage & Peripherals-0.63% | | | | | |
Apple, Inc., 0.75%, 05/11/2023 | | | 7,143,000 | | | | 7,217,348 | |
Hewlett Packard Enterprise Co. | | | | | | | | |
0.93% (3 mo. USD LIBOR + 0.68%), 03/12/2021(d) | | | 4,580,000 | | | | 4,587,727 | |
0.95% (3 mo. USD LIBOR + 0.72%), 10/05/2021(d) | | | 7,059,000 | | | | 7,059,965 | |
| | | | | | | | |
| | | | | | | 18,865,040 | |
| | | | | | | | |
| |
Trading Companies & Distributors-0.42% | | | | | |
Air Lease Corp., 3.50%, 01/15/2022 | | | 12,260,000 | | | | 12,548,229 | |
| | | | | | | | |
| | | | | | | | |
| | | Principal
Amount | | | Value | |
Trucking-0.37% | | | | | | | | |
Aviation Capital Group LLC | | | | | | | | |
1.20% (3 mo. USD LIBOR + 0.95%), | | | | | | | | |
06/01/2021(b)(d) | | $ | 9,574,000 | | | $ | 9,436,195 | |
0.88% (3 mo. USD LIBOR + 0.67%), | | | | | | | | |
07/30/2021(b)(d) | | | 1,775,000 | | | | 1,736,685 | |
| | | | | | | | |
| | | | | | | 11,172,880 | |
| | | | | | | | |
Total U.S. Dollar Denominated Bonds & Notes
(Cost $1,375,757,091) | | | | 1,386,361,496 | |
| | | | | | | | |
|
| Asset-Backed Securities-14.47% | |
ABPCI Direct Lending Fund CLO I LLC (Cayman Islands), Series 2017-1A, Class A1, 2.05% (3 mo. USD LIBOR + 1.78%), 07/20/2029(b)(d) | | | 1,800,000 | | | | 1,795,419 | |
ACIS CLO Ltd. (Cayman Islands), Series 2015-6A, Classs A1, 1.80% (3 mo. USD LIBOR + 1.59%), 05/01/2027(b)(d) | | | 681,304 | | | | 681,672 | |
Angel Oak Mortgage Trust, Series 2020-1, Class A1, 2.47%,
12/25/2059(b)(f) | | | 6,219,405 | | | | 6,280,880 | |
Angel Oak Mortgage Trust I LLC | | | | | | | | |
Series 2019-1, Class A1, 3.92%, 11/25/2048(b)(f) | | | 5,483,647 | | | | 5,624,509 | |
Series 2019-2, Class A1, 3.63%, 03/25/2049(b)(f) | | | 6,033,019 | | | | 6,185,771 | |
Series 2019-4, Class A1, 2.99%, 07/26/2049(b)(f) | | | 4,526,064 | | | | 4,586,801 | |
Angel Oak Mortgage Trust LLC, Series 2020-5, Class A1, 1.37%,
05/25/2065(b)(f) | | | 10,289,634 | | | | 10,310,580 | |
Atrium XIII (Cayman Islands), Series 13A, Class A1, 1.39% (3 mo. USD LIBOR + 1.18%), 11/21/2030(b)(d) | | | 3,000,000 | | | | 2,984,319 | |
Avery Point V CLO Ltd. (Cayman Islands), Series 2014-5A, Class AR, 1.20% (3 mo. USD LIBOR + 0.98%), 07/17/2026(b)(d) | | | 2,036,355 | | | | 2,031,932 | |
Avery Point VI CLO Ltd. (Cayman Islands), Series 2015-6A, Class AR, 1.30% (3 mo. USD LIBOR + 1.05%), 08/05/2027(b)(d) | | | 8,997,907 | | | | 8,955,371 | |
Bear Stearns Asset Backed Securities I Trust, Series 2006-HE9, Class 2A, 0.29% (1 mo. USD LIBOR + 0.14%), 11/25/2036(d) | | | 1,590,638 | | | | 1,531,866 | |
BMW Vehicle Owner Trust, Series 2020-A, Class A2, 0.39%, 02/27/2023 | | | 4,625,000 | | | | 4,628,857 | |
CarMax Auto Owner Trust, Series 2017-2, Class A3, 1.93%, 03/15/2022 | | | 444,592 | | | | 445,275 | |
CBAM Ltd. (Cayman Islands), Series 2018-5A, Class A, 1.24% (3 mo. USD LIBOR + 1.02%),
04/17/2031(b)(d) | | | 6,250,000 | | | | 6,155,986 | |
Chesapeake Funding II LLC (Canada), Series 2018-3A, Class A1, 3.39%, 01/15/2031(b) | | | 3,826,591 | | | | 3,943,716 | |
CIT Mortgage Loan Trust, Series 2007-1, Class 1A, 1.50% (1 mo. USD LIBOR + 1.35%), 10/25/2037(b)(d) | | | 1,482,300 | | | | 1,488,784 | |
See accompanying Notes to Financial Statements which are an integral part of the financial statements.
Invesco Ultra Short Duration ETF (GSY)–(continued)
October 31, 2020
| | | | | | | | |
| | | Principal
Amount | | | Value | |
COLT Mortgage Loan Trust | | | | | | | | |
Series 2019-1, Class A1, 3.71%, 03/25/2049(b)(f) | | $ | 1,411,603 | | | $ | 1,420,726 | |
Series 2019-4, Class A1, 2.58%, 11/25/2049(b)(f) | | | 7,757,435 | | | | 7,862,671 | |
Series 2020-1, Class A1, 2.49%, 02/25/2050(b)(f) | | | 8,907,573 | | | | 9,000,418 | |
Series 2020-1R, Class A1, 1.26%, 09/25/2065(b)(f) | | | 10,608,349 | | | | 10,626,241 | |
Series 2020-2R, Class A1, 1.33%, 10/26/2065(b)(f) | | | 10,000,000 | | | | 9,999,887 | |
Countrywide Asset-Backed Ctfs. | | | | | | | | |
Series 2004-SD2, Class M1, 0.77% (1 mo. USD LIBOR + 0.62%), 06/25/2033(b)(d) | | | 183,410 | | | | 182,113 | |
Series 2006-6, Class 1A1, 0.32% (1 mo. USD LIBOR + 0.17%),
09/25/2036(d) | | | 1,677,472 | | | | 1,661,479 | |
Crown Point CLO III Ltd. (Cayman Islands), Series 2015-3A, Class A2R, 1.69% (3 mo. USD LIBOR + 1.45%), 12/31/2027(b)(d) | | | 2,000,000 | | | | 1,972,848 | |
CSMC, Series 2014-2R, Class 27A1, 0.35% (1 mo. USD LIBOR + 0.20%), 02/27/2046(b)(d) | | | 162,163 | | | | 159,033 | |
CWABS, Inc. Asset-Backed Ctfs. Trust, Series 2004-4, Class M1, 0.87% (1 mo. USD LIBOR + 0.72%), 07/25/2034(d) | | | 1,834,612 | | | | 1,808,974 | |
Deephaven Residential Mortgage Trust | | | | | | | | |
Series 2019-1A, Class A1, 3.74%, 01/25/2059(b)(f) | | | 4,319,897 | | | | 4,368,640 | |
Series 2019-2A, Class A1, 3.56%, 04/25/2059(b)(f) | | | 3,774,476 | | | | 3,823,423 | |
Diamond CLO Ltd. (Cayman Islands), Series 2019-1A, Class A1, 1.82% (3 mo. USD LIBOR + 1.60%), 04/25/2029(b)(d) | | | 12,000,000 | | | | 11,941,408 | |
Discover Card Execution Note Trust, Series 2019-A2, Class A, 0.42% (1 mo. USD LIBOR + 0.27%), 12/15/2023(d) | | | 7,500,000 | | | | 7,519,552 | |
DT Auto Owner Trust, Series 2019-3A, Class A, 2.55%, 08/15/2022(b) | | | 1,123,202 | | | | 1,127,074 | |
Ellington Financial Mortgage Trust | | | | | | | | |
Series 2019-2, Class A1, 2.74%, 11/25/2059(b)(f) | | | 6,037,622 | | | | 6,175,089 | |
Series 2020-2, Class A1, 1.18%, 10/25/2065(b)(f) | | | 1,500,000 | | | | 1,511,196 | |
Enterprise Fleet Financing LLC, Series 2019-1, Class A2, 2.98%, 10/20/2024(b) | | | 2,710,854 | | | | 2,762,252 | |
Fortress Credit Opportunities IX CLO Ltd. (Cayman Islands), Series 2017-9A, Class A1T, 1.83% (3 mo. USD LIBOR + 1.55%), 11/15/2029(b)(d) | | | 2,000,000 | | | | 1,992,662 | |
FS KKR MM CLO 1 LLC, Series 2019-1A, Class A1, 1.98% (3 mo. USD LIBOR + 1.70%), 07/15/2030(b)(d) | | | 9,000,000 | | | | 8,884,187 | |
Galaxy XXII CLO Ltd. (Cayman Islands), Series 2016-22A, Class A1R, 1.23% (3 mo. USD LIBOR + 1.00%), 07/16/2028(b)(d) | | | 4,834,474 | | | | 4,804,640 | |
| | | | | | | | |
| | | Principal
Amount | | | Value | |
GCAT LLC, Series 2019-NQM1, Class A1, 2.99%, 02/25/2059(b)(g) | | $ | 9,770,443 | | | $ | 9,941,703 | |
GCAT Trust, Series 2019-NQM2, Class A1, 2.86%, 09/25/2059(b)(g) | | | 8,679,155 | | | | 8,859,893 | |
Goldentree Loan Management US CLO 2 Ltd. (Cayman Islands), Series 2017-2A, Class A, 1.37% (3 mo. USD LIBOR + 1.15%), 11/28/2030(b)(d) | | | 10,000,000 | | | | 9,897,732 | |
Golub Capital Partners CLO 16 Ltd. (Cayman Islands), Series 2013-16A, Class A1R, 1.92% (3 mo. USD LIBOR + 1.70%), 07/25/2029(b)(d) | | | 4,800,000 | | | | 4,773,579 | |
Golub Capital Partners CLO 36M Ltd. (Cayman Islands), Series 2018-36A, Class A, 1.55% (3 mo. USD LIBOR + 1.30%), 02/05/2031(b)(d) | | | 5,000,000 | | | | 4,823,525 | |
Golub Capital Partners CLO 39B Ltd. (Cayman Islands), Series 2018-39A, Class A1, 1.37% (3 mo. USD LIBOR + 1.15%), 10/20/2028(b)(d) | | | 10,000,000 | | | | 9,978,175 | |
GS Mortgage Securities Corp. Trust, Series 2017-STAY, Class A, 1.25% (1 mo. USD LIBOR + 1.10%),
07/15/2032(b)(d) | | | 12,200,000 | | | | 12,079,314 | |
GS Mortgage-Backed Securities Trust, Series 2020-NQM1, Class A1, 1.38%, 09/27/2060(b)(f) | | | 8,384,252 | | | | 8,413,775 | |
GSAMP Trust, Series 2005-HE6, Class M1, 0.59% (1 mo. USD LIBOR + 0.44%), 11/25/2035(d) | | | 356,299 | | | | 357,053 | |
Halcyon Loan Advisors Funding Ltd. (Cayman Islands), Series 2012-1A, Class B, 3.28% (3 mo. USD LIBOR + 3.00%), 08/15/2023(b)(d) | | | 392,750 | | | | 392,568 | |
Homeward Opportunities Fund I Trust, Series 2019-1, Class A1, 3.45%, 01/25/2059(b)(f) | | | 6,003,943 | | | | 6,060,666 | |
HSI Asset Securitization Corp. Trust, Series 2006-OPT2, Class M2, 0.73% (1 mo. USD LIBOR + 0.39%),
01/25/2036(d) | | | 2,500,000 | | | | 2,482,101 | |
Hunt CRE Ltd. (Cayman Islands), Series 2017-FL1, Class A, 1.15% (1 mo. USD LIBOR + 1.00%), 08/15/2034(b)(d) | | | 4,497,848 | | | | 4,462,905 | |
KKR CLO 21 Ltd. (Cayman Islands), Series A, 1.24% (3 mo. USD LIBOR + 1.00%), 04/15/2031(b)(d) | | | 2,000,000 | | | | 1,965,905 | |
Nationstar Home Equity Loan Trust, Series 2007-B, Class 1AV1, 0.37% (1 mo. USD LIBOR + 0.22%), 04/25/2037(d) | | | 1,864,142 | | | | 1,843,382 | |
Navient Private Education Refi Loan Trust | | | | | | | | |
Series 2019-FA, Class A1, 2.18%, 08/15/2068(b) | | | 1,381,814 | | | | 1,385,595 | |
Series 2020-FA, Class A, 1.22%, 07/15/2069(b) | | | 6,308,215 | | | | 6,332,749 | |
Neuberger Berman CLO XIV Ltd. (Cayman Islands), Series 2013-14A, Class AR2, 1.25% (3 mo. USD LIBOR + 1.03%), 01/28/2030(b)(d) | | | 10,000,000 | | | | 9,935,624 | |
See accompanying Notes to Financial Statements which are an integral part of the financial statements.
Invesco Ultra Short Duration ETF (GSY)–(continued)
October 31, 2020
| | | | | | | | |
| | | Principal
Amount | | | Value | |
New Residential Mortgage Loan Trust | | | | | | | | |
Series 2017-5A, Class A1, 1.65% (1 mo. USD LIBOR + 1.50%), 06/25/2057(b)(d) | | $ | 722,666 | | | $ | 726,614 | |
Series 2019-NQM3, Class A1, 2.80%, 07/25/2049(b)(f) | | | 8,662,212 | | | | 8,748,671 | |
Series 2019-NQM4, Class A1, 2.49%, 09/25/2059(b)(f) | | | 9,059,594 | | | | 9,229,284 | |
Series 2020-NQM1, Series A1, 2.46%, 01/26/2060(b)(f) | | | 4,950,091 | | | | 5,036,928 | |
Newstar Commercial Loan Funding LLC, Series 2017-1A, Class BN, 2.73%
(3 mo. USD LIBOR + 2.50%), 03/20/2027(b)(d) | | | 2,500,000 | | | | 2,472,292 | |
NextGear Floorplan Master Owner Trust | | | | | | | | |
Series 2019-1A, Class A1, 0.80%
(1 mo. USD LIBOR + 0.65%),
02/15/2024(b)(d) | | | 12,750,000 | | | | 12,784,382 | |
Series 2019-2A, Class A1, 0.85%
(1 mo. USD LIBOR + 0.70%),
10/15/2024(b)(d) | | | 10,000,000 | | | | 10,042,780 | |
NXT Capital CLO LLC, Series 2017-1A, Class A, 1.92% (3 mo. USD LIBOR + 1.70%), 04/20/2029(b)(d) | | | 7,500,000 | | | | 7,466,721 | |
OBX Trust, Series 2018-EXP1, Class 2A1, 1.00% (1 mo. USD LIBOR + 0.85%), 04/25/2048(b)(d) | | | 1,918,364 | | | | 1,923,706 | |
OCP CLO Ltd. (Cayman Islands), Series 2014-7A, Class A1RR, 1.34% (3 mo. USD LIBOR + 1.12%), 07/20/2029(b)(d) | | | 6,750,000 | | | | 6,723,344 | |
Octagon Investment Partners XVII Ltd. (Cayman Islands), Series 2013-1A, Class A1R2, 1.22% (3 mo. USD LIBOR + 1.00%), 01/25/2031(b)(d) | | | 5,000,000 | | | | 4,938,614 | |
Race Point VIII CLO Ltd. (Cayman Islands), Series 2013-8A, Class AR2, 1.29% (3 mo. USD LIBOR + 1.04%), 02/20/2030(b)(d) | | | 9,873,273 | | | | 9,753,339 | |
Recette CLO Ltd. (Cayman Islands), Series 2015-1A, Class BR, 1.52%
(3 mo. USD LIBOR + 1.30%),
10/20/2027(b)(d) | | | 2,000,000 | | | | 1,989,912 | |
Residential Mortgage Loan Trust | | | | | | | | |
Series 2019-1, Class A1, 3.94%, 10/25/2058(b)(f) | | | 5,636,422 | | | | 5,720,984 | |
Series 2019-3, Class A1, 2.63%, 09/25/2059(b)(f) | | | 8,367,575 | | | | 8,543,317 | |
Series 2020-1, Class A1, 2.38%, 02/25/2024(b)(f) | | | 5,887,250 | | | | 5,976,570 | |
SoFi Professional Loan Program LLC, Series 2019-B, Class A1FX, 2.78%, 08/17/2048(b) | | | 1,163,430 | | | | 1,169,269 | |
Starwood Mortgage Residential Trust, Series 2020-1, Class A1, 2.28%, 02/25/2050(b)(f) | | | 5,991,039 | | | | 6,104,229 | |
Sudbury Mill CLO Ltd. (Cayman Islands), Series 2013-1A, Class B1R, 1.87%
(3 mo. USD LIBOR + 1.65%), 01/17/2026(b)(d) | | | 2,500,000 | | | | 2,482,592 | |
Tesla Auto Lease Trust, Series 2020-A, Class A2, 0.55%, 05/22/2023(b) | | | 2,250,000 | | | | 2,254,872 | |
| | | | | | | | |
| | | Principal
Amount | | | Value | |
TICP CLO II-2 Ltd. (Cayman Islands), Series 2018-IIA, Class A1, 1.06%
(3 mo. USD LIBOR + 0.84%),
04/20/2028(b)(d) | | $ | 9,964,856 | | | $ | 9,801,908 | |
Venture XII CLO Ltd. (Cayman Islands), Series 2012-12A, Class ARR, 1.06% (3 mo. USD LIBOR + 0.80%), 02/28/2026(b)(d) | | | 3,142,364 | | | | 3,121,439 | |
Venture XVI CLO Ltd. (Cayman Islands), Series 2014-16A, Class ARR, 1.09% (3 mo. USD LIBOR + 0.85%), 01/15/2028(b)(d) | | | 1,178,243 | | | | 1,168,658 | |
Verus Securitization Trust | | | | | | | | |
Series 2019-1, Class A1, 3.84%, 02/25/2059(b)(f) | | | 5,326,716 | | | | 5,379,388 | |
Series 2019-2, Class A1, 3.21%, 05/25/2059(b)(f) | | | 4,920,283 | | | | 4,974,906 | |
Series 2020-1, Class A1, 2.42%, 01/25/2060(b)(g) | | | 12,277,615 | | | | 12,490,177 | |
Series 2020-5, Class A1, 1.22%, 05/25/2065(b)(g) | | | 10,000,000 | | | | 10,048,919 | |
Woodmont Trust, Series 2017-2A, Class A, 2.02% (3 mo. USD LIBOR + 1.80%), 07/18/2028(b)(d) | | | 3,600,000 | | | | 3,562,731 | |
| | | | | | | | |
Total Asset-Backed Securities
(Cost $434,324,649) | | | | | | | 435,859,041 | |
| | | | | | | | |
|
| U.S. Treasury Securities-4.31% | |
U.S. Treasury Bills-3.02% | | | | | | | | |
0.15%, 12/01/2020(h) | | | 4,150,000 | | | | 4,149,758 | |
0.10%, 01/28/2021(h) | | | 7,500,000 | | | | 7,498,459 | |
0.11%, 02/04/2021(h) | | | 46,700,000 | | | | 46,689,324 | |
0.14%, 07/15/2021(h) | | | 32,600,000 | | | | 32,578,063 | |
| | | | | | | | |
| | | | | | | 90,915,604 | |
| | | | | | | | |
| | |
U.S. Treasury Notes-1.29% | | | | | | | | |
0.13%, 05/15/2023 | | | 20,000,000 | | | | 19,976,562 | |
0.13%, 08/15/2023 | | | 19,000,000 | | | | 18,967,344 | |
| | | | | | | | |
| | | | | | | 38,943,906 | |
| | | | | | | | |
Total U.S. Treasury Securities
(Cost $129,762,266) | | | | | | | 129,859,510 | |
| | | | | | | | |
|
| Variable Rate Senior Loan Interests-0.06%(i)(j) | |
Aerospace & Defense-0.06% | | | | | | | | |
Fly Funding II S.a.r.l. (Ireland), Term Loan B, 1.99% (3 mo. USD LIBOR + 1.75%), 08/09/2025 (Cost $1,872,427) | | | 1,876,701 | | | | 1,639,767 | |
| | | | | | | | |
|
| Commercial Paper-27.97% | |
Alexandria Real Estate Equities, Inc. | | | | | | | | |
0.20%-0.20%, 11/04/2020(b)(h) | | | 11,900,000 | | | | 11,899,479 | |
0.23%, 11/18/2020(b)(h) | | | 30,000,000 | | | | 29,994,601 | |
Barclays Bank PLC, 0.32%,
03/22/2021(h) | | | 24,300,000 | | | | 24,281,660 | |
BAT International Finance PLC, 0.22%, 11/24/2020(b)(h) | | | 11,500,000 | | | | 11,498,547 | |
Boeing Co. (The), 2.19%, 11/17/2020(b)(h) | | | 10,000,000 | | | | 9,996,315 | |
Brookfield BRP Holdings Canada, Inc., 0.28%-0.33%, 11/10/2020(h) | | | 30,500,000 | | | | 30,498,555 | |
See accompanying Notes to Financial Statements which are an integral part of the financial statements.
Invesco Ultra Short Duration ETF (GSY)–(continued)
October 31, 2020
| | | | | | | | |
| | | Principal
Amount | | | Value | |
Bunge Asset Funding Corp., 0.95%, 12/04/2020(b)(h) | | $ | 25,000,000 | | | $ | 24,990,512 | |
Canadian Natural Resources Ltd., 0.24%, 11/25/2020(b)(h) | | | 14,900,000 | | | | 14,898,042 | |
Cigna Corp., 0.22%, 11/10/2020(b)(h) | | | 23,750,000 | | | | 23,748,875 | |
CommonSpirit Health, Series A, 0.35%, 03/25/2021(h) | | | 25,000,000 | | | | 24,981,040 | |
Crown Castle International Corp., 0.47%, 11/24/2020(b)(h) | | | 23,000,000 | | | | 22,993,819 | |
Eastman Chemical Co. | | | | | | | | |
0.30%, 11/12/2020(b)(h) | | | 10,000,000 | | | | 9,999,422 | |
0.32%, 11/18/2020(b)(h) | | | 10,000,000 | | | | 9,999,082 | |
Enable Midstream Partners L.P. | | | | | | | | |
0.54%, 11/10/2020(b)(h) | | | 24,000,000 | | | | 23,996,942 | |
0.53%, 12/09/2020(b)(h) | | | 35,000,000 | | | | 34,982,811 | |
Enel Finance America LLC | | | | | | | | |
0.24%, 11/18/2020(b)(h) | | | 9,742,000 | | | | 9,741,126 | |
0.30%, 02/25/2021(b)(h) | | | 10,000,000 | | | | 9,991,412 | |
ENGIE S.A, 0.28%, 11/17/2020(b)(h) | | | 17,600,000 | | | | 17,598,618 | |
Eni Finance USA, Inc. | | | | | | | | |
0.30%, 12/09/2020(b)(h) | | | 4,000,000 | | | | 3,999,076 | |
0.37%, 01/06/2021(b)(h) | | | 21,000,000 | | | | 20,991,035 | |
0.35%, 01/15/2021(b)(h) | | | 12,500,000 | | | | 12,493,637 | |
Entergy Corp., 0.22%, 01/20/2021(b)(h) | | | 25,118,000 | | | | 25,100,264 | |
ETP Legacy L.P. | | | | | | | | |
0.60%, 11/02/2020(b)(h) | | | 50,800,000 | | | | 50,798,328 | |
0.68%, 11/03/2020(b)(h) | | | 2,600,000 | | | | 2,599,886 | |
General Motors Financial Co., Inc., 0.80%, 02/19/2021(b)(h) | | | 9,000,000 | | | | 8,974,324 | |
Glencore Funding LLC, 0.57%, 12/07/2020(b)(h) | | | 20,000,000 | | | | 19,991,281 | |
Harley-Davidson Financial Services, Inc. | | | | | | | | |
0.58%, 03/03/2021(b)(h) | | | 14,400,000 | | | | 14,364,536 | |
0.81%, 04/06/2021(b)(h) | | | 4,000,000 | | | | 3,984,744 | |
HSBC USA, Inc., 0.55%, 02/01/2021(b)(h) | | | 35,000,000 | | | | 34,987,023 | |
Humana, Inc., 0.20%, 12/18/2020(b)(h) | | | 17,200,000 | | | | 17,187,335 | |
Intercontinental Exchange, Inc. | | | | | | | | |
0.37%, 11/16/2020(b)(h) | | | 25,000,000 | | | | 24,996,237 | |
0.37%, 01/06/2021(b)(h) | | | 10,000,000 | | | | 9,993,345 | |
Jabil, Inc. | | | | | | | | |
0.73%, 11/02/2020(b)(h) | | | 10,000,000 | | | | 9,999,671 | |
0.71%-0.73%, 11/16/2020(b)(h) | | | 26,500,000 | | | | 26,494,632 | |
0.72%, 11/18/2020(b)(h) | | | 22,000,000 | | | | 21,994,961 | |
Motiva Enterprises LLC, 0.27%, 11/04/2020(h) | | | 31,376,000 | | | | 31,375,368 | |
NatWest Markets PLC, Series G, 2.27%, 01/07/2021(b)(h) | | | 10,000,000 | | | | 9,996,531 | |
Shell International Finance B.V., 2.11%, 02/02/2021(b)(h) | | | 12,275,000 | | | | 12,266,934 | |
Starbucks Corp., 1.93%, 01/29/2021(b)(h) | | | 20,000,000 | | | | 19,981,042 | |
TransCanada PipeLines Ltd., 0.29%, 01/08/2021(b)(h) | | | 13,000,000 | | | | 12,994,641 | |
Waste Management, Inc., 0.40%, 08/16/2021(b)(h) | | | 22,300,000 | | | | 22,237,665 | |
WGL Holdings, Inc. | | | | | | | | |
0.25%, 11/02/2020(b)(h) | | | 2,600,000 | | | | 2,599,971 | |
0.25%, 11/04/2020(b)(h) | | | 10,000,000 | | | | 9,999,812 | |
0.25%, 11/10/2020(b)(h) | | | 10,000,000 | | | | 9,999,587 | |
White Plains Capital Co. LLC | | | | | | | | |
1.31%, 01/12/2021(b)(h) | | | 14,500,000 | | | | 14,488,257 | |
| | | | | | | | |
| | | Principal
Amount | | | Value | |
1.06%, 02/17/2021(b)(h) | | $ | 12,500,000 | | | $ | 12,486,823 | |
1.01%, 04/06/2021(b)(h) | | | 14,000,000 | | | | 13,977,388 | |
1.01%, 04/13/2021(b)(h) | | | 15,000,000 | | | | 14,974,563 | |
| | | | | | | | |
| | |
Total Commercial Paper
(Cost $842,024,421) | | | | | | | 842,419,755 | |
| | | | | | | | |
| | |
| | | Repurchase
Amount | | | | |
| Repurchase Agreements-6.15%(k) | |
Citigroup Global Markets, Inc., joint open agreement dated 03/17/2020 (collateralized by domestic and foreign non-agency asset-backed securities, domestic non-agency mortgage-backed securities and foreign corporate obligations valued at $280,918,444; 0.00% - 7.48%; 01/25/2022 - 10/28/2064), 0.70%(l) | | | - | | | | 50,000,000 | |
J.P. Morgan Securities LLC, joint open agreement dated 03/02/2020 (collateralized by a domestic non-agency asset-backed security, domestic non-agency mortgage-backed securities and domestic and foreign corporate obligations valued at $134,899,911; 0.00% - 5.00%; 12/15/2020 - 02/25/2050), 0.56%(l) | | | - | | | | 25,000,000 | |
Nomura Securities International, Inc., joint term agreement dated 10/30/2020, aggregate maturing value of $50,000,000 (collateralized by domestic non-agency mortgage-backed securities valued at $55,000,000; 0.00% - 0.75%; 04/25/2036 - 04/30/2050), 0.97%, 02/26/2021(d) | | | 25,000,000 | | | | 25,000,000 | |
Societe Generale, joint term agreement dated 08/05/2020, aggregate maturing value of $100,000,000 (collateralized by domestic agency and non-agency mortgage-backed securities, domestic and foreign non-agency asset-backed securities and domestic and foreign corporate obligations valued at $109,619,339; 0.00% - 12.25%; 01/07/2021 - 10/07/2079), 0.73%, 04/22/2021(d) | | | 50,000,000 | | | | 50,000,000 | |
Truist Securities, joint term agreement dated 10/13/2020, aggregate maturing value of $70,023,333 (collateralized by U.S. Treasury obligations and domestic and foreign corporate obligations valued at $76,245,371; 0.00% - 7.88%; 11/12/2020 - 10/01/2060), 0.50%, 11/06/2020(m) | | | 35,011,667 | | | | 35,000,000 | |
| | | | | | | | |
Total Repurchase Agreements
(Cost $185,000,000) | | | | | | | 185,000,000 | |
| | | | | | | | |
See accompanying Notes to Financial Statements which are an integral part of the financial statements.
Invesco Ultra Short Duration ETF (GSY)–(continued)
October 31, 2020
| | | | | | | | |
| | | Principal
Amount | | | Value | |
| Certificate of Deposit-0.83% | |
Diversified Banks-0.83% | | | | | | | | |
Sumitomo Mitsui Banking Corp. (Japan), 0.70%, 07/08/2022
(Cost $25,000,000) | | $ | 25,000,000 | | | $ | 25,022,747 | |
| | | | | | | | |
TOTAL INVESTMENTS IN SECURITIES
(excluding investments purchased with cash collateral from securities on loan)-99.82%
(Cost $2,993,740,854) | | | | 3,006,162,316 | |
| | | | | | | | |
| | |
| | | Shares | | | | |
| Investments Purchased with Cash Collateral from Securities on Loan | | | | | |
| |
| Money Market Funds-0.07% | | | | | |
Invesco Private Government Fund, 0.04%(n)(o)(p) | | | 866,215 | | | | 866,215 | |
| | |
Investment Abbreviations: |
BR | | -Bearer Shares |
CLO | | -Collateralized Loan Obligation |
Ctfs. | | -Certificates |
LIBOR | | -London Interbank Offered Rate |
REIT | | -Real Estate Investment Trust |
SOFR | | -Secured Overnight Financing Rate |
USD | | -U.S. Dollar |
| | | | | | | | |
| | | Shares | | | Value | |
| Money Market Funds-(continued) | | | | | |
Invesco Private Prime Fund,
0.11%(n)(o)(p) | | | 1,298,934 | | | $ | 1,299,323 | |
| | | | | | | | |
Total Investments Purchased with Cash Collateral from Securities on Loan
(Cost $2,165,538) | | | | 2,165,538 | |
| | | | | | | | |
TOTAL INVESTMENTS IN SECURITIES-99.89%
(Cost $2,995,906,392) | | | | 3,008,327,854 | |
OTHER ASSETS LESS LIABILITIES-0.11% | | | | 3,279,185 | |
| | | | | | | | |
NET ASSETS-100.00% | | | | | | $ | 3,011,607,039 | |
| | | | | | | | |
See accompanying Notes to Financial Statements which are an integral part of the financial statements.
Invesco Ultra Short Duration ETF (GSY)–(continued)
October 31, 2020
Notes to Schedule of Investments:
| (a) | Industry and/or sector classifications used in this report are generally according to the Global Industry Classification Standard, which was developed by and is the exclusive property and a service mark of MSCI Inc. and Standard & Poor’s. |
| (b) | Security purchased or received in a transaction exempt from registration under the Securities Act of 1933, as amended (the “1933 Act”). The security may be resold pursuant to an exemption from registration under the 1933 Act, typically to qualified institutional buyers. The aggregate value of these securities at October 31, 2020 was $1,695,797,148, which represented 56.31% of the Fund’s Net Assets. |
| (c) | All or a portion of this security was out on loan at October 31, 2020. |
| (d) | Interest or dividend rate is redetermined periodically. Rate shown is the rate in effect on October 31, 2020. |
| (e) | Security issued at a fixed rate for a specific period of time, after which it will convert to a variable rate. |
| (f) | Interest rate is redetermined periodically based on the cash flows generated by the pool of assets backing the security, less any applicable fees. The rate shown is the rate in effect on October 31, 2020. |
| (g) | Step coupon bond. The interest rate represents the coupon rate at which the bond will accrue at a specified future date. |
| (h) | Security traded on a discount basis. The interest rate shown represents the discount rate at the time of purchase by the Fund. |
| (i) | Variable rate senior loan interests often require prepayments from excess cash flow or permit the borrower to repay at its election. The degree to which borrowers repay, whether as a contractual requirement or at their election, cannot be predicted with any accuracy. As a result, the actual remaining maturity may be substantially less than the stated maturities shown. However, it is anticipated that the variable rate senior loan interests will have an expected average life of three to five years. |
| (j) | Variable rate senior loan interests are, at present, not readily marketable, not registered under the 1933 Act and may be subject to contractual and legal restrictions on sale. Variable rate senior loan interests in the Fund’s portfolio generally have variable rates which adjust to a base, such as the LIBOR, on set dates, typically every 30 days, but not greater than one year, and/or have interest rates that float at margin above a widely recognized base lending rate such as the Prime Rate of a designated U.S. bank. |
| (k) | Principal amount equals value at period end. See Note 2K. |
| (l) | Either party may terminate the agreement upon demand. Interest rates, principal amount and collateral are redetermined daily. |
(m) The Fund may demand payment of the term repurchase agreement upon one to seven business days’ notice depending on the timing of the demand.
| (n) | Affiliated issuer. The issuer and/or the Fund is a wholly-owned subsidiary of Invesco Ltd., or is affiliated by having an investment adviser that is under common control of Invesco Ltd. The table below shows the Fund’s transactions in, and earnings from, its investments in affiliates for the fiscal year ended October 31, 2020. |
| | | | | | | | | | | | | | | | | | | | | | | | | | | | | | | | | | | |
| | | | | | | | | Change in | | Realized | | | | |
| | | Value | | Purchases | | Proceeds | | Unrealized | | Gain | | Value | | Dividend |
| | | October 31, 2019 | | at Cost | | from Sales | | Appreciation | | (Loss) | | October 31, 2020 | | Income |
| Investments Purchased with Cash Collateral from Securities on Loan: | | | | | | | | | | | | | | | | | | | | | | | | | | | | | | | | | | | |
| | | | | | | |
| Invesco Government & Agency Portfolio, Institutional Class | | | $ | 947,040 | | | | $ | 22,650,050 | | | | $ | (23,597,090 | ) | | | $ | - | | | | $ | - | | | | $ | - | | | | $ | 12,551 | * |
| | | | | | | |
| Invesco Liquid Assets Portfolio, Institutional Class | | | | 315,445 | | | | | 7,074,807 | | | | | (7,390,014 | ) | | | | - | | | | | (238 | ) | | | | - | | | | | 4,706 | * |
| | | | | | | |
| Invesco Private Government Fund | | | | - | | | | | 49,410,851 | | | | | (48,544,636 | ) | | | | - | | | | | - | | | | | 866,215 | | | | | 591 | * |
| | | | | | | |
| Invesco Private Prime Fund | | | | - | | | | | 11,586,580 | | | | | (10,287,548 | ) | | | | - | | | | | 291 | | | | | 1,299,323 | | | | | 560 | * |
| | | | | | | | | | | | | | | | | | | | | | | | | | | | | | | | | | | |
| | | | | | | |
| Total | | | $ | 1,262,485 | | | | $ | 90,722,288 | | | | $ | (89,819,288 | ) | | | $ | - | | | | $ | 53 | | | | $ | 2,165,538 | | | | $ | 18,408 | |
| | | | | | | | | | | | | | | | | | | | | | | | | | | | | | | | | | | |
| * | Represents the income earned on the investment of cash collateral, which is included in securities lending income on the Statement of Operations. Does not include rebates and fees paid to lending agent or premiums received from borrowers, if any. |
| (o) | The rate shown is the 7-day SEC standardized yield as of October 31, 2020. |
| (p) | The security has been segregated to satisfy the commitment to return the cash collateral received in securities lending transactions upon the borrower’s return of the securities loaned. See Note 2N. |
See accompanying Notes to Financial Statements which are an integral part of the financial statements.
Invesco Variable Rate Investment Grade ETF (VRIG)
October 31, 2020
Schedule of Investments(a)
| | | | | | | | |
| | | Principal
Amount | | | Value | |
| U.S. Dollar Denominated Bonds & Notes-47.78% | |
Automobile Manufacturers-3.63% | | | | | |
American Honda Finance Corp. | | | | | | | | |
0.73% (3 mo. USD LIBOR + 0.45%), 02/15/2022(b) | | $ | 2,500,000 | | | $ | 2,507,937 | |
0.61% (3 mo. USD LIBOR + 0.37%), 05/10/2023(b) | | | 2,000,000 | | | | 2,001,875 | |
Daimler Finance North America LLC (Germany) | | | | | | | | |
0.77% (3 mo. USD LIBOR + 0.55%), 05/04/2021(b)(c) | | | 2,000,000 | | | | 2,002,955 | |
1.18% (3 mo. USD LIBOR + 0.90%), 02/15/2022(b)(c) | | | 1,500,000 | | | | 1,510,035 | |
Ford Motor Credit Co. LLC | | | | | | | | |
1.50% (3 mo. USD LIBOR + 1.27%), 03/28/2022(b) | | | 1,000,000 | | | | 965,467 | |
1.30% (3 mo. USD LIBOR + 1.08%), 08/03/2022(b) | | | 1,500,000 | | | | 1,439,303 | |
General Motors Financial Co., Inc. | | | | | | | | |
1.35% (3 mo. USD LIBOR + 1.10%), 11/06/2021(b) | | | 2,000,000 | | | | 1,999,598 | |
1.53% (3 mo. USD LIBOR + 1.31%), 06/30/2022(b) | | | 1,000,000 | | | | 1,001,504 | |
1.22% (3 mo. USD LIBOR + 0.99%), 01/05/2023(b) | | | 1,000,000 | | | | 990,413 | |
Volkswagen Group of America Finance LLC (Germany), 1.20% (3 mo. USD LIBOR + 0.94%), 11/12/2021(b)(c) | | | 2,000,000 | | | | 2,012,991 | |
| | | | | | | | |
| | | | | | | 16,432,078 | |
| | | | | | | | |
| | |
Biotechnology-0.67% | | | | | | | | |
AbbVie, Inc., 0.90% (3 mo. USD LIBOR + 0.65%), 11/21/2022(b)(c) | | | 3,000,000 | | | | 3,014,492 | |
| | | | | | | | |
| | |
Consumer Finance-0.22% | | | | | | | | |
Capital One Financial Corp., 0.93% (3 mo. USD LIBOR + 0.72%),
01/30/2023(b) | | | 1,000,000 | | | | 1,000,773 | |
| | | | | | | | |
| | |
Distillers & Vintners-0.99% | | | | | | | | |
Constellation Brands, Inc., 0.98% (3 mo. USD LIBOR + 0.70%),
11/15/2021(b) | | | 4,466,000 | | | | 4,466,247 | |
| | | | | | | | |
| | |
Diversified Banks-17.71% | | | | | | | | |
Banco Santander S.A. (Spain), 1.78% (3 mo. USD LIBOR + 1.56%),
04/11/2022(b) | | | 5,200,000 | | | | 5,251,392 | |
Bank of America Corp. | | | | | | | | |
1.22% (3 mo. USD LIBOR + 1.00%), 04/24/2023(b) | | | 3,281,000 | | | | 3,313,710 | |
1.04% (3 mo. USD LIBOR + 0.79%), 03/05/2024(b) | | | 3,750,000 | | | | 3,775,084 | |
0.82% (SOFR + 0.73%), 10/24/2024(b) | | | 2,000,000 | | | | 2,003,276 | |
1.02% (3 mo. USD LIBOR + 0.77%), 02/05/2026(b) | | | 1,042,000 | | | | 1,042,682 | |
1.01% (3 mo. USD LIBOR + 0.76%), 09/15/2026(b) | | | 2,696,000 | | | | 2,650,490 | |
| | | | | | | | |
| | | Principal
Amount | | | Value | |
Diversified Banks-(continued) | | | | | | | | |
Barclays PLC (United Kingdom) | | | | | | | | |
1.85% (3 mo. USD LIBOR + 1.63%), 01/10/2023(b) | | $ | 2,000,000 | | | $ | 2,016,823 | |
1.71% (3 mo. USD LIBOR + 1.43%), 02/15/2023(b) | | | 2,000,000 | | | | 2,010,357 | |
1.66% (3 mo. USD LIBOR + 1.38%), 05/16/2024(b) | | | 3,000,000 | | | | 3,018,111 | |
BBVA USA, 0.98% (3 mo. USD LIBOR + 0.73%), 06/11/2021(b) | | | 1,000,000 | | | | 1,002,824 | |
BPCE S.A. (France), 1.48% (3 mo. USD LIBOR + 1.22%), 05/22/2022(b)(c) | | | 4,000,000 | | | | 4,046,289 | |
Capital One N.A., 1.36% (3 mo. USD LIBOR + 1.15%), 01/30/2023(b) | | | 3,750,000 | | | | 3,778,053 | |
Citigroup, Inc. | | | | | | | | |
0.96% (SOFR + 0.87%), 11/04/2022(b) | | | 2,500,000 | | | | 2,512,888 | |
1.17% (3 mo. USD LIBOR + 0.95%), 07/24/2023(b) | | | 1,500,000 | | | | 1,511,387 | |
1.68% (3 mo. USD LIBOR + 1.43%), 09/01/2023(b) | | | 2,500,000 | | | | 2,541,106 | |
1.27% (3 mo. USD LIBOR + 1.02%), 06/01/2024(b) | | | 4,010,000 | | | | 4,048,998 | |
HSBC Holdings PLC (United Kingdom), 1.63% (3 mo. USD LIBOR + 1.38%), 09/12/2026(b) | | | 3,000,000 | | | | 3,003,106 | |
ING Groep N.V. (Netherlands), 1.23% (3 mo. USD LIBOR + 1.00%),
10/02/2023(b)(d) | | | 3,500,000 | | | | 3,552,268 | |
JPMorgan Chase & Co. | | | | | | | | |
1.45% (3 mo. USD LIBOR + 1.23%), 10/24/2023(b) | | | 1,900,000 | | | | 1,934,203 | |
Series I, 3.68% (3 mo. USD LIBOR + 3.47%)(b)(e) | | | 978,000 | | | | 923,804 | |
Series V, 3.55% (3 mo. USD LIBOR + 3.32%)(b)(e) | | | 2,500,000 | | | | 2,330,397 | |
Mizuho Financial Group, Inc. (Japan), 1.07% (3 mo. USD LIBOR + 0.84%), 07/16/2023(b) | | | 2,500,000 | | | | 2,513,236 | |
Natwest Group PLC (United Kingdom) | | | | | | | | |
1.75% (3 mo. USD LIBOR + 1.47%), 05/15/2023(b) | | | 4,000,000 | | | | 4,026,808 | |
1.78% (3 mo. USD LIBOR + 1.55%), 06/25/2024(b) | | | 4,000,000 | | | | 4,032,963 | |
NatWest Markets PLC (United Kingdom), 1.62% (3 mo. USD LIBOR + 1.40%), 09/29/2022(b)(c) | | | 2,500,000 | | | | 2,522,523 | |
Nordea Bank Abp (Finland), 1.20% (3 mo. USD LIBOR + 0.94%), 08/30/2023(b)(c) | | | 2,987,000 | | | | 2,993,965 | |
Standard Chartered PLC (United Kingdom) | | | | | | | | |
1.45% (3 mo. USD LIBOR + 1.20%), 09/10/2022(b)(c) | | | 1,667,000 | | | | 1,672,652 | |
1.37% (3 mo. USD LIBOR + 1.15%), 01/20/2023(b)(c) | | | 3,316,000 | | | | 3,326,846 | |
Truist Bank, 0.82% (SOFR + 0.73%), 03/09/2023(b) | | | 2,000,000 | | | | 2,016,410 | |
USB Realty Corp., 1.38% (3 mo. USD LIBOR + 1.15%)(b)(c)(e) | | | 1,100,000 | | | | 853,737 | |
| | | | | | | | |
| | | | | | | 80,226,388 | |
| | | | | | | | |
See accompanying Notes to Financial Statements which are an integral part of the financial statements.
Invesco Variable Rate Investment Grade ETF (VRIG)–(continued)
October 31, 2020
| | | | | | | | |
| | | Principal
Amount | | | Value | |
Health Care Distributors-0.89% | | | | | | | | |
Cardinal Health, Inc., 1.02% (3 mo. USD LIBOR + 0.77%), 06/15/2022(b) | | $ | 4,000,000 | | | $ | 4,030,000 | |
| | | | | | | | |
| | |
Health Care Equipment-0.94% | | | | | | | | |
Becton, Dickinson and Co., 1.28% (3 mo. USD LIBOR + 1.03%), 06/06/2022(b) | | | 4,225,000 | | | | 4,259,859 | |
| | | | | | | | |
| | |
Health Care Services-2.12% | | | | | | | | |
Cigna Corp., 1.13% (3 mo. USD LIBOR + 0.89%), 07/15/2023(b) | | | 4,543,000 | | | | 4,592,397 | |
CVS Health Corp., 0.96% (3 mo. USD LIBOR + 0.72%), 03/09/2021(b) | | | 5,000,000 | | | | 5,010,148 | |
| | | | | | | | |
| | | | | | | 9,602,545 | |
| | | | | | | | |
| | |
Household Products-0.61% | | | | | | | | |
Reckitt Benckiser Treasury Services PLC (United Kingdom), 0.78% (3 mo. USD LIBOR + 0.56%), 06/24/2022(b)(c) | | | 2,750,000 | | | | 2,760,790 | |
| | | | | | | | |
| |
Integrated Telecommunication Services-2.39% | | | | | |
AT&T, Inc. | | | | | | | | |
1.16% (3 mo. USD LIBOR + 0.89%), 02/15/2023(b) | | | 2,669,000 | | | | 2,691,626 | |
1.43% (3 mo. USD LIBOR + 1.18%), 06/12/2024(b) | | | 3,832,000 | | | | 3,920,670 | |
Verizon Communications, Inc., 1.38% (3 mo. USD LIBOR + 1.10%),
05/15/2025(b) | | | 4,127,000 | | | | 4,230,423 | |
| | | | | | | | |
| | | | | | | 10,842,719 | |
| | | | | | | | |
| |
Interactive Media & Services-0.25% | | | | | |
Tencent Holdings Ltd. (China), 0.82% (3 mo. USD LIBOR + 0.61%),
01/19/2023(b)(c) | | | 1,143,000 | | | | 1,133,879 | |
| | | | | | | | |
| |
Investment Banking & Brokerage-5.69% | | | | | |
Goldman Sachs Group, Inc. (The) | | | | | | | | |
2.02% (3 mo. USD LIBOR + 1.77%), 02/25/2021(b) | | | 4,134,000 | | | | 4,155,889 | |
1.01% (3 mo. USD LIBOR + 0.75%), 02/23/2023(b) | | | 3,000,000 | | | | 3,015,001 | |
1.30% (3 mo. USD LIBOR + 1.05%), 06/05/2023(b)(d) | | | 2,500,000 | | | | 2,520,924 | |
1.22% (3 mo. USD LIBOR + 1.00%), 07/24/2023(b) | | | 4,500,000 | | | | 4,539,107 | |
1.97% (3 mo. USD LIBOR + 1.75%), 10/28/2027(b) | | | 1,220,000 | | | | 1,271,731 | |
Morgan Stanley | | | | | | | | |
1.15% (3 mo. USD LIBOR + 0.93%), 07/22/2022(b) | | | 2,500,000 | | | | 2,512,181 | |
0.79% (SOFR + 0.70%), 01/20/2023(b) | | | 3,500,000 | | | | 3,512,771 | |
TD Ameritrade Holding Corp., 0.64% (3 mo. USD LIBOR + 0.43%),
11/01/2021(b) | | | 4,250,000 | | | | 4,265,381 | |
| | | | | | | | |
| | | | | | | 25,792,985 | |
| | | | | | | | |
| | |
Life & Health Insurance-2.51% | | | | | | | | |
Athene Global Funding, 1.46% (3 mo. USD LIBOR + 1.23%), 07/01/2022(b)(c) | | | 5,300,000 | | | | 5,339,485 | |
| | | | | | | | |
| | | Principal
Amount | | | Value | |
Life & Health Insurance-(continued) | | | | | |
Jackson National Life Global Funding 0.55% (3 mo. USD LIBOR + 0.31%),
03/16/2021(b)(c)(d) | | $ | 3,000,000 | | | $ | 3,002,439 | |
0.96% (3 mo. USD LIBOR + 0.73%),
06/27/2022(b)(c) | | | 1,000,000 | | | | 1,008,402 | |
Metropolitan Life Global Funding I, 0.66% (SOFR + 0.57%), 01/13/2023(b)(c) | | | 2,000,000 | | | | 2,008,925 | |
| | | | | | | | |
| | | | | | | 11,359,251 | |
| | | | | | | | |
| | |
Multi-Utilities-1.28% | | | | | | | | |
Dominion Energy, Inc., Series D, 0.78% (3 mo. USD LIBOR + 0.53%), 09/15/2023(b) . | | | 769,000 | | | | 771,259 | |
Sempra Energy, 0.70% (3 mo. USD LIBOR + 0.45%), 03/15/2021(b) | | | 5,000,000 | | | | 5,006,398 | |
| | | | | | | | |
| | | | | | | 5,777,657 | |
| | | | | | | | |
| |
Oil & Gas Exploration & Production-0.33% | | | | | |
ConocoPhillips, 1.18% (3 mo. USD LIBOR + 0.90%), 05/15/2022(b) | | | 1,500,000 | | | | 1,509,204 | |
| | | | | | | | |
| |
Oil & Gas Storage & Transportation-0.49% | | | | | |
Enbridge, Inc. (Canada), 0.77% (3 mo. USD LIBOR + 0.50%), 02/18/2022(b) | | | 1,300,000 | | | | 1,302,333 | |
MPLX L.P., 1.34% (3 mo. USD LIBOR + 1.10%), 09/09/2022(b) | | | 914,000 | | | | 914,107 | |
| | | | | | | | |
| | | | | | | 2,216,440 | |
| | | | | | | | |
| | |
Packaged Foods & Meats-0.88% | | | | | | | | |
General Mills, Inc., 1.23% (3 mo. USD LIBOR + 1.01%), 10/17/2023(b) | | | 3,937,000 | | | | 3,980,184 | |
| | | | | | | | |
| | |
Pharmaceuticals-1.66% | | | | | | | | |
Bayer US Finance II LLC (Germany) | | | | | | | | |
0.86% (3 mo. USD LIBOR + 0.63%), 06/25/2021(b)(c) | | | 3,395,000 | | | | 3,402,729 | |
1.26% (3 mo. USD LIBOR + 1.01%), 12/15/2023(b)(c) | | | 4,105,000 | | | | 4,140,569 | |
| | | | | | | | |
| | | | | | | 7,543,298 | |
| | | | | | | | |
| | |
Regional Banks-0.65% | | | | | | | | |
M&T Bank Corp., 0.90% (3 mo. USD LIBOR + 0.68%), 07/26/2023(b) | | | 2,940,000 | | | | 2,968,151 | |
| | | | | | | | |
| | |
Semiconductors-1.10% | | | | | | | | |
QUALCOMM, Inc., 0.94% (3 mo. USD LIBOR + 0.73%), 01/30/2023(b) | | | 4,950,000 | | | | 5,000,328 | |
| | | | | | | | |
| | |
Specialty Chemicals-0.49% | | | | | | | | |
DuPont de Nemours, Inc., 0.99% (3 mo. USD LIBOR + 0.71%), 11/15/2020(b) | | | 2,230,000 | | | | 2,230,534 | |
| | | | | | | | |
| |
Technology Hardware, Storage & Peripherals-0.44% | | | | | |
Dell International LLC/EMC Corp., 5.88%, 06/15/2021(c) | | | 1,986,000 | | | | 1,993,269 | |
| | | | | | | | |
| | |
Tobacco-0.78% | | | | | | | | |
BAT Capital Corp. (United Kingdom), 1.16% (3 mo. USD LIBOR + 0.88%), 08/15/2022(b) | | | 3,500,000 | | | | 3,519,322 | |
| | | | | | | | |
| |
Trading Companies & Distributors-0.67% | | | | | |
BOC Aviation Ltd. (Singapore), 1.36% (3 mo. USD LIBOR + 1.13%), 09/26/2023(b)(c) | | | 3,082,000 | | | | 3,028,327 | |
| | | | | | | | |
See accompanying Notes to Financial Statements which are an integral part of the financial statements.
Invesco Variable Rate Investment Grade ETF (VRIG)–(continued)
October 31, 2020
| | | | | | | | |
| | | Principal
Amount | | | Value | |
Trucking-0.39% | | | | | | | | |
Aviation Capital Group LLC, 1.20% (3 mo. USD LIBOR + 0.95%), 06/01/2021(b)(c) | | $ | 1,777,000 | | | $ | 1,751,422 | |
| | | | | | | | |
Total U.S. Dollar Denominated Bonds & Notes (Cost $216,139,750) | | | | | | | 216,440,142 | |
| | | | | | | | |
| |
| Asset-Backed Securities-17.52% | | | | | |
Adjustable Rate Mortgage Trust, Series 2004-2, Class 6A1, 2.76%, 02/25/2035(f) | | | 200,402 | | | | 204,134 | |
BAMLL Commercial Mortgage Securities | | | | | | | | |
Trust, Series 2019-RLJ, Class B, 1.50% (1 mo. USD LIBOR + 1.35%), 04/15/2036(b)(c) | | | 4,000,000 | | | | 3,837,654 | |
BBCMS Mortgage Trust, Series 2019-BWAY, Class B, 1.46% (1 mo. USD LIBOR + 1.31%), 11/15/2034(b)(c) | | | 3,250,000 | | | | 3,132,202 | |
Bear Stearns Adjustable Rate Mortgage Trust | | | | | | | | |
Series 2003-7, Class 6A, 2.75%, 10/25/2033(f) | | | 247,404 | | | | 248,606 | |
Series 2003-8, Class 4A1, 3.28%, 01/25/2034(f) | | | 206,372 | | | | 211,826 | |
BFLD Trust, Series 2019-DPLO, Class A, 1.24% (1 mo. USD LIBOR + 1.09%), 10/15/2034(b)(c) | | | 1,500,000 | | | | 1,457,448 | |
BX Trust, Series 2018-GW, Class A, 0.95% (1 mo. USD LIBOR + 0.80%),
05/15/2035(b)(c) | | | 4,500,000 | | | | 4,329,033 | |
Capital One Multi-Asset Execution Trust, Series 2016-A2, Class A2, 0.78% (1 mo. USD LIBOR + 0.63%), 02/15/2024(b) | | | 250,000 | | | | 250,669 | |
Commercial Mortgage Trust | | | | | | | | |
Series 2014-FL5, Class B, 1.55% (1 mo. USD LIBOR + 2.15%), 10/15/2031(b)(c) | | | 94,811 | | | | 92,512 | |
Series 2019-521F, Class C, 1.45% (1 mo. USD LIBOR + 1.30%), 06/15/2034(b)(c) | | | 4,000,000 | | | | 3,829,007 | |
Commonbond Student Loan Trust | | | | | | | | |
Series 2017-BGS, Class A2, 0.80% (1 mo. USD LIBOR + 0.65%), 09/25/2042(b)(c) | | | 774,541 | | | | 770,073 | |
Series 2018-AGS, Class A2, 0.65% (1 mo. USD LIBOR + 0.50%), 02/25/2044(b)(c) | | | 1,445,367 | | | | 1,426,002 | |
CSWF, Series 2018-TOP, Class B, 1.45% (1 mo. USD LIBOR + 1.30%), 08/15/2035(b)(c) | | | 2,400,000 | | | | 2,310,741 | |
DBGS Mortgage Trust, Series 2018-5BP, Class B, 0.98% (1 mo. USD LIBOR + 0.83%), 06/15/2033(b)(c) | | | 3,000,000 | | | | 2,959,147 | |
Deephaven Residential Mortgage Trust, Series 2019-2A, Class A1, 3.56%, 04/25/2059(c)(f) | | | 472,356 | | | | 478,482 | |
Domino’s Pizza Master Issuer LLC, Series 2017-1A, Class A2I, 1.47% (3 mo. USD LIBOR + 1.25%), 07/25/2047(b)(c) | | | 4,544,450 | | | | 4,571,224 | |
Edsouth Indenture No. 9 LLC, Series 2015-1, Class A, 0.95% (1 mo. USD LIBOR + 0.80%), 10/25/2056(b)(c) | | | 637,914 | | | | 628,156 | |
Home Equity Asset Trust, Series 2004-5, Class M2, 1.09% (1 mo. USD LIBOR + 0.95%), 11/25/2034(b) | | | 1,106,896 | | | | 1,092,501 | |
| | | | | | | | |
| | | Principal
Amount | | | Value | |
Home Partners of America Trust | | | | | | | | |
Series 2017-1, Class A, 0.96% (1 mo. USD LIBOR + 0.82%), 07/17/2034(b)(c) | | $ | 3,185,546 | | | $ | 3,190,462 | |
Series 2018-1, Class A, 1.05% (1 mo. USD LIBOR + 0.90%), 07/17/2037(b)(c) | | | 3,562,562 | | | | 3,564,566 | |
Series 2018-1, Class B, 1.25% (1 mo. USD LIBOR + 1.10%), 07/17/2037(b)(c) | | | 1,760,000 | | | | 1,761,774 | |
Invitation Homes Trust | | | | | | | | |
Series 2017-SFR2, Class A, 1.00% (1 mo. USD LIBOR + 0.85%),
12/17/2036(b)(c) | | | 1,804,756 | | | | 1,805,302 | |
Series 2017-SFR2, Class C, 1.60% (1 mo. USD LIBOR + 1.45%),
12/17/2036(b)(c) | | | 5,620,000 | | | | 5,640,739 | |
Series 2018-SFR1, Class B, 1.10% (1 mo. USD LIBOR + 0.95%),
03/17/2037(b)(c) | | | 1,000,000 | | | | 988,677 | |
Series 2018-SFR3, Class B, 1.30% (1 mo. USD LIBOR + 1.15%),
07/17/2037(b)(c) | | | 4,000,000 | | | | 4,013,899 | |
Series 2018-SFR4, Class C, 1.55% (1 mo. USD LIBOR + 1.40%),
01/17/2038(b)(c) | | | 3,000,000 | | | | 3,011,691 | |
JP Morgan Mortgage Trust | | | | | | | | |
Series 2019-6, Class A11, 1.05% (1 mo. USD LIBOR + 0.90%), 12/25/2049(b)(c) | | | 360,882 | | | | 361,513 | |
Series 2019-INV2, Class A1, 1.05% (1 mo. USD LIBOR + 0.90%),
02/25/2050(b)(c) | | | 951,072 | | | | 950,777 | |
Series 2019-LTV3, Class A1, 1.00% (1 mo. USD LIBOR + 0.85%),
03/25/2050(b)(c) | | | 1,014,901 | | | | 1,011,677 | |
Merrill Lynch Mortgage Investors Trust | | | | | | | | |
Series 2003-F, Class A1, 0.79% (1 mo. USD LIBOR + 0.64%), 10/25/2028(b) | | | 179,452 | | | | 177,503 | |
Series 2005-A2, Class A5, 3.79%, 02/25/2035(f) | | | 77,820 | | | | 80,578 | |
OBX Trust | | | | | | | | |
Series 2018-EXP1, Class 2A1, 1.00% (1 mo. USD LIBOR + 0.85%),
04/25/2048(b)(c) | | | 2,007,591 | | | | 2,013,181 | |
Series 2018-EXP2, Class 2A2, 1.10% (1 mo. USD LIBOR + 0.95%),
07/25/2058(b)(c) | | | 1,618,823 | | | | 1,634,318 | |
Series 2019-EXP1, Class 2A2, 1.30% (1 mo. USD LIBOR + 1.15%),
01/25/2059(b)(c) | | | 702,404 | | | | 698,069 | |
Series 2019-EXP2, Class 2A2, 1.35% (1 mo. USD LIBOR + 1.20%),
06/25/2059(b)(c) | | | 1,394,386 | | | | 1,383,695 | |
Series 2020-EXP1, Class 2A2, 1.10% (1 mo. USD LIBOR + 0.95%),
02/25/2060(b)(c) | | | 1,255,359 | | | | 1,245,263 | |
Onslow Bay Financial LLC | | | | | | | | |
Series 2020-EXP3, Class 2A2, 1.35% (1 mo. USD LIBOR + 1.20%),
01/25/2060(b)(c) | | | 1,920,656 | | | | 1,923,324 | |
Series 2020-INV1, Class A11, 1.05% (1 mo. USD LIBOR + 0.90%),
12/25/2049(b)(c) | | | 886,957 | | | | 889,336 | |
Pennsylvania Higher Education Assistance | | | | | | | | |
Agency, Series 2009-2, Class A2, 1.32% (3 mo. USD LIBOR + 1.10%), 01/25/2028(b) | | | 796,797 | | | | 797,761 | |
See accompanying Notes to Financial Statements which are an integral part of the financial statements.
Invesco Variable Rate Investment Grade ETF (VRIG)–(continued)
October 31, 2020
| | | | | | | | |
| | | Principal
Amount | | | Value | |
Residential Mortgage Loan Trust, Series 2019-1, Class A1, 3.94%,
10/25/2058(c)(f) | | $ | 939,404 | | | $ | 953,497 | |
Rosslyn Portfolio Trust, Series 2017-ROSS, Class B, 2.24% (1 mo. USD LIBOR + 1.25%), 06/15/2033(b)(c) | | | 853,164 | | | | 848,046 | |
SMB Private Education Loan Trust | | | | | | | | |
Series 2019-B, Class A2B, 1.15% (1 mo. USD LIBOR + 1.00%),
06/15/2037(b)(c) | | | 4,000,000 | | | | 4,012,200 | |
Series 2020-A, Class A2B, 0.98% (1 mo. USD LIBOR + 0.83%),
09/15/2037(b)(c) | | | 2,000,000 | | | | 1,983,813 | |
WaMu Mortgage Pass-Through Ctfs. Trust, Series 2004-AR3, Class A2, 3.66%, 06/25/2034(f) | | | 90,866 | | | | 91,792 | |
Wells Fargo Commercial Mortgage Trust, Series 2016-NXS5, Class A6FL, 1.70% (1 mo. USD LIBOR + 1.55%), 01/15/2059(b)(c) | | | 2,500,000 | | | | 2,512,992 | |
| | | | | | | | |
Total Asset-Backed Securities
(Cost $80,047,379) | | | | | | | 79,375,862 | |
| | | | | | | | |
|
| Agency Credit Risk Transfer Notes-15.08% | |
Connecticut Avenue Securities Trust | | | | | | | | |
Series 2019-R01, Class 2M2, 2.60% (1 mo. USD LIBOR + 2.45%), 07/25/2031(b)(c)(g) | | | 4,222,021 | | | | 4,202,653 | |
Series 2019-R02, Class 1M2, 2.45% (1 mo. USD LIBOR + 2.30%), 08/25/2031(b)(c)(g) | | | 1,958,102 | | | | 1,953,553 | |
Fannie Mae Connecticut Avenue Securities | | | | | | | | |
Series 2015-C02, Class 2M2, 4.15% (1 mo. USD LIBOR + 4.00%), 05/25/2025(b)(g) | | | 480,095 | | | | 488,011 | |
Series 2015-C04, Class 1M2, 5.85% (1 mo. USD LIBOR + 5.70%), 04/25/2028(b)(g) | | | 1,203,099 | | | | 1,279,422 | |
Series 2016-C02, Class 1M2, 6.15% (1 mo. USD LIBOR + 6.00%), 09/25/2028(b)(g) | | | 1,412,147 | | | | 1,490,601 | |
Series 2017-C01, Class 1M2, 3.70% (1 mo. USD LIBOR + 3.55%), 07/25/2029(b)(g) | | | 1,586,305 | | | | 1,636,774 | |
Series 2017-C03, Class 1M2, 3.15% (1 mo. USD LIBOR + 3.00%), 10/25/2029(b)(g) | | | 4,349,205 | | | | 4,399,421 | |
Series 2017-C05, Class 1M2, 2.35% (1 mo. USD LIBOR + 2.20%), 01/25/2030(b)(g) | | | 4,404,698 | | | | 4,368,357 | |
Series 2018-C01, Class 1M2, 2.40% (1 mo. USD LIBOR + 2.25%), 07/25/2030(b)(g) | | | 1,283,000 | | | | 1,269,246 | |
Series 2018-C04, Class 2M2, 2.70% (1 mo. USD LIBOR + 2.55%), 12/25/2030(b)(g) | | | 4,417,826 | | | | 4,352,799 | |
Series 2018-C06, Class 1M2, 2.15% (1 mo. USD LIBOR + 2.00%), 03/25/2031(b)(g) | | | 3,731,802 | | | | 3,634,787 | |
| | | | | | | | |
| | | Principal
Amount | | | Value | |
Freddie Mac | | | | | | | | |
Series 2014-DN1, Class M2, STACR® , 2.35% (1 mo. USD LIBOR + 2.20%), 02/25/2024(b)(h) | | $ | 385,537 | | | $ | 386,010 | |
Series 2014-HQ2, Class M2, STACR® , 2.35% (1 mo. USD LIBOR + 2.20%), 09/25/2024(b)(h) | | | 801,693 | | | | 802,087 | |
Series 2015-DNA1, Class M3, STACR® , 3.45% (1 mo. USD LIBOR + 3.30%), 10/25/2027(b)(h) | | | 2,298,062 | | | | 2,374,862 | |
Series 2015-HQ2, Class M2, STACR® , 2.10% (1 mo. USD LIBOR + 1.95%), 05/25/2025(b)(h) | | | 824,928 | | | | 825,259 | |
Series 2016-HQA2, Class M3, STACR® , 5.30% (1 mo. USD LIBOR + 5.15%), 11/25/2028(b)(h) | | | 1,345,038 | | | | 1,407,747 | |
Series 2016-HQA3, Class M2, STACR® , 1.50% (1 mo. USD LIBOR + 1.35%), 03/25/2029(b)(h) | | | 732,003 | | | | 732,352 | |
Series 2017-DNA3, Class M2, STACR® , 2.65% (1 mo. USD LIBOR + 2.50%), 03/25/2030(b)(h) | | | 5,455,486 | | | | 5,538,849 | |
Series 2018-HQA1, Class M2, STACR® , 2.45% (1 mo. USD LIBOR + 2.30%), 09/25/2030(b)(h) | | | 4,334,328 | | | | 4,258,537 | |
Series 2018-HQA2, Class M2, STACR® , 2.45% (1 mo. USD LIBOR + 2.30%), 10/25/2048(b)(c)(h) | | | 5,500,000 | | | | 5,370,290 | |
Series 2018-HRP2, Class M2, STACR® , 1.40% (1 mo. USD LIBOR + 1.25%), 02/25/2047(b)(c)(h) | | | 1,997,746 | | | | 1,971,368 | |
Series 2019-DNA2, Class M2, STACR® , 2.60% (1 mo. USD LIBOR + 2.45%),
03/25/2049(b)(c)(h) | | | 3,984,541 | | | | 3,938,201 | |
Series 2019-DNA3, Class M2, STACR® , 2.20% (1 mo. USD LIBOR + 2.05%),
07/25/2049(b)(c)(h) | | | 4,554,439 | | | | 4,482,180 | |
Series 2019-HQA2, Class M2, STACR® , 2.20% (1 mo. USD LIBOR + 2.05%), 04/25/2049(b)(c)(h) | | | 3,047,030 | | | | 3,006,859 | |
Series 2019-HQA3, Class M2, STACR® , 2.00% (1 mo. USD LIBOR + 1.85%),
09/25/2049(b)(c)(h) | | | 3,546,131 | | | | 3,487,152 | |
Series 2020-DNA5, Class M1, STACR® , 1.39% (SOFR + 1.30%),
10/25/2050(b)(c)(h) | | | 675,000 | | | | 676,688 | |
| | | | | | | | |
Total Agency Credit Risk Transfer Notes
(Cost $68,903,854) | | | | | | | 68,334,065 | |
| | | | | | | | |
| |
| U.S. Treasury Securities-12.89% | | | | | |
U.S. Treasury Notes-12.89% | | | | | | | | |
0.16% (3 mo. U.S. Treasury Bill Money Market Yield Rate + 0.06%), 07/31/2022(b) (Cost $58,402,058) | | | 58,400,000 | | | | 58,407,723 | |
| | | | | | | | |
See accompanying Notes to Financial Statements which are an integral part of the financial statements.
Invesco Variable Rate Investment Grade ETF (VRIG)–(continued)
October 31, 2020
| | | | | | | | |
| | | Principal
Amount | | | Value | |
| U.S. Government Sponsored Agency Mortgage-Backed Securities-6.15% | |
Collateralized Mortgage Obligations-5.36% | | | | | |
Fannie Mae REMICs | | | | | | | | |
Series 2011-127, Class FJ, 0.50% (1 mo. USD LIBOR + 0.35%),
09/25/2041(b) | | $ | 63,026 | | | $ | 63,192 | |
Series 2014-92, Class FB, 0.48% (1 mo. USD LIBOR + 0.32%),
01/25/2045(b) | | | 1,222,128 | | | | 1,205,414 | |
Series 2016-25, Class FL, 0.65% (1 mo. USD LIBOR + 0.50%),
05/25/2046(b) | | | 386,447 | | | | 389,126 | |
Series 2017-100, Class FM, 0.48% (1 mo. USD LIBOR + 0.32%),
12/25/2047(b) | | | 431,219 | | | | 430,018 | |
Series 2017-68, Class AF, 0.46% (1 mo. USD LIBOR + 0.30%),
09/25/2047(b) | | | 1,271,989 | | | | 1,267,302 | |
Freddie Mac Multifamily Structured | | | | | | | | |
Pass-Through Ctfs. | | | | | | | | |
Series KF35, Class A, 0.50% (1 mo. USD LIBOR + 0.35%), 08/25/2024(b) | | | 887,845 | | | | 889,700 | |
Series KF35, Class A, 0.54% (1 mo. USD LIBOR + 0.39%), 10/25/2025(b) | | | 2,908,920 | | | | 2,923,194 | |
Series KF81, Class AS, 0.49% (SOFR + 0.40%), 06/25/2027(b) | | | 4,999,503 | | | | 5,021,280 | |
Series Q008, Class A, 0.54% (1 mo. USD LIBOR + 0.39%), 10/25/2045(b) | | | 2,149,099 | | | | 2,157,801 | |
Freddie Mac REMICs | | | | | | | | |
Series 4091, Class JF, 0.65% (1 mo. USD LIBOR + 0.50%), 06/15/2041(b) | | | 291,785 | | | | 294,854 | |
Series 4547, Class FA, 0.61% (1 mo. USD LIBOR + 0.45%), 09/15/2040(b) | | | 1,036,275 | | | | 1,040,389 | |
Series 4683, Class FA, 0.51% (1 mo. USD LIBOR + 0.35%), 09/15/2038(b) | | | 1,285,248 | | | | 1,299,652 | |
Series 4750, Class CF, 0.50% (1 mo. USD LIBOR + 0.35%), 01/15/2048(b) | | | 6,056,438 | | | | 6,086,923 | |
Series 4770, Class FA, 0.48% (1 mo. USD LIBOR + 0.32%), 08/15/2043(b) | | | 1,216,036 | | | | 1,229,907 | |
| | | | | | | | |
| | | | | | | 24,298,752 | |
| | | | | | | | |
| |
Federal Home Loan Mortgage Corp. (FHLMC)-0.30% | | | | | |
ARM, 3.59% (1 yr. USD LIBOR + 1.62%), 06/01/2037(b) | | | 304,307 | | | | 319,648 | |
ARM, 2.93% (1 yr. USD LIBOR + 1.74%), 11/01/2038(b) | | | 543,250 | | | | 573,040 | |
ARM, 3.10% (1 yr. USD LIBOR + 1.73%), 03/01/2043(b) | | | 436,229 | | | | 456,288 | |
| | | | | | | | |
| | | | | | | 1,348,976 | |
| | | | | | | | |
| |
Federal National Mortgage Association (FNMA)-0.49% | | | | | |
ARM, 3.64% (1 yr. USD LIBOR + 1.64%), 02/01/2035(b) | | | 56,179 | | | | 56,227 | |
| | |
| Investment Abbreviations: |
| ARM | | -Adjustable Rate Mortgage |
| Ctfs. | | -Certificates |
| ETF | | -Exchange-Traded Fund |
| LIBOR | | -London Interbank Offered Rate |
| REMICs | | -Real Estate Mortgage Investment Conduits |
| SOFR | | -Secured Overnight Financing Rate |
| STACR® | | -Structured Agency Credit Risk |
| USD | | -U.S. Dollar |
| | | | | | | | |
| | | Principal
Amount | | | Value | |
Federal National Mortgage Association (FNMA)-(continued) | |
ARM, 2.25% (6 mo. USD LIBOR + 1.57%), 07/01/2035(b) | | $ | 73,027 | | | $ | 75,840 | |
ARM, 3.12% (1 yr. U.S. Treasury Yield Curve Rate + 2.32%), 07/01/2035(b) | | | 1,074,043 | | | | 1,137,701 | |
ARM, 2.28% (1 yr. USD LIBOR + 1.78%), 10/01/2036(b) | | | 351,048 | | | | 369,029 | |
ARM, 3.78% (1 yr. USD LIBOR + 1.78%), 03/01/2037(b) | | | 221,183 | | | | 223,241 | |
ARM, 3.29% (1 yr. USD LIBOR + 1.59%), 11/01/2037(b) | | | 316,354 | | | | 331,976 | |
| | | | | | | | |
| | | | | | | 2,194,014 | |
| | | | | | | | |
Total U.S. Government Sponsored Agency Mortgage-Backed Securities
(Cost $27,772,777) | | | | 27,841,742 | |
| | | | | | | | |
| | | Shares | | | | |
| Exchange-Traded Funds-0.38% | | | | | |
Invesco Variable Rate Preferred ETF(d)(i) (Cost $1,606,600) | | | 70,000 | | | | 1,723,400 | |
| | | | | | | | |
| |
| Money Market Funds-0.19% | | | | | |
Invesco Government & Agency Portfolio, Institutional Class, 0.01%(i)(j)
(Cost $886,923) | | | 886,923 | | | | 886,923 | |
| | | | | | | | |
TOTAL INVESTMENTS IN SECURITIES (excluding investments purchased with cash collateral from securities on loan)-99.99%
(Cost $453,759,341) | | | | | | | 453,009,857 | |
| | | | | | | | |
| |
| Investments Purchased with Cash Collateral from Securities on Loan | | | | | |
| |
| Money Market Funds-0.17% | | | | | |
Invesco Private Government Fund,
0.04%(i)(j)(k) | | | 302,095 | | | | 302,095 | |
Invesco Private Prime Fund,
0.11%(i)(j)(k) | | | 453,009 | | | | 453,145 | |
| | | | | | | | |
Total Investments Purchased with Cash Collateral from Securities on Loan
(Cost $755,240) | | | | 755,240 | |
| | | | | | | | |
TOTAL INVESTMENTS IN SECURITIES-100.16%
(Cost $454,514,581) | | | | 453,765,097 | |
OTHER ASSETS LESS LIABILITIES-(0.16)% | | | | (743,999 | ) |
| | | | | | | | |
NET ASSETS-100.00% | | | $ | 453,021,098 | |
| | | | | | | | |
See accompanying Notes to Financial Statements which are an integral part of the financial statements.
Invesco Variable Rate Investment Grade ETF (VRIG)–(continued)
October 31, 2020
Notes to Schedule of Investments:
| (a) | Industry and/or sector classifications used in this report are generally according to the Global Industry Classification Standard, which was developed by and is the exclusive property and a service mark of MSCI Inc. and Standard & Poor’s. |
| (b) | Interest or dividend rate is redetermined periodically. Rate shown is the rate in effect on October 31, 2020. |
| (c) | Security purchased or received in a transaction exempt from registration under the Securities Act of 1933, as amended (the “1933 Act”). The security may be resold pursuant to an exemption from registration under the 1933 Act, typically to qualified institutional buyers. The aggregate value of these securities at October 31, 2020 was $158,836,157, which represented 35.06% of the Fund’s Net Assets. |
| (d) | All or a portion of this security was out on loan at October 31, 2020. |
| (e) | Perpetual bond with no specified maturity date. |
| (f) | Interest rate is redetermined periodically based on the cash flows generated by the pool of assets backing the security, less any applicable fees. The rate shown is the rate in effect on October 31, 2020. |
| (g) | CAS notes are bonds issued by Fannie Mae. The amount of periodic principal and ultimate principal paid by Fannie Mae is determined by the performance of a large and diverse reference pool. |
| (h) | Principal payments are determined by the delinquency and principal payment experience on the STACR® reference pool. Freddie Mac transfers credit risk from the mortgages in the reference pool to credit investors who invest in the STACR® debt notes. |
| (i) | Affiliated issuer. The issuer and/or the Fund is a wholly-owned subsidiary of Invesco Ltd., or is affiliated by having an investment adviser that is under common control of Invesco Ltd. The table below shows the Fund’s transactions in, and earnings from, its investments in affiliates for the fiscal year ended October 31, 2020. |
| | | | | | | | | | | | | | | | | | | | | | | | | | | | | | | | | | | |
| | | Value
October 31, 2019 | | Purchases
at Cost | | Proceeds
from Sales | | Change in
Unrealized
Appreciation
(Depreciation) | | Realized
Gain
(Loss) | | Value
October 31, 2020 | | Dividend
Income |
Invesco Variable Rate Preferred ETF | | | | $7,719,000 | | | | | $1,606,600 | | | | | $(7,543,333 | ) | | | | $(126,200 | ) | | | | $67,333 | | | | | $1,723,400 | | | | | $147,065 | |
| | | | | | | |
Investments in Affiliated Money Market Funds: | | | | | | | | | | | | | | | | | | | | | | | | | | | | | | | | | | | |
| | | | | | | |
Invesco Government & Agency Portfolio, Institutional Class | | | | - | | | | | 13,116,987 | | | | | (12,230,064 | ) | | | | - | | | | | - | | | | | 886,923 | | | | | 23 | |
| | | | | | | |
Invesco Premier U.S. Government Money Portfolio, Institutional Class | | | | 4,141,764 | | | | | 239,424,117 | | | | | (243,565,881 | ) | | | | - | | | | | - | | | | | - | | | | | 14,223 | |
| | | | | | | |
Investments Purchased with Cash Collateral from Securities on Loan: | | | | | | | | | | | | | | | | | | | | | | | | | | | | | | | | | | | |
| | | | | | | |
Invesco Government & Agency Portfolio, Institutional Class | | | | - | | | | | 989,053 | | | | | (989,053 | ) | | | | - | | | | | - | | | | | - | | | | | 12 | * |
| | | | | | | |
Invesco Private Government Fund | | | | - | | | | | 38,134,513 | | | | | (37,832,418 | ) | | | | - | | | | | - | | | | | 302,095 | | | | | 227 | * |
| | | | | | | |
Invesco Private Prime Fund | | | | - | | | | | 13,360,313 | | | | | (12,907,106 | ) | | | | - | | | | | (62 | ) | | | | 453,145 | | | | | 215 | * |
| | | | | | | | | | | | | | | | | | | | | | | | | | | | | | | | | | | |
| | | | | | | |
Total | | | | $11,860,764 | | | | | $306,631,583 | | | | | $(315,067,855 | ) | | | | $(126,200 | ) | | | | $67,271 | | | | | $3,365,563 | | | | | $161,765 | |
| | | | | | | | | | | | | | | | | | | | | | | | | | | | | | | | | | | |
| * | Represents the income earned on the investment of cash collateral, which is included in securities lending income on the Statement of Operations. Does not include rebates and fees paid to lending agent or premiums received from borrowers, if any. |
| (j) | The rate shown is the 7-day SEC standardized yield as of October 31, 2020. |
| (k) | The security has been segregated to satisfy the commitment to return the cash collateral received in securities lending transactions upon the borrower’s return of the securities loaned. See Note 2N. |
See accompanying Notes to Financial Statements which are an integral part of the financial statements.
Statements of Assets and Liabilities
October 31, 2020
| | | | | | | | | | | | | | | | | | | | | | | | | |
| | | Invesco
Active
U.S. Real
Estate
ETF (PSR) | | Invesco
Balanced
Multi-Asset
Allocation
ETF (PSMB) | | Invesco
Conservative
Multi-Asset
Allocation
ETF (PSMC) | | Invesco Growth
Multi-Asset
Allocation ETF
(PSMG) | | Invesco
Moderately
Conservative
Multi-Asset
Allocation
ETF (PSMM) |
| Assets: | | | | | | | | | | | | | | | | | | | | | | | | | |
Unaffiliated investments in securities, at value(a) | | | $ | 78,252,022 | | | | $ | - | | | | $ | - | | | | $ | - | | | | $ | - | |
Affiliated investments in securities, at value(a) | | | | 492,837 | | | | | 8,551,732 | | | | | 8,830,913 | | | | | 5,835,528 | | | | | 4,321,646 | |
Other investments: | | | | | | | | | | | | | | | | | | | | | | | | | |
Unrealized appreciation on forward foreign currency contracts outstanding | | | | - | | | | | - | | | | | - | | | | | - | | | | | - | |
Cash | | | | - | | | | | - | | | | | - | | | | | - | | | | | - | |
Foreign currencies, at value | | | | - | | | | | - | | | | | - | | | | | - | | | | | - | |
Deposits with brokers: | | | | | | | | | | | | | | | | | | | | | | | | | |
Cash collateral-futures contracts | | | | - | | | | | - | | | | | - | | | | | - | | | | | - | |
Cash collateral-centrally cleared swap agreements | | | | - | | | | | - | | | | | - | | | | | - | | | | | - | |
Receivable for: | | | | | | | | | | | | | | | | | | | | | | | | | |
Dividends and interest | | | | 41,851 | | | | | - | | | | | - | | | | | - | | | | | - | |
Variation margin on futures contracts | | | | - | | | | | - | | | | | - | | | | | - | | | | | - | |
Securities lending | | | | 38 | | | | | 3,799 | | | | | 1,195 | | | | | 2,918 | | | | | 440 | |
Investments sold | | | | - | | | | | - | | | | | - | | | | | - | | | | | - | |
Investments sold - affiliated broker | | | | - | | | | | - | | | | | - | | | | | - | | | | | - | |
Fund shares sold | | | | - | | | | | - | | | | | - | | | | | - | | | | | - | |
| | | | | | | | | | | | | | | | | | | | | | | | | |
Total assets | | | | 78,786,748 | | | | | 8,555,531 | | | | | 8,832,108 | | | | | 5,838,446 | | | | | 4,322,086 | |
| | | | | | | | | | | | | | | | | | | | | | | | | |
| | | | | |
| Liabilities: | | | | | | | | | | | | | | | | | | | | | | | | | |
Other investments: | | | | | | | | | | | | | | | | | | | | | | | | | |
Unrealized depreciation on forward foreign currency contracts outstanding | | | | - | | | | | - | | | | | - | | | | | - | | | | | - | |
Due to custodian | | | | - | | | | | 1,911 | | | | | 110 | | | | | 1,585 | | | | | - | |
Payable for: | | | | | | | | | | | | | | | | | | | | | | | | | |
Investments purchased | | | | - | | | | | - | | | | | - | | | | | - | | | | | - | |
Collateral upon return of securities loaned | | | | 492,652 | | | | | 394,228 | | | | | 1,128,524 | | | | | 219,645 | | | | | 288,696 | |
Accrued unitary management fees | | | | 24,501 | | | | | 354 | | | | | 330 | | | | | 245 | | | | | 174 | |
Accrued advisory fees | | | | - | | | | | - | | | | | - | | | | | - | | | | | - | |
Accrued trustees’ and officer’s fees | | | | - | | | | | - | | | | | - | | | | | - | | | | | - | |
Accrued expenses | | | | - | | | | | - | | | | | - | | | | | - | | | | | - | |
| | | | | | | | | | | | | | | | | | | | | | | | | |
Total liabilities | | | | 517,153 | | | | | 396,493 | | | | | 1,128,964 | | | | | 221,475 | | | | | 288,870 | |
| | | | | | | | | | | | | | | | | | | | | | | | | |
Net Assets | | | $ | 78,269,595 | | | | $ | 8,159,038 | | | | $ | 7,703,144 | | | | $ | 5,616,971 | | | | $ | 4,033,216 | |
| | | | | | | | | | | | | | | | | | | | | | | | | |
| | | | | |
| Net assets consist of: | | | | | | | | | | | | | | | | | | | | | | | | | |
Shares of beneficial interest | | | $ | 98,101,849 | | | | $ | 8,192,401 | | | | $ | 7,689,815 | | | | $ | 5,834,584 | | | | $ | 4,101,165 | |
Distributable earnings (loss) | | | | (19,832,254 | ) | | | | (33,363 | ) | | | | 13,329 | | | | | (217,613 | ) | | | | (67,949 | ) |
| | | | | | | | | | | | | | | | | | | | | | | | | |
Net Assets | | | $ | 78,269,595 | | | | $ | 8,159,038 | | | | $ | 7,703,144 | | | | $ | 5,616,971 | | | | $ | 4,033,216 | |
| | | | | | | | | | | | | | | | | | | | | | | | | |
Shares outstanding (unlimited amount authorized, $0.01 par value) | | | | 1,000,000 | | | | | 600,001 | | | | | 600,001 | | | | | 400,001 | | | | | 300,001 | |
Net asset value | | | $ | 78.27 | | | | $ | 13.60 | | | | $ | 12.84 | | | | $ | 14.04 | | | | $ | 13.44 | |
| | | | | | | | | | | | | | | | | | | | | | | | | |
Market price | | | $ | 78.23 | | | | $ | 13.57 | | | | $ | 12.82 | | | | $ | 14.05 | | | | $ | 13.43 | |
| | | | | | | | | | | | | | | | | | | | | | | | | |
Unaffiliated investments in securities, at cost | | | $ | 87,111,177 | | | | $ | - | | | | $ | - | | | | $ | - | | | | $ | - | |
| | | | | | | | | | | | | | | | | | | | | | | | | |
Affiliated investments in securities, at cost | | | $ | 492,837 | | | | $ | 8,390,787 | | | | $ | 8,769,997 | | | | $ | 5,885,360 | | | | $ | 4,343,122 | |
| | | | | | | | | | | | | | | | | | | | | | | | | |
Foreign currencies, at cost | | | $ | - | | | | $ | - | | | | $ | - | | | | $ | - | | | | $ | - | |
| | | | | | | | | | | | | | | | | | | | | | | | | |
(a) Includes securities on loan with an aggregate value of: | | | $ | 483,707 | | | | $ | 374,410 | | | | $ | 1,102,936 | | | | $ | 207,999 | | | | $ | 281,317 | |
| | | | | | | | | | | | | | | | | | | | | | | | | |
See accompanying Notes to Financial Statements which are an integral part of the financial statements.
| | | | | | | | | | | | | | | | | | |
| | | |
Invesco
S&P 500®
Downside Hedged
ETF (PHDG) | | Invesco Total Return
Bond ETF (GTO) | | Invesco Ultra Short
Duration ETF (GSY) | | Invesco
Variable Rate
Investment Grade
ETF (VRIG) |
| | | | | | | | | | | | | | | | | | | |
| | $ | - | | | | $ | 451,316,227 | | | | $ | 3,006,162,316 | | | | $ | 450,399,534 | |
| | | 43,318,687 | | | | | 19,924,004 | | | | | 2,165,538 | | | | | 3,365,563 | |
| | | | | | | | | | | | | | | | | | | |
| | | | | | | | | | | | | | | | | | | |
| | | - | | | | | 20,331 | | | | | - | | | | | - | |
| | | 119 | | | | | 48,557,168 | | | | | 99,847 | | | | | - | |
| | | - | | | | | 500,871 | | | | | 191 | | | | | - | |
| | | | | | | | | | | | | | | | | | | |
| | | 15,982,842 | | | | | - | | | | | - | | | | | - | |
| | | - | | | | | 615,891 | | | | | - | | | | | - | |
| | | | | | | | | | | | | | | | | | | |
| | | 71,110 | | | | | 1,873,812 | | | | | 6,275,021 | | | | | 489,997 | |
| | | - | | | | | 186,717 | | | | | - | | | | | - | |
| | | 11 | | | | | 2,529 | | | | | 539 | | | | | 138 | |
| | | - | | | | | 10,126,921 | | | | | - | | | | | 19,560 | |
| | | 83,712,508 | | | | | - | | | | | - | | | | | - | |
| | | 70 | | | | | 5,762,445 | | | | | - | | | | | - | |
| | | | | | | | | | | | | | | | | | | |
| | | 143,085,347 | | | | | 538,886,916 | | | | | 3,014,703,452 | | | | | 454,274,792 | |
| | | | | | | | | | | | | | | | | | | |
| | | |
| | | | | | | | | | | | | | | | | | | |
| | | |
| | | | | | | | | | | | | | | | | | | |
| | | - | | | | | 620 | | | | | - | | | | | - | |
| | | - | | | | | - | | | | | - | | | | | 383,060 | |
| | | | | | | | | | | | | | | | | | | |
| | | - | | | | | 55,324,890 | | | | | - | | | | | - | |
| | | - | | | | | 19,924,004 | | | | | 2,165,538 | | | | | 755,240 | |
| | | 43,063 | | | | | 180,570 | | | | | - | | | | | 115,394 | |
| | | - | | | | | - | | | | | 509,077 | | | | | - | |
| | | - | | | | | - | | | | | 39,085 | | | | | - | |
| | | - | | | | | - | | | | | 382,713 | | | | | - | |
| | | | | | | | | | | | | | | | | | | |
| | | 43,063 | | | | | 75,430,084 | | | | | 3,096,413 | | | | | 1,253,694 | |
| | | | | | | | | | | | | | | | | | | |
| | $ | 143,042,284 | | | | $ | 463,456,832 | | | | $ | 3,011,607,039 | | | | $ | 453,021,098 | |
| | | | | | | | | | | | | | | | | | | |
| | | |
| | | | | | | | | | | | | | | | | | | |
| | $ | 214,988,334 | | | | $ | 446,129,868 | | | | $ | 3,001,170,662 | | | | $ | 459,696,112 | |
| | | (71,946,050 | ) | | | | 17,326,964 | | | | | 10,436,377 | | | | | (6,675,014 | ) |
| | | | | | | | | | | | | | | | | | | |
| | $ | 143,042,284 | | | | $ | 463,456,832 | | | | $ | 3,011,607,039 | | | | $ | 453,021,098 | |
| | | | | | | | | | | | | | | | | | | |
| | | | | | | | | | | | | | | | | | | |
| | | 4,400,000 | | | | | 8,050,000 | | | | | 59,600,000 | | | | | 18,200,001 | |
| | $ | 32.51 | | | | $ | 57.57 | | | | $ | 50.53 | | | | $ | 24.89 | |
| | | | | | | | | | | | | | | | | | | |
| | $ | 32.58 | | | | $ | 57.57 | | | | $ | 50.54 | | | | $ | 24.89 | |
| | | | | | | | | | | | | | | | | | | |
| | $ | - | | | | $ | 443,725,103 | | | | $ | 2,993,740,854 | | | | $ | 451,265,818 | |
| | | | | | | | | | | | | | | | | | | |
| | $ | 43,327,330 | | | | $ | 19,924,004 | | | | $ | 2,165,538 | | | | $ | 3,248,763 | |
| | | | | | | | | | | | | | | | | | | |
| | $ | - | | | | $ | 502,021 | | | | $ | 182 | | | | $ | - | |
| | | | | | | | | | | | | | | | | | | |
| | | | | | | | | | | | | | | | | | | |
| | | |
| | $ | - | | | | $ | 19,333,859 | | | | $ | 2,096,607 | | | | $ | 736,145 | |
| | | | | | | | | | | | | | | | | | | |
Statements of Operations
For the year ended October 31, 2020
| | | | | | | | | | | | | | | | | | | | |
| | | | |
| | | Invesco
Active
U.S. Real
Estate
ETF (PSR) | | Invesco
Balanced
Multi-Asset
Allocation
ETF (PSMB) | | Invesco
Conservative
Multi-Asset
Allocation
ETF (PSMC) | | Invesco Growth
Multi-Asset
Allocation ETF
(PSMG) |
| Investment income: | | | | | | | | | | | | | | | | | | | | |
Unaffiliated interest income | | | $ | - | | | | $ | - | | | | $ | - | | | | $ | - | |
Unaffiliated dividend income | | | | 3,012,364 | | | | | - | | | | | - | | | | | - | |
Affiliated dividend income | | | | 465 | | | | | 136,890 | | | | | 154,542 | | | | | 142,672 | |
Securities lending income | | | | 638 | | | | | 27,493 | | | | | 20,479 | | | | | 20,051 | |
| | | | | | | | | | | | | | | | | | | | |
Total investment income | | | | 3,013,467 | | | | | 164,383 | | | | | 175,021 | | | | | 162,723 | |
| | | | | | | | | | | | | | | | | | | | |
| | | | |
| Expenses: | | | | | | | | | | | | | | | | | | | | |
Unitary management fees | | | | 374,794 | | | | | 2,972 | | | | | 2,861 | | | | | 2,655 | |
Advisory fees | | | | - | | | | | - | | | | | - | | | | | - | |
Accounting & administration fees | | | | - | | | | | - | | | | | - | | | | | - | |
Custodian & transfer agent fees | | | | - | | | | | - | | | | | - | | | | | - | |
Trustees’ and officer’s fees | | | | - | | | | | - | | | | | - | | | | | - | |
Tax expenses | | | | - | | | | | - | | | | | - | | | | | 59 | |
Other expenses | | | | - | | | | | - | | | | | - | | | | | - | |
| | | | | | | | | | | | | | | | | | | | |
Total expenses | | | | 374,794 | | | | | 2,972 | | | | | 2,861 | | | | | 2,714 | |
| | | | | | | | | | | | | | | | | | | | |
Less: Waivers | | | | (139 | ) | | | | (7 | ) | | | | (7 | ) | | | | (7 | ) |
| | | | | | | | | | | | | | | | | | | | |
Net expenses | | | | 374,655 | | | | | 2,965 | | | | | 2,854 | | | | | 2,707 | |
| | | | | | | | | | | | | | | | | | | | |
Net investment income | | | | 2,638,812 | | | | | 161,418 | | | | | 172,167 | | | | | 160,016 | |
| | | | | | | | | | | | | | | | | | | | |
| | | | |
| Realized and unrealized gain (loss) from: | | | | | | | | | | | | | | | | | | | | |
Net realized gain (loss) from: | | | | | | | | | | | | | | | | | | | | |
Unaffiliated investment securities | | | | (13,103,685 | ) | | | | - | | | | | - | | | | | - | |
Affiliated investment securities | | | | (226 | ) | | | | (221,483 | ) | | | | (102,705 | ) | | | | (188,381 | ) |
Unaffiliated in-kind redemptions | | | | 1,796,362 | | | | | - | | | | | - | | | | | - | |
Affiliated in-kind redemptions | | | | - | | | | | - | | | | | 138,406 | | | | | 308,913 | |
Foreign currencies | | | | - | | | | | - | | | | | - | | | | | - | |
Forward foreign currency contracts | | | | - | | | | | - | | | | | - | | | | | - | |
Futures contracts | | | | - | | | | | - | | | | | - | | | | | - | |
Swap agreements | | | | - | | | | | - | | | | | - | | | | | - | |
Written options | | | | - | | | | | - | | | | | - | | | | | - | |
Distributions of underlying fund shares | | | | - | | | | | 1,589 | | | | | 2,503 | | | | | 1,469 | |
| | | | | | | | | | | | | | | | | | | | |
Net realized gain (loss) | | | | (11,307,549 | ) | | | | (219,894 | ) | | | | 38,204 | | | | | 122,001 | |
| | | | | | | | | | | | | | | | | | | | |
Change in net unrealized appreciation (depreciation) of: | | | | | | | | | | | | | | | | | | | | |
Unaffiliated investment securities | | | | (15,427,571 | ) | | | | - | | | | | - | | | | | - | |
Affiliated investment securities | | | | - | | | | | 126,291 | | | | | (22,945 | ) | | | | (196,015 | ) |
Foreign currencies | | | | - | | | | | - | | | | | - | | | | | - | |
Forward foreign currency contracts | | | | - | | | | | - | | | | | - | | | | | - | |
Futures contracts | | | | - | | | | | - | | | | | - | | | | | - | |
Swap agreements | | | | - | | | | | - | | | | | - | | | | | - | |
| | | | | | | | | | | | | | | | | | | | |
Change in net unrealized appreciation (depreciation) | | | | (15,427,571 | ) | | | | 126,291 | | | | | (22,945 | ) | | | | (196,015 | ) |
| | | | | | | | | | | | | | | | | | | | |
Net realized and unrealized gain (loss) | | | | (26,735,120 | ) | | | | (93,603 | ) | | | | 15,259 | | | | | (74,014 | ) |
| | | | | | | | | | | | | | | | | | | | |
Net increase (decrease) in net assets resulting from operations | | | $ | (24,096,308 | ) | | | $ | 67,815 | | | | $ | 187,426 | | | | $ | 86,002 | |
| | | | | | | | | | | | | | | | | | | | |
See accompanying Notes to Financial Statements which are an integral part of the financial statements.
| | | | | | | | | | | | | | | | | | | | | | | |
Invesco
Moderately
Conservative
Multi-Asset
Allocation
ETF (PSMM) | | Invesco
S&P 500®
Downside Hedged
ETF (PHDG) | | Invesco Total Return
Bond ETF (GTO) | | Invesco Ultra Short
Duration ETF (GSY) | | Invesco
Variable Rate
Investment Grade
ETF (VRIG) |
| | | | | | | | | | | | | | | | | | | | | | | | |
| | $ | - | | | | $ | - | | | | $ | 7,812,805 | | | | $ | 50,883,877 | | | | $ | 7,128,895 | |
| | | - | | | | | 553,032 | | | | | 18,541 | | | | | - | | | | | - | |
| | | 156,607 | | | | | 22,598 | | | | | - | | | | | - | | | | | 161,311 | |
| | | 22,069 | | | | | 267 | | | | | 8,884 | | | | | 7,652 | | | | | 1,584 | |
| | | | | | | | | | | | | | | | | | | | | | | | |
| | | 178,676 | | | | | 575,897 | | | | | 7,840,230 | | | | | 50,891,529 | | | | | 7,291,790 | |
| | | | | | | | | | | | | | | | | | | | | | | | |
| | | | |
| | | | | | | | | | | | | | | | | | | | | | | | |
| | | 2,947 | | | | | 220,406 | | | | | 1,426,589 | | | | | - | | | | | 1,132,265 | |
| | | - | | | | | - | | | | | - | | | | | 5,367,215 | | | | | - | |
| | | - | | | | | - | | | | | - | | | | | 192,081 | | | | | - | |
| | | - | | | | | - | | | | | - | | | | | 39,266 | | | | | - | |
| | | - | | | | | - | | | | | - | | | | | 43,355 | | | | | - | |
| | | - | | | | | - | | | | | 144 | | | | | - | | | | | - | |
| | | - | | | | | - | | | | | - | | | | | 220,858 | | | | | - | |
| | | | | | | | | | | | | | | | | | | | | | | | |
| | | 2,947 | | | | | 220,406 | | | | | 1,426,733 | | | | | 5,862,775 | | | | | 1,132,265 | |
| | | | | | | | | | | | | | | | | | | | | | | | |
| | | (9 | ) | | | | (30,648 | ) | | | | - | | | | | - | | | | | (21,720 | ) |
| | | | | | | | | | | | | | | | | | | | | | | | |
| | | 2,938 | | | | | 189,758 | | | | | 1,426,733 | | | | | 5,862,775 | | | | | 1,110,545 | |
| | | | | | | | | | | | | | | | | | | | | | | | |
| | | 175,738 | | | | | 386,139 | | | | | 6,413,497 | | | | | 45,028,754 | | | | | 6,181,245 | |
| | | | | | | | | | | | | | | | | | | | | | | | |
| | | | |
| | | | | | | | | | | | | | | | | | | | | | | | |
| | | | | | | | | | | | | | | | | | | | | | | | |
| | | - | | | | | 4,641,429 | | | | | 10,541,217 | | | | | (2,552,434 | ) | | | | (1,403,896 | ) |
| | | (129,912 | ) | | | | (6 | ) | | | | (5,398 | ) | | | | 53 | | | | | 67,271 | |
| | | - | | | | | 837,964 | | | | | - | | | | | - | | | | | - | |
| | | 471,089 | | | | | - | | | | | - | | | | | - | | | | | - | |
| | | - | | | | | - | | | | | (3,102 | ) | | | | (83,890 | ) | | | | - | |
| | | - | | | | | - | | | | | (56,579 | ) | | | | 557,985 | | | | | - | |
| | | - | | | | | 1,328,906 | | | | | (1,309,181 | ) | | | | - | | | | | - | |
| | | - | | | | | - | | | | | (94,931 | ) | | | | - | | | | | - | |
| | | - | | | | | - | | | | | (13,656 | ) | | | | - | | | | | - | |
| | | 4,098 | | | | | - | | | | | - | | | | | - | | | | | - | |
| | | | | | | | | | | | | | | | | | | | | | | | |
| | | 345,275 | | | | | 6,808,293 | | | | | 9,058,370 | | | | | (2,078,286 | ) | | | | (1,336,625 | ) |
| | | | | | | | | | | | | | | | | | | | | | | | |
| | | | | | | | | | | | | | | | | | | | | | | | |
| | | - | | | | | (601,562 | ) | | | | 3,760,472 | | | | | 1,656,077 | | | | | (1,041,606 | ) |
| | | (205,589 | ) | | | | (1,706 | ) | | | | - | | | | | - | | | | | (126,200 | ) |
| | | - | | | | | - | | | | | (2,612 | ) | | | | 180,513 | | | | | - | |
| | | - | | | | | - | | | | | 19,578 | | | | | 59,744 | | | | | - | |
| | | - | | | | | (35,448 | ) | | | | 1,159,676 | | | | | - | | | | | - | |
| | | - | | | | | - | | | | | 11,859 | | | | | - | | | | | - | |
| | | | | | | | | | | | | | | | | | | | | | | | |
| | | (205,589 | ) | | | | (638,716 | ) | | | | 4,948,973 | | | | | 1,896,334 | | | | | (1,167,806 | ) |
| | | | | | | | | | | | | | | | | | | | | | | | |
| | | 139,686 | | | | | 6,169,577 | | | | | 14,007,343 | | | | | (181,952 | ) | | | | (2,504,431 | ) |
| | | | | | | | | | | | | | | | | | | | | | | | |
| | $ | 315,424 | | | | $ | 6,555,716 | | | | $ | 20,420,840 | | | | $ | 44,846,802 | | | | $ | 3,676,814 | |
| | | | | | | | | | | | | | | | | | | | | | | | |
Statements of Changes in Net Assets
For the years ended October 31, 2020 and 2019
| | | | | | | | | | | | | | | | |
| | | Invesco Active U.S. Real
Estate ETF (PSR) | | | Invesco Balanced Multi-Asset
Allocation ETF (PSMB) | |
| | | 2020 | | | 2019 | | | 2020 | | | 2019 | |
| Operations: | | | | | | | | | | | | | | | | |
Net investment income | | $ | 2,638,812 | | | $ | 1,391,586 | | | $ | 161,418 | | | $ | 115,698 | |
Net realized gain (loss) | | | (11,307,549 | ) | | | 6,141,384 | | | | (219,894 | ) | | | 602,066 | |
Change in net unrealized appreciation (depreciation) | | | (15,427,571 | ) | | | 5,252,874 | | | | 126,291 | | | | 44,652 | |
| | | | | | | | | | | | | | | | |
Net increase (decrease) in net assets resulting from operations | | | (24,096,308 | ) | | | 12,785,844 | | | | 67,815 | | | | 762,416 | |
| | | | | | | | | | | | | | | | |
| | | | |
| Distributions to Shareholders from: | | | | | | | | | | | | | | | | |
Distributable earnings | | | (3,410,344 | ) | | | (1,794,273 | ) | | | (281,968 | ) | | | (94,498 | ) |
| | | | | | | | | | | | | | | | |
| | | | |
| Shareholder Transactions: | | | | | | | | | | | | | | | | |
Proceeds from shares sold | | | 45,036,091 | | | | 110,777,526 | | | | 4,126,814 | | | | 13,727,128 | |
Value of shares repurchased | | | (60,811,390 | ) | | | (28,024,316 | ) | | | - | | | | (12,769,071 | ) |
| | | | | | | | | | | | | | | | |
Net increase (decrease) in net assets resulting from share transactions | | | (15,775,299 | ) | | | 82,753,210 | | | | 4,126,814 | | | | 958,057 | |
| | | | | | | | | | | | | | | | |
Net increase (decrease) in net assets | | | (43,281,951 | ) | | | 93,744,781 | | | | 3,912,661 | | | | 1,625,975 | |
| | | | | | | | | | | | | | | | |
| | | | |
| Net assets: | | | | | | | | | | | | | | | | |
Beginning of year | | | 121,551,546 | | | | 27,806,765 | | | | 4,246,377 | | | | 2,620,402 | |
| | | | | | | | | | | | | | | | |
End of year | | $ | 78,269,595 | | | $ | 121,551,546 | | | $ | 8,159,038 | | | $ | 4,246,377 | |
| | | | | | | | | | | | | | | | |
| | | | |
| Changes in Shares Outstanding: | | | | | | | | | | | | | | | | |
Shares sold | | | 500,000 | | | | 1,200,000 | | | | 300,000 | | | | 1,000,000 | |
Shares repurchased | | | (750,000 | ) | | | (300,000 | ) | | | - | | | | (900,000 | ) |
Shares outstanding, beginning of year | | | 1,250,000 | | | | 350,000 | | | | 300,001 | | | | 200,001 | |
| | | | | | | | | | | | | | | | |
Shares outstanding, end of year | | | 1,000,000 | | | | 1,250,000 | | | | 600,001 | | | | 300,001 | |
| | | | | | | | | | | | | | | | |
See accompanying Notes to Financial Statements which are an integral part of the financial statements.
| | | | | | | | | | | | | | | | | | | | | | | | | | | | |
Invesco Conservative Multi-Asset
Allocation ETF (PSMC) | | Invesco Growth Multi-Asset
Allocation ETF (PSMG) | | Invesco Moderately Conservative
Multi-Asset Allocation ETF (PSMM) |
| 2020 | | 2019 | | 2020 | | 2019 | | 2020 | | 2019 |
| | | | | | | | | | | | | | | | | | | | | | | | | | | | | |
| | $ | 172,167 | | | | $ | 190,401 | | | | $ | 160,016 | | | | $ | 114,995 | | | | $ | 175,738 | | | | $ | 141,866 | |
| | | 38,204 | | | | | 673,587 | | | | | 122,001 | | | | | 277,200 | | | | | 345,275 | | | | | 146,406 | |
| | | (22,945 | ) | | | | 89,616 | | | | | (196,015 | ) | | | | 141,956 | | | | | (205,589 | ) | | | | 168,743 | |
| | | | | | | | | | | | | | | | | | | | | | | | | | | | | |
| | | 187,426 | | | | | 953,604 | | | | | 86,002 | | | | | 534,151 | | | | | 315,424 | | | | | 457,015 | |
| | | | | | | | | | | | | | | | | | | | | | | | | | | | | |
| | | | | |
| | | | | | | | | | | | | | | | | | | | | | | | | | | | | |
| | | (246,396 | ) | | | | (181,438 | ) | | | | (293,308 | ) | | | | (122,002 | ) | | | | (339,093 | ) | | | | (124,458 | ) |
| | | | | | | | | | | | | | | | | | | | | | | | | | | | | |
| | | | | |
| | | | | | | | | | | | | | | | | | | | | | | | | | | | | |
| | | 5,157,552 | | | | | 13,463,524 | | | | | 5,914,103 | | | | | 2,698,237 | | | | | 4,076,612 | | | | | 3,907,547 | |
| | | (1,300,607 | ) | | | | (11,579,555 | ) | | | | (4,489,862 | ) | | | | (1,401,116 | ) | | | | (5,536,215 | ) | | | | - | |
| | | | | | | | | | | | | | | | | | | | | | | | | | | | | |
| | | 3,856,945 | | | | | 1,883,969 | | | | | 1,424,241 | | | | | 1,297,121 | | | | | (1,459,603 | ) | | | | 3,907,547 | |
| | | | | | | | | | | | | | | | | | | | | | | | | | | | | |
| | | 3,797,975 | | | | | 2,656,135 | | | | | 1,216,935 | | | | | 1,709,270 | | | | | (1,483,272 | ) | | | | 4,240,104 | |
| | | | | | | | | | | | | | | | | | | | | | | | | | | | | |
| | | | | |
| | | | | | | | | | | | | | | | | | | | | | | | | | | | | |
| | | 3,905,169 | | | | | 1,249,034 | | | | | 4,400,036 | | | | | 2,690,766 | | | | | 5,516,488 | | | | | 1,276,384 | |
| | | | | | | | | | | | | | | | | | | | | | | | | | | | | |
| | $ | 7,703,144 | | | | $ | 3,905,169 | | | | $ | 5,616,971 | | | | $ | 4,400,036 | | | | $ | 4,033,216 | | | | $ | 5,516,488 | |
| | | | | | | | | | | | | | | | | | | | | | | | | | | | | |
| | | | | |
| | | | | | | | | | | | | | | | | | | | | | | | | | | | | |
| | | 400,000 | | | | | 1,100,000 | | | | | 400,000 | | | | | 200,000 | | | | | 300,000 | | | | | 300,000 | |
| | | (100,000 | ) | | | | (900,000 | ) | | | | (300,000 | ) | | | | (100,000 | ) | | | | (400,000 | ) | | | | - | |
| | | 300,001 | | | | | 100,001 | | | | | 300,001 | | | | | 200,001 | | | | | 400,001 | | | | | 100,001 | |
| | | | | | | | | | | | | | | | | | | | | | | | | | | | | |
| | | 600,001 | | | | | 300,001 | | | | | 400,001 | | | | | 300,001 | | | | | 300,001 | | | | | 400,001 | |
| | | | | | | | | | | | | | | | | | | | | | | | | | | | | |
Statements of Changes in Net Assets–(continued)
For the years ended October 31, 2020 and 2019
| | | | | | | | | | | | | | | | | | | | |
| | | Invesco S&P 500® Downside
Hedged ETF (PHDG) | | Invesco Total Return Bond ETF (GTO) |
| | | 2020 | | 2019 | | 2020 | | 2019 |
| Operations: | | | | | | | | | | | | | | | | | | | | |
Net investment income | | | $ | 386,139 | | | | $ | 515,126 | | | | $ | 6,413,497 | | | | $ | 1,835,065 | |
Net realized gain (loss) | | | | 6,808,293 | | | | | (1,621,783 | ) | | | | 9,058,370 | | | | | 512,761 | |
Change in net unrealized appreciation (depreciation) | | | | (638,716 | ) | | | | 832,829 | | | | | 4,948,973 | | | | | 5,210,441 | |
| | | | | | | | | | | | | | | | | | | | |
Net increase (decrease) in net assets resulting from operations | | | | 6,555,716 | | | | | (273,828 | ) | | | | 20,420,840 | | | | | 7,558,267 | |
| | | | | | | | | | | | | | | | | | | | |
| | | | |
| Distributions to Shareholders from: | | | | | | | | | | | | | | | | | | | | |
Distributable earnings | | | | (482,030 | ) | | | | (483,318 | ) | | | | (7,483,301 | ) | | | | (2,627,276 | ) |
Return of capital | | | | - | | | | | - | | | | | - | | | | | - | |
| | | | | | | | | | | | | | | | | | | | |
Total distributions to shareholders | | | | (482,030 | ) | | | | (483,318 | ) | | | | (7,483,301 | ) | | | | (2,627,276 | ) |
| | | | | | | | | | | | | | | | | | | | |
| | | | |
| Shareholder Transactions: | | | | | | | | | | | | | | | | | | | | |
Proceeds from shares sold | | | | 146,491,207 | | | | | 16,147,665 | | | | | 294,713,343 | | | | | 131,138,988 | |
Value of shares repurchased | | | | (29,560,002 | ) | | | | (21,875,872 | ) | | | | (20,976,835 | ) | | | | - | |
| | | | | | | | | | | | | | | | | | | | |
Net increase (decrease) in net assets resulting from share transactions | | | | 116,931,205 | | | | | (5,728,207 | ) | | | | 273,736,508 | | | | | 131,138,988 | |
| | | | | | | | | | | | | | | | | | | | |
Net increase (decrease) in net assets | | | | 123,004,891 | | | | | (6,485,353 | ) | | | | 286,674,047 | | | | | 136,069,979 | |
| | | | | | | | | | | | | | | | | | | | |
| | | | |
| Net assets: | | | | | | | | | | | | | | | | | | | | |
Beginning of year | | | | 20,037,393 | | | | | 26,522,746 | | | | | 176,782,785 | | | | | 40,712,806 | |
| | | | | | | | | | | | | | | | | | | | |
End of year | | | $ | 143,042,284 | | | | $ | 20,037,393 | | | | $ | 463,456,832 | | | | $ | 176,782,785 | |
| | | | | | | | | | �� | | | | | | | | | | |
| | | | |
| Changes in Shares Outstanding: | | | | | | | | | | | | | | | | | | | | |
Shares sold | | | | 4,600,000 | | | | | 600,000 | | | | | 5,200,000 | | | | | 2,450,000 | |
Shares repurchased | | | | (950,000 | ) | | | | (800,000 | ) | | | | (400,000 | ) | | | | - | |
Shares outstanding, beginning of year | | | | 750,000 | | | | | 950,000 | | | | | 3,250,000 | | | | | 800,000 | |
| | | | | | | | | | | | | | | | | | | | |
Shares outstanding, end of year | | | | 4,400,000 | | | | | 750,000 | | | | | 8,050,000 | | | | | 3,250,000 | |
| | | | | | | | | | | | | | | | | | | | |
See accompanying Notes to Financial Statements which are an integral part of the financial statements.
| | | | | | | | | | | | | | | | | | |
Invesco Ultra Short Duration ETF (GSY) | | Invesco Variable Rate Investment
Grade ETF (VRIG) |
| 2020 | | 2019 | | 2020 | | 2019 |
| | | | | | | | | | | | | | | | | | | |
| | $ | 45,028,754 | | | | $ | 62,514,805 | | | | $ | 6,181,245 | | | | $ | 12,434,064 | |
| | | (2,078,286 | ) | | | | 1,264,412 | | | | | (1,336,625 | ) | | | | (2,323,118 | ) |
| | | 1,896,334 | | | | | 9,522,070 | | | | | (1,167,806 | ) | | | | 1,304,737 | |
| | | | | | | | | | | | | | | | | | | |
| | | 44,846,802 | | | | | 73,301,287 | | | | | 3,676,814 | | | | | 11,415,683 | |
| | | | | | | | | | | | | | | | | | | |
| | | |
| |
|
(46,872,807 |
) | | | | (63,730,963 | ) | | | | (6,538,546 | ) | | | | (13,248,198 | ) |
| | | - | | | | | - | | | | | (508,191 | ) | | | | - | |
| | | | | | | | | | | | | | | | | | | |
| | | (46,872,807 | ) | | | | (63,730,963 | ) | | | | (7,046,737 | ) | | | | (13,248,198 | ) |
| | | | | | | | | | | | | | | | | | | |
| | | |
| | | | | | | | | | | | | | | | | | | |
| | | 1,639,116,413 | | | | | 3,061,250,919 | | | | | 193,260,523 | | | | | 24,927,861 | |
| | | (1,247,267,685 | ) | | | | (2,060,592,233 | ) | | | | (128,396,296 | ) | | | | (79,436,569 | ) |
| | | | | | | | | | | | | | | | | | | |
| | | 391,848,728 | | | | | 1,000,658,686 | | | | | 64,864,227 | | | | | (54,508,708 | ) |
| | | | | | | | | | | | | | | | | | | |
| | | 389,822,723 | | | | | 1,010,229,010 | | | | | 61,494,304 | | | | | (56,341,223 | ) |
| | | | | | | | | | | | | | | | | | | |
| | | 2,621,784,316 | | | | | 1,611,555,306 | | | | | 391,526,794 | | | | | 447,868,017 | |
| | | | | | | | | | | | | | | | | | | |
| | | |
| | | | | | | | | | | | | | | | | | | |
| | $ | 3,011,607,039 | | | | $ | 2,621,784,316 | | | | $ | 453,021,098 | | | | $ | 391,526,794 | |
| | | | | | | | | | | | | | | | | | | |
| | | |
| | | | | | | | | | | | | | | | | | | |
| | | 32,500,000 | | | | | 60,900,000 | | | | | 7,800,000 | | | | | 1,000,000 | |
| | | (24,900,000 | ) | | | | (41,000,000 | ) | | | | (5,300,000 | ) | | | | (3,200,000 | ) |
| | | 52,000,000 | | | | | 32,100,000 | | | | | 15,700,001 | | | | | 17,900,001 | |
| | | | | | | | | | | | | | | | | | | |
| | | 59,600,000 | | | | | 52,000,000 | | | | | 18,200,001 | | | | | 15,700,001 | |
| | | | | | | | | | | | | | | | | | | |
Financial Highlights
Invesco Active U.S. Real Estate ETF (PSR)
| | | | | | | | | | | | | | | | | | | | |
| | | Years Ended October 31, | |
| | | 2020 | | | 2019 | | | 2018 | | | 2017 | | | 2016 | |
| Per Share Operating Performance: | | | | | | | | | | | | | �� | | | | | | | |
Net asset value at beginning of year | | $ | 97.24 | | | $ | 79.45 | | | $ | 80.07 | | | $ | 75.57 | | | $ | 73.43 | |
Net investment income(a) | | | 2.11 | | | | 2.16 | | | | 2.05 | | | | 0.75 | | | | 1.73 | |
Net realized and unrealized gain (loss) on investments | | | (18.34 | ) | | | 18.01 | | | | (1.24 | ) | | | 5.44 | | | | 3.04 | |
Total from investment operations | | | (16.23 | ) | | | 20.17 | | | | 0.81 | | | | 6.19 | | | | 4.77 | |
Distributions to shareholders from: | | | | | | | | | | | | | | | | | | | | |
Net investment income | | | (2.74 | ) | | | (2.38 | ) | | | (1.43 | ) | | | (1.69 | ) | | | (1.80 | ) |
Net realized gains | | | - | | | | - | | | | - | | | | - | | | | (0.83 | ) |
Total distributions | | | (2.74 | ) | | | (2.38 | ) | | | (1.43 | ) | | | (1.69 | ) | | | (2.63 | ) |
Net asset value at end of year | | $ | 78.27 | | | $ | 97.24 | | | $ | 79.45 | | | $ | 80.07 | | | $ | 75.57 | |
Market price at end of year(b) | | $ | 78.23 | | | $ | 97.13 | | | $ | 79.30 | | | $ | 80.04 | | | $ | 75.55 | |
| Net Asset Value Total Return(c) | | | (16.56 | )% | | | 25.82 | % | | | 1.02 | % | | | 8.37 | % | | | 6.65 | % |
| Market Price Total Return(c) | | | (16.52 | )% | | | 25.90 | % | | | 0.87 | % | | | 8.36 | % | | | 6.53 | % |
| Ratios/Supplemental Data: | | | | | | | | | | | | | | | | | | | | |
Net assets at end of year (000’s omitted) | | $ | 78,270 | | | $ | 121,552 | | | $ | 27,807 | | | $ | 24,020 | | | $ | 26,450 | |
Ratio to average net assets of: | | | | | | | | | | | | | | | | | | | | |
Expenses | | | 0.35 | % | | | 0.35 | % | | | 0.53 | % | | | 0.80 | % | | | 0.80 | % |
Net investment income | | | 2.46 | % | | | 2.40 | % | | | 2.58 | % | | | 0.97 | % | | | 2.34 | % |
Portfolio turnover rate(d) | | | 51 | % | | | 30 | % | | | 92 | % | | | 134 | % | | | 192 | % |
| (a) | Based on average shares outstanding. |
| (b) | The mean between the last bid and ask prices. |
| (c) | Net asset value total return is calculated assuming an initial investment made at the net asset value at the beginning of the period, reinvestment of all dividends and distributions at net asset value during the period, and redemption at net asset value on the last day of the period. Net asset value total return includes adjustments in accordance with accounting principles generally accepted in the United States of America and as such, the net asset value for financial reporting purposes and the returns based upon those net asset values may differ from the net asset value and returns for shareholder transactions. Market price total return is calculated assuming an initial investment made at the market price at the beginning of the period, reinvestment of all dividends and distributions at market price during the period, and sale at the market price on the last day of the period. Total investment returns calculated for a period of less than one year are not annualized. |
| (d) | Portfolio turnover rate is not annualized for periods less than one year, if applicable, and does not include securities received or delivered from processing creations or redemptions. |
See accompanying Notes to Financial Statements which are an integral part of the financial statements.
Financial Highlights–(continued)
Invesco Balanced Multi-Asset Allocation ETF (PSMB)
| | | | | | | | | | | | | | | | | | | | |
| | | Years Ended October 31, | | For the Period
February 21, 2017(a)
Through
October 31, |
| | | 2020 | | 2019 | | 2018 | | 2017 |
Per Share Operating Performance: | | | | | | | | | | | | | | | | | | | | |
Net asset value at beginning of period | | | $ | 14.15 | | | | $ | 13.10 | | | | $ | 13.32 | | | | $ | 12.50 | |
Net investment income(b)(c) | | | | 0.37 | | | | | 0.38 | | | | | 0.36 | | | | | 0.18 | |
Net realized and unrealized gain (loss) on investments | | | | (0.12 | ) | | | | 1.09 | | | | | (0.23 | ) | | | | 0.76 | |
Total from investment operations | | | | 0.25 | | | | | 1.47 | | | | | 0.13 | | | | | 0.94 | |
Distributions to shareholders from: | | | | | | | | | | | | | | | | | | | | |
Net investment income | | | | (0.45 | ) | | | | (0.38 | ) | | | | (0.32 | ) | | | | (0.12 | ) |
Net realized gains | | | | (0.35 | ) | | | | (0.04 | ) | | | | (0.03 | ) | | | | - | |
Total distributions | | | | (0.80 | ) | | | | (0.42 | ) | | | | (0.35 | ) | | | | (0.12 | ) |
Net asset value at end of period | | | $ | 13.60 | | | | $ | 14.15 | | | | $ | 13.10 | | | | $ | 13.32 | |
Market price at end of period(d) | | | $ | 13.57 | | | | $ | 14.17 | | | | $ | 13.14 | | | | $ | 13.33 | |
Net Asset Value Total Return(e) | | | | 1.86 | % | | | | 11.57 | % | | | | 0.89 | % | | | | 7.57 | %(f) |
Market Price Total Return(e) | | | | 1.49 | % | | | | 11.37 | % | | | | 1.12 | % | | | | 7.65 | %(f) |
Ratios/Supplemental Data: | | | | | | | | | | | | | | | | | | | | |
Net assets at end of period (000’s omitted) | | | $ | 8,159 | | | | $ | 4,246 | | | | $ | 2,620 | | | | $ | 1,332 | |
Ratio to average net assets of: | | | | | | | | | | | | | | | | | | | | |
Expenses(g) | | | | 0.05 | % | | | | 0.11 | %(h) | | | | 0.05 | % | | | | 0.05 | %(i) |
Net investment income(c) | | | | 2.72 | % | | | | 2.81 | %(h) | | | | 2.68 | % | | | | 2.08 | %(i) |
Portfolio turnover rate(j) | | | | 50 | % | | | | 56 | % | | | | 26 | % | | | | 6 | % |
| (a) | Commencement of investment operations. |
| (b) | Based on average shares outstanding. |
| (c) | Net investment income (loss) is affected by the timing of the declaration of dividends by the underlying funds in which the Fund invests. Ratio of net investment income (loss) does not include net investment income of the underlying funds in which the Fund invests. |
| (d) | The mean between the last bid and ask prices. |
| (e) | Net asset value total return is calculated assuming an initial investment made at the net asset value at the beginning of the period, reinvestment of all dividends and distributions at net asset value during the period, and redemption at net asset value on the last day of the period. Net asset value total return includes adjustments in accordance with accounting principles generally accepted in the United States of America and as such, the net asset value for financial reporting purposes and the returns based upon those net asset values may differ from the net asset value and returns for shareholder transactions. Market price total return is calculated assuming an initial investment made at the market price at the beginning of the period, reinvestment of all dividends and distributions at market price during the period, and sale at the market price on the last day of the period. Total investment returns calculated for a period of less than one year are not annualized. |
| (f) | The net asset value total return from Fund Inception (February 23, 2017, the first day of trading on the Exchange) to October 31, 2017 was 7.74%. The market price total return from Fund Inception to October 31, 2017 was 7.65%. |
| (g) | In addition to the fees and expenses which the Fund bears directly, the Fund indirectly bears a pro rata share of the fees and expenses of the investment companies in which the Fund invests. Estimated investment companies’ expenses are not expenses that are incurred directly by the Fund. They are expenses that are incurred directly by the investment companies and are deducted from the value of the investment companies the Fund invests in. The effect of the estimated investment companies’ expenses that the Fund bears indirectly is included in the Fund’s total return. |
| (h) | Ratios include non-recurring costs associated with a proxy statement of 0.06%. |
| (j) | Portfolio turnover rate is not annualized for periods less than one year, if applicable, and does not include securities received or delivered from processing creations or redemptions. |
See accompanying Notes to Financial Statements which are an integral part of the financial statements.
Financial Highlights–(continued)
Invesco Conservative Multi-Asset Allocation ETF (PSMC)
| | | | | | | | | | | | | | | | | | | | |
| | | Years Ended October 31, | | For the Period
February 21, 2017(a)
Through October 31, |
| | | 2020 | | 2019 | | 2018 | | 2017 |
Per Share Operating Performance: | | | | | | | | | | | | | | | | | | | | |
Net asset value at beginning of period | | | $ | 13.02 | | | | $ | 12.49 | | | | $ | 12.87 | | | | $ | 12.50 | |
Net investment income(b)(c) | | | | 0.38 | | | | | 0.46 | | | | | 0.44 | | | | | 0.21 | |
Net realized and unrealized gain (loss) on investments | | | | 0.09 | | | | | 0.73 | | | | | (0.38 | ) | | | | 0.31 | |
Total from investment operations | | | | 0.47 | | | | | 1.19 | | | | | 0.06 | | | | | 0.52 | |
Distributions to shareholders from: | | | | | | | | | | | | | | | | | | | | |
Net investment income | | | | (0.36 | ) | | | | (0.66 | ) | | | | (0.42 | ) | | | | (0.15 | ) |
Net realized gains | | | | (0.29 | ) | | | | - | | | | | (0.02 | ) | | | | - | |
Total distributions | | | | (0.65 | ) | | | | (0.66 | ) | | | | (0.44 | ) | | | | (0.15 | ) |
Net asset value at end of period | | | $ | 12.84 | | | | $ | 13.02 | | | | $ | 12.49 | | | | $ | 12.87 | |
Market price at end of period(d) | | | $ | 12.82 | | | | $ | 13.04 | | | | $ | 12.49 | | | | $ | 12.88 | |
Net Asset Value Total Return(e) | | | | 3.84 | % | | | | 9.80 | % | | | | 0.39 | % | | | | 4.18 | %(f) |
Market Price Total Return(e) | | | | 3.51 | % | | | | 9.96 | % | | | | 0.31 | % | | | | 4.26 | %(f) |
Ratios/Supplemental Data: | | | | | | | | | | | | | | | | | | | | |
Net assets at end of period (000’s omitted) | | | $ | 7,703 | | | | $ | 3,905 | | | | $ | 1,249 | | | | $ | 1,287 | |
Ratio to average net assets of: | | | | | | | | | | | | | | | | | | | | |
Expenses(g) | | | | 0.05 | % | | | | 0.09 | %(h) | | | | 0.05 | % | | | | 0.05 | %(i) |
Net investment income(c) | | | | 3.01 | % | | | | 3.60 | %(h) | | | | 3.42 | % | | | | 2.36 | %(i) |
Portfolio turnover rate(j) | | | | 41 | % | | | | 32 | % | | | | 38 | % | | | | 4 | % |
| (a) | Commencement of investment operations. |
| (b) | Based on average shares outstanding. |
| (c) | Net investment income (loss) is affected by the timing of the declaration of dividends by the underlying funds in which the Fund invests. Ratio of net investment income (loss) does not include net investment income of the underlying funds in which the Fund invests. |
| (d) | The mean between the last bid and ask prices. |
| (e) | Net asset value total return is calculated assuming an initial investment made at the net asset value at the beginning of the period, reinvestment of all dividends and distributions at net asset value during the period, and redemption at net asset value on the last day of the period. Net asset value total return includes adjustments in accordance with accounting principles generally accepted in the United States of America and as such, the net asset value for financial reporting purposes and the returns based upon those net asset values may differ from the net asset value and returns for shareholder transactions. Market price total return is calculated assuming an initial investment made at the market price at the beginning of the period, reinvestment of all dividends and distributions at market price during the period, and sale at the market price on the last day of the period. Total investment returns calculated for a period of less than one year are not annualized. |
| (f) | The net asset value total return from Fund Inception (February 23, 2017, the first day of trading on the Exchange) to October 31, 2017 was 4.26%. The market price total return from Fund Inception to October 31, 2017 was 4.17%. |
| (g) | In addition to the fees and expenses which the Fund bears directly, the Fund indirectly bears a pro rata share of the fees and expenses of the investment companies in which the Fund invests. Estimated investment companies’ expenses are not expenses that are incurred directly by the Fund. They are expenses that are incurred directly by the investment companies and are deducted from the value of the investment companies the Fund invests in. The effect of the estimated investment companies’ expenses that the Fund bears indirectly is included in the Fund’s total return. |
| (h) | Ratios include non-recurring costs associated with a proxy statement of 0.04%. |
| (j) | Portfolio turnover rate is not annualized for periods less than one year, if applicable, and does not include securities received or delivered from processing creations or redemptions. |
See accompanying Notes to Financial Statements which are an integral part of the financial statements.
Financial Highlights–(continued)
Invesco Growth Multi-Asset Allocation ETF (PSMG)
| | | | | | | | | | | | | | | | | | | | |
| | | Years Ended October 31, | | For the Period
February 21, 2017(a)
Through
October 31, |
| | | 2020 | | 2019 | | 2018 | | 2017 |
Per Share Operating Performance: | | | | | | | | | | | | | | | | | | | | |
Net asset value at beginning of period | | | $ | 14.67 | | | | $ | 13.45 | | | | $ | 13.56 | | | | $ | 12.50 | |
Net investment income(b)(c) | | | | 0.42 | | | | | 0.38 | | | | | 0.35 | | | | | 0.17 | |
Net realized and unrealized gain (loss) on investments | | | | (0.49 | ) | | | | 1.23 | | | | | (0.15 | ) | | | | 1.00 | |
Total from investment operations | | | | (0.07 | ) | | | | 1.61 | | | | | 0.20 | | | | | 1.17 | |
Distributions to shareholders from: | | | | | | | | | | | | | | | | | | | | |
Net investment income | | | | (0.34 | ) | | | | (0.35 | ) | | | | (0.28 | ) | | | | (0.11 | ) |
Net realized gains | | | | (0.22 | ) | | | | (0.04 | ) | | | | (0.03 | ) | | | | - | |
Total distributions | | | | (0.56 | ) | | | | (0.39 | ) | | | | (0.31 | ) | | | | (0.11 | ) |
Net asset value at end of period | | | $ | 14.04 | | | | $ | 14.67 | | | | $ | 13.45 | | | | $ | 13.56 | |
Market price at end of period(d) | | | $ | 14.05 | | | | $ | 14.69 | | | | $ | 13.50 | | | | $ | 13.59 | |
Net Asset Value Total Return(e) | | | | (0.45 | )% | | | | 12.24 | % | | | | 1.43 | % | | | | 9.36 | %(f) |
Market Price Total Return(e) | | | | (0.52 | )% | | | | 11.97 | % | | | | 1.58 | % | | | | 9.60 | %(f) |
Ratios/Supplemental Data: | | | | | | | | | | | | | | | | | | | | |
Net assets at end of period (000’s omitted) | | | $ | 5,617 | | | | $ | 4,400 | | | | $ | 2,691 | | | | $ | 1,356 | |
Ratio to average net assets of: | | | | | | | | | | | | | | | | | | | | |
Expenses(g) | | | | 0.05 | % | | | | 0.10 | %(h) | | | | 0.05 | % | | | | 0.05 | %(i) |
Net investment income(c) | | | | 3.01 | % | | | | 2.70 | %(h) | | | | 2.51 | % | | | | 1.90 | %(i) |
Portfolio turnover rate(j) | | | | 43 | % | | | | 81 | % | | | | 21 | % | | | | 6 | % |
| (a) | Commencement of investment operations. |
| (b) | Based on average shares outstanding. |
| (c) | Net investment income (loss) is affected by the timing of the declaration of dividends by the underlying funds in which the Fund invests. Ratio of net investment income (loss) does not include net investment income of the underlying funds in which the Fund invests. |
| (d) | The mean between the last bid and ask prices. |
| (e) | Net asset value total return is calculated assuming an initial investment made at the net asset value at the beginning of the period, reinvestment of all dividends and distributions at net asset value during the period, and redemption at net asset value on the last day of the period. Net asset value total return includes adjustments in accordance with accounting principles generally accepted in the United States of America and as such, the net asset value for financial reporting purposes and the returns based upon those net asset values may differ from the net asset value and returns for shareholder transactions. Market price total return is calculated assuming an initial investment made at the market price at the beginning of the period, reinvestment of all dividends and distributions at market price during the period, and sale at the market price on the last day of the period. Total investment returns calculated for a period of less than one year are not annualized. |
| (f) | The net asset value total return from Fund Inception (February 23, 2017, the first day of trading on the Exchange) to October 31, 2017 was 9.54%. The market price total return from Fund Inception to October 31, 2017 was 9.69%. |
| (g) | In addition to the fees and expenses which the Fund bears directly, the Fund indirectly bears a pro rata share of the fees and expenses of the investment companies in which the Fund invests. Estimated investment companies’ expenses are not expenses that are incurred directly by the Fund. They are expenses that are incurred directly by the investment companies and are deducted from the value of the investment companies the Fund invests in. The effect of the estimated investment companies’ expenses that the Fund bears indirectly is included in the Fund’s total return. |
| (h) | Ratios include non-recurring costs associated with a proxy statement of 0.05%. |
| (j) | Portfolio turnover rate is not annualized for periods less than one year, if applicable, and does not include securities received or delivered from processing creations or redemptions. |
See accompanying Notes to Financial Statements which are an integral part of the financial statements.
Financial Highlights–(continued)
Invesco Moderately Conservative Multi-Asset Allocation ETF (PSMM)
| | | | | | | | | | | | | | | | | | | | |
| | | Years Ended October 31, | | For the Period
February 21, 2017(a)
Through
October 31, |
| | | 2020 | | 2019 | | 2018 | | 2017 |
Per Share Operating Performance: | | | | | | | | | | | | | | | | | | | | |
Net asset value at beginning of period | | | $ | 13.79 | | | | $ | 12.76 | | | | $ | 13.10 | | | | $ | 12.50 | |
Net investment income(b)(c) | | | | 0.40 | | | | | 0.46 | | | | | 0.40 | | | | | 0.20 | |
Net realized and unrealized gain (loss) on investments | | | | (0.08 | ) | | | | 0.94 | | | | | (0.34 | ) | | | | 0.54 | |
Total from investment operations | | | | 0.32 | | | | | 1.40 | | | | | 0.06 | | | | | 0.74 | |
Distributions to shareholders from: | | | | | | | | | | | | | | | | | | | | |
Net investment income | | | | (0.42 | ) | | | | (0.36 | ) | | | | (0.37 | ) | | | | (0.14 | ) |
Net realized gains | | | | (0.25 | ) | | | | (0.01 | ) | | | | (0.03 | ) | | | | — | |
Total distributions | | | | (0.67 | ) | | | | (0.37 | ) | | | | (0.40 | ) | | | | (0.14 | ) |
Net asset value at end of period | | | $ | 13.44 | | | | $ | 13.79 | | | | $ | 12.76 | | | | $ | 13.10 | |
Market price at end of period(d) | | | $ | 13.43 | | | | $ | 13.82 | | | | $ | 12.78 | | | | $ | 13.12 | |
Net Asset Value Total Return(e) | | | | 2.55 | % | | | | 11.22 | % | | | | 0.40 | % | | | | 5.94 | %(f) |
Market Price Total Return(e) | | | | 2.25 | % | | | | 11.28 | % | | | | 0.41 | % | | | | 6.10 | %(f) |
Ratios/Supplemental Data: | | | | | | | | | | | | | | | | | | | | |
Net assets at end of period (000’s omitted) | | | $ | 4,033 | | | | $ | 5,516 | | | | $ | 1,276 | | | | $ | 1,310 | |
Ratio to average net assets of: | | | | | | | | | | | | | | | | | | | | |
Expenses(g) | | | | 0.05 | % | | | | 0.11 | %(h) | | | | 0.05 | % | | | | 0.05 | %(i) |
Net investment income(c) | | | | 2.98 | % | | | | 3.48 | %(h) | | | | 3.03 | % | | | | 2.23 | %(i) |
Portfolio turnover rate(j) | | | | 43 | % | | | | 65 | % | | | | 32 | % | | | | 5 | % |
| (a) | Commencement of investment operations. |
| (b) | Based on average shares outstanding. |
| (c) | Net investment income (loss) is affected by the timing of the declaration of dividends by the underlying funds in which the Fund invests. Ratio of net investment income (loss) does not include net investment income of the underlying funds in which the Fund invests. |
| (d) | The mean between the last bid and ask prices. |
| (e) | Net asset value total return is calculated assuming an initial investment made at the net asset value at the beginning of the period, reinvestment of all dividends and distributions at net asset value during the period, and redemption at net asset value on the last day of the period. Net asset value total return includes adjustments in accordance with accounting principles generally accepted in the United States of America and as such, the net asset value for financial reporting purposes and the returns based upon those net asset values may differ from the net asset value and returns for shareholder transactions. Market price total return is calculated assuming an initial investment made at the market price at the beginning of the period, reinvestment of all dividends and distributions at market price during the period, and sale at the market price on the last day of the period. Total investment returns calculated for a period of less than one year are not annualized. |
| (f) | The net asset value total return from Fund Inception (February 23, 2017, the first day of trading on the Exchange) to October 31, 2017 was 6.03%. The market price total return from Fund Inception to October 31, 2017 was 6.02%. |
| (g) | In addition to the fees and expenses which the Fund bears directly, the Fund indirectly bears a pro rata share of the fees and expenses of the investment companies in which the Fund invests. Estimated investment companies’ expenses are not expenses that are incurred directly by the Fund. They are expenses that are incurred directly by the investment companies and are deducted from the value of the investment companies the Fund invests in. The effect of the estimated investment companies’ expenses that the Fund bears indirectly is included in the Fund’s total return. |
| (h) | Ratios include non-recurring costs associated with a proxy statement of 0.06%. |
| (j) | Portfolio turnover rate is not annualized for periods less than one year, if applicable, and does not include securities received or delivered from processing creations or redemptions. |
See accompanying Notes to Financial Statements which are an integral part of the financial statements.
Financial Highlights–(continued)
Invesco S&P 500® Downside Hedged ETF (PHDG)
| | | | | | | | | | | | | | | | | | | | |
| | | Years Ended October 31, | |
| | | 2020 | | | 2019 | | | 2018 | | | 2017 | | | 2016 | |
Per Share Operating Performance: | | | | | | | | | | | | | | | | | | | | |
Net asset value at beginning of year | | $ | 26.72 | | | $ | 27.92 | | | $ | 26.67 | | | $ | 23.42 | | | $ | 24.89 | |
| | | | | | | | | | | | | | | | | | | | |
Net investment income(a) | | | 0.21 | | | | 0.46 | | | | 0.41 | | | | 0.40 | | | | 0.37 | |
Net realized and unrealized gain (loss) on investments | | | 5.94 | | | | (1.21 | ) | | | 1.36 | | | | 3.37 | | | | (1.37 | ) |
| | | | | | | | | | | | | | | | | | | | |
Total from investment operations | | | 6.15 | | | | (0.75 | ) | | | 1.77 | | | | 3.77 | | | | (1.00 | ) |
| | | | | | | | | | | | | | | | | | | | |
Distributions to shareholders from: | | | | | | | | | | | | | | | | | | | | |
Net investment income | | | (0.36 | ) | | | (0.45 | ) | | | (0.52 | ) | | | (0.52 | ) | | | (0.47 | ) |
| | | | | | | | | | | | | | | | | | | | |
Net asset value at end of year | | $ | 32.51 | | | $ | 26.72 | | | $ | 27.92 | | | $ | 26.67 | | | $ | 23.42 | |
| | | | | | | | | | | | | | | | | | | | |
Market price at end of year(b) | | $ | 32.58 | | | $ | 26.65 | | | $ | 27.86 | | | $ | 26.68 | | | $ | 23.45 | |
| | | | | | | | | | | | | | | | | | | | |
Net Asset Value Total Return(c) | | | 23.19 | % | | | (2.71 | )% | | | 6.61 | % | | | 16.27 | % | | | (4.10 | )% |
Market Price Total Return(c) | | | 23.78 | % | | | (2.75 | )% | | | 6.33 | % | | | 16.16 | % | | | (4.09 | )% |
Ratios/Supplemental Data: | | | | | | | | | | | | | | | | | | | | |
Net assets at end of year (000’s omitted) | | $ | 143,042 | | | $ | 20,037 | | | $ | 26,523 | | | $ | 24,006 | | | $ | 106,574 | |
Ratio to average net assets of: | | | | | | | | | | | | | | | | | | | | |
Expenses, after Waivers(d) | | | 0.34 | % | | | 0.36 | %(e) | | | 0.38 | % | | | 0.39 | % | | | 0.37 | % |
Expenses, prior to Waivers(d) | | | 0.39 | % | | | 0.40 | %(e) | | | 0.39 | % | | | 0.39 | % | | | 0.39 | % |
Net investment income | | | 0.68 | % | | | 1.66 | %(e) | | | 1.45 | % | | | 1.59 | % | | | 1.52 | % |
Portfolio turnover rate(f) | | | 1,172 | % | | | 608 | % | | | 542 | % | | | 54 | % | | | 373 | % |
| (a) | Based on average shares outstanding. |
| (b) | The mean between the last bid and ask prices. |
| (c) | Net asset value total return is calculated assuming an initial investment made at the net asset value at the beginning of the period, reinvestment of all dividends and distributions at net asset value during the period, and redemption at net asset value on the last day of the period. Net asset value total return includes adjustments in accordance with accounting principles generally accepted in the United States of America and as such, the net asset value for financial reporting purposes and the returns based upon those net asset values may differ from the net asset value and returns for shareholder transactions. Market price total return is calculated assuming an initial investment made at the market price at the beginning of the period, reinvestment of all dividends and distributions at market price during the period, and sale at the market price on the last day of the period. Total investment returns calculated for a period of less than one year are not annualized. |
| (d) | In addition to the fees and expenses which the Fund bears directly, the Fund indirectly bears a pro rata share of the fees and expenses of the investment companies in which the Fund invests. Estimated investment companies’ expenses are not expenses that are incurred directly by the Fund. They are expenses that are incurred directly by the investment companies and are deducted from the value of the investment companies the Fund invests in. The effect of the estimated investment companies’ expenses that the Fund bears indirectly is included in the Fund’s total return. |
| (e) | Ratios include non-recurring costs associated with a proxy statement of 0.01%. |
| (f) | Portfolio turnover rate is not annualized for periods less than one year, if applicable, and does not include securities received or delivered from processing creations or redemptions. |
See accompanying Notes to Financial Statements which are an integral part of the financial statements.
Financial Highlights–(continued)
Invesco Total Return Bond ETF (GTO)
| | | | | | | | | | | | | | | | | | | | | | | | | | | | | | |
| | | Years Ended October 31, | | Two Months Ended
October 31, | | Years Ended August 31, | | For the Period
February 10, 2016(a)
Through
August 31, |
| | | 2020 | | 2019 | | 2018 | | 2018 | | 2017 | | 2016 |
Per Share Operating Performance: | | | | | | | | | | | | | | | | | | | | | | | | | | | | | | |
Net asset value at beginning of period | | | $ | 54.39 | | | | $ | 50.89 | | | | $ | 52.10 | | | | $ | 52.61 | | | | $ | 52.54 | | | | $ | 49.97 | |
| | | | | | | | | | | | | | | | | | | | | | | | | | | | | | |
Net investment income(b) | | | | 1.26 | | | | | 1.44 | | | | | 0.31 | | | | | 1.47 | | | | | 1.47 | | | | | 0.72 | |
Net realized and unrealized gain (loss) on investments | | | | 3.47 | | | | | 4.57 | | | | | (1.20 | ) | | | | (0.37 | ) | | | | 0.29 | | | | | 2.42 | |
| | | | | | | | | | | | | | | | | | | | | | | | | | | | | | |
Total from investment operations | | | | 4.73 | | | | | 6.01 | | | | | (0.89 | ) | | | | 1.10 | | | | | 1.76 | | | | | 3.14 | |
| | | | | | | | | | | | | | | | | | | | | | | | | | | | | | |
Distributions to shareholders from: | | | | | | | | | | | | | | | | | | | | | | | | | | | | | | |
Net investment income | | | | (1.29 | ) | | | | (1.55 | ) | | | | (0.32 | ) | | | | (1.49 | ) | | | | (1.38 | ) | | | | (0.57 | ) |
Net realized gains | | | | (0.26 | ) | | | | (0.96 | ) | | | | - | | | | | (0.12 | ) | | | | (0.31 | ) | | | | - | |
| | | | | | | | | | | | | | | | | | | | | | | | | | | | | | |
Total distributions | | | | (1.55 | ) | | | | (2.51 | ) | | | | (0.32 | ) | | | | (1.61 | ) | | | | (1.69 | ) | | | | (0.57 | ) |
| | | | | | | | | | | | | | | | | | | | | | | | | | | | | | |
Net asset value at end of period | | | $ | 57.57 | | | | $ | 54.39 | | | | $ | 50.89 | | | | $ | 52.10 | | | | $ | 52.61 | | | | $ | 52.54 | |
Market price at end of period | | | $ | 57.57 | (c) | | | $ | 54.43 | (c) | | | $ | 50.93 | (c) | | | $ | 52.10 | (c) | | | $ | 52.67 | | | | $ | 52.60 | |
| | | | | | | | | | | | | | | | | | | | | | | | | | | | | | |
Net Asset Value Total Return(d) | | | | 8.85 | % | | | | 12.22 | % | | | | (1.72 | )% | | | | 2.14 | % | | | | 3.47 | % | | | | 6.29 | % |
Market Price Total Return(d) | | | | 8.77 | % | | | | 12.20 | % | | | | (1.64 | )% | | | | 2.02 | % | | | | | | | | | | |
Ratios/Supplemental Data: | | | | | | | | | | | | | | | | | | | | | | | | | | | | | | |
Net assets at end of period (000’s omitted) | | | $ | 463,457 | | | | $ | 176,783 | | | | $ | 40,713 | | | | $ | 41,678 | | | | $ | 81,538 | | | | $ | 21,014 | |
Ratio to average net assets of: | | | | | | | | | | | | | | | | | | | | | | | | | | | | | | |
Expenses, after Waivers | | | | 0.50 | % | | | | 0.50 | %(e) | | | | 0.50 | %(f) | | | | 0.50 | % | | | | 0.49 | % | | | | 0.49 | %(f) |
Expenses, prior to Waivers | | | | 0.50 | % | | | | 0.50 | %(e) | | | | 0.50 | %(f) | | | | 0.51 | % | | | | 0.51 | % | | | | 0.50 | %(f) |
Net investment income | | | | 2.25 | % | | | | 2.75 | % | | | | 3.58 | %(f) | | | | 2.80 | % | | | | 2.87 | % | | | | 2.56 | %(f) |
Portfolio turnover rate(g) | | | | 434 | % | | | | 511 | % | | | | 53 | % | | | | 219 | % | | | | 171 | % | | | | 131 | % |
| (a) | Commencement of investment operations. |
| (b) | Based on average shares outstanding. |
| (c) | The mean between the last bid and ask prices. |
| (d) | Net asset value total return is calculated assuming an initial investment made at the net asset value at the beginning of the period, reinvestment of all dividends and distributions at net asset value during the period, and redemption at net asset value on the last day of the period. Net asset value total return includes adjustments in accordance with accounting principles generally accepted in the United States of America and as such, the net asset value for financial reporting purposes and the returns based upon those net asset values may differ from the net asset value and returns for shareholder transactions. Market price total return is calculated assuming an initial investment made at the market price at the beginning of the period, reinvestment of all dividends and distributions at market price during the period, and sale at the market price on the last day of the period. Total investment returns calculated for a period of less than one year are not annualized. |
| (e) | In addition to the fees and expenses which the Fund bears directly, the Fund indirectly bears a pro rata share of the fees and expenses of the investment companies in which the Fund invests. Estimated investment companies’ expenses are not expenses that are incurred directly by the Fund. They are expenses that are incurred directly by the investment companies and are deducted from the value of the investment companies the Fund invests in. The effect of the estimated investment companies’ expenses that the Fund bears indirectly is included in the Fund’s total return. |
| (g) | Portfolio turnover rate is not annualized for periods less than one year, if applicable, and does not include securities received or delivered from processing creations or redemptions. |
See accompanying Notes to Financial Statements which are an integral part of the financial statements.
Financial Highlights–(continued)
Invesco Ultra Short Duration ETF (GSY)
| | | | | | | | | | | | | | | | | | | | | | | | | | | | | | |
| | | Years Ended October 31, | | Five Months Ended
October 31, | | Years Ended May 31, |
| | | 2020 | | 2019 | | 2018 | | 2018 | | 2017 | | 2016 |
Per Share Operating Performance: | | | | | | | | | | | | | | | | | | | | | | | | | | | | | | |
Net asset value at beginning of period | | | $ | 50.42 | | | | $ | 50.20 | | | | $ | 50.28 | | | | $ | 50.28 | | | | $ | 50.01 | | | | $ | 50.10 | |
| | | | | | | | | | | | | | | | | | | | | | | | | | | | | | |
Net investment income(a) | | | | 0.84 | | | | | 1.38 | | | | | 0.55 | | | | | 0.87 | | | | | 0.70 | | | | | 0.60 | |
Net realized and unrealized gain (loss) on investments | | | | 0.17 | | | | | 0.24 | | | | | (0.06 | ) | | | | 0.14 | | | | | 0.24 | | | | | (0.11 | ) |
| | | | | | | | | | | | | | | | | | | | | | | | | | | | | | |
Total from investment operations | | | | 1.01 | | | | | 1.62 | | | | | 0.49 | | | | | 1.01 | | | | | 0.94 | | | | | 0.49 | |
| | | | | | | | | | | | | | | | | | | | | | | | | | | | | | |
Distributions to shareholders from: | | | | | | | | | | | | | | | | | | | | | | | | | | | | | | |
Net investment income | | | | (0.88 | ) | | | | (1.39 | ) | | | | (0.57 | ) | | | | (1.01 | ) | | | | (0.67 | ) | | | | (0.58 | ) |
Net realized gains | | | | (0.02 | ) | | | | (0.01 | ) | | | | - | | | | | - | | | | | - | | | | | - | |
| | | | | | | | | | | | | | | | | | | | | | | | | | | | | | |
Total distributions | | | | (0.90 | ) | | | | (1.40 | ) | | | | (0.57 | ) | | | | (1.01 | ) | | | | (0.67 | ) | | | | (0.58 | ) |
| | | | | | | | | | | | | | | | | | | | | | | | | | | | | | |
Net asset value at end of period | | | $ | 50.53 | | | | $ | 50.42 | | | | $ | 50.20 | | | | $ | 50.28 | | | | $ | 50.28 | | | | $ | 50.01 | |
| | | | | | | | | | | | | | | | | | | | | | | | | | | | | | |
Market price at end of period | | | $ | 50.54 | (b) | | | $ | 50.42 | (b) | | | $ | 50.22 | (b) | | | $ | 50.29 | (b) | | | $ | 50.29 | | | | $ | 50.03 | |
| | | | | | | | | | | | | | | | | | | | | | | | | | | | | | |
Net Asset Value Total Return(c) | | | | 2.01 | % | | | | 3.25 | % | | | | 0.98 | % | | | | 2.02 | % | | | | 1.90 | % | | | | 0.98 | % |
Market Price Total Return(c) | | | | 2.04 | % | | | | 3.20 | % | | | | 1.00 | % | | | | 2.02 | % | | | | | | | | | | |
Ratios/Supplemental Data: | | | | | | | | | | | | | | | | | | | | | | | | | | | | | | |
Net assets at end of period (000’s omitted) | | | $ | 3,011,607 | | | | $ | 2,621,784 | | | | $ | 1,611,555 | | | | $ | 1,166,465 | | | | $ | 1,076,092 | | | | $ | 715,109 | |
Ratio to average net assets of: | | | | | | | | | | | | | | | | | | | | | | | | | | | | | | |
Expenses, after Waivers | | | | 0.22 | % | | | | 0.23 | % | | | | 0.25 | %(d) | | | | 0.27 | % | | | | 0.27 | % | | | | 0.28 | % |
Expenses, prior to Waivers | | | | 0.22 | % | | | | 0.23 | % | | | | 0.25 | %(d) | | | | 0.28 | % | | | | 0.28 | % | | | | 0.28 | % |
Net investment income | | | | 1.68 | % | | | | 2.77 | % | | | | 2.64 | %(d) | | | | 1.74 | % | | | | 1.40 | % | | | | 1.21 | % |
Portfolio turnover rate(e) | | | | 53 | % | | | | 30 | % | | | | 6 | % | | | | 56 | % | | | | 52 | % | | | | 25 | % |
| (a) | Based on average shares outstanding. |
| (b) | The mean between the last bid and ask prices. |
| (c) | Net asset value total return is calculated assuming an initial investment made at the net asset value at the beginning of the period, reinvestment of all dividends and distributions at net asset value during the period, and redemption at net asset value on the last day of the period. Net asset value total return includes adjustments in accordance with accounting principles generally accepted in the United States of America and as such, the net asset value for financial reporting purposes and the returns based upon those net asset values may differ from the net asset value and returns for shareholder transactions. Market price total return is calculated assuming an initial investment made at the market price at the beginning of the period, reinvestment of all dividends and distributions at market price during the period, and sale at the market price on the last day of the period. Total investment returns calculated for a period of less than one year are not annualized. |
| (e) | Portfolio turnover rate is not annualized for periods less than one year, if applicable, and does not include securities received or delivered from processing creations or redemptions. |
See accompanying Notes to Financial Statements which are an integral part of the financial statements.
Financial Highlights–(continued)
Invesco Variable Rate Investment Grade ETF (VRIG)
| | | | | | | | | | | | | | | | | | | | | | | | | |
| | | Years Ended October 31, | | For the Period
September 20, 2016(a)
Through October 31, |
| | | 2020 | | 2019 | | 2018 | | 2017 | | 2016 |
Per Share Operating Performance: | | | | | | | | | | | | | | | | | | | | | | | | | |
Net asset value at beginning of period | | | $ | 24.94 | | | | $ | 25.02 | | | | $ | 25.20 | | | | $ | 24.98 | | | | $ | 25.00 | |
| | | | | | | | | | | | | | | | | | | | | | | | | |
Net investment income(b) | | | | 0.40 | | | | | 0.75 | | | | | 0.65 | | | | | 0.50 | | | | | 0.06 | |
Net realized and unrealized gain (loss) on investments | | | | 0.02 | | | | | (0.03 | ) | | | | (0.15 | ) | | | | 0.29 | | | | | (0.03 | ) |
| | | | | | | | | | | | | | | | | | | | | | | | | |
Total from investment operations | | | | 0.42 | | | | | 0.72 | | | | | 0.50 | | �� | | | 0.79 | | | | | 0.03 | |
| | | | | | | | | | | | | | | | | | | | | | | | | |
Distributions to shareholders from: | | | | | | | | | | | | | | | | | | | | | | | | | |
Net investment income | | | | (0.44 | ) | | | | (0.80 | ) | | | | (0.68 | ) | | | | (0.56 | ) | | | | (0.05 | ) |
Return of capital | | | | (0.03 | ) | | | | - | | | | | - | | | | | (0.01 | ) | | | | (0.00 | )(c) |
| | | | | | | | | | | | | | | | | | | | | | | | | |
Total distributions | | | | (0.47 | ) | | | | (0.80 | ) | | | | (0.68 | ) | | | | (0.57 | ) | | | | (0.05 | ) |
| | | | | | | | | | | | | | | | | | | | | | | | | |
Net asset value at end of period | | | $ | 24.89 | | | | $ | 24.94 | | | | $ | 25.02 | | | | $ | 25.20 | | | | $ | 24.98 | |
Market price at end of period(d) | | | $ | 24.89 | | | | $ | 24.95 | | | | $ | 25.02 | | | | $ | 25.22 | | | | $ | 25.04 | |
| | | | | | | | | | | | | | | | | | | | | | | | | |
Net Asset Value Total Return(e) | | | | 1.75 | % | | | | 2.92 | % | | | | 2.01 | % | | | | 3.21 | % | | | | 0.14 | %(f) |
Market Price Total Return(e) | | | | 1.72 | % | | | | 2.96 | % | | | | 1.92 | % | | | | 3.04 | % | | | | 0.38 | %(f) |
Ratios/Supplemental Data: | | | | | | | | | | | | | | | | | | | | | | | | | |
Net assets at end of period (000’s omitted) | | | $ | 453,021 | | | | $ | 391,527 | | | | $ | 447,868 | | | | $ | 133,548 | | | | $ | 49,956 | |
Ratio to average net assets of: | | | | | | | | | | | | | | | | | | | | | | | | | |
Expenses, after Waivers | | | | 0.29 | % | | | | 0.30 | % | | | | 0.30 | % | | | | 0.30 | % | | | | 0.30 | %(g) |
Expenses, prior to Waivers | | | | 0.30 | % | | | | 0.30 | % | | | | 0.30 | % | | | | 0.30 | % | | | | 0.30 | %(g) |
Net investment income | | | | 1.64 | % | | | | 3.00 | % | | | | 2.59 | % | | | | 1.98 | % | | | | 2.03 | %(g) |
Portfolio turnover rate(h) | | | | 99 | % | | | | 62 | % | | | | 26 | % | | | | 23 | % | | | | 2 | % |
| (a) | Commencement of investment operations. |
| (b) | Based on average shares outstanding. |
| (c) | Amount represents less than $(0.005). |
| (d) | The mean between the last bid and ask prices. |
| (e) | Net asset value total return is calculated assuming an initial investment made at the net asset value at the beginning of the period, reinvestment of all dividends and distributions at net asset value during the period, and redemption at net asset value on the last day of the period. Net asset value total return includes adjustments in accordance with accounting principles generally accepted in the United States of America and as such, the net asset value for financial reporting purposes and the returns based upon those net asset values may differ from the net asset value and returns for shareholder transactions. Market price total return is calculated assuming an initial investment made at the market price at the beginning of the period, reinvestment of all dividends and distributions at market price during the period, and sale at the market price on the last day of the period. Total investment returns calculated for a period of less than one year are not annualized. |
| (f) | The net asset value total return from Fund Inception (September 22, 2016, the first day of trading on the Exchange) to October 31, 2016 was 0.18%. The market price total return from Fund Inception to October 31, 2016 was 0.22%. |
| (h) | Portfolio turnover rate is not annualized for periods less than one year, if applicable, and does not include securities received or delivered from processing creations or redemptions. |
See accompanying Notes to Financial Statements which are an integral part of the financial statements.
Notes to Financial Statements
Invesco Actively Managed Exchange-Traded Fund Trust
October 31, 2020
NOTE 1–Organization
Invesco Actively Managed Exchange-Traded Fund Trust (the “Trust”) was organized as a Delaware statutory trust on November 6, 2007 and is authorized to have multiple series of portfolios. The Trust is an open-end management investment company registered under the Investment Company Act of 1940, as amended (the “1940 Act”). This report includes the following portfolios:
| | | | |
| | | Full Name | | Short Name |
| | Invesco Active U.S. Real Estate ETF (PSR) | | “Active U.S. Real Estate ETF” |
| | |
| | Invesco Balanced Multi-Asset Allocation ETF (PSMB) | | “Balanced Multi-Asset Allocation ETF” |
| | |
| | Invesco Conservative Multi-Asset Allocation ETF (PSMC) | | “Conservative Multi-Asset Allocation ETF” |
| | |
| | Invesco Growth Multi-Asset Allocation ETF (PSMG) | | “Growth Multi-Asset Allocation ETF” |
| | |
| | Invesco Moderately Conservative Multi-Asset Allocation ETF (PSMM) | | “Moderately Conservative Multi-Asset Allocation ETF” |
| | |
| | Invesco S&P 500® Downside Hedged ETF (PHDG) | | “S&P 500® Downside Hedged ETF” |
| | |
| | Invesco Total Return Bond ETF (GTO) | | “Total Return Bond ETF” |
| | |
| | Invesco Ultra Short Duration ETF (GSY) | | “Ultra Short Duration ETF” |
| | |
| | Invesco Variable Rate Investment Grade ETF (VRIG) | | “Variable Rate Investment Grade ETF” |
Each portfolio (each, a “Fund”, and collectively, the “Funds”) represents a separate series of the Trust. The shares of the Funds are referred to herein as “Shares” or “Fund’s Shares.” Each Fund’s Shares are listed and traded on the following exchanges:
| | | | |
| | | Fund | | Exchange |
| | Active U.S. Real Estate ETF | | NYSE Arca, Inc. |
| | |
| | Balanced Multi-Asset Allocation ETF | | Cboe BZX Exchange, Inc. |
| | |
| | Conservative Multi-Asset Allocation ETF | | Cboe BZX Exchange, Inc. |
| | |
| | Growth Multi-Asset Allocation ETF | | Cboe BZX Exchange, Inc. |
| | |
| | Moderately Conservative Multi-Asset Allocation ETF | | Cboe BZX Exchange, Inc. |
| | |
| | S&P 500® Downside Hedged ETF | | NYSE Arca, Inc. |
| | |
| | Total Return Bond ETF | | NYSE Arca, Inc. |
| | |
| | Ultra Short Duration ETF | | NYSE Arca, Inc. |
| | |
| | Variable Rate Investment Grade ETF | | The NASDAQ Stock Market |
The market price of each Share may differ to some degree from a Fund’s net asset value (“NAV”). Unlike conventional mutual funds, each Fund issues and redeems Shares on a continuous basis, at NAV, only in a large specified number of Shares, each called a “Creation Unit.” Creation Units for Active U.S. Real Estate ETF, Balanced Multi-Asset Allocation ETF, Conservative Multi-Asset Allocation ETF, Growth Multi-Asset Allocation ETF and Moderately Conservative Multi-Asset Allocation ETF are issued and redeemed principally in exchange for the deposit or delivery of a basket of securities (“Deposit Securities”). Creation Units for Total Return Bond ETF, Ultra Short Duration ETF and Variable Rate Investment Grade ETF are issued and redeemed principally in exchange for the deposit or delivery of cash. Creation Units for S&P 500® Downside Hedged ETF are issued and redeemed partially in exchange for the deposit or delivery of cash and partially in exchange for Deposit Securities. Except when aggregated in Creation Units by authorized participants, the Shares are not individually redeemable securities of the Funds.
Balanced Multi-Asset Allocation ETF, Conservative Multi-Asset Allocation ETF, Growth Multi-Asset Allocation ETF and Moderately Conservative Multi-Asset Allocation ETF are each a “fund of funds,” in that each invests in other exchange-traded funds (“Underlying Funds”) advised by Invesco Capital Management LLC (the “Adviser”) or its affiliates, or other unaffiliated advisers. Each affiliated Underlying Fund’s accounting policies are outlined in that affiliated Underlying Fund’s financial statements and are publicly available at www.invesco.com/us.
The investment objective for Active U.S. Real Estate ETF is to seek to achieve high total return through growth of capital and current income. The investment objective for Balanced Multi-Asset Allocation ETF is to seek to provide current income and capital appreciation. The investment objective for Conservative Multi-Asset Allocation ETF is to seek total return consistent with a lower level of risk relative to the broad stock market. The investment objective for Growth Multi-Asset Allocation ETF is to seek to provide long-term capital appreciation. The investment objective for Moderately Conservative Multi-Asset Allocation ETF is to seek to provide current income and some capital appreciation. The investment objective for S&P 500® Downside Hedged ETF is to seek to achieve positive total returns in rising or falling markets that are not directly correlated to broad equity or fixed income
market returns. The investment objective for Total Return Bond ETF is to seek maximum total return, comprised of income and capital appreciation. The investment objective of Ultra Short Duration ETF is to seek maximum current income, consistent with preservation of capital and daily liquidity. The investment objective for Variable Rate Investment Grade ETF is to seek to generate current income while maintaining low portfolio duration as a primary objective and capital appreciation as a secondary objective.
NOTE 2–Significant Accounting Policies
The following is a summary of the significant accounting policies followed by the Funds in preparation of their financial statements.
Each Fund is an investment company and accordingly follows the investment company accounting and reporting guidance in accordance with Financial Accounting Standards Board Accounting Standards Codification Topic 946, Financial Services–Investment Companies.
| A. | Security Valuation - Securities, including restricted securities, are valued according to the following policies: |
A security listed or traded on an exchange (except convertible securities) is generally valued at its last sales price or official closing price as of the close of the customary trading session on the exchange where the security is principally traded or, lacking any sales or official closing price on a particular day, the security may be valued at the closing bid price on that day. Securities traded in the over-the-counter market are valued based on prices furnished by independent pricing services or market makers. When such securities are valued by an independent pricing service they may be considered fair valued. Futures contracts are valued at the final settlement price set by an exchange on which they are principally traded. Listed options are valued at the mean between the last bid and asked prices from the exchange on which they are principally traded, or at the final settlement price set by such exchange. Swaps and options not listed on an exchange are valued by an independent source. For purposes of determining NAV per Share, futures and option contracts generally are valued 15 minutes after the close of the customary trading session of the New York Stock Exchange (“NYSE”).
Investment companies are valued using such company’s NAV per share, unless the shares are exchange-traded, in which case they are valued at the last sales price or official closing price as of the close of the customary trading session on the exchange where the security is principally traded.
Debt obligations (including convertible securities) and unlisted equities are fair valued using an evaluated quote provided by an independent pricing service. Evaluated quotes provided by the pricing service may be determined without exclusive reliance on quoted prices, and may reflect appropriate factors such as institution-size trading in similar groups of securities, developments related to specific securities, dividend rate (for unlisted equities), yield (for debt obligations), quality, type of issue, coupon rate (for debt obligations), maturity (for debt obligations), individual trading characteristics and other market data. Securities with a demand feature exercisable within one to seven days are valued at par. Pricing services generally value debt obligations assuming orderly transactions of institutional round lot size, but a Fund may hold or transact in the same securities in smaller, odd lot sizes. Odd lots often trade at lower prices than institutional round lots. Debt obligations are subject to interest rate and credit risks. In addition, all debt obligations involve some risk of default with respect to interest and/or principal payments.
Foreign securities’ (including foreign exchange contracts’) prices are converted into U.S. dollar amounts using the applicable exchange rates as of the close of the London world markets. If market quotations are available and reliable for foreign exchange-traded equity securities, the securities will be valued at the market quotations. Because trading hours for certain foreign securities end before the close of the NYSE, closing market quotations may become unreliable. If between the time trading ends on a particular security and the close of the customary trading session on the NYSE, events occur that Invesco Capital Management LLC (the “Adviser”) determines are significant and make the closing price unreliable, a Fund may fair value the security. If the event is likely to have affected the closing price of the security, the security will be valued at fair value in good faith using procedures approved by the Board of Trustees. Adjustments to closing prices to reflect fair value may also be based on a screening process of an independent pricing service to indicate the degree of certainty, based on historical data, that the closing price in the principal market where a foreign security trades is not the current value as of the close of the NYSE. Foreign securities’ prices meeting the approved degree of certainty that the price is not reflective of current value will be priced at the indication of fair value from the independent pricing service. Multiple factors may be considered by the independent pricing service in determining adjustments to reflect fair value and may include information relating to sector indices, American Depositary Receipts and domestic and foreign index futures. Foreign securities may have additional risks including exchange rate changes, the potential for sharply devalued currencies and high inflation, political and economic upheaval, the relative lack of issuer information, relatively low market liquidity and the potential lack of strict financial and accounting controls and standards.
Securities for which market prices are not provided by any of the above methods may be valued based upon quotes furnished by independent sources. The last bid price may be used to value exchange-traded equity securities. The mean between the last bid and asked prices may be used to value debt obligations, including corporate loans, and unlisted equity securities.
Securities for which market quotations are not readily available or became unreliable are valued at fair value as determined in good faith following procedures approved by the Board of Trustees. Issuer-specific events, market trends, bid/asked quotes
of brokers and information providers and other market data may be reviewed in the course of making a good faith determination of a security’s fair value.
Each Fund may invest in securities that are subject to interest rate risk, meaning the risk that the prices will generally fall as interest rates rise and, conversely, the prices will generally rise as interest rates fall. Specific securities differ in their sensitivity to changes in interest rates depending on their individual characteristics. Changes in interest rates may result in increased market volatility, which may affect the value and/or liquidity of certain Fund investments.
Valuations change in response to many factors, including the historical and prospective earnings of the issuer, the value of the issuer’s assets, general market conditions which are not specifically related to the particular issuer, such as real or perceived adverse economic conditions, changes in the general outlook for revenues or corporate earnings, changes in interest or currency rates, regional or global instability, natural or environmental disasters, widespread disease or other public health issues, war, acts of terrorism or adverse investor sentiment generally and market liquidity. Because of the inherent uncertainties of valuation, the values reflected in the financial statements may materially differ from the value received upon actual sale of those investments.
Active Trading Risk. Active trading of portfolio securities may result in added expenses, a lower return and increased tax liability.
Agency Debt Risk. Certain Funds may invest in debt issued by government agencies, including the Federal National Mortgage Association (“Fannie Mae”) and the Federal Home Loan Mortgage Corporation (“Freddie Mac”). Instruments issued by government agencies generally are backed only by the general creditworthiness and reputation of the government agency issuing the instrument and are not backed by the full faith and credit of the U.S. government. As a result, there is uncertainty as to the current status of many obligations of Fannie Mae, Freddie Mac and other agencies that are placed under conservatorship of the federal government.
Authorized Participant Concentration Risk. Only authorized participants (“APs”) may engage in creation or redemption transactions directly with each Fund. Each Fund has a limited number of institutions that may act as APs, and such APs have no obligation to submit creation or redemption orders. Consequently, there is no assurance that APs will establish or maintain an active trading market for the Shares. This risk may be heightened to the extent that securities held by each Fund are traded outside a collateralized settlement system. In that case, APs may be required to post collateral on certain trades on an agency basis (i.e., on behalf of other market participants), which only a limited number of APs may be able to do. In addition, to the extent that APs exit the business or are unable to proceed with creation and/or redemption orders with respect to each Fund and no other AP is able to step forward to create or redeem Creation Units, this may result in a significantly diminished trading market for Shares, and Shares may be more likely to trade at a premium or discount to a Fund’s NAV and to face trading halts and/or delisting. Investments in non-U.S. securities, which may have lower trading volumes, may increase this risk.
Call Risk. If interest rates fall, it is possible that issuers of callable securities with high interest coupons will “call” (or prepay) their bonds before their maturity date. If an issuer exercises such a call during a period of declining interest rates, a Fund may have to replace such called security with a lower yielding security. If that were to happen, such Fund’s net investment income could fall.
Cash Transaction Risk. Most exchange-traded funds (“ETFs”) generally make in-kind redemptions to avoid being taxed on gains on the distributed portfolio securities at the fund level. However, unlike most ETFs, certain Funds currently intend to effect creations and redemptions principally for cash, rather than principally in-kind, because of the nature of the Fund’s investments. As such, each Fund may be required to sell portfolio securities to obtain the cash needed to distribute redemption proceeds. Therefore, a Fund may recognize a capital gain on these sales that might not have been incurred if the Fund had made a redemption in-kind. This may decrease the tax efficiency of each Fund compared to ETFs that utilize an in-kind redemption process and there may be a substantial difference in the after-tax rate of return between each Fund and conventional ETFs.
Collateralized Loan Obligations (“CLOs”) and Collateralized Debt Obligations (“CDOs”) Risk. Certain Funds may invest in CLOs and CDOs. CLOs bear many of the same risks as other forms of asset-backed securities (“ABS”), including interest rate risk, credit risk and default risk. As they are backed by pools of loans, CLOs also bear similar risks to investing in loans directly. CLOs issue classes or “tranches’’ that vary in risk and yield. CLOs may experience substantial losses attributable to loan defaults. Losses caused by defaults on underlying assets are borne first by the holders of subordinate tranches. Each Fund’s investment in CLOs may decrease in market value when the CLO experiences loan defaults or credit impairment, the disappearance of a subordinate tranche, or market anticipation of defaults and investor aversion to CLO securities as a class.
Commercial Paper Risk. Certain Funds may invest in commercial paper. The value of the Fund’s investment in commercial paper, which is an unsecured promissory note that generally has a maturity date between one and 270 days and is issued by a U.S. or foreign entity, is susceptible to changes in the issuer’s financial condition or credit quality. Investments in commercial paper are usually discounted from their value at maturity. Commercial paper can be fixed-rate or variable rate and can be adversely affected by changes in interest rates.
Commodity Pool Risk. S&P 500® Downside Hedged ETF’s investments in futures contracts has caused it to be deemed commodity pools, thereby subjecting it to regulation under the Commodity Exchange Act and Commodity Futures Trading
Commission (“CFTC”) rules. The Adviser is registered as a commodity pool operator (“CPO”) and as a commodity trading advisor (“CTA”), and will manage the Fund in accordance with CFTC rules, as well as the rules that apply to registered investment companies. Registration as a CPO or CTA subjects the Adviser to additional laws, regulations and enforcement policies, which could increase compliance costs and may affect the operations and financial performance of the Fund. Registration as a commodity pool may have negative effects on the ability of the Fund to engage in its planned investment program. Additionally, the Fund’s positions in futures contracts may have to be liquidated at disadvantageous times or prices to prevent the Fund from exceeding any applicable position limits established by the CFTC. Such actions may subject the Fund to substantial losses.
Credit Risk. The issuer of instruments in which certain Funds invest may be unable to meet interest and/or principal payments. An issuer’s securities may decrease in value if its financial strength weakens, which may reduce its credit rating and possibly its ability to meet its contractual obligations. Even in the case of collateralized debt obligations, there is no assurance that the sale of collateral would raise enough cash to satisfy an issuer’s payment obligations or that the collateral can or will be liquidated.
Currency Risk. Because each Fund’s NAV is determined in U.S. dollars, a Fund’s NAV could decline if the currency of a non-U.S. market in which the Fund invests depreciates against the U.S. dollar. Generally, an increase in the value of the U.S. dollar against a foreign currency will reduce the value of a security denominated in that foreign currency, thereby decreasing a Fund’s overall NAV. Exchange rates may be volatile and may change quickly and unpredictably in response to both global economic developments and economic conditions, causing an adverse impact on the Fund. As a result, investors have the potential for losses regardless of the length of time they intend to hold Shares.
Derivatives Risk. Derivatives involve risks different from, or possibly greater than, risks associated with other types of investments. Derivatives may be harder to value and may also be less tax efficient. To the extent that a Fund uses derivatives for hedging or to gain or limit exposure to a particular market or market segment, there may be imperfect correlation between the value of the derivative instrument and the value of the instrument being hedged or the relevant market or market segment, in which case the Fund may not realize the intended benefits. There is also the risk that during adverse market conditions, an instrument which would usually operate as a hedge provides no hedging benefits at all. A Fund’s use of derivatives may be limited by the requirements for taxation of the Fund as a regulated investment company as well as regulatory changes.
Emerging Markets Investment Risk. For certain Funds, investments in the securities of issuers in emerging market countries involve risks often not associated with investments in the securities of issuers in developed countries. Securities in emerging markets may be subject to greater price fluctuations than securities in more developed markets. Fluctuations in the value of the U.S. dollar relative to the values of other currencies may adversely affect investments in emerging market securities, and emerging market securities may have relatively low market liquidity, decreased publicly available information about issuers, and inconsistent and potentially less stringent accounting, auditing and financial reporting requirements and standards of practice comparable to those applicable to domestic issuers. Emerging market securities also are subject to the risks of expropriation, nationalization or other adverse political or economic developments and the difficulty of enforcing obligations in other countries. Investments in emerging market securities also may be subject to dividend withholding or confiscatory taxes, currency blockage and/or transfer restrictions. Emerging markets usually are subject to greater market volatility, lower trading volume, political and economic instability, uncertainty regarding the existence of trading markets and more governmental limitations on foreign investment than are more developed markets. Securities law in many emerging market countries is relatively new and unsettled. Therefore, laws regarding foreign investment in emerging market securities, securities regulation, title to securities, and shareholder rights may change quickly and unpredictably. In addition, the enforcement of systems of taxation at federal, regional and local levels in emerging market countries may be inconsistent and subject to sudden change.
Equity Risk. Equity risk is the risk that the value of equity securities, including common stocks, may fall due to both changes in general economic conditions that impact the market as a whole, as well as factors that directly relate to a specific company or its industry. Such general economic conditions include changes in interest rates, periods of market turbulence or instability, or general and prolonged periods of economic decline and cyclical change. It is possible that a drop in the stock market may depress the price of most or all of the common stocks that each Fund holds. In addition, equity risk includes the risk that investor sentiment toward one or more industries will become negative, resulting in those investors exiting their investments in those industries, which could cause a reduction in the value of companies in those industries more broadly. The value of a company’s common stock may fall solely because of factors, such as an increase in production costs that negatively impact other companies in the same region, industry or sector of the market. A company’s common stock also may decline significantly in price over a short period of time due to factors specific to that company, including decisions made by its management or lower demand for the company’s products or services. For example, an adverse event, such as an unfavorable earnings report or the failure to make anticipated dividend payments, may depress the value of common stock.
Fixed-Income Securities Risk. Fixed-income securities are subject to interest rate risk and credit risk. Interest rate risk refers to fluctuations in the value of a fixed-income security resulting from changes in the general level of interest rates. When the general level of interest rates goes up, the prices of most fixed-income securities go down. When the general level of interest rates goes down, the prices of most fixed-income securities go up. Fixed-income securities with longer maturities typically are
more sensitive to changes in interest rates, making them more volatile than securities with shorter maturities. Credit risk refers to the possibility that the issuer of a security will be unable and/or unwilling to make timely interest payments and/or repay the principal on its debt. Debt instruments are subject to varying degrees of credit risk, which may be reflected in credit ratings. There is a possibility that the credit rating of a fixed-income security may be downgraded after purchase, which may adversely affect the value of the security.
Foreign Investment Risk. Investments in the securities of non-U.S. issuers involve risks beyond those associated with investments in U.S. securities. Foreign securities may have relatively low market liquidity, greater market volatility, decreased publicly available information and less reliable financial information about issuers, and inconsistent and potentially less stringent accounting, auditing and financial reporting requirements and standards of practice comparable to those applicable to domestic issuers. Foreign securities also are subject to the risks of expropriation, nationalization, political instability, or other adverse political or economic developments and the difficulty of enforcing obligations in other countries. Investments in foreign securities also may be subject to dividend withholding or confiscatory taxes, currency blockage and/or transfer restrictions and higher transactional costs. If a Fund invests in securities denominated in foreign currencies, fluctuations in the value of the U.S. dollar relative to the values of other currencies may adversely affect investments in foreign securities and may negatively impact the Fund’s returns.
High Yield Securities (Junk Bond) Risk. Compared to higher quality debt securities, high yield debt securities (commonly referred to as “junk bonds”) involve a greater risk of default or price changes due to changes in the credit quality of the issuer because they are generally unsecured and may be subordinated to other creditors’ claims. They are considered speculative with respect to the issuer’s capacity to pay interest and repay principal. High yield debt securities often are issued by smaller, less creditworthy companies or by highly leveraged (indebted) firms, which generally are less able than more financially stable firms to make scheduled payment of interest and principal. The values of junk bond often fluctuate more in response to company, political, regulatory or economic developments than higher quality bonds, and their values can decline significantly over short periods of time or during periods of economic difficulty when the bonds could be difficult to value or sell at a fair price.
Industry Concentration Risk. Certain Funds are concentrated to a significant degree in securities of issuers operating in a single industry or industry group. By concentrating its investments in an industry or industry group, such Funds may face more risks than if they were diversified broadly over numerous industries or industry groups. Such industry-based risks, any of which may adversely affect the companies in which some Funds invest, may include, but are not limited to, the following: general economic conditions or cyclical market patterns that could negatively affect supply and demand in a particular industry; competition for resources, adverse labor relations, political or world events; obsolescence of technologies; and increased competition or new product introductions that may affect the profitability or viability of companies in an industry. In addition, at times, such industry or industry group may be out of favor and underperform other industries or the market as a whole.
Interest Rate Risk. Interest rate risk refers to the risk that bond prices generally fall as interest rates rise; conversely, bond prices generally rise as interest rates fall. Specific bonds differ in their sensitivity to changes in interest rates depending on their individual characteristics, including duration. “Duration risk” is related to interest rate risk; it refers to the risks associated with the sensitivity of a bond’s price to a one percent change in interest rates. Bonds with longer durations (i.e., a greater length of time until they reach maturity) face greater duration risk, meaning that they tend to exhibit greater volatility and are more sensitive to changes in interest rates than bonds with shorter durations. The Fund seeks to limit its exposure to interest rate risk and duration risk by constructing a portfolio of instruments that have an average duration of less than one year.
Investing in ETFs and Other Investment Companies Risk. Because certain Funds may invest in ETFs and other investment companies, a Fund’s investment performance may depend on the investment performance of the funds in which it invests. An investment in an investment company is subject to the risks associated with that investment company. Certain Funds will pay indirectly a proportional share of the fees and expenses of the investment companies in which such Funds invest (including costs and fees of the investment companies), while continuing to pay their own management fee to the Adviser. As a result, shareholders will absorb duplicate levels of fees with respect to a Fund’s investments in other investment companies.
Issuer-Specific Changes Risk. The value of an individual security or particular type of security may be more volatile than the market as a whole and may perform differently from the value of the market as a whole.
LIBOR Risk. Certain Funds may invest in financial instruments that utilize LIBOR as the reference or benchmark rate for variable interest rate calculations. On July 27, 2017, the head of the United Kingdom’s Financial Conduct Authority announced a desire to phase out the use of LIBOR by the end of 2021, and it is currently anticipated that LIBOR will cease to be published after that time, although there are initiatives underway for the discontinuation to be extended beyond 2021 for certain LIBOR rates. There remains uncertainty regarding the effect of the LIBOR transition process and therefore any impact of a transition away from LIBOR on the Fund or the instruments in which the Fund invests cannot yet be determined. There is no assurance that the composition or characteristics of any alternative reference rate will be similar to or produce the same value or economic equivalence as LIBOR or that instruments using an alternative rate will have the same volume or liquidity. As a result, the transition process might lead to increased volatility and reduced liquidity in markets that currently rely on LIBOR to determine interest rates; a reduction in the value of some LIBOR-based investments; increased difficulty in borrowing
or refinancing and diminished effectiveness of any applicable hedging strategies against instruments whose terms currently include LIBOR; and/or costs incurred in connection with temporary borrowings and closing out positions and entering into new agreements. Any such effects of the transition away from LIBOR and the adoption of alternative reference rates could result in losses to the Fund.
Liquidity Risk. Liquidity risk exists when a particular investment is difficult to purchase or sell. If a Fund invests in illiquid securities or current portfolio securities become illiquid, it may reduce the returns of the Fund because the Fund may be unable to sell the illiquid securities at an advantageous time or price.
Management Risk. The Funds are subject to management risk because they are actively managed portfolios. In managing a Fund’s portfolio securities, the Adviser or a sub-adviser (as applicable and as set forth below), applies investment techniques and risk analyses in making investment decisions, but there can be no guarantee that these will produce the desired results.
Market Risk. The Funds’ holdings are subject to market fluctuations. You should anticipate that the value of the Shares will decline more or less, in correlation with any decline in value of the holdings in a Fund’s portfolio. Additionally, natural or environmental disasters, widespread disease or other public health issues, war, acts of terrorism or other events could result in increased premiums or discounts to each Fund’s NAV.
Mortgage-Backed and Asset-Backed Securities Risk. For certain Funds, investments in mortgage- and asset-backed securities are subject to prepayment or call risk, which is the risk that payments from the borrower may be received earlier than expected due to changes in the rate at which the underlying loans are prepaid. Securities may be prepaid at a price less than the original purchase value. In addition, TBA transactions involve the risk that the securities received may be less favorable than what was anticipated by the Fund when entering into the TBA transaction and counterparty risk. Default or bankruptcy of a counterparty to a TBA transaction would expose the Fund to potential loss and could affect the Fund’s returns.
Non-Diversified Fund Risk. Because each Fund (except Active U.S. Real Estate ETF, S&P 500® Downside Hedged ETF and Variable Rate Investment Grade ETF) is non-diversified and can invest a greater portion of its assets in securities of individual issuers than a diversified fund, changes in the market value of a single investment could cause greater fluctuations in Share price than would occur in a diversified fund. This may increase each Fund’s volatility and cause the performance of a relatively small number of issuers to have a greater impact on each Fund’s performance.
Portfolio Size Risk. Under normal market conditions, certain Funds typically will hold a small number of positions (approximately 10-20 Underlying Funds). To the extent that a significant portion of a Fund’s total assets is invested in a limited number of holdings, the appreciation or depreciation of any one Underlying Fund may have a greater impact on such Fund’s NAV than it would if the Fund held a greater number of constituents.
Portfolio Turnover Risk. Certain Funds may engage in frequent trading of their respective portfolio securities, which may result in a high portfolio turnover rate. A portfolio turnover rate of 200%, for example, is equivalent to a Fund buying and selling all of its securities two times during the course of a year. A high portfolio turnover rate (such as 100% or more) could result in high brokerage costs for a Fund. While a high portfolio turnover rate may increase a fund’s transaction costs it may also generate a greater amount of taxable capital gain distributions to the fund’s shareholders. Funds that engage in TBA transactions are also subject to portfolio turnover risk.
REIT Risk. REITs are pooled investment vehicles that trade like stocks and invest substantially all of their assets in real estate and may qualify for special tax considerations. REITs are subject to certain risks inherent in the direct ownership of real estate, including without limitation, a possible lack of mortgage funds and associated interest rate risks, overbuilding, property vacancies, increases in property taxes and operating expenses, changes in zoning laws, losses due to environmental damages and changes in neighborhood values and appeal to purchasers. Further, failure of a company to qualify as a REIT under federal tax law may have adverse consequences to the REIT’s shareholders. In addition, REITs may have expenses, including advisory and administration expenses, and REIT shareholders will incur a proportionate share of the underlying expenses.
Risk of Investing in Loans. Investments in loans, including loan syndicates and other direct lending opportunities, involve special types of risks, including credit risk, interest rate risk, counterparty risk and prepayment risk. Loans may offer a fixed or floating interest rate. Loans are often generally below investment grade and may be unrated. A Fund’s investments in loans can be difficult to value accurately and may be more susceptible to liquidity risk than fixed-income instruments of similar credit quality and/or maturity. A Fund is also subject to the risk that the value of the collateral for the loan may be insufficient to cover the borrower’s obligations should the borrower fail to make payments or become insolvent. Participations in loans may subject the Fund to the credit risk of both the borrower and the issuer of the participation and may make enforcement of loan covenants more difficult for the Fund as legal action may have to go through the issuer of the participations. Transactions in loans are often subject to long settlement periods, thus potentially limiting the ability of a Fund to invest sale proceeds in other investments and to use proceeds to meet its current redemption obligations. Thus, to the extent a Fund effects redemptions in cash, the Fund is subject to the risk of selling other investments or taking other actions necessary to raise cash to meet its redemption obligations.
Small- and Mid-Capitalization Company Risk. Investing in securities of small- and mid-capitalization companies involves greater risk than customarily is associated with investing in larger, more established companies. These companies’ securities may be more volatile and less liquid than those of more established companies. These securities may have returns that vary, sometimes significantly, from the overall securities market. Often small- and mid-capitalization companies and the industries in which they focus are still evolving and, as a result, they may be more sensitive to changing market conditions.
Tax Risk. There is no guarantee that the income from certain Funds will be exempt from federal or state income taxes. Events occurring after the date of issuance of a municipal bond or after a Fund’s acquisition of a municipal bond may result in a determination that interest on that bond is includible in gross income for federal income tax purposes retroactively to its date of issuance. Such a determination may cause a portion of prior distributions by a Fund to its shareholders to be taxable to those shareholders in the year of receipt. Federal or state changes in income or alternative minimum tax rates or in the tax treatment of municipal bonds may make municipal bonds less attractive as investments and cause them to lose value.
To-Be-Announced (TBA) Transactions Risk. TBA purchase commitments involve a risk of loss if the value of the securities to be purchased declines prior to the settlement date or if the counterparty may not deliver the securities as promised. Selling a TBA involves a risk of loss if the value of the securities to be sold goes up prior to the settlement date. TBA transactions involve counterparty risk. Default or bankruptcy of a counterparty to a TBA transaction would expose a Fund to potential loss and could affect the Fund’s returns.
U.S. Government Obligations Risk. Certain Funds may invest in U.S. Government obligations issued or guaranteed by the U.S. Government, its agencies and instrumentalities, including bills, notes and bonds issued by the U.S. Treasury. U.S. Government securities include securities that are issued or guaranteed by the United States Treasury, by various agencies of the U.S. Government, or by various instrumentalities which have been established or sponsored by the U.S. Government. U.S. Treasury securities are backed by the “full faith and credit” of the United States. Securities issued or guaranteed by federal agencies and U.S. Government-sponsored instrumentalities may or may not be backed by the full faith and credit of the United States. In the case of those U.S. Government securities not backed by the full faith and credit of the United States, the investor must look principally to the agency or instrumentality issuing or guaranteeing the security for ultimate repayment, and may not be able to assert a claim against the United States itself in the event that the agency or instrumentality does not meet its commitment. The U.S. Government, its agencies and instrumentalities do not guarantee the market value of their securities, and consequently, the value of such securities may fluctuate.
VIX Index Risk. For S&P 500® Downside Hedged ETF, the Chicago Board Options Exchange (“CBOE”) can make methodological changes to the calculation of the Chicago Board Options Exchange Volatility Index (“VIX Index”) that could affect the value of the futures contracts on the VIX Index. There can be no assurance that the CBOE will not change the VIX Index calculation methodology in a way that may affect the value of each Fund’s Shares. Additionally, the CBOE may alter, discontinue or suspend calculation or dissemination of the VIX Index and/or the exercise settlement value. Any of these actions could adversely affect the value of each Fund’s Shares.
| C. | Investment Transactions and Investment Income - Investment transactions are accounted for on a trade date basis. Realized gains and losses from the sale or disposition of securities are computed on the specific identified cost basis. Interest income is recorded on an accrual basis from the settlement date. Pay-in-kind interest income and non-cash dividend income received in the form of securities in-lieu of cash are recorded at the fair value of the securities received. Dividend income (net of withholding tax, if any) is recorded on the ex-dividend date. Dividend income from REITs is recorded based on the income included in the distributions received from the REIT investments using published REIT classifications, including some management estimates when actual amounts are not available. Distributions received in excess of this estimated amount are recorded as a reduction of the cost of investments or reclassified to capital gains. The actual amounts of income, return of capital, and capital gains are only determined by each REIT after its fiscal year-end, and may differ from the estimated amounts. Realized gains, dividends and interest received by a Fund may give rise to withholding and other taxes imposed by foreign countries. Tax conventions between certain countries and the United States may reduce or eliminate such taxes. |
The Funds may periodically participate in litigation related to each Fund’s investments. As such, the Funds may receive proceeds from litigation settlements. Any proceeds received are included in the Statements of Operations as realized gain (loss) for investments no longer held and as unrealized gain (loss) for investments still held.
Brokerage commissions and mark ups are considered transaction costs and are recorded as an increase to the cost basis of securities purchased and/or a reduction of proceeds on a sale of securities. Such transaction costs are included in the determination of net realized and unrealized gain (loss) from investment securities reported in the Statements of Operations and the Statements of Changes in Net Assets and the net realized and unrealized gains (losses) on securities per share in the Financial Highlights. Transaction costs are included in the calculation of each Fund’s NAV and, accordingly, they reduce each Fund’s total returns. These transaction costs are not considered operating expenses and are not reflected in net investment income reported in the Statements of Operations and the Statements of Changes in Net Assets, or the net investment income per share and the ratios of expenses and net investment income reported in the Financial Highlights, nor are they limited by any expense limitation arrangements between each Fund and the Adviser.
| D. | Country Determination - For the purposes of presentation in the Schedules of Investments, the Adviser may determine the country in which an issuer is located and/or credit risk exposure based on various factors. These factors may include the laws of the country under which the issuer is organized, where the issuer maintains a principal office, the country in which the issuer derives 50% or more of its total revenues and the country that has the primary market for the issuer’s securities, as well as other criteria. Among the other criteria that may be evaluated for making this determination are the country in which the issuer maintains 50% or more of its assets, the type of security, financial guarantees and enhancements, the nature of the collateral and the sponsor organization. Country of issuer and/or credit risk exposure has been determined to be the United States of America, unless otherwise noted. |
| E. | Dividends and Distributions to Shareholders - Each Fund (except Total Return Bond ETF, Ultra Short Duration ETF and Variable Rate Investment Grade ETF) declares and pays dividends from net investment income, if any, to their shareholders quarterly and record such dividends on the ex-dividend date. Total Return Bond ETF, Ultra Short Duration ETF and Variable Rate Investment Grade ETF each declares and pays dividends from net investment income, if any, to its shareholders monthly and records such dividends on the ex-dividend date. Generally, each Fund distributes net realized taxable capital gains, if any, annually in cash and records them on the ex-dividend date. Such distributions on a tax basis are determined in conformity with federal income tax regulations which may differ from accounting principles generally accepted in the United States of America (“GAAP”). Distributions in excess of tax basis earnings and profits, if any, are reported in such Fund’s financial statements as a tax return of capital at fiscal year-end. |
| F. | Federal Income Taxes - Each Fund intends to comply with the provisions of the Internal Revenue Code of 1986, as amended (the “Internal Revenue Code”), applicable to regulated investment companies and to distribute substantially all of the Fund’s taxable earnings to its shareholders. As such, the Funds will not be subject to federal income taxes on otherwise taxable income (including net realized gains) that is distributed to the shareholders. Therefore, no provision for federal income taxes is recorded in the financial statements. |
Each Fund recognizes the tax benefits of uncertain tax positions only when the position is more likely than not to be sustained. Management has analyzed each Fund’s uncertain tax positions and concluded that no liability for unrecognized tax benefits should be recorded related to uncertain tax positions. Management is not aware of any tax positions for which it is reasonably possible that the total amounts of unrecognized tax benefits will change materially in the next 12 months.
Income and capital gain distributions are determined in accordance with federal income tax regulations, which may differ from GAAP. These differences are primarily due to differing book and tax treatments for in-kind transactions, losses deferred due to wash sales, and passive foreign investment company adjustments, if any.
The Funds file U.S. federal tax returns and tax returns in certain other jurisdictions. Generally, a Fund is subject to examinations by such taxing authorities for up to three years after the filing of the return for the tax period.
| G. | Expenses - Each Fund (except Ultra Short Duration ETF) has agreed to pay an annual unitary management fee to the Adviser. Out of the unitary management fee, the Adviser has agreed to pay for substantially all expenses of the Funds, including payments to the Affiliated Sub-Advisers (as defined below) for each Fund (except S&P 500® Downside Hedged ETF), and for each Fund, the cost of transfer agency, custody, fund administration, legal, audit and other services, except for distribution fees, if any, brokerage expenses, taxes, interest, litigation expenses, acquired fund fees and expenses, if any, and other extraordinary expenses, including proxy expenses (except for such proxies related to: (i) changes to the Investment Advisory Agreement, (ii) the election of any Board member who is an “interested person” of the Trust, or (iii) any other matters that directly benefit the Adviser). |
Ultra Short Duration ETF is responsible for all of its expenses, including, but not limited to, the investment advisory fees, cost of transfer agency, custody, fund administration, legal, audit and other services, interest, taxes, acquired fund fees and expense, if any, brokerage commissions and other expenses connected with executions of portfolio transactions, any distribution fees or expenses, litigation expenses, fees payable to the Trust’s Board members who are not “interested persons” (as defined in the 1940 Act) of the Trust (the “Independent Trustees”), expenses incurred in connection with the Board members’ services, including travel expenses and legal fees of counsel for the Independent Trustees, acquired fund fees and expenses, if any, and extraordinary expenses, including proxy expenses (except for such proxies related to: (i) changes to the Investment Advisory Agreement, (ii) the election of any Board member who is an “interested person” of the Trust, or (iii) any other matters that directly benefit the Adviser).
Expenses of the Trust that are excluded from a Fund’s unitary management fee (if applicable) and are directly identifiable to a specific Fund are applied to that Fund. Expenses of the Trust that are excluded from each Fund’s unitary management fee (if applicable) and that are not readily identifiable to a specific Fund are allocated in such a manner as deemed equitable, taking into consideration the nature and type of expense and the relative net assets of each Fund.
To the extent a Fund invests in other investment companies, the expenses shown in the accompanying financial statements reflect the expenses of the Fund and do not include any expenses of the investment companies in which it invests. The effects of such investment companies’ expenses are included in the realized and unrealized gain or loss on the investments in the investment companies.
| H. | Accounting Estimates - The preparation of the financial statements in accordance with GAAP requires management to make estimates and assumptions that affect the reported amounts and disclosures in the financial statements, including estimates and assumptions related to taxation. Actual results could differ from these estimates. In addition, the Funds monitor for material events or transactions that may occur or become known after the period-end date and before the date the financial statements are released to print. |
| I. | Indemnifications - Under the Trust’s organizational documents, its Officers and Trustees are indemnified against certain liabilities arising out of the performance of their duties to the Trust. Each Independent Trustee is also indemnified against certain liabilities arising out of the performance of their duties to the Trust pursuant to an Indemnification Agreement between such trustee and the Trust. Additionally, in the normal course of business, the Trust enters into contracts with service |
providers that contain general indemnification clauses. The Trust’s maximum exposure under these arrangements is unknown, as this would involve future claims that may be made against the Trust that have not yet occurred. However, based on experience, the Trust believes the risk of loss to be remote.
| J. | Commercial Mortgage-Backed Securities - Total Return Bond ETF, Ultra Short Duration ETF and Variable Rate Investment Grade ETF may invest in both single and multi-issuer Commercial Mortgage-Backed Securities (“CMBS”). This includes both investment grade and non-investment grade CMBS as well as other non-rated CMBS. A CMBS is a type of mortgage-backed security that is secured by one or more mortgage loans on interests in commercial real estate property. CMBS differ from conventional debt securities because principal is paid back over the life of the security rather than at maturity. Investments in CMBS are subject to the various risks which relate to the pool of underlying assets in which the CMBS represents an interest. Securities backed by commercial real estate assets are subject to securities market risks as well as risks similar to those of direct ownership of commercial real estate loans. Risks include the ability of a borrower to meet its obligations on the loan which could lead to default or foreclosure of the property. Such actions may impact the amount of proceeds ultimately derived from the loan, and the timing of receipt of such proceeds. |
Management estimates future expected cash flows at the time of purchase based on the anticipated repayment dates on the CMBS. Subsequent changes in expected cash flow projection may result in a prospective change in the timing or character of income recognized on these securities, or the amortized cost of these securities. Each Fund amortizes premiums and/or accretes discounts based on the projected cash flows. Realized and unrealized gains and losses on CMBS are included in the Statements of Operations as Net realized gain (loss) from investment securities and Change in net unrealized appreciation (depreciation) of investment securities, respectively.
| K. | Repurchase Agreements - The Funds may enter into repurchase agreements. Collateral on repurchase agreements, including each Fund’s pro-rata interest in joint repurchase agreements, is taken into possession by such Funds upon entering into the repurchase agreement. Collateral consisting of U.S. Government Securities and U.S. Government Sponsored Agency Securities is marked to market daily to ensure its market value is at least 102% of the sales price of the repurchase agreement. Collateral consisting of non-government securities is marked to market daily to ensure its market value is at least 105% of the sales price of the repurchase agreement. The investments in some repurchase agreements, pursuant to procedures approved by the Board of Trustees, are through participation with other mutual funds, private accounts and certain non-registered investment companies managed by the investment advisor or its affiliates (“Joint repurchase agreements”). The principal amount of the repurchase agreement is equal to the value at period-end. If the seller of a repurchase agreement fails to repurchase the security in accordance with the terms of the agreement, the Funds might incur expenses in enforcing their rights, and could experience losses, including a decline in the value of the collateral and loss of income. |
| L. | Securities Purchased on a When-Issued and Delayed Delivery Basis - The Funds may purchase and sell interests in corporate loans and corporate debt securities and other portfolio securities on a when issued and delayed delivery basis, with payment and delivery scheduled for a future date. No income accrues to the Fund on such interests or securities in connection with such transactions prior to the date the Fund actually takes delivery of such interests or securities. These transactions are subject to market fluctuations and are subject to the risk that the value of the interests or securities at delivery may be more or less than the trade date purchase price. Although the Fund will generally purchase these securities with the intention of acquiring such securities, it may sell such securities prior to the settlement date. |
| M. | Structured Securities - Certain Funds may invest in structured securities. Structured securities are a type of derivative security whose value is determined by reference to changes in the value of underlying securities, currencies, interest rates, commodities, indices or other financial indicators (“reference instruments”). Most structured securities are fixed-income securities that have maturities of three years or less. Structured securities may be positively or negatively indexed (i.e., their principal value or interest rates may increase or decrease if the underlying reference instrument appreciates) and may have return characteristics similar to direct investments in the underlying reference instrument. |
Structured securities may entail a greater degree of market risk than other types of debt securities because the investor bears the risk of the reference instruments. In addition to the credit risk of structured securities and the normal risks of price changes in response to changes in interest rates, the principal amount of structured notes or indexed securities may decrease as a result of changes in the value of the underlying reference instruments. Changes in the daily value of structured securities are recorded as unrealized gains (losses) in the Statements of Operations. When the structured securities mature or are sold, the Fund recognizes a realized gain (loss) on the Statements of Operations.
| N. | Securities Lending - Each Fund may participate in securities lending and may loan portfolio securities having a market value up to one-third of the Fund’s total assets. Such loans are secured by cash collateral equal to no less than 102% (105% for international securities) of the market value of the loaned securities determined daily by the securities lending provider. Cash collateral received in connection with these loans is generally invested in an affiliated money market fund and is shown as such on the Schedules of Investments. Each Fund bears the risk of loss with respect to the investment of collateral. It is the policy of these Funds to obtain additional collateral from or return excess collateral to the borrower by the end of the next business day, following the valuation date of the securities loaned. Therefore, the value of the collateral held may be temporarily less than the value of the securities on loan. When loaning securities, each Fund retains certain benefits of owning the securities, including the economic equivalent of dividends or interest generated by the security. Lending securities entails a risk of loss to each Fund if, and to the extent that, the market value of the securities loaned were to increase, and the |
| | borrower did not increase the collateral accordingly, and the borrower failed to return the securities. The securities loaned are subject to termination at the option of the borrower or each Fund. Upon termination, the borrower will return to each Fund the securities loaned and each Fund will return the collateral. Upon the failure of the borrower to return the securities, collateral may be liquidated and the securities may be purchased on the open market to replace the loaned securities. Each Fund could experience delays and costs in gaining access to the collateral and the securities may lose value during the delay which could result in potential losses to each Fund. Some of these losses may be indemnified by the lending agent. Each Fund bears the risk of any deficiency in the amount of the collateral available for return to the borrower due to any loss on the collateral invested. For Funds that participated in securities lending, dividends received on cash collateral investments for securities lending transactions, which are net of compensation to counterparties, are included in Securities lending income on the Statements of Operations. The aggregate value of securities out on loan, if any, is shown on the Statements of Assets and Liabilities. |
| O. | Foreign Currency Translations - Foreign currency is valued at the close of the NYSE based on quotations posted by banks and major currency dealers. Portfolio securities and other assets and liabilities denominated in foreign currencies are translated into U.S. dollar amounts at the date of valuation. Purchases and sales of portfolio securities (net of foreign taxes withheld on disposition) and income items denominated in foreign currencies are translated into U.S. dollar amounts on the respective dates of such transactions. Each Fund does not separately account for the portion of the results of operations resulting from changes in foreign exchange rates on investments and the fluctuations arising from changes in market prices of securities held. The combined results of changes in foreign exchange rates and the fluctuation of market prices on investments (net of estimated foreign tax withholding) are included with the net realized and unrealized gain or loss from investments in the Statements of Operations. Reported net realized foreign currency gains or losses arise from (1) sales of foreign currencies, (2) currency gains or losses realized between the trade and settlement dates on securities transactions, and (3) the difference between the amounts of dividends, interest, and foreign withholding taxes recorded on a Fund’s books and the U.S. dollar equivalent of the amounts actually received or paid. Net unrealized foreign currency gains and losses arise from changes in the fair values of assets and liabilities, other than investments in securities at fiscal period-end, resulting from changes in exchange rates. |
Each Fund may invest in foreign securities, which may be subject to foreign taxes on income, gains on investments or currency repatriation, a portion of which may be recoverable. Foreign taxes, if any, are recorded based on the tax regulations and rates that exist in the foreign markets in which a Fund invests.
| P. | Forward Foreign Currency Contracts - Certain Funds may engage in foreign currency transactions either on a spot (i.e. for prompt delivery and settlement) basis at the rate prevailing in the currency exchange market at the time or through forward foreign currency contracts to manage or minimize currency or exchange rate risk. |
A Fund may also enter into forward foreign currency contracts for the purchase or sale of a security denominated in a foreign currency in order to “lock in” the U.S. dollar price of that security, or the Fund may enter into forward foreign currency contracts that do not provide for physical settlement of the two currencies, but instead are settled by a single cash payment calculated as the difference between the agreed upon exchange rate and the spot rate at settlement based upon an agreed upon notional amount (non-deliverable forwards). The Fund will set aside liquid assets in an amount equal to the daily mark-to-market obligation for forward foreign currency contracts.
A forward foreign currency contract is an obligation between two parties (“Counterparties”) to purchase or sell a specific currency for an agreed-upon price at a future date. The use of forward foreign currency contracts does not eliminate fluctuations in the price of the underlying securities the Fund owns or intends to acquire but establishes a rate of exchange in advance. Fluctuations in the value of these contracts are measured by the difference in the contract date and reporting date exchange rates and are recorded as unrealized appreciation (depreciation) until the contracts are closed. When the contracts are closed, realized gains (losses) are recorded. Realized and unrealized gains (losses) on the contracts are included in the Statements of Operations. The primary risks associated with forward foreign currency contracts include failure of the Counterparty to meet the terms of the contract and the value of the foreign currency changing unfavorably. These risks may be in excess of the amounts reflected in the Statements of Assets and Liabilities.
| Q. | Futures Contracts - Certain Funds may enter into futures contracts to simulate full investment in securities or manage exposure to equity and market price movements and/or currency risks and provide exposure to markets and indexes. |
A futures contract is an agreement between Counterparties to purchase or sell a specified underlying security or index for a specified price at a future date. Certain Funds will only enter into futures contracts that are traded on a U.S. exchange and that are standardized as to maturity date and underlying financial instrument. Initial margin deposits required upon entering into futures contracts are satisfied by the segregation of specific securities or cash as collateral at the futures commission merchant broker. During the period the futures contracts are open, changes in the value of the contracts are recognized as unrealized gains or losses by recalculating the value of the contracts on a daily basis. Subsequent or variation margin payments are received or made depending upon whether unrealized gains or losses are incurred. These amounts are reflected as a receivable or payable on the Statements of Assets and Liabilities. When the contracts are closed or expire, each Fund recognizes a realized gain or loss equal to the difference between the proceeds from, or cost of, the closing transaction and the Fund’s basis in the contract. The net realized gain (loss) and the change in unrealized gain (loss) on futures contracts held during the period is included on the Statements of Operations.
The primary risks associated with futures contracts are market risk, leverage risk and the absence of a liquid secondary market. If a Fund were unable to liquidate a futures contract and/or enter into an offsetting closing transaction, the Fund would continue to be subject to market risk with respect to the value of the contracts and may be required to continue to maintain the margin deposits on the futures contracts until the position expired or matured. As futures contracts approach expiration, they may be replaced by similar contracts that have a later expiration. This process is referred to as “rolling.” If the market for these contracts is in “contango,” meaning that the prices of futures contracts in the nearer months are lower than the price of contracts in the distant months, the sale of the near-term month contract would be at a lower price than the longer-term contract, resulting in a cost to “roll” the futures contract. The actual realization of a potential roll cost will depend on the difference in price of the near and distant contracts. The contracts included in the VIX Index historically have traded in “contango” markets, resulting in a roll cost, which could adversely affect the value of Shares of the S&P 500® Downside Hedged ETF. Futures have minimal Counterparty risk since the exchange’s clearinghouse, as Counterparty to all exchange-traded futures contracts, guarantees the futures against default. Risks may exceed amounts recognized in the Statements of Assets and Liabilities.
| R. | Call Options Purchased and Written - Certain Funds may write call options and/or buy call options. A covered call option gives the purchaser of such option the right to buy, and the writer the obligation to sell, the underlying security or foreign currency at the stated exercise price during the option period. An uncovered call option exists without the ownership of the underlying security. Options written by the Fund normally will have expiration dates between three and nine months from the date written. The exercise price of a call option may be below, equal to, or above the current market value of the underlying security at the time the option is written. |
When the Fund writes a covered call option, an amount equal to the premium received by the Fund is recorded as an asset and an equivalent liability in the Statements of Assets and Liabilities. The amount of the liability is subsequently “marked-to-market” to reflect the current market value of the option written. If a written covered call option expires on the stipulated expiration date, or if the Fund enters into a closing purchase transaction, the Fund realizes a gain (or a loss if the closing purchase transaction exceeds the premium received when the option was written) without regard to any unrealized gain or loss on the underlying security, and the liability related to such option is extinguished. If a written covered call option is exercised, the Fund realizes a gain or a loss from the sale of the underlying security and the proceeds of the sale are increased by the premium originally received. Realized and unrealized gains and losses on call options written are included in the Statements of Operations as Net realized gain (loss) from and Change in net unrealized appreciation (depreciation) of Option contracts written. A risk in writing a covered call option is that the Fund gives up the opportunity for profit if the market price of the security increases and the option is exercised. The risk in writing an uncovered call option is that the Fund may incur significant losses if the value of the written security exceeds the exercise price of the option.
When the Fund buys a call option, an amount equal to the premium paid by the Fund is recorded as an investment on the Statements of Assets and Liabilities. The amount of the investment is subsequently “marked-to-market” to reflect the current value of the option purchased. Realized and unrealized gains and losses on call options purchased are included in the Statements of Operations as Net realized gain (loss) from and Change in net unrealized appreciation (depreciation) of Investment securities. A risk in buying an option is that the Fund pays a premium whether or not the option is exercised. In addition, there can be no assurance that a liquid secondary market will exist for any option purchased.
| S. | Put Options Purchased and Written - Certain Funds may purchase and write put options including options on securities indexes, or foreign currency and/or futures contracts. By purchasing a put option, the Fund obtains the right (but not the obligation) to sell the option’s underlying instrument at a fixed strike price. In return for this right, the Fund pays an option premium. The option’s underlying instrument may be a security, securities index, or a futures contract. |
Put options may be used by the Fund to hedge securities it owns by locking in a minimum price at which the Fund can sell. If security prices fall, the put option could be exercised to offset all or a portion of the Fund’s resulting losses. At the same time, because the maximum the Fund has at risk is the cost of the option, purchasing put options does not eliminate the potential for the Fund to profit from an increase in the value of the underlying portfolio securities. The Fund may write put options to earn additional income in the form of option premiums if it expects the price of the underlying instrument to remain stable or rise during the option period so that the option will not be exercised. The risk in this strategy is that the price of the underlying portfolio securities may decline by an amount greater than the premium received. Put options written are reported as a liability in the Statements of Assets and Liabilities. Realized and unrealized gains and losses on put options purchased and put options written are included in the Statements of Operations as Net realized gain (loss) from and Change in net unrealized appreciation (depreciation) of Investment securities and Option contracts written, respectively.
A risk in buying an option is that the Fund pays a premium whether or not the option is exercised. In addition, there can be no assurance that a liquid secondary market will exist for any option purchased.
| T. | Swap Agreements - Certain Funds may enter into various swap transactions, including interest rate, total return, index, currency exchange rate and credit default swap contracts (“CDS”) for investment purposes or to manage interest rate, currency or credit risk. Such transactions are agreements between Counterparties. These agreements may contain, among other conditions, events of default and termination events, and various covenants and representations such as provisions that require the Fund to maintain a pre-determined level of net assets, and/or provide limits regarding the decline of the Fund’s |
| | NAV over specific periods of time. If the Fund were to trigger such provisions and have open derivative positions at that time, the Counterparty may be able to terminate such agreement and request immediate payment in an amount equal to the net liability positions, if any. |
Interest rate, total return, index and currency exchange rate swap agreements are two- party contracts entered into primarily to exchange the returns (or differentials in rates of returns) earned or realized on particular predetermined investments or instruments. The gross returns to be exchanged or “swapped” between the parties are calculated with respect to a notional amount, i.e., the return on or increase in value of a particular dollar amount invested at a particular interest rate or return of an underlying asset, in a particular foreign currency, or in a “basket” of securities representing a particular index.
In a centrally cleared swap, the Fund’s ultimate Counterparty is a central clearinghouse. The Fund initially will enter into centrally cleared swaps through an executing broker. When a fund enters into a centrally cleared swap, it must deliver to the central Counterparty (via the futures commission merchant (“FCM”)) an amount referred to as “initial margin.” Initial margin requirements are determined by the central Counterparty, but an FCM may require additional initial margin above the amount required by the central Counterparty. Initial margin deposits required upon entering into centrally cleared swaps are satisfied by cash or securities as collateral at the FCM. Securities deposited as initial margin are designated on the Schedule of Investments and cash deposited is recorded on the Statements of Assets and Liabilities. During the term of a cleared swap agreement, a “variation margin” amount may be required to be paid by the Fund or may be received by the Fund, based on the daily change in price of the underlying reference instrument subject to the swap agreement and is recorded as a receivable or payable for variation margin in the Statements of Assets and Liabilities until the centrally cleared swap is terminated at which time a realized gain or loss is recorded.
Changes in the value of swap agreements are recognized as unrealized gains (losses) in the Statements of Operations by “marking to market” on a daily basis to reflect the value of the swap agreement at the end of each trading day. Payments received or paid at the beginning of the agreement are reflected as such on the Statements of Assets and Liabilities and may be referred to as upfront payments. The Fund accrues for the fixed payment stream and amortizes upfront payments, if any, on swap agreements on a daily basis with the net amount, recorded as a component of realized gain (loss) on the Statements of Operations. A liquidation payment received or made at the termination of a swap agreement is recorded as realized gain (loss) on the Statements of Operations. The Fund segregates cash or liquid securities having a value at least equal to the amount of the potential obligation of the Fund under any swap transaction. Cash held as collateral is recorded as deposits with brokers on the Statements of Assets and Liabilities. Entering into these agreements involves, to varying degrees, lack of liquidity and elements of credit, market, and counterparty risk in excess of amounts recognized on the Statements of Assets and Liabilities. Such risks involve the possibility that a swap is difficult to sell or liquidate, the Counterparty does not honor its obligations under the agreement and unfavorable interest rates and market fluctuations. It is possible that developments in the swaps market, including potential government regulation, could adversely affect the Fund’s ability to terminate existing swap agreements or to realize amounts to be received under such agreements. Additionally, an International Swaps and Derivatives Association Master Agreement (“ISDA Master Agreement”) includes credit related contingent features which allow Counterparties to over-the-counter (“OTC”) derivatives to terminate derivative contracts prior to maturity in the event that, for example, the Fund’s net assets decline by a stated percentage or the Fund fails to meet the terms of its ISDA master agreements, which would cause the Fund to accelerate payment of any net liability owed to the Counterparty.
NOTE 3–Investment Advisory Agreements and Other Agreements
The Trust has entered into Investment Advisory Agreements with the Adviser on behalf of each Fund, pursuant to which the Adviser has overall responsibility for the selection and ongoing monitoring of the Funds’ investments, managing the Funds’ business affairs, providing certain clerical, bookkeeping and other administrative services, and for each Fund (except S&P 500® Downside Hedged ETF), oversight of Invesco Advisers, Inc., Invesco Asset Management Deutschland GmbH, Invesco Asset Management Limited, Invesco Asset Management (Japan) Limited, Invesco Hong Kong Limited, Invesco Senior Secured Management, Inc. and Invesco Canada Ltd. (collectively, the “Affiliated Sub-Advisers”).
Pursuant to an Investment Management Agreement, each Fund (except Ultra Short Duration ETF) accrues daily and pays monthly to the Adviser an annual unitary management fee equal to a percentage of its average daily net assets as follows:
| | | | |
| | | | | Unitary Management Fees
(as a % of average daily net assets) |
| | Active U.S. Real Estate ETF | | 0.35% |
| | |
| | Balanced Multi-Asset Allocation ETF | | 0.05% |
| | |
| | Conservative Multi-Asset Allocation ETF | | 0.05% |
| | |
| | Growth Multi-Asset Allocation ETF | | 0.05% |
| | |
| | Moderately Conservative Multi-Asset Allocation ETF | | 0.05% |
| | |
| | S&P 500® Downside Hedged ETF | | 0.39% |
| | |
| | Total Return Bond ETF | | 0.50% |
| | |
| | Variable Rate Investment Grade ETF | | 0.30% |
Out of the unitary management fee, the Adviser has agreed to pay for substantially all expenses of the Funds, including payments to the Affiliated Sub-Advisers for each Fund (except S&P 500® Downside Hedged ETF), and for each Fund the cost of transfer agency, custody, fund administration, legal, audit and other services, except for distribution fees, if any, brokerage expenses, taxes, interest, litigation expenses, acquired fund fees and expenses, if any, and other extraordinary expenses, including proxy expenses (except for such proxies related to: (i) changes to the Investment Advisory Agreement, (ii) the election of any Board member who is an “interested person” of the Trust, or (iii) any other matters that directly benefit the Adviser).
Pursuant to another Investment Advisory Agreement, Ultra Short Duration ETF accrues daily and pays monthly to the Adviser an annual management fee equal to 0.20% of the Fund’s average daily net assets. Ultra Short Duration ETF is responsible for all of its own expenses, including its management fee, costs of transfer agency, custody, fund administration, legal, audit and other services, interest, taxes, Acquired Fund Fees and Expenses, if any, brokerage commissions and other expenses connected with executions of portfolio transactions, any distribution fees or expenses, litigation expenses, fees payable to the Trust’s Independent Trustees, expenses incurred in connection with the Board members’ services, including travel expenses and legal fees of counsel for the Independent Trustees and extraordinary expenses, including proxy expenses (except for such proxies related to: (i) changes to the Investment Advisory Agreement, (ii) the election of any Board member who is an “interested person” of the Trust, or (iii) any other matters that directly benefit the Adviser).
The Adviser has entered into an Investment Sub-Advisory Agreement with the Affiliated Sub-Advisers for each Fund (except S&P 500® Downside Hedged ETF). The sub-advisory fee for these Funds is paid by the Adviser to the Affiliated Sub-Advisers at 40% of the Adviser’s compensation of the sub-advised assets of each Fund.
The Adviser has contractually agreed to waive fees and/or pay Fund expenses for Ultra Short Duration ETF to the extent necessary to prevent the operating expenses of the Fund (excluding interest expenses, brokerage commissions and other trading expenses, offering costs, taxes, acquired fund fees and expenses, if any, taxes and extraordinary expenses) from exceeding 0.27% of the Fund’s average daily net assets per year (the “Expense Cap”), through at least August 31, 2022.
Additionally, through at least August 31, 2022, the Adviser has contractually agreed to waive a portion of the Total Return Bond ETF and the Ultra Short Duration ETF’s management fee and/or reimburse Fund expenses for each Fund in an amount equal to 100% of the net advisory fees that an affiliated person of the Adviser (an “Affiliated Person”) or the Adviser receives that are attributable to each Fund’s investments in any other fund managed by such Affiliated Person or the Adviser. This waiver will have the effect of reducing the Acquired Fund Fees and Expenses that are indirectly borne by each Fund.
Further, through at least August 31, 2022, the Adviser has contractually agreed to waive a portion of each Fund’s management fee in an amount equal to 100% of the net advisory fees an affiliate of the Adviser receives that are attributable to the Fund’s investments of otherwise uninvested cash in money market funds managed by that affiliate (excluding investments of cash collateral from securities lending). There is no guarantee that the Adviser will extend the waiver of these fees past that date.
Additionally, Variable Rate Investment Grade ETF may invest in other ETFs managed by the Adviser, and the indirect portion of the management fee that such Fund incurs through such investments is in addition to the Adviser’s unitary management fee. Therefore, the Adviser also has agreed to waive, through August 31, 2022, the management fees that it receives under the unitary management fee from Variable Rate Investment Grade ETF in an amount equal to the indirect management fees that the Fund incurs through its investments in affiliated ETFs managed by the Adviser. There is no guarantee that the Adviser will extend this waiver past that date.
For the year ended October 31, 2020, the Adviser waived fees and/or paid Fund expenses for each Fund in the following amounts:
| | | | | | |
| | Active U.S. Real Estate ETF | | $ | 139 | |
| | |
| | Balanced Multi-Asset Allocation ETF | | | 7 | |
| | |
| | Conservative Multi-Asset Allocation ETF | | | 7 | |
| | |
| | Growth Multi-Asset Allocation ETF | | | 7 | |
| | |
| | Moderately Conservative Multi-Asset Allocation ETF | | | 9 | |
| | |
| | S&P 500® Downside Hedged ETF | | | 30,648 | |
| | |
| | Total Return Bond ETF | | | - | |
| | |
| | Ultra Short Duration ETF | | | - | |
| | |
| | Variable Rate Investment Grade ETF | | | 21,720 | |
The fees waived and/or expenses borne by the Adviser for Ultra Short Duration ETF pursuant to the Expense Cap are subject to recapture by the Adviser up to three years from the date the fees were waived or the expenses were incurred, but no recapture payment will be made by the Fund if it would result in the Fund exceeding (i) the Expense Cap or (ii) the expense cap in effect at the time the fees and/or expenses subject to recapture were waived and/or borne by the Adviser.
There are no amounts available for potential recapture by the Adviser as of October 31, 2020.
The Trust has entered into a Distribution Agreement with Invesco Distributors, Inc. (the “Distributor”), which serves as the distributor of Creation Units for each Fund. The Distributor does not maintain a secondary market in the Shares. The Funds are not charged any fees pursuant to the Distribution Agreement. The Distributor is an affiliate of the Adviser.
The Trust has entered into service agreements whereby The Bank of New York Mellon, a wholly-owned subsidiary of The Bank of New York Mellon Corporation, serves as the administrator, custodian, fund accountant and transfer agent for each Fund.
For the fiscal year ended October 31, 2020, the following Funds incurred brokerage commissions with Invesco Capital Markets, Inc. (“ICMI”), an affiliate of the Adviser and Distributor, for portfolio transactions executed on behalf of the Fund, as listed below:
| | | | | | |
| | Active U.S. Real Estate ETF | | $ | 11,739 | |
| | |
| | Balanced Multi-Asset Allocation ETF | | | 25 | |
| | |
| | Conservative Multi-Asset Allocation ETF | | | 17 | |
| | |
| | Growth Multi-Asset Allocation ETF | | | 21 | |
| | |
| | Moderately Conservative Multi-Asset Allocation ETF | | | 22 | |
| | |
| | S&P 500® Downside Hedged ETF | | | 27,191 | |
Portfolio transactions with ICMI that have not settled at period-end, if any, are shown in the Statements of Assets and Liabilities under the receivable caption Investments sold - affiliated broker and/or payable caption Investments purchased - affiliated broker.
NOTE 4–Security Transactions with Affiliated Funds
Each Fund is permitted to purchase or sell securities from or to certain other affiliated funds under specified conditions outlined in procedures adopted by the Board of Trustees of the Trust. The procedures have been designed to ensure that any purchase or sale of securities by each Fund from or to another fund or portfolio that is or could be considered an affiliate by virtue of having a common investment adviser (or affiliated investment advisers), common Trustees and/or common officers complies with Rule 17a-7 of the 1940 Act. Further, as defined under the procedures, each transaction is effected at the current market price.
For the fiscal year ended October 31, 2020, the following Fund engaged in transactions with affiliates as listed below:
| | | | | | | | | | | | | | | |
| | | Securities Purchases | | Securities Sales | | Net Realized Gains* |
S&P 500® Downside Hedged ETF | | | $ | 11,627 | | | | $ | 266 | | | | $ | 13 | |
| * | Net realized gains (losses) from securities sold to affiliates are included in net realized gain (loss) from investment securities in the Statements of Operations. |
NOTE 5–Additional Valuation Information
GAAP defines fair value as the price that would be received to sell an asset or paid to transfer a liability in an orderly transaction between market participants at the measurement date, under current market conditions. GAAP establishes a hierarchy that prioritizes the inputs to valuation methods, giving the highest priority to readily available unadjusted quoted prices in an active market for identical assets (Level 1) and the lowest priority to significant unobservable inputs (Level 3), generally when market prices are not readily available or are unreliable. Based on the valuation inputs, the securities or other investments are tiered into one of three levels. Changes in valuation methods may result in transfers in or out of an investment’s assigned level:
| | Level 1 – | Prices are determined using quoted prices in an active market for identical assets. |
| | Level 2 – | Prices are determined using other significant observable inputs. Observable inputs are inputs that other market participants may use in pricing a security. These may include quoted prices for similar securities, interest rates, prepayment speeds, credit risk, yield curves, loss severities, default rates, discount rates, volatilities and others. |
| | Level 3 – | Prices are determined using significant unobservable inputs. In situations where quoted prices or observable inputs are unavailable (for example, when there is little or no market activity for an investment at the end of the period), unobservable inputs may be used. Unobservable inputs reflect a Fund’s own assumptions about the factors market participants would use in determining fair value of the securities or instruments and would be based on the best available information. |
The following is a summary of the tiered valuation input levels, as of October 31, 2020, for each Fund (except for S&P 500® Downside Hedged ETF and Ultra Short Duration ETF). As of October 31, 2020, all of the securities in S&P 500® Downside Hedged ETF were valued based on Level 1 inputs and all of the securities in Ultra Short Duration ETF were valued based on Level 2 inputs (see the Schedules of Investments for security categories). The level assigned to the securities valuations may not be an indication of the risk or liquidity associated with investing in those securities. Because of the inherent uncertainties of valuation, the values reflected in the financial statements may materially differ from the value received upon actual sale of those investments.
| | | | | | | | | | | | | | | | | | | | | | |
| | | | | Level 1 | | Level 2 | | Level 3 | | Total |
| | Active U.S. Real Estate ETF | | | | | | | | | | | | | | | | | | | | |
| | | | | |
| | Investments in Securities | | | | | | | | | | | | | | | | | | | | |
| | | | | |
| | Common Stocks & Other Equity Interests | | | $ | 78,252,022 | | | | $ | - | | | | $ | - | | | | $ | 78,252,022 | |
| | | | | |
| | Money Market Funds | | | | 185 | | | | | 492,652 | | | | | - | | | | | 492,837 | |
| | | | | | | | | | | | | | | | | | | | | | |
| | | | | |
| | Total Investments | | | $ | 78,252,207 | | | | $ | 492,652 | | | | $ | - | | | | $ | 78,744,859 | |
| | | | | | | | | | | | | | | | | | | | | | |
| | | | | | | | | | | | | | | | | | | | |
| | | Level 1 | | Level 2 | | Level 3 | | Total |
| | | | |
Balanced Multi-Asset Allocation ETF | | | | | | | | | | | | | | | | | | | | |
| | | | |
| Investments in Securities | | | | | | | | | | | | | | | | | | | | |
| | | | |
Affiliated Issuers | | | $ | 8,157,504 | | | | $ | - | | | | $ | - | | | | $ | 8,157,504 | |
| | | | |
Money Market Funds | | | | - | | | | | 394,228 | | | | | - | | | | | 394,228 | |
| | | | | | | | | | | | | | | | | | | | |
| | | | |
Total Investments | | | $ | 8,157,504 | | | | $ | 394,228 | | | | $ | - | | | | $ | 8,551,732 | |
| | | | | | | | | | | | | | | | | | | | |
| | | | |
| Conservative Multi-Asset Allocation ETF | | | | | | | | | | | | | | | | | | | | |
| | | | |
| Investments in Securities | | | | | | | | | | | | | | | | | | | | |
| | | | |
Affiliated Issuers | | | $ | 7,702,389 | | | | $ | - | | | | $ | - | | | | $ | 7,702,389 | |
| | | | |
Money Market Funds | | | | - | | | | | 1,128,524 | | | | | - | | | | | 1,128,524 | |
| | | | | | | | | | | | | | | | | | | | |
| | | | |
Total Investments | | | $ | 7,702,389 | | | | $ | 1,128,524 | | | | $ | - | | | | $ | 8,830,913 | |
| | | | | | | | | | | | | | | | | | | | |
Growth Multi-Asset Allocation ETF | | | | | | | | | | | | | | | | | | | | |
| | | | |
| Investments in Securities | | | | | | | | | | | | | | | | | | | | |
| | | | |
Affiliated Issuers | | | $ | 5,615,883 | | | | $ | - | | | | $ | - | | | | $ | 5,615,883 | |
| | | | |
Money Market Funds | | | | - | | | | | 219,645 | | | | | - | | | | | 219,645 | |
| | | | | | | | | | | | | | | | | | | | |
| | | | |
Total Investments | | | $ | 5,615,883 | | | | $ | 219,645 | | | | $ | - | | | | $ | 5,835,528 | |
| | | | | | | | | | | | | | | | | | | | |
| | | | |
| Moderately Conservative Multi-Asset Allocation ETF | | | | | | | | | | | | | | | | | | | | |
| | | | |
| Investments in Securities | | | | | | | | | | | | | | | | | | | | |
| | | | |
Affiliated Issuers | | | $ | 4,032,892 | | | | $ | - | | | | $ | - | | | | $ | 4,032,892 | |
| | | | |
Money Market Funds | | | | 58 | | | | | 288,696 | | | | | - | | | | | 288,754 | |
| | | | | | | | | | | | | | | | | | | | |
| | | | |
Total Investments | | | $ | 4,032,950 | | | | $ | 288,696 | | | | $ | - | | | | $ | 4,321,646 | |
| | | | | | | | | | | | | | | | | | | | |
| | | | |
| Total Return Bond ETF | | | | | | | | | | | | | | | | | | | | |
| | | | |
| Investments in Securities | | | | | | | | | | | | | | | | | | | | |
| | | | |
U.S. Dollar Denominated Bonds & Notes | | | $ | - | | | | $ | 193,407,262 | | | | $ | - | | | | $ | 193,407,262 | |
| | | | |
U.S. Treasury Securities | | | | - | | | | | 119,393,643 | | | | | - | | | | | 119,393,643 | |
| | | | |
U.S. Government Sponsored Agency Mortgage-Backed Securities | | | | - | | | | | 77,517,583 | | | | | - | | | | | 77,517,583 | |
| | | | |
Asset-Backed Securities | | | | - | | | | | 51,442,426 | | | | | - | | | | | 51,442,426 | |
| | | | |
U.S. Government Sponsored Agency Securities | | | | - | | | | | 3,132,310 | | | | | - | | | | | 3,132,310 | |
| | | | |
Municipal Obligations | | | | - | | | | | 2,581,367 | | | | | - | | | | | 2,581,367 | |
| | | | |
Agency Credit Risk Transfer Notes | | | | - | | | | | 2,321,088 | | | | | - | | | | | 2,321,088 | |
| | | | |
Non-U.S. Dollar Denominated Bonds & Notes | | | | - | | | | | 987,428 | | | | | - | | | | | 987,428 | |
| | | | |
Preferred Stocks | | | | 358,770 | | | | | - | | | | | - | | | | | 358,770 | |
| | | | |
Options Purchased | | | | 174,350 | | | | | - | | | | | - | | | | | 174,350 | |
| | | | |
Money Market Funds | | | | - | | | | | 19,924,004 | | | | | - | | | | | 19,924,004 | |
| | | | | | | | | | | | | | | | | | | | |
| | | | |
Total Investments in Securities | | | | 533,120 | | | | | 470,707,111 | | | | | - | | | | | 471,240,231 | |
| | | | | | | | | | | | | | | | | | | | |
| | | | |
Other Investments - Assets* | | | | | | | | | | | | | | | | | | | | |
| | | | |
Forward Foreign Currency Contracts | | | | - | | | | | 20,331 | | | | | - | | | | | 20,331 | |
| | | | |
Futures Contracts | | | | 1,603,776 | | | | | - | | | | | - | | | | | 1,603,776 | |
| | | | |
Swap Agreements | | | | - | | | | | 11,859 | | | | | - | | | | | 11,859 | |
| | | | | | | | | | | | | | | | | | | | |
| | | | |
| | | | 1,603,776 | | | | | 32,190 | | | | | - | | | | | 1,635,966 | |
| | | | | | | | | | | | | | | | | | | | |
| | | | |
Other Investments - Liabilities* | | | | | | | | | | | | | | | | | | | | |
| | | | |
Forward Foreign Currency Contracts | | | | - | | | | | (620) | | | | | - | | | | | (620) | |
| | | | |
Futures Contracts | | | | (337,025 | ) | | | | - | | | | | - | | | | | (337,025) | |
| | | | | | | | | | | | | | | | | | | | |
| | | | |
| | | | (337,025 | ) | | | | (620) | | | | | - | | | | | (337,645) | |
| | | | | | | | | | | | | | | | | | | | |
| | | | |
Total Other Investments | | | | 1,266,751 | | | | | 31,570 | | | | | - | | | | | 1,298,321 | |
| | | | | | | | | | | | | | | | | | | | |
| | | | |
Total Investments | | | $ | 1,799,871 | | | | $ | 470,738,681 | | | | $ | - | | | | $ | 472,538,552 | |
| | | | | | | | | | | | | | | | | | | | |
| | | | | | | | | | | | | | | | | | | | |
| | | Level 1 | | Level 2 | | Level 3 | | Total |
Variable Rate Investment Grade ETF | | | | | | | | | | | | | | | | | | | | |
| | | | |
Investments in Securities | | | | | | | | | | | | | | | | | | | | |
| | | | |
U.S. Dollar Denominated Bonds & Notes | | | $ | - | | | | $ | 216,440,142 | | | | $ | - | | | | $ | 216,440,142 | |
| | | | |
Asset-Backed Securities | | | | - | | | | | 79,375,862 | | | | | - | | | | | 79,375,862 | |
| | | | |
Agency Credit Risk Transfer Notes | | | | - | | | | | 68,334,065 | | | | | - | | | | | 68,334,065 | |
| | | | |
U.S. Treasury Securities | | | | - | | | | | 58,407,723 | | | | | - | | | | | 58,407,723 | |
| | | | |
U.S. Government Sponsored Agency Mortgage-Backed Securities | | | | - | | | | | 27,841,742 | | | | | - | | | | | 27,841,742 | |
| | | | |
Exchange-Traded Funds | | | | 1,723,400 | | | | | - | | | | | - | | | | | 1,723,400 | |
| | | | |
Money Market Funds | | | | 886,923 | | | | | 755,240 | | | | | - | | | | | 1,642,163 | |
| | | | | | | | | | | | | | | | | | | | |
| | | | |
Total Investments | | | | $2,610,323 | | | | $ | 451,154,774 | | | | $ | - | | | | $ | 453,765,097 | |
| | | | | | | | | | | | | | | | | | | | |
| * | Forward foreign currency contracts, futures contracts and swap agreements are valued at unrealized appreciation (depreciation). |
NOTE 6–Derivative Investments
The Funds may enter into an ISDA Master Agreement under which a Fund may trade OTC derivatives. An OTC transaction entered into under an ISDA Master Agreement typically involves a collateral posting arrangement, payment netting provisions and close-out netting provisions. These netting provisions allow for reduction of credit risk through netting of contractual obligations. The enforceability of the netting provisions of the ISDA Master Agreement depends on the governing law of the ISDA Master Agreement, among other factors.
For financial reporting purposes, the Funds do not offset OTC derivative assets or liabilities that are subject to ISDA Master Agreements in the Statements of Assets and Liabilities.
Value of Derivative Investments at Period-End
The table below summarizes the value of each Fund’s derivative investments, detailed by primary risk exposure, held as of October 31, 2020:
| | | | | | | | | | | | | | | | | | | | | | | | | |
| | | Value |
| | | Total Return Bond ETF |
| Derivative Assets | | Credit
Risk | | Currency
Risk | | Equity
Risk | | Interest Rate
Risk | | Total |
Unrealized appreciation on forward foreign currency contracts
outstanding(a) | | | $ | - | | | | $ | 20,331 | | | | $ | - | | | | $ | - | | | | $ | 20,331 | |
| | | | | |
| Unrealized appreciation on futures contracts–Exchange-Traded(b) | | | | - | | | | | - | | | | | - | | | | | 1,603,776 | | | | | 1,603,776 | |
| | | | | |
| Unrealized appreciation on swap agreements–Centrally Cleared | | | | 11,859 | | | | | - | | | | | - | | | | | - | | | | | 11,859 | |
| | | | | |
| Purchased options, at value - Exchange-Traded | | | | - | | | | | - | | | | | 174,350 | | | | | - | | | | | 174,350 | |
| | | | | | | | | | | | | | | | | | | | | | | | | |
| | | | | |
| Total Derivative Assets | | | | 11,859 | | | | | 20,331 | | | | | 174,350 | | | | | 1,603,776 | | | | | 1,810,316 | |
| | | | | | | | | | | | | | | | | | | | | | | | | |
| | | | | |
| Derivatives not subject to master netting agreements | | | | (11,859 | ) | | | | - | | | | | (174,350 | ) | | | | (1,603,776 | ) | | | | (1,789,985 | ) |
| | | | | | | | | | | | | | | | | | | | | | | | | |
| | | | | |
| Total Derivative Assets subject to master netting agreements | | | $ | - | | | | $ | 20,331 | | | | $ | - | | | | $ | - | | | | $ | 20,331 | |
| | | | | | | | | | | | | | | | | | | | | | | | | |
| |
| | | Value |
| | | Total Return Bond ETF |
| Derivative Liabilities | | Credit
Risk | | Currency
Risk | | Equity
Risk | | Interest Rate
Risk | | Total |
Unrealized depreciation on forward foreign currency contracts
outstanding(a) | | | $ | - | | | | $ | (620 | ) | | | $ | - | | | | $ | - | | | | $ | (620 | ) |
| | | | | |
Unrealized depreciation on futures contracts–Exchange-Traded(b) | | | | - | | | | | - | | | | | - | | | | | (337,025 | ) | | | | (337,025 | ) |
| | | | | | | | | | | | | | | | | | | | | | | | | |
| | | | | |
Total Derivative Liabilities | | | | - | | | | | (620 | ) | | | | - | | | | | (337,025 | ) | | | | (337,645 | ) |
| | | | | | | | | | | | | | | | | | | | | | | | | |
| | | | | |
Derivatives not subject to master netting agreements | | | | - | | | | | - | | | | | - | | | | | 337,025 | | | | | 337,025 | |
| | | | | | | | | | | | | | | | | | | | | | | | | |
| | | | | |
Total Derivative Liabilities subject to master netting agreements | | | $ | - | | | | $ | (620 | ) | | | $ | - | | | | $ | - | | | | $ | (620 | ) |
| | | | | | | | | | | | | | | | | | | | | | | | | |
| (a) | Values are disclosed on the Statements of Assets and Liabilities under the caption Unrealized appreciation on forward foreign currency contracts outstanding and Unrealized depreciation on forward foreign currency contracts outstanding. |
| (b) | Values include cumulative appreciation (depreciation) on futures contracts. Only current day’s variation margin is reported within the Statements of Assets and Liabilities. |
Offsetting Assets and Liabilities
The table below reflects the Funds’ exposure to Counterparties subject to either an ISDA Master Agreement or other agreement for OTC derivative transactions as of October 31, 2020:
| | | | | | | | | | | | | | | | | | | | | | | | | | | | | | |
| | | | | | |
| Total Return Bond ETF | | | | | | | | | | | | | | | | | | | | | | | | | | | | | | |
| | | Financial Derivative
Assets | | Financial Derivative
Liabilities | | | | Collateral
(Received)/Pledged | | |
Counterparty | | Forward foreign
currency contracts | | Forward foreign
currency contracts | | Net Value of
Derivatives | | Non-Cash | | Cash | | Net Amount |
| Barclays Capital Inc. | | | $ | - | | | | $ | (620 | ) | | | $ | (620 | ) | | | $ | - | | | | $ | - | | | | $ | (620 | ) |
| | | | | | |
| Goldman Sachs & Co. | | | | 20,331 | | | | | - | | | | | 20,331 | | | | | - | | | | | - | | | | | 20,331 | |
| | | | | | | | | | | | | | | | | | | | | | | | | | | | | | |
| | | | | | |
| Total | | | $ | 20,331 | | | | $ | (620 | ) | | | $ | 19,711 | | | | $ | - | | | | $ | - | | | | $ | 19,711 | |
| | | | | | | | | | | | | | | | | | | | | | | | | | | | | | |
Effect of Derivative Investments for the Fiscal Year Ended October 31, 2020
The table below summarizes each Fund’s gains (losses) on derivative investments, detailed by primary risk exposure, recognized in earnings during the period:
| | | | | | | | | | | | | | | | | | | | | | | | | | | | | | | | | | | |
| | | Location of Gain (Loss) on Statements of Operations |
| | | S&P 500® Downside Hedged ETF | | Total Return Bond ETF | | Ultra Short Duration ETF |
| | | Equity
Risk | | Credit
Risk | | Currency
Risk | | Equity
Risk | | Interest
Rate Risk | | Total | | Currency
Risk |
Realized Gain (Loss): | | | | | | | | | | | | | | | | | | | | | | | | | | | | | | | | | | | |
| | | | | | | |
Forward foreign currency contracts | | | $ | - | | | | $ | - | | | | $ | (56,579 | ) | | | $ | - | | | | $ | - | | | | $ | (56,579 | ) | | | $ | 557,985 | |
| | | | | | | |
Futures contracts | | | | 1,328,906 | | | | | - | | | | | - | | | | | - | | | | | (1,309,181 | ) | | | | (1,309,181 | ) | | | | - | |
| | | | | | | |
Options purchased(a) | | | | - | | | | | - | | | | | - | | | | | 127,723 | | | | | - | | | | | 127,723 | | | | | - | |
| | | | | | | |
Options written | | | | - | | | | | - | | | | | - | | | | | (13,656 | ) | | | | - | | | | | (13,656 | ) | | | | - | |
| | | | | | | |
Swap agreements | | | | - | | | | | (94,931 | ) | | | | - | | | | | - | | | | | - | | | | | (94,931 | ) | | | | - | |
| | | | | | | |
Change in Net Unrealized Appreciation (Depreciation): | | | | | | | | | | | | | | | | | | | | | | | | | | | | | | | | | | | |
| | | | | | | |
Forward foreign currency contracts | | | | - | | | | | - | | | | | 19,578 | | | | | - | | | | | - | | | | | 19,578 | | | | | 59,744 | |
| | | | | | | |
Futures contracts | | | | (35,448 | ) | | | | - | | | | | - | | | | | - | | | | | 1,159,676 | | | | | 1,159,676 | | | | | - | |
| | | | | | | |
Options purchased(a) | | | | - | | | | | - | | | | | - | | | | | (102,203 | ) | | | | - | | | | | (102,203 | ) | | | | - | |
| | | | | | | | | | | | | | | | | | | | | | | | | | | | | | | | | | | |
| | | | | | | |
Total | | | $ | 1,293,458 | | | | $ | (94,931 | ) | | | $ | (37,001 | ) | | | $ | 11,864 | | | | $ | (149,505 | ) | | | $ | (269,573 | ) | | | $ | 617,729 | |
| | | | | | | | | | | | | | | | | | | | | | | | | | | | | | | | | | | |
| (a) | Options purchased are included in the net realized gain (loss) from investment securities and the change in net unrealized appreciation (depreciation) on investment securities. |
The table below summarizes the average notional value of derivatives held during the period.
| | | | | | | | | | | | | | | |
| | | Average Notional Value |
| | | S&P 500® Downside Hedged ETF | | Total Return Bond ETF | | Ultra Short Duration ETF |
Forward foreign currency contracts | | | $ | - | | | | $ | 1,457,912 | | | | $ | 83,686,139 | |
| | | |
Futures contracts | | | | 21,027,188 | | | | | 126,535,174 | | | | | - | |
| | | |
Options purchased | | | | - | | | | | 2,138,846 | | | | | - | |
| | | |
Options written | | | | - | | | | | 320,000 | | | | | - | |
| | | |
Swap agreements | | | | - | | | | | 10,504,875 | | | | | - | |
NOTE 7–Distributions to Shareholders and Tax Components of Net Assets
Tax Character of Distributions to Shareholders Paid During the Fiscal Years Ended October 31, 2020 and 2019:
| | | | | | | | | | | | | | | | | | | | |
| | | 2020 | | | 2019 | |
| | | Ordinary
Income* | | | Long-Term
Capital Gains | | | Return of
Capital | | | Ordinary
Income* | | | Long-Term
Capital Gains | |
Active U.S. Real Estate ETF | | $ | 3,410,344 | | | $ | - | | | $ | - | | | $ | 1,794,273 | | | $ | - | |
| | | | | |
Balanced Multi-Asset Allocation ETF | | | 197,961 | | | | 84,007 | | | | - | | | | 92,586 | | | | 1,912 | |
| | | | | |
Conservative Multi-Asset Allocation ETF | | | 242,889 | | | | 3,507 | | | | - | | | | 181,438 | | | | - | |
| | | | | |
Growth Multi-Asset Allocation ETF | | | 275,551 | | | | 17,757 | | | | - | | | | 118,384 | | | | 3,618 | |
| | | | | |
Moderately Conservative Multi-Asset Allocation ETF | | | 281,238 | | | | 57,855 | | | | - | | | | 124,458 | | | | - | |
| | | | | |
S&P 500® Downside Hedged ETF | | | 482,030 | | | | - | | | | - | | | | 483,318 | | | | - | |
| | | | | | | | | | | | | | | | | | | | |
| | | 2020 | | | 2019 | |
| | | Ordinary
Income* | | | Long-Term
Capital Gains | | | Return of
Capital | | | Ordinary
Income* | | | Long-Term
Capital Gains | |
Total Return Bond ETF | | $ | 7,483,301 | | | $ | - | | | $ | - | | | $ | 2,364,655 | | | $ | 262,621 | |
| | | | | |
Ultra Short Duration ETF | | | 46,470,837 | | | | 401,970 | | | | - | | | | 63,523,056 | | | | 207,907 | |
| | | | | |
Variable Rate Investment Grade ETF | | | 6,538,546 | | | | - | | | | 508,191 | | | | 13,248,198 | | | | - | |
| * | Includes short-term capital gain distributions, if any. |
Tax Components of Net Assets at Fiscal Year-End:
| | | | | | | | | | | | | | | | | | | | | | | | | | | | | | | | | | | | | | | | |
| | | Undistributed
Ordinary
Income | | Temporary
Book/Tax
Differences | | Net
Unrealized
Appreciation
(Depreciation)-
Investments | | Net
Unrealized
Appreciation-
Other
Investments | | Net Unrealized
Appreciation
(Depreciation)-
Foreign
Currencies | | Capital Loss
Carryforwards | | Shares of
Beneficial
Interest | | Total
Net Assets |
Active U.S. Real Estate ETF | | | $ | - | | | | $ | - | | | | $ | (9,555,996) | | | | $ | - | | | | $ | - | | | | $ | (10,276,258) | | | | $ | 98,101,849 | | | | $ | 78,269,595 | |
| | | | | | | | |
Balanced Multi-Asset Allocation ETF | | | | 26,162 | | | | | - | | | | | 56,747 | | | | | - | | | | | - | | | | | (116,272) | | | | | 8,192,401 | | | | | 8,159,038 | |
| | | | | | | | |
Conservative Multi-Asset Allocation ETF | | | | 28,531 | | | | | - | | | | | (1,748) | | | | | - | | | | | - | | | | | (13,454) | | | | | 7,689,815 | | | | | 7,703,144 | |
| | | | | | | | |
Growth Multi-Asset Allocation ETF | | | | 20,483 | | | | | - | | | | | (90,989) | | | | | - | | | | | - | | | | | (147,107) | | | | | 5,834,584 | | | | | 5,616,971 | |
| | | | | | | | |
Moderately Conservative Multi-Asset Allocation ETF | | | | 14,548 | | | | | - | | | | | (27,642) | | | | | - | | | | | - | | | | | (54,855) | | | | | 4,101,165 | | | | | 4,033,216 | |
| | | | | | | | |
S&P 500® Downside Hedged ETF | | | | - | | | | | - | | | | | - | | | | | - | | | | | - | | | | | (71,946,050) | | | | | 214,988,334 | | | | | 143,042,284 | |
| | | | | | | | |
Total Return Bond ETF | | | | 10,224,918 | | | | | - | | | | | 5,804,225 | | | | | 1,298,321 | | | | | (500) | | | | | - | | | | | 446,129,868 | | | | | 463,456,832 | |
| | | | | | | | |
Ultra Short Duration ETF | | | | 621,631 | | | | | (20,648) | | | | | 12,421,462 | | | | | - | | | | | 9 | | | | | (2,586,077) | | | | | 3,001,170,662 | | | | | 3,011,607,039 | |
| | | | | | | | |
Variable Rate Investment Grade ETF | | | | - | | | | | - | | | | | (670,613) | | | | | - | | | | | - | | | | | (6,004,401) | | | | | 459,696,112 | | | | | 453,021,098 | |
Capital loss carryforwards are calculated and reported as of a specific date. Results of transactions and other activity after that date may affect the amount of capital loss carryforwards actually available for the Funds to utilize. The ability to utilize capital loss carryforwards in the future may be limited under the Internal Revenue Code and related regulations based on the results of future transactions.
The following table presents available capital loss carryforwards for each Fund as of October 31, 2020:
| | | | | | | | | | | | |
| | | No expiration | | | | |
| | | Short-Term | | | Long-Term | | | Total* | |
Active U.S. Real Estate ETF | | $ | 7,841,367 | | | $ | 2,434,891 | | | $ | 10,276,258 | |
| | | |
Balanced Multi-Asset Allocation ETF | | | 90,515 | | | | 25,757 | | | | 116,272 | |
| | | |
Conservative Multi-Asset Allocation ETF | | | 11,504 | | | | 1,950 | | | | 13,454 | |
| | | |
Growth Multi-Asset Allocation ETF | | | 119,043 | | | | 28,064 | | | | 147,107 | |
| | | |
Moderately Conservative Multi-Asset Allocation ETF | | | 44,142 | | | | 10,713 | | | | 54,855 | |
| | | |
S&P 500® Downside Hedged ETF | | | 18,520,244 | | | | 53,425,806 | | | | 71,946,050 | |
| | | |
Total Return Bond ETF | | | - | | | | - | | | | - | |
| | | |
Ultra Short Duration ETF | | | 1,991,368 | | | | 594,709 | | | | 2,586,077 | |
| | | |
Variable Rate Investment Grade ETF | | | 1,818,585 | | | | 4,185,816 | | | | 6,004,401 | |
| * | Capital loss carryforwards are reduced for limitations, if any, to the extent required by the Internal Revenue Code and may be further limited depending upon a variety of factors, including the realization of net unrealized gains or losses as of the date of any reorganization. |
NOTE 8—Investment Transactions
For the fiscal year ended October 31, 2020, the cost of securities purchased and the proceeds from sales of securities (other than short-term securities, U.S. Treasury obligations, money market funds and in-kind transactions, if any) were as follows:
| | | | | | | | |
| | | Purchases | | | Sales | |
Active U.S. Real Estate ETF | | $ | 54,846,575 | | | $ | 62,693,517 | |
| | |
Balanced Multi-Asset Allocation ETF | | | 3,033,865 | | | | 3,151,205 | |
| | |
Conservative Multi-Asset Allocation ETF | | | 2,309,391 | | | | 2,379,295 | |
| | |
Growth Multi-Asset Allocation ETF | | | 2,175,061 | | | | 2,308,051 | |
| | |
Moderately Conservative Multi-Asset Allocation ETF | | | 2,548,382 | | | | 2,709,340 | |
| | |
S&P 500® Downside Hedged ETF | | | 346,142,763 | | | | 429,113,220 | |
| | |
Total Return Bond ETF | | | 760,845,530 | | | | 557,429,730 | |
| | |
Ultra Short Duration ETF | | | 942,629,791 | | | | 919,659,601 | |
| | |
Variable Rate Investment Grade ETF | | | 224,009,240 | | | | 191,751,054 | |
For the fiscal year ended October 31, 2020, the cost of securities purchased and the proceeds from sales of U.S. Treasury obligations (other than short-term securities, money market funds and in-kind transactions), were as follows:
| | | | | | | | |
| | | Purchases | | | Sales | |
Total Return Bond ETF | | $ | 750,329,663 | | | $ | 697,377,581 | |
Ultra Short Duration ETF | | | 38,859,023 | | | | - | |
Variable Rate Investment Grade ETF | | | 200,642,999 | | | | 174,368,679 | |
For the fiscal year ended October 31, 2020, in-kind transactions associated with creations and redemptions were as follows:
| | | | | | | | |
| | | Cost of
Securities
Received | | | Value of
Securities
Delivered | |
Active U.S. Real Estate ETF | | $ | 42,927,265 | | | $ | 50,831,556 | |
| | |
Balanced Multi-Asset Allocation ETF | | | 4,125,028 | | | | - | |
| | |
Conservative Multi-Asset Allocation ETF | | | 5,155,538 | | | | 1,300,449 | |
| | |
Growth Multi-Asset Allocation ETF | | | 5,913,038 | | | | 4,488,241 | |
| | |
Moderately Conservative Multi-Asset Allocation ETF | | | 4,076,945 | | | | 5,534,801 | |
| | |
S&P 500® Downside Hedged ETF | | | 81,832,240 | | | | 19,226,516 | |
| | |
Total Return Bond ETF | | | - | | | | - | |
| | |
Ultra Short Duration ETF | | | - | | | | - | |
| | |
Variable Rate Investment Grade ETF | | | - | | | | - | |
Gains (losses) on in-kind transactions are generally not considered taxable gains (losses) for federal income tax purposes.
At October 31, 2020, the aggregate cost of investments, including any derivatives, on a tax basis includes adjustments for financial reporting purposes as of the most recently completed federal income tax reporting period-end:
| | | | | | | | | | | | | | | | |
| | | Gross
Unrealized
Appreciation | | | Gross
Unrealized
(Depreciation) | | | Net
Unrealized
Appreciation
(Depreciation) | | | Cost | |
Active U.S. Real Estate ETF | | $ | 4,718,824 | | | $ | (14,274,820 | ) | | $ | (9,555,996 | ) | | $ | 88,300,855 | |
| | | | |
Balanced Multi-Asset Allocation ETF | | | 255,974 | | | | (199,227 | ) | | | 56,747 | | | | 8,494,985 | |
| | | | |
Conservative Multi-Asset Allocation ETF | | | 121,066 | | | | (122,814 | ) | | | (1,748 | ) | | | 8,832,661 | |
| | | | |
Growth Multi-Asset Allocation ETF | | | 172,222 | | | | (263,211 | ) | | | (90,989 | ) | | | 5,926,517 | |
| | | | |
Moderately Conservative Multi-Asset Allocation ETF | | | 74,765 | | | | (102,407 | ) | | | (27,642 | ) | | | 4,349,288 | |
| | | | |
S&P 500® Downside Hedged ETF | | | 8,643 | | | | (8,643 | ) | | | - | | | | 43,318,687 | |
| | | | |
Total Return Bond ETF | | | 13,181,170 | | | | (6,078,624 | ) | | | 7,102,546 | | | | 465,436,006 | |
| | | | |
Ultra Short Duration ETF | | | 14,576,904 | | | | (2,155,442 | ) | | | 12,421,462 | | | | 2,995,906,392 | |
| | | | |
Variable Rate Investment Grade ETF | | | 1,894,017 | | | | (2,564,630 | ) | | | (670,613 | ) | | | 454,435,710 | |
NOTE 9–Reclassification of Permanent Differences
Primarily as a result of differing book/tax treatment of in-kind transactions, distributions, paydowns, foreign currency transactions and income from swap agreements, amounts were reclassified between undistributed net investment income (loss), undistributed net realized gain (loss) and Shares of beneficial interest. These reclassifications had no effect on the net assets of each Fund. For the fiscal year ended October 31, 2020, the reclassifications were as follows:
| | | | | | | | | | | | | | | |
| | | Undistributed Net
Investment Income (Loss) | | Undistributed Net
Realized Gain (Loss) | | Shares of
Beneficial Interest |
| | | |
Active U.S. Real Estate ETF | | | $ | 771,532 | | | | $ | 844,294 | | | | $ | (1,615,826 | ) |
| | | |
Balanced Multi-Asset Allocation ETF | | | | (1,986 | ) | | | | 1,982 | | | | | 4 | |
| | | |
Conservative Multi-Asset Allocation ETF | | | | (922 | ) | | | | (112,502 | ) | | | | 113,424 | |
| | | |
Growth Multi-Asset Allocation ETF | | | | (578 | ) | | | | (305,521 | ) | | | | 306,099 | |
| | | |
Moderately Conservative Multi-Asset Allocation ETF | | | | (2,273 | ) | | | | (400,936 | ) | | | | 403,209 | |
| | | |
S&P 500® Downside Hedged ETF | | | | 9,155 | | | | | 994 | | | | | (10,149 | ) |
| | | |
Total Return Bond ETF | | | | 129,870 | | | | | (129,868 | ) | | | | (2 | ) |
| | | |
Ultra Short Duration ETF | | | | 506,667 | | | | | (506,667 | ) | | | | - | |
| | | |
Variable Rate Investment Grade ETF | | | | 293,511 | | | | | (293,512 | ) | | | | 1 | |
NOTE 10–Trustees’ and Officer’s Fees
Trustees’ and Officer’s Fees include amounts accrued by the Funds to pay remuneration to the Independent Trustees and an Officer of the Trust. The Adviser, as a result of each Fund’s unitary management fee (except for Ultra Short Duration ETF), pays for such compensation for each Fund. The Trustee who is an “interested person” of the Trust does not receive any Trustees’ fees.
The Trust has adopted a deferred compensation plan (the “Plan”). Under the Plan, each Independent Trustee who has executed a Deferred Fee Agreement (a “Participating Trustee”) may defer receipt of all or a portion of their compensation (“Deferral Fees”). Such Deferral Fees are deemed to be invested in select Invesco Funds. The Deferral Fees payable to a Participating Trustee are valued as of the date such Deferral Fees would have been paid to the Participating Trustee. The value increases with contributions or with increases in the value of the Shares selected, and the value decreases with distributions or with declines in the value of the Shares selected. Obligations under the Plan represent unsecured claims against the general assets of the Funds.
NOTE 11–Capital
Shares are issued and redeemed by each Fund only in Creation Units consisting of a specified number of Shares as set forth in each Fund’s prospectus. Only Authorized Participants are permitted to purchase or redeem Creation Units from the Funds. For Active U.S. Real Estate ETF, Balanced Multi-Asset Allocation ETF, Conservative Multi-Asset Allocation ETF, Growth Multi-Asset Allocation ETF and Moderately Conservative Multi-Asset Allocation ETF, such transactions are principally permitted in exchange for Deposit Securities, with a balancing cash component to equate the transaction to the NAV per Share of the Fund on the transaction date. For Total Return Bond ETF, Ultra Short Duration ETF and Variable Rate Investment Grade ETF, Creation Units are issued and redeemed principally in exchange for the deposit or delivery of cash. For S&P 500® Downside Hedged ETF, Creation Units are issued and redeemed partially in exchange for the deposit or delivery of cash and partially in exchange for Deposit Securities. However, for all Funds, cash in an amount equivalent to the value of certain securities may be substituted, generally when the securities are not available in sufficient quantity for delivery, not eligible for trading by the Authorized Participant or as a result of other market circumstances.
To the extent that the Funds permit transactions in exchange for Deposit Securities, each Fund may issue Shares in advance of receipt of Deposit Securities subject to various conditions, including a requirement to maintain on deposit with the Trust cash at least equal to 105% of the market value of the missing Deposit Securities. In accordance with the Trust’s Participant Agreement, Creation Units will be issued to an Authorized Participant, notwithstanding the fact that the corresponding Deposit Securities have not been received in part or in whole, in reliance on the undertaking of the Authorized Participant to deliver the missing Deposit Securities as soon as possible, which undertaking shall be secured by the Authorized Participant’s delivery and maintenance of collateral consisting of cash in the form of U.S. dollars in immediately available funds having a value (marked-to-market daily) at least equal to 105%, which the Adviser may change from time to time, of the value of the missing Deposit Securities.
Certain transaction fees may be charged by the Funds for creations and redemptions, which are treated as increases in capital.
Transactions in each Fund’s Shares are disclosed in detail in the Statements of Changes in Net Assets.
NOTE 12–Coronavirus (COVID-19) Pandemic
During the first quarter of 2020, the World Health Organization declared COVID-19 to be a public health emergency. COVID-19 has led to increased short-term market volatility and may have adverse long-term effects on U.S. and world economies and markets in general. COVID-19 may adversely impact the value of the Funds’ investments. Because of the uncertainties on
valuation, the global economy and business operations, values reflected in these financial statements may materially differ from the value received upon actual sales of those investments.
The extent of the impact on the performance of the Funds and their investments will depend on future developments, including the duration and spread of the COVID-19 outbreak, related restrictions and advisories, and the effects on the financial markets and economy overall, all of which are highly uncertain and cannot be predicted.
Report of Independent Registered Public Accounting Firm
To the Board of Trustees of Invesco Actively Managed Exchange-Traded Fund Trust and Shareholders of each of the nine Funds listed in the table below
Opinions on the Financial Statements
We have audited the accompanying statements of assets and liabilities, including the schedules of investments, of each of the funds listed in the table below (nine of the funds constituting Invesco Actively Managed Exchange-Traded Fund Trust, hereafter collectively referred to as the “Funds”) as of October 31, 2020, the related statements of operations for the year ended October 31, 2020, the statements of changes in net assets for each of the two years in the period ended October 31, 2020, including the related notes, and the financial highlights for each of the periods indicated in the table below (collectively referred to as the “financial statements”). In our opinion, the financial statements present fairly, in all material respects, the financial position of each of the Funds as of October 31, 2020, the results of each of their operations for the year then ended, the changes in each of their net assets for each of the two years in the period ended October 31, 2020 and each of the financial highlights for each of the periods indicated in the table below in conformity with accounting principles generally accepted in the United States of America.
| | |
| Fund Name | | Predecessor Fund |
| |
Invesco Active U.S. Real Estate ETF (1) | | – |
| |
Invesco Balanced Multi-Asset Allocation ETF (2) | | – |
| |
Invesco Conservative Multi-Asset Allocation ETF (2) | | – |
| |
Invesco Growth Multi-Asset Allocation ETF (2) | | – |
| |
Invesco Moderately Conservative Multi-Asset Allocation ETF (2) | | – |
| |
Invesco S&P 500 Downside Hedged ETF (1) | | – |
| |
Invesco Total Return Bond ETF (3) | | Guggenheim Total Return Bond ETF |
| |
Invesco Ultra Short Duration ETF (4) | | Guggenheim Ultra Short Duration ETF |
| |
Invesco Variable Rate Investment Grade ETF (5) | | – |
(1) The financial highlights for each of the five years in the period ended October 31, 2020
(2) The financial highlights for each of the three years in the period ended October 31, 2020 and for the period February 21, 2017 (commencement of investment operations) through October 31, 2017
(3) The financial highlights for each of the two years in the period ended October 31, 2020, for the period September 1, 2018 through October 31, 2018 and for the year ended August 31, 2018
(4) The financial highlights for each of the two years in the period ended October 31, 2020, for the period June 1, 2018 through October 31, 2018 and for the year ended May 31, 2018
(5) The financial highlights for each of the four years in the period ended October 31, 2020 and for the period September 20, 2016 (commencement of investment operations) through October 31, 2016
The financial statements of the Invesco Total Return Bond ETF (Predecessor Fund: Guggenheim Total Return Bond ETF) as of and for the year ended August 31, 2017 and the financial highlights for each of the periods ended on or prior to August 31, 2017 (not presented herein, other than the financial highlights) were audited by other auditors whose report dated October 30, 2017 expressed an unqualified opinion on those financial statements and financial highlights.
The financial statements of the Invesco Ultra Short Duration ETF (Predecessor Fund: Guggenheim Ultra Short Duration ETF) as of and for the year ended May 31, 2017 and the financial highlights for each of the periods ended on or prior to May 31, 2017 (not presented herein, other than the financial highlights) were audited by other auditors whose report dated July 31, 2017 expressed an unqualified opinion on those financial statements and financial highlights.
Report of Independent Registered Public Accounting Firm–(continued)
Basis for Opinions
These financial statements are the responsibility of the Funds’ management. Our responsibility is to express an opinion on the Funds’ financial statements based on our audits. We are a public accounting firm registered with the Public Company Accounting Oversight Board (United States) (“PCAOB”) and are required to be independent with respect to the Funds in accordance with the U.S. federal securities laws and the applicable rules and regulations of the Securities and Exchange Commission and the PCAOB.
We conducted our audits of these financial statements in accordance with the standards of the PCAOB. Those standards require that we plan and perform the audit to obtain reasonable assurance about whether the financial statements are free of material misstatement, whether due to error or fraud.
Our audits included performing procedures to assess the risks of material misstatement of the financial statements, whether due to error or fraud, and performing procedures that respond to those risks. Such procedures included examining, on a test basis, evidence regarding the amounts and disclosures in the financial statements. Our audits also included evaluating the accounting principles used and significant estimates made by management, as well as evaluating the overall presentation of the financial statements. Our procedures included confirmation of securities owned as of October 31, 2020 by correspondence with the custodian, transfer agent, and brokers; when replies were not received from brokers, we performed other auditing procedures. We believe that our audits provide a reasonable basis for our opinions.
/s/ PricewaterhouseCoopers LLP
Chicago, Illinois
December 23, 2020
We have served as the auditor of one or more of the investment companies in the Invesco group of investment companies since at least 1995. We have not been able to determine the specific year we began serving as auditor.
Calculating your ongoing Fund expenses
Example
As a shareholder of a Fund of the Invesco Actively Managed Exchange-Traded Fund Trust (excluding Invesco Ultra Short Duration ETF), you incur a unitary management fee. In addition to the unitary management fee, a shareholder may pay distribution fees, if any, brokerage expenses, taxes, interest, litigation expenses, acquired fund fees and expenses, if any, and other extraordinary expenses. As a shareholder of the Invesco Ultra Short Duration ETF, you incur advisory fees and other Fund expenses. The expense examples below are intended to help you understand your ongoing costs (in dollars) of investing in the Funds and to compare these costs with the ongoing costs of investing in other funds.
The example is based on an investment of $1,000 invested at the beginning of the period and held for the entire period May 1, 2020 through October 31, 2020.
In addition to the fees and expenses which the Invesco Balanced Multi-Asset Allocation ETF, Invesco Conservative Multi-Asset Allocation ETF, Invesco Growth Multi-Asset Allocation ETF, Invesco Moderately Conservative Multi-Asset Allocation ETF and Invesco S&P 500® Downside Hedged ETF (collectively, the “Portfolios”) bear directly, the Portfolios indirectly bear a pro rata share of the fees and expenses of the investment companies in which the Portfolios invest. The amount of fees and expenses incurred indirectly by the Portfolios will vary because the investment companies have varied expenses and fee levels and the Portfolios may own different proportions of the investment companies at different times. Estimated investment companies’ expenses are not expenses that are incurred directly by the Portfolios. They are expenses that are incurred directly by the investment companies and are deducted from the value of the investment companies the Portfolios invest in. The effect of the estimated investment companies’ expenses that the Portfolios bear indirectly is included in each Portfolio’s total return.
Actual Expenses
The first line in the following table provides information about actual account values and actual expenses. You may use the information in this line, together with the amount you invested, to estimate the expenses that you paid over the period. Simply divide your account value by $1,000 (for example, an $8,600 account value divided by $1,000 = 8.6), then multiply the result by the number in the first line under the heading “Expenses Paid During the Six-Month Period” to estimate the expenses you paid on your account during this period.
Hypothetical Example for Comparison Purposes
The second line in the following table provides information about hypothetical account values and hypothetical expenses based on each Fund’s actual expense ratio and an assumed annualized rate of return of 5% per year before expenses, which is not the Fund’s actual return. The hypothetical account values and expenses may not be used to estimate the actual ending account balance or expenses you paid for the period. You may use this information to compare the ongoing costs of investing in the Funds and other funds. To do so, compare this 5% hypothetical example with the 5% hypothetical examples that appear in the shareholder reports of the other funds.
Please note that the expenses shown in the table are meant to highlight your ongoing costs only, and do not reflect any transactional costs, such as sales charges and brokerage commissions. Therefore, the second line in the table is useful in comparing ongoing costs only, and will not help you determine the relative total costs of owning different funds. In addition, expenses shown in the table do not include the expenses of the underlying funds, which are borne indirectly by a Fund. If transaction costs and indirect expenses were included, your costs would have been higher.
| | | | | | | | | | | | | | | | | | | | |
| | | Beginning
Account Value
May 1, 2020 | | Ending
Account Value October 31, 2020 | | Annualized
Expense Ratio Based on the Six-Month Period | | Expenses Paid During the Six-Month Period(1) |
Invesco Active U.S. Real Estate ETF (PSR) | | | | | | | | | | | | | | | | | | | | |
| | | | |
Actual | | | $ | 1,000.00 | | | | $ | 1,016.00 | | | | | 0.35 | % | | | $ | 1.77 | |
| | | | |
Hypothetical (5% return before expenses) | | | | 1,000.00 | | | | | 1,023.38 | | | | | 0.35 | | | | | 1.78 | |
| | | | |
Invesco Balanced Multi-Asset Allocation ETF (PSMB) | | | | | | | | | | | | | | | | | | | | |
| | | | |
Actual | | | | 1,000.00 | | | | | 1,093.00 | | | | | 0.05 | | | | | 0.26 | |
| | | | |
Hypothetical (5% return before expenses) | | | | 1,000.00 | | | | | 1,024.89 | | | | | 0.05 | | | | | 0.25 | |
Calculating your ongoing Fund expenses–(continued)
| | | | | | | | | | | | | | | | | | | | |
| | | Beginning
Account Value
May 1, 2020 | | Ending
Account Value
October 31, 2020 | | Annualized
Expense Ratio Based on the Six-Month Period | | Expenses Paid
During the Six-Month Period(1) |
Invesco Conservative Multi-Asset Allocation ETF (PSMC) | | | | | | | | | | | | | | | | | | | | |
| | | | |
Actual | | | $ | 1,000.00 | | | | $ | 1,068.10 | | | | | 0.05 | % | | | $ | 0.26 | |
| | | | |
Hypothetical (5% return before expenses) | | | | 1,000.00 | | | | | 1,024.89 | | | | | 0.05 | | | | | 0.25 | |
| | | | |
Invesco Growth Multi-Asset Allocation ETF (PSMG) | | | | | | | | | | | | | | | | | | | | |
| | | | |
Actual | | | | 1,000.00 | | | | | 1,098.30 | | | | | 0.05 | | | | | 0.26 | |
| | | | |
Hypothetical (5% return before expenses) | | | | 1,000.00 | | | | | 1,024.89 | | | | | 0.05 | | | | | 0.25 | |
| | | | |
Invesco Moderately Conservative Multi-Asset Allocation ETF (PSMM) | | | | | | | | | | | | | | | | | | | | |
| | | | |
Actual | | | | 1,000.00 | | | | | 1,077.10 | | | | | 0.05 | | | | | 0.26 | |
| | | | |
Hypothetical (5% return before expenses) | | | | 1,000.00 | | | | | 1,024.89 | | | | | 0.05 | | | | | 0.25 | |
| | | | |
Invesco S&P 500® Downside Hedged ETF (PHDG) | | | | | | | | | | | | | | | | | | | | |
| | | | |
Actual | | | | 1,000.00 | | | | | 1,102.60 | | | | | 0.33 | | | | | 1.74 | |
| | | | |
Hypothetical (5% return before expenses) | | | | 1,000.00 | | | | | 1,023.48 | | | | | 0.33 | | | | | 1.68 | |
| | | | |
Invesco Total Return Bond ETF (GTO) | | | | | | | | | | | | | | | | | | | | |
| | | | |
Actual | | | | 1,000.00 | | | | | 1,058.80 | | | | | 0.50 | | | | | 2.59 | |
| | | | |
Hypothetical (5% return before expenses) | | | | 1,000.00 | | | | | 1,022.62 | | | | | 0.50 | | | | | 2.54 | |
| | | | |
Invesco Ultra Short Duration ETF (GSY) | | | | | | | | | | | | | | | | | | | | |
| | | | |
Actual | | | | 1,000.00 | | | | | 1,016.10 | | | | | 0.22 | | | | | 1.11 | |
| | | | |
Hypothetical (5% return before expenses) | | | | 1,000.00 | | | | | 1,024.03 | | | | | 0.22 | | | | | 1.12 | |
| | | | |
Invesco Variable Rate Investment Grade ETF (VRIG) | | | | | | | | | | | | | | | | | | | | |
| | | | |
Actual | | | | 1,000.00 | | | | | 1,053.20 | | | | | 0.30 | | | | | 1.55 | |
| | | | |
Hypothetical (5% return before expenses) | | | | 1,000.00 | | | | | 1,023.63 | | | | | 0.30 | | | | | 1.53 | |
| (1) | Expenses are calculated using the annualized expense ratio, which represents the ongoing expenses as a percentage of net assets for the six-month period ended October 31, 2020. Expenses are calculated by multiplying the Fund’s annualized expense ratio by the average account value for the period, then multiplying the result by 184/366. Expense ratios for the most recent six-month period may differ from expense ratios based on the annualized data in the Financial Highlights. |
Tax Information
Form 1099-DIV, Form 1042-S and other year-end tax information provide shareholders with actual calendar year amounts that should be included in their tax returns. Shareholders should consult their tax advisers.
The following distribution information is being provided as required by the Internal Revenue Code or to meet a specific state’s requirement.
Each Fund designates the following amounts or, if subsequently determined to be different, the maximum amount allowable for its fiscal year ended October 31, 2020:
| | | | | | | | | | | | | | | | | | | | | | | | | | | | | | | | | | | | | | | | |
| | | Qualified
Business
Income* | | Qualified
Dividend
Income* | | Corporate Dividends
Received
Deduction* | | U.S. Treasury
Obligations* | | Business
Interest
Income* | | Qualified
Interest
Income* | | Long Term
Capital Gains | | Qualified Short
Term Gains |
| Invesco Active U.S Real Estate ETF | | | | 72 | % | | | | 2 | % | | | | 0 | % | | | | 0 | % | | | | 0 | % | | | | 0 | % | | | $ | - | | | | $ | - | |
| | | | | | | | |
| Invesco Balanced Multi-Asset Allocation ETF | | | | 0 | % | | | | 6 | % | | | | 1 | % | | | | 0 | % | | | | 0 | % | | | | 0 | % | | | | 84,007 | | | | | 19,021 | |
| | | | | | | | |
| Invesco Conservative Multi-Asset Allocation ETF | | | | 0 | % | | | | 1 | % | | | | 0 | % | | | | 0 | % | | | | 0 | % | | | | 0 | % | | | | 3,507 | | | | | 82,721 | |
| | | | | | | | |
| Invesco Growth Multi-Asset Allocation ETF | | | | 0 | % | | | | 12 | % | | | | 2 | % | | | | 0 | % | | | | 0 | % | | | | 0 | % | | | | 17,757 | | | | | 115,604 | |
| | | | | | | | |
| Invesco Moderately Conservative Multi-Asset Allocation ETF | | | | 0 | % | | | | 7 | % | | | | 1 | % | | | | 0 | % | | | | 0 | % | | | | 0 | % | | | | 57,855 | | | | | 90,907 | |
| | | | | | | | |
| Invesco S&P 500® Downside Hedged ETF | | | | 0 | % | | | | 0 | % | | | | 0 | % | | | | 0 | % | | | | 0 | % | | | | 0 | % | | | | - | | | | | - | |
| | | | | | | | |
| Invesco Total Return Bond ETF | | | | 0 | % | | | | 1 | % | | | | 1 | % | | | | 3 | % | | | | 43 | % | | | | 41 | % | | | | - | | | | | 1,019,729 | |
| | | | | | | | |
| Invesco Ultra Short Duration ETF | | | | 0 | % | | | | 0 | % | | | | 0 | % | | | | 0 | % | | | | 94 | % | | | | 77 | % | | | | 401,970 | | | | | 445,903 | |
| | | | | | | | |
| Invesco Variable Rate Investment Grade ETF | | | | 0 | % | | | | 3 | % | | | | 3 | % | | | | 4 | % | | | | 97 | % | | | | 90 | % | | | | - | | | | | - | |
| * | The above percentages are based on ordinary income dividends paid to shareholders during the Fund’s fiscal year. |
Trustees and Officers
The Independent Trustees of the Trust, their term of office and length of time served, their principal business occupations during at least the past five years, the number of portfolios in the Fund Complex (as defined below) overseen by each Independent Trustee and the other directorships, if any, held by each Independent Trustee are shown below.
As of October 31, 2020
| | | | | | | | | | |
Name, Address and Year of
Birth of Independent Trustees | | Position(s)
Held
with Trust | | Term of
Office and
Length of
Time Served* | | Principal
Occupation(s) During
the Past 5 Years | | Number of
Portfolios
in Fund
Complex** Overseen by
Independent
Trustees | | Other Directorships
Held by
Independent
Trustees During
the Past 5 Years |
Ronn R. Bagge–1958 c/o Invesco Capital Management LLC 3500 Lacey Road, Suite 700 Downers Grove, IL 60515 | | Vice Chairman of the Board; Chairman of the Nominating and Governance Committee and Trustee | | Vice Chairman since 2018; Chairman of the Nominating and Governance Committee and Trustee since 2008 | | Founder and Principal, YQA Capital Management LLC (1998-Present); formerly, Owner/CEO of Electronic Dynamic Balancing Co., Inc. (high-speed rotating equipment service provider). | | 216 | | Trustee and Investment Oversight Committee member, Mission Aviation Fellowship (2017-Present). |
| | | | | |
Todd J. Barre–1957 c/o Invesco Capital Management LLC 3500 Lacey Road, Suite 700 Downers Grove, IL 60515 | | Trustee | | Since 2010 | | Assistant Professor of Business, Trinity Christian College (2010-2016); formerly, Vice President and Senior Investment Strategist (2001-2008), Director of Open Architecture and Trading (2007-2008), Head of Fundamental Research (2004-2007) and Vice President and Senior Fixed Income Strategist (1994-2001), BMO Financial Group/Harris Private Bank. | | 216 | | None. |
| * | This is the date the Independent Trustee began serving the Trust. Each Independent Trustee serves an indefinite term, until his or her successor is elected. |
| ** | Fund Complex includes all open- and closed-end funds (including all of their portfolios) advised by the Adviser and any affiliated person of the Adviser. |
Trustees and Officers–(continued)
| | | | | | | | | | |
Name, Address and Year of
Birth of Independent Trustees | | Position(s)
Held
with Trust | | Term of
Office and
Length of
Time Served* | | Principal
Occupation(s) During
the Past 5 Years | | Number of
Portfolios
in Fund
Complex** Overseen by
Independent
Trustees | | Other Directorships
Held by
Independent
Trustees During
the Past 5 Years |
Edmund P. Giambastiani, Jr.–1948 c/o Invesco Capital Management LLC 3500 Lacey Road, Suite 700 Downers Grove, IL 60515 | | Trustee | | Since 2019 | | President, Giambastiani Group LLC (national security and energy consulting) (2007-Present); Director, The Boeing Company (2009-Present); Trustee, MITRE Corporation (federally-funded research development) (2008-Present); Director, THL Credit, Inc. (alternative credit investment manager) (2016-Present); Trustee, U.S. Naval Academy Foundation Athletic & Scholarship Program (2010-Present); Advisory Board Member, Massachusetts Institute of Technology Lincoln Laboratory (federally-funded research development) (2010-Present); Defense Advisory Board Member, Lawrence Livermore National Laboratory (2013-Present); formerly, Chairman (2015-2016), Lead Director (2011-2015) and Director (2008-2011), Monster Worldwide, Inc. (career services); Advisory Board Member, Maxwell School of Citizenship and Public Affairs of Syracuse University (2012-2016); United States Navy, career nuclear submarine officer (1970-2007); Seventh Vice Chairman of the Joint Chiefs of Staff (2005-2007); first NATO Supreme Allied Commander Transformation (2003-2005); Commander, U.S. Joint Forces Command (2002-2005). | | 216 | | Formerly, Trustee, certain funds of the Oppenheimer Funds complex (2013- 2019); Director, Mercury Defense Systems Inc. (information technology) (2011-2013); Independent Director, QinetiQ Group Plc (defense technology and security) (2008-2011); Chairman, Alenia North America, Inc. (military and defense products) (2008-2009); Director, SRA International, Inc. (information technology and services) (2008- 2011). |
| * | This is the date the Independent Trustee began serving the Trust. Each Independent Trustee serves an indefinite term, until his or her successor is elected. |
| ** | Fund Complex includes all open- and closed-end funds (including all of their portfolios) advised by the Adviser and any affiliated person of the Adviser. |
Trustees and Officers–(continued)
| | | | | | | | | | |
Name, Address and Year of
Birth of Independent Trustees | | Position(s)
Held
with Trust | | Term of
Office and
Length of
Time Served* | | Principal
Occupation(s) During
the Past 5 Years | | Number of
Portfolios
in Fund
Complex** Overseen by
Independent
Trustees | | Other Directorships
Held by
Independent
Trustees During
the Past 5 Years |
Victoria J. Herget–1951 c/o Invesco Capital Management LLC 3500 Lacey Road, Suite 700 Downers Grove, IL 60515 | | Trustee | | Since 2019 | | Formerly, Managing Director (1993-2001), Principal (1985-1993), Vice President (1978-1985) and Assistant Vice President (1973-1978), Zurich Scudder Investments (investment adviser) (and its predecessor firms). | | 216 | | Trustee (2000- Present) and Chair (2010-2017), Newberry Library; Trustee, Mather LifeWays (2001-Present); Trustee, Chikaming Open Lands (2014-Present); formerly, Trustee, certain funds in the Oppenheimer Funds complex (2012-2019); Board Chair (2008-2015) and Director (2004-2018), United Educators Insurance Company; Independent Director, First American Funds (2003-2011); Trustee (1992-2007), Chair of the Board of Trustees (1999-2007), Investment Committee Chair (1994-1999) and Investment Committee member (2007-2010), Wellesley College; Trustee, BoardSource (2006-2009); Trustee, Chicago City Day School (1994-2005). |
| * | This is the date the Independent Trustee began serving the Trust. Each Independent Trustee serves an indefinite term, until his or her successor is elected. |
| ** | Fund Complex includes all open- and closed-end funds (including all of their portfolios) advised by the Adviser and any affiliated person of the Adviser. |
Trustees and Officers–(continued)
| | | | | | | | | | |
Name, Address and Year of
Birth of Independent Trustees | | Position(s)
Held
with Trust | | Term of
Office and
Length of
Time Served* | | Principal
Occupation(s) During
the Past 5 Years | | Number of
Portfolios
in Fund
Complex** Overseen by
Independent
Trustees | | Other Directorships
Held by
Independent
Trustees During
the Past 5 Years |
Marc M. Kole–1960 c/o Invesco Capital Management LLC 3500 Lacey Road, Suite 700 Downers Grove, IL 60515 | | Chairman of the Audit Committee and Trustee | | Chairman of the Audit Committee and Trustee since 2008 | | Senior Director of Finance, By The Hand Club for Kids (not-for-profit) (2015-Present); formerly, Chief Financial Officer, Hope Network (social services) (2008-2012); Assistant Vice President and Controller, Priority Health (health insurance) (2005-2008); Regional Chief Financial Officer, United Healthcare (2005); Chief Accounting Officer, Senior Vice President of Finance, Oxford Health Plans (2000-2004); Audit Partner, Arthur Andersen LLP (1996-2000). | | 216 | | Treasurer (2018-Present), Finance Committee Member (2015-Present) and Audit Committee Member (2015), Thornapple Evangelical Covenant Church; formerly, Board and Finance Committee Member (2009-2017) and Treasurer (2010-2015, 2017), NorthPointe Christian Schools. |
| | | | | |
Yung Bong Lim–1964 c/o Invesco Capital Management LLC 3500 Lacey Road, Suite 700 Downers Grove, IL 60515 | | Chairman of the Investment Oversight Committee and Trustee | | Chairman of the Investment Oversight Committee since 2014; Trustee since 2013 | | Managing Partner, RDG Funds LLC (real estate) (2008-Present); formerly, Managing Director, Citadel LLC (1999-2007). | | 216 | | Advisory Board Member, Performance Trust Capital Partners, LLC (2008-Present); Board Director, Beacon Power Services, Corp. (2019-Present). |
| * | This is the date the Independent Trustee began serving the Trust. Each Independent Trustee serves an indefinite term, until his or her successor is elected. |
| ** | Fund Complex includes all open- and closed-end funds (including all of their portfolios) advised by the Adviser and any affiliated person of the Adviser. |
Trustees and Officers–(continued)
| | | | | | | | | | |
Name, Address and Year of
Birth of Independent Trustees | | Position(s)
Held
with Trust | | Term of
Office and
Length of
Time Served* | | Principal
Occupation(s) During
the Past 5 Years | | Number of
Portfolios
in Fund
Complex** Overseen by
Independent
Trustees | | Other Directorships
Held by
Independent
Trustees During
the Past 5 Years |
Joanne Pace–1958 c/o Invesco Capital Management LLC 3500 Lacey Road, Suite 700 Downers Grove, IL 60515 | | Trustee | | Since 2019 | | Formerly, Senior Advisor, SECOR Asset Management, LP (2010-2011); Managing Director and Chief Operating Officer, Morgan Stanley Investment Management (2006-2010); Partner and Chief Operating Officer, FrontPoint Partners, LLC (alternative investments) (2005- 2006); Managing Director (2003-2005), Global Head of Human Resources and member of Executive Board and Operating Committee (2004-2005), Global Head of Operations and Product Control (2003-2004), Credit Suisse (investment banking); Managing Director (1997-2003), Controller and Principal Accounting Officer (1999-2003), Chief Financial Officer (temporary assignment) for the Oversight Committee, Long Term Capital Management (1998-1999), Morgan Stanley. | | 216 | | Board Director, Horizon Blue Cross Blue Shield of New Jersey (2012- Present); Advisory Board Director, The Alberleen Group LLC (2012-Present); Governing Council Member (2016- Present) and Chair of Education Committee (2017-Present), Independent Directors Council (IDC); Board Member, 100 Women in Finance (2015-Present); Council Member, New York-Presbyterian Hospital’s Leadership Council on Children’s and Women’s Health (2012-Present); formerly, Trustee, certain funds in the Oppenheimer Funds complex (2012- 2019); Lead Independent Director and Chair of the Audit and Nominating Committee of The Global Chartist Fund, LLC, Oppenheimer Asset Management (2011-2012); Board Director, Managed Funds Association (2008-2010); Board Director (2007-2010) and Investment Committee Chair (2008-2010), Morgan Stanley Foundation. |
| * | This is the date the Independent Trustee began serving the Trust. Each Independent Trustee serves an indefinite term, until his or her successor is elected. |
| ** | Fund Complex includes all open- and closed-end funds (including all of their portfolios) advised by the Adviser and any affiliated person of the Adviser. |
Trustees and Officers–(continued)
| | | | | | | | | | |
Name, Address and Year of
Birth of Independent Trustees | | Position(s)
Held
with Trust | | Term of
Office and
Length of
Time Served* | | Principal
Occupation(s) During
the Past 5 Years | | Number of
Portfolios
in Fund
Complex** Overseen by
Independent
Trustees | | Other Directorships
Held by
Independent
Trustees During
the Past 5 Years |
Gary R. Wicker-1961 c/o Invesco Capital Management LLC 3500 Lacey Road, Suite 700 Downers Grove, IL 60515 | | Trustee | | Since 2013 | | Senior Vice President of Global Finance and Chief Financial Officer, RBC Ministries (publishing company) (2013-Present); formerly, Executive Vice President and Chief Financial Officer, Zondervan Publishing (a division of Harper Collins/NewsCorp) (2007-2012); Senior Vice President and Group Controller (2005-2006), Senior Vice President and Chief Financial Officer (2003-2004), Chief Financial Officer (2001-2003), Vice President, Finance and Controller (1999-2001) and Assistant Controller (1997-1999), divisions of The Thomson Corporation (information services provider); Senior Audit Manager (1994-1997), PricewaterhouseCoopers LLP. | | 216 | | Board Member and Treasurer, Our Daily Bread Ministries Canada (2015- Present); Board and Finance Committee Member, West Michigan Youth For Christ (2010- Present). |
| | | | | |
Donald H. Wilson-1959 c/o Invesco Capital Management LLC 3500 Lacey Road, Suite 700 Downers Grove, IL 60515 | | Chairman of the Board and Trustee | | Chairman since 2012; Trustee since 2008 | | Chairman, President and Chief Executive Officer, McHenry Bancorp Inc. and McHenry Savings Bank (subsidiary) (2018-Present); formerly, Chairman and Chief Executive Officer, Stone Pillar Advisors, Ltd. (2010-2017); President and Chief Executive Officer, Stone Pillar Investments, Ltd. (advisory services to the financial sector) (2016-2018); Chairman, President and Chief Executive Officer, Community Financial Shares, Inc. and Community Bank–Wheaton/Glen Ellyn (subsidiary) (2013-2015); Chief Operating Officer, AMCORE Financial, Inc. (bank holding company) (2007-2009); Executive Vice President and Chief Financial Officer, AMCORE Financial, Inc. (2006-2007); Senior Vice President and Treasurer, Marshall & Ilsley Corp. (bank holding company) (1995-2006). | | 216 | | Director, Penfield Children’s Center (2004-Present); Board Chairman, Gracebridge Alliance, Inc. (2015-Present). |
| * | This is the date the Independent Trustee began serving the Trust. Each Independent Trustee serves an indefinite term, until his or her successor is elected. |
| ** | Fund Complex includes all open- and closed-end funds (including all of their portfolios) advised by the Adviser and any affiliated person of the Adviser. |
Trustees and Officers–(continued)
The Interested Trustee and the executive officers of the Trust, their term of office and length of time served, their principal business occupations during at least the past five years, the number of portfolios in the Fund Complex overseen by the Interested Trustee and the other directorships, if any, held by the Interested Trustee, are shown below:
| | | | | | | | | | |
Name, Address and Year of
Birth of Interested Trustee | | Position(s)
Held
with Trust | | Term of
Office and
Length of
Time Served* | | Principal
Occupation(s) During
the Past 5 Years | | Number of
Portfolios
in Fund
Complex** Overseen by
Interested
Trustee | | Other Directorships
Held by
Interested
Trustee During
the Past 5 Years |
Kevin M. Carome–1956 Invesco Ltd. Two Peachtree Pointe 1555 Peachtree St., N.E., Suite 1800 Atlanta, GA 30309 | | Trustee | | Since 2010 | | Senior Managing Director, Secretary and General Counsel, Invesco Ltd. (2007-Present); Director, Invesco Advisers, Inc. (2009-Present); Director (2006-Present) and Executive Vice President (2008-Present), Invesco North American Holdings, Inc.; Executive Vice President (2008-Present), Invesco Investments (Bermuda) Ltd.; Manager, Horizon Flight Works LLC; and Executive Vice President (2014-Present), INVESCO Asset Management (Bermuda) Ltd.; formerly, Director and Secretary (2012-2020), Invesco Services (Bahamas) Private Limited; Director, Invesco Finance PLC (2011-2019); Director, INVESCO Asset Management (Bermuda) Ltd. (2014-2019); Director and Executive Vice President, Invesco Finance, Inc. (2011-2018); Director (2006-2018) and Executive Vice President (2008-2018), Invesco Group Services, Inc., Invesco Holding Company (US), Inc.; Director, Invesco Holding Company Limited (2007-2019); Director and Chairman, INVESCO Funds Group, Inc., Senior Vice President, Secretary and General Counsel, Invesco Advisers, Inc. (2003-2006); Director, Invesco Investments (Bermuda) Ltd. (2008-2016); Senior Vice President and General Counsel, Liberty Financial Companies, Inc. (2000-2001); General Counsel of certain investment management subsidiaries of Liberty Financial Companies, Inc. (1998-2000); Associate General Counsel, Liberty Financial Companies, Inc. (1993-1998); Associate, Ropes & Gray LLP. | | 216 | | None |
| * | This is the date the Interested Trustee began serving the Trust. The Interested Trustee serves an indefinite term, until his successor is elected. |
| ** | Fund Complex includes all open- and closed-end funds (including all of their portfolios) advised by the Adviser and any affiliated person of the Adviser. |
Trustees and Officers–(continued)
| | | | | | |
Name, Address and Year of Birth of Executive Officers | | Position(s) Held with Trust | | Length of Time
Served* | | Principal Occupation(s) During the Past 5 Years |
Anna Paglia–1974 Invesco Capital Management LLC 3500 Lacey Road, Suite 700 Downers Grove, IL 60515 | | President and Principal Executive Officer | | Since 2020 | | President and Principal Executive Officer, Invesco Exchange-Traded Fund Trust, Invesco Exchange-Traded Fund Trust II, Invesco India Exchange-Traded Fund Trust, Invesco Actively Managed Exchange-Traded Fund Trust, Invesco Actively Managed Exchange-Traded Commodity Fund Trust and Invesco Exchange-Traded Self-Indexed Fund Trust (2020-Present); Managing Director and Global Head of ETFs and Indexed Strategies, Chief Executive Officer and Principal Executive Officer, Invesco Capital Management LLC (2020-Present); Chief Executive Officer, Manager and Principal Executive Officer, Invesco Specialized Products, LLC (2020-Present); Vice President, Invesco Indexing LLC (2020-Present); Authorized Person, Accretive Asset Management LLC (2018-Present); formerly, Secretary, Invesco Exchange-Traded Fund Trust, Invesco Exchange-Traded Fund Trust II, Invesco India Exchange-Traded Fund Trust and Invesco Actively Managed Exchange-Traded Fund Trust (2011-2020), Invesco Actively Managed Exchange-Traded Commodity Fund Trust (2014-2020) and Invesco Exchange-Traded Self-Indexed Fund Trust (2015-2020); Head of Legal (2010-2020) and Secretary (2015-2020), Invesco Capital Management LLC; Manager and Assistant Secretary, Invesco Indexing LLC (2017-2020); Head of Legal and Secretary, Invesco Specialized Products, LLC (2018-2020); Partner, K&L Gates LLP (formerly, Bell Boyd & Lloyd LLP) (2007-2010); and Associate Counsel at Barclays Global Investors Ltd. (2004-2006). |
| | | |
Kelli Gallegos–1970 Invesco Capital Management LLC 11 Greenway Plaza, Suite 1000 Houston, TX 77046 | | Vice President and Treasurer | | Since 2018 | | Vice President, Invesco Advisers, Inc. (2020-Present); Principal Financial and Accounting Officer-Pooled Investments, Invesco Specialized Products, LLC (2018-Present); Vice President and Treasurer, Invesco Exchange-Traded Fund Trust, Invesco Exchange-Traded Fund Trust II, Invesco India Exchange-Traded Fund Trust, Invesco Actively Managed Exchange-Traded Fund Trust, Invesco Actively Managed Exchange-Traded Commodity Fund Trust and Invesco Exchange-Traded Self-Indexed Fund Trust (2018-Present); Principal Financial and Accounting Officer-Pooled Investments, Invesco Capital Management LLC (2018-Present); Vice President, Principal Financial Officer (2016-Present) and Assistant Treasurer (2008-Present), The Invesco Funds; formerly, Assistant Treasurer, Invesco Specialized Products, LLC (2018); Assistant Treasurer, Invesco Exchange-Traded Fund Trust, Invesco Exchange-Traded Fund Trust II, Invesco India Exchange-Traded Fund Trust and Invesco Actively Managed Exchange-Traded Fund Trust (2012-2018), Invesco Actively Managed Exchange-Traded Commodity Fund Trust (2014-2018) and Invesco Exchange-Traded Self-Indexed Fund Trust (2016-2018); Assistant Treasurer, Invesco Capital Management LLC (2013-2018); and Assistant Vice President, The Invesco Funds (2008-2016). |
| * | This is the date each Officer began serving the Trust in their current position. Each Officer serves an indefinite term, until his or her successor is elected. |
Trustees and Officers–(continued)
| | | | | | |
Name, Address and Year of Birth of Executive Officers | | Position(s) Held with Trust | | Length of Time
Served* | | Principal Occupation(s) During the Past 5 Years |
Adam Henkel–1980 Invesco Capital Management LLC 3500 Lacey Road, Suite 700 Downers Grove, IL 60515 | | Secretary | | Since 2020 | | Head of Legal – US ETFs and Secretary, Invesco Capital Management LLC (2020-Present); Head of Legal and Secretary, Invesco Specialized Products, LLC (2020-Present); Secretary, Invesco Exchange-Traded Fund Trust, Invesco Exchange-Traded Fund Trust II, Invesco India Exchange-Traded Fund Trust, Invesco Actively Managed Exchange-Traded Fund Trust, Invesco Actively Managed Exchange-Traded Commodity Fund Trust and Invesco Exchange-Traded Self-Indexed Fund Trust (2020-Present); Manager and Assistant Secretary, Invesco Indexing LLC (2020-Present); Assistant Secretary (2020-Present), Invesco Capital Markets, Inc. and Invesco Investment Advisers LLC; Assistant Secretary, The Invesco Funds (2014-Present); formerly, Assistant Secretary, Invesco Capital Management LLC (2015-2020) and Invesco Specialized Products, LLC (2018-2020); Assistant Secretary (2014-2020) and Chief Compliance Officer (2017), Invesco Exchange-Traded Fund Trust, Invesco Exchange-Traded Fund Trust II, Invesco India Exchange- Traded Fund Trust and Invesco Actively Managed Exchange-Traded Fund Trust, Invesco Actively Managed Exchange-Traded Commodity Fund Trust and Invesco Exchange-Traded Self-Indexed Fund Trust; Senior Counsel, Invesco Ltd. (2013-2020). |
| | | |
Peter Hubbard–1981 Invesco Capital Management LLC 3500 Lacey Road, Suite 700 Downers Grove, IL 60515 | | Vice President | | Since 2009 | | Vice President, Invesco Specialized Products, LLC (2018-Present); Vice President, Invesco Exchange-Traded Fund Trust, Invesco Exchange-Traded Fund Trust II, Invesco India Exchange-Traded Fund Trust, Invesco Actively Managed Exchange-Traded Fund Trust (2009-Present), Invesco Actively Managed Exchange-Traded Commodity Fund Trust (2014-Present) and Invesco Exchange-Traded Self-Indexed Fund Trust (2016-Present); Vice President and Director of Portfolio Management, Invesco Capital Management LLC (2010-Present); formerly, Vice President of Portfolio Management, Invesco Capital Management LLC (2008-2010); Portfolio Manager, Invesco Capital Management LLC (2007-2008); Research Analyst, Invesco Capital Management LLC (2005-2007); Research Analyst and Trader, Ritchie Capital, a hedge fund operator (2003-2005). |
| | | |
Sheri Morris–1964 Invesco Capital Management LLC 11 Greenway Plaza, Suite 1000 Houston, TX 77046 | | Vice President | | Since 2012 | | Head of Global Fund Services, Invesco Ltd. (2019-Present); Vice President, OppenheimerFunds, Inc. (2019-Present); President and Principal Executive Officer, The Invesco Funds (2016-Present); Treasurer, The Invesco Funds (2008-Present); Vice President, Invesco Advisers, Inc. (formerly known as Invesco Institutional (N.A.), Inc.) (registered investment adviser) (2009-Present) and Vice President, Invesco Exchange-Traded Fund Trust, Invesco Exchange-Traded Fund Trust II, Invesco India Exchange-Traded Fund Trust, Invesco Actively Managed Exchange-Traded Fund Trust (2012-Present), Invesco Actively Managed Exchange-Traded Commodity Fund Trust (2014-Present) and Invesco Exchange-Traded Self-Indexed Fund Trust (2016-Present); formerly, Vice President and Principal Financial Officer, The Invesco Funds (2008-2016); Treasurer, Invesco Exchange-Traded Fund Trust, Invesco Exchange-Traded Fund Trust II, Invesco India Exchange-Traded Fund Trust and Invesco Actively Managed Exchange-Traded Fund Trust (2011-2013); Vice President, Invesco Aim Advisers, Inc., Invesco Aim Capital Management, Inc. and Invesco Aim Private Asset Management, Inc.; Assistant Vice President and Assistant Treasurer, The Invesco Funds and Assistant Vice President, Invesco Advisers, Inc., Invesco Aim Capital Management, Inc. and Invesco Aim Private Asset Management, Inc. |
| * | This is the date each Officer began serving the Trust in their current position. Each Officer serves an indefinite term, until his or her successor is elected. |
Trustees and Officers–(continued)
| | | | | | |
Name, Address and Year of Birth of Executive Officers | | Position(s) Held with Trust | | Length of Time
Served* | | Principal Occupation(s) During the Past 5 Years |
Rudolf E. Reitmann–1971 Invesco Capital Management LLC 3500 Lacey Road, Suite 700 Downers Grove, IL 60515 | | Vice President | | Since 2013 | | Head of Global Exchange Traded Funds Services, Invesco Specialized Products, LLC (2018-Present); Vice President, Invesco Exchange-Traded Fund Trust, Invesco Exchange-Traded Fund Trust II, Invesco India Exchange-Traded Fund Trust, Invesco Actively Managed Exchange-Traded Fund Trust (2013-Present), Invesco Actively Managed Exchange-Traded Commodity Fund Trust (2014-Present) and Invesco Exchange-Traded Self-Indexed Fund Trust (2016-Present); Head of Global Exchange Traded Funds Services, Invesco Capital Management LLC (2013-Present); Vice President, Invesco Capital Markets, Inc. (2018-Present). |
| | | |
Melanie Zimdars–1976 Invesco Capital Management LLC 3500 Lacey Road, Suite 700 Downers Grove, IL 60515 | | Chief Compliance Officer | | Since 2017 | | Chief Compliance Officer, Invesco Specialized Products, LLC (2018-Present); Chief Compliance Officer, Invesco Capital Management LLC (2017-Present); Chief Compliance Officer, Invesco Exchange-Traded Fund Trust, Invesco Exchange-Traded Fund Trust II, Invesco India Exchange-Traded Fund Trust, Invesco Actively Managed Exchange-Traded Fund Trust, Invesco Actively Managed Exchange-Traded Commodity Fund Trust and Invesco Exchange-Traded Self-Indexed Fund Trust (2017-Present); formerly, Vice President and Deputy Chief Compliance Officer, ALPS Holding, Inc. (2009-2017); Mutual Fund Treasurer/ Chief Financial Officer, Wasatch Advisors, Inc. (2005-2008); Compliance Officer, U.S. Bancorp Fund Services, LLC (2001-2005). |
| * | This is the date each Officer began serving the Trust in their current position. Each Officer serves an indefinite term, until his or her successor is elected. |
Availability of Additional Information About the Trustees
The Statement of Additional Information includes additional information about the Trustees and is available, without charge, upon request at (800) 983-0903.
Proxy Voting Policies and Procedures
A description of the Trust’s proxy voting policies and procedures that the Funds use to determine how to vote proxies relating to portfolio securities is available, without charge and upon request, by calling (800) 983-0903. This information is also available on the Securities and Exchange Commission’s (the “Commission”) website at www.sec.gov.
Information regarding how each Fund voted proxies for portfolio securities, if applicable, during the most recent 12-month period ended June 30, is available, without charge and upon request, by (i) calling (800) 983-0903; or (ii) accessing the Trust’s Form N-PX on the Commission’s website at www.sec.gov.
Quarterly Portfolios
The Trust files its complete schedule of portfolio holdings for the Funds with the Commission for the first and third quarters of each fiscal year as an exhibit to its reports on Form N-PORT. The Forms N-PORT are available on the Commission’s website at www.sec.gov.
Frequency Distribution of Discounts and Premiums
A table showing the number of days the market price of each Fund’s shares was greater than the Fund’s net asset value, and the number of days it was less than the Fund’s net asset value (i.e., premium or discount) for the most recently completed calendar year, and the calendar quarters since that year end (or the life of the Fund, if shorter) may be found at the Fund’s website at www.invesco.com/ETFs.
| | | | |
| ©2020 Invesco Capital Management LLC | | | | |
| 3500 Lacey Road, Suite 700 | | | | |
| Downers Grove, IL 60515 | | P-PS-AR-10 | | invesco.com/ETFs |
Item 2. Code of Ethics.
The Registrant has adopted a Code of Ethics that applies to the Registrant’s principal executive officer and principal financial officer. This Code is filed as an exhibit to this report on Form N-CSR under Item 13(a)(1). No substantive amendments to this Code were made during the reporting period. There were no waivers for the fiscal year ended October 31, 2020.
Item 3. Audit Committee Financial Expert.
The Registrant’s Board of Trustees (the “Board”) has determined that the Registrant has four “audit committee financial experts” serving on its audit committee: Mr. Marc M. Kole, Ms. Joanne Pace, Mr. Gary R. Wicker, and Mr. Donald H. Wilson. Each of these audit committee members is “independent,” meaning that he/she is not an “interested person” of the Registrant (as that term is defined in Section 2(a)(19) of the Investment Company Act of 1940, as amended) and he/she does not accept any consulting, advisory, or other compensatory fee from the Registrant (except in his/her capacity as a Board or committee member).
An “audit committee financial expert” is not an “expert” for any purpose, including for purposes of Section 11 of the Securities Act of 1933, as a result of being designated as an “audit committee financial expert.” Further, the designation of a person as an “audit committee financial expert” does not mean that a person has any greater duties, obligations, or liability than those imposed on a person without the “audit committee financial expert” designation. Similarly, the designation of a person as an “audit committee financial expert” does not affect the duties, obligations, or liability of any other member of the audit committee or Board.
Item 4. Principal Accountant Fees and Services.
(a) to (d)
Fees Billed by PwC to the Registrant
PricewaterhouseCoopers LLP (“PwC”), the Registrant’s independent registered public accounting firm, billed the Registrant aggregate fees for pre-approved services rendered to the Registrant for the last two fiscal years as shown in the following table. The Audit Committee pre-approved all audit and non-audit services provided to the Registrant.
| | | | | | | | | | |
| | | Fees Billed by PwC for Services Rendered to the
Registrant for Fiscal Year End 2020 | | Fees Billed by PwC for Services Rendered to the
Registrant for Fiscal Year End 2019 |
Audit Fees | | | $ | 206,800 | | | | $ | 206,800 | |
Audit-Related Fees | | | $ | 0 | | | | $ | 0 | |
Tax Fees(1) | | | $ | 121,131 | | | | $ | 118,341 | |
All Other Fees | | | $ | 0 | | | | $ | 0 | |
Total Fees | | | $ | 327,931 | | | | $ | 325,141 | |
| | (1) | Tax Fees for the fiscal years ended October 31, 2020 and 2019 include fees billed for preparation of U.S. Tax Returns and Taxable Income calculations, including excise and year-to-date estimates for various book-to-tax differences. |
Fees Billed by PwC Related to Invesco and Invesco Affiliates
PwC billed Invesco Capital Management LLC (“Invesco” or “Adviser”), the Registrant’s investment adviser, and any entity controlling, controlled by or under common control with Invesco that provides ongoing services to the Registrant (“Affiliates”), aggregate fees for pre-approved non-audit services rendered to Invesco and Affiliates for the last two fiscal years as shown in the following table. The Audit Committee pre-approved all non-audit services provided to Invesco and Affiliates that were required to be pre-approved.
| | | | | | | | | | |
| | | Fees Billed for Non-
Audit Services
Rendered to
Invesco and
Affiliates for Fiscal
Year End 2020 That
Were Required to be Pre-Approved by the Registrant’s Audit Committee | | Fees Billed for Non-
Audit Services
Rendered to
Invesco and
Affiliates for Fiscal
Year End 2019 That
Were Required to be Pre-Approved by the Registrant’s Audit Committee |
Audit-Related Fees(1) | | | $ | 701,000 | | | | $ | 690,000 | |
Tax Fees | | | $ | 0 | | | | $ | 0 | |
All Other Fees | | | $ | 0 | | | | $ | 0 | |
Total Fees | | | $ | 701,000 | | | | $ | 690,000 | |
| | (1) | Audit-Related Fees for the fiscal years ended 2020 and 2019 include fees billed related to reviewing controls at a service organization. |
(e)(1) Audit Committee Pre-Approval Policies and Procedures
Pre-Approval of Audit and Non-Audit Services Policies and Procedures
As Adopted by the Audit Committee of the Invesco ETFs
| | |
| Applicable to | | Invesco Exchange-Traded Fund Trust, Invesco Exchange-Traded Fund Trust II, Invesco India Exchange-Traded Fund Trust, Invesco Actively Managed Exchange-Traded Fund Trust, Invesco Actively Managed Exchange-Traded Commodity Fund Trust and Invesco Exchange-Traded Self-Indexed Fund Trust (collectively the “Funds”) |
| Risk Addressed by Policy | | Approval of Audit and Non-Audit Services |
| Relevant Law and Other Sources | | Sarbanes-Oxley Act of 2002; Regulation S-X. |
| Last Reviewed by Compliance for Accuracy | | June 15, 2018 |
| Approved/Adopted Date | | June 2009 |
Statement of Principles
Under the Sarbanes-Oxley Act of 2002 and rules adopted by the Securities and Exchange Commission (“SEC”) (“Rules”), the Audit Committee of the Funds’ (the “Audit Committee”) Board of Trustees (the “Board”) is responsible for the appointment, compensation and oversight of the work of independent accountants (an “Auditor”). As part of this responsibility and to assure that the Auditor’s independence is not impaired, the Audit Committee pre-approves the audit and non-audit services provided to the Funds by each Auditor, as well as all non-audit services provided by the Auditor to the Funds’ investment adviser and to affiliates of the adviser that provide ongoing services to the Funds (“Service Affiliates”) if the services directly impact the Funds’ operations or financial reporting. The SEC Rules also specify the types of services that an Auditor may not provide to its audit client. The following policies and procedures comply with the requirements for pre-approval and provide a mechanism by which management of the Funds may request and secure pre-approval of audit and non-audit services in an orderly manner with minimal disruption to normal business operations.
Proposed services either may be pre-approved without consideration of specific case-by-case services by the Audit Committee (“general pre-approval”) or require the specific pre-approval of the Audit Committee (“specific pre-approval”). As set forth in these policies and procedures, unless a type of service has received general pre-approval, it will require specific pre-approval by the Audit Committee. Additionally, any fees exceeding 110% of estimated pre-approved fee levels provided at the time the service was pre-approved will also require specific approval by the Audit Committee before payment is made. The Audit Committee will also consider the impact of additional fees on the Auditor’s independence when determining whether to approve any additional fees for previously pre-approved services.
The Audit Committee will annually review and generally pre-approve the services that may be provided by each Auditor without obtaining specific pre-approval from the Audit Committee. The term of any general pre-approval runs from the date of such pre-approval through June 30th of the following year, unless the Audit Committee considers a different period and states otherwise. The Audit Committee will add to or subtract from the list of general pre-approved services from time to time, based on subsequent determinations.
The purpose of these policies and procedures is to set forth the guidelines to assist the Audit Committee in fulfilling its responsibilities.
Delegation
The Chairman of the Audit Committee (or, in his or her absence, any member of the Audit Committee) may grant specific pre-approval for non-prohibited services. All such delegated pre-approvals shall be presented to the Audit Committee no later than the next Audit Committee meeting.
Audit Services
The annual Audit services engagement terms will be subject to specific pre-approval of the Audit Committee. Audit services include the annual financial statement audit and other procedures such as tax provision work that is required to be performed by the independent auditor to be able to form an opinion on the Funds’ financial statements. The Audit Committee will obtain, review and consider sufficient information concerning the proposed Auditor to make a reasonable evaluation of the Auditor’s qualifications and independence.
In addition to the annual Audit services engagement, the Audit Committee may grant either general or specific pre-approval of other Audit services, which are those services that only the independent auditor reasonably can provide. Other Audit services may include services such as issuing consents for the inclusion of audited financial statements with SEC registration statements, periodic reports and other documents filed with the SEC or other documents issued in connection with securities offerings.
Non-Audit Services
The Audit Committee may provide either general or specific pre-approval of any non-audit services to the Funds and its Service Affiliates if the Audit Committee believes that the provision of the service will not impair the independence of the Auditor, is consistent with the SEC’s Rules on auditor independence, and otherwise conforms to the Audit Committee’s general principles and policies as set forth herein.
Audit-Related Services
“Audit-related services” are assurance and related services that are reasonably related to the performance of the audit or review of the Funds’ financial statements or that are traditionally performed by the independent auditor. Audit-related services include, among others, accounting consultations related to accounting, financial reporting or disclosure matters not classified as “Audit services”; and assistance with understanding and implementing new accounting and financial reporting guidance from rulemaking authorities.
Tax Services
“Tax services” include, but are not limited to, the review and signing of the Funds’ federal tax returns, the review of required distributions by the Funds and consultations regarding tax matters such as the tax treatment of new investments or the impact of new regulations. The Audit Committee will scrutinize carefully the retention of the Auditor in connection with a transaction initially recommended by the Auditor, the major business purpose of which may be tax avoidance or the tax treatment of which may not be supported in the Internal Revenue Code and related regulations. The Audit Committee will consult with the Funds’ Treasurer (or his or her designee) and may consult with outside counsel or advisors as necessary to ensure the consistency of Tax services rendered by the Auditor with the foregoing policy.
No Auditor shall represent any Fund or any Service Affiliate before a tax court, district court or federal court of claims.
Under rules adopted by the Public Company Accounting Oversight Board and approved by the SEC, in connection with seeking Audit Committee pre-approval of permissible Tax services, the Auditor shall:
| | 1. | Describe in writing to the Audit Committee, which writing may be in the form of the proposed engagement letter: |
| | a. | The scope of the service, the fee structure for the engagement, and any side letter or amendment to the engagement letter, or any other agreement between the Auditor and the Fund, relating to the service; and |
| | b. | Any compensation arrangement or other agreement, such as a referral agreement, a referral fee or fee-sharing arrangement, between the Auditor and any person (other than the Fund) with respect to the promoting, marketing, or recommending of a transaction covered by the service; |
| | 2. | Discuss with the Audit Committee the potential effects of the services on the independence of the Auditor; and |
| | 3. | Document the substance of its discussion with the Audit Committee. |
All Other Auditor Services
The Audit Committee may pre-approve non-audit services classified as “All other services” that are not categorically prohibited by the SEC, as listed in Exhibit 1 to this policy.
Pre-Approval Fee Levels or Established Amounts
Pre-approval of estimated fees or established amounts for services to be provided by the Auditor under general or specific pre-approval policies will be set periodically by the Audit Committee. Any proposed fees exceeding 110% of the maximum estimated pre-approved fees or established amounts for pre-approved audit and non-audit services will be reported to the Audit Committee at the quarterly Audit Committee meeting and will require specific approval by the Audit Committee before payment is made. The Audit Committee will always factor in the overall relationship of fees for audit and non-audit services in determining whether to pre-approve any such services and in determining whether to approve any additional fees exceeding 110% of the maximum pre-approved fees or established amounts for previously pre-approved services.
Procedures
On an annual basis, the Auditor will submit to the Audit Committee for general pre-approval, a list of non-audit services that the Funds or Service Affiliates of the Funds may request from the Auditor. The list will describe the non-audit services in reasonable detail and will include an estimated range of fees and such other information as the Audit Committee may request.
Each request for services to be provided by the Auditor under the general pre-approval of the Audit Committee will be submitted to the Funds’ Treasurer (or his or her designee) and must include a detailed description of the services to be rendered. The Treasurer or his or her designee will ensure that such services are included within the list of services that have received the general pre-approval of the Audit Committee.
Each request to provide services that require specific approval by the Audit Committee shall be submitted to the Audit Committee jointly by the Funds’ Treasurer or his or her designee and the Auditor, and must include a joint statement that, in their view, such request is consistent with the pre-approval policies and procedures and the SEC Rules.
Each request to provide Tax services under either the general or specific pre-approval of the Audit Committee will describe in writing: (i) the scope of the service, the fee structure for the engagement, and any side letter or amendment to the engagement letter, or any other agreement between the Auditor and the audit client, relating to the service; and (ii) any compensation arrangement or other agreement between the Auditor and any person (other than the audit client) with respect to the promoting, marketing, or recommending of a transaction covered by the service. The Auditor will discuss with the Audit Committee the potential effects of the services on the Auditor’s independence and will document the substance of the discussion.
Non-audit services pursuant to the de minimis exception provided by the SEC Rules will be promptly brought to the attention of the Audit Committee for approval, including documentation that each of the conditions for this exception, as set forth in the SEC Rules, has been satisfied.
On at least an annual basis, the Auditor will prepare a summary of all the services provided to any entity in the investment company complex as defined in section 2-01(f)(14) of Regulation S-X in sufficient detail as to the nature of the engagement and the fees associated with those services.
The Audit Committee has designated the Funds’ Treasurer to monitor the performance of all services provided by the Auditor and to ensure such services are in compliance with these policies and procedures. The Funds’ Treasurer will report to the Audit Committee on a periodic basis as to the results of such monitoring. Both the Funds’ Treasurer and management will immediately report to the Chairman of the Audit Committee any breach of these policies and procedures that comes to the attention of the Funds’ Treasurer or senior management.
Adopted: June 26, 2009
Amended: June 15, 2018
Exhibit 1 to Pre-Approval of Audit and Non-Audit Services Policies and Procedures
Conditionally Prohibited Non-Audit Services (not prohibited if the Fund can reasonably conclude that the results of the service would not be subject to audit procedures in connection with the audit of the Fund’s financial statements)
| | • | | Bookkeeping or other services related to the accounting records or financial statements of the audit client |
| | • | | Financial information systems design and implementation |
| | • | | Appraisal or valuation services, fairness opinions, or contribution-in-kind reports |
| | • | | Internal audit outsourcing services |
Categorically Prohibited Non-Audit Services
| | • | | Broker-dealer, investment adviser, or investment banking services |
| | • | | Expert services unrelated to the audit |
| | • | | Any service or product provided for a contingent fee or a commission |
| | • | | Services related to marketing, planning, or opining in favor of the tax treatment of confidential transactions or aggressive tax position transactions, a significant purpose of which is tax avoidance |
| | • | | Tax services for persons in financial reporting oversight roles at the Fund |
| | • | | Any other service that the Public Company Oversight Board determines by regulation is impermissible. |
| (e)(2) | There were no amounts that were pre-approved by the Audit Committee pursuant to the de minimus exception under Rule 2-01 of Regulation S-X. |
| | (g) | In addition to the amounts shown in the tables above, PwC billed Invesco and Affiliates aggregate fees of $ 6,227,000 for the fiscal year ended October 31, 2020 and $3,294,000 for the fiscal year ended October 31, 2019 for non-audit services not required to be pre-approved by the Registrant’s Audit Committee. In total, PwC billed the Registrant, Invesco and Affiliates aggregate non-audit fees of $7,049,131 for the fiscal year ended October 31, 2020 and $ 4,102,341 for the fiscal year ended October 31, 2019. |
| | (h) | With respect to the non-audit services above billed to Invesco and Affiliates that were not required to be pre-approved by the Registrant’s Audit Committee, the Audit Committee received information from PwC about such services, including by way of comparison, that PwC provided audit services to entities within the Investment Company Complex, as defined by Rule 2-01(f)(14) of Regulation S-X, of approximately $31 million and non-audit services of approximately $20 million for the fiscal year ended 2020. The Audit Committee considered this information in evaluating PwC’s independence. |
Pursuant to PCAOB Rule 3526, PwC advised the Registrant’s Audit Committee of the following matters identified between November 1, 2019 to December 23, 2020 that may be reasonably thought to bear on PwC’s independence. PwC advised the Audit Committee that four PwC Managers and three PwC Associates each held financial interests in investment companies within the complex that includes the Funds as well as all registered investment companies advised by the Adviser and its affiliates, including other subsidiaries of the Adviser’s parent company, Invesco Ltd. (collectively, the “Invesco Fund Complex”) that were inconsistent with the requirements of Rule 2-01(c)(1) of Regulation S-X. In reporting the matters to the Audit Committee, PwC noted, among other things, that the impermissible holdings were disposed of by the individuals, the individuals were not in the chain of command of the audit or the audit partners of the Funds, the financial interests were not material to the net worth of each individual or their respective immediate family members and senior leadership of the Funds’ audit engagement team was unaware of the impermissible holdings until after the matters were confirmed to be independence exceptions or individuals ceased providing their non-audit services. In addition, PwC considered that audit work was performed by the PwC Associates, but such audit work was of a limited nature and/or was reviewed by other engagement team members. Based on the mitigating factors noted above, PwC advised the Audit Committee that it concluded that its objectivity and impartiality with respect to all issues encompassed within the audit engagement has not been impaired and it believes that a reasonable investor with knowledge of all relevant facts and circumstances for the violations would conclude that PwC is capable of exercising objective and impartial judgment on all issues encompassed within the audits of the financial statements of the Funds in the Registrant for the impacted periods.
Item 5. Audit Committee of Listed Registrants.
| | (a) | The Registrant has a separately designated Audit Committee established in accordance with Section 3(a)(58)(A) of the Securities Exchange Act of 1934, as amended, which consists solely of independent trustees. The Audit Committee members are Marc M. Kole, Joanne Pace, Gary R. Wicker, and Donald H. Wilson. |
Item 6. Schedule of Investments.
| (a) | The Schedules of Investments are included as a part of the report to shareholders filed under Item 1 of this Form N-CSR. |
Item 7. Disclosure of Proxy Voting Policies and Procedures for Closed-End Management Investment Companies.
Not applicable.
Item 8. Portfolio Managers of Closed-End Management Investment Companies.
Not applicable.
| Item 9. | Purchases of Equity Securities by Closed-End Management Investment Company and Affiliated Purchasers. |
Not applicable.
Item 10. Submission of Matters to a Vote of Security Holders.
There have been no material changes to the procedures by which shareholders may recommend nominees to the Board that would require disclosure herein.
Item 11. Controls and Procedures.
| (a) | Based on their evaluation of the Registrant’s disclosure controls and procedures (as defined in Rule 30a-3(c) under the Investment Company Act of 1940) as of a date within 90 days of the filing date of this report, the Registrant’s President (principal executive officer) and Treasurer (principal financial officer) have concluded that such disclosure controls and procedures are effective. |
| (b) | There were no changes in the registrant’s internal control over financial reporting (as defined in Rule 30a-3(d) under the Investment Company Act of 1940) that occurred during the period covered by this report that has materially affected, or is reasonably likely to materially affect, the registrant’s internal control over financial reporting. |
| Item 12. | Disclosure of Securities Lending Activities for Closed-End Management Investment Companies. |
Not applicable.
Item 13. Exhibits.
SIGNATURES
Pursuant to the requirements of the Securities Exchange Act of 1934 and the Investment Company Act of 1940, the Registrant has duly caused this report to be signed on its behalf by the undersigned, thereunto duly authorized.
(Registrant) Invesco Actively Managed Exchange-Traded Fund Trust
|
By: /s/ Anna Paglia |
|
Name: Anna Paglia |
Title: President |
Date: January 8, 2021
Pursuant to the requirements of the Securities Exchange Act of 1934 and the Investment Company Act of 1940, this report has been signed below by the following persons on behalf of the Registrant and in the capacities and on the dates indicated.
|
By: /s/ Anna Paglia |
|
Name: Anna Paglia |
Title: President |
Date: January 8, 2021
|
By: /s/ Kelli Gallegos |
|
Name: Kelli Gallegos |
Title: Treasurer |
Date: January 8, 2021