UNITED STATES
SECURITIES AND EXCHANGE COMMISSION
Washington, D.C. 20549
FORM N-CSR
CERTIFIED SHAREHOLDER REPORT OF REGISTERED MANAGEMENT
INVESTMENT COMPANIES
Investment Company Act file number 811-22148
Invesco Actively Managed Exchange-Traded Fund Trust
(Exact name of registrant as specified in charter)
3500 Lacey Road
Downers Grove, IL 60515
(Address of principal executive offices) (Zip code)
Anna Paglia
President
3500 Lacey Road
Downers Grove, IL 60515
(Name and address of agent for service)
Registrant’s telephone number, including area code: 800-983-0903
Date of fiscal year end: October 31
Date of reporting period: October 31, 2022
Form N-CSR is to be used by management investment companies to file reports with the Commission not later than 10 days after the transmission to stockholders of any report that is required to be transmitted to stockholders under Rule 30e-1 under the Investment Company Act of 1940 (17 CFR 270.30e-1). The Commission may use the information provided on Form N-CSR in its regulatory, disclosure review, inspection, and policymaking roles.
A registrant is required to disclose the information specified by Form N-CSR, and the Commission will make this information public. A registrant is not required to respond to the collection of information contained in Form N-CSR unless the Form displays a currently valid Office of Management and Budget (“OMB”) control number. Please direct comments concerning the accuracy of the information collection burden estimate and any suggestions for reducing the burden to Secretary, Securities and Exchange Commission, 450 Fifth Street, NW, Washington, DC 20549-0609. The OMB has reviewed this collection of information under the clearance requirements of 44 U.S.C. § 3507.
Item 1. Reports to Stockholders.
| (a) | The Registrant’s annual report transmitted to shareholders pursuant to Rule 30e-1 under the Investment Company Act of 1940 is as follows: |
| | | | |
| | |
 | | Invesco Annual Report to Shareholders October 31, 2022 |
| | PSR PSMB PSMC PSMG IHYF PSMM PHDG GTO GSY VRIG | | Invesco Active U.S. Real Estate ETF Invesco Balanced Multi-Asset Allocation ETF Invesco Conservative Multi-Asset Allocation ETF Invesco Growth Multi-Asset Allocation ETF Invesco High Yield Bond Factor ETF Invesco Moderately Conservative Multi-Asset Allocation ETF Invesco S&P 500® Downside Hedged ETF Invesco Total Return Bond ETF Invesco Ultra Short Duration ETF Invesco Variable Rate Investment Grade ETF |
Table of Contents
The Market Environment
Domestic Equity Market Overview
The fiscal year ended October 31, 2022 began with continued volatility in equity markets in the fourth quarter of 2021 amid substantial inflation and the emergence of a new COVID-19 variant. Pandemic-related supply chain disruption and labor shortages intensified during the quarter, resulting in broadly higher input costs for companies and consumers alike. Additionally, the price of oil rose,1 causing higher gas prices for consumers, and the Consumer Price Index (CPI) reported for November 2021 increased 0.8%, resulting in a 6.8% increase over the prior 12 months, the highest since 1982.2 To combat inflation, the US Federal Reserve (the Fed) announced the potential for three or more interest rate increases in 2022. With solid corporate earnings and optimism about the COVID-19 Omicron variant reporting milder symptoms, stocks rallied at the 2021 year-end.
Equity markets declined in the first quarter of 2022 amid volatility sparked by Russia’s invasion of Ukraine, rising commodity prices, rampant global inflation and the Fed’s shift toward tighter monetary policy. Russia’s invasion exacerbated inflation pressures, disrupting already strained supply chains and increasing shortages of oil, gas and raw materials. The price of oil rose sharply, with crude prices reaching their highest price per barrel since 2008.1 Inflation continued to be a top concern for consumers, investors and the Fed. To combat inflation, the Fed raised the federal funds rate by one-quarter percentage point in March and the Fed indicated it would “taper” its asset purchase program quickly.3
As the war in Ukraine continued and corporate earnings in high-profile names like Netflix reported slowing growth and profits, the equity markets sold off for much of April 2022. The downward direction of the equity markets continued into the second quarter of 2022 amid record inflation, rising interest rates and an increasing likelihood of a US recession. Driven by higher food and energy prices, the CPI rose by yet another 40-year high to 8.6% for the 12 months ended May 2022.2 Oil prices peaked near $122 per barrel in early June, resulting in skyrocketing gasoline prices; the national average price reached a record high above $5 per gallon in early June.1 To tame inflation, the Fed raised the benchmark federal funds rate three more times, by 0.50% in May, by 0.75% in June and another 0.75% in July, which were the largest increases in nearly 30 years.3 US equity markets rose in July and much of August until Fed chairman Jerome Powell’s hawkish comments at an economic policy symposium held in Jackson Hole, Wyoming, sparked a sharp selloff at month-end. The Fed reiterated that it would continue taking aggressive action to curb inflation, even though such measures could “bring pain to households and businesses,” and the Fed raised the benchmark federal funds rate by another 0.75% in September.3
After experiencing a sharp drop in September 2022, US equity markets rebounded in October with strong gains, despite mixed data on the economy and corporate earnings. Inflation data
reported in October came in higher than expected; however, the labor market remained strong, with payroll employment gains and a decline in the unemployment rate to a near record low of 3.5% in September.2 The initial estimate of third quarter real gross domestic product showed an increase of 2.6% (annualized) after falling in the prior two quarters, but the headline number masked a drop in demand and investment. Corporate earnings were generally in line with expectations, but many companies’ forward earnings guidance was weaker than expected.
In this environment, US stocks had negative double-digit returns for the fiscal year ended October 31, 2022 of -14.61%, as measured by the S&P 500 Index.4
| 2 | Source: US Bureau of Labor Statistics |
| 3 | Source: US Federal Reserve |
Fixed Income
In the fourth quarter of 2021, concerns about inflation heightened as US inflation rose 7%,1 its highest level in nearly 40 years. Though the US Federal Reserve (the Fed) left policy rates unchanged during the quarter, the Fed indicated its accommodative policies were coming to an end in 2022 through a willingness to raise interest rates to combat inflation and the announced reduction of its monthly bond purchase program. Additionally, US interest rate moves and inflation risk significantly affected fixed income valuations during the quarter. The two-year Treasury yield rose moderately from 0.27% to 0.73%, while the 10-year increased slightly from 1.48% to 1.52% during the quarter.2 The yield curve, as measured by the yield differential between two- and 10-year Treasuries, flattened during the quarter.
At the beginning of 2022, geopolitical and economic tensions between Ukraine and Russia culminated with the latter invading Ukrainian territory. World leaders levied sanctions against Russia that had material effects on its fixed income markets, particularly sovereign debt and corporates, and levels of liquidity. The Russia-Ukraine war exacerbated inflationary pressures while also exerting downward pressure on economic growth through a surge in commodity/energy prices. Additionally, surges of COVID-19 in China exacerbated supply chain issues and aggravated inflation. During the second quarter of 2022, the two-year Treasury yield rose significantly from 0.78% to 2.28%, while the 10-year increased slightly from 1.63% to 2.32%.2
In the second quarter of 2022, the macro backdrop of tightening financial conditions and slowing economic growth was negative for credit asset classes. Inflation, as measured by the Consumer Price Index, increased further to 9.1% and fixed income markets experienced significant negative performance as all bond sectors felt the impact of rising interest rates with negative performance ranging from -0.9% (Bloomberg Asset-Backed Securities) to
The Market Environment (continued)
-9.8% (Bloomberg US Corporate High Yield).3 Credit spreads increased across all major credit-sensitive sectors, reflecting anticipation of an economic slowdown and increasing concerns about recession risk, with corporate spreads ending the second quarter above their long-term historical average. The Fed continued its rapid tightening of monetary policy in an effort to combat inflation via higher interest rates while simultaneously engineering a soft landing so as to not push the economy into a recession. The Fed aggressively raised its key Fed funds rate during the fiscal year, including a 0.50% hike in May, and three 0.75% hikes in June, July and November, the largest hikes since 1994, to a target Fed funds rate of 3.75-4.00%, the highest since 2008.4 At their November 2022 meeting, the Fed signaled that its hawkish policies would continue, though a slowing of the pace of rate increases was likely. While rates remained elevated across all maturities on the yield curve, the two-year Treasury rates increased from 2.92% to 4.51% during the fiscal year, while 10-year Treasury rates increased from 2.98% to 4.10%.2 At the end of the fiscal year, the yield curve remained inverted, which historically has been an indicator of a potential recession.
| 1 | Source: US Bureau of Labor Statistics |
| 2 | Source: US Department of the Treasury |
| 4 | Source: Federal Reserve of Economic Data |
Global Equity
At the beginning of the fiscal year ended October 31, 2022, developed global equity markets were mostly positive, despite rising inflation and the emergence of Omicron, a new COVID-19 variant. Pandemic-related supply chain disruptions and labor shortages intensified at the end of 2021, resulting in broadly higher costs for companies and consumers. Emerging market equities declined due in part to COVID-19 concerns and China’s ongoing regulatory tightening in the private education and technology sectors and slowing economic growth.
Global equity markets declined in the first half of 2022 amid volatility sparked by Russia’s invasion of Ukraine, rising commodity prices, rampant global inflation and central banks shifting toward tighter monetary policy. Russia’s invasion exacerbated inflationary pressures, disrupting already strained supply chains, and increasing shortages of oil, gas and raw materials, with the price of oil rising sharply.
Inflation headwinds continued into the third quarter of 2022. The US Federal Reserve (the Fed), the European Central Bank and the Bank of England all raised interest rates. In contrast, the People’s Bank of China lowered its policy rate and the Bank of Japan kept rates the same. Emerging market equities, hampered by the strong US dollar, underperformed developed market equities.
During October 2022, developed market equities rebounded and were in positive territory. Developed market equities
outperformed emerging market equities, which declined primarily driven by weakness in China as Chinese markets reacted to the reappointment of President Xi and his authority, with no signs of the country’s zero-COVID-19 policy being relaxed. Despite the rebound in October for developed market equities, at the end of the fiscal year, trailing one-year returns for developed market equities and emerging market equities were both in negative territory.
| | |
| PSR | | Management’s Discussion of Fund Performance |
| | Invesco Active U.S. Real Estate ETF (PSR) |
The Invesco Active U.S. Real Estate ETF (the “Fund”) is an actively managed exchange-traded fund whose investment objective is to achieve high total return through growth of capital and current income. The Fund seeks to achieve its investment objective by investing, under normal market conditions, at least 80% of its assets in securities of companies that are principally engaged in the U.S. real estate industry and included within the FTSE NAREIT All Equity REITs Index (the “Benchmark Index”). The Fund considers a company to be principally engaged in the U.S. real estate industry if it: (i) derives 50% of its revenues or profits from the ownership, leasing, management, construction, financing or sale of U.S. real estate; or (ii) has at least 50% of the value of its assets invested in U.S. real estate. The Fund plans to invest principally in equity real estate investment trusts (“REITs”). Equity REITs pool investors’ funds for investments primarily in real estate properties or real estate-related loans (such as mortgages). The Fund also may invest in real estate operating companies (“REOCs”), as well as securities of other companies principally engaged in the U.S. real estate industry. REOCs are similar to REITs, except that REOCs reinvest their earnings into the business, rather than distributing them to unitholders like REITs.
For the fiscal year ended October 31, 2022, on a market price basis, the Fund returned (18.65)%. On a net asset value (“NAV”) basis, the Fund returned (18.66)%. During the same time period, the Benchmark Index returned (19.16)%.
Relative to the Benchmark Index, the Fund was most overweight in the specialized REITs sub-industry and most underweight in the retail REITs sub-industry during the fiscal year ended October 31, 2022. The majority of the Fund’s outperformance relative to the Benchmark Index during the period can be attributed to the Fund’s security selection in the industrial REITs and office REITs sub-industries, respectively.
For the fiscal year ended October 31, 2022, no sub-industries contributed positively to the Fund’s return. During the period, the specialized REITs and residential REITs sub-industries detracted most from the Fund’s return.
Positions that contributed most significantly to the Fund’s return for the fiscal year ended October 31, 2022 included CoreSite Realty Corp., an specialized REITs company (no longer held at fiscal year-end), and Veris Residential, Inc., an office REIT company (portfolio average weight of 0.27%). Positions that detracted most significantly from the Fund’s return included Crown Castle Inc., a specialized REIT company (portfolio average weight of 6.19%), and American Tower Corp., a specialized REIT company (portfolio average weight of 6.18%).
| | | | |
Property Type and Sub-Industry Breakdown
(% of the Fund’s Net Assets)
as of October 31, 2022 | |
| Infrastructure REITs | | | 18.67 | |
| Industrial | | | 10.84 | |
| Apartments | | | 10.42 | |
| Self Storage | | | 8.85 | |
| Data Centers | | | 7.91 | |
| Health Care | | | 7.12 | |
| Shopping Centers | | | 6.36 | |
| Free Standing | | | 5.43 | |
| Specialty | | | 4.77 | |
| Office | | | 4.42 | |
| Manufactured Homes | | | 3.53 | |
| Diversified | | | 3.38 | |
| Timber REITs | | | 2.68 | |
| Lodging Resorts | | | 2.65 | |
| Single Family Homes | | | 2.19 | |
| Regional Malls | | | 0.82 | |
| Money Market Funds Plus Other Assets Less Liabilities | | | (0.04) | |
|
Top Ten Fund Holdings*
(% of the Fund’s Net Assets)
as of October 31, 2022 | |
| Security | | | | |
| American Tower Corp. | | | 6.39 | |
| SBA Communications Corp., Class A | | | 6.33 | |
| Crown Castle, Inc. | | | 5.95 | |
| Digital Realty Trust, Inc. | | | 3.96 | |
| Equinix, Inc. | | | 3.95 | |
| CubeSmart | | | 1.81 | |
| Public Storage | | | 1.77 | |
| Life Storage, Inc. | | | 1.76 | |
| Extra Space Storage, Inc. | | | 1.76 | |
| National Storage Affiliates Trust | | | 1.75 | |
| Total | | | 35.43 | |
| * | Excluding money market fund holdings. |
Invesco Active U.S. Real Estate ETF (PSR) (continued)
Growth of a $10,000 Investment
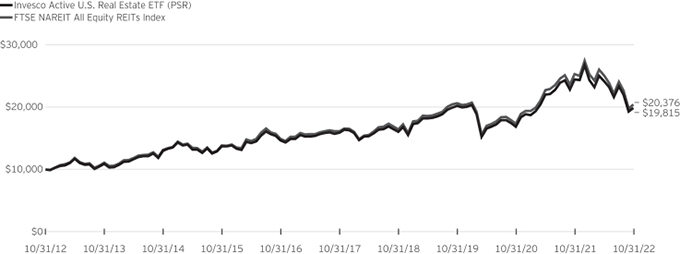
Fund Performance History as of October 31, 2022
| | | | | | | | | | | | | | | | | | | | | | | | | | | | | | | | | | | | | | | | |
| | | 1 Year | | | 3 Years
Average
Annualized | | | 3 Years
Cumulative | | | 5 Years
Average
Annualized | | | 5 Years Cumulative | | | 10 Years
Average
Annualized | | | 10 Years
Cumulative | | | | | | Fund Inception | |
| Index | | | | | Average
Annualized | | | Cumulative | |
FTSE Nareit All Equity REITs Index | | | (19.16 | )% | | | (0.35 | )% | | | (1.05 | )% | | | 4.77 | % | | | 26.22 | % | | | 7.38 | % | | | 103.76 | % | | | | | | | 14.26 | % | | | 541.64 | % |
Fund | | | | | | | | | | | | | | | | | | | | | | | | | | | | | | | | | | | | | | | | |
NAV Return | | | (18.66 | ) | | | (0.60 | ) | | | (1.78 | ) | | | 4.53 | | | | 24.83 | | | | 7.08 | | | | 98.15 | | | | | | | | 13.63 | | | | 493.84 | |
Market Price Return | | | (18.65 | ) | | | (0.55 | ) | | | (1.65 | ) | | | 4.55 | | | | 24.90 | | | | 7.09 | | | | 98.38 | | | | | | | | 13.68 | | | | 497.82 | |
Fund Inception: November 20, 2008
Performance quoted above represents past performance. Past performance is not a guarantee of future results and current performance may be higher or lower than performance quoted. Investment returns and principal value will fluctuate, and shares of the Fund (“Fund Shares”), when redeemed or sold, may be worth more or less than their original cost. Fund performance reflects any applicable fee waivers and/or expense reimbursements. Had the adviser not waived fees and/or reimbursed expenses currently or in the past, returns would have been lower. See the current prospectus for more information. According to the Fund’s current prospectus, as supplemented to date, the Fund’s expense ratio of 0.35% is expressed as a unitary management fee to cover operating expenses and expenses incurred in connection with managing the portfolio. NAV and Market Price returns assume that dividends and capital gain distributions have been reinvested in the Fund at NAV and Market Price, respectively. The returns shown in the table above do not reflect the deduction of taxes that a shareholder would pay on Fund distributions or the redemption or sale of Fund Shares. See invesco.com/ETFs to find the most recent month-end performance numbers.
Performance results for the index stated above are based upon a hypothetical investment in their respective constituent securities. The returns of an index do not represent Fund returns. An investor cannot invest directly in an index. The index does not charge management fees or brokerage expenses, and no such fees or expenses were deducted from the hypothetical performance shown. In addition, the results actual investors might have achieved would have differed from those shown because of differences in the timing, amounts of their investments, and fees and expenses associated with an investment in the Fund.
Notes Regarding Index and Fund Performance History:
| - | Average Annualized and Cumulative Inception returns for the Fund and index are based on the inception date of the Fund. |
| | |
| PSMB | | Management’s Discussion of Fund Performance |
| | Invesco Balanced Multi-Asset Allocation ETF (PSMB) |
The Invesco Balanced Multi-Asset Allocation ETF (the “Fund”) is an actively managed exchange-traded fund (“ETF”) which seeks to provide current income and capital appreciation. The Fund is a “fund of funds,” meaning that it invests its assets primarily in other ETFs (“Underlying ETFs”), rather than in securities of individual companies. Under normal circumstances, most of those Underlying ETFs will be ETFs that are advised by the Fund’s adviser or one of its affiliates (the “Invesco ETFs”). However, at times the Fund also may invest a portion of its assets in Underlying ETFs that are advised by unaffiliated advisers. The Fund and the Invesco ETFs are part of the same group of investment companies. The Fund seeks to achieve its investment objective by allocating its assets using a balanced investment style that seeks to maximize the benefits of diversification, which focuses on investing portions of the Fund’s assets both in Underlying ETFs that invest primarily in fixed-income securities (“Fixed Income ETFs”) as well as in Underlying ETFs that invest primarily in equity securities (“Equity ETFs”).
Invesco Advisers, Inc., the Fund’s sub-adviser, uses the following investment process to construct the Fund’s portfolio: (1) a strategic allocation across broad asset classes (i.e., equities and fixed income securities) and particular investment factors within those classes (e.g., for fixed income securities, exposure to domestic, international, corporate, government, high-yield and investment grade bonds; for equity securities, exposure to domestic and international issuers); (2) selection of Underlying ETFs that best represent those broad asset classes and factor exposures, based on a comprehensive quantitative and qualitative criteria (such as management experience and structure, investment process, performance and risk metrics); (3) determination by the Fund’s sub-adviser of target weightings in each Underlying ETF in a manner that seeks to manage the amount of active risk contributed by each Underlying ETF; and (4) ongoing monitoring of the Fund’s performance and risk. The Fund typically holds a limited number of securities (generally 10-20).
For the fiscal year ended October 31, 2022, on a market price basis, the Fund returned (13.44)%. On a net asset value (“NAV”) basis, the Fund returned (13.54)%. During the same time period, the Custom Invesco Balanced Allocation ETF Index (the “Benchmark Index”) returned (18.04)%, while the S&P 500® Index returned (14.61)%.
The Fund’s performance, on a NAV basis, was higher than the return of the Benchmark Index during the period primarily due to the Fund’s higher relative exposure to U.S. equity securities. Exposure to small and mid-cap equity securities, along with exposure to non-U.S. developed equities, also contributed to the Fund’s relative performance. The Fund’s performance, on a NAV basis, was higher than the return of the S&P 500® Index during the period primarily due to the Fund’s lower relative exposure to U.S. equities.
For the fiscal year ended October 31, 2022, from an asset class perspective, there were no positive contributors to the Fund’s performance. Exposure to fixed income through the Underlying ETFs were the largest detractors to the Fund’s absolute return, followed by U.S. equity.
There were no positions that positively contributed to the Fund’s absolute return. Positions that detracted most significantly from the Fund’s absolute return included the Invesco 1-30 Laddered Treasury ETF (portfolio average weight of 9.75%) and the Invesco Taxable Municipal Bond ETF (portfolio average weight of 8.46%).
| | | | |
Market Segment Breakdown
(% of the Fund’s Net Assets)*
as of October 31, 2022 | |
| U.S. Equities | | | 48.66 | |
| Fixed Income | | | 37.33 | |
| International and Developed Equities | | | 8.78 | |
| Emerging Markets Equities | | | 5.20 | |
| Money Market Funds Plus Other Assets Less Liabilities | | | 0.03 | |
| * | Reflects exposure achieved through investments in underlying funds. |
| | | | |
|
Top Ten Fund Holdings*
(% of the Fund’s Net Assets)
as of October 31, 2022 | |
| Security | | | | |
| Invesco S&P 500® Pure Growth ETF | | | 13.46 | |
| Invesco 1-30 Laddered Treasury ETF | | | 11.86 | |
| Invesco RAFI™ Strategic US ETF | | | 11.77 | |
| Invesco Russell 1000 Dynamic Multifactor ETF | | | 8.60 | |
| Invesco Taxable Municipal Bond ETF | | | 5.30 | |
| Invesco Variable Rate Investment Grade ETF | | | 4.84 | |
| Invesco S&P 500® Low Volatility ETF | | | 4.60 | |
| Invesco RAFI™ Strategic Developed ex-US ETF | | | 4.45 | |
| Invesco S&P International Developed Low Volatility ETF | | | 4.33 | |
| Invesco Fundamental High Yield® Corporate Bond ETF | | | 3.95 | |
| Total | | | 73.16 | |
| * | Excluding money market fund holdings. |
Invesco Balanced Multi-Asset Allocation ETF (PSMB) (continued)
Growth of a $10,000 Investment Since Inception
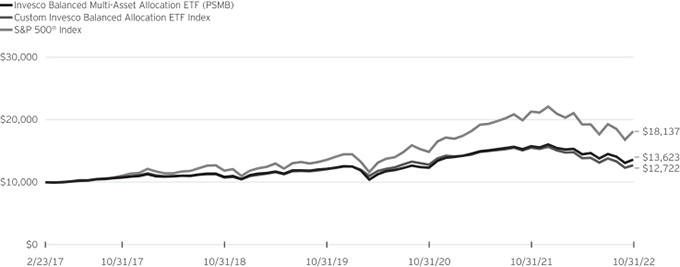
Fund Performance History as of October 31, 2022
| | | | | | | | | | | | | | | | | | | | | | | | | | | | | | | | |
| | | 1 Year | | | 3 Years
Average
Annualized | | | 3 Years
Cumulative | | | 5 Years
Average
Annualized | | | 5 Years
Cumulative | | | | | | Fund Inception | |
| Index | | | | | Average
Annualized | | | Cumulative | |
| Custom Invesco Balanced Allocation ETF Index | | | (18.04 | )% | | | 1.69 | % | | | 5.17 | % | | | 3.22 | % | | | 17.18 | % | | | | | | | 4.33 | % | | | 27.22 | % |
| S&P 500® Index | | | (14.61 | ) | | | 10.22 | | | | 33.88 | | | | 10.44 | | | | 64.31 | | | | | | | | 11.05 | | | | 81.37 | |
| Fund | | | | | | | | | | | | | | | | | | | | | | | | | | | | | | | | |
| NAV Return | | | (13.54 | ) | | | 3.95 | | | | 12.34 | | | | 4.80 | | | | 26.45 | | | | | | | | 5.59 | | | | 36.23 | |
| Market Price Return | | | (13.44 | ) | | | 3.90 | | | | 12.17 | | | | 4.78 | | | | 26.32 | | | | | | | | 5.56 | | | | 35.98 | |
Fund Inception: February 23, 2017
Performance quoted above represents past performance. Past performance is not a guarantee of future results and current performance may be higher or lower than performance quoted. Investment returns and principal value will fluctuate, and shares of the Fund (“Fund Shares”), when redeemed or sold, may be worth more or less than their original cost. Fund performance reflects any applicable fee waivers and/or expense reimbursements. Had the adviser not waived fees and/or reimbursed expenses currently or in the past, returns would have been lower. See the current prospectus for more information. According to the Fund’s current prospectus, the Fund’s expense ratio of 0.32% includes the unitary management fee of 0.05% and acquired fund fees and expenses of 0.27%. NAV and Market Price returns assume that dividends and capital gain distributions have been reinvested in the Fund at NAV and Market Price, respectively. The returns shown in the table above do not reflect the deduction of taxes that a shareholder would pay on Fund distributions or the redemption or sale of Fund Shares. See invesco.com/ETFs to find the most recent month-end performance numbers.
Performance results for the indexes stated above are based upon a hypothetical investment in their respective constituent securities. The returns of an index do not represent Fund returns. An investor cannot invest directly in an index. The indexes do not charge management fees or brokerage expenses, and no such fees or expenses were deducted from the hypothetical performance shown. In addition, the results actual investors might have achieved would have differed from those shown because of differences in the timing, amounts of their investments, and fees and expenses associated with an investment in the Fund.
Notes Regarding Indexes and Fund Performance History:
| - | Average Annualized and Cumulative Inception returns for the Fund and the indexes are based on the inception date of the Fund. |
| - | The Benchmark Index is a custom benchmark that consists of 60% MSCI ACWI Index (Net) and 40% Bloomberg U.S. Aggregate Bond Index. |
| | |
| PSMC | | Management’s Discussion of Fund Performance |
| | Invesco Conservative Multi-Asset Allocation ETF (PSMC) |
The Invesco Conservative Multi-Asset Allocation ETF (the “Fund”) is an actively managed exchange-traded fund (“ETF”) which seeks total return consistent with a lower level of risk relative to the broad stock market. The Fund is a “fund of funds,” meaning that it invests its assets primarily in other ETFs (“Underlying ETFs”), rather than in securities of individual companies. Under normal circumstances, most of those Underlying ETFs will be ETFs that are advised by the Fund’s adviser or one of its affiliates (the “Invesco ETFs”). However, at times the Fund also may invest a portion of its assets in Underlying ETFs that are advised by unaffiliated advisers. The Fund and the Invesco ETFs are part of the same group of investment companies. The Fund seeks to achieve its investment objective by allocating its assets using a conservative investment style that seeks to maximize the benefits of diversification, which focuses on investing a greater portion of the Fund’s assets in Underlying ETFs that invest primarily in fixed- income securities (“Fixed Income ETFs”), but also provides some exposure to Underlying ETFs that invest primarily in equity securities (“Equity ETFs”).
Invesco Advisers, Inc., the Fund’s sub-adviser, uses the following investment process to construct the Fund’s portfolio: (1) a strategic allocation across broad asset classes (i.e., equities and fixed income securities) and particular investment factors within those classes (e.g., for fixed income securities, exposure to domestic, international, corporate, government, high-yield and investment grade bonds; for equity securities, exposure to domestic and international issuers); (2) selection of Underlying ETFs that best represent those broad asset classes and factor exposures, based on comprehensive quantitative and qualitative criteria (such as management experience and structure, investment process, performance and risk metrics); (3) determination by the Fund’s sub-adviser of target weightings in each Underlying ETF in a manner that seeks to manage the amount of active risk contributed by each Underlying ETF; and (4) ongoing monitoring of the Fund’s performance and risk. The Fund typically holds a limited number of securities (generally 10-20).
For the fiscal year ended October 31, 2022, on a market price basis, the Fund returned (13.29)%. On a net asset value (“NAV”) basis, the Fund returned (13.22)%. During the same time period, the Custom Invesco Conservative Allocation ETF Index (the “Benchmark Index”) returned (16.40)%, while the S&P 500® Index returned (14.61)%.
The Fund’s performance, on a NAV basis, was higher than the return of the Benchmark Index during the period primarily due to the Fund’s security selection in fixed income securities. Exposure to U.S. equities, along with small and mid-cap equities, also contributed to the Fund’s relative performance. The Fund’s performance, on a NAV basis, was higher than the return of the S&P 500® Index during the period primarily due to the Fund’s lower relative exposure to U.S. equities. For the fiscal year ended
October 31, 2022, from an asset class perspective, there were no positive contributors to the Fund’s performance. Exposure to fixed income through Underlying ETFs was the largest detractor to the Fund’s absolute return, followed by exposure to U.S. equities.
There were no positions that positively contributed to the Fund’s absolute return. Invesco Taxable Municipal Bond ETF (portfolio average weight of 17.06%) along with the Invesco 1-30 Laddered Treasury ETF (portfolio average weight of 11.47%) and the Invesco Fundamental High Yield® Corporate Bond ETF (portfolio average weight of 12.57%) detracted from the Fund’s absolute return.
| | | | |
Market Segment Breakdown
(% of the Fund’s Net Assets)*
as of October 31, 2022 | |
| Fixed Income | | | 76.01 | |
| U.S. Equities | | | 19.28 | |
| International and Developed Equities | | | 3.63 | |
| Emerging Markets Equities | | | 1.05 | |
| Money Market Funds Plus Other Assets Less Liabilities | | | 0.03 | |
| * | Reflects exposure achieved through investments in underlying funds. |
| | | | |
|
Top Ten Fund Holdings*
(% of the Fund’s Net Assets)
as of October 31, 2022 | |
| Security | | | | |
| Invesco Taxable Municipal Bond ETF | | | 16.40 | |
| Invesco 1-30 Laddered Treasury ETF | | | 13.51 | |
| Invesco Fundamental High Yield® Corporate Bond ETF | | | 13.00 | |
| Invesco Variable Rate Investment Grade ETF | | | 11.77 | |
| Invesco PureBetaSM 0-5 Yr US TIPS ETF | | | 6.66 | |
| Invesco Senior Loan ETF | | | 5.20 | |
| Invesco S&P 500® Pure Growth ETF | | | 4.98 | |
| Invesco Investment Grade Defensive ETF | | | 3.86 | |
| Invesco Emerging Markets Sovereign Debt ETF | | | 3.50 | |
| Invesco Preferred ETF | | | 3.49 | |
| Total | | | 82.37 | |
| * | Excluding money market fund holdings. |
Invesco Conservative Multi-Asset Allocation ETF (PSMC) (continued)
Growth of a $10,000 Investment Since Inception
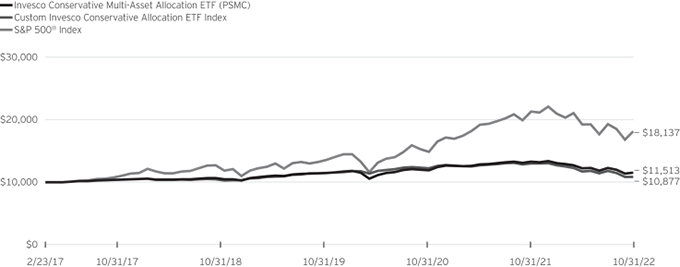
Fund Performance History as of October 31, 2022
| | | | | | | | | | | | | | | | | | | | | | | | | | | | | | | | |
| | | 1 Year | | | 3 Years
Average
Annualized | | | 3 Years
Cumulative | | | 5 Years
Average
Annualized | | | 5 Years
Cumulative | | | | | | Fund Inception | |
| Index | | | | | Average
Annualized | | | Cumulative | |
| Custom Invesco Conservative Allocation ETF Index | | | (16.40 | )% | | | (1.86 | )% | | | (5.48 | )% | | | 0.80 | % | | | 4.09 | % | | | | | | | 1.49 | % | | | 8.77 | % |
| S&P 500® Index | | | (14.61 | ) | | | 10.22 | | | | 33.88 | | | | 10.44 | | | | 64.31 | | | | | | | | 11.05 | | | | 81.37 | |
| Fund | | | | | | | | | | | | | | | | | | | | | | | | | | | | | | | | |
| NAV Return | | | (13.22 | ) | | | 0.06 | | | | 0.18 | | | | 2.00 | | | | 10.42 | | | | | | | | 2.51 | | | | 15.13 | |
| Market Price Return | | | (13.29 | ) | | | 0.01 | | | | 0.02 | | | | 1.98 | | | | 10.32 | | | | | | | | 2.48 | | | | 14.92 | |
Fund Inception: February 23, 2017
Performance quoted above represents past performance. Past performance is not a guarantee of future results and current performance may be higher or lower than performance quoted. Investment returns and principal value will fluctuate, and shares of the Fund (“Fund Shares”), when redeemed or sold, may be worth more or less than their original cost. Fund performance reflects any applicable fee waivers and/or expense reimbursements. Had the adviser not waived fees and/or reimbursed expenses currently or in the past, returns would have been lower. See the current prospectus for more information. According to the Fund’s current prospectus, the Fund’s expense ratio of 0.37% includes the unitary management fee of 0.05% and acquired fund fees and expenses of 0.32%. NAV and Market Price returns assume that dividends and capital gain distributions have been reinvested in the Fund at NAV and Market Price, respectively. The returns shown in the table above do not reflect the deduction of taxes that a shareholder would pay on Fund distributions or the redemption or sale of Fund Shares. See invesco.com/ETFs to find the most recent month-end performance numbers.
Performance results for the indexes stated above are based upon a hypothetical investment in their respective constituent securities. The returns of an index do not represent Fund returns. An investor cannot invest directly in an index. The indexes do not charge management fees or brokerage expenses, and no such fees or expenses were deducted from the hypothetical performance shown. In addition, the results actual investors might have achieved would have differed from those shown because of differences in the timing, amounts of their investments, and fees and expenses associated with an investment in the Fund.
Notes Regarding Indexes and Fund Performance History:
| - | Average Annualized and Cumulative Inception returns for the Fund and the indexes are based on the inception date of the Fund. |
| - | The Benchmark Index is a custom benchmark that consists of 20% MSCI ACWI Index (Net) and 80% Bloomberg U.S. Aggregate Bond Index. |
| | |
| PSMG | | Management’s Discussion of Fund Performance |
| | Invesco Growth Multi-Asset Allocation ETF (PSMG) |
The Invesco Growth Multi-Asset Allocation ETF (the “Fund”) is an actively managed exchange-traded fund (“ETF”) which seeks to provide long-term capital appreciation. The Fund is a “fund of funds,” meaning that it invests its assets primarily in other ETFs (“Underlying ETFs”), rather than in securities of individual companies. Under normal circumstances, most of those Underlying ETFs will be ETFs that are advised by the Fund’s adviser or one of its affiliates (the “Invesco ETFs”). However, at times the Fund also may invest a portion of its assets in Underlying ETFs that are advised by unaffiliated advisers. The Fund and the Invesco ETFs are part of the same group of investment companies. The Fund seeks to achieve its investment objective by allocating its assets using a growth investment style that seeks to maximize the benefits of diversification, which focuses on investing a greater portion of Fund assets in Underlying ETFs that invest primarily in equity securities (“Equity ETFs”), but also provides some exposure to Underlying ETFs that invest primarily in fixed-income securities (“Fixed Income ETFs”).
Invesco Advisers, Inc., the Fund’s sub-adviser, uses the following investment process to construct the Fund’s portfolio: (1) a strategic allocation across broad asset classes (i.e., equities and fixed income securities) and particular investment factors within those classes (e.g., for fixed income securities, exposure to domestic, international, corporate, government, high-yield and investment grade bonds; for equity securities, exposure to domestic and international stocks); (2) selection of Underlying ETFs that best represent those broad asset classes and factor exposures, based on comprehensive quantitative and qualitative criteria (such as management experience and structure, investment process, performance and risk metrics); (3) determination by the Fund’s sub-adviser of target weightings in each Underlying ETF in a manner that seeks to manage the amount of active risk contributed by each Underlying ETF; and (4) ongoing monitoring of the Fund’s performance and risk. The Fund typically holds a limited number of securities (generally 10-20).
For the fiscal year ended October 31, 2022, on a market price basis, the Fund returned (12.78)%. On a net asset value (“NAV”) basis, the Fund returned (12.83)%. During the same time period, the Custom Invesco Growth Allocation ETF Index (the “Benchmark Index”) returned (18.97)%, while the S&P 500® Index returned (14.61)%.
The Fund’s performance, on a NAV basis, was higher than the return of the Benchmark Index during the period primarily due to the Fund’s higher relative exposure to U.S. equity securities. Exposure to small and mid-cap equity securities, along with exposure to non-U.S. developed equities, also contributed to the Fund’s relative performance. The Fund’s performance, on a NAV basis, was higher than the return of the S&P 500® Index during the period primarily due to the Fund’s lower relative exposure to U.S. equities.
For the fiscal year ended October 31, 2022, there were no positive contributors to the Fund’s absolute returns. Exposure to U.S. equities through Underlying ETFs was the largest detractor to the Fund’s absolute return, followed by non-U.S. developed equity.
There were no positions that positively contributed to the Fund’s absolute return. Invesco S&P 500® Pure Growth ETF (portfolio average weight of 13.49%), Invesco 1-30 Laddered Treasury ETF (portfolio average weight of 7.63%) and Invesco RAFITM Strategic Emerging Markets ETF (portfolio average weight of 3.66%) were the largest detractors from the Fund’s absolute return.
| | | | |
Market Segment Breakdown
(% of the Fund’s Net Assets)*
as of October 31, 2022 | |
| U.S. Equities | | | 61.53 | |
| Fixed Income | | | 19.65 | |
| International and Developed Equities | | | 11.73 | |
| Emerging Markets Equities | | | 7.09 | |
| Money Market Funds Plus Other Assets Less Liabilities | | | 0.00 | |
| * | Reflects exposure achieved through investments in underlying funds. |
| | | | |
|
Top Ten Fund Holdings*
(% of the Fund’s Net Assets)
as of October 31, 2022 | |
| Security | | | | |
| Invesco S&P 500® Pure Growth ETF | | | 15.44 | |
| Invesco RAFI™ Strategic US ETF | | | 14.95 | |
| Invesco Russell 1000 Dynamic Multifactor ETF | | | 11.45 | |
| Invesco S&P 500® Low Volatility ETF | | | 8.92 | |
| Invesco 1-30 Laddered Treasury ETF | | | 8.90 | |
| Invesco RAFI™ Strategic Developed ex-US ETF | | | 5.92 | |
| Invesco S&P International Developed Low Volatility ETF | | | 5.81 | |
| Invesco RAFI™ Strategic US Small Company ETF | | | 4.44 | |
| Invesco S&P Emerging Markets Low Volatility ETF | | | 3.80 | |
| Invesco S&P MidCap Low Volatility ETF | | | 3.66 | |
| Total | | | 83.29 | |
| * | Excluding money market fund holdings. |
Invesco Growth Multi-Asset Allocation ETF (PSMG) (continued)
Growth of a $10,000 Investment Since Inception
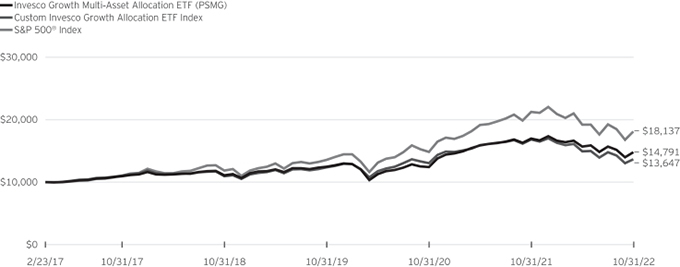
Fund Performance History as of October 31, 2022
| | | | | | | | | | | | | | | | | | | | | | | | | | | | | | | | |
| | | 1 Year | | | 3 Years
Average
Annualized | | | 3 Years
Cumulative | | | 5 Years
Average
Annualized | | | 5 Years
Cumulative | | | | | | Fund Inception | |
| Index | | | | | Average
Annualized | | | Cumulative | |
| Custom Invesco Growth Allocation ETF Index | | | (18.97 | )% | | | 3.32 | % | | | 10.30 | % | | | 4.28 | % | | | 23.32 | % | | | | | | | 5.63 | % | | | 36.47 | % |
| S&P 500® Index | | | (14.61 | ) | | | 10.22 | | | | 33.88 | | | | 10.44 | | | | 64.31 | | | | | | | | 11.05 | | | | 81.37 | |
| Fund | | | | | | | | | | | | | | | | | | | | | | | | | | | | | | | | |
| NAV Return | | | (12.83 | ) | | | 5.85 | | | | 18.61 | | | | 6.19 | | | | 35.03 | | | | | | | | 7.13 | | | | 47.91 | |
| Market Price Return | | | (12.78 | ) | | | 5.83 | | | | 18.52 | | | | 6.15 | | | | 34.80 | | | | | | | | 7.13 | | | | 47.86 | |
Fund Inception: February 23, 2017
Performance quoted above represents past performance. Past performance is not a guarantee of future results and current performance may be higher or lower than performance quoted. Investment returns and principal value will fluctuate, and shares of the Fund (“Fund Shares”), when redeemed or sold, may be worth more or less than their original cost. Fund performance reflects any applicable fee waivers and/or expense reimbursements. Had the adviser not waived fees and/or reimbursed expenses currently or in the past, returns would have been lower. See the current prospectus for more information. According to the Fund’s current prospectus, the Fund’s expense ratio of 0.31% includes the unitary management fee of 0.05% and acquired fund fees and expenses of 0.26%. NAV and Market Price returns assume that dividends and capital gain distributions have been reinvested in the Fund at NAV and Market Price, respectively. The returns shown in the table above do not reflect the deduction of taxes that a shareholder would pay on Fund distributions or the redemption or sale of Fund Shares. See invesco.com/ETFs to find the most recent month-end performance numbers.
Performance results for the indexes stated above are based upon a hypothetical investment in their respective constituent securities. The returns of an index do not represent Fund returns. An investor cannot invest directly in an index. The indexes do not charge management fees or brokerage expenses, and no such fees or expenses were deducted from the hypothetical performance shown. In addition, the results actual investors might have achieved would have differed from those shown because of differences in the timing, amounts of their investments, and fees and expenses associated with an investment in the Fund.
Notes Regarding Indexes and Fund Performance History:
| - | Average Annualized and Cumulative Inception returns for the Fund and the indexes are based on the inception date of the Fund. |
| - | The Benchmark Index is a custom benchmark that consists of 80% MSCI ACWI Index (Net) and 20% Bloomberg U.S. Aggregate Bond Index. |
| | |
| IHYF | | Management’s Discussion of Fund Performance |
| | Invesco High Yield Bond Factor ETF (IHYF) |
The Invesco High Yield Bond Factor ETF (the “Fund”) is an actively managed exchange-traded fund (“ETF”) which seeks to provide total return. The Fund seeks to achieve its investment objective by investing, under normal market conditions, at least 80% of its net assets (plus the amount of any borrowings for investment purposes) in high-yield, below-investment grade, fixed-income securities (also referred to as “junk” bonds), and in derivatives and other instruments that have economic characteristics similar to such securities.
Invesco Advisers, Inc., the Fund’s sub-adviser, selects securities for the Fund’s portfolio by utilizing a factor-based strategy that involves systematically targeting securities exhibiting quantifiable issuer characteristics (or “factors”) that the sub-adviser believes will have higher returns than other fixed income securities with comparable characteristics over market cycles. In practice, this means the Fund may have higher allocations to: value bonds (bonds that have high spreads relative to other securities of similar credit quality and/or sector); low volatility bonds (bonds that have lower levels of price volatility); and high carry bonds (bonds with higher absolute yield or spread). The portfolio managers expect to include additional factors, modify the factors used to build the Fund’s portfolio, or, alternatively, actively manage the Fund’s portfolio to minimize certain risks, as it deems appropriate.
For the fiscal year ended October 31, 2022, on a market price basis, the Fund returned (12.59)%. On a net asset value (“NAV”) basis, the Fund returned (12.61)%. During the same time period, the Bloomberg U.S. Corporate High Yield 2% Issuer Cap Index (the “Benchmark Index”) returned (11.76)%.
During the same time period, the Fund underperformed the Benchmark Index, driven by the Fund’s large allocation to the industrials sector. The Fund’s performance, on a NAV basis, was less than the return of the Benchmark Index during the period primarily because of the Fund’s security selection in and allocation to the industrials sector and the consumer staples sector. Exposure to the communication services sector also detracted from the Fund’s relative performance.
For the fiscal year ended October 31, 2022, from an industry perspective, exposure in energy equipment & services was the largest contributor to the Fund’s absolute return, followed by independent power and renewable electricity producers. In contrast, exposure to media and pharmaceuticals detracted from the Fund’s performance.
Positions that contributed most significantly to the Fund’s absolute return included the PBF Holding Co. LLC/PBF Finance Corp., 6.00% coupon, due 02/15/2028 (portfolio average weight of 0.10%) and Viasat, Inc., 5.63% coupon, due 09/15/2025 (portfolio average weight of 0.40%). Positions that detracted most significantly from the Fund’s absolute return included
Embarq Corp., 8.00% coupon; due 06/01/2036 (portfolio average weight of 0.30%) and EnfraGen Energia Sur S.A./EnfraGen Spain S.A./Prime Energia S.p.A, 5.38% coupon; due 12/30/2030 (portfolio average weight of 0.40%).
| | | | |
Security Type Breakdown
(% of the Fund’s Net Assets)
as of October 31, 2022 | |
| U.S. Dollar Denominated Bonds & Notes | | | 96.58 | |
| U.S. Treasury Securities | | | 0.36 | |
| Money Market Funds Plus Other Assets Less Liabilities | | | 3.06 | |
|
Top Ten Fund Holdings*
(% of the Fund’s Net Assets)
as of October 31, 2022 | |
| Security | | | | |
| DIRECTV Financing LLC/DIRECTV Financing Co-Obligor, Inc., 5.88%, 08/15/2027 | | | 0.89 | |
| TransDigm, Inc., 6.25%, 03/15/2026 | | | 0.79 | |
| GFL Environmental, Inc., 4.25%, 06/01/2025 | | | 0.75 | |
| Domtar Corp., 6.75%, 10/01/2028 | | | 0.71 | |
| Sprint Corp., 7.88%, 09/15/2023 | | | 0.70 | |
| Sprint Corp., 7.13%, 06/15/2024 | | | 0.70 | |
| CVR Energy, Inc., 5.25%, 02/15/2025 | | | 0.69 | |
| Community Health Systems, Inc., 8.00%, 03/15/2026 | | | 0.69 | |
| Staples, Inc., 7.50%, 04/15/2026 | | | 0.67 | |
| NGL Energy Operating LLC/NGL Energy Finance Corp., 7.50%, 02/01/2026 | | | 0.63 | |
| Total | | | 7.22 | |
| * | Excluding money market fund holdings. |
Invesco High Yield Bond Factor ETF (IHYF) (continued)
Growth of a $10,000 Investment Since Inception
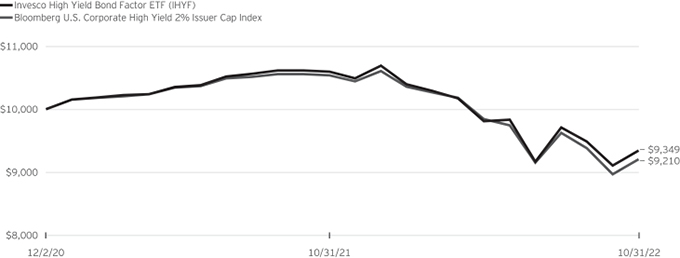
Fund Performance History as of October 31, 2022
| | | | | | | | | | | | | | | | |
| | | 1 Year | | | | | | Fund Inception | |
| Index | | | | | Average
Annualized | | | Cumulative | |
| Bloomberg U.S. Corporate High Yield 2% Issuer Cap Index | | | (11.76 | )% | | | | | | | (3.46 | )% | | | (6.51 | )% |
| Fund | | | | | | | | | | | | | | | | |
| NAV Return | | | (12.61 | ) | | | | | | | (4.21 | ) | | | (7.90 | ) |
| Market Price Return | | | (12.59 | ) | | | | | | | (4.24 | ) | | | (7.95 | ) |
Fund Inception: December 2, 2020
Performance quoted above represents past performance. Past performance is not a guarantee of future results and current performance may be higher or lower than performance quoted.
Investment returns and principal value will fluctuate, and shares of the Fund (“Fund Shares”), when redeemed or sold, may be worth more or less than their original cost. Fund performance reflects any applicable fee waivers and/or expense reimbursements. Had the adviser not waived fees and/or reimbursed expenses currently or in the past, returns would have been lower. See the current prospectus for more information. According to the Fund’s current prospectus, the Fund’s expense ratio of 0.40% includes the unitary management fee of 0.39% and other expenses of 0.01%. NAV and Market Price returns assume that dividends and capital gain distributions have been reinvested in the Fund at NAV and Market Price, respectively. The returns shown in the table above do not reflect the deduction of taxes that a shareholder would pay on Fund distributions or the redemption or sale of Fund Shares. See invesco.com/ETFs to find the most recent month-end performance numbers.
Performance results for the index stated above are based upon a hypothetical investment in their respective constituent securities. The returns of an index do not represent Fund returns. An investor cannot invest directly in an index. The index does not charge management fees or brokerage expenses, and no such fees or expenses were deducted from the hypothetical performance shown. In addition, the results actual investors might have achieved would have differed from those shown because of differences in the timing, amounts of their investments, and fees and expenses associated with an investment in the Fund.
Notes Regarding Indexes and Fund Performance History:
| - | Average Annualized and Cumulative Inception returns for the Fund and index are based on the inception date of the Fund. |
| | |
| PSMM | | Management’s Discussion of Fund Performance |
| | Invesco Moderately Conservative Multi-Asset Allocation ETF (PSMM) |
The Invesco Moderately Conservative Multi-Asset Allocation ETF (the “Fund”) is an actively managed exchange-traded fund (“ETF”) which seeks to provide current income and some capital appreciation. The Fund is a “fund of funds,” meaning that it invests its assets primarily in other ETFs (“Underlying ETFs”), rather than in securities of individual companies. Under normal circumstances, most of those Underlying ETFs will be ETFs that are advised by the Fund’s adviser or one of its affiliates (the “Invesco ETFs”). However, at times the Fund also may invest a portion of its assets in Underlying ETFs that are advised by unaffiliated advisers. The Fund and the Invesco ETFs are part of the same group of investment companies. The Fund seeks to achieve its investment objective by allocating its assets using a moderately conservative investment style that seeks to maximize the benefits of diversification, which focuses on investing portions of the Fund’s assets in Underlying ETFs that invest primarily in equity securities (“Equity ETFs”), as well as in Underlying ETFs that invest primarily in fixed-income securities (“Fixed Income ETFs”).
Invesco Advisers, Inc., the Fund’s sub-adviser uses the following investment process to construct the Fund’s portfolio: (1) a strategic allocation across broad asset classes (i.e., equities and fixed income securities) and particular investment factors within those classes (e.g., for fixed income securities, exposure to domestic, international, corporate, government, high-yield and investment grade bonds; for equity securities, exposure to domestic and international stocks); (2) selection of Underlying ETFs that best represent those broad asset classes and factor exposures, based on comprehensive quantitative and qualitative criteria (such as management experience and structure, investment process, performance and risk metrics); (3) determination by the Fund’s sub-adviser of target weightings in each Underlying ETF in a manner that seeks to manage the amount of active risk contributed by each Underlying ETF; and (4) ongoing monitoring of the Fund’s performance and risk. The Fund typically holds a limited number of securities (generally 10-20).
For the fiscal year ended October 31, 2022, on a market price basis, the Fund returned (13.68)%. On a net asset value (“NAV”) basis, the Fund returned (13.56)%. During the same time period, the Custom Invesco Moderately Conservative Allocation ETF Index (the “Benchmark Index”) returned (17.19)%, while the S&P 500® Index returned (14.61)%.
The Fund’s performance, on a NAV basis, was higher than the return of the Benchmark Index during the period primarily due to the Fund’s higher relative exposure to U.S. equities and fixed income. There were no detractors from the Fund’s relative performance. The Fund’s performance, on a NAV basis, was higher than the return of the S&P 500® Index during the period primarily due to the Fund’s lower relative exposure to U.S. equities.
For the fiscal year ended October 31, 2022, from an asset class perspective, there were no positive contributors to the Fund’s performance. Exposure to fixed income securities through Underlying ETFs was the largest detractor to the Fund’s absolute return, followed by exposure to U.S. equities.
There were no positions that positively contributed to the Fund’s absolute return. Positions that detracted most significantly from the Fund’s absolute return included Invesco S&P 500® Pure Growth ETF (portfolio average weight of 13.49%) and Invesco 1-30 Laddered Treasury ETF (portfolio average weight of 7.63%).
| | | | |
Market Segment Breakdown
(% of the Fund’s Net Assets)*
as of October 31, 2022 | |
| Fixed Income | | | 56.42 | |
| U.S. Equities | | | 34.08 | |
| International and Developed Equities | | | 5.89 | |
| Emerging Markets Equities | | | 3.59 | |
| Money Market Funds Plus Other Assets Less Liabilities | | | 0.02 | |
| * | Reflects exposure achieved through investments in underlying funds. |
| | | | |
|
Top Ten Fund Holdings*
(% of the Fund’s Net Assets)
as of October 31, 2022 | |
| Security | | | | |
| Invesco Taxable Municipal Bond ETF | | | 12.86 | |
| Invesco 1-30 Laddered Treasury ETF | | | 12.77 | |
| Invesco S&P 500® Pure Growth ETF | | | 9.09 | |
| Invesco RAFI™ Strategic US ETF | | | 8.33 | |
| Invesco Fundamental High Yield® Corporate Bond ETF | | | 7.95 | |
| Invesco Variable Rate Investment Grade ETF | | | 6.84 | |
| Invesco PureBetaSM 0-5 Yr US TIPS ETF | | | 5.68 | |
| Invesco Russell 1000 Dynamic Multifactor ETF | | | 5.55 | |
| Invesco Senior Loan ETF | | | 3.85 | |
| Invesco S&P 500® Low Volatility ETF | | | 3.05 | |
| Total | | | 75.97 | |
| * | Excluding money market fund holdings. |
Invesco Moderately Conservative Multi-Asset Allocation ETF (PSMM) (continued)
Growth of a $10,000 Investment Since Inception
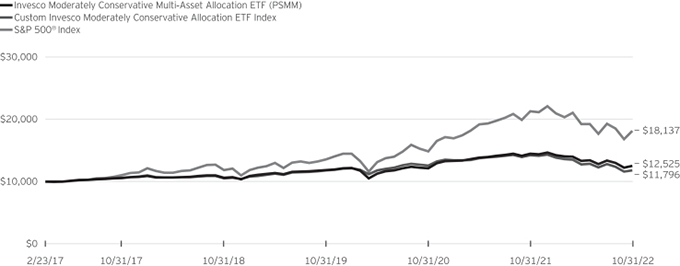
Fund Performance History as of October 31, 2022
| | | | | | | | | | | | | | | | | | | | | | | | | | | | | | | | |
| | | 1 Year | | | 3 Years
Average
Annualized | | | 3 Years
Cumulative | | | 5 Years
Average
Annualized | | | 5 Years
Cumulative | | | | | | Fund Inception | |
| Index | | | | | Average
Annualized | | | Cumulative | |
| Custom Invesco Moderately Conservative Allocation ETF Index | | | (17.19 | )% | | | (0.04 | )% | | | (0.11 | )% | | | 2.06 | % | | | 10.74 | % | | | | | | | 2.95 | % | | | 17.96 | % |
| S&P 500® Index | | | (14.61 | ) | | | 10.22 | | | | 33.88 | | | | 10.44 | | | | 64.31 | | | | | | | | 11.05 | | | | 81.37 | |
| Fund | | | | | | | | | | | | | | | | | | | | | | | | | | | | | | | | |
| NAV Return | | | (13.56 | ) | | | 1.89 | | | | 5.78 | | | | 3.39 | | | | 18.13 | | | | | | | | 4.04 | | | | 25.25 | |
| Market Price Return | | | (13.68 | ) | | | 1.82 | | | | 5.55 | | | | 3.35 | | | | 17.93 | | | | | | | | 4.01 | | | | 25.03 | |
Fund Inception: February 23, 2017
Performance quoted above represents past performance. Past performance is not a guarantee of future results and current performance may be higher or lower than performance quoted. Investment returns and principal value will fluctuate, and shares of the Fund (“Fund Shares”), when redeemed or sold, may be worth more or less than their original cost. Fund performance reflects any applicable fee waivers and/or expense reimbursements. Had the adviser not waived fees and/or reimbursed expenses currently or in the past, returns would have been lower. See the current prospectus for more information. According to the Fund’s current prospectus, the Fund’s expense ratio of 0.35% includes the unitary management fee of 0.05% and acquired fund fees and expenses of 0.30%. NAV and Market Price returns assume that dividends and capital gain distributions have been reinvested in the Fund at NAV and Market Price, respectively. The returns shown in the table above do not reflect the deduction of taxes that a shareholder would pay on Fund distributions or the redemption or sale of Fund Shares. See invesco.com/ETFs to find the most recent month-end performance numbers.
Performance results for the indexes stated above are based upon a hypothetical investment in their respective constituent securities. The returns of an index do not represent Fund returns. An investor cannot invest directly in an index. The indexes do not charge management fees or brokerage expenses, and no such fees or expenses were deducted from the hypothetical performance shown. In addition, the results actual investors might have achieved would have differed from those shown because of differences in the timing, amounts of their investments, and fees and expenses associated with an investment in the Fund.
Notes Regarding Indexes and Fund Performance History:
| - | Average Annualized and Cumulative Inception returns for the Fund and the indexes are based on the inception date of the Fund. |
| - | The Benchmark Index is a custom benchmark that consists of 40% MSCI ACWI Index (Net) and 60% Bloomberg U.S. Aggregate Bond Index. |
| | |
| PHDG | | Management’s Discussion of Fund Performance |
| | Invesco S&P 500® Downside Hedged ETF (PHDG) |
The Invesco S&P 500® Downside Hedged ETF (the “Fund”) is an actively managed exchange-traded fund (“ETF”) that seeks to achieve positive total returns in rising or falling markets that are not directly correlated to broad equity or fixed income market returns. The Fund seeks to achieve its investment objective by allocating its assets generally among the components of the S&P 500® Dynamic VEQTOR Index (the “Benchmark Index”). The Benchmark Index is composed of up to three types of components: (i) an equity component, represented by the S&P 500® Index; (ii) a volatility hedge component, represented by the S&P 500® VIX Short-Term Futures Index (“VIX Futures Index”); and (iii) cash. The Benchmark is designed to measure the performance of the broad equity markets with an implied volatility hedge. “Implied volatility” is a measure of the expected volatility of the S&P 500® Index that is reflected in the value of the Chicago Board Options Exchange (“CBOE”) Volatility Index (“VIX Index”). Known as the “fear gauge” of the broader U.S. equities market, the VIX Index measures market volatility in large capitalization U.S. stocks and is calculated based on the prices of certain put and call options on the S&P 500® Index.
The VIX Futures Index is designed to measure the returns from long positions in futures contracts on the VIX Index. The Benchmark Index’s allocation to the VIX Futures Index is designed to serve as a volatility hedge, as volatility historically tends to correlate negatively to the performance of the U.S. equity markets (i.e., rapid declines in the performance of U.S. equity markets generally are associated with high volatility in such markets). Accordingly, pursuant to its methodology, the Benchmark Index allocates a greater portion of its weight to its equity component (the S&P 500® Index) during periods of low volatility, and a greater portion of its weight to its volatility hedge component (the VIX Futures Index) during periods of increased volatility.
Under normal circumstances, the Fund will invest its portfolio in a combination of assets that are similar, but not necessarily identical, to that of the Benchmark Index. The Fund’s portfolio is composed of: (i) an equity sleeve, consisting of the component securities of the S&P 500® Index, (ii) a volatility hedge sleeve, consisting of VIX Index-Related Instruments (defined below), which include futures contracts on the VIX Index, (iii) futures contracts that track the S&P 500® Index (“S&P 500 Futures”); and (iv) various liquid investments, including short-term high quality U.S. Treasury Securities, money market instruments, cash and cash equivalents. With respect to its equity sleeve, the Fund utilizes a “passive” investment strategy that seeks to track the performance of the S&P 500® Index as closely as possible. To do so, the Fund employs a “full replication” methodology; “full replication” means that the Fund generally invests the portion of its portfolio allocated to its equity sleeve in all of the component securities of the S&P 500® Index in proportion to their weightings in the S&P 500® Index. Although the Fund employs a passive strategy with respect to its equity sleeve, Invesco Capital Management LLC (the “Adviser”), the Fund’s adviser, will actively
manage the Fund’s investments in VIX Index-Related Instruments, S&P 500 Futures, short-term instruments and cash, as well as the Fund’s allocation of its assets among the equity and volatility hedge sleeves. Such allocations may not correspond to the Benchmark Index’s allocations. Instead, the Adviser will seek to obtain returns for the Fund that exceed the Benchmark Index by providing the Fund with equity or volatility hedge sleeve allocations that are higher or lower than those of the Benchmark Index at any time given the market conditions at that time.
In addition to its investments in futures contracts on the VIX Index, the Fund may invest in U.S.-listed exchange-traded funds (“ETFs”) and exchange-traded notes (“ETNs”) that provide exposure to the VIX Index (such ETFs and ETNs, along with futures contracts on the VIX Index, are collectively the “VIX Index-Related Instruments”). The Fund may invest in the short-term instruments and cash to provide liquidity or to protect the Fund during periods of heightened volatility when the Adviser believes that it is in the best interest of the Fund to do so.
For the fiscal year ended October 31, 2022, on a market price basis, the Fund returned (3.51)%. On a net asset value (“NAV”) basis, the Fund returned (3.78)%. During the same time period, the Benchmark Index returned (3.33)%. The Fund’s underperformance on a NAV basis, relative to the Benchmark Index was primarily due to fees and transaction costs incurred by the Fund during the fiscal year.
During this same time period, the S&P 500® Index returned (14.61)% and the U.S. 3-Month Treasury Bill Index (the “T-Bill 3-Month Index”) returned 1.30% (these indexes, collectively with the Benchmark Index, are referred to as the “Indexes”). The Indexes were selected for their recognition in the marketplace. The S&P 500® Index was selected because its performance comparison is a useful measure for investors as a broad representation of the equity market. The T-Bill 3-Month Index was selected because its performance comparison is a useful measure for investors as a broad representation of the short-term U.S. fixed income market.
The Fund’s performance, on a NAV basis, differed from the return of the S&P 500® Index during the period primarily because of the Fund’s consistent allocation to VIX futures, which generally have an inverse correlation to the S&P 500® Index. The Fund’s performance, on a NAV basis, differed from the return of the U.S. 3-Month Treasury Bill Index during the period primarily because of the Fund’s consistent allocation to VIX Futures.
For the fiscal year ended October 31, 2022, the energy sector contributed most significantly to the Fund’s return, followed by the health care sector. The Fund’s VIX futures allocations and exposure to the communication services sector were the largest detractors from the Fund’s return.
Invesco S&P 500® Downside Hedged ETF (PHDG) (continued)
Positions that contributed most significantly to the Fund’s return included the CBOE VIX (CBF) Oct 22, a VIX futures contract (portfolio average weight of 1.61%), and the E-Mini S&P 500 (CME) Sep 22 futures contract (portfolio average weight of 3.46%). The positions that detracted most significantly from the Fund’s return were the CBOE VIX (CBF) Apr 22, a VIX futures contract (portfolio average weight of 1.48%), and CBOE VIX (CBF) Jun 22, a VIX futures contract (portfolio average weight of 1.13%).
| | | | |
Sector Breakdown
(% of the Fund’s Net Assets)
as of October 31, 2022 | |
| Information Technology | | | 17.97 | |
| Health Care | | | 10.47 | |
| Financials | | | 7.83 | |
| Consumer Discretionary | | | 7.43 | |
| Industrials | | | 5.65 | |
| Communication Services | | | 5.03 | |
| Consumer Staples | | | 4.74 | |
| Energy | | | 3.67 | |
| Sector Types Each Less Than 3% | | | 5.56 | |
| Money Market Funds Plus Other Assets Less Liabilities | | | 31.65 | |
| | | | |
Top Ten Fund Holdings*
(% of the Fund’s Net Assets)
as of October 31, 2022 | |
| Security | | | | |
| Apple, Inc. | | | 4.87 | |
| Microsoft Corp. | | | 3.64 | |
| Amazon.com, Inc. | | | 1.91 | |
| Tesla, Inc. | | | 1.27 | |
| Alphabet, Inc., Class A | | | 1.19 | |
| Berkshire Hathaway, Inc., Class B | | | 1.12 | |
| UnitedHealth Group, Inc. | | | 1.09 | |
| Alphabet, Inc., Class C | | | 1.07 | |
| Exxon Mobil Corp. | | | 0.97 | |
| Johnson & Johnson | | | 0.96 | |
| Total | | | 18.09 | |
| * | Excluding money market fund holdings. |
Invesco S&P 500® Downside Hedged ETF (PHDG) (continued)
Growth of a $10,000 Investment
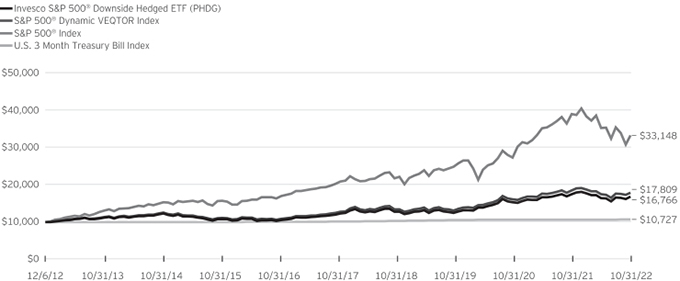
Fund Performance History as of October 31, 2022
| | | | | | | | | | | | | | | | | | | | | | | | | | | | | | | | |
| | | 1 Year | | | 3 Years
Average
Annualized | | | 3 Years
Cumulative | | | 5 Years
Average
Annualized | | | 5 Years
Cumulative | | | | | | Fund Inception | |
| Index | | | | | Average
Annualized | | | Cumulative | |
| S&P 500® Dynamic VEQTOR Index | | | (3.33 | )% | | | 10.78 | % | | | 35.96 | % | | | 7.49 | % | | | 43.49 | % | | | | | | | 6.00 | % | | | 78.09 | % |
| S&P 500® Index | | | (14.61 | ) | | | 10.22 | | | | 33.88 | | | | 10.44 | | | | 64.31 | | | | | | | | 12.87 | | | | 231.48 | |
| U.S. 3 Month Treasury Bill Index | | | 1.30 | | | | 0.65 | | | | 1.97 | | | | 1.18 | | | | 6.02 | | | | | | | | 0.71 | | | | 7.27 | |
| Fund | | | | | | | | | | | | | | | | | | | | | | | | | | | | | | | | |
| NAV Return | | | (3.78 | ) | | | 10.51 | | | | 34.96 | | | | 6.96 | | | | 40.00 | | | | | | | | 5.36 | | | | 67.66 | |
| Market Price Return | | | (3.51 | ) | | | 10.67 | | | | 35.56 | | | | 6.99 | | | | 40.17 | | | | | | | | 5.37 | | | | 67.86 | |
Fund Inception: December 6, 2012
Performance quoted above represents past performance. Past performance is not a guarantee of future results and current performance may be higher or lower than performance quoted. Investment returns and principal value will fluctuate, and shares of the Fund (“Fund Shares”), when redeemed or sold, may be worth more or less than their original cost. Fund performance reflects any applicable fee waivers and/or expense reimbursements. Had the adviser not waived fees and/or reimbursed expenses currently or in the past, returns would have been lower. See the current prospectus for more information. The adviser has contractually agreed to waive fees and/or pay certain Fund expenses through August 31, 2024. According to the Fund’s current prospectus, the Fund’s expense ratio of 0.41% (0.40% after fee waiver) includes the unitary management fee of 0.39% and acquired fund fees and expenses of 0.02%. NAV and Market Price returns assume that dividends and capital gain distributions have been reinvested in the Fund at NAV and Market Price, respectively. The returns shown in the table above do not reflect the deduction of taxes that a shareholder would pay on Fund distributions or the redemption or sale of Fund Shares. See invesco.com/ETFs to find the most recent month-end performance numbers.
Performance results for the indexes stated above are based upon a hypothetical investment in their respective constituent securities. The returns of an index do not represent Fund returns. An investor cannot invest directly in an index. The indexes do not charge management fees or brokerage expenses, and no such fees or expenses were deducted from the hypothetical performance shown. In addition, the results actual investors might have achieved would have differed from those shown because of differences in the timing, amounts of their investments, and fees and expenses associated with an investment in the Fund.
Notes Regarding Indexes and Fund Performance History:
| - | Average Annualized and Cumulative Inception returns for the Fund and the indexes are based on the inception date of the Fund. |
| | |
| GTO | | Management’s Discussion of Fund Performance |
| | Invesco Total Return Bond ETF (GTO) |
The Invesco Total Return Bond ETF (the “Fund”) is an actively managed exchange-traded fund (“ETF”) whose investment objective is to seek maximum total return, comprised of income and capital appreciation. The Fund will normally invest in a portfolio of fixed income instruments of varying maturities and of any credit quality. The Fund will normally invest at least 80% of its net assets (plus any borrowings for investment purposes) in fixed income instruments, which may be represented by certain derivative instruments as discussed below, and also include exchange-traded funds (“ETFs”) and closed-end funds (“CEFs”) that invest substantially all of their assets in fixed income instruments (which may include ETFs and CEFs affiliated with the Fund). The fixed income instruments in which the Fund will invest include corporate debt securities of U.S. and non-U.S. issuers, including corporate bonds, and other similar instruments, such as Treasury securities, collateralized loan obligations, mortgage- backed securities and asset-backed securities, issued by various U.S. and non-U.S. public- or private-sector entities, and municipal securities, which are debt securities issued by states or local governments and their agencies, authorities and other government sponsored enterprises.
For the fiscal year ended October 31, 2022, on a market price basis, the Fund returned (18.81)%. On a net asset value (“NAV”) basis, the Fund returned (18.65)%. During this same time period, the Bloomberg U.S. Aggregate Bond Index (the “Benchmark Index”) returned (15.68)%. The Benchmark Index is an unmanaged index weighted by market capitalization based on the average performance of approximately 11,570 securities. The Benchmark Index was selected for its recognition in the marketplace, and its performance comparison is a useful measure for investors as a broad representation of the U.S. bond market.
The Fund’s underperformance, on a NAV basis, relative to the Benchmark Index during the period was primarily due to the Fund’s security selection in the health care sector. Security selection within the consumer staples sector also detracted from the Fund’s performance relative to the Benchmark Index during the period.
For the fiscal year ended October 31, 2022, from an industry perspective, exposure to tobacco was the largest contributor to the Fund’s absolute return, followed by paper & forest products. In contrast, exposure to the banking and capital markets industries detracted from the Fund’s performance.
Positions that contributed most significantly to the Fund’s return included Enerflex Ltd., 9.00% coupon; due 10/15/2027 (portfolio average weight of 0.10%) and Uniform Mortgage-Backed Securities, 5.00% coupon; due 11/14/2022 (portfolio average weight of 3.00%). Positions that detracted most significantly from the Fund’s return included a U.S. Treasury Bond, 2.88% coupon; due 05/15/2052 (portfolio average
weight of 0.30%) and JAB Holdings B.V., 4.50% coupon; due 04/08/2052 (portfolio average weight of 0.50%).
| | | | |
Asset Group
(% of the Fund’s Net Assets)
as of October 31, 2022 | |
| U.S. Dollar Denominated Bonds & Notes | | | 64.08 | |
| Asset-Backed Securities | | | 25.95 | |
| U.S. Government Sponsored Agency Mortgage-Backed Securities | | | 22.23 | |
| U.S. Treasury Securities | | | 1.44 | |
| Agency Credit Risk Transfer Notes | | | 0.91 | |
| Municipal Obligations | | | 0.41 | |
| Open Over-The-Counter Foreign Currency | | | 0.37 | |
| U.S. Government Sponsored Agency Securities | | | 0.33 | |
| Open Exchange-Traded Index Options Purchased | | | 0.03 | |
| Non-U.S. Dollar Denominated Bonds & Notes | | | 0.02 | |
| Money Market Funds Plus Other Assets Less Liabilities | | | (15.77) | |
|
Top Ten Fund Holdings*
(% of the Fund’s Net Assets)
as of October 31, 2022 | |
| Security | | | | |
| Uniform Mortgage-Backed Securities, TBA, 5.50%, 11/01/2052 | | | 4.01 | |
| Uniform Mortgage-Backed Securities, TBA, 5.00%, 11/01/2052 | | | 3.00 | |
| Uniform Mortgage-Backed Securities, TBA, 6.00%, 11/01/2052 | | | 2.99 | |
| Uniform Mortgage-Backed Securities, TBA, 2.00%, 11/01/2052 | | | 2.76 | |
| Uniform Mortgage-Backed Securities, TBA, 2.50%, 11/01/2052 | | | 1.93 | |
| BX Trust, Series 2021-LGCY, Class B, 4.27%, 10/15/2023 | | | 1.27 | |
| Uniform Mortgage-Backed Securities, TBA, 4.50%, 11/01/2052 | | | 1.18 | |
| Uniform Mortgage-Backed Securities, TBA, 4.00%, 11/01/2052 | | | 1.14 | |
| BX Commercial Mortgage Trust, Series 2021-VOLT, Class D, 5.06%, 09/15/2036 | | | 1.11 | |
| Algonquin Power & Utilities Corp., 4.75%, 01/18/2082 | | | 1.08 | |
| Total | | | 20.47 | |
| * | Excluding money market fund holdings. |
Invesco Total Return Bond ETF (GTO) (continued)
Growth of a $10,000 Investment Since Inception
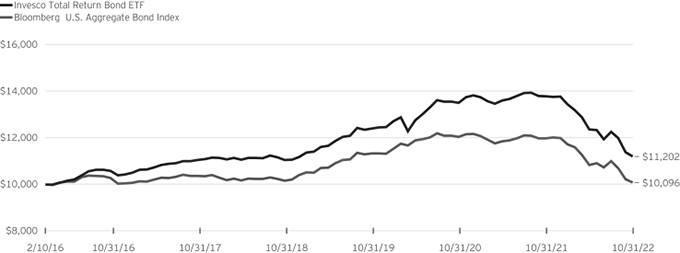
Fund Performance History as of October 31, 2022
| | | | | | | | | | | | | | | | | | | | | | | | | | | | | | | | |
| | | 1 Year | | | 3 Years
Average
Annualized | | | 3 Years
Cumulative | | | 5 Years
Average
Annualized | | | 5 Years
Cumulative | | | | | | Fund Inception | |
| Index | | | | | Average
Annualized | | | Cumulative | |
| Bloomberg U.S. Aggregate Bond Index | | | (15.68 | )% | | | (3.77 | )% | | | (10.89 | )% | | | (0.54 | )% | | | (2.68 | )% | | | | | | | 0.14 | % | | | 0.96 | % |
| Fund | | | | | | | | | | | | | | | | | | | | | | | | | | | | | | | | |
| NAV Return | | | (18.65 | ) | | | (3.32 | ) | | | (9.63 | ) | | | 0.27 | | | | 1.38 | | | | | | | | 1.70 | | | | 12.02 | |
| Market Price Return | | | (18.81 | ) | | | (3.38 | ) | | | (9.80 | ) | | | 0.20 | | | | 1.01 | | | | | | | | 1.68 | | | | 11.85 | |
Guggenheim Total Return Bond ETF (the “Predecessor Fund”) Inception: February 10, 2016
Performance quoted above represents past performance. Past performance is not a guarantee of future results and current performance may be higher or lower than performance quoted. Investment returns and principal value will fluctuate, and shares of the Fund (“Fund Shares”), when redeemed or sold, may be worth more or less than their original cost. Fund performance reflects any applicable fee waivers and/or expense reimbursements. Had the adviser not waived fees and/or reimbursed expenses currently or in the past, returns would have been lower. See the current prospectus for more information. According to the Fund’s current prospectus, the Fund’s expense ratio of 0.50% is expressed as a unitary management fee to cover operating expenses and expenses incurred in connection with managing the portfolio. NAV and Market Price returns assume that dividends and capital gain distributions have been reinvested in the Fund at NAV and Market Price, respectively. The returns shown in the table above do not reflect the deduction of taxes that a shareholder would pay on Fund
distributions or the redemption or sale of Fund Shares. See invesco.com/ETFs to find the most recent month-end performance numbers.
Performance results for the index stated above are based upon a hypothetical investment in their respective constituent securities. The returns of an index do not represent Fund returns. An investor cannot invest directly in an index. The index does not charge management fees or brokerage expenses, and no such fees or expenses were deducted from the hypothetical performance shown. In addition, the results actual investors might have achieved would have differed from those shown because of differences in the timing, amounts of their investments, and fees and expenses associated with an investment in the Fund.
Notes Regarding Index and Fund Performance History:
| - | Average Annualized and Cumulative Inception returns for the Fund and the index are based on the inception date of the Predecessor Fund. |
| - | Effective after the close of business on April 6, 2018, the Predecessor Fund was reorganized into the Fund. Fund returns shown are blended returns of the Predecessor Fund and the Fund. |
| | |
| GSY | | Management’s Discussion of Fund Performance |
| | Invesco Ultra Short Duration ETF (GSY) |
The Invesco Ultra Short Duration ETF (the “Fund”) is an actively managed exchange-traded fund (“ETF”) whose investment objective is to seek maximum current income, consistent with preservation of capital and daily liquidity. The Fund will invest at least 80% of its net assets (plus any borrowings for investment purposes) in fixed income securities and in exchange-traded funds (“ETFs”) and closed-end funds that invest substantially all of their assets in fixed income securities. The Fund uses a low duration strategy to seek to outperform the ICE BofA US Treasury Bill Index (the “Benchmark Index”) in addition to providing returns in excess of those available in U.S. Treasury bills, government repurchase agreements, and money market funds, while seeking to provide preservation of capital and daily liquidity. The Fund expects, under normal circumstances, to hold a diversified portfolio of fixed income instruments of varying maturities, but that have an average duration of less than one year.
The Fund is primarily invested in corporate bonds, commercial paper and asset-backed securities. The Fund’s high allocation to floating rate securities reduces interest rate risk while commercial paper helps the Fund manage its liquidity needs. The Fund’s focus on high-quality short maturity holdings helps the Fund manage credit risk. The Fund continues to maintain an average effective duration below one year. The portfolio management team believes the Fund is well positioned for interest rate volatility and broader financial market sell-offs overall and relative to other conservative ultra-short fixed income funds. The Fund’s significant holdings in high quality investment grade assets and money market securities continue to help reduce drawdown risks, while preserving capital and maintaining a competitive yield.
For the fiscal year ended October 31, 2022, on a market price basis, the Fund returned (1.15)%. On a net asset value (“NAV”) basis, the Fund returned (1.13)%. During the same time period, the Benchmark Index returned 0.62%. The Fund’s underperformance, on a NAV basis, relative to the return of the Benchmark Index during the year was primarily due to the Fund maintaining an overweight position in long maturity investment grade credit securities.
Allocation to and security selection within investment grade corporate bonds of communication services companies and cash securities were positive contributors to the Fund’s performance relative to the Benchmark Index. Additionally, the Fund’s performance was positively impacted by its overweight allocation to the gas utilities, diversified telecommunication services, and hotels, restaurants & leisure industries. The allocation to the banks industry was a detractor from the Fund’s performance relative to the Benchmark Index.
Positions that contributed most significantly to the Fund’s return included Cerberus Loan Funding XXXIV L.P. (portfolio average weight of 0.27%) and a Macquarie Group Ltd. (portfolio average weight of 0.95%). Positions that detracted most significantly from
the Fund’s return included COLT Mortgage Loan Trust (portfolio average weight of 0.49% ) and Verus Securitization Trust (portfolio average weight of 0.40%).
| | | | |
Security Type Breakdown
(% of the Fund’s Net Assets)
as of October 31, 2022 | |
| U.S. Dollar Denominated Bonds & Notes | | | 42.21 | |
| Commercial Paper | | | 37.38 | |
| Asset-Backed Securities | | | 13.27 | |
| Repurchase Agreements | | | 3.79 | |
| Non-U.S. Dollar Denominated Bonds & Notes | | | 2.81 | |
| U.S. Treasury Securities | | | 1.82 | |
| Certificates of Deposit | | | 0.13 | |
| Variable Rate Senior Loan Interests | | | 0.07 | |
| Money Market Funds Plus Other Assets Less Liabilities | | | (1.48) | |
|
Top Ten Fund Holdings*
(% of the Fund’s Net Assets)
as of October 31, 2022 | |
| Security | | | | |
| Japan Treasury Discount Bill, Series 1111, 0.00%, 01/11/2023 | | | 2.81 | |
| Citigroup Global Markets, Inc., joint term agreement dated 10/19/2022, 3.71%, 11/01/2022 | | | 2.37 | |
| Barclays Capital, Inc., 1.06%, 02/02/2023 | | | 1.73 | |
| Alimentation Couche-Tard, Inc., 3.88%, 11/14/2022 | | | 1.52 | |
| J.P. Morgan Securities LLC, joint open agreement dated 06/11/2021, 3.37%, 11/01/2022 | | | 1.42 | |
| Brookfield Infrastructure Holdings Canada, Inc., 4.32%, 12/01/2022 | | | 1.18 | |
| Discover Bank, 3.35%, 02/06/2023 | | | 1.18 | |
| Bank of Nova Scotia (The), 1.95%, 02/01/2023 | | | 1.18 | |
| National Bank of Canada, 2.10%, 02/01/2023 | | | 1.18 | |
| HSBC USA, Inc., 0.78%, 01/06/2023 | | | 1.18 | |
| Total | | | 15.75 | |
| * | Excluding money market fund holdings. |
Invesco Ultra Short Duration ETF (GSY) (continued)
Growth of a $10,000 Investment
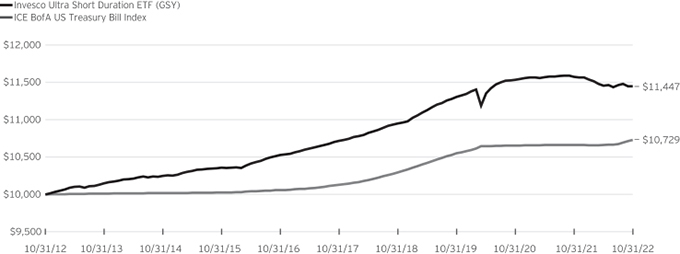
Fund Performance History as of October 31, 2022
| | | | | | | | | | | | | | | | | | | | | | | | | | | | | | | | | | | | | | | | |
| | | 1 Year | | | 3 Years
Average
Annualized | | | 3 Years
Cumulative | | | 5 Years
Average
Annualized | | | 5 Years
Cumulative | | | 10 Years
Average
Annualized | | | 10 Years
Cumulative | | | | | | Fund Inception | |
| Index | | Average
Annualized | | | Cumulative | |
| ICE BofA US Treasury Bill Index | | | 0.62 | % | | | 0.56 | % | | | 1.69 | % | | | 1.16 | % | | | 5.92 | % | | | 0.71 | % | | | 7.29 | % | | | | | | | 0.66 | % | | | 10.17 | % |
| Fund | | | | | | | | | | | | | | | | | | | | | | | | | | | | | | | | | | | | | | | | |
| NAV Return | | | (1.13 | ) | | | 0.40 | | | | 1.21 | | | | 1.32 | | | | 6.79 | | | | 1.36 | | | | 14.47 | | | | | | | | 1.12 | | | | 17.77 | |
| Market Price Return | | | (1.15 | ) | | | 0.40 | | | | 1.19 | | | | 1.32 | | | | 6.78 | | | | 1.36 | | | | 14.43 | | | | | | | | 1.12 | | | | 17.74 | |
Guggenheim Ultra Short Duration ETF (the “Predecessor Fund”) Inception: February 12, 2008
Performance quoted above represents past performance. Past performance is not a guarantee of future results and current performance may be higher or lower than performance quoted. Investment returns and principal value will fluctuate, and shares of the Fund (“Fund Shares”), when redeemed or sold, may be worth more or less than their original cost. Fund performance reflects any applicable fee waivers and/or expense reimbursements. Had the adviser not waived fees and/or reimbursed expenses currently or in the past, returns would have been lower. See the current prospectus for more information. According to the Fund’s current prospectus, the total annual operating expense ratio was indicated as 0.22%. The Financial Highlights section of the Shareholder Report presents the expense ratios based on expenses incurred during the period covered by this report. NAV and Market Price returns assume that dividends and capital gain distributions have been reinvested in the Fund at NAV and Market Price, respectively. The returns shown in the table above do not reflect the deduction of taxes that a shareholder would pay on Fund distributions or the redemption or
sale of Fund Shares. See invesco.com/ETFs to find the most recent month-end performance numbers.
Performance results for the index stated above are based upon a hypothetical investment in their respective constituent securities. The returns of an index do not represent Fund returns. An investor cannot invest directly in an index. The index does not charge management fees or brokerage expenses, and no such fees or expenses were deducted from the hypothetical performance shown. In addition, the results actual investors might have achieved would have differed from those shown because of differences in the timing, amounts of their investments, and fees and expenses associated with an investment in the Fund.
Notes Regarding Index and Fund Performance History:
| - | Average Annualized and Cumulative Inception returns for the Fund and the index are based on the inception date of the Predecessor Fund. |
| - | Effective after the close of business on April 6, 2018, the Predecessor Fund was reorganized into the Fund. Fund returns shown are blended returns of the Predecessor Fund and the Fund. |
| | |
| VRIG | | Management’s Discussion of Fund Performance |
| | Invesco Variable Rate Investment Grade ETF (VRIG) |
The Invesco Variable Rate Investment Grade ETF (the “Fund”) is an actively managed exchange-traded fund (“ETF”) whose investment objectives are seeking to generate current income while maintaining low portfolio duration as a primary objective and capital appreciation as a secondary objective. The Fund seeks to achieve its investment objectives by investing, under normal market conditions, at least 80% of its net assets (plus any borrowings for investment purposes) in a portfolio of investment grade, variable rate or floating rate debt securities that are denominated in U.S. dollars and are issued by U.S. private sector entities or U.S. government agencies and instrumentalities.
Invesco Advisers, Inc., the sub-adviser to the Fund, selects the following types of securities for the Fund: (i) floating rate non-agency commercial mortgage-backed securities (“MBS”); variable rate non-agency residential MBS; variable rate agency MBS and floating rate non-agency asset-backed securities (“ABS”) (including floating rate non-agency commercial real estate collateralized loan obligations); (ii) floating rate corporate debt securities (comprised of corporate notes, bonds, debentures or privately issued securities offered pursuant to Rule 144A of the Securities Act of 1933, as amended); (iii) floating rate government sponsored enterprise credit risk transfers; (iv) floating rate U.S. Government securities (including floating rate agency debt securities); (v) variable rate preferred stock; and (vi) affiliated ETFs that invest primarily in any or all of the foregoing securities (collectively, “Variable Rate Instruments”), to the extent permitted by the Investment Company Act of 1940, as amended.
During the fiscal year ended October 31, 2022, on a market price basis, the Fund returned (0.53)%. On a net asset value (“NAV”) basis, the Fund returned (0.45)%. During the same time period, the Bloomberg US Floating Rate Note Index (the “Benchmark Index”) returned 0.29%.
The Fund’s underperformance relative to the Benchmark Index was driven largely by its security selection within the communication services sector, as well as security selection within the energy sector. The Fund’s allocation to the financials sector was also a negative contributor for the period. The Fund’s allocation to the utilities sector and the health care sector contributed to the Fund’s relative performance for the period.
Positions that contributed most significantly to the Fund’s return included BOC Aviation Ltd., 4.77% coupon, due 09/26/2023 (portfolio average weight of 0.50%) and QUALCOMM, Inc., 5.15% coupon, due 01/30/2023 (portfolio average weight of 0.90%). Positions that detracted most significantly from the Fund’s return were Freddie Mac Multifamily Structured Credit Risk, Series 2021-MN2, Class M1, 4.80% coupon, due 07/25/2041 (portfolio average weight of 0.60%) and Mello Mortgage Capital Acceptance Trust, Series 2021-INV2, Class A1, 3.23% coupon, due 08/25/2051 (portfolio average weight of 0.50%).
| | | | |
Security Type Breakdown
(% of the Fund’s Net Assets)
as of October 31, 2022 | |
| U.S. Dollar Denominated Bonds & Notes | | | 48.05 | |
| Agency Credit Risk Transfer Notes | | | 16.71 | |
| Asset-Backed Securities | | | 16.62 | |
| U.S. Treasury Securities | | | 15.12 | |
| U.S. Government Sponsored Agency Mortgage-Backed Securities | | | 3.03 | |
| Money Market Funds Plus Other Assets Less Liabilities | | | 0.47 | |
|
Top Ten Fund Holdings*
(% of the Fund’s Net Assets)
as of October 31, 2022 | |
| Security | | | | |
| U.S. Treasury Floating Rate Notes, 4.04%, 04/30/2024 | | | 12.02 | |
| U.S. Treasury Floating Rate Notes, 4.15%, 07/31/2024 | | | 3.10 | |
| American Express Co., 3.69%, 02/27/2023 | | | 0.91 | |
| Freddie Mac, Series 2021-DNA6, Class M2, STACR®, 4.50%, 10/25/2041 | | | 0.90 | |
| QUALCOMM, Inc., 5.15%, 01/30/2023 | | | 0.87 | |
| ING Groep N.V., 4.74%, 10/02/2023 | | | 0.87 | |
| Athene Global Funding, 3.49%, 05/24/2024 | | | 0.86 | |
| STAR Trust, Series 2022-SFR3, Class B, 5.37%, 05/17/2024 | | | 0.85 | |
| NextEra Energy Capital Holdings, Inc., 4.04%, 03/21/2024 | | | 0.84 | |
| Freddie Mac, Series 2021-DNA2, Class M2, STACR®, 5.30%, 08/25/2033 | | | 0.80 | |
| Total | | | 22.02 | |
| * | Excluding money market fund holdings. |
Invesco Variable Rate Investment Grade ETF (VRIG) (continued)
Growth of a $10,000 Investment Since Inception
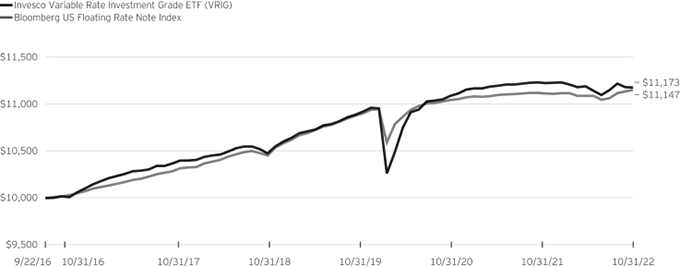
Fund Performance History as of October 31, 2022
| | | | | | | | | | | | | | | | | | | | | | | | | | | | | | | | |
| | | 1 Year | | | 3 Years
Average
Annualized | | | 3 Years
Cumulative | | | 5 Years
Average
Annualized | | | 5 Years
Cumulative | | | | | | Fund Inception | |
| Index | | | | | Average
Annualized | | | Cumulative | |
| Bloomberg US Floating Rate Note Index | | | 0.29 | % | | | 0.92 | % | | | 2.77 | % | | | 1.68 | % | | | 8.71 | % | | | | | | | 1.79 | % | | | 11.47 | % |
| Fund | | | | | | | | | | | | | | | | | | | | | | | | | | | | | | | | |
| NAV Return | | | (0.45 | ) | | | 0.97 | | | | 2.93 | | | | 1.56 | | | | 8.06 | | | | | | | | 1.83 | | | | 11.73 | |
| Market Price Return | | | (0.53 | ) | | | 0.94 | | | | 2.85 | | | | 1.54 | | | | 7.93 | | | | | | | | 1.80 | | | | 11.48 | |
Fund Inception: September 22, 2016
Performance quoted above represents past performance. Past performance is not a guarantee of future results and current performance may be higher or lower than performance quoted. Investment returns and principal value will fluctuate, and shares of the Fund (“Fund Shares”), when redeemed or sold, may be worth more or less than their original cost. Fund performance reflects any applicable fee waivers and/or expense reimbursements. Had the adviser not waived fees and/or reimbursed expenses currently or in the past, returns would have been lower. See the current prospectus for more information. According to the Fund’s current prospectus, the Fund’s expense ratio of 0.30% is expressed as a unitary management fee to cover operating expenses and expenses incurred in connection with managing the portfolio. NAV and Market Price returns assume that dividends and capital gain distributions have been reinvested in the Fund at NAV and Market Price, respectively. The returns shown in the table above do not reflect the deduction of taxes that a shareholder would pay on Fund distributions or the redemption or sale of Fund Shares. See invesco.com/ETFs to find the most recent month-end performance numbers.
Performance results for the Benchmark Indexes stated above are based upon a hypothetical investment in their respective constituent securities. The returns of an index do not represent Fund returns. An investor cannot invest directly in an index. The Benchmark Index does not charge management fees or brokerage expenses, and no such fees or expenses were deducted from the hypothetical performance shown. In addition, the results actual investors might have achieved would have differed from those shown because of differences in the timing, amounts of their investments, and fees and expenses associated with an investment in the Fund.
Notes Regarding Index and Fund Performance History:
| - | Average Annualized and Cumulative Inception returns for the Fund and index are based on the inception date of the Fund. |
Invesco Active U.S. Real Estate ETF (PSR)
October 31, 2022
Schedule of Investments(a)
| | | | | | | | |
| | | Shares | | Value | |
Common Stocks & Other Equity Interests-100.04% | |
Apartments-10.42% | | | | | | | | |
Apartment Income REIT Corp. | | | 33,322 | | | $ | 1,280,565 | |
AvalonBay Communities, Inc. | | | 7,059 | | | | 1,236,172 | |
Camden Property Trust | | | 10,844 | | | | 1,253,024 | |
Equity Residential | | | 19,409 | | | | 1,223,155 | |
Essex Property Trust, Inc. | | | 5,414 | | | | 1,203,207 | |
Independence Realty Trust, Inc. | | | 78,710 | | | | 1,319,180 | |
Mid-America Apartment Communities, Inc. | | | 8,469 | | | | 1,333,444 | |
UDR, Inc. | | | 31,791 | | | | 1,264,010 | |
Veris Residential, Inc.(b) | | | 103,355 | | | | 1,636,110 | |
| | | | | | | | |
| | | | | | | 11,748,867 | |
| | | | | | | | |
Data Centers-7.91% | | | | | | | | |
Digital Realty Trust, Inc. | | | 44,614 | | | | 4,472,553 | |
Equinix, Inc. | | | 7,858 | | | | 4,451,086 | |
| | | | | | | | |
| | | | | | | 8,923,639 | |
| | | | | | | | |
Diversified-3.38% | | | | | | | | |
Elme Communities(c) | | | 71,858 | | | | 1,371,769 | |
JBG SMITH Properties | | | 43,119 | | | | 848,582 | |
Vornado Realty Trust | | | 31,555 | | | | 744,383 | |
W.P. Carey, Inc.(c) | | | 11,120 | | | | 848,456 | |
| | | | | | | | |
| | | | | | | 3,813,190 | |
| | | | | | | | |
Free Standing-5.43% | | | | | | | | |
Agree Realty Corp. | | | 12,427 | | | | 853,735 | |
Essential Properties Realty Trust, Inc. | | | 41,443 | | | | 891,853 | |
Four Corners Property Trust, Inc. | | | 34,258 | | | | 877,690 | |
National Retail Properties, Inc. | | | 20,859 | | | | 876,704 | |
NETSTREIT Corp.(c) | | | 45,487 | | | | 856,065 | |
Realty Income Corp. | | | 14,232 | | | | 886,227 | |
Spirit Realty Capital, Inc. | | | 22,743 | | | | 883,111 | |
| | | | | | | | |
| | | | | | | 6,125,385 | |
| | | | | | | | |
Health Care-7.12% | | | | | | | | |
CareTrust REIT, Inc. | | | 64,398 | | | | 1,202,955 | |
Healthcare Realty Trust, Inc. | | | 55,653 | | | | 1,131,425 | |
Healthpeak Properties, Inc. | | | 47,571 | | | | 1,128,860 | |
National Health Investors, Inc. | | | 20,404 | | | | 1,156,907 | |
Physicians Realty Trust(c) | | | 76,770 | | | | 1,156,156 | |
Ventas, Inc. | | | 29,037 | | | | 1,136,218 | |
Welltower, Inc. | | | 18,296 | | | | 1,116,788 | |
| | | | | | | | |
| | | | | | | 8,029,309 | |
| | | | | | | | |
Industrial-10.84% | | | | | | | | |
Americold Realty Trust, Inc.(c) | | | 69,939 | | | | 1,696,021 | |
EastGroup Properties, Inc. | | | 11,260 | | | | 1,764,329 | |
First Industrial Realty Trust, Inc. | | | 36,485 | | | | 1,737,781 | |
Prologis, Inc. | | | 15,960 | | | | 1,767,570 | |
Rexford Industrial Realty, Inc. | | | 31,220 | | | | 1,725,842 | |
STAG Industrial, Inc. | | | 57,273 | | | | 1,809,254 | |
Terreno Realty Corp. | | | 30,253 | | | | 1,728,656 | |
| | | | | | | | |
| | | | | | | 12,229,453 | |
| | | | | | | | |
Infrastructure REITs-18.67% | | | | | | | | |
American Tower Corp. | | | 34,797 | | | | 7,209,590 | |
Crown Castle, Inc. | | | 50,347 | | | | 6,709,241 | |
SBA Communications Corp., Class A | | | 26,432 | | | | 7,133,997 | |
| | | | | | | | |
| | | | | | | 21,052,828 | |
| | | | | | | | |
| | | | | | | | |
| | | Shares | | Value | |
Lodging Resorts-2.65% | | | | | | | | |
Apple Hospitality REIT, Inc. | | | 21,572 | | | $ | 369,313 | |
DiamondRock Hospitality Co. | | | 40,789 | | | | 380,969 | |
Host Hotels & Resorts, Inc. | | | 19,767 | | | | 373,201 | |
Pebblebrook Hotel Trust | | | 22,289 | | | | 357,516 | |
RLJ Lodging Trust | | | 31,037 | | | | 377,720 | |
Ryman Hospitality Properties, Inc. | | | 4,122 | | | | 366,528 | |
Summit Hotel Properties, Inc.(c) | | | 46,170 | | | | 398,909 | |
Sunstone Hotel Investors, Inc.(c) | | | 32,760 | | | | 365,274 | |
| | | | | | | | |
| | | | | | | 2,989,430 | |
| | | | | | | | |
Manufactured Homes-3.53% | | | | | | | | |
Equity LifeStyle Properties, Inc. | | | 20,150 | | | | 1,288,794 | |
Sun Communities, Inc. | | | 9,941 | | | | 1,340,544 | |
UMH Properties, Inc.(c) | | | 77,001 | | | | 1,350,597 | |
| | | | | | | | |
| | | | | | | 3,979,935 | |
| | | | | | | | |
Office-4.42% | | | | | | | | |
Alexandria Real Estate Equities, Inc. | | | 5,065 | | | | 735,944 | |
Boston Properties, Inc. | | | 9,288 | | | | 675,238 | |
Corporate Office Properties Trust | | | 28,566 | | | | 761,284 | |
Cousins Properties, Inc. | | | 29,817 | | | | 708,452 | |
Douglas Emmett, Inc. | | | 39,388 | | | | 692,835 | |
Kilroy Realty Corp. | | | 16,501 | | | | 705,253 | |
Orion Office REIT, Inc.(c) | | | 74,860 | | | | 701,438 | |
| | | | | | | | |
| | | | | | | 4,980,444 | |
| | | | | | | | |
Regional Malls-0.82% | | | | | | | | |
Simon Property Group, Inc. | | | 8,534 | | | | 930,035 | |
| | | | | | | | |
Self Storage-8.85% | | | | | | | | |
CubeSmart | | | 48,831 | | | | 2,044,554 | |
Extra Space Storage, Inc. | | | 11,148 | | | | 1,978,101 | |
Life Storage, Inc. | | | 17,971 | | | | 1,987,772 | |
National Storage Affiliates Trust | | | 46,290 | | | | 1,974,732 | |
Public Storage | | | 6,429 | | | | 1,991,383 | |
| | | | | | | | |
| | | | | | | 9,976,542 | |
| | | | | | | | |
Shopping Centers-6.36% | | | | | | | | |
Acadia Realty Trust | | | 62,905 | | | | 878,783 | |
Brixmor Property Group, Inc. | | | 43,009 | | | | 916,522 | |
Federal Realty Investment Trust | | | 9,017 | | | | 892,502 | |
InvenTrust Properties Corp.(c) | | | 36,490 | | | | 919,548 | |
Kimco Realty Corp. | | | 42,318 | | | | 904,759 | |
Regency Centers Corp. | | | 14,963 | | | | 905,411 | |
Retail Opportunity Investments Corp. | | | 58,686 | | | | 849,773 | |
SITE Centers Corp. | | | 73,013 | | | | 903,901 | |
| | | | | | | | |
| | | | | | | 7,171,199 | |
| | | | | | | | |
Single Family Homes-2.19% | | | | | | | | |
American Homes 4 Rent, Class A | | | 39,432 | | | | 1,259,458 | |
Invitation Homes, Inc. | | | 38,206 | | | | 1,210,748 | |
| | | | | | | | |
| | | | | | | 2,470,206 | |
| | | | | | | | |
Specialty-4.77% | | | | | | | | |
Gaming and Leisure Properties, Inc. | | | 26,540 | | | | 1,330,185 | |
Lamar Advertising Co., Class A | | | 14,759 | | | | 1,361,222 | |
Outfront Media, Inc.(c) | | | 76,132 | | | | 1,374,183 | |
VICI Properties, Inc. | | | 40,849 | | | | 1,307,985 | |
| | | | | | | | |
| | | | | | | 5,373,575 | |
| | | | | | | | |
See accompanying Notes to Financial Statements which are an integral part of the financial statements.
Invesco Active U.S. Real Estate ETF (PSR)–(continued)
October 31, 2022
| | | | | | | | |
| | | Shares | | | Value | |
Timber REITs-2.68% | | | | | | | | |
PotlatchDeltic Corp.(c) | | | 22,517 | | | $ | 1,001,781 | |
Rayonier, Inc. | | | 29,432 | | | | 991,858 | |
Weyerhaeuser Co. | | | 33,136 | | | | 1,024,897 | |
| | | | | | | | |
| | | | | | | 3,018,536 | |
| | | | | | | | |
TOTAL INVESTMENTS IN SECURITIES
(excluding investments purchased with cash collateral from securities on loan)-100.04%
(Cost $130,228,835) | | | | | | | 112,812,573 | |
| | | | | | | | |
| |
| Investments Purchased with Cash Collateral from Securities on Loan | | | | | |
| |
Money Market Funds-5.35% | | | | | |
Invesco Private Government Fund,
3.18%(d)(e)(f) | | | 1,689,902 | | | | 1,689,902 | |
| | | | | | | | |
| | | Shares | | | Value | |
Money Market Funds-(continued) | | | | | |
Invesco Private Prime Fund, 3.28%(d)(e)(f) | | | 4,344,289 | | | $ | 4,344,289 | |
| | | | | | | | |
Total Investments Purchased with Cash Collateral from Securities on Loan
(Cost $6,034,115) | | | | 6,034,191 | |
| | | | | | | | |
TOTAL INVESTMENTS IN SECURITIES-105.39%
(Cost $136,262,950) | | | | 118,846,764 | |
OTHER ASSETS LESS LIABILITIES-(5.39)% | | | | (6,076,829 | ) |
| | | | | | | | |
NET ASSETS-100.00% | | | | | | $ | 112,769,935 | |
| | | | | | | | |
Investment Abbreviations:
REIT -Real Estate Investment Trust
Notes to Schedule of Investments:
| (a) | Property type classifications used in this report are generally according to FTSE National Association of Real Estate Investment Trusts (“NAREIT”) Equity REITs Index, which is exclusively owned by NAREIT. |
| (b) | Non-income producing security. |
| (c) | All or a portion of this security was out on loan at October 31, 2022. |
| (d) | Affiliated issuer. The issuer and/or the Fund is a wholly-owned subsidiary of Invesco Ltd., or is affiliated by having an investment adviser that is under common control of Invesco Ltd. The table below shows the Fund’s transactions in, and earnings from, its investments in affiliates for the fiscal year ended October 31, 2022. |
| | | | | | | | | | | | | | | | | | | | | | | | | | | | | | | | | | | | | | | | | | | | | | | | | | | | | | | |
| | | Value
October 31, 2021 | | Purchases
at Cost | | Proceeds
from Sales | | Change in
Unrealized
Appreciation | | Realized
Gain
(Loss) | | Value
October 31, 2022 | | Dividend
Income |
| | | | | | | | | | | |
Investments in Affiliated Money Market Funds: | | | | | | | | | | | | | | | | | | | | | | | | | | | | | | | | | | | | | | | | | | | | | | | | | | | | | | | |
| | | | | | | | | | | |
Invesco Government & Agency Portfolio, Institutional Class | | | | | | | | $ | 12,688 | | | | | | | | | $ | 3,160,808 | | | | $ | (3,173,496 | ) | | | $ | - | | | | $ | - | | | | | | | | | $ | - | | | | | | | | | $ | 653 | |
| | | | | | | | | | | |
Investments Purchased with Cash Collateral from Securities on Loan: | | | | | | | | | | | | | | | | | | | | | | | | | | | | | | | | | | | | | | | | | | | | | | | | | | | | | | | |
| | | | | | | | | | | |
Invesco Private Government Fund | | | | | | | | | 454,874 | | | | | | | | | | 41,229,040 | | | | | (39,994,012 | ) | | | | - | | | | | - | | | | | | | | | | 1,689,902 | | | | | | | | | | 22,589 | * |
| | | | | | | | | | | |
Invesco Private Prime Fund | | | | | | | | | 1,061,374 | | | | | | | | | | 91,996,522 | | | | | (88,711,888 | ) | | | | 76 | | | | | (1,795 | ) | | | | | | | | | 4,344,289 | | | | | | | | | | 61,054 | * |
| | | | | | | | | | | | | | | | | | | | | | | | | | | | | | | | | | | | | | | | | | | | | | | | | | | | | | | |
| | | | | | | | | | | |
Total | | | | | | | | $ | 1,528,936 | | | | | | | | | $ | 136,386,370 | | | | $ | (131,879,396 | ) | | | $ | 76 | | | | $ | (1,795 | ) | | | | | | | | $ | 6,034,191 | | | | | | | | | $ | 84,296 | |
| | | | | | | | | | | | | | | | | | | | | | | | | | | | | | | | | | | | | | | | | | | | | | | | | | | | | | | |
| * | Represents the income earned on the investment of cash collateral, which is included in securities lending income on the Statements of Operations. Does not include rebates and fees paid to lending agent or premiums received from borrowers, if any. |
| (e) | The rate shown is the 7-day SEC standardized yield as of October 31, 2022. |
| (f) | The security has been segregated to satisfy the commitment to return the cash collateral received in securities lending transactions upon the borrower’s return of the securities loaned. See Note 2M. |
See accompanying Notes to Financial Statements which are an integral part of the financial statements.
Invesco Balanced Multi-Asset Allocation ETF (PSMB)
October 31, 2022
Schedule of Investments
Schedule of Investments in Affiliated Issuers- 102.43%(a)
| | | | | | | | | | | | | | | | | | | | | | | | | | | | | | | | | | | | |
| | | % of
Net
Assets
10/31/22 | | | Value
10/31/21 | | | Purchases
at Cost | | | Proceeds
from Sales | | | Change in
Unrealized
Appreciation
(Depreciation) | | | Realized
Gain
(Loss) | | | Dividend
Income | | | Shares
10/31/22 | | | Value
10/31/22 | |
Domestic Equity Funds-48.66% | | | | | | | | | | | | | | | | | | | | | | | | | | | | | | | | | | | | |
Invesco Preferred ETF(b) | | | 1.97% | | | $ | 431,891 | | | $ | 708,723 | | | $ | (238,386 | ) | | $ | (172,850 | ) | | $ | (15,247 | ) | | $ | 31,872 | | | | 63,648 | | | $ | 714,131 | |
Invesco RAFI™ Strategic US ETF | | | 11.77% | | | | 1,862,600 | | | | 4,285,666 | | | | (1,512,489 | ) | | | (576,054 | ) | | | 212,556 | | | | 55,183 | | | | 117,102 | | | | 4,272,279 | |
Invesco RAFI™ Strategic US Small Company ETF(b) | | | 3.09% | | | | 1,196,360 | | | | 1,368,517 | | | | (1,248,257 | ) | | | (260,151 | ) | | | 66,159 | | | | 10,521 | | | | 33,352 | | | | 1,122,628 | |
Invesco Russell 1000 Dynamic Multifactor ETF | | | 8.60% | | | | 1,630,133 | | | | 2,956,745 | | | | (1,104,152 | ) | | | (484,201 | ) | | | 123,557 | | | | 31,902 | | | | 72,708 | | | | 3,122,082 | |
Invesco S&P 500® Low Volatility ETF | | | 4.60% | | | | 986,309 | | | | 1,454,794 | | | | (686,680 | ) | | | (123,081 | ) | | | 40,207 | | | | 28,090 | | | | 27,074 | | | | 1,671,549 | |
Invesco S&P 500® Pure Growth ETF | | | 13.46% | | | | 1,951,231 | | | | 5,710,859 | | | | (1,811,169 | ) | | | (1,010,975 | ) | | | 47,832 | | | | 19,638 | | | | 31,350 | | | | 4,887,778 | |
Invesco S&P MidCap Low Volatility ETF(b) | | | 3.09% | | | | 1,088,133 | | | | 1,164,404 | | | | (1,070,843 | ) | | | (112,569 | ) | | | 52,199 | | | | 22,271 | | | | 21,322 | | | | 1,121,324 | |
Invesco S&P SmallCap Low Volatility ETF(b) | | | 2.08% | | | | 982,475 | | | | 900,201 | | | | (1,044,271 | ) | | | (124,672 | ) | | | 41,433 | | | | 22,304 | | | | 16,456 | | | | 755,166 | |
| | | | | | | | | | | | | | | | | | | | | | | | | | | | | | | | | | | | |
Total Domestic Equity Funds | | | | | | | 10,129,132 | | | | 18,549,909 | | | | (8,716,247 | ) | | | (2,864,553 | ) | | | 568,696 | | | | 221,781 | | | | | | | | 17,666,937 | |
| | | | | | | | | | | | | | | | | | | | | | | | | | | | | | | | | | | | |
Fixed Income Funds-37.33% | | | | | | | | | | | | | | | | | | | | | | | | | | | | | | | | | | | | |
Invesco 1-30 Laddered Treasury ETF | | | 11.86% | | | | 1,514,703 | | | | 5,008,597 | | | | (1,366,310 | ) | | | (740,329 | ) | | | (110,120 | ) | | | 52,302 | | | | 153,860 | | | | 4,306,541 | |
Invesco Emerging Markets Sovereign Debt ETF | | | 2.18% | | | | 216,350 | | | | 1,015,404 | | | | (203,175 | ) | | | (222,468 | ) | | | (16,831 | ) | | | 33,406 | | | | 46,786 | | | | 789,280 | |
Invesco Fundamental High Yield® Corporate Bond ETF | | | 3.95% | | | | 645,931 | | | | 1,456,968 | | | | (509,702 | ) | | | (132,769 | ) | | | (25,348 | ) | | | 36,918 | | | | 85,067 | | | | 1,435,080 | |
Invesco Investment Grade Defensive ETF | | | 1.86% | | | | 429,326 | | | | 625,705 | | | | (308,184 | ) | | | (58,543 | ) | | | (10,741 | ) | | | 8,449 | | | | 28,739 | | | | 674,361 | |
Invesco Investment Grade Value ETF | | | 0.99% | | | | 215,506 | | | | 332,620 | | | | (121,694 | ) | | | (62,186 | ) | | | (5,007 | ) | | | 7,806 | | | | 16,348 | | | | 357,531 | |
Invesco PureBetaSM 0-5 Yr US TIPS ETF | | | 3.90% | | | | 864,064 | | | | 1,296,120 | | | | (632,486 | ) | | | (102,229 | ) | | | (8,480 | ) | | | 67,024 | | | | 57,612 | | | | 1,416,679 | |
Invesco Senior Loan ETF | | | 2.45% | | | | 751,427 | | | | 913,611 | | | | (719,709 | ) | | | (42,141 | ) | | | (14,197 | ) | | | 32,428 | | | | 42,905 | | | | 888,991 | |
Invesco Taxable Municipal Bond ETF | | | 5.30% | | | | 2,706,663 | | | | 2,789,930 | | | | (2,830,292 | ) | | | (426,336 | ) | | | (314,324 | ) | | | 68,430 | | | | 77,553 | | | | 1,925,641 | |
Invesco Variable Rate Investment Grade ETF | | | 4.84% | | | | 860,156 | | | | 1,774,041 | | | | (840,102 | ) | | | (29,686 | ) | | | (5,770 | ) | | | 26,277 | | | | 71,635 | | | | 1,758,639 | |
| | | | | | | | | | | | | | | | | | | | | | | | | | | | | | | | | | | | |
Total Fixed Income Funds | | | | | | | 8,204,126 | | | | 15,212,996 | | | | (7,531,654 | ) | | | (1,816,687 | ) | | | (510,818 | ) | | | 333,040 | | | | | | | | 13,552,743 | |
| | | | | | | | | | | | | | | | | | | | | | | | | | | | | | | | | | | | |
Foreign Equity Funds-13.98% | | | | | | | | | | | | | | | | | | | | | | | | | | | | | | | | | | | | |
Invesco RAFI™ Strategic Developed ex-US ETF | | | 4.45% | | | | 1,185,074 | | | | 1,637,464 | | | | (874,248 | ) | | | (373,334 | ) | | | 46,568 | | | | 60,832 | | | | 65,342 | | | | 1,613,947 | |
Invesco RAFI™ Strategic Emerging Markets ETF(b) | | | 2.52% | | | | 621,274 | | | | 1,160,200 | | | | (482,259 | ) | | | (347,497 | ) | | | (37,145 | ) | | | 62,565 | | | | 49,383 | | | | 914,573 | |
Invesco S&P Emerging Markets Low Volatility ETF | | | 2.68% | | | | 645,051 | | | | 943,796 | | | | (466,058 | ) | | | (150,151 | ) | | | 1,432 | | | | 40,630 | | | | 45,496 | | | | 974,070 | |
Invesco S&P International Developed Low Volatility ETF(b) | | | 4.33% | | | | 981,203 | | | | 1,464,353 | | | | (520,777 | ) | | | (348,198 | ) | | | (3,714 | ) | | | 61,438 | | | | 63,142 | | | | 1,572,867 | |
| | | | | | | | | | | | | | | | | | | | | | | | | | | | | | | | | | | | |
Total Foreign Equity Funds | | | | | | | 3,432,602 | | | | 5,205,813 | | | | (2,343,342 | ) | | | (1,219,180 | ) | | | 7,141 | | | | 225,465 | | | | | | | | 5,075,457 | |
| | | | | | | | | | | | | | | | | | | | | | | | | | | | | | | | | | | | |
See accompanying Notes to Financial Statements which are an integral part of the financial statements.
Invesco Balanced Multi-Asset Allocation ETF (PSMB)–(continued)
October 31, 2022
Schedule of Investments in Affiliated Issuers- 102.43%(a)
| | | | | | | | | | | | | | | | | | | | | | | | | | | | | | | | | | | | |
| | | % of
Net
Assets
10/31/22 | | | Value
10/31/21 | | | Purchases
at Cost | | | Proceeds
from Sales | | | Change in
Unrealized
Appreciation
(Depreciation) | | | Realized
Gain
(Loss) | | | Dividend
Income | | | Shares
10/31/22 | | | Value
10/31/22 | |
Money Market Funds-0.00% | | | | | | | | | | | | | | | | | | | | | | | | | | | | | | | | | | | | |
Invesco Government & Agency Portfolio, Institutional Class, 3.07%(c) | | | 0.00% | | | $ | 125 | | | $ | 343,733 | | | $ | (342,654 | ) | | $ | - | | | $ | - | | | $ | 42 | | | | 1,204 | | | $ | 1,204 | |
| | | | | | | | | | | | | | | | | | | | | | | | | | | | | | | | | | | | |
TOTAL INVESTMENTS IN AFFILIATED ISSUERS (excluding investments purchased with cash collateral from securities on loan)-99.97%
(Cost $40,297,636) | | | 99.97% | | | | 21,765,985 | | | | 39,312,451 | | | | (18,933,897 | ) | | | (5,900,420 | ) | | | 65,019 | | | | 780,328 | | | | | | | | 36,296,341 | |
| | | | | | | | | | | | | | | | | | | | | | | | | | | | | | | | | | | | |
| | | | | | | | | |
| Investments Purchased with Cash Collateral from Securities on Loan | | | | | | | | | | | | | | | | | | | | | | | | | | | | | | | | | | | | |
Money Market Funds-2.46% | | | | | | | | | | | | | | | | | | | | | | | | | | | | | | | | | | | | |
Invesco Private Government Fund, 3.18%(c)(d) | | | 0.69% | | | | 557,164 | | | | 20,210,140 | | | | (20,517,258 | ) | | | - | | | | - | | | | 5,487 | * | | | 250,046 | | | | 250,046 | |
Invesco Private Prime Fund, 3.28%(c)(d) | | | 1.77% | | | | 1,313,309 | | | | 40,296,587 | | | | (40,966,362 | ) | | | 5 | | | | (380 | ) | | | 14,904 | * | | | 643,159 | | | | 643,159 | |
| | | | | | | | | | | | | | | | | | | | | | | | | | | | | | | | | | | | |
Total Investments Purchased with Cash Collateral from Securities on Loan
(Cost $893,200) | | | 2.46% | | | | 1,870,473 | | | | 60,506,727 | | | | (61,483,620 | ) | | | 5 | | | | (380 | ) | | | 20,391 | | | | | | | | 893,205 | |
| | | | | | | | | | | | | | | | | | | | | | | | | | | | | | | | | | | | |
TOTAL INVESTMENTS IN AFFILIATED ISSUERS (Cost $41,190,836) | | | 102.43% | | | $ | 23,636,458 | | | $ | 99,819,178 | | | $ | (80,417,517 | ) | | $ | (5,900,415 | ) | | $ | 64,639 | (e) | | $ | 800,719 | | | | | | | $ | 37,189,546 | |
| | | | | | | | | | | | | | | | | | | | | | | | | | | | | | | | | | | | |
| OTHER ASSETS LESS LIABILITIES | | | (2.43)% | | | | | | | | | | | | | | | | | | | | | | | | | | | | | | | | (882,401 | ) |
| | | | | | | | | | | | | | | | | | | | | | | | | | | | | | | | | | | | |
NET ASSETS | | | 100.00% | | | | | | | | | | | | | | | | | | | | | | | | | | | | | | | $ | 36,307,145 | |
| | | | | | | | | | | | | | | | | | | | | | | | | | | | | | | | | | | | |
Investment Abbreviations:
ETF-Exchange-Traded Fund
Notes to Schedule of Investments:
| (a) | Each underlying fund and the Fund are affiliated by either having the same investment adviser or an investment adviser under common control with the Fund’s investment adviser. |
| (b) | All or a portion of this security was out on loan at October 31, 2022. |
| (c) | The rate shown is the 7-day SEC standardized yield as of October 31, 2022. |
| (d) | The security has been segregated to satisfy the commitment to return the cash collateral received in securities lending transactions upon the borrower’s return of the securities loaned. See Note 2M. |
| (e) | Includes capital gains distributions from affiliated underlying funds as follows: |
| | | | | | | |
| Fund Name | | | | Capital Gain |
| | |
Invesco Investment Grade Defensive ETF | | | | | | | $3,202 |
| | |
Invesco Investment Grade Value ETF | | | | | | | 1,708 |
| | |
Invesco PureBetaSM 0-5 Yr US TIPS ETF | | | | | | | 310 |
| | |
Invesco RAFI™ Strategic Developed ex-US ETF | | | | | | | 7,577 |
| * | Represents the income earned on the investment of cash collateral, which is included in securities lending income on the Statements of Operations. Does not include rebates and fees paid to lending agent or premiums received from borrowers, if any. |
See accompanying Notes to Financial Statements which are an integral part of the financial statements.
Invesco Conservative Multi-Asset Allocation ETF (PSMC)
October 31, 2022
Schedule of Investments
Schedule of Investments in Affiliated Issuers- 108.80%(a)
| | | | | | | | | | | | | | | | | | | | | | | | | | | | | | | | | | | | |
| | | % of
Net
Assets
10/31/22 | | | Value
10/31/21 | | | Purchases
at Cost | | | Proceeds
from Sales | | | Change in
Unrealized
Appreciation
(Depreciation) | | | Realized
Gain
(Loss) | | | Dividend
Income | | | Shares
10/31/22 | | | Value
10/31/22 | |
Domestic Equity Funds-19.28% | | | | | | | | | | | | | | | | | | | | | | | | | | | | | | | | | | | | |
Invesco Preferred ETF(b) | | | 3.49% | | | $ | 555,215 | | | $ | 381,998 | | | $ | (357,824 | ) | | $ | (130,595 | ) | | $ | (29,491 | ) | | $ | 27,957 | | | | 37,371 | | | $ | 419,303 | |
Invesco RAFI™ Strategic US ETF | | | 2.86% | | | | 634,918 | | | | 372,934 | | | | (652,419 | ) | | | (36,444 | ) | | | 25,524 | | | | 9,481 | | | | 9,443 | | | | 344,513 | |
Invesco RAFI™ Strategic US Small Company ETF | | | 1.77% | | | | 210,252 | | | | 213,064 | | | | (173,540 | ) | | | (31,473 | ) | | | (4,865 | ) | | | 2,002 | | | | 6,341 | | | | 213,438 | |
Invesco Russell 1000 Dynamic Multifactor ETF | | | 3.07% | | | | 419,257 | | | | 303,184 | | | | (298,113 | ) | | | (52,282 | ) | | | (2,333 | ) | | | 5,267 | | | | 8,610 | | | | 369,713 | |
Invesco S&P 500® Low Volatility ETF | | | 3.11% | | | | 211,343 | | | | 439,488 | | | | (251,762 | ) | | | (40,334 | ) | | | 15,163 | | | | 7,082 | | | | 6,056 | | | | 373,898 | |
Invesco S&P 500® Pure Growth ETF | | | 4.98% | | | | 516,303 | | | | 742,628 | | | | (480,364 | ) | | | (161,226 | ) | | | (18,179 | ) | | | 2,775 | | | | 3,843 | | | | 599,162 | |
Invesco S&P SmallCap Low Volatility ETF | | | - | | | | 140,269 | | | | 69,179 | | | | (203,263 | ) | | | (7,634 | ) | | | 1,449 | | | | 1,177 | | | | - | | | | - | |
| | | | | | | | | | | | | | | | | | | | | | | | | | | | | | | | | | | | |
Total Domestic Equity Funds | | | | | | | 2,687,557 | | | | 2,522,475 | | | | (2,417,285 | ) | | | (459,988 | ) | | | (12,732 | ) | | | 55,741 | | | | | | | | 2,320,027 | |
| | | | | | | | | | | | | | | | | | | | | | | | | | | | | | | | | | | | |
Fixed Income Funds-76.01% | | | | | | | | | | | | | | | | | | | | | | | | | | | | | | | | | | | | |
Invesco 1-30 Laddered Treasury ETF | | | 13.51% | | | | 1,250,956 | | | | 1,770,176 | | | | (950,532 | ) | | | (406,448 | ) | | | (38,605 | ) | | | 27,416 | | | | 58,076 | | | | 1,625,547 | |
Invesco Emerging Markets Sovereign Debt ETF | | | 3.50% | | | | 208,634 | | | | 621,515 | | | | (241,774 | ) | | | (149,095 | ) | | | (17,969 | ) | | | 23,670 | | | | 24,974 | | | | 421,311 | |
Invesco Fundamental High Yield® Corporate Bond ETF | | | 13.00% | | | | 1,659,633 | | | | 1,140,189 | | | | (965,313 | ) | | | (233,741 | ) | | | (35,890 | ) | | | 60,400 | | | | 92,761 | | | | 1,564,878 | |
Invesco Investment Grade Defensive ETF(b) | | | 3.86% | | | | 551,533 | | | | 315,726 | | | | (332,016 | ) | | | (58,326 | ) | | | (8,430 | ) | | | 7,906 | | | | 19,793 | | | | 464,443 | |
Invesco Investment Grade Value ETF | | | 2.09% | | | | 276,865 | | | | 191,750 | | | | (149,340 | ) | | | (60,836 | ) | | | (4,340 | ) | | | 7,455 | | | | 11,520 | | | | 251,942 | |
Invesco PureBetaSM 0-5 Yr US TIPS ETF(b) | | | 6.67% | | | | 832,697 | | | | 633,284 | | | | (586,980 | ) | | | (68,880 | ) | | | (7,726 | ) | | | 48,269 | | | | 32,619 | | | | 802,101 | |
Invesco Senior Loan ETF | | | 5.21% | | | | 1,103,536 | | | | 603,349 | | | | (1,028,387 | ) | | | (32,375 | ) | | | (19,757 | ) | | | 33,148 | | | | 30,230 | | | | 626,366 | |
Invesco Taxable Municipal Bond ETF | | | 16.40% | | | | 2,505,807 | | | | 1,625,968 | | | | (1,427,705 | ) | | | (625,879 | ) | | | (103,982 | ) | | | 72,450 | | | | 79,509 | | | | 1,974,209 | |
Invesco Variable Rate Investment Grade ETF | | | 11.77% | | | | 2,141,055 | | | | 1,183,723 | | | | (1,867,942 | ) | | | (30,788 | ) | | | (9,906 | ) | | | 28,453 | | | | 57,684 | | | | 1,416,142 | |
| | | | | | | | | | | | | | | | | | | | | | | | | �� | | | | | | | | | | | |
Total Fixed Income Funds | | | | | | | 10,530,716 | | | | 8,085,680 | | | | (7,549,989 | ) | | | (1,666,368 | ) | | | (246,605 | ) | | | 309,167 | | | | | | | | 9,146,939 | |
| | | | | | | | | | | | | | | | | | | | | | | | | | | | | | | | | | | | |
Foreign Equity Funds-4.68% | | | | | | | | | | | | | | | | | | | | | | | | | | | | | | | | | | | | |
Invesco RAFI™ Strategic Developed ex-US ETF | | | 1.77% | | | | 276,946 | | | | 185,158 | | | | (193,934 | ) | | | (49,985 | ) | | | (3,482 | ) | | | 11,382 | | | | 8,622 | | | | 212,963 | |
Invesco RAFI™ Strategic Emerging Markets ETF | | | 1.05% | | | | 133,019 | | | | 145,887 | | | | (89,861 | ) | | | (60,417 | ) | | | (2,599 | ) | | | 10,821 | | | | 6,805 | | | | 126,029 | |
Invesco S&P International Developed Low Volatility ETF | | | 1.86% | | | | 280,126 | | | | 178,958 | | | | (174,222 | ) | | | (57,947 | ) | | | (2,476 | ) | | | 12,403 | | | | 9,010 | | | | 224,439 | |
| | | | | | | | | | | | | | | | | | | | | | | | | | | | | | | | | | | | |
Total Foreign Equity Funds | | | | | | | 690,091 | | | | 510,003 | | | | (458,017 | ) | | | (168,349 | ) | | | (8,557 | ) | | | 34,606 | | | | | | | | 563,431 | |
| | | | | | | | | | | | | | | | | | | | | | | | | | | | | | | | | | | | |
Money Market Funds-0.00% | | | | | | | | | | | | | | | | | | | | | | | | | | | | | | | | | | | | |
Invesco Government & Agency Portfolio, Institutional Class | | | - | | | | - | | | | 290,517 | | | | (290,517 | ) | | | - | | | | - | | | | 31 | | | | - | | | | - | |
| | | | | | | | | | | | | | | | | | | | | | | | | | | | | | | | | | | | |
TOTAL INVESTMENTS IN AFFILIATED ISSUERS (excluding investments purchased with cash collateral from securities on loan)-99.97%
(Cost $14,145,578) | | | 99.97% | | | | 13,908,364 | | | | 11,408,675 | | | | (10,715,808 | ) | | | (2,294,705 | ) | | | (267,894 | ) | | | 399,545 | | | | | | | | 12,030,397 | |
| | | | | | | | | | | | | | | | | | | | | | | | | | | | | | | | | | | | |
See accompanying Notes to Financial Statements which are an integral part of the financial statements.
Invesco Conservative Multi-Asset Allocation ETF (PSMC)–(continued)
October 31, 2022
Schedule of Investments in Affiliated Issuers- 108.80%(a)
| | | | | | | | | | | | | | | | | | | | | | | | | | | | | | | | | | | | |
| | | % of
Net
Assets
10/31/22 | | | Value
10/31/21 | | | Purchases
at Cost | | | Proceeds
from Sales | | | Change in
Unrealized
Appreciation
(Depreciation) | | | Realized
Gain
(Loss) | | | Dividend
Income | | | Shares
10/31/22 | | | Value
10/31/22 | |
| | | | | | | | | |
| Investments Purchased with Cash Collateral from Securities on Loan | | | | | | | | | | | | | | | | | | | | | | | | | | | | | | | | | | | | |
Money Market Funds-8.83% | | | | | | | | | | | | | | | | | | | | | | | | | | | | | | | | | | | | |
Invesco Private Government Fund, 3.18%(c)(d) | | | 2.47% | | | $ | 592,730 | | | $ | 9,586,994 | | | $ | (9,882,028 | ) | | $ | - | | | $ | - | | | $ | 3,840 | * | | | 297,696 | | | $ | 297,696 | |
Invesco Private Prime Fund, 3.28%(c)(d) | | | 6.36% | | | | 1,460,114 | | | | 20,558,933 | | | | (21,253,278 | ) | | | 8 | | | | (449 | ) | | | 10,963 | * | | | 765,328 | | | | 765,328 | |
| | | | | | | | | | | | | | | | | | | | | | | | | | | | | | | | | | | | |
Total Investments Purchased with Cash Collateral from Securities on Loan
(Cost $1,063,016) | | | 8.83% | | | | 2,052,844 | | | | 30,145,927 | | | | (31,135,306 | ) | | | 8 | | | | (449 | ) | | | 14,803 | | | | | | | | 1,063,024 | |
| | | | | | | | | | | | | | | | | | | | | | | | | | | | | | | | | | | | |
TOTAL INVESTMENTS IN AFFILIATED ISSUERS
(Cost $15,208,594) | | | 108.80% | | | $ | 15,961,208 | | | $ | 41,554,602 | | | $ | (41,851,114 | ) | | $ | (2,294,697 | ) | | $ | (268,343 | )(e) | | $ | 414,348 | | | | | | | $ | 13,093,421 | |
| | | | | | | | | | | | | | | | | | | | | | | | | | | | | | | | | | | | |
| OTHER ASSETS LESS LIABILITIES | | | (8.80)% | | | | | | | | | | | | | | | | | | | | | | | | | | | | | | | | (1,058,748 | ) |
| | | | | | | | | | | | | | | | | | | | | | | | | | | | | | | | | | | | |
NET ASSETS | | | 100.00% | | | | | | | | | | | | | | | | | | | | | | | | | | | | | | | $ | 12,034,673 | |
| | | | | | | | | | | | | | | | | | | | | | | | | | | | | | | | | | | | |
Investment Abbreviations:
ETF- Exchange- Traded Fund
Notes to Schedule of Investments:
| (a) | Each underlying fund and the Fund are affiliated by either having the same investment adviser or an investment adviser under common control with the Fund’s investment adviser. |
| (b) | All or a portion of this security was out on loan at October 31, 2022. |
| (c) | The rate shown is the 7-day SEC standardized yield as of October 31, 2022. |
| (d) | The security has been segregated to satisfy the commitment to return the cash collateral received in securities lending transactions upon the borrower’s return of the securities loaned. See Note 2M. |
| (e) | Includes capital gains distributions from affiliated underlying funds as follows: |
| | | | | | | |
| Fund Name | | | | Capital Gain |
| | |
Invesco Investment Grade Defensive ETF | | | | | | | $4,044 |
| | |
Invesco Investment Grade Value ETF | | | | | | | 2,157 |
| | |
Invesco PureBetaSM 0-5 Yr US TIPS ETF | | | | | | | 294 |
| | |
Invesco RAFI™ Strategic Developed ex-US ETF | | | | | | | 1,740 |
| * | Represents the income earned on the investment of cash collateral, which is included in securities lending income on the Statements of Operations. Does not include rebates and fees paid to lending agent or premiums received from borrowers, if any. |
See accompanying Notes to Financial Statements which are an integral part of the financial statements.
Invesco Growth Multi-Asset Allocation ETF (PSMG)
October 31, 2022
Schedule of Investments
Schedule of Investments in Affiliated Issuers- 101.88%(a)
| | | | | | | | | | | | | | | | | | | | | | | | | | | | | | | | | | | | |
| | | % of
Net
Assets
10/31/22 | | | Value
10/31/21 | | | Purchases
at Cost | | | Proceeds
from Sales | | | Change in
Unrealized
Appreciation
(Depreciation) | | | Realized
Gain
(Loss) | | | Dividend
Income | | | Shares
10/31/22 | | | Value
10/31/22 | |
Domestic Equity Funds-61.53% | | | | | | | | | | | | | | | | | | | | | | | | | | | | | | | | | | | | |
Invesco RAFI™ Strategic US ETF(b) | | | 14.95% | | | $ | 2,142,039 | | | $ | 3,275,197 | | | $ | (1,199,831 | ) | | $ | (470,512 | ) | | $ | 193,825 | | | $ | 52,632 | | | | 108,014 | | | $ | 3,940,718 | |
Invesco RAFI™ Strategic US Small Company ETF(b) | | | 4.44% | | | | 1,353,126 | | | | 1,081,988 | | | | (1,076,208 | ) | | | (243,794 | ) | | | 53,664 | | | | 10,797 | | | | 34,723 | | | | 1,168,776 | |
Invesco Russell 1000 Dynamic Multifactor ETF | | | 11.45% | | | | 1,834,940 | | | | 2,416,557 | | | | (912,686 | ) | | | (443,609 | ) | | | 121,805 | | | | 30,766 | | | | 70,261 | | | | 3,017,007 | |
Invesco S&P 500® Low Volatility ETF | | | 8.92% | | | | 1,168,713 | | | | 1,975,208 | | | | (677,982 | ) | | | (150,681 | ) | | | 35,184 | | | | 36,363 | | | | 38,070 | | | | 2,350,442 | |
Invesco S&P 500® Pure Growth ETF | | | 15.44% | | | | 2,345,926 | | | | 3,952,148 | | | | (1,332,618 | ) | | | (984,682 | ) | | | 89,101 | | | | 15,522 | | | | 26,104 | | | | 4,069,875 | |
Invesco S&P MidCap Low Volatility ETF | | | 3.66% | | | | 1,160,366 | | | | 820,600 | | | | (982,925 | ) | | | (88,093 | ) | | | 54,132 | | | | 20,166 | | | | 18,332 | | | | 964,080 | |
Invesco S&P SmallCap Low Volatility ETF | | | 2.67% | | | | 1,164,072 | | | | 723,737 | | | | (1,106,842 | ) | | | (106,508 | ) | | | 29,126 | | | | 21,960 | | | | 15,332 | | | | 703,585 | |
| | | | | | | | | | | | | | | | | | | | | | | | | | | | | | | | | | | | |
Total Domestic Equity Funds | | | | | | | 11,169,182 | | | | 14,245,435 | | | | (7,289,092 | ) | | | (2,487,879 | ) | | | 576,837 | | | | 188,206 | | | | | | | | 16,214,483 | |
| | | | | | | | | | | | | | | | | | | | | | | | | | | | | | | | | | | | |
Fixed Income Funds-19.65% | | | | | | | | | | | | | | | | | | | | | | | | | | | | | | | | | | | | |
Invesco 1-30 Laddered Treasury ETF | | | 8.90% | | | | 1,153,776 | | | | 2,439,933 | | | | (755,532 | ) | | | (425,498 | ) | | | (66,837 | ) | | | 29,523 | | | | 83,810 | | | | 2,345,842 | |
Invesco Fundamental High Yield® Corporate Bond ETF | | | 1.97% | | | | 191,347 | | | | 550,449 | | | | (173,371 | ) | | | (37,500 | ) | | | (12,173 | ) | | | 12,269 | | | | 30,750 | | | | 518,752 | |
Invesco Investment Grade Defensive ETF | | | 1.95% | | | | 190,759 | | | | 559,337 | | | | (194,634 | ) | | | (31,971 | ) | | | (7,826 | ) | | | 5,510 | | | | 21,917 | | | | 514,282 | |
Invesco Investment Grade Value ETF | | | - | | | | 191,497 | | | | 98,357 | | | | (264,070 | ) | | | (530 | ) | | | (23,779 | ) | | | 1,788 | | | | - | | | | - | |
Invesco PureBetaSM 0-5 Yr US TIPS ETF | | | 1.94% | | | | 383,927 | | | | 385,205 | | | | (217,812 | ) | | | (37,519 | ) | | | (1,334 | ) | | | 24,484 | | | | 20,835 | | | | 512,333 | |
Invesco Senior Loan ETF | | | 1.47% | | | | 381,587 | | | | 330,371 | | | | (300,626 | ) | | | (15,780 | ) | | | (8,378 | ) | | | 14,352 | | | | 18,686 | | | | 387,174 | |
Invesco Taxable Municipal Bond ETF | | | 1.48% | | | | 962,125 | | | | 682,027 | | | | (1,045,191 | ) | | | (83,466 | ) | | | (126,980 | ) | | | 18,368 | | | | 15,647 | | | | 388,515 | |
Invesco Variable Rate Investment Grade ETF | | | 1.94% | | | | 382,197 | | | | 381,358 | | | | (242,026 | ) | | | (11,307 | ) | | | 713 | | | | 7,763 | | | | 20,812 | | | | 510,935 | |
| | | | | | | | | | | | | | | | | | | | | | | | | | | | | | | | | | | | |
Total Fixed Income Funds | | | | | | | 3,837,215 | | | | 5,427,037 | | | | (3,193,262 | ) | | | (643,571 | ) | | | (246,594 | ) | | | 114,057 | | | | | | | | 5,177,833 | |
| | | | | | | | | | | | | | | | | | | | | | | | | | | | | | | | | | | | |
Foreign Equity Funds-18.82% | | | | | | | | | | | | | | | | | | | | | | | | | | | | | | | | | | | | |
Invesco RAFI™ Strategic Developed ex-US ETF(b) | | | 5.92% | | | | 1,436,092 | | | | 1,332,545 | | | | (890,806 | ) | | | (357,363 | ) | | | 48,879 | | | | 63,043 | | | | 63,175 | | | | 1,560,422 | |
Invesco RAFI™ Strategic Emerging Markets ETF(b) | | | 3.29% | | | | 736,142 | | | | 983,954 | | | | (477,863 | ) | | | (325,151 | ) | | | (49,679 | ) | | | 57,507 | | | | 46,836 | | | | 867,403 | |
Invesco S&P Emerging Markets Low Volatility ETF | | | 3.80% | | | | 859,851 | | | | 821,655 | | | | (547,652 | ) | | | (147,065 | ) | | | 13,272 | | | | 45,097 | | | | 46,710 | | | | 1,000,061 | |
Invesco S&P International Developed Low Volatility ETF | | | 5.81% | | | | 1,356,364 | | | | 1,255,702 | | | | (754,308 | ) | | | (291,256 | ) | | | (36,928 | ) | | | 63,680 | | | | 61,404 | | | | 1,529,574 | |
| | | | | | | | | | | | | | | | | | | | | | | | | | | | | | | | | | | | |
Total Foreign Equity Funds | | | | | | | 4,388,449 | | | | 4,393,856 | | | | (2,670,629 | ) | | | (1,120,835 | ) | | | (24,456 | ) | | | 229,327 | | | | | | | | 4,957,460 | |
| | | | | | | | | | | | | | | | | | | | | | | | | | | | | | | | | | | | |
Money Market Funds-0.00% | | | | | | | | | | | | | | | | | | | | | | | | | | | | | | | | | | | | |
Invesco Government & Agency Portfolio, Institutional Class | | | - | | | | - | | | | 211,576 | | | | (211,576 | ) | | | - | | | | - | | | | 25 | | | | - | | | | - | |
| | | | | | | | | | | | | | | | | | | | | | | | | | | | | | | | | | | | |
TOTAL INVESTMENTS IN AFFILIATED ISSUERS (excluding investments purchased with cash collateral from securities on loan)-100.00%
(Cost $28,365,228) | | | 100.00% | | | | 19,394,846 | | | | 24,277,904 | | | | (13,364,559 | ) | | | (4,252,285 | ) | | | 305,787 | | | | 531,615 | | | | | | | | 26,349,776 | |
| | | | | | | | | | | | | | | | | | | | | | | | | | | | | | | | | | | | |
See accompanying Notes to Financial Statements which are an integral part of the financial statements.
Invesco Growth Multi-Asset Allocation ETF (PSMG)–(continued)
October 31, 2022
Schedule of Investments in Affiliated Issuers- 101.88%(a)
| | | | | | | | | | | | | | | | | | | | | | | | | | | | | | | | | | | | |
| | | % of
Net
Assets
10/31/22 | | | Value
10/31/21 | | | Purchases
at Cost | | | Proceeds
from Sales | | | Change in
Unrealized
Appreciation
(Depreciation) | | | Realized
Gain
(Loss) | | | Dividend
Income | | | Shares
10/31/22 | | | Value
10/31/22 | |
| | | | | | | | | |
| Investments Purchased with Cash Collateral from Securities on Loan | | | | | | | | | | | | | | | | | | | | | | | | | | | | | | | | | | | | |
Money Market Funds-1.88% | | | | | | | | | | | | | | | | | | | | | | | | | | | | | | | | | | | | |
Invesco Private Government Fund, 3.18%(c)(d) | | | 0.56% | | | $ | 370,776 | | | $ | 13,661,253 | | | $ | (13,883,019 | ) | | $ | - | | | $ | - | | | $ | 2,928 | * | | | 149,010 | | | $ | 149,010 | |
Invesco Private Prime Fund, 3.28%(c)(d) | | | 1.32% | | | | 865,143 | | | | 30,609,255 | | | | (31,126,260 | ) | | | 33 | | | | (146 | ) | | | 8,285 | * | | | 348,025 | | | | 348,025 | |
| | | | | | | | | | | | | | | | | | | | | | | | | | | | | | | | | | | | |
Total Investments Purchased with Cash Collateral from Securities on Loan
(Cost $497,002) | | | 1.88% | | | | 1,235,919 | | | | 44,270,508 | | | | (45,009,279 | ) | | | 33 | | | | (146 | ) | | | 11,213 | | | | | | | | 497,035 | |
| | | | | | | | | | | | | | | | | | | | | | | | | | | | | | | | | | | | |
TOTAL INVESTMENTS IN AFFILIATED ISSUERS
(Cost $28,862,230) | | | 101.88% | | | $ | 20,630,765 | | | $ | 68,548,412 | | | $ | (58,373,838 | ) | | $ | (4,252,252 | ) | | $ | 305,641 | (e) | | $ | 542,828 | | | | | | | $ | 26,846,811 | |
| | | | | | | | | | | | | | | | | | | | | | | | | | | | | | | | | | | | |
| OTHER ASSETS LESS LIABILITIES | | | (1.88)% | | | | | | | | | | | | | | | | | | | | | | | | | | | | | | | | (496,049 | ) |
| | | | | | | | | | | | | | | | | | | | | | | | | | | | | | | | | | | | |
NET ASSETS | | | 100.00% | | | | | | | | | | | | | | | | | | | | | | | | | | | | | | | $ | 26,350,762 | |
| | | | | | | | | | | | | | | | | | | | | | | | | | | | | | | | | | | | |
Investment Abbreviations:
ETF-Exchange-Traded Fund
Notes to Schedule of Investments:
| (a) | Each underlying fund and the Fund are affiliated by either having the same investment adviser or an investment adviser under common control with the Fund’s investment adviser. |
| (b) | All or a portion of this security was out on loan at October 31, 2022. |
| (c) | The rate shown is the 7-day SEC standardized yield as of October 31, 2022. |
| (d) | The security has been segregated to satisfy the commitment to return the cash collateral received in securities lending transactions upon the borrower’s return of the securities loaned. See Note 2M. |
| (e) | Includes capital gains distributions from affiliated underlying funds as follows: |
| | | | | | | |
| Fund Name | | | | Capital Gain |
| | |
Invesco Investment Grade Defensive ETF | | | | | | | $1,383 |
| | |
Invesco Investment Grade Value ETF | | | | | | | 1,475 |
| | |
Invesco PureBetaSM 0-5 Yr US TIPS ETF | | | | | | | 134 |
| | |
Invesco RAFI™ Strategic Developed ex-US ETF | | | | | | | 8,925 |
| * | Represents the income earned on the investment of cash collateral, which is included in securities lending income on the Statements of Operations. Does not include rebates and fees paid to lending agent or premiums received from borrowers, if any. |
See accompanying Notes to Financial Statements which are an integral part of the financial statements.
Invesco High Yield Bond Factor ETF (IHYF)
October 31, 2022
Schedule of Investments(a)
| | | | | | | | |
| | | Principal
Amount | | | Value | |
U.S. Dollar Denominated Bonds & Notes-96.58% | |
Aerospace & Defense-1.97% | | | | | | | | |
Bombardier, Inc. (Canada), 7.50%, 03/15/2025(b) | | $ | 52,000 | | | $ | 51,688 | |
Howmet Aerospace, Inc. | | | | | | | | |
5.13%, 10/01/2024 | | | 51,000 | | | | 50,530 | |
6.88%, 05/01/2025(c) | | | 115,000 | | | | 117,248 | |
Rolls-Royce PLC (United Kingdom), 5.75%, 10/15/2027(b)(c) | | | 200,000 | | | | 181,268 | |
TransDigm, Inc., 6.25%, 03/15/2026(b) | | | 274,000 | | | | 270,185 | |
| | | | | | | | |
| | | | | | | 670,919 | |
| | | | | | | | |
Airlines-2.04% | | | | | | | | |
American Airlines Pass-Through Trust | | | | | | | | |
Series 16-1, Class A, 4.10%, 01/15/2028 | | | 26,431 | | | | 20,780 | |
Series 2014-1, Class A, 3.70%, 04/01/2028 | | | 11,515 | | | | 9,732 | |
American Airlines, Inc., 11.75%, 07/15/2025(b) | | | 127,000 | | | | 139,066 | |
American Airlines, Inc./AAdvantage Loyalty IP Ltd., 5.50%, 04/20/2026(b) | | | 140,000 | | | | 133,822 | |
Delta Air Lines, Inc., 7.38%, 01/15/2026(c) | | | 138,000 | | | | 141,104 | |
Hawaiian Brand Intellectual Property Ltd./HawaiianMiles Loyalty Ltd., 5.75%, 01/20/2026(b) | | | 102,000 | | | | 95,017 | |
United Airlines, Inc., 4.38%, 04/15/2026(b) | | | 169,000 | | | | 154,547 | |
| | | | | | | | |
| | | | | | | 694,068 | |
| | | | | | | | |
Alternative Carriers-0.83% | | | | | | | | |
Lumen Technologies, Inc. | | | | | | | | |
4.50%, 01/15/2029(b) | | | 51,000 | | | | 36,096 | |
Series P, 7.60%, 09/15/2039 | | | 177,000 | | | | 117,090 | |
Series U, 7.65%, 03/15/2042 | | | 75,000 | | | | 49,800 | |
Qwest Corp., 7.25%, 09/15/2025 | | | 77,000 | | | | 77,853 | |
| | | | | | | | |
| | | | | | | 280,839 | |
| | | | | | | | |
Aluminum-0.44% | | | | | | | | |
Kaiser Aluminum Corp., 4.50%, 06/01/2031(b) | | | 185,000 | | | | 148,659 | |
| | | | | | | | |
Apparel Retail-0.35% | | | | | | | | |
Foot Locker, Inc., 4.00%, 10/01/2029(b) | | | 67,000 | | | | 51,321 | |
Gap, Inc. (The), 3.63%, 10/01/2029(b) | | | 98,000 | | | | 69,247 | |
| | | | | | | | |
| | | | | | | 120,568 | |
| | | | | | | | |
Apparel, Accessories & Luxury Goods-1.00% | |
G-III Apparel Group Ltd., 7.88%, 08/15/2025(b) | | | 88,000 | | | | 83,506 | |
Hanesbrands, Inc., 4.88%, 05/15/2026(b) | | | 81,000 | | | | 74,175 | |
Macy’s Retail Holdings LLC, 6.13%, 03/15/2032(b) | | | 93,000 | | | | 77,542 | |
Under Armour, Inc., 3.25%, 06/15/2026 | | | 122,000 | | | | 105,261 | |
| | | | | | | | |
| | | | | | | 340,484 | |
| | | | | | | | |
Application Software-0.21% | | | | | | | | |
Open Text Corp. (Canada), 3.88%, 12/01/2029(b) | | | 91,000 | | | | 72,668 | |
| | | | | | | | |
Auto Parts & Equipment-1.54% | | | | | | | | |
Clarios Global L.P./Clarios US Finance Co., 8.50%, 05/15/2027(b) | | | 37,000 | | | | 36,492 | |
IHO Verwaltungs GmbH (Germany), 7.13% PIK Rate, 6.38% Cash Rate,
05/15/2029(b)(d) | | | 200,000 | | | | 171,614 | |
| | | | | | | | |
| | | Principal
Amount | | | Value | |
Auto Parts & Equipment-(continued) | | | | | | | | |
Patrick Industries, Inc., 4.75%, 05/01/2029(b) | | $ | 180,000 | | | $ | 136,185 | |
ZF North America Capital, Inc. (Germany), 4.75%, 04/29/2025(b) | | | 192,000 | | | | 179,920 | |
| | | | | | | | |
| | | | | | | 524,211 | |
| | | | | | | | |
Automobile Manufacturers-3.01% | | | | | | | | |
Ford Motor Credit Co. LLC | | | | | | | | |
4.06%, 11/01/2024 | | | 200,000 | | | | 191,687 | |
5.13%, 06/16/2025 | | | 200,000 | | | | 193,838 | |
4.13%, 08/04/2025 | | | 200,000 | | | | 186,474 | |
Jaguar Land Rover Automotive PLC (United Kingdom) | | | | | | | | |
7.75%, 10/15/2025(b) | | | 200,000 | | | | 184,960 | |
5.88%, 01/15/2028(b) | | | 216,000 | | | | 160,294 | |
PM General Purchaser LLC, 9.50%, 10/01/2028(b) | | | 123,000 | | | | 106,049 | |
| | | | | | | | |
| | | | | | | 1,023,302 | |
| | | | | | | | |
Automotive Retail-0.33% | | | | | | | | |
Penske Automotive Group, Inc., 3.50%, 09/01/2025(c) | | | 120,000 | | | | 111,713 | |
| | | | | | | | |
Biotechnology-0.15% | | | | | | | | |
Emergent BioSolutions, Inc., 3.88%, 08/15/2028(b) | | | 84,000 | | | | 50,431 | |
| | | | | | | | |
Broadcasting-1.92% | | | | | | | | |
AMC Networks, Inc. | | | | | | | | |
5.00%, 04/01/2024 | | | 55,000 | | | | 53,470 | |
4.75%, 08/01/2025 | | | 72,000 | | | | 65,976 | |
iHeartCommunications, Inc. | | | | | | | | |
6.38%, 05/01/2026 | | | 72,000 | | | | 68,799 | |
8.38%, 05/01/2027(c) | | | 45,000 | | | | 40,501 | |
Liberty Interactive LLC | | | | | | | | |
8.50%, 07/15/2029 | | | 155,000 | | | | 98,664 | |
8.25%, 02/01/2030 | | | 79,000 | | | | 48,709 | |
Paramount Global, 6.38%, 03/30/2062(e) | | | 118,000 | | | | 100,054 | |
TEGNA, Inc., 4.75%, 03/15/2026(b) | | | 50,000 | | | | 48,680 | |
Univision Communications, Inc., 5.13%, 02/15/2025(b) | | | 73,000 | | | | 70,657 | |
Urban One, Inc., 7.38%, 02/01/2028(b) | | | 67,000 | | | | 58,708 | |
| | | | | | | | |
| | | | | | | 654,218 | |
| | | | | | | | |
Building Products-2.16% | | | | | | | | |
Builders FirstSource, Inc., 4.25%, 02/01/2032(b) | | | 194,000 | | | | 155,566 | |
Cornerstone Building Brands, Inc., 6.13%, 01/15/2029(b) | | | 89,000 | | | | 55,375 | |
Masonite International Corp. | | | | | | | | |
5.38%, 02/01/2028(b) | | | 100,000 | | | | 91,689 | |
3.50%, 02/15/2030(b) | | | 90,000 | | | | 71,653 | |
Standard Industries, Inc. | | | | | | | | |
5.00%, 02/15/2027(b) | | | 156,000 | | | | 141,524 | |
4.75%, 01/15/2028(b) | | | 80,000 | | | | 70,297 | |
4.38%, 07/15/2030(b) | | | 108,000 | | | | 87,951 | |
3.38%, 01/15/2031(b) | | | 81,000 | | | | 60,798 | |
| | | | | | | | |
| | | | | | | 734,853 | |
| | | | | | | | |
See accompanying Notes to Financial Statements which are an integral part of the financial statements.
Invesco High Yield Bond Factor ETF (IHYF)–(continued)
October 31, 2022
| | | | | | | | |
| | | Principal
Amount | | | Value | |
Cable & Satellite-5.65% | | | | | | | | |
Altice Financing S.A. (Luxembourg), 5.75%, 08/15/2029(b) | | $ | 200,000 | | | $ | 158,431 | |
CCO Holdings LLC/CCO Holdings Capital Corp., 5.50%, 05/01/2026(b) | | | 88,000 | | | | 84,820 | |
CSC Holdings LLC | | | | | | | | |
5.25%, 06/01/2024(c) | | | 69,000 | | | | 67,003 | |
6.50%, 02/01/2029(b) | | | 200,000 | | | | 188,823 | |
5.75%, 01/15/2030(b) | | | 200,000 | | | | 155,067 | |
4.63%, 12/01/2030(b) | | | 200,000 | | | | 144,334 | |
DIRECTV Financing LLC/DIRECTV Financing Co-Obligor, Inc., 5.88%, 08/15/2027(b) | | | 334,000 | | | | 301,428 | |
DISH DBS Corp. | | | | | | | | |
7.38%, 07/01/2028 | | | 176,000 | | | | 134,233 | |
5.75%, 12/01/2028(b) | | | 166,000 | | | | 134,485 | |
5.13%, 06/01/2029 | | | 119,000 | | | | 80,262 | |
LCPR Senior Secured Financing DAC, 6.75%, 10/15/2027(b) | | | 200,000 | | | | 186,756 | |
Radiate Holdco LLC/Radiate Finance, Inc., 6.50%, 09/15/2028(b) | | | 40,000 | | | | 25,297 | |
Telenet Finance Luxembourg Notes S.a r.l. (Belgium), 5.50%, 03/01/2028(b) | | | 200,000 | | | | 175,720 | |
Telesat Canada/Telesat LLC (Canada), 5.63%, 12/06/2026(b) | | | 180,000 | | | | 85,236 | |
| | | | | | | | |
| | | | | | | 1,921,895 | |
| | | | | | | | |
Casinos & Gaming-3.64% | | | | | | | | |
Affinity Gaming, 6.88%, 12/15/2027(b) | | | 187,000 | | | | 156,359 | |
Caesars Entertainment, Inc. | | | | | | | | |
8.13%, 07/01/2027(b) | | | 101,000 | | | | 98,400 | |
4.63%, 10/15/2029(b) | | | 45,000 | | | | 35,991 | |
Caesars Resort Collection LLC/CRC Finco, Inc., 5.75%, 07/01/2025(b)(c) | | | 193,000 | | | | 188,778 | |
Las Vegas Sands Corp., 2.90%, 06/25/2025(c) | | | 200,000 | | | | 181,317 | |
Melco Resorts Finance Ltd. (Hong Kong), 5.75%, 07/21/2028(b) | | | 200,000 | | | | 116,000 | |
MGM Resorts International, 6.75%, 05/01/2025 | | | 36,000 | | | | 35,682 | |
Premier Entertainment Sub LLC/Premier Entertainment Finance Corp., 5.88%, 09/01/2031(b) | | | 234,000 | | | | 166,486 | |
Sabre GLBL, Inc. | | | | | | | | |
9.25%, 04/15/2025(b) | | | 154,000 | | | | 149,402 | |
7.38%, 09/01/2025(b) | | | 117,000 | | | | 109,660 | |
| | | | | | | | |
| | | | | | | 1,238,075 | |
| | | | | | | | |
Commodity Chemicals-0.62% | | | | | | | | |
Koppers, Inc., 6.00%, 02/15/2025(b) | | | 112,000 | | | | 100,385 | |
Methanex Corp. (Canada), 5.25%, 12/15/2029(c) | | | 127,000 | | | | 109,339 | |
| | | | | | | | |
| | | | | | | 209,724 | |
| | | | | | | | |
Communications Equipment-0.68% | | | | | | | | |
CommScope Technologies LLC, 6.00%, 06/15/2025(b)(c) | | | 40,000 | | | | 37,395 | |
Hughes Satellite Systems Corp., 6.63%, 08/01/2026(c) | | | 79,000 | | | | 74,627 | |
Viasat, Inc., 5.63%, 09/15/2025(b) | | | 130,000 | | | | 120,068 | |
| | | | | | | | |
| | | | | | | 232,090 | |
| | | | | | | | |
| | | | | | | | |
| | | Principal
Amount | | | Value | |
Construction & Engineering-0.42% | | | | | | | | |
Arcosa, Inc., 4.38%, 04/15/2029(b) | | $ | 120,000 | | | $ | 103,628 | |
Artera Services LLC, 9.03%, 12/04/2025(b) | | | 46,000 | | | | 38,546 | |
| | | | | | | | |
| | | | | | | 142,174 | |
| | | | | | | | |
Construction Machinery & Heavy Trucks-0.39% | |
Manitowoc Co., Inc. (The), 9.00%, 04/01/2026(b) | | | 40,000 | | | | 36,438 | |
Trinity Industries, Inc., 4.55%, 10/01/2024 | | | 100,000 | | | | 94,636 | |
| | | | | | | | |
| | | | | | | 131,074 | |
| | | | | | | | |
Construction Materials-0.39% | | | | | | | | |
Camelot Return Merger Sub, Inc., 8.75%, 08/01/2028(b) | | | 70,000 | | | | 58,450 | |
Eco Material Technologies, Inc., 7.88%, 01/31/2027(b) | | | 78,000 | | | | 73,010 | |
| | | | | | | | |
| | | | | | | 131,460 | |
| | | | | | | | |
Consumer Finance-2.84% | | | | | | | | |
Ally Financial, Inc., 5.75%, 11/20/2025 | | | 92,000 | | | | 89,035 | |
ASG Finance Designated Activity Co. (Cyprus), 7.88%, 12/03/2024(b) | | | 200,000 | | | | 188,900 | |
Credit Acceptance Corp., 5.13%, 12/31/2024(b) | | | 80,000 | | | | 75,287 | |
Navient Corp. | | | | | | | | |
6.13%, 03/25/2024 | | | 163,000 | | | | 160,295 | |
5.88%, 10/25/2024 | | | 77,000 | | | | 74,985 | |
5.00%, 03/15/2027(c) | | | 153,000 | | | | 129,276 | |
5.63%, 08/01/2033 | | | 62,000 | | | | 43,834 | |
OneMain Finance Corp., 6.88%, 03/15/2025 | | | 72,000 | | | | 70,064 | |
PRA Group, Inc., 7.38%, 09/01/2025(b) | | | 140,000 | | | | 134,300 | |
| | | | | | | | |
| | | | | | | 965,976 | |
| | | | | | | | |
Department Stores-0.42% | | | | | | | | |
Nordstrom, Inc. | | | | | | | | |
4.38%, 04/01/2030 | | | 94,000 | | | | 72,294 | |
4.25%, 08/01/2031 | | | 96,000 | | | | 69,838 | |
| | | | | | | | |
| | | | | | | 142,132 | |
| | | | | | | | |
Diversified Banks-0.98% | | | | | | | | |
Commerzbank AG (Germany), 8.13%, 09/19/2023(b) | | | 200,000 | | | | 199,336 | |
Intesa Sanpaolo S.p.A. (Italy), 4.20%, 06/01/2032(b)(e) | | | 200,000 | | | | 135,468 | |
| | | | | | | | |
| | | | | | | 334,804 | |
| | | | | | | | |
Diversified Capital Markets-0.40% | | | | | | | | |
Deutsche Bank AG (Germany), 3.74%, 01/07/2033(e) | | | 200,000 | | | | 136,304 | |
| | | | | | | | |
Diversified Chemicals-0.13% | | | | | | | | |
Trinseo Materials Operating S.C.A./Trinseo Materials Finance, Inc., 5.13%, 04/01/2029(b) | | | 78,000 | | | | 44,378 | |
| | | | | | | | |
Diversified Metals & Mining-0.68% | | | | | | | | |
Mineral Resources Ltd. (Australia) | | | | | | | | |
8.13%, 05/01/2027(b) | | | 86,000 | | | | 85,756 | |
8.50%, 05/01/2030(b) | | | 148,000 | | | | 145,985 | |
| | | | | | | | |
| | | | | | | 231,741 | |
| | | | | | | | |
Diversified Real Estate Activities-0.12% | | | | | | | | |
Five Point Operating Co. L.P./Five Point Capital Corp., 7.88%, 11/15/2025(b) | | | 51,000 | | | | 42,215 | |
| | | | | | | | |
See accompanying Notes to Financial Statements which are an integral part of the financial statements.
Invesco High Yield Bond Factor ETF (IHYF)–(continued)
October 31, 2022
| | | | | | | | |
| | | Principal
Amount | | | Value | |
Diversified REITs-0.33% | | | | | | | | |
Uniti Group L.P./Uniti Fiber Holdings, Inc./CSL Capital LLC, 7.88%, 02/15/2025(b) | | $ | 113,000 | | | $ | 112,270 | |
| | | | | | | | |
Diversified Support Services-0.20% | | | | | | | | |
MPH Acquisition Holdings LLC, 5.75%, 11/01/2028(b) | | | 87,000 | | | | 67,452 | |
| | | | | | | | |
Drug Retail-0.31% | | | | | | | | |
Rite Aid Corp., 8.00%, 11/15/2026(b) | | | 160,000 | | | | 104,072 | |
| | | | | | | | |
Education Services-0.33% | | | | | | | | |
Grand Canyon University, 4.13%, 10/01/2024 | | | 118,000 | | | | 110,625 | |
| | | | | | | | |
Electric Utilities-1.21% | | | | | | | | |
Drax Finco PLC (United Kingdom), 6.63%, 11/01/2025(b) | | | 200,000 | | | | 186,273 | |
Midland Cogeneration Venture L.P., 6.00%, 03/15/2025(b) | | | 70,650 | | | | 71,710 | |
Talen Energy Supply LLC, 7.25%, 05/15/2027(b)(f)(g) | | | 152,000 | | | | 154,533 | |
| | | | | | | | |
| | | | | | | 412,516 | |
| | | | | | | | |
Electrical Components & Equipment-0.65% | | | | | | | | |
Sensata Technologies B.V., 5.00%, 10/01/2025(b) | | | 109,000 | | | | 106,029 | |
WESCO Distribution, Inc., 7.13%, 06/15/2025(b) | | | 114,000 | | | | 115,282 | |
| | | | | | | | |
| | | | | | | 221,311 | |
| | | | | | | | |
Electronic Components-0.38% | | | | | | | | |
Likewize Corp., 9.75%, 10/15/2025(b) | | | 141,000 | | | | 127,771 | |
| | | | | | | | |
Environmental & Facilities Services-0.83% | | | | | | | | |
GFL Environmental, Inc. (Canada), 4.25%, 06/01/2025(b) | | | 267,000 | | | | 255,287 | |
Stericycle, Inc., 5.38%, 07/15/2024(b) | | | 28,000 | | | | 27,642 | |
| | | | | | | | |
| | | | | | | 282,929 | |
| | | | | | | | |
Financial Exchanges & Data-0.75% | | | | | | | | |
Coinbase Global, Inc. | | | | | | | | |
3.38%, 10/01/2028(b) | | | 189,000 | | | | 124,108 | |
3.63%, 10/01/2031(b) | | | 219,000 | | | | 130,189 | |
| | | | | | | | |
| | | | | | | 254,297 | |
| | | | | | | | |
Food Distributors-0.63% | | | | | | | | |
C&S Group Enterprises LLC, 5.00%, 12/15/2028(b) | | | 224,000 | | | | 165,914 | |
US Foods, Inc., 6.25%, 04/15/2025(b) | | | 50,000 | | | | 49,828 | |
| | | | | | | | |
| | | | | | | 215,742 | |
| | | | | | | | |
Food Retail-0.17% | | | | | | | | |
Albertson’s Cos., Inc./Safeway, Inc./New Albertson’s L.P./Albertson’s LLC, 4.63%, 01/15/2027(b) | | | 64,000 | | | | 59,415 | |
| | | | | | | | |
Footwear-0.41% | | | | | | | | |
Abercrombie & Fitch Management Co., 8.75%, 07/15/2025(b) | | | 147,000 | | | | 138,626 | |
| | | | | | | | |
Gas Utilities-1.44% | | | | | | | | |
AmeriGas Partners L.P./AmeriGas Finance Corp. | | | | | | | | |
5.63%, 05/20/2024 | | | 122,000 | | | | 119,487 | |
5.88%, 08/20/2026 | | | 60,000 | | | | 56,290 | |
5.75%, 05/20/2027 | | | 114,000 | | | | 105,289 | |
| | | | | | | | |
| | | Principal
Amount | | | Value | |
Gas Utilities-(continued) | | | | | | | | |
Crescent Energy Finance LLC, 7.25%, 05/01/2026(b) | | $ | 157,000 | | | $ | 145,987 | |
Ferrellgas L.P./Ferrellgas Finance Corp., 5.88%, 04/01/2029(b) | | | 75,000 | | | | 63,033 | |
| | | | | | | | |
| | | | | | | 490,086 | |
| | | | | | | | |
Health Care Equipment-0.28% | | | | | | | | |
Varex Imaging Corp., 7.88%, 10/15/2027(b) | | | 96,000 | | | | 93,832 | |
| | | | | | | | |
Health Care Facilities-0.63% | | | | | | | | |
RegionalCare Hospital Partners Holdings, Inc./LifePoint Health, Inc., 9.75%, 12/01/2026(b) | | | 26,000 | | | | 20,818 | |
Tenet Healthcare Corp., 4.88%, 01/01/2026(b) | | | 204,000 | | | | 192,659 | |
| | | | | | | | |
| | | | | | | 213,477 | |
| | | | | | | | |
Health Care REITs-0.54% | | | | | | | | |
Diversified Healthcare Trust | | | | | | | | |
4.75%, 05/01/2024 | | | 92,000 | | | | 78,957 | |
9.75%, 06/15/2025 | | | 73,000 | | | | 68,945 | |
4.75%, 02/15/2028 | | | 52,000 | | | | 35,179 | |
| | | | | | | | |
| | | | | | | 183,081 | |
| | | | | | | | |
Health Care Services-2.41% | | | | | | | | |
Akumin, Inc., 7.00%, 11/01/2025(b) | | | 155,000 | | | | 125,599 | |
Community Health Systems, Inc. | | | | | | | | |
8.00%, 03/15/2026(b) | | | 270,000 | | | | 233,400 | |
6.88%, 04/15/2029(b) | | | 102,000 | | | | 41,293 | |
6.13%, 04/01/2030(b) | | | 84,000 | | | | 34,647 | |
5.25%, 05/15/2030(b) | | | 196,000 | | | | 136,111 | |
Global Medical Response, Inc., 6.50%, 10/01/2025(b) | | | 10,000 | | | | 7,973 | |
Prime Healthcare Services, Inc., 7.25%, 11/01/2025(b) | | | 75,000 | | | | 65,539 | |
US Acute Care Solutions LLC, 6.38%, 03/01/2026(b) | | | 192,000 | | | | 174,548 | |
| | | | | | | | |
| | | | | | | 819,110 | |
| | | | | | | | |
Health Care Technology-0.31% | | | | | | | | |
AthenaHealth Group, Inc., 6.50%, 02/15/2030(b) | | | 135,000 | | | | 105,370 | |
| | | | | | | | |
Home Furnishings-0.84% | | | | | | | | |
Tempur Sealy International, Inc. | | | | | | | | |
4.00%, 04/15/2029(b)(c) | | | 179,000 | | | | 144,385 | |
3.88%, 10/15/2031(b) | | | 187,000 | | | | 140,798 | |
| | | | | | | | |
| | | | | | | 285,183 | |
| | | | | | | | |
Home Improvement Retail-0.61% | | | | | | | | |
JELD-WEN, Inc. | | | | | | | | |
4.63%, 12/15/2025(b) | | | 81,000 | | | | 66,972 | |
4.88%, 12/15/2027(b)(c) | | | 60,000 | | | | 44,843 | |
Specialty Building Products Holdings LLC/SBP Finance Corp., 6.38%, 09/30/2026(b) | | | 117,000 | | | | 94,299 | |
| | | | | | | | |
| | | | | | | 206,114 | |
| | | | | | | | |
Homebuilding-1.76% | | | | | | | | |
Beazer Homes USA, Inc., 5.88%, 10/15/2027(c) | | | 126,000 | | | | 105,350 | |
Century Communities, Inc., 6.75%, 06/01/2027 | | | 107,000 | | | | 102,323 | |
LGI Homes, Inc., 4.00%, 07/15/2029(b) | | | 202,000 | | | | 155,218 | |
See accompanying Notes to Financial Statements which are an integral part of the financial statements.
Invesco High Yield Bond Factor ETF (IHYF)–(continued)
October 31, 2022
| | | | | | | | |
| | | Principal
Amount | | | Value | |
Homebuilding-(continued) | | | | | | | | |
New Home Co., Inc. (The), 7.25%, 10/15/2025(b) | | $ | 80,000 | | | $ | 62,244 | |
Taylor Morrison Communities, Inc., 5.75%, 01/15/2028(b) | | | 80,000 | | | | 73,431 | |
Tri Pointe Homes, Inc., 5.25%, 06/01/2027 | | | 118,000 | | | | 101,740 | |
| | | | | | | | |
| | | | | | | 600,306 | |
| | | | | | | | |
Homefurnishing Retail-0.06% | | | | | | | | |
Bed Bath & Beyond, Inc., 3.75%, 08/01/2024 | | | 97,000 | | | | 20,213 | |
| | | | | | | | |
Hotel & Resort REITs-1.30% | | | | | | | | |
Service Properties Trust | | | | | | | | |
4.65%, 03/15/2024 | | | 108,000 | | | | 101,855 | |
4.35%, 10/01/2024 | | | 138,000 | | | | 126,797 | |
4.50%, 03/15/2025 | | | 57,000 | | | | 50,519 | |
4.75%, 10/01/2026 | | | 150,000 | | | | 122,400 | |
4.95%, 02/15/2027 | | | 49,000 | | | | 39,740 | |
| | | | | | | | |
| | | | | | | 441,311 | |
| | | | | | | | |
Hotels, Resorts & Cruise Lines-3.56% | | | | | | | | |
Carnival Corp. | | | | | | | | |
10.50%, 02/01/2026(b) | | | 107,000 | | | | 105,020 | |
5.75%, 03/01/2027(b) | | | 282,000 | | | | 196,502 | |
Carnival Holdings Bermuda Ltd., 10.38%, 05/01/2028(b) | | | 125,000 | | | | 127,062 | |
Royal Caribbean Cruises Ltd. | | | | | | | | |
11.50%, 06/01/2025(b) | | | 189,000 | | | | 203,784 | |
11.63%, 08/15/2027(b) | | | 99,000 | | | | 96,424 | |
5.50%, 04/01/2028(b) | | | 138,000 | | | | 106,660 | |
Six Flags Theme Parks, Inc., 7.00%, 07/01/2025(b)(c) | | | 66,000 | | | | 66,739 | |
Travel + Leisure Co., Series J, 6.00%, 04/01/2027 | | | 188,000 | | | | 174,611 | |
VOC Escrow Ltd., 5.00%, 02/15/2028(b) | | | 163,000 | | | | 134,620 | |
| | | | | | | | |
| | | | | | | 1,211,422 | |
| | | | | | | | |
Housewares & Specialties-0.50% | | | | | | | | |
Newell Brands, Inc., 4.45%, 04/01/2026 | | | 183,000 | | | | 170,573 | |
| | | | | | | | |
Independent Power Producers & Energy Traders-0.41% | |
EnfraGen Energia Sur S.A./EnfraGen Spain S.A./Prime Energia S.p.A. (Colombia), 5.38%, 12/30/2030(b) | | | 270,000 | | | | 138,360 | |
| | | | | | | | |
Industrial Machinery-0.33% | | | | | | | | |
CD&R Smokey Buyer, Inc., 6.75%, 07/15/2025(b) | | | 57,000 | | | | 54,471 | |
JPW Industries Holding Corp., 9.00%, 10/01/2024(b) | | | 65,000 | | | | 56,307 | |
| | | | | | | | |
| | | | | | | 110,778 | |
| | | | | | | | |
Insurance Brokers-0.41% | | | | | | | | |
Alliant Holdings Intermediate LLC/Alliant Holdings Co-Issuer, 6.75%, 10/15/2027(b) | | | 50,000 | | | | 45,680 | |
HUB International Ltd., 7.00%, 05/01/2026(b) | | | 96,000 | | | | 94,977 | |
| | | | | | | | |
| | | | | | | 140,657 | |
| | | | | | | | |
Integrated Oil & Gas-0.78% | | | | | | | | |
Occidental Petroleum Corp. | | | | | | | | |
5.88%, 09/01/2025(c) | | | 134,000 | | | | 135,168 | |
5.55%, 03/15/2026 | | | 129,000 | | | | 131,118 | |
| | | | | | | | |
| | | | | | | 266,286 | |
| | | | | | | | |
| | | | | | | | |
| | | Principal
Amount | | | Value | |
Integrated Telecommunication Services-2.87% | |
Connect Finco S.a.r.l./Connect US Finco LLC (United Kingdom), 6.75%, 10/01/2026(b) | | $ | 200,000 | | | $ | 188,330 | |
Consolidated Communications, Inc., 6.50%, 10/01/2028(b) | | | 53,000 | | | | 43,741 | |
Embarq Corp., 8.00%, 06/01/2036 | | | 217,000 | | | | 88,469 | |
Frontier North, Inc., Series G, 6.73%, 02/15/2028 | | | 154,000 | | | | 141,806 | |
Ligado Networks LLC, 15.50% PIK Rate, 0.00% Cash Rate, 11/01/2023(b)(d) | | | 33,883 | | | | 14,188 | |
Telecom Italia Capital S.A. (Italy), 7.20%, 07/18/2036 | | | 177,000 | | | | 138,278 | |
Telecom Italia S.p.A. (Italy), 5.30%, 05/30/2024(b) | | | 200,000 | | | | 188,500 | |
Windstream Escrow LLC/Windstream Escrow Finance Corp., 7.75%, 08/15/2028(b)(c) | | | 198,000 | | | | 171,879 | |
| | | | | | | | |
| | | | | | | 975,191 | |
| | | | | | | | |
Interactive Media & Services-0.48% | | | | | | | | |
Diamond Sports Group LLC/Diamond Sports Finance Co., 5.38%, 08/15/2026(b) | | | 101,000 | | | | 9,469 | |
TripAdvisor, Inc., 7.00%, 07/15/2025(b) | | | 157,000 | | | | 155,387 | |
| | | | | | | | |
| | | | | | | 164,856 | |
| | | | | | | | |
Internet & Direct Marketing Retail-0.88% | | | | | | | | |
Macy’s Retail Holdings LLC, 5.88%, 04/01/2029(b) | | | 121,000 | | | | 104,841 | |
Photo Holdings Merger Sub, Inc., 8.50%, 10/01/2026(b) | | | 79,000 | | | | 52,174 | |
QVC, Inc. | | | | | | | | |
4.75%, 02/15/2027 | | | 125,000 | | | | 100,143 | |
5.45%, 08/15/2034 | | | 68,000 | | | | 43,029 | |
| | | | | | | | |
| | | | | | | 300,187 | |
| | | | | | | | |
Internet Services & Infrastructure-0.39% | | | | | | | | |
Cogent Communications Group, Inc., 3.50%, 05/01/2026(b) | | | 43,000 | | | | 38,681 | |
Condor Merger Sub, Inc., 7.38%, 02/15/2030(b) | | | 114,000 | | | | 94,475 | |
| | | | | | | | |
| | | | | | | 133,156 | |
| | | | | | | | |
Investment Banking & Brokerage-0.51% | | | | | | | | |
FS Energy and Power Fund, 7.50%, 08/15/2023(b) | | | 47,000 | | | | 47,197 | |
NFP Corp., 6.88%, 08/15/2028(b) | | | 119,000 | | | | 101,522 | |
StoneX Group, Inc., 8.63%, 06/15/2025(b) | | | 26,000 | | | | 25,642 | |
| | | | | | | | |
| | | | | | | 174,361 | |
| | | | | | | | |
Leisure Facilities-0.53% | | | | | | | | |
Cedar Fair L.P./Canada’s Wonderland Co./Magnum Management Corp., 5.50%, 05/01/2025(b) | | | 110,000 | | | | 109,312 | |
Vail Resorts, Inc., 6.25%, 05/15/2025(b) | | | 70,000 | | | | 69,814 | |
| | | | | | | | |
| | | | | | | 179,126 | |
| | | | | | | | |
Marine-0.57% | | | | | | | | |
NCL Corp. Ltd., 5.88%, 03/15/2026(b) | | | 161,000 | | | | 132,154 | |
Seaspan Corp. (Hong Kong), 5.50%, 08/01/2029(b) | | | 81,000 | | | | 62,592 | |
| | | | | | | | |
| | | | | | | 194,746 | |
| | | | | | | | |
See accompanying Notes to Financial Statements which are an integral part of the financial statements.
Invesco High Yield Bond Factor ETF (IHYF)–(continued)
October 31, 2022
| | | | | | | | |
| | | Principal
Amount | | | Value | |
Metal & Glass Containers-1.03% | | | | | | | | |
Ardagh Packaging Finance PLC/Ardagh Holdings USA, Inc., 5.25%, 04/30/2025(b) | | $ | 200,000 | | | $ | 189,045 | |
Ball Corp., 4.88%, 03/15/2026 | | | 73,000 | | | | 70,239 | |
Intelligent Packaging Ltd. Finco, Inc./Intelligent Packaging Ltd. Co-Issuer LLC (Canada), 6.00%, 09/15/2028(b) | | | 49,000 | | | | 36,601 | |
Mauser Packaging Solutions Holding Co. | | | | | | | | |
8.50%, 04/15/2024(b) | | | 30,000 | | | | 28,948 | |
7.25%, 04/15/2025(b) | | | 28,000 | | | | 25,244 | |
| | | | | | | | |
| | | | | | | 350,077 | |
| | | | | | | | |
Mortgage REITs-0.70% | | | | | | | | |
Ladder Capital Finance Holdings LLLP/Ladder Capital Finance Corp., 5.25%, 10/01/2025(b) | | | 82,000 | | | | 75,722 | |
Rithm Capital Corp., 6.25%, 10/15/2025(b) | | | 115,000 | | | | 100,240 | |
Starwood Property Trust, Inc., 5.50%, 11/01/2023(b) | | | 63,000 | | | | 62,284 | |
| | | | | | | | |
| | | | | | | 238,246 | |
| | | | | | | | |
Movies & Entertainment-1.19% | | | | | | | | |
Banijay Entertainment S.A.S.U. (France), 5.38%, 03/01/2025(b) | | | 200,000 | | | | 185,622 | |
Cinemark USA, Inc., 8.75%, 05/01/2025(b) | | | 145,000 | | | | 145,595 | |
Netflix, Inc., 5.88%, 02/15/2025 | | | 72,000 | | | | 72,519 | |
| | | | | | | | |
| | | | | | | 403,736 | |
| | | | | | | | |
Multi-Utilities-0.27% | | | | | | | | |
Algonquin Power & Utilities Corp. (Canada), 4.75%, 01/18/2082(e) | | | 114,000 | | | | 91,236 | |
| | | | | | | | |
Office Services & Supplies-0.69% | | | | | | | | |
ACCO Brands Corp., 4.25%, 03/15/2029(b) | | | 171,000 | | | | 136,596 | |
Pitney Bowes, Inc. | | | | | | | | |
6.88%, 03/15/2027(b) | | | 78,000 | | | | 50,147 | |
7.25%, 03/15/2029(b)(c) | | | 75,000 | | | | 48,375 | |
| | | | | | | | |
| | | | | | | 235,118 | |
| | | | | | | | |
Oil & Gas Drilling-1.78% | | | | | | | | |
Harvest Midstream I L.P., 7.50%, 09/01/2028(b) | | | 84,000 | | | | 81,063 | |
NGL Energy Operating LLC/NGL Energy Finance Corp., 7.50%, 02/01/2026(b) | | | 235,000 | | | | 212,736 | |
Patterson-UTI Energy, Inc., 5.15%, 11/15/2029 | | | 71,000 | | | | 62,352 | |
Rockies Express Pipeline LLC | | | | | | | | |
3.60%, 05/15/2025(b) | | | 118,000 | | | | 109,902 | |
7.50%, 07/15/2038(b) | | | 62,000 | | | | 54,202 | |
6.88%, 04/15/2040(b) | | | 104,000 | | | | 85,116 | |
| | | | | | | | |
| | | | | | | 605,371 | |
| | | | | | | | |
Oil & Gas Equipment & Services-1.46% | | | | | | | | |
Oceaneering International, Inc. | | | | | | | | |
4.65%, 11/15/2024 | | | 145,000 | | | | 138,389 | |
6.00%, 02/01/2028 | | | 41,000 | | | | 36,644 | |
USA Compression Partners L.P./USA Compression Finance Corp., 6.88%, 04/01/2026 | | | 190,000 | | | | 182,847 | |
| | | | | | | | |
| | | Principal
Amount | | | Value | |
Oil & Gas Equipment & Services-(continued) | | | | | |
Weatherford International Ltd. | | | | | | | | |
11.00%, 12/01/2024(b) | | $ | 41,000 | | | $ | 42,272 | |
8.63%, 04/30/2030(b)(c) | | | 102,000 | | | | 95,988 | |
| | | | | | | | |
| | | | | | | 496,140 | |
| | | | | | | | |
Oil & Gas Exploration & Production-2.50% | | | | | | | | |
CrownRock L.P./CrownRock Finance, Inc., 5.63%, 10/15/2025(b) | | | 119,000 | | | | 115,238 | |
Hilcorp Energy I L.P./Hilcorp Finance Co. | | | | | | | | |
6.25%, 11/01/2028(b) | | | 185,000 | | | | 174,423 | |
6.00%, 04/15/2030(b) | | | 75,000 | | | | 68,017 | |
Moss Creek Resources Holdings, Inc. | | | | | | | | |
7.50%, 01/15/2026(b) | | | 57,000 | | | | 52,293 | |
10.50%, 05/15/2027(b) | | | 46,000 | | | | 44,235 | |
Murphy Oil Corp., 6.13%, 12/01/2042 | | | 90,000 | | | | 71,106 | |
PDC Energy, Inc., 6.13%, 09/15/2024 | | | 77,000 | | | | 76,603 | |
Southwestern Energy Co., 5.70%, 01/23/2025 | | | 88,000 | | | | 87,078 | |
WPX Energy, Inc., 5.25%, 09/15/2024 | | | 161,000 | | | | 161,589 | |
| | | | | | | | |
| | | | | | | 850,582 | |
| | | | | | | | |
Oil & Gas Refining & Marketing-1.57% | | | | | | | | |
CVR Energy, Inc., 5.25%, 02/15/2025(b)(c) | | | 244,000 | | | | 235,283 | |
EnLink Midstream Partners L.P. | | | | | | | | |
4.15%, 06/01/2025 | | | 28,000 | | | | 26,326 | |
4.85%, 07/15/2026 | | | 118,000 | | | | 111,237 | |
NuStar Logistics L.P. | | | | | | | | |
6.00%, 06/01/2026 | | | 70,000 | | | | 67,989 | |
5.63%, 04/28/2027 | | | 65,000 | | | | 60,405 | |
PBF Holding Co. LLC/PBF Finance Corp., 6.00%, 02/15/2028 | | | 36,000 | | | | 32,780 | |
| | | | | | | | |
| | | | | | | 534,020 | |
| | | | | | | | |
Oil & Gas Storage & Transportation-4.46% | | | | | | | | |
Altera Infrastructure L.P./Teekay Offshore Finance Corp., 8.50%, 12/31/2049(b)(f)(g) | | | 107,000 | | | | 6,688 | |
Blue Racer Midstream LLC/Blue Racer Finance Corp., 7.63%, 12/15/2025(b) | | | 54,000 | | | | 53,451 | |
Buckeye Partners L.P., 4.13%, 03/01/2025(b) | | | 110,000 | | | | 103,825 | |
Crestwood Midstream Partners L.P./Crestwood Midstream Finance Corp. | | | | | | | | |
6.00%, 02/01/2029(b) | | | 51,000 | | | | 47,807 | |
8.00%, 04/01/2029(b) | | | 35,000 | | | | 35,050 | |
EQM Midstream Partners L.P. | | | | | | | | |
4.00%, 08/01/2024 | | | 118,000 | | | | 112,845 | |
5.50%, 07/15/2028 | | | 62,000 | | | | 55,520 | |
7.50%, 06/01/2030(b) | | | 37,000 | | | | 36,032 | |
Genesis Energy L.P./Genesis Energy Finance Corp. | | | | | | | | |
8.00%, 01/15/2027 | | | 112,000 | | | | 108,670 | |
7.75%, 02/01/2028 | | | 58,000 | | | | 55,459 | |
ITT Holdings LLC, 6.50%, 08/01/2029(b) | | | 92,000 | | | | 74,391 | |
New Fortress Energy, Inc. | | | | | | | | |
6.75%, 09/15/2025(b) | | | 189,000 | | | | 186,210 | |
6.50%, 09/30/2026(b) | | | 141,000 | | | | 136,840 | |
Northriver Midstream Finance L.P. (Canada), 5.63%, 02/15/2026(b) | | | 73,000 | | | | 69,215 | |
Summit Midstream Holdings LLC/Summit Midstream Finance Corp., 8.50%, 10/15/2026(b) | | | 104,000 | | | | 99,967 | |
See accompanying Notes to Financial Statements which are an integral part of the financial statements.
Invesco High Yield Bond Factor ETF (IHYF)–(continued)
October 31, 2022
| | | | | | | | |
| | | Principal
Amount | | | Value | |
Oil & Gas Storage & Transportation-(continued) | |
Tallgrass Energy Partners L.P./Tallgrass Energy Finance Corp. | | | | | | | | |
7.50%, 10/01/2025(b) | | $ | 75,000 | | | $ | 75,917 | |
6.00%, 03/01/2027(b) | | | 51,000 | | | | 48,172 | |
5.50%, 01/15/2028(b) | | | 55,000 | | | | 49,443 | |
6.00%, 12/31/2030(b) | | | 138,000 | | | | 125,271 | |
Western Midstream Operating L.P., 3.35%, 02/01/2025 | | | 40,000 | | | | 38,216 | |
| | | | | | | | |
| | | | | | | 1,518,989 | |
| | | | | | | | |
Other Diversified Financial Services-2.26% | |
AG Issuer LLC, 6.25%, 03/01/2028(b) | | | 92,000 | | | | 85,787 | |
Albion Financing 2 S.a.r.l. (Luxembourg), 8.75%, 04/15/2027(b) | | | 200,000 | | | | 170,000 | |
Midcap Financial Issuer Trust, 5.63%, 01/15/2030(b) | | | 209,000 | | | | 161,271 | |
Scientific Games Holdings L.P./Scientific Games | | | | | | | | |
US FinCo, Inc., 6.63%, 03/01/2030(b)(c) | | | 163,000 | | | | 140,508 | |
United Wholesale Mortgage LLC | | | | | | | | |
5.50%, 11/15/2025(b) | | | 121,000 | | | | 108,914 | |
5.75%, 06/15/2027(b) | | | 47,000 | | | | 38,353 | |
5.50%, 04/15/2029(b) | | | 85,000 | | | | 64,769 | |
| | | | | | | | |
| | | | | | | 769,602 | |
| | | | | | | | |
Packaged Foods & Meats-0.67% | | | | | | | | |
FAGE International S.A./FAGE USA Dairy Industry, Inc. (Luxembourg), 5.63%, 08/15/2026(b) | | | 232,000 | | | | 203,822 | |
TreeHouse Foods, Inc., 4.00%, 09/01/2028 | | | 28,000 | | | | 23,661 | |
| | | | | | | | |
| | | | | | | 227,483 | |
| | | | | | | | |
Paper Packaging-0.22% | | | | | | | | |
Berry Global, Inc., 4.50%, 02/15/2026(b)(c) | | | 82,000 | | | | 76,381 | |
| | | | | | | | |
Paper Products-0.90% | | | | | | | | |
Domtar Corp., 6.75%, 10/01/2028(b) | | | 283,000 | | | | 241,248 | |
Glatfelter Corp., 4.75%, 11/15/2029(b) | | | 101,000 | | | | 65,222 | |
| | | | | | | | |
| | | | | | | 306,470 | |
| | | | | | | | |
Personal Products-0.26% | | | | | | | | |
Herbalife Nutrition Ltd./HLF Financing, Inc., 7.88%, 09/01/2025(b) | | | 95,000 | | | | 88,911 | |
| | | | | | | | |
Pharmaceuticals-1.56% | | | | | | | | |
1375209 BC Ltd. (Canada), 9.00%, 01/30/2028(b) | | | 79,000 | | | | 76,827 | |
Bausch Health Cos., Inc. | | | | | | | | |
5.50%, 11/01/2025(b) | | | 230,000 | | | | 185,026 | |
6.13%, 02/01/2027(b) | | | 35,000 | | | | 23,076 | |
4.88%, 06/01/2028(b) | | | 127,000 | | | | 78,057 | |
Endo DAC/Endo Finance LLC/Endo Finco, Inc., 6.00%, 06/30/2028(b)(f)(g) | | | 36,000 | | | | 1,710 | |
P&L Development LLC/PLD Finance Corp., 7.75%, 11/15/2025(b) | | | 34,000 | | | | 26,293 | |
Par Pharmaceutical, Inc., 7.50%, 04/01/2027(b)(f)(g) | | | 183,000 | | | | 140,325 | |
| | | | | | | | |
| | | | | | | 531,314 | |
| | | | | | | | |
| | | | | | | | |
| | | Principal
Amount | | | Value | |
Reinsurance-0.84% | | | | | | | | |
Enstar Finance LLC | | | | | | | | |
5.75%, 09/01/2040(e) | | $ | 65,000 | | | $ | 57,899 | |
5.50%, 01/15/2042(e) | | | 136,000 | | | | 107,073 | |
Global Atlantic Fin Co., 4.70%, 10/15/2051(b)(e) | | | 165,000 | | | | 122,003 | |
| | | | | | | | |
| | | | | | | 286,975 | |
| | | | | | | | |
Renewable Electricity-0.30% | | | | | | | | |
Sunnova Energy Corp., 5.88%, 09/01/2026(b)(c) | | | 115,000 | | | | 101,379 | |
| | | | | | | | |
Restaurants-0.52% | | | | | | | | |
Aramark Services, Inc., 6.38%, 05/01/2025(b) | | | 131,000 | | | | 129,938 | |
Sizzling Platter LLC/Sizzling Platter Finance Corp., 8.50%, 11/28/2025(b) | | | 52,000 | | | | 45,500 | |
| | | | | | | | |
| | | | | | | 175,438 | |
| | | | | | | | |
Retail REITs-0.64% | | | | | | | | |
Brookfield Property REIT, Inc./BPR Cumulus LLC/BPR Nimbus LLC/GGSI Sellco LLC | | | | | | | | |
5.75%, 05/15/2026(b)(c) | | | 68,000 | | | | 63,275 | |
4.50%, 04/01/2027(b) | | | 83,000 | | | | 70,792 | |
Necessity Retail REIT, Inc. (The)/American Finance Operating Partner L.P., 4.50%, 09/30/2028(b) | | | 116,000 | | | | 84,867 | |
| | | | | | | | |
| | | | | | | 218,934 | |
| | | | | | | | |
Security & Alarm Services-0.72% | | | | | | | | |
CoreCivic, Inc., 4.75%, 10/15/2027 | | | 153,000 | | | | 127,184 | |
Prime Security Services Borrower LLC/Prime Finance, Inc., 5.75%, 04/15/2026(b) | | | 120,000 | | | | 116,993 | |
| | | | | | | | |
| | | | | | | 244,177 | |
| | | | | | | | |
Soft Drinks-0.10% | | | | | | | | |
Triton Water Holdings, Inc., 6.25%, 04/01/2029(b) | | | 45,000 | | | | 34,191 | |
| | | | | | | | |
Specialized Consumer Services-0.10% | | | | | | | | |
WW International, Inc., 4.50%, 04/15/2029(b) | | | 62,000 | | | | 34,110 | |
| | | | | | | | |
Specialized REITs-0.80% | | | | | | | | |
Iron Mountain, Inc. | | | | | | | | |
4.88%, 09/15/2029(b) | | | 127,000 | | | | 109,858 | |
5.25%, 07/15/2030(b) | | | 188,000 | | | | 162,475 | |
| | | | | | | | |
| | | | | | | 272,333 | |
| | | | | | | | |
Specialty Chemicals-1.25% | | | | | | | | |
Avient Corp., 5.75%, 05/15/2025(b) | | | 149,000 | | | | 145,717 | |
Rayonier A.M. Products, Inc., 7.63%, 01/15/2026(b) | | | 240,000 | | | | 208,949 | |
WR Grace Holdings LLC, 5.63%, 08/15/2029(b) | | | 90,000 | | | | 69,300 | |
| | | | | | | | |
| | | | | | | 423,966 | |
| | | | | | | | |
Specialty Stores-1.76% | | | | | | | | |
Bath & Body Works, Inc. | | | | | | | | |
9.38%, 07/01/2025(b) | | | 66,000 | | | | 68,559 | |
6.63%, 10/01/2030(b)(c) | | | 77,000 | | | | 69,463 | |
LSF9 Atlantis Holdings LLC/Victra Finance Corp., 7.75%, 02/15/2026(b) | | | 111,000 | | | | 100,435 | |
Michaels Cos., Inc. (The), 7.88%, 05/01/2029(b) | | | 39,000 | | | | 21,711 | |
See accompanying Notes to Financial Statements which are an integral part of the financial statements.
Invesco High Yield Bond Factor ETF (IHYF)–(continued)
October 31, 2022
| | | | | | | | |
| | | Principal
Amount | | | Value | |
Specialty Stores-(continued) | | | | | | | | |
Sally Holdings LLC/Sally Capital, Inc., 5.63%, 12/01/2025 | | $ | 117,000 | | | $ | 110,559 | |
Staples, Inc., 7.50%, 04/15/2026(b) | | | 263,000 | | | | 228,952 | |
| | | | | | | | |
| | | | | | | 599,679 | |
| | | | | | | | |
Steel-0.59% | | | | | | | | |
Cleveland-Cliffs, Inc., 6.75%, 03/15/2026(b) | | | 106,000 | | | | 105,408 | |
Infrabuild Australia Pty. Ltd. (Australia), 12.00%, 10/01/2024(b) | | | 102,000 | | | | 94,881 | |
| | | | | | | | |
| | | | | | | 200,289 | |
| | | | | | | | |
Systems Software-0.95% | | | | | | | | |
NortonLifeLock, Inc., 5.00%, 04/15/2025(b) | | | 150,000 | | | | 145,902 | |
Rackspace Technology Global, Inc., 3.50%, 02/15/2028(b) | | | 52,000 | | | | 34,434 | |
Veritas US, Inc./Veritas Bermuda Ltd., 7.50%, 09/01/2025(b) | | | 171,000 | | | | 144,251 | |
| | | | | | | | |
| | | | | | | 324,587 | |
| | | | | | | | |
Technology Hardware, Storage & Peripherals-1.20% | | | | | |
Seagate HDD Cayman, 3.38%, 07/15/2031 | | | 139,000 | | | | 99,530 | |
Xerox Corp., 6.75%, 12/15/2039 | | | 147,000 | | | | 108,555 | |
Xerox Holdings Corp. | | | | | | | | |
5.00%, 08/15/2025(b) | | | 57,000 | | | | 51,594 | |
5.50%, 08/15/2028(b)(c) | | | 189,000 | | | | 149,866 | |
| | | | | | | | |
| | | | | | | 409,545 | |
| | | | | | | | |
Thrifts & Mortgage Finance-0.64% | | | | | | | | |
Enact Holdings, Inc., 6.50%, 08/15/2025(b) | | | 137,000 | | | | 135,275 | |
NMI Holdings, Inc., 7.38%, 06/01/2025(b) | | | 81,000 | | | | 81,032 | |
| | | | | | | | |
| | | | | | | 216,307 | |
| | | | | | | | |
Tires & Rubber-0.26% | | | | | | | | |
FXI Holdings, Inc., 12.25%, 11/15/2026(b) | | | 101,000 | | | | 87,840 | |
| | | | | | | | |
Tobacco-0.27% | | | | | | | | |
Vector Group Ltd., 5.75%, 02/01/2029(b) | | | 106,000 | | | | 93,009 | |
| | | | | | | | |
Trading Companies & Distributors-0.21% | | | | | | | | |
Fortress Transportation and Infrastructure Investors LLC, 6.50%, 10/01/2025(b) | | | 74,000 | | | | 71,410 | |
| | | | | | | | |
Wireless Telecommunication Services-2.00% | |
Sprint Corp. | | | | | | | | |
7.88%, 09/15/2023 | | | 235,000 | | | | 239,232 | |
7.13%, 06/15/2024 | | | 235,000 | | | | 237,742 | |
7.63%, 02/15/2025 | | | 199,000 | | | | 204,741 | |
| | | | | | | | |
| | | | | | | 681,715 | |
| | | | | | | | |
Total U.S. Dollar Denominated Bonds & Notes
(Cost $37,082,784) | | | | | | | 32,855,343 | |
| | | | | | | | |
Investment Abbreviations:
PIK -Pay-in-Kind
REIT -Real Estate Investment Trust
| | | | | | | | |
| | | Principal
Amount | | | Value | |
U.S. Treasury Securities-0.36% | | | | | | | | |
U.S. Treasury Bills-0.36% | | | | | | | | |
1.46%–2.07%, 11/17/2022(h)(i)
(Cost $122,917) | | $ | 123,000 | | | $ | 122,845 | |
| | | | | | | | |
| | | Shares | | | | |
Money Market Funds-0.89% | | | | | | | | |
Invesco Government & Agency Portfolio, Institutional Class, 3.07%(j)(k)
(Cost $302,214) | | | 302,214 | | | | 302,214 | |
| | | | | | | | |
TOTAL INVESTMENTS IN SECURITIES (excluding investments purchased with cash collateral from securities on loan)-97.83%
(Cost $37,507,915) | | | | 33,280,402 | |
| | | | | | | | |
| |
| Investments Purchased with Cash Collateral from Securities on Loan | | | | | |
| | |
Money Market Funds-7.82% | | | | | | | | |
Invesco Private Government Fund,
3.18%(j)(k)(l) | | | 745,329 | | | | 745,329 | |
Invesco Private Prime Fund, 3.28%(j)(k)(l) | | | 1,916,067 | | | | 1,916,067 | |
| | | | | | | | |
| | |
Total Investments Purchased with Cash Collateral from Securities on Loan
(Cost $2,661,443) | | | | | | | 2,661,396 | |
| | | | | | | | |
| |
TOTAL INVESTMENTS IN SECURITIES-105.65%
(Cost $40,169,358) | | | | 35,941,798 | |
OTHER ASSETS LESS LIABILITIES-(5.65)% | | | | (1,921,608 | ) |
| | | | | | | | |
NET ASSETS-100.00% | | | $ | 34,020,190 | |
| | | | | | | | |
See accompanying Notes to Financial Statements which are an integral part of the financial statements.
Invesco High Yield Bond Factor ETF (IHYF)–(continued)
October 31, 2022
Notes to Schedule of Investments:
| (a) | Industry and/or sector classifications used in this report are generally according to the Global Industry Classification Standard, which was developed by and is the exclusive property and a service mark of MSCI Inc. and Standard & Poor’s. |
| (b) | Security purchased or received in a transaction exempt from registration under the Securities Act of 1933, as amended (the “1933 Act”). The security may be resold pursuant to an exemption from registration under the 1933 Act, typically to qualified institutional buyers. The aggregate value of these securities at October 31, 2022 was $23,877,907, which represented 70.19% of the Fund’s Net Assets. |
| (c) | All or a portion of this security was out on loan at October 31, 2022. |
| (d) | All or a portion of this security is Pay-in-Kind. Pay-in-Kind securities pay interest income in the form of securities. |
| (e) | Security issued at a fixed rate for a specific period of time, after which it will convert to a variable rate. |
| (f) | The borrower has filed for protection in federal bankruptcy court. |
| (g) | Defaulted security. Currently, the issuer is in default with respect to principal and/or interest payments. The aggregate value of these securities at October 31, 2022 was $303,256, which represented less than 1% of the Fund’s Net Assets. |
| (h) | $122,845 was pledged as collateral to cover margin requirements for open futures contracts. See Note 2P. |
| (i) | Security traded on a discount basis. The interest rate shown represents the discount rate at the time of purchase by the Fund. |
| (j) | Affiliated issuer. The issuer and/or the Fund is a wholly-owned subsidiary of Invesco Ltd., or is affiliated by having an investment adviser that is under common control of Invesco Ltd. The table below shows the Fund’s transactions in, and earnings from, its investments in affiliates for the fiscal year ended October 31, 2022. |
| | | | | | | | | | | | | | | | | | | | | | | | | | | | | | | | | | | | | | | | | | | | | | | | | | | | | | | |
| | | Value
October 31, 2021 | | Purchases
at Cost | | Proceeds
from Sales | | Change in
Unrealized
Appreciation
(Depreciation) | | Realized
Gain
(Loss) | | Value
October 31, 2022 | | Dividend
Income |
| | | | | | | | | | | |
Investments in Affiliated Money Market Funds: | | | | | | | | | | | | | | | | | | | | | | | | | | | | | | | | | | | | | | | | | | | | | | | | | | | | | | | |
| | | | | | | | | | | |
Invesco Government & Agency Portfolio, Institutional Class | | | | | | | | $ | 242,352 | | | | | | | | | $ | 10,606,419 | | | | $ | (10,546,557 | ) | | | $ | - | | | | $ | - | | | | | | | | | $ | 302,214 | | | | | | | | | $ | 2,769 | |
| | | | | | | | | | | |
Investments Purchased with Cash Collateral from Securities on Loan: | | | | | | | | | | | | | | | | | | | | | | | | | | | | | | | | | | | | | | | | | | | | | | | | | | | | | | | |
| | | | | | | | | | | |
Invesco Private Government Fund | | | | | | | | | 1,418,750 | | | | | | | | | | 6,467,336 | | | | | (7,140,757 | ) | | | | - | | | | | - | | | | | | | | | | 745,329 | | | | | | | | | | 5,977 | * |
| | | | | | | | | | | |
Invesco Private Prime Fund | | | | | | | | | 3,310,417 | | | | | | | | | | 11,254,644 | | | | | (12,647,318 | ) | | | | (47 | ) | | | | (1,629 | ) | | | | | | | | | 1,916,067 | | | | | | | | | | 16,840 | * |
| | | | | | | | | | | | | | | | | | | | | | | | | | | | | | | | | | | | | | | | | | | | | | | | | | | | | | | |
| | | | | | | | | | | |
Total | | | | | | | | $ | 4,971,519 | | | | | | | | | $ | 28,328,399 | | | | $ | (30,334,632 | ) | | | $ | (47 | ) | | | $ | (1,629 | ) | | | | | | | | $ | 2,963,610 | | | | | | | | | $ | 25,586 | |
| | | | | | | | | | | | | | | | | | | | | | | | | | | | | | | | | | | | | | | | | | | | | | | | | | | | | | | |
| * | Represents the income earned on the investment of cash collateral, which is included in securities lending income on the Statements of Operations. Does not include rebates and fees paid to lending agent or premiums received from borrowers, if any. |
| (k) | The rate shown is the 7-day SEC standardized yield as of October 31, 2022. |
| (l) | The security has been segregated to satisfy the commitment to return the cash collateral received in securities lending transactions upon the borrower’s return of the securities loaned. See Note 2M. |
| | | | | | | | | | | | | | | | | | | | | | | | | | | | | | | | | | | | | |
| | | Open Futures Contracts |
| | | Long Futures Contracts | | Number of
Contracts | | Expiration
Month | | Notional
Value | | Value | | Unrealized
Appreciation
(Depreciation) |
| | | | | | | | |
| | Interest Rate Risk | | | | | | | | | | | | | | | | | | | | | | | | | | | | | | | | | | | |
| | | | | | | | |
| | U.S. Treasury 10 Year Notes | | | | 31 | | | | | December-2022 | | | | $ | 3,428,406 | | | | $ | (191,189 | ) | | | | | | | | $ | (191,189 | ) | | | | | |
| | | | | | | | |
| | U.S. Treasury 10 Year Ultra Notes | | | | 7 | | | | | December-2022 | | | | | 811,891 | | | | | (61,561 | ) | | | | | | | | | (61,561 | ) | | | | | |
| | | | | | | | |
| | U.S. Treasury 5 Year Notes | | | | 4 | | | | | December-2022 | | | | | 426,375 | | | | | (6,897 | ) | | | | | | | | | (6,897 | ) | | | | | |
| | | | | | | | |
| | U.S. Treasury Long Bonds | | | | 1 | | | | | December-2022 | | | | | 120,500 | | | | | (439 | ) | | | | | | | | | (439 | ) | | | | | |
| | | | | | | | |
| | U.S. Treasury Ultra Bonds | | | | 1 | | | | | December-2022 | | | | | 127,656 | | | | | (21,221 | ) | | | | | | | | | (21,221 | ) | | | | | |
| | | | | | | | | | | | | | | | | | | | | | | | | | | | | | | | | | | | | |
| | | | | | | | |
| | Subtotal–Long Futures Contracts | | | | | | | | | | | | | | | | | | | (281,307 | ) | | | | | | | | | (281,307 | ) | | | | | |
| | | | | | | | | | | | | | | | | | | | | | | | | | | | | | | | | | | | | |
| | | | | | | | |
| | Short Futures Contracts | | | | | | | | | | | | | | | | | | | | | | | | | | | | | | | | | | | |
| | | | | | | | |
| | Interest Rate Risk | | | | | | | | | | | | | | | | | | | | | | | | | | | | | | | | | | | |
| | | | | | | | |
| | U.S. Treasury 2 Year Notes | | | | 13 | | | | | December-2022 | | | | | (2,656,976 | ) | | | | 55,498 | | | | | | | | | | 55,498 | | | | | | |
| | | | | | | | | | | | | | | | | | | | | | | | | | | | | | | | | | | | | |
| | | | | | | | |
| | Total Futures Contracts | | | | | | | | | | | | | | | | | | $ | (225,809 | ) | | | | | | | | $ | (225,809 | ) | | | | | |
| | | | | | | | | | | | | | | | | | | | | | | | | | | | | | | | | | | | | |
See accompanying Notes to Financial Statements which are an integral part of the financial statements.
Invesco High Yield Bond Factor ETF (IHYF)–(continued)
October 31, 2022
| | | | | | | | | | | | | | | | | | | | | | | | | | | | | | | | | | | | | | | | | | | | | | | | | | | | |
| Open Centrally Cleared Credit Default Swap Agreements(a) | |
Reference Entity | | Buy/Sell
Protection | | | (Pay)/
Receive
Fixed
Rate | | | Payment
Frequency | | | Maturity Date | | | Implied
Credit
Spread(b) | | | Notional
Value | | | Upfront
Payments
Paid
(Received) | | | Value | | | Unrealized
Appreciation | |
| | | | | | | | | | | | | |
Credit Risk | | | | | | | | | | | | | | | | | | | | | | | | | | | | | | | | | | | | | | | | | | | | | | | | | | | | |
| | | | | | | | | | | | | |
| Markit CDX North America High Yield Index, Series 38, Version 2 | | | Sell | | | | 5.00% | | | | Quarterly | | | | 06/20/2027 | | | | 4.7931% | | | | USD 1,752,300 | | | | | | | $ | 9,890 | | | | | | | $ | 13,258 | | | | | | | $ | 13,589 | | | | | |
| | | | | | | | | | | | | | | | | | | | | | | | | | | | | | | | | | | | | | | | | | | | | | | | | | | | |
| (a) | Centrally cleared swap agreements collateralized by $164,978 cash held with the broker. |
| (b) | Implied credit spreads represent the current level, as of October 31, 2022, at which protection could be bought or sold given the terms of the existing credit default swap agreement and serve as an indicator of the current status of the payment/performance risk of the credit default swap agreement. An implied credit spread that has widened or increased since entry into the initial agreement may indicate a deteriorating credit profile and increased risk of default for the reference entity. A declining or narrowing spread may indicate an improving credit profile or decreased risk of default for the reference entity. Alternatively, credit spreads may increase or decrease reflecting the general tolerance for risk in the credit markets generally. |
See accompanying Notes to Financial Statements which are an integral part of the financial statements.
Invesco Moderately Conservative Multi-Asset Allocation ETF (PSMM)
October 31, 2022
Schedule of Investments
Schedule of Investments in Affiliated Issuers- 111.29%(a)
| | | | | | | | | | | | | | | | | | | | | | | | | | | | | | | | | | | | |
| | | % of | | | | | | | | | | | | Change in | | | | | | | | | | | | | |
| | | Net | | | | | | | | | | | | Unrealized | | | Realized | | | | | | | | | | |
| | | Assets | | | Value | | | Purchases | | | Proceeds | | | Appreciation | | | Gain | | | Dividend | | | Shares | | | Value | |
| | | 10/31/22 | | | 10/31/21 | | | at Cost | | | from Sales | | | (Depreciation) | | | (Loss) | | | Income | | | 10/31/22 | | | 10/31/22 | |
Domestic Equity Funds-34.08% | | | | | | | | | | | | | | | | | | | | | | | | | | | | | |
Invesco Preferred ETF(b) | | | 2.97% | | | $ | 544,267 | | | $ | 1,297,218 | | | $ | (966,234 | ) | | $ | (179,915 | ) | | $ | (50,051 | ) | | $ | 35,752 | | | | 57,512 | | | $ | 645,285 | |
Invesco RAFI™ Strategic US ETF(b) | | | 8.33% | | | | 1,379,920 | | | | 3,440,381 | | | | (2,837,492 | ) | | | (300,991 | ) | | | 124,511 | | | | 30,386 | | | | 49,511 | | | | 1,806,329 | |
Invesco RAFI™ Strategic US Small Company ETF(b) | | | 2.06% | | | | 456,592 | | | | 1,045,539 | | | | (970,363 | ) | | | (117,293 | ) | | | 31,621 | | | | 4,207 | | | | 13,253 | | | | 446,096 | |
Invesco Russell 1000 Dynamic Multifactor ETF | | | 5.55% | | | | 1,003,769 | | | | 2,386,777 | | | | (1,993,611 | ) | | | (219,891 | ) | | | 27,638 | | | | 14,758 | | | | 28,055 | | | | 1,204,682 | |
Invesco S&P 500® Low Volatility ETF | | | 3.05% | | | | 552,112 | | | | 1,264,070 | | | | (1,128,402 | ) | | | (77,961 | ) | | | 51,663 | | | | 14,062 | | | | 10,714 | | | | 661,482 | |
Invesco S&P 500® Pure Growth ETF | | | 9.09% | | | | 1,349,336 | | | | 4,227,199 | | | | (2,953,042 | ) | | | (577,468 | ) | | | (75,323 | ) | | | 7,941 | | | | 12,640 | | | | 1,970,702 | |
Invesco S&P MidCap Low Volatility ETF | | | 3.03% | | | | 365,468 | | | | 1,236,752 | | | | (903,794 | ) | | | (42,660 | ) | | | 1,241 | | | | 10,712 | | | | 12,493 | | | | 657,007 | |
Invesco S&P SmallCap Low Volatility ETF | | | - | | | | 366,638 | | | | 656,504 | | | | (999,959 | ) | | | (36,340 | ) | | | 13,157 | | | | 3,554 | | | | - | | | | - | |
| | | | | | | | | | | | | | | | | | | | | | | | | | | | | | | | | | | | |
Total Domestic Equity Funds | | | | | | | 6,018,102 | | | | 15,554,440 | | | | (12,752,897 | ) | | | (1,552,519 | ) | | | 124,457 | | | | 121,372 | | | | | | | | 7,391,583 | |
| | | | | | | | | | | | | | | | | | | | | | | | | | | | | | | | | | | | |
| | | | | | | |
Fixed Income Funds-56.42% | | | | | | | | | | | | | | | | | | | | | | | | | | | | | |
Invesco 1-30 Laddered Treasury ETF(b) | | | 12.77% | | | | 1,453,533 | | | | 5,723,388 | | | | (3,710,373 | ) | | | (595,432 | ) | | | (101,589 | ) | | | 40,661 | | | | 98,947 | | | | 2,769,527 | |
Invesco Emerging Markets Sovereign Debt ETF | | | 2.52% | | | | 181,693 | | | | 1,204,081 | | | | (640,263 | ) | | | (163,742 | ) | | | (35,721 | ) | | | 26,626 | | | | 32,368 | | | | 546,048 | |
Invesco Fundamental High Yield® Corporate Bond ETF | | | 7.95% | | | | 1,627,107 | | | | 3,565,048 | | | | (3,147,099 | ) | | | (209,437 | ) | | | (111,050 | ) | | | 63,286 | | | | 102,227 | | | | 1,724,569 | |
Invesco Investment Grade Defensive ETF(b) | | | 2.56% | | | | 450,598 | | | | 1,070,353 | | | | (892,538 | ) | | | (57,140 | ) | | | (13,591 | ) | | | 8,144 | | | | 23,617 | | | | 554,173 | |
Invesco Investment Grade Value ETF | | | 1.39% | | | | 271,436 | | | | 607,628 | | | | (497,638 | ) | | | (60,210 | ) | | | (18,368 | ) | | | 8,135 | | | | 13,745 | | | | 300,603 | |
Invesco PureBetaSM 0-5 Yr US TIPS ETF(b) | | | 5.68% | | | | 906,909 | | | | 2,415,402 | | | | (1,999,105 | ) | | | (94,044 | ) | | | 4,219 | | | | 62,390 | | | | 50,144 | | | | 1,233,041 | |
Invesco Senior Loan ETF(b) | | | 3.85% | | | | 811,241 | | | | 1,786,629 | | | | (1,692,139 | ) | | | (41,771 | ) | | | (28,343 | ) | | | 34,832 | | | | 40,329 | | | | 835,617 | |
Invesco Taxable Municipal Bond ETF | | | 12.86% | | | | 2,909,041 | | | | 6,521,557 | | | | (5,610,831 | ) | | | (725,102 | ) | | | (303,996 | ) | | | 94,301 | | | | 112,391 | | | | 2,790,669 | |
Invesco Variable Rate Investment Grade ETF | | | 6.84% | | | | 1,715,344 | | | | 3,680,277 | | | | (3,872,044 | ) | | | (28,552 | ) | | | (10,757 | ) | | | 26,810 | | | | 60,459 | | | | 1,484,268 | |
| | | | | | | | | | | | | | | | | | | | | | | | | | | | | | | | | | | | |
Total Fixed Income Funds | | | | | | | 10,326,902 | | | | 26,574,363 | | | | (22,062,030 | ) | | | (1,975,430 | ) | | | (619,196 | ) | | | 365,185 | | | | | | | | 12,238,515 | |
| | | | | | | | | | | | | | | | | | | | | | | | | | | | | | | | | | | | |
| | | | | | | |
Foreign Equity Funds-9.48% | | | | | | | | | | | | | | | | | | | | | | | | | | | | | |
Invesco RAFI™ Strategic Developed ex-US ETF | | | 3.01% | | | | 633,217 | | | | 1,457,130 | | | | (1,267,360 | ) | | | (158,566 | ) | | | (6,829 | ) | | | 29,533 | | | | 26,452 | | | | 653,364 | |
Invesco RAFI™ Strategic Emerging Markets ETF | | | 1.75% | | | | 347,774 | | | | 949,269 | | | | (721,007 | ) | | | (163,119 | ) | | | (32,331 | ) | | | 27,657 | | | | 20,550 | | | | 380,586 | |
Invesco S&P Emerging Markets Low Volatility ETF | | | 1.84% | | | | 361,083 | | | | 842,032 | | | | (744,310 | ) | | | (75,731 | ) | | | 16,223 | | | | 19,792 | | | | 18,650 | | | | 399,297 | |
Invesco S&P International | | | | | | | | | | | | | | | | | | | | | | | | | | | | | | | | | | | | |
Developed Low Volatility ETF | | | 2.88% | | | | 549,249 | | | | 1,253,487 | | | | (1,017,026 | ) | | | (143,473 | ) | | | (18,291 | ) | | | 28,241 | | | | 25,048 | | | | 623,946 | |
| | | | | | | | | | | | | | | | | | | | | | | | | | | | | | | | | | | | |
Total Foreign Equity Funds | | | | | | | 1,891,323 | | | | 4,501,918 | | | | (3,749,703 | ) | | | (540,889 | ) | | | (41,228 | ) | | | 105,223 | | | | | | | | 2,057,193 | |
| | | | | | | | | | | | | | | | | | | | | | | | | | | | | | | | | | | | |
See accompanying Notes to Financial Statements which are an integral part of the financial statements.
Invesco Moderately Conservative Multi-Asset Allocation ETF (PSMM)–(continued)
October 31, 2022
Schedule of Investments in Affiliated Issuers- 111.29%(a)
| | | | | | | | | | | | | | | | | | | | | | | | | | | | | | | | | | | | |
| | | % of
Net
Assets
10/31/22 | | | Value
10/31/21 | | | Purchases
at Cost | | | Proceeds
from Sales | | | Change in
Unrealized
Appreciation
(Depreciation) | | | Realized
Gain
(Loss) | | | Dividend
Income | | | Shares
10/31/22 | | | Value
10/31/22 | |
| | | | | | | | | |
| Money Market Funds-0.00% | | | | | | | | | | | | | | | | | | | | | | | | | | | | | | | | | | | | |
| | | | | | | | | |
Invesco Government & Agency Portfolio, Institutional Class | | | - | | | $ | - | | | $ | 250,258 | | | $ | (250,258 | ) | | $ | - | | | $ | - | | | $ | 24 | | | | - | | | $ | - | |
| | | | | | | | | | | | | | | | | | | | | | | | | | | | | | | | | | | | |
| | | | | | | | | |
TOTAL INVESTMENTS IN AFFILIATED ISSUERS (excluding investments purchased with cash collateral from securities on loan)-99.98%
(Cost $24,952,030) | | | 99.98% | | | | 18,236,327 | | | | 46,880,979 | | | | (38,814,888 | ) | | | (4,068,838 | ) | | | (535,967 | ) | | | 591,804 | | | | | | | | 21,687,291 | |
| | | | | | | | | | | | | | | | | | | | | | | | | | | | | | | | | | | | |
| | | | | | | | | |
| Investments Purchased with Cash Collateral from Securities on Loan | | | | | | | | | | | | | | | | | | | | | | | | | | | | | | | | | | | | |
Money Market Funds-11.31% | | | | | | | | | | | | | | | | | | | | | | | | | | | | | | | | | | | | |
| | | | | | | | | |
Invesco Private Government Fund, 3.18%(c)(d) | | | 3.17% | | | | 756,635 | | | | 19,151,349 | | | | (19,220,866 | ) | | | - | | | | - | | | | 5,826 | * | | | 687,118 | | | | 687,118 | |
| | | | | | | | | |
Invesco Private Prime Fund, 3.28%(c)(d) | | | 8.14% | | | | 1,765,482 | | | | 40,086,169 | | | | (40,084,836 | ) | | | 63 | | | | (291 | ) | | | 16,289 | * | | | 1,766,587 | | | | 1,766,587 | |
| | | | | | | | | | | | | | | | | | | | | | | | | | | | | | | | | | | | |
| | | | | | | | | |
Total Investments Purchased with Cash Collateral from Securities on Loan
(Cost $2,453,642) | | | 11.31% | | | | 2,522,117 | | | | 59,237,518 | | | | (59,305,702 | ) | | | 63 | | | | (291 | ) | | | 22,115 | | | | | | | | 2,453,705 | |
| | | | | | | | | | | | | | | | | | | | | | | | | | | | | | | | | | | | |
| | | | | | | | | |
TOTAL INVESTMENTS IN AFFILIATED ISSUERS
(Cost $27,405,672) | | | 111.29% | | | $ | 20,758,444 | | | $ | 106,118,497 | | | $ | (98,120,590 | ) | | $ | (4,068,775 | ) | | $ | (536,258 | )(e) | | $ | 613,919 | | | | | | | $ | 24,140,996 | |
| | | | | | | | | | | | | | | | | | | | | | | | | | | | | | | | | | | | |
| | | | | | | | | |
| OTHER ASSETS LESS LIABILITIES | | | (11.29)% | | | | | | | | | | | | | | | | | | | | | | | | | | | | | | | | (2,448,449 | ) |
| | | | | | | | | | | | | | | | | | | | | | | | | | | | | | | | | | | | |
| | | | | | | | | |
NET ASSETS | | | 100.00% | | | | | | | | | | | | | | | | | | | | | | | | | | | | | | | $ | 21,692,547 | |
| | | | | | | | | | | | | | | | | | | | | | | | | | | | | | | | | | | | |
Investment Abbreviations:
ETF-Exchange-Traded Fund
Notes to Schedule of Investments:
| (a) | Each underlying fund and the Fund are affiliated by either having the same investment adviser or an investment adviser under common control with the Fund’s investment adviser. |
| (b) | All or a portion of this security was out on loan at October 31, 2022. |
| (c) | The rate shown is the 7-day SEC standardized yield as of October 31, 2022. |
| (d) | The security has been segregated to satisfy the commitment to return the cash collateral received in securities lending transactions upon the borrower’s return of the securities loaned. See Note 2M. |
| (e) | Includes capital gains distributions from affiliated underlying funds as follows: |
| | | | | | | |
| Fund Name | | | | Capital Gain |
| | |
Invesco Investment Grade Defensive ETF | | | | | | | $3,509 |
| | |
Invesco Investment Grade Value ETF | | | | | | | 2,245 |
| | |
Invesco PureBetaSM 0-5 Yr US TIPS ETF | | | | | | | 340 |
| | |
Invesco RAFI™ Strategic Developed ex-US ETF | | | | | | | 4,228 |
| * | Represents the income earned on the investment of cash collateral, which is included in securities lending income on the Statements of Operations. Does not include rebates and fees paid to lending agent or premiums received from borrowers, if any. |
See accompanying Notes to Financial Statements which are an integral part of the financial statements.
Invesco S&P 500® Downside Hedged ETF (PHDG)
October 31, 2022
Schedule of Investments(a)
| | | | | | | | |
| | | Shares | | Value | |
Common Stocks & Other Equity Interests-68.35% | |
Communication Services-5.03% | | | | | | | | |
Activision Blizzard, Inc. | | | 4,182 | | | $ | 304,450 | |
Alphabet, Inc., Class A(b) | | | 35,226 | | | | 3,329,209 | |
Alphabet, Inc., Class C(b) | | | 31,501 | | | | 2,981,885 | |
AT&T, Inc. | | | 41,865 | | | | 763,199 | |
Charter Communications, Inc.,
Class A(b) | | | 651 | | | | 239,321 | |
Comcast Corp., Class A | | | 25,872 | | | | 821,177 | |
DISH Network Corp., Class A(b) | | | 1,475 | | | | 21,992 | |
Electronic Arts, Inc. | | | 1,552 | | | | 195,490 | |
Fox Corp., Class A | | | 1,801 | | | | 51,995 | |
Fox Corp., Class B | | | 827 | | | | 22,494 | |
Interpublic Group of Cos., Inc. (The) | | | 2,297 | | | | 68,428 | |
Live Nation Entertainment, Inc.(b) | | | 835 | | | | 66,474 | |
Lumen Technologies, Inc.(c) | | | 5,596 | | | | 41,187 | |
Match Group, Inc.(b) | | | 1,663 | | | | 71,842 | |
Meta Platforms, Inc., Class A(b) | | | 13,399 | | | | 1,248,251 | |
Netflix, Inc.(b) | | | 2,613 | | | | 762,682 | |
News Corp., Class A | | | 2,265 | | | | 38,211 | |
News Corp., Class B | | | 702 | | | | 12,025 | |
Omnicom Group, Inc. | | | 1,203 | | | | 87,518 | |
Paramount Global, Class B | | | 2,967 | | | | 54,355 | |
Take-Two Interactive Software, Inc.(b) | | | 921 | | | | 109,120 | |
T-Mobile US, Inc.(b) | | | 3,536 | | | | 535,916 | |
Verizon Communications, Inc. | | | 24,673 | | | | 922,030 | |
Walt Disney Co. (The)(b) | | | 10,710 | | | | 1,141,043 | |
Warner Bros Discovery, Inc.(b)(c) | | | 12,979 | | | | 168,727 | |
| | | | | | | | |
| | | | | | | 14,059,021 | |
| | | | | | | | |
Consumer Discretionary-7.43% | | | | | | | | |
Advance Auto Parts, Inc. | | | 356 | | | | 67,612 | |
Amazon.com, Inc.(b) | | | 52,071 | | | | 5,334,153 | |
Aptiv PLC(b) | | | 1,592 | | | | 144,983 | |
AutoZone, Inc.(b) | | | 114 | | | | 288,748 | |
Bath & Body Works, Inc. | | | 1,341 | | | | 44,763 | |
Best Buy Co., Inc. | | | 1,177 | | | | 80,519 | |
Booking Holdings, Inc.(b) | | | 233 | | | | 435,589 | |
BorgWarner, Inc. | | | 1,391 | | | | 52,204 | |
Caesars Entertainment, Inc.(b) | | | 1,260 | | | | 55,100 | |
CarMax, Inc.(b)(c) | | | 935 | | | | 58,914 | |
Carnival Corp.(b)(c) | | | 5,799 | | | | 52,539 | |
Chipotle Mexican Grill, Inc.(b) | | | 163 | | | | 244,228 | |
D.R. Horton, Inc. | | | 1,858 | | | | 142,843 | |
Darden Restaurants, Inc. | | | 720 | | | | 103,061 | |
Dollar General Corp. | | | 1,334 | | | | 340,237 | |
Dollar Tree, Inc.(b) | | | 1,240 | | | | 196,540 | |
Domino’s Pizza, Inc. | | | 211 | | | | 70,103 | |
eBay, Inc. | | | 3,228 | | | | 128,603 | |
Etsy, Inc.(b)(c) | | | 744 | | | | 69,869 | |
Expedia Group, Inc.(b) | | | 893 | | | | 83,469 | |
Ford Motor Co.(c) | | | 23,203 | | | | 310,224 | |
Garmin Ltd. | | | 906 | | | | 79,764 | |
General Motors Co. | | | 8,566 | | | | 336,215 | |
Genuine Parts Co. | | | 831 | | | | 147,802 | |
Hasbro, Inc. | | | 763 | | | | 49,786 | |
Hilton Worldwide Holdings, Inc. | | | 1,611 | | | | 217,904 | |
Home Depot, Inc. (The) | | | 6,038 | | | | 1,788,033 | |
Las Vegas Sands Corp.(b) | | | 1,930 | | | | 73,359 | |
Lennar Corp., Class A | | | 1,498 | | | | 120,889 | |
| | | | | | | | |
| | | Shares | | Value | |
Consumer Discretionary-(continued) | | | | | | | | |
LKQ Corp. | | | 1,531 | | | $ | 85,185 | |
Lowe’s Cos., Inc. | | | 3,755 | | | | 732,037 | |
Marriott International, Inc., Class A | | | 1,621 | | | | 259,538 | |
McDonald’s Corp. | | | 4,322 | | | | 1,178,436 | |
MGM Resorts International | | | 1,917 | | | | 68,188 | |
Mohawk Industries, Inc.(b) | | | 310 | | | | 29,372 | |
Newell Brands, Inc. | | | 2,211 | | | | 30,534 | |
NIKE, Inc., Class B. | | | 7,424 | | | | 688,056 | |
Norwegian Cruise Line Holdings
Ltd.(b)(c) | | | 2,476 | | | | 41,820 | |
NVR, Inc.(b) | | | 18 | | | | 76,279 | |
O’Reilly Automotive, Inc.(b) | | | 375 | | | | 313,939 | |
Pool Corp. | | | 233 | | | | 70,886 | |
PulteGroup, Inc. | | | 1,360 | | | | 54,386 | |
Ralph Lauren Corp.(c) | | | 252 | | | | 23,358 | |
Ross Stores, Inc. | | | 2,056 | | | | 196,739 | |
Royal Caribbean Cruises Ltd.(b) | | | 1,289 | | | | 68,807 | |
Starbucks Corp. | | | 6,741 | | | | 583,703 | |
Tapestry, Inc. | | | 1,479 | | | | 46,855 | |
Target Corp. | | | 2,724 | | | | 447,417 | |
Tesla, Inc.(b) | | | 15,648 | | | | 3,560,546 | |
TJX Cos., Inc. (The) | | | 6,883 | | | | 496,264 | |
Tractor Supply Co. | | | 652 | | | | 143,290 | |
Ulta Beauty, Inc.(b) | | | 304 | | | | 127,488 | |
VF Corp. | | | 1,940 | | | | 54,805 | |
Whirlpool Corp. | | | 320 | | | | 44,237 | |
Wynn Resorts Ltd.(b)(c) | | | 608 | | | | 38,851 | |
Yum! Brands, Inc. | | | 1,672 | | | | 197,714 | |
| | | | | | | | |
| | | | | | | 20,776,783 | |
| | | | | | | | |
Consumer Staples-4.74% | | | | | | | | |
Altria Group, Inc. | | | 10,580 | | | | 489,537 | |
Archer-Daniels-Midland Co. | | | 3,293 | | | | 319,355 | |
Brown-Forman Corp., Class B | | | 1,074 | | | | 73,032 | |
Campbell Soup Co. | | | 1,183 | | | | 62,593 | |
Church & Dwight Co., Inc. | | | 1,427 | | | | 105,783 | |
Clorox Co. (The) | | | 724 | | | | 105,733 | |
Coca-Cola Co. (The) | | | 22,866 | | | | 1,368,530 | |
Colgate-Palmolive Co. | | | 4,900 | | | | 361,816 | |
Conagra Brands, Inc. | | | 2,821 | | | | 103,531 | |
Constellation Brands, Inc., Class A | | | 936 | | | | 231,267 | |
Costco Wholesale Corp. | | | 2,602 | | | | 1,304,903 | |
Estee Lauder Cos., Inc. (The), Class A | | | 1,362 | | | | 273,067 | |
General Mills, Inc. | | | 3,500 | | | | 285,530 | |
Hershey Co. (The) | | | 863 | | | | 206,058 | |
Hormel Foods Corp. | | | 1,700 | | | | 78,965 | |
JM Smucker Co. (The) | | | 626 | | | | 94,313 | |
Kellogg Co. | | | 1,499 | | | | 115,153 | |
Keurig Dr Pepper, Inc. | | | 4,992 | | | | 193,889 | |
Kimberly-Clark Corp. | | | 1,984 | | | | 246,929 | |
Kraft Heinz Co. (The) | | | 4,680 | | | | 180,040 | |
Kroger Co. (The) | | | 3,826 | | | | 180,932 | |
Lamb Weston Holdings, Inc. | | | 844 | | | | 72,770 | |
McCormick & Co., Inc. | | | 1,472 | | | | 115,758 | |
Molson Coors Beverage Co., Class B | | | 1,106 | | | | 55,776 | |
Mondelez International, Inc., Class A | | | 8,052 | | | | 495,037 | |
Monster Beverage Corp.(b) | | | 2,260 | | | | 211,807 | |
PepsiCo, Inc. | | | 8,108 | | | | 1,472,251 | |
Philip Morris International, Inc. | | | 9,107 | | | | 836,478 | |
See accompanying Notes to Financial Statements which are an integral part of the financial statements.
Invesco S&P 500® Downside Hedged ETF (PHDG)–(continued)
October 31, 2022
| | | | | | | | |
| | | Shares | | Value | |
Consumer Staples-(continued) | | | | | | | | |
Procter & Gamble Co. (The) | | | 14,039 | | | $ | 1,890,632 | |
Sysco Corp. | | | 2,993 | | | | 259,074 | |
Tyson Foods, Inc., Class A | | | 1,701 | | | | 116,263 | |
Walgreens Boots Alliance, Inc. | | | 4,214 | | | | 153,811 | |
Walmart, Inc. | | | 8,374 | | | | 1,191,871 | |
| | | | | | | | |
| | | | | | | 13,252,484 | |
| | | | | | | | |
Energy-3.67% | | | | | | | | |
APA Corp. | | | 1,918 | | | | 87,192 | |
Baker Hughes Co., Class A | | | 5,944 | | | | 164,411 | |
Chevron Corp. | | | 10,580 | | | | 1,913,922 | |
ConocoPhillips | | | 7,479 | | | | 943,027 | |
Coterra Energy, Inc. | | | 4,674 | | | | 145,502 | |
Devon Energy Corp. | | | 3,847 | | | | 297,565 | |
Diamondback Energy, Inc. | | | 1,044 | | | | 164,023 | |
EOG Resources, Inc. | | | 3,443 | | | | 470,038 | |
EQT Corp. | | | 2,171 | | | | 90,835 | |
Exxon Mobil Corp. | | | 24,485 | | | | 2,713,183 | |
Halliburton Co | | | 5,328 | | | | 194,046 | |
Hess Corp. | | | 1,637 | | | | 230,948 | |
Kinder Morgan, Inc. | | | 11,648 | | | | 211,062 | |
Marathon Oil Corp. | | | 3,981 | | | | 121,221 | |
Marathon Petroleum Corp. | | | 2,929 | | | | 332,793 | |
Occidental Petroleum Corp. | | | 4,378 | | | | 317,843 | |
ONEOK, Inc. | | | 2,625 | | | | 155,715 | |
Phillips 66 | | | 2,826 | | | | 294,724 | |
Pioneer Natural Resources Co. | | | 1,402 | | | | 359,487 | |
Schlumberger Ltd. | | | 8,310 | | | | 432,369 | |
Targa Resources Corp. | | | 1,317 | | | | 90,043 | |
Valero Energy Corp. | | | 2,315 | | | | 290,648 | |
Williams Cos., Inc. (The) | | | 7,159 | | | | 234,314 | |
| | | | | | | | |
| | | | | | | 10,254,911 | |
| | | | | | | | |
Financials-7.83% | | | | | | | | |
Aflac, Inc. | | | 3,378 | | | | 219,942 | |
Allstate Corp. (The) | | | 1,588 | | | | 200,485 | |
American Express Co. | | | 3,524 | | | | 523,138 | |
American International Group, Inc. | | | 4,467 | | | | 254,619 | |
Ameriprise Financial, Inc. | | | 635 | | | | 196,291 | |
Aon PLC, Class A | | | 1,239 | | | | 348,766 | |
Arch Capital Group Ltd.(b) | | | 2,176 | | | | 125,120 | |
Arthur J. Gallagher & Co. | | | 1,236 | | | | 231,231 | |
Assurant, Inc. | | | 313 | | | | 42,524 | |
Bank of America Corp. | | | 41,070 | | | | 1,480,163 | |
Bank of New York Mellon Corp. (The) | | | 4,320 | | | | 181,915 | |
Berkshire Hathaway, Inc., Class B(b) | | | 10,603 | | | | 3,128,839 | |
BlackRock, Inc. | | | 886 | | | | 572,276 | |
Brown & Brown, Inc. | | | 1,377 | | | | 80,954 | |
Capital One Financial Corp. | | | 2,255 | | | | 239,075 | |
Cboe Global Markets, Inc. | | | 623 | | | | 77,564 | |
Charles Schwab Corp. (The) | | | 8,971 | | | | 714,720 | |
Chubb Ltd. | | | 2,454 | | | | 527,340 | |
Cincinnati Financial Corp. | | | 935 | | | | 96,604 | |
Citigroup, Inc. | | | 11,378 | | | | 521,795 | |
Citizens Financial Group, Inc. | | | 2,912 | | | | 119,101 | |
CME Group, Inc., Class A | | | 2,112 | | | | 366,010 | |
Comerica, Inc. | | | 769 | | | | 54,215 | |
Discover Financial Services | | | 1,605 | | | | 167,658 | |
Everest Re Group Ltd. | | | 232 | | | | 74,857 | |
FactSet Research Systems, Inc. | | | 223 | | | | 94,884 | |
Fifth Third Bancorp | | | 4,031 | | | | 143,866 | |
| | | | | | | | |
| | | Shares | | Value | |
Financials-(continued) | | | | | | | | |
First Republic Bank | | | 1,073 | | | $ | 128,867 | |
Franklin Resources, Inc. | | | 1,669 | | | | 39,138 | |
Globe Life, Inc. | | | 532 | | | | 61,457 | |
Goldman Sachs Group, Inc. (The) | | | 2,005 | | | | 690,743 | |
Hartford Financial Services Group, Inc. (The) | | | 1,898 | | | | 137,434 | |
Huntington Bancshares, Inc. | | | 8,473 | | | | 128,620 | |
Intercontinental Exchange, Inc. | | | 3,281 | | | | 313,565 | |
Invesco Ltd.(d) | | | 2,673 | | | | 40,950 | |
JPMorgan Chase & Co. | | | 17,229 | | | | 2,168,787 | |
KeyCorp | | | 5,479 | | | | 97,910 | |
Lincoln National Corp. | | | 910 | | | | 49,022 | |
Loews Corp. | | | 1,175 | | | | 66,999 | |
M&T Bank Corp. | | | 1,032 | | | | 173,758 | |
MarketAxess Holdings, Inc. | | | 221 | | | | 53,933 | |
Marsh & McLennan Cos., Inc. | | | 2,932 | | | | 473,489 | |
MetLife, Inc. | | | 3,936 | | | | 288,155 | |
Moody’s Corp.(c) | | | 927 | | | | 245,534 | |
Morgan Stanley | | | 7,867 | | | | 646,431 | |
MSCI, Inc. | | | 473 | | | | 221,771 | |
Nasdaq, Inc. | | | 1,991 | | | | 123,920 | |
Northern Trust Corp. | | | 1,224 | | | | 103,244 | |
PNC Financial Services Group, Inc. (The) | | | 2,409 | | | | 389,848 | |
Principal Financial Group, Inc. | | | 1,362 | | | | 120,033 | |
Progressive Corp. (The) | | | 3,436 | | | | 441,182 | |
Prudential Financial, Inc. | | | 2,185 | | | | 229,840 | |
Raymond James Financial, Inc. | | | 1,141 | | | | 134,798 | |
Regions Financial Corp. | | | 5,490 | | | | 120,506 | |
S&P Global, Inc. | | | 2,002 | | | | 643,142 | |
Signature Bank | | | 370 | | | | 58,656 | |
State Street Corp. | | | 2,160 | | | | 159,840 | |
SVB Financial Group(b) | | | 347 | | | | 80,143 | |
Synchrony Financial | | | 2,830 | | | | 100,635 | |
T. Rowe Price Group, Inc.(c) | | | 1,326 | | | | 140,768 | |
Travelers Cos., Inc. (The) | | | 1,394 | | | | 257,137 | |
Truist Financial Corp. | | | 7,793 | | | | 349,048 | |
U.S. Bancorp | | | 7,943 | | | | 337,180 | |
W.R. Berkley Corp. | | | 1,200 | | | | 89,256 | |
Wells Fargo & Co. | | | 22,284 | | | | 1,024,841 | |
Willis Towers Watson PLC | | | 646 | | | | 140,964 | |
Zions Bancorporation N.A | | | 884 | | | | 45,915 | |
| | | | | | | | |
| | | | | | | 21,901,411 | |
| | | | | | | | |
Health Care-10.47% | | | | | | | | |
Abbott Laboratories | | | 10,288 | | | | 1,017,895 | |
AbbVie, Inc. | | | 10,388 | | | | 1,520,803 | |
ABIOMED, Inc.(b) | | | 267 | | | | 67,305 | |
Agilent Technologies, Inc. | | | 1,755 | | | | 242,804 | |
Align Technology, Inc.(b) | | | 427 | | | | 82,966 | |
AmerisourceBergen Corp. | | | 913 | | | | 143,542 | |
Amgen, Inc. | | | 3,143 | | | | 849,710 | |
Baxter International, Inc. | | | 2,959 | | | | 160,822 | |
Becton, Dickinson and Co. | | | 1,676 | | | | 395,486 | |
Biogen, Inc.(b) | | | 853 | | | | 241,774 | |
Bio-Rad Laboratories, Inc., Class A(b) | | | 126 | | | | 44,315 | |
Bio-Techne Corp. | | | 230 | | | | 68,140 | |
Boston Scientific Corp.(b) | | | 8,411 | | | | 362,598 | |
Bristol-Myers Squibb Co. | | | 12,545 | | | | 971,861 | |
Cardinal Health, Inc. | | | 1,601 | | | | 121,516 | |
Catalent, Inc.(b) | | | 1,053 | | | | 69,214 | |
Centene Corp.(b) | | | 3,358 | | | | 285,867 | |
See accompanying Notes to Financial Statements which are an integral part of the financial statements.
Invesco S&P 500® Downside Hedged ETF (PHDG)–(continued)
October 31, 2022
| | | | | | | | |
| | | Shares | | Value | |
Health Care-(continued) | | | | | | | | |
Charles River Laboratories International, Inc.(b) | | | 299 | | | $ | 63,463 | |
Cigna Corp. | | | 1,793 | | | | 579,247 | |
Cooper Cos., Inc. (The) | | | 290 | | | | 79,283 | |
CVS Health Corp. | | | 7,713 | | | | 730,421 | |
Danaher Corp. | | | 3,846 | | | | 967,923 | |
DaVita, Inc.(b) | | | 327 | | | | 23,874 | |
DENTSPLY SIRONA, Inc. | | | 1,266 | | | | 39,018 | |
DexCom, Inc.(b) | | | 2,306 | | | | 278,519 | |
Edwards Lifesciences Corp.(b) | | | 3,642 | | | | 263,790 | |
Elevance Health, Inc. | | | 1,410 | | | | 770,946 | |
Eli Lilly and Co. | | | 4,633 | | | | 1,677,563 | |
Gilead Sciences, Inc. | | | 7,364 | | | | 577,779 | |
HCA Healthcare, Inc. | | | 1,265 | | | | 275,100 | |
Henry Schein, Inc.(b) | | | 800 | | | | 54,768 | |
Hologic, Inc.(b) | | | 1,467 | | | | 99,463 | |
Humana, Inc. | | | 744 | | | | 415,211 | |
IDEXX Laboratories, Inc.(b) | | | 489 | | | | 175,883 | |
Illumina, Inc.(b)(c) | | | 923 | | | | 211,201 | |
Incyte Corp.(b) | | | 1,085 | | | | 80,659 | |
Intuitive Surgical, Inc.(b) | | | 2,098 | | | | 517,094 | |
IQVIA Holdings, Inc.(b) | | | 1,096 | | | | 229,798 | |
Johnson & Johnson | | | 15,446 | | | | 2,687,141 | |
Laboratory Corp. of America Holdings | | | 531 | | | | 117,808 | |
McKesson Corp. | | | 844 | | | | 328,628 | |
Medtronic PLC | | | 7,806 | | | | 681,776 | |
Merck & Co., Inc. | | | 14,883 | | | | 1,506,160 | |
Mettler-Toledo International, Inc.(b) | | | 132 | | | | 166,971 | |
Moderna, Inc.(b) | | | 1,977 | | | | 297,202 | |
Molina Healthcare, Inc.(b) | | | 341 | | | | 122,371 | |
Organon & Co. | | | 1,494 | | | | 39,113 | |
PerkinElmer, Inc. | | | 742 | | | | 99,116 | |
Pfizer, Inc. | | | 32,973 | | | | 1,534,893 | |
Quest Diagnostics, Inc. | | | 685 | | | | 98,400 | |
Regeneron Pharmaceuticals, Inc.(b) | | | 630 | | | | 471,712 | |
ResMed, Inc. | | | 860 | | | | 192,373 | |
STERIS PLC | | | 588 | | | | 101,477 | |
Stryker Corp.(c) | | | 1,978 | | | | 453,437 | |
Teleflex, Inc. | | | 276 | | | | 59,219 | |
Thermo Fisher Scientific, Inc. | | | 2,302 | | | | 1,183,159 | |
UnitedHealth Group, Inc. | | | 5,495 | | | | 3,050,549 | |
Universal Health Services, Inc., Class B | | | 386 | | | | 44,726 | |
Vertex Pharmaceuticals, Inc.(b) | | | 1,507 | | | | 470,184 | |
Viatris, Inc. | | | 7,124 | | | | 72,166 | |
Waters Corp.(b) | | | 352 | | | | 105,308 | |
West Pharmaceutical Services, Inc. | | | 435 | | | | 100,093 | |
Zimmer Biomet Holdings, Inc. | | | 1,233 | | | | 139,761 | |
Zoetis, Inc. | | | 2,750 | | | | 414,645 | |
| | | | | | | | |
| | | | | | | 29,296,009 | |
| | | | | | | | |
Industrials-5.65% | | | | | | | | |
3M Co. | | | 3,252 | | | | 409,069 | |
A.O. Smith Corp. | | | 755 | | | | 41,359 | |
Alaska Air Group, Inc.(b)(c) | | | 745 | | | | 33,123 | |
Allegion PLC | | | 516 | | | | 54,061 | |
American Airlines Group, Inc.(b) | | | 3,818 | | | | 54,139 | |
AMETEK, Inc. | | | 1,349 | | | | 174,911 | |
Boeing Co. (The)(b) | | | 3,279 | | | | 467,290 | |
C.H. Robinson Worldwide, Inc. | | | 728 | | | | 71,140 | |
Carrier Global Corp. | | | 4,944 | | | | 196,573 | |
| | | | | | | | |
| | | Shares | | Value | |
Industrials-(continued) | | | | | | | | |
Caterpillar, Inc. | | | 3,101 | | | $ | 671,242 | |
Cintas Corp. | | | 505 | | | | 215,913 | |
Copart, Inc.(b) | | | 1,257 | | | | 144,580 | |
CoStar Group, Inc.(b) | | | 2,326 | | | | 192,407 | |
CSX Corp. | | | 12,580 | | | | 365,575 | |
Cummins, Inc. | | | 828 | | | | 202,454 | |
Deere & Co. | | | 1,634 | | | | 646,770 | |
Delta Air Lines, Inc.(b) | | | 3,767 | | | | 127,814 | |
Dover Corp. | | | 843 | | | | 110,172 | |
Eaton Corp. PLC | | | 2,340 | | | | 351,164 | |
Emerson Electric Co. | | | 3,474 | | | | 300,848 | |
Equifax, Inc.(c) | | | 719 | | | | 121,899 | |
Expeditors International of Washington, Inc. | | | 961 | | | | 94,034 | |
Fastenal Co. | | | 3,376 | | | | 163,162 | |
FedEx Corp. | | | 1,404 | | | | 225,033 | |
Fortive Corp. | | | 2,090 | | | | 133,551 | |
Fortune Brands Home & Security, Inc. | | | 760 | | | | 45,843 | |
Generac Holdings, Inc.(b) | | | 375 | | | | 43,466 | |
General Dynamics Corp. | | | 1,321 | | | | 329,986 | |
General Electric Co. | | | 6,442 | | | | 501,252 | |
Honeywell International, Inc. | | | 3,958 | | | | 807,511 | |
Howmet Aerospace, Inc. | | | 2,172 | | | | 77,215 | |
Huntington Ingalls Industries, Inc. | | | 235 | | | | 60,411 | |
IDEX Corp. | | | 443 | | | | 98,483 | |
Illinois Tool Works, Inc. | | | 1,655 | | | | 353,392 | |
Ingersoll Rand, Inc.(c) | | | 2,369 | | | | 119,635 | |
J.B. Hunt Transport Services, Inc. | | | 488 | | | | 83,482 | |
Jacobs Solutions, Inc. | | | 750 | | | | 86,415 | |
Johnson Controls International PLC | | | 4,047 | | | | 234,079 | |
L3Harris Technologies, Inc. | | | 1,124 | | | | 277,032 | |
Leidos Holdings, Inc. | | | 802 | | | | 81,475 | |
Lockheed Martin Corp.(c) | | | 1,386 | | | | 674,539 | |
Masco Corp. | | | 1,325 | | | | 61,308 | |
Nordson Corp. | | | 318 | | | | 71,550 | |
Norfolk Southern Corp. | | | 1,380 | | | | 314,737 | |
Northrop Grumman Corp. | | | 854 | | | | 468,855 | |
Old Dominion Freight Line, Inc. | | | 538 | | | | 147,735 | |
Otis Worldwide Corp. | | | 2,469 | | | | 174,410 | |
PACCAR, Inc. | | | 2,043 | | | | 197,824 | |
Parker-Hannifin Corp. | | | 754 | | | | 219,128 | |
Pentair PLC | | | 966 | | | | 41,490 | |
Quanta Services, Inc. | | | 840 | | | | 119,314 | |
Raytheon Technologies Corp. | | | 8,675 | | | | 822,564 | |
Republic Services, Inc. | | | 1,206 | | | | 159,940 | |
Robert Half International, Inc.(c) | | | 644 | | | | 49,240 | |
Rockwell Automation, Inc. | | | 678 | | | | 173,093 | |
Rollins, Inc. | | | 1,360 | | | | 57,229 | |
Snap-on, Inc. | | | 313 | | | | 69,502 | |
Southwest Airlines Co.(b) | | | 3,486 | | | | 126,716 | |
Stanley Black & Decker, Inc. | | | 868 | | | | 68,129 | |
Textron, Inc. | | | 1,243 | | | | 85,071 | |
Trane Technologies PLC | | | 1,361 | | | | 217,256 | |
TransDigm Group, Inc. | | | 303 | | | | 174,455 | |
Union Pacific Corp. | | | 3,669 | | | | 723,307 | |
United Airlines Holdings, Inc.(b) | | | 1,920 | | | | 82,714 | |
United Parcel Service, Inc., Class B | | | 4,300 | | | | 721,411 | |
United Rentals, Inc.(b)(c) | | | 411 | | | | 129,757 | |
Verisk Analytics, Inc. | | | 922 | | | | 168,569 | |
W.W. Grainger, Inc. | | | 266 | | | | 155,437 | |
Wabtec Corp. | | | 1,069 | | | | 99,716 | |
See accompanying Notes to Financial Statements which are an integral part of the financial statements.
Invesco S&P 500® Downside Hedged ETF (PHDG)–(continued)
October 31, 2022
| | | | | | | | |
| | | Shares | | Value | |
Industrials-(continued) | | | | | | | | |
Waste Management, Inc. | | | 2,210 | | | $ | 349,998 | |
Xylem, Inc. | | | 1,059 | | | | 108,473 | |
| | | | | | | | |
| | | | | | | 15,801,427 | |
| | | | | | | | |
Information Technology-17.97% | | | | | | | | |
Accenture PLC, Class A | | | 3,716 | | | | 1,054,972 | |
Adobe, Inc.(b) | | | 2,749 | | | | 875,556 | |
Advanced Micro Devices, Inc.(b) | | | 9,484 | | | | 569,609 | |
Akamai Technologies, Inc.(b) | | | 934 | | | | 82,500 | |
Amphenol Corp., Class A | | | 3,495 | | �� | | 265,026 | |
Analog Devices, Inc. | | | 3,054 | | | | 435,561 | |
ANSYS, Inc.(b) | | | 512 | | | | 113,234 | |
Apple, Inc. | | | 88,751 | | | | 13,609,078 | |
Applied Materials, Inc. | | | 5,111 | | | | 451,250 | |
Arista Networks, Inc.(b) | | | 1,448 | | | | 175,005 | |
Autodesk, Inc.(b) | | | 1,276 | | | | 273,447 | |
Automatic Data Processing, Inc. | | | 2,441 | | | | 589,990 | |
Broadcom, Inc. | | | 2,372 | | | | 1,115,125 | |
Broadridge Financial Solutions, Inc. | | | 689 | | | | 103,391 | |
Cadence Design Systems, Inc.(b) | | | 1,609 | | | | 243,587 | |
CDW Corp. | | | 795 | | | | 137,384 | |
Ceridian HCM Holding, Inc.(b) | | | 899 | | | | 59,505 | |
Cisco Systems, Inc. | | | 24,328 | | | | 1,105,221 | |
Cognizant Technology Solutions Corp., Class A | | | 3,042 | | | | 189,365 | |
Corning, Inc. | | | 4,470 | | | | 143,800 | |
DXC Technology Co.(b) | | | 1,351 | | | | 38,841 | |
Enphase Energy, Inc.(b) | | | 796 | | | | 244,372 | |
EPAM Systems, Inc.(b) | | | 337 | | | | 117,950 | |
F5, Inc.(b)(c) | | | 350 | | | | 50,019 | |
Fidelity National Information Services, Inc. | | | 3,572 | | | | 296,440 | |
Fiserv, Inc.(b) | | | 3,758 | | | | 386,097 | |
FleetCor Technologies, Inc.(b) | | | 441 | | | | 82,079 | |
Fortinet, Inc.(b) | | | 3,845 | | | | 219,780 | |
Gartner, Inc.(b) | | | 465 | | | | 140,393 | |
Global Payments, Inc.(c) | | | 1,628 | | | | 186,015 | |
Hewlett Packard Enterprise Co. | | | 7,634 | | | | 108,937 | |
HP, Inc. | | | 5,346 | | | | 147,657 | |
Intel Corp. | | | 24,123 | | | | 685,817 | |
International Business Machines Corp. | | | 5,306 | | | | 733,767 | |
Intuit, Inc. | | | 1,657 | | | | 708,368 | |
Jack Henry & Associates, Inc. | | | 428 | | | | 85,198 | |
Juniper Networks, Inc. | | | 1,895 | | | | 57,987 | |
Keysight Technologies, Inc.(b) | | | 1,057 | | | | 184,077 | |
KLA Corp. | | | 833 | | | | 263,603 | |
Lam Research Corp. | | | 805 | | | | 325,848 | |
Mastercard, Inc., Class A | | | 5,013 | | | | 1,645,166 | |
Microchip Technology, Inc. | | | 3,246 | | | | 200,408 | |
Micron Technology, Inc. | | | 6,481 | | | | 350,622 | |
Microsoft Corp. | | | 43,815 | | | | 10,170,776 | |
Monolithic Power Systems, Inc. | | | 261 | | | | 88,596 | |
Motorola Solutions, Inc. | | | 980 | | | | 244,716 | |
NetApp, Inc. | | | 1,291 | | | | 89,428 | |
NortonLifeLock, Inc. | | | 3,478 | | | | 78,359 | |
NVIDIA Corp. | | | 14,711 | | | | 1,985,544 | |
NXP Semiconductors N.V. (China) | | | 1,543 | | | | 225,401 | |
ON Semiconductor Corp.(b) | | | 2,545 | | | | 156,339 | |
Oracle Corp. | | | 8,924 | | | | 696,697 | |
Paychex, Inc. | | | 1,882 | | | | 222,659 | |
Paycom Software, Inc.(b) | | | 286 | | | | 98,956 | |
| | | | | | | | |
| | | Shares | | Value | |
Information Technology-(continued) | | | | | | | | |
PayPal Holdings, Inc.(b) | | | 6,794 | | | $ | 567,843 | |
PTC, Inc.(b) | | | 621 | | | | 73,172 | |
Qorvo, Inc.(b) | | | 606 | | | | 52,164 | |
QUALCOMM, Inc. | | | 6,598 | | | | 776,321 | |
Roper Technologies, Inc. | | | 623 | | | | 258,258 | |
salesforce.com, inc.(b) | | | 5,846 | | | | 950,501 | |
Seagate Technology Holdings PLC | | | 1,147 | | | | 56,960 | |
ServiceNow, Inc.(b) | | | 1,187 | | | | 499,418 | |
Skyworks Solutions, Inc. | | | 943 | | | | 81,107 | |
SolarEdge Technologies, Inc.(b)(c) | | | 327 | | | | 75,220 | |
Synopsys, Inc.(b) | | | 899 | | | | 263,002 | |
TE Connectivity Ltd. (Switzerland) | | | 1,879 | | | | 229,670 | |
Teledyne Technologies, Inc.(b) | | | 275 | | | | 109,445 | |
Teradyne, Inc.(c) | | | 921 | | | | 74,923 | |
Texas Instruments, Inc. | | | 5,368 | | | | 862,262 | |
Trimble, Inc.(b) | | | 1,455 | | | | 87,533 | |
Tyler Technologies, Inc.(b) | | | 244 | | | | 78,893 | |
VeriSign, Inc.(b) | | | 548 | | | | 109,852 | |
Visa, Inc., Class A(c) | | | 9,606 | | | | 1,989,979 | |
Western Digital Corp.(b) | | | 1,840 | | | | 63,241 | |
Zebra Technologies Corp., Class A(b) | | | 304 | | | | 86,099 | |
| | | | | | | | |
| | | | | | | 50,255,381 | |
| | | | | | | | |
Materials-1.73% | | | | | | | | |
Air Products and Chemicals, Inc. | | | 1,303 | | | | 326,271 | |
Albemarle Corp. | | | 688 | | | | 192,550 | |
Amcor PLC | | | 8,829 | | | | 102,240 | |
Avery Dennison Corp. | | | 477 | | | | 80,875 | |
Ball Corp.(c) | | | 1,847 | | | | 91,223 | |
Celanese Corp. | | | 586 | | | | 56,326 | |
CF Industries Holdings, Inc. | | | 1,171 | | | | 124,430 | |
Corteva, Inc. | | | 4,222 | | | | 275,865 | |
Dow, Inc. | | | 4,219 | | | | 197,196 | |
DuPont de Nemours, Inc. | | | 2,943 | | | | 168,340 | |
Eastman Chemical Co. | | | 722 | | | | 55,457 | |
Ecolab, Inc. | | | 1,457 | | | | 228,851 | |
FMC Corp. | | | 740 | | | | 87,986 | |
Freeport-McMoRan, Inc. | | | 8,401 | | | | 266,228 | |
International Flavors & Fragrances, Inc. | | | 1,498 | | | | 146,220 | |
International Paper Co. | | | 2,127 | | | | 71,488 | |
Linde PLC (United Kingdom) | | | 2,928 | | | | 870,641 | |
LyondellBasell Industries N.V.,
Class A(c) | | | 1,495 | | | | 114,293 | |
Martin Marietta Materials, Inc. | | | 366 | | | | 122,969 | |
Mosaic Co. (The) | | | 2,028 | | | | 109,005 | |
Newmont Corp. | | | 4,663 | | | | 197,338 | |
Nucor Corp. | | | 1,538 | | | | 202,062 | |
Packaging Corp. of America | | | 551 | | | | 66,236 | |
PPG Industries, Inc. | | | 1,381 | | | | 157,683 | |
Sealed Air Corp. | | | 853 | | | | 40,620 | |
Sherwin-Williams Co. (The) | | | 1,386 | | | | 311,892 | |
Vulcan Materials Co. | | | 781 | | | | 127,850 | |
WestRock Co. | | | 1,494 | | | | 50,886 | |
| | | | | | | | |
| | | | | | | 4,843,021 | |
| | | | | | | | |
Real Estate-1.81% | | | | | | | | |
Alexandria Real Estate Equities, Inc. | | | 872 | | | | 126,702 | |
American Tower Corp. | | | 2,735 | | | | 566,665 | |
AvalonBay Communities, Inc. | | | 822 | | | | 143,949 | |
Boston Properties, Inc. | | | 838 | | | | 60,923 | |
Camden Property Trust | | | 626 | | | | 72,334 | |
CBRE Group, Inc., Class A(b)(c) | | | 1,887 | | | | 133,864 | |
See accompanying Notes to Financial Statements which are an integral part of the financial statements.
Invesco S&P 500® Downside Hedged ETF (PHDG)–(continued)
October 31, 2022
| | | | | | | | |
| | | Shares | | Value | |
Real Estate-(continued) | | | | | | | | |
Crown Castle, Inc. | | | 2,544 | | | $ | 339,013 | |
Digital Realty Trust, Inc.(c) | | | 1,689 | | | | 169,322 | |
Equinix, Inc. | | | 535 | | | | 303,045 | |
Equity Residential | | | 1,989 | | | | 125,347 | |
Essex Property Trust, Inc. | | | 383 | | | | 85,118 | |
Extra Space Storage, Inc. | | | 787 | | | | 139,645 | |
Federal Realty Investment Trust | | | 428 | | | | 42,363 | |
Healthpeak Properties, Inc. | | | 3,170 | | | | 75,224 | |
Host Hotels & Resorts, Inc.(c) | | | 4,200 | | | | 79,296 | |
Invitation Homes, Inc. | | | 3,407 | | | | 107,968 | |
Iron Mountain, Inc.(c) | | | 1,708 | | | | 85,520 | |
Kimco Realty Corp. | | | 3,634 | | | | 77,695 | |
Mid-America Apartment Communities, Inc. | | | 678 | | | | 106,751 | |
Prologis, Inc. | | | 5,424 | | | | 600,708 | |
Public Storage | | | 928 | | | | 287,448 | |
Realty Income Corp. | | | 3,628 | | | | 225,916 | |
Regency Centers Corp. | | | 905 | | | | 54,761 | |
SBA Communications Corp., Class A | | | 634 | | | | 171,117 | |
Simon Property Group, Inc.(c) | | | 1,923 | | | | 209,568 | |
UDR, Inc. | | | 1,794 | | | | 71,329 | |
Ventas, Inc. | | | 2,348 | | | | 91,877 | |
VICI Properties, Inc. | | | 5,658 | | | | 181,169 | |
Vornado Realty Trust | | | 946 | | | | 22,316 | |
Welltower, Inc. | | | 2,722 | | | | 166,151 | |
Weyerhaeuser Co. | | | 4,349 | | | | 134,515 | |
| | | | | | | | |
| | | | | | | 5,057,619 | |
| | | | | | | | |
Utilities-2.02% | | | | | | | | |
AES Corp. (The) | | | 3,924 | | | | 102,652 | |
Alliant Energy Corp. | | | 1,474 | | | | 76,899 | |
Ameren Corp. | | | 1,518 | | | | 123,747 | |
American Electric Power Co., Inc. | | | 3,018 | | | | 265,343 | |
American Water Works Co., Inc. | | | 1,068 | | | | 155,223 | |
Atmos Energy Corp. | | | 822 | | | | 87,584 | |
CenterPoint Energy, Inc. | | | 3,698 | | | | 105,800 | |
CMS Energy Corp. | | | 1,705 | | | | 97,270 | |
Consolidated Edison, Inc. | | | 2,083 | | | | 183,221 | |
Constellation Energy Corp. | | | 1,920 | | | | 181,517 | |
Dominion Energy, Inc. | | | 4,891 | | | | 342,223 | |
DTE Energy Co. | | | 1,138 | | | | 127,581 | |
Duke Energy Corp. | | | 4,524 | | | | 421,546 | |
Edison International | | | 2,241 | | | | 134,550 | |
Entergy Corp. | | | 1,195 | | | | 128,032 | |
Evergy, Inc. | | | 1,348 | | | | 82,403 | |
| | | | | | | | |
| | | Shares | | Value | |
Utilities-(continued) | | | | | | | | |
Eversource Energy | | | 2,035 | | | $ | 155,230 | |
Exelon Corp. | | | 5,827 | | | | 224,864 | |
FirstEnergy Corp. | | | 3,189 | | | | 120,257 | |
NextEra Energy, Inc. | | | 11,543 | | | | 894,583 | |
NiSource, Inc. | | | 2,385 | | | | 61,271 | |
NRG Energy, Inc. | | | 1,381 | | | | 61,316 | |
PG&E Corp.(b)(c) | | | 9,607 | | | | 143,433 | |
Pinnacle West Capital Corp. | | | 664 | | | | 44,627 | |
PPL Corp. | | | 4,325 | | | | 114,569 | |
Public Service Enterprise Group, Inc. | | | 2,931 | | | | 164,341 | |
Sempra Energy | | | 1,847 | | | | 278,786 | |
Southern Co. (The) | | | 6,245 | | | | 408,923 | |
WEC Energy Group, Inc. | | | 1,853 | | | | 169,234 | |
Xcel Energy, Inc. | | | 3,214 | | | | 209,264 | |
| | | | | | | | |
| | | | | | | 5,666,289 | |
| | | | | | | | |
Total Common Stocks & Other Equity Interests
(Cost $187,157,059) | | | | 191,164,356 | |
| | | | | | | | |
| | |
Money Market Funds-20.18% | | | | | | | | |
Invesco Government & Agency Portfolio, Institutional Class, 3.07%(d)(e)
(Cost $56,456,197) | | | 56,456,197 | | | | 56,456,197 | |
| | | | | | | | |
TOTAL INVESTMENTS IN SECURITIES
(excluding investments purchased with cash collateral from securities on loan)-88.53%
(Cost $243,613,256) | | | | 247,620,553 | |
| | | | | | | | |
|
Investments Purchased with Cash Collateral from Securities on Loan | |
| | |
Money Market Funds-1.68% | | | | | | | | |
Invesco Private Government Fund, 3.18%(d)(e)(f) | | | 1,372,606 | | | | 1,372,606 | |
Invesco Private Prime Fund,
3.28%(d)(e)(f) | | | 3,328,929 | | | | 3,328,929 | |
| | | | | | | | |
Total Investments Purchased with Cash Collateral from Securities on Loan
(Cost $4,701,340) | | | | 4,701,535 | |
| | | | | | | | |
TOTAL INVESTMENTS IN SECURITIES-90.21%
(Cost $248,314,596) | | | | 252,322,088 | |
OTHER ASSETS LESS LIABILITIES-9.79% | | | | 27,374,337 | |
| | | | | | | | |
NET ASSETS-100.00% | | | | | | $ | 279,696,425 | |
| | | | | | | | |
Notes to Schedule of Investments:
| (a) | Industry and/or sector classifications used in this report are generally according to the Global Industry Classification Standard, which was developed by and is the exclusive property and a service mark of MSCI Inc. and Standard & Poor’s. |
| (b) | Non-income producing security. |
| (c) | All or a portion of this security was out on loan at October 31, 2022. |
| (d) | Affiliated issuer. The issuer and/or the Fund is a wholly-owned subsidiary of Invesco Ltd., or is affiliated by having an investment adviser that is under common control of Invesco Ltd. The table below shows the Fund’s transactions in, and earnings from, its investments in affiliates for the fiscal year ended October 31, 2022. |
| | | | | | | | | | | | | | |
| | | Value
October 31, 2021 | | Purchases
at Cost | | Proceeds
from Sales | | Change in
Unrealized
Appreciation | | Realized
Gain
(Loss) | | Value
October 31, 2022 | | Dividend
Income |
| | | | | | | |
| Invesco Ltd. | | $ 11,689 | | $ 111,370 | | $ (76,051) | | $1,123 | | $(7,181) | | $ 40,950 | | $ 592 |
See accompanying Notes to Financial Statements which are an integral part of the financial statements.
Invesco S&P 500® Downside Hedged ETF (PHDG)–(continued)
October 31, 2022
| | | | | | | | | | | | | | | | | | | | | | | | | | | | | | | | | | | | | | | | | | | | | | | | | | | | | | | |
| | | Value
October 31, 2021 | | Purchases
at Cost | | Proceeds
from Sales | | Change in
Unrealized
Appreciation | | Realized
Gain
(Loss) | | Value
October 31, 2022 | | Dividend
Income |
| | | | | | | | | | | |
Investments in Affiliated Money Market Funds: | | | | | | | | | | | | | | | | | | | | | | | | | | | | | | | | | | | | | | | | | | | | | | | | | | | | | | | |
| | | | | | | | | | | |
Invesco Government & Agency Portfolio, Institutional Class | | | | | | | | $ | 78,548,777 | | | | | | | | | $ | 2,656,716,699 | | | | $ | (2,678,809,279 | ) | | | $ | - | | | | $ | - | | | | | | | | | $ | 56,456,197 | | | | | | | | | $ | 711,504 | |
| | | | | | | | | | | |
Investments Purchased with Cash Collateral from Securities on Loan: | | | | | | | | | | | | | | | | | | | | | | | | | | | | | | | | | | | | | | | | | | | | | | | | | | | | | | | |
| | | | | | | | | | | |
Invesco Private Government Fund | | | | | | | | | 46,821 | | | | | | | | | | 23,798,311 | | | | | (22,472,526 | ) | | | | - | | | | | - | | | | | | | | | | 1,372,606 | | | | | | | | | | 6,537 | * |
| | | | | | | | | | | |
Invesco Private Prime Fund | | | | | | | | | 109,249 | | | | | | | | | | 40,590,471 | | | | | (37,371,536 | ) | | | | 195 | | | | | 550 | | | | | | | | | | 3,328,929 | | | | | | | | | | 17,731 | * |
| | | | | | | | | | | | | | | | | | | | | | | | | | | | | | | | | | | | | | | | | | | | | | | | | | | | | | | |
| | | | | | | | | | | |
Total | | | | | | | | $ | 78,716,536 | | | | | | | | | $ | 2,721,216,851 | | | | $ | (2,738,729,392 | ) | | | $ | 1,318 | | | | $ | (6,631 | ) | | | | | | | | $ | 61,198,682 | | | | | | | | | $ | 736,364 | |
| | | | | | | | | | | | | | | | | | | | | | | | | | | | | | | | | | | | | | | | | | | | | | | | | | | | | | | |
| * | Represents the income earned on the investment of cash collateral, which is included in securities lending income on the Statements of Operations. Does not include rebates and fees paid to lending agent or premiums received from borrowers, if any. |
| (e) | The rate shown is the 7-day SEC standardized yield as of October 31, 2022. |
| (f) | The security has been segregated to satisfy the commitment to return the cash collateral received in securities lending transactions upon the borrower’s return of the securities loaned. See Note 2M. |
| | | | | | | | | | | | | | | | | | | | | | | | | | | | | | | | | | | | | |
Open Futures Contracts(a) |
| | | Long Futures Contracts | | Number of
Contracts | | Expiration
Month | | Notional
Value | | Value | | Unrealized
Appreciation
(Depreciation) |
| | | | | | | | |
| | Equity Risk | | | | | | | | | | | | | | | | | | | | | | | | | | | | | | | | | | | |
| | | | | | | | |
| | CBOE Volatility Index | | | | 884 | | | | | November-2022 | | | | $ | 22,873,765 | | | | $ | (4,512,113 | ) | | | | | | | | $ | (4,512,113 | ) | | | | | |
| | | | | | | | |
| | CBOE Volatility Index | | | | 724 | | | | | December-2022 | | | | | 19,113,311 | | | | | (1,289,192 | ) | | | | | | | | | (1,289,192 | ) | | | | | |
| | | | | | | | |
| | E-Mini S&P 500 Index | | | | 239 | | | | | December-2022 | | | | | 46,401,850 | | | | | 2,013,419 | | | | | | | | | | 2,013,419 | | | | | | |
| | | | | | | | |
| | Micro E-Mini S&P 500 | | | | 7 | | | | | December-2022 | | | | | 135,905 | | | | | 40 | | | | | | | | | | 40 | | | | | | |
| | | | | | | | | | | | | | | | | | | | | | | | | | | | | | | | | | | | | |
| | Total Futures Contracts | | | | | | | | | | | | | | | | | | $ | (3,787,846 | ) | | | | | | | | $ | (3,787,846 | ) | | | | | |
| | | | | | | | | | | | | | | | | | | | | | | | | | | | | | | | | | | | | |
| (a) | Futures contracts collateralized by $35,790,606 cash held with Merrill Lynch International, the futures commission merchant. |
See accompanying Notes to Financial Statements which are an integral part of the financial statements.
Invesco Total Return Bond ETF (GTO)
October 31, 2022
Schedule of Investments(a)
| | | | | | | | |
| | | Principal
Amount | | | Value | |
U.S. Dollar Denominated Bonds & Notes-64.08% | |
Advertising-0.06% | | | | | | | | |
Lamar Media Corp., 3.75%, 02/15/2028(b) | | | $ 518,000 | | | $ | 455,894 | |
| | | | | | | | |
Aerospace & Defense-0.70% | | | | | | | | |
Boeing Co. (The), 2.20%, 02/04/2026 | | | 380,000 | | | | 336,331 | |
Lockheed Martin Corp. | | | | | | | | |
5.10%, 11/15/2027(b) | | | 1,116,000 | | | | 1,118,709 | |
5.25%, 01/15/2033 | | | 1,332,000 | | | | 1,335,793 | |
4.15%, 06/15/2053 | | | 437,000 | | | | 348,159 | |
5.70%, 11/15/2054 | | | 811,000 | | | | 814,198 | |
4.30%, 06/15/2062 | | | 537,000 | | | | 427,517 | |
5.90%, 11/15/2063 | | | 811,000 | | | | 822,318 | |
| | | | | | | | |
| | | | | | | 5,203,025 | |
| | | | | | | | |
Agricultural & Farm Machinery-0.33% | | | | | | | | |
Cargill, Inc. | | | | | | | | |
3.63%, 04/22/2027(c) | | | 609,000 | | | | 571,531 | |
4.00%, 06/22/2032(c) | | | 731,000 | | | | 653,965 | |
5.13%, 10/11/2032(c) | | | 765,000 | | | | 746,098 | |
4.38%, 04/22/2052(c) | | | 541,000 | | | | 438,413 | |
| | | | | | | | |
| | | | | | | 2,410,007 | |
| | | | | | | | |
Airlines-0.87% | | | | | | | | |
Allegiant Travel Co., 7.25%,
08/15/2027(b)(c) | | | 191,000 | | | | 179,859 | |
American Airlines Pass-Through Trust | | | | | | | | |
Series 2021-1, Class A, 2.88%, 07/11/2034 | | | 1,577,000 | | | | 1,231,422 | |
Series 2021-1, Class B, 3.95%, 07/11/2030 | | | 2,341,000 | | | | 1,836,378 | |
British Airways Pass-Through Trust (United Kingdom) | | | | | | | | |
Series 2019-1, Class A, 3.35%, 06/15/2029(c) | | | 198,750 | | | | 169,199 | |
Series 2019-1, Class AA, 3.30%, 12/15/2032(c) | | | 198,771 | | | | 166,192 | |
Series 2021-1, Class A, 2.90%, 03/15/2035(c) | | | 1,048,309 | | | | 837,882 | |
Delta Air Lines, Inc./SkyMiles IP Ltd. | | | | | | | | |
4.50%, 10/20/2025(c) | | | 768,350 | | | | 748,860 | |
4.75%, 10/20/2028(c) | | | 437,984 | | | | 407,626 | |
United Airlines Pass-Through Trust, Series 2020-1, Class A, 5.88%, 10/15/2027 | | | 359,624 | | | | 347,429 | |
United Airlines, Inc. | | | | | | | | |
4.38%, 04/15/2026(c) | | | 238,000 | | | | 217,647 | |
4.63%, 04/15/2029(c) | | | 349,000 | | | | 299,971 | |
| | | | | | | | |
| | | | | | | 6,442,465 | |
| | | | | | | | |
Apparel Retail-0.04% | | | | | | | | |
Ross Stores, Inc., 3.38%, 09/15/2024 | | | 344,000 | | | | 332,267 | |
| | | | | | | | |
Application Software-0.16% | | | | | | | | |
salesforce.com, inc., 2.90%, 07/15/2051 | | | 646,000 | | | | 415,016 | |
Workday, Inc., 3.70%, 04/01/2029(b) | | | 878,000 | | | | 782,310 | |
| | | | | | | | |
| | | | | | | 1,197,326 | |
| | | | | | | | |
| | | | | | | | |
| | | Principal
Amount | | | Value | |
Asset Management & Custody Banks-1.25% | |
Ameriprise Financial, Inc. | | | | | | | | |
3.00%, 04/02/2025 | | | $ 103,000 | | | $ | 97,779 | |
4.50%, 05/13/2032(b) | | | 452,000 | | | | 418,558 | |
Bank of New York Mellon Corp. (The) | | | | | | | | |
4.60%, 07/26/2030(d) | | | 386,000 | | | | 362,300 | |
5.83%, 10/25/2033(d) | | | 1,188,000 | | | | 1,189,566 | |
Series I, 3.75%(d)(e) | | | 1,364,000 | | | | 1,053,758 | |
Blackstone Holdings Finance Co. LLC,
6.20%, 04/22/2033(c) | | | 2,920,000 | | | | 2,914,978 | |
Blackstone Secured Lending Fund | | | | | | | | |
2.75%, 09/16/2026(b) | | | 578,000 | | | | 496,078 | |
2.13%, 02/15/2027 | | | 771,000 | | | | 622,780 | |
2.85%, 09/30/2028 | | | 451,000 | | | | 344,650 | |
Northern Trust Corp., 6.13%, 11/02/2032 | | | 1,347,000 | | | | 1,348,528 | |
State Street Corp., 4.16%, 08/04/2033(d) | | | 416,000 | | | | 368,756 | |
| | | | | | | | |
| | | | | | | 9,217,731 | |
| | | | | | | | |
Auto Parts & Equipment-0.30% | | | | | | | | |
Avis Budget Car Rental LLC/Avis Budget Finance, Inc. | | | | | | | | |
4.75%, 04/01/2028(b)(c) | | | 1,225,000 | | | | 1,078,283 | |
5.38%, 03/01/2029(b)(c) | | | 550,000 | | | | 477,534 | |
Nemak S.A.B. de C.V. (Mexico), 3.63%, 06/28/2031(c) | | | 955,000 | | | | 696,162 | |
| | | | | | | | |
| | | | | | | 2,251,979 | |
| | | | | | | | |
Automobile Manufacturers-1.39% | | | | | | | | |
BMW US Capital LLC (Germany) | | | | | | | | |
3.89% (SOFR + 0.84%), 04/01/2025(c)(f) | | | 364,000 | | | | 362,251 | |
3.70%, 04/01/2032(c) | | | 541,000 | | | | 464,676 | |
Ford Motor Co., 6.10%, 08/19/2032(b) | | | 1,839,000 | | | | 1,691,144 | |
Ford Motor Credit Co. LLC, 2.70%, 08/10/2026 | | | 2,541,000 | | | | 2,213,846 | |
General Motors Financial Co., Inc. | | | | | | | | |
3.80%, 04/07/2025 | | | 495,000 | | | | 467,976 | |
5.00%, 04/09/2027 | | | 805,000 | | | | 761,190 | |
4.30%, 04/06/2029 | | | 1,055,000 | | | | 927,408 | |
Hyundai Capital America | | | | | | | | |
5.88%, 04/07/2025(b)(c) | | | 73,000 | | | | 72,266 | |
2.00%, 06/15/2028(c) | | | 433,000 | | | | 337,050 | |
Nissan Motor Acceptance Co. LLC, 1.85%, 09/16/2026(c) | | | 572,000 | | | | 449,075 | |
Stellantis Finance US, Inc., 6.38%, 09/12/2032(b)(c) | | | 547,000 | | | | 506,794 | |
Toyota Motor Credit Corp., 4.55%, 09/20/2027 | | | 1,257,000 | | | | 1,223,744 | |
Volkswagen Group of America Finance LLC (Germany), 4.60%, 06/08/2029(c) | | | 864,000 | | | | 783,809 | |
| | | | | | | | |
| | | | | | | 10,261,229 | |
| | | | | | | | |
Automotive Retail-0.68% | | | | | | | | |
Asbury Automotive Group, Inc., 5.00%, 02/15/2032(c) | | | 516,000 | | | | 416,629 | |
AutoZone, Inc., 4.75%, 08/01/2032 | | | 735,000 | | | | 683,345 | |
See accompanying Notes to Financial Statements which are an integral part of the financial statements.
Invesco Total Return Bond ETF (GTO)–(continued)
October 31, 2022
| | | | | | | | |
| | | Principal
Amount | | | Value | |
Automotive Retail-(continued) | | | | | | | | |
Lithia Motors, Inc., 3.88%, 06/01/2029(b)(c) | | | $ 2,262,000 | | | $ | 1,828,770 | |
Sonic Automotive, Inc. | | | | | | | | |
4.63%, 11/15/2029(b)(c) | | | 1,615,000 | | | | 1,269,124 | |
4.88%, 11/15/2031(c) | | | 1,069,000 | | | | 814,551 | |
| | | | | | | | |
| | | | | | | 5,012,419 | |
| | | | | | | | |
Biotechnology-0.11% | | | | | | | | |
CSL Finance PLC (Australia) | | | | | | | | |
3.85%, 04/27/2027(c) | | | 342,000 | | | | 322,412 | |
4.05%, 04/27/2029(c) | | | 265,000 | | | | 243,569 | |
4.63%, 04/27/2042(c) | | | 262,000 | | | | 220,755 | |
| | | | | | | | |
| | | | | | | 786,736 | |
| | | | | | | | |
Broadcasting-0.01% | | | | | | | | |
Fox Corp., 4.71%, 01/25/2029 | | | 73,000 | | | | 67,964 | |
| | | | | | | | |
Building Products-0.08% | | | | | | | | |
Advanced Drainage Systems, Inc., 6.38%, 06/15/2030(c) | | | 270,000 | | | | 261,317 | |
HP Communities LLC | | | | | | | | |
5.78%, 03/15/2046(c) | | | 150,000 | | | | 139,337 | |
5.86%, 09/15/2053(c) | | | 100,000 | | | | 79,527 | |
Masco Corp., 2.00%, 02/15/2031(b) | | | 108,000 | | | | 79,771 | |
| | | | | | | | |
| | | | | | | 559,952 | |
| | | | | | | | |
Cable & Satellite-0.82% | | | | | | | | |
CCO Holdings LLC/CCO Holdings Capital Corp. | | | | | | | | |
6.38%, 09/01/2029(b)(c) | | | 1,604,000 | | | | 1,482,104 | |
4.50%, 06/01/2033(c) | | | 462,000 | | | | 351,730 | |
Charter Communications Operating LLC/Charter Communications Operating Capital Corp. | | | | | | | | |
5.05%, 03/30/2029 | | | 76,000 | | | | 69,854 | |
3.50%, 03/01/2042 | | | 554,000 | | | | 345,598 | |
Comcast Corp. | | | | | | | | |
4.15%, 10/15/2028 | | | 50,000 | | | | 46,980 | |
5.50%, 11/15/2032 | | | 2,101,000 | | | | 2,087,722 | |
3.25%, 11/01/2039 | | | 263,000 | | | | 190,214 | |
3.45%, 02/01/2050 | | | 199,000 | | | | 134,112 | |
2.80%, 01/15/2051 | | | 95,000 | | | | 56,344 | |
2.89%, 11/01/2051 | | | 17,000 | | | | 10,190 | |
2.99%, 11/01/2063 | | | 22,000 | | | | 12,332 | |
Cox Communications, Inc., 2.95%, 10/01/2050(c) | | | 90,000 | | | | 50,959 | |
Sirius XM Radio, Inc., 3.88%, 09/01/2031(c) | | | 1,568,000 | | | | 1,239,190 | |
| | | | | | | | |
| | | | | | | 6,077,329 | |
| | | | | | | | |
Casinos & Gaming-0.23% | | | | | | | | |
Boyne USA, Inc., 4.75%, 05/15/2029(c) | | | 653,000 | | | | 572,821 | |
CDI Escrow Issuer, Inc., 5.75%, 04/01/2030(c) | | | 1,001,000 | | | | 904,904 | |
MGM China Holdings Ltd. (Macau), 5.38%, 05/15/2024(b)(c) | | | 218,000 | | | | 188,069 | |
| | | | | | | | |
| | | | | | | 1,665,794 | |
| | | | | | | | |
| | | | | | | | |
| | | Principal
Amount | | | Value | |
Construction Machinery & Heavy Trucks-0.21% | |
Daimler Trucks Finance North America LLC (Germany), 3.65%, 04/07/2027(c) | | | $ 1,708,000 | | | $ | 1,544,326 | |
| | | | | | | | |
Consumer Finance-0.49% | | | | | | | | |
American Express Co. | | | | | | | | |
2.55%, 03/04/2027 | | | 709,000 | | | | 623,372 | |
4.99%, 05/26/2033(d) | | | 737,000 | | | | 666,665 | |
4.42%, 08/03/2033(d) | | | 1,739,000 | | | | 1,544,910 | |
OneMain Finance Corp., 3.88%, 09/15/2028 | | | 1,014,000 | | | | 792,481 | |
| | | | | | | | |
| | | | | | | 3,627,428 | |
| | | | | | | | |
Copper-0.20% | | | | | | | | |
PT Freeport Indonesia (Indonesia) | | | | | | | | |
4.76%, 04/14/2027(b)(c) | | | 476,000 | | | | 430,066 | |
5.32%, 04/14/2032(b)(c) | | | 716,000 | | | | 605,915 | |
6.20%, 04/14/2052(c) | | | 633,000 | | | | 478,611 | |
| | | | | | | | |
| | | | | | | 1,514,592 | |
| | | | | | | | |
Data Processing & Outsourced Services-0.37% | |
Block, Inc., 3.50%, 06/01/2031(b) | | | 1,408,000 | | | | 1,137,087 | |
Clarivate Science Holdings Corp., 3.88%, 07/01/2028(c) | | | 976,000 | | | | 839,441 | |
Fidelity National Information Services, Inc., 3.10%, 03/01/2041 | | | 105,000 | | | | 68,429 | |
PayPal Holdings, Inc. | | | | | | | | |
2.85%, 10/01/2029(b) | | | 30,000 | | | | 25,516 | |
5.05%, 06/01/2052(b) | | | 741,000 | | | | 638,915 | |
| | | | | | | | |
| | | | | | | 2,709,388 | |
| | | | | | | | |
Distributors-0.12% | | | | | | | | |
Genuine Parts Co., 2.75%, 02/01/2032(b) | | | 1,144,000 | | | | 886,984 | |
| | | | | | | | |
Diversified Banks-11.26% | | | | | | | | |
Africa Finance Corp. (Supranational), 4.38%, 04/17/2026(c) | | | 280,000 | | | | 249,015 | |
African Export-Import Bank (The) (Supranational) | | | | | | | | |
2.63%, 05/17/2026(c) | | | 398,000 | | | | 331,335 | |
3.80%, 05/17/2031(c) | | | 500,000 | | | | 385,355 | |
Australia & New Zealand Banking Group Ltd. (Australia), 6.75%(c)(d)(e) | | | 1,444,000 | | | | 1,384,135 | |
Banco do Brasil S.A. (Brazil), 3.25%, 09/30/2026(c) | | | 1,050,000 | | | | 934,547 | |
Banco Mercantil del Norte S.A. (Mexico), 6.63%(c)(d)(e) | | | 588,000 | | | | 441,882 | |
See accompanying Notes to Financial Statements which are an integral part of the financial statements.
Invesco Total Return Bond ETF (GTO)–(continued)
October 31, 2022
| | | | | | | | |
| | | Principal
Amount | | | Value | |
Diversified Banks-(continued) | | | | | | | | |
Bank of America Corp. | | | | | | | | |
4.11% (SOFR + 1.05%), 02/04/2028(f) | | | $ 1,194,000 | | | $ | 1,142,696 | |
4.38%, 04/27/2028(d) | | | 1,387,000 | | | | 1,290,864 | |
4.95%, 07/22/2028(b)(d) | | | 1,125,000 | | | | 1,073,295 | |
2.69%, 04/22/2032(d) | | | 495,000 | | | | 382,824 | |
2.57%, 10/20/2032(d) | | | 452,000 | | | | 340,806 | |
2.97%, 02/04/2033(d) | | | 580,000 | | | | 447,928 | |
4.57%, 04/27/2033(d) | | | 1,153,000 | | | | 1,022,439 | |
5.02%, 07/22/2033(d) | | | 1,541,000 | | | | 1,413,681 | |
2.48%, 09/21/2036(d) | | | 616,000 | | | | 440,576 | |
3.85%, 03/08/2037(d) | | | 411,000 | | | | 329,481 | |
Series RR, 4.38%(d)(e) | | | 1,518,000 | | | | 1,221,990 | |
Series TT, 6.13%(b)(d)(e) | | | 2,326,000 | | | | 2,203,885 | |
Bank of Nova Scotia (The) (Canada) | | | | | | | | |
4.59%, 05/04/2037(d) | | | 1,886,000 | | | | 1,551,255 | |
8.63%, 10/27/2082(d) | | | 2,115,000 | | | | 2,127,334 | |
Barclays PLC (United Kingdom) | | | | | | | | |
7.44%, 11/02/2033(d) | | | 2,230,000 | | | | 2,225,774 | |
8.00%(d)(e) | | | 1,692,000 | | | | 1,520,107 | |
BNP Paribas S.A. (France), 1.32%, 01/13/2027(c)(d) | | | 854,000 | | | | 719,281 | |
Citigroup, Inc. | | | | | | | | |
3.75% (SOFR + 0.69%), 01/25/2026(b)(f) | | | 543,000 | | | | 526,632 | |
4.66%, 05/24/2028(b)(d) | | | 668,000 | | | | 630,454 | |
3.98%, 03/20/2030(d) | | | 199,000 | | | | 175,445 | |
2.57%, 06/03/2031(d) | | | 175,000 | | | | 136,917 | |
3.79%, 03/17/2033(d) | | | 1,264,000 | | | | 1,047,621 | |
4.91%, 05/24/2033(b)(d) | | | 761,000 | | | | 692,400 | |
3.88%(b)(d)(e) | | | 1,432,000 | | | | 1,179,252 | |
Series A, 5.95%(d)(e) | | | 248,000 | | | | 246,760 | |
Series P, 5.95%(b)(d)(e) | | | 330,000 | | | | 299,120 | |
Cooperatieve Rabobank U.A. (Netherlands) | | | | | | | | |
3.65%, 04/06/2028(b)(c)(d) | | | 1,221,000 | | | | 1,088,645 | |
4.66%, 08/22/2028(b)(c)(d) | | | 1,445,000 | | | | 1,337,297 | |
3.76%, 04/06/2033(b)(c)(d) | | | 1,129,000 | | | | 910,022 | |
Corp. Andina de Fomento (Supranational), 1.25%, 10/26/2024 | | | 2,769,000 | | | | 2,559,077 | |
Credit Agricole S.A. (France), 4.75%(c)(d)(e) | | | 1,284,000 | | | | 925,224 | |
Development Bank of Kazakhstan JSC (Kazakhstan), 5.75%, 05/12/2025(c) | | | 1,730,000 | | | | 1,717,821 | |
Federation des caisses Desjardins du Quebec (Canada), 4.55%, 08/23/2027(c) | | | 2,501,000 | | | | 2,339,010 | |
HSBC Holdings PLC (United Kingdom) | | | | | | | | |
4.32% (SOFR + 1.43%), 03/10/2026(f) | | | 1,907,000 | | | | 1,865,216 | |
5.21%, 08/11/2028(d) | | | 1,464,000 | | | | 1,341,201 | |
5.40%, 08/11/2033(b)(d) | | | 1,938,000 | | | | 1,681,438 | |
8.11%, 11/03/2033(d) | | | 2,247,000 | | | | 2,245,915 | |
ING Groep N.V. (Netherlands), 4.06% (SOFR + 1.01%), 04/01/2027(f) | | | 885,000 | | | | 844,972 | |
| | | | | | | | |
| | | Principal
Amount | | | Value | |
Diversified Banks-(continued) | | | | | | | | |
JPMorgan Chase & Co. | | | | | | | | |
5.22% (3 mo. USD LIBOR + 0.89%), 07/23/2024(f) | | | $ 92,000 | | | $ | 91,857 | |
4.32%, 04/26/2028(d) | | | 1,377,000 | | | | 1,281,565 | |
4.85%, 07/25/2028(d) | | | 1,200,000 | | | | 1,141,346 | |
3.70%, 05/06/2030(d) | | | 199,000 | | | | 173,290 | |
2.96%, 01/25/2033(d) | | | 316,000 | | | | 246,927 | |
4.59%, 04/26/2033(d) | | | 832,000 | | | | 741,395 | |
4.91%, 07/25/2033(d) | | | 1,839,000 | | | | 1,682,150 | |
5.72%, 09/14/2033(d) | | | 2,722,000 | | | | 2,540,438 | |
KeyBank N.A., 4.90%, 08/08/2032 | | | 1,984,000 | | | | 1,759,432 | |
Mitsubishi UFJ Financial Group, Inc. (Japan) | | | | | | | | |
1.64%, 10/13/2027(b)(d) | | | 623,000 | | | | 524,717 | |
5.02%, 07/20/2028(d) | | | 1,079,000 | | | | 1,025,858 | |
1.80%, 07/20/2033(d) | | | 1,410,000 | | | | 1,280,542 | |
Mizuho Financial Group, Inc. (Japan), 5.67%, 09/13/2033(b)(d) | | | 1,899,000 | | | | 1,778,579 | |
Nordea Bank Abp (Finland) | | | | | | | | |
4.75%, 09/22/2025(c) | | | 1,613,000 | | | | 1,580,484 | |
5.38%, 09/22/2027(c) | | | 858,000 | | | | 827,199 | |
6.63%(c)(d)(e) | | | 859,000 | | | | 813,451 | |
Royal Bank of Canada (Canada), 3.77% (SOFR + 0.71%), 01/21/2027(f) | | | 1,719,000 | | | | 1,658,115 | |
Standard Chartered PLC (United Kingdom) | | | | | | | | |
2.68%, 06/29/2032(c)(d) | | | 810,000 | | | | 567,579 | |
4.30%(c)(d)(e) | | | 1,362,000 | | | | 898,821 | |
7.75%(b)(c)(d)(e) | | | 2,174,000 | | | | 2,149,353 | |
7.75%(b)(c)(d)(e) | | | 2,112,000 | | | | 1,935,120 | |
Sumitomo Mitsui Financial Group, Inc. (Japan) | | | | | | | | |
2.13%, 07/08/2030 | | | 797,000 | | | | 598,226 | |
2.14%, 09/23/2030 | | | 280,000 | | | | 205,587 | |
Swedbank AB (Sweden), 5.34%, 09/20/2027(c) | | | 1,031,000 | | | | 981,662 | |
Toronto-Dominion Bank (The) (Canada), 8.13%, 10/31/2082(d) | | | 1,740,000 | | | | 1,765,143 | |
U.S. Bancorp | | | | | | | | |
4.55%, 07/22/2028(d) | | | 1,195,000 | | | | 1,136,293 | |
4.97%, 07/22/2033(d) | | | 911,000 | | | | 830,021 | |
5.85%, 10/21/2033(d) | | | 1,888,000 | | | | 1,881,498 | |
2.49%, 11/03/2036(d) | | | 1,665,000 | | | | 1,220,818 | |
Wells Fargo & Co. | | | | | | | | |
3.53%, 03/24/2028(d) | | | 625,000 | | | | 563,183 | |
4.81%, 07/25/2028(d) | | | 691,000 | | | | 654,777 | |
4.15%, 01/24/2029 | | | 199,000 | | | | 181,189 | |
4.90%, 07/25/2033(d) | | | 679,000 | | | | 619,529 | |
4.61%, 04/25/2053(d) | | | 1,026,000 | | | | 816,502 | |
| | | | | | | | |
| | | | | | | 83,123,570 | |
| | | | | | | | |
Diversified Capital Markets-1.47% | | | | | | | | |
Credit Suisse AG (Switzerland), 5.00%, 07/09/2027 | | | 2,140,000 | | | | 1,930,691 | |
See accompanying Notes to Financial Statements which are an integral part of the financial statements.
Invesco Total Return Bond ETF (GTO)–(continued)
October 31, 2022
| | | | | | | | |
| | | Principal
Amount | | | Value | |
Diversified Capital Markets-(continued) | |
Credit Suisse Group AG (Switzerland) | | | | | | | | |
6.44%, 08/11/2028(b)(c)(d) | | | $ 1,920,000 | | | $ | 1,733,997 | |
6.54%, 08/12/2033(c)(d) | | | 2,942,000 | | | | 2,562,401 | |
4.50%(b)(c)(d)(e) | | | 810,000 | | | | 484,298 | |
5.10%(c)(d)(e) | | | 492,000 | | | | 303,251 | |
5.25%(c)(d)(e) | | | 471,000 | | | | 334,820 | |
7.50%(c)(d)(e) | | | 631,000 | | | | 560,801 | |
9.75%(b)(c)(d)(e) | | | 1,581,000 | | | | 1,505,265 | |
OWL Rock Core Income Corp., 4.70%, 02/08/2027 | | | 468,000 | | | | 411,854 | |
UBS Group AG (Switzerland), 4.75%, 05/12/2028(c)(d) | | | 1,119,000 | | | | 1,025,878 | |
| | | | | | | | |
| | | | | | | 10,853,256 | |
| | | | | | | | |
Diversified Chemicals-0.82% | | | | | | | | |
Celanese US Holdings LLC | | | | | | | | |
5.90%, 07/05/2024 | | | 1,529,000 | | | | 1,502,492 | |
6.05%, 03/15/2025 | | | 1,634,000 | | | | 1,589,348 | |
6.17%, 07/15/2027 | | | 1,711,000 | | | | 1,616,742 | |
6.38%, 07/15/2032(b) | | | 1,102,000 | | | | 1,003,280 | |
OCP S.A. (Morocco), 5.13%, 06/23/2051(c) | | | 508,000 | | | | 312,723 | |
| | | | | | | | |
| | | | | | | 6,024,585 | |
| | | | | | | | |
Diversified Metals & Mining-0.17% | | | | | | | | |
FMG Resources August 2006 Pty. Ltd. (Australia), 4.38%, 04/01/2031(b)(c) | | | 746,000 | | | | 590,541 | |
South32 Treasury Ltd. (Australia), 4.35%, 04/14/2032(c) | | | 779,000 | | | | 654,194 | |
| | | | | | | | |
| | | | | | | 1,244,735 | |
| | | | | | | | |
Diversified REITs-0.51% | | | | | | | | |
Atlantic Marine Corps Communities LLC, 5.34%, 12/01/2050(c) | | | 93,042 | | | | 82,140 | |
CubeSmart L.P., 2.25%, 12/15/2028 | | | 161,000 | | | | 129,294 | |
Fort Benning Family Communities LLC, 5.81%, 01/15/2051(c) | | | 200,000 | | | | 160,804 | |
Trust Fibra Uno (Mexico) | | | | | | | | |
4.87%, 01/15/2030(b)(c) | | | 1,080,000 | | | | 815,362 | |
6.39%, 01/15/2050(c) | | | 385,000 | | | | 255,988 | |
VICI Properties L.P | | | | | | | | |
4.75%, 02/15/2028 | | | 938,000 | | | | 857,455 | |
4.95%, 02/15/2030 | | | 938,000 | | | | 849,019 | |
5.13%, 05/15/2032(b) | | | 681,000 | | | | 604,932 | |
| | | | | | | | |
| | | | | | | 3,754,994 | |
| | | | | | | | |
Diversified Support Services-0.07% | | | | | | | | |
Atento Luxco 1 S.A. (Brazil), 8.00%, 02/10/2026(c) | | | 1,305,000 | | | | 517,889 | |
| | | | | | | | |
Education Services-0.16% | | | | | | | | |
Grand Canyon University, 3.25%, 10/01/2023 | | | 1,235,000 | | | | 1,219,563 | |
| | | | | | | | |
Electric Utilities-2.86% | | | | | | | | |
AEP Texas, Inc. | | | | | | | | |
4.70%, 05/15/2032(b) | | | 454,000 | | | | 413,109 | |
5.25%, 05/15/2052 | | | 533,000 | | | | 464,738 | |
Alfa Desarrollo S.p.A. (Chile), 4.55%, 09/27/2051(c) | | | 971,446 | | | | 622,904 | |
| | | | | | | | |
| | | Principal
Amount | | | Value | |
Electric Utilities-(continued) | | | | | | | | |
American Electric Power Co., Inc. | | | | | | | | |
5.75%, 11/01/2027 | | | $ 1,075,000 | | | $ | 1,072,151 | |
5.95%, 11/01/2032 | | | 781,000 | | | | 775,666 | |
3.88%, 02/15/2062(d) | | | 2,240,000 | | | | 1,720,152 | |
Commonwealth Edison Co., Series 127, 3.20%, 11/15/2049 | | | 140,000 | | | | 92,450 | |
Drax Finco PLC (United Kingdom), 6.63%, 11/01/2025(c) | | | 200,000 | | | | 186,273 | |
Duke Energy Corp. | | | | | | | | |
4.30%, 03/15/2028 | | | 889,000 | | | | 836,162 | |
5.00%, 08/15/2052(b) | | | 1,402,000 | | | | 1,158,087 | |
3.25%, 01/15/2082(d) | | | 655,000 | | | | 458,938 | |
EDP Finance B.V. (Portugal), 6.30%, 10/11/2027(b)(c) | | | 486,000 | | | | 484,367 | |
Enel Finance America LLC (Italy), 7.10%, 10/14/2027(c) | | | 533,000 | | | | 531,614 | |
Enel Finance International N.V. (Italy) | | | | | | | | |
6.80%, 10/14/2025(c) | | | 1,072,000 | | | | 1,076,746 | |
7.50%, 10/14/2032(b)(c) | | | 692,000 | | | | 693,465 | |
7.75%, 10/14/2052(b)(c) | | | 828,000 | | | | 791,819 | |
Interconexion Electrica S.A. ESP (Colombia), 3.83%, 11/26/2033(c) | | | 439,000 | | | | 335,021 | |
Mercury Chile Holdco LLC (Chile), 6.50%, 01/24/2027(c) | | | 5,000,000 | | | | 4,132,750 | |
National Rural Utilities Cooperative Finance Corp. | | | | | | | | |
2.75%, 04/15/2032 | | | 627,000 | | | | 502,945 | |
5.80%, 01/15/2033 | | | 789,000 | | | | 799,720 | |
NextEra Energy Capital Holdings, Inc. | | | | | | | | |
4.63%, 07/15/2027 | | | 1,290,000 | | | | 1,240,750 | |
5.00%, 07/15/2032 | | | 406,000 | | | | 385,834 | |
Southern Co. (The), 5.70%, 10/15/2032 | | | 808,000 | | | | 799,099 | |
Tampa Electric Co., 5.00%, 07/15/2052 | | | 470,000 | | | | 411,867 | |
Virginia Electric and Power Co. | | | | | | | | |
Series B, 3.75%, 05/15/2027 | | | 576,000 | | | | 540,476 | |
Series C, 4.63%, 05/15/2052 | | | 668,000 | | | | 553,630 | |
| | | | | | | | |
| | | | | | | 21,080,733 | |
| | | | | | | | |
Electrical Components & Equipment-0.80% | |
CenterPoint Energy Houston Electric LLC | | | | | | | | |
Series AI, 4.45%, 10/01/2032 | | | 2,002,000 | | | | 1,876,733 | |
Series AJ, 4.85%, 10/01/2052(b) | | | 2,021,000 | | | | 1,774,402 | |
Sensata Technologies B.V. | | | | | | | | |
4.00%, 04/15/2029(c) | | | 2,179,000 | | | | 1,838,651 | |
5.88%, 09/01/2030(c) | | | 411,000 | | | | 391,060 | |
| | | | | | | | |
| | | | | | | 5,880,846 | |
| | | | | | | | |
Electronic Components-0.03% | | | | | | | | |
Corning, Inc., 5.45%, 11/15/2079 | | | 274,000 | | | | 219,494 | |
| | | | | | | | |
Electronic Equipment & Instruments-0.05% | |
Vontier Corp. | | | | | | | | |
2.40%, 04/01/2028 | | | 272,000 | | | | 210,728 | |
2.95%, 04/01/2031 | | | 284,000 | | | | 199,791 | |
| | | | | | | | |
| | | | | | | 410,519 | |
| | | | | | | | |
See accompanying Notes to Financial Statements which are an integral part of the financial statements.
Invesco Total Return Bond ETF (GTO)–(continued)
October 31, 2022
| | | | | | | | |
| | | Principal
Amount | | | Value | |
Environmental & Facilities Services-0.20% | |
Covanta Holding Corp., 4.88%, 12/01/2029(c) | | | $ 1,212,000 | | | $ | 1,034,872 | |
GFL Environmental, Inc. (Canada), 3.50%, 09/01/2028(b)(c) | | | 509,000 | | | | 435,297 | |
| | | | | | | | |
| | | | | | | 1,470,169 | |
| | | | | | | | |
Financial Exchanges & Data-1.16% | | | | | | | | |
B3 S.A. - Brasil, Bolsa, Balcao (Brazil), 4.13%, 09/20/2031(c) | | | 1,884,000 | | | | 1,503,488 | |
Cboe Global Markets, Inc., 3.00%, 03/16/2032 | | | 1,596,000 | | | | 1,295,272 | |
Intercontinental Exchange, Inc. | | | | | | | | |
4.00%, 09/15/2027 | | | 964,000 | | | | 914,824 | |
4.35%, 06/15/2029 | | | 742,000 | | | | 703,549 | |
4.60%, 03/15/2033 | | | 646,000 | | | | 593,935 | |
4.95%, 06/15/2052(b) | | | 886,000 | | | | 768,797 | |
5.20%, 06/15/2062 | | | 673,000 | | | | 601,952 | |
Moody’s Corp. | | | | | | | | |
4.25%, 08/08/2032 | | | 460,000 | �� | | | 414,243 | |
3.75%, 02/25/2052(b) | | | 570,000 | | | | 401,727 | |
3.10%, 11/29/2061 | | | 1,055,000 | | | | 608,003 | |
MSCI, Inc. | | | | | | | | |
3.88%, 02/15/2031(c) | | | 283,000 | | | | 238,972 | |
3.63%, 11/01/2031(c) | | | 545,000 | | | | 447,635 | |
S&P Global, Inc., 1.25%, 08/15/2030(b) | | | 79,000 | | | | 58,771 | |
| | | | | | | | |
| | | | | | | 8,551,168 | |
| | | | | | | | |
Food Distributors-0.10% | | | | | | | | |
American Builders & Contractors Supply Co., Inc., 3.88%, 11/15/2029(c) | | | 884,000 | | | | 727,231 | |
| | | | | | | | |
General Merchandise Stores-0.46% | | | | | | | | |
Dollar General Corp. | | | | | | | | |
4.63%, 11/01/2027 | | | 582,000 | | | | 562,299 | |
5.00%, 11/01/2032(b) | | | 512,000 | | | | 487,720 | |
5.50%, 11/01/2052(b) | | | 1,024,000 | | | | 948,249 | |
Target Corp., 4.50%, 09/15/2032 | | | 1,475,000 | | | | 1,391,244 | |
| | | | | | | | |
| | | | | | | 3,389,512 | |
| | | | | | | | |
Health Care Facilities-0.08% | | | | | | | | |
Tenet Healthcare Corp., 6.13%, 06/15/2030(c) | | | 675,000 | | | | 623,518 | |
| | | | | | | | |
| | |
Health Care REITs-0.01% | | | | | | | | |
Healthcare Realty Holdings L.P., 2.00%, 03/15/2031 | | | 99,000 | | | | 71,355 | |
| | | | | | | | |
Health Care Services-0.37% | | | | | | | | |
Piedmont Healthcare, Inc. | | | | | | | | |
2.86%, 01/01/2052 | | | 2,000,000 | | | | 1,148,828 | |
Series 2032, 2.04%, 01/01/2032 | | | 1,275,000 | | | | 945,569 | |
Series 2042, 2.72%, 01/01/2042 | | | 1,000,000 | | | | 636,121 | |
| | | | | | | | |
| | | | | | | 2,730,518 | |
| | | | | | | | |
Highways & Railtracks-0.04% | | | | | | | | |
TransJamaican Highway Ltd. (Jamaica), 5.75%, 10/10/2036(c) | | | 373,342 | | | | 296,993 | |
| | | | | | | | |
| | |
Home Improvement Retail-1.08% | | | | | | | | |
Home Depot, Inc. (The) | | | | | | | | |
4.50%, 09/15/2032(b) | | | 1,472,000 | | | | 1,395,237 | |
4.95%, 09/15/2052(b) | | | 743,000 | | | | 666,051 | |
| | | | | | | | |
| | | Principal
Amount | | | Value | |
Home Improvement Retail-(continued) | | | | | | | | |
Lowe’s Cos., Inc. | | | | | | | | |
5.00%, 04/15/2033(b) | | | $ 2,729,000 | | | $ | 2,574,588 | |
5.63%, 04/15/2053(b) | | | 2,039,000 | | | | 1,832,664 | |
5.80%, 09/15/2062 | | | 1,699,000 | | | | 1,516,356 | |
| | | | | | | | |
| | | | | | | 7,984,896 | |
| | | | | | | | |
Homebuilding-0.29% | | | | | | | | |
Lennar Corp., 4.75%, 11/29/2027(b) | | | 796,000 | | | | 736,764 | |
M.D.C. Holdings, Inc. | | | | | | | | |
3.85%, 01/15/2030 | | | 452,000 | | | | 347,633 | |
3.97%, 08/06/2061 | | | 1,524,000 | | | | 758,581 | |
Mattamy Group Corp. (Canada), 5.25%, 12/15/2027(c) | | | 315,000 | | | | 269,634 | |
| | | | | | | | |
| | | | | | | 2,112,612 | |
| | | | | | | | |
Hotels, Resorts & Cruise Lines-0.05% | |
Hilton Domestic Operating Co., Inc., 3.63%, 02/15/2032(c) | | | 486,000 | | | | 386,516 | |
| | | | | | | | |
Household Products-0.20% | | | | | | | | |
Church & Dwight Co., Inc., 5.60%, 11/15/2032 | | | 664,000 | | | | 662,772 | |
Colgate-Palmolive Co., 3.10%, 08/15/2027 | | | 861,000 | | | | 804,010 | |
| | | | | | | | |
| | | | | | | 1,466,782 | |
| | | | | | | | |
Hypermarkets & Super Centers-0.31% | |
Walmart, Inc. | | | | | | | | |
4.15%, 09/09/2032(b) | | | 1,406,000 | | | | 1,330,476 | |
4.50%, 09/09/2052 | | | 1,098,000 | | | | 972,702 | |
| | | | | | | | |
| | | | | | | 2,303,178 | |
| | | | | | | | |
Independent Power Producers & Energy Traders-0.31% | |
AES Corp. (The), 2.45%, 01/15/2031 | | | 170,000 | | | | 128,272 | |
Calpine Corp., 3.75%, 03/01/2031(b)(c) | | | 833,000 | | | | 684,502 | |
EnfraGen Energia Sur S.A./EnfraGen Spain S.A./Prime Energia S.p.A. (Colombia), 5.38%, 12/30/2030(c) | | | 1,450,000 | | | | 743,045 | |
Vistra Corp., 7.00%(c)(d)(e) | | | 796,000 | | | | 712,615 | |
| | | | | | | | |
| | | | | | | 2,268,434 | |
| | | | | | | | |
Industrial Conglomerates-0.55% | | | | | | | | |
Bidvest Group UK PLC (The) (South Africa), 3.63%, 09/23/2026(c) | | | 931,000 | | | | 789,981 | |
Honeywell International, Inc., 5.00%, 02/15/2033 | | | 3,287,000 | | | | 3,251,837 | |
| | | | | | | | |
| | | | | | | 4,041,818 | |
| | | | | | | | |
Industrial Machinery-0.04% | | | | | | | | |
Flowserve Corp., 2.80%, 01/15/2032 | | | 374,000 | | | | 268,688 | |
| | | | | | | | |
Insurance Brokers-0.16% | | | | | | | | |
Marsh & McLennan Cos., Inc., 6.25%, 11/01/2052 | | | 550,000 | | | | 560,185 | |
Willis North America, Inc., 4.65%, 06/15/2027 | | | 662,000 | | | | 623,212 | |
| | | | | | | | |
| | | | | | | 1,183,397 | |
| | | | | | | | |
Integrated Oil & Gas-0.94% | | | | | | | | |
BP Capital Markets America, Inc., 3.06%, 06/17/2041 | | | 525,000 | | | | 366,787 | |
BP Capital Markets PLC (United Kingdom), 4.38%(d)(e) | | | 431,000 | | | | 405,679 | |
See accompanying Notes to Financial Statements which are an integral part of the financial statements.
Invesco Total Return Bond ETF (GTO)–(continued)
October 31, 2022
| | | | | | | | |
| | | Principal
Amount | | | Value | |
Integrated Oil & Gas-(continued) | | | | | | | | |
Gray Oak Pipeline LLC, 2.60%, 10/15/2025(c) | | | $ 194,000 | | | $ | 174,421 | |
Petroleos Mexicanos (Mexico) | | | | | | | | |
8.75%, 06/02/2029 | | | 2,074,000 | | | | 1,853,618 | |
6.70%, 02/16/2032 | | | 1,323,000 | | | | 1,002,715 | |
Petronas Capital Ltd. (Malaysia) | | | | | | | | |
2.48%, 01/28/2032(c) | | | 452,000 | | | | 360,633 | |
3.40%, 04/28/2061(c) | | | 1,716,000 | | | | 1,067,010 | |
Qatar Energy (Qatar), 3.30%, 07/12/2051(c) | | | 1,070,000 | | | | 728,873 | |
SA Global Sukuk Ltd. (Saudi Arabia), 1.60%, 06/17/2026(c) | | | 541,000 | | | | 474,324 | |
Shell International Finance B.V. (Netherlands), 3.00%, 11/26/2051 | | | 844,000 | | | | 541,290 | |
| | | | | | | | |
| | | | | | | 6,975,350 | |
| | | | | | | | |
Integrated Telecommunication Services-0.47% | |
AT&T, Inc. | | | | | | | | |
4.42% (3 mo. USD LIBOR + 1.18%), 06/12/2024(f) | | | 44,000 | | | | 44,155 | |
3.55%, 09/15/2055 | | | 95,000 | | | | 60,388 | |
British Telecommunications PLC (United Kingdom), 4.25%, 11/23/2081(b)(c)(d) | | | 1,870,000 | | | | 1,570,898 | |
IHS Holding Ltd. (Nigeria) | | | | | | | | |
5.63%, 11/29/2026(c) | | | 771,000 | | | | 588,157 | |
6.25%, 11/29/2028(c) | | | 586,000 | | | | 427,077 | |
Level 3 Financing, Inc., 3.75%, 07/15/2029(c) | | | 846,000 | | | | 645,007 | |
Verizon Communications, Inc. | | | | | | | | |
3.88%, 02/08/2029(b) | | | 112,000 | | | | 101,510 | |
3.55%, 03/22/2051 | | | 66,000 | | | | 44,461 | |
| | | | | | | | |
| | | | | | | 3,481,653 | |
| | | | | | | | |
Interactive Home Entertainment-0.41% | |
ROBLOX Corp., 3.88%,
05/01/2030(b)(c) | | | 1,712,000 | | | | 1,415,250 | |
Take-Two Interactive Software, Inc., 4.00%, 04/14/2032(b) | | | 668,000 | | | | 575,042 | |
WMG Acquisition Corp., 3.00%, 02/15/2031(b)(c) | | | 1,333,000 | | | | 1,042,953 | |
| | | | | | | | |
| | | | | | | 3,033,245 | |
| | | | | | | | |
Interactive Media & Services-0.70% | |
Match Group Holdings II LLC | | | | | | | | |
4.63%, 06/01/2028(c) | | | 182,000 | | | | 162,390 | |
5.63%, 02/15/2029(b)(c) | | | 321,000 | | | | 284,931 | |
Meta Platforms, Inc. | | | | | | | | |
3.85%, 08/15/2032(c) | | | 2,203,000 | | | | 1,877,986 | |
4.45%, 08/15/2052(c) | | | 2,261,000 | | | | 1,675,012 | |
4.65%, 08/15/2062(c) | | | 1,572,000 | | | | 1,157,220 | |
| | | | | | | | |
| | | | | | | 5,157,539 | |
| | | | | | | | |
Internet & Direct Marketing Retail-0.19% | |
Meituan (China), 2.13%,
10/28/2025(b)(c) | | | 870,000 | | | | 721,996 | |
Prosus N.V. (China), 3.26%, 01/19/2027(c) | | | 875,000 | | | | 720,998 | |
| | | | | | | | |
| | | | | | | 1,442,994 | |
| | | | | | | | |
| | | | | | | | |
| | | Principal
Amount | | | Value | |
Internet Services & Infrastructure-0.37% | |
Twilio, Inc. | | | | | | | | |
3.63%, 03/15/2029 | | | $ 717,000 | | | $ | 593,160 | |
3.88%, 03/15/2031(b) | | | 714,000 | | | | 583,470 | |
ZoomInfo Technologies LLC/ZoomInfo Finance Corp., 3.88%, 02/01/2029(c) | | | 1,819,000 | | | | 1,524,156 | |
| | | | | | | | |
| | | | | | | 2,700,786 | |
| | | | | | | | |
Investment Banking & Brokerage-2.18% | |
Charles Schwab Corp. (The) | | | | | | | | |
3.92% (SOFR + 1.05%), 03/03/2027(f) | | | 1,447,000 | | | | 1,416,907 | |
2.90%, 03/03/2032(b) | | | 658,000 | | | | 534,324 | |
5.00%(b)(d)(e) | | | 674,000 | | | | 599,860 | |
Goldman Sachs Group, Inc. (The) | | | | | | | | |
3.49% (SOFR + 0.58%), 03/08/2024(f) | | | 777,000 | | | | 767,526 | |
3.76% (SOFR + 0.70%), 01/24/2025(f) | | | 1,004,000 | | | | 987,180 | |
3.71% (SOFR + 0.79%), 12/09/2026(f) | | | 594,000 | | | | 570,798 | |
3.73% (SOFR + 0.81%), 03/09/2027(f) | | | 1,058,000 | | | | 1,004,653 | |
3.98% (SOFR + 0.92%), 10/21/2027(f) | | | 2,009,000 | | | | 1,908,385 | |
3.91% (SOFR + 1.12%), 02/24/2028(f) | | | 494,000 | | | | 471,640 | |
3.62%, 03/15/2028(d) | | | 1,389,000 | | | | 1,252,478 | |
4.48%, 08/23/2028(d) | | | 1,029,000 | | | | 956,245 | |
2.62%, 04/22/2032(d) | | | 127,000 | | | | 97,054 | |
2.65%, 10/21/2032(d) | | | 541,000 | | | | 407,990 | |
3.21%, 04/22/2042(d) | | | 134,000 | | | | 89,125 | |
3.44%, 02/24/2043(d) | | | 474,000 | | | | 323,451 | |
Series V, 4.13%(b)(d)(e) | | | 746,000 | | | | 586,542 | |
JAB Holdings B.V. (Austria), 4.50%, 04/08/2052(c) | | | 5,471,000 | | | | 3,386,105 | |
Morgan Stanley | | | | | | | | |
3.69% (SOFR + 0.63%),
01/24/2025(b)(f) | | | 716,000 | | | | 702,988 | |
3.22%, 04/22/2042(d) | | | 91,000 | | | | 61,871 | |
| | | | | | | | |
| | | | | | | 16,125,122 | |
| | | | | | | | |
IT Consulting & Other Services-0.06% | |
DXC Technology Co., 2.38%, 09/15/2028(b) | | | 541,000 | | | | 445,486 | |
| | | | | | | | |
|
Leisure Products-0.36% | |
Brunswick Corp. | | | | | | | | |
4.40%, 09/15/2032(b) | | | 937,000 | | | | 745,120 | |
5.10%, 04/01/2052 | | | 2,833,000 | | | | 1,881,119 | |
| | | | | | | | |
| | | | | | | 2,626,239 | |
| | | | | | | | |
Life & Health Insurance-2.24% | |
American Equity Investment Life Holding Co., 5.00%, 06/15/2027(b) | | | 251,000 | | | | 235,397 | |
Athene Global Funding, 1.45%, 01/08/2026(c) | | | 196,000 | | | | 169,687 | |
Athene Holding Ltd. | | | | | | | | |
6.15%, 04/03/2030(b) | | | 105,000 | | | | 101,952 | |
3.45%, 05/15/2052 | | | 668,000 | | | | 389,383 | |
See accompanying Notes to Financial Statements which are an integral part of the financial statements.
Invesco Total Return Bond ETF (GTO)–(continued)
October 31, 2022
| | | | | | | | |
| | | Principal
Amount | | | Value | |
Life & Health Insurance-(continued) | |
Delaware Life Global Funding | | | | | | | | |
Series 21-1, 2.66%, 06/29/2026(c) | | | $ 4,125,000 | | | $ | 3,616,935 | |
Series 22-1, 3.31%, 03/10/2025(c) | | | 2,375,000 | | | | 2,203,247 | |
F&G Global Funding, 0.90%, 09/20/2024(c) | | | 973,000 | | | | 884,257 | |
GA Global Funding Trust | | | | | | | | |
2.25%, 01/06/2027(c) | | | 562,000 | | | | 483,616 | |
2.90%, 01/06/2032(c) | | | 997,000 | | | | 756,007 | |
MAG Mutual Holding Co., 4.75%, 04/30/2041(g) | | | 3,179,000 | | | | 2,576,051 | |
MetLife, Inc. | | | | | | | | |
9.25%, 04/08/2038(c) | | | 350,000 | | | | 401,702 | |
5.00%, 07/15/2052 | | | 404,000 | | | | 351,863 | |
Nationwide Financial Services, Inc., 3.90%, 11/30/2049(c) | | | 69,000 | | | | 45,119 | |
Pacific Life Global Funding II | | | | | | | | |
3.85% (SOFR + 0.80%), 03/30/2025(c)(f) | | | 2,135,000 | | | | 2,105,607 | |
3.49% (SOFR + 0.62%), 06/04/2026(c)(f) | | | 946,000 | | | | 905,497 | |
Penn Mutual Life Insurance Co. (The), 3.80%, 04/29/2061(c) | | | 114,000 | | | | 68,556 | |
Prudential Financial, Inc., 6.00%, 09/01/2052(b)(d) | | | 1,328,000 | | | | 1,212,206 | |
Western & Southern Life Insurance Co. (The), 3.75%, 04/28/2061(c) | | | 102,000 | | | | 65,064 | |
| | | | | | | | |
| | | | | | | 16,572,146 | |
| | | | | | | | |
Life Sciences Tools & Services-0.06% | |
Illumina, Inc., 2.55%, 03/23/2031 | | | 557,000 | | | | 425,319 | |
| | | | | | | | |
Managed Health Care-2.39% | |
Centene Corp., 2.50%, 03/01/2031(b) | | | 3,272,000 | | | | 2,520,847 | |
Elevance Health, Inc. | | | | | | | | |
5.50%, 10/15/2032 | | | 662,000 | | | | 659,242 | |
6.10%, 10/15/2052 | | | 472,000 | | | | 479,937 | |
Kaiser Foundation Hospitals | | | | | | | | |
Series 2021, 2.81%, 06/01/2041 | | | 1,760,000 | | | | 1,176,644 | |
Series 2021, 3.00%, 06/01/2051 | | | 2,180,000 | | | | 1,343,826 | |
UnitedHealth Group, Inc. | | | | | | | | |
3.70%, 05/15/2027(b) | | | 741,000 | | | | 700,454 | |
5.25%, 02/15/2028(b) | | | 1,534,000 | | | | 1,537,681 | |
4.00%, 05/15/2029 | | | 2,295,000 | | | | 2,134,868 | |
5.30%, 02/15/2030(b) | | | 2,610,000 | | | | 2,606,646 | |
5.35%, 02/15/2033 | | | 2,243,000 | | | | 2,249,740 | |
5.88%, 02/15/2053(b) | | | 1,121,000 | | | | 1,142,778 | |
6.05%, 02/15/2063(b) | | | 1,030,000 | | | | 1,056,404 | |
| | | | | | | | |
| | | | | | | 17,609,067 | |
| | | | | | | | |
Metal & Glass Containers-0.03% | |
Ardagh Metal Packaging Finance USA LLC/Ardagh Metal Packaging Finance PLC, 6.00%, 06/15/2027(c) | | | 214,000 | | | | 205,678 | |
| | | | | | | | |
Movies & Entertainment-0.52% | |
Warnermedia Holdings, Inc. | | | | | | | | |
5.05%, 03/15/2042(c) | | | 1,614,000 | | | | 1,180,104 | |
5.14%, 03/15/2052(c) | | | 2,000,000 | | | | 1,400,154 | |
5.39%, 03/15/2062(c) | | | 1,767,000 | | | | 1,228,857 | |
| | | | | | | | |
| | | | | | | 3,809,115 | |
| | | | | | | | |
| | | | | | | | |
| | | Principal
Amount | | | Value | |
Multi-line Insurance-0.20% | | | | | | | | |
Allianz SE (Germany), 3.20%(c)(d)(e) | | | $ 629,000 | | | $ | 426,336 | |
Boardwalk Pipelines L.P., 3.60%, 09/01/2032 | | | 1,319,000 | | | | 1,046,168 | |
| | | | | | | | |
| | | | | | | 1,472,504 | |
| | | | | | | | |
Multi-Utilities-1.23% | | | | | | | | |
Algonquin Power & Utilities Corp. (Canada), 4.75%, 01/18/2082(d) | | | 10,000,000 | | | | 8,003,150 | |
Dominion Energy, Inc., Series C, 3.38%, 04/01/2030 | | | 83,000 | | | | 71,257 | |
WEC Energy Group, Inc., 5.15%, 10/01/2027 | | | 1,018,000 | | | | 1,003,852 | |
| | | | | | | | |
| | | | | | | 9,078,259 | |
| | | | | | | | |
Office REITs-0.15% | | | | | | | | |
Boston Properties L.P., 3.25%, 01/30/2031 | | | 62,000 | | | | 49,419 | |
Office Properties Income Trust | | | | | | | | |
4.25%, 05/15/2024 | | | 630,000 | | | | 572,250 | |
4.50%, 02/01/2025 | | | 188,000 | | | | 156,359 | |
2.65%, 06/15/2026 | | | 69,000 | | | | 50,344 | |
2.40%, 02/01/2027 | | | 379,000 | | | | 260,630 | |
| | | | | | | | |
| | | | | | | 1,089,002 | |
| | | | | | | | |
Oil & Gas Equipment & Services-0.20% | |
Enerflex Ltd. (Canada), 9.00%, 10/15/2027(c) | | | 728,000 | | | | 709,334 | |
Petrofac Ltd. (United Kingdom), 9.75%, 11/15/2026(c) | | | 1,052,000 | | | | 783,482 | |
| | | | | | | | |
| | | | | | | 1,492,816 | |
| | | | | | | | |
Oil & Gas Exploration & Production-1.26% | |
Apache Corp., 7.75%, 12/15/2029 | | | 682,000 | | | | 698,294 | |
CNX Resources Corp., 7.38%, 01/15/2031(b)(c) | | | 498,000 | | | | 494,935 | |
EQT Corp., 5.70%, 04/01/2028 | | | 578,000 | | | | 563,082 | |
Galaxy Pipeline Assets Bidco Ltd. (United Arab Emirates) | | | | | | | | |
2.16%, 03/31/2034(c) | | | 1,679,183 | | | | 1,371,916 | |
2.94%, 09/30/2040(c) | | | 2,191,124 | | | | 1,650,382 | |
Gazprom PJSC Via Gaz Finance PLC (Russia), 2.95%, 01/27/2029(c)(h) | | | 2,242,000 | | | | 1,244,310 | |
Hilcorp Energy I L.P./Hilcorp Finance Co. | | | | | | | | |
6.00%, 04/15/2030(c) | | | 432,000 | | | | 391,778 | |
6.25%, 04/15/2032(b)(c) | | | 414,000 | | | | 380,259 | |
Murphy Oil Corp., 6.38%, 07/15/2028(b) | | | 592,000 | | | | 577,662 | |
Rockcliff Energy II LLC, 5.50%, 10/15/2029(c) | | | 1,058,000 | | | | 944,916 | |
Uzbekneftegaz JSC (Uzbekistan), 4.75%, 11/16/2028(c) | | | 1,278,000 | | | | 968,309 | |
| | | | | | | | |
| | | | | | | 9,285,843 | |
| | | | | | | | |
Oil & Gas Refining & Marketing-0.06% | |
Parkland Corp. (Canada), 4.50%, 10/01/2029(c) | | | 497,000 | | | | 419,498 | |
| | | | | | | | |
Oil & Gas Storage & Transportation-2.02% | |
El Paso Natural Gas Co. LLC, 8.38%, 06/15/2032 | | | 359,000 | | | | 395,868 | |
See accompanying Notes to Financial Statements which are an integral part of the financial statements.
Invesco Total Return Bond ETF (GTO)–(continued)
October 31, 2022
| | | | | | | | |
| | | Principal
Amount | | | Value | |
Oil & Gas Storage & Transportation-(continued) | |
Enbridge, Inc. (Canada) | | | | | | | | |
3.34% (SOFR + 0.63%), 02/16/2024(f) | | | $ 1,924,000 | | | $ | 1,903,091 | |
7.38%, 01/15/2083(d) | | | 1,790,000 | | | | 1,686,936 | |
7.63%, 01/15/2083(d) | | | 1,357,000 | | | | 1,299,444 | |
Energy Transfer L.P. | | | | | | | | |
5.50%, 06/01/2027 | | | 741,000 | | | | 721,494 | |
6.00%, 06/15/2048 | | | 12,000 | | | | 10,081 | |
Series 20Y, 5.80%, 06/15/2038 | | | 12,000 | | | | 10,224 | |
EQM Midstream Partners L.P., 7.50%, 06/01/2030(c) | | | 270,000 | | | | 262,939 | |
Kinder Morgan, Inc. | | | | | | | | |
7.80%, 08/01/2031 | | | 601,000 | | | | 650,487 | |
4.80%, 02/01/2033(b) | | | 1,015,000 | | | | 906,873 | |
5.45%, 08/01/2052 | | | 2,124,000 | | | | 1,793,688 | |
Kinetik Holdings L.P., 5.88%, 06/15/2030(c) | | | 859,000 | | | | 809,144 | |
MPLX L.P., 4.95%, 03/14/2052(b) | | | 1,079,000 | | | | 830,971 | |
NGPL PipeCo LLC, 7.77%, 12/15/2037(c) | | | 668,000 | | | | 666,312 | |
Targa Resources Corp. | | | | | | | | |
5.20%, 07/01/2027 | | | 765,000 | | | | 736,623 | |
6.25%, 07/01/2052 | | | 867,000 | | | | 771,480 | |
Venture Global Calcasieu Pass LLC, 3.88%, 11/01/2033(c) | | | 1,125,000 | | | | 904,978 | |
Williams Cos., Inc. (The), 2.60%, 03/15/2031(b) | | | 748,000 | | | | 586,202 | |
| | | | | | | | |
| | | | | | | 14,946,835 | |
| | | | | | | | |
Other Diversified Financial Services-1.02% | |
AerCap Ireland Capital DAC/AerCap Global Aviation Trust (Ireland) | | | | | | | | |
4.50%, 09/15/2023 | | | 442,000 | | | | 434,204 | |
1.75%, 01/30/2026 | | | 756,000 | | | | 644,030 | |
AMC East Communities LLC, 6.01%, 01/15/2053(c) | | | 185,917 | | | | 169,805 | |
Avolon Holdings Funding Ltd. (Ireland), 4.25%, 04/15/2026(c) | | | 121,000 | | | | 105,836 | |
Corebridge Financial, Inc. | | | | | | | | |
4.40%, 04/05/2052(c) | | | 477,000 | | | | 347,935 | |
6.88%, 12/15/2052(c)(d) | | | 1,665,000 | | | | 1,493,854 | |
Jackson Financial, Inc. | | | | | | | | |
5.17%, 06/08/2027(b) | | | 576,000 | | | | 550,654 | |
5.67%, 06/08/2032(b) | | | 661,000 | | | | 601,719 | |
Mid-Atlantic Military Family Communities LLC, 5.30%, 08/01/2050(c) | | | 219,955 | | | | 178,952 | |
Pacific Beacon LLC | | | | | | | | |
5.38%, 07/15/2026(c) | | | 57,683 | | | | 56,961 | |
5.51%, 07/15/2036(c) | | | 500,000 | | | | 470,716 | |
Pershing Square Holdings Ltd. | | | | | | | | |
3.25%, 11/15/2030(c) | | | 1,000,000 | | | | 766,605 | |
3.25%, 10/01/2031(c) | | | 2,300,000 | | | | 1,683,163 | |
| | | | | | | | |
| | | | | | | 7,504,434 | |
| | | | | | | | |
| | | | | | | | |
| | | Principal
Amount | | | Value | |
Packaged Foods & Meats-0.33% | | | | | | | | |
JBS USA LUX S.A./JBS USA Food Co./JBS USA Finance, Inc., 3.63%, 01/15/2032(b)(c) | | | $ 724,000 | | | $ | 563,963 | |
Minerva Luxembourg S.A. (Brazil), 4.38%, 03/18/2031(c) | | | 2,418,000 | | | | 1,840,557 | |
| | | | | | | | |
| | | | | | | 2,404,520 | |
| | | | | | | | |
Paper Packaging-0.12% | | | | | | | | |
Berry Global, Inc. | | | | | | | | |
4.88%, 07/15/2026(c) | | | 497,000 | | | | 468,077 | |
1.65%, 01/15/2027 | | | 541,000 | | | | 446,148 | |
| | | | | | | | |
| | | | | | | 914,225 | |
| | | | | | | | |
Pharmaceuticals-0.08% | | | | | | | | |
AdaptHealth LLC, 4.63%, 08/01/2029(c) | | | 334,000 | | | | 282,198 | |
Mayo Clinic, Series 2021, 3.20%, 11/15/2061 | | | 524,000 | | | | 314,240 | |
| | | | | | | | |
| | | | | | | 596,438 | |
| | | | | | | | |
Property & Casualty Insurance-0.45% | | | | | | | | |
Fairfax Financial Holdings Ltd. (Canada) | | | | | | | | |
3.38%, 03/03/2031 | | | 250,000 | | | | 195,197 | |
5.63%, 08/16/2032(c) | | | 1,654,000 | | | | 1,504,604 | |
First American Financial Corp., 4.30%, 02/01/2023 | | | 72,000 | | | | 71,752 | |
Liberty Mutual Group, Inc., 5.50%, 06/15/2052(c) | | | 854,000 | | | | 701,613 | |
Progressive Corp. (The), 2.50%, 03/15/2027 | | | 409,000 | | | | 365,254 | |
Stewart Information Services Corp., 3.60%, 11/15/2031 | | | 623,000 | | | | 468,610 | |
| | | | | | | | |
| | | | | | | 3,307,030 | |
| | | | | | | | |
Railroads-1.63% | | | | | | | | |
Canadian Pacific Railway Co. (Canada), 6.13%, 09/15/2115 | | | 719,000 | | | | 650,425 | |
CSX Corp. | | | | | | | | |
4.10%, 11/15/2032(b) | | | 1,691,000 | | | | 1,522,278 | |
6.15%, 05/01/2037 | | | 1,884,000 | | | | 1,928,444 | |
4.50%, 11/15/2052 | | | 1,691,000 | | | | 1,380,359 | |
Empresa de los Ferrocarriles del Estado (Chile), 3.83%, 09/14/2061(c) | | | 976,000 | | | | 595,643 | |
Norfolk Southern Corp., 4.55%, 06/01/2053 | | | 519,000 | | | | 421,368 | |
Union Pacific Corp. | | | | | | | | |
4.50%, 01/20/2033(b) | | | 2,026,000 | | | | 1,910,675 | |
4.95%, 09/09/2052(b) | | | 2,000,000 | | | | 1,795,473 | |
5.15%, 01/20/2063 | | | 2,047,000 | | | | 1,827,538 | |
| | | | | | | | |
| | | | | | | 12,032,203 | |
| | | | | | | | |
Real Estate Development-0.19% | | | | | | | | |
Agile Group Holdings Ltd. (China) | | | | | | | | |
5.75%, 01/02/2025(c) | | | 208,000 | | | | 50,299 | |
5.50%, 04/21/2025(c) | | | 874,000 | | | | 185,397 | |
6.05%, 10/13/2025(b)(c) | | | 488,000 | | | | 96,153 | |
5.50%, 05/17/2026(c) | | | 425,000 | | | | 82,427 | |
Essential Properties L.P., 2.95%, 07/15/2031 | | | 358,000 | | | | 254,763 | |
Greentown China Holdings Ltd. (China), 4.70%, 04/29/2025(c) | | | 962,000 | | | | 443,001 | |
See accompanying Notes to Financial Statements which are an integral part of the financial statements.
Invesco Total Return Bond ETF (GTO)–(continued)
October 31, 2022
| | | | | | | | |
| | | Principal
Amount | | | Value | |
Real Estate Development-(continued) | | | | | | | | |
Logan Group Co. Ltd. (China) | | | | | | | | |
4.25%, 07/12/2025(b)(c) | | | $ 725,000 | | | $ | 59,128 | |
4.50%, 01/13/2028(b)(c) | | | 250,000 | | | | 21,371 | |
Piedmont Operating Partnership L.P., 3.15%, 08/15/2030 | | | 96,000 | | | | 72,618 | |
Sino-Ocean Land Treasure Finance I Ltd. (China), 6.00%, 07/30/2024(c) | | | 730,000 | | | | 129,831 | |
| | | | | | | | |
| | | | | | | 1,394,988 | |
| | | | | | | | |
Regional Banks-2.74% | | | | | | | | |
Citizens Financial Group, Inc. | | | | | | | | |
4.30%, 12/03/2025 | | | 773,000 | | | | 736,629 | |
2.50%, 02/06/2030 | | | 95,000 | | | | 73,468 | |
5.64%, 05/21/2037(d) | | | 986,000 | | | | 893,449 | |
Series G, 4.00%(d)(e) | | | 1,481,000 | | | | 1,177,038 | |
Fifth Third Bancorp | | | | | | | | |
2.55%, 05/05/2027 | | | 66,000 | | | | 57,610 | |
6.36%, 10/27/2028(b)(d) | | | 1,264,000 | | | | 1,269,916 | |
4.77%, 07/28/2030(d) | | | 1,465,000 | | | | 1,344,767 | |
4.34%, 04/25/2033(b)(d) | | | 734,000 | | | | 636,852 | |
Huntington Bancshares, Inc. | | | | | | | | |
4.44%, 08/04/2028(d) | | | 794,000 | | | | 740,170 | |
2.49%, 08/15/2036(d) | | | 311,000 | | | | 215,992 | |
KeyCorp, 4.79%, 06/01/2033(b)(d) | | | 464,000 | | | | 419,893 | |
PNC Financial Services Group, Inc. (The) | | | | | | | | |
4.63%, 06/06/2033(b)(d) | | | 1,602,000 | | | | 1,417,691 | |
6.04%, 10/28/2033(d) | | | 1,486,000 | | | | 1,491,487 | |
Series U, 6.00%(b)(d)(e) | | | 1,371,000 | | | | 1,275,030 | |
Series V, 6.20%(d)(e) | | | 1,817,000 | | | | 1,725,605 | |
SVB Financial Group | | | | | | | | |
Series D, 4.25%(d)(e) | | | 2,008,000 | | | | 1,344,916 | |
Series E, 4.70%(d)(e) | | | 1,348,000 | | | | 906,530 | |
Truist Financial Corp. | | | | | | | | |
4.12%, 06/06/2028(b)(d) | | | 890,000 | | | | 823,613 | |
4.92%, 07/28/2033(b)(d) | | | 2,472,000 | | | | 2,202,668 | |
6.12%, 10/28/2033(d) | | | 1,463,000 | | | | 1,464,069 | |
| | | | | | | | |
| | | | | | | 20,217,393 | |
| | | | | | | | |
Reinsurance-0.19% | | | | | | | | |
Global Atlantic Fin Co. | | | | | | | | |
4.40%, 10/15/2029(c) | | | 221,000 | | | | 181,255 | |
4.70%, 10/15/2051(c)(d) | | | 1,648,000 | | | | 1,218,556 | |
| | | | | | | | |
| | | | | | | 1,399,811 | |
| | | | | | | | |
Renewable Electricity-0.18% | | | | | | | | |
Adani Green Energy Ltd. (India), 4.38%, 09/08/2024(c) | | | 1,198,000 | | | | 904,490 | |
NSTAR Electric Co., 4.55%, 06/01/2052 | | | 535,000 | | | | 449,214 | |
| | | | | | | | |
| | | | | | | 1,353,704 | |
| | | | | | | | |
Residential REITs-0.21% | | | | | | | | |
American Homes 4 Rent L.P. | | | | | | | | |
2.38%, 07/15/2031 | | | 86,000 | | | | 63,454 | |
3.63%, 04/15/2032(b) | | | 832,000 | | | | 670,318 | |
Invitation Homes Operating Partnership L.P. | | | | | | | | |
2.30%, 11/15/2028 | | | 166,000 | | | | 132,221 | |
2.70%, 01/15/2034 | | | 536,000 | | | | 370,739 | |
| | | | | | | | |
| | | Principal | | | | |
| | | Amount | | | Value | |
Residential REITs-(continued) | | | | | | | | |
Mid-America Apartments L.P., 2.88%, 09/15/2051 | | | $ 93,000 | | | $ | 53,722 | |
Spirit Realty L.P. | | | | | | | | |
2.10%, 03/15/2028 | | | 128,000 | | | | 100,777 | |
2.70%, 02/15/2032 | | | 114,000 | | | | 80,636 | |
Sun Communities Operating L.P., 2.70%, 07/15/2031 | | | 107,000 | | | | 78,800 | |
| | | | | | | | |
| | | | | | | 1,550,667 | |
| | | | | | | | |
Restaurants-0.68% | | | | | | | | |
1011778 BC ULC/New Red Finance, Inc. (Canada), 4.00%, 10/15/2030(c) | | | 746,000 | | | | 605,453 | |
Arcos Dorados B.V. (Brazil), 6.13%, 05/27/2029(c) | | | 1,565,000 | | | | 1,442,038 | |
McDonald’s Corp., 5.15%, 09/09/2052(b) | | | 1,805,000 | | | | 1,620,244 | |
Starbucks Corp., 3.00%, 02/14/2032(b) | | | 1,594,000 | | | | 1,319,514 | |
| | | | | | | | |
| | | | | | | 4,987,249 | |
| | | | | | | | |
Retail REITs-0.27% | | | | | | | | |
Agree L.P. | | | | | | | | |
2.00%, 06/15/2028 | | | 139,000 | | | | 110,843 | |
4.80%, 10/01/2032 | | | 739,000 | | | | 650,163 | |
Kimco Realty Corp., 2.70%, 10/01/2030 | | | 71,000 | | | | 55,938 | |
Kite Realty Group Trust, 4.75%, 09/15/2030 | | | 96,000 | | | | 82,038 | |
Realty Income Corp. | | | | | | | | |
2.20%, 06/15/2028 | | | 97,000 | | | | 80,408 | |
5.63%, 10/13/2032 | | | 1,021,000 | | | | 998,447 | |
| | | | | | | | |
| | | | | | | 1,977,837 | |
| | | | | | | | |
Semiconductor Equipment-0.18% | | | | | | | | |
Entegris Escrow Corp., 5.95%, 06/15/2030(c) | | | 855,000 | | | | 783,152 | |
KLA Corp., 4.95%, 07/15/2052 | | | 642,000 | | | | 557,738 | |
| | | | | | | | |
| | | | | | | 1,340,890 | |
| | | | | | | | |
Semiconductors-0.03% | | | | | | | | |
Broadcom, Inc., 3.19%, 11/15/2036(c) | | | 182,000 | | | | 123,881 | |
Micron Technology, Inc. | | | | | | | | |
4.98%, 02/06/2026(b) | | | 10,000 | | | | 9,726 | |
4.19%, 02/15/2027 | | | 56,000 | | | | 51,991 | |
Skyworks Solutions, Inc., 1.80%, 06/01/2026 | | | 59,000 | | | | 50,357 | |
| | | | | | | | |
| | | | | | | 235,955 | |
| | | | | | | | |
Soft Drinks-0.44% | | | | | | | | |
Coca-Cola Icecek A.S. (Turkey), 4.50%, 01/20/2029(c) | | | 2,973,000 | | | | 2,396,684 | |
PepsiCo, Inc. | | | | | | | | |
3.60%, 02/18/2028 | | | 496,000 | | | | 467,020 | |
3.90%, 07/18/2032(b) | | | 411,000 | | | | 380,644 | |
| | | | | | | | |
| | | | | | | 3,244,348 | |
| | | | | | | | |
Sovereign Debt-2.86% | | | | | | | | |
Airport Authority (Hong Kong), 3.25%, 01/12/2052(c) | | | 1,971,000 | | | | 1,290,498 | |
See accompanying Notes to Financial Statements which are an integral part of the financial statements.
Invesco Total Return Bond ETF (GTO)–(continued)
October 31, 2022
| | | | | | | | |
| | | Principal
Amount | | | Value | |
Sovereign Debt-(continued) | |
Bahamas Government International Bond (Bahamas), 9.00%, 06/16/2029(c) | | $ | 2,993,000 | | | $ | 2,170,813 | |
Bermuda Government International Bond (Bermuda), 5.00%, 07/15/2032(c) | | | 1,163,000 | | | | 1,080,468 | |
China Government International Bond (China), 2.50%, 10/26/2051(c) | | | 4,821,000 | | | | 3,060,674 | |
Dominican Republic International Bond (Dominican Republic), 5.30%, 01/21/2041(c) | | | 560,000 | | | | 387,974 | |
Egypt Government International Bond (Egypt) | | | | | | | | |
5.25%, 10/06/2025(c) | | | 519,000 | | | | 433,518 | |
5.88%, 02/16/2031(c) | | | 689,000 | | | | 426,512 | |
Ghana Government International Bond (Ghana), 7.75%, 04/07/2029(c) | | | 1,119,000 | | | | 329,490 | |
Guatemala Government Bond (Guatemala), 3.70%, 10/07/2033(b)(c) | | | 3,623,000 | | | | 2,757,863 | |
Indonesia Government International Bond (Indonesia), 3.20%, 09/23/2061(b) | | | 1,160,000 | | | | 714,922 | |
Mexico Government International Bond (Mexico) | | | | | | | | |
3.50%, 02/12/2034 | | | 1,645,000 | | | | 1,267,403 | |
4.40%, 02/12/2052 | | | 2,256,000 | | | | 1,559,775 | |
Morocco Government International Bond (Morocco), 4.00%, 12/15/2050(c) | | | 365,000 | | | | 217,168 | |
Oman Government International Bond (Oman), 6.25%, 01/25/2031(c) | | | 795,000 | | | | 759,821 | |
Paraguay Government International Bond (Paraguay), 5.40%, 03/30/2050(c) | | | 1,200,000 | | | | 927,434 | |
Perusahaan Penerbit SBSN Indonesia III (Indonesia), 3.55%, 06/09/2051(c) | | | 1,886,000 | | | | 1,285,034 | |
Qatar Government International Bond (Qatar), 3.38%, 03/14/2024(c) | | | 200,000 | | | | 196,396 | |
UAE International Government Bond (United Arab Emirates) | | | | | | | | |
2.00%, 10/19/2031(c) | | | 733,000 | | | | 583,200 | |
2.88%, 10/19/2041(c) | | | 1,108,000 | | | | 783,705 | |
3.25%, 10/19/2061(c) | | | 1,390,000 | | | | 918,234 | |
| | | | | | | | |
| | | | | | | 21,150,902 | |
| | | | | | | | |
Specialized Finance-0.67% | |
Blackstone Private Credit Fund | | | | | | | | |
1.75%, 09/15/2024 | | | 470,000 | | | | 429,977 | |
7.05%, 09/29/2025(b)(c) | | | 915,000 | | | | 907,242 | |
IP Lending VII Ltd. (Bermuda), Series 2022-7A, Class SNR, 8.00%, 10/11/2027(c) | | | 2,746,000 | | | | 2,746,000 | |
Mitsubishi HC Capital, Inc. (Japan), 3.64%, 04/13/2025(b)(c) | | | 894,000 | | | | 852,545 | |
| | | | | | | | |
| | | | | | | 4,935,764 | |
| | | | | | | | |
Specialized REITs-0.74% | |
American Tower Corp. | | | | | | | | |
2.70%, 04/15/2031(b) | | | 383,000 | | | | 298,760 | |
4.05%, 03/15/2032(b) | | | 431,000 | | | | 368,712 | |
| | | | | | | | |
| | | Principal
Amount | | | Value | |
Specialized REITs-(continued) | |
EPR Properties | | | | | | | | |
4.75%, 12/15/2026 | | $ | 307,000 | | | $ | 264,548 | |
3.60%, 11/15/2031 | | | 644,000 | | | | 435,012 | |
Prologis L.P. | | | | | | | | |
2.88%, 11/15/2029 | | | 559,000 | | | | 468,269 | |
4.63%, 01/15/2033(b) | | | 1,992,000 | | | | 1,846,596 | |
SBA Communications Corp. | | | | | | | | |
3.88%, 02/15/2027 | | | 1,190,000 | | | | 1,076,206 | |
3.13%, 02/01/2029 | | | 892,000 | | | | 724,112 | |
| | | | | | | | |
| | | | | | | 5,482,215 | |
| | | | | | | | |
Specialty Chemicals-0.77% | |
Braskem Idesa S.A.P.I. (Mexico) | | | | | | | | |
7.45%, 11/15/2029(c) | | | 289,000 | | | | 221,800 | |
6.99%, 02/20/2032(c) | | | 2,162,000 | | | | 1,451,340 | |
Sasol Financing USA LLC (South Africa) | | | | | | | | |
4.38%, 09/18/2026 | | | 1,785,000 | | | | 1,567,346 | |
5.50%, 03/18/2031 | | | 3,250,000 | | | | 2,452,515 | |
| | | | | | | | |
| | | | | | | 5,693,001 | |
| | | | | | | | |
Systems Software-0.16% | |
Crowdstrike Holdings, Inc., 3.00%, 02/15/2029(b) | | | 1,409,000 | | | | 1,191,152 | |
| | | | | | | | |
Technology Hardware, Storage & Peripherals-0.25% | |
Apple, Inc. | | | | | | | | |
3.35%, 08/08/2032(b) | | | 1,713,000 | | | | 1,510,779 | |
2.80%, 02/08/2061 | | | 556,000 | | | | 328,840 | |
| | | | | | | | |
| | | | | | | 1,839,619 | |
| | | | | | | | |
Trading Companies & Distributors-0.15% | |
Aircastle Ltd., 4.40%, 09/25/2023 | | | 99,000 | | | | 96,788 | |
GATX Corp., 4.90%, 03/15/2033(b) | | | 1,147,000 | | | | 1,020,365 | |
| | | | | | | | |
| | | | | | | 1,117,153 | |
| | | | | | | | |
Trucking-0.66% | |
Aviation Capital Group LLC, 4.13%, 08/01/2025(c) | | | 25,000 | | | | 22,794 | |
Ryder System, Inc., 4.30%, 06/15/2027(b) | | | 489,000 | | | | 458,303 | |
SMBC Aviation Capital Finance DAC (Ireland), 1.90%, 10/15/2026(b)(c) | | | 644,000 | | | | 534,623 | |
Triton Container International Ltd. (Bermuda) | | | | | | | | |
2.05%, 04/15/2026(c) | | | 742,000 | | | | 627,056 | |
3.15%, 06/15/2031(c) | | | 2,283,000 | | | | 1,684,447 | |
Uber Technologies, Inc., 4.50%, 08/15/2029(b)(c) | | | 1,800,000 | | | | 1,549,665 | |
| | | | | | | | |
| | | | | | | 4,876,888 | |
| | | | | | | | |
Wireless Telecommunication Services-1.01% | |
America Movil S.A.B. de C.V. (Mexico), 5.38%, 04/04/2032(c) | | | 1,888,000 | | | | 1,604,243 | |
Rogers Communications, Inc. (Canada), 4.55%, 03/15/2052(c) | | | 983,000 | | | | 758,708 | |
T-Mobile USA, Inc. | | | | | | | | |
2.25%, 02/15/2026 | | | 687,000 | | | | 619,392 | |
2.63%, 04/15/2026 | | | 700,000 | | | | 632,744 | |
3.40%, 10/15/2052 | | | 1,317,000 | | | | 853,586 | |
5.65%, 01/15/2053 | | | 852,000 | | | | 784,753 | |
See accompanying Notes to Financial Statements which are an integral part of the financial statements.
Invesco Total Return Bond ETF (GTO)–(continued)
October 31, 2022
| | | | | | | | |
| | | Principal
Amount | | �� | Value | |
Wireless Telecommunication Services-(continued) | |
VEON Holdings B.V. (Netherlands), 3.38%, 11/25/2027(c) | | $ | 556,000 | | | $ | 297,460 | |
Vodafone Group PLC (United Kingdom) | | | | | | | | |
3.25%, 06/04/2081(d) | | | 691,000 | | | | 555,170 | |
4.13%, 06/04/2081(d) | | | 882,000 | | | | 627,764 | |
5.13%, 06/04/2081(d) | | | 1,011,000 | | | | 701,027 | |
| | | | | | | | |
| | | | | | | 7,434,847 | |
| | | | | | | | |
Total U.S. Dollar Denominated Bonds & Notes
(Cost $560,188,698) | | | | 473,009,533 | |
| | | | | | | | |
|
Asset-Backed Securities-25.95% | |
AMSR Trust, Series 2021-SFR3, Class B, 1.73%, 10/17/2038(c) | | | 4,460,000 | | | | 3,753,007 | |
Angel Oak Mortgage Trust | | | | | | | | |
Series 2020-1, Class A1, 2.47%, 12/25/2059(c)(i) | | | 87,257 | | | | 81,121 | |
Series 2020-3, Class A1, 1.69%, 04/25/2065(c)(i) | | | 280,768 | | | | 253,806 | |
Series 2020-5, Class A1, 1.37%, 05/25/2065(c)(i) | | | 343,852 | | | | 302,036 | |
Series 2021-3, Class A1, 1.07%, 05/25/2066(c)(i) | | | 1,358,145 | | | | 1,041,077 | |
Series 2022-1, Class A1, 2.88%, 12/25/2066(c)(j) | | | 2,784,897 | | | | 2,365,299 | |
Bain Capital Credit CLO Ltd. (Cayman Islands), Series 2017-2A, Class AR2, 5.54% (3 mo. USD LIBOR + 1.18%), 07/25/2034(c)(f) | | | 3,000,000 | | | | 2,877,459 | |
Bayview MSR Opportunity Master Fund Trust | | | | | | | | |
Series 2021-4, Class A3, 3.00%, 10/25/2051(c)(i) | | | 1,805,846 | | | | 1,452,562 | |
Series 2021-4, Class A4, 2.50%, 10/25/2051(c)(i) | | | 1,805,846 | | | | 1,397,651 | |
Series 2021-4, Class A8, 2.50%, 10/25/2051(c)(i) | | | 1,720,795 | | | | 1,476,506 | |
Series 2021-5, Class A1, 3.00%, 11/25/2051(c)(i) | | | 2,021,673 | | | | 1,633,616 | |
Series 2021-5, Class A2, 2.50%, 11/25/2051(c)(i) | | | 2,466,896 | | | | 1,909,898 | |
Bear Stearns Asset Backed Securities I Trust, Series 2006-HE9, Class 2A, 3.73% (1 mo. USD LIBOR + 0.14%), 11/25/2036(f) | | | 147,071 | | | | 141,604 | |
Benchmark Mortgage Trust | | | | | | | | |
Series 2018-B3, Class C, 4.54%, 04/10/2051(i) | | | 2,500,000 | | | | 2,146,366 | |
Series 2019-B14, Class A5, 3.05%, 12/15/2062 | | | 2,000,000 | | | | 1,691,615 | |
Series 2019-B14, Class C, 3.77%, 12/15/2062(i) | | | 930,000 | | | | 724,660 | |
Series 2019-B15, Class B, 3.56%, 12/15/2072 | | | 2,000,000 | | | | 1,603,470 | |
Series 2019-B9, Class C, 4.97%, 03/15/2052(i) | | | 3,369,000 | | | | 2,876,181 | |
Series 2020-B17, Class C, 3.37%, 03/15/2053(i) | | | 3,000,000 | | | | 2,241,803 | |
| | | | | | | | |
| | | Principal
Amount | | | Value | |
BRAVO Residential Funding Trust | | | | | | | | |
Series 2021-NQM2, Class A1, 0.97%, 03/25/2060(c)(i) | | $ | 488,745 | | | $ | 460,748 | |
Series 2021-NQM2, Class A2, 1.28%, 03/25/2060(c)(i) | | | 1,605,012 | | | | 1,514,781 | |
BX Commercial Mortgage Trust | | | | | | | | |
Series 2021-ACNT, Class A, 4.26% (1 mo. USD LIBOR + 0.85%), 11/15/2038(c)(f) | | | 1,135,000 | | | | 1,083,664 | |
Series 2021-VOLT, Class C, 4.51% (1 mo. USD LIBOR + 1.10%), 09/15/2036(c)(f) | | | 3,005,000 | | | | 2,779,664 | |
Series 2021-VOLT, Class D, 5.06% (1 mo. USD LIBOR + 1.65%), 09/15/2036(c)(f) | | | 8,799,000 | | | | 8,164,136 | |
Series 2021-XL2, Class B, 4.41% (1 mo. USD LIBOR + 1.00%), 10/15/2038(c)(f) | | | 732,105 | | | | 684,344 | |
BX Trust | | | | | | | | |
Series 2021-LGCY, Class B, 4.27% (1 mo. USD LIBOR + 0.86%), 10/15/2023(c)(f) | | | 10,000,000 | | | | 9,350,253 | |
Series 2022-LBA6, Class A, 4.38% (1 mo. Term SOFR + 1.00%), 01/15/2039(c)(f) | | | 2,085,000 | | | | 1,985,042 | |
Series 2022-LBA6, Class B, 4.68% (1 mo. Term SOFR + 1.30%), 01/15/2039(c)(f) | | | 1,285,000 | | | | 1,211,975 | |
Series 2022-LBA6, Class C, 4.98% (1 mo. Term SOFR + 1.60%), 01/15/2039(c)(f) | | | 690,000 | | | | 644,007 | |
Chase Home Lending Mortgage Trust, Series 2019-ATR2, Class A3, 3.50%, 07/25/2049(c)(i) | | | 91,295 | | | | 80,736 | |
CIFC Funding Ltd. (Cayman Islands) | | | | | | | | |
Series 2014-5A, Class A1R2, 5.28% (3 mo. USD LIBOR + 1.20%), 10/17/2031(c)(f) | | | 1,281,000 | | | | 1,253,821 | |
Series 2016-1A, Class ARR, 5.36% (3 mo. USD LIBOR + 1.08%), 10/21/2031(c)(f) | | | 957,000 | | | | 923,319 | |
Citigroup Commercial Mortgage Trust | | | | | | | | |
Series 2013-GC11, Class D, 4.41%, 04/10/2046(c)(i) | | | 1,650,000 | | | | 1,571,946 | |
Series 2014-GC23, Class B, 4.18%, 07/10/2047(i) | | | 184,000 | | | | 174,622 | |
Citigroup Mortgage Loan Trust, Inc., Series 2021-INV3, Class A3, 2.50%, 05/25/2051(c)(i) | | | 1,850,308 | | | | 1,437,136 | |
COLT Mortgage Loan Trust | | | | | | | | |
Series 2020-2, Class A1, 1.85%, 03/25/2065(c)(i) | | | 23,603 | | | | 23,110 | |
Series 2022-1, Class A1, 2.28%, 12/27/2066(c)(i) | | | 1,619,256 | | | | 1,333,132 | |
Series 2022-2, Class A1, 2.99%, 02/25/2067(c)(j) | | | 1,689,073 | | | | 1,426,826 | |
Credit Suisse Mortgage Capital Ctfs., Series 2020-SPT1, Class A1, 1.62%, 04/25/2065(c)(j) | | | 89,614 | | | | 88,026 | |
See accompanying Notes to Financial Statements which are an integral part of the financial statements.
Invesco Total Return Bond ETF (GTO)–(continued)
October 31, 2022
| | | | | | | | |
| | | Principal
Amount | | | Value | |
Credit Suisse Mortgage Capital Trust | | | | | | | | |
Series 2021-NQM1, Class A1, 0.81%, 05/25/2065(c)(i) | | $ | 561,949 | | | $ | 513,154 | |
Series 2021-NQM2, Class A1, 1.18%, 02/25/2066(c)(i) | | | 288,125 | | | | 243,983 | |
Series 2022-ATH1, Class A1A, 2.87%, 01/25/2067(c)(i) | | | 2,246,619 | | | | 2,028,630 | |
Series 2022-ATH1, Class A1B, 3.35%, 01/25/2067(c)(i) | | | 1,160,000 | | | | 927,423 | |
CSAIL Commercial Mortgage Trust, Series 2020-C19, Class A3, 2.56%, 03/15/2053 | | | 1,459,000 | | | | 1,181,270 | |
Domino’s Pizza Master Issuer LLC, Series 2019-1A, Class A2, 3.67%, 10/25/2049(c) | | | 1,945,000 | | | | 1,626,541 | |
Dryden 93 CLO Ltd. (Cayman Islands), Series 2021-93A, Class A1A, 5.16% (3 mo. USD LIBOR + 1.08%), 01/15/2034(c)(f) | | | 532,495 | | | | 513,705 | |
DT Auto Owner Trust, Series 2019-3A, Class D, 2.96%, 04/15/2025(c) | | | 188,515 | | | | 185,445 | |
Ellington Financial Mortgage Trust | | | | | | | | |
Series 2019-2, Class A1, 2.74%, 11/25/2059(c)(i) | | | 233,715 | | | | 220,703 | |
Series 2020-1, Class A1, 2.01%, 05/25/2065(c)(i) | | | 39,916 | | | | 38,581 | |
Series 2021-1, Class A1, 0.80%, 02/25/2066(c)(i) | | | 336,593 | | | | 264,557 | |
Series 2022-1, Class A1, 2.21%, 01/25/2067(c)(i) | | | 1,480,096 | | | | 1,178,214 | |
Extended Stay America Trust, Series 2021-ESH, Class B, 4.79% (1 mo. USD LIBOR + 1.38%),
07/15/2038(c)(f) | | | 678,454 | | | | 645,140 | |
Flagstar Mortgage Trust | | | | | | | | |
Series 2021-11IN, Class A6, 3.70%, 11/25/2051(c)(i) | | | 3,084,191 | | | | 2,631,909 | |
Series 2021-8INV, Class A6, 2.50%, 09/25/2051(c)(i) | | | 1,121,799 | | | | 957,292 | |
FREMF Mortgage Trust, Series 2013- K29, Class X2A, IO, 0.13%, 05/25/2046(c)(k) | | | 22,958,452 | | | | 3,963 | |
GCAT Trust, Series 2019-NQM3, Class A1, 2.69%, 11/25/2059(c)(i) | | | 326,209 | | | | 303,473 | |
GoldenTree Loan Management US CLO 1 Ltd. (Cayman Islands), Series 2021-9A, Class A, 5.31% (3 mo. USD LIBOR + 1.07%), 01/20/2033(c)(f) | | | 4,000,000 | | | | 3,866,660 | |
GoldenTree Loan Management US CLO 2 Ltd. (Cayman Islands), Series 2017-2A, Class AR, 5.15% (3 mo. USD LIBOR + 0.91%), 11/20/2030(c)(f) | | | 2,362,000 | | | | 2,306,687 | |
GoldenTree Loan Management US CLO 5 Ltd. (Cayman Islands), Series 2019-5A, Class AR, 5.31% (3 mo. USD LIBOR + 1.07%),
10/20/2032(c)(f) | | | 5,000,000 | | | | 4,822,285 | |
| | | | | | | | |
| | | Principal
Amount | | | Value | |
Golub Capital Partners CLO 40(A) Ltd. (Cayman Islands), Series 2019-40A, Class AR, 5.45% (3 mo. USD LIBOR + 1.09%), 01/25/2032(c)(f) | | $ | 8,000,000 | | | $ | 7,741,792 | |
GS Mortgage Securities Trust | | | | | | | | |
Series 2013-GC14, Class B, 4.72%, 08/10/2046(c)(i) | | | 325,000 | | | | 314,650 | |
Series 2020-GC45, Class A5, 2.91%, 02/13/2053 | | | 1,560,000 | | | | 1,292,152 | |
Series 2020-GC47, Class A5, 2.38%, 05/12/2053 | | | 1,530,000 | | | | 1,223,641 | |
GS Mortgage-Backed Securities Trust, Series 2021-INV1, Class A6, 2.50%, 12/25/2051(c)(i) | | | 4,290,992 | | | | 3,686,949 | |
Hertz Vehicle Financing III L.P. | | | | | | | | |
Series 2021-2A, Class A, 1.68%, 12/27/2027(c) | | | 539,000 | | | | 455,295 | |
Series 2021-2A, Class B, 2.12%, 12/27/2027(c) | | | 286,000 | | | | 240,726 | |
Hertz Vehicle Financing LLC | | | | | | | | |
Series 2021-1A, Class A, 1.21%, 12/26/2025(c) | | | 394,000 | | | | 358,270 | |
Series 2021-1A, Class B, 1.56%, 12/26/2025(c) | | | 175,000 | | | | 159,367 | |
IP Lending III Ltd. (Cayman Islands), Series 2022-3A, Class SNR, 3.38%, 11/02/2026(c)(g) | | | 1,474,000 | | | | 1,313,186 | |
JP Morgan Mortgage Trust, Series 2021-LTV2, Class A1, 2.52%, 05/25/2052(c)(i) | | | 2,504,707 | | | | 1,931,702 | |
JPMDB Commercial Mortgage Securities Trust | | | | | | | | |
Series 2020-COR7, Class A5, 2.18%, 05/13/2053 | | | 3,000,000 | | | | 2,325,254 | |
Series 2020-COR7, Class C, 3.72%, 05/13/2053(i) | | | 2,908,000 | | | | 2,200,264 | |
KKR CLO 30 Ltd. (Cayman Islands), Series 30A, Class A1R, 5.10% (3 mo. USD LIBOR + 1.02%), 10/17/2031(c)(f) | | | 5,000,000 | | | | 4,870,255 | |
Life Mortgage Trust | | | | | | | | |
Series 2021-BMR, Class A, 4.11% (1 mo. USD LIBOR + 0.70%), 03/15/2038(c)(f) | | | 1,798,835 | | | | 1,722,107 | |
Series 2021-BMR, Class B, 4.29% (1 mo. USD LIBOR + 0.88%), 03/15/2038(c)(f) | | | 1,213,968 | | | | 1,144,315 | |
Series 2021-BMR, Class C, 4.51% (1 mo. USD LIBOR + 1.10%), 03/15/2038(c)(f) | | | 491,485 | | | | 462,376 | |
Med Trust | | | | | | | | |
Series 2021-MDLN, Class A, 4.36% (1 mo. USD LIBOR + 0.95%), 11/15/2038(c)(f) | | | 1,360,000 | | | | 1,297,907 | |
Series 2021-MDLN, Class B, 4.86% (1 mo. USD LIBOR + 1.45%), 11/15/2038(c)(f) | | | 2,204,000 | | | | 2,093,394 | |
See accompanying Notes to Financial Statements which are an integral part of the financial statements.
Invesco Total Return Bond ETF (GTO)–(continued)
October 31, 2022
| | | | | | | | |
| | | Principal
Amount | | | Value | |
Mello Mortgage Capital Acceptance Trust | | | | | | | | |
Series 2021-INV2, Class A4, 2.50%, 08/25/2051(c)(i) | | $ | 1,109,631 | | | $ | 946,909 | |
Series 2021-INV3, Class A4, 2.50%, 10/25/2051(c)(i) | | | 1,169,059 | | | | 997,623 | |
MFA Trust | | | | | | | | |
Series 2021-AEI1, Class A3, 2.50%, 08/25/2051(c)(i) | | | 1,358,050 | | | | 1,054,799 | |
Series 2021-AEI1, Class A4, 2.50%, 08/25/2051(c)(i) | | | 1,645,073 | | | | 1,412,024 | |
Series 2021-INV2, Class A1, 1.91%, 11/25/2056(c)(i) | | | 4,573,137 | | | | 3,635,138 | |
MHP Commercial Mortgage Trust | | | | | | | | |
Series 2021-STOR, Class A, 4.11% (1 mo. USD LIBOR + 0.70%), 07/15/2038(c)(f) | | | 815,000 | | | | 774,138 | |
Series 2021-STOR, Class B, 4.31% (1 mo. USD LIBOR + 0.90%), 07/15/2038(c)(f) | | | 615,000 | | | | 581,579 | |
MMAF Equipment Finance LLC, Series 2020-A, Class A5, 1.56%, 10/09/2042(c) | | | 1,500,000 | | | | 1,271,770 | |
Morgan Stanley Bank of America Merrill Lynch Trust, Series 2015-C25, Class B, 4.53%, 10/15/2048(i) | | | 1,032,000 | | | | 963,489 | |
Morgan Stanley Capital I Trust, Series 2019-L3, Class AS, 3.49%, 11/15/2052 | | | 1,580,000 | | | | 1,339,757 | |
Neuberger Berman Loan Advisers CLO 40 Ltd. (Cayman Islands), Series 2021-40A, Class A, 5.14% (3 mo. USD LIBOR + 1.06%), 04/16/2033(c)(f) | | | 1,023,000 | | | | 992,435 | |
New Residential Mortgage Loan Trust | | | | | | | | |
Series 2019-NQM4, Class A1, 2.49%, 09/25/2059(c)(i) | | | 174,584 | | | | 158,021 | |
Series 2020-NQM1, Class A1, 2.46%, 01/26/2060(c)(i) | | | 566,400 | | | | 503,367 | |
Series 2022-NQM2, Class A1, 3.08%, 03/27/2062(c)(i) | | | 1,579,317 | | | | 1,347,022 | |
OBX Trust | | | | | | | | |
Series 2022-NQM1, Class A1, 2.31%, 11/25/2061(c)(i) | | | 1,865,711 | | | | 1,493,104 | |
Series 2022-NQM2, Class A1, 2.94%, 01/25/2062(c)(i) | | | 2,414,757 | | | | 2,064,290 | |
Series 2022-NQM2, Class A1A, 2.78%, 01/25/2062(c)(j) | | | 1,567,589 | | | | 1,389,487 | |
Series 2022-NQM2, Class A1B, 3.38%, 01/25/2062(c)(j) | | | 1,415,000 | | | | 1,105,202 | |
Oceanview Mortgage Trust, Series 2021-3, Class A5, 2.50%, 07/25/2051(c)(i) | | | 1,244,242 | | | | 1,069,393 | |
OCP CLO Ltd. (Cayman Islands) | | | | | | | | |
Series 2017-13A, Class A1AR, 5.04% (3 mo. USD LIBOR + 0.96%), 07/15/2030(c)(f) | | | 3,000,000 | | | | 2,930,556 | |
Series 2020-8RA, Class A1, 5.30% (3 mo. USD LIBOR + 1.22%), 01/17/2032(c)(f) | | | 1,730,000 | | | | 1,686,617 | |
| | | | | | | | |
| | | Principal
Amount | | | Value | |
Octagon Investment Partners 31 LLC (Cayman Islands), Series 2017-1A, Class AR, 5.29% (3 mo. USD LIBOR + 1.05%), 07/20/2030(c)(f) | | $ | 4,000,000 | | | $ | 3,915,204 | |
Octagon Investment Partners 49 Ltd. (Cayman Islands), Series 2020-5A, Class A1, 5.30% (3 mo. USD LIBOR + 1.22%), 01/15/2033(c)(f) | | | 3,000,000 | | | | 2,921,187 | |
One Bryant Park Trust, Series 2019-OBP, Class A, 2.52%, 09/15/2054(c) | | | 457,000 | | | | 365,026 | |
Onslow Bay Mortgage Loan Trust, Series 2021-NQM4, Class A1, 1.96%, 10/25/2061(c)(i) | | | 2,019,190 | | | | 1,575,610 | |
PPM CLO 3 Ltd. (United Kingdom), Series 2019-3A, Class AR, 5.17% (3 mo. USD LIBOR + 1.09%), 04/17/2034(c)(f) | | | 250,000 | | | | 238,046 | |
Progress Residential Trust, Series 2020-SFR1, Class A, 1.73%, 04/17/2037(c) | | | 869,157 | | | | 786,647 | |
Race Point VIII CLO Ltd. (Cayman Islands), Series 2013-8A, Class AR2, 4.02% (3 mo. USD LIBOR + 1.04%), 02/20/2030(c)(f) | | | 646,548 | | | | 635,778 | |
Residential Mortgage Loan Trust | | | | | | | | |
Series 2019-3, Class A1, 2.63%, 09/25/2059(c)(i) | | | 19,220 | | | | 18,630 | |
Series 2020-1, Class A1, 2.38%, 01/26/2060(c)(i) | | | 67,433 | | | | 63,813 | |
SG Residential Mortgage Trust, Series 2022-1, Class A1, 3.17%,
03/27/2062(c)(i) | | | 2,762,924 | | | | 2,396,374 | |
Sonic Capital LLC | | | | | | | | |
Series 2020-1A, Class A2I, 3.85%, 01/20/2050(c) | | | 1,592,727 | | | | 1,411,258 | |
Series 2021-1A, Class A2I, 2.19%, 08/20/2051(c) | | | 1,820,067 | | | | 1,427,435 | |
Series 2021-1A, Class A2II, 2.64%, 08/20/2051(c) | | | 1,859,633 | | | | 1,300,420 | |
STAR Trust | | | | | | | | |
Series 2021-1, Class A1, 1.22%, 05/25/2065(c)(i) | | | 1,098,313 | | | | 1,015,935 | |
Series 2021-SFR1, Class B, 4.16% (1 mo. USD LIBOR + 0.75%), 04/17/2038(c)(f) | | | 475,000 | | | | 450,719 | |
Series 2021-SFR1, Class C, 4.46% (1 mo. USD LIBOR + 1.05%), 04/17/2038(c)(f) | | | 1,125,000 | | | | 1,071,187 | |
Series 2021-SFR1, Class D, 4.71% (1 mo. USD LIBOR + 1.30%), 04/17/2038(c)(f) | | | 1,665,000 | | | | 1,576,193 | |
Starwood Mortgage Residential Trust | | | | | | | | |
Series 2020-1, Class A1, 2.28%, 02/25/2050(c)(i) | | | 16,051 | | | | 15,918 | |
Series 2020-INV1, Class A1, 1.03%, 11/25/2055(c)(i) | | | 676,876 | | | | 623,877 | |
Series 2021-6, Class A1, 1.92%, 11/25/2066(c)(i) | | | 2,643,006 | | | | 2,069,115 | |
Series 2022-1, Class A1, 2.45%, 12/25/2066(c)(i) | | | 1,979,812 | | | | 1,607,992 | |
See accompanying Notes to Financial Statements which are an integral part of the financial statements.
Invesco Total Return Bond ETF (GTO)–(continued)
October 31, 2022
| | | | | | | | |
| | | Principal
Amount | | | Value | |
Store Master Funding I-VII, Series 2016- 1A, Class A2, 4.32%, 10/20/2046(c) | | $ | 446,916 | | | $ | 412,210 | |
Taco Bell Funding LLC, Series 2016-1A, Class A23, 4.97%, 05/25/2046(c) | | | 142,125 | | | | 135,196 | |
Textainer Marine Containers VII Ltd. (China), Series 2021-2A, Class A, 2.23%, 04/20/2046(c) | | | 1,416,800 | | | | 1,186,892 | |
Tricon American Homes Trust, Series 2020-SFR2, Class A, 1.48%, 11/17/2039(c) | | | 1,094,751 | | | | 888,182 | |
Verus Securitization Trust | | | | | | | | |
Series 2020-INV1, Class A1, 0.33%, 03/25/2060(c)(i) | | | 52,104 | | | | 50,814 | |
Series 2021-1, Class A1B, 1.32%, 01/25/2066(c)(i) | | | 1,130,926 | | | | 879,632 | |
Series 2021-2, Class A1, 1.03%, 02/25/2066(c)(i) | | | 1,474,818 | | | | 1,188,434 | |
Series 2021-7, Class A1, 1.83%, 10/25/2066(c)(i) | | | 1,986,810 | | | | 1,597,856 | |
Series 2021-R1, Class A1, 0.82%, 10/25/2063(c)(i) | | | 983,951 | | | | 894,972 | |
Series 2022-1, Class A1, 2.72%, 01/25/2067(c)(j) | | | 1,538,082 | | | | 1,261,378 | |
Visio Trust, Series 2020-1R, Class A1, 1.31%, 11/25/2055(c) | | | 253,066 | | | | 232,355 | |
Wells Fargo Commercial Mortgage Trust, Series 2016-NXS5, Class XA, IO, 1.42%, 01/15/2059(l) | | | 1,442,646 | | | | 48,671 | |
Wendy’s Funding LLC, Series 2019-1A, Class A2II, 4.08%, 06/15/2049(c) | | | 456,250 | | | | 396,983 | |
WFRBS Commercial Mortgage Trust, Series 2014-C23, Class B, 4.39%, 10/15/2057(i) | | | 307,000 | | | | 291,229 | |
Zaxby’s Funding LLC, Series 2021-1A, Class A2, 3.24%, 07/30/2051(c) | | | 4,246,250 | | | | 3,387,559 | |
| | | | | | | | |
Total Asset-Backed Securities
(Cost $220,370,560) | | | | 191,509,689 | |
| | | | | | | | |
|
| U.S. Government Sponsored Agency Mortgage-Backed Securities-22.23% | |
Collateralized Mortgage Obligations-0.63% | |
Freddie Mac Military Housing Bonds Resecuritization Trust Ctfs., Series 2015-R1, Class B1, 5.25%, 11/25/2055(c)(i) | | | 919,984 | | | | 859,038 | |
Freddie Mac Multifamily Structured Pass-Through Ctfs. | | | | | | | | |
Series 2013-K026, Class X1, IO, 0.88%, 11/25/2022(l) | | | 575,927 | | | | 6 | |
Series 2013-K035, Class X1, IO, 0.32%, 08/25/2023(l) | | | 7,520,824 | | | | 15,932 | |
Series 2014-K036, Class X1, IO, 0.77%, 10/25/2023(l) | | | 5,512,365 | | | | 27,194 | |
Series 2014-K037, Class X1, IO, 0.91%, 01/25/2024(l) | | | 5,848,897 | | | | 49,335 | |
Series 2015-K042, Class X1, IO, 1.02%, 12/25/2024(l) | | | 4,136,590 | | | | 70,471 | |
Series 2017-K066, Class AM, 3.20%, 06/25/2027 | | | 250,000 | | | | 231,627 | |
| | | | | | | | |
| | | Principal
Amount | | | Value | |
Collateralized Mortgage Obligations-(continued) | |
Series 2017-KGX1, Class AFX, 3.00%, 10/25/2027 | | $ | 1,000,000 | | | $ | 918,840 | |
Series 2018-K074, Class AM, 3.60%, 02/25/2028 | | | 1,000,000 | | | | 937,812 | |
Series 2018-K154, Class A3, 3.46%, 11/25/2032 | | | 1,000,000 | | | | 883,471 | |
Series K038, Class X1, IO, 1.08%, 03/25/2024(l) | | | 3,864,621 | | | | 42,675 | |
Seasoned Credit Risk Transfer Trust | | | | | | | | |
Series 2017-3, Class HT, 3.25%, 07/25/2056(j) | | | 275,319 | | | | 245,384 | |
Series 2017-4, Class HT, 3.25%, 06/25/2057(j) | | | 426,983 | | | | 385,493 | |
| | | | | | | | |
| | | | | | | 4,667,278 | |
| | | | | | | | |
Federal Home Loan Mortgage Corp. (FHLMC)-0.37% | | | | | |
0.00%, 12/14/2029(m) | | | 150,000 | | | | 109,929 | |
3.55%, 10/01/2033 | | | 469,118 | | | | 411,257 | |
3.00%, 10/01/2034 | | | 274,968 | | | | 253,895 | |
4.00%, 11/01/2048 to 07/01/2049 | | | 282,131 | | | | 261,601 | |
3.50%, 08/01/2049 | | | 1,890,773 | | | | 1,688,250 | |
| | | | | | | | |
| | | | | | | 2,724,932 | |
| | | | | | | | |
Federal National Mortgage Association (FNMA)-1.28% | |
2.82%, 10/01/2029 | | | 491,491 | | | | 437,525 | |
2.90%, 11/01/2029 | | | 500,000 | | | | 445,195 | |
3.08%, 10/01/2032 | | | 750,000 | | | | 645,673 | |
3.24%, 11/01/2032 | | | 456,750 | | | | 402,289 | |
3.31%, 01/01/2033 | | | 1,000,000 | | | | 879,667 | |
2.50%, 10/01/2034 to 12/01/2034 | | | 2,389,247 | | | | 2,166,518 | |
3.50%, 05/01/2047 to 06/01/2047 | | | 1,760,641 | | | | 1,588,310 | |
4.00%, 11/01/2047 | | | 78,661 | | | | 73,345 | |
3.00%, 09/01/2049 to 10/01/2049 | | | 3,254,240 | | | | 2,798,553 | |
| | | | | | | | |
| | | | | | | 9,437,075 | |
| | | | | | | | |
Government National Mortgage Association (GNMA)-1.37% | |
4.00%, 07/20/2049 | | | 48,766 | | | | 45,218 | |
TBA, 2.00%, 11/01/2052(n) | | | 6,645,000 | | | | 5,460,581 | |
TBA, 2.50%, 11/01/2052(n) | | | 5,400,000 | | | | 4,575,656 | |
| | | | | | | | |
| | | | | | | 10,081,455 | |
| | | | | | | | |
Uniform Mortgage-Backed Securities-18.58% | |
TBA, 1.50%, 11/01/2037(n) | | | 8,760,000 | | | | 7,460,251 | |
TBA, 2.00%, 11/01/2037 to 11/01/2052(n) | | | 30,491,850 | | | | 24,478,453 | |
TBA, 2.50%, 11/01/2052(n) | | | 17,400,000 | | | | 14,259,844 | |
TBA, 4.00%, 11/01/2052(n) | | | 9,249,000 | | | | 8,419,480 | |
TBA, 4.50%, 11/01/2052(n) | | | 9,249,000 | | | | 8,679,970 | |
TBA, 5.00%, 11/01/2052(n) | | | 23,000,000 | | | | 22,162,656 | |
TBA, 5.50%, 11/01/2052(n) | | | 30,000,000 | | | | 29,568,750 | |
TBA, 6.00%, 11/01/2052(n) | | | 22,000,000 | | | | 22,113,438 | |
| | | | | | | | |
| | | | | | | 137,142,842 | |
| | | | | | | | |
Total U.S. Government Sponsored Agency Mortgage- Backed Securities
(Cost $167,581,049) | | | | 164,053,582 | |
| | | | | | | | |
See accompanying Notes to Financial Statements which are an integral part of the financial statements.
Invesco Total Return Bond ETF (GTO)–(continued)
October 31, 2022
| | | | | | | | |
| | | Principal | | | | |
| | | Amount | | | Value | |
U.S. Treasury Securities-1.44% | |
U.S. Treasury Bills-0.24%(o) | | | | | | | | |
1.46%, 11/17/2022(l)(p) | | $ | 1,138,000 | | | $ | 1,136,566 | |
4.15%, 03/09/2023(p) | | | 654,000 | | | | 644,273 | |
| | | | | | | | |
| | | | | | | 1,780,839 | |
| | | | | | | | |
U.S. Treasury Bonds-0.56% | | | | | | | | |
3.38%, 08/15/2042 | | | 2,664,000 | | | | 2,290,624 | |
2.88%, 05/15/2052 | | | 2,411,800 | | | | 1,862,738 | |
| | | | | | | | |
| | | | | | | 4,153,362 | |
| | | | | | | | |
U.S. Treasury Notes-0.64% | | | | | | | | |
4.38%, 10/31/2024 | | | 641,700 | | | | 640,221 | |
4.25%, 10/15/2025 | | | 230,200 | | | | 228,905 | |
4.13%, 10/31/2027 | | | 2,289,900 | | | | 2,277,377 | |
4.00%, 10/31/2029 | | | 1,400,300 | | | | 1,386,844 | |
2.75%, 08/15/2032 | | | 190,600 | | | | 170,394 | |
| | | | | | | | |
| | | | | | | 4,703,741 | |
| | | | | | | | |
Total U.S. Treasury Securities
(Cost $10,851,658) | | | | | | | 10,637,942 | |
| | | | | | | | |
|
Agency Credit Risk Transfer Notes-0.91% | |
Fannie Mae Connecticut Avenue Securities | | | | | | | | |
Series 2019-R03, Class 1M2, 5.74% (1 mo. USD LIBOR + 2.15%), 09/25/2031(c)(f)(q) | | | 14,977 | | | | 14,941 | |
Series 2019-R06, Class 2M2, 5.69% (1 mo. USD LIBOR + 2.10%), 09/25/2039(c)(f)(q) | | | 5,438 | | | | 5,424 | |
Series 2022-R03, Class 1M1, 5.10% (30 Day Average SOFR + 2.10%), 03/25/2042(c)(f)(q) | | | 2,464,195 | | | | 2,431,998 | |
Series 2022-R04, Class 1M1, 5.00% (30 Day Average SOFR + 2.00%), 03/25/2042(c)(f)(q) | | | 1,225,743 | | | | 1,205,635 | |
Freddie Mac | | | | | | | | |
Series 2020-DNA5, Class M2, STACR® , 5.80% (30 Day Average SOFR + 2.80%), 10/25/2050(c)(f)(r) | | | 393,980 | | | | 394,129 | |
Series 2022-DNA3, Class M1A, STACR® , 5.00% (30 Day Average SOFR + 2.00%), 04/25/2042(c)(f)(r) | | | 1,745,197 | | | | 1,711,469 | |
Series 2022-HQA3, Class M1, STACR® , 5.30% (30 Day Average SOFR + 2.30%), 08/25/2042(c)(f)(r) | | | 990,488 | | | | 985,663 | |
| | | | | | | | |
Total Agency Credit Risk Transfer Notes
(Cost $6,840,712) | | | | 6,749,259 | |
| | | | | | | | |
| | |
Municipal Obligations-0.41% | | | | | | | | |
California (State of) Health Facilities Financing Authority (Social Bonds) | | | | | | | | |
Series 2022, RB, 4.19%, 06/01/2037 | | | 735,000 | | | | 620,786 | |
Series 2022, RB, 4.35%, 06/01/2041 | | | 590,000 | | | | 485,043 | |
| | | | | | | | |
| | | Principal | | | | |
| | | Amount | | | Value | |
California State University | | | | | | | | |
Series 2021 B, Ref. RB, 2.72%, 11/01/2052 | | $ | 695,000 | | | $ | 402,969 | |
Series 2021 B, Ref. RB, 2.94%, 11/01/2052 | | | 1,040,000 | | | | 642,241 | |
Illinois (State of), Series 2010-1, GO Bonds, (INS - AGM), 6.63%, 02/01/2035(s) | | | 200,000 | | | | 206,676 | |
Los Angeles (City of), CA Department of Water & Power, Series 2010, RB, 6.57%, 07/01/2045 | | | 255,000 | | | | 285,046 | |
Texas (State of) Transportation Commission (Central Texas Turnpike System), Series 2020 C, Ref. RB, 3.03%, 08/15/2041 | | | 580,000 | | | | 369,045 | |
| | | | | | | | |
Total Municipal Obligations(t)
(Cost $4,228,803) | | | | | | | 3,011,806 | |
| | | | | | | | |
| | | Shares | | | | |
Preferred Stocks-0.37% | | | | | | | | |
Diversified Banks-0.26% | | | | | | | | |
Citigroup, Inc. | | | | | | | | |
Series U, Pfd., 5.00%(b)(d) | | | 1,196,000 | | | | 1,067,071 | |
Series W, Pfd., 4.00%(d) | | | 691,000 | | | | 584,586 | |
Wells Fargo & Co., Class A, Series L, Conv. Pfd., 7.50% | | | 232 | | | | 270,403 | |
| | | | | | | | |
| | | | | | | 1,922,060 | |
| | | | | | | | |
Integrated Telecommunication Services-0.06% | |
AT&T, Inc., Series B, Pfd., 2.88%(d) | | | 500,000 | | | | 442,747 | |
| | | | | | | | |
Life & Health Insurance-0.02% | |
MetLife, Inc., Series G, Pfd., 3.85%(b)(d) | | | 127,000 | | | | 111,917 | |
| | | | | | | | |
Other Diversified Financial Services-0.03% | |
Equitable Holdings, Inc., Series B, Pfd., 4.95%(b)(d) | | | 269,000 | | | | 250,843 | |
| | | | | | | | |
Total Preferred Stocks
(Cost $3,134,872) | | | | | | | 2,727,567 | |
| | | | | | | | |
| | | Principal
Amount | | | | |
U.S. Government Sponsored Agency Securities-0.33% | |
Fannie Mae STRIPS | | | | | | | | |
0.00%, 05/15/2029(m) | | $ | 450,000 | | | | 333,158 | |
0.00%, 01/15/2030(b)(m) | | | 1,300,000 | | | | 957,313 | |
0.00%, 05/15/2030(m) | | | 850,000 | | | | 606,286 | |
Freddie Mac STRIPS, 0.00%, 09/15/2030(m) | | | 350,000 | | | | 247,273 | |
Tennessee Valley Authority | | | | | | | | |
5.38%, 04/01/2056 | | | 100,000 | | | | 99,173 | |
4.25%, 09/15/2065 | | | 250,000 | | | | 210,272 | |
| | | | | | | | |
Total U.S. Government Sponsored Agency Securities
(Cost $2,475,091) | | | | 2,453,475 | |
| | | | | | | | |
|
Non-U.S. Dollar Denominated Bonds & Notes-0.02%(u) | |
Movies & Entertainment-0.01% | | | | | | | | |
Netflix, Inc., 3.88%, 11/15/2029(c) | | EUR | 100,000 | | | | 92,082 | |
| | | | | | | | |
See accompanying Notes to Financial Statements which are an integral part of the financial statements.
Invesco Total Return Bond ETF (GTO)–(continued)
October 31, 2022
| | | | | | | | |
| | | Principal | | | | |
| | | Amount | | | Value | |
Sovereign Debt-0.01% | | | | | | | | |
Ukraine Government International Bond (Ukraine), 4.38%, 01/27/2032(c)(h) | | EUR | 309,000 | | | $ | 47,034 | |
| | | | | | | | |
Total Non-U.S. Dollar Denominated Bonds & Notes
(Cost $454,258) | | | | | | | 139,116 | |
| | | | | | | | |
| | | Shares | | | | |
Options Purchased-0.03% | | | | | | | | |
(Cost $584,630)† | | | | | | | 251,030 | |
| | | | | | | | |
TOTAL INVESTMENTS IN SECURITIES
(excluding investments purchased with cash collateral from securities on loan)-115.77%
(Cost $976,710,331) | | | | 854,542,999 | |
| | | | | | | | |
|
Investments Purchased with Cash Collateral from Securities on Loan | |
| |
Money Market Funds-11.30% | | | | | |
Invesco Private Government Fund, 3.18%(v)(w)(x) | | | 23,693,081 | | | | 23,693,081 | |
| | |
| Investment Abbreviations: |
| AGM | | -Assured Guaranty Municipal Corp. |
| CLO | | -Collateralized Loan Obligation |
| Conv. | | -Convertible |
| Ctfs. | | -Certificates |
| EUR | | -Euro |
| GO | | -General Obligation |
| INS | | -Insurer |
| IO | | -Interest Only |
| LIBOR | | -London Interbank Offered Rate |
| Pfd. | | -Preferred |
| RB | | -Revenue Bonds |
| Ref. | | -Refunding |
| REIT | | -Real Estate Investment Trust |
| SOFR | | -Secured Overnight Financing Rate |
| STACR® | | -Structured Agency Credit Risk |
| STRIPS | | -Separately Traded Registered Interest and Principal Security |
| TBA | | -To Be Announced |
| USD | | -U.S. Dollar |
| | | | | | | | |
| | | Principal | | | | |
| | | Amount | | | Value | |
Money Market Funds-(continued) | |
Invesco Private Prime Fund,
3.28%(v)(w)(x) | | | 59,702,935 | | | $ | 59,702,935 | |
| | | | | | | | |
Total Investments Purchased with Cash Collateral from Securities on Loan
(Cost $83,396,651) | | | | 83,396,016 | |
| | | | | | | | |
TOTAL INVESTMENTS IN SECURITIES-127.07%
(Cost $1,060,106,982) | | | | 937,939,015 | |
OTHER ASSETS LESS LIABILITIES-(27.07)% | | | | (199,825,575 | ) |
| | | | | | | | |
NET ASSETS-100.00% | | | | | | $ | 738,113,440 | |
| | | | | | | | |
See accompanying Notes to Financial Statements which are an integral part of the financial statements.
Invesco Total Return Bond ETF (GTO)–(continued)
October 31, 2022
Notes to Schedule of Investments:
| (a) | Industry and/or sector classifications used in this report are generally according to the Global Industry Classification Standard, which was developed by and is the exclusive property and a service mark of MSCI Inc. and Standard & Poor’s. |
| (b) | All or a portion of this security was out on loan at October 31, 2022. |
| (c) | Security purchased or received in a transaction exempt from registration under the Securities Act of 1933, as amended (the “1933 Act”). The security may be resold pursuant to an exemption from registration under the 1933 Act, typically to qualified institutional buyers. The aggregate value of these securities at October 31, 2022 was $358,072,702, which represented 48.51% of the Fund’s Net Assets. |
| (d) | Security issued at a fixed rate for a specific period of time, after which it will convert to a variable rate. |
| (e) | Perpetual bond with no specified maturity date. |
| (f) | Interest or dividend rate is redetermined periodically. Rate shown is the rate in effect on October 31, 2022. |
| (g) | Security valued using significant unobservable inputs (Level 3). See Note 5. |
| (h) | Defaulted security. Currently, the issuer is in default with respect to principal and/or interest payments. The aggregate value of these securities at October 31, 2022 was $1,291,344, which represented less than 1% of the Fund’s Net Assets. |
| (i) | Interest rate is redetermined periodically based on the cash flows generated by the pool of assets backing the security, less any applicable fees. The rate shown is the rate in effect on October 31, 2022. |
| (j) | Step coupon bond. The interest rate represents the coupon rate at which the bond will accrue at a specified future date. |
| (k) | Interest only security. Principal amount shown is the notional principal and does not reflect the maturity value of the security. |
| (l) | Interest only security. Principal amount shown is the notional principal and does not reflect the maturity value of the security. Interest rate is redetermined periodically based on the cash flows generated by the pool of assets backing the security, less any applicable fees. The rate shown is the rate in effect on October 31, 2022. |
| (m) | Denotes a zero coupon security issued at a substantial discount from its value at maturity. |
| (n) | Security purchased on a forward commitment basis. This security is subject to dollar roll transactions. See Note 2J. |
| (o) | Security traded on a discount basis. The interest rate shown represents the discount rate at the time of purchase by the Fund. |
| (p) | $1,780,839 was pledged as collateral to cover margin requirements for open futures contracts. See Note 2P. |
| (q) | CAS notes are bonds issued by Fannie Mae. The amount of periodic principal and ultimate principal paid by Fannie Mae is determined by the performance of a large and diverse reference pool. |
| (r) | Principal payments are determined by the delinquency and principal payment experience on the STACR® reference pool. Freddie Mac transfers credit risk from the mortgages in the reference pool to credit investors who invest in the STACR® debt notes. |
| (s) | Principal and/or interest payments are secured by the bond insurance company listed. |
| (t) | Entities may either issue, guarantee, back or otherwise enhance the credit quality of a security. The entities are not primarily responsible for the issuer’s obligations but may be called upon to satisfy the issuer’s obligations. No concentration of any single entity was greater than 5% each. |
| (u) | Foreign denominated security. Principal amount is denominated in the currency indicated. |
| (v) | Affiliated issuer. The issuer and/or the Fund is a wholly-owned subsidiary of Invesco Ltd., or is affiliated by having an investment adviser that is under common control of Invesco Ltd. The table below shows the Fund’s transactions in, and earnings from, its investments in affiliates for the fiscal year ended October 31, 2022. |
| | | | | | | | | | | | | | | | | | | | | | | | | | | | | | | | | | | | | | | | | | | | | | | | | | | | | | | |
| | | Value
October 31, 2021 | | Purchases
at Cost | | Proceeds
from Sales | | Change in
Unrealized
Appreciation
(Depreciation) | | Realized
Gain
(Loss) | | Value
October 31, 2022 | | Dividend
Income |
| | | | | | | | | | | |
Investments Purchased with Cash Collateral from Securities on Loan: | | | | | | | | | | | | | | | | | | | | | | | | | | | | | | | | | | | | | | | | | | | | | | | | | | | | | | | |
| | | | | | | | | | | |
Invesco Private Government Fund | | | | | | | | $ | 21,439,698 | | | | | | | | | $ | 524,944,660 | | | | $ | (522,691,277 | ) | | | $ | - | | | | $ | - | | | | | | | | | $ | 23,693,081 | | | | | | | | | $ | 196,378 | * |
| | | | | | | | | | | |
Invesco Private Prime Fund | | | | | | | | | 50,025,963 | | | | | | | | | | 1,119,029,436 | | | | | (1,109,326,904 | ) | | | | (636 | ) | | | | (24,924 | ) | | | | | | | | | 59,702,935 | | | | | | | | | | 544,219 | * |
| | | | | | | | | | | | | | | | | | | | | | | | | | | | | | | | | | | | | | | | | | | | | | | | | | | | | | | |
| | | | | | | | | | | |
Total | | | | | | | | $ | 71,465,661 | | | | | | | | | $ | 1,643,974,096 | | | | $ | (1,632,018,181 | ) | | | $ | (636 | ) | | | $ | (24,924 | ) | | | | | | | | $ | 83,396,016 | | | | | | | | | $ | 740,597 | |
| | | | | | | | | | | | | | | | | | | | | | | | | | | | | | | | | | | | | | | | | | | | | | | | | | | | | | | |
| * | Represents the income earned on the investment of cash collateral, which is included in securities lending income on the Statements of Operations. Does not include rebates and fees paid to lending agent or premiums received from borrowers, if any. |
| (w) | The rate shown is the 7-day SEC standardized yield as of October 31, 2022. |
| (x) | The security has been segregated to satisfy the commitment to return the cash collateral received in securities lending transactions upon the borrower’s return of the securities loaned. See Note 2M. |
| † | The table below details options purchased. |
See accompanying Notes to Financial Statements which are an integral part of the financial statements.
Invesco Total Return Bond ETF (GTO)–(continued)
October 31, 2022
| | | | | | | | | | | | | | | | | | | | | | | | |
Open Exchange-Traded Equity Options Purchased | |
| |
Description | | Type of
Contract | | | Expiration Date | | | Number of
Contracts | | | Exercise Price | | | Notional
Value* | | | Value | |
| | | | | | |
Equity Risk | | | | | | | | | | | | | | | | | | | | | | | | |
| | | | | | |
iShares China Large-Cap ETF | | | Call | | | | 01/20/2023 | | | | 1,153 | | | | $41 | | | | $4,727,300 | | | | $1,730 | |
| * | Notional Value is calculated by multiplying the Number of Contracts by the Exercise Price by the multiplier. |
| | | | | | | | | | | | | | | | | | | | | | | | |
Open Exchange-Traded Index Options Purchased | |
| |
Description | | Type of
Contract | | | Expiration Date | | | Number of
Contracts | | | Exercise Price | | | Notional
Value* | | | Value | |
| | | | | | |
Equity Risk | | | | | | | | | | | | | | | | | | | | | | | | |
| | | | | | |
S&P 500 Index Option | | | Call | | | | 04/21/2023 | | | | 12 | | | | $4,020 | | | | $4,824,000 | | | | $249,300 | |
| * | Notional Value is calculated by multiplying the Number of Contracts by the Exercise Price by the multiplier. |
| | | | | | | | | | | | | | | | | | | | |
Open Futures Contracts | |
| |
Long Futures Contracts | | Number of
Contracts | | | Expiration
Month | | | Notional
Value | | | Value | | | Unrealized
Appreciation
(Depreciation) | |
| | | | | |
Interest Rate Risk | | | | | | | | | | | | | | | | | | | | |
| | | | | |
U.S. Treasury 2 Year Notes | | | 167 | | | | December-2022 | | | $ | 34,131,930 | | | $ | (726,282 | ) | | $ | (726,282 | ) |
| | | | | |
U.S. Treasury Long Bonds | | | 317 | | | | December-2022 | | | | 38,198,500 | | | | (3,912,355 | ) | | | (3,912,355 | ) |
| | | | | | | | | | | | | | | | | | | | |
| | | | | |
Subtotal–Long Futures Contracts | | | | | | | | | | | | | | | (4,638,637 | ) | | | (4,638,637 | ) |
| | | | | | | | | | | | | | | | | | | | |
| | | | | |
Short Futures Contracts | | | | | | | | | | | | | | | |
| | | | | |
Interest Rate Risk | | | | | | | | | | | | | | | | | | | | |
| | | | | |
U.S. Treasury 5 Year Notes | | | 6 | | | | December-2022 | | | | (639,563 | ) | | | 500 | | | | 500 | |
| | | | | |
U.S. Treasury 10 Year Notes | | | 419 | | | | December-2022 | | | | (46,338,781 | ) | | | 1,490,923 | | | | 1,490,923 | |
| | | | | |
U.S. Treasury 10 Year Ultra Notes | | | 543 | | | | December-2022 | | | | (62,979,516 | ) | | | 4,352,206 | | | | 4,352,206 | |
| | | | | |
U.S. Treasury Ultra Bonds | | | 6 | | | | December-2022 | | | | (765,937 | ) | | | (2,972 | ) | | | (2,972 | ) |
| | | | | | | | | | | | | | | | | | | | |
| | | | | |
Subtotal–Short Futures Contracts | | | | | | | | | | | | | | | 5,840,657 | | | | 5,840,657 | |
| | | | | | | | | | | | | | | | | | | | |
| | | | | |
Total Futures Contracts | | | | | | | | | | | | | | $ | 1,202,020 | | | $ | 1,202,020 | |
| | | | | | | | | | | | | | | | | | | | |
See accompanying Notes to Financial Statements which are an integral part of the financial statements.
Invesco Ultra Short Duration ETF (GSY)
October 31, 2022
Schedule of Investments(a)
| | | | | | | | |
| | | Principal
Amount | | Value | |
U.S. Dollar Denominated Bonds & Notes-42.21% | |
Aerospace & Defense-0.10% | | | | | | | | |
Boeing Co. (The), 1.17%, 02/04/2023 | | $ | 2,046,000 | | | $ | 2,025,999 | |
| | | | | | | | |
Agricultural & Farm Machinery-0.13% | | | | | | | | |
John Deere Capital Corp., 1.20%, 04/06/2023 | | | 2,687,000 | | | | 2,647,820 | |
| | | | | | | | |
Application Software-0.23% | | | | | | | | |
Intuit, Inc., 0.65%, 07/15/2023 | | | 5,000,000 | | | | 4,852,657 | |
| | | | | | | | |
Asset Management & Custody Banks-0.34% | | | | | |
Ares Capital Corp., 3.50%, 02/10/2023 | | | 7,250,000 | | | | 7,208,411 | |
| | | | | | | | |
Automobile Manufacturers-4.39% | | | | | | | | |
BMW US Capital LLC (Germany) | | | | | | | | |
3.80%, 04/06/2023(b) | | | 10,000,000 | | | | 9,951,576 | |
0.75%, 08/12/2024(b) | | | 11,111,000 | | | | 10,263,009 | |
General Motors Financial Co., Inc., 1.20%, 10/15/2024 | | | 8,824,000 | | | | 8,064,424 | |
Hyundai Capital America | | | | | | | | |
2.38%, 02/10/2023(b) | | | 11,205,000 | | | | 11,109,227 | |
1.25%, 09/18/2023(b) | | | 12,730,000 | | | | 12,232,165 | |
1.00%, 09/17/2024(b) | | | 8,721,000 | | | | 7,896,068 | |
Mercedes-Benz Finance North America LLC (Germany), 3.35%,
02/22/2023(b)(c) | | | 21,462,000 | | | | 21,359,812 | |
Volkswagen Group of America Finance LLC (Germany) | | | | | | | | |
3.13%, 05/12/2023(b) | | | 5,091,000 | | | | 5,032,396 | |
0.88%, 11/22/2023(b) | | | 7,000,000 | | | | 6,665,961 | |
| | | | | | | | |
| | | | | | | 92,574,638 | |
| | | | | | | | |
Consumer Finance-0.89% | | | | | | | | |
Ally Financial, Inc., 1.45%, 10/02/2023 | | | 5,309,000 | | | | 5,092,645 | |
Capital One Financial Corp., 2.60%, 05/11/2023 | | | 13,823,000 | | | | 13,641,600 | |
| | | | | | | | |
| | | | | | | 18,734,245 | |
| | | | | | | | |
Data Processing & Outsourced Services-0.62% | | | | | |
Fidelity National Information Services, Inc., 0.38%, 03/01/2023 | | | 3,571,000 | | | | 3,515,647 | |
PayPal Holdings, Inc., 1.35%, 06/01/2023 | | | 9,688,000 | | | | 9,481,742 | |
| | | | | | | | |
| | | | | | | 12,997,389 | |
| | | | | | | | |
Department Stores-0.28% | | | | | | | | |
7-Eleven, Inc., 0.63%, 02/10/2023(b) | | | 5,882,000 | | | | 5,810,463 | |
| | | | | | | | |
Diversified Banks-9.93% | | | | | | | | |
Banco Santander S.A. (Spain), 3.89%, 05/24/2024 | | | 17,000,000 | | | | 16,484,986 | |
Bank of Montreal (Canada), 3.62% (SOFR + 0.71%), 03/08/2024(d) | | | 13,043,000 | | | | 12,960,434 | |
Bank of Nova Scotia (The) (Canada), 1.95%, 02/01/2023(c) | | | 25,000,000 | | | | 24,838,800 | |
| | | | | | | | |
| | | Principal
Amount | | Value | |
Diversified Banks-(continued) | | | | | | | | |
Banque Federative du Credit Mutuel S.A. (France), 0.65%, 02/27/2024(b) | | $ | 7,955,000 | | | $ | 7,460,453 | |
BPCE S.A. (France), 5.15%, 07/21/2024(b) | | | 5,040,000 | | | | 4,860,661 | |
Canadian Imperial Bank of Commerce (Canada) | | | | | | | | |
0.45%, 06/22/2023 | | | 15,000,000 | | | | 14,554,691 | |
0.95%, 06/23/2023 | | | 17,045,000 | | | | 16,560,555 | |
Discover Bank, 3.35%, 02/06/2023 | | | 25,000,000 | | | | 24,884,522 | |
JPMorgan Chase & Co., 0.65%, 09/16/2024(e) | | | 13,500,000 | | | | 12,888,643 | |
Lloyds Banking Group PLC (United Kingdom), 4.05%, 08/16/2023 | | | 16,883,000 | | | | 16,686,483 | |
Mitsubishi UFJ Financial Group, Inc. (Japan), 3.46%, 03/02/2023 | | | 11,785,000 | | | | 11,732,309 | |
National Bank of Canada (Canada), 2.10%, 02/01/2023 | | | 25,000,000 | | | | 24,821,454 | |
Sumitomo Mitsui Financial Group, Inc. (Japan), 0.51%, 01/12/2024 | | | 1,364,000 | | | | 1,285,407 | |
Sumitomo Mitsui Trust Bank Ltd. (Japan) | | | | | | | | |
0.80%, 09/12/2023(b) | | | 11,102,000 | | | | 10,667,685 | |
2.55%, 03/10/2025(b) | | | 5,122,000 | | | | 4,773,037 | |
UBS AG (Switzerland), 0.70%, 08/09/2024(b) | | | 4,288,000 | | | | 3,940,189 | |
| | | | | | | | |
| | | | | | | 209,400,309 | |
| | | | | | | | |
Diversified Capital Markets-0.93% | | | | | | | | |
Credit Suisse AG (Switzerland), 1.00%, 05/05/2023(c) | | | 13,636,000 | | | | 13,224,423 | |
Macquarie Group Ltd. (Australia), 1.20%, 10/14/2025(b)(e) | | | 7,143,000 | | | | 6,470,711 | |
| | | | | | | | |
| | | | | | | 19,695,134 | |
| | | | | | | | |
Electric Utilities-2.17% | | | | | | | | |
American Electric Power Co., Inc., Series M, 0.75%, 11/01/2023 | | | 3,797,000 | | | | 3,623,348 | |
Florida Power & Light Co., 2.92% (SOFR + 0.25%), 05/10/2023(d) | | | 13,043,000 | | | | 12,996,201 | |
NextEra Energy Capital Holdings, Inc. | | | | | | | | |
3.39% (SOFR + 0.54%), 03/01/2023(d) | | | 3,704,000 | | | | 3,699,248 | |
4.26%, 09/01/2024 | | | 7,895,000 | | | | 7,742,801 | |
Southern Co. (The), Series 2021, 3.04% (SOFR + 0.37%), 05/10/2023(d) | | | 10,526,000 | | | | 10,481,248 | |
Tampa Electric Co., 3.88%, 07/12/2024 | | | 3,188,000 | | | | 3,106,509 | |
Xcel Energy, Inc., 0.50%, 10/15/2023 | | | 4,372,000 | | | | 4,173,867 | |
| | | | | | | | |
| | | | | | | 45,823,222 | |
| | | | | | | | |
See accompanying Notes to Financial Statements which are an integral part of the financial statements.
Invesco Ultra Short Duration ETF (GSY)–(continued)
October 31, 2022
| | | | | | | | |
| | | Principal
Amount | | Value | |
Fertilizers & Agricultural Chemicals-0.25% | |
Nutrien Ltd. (Canada), 1.90%, 05/13/2023 | | $ | 5,300,000 | | | $ | 5,202,194 | |
| | | | | | | | |
Gas Utilities-0.86% | | | | | | | | |
Atmos Energy Corp., 3.57% (3 mo. USD LIBOR + 0.38%), 03/09/2023(d) | | | 9,756,000 | | | | 9,733,717 | |
CenterPoint Energy Resources Corp., 3.60% (3 mo. USD LIBOR + 0.50%), 03/02/2023(d) | | | 8,333,000 | | | | 8,302,910 | |
| | | | | | | | |
| | | | | | | 18,036,627 | |
| | | | | | | | |
Health Care Distributors-0.21% | | | | | | | | |
AmerisourceBergen Corp., 0.74%, 03/15/2023(c) | | | 4,588,000 | | | | 4,516,789 | |
| | | | | | | | |
Integrated Telecommunication Services-0.96% | |
AT&T, Inc., 3.69% (SOFR + 0.64%), 03/25/2024(d) | | | 9,917,000 | | | | 9,860,640 | |
Verizon Communications, Inc., 3.53% (SOFR + 0.50%), 03/22/2024(d) | | | 10,417,000 | | | | 10,332,695 | |
| | | | | | | | |
| | | | | | | 20,193,335 | |
| | | | | | | | |
Investment Banking & Brokerage-3.71% | |
Goldman Sachs Group, Inc. (The) | | | | | | | | |
0.63%, 11/17/2023(e) | | | 21,111,000 | | | | 21,056,898 | |
3.00%, 03/15/2024 | | | 14,085,000 | | | | 13,618,821 | |
5.70%, 11/01/2024 | | | 4,165,000 | | | | 4,162,883 | |
Morgan Stanley | | | | | | | | |
3.13%, 01/23/2023 | | | 14,598,000 | | | | 14,549,182 | |
0.56% (SOFR + 0.47%), 11/10/2023(e) | | | 6,000,000 | | | | 5,992,270 | |
3.69% (SOFR + 0.63%), 01/24/2025(d) | | | 7,228,000 | | | | 7,096,640 | |
3.62%, 04/17/2025(e) | | | 12,230,000 | | | | 11,819,531 | |
| | | | | | | | |
| | | | | | | 78,296,225 | |
| | | | | | | | |
Life & Health Insurance-5.35% | | | | | | | | |
Athene Global Funding | | | | | | | | |
2.80%, 05/26/2023(b) | | | 17,500,000 | | | | 17,257,444 | |
0.95%, 01/08/2024(b) | | | 5,000,000 | | | | 4,721,771 | |
2.51%, 03/08/2024(b) | | | 10,173,000 | | | | 9,696,260 | |
3.49% (SOFR + 0.70%),
05/24/2024(b)(d) | | | 9,750,000 | | | | 9,557,780 | |
Brighthouse Financial Global Funding | | | | | | | | |
0.60%, 06/28/2023(b) | | | 3,255,000 | | | | 3,152,719 | |
1.75%, 01/13/2025(b) | | | 12,727,000 | | | | 11,596,726 | |
GA Global Funding Trust, 0.80%, 09/13/2024(b) | | | 10,909,000 | | | | 9,847,496 | |
Jackson National Life Global Funding, 3.66% (SOFR + 0.60%),
01/06/2023(b)(d) | | | 10,000,000 | | | | 9,995,296 | |
MassMutual Global Funding II, 3.42% (SOFR + 0.36%), 04/12/2024(b)(d) | | | 15,022,000 | | | | 14,879,950 | |
MET Tower Global Funding, 3.61% (SOFR + 0.55%), 01/17/2023(b)(d) | | | 10,000,000 | | | | 9,997,786 | |
| | | | | | | | |
| | | Principal
Amount | | Value | |
Life & Health Insurance-(continued) | | | | | | | | |
New York Life Global Funding, 1.10%, 05/05/2023(b) | | $ | 3,243,000 | | | $ | 3,179,752 | |
Principal Life Global Funding II, 3.51% (SOFR + 0.45%), 04/12/2024(b)(d) | | | 5,882,000 | | | | 5,846,948 | |
Protective Life Global Funding, 0.63%, 10/13/2023(b) | | | 3,192,000 | | | | 3,059,976 | |
| | | | | | | | |
| | | | | | | 112,789,904 | |
| | | | | | | | |
Life Sciences Tools & Services-0.60% | | | | | | | | |
Thermo Fisher Scientific, Inc., 0.80%, 10/18/2023 | | | 13,208,000 | | | | 12,683,112 | |
| | | | | | | | |
Managed Health Care-0.13% | | | | | | | | |
Humana, Inc., 0.65%, 08/03/2023 | | | 2,917,000 | | | | 2,818,539 | |
| | | | | | | | |
Multi-line Insurance-0.18% | | | | | | | | |
Metropolitan Life Global Funding I, 3.63% (SOFR + 0.57%), 01/13/2023(b)(d) | | | 3,749,000 | | | | 3,750,170 | |
| | | | | | | | |
Multi-Utilities-0.36% | | | | | | | | |
Dominion Energy, Inc., Series D, 3.82% (3 mo. USD LIBOR + 0.53%), 09/15/2023(d) | | | 7,692,000 | | | | 7,662,400 | |
| | | | | | | | |
Oil & Gas Exploration & Production-1.14% | | | | | |
Canadian Natural Resources Ltd. (Canada), 2.95%, 01/15/2023 | | | 20,729,000 | | | | 20,648,415 | |
Pioneer Natural Resources Co., 0.55%, 05/15/2023 | | | 3,509,000 | | | | 3,424,443 | |
| | | | | | | | |
| | | | | | | 24,072,858 | |
| | | | | | | | |
Oil & Gas Refining & Marketing-0.87% | | | | | | | | |
Phillips 66 | | | | | | | | |
3.70%, 04/06/2023 | | | 12,500,000 | | | | 12,434,998 | |
0.90%, 02/15/2024 | | | 6,250,000 | | | | 5,914,220 | |
| | | | | | | | |
| | | | | | | 18,349,218 | |
| | | | | | | | |
Oil & Gas Storage & Transportation-2.88% | | | | | |
Enbridge, Inc. (Canada) | | | | | | | | |
3.13% (SOFR + 0.40%), 02/17/2023(d) | | | 3,571,000 | | | | 3,564,697 | |
4.00%, 10/01/2023 | | | 15,000,000 | | | | 14,798,750 | |
3.34% (SOFR + 0.63%), 02/16/2024(d) | | | 4,606,000 | | | | 4,555,944 | |
Enterprise Products Operating LLC, 3.35%, 03/15/2023 | | | 3,650,000 | | | | 3,630,310 | |
Kinder Morgan, Inc., 5.63%, 11/15/2023(b) | | | 12,000,000 | | | | 11,980,811 | |
Plains All American Pipeline L.P./PAA Finance Corp., 2.85%, 01/31/2023 | | | 22,442,000 | | | | 22,297,165 | |
| | | | | | | | |
| | | | | | | 60,827,677 | |
| | | | | | | | |
Other Diversified Financial Services-0.34% | | | | | |
AIG Global Funding, 0.80%, 07/07/2023(b) | | | 7,317,000 | | | | 7,108,278 | |
| | | | | | | | |
Packaged Foods & Meats-0.20% | | | | | | | | |
Conagra Brands, Inc., 0.50%, 08/11/2023 | | | 4,327,000 | | | | 4,163,886 | |
| | | | | | | | |
See accompanying Notes to Financial Statements which are an integral part of the financial statements.
Invesco Ultra Short Duration ETF (GSY)–(continued)
October 31, 2022
| | | | | | | | |
| | | Principal
Amount | | Value | |
Pharmaceuticals-0.57% | | | | | | | | |
Bristol-Myers Squibb Co., 0.54%, 11/13/2023 | | $ | 12,500,000 | | | $ | 11,962,631 | |
| | | | | | | | |
Real Estate Development-0.33% | | | | | | | | |
Piedmont Operating Partnership L.P., 3.40%, 06/01/2023 | | | 7,000,000 | | | | 6,903,371 | |
| | | | | | | | |
Regional Banks-0.35% | | | | | | | | |
ANZ New Zealand (Int’l) Ltd. (New Zealand), 3.34% (SOFR + 0.60%), 02/18/2025(b)(d) | | | 7,500,000 | | | | 7,418,648 | |
| | | | | | | | |
Restaurants-0.30% | | | | | | | | |
Starbucks Corp., 3.11% (SOFR + 0.42%), 02/14/2024(d) | | | 6,318,000 | | | | 6,292,851 | |
| | | | | | | | |
Specialized Finance-0.55% | | | | | | | | |
Blackstone Private Credit Fund, 2.70%, 01/15/2025 | | | 12,645,000 | | | | 11,554,725 | |
| | | | | | | | |
Specialized REITs-0.54% | | | | | | | | |
Crown Castle, Inc., 3.15%, 07/15/2023 | | | 11,626,000 | | | | 11,448,167 | |
| | | | | | | | |
Specialty Chemicals-0.22% | | | | | | | | |
Sherwin-Williams Co. (The), 4.05%, 08/08/2024 | | | 4,808,000 | | | | 4,719,388 | |
| | | | | | | | |
Systems Software-0.37% | | | | | | | | |
VMware, Inc., 0.60%, 08/15/2023 | | | 8,064,000 | | | | 7,765,897 | |
| | | | | | | | |
Technology Hardware, Storage & Peripherals-0.33% | |
Apple, Inc., 0.75%, 05/11/2023 | | | 7,143,000 | | | | 7,004,000 | |
| | | | | | | | |
Trading Companies & Distributors-0.60% | | | | | |
Air Lease Corp. | | | | | | | | |
3.00%, 09/15/2023 | | | 7,000,000 | | | | 6,534,283 | |
0.80%, 08/18/2024 | | | 6,650,000 | | | | 6,056,958 | |
| | | | | | | | |
| | | | | | | 12,591,241 | |
| | | | | | | | |
Total U.S. Dollar Denominated Bonds & Notes
(Cost $912,608,006) | | | | 889,902,418 | |
| | | | | | | | |
| |
Asset-Backed Securities-13.27% | | | | | |
ABPCI Direct Lending Fund CLO II LLC (Cayman Islands), Series 2017-1A, Class A1R, 5.84% (3 mo. USD LIBOR + 1.60%), 04/20/2032(b)(d) | | | 2,000,000 | | | | 1,895,703 | |
Angel Oak Mortgage Trust | | | | | | | | |
Series 2020-1, Class A1, 2.47%, 12/25/2059(b)(f) | | | 1,457,285 | | | | 1,354,809 | |
Series 2020-5, Class A1, 1.37%, 05/25/2065(b)(f) | | | 2,583,024 | | | | 2,268,899 | |
Series 2021-3, Class A1, 1.07%, 05/25/2066(b)(f) | | | 6,787,893 | | | | 5,203,217 | |
Angel Oak Mortgage Trust I LLC | | | | | | | | |
Series 2019-1, Class A1, 3.92%, 11/25/2048(b)(f) | | | 187,084 | | | | 185,999 | |
Series 2019-4, Class A1, 2.99%, 07/26/2049(b)(f) | | | 218,359 | | | | 216,793 | |
Atrium XIII (Cayman Islands), Series 13A, Class A1, 5.51% (3 mo. USD LIBOR + 1.18%), 11/21/2030(b)(d) | | | 3,000,000 | | | | 2,953,884 | |
| | | | | | | | |
| | | Principal
Amount | | Value | |
Bear Stearns Asset Backed Securities I Trust, Series 2006- HE9, Class 2A, 3.73% (1 mo. USD LIBOR + 0.14%), 11/25/2036(d) | | $ | 882,424 | | | $ | 849,621 | |
BINOM Securitization Trust, Series 2021-INV1, Class A1, 2.03%,
06/25/2056(b)(f) | | | 4,434,040 | | | | 3,760,237 | |
BRAVO Residential Funding Trust, Series 2021-NQM2, Class A1, 0.97%,
03/25/2060(b)(f) | | | 3,643,706 | | | | 3,434,978 | |
CBAM Ltd. (Cayman Islands), Series 2018-5A, Class A, 5.10% (3 mo. USD LIBOR + 1.02%), 04/17/2031(b)(d) | | | 6,250,000 | | | | 6,101,969 | |
Cerberus Loan Funding XXXIV L.P. (Cayman Islands), Series 2021- 4A, Class A, 5.58% (3 mo. USD LIBOR + 1.50%), 08/13/2033(b)(d) | | | 5,623,711 | | | | 5,602,385 | |
Chesapeake Funding II LLC (Canada), Series 2018-3A, Class A1, 3.39%, 01/15/2031(b) | | | 3,710 | | | | 3,709 | |
CIT Mortgage Loan Trust, Series 2007-1, Class 1A, 4.94% (1 mo. USD LIBOR + 1.35%), 10/25/2037(b)(d) | | | 382,726 | | | | 380,156 | |
COLT Mortgage Loan Trust | | | | | | | | |
Series 2020-2R, Class A1, 1.33%, 10/26/2065(b)(f) | | | 2,117,595 | | | | 1,888,697 | |
Series 2021-4, Class A1, 1.40%, 10/25/2066(b)(f) | | | 12,989,523 | | | | 10,281,840 | |
Countrywide Asset-Backed Ctfs. Trust, Series 2006-6, Class 1A1, 3.93% (1 mo. USD LIBOR + 0.34%), 09/25/2036(d) | | | 172,405 | | | | 172,213 | |
Credit Suisse Mortgage Capital Trust, Series 2014-2R, Class 27A1, 3.28% (1 mo. USD LIBOR + 0.20%), 02/27/2046(b)(d) | | | 52,167 | | | | 51,475 | |
CWABS, Inc. Asset-Backed Ctfs. Trust, Series 2004-4, Class M1, 4.31% (1 mo. USD LIBOR + 0.72%), 07/25/2034(d) | | | 744,705 | | | | 728,208 | |
Deephaven Residential Mortgage Trust, Series 2021-2, Class A1, 0.90%, 04/25/2066(b)(f) | | | 5,889,244 | | | | 4,896,991 | |
Dryden 30 Senior Loan Fund (Cayman Islands), Series 2013- 30A, Class AR, 3.73% (3 mo. USD LIBOR + 0.82%),
11/15/2028(b)(d) | | | 12,827,642 | | | | 12,619,577 | |
Ellington Financial Mortgage Trust | | | | | | | | |
Series 2019-2, Class A1, 2.74%, 11/25/2059(b)(f) | | | 1,683,615 | | | | 1,589,878 | |
Series 2020-2, Class A1, 1.18%, 10/25/2065(b)(f) | | | 400,991 | | | | 356,276 | |
See accompanying Notes to Financial Statements which are an integral part of the financial statements.
Invesco Ultra Short Duration ETF (GSY)–(continued)
October 31, 2022
| | | | | | | | |
| | | Principal
Amount | | Value | |
FS KKR MM CLO 1 LLC, Series 2019-1A, Class A1R, 5.93% (3 mo. USD LIBOR + 1.85%), 01/15/2031(b)(d) | | $ | 9,000,000 | | | $ | 8,724,918 | |
GoldenTree Loan Management US CLO 2 Ltd. (Cayman Islands), Series 2017-2A, Class AR, 5.15% (3 mo. USD LIBOR + 0.91%), 11/20/2030(b)(d) | | | 10,000,000 | | | | 9,765,820 | |
GoldenTree Loan Opportunities IX Ltd. (Cayman Islands), Series 2014-9A, Class AR2, 5.52% (3 mo. USD LIBOR + 1.11%), 10/29/2029(b)(d) | | | 11,518,098 | | | | 11,377,727 | |
Golub Capital Partners CLO 34(M) Ltd. (Cayman Islands), Series 2017-34A, Class AR2, 4.28% (3 mo. USD LIBOR + 1.45%), 03/14/2031(b)(d) | | | 14,000,000 | | | | 13,474,165 | |
Golub Capital Partners CLO 36(M) Ltd. (Cayman Islands), Series 2018-36A, Class A, 4.13% (3 mo. USD LIBOR + 1.30%), 02/05/2031(b)(d) | | | 5,000,000 | | | | 4,828,024 | |
Golub Capital Partners CLO 45(M) Ltd. (Cayman Islands), Series 2019-45A, Class A, 5.96% (3 mo. USD LIBOR + 1.72%), 10/20/2031(b)(d) | | | 5,000,000 | | | | 4,818,498 | |
Golub Capital Partners CLO 47(M) Ltd. (Cayman Islands), Series 2020-47A, Class A1, 4.51% (3 mo. USD LIBOR + 1.68%), 05/05/2032(b)(d) | | | 10,000,000 | | | | 9,583,193 | |
GS Mortgage-Backed Securities Trust, Series 2020-NQM1, Class A1, 1.38%, 09/27/2060(b)(f) | | | 2,208,037 | | | | 2,016,771 | |
HSI Asset Securitization Corp. Trust, Series 2006-OPT2, Class M2, 4.17% (1 mo. USD LIBOR + 0.59%), 01/25/2036(d) | | | 933,360 | | | | 917,219 | |
JP Morgan Mortgage Trust, Series 2021-LTV2, Class A1, 2.52%,
05/25/2052(b)(f) | | | 9,887,951 | | | | 7,625,870 | |
KKR CLO 21 Ltd. (Cayman Islands), Series A, 5.08% (3 mo. USD LIBOR + 1.00%), 04/15/2031(b)(d) | | | 2,000,000 | | | | 1,952,020 | |
Nationstar Home Equity Loan Trust, Series 2007-B, Class 1AV1, 3.81% (1 mo. USD LIBOR + 0.22%), 04/25/2037(d) | | | 539,888 | | | | 534,348 | |
Navient Private Education Refi Loan Trust | | | | | | | | |
Series 2020-FA, Class A, 1.22%, 07/15/2069(b) | | | 2,358,997 | | | | 2,075,845 | |
Series 2021-FA, Class A, 1.11%, 02/18/2070(b) | | | 4,157,449 | | | | 3,373,804 | |
| | | | | | | | |
| | | Principal
Amount | | Value | |
Neuberger Berman CLO XIV Ltd. (Cayman Islands), Series 2013- 14A, Class AR2, 5.40% (3 mo. USD LIBOR + 1.03%), 01/28/2030(b)(d) | | $ | 9,751,573 | | | $ | 9,565,093 | |
Neuberger Berman Loan Advisers CLO 25 Ltd. (Cayman Islands), Series 2017-25A, Class AR, 5.12% (3 mo. USD LIBOR + 0.93%), 10/18/2029(b)(d) | | | 9,750,000 | | | | 9,534,486 | |
New Residential Mortgage Loan Trust | | | | | | | | |
Series 2017-5A, Class A1, 5.09% (1 mo. USD LIBOR + 1.50%), 06/25/2057(b)(d) | | | 341,373 | | | | 335,613 | |
Series 2019-NQM4, Class A1, 2.49%, 09/25/2059(b)(f) | | | 2,095,012 | | | | 1,896,249 | |
Series 2020-NQM1, Class A1, 2.46%, 01/26/2060(b)(f) | | | 1,356,999 | | | | 1,205,983 | |
OBX Trust | | | | | | | | |
Series 2018-EXP1, Class 2A1, 4.44% (1 mo. USD LIBOR + 0.85%), 04/25/2048(b)(d) | | | 192,270 | | | | 189,992 | |
Series 2021-NQM2, Class A1, 1.10%, 05/25/2061(b)(f) | | | 9,831,046 | | | | 7,616,283 | |
OCP CLO Ltd. (Cayman Islands), Series 2014-7A, Class A1RR, 5.36% (3 mo. USD LIBOR + 1.12%), 07/20/2029(b)(d) | | | 6,332,199 | | | | 6,214,351 | |
Octagon Investment Partners XVII Ltd. (Cayman Islands), Series 2013-1A, Class A1R2, 5.36% (3 mo. USD LIBOR + 1.00%), 01/25/2031(b)(d) | | | 5,000,000 | | | | 4,897,550 | |
Race Point VIII CLO Ltd. (Cayman Islands), Series 2013-8A, Class AR2, 4.02% (3 mo. USD LIBOR + 1.04%),
02/20/2030(b)(d) | | | 9,494,098 | | | | 9,335,945 | |
Residential Mortgage Loan Trust | | | | | | | | |
Series 2019-3, Class A1, 2.63%, 09/25/2059(b)(f) | | | 1,195,002 | | | | 1,158,318 | |
Series 2020-1, Class A1, 2.38%, 01/26/2060(b)(f) | | | 1,426,800 | | | | 1,350,206 | |
STAR Trust, Series 2021-SFR1, Class A, 4.01% (1 mo. USD LIBOR + 0.60%), 04/17/2038(b)(d) | | | 19,775,913 | | | | 19,056,141 | |
Starwood Mortgage Residential Trust | | | | | | | | |
Series 2020-1, Class A1, 2.28%, 02/25/2050(b)(f) | | | 265,271 | | | | 263,068 | |
Series 2020-INV1, Class A1, 1.03%, 11/25/2055(b)(f) | | | 3,387,348 | | | | 3,122,122 | |
Series 2021-2, Class A1, 0.94%, 05/25/2065(b)(f) | | | 3,454,570 | | | | 3,205,899 | |
Series 2021-4, Class A1, 1.16%, 08/25/2056(b)(f) | | | 9,828,100 | | | | 7,985,426 | |
Series 2021-6, Class A1, 1.92%, 11/25/2066(b)(f) | | | 10,512,454 | | | | 8,229,825 | |
See accompanying Notes to Financial Statements which are an integral part of the financial statements.
Invesco Ultra Short Duration ETF (GSY)–(continued)
October 31, 2022
| | | | | | | | |
| | | Principal
Amount | | Value | |
Stratus CLO Ltd. (Cayman Islands), Series 2021-2A, Class A, 5.14% (3 mo. USD LIBOR + 0.90%), 12/28/2029(b)(d) | | | $ 10,679,205 | | | $ | 10,416,230 | |
TICP CLO II-2 Ltd. (Cayman Islands), Series 2018-IIA, Class A1, 5.08% (3 mo. USD LIBOR + 0.84%), 04/20/2028(b)(d) | | | 3,927,080 | | | | 3,878,915 | |
TRK Trust, Series 2021-INV1, Class A1, 1.15%, 07/25/2056(b)(f) | | | 7,466,186 | | | | 6,223,417 | |
Verus Securitization Trust | | | | | | | | |
Series 2020-1, Class A1, 2.42%, 01/25/2060(b)(g) | | | 1,592,061 | | | | 1,504,439 | |
Series 2020-5, Class A1, 1.22%, 05/25/2065(b)(g) | | | 3,622,285 | | | | 3,290,738 | |
Series 2021-4, Class A1, 0.94%, 07/25/2066(b)(f) | | | 11,035,315 | | | | 8,510,496 | |
Visio Trust, Series 2020-1R, Class A1, 1.31%, 11/25/2055(b) | | | 3,145,247 | | | | 2,887,843 | |
| | | | | | | | |
Total Asset-Backed Securities (Cost $306,335,605) | | | | | | | 279,740,364 | |
| | | | | | | | |
|
Non-U.S. Dollar Denominated Bonds & Notes-2.81% | |
Sovereign Debt-2.81% | | | | | | | | |
Japan Treasury Discount Bill (Japan), Series 1111, 0.00%, 01/11/2023(h)(i)
(Cost $60,952,038) | | | JPY8,800,000,000 | | | | 59,223,638 | |
| | | | | | | | |
| |
U.S. Treasury Securities-1.82% | | | | | |
U.S. Treasury Bills-1.82% | | | | | | | | |
4.12%–4.37%, 10/05/2023(j) (Cost $38,466,582) | | | $ 40,000,000 | | | | 38,337,290 | |
| | | | | | | | |
|
Variable Rate Senior Loan Interests-0.07%(k)(l) | |
Aerospace & Defense-0.07% | | | | | | | | |
Fly Funding II S.a.r.l. (India), Term Loan B, 4.62% (3 mo. USD LIBOR + 1.75%), 08/09/2025
(Cost $1,658,824) | | | 1,662,610 | | | | 1,403,609 | |
| | | | | | | | |
| |
Commercial Paper-37.38%(j) | | | | | |
Alimentation Couche-Tard, Inc. | | | | | | | | |
3.88%, 11/14/2022(b) | | | 32,000,000 | | | | 31,951,280 | |
4.13%, 11/17/2022(b) | | | 5,000,000 | | | | 4,990,685 | |
Arrow Electronics, Inc. | | | | | | | | |
3.91%, 11/02/2022(b) | | | 19,200,000 | | | | 19,195,892 | |
3.86%, 11/04/2022(b) | | | 15,000,000 | | | | 14,993,407 | |
3.89%, 11/07/2022(b) | | | 10,000,000 | | | | 9,991,999 | |
AT&T, Inc. | | | | | | | | |
4.18%, 11/22/2022(b) | | | 15,000,000 | | | | 14,964,113 | |
1.11%, 12/05/2022(b) | | | 19,500,000 | | | | 19,423,693 | |
Aviation Capital Group LLC | | | | | | | | |
4.20%, 11/10/2022(b) | | | 10,000,000 | | | | 9,989,903 | |
4.32%, 11/15/2022(b) | | | 10,000,000 | | | | 9,984,646 | |
Barclays Capital, Inc., 1.06%, 02/02/2023 | | | 36,900,000 | | | | 36,454,670 | |
| | | | | | | | |
| | | Principal
Amount | | Value | |
Brookfield Infrastructure Holdings Canada, Inc. | | | | | | | | |
3.81%, 11/03/2022 | | $ | 17,524,000 | | | $ | 17,518,895 | |
4.32%, 12/01/2022 | | | 25,000,000 | | | | 24,912,748 | |
Constellation Brands, Inc., 3.87%, 11/02/2022(b) | | | 15,000,000 | | | | 14,996,892 | |
Crown Castle, Inc. | | | | | | | | |
4.35%, 11/15/2022(b) | | | 9,300,000 | | | | 9,283,988 | |
4.57%, 11/29/2022(b) | | | 15,000,000 | | | | 14,948,235 | |
E.ON SE, 4.16%, 11/17/2022(b) | | | 500,000 | | | | 499,085 | |
Electricite de France S.A., 4.11%, 11/28/2022(b) | | | 7,500,000 | | | | 7,476,824 | |
Enbridge US, Inc. | | | | | | | | |
4.11%, 11/09/2022(b) | | | 15,000,000 | | | | 14,985,124 | |
4.16%, 11/18/2022(b) | | | 1,825,000 | | | | 1,821,317 | |
Enel Finance America LLC | | | | | | | | |
3.98%, 11/14/2022(b) | | | 11,000,000 | | | | 10,983,034 | |
3.30%, 04/17/2023(b) | | | 15,000,000 | | | | 14,594,490 | |
Energy Transfer L.P., 3.70%, 11/01/2022 | | | 20,000,000 | | | | 19,997,966 | |
Fidelity National Information Services, Inc., 4.05%, 11/07/2022(b) | | | 14,000,000 | | | | 13,989,751 | |
General Motors Financial Co., Inc. | | | | | | | | |
1.11%, 11/01/2022(b) | | | 10,000,000 | | | | 9,999,004 | |
5.72%, 04/12/2023(b) | | | 10,000,000 | | | | 9,751,968 | |
4.27%, 06/06/2023(b) | | | 12,500,000 | | | | 12,080,501 | |
Harley-Davidson Financial Services, Inc. | | | | | | | | |
3.82%, 11/04/2022(b) | | | 15,000,000 | | | | 14,993,893 | |
4.01%, 11/09/2022(b) | | | 7,000,000 | | | | 6,993,189 | |
4.33%, 11/17/2022(b) | | | 20,000,000 | | | | 19,962,184 | |
Healthpeak Properties, Inc., 3.93%, 11/29/2022(b) | | | 18,500,000 | | | | 18,439,882 | |
HSBC USA, Inc. | | | | | | | | |
0.78%, 01/06/2023(b) | | | 25,000,000 | | | | 24,806,445 | |
3.40% (SOFR + 0.35%), 02/10/2023(d) | | | 14,000,000 | | | | 13,994,817 | |
Humana, Inc., 4.01%, 11/18/2022(b) | | | 2,000,000 | | | | 1,996,075 | |
Jabil, Inc., 4.18%, 11/07/2022(b) | | | 17,150,000 | | | | 17,135,811 | |
Macquarie Bank Ltd., 3.65% (SOFR + 0.60%), 03/02/2023(b)(d) | | | 20,000,000 | | | | 20,002,680 | |
Mohawk Industries, Inc., 4.03%, 11/08/2022(b) | | | 4,000,000 | | | | 3,996,639 | |
Nutrien Ltd. | | | | | | | | |
3.72%, 11/16/2022(b) | | | 16,000,000 | | | | 15,972,302 | |
3.77%-4.26%, 11/18/2022(b) | | | 12,292,000 | | | | 12,267,938 | |
3.72%, 11/21/2022(b) | | | 5,200,000 | | | | 5,188,034 | |
Oglethorpe Power Corp. | | | | | | | | |
3.68%, 11/03/2022(b) | | | 15,000,000 | | | | 14,995,545 | |
4.01%, 11/14/2022(b) | | | 20,000,000 | | | | 19,969,737 | |
4.19%, 11/28/2022(b) | | | 12,000,000 | | | | 11,961,575 | |
ONEOK, Inc. | | | | | | | | |
4.01%-4.01%, 11/03/2022(b) | | | 11,000,000 | | | | 10,996,625 | |
4.33%, 11/08/2022(b) | | | 9,000,000 | | | | 8,992,088 | |
4.11%, 11/09/2022(b) | | | 18,300,000 | | | | 18,281,851 | |
4.29%, 11/16/2022(b) | | | 5,500,000 | | | | 5,490,112 | |
Regatta Funding Co. LLC, 2.84%, 05/16/2023(b) | | | 10,000,000 | | | | 9,718,509 | |
See accompanying Notes to Financial Statements which are an integral part of the financial statements.
Invesco Ultra Short Duration ETF (GSY)–(continued)
October 31, 2022
| | | | | | | | |
| | | Principal
Amount | | Value | |
Suncor Energy, Inc. | | | | | | | | |
4.11%, 11/09/2022(b) | | $ | 15,000,000 | | | $ | 14,985,799 | |
3.84%, 11/29/2022(b) | | | 11,160,000 | | | | 11,124,004 | |
UDR, Inc., 4.15%, 11/21/2022(b) | | | 13,000,000 | | | | 12,970,296 | |
V.F. Corp. | | | | | | | | |
3.87%, 11/21/2022(b) | | | 20,000,000 | | | | 19,956,635 | |
3.97%, 11/28/2022(b) | | | 10,000,000 | | | | 9,970,499 | |
Verizon Communications, Inc., 3.72%, 11/21/2022(b) | | | 12,900,000 | | | | 12,870,525 | |
VF Corp., 3.67%, 11/02/2022(b) | | | 1,641,000 | | | | 1,640,704 | |
Walt Disney Co. (The), 2.98%, 11/18/2022(b) | | | 19,000,000 | | | | 18,965,468 | |
White Plains Capital Co. LLC | | | | | | | | |
3.93%, 01/24/2023(b) | | | 20,000,000 | | | | 19,787,594 | |
3.98%, 02/01/2023(b) | | | 20,000,000 | | | | 19,763,987 | |
| | | | | | | | |
Total Commercial Paper
(Cost $789,068,584) | | | | | | | 787,971,552 | |
| | | | | | | | |
| | | Repurchase
Amount | | | |
Repurchase Agreements-3.79%(m) | | | | | |
Citigroup Global Markets, Inc., joint term agreement dated 10/19/2022, aggregate maturing value of $263,351,069 (collateralized by non-agency mortgage-backed securities, a non-agency asset-backed security and a U.S. Treasury obligation valued at $285,315,855; 0.00% - 9.91%; 08/15/2023 - 10/25/2059), 3.71%, 11/01/2022 | | | 50,066,743 | | | | 50,000,000 | |
J.P. Morgan Securities LLC, joint open agreement dated 06/11/2021 (collateralized by corporate obligations valued at $82,500,037; 0.00% - 13.38%; 03/15/2023 - 08/15/2049), 3.37%, 11/01/2022(n) | | | 30,081,442 | | | | 30,000,000 | |
| | | | | | | | |
Total Repurchase Agreements
(Cost $80,000,000) | | | | | | | 80,000,000 | |
| | | | | | | | |
| | | | | | | | |
| | | Principal
Amount | | Value | |
Certificates of Deposit-0.13% | | | | | |
Diversified Banks-0.13% | | | | | | | | |
Sumitomo Mitsui Banking Corp. (Japan), 3.00%, 07/03/2023
(Cost $2,700,000) | | $ | 2,700,000 | | | $ | 2,658,610 | |
| | | | | | | | |
TOTAL INVESTMENTS IN SECURITIES
(excluding investments purchased with cash collateral from securities on loan)-101.48%
(Cost $2,191,789,639) | | | | | | | 2,139,237,481 | |
| | | | | | | | |
| | |
| | | Shares | | | |
| Investments Purchased with Cash Collateral from Securities on Loan | | | | | |
| |
Money Market Funds-0.09% | | | | | |
Invesco Private Government Fund,
3.18%(o)(p)(q) | | | 546,142 | | | | 546,142 | |
Invesco Private Prime Fund,
3.28%(o)(p)(q) | | | 1,404,000 | | | | 1,404,000 | |
| | | | | | | | |
Total Investments Purchased with Cash Collateral from Securities on Loan
(Cost $1,950,142) | | | | 1,950,142 | |
| | | | | | | | |
TOTAL INVESTMENTS IN SECURITIES-101.57%
(Cost $2,193,739,781) | | | | 2,141,187,623 | |
OTHER ASSETS LESS LIABILITIES-(1.57)% | | | | (33,163,490 | ) |
| | | | | | | | |
NET ASSETS-100.00% | | | | | | $ | 2,108,024,133 | |
| | | | | | | | |
| | |
| Investment Abbreviations: |
| CLO | | -Collateralized Loan Obligation |
| Ctfs. | | -Certificates |
| JPY | | -Japanese Yen |
| LIBOR | | -London Interbank Offered Rate |
| REIT | | -Real Estate Investment Trust |
| SOFR | | -Secured Overnight Financing Rate |
| USD | | -U.S. Dollar |
See accompanying Notes to Financial Statements which are an integral part of the financial statements.
Invesco Ultra Short Duration ETF (GSY)–(continued)
October 31, 2022
Notes to Schedule of Investments:
| (a) | Industry and/or sector classifications used in this report are generally according to the Global Industry Classification Standard, which was developed by and is the exclusive property and a service mark of MSCI Inc. and Standard & Poor’s. |
| (b) | Security purchased or received in a transaction exempt from registration under the Securities Act of 1933, as amended (the “1933 Act”). The security may be resold pursuant to an exemption from registration under the 1933 Act, typically to qualified institutional buyers. The aggregate value of these securities at October 31, 2022 was $1,223,172,435, which represented 58.02% of the Fund’s Net Assets. |
| (c) | All or a portion of this security was out on loan at October 31, 2022. |
| (d) | Interest or dividend rate is redetermined periodically. Rate shown is the rate in effect on October 31, 2022. |
| (e) | Security issued at a fixed rate for a specific period of time, after which it will convert to a variable rate. |
| (f) | Interest rate is redetermined periodically based on the cash flows generated by the pool of assets backing the security, less any applicable fees. The rate shown is the rate in effect on October 31, 2022. |
| (g) | Step coupon bond. The interest rate represents the coupon rate at which the bond will accrue at a specified future date. |
| (h) | Foreign denominated security. Principal amount is denominated in the currency indicated. |
| (i) | Security traded at a premium. |
| (j) | Security traded on a discount basis. The interest rate shown represents the discount rate at the time of purchase by the Fund. |
| (k) | Variable rate senior loan interests often require prepayments from excess cash flow or permit the borrower to repay at its election. The degree to which borrowers repay, whether as a contractual requirement or at their election, cannot be predicted with any accuracy. As a result, the actual remaining maturity may be substantially less than the stated maturities shown. However, it is anticipated that the variable rate senior loan interests will have an expected average life of three to five years. |
| (l) | Variable rate senior loan interests are, at present, not readily marketable, not registered under the 1933 Act and may be subject to contractual and legal restrictions on sale. Variable rate senior loan interests in the Fund’s portfolio generally have variable rates which adjust to a base, such as the LIBOR, on set dates, typically every 30 days, but not greater than one year, and/or have interest rates that float at margin above a widely recognized base lending rate such as the Prime Rate of a designated U.S. bank. |
| (m) | Principal amount equals value at period end. See Note 2K. |
| (n) | Either party may terminate the agreement upon demand. Interest rates, principal amount and collateral are redetermined periodically. The Maturity Date represents the next reset date, and the Repurchase Amount is calculated based on the next reset date. |
| (o) | Affiliated issuer. The issuer and/or the Fund is a wholly-owned subsidiary of Invesco Ltd., or is affiliated by having an investment adviser that is under common control of Invesco Ltd. The table below shows the Fund’s transactions in, and earnings from, its investments in affiliates for the fiscal year ended October 31, 2022. |
| | | | | | | | | | | | | | | | | | | | | | | | | | | | | | | | | | | | | | | | | | | | | | | | | | | | | | | |
| | | Value
October 31, 2021 | | Purchases
at Cost | | Proceeds
from Sales | | Change in
Unrealized
Appreciation | | Realized
Gain
(Loss) | | Value
October 31, 2022 | | Dividend
Income |
| | | | | | | | | | | |
Investments Purchased with Cash Collateral from Securities on Loan: | | | | | | | | | | | | | | | | | | | | | | | | | | | | | | | | | | | | | | | | | | | | | | | | | | | | | | | |
| | | | | | | | | | | |
Invesco Private Government Fund | | | | | | | | $ | 3,241,242 | | | | | | | | | $ | 25,667,553 | | | | $ | (28,362,653 | ) | | | $ | - | | | | $ | - | | | | | | | | | $ | 546,142 | | | | | | | | | $ | 7,184 | * |
| | | | | | | | | | | |
Invesco Private Prime Fund | | | | | | | | | 7,562,898 | | | | | | | | | | 44,511,722 | | | | | (50,668,502 | ) | | | | - | | | | | (2,118 | ) | | | | | | | | | 1,404,000 | | | | | | | | | | 20,197 | * |
| | | | | | | | | | | | | | | | | | | | | | | | | | | | | | | | | | | | | | | | | | | | | | | | | | | | | | | |
| | | | | | | | | | | |
Total | | | | | | | | $ | 10,804,140 | | | | | | | | | $ | 70,179,275 | | | | $ | (79,031,155 | ) | | | $ | - | | | | $ | (2,118 | ) | | | | | | | | $ | 1,950,142 | | | | | | | | | $ | 27,381 | |
| | | | | | | | | | | | | | | | | | | | | | | | | | | | | | | | | | | | | | | | | | | | | | | | | | | | | | | |
| * | Represents the income earned on the investment of cash collateral, which is included in securities lending income on the Statements of Operations. Does not include rebates and fees paid to lending agent or premiums received from borrowers, if any. |
| (p) | The rate shown is the 7-day SEC standardized yield as of October 31, 2022. |
| (q) | The security has been segregated to satisfy the commitment to return the cash collateral received in securities lending transactions upon the borrower’s return of the securities loaned. See Note 2M. |
| | | | | | | | | | | | | | | | | | | | | | |
Open Forward Foreign Currency Contracts | |
| |
| | | | | Contract to | | | | | | | |
| Settlement Date | | Counterparty | | Deliver | | | Receive | | | | | | Unrealized
Appreciation | |
| | | | | | | |
Currency Risk | | | | | | | | | | | | | | | | | | | | | | |
| | | | | | | |
1/11/2023 | | RBC Capital Markets LLC | | JPY | | | 8,800,000,000 | | | USD | | | 61,514,888 | | | | | | | $ | 1,719,513 | |
| | | | | | | | | | | | | | | | | | | | | | |
Abbreviations:
JPY -Japanese Yen
USD-U.S. Dollar
See accompanying Notes to Financial Statements which are an integral part of the financial statements.
Invesco Variable Rate Investment Grade ETF (VRIG)
October 31, 2022
Schedule of Investments(a)
| | | | | | | | |
| | | Principal
Amount | | | Value | |
U.S. Dollar Denominated Bonds & Notes-48.05% | |
Agricultural & Farm Machinery-0.12% | |
John Deere Capital Corp., 3.42% (SOFR + 0.56%), 03/07/2025(b)(c) | | $ | 678,000 | | | $ | 672,208 | |
| | | | | | | | |
|
Auto Parts & Equipment-0.35% | |
American Honda Finance Corp., 3.28% (3 mo. USD LIBOR + 0.37%), 05/10/2023(c) . | | | 2,000,000 | | | | 1,999,930 | |
| | | | | | | | |
|
Automobile Manufacturers-1.77% | |
BMW US Capital LLC (Germany), 3.89% (SOFR + 0.84%), 04/01/2025(c)(d) | | | 897,000 | | | | 892,690 | |
General Motors Financial Co., Inc. | | | | | | | | |
4.74% (3 mo. USD LIBOR + 0.99%), 01/05/2023(c) | | | 1,000,000 | | | | 997,701 | |
3.67% (SOFR + 0.76%), 03/08/2024(c) | | | 1,154,000 | | | | 1,133,941 | |
4.36% (SOFR + 1.30%), 04/07/2025(c) | | | 2,500,000 | | | | 2,439,634 | |
Toyota Motor Credit Corp., 3.25% (SOFR + 0.26%), 06/18/2024(b)(c) | | | 3,000,000 | | | | 2,970,888 | |
Volkswagen Group of America Finance LLC (Germany), 3.84% (SOFR + 0.95%), 06/07/2024(c)(d) | | | 1,667,000 | | | | 1,661,989 | |
| | | | | | | | |
| | | | | | | 10,096,843 | |
| | | | | | | | |
|
Construction Machinery & Heavy Trucks-1.13% | |
Daimler Trucks Finance North America LLC (Germany) | | | | | | | | |
4.06% (SOFR + 1.00%), 04/05/2024(c)(d) | | | 3,500,000 | | | | 3,491,147 | |
3.72% (SOFR + 0.75%), 12/13/2024(c)(d) | | | 3,000,000 | | | | 2,961,128 | |
| | | | | | | | |
| | | | | | | 6,452,275 | |
| | | | | | | | |
| | |
Consumer Finance-2.90% | | | | | | | | |
American Express Co. | | | | | | | | |
3.69% (3 mo. USD LIBOR + 0.65%), 02/27/2023(c) | | | 5,215,000 | | | | 5,211,730 | |
3.29% (SOFR + 0.23%), 11/03/2023(c) | | | 2,500,000 | | | | 2,483,101 | |
Capital One Financial Corp. | | | | | | | | |
5.14% (3 mo. USD LIBOR + 0.72%), 01/30/2023(c) | | | 2,500,000 | | | | 2,499,478 | |
3.60% (SOFR + 0.69%), 12/06/2024(c) | | | 3,000,000 | | | | 2,923,609 | |
4.03% (SOFR + 1.35%), 05/09/2025(b)(c) | | | 3,499,000 | | | | 3,450,033 | |
| | | | | | | | |
| | | | | | | 16,567,951 | |
| | | | | | | | |
|
Diversified Banks-17.09% | |
Banco Santander S.A. (Spain), 3.99% (SOFR + 1.24%), 05/24/2024(c) | | | 2,600,000 | | | | 2,592,828 | |
Bank of America Corp. | | | | | | | | |
3.95% (3 mo. USD LIBOR + 0.79%), 03/05/2024(b)(c) | | | 3,750,000 | | | | 3,732,216 | |
3.79% (SOFR + 0.73%), 10/24/2024(b)(c) | | | 2,000,000 | | | | 1,976,212 | |
4.16% (SOFR + 1.10%), 04/25/2025(b)(c) | | | 3,500,000 | | | | 3,489,290 | |
3.60% (3 mo. USD LIBOR + 0.77%), 02/05/2026(c) | | | 1,042,000 | | | | 1,017,182 | |
4.05% (3 mo. USD LIBOR + 0.76%), 09/15/2026(c) | | | 2,696,000 | | | | 2,581,234 | |
4.11% (SOFR + 1.05%), 02/04/2028(c) | | | 1,685,000 | | | | 1,612,598 | |
Bank of Nova Scotia (The) (Canada), 3.41% (SOFR + 0.55%), 03/02/2026(c) | | | 2,500,000 | | | | 2,408,995 | |
Barclays PLC (United Kingdom), 4.30% (3 mo. USD LIBOR + 1.38%), 05/16/2024(c) | | | 3,000,000 | | | | 2,963,856 | |
| | | | | | | | |
| | | Principal
Amount | | | Value | |
Diversified Banks-(continued) | | | | | | | | |
Canadian Imperial Bank of Commerce (Canada), 3.82% (SOFR + 0.80%), 03/17/2023(c) | | $ | 3,000,000 | | | $ | 2,999,151 | |
Citigroup, Inc. | | | | | | | | |
4.11% (3 mo. USD LIBOR + 1.02%), 06/01/2024(c) | | | 4,010,000 | | | | 4,003,052 | |
3.73% (SOFR + 0.67%), 05/01/2025(b)(c) | | | 2,500,000 | | | | 2,447,128 | |
4.16% (SOFR + 1.37%), 05/24/2025(b)(c) | | | 3,000,000 | | | | 2,997,510 | |
4.99% (3 mo. USD LIBOR + 1.25%), 07/01/2026(c) | | | 1,882,000 | | | | 1,859,629 | |
Commonwealth Bank of Australia (Australia), 3.49% (SOFR + 0.52%), 06/15/2026(c)(d) | | | 3,000,000 | | | | 2,936,512 | |
HSBC Holdings PLC (United Kingdom) | | | | | | | | |
4.32% (SOFR + 1.43%), 03/10/2026(b)(c) | | | 3,500,000 | | | | 3,423,311 | |
4.62% (3 mo. USD LIBOR + 1.38%), 09/12/2026(c) | | | 3,000,000 | | | | 2,912,453 | |
ING Groep N.V. (Netherlands) | | | | | | | | |
4.74% (3 mo. USD LIBOR + 1.00%), 10/02/2023(b)(c) | | | 4,950,000 | | | | 4,947,898 | |
4.69% (SOFR + 1.64%), 03/28/2026(c) | | | 2,500,000 | | | | 2,463,315 | |
4.06% (SOFR + 1.01%), 04/01/2027(c) | | | 2,999,000 | | | | 2,863,358 | |
JPMorgan Chase & Co. | | | | | | | | |
3.39% (SOFR + 0.54%), 06/01/2025(b)(c) | | | 4,000,000 | | | | 3,916,733 | |
3.52% (SOFR + 0.60%), 12/10/2025(c) | | | 3,000,000 | | | | 2,923,999 | |
4.38% (SOFR + 1.32%), 04/26/2026(c) | | | 2,400,000 | | | | 2,366,785 | |
Mitsubishi UFJ Financial Group, Inc. (Japan), 4.71% (SOFR + 1.65%), 07/18/2025(c) | | | 2,500,000 | | | | 2,505,631 | |
NatWest Group PLC (United Kingdom), 5.19% (3 mo. USD LIBOR + 1.55%), 06/25/2024(c) | | | 4,000,000 | | | | 3,985,730 | |
NatWest Markets PLC (United Kingdom), 3.21% (SOFR + 0.53%), 08/12/2024(c)(d) | | | 571,000 | | | | 559,907 | |
Nordea Bank Abp (Finland), 3.98% (3 mo. USD LIBOR + 0.94%), 08/30/2023(c)(d) | | | 2,987,000 | | | | 2,992,748 | |
Royal Bank of Canada (Canada), 3.90% (SOFR + 0.84%), 04/14/2025(c) | | | 4,000,000 | | | | 3,939,712 | |
Societe Generale S.A. (France), 4.11% (SOFR + 1.05%), 01/21/2026(c)(d) | | | 3,000,000 | | | | 2,869,203 | |
Standard Chartered PLC (United Kingdom), 4.79% (SOFR + 1.74%), 03/30/2026(c)(d) | | | 3,108,000 | | | | 3,043,888 | |
Swedbank AB (Sweden), 3.97% (SOFR + 0.91%), 04/04/2025(c)(d) | | | 4,615,000 | | | | 4,565,274 | |
Truist Bank | | | | | | | | |
3.65% (SOFR + 0.73%), 03/09/2023(c) | | | 2,000,000 | | | | 1,999,674 | |
3.26% (SOFR + 0.20%), 01/17/2024(c) | | | 3,000,000 | | | | 2,968,416 | |
USB Realty Corp., 5.23% (3 mo. USD LIBOR + 1.15%)(c)(d)(e) | | | 1,100,000 | | | | 814,000 | |
Wells Fargo & Co., 4.38% (SOFR + 1.32%), 04/25/2026(b)(c) | | | 2,000,000 | | | | 1,981,505 | |
| | | | | | | | |
| | | | | | | 97,660,933 | |
| | | | | | | | |
|
Electric Utilities-3.18% | |
American Electric Power Co., Inc., Series A, 4.92% (3 mo. USD LIBOR + 0.48%), 11/01/2023(c) | | | 3,000,000 | | | | 2,979,849 | |
Eversource Energy, Series T, 2.94% (SOFR + 0.25%), 08/15/2023(b)(c) | | | 3,000,000 | | | | 2,983,953 | |
See accompanying Notes to Financial Statements which are an integral part of the financial statements.
Invesco Variable Rate Investment Grade ETF (VRIG)–(continued)
October 31, 2022
| | | | | | | | |
| | | Principal
Amount | | | Value | |
|
Electric Utilities-(continued) | |
Florida Power & Light Co., 2.92% (SOFR + 0.25%), 05/10/2023(c) | | $ | 1,478,000 | | | $ | 1,472,697 | |
NextEra Energy Capital Holdings, Inc. | | | | | | | | |
3.25% (3 mo. USD LIBOR + 0.27%), 02/22/2023(c) | | | 4,000,000 | | | | 3,993,093 | |
4.04% (SOFR + 1.02%), 03/21/2024(b)(c) . | | | 4,850,000 | | | | 4,822,887 | |
Pacific Gas and Electric Co., 3.84% (SOFR + 1.15%), 11/14/2022(c) | | | 600,000 | | | | 599,582 | |
Southern Co. (The), Series 2021, 3.04% (SOFR + 0.37%), 05/10/2023(c) | | | 1,316,000 | | | | 1,310,405 | |
| | | | | | | | |
| | | | | | | 18,162,466 | |
| | | | | | | | |
Gas Utilities-0.57% | |
CenterPoint Energy Resources Corp., 3.60% (3 mo. USD LIBOR + 0.50%), 03/02/2023(c) | | | 3,250,000 | | | | 3,238,264 | |
| | | | | | | | |
Health Care Equipment-0.52% | |
Baxter International, Inc., 3.11% (SOFR + 0.26%), 12/01/2023(c) | | | 3,000,000 | | | | 2,973,879 | |
| | | | | | | | |
Health Care Services-1.17% | |
Cigna Corp., 4.97% (3 mo. USD LIBOR + 0.89%), 07/15/2023(c) | | | 4,543,000 | | | | 4,544,048 | |
Roche Holdings, Inc., 3.11% (SOFR + 0.24%), 03/05/2024(c)(d) | | | 2,161,000 | | | | 2,147,009 | |
| | | | | | | | |
| | | | | | | 6,691,057 | |
| | | | | | | | |
Integrated Telecommunication Services-2.20% | |
AT&T, Inc. | | | | | | | | |
3.80% (3 mo. USD LIBOR + 0.89%), 02/15/2023(c) | | | 2,669,000 | | | | 2,669,127 | |
4.42% (3 mo. USD LIBOR + 1.18%), 06/12/2024(c) | | | 3,832,000 | | | | 3,845,443 | |
Verizon Communications, Inc. | | | | | | | | |
4.01% (3 mo. USD LIBOR + 1.10%), 05/15/2025(c) | | | 4,127,000 | | | | 4,126,745 | |
3.79% (SOFR + 0.79%), 03/20/2026(c) | | | 2,000,000 | | | | 1,952,477 | |
| | | | | | | | |
| | | | | | | 12,593,792 | |
| | | | | | | | |
Investment Banking & Brokerage-4.16% | |
Charles Schwab Corp. (The) | | | | | | | | |
3.21% (SOFR + 0.52%), 05/13/2026(c) | | | 4,303,000 | | | | 4,176,504 | |
3.92% (SOFR + 1.05%), 03/03/2027(b)(c) | | | 4,000,000 | | | | 3,916,814 | |
Goldman Sachs Group, Inc. (The) | | | | | | | | |
3.71% (3 mo. USD LIBOR + 0.75%), 02/23/2023(c) | | | 3,000,000 | | | | 2,998,612 | |
3.27% (SOFR + 0.54%), 11/17/2023(c) | | | 3,957,000 | | | | 3,938,299 | |
3.49% (SOFR + 0.58%), 03/08/2024(c) | | | 2,069,000 | | | | 2,043,773 | |
3.76% (SOFR + 0.70%), 01/24/2025(c) | | | 2,535,000 | | | | 2,492,532 | |
6.12% (3 mo. USD LIBOR + 1.75%), 10/28/2027(c) | | | 1,220,000 | | | | 1,208,763 | |
Morgan Stanley, 4.22% (SOFR + 1.17%), 04/17/2025(b)(c) | | | 3,000,000 | | | | 2,981,251 | |
| | | | | | | | |
| | | | | | | 23,756,548 | |
| | | | | | | | |
Life & Health Insurance-4.26% | |
Athene Global Funding | | | | | | | | |
3.49% (SOFR + 0.70%), 05/24/2024(b)(c)(d) | | | 5,000,000 | | | | 4,901,426 | |
3.77% (SOFR + 0.72%), 01/07/2025(c)(d) | | | 3,500,000 | | | | 3,379,931 | |
| | | | | | | | |
| | | Principal
Amount | | | Value | |
Life & Health Insurance-(continued) | |
Equitable Financial Life Global Funding, 3.45% (SOFR + 0.39%), 04/06/2023(b)(c)(d) | | $ | 2,500,000 | | | $ | 2,492,259 | |
GA Global Funding Trust | | | | | | | | |
3.44% (SOFR + 0.50%), 09/13/2024(c)(d) | | | 4,000,000 | | | | 3,878,020 | |
4.42% (SOFR + 1.36%), 04/11/2025(c)(d) | | | 4,000,000 | | | | 3,932,213 | |
New York Life Global Funding, 3.40% (SOFR + 0.48%), 06/09/2026(c)(d) | | | 3,000,000 | | | | 2,900,765 | |
Pacific Life Global Funding II, 3.49% (SOFR + 0.62%), 06/04/2026(c)(d) | | | 3,000,000 | | | | 2,871,556 | |
| | | | | | | | |
| | | | | | | 24,356,170 | |
| | | | | | | | |
Life Sciences Tools & Services-0.96% | |
Thermo Fisher Scientific, Inc. | | | | | | | | |
3.41% (SOFR + 0.35%), 04/18/2023(b)(c) | | | 3,000,000 | | | | 2,995,537 | |
3.45% (SOFR + 0.39%), 10/18/2023(c) | | | 2,500,000 | | | | 2,490,359 | |
| | | | | | | | |
| | | | | | | 5,485,896 | |
| | | | | | | | |
Movies & Entertainment-0.52% | |
Magallanes, Inc., 4.75% (SOFR + 1.78%), 03/15/2024(c)(d) | | | 3,000,000 | | | | 2,992,515 | |
| | | | | | | | |
Multi-line Insurance-0.83% | |
Metropolitan Life Global Funding I | | | | | | | | |
3.63% (SOFR + 0.57%), 01/13/2023(c)(d) | | | 2,000,000 | | | | 2,000,624 | |
3.38% (SOFR + 0.32%), 01/07/2024(c)(d) | | | 2,750,000 | | | | 2,727,560 | |
| | | | | | | | |
| | | | | | | 4,728,184 | |
| | | | | | | | |
Multi-Utilities-0.41% | |
CenterPoint Energy, Inc., 3.34% (SOFR + 0.65%), 05/13/2024(c) | | | 1,639,000 | | | | 1,605,225 | |
Dominion Energy, Inc., Series D, 3.82% (3 mo. USD LIBOR + 0.53%), 09/15/2023(c) | | | 769,000 | | | | 766,041 | |
| | | | | | | | |
| | | | | | | 2,371,266 | |
| | | | | | | | |
Oil & Gas Storage & Transportation-0.26% | |
Enbridge, Inc. (Canada) | | | | | | | | |
3.13% (SOFR + 0.40%), 02/17/2023(c) | | | 357,000 | | | | 356,370 | |
3.34% (SOFR + 0.63%), 02/16/2024(c) | | | 1,152,000 | | | | 1,139,480 | |
| | | | | | | | |
| | | | | | | 1,495,850 | |
| | | | | | | | |
Other Diversified Financial Services-0.51% | |
AerCap Ireland Capital DAC/AerCap Global Aviation Trust (Ireland), 3.73% (SOFR + 0.68%), 09/29/2023(c) | | | 3,000,000 | | | | 2,936,333 | |
| | | | | | | | |
Packaged Foods & Meats-0.69% | |
General Mills, Inc., 5.09% (3 mo. USD LIBOR + 1.01%), 10/17/2023(b)(c) | | | 3,937,000 | | | | 3,957,052 | |
| | | | | | | | |
Personal Products-0.44% | |
GSK Consumer Healthcare Capital US LLC, 3.94% (SOFR + 0.89%), 03/24/2024(c)(d) | | | 2,500,000 | | | | 2,492,615 | |
| | | | | | | | |
Pharmaceuticals-0.72% | |
Bayer US Finance II LLC (Germany), 4.30% (3 mo. USD LIBOR + 1.01%), 12/15/2023(c)(d) | | | 4,105,000 | | | | 4,085,334 | |
| | | | | | | | |
See accompanying Notes to Financial Statements which are an integral part of the financial statements.
Invesco Variable Rate Investment Grade ETF (VRIG)–(continued)
October 31, 2022
| | | | | | | | |
| | | Principal
Amount | | | Value | |
Regional Banks-0.98% | | | | | | | | |
M&T Bank Corp., 5.01% (3 mo. USD LIBOR + 0.68%), 07/26/2023(c) | | $ | 2,940,000 | | | $ | 2,940,140 | |
Truist Financial Corp., 3.32% (SOFR + 0.40%), 06/09/2025(b)(c) | | | 2,702,000 | | | | 2,644,657 | |
| | | | | | | | |
| | | | | | | 5,584,797 | |
| | | | | | | | |
Semiconductors-0.87% | |
QUALCOMM, Inc., 5.15% (3 mo. USD LIBOR + 0.73%), 01/30/2023(b)(c) | | | 4,950,000 | | | | 4,952,675 | |
| | | | | | | | |
Thrifts & Mortgage Finance-0.38% | |
Nationwide Building Society (United Kingdom), 4.00% (SOFR + 1.29%), 02/16/2028(c)(d) | | | 2,300,000 | | | | 2,148,793 | |
| | | | | | | | |
Trading Companies & Distributors-1.06% | |
Air Lease Corp., 3.64% (3 mo. USD LIBOR + 0.35%), 12/15/2022(c) | | | 3,000,000 | | | | 2,997,932 | |
BOC Aviation Ltd. (Singapore), 4.77% (3 mo. USD LIBOR + 1.13%), 09/26/2023(c)(d) | | | 3,082,000 | | | | 3,076,514 | |
| | | | | | | | |
| | | | | | | 6,074,446 | |
| | | | | | | | |
Total U.S. Dollar Denominated Bonds & Notes
(Cost $278,033,481) | | | | 274,528,072 | |
| | | | | | | | |
|
Agency Credit Risk Transfer Notes-16.71% | |
Fannie Mae Connecticut Avenue Securities | |
Series 2015-C04, Class 1M2, 9.29% (1 mo. USD LIBOR + 5.70%), 04/25/2028(c)(f) | | | 849,600 | | | | 895,754 | |
Series 2018-C06, Class 1M2, 5.59% (1 mo. USD LIBOR + 2.00%), 03/25/2031(c)(f) | | | 2,791,113 | | | | 2,782,031 | |
Series 2019-R01, Class 2M2, 6.04% (1 mo. USD LIBOR + 2.45%),
07/25/2031(c)(d)(f) | | | 690,786 | | | | 688,376 | |
Series 2019-R02, Class 1M2, 5.89% (1 mo. USD LIBOR + 2.30%),
08/25/2031(c)(d)(f) | | | 810,741 | | | | 809,817 | |
Series 2021-R01, Class 1M1, 3.75% (30 Day Average SOFR + 0.75%), 10/25/2041(c)(d)(f) | | | 1,431,490 | | | | 1,409,528 | |
Series 2021-R03, Class 1M1, 3.85% (30 Day Average SOFR + 0.85%), 12/25/2041(c)(d)(f) | | | 3,781,356 | | | | 3,663,958 | |
Series 2022-R01, Class 1M1, 4.00% (30 Day Average SOFR + 1.00%), 12/25/2041(c)(d)(f) | | | 1,374,567 | | | | 1,332,593 | |
Series 2022-R01, Class 1M2, 4.90% (30 Day Average SOFR + 1.90%), 12/25/2041(c)(d)(f) | | | 1,000,000 | | | | 910,339 | |
Series 2022-R02, Class 2M1, 4.20% (30 Day Average SOFR + 1.20%), 01/25/2042(c)(d)(f) | | | 3,116,534 | | | | 3,029,064 | |
Series 2022-R02, Class 2M2, 6.00% (30 Day Average SOFR + 3.00%), 01/25/2042(c)(d)(f) | | | 2,000,000 | | | | 1,792,323 | |
Series 2022-R03, Class 1M1, 5.10% (30 Day Average SOFR + 2.10%), 03/25/2042(c)(d)(f) | | | 1,788,730 | | | | 1,765,359 | |
| | | | | | | | |
| | | Principal
Amount | | | Value | |
Series 2022-R03, Class 1M2, 6.50% (30 Day Average SOFR + 3.50%),
03/25/2042(c)(d)(f) | | $ | 4,250,000 | | | $ | 4,054,978 | |
Series 2022-R04, Class 1M1, 5.00% (30 Day Average SOFR + 2.00%),
03/25/2042(c)(d)(f) | | | 2,539,039 | | | | 2,497,387 | |
Series 2022-R04, Class 1M2, 6.10% (30 Day Average SOFR + 3.10%),
03/25/2042(c)(d)(f) | | | 3,400,000 | | | | 3,193,536 | |
Series 2022-R05, Class 2M1, 4.90% (30 Day Average SOFR + 1.90%),
04/25/2042(c)(d)(f) | | | 3,131,779 | | | | 3,075,195 | |
Series 2022-R05, Class 2M2, 6.00% (30 Day Average SOFR + 3.00%),
04/25/2042(c)(d)(f) | | | 1,750,000 | | | | 1,610,981 | |
Series 2022-R06, Class 1M1, 5.75% (30 Day Average SOFR + 2.75%),
05/25/2042(c)(d)(f) | | | 1,459,881 | | | | 1,453,488 | |
Series 2022-R06, Class 1M2, 6.85% (30 Day Average SOFR + 3.85%),
05/25/2042(c)(d)(f) | | | 1,250,000 | | | | 1,201,373 | |
Series 2022-R07, Class 1M1, 5.98% (30 Day Average SOFR + 2.95%),
06/25/2042(c)(d)(f) | | | 1,375,304 | | | | 1,382,140 | |
Series 2022-R07, Class 1M2, 7.68% (30 Day Average SOFR + 4.65%),
06/25/2042(c)(d)(f) | | | 600,000 | | | | 598,479 | |
Series 2022-R08, Class 1M1, 5.55% (30 Day Average SOFR + 2.55%),
07/25/2042(c)(d)(f) | | | 1,906,568 | | | | 1,899,703 | |
Series 2022-R08, Class 1M2, 6.60% (30 Day Average SOFR + 3.60%),
07/25/2042(c)(d)(f) | | | 1,500,000 | | | | 1,422,188 | |
Freddie Mac | | | | | | | | |
Series 2020-DNA5, Class M2, STACR®, 5.80% (30 Day Average SOFR + 2.80%), 10/25/2050(c)(d)(g) | | | 1,221,256 | | | | 1,221,716 | |
Series 2021-DNA2, Class M1, STACR®, 3.80% (30 Day Average SOFR + 0.80%), 08/25/2033(c)(d)(g) | | | 372,718 | | | | 371,122 | |
Series 2021-DNA2, Class M2, STACR®, 5.30% (30 Day Average SOFR + 2.30%), 08/25/2033(c)(d)(g) | | | 4,820,000 | | | | 4,594,129 | |
Series 2021-DNA3, Class M1, STACR®, 3.75% (30 Day Average SOFR + 0.75%), 10/25/2033(c)(d)(g) | | | 1,444,330 | | | | 1,420,484 | |
Series 2021-DNA3, Class M2, STACR®, 5.10% (30 Day Average SOFR + 2.10%), 10/25/2033(c)(d)(g) | | | 3,125,000 | | | | 2,984,379 | |
Series 2021-DNA5, Class M2, STACR®, 4.65% (30 Day Average SOFR + 1.65%), 01/25/2034(c)(d)(g) | | | 3,538,639 | | | | 3,445,055 | |
Series 2021-DNA6, Class M2, STACR®, 4.50% (30 Day Average SOFR + 1.50%), 10/25/2041(c)(d)(g) | | | 5,571,181 | | | | 5,124,658 | |
Series 2021-HQA1, Class M1, STACR®, 3.70% (30 Day Average SOFR + 0.70%), 08/25/2033(c)(d)(g) | | | 463,255 | | | | 460,984 | |
See accompanying Notes to Financial Statements which are an integral part of the financial statements.
Invesco Variable Rate Investment Grade ETF (VRIG)–(continued)
October 31, 2022
| | | | | | | | |
| | | Principal
Amount | | | Value | |
Series 2021-HQA3, Class M1, STACR®, 3.85% (30 Day Average SOFR + 0.85%), 09/25/2041(c)(d)(g) | | $ | 2,717,290 | | | $ | 2,571,999 | |
Series 2022-DNA1, Class M2, STACR®, 5.29% (1 mo. USD LIBOR + 1.70%), 01/25/2050(c)(d)(g) | | | 473,652 | | | | 465,396 | |
Series 2022-DNA2, Class M1A, STACR®, 4.30% (30 Day Average SOFR + 1.30%), 02/25/2042(c)(d)(g) | | | 2,351,810 | | | | 2,301,640 | |
Series 2022-DNA2, Class M1B, STACR®, 5.40% (30 Day Average SOFR + 2.40%), 02/25/2042(c)(d)(g) | | | 4,250,000 | | | | 3,921,199 | |
Series 2022-DNA3, Class M1A, STACR®, 5.00% (30 Day Average SOFR + 2.00%), 04/25/2042(c)(d)(g) | | | 3,499,055 | | | | 3,431,431 | |
Series 2022-DNA3, Class M1B, STACR®, 5.90% (30 Day Average SOFR + 2.90%), 04/25/2042(c)(d)(g) | | | 4,500,000 | | | | 4,186,776 | |
Series 2022-DNA4, Class M1A, STACR®, 5.20% (30 Day Average SOFR + 2.20%), 05/25/2042(c)(d)(g) | | | 2,676,092 | | | | 2,647,426 | |
Series 2022-DNA4, Class M1B, STACR®, 6.35% (30 Day Average SOFR + 3.35%), 05/25/2042(c)(d)(g) | | | 1,500,000 | | | | 1,418,171 | |
Series 2022-DNA5, Class M1A, STACR®, 5.95% (30 Day Average SOFR + 2.95%), 06/25/2042(c)(d)(g) | | | 2,064,995 | | | | 2,078,052 | |
Series 2022-DNA5, Class M1B, STACR®, 7.50% (30 Day Average SOFR + 4.50%), 06/25/2042(c)(d)(g) | | | 1,500,000 | | | | 1,498,425 | |
Series 2022-HQA1, Class M1A, STACR®, 5.10% (30 Day Average SOFR + 2.10%), 03/25/2042(c)(d)(g) | | | 2,702,455 | | | | 2,689,583 | |
Series 2022-HQA1, Class M1B, STACR®, 6.50% (30 Day Average SOFR + 3.50%), 03/25/2042(c)(d)(g) | | | 2,000,000 | | | | 1,916,417 | |
Series 2022-HQA2, Class M1, STACR®, 7.00% (30 Day Average SOFR + 4.00%), 07/25/2042(c)(d)(g) | | | 1,500,000 | | | | 1,466,692 | |
Series 2022-HQA2, Class M1A, STACR®, 5.65% (30 Day Average SOFR + 2.65%), 07/25/2042(c)(d)(g) | | | 1,720,995 | | | | 1,722,001 | |
Series 2022-HQA3, Class M1, STACR®, 5.30% (30 Day Average SOFR + 2.30%), 08/25/2042(c)(d)(g) | | | 802,053 | | | | 798,146 | |
Series 2022-HQA3, Class M1, STACR®, 6.55% (30 Day Average SOFR + 3.55%), 08/25/2042(c)(d)(g) | | | 1,380,000 | | | | 1,295,843 | |
| | | | | | | | |
Total Agency Credit Risk Transfer Notes (Cost $98,949,941) | | | | | | | 95,500,314 | |
| | | | | | | | |
| | |
Asset-Backed Securities-16.62% | | | | | | | | |
Adjustable Rate Mortgage Trust, Series 2004-2, Class 6A1, 3.82%, 02/25/2035(h) | | | 85,916 | | | | 38,422 | |
BAMLL Commercial Mortgage Securities Trust, Series 2019-RLJ, Class B, 4.76% (1 mo. USD LIBOR + 1.35%), 04/15/2036(c)(d) | | | 4,000,000 | | | | 3,910,368 | |
| | | | | | | | |
| | | Principal
Amount | | | Value | |
BBCMS Mortgage Trust, Series 2019-BWAY, Class B, 4.72% (1 mo. USD LIBOR + 1.31%), 11/15/2034(c)(d) | | $ | 3,250,000 | | | $ | 3,062,310 | |
Bear Stearns Adjustable Rate Mortgage Trust | | | | | | | | |
Series 2003-7, Class 6A, 3.82%, 10/25/2033(h) | | | 128,166 | | | | 119,858 | |
Series 2003-8, Class 4A1, 3.32%, 01/25/2034(h) | | | 125,696 | | | | 120,579 | |
BX Commercial Mortgage Trust | | | | | | | | |
Series 2020-VKNG, Class A, 4.34% (1 mo. USD LIBOR + 0.93%), 10/15/2037(c)(d) | | | 1,388,820 | | | | 1,340,565 | |
Series 2021-ACNT, Class B, 4.66% (1 mo. USD LIBOR + 1.25%), 11/15/2038(c)(d) | | | 4,000,000 | | | | 3,773,112 | |
Series 2021-VINO, Class B, 4.26% (1 mo. USD LIBOR + 0.85%), 05/15/2038(c)(d) | | | 2,350,000 | | | | 2,212,332 | |
Series 2021-VOLT, Class B, 4.36% (1 mo. USD LIBOR + 0.95%), 09/15/2036(c)(d) | | | 2,000,000 | | | | 1,882,527 | |
Series 2021-VOLT, Class D, 5.06% (1 mo. USD LIBOR + 1.65%), 09/15/2036(c)(d) | | | 1,250,000 | | | | 1,159,810 | |
BX Trust | | | | | | | | |
Series 2021-LGCY, Class B, 4.27% (1 mo. USD LIBOR + 0.86%), 10/15/2023(c)(d) | | | 3,630,000 | | | | 3,396,294 | |
Series 2022-IND, Class C, 5.71% (1 mo. Term SOFR + 2.29%), 04/15/2037(c)(d) | | | 3,326,913 | | | | 3,134,530 | |
Series 2022-LBA6, Class B, 4.68% (1 mo. Term SOFR + 1.30%), 01/15/2039(c)(d) | | | 1,000,000 | | | | 943,171 | |
Chesapeake Funding II LLC (Canada), Series 2019-2A, Class C, 2.27%, 09/15/2031(d) | | | 400,000 | | | | 395,537 | |
COMM Mortgage Trust, Series 2019-521F, Class C, 4.71% (1 mo. USD LIBOR + 1.30%), 06/15/2034(c)(d) | | | 4,000,000 | | | | 3,785,916 | |
Commonbond Student Loan Trust | | | | | | | | |
Series 2017-BGS, Class A2, 4.24% (1 mo. USD LIBOR + 0.65%), 09/25/2042(c)(d) | | | 364,101 | | | | 354,967 | |
Series 2018-AGS, Class A2, 4.09% (1 mo. USD LIBOR + 0.50%), 02/25/2044(c)(d) | | | 648,768 | | | | 636,600 | |
DBCG Mortgage Trust, Series 2017-BBG, Class C, 4.41% (1 mo. USD LIBOR + 1.00%), 06/15/2034(c)(d) | | | 3,750,000 | | | | 3,609,547 | |
Edsouth Indenture No. 9 LLC, Series 2015-1, Class A, 4.39% (1 mo. USD LIBOR + 0.80%), 10/25/2056(c)(d) | | | 425,503 | | | | 417,717 | |
Great Wolf Trust, Series 2019-WOLF, Class B, 4.75% (1 mo. USD LIBOR + 1.33%), 12/15/2036(c)(d) | | | 3,384,000 | | | | 3,221,931 | |
GS Mortgage Securities Corp. Trust | | | | | | | | |
Series 2018-TWR, Class A, 4.56% (1 mo. USD LIBOR + 1.15%), 07/15/2031(c)(d) | | | 3,000,000 | | | | 2,919,944 | |
Series 2021-ROSS, Class A, 4.56% (1 mo. USD LIBOR + 1.15%), 05/15/2026(c)(d) | | | 2,500,000 | | | | 2,325,625 | |
Series 2022-SHIP, Class B, 4.80% (1 mo. Term SOFR + 1.42%), 08/15/2036(c)(d) | | | 3,000,000 | | | | 2,949,314 | |
Home Equity Asset Trust, Series 2004-5, Class M2, 4.53% (1 mo. USD LIBOR + 0.95%), 11/25/2034(c) | | | 1,106,896 | | | | 1,092,474 | |
See accompanying Notes to Financial Statements which are an integral part of the financial statements.
Invesco Variable Rate Investment Grade ETF (VRIG)–(continued)
October 31, 2022
| | | | | | | | |
| | | Principal
Amount | | | Value | |
Invitation Homes Trust | | | | | | | | |
Series 2018-SFR1, Class B, 4.36% (1 mo. USD LIBOR + 0.95%), 03/17/2037(c)(d) | | $ | 999,857 | | | $ | 979,803 | |
Series 2018-SFR4, Class C, 4.81% (1 mo. USD LIBOR + 1.40%), 01/17/2038(c)(d) | | | 2,999,862 | | | | 2,923,542 | |
J.P. Morgan Chase Commercial Mortgage Securities Trust, Series 2018-PHH, Class B, 4.87% (1 mo. USD LIBOR + 1.46%), 06/15/2035(c)(d) | | | 2,385,000 | | | | 2,282,428 | |
JP Morgan Mortgage Trust | | | | | | | | |
Series 2019-6, Class A11, 4.49% (1 mo. USD LIBOR + 0.90%), 12/25/2049(c)(d) | | | 84,815 | | | | 78,549 | |
Series 2019-INV2, Class A1, 4.49% (1 mo. USD LIBOR + 0.90%), 02/25/2050(c)(d) | | | 215,820 | | | | 202,378 | |
Series 2019-INV3, Class A11, 4.08% (1 mo. USD LIBOR + 1.00%), 05/25/2050(c)(d) | | | 99,136 | | | | 91,638 | |
Series 2019-LTV3, Class A1, 3.93% (1 mo. USD LIBOR + 0.85%), 03/25/2050(c)(d) | | | 46,540 | | | | 46,322 | |
Series 2020-8, Class A11, 3.18% (30 Day Average SOFR + 0.90%), 03/25/2051(c)(d) | | | 228,161 | | | | 209,883 | |
Series 2020-LTV1, Class A11, 4.08% (1 mo. USD LIBOR + 1.00%), 06/25/2050(c)(d) | | | 20,697 | | | | 20,459 | |
Series 2021-1, Class A11, 2.93% (30 Day Average SOFR + 0.65%), 06/25/2051(c)(d) | | | 660,449 | | | | 595,297 | |
Med Trust, Series 2021-MDLN, Class B, 4.86% (1 mo. USD LIBOR + 1.45%), 11/15/2038(c)(d) | | | 3,000,000 | | | | 2,849,447 | |
Mello Mortgage Capital Acceptance Trust, Series 2021-INV2, Class A1, 3.95% (30 Day Average SOFR + 0.95%), 08/25/2051(c)(d) | | | 3,136,476 | | | | 2,850,477 | |
Merrill Lynch Mortgage Investors Trust | | | | | | | | |
Series 2003-F, Class A1, 4.23% (1 mo. USD LIBOR + 0.64%), 10/25/2028(c) | | | 80,636 | | | | 75,368 | |
Series 2005-A2, Class A5, 2.77%, 02/25/2035(h) | | | 48,062 | | | | 44,983 | |
MHP Commercial Mortgage Trust, Series 2021-STOR, Class B, 4.31% (1 mo. USD LIBOR + 0.90%), 07/15/2038(c)(d) | | | 2,500,000 | | | | 2,364,144 | |
New Residential Advance Receivables Trust, Series 2020-APT1, Class AT1, 1.04%, 12/16/2052(d) | | | 3,500,000 | | | | 3,475,018 | |
NRZ Advance Receivables Trust, Series 2020-T2, Class AT2, 1.48%, 09/15/2053(d) | | | 1,999,621 | | | | 1,907,006 | |
OBX Trust | | | | | | | | |
Series 2018-EXP1, Class 2A1, 4.44% (1 mo. USD LIBOR + 0.85%), 04/25/2048(c)(d) | | | 201,213 | | | | 198,828 | |
Series 2018-EXP2, Class 2A2, 4.54% (1 mo. USD LIBOR + 0.95%), 07/25/2058(c)(d) | | | 293,008 | | | | 286,994 | |
| | | | | | | | |
| | | Principal
Amount | | | Value | |
Series 2019-EXP1, Class 2A2, 4.23% (1 mo. USD LIBOR + 1.15%), 01/25/2059(c)(d) | | $ | 196,753 | | | $ | 190,568 | |
Series 2019-EXP2, Class 2A2, 4.28% (1 mo. USD LIBOR + 1.20%), 06/25/2059(c)(d) | | | 302,563 | | | | 290,872 | |
Series 2020-EXP1, Class 2A2, 4.54% (1 mo. USD LIBOR + 0.95%), 02/25/2060(c)(d) | | | 309,215 | | | | 298,104 | |
Series 2020-EXP3, Class 2A2, 4.79% (1 mo. USD LIBOR + 1.20%), 01/25/2060(c)(d) | | | 503,657 | | | | 492,242 | |
Series 2020-INV1, Class A11, 3.98% (1 mo. USD LIBOR + 0.90%), 12/25/2049(c)(d) | | | 226,186 | | | | 209,083 | |
RLGH Trust, Series 2021-TROT, Class B, 4.58% (1 mo. USD LIBOR + 1.16%), 04/15/2036(c)(d) | | | 3,000,000 | | | | 2,891,232 | |
SMB Private Education Loan Trust | | | | | | | | |
Series 2019-B, Class A2B, 4.41% (1 mo. USD LIBOR + 1.00%), 06/15/2037(c)(d) | | | 2,438,797 | | | | 2,359,479 | |
Series 2020-A, Class A2B, 4.24% (1 mo. USD LIBOR + 0.83%), 09/15/2037(c)(d) | | | 1,435,152 | | | | 1,383,743 | |
Series 2021-A, Class A2A2, 4.14% (1 mo. USD LIBOR + 0.73%), 01/15/2053(c)(d) | | | 4,120,966 | | | | 3,906,655 | |
Series 2022-C, Class A1B, 4.64% (30 Day Average SOFR + 1.85%), 05/16/2050(c)(d) | | | 2,841,605 | | | | 2,829,427 | |
SMRT, Series 2022-MINI, Class B, 4.73% (1 mo. Term SOFR + 1.35%), 01/15/2039(c)(d) | | | 4,655,000 | | | | 4,433,569 | |
STAR Trust, Series 2022-SFR3, Class B, 5.37% (1 mo. Term SOFR + 1.95%), 05/17/2024(c)(d) | | | 5,000,000 | | | | 4,882,742 | |
WaMu Mortgage Pass-Through Ctfs. Trust, Series 2004-AR3, Class A2, 3.10%, 06/25/2034(h) | | | 53,510 | | | | 49,273 | |
Wells Fargo Commercial Mortgage Trust, Series 2016-NXS5, Class A6FL, 4.96% (1 mo. USD LIBOR + 1.55%), 01/15/2059(c)(d) | | | 2,500,000 | | | | 2,462,125 | |
| | | | | | | | |
Total Asset-Backed Securities (Cost $98,185,410) | | | | | | | 94,965,128 | |
| | | | | | | | |
| | |
U.S. Treasury Securities-15.12% | | | | | | | | |
U.S. Treasury Floating Rate Notes-15.12% | |
4.04% (3 mo. U.S. Treasury Bill Money Market Yield Rate - 0.08%), 04/30/2024(c) | | | 68,750,000 | | | | 68,650,164 | |
4.15% (3 mo. U.S. Treasury Bill Money Market Yield Rate + 0.04%), 07/31/2024(c) | | | 17,750,000 | | | | 17,732,734 | |
| | | | | | | | |
Total U.S. Treasury Securities
(Cost $86,478,825) | | | | | | | 86,382,898 | |
| | | | | | | | |
See accompanying Notes to Financial Statements which are an integral part of the financial statements.
Invesco Variable Rate Investment Grade ETF (VRIG)–(continued)
October 31, 2022
| | | | | | | | |
| | | Principal | | | | |
| | | Amount | | | Value | |
| U.S. Government Sponsored Agency Mortgage-Backed Securities-3.03% | |
Collateralized Mortgage Obligations-2.67% | |
Fannie Mae REMICs | | | | | | | | |
3.89% (1 mo. USD LIBOR + 0.30%), 04/25/2035(c) | | $ | 1,288,475 | | | $ | 1,283,036 | |
3.94% (1 mo. USD LIBOR + 0.35%), 09/25/2041(c) | | | 5,841 | | | | 5,829 | |
2.88%, (1 mo. USD LIBOR + 0.32%), 01/25/45 to 12/25/47(c) | | | 944,372 | | | | 908,296 | |
4.09% (1 mo. USD LIBOR + 0.50%), 05/25/2046(c) | | | 246,616 | | | | 241,564 | |
2.86% (1 mo. USD LIBOR + 0.30%), 09/25/2047(c) | | | 683,885 | | | | 665,953 | |
Freddie Mac Multifamily Structured Credit Risk, Series 2021-MN2, Class M1, 4.80% (30 Day Average SOFR + 1.80%), 07/25/2041(c)(d) | | | 3,594,480 | | | | 3,262,775 | |
Freddie Mac Multifamily Structured Pass-Through Ctfs. | | | | | | | | |
Series KF35, Class A, 3.49% (1 mo. USD LIBOR + 0.35%), 08/25/2024(c) | | | 165,691 | | | | 165,139 | |
Series KF35, Class A, 3.53% (1 mo. USD LIBOR + 0.39%), 10/25/2025(c) | | | 1,230,989 | | | | 1,211,883 | |
Series KF81, Class AS, 2.87% (30 Day Average SOFR + 0.40%), 06/25/2027(c) | | | 1,591,657 | | | | 1,578,887 | |
Series Q008, Class A, 3.53% (1 mo. USD LIBOR + 0.39%), 10/25/2045(c) | | | 1,031,640 | | | | 1,022,086 | |
Freddie Mac REMICs | | | | | | | | |
2.91% (1 mo. USD LIBOR + 0.35%), 09/15/2038(c) | | | 701,965 | | | | 699,683 | |
2.95% (1 mo. USD LIBOR + 0.45%), 09/15/2040(c) | | | 570,539 | | | | 557,840 | |
3.91% (1 mo. USD LIBOR + 0.50%), 06/15/2041(c) | | | 175,195 | | | | 172,832 | |
2.88% (1 mo. USD LIBOR + 0.32%), 08/15/2043(c) | | | 691,272 | | | | 681,651 | |
3.76% (1 mo. USD LIBOR + 0.35%), 01/15/2048(c) | | | 2,908,146 | | | | 2,808,422 | |
| | | | | | | | |
| | | | | | | 15,265,876 | |
| | | | | | | | |
|
Federal Home Loan Mortgage Corp. (FHLMC)-0.15% | |
ARM, 2.28% (1 yr. USD LIBOR + 1.62%), 06/01/2037(c) | | | 274,363 | | | | 273,723 | |
ARM, 3.29% (1 yr. USD LIBOR + 1.74%), 11/01/2038(c) | | | 283,497 | | | | 286,587 | |
ARM, 3.05% (1 yr. USD LIBOR + 1.73%), 03/01/2043(c) | | | 256,179 | | | | 256,470 | |
| | | | | | | | |
| | | | | | | 816,780 | |
| | | | | | | | |
| | |
| Investment Abbreviations: |
| ARM | | -Adjustable Rate Mortgage |
| Ctfs. | | -Certificates |
| LIBOR | | -London Interbank Offered Rate |
| REMICs | | -Real Estate Mortgage Investment Conduits |
| SOFR | | -Secured Overnight Financing Rate |
| STACR® | | -Structured Agency Credit Risk |
| USD | | -U.S. Dollar |
| | | | | | | | |
| | | Principal | | | | |
| | | Amount | | | Value | |
Federal National Mortgage Association (FNMA)-0.21% | |
ARM, 2.02% (1 yr. USD LIBOR + 1.64%), 02/01/2035(c) | | $ | 48,531 | | | $ | 47,642 | |
ARM, 3.50% (6 mo. USD LIBOR + 1.57%), 07/01/2035(c) | | | 45,203 | | | | 46,114 | |
ARM, 3.76% (1 yr. U.S. Treasury Yield Curve Rate + 2.33%), 07/01/2035(c) | | | 659,509 | | | | 674,653 | |
ARM, 3.97% (1 yr. USD LIBOR + 1.72%), 10/01/2036(c) | | | 133,746 | | | | 134,002 | |
ARM, 2.53% (1 yr. USD LIBOR + 1.78%), 03/01/2037(c) | | | 197,114 | | | | 194,281 | |
ARM, 2.86% (1 yr. USD LIBOR + 1.53%), 11/01/2037(c) | | | 112,628 | | | | 113,114 | |
| | | | | | | | |
| | | | | | | 1,209,806 | |
| | | | | | | | |
| |
Total U.S. Government Sponsored Agency Mortgage- Backed Securities
(Cost $17,948,424) | | | | 17,292,462 | |
| | | | | | | | |
| | |
| | | Shares | | | | |
Money Market Funds-0.19% | |
Invesco Government & Agency Portfolio, Institutional Class, 3.07%(i)(j)
(Cost $1,075,009) | | | 1,075,009 | | | | 1,075,009 | |
| | | | | | | | |
TOTAL INVESTMENTS IN SECURITIES
(excluding investments purchased with cash collateral from securities on loan)-99.72%
(Cost $580,671,090) | | | | 569,743,883 | |
| | | | | | | | |
|
| Investments Purchased with Cash Collateral from Securities on Loan | |
|
Money Market Funds-3.42% | |
Invesco Private Government Fund,
3.18%(i)(j)(k) | | | 5,473,023 | | | | 5,473,023 | |
Invesco Private Prime Fund, 3.28%(i)(j)(k) | | | 14,069,884 | | | | 14,069,884 | |
| | | | | | | | |
Total Investments Purchased with Cash Collateral from Securities on Loan
(Cost $19,542,286) | | | | 19,542,907 | |
| | | | | | | | |
TOTAL INVESTMENTS IN SECURITIES-103.14%
(Cost $600,213,376) | | | | 589,286,790 | |
OTHER ASSETS LESS LIABILITIES-(3.14)% | | | | (17,960,209 | ) |
| | | | | | | | |
NET ASSETS-100.00%. | | | $ | 571,326,581 | |
| | | | | | | | |
See accompanying Notes to Financial Statements which are an integral part of the financial statements.
Invesco Variable Rate Investment Grade ETF (VRIG)–(continued)
October 31, 2022
Notes to Schedule of Investments:
| (a) | Industry and/or sector classifications used in this report are generally according to the Global Industry Classification Standard, which was developed by and is the exclusive property and a service mark of MSCI Inc. and Standard & Poor’s. |
| (b) | All or a portion of this security was out on loan at October 31, 2022. |
| (c) | Interest or dividend rate is redetermined periodically. Rate shown is the rate in effect on October 31, 2022. |
| (d) | Security purchased or received in a transaction exempt from registration under the Securities Act of 1933, as amended (the “1933 Act”). The security may be resold pursuant to an exemption from registration under the 1933 Act, typically to qualified institutional buyers. The aggregate value of these securities at October 31, 2022 was $261,325,095, which represented 45.74% of the Fund’s Net Assets. |
| (e) | Perpetual bond with no specified maturity date. |
| (f) | CAS notes are bonds issued by Fannie Mae. The amount of periodic principal and ultimate principal paid by Fannie Mae is determined by the performance of a large and diverse reference pool. |
| (g) | Principal payments are determined by the delinquency and principal payment experience on the STACR® reference pool. Freddie Mac transfers credit risk from the mortgages in the reference pool to credit investors who invest in the STACR® debt notes. |
| (h) | Interest rate is redetermined periodically based on the cash flows generated by the pool of assets backing the security, less any applicable fees. The rate shown is the rate in effect on October 31, 2022. |
| (i) | Affiliated issuer. The issuer and/or the Fund is a wholly-owned subsidiary of Invesco Ltd., or is affiliated by having an investment adviser that is under common control of Invesco Ltd. The table below shows the Fund’s transactions in, and earnings from, its investments in affiliates for the fiscal year ended October 31, 2022. |
| | | | | | | | | | | | | | | | | | | | | | | | | | | | | | | | | | | |
| | | | | | | | | Change in | | Realized | | | | |
| | | Value | | Purchases | | Proceeds | | Unrealized | | Gain | | Value | | Dividend |
| | | October 31, 2021 | | at Cost | | from Sales | | Appreciation | | (Loss) | | October 31, 2022 | | Income |
| | | | | | | |
Investments in Affiliated Money Market Funds: | | | | | | | | | | | | | | | | | | | | | | | | | | | | | | | | | | | |
| | | | | | | |
Invesco Government & Agency Portfolio, Institutional Class | | | $ | 178,982 | | | | $ | 461,938,561 | | | | $ | (461,042,534 | ) | | | $ | - | | | | $ | - | | | | $ | 1,075,009 | | | | $ | 49,024 | |
| | | | | | | |
Investments Purchased with Cash Collateral from Securities on Loan: | | | | | | | | | | | | | | | | | | | | | | | | | | | | | | | | | | | |
| | | | | | | |
Invesco Private Government Fund | | | | 3,309,054 | | | | | 92,155,437 | | | | | (89,991,468 | ) | | | | - | | | | | - | | | | | 5,473,023 | | | | | 41,330 | * |
| | | | | | | |
Invesco Private Prime Fund | | | | 7,721,126 | | | | | 210,192,337 | | | | | (203,838,467 | ) | | | | 621 | | | | | (5,733 | ) | | | | 14,069,884 | | | | | 113,515 | * |
| | | | | | | |
| | | | | | | | | | | | | | | | | | | | | | | | | | | | | | | | | | | |
| | | | | | | |
Total | | | $ | 11,209,162 | | | | $ | 764,286,335 | | | | $ | (754,872,469 | ) | | | $ | 621 | | | | $ | (5,733 | ) | | | $ | 20,617,916 | | | | $ | 203,869 | |
| | | | | | | | | | | | | | | | | | | | | | | | | | | | | | | | | | | |
| * | Represents the income earned on the investment of cash collateral, which is included in securities lending income on the Statements of Operations. Does not include rebates and fees paid to lending agent or premiums received from borrowers, if any. |
| (j) | The rate shown is the 7-day SEC standardized yield as of October 31, 2022. |
| (k) | The security has been segregated to satisfy the commitment to return the cash collateral received in securities lending transactions upon the borrower’s return of the securities loaned. See Note 2M. |
See accompanying Notes to Financial Statements which are an integral part of the financial statements.
(This Page Intentionally Left Blank)
Statements of Assets and Liabilities
October 31, 2022
| | | | | | | | | | | | | | | | | | | | | | | | | |
| | |
Invesco
Active
U.S. Real
Estate
ETF (PSR) | | | | Invesco
Balanced
Multi-Asset
Allocation
ETF (PSMB) | | | | Invesco
Conservative
Multi-Asset
Allocation
ETF (PSMC) |
Assets: | | | | | | | | | | | | | | | | | | | | | | | | | |
Unaffiliated investments in securities, at value(a) | | | $ | 112,812,573 | | | | | | | | | $ | - | | | | | | | | | $ | - | |
Affiliated investments in securities, at value(a) | | | | 6,034,191 | | | | | | | | | | 37,189,546 | | | | | | | | | | 13,093,421 | |
Deposits with brokers: | | | | | | | | | | | | | | | | | | | | | | | | | |
Cash collateral-futures contracts | | | | - | | | | | | | | | | - | | | | | | | | | | - | |
Cash collateral-centrally cleared swap agreements | | | | - | | | | | | | | | | - | | | | | | | | | | - | |
Receivable for: | | | | | | | | | | | | | | | | | | | | | | | | | |
Dividends and interest | | | | 44,017 | | | | | | | | | | 8 | | | | | | | | | | 3 | |
Variation margin on centrally cleared swap agreements | | | | - | | | | | | | | | | - | | | | | | | | | | - | |
Securities lending | | | | 750 | | | | | | | | | | 11,961 | | | | | | | | | | 7,349 | |
Investments sold | | | | - | | | | | | | | | | - | | | | | | | | | | - | |
Fund shares sold | | | | - | | | | | | | | | | 428,824 | | | | | | | | | | - | |
| | | | | | | | | | | | | | | | | | | | | | | | | |
Total assets | | | | 118,891,531 | | | | | | | | | | 37,630,339 | | | | | | | | | | 13,100,773 | |
| | | | | | | | | | | | | | | | | | | | | | | | | |
| | | | | |
Liabilities: | | | | | | | | | | | | | | | | | | | | | | | | | |
Other investments:
| | | | | | | | | | | | | | | | | | | | | | | | | |
Unrealized depreciation on futures contracts | | | | - | | | | | | | | | | - | | | | | | | | | | - | |
Due to custodian | | | | 55,945 | | | | | | | | | | - | | | | | | | | | | 2,576 | |
Payable for: | | | | | | | | | | | | | | | | | | | | | | | | | |
Variation margin on futures contracts | | | | - | | | | | | | | | | - | | | | | | | | | | - | |
Investments purchased | | | | - | | | | | | | | | | 428,499 | | | | | | | | | | - | |
Collateral upon return of securities loaned | | | | 6,034,115 | | | | | | | | | | 893,200 | | | | | | | | | | 1,063,016 | |
Accrued unitary management fees | | | | 31,536 | | | | | | | | | | 1,495 | | | | | | | | | | 508 | |
| | | | | | | | | | | | | | | | | | | | | | | | | |
Total liabilities | | | | 6,121,596 | | | | | | | | | | 1,323,194 | | | | | | | | | | 1,066,100 | |
| | | | | | | | | | | | | | | | | | | | | | | | | |
Net Assets | | | $ | 112,769,935 | | | | | | | | | $ | 36,307,145 | | | | | | | | | $ | 12,034,673 | |
| | | | | | | | | | | | | | | | | | | | | | | | | |
| | | | | |
Net assets consist of: | | | | | | | | | | | | | | | | | | | | | | | | | |
Shares of beneficial interest | | | $ | 136,244,971 | | | | | | | | | $ | 41,013,338 | | | | | | | | | $ | 14,194,210 | |
Distributable earnings (loss) | | | | (23,475,036 | ) | | | | | | | | | (4,706,193 | ) | | | | | | | | | (2,159,537 | ) |
| | | | | | | | | | | | | | | | | | | | | | | | | |
Net Assets | | | $ | 112,769,935 | | | | | | | | | $ | 36,307,145 | | | | | | | | | $ | 12,034,673 | |
| | | | | | | | | | | | | | | | | | | | | | | | | |
Shares outstanding (unlimited amount authorized, $0.01 par value) | | | | 1,290,000 | | | | | | | | | | 2,540,001 | | | | | | | | | | 1,030,001 | |
Net asset value | | | $ | 87.42 | | | | | | | | | $ | 14.29 | | | | | | | | | $ | 11.68 | |
| | | | | | | | | | | | | | | | | | | | | | | | | |
Market price | | | $ | 87.45 | | | | | | | | | $ | 14.29 | | | | | | | | | $ | 11.68 | |
| | | | | | | | | | | | | | | | | | | | | | | | | |
Unaffiliated investments in securities, at cost | | | $ | 130,228,835 | | | | | | | | | $ | - | | | | | | | | | $ | - | |
| | | | | | | | | | | | | | | | | | | | | | | | | |
Affiliated investments in securities, at cost | | | $ | 6,034,115 | | | | | | | | | $ | 41,190,836 | | | | | | | | | $ | 15,208,594 | |
| | | | | | | | | | | | | | | | | | | | | | | | | |
(a) Includes securities on loan with an aggregate value of: | | | $ | 5,907,945 | | | | | | | | | $ | 854,498 | | | | | | | | | $ | 1,029,519 | |
| | | | | | | | | | | | | | | | | | | | | | | | | |
See accompanying Notes to Financial Statements which are an integral part of the financial statements.
| | | | | | | | | | | | | | | | | | | | | | | | | | | | | | | | | | | | | | | | | | | |
Invesco Growth
Multi-Asset
Allocation ETF
(PSMG) | | Invesco High Yield
Bond Factor ETF (IHYF) | | Invesco Moderately
Conservative Multi-Asset
Allocation ETF (PSMM) | | Invesco S&P 500® Downside
Hedged ETF (PHDG) |
| | | | | | | | | | | | | | | | | | | | | | | | | | | | | | | | | | | | | | | | | | | | |
| | $ | - | | | | | | | | | $ | 32,978,188 | | | | | | | | | | | | | | $ | - | | | | | | | | | | | | | | $ | 191,123,406 | |
| | | 26,846,811 | | | | | | | | | | 2,963,610 | | | | | | | | | | | | | | | 24,140,996 | | | | | | | | | | | | | | | 61,198,682 | |
| | | | | | | | | | | | | | | | | | | | | | | | | | | | | | | | | | | | | | | | | | | | |
| | | - | | | | | | | | | | - | | | | | | | | | | | | | | | - | | | | | | | | | | | | | | | 35,790,606 | |
| | | - | | | | | | | | | | 164,978 | | | | | | | | | | | | | | | - | | | | | | | | | | | | | | | - | |
| | | | | | | | | | | | | | | | | | | | | | | | | | | | | | | | | | | | | | | | | | | | |
| | | 5 | | | | | | | | | | 577,379 | | | | | | | | | | | | | | | 5 | | | | | | | | | | | | | | | 285,870 | |
| | | - | | | | | | | | | | 23,543 | | | | | | | | | | | | | | | - | | | | | | | | | | | | | | | - | |
| | | 6,436 | | | | | | | | | | 574 | | | | | | | | | | | | | | | 7,755 | | | | | | | | | | | | | | | 354 | |
| | | - | | | | | | | | | | - | | | | | | | | | | | | | | | - | | | | | | | | | | | | | | | 285,741 | |
| | | - | | | | | | | | | | - | | | | | | | | | | | | | | | 264,542 | | | | | | | | | | | | | | | - | |
| | | | | | | | | | | | | | | | | | | | | | | | | | | | | | | | | | | | | | | | | | | | |
| | | 26,853,252 | | | | | | | | | | 36,708,272 | | | | | | | | | | | | | | | 24,413,298 | | | | | | | | | | | | | | | 288,684,659 | |
| | | | | | | | | | | | | | | | | | | | | | | | | | | | | | | | | | | | | | | | | | | | |
| | | | | | | | |
| | | | | | | | | | | | | | | | | | | | | | | | | | | | | | | | | | | | | | | | | | | | |
| | | | | | | | | | | | | | | | | | | | | | | | | | | | | | | | | | | | | | | | | | | | |
| | | - | | | | | | | | | | - | | | | | | | | | | | | | | | - | | | | | | | | | | | | | | | 3,787,846 | |
| | | 4,438 | | | | | | | | | | - | | | | | | | | | | | | | | | 1,816 | | | | | | | | | | | | | | | - | |
| | | | | | | | | | | | | | | | | | | | | | | | | | | | | | | | | | | | | | | | | | | | |
| | | - | | | | | | | | | | 15,524 | | | | | | | | | | | | | | | - | | | | | | | | | | | | | | | 285,740 | |
| | | - | | | | | | | | | | - | | | | | | | | | | | | | | | 264,401 | | | | | | | | | | | | | | | 125,140 | |
| | | 497,002 | | | | | | | | | | 2,661,443 | | | | | | | | | | | | | | | 2,453,642 | | | | | | | | | | | | | | | 4,701,340 | |
| | | 1,050 | | | | | | | | | | 11,115 | | | | | | | | | | | | | | | 892 | | | | | | | | | | | | | | | 88,168 | |
| | | | | | | | | | | | | | | | | | | | | | | | | | | | | | | | | | | | | | | | | | | | |
| | | 502,490 | | | | | | | | | | 2,688,082 | | | | | | | | | | | | | | | 2,720,751 | | | | | | | | | | | | | | | 8,988,234 | |
| | | | | | | | | | | | | | | | | | | | | | | | | | | | | | | | | | | | | | | | | | | | |
| | $ | 26,350,762 | | | | | | | | | $ | 34,020,190 | | | | | | | | | | | | | | $ | 21,692,547 | | | | | | | | | | | | | | $ | 279,696,425 | |
| | | | | | | | | | | | | | | | | | | | | | | | | | | | | | | | | | | | | | | | | | | | |
| | | | | | | | |
| | | | | | | | | | | | | | | | | | | | | | | | | | | | | | | | | | | | | | | | | | | | |
| | $ | 29,003,877 | | | | | | | | | $ | 40,874,614 | | | | | | | | | | | | | | $ | 25,085,216 | | | | | | | | | | | | | | $ | 356,085,515 | |
| | | (2,653,115 | ) | | | | | | | | | (6,854,424 | ) | | | | | | | | | | | | | | (3,392,669 | ) | | | | | | | | | | | | | | (76,389,090 | ) |
| | | | | | | | | | | | | | | | | | | | | | | | | | | | | | | | | | | | | | | | | | | | |
| | $ | 26,350,762 | | | | | | | | | $ | 34,020,190 | | | | | | | | | | | | | | $ | 21,692,547 | | | | | | | | | | | | | | $ | 279,696,425 | |
| | | | | | | | | | | | | | | | | | | | | | | | | | | | | | | | | | | | | | | | | | | | |
| | | 1,650,001 | | | | | | | | | | 1,620,001 | | | | | | | | | | | | | | | 1,640,001 | | | | | | | | | | | | | | | 7,950,000 | |
| | $ | 15.97 | | | | | | | | | $ | 21.00 | | | | | | | | | | | | | | $ | 13.23 | | | | | | | | | | | | | | $ | 35.18 | |
| | | | | | | | | | | | | | | | | | | | | | | | | | | | | | | | | | | | | | | | | | | | |
| | $ | 15.98 | | | | | | | | | $ | 21.05 | | | | | | | | | | | | | | $ | 13.23 | | | | | | | | | | | | | | $ | 35.24 | |
| | | | | | | | | | | | | | | | | | | | | | | | | | | | | | | | | | | | | | | | | | | | |
| | $ | - | | | | | | | | | $ | 37,205,701 | | | | | | | | | | | | | | $ | - | | | | | | | | | | | | | | $ | 187,114,247 | |
| | | | | | | | | | | | | | | | | | | | | | | | | | | | | | | | | | | | | | | | | | | | |
| | $ | 28,862,230 | | | | | | | | | $ | 2,963,657 | | | | | | | | | | | | | | $ | 27,405,672 | | | | | | | | | | | | | | $ | 61,200,349 | |
| | | | | | | | | | | | | | | | | | | | | | | | | | | | | | | | | | | | | | | | | | | | |
| | $ | 484,337 | | | | | | | | | $ | 2,543,064 | | | | | | | | | | | | | | $ | 2,384,587 | | | | | | | | | | | | | | $ | 4,561,548 | |
| | | | | | | | | | | | | | | | | | | | | | | | | | | | | | | | | | | | | | | | | | | | |
Statements of Assets and Liabilities—(continued)
October 31, 2022
| | | | | | | | | | | | | | | | | | | | | | | | | | | | | | | | | | | | | | | | | | | | | |
| | | Invesco Total Return
Bond ETF (GTO) | | Invesco Ultra Short
Duration ETF (GSY) | | Invesco Variable Rate
Investment Grade
ETF (VRIG) |
Assets: | | | | | | | | | | | | | | | | | | | | | | | | | | | | | | | | | | | | | | | | | | | | | |
Unaffiliated investments in securities, at value(a) | | | | | | | | $ | 854,542,999 | | | | | | | | | | | | | | $ | 2,139,237,481 | | | | | | | | | | | | | | $ | 568,668,874 | | | | | | |
Affiliated investments in securities, at value(a) | | | | | | | | | 83,396,016 | | | | | | | | | | | | | | | 1,950,142 | | | | | | | | | | | | | | | 20,617,916 | | | | | | |
Other investments:
| | | | | | | | | | | | | | | | | | | | | | | | | | | | | | | | | | | | | | | | | | | | | |
Unrealized appreciation on forward foreign currency contracts outstanding | | | | | | | | | - | | | | | | | | | | | | | | | 1,719,513 | | | | | | | | | | | | | | | - | | | | | | |
Cash | | | | | | | | | 42,680,529 | | | | | | | | | | | | | | | 442,210 | | | | | | | | | | | | | | | 6,238 | | | | | | |
Foreign currencies, at value | | | | | | | | | 148,713 | | | | | | | | | | | | | | | 673 | | | | | | | | | | | | | | | - | | | | | | |
Cash collateral-TBAs | | | | | | | | | 960,000 | | | | | | | | | | | | | | | - | | | | | | | | | | | | | | | - | | | | | | |
Receivable for: | | | | | | | | | | | | | | | | | | | | | | | | | | | | | | | | | | | | | | | | | | | | | |
Dividends and interest | | | | | | | | | 5,915,777 | | | | | | | | | | | | | | | 5,816,797 | | | | | | | | | | | | | | | 1,681,230 | | | | | | |
Variation margin on futures contracts | | | | | | | | | 242,563 | | | | | | | | | | | | | | | - | | | | | | | | | | | | | | | - | | | | | | |
Securities lending | | | | | | | | | 16,717 | | | | | | | | | | | | | | | 202 | | | | | | | | | | | | | | | 4,556 | | | | | | |
Investments sold | | | | | | | | | 21,758,292 | | | | | | | | | | | | | | | - | | | | | | | | | | | | | | | 38,108 | | | | | | |
Investments matured, at value | | | | | | | | | 46,206 | | | | | | | | | | | | | | | - | | | | | | | | | | | | | | | - | | | | | | |
Other assets | | | | | | | | | - | | | | | | | | | | | | | | | 39,357 | | | | | | | | | | | | | | | - | | | | | | |
| | | | | | | | | | | | | | | | | | | | | | | | | | | | | | | | | | | | | | | | | | | | | |
Total assets | | | | | | | | | 1,009,707,812 | | | | | | | | | | | | | | | 2,149,206,375 | | | | | | | | | | | | | | | 591,016,922 | | | | | | |
| | | | | | | | | | | | | | | | | | | | | | | | | | | | | | | | | | | | | | | | | | | | | |
| | | | | | | | | |
Liabilities: | | | | | | | | | | | | | | | | | | | | | | | | | | | | | | | | | | | | | | | | | | | | | |
Payable for: | | | | | | | | | | | | | | | | | | | | | | | | | | | | | | | | | | | | | | | | | | | | | |
Investments purchased | | | | | | | | | 30,384,873 | | | | | | | | | | | | | | | 4,162,667 | | | | | | | | | | | | | | | - | | | | | | |
Investments purchased - TBA | | | | | | | | | 148,528,711 | | | | | | | | | | | | | | | - | | | | | | | | | | | | | | | - | | | | | | |
Collateral upon return of securities loaned | | | | | | | | | 83,396,651 | | | | | | | | | | | | | | | 1,950,142 | | | | | | | | | | | | | | | 19,542,286 | | | | | | |
Fund shares repurchased | | | | | | | | | 8,946,932 | | | | | | | | | | | | | | | 34,478,147 | | | | | | | | | | | | | | | - | | | | | | |
Accrued unitary management fees | | | | | | | | | 327,541 | | | | | | | | | | | | | | | - | | | | | | | | | | | | | | | 148,055 | | | | | | |
Accrued advisory fees | | | | | | | | | - | | | | | | | | | | | | | | | 368,447 | | | | | | | | | | | | | | | - | | | | | | |
Accrued trustees’ and officer’s fees | | | | | | | | | - | | | | | | | | | | | | | | | 16,888 | | | | | | | | | | | | | | | - | | | | | | |
Accrued expenses | | | | | | | | | - | | | | | | | | | | | | | | | 205,951 | | | | | | | | | | | | | | | - | | | | | | |
Other payables | | | | | | | | | 9,664 | | | | | | | | | | | | | | | - | | | | | | | | | | | | | | | - | | | | | | |
| | | | | | | | | | | | | | | | | | | | | | | | | | | | | | | | | | | | | | | | | | | | | |
Total liabilities | | | | | | | | | 271,594,372 | | | | | | | | | | | | | | | 41,182,242 | | | | | | | | | | | | | | | 19,690,341 | | | | | | |
| | | | | | | | | | | | | | | | | | | | | | | | | | | | | | | | | | | | | | | | | | | | | |
Net Assets | | | | | | | | $ | 738,113,440 | | | | | | | | | | | | | | $ | 2,108,024,133 | | | | | | | | | | | | | | $ | 571,326,581 | | | | | | |
| | | | | | | | | | | | | | | | | | | | | | | | | | | | | | | | | | | | | | | | | | | | | |
| | | | | | | | | |
Net assets consist of: | | | | | | | | | | | | | | | | | | | | | | | | | | | | | | | | | | | | | | | | | | | | | |
Shares of beneficial interest | | | | | | | | $ | 954,752,680 | | | | | | | | | | | | | | $ | 2,163,287,547 | | | | | | | | | | | | | | $ | 586,926,990 | | | | | | |
Distributable earnings (loss) | | | | | | | | | (216,639,240 | ) | | | | | | | | | | | | | | (55,263,414 | ) | | | | | | | | | | | | | | (15,600,409 | ) | | | | | |
| | | | | | | | | | | | | | | | | | | | | | | | | | | | | | | | | | | | | | | | | | | | | |
Net Assets | | | | | | | | $ | 738,113,440 | | | | | | | | | | | | | | $ | 2,108,024,133 | | | | | | | | | | | | | | $ | 571,326,581 | | | | | | |
| | | | | | | | | | | | | | | | | | | | | | | | | | | | | | | | | | | | | | | | | | | | | |
Shares outstanding (unlimited amount authorized, $0.01 par value) | | | | | | | | | 16,500,000 | | | | | | | | | | | | | | | 42,800,000 | | | | | | | | | | | | | | | 23,250,001 | | | | | | |
Net asset value | | | | | | | | $ | 44.73 | | | | | | | | | | | | | | $ | 49.25 | | | | | | | | | | | | | | $ | 24.57 | | | | | | |
| | | | | | | | | | | | | | | | | | | | | | | | | | | | | | | | | | | | | | | | | | | | | |
Market price | | | | | | | | $ | 44.67 | | | | | | | | | | | | | | $ | 49.24 | | | | | | | | | | | | | | $ | 24.56 | | | | | | |
| | | | | | | | | | | | | | | | | | | | | | | | | | | | | | | | | | | | | | | | | | | | | |
Unaffiliated investments in securities, at cost | | | | | | | | $ | 976,710,331 | | | | | | | | | | | | | | $ | 2,191,789,639 | | | | | | | | | | | | | | $ | 579,596,081 | | | | | | |
| | | | | | | | | | | | | | | | | | | | | | | | | | | | | | | | | | | | | | | | | | | | | |
Affiliated investments in securities, at cost | | | | | | | | $ | 83,396,651 | | | | | | | | | | | | | | $ | 1,950,142 | | | | | | | | | | | | | | $ | 20,617,295 | | | | | | |
| | | | | | | | | | | | | | | | | | | | | | | | | | | | | | | | | | | | | | | | | | | | | |
Foreign currencies, at cost | | | | | | | | $ | 161,935 | | | | | | | | | | | | | | $ | 689 | | | | | | | | | | | | | | $ | - | | | | | | |
| | | | | | | | | | | | | | | | | | | | | | | | | | | | | | | | | | | | | | | | | | | | | |
Investments matured, at cost | | | | | | | | $ | 748,467 | | | | | | | | | | | | | | $ | - | | | | | | | | | | | | | | $ | - | | | | | | |
| | | | | | | | | | | | | | | | | | | | | | | | | | | | | | | | | | | | | | | | | | | | | |
(a) Includes securities on loan with an aggregate value of: | | | | | | | | $ | 80,139,922 | | | | | | | | | | | | | | $ | 1,890,826 | | | | | | | | | | | | | | $ | 19,063,640 | | | | | | |
| | | | | | | | | | | | | | | | | | | | | | | | | | | | | | | | | | | | | | | | | | | | | |
See accompanying Notes to Financial Statements which are an integral part of the financial statements.
(This Page Intentionally Left Blank)
Statements of Operations
For the year ended October 31, 2022
| | | | | | | | | | | | | | | | | | | | | | | | | | | | | | | | | | | | | | | | | | | | | |
| | | Invesco
Active
U.S. Real
Estate
ETF (PSR) | | Invesco Balanced Multi-Asset
Allocation ETF (PSMB) | | Invesco
Conservative
Multi-Asset
Allocation ETF (PSMC) | | Invesco Growth
Multi-Asset
Allocation
ETF (PSMG) |
Investment income: | | | | | | | | | | | | | | | | | | | | | | | | | | | | | | | | | | | | | | | | | | | | | |
Unaffiliated interest income | | | $ | - | | | | | | | | | $ | - | | | | | | | | | | | | | | $ | - | | | | | | | | | $ | - | | | | | | |
Unaffiliated dividend income | | | | 2,702,086 | | | | | | | | | | - | | | | | | | | | | | | | | | - | | | | | | | | | | - | | | | | | |
Affiliated dividend income | | | | 653 | | | | | | | | | | 780,328 | | | | | | | | | | | | | | | 399,545 | | | | | | | | | | 531,615 | | | | | | |
Securities lending income, net | | | | 8,297 | | | | | | | | | | 99,516 | | | | | | | | | | | | | | | 49,235 | | | | | | | | | | 71,868 | | | | | | |
Foreign withholding tax | | | | - | | | | | | | | | | - | | | | | | | | | | | | | | | - | | | | | | | | | | - | | | | | | |
| | | | | | | | | | | | | | | | | | | | | | | | | | | | | | | | | | | | | | | | | | | | | |
Total investment income | | | | 2,711,036 | | | | | | | | | | 879,844 | | | | | | | | | | | | | | | 448,780 | | | | | | | | | | 603,483 | | | | | | |
| | | | | | | | | | | | | | | | | | | | | | | | | | | | | | | | | | | | | | | | | | | | | |
| | | | | | | | | |
Expenses: | | | | | | | | | | | | | | | | | | | | | | | | | | | | | | | | | | | | | | | | | | | | | |
Unitary management fees | | | | 446,984 | | | | | | | | | | 14,639 | | | | | | | | | | | | | | | 7,247 | | | | | | | | | | 11,331 | | | | | | |
Advisory fees | | | | - | | | | | | | | | | - | | | | | | | | | | | | | | | - | | | | | | | | | | - | | | | | | |
Accounting & administration fees | | | | - | | | | | | | | | | - | | | | | | | | | | | | | | | - | | | | | | | | | | - | | | | | | |
Custodian & transfer agent fees | | | | - | | | | | | | | | | - | | | | | | | | | | | | | | | - | | | | | | | | | | - | | | | | | |
Trustees’ and officer’s fees | | | | - | | | | | | | | | | - | | | | | | | | | | | | | | | - | | | | | | | | | | - | | | | | | |
Tax expenses | | | | - | | | | | | | | | | - | | | | | | | | | | | | | | | - | | | | | | | | | | - | | | | | | |
Other expenses | | | | - | | | | | | | | | | - | | | | | | | | | | | | | | | - | | | | | | | | | | - | | | | | | |
| | | | | | | | | | | | | | | | | | | | | | | | | | | | | | | | | | | | | | | | | | | | | |
Total expenses | | | | 446,984 | | | | | | | | | | 14,639 | | | | | | | | | | | | | | | 7,247 | | | | | | | | | | 11,331 | | | | | | |
| | | | | | | | | | | | | | | | | | | | | | | | | | | | | | | | | | | | | | | | | | | | | |
Less: Waivers | | | | (38 | ) | | | | | | | | | (3 | ) | | | | | | | | | | | | | | (2 | ) | | | | | | | | | (2 | ) | | | | | |
| | | | | | | | | | | | | | | | | | | | | | | | | | | | | | | | | | | | | | | | | | | | | |
Net expenses | | | | 446,946 | | | | | | | | | | 14,636 | | | | | | | | | | | | | | | 7,245 | | | | | | | | | | 11,329 | | | | | | |
| | | | | | | | | | | | | | | | | | | | | | | | | | | | | | | | | | | | | | | | | | | | | |
Net investment income | | | | 2,264,090 | | | | | | | | | | 865,208 | | | | | | | | | | | | | | | 441,535 | | | | | | | | | | 592,154 | | | | | | |
| | | | | | | | | | | | | | | | | | | | | | | | | | | | | | | | | | | | | | | | | | | | | |
| | | | | | | | | |
Realized and unrealized gain (loss) from: | | | | | | | | | | | | | | | | | | | | | | | | | | | | | | | | | | | | | | | | | | | | | |
Net realized gain (loss) from: | | | | | | | | | | | | | | | | | | | | | | | | | | | | | | | | | | | | | | | | | | | | | |
Unaffiliated investment securities | | | | (366,255 | ) | | | | | | | | | - | | | | | | | | | | | | | | | - | | | | | | | | | | - | | | | | | |
Affiliated investment securities | | | | (1,795 | ) | | | | | | | | | (839,726 | ) | | | | | | | | | | | | | | (197,694 | ) | | | | | | | | | (542,216 | ) | | | | | |
Unaffiliated in-kind redemptions | | | | 6,624,717 | | | | | | | | | | - | | | | | | | | | | | | | | | - | | | | | | | | | | - | | | | | | |
Affiliated in-kind redemptions | | | | - | | | | | | | | | | 891,568 | | | | | | | | | | | | | | | (78,884 | ) | | | | | | | | | 835,940 | | | | | | |
Foreign currencies | | | | - | | | | | | | | | | - | | | | | | | | | | | | | | | - | | | | | | | | | | - | | | | | | |
Forward foreign currency contracts | | | | - | | | | | | | | | | - | | | | | | | | | | | | | | | - | | | | | | | | | | - | | | | | | |
Futures contracts | | | | - | | | | | | | | | | - | | | | | | | | | | | | | | | - | | | | | | | | | | - | | | | | | |
Swap agreements | | | | - | | | | | | | | | | - | | | | | | | | | | | | | | | - | | | | | | | | | | - | | | | | | |
Written options | | | | - | | | | | | | | | | - | | | | | | | | | | | | | | | - | | | | | | | | | | - | | | | | | |
Distributions of underlying fund shares | | | | - | | | | | | | | | | 12,797 | | | | | | | | | | | | | | | 8,235 | | | | | | | | | | 11,917 | | | | | | |
| | | | | | | | | | | | | | | | | | | | | | | | | | | | | | | | | | | | | | | | | | | | | |
Net realized gain (loss) | | | | 6,256,667 | | | | | | | | | | 64,639 | | | | | | | | | | | | | | | (268,343 | ) | | | | | | | | | 305,641 | | | | | | |
| | | | | | | | | | | | | | | | | | | | | | | | | | | | | | | | | | | | | | | | | | | | | |
Change in net unrealized appreciation (depreciation) of: | | | | | | | | | | | | | | | | | | | | | | | | | | | | | | | | | | | | | | | | | | | | | |
Unaffiliated investment securities | | | | (35,989,928 | ) | | | | | | | | | - | | | | | | | | | | | | | | | - | | | | | | | | | | - | | | | | | |
Affiliated investment securities | | | | 76 | | | | | | | | | | (5,900,415 | ) | | | | | | | | | | | | | | (2,294,697 | ) | | | | | | | | | (4,252,252 | ) | | | | | |
Foreign currencies | | | | - | | | | | | | | | | - | | | | | | | | | | | | | | | - | | | | | | | | | | - | | | | | | |
Forward foreign currency contracts | | | | - | | | | | | | | | | - | | | | | | | | | | | | | | | - | | | | | | | | | | - | | | | | | |
Futures contracts | | | | - | | | | | | | | | | - | | | | | | | | | | | | | | | - | | | | | | | | | | - | | | | | | |
Swap agreements | | | | - | | | | | | | | | | - | | | | | | | | | | | | | | | - | | | | | | | | | | - | | | | | | |
Written options | | | | - | | | | | | | | | | - | | | | | | | | | | | | | | | - | | | | | | | | | | - | | | | | | |
| | | | | | | | | | | | | | | | | | | | | | | | | | | | | | | | | | | | | | | | | | | | | |
Change in net unrealized appreciation (depreciation) | | | | (35,989,852 | ) | | | | | | | | | (5,900,415 | ) | | | | | | | | | | | | | | (2,294,697 | ) | | | | | | | | | (4,252,252 | ) | | | | | |
| | | | | | | | | | | | | | | | | | | | | | | | | | | | | | | | | | | | | | | | | | | | | |
Net realized and unrealized gain (loss) | | | | (29,733,185 | ) | | | | | | | | | (5,835,776 | ) | | | | | | | | | | | | | | (2,563,040 | ) | | | | | | | | | (3,946,611 | ) | | | | | |
| | | | | | | | | | | | | | | | | | | | | | | | | | | | | | | | | | | | | | | | | | | | | |
Net increase (decrease) in net assets resulting from operations | | | $ | (27,469,095 | ) | | | | | | | | $ | (4,970,568 | ) | | | | | | | | | | | | | $ | (2,121,505 | ) | | | | | | | | $ | (3,354,457 | ) | | | | | |
| | | | | | | | | | | | | | | | | | | | | | | | | | | | | | | | | | | | | | | | | | | | | |
See accompanying Notes to Financial Statements which are an integral part of the financial statements.
| | | | | | | | | | | | | | | | | | | | | | | | | | | | | | | | | | | | | | | | | | | | | | | | | | | | | | | | | | | | | | | | | | | | | | | | | | | | | | |
Invesco High Yield
Bond Factor ETF (IHYF) | | Invesco
Moderately
Conservative
Multi-Asset
Allocation
ETF (PSMM) | | Invesco
S&P 500®
Downside Hedged
ETF (PHDG) | | Invesco Total Return
Bond ETF (GTO) | | Invesco Ultra Short
Duration ETF (GSY) | | Invesco
Variable Rate
Investment Grade
ETF (VRIG) |
| | | | | | | | | | | | | | | | | | | | | | | | | | | | | | | | | | | | | | | | | | | | | | | | | | | | | | | | | | | | | | | | | | | | | | | | | | | | | | | |
| | $ | 1,991,117 | | | | | | | | | $ | - | | | | | | | | | | | | | | $ | - | | | | | | | | | | | | | | $ | 30,873,076 | | | | | | | | | | | | | | $ | 34,553,574 | | | | | | | | | | | | | | $ | 11,836,154 | | | | | | |
| | | - | | | | | | | | | | - | | | | | | | | | | | | | | | 3,124,541 | | | | | | | | | | | | | | | 18,210 | | | | | | | | | | | | | | | - | | | | | | | | | | | | | | | 3 | | | | | | |
| | | 2,769 | | | | | | | | | | 591,804 | | | | | | | | | | | | | | | 712,096 | | | | | | | | | | | | | | | - | | | | | | | | | | | | | | | - | | | | | | | | | | | | | | | 49,024 | | | | | | |
| | | 10,539 | | | | | | | | | | 75,757 | | | | | | | | | | | | | | | 3,402 | | | | | | | | | | | | | | | 240,921 | | | | | | | | | | | | | | | 12,352 | | | | | | | | | | | | | | | 30,581 | | | | | | |
| | | - | | | | | | | | | | - | | | | | | | | | | | | | | | (550 | ) | | | | | | | | | | | | | | (420 | ) | | | | | | | | | | | | | | (6,992 | ) | | | | | | | | | | | | | | - | | | | | | |
| | | | | | | | | | | | | | | | | | | | | | | | | | | | | | | | | | | | | | | | | | | | | | | | | | | | | | | | | | | | | | | | | | | | | | | | | | | | | | | |
| | | 2,004,425 | | | | | | | | | | 667,561 | | | | | | | | | | | | | | | 3,839,489 | | | | | | | | | | | | | | | 31,131,787 | | | | | | | | | | | | | | | 34,558,934 | | | | | | | | | | | | | | | 11,915,762 | | | | | | |
| | | | | | | | | | | | | | | | | | | | | | | | | | | | | | | | | | | | | | | | | | | | | | | | | | | | | | | | | | | | | | | | | | | | | | | | | | | | | | | |
| | | | | | | | | | | | | | | |
| | | | | | | | | | | | | | | | | | | | | | | | | | | | | | | | | | | | | | | | | | | | | | | | | | | | | | | | | | | | | | | | | | | | | | | | | | | | | | | |
| | | 149,917 | | | | | | | | | | 11,341 | | | | | | | | | | | | | | | 1,232,904 | | | | | | | | | | | | | | | 4,728,333 | | | | | | | | | | | | | | | - | | | | | | | | | | | | | | | 1,747,083 | | | | | | |
| | | - | | | | | | | | | | - | | | | | | | | | | | | | | | - | | | | | | | | | | | | | | | - | | | | | | | | | | | | | | | 5,014,910 | | | | | | | | | | | | | | | - | | | | | | |
| | | - | | | | | | | | | | - | | | | | | | | | | | | | | | - | | | | | | | | | | | | | | | - | | | | | | | | | | | | | | | 218,188 | | | | | | | | | | | | | | | - | | | | | | |
| | | - | | | | | | | | | | - | | | | | | | | | | | | | | | - | | | | | | | | | | | | | | | - | | | | | | | | | | | | | | | 24,134 | | | | | | | | | | | | | | | - | | | | | | |
| | | - | | | | | | | | | | - | | | | | | | | | | | | | | | - | | | | | | | | | | | | | | | - | | | | | | | | | | | | | | | 13,524 | | | | | | | | | | | | | | | - | | | | | | |
| | | - | | | | | | | | | | - | | | | | | | | | | | | | | | 103 | | | | | | | | | | | | | | | 2,635 | | | | | | | | | | | | | | | - | | | | | | | | | | | | | | | - | | | | | | |
| | | - | | | | | | | | | | - | | | | | | | | | | | | | | | - | | | | | | | | | | | | | | | - | | | | | | | | | | | | | | | 276,961 | | | | | | | | | | | | | | | - | | | | | | |
| | | | | | | | | | | | | | | | | | | | | | | | | | | | | | | | | | | | | | | | | | | | | | | | | | | | | | | | | | | | | | | | | | | | | | | | | | | | | | | |
| | | 149,917 | | | | | | | | | | 11,341 | | | | | | | | | | | | | | | 1,233,007 | | | | | | | | | | | | | | | 4,730,968 | | | | | | | | | | | | | | | 5,547,717 | | | | | | | | | | | | | | | 1,747,083 | | | | | | |
| | | | | | | | | | | | | | | | | | | | | | | | | | | | | | | | | | | | | | | | | | | | | | | | | | | | | | | | | | | | | | | | | | | | | | | | | | | | | | | |
| | | (153 | ) | | | | | | | | | (2 | ) | | | | | | | | | | | | | | (45,429 | ) | | | | | | | | | | | | | | - | | | | | | | | | | | | | | | - | | | | | | | | | | | | | | | (3,790 | ) | | | | | |
| | | | | | | | | | | | | | | | | | | | | | | | | | | | | | | | | | | | | | | | | | | | | | | | | | | | | | | | | | | | | | | | | | | | | | | | | | | | | | | |
| | | 149,764 | | | | | | | | | | 11,339 | | | | | | | | | | | | | | | 1,187,578 | | | | | | | | | | | | | | | 4,730,968 | | | | | | | | | | | | | | | 5,547,717 | | | | | | | | | | | | | | | 1,743,293 | | | | | | |
| | | | | | | | | | | | | | | | | | | | | | | | | | | | | | | | | | | | | | | | | | | | | | | | | | | | | | | | | | | | | | | | | | | | | | | | | | | | | | | |
| | | 1,854,661 | | | | | | | | | | 656,222 | | | | | | | | | | | | | | | 2,651,911 | | | | | | | | | | | | | | | 26,400,819 | | | | | | | | | | | | | | | 29,011,217 | | | | | | | | | | | | | | | 10,172,469 | | | | | | |
| | | | | | | | | | | | | | | | | | | | | | | | | | | | | | | | | | | | | | | | | | | | | | | | | | | | | | | | | | | | | | | | | | | | | | | | | | | | | | | |
| | | | | | | | | | | | | | | |
| | | | | | | | | | | | | | | | | | | | | | | | | | | | | | | | | | | | | | | | | | | | | | | | | | | | | | | | | | | | | | | | | | | | | | | | | | | | | | | |
| | | | | | | | | | | | | | | | | | | | | | | | | | | | | | | | | | | | | | | | | | | | | | | | | | | | | | | | | | | | | | | | | | | | | | | | | | | | | | | |
| | | (1,834,078 | ) | | | | | | | | | - | | | | | | | | | | | | | | | (11,642,146 | ) | | | | | | | | | | | | | | (100,602,161 | ) | | | | | | | | | | | | | | (7,139,862 | ) | | | | | | | | | | | | | | 421,915 | | | | | | |
| | | (1,629 | ) | | | | | | | | | (538,645 | ) | | | | | | | | | | | | | | (6,631 | ) | | | | | | | | | | | | | | (24,924 | ) | | | | | | | | | | | | | | (2,118 | ) | | | | | | | | | | | | | | (5,733 | ) | | | | | |
| | | - | | | | | | | | | | - | | | | | | | | | | | | | | | (164,369 | ) | | | | | | | | | | | | | | - | | | | | | | | | | | | | | | - | | | | | | | | | | | | | | | - | | | | | | |
| | | - | | | | | | | | | | (7,935 | ) | | | | | | | | | | | | | | - | | | | | | | | | | | | | | | - | | | | | | | | | | | | | | | - | | | | | | | | | | | | | | | - | | | | | | |
| | | - | | | | | | | | | | - | | | | | | | | | | | | | | | - | | | | | | | | | | | | | | | (3,997 | ) | | | | | | | | | | | | | | 67,976 | | | | | | | | | | | | | | | - | | | | | | |
| | | - | | | | | | | | | | - | | | | | | | | | | | | | | | - | | | | | | | | | | | | | | | 212,978 | | | | | | | | | | | | | | | 539,872 | | | | | | | | | | | | | | | - | | | | | | |
| | | (612,977 | ) | | | | | | | | | - | | | | | | | | | | | | | | | (5,411,441 | ) | | | | | | | | | | | | | | 8,432,619 | | | | | | | | | | | | | | | - | | | | | | | | | | | | | | | - | | | | | | |
| | | (22,411 | ) | | | | | | | | | - | | | | | | | | | | | | | | | - | | | | | | | | | | | | | | | (510,522 | ) | | | | | | | | | | | | | | - | | | | | | | | | | | | | | | - | | | | | | |
| | | - | | | | | | | | | | - | | | | | | | | | | | | | | | - | | | | | | | | | | | | | | | (200,364 | ) | | | | | | | | | | | | | | - | | | | | | | | | | | | | | | - | | | | | | |
| | | - | | | | | | | | | | 10,322 | | | | | | | | | | | | | | | - | | | | | | | | | | | | | | | - | | | | | | | | | | | | | | | - | | | | | | | | | | | | | | | - | | | | | | |
| | | | | | | | | | | | | | | | | | | | | | | | | | | | | | | | | | | | | | | | | | | | | | | | | | | | | | | | | | | | | | | | | | | | | | | | | | | | | | | |
| | | (2,471,095 | ) | | | | | | | | | (536,258 | ) | | | | | | | | | | | | | | (17,224,587 | ) | | | | | | | | | | | | | | (92,696,371 | ) | | | | | | | | | | | | | | (6,534,132 | ) | | | | | | | | | | | | | | 416,182 | | | | | | |
| | | | | | | | | | | | | | | | | | | | | | | | | | | | | | | | | | | | | | | | | | | | | | | | | | | | | | | | | | | | | | | | | | | | | | | | | | | | | | | |
| | | | | | | | | | | | | | | | | | | | | | | | | | | | | | | | | | | | | | | | | | | | | | | | | | | | | | | | | | | | | | | | | | | | | | | | | | | | | | | |
| | | (4,439,851 | ) | | | | | | | | | - | | | | | | | | | | | | | | | (991,068 | ) | | | | | | | | | | | | | | (127,518,905 | ) | | | | | | | | | | | | | | (54,344,731 | ) | | | | | | | | | | | | | | (13,413,325 | ) | | | | | |
| | | (47 | ) | | | | | | | | | (4,068,775 | ) | | | | | | | | | | | | | | 1,318 | | | | | | | | | | | | | | | (636 | ) | | | | | | | | | | | | | | - | | | | | | | | | | | | | | | 621 | | | | | | |
| | | - | | | | | | | | | | - | | | | | | | | | | | | | | | - | | | | | | | | | | | | | | | (18,948 | ) | | | | | | | | | | | | | | 60 | | | | | | | | | | | | | | | - | | | | | | |
| | | - | | | | | | | | | | - | | | | | | | | | | | | | | | - | | | | | | | | | | | | | | | (11,600 | ) | | | | | | | | | | | | | | 1,719,513 | | | | | | | | | | | | | | | - | | | | | | |
| | | (162,004 | ) | | | | | | | | | - | | | | | | | | | | | | | | | (6,624,453 | ) | | | | | | | | | | | | | | (80,514 | ) | | | | | | | | | | | | | | - | | | | | | | | | | | | | | | - | | | | | | |
| | | 12,736 | | | | | | | | | | - | | | | | | | | | | | | | | | - | | | | | | | | | | | | | | | (71,657 | ) | | | | | | | | | | | | | | - | | | | | | | | | | | | | | | - | | | | | | |
| | | - | | | | | | | | | | - | | | | | | | | | | | | | | | - | | | | | | | | | | | | | | | (20,037 | ) | | | | | | | | | | | | | | - | | | | | | | | | | | | | | | - | | | | | | |
| | | | | | | | | | | | | | | | | | | | | | | | | | | | | | | | | | | | | | | | | | | | | | | | | | | | | | | | | | | | | | | | | | | | | | | | | | | | | | | |
| | | (4,589,166 | ) | | | | | | | | | (4,068,775 | ) | | | | | | | | | | | | | | (7,614,203 | ) | | | | | | | | | | | | | | (127,722,297 | ) | | | | | | | | | | | | | | (52,625,158 | ) | | | | | | | | | | | | | | (13,412,704 | ) | | | | | |
| | | | | | | | | | | | | | | | | | | | | | | | | | | | | | | | | | | | | | | | | | | | | | | | | | | | | | | | | | | | | | | | | | | | | | | | | | | | | | | |
| | | (7,060,261 | ) | | | | | | | | | (4,605,033 | ) | | | | | | | | | | | | | | (24,838,790 | ) | | | | | | | | | | | | | | (220,418,668 | ) | | | | | | | | | | | | | | (59,159,290 | ) | | | | | | | | | | | | | | (12,996,522 | ) | | | | | |
| | | | | | | | | | | | | | | | | | | | | | | | | | | | | | | | | | | | | | | | | | | | | | | | | | | | | | | | | | | | | | | | | | | | | | | | | | | | | | | |
| | $ | (5,205,600 | ) | | | | | | | | $ | (3,948,811 | ) | | | | | | | | | | | | | $ | (22,186,879 | ) | | | | | | | | | | | | | $ | (194,017,849 | ) | | | | | | | | | | | | | $ | (30,148,073 | ) | | | | | | | | | | | | | $ | (2,824,053 | ) | | | | | |
| | | | | | | | | | | | | | | | | | | | | | | | | | | | | | | | | | | | | | | | | | | | | | | | | | | | | | | | | | | | | | | | | | | | | | | | | | | | | | | |
Statements of Changes in Net Assets
For the years ended October 31, 2022 and 2021
| | | | | | | | | | | | | | | | | | | | |
| | | Invesco Active U.S. Real Estate
ETF (PSR) | | Invesco Balanced Multi-Asset
Allocation ETF (PSMB) |
| | | 2022 | | 2021 | | 2022 | | 2021 |
Operations: | | | | | | | | | | | | | | | | | | | | |
Net investment income | | | $ | 2,264,090 | | | | $ | 1,752,191 | | | | $ | 865,208 | | | | $ | 279,331 | |
Net realized gain (loss) | | | | 6,256,667 | | | | | 8,106,247 | | | | | 64,639 | | | | | 541,115 | |
Change in net unrealized appreciation (depreciation) | | | | (35,989,852 | ) | | | | 27,432,821 | | | | | (5,900,415 | ) | | | | 1,738,180 | |
| | | | | | | | | | | | | | | | | | | | |
Net increase (decrease) in net assets resulting from operations | | | | (27,469,095 | ) | | | | 37,291,259 | | | | | (4,970,568 | ) | | | | 2,558,626 | |
| | | | | | | | | | | | | | | | | | | | |
| | | | |
Distributions to Shareholders from: | | | | | | | | | | | | | | | | | | | | |
Distributable earnings | | | | (3,208,010 | ) | | | | (2,872,518 | ) | | | | (851,423 | ) | | | | (245,687 | ) |
Return of capital | | | | - | | | | | - | | | | | - | | | | | - | |
| | | | | | | | | | | | | | | | | | | | |
Total distributions to shareholders | | | | (3,208,010 | ) | | | | (2,872,518 | ) | | | | (851,423 | ) | | | | (245,687 | ) |
| | | | | | | | | | | | | | | | | | | | |
| | | | |
Shareholder Transactions: | | | | | | | | | | | | | | | | | | | | |
Proceeds from shares sold | | | | 63,317,998 | | | | | 41,753,739 | | | | | 29,426,264 | | | | | 14,517,098 | |
Value of shares repurchased | | | | (49,964,637 | ) | | | | (24,348,396 | ) | | | | (9,064,426 | ) | | | | (3,221,777 | ) |
| | | | | | | | | | | | | | | | | | | | |
Net increase (decrease) in net assets resulting from share transactions | | | | 13,353,361 | | | | | 17,405,343 | | | | | 20,361,838 | | | | | 11,295,321 | |
| | | | | | | | | | | | | | | | | | | | |
Net increase (decrease) in net assets | | | | (17,323,744 | ) | | | | 51,824,084 | | | | | 14,539,847 | | | | | 13,608,260 | |
| | | | | | | | | | | | | | | | | | | | |
| | | | |
Net assets: | | | | | | | | | | | | | | | | | | | | |
Beginning of year | | | | 130,093,679 | | | | | 78,269,595 | | | | | 21,767,298 | | | | | 8,159,038 | |
| | | | | | | | | | | | | | | | | | | | |
End of year | | | $ | 112,769,935 | | | | $ | 130,093,679 | | | | $ | 36,307,145 | | | | $ | 21,767,298 | |
| | | | | | | | | | | | | | | | | | | | |
| | | | |
Changes in Shares Outstanding: | | | | | | | | | | | | | | | | | | | | |
Shares sold | | | | 610,000 | | | | | 420,000 | | | | | 1,860,000 | | | | | 890,000 | |
Shares repurchased | | | | (500,000 | ) | | | | (240,000 | ) | | | | (600,000 | ) | | | | (210,000 | ) |
Shares outstanding, beginning of year | | | | 1,180,000 | | | | | 1,000,000 | | | | | 1,280,001 | | | | | 600,001 | |
| | | | | | | | | | | | | | | | | | | | |
Shares outstanding, end of year | | | | 1,290,000 | | | | | 1,180,000 | | | | | 2,540,001 | | | | | 1,280,001 | |
| | | | | | | | | | | | | | | | | | | | |
| (a) | For the period November 30, 2020 (commencement of investment operations) through October 31, 2021. |
See accompanying Notes to Financial Statements which are an integral part of the financial statements.
| | | | | | | | | | | | | | | | | | | | | | | | | | | | | | | | | | | | | | | | |
| | | Invesco Conservative Multi-Asset
Allocation ETF (PSMC) | | Invesco Growth Multi-Asset
Allocation ETF (PSMG) | | Invesco High Yield
Bond Factor ETF (IHYF) | | Invesco Moderately Conservative
Multi-Asset Allocation ETF (PSMM) |
| | | 2022 | | 2021 | | 2022 | | 2021 | | 2022 | | 2021(a) | | 2022 | | 2021 |
| | | | | | | | | | | | | | | | | | | | | | | | | | | | | | | | | | | | | | | | |
| | | $ | 441,535 | | | | $ | 257,499 | | | | $ | 592,154 | | | | $ | 238,002 | | | | $ | 1,854,661 | | | | $ | 1,393,289 | | | | $ | 656,222 | | | | $ | 207,379 | |
| | | | (268,343 | ) | | | | 591,830 | | | | | 305,641 | | | | | 283,544 | | | | | (2,471,095 | ) | | | | 239,932 | | | | | (536,258 | ) | | | | 135,286 | |
| | | | (2,294,697 | ) | | | | 118,608 | | | | | (4,252,252 | ) | | | | 2,286,665 | | | | | (4,589,166 | ) | | | | 149,386 | | | | | (4,068,775 | ) | | | | 825,575 | |
| | | | | | | | | | | | | | | | | | | | | | | | | | | | | | | | | | | | | | | | |
| | | | (2,121,505 | ) | | | | 967,937 | | | | | (3,354,457 | ) | | | | 2,808,211 | | | | | (5,205,600 | ) | | | | 1,782,607 | | | | | (3,948,811 | ) | | | | 1,168,240 | |
| | | | | | | | | | | | | | | | | | | | | | | | | | | | | | | | | | | | | | | | |
| | | | | | | | |
| | | | | | | | | | | | | | | | | | | | | | | | | | | | | | | | | | | | | | | | |
| | | | (460,035 | ) | | | | (237,183 | ) | | | | (603,116 | ) | | | | (221,953 | ) | | | | (2,033,283 | ) | | | | (1,401,608 | ) | | | | (563,154 | ) | | | | (157,476 | ) |
| | | | - | | | | | - | | | | | - | | | | | - | | | | | (166,039 | ) | | | | - | | | | | - | | | | | - | |
| | | | | | | | | | | | | | | | | | | | | | | | | | | | | | | | | | | | | | | | |
| | | | (460,035 | ) | | | | (237,183 | ) | | | | (603,116 | ) | | | | (221,953 | ) | | | | (2,199,322 | ) | | | | (1,401,608 | ) | | | | (563,154 | ) | | | | (157,476 | ) |
| | | | | | | | | | | | | | | | | | | | | | | | | | | | | | | | | | | | | | | | |
| | | | | | | | |
| | | | | | | | | | | | | | | | | | | | | | | | | | | | | | | | | | | | | | | | |
| | | | 7,327,955 | | | | | 26,952,467 | | | | | 16,294,064 | | | | | 12,083,425 | | | | | 1,004,724 | | | | | 41,110,278 | | | | | 39,360,995 | | | | | 14,477,305 | |
| | | | (6,621,527 | ) | | | | (21,476,580 | ) | | | | (5,382,346 | ) | | | | (890,037 | ) | | | | (1,070,889 | ) | | | | - | | | | | (31,393,642 | ) | | | | (1,284,126 | ) |
| | | | | | | | | | | | | | | | | | | | | | | | | | | | | | | | | | | | | | | | |
| | | | 706,428 | | | | | 5,475,887 | | | | | 10,911,718 | | | | | 11,193,388 | | | | | (66,165 | ) | | | | 41,110,278 | | | | | 7,967,353 | | | | | 13,193,179 | |
| | | | | | | | | | | | | | | | | | | | | | | | | | | | | | | | | | | | | | | | |
| | | | (1,875,112 | ) | | | | 6,206,641 | | | | | 6,954,145 | | | | | 13,779,646 | | | | | (7,471,087 | ) | | | | 41,491,277 | | | | | 3,455,388 | | | | | 14,203,943 | |
| | | | | | | | | | | | | | | | | | | | | | | | | | | | | | | | | | | | | | | | |
| | | | | | | | |
| | | | | | | | | | | | | | | | | | | | | | | | | | | | | | | | | | | | | | | | |
| | | | 13,909,785 | | | | | 7,703,144 | | | | | 19,396,617 | | | | | 5,616,971 | | | | | 41,491,277 | | | | | - | | | | | 18,237,159 | | | | | 4,033,216 | |
| | | | | | | | | | | | | | | | | | | | | | | | | | | | | | | | | | | | | | | | |
| | | $ | 12,034,673 | | | | $ | 13,909,785 | | | | $ | 26,350,762 | | | | $ | 19,396,617 | | | | $ | 34,020,190 | | | | $ | 41,491,277 | | | | $ | 21,692,547 | | | | $ | 18,237,159 | |
| | | | | | | | | | | | | | | | | | | | | | | | | | | | | | | | | | | | | | | | |
| | | | | | | | |
| | | | | | | | | | | | | | | | | | | | | | | | | | | | | | | | | | | | | | | | |
| | | | 550,000 | | | | | 1,980,000 | | | | | 940,000 | | | | | 680,000 | | | | | 40,000 | | | | | 1,630,001 | | | | | 2,640,000 | | | | | 950,000 | |
| | | | (520,000 | ) | | | | (1,580,000 | ) | | | | (320,000 | ) | | | | (50,000 | ) | | | | (50,000 | ) | | | | - | | | | | (2,160,000 | ) | | | | (90,000 | ) |
| | | | 1,000,001 | | | | | 600,001 | | | | | 1,030,001 | | | | | 400,001 | | | | | 1,630,001 | | | | | - | | | | | 1,160,001 | | | | | 300,001 | |
| | | | | | | | | | | | | | | | | | | | | | | | | | | | | | | | | | | | | | | | |
| | | | 1,030,001 | | | | | 1,000,001 | | | | | 1,650,001 | | | | | 1,030,001 | | | | | 1,620,001 | | | | | 1,630,001 | | | | | 1,640,001 | | | | | 1,160,001 | |
| | | | | | | | | | | | | | | | | | | | | | | | | | | | | | | | | | | | | | | | |
Statements of Changes in Net Assets–(continued)
For the years ended October 31, 2022 and 2021
| | | | | | | | | | | | | | | | | | | | | | | | | | | | | | | | | | | |
| | | Invesco S&P 500® Downside
Hedged ETF (PHDG) | | Invesco Total Return Bond ETF (GTO) |
| | | 2022 | | | | 2021 | | 2022 | | | | 2021 |
Operations: | | | | | | | | | | | | | | | | | | | | | | | | | | | | | | | | | | | |
Net investment income | | | $ | 2,651,911 | | | | | | | | | $ | 892,506 | | | | | | | | | $ | 26,400,819 | | | | | | | | | $ | 13,733,102 | |
Net realized gain (loss) | | | | (17,224,587 | ) | | | | | | | | | 12,023,258 | | | | | | | | | | (92,696,371 | ) | | | | | | | | | (136,638 | ) |
Change in net unrealized appreciation (depreciation) | | | | (7,614,203 | ) | | | | | | | | | 7,842,478 | | | | | | | | | | (127,722,297 | ) | | | | | | | | | (2,849,319 | ) |
| | | | | | | | | | | | | | | | | | | | | | | | | | | | | | | | | | | |
Net increase (decrease) in net assets resulting from operations | | | | (22,186,879 | ) | | | | | | | | | 20,758,242 | | | | | | | | | | (194,017,849 | ) | | | | | | | | | 10,747,145 | |
| | | | | | | | | | | | | | | | | | | | | | | | | | | | | | | | | | | |
| | | | | | | |
Distributions to Shareholders from: | | | | | | | | | | | | | | | | | | | | | | | | | | | | | | | | | | | |
Distributable earnings | | | | (2,159,005 | ) | | | | | | | | | (849,261 | ) | | | | | | | | | (27,071,935 | ) | | | | | | | | | (23,394,492 | ) |
| | | | | | | | | | | | | | | | | | | | | | | | | | | | | | | | | | | |
| | | | | | | |
Shareholder Transactions: | | | | | | | | | | | | | | | | | | | | | | | | | | | | | | | | | | | |
Proceeds from shares sold | | | | 273,519,437 | | | | | | | | | | 197,749,727 | | | | | | | | | | 339,347,967 | | | | | | | | | | 591,077,610 | |
Value of shares repurchased | | | | (219,854,579 | ) | | | | | | | | | (110,323,541 | ) | | | | | | | | | (376,751,352 | ) | | | | | | | | | (45,280,486 | ) |
| | | | | | | | | | | | | | | | | | | | | | | | | | | | | | | | | | | |
Net increase (decrease) in net assets resulting from share transactions | | | | 53,664,858 | | | | | | | | | | 87,426,186 | | | | | | | | | | (37,403,385 | ) | | | | | | | | | 545,797,124 | |
| | | | | | | | | | | | | | | | | | | | | | | | | | | | | | | | | | | |
Net increase (decrease) in net assets | | | | 29,318,974 | | | | | | | | | | 107,335,167 | | | | | | | | | | (258,493,169 | ) | | | | | | | | | 533,149,777 | |
| | | | | | | | | | | | | | | | | | | | | | | | | | | | | | | | | | | |
| | | | | | | |
Net assets: | | | | | | | | | | | | | | | | | | | | | | | | | | | | | | | | | | | |
Beginning of year | | | | 250,377,451 | | | | | | | | | | 143,042,284 | | | | | | | | | | 996,606,609 | | | | | | | | | | 463,456,832 | |
| | | | | | | | | | | | | | | | | | | | | | | | | | | | | | | | | | | |
End of year | | | $ | 279,696,425 | | | | | | | | | $ | 250,377,451 | | | | | | | | | $ | 738,113,440 | | | | | | | | | $ | 996,606,609 | |
| | | | | | | | | | | | | | | | | | | | | | | | | | | | | | | | | | | |
| | | | | | | |
Changes in Shares Outstanding: | | | | | | | | | | | | | | | | | | | | | | | | | | | | | | | | | | | |
Shares sold | | | | 7,450,000 | | | | | | | | | | 5,600,000 | | | | | | | | | | 6,450,000 | | | | | | | | | | 10,350,000 | |
Shares repurchased | | | | (6,300,000 | ) | | | | | | | | | (3,200,000 | ) | | | | | | | | | (7,550,000 | ) | | | | | | | | | (800,000 | ) |
Shares outstanding, beginning of year | | | | 6,800,000 | | | | | | | | | | 4,400,000 | | | | | | | | | | 17,600,000 | | | | | | | | | | 8,050,000 | |
| | | | | | | | | | | | | | | | | | | | | | | | | | | | | | | | | | | |
Shares outstanding, end of year | | | | 7,950,000 | | | | | | | | | | 6,800,000 | | | | | | | | | | 16,500,000 | | | | | | | | | | 17,600,000 | |
| | | | | | | | | | | | | | | | | | | | | | | | | | | | | | | | | | | |
See accompanying Notes to Financial Statements which are an integral part of the financial statements.
| | | | | | | | | | | | | | | | | | | | | | | | | | | | |
| | | Invesco Ultra Short Duration ETF (GSY) | | | Invesco Variable Rate Investment
Grade ETF (VRIG) | |
| | | 2022 | | | | | | 2021 | | | 2022 | | | | | | 2021 | |
| | | | | | | | | | | | | | | | | | | | | | | | | | | | |
| | $ | 29,011,217 | | | | | | | $ | 18,990,157 | | | | | | | $ | 10,172,469 | | | | | | | $ | 3,587,926 | |
| | | (6,534,132 | ) | | | | | | | 2,218,969 | | | | | | | | 416,182 | | | | | | | | 497,407 | |
| | | (52,625,158 | ) | | | | | | | (10,628,974 | ) | | | | | | | (13,412,704 | ) | | | | | | | 3,235,602 | |
| | | | | | | | | | | | | | | | | | | | | | | | | | | | |
| | | (30,148,073 | ) | | | | | | | 10,580,152 | | | | | | | | (2,824,053 | ) | | | | | | | 7,320,935 | |
| | | | | | | | | | | | | | | | | | | | | | | | | | | | |
| | | | | | | |
| | | | | | | | | | | | | | | | | | | | | | | | | | | | |
| | | (26,604,416 | ) | | | | | | | (19,527,454 | ) | | | | | | | (9,861,832 | ) | | | | | | | (3,754,424 | ) |
| | | | | | | | | | | | | | | | | | | | | | | | | | | | |
| | | | | | | |
| | | | | | | | | | | | | | | | | | | | | | | | | | | | |
| | | 184,509,896 | | | | | | | | 298,120,823 | | | | | | | | 244,635,632 | | | | | | | | 107,814,462 | |
| | | (961,961,493 | ) | | | | | | | (358,552,341 | ) | | | | | | | (132,275,441 | ) | | | | | | | (92,749,796 | ) |
| | | | | | | | | | | | | | | | | | | | | | | | | | | | |
| | | (777,451,597 | ) | | | | | | | (60,431,518 | ) | | | | | | | 112,360,191 | | | | | | | | 15,064,666 | |
| | | | | | | | | | | | | | | | | | | | | | | | | | | | |
| | | (834,204,086 | ) | | | | | | | (69,378,820 | ) | | | | | | | 99,674,306 | | | | | | | | 18,631,177 | |
| | | | | | | | | | | | | | | | | | | | | | | | | | | | |
| | | | | | | |
| | | | | | | | | | | | | | | | | | | | | | | | | | | | |
| | | 2,942,228,219 | | | | | | | | 3,011,607,039 | | | | | | | | 471,652,275 | | | | | | | | 453,021,098 | |
| | | | | | | | | | | | | | | | | | | | | | | | | | | | |
| | $ | 2,108,024,133 | | | | | | | $ | 2,942,228,219 | | | | | | | $ | 571,326,581 | | | | | | | $ | 471,652,275 | |
| | | | | | | | | | | | | | | | | | | | | | | | | | | | |
| | | | | | | |
| | | | | | | | | | | | | | | | | | | | | | | | | | | | |
| | | 3,700,000 | | | | | | | | 5,900,000 | | | | | | | | 9,800,000 | | | | | | | | 4,300,000 | |
| | | (19,300,000 | ) | | | | | | | (7,100,000 | ) | | | | | | | (5,350,000 | ) | | | | | | | (3,700,000 | ) |
| | | 58,400,000 | | | | | | | | 59,600,000 | | | | | | | | 18,800,001 | | | | | | | | 18,200,001 | |
| | | | | | | | | | | | | | | | | | | | | | | | | | | | |
| | | 42,800,000 | | | | | | | | 58,400,000 | | | | | | | | 23,250,001 | | | | | | | | 18,800,001 | |
| | | | | | | | | | | | | | | | | | | | | | | | | | | | |
Financial Highlights
Invesco Active U.S. Real Estate ETF (PSR)
| | | | | | | | | | | | | | | | | | | | |
| | | | | | | | | | | | | | | | |
| | | Years Ended October 31, | |
| | | 2022 | | | 2021 | | | 2020 | | | 2019 | | | 2018 | |
Per Share Operating Performance: | | | | | | | | | | | | | | | | | | | | |
Net asset value at beginning of year | | $ | 110.25 | | | $ | 78.27 | | | $ | 97.24 | | | $ | 79.45 | | | $ | 80.07 | |
| | | | | | | | | | | | | | | | | | | | |
Net investment income(a) | | | 1.83 | | | | 1.59 | | | | 2.11 | | | | 2.16 | | | | 2.05 | |
Net realized and unrealized gain (loss) on investments | | | (22.07 | ) | | | 32.99 | | | | (18.34 | ) | | | 18.01 | | | | (1.24 | ) |
| | | | | | | | | | | | | | | | | | | | |
Total from investment operations | | | (20.24 | ) | | | 34.58 | | | | (16.23 | ) | | | 20.17 | | | | 0.81 | |
| | | | | | | | | | | | | | | | | | | | |
Distributions to shareholders from: | | | | | | | | | | | | | | | | | | | | |
Net investment income | | | (2.59 | ) | | | (2.60 | ) | | | (2.74 | ) | | | (2.38 | ) | | | (1.43 | ) |
| | | | | | | | | | | | | | | | | | | | |
Net asset value at end of year | | $ | 87.42 | | | $ | 110.25 | | | $ | 78.27 | | | $ | 97.24 | | | $ | 79.45 | |
| | | | | | | | | | | | | | | | | | | | |
Market price at end of year(b) | | $ | 87.45 | | | $ | 110.26 | | | $ | 78.23 | | | $ | 97.13 | | | $ | 79.30 | |
| | | | | | | | | | | | | | | | | | | | |
Net Asset Value Total Return(c) | | | (18.66 | )% | | | 44.71 | % | | | (16.56 | )% | | | 25.82 | % | | | 1.02 | % |
Market Price Total Return(c) | | | (18.65 | )% | | | 44.82 | % | | | (16.52 | )% | | | 25.90 | % | | | 0.87 | % |
Ratios/Supplemental Data: | | | | | | | | | | | | | | | | | | | | |
Net assets at end of year (000’s omitted) | | $ | 112,770 | | | $ | 130,094 | | | $ | 78,270 | | | $ | 121,552 | | | $ | 27,807 | |
Ratio to average net assets of: | | | | | | | | | | | | | | | | | | | | |
Expenses | | | 0.35 | % | | | 0.35 | % | | | 0.35 | % | | | 0.35 | % | | | 0.53 | % |
Net investment income | | | 1.77 | % | | | 1.61 | % | | | 2.46 | % | | | 2.40 | % | | | 2.58 | % |
Portfolio turnover rate(d) | | | 68 | % | | | 83 | % | | | 51 | % | | | 30 | % | | | 92 | % |
| (a) | Based on average shares outstanding. |
| (b) | The mean between the last bid and ask prices. |
| (c) | Net asset value total return is calculated assuming an initial investment made at the net asset value at the beginning of the period, reinvestment of all dividends and distributions at net asset value during the period, and redemption at net asset value on the last day of the period. Net asset value total return includes adjustments in accordance with accounting principles generally accepted in the United States of America and as such, the net asset value for financial reporting purposes and the returns based upon those net asset values may differ from the net asset value and returns for shareholder transactions. Market price total return is calculated assuming an initial investment made at the market price at the beginning of the period, reinvestment of all dividends and distributions at market price during the period, and sale at the market price on the last day of the period. Total investment returns calculated for a period of less than one year are not annualized. |
| (d) | Portfolio turnover rate is not annualized for periods less than one year, if applicable, and does not include securities received or delivered from processing creations or redemptions. |
See accompanying Notes to Financial Statements which are an integral part of the financial statements.
Financial Highlights–(continued)
Invesco Balanced Multi-Asset Allocation ETF (PSMB)
| | | | | | | | | | | | | | | | | | | | |
| | | | | | | | | | | | | | | | |
| | | Years Ended October 31, | |
| | | 2022 | | | 2021 | | | 2020 | | | 2019 | | | 2018 | |
Per Share Operating Performance: | | | | | | | | | | | | | | | | | | | | |
Net asset value at beginning of year | | $ | 17.01 | | | $ | 13.60 | | | $ | 14.15 | | | $ | 13.10 | | | $ | 13.32 | |
| | | | | | | | | | | | | | | | | | | | |
Net investment income(a)(b) | | | 0.46 | | | | 0.33 | | | | 0.37 | | | | 0.38 | | | | 0.36 | |
Net realized and unrealized gain (loss) on investments | | | (2.74 | ) | | | 3.39 | | | | (0.12 | ) | | | 1.09 | | | | (0.23 | ) |
| | | | | | | | | | | | | | | | | | | | |
Total from investment operations | | | (2.28 | ) | | | 3.72 | | | | 0.25 | | | | 1.47 | | | | 0.13 | |
| | | | | | | | | | | | | | | | | | | | |
Distributions to shareholders from: | | | | | | | | | | | | | | | | | | | | |
Net investment income | | | (0.44 | ) | | | (0.31 | ) | | | (0.45 | ) | | | (0.38 | ) | | | (0.32 | ) |
Net realized gains | | | - | | | | - | | | | (0.35 | ) | | | (0.04 | ) | | | (0.03 | ) |
| | | | | | | | | | | | | | | | | | | | |
Total distributions | | | (0.44 | ) | | | (0.31 | ) | | | (0.80 | ) | | | (0.42 | ) | | | (0.35 | ) |
| | | | | | | | | | | | | | | | | | | | |
Net asset value at end of year | | $ | 14.29 | | | $ | 17.01 | | | $ | 13.60 | | | $ | 14.15 | | | $ | 13.10 | |
| | | | | | | | | | | | | | | | | | | | |
Market price at end of year(c) | | $ | 14.29 | | | $ | 16.99 | | | $ | 13.57 | | | $ | 14.17 | | | $ | 13.14 | |
| | | | | | | | | | | | | | | | | | | | |
Net Asset Value Total Return(d) | | | (13.54 | )% | | | 27.55 | % | | | 1.86 | % | | | 11.57 | % | | | 0.89 | % |
Market Price Total Return(d) | | | (13.44 | )% | | | 27.68 | % | | | 1.49 | % | | | 11.37 | % | | | 1.12 | % |
Ratios/Supplemental Data: | | | | | | | | | | | | | | | | | | | | |
Net assets at end of year (000’s omitted) | | $ | 36,307 | | | $ | 21,767 | | | $ | 8,159 | | | $ | 4,246 | | | $ | 2,620 | |
Ratio to average net assets of: | | | | | | | | | | | | | | | | | | | | |
Expenses(e) | | | 0.05 | % | | | 0.05 | % | | | 0.05 | % | | | 0.11 | %(f) | | | 0.05 | % |
Net investment income(b) | | | 2.96 | % | | | 2.02 | % | | | 2.72 | % | | | 2.81 | %(f) | | | 2.68 | % |
Portfolio turnover rate(g) | | | 32 | % | | | 28 | % | | | 50 | % | | | 56 | % | | | 26 | % |
| (a) | Based on average shares outstanding. |
| (b) | Net investment income (loss) is affected by the timing of the declaration of dividends by the underlying funds in which the Fund invests. Ratio of net investment income (loss) does not include net investment income of the underlying funds in which the Fund invests. |
| (c) | The mean between the last bid and ask prices. |
| (d) | Net asset value total return is calculated assuming an initial investment made at the net asset value at the beginning of the period, reinvestment of all dividends and distributions at net asset value during the period, and redemption at net asset value on the last day of the period. Net asset value total return includes adjustments in accordance with accounting principles generally accepted in the United States of America and as such, the net asset value for financial reporting purposes and the returns based upon those net asset values may differ from the net asset value and returns for shareholder transactions. Market price total return is calculated assuming an initial investment made at the market price at the beginning of the period, reinvestment of all dividends and distributions at market price during the period, and sale at the market price on the last day of the period. Total investment returns calculated for a period of less than one year are not annualized. |
| (e) | In addition to the fees and expenses which the Fund bears directly, the Fund indirectly bears a pro rata share of the fees and expenses of the investment companies in which the Fund invests. Estimated investment companies’ expenses are not expenses that are incurred directly by the Fund. They are expenses that are incurred directly by the investment companies and are deducted from the value of the investment companies the Fund invests in. The effect of the estimated investment companies’ expenses that the Fund bears indirectly is included in the Fund’s total return. |
| (f) | Ratios include non-recurring costs associated with a proxy statement of 0.06%. |
| (g) | Portfolio turnover rate is not annualized for periods less than one year, if applicable, and does not include securities received or delivered from processing creations or redemptions. |
See accompanying Notes to Financial Statements which are an integral part of the financial statements.
Financial Highlights–(continued)
Invesco Conservative Multi-Asset Allocation ETF (PSMC)
| | | | | | | | | | | | | | | | | | | | |
| | | | | | | | | | | | | | | | |
| | | Years Ended October 31, | |
| | | 2022 | | | 2021 | | | 2020 | | | 2019 | | | 2018 | |
Per Share Operating Performance: | | | | | | | | | | | | | | | | | | | | |
Net asset value at beginning of year | | $ | 13.91 | | | $ | 12.84 | | | $ | 13.02 | | | $ | 12.49 | | | $ | 12.87 | |
| | | | | | | | | | | | | | | | | | | | |
Net investment income(a)(b) | | | 0.39 | | | | 0.35 | | | | 0.38 | | | | 0.46 | | | | 0.44 | |
Net realized and unrealized gain (loss) on investments | | | (2.20 | ) | | | 1.07 | | | | 0.09 | | | | 0.73 | | | | (0.38 | ) |
| | | | | | | | | | | | | | | | | | | | |
Total from investment operations | | | (1.81 | ) | | | 1.42 | | | | 0.47 | | | | 1.19 | | | | 0.06 | |
| | | | | | | | | | | | | | | | | | | | |
Distributions to shareholders from: | | | | | | | | | | | | | | | | | | | | |
Net investment income | | | (0.41 | ) | | | (0.35 | ) | | | (0.36 | ) | | | (0.66 | ) | | | (0.42 | ) |
Net realized gains | | | (0.01 | ) | | | - | | | | (0.29 | ) | | | - | | | | (0.02 | ) |
| | | | | | | | | | | | | | | | | | | | |
Total distributions | | | (0.42 | ) | | | (0.35 | ) | | | (0.65 | ) | | | (0.66 | ) | | | (0.44 | ) |
| | | | | | | | | | | | | | | | | | | | |
Net asset value at end of year | | $ | 11.68 | | | $ | 13.91 | | | $ | 12.84 | | | $ | 13.02 | | | $ | 12.49 | |
| | | | | | | | | | | | | | | | | | | | |
Market price at end of year(c) | | $ | 11.68 | | | $ | 13.92 | | | $ | 12.82 | | | $ | 13.04 | | | $ | 12.49 | |
| | | | | | | | | | | | | | | | | | | | |
Net Asset Value Total Return(d) | | | (13.22 | )% | | | 11.18 | % | | | 3.84 | % | | | 9.80 | % | | | 0.39 | % |
Market Price Total Return(d) | | | (13.29 | )% | | | 11.44 | % | | | 3.51 | % | | | 9.96 | % | | | 0.31 | % |
Ratios/Supplemental Data: | | | | | | | | | | | | | | | | | | | | |
Net assets at end of year (000’s omitted) | | $ | 12,035 | | | $ | 13,910 | | | $ | 7,703 | | | $ | 3,905 | | | $ | 1,249 | |
Ratio to average net assets of: | | | | | | | | | | | | | | | | | | | | |
Expenses(e) | | | 0.05 | % | | | 0.05 | % | | | 0.05 | % | | | 0.09 | %(f) | | | 0.05 | % |
Net investment income(b) | | | 3.05 | % | | | 2.56 | % | | | 3.01 | % | | | 3.60 | %(f) | | | 3.42 | % |
Portfolio turnover rate(g) | | | 26 | % | | | 33 | % | | | 41 | % | | | 32 | % | | | 38 | % |
| (a) | Based on average shares outstanding. |
| (b) | Net investment income (loss) is affected by the timing of the declaration of dividends by the underlying funds in which the Fund invests. Ratio of net investment income (loss) does not include net investment income of the underlying funds in which the Fund invests. |
| (c) | The mean between the last bid and ask prices. |
| (d) | Net asset value total return is calculated assuming an initial investment made at the net asset value at the beginning of the period, reinvestment of all dividends and distributions at net asset value during the period, and redemption at net asset value on the last day of the period. Net asset value total return includes adjustments in accordance with accounting principles generally accepted in the United States of America and as such, the net asset value for financial reporting purposes and the returns based upon those net asset values may differ from the net asset value and returns for shareholder transactions. Market price total return is calculated assuming an initial investment made at the market price at the beginning of the period, reinvestment of all dividends and distributions at market price during the period, and sale at the market price on the last day of the period. Total investment returns calculated for a period of less than one year are not annualized. |
| (e) | In addition to the fees and expenses which the Fund bears directly, the Fund indirectly bears a pro rata share of the fees and expenses of the investment companies in which the Fund invests. Estimated investment companies’ expenses are not expenses that are incurred directly by the Fund. They are expenses that are incurred directly by the investment companies and are deducted from the value of the investment companies the Fund invests in. The effect of the estimated investment companies’ expenses that the Fund bears indirectly is included in the Fund’s total return. |
| (f) | Ratios include non-recurring costs associated with a proxy statement of 0.04%. |
| (g) | Portfolio turnover rate is not annualized for periods less than one year, if applicable, and does not include securities received or delivered from processing creations or redemptions. |
See accompanying Notes to Financial Statements which are an integral part of the financial statements.
Financial Highlights–(continued)
Invesco Growth Multi-Asset Allocation ETF (PSMG)
| | | | | | | | | | | | | | | | | | | | |
| | | | | | | | | | | | | | | | |
| | | Years Ended October 31, | |
| | | 2022 | | | 2021 | | | 2020 | | | 2019 | | | 2018 | |
Per Share Operating Performance: | | | | | | | | | | | | | | | | | | | | |
Net asset value at beginning of year | | $ | 18.83 | | | $ | 14.04 | | | $ | 14.67 | | | $ | 13.45 | | | $ | 13.56 | |
| | | | | | | | | | | | | | | | | | | | |
Net investment income(a)(b) | | | 0.45 | | | | 0.34 | | | | 0.42 | | | | 0.38 | | | | 0.35 | |
Net realized and unrealized gain (loss) on investments | | | (2.84 | ) | | | 4.77 | | | | (0.49 | ) | | | 1.23 | | | | (0.15 | ) |
| | | | | | | | | | | | | | | | | | | | |
Total from investment operations | | | (2.39 | ) | | | 5.11 | | | | (0.07 | ) | | | 1.61 | | | | 0.20 | |
| | | | | | | | | | | | | | | | | | | | |
Distributions to shareholders from: | | | | | | | | | | | | | | | | | | | | |
Net investment income | | | (0.47 | ) | | | (0.32 | ) | | | (0.34 | ) | | | (0.35 | ) | | | (0.28 | ) |
Net realized gains | | | - | | | | - | | | | (0.22 | ) | | | (0.04 | ) | | | (0.03 | ) |
| | | | | | | | | | | | | | | | | | | | |
Total distributions | | | (0.47 | ) | | | (0.32 | ) | | | (0.56 | ) | | | (0.39 | ) | | | (0.31 | ) |
| | | | | | | | | | | | | | | | | | | | |
Net asset value at end of year | | $ | 15.97 | | | $ | 18.83 | | | $ | 14.04 | | | $ | 14.67 | | | $ | 13.45 | |
| | | | | | | | | | | | | | | | | | | | |
Market price at end of year(c) | | $ | 15.98 | | | $ | 18.83 | | | $ | 14.05 | | | $ | 14.69 | | | $ | 13.50 | |
| | | | | | | | | | | | | | | | | | | | |
Net Asset Value Total Return(d) | | | (12.83 | )% | | | 36.68 | % | | | (0.45 | )% | | | 12.24 | % | | | 1.43 | % |
Market Price Total Return(d) | | | (12.78 | )% | | | 36.58 | % | | | (0.52 | )% | | | 11.97 | % | | | 1.58 | % |
Ratios/Supplemental Data: | | | | | | | | | | | | | | | | | | | | |
Net assets at end of year (000’s omitted) | | $ | 26,351 | | | $ | 19,397 | | | $ | 5,617 | | | $ | 4,400 | | | $ | 2,691 | |
Ratio to average net assets of: | | | | | | | | | | | | | | | | | | | | |
Expenses(e) | | | 0.05 | % | | | 0.05 | % | | | 0.05 | % | | | 0.10 | %(f) | | | 0.05 | % |
Net investment income(b) | | | 2.61 | % | | | 1.92 | % | | | 3.01 | % | | | 2.70 | %(f) | | | 2.51 | % |
Portfolio turnover rate(g) | | | 34 | % | | | 25 | % | | | 43 | % | | | 81 | % | | | 21 | % |
| (a) | Based on average shares outstanding. |
| (b) | Net investment income (loss) is affected by the timing of the declaration of dividends by the underlying funds in which the Fund invests. Ratio of net investment income (loss) does not include net investment income of the underlying funds in which the Fund invests. |
| (c) | The mean between the last bid and ask prices. |
| (d) | Net asset value total return is calculated assuming an initial investment made at the net asset value at the beginning of the period, reinvestment of all dividends and distributions at net asset value during the period, and redemption at net asset value on the last day of the period. Net asset value total return includes adjustments in accordance with accounting principles generally accepted in the United States of America and as such, the net asset value for financial reporting purposes and the returns based upon those net asset values may differ from the net asset value and returns for shareholder transactions. Market price total return is calculated assuming an initial investment made at the market price at the beginning of the period, reinvestment of all dividends and distributions at market price during the period, and sale at the market price on the last day of the period. Total investment returns calculated for a period of less than one year are not annualized. |
| (e) | In addition to the fees and expenses which the Fund bears directly, the Fund indirectly bears a pro rata share of the fees and expenses of the investment companies in which the Fund invests. Estimated investment companies’ expenses are not expenses that are incurred directly by the Fund. They are expenses that are incurred directly by the investment companies and are deducted from the value of the investment companies the Fund invests in. The effect of the estimated investment companies’ expenses that the Fund bears indirectly is included in the Fund’s total return. |
| (f) | Ratios include non-recurring costs associated with a proxy statement of 0.05%. |
| (g) | Portfolio turnover rate is not annualized for periods less than one year, if applicable, and does not include securities received or delivered from processing creations or redemptions. |
See accompanying Notes to Financial Statements which are an integral part of the financial statements.
Financial Highlights–(continued)
Invesco High Yield Bond Factor ETF (IHYF)
| | | | | | | | | | | | | | | |
| | | Year Ended
October 31,
2022 | | | | For the Period
November 30, 2020(a)
Through
October 31,
2021 |
Per Share Operating Performance: | | | | | | | | | | | | | | | |
Net asset value at beginning of period | | | $ | 25.45 | | | | | | | | | $ | 25.00 | |
| | | | | | | | | | | | | | | |
Net investment income(b) | | | | 1.12 | | | | | | | | | | 0.97 | |
Net realized and unrealized gain (loss) on investments | | | | (4.14 | ) | | | | | | | | | 0.43 | |
| | | | | | | | | | | | | | | |
Total from investment operations | | | | (3.02 | ) | | | | | | | | | 1.40 | |
| | | | | | | | | | | | | | | |
Distributions to shareholders from: | | | | | | | | | | | | | | | |
Net investment income | | | | (1.22 | ) | | | | | | | | | (0.95 | ) |
Net realized gains | | | | (0.11 | ) | | | | | | | | | - | |
Return of capital | | | | (0.10 | ) | | | | | | | | | - | |
| | | | | | | | | | | | | | | |
Total distributions | | | | (1.43 | ) | | | | | | | | | (0.95 | ) |
| | | | | | | | | | | | | | | |
Net asset value at end of period | | | $ | 21.00 | | | | | | | | | $ | 25.45 | |
| | | | | | | | | | | | | | | |
Market price at end of period(c) | | | $ | 21.05 | | | | | | | | | $ | 25.51 | |
| | | | | | | | | | | | | | | |
Net Asset Value Total Return(d) | | | | (12.57 | )% | | | | | | | | | 5.65 | %(e) |
Market Price Total Return(d) | | | | (12.59 | )% | | | | | | | | | 5.88 | %(e) |
Ratios/Supplemental Data: | | | | | | | | | | | | | | | |
Net assets at end of period (000’s omitted) | | | $ | 34,020 | | | | | | | | | $ | 41,491 | |
Ratio to average net assets of: | | | | | | | | | | | | | | | |
Expenses | | | | 0.39 | % | | | | | | | | | 0.40 | %(f) |
Net investment income | | | | 4.82 | % | | | | | | | | | 4.14 | %(f) |
Portfolio turnover rate(g) | | | | 71 | % | | | | | | | | | 49 | % |
| (a) | Commencement of investment operations. |
| (b) | Based on average shares outstanding. |
| (c) | The mean between the last bid and ask prices. |
| (d) | Net asset value total return is calculated assuming an initial investment made at the net asset value at the beginning of the period, reinvestment of all dividends and distributions at net asset value during the period, and redemption at net asset value on the last day of the period. Net asset value total return includes adjustments in accordance with accounting principles generally accepted in the United States of America and as such, the net asset value for financial reporting purposes and the returns based upon those net asset values may differ from the net asset value and returns for shareholder transactions. Market price total return is calculated assuming an initial investment made at the market price at the beginning of the period, reinvestment of all dividends and distributions at market price during the period, and sale at the market price on the last day of the period. Total investment returns calculated for a period of less than one year are not annualized. |
| (e) | The net asset value total return from Fund Inception (December 2, 2020, the first day of trading on the exchange) to October 31, 2021 was 5.39%. The market price total return from Fund Inception to October 31, 2021 was 5.30%. |
| (g) | Portfolio turnover rate is not annualized for periods less than one year, if applicable, and does not include securities received or delivered from processing creations or redemptions. |
See accompanying Notes to Financial Statements which are an integral part of the financial statements.
Financial Highlights–(continued)
Invesco Moderately Conservative Multi-Asset Allocation ETF (PSMM)
| | | | | | | | | | | | | | | | | | | | |
| | | | | | | | | | | | | | | | |
| | | Years Ended October 31, | |
| | | 2022 | | | 2021 | | | 2020 | | | 2019 | | | 2018 | |
Per Share Operating Performance: | | | | | | | | | | | | | | | | | | | | |
Net asset value at beginning of year | | $ | 15.72 | | | $ | 13.44 | | | $ | 13.79 | | | $ | 12.76 | | | $ | 13.10 | |
| | | | | | | | | | | | | | | | | | | | |
Net investment income(a)(b) | | | 0.42 | | | | 0.34 | | | | 0.40 | | | | 0.46 | | | | 0.40 | |
Net realized and unrealized gain (loss) on investments | | | (2.52 | ) | | | 2.24 | | | | (0.08 | ) | | | 0.94 | | | | (0.34 | ) |
| | | | | | | | | | | | | | | | | | | | |
Total from investment operations | | | (2.10 | ) | | | 2.58 | | | | 0.32 | | | | 1.40 | | | | 0.06 | |
| | | | | | | | | | | | | | | | | | | | |
Distributions to shareholders from: | | | | | | | | | | | | | | | | | | | | |
Net investment income | | | (0.39 | ) | | | (0.30 | ) | | | (0.42 | ) | | | (0.36 | ) | | | (0.37 | ) |
Net realized gains | | | - | | | | - | | | | (0.25 | ) | | | (0.01 | ) | | | (0.03 | ) |
| | | | | | | | | | | | | | | | | | | | |
Total distributions | | | (0.39 | ) | | | (0.30 | ) | | | (0.67 | ) | | | (0.37 | ) | | | (0.40 | ) |
| | | | | | | | | | | | | | | | | | | | |
Net asset value at end of year | | $ | 13.23 | | | $ | 15.72 | | | $ | 13.44 | | | $ | 13.79 | | | $ | 12.76 | |
| | | | | | | | | | | | | | | | | | | | |
Market price at end of year(c) | | $ | 13.23 | | | $ | 15.74 | | | $ | 13.43 | | | $ | 13.82 | | | $ | 12.78 | |
| | | | | | | | | | | | | | | | | | | | |
Net Asset Value Total Return(d) | | | (13.56 | )% | | | 19.34 | % | | | 2.55 | % | | | 11.22 | % | | | 0.40 | % |
Market Price Total Return(d) | | | (13.68 | )% | | | 19.57 | % | | | 2.25 | % | | | 11.28 | % | | | 0.41 | % |
Ratios/Supplemental Data: | | | | | | | | | | | | | | | | | | | | |
Net assets at end of year (000’s omitted) | | $ | 21,693 | | | $ | 18,237 | | | $ | 4,033 | | | $ | 5,516 | | | $ | 1,276 | |
Ratio to average net assets of: | | | | | | | | | | | | | | | | | | | | |
Expenses(e) | | | 0.05 | % | | | 0.05 | % | | | 0.05 | % | | | 0.11 | %(f) | | | 0.05 | % |
Net investment income(b) | | | 2.89 | % | | | 2.20 | % | | | 2.98 | % | | | 3.48 | %(f) | | | 3.03 | % |
Portfolio turnover rate(g) | | | 33 | % | | | 27 | % | | | 43 | % | | | 65 | % | | | 32 | % |
| (a) | Based on average shares outstanding. |
| (b) | Net investment income (loss) is affected by the timing of the declaration of dividends by the underlying funds in which the Fund invests. Ratio of net investment income (loss) does not include net investment income of the underlying funds in which the Fund invests. |
| (c) | The mean between the last bid and ask prices. |
| (d) | Net asset value total return is calculated assuming an initial investment made at the net asset value at the beginning of the period, reinvestment of all dividends and distributions at net asset value during the period, and redemption at net asset value on the last day of the period. Net asset value total return includes adjustments in accordance with accounting principles generally accepted in the United States of America and as such, the net asset value for financial reporting purposes and the returns based upon those net asset values may differ from the net asset value and returns for shareholder transactions. Market price total return is calculated assuming an initial investment made at the market price at the beginning of the period, reinvestment of all dividends and distributions at market price during the period, and sale at the market price on the last day of the period. Total investment returns calculated for a period of less than one year are not annualized. |
| (e) | In addition to the fees and expenses which the Fund bears directly, the Fund indirectly bears a pro rata share of the fees and expenses of the investment companies in which the Fund invests. Estimated investment companies’ expenses are not expenses that are incurred directly by the Fund. They are expenses that are incurred directly by the investment companies and are deducted from the value of the investment companies the Fund invests in. The effect of the estimated investment companies’ expenses that the Fund bears indirectly is included in the Fund’s total return. |
| (f) | Ratios include non-recurring costs associated with a proxy statement of 0.06%. |
| (g) | Portfolio turnover rate is not annualized for periods less than one year, if applicable, and does not include securities received or delivered from processing creations or redemptions. |
See accompanying Notes to Financial Statements which are an integral part of the financial statements.
Financial Highlights–(continued)
Invesco S&P 500® Downside Hedged ETF (PHDG)
| | | | | | | | | | | | | | | | | | | | |
| | | | | | | | | | | | | | | | |
| | | Years Ended October 31, | |
| | | 2022 | | | 2021 | | | 2020 | | | 2019 | | | 2018 | |
Per Share Operating Performance: | | | | | | | | | | | | | | | | | | | | |
Net asset value at beginning of year | | $ | 36.82 | | | $ | 32.51 | | | $ | 26.72 | | | $ | 27.92 | | | $ | 26.67 | |
| | | | | | | | | | | | | | | | | | | | |
Net investment income(a) | | | 0.30 | | | | 0.18 | | | | 0.21 | | | | 0.46 | | | | 0.41 | |
Net realized and unrealized gain (loss) on investments | | | (1.69 | ) | | | 4.31 | | | | 5.94 | | | | (1.21 | ) | | | 1.36 | |
| | | | | | | | | | | | | | | | | | | | |
Total from investment operations | | | (1.39 | ) | | | 4.49 | | | | 6.15 | | | | (0.75 | ) | | | 1.77 | |
| | | | | | | | | | | | | | | | | | | | |
Distributions to shareholders from: | | | | | | | | | | | | | | | | | | | | |
Net investment income | | | (0.25 | ) | | | (0.18 | ) | | | (0.36 | ) | | | (0.45 | ) | | | (0.52 | ) |
| | | | | | | | | | | | | | | | | | | | |
Net asset value at end of year | | $ | 35.18 | | | $ | 36.82 | | | $ | 32.51 | | | $ | 26.72 | | | $ | 27.92 | |
| | | | | | | | | | | | | | | | | | | | |
Market price at end of year(b) | | $ | 35.24 | | | $ | 36.78 | | | $ | 32.58 | | | $ | 26.65 | | | $ | 27.86 | |
| | | | | | | | | | | | | | | | | | | | |
Net Asset Value Total Return(c) | | | (3.78 | )% | | | 13.86 | % | | | 23.19 | % | | | (2.71 | )% | | | 6.61 | % |
Market Price Total Return(c) | | | (3.51 | )% | | | 13.49 | % | | | 23.78 | % | | | (2.75 | )% | | | 6.33 | % |
Ratios/Supplemental Data: | | | | | | | | | | | | | | | | | | | | |
Net assets at end of year (000’s omitted) | | $ | 279,696 | | | $ | 250,377 | | | $ | 143,042 | | | $ | 20,037 | | | $ | 26,523 | |
Ratio to average net assets of: | | | | | | | | | | | | | | | | | | | | |
Expenses, after Waivers(d) | | | 0.38 | % | | | 0.38 | % | | | 0.34 | % | | | 0.36 | %(e) | | | 0.38 | % |
Expenses, prior to Waivers(d) | | | 0.39 | % | | | 0.39 | % | | | 0.39 | % | | | 0.40 | %(e) | | | 0.39 | % |
Net investment income | | | 0.84 | % | | | 0.52 | % | | | 0.68 | % | | | 1.66 | %(e) | | | 1.45 | % |
Portfolio turnover rate(f) | | | 1,189 | % | | | 597 | % | | | 1,172 | % | | | 608 | % | | | 542 | % |
| (a) | Based on average shares outstanding. |
| (b) | The mean between the last bid and ask prices. |
| (c) | Net asset value total return is calculated assuming an initial investment made at the net asset value at the beginning of the period, reinvestment of all dividends and distributions at net asset value during the period, and redemption at net asset value on the last day of the period. Net asset value total return includes adjustments in accordance with accounting principles generally accepted in the United States of America and as such, the net asset value for financial reporting purposes and the returns based upon those net asset values may differ from the net asset value and returns for shareholder transactions. Market price total return is calculated assuming an initial investment made at the market price at the beginning of the period, reinvestment of all dividends and distributions at market price during the period, and sale at the market price on the last day of the period. Total investment returns calculated for a period of less than one year are not annualized. |
| (d) | In addition to the fees and expenses which the Fund bears directly, the Fund indirectly bears a pro rata share of the fees and expenses of the investment companies in which the Fund invests. Estimated investment companies’ expenses are not expenses that are incurred directly by the Fund. They are expenses that are incurred directly by the investment companies and are deducted from the value of the investment companies the Fund invests in. The effect of the estimated investment companies’ expenses that the Fund bears indirectly is included in the Fund’s total return. |
| (e) | Ratios include non-recurring costs associated with a proxy statement of 0.01%. |
| (f) | Portfolio turnover rate is not annualized for periods less than one year, if applicable, and does not include securities received or delivered from processing creations or redemptions. |
See accompanying Notes to Financial Statements which are an integral part of the financial statements.
Financial Highlights–(continued)
Invesco Total Return Bond ETF (GTO)
| | | | | | | | | | | | | | | | | | | | | | | | | | | | | | | | | | | | | | | | | | | | |
| | | | | | | | | | | | | | | Two Months Ended | | | | | | | |
| | | Years Ended October 31, | | | October 31, | | | | | | Year Ended August 31, | |
| | | 2022 | | | 2021 | | | 2020 | | | 2019 | | | 2018 | | | | | | 2018 | |
Per Share Operating Performance: | | | | | | | | | | | | | | | | | | | | | | | | | | | | | | | | | | | | | | | | | | | | |
Net asset value at beginning of period | | $ | 56.63 | | | $ | 57.57 | | | $ | 54.39 | | | $ | 50.89 | | | | | | | $ | 52.10 | | | | | | | | | | | | | | | $ | 52.61 | | | | | |
| | | | | | | | | | | | | | | | | | | | | | | | | | | | | | | | | | | | | | | | | | | | |
Net investment income(a) | | | 1.43 | | | | 1.11 | | | | 1.26 | | | | 1.44 | | | | | | | | 0.31 | | | | | | | | | | | | | | | | 1.47 | | | | | |
Net realized and unrealized gain (loss) on investments | | | (11.85 | ) | | | 0.08 | | | | 3.47 | | | | 4.57 | | | | | | | | (1.20 | ) | | | | | | | | | | | | | | | (0.37 | ) | | | | |
| | | | | | | | | | | | | | | | | | | | | | | | | | | | | | | | | | | | | | | | | | | | |
Total from investment operations | | | (10.42 | ) | | | 1.19 | | | | 4.73 | | | | 6.01 | | | | | | | | (0.89 | ) | | | | | | | | | | | | | | | 1.10 | | | | | |
| | | | | | | | | | | | | | | | | | | | | | | | | | | | | | | | | | | | | | | | | | | | |
Distributions to shareholders from: | | | | | | | | | | | | | | | | | | | | | | | | | | | | | | | | | | | | | | | | | | | | |
Net investment income | | | (1.48 | ) | | | (1.04 | ) | | | (1.29 | ) | | | (1.55 | ) | | | | | | | (0.32 | ) | | | | | | | | | | | | | | | (1.49 | ) | | | | |
Net realized gains | | | - | | | | (1.09 | ) | | | (0.26 | ) | | | (0.96 | ) | | | | | | | - | | | | | | | | | | | | | | | | (0.12 | ) | | | | |
| | | | | | | | | | | | | | | | | | | | | | | | | | | | | | | | | | | | | | | | | | | | |
Total distributions | | | (1.48 | ) | | | (2.13 | ) | | | (1.55 | ) | | | (2.51 | ) | | | | | | | (0.32 | ) | | | | | | | | | | | | | | | (1.61 | ) | | | | |
| | | | | | | | | | | | | | | | | | | | | | | | | | | | | | | | | | | | | | | | | | | | |
Net asset value at end of period | | $ | 44.73 | | | $ | 56.63 | | | $ | 57.57 | | | $ | 54.39 | | | | | | | $ | 50.89 | | | | | | | | | | | | | | | $ | 52.10 | | | | | |
| | | | | | | | | | | | | | | | | | | | | | | | | | | | | | | | | | | | | | | | | | | | |
Market price at end of period(b) | | $ | 44.67 | | | $ | 56.67 | | | $ | 57.57 | | | $ | 54.43 | | | | | | | $ | 50.93 | | | | | | | | | | | | | | | $ | 52.10 | | | | | |
| | | | | | | | | | | | | | | | | | | | | | | | | | | | | | | | | | | | | | | | | | | | |
Net Asset Value Total Return(c) | | | (18.65 | )% | | | 2.06 | % | | | 8.85 | % | | | 12.22 | % | | | | | | | (1.72 | )% | | | | | | | | | | | | | | | 2.14 | % | | | | |
Market Price Total Return(c) | | | (18.81 | )% | | | 2.14 | % | | | 8.77 | % | | | 12.20 | % | | | | | | | (1.64 | )% | | | | | | | | | | | | | | | 2.02 | % | | | | |
Ratios/Supplemental Data: | | | | | | | | | | | | | | | | | | | | | | | | | | | | | | | | | | | | | | | | | | | | |
Net assets at end of period (000’s omitted) | | $ | 738,113 | | | $ | 996,607 | | | $ | 463,457 | | | $ | 176,783 | | | | | | | $ | 40,713 | | | | | | | | | | | | | | | $ | 41,678 | | | | | |
Ratio to average net assets of: | | | | | | | | | | | | | | | | | | | | | | | | | | | | | | | | | | | | | | | | | | | | |
Expenses | | | 0.50 | % | | | 0.50 | % | | | 0.50 | % | | | 0.50 | %(d) | | | | | | | 0.50 | %(e) | | | | | | | | | | | | | | | 0.50 | % | | | | |
Expenses, prior to Waivers | | | 0.50 | % | | | 0.50 | % | | | 0.50 | % | | | 0.50 | %(d) | | | | | | | 0.50 | %(e) | | | | | | | | | | | | | | | 0.51 | % | | | | |
Net investment income | | | 2.79 | % | | | 1.96 | % | | | 2.25 | % | | | 2.75 | % | | | | | | | 3.58 | %(e) | | | | | | | | | | | | | | | 2.80 | % | | | | |
Portfolio turnover rate(f) | | | 361 | % | | | 475 | % | | | 434 | % | | | 511 | % | | | | | | | 53 | % | | | | | | | | | | | | | | | 219 | % | | | | |
| (a) | Based on average shares outstanding. |
| (b) | The mean between the last bid and ask prices. |
| (c) | Net asset value total return is calculated assuming an initial investment made at the net asset value at the beginning of the period, reinvestment of all dividends and distributions at net asset value during the period, and redemption at net asset value on the last day of the period. Net asset value total return includes adjustments in accordance with accounting principles generally accepted in the United States of America and as such, the net asset value for financial reporting purposes and the returns based upon those net asset values may differ from the net asset value and returns for shareholder transactions. Market price total return is calculated assuming an initial investment made at the market price at the beginning of the period, reinvestment of all dividends and distributions at market price during the period, and sale at the market price on the last day of the period. Total investment returns calculated for a period of less than one year are not annualized. |
| (d) | In addition to the fees and expenses which the Fund bears directly, the Fund indirectly bears a pro rata share of the fees and expenses of the investment companies in which the Fund invests. Estimated investment companies’ expenses are not expenses that are incurred directly by the Fund. They are expenses that are incurred directly by the investment companies and are deducted from the value of the investment companies the Fund invests in. The effect of the estimated investment companies’ expenses that the Fund bears indirectly is included in the Fund’s total return. |
| (f) | Portfolio turnover rate is not annualized for periods less than one year, if applicable, and does not include securities received or delivered from processing creations or redemptions. |
See accompanying Notes to Financial Statements which are an integral part of the financial statements.
Financial Highlights–(continued)
Invesco Ultra Short Duration ETF (GSY)
| | | | | | | | | | | | | | | | | | | | | | | | | | | | | | | | | | | | | | | | | | | | |
| | | | | | | | | | | | | | | Five Months Ended | | | | | | | |
| | | Years Ended October 31, | | | October 31, | | | | | | Year Ended May 31, | |
| | | 2022 | | | 2021 | | | 2020 | | | 2019 | | | 2018 | | | | | | 2018 | |
Per Share Operating Performance: | | | | | | | | | | | | | | | | | | | | | | | | | | | | | | | | | | | | | | | | | | | | |
Net asset value at beginning of year | | $ | 50.38 | | | $ | 50.53 | | | $ | 50.42 | | | $ | 50.20 | | | | | | | $ | 50.28 | | | | | | | | | | | | | | | $ | 50.28 | | | | | |
| | | | | | | | | | | | | | | | | | | | | | | | | | | | | | | | | | | | | | | | | | | | |
Net investment income(a) | | | 0.58 | | | | 0.32 | | | | 0.84 | | | | 1.38 | | | | | | | | 0.55 | | | | | | | | | | | | | | | | 0.87 | | | | | |
Net realized and unrealized gain (loss)on investments | | | (1.15 | ) | | | (0.14 | ) | | | 0.17 | | | | 0.24 | | | | | | | | (0.06 | ) | | | | | | | | | | | | | | | 0.14 | | | | | |
| | | | | | | | | | | | | | | | | | | | | | | | | | | | | | | | | | | | | | | | | | | | |
Total from investment operations | | | (0.57 | ) | | | 0.18 | | | | 1.01 | | | | 1.62 | | | | | | | | 0.49 | | | | | | | | | | | | | | | | 1.01 | | | | | |
| | | | | | | | | | | | | | | | | | | | | | | | | | | | | | | | | | | | | | | | | | | | |
Distributions to shareholders from: | | | | | | | | | | | | | | | | | | | | | | | | | | | | | | | | | | | | | | | | | | | | |
Net investment income | | | (0.56 | ) | | | (0.33 | ) | | | (0.88 | ) | | | (1.39 | ) | | | | | | | (0.57 | ) | | | | | | | | | | | | | | | (1.01 | ) | | | | |
Net realized gains | | | - | | | | - | | | | (0.02 | ) | | | (0.01 | ) | | | | | | | - | | | | | | | | | | | | | | | | - | | | | | |
| | | | | | | | | | | | | | | | | | | | | | | | | | | | | | | | | | | | | | | | | | | | |
Total distributions | | | (0.56 | ) | | | (0.33 | ) | | | (0.90 | ) | | | (1.40 | ) | | | | | | | (0.57 | ) | | | | | | | | | | | | | | | (1.01 | ) | | | | |
| | | | | | | | | | | | | | | | | | | | | | | | | | | | | | | | | | | | | | | | | | | | |
Net asset value at end of year | | $ | 49.25 | | | $ | 50.38 | | | $ | 50.53 | | | $ | 50.42 | | | | | | | $ | 50.20 | | | | | | | | | | | | | | | $ | 50.28 | | | | | |
| | | | | | | | | | | | | | | | | | | | | | | | | | | | | | | | | | | | | | | | | | | | |
Market price at end of year(b) | | $ | 49.24 | | | $ | 50.38 | | | $ | 50.54 | | | $ | 50.42 | | | | | | | $ | 50.22 | | | | | | | | | | | | | | | $ | 50.29 | | | | | |
| | | | | | | | | | | | | | | | | | | | | | | | | | | | | | | | | | | | | | | | | | | | |
Net Asset Value Total Return(c) | | | (1.13 | )% | | | 0.36 | % | | | 2.01 | % | | | 3.25 | % | | | | | | | 0.98 | % | | | | | | | | | | | | | | | 2.02 | % | | | | |
Market Price Total Return(c) | | | (1.15 | )% | | | 0.34 | % | | | 2.04 | % | | | 3.20 | % | | | | | | | 1.00 | % | | | | | | | | | | | | | | | 2.02 | % | | | | |
Ratios/Supplemental Data: | | | | | | | | | | | | | | | | | | | | | | | | | | | | | | | | | | | | | | | | | | | | |
Net assets at end of year (000’s omitted) | | $ | 2,108,024 | | | $ | 2,942,228 | | | $ | 3,011,607 | | | $ | 2,621,784 | | | | | | | $ | 1,611,555 | | | | | | | | | | | | | | | $ | 1,166,465 | | | | | |
Ratio to average net assets of: | | | | | | | | | | | | | | | | | | | | | | | | | | | | | | | | | | | | | | | | | | | | |
Expenses | | | 0.22 | % | | | 0.22 | % | | | 0.22 | % | | | 0.23 | % | | | | | | | 0.25 | %(d) | | | | | | | | | | | | | | | 0.27 | % | | | | |
Expenses, prior to Waivers | | | 0.22 | % | | | 0.22 | % | | | 0.22 | % | | | 0.23 | % | | | | | | | 0.25 | %(d) | | | | | | | | | | | | | | | 0.28 | % | | | | |
Net investment income | | | 1.16 | % | | | 0.63 | % | | | 1.68 | % | | | 2.77 | % | | | | | | | 2.64 | %(d) | | | | | | | | | | | | | | | 1.74 | % | | | | |
Portfolio turnover rate(e) | | | 28 | % | | | 57 | % | | | 53 | % | | | 30 | % | | | | | | | 6 | % | | | | | | | | | | | | | | | 56 | % | | | | |
| (a) | Based on average shares outstanding. |
| (b) | The mean between the last bid and ask prices. |
| (c) | Net asset value total return is calculated assuming an initial investment made at the net asset value at the beginning of the period, reinvestment of all dividends and distributions at net asset value during the period, and redemption at net asset value on the last day of the period. Net asset value total return includes adjustments in accordance with accounting principles generally accepted in the United States of America and as such, the net asset value for financial reporting purposes and the returns based upon those net asset values may differ from the net asset value and returns for shareholder transactions. Market price total return is calculated assuming an initial investment made at the market price at the beginning of the period, reinvestment of all dividends and distributions at market price during the period, and sale at the market price on the last day of the period. Total investment returns calculated for a period of less than one year are not annualized. |
| (e) | Portfolio turnover rate is not annualized for periods less than one year, if applicable, and does not include securities received or delivered from processing creations or redemptions. |
See accompanying Notes to Financial Statements which are an integral part of the financial statements.
Financial Highlights–(continued)
Invesco Variable Rate Investment Grade ETF (VRIG)
| | | | | | | | | | | | | | | | | | | | |
| | | | | | | | | | | | | | | | |
| | | Years Ended October 31, | |
| | | 2022 | | | 2021 | | | 2020 | | | 2019 | | | 2018 | |
Per Share Operating Performance: | | | | | | | | | | | | | | | | | | | | |
Net asset value at beginning of year | | $ | 25.09 | | | $ | 24.89 | | | $ | 24.94 | | | $ | 25.02 | | | $ | 25.20 | |
| | | | | | | | | | | | | | | | | | | | |
Net investment income(a) | | | 0.43 | | | | 0.19 | | | | 0.40 | | | | 0.75 | | | | 0.65 | |
Net realized and unrealized gain (loss) on investments | | | (0.54 | ) | | | 0.21 | | | | 0.02 | | | | (0.03 | ) | | | (0.15 | ) |
| | | | | | | | | | | | | | | | | | | | |
Total from investment operations | | | (0.11 | ) | | | 0.40 | | | | 0.42 | | | | 0.72 | | | | 0.50 | |
| | | | | | | | | | | | | | | | | | | | |
Distributions to shareholders from: | | | | | | | | | | | | | | | | | | | | |
Net investment income | | | (0.41 | ) | | | (0.20 | ) | | | (0.44 | ) | | | (0.80 | ) | | | (0.68 | ) |
Return of capital | | | - | | | | - | | | | (0.03 | ) | | | - | | | | - | |
| | | | | | | | | | | | | | | | | | | | |
Total distributions | | | (0.41 | ) | | | (0.20 | ) | | | (0.47 | ) | | | (0.80 | ) | | | (0.68 | ) |
| | | | | | | | | | | | | | | | | | | | |
Net asset value at end of year | | $ | 24.57 | | | $ | 25.09 | | | $ | 24.89 | | | $ | 24.94 | | | $ | 25.02 | |
| | | | | | | | | | | | | | | | | | | | |
Market price at end of year(b) | | $ | 24.56 | | | $ | 25.10 | | | $ | 24.89 | | | $ | 24.95 | | | $ | 25.02 | |
| | | | | | | | | | | | | | | | | | | | |
Net Asset Value Total Return(c) | | | (0.45 | )% | | | 1.62 | % | | | 1.75 | % | | | 2.92 | % | | | 2.01 | % |
Market Price Total Return(c) | | | (0.53 | )% | | | 1.66 | % | | | 1.72 | % | | | 2.96 | % | | | 1.92 | % |
Ratios/Supplemental Data: | | | | | | | | | | | | | | | | | | | | |
Net assets at end of year (000’s omitted) | | $ | 571,327 | | | $ | 471,652 | | | $ | 453,021 | | | $ | 391,527 | | | $ | 447,868 | |
Ratio to average net assets of: | | | | | | | | | | | | | | | | | | | | |
Expenses, after Waivers | | | 0.30 | % | | | 0.30 | % | | | 0.29 | % | | | 0.30 | % | | | 0.30 | % |
Expenses, prior to Waivers | | | 0.30 | % | | | 0.30 | % | | | 0.30 | % | | | 0.30 | % | | | 0.30 | % |
Net investment income | | | 1.75 | % | | | 0.77 | % | | | 1.64 | % | | | 3.00 | % | | | 2.59 | % |
Portfolio turnover rate(d) | | | 101 | % | | | 93 | % | | | 99 | % | | | 62 | % | | | 26 | % |
| (a) | Based on average shares outstanding. |
| (b) | The mean between the last bid and ask prices. |
| (c) | Net asset value total return is calculated assuming an initial investment made at the net asset value at the beginning of the period, reinvestment of all dividends and distributions at net asset value during the period, and redemption at net asset value on the last day of the period. Net asset value total return includes adjustments in accordance with accounting principles generally accepted in the United States of America and as such, the net asset value for financial reporting purposes and the returns based upon those net asset values may differ from the net asset value and returns for shareholder transactions. Market price total return is calculated assuming an initial investment made at the market price at the beginning of the period, reinvestment of all dividends and distributions at market price during the period, and sale at the market price on the last day of the period. Total investment returns calculated for a period of less than one year are not annualized. |
| (d) | Portfolio turnover rate is not annualized for periods less than one year, if applicable, and does not include securities received or delivered from processing creations or redemptions. |
See accompanying Notes to Financial Statements which are an integral part of the financial statements.
Notes to Financial Statements
Invesco Actively Managed Exchange-Traded Fund Trust
October 31, 2022
NOTE 1–Organization
Invesco Actively Managed Exchange-Traded Fund Trust (the “Trust”) was organized as a Delaware statutory trust and is authorized to have multiple series of portfolios. The Trust is an open-end management investment company registered under the Investment Company Act of 1940, as amended (the “1940 Act”). This report includes the following portfolios:
| | |
Full Name | | Short Name |
| |
| Invesco Active U.S. Real Estate ETF (PSR) | | “Active U.S. Real Estate ETF” |
| |
| Invesco Balanced Multi-Asset Allocation ETF (PSMB) | | “Balanced Multi-Asset Allocation ETF” |
| |
| Invesco Conservative Multi-Asset Allocation ETF (PSMC) | | “Conservative Multi-Asset Allocation ETF” |
| |
| Invesco Growth Multi-Asset Allocation ETF (PSMG) | | “Growth Multi-Asset Allocation ETF” |
| |
| Invesco High Yield Bond Factor ETF (IHYF) | | “High Yield Bond Factor ETF” |
| |
| Invesco Moderately Conservative Multi-Asset Allocation ETF (PSMM) | | “Moderately Conservative Multi-Asset Allocation ETF” |
| |
| Invesco S&P 500® Downside Hedged ETF (PHDG) | | “S&P 500® Downside Hedged ETF” |
| |
| Invesco Total Return Bond ETF (GTO) | | “Total Return Bond ETF” |
| |
| Invesco Ultra Short Duration ETF (GSY) | | “Ultra Short Duration ETF” |
| |
| Invesco Variable Rate Investment Grade ETF (VRIG) | | “Variable Rate Investment Grade ETF” |
Each portfolio (each, a “Fund”, and collectively, the “Funds”) represents a separate series of the Trust. The shares of the Funds are referred to herein as “Shares” or “Fund’s Shares.” Each Fund’s Shares are listed and traded on the following exchanges:
| | |
Fund | | Exchange |
| |
| Active U.S. Real Estate ETF | | NYSE Arca, Inc. |
| |
| Balanced Multi-Asset Allocation ETF | | Cboe BZX Exchange, Inc. |
| |
| Conservative Multi-Asset Allocation ETF | | Cboe BZX Exchange, Inc. |
| |
| Growth Multi-Asset Allocation ETF | | Cboe BZX Exchange, Inc. |
| |
| High Yield Bond Factor ETF | | The NASDAQ Stock Market |
| |
| Moderately Conservative Multi-Asset Allocation ETF | | Cboe BZX Exchange, Inc. |
| |
| S&P 500® Downside Hedged ETF | | NYSE Arca, Inc. |
| |
| Total Return Bond ETF | | NYSE Arca, Inc. |
| |
| Ultra Short Duration ETF | | NYSE Arca, Inc. |
| |
| Variable Rate Investment Grade ETF | | The NASDAQ Stock Market |
The market price of each Share may differ to some degree from a Fund’s net asset value (“NAV”). Unlike conventional mutual funds, each Fund issues and redeems Shares on a continuous basis, at NAV, only in a large specified number of Shares, each called a “Creation Unit.” Creation Units for Active U.S. Real Estate ETF, Balanced Multi-Asset Allocation ETF, Conservative Multi-Asset Allocation ETF, Growth Multi-Asset Allocation ETF and Moderately Conservative Multi-Asset Allocation ETF are issued and redeemed principally in exchange for the deposit or delivery of a basket of securities (“Deposit Securities”). Creation Units for High Yield Bond Factor ETF, Total Return Bond ETF, Ultra Short Duration ETF and Variable Rate Investment Grade ETF are issued and redeemed principally in exchange for the deposit or delivery of cash. Creation Units for S&P 500® Downside Hedged ETF are issued and redeemed partially in exchange for the deposit or delivery of cash and partially in exchange for Deposit Securities. Except when aggregated in Creation Units by authorized participants (“APs”), the Shares are not individually redeemable securities of the Funds.
Balanced Multi-Asset Allocation ETF, Conservative Multi-Asset Allocation ETF, Growth Multi-Asset Allocation ETF and Moderately Conservative Multi-Asset Allocation ETF are each a “fund of funds,” in that each invests in other exchange-traded funds (“Underlying Funds”) advised by Invesco Capital Management LLC (the “Adviser”) or its affiliates, or other unaffiliated advisers. Each affiliated Underlying Fund’s accounting policies are outlined in that affiliated Underlying Fund’s financial statements and are publicly available at www.invesco.com/us.
The investment objective for Active U.S. Real Estate ETF is to seek to achieve high total return through growth of capital and current income. The investment objective for Balanced Multi-Asset Allocation ETF is to seek to provide current income and capital appreciation. The investment objective for Conservative Multi-Asset Allocation ETF is to seek total return consistent with a lower level of risk relative to the broad stock market. The investment objective for Growth Multi-Asset Allocation ETF is to seek to provide long-term capital appreciation. The investment objective for High Yield Bond Factor ETF is to seek total return. The
investment objective for Moderately Conservative Multi-Asset Allocation ETF is to seek to provide current income and some capital appreciation. The investment objective for S&P 500® Downside Hedged ETF is to seek to achieve positive total returns in rising or falling markets that are not directly correlated to broad equity or fixed income market returns. The investment objective for Total Return Bond ETF is to seek maximum total return, comprised of income and capital appreciation. The investment objective of Ultra Short Duration ETF is to seek maximum current income, consistent with preservation of capital and daily liquidity. The investment objective for Variable Rate Investment Grade ETF is to seek to generate current income while maintaining low portfolio duration as a primary objective and capital appreciation as a secondary objective.
NOTE 2–Significant Accounting Policies
The following is a summary of the significant accounting policies followed by the Funds in preparation of their financial statements.
Each Fund is an investment company and accordingly follows the investment company accounting and reporting guidance in accordance with Financial Accounting Standards Board Accounting Standards Codification Topic 946, Financial Services–Investment Companies.
| A. | Security Valuation - Securities, including restricted securities, are valued according to the following policies: |
A security listed or traded on an exchange is generally valued at its trade price or official closing price that day as of the close of the exchange where the security is principally traded or, lacking any trades or official closing price on a particular day, the security may be valued at the closing bid price on that day. Securities traded in the over-the-counter (“OTC”) market are valued based on prices furnished by independent pricing services or market makers. When such securities are valued using prices provided by an independent pricing service they may be considered fair valued. Futures contracts are valued at the daily settlement price set by an exchange on which they are principally traded. U.S. exchange-traded options are valued at the mean between the last bid and asked prices from the exchange on which they are principally traded. Non-U.S. exchange-traded options are valued at the final settlement price set by the exchange on which they trade. Options not listed on an exchange and swaps generally are valued using pricing provided from independent pricing services.
Securities of investment companies that are not exchange-traded (e.g., open-end mutual funds) are valued using such company’s end-of-business-day NAV per share.
Deposits, other obligations of U.S. and non-U.S. banks and financial institutions are valued at their daily account value.
Fixed income securities (including convertible debt securities) generally are valued on the basis of prices provided by independent pricing services. Prices provided by the pricing service may be determined without exclusive reliance on quoted prices, and may reflect appropriate factors such as institution-size trading in similar groups of securities, developments related to specific securities, dividend rate (for unlisted equities), yield (for debt obligations), quality, type of issue, coupon rate (for debt obligations), maturity (for debt obligations), individual trading characteristics and other market data. Securities with a demand feature exercisable within one to seven days are valued at par. Pricing services generally value debt obligations assuming orderly transactions of institutional round lot size, but a Fund may hold or transact in the same securities in smaller, odd lot sizes. Odd lots often trade at lower prices than institutional round lots, and their value may be adjusted accordingly. Debt obligations are subject to interest rate and credit risks. In addition, all debt obligations involve some risk of default with respect to interest and/or principal payments.
Foreign securities’ (including foreign exchange contracts’) prices are converted into U.S. dollar amounts using the applicable exchange rates as of the close of the London world markets. If market quotations are available and reliable for foreign exchange-traded equity securities, the securities will be valued at the market quotations. Invesco Capital Management LLC (the “Adviser”) may use various pricing services to obtain market quotations as well as fair value prices. Because trading hours for certain foreign securities end before the close of the New York Stock Exchange (“NYSE”), closing market quotations may become not representative of market value in the Adviser’s judgment (“unreliable”). If, between the time trading ends on a particular security and the close of the customary trading session on the NYSE, a significant event occurs that makes the closing price of the security unreliable, the Adviser may fair value the security. If the event is likely to have affected the closing price of the security, the security will be valued at fair value in good faith in accordance with Board-approved policies and related Adviser procedures (“Valuation Procedures”). Adjustments to closing prices to reflect fair value may also be based on a screening process of an independent pricing service to indicate the degree of certainty, based on historical data, that the closing price in the principal market where a foreign security trades is not the current value as of the close of the NYSE. Foreign securities’ prices meeting the degree of certainty that the price is not reflective of current value will be priced at the indication of fair value from the independent pricing service. Multiple factors may be considered by the independent pricing service in determining adjustments to reflect fair value and may include information relating to sector indices, American depositary receipts and domestic and foreign index futures. Foreign securities may have additional risks including exchange rate changes, the potential for sharply devalued currencies and high inflation, political and economic upheaval, the relative lack of issuer information, relatively low market liquidity and the potential lack of strict financial and accounting controls and standards.
Unlisted securities will be valued using prices provided by independent pricing services or by another method that the Adviser, in its judgment, believes better reflects the security’s fair value in accordance with the Valuation Procedures.
Securities for which market prices are not provided by any of the above methods may be valued based upon quotes furnished by independent sources. The last bid price may be used to value exchange-traded equity securities. The mean between the last bid and asked prices may be used to value debt obligations, including corporate loans, and unlisted equity securities.
Securities for which market quotations are not readily available are fair valued by the Adviser in accordance with the Valuation Procedures. If a fair value price provided by a pricing service is unreliable, the Adviser will fair value the security using the Valuation Procedures. Issuer-specific events, market trends, bid/asked quotes of brokers and information providers and other market data may be reviewed in the course of making a good faith determination of a security’s fair value.
Each Fund may invest in securities that are subject to interest rate risk, meaning the risk that the prices will generally fall as interest rates rise and, conversely, the prices will generally rise as interest rates fall. Specific securities differ in their sensitivity to changes in interest rates depending on their individual characteristics. Changes in interest rates may result in increased market volatility, which may affect the value and/or liquidity of certain Fund investments.
Valuations change in response to many factors, including the historical and prospective earnings of the issuer, the value of the issuer’s assets, general market conditions which are not specifically related to the particular issuer, such as real or perceived adverse economic conditions, changes in the general outlook for revenues or corporate earnings, changes in interest or currency rates, regional or global instability, natural or environmental disasters, widespread disease or other public health issues, war, acts of terrorism, significant governmental actions or adverse investor sentiment generally and market liquidity. Because of the inherent uncertainties of valuation, the values reflected in the financial statements may materially differ from the value received upon actual sale of those investments.
The price a Fund could receive upon the sale of any investment may differ from the Adviser’s valuation of the investment, particularly for securities that are valued using a fair valuation technique. When fair valuation techniques are applied, the Adviser uses available information, including both observable and unobservable inputs and assumptions, to determine a methodology that will result in a valuation that the Adviser believes approximates market value. Fund securities that are fair valued may be subject to greater fluctuation in their value from one day to the next than would be the case if market quotations were used. Because of the inherent uncertainties of valuation, and the degree of subjectivity in such decisions, a Fund could realize a greater or lesser than expected gain or loss upon the sale of the investment.
| B. | Investment Transactions and Investment Income - Investment transactions are accounted for on a trade date basis. Realized gains and losses from the sale or disposition of securities are computed on the specific identified cost basis. Interest income is recorded on an accrual basis from settlement date and includes coupon interest and amortization of premium and accretion of discount on debt securities as applicable. Pay-in-kind interest income and non-cash dividend income received in the form of securities in-lieu of cash are recorded at the fair value of the securities received. Dividend income (net of withholding tax, if any) is recorded on the ex-dividend date. Dividend income from REITs is recorded based on the income included in the distributions received from the REIT investments using published REIT classifications, including some management estimates when actual amounts are not available. Distributions received in excess of this estimated amount are recorded as a reduction of the cost of investments or reclassified to capital gains. The actual amounts of income, return of capital, and capital gains are only determined by each REIT after its fiscal year-end, and may differ from the estimated amounts. Realized gains, dividends and interest received by a Fund may give rise to withholding and other taxes imposed by foreign countries. Tax conventions between certain countries and the United States may reduce or eliminate such taxes. |
The Funds may periodically participate in litigation related to a Fund’s investments. As such, the Funds may receive proceeds from litigation settlements. Any proceeds received are included in the Statements of Operations as realized gain (loss) for investments no longer held and as unrealized gain (loss) for investments still held.
Brokerage commissions and mark ups are considered transaction costs and are recorded as an increase to the cost basis of securities purchased and/or a reduction of proceeds on a sale of securities. Such transaction costs are included in the determination of net realized and unrealized gain (loss) from investment securities reported in the Statements of Operations and the Statements of Changes in Net Assets and the net realized and unrealized gains (losses) on securities per share in the Financial Highlights. Transaction costs are included in the calculation of a Fund’s NAV and, accordingly, they reduce a Fund’s total returns. These transaction costs are not considered operating expenses and are not reflected in net investment income reported in the Statements of Operations and the Statements of Changes in Net Assets, or the net investment income per share and the ratios of expenses and net investment income reported in the Financial Highlights, nor are they limited by any expense limitation arrangements between each Fund and the Adviser.
| C. | Country Determination - For the purposes of presentation in the Schedules of Investments, the Adviser may determine the country in which an issuer is located and/or credit risk exposure based on various factors. These factors may include the laws of the country under which the issuer is organized, where the issuer maintains a principal office, the country in which the issuer derives 50% or more of its total revenues, the country that has the primary market for the issuer’s securities and its “country of risk” as determined by a third party service provider, as well as other criteria. Among the other criteria that may be evaluated for making this determination are the country in which the issuer maintains 50% or more of its assets, the type of security, financial guarantees and enhancements, the nature of the collateral and the sponsor organization. Country of issuer and/or credit risk exposure has been determined to be the United States of America, unless otherwise noted. |
| D. | Dividends and Distributions to Shareholders - Each Fund (except High Yield Bond Factor ETF, Total Return Bond ETF, Ultra Short Duration ETF and Variable Rate Investment Grade ETF) declares and pays dividends from net investment income, if any, to their shareholders quarterly and records such dividends on the ex-dividend date. High Yield Bond Factor ETF, Total Return Bond ETF, Ultra Short Duration ETF and Variable Rate Investment Grade ETF each declares and pays dividends from net investment income, if any, to its shareholders monthly and records such dividends on the ex-dividend date. Generally, each Fund distributes net realized taxable capital gains, if any, annually in cash and records them on the ex-dividend date. Such distributions on a tax basis are determined in conformity with federal income tax regulations which may differ from accounting principles generally accepted in the United States of America (“GAAP”). Distributions in excess of tax basis earnings and profits, if any, are reported in such Fund’s financial statements as a tax return of capital at fiscal year-end. |
| E. | Federal Income Taxes - Each Fund intends to comply with the provisions of the Internal Revenue Code of 1986, as amended (the “Internal Revenue Code”), applicable to regulated investment companies and to distribute substantially all of the Fund’s taxable earnings to its shareholders. As such, the Funds will not be subject to federal income taxes on otherwise taxable income (including net realized gains) that is distributed to the shareholders. Therefore, no provision for federal income taxes is recorded in the financial statements. |
Each Fund recognizes the tax benefits of uncertain tax positions only when the position is more likely than not to be sustained. Management has analyzed each Fund’s uncertain tax positions and concluded that no liability for unrecognized tax benefits should be recorded related to uncertain tax positions. Management is not aware of any tax positions for which it is reasonably possible that the total amounts of unrecognized tax benefits will change materially in the next 12 months.
Income and capital gain distributions are determined in accordance with federal income tax regulations, which may differ from GAAP. These differences are primarily due to differing book and tax treatments for in-kind transactions, losses deferred due to wash sales, and passive foreign investment company adjustments, if any.
The Funds file U.S. federal tax returns and tax returns in certain other jurisdictions. Generally, a Fund is subject to examinations by such taxing authorities for up to three years after the filing of the return for the tax period.
| F. | Expenses - Each Fund (except Ultra Short Duration ETF) has agreed to pay an annual unitary management fee to the Adviser. Out of the unitary management fee, the Adviser has agreed to pay for substantially all expenses of the Funds, including payments to the Affiliated Sub-Advisers (as defined below) for each Fund (except S&P 500® Downside Hedged ETF), and for each Fund, the cost of transfer agency, custody, fund administration, legal, audit and other services, except for distribution fees, if any, brokerage expenses, taxes, interest, acquired fund fees and expenses, if any, litigation expenses and other extraordinary expenses, including proxy expenses (except for such proxies related to: (i) changes to the Investment Advisory Agreement, (ii) the election of any Board member who is an “interested person” of the Trust, or (iii) any other matters that directly benefit the Adviser). |
Ultra Short Duration ETF is responsible for all of its expenses, including, but not limited to, the investment advisory fees, cost of transfer agency, custody, fund administration, legal, audit and other services, interest, taxes, acquired fund fees and expense, if any, brokerage commissions and other expenses connected with executions of portfolio transactions, any distribution fees or expenses, litigation expenses, fees payable to the Trust’s Board members who are not “interested persons” (as defined in the 1940 Act) of the Trust (the “Independent Trustees”), expenses incurred in connection with the Board members’ services, including travel expenses and legal fees of counsel for the Independent Trustees, acquired fund fees and expenses, if any, and extraordinary expenses, including proxy expenses (except for such proxies related to: (i) changes to the Investment Advisory Agreement, (ii) the election of any Board member who is an “interested person” of the Trust, or (iii) any other matters that directly benefit the Adviser).
Expenses of the Trust that are excluded from a Fund’s unitary management fee (if applicable) and are directly identifiable to a specific Fund are applied to that Fund. Expenses of the Trust that are excluded from each Fund’s unitary management fee (if applicable) and are not readily identifiable to a specific Fund are allocated in such a manner as deemed equitable, taking into consideration the nature and type of expense and the relative net assets of each Fund.
To the extent a Fund invests in other investment companies, the expenses shown in the accompanying financial statements reflect the expenses of the Fund and do not include any expenses of the investment companies in which it invests. The effects of such investment companies’ expenses are included in the realized and unrealized gain or loss on the investments in the investment companies.
| G. | Accounting Estimates - The preparation of the financial statements in accordance with GAAP requires management to make estimates and assumptions that affect the reported amounts and disclosures in the financial statements, including estimates and assumptions related to taxation. Actual results could differ from these estimates. In addition, the Funds monitor for material events or transactions that may occur or become known after the period-end date and before the date the financial statements are released to print. |
| H. | Indemnifications - Under the Trust’s organizational documents, its Officers and Trustees are indemnified against certain liabilities arising out of the performance of their duties to the Trust. Each Independent Trustee is also indemnified against certain liabilities arising out of the performance of their duties to the Trust pursuant to an Indemnification Agreement between such trustee and the Trust. Additionally, in the normal course of business, the Trust enters into contracts with service |
| | providers that contain general indemnification clauses. The Trust’s maximum exposure under these arrangements is unknown, as this would involve future claims that may be made against the Trust that have not yet occurred. The risk of material loss as a result of such indemnification claims is considered remote. |
| I. | Commercial Mortgage-Backed Securities - Total Return Bond ETF, Ultra Short Duration ETF and Variable Rate Investment Grade ETF may invest in both single and multi-issuer Commercial Mortgage-Backed Securities (“CMBS”). This includes both investment grade and non-investment grade CMBS as well as other non-rated CMBS. A CMBS is a type of mortgage-backed security that is secured by one or more mortgage loans on interests in commercial real estate property. CMBS differ from conventional debt securities because principal is paid back over the life of the security rather than at maturity. Investments in CMBS are subject to the various risks which relate to the pool of underlying assets in which the CMBS represents an interest. Securities backed by commercial real estate assets are subject to securities market risks as well as risks similar to those of direct ownership of commercial real estate loans. Risks include the ability of a borrower to meet its obligations on the loan which could lead to default or foreclosure of the property. Such actions may impact the amount of proceeds ultimately derived from the loan, and the timing of receipt of such proceeds. |
Management estimates future expected cash flows at the time of purchase based on the anticipated repayment dates on the CMBS. Subsequent changes in expected cash flow projection may result in a prospective change in the timing or character of income recognized on these securities, or the amortized cost of these securities. Each Fund amortizes premiums and/or accretes discounts based on the projected cash flows. Realized and unrealized gains and losses on CMBS are included in the Statements of Operations as Net realized gain (loss) from investment securities and Change in net unrealized appreciation (depreciation) of investment securities, respectively.
| J. | Securities Purchased on a When-Issued and Delayed Delivery Basis - The Funds may purchase and sell interests in corporate loans and corporate debt securities and other portfolio securities on a when issued and delayed delivery basis, with payment and delivery scheduled for a future date. No income accrues to the Fund on such interests or securities in connection with such transactions prior to the date the Fund actually takes delivery of such interests or securities. These transactions are subject to market fluctuations and are subject to the risk that the value of the interests or securities at delivery may be more or less than the trade date purchase price. Although the Fund will generally purchase these securities with the intention of acquiring such securities, it may sell such securities prior to the settlement date. |
| K. | Repurchase Agreements - The Funds may enter into repurchase agreements. Collateral on repurchase agreements, including each Fund’s pro-rata interest in joint repurchase agreements, is taken into possession by such Funds upon entering into the repurchase agreement. Collateral consisting of U.S. Government Securities and U.S. Government Sponsored Agency Securities is marked to market daily to ensure its market value is at least 102% of the sales price of the repurchase agreement. Collateral consisting of non-government securities is marked to market daily to ensure its market value is at least 105% of the sales price of the repurchase agreement. The investments in some repurchase agreements, pursuant to procedures approved by the Board of Trustees, are through participation with other mutual funds, private accounts and certain non-registered investment companies managed by the investment advisor or its affiliates (“Joint repurchase agreements”). The principal amount of the repurchase agreement is equal to the value at period-end. If the seller of a repurchase agreement fails to repurchase the security in accordance with the terms of the agreement, the Funds might incur expenses in enforcing their rights, and could experience losses, including a decline in the value of the collateral and loss of income. |
| L. | Structured Securities - Certain Funds may invest in structured securities. Structured securities are a type of derivative security whose value is determined by reference to changes in the value of underlying securities, currencies, interest rates, commodities, indices or other financial indicators (“reference instruments”). Most structured securities are fixed-income securities that have maturities of three years or less. Structured securities may be positively or negatively indexed (i.e., their principal value or interest rates may increase or decrease if the underlying reference instrument appreciates) and may have return characteristics similar to direct investments in the underlying reference instrument. |
Structured securities may entail a greater degree of market risk than other types of debt securities because the investor bears the risk of the reference instruments. In addition to the credit risk of structured securities and the normal risks of price changes in response to changes in interest rates, the principal amount of structured notes or indexed securities may decrease as a result of changes in the value of the underlying reference instruments. Changes in the daily value of structured securities are recorded as unrealized gains (losses) in the Statements of Operations. When the structured securities mature or are sold, the Fund recognizes a realized gain (loss) on the Statements of Operations.
| M. | Securities Lending - Each Fund may participate in securities lending and may loan portfolio securities having a market value up to one-third of each Fund’s total assets. Such loans are secured by cash collateral equal to no less than 102% (105% for international securities) of the market value of the loaned securities determined daily by the securities lending provider. Cash collateral received in connection with these loans is invested in short-term money market instruments or affiliated, unregistered investment companies that comply with Rule 2a-7 under the 1940 Act and money market funds (collectively, “affiliated money market funds”) and is shown as such on the Schedules of Investments. Each Fund bears the risk of loss with respect to the investment of collateral. It is the policy of these Funds to obtain additional collateral from or return excess collateral to the borrower by the end of the next business day, following the valuation date of the securities loaned. Therefore, the value of the collateral held may be temporarily less than the value of the securities on loan. When loaning securities, each Fund retains certain benefits of owning the securities, including the economic equivalent of dividends or interest generated by |
| | the security. Lending securities entails a risk of loss to each Fund if, and to the extent that, the market value of the securities loaned were to increase, and the borrower did not increase the collateral accordingly, and the borrower failed to return the securities. The securities loaned are subject to termination at the option of the borrower or each Fund. Upon termination, the borrower will return to each Fund the securities loaned and each Fund will return the collateral. Upon the failure of the borrower to return the securities, collateral may be liquidated and the securities may be purchased on the open market to replace the loaned securities. Each Fund could experience delays and costs in gaining access to the collateral and the securities may lose value during the delay which could result in potential losses to each Fund. Some of these losses may be indemnified by the lending agent. Each Fund bears the risk of any deficiency in the amount of the collateral available for return to the borrower due to any loss on the collateral invested. For Funds that participated in securities lending, dividends received on cash collateral investments for securities lending transactions, which are net of compensation to counterparties, are included in Securities lending income on the Statements of Operations. The aggregate value of securities out on loan, if any, is shown on the Statements of Assets and Liabilities. |
Invesco Advisers, Inc. (“Invesco”), an affiliate of the Adviser, serves as an affiliated securities lending agent for each Fund participating in the securities lending program. The Bank of New York Mellon (“BNYM”) also serves as a lending agent. To the extent a Fund utilizes Invesco as an affiliated securities lending agent, the Fund conducts its securities lending in accordance with, and in reliance upon, no-action letters issued by the SEC staff that provide guidance on how an affiliate may act as a direct agent lender and receive compensation for those services in a manner consistent with the federal securities laws. For the fiscal year ended October 31, 2022, each Fund (except for High Yield Bond Factor ETF, Total Return Bond ETF, Ultra Short Duration ETF and Variable Rate Investment Grade ETF) had affiliated securities lending transactions with Invesco. Fees paid to Invesco for securities lending agent services, which are included in Securities lending income on the Statements of Operations, were incurred by each applicable Fund as listed below:
| | | | |
| | | Amount | |
| |
| Active U.S. Real Estate ETF | | | $582 | |
| |
| Balanced Multi-Asset Allocation ETF | | | 6,735 | |
| |
| Conservative Multi-Asset Allocation ETF | | | 2,510 | |
| |
| Growth Multi-Asset Allocation ETF | | | 4,955 | |
| |
| Moderately Conservative Multi-Asset Allocation ETF | | | 4,441 | |
| |
| S&P 500® Downside Hedged ETF | | | 348 | |
| N. | Foreign Currency Translations - Foreign currency is valued at the close of the NYSE based on quotations posted by banks and major currency dealers. Portfolio securities and other assets and liabilities denominated in foreign currencies are translated into U.S. dollar amounts at the date of valuation. Purchases and sales of portfolio securities (net of foreign taxes withheld on disposition) and income items denominated in foreign currencies are translated into U.S. dollar amounts on the respective dates of such transactions. Each Fund does not separately account for the portion of the results of operations resulting from changes in foreign exchange rates on investments and the fluctuations arising from changes in market prices of securities held. The combined results of changes in foreign exchange rates and the fluctuation of market prices on investments (net of estimated foreign tax withholding) are included with the net realized and unrealized gain or loss from investments in the Statements of Operations. Reported net realized foreign currency gains or losses arise from (1) sales of foreign currencies, (2) currency gains or losses realized between the trade and settlement dates on securities transactions, and (3) the difference between the amounts of dividends, interest, and foreign withholding taxes recorded on a Fund’s books and the U.S. dollar equivalent of the amounts actually received or paid. Net unrealized foreign currency gains and losses arise from changes in the fair values of assets and liabilities, other than investments in securities at fiscal period-end, resulting from changes in exchange rates. |
Each Fund may invest in foreign securities, which may be subject to foreign taxes on income, gains on investments or currency repatriation, a portion of which may be recoverable. Foreign taxes, if any, are recorded based on the tax regulations and rates that exist in the foreign markets in which a Fund invests.
| O. | Forward Foreign Currency Contracts - Certain Funds may engage in foreign currency transactions either on a spot (i.e. for prompt delivery and settlement) basis at the rate prevailing in the currency exchange market at the time or through forward foreign currency contracts to manage or minimize currency or exchange rate risk. |
A Fund may also enter into forward foreign currency contracts for the purchase or sale of a security denominated in a foreign currency in order to “lock in” the U.S. dollar price of that security, or the Fund may enter into forward foreign currency contracts that do not provide for physical exchange of the two currencies on the settlement date, but instead are settled by a single cash payment calculated as the difference between the agreed upon exchange rate and the spot rate at settlement based upon an agreed upon notional amount (non-deliverable forwards).
A forward foreign currency contract is an obligation between two parties (“Counterparties”) to purchase or sell a specific currency for an agreed-upon price at a future date. The use of forward foreign currency contracts for hedging does not eliminate fluctuations in the price of the underlying securities the Fund owns or intends to acquire but establishes a rate of exchange in advance. Fluctuations in the value of these contracts are measured by the difference in the contract date and
reporting date exchange rates and are recorded as unrealized appreciation (depreciation) until the contracts are closed. When the contracts are closed, realized gains (losses) are recorded. Realized and unrealized gains (losses) on the contracts are included in the Statements of Operations. The primary risks associated with forward foreign currency contracts include failure of the Counterparty to meet the terms of the contract and the value of the foreign currency changing unfavorably. These risks may be in excess of the amounts reflected in the Statements of Assets and Liabilities.
| P. | Futures Contracts - Certain Funds may enter into futures contracts to simulate full investment in securities or manage exposure to equity and market price movements and/or currency risks and provide exposure to markets and indexes. |
A futures contract is an agreement between Counterparties to purchase or sell a specified underlying security or index for a specified price at a future date. Certain Funds will only enter into futures contracts that are traded on a U.S. exchange and that are standardized as to maturity date and underlying instrument or asset. Initial margin deposits required upon entering into futures contracts are satisfied by the segregation of specific securities or cash as collateral at the futures commission merchant broker. During the period the futures contracts are open, changes in the value of the contracts are recognized as unrealized gains or losses by recalculating the value of the contracts on a daily basis. Subsequent or variation margin payments are received or made depending upon whether unrealized gains or losses are incurred. These amounts are reflected as a receivable or payable on the Statements of Assets and Liabilities. When the contracts are closed or expire, each Fund recognizes a realized gain or loss equal to the difference between the proceeds from, or cost of, the closing transaction and the Fund’s basis in the contract. The net realized gain (loss) and the change in unrealized gain (loss) on futures contracts held during the period is included on the Statements of Operations.
The primary risks associated with futures contracts are market risk, leverage risk and the absence of a liquid secondary market. If a Fund were unable to liquidate a futures contract and/or enter into an offsetting closing transaction, the Fund would continue to be subject to market risk with respect to the value of the contracts and may be required to continue to maintain the margin deposits on the futures contracts until the position expired or matured. As futures contracts approach expiration, they may be replaced by similar contracts that have a later expiration. This process is referred to as “rolling.” If the market for these contracts is in “contango,” meaning that the prices of futures contracts in the nearer months are lower than the price of contracts in the distant months, the sale of the near-term month contract would be at a lower price than the longer-term contract, resulting in a cost to “roll” the futures contract. The actual realization of a potential roll cost will depend on the difference in price of the near and distant contracts. The contracts included in the VIX Index historically have traded in “contango” markets, resulting in a roll cost, which could adversely affect the value of Shares of the S&P 500® Downside Hedged ETF. Futures have minimal Counterparty risk since the exchange’s clearinghouse, as Counterparty to all exchange-traded futures contracts, guarantees the futures against default. Risks may exceed amounts recognized in the Statements of Assets and Liabilities.
| Q. | Call Options Purchased and Written - Certain Funds may write call options and/or buy call options. A covered call option gives the purchaser of such option the right to buy, and the writer the obligation to sell, the underlying security or foreign currency at the stated exercise price during the option period. An uncovered call option exists without the ownership of the underlying security. Options written by the Fund normally will have expiration dates between three and nine months from the date written. The exercise price of a call option may be below, equal to, or above the current market value of the underlying security at the time the option is written. |
When the Fund writes a covered call option, an amount equal to the premium received by the Fund is recorded as an asset and an equivalent liability in the Statements of Assets and Liabilities. The amount of the liability is subsequently “marked-to-market” to reflect the current market value of the option written. If a written covered call option expires on the stipulated expiration date, or if the Fund enters into a closing purchase transaction, the Fund realizes a gain (or a loss if the closing purchase transaction exceeds the premium received when the option was written) without regard to any unrealized gain or loss on the underlying security, and the liability related to such option is extinguished. If a written covered call option is exercised, the Fund realizes a gain or a loss from the sale of the underlying security and the proceeds of the sale are increased by the premium originally received. Realized and unrealized gains and losses on call options written are included in the Statements of Operations as Net realized gain (loss) from and Change in net unrealized appreciation (depreciation) of Option contracts written. A risk in writing a covered call option is that the Fund gives up the opportunity for profit if the market price of the security increases and the option is exercised. The risk in writing an uncovered call option is that the Fund may incur significant losses if the value of the written security exceeds the exercise price of the option.
When the Fund buys a call option, an amount equal to the premium paid by the Fund is recorded as an investment on the Statements of Assets and Liabilities. The amount of the investment is subsequently “marked-to-market” to reflect the current value of the option purchased. Realized and unrealized gains and losses on call options purchased are included in the Statements of Operations as Net realized gain (loss) from and Change in net unrealized appreciation (depreciation) of Investment securities. A risk in buying an option is that the Fund pays a premium whether or not the option is exercised. In addition, there can be no assurance that a liquid secondary market will exist for any option purchased.
| R. | Put Options Purchased and Written - Certain Funds may purchase and write put options including options on securities indexes, or foreign currency and/or futures contracts. By purchasing a put option, the Fund obtains the right (but not the obligation) to sell the option’s underlying instrument at a fixed strike price. In return for this right, the Fund pays an option premium. The option’s underlying instrument may be a security, securities index, or a futures contract. |
Put options may be used by the Fund to hedge securities it owns by locking in a minimum price at which the Fund can sell. If security prices fall, the put option could be exercised to offset all or a portion of the Fund’s resulting losses. At the same time, because the maximum the Fund has at risk is the cost of the option, purchasing put options does not eliminate the potential for the Fund to profit from an increase in the value of the underlying portfolio securities. The Fund may write put options to earn additional income in the form of option premiums if it expects the price of the underlying instrument to remain stable or rise during the option period so that the option will not be exercised. The risk in this strategy is that the price of the underlying portfolio securities may decline by an amount greater than the premium received. Put options written are reported as a liability in the Statements of Assets and Liabilities. Realized and unrealized gains and losses on put options purchased and put options written are included in the Statements of Operations as Net realized gain (loss) from and Change in net unrealized appreciation (depreciation) of Investment securities and Option contracts written, respectively.
A risk in buying an option is that the Fund pays a premium whether or not the option is exercised. In addition, there can be no assurance that a liquid secondary market will exist for any option purchased.
| S. | Swap Agreements - Certain Funds may enter into various swap transactions, including interest rate, total return, index, currency exchange rate and credit default swap contracts (“CDS”) for investment purposes or to manage interest rate, currency or credit risk. Such transactions are agreements between Counterparties. These agreements may contain, among other conditions, events of default and termination events, and various covenants and representations such as provisions that require each Fund to maintain a pre-determined level of net assets, and/or provide limits regarding the decline of each Fund’s NAV over specific periods of time. If each Fund were to trigger such provisions and have open derivative positions at that time, the Counterparty may be able to terminate such agreement and request immediate payment in an amount equal to the net liability positions, if any. |
Interest rate, total return, index and currency exchange rate swap agreements are two-party contracts entered into primarily to exchange the returns (or differentials in rates of returns) earned or realized on particular predetermined investments or instruments. The gross returns to be exchanged or “swapped” between the parties are calculated with respect to a notional amount, i.e., the return on or increase in value of a particular dollar amount invested at a particular interest rate or return of an underlying asset, in a particular foreign currency, or in a “basket” of securities representing a particular index.
In a centrally cleared swap, the Fund’s ultimate Counterparty is a central clearinghouse. The Fund initially will enter into centrally cleared swaps through an executing broker. When a fund enters into a centrally cleared swap, it must deliver to the central Counterparty (via the futures commission merchant (“FCM”)) an amount referred to as “initial margin.” Initial margin requirements are determined by the central Counterparty, but an FCM may require additional initial margin above the amount required by the central Counterparty. Initial margin deposits required upon entering into centrally cleared swaps are satisfied by cash or securities as collateral at the FCM. Securities deposited as initial margin are designated on the Schedule of Investments and cash deposited is recorded on the Statements of Assets and Liabilities. During the term of a cleared swap agreement, a “variation margin” amount may be required to be paid by the Fund or may be received by the Fund, based on the daily change in price of the underlying reference instrument subject to the swap agreement and is recorded as a receivable or payable for variation margin in the Statements of Assets and Liabilities until the centrally cleared swap is terminated at which time a realized gain or loss is recorded.
Changes in the value of swap agreements are recognized as unrealized gains (losses) in the Statements of Operations by “marking to market” on a daily basis to reflect the value of the swap agreement at the end of each trading day. Payments received or paid at the beginning of the agreement are reflected as such on the Statements of Assets and Liabilities and may be referred to as upfront payments. The Fund accrues for the fixed payment stream and amortizes upfront payments, if any, on swap agreements on a daily basis with the net amount, recorded as a component of realized gain (loss) on the Statements of Operations. A liquidation payment received or made at the termination of a swap agreement is recorded as realized gain (loss) on the Statements of Operations. Cash held as collateral is recorded as deposits with brokers on the Statements of Assets and Liabilities. Entering into these agreements involves, to varying degrees, lack of liquidity and elements of credit, market, and counterparty risk in excess of amounts recognized on the Statements of Assets and Liabilities. Such risks involve the possibility that a swap is difficult to sell or liquidate, the Counterparty does not honor its obligations under the agreement and unfavorable interest rates and market fluctuations. It is possible that developments in the swaps market, including potential government regulation, could adversely affect the Fund’s ability to terminate existing swap agreements or to realize amounts to be received under such agreements. Additionally, an International Swaps and Derivatives Association Master Agreement (“ISDA Master Agreement”) includes credit related contingent features which allow Counterparties to OTC derivatives to terminate derivative contracts prior to maturity in the event that, for example, the Fund’s net assets decline by a stated percentage or the Fund fails to meet the terms of its ISDA Master Agreements, which would cause the Fund to accelerate payment of any net liability owed to the Counterparty.
Active Trading Risk. Active trading of portfolio securities may result in added expenses, a lower return and increased tax liability.
Agency Debt Risk. Certain Funds may invest in debt issued by government agencies, including the Federal National Mortgage Association (“Fannie Mae”) and the Federal Home Loan Mortgage Corporation (“Freddie Mac”). Instruments issued by government agencies generally are backed only by the general creditworthiness and reputation of the government agency issuing the instrument and are not backed by the full faith and credit of the U.S. government. As a result, there is uncertainty as to the current status of many obligations of Fannie Mae, Freddie Mac and other agencies that are placed under conservatorship of the federal government.
AP Concentration Risk. Only APs may engage in creation or redemption transactions directly with each Fund. Each Fund has a limited number of institutions that may act as APs, and such APs have no obligation to submit creation or redemption orders. Consequently, there is no assurance that APs will establish or maintain an active trading market for the Shares. This risk may be heightened to the extent that securities held by each Fund are traded outside a collateralized settlement system. In that case, APs may be required to post collateral on certain trades on an agency basis (i.e., on behalf of other market participants), which only a limited number of APs may be able to do. In addition, to the extent that APs exit the business or are unable to proceed with creation and/or redemption orders with respect to each Fund and no other AP is able to step forward to create or redeem Creation Units, this may result in a significantly diminished trading market for Fund Shares, and Shares may be more likely to trade at a premium or discount to a Fund’s NAV and to face trading halts and/or delisting. Investments in non-U.S. securities, which may have lower trading volumes or could experience extended market closures or trading halts, may increase the risk that APs may not be able to effectively create or redeem Creation Units or the risk that the Shares may be halted and/or delisted.
Call Risk. If interest rates fall, it is possible that issuers of callable securities with high interest coupons will “call” (or prepay) their bonds before their maturity date. If an issuer exercises such a call during a period of declining interest rates, a Fund may have to replace such called security with a lower yielding security. If that were to happen, such Fund’s net investment income could fall.
Cash Transaction Risk. Most exchange-traded funds (“ETFs”) generally make in-kind redemptions to avoid being taxed at the fund level on gains on the distributed portfolio securities. However, unlike most ETFs, certain Funds currently intend to effect creations and redemptions principally for cash, rather than principally in-kind, because of the nature of the Fund’s investments. As such, each Fund may be required to sell portfolio securities to obtain the cash needed to distribute redemption proceeds. Therefore, a Fund may recognize a capital gain on these sales that might not have been incurred if the Fund had made a redemption in-kind. This may decrease the tax efficiency of each Fund compared to ETFs that utilize an in-kind redemption process and there may be a substantial difference in the after-tax rate of return between each Fund and conventional ETFs.
Collateralized Loan Obligations (“CLOs”) and Collateralized Debt Obligations (“CDOs”) Risk. Certain Funds may invest in CLOs and CDOs. CLOs bear many of the same risks as other forms of asset-backed securities (“ABS”), including interest rate risk, credit risk and default risk. As they are backed by pools of loans, CLOs also bear similar risks to investing in loans directly. CLOs issue classes or “tranches’’ that vary in risk and yield. CLOs may experience substantial losses attributable to loan defaults. Losses caused by defaults on underlying assets are borne first by the holders of subordinate tranches. Each Fund’s investment in CLOs may decrease in market value when the CLO experiences loan defaults or credit impairment, the disappearance of a subordinate tranche, or market anticipation of defaults and investor aversion to CLO securities as a class.
Commercial Paper Risk. Certain Funds may invest in commercial paper. The value of the Fund’s investment in commercial paper, which is an unsecured promissory note that generally has a maturity date between one and 270 days and is issued by a U.S. or foreign entity, is susceptible to changes in the issuer’s financial condition or credit quality. Investments in commercial paper are usually discounted from their value at maturity. Commercial paper can be fixed-rate or variable rate and can be adversely affected by changes in interest rates.
Commodity Pool Risk. S&P 500® Downside Hedged ETF’s investments in futures contracts has caused it to be deemed a commodity pool, thereby subjecting it to regulation under the Commodity Exchange Act and Commodity Futures Trading Commission (“CFTC”) rules. The Adviser is registered as a commodity pool operator (“CPO”) and as a commodity trading advisor (“CTA”), and will manage the Fund in accordance with CFTC rules, as well as the rules that apply to registered investment companies. Registration as a CPO or CTA subjects the Adviser to additional laws, regulations and enforcement policies, which could increase compliance costs and may affect the operations and financial performance of the Fund. Registration as a commodity pool may have negative effects on the ability of the Fund to engage in its planned investment program. Additionally, the Fund’s positions in futures contracts may have to be liquidated at disadvantageous times or prices to prevent the Fund from exceeding any applicable position limits established by the CFTC. Such actions may subject the Fund to substantial losses.
Currency Risk. Because each Fund’s NAV is determined in U.S. dollars, a Fund’s NAV could decline if the currency of a non-U.S. market in which the Fund invests depreciates against the U.S. dollar. Generally, an increase in the value of the U.S. dollar against a foreign currency will reduce the value of a security denominated in that foreign currency, thereby decreasing a Fund’s overall NAV. Exchange rates may be volatile and may change quickly and unpredictably in response to both global
economic developments and economic conditions, causing an adverse impact on a Fund. As a result, investors have the potential for losses regardless of the length of time they intend to hold Shares.
Emerging Markets Investment Risk. For certain Funds, investments in the securities of issuers in emerging market countries involve risks often not associated with investments in the securities of issuers in developed countries. Securities in emerging markets may be subject to greater price fluctuations than securities in more developed markets. Companies in emerging market countries generally may be subject to less stringent regulatory, disclosure, financial reporting, accounting, auditing and recordkeeping standards than companies in more developed countries. In addition, information about such companies may be less available and reliable. Emerging markets usually are subject to greater market volatility, political, social and economic instability, uncertainty regarding the existence of trading markets and more governmental limitations on foreign investment than are more developed markets. Securities law in many emerging market countries is relatively new and unsettled. Therefore, laws regarding foreign investment in emerging market securities, securities regulation, title to securities, and shareholder rights may change quickly and unpredictably, and the ability to bring and enforce actions, or to obtain information needed to pursue or enforce such actions, may be limited. In addition, the enforcement of systems of taxation at federal, regional and local levels in emerging market countries may be inconsistent and subject to sudden change. Investments in emerging market securities may be subject to additional transaction costs, delays in settlement procedures, unexpected market closures, and lack of timely information.
Equity Risk. Equity risk is the risk that the value of equity securities, including common stocks, may fall due to both changes in general economic conditions that impact the market as a whole, as well as factors that directly relate to a specific company or its industry. Such general economic conditions include changes in interest rates, periods of market turbulence or instability, or general and prolonged periods of economic decline and cyclical change. It is possible that a drop in the stock market may depress the price of most or all of the common stocks that each Fund holds. In addition, equity risk includes the risk that investor sentiment toward one or more industries will become negative, resulting in those investors exiting their investments in those industries, which could cause a reduction in the value of companies in those industries more broadly. The value of a company’s common stock may fall solely because of factors, such as an increase in production costs that negatively impact other companies in the same region, industry or sector of the market. A company’s common stock also may decline significantly in price over a short period of time due to factors specific to that company, including decisions made by its management or lower demand for the company’s products or services. For example, an adverse event, such as an unfavorable earnings report or the failure to make anticipated dividend payments, may depress the value of common stock.
Fixed-Income Securities Risk. Fixed-income securities are subject to interest rate risk and credit risk. Interest rate risk refers to fluctuations in the value of a fixed-income security resulting from changes in the general level of interest rates. When the general level of interest rates goes up, the prices of most fixed-income securities go down. When the general level of interest rates goes down, the prices of most fixed-income securities go up. Fixed-income securities with longer maturities typically are more sensitive to changes in interest rates, making them more volatile than securities with shorter maturities. Credit risk refers to the possibility that the issuer of a security will be unable and/or unwilling to make timely interest payments and/or repay the principal on its debt. Debt instruments are subject to varying degrees of credit risk, which may be reflected in credit ratings. There is a possibility that the credit rating of a fixed-income security may be downgraded after purchase, which may occur quickly and without advance warning following sudden market downturns or unexpected developments involving an issuer, and which may adversely affect the liquidity and value of the security.
Foreign Fixed-Income Investment Risk. For certain Funds, investments in fixed-income securities of non-U.S. issuers are subject to the same risks as other debt securities, notably credit risk, market risk, interest rate risk and liquidity risk, while also facing risks beyond those associated with investments in U.S. securities. For example, foreign securities may have relatively low market liquidity, greater market volatility, decreased publicly available information, and less reliable financial information about issuers, and inconsistent and potentially less stringent accounting, auditing and financial reporting requirements and standards of practice, including recordkeeping standards, comparable to those applicable to domestic issuers. Foreign securities also are subject to the risks of expropriation, nationalization, political instability or other adverse political or economic developments and the difficulty of enforcing obligations in other countries. Investments in foreign securities also may be subject to dividend withholding or confiscatory taxes, currency blockage and/or transfer restrictions and higher transactional costs.
Foreign Investment Risk. Investments in the securities of non-U.S. issuers involve risks beyond those associated with investments in U.S. securities. Foreign securities may have relatively low market liquidity, greater market volatility, decreased publicly available information and less reliable financial information about issuers and inconsistent and potentially less stringent accounting, auditing and financial reporting requirements and standards of practice, including recordkeeping standards, comparable to those applicable to domestic issuers. Foreign securities are also subject to the risks of expropriation, nationalization, political instability or other adverse political or economic developments and the difficulty of enforcing obligations in other countries. Investments in foreign securities also may be subject to dividend withholding or confiscatory taxes, currency blockage and/or transfer restrictions and higher transactional costs. If a Fund invests in securities denominated in foreign currencies, fluctuations in the value of the U.S. dollar relative to the values of other currencies may adversely affect investments in foreign securities and may negatively impact the Fund’s returns.
High Yield Securities (Junk Bond) Risk. Compared to higher quality debt securities, high yield debt securities (commonly referred to as “junk bonds”) involve a greater risk of default or price changes due to changes in the credit quality of the issuer because they are generally unsecured and may be subordinated to other creditors’ claims. They are considered speculative with respect to the issuer’s capacity to pay interest and repay principal. High yield debt securities often are issued by smaller, less creditworthy companies or by highly leveraged (indebted) firms, which generally are less able than more financially stable firms to make scheduled payments of interest and principal. The values of junk bonds often fluctuate more in response to company, political, regulatory or economic developments than higher quality bonds, and their values can decline significantly over short periods of time or during periods of economic difficulty when the bonds could be difficult to value or sell at a fair price.
Industry Concentration Risk. Certain Funds are concentrated to a significant degree in securities of issuers operating in a single industry or industry group. By concentrating their investments in an industry or industry group, such Funds may face more risks than if they were diversified broadly over numerous industries or industry groups. Such industry-based risks, any of which may adversely affect the companies in which some Funds invest, may include, but are not limited to, the following: general economic conditions or cyclical market patterns that could negatively affect supply and demand in a particular industry; competition for resources, adverse labor relations, political or world events; obsolescence of technologies; and increased competition or new product introductions that may affect the profitability or viability of companies in an industry. In addition, at times, such industry or industry group may be out of favor and underperform other industries or the market as a whole.
Interest Rate Risk. Interest rate risk refers to the risk that bond prices generally fall as interest rates rise; conversely, bond prices generally rise as interest rates fall. Specific bonds differ in their sensitivity to changes in interest rates depending on their individual characteristics, including duration. “Duration risk” is related to interest rate risk; it refers to the risks associated with the sensitivity of a bond’s price to a one percent change in interest rates. Bonds with longer durations (i.e., a greater length of time until they reach maturity) face greater duration risk, meaning that they tend to exhibit greater volatility and are more sensitive to changes in interest rates than bonds with shorter durations. The Fund seeks to limit its exposure to interest rate risk and duration risk by constructing a portfolio of instruments that have an average duration of less than one year.
Investment in Investment Companies Risk. Investing in other investment companies, including ETFs and closed-end funds, subjects a Fund to those risks affecting the investment company, including the possibility that the value of the underlying securities held by the investment company could decrease or the portfolio becomes illiquid. Moreover, a Fund will pay indirectly a proportional share of the fees and expenses of the investment companies in which it invests. Investments in another ETF or closed-end fund are subject to, among other risks, the risk that the ETF’s or closed-end fund’s shares may trade at a discount or premium relative to the NAV of its shares and the listing exchange may halt trading of the fund’s shares.
Issuer-Specific Changes Risk. The value of an individual security or particular type of security may be more volatile than the market as a whole and may perform differently from the value of the market as a whole.
LIBOR Transition Risk. Certain Funds may have investments in financial instruments that utilize the London Interbank Offered Rate (“LIBOR”) as the reference or benchmark rate for variable interest rate calculations. LIBOR is intended to measure the rate generally at which banks can lend and borrow from one another in the relevant currency on an unsecured basis. The UK Financial Conduct Authority (“FCA”), the regulator that oversees LIBOR, announced that the majority of LIBOR rates would cease to be published or would no longer be representative on January 1, 2022. Although the publication of most LIBOR rates ceased at the end of 2021, a selection of widely used USD LIBOR rates continues to be published until June 2023 to allow for an orderly transition away from these rates.
There remains uncertainty and risks relating to the continuing LIBOR transition and its effects on the Funds and the instruments in which the Funds invest. There can be no assurance that the composition or characteristics of any alternative reference rates (“ARRs”) or financial instruments in which the Funds invest that utilize ARRs will be similar to or produce the same value or economic equivalence as LIBOR or that these instruments will have the same volume or liquidity. Additionally, there remains uncertainty and risks relating to certain “legacy” USD LIBOR instruments that were issued or entered into before December 31, 2021 and the process by which a replacement interest rate will be identified and implemented into these instruments when USD LIBOR is ultimately discontinued. The effects of such uncertainty and risks in “legacy” USD LIBOR instruments held by the Funds could result in losses to the Funds.
Liquidity Risk. Liquidity risk exists when a particular investment is difficult to purchase or sell. If a Fund invests in illiquid securities or current portfolio securities become illiquid, it may reduce the returns of the Fund because the Fund may be unable to sell the illiquid securities at an advantageous time or price.
Management Risk. The Funds are subject to management risk because they are actively managed portfolios. In managing a Fund’s portfolio securities, the Adviser or a sub-adviser (as applicable and as set forth below) applies investment techniques and risk analyses in making investment decisions, but there can be no guarantee that these will produce the desired results.
Market Risk. The Funds’ holdings are subject to market fluctuations. You should anticipate that the value of the Shares will decline more or less, in correlation with any decline in value of the holdings in a Fund’s portfolio. Additionally, natural or environmental disasters, widespread disease or other public health issues, war, acts of terrorism or other events could result in increased premiums or discounts to each Fund’s NAV.
Mortgage-Backed and Asset-Backed Securities Risk. For certain Funds, investments in mortgage- and asset-backed securities are subject to call (prepayment) risk, reinvestment risk and extension risk. In addition, these securities are susceptible to an unexpectedly high rate of defaults on the mortgages held by a mortgage pool, which may adversely affect their value. The risk of such defaults depends on the quality of the mortgages underlying such security, the credit quality of its issuer or guarantor, and the nature and structure of its credit support. For example, the risk of default generally is higher in the case of mortgage pools that include subprime mortgages, which are loans made to borrowers with weakened credit histories or with lower capacity to make timely mortgage payments.
Portfolio Turnover Risk. Certain Funds may engage in frequent trading of their respective portfolio securities, which may result in a high portfolio turnover rate. A portfolio turnover rate of 200%, for example, is equivalent to a Fund buying and selling all of its securities two times during the course of a year. A high portfolio turnover rate (such as 100% or more) could result in high brokerage costs for a Fund. While a high portfolio turnover rate may increase a fund’s transaction costs it may also generate a greater amount of taxable capital gain distributions to the fund’s shareholders. Funds that engage in To-Be-Announced (“TBA”) transactions are also subject to portfolio turnover risk.
REIT Risk. REITs are pooled investment vehicles that trade like stocks and invest substantially all of their assets in real estate and may qualify for special tax considerations. REITs are subject to certain risks inherent in the direct ownership of real estate, including without limitation, a possible lack of mortgage funds and associated interest rate risks, overbuilding, property vacancies, increases in property taxes and operating expenses, changes in zoning laws, losses due to environmental damages and changes in neighborhood values and appeal to purchasers. Further, failure of a company to qualify as a REIT under federal tax law may have adverse consequences to the REIT’s shareholders. In addition, REITs may have expenses, including advisory and administration expenses, and REIT shareholders will incur a proportionate share of the underlying expenses.
Risk of Investing in Loans. Investments in loans, including loan syndicates and other direct lending opportunities, involve special types of risks, including credit risk, interest rate risk, counterparty risk and prepayment risk. Loans may offer a fixed or floating interest rate. Loans are often generally below investment grade and may be unrated. A Fund’s investments in loans can be difficult to value accurately and may be more susceptible to liquidity risk than fixed-income instruments of similar credit quality and/or maturity. A Fund is also subject to the risk that the value of the collateral for the loan may be insufficient to cover the borrower’s obligations should the borrower fail to make payments or become insolvent. Participations in loans may subject the Fund to the credit risk of both the borrower and the issuer of the participation and may make enforcement of loan covenants more difficult for the Fund as legal action may have to go through the issuer of the participations. Transactions in loans are often subject to long settlement periods, thus potentially limiting the ability of a Fund to invest sale proceeds in other investments and to use proceeds to meet its current redemption obligations. Thus, to the extent a Fund effects redemptions in cash, the Fund is subject to the risk of selling other investments or taking other actions necessary to raise cash to meet its redemption obligations.
Small- and Mid-Capitalization Company Risk. Investing in securities of small- and mid-capitalization companies involves greater risk than customarily is associated with investing in larger, more established companies. These companies’ securities may be more volatile and less liquid than those of more established companies. These securities may have returns that vary, sometimes significantly, from the overall securities market. Often small- and mid-capitalization companies and the industries in which they focus are still evolving and, as a result, they may be more sensitive to changing market conditions.
TBA Transactions Risk. TBA purchase commitments involve a risk of loss if the value of the securities to be purchased declines prior to the settlement date or if the counterparty may not deliver the securities as promised. Selling a TBA involves a risk of loss if the value of the securities to be sold goes up prior to the settlement date. TBA transactions involve counterparty risk. Default or bankruptcy of a counterparty to a TBA transaction would expose a Fund to potential loss and could affect the Fund’s returns.
U.S. Government Obligations Risk. Certain Funds may invest in U.S. government obligations issued or guaranteed by the U.S. Government, its agencies and instrumentalities, including bills, notes and bonds issued by the U.S. Treasury. U.S. Government securities include securities that are issued or guaranteed by the United States Treasury, by various agencies of the U.S. Government, or by various instrumentalities which have been established or sponsored by the U.S. Government. U.S. Treasury securities are backed by the “full faith and credit” of the United States. Securities issued or guaranteed by federal agencies and U.S. Government-sponsored instrumentalities may or may not be backed by the full faith and credit of the United States. In the case of those U.S. Government securities not backed by the full faith and credit of the United States, the investor must look principally to the agency or instrumentality issuing or guaranteeing the security for ultimate repayment, and may not be able to assert a claim against the United States itself in the event that the agency or instrumentality does not meet its commitment. The U.S. Government, its agencies and instrumentalities do not guarantee the market value of their securities, and consequently, the value of such securities may fluctuate. Additionally, from time to time, uncertainty regarding the status of negotiations in the U.S. Government to increase the statutory debt limit, commonly called the “debt ceiling”, could increase the risk that the U.S. Government may default on payments on certain U.S. Government securities, cause the credit rating of the U.S. Government to be downgraded, increase volatility in the stock and bond markets, result in higher interest rates, reduce prices of U.S. Treasury securities, and/or increase the costs of various kinds of debt. If a U.S. Government-sponsored entity is negatively impacted by legislative or regulatory action, is unable to meet its obligations, or its creditworthiness declines, the performance of a Fund that holds securities of that entity will be adversely impacted.
Valuation Risk. Financial information related to securities of non-U.S. issuers may be less reliable than information related to securities of U.S. issuers, which may make it difficult to obtain a current price for a non-U.S. security held by a Fund. In certain circumstances, market quotations may not be readily available for some Fund securities, and those securities may be fair valued. The value established for a security through fair valuation may be different from what would be produced if the security had been valued using market quotations. Fund securities that are valued using techniques other than market quotations, including “fair valued” securities, may be subject to greater fluctuations in their value from one day to the next than would be the case if market quotations were used. In addition, there is no assurance that a Fund could sell a portfolio security for the value established for it at any time, and it is possible that a Fund would incur a loss because a security is sold at a discount to its established value.
COVID-19 Risk. The COVID-19 strain of coronavirus has resulted in instances of market closures and dislocations, extreme volatility, liquidity constraints and increased trading costs. Efforts to contain its spread have resulted in travel restrictions, disruptions of healthcare systems, business operations (including business closures) and supply chains, layoffs, lower consumer demand and employee availability, and defaults and credit downgrades, among other significant economic impacts that have disrupted global economic activity across many industries. Such economic impacts may exacerbate other pre-existing political, social and economic risks locally or globally and cause general concern and uncertainty. The full economic impact and ongoing effects of COVID-19 (or other future epidemics or pandemics) at the macro-level and on individual businesses are unpredictable and may result in significant and prolonged effects on the Funds’ performance.
NOTE 3–Investment Advisory Agreements and Other Agreements
The Trust has entered into Investment Advisory Agreements with the Adviser on behalf of each Fund, pursuant to which the Adviser has overall responsibility for the selection and ongoing monitoring of the Funds’ investments, managing the Funds’ business affairs, providing certain clerical, bookkeeping and other administrative services, and for each Fund (except S&P 500® Downside Hedged ETF), oversight of Invesco, Invesco Asset Management Deutschland GmbH, Invesco Asset Management Limited, Invesco Asset Management (Japan) Limited, Invesco Hong Kong Limited, Invesco Senior Secured Management, Inc. and Invesco Canada Ltd. (collectively, the “Affiliated Sub-Advisers”).
Pursuant to an Investment Advisory Agreement, each Fund (except Ultra Short Duration ETF) accrues daily and pays monthly to the Adviser an annual unitary management fee. Out of the unitary management fee, the Adviser has agreed to pay for substantially all expenses of the Funds, including payments to the Affiliated Sub-Advisers for each Fund (except S&P 500® Downside Hedged ETF), and for each Fund the cost of transfer agency, custody, fund administration, legal, audit and other services, except for distribution fees, if any, brokerage expenses, taxes, interest, acquired fund fees and expenses, if any, litigation expenses and other extraordinary expenses, including proxy expenses (except for such proxies related to: (i) changes to the Investment Advisory Agreement, (ii) the election of any Board member who is an “interested person” of the Trust, or (iii) any other matters that directly benefit the Adviser). The unitary management fee is paid by each Fund to the Adviser at the following annual rates:
| | |
| | | Unitary Management Fees
(as a % of average daily net assets) |
| |
| Active U.S. Real Estate ETF | | 0.35% |
| |
| Balanced Multi-Asset Allocation ETF | | 0.05% |
| |
| Conservative Multi-Asset Allocation ETF | | 0.05% |
| |
| Growth Multi-Asset Allocation ETF | | 0.05% |
| |
| High Yield Bond Factor ETF | | 0.39% |
| |
| Moderately Conservative Multi-Asset Allocation ETF | | 0.05% |
| |
| S&P 500® Downside Hedged ETF | | 0.39% |
| |
| Total Return Bond ETF | | 0.50% |
| |
| Variable Rate Investment Grade ETF | | 0.30% |
Pursuant to another Investment Advisory Agreement, Ultra Short Duration ETF accrues daily and pays monthly to the Adviser an annual management fee equal to 0.20% of the Fund’s average daily net assets. Ultra Short Duration ETF is responsible for all of its own expenses, including its management fee, costs of transfer agency, custody, fund administration, legal, audit and other services, interest, taxes, Acquired Fund Fees and Expenses, if any, brokerage commissions and other expenses connected with executions of portfolio transactions, any distribution fees or expenses, litigation expenses, fees payable to the Trust’s Independent Trustees, expenses incurred in connection with the Board members’ services, including travel expenses and legal fees of counsel for the Independent Trustees and extraordinary expenses, including proxy expenses (except for such proxies related to: (i) changes to the Investment Advisory Agreement, (ii) the election of any Board member who is an “interested person” of the Trust, or (iii) any other matters that directly benefit the Adviser).
The Adviser has entered into an Investment Sub-Advisory Agreement with the Affiliated Sub-Advisers for each Fund (except S&P 500® Downside Hedged ETF). The sub-advisory fee for these Funds is paid by the Adviser to the Affiliated Sub-Advisers at 40% of the Adviser’s compensation of the sub-advised assets of each Fund.
The Adviser has contractually agreed to waive fees and/or pay Fund expenses for Ultra Short Duration ETF to the extent necessary to prevent the operating expenses of the Fund (excluding interest expenses, offering costs, brokerage commissions and other trading expenses, taxes, acquired fund fees and expenses, if any, and extraordinary expenses) from exceeding 0.27% of the Fund’s average daily net assets per year (the “Expense Cap”), through at least August 31, 2024.
Further, the Adviser has contractually agreed to waive the management fee payable by each Fund (except for Total Return Bond ETF and Ultra Short Duration ETF) in an amount equal to the lesser of: (i) 100% of the net advisory fees earned by the Adviser or an affiliate of the Adviser that are attributable to the Fund’s investments in money market funds that are managed by affiliates of the Adviser and other funds (including ETFs) managed by the Adviser or affiliates of the Adviser (collectively, “Underlying Affiliated Investments”) or (ii) the management fee available to be waived. For Total Return Bond ETF and Ultra Short Duration ETF, the Adviser has contractually agreed to waive a portion of the management fee payable and/or reimburse Fund expenses in an amount equal to 100% of the net advisory fees earned by the Adviser or an affiliate of the Adviser that are attributable to the Fund’s Underlying Affiliated Investments. These waivers do not apply to a Fund’s investment of cash collateral received for securities lending. These waivers (except for Total Return Bond ETF and Ultra Short Duration ETF) are in place through at least August 31, 2024, and there is no guarantee that the Adviser will extend them past that date. This agreement is not subject to recapture by the Adviser.
For the fiscal year ended October 31, 2022, the Adviser waived fees for each Fund in the following amounts:
| | | | |
| |
| Active U.S. Real Estate ETF | | $ | 38 | |
| |
| Balanced Multi-Asset Allocation ETF | | | 3 | |
| |
| Conservative Multi-Asset Allocation ETF | | | 2 | |
| |
| Growth Multi-Asset Allocation ETF | | | 2 | |
| |
| High Yield Bond Factor ETF | | | 153 | |
| |
| Moderately Conservative Multi-Asset Allocation ETF | | | 2 | |
| |
| S&P 500® Downside Hedged ETF | | | 45,429 | |
| |
| Total Return Bond ETF | | | - | |
| |
| Ultra Short Duration ETF | | | - | |
| |
| Variable Rate Investment Grade ETF | | | 3,790 | |
The fees waived and/or expenses borne by the Adviser for Ultra Short Duration ETF pursuant to the Expense Cap are subject to recapture by the Adviser up to three years from the date the fees were waived or the expenses were incurred, but no recapture payment will be made by the Fund if it would result in the Fund exceeding (i) the Expense Cap or (ii) the expense cap in effect at the time the fees and/or expenses subject to recapture were waived and/or borne by the Adviser.
There are no amounts available for potential recapture by the Adviser as of October 31, 2022.
The Trust has entered into a Distribution Agreement with Invesco Distributors, Inc. (the “Distributor”), which serves as the distributor of Creation Units for each Fund. The Distributor does not maintain a secondary market in the Shares. The Funds are not charged any fees pursuant to the Distribution Agreement. The Distributor is an affiliate of the Adviser.
The Trust has entered into service agreements whereby BNYM, a wholly-owned subsidiary of The Bank of New York Mellon Corporation, serves as the administrator, custodian, fund accountant and transfer agent for each Fund.
For the fiscal year ended October 31, 2022, the following Funds incurred brokerage commissions with Invesco Capital Markets, Inc. (“ICMI”), an affiliate of the Adviser and Distributor, for portfolio transactions executed on behalf of the Funds, as listed below:
| | | | |
| |
| Active U.S. Real Estate ETF | | $ | 22,557 | |
| |
| Balanced Multi-Asset Allocation ETF | | | 104 | |
| |
| Conservative Multi-Asset Allocation ETF | | | 229 | |
| |
| Growth Multi-Asset Allocation ETF | | | 103 | |
| |
| Moderately Conservative Multi-Asset Allocation ETF | | | 92 | |
| |
| S&P 500® Downside Hedged ETF | | | 264,241 | |
Portfolio transactions with ICMI that have not settled at period-end, if any, are shown in the Statements of Assets and Liabilities under the receivable caption Investments sold - affiliated broker and/or payable caption Investments purchased - affiliated broker.
NOTE 4–Security Transactions with Affiliated Funds
Each Fund is permitted to purchase securities from or sell securities to certain other affiliated funds under specified conditions outlined in procedures adopted by the Board of Trustees of the Trust. The procedures have been designed to ensure that any purchase or sale of securities by each Invesco ETF from or to another fund that is or could be considered an “affiliated person” by virtue of having a common investment adviser (or affiliated investment advisers), common Trustees and/or common officers is
made in reliance on Rule 17a-7 of the 1940 Act and, to the extent applicable, related SEC staff positions. Each such transaction is effected at the security’s “current market price”, as provided for in these procedures and Rule 17a-7.
For the fiscal year ended October 31, 2022, the following Fund engaged in transactions with affiliates as listed below:
| | | | | | |
| | | Securities Purchases | | Securities Sales | | Net Realized Gains |
| | | |
| S&P 500® Downside Hedged ETF | | $122,789 | | $- | | $- |
NOTE 5–Additional Valuation Information
GAAP defines fair value as the price that would be received to sell an asset or paid to transfer a liability in an orderly transaction between market participants at the measurement date, under current market conditions. GAAP establishes a hierarchy that prioritizes the inputs to valuation methods, giving the highest priority to readily available unadjusted quoted prices in an active market for identical assets (Level 1) and the lowest priority to significant unobservable inputs (Level 3), generally when market prices are not readily available. Based on the valuation inputs, the securities or other investments are tiered into one of three levels. Changes in valuation methods may result in transfers in or out of an investment’s assigned level:
| | |
| Level 1 – | | Prices are determined using quoted prices in an active market for identical assets. |
| |
| Level 2 – | | Prices are determined using other significant observable inputs. Observable inputs are inputs that other market participants may use in pricing a security. These may include quoted prices for similar securities, interest rates, prepayment speeds, credit risk, yield curves, loss severities, default rates, discount rates, volatilities and others. |
| |
| Level 3 – | | Prices are determined using significant unobservable inputs. In situations where quoted prices or observable inputs are unavailable (for example, when there is little or no market activity for an investment at the end of the period), unobservable inputs may be used. Unobservable inputs reflect the Adviser’s assumptions about the factors market participants would use in determining fair value of the securities or instruments and would be based on the best available information. |
The following is a summary of the tiered valuation input levels, as of October 31, 2022, for each Fund (except for Ultra Short Duration ETF). As of October 31, 2022, all of the securities in Ultra Short Duration ETF were valued based on Level 2 inputs (see the Schedules of Investments for security categories). The level assigned to the securities valuations may not be an indication of the risk or liquidity associated with investing in those securities. Because of the inherent uncertainties of valuation, the values reflected in the financial statements may materially differ from the value received upon actual sale of those investments.
| | | | | | | | | | | | | | | | | | | | |
| | | Level 1 | | Level 2 | | Level 3 | | Total |
| | | | |
Active U.S. Real Estate ETF | | | | | | | | | | | | | | | | | | | | |
| | | | |
Investments in Securities | | | | | | | | | | | | | | | | | | | | |
| | | | |
Common Stocks & Other Equity Interests | | | $ | 112,812,573 | | | | $ | - | | | | $ | - | | | | $ | 112,812,573 | |
| | | | |
Money Market Funds | | | | - | | | | | 6,034,191 | | | | | - | | | | | 6,034,191 | |
| | | | | | | | | | | | | | | | | | | | |
| | | | |
Total Investments | | | $ | 112,812,573 | | | | $ | 6,034,191 | | | | $ | - | | | | $ | 118,846,764 | |
| | | | | | | | | | | | | | | | | | | | |
| | | | |
Balanced Multi-Asset Allocation ETF | | | | | | | | | | | | | | | | | | | | |
| | | | |
Investments in Securities | | | | | | | | | | | | | | | | | | | | |
| | | | |
Affiliated Issuers | | | $ | 36,295,137 | | | | $ | - | | | | $ | - | | | | $ | 36,295,137 | |
| | | | |
Money Market Funds | | | | 1,204 | | | | | 893,205 | | | | | - | | | | | 894,409 | |
| | | | | | | | | | | | | | | | | | | | |
| | | | |
Total Investments | | | $ | 36,296,341 | | | | $ | 893,205 | | | | $ | - | | | | $ | 37,189,546 | |
| | | | | | | | | | | | | | | | | | | | |
| | | | |
Conservative Multi-Asset Allocation ETF | | | | | | | | | | | | | | | | | | | | |
| | | | |
Investments in Securities | | | | | | | | | | | | | | | | | | | | |
| | | | |
Affiliated Issuers | | | $ | 12,030,397 | | | | $ | - | | | | $ | - | | | | $ | 12,030,397 | |
| | | | |
Money Market Funds | | | | - | | | | | 1,063,024 | | | | | - | | | | | 1,063,024 | |
| | | | | | | | | | | | | | | | | | | | |
| | | | |
Total Investments | | | $ | 12,030,397 | | | | $ | 1,063,024 | | | | $ | - | | | | $ | 13,093,421 | |
| | | | | | | | | | | | | | | | | | | | |
| | | | |
Growth Multi-Asset Allocation ETF | | | | | | | | | | | | | | | | | | | | |
| | | | |
Investments in Securities | | | | | | | | | | | | | | | | | | | | |
| | | | |
Affiliated Issuers | | | $ | 26,349,776 | | | | $ | - | | | | $ | - | | | | $ | 26,349,776 | |
| | | | |
Money Market Funds | | | | - | | | | | 497,035 | | | | | - | | | | | 497,035 | |
| | | | | | | | | | | | | | | | | | | | |
| | | | |
Total Investments | | | $ | 26,349,776 | | | | $ | 497,035 | | | | $ | - | | | | $ | 26,846,811 | |
| | | | | | | | | | | | | | | | | | | | |
| | | | | | | | | | | | | | | | |
| | | Level 1 | | | Level 2 | | | Level 3 | | | Total | |
| | | | |
High Yield Bond Factor ETF | | | | | | | | | | | | | | | | |
| | | | |
Investments in Securities | | | | | | | | | | | | | | | | |
| | | | |
U.S. Dollar Denominated Bonds & Notes | | $ | - | | | $ | 32,855,343 | | | $ | - | | | $ | 32,855,343 | |
| | | | |
U.S. Treasury Securities | | | - | | | | 122,845 | | | | - | | | | 122,845 | |
| | | | |
Money Market Funds | | | 302,214 | | | | 2,661,396 | | | | - | | | | 2,963,610 | |
| | | | | | | | | | | | | | | | |
| | | | |
Total Investments in Securities | | | 302,214 | | | | 35,639,584 | | | | - | | | | 35,941,798 | |
| | | | | | | | | | | | | | | | |
| | | | |
Other Investments - Assets* | | | | | | | | | | | | | | | | |
| | | | |
Futures Contracts | | | 55,498 | | | | - | | | | - | | | | 55,498 | |
| | | | |
Swap Agreements | | | - | | | | 13,589 | | | | - | | | | 13,589 | |
| | | | | | | | | | | | | | | | |
| | | | |
| | | 55,498 | | | | 13,589 | | | | - | | | | 69,087 | |
| | | | | | | | | | | | | | | | |
| | | | |
Other Investments - Liabilities* | | | | | | | | | | | | | | | | |
| | | | |
Futures Contracts | | | (281,307 | ) | | | - | | | | - | | | | (281,307 | ) |
| | | | | | | | | | | | | | | | |
| | | | |
Total Other Investments | | | (225,809 | ) | | | 13,589 | | | | - | | | | (212,220 | ) |
| | | | | | | | | | | | | | | | |
| | | | |
Total Investments | | $ | 76,405 | | | $ | 35,653,173 | | | $ | - | | | $ | 35,729,578 | |
| | | | | | | | | | | | | | | | |
| | | | |
Moderately Conservative Multi-Asset Allocation ETF | | | | | | | | | | | | | | | | |
| | | | |
Investments in Securities | | | | | | | | | | | | | | | | |
| | | | |
Affiliated Issuers | | $ | 21,687,291 | | | $ | - | | | $ | - | | | $ | 21,687,291 | |
| | | | |
Money Market Funds | | | - | | | | 2,453,705 | | | | - | | | | 2,453,705 | |
| | | | | | | | | | | | | | | | |
| | | | |
Total Investments | | $ | 21,687,291 | | | $ | 2,453,705 | | | $ | - | | | $ | 24,140,996 | |
| | | | | | | | | | | | | | | | |
| | | | |
S&P 500® Downside Hedged ETF | | | | | | | | | | | | | | | | |
| | | | |
Investments in Securities | | | | | | | | | | | | | | | | |
| | | | |
Common Stocks & Other Equity Interests | | $ | 191,164,356 | | | $ | - | | | $ | - | | | $ | 191,164,356 | |
| | | | |
Money Market Funds | | | 56,456,197 | | | | 4,701,535 | | | | - | | | | 61,157,732 | |
| | | | | | | | | | | | | | | | |
| | | | |
Total Investments in Securities | | | 247,620,553 | | | | 4,701,535 | | | | - | | | | 252,322,088 | |
| | | | | | | | | | | | | | | | |
| | | | |
Other Investments - Assets* | | | | | | | | | | | | | | | | |
| | | | |
Futures Contracts | | | 2,013,459 | | | | - | | | | - | | | | 2,013,459 | |
| | | | | | | | | | | | | | | | |
| | | | |
Other Investments - Liabilities* | | | | | | | | | | | | | | | | |
| | | | |
Futures Contracts | | | (5,801,305 | ) | | | - | | | | - | | | | (5,801,305 | ) |
| | | | | | | | | | | | | | | | |
| | | | |
Total Other Investments | | | (3,787,846 | ) | | | - | | | | - | | | | (3,787,846 | ) |
| | | | | | | | | | | | | | | | |
| | | | |
Total Investments | | $ | 243,832,707 | | | $ | 4,701,535 | | | $ | - | | | $ | 248,534,242 | |
| | | | | | | | | | | | | | | | |
| | | | |
Total Return Bond ETF | | | | | | | | | | | | | | | | |
| | | | |
Investments in Securities | | | | | | | | | | | | | | | | |
| | | | |
U.S. Dollar Denominated Bonds & Notes | | $ | - | | | $ | 470,433,482 | | | $ | 2,576,051 | | | $ | 473,009,533 | |
| | | | |
Asset-Backed Securities | | | - | | | | 190,196,503 | | | | 1,313,186 | | | | 191,509,689 | |
| | | | |
U.S. Government Sponsored Agency Mortgage-Backed Securities | | | - | | | | 164,053,582 | | | | - | | | | 164,053,582 | |
| | | | |
U.S. Treasury Securities | | | - | | | | 10,637,942 | | | | - | | | | 10,637,942 | |
| | | | |
Agency Credit Risk Transfer Notes | | | - | | | | 6,749,259 | | | | - | | | | 6,749,259 | |
| | | | |
Municipal Obligations | | | - | | | | 3,011,806 | | | | - | | | | 3,011,806 | |
| | | | |
Preferred Stocks | | | 270,403 | | | | 2,457,164 | | | | - | | | | 2,727,567 | |
| | | | |
U.S. Government Sponsored Agency Securities | | | - | | | | 2,453,475 | | | | - | | | | 2,453,475 | |
| | | | |
Options Purchased | | | 251,030 | | | | - | | | | - | | | | 251,030 | |
| | | | |
Non-U.S. Dollar Denominated Bonds & Notes | | | - | | | | 139,116 | | | | - | | | | 139,116 | |
| | | | |
Money Market Funds | | | - | | | | 83,396,016 | | | | - | | | | 83,396,016 | |
| | | | | | | | | | | | | | | | |
| | | | |
Total Investments in Securities | | | 521,433 | | | | 933,528,345 | | | | 3,889,237 | | | | 937,939,015 | |
| | | | | | | | | | | | | | | | |
| | | | |
Other Investments - Assets* | | | | | | | | | | | | | | | | |
| | | | |
Futures Contracts | | | 5,843,629 | | | | - | | | | - | | | | 5,843,629 | |
| | | | |
Investments Matured | | | - | | | | 46,206 | | | | - | | | | 46,206 | |
| | | | | | | | | | | | | | | | |
| | | | |
| | | 5,843,629 | | | | 46,206 | | | | - | | | | 5,889,835 | |
| | | | | | | | | | | | | | | | |
| | | | |
Other Investments - Liabilities* | | | | | | | | | | | | | | | | |
| | | | |
Futures Contracts | | | (4,641,609 | ) | | | - | | | | - | | | | (4,641,609 | ) |
| | | | | | | | | | | | | | | | |
| | | | |
Total Other Investments | | | 1,202,020 | | | | 46,206 | | | | - | | | | 1,248,226 | |
| | | | | | | | | | | | | | | | |
| | | | |
Total Investments | | $ | 1,723,453 | | | $ | 933,574,551 | | | $ | 3,889,237 | | | $ | 939,187,241 | |
| | | | | | | | | | | | | | | | |
| | | | | | | | | | | | | | | | |
| | | Level 1 | | | Level 2 | | | Level 3 | | | Total | |
| | | | |
Variable Rate Investment Grade ETF | | | | | | | | | | | | | | | | |
| | | | |
Investments in Securities | | | | | | | | | | | | | | | | |
| | | | |
U.S. Dollar Denominated Bonds & Notes | | $ | - | | | $ | 274,528,072 | | | $ | - | | | $ | 274,528,072 | |
| | | | |
Agency Credit Risk Transfer Notes | | | - | | | | 95,500,314 | | | | - | | | | 95,500,314 | |
| | | | |
Asset-Backed Securities | | | - | | | | 94,965,128 | | | | - | | | | 94,965,128 | |
| | | | |
U.S. Treasury Securities | | | - | | | | 86,382,898 | | | | - | | | | 86,382,898 | |
| | | | |
U.S. Government Sponsored Agency Mortgage-Backed Securities | | | - | | | | 17,292,462 | | | | - | | | | 17,292,462 | |
| | | | |
Money Market Funds | | | 1,075,009 | | | | 19,542,907 | | | | - | | | | 20,617,916 | |
| | | | | | | | | | | | | | | | |
| | | | |
Total Investments | | $ | 1,075,009 | | | $ | 588,211,781 | | | $ | - | | | $ | 589,286,790 | |
| | | | | | | | | | | | | | | | |
| * | Forward foreign currency contracts, futures contracts and swap agreements are valued at unrealized appreciation (depreciation). Investments matured is shown at value. |
NOTE 6–Derivative Investments
The Funds may enter into an ISDA Master Agreement under which a Fund may trade OTC derivatives. An OTC transaction entered into under an ISDA Master Agreement typically involves a collateral posting arrangement, payment netting provisions and close-out netting provisions. These netting provisions allow for reduction of credit risk through netting of contractual obligations. The enforceability of the netting provisions of the ISDA Master Agreement depends on the governing law of the ISDA Master Agreement, among other factors.
For financial reporting purposes, the Funds do not offset OTC derivative assets or liabilities that are subject to ISDA Master Agreements in the Statements of Assets and Liabilities.
Value of Derivative Investments at Period-End
The table below summarizes the value of each Fund’s derivative investments, detailed by primary risk exposure, held as of October 31, 2022:
| | | | | | | | | | | | | | | | | | | | | | | | | | | | | | | | |
Derivative Assets | | Value | |
| | High Yield Bond Factor ETF | | | S&P 500®
Downside
Hedged ETF | | | Total Return Bond ETF | | | Ultra Short
Duration ETF | |
|
|
| | Credit
Risk | | | Interest Rate
Risk | | | Total | | | Equity
Risk | | | Equity
Risk | | | Interest Rate
Risk | | | Total | | | Currency
Risk | |
|
| | | | | | | | |
| Unrealized appreciation on forward foreign currency contracts outstanding(a) | | $ | - | | | $ | - | | | $ | - | | | $ | - | | | $ | - | | | $ | - | | | $ | - | | | $ | 1,719,513 | |
| | | | | | | | |
| Unrealized appreciation on futures contracts–Exchange-Traded(b) | | | - | | | | 55,498 | | | | 55,498 | | | | 2,013,459 | | | | - | | | | 5,843,629 | | | | 5,843,629 | | | | - | |
| | | | | | | | |
| Unrealized appreciation on swap agreements–Centrally Cleared | | | 13,589 | | | | - | | | | 13,589 | | | | - | | | | - | | | | - | | | | - | | | | - | |
| | | | | | | | |
| Purchased options, at value - Exchange-Traded | | | - | | | | - | | | | - | | | | - | | | | 251,030 | | | | - | | | | 251,030 | | | | - | |
| | | | | | | | | | | | | | | | | | | | | | | | | | | | | | | | |
| | | | | | | | |
| Total Derivative Assets | | | 13,589 | | | | 55,498 | | | | 69,087 | | | | 2,013,459 | | | | 251,030 | | | | 5,843,629 | | | | 6,094,659 | | | | 1,719,513 | |
| | | | | | | | | | | | | | | | | | | | | | | | | | | | | | | | |
| | | | | | | | |
| Derivatives not subject to master netting agreements | | | (13,589 | ) | | | (55,498 | ) | | | (69,087 | ) | | | (2,013,459 | ) | | | (251,030 | ) | | | (5,843,629 | ) | | | (6,094,659 | ) | | | - | |
| | | | | | | | | | | | | | | | | | | | | | | | | | | | | | | | |
| | | | | | | | |
| Total Derivative Assets subject to master netting agreements | | $ | - | | | $ | - | | | $ | - | | | $ | - | | | $ | - | | | $ | - | | | $ | - | | | $ | 1,719,513 | |
| | | | | | | | | | | | | | | | | | | | | | | | | | | | | | | | |
| | | | | | | | | | | | | | | | | | | | | | | | | | | | | | | | |
| Derivative Liabilities | | Value | |
| | High Yield Bond Factor ETF | | | S&P 500®
Downside
Hedged ETF | | | Total Return Bond ETF | | | Ultra Short
Duration ETF | |
|
|
| | Credit
Risk | | | Interest Rate
Risk | | | Total | | | Equity
Risk | | | Equity
Risk | | | Interest Rate
Risk | | | Total | | | Currency
Risk | |
|
| | | | | | | | |
| Unrealized depreciation on futures contracts–Exchange-Traded(b) | | $ | - | | | $ | (281,307 | ) | | $ | (281,307 | ) | | $ | (5,801,305 | ) | | $ | - | | | $ | (4,641,609 | ) | | $ | (4,641,609 | ) | | $ | - | |
| | | | | | | | |
| Derivatives not subject to master netting agreements | | | - | | | | 281,307 | | | | 281,307 | | | | 5,801,305 | | | | - | | | | 4,641,609 | | | | 4,641,609 | | | | - | |
| | | | | | | | | | | | | | | | | | | | | | | | | | | | | | | | |
| | | | | | | | |
| Total Derivative Liabilities subject to master netting agreements | | $ | - | | | $ | - | | | $ | - | | | $ | - | | | $ | - | | | $ | - | | | $ | - | | | $ | - | |
| | | | | | | | | | | | | | | | | | | | | | | | | | | | | | | | |
| (a) | Values are disclosed on the Statements of Assets and Liabilities under the caption Unrealized appreciation on forward foreign currency contracts outstanding and Unrealized depreciation on forward foreign currency contracts outstanding. |
| (b) | Except for Total Return Bond ETF, values are disclosed on the Statements of Assets and Liabilities under the caption Unrealized appreciation on futures contracts and Unrealized depreciation on futures contracts. For Total Return Bond ETF, values include cumulative appreciation (depreciation) on futures contracts. Only current day’s variation margin is reported within the Statements of Assets and Liabilities. |
Offsetting Assets and Liabilities
The table below reflects the Funds’ exposure to Counterparties subject to either an ISDA Master Agreement or other agreement for OTC derivative transactions as of October 31, 2022:
Ultra Short Duration ETF
| | | | | | | | | | | | | | | | | | | | | | | | | | | | | | |
| | | Financial Derivative
Assets | | Financial Derivative
Liabilities | | | | Collateral
(Received)/Pledged | | |
| |
| | | Forward foreign
currency contracts | | Forward foreign
currency contracts | | Net Value of
Derivatives | | Non-Cash | | Cash | | Net Amount |
Counterparty |
| | | | | | |
RBC Capital Markets LLC | | $1,719,513 | | $– | | $1,719,513 | | $- | | $- | | $1,719,513 |
Effect of Derivative Investments for the Fiscal Year Ended October 31, 2022
The table below summarizes each Fund’s gains (losses) on derivative investments, detailed by primary risk exposure, recognized in earnings during the period:
| | | | | | | | | | | | | | | | |
| | | Location of Gain (Loss) on Statements of Operations | |
| | | | | | | | | | | | S&P 500®
Downside | |
| | | High Yield Bond Factor ETF | | | Hedged ETF | |
| | | Credit | | | Interest | | | | | | Equity | |
| | | Risk | | | Rate Risk | | | Total | | | Risk | |
| | | | |
Realized Gain (Loss): | | | | | | | | | | | | | | | | |
| | | | |
Forward foreign currency contracts | | $ | - | | | $ | - | | | $ | - | | | $ | - | |
| | | | |
Futures contracts | | | - | | | | (612,977 | ) | | | (612,977 | ) | | | (5,411,441 | ) |
| | | | |
Options purchased(a) | | | - | | | | - | | | | - | | | | - | |
| | | | |
Options written | | | - | | | | - | | | | - | | | | - | |
| | | | |
Swap agreements | | | (22,411 | ) | | | - | | | | (22,411 | ) | | | - | |
| | | | |
Change in Net Unrealized Appreciation (Depreciation): | | | | | | | | | | | | | | | | |
| | | | |
Forward foreign currency contracts | | | - | | | | - | | | | - | | | | - | |
| | | | |
Futures contracts | | | - | | | | (162,004 | ) | | | (162,004 | ) | | | (6,624,453 | ) |
| | | | |
Options purchased(a) | | | - | | | | - | | | | - | | | | - | |
| | | | |
Options written | | | - | | | | - | | | | - | | | | - | |
| | | | |
Swap agreements | | | 12,736 | | | | - | | | | 12,736 | | | | - | |
| | | | | | | | | | | | | | | | |
| | | | |
Total | | $ | (9,675 | ) | | $ | (774,981 | ) | | $ | (784,656 | ) | | $ | (12,035,894 | ) |
| | | | | | | | | | | | | | | | |
| (a) | Options purchased are included in the net realized gain (loss) from investment securities and the change in net unrealized appreciation (depreciation) on investment securities. |
| | | | | | | | | | | | | | | | | | | | | | | | | | | | | | |
| | | Location of Gain (Loss) on Statements of Operations |
| | |
| | | Total Return Bond ETF | | Ultra Short
Duration ETF |
| | | | | | |
| | | Credit
Risk | | Currency
Risk | | Equity
Risk | | Interest
Rate Risk | | Total | | Currency
Risk |
| | | | | | |
Realized Gain (Loss): | | | | | | | | | | | | | | | | | | | | | | | | | | | | | | |
| | | | | | |
Forward foreign currency contracts | | | $ | - | | | | $ | 212,978 | | | | $ | - | | | | $ | - | | | | $ | 212,978 | | | | $ | 539,872 | |
| | | | | | |
Futures contracts | | | | - | | | | | - | | | | | - | | | | | 8,432,619 | | | | | 8,432,619 | | | | | - | |
| | | | | | |
Options purchased(a) | | | | - | | | | | - | | | | | (240,462 | ) | | | | - | | | | | (240,462 | ) | | | | - | |
| | | | | | |
Options written | | | | - | | | | | - | | | | | (200,364 | ) | | | | - | | | | | (200,364 | ) | | | | - | |
| | | | | | |
Swap agreements | | | | (510,522 | ) | | | | - | | | | | - | | | | | - | | | | | (510,522 | ) | | | | - | |
| | | | | | |
Change in Net Unrealized Appreciation (Depreciation): | | | | | | | | | | | | | | | | | | | | | | | | | | | | | | |
| | | | | | |
Forward foreign currency contracts | | | | - | | | | | (11,600 | ) | | | | - | | | | | - | | | | | (11,600 | ) | | | | 1,719,513 | |
| | | | | | |
Futures contracts | | | | - | | | | | - | | | | | - | | | | | (80,514 | ) | | | | (80,514 | ) | | | | - | |
| | | | | | |
Options purchased(a) | | | | - | | | | | - | | | | | (338,162 | ) | | | | - | | | | | (338,162 | ) | | | | - | |
| | | | | | |
Options written | | | | - | | | | | - | | | | | (20,037 | ) | | | | - | | | | | (20,037 | ) | | | | - | |
| | | | | | |
Swap agreements | | | | (71,657 | ) | | | | - | | | | | - | | | | | - | | | | | (71,657 | ) | | | | - | |
| | | | | | | | | | | | | | | | | | | | | | | | | | | | | | |
| | | | | | |
Total | | | $ | (582,179 | ) | | | $ | 201,378 | | | | $ | (799,025 | ) | | | $ | 8,352,105 | | | | $ | 7,172,279 | | | | $ | 2,259,385 | |
| | | | | | | | | | | | | | | | | | | | | | | | | | | | | | |
| (a) | Options purchased are included in the net realized gain (loss) from investment securities and the change in net unrealized appreciation (depreciation) on investment securities. |
The table below summarizes the average notional value of derivatives held during the period.
| | | | | | | | | | | | | | | | |
| | | Average Notional Value |
| | | | |
| | | High Yield Bond Factor ETF | | S&P 500®
Downside
Hedged ETF | | | Total Return Bond ETF | | Ultra Short
Duration ETF | |
| | | | |
Forward foreign currency contracts | | | $ - | | | | $ - | | | | $ 17,136,316 | | | | $12,292,539 | |
| | | | |
Futures contracts | | | 10,370,044 | | | | 100,066,217 | | | | 233,079,872 | | | | - | |
| | | | |
Options purchased | | | - | | | | - | | | | 26,551,654 | | | | - | |
| | | | |
Options written | | | - | | | | - | | | | 15,362,231 | | | | - | |
| | | | |
Swap agreements | | | 1,264,838 | | | | - | | | | 6,507,779 | | | | - | |
NOTE 7–Distributions to Shareholders and Tax Components of Net Assets
Tax Character of Distributions to Shareholders Paid During the Fiscal Years Ended October 31, 2022 and 2021:
| | | | | | | | | | | | | | | |
| | | 2022 | | 2021 |
| | | |
| | | Ordinary
Income* | | Return of
Capital | | Ordinary
Income* |
| | | |
Active U.S. Real Estate ETF | | | $ | 3,208,010 | | | | $ | - | | | | $ | 2,872,518 | |
| | | |
Balanced Multi-Asset Allocation ETF | | | | 851,423 | | | | | - | | | | | 245,687 | |
| | | |
Conservative Multi-Asset Allocation ETF | | | | 460,035 | | | | | - | | | | | 237,183 | |
| | | |
Growth Multi-Asset Allocation ETF | | | | 603,116 | | | | | - | | | | | 221,953 | |
| | | |
High Yield Bond Factor ETF | | | | 2,033,283 | | | | | 166,039 | | | | | 1,401,608 | |
| | | |
Moderately Conservative Multi-Asset Allocation ETF | | | | 563,154 | | | | | - | | | | | 157,476 | |
| | | |
S&P 500® Downside Hedged ETF | | | | 2,159,005 | | | | | - | | | | | 849,261 | |
| | | |
Total Return Bond ETF | | | | 27,071,935 | | | | | - | | | | | 23,394,492 | |
| | | |
Ultra Short Duration ETF | | | | 26,604,416 | | | | | - | | | | | 19,527,454 | |
| | | |
Variable Rate Investment Grade ETF | | | | 9,861,832 | | | | | - | | | | | 3,754,424 | |
| * | Includes short-term capital gain distributions, if any. |
Tax Components of Net Assets at Fiscal Year-End:
| | | | | | | | | | | | | | | | | | | | | | | | | | | | | | | | |
| | | | | | | | |
| | | Undistributed
Ordinary
Income | | Temporary
Book/Tax
Differences | | Net
Unrealized
Appreciation
(Depreciation)-
Investments | | | Net
Unrealized
Appreciation
(Depreciation)-
Other
Investments | | Net
Unrealized
(Depreciation)-
Foreign
Currencies | | Capital Loss
Carryforwards | | | Shares of
Beneficial
Interest | | | Total
Net Assets | |
| | | | | | | | |
Active U.S. Real Estate ETF | | | $ - | | | | $ - | | | $ | (20,922,630 | ) | | | $ - | | | | $ - | | | $ | (2,552,406 | ) | | $ | 136,244,971 | | | $ | 112,769,935 | |
| | | | | | | | |
Balanced Multi-Asset Allocation ETF | | | 89,059 | | | | - | | | | (4,430,720 | ) | | | - | | | | - | | | | (364,532 | ) | | | 41,013,338 | | | | 36,307,145 | |
| | | | | | | | |
Conservative Multi-Asset Allocation ETF | | | 58,160 | | | | - | | | | (2,200,490 | ) | | | - | | | | - | | | | (17,207 | ) | | | 14,194,210 | | | | 12,034,673 | |
| | | | | | | | |
Growth Multi-Asset Allocation ETF | | | 39,580 | | | | - | | | | (2,369,802 | ) | | | - | | | | - | | | | (322,893 | ) | | | 29,003,877 | | | | 26,350,762 | |
| | | | | | | | |
High Yield Bond Factor ETF | | | - | | | | - | | | | (4,038,304 | ) | | | (212,220 | ) | | | - | | | | (2,603,900 | ) | | | 40,874,614 | | | | 34,020,190 | |
| | | | | | | | |
Moderately Conservative Multi-Asset Allocation ETF | | | 168,020 | | | | - | | | | (3,466,401 | ) | | | - | | | | - | | | | (94,288 | ) | | | 25,085,216 | | | | 21,692,547 | |
| | | | | | | | |
S&P 500® Downside Hedged ETF | | | 522,212 | | | | - | | | | 3,788,041 | | | | (3,787,846 | ) | | | (14 | ) | | | (76,911,483 | ) | | | 356,085,515 | | | | 279,696,425 | |
| | | | | | | | |
Total Return Bond ETF | | | 258,466 | | | | (81,245 | ) | | | (127,097,795 | ) | | | 1,202,020 | | | | (14,463 | ) | | | (90,906,223 | ) | | | 954,752,680 | | | | 738,113,440 | |
| | | | | | | | |
Ultra Short Duration ETF | | | 4,522,064 | | | | (21,990 | ) | | | (54,271,671 | ) | | | 1,719,513 | | | | (16 | ) | | | (7,211,314 | ) | | | 2,163,287,547 | | | | 2,108,024,133 | |
| | | | | | | | |
Variable Rate Investment Grade ETF | | | 567,978 | | | | - | | | | (11,156,009 | ) | | | - | | | | - | | | | (5,012,378 | ) | | | 586,926,990 | | | | 571,326,581 | |
Capital loss carryforwards are calculated and reported as of a specific date. Results of transactions and other activity after that date may affect the amount of capital loss carryforwards actually available for the Funds to utilize. The ability to utilize capital loss carryforwards in the future may be limited under the Internal Revenue Code and related regulations based on the results of future transactions.
The Funds have capital loss carryforwards as of October 31, 2022, as follows:
| | | | | | | | | | | | |
| | |
| | | No expiration | | | | |
| | | |
| | | Short-Term | | | Long-Term | | | Total* | |
| | | |
Active U.S. Real Estate ETF | | $ | 2,288,467 | | | $ | 263,939 | | | $ | 2,552,406 | |
| | | |
Balanced Multi-Asset Allocation ETF | | | 286,453 | | | | 78,079 | | | | 364,532 | |
| | | |
Conservative Multi-Asset Allocation ETF | | | 8,646 | | | | 8,561 | | | | 17,207 | |
| | | |
Growth Multi-Asset Allocation ETF | | | 243,502 | | | | 79,391 | | | | 322,893 | |
| | | |
High Yield Bond Factor ETF | | | 926,666 | | | | 1,677,234 | | | | 2,603,900 | |
| | | |
Moderately Conservative Multi-Asset Allocation ETF | | | 77,094 | | | | 17,194 | | | | 94,288 | |
| | | |
S&P 500® Downside Hedged ETF | | | 5,164,989 | | | | 71,746,494 | | | | 76,911,483 | |
| | | |
Total Return Bond ETF | | | 68,815,122 | | | | 22,091,101 | | | | 90,906,223 | |
| | | |
Ultra Short Duration ETF | | | 5,237,562 | | | | 1,973,752 | | | | 7,211,314 | |
| | | |
Variable Rate Investment Grade ETF | | | 1,126,672 | | | | 3,885,706 | | | | 5,012,378 | |
| * | Capital loss carryforwards are reduced for limitations, if any, to the extent required by the Internal Revenue Code and may be further limited depending upon a variety of factors, including the realization of net unrealized gains or losses as of the date of any reorganization. |
NOTE 8–Investment Transactions
For the fiscal year ended October 31, 2022, the cost of securities purchased and the proceeds from sales of securities (other than short-term securities, U.S. Government obligations, money market funds and in-kind transactions, if any) were as follows:
| | | | | | | | |
| | |
| | | Purchases | | | Sales | |
| | |
Active U.S. Real Estate ETF | | $ | 86,642,077 | | | $ | 86,019,742 | |
| | |
Balanced Multi-Asset Allocation ETF | | | 9,546,012 | | | | 9,528,866 | |
| | |
Conservative Multi-Asset Allocation ETF | | | 3,793,224 | | | | 3,813,355 | |
| | | | | | | | |
| | | Purchases | | | Sales | |
| | |
Growth Multi-Asset Allocation ETF | | $ | 7,776,394 | | | $ | 7,775,124 | |
| | |
High Yield Bond Factor ETF | | | 26,339,587 | | | | 27,117,459 | |
| | |
Moderately Conservative Multi-Asset Allocation ETF | | | 7,275,879 | | | | 7,171,492 | |
| | |
S&P 500® Downside Hedged ETF | | | 2,504,389,921 | | | | 2,512,561,669 | |
| | |
Total Return Bond ETF | | | 1,756,734,539 | | | | 1,577,533,658 | |
| | |
Ultra Short Duration ETF | | | 342,789,109 | | | | 1,041,605,146 | |
| | |
Variable Rate Investment Grade ETF | | | 287,813,346 | | | | 217,860,618 | |
For the fiscal year ended October 31, 2022, in-kind transactions associated with creations and redemptions were as follows:
| | | | | | | | |
| | | In-kind
Purchases | | | In-kind
Sales | |
| | |
Active U.S. Real Estate ETF | | $ | 62,744,913 | | | $ | 49,351,245 | |
| | |
Balanced Multi-Asset Allocation ETF | | | 29,422,704 | | | | 9,062,090 | |
| | |
Conservative Multi-Asset Allocation ETF | | | 7,324,934 | | | | 6,621,019 | |
| | |
Growth Multi-Asset Allocation ETF | | | 16,289,932 | | | | 5,377,845 | |
| | |
High Yield Bond Factor ETF | | | - | | | | - | |
| | |
Moderately Conservative Multi-Asset Allocation ETF | | | 39,354,844 | | | | 31,391,884 | |
| | |
S&P 500® Downside Hedged ETF | | | 72,232,792 | | | | 13,346,738 | |
| | |
Total Return Bond ETF | | | - | | | | - | |
| | |
Ultra Short Duration ETF | | | - | | | | - | |
| | |
Variable Rate Investment Grade ETF | | | - | | | | - | |
Gains (losses) on in-kind transactions are generally not considered taxable gains (losses) for federal income tax purposes.
As of October 31, 2022, the aggregate cost of investments, including any derivatives, on a tax basis includes adjustments for financial reporting purposes as of the most recently completed federal income tax reporting period-end:
| | | | | | | | | | | | | | | | |
| | | Gross
Unrealized
Appreciation | | | Gross
Unrealized
(Depreciation) | | | Net
Unrealized
Appreciation
(Depreciation) | | | Cost | |
| | | | |
Active U.S. Real Estate ETF | | $ | 1,417,267 | | | $ | (22,339,897 | ) | | $ | (20,922,630 | ) | | $ | 139,769,394 | |
| | | | |
Balanced Multi-Asset Allocation ETF | | | 59,733 | | | | (4,490,453 | ) | | | (4,430,720 | ) | | | 41,620,266 | |
| | | | |
Conservative Multi-Asset Allocation ETF | | | 2,271 | | | | (2,202,761 | ) | | | (2,200,490 | ) | | | 15,293,911 | |
| | | | |
Growth Multi-Asset Allocation ETF | | | 162,298 | | | | (2,532,100 | ) | | | (2,369,802 | ) | | | 29,216,613 | |
| | | | |
High Yield Bond Factor ETF | | | 371,449 | | | | (4,621,973 | ) | | | (4,250,524 | ) | | | 39,980,102 | |
| | | | |
Moderately Conservative Multi-Asset Allocation ETF | | | 63 | | | | (3,466,464 | ) | | | (3,466,401 | ) | | | 27,607,397 | |
| | | | |
S&P 500® Downside Hedged ETF | | | 11,781,032 | | | | (11,780,837 | ) | | | 195 | | | | 248,534,047 | |
| | | | |
Total Return Bond ETF | | | 6,612,027 | | | | (132,507,802 | ) | | | (125,895,775 | ) | | | 1,065,083,016 | |
| | | | |
Ultra Short Duration ETF | | | 1,759,254 | | | | (54,311,412 | ) | | | (52,552,158 | ) | | | 2,195,459,294 | |
| | | | |
Variable Rate Investment Grade ETF | | | 129,789 | | | | (11,285,798 | ) | | | (11,156,009 | ) | | | 600,442,799 | |
NOTE 9–Reclassification of Permanent Differences
Primarily as a result of differing book/tax treatment of in-kind transactions, distributions, wash sales, return of capital distributions, derivative instruments, paydowns, foreign currency transactions, hybrid securities and low-rated debt securities, amounts were reclassified between undistributed net investment income (loss), undistributed net realized gain (loss) and Shares of beneficial interest. These reclassifications had no effect on the net assets of each Fund. For the fiscal year ended October 31, 2022, the reclassifications were as follows:
| | | | | | | | | | | | | | | |
| | | Undistributed Net
Investment Income (Loss) | | Undistributed Net
Realized Gain (Loss) | | Shares of
Beneficial Interest |
| | | |
Active U.S. Real Estate ETF | | | $ | 943,920 | | | | $ | (5,491,563 | ) | | | $ | 4,547,643 | |
| | | |
Balanced Multi-Asset Allocation ETF | | | | 5,844 | | | | | (703,823 | ) | | | | 697,979 | |
| | | |
Conservative Multi-Asset Allocation ETF | | | | 1,885 | | | | | 186,093 | | | | | (187,978 | ) |
| | | |
Growth Multi-Asset Allocation ETF | | | | 6,554 | | | | | (776,482 | ) | | | | 769,928 | |
| | | |
High Yield Bond Factor ETF | | | | (3,857 | ) | | | | 3,857 | | | | | - | |
| | | |
Moderately Conservative Multi-Asset Allocation ETF | | | | 4,199 | | | | | 300,925 | | | | | (305,124 | ) |
| | | | | | | | | | | | | | | |
| | | Undistributed Net
Investment Income (Loss) | | Undistributed Net
Realized Gain (Loss) | | Shares of
Beneficial Interest |
| | | |
S&P 500® Downside Hedged ETF | | | $ | (4,723 | ) | | | $ | - | | | | $ | 4,723 | |
| | | |
Total Return Bond ETF | | | | 190,037 | | | | | (187,406 | ) | | | | (2,631 | ) |
| | | |
Ultra Short Duration ETF | | | | 186,757 | | | | | (186,757 | ) | | | | - | |
| | | |
Variable Rate Investment Grade ETF | | | | 57,339 | | | | | (57,339 | ) | | | | - | |
NOTE 10–Trustees’ and Officer’s Fees
Trustees’ and Officer’s Fees include amounts accrued by the Funds to pay remuneration to the Independent Trustees and an Officer of the Trust. The Adviser, as a result of each Fund’s unitary management fee (except for Ultra Short Duration ETF), pays for such compensation for each Fund. The Trustee who is an “interested person” of the Trust does not receive any Trustees’ fees.
The Trust has adopted a deferred compensation plan (the “Plan”). Under the Plan, each Independent Trustee who has executed a Deferred Fee Agreement (a “Participating Trustee”) may defer receipt of all or a portion of their compensation (“Deferral Fees”). Such Deferral Fees are deemed to be invested in select Invesco Funds. The Deferral Fees payable to a Participating Trustee are valued as of the date such Deferral Fees would have been paid to the Participating Trustee. The value increases with contributions or with increases in the value of the Shares selected, and the value decreases with distributions or with declines in the value of the Shares selected. Obligations under the Plan represent unsecured claims against the general assets of the Funds.
NOTE 11–Capital
Shares are issued and redeemed by each Fund only in Creation Units consisting of a specified number of Shares as set forth in each Fund’s prospectus. Only APs are permitted to purchase or redeem Creation Units from the Funds. For Active U.S. Real Estate ETF, Balanced Multi-Asset Allocation ETF, Conservative Multi-Asset Allocation ETF, Growth Multi-Asset Allocation ETF and Moderately Conservative Multi-Asset Allocation ETF, such transactions are principally permitted in exchange for Deposit Securities, with a balancing cash component to equate the transaction to the NAV per Share of the Fund on the transaction date. For High Yield Bond Factor ETF, Total Return Bond ETF, Ultra Short Duration ETF and Variable Rate Investment Grade ETF, Creation Units are issued and redeemed principally in exchange for the deposit or delivery of cash. For S&P 500® Downside Hedged ETF, Creation Units are issued and redeemed partially in exchange for the deposit or delivery of cash and partially in exchange for Deposit Securities. However, for all Funds, cash in an amount equivalent to the value of certain securities may be substituted, generally when the securities are not available in sufficient quantity for delivery, not eligible for trading by the AP or as a result of other market circumstances.
To the extent that the Funds permit transactions in exchange for Deposit Securities, each Fund may issue Shares in advance of receipt of Deposit Securities subject to various conditions, including a requirement to maintain on deposit with the Trust cash at least equal to 105% of the market value of the missing Deposit Securities. In accordance with the Trust’s Participant Agreement, Creation Units will be issued to an AP, notwithstanding the fact that the corresponding Deposit Securities have not been received in part or in whole, in reliance on the undertaking of the AP to deliver the missing Deposit Securities as soon as possible, which undertaking shall be secured by the AP’s delivery and maintenance of collateral consisting of cash in the form of U.S. dollars in immediately available funds having a value (marked-to-market daily) at least equal to 105%, which the Adviser may change from time to time, of the value of the missing Deposit Securities.
Certain transaction fees may be charged by the Funds for creations and redemptions, which are treated as increases in capital.
Transactions in each Fund’s Shares are disclosed in detail in the Statements of Changes in Net Assets.
Report of Independent Registered Public Accounting Firm
To the Board of Trustees of Invesco Actively Managed Exchange-Traded Fund Trust and Shareholders of each of the ten Funds listed in the table below
Opinions on the Financial Statements
We have audited the accompanying statements of assets and liabilities, including the schedules of investments, of each of the funds listed in the table below (ten of the funds constituting Invesco Actively Managed Exchange-Traded Fund Trust, hereafter collectively referred to as the “Funds”) as of October 31, 2022, the related statements of operations for the year ended October 31, 2022, the statements of changes in net assets for each of the periods indicated in the table below, including the related notes, and the financial highlights for each of the periods indicated in the table below (collectively referred to as the “financial statements”). In our opinion, the financial statements present fairly, in all material respects, the financial position of each of the Funds as of October 31, 2022, the results of each of their operations for the year then ended, the changes in each of their net assets, and each of the financial highlights for each of the periods indicated in the table below in conformity with accounting principles generally accepted in the United States of America.
| | |
Fund Name | | Fund Name |
| |
Invesco Active U.S. Real Estate ETF (1) | | Invesco Moderately Conservative Multi-Asset Allocation ETF (1) |
| |
Invesco Balanced Multi-Asset Allocation ETF (1) | | Invesco S&P 500® Downside Hedged ETF (1) |
| |
Invesco Conservative Multi-Asset Allocation ETF (1) | | Invesco Total Return Bond ETF (3) |
| |
Invesco Growth Multi-Asset Allocation ETF (1) | | Invesco Ultra Short Duration ETF (4) |
| |
Invesco High Yield Bond Factor ETF (2) | | Invesco Variable Rate Investment Grade ETF (1) |
(1) Statement of changes in net assets for each of the two years in the period ended October 31, 2022 and the financial highlights for each of the five years in the period ended October 31, 2022
(2) Statement of changes in net assets and the financial highlights for the year ended October 31, 2022 and for the period November 30, 2020 (commencement of investment operations) through October 31, 2021
(3) Statement of changes in net assets for each of the two years in the period ended October 31, 2022 and the financial highlights for each of the four years in the period ended October 31, 2022, for the period September 1, 2018 through October 31, 2018 and for the year ended August 31, 2018
(4) Statement of changes in net assets for each of the two years in the period ended October 31, 2022 and the financial highlights for each of the four years in the period ended October 31, 2022, for the period June 1, 2018 through October 31, 2018 and for the year ended May 31, 2018
Basis for Opinions
These financial statements are the responsibility of the Funds’ management. Our responsibility is to express an opinion on the Funds’ financial statements based on our audits. We are a public accounting firm registered with the Public Company Accounting Oversight Board (United States) (“PCAOB”) and are required to be independent with respect to the Funds in accordance with the U.S. federal securities laws and the applicable rules and regulations of the Securities and Exchange Commission and the PCAOB.
We conducted our audits of these financial statements in accordance with the standards of the PCAOB. Those standards require that we plan and perform the audit to obtain reasonable assurance about whether the financial statements are free of material misstatement, whether due to error or fraud.
Our audits included performing procedures to assess the risks of material misstatement of the financial statements, whether due to error or fraud, and performing procedures that respond to those risks. Such procedures included examining, on a test basis, evidence regarding the amounts and disclosures in the financial statements. Our audits also included evaluating the accounting principles used and significant estimates made by management, as well as evaluating the overall presentation of the financial statements. Our procedures included confirmation of securities owned as of October 31, 2022 by correspondence with the custodian, transfer agent, and brokers; when replies were not received from brokers, we performed other auditing procedures. We believe that our audits provide a reasonable basis for our opinions.
Report of Independent Registered Public Accounting Firm–(continued)
/s/ PricewaterhouseCoopers LLP
Chicago, Illinois
December 23, 2022
We have served as the auditor of one or more of the investment companies in the Invesco group of investment companies since at least 1995. We have not been able to determine the specific year we began serving as auditor.
Calculating your ongoing Fund expenses
Example
As a shareholder of a Fund of the Invesco Actively Managed Exchange-Traded Fund Trust (excluding Invesco Ultra Short Duration ETF), you incur a unitary management fee. As a shareholder of the Invesco Ultra Short Duration ETF, you incur advisory fees and other Fund expenses. In addition to the advisory fee or unitary management fee, a shareholder may pay distribution fees, if any, brokerage expenses, taxes, interest, acquired fund fees and expenses, if any, litigation expenses and other extraordinary expenses, including proxy expenses (except for such proxies related to: (i) changes to the Investment Advisory Agreement, (ii) the election of any Board member who is an “interested person” of the Trust, or (iii) any other matters that directly benefit the Adviser). The expense examples below are intended to help you understand your ongoing costs (in dollars) of investing in the Funds and to compare these costs with the ongoing costs of investing in other funds.
The example is based on an investment of $1,000 invested at the beginning of the period and held for the entire period May 1, 2022 through October 31, 2022.
In addition to the fees and expenses which the Invesco Balanced Multi-Asset Allocation ETF, Invesco Conservative Multi-Asset Allocation ETF, Invesco Growth Multi-Asset Allocation ETF, Invesco Moderately Conservative Multi-Asset Allocation ETF and Invesco S&P 500® Downside Hedged ETF (collectively, the “Portfolios”) bear directly, the Portfolios indirectly bear a pro rata share of the fees and expenses of the investment companies in which the Portfolios invest. The amount of fees and expenses incurred indirectly by the Portfolios will vary because the investment companies have varied expenses and fee levels and the Portfolios may own different proportions of the investment companies at different times. Estimated investment companies’ expenses are not expenses that are incurred directly by the Portfolios. They are expenses that are incurred directly by the investment companies and are deducted from the value of the investment companies the Portfolios invest in. The effect of the estimated investment companies’ expenses that the Portfolios bear indirectly is included in each Portfolio’s total return.
Actual Expenses
The first line in the following table provides information about actual account values and actual expenses. You may use the information in this line, together with the amount you invested, to estimate the expenses that you paid over the period. Simply divide your account value by $1,000 (for example, an $8,600 account value divided by $1,000 = 8.6), then multiply the result by the number in the first line under the heading “Expenses Paid During the Six-Month Period” to estimate the expenses you paid on your account during this period.
Hypothetical Example for Comparison Purposes
The second line in the following table provides information about hypothetical account values and hypothetical expenses based on each Fund’s actual expense ratio and an assumed annualized rate of return of 5% per year before expenses, which is not the Fund’s actual return. The hypothetical account values and expenses may not be used to estimate the actual ending account balance or expenses you paid for the period. You may use this information to compare the ongoing costs of investing in the Funds and other funds. To do so, compare this 5% hypothetical example with the 5% hypothetical examples that appear in the shareholder reports of the other funds.
Please note that the expenses shown in the table are meant to highlight your ongoing costs only, and do not reflect any transactional costs, such as sales charges and brokerage commissions. Therefore, the second line in the table is useful in comparing ongoing costs only, and will not help you determine the relative total costs of owning different funds. In addition, expenses shown in the table do not include the expenses of the underlying funds, which are borne indirectly by a Fund. If transaction costs and indirect expenses were included, your costs would have been higher.
| | | | | | | | | | | | | | | | |
| | | Beginning
Account Value
May 1, 2022 | | Ending Account Value
October 31, 2022 | | Annualized
Expense Ratio
Based on the
Six-Month Period | | Expenses Paid
During the Six-Month Period(1) |
Invesco Active U.S. Real Estate ETF (PSR) | | | | | | | | | | | | | | | | |
| | | | |
Actual | | | $1,000.00 | | | | $ 823.50 | | | | 0.35 | % | | | $1.61 | |
| | | | |
Hypothetical (5% return before expenses) | | | 1,000.00 | | | | 1,023.44 | | | | 0.35 | | | | 1.79 | |
Calculating your ongoing Fund expenses–(continued)
| | | | | | | | | | | | | | | | |
| | | Beginning
Account Value
May 1, 2022 | | Ending
Account Value
October 31, 2022 | | Annualized
Expense Ratio
Based on the
Six-Month Period | | Expenses Paid
During the Six-Month Period(1) |
| | | | |
Invesco Balanced Multi-Asset Allocation ETF (PSMB) | | | | | | | | | | | | | | | | |
| | | | |
Actual | | | $1,000.00 | | | | $ 942.10 | | | | 0.05 | % | | | $0.24 | |
| | | | |
Hypothetical (5% return before expenses) | | | 1,000.00 | | | | 1,024.95 | | | | 0.05 | | | | 0.26 | |
| | | | |
Invesco Conservative Multi-Asset Allocation ETF (PSMC) | | | | | | | | | | | | | | | | |
| | | | |
Actual | | | 1,000.00 | | | | 941.90 | | | | 0.05 | | | | 0.24 | |
| | | | |
Hypothetical (5% return before expenses) | | | 1,000.00 | | | | 1,024.95 | | | | 0.05 | | | | 0.26 | |
| | | | |
Invesco Growth Multi-Asset Allocation ETF (PSMG) | | | | | | | | | | | | | | | | |
| | | | |
Actual | | | 1,000.00 | | | | 943.20 | | | | 0.05 | | | | 0.24 | |
| | | | |
Hypothetical (5% return before expenses) | | | 1,000.00 | | | | 1,024.95 | | | | 0.05 | | | | 0.26 | |
| | | | |
Invesco High Yield Bond Factor ETF (IHYF) | | | | | | | | | | | | | | | | |
| | | | |
Actual | | | 1,000.00 | | | | 935.60 | | | | 0.39 | | | | 1.90 | |
| | | | |
Hypothetical (5% return before expenses) | | | 1,000.00 | | | | 1,023.24 | | | | 0.39 | | | | 1.99 | |
| | | | |
Invesco Moderately Conservative Multi-Asset Allocation ETF (PSMM) | | | | | | | | | | | | | | | | |
| | | | |
Actual | | | 1,000.00 | | | | 940.80 | | | | 0.05 | | | | 0.24 | |
| | | | |
Hypothetical (5% return before expenses) | | | 1,000.00 | | | | 1,024.95 | | | | 0.05 | | | | 0.26 | |
| | | | |
Invesco S&P 500® Downside Hedged ETF (PHDG) | | | | | | | | | | | | | | | | |
| | | | |
Actual | | | 1,000.00 | | | | 1,021.50 | | | | 0.36 | | | | 1.83 | |
| | | | |
Hypothetical (5% return before expenses) | | | 1,000.00 | | | | 1,023.39 | | | | 0.36 | | | | 1.84 | |
| | | | |
Invesco Total Return Bond ETF (GTO) | | | | | | | | | | | | | | | | |
| | | | |
Actual | | | 1,000.00 | | | | 907.00 | | | | 0.50 | | | | 2.40 | |
| | | | |
Hypothetical (5% return before expenses) | | | 1,000.00 | | | | 1,022.68 | | | | 0.50 | | | | 2.55 | |
| | | | |
Invesco Ultra Short Duration ETF (GSY) | | | | | | | | | | | | | | | | |
| | | | |
Actual | | | 1,000.00 | | | | 998.90 | | | | 0.23 | | | | 1.16 | |
| | | | |
Hypothetical (5% return before expenses) | | | 1,000.00 | | | | 1,024.05 | | | | 0.23 | | | | 1.17 | |
| | | | |
Invesco Variable Rate Investment Grade ETF (VRIG) | | | | | | | | | | | | | | | | |
| | | | |
Actual | | | 1,000.00 | | | | 999.00 | | | | 0.30 | | | | 1.51 | |
| | | | |
Hypothetical (5% return before expenses) | | | 1,000.00 | | | | 1,023.69 | | | | 0.30 | | | | 1.53 | |
| (1) | Expenses are calculated using the annualized expense ratio, which represents the ongoing expenses as a percentage of net assets for the six-month period ended October 31, 2022. Expenses are calculated by multiplying the Fund’s annualized expense ratio by the average account value for the period, then multiplying the result by 184/365. Expense ratios for the most recent six-month period may differ from expense ratios based on the annualized data in the Financial Highlights. |
Tax Information
Form 1099-DIV, Form 1042-S and other year–end tax information provide shareholders with actual calendar year amounts that should be included in their tax returns. Shareholders should consult their tax advisers.
The following distribution information is being provided as required by the Internal Revenue Code or to meet a specific state’s requirement.
Each Fund designates the following amounts or, if subsequently determined to be different, the maximum amount allowable for its fiscal year ended October 31, 2022:
| | | | | | | | | | | | | | | | | | | | | | | | | | | | | | | | | | | |
| | | Qualified
Business
Income* | | Qualified
Dividend
Income* | | Corporate
Dividends
Received
Deduction* | | U.S.
Treasury
Obligations* | | Business
Interest
Income* | | Qualified
Interest
Income* | | Qualified
Short
Term
Gains |
| | | | | | | |
Invesco Active U.S. Real Estate ETF | | | | 69 | % | | | | 1 | % | | | | 0 | % | | | | 0 | % | | | | 0 | % | | | | 0 | % | | | $ | - | |
| | | | | | | |
Invesco Balanced Multi-Asset Allocation ETF | | | | 1 | % | | | | 5 | % | | | | 2 | % | | | | 0 | % | | | | 0 | % | | | | 0 | % | | | | - | |
| | | | | | | |
Invesco Conservative Multi-Asset Allocation ETF | | | | 1 | % | | | | 4 | % | | | | 1 | % | | | | 0 | % | | | | 0 | % | | | | 0 | % | | | | 9,860 | |
| | | | | | | |
Invesco Growth Multi-Asset Allocation ETF | | | | 2 | % | | | | 9 | % | | | | 4 | % | | | | 0 | % | | | | 0 | % | | | | 0 | % | | | | - | |
| | | | | | | |
Invesco High Yield Bond Factor ETF | | | | 0 | % | | | | 0 | % | | | | 0 | % | | | | 0 | % | | | | 99 | % | | | | 83 | % | | | | 175,520 | |
| | | | | | | |
Invesco Moderately Conservative Multi-Asset Allocation ETF | | | | 1 | % | | | | 7 | % | | | | 5 | % | | | | 0 | % | | | | 5 | % | | | | 5 | % | | | | - | |
| | | | | | | |
Invesco S&P 500® Downside Hedged ETF | | | | 0 | % | | | | 0 | % | | | | 0 | % | | | | 0 | % | | | | 0 | % | | | | 0 | % | | | | - | |
| | | | | | | |
Invesco Total Return Bond ETF | | | | 0 | % | | | | 4 | % | | | | 4 | % | | | | 11 | % | | | | 96 | % | | | | 74 | % | | | | 124,095 | |
| | | | | | | |
Invesco Ultra Short Duration ETF | | | | 0 | % | | | | 0 | % | | | | 0 | % | | | | 0 | % | | | | 94 | % | | | | 74 | % | | | | - | |
| | | | | | | |
Invesco Variable Rate Investment Grade ETF | | | | 0 | % | | | | 0 | % | | | | 0 | % | | | | 12 | % | | | | 100 | % | | | | 88 | % | | | | - | |
| * | The above percentages are based on ordinary income dividends paid to shareholders during the Fund’s fiscal year. |
Trustees and Officers
The Independent Trustees of the Trust, their term of office and length of time served, their principal business occupations during at least the past five years, the number of portfolios in the Fund Complex (as defined below) overseen by each Independent Trustee and the other directorships, if any, held by each Independent Trustee are shown below:
As of October 31, 2022
| | | | | | | | | | |
Name, Address and Year of Birth of Independent Trustees | | Position(s)
Held with Trust | | Term of
Office and Length of
Time
Served* | | Principal Occupation(s) During the Past 5 Years | | Number of
Portfolios in Fund
Complex**
Overseen by Independent Trustees | | Other Directorships Held by Independent Trustees During the Past 5 Years |
Ronn R. Bagge–1958 c/o Invesco Capital Management LLC 3500 Lacey Road, Suite 700 Downers Grove, IL 60515 | | Vice Chair of the Board; Chair of the Nominating and Governance Committee and Trustee | | Vice Chair since 2018; Chair of the Nominating and Governance Committee and Trustee since 2008 | | Founder and Principal, YQA Capital Management LLC (1998-Present); formerly, Owner/CEO of Electronic Dynamic Balancing Co., Inc. (high-speed rotating equipment service provider). | | 234 | | Chair (since 2021) and member (since 2017) of the Joint Investment Committee, Mission Aviation Fellowship and MAF Foundation; Trustee, Mission Aviation Fellowship (2017-Present). |
| | | | | |
Todd J. Barre–1957 c/o Invesco Capital Management LLC 3500 Lacey Road, Suite 700 Downers Grove, IL 60515 | | Trustee | | Since 2010 | | Assistant Professor of Business, Trinity Christian College (2010-2016); formerly, Vice President and Senior Investment Strategist (2001-2008), Director of Open Architecture and Trading (2007-2008), Head of Fundamental Research (2004-2007) and Vice President and Senior Fixed Income Strategist (1994-2001), BMO Financial Group/Harris Private Bank. | | 234 | | None. |
| * | This is the date the Independent Trustee began serving the Trust. Each Independent Trustee serves an indefinite term, until his or her successor is elected. |
| ** | Fund Complex includes all open- and closed-end funds (including all of their portfolios) advised by the Adviser and any affiliated person of the Adviser. |
Trustees and Officers–(continued)
| | | | | | | | | | |
Name, Address and Year of
Birth of Independent Trustees | | Position(s)
Held with Trust | | Term of
Office and Length of
Time
Served* | | Principal Occupation(s) During the Past 5 Years | | Number of
Portfolios in Fund
Complex**
Overseen by
Independent
Trustees | | Other Directorships Held by Independent Trustees During the Past 5 Years |
Edmund P. Giambastiani, Jr.–1948 c/o Invesco Capital Management LLC 3500 Lacey Road, Suite 700 Downers Grove, IL 60515 | | Trustee | | Since 2019 | | President, Giambastiani Group LLC (national security and energy consulting) (2007-Present); Director, First Eagle Alternative Credit LLC (2020-Present); Advisory Board Member, Massachusetts Institute of Technology Lincoln Laboratory (federally-funded research development) (2010-Present); Defense Advisory Board Member, Lawrence Livermore National Laboratory (2013-Present); formerly, Director, The Boeing Company (2009-2021); Trustee, MITRE Corporation (federally funded research development) (2008-2020); Director, THL Credit, Inc. (alternative credit investment manager) (2016-2020); Chair (2015-2016), Lead Director (2011-2015) and Director (2008-2011), Monster Worldwide, Inc. (career services); United States Navy, career nuclear submarine officer (1970-2007); Seventh Vice Chair of the Joint Chiefs of Staff (2005-2007); first NATO Supreme Allied Commander Transformation (2003-2005); Commander, U.S. Joint Forces Command (2002-2005). | | 234 | | Trustee, U.S. Naval Academy Foundation Athletic & Scholarship Program (2010- Present); formerly, Trustee, certain funds of the Oppenheimer Funds complex (2013-2019); Advisory Board Member, Maxwell School of Citizenship and Public Affairs of Syracuse University (2012-2016). |
| * | This is the date the Independent Trustee began serving the Trust. Each Independent Trustee serves an indefinite term, until his or her successor is elected. |
| ** | Fund Complex includes all open- and closed-end funds (including all of their portfolios) advised by the Adviser and any affiliated person of the Adviser. |
Trustees and Officers–(continued)
| | | | | | | | | | |
Name, Address and Year of
Birth of Independent Trustees | | Position(s)
Held with Trust | | Term of
Office and Length of
Time
Served* | | Principal Occupation(s) During the Past 5 Years | | Number of
Portfolios in Fund
Complex**
Overseen by
Independent
Trustees | | Other Directorships Held by Independent Trustees During the Past 5 Years |
Victoria J. Herget–1951 c/o Invesco Capital Management LLC 3500 Lacey Road, Suite 700 Downers Grove, IL 60515 | | Trustee | | Since 2019 | | Formerly, Managing Director (1993-2001), Principal (1985-1993), Vice President (1978-1985) and Assistant Vice President (1973-1978), Zurich Scudder Investments (investment adviser) (and its predecessor firms). | | 234 | | Trustee (2000- Present) and Chair (2010-2017), Newberry Library; Trustee, Chikaming Open Lands (2014-Present); formerly, Trustee, Mather LifeWays (2001-2021); Trustee, certain funds in the Oppenheimer Funds complex (2012-2019); Board Chair (2008-2015) and Director (2004-2018), United Educators Insurance Company; Independent Director, First American Funds (2003-2011); Trustee (1992-2007), Chair of the Board of Trustees (1999-2007), Investment Committee Chair (1994-1999) and Investment Committee member (2007-2010), Wellesley College; Trustee, BoardSource (2006-2009); Trustee, Chicago City Day School (1994-2005). |
| * | This is the date the Independent Trustee began serving the Trust. Each Independent Trustee serves an indefinite term, until his or her successor is elected. |
| ** | Fund Complex includes all open- and closed-end funds (including all of their portfolios) advised by the Adviser and any affiliated person of the Adviser. |
Trustees and Officers–(continued)
| | | | | | | | | | |
Name, Address and Year of
Birth of Independent Trustees | | Position(s)
Held with Trust | | Term of
Office and Length of
Time
Served* | | Principal Occupation(s) During the Past 5 Years | | Number of
Portfolios in Fund
Complex**
Overseen by
Independent
Trustees | | Other Directorships Held by Independent Trustees During the Past 5 Years |
Marc M. Kole–1960 c/o Invesco Capital Management LLC 3500 Lacey Road, Suite 700 Downers Grove, IL 60515 | | Chair of the Audit Committee and Trustee | | Chair of the Audit Committee since 2008; Trustee since 2008 | | Formerly, Managing Director of Finance (2020-2021) and Senior Director of Finance (2015-2020), By The Hand Club for Kids (not-for-profit); Chief Financial Officer, Hope Network (social services) (2008-2012); Assistant Vice President and Controller, Priority Health (health insurance) (2005-2008); Regional Chief Financial Officer, United Healthcare (2005); Chief Accounting Officer, Senior Vice President of Finance, Oxford Health Plans (2000-2004); Audit Partner, Arthur Andersen LLP (1996-2000). | | 234 | | Formerly, Treasurer (2018-2021), Finance Committee Member (2015-2021) and Audit Committee Member (2015), Thornapple Evangelical Covenant Church; Board and Finance Committee Member (2009-2017) and Treasurer (2010-2015, 2017), NorthPointe Christian Schools. |
| | | | | |
Yung Bong Lim–1964 c/o Invesco Capital Management LLC 3500 Lacey Road, Suite 700 Downers Grove, IL 60515 | | Chair of the Investment Oversight Committee and Trustee | | Chair of the Investment Oversight Committee since 2014; Trustee since 2013 | | Managing Partner, RDG Funds LLC (real estate) (2008-Present); formerly, Managing Director, Citadel LLC (1999-2007). | | 234 | | Board Director, Beacon Power Services, Corp. (2019-Present); formerly, Advisory Board Member, Performance Trust Capital Partners, LLC (2008-2020). |
| * | This is the date the Independent Trustee began serving the Trust. Each Independent Trustee serves an indefinite term, until his or her successor is elected. |
| ** | Fund Complex includes all open- and closed-end funds (including all of their portfolios) advised by the Adviser and any affiliated person of the Adviser. |
Trustees and Officers–(continued)
| | | | | | | | | | |
Name, Address and Year of
Birth of Independent Trustees | | Position(s)
Held with Trust | | Term of
Office and Length of
Time
Served* | | Principal Occupation(s) During the Past 5 Years | | Number of
Portfolios in Fund
Complex**
Overseen by
Independent
Trustees | | Other Directorships Held by Independent Trustees During the Past 5 Years |
Joanne Pace–1958 c/o Invesco Capital Management LLC 3500 Lacey Road, Suite 700 Downers Grove, IL 60515 | | Trustee | | Since 2019 | | Formerly, Senior Advisor, SECOR Asset Management, LP (2010-2011); Managing Director and Chief Operating Officer, Morgan Stanley Investment Management (2006-2010); Partner and Chief Operating Officer, FrontPoint Partners, LLC (alternative investments) (2005-2006); Managing Director (2003-2005), Global Head of Human Resources and member of Executive Board and Operating Committee (2004-2005), Global Head of Operations and Product Control (2003-2004), Credit Suisse (investment banking); Managing Director (1997-2003), Controller and Principal Accounting Officer (1999-2003), Chief Financial Officer (temporary assignment) for the Oversight Committee, Long Term Capital Management (1998-1999), Morgan Stanley. | | 234 | | Board Director, Horizon Blue Cross Blue Shield of New Jersey (2012- Present); Governing Council Member (2016-Present) and Chair of Education Committee (2017-2021), Independent Directors Council (IDC); Council Member, New York-Presbyterian Hospital’s Leadership Council on Children’s and Women’s Health (2012-Present); formerly, Advisory Board Director, The Alberleen Group LLC (2012-2021); Board Member, 100 Women in Finance (2015-2020); Trustee, certain funds in the Oppenheimer Funds complex (2012-2019); Lead Independent Director and Chair of the Audit and Nominating Committee of The Global Chartist Fund, LLC, Oppenheimer Asset Management (2011-2012); Board Director, Managed Funds Association (2008-2010); Board Director (2007-2010) and Investment Committee Chair (2008-2010), Morgan Stanley Foundation. |
| * | This is the date the Independent Trustee began serving the Trust. Each Independent Trustee serves an indefinite term, until his or her successor is elected. |
| ** | Fund Complex includes all open- and closed-end funds (including all of their portfolios) advised by the Adviser and any affiliated person of the Adviser. |
Trustees and Officers–(continued)
| | | | | | | | | | |
Name, Address and Year of
Birth of Independent Trustees | | Position(s)
Held with Trust | | Term of
Office and Length of
Time
Served* | | Principal Occupation(s) During the Past 5 Years | | Number of
Portfolios in Fund
Complex**
Overseen by
Independent
Trustees | | Other Directorships Held by Independent Trustees During the Past 5 Years |
Gary R. Wicker–1961 c/o Invesco Capital Management LLC 3500 Lacey Road, Suite 700 Downers Grove, IL 60515 | | Trustee | | Since 2013 | | Senior Vice President of Global Finance and Chief Financial Officer, RBC Ministries (publishing company) (2013-Present); formerly, Executive Vice President and Chief Financial Officer, Zondervan Publishing (a division of Harper Collins/NewsCorp) (2007-2012); Senior Vice President and Group Controller (2005- 2006), Senior Vice President and Chief Financial Officer (2003-2004), Chief Financial Officer (2001-2003), Vice President, Finance and Controller (1999-2001) and Assistant Controller (1997-1999), divisions of The Thomson Corporation (information services provider); Senior Audit Manager (1994-1997), PricewaterhouseCoopers LLP. | | 234 | | Board Member and Treasurer, Our Daily Bread Ministries Canada (2015- Present); Board and Finance Committee Member, West Michigan Youth For Christ (2010- Present). |
| | | | | |
Donald H. Wilson–1959 c/o Invesco Capital Management LLC 3500 Lacey Road, Suite 700 Downers Grove, IL 60515 | | Chair of the Board and Trustee | | Chair since 2012; Trustee since 2008 | | Chair, President and Chief Executive Officer, McHenry Bancorp Inc. and McHenry Savings Bank (subsidiary) (2018-Present); formerly, Chair and Chief Executive Officer, Stone Pillar Advisors, Ltd. (2010-2017); President and Chief Executive Officer, Stone Pillar Investments, Ltd. (advisory services to the financial sector) (2016-2018); Chair, President and Chief Executive Officer, Community Financial Shares, Inc. and Community Bank—Wheaton/Glen Ellyn (subsidiary) (2013-2015); Chief Operating Officer, AMCORE Financial, Inc. (bank holding company) (2007-2009); Executive Vice President and Chief Financial Officer, AMCORE Financial, Inc. (2006-2007); Senior Vice President and Treasurer, Marshall & Ilsley Corp. (bank holding company) (1995-2006). | | 234 | | Director, Penfield Children’s Center (2004-Present); Board Chair, Gracebridge Alliance, Inc. (2015-Present). |
| * | This is the date the Independent Trustee began serving the Trust. Each Independent Trustee serves an indefinite term, until his or her successor is elected. |
| ** | Fund Complex includes all open- and closed-end funds (including all of their portfolios) advised by the Adviser and any affiliated person of the Adviser. |
Trustees and Officers–(continued)
The Interested Trustee and the executive officers of the Trust, their term of office and length of time served, their principal business occupations during at least the past five years, the number of portfolios in the Fund Complex overseen by the Interested Trustee and the other directorships, if any, held by the Interested Trustee are shown below:
| | | | | | | | | | |
Name, Address and Year of
Birth of Interested Trustee | | Position(s)
Held with Trust | | Term of
Office and Length of
Time
Served* | | Principal Occupation(s) During the Past 5 Years | | Number of
Portfolios in Fund
Complex**
Overseen by
Interested
Trustee | | Other Directorships Held by Interested Trustee During the Past 5 Years |
Anna Paglia–1974 Invesco Capital Management LLC 3500 Lacey Road Suite 700 Downers Grove, IL 60515 | | Trustee, President and Principal Executive Officer | | Trustee since 2022, President and Principal Executive Officer since 2020 | | President and Principal Executive Officer (2020-Present) and Trustee (2022-Present), Invesco Exchange- Traded Fund Trust, Invesco Exchange-Traded Fund Trust II, Invesco India Exchange-Traded Fund Trust, Invesco Actively Managed Exchange-Traded Fund Trust, Invesco Actively Managed Exchange-Traded Commodity Fund Trust and Invesco Exchange-Traded Self-Indexed Fund Trust; Managing Director and Global Head of ETFs and Indexed Strategies, Chief Executive Officer and Principal Executive Officer, Invesco Capital Management LLC (2020-Present); Chief Executive Officer, Manager and Principal Executive Officer, Invesco Specialized Products, LLC (2020-Present); Vice President, Invesco Indexing LLC (2020-Present); formerly, Secretary, Invesco Exchange-Traded Fund Trust, Invesco Exchange-Traded Fund Trust II, Invesco India Exchange-Traded Fund Trust and Invesco Actively Managed Exchange-Traded Fund Trust (2011-2020), Invesco Actively Managed Exchange-Traded Commodity Fund Trust (2014-2020) and Invesco Exchange-Traded Self-Indexed Fund Trust (2015- 2020); Head of Legal (2010-2020) and Secretary (2015-2020), Invesco Capital Management LLC; Manager and Assistant Secretary, Invesco Indexing LLC (2017-2020); Head of Legal and Secretary, Invesco Specialized Products, LLC (2018-2020); Partner, K&L Gates LLP (formerly, Bell Boyd & Lloyd LLP) (2007-2010); and Associate Counsel at Barclays Global Investors Ltd. (2004-2006). | | 234 | | None |
| * | This is the date the Interested Trustee began serving the Trust. The Interested Trustee serves an indefinite term, until his successor is elected. |
| ** | Fund Complex includes all open- and closed-end funds (including all of their portfolios) advised by the Adviser and any affiliated person of the Adviser. |
Trustees and Officers–(continued)
| | | | | | |
Name, Address and Year of Birth
of Executive Officers | | Position(s)
Held with Trust | | Length of
Time
Served* | | Principal Occupation(s) During the Past 5 Years |
Adrien Deberghes–1967 Invesco Capital Management LLC 11 Greenway Plaza, Suite 1000 Houston, TX 77046 | | Vice President | | Since 2020 | | Vice President, Invesco Exchange-Traded Fund Trust, Invesco Exchange-Traded Fund Trust II, Invesco India Exchange-Traded Fund Trust, Invesco Actively Managed Exchange-Traded Fund Trust, Invesco Actively Managed Exchange- Traded Commodity Fund Trust and Invesco Exchange-Traded Self-Indexed Fund Trust (2020-Present); Head of the Fund Office of the CFO, Fund Administration and Vice President, Invesco Advisers, Inc. (2020-Present); Principal Financial Officer, Treasurer and Vice President, The Invesco Funds (2020-Present); formerly, Senior Vice President and Treasurer, Fidelity Investments (2008-2020). |
| | | |
Kelli Gallegos–1970 Invesco Capital Management LLC 11 Greenway Plaza, Suite 1000 Houston, TX 77046 | | Vice President and Treasurer | | Since 2018 | | Vice President, Invesco Advisers, Inc. (2020-Present); Principal Financial and Accounting Officer- Pooled Investments, Invesco Specialized Products, LLC (2018-Present); Vice President and Treasurer, Invesco Exchange-Traded Fund Trust, Invesco Exchange-Traded Fund Trust II, Invesco India Exchange-Traded Fund Trust, Invesco Actively Managed Exchange-Traded Fund Trust, Invesco Actively Managed Exchange-Traded Commodity Fund Trust and Invesco Exchange-Traded Self-Indexed Fund Trust (2018-Present); Principal Financial and Accounting Officer-Pooled Investments, Invesco Capital Management LLC (2018-Present); Vice President and Assistant Treasurer (2008-Present), The Invesco Funds; formerly, Principal Financial Officer (2016-2020) and Assistant Vice President (2008-2016), The Invesco Funds; Assistant Treasurer, Invesco Specialized Products, LLC (2018); Assistant Treasurer, Invesco Exchange- Traded Fund Trust, Invesco Exchange-Traded Fund Trust II, Invesco India Exchange-Traded Fund Trust and Invesco Actively Managed Exchange-Traded Fund Trust (2012-2018), Invesco Actively Managed Exchange-Traded Commodity Fund Trust (2014-2018) and Invesco Exchange-Traded Self-Indexed Fund Trust (2016-2018); and Assistant Treasurer, Invesco Capital Management LLC (2013-2018). |
| | | |
Adam Henkel–1980 Invesco Capital Management LLC 3500 Lacey Road, Suite 700 Downers Grove, IL 60515 | | Secretary | | Since 2020 | | Head of Legal and Secretary, Invesco Capital Management LLC and Invesco Specialized Products, LLC (2020-present); Secretary, Invesco Exchange-Traded Fund Trust, Invesco Exchange-Traded Fund Trust II, Invesco India Exchange- Traded Fund Trust, Invesco Actively Managed Exchange-Traded Fund Trust, Invesco Actively Managed Exchange-Traded Commodity Fund Trust and Invesco Exchange-Traded Self-Indexed Fund Trust (2020-Present); Assistant Secretary, Invesco Capital Markets, Inc. (2020-Present); Assistant Secretary, The Invesco Funds (2014-Present); Manager and Assistant Secretary, Invesco Indexing LLC (2020-Present); Assistant Secretary, Invesco Investment Advisers LLC (2020-Present); formerly, Assistant Secretary of Invesco Exchange-Traded Fund Trust, Invesco Exchange-Traded Fund Trust II, Invesco India Exchange- Traded Fund Trust, Invesco Actively Managed Exchange-Traded Fund Trust and Invesco Actively Managed Exchange-Traded Commodity Fund Trust (2014-2020); Chief Compliance Officer of Invesco Capital Management LLC (2017); Chief Compliance Officer of Invesco Exchange-Traded Fund Trust, Invesco Exchange-Traded Fund Trust II, Invesco India Exchange-Traded Fund Trust, Invesco Actively Managed Exchange-Traded Fund Trust and Invesco Actively Managed Exchange-Traded Commodity Fund Trust (2017); Senior Counsel, Invesco, Ltd. (2013-2020); Assistant Secretary, Invesco Specialized Products, LLC (2018-2020). |
| * | This is the date each Officer began serving the Trust in their current position. Each Officer serves an indefinite term, until his or her successor is elected. |
Trustees and Officers–(continued)
| | | | | | |
Name, Address and Year of Birth
of Executive Officers | | Position(s)
Held with Trust | | Length of
Time
Served* | | Principal Occupation(s) During the Past 5 Years |
Peter Hubbard–1981 Invesco Capital Management LLC 3500 Lacey Road, Suite 700 Downers Grove, IL 60515 | | Vice President | | Since 2009 | | Vice President, Invesco Specialized Products, LLC (2018-Present); Vice President, Invesco Exchange-Traded Fund Trust, Invesco Exchange-Traded Fund Trust II, Invesco India Exchange-Traded Fund Trust, Invesco Actively Managed Exchange-Traded Fund Trust (2009-Present), Invesco Actively Managed Exchange-Traded Commodity Fund Trust (2014-Present) and Invesco Exchange-Traded Self-Indexed Fund Trust (2016-Present); Vice President and Director of Portfolio Management, Invesco Capital Management LLC (2010-Present); and Vice President, Invesco Advisers, Inc. (2020-Present); formerly, Vice President of Portfolio Management, Invesco Capital Management LLC (2008-2010); Portfolio Manager, Invesco Capital Management LLC (2007-2008); Research Analyst, Invesco Capital Management LLC (2005-2007); Research Analyst and Trader, Ritchie Capital, a hedge fund operator (2003-2005). |
| | | |
Sheri Morris–1964 Invesco Capital Management LLC 11 Greenway Plaza, Suite 1000 Houston, TX 77046 | | Vice President | | Since 2012 | | Head of Global Fund Services, Invesco Ltd. (2019-Present); Vice President, OppenheimerFunds, Inc. (2019-Present); President and Principal Executive Officer, The Invesco Funds (2016-Present); Senior Vice President, Invesco Advisers, Inc. (formerly known as Invesco Institutional (N.A.), Inc.) (registered investment adviser) (2020-Present); Director, Invesco Trust Company (2022-Present) and Vice President, Invesco Exchange-Traded Fund Trust, Invesco Exchange-Traded Fund Trust II, Invesco India Exchange-Traded Fund Trust, Invesco Actively Managed Exchange-Traded Fund Trust (2012-Present), Invesco Actively Managed Exchange-Traded Commodity Fund Trust (2014-Present) and Invesco Exchange-Traded Self-Indexed Fund Trust (2016-Present); formerly, Treasurer (2008-2020), Vice President and Principal Financial Officer, The Invesco Funds (2008-2016); Treasurer, Invesco Exchange-Traded Fund Trust, Invesco Exchange-Traded Fund Trust II, Invesco India Exchange-Traded Fund Trust and Invesco Actively Managed Exchange- Traded Fund Trust (2011-2013); Vice President, Invesco Aim Advisers, Inc., Invesco Aim Capital Management, Inc. and Invesco Aim Private Asset Management, Inc.; Treasurer, Assistant Vice President and Assistant Treasurer, The Invesco Funds and Assistant Vice President, Invesco Advisers, Inc., Invesco Aim Capital Management, Inc. and Invesco Aim Private Asset Management, Inc.; Vice President, Invesco Advisers, Inc. (2009-2020). |
| | | |
Rudolf E. Reitmann–1971 Invesco Capital Management LLC 3500 Lacey Road, Suite 700 Downers Grove, IL 60515 | | Vice President | | Since 2013 | | Head of Global Exchange Traded Funds Services, Invesco Specialized Products, LLC (2018-Present); Vice President, Invesco Exchange-Traded Fund Trust, Invesco Exchange-Traded Fund Trust II, Invesco India Exchange-Traded Fund Trust, Invesco Actively Managed Exchange-Traded Fund Trust (2013-Present), Invesco Actively Managed Exchange-Traded Commodity Fund Trust (2014-Present) and Invesco Exchange-Traded Self-Indexed Fund Trust (2016-Present); Head of Global Exchange Traded Funds Services, Invesco Capital Management LLC (2013-Present); Vice President, Invesco Capital Markets, Inc. (2018-Present). |
| * | This is the date each Officer began serving the Trust in their current position. Each Officer serves an indefinite term, until his or her successor is elected. |
Trustees and Officers–(continued)
| | | | | | |
Name, Address and Year of Birth
of Executive Officers | | Position(s)
Held with Trust | | Length of
Time
Served* | | Principal Occupation(s) During the Past 5 Years |
Melanie Zimdars–1976 Invesco Capital Management LLC 3500 Lacey Road, Suite 700 Downers Grove, IL 60515 | | Chief Compliance Officer | | Since 2017 | | Chief Compliance Officer, Invesco Specialized Products, LLC (2018-Present); Chief Compliance Officer, Invesco Capital Management LLC (2017-Present); Chief Compliance Officer, Invesco Exchange-Traded Fund Trust, Invesco Exchange-Traded Fund Trust II, Invesco India Exchange-Traded Fund Trust, Invesco Actively Managed Exchange-Traded Fund Trust, Invesco Actively Managed Exchange-Traded Commodity Fund Trust and Invesco Exchange- Traded Self-Indexed Fund Trust (2017-Present); formerly, Vice President and Deputy Chief Compliance Officer, ALPS Holding, Inc. (2009-2017); Mutual Fund Treasurer/ Chief Financial Officer, Wasatch Advisors, Inc. (2005-2008); Compliance Officer, U.S. Bancorp Fund Services, LLC (2001-2005). |
| * | This is the date each Officer began serving the Trust in their current position. Each Officer serves an indefinite term, until his or her successor is elected. |
Availability of Additional Information About the Trustees
The Statement of Additional Information includes additional information about the Trustees and is available, without charge, upon request at (800) 983-0903.
(This Page Intentionally Left Blank)
(This Page Intentionally Left Blank)
Proxy Voting Policies and Procedures
A description of the Trust’s proxy voting policies and procedures that the Funds use to determine how to vote proxies relating to portfolio securities is available, without charge and upon request, by calling (800) 983-0903. This information is also available on the Securities and Exchange Commission’s (the “Commission”) website at www.sec.gov.
Information regarding how each Fund voted proxies for portfolio securities, if applicable, during the most recent 12-month period ended June 30, is available, without charge and upon request, by (i) calling (800) 983-0903; or (ii) accessing the Trust’s Form N-PX on the Commission’s website at www.sec.gov.
Quarterly Portfolios
The Trust files its complete schedule of portfolio holdings for the Funds with the Commission for the first and third quarters of each fiscal year as an exhibit to its reports on Form N-PORT. The Forms N-PORT are available on the Commission’s website at www.sec.gov.
Frequency Distribution of Discounts and Premiums
A table showing the number of days the market price of each Fund’s shares was greater than the Fund’s net asset value, and the number of days it was less than the Fund’s net asset value (i.e., premium or discount) for the most recently completed calendar year, and the calendar quarters since that year end (or the life of the Fund, if shorter) may be found at the Fund’s website at www.invesco.com/ETFs.
| | | | |
| ©2022 Invesco Capital Management LLC | | | | |
| 3500 Lacey Road, Suite 700 | | | | |
| Downers Grove, IL 60515 | | P-PS-AR-10 | | invesco.com/ETFs |
| | | | |
 | | Invesco Annual Report to Shareholders October 31, 2022 |
| | IVDG | | Invesco Focused Discovery Growth ETF |
| | IVRA | | Invesco Real Assets ESG ETF |
| | |
| | IVSG | | Invesco Select Growth ETF |
| | |
| | IVLC | | Invesco US Large Cap Core ESG ETF |
Table of Contents
The Market Environment
Domestic Equity
The fiscal year ended October 31, 2022 began with continued volatility in equity markets in the fourth quarter of 2021 amid substantial inflation and the emergence of a new COVID-19 variant. Pandemic-related supply chain disruption and labor shortages intensified during the quarter, resulting in broadly higher input costs for companies and consumers alike. Additionally, the price of oil rose,1 causing higher gas prices for consumers, and the Consumer Price Index (CPI) reported for November 2021 increased 0.8%, resulting in a 6.8% increase over the prior 12 months, the highest since 1982.2 To combat inflation, the US Federal Reserve (the Fed) announced the potential for three or more interest rate increases in 2022. With solid corporate earnings and optimism about the COVID-19 Omicron variant reporting milder symptoms, stocks rallied at the 2021 year-end.
Equity markets declined in the first quarter of 2022 amid volatility sparked by Russia’s invasion of Ukraine, rising commodity prices, rampant global inflation and the Fed’s shift toward tighter monetary policy. Russia’s invasion exacerbated inflation pressures, disrupting already strained supply chains and increasing shortages of oil, gas and raw materials. The price of oil rose sharply, with crude prices reaching their highest price per barrel since 2008.1 Inflation continued to be a top concern for consumers, investors and the Fed. To combat inflation, the Fed raised the federal funds rate by one-quarter percentage point in March and the Fed indicated it would “taper” its asset purchase program quickly.3
As the war in Ukraine continued and corporate earnings in high-profile names like Netflix reported slowing growth and profits, the equity markets sold off for much of April 2022. The downward direction of the equity markets continued into the second quarter of 2022 amid record inflation, rising interest rates and an increasing likelihood of a US recession. Driven by higher food and energy prices, the CPI rose by yet another 40-year high to 8.6% for the 12 months ended May 2022.2 Oil prices peaked near $122 per barrel in early June, resulting in skyrocketing gasoline prices; the national average price reached a record high above $5 per gallon in early June.1 To tame inflation, the Fed raised the benchmark federal funds rate three more times, by 0.50% in May, by 0.75% in June and another 0.75% in July, which were the largest increases in nearly 30 years.3 US equity markets rose in July and much of August until Fed chairman Jerome Powell’s hawkish comments at an economic policy symposium held in Jackson Hole, Wyoming, sparked a sharp selloff at month-end. The Fed reiterated that it would continue taking aggressive action to curb inflation, even though such measures could “bring pain to households and businesses,” and the Fed raised the benchmark federal funds rate by another 0.75% in September.3
After experiencing a sharp drop in September 2022, US equity markets rebounded in October with strong gains, despite mixed data on the economy and corporate earnings. Inflation data
reported in October came in higher than expected; however, the labor market remained strong, with payroll employment gains and a decline in the unemployment rate to a near record low of 3.5% in September.2 The initial estimate of third quarter real gross domestic product showed an increase of 2.6% (annualized) after falling in the prior two quarters, but the headline number masked a drop in demand and investment. Corporate earnings were generally in line with expectations, but many companies’ forward earnings guidance was weaker than expected.
In this environment, US stocks had negative double-digit returns for the fiscal year ended October 31, 2022 of -14.61%, as measured by the S&P 500 Index.4
| 2 | Source: US Bureau of Labor Statistics |
| 3 | Source: US Federal Reserve |
| | |
| IVDG | | Management’s Discussion of Fund Performance |
| | Invesco Focused Discovery Growth ETF (IVDG) |
The Invesco Focused Discovery Growth ETF (the “Fund”) is an actively managed exchange-traded fund (“ETF”) that seeks capital appreciation. The Fund operates pursuant to an exemptive order from the SEC (the “Order”) and is not required to publicly disclose its complete portfolio holdings each day that the Fund is open (a “Business Day”). Instead, the Fund publishes each Business Day on its website a “Substitute Basket,” which is designed to closely track the daily performance of the Fund but is not the Fund’s actual portfolio. The Substitute Basket often will include a significant percentage of the securities held in the Fund’s portfolio, but it will exclude (or modify the weightings of) certain securities held in the Fund’s portfolio, such as those securities that the Fund’s portfolio managers are actively looking to purchase or sell, or securities which, if disclosed, could increase the risk of front- running or free-riding. The Substitute Basket may also include cash.
The Fund seeks to achieve its investment objective by investing primarily in exchange-traded common stocks of U.S. companies that Invesco Advisers, Inc. (the “Sub-Adviser”) expects to have above average growth rates. The Fund seeks to invest in newer companies or in more established companies that are in the early growth phase of their business cycle, which is typically marked by above average growth rates. The Fund may invest in securities of issuers of all capitalization sizes; however, it will primarily hold securities of mid-capitalization issuers. The Fund defines mid-capitalization issuers as those issuers that are within the range of market capitalizations of the Russell Midcap® Growth Index. This range is subject to change at any time due to market activity or changes in the composition of that index. The Fund measures a company’s capitalization at the time the Fund buys a security and is not required to sell a security if the issuer’s capitalization moves outside of the Fund’s definition of mid-capitalization issuers. The Fund may invest up to 25% of its net assets in common stock of foreign issuers, including up to 10% of its net assets in emerging market countries, i.e., those that are in the early stages of their industrial cycles. The Fund may make such investment in common stock of foreign issuers by either: (i) investing directly in common stock listed on a foreign exchange that trades on such exchange contemporaneously with the Fund’s Shares (currently limited to Canada and Mexico); or (ii) investing in exchange-traded American depositary receipts (“ADRs”) representing common stock trading on any foreign exchange that trades contemporaneously with the Shares.
For the fiscal year ended October 31, 2022, on a market price basis, the Fund returned (29.61)%. On a net asset value (“NAV”) basis, the Fund returned (29.56)%. During the same time period, the Russell Midcap® Growth Index (the “Benchmark Index”) returned (28.94)%.
The Fund’s underperformance relative to the Benchmark Index is primarily due to the Fund’s active security selection, as well as Fund fees and transaction costs. The Benchmark Index was selected for its recognition in the marketplace, and its
performance comparison is a useful measure for investors as a broad representation of the market for U.S. mid cap growth stocks.
For the fiscal year ended October 31, 2022, the energy sector contributed most significantly to the Fund’s return, followed by the consumer staples sector. The information technology sector detracted most significantly from the Fund’s return, followed by the health care sector.
Positions that contributed most significantly to the Fund’s return included Cheniere Energy, Inc., an energy company (portfolio average weight of 3.55%), and LPL Financial Holdings, Inc., a financials company (portfolio average weight of 2.45%). The positions that detracted most significantly from the Fund’s return was MongoDB, Inc. Class A, an information technology company (no longer held at fiscal year-end) and Marvell Technology, Inc., an information technology company (no longer held at fiscal year-end).
| | | | |
Sector Breakdown
(% of the Fund’s Net Assets)
as of October 31, 2022 | |
| Information Technology | | | 29.08 | |
| Health Care | | | 17.96 | |
| Industrials | | | 17.96 | |
| Consumer Discretionary | | | 13.19 | |
| Financials | | | 8.49 | |
| Energy | | | 3.96 | |
| Consumer Staples | | | 3.65 | |
| Sector Types Each Less Than 3% | | | 3.61 | |
| Money Market Funds Plus Other Assets Less Liabilities | | | 2.10 | |
|
Top Ten Fund Holdings*
(% of the Fund’s Net Assets)
as of October 31, 2022 | |
| Security | | | | |
| Cheniere Energy, Inc. | | | 3.96 | |
| Paylocity Holding Corp. | | | 3.92 | |
| Waste Connections, Inc. | | | 3.68 | |
| Motorola Solutions, Inc. | | | 3.57 | |
| LPL Financial Holdings, Inc. | | | 3.48 | |
| Arthur J. Gallagher & Co. | | | 3.42 | |
| Molina Healthcare, Inc. | | | 3.22 | |
| Gartner, Inc. | | | 3.06 | |
| AmerisourceBergen Corp. | | | 3.05 | |
| Repligen Corp. | | | 2.94 | |
| Total | | | 34.30 | |
| * | Excluding money market fund holdings. |
Invesco Focused Discovery Growth ETF (IVDG) (continued)
Growth of a $10,000 Investment Since Inception
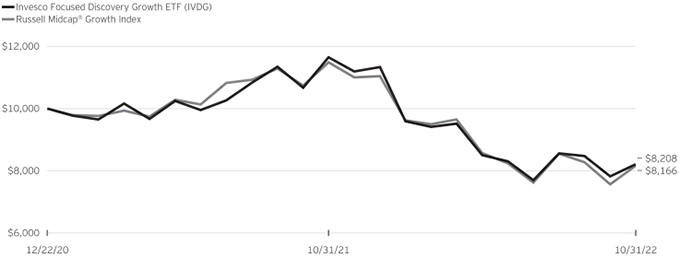
Fund Performance History as of October 31, 2022
| | | | | | | | | | | | | | | | |
| | | | | | | | | Fund Inception | |
| Index | | 1 Year | | | | | | Average
Annualized | | | Cumulative | |
| Russell Midcap® Growth Index | | | (28.94 | )% | | | | | | | (10.33 | )% | | | (18.34 | )% |
| Fund | | | | | | | | | | | | | | | | |
| NAV Return | | | (29.56 | ) | | | | | | | (10.09 | ) | | | (17.92 | ) |
| Market Price Return | | | (29.61 | ) | | | | | | | (10.09 | ) | | | (17.92 | ) |
Fund Inception: December 22, 2020
Performance quoted above represents past performance. Past performance is not a guarantee of future results and current performance may be higher or lower than performance quoted. Investment returns and principal value will fluctuate, and shares of the Fund (“Fund Shares”), when redeemed or sold, may be worth more or less than their original cost. Fund performance reflects any applicable fee waivers and/or expense reimbursements. Had the adviser not waived fees and/or reimbursed expenses currently or in the past, returns would have been lower. See the current prospectus for more information. According to the Fund’s current prospectus, as supplemented to date, the Fund’s expense ratio of 0.59% is expressed as a unitary management fee to cover operating expenses and expenses incurred in connection with managing the portfolio. NAV and Market Price returns assume that dividends and capital gain distributions have been reinvested in the Fund at NAV and Market Price, respectively. The returns shown in the table above do not reflect the deduction of taxes that a shareholder would pay on Fund distributions or the redemption or sale of Fund Shares. See invesco.com/ETFs to find the most recent month-end performance numbers.
Performance results for the index stated above are based upon a hypothetical investment in their respective constituent securities. The returns of an index do not represent Fund returns. An investor cannot invest directly in an index. The index does not charge management fees or brokerage expenses, and no such fees or expenses were deducted from the hypothetical performance shown. In addition, the results actual investors might have achieved would have differed from those shown because of differences in the timing, amounts of their investments, and fees and expenses associated with an investment in the Fund.
Notes Regarding Index and Fund Performance History:
| - | Average Annualized and Cumulative Inception returns for the Fund and index are based on the inception date of the Fund. |
| | |
| IVRA | | Management’s Discussion of Fund Performance |
| | Invesco Real Assets ESG ETF (IVRA) |
The Invesco Real Assets ESG ETF (the “Fund”) is an actively managed exchange-traded fund (“ETF”) that seeks capital appreciation with a secondary objective of current income. The Fund operates pursuant to an exemptive order from the SEC (the “Order”) and is not required to publicly disclose its complete portfolio holdings each day that the Fund is open (a “Business Day”). Instead, the Fund publishes each Business Day on its website a “Tracking Basket,” which is designed to closely track the daily performance of the Fund but is not the Fund’s actual portfolio. The Tracking Basket is comprised of: (1) select recently disclosed portfolio holdings (“Strategy Components”); (2) ETFs that convey information about the types of instruments (that are not otherwise fully represented by the Strategy Components) in which the Fund invests (“Representative ETFs”); and (3) cash and cash equivalents.
The Fund seeks to achieve its investment objective by investing, under normal circumstances, at least 80% of the value of its net assets (plus the amount of any borrowings for investment purposes) in exchange-traded equity securities of “real assets” companies (as identified below). The “real assets” companies in which the Fund invests are located in North America and must meet environmental, social and governance (“ESG”) standards, as determined by the Fund’s sub-adviser, Invesco Adviser’s Inc. (the “Sub-Adviser”), through the process described below. Real assets are characterized by having physical attributes, including real estate, infrastructure, natural resources and timber. The Sub-Adviser considers “real assets” companies to be those that are either principally engaged in real estate, infrastructure, natural resources or timber industries, or support such businesses, and it anticipates focusing the Fund’s investments in such industries. In selecting equity securities for the Fund, the Sub-Adviser uses fundamental analysis to identify securities that adhere to ESG principles described herein and are viewed to have relatively favorable long-term prospects. Some of the factors that the Sub-Adviser considers include, but are not limited to: assessment of long-term fundamental growth, sustainable dividends, attractive physical and locational attributes and capital structure viability. As a result of that analysis, the portfolio managers generally favor companies with a balanced mix of the factors above. The Sub-Adviser will consider selling a security when it no longer meets the investment criteria, or a more attractive alternative is identified. The Fund may invest in companies of any market capitalization. The Fund may invest up to 25% of its net assets in common stock of foreign issuers, including up to 10% of its net assets in emerging markets countries, i.e., those that are in the early stages of their industrial cycles. The Fund may make such investment in common stock of foreign issuers by either: (i) investing directly in common stock listed on a foreign exchange that trades on such exchange contemporaneously with the Fund’s Shares (currently limited to Canada and Mexico); or (ii) investing in exchange-traded American depositary receipts (“ADRs”)
representing common stock trading on any foreign exchange that trades contemporaneously with the Shares.
Under normal market conditions, the Sub-Adviser will employ the following ESG methodology to assess all investment opportunities (as identified by the strategy described above) as an integral part of the process for selecting portfolio holdings: The investment team first employs a proprietary ESG screen to exclude issuers from the investment universe of securities in which the Fund may invest that do not meet its investment criteria. Such screens include substantial involvement (generally defined as generating more than 0-10% of its revenue, depending on the screen) in the following areas: tobacco, alcohol, controversial and conventional weapons, recreational cannabis, extraction of thermal coal, extraction of fossil fuels from unconventional sources, and operators of private prisons. Issuers will also be excluded based on their non-compliance with United Nations (“UN”) Global Compact principles (whether or not the issuer has signed on to the UN Global Compact itself). The principles of the UN Global Compact represent a set of values that the UN believes responsible businesses should incorporate into their operations in order to meet fundamental responsibilities in the areas of human rights, labor, environment and anti-corruption. In implementing this screen, the Sub-Adviser utilizes a third-party ESG data provider (the “ESG Vendor”), which assesses issuers for their involvement in the screened business areas. The Sub-Adviser has selected the ESG Vendor through a comprehensive due diligence process and continuously monitors its performance and screening. To the extent an issuer’s status changes to meet the qualification for exclusion, the Fund shall take steps to divest its holdings of the issuer within a reasonable period of time. This screening criteria may be updated periodically.
Next, based on research and due diligence, each investment opportunity is evaluated by the investment team related to multiple ESG factors under each individual pillar of the ESG framework and specific real asset sector. The individual pillars can include but are not limited to the following: environmental pillar (“E”) factors: natural resources, pollution and waste, supply chain impact, and environmental opportunities; social pillar (“S”) factors: workforce, community, product responsibility, and human rights; governance pillar (“G”) factors: management, shareholders, board of directors, auditors, regulatory issuers, corporate social responsibility strategy, anti-corruption, and business ethics. The investment team considers each ESG pillar and investment opportunity separately and neither weighs each pillar equally, nor consistently emphasizes one pillar over another. This analysis generally identifies those companies with relatively attractive ESG factors and favors those that provide functionally efficient assets with positive environmental credentials, operating as highest and best use with relatively positive local impact. In making such scoring determinations, the Sub-Adviser may employ a proprietary ESG scoring tool, as well as, and in combination with, certain data provided by the ESG Vendor. Both the ESG Vendor and the
Invesco Real Assets ESG ETF (IVRA) (continued)
proprietary ESG scoring tool are continuously assessed and reviewed by the Sub-Adviser for screening and scoring outcomes. The foregoing factors in each ESG pillar may be updated periodically. The investment team considers each ESG pillar and investment opportunity separately and neither weighs each pillar equally, nor consistently emphasizes one pillar over another.
For the fiscal year ended October 31, 2022, on a market price basis, the Fund returned (8.16)%. On a net asset value (“NAV”) basis, the Fund returned (8.01)%. During this same time period, the S&P U.S., Canada & Mexico Real Assets Equity Index returned (3.87)% and the S&P 500® Index returned (14.61)% (collectively, the “Benchmark Indexes”).
The Fund’s underperformance, relative to the S&P U.S., Canada & Mexico Real Assets Equity Index, is primarily due to the Fund’s active security selection as well as fund fees and transaction costs. The S&P U.S., Canada & Mexico Real Assets Equity Index was selected for its recognition in the marketplace, and its performance comparison is a useful measure for investors as a broad representation of the global property, infrastructure, natural resources, and timber and forestry market in the U.S., Canada and Mexico.
The Fund’s outperformance, relative to the S&P 500® Index, is primarily due to the Fund’s active security selection, which was partially offset by fund fees and transaction costs. The S&P 500® Index was selected for its recognition in the marketplace, and its performance comparison is a useful measure for investors as a broad representation of the U.S. equity market.
For the fiscal year ended October 31, 2022, the real estate sector detracted most significantly from the Fund’s return, followed by the materials sector. The energy sector contributed most significantly to the Fund’s return.
Positions that contributed most significantly to the Fund’s return included Cheniere Energy, Inc., an energy company (portfolio average weight of 3.43%), and FMC Corp., a materials company (portfolio average weight of 0.89%). Positions that detracted most significantly from the Fund’s return included American Tower Corp., a real estate company (portfolio average weight of 5.73%), and Prologis, Inc., a real estate company (portfolio average weight of 5.98%).
| | | | |
Sector Breakdown
(% of the Fund’s Net Assets)
as of October 31, 2022 | |
| Real Estate | | | 51.77 | |
| Energy | | | 27.24 | |
| Materials | | | 11.93 | |
| Utilities | | | 8.24 | |
| Industrials | | | 0.33 | |
| Money Market Funds Plus Other Assets Less Liabilities | | | 0.49 | |
Top Ten Fund Holdings* (% of the Fund’s Net Assets)
as of October 31, 2022 | |
| Security | | | | |
| Prologis, Inc. | | | 6.15 | |
| American Tower Corp. | | | 6.05 | |
| Enbridge, Inc. | | | 5.73 | |
| ONEOK, Inc. | | | 4.02 | |
| Cheniere Energy, Inc. | | | 4.00 | |
| Targa Resources Corp. | | | 3.46 | |
| Simon Property Group, Inc. | | | 3.31 | |
| SBA Communications Corp., Class A | | | 3.10 | |
| Sempra Energy | | | 2.90 | |
| Pembina Pipeline Corp. | | | 2.89 | |
| Total | | | 41.61 | |
| * | Excluding money market fund holdings. |
Invesco Real Assets ESG ETF (IVRA) (continued)
Growth of a $10,000 Investment Since Inception
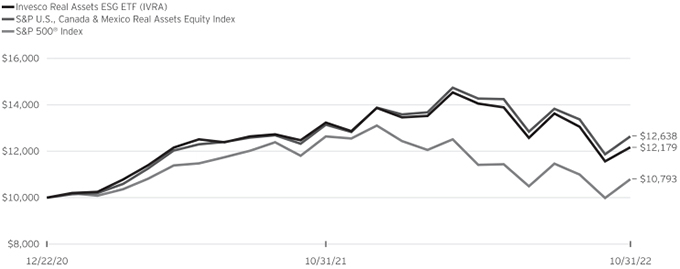
Fund Performance History as of October 31, 2022
| | | | | | | | | | | | | | | | |
| | | | | | | | | Fund Inception | |
| Index | | 1 Year | | | | | | Average
Annualized | | | Cumulative | |
| S&P U.S., Canada & Mexico Real Assets Equity Index | | | (3.87 | )% | | | | | | | 13.43 | % | | | 26.38 | % |
| S&P 500® Index | | | (14.61 | ) | | | | | | | 4.19 | | | | 7.93 | |
| Fund | | | | | | | | | | | | | | | | |
| NAV Return | | | (8.01 | ) | | | | | | | 11.20 | | | | 21.79 | |
| Market Price Return | | | (8.16 | ) | | | | | | | 11.42 | | | | 22.25 | |
Fund Inception: December 22, 2020
Performance quoted above represents past performance. Past performance is not a guarantee of future results and current performance may be higher or lower than performance quoted. Investment returns and principal value will fluctuate, and shares of the Fund (“Fund Shares”), when redeemed or sold, may be worth more or less than their original cost. Fund performance reflects any applicable fee waivers and/or expense reimbursements. Had the adviser not waived fees and/or reimbursed expenses currently or in the past, returns would have been lower. See the current prospectus for more information. According to the Fund’s current prospectus, as supplemented to date, the Fund’s expense ratio of 0.60% includes a unitary management fee of 0.59% and other expenses of 0.01%. NAV and Market Price returns assume that dividends and capital gain distributions have been reinvested in the Fund at NAV and Market Price, respectively. The returns shown in the table above do not reflect the deduction of taxes
that a shareholder would pay on Fund distributions or the redemption or sale of Fund Shares. See invesco.com/ETFs to find the most recent month-end performance numbers.
Performance results for the indexes stated above are based upon a hypothetical investment in their respective constituent securities. The returns of an index do not represent Fund returns. An investor cannot invest directly in an index. The indexes do not charge management fees or brokerage expenses, and no such fees or expenses were deducted from the hypothetical performance shown. In addition, the results actual investors might have achieved would have differed from those shown because of differences in the timing, amounts of their investments, and fees and expenses associated with an investment in the Fund.
Notes Regarding Index and Fund Performance History:
| - | Average Annualized and Cumulative Inception returns for the Fund and indexes are based on the inception date of the Fund. |
| | |
| IVSG | | Management’s Discussion of Fund Performance |
| | Invesco Select Growth ETF (IVSG) |
The Invesco Select Growth ETF (the “Fund”) is an actively managed exchange-traded fund (“ETF”) that seeks long-term capital appreciation. The Fund operates pursuant to an exemptive order from the SEC (the “Order”) and is not required to publicly disclose its complete portfolio holdings each day that the Fund is open (a “Business Day”). Instead, the Fund publishes each Business Day on its website a “Substitute Basket,” which is designed to closely track the daily performance of the Fund but is not the Fund’s actual portfolio. The Substitute Basket often will include a significant percentage of the securities held in the Fund’s portfolio, but it will exclude (or modify the weightings of) certain securities held in the Fund’s portfolio, such as those securities that the Fund’s portfolio managers are actively looking to purchase or sell, or securities which, if disclosed, could increase the risk of front-running or free- riding. The Substitute Basket may also include cash.
The Fund seeks to achieve its investment objective by investing primarily in exchange-traded common stocks of U.S. companies that Invesco Advisers, Inc. (the “Sub-Adviser”) believes have potential for earnings or revenue growth. The Fund deems an issuer to be a U.S. issuer if (i) its principal securities trading market (i.e., a U.S. stock exchange, NASDAQ or over-the-counter markets) is in the U.S.; (ii) it (alone or through its consolidated subsidiaries) derives 50% or more of its annual revenue from either goods produced, sales made or services performed in the U.S.; (iii) it is organized under the laws of, or has a principal office in, the U.S; or (iv) its “country of risk” is the U.S. as determined by a third party service provider such as Bloomberg. The Fund may invest in securities of issuers of all capitalization sizes; however, it will primarily hold securities of large and mid-capitalization issuers. The Fund considers large- and mid-capitalization issuers to be those issuers that are within the ranges of market capitalizations of the Russell 1000® Growth Index and Russell Midcap® Growth Index, respectively. These ranges are subject to change at any time due to market activity or changes in the composition of those indices. The Fund measures a company’s capitalization at the time the Fund buys a security and is not required to sell a security if the issuer’s capitalization moves outside of the Fund’s definition of large- or mid-capitalization issuers. The Fund usually will hold a relatively small number of stocks (approximately 25-30) and may invest more than 25% of its assets in a given sector. The Fund may invest up to 25% of its net assets in common stock of foreign issuers, which include issuers in emerging markets countries, i.e., those that are in the early stages of their industrial cycles. The Fund may make such investment in common stock of foreign issuers by either: (i) investing directly in common stock listed on a foreign exchange that trades on such exchange contemporaneously with the Fund’s Shares (currently limited to Canada and Mexico); or (ii) investing in exchange-traded American depositary receipts (“ADRs”) representing common stock trading on any foreign exchange that trades contemporaneously with the Shares.
For the fiscal year ended October 31, 2022, on a market price basis, the Fund returned (30.93)%. On a net asset value (“NAV”) basis, the Fund returned (30.97)%. During the same time period, the Russell 1000® Growth Index (the “Benchmark Index”) returned (24.60)%.
The Fund’s underperformance relative to the Benchmark Index is primarily due to the Fund’s active security selection, as well as fund fees and transaction costs. The Benchmark Index was selected for its recognition in the marketplace and its performance comparison is a useful measure for investors as a broad representation of domestic growth stocks.
For the fiscal year ended October 31, 2022, the energy sector contributed most significantly to the Fund’s return. The information technology sector detracted most significantly from the Fund’s return, followed by the consumer discretionary sector.
Positions that contributed most significantly to the Fund’s return included APA Corp., an energy company (no longer held at fiscal year-end), and Schlumberger Ltd., an energy company (portfolio average weight of 0.46%). Positions that detracted most significantly from the Fund’s return were Microsoft Corp., an information technology company (portfolio average weight of 12.88%) and Alphabet, Inc. Class A, a communication services company (portfolio average weight of 6.87%), respectively.
| | | | |
Sector Breakdown
(% of the Fund’s Net Assets)
as of October 31, 2022 | |
| Information Technology | | | 39.91 | |
| Communication Services | | | 17.14 | |
| Consumer Discretionary | | | 11.94 | |
| Health Care | | | 10.47 | |
| Industrials | | | 7.13 | |
| Financials | | | 4.85 | |
| Energy | | | 3.96 | |
| Consumer Staples | | | 3.26 | |
| Money Market Funds Plus Other Assets Less Liabilities | | | 1.34 | |
Invesco Select Growth ETF (IVSG) (continued)
| | | | |
Top Ten Fund Holdings* (% of the Fund’s Net Assets)
as of October 31, 2022 | |
| Security | | | | |
| Microsoft Corp. | | | 11.32 | |
| Apple, Inc. | | | 7.20 | |
| UnitedHealth Group, Inc. | | | 6.21 | |
| Amazon.com, Inc. | | | 6.20 | |
| Alphabet, Inc., Class A | | | 5.96 | |
| Take-Two Interactive Software, Inc. | | | 5.03 | |
| Chubb Ltd. | | | 4.85 | |
| Visa, Inc., Class A | | | 4.53 | |
| Palo Alto Networks, Inc. | | | 4.39 | |
| Schlumberger Ltd. | | | 3.96 | |
| Total | | | 59.65 | |
| * | Excluding money market fund holdings. |
Growth of a $10,000 Investment Since Inception
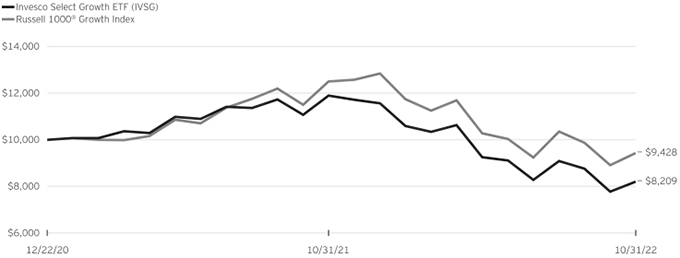
Fund Performance History as of October 31, 2022
| | | | | | | | | | | | | | | | |
| | | | | | | | | Fund Inception | |
| Index | | 1 Year | | | | | | Average
Annualized | | | Cumulative | |
| Russell 1000® Growth Index | | | (24.60 | )% | | | | | | | (3.12 | )% | | | (5.72 | )% |
| Fund | | | | | | | | | | | | | | | | |
| NAV Return | | | (30.97 | ) | | | | | | | (10.08 | ) | | | (17.91 | ) |
| Market Price Return | | | (30.93 | ) | | | | | | | (10.16 | ) | | | (18.05 | ) |
Invesco Select Growth ETF (IVSG) (continued)
Fund Inception: December 22, 2020
Performance quoted above represents past performance. Past performance is not a guarantee of future results and current performance may be higher or lower than performance quoted. Investment returns and principal value will fluctuate, and shares of the Fund (“Fund Shares”), when redeemed or sold, may be worth more or less than their original cost. Fund performance reflects any applicable fee waivers and/or expense reimbursements. Had the adviser not waived fees and/or reimbursed expenses currently or in the past, returns would have been lower. See the current prospectus for more information. According to the Fund’s current prospectus, as supplemented to date, the Fund’s expense ratio of 0.48% is expressed as a unitary management fee to cover operating expenses and expenses incurred in connection with managing the portfolio. NAV and Market Price returns assume that dividends and capital gain distributions have been reinvested in the Fund at NAV and Market Price, respectively. The returns shown in the table above do not reflect the deduction of taxes that a shareholder would pay on Fund distributions or the redemption or sale of Fund Shares. See invesco.com/ETFs to find the most recent month-end performance numbers.
Performance results for the index stated above are based upon a hypothetical investment in their respective constituent securities. The returns of an index do not represent Fund returns. An investor cannot invest directly in an index. The index does not charge management fees or brokerage expenses, and no such fees or expenses were deducted from the hypothetical performance shown. In addition, the results actual investors might have achieved would have differed from those shown because of differences in the timing, amounts of their investments, and fees and expenses associated with an investment in the Fund.
Notes Regarding Index and Fund Performance History:
| - | Average Annualized and Cumulative Inception returns for the Fund and index are based on the inception date of the Fund. |
| | |
| IVLC | | Management’s Discussion of Fund Performance |
| | Invesco US Large Cap Core ESG ETF (IVLC) |
The Invesco US Large Cap Core ESG ETF (the “Fund”) is an actively managed exchange-traded fund (“ETF”) that seeks capital appreciation. The Fund operates pursuant to an exemptive order from the SEC (the “Order”) and is not required to publicly disclose its complete portfolio holdings each day that the Fund is open (a “Business Day”). Instead, the Fund publishes each Business Day on its website a “Tracking Basket,” which is designed to closely track the daily performance of the Fund but is not the Fund’s actual portfolio. The Tracking Basket is comprised of: (1) select recently disclosed portfolio holdings (“Strategy Components”); (2) ETFs that convey information about the types of instruments (that are not otherwise fully represented by the Strategy Components) in which the Fund invests (“Representative ETFs”); and (3) cash and cash equivalents.
The Fund invests, under normal market conditions, at least 80% of the value of its net assets (plus the amount of any borrowings for investment purposes) in exchange-traded equity securities of U.S. large capitalization issuers. Additionally, the Fund seeks to achieve its investment objective by investing mainly in common stock of U.S. companies that meet environmental, social and governance (“ESG”) standards, as determined by the Fund’s sub-adviser, Invesco Adviser’s Inc. (the “Sub-Adviser”). The Fund may invest up to 20% of its net assets in common stock of foreign issuers, including up to 10% of its net assets in emerging market countries, i.e., those that are in the early stages of their industrial cycles. The Fund may make such investment in common stock of foreign issuers by either: (i) investing directly in common stock listed on a foreign exchange that trades on such exchange contemporaneously with the Fund’s Shares (currently limited to Canada and Mexico); or (ii) investing in exchange-traded American depositary receipts (“ADRs”) representing common stock trading on any foreign exchange that trades contemporaneously with the Shares.
For the fiscal year ended October 31, 2022, on a market price basis, the Fund returned (18.37)%. On a net asset value (“NAV”) basis, the Fund returned (18.36)%. During the same time period, the S&P 500® Index (the “Benchmark Index”) returned (14.61)%.
The Fund’s underperformance relative to the Benchmark Index is primarily due to the Fund’s active security selection. The Benchmark Index was selected for its recognition in the marketplace, and its performance comparison is a useful measure for investors as a broad representation of the U.S. equity market.
For the fiscal year ended October 31, 2022, the health care sector contributed most significantly to the Fund’s return, followed by the consumer staples sector. The information technology sector detracted most significantly from the Fund’s return, followed by the consumer discretionary sector.
Positions that contributed most significantly to the Fund’s return included Eli Lilly and Company, a health care company (portfolio
average weight of 2.06%), and UnitedHealth Group, Inc,. a health care company (portfolio average weight of 3.33%). Positions that detracted most significantly from the Fund’s return were Amazon.com, Inc., a consumer discretionary company (portfolio average weight of 4.72%), and Microsoft Corp., an information technology company (portfolio average weight of 6.84%).
| | | | |
Sector Breakdown
(% of the Fund’s Net Assets)
as of October 31, 2022 | |
| Information Technology | | | 26.25 | |
| Health Care | | | 15.53 | |
| Financials | | | 12.35 | |
| Consumer Discretionary | | | 11.56 | |
| Industrials | | | 11.12 | |
| Communication Services | | | 7.29 | |
| Consumer Staples | | | 7.16 | |
| Real Estate | | | 3.05 | |
| Sector Types Each Less Than 3% | | | 5.42 | |
| Money Market Funds Plus Other Assets Less Liabilities | | | 0.27 | |
|
Top Ten Fund Holdings*
(% of the Fund’s Net Assets)
as of October 31, 2022 | |
| Security | | | | |
| Apple, Inc. | | | 7.48 | |
| Microsoft Corp. | | | 6.30 | |
| Amazon.com, Inc. | | | 3.84 | |
| UnitedHealth Group, Inc. | | | 3.81 | |
| Alphabet, Inc., Class A | | | 3.73 | |
| Eli Lilly and Co. | | | 2.80 | |
| JPMorgan Chase & Co. | | | 2.21 | |
| HCA Healthcare, Inc. | | | 2.21 | |
| Baker Hughes Co., Class A | | | 2.20 | |
| United Parcel Service, Inc., Class B | | | 2.13 | |
| Total | | | 36.71 | |
| * | Excluding money market fund holdings. |
Invesco US Large Cap Core ESG ETF (IVLC) (continued)
Growth of a $10,000 Investment Since Inception
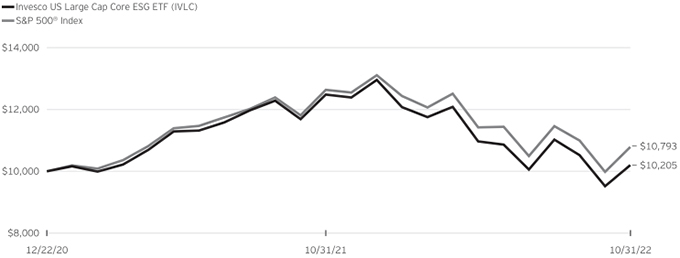
Fund Performance History as of October 31, 2022
| | | | | | | | | | | | | | | | |
| | | | | | | | | Fund Inception | |
| Index | | 1 Year | | | | | | Average
Annualized | | | Cumulative | |
| S&P 500® Index | | | (14.61 | )% | | | | | | | 4.19 | % | | | 7.93 | % |
| Fund | | | | | | | | | | | | | | | | |
| NAV Return | | | (18.36 | ) | | | | | | | 1.10 | | | | 2.05 | |
| Market Price Return | | | (18.37 | ) | | | | | | | 1.01 | | | | 1.88 | |
Fund Inception: December 22, 2020
Performance quoted above represents past performance. Past performance is not a guarantee of future results and current performance may be higher or lower than performance quoted. Investment returns and principal value will fluctuate, and shares of the Fund (“Fund Shares”), when redeemed or sold, may be worth more or less than their original cost. Fund performance reflects any applicable fee waivers and/or expense reimbursements. Had the adviser not waived fees and/or reimbursed expenses currently or in the past, returns would have been lower. See the current prospectus for more information. According to the Fund’s current prospectus, as supplemented to date, the Fund’s expense ratio of 0.48% is expressed as a unitary management fee to cover operating expenses and expenses incurred in connection with managing the portfolio. NAV and Market Price returns assume that dividends and capital gain distributions have been reinvested in the Fund at NAV and Market Price, respectively. The returns shown in the table above do not reflect the deduction of taxes that a shareholder would pay on Fund distributions or the redemption or sale of Fund Shares. See invesco.com/ETFs to find the most recent month-end performance numbers.
Performance results for the index stated above are based upon a hypothetical investment in their respective constituent securities. The returns of an index do not represent Fund returns. An investor cannot invest directly in an index. The index does not charge management fees or brokerage expenses, and no such fees or expenses were deducted from the hypothetical performance shown. In addition, the results actual investors might have achieved would have differed from those shown because of differences in the timing, amounts of their investments, and fees and expenses associated with an investment in the Fund.
Notes Regarding Index and Fund Performance History:
| - | Average Annualized and Cumulative Inception returns for the Fund and index are based on the inception date of the Fund. |
Invesco Focused Discovery Growth ETF (IVDG)
October 31, 2022
Schedule of Investments(a)
| | | | | | | | |
| | | Shares | | | Value | |
| Common Stocks & Other Equity Interests-97.90% | |
Consumer Discretionary-13.19% | | | | | | | | |
Chipotle Mexican Grill, Inc.(b) | | | 9 | | | $ | 13,485 | |
Dollar General Corp. | | | 47 | | | | 11,987 | |
Hilton Worldwide Holdings, Inc. | | | 117 | | | | 15,826 | |
lululemon athletica, inc.(b) | | | 23 | | | | 7,568 | |
O’Reilly Automotive, Inc.(b) | | | 18 | | | | 15,069 | |
Ulta Beauty, Inc.(b) | | | 37 | | | | 15,517 | |
| | | | | | | | |
| | | | | | | 79,452 | |
| | | | | | | | |
Consumer Staples-3.65% | | | | | | | | |
BJ’s Wholesale Club Holdings, Inc.(b) | | | 127 | | | | 9,830 | |
Hershey Co. (The) | | | 51 | | | | 12,177 | |
| | | | | | | | |
| | | | | | | 22,007 | |
| | | | | | | | |
Energy-3.96% | | | | | | | | |
Cheniere Energy, Inc. | | | 135 | | | | 23,815 | |
| | | | | | | | |
| | |
Financials-8.49% | | | | | | | | |
Arthur J. Gallagher & Co. | | | 110 | | | | 20,579 | |
LPL Financial Holdings, Inc. | | | 82 | | | | 20,963 | |
W.R. Berkley Corp. | | | 129 | | | | 9,595 | |
| | | | | | | | |
| | | | | | | 51,137 | |
| | | | | | | | |
Health Care-17.96% | | | | | | | | |
AmerisourceBergen Corp. | | | 117 | | | | 18,395 | |
Humana, Inc. | | | 27 | | | | 15,068 | |
Insulet Corp.(b) | | | 47 | | | | 12,164 | |
Mettler-Toledo International, Inc.(b) | | | 10 | | | | 12,649 | |
Molina Healthcare, Inc.(b) | | | 54 | | | | 19,378 | |
Repligen Corp.(b) | | | 97 | | | | 17,702 | |
Royalty Pharma PLC, Class A | | | 303 | | | | 12,823 | |
| | | | | | | | |
| | | | | | | 108,179 | |
| | | | | | | | |
Industrials-17.96% | | | | | | | | |
AMETEK, Inc. | | | 86 | | | | 11,151 | |
CoStar Group, Inc.(b) | | | 154 | | | | 12,739 | |
Northrop Grumman Corp. | | | 29 | | | | 15,921 | |
Old Dominion Freight Line, Inc. | | | 44 | | | | 12,083 | |
Quanta Services, Inc. | | | 82 | | | | 11,647 | |
| | | | | | | | |
| | | Shares | | | Value | |
Industrials-(continued) | | | | | | | | |
Republic Services, Inc. | | | 84 | | | $ | 11,140 | |
Waste Connections, Inc. | | | 168 | | | | 22,162 | |
WillScot Mobile Mini Holdings Corp.(b) | | | 266 | | | | 11,313 | |
| | | | | | | | |
| | | | | | | 108,156 | |
| | | | | | | | |
Information Technology-29.08% | | | | | | | | |
Amdocs Ltd. | | | 72 | | | | 6,214 | |
Cadence Design Systems, Inc.(b) | | | 75 | | | | 11,354 | |
Enphase Energy, Inc.(b) | | | 38 | | | | 11,666 | |
Gartner, Inc.(b) | | | 61 | | | | 18,417 | |
Manhattan Associates, Inc.(b) | | | 80 | | | | 9,734 | |
Monolithic Power Systems, Inc. | | | 40 | | | | 13,578 | |
Motorola Solutions, Inc. | | | 86 | | | | 21,475 | |
Palo Alto Networks, Inc.(b) | | | 81 | | | | 13,899 | |
Paylocity Holding Corp.(b) | | | 102 | | | | 23,643 | |
Roper Technologies, Inc. | | | 37 | | | | 15,338 | |
Synopsys, Inc.(b) | | | 60 | | | | 17,553 | |
Tyler Technologies, Inc.(b) | | | 38 | | | | 12,286 | |
| | | | | | | | |
| | | | | | | 175,157 | |
| | | | | | | | |
Materials-1.86% | | | | | | | | |
Avery Dennison Corp. | | | 66 | | | | 11,190 | |
| | | | | | | | |
| | |
Real Estate-1.75% | | | | | | | | |
SBA Communications Corp., Class A | | | 39 | | | | 10,526 | |
| | | | | | | | |
Total Common Stocks & Other Equity Interests
(Cost $592,830) | | | | 589,619 | |
| | | | | |
| |
| Money Market Funds-2.82% | | | | | |
Invesco Government & Agency Portfolio, Institutional Class, 3.07%(c)(d)
(Cost $16,956) | | | 16,956 | | | | 16,956 | |
| | | | | | | | |
TOTAL INVESTMENTS IN SECURITIES-100.72%
(Cost $609,786) | | | | 606,575 | |
OTHER ASSETS LESS LIABILITIES-(0.72)% | | | | (4,325 | ) |
| | | | | |
NET ASSETS-100.00% | | | $ | 602,250 | |
| | | | | | | | |
Notes to Schedule of Investments:
| (a) | Industry and/or sector classifications used in this report are generally according to the Global Industry Classification Standard, which was developed by and is the exclusive property and a service mark of MSCI Inc. and Standard & Poor’s. |
| (b) | Non-income producing security. |
| (c) | Affiliated issuer. The issuer and/or the Fund is a wholly-owned subsidiary of Invesco Ltd., or is affiliated by having an investment adviser that is under common control of Invesco Ltd. The table below shows the Fund’s transactions in, and earnings from, its investments in affiliates for the fiscal year ended October 31, 2022. |
| | | | | | | | | | | | | | | | | | | | | | | | | | | | | | | | | | | |
| | | Value
October 31, 2021 | | Purchases
at Cost | | Proceeds
from Sales | | Change in
Unrealized
Appreciation | | Realized
Gain
(Loss) | | Value
October 31, 2022 | | Dividend
Income |
| | | | | | | |
| Investments in Affiliated Money Market Funds: | | | | | | | | | | | | | | |
| | | | | | | |
| Invesco Government & Agency Portfolio, Institutional Class | | $16,890 | | $375,268 | | $(375,202) | | $- | | $ - | | $16,956 | | $236 |
See accompanying Notes to Financial Statements which are an integral part of the financial statements.
Invesco Focused Discovery Growth ETF (IVDG)–(continued)
October 31, 2022
| | | | | | | | | | | | | | | | | | | | | | | | | | | | | | | | | | | | | | | |
| | | Value
October 31, 2021 | | Purchases
at Cost | | Proceeds
from Sales | | Change in
Unrealized
Appreciation | | Realized
Gain
(Loss) | | Value
October 31, 2022 | | Dividend
Income |
| | | | | | | | | |
| Investments Purchased with Cash Collateral from Securities on Loan: | | | | | | | | | | | | | | | | | | | | | | | | | | | | | | | | | | | | | | | |
| | | | | | | | | |
| Invesco Private Government Fund | | | $ | - | | | | $ | 19,962 | | | | $ | (19,962 | ) | | | $ | - | | | | $ | - | | | | $ | - | | | | | | $ | - | | | |
| | | | | | | | | |
| Invesco Private Prime Fund | | | | - | | | | | 42,230 | | | | | (42,228 | ) | | | | - | | | | | (2 | ) | | | | - | | | | | | | 1 | * | | |
| | | | | | | | | | | | | | | | | | | | | | | | | | | | | | | | | | | | | | | |
| Total | | | $ | 16,890 | | | | $ | 437,460 | | | | $ | (437,392 | ) | | | $ | - | | | | $ | (2 | ) | | | $ | 16,956 | | | | | | $ | 237 | | | |
| | | | | | | | | | | | | | | | | | | | | | | | | | | | | | | | | | | | | | | |
| * | Represents the income earned on the investment of cash collateral, which is included in securities lending income on the Statements of Operations. Does not include rebates and fees paid to lending agent or premiums received from borrowers, if any. |
| (d) | The rate shown is the 7-day SEC standardized yield as of October 31, 2022. |
See accompanying Notes to Financial Statements which are an integral part of the financial statements.
Invesco Real Assets ESG ETF (IVRA)
October 31, 2022
Schedule of Investments(a)
| | | | | | | | |
| | | Shares | | | Value | |
| Common Stocks & Other Equity Interests-99.51% | |
Energy-27.24% | | | | | | | | |
Cheniere Energy, Inc. | | | 680 | | | $ | 119,959 | |
Enbridge, Inc. (Canada) | | | 4,420 | | | | 171,998 | |
Keyera Corp. (Canada) | | | 3,931 | | | | 84,150 | |
Kinder Morgan, Inc. | | | 2,242 | | | | 40,625 | |
ONEOK, Inc. | | | 2,035 | | | | 120,716 | |
Pembina Pipeline Corp. (Canada) | | | 2,633 | | | | 86,824 | |
Targa Resources Corp. | | | 1,521 | | | | 103,991 | |
TC Energy Corp. (Canada) | | | 1,014 | | | | 44,484 | |
Williams Cos., Inc. (The) | | | 1,380 | | | | 45,167 | |
| | | | | | | | |
| | | | | | | 817,914 | |
| | | | | | | | |
Industrials-0.33% | | | | | | | | |
Grupo Aeroportuario del Sureste S.A.B. de C.V., ADR (Mexico) | | | 42 | | | | 9,804 | |
| | | | | | | | |
| | |
Materials-11.93% | | | | | | | | |
Agnico Eagle Mines Ltd. (Canada) | | | 1,288 | | | | 56,589 | |
Canfor Corp. (Canada)(b) | | | 3,561 | | | | 53,439 | |
Corteva, Inc. | | | 304 | | | | 19,863 | |
First Quantum Minerals Ltd. (Zambia) | | | 935 | | | | 16,472 | |
FMC Corp. | | | 251 | | | | 29,844 | |
Interfor Corp. (Canada)(b) | | | 2,431 | | | | 43,129 | |
Lundin Mining Corp. (Chile) | | | 13,529 | | | | 70,816 | |
Nutrien Ltd. (Canada) | | | 482 | | | | 40,675 | |
West Fraser Timber Co. Ltd. (Canada) | | | 164 | | | | 12,298 | |
WestRock Co. | | | 445 | | | | 15,157 | |
| | | | | | | | |
| | | | | | | 358,282 | |
| | | | | | | | |
Real Estate-51.77% | | | | | | | | |
Alexandria Real Estate Equities, Inc. | | | 382 | | | | 55,505 | |
American Homes 4 Rent, Class A | | | 695 | | | | 22,198 | |
American Tower Corp. | | | 877 | | | | 181,706 | |
Camden Property Trust | | | 158 | | | | 18,257 | |
Canadian Apartment Properties REIT (Canada) | | | 947 | | | | 29,291 | |
Crown Castle, Inc. | | | 100 | | | | 13,326 | |
CubeSmart | | | 1,531 | | | | 64,103 | |
Digital Realty Trust, Inc. | | | 595 | | | | 59,649 | |
Douglas Emmett, Inc. | | | 2,906 | | | | 51,117 | |
Equinix, Inc. | | | 144 | | | | 81,567 | |
| | | | | | | | |
| | | Shares | | | Value | |
Real Estate-(continued) | | | | | | | | |
Equity Residential | | | 426 | | | $ | 26,846 | |
Healthpeak Properties, Inc. | | | 3,198 | | | | 75,889 | |
Kilroy Realty Corp. | | | 1,427 | | | | 60,990 | |
Life Storage, Inc. | | | 538 | | | | 59,508 | |
Mid-America Apartment Communities, Inc. | | | 342 | | | | 53,848 | |
Pebblebrook Hotel Trust | | | 1,113 | | | | 17,853 | |
Prologis, Inc. | | | 1,666 | | | | 184,509 | |
Regency Centers Corp. | | | 373 | | | | 22,570 | |
Rexford Industrial Realty, Inc. | | | 618 | | | | 34,163 | |
SBA Communications Corp., Class A | | | 345 | | | | 93,115 | |
Simon Property Group, Inc. | | | 913 | | | | 99,499 | |
SITE Centers Corp. | | | 2,353 | | | | 29,130 | |
STAG Industrial, Inc. | | | 997 | | | | 31,495 | |
Summit Hotel Properties, Inc. | | | 5,467 | | | | 47,235 | |
UDR, Inc. | | | 1,715 | | | | 68,188 | |
Welltower, Inc. | | | 1,188 | | | | 72,515 | |
| | | | | | | | |
| | | | | | | 1,554,072 | |
| | | | | | | | |
Utilities-8.24% | | | | | | | | |
American Water Works Co., Inc. | | | 298 | | | | 43,311 | |
CenterPoint Energy, Inc. | | | 1,785 | | | | 51,069 | |
Essential Utilities, Inc. | | | 1,492 | | | | 65,976 | |
Sempra Energy | | | 576 | | | | 86,942 | |
| | | | | | | | |
| | | | | | | 247,298 | |
| | | | | | | | |
Total Common Stocks & Other Equity Interests
(Cost $3,110,454) | | | | 2,987,370 | |
| | | | | |
| |
| Money Market Funds-0.25% | | | | | |
Invesco Government & Agency Portfolio, Institutional Class, 3.07%(c)(d)
(Cost $7,655) | | | 7,655 | | | | 7,655 | |
| | | | | | | | |
TOTAL INVESTMENTS IN SECURITIES-99.76%
(Cost $3,118,109) | | | | 2,995,025 | |
OTHER ASSETS LESS LIABILITIES-0.24% | | | | 7,137 | |
| | | | | |
NET ASSETS-100.00% | | | $ | 3,002,162 | |
| | | | | | | | |
Investment Abbreviations:
ADR -American Depositary Receipt
REIT-Real Estate Investment Trust
See accompanying Notes to Financial Statements which are an integral part of the financial statements.
Invesco Real Assets ESG ETF (IVRA)–(continued)
October 31, 2022
Notes to Schedule of Investments:
| (a) | Industry and/or sector classifications used in this report are generally according to the Global Industry Classification Standard, which was developed by and is the exclusive property and a service mark of MSCI Inc. and Standard & Poor’s. |
| (b) | Non-income producing security. |
| (c) | Affiliated issuer. The issuer and/or the Fund is a wholly-owned subsidiary of Invesco Ltd., or is affiliated by having an investment adviser that is under common control of Invesco Ltd. The table below shows the Fund’s transactions in, and earnings from, its investments in affiliates for the fiscal year ended October 31, 2022. |
| | | | | | | | | | | | | | | | | | | | | | | | | | | | | | | | | | | |
| | | Value
October 31, 2021 | | Purchases
at Cost | | Proceeds
from Sales | | Change in
Unrealized
Appreciation | | Realized
Gain | | Value
October 31, 2022 | | Dividend
Income |
| | | | | | | |
| Investments in Affiliated Money Market Funds: | | | | | | | | | | | | | | | | | | | | | | | | | | | | | | | | | | | |
| | | | | | | |
| Invesco Government & Agency Portfolio, Institutional Class | | | $ | 12,077 | | | | $ | 546,657 | | | | $ | (551,079 | ) | | | $ | - | | | | $ | - | | | | $ | 7,655 | | | | $ | 208 | |
| | | | | | | |
| Investments Purchased with Cash Collateral from Securities on Loan: | | | | | | | | | | | | | | | | | | | | | | | | | | | | | | | | | | | |
| | | | | | | |
| Invesco Private Government Fund | | | | 1,639 | | | | | 754,210 | | | | | (755,849 | ) | | | | - | | | | | - | | | | | - | | | | | 267 | * |
| | | | | | | |
| Invesco Private Prime Fund | | | | 3,665 | | | | | 1,556,714 | | | | | (1,560,384 | ) | | | | - | | | | | 5 | | | | | - | | | | | 748 | * |
| | | | | | | | | | | | | | | | | | | | | | | | | | | | | | | | | | | |
Total | | | $ | 17,381 | | | | $ | 2,857,581 | | | | $ | (2,867,312 | ) | | | $ | - | | | | $ | 5 | | | | $ | 7,655 | | | | $ | 1,223 | |
| | | | | | | | | | | | | | | | | | | | | | | | | | | | | | | | | | | |
| * | Represents the income earned on the investment of cash collateral, which is included in securities lending income on the Statements of Operations. Does not include rebates and fees paid to lending agent or premiums received from borrowers, if any. |
| (d) | The rate shown is the 7-day SEC standardized yield as of October 31, 2022. |
This Fund has holdings greater than 10% of net assets in the following country:
See accompanying Notes to Financial Statements which are an integral part of the financial statements.
Invesco Select Growth ETF (IVSG)
October 31, 2022
Schedule of Investments(a)
| | | | | | | | |
| | | Shares | | | Value | |
| Common Stocks & Other Equity Interests-98.66% | |
Communication Services-17.14% | | | | | | | | |
Alphabet, Inc., Class A(b) | | | 620 | | | $ | 58,596 | |
Netflix, Inc.(b) | | | 119 | | | | 34,734 | |
Take-Two Interactive Software, Inc.(b) | | | 418 | | | | 49,525 | |
Trade Desk, Inc. (The), Class A(b) | | | 485 | | | | 25,822 | |
| | | | | | | | |
| | | | | | | 168,677 | |
| | | | | | | | |
Consumer Discretionary-11.94% | | | | | | | | |
Amazon.com, Inc.(b) | | | 596 | | | | 61,054 | |
Farfetch Ltd., Class A (United
Kingdom)(b)(c) | | | 1,039 | | | | 8,811 | |
JD.com, Inc., ADR (China) | | | 212 | | | | 7,905 | |
O’Reilly Automotive, Inc.(b) | | | 35 | | | | 29,301 | |
PENN Entertainment, Inc.(b) | | | 316 | | | | 10,460 | |
| | | | | | | | |
| | | | | | | 117,531 | |
| | | | | | | | |
Consumer Staples-3.26% | | | | | | | | |
Monster Beverage Corp.(b) | | | 342 | | | | 32,052 | |
| | | | | | | | |
| | |
Energy-3.96% | | | | | | | | |
Schlumberger Ltd. | | | 750 | | | | 39,023 | |
| | | | | | | | |
| | |
Financials-4.85% | | | | | | | | |
Chubb Ltd. | | | 222 | | | | 47,706 | |
| | | | | | | | |
| | |
Health Care-10.47% | | | | | | | | |
Regeneron Pharmaceuticals, Inc.(b) | | | 32 | | | | 23,960 | |
Thermo Fisher Scientific, Inc. | | | 35 | | | | 17,989 | |
UnitedHealth Group, Inc. | | | 110 | | | | 61,066 | |
| | | | | | | | |
| | | | | | | 103,015 | |
| | | | | | | | |
Industrials-7.13% | | | | | | | | |
Deere & Co. | | | 90 | | | | 35,624 | |
Lockheed Martin Corp. | | | 71 | | | | 34,554 | |
| | | | | | | | |
| | | | | | | 70,178 | |
| | | | | | | | |
Information Technology-39.91% | | | | | | | | |
Apple, Inc. | | | 462 | | | | 70,843 | |
Crowdstrike Holdings, Inc., Class A(b) | | | 230 | | | | 37,076 | |
Microsoft Corp. | | | 480 | | | | 111,422 | |
| | | | | | | | |
| | | Shares | | | Value | |
Information Technology-(continued) | | | | | | | | |
MongoDB, Inc.(b) | | | 113 | | | $ | 20,682 | |
Monolithic Power Systems, Inc. | | | 87 | | | | 29,532 | |
NVIDIA Corp. | | | 116 | | | | 15,657 | |
Palo Alto Networks, Inc.(b) | | | 252 | | | | 43,241 | |
QUALCOMM, Inc. | | | 168 | | | | 19,767 | |
Visa, Inc., Class A | | | 215 | | | | 44,539 | |
| | | | | | | | |
| | | | | | | 392,759 | |
| | | | | | | | |
Total Common Stocks & Other Equity Interests
(Cost $1,171,910) | | | | 970,941 | |
| | | | | |
| |
| Money Market Funds-1.37% | | | | | |
Invesco Government & Agency Portfolio, Institutional Class, 3.07%(d)(e)
(Cost $13,501) | | | 13,501 | | | | 13,501 | |
| | | | | | | | |
TOTAL INVESTMENTS IN SECURITIES
(excluding investments purchased with cash collateral from securities on loan)-100.03%
(Cost $1,185,411) | | | | 984,442 | |
| | | | | | | | |
|
| Investments Purchased with Cash Collateral from Securities on Loan | |
| | |
| Money Market Funds-0.91% | | | | | | | | |
Invesco Private Government Fund,
3.18%(d)(e)(f) | | | 2,703 | | | | 2,703 | |
Invesco Private Prime Fund, 3.28%(d)(e)(f) | | | 6,292 | | | | 6,292 | |
| | | | | | | | |
Total Investments Purchased with Cash Collateral from Securities on Loan
(Cost $8,995) | | | | 8,995 | |
| | | | | |
TOTAL INVESTMENTS IN SECURITIES-100.94%
(Cost $1,194,406) | | | | 993,437 | |
OTHER ASSETS LESS LIABILITIES-(0.94)% | | | | (9,259 | ) |
| | | | | |
NET ASSETS-100.00% | | | $ | 984,178 | |
| | | | | | | | |
Investment Abbreviations:
ADR-American Depositary Receipt
Notes to Schedule of Investments:
| (a) | Industry and/or sector classifications used in this report are generally according to the Global Industry Classification Standard, which was developed by and is the exclusive property and a service mark of MSCI Inc. and Standard & Poor’s. |
| (b) | Non-income producing security. |
| (c) | All or a portion of this security was out on loan at October 31, 2022. |
| (d) | Affiliated issuer. The issuer and/or the Fund is a wholly-owned subsidiary of Invesco Ltd., or is affiliated by having an investment adviser that is under common control of Invesco Ltd. The table below shows the Fund’s transactions in, and earnings from, its investments in affiliates for the fiscal year ended October 31, 2022. |
| | | | | | | | | | | | | | | | | | | | | | | | | | | | | | | | | | | |
| | | Value
October 31, 2021 | | Purchases
at Cost | | Proceeds
from Sales | | Change in
Unrealized
Appreciation | | Realized
Gain | | Value
October 31, 2022 | | Dividend
Income |
| | | | | | | |
| Investments in Affiliated Money Market Funds: | | | | | | | | | | | | | | | | | | | | | | | | | | | | | | | | | | | |
| | | | | | | |
| Invesco Government & Agency Portfolio, Institutional Class | | | $ | 6,376 | | | | $ | 114,270 | | | | $ | (107,145 | ) | | | $ | - | | | | $ | - | | | | $ | 13,501 | | | | | $ 87 | |
See accompanying Notes to Financial Statements which are an integral part of the financial statements.
Invesco Select Growth ETF (IVSG)–(continued)
October 31, 2022
| | | | | | | | | | | | | | | | | | | | | | | | | | | | | | | | | | | | | | | |
| | | Value
October 31, 2021 | | Purchases
at Cost | | Proceeds
from Sales | | Change in
Unrealized
Appreciation | | Realized
Gain | | Value
October 31, 2022 | | Dividend
Income |
| | | | | | | | | |
| Investments Purchased with Cash Collateral from Securities on Loan: | | | | | | | | | | | | | | | | | | | | | | | | | | | | | | | | | | | | | | | |
| | | | | | | | | |
| Invesco Private Government Fund | | | $ | 20,688 | | | | $ | 35,661 | | | | $ | (53,646 | ) | | | $ | - | | | | $ | - | | | | $ | 2,703 | | | | | | $ | 3 | * | | |
| | | | | | | | | |
| Invesco Private Prime Fund | | | | 48,272 | | | | | 76,156 | | | | | (118,136 | ) | | | | - | | | | | - | | | | | 6,292 | | | | | | | 10 | * | | |
| | | | | | | | | | | | | | | | | | | | | | | | | | | | | | | | | | | | | | | |
Total | | | $ | 75,336 | | | | $ | 226,087 | | | | $ | (278,927 | ) | | | $ | - | | | | $ | - | | | | $ | 22,496 | | | | | | $ | 100 | | | |
| | | | | | | | | | | | | | | | | | | | | | | | | | | | | | | | | | | | | | | |
| * | Represents the income earned on the investment of cash collateral, which is included in securities lending income on the Statements of Operations. Does not include rebates and fees paid to lending agent or premiums received from borrowers, if any. |
| (e) | The rate shown is the 7-day SEC standardized yield as of October 31, 2022. |
| (f) | The security has been segregated to satisfy the commitment to return the cash collateral received in securities lending transactions upon the borrower’s return of the securities loaned. See Note 2I. |
See accompanying Notes to Financial Statements which are an integral part of the financial statements.
Invesco US Large Cap Core ESG ETF (IVLC)
October 31, 2022
Schedule of Investments(a)
| | | | | | | | |
| | | Shares | | | Value | |
| Common Stocks & Other Equity Interests-99.73% | |
Communication Services-7.29% | | | | | | | | |
Alphabet, Inc., Class A(b) | | | 2,207 | | | $ | 208,583 | |
Comcast Corp., Class A | | | 1,581 | | | | 50,181 | |
Electronic Arts, Inc. | | | 534 | | | | 67,263 | |
Verizon Communications, Inc. | | | 2,191 | | | | 81,878 | |
| | | | | | | | |
| | | | | | | 407,905 | |
| | | | | | | | |
Consumer Discretionary-11.56% | | | | | | | | |
Amazon.com, Inc.(b) | | | 2,098 | | | | 214,919 | |
Aptiv PLC(b) | | | 451 | | | | 41,072 | |
D.R. Horton, Inc. | | | 729 | | | | 56,045 | |
Dollar General Corp. | | | 253 | | | | 64,528 | |
Expedia Group, Inc.(b) | | | 549 | | | | 51,315 | |
Home Depot, Inc. (The) | | | 375 | | | | 111,049 | |
O’Reilly Automotive, Inc.(b) | | | 129 | | | | 107,995 | |
| | | | | | | | |
| | | | | | | 646,923 | |
| | | | | | | | |
Consumer Staples-7.16% | | | | | | | | |
Mondelez International, Inc., Class A | | | 1,413 | | | | 86,871 | |
PepsiCo, Inc. | | | 614 | | | | 111,490 | |
Procter & Gamble Co. (The) | | | 782 | | | | 105,312 | |
Sysco Corp. | | | 1,125 | | | | 97,380 | |
| | | | | | | | |
| | | | | | | 401,053 | |
| | | | | | | | |
Energy-2.20% | | | | | | | | |
Baker Hughes Co., Class A | | | 4,459 | | | | 123,336 | |
| | | | | | | | |
| | |
Financials-12.35% | | | | | | | | |
Allstate Corp. (The) | | | 444 | | | | 56,055 | |
American Express Co. | | | 485 | | | | 71,998 | |
Bank of America Corp. | | | 1,963 | | | | 70,747 | |
Equitable Holdings, Inc. | | | 3,379 | | | | 103,465 | |
First Citizens BancShares, Inc., Class A | | | 114 | | | | 93,722 | |
Intercontinental Exchange, Inc. | | | 587 | | | | 56,100 | |
JPMorgan Chase & Co. | | | 984 | | | | 123,866 | |
Marsh & McLennan Cos., Inc. | | | 458 | | | | 73,962 | |
S&P Global, Inc. | | | 129 | | | | 41,441 | |
| | | | | | | | |
| | | | | | | 691,356 | |
| | | | | | | | |
Health Care-15.53% | | | | | | | | |
AstraZeneca PLC, ADR (United Kingdom) | | | 1,774 | | | | 104,329 | |
Bristol-Myers Squibb Co. | | | 944 | | | | 73,132 | |
Cooper Cos., Inc. (The) | | | 211 | | | | 57,685 | |
Danaher Corp. | | | 336 | | | | 84,561 | |
Eli Lilly and Co. | | | 433 | | | | 156,785 | |
HCA Healthcare, Inc. | | | 569 | | | | 123,740 | |
Seagen, Inc.(b) | | | 440 | | | | 55,950 | |
UnitedHealth Group, Inc. | | | 384 | | | | 213,178 | |
| | | | | | | | |
| | | | | | | 869,360 | |
| | | | | | | | |
Industrials-11.12% | | | | | | | | |
Carrier Global Corp. | | | 1,567 | | | | 62,304 | |
Deere & Co. | | | 241 | | | | 95,392 | |
Hubbell, Inc. | | | 333 | | | | 79,081 | |
Otis Worldwide Corp. | | | 1,017 | | | | 71,841 | |
Rockwell Automation, Inc. | | | 263 | | | | 67,144 | |
Union Pacific Corp. | | | 379 | | | | 74,716 | |
United Parcel Service, Inc., Class B | | | 712 | | | | 119,452 | |
Waste Connections, Inc. | | | 400 | | | | 52,764 | |
| | | | | | | | |
| | | | | | | 622,694 | |
| | | | | | | | |
| | | | | | | | |
| | | Shares | | | Value | |
Information Technology-26.25% | | | | | | | | |
Accenture PLC, Class A | | | 373 | | | $ | 105,895 | |
Advanced Micro Devices, Inc.(b) | | | 786 | | | | 47,207 | |
Apple, Inc. | | | 2,730 | | | | 418,618 | |
Applied Materials, Inc. | | | 934 | | | | 82,463 | |
Fiserv, Inc.(b) | | | 925 | | | | 95,035 | |
Microsoft Corp. | | | 1,519 | | | | 352,605 | |
NVIDIA Corp. | | | 292 | | | | 39,411 | |
QUALCOMM, Inc. | | | 626 | | | | 73,655 | |
Synopsys, Inc.(b) | | | 136 | | | | 39,787 | |
TE Connectivity Ltd. (Switzerland) | | | 408 | | | | 49,870 | |
Visa, Inc., Class A | | | 461 | | | | 95,501 | |
VMware, Inc., Class A | | | 619 | | | | 69,656 | |
| | | | | | | | |
| | | | | | | 1,469,703 | |
| | | | | | | | |
Materials-0.89% | | | | | | | | |
Crown Holdings, Inc. | | | 723 | | | | 49,591 | |
| | | | | | | | |
| | |
Real Estate-3.05% | | | | | | | | |
Alexandria Real Estate Equities, Inc. | | | 178 | | | | 25,863 | |
American Tower Corp. | | | 169 | | | | 35,015 | |
Prologis, Inc. | | | 990 | | | | 109,643 | |
| | | | | | | | |
| | | | | | | 170,521 | |
| | | | | | | | |
Utilities-2.33% | | | | | | | | |
Avangrid, Inc.(c) | | | 1,229 | | | | 49,996 | |
NextEra Energy, Inc. | | | 1,038 | | | | 80,445 | |
| | | | | | | | |
| | | | | | | 130,441 | |
| | | | | | | | |
Total Common Stocks & Other Equity Interests
(Cost $6,156,170) | | | | 5,582,883 | |
| | | | | | | | |
| | |
| Money Market Funds-0.23% | | | | | | | | |
Invesco Government & Agency Portfolio, Institutional Class, 3.07%(d)(e)
(Cost $13,140) | | | 13,140 | | | | 13,140 | |
| | | | | | | | |
TOTAL INVESTMENTS IN SECURITIES
(excluding investments purchased with cash collateral from securities on loan)-99.96%
(Cost $6,169,310) | | | | 5,596,023 | |
| | | | | | | | |
|
| Investments Purchased with Cash Collateral from Securities on Loan | |
|
| Money Market Funds-0.91% | |
Invesco Private Government Fund, 3.18%(d)(e)(f) | | | 14,212 | | | | 14,212 | |
Invesco Private Prime Fund,
3.28%(d)(e)(f) | | | 36,557 | | | | 36,557 | |
| | | | | | | | |
Total Investments Purchased with Cash Collateral from Securities on Loan
(Cost $50,768) | | | | 50,769 | |
| | | | | |
TOTAL INVESTMENTS IN SECURITIES-100.87%
(Cost $6,220,078) | | | | 5,646,792 | |
OTHER ASSETS LESS LIABILITIES-(0.87)% | | | | (48,835 | ) |
| | | | | |
NET ASSETS-100.00% | | | $ | 5,597,957 | |
| | | | | | | | |
See accompanying Notes to Financial Statements which are an integral part of the financial statements.
Invesco US Large Cap Core ESG ETF (IVLC)–(continued)
October 31, 2022
Investment Abbreviations:
ADR-American Depositary Receipt
Notes to Schedule of Investments:
| (a) | Industry and/or sector classifications used in this report are generally according to the Global Industry Classification Standard, which was developed by and is the exclusive property and a service mark of MSCI Inc. and Standard & Poor’s. |
| (b) | Non-income producing security. |
| (c) | All or a portion of this security was out on loan at October 31, 2022. |
| (d) | Affiliated issuer. The issuer and/or the Fund is a wholly-owned subsidiary of Invesco Ltd., or is affiliated by having an investment adviser that is under common control of Invesco Ltd. The table below shows the Fund’s transactions in, and earnings from, its investments in affiliates for the fiscal year ended October 31, 2022. |
| | | | | | | | | | | | | | | | | | | | | | | | | | | | | | | | | | | |
| | | Value
October 31, 2021 | | Purchases
at Cost | | Proceeds
from Sales | | Change in
Unrealized
Appreciation | | Realized
Gain | | Value
October 31, 2022 | | Dividend
Income |
| | | | | | | |
| Investments in Affiliated Money Market Funds: | | | | | | | | | | | | | | | | | | | | | | | | | | | | | | | | | | | |
| | | | | | | |
| Invesco Government & Agency Portfolio, Institutional Class | | | $ | 26,020 | | | | $ | 210,093 | | | | $ | (222,973 | ) | | | $ | - | | | | $ | - | | | | $ | 13,140 | | | | $ | 101 | |
| | | | | | | |
| Investments Purchased with Cash Collateral from Securities on Loan: | | | | | | | | | | | | | | | | | | | | | | | | | | | | | | | | | | | |
| | | | | | | |
| Invesco Private Government Fund | | | | 12,583 | | | | | 256,756 | | | | | (255,127 | ) | | | | - | | | | | - | | | | | 14,212 | | | | | 148 | * |
| | | | | | | |
| Invesco Private Prime Fund | | | | 27,638 | | | | | 534,950 | | | | | (526,051 | ) | | | | 1 | | | | | 19 | | | | | 36,557 | | | | | 407 | * |
| | | | | | | | | | | | | | | | | | | | | | | | | | | | | | | | | | | |
| | | | | | | |
Total | | | $ | 66,241 | | | | $ | 1,001,799 | | | | $ | (1,004,151 | ) | | | $ | 1 | | | | $ | 19 | | | | $ | 63,909 | | | | $ | 656 | |
| | | | | | | | | | | | | | | | | | | | | | | | | | | | | | | | | | | |
| * | Represents the income earned on the investment of cash collateral, which is included in securities lending income on the Statements of Operations. Does not include rebates and fees paid to lending agent or premiums received from borrowers, if any. |
| (e) | The rate shown is the 7-day SEC standardized yield as of October 31, 2022. |
| (f) | The security has been segregated to satisfy the commitment to return the cash collateral received in securities lending transactions upon the borrower’s return of the securities loaned. See Note 2I. |
See accompanying Notes to Financial Statements which are an integral part of the financial statements.
Statements of Assets and Liabilities
October 31, 2022
| | | | | | | | | | | | | | | | | | | | |
| | | Invesco Focused Discovery
Growth ETF (IVDG) | | Invesco Real Assets
ESG ETF (IVRA) | | Invesco Select
Growth ETF (IVSG) | | Invesco US Large Cap
Core ESG ETF (IVLC) |
| Assets: | | | | | | | | | | | | | | | | | | | | |
Unaffiliated investments in securities, at value(a) | | | $ | 589,619 | | | | $ | 2,987,370 | | | | $ | 970,941 | | | | $ | 5,582,883 | |
Affiliated investments in securities, at value | | | | 16,956 | | | | | 7,655 | | | | | 22,496 | | | | | 63,909 | |
Foreign currencies, at value | | | | - | | | | | 572 | | | | | - | | | | | - | |
Receivable for: | | | | | | | | | | | | | | | | | | | | |
Dividends | | | | 54 | | | | | 4,020 | | | | | 127 | | | | | 4,130 | |
Securities lending | | | | -13 | | | | | | | | | | - | | | | | 4 | |
Investments sold | | | | 17,970 | | | | | 155,951 | | | | | - | | | | | - | |
| | | | | | | | | | | | | | | | | | | | |
Total assets | | | | 624,599 | | | | | 3,155,581 | | | | | 993,564 | | | | | 5,650,926 | |
| | | | | | | | | | | | | | | | | | | | |
| | | | |
| Liabilities: | | | | | | | | | | | | | | | | | | | | |
Payable for: | | | | | | | | | | | | | | | | | | | | |
Investments purchased | | | | 22,058 | | | | | 151,983 | | | | | - | | | | | - | |
Collateral upon return of securities loaned | | | | - | | | | | - | | | | | 8,995 | | | | | 50,768 | |
Accrued unitary management fees | | | | 291 | | | | | 1,436 | | | | | 391 | | | | | 2,201 | |
| | | | | | | | | | | | | | | | | | | | |
Total liabilities | | | | 22,349 | | | | | 153,419 | | | | | 9,386 | | | | | 52,969 | |
| | | | | | | | | | | | | | | | | | | | |
| Net Assets | | | $ | 602,250 | | | | $ | 3,002,162 | | | | $ | 984,178 | | | | $ | 5,597,957 | |
| | | | | | | | | | | | | | | | | | | | |
| | | | |
| Net assets consist of: | | | | | | | | | | | | | | | | | | | | |
Shares of beneficial interest | | | $ | 963,975 | | | | $ | 3,161,267 | | | | $ | 1,492,616 | | | | $ | 6,486,211 | |
Distributable earnings (loss) | | | | (361,725 | ) | | | | (159,105 | ) | | | | (508,438 | ) | | | | (888,254 | ) |
| | | | | | | | | | | | | | | | | | | | |
| Net Assets | | | $ | 602,250 | | | | $ | 3,002,162 | | | | $ | 984,178 | | | | $ | 5,597,957 | |
| | | | | | | | | | | | | | | | | | | | |
Shares outstanding (unlimited amount authorized, $0.01 par value) | | | | 60,001 | | | | | 230,001 | | | | | 100,001 | | | | | 470,001 | |
Net asset value | | | $ | 10.04 | | | | $ | 13.05 | | | | $ | 9.84 | | | | $ | 11.91 | |
| | | | | | | | | | | | | | | | | | | | |
Market price | | | $ | 10.03 | | | | $ | 13.10 | | | | $ | 9.84 | | | | $ | 11.90 | |
| | | | | | | | | | | | | | | | | | | | |
Unaffiliated investments in securities, at cost | | | $ | 592,830 | | | | $ | 3,110,454 | | | | $ | 1,171,910 | | | | $ | 6,156,170 | |
| | | | | | | | | | | | | | | | | | | | |
Affiliated investments in securities, at cost | | | $ | 16,956 | | | | $ | 7,655 | | | | $ | 22,496 | | | | $ | 63,908 | |
| | | | | | | | | | | | | | | | | | | | |
Foreign currencies, at cost | | | $ | - | | | | $ | 572 | | | | $ | - | | | | $ | - | |
| | | | | | | | | | | | | | | | | | | | |
(a) Includes securities on loan with an aggregate value of: | | | $ | - | | | | $ | - | | | | $ | 8,717 | | | | $ | 49,467 | |
| | | | | | | | | | | | | | | | | | | | |
See accompanying Notes to Financial Statements which are an integral part of the financial statements.
Statements of Operations
For the year ended October 31, 2022
| | | | | | | | | | | | | | | | | | | | |
| | | Invesco Focused Discovery
Growth ETF (IVDG) | | Invesco Real Assets
ESG ETF (IVRA) | | Invesco Select
Growth ETF (IVSG) | | Invesco US Large Cap
Core ESG ETF (IVLC) |
| Investment income: | | | | | | | | | | | | | | | | | | | | |
Unaffiliated dividend income | | | $ | 4,351 | | | | $ | 80,553 | | | | $ | 6,756 | | | | $ | 83,689 | |
Affiliated dividend income | | | | 236 | | | | | 208 | | | | | 87 | | | | | 101 | |
Securities lending income, net | | | | 1 | | | | | 259 | | | | | 3 | | | | | 50 | |
Foreign withholding tax | | | | (37 | ) | | | | (4,688 | ) | | | | - | | | | | (106 | ) |
| | | | | | | | | | | | | | | | | | | | |
Total investment income | | | | 4,551 | | | | | 76,332 | | | | | 6,846 | | | | | 83,734 | |
| | | | | | | | | | | | | | | | | | | | |
| | | | |
| Expenses: | | | | | | | | | | | | | | | | | | | | |
Unitary management fees | | | | 4,920 | | | | | 17,263 | | | | | 5,670 | | | | | 30,679 | |
| | | | | | | | | | | | | | | | | | | | |
Less: Waivers | | | | (14 | ) | | | | (12 | ) | | | | (4 | ) | | | | (5 | ) |
| | | | | | | | | | | | | | | | | | | | |
Net expenses | | | | 4,906 | | | | | 17,251 | | | | | 5,666 | | | | | 30,674 | |
| | | | | | | | | | | | | | | | | | | | |
Net investment income (loss) | | | | (355 | ) | | | | 59,081 | | | | | 1,180 | | | | | 53,060 | |
| | | | | | | | | | | | | | | | | | | | |
| | | | |
| Realized and unrealized gain (loss) from: | | | | | | | | | | | | | | | | | | | | |
Net realized gain (loss) from: | | | | | | | | | | | | | | | | | | | | |
Unaffiliated investment securities | | | | (282,695 | ) | | | | (36,059 | ) | | | | (285,070 | ) | | | | (317,760 | ) |
Affiliated investment securities | | | | (2 | ) | | | | 5 | | | | | - | | | | | 19 | |
In-kind redemptions | | | | 185,219 | | | | | - | | | | | 276,189 | | | | | 180,338 | |
Short Sales | | | | 7 | | | | | - | | | | | - | | | | | - | |
Foreign currencies | | | | - | | | | | 351 | | | | | - | | | | | - | |
| | | | | | | | | | | | | | | | | | | | |
Net realized gain (loss) | | | | (97,471 | ) | | | | (35,703 | ) | | | | (8,881 | ) | | | | (137,403 | ) |
| | | | | | | | | | | | | | | | | | | | |
Change in net unrealized appreciation (depreciation) of: | | | | | | | | | | | | | | | | | | | | |
Unaffiliated investment securities | | | | (242,693 | ) | | | | (362,470 | ) | | | | (453,623 | ) | | | | (1,152,471 | ) |
Affiliated investment securities | | | | - | | | | | - | | | | | - | | | | | 1 | |
Foreign currencies | | | | - | | | | | 16 | | | | | - | | | | | - | |
| | | | | | | | | | | | | | | | | | | | |
Change in net unrealized appreciation (depreciation) | | | | (242,693 | ) | | | | (362,454 | ) | | | | (453,623 | ) | | | | (1,152,470 | ) |
| | | | | | | | | | | | | | | | | | | | |
Net realized and unrealized gain (loss) | | | | (340,164 | ) | | | | (398,157 | ) | | | | (462,504 | ) | | | | (1,289,873 | ) |
| | | | | | | | | | | | | | | | | | | | |
Net increase (decrease) in net assets resulting from operations | | | $ | (340,519 | ) | | | $ | (339,076 | ) | | | $ | (461,324 | ) | | | $ | (1,236,813 | ) |
| | | | | | | | | | | | | | | | | | | | |
See accompanying Notes to Financial Statements which are an integral part of the financial statements.
Statements of Changes in Net Assets
For the years ended October 31, 2022 and 2021
| | | | | | | | | | | | | | | | | | | | | | | | | | | | | | | | | | | | | | | | | | | | | | | | |
| | | | | Invesco Focused Discovery
Growth ETF (IVDG) | | | | Invesco Real Assets ESG ETF (IVRA) |
| | | | | 2022 | | | | | | 2021(a) | | | | | | | | 2022 | | | | | | 2021(a) |
| Operations: | | | | | | | | | | | | | | | | | | | | | | | | | | | | | | | | | | | | | | | | | | | | | | | | |
Net investment income (loss) | | | | | | | | $ | (355 | ) | | | | | | | | | | | | | $ | (4,063 | ) | | | | | | | | | | | | $ | 59,081 | | | | | | | | $ | 24,949 | |
Net realized gain (loss) | | | | | | | | | (97,471 | ) | | | | | | | | | | | | | | (11,527 | ) | | | | | | | | | | | | | (35,703 | ) | | | | | | | | 78,434 | |
Change in net unrealized appreciation (depreciation) | | | | | | | | | (242,693 | ) | | | | | | | | | | | | | | 239,482 | | | | | | | | | | | | | | (362,454 | ) | | | | | | | | 239,385 | |
| | | | | | | | | | | | | | | | | | | | | | | | | | | | | | | | | | | | | | | | | | | | | | | | |
Net increase (decrease) in net assets resulting from operations | | | | | | | | | (340,519 | ) | | | | | | | | | | | | | | 223,892 | | | | | | | | | | | | | | (339,076 | ) | | | | | | | | 342,768 | |
| | | | | | | | | | | | | | | | | | | | | | | | | | | | | | | | | | | | | | | | | | | | | | | | |
| | | | | | | | | | | | |
| Distributions to Shareholders from: | | | | | | | | | | | | | | | | | | | | | | | | | | | | | | | | | | | | | | | | | | | | | | | | |
Distributable earnings | | | | | | | | | - | | | | | | | | | | | | | | | - | | | | | | | | | | | | | | (122,551 | ) | | | | | | | | (41,522 | ) |
| | | | | | | | | | | | | | | | | | | | | | | | | | | | | | | | | | | | | | | | | | | | | | | | |
| | | | | | | | | | | | |
| Shareholder Transactions: | | | | | | | | | | | | | | | | | | | | | | | | | | | | | | | | | | | | | | | | | | | | | | | | |
Proceeds from shares sold | | | | | | | | | 2,317,594 | | | | | | | | | | | | | | | 1,320,645 | | | | | | | | | | | | | | 1,529,409 | | | | | | | | | 1,633,134 | |
Value of shares repurchased | | | | | | | | | (2,513,948 | ) | | | | | | | | | | | | | | (405,414 | ) | | | | | | | | | | | | | - | | | | | | | | | - | |
| | | | | | | | | | | | | | | | | | | | | | | | | | | | | | | | | | | | | | | | | | | | | | | | |
Net increase (decrease) in net assets resulting from share transactions | | | | | | | | | (196,354 | ) | | | | | | | | | | | | | | 915,231 | | | | | | | | | | | | | | 1,529,409 | | | | | | | | | 1,633,134 | |
| | | | | | | | | | | | | | | | | | | | | | | | | | | | | | | | | | | | | | | | | | | | | | | | |
Net increase (decrease) in net assets | | | | | | | | | (536,873 | ) | | | | | | | | | | | | | | 1,139,123 | | | | | | | | | | | | | | 1,067,782 | | | | | | | | | 1,934,380 | |
| | | | | | | | | | | | | | | | | | | | | | | | | | | | | | | | | | | | | | | | | | | | | | | | |
| | | | | | | | | | | | |
| Net assets: | | | | | | | | | | | | | | | | | | | | | | | | | | | | | | | | | | | | | | | | | | | | | | | | |
Beginning of period | | | | | | | | | 1,139,123 | | | | | | | | | | | | | | | - | | | | | | | | | | | | | | 1,934,380 | | | | | | | | | - | |
| | | | | | | | | | | | | | | | | | | | | | | | | | | | | | | | | | | | | | | | | | | | | | | | |
End of period | | | | | | | | $ | 602,250 | | | | | | | | | | | | | | $ | 1,139,123 | | | | | | | | | | | | | $ | 3,002,162 | | | | | | | | $ | 1,934,380 | |
| | | | | | | | | | | | | | | | | | | | | | | | | | | | | | | | | | | | | | | | | | | | | | | | |
| | | | | | | | | | | | |
| Changes in Shares Outstanding: | | | | | | | | | | | | | | | | | | | | | | | | | | | | | | | | | | | | | | | | | | | | | | | | |
Shares sold | | | | | | | | | 170,000 | | | | | | | | | | | | | | | 110,001 | | | | | | | | | | | | | | 100,000 | | | | | | | | | 130,001 | |
Shares repurchased | | | | | | | | | (190,000 | ) | | | | | | | | | | | | | | (30,000 | ) | | | | | | | | | | | | | - | | | | | | | | | - | |
Shares outstanding, beginning of period | | | | | | | | | 80,001 | | | | | | | | | | | | | | | - | | | | | | | | | | | | | | 130,001 | | | | | | | | | - | |
| | | | | | | | | | | | | | | | | | | | | | | | | | | | | | | | | | | | | | | | | | | | | | | | |
Shares outstanding, end of period | | | | | | | | | 60,001 | | | | | | | | | | | | | | | 80,001 | | | | | | | | | | | | | | 230,001 | | | | | | | | | 130,001 | |
| | | | | | | | | | | | | | | | | | | | | | | | | | | | | | | | | | | | | | | | | | | | | | | | |
| (a) | For the period December 17, 2020 (commencement of investment operations) through October 31, 2021. |
See accompanying Notes to Financial Statements which are an integral part of the financial statements.
| | | | | | | | | | | | | | | | | | | | | | | |
| | | Invesco Select
Growth ETF (IVSG) | | Invesco US Large Cap
Core ESG ETF (IVLC) |
| | | 2022 | | 2021(a) | | 2022 | | 2021(a) |
| | | | | | | | | | | | | | | | | | | | | | | | |
| | | | | | | | $ 1,180 | | | | $ | (591 | ) | | | $ | 53,060 | | | | $ | 31,865 | |
| | | | | | | | (8,881 | ) | | | | (25,173 | ) | | | | (137,403 | ) | | | | 135,434 | |
| | | | | | | | (453,623 | ) | | | | 252,654 | | | | | (1,152,470 | ) | | | | 579,184 | |
| | | | | | | | | | | | | | | | | | | | | | | | |
| | | | | | | | (461,324 | ) | | | | 226,890 | | | | | (1,236,813 | ) | | | | 746,483 | |
| | | | | | | | | | | | | | | | | | | | | | | | |
| | | | |
| | | | | | | | | | | | | | | | | | | | | | | | |
| | | | | | | | (1,017 | ) | | | | (125 | ) | | | | (90,907 | ) | | | | (29,001 | ) |
| | | | | | | | | | | | | | | | | | | | | | | | |
| | | | |
| | | | | | | | | | | | | | | | | | | | | | | | |
| | | | | | | | 2,466,126 | | | | | 1,200,012 | | | | | 1,490,789 | | | | | 7,062,656 | |
| | | | | | | | (2,446,384 | ) | | | | - | | | | | (1,515,475 | ) | | | | (829,775 | ) |
| | | | | | | | | | | | | | | | | | | | | | | | |
| | | | | | | | 19,742 | | | | | 1,200,012 | | | | | (24,686 | ) | | | | 6,232,881 | |
| | | | | | | | | | | | | | | | | | | | | | | | |
| | | | | | | | (442,599 | ) | | | | 1,426,777 | | | | | (1,352,406 | ) | | | | 6,950,363 | |
| | | | | | | | | | | | | | | | | | | | | | | | |
| | | | |
| | | | | | | | | | | | | | | | | | | | | | | | |
| | | | | | | | 1,426,777 | | | | | - | | | | | 6,950,363 | | | | | - | |
| | | | | | | | | | | | | | | | | | | | | | | | |
| | | | | | | | $ 984,178 | | | | $ | 1,426,777 | | | | $ | 5,597,957 | | | | $ | 6,950,363 | |
| | | | | | | | | | | | | | | | | | | | | | | | |
| | | | |
| | | | | | | | | | | | | | | | | | | | | | | | |
| | | | | | | | 180,000 | | | | | 100,001 | | | | | 110,000 | | | | | 530,001 | |
| | | | | | | | (180,000 | ) | | | | - | | | | | (110,000 | ) | | | | (60,000 | ) |
| | | | | | | | 100,001 | | | | | - | | | | | 470,001 | | | | | - | |
| | | | | | | | | | | | | | | | | | | | | | | | |
| | | | | | | | 100,001 | | | | | 100,001 | | | | | 470,001 | | | | | 470,001 | |
| | | | | | | | | | | | | | | | | | | | | | | | |
Financial Highlights
Invesco Focused Discovery Growth ETF (IVDG)
| | | | | | | | | | |
| | | Year Ended
October 31,
2022 | | For the Period
December 17, 2020(a)
Through
October 31,
2021 |
Per Share Operating Performance: | | | | | | | | | | |
Net asset value at beginning of period | | | $ | 14.24 | | | | $ | 12.00 | |
| | | | | | | | | | |
Net investment income (loss)(b) | | | | (0.00 | )(c) | | | | (0.04 | ) |
Net realized and unrealized gain (loss) on investments | | | | (4.20 | ) | | | | 2.28 | |
| | | | | | | | | | |
Total from investment operations | | | | (4.20 | ) | | | | 2.24 | |
| | | | | | | | | | |
Net asset value at end of period | | | $ | 10.04 | | | | $ | 14.24 | |
| | | | | | | | | | |
Market price at end of period(d) | | | $ | 10.03 | | | | $ | 14.25 | |
| | | | | | | | | | |
Net Asset Value Total Return(e) | | | | (29.49 | )% | | | | 18.67 | %(f) |
Market Price Total Return(e) | | | | (29.61 | )% | | | | 18.75 | %(f) |
Ratios/Supplemental Data: | | | | | | | | | | |
Net assets at end of period (000’s omitted) | | | $ | 602 | | | | $ | 1,139 | |
Ratio to average net assets of: | | | | | | | | | | |
Expenses | | | | 0.59 | % | | | | 0.58 | %(g) |
Net investment income (loss) | | | | (0.04 | )% | | | | (0.36 | )%(g) |
Portfolio turnover rate(h) | | | | 157 | % | | | | 135 | % |
| (a) | Commencement of investment operations. |
| (b) | Based on average shares outstanding. |
| (c) | Amount represents less than $(0.005). |
| (d) | The mean between the last bid and ask prices. |
| (e) | Net asset value total return is calculated assuming an initial investment made at the net asset value at the beginning of the period, reinvestment of all dividends and distributions at net asset value during the period, and redemption at net asset value on the last day of the period. Net asset value total return includes adjustments in accordance with accounting principles generally accepted in the United States of America and as such, the net asset value for financial reporting purposes and the returns based upon those net asset values may differ from the net asset value and returns for shareholder transactions. Market price total return is calculated assuming an initial investment made at the market price at the beginning of the period, reinvestment of all dividends and distributions at market price during the period, and sale at the market price on the last day of the period. Total investment returns calculated for a period of less than one year are not annualized. |
| (f) | The net asset value total return from Fund Inception (December 22, 2020, the first day of trading on the exchange) to October 31, 2021 was 16.53%. The market price total return from Fund Inception to October 31, 2021 was 16.61%. |
| (h) | Portfolio turnover rate is not annualized for periods less than one year, if applicable, and does not include securities received or delivered from processing creations or redemptions. |
See accompanying Notes to Financial Statements which are an integral part of the financial statements.
Financial Highlights–(continued)
Invesco Real Assets ESG ETF (IVRA)
| | | | | | | | | | |
| | | Year Ended
October 31,
2022 | | For the Period
December 17, 2020(a)
Through
October 31,
2021 |
Per Share Operating Performance: | | | | | | | | | | |
Net asset value at beginning of period | | | $ | 14.88 | | | | $ | 12.00 | |
| | | | | | | | | | |
Net investment income(b) | | | | 0.29 | | | | | 0.22 | |
Net realized and unrealized gain (loss) on investments | | | | (1.43 | ) | | | | 3.04 | |
| | | | | | | | | | |
Total from investment operations | | | | (1.14 | ) | | | | 3.26 | |
| | | | | | | | | | |
Distributions to shareholders from: | | | | | | | | | | |
Net investment income | | | | (0.29 | ) | | | | (0.38 | ) |
Net realized gains | | | | (0.40 | ) | | | | - | |
| | | | | | | | | | |
Total distributions | | | | (0.69 | ) | | | | (0.38 | ) |
| | | | | | | | | | |
Net asset value at end of period | | | $ | 13.05 | | | | $ | 14.88 | |
| | | | | | | | | | |
Market price at end of period(c) | | | $ | 13.10 | | | | $ | 14.96 | |
| | | | | | | | | | |
Net Asset Value Total Return(d) | | | | (8.01 | )% | | | | 27.65 | %(e) |
Market Price Total Return(d) | | | | (8.16 | )% | | | | 28.33 | %(e) |
Ratios/Supplemental Data: | | | | | | | | | | |
Net assets at end of period (000’s omitted) | | | $ | 3,002 | | | | $ | 1,934 | |
Ratio to average net assets of: | | | | | | | | | | |
Expenses | | | | 0.59 | % | | | | 0.60 | %(f) |
Net investment income | | | | 2.02 | % | | | | 1.86 | %(f) |
Portfolio turnover rate(g) | | | | 82 | % | | | | 52 | % |
| (a) | Commencement of investment operations. |
| (b) | Based on average shares outstanding. |
| (c) | The mean between the last bid and ask prices. |
| (d) | Net asset value total return is calculated assuming an initial investment made at the net asset value at the beginning of the period, reinvestment of all dividends and distributions at net asset value during the period, and redemption at net asset value on the last day of the period. Net asset value total return includes adjustments in accordance with accounting principles generally accepted in the United States of America and as such, the net asset value for financial reporting purposes and the returns based upon those net asset values may differ from the net asset value and returns for shareholder transactions. Market price total return is calculated assuming an initial investment made at the market price at the beginning of the period, reinvestment of all dividends and distributions at market price during the period, and sale at the market price on the last day of the period. Total investment returns calculated for a period of less than one year are not annualized. |
| (e) | The net asset value total return from Fund Inception (December 22, 2020, the first day of trading on the exchange) to October 31, 2021 was 32.40%. The market price total return from Fund Inception to October 31, 2021 was 32.53%. |
| (g) | Portfolio turnover rate is not annualized for periods less than one year, if applicable, and does not include securities received or delivered from processing creations or redemptions. |
See accompanying Notes to Financial Statements which are an integral part of the financial statements.
Financial Highlights–(continued)
Invesco Select Growth ETF (IVSG)
| | | | | | | | | | |
| | | Year Ended
October 31,
2022 | | For the Period
December 17, 2020(a)
Through
October 31,
2021 |
Per Share Operating Performance: | | | | | | | | | | |
Net asset value at beginning of period | | | $ | 14.27 | | | | $ | 12.00 | |
| | | | | | | | | | |
Net investment income (loss)(b) | | | | 0.01 | | | | | (0.01 | ) |
Net realized and unrealized gain (loss) on investments | | | | (4.43 | ) | | | | 2.28 | |
| | | | | | | | | | |
Total from investment operations | | | | (4.42 | ) | | | | 2.27 | |
| | | | | | | | | | |
Distributions to shareholders from: | | | | | | | | | | |
Net investment income | | | | (0.01 | ) | | | | - | |
| | | | | | | | | | |
Net asset value at end of period | | | $ | 9.84 | | | | $ | 14.27 | |
| | | | | | | | | | |
Market price at end of period(c) | | | $ | 9.84 | | | | $ | 14.26 | |
| | | | | | | | | | |
Net Asset Value Total Return(d) | | | | (30.97 | )% | | | | 18.93 | %(e) |
Market Price Total Return(d) | | | | (30.93 | )% | | | | 18.84 | %(e) |
Ratios/Supplemental Data: | | | | | | | | | | |
Net assets at end of period (000’s omitted) | | | $ | 984 | | | | $ | 1,427 | |
Ratio to average net assets of: | | | | | | | | | | |
Expenses | | | | 0.48 | % | | | | 0.47 | %(f) |
Net investment income (loss) | | | | 0.10 | % | | | | (0.05 | )%(f) |
Portfolio turnover rate(g) | | | | 113 | % | | | | 33 | % |
| (a) | Commencement of investment operations. |
| (b) | Based on average shares outstanding. |
| (c) | The mean between the last bid and ask prices. |
| (d) | Net asset value total return is calculated assuming an initial investment made at the net asset value at the beginning of the period, reinvestment of all dividends and distributions at net asset value during the period, and redemption at net asset value on the last day of the period. Net asset value total return includes adjustments in accordance with accounting principles generally accepted in the United States of America and as such, the net asset value for financial reporting purposes and the returns based upon those net asset values may differ from the net asset value and returns for shareholder transactions. Market price total return is calculated assuming an initial investment made at the market price at the beginning of the period, reinvestment of all dividends and distributions at market price during the period, and sale at the market price on the last day of the period. Total investment returns calculated for a period of less than one year are not annualized. |
| (e) | The net asset value total return from Fund Inception (December 22, 2020, the first day of trading on the exchange) to October 31, 2021 was 18.93%. The market price total return from Fund Inception to October 31, 2021 was 18.65%. |
| (g) | Portfolio turnover rate is not annualized for periods less than one year, if applicable, and does not include securities received or delivered from processing creations or redemptions. |
See accompanying Notes to Financial Statements which are an integral part of the financial statements.
Financial Highlights–(continued)
Invesco US Large Cap Core ESG ETF (IVLC)
| | | | | | | | | | |
| | | Year Ended
October 31,
2022 | | For the Period
December 17, 2020(a)
Through
October 31,
2021 |
Per Share Operating Performance: | | | | | | | | | | |
Net asset value at beginning of period | | | $ | 14.79 | | | | $ | 12.00 | |
| | | | | | | | | | |
Net investment income(b) | | | | 0.11 | | | | | 0.10 | |
Net realized and unrealized gain (loss) on investments | | | | (2.80 | ) | | | | 2.78 | |
| | | | | | | | | | |
Total from investment operations | | | | (2.69 | ) | | | | 2.88 | |
| | | | | | | | | | |
Distributions to shareholders from: | | | | | | | | | | |
Net investment income | | | | (0.11 | ) | | | | (0.09 | ) |
Net realized gains | | | | (0.08 | ) | | | | - | |
| | | | | | | | | | |
Total distributions | | | | (0.19 | ) | | | | (0.09 | ) |
| | | | | | | | | | |
Net asset value at end of period | | | $ | 11.91 | | | | $ | 14.79 | |
| | | | | | | | | | |
Market price at end of period(c) | | | $ | 11.90 | | | | $ | 14.78 | |
| | | | | | | | | | |
Net Asset Value Total Return(d) | | | | (18.36 | )% | | | | 24.07 | %(e) |
Market Price Total Return(d) | | | | (18.37 | )% | | | | 23.98 | %(e) |
Ratios/Supplemental Data: | | | | | | | | | | |
Net assets at end of period (000’s omitted) | | | $ | 5,598 | | | | $ | 6,950 | |
Ratio to average net assets of: | | | | | | | | | | |
Expenses | | | | 0.48 | % | | | | 0.47 | %(f) |
Net investment income | | | | 0.83 | % | | | | 0.82 | %(f) |
Portfolio turnover rate(g) | | | | 18 | % | | | | 50 | % |
| (a) | Commencement of investment operations. |
| (b) | Based on average shares outstanding. |
| (c) | The mean between the last bid and ask prices. |
| (d) | Net asset value total return is calculated assuming an initial investment made at the net asset value at the beginning of the period, reinvestment of all dividends and distributions at net asset value during the period, and redemption at net asset value on the last day of the period. Net asset value total return includes adjustments in accordance with accounting principles generally accepted in the United States of America and as such, the net asset value for financial reporting purposes and the returns based upon those net asset values may differ from the net asset value and returns for shareholder transactions. Market price total return is calculated assuming an initial investment made at the market price at the beginning of the period, reinvestment of all dividends and distributions at market price during the period, and sale at the market price on the last day of the period. Total investment returns calculated for a period of less than one year are not annualized. |
| (e) | The net asset value total return from Fund Inception (December 22, 2020, the first day of trading on the exchange) to October 31, 2021 was 25.01%. The market price total return from Fund Inception to October 31, 2021 was 24.82%. |
| (g) | Portfolio turnover rate is not annualized for periods less than one year, if applicable, and does not include securities received or delivered from processing creations or redemptions. |
See accompanying Notes to Financial Statements which are an integral part of the financial statements.
Notes to Financial Statements
Invesco Actively Managed Exchange-Traded Fund Trust
October 31, 2022
NOTE 1–Organization
Invesco Actively Managed Exchange-Traded Fund Trust (the “Trust”) was organized as a Delaware statutory trust and is authorized to have multiple series of portfolios. The Trust is an open-end management investment company registered under the Investment Company Act of 1940, as amended (the “1940 Act”). This report includes the following portfolios:
| | |
Full Name | | Short Name |
| |
| Invesco Focused Discovery Growth ETF (IVDG) | | “Focused Discovery Growth ETF” |
| |
| Invesco Real Assets ESG ETF (IVRA) | | “Real Assets ESG ETF” |
| |
| Invesco Select Growth ETF (IVSG) | | “Select Growth ETF” |
| |
| Invesco US Large Cap Core ESG ETF (IVLC) | | “US Large Cap Core ESG ETF” |
Each portfolio (each, a “Fund”, and collectively, the “Funds”) represents a separate series of the Trust. The shares of the Funds are referred to herein as “Shares” or “Fund’s Shares.” Each Fund’s Shares are listed and traded on the Cboe BZX Exchange, Inc.
The market price of each Share may differ to some degree from a Fund’s net asset value (“NAV”). Unlike conventional mutual funds, each Fund issues and redeems Shares on a continuous basis, at NAV, only in a large specified number of Shares, each called a “Creation Unit.” Creation Units for Focused Discovery Growth ETF and Select Growth ETF are issued and redeemed principally in exchange for the deposit or delivery of a basket of securities which includes a significant percentage of securities held in each Fund’s portfolio, but excludes or modifies the weightings of certain securities (the “Substitute Basket”), as well as cash included in the Fund’s Substitute Basket. Creation Units for Real Assets ESG ETF and US Large Cap Core ESG ETF are issued and redeemed principally in exchange for (1) select recently disclosed portfolio holdings (“Strategy Components”), (2) an amount of cash corresponding to the value of ETFs that convey information about the types of instruments in which each Fund invests (“Representative ETFs”) and (3) cash and cash equivalents, which, together with the Strategy Components and Representative ETFs, constitute the “Tracking Basket”. Except when aggregated in Creation Units by authorized participants (“APs”), the Shares are not individually redeemable securities of the Funds.
The investment objective of Focused Discovery Growth ETF and US Large Cap Core ESG ETF is to seek capital appreciation. The investment objective of Real Assets ESG ETF is to seek capital appreciation with a secondary objective of current income. The investment objective of Select Growth ETF is to seek long-term capital appreciation.
NOTE 2–Significant Accounting Policies
The following is a summary of the significant accounting policies followed by the Funds in preparation of their financial statements.
Each Fund is an investment company and accordingly follows the investment company accounting and reporting guidance in accordance with Financial Accounting Standards Board Accounting Standards Codification Topic 946, Financial Services–Investment Companies.
| A. | Security Valuation - Securities, including restricted securities, are valued according to the following policies: |
A security listed or traded on an exchange is generally valued at its trade price or official closing price that day as of the close of the exchange where the security is principally traded or, lacking any trades or official closing price on a particular day, the security may be valued at the closing bid price on that day. Securities traded in the over-the-counter market are valued based on prices furnished by independent pricing services or market makers. When such securities are valued using prices provided by an independent pricing service they may be considered fair valued. Futures contracts are valued at the daily settlement price set by an exchange on which they are principally traded. U.S. exchange-traded options are valued at the mean between the last bid and asked prices from the exchange on which they are principally traded. Non-U.S. exchange-traded options are valued at the final settlement price set by the exchange on which they trade. Options not listed on an exchange and swaps generally are valued using pricing provided from independent pricing services.
Securities of investment companies that are not exchange-traded (e.g., open-end mutual funds) are valued using such company’s end-of-business-day NAV per share.
Deposits, other obligations of U.S. and non-U.S. banks and financial institutions are valued at their daily account value.
Fixed income securities (including convertible debt securities) generally are valued on the basis of prices provided by independent pricing services. Prices provided by the pricing service may be determined without exclusive reliance on quoted prices, and may reflect appropriate factors such as institution-size trading in similar groups of securities, developments related to specific securities, dividend rate (for unlisted equities), yield (for debt obligations), quality, type of issue, coupon rate (for debt obligations), maturity (for debt obligations), individual trading characteristics and other market data. Securities with a
demand feature exercisable within one to seven days are valued at par. Pricing services generally value debt obligations assuming orderly transactions of institutional round lot size, but a Fund may hold or transact in the same securities in smaller, odd lot sizes. Odd lots often trade at lower prices than institutional round lots, and their value may be adjusted accordingly. Debt obligations are subject to interest rate and credit risks. In addition, all debt obligations involve some risk of default with respect to interest and/or principal payments.
Foreign securities’ (including foreign exchange contracts’) prices are converted into U.S. dollar amounts using the applicable exchange rates as of the close of the London world markets. If market quotations are available and reliable for foreign exchange-traded equity securities, the securities will be valued at the market quotations. Invesco Capital Management LLC (the “Adviser”) may use various pricing services to obtain market quotations as well as fair value prices. Because trading hours for certain foreign securities end before the close of the New York Stock Exchange (“NYSE”), closing market quotations may become not representative of market value in the Adviser’s judgment (“unreliable”). If, between the time trading ends on a particular security and the close of the customary trading session on the NYSE, a significant event occurs that makes the closing price of the security unreliable, the Adviser may fair value the security. If the event is likely to have affected the closing price of the security, the security will be valued at fair value in good faith in accordance with Board-approved policies and related Adviser procedures (“Valuation Procedures”). Adjustments to closing prices to reflect fair value may also be based on a screening process of an independent pricing service to indicate the degree of certainty, based on historical data, that the closing price in the principal market where a foreign security trades is not the current value as of the close of the NYSE. Foreign securities’ prices meeting the degree of certainty that the price is not reflective of current value will be priced at the indication of fair value from the independent pricing service. Multiple factors may be considered by the independent pricing service in determining adjustments to reflect fair value and may include information relating to sector indices, American depositary receipts and domestic and foreign index futures. Foreign securities may have additional risks including exchange rate changes, the potential for sharply devalued currencies and high inflation, political and economic upheaval, the relative lack of issuer information, relatively low market liquidity and the potential lack of strict financial and accounting controls and standards.
Unlisted securities will be valued using prices provided by independent pricing services or by another method that the Adviser, in its judgment, believes better reflects the security’s fair value in accordance with the Valuation Procedures.
Securities for which market prices are not provided by any of the above methods may be valued based upon quotes furnished by independent sources. The last bid price may be used to value exchange-traded equity securities. The mean between the last bid and asked prices may be used to value debt obligations, including corporate loans, and unlisted equity securities.
Securities for which market quotations are not readily available are fair valued by the Adviser in accordance with the Valuation Procedures. If a fair value price provided by a pricing service is unreliable, the Adviser will fair value the security using the Valuation Procedures. Issuer-specific events, market trends, bid/asked quotes of brokers and information providers and other market data may be reviewed in the course of making a good faith determination of a security’s fair value.
Each Fund may invest in securities that are subject to interest rate risk, meaning the risk that the prices will generally fall as interest rates rise and, conversely, the prices will generally rise as interest rates fall. Specific securities differ in their sensitivity to changes in interest rates depending on their individual characteristics. Changes in interest rates may result in increased market volatility, which may affect the value and/or liquidity of certain Fund investments.
Valuations change in response to many factors, including the historical and prospective earnings of the issuer, the value of the issuer’s assets, general market conditions which are not specifically related to the particular issuer, such as real or perceived adverse economic conditions, changes in the general outlook for revenues or corporate earnings, changes in interest or currency rates, regional or global instability, natural or environmental disasters, widespread disease or other public health issues, war, acts of terrorism, significant governmental actions or adverse investor sentiment generally and market liquidity. Because of the inherent uncertainties of valuation, the values reflected in the financial statements may materially differ from the value received upon actual sale of those investments.
The price a Fund could receive upon the sale of any investment may differ from the Adviser’s valuation of the investment, particularly for securities that are valued using a fair valuation technique. When fair valuation techniques are applied, the Adviser uses available information, including both observable and unobservable inputs and assumptions, to determine a methodology that will result in a valuation that the Adviser believes approximates market value. Fund securities that are fair valued may be subject to greater fluctuation in their value from one day to the next than would be the case if market quotations were used. Because of the inherent uncertainties of valuation, and the degree of subjectivity in such decisions, a Fund could realize a greater or lesser than expected gain or loss upon the sale of the investment.
| B. | Investment Transactions and Investment Income - Investment transactions are accounted for on a trade date basis. Realized gains and losses from the sale or disposition of securities are computed on the specific identified cost basis. Interest income is recorded on an accrual basis from settlement date and includes coupon interest and amortization of premium and accretion of discount on debt securities as applicable. Pay-in-kind interest income and non-cash dividend income received in the form of securities in-lieu of cash are recorded at the fair value of the securities received. Dividend income (net of withholding tax, if any) is recorded on the ex-dividend date. Dividend income from REITs is recorded based on the income included in the distributions received from the REIT investments using published REIT classifications, including some |
| | management estimates when actual amounts are not available. Distributions received in excess of this estimated amount are recorded as a reduction of the cost of investments or reclassified to capital gains. The actual amounts of income, return of capital, and capital gains are only determined by each REIT after its fiscal year-end, and may differ from the estimated amounts. Realized gains, dividends and interest received by a Fund may give rise to withholding and other taxes imposed by foreign countries. Tax conventions between certain countries and the United States may reduce or eliminate such taxes. |
The Funds may periodically participate in litigation related to a Fund’s investments. As such, the Funds may receive proceeds from litigation settlements. Any proceeds received are included in the Statements of Operations as realized gain (loss) for investments no longer held and as unrealized gain (loss) for investments still held.
Brokerage commissions and mark ups are considered transaction costs and are recorded as an increase to the cost basis of securities purchased and/or a reduction of proceeds on a sale of securities. Such transaction costs are included in the determination of net realized and unrealized gain (loss) from investment securities reported in the Statements of Operations and the Statements of Changes in Net Assets and the net realized and unrealized gains (losses) on securities per share in the Financial Highlights. Transaction costs are included in the calculation of a Fund’s NAV and, accordingly, they reduce a Fund’s total returns. These transaction costs are not considered operating expenses and are not reflected in net investment income reported in the Statements of Operations and the Statements of Changes in Net Assets, or the net investment income per share and the ratios of expenses and net investment income reported in the Financial Highlights, nor are they limited by any expense limitation arrangements between each Fund and the Adviser.
| C. | Country Determination - For the purposes of presentation in the Schedules of Investments, the Adviser may determine the country in which an issuer is located and/or credit risk exposure based on various factors. These factors may include the laws of the country under which the issuer is organized, where the issuer maintains a principal office, the country in which the issuer derives 50% or more of its total revenues, the country that has the primary market for the issuer’s securities and its “country of risk” as determined by a third party service provider, as well as other criteria. Among the other criteria that may be evaluated for making this determination are the country in which the issuer maintains 50% or more of its assets, the type of security, financial guarantees and enhancements, the nature of the collateral and the sponsor organization. Country of issuer and/or credit risk exposure has been determined to be the United States of America, unless otherwise noted. |
| D. | Dividends and Distributions to Shareholders - Each Fund (except Real Assets ESG ETF) declares and pays dividends from net investment income, if any, to their shareholders quarterly and records such dividends on the ex-dividend date. Real Assets ESG ETF declares and pays dividends from net investment income, if any, to its shareholders monthly and records such dividends on the ex-dividend date. Generally, each Fund distributes net realized taxable capital gains, if any, annually in cash and records them on the ex-dividend date. Such distributions on a tax basis are determined in conformity with federal income tax regulations which may differ from accounting principles generally accepted in the United States of America (“GAAP”). Distributions in excess of tax basis earnings and profits, if any, are reported in such Fund’s financial statements as a tax return of capital at fiscal year-end. |
| E. | Federal Income Taxes - Each Fund intends to comply with the provisions of the Internal Revenue Code of 1986, as amended (the “Internal Revenue Code”), applicable to regulated investment companies and to distribute substantially all of the Fund’s taxable earnings to its shareholders. As such, the Funds will not be subject to federal income taxes on otherwise taxable income (including net realized gains) that is distributed to the shareholders. Therefore, no provision for federal income taxes is recorded in the financial statements. |
Each Fund recognizes the tax benefits of uncertain tax positions only when the position is more likely than not to be sustained. Management has analyzed each Fund’s uncertain tax positions and concluded that no liability for unrecognized tax benefits should be recorded related to uncertain tax positions. Management is not aware of any tax positions for which it is reasonably possible that the total amounts of unrecognized tax benefits will change materially in the next 12 months.
Income and capital gain distributions are determined in accordance with federal income tax regulations, which may differ from GAAP. These differences are primarily due to differing book and tax treatments for in-kind transactions, losses deferred due to wash sales, and passive foreign investment company adjustments, if any.
The Funds file U.S. federal tax returns and tax returns in certain other jurisdictions. Generally, a Fund is subject to examinations by such taxing authorities for up to three years after the filing of the return for the tax period.
| F. | Expenses - Each Fund has agreed to pay an annual unitary management fee to the Adviser. Out of the unitary management fee, the Adviser has agreed to pay for substantially all expenses of the Funds, including payments to Invesco Advisers, Inc. (the “Affiliated Sub-Adviser” or “Invesco”), and for each Fund, the cost of transfer agency, custody, fund administration, legal, audit and other services, except for distribution fees, if any, brokerage expenses, taxes, interest, acquired fund fees and expenses, if any, litigation expenses and other extraordinary expenses, including proxy expenses (except for such proxies related to: (i) changes to the Investment Advisory Agreement, (ii) the election of any Board member who is an “interested person” of the Trust, or (iii) any other matters that directly benefit the Adviser). |
Expenses of the Trust that are excluded from a Fund’s unitary management fee and are directly identifiable to a specific Fund are applied to that Fund. Expenses of the Trust that are excluded from a Fund’s unitary management fee and are not readily identifiable to a specific Fund are allocated in such a manner as deemed equitable, taking into consideration the nature and type of expense and the relative net assets of each Fund.
To the extent a Fund invests in other investment companies, the expenses shown in the accompanying financial statements reflect the expenses of the Fund and do not include any expenses of the investment companies in which it invests. The effects of such investment companies’ expenses are included in the realized and unrealized gain or loss on the investments in the investment companies.
| G. | Accounting Estimates - The preparation of the financial statements in accordance with GAAP requires management to make estimates and assumptions that affect the reported amounts and disclosures in the financial statements, including estimates and assumptions related to taxation. Actual results could differ from these estimates. In addition, the Funds monitor for material events or transactions that may occur or become known after the period-end date and before the date the financial statements are released to print. |
| H. | Indemnifications - Under the Trust’s organizational documents, its Officers and Trustees are indemnified against certain liabilities arising out of the performance of their duties to the Trust. Each Independent Trustee is also indemnified against certain liabilities arising out of the performance of their duties to the Trust pursuant to an Indemnification Agreement between such trustee and the Trust. Additionally, in the normal course of business, the Trust enters into contracts with service providers that contain general indemnification clauses. The Trust’s maximum exposure under these arrangements is unknown, as this would involve future claims that may be made against the Trust that have not yet occurred. The risk of material loss as a result of such indemnification claims is considered remote. |
| I. | Securities Lending - Each Fund may participate in securities lending and may loan portfolio securities having a market value up to one-third of each Fund’s total assets. Such loans are secured by cash collateral equal to no less than 102% (105% for international securities) of the market value of the loaned securities determined daily by the securities lending provider. Cash collateral received in connection with these loans is invested in short-term money market instruments or affiliated, unregistered investment companies that comply with Rule 2a-7 under the 1940 Act and money market funds (collectively, “affiliated money market funds”) and is shown as such on the Schedules of Investments. Each Fund bears the risk of loss with respect to the investment of collateral. It is the policy of these Funds to obtain additional collateral from or return excess collateral to the borrower by the end of the next business day, following the valuation date of the securities loaned. Therefore, the value of the collateral held may be temporarily less than the value of the securities on loan. When loaning securities, each Fund retains certain benefits of owning the securities, including the economic equivalent of dividends or interest generated by the security. Lending securities entails a risk of loss to each Fund if, and to the extent that, the market value of the securities loaned were to increase, and the borrower did not increase the collateral accordingly, and the borrower failed to return the securities. The securities loaned are subject to termination at the option of the borrower or each Fund. Upon termination, the borrower will return to each Fund the securities loaned and each Fund will return the collateral. Upon the failure of the borrower to return the securities, collateral may be liquidated and the securities may be purchased on the open market to replace the loaned securities. Each Fund could experience delays and costs in gaining access to the collateral and the securities may lose value during the delay which could result in potential losses to each Fund. Some of these losses may be indemnified by the lending agent. Each Fund bears the risk of any deficiency in the amount of the collateral available for return to the borrower due to any loss on the collateral invested. For Funds that participated in securities lending, dividends received on cash collateral investments for securities lending transactions, which are net of compensation to counterparties, are included in Securities lending income on the Statements of Operations. The aggregate value of securities out on loan, if any, is shown on the Statements of Assets and Liabilities. |
Invesco, an affiliate of the Adviser, serves as an affiliated securities lending agent for each Fund participating in the securities lending program. The Bank of New York Mellon (“BNYM”) also serves as a lending agent. To the extent a Fund utilizes Invesco as an affiliated securities lending agent, the Fund conducts its securities lending in accordance with, and in reliance upon, no-action letters issued by the SEC staff that provide guidance on how an affiliate may act as a direct agent lender and receive compensation for those services in a manner consistent with the federal securities laws. For the fiscal year ended October 31, 2022, each Fund had affiliated securities lending transactions with Invesco. Fees paid to Invesco for securities lending agent services, which are included in Securities lending income on the Statements of Operations, were incurred by each Fund as listed below:
| | | | |
| | | Amount | |
| |
Focused Discovery Growth ETF | | | $0 | |
| |
Real Assets ESG ETF | | | 5 | |
| |
Select Growth ETF | | | 0 | |
| |
US Large Cap Core ESG ETF | | | 5 | |
| J. | Foreign Currency Translations - Foreign currency is valued at the close of the NYSE based on quotations posted by banks and major currency dealers. Portfolio securities and other assets and liabilities denominated in foreign currencies are translated into U.S. dollar amounts at the date of valuation. Purchases and sales of portfolio securities (net of foreign taxes withheld on disposition) and income items denominated in foreign currencies are translated into U.S. dollar amounts on the respective dates of such transactions. Each Fund does not separately account for the portion of the results of operations resulting from changes in foreign exchange rates on investments and the fluctuations arising from changes in market prices of |
securities held. The combined results of changes in foreign exchange rates and the fluctuation of market prices on investments (net of estimated foreign tax withholding) are included with the net realized and unrealized gain or loss from investments in the Statements of Operations. Reported net realized foreign currency gains or losses arise from (1) sales of foreign currencies, (2) currency gains or losses realized between the trade and settlement dates on securities transactions, and (3) the difference between the amounts of dividends, interest, and foreign withholding taxes recorded on a Fund’s books and the U.S. dollar equivalent of the amounts actually received or paid. Net unrealized foreign currency gains and losses arise from changes in the fair values of assets and liabilities, other than investments in securities at fiscal period-end, resulting from changes in exchange rates.
Each Fund may invest in foreign securities, which may be subject to foreign taxes on income, gains on investments or currency repatriation, a portion of which may be recoverable. Foreign taxes, if any, are recorded based on the tax regulations and rates that exist in the foreign markets in which a Fund invests.
ADR Risk. Certain Funds may invest in American depositary receipts (“ADRs”). ADRs are certificates that evidence ownership of shares of a foreign issuer and are alternatives to purchasing the underlying foreign securities directly in their national markets and currencies. ADRs may be subject to certain of the risks associated with direct investments in the securities of foreign companies, such as currency, political, economic and market risks, because their values depend on the performance of the non-dollar denominated underlying foreign securities. Moreover, ADRs may not track the price of the underlying foreign securities on which they are based, and their value may change materially at times when U.S. markets are not open for trading.
AP Concentration Risk. Only APs may engage in creation or redemption transactions directly with each Fund. Each Fund has a limited number of institutions that may act as APs, and such APs have no obligation to submit creation or redemption orders. Consequently, there is no assurance that APs will establish or maintain an active trading market for the Shares. This risk may be heightened to the extent that securities held by each Fund are traded outside a collateralized settlement system. In that case, APs may be required to post collateral on certain trades on an agency basis (i.e., on behalf of other market participants), which only a limited number of APs may be able to do. In addition, to the extent that APs exit the business or are unable to proceed with creation and/or redemption orders with respect to each Fund and no other AP is able to step forward to create or redeem Creation Units, this may result in a significantly diminished trading market for Fund Shares, and Shares may be more likely to trade at a premium or discount to a Fund’s NAV and to face trading halts and/or delisting. Investments in non-U.S. securities, which may have lower trading volumes or could experience extended market closures or trading halts, may increase the risk that APs may not be able to effectively create or redeem Creation Units or the risk that the Shares may be halted and/or delisted.
Arbitrage Risk. Unlike ETFs that publicly disclose their complete portfolio holdings each Business Day, the Funds provide certain other information intended to allow market participants to estimate the value of positions in Fund shares. Although this information is designed to facilitate arbitrage opportunities in Shares to reduce bid/ask spread and minimize discounts or premiums between the market price and the NAV of the Shares, there is no guarantee the Funds’ arbitrage mechanism will operate as intended and that the Funds will not experience wide bid/ask spreads and/or large discounts or premiums to NAV. In addition, market participants may attempt to use the disclosed information to “reverse engineer” the Funds’ trading strategy, which, if successful, could increase opportunities for predatory trading practices that may have the potential to negatively impact the Funds’ performance.
Emerging Markets Investment Risk. For certain Funds, investments in the securities of issuers in emerging market countries involve risks often not associated with investments in the securities of issuers in developed countries. Securities in emerging markets may be subject to greater price fluctuations than securities in more developed markets. Companies in emerging market countries generally may be subject to less stringent regulatory, disclosure, financial reporting, accounting, auditing and recordkeeping standards than companies in more developed countries. In addition, information about such companies may be less available and reliable. Emerging markets usually are subject to greater market volatility, political, social and economic instability, uncertainty regarding the existence of trading markets and more governmental limitations on foreign investment than are more developed markets. Securities law in many emerging market countries is relatively new and unsettled. Therefore, laws regarding foreign investment in emerging market securities, securities regulation, title to securities, and shareholder rights may change quickly and unpredictably, and the ability to bring and enforce actions, or to obtain information needed to pursue or enforce such actions, may be limited. In addition, the enforcement of systems of taxation at federal, regional and local levels in emerging market countries may be inconsistent and subject to sudden change. Investments in emerging market securities may be subject to additional transaction costs, delays in settlement procedures, unexpected market closures, and lack of timely information.
Equity Risk. Equity risk is the risk that the value of equity securities, including common stocks, may fall due to both changes in general economic conditions that impact the market as a whole, as well as factors that directly relate to a specific company or its industry. Such general economic conditions include changes in interest rates, periods of market turbulence or instability, or general and prolonged periods of economic decline and cyclical change. It is possible that a drop in the stock market may depress the price of most or all of the common stocks that each Fund holds. In addition, equity risk includes the risk that investor sentiment toward one or more industries will become negative, resulting in those investors exiting their investments
in those industries, which could cause a reduction in the value of companies in those industries more broadly. The value of a company’s common stock may fall solely because of factors, such as an increase in production costs that negatively impact other companies in the same region, industry or sector of the market. A company’s common stock also may decline significantly in price over a short period of time due to factors specific to that company, including decisions made by its management or lower demand for the company’s products or services. For example, an adverse event, such as an unfavorable earnings report or the failure to make anticipated dividend payments, may depress the value of common stock.
ESG Risk. Because Real Assets ESG ETF and US Large Cap Core ESG ETF evaluate ESG factors to assess and exclude certain investments for non-financial reasons, such Funds may forego some market opportunities available to funds that do not use these factors. The securities of companies that score favorably under a Fund’s ESG scoring methodology may underperform similar companies that do not score as well or may underperform the stock market as a whole. As a result, Real Assets ESG ETF and US Large Cap Core ESG ETF may underperform funds that do not screen or score companies based on ESG factors or funds that use a different ESG methodology. Information used by a Fund to evaluate such factors may not be readily available, complete or accurate, which could negatively impact the Fund’s ability to apply its methodology, which in turn could negatively impact the Fund’s performance. In addition, a Fund’s assessment of an issuer, based on the issuer’s level of involvement in a particular industry or the issuer’s ESG score, may differ from that of other funds or an investor. As a result, the issuers deemed eligible for inclusion in a Fund’s portfolio may not reflect the beliefs or values of any particular investor and may not be deemed to exhibit positive or favorable ESG characteristics if different metrics were used to evaluate them.
Fluctuation of Net Asset Value and Share Price Risk. Shares may trade at a larger premium or discount to the NAV than shares of other ETFs, including ETFs that make their daily holdings public. The NAV of the Funds will generally fluctuate with changes in the market value of the Funds’ holdings. The Shares can be bought and sold in the secondary market at market prices. Disruptions to creations and redemptions, the existence of extreme market volatility or potential lack of an active trading market for the Shares may result in the Shares trading significantly above (at a premium) or below (at a discount) NAV. In addition, in stressed market conditions or periods of market disruption or volatility, the market for Shares may become less liquid in response to deteriorating liquidity in the markets for the Funds’ underlying portfolio holdings.
Foreign Investment Risk. Investments in the securities of non-U.S. issuers involve risks beyond those associated with investments in U.S. securities. Foreign securities may have relatively low market liquidity, greater market volatility, decreased publicly available information and less reliable financial information about issuers and inconsistent and potentially less stringent accounting, auditing and financial reporting requirements and standards of practice, including recordkeeping standards, comparable to those applicable to domestic issuers. Foreign securities are also subject to the risks of expropriation, nationalization, political instability or other adverse political or economic developments and the difficulty of enforcing obligations in other countries. Investments in foreign securities also may be subject to dividend withholding or confiscatory taxes, currency blockage and/or transfer restrictions and higher transactional costs. If a Fund invests in securities denominated in foreign currencies, fluctuations in the value of the U.S. dollar relative to the values of other currencies may adversely affect investments in foreign securities and may negatively impact the Fund’s returns.
Industry Concentration Risk. Certain Funds are concentrated to a significant degree in securities of issuers operating in a single industry or industry group. By concentrating their investments in an industry or industry group, such Funds may face more risks than if they were diversified broadly over numerous industries or industry groups. Such industry-based risks, any of which may adversely affect the companies in which some Funds invest, may include, but are not limited to, the following: general economic conditions or cyclical market patterns that could negatively affect supply and demand in a particular industry; competition for resources, adverse labor relations, political or world events; obsolescence of technologies; and increased competition or new product introductions that may affect the profitability or viability of companies in an industry. In addition, at times, such industry or industry group may be out of favor and underperform other industries or the market as a whole.
Management Risk. The Funds are subject to management risk because they are actively managed portfolios. In managing a Fund’s portfolio securities, the Adviser or a sub-adviser (as applicable and as set forth below) applies investment techniques and risk analyses in making investment decisions, but there can be no guarantee that these will produce the desired results.
Market Risk. The Funds’ holdings are subject to market fluctuations. You should anticipate that the value of the Shares will decline more or less, in correlation with any decline in value of the holdings in a Fund’s portfolio. Additionally, natural or environmental disasters, widespread disease or other public health issues, war, acts of terrorism or other events could result in increased premiums or discounts to each Fund’s NAV.
Non-Diversified Fund Risk. Because each Fund is non-diversified and can invest a greater portion of its assets in securities of individual issuers than can a diversified fund, changes in the market value of a single investment could cause greater fluctuations in Share price than would occur in a diversified fund. This may increase a Fund’s volatility and cause the performance of a relatively small number of issuers to have a greater impact on a Fund’s performance.
Non-Transparent Actively Managed Fund Risk. Focused Discovery Growth ETF and Select Growth ETF publish each Business Day on each Fund’s website a “Substitute Basket,” which is designed to closely track the daily performance of each Fund but is not each Fund’s actual portfolio. The Substitute Basket often will include a significant percentage of the securities held in each Fund’s portfolio, but it will exclude (or modify the weightings of) certain securities held in each Fund’s portfolio, such as those securities that each Fund’s portfolio managers are actively looking to purchase or sell. Disclosure of the
Substitute Basket structure may affect the price at which Shares trade in the secondary market. Although the Substitute Basket is intended to provide investors with enough information to allow for an effective arbitrage mechanism that will keep the market price of each Fund at or close to each Fund’s NAV per share, there is a risk that market prices will vary significantly from NAV. By trading on the basis of a published Substitute Basket, each Fund may trade at a wider bid/ask spread than ETFs that publish their full portfolios on a daily basis, and therefore, may cost investors more to trade. These risks may increase during periods of market disruption or volatility. In addition, although each Fund seeks to benefit from keeping its portfolio information secret, market participants may attempt to use the Substitute Basket to identify the fund’s trading strategy. If successful, this could result in such market participants engaging in certain predatory trading practices that may have the potential to harm each Fund and its shareholders, such as front running each Fund’s trades of portfolio securities.
Real Assets ESG ETF and US Large Cap Core ESG ETF publish each Business Day on each Fund’s website a “Tracking Basket,” which is designed to closely track the daily performance of each Fund but is not each Fund’s actual portfolio. The Tracking Basket is comprised of: (1) Strategy Components; (2) Representative ETFs; and (3) cash and cash equivalents.
Each Fund also publishes each Business Day on its website the “Tracking Basket Weight Overlap,” which is the percentage weight overlap between the holdings of the prior Business Day’s Tracking Basket compared to the holdings of each Fund that formed the basis for each Fund’s calculation of NAV per share at the end of the prior Business Day. The Tracking Basket Weight Overlap is designed to provide investors with an understanding of how similar the Tracking Basket is to each Fund’s actual portfolio in percentage terms. Given the differences between each Fund and ETFs that disclose their complete holdings daily, there is a risk that market prices of each Fund may vary significantly from NAV, and that the Shares may trade at a wider bid/ask spread–and therefore cost investors more to trade–than shares of other ETFs. These risks are heightened during periods of market disruption or volatility. Similarly to mutual funds and other ETFs, each Fund discloses the complete schedule of its portfolio holdings on Form N-PORT after its first and third fiscal quarters and in shareholder reports after its second and fourth fiscal quarters.
Portfolio Turnover Risk. Certain Funds may engage in frequent trading of their portfolio securities in connection with the rebalancing or adjustment of their respective Underlying Index. A portfolio turnover rate of 200%, for example, is equivalent to a Fund buying and selling all of its securities two times during the course of a year. A high portfolio turnover rate (such as 100% or more) could result in high brokerage costs for a Fund. While a high portfolio turnover rate can result in an increase in taxable capital gains distributions to a Fund’s shareholders, a Fund will seek to utilize the in-kind creation and redemption mechanism to minimize the realization of capital gains to the extent possible.
Real Assets Companies Risk. Investments in real assets companies may involve a higher degree of risk, including significant financial, operating, and competitive risks, and may expose the Real Assets ESG ETF to adverse macroeconomic conditions, such as changes and volatility in commodity prices, a rise in interest rates or a downturn in the economy in which the asset is located, elevating the risk of loss.
REIT Risk. REITs are pooled investment vehicles that trade like stocks and invest substantially all of their assets in real estate and may qualify for special tax considerations. REITs are subject to certain risks inherent in the direct ownership of real estate, including without limitation, a possible lack of mortgage funds and associated interest rate risks, overbuilding, property vacancies, increases in property taxes and operating expenses, changes in zoning laws, losses due to environmental damages and changes in neighborhood values and appeal to purchasers. Further, failure of a company to qualify as a REIT under federal tax law may have adverse consequences to the REIT’s shareholders. In addition, REITs may have expenses, including advisory and administration expenses, and REIT shareholders will incur a proportionate share of the underlying expenses.
Small- and Mid-Capitalization Company Risk. Investing in securities of small- and mid-capitalization companies involves greater risk than customarily is associated with investing in larger, more established companies. These companies’ securities may be more volatile and less liquid than those of more established companies. These securities may have returns that vary, sometimes significantly, from the overall securities market. Often small- and mid-capitalization companies and the industries in which they focus are still evolving and, as a result, they may be more sensitive to changing market conditions.
Trading Halt Risk. There may be circumstances where a security held in a Fund’s portfolio but not in the Substitute Basket or Tracking Basket does not have readily available market quotations. If the Adviser or the Affiliated Sub-Adviser determines that such circumstance may affect the reliability of the Substitute Basket or Tracking Basket as an arbitrage vehicle, that information, along with the identity and weighting of that security in the Fund’s portfolio, will be publicly disclosed on the Fund’s website and the Adviser or the Sub-Adviser will assess appropriate remedial measures. In these circumstances, market participants may use this information to engage in certain predatory trading practices that may have the potential to harm the Fund and its shareholders. If securities representing 10% or more of the Fund’s portfolio do not have readily available market quotations, the Adviser would promptly request the Cboe BZX Exchange, Inc. (the “Exchange”) to halt trading on the Fund, meaning that investors would not be able to trade the Shares. Moreover, trading in Shares on the Exchange may be halted due to market conditions or for reasons that, in the view of the Exchange, make trading in Shares inadvisable. In addition, trading in Shares on the Exchange is subject to trading halts caused by extraordinary market volatility pursuant to the Exchange’s “circuit breaker” rules. There can be no assurance that the requirements of the Exchange necessary to maintain the listing of the Fund will continue to be met or will remain unchanged.
COVID-19 Risk. The COVID-19 strain of coronavirus has resulted in instances of market closures and dislocations, extreme volatility, liquidity constraints and increased trading costs. Efforts to contain its spread have resulted in travel restrictions,
disruptions of healthcare systems, business operations (including business closures) and supply chains, layoffs, lower consumer demand and employee availability, and defaults and credit downgrades, among other significant economic impacts that have disrupted global economic activity across many industries. Such economic impacts may exacerbate other pre-existing political, social and economic risks locally or globally and cause general concern and uncertainty. The full economic impact and ongoing effects of COVID-19 (or other future epidemics or pandemics) at the macro-level and on individual businesses are unpredictable and may result in significant and prolonged effects on the Funds’ performance.
NOTE 3–Investment Advisory Agreements and Other Agreements
The Trust has entered into Investment Advisory Agreements with the Adviser on behalf of each Fund, pursuant to which the Adviser has overall responsibility for the selection and ongoing monitoring of the Funds’ investments, managing the Funds’ business affairs, providing certain clerical, bookkeeping and other administrative services, and for each Fund, oversight of the Affiliated Sub-Adviser.
Pursuant to an Investment Advisory Agreement, each Fund accrues daily and pays monthly to the Adviser an annual unitary management fee. Out of the unitary management fee, the Adviser has agreed to pay for substantially all expenses of the Funds, including payments to the Affiliated Sub-Adviser for each Fund, and for each Fund the cost of transfer agency, custody, fund administration, legal, audit and other services, except for distribution fees, if any, brokerage expenses, taxes, interest, acquired fund fees and expenses, if any, litigation expenses and other extraordinary expenses, including proxy expenses (except for such proxies related to: (i) changes to the Investment Advisory Agreement, (ii) the election of any Board member who is an “interested person” of the Trust, or (iii) any other matters that directly benefit the Adviser). The unitary management fee is paid by each Fund to the Adviser at the following annual rates:
| | |
| | | Unitary Management Fees
(as a % of average daily net assets) |
| |
Focused Discovery Growth ETF | | 0.59% |
| |
Real Assets ESG ETF | | 0.59% |
| |
Select Growth ETF | | 0.48% |
| |
US Large Cap Core ESG ETF | | 0.48% |
The Adviser has entered into an Investment Sub-Advisory Agreement with the Affiliated Sub-Adviser for each Fund. The sub-advisory fee for these Funds is paid by the Adviser to the Affiliated Sub-Adviser at 40% of the Adviser’s compensation of the sub-advised assets of each Fund.
Through at least August 31, 2024, the Adviser has contractually agreed to waive the management fee payable by each Fund in an amount equal to the lesser of: (i) 100% of the net advisory fees earned by the Adviser or an affiliate of the Adviser that are attributable to the Fund’s investments in money market funds that are managed by affiliates of the Adviser and other funds (including ETFs) managed by the Adviser or affiliates of the Adviser or (ii) the management fee available to be waived. This waiver does not apply to a Fund’s investment of cash collateral received for securities lending. There is no guarantee that the Adviser will extend the waiver of these fees past that date.
For the fiscal year ended October 31, 2022, the Adviser waived fees for each Fund in the following amounts:
| | | | |
| |
Focused Discovery Growth ETF | | | $14 | |
| |
Real Assets ESG ETF | | | 12 | |
| |
Select Growth ETF | | | 4 | |
| |
US Large Cap Core ESG ETF | | | 5 | |
The Trust has entered into a Distribution Agreement with Invesco Distributors, Inc. (the “Distributor”), which serves as the distributor of Creation Units for each Fund. The Distributor does not maintain a secondary market in the Shares. The Funds are not charged any fees pursuant to the Distribution Agreement. The Distributor is an affiliate of the Adviser.
The Trust has entered into service agreements whereby BNYM, a wholly-owned subsidiary of The Bank of New York Mellon Corporation, serves as the administrator, custodian, fund accountant and transfer agent for each Fund.
Portfolio transactions with ICMI that have not settled at period-end, if any, are shown in the Statements of Assets and Liabilities under the receivable caption Investments sold - affiliated broker and/or payable caption Investments purchased - affiliated broker.
NOTE 4–Additional Valuation Information
GAAP defines fair value as the price that would be received to sell an asset or paid to transfer a liability in an orderly transaction between market participants at the measurement date, under current market conditions. GAAP establishes a hierarchy that prioritizes the inputs to valuation methods, giving the highest priority to readily available unadjusted quoted prices in an active market for identical assets (Level 1) and the lowest priority to significant unobservable inputs (Level 3), generally when market
prices are not readily available. Based on the valuation inputs, the securities or other investments are tiered into one of three levels. Changes in valuation methods may result in transfers in or out of an investment’s assigned level:
| | Level 1 – | Prices are determined using quoted prices in an active market for identical assets. |
| | Level 2 – | Prices are determined using other significant observable inputs. Observable inputs are inputs that other market participants may use in pricing a security. These may include quoted prices for similar securities, interest rates, prepayment speeds, credit risk, yield curves, loss severities, default rates, discount rates, volatilities and others. |
| | Level 3 – | Prices are determined using significant unobservable inputs. In situations where quoted prices or observable inputs are unavailable (for example, when there is little or no market activity for an investment at the end of the period), unobservable inputs may be used. Unobservable inputs reflect the Adviser’s assumptions about the factors market participants would use in determining fair value of the securities or instruments and would be based on the best available information. |
The following is a summary of the tiered valuation input levels, as of October 31, 2022, for each Fund (except for Focused Discovery Growth ETF and Real Assets ESG ETF). As of October 31, 2022, all of the securities in Focused Discovery Growth ETF and Real Assets ESG ETF were valued based on Level 1 inputs (see the Schedules of Investments for security categories). The level assigned to the securities valuations may not be an indication of the risk or liquidity associated with investing in those securities. Because of the inherent uncertainties of valuation, the values reflected in the financial statements may materially differ from the value received upon actual sale of those investments.
| | | | | | | | | | | | | | | | | | | | |
| | | Level 1 | | Level 2 | | Level 3 | | Total |
| | | | |
Select Growth ETF | | | | | | | | | | | | | | | | | | | | |
| | | | |
Investments in Securities | | | | | | | | | | | | | | | | | | | | |
| | | | |
Common Stocks & Other Equity Interests | | | $ | 970,941 | | | | $ | - | | | | $ | - | | | | $ | 970,941 | |
| | | | |
Money Market Funds | | | | 13,501 | | | | | 8,995 | | | | | - | | | | | 22,496 | |
| | | | | | | | | | | | | | | | | | | | |
| | | | |
Total Investments | | | $ | 984,442 | | | | $ | 8,995 | | | | $ | - | | | | $ | 993,437 | |
| | | | | | | | | | | | | | | | | | | | |
| | | | |
US Large Cap Core ESG ETF | | | | | | | | | | | | | | | | | | | | |
| | | | |
Investments in Securities | | | | | | | | | | | | | | | | | | | | |
| | | | |
Common Stocks & Other Equity Interests | | | $ | 5,582,883 | | | | $ | - | | | | $ | - | | | | $ | 5,582,883 | |
| | | | |
Money Market Funds | | | | 13,140 | | | | | 50,769 | | | | | - | | | | | 63,909 | |
| | | | | | | | | | | | | | | | | | | | |
| | | | |
Total Investments | | | $ | 5,596,023 | | | | $ | 50,769 | | | | $ | - | | | | $ | 5,646,792 | |
| | | | | | | | | | | | | | | | | | | | |
NOTE 5–Distributions to Shareholders and Tax Components of Net Assets
Tax Character of Distributions to Shareholders Paid During the Fiscal Years Ended October 31, 2022 and 2021:
| | | | | | | | | | | | | | | |
| | | 2022 | | 2021 |
| | | Ordinary
Income* | | Long-Term
Capital Gains | | Ordinary
Income* |
| | | |
Focused Discovery Growth ETF | | | $ | - | | | | $ | - | | | | $ | - | |
| | | |
Real Assets ESG ETF | | | | 118,496 | | | | | 4,055 | | | | | 41,522 | |
| | | |
Select Growth ETF | | | | 1,017 | | | | | - | | | | | 125 | |
| | | |
US Large Cap Core ESG ETF | | | | 90,907 | | | | | - | | | | | 29,001 | |
| * | Includes short-term capital gain distributions, if any. |
Tax Components of Net Assets at Fiscal Year-End:
| | | | | | | | | | | | | | | | | | | | | | | | | | | | | | |
| | | Undistributed
Ordinary
Income | | Net
Unrealized
Appreciation
(Depreciation)-
Investments | | Net
Unrealized
Appreciation-
Foreign
Currencies | | Capital Loss
Carryforwards | | Shares of
Beneficial
Interest | | Total
Net Assets |
| | | | | | |
Focused Discovery Growth ETF | | | $ | - | | | | $ | (5,200 | ) | | | $ | - | | | | $ | (356,525 | ) | | | $ | 963,975 | | | | $ | 602,250 | |
| | | | | | |
Real Assets ESG ETF | | | | - | | | | | (147,215 | ) | | | | 15 | | | | | (11,905 | ) | | | | 3,161,267 | | | | | 3,002,162 | |
| | | | | | |
Select Growth ETF | | | | - | | | | | (207,631 | ) | | | | - | | | | | (300,807 | ) | | | | 1,492,616 | | | | | 984,178 | |
| | | | | | |
US Large Cap Core ESG ETF | | | | 2,774 | | | | | (574,070 | ) | | | | - | | | | | (316,958 | ) | | | | 6,486,211 | | | | | 5,597,957 | |
Capital loss carryforwards are calculated and reported as of a specific date. Results of transactions and other activity after that date may affect the amount of capital loss carryforwards actually available for the Funds to utilize. The ability to utilize capital loss carryforwards in the future may be limited under the Internal Revenue Code and related regulations based on the results of future transactions.
The Funds have capital loss carryforwards as of October 31, 2022, as follows:
| | | | | | |
| | | No expiration | | |
| | | Short-Term | | Long-Term | | Total |
| | | |
Focused Discovery Growth ETF | | $356,525 | | $ - | | $356,525 |
| | | |
Real Assets ESG ETF | | 11,905 | | - | | 11,905 |
| | | |
Select Growth ETF | | 300,807 | | - | | 300,807 |
| | | |
US Large Cap Core ESG ETF | | 175,462 | | 141,496 | | 316,958 |
NOTE 6–Investment Transactions
For the fiscal year ended October 31, 2022, the cost of securities purchased and the proceeds from sales of securities (other than short-term securities, U.S. Government obligations, money market funds and in-kind transactions, if any) were as follows:
| | | | | | | | |
| | | Purchases | | | Sales | |
| | |
Focused Discovery Growth ETF | | $ | 1,268,675 | | | $ | 1,303,969 | |
| | |
Real Assets ESG ETF | | | 2,848,536 | | | | 2,353,714 | |
| | |
Select Growth ETF | | | 1,320,912 | | | | 1,917,577 | |
| | |
US Large Cap Core ESG ETF | | | 1,166,852 | | | | 1,221,442 | |
For the fiscal year ended October 31, 2022, in-kind transactions associated with creations and redemptions were as follows:
| | | | | | | | |
| | | In-kind
Purchases | | | In-kind
Sales | |
| | |
Focused Discovery Growth ETF | | $ | 2,015,901 | | | $ | 2,173,583 | |
| | |
Real Assets ESG ETF | | | 984,646 | | | | - | |
| | |
Select Growth ETF | | | 2,291,350 | | | | 1,681,962 | |
| | |
US Large Cap Core ESG ETF | | | 1,367,176 | | | | 1,355,611 | |
Gains (losses) on in-kind transactions are generally not considered taxable gains (losses) for federal income tax purposes.
As of October 31, 2022, the aggregate cost of investments, including any derivatives, on a tax basis includes adjustments for financial reporting purposes as of the most recently completed federal income tax reporting period-end:
| | | | | | | | | | | | | | | | | | | | | | | | | | |
| | | Gross
Unrealized
Appreciation | | | | Gross
Unrealized
(Depreciation) | | | | Net
Unrealized
Appreciation
(Depreciation) | | | | Cost |
| | | | | | | |
Focused Discovery Growth ETF | | | $ | 34,388 | | | | | | $ | (39,588 | ) | | | | | $ | (5,200 | ) | | | | | $ | 611,775 | |
| | | | | | | |
Real Assets ESG ETF | | | | 172,249 | | | | | | | (319,464 | ) | | | | | | (147,215 | ) | | | | | | 3,142,240 | |
| | | | | | | |
Select Growth ETF | | | | 35,327 | | | | | | | (242,958 | ) | | | | | | (207,631 | ) | | | | | | 1,201,068 | |
| | | | | | | |
US Large Cap Core ESG ETF | | | | 284,547 | | | | | | | (858,617 | ) | | | | | | (574,070 | ) | | | | | | 6,220,862 | |
NOTE 7–Reclassification of Permanent Differences
Primarily as a result of differing book/tax treatment of in-kind transactions, distributions, foreign currency transactions and REITs, amounts were reclassified between undistributed net investment income (loss), undistributed net realized gain (loss) and Shares of beneficial interest. These reclassifications had no effect on the net assets of each Fund. For the fiscal year ended October 31, 2022, the reclassifications were as follows:
| | | | | | | | | | | | | | | |
| | | Undistributed Net
Investment Income (Loss) | | Undistributed Net
Realized Gain (Loss) | | Shares of
Beneficial Interest |
| | | |
Focused Discovery Growth ETF | | | $ | 4,047 | | | | $ | (180,309 | ) | | | $ | 176,262 | |
| | | |
Real Assets ESG ETF | | | | (130 | ) | | | | 1,262 | | | | | (1,132 | ) |
| | | |
Select Growth ETF | | | | 271 | | | | | (273,415 | ) | | | | 273,144 | |
| | | |
US Large Cap Core ESG ETF | | | | (1,258 | ) | | | | (178,222 | ) | | | | 179,480 | |
NOTE 8–Trustees’ and Officer’s Fees
The Adviser, as a result of each Fund’s unitary management fee, pays remuneration to the Independent Trustees and an Officer of the Trust on behalf of the Funds. The Trustee who is an “interested person” of the Trust does not receive any Trustees’ fees.
The Trust has adopted a deferred compensation plan (the “Plan”). Under the Plan, each Independent Trustee who has executed a Deferred Fee Agreement (a “Participating Trustee”) may defer receipt of all or a portion of their compensation (“Deferral Fees”). Such Deferral Fees are deemed to be invested in select Invesco ETFs. The Deferral Fees payable to a Participating Trustee are valued as of the date such Deferral Fees would have been paid to a Participating Trustee. The value increases with contributions or with increases in the value of the Shares selected, and the value decreases with distributions or with declines in the value of the Shares selected. Obligations under the Plan represent unsecured claims against the general assets of the Funds.
NOTE 9–Capital
Shares are issued and redeemed by each Fund only in Creation Units consisting of a specified number of Shares as set forth in each Fund’s prospectus. Only APs are permitted to purchase or redeem Creation Units from the Funds. For Focused Discovery Growth ETF and Select Growth ETF, such transactions are principally permitted in exchange for the securities and cash in each Fund’s Substitution Basket. For Real Assets ESG ETF and US Large Cap Core ESG ETF, such transactions are principally permitted in exchange for the Strategy Components included in each Fund’s Tracking Basket, together with an amount of cash corresponding to the value of the Representative ETFs and cash and cash equivalents that form the remainder of the Tracking Basket. However, for all Funds, cash in an amount equivalent to the value of certain securities may be substituted, generally when the securities are not available in sufficient quantity for delivery, not eligible for trading by the AP or as a result of other market circumstances.
To the extent that the Funds permit transactions in exchange for Deposit Securities, each Fund may issue Shares in advance of receipt of Deposit Securities subject to various conditions, including a requirement to maintain on deposit with the Trust cash at least equal to 105% of the market value of the missing Deposit Securities. In accordance with the Trust’s Participant Agreement, Creation Units will be issued to an AP, notwithstanding the fact that the corresponding Deposit Securities have not been received in part or in whole, in reliance on the undertaking of the AP to deliver the missing Deposit Securities as soon as possible, which undertaking shall be secured by the AP’s delivery and maintenance of collateral consisting of cash in the form of U.S. dollars in immediately available funds having a value (marked-to-market daily) at least equal to 105%, which the Adviser may change from time to time, of the value of the missing Deposit Securities.
Certain transaction fees may be charged by the Funds for creations and redemptions, which are treated as increases in capital.
Transactions in each Fund’s Shares are disclosed in detail in the Statements of Changes in Net Assets.
Report of Independent Registered Public Accounting Firm
To the Board of Trustees of Invesco Actively Managed Exchange-Traded Fund Trust and Shareholders of Invesco Focused Discovery Growth ETF, Invesco Real Assets ESG ETF, Invesco Select Growth ETF and Invesco US Large Cap Core ESG ETF
Opinions on the Financial Statements
We have audited the accompanying statements of assets and liabilities, including the schedules of investments, of Invesco Focused Discovery Growth ETF, Invesco Real Assets ESG ETF, Invesco Select Growth ETF and Invesco US Large Cap Core ESG ETF (four of the funds constituting Invesco Actively Managed Exchange-Traded Fund Trust, hereafter collectively referred to as the “Funds”) as of October 31, 2022, the related statements of operations for the year ended October 31, 2022, and the statements of changes in net assets and the financial highlights for the year ended October 31, 2022 and for the period December 17, 2020 (commencement of investment operations) through October 31, 2021, including the related notes (collectively referred to as the “financial statements”). In our opinion, the financial statements present fairly, in all material respects, the financial position of each of the Funds as of October 31, 2022, the results of each of their operations for the year then ended, and the changes in each of their net assets and each of the financial highlights for the year ended October 31, 2022 and for the period December 17, 2020 (commencement of investment operations) through October 31, 2021 in conformity with accounting principles generally accepted in the United States of America.
Basis for Opinions
These financial statements are the responsibility of the Funds’ management. Our responsibility is to express an opinion on the Funds’ financial statements based on our audits. We are a public accounting firm registered with the Public Company Accounting Oversight Board (United States) (“PCAOB”) and are required to be independent with respect to the Funds in accordance with the U.S. federal securities laws and the applicable rules and regulations of the Securities and Exchange Commission and the PCAOB.
We conducted our audits of these financial statements in accordance with the standards of the PCAOB. Those standards require that we plan and perform the audit to obtain reasonable assurance about whether the financial statements are free of material misstatement, whether due to error or fraud.
Our audits included performing procedures to assess the risks of material misstatement of the financial statements, whether due to error or fraud, and performing procedures that respond to those risks. Such procedures included examining, on a test basis, evidence regarding the amounts and disclosures in the financial statements. Our audits also included evaluating the accounting principles used and significant estimates made by management, as well as evaluating the overall presentation of the financial statements. Our procedures included confirmation of securities owned as of October 31, 2022 by correspondence with the custodian, transfer agent and brokers; when replies were not received from brokers, we performed other auditing procedures. We believe that our audits provide a reasonable basis for our opinions.
/s/PricewaterhouseCoopers LLP
Chicago, Illinois
December 23, 2022
We have served as the auditor of one or more of the investment companies in the Invesco group of investment companies since at least 1995. We have not been able to determine the specific year we began serving as auditor.
Calculating your ongoing Fund expenses
Example
As a shareholder of a Fund of the Invesco Actively Managed Exchange-Traded Fund Trust, you incur a unitary management fee. In addition to the unitary management fee, a shareholder may pay distribution fees, if any, brokerage expenses, taxes, interest, acquired fund fees and expenses, if any, litigation expenses and other extraordinary expenses, including proxy expenses (except for such proxies related to: (i) changes to the Investment Advisory Agreement, (ii) the election of any Board member who is an “interested person” of the Trust, or (iii) any other matters that directly benefit the Adviser). The expense examples below are intended to help you understand your ongoing costs (in dollars) of investing in the Funds and to compare these costs with the ongoing costs of investing in other funds.
The example is based on an investment of $1,000 invested at the beginning of the period and held for the entire period May 1, 2022 through October 31, 2022.
Actual Expenses
The first line in the following table provides information about actual account values and actual expenses. You may use the information in this line, together with the amount you invested, to estimate the expenses that you paid over the period. Simply divide your account value by $1,000 (for example, an $8,600 account value divided by $1,000 = 8.6), then multiply the result by the number in the first line under the heading “Expenses Paid During the Six-Month Period” to estimate the expenses you paid on your account during this period.
Hypothetical Example for Comparison Purposes
The second line in the following table provides information about hypothetical account values and hypothetical expenses based on each Fund’s actual expense ratio and an assumed annualized rate of return of 5% per year before expenses, which is not the Fund’s actual return. The hypothetical account values and expenses may not be used to estimate the actual ending account balance or expenses you paid for the period. You may use this information to compare the ongoing costs of investing in the Funds and other funds. To do so, compare this 5% hypothetical example with the 5% hypothetical examples that appear in the shareholder reports of the other funds.
Please note that the expenses shown in the table are meant to highlight your ongoing costs only, and do not reflect any transactional costs, such as sales charges and brokerage commissions. Therefore, the second line in the table is useful in comparing ongoing costs only, and will not help you determine the relative total costs of owning different funds. In addition, expenses shown in the table do not include the expenses of the underlying funds, which are borne indirectly by a Fund. If transaction costs and indirect expenses were included, your costs would have been higher.
| | | | | | | | |
| | | Beginning
Account Value
May 1, 2022 | | Ending Account Value
October 31, 2022 | | Annualized
Expense Ratio
Based on the
Six-Month Period | | Expenses Paid
During the
Six-Month Period(1) |
| | | | |
Invesco Focused Discovery Growth ETF (IVDG) | | | | | | | | |
| | | | |
Actual | | $1,000.00 | | $ 964.40 | | 0.59% | | $2.92 |
| | | | |
Hypothetical (5% return before expenses) | | 1,000.00 | | 1,022.23 | | 0.59 | | 3.01 |
Invesco Real Assets ESG ETF (IVRA) | | | | | | | | |
| | | | |
Actual | | 1,000.00 | | 866.50 | | 0.59 | | 2.78 |
| | | | |
Hypothetical (5% return before expenses) | | 1,000.00 | | 1,022.23 | | 0.59 | | 3.01 |
| | | | |
Invesco Select Growth ETF (IVSG) | | | | | | | | |
| | | | |
Actual | | 1,000.00 | | 887.40 | | 0.48 | | 2.28 |
| | | | |
Hypothetical (5% return before expenses) | | 1,000.00 | | 1,022.79 | | 0.48 | | 2.45 |
| | | | |
Invesco US Large Cap Core ESG ETF (IVLC) | | | | | | | | |
| | | | |
Actual | | 1,000.00 | | 929.90 | | 0.48 | | 2.33 |
| | | | |
Hypothetical (5% return before expenses) | | 1,000.00 | | 1,022.79 | | 0.48 | | 2.45 |
| (1) | Expenses are calculated using the annualized expense ratio, which represents the ongoing expenses as a percentage of net assets for the six-month period ended October 31, 2022. Expenses are calculated by multiplying the Fund’s annualized expense ratio by the average account value for the period, then multiplying the result by 184/365. Expense ratios for the most recent six-month period may differ from expense ratios based on the annualized data in the Financial Highlights. |
Tax Information
Form 1099-DIV, Form 1042-S and other year–end tax information provide shareholders with actual calendar year amounts that should be included in their tax returns. Shareholders should consult their tax advisers.
The following distribution information is being provided as required by the Internal Revenue Code or to meet a specific state’s requirement.
Each Fund designates the following amounts or, if subsequently determined to be different, the maximum amount allowable for its fiscal year ended October 31, 2022:
| | | | | | | | | | | | | | | | | | | | | | | | | | | | | | | | | | | | | | | | |
| | | Qualified
Business
Income* | | Qualified
Dividend
Income* | | Corporate
Dividends
Received
Deduction* | | U.S.
Treasury
Obligations* | | Business
Interest
Income* | | Qualified
Interest
Income* | | Long Term
Capital Gains | | Qualified
Short
Term
Gains |
Invesco Focused Discovery Growth ETF | | | | 0 | % | | | | 0 | % | | | | 0 | % | | | | 0 | % | | | | 0 | % | | | | 0 | % | | | $ | - | | | | $ | - | |
Invesco Real Assets ESG ETF | | | | 23 | % | | | | 45 | % | | | | 20 | % | | | | 0 | % | | | | 0 | % | | | | 0 | % | | | | 4,055 | | | | | 57,041 | |
Invesco Select Growth ETF | | | | 0 | % | | | | 100 | % | | | | 100 | % | | | | 0 | % | | | | 0 | % | | | | 1 | % | | | | - | | | | | - | |
Invesco US Large Cap Core ESG ETF | | | | 0 | % | | | | 85 | % | | | | 83 | % | | | | 0 | % | | | | 0 | % | | | | 0 | % | | | | - | | | | | 37,743 | |
| * | The above percentages are based on ordinary income dividends paid to shareholders during the Fund’s fiscal year. |
Trustees and Officers
The Independent Trustees of the Trust, their term of office and length of time served, their principal business occupations during at least the past five years, the number of portfolios in the Fund Complex (as defined below) overseen by each Independent Trustee and the other directorships, if any, held by each Independent Trustee are shown below:
As of October 31, 2022
| | | | | | | | | | |
Name, Address and Year of Birth of Independent Trustees | | Position(s)
Held
with Trust | | Term of
Office and Length of
Time Served* | | Principal Occupation(s) During the Past 5 Years | | Number of
Portfolios in Fund
Complex**
Overseen by
Independent
Trustees | | Other Directorships Held by Independent
Trustees During
the Past 5 Years |
Ronn R. Bagge–1958 c/o Invesco Capital Management LLC 3500 Lacey Road, Suite 700 Downers Grove, IL 60515 | | Vice Chair of the Board; Chair of the Nominating and Governance Committee and Trustee | | Vice Chair since 2018; Chair of the Nominating and Governance Committee and Trustee since 2008 | | Founder and Principal, YQA Capital Management LLC (1998-Present); formerly, Owner/CEO of Electronic Dynamic Balancing Co., Inc. (high-speed rotating equipment service provider). | | 234 | | Chair (since 2021) and member (since 2017) of the Joint Investment Committee, Mission Aviation Fellowship and MAF Foundation; Trustee, Mission Aviation Fellowship (2017-Present). |
| | | | | |
Todd J. Barre–1957 c/o Invesco Capital Management LLC 3500 Lacey Road, Suite 700 Downers Grove, IL 60515 | | Trustee | | Since 2010 | | Assistant Professor of Business, Trinity Christian College (2010-2016); formerly, Vice President and Senior Investment Strategist (2001-2008), Director of Open Architecture and Trading (2007-2008), Head of Fundamental Research (2004-2007) and Vice President and Senior Fixed Income Strategist (1994-2001), BMO Financial Group/Harris Private Bank. | | 234 | | None. |
| * | This is the date the Independent Trustee began serving the Trust. Each Independent Trustee serves an indefinite term, until his or her successor is elected. |
| ** | Fund Complex includes all open- and closed-end funds (including all of their portfolios) advised by the Adviser and any affiliated person of the Adviser. |
Trustees and Officers–(continued)
| | | | | | | | | | |
Name, Address and Year of Birth of Independent Trustees | | Position(s)
Held
with Trust | | Term of
Office and Length of
Time Served* | | Principal Occupation(s) During the Past 5 Years | | Number of
Portfolios in Fund
Complex**
Overseen by
Independent
Trustees | | Other Directorships Held by Independent
Trustees During
the Past 5 Years |
Edmund P. Giambastiani, Jr.–1948 c/o Invesco Capital Management LLC 3500 Lacey Road, Suite 700 Downers Grove, IL 60515 | | Trustee | | Since 2019 | | President, Giambastiani Group LLC (national security and energy consulting) (2007-Present); Director, First Eagle Alternative Credit LLC (2020-Present); Advisory Board Member, Massachusetts Institute of Technology Lincoln Laboratory (federally-funded research development) (2010-Present); Defense Advisory Board Member, Lawrence Livermore National Laboratory (2013-Present); formerly, Director, The Boeing Company (2009-2021); Trustee, MITRE Corporation (federally funded research development) (2008-2020); Director, THL Credit, Inc. (alternative credit investment manager) (2016-2020); Chair (2015-2016), Lead Director (2011-2015) and Director (2008-2011), Monster Worldwide, Inc. (career services); United States Navy, career nuclear submarine officer (1970-2007); Seventh Vice Chair of the Joint Chiefs of Staff (2005-2007); first NATO Supreme Allied Commander Transformation (2003-2005); Commander, U.S. Joint Forces Command (2002-2005). | | 234 | | Trustee, U.S. Naval Academy Foundation Athletic & Scholarship Program (2010- Present); formerly, Trustee, certain funds of the Oppenheimer Funds complex (2013-2019); Advisory Board Member, Maxwell School of Citizenship and Public Affairs of Syracuse University (2012-2016). |
| * | This is the date the Independent Trustee began serving the Trust. Each Independent Trustee serves an indefinite term, until his or her successor is elected. |
| ** | Fund Complex includes all open- and closed-end funds (including all of their portfolios) advised by the Adviser and any affiliated person of the Adviser. |
Trustees and Officers–(continued)
| | | | | | | | | | |
Name, Address and Year of Birth of Independent Trustees | | Position(s)
Held
with Trust | | Term of
Office and Length of
Time Served* | | Principal Occupation(s) During the Past 5 Years | | Number of
Portfolios in Fund
Complex**
Overseen by
Independent
Trustees | | Other Directorships Held by Independent
Trustees During
the Past 5 Years |
Victoria J. Herget–1951 c/o Invesco Capital Management LLC 3500 Lacey Road, Suite 700 Downers Grove, IL 60515 | | Trustee | | Since 2019 | | Formerly, Managing Director (1993-2001), Principal (1985-1993), Vice President (1978-1985) and Assistant Vice President (1973-1978), Zurich Scudder Investments (investment adviser) (and its predecessor firms). | | 234 | | Trustee (2000- Present) and Chair (2010-2017), Newberry Library; Trustee, Chikaming Open Lands (2014-Present); formerly, Trustee, Mather LifeWays (2001-2021); Trustee, certain funds in the Oppenheimer Funds complex (2012-2019); Board Chair (2008-2015) and Director (2004-2018), United Educators Insurance Company; Independent Director, First American Funds (2003-2011); Trustee (1992-2007), Chair of the Board of Trustees (1999-2007), Investment Committee Chair (1994-1999) and Investment Committee member (2007-2010), Wellesley College; Trustee, BoardSource (2006-2009); Trustee, Chicago City Day School (1994-2005). |
| * | This is the date the Independent Trustee began serving the Trust. Each Independent Trustee serves an indefinite term, until his or her successor is elected. |
| ** | Fund Complex includes all open- and closed-end funds (including all of their portfolios) advised by the Adviser and any affiliated person of the Adviser. |
Trustees and Officers–(continued)
| | | | | | | | | | |
Name, Address and Year of Birth of Independent Trustees | | Position(s)
Held
with Trust | | Term of
Office and Length of
Time Served* | | Principal Occupation(s) During the Past 5 Years | | Number of
Portfolios in Fund
Complex**
Overseen by
Independent
Trustees | | Other Directorships Held by Independent
Trustees During
the Past 5 Years |
Marc M. Kole–1960 c/o Invesco Capital Management LLC 3500 Lacey Road, Suite 700 Downers Grove, IL 60515 | | Chair of the Audit Committee and Trustee | | Chair of the Audit Committee since 2008; Trustee since 2008 | | Formerly, Managing Director of Finance (2020-2021) and Senior Director of Finance (2015-2020), By The Hand Club for Kids (not-for-profit); Chief Financial Officer, Hope Network (social services) (2008-2012); Assistant Vice President and Controller, Priority Health (health insurance) (2005-2008); Regional Chief Financial Officer, United Healthcare (2005); Chief Accounting Officer, Senior Vice President of Finance, Oxford Health Plans (2000-2004); Audit Partner, Arthur Andersen LLP (1996-2000). | | 234 | | Formerly, Treasurer (2018-2021), Finance Committee Member (2015-2021) and Audit Committee Member (2015), Thornapple Evangelical Covenant Church; Board and Finance Committee Member (2009-2017) and Treasurer (2010-2015, 2017), NorthPointe Christian Schools. |
| | | | | |
Yung Bong Lim–1964 c/o Invesco Capital Management LLC 3500 Lacey Road, Suite 700 Downers Grove, IL 60515 | | Chair of the Investment Oversight Committee and Trustee | | Chair of the Investment Oversight Committee since 2014; Trustee since 2013 | | Managing Partner, RDG Funds LLC (real estate) (2008-Present); formerly, Managing Director, Citadel LLC (1999-2007). | | 234 | | Board Director, Beacon Power Services, Corp. (2019-Present); formerly, Advisory Board Member, Performance Trust Capital Partners, LLC (2008-2020). |
| * | This is the date the Independent Trustee began serving the Trust. Each Independent Trustee serves an indefinite term, until his or her successor is elected. |
| ** | Fund Complex includes all open- and closed-end funds (including all of their portfolios) advised by the Adviser and any affiliated person of the Adviser. |
Trustees and Officers–(continued)
| | | | | | | | | | |
Name, Address and Year of Birth of Independent Trustees | | Position(s)
Held
with Trust | | Term of
Office and Length of
Time Served* | | Principal Occupation(s) During the Past 5 Years | | Number of
Portfolios in Fund
Complex**
Overseen by
Independent
Trustees | | Other Directorships Held by Independent
Trustees During
the Past 5 Years |
Joanne Pace–1958 c/o Invesco Capital Management LLC 3500 Lacey Road, Suite 700 Downers Grove, IL 60515 | | Trustee | | Since 2019 | | Formerly, Senior Advisor, SECOR Asset Management, LP (2010-2011); Managing Director and Chief Operating Officer, Morgan Stanley Investment Management (2006-2010); Partner and Chief Operating Officer, FrontPoint Partners, LLC (alternative investments) (2005-2006); Managing Director (2003-2005), Global Head of Human Resources and member of Executive Board and Operating Committee (2004-2005), Global Head of Operations and Product Control (2003-2004), Credit Suisse (investment banking); Managing Director (1997-2003), Controller and Principal Accounting Officer (1999-2003), Chief Financial Officer (temporary assignment) for the Oversight Committee, Long Term Capital Management (1998-1999), Morgan Stanley. | | 234 | | Board Director, Horizon Blue Cross Blue Shield of New Jersey (2012-Present); Governing Council Member (2016-Present) and Chair of Education Committee (2017-2021), Independent Directors Council (IDC); Council Member, New York-Presbyterian Hospital’s Leadership Council on Children’s and Women’s Health (2012-Present); formerly, Advisory Board Director, The Alberleen Group LLC (2012-2021); Board Member, 100 Women in Finance (2015-2020); Trustee, certain funds in the Oppenheimer Funds complex (2012-2019); Lead Independent Director and Chair of the Audit and Nominating Committee of The Global Chartist Fund, LLC, Oppenheimer Asset Management (2011-2012); Board Director, Managed Funds Association (2008-2010); Board Director (2007-2010) and Investment Committee Chair (2008-2010), Morgan Stanley Foundation. |
| * | This is the date the Independent Trustee began serving the Trust. Each Independent Trustee serves an indefinite term, until his or her successor is elected. |
| ** | Fund Complex includes all open- and closed-end funds (including all of their portfolios) advised by the Adviser and any affiliated person of the Adviser. |
Trustees and Officers–(continued)
| | | | | | | | | | |
Name, Address and Year of Birth of Independent Trustees | | Position(s)
Held
with Trust | | Term of
Office and Length of
Time Served* | | Principal Occupation(s) During the Past 5 Years | | Number of
Portfolios in Fund
Complex**
Overseen by
Independent
Trustees | | Other Directorships Held by Independent
Trustees During
the Past 5 Years |
Gary R. Wicker–1961 c/o Invesco Capital Management LLC 3500 Lacey Road, Suite 700 Downers Grove, IL 60515 | | Trustee | | Since 2013 | | Senior Vice President of Global Finance and Chief Financial Officer, RBC Ministries (publishing company) (2013-Present); formerly, Executive Vice President and Chief Financial Officer, Zondervan Publishing (a division of Harper Collins/NewsCorp) (2007-2012); Senior Vice President and Group Controller (2005-2006), Senior Vice President and Chief Financial Officer (2003-2004), Chief Financial Officer (2001-2003), Vice President, Finance and Controller (1999-2001) and Assistant Controller (1997-1999), divisions of The Thomson Corporation (information services provider); Senior Audit Manager (1994-1997), PricewaterhouseCoopers LLP. | | 234 | | Board Member and Treasurer, Our Daily Bread Ministries Canada (2015-Present); Board and Finance Committee Member, West Michigan Youth For Christ (2010-Present). |
| | | | | |
Donald H. Wilson–1959 c/o Invesco Capital Management LLC 3500 Lacey Road, Suite 700 Downers Grove, IL 60515 | | Chair of the Board and Trustee | | Chair since 2012; Trustee since 2008 | | Chair, President and Chief Executive Officer, McHenry Bancorp Inc. and McHenry Savings Bank (subsidiary) (2018-Present); formerly, Chair and Chief Executive Officer, Stone Pillar Advisors, Ltd. (2010-2017); President and Chief Executive Officer, Stone Pillar Investments, Ltd. (advisory services to the financial sector) (2016-2018); Chair, President and Chief Executive Officer, Community Financial Shares, Inc. and Community Bank-Wheaton/Glen Ellyn (subsidiary) (2013-2015); Chief Operating Officer, AMCORE Financial, Inc. (bank holding company) (2007-2009); Executive Vice President and Chief Financial Officer, AMCORE Financial, Inc. (2006-2007); Senior Vice President and Treasurer, Marshall & Ilsley Corp. (bank holding company) (1995-2006). | | 234 | | Director, Penfield Children’s Center (2004-Present); Board Chair, Gracebridge Alliance, Inc. (2015-Present). |
| * | This is the date the Independent Trustee began serving the Trust. Each Independent Trustee serves an indefinite term, until his or her successor is elected. |
| ** | Fund Complex includes all open- and closed-end funds (including all of their portfolios) advised by the Adviser and any affiliated person of the Adviser. |
Trustees and Officers–(continued)
The Interested Trustee and the executive officers of the Trust, their term of office and length of time served, their principal business occupations during at least the past five years, the number of portfolios in the Fund Complex overseen by the Interested Trustee and the other directorships, if any, held by the Interested Trustee are shown below:
| | | | | | | | | | |
Name, Address and Year of Birth
of Interested Trustee | | Position(s)
Held
with Trust | | Term of
Office and Length of
Time Served* | | Principal Occupation(s) During the Past 5 Years | | Number of
Portfolios in Fund
Complex**
Overseen by
Interested
Trustee | | Other Directorships Held by Interested Trustee During
the Past 5 Years |
Anna Paglia–1974 Invesco Capital Management LLC 3500 Lacey Road Suite 700 Downers Grove, IL 60515 | | Trustee, President and Principal Executive Officer | | Trustee since 2022, President and Principal Executive Officer since 2020 | | President and Principal Executive Officer (2020-Present) and Trustee (2022-Present), Invesco Exchange-Traded Fund Trust, Invesco Exchange-Traded Fund Trust II, Invesco India Exchange-Traded Fund Trust, Invesco Actively Managed Exchange-Traded Fund Trust, Invesco Actively Managed Exchange-Traded Commodity Fund Trust and Invesco Exchange-Traded Self-Indexed Fund Trust; Managing Director and Global Head of ETFs and Indexed Strategies, Chief Executive Officer and Principal Executive Officer, Invesco Capital Management LLC (2020-Present); Chief Executive Officer, Manager and Principal Executive Officer, Invesco Specialized Products, LLC (2020-Present); Vice President, Invesco Indexing LLC (2020-Present); formerly, Secretary, Invesco Exchange-Traded Fund Trust, Invesco Exchange-Traded Fund Trust II, Invesco India Exchange-Traded Fund Trust and Invesco Actively Managed Exchange-Traded Fund Trust (2011-2020), Invesco Actively Managed Exchange-Traded Commodity Fund Trust (2014-2020) and Invesco Exchange-Traded Self-Indexed Fund Trust (2015-2020); Head of Legal (2010-2020) and Secretary (2015-2020), Invesco Capital Management LLC; Manager and Assistant Secretary, Invesco Indexing LLC (2017-2020); Head of Legal and Secretary, Invesco Specialized Products, LLC (2018-2020); Partner, K&L Gates LLP (formerly, Bell Boyd & Lloyd LLP) (2007-2010); and Associate Counsel at Barclays Global Investors Ltd. (2004-2006). | | 234 | | None |
| * | This is the date the Interested Trustee began serving the Trust. The Interested Trustee serves an indefinite term, until his successor is elected. |
| ** | Fund Complex includes all open- and closed-end funds (including all of their portfolios) advised by the Adviser and any affiliated person of the Adviser. |
Trustees and Officers–(continued)
| | | | | | |
Name, Address and Year of Birth of Executive Officers | | Position(s)
Held with Trust | | Length of
Time
Served* | | Principal Occupation(s) During the Past 5 Years |
Adrien Deberghes–1967 Invesco Capital Management LLC 11 Greenway Plaza, Suite 1000 Houston, TX 77046 | | Vice President | | Since 2020 | | Vice President, Invesco Exchange-Traded Fund Trust, Invesco Exchange-Traded Fund Trust II, Invesco India Exchange-Traded Fund Trust, Invesco Actively Managed Exchange-Traded Fund Trust, Invesco Actively Managed Exchange-Traded Commodity Fund Trust and Invesco Exchange-Traded Self-Indexed Fund Trust (2020-Present); Head of the Fund Office of the CFO, Fund Administration and Vice President, Invesco Advisers, Inc. (2020-Present); Principal Financial Officer, Treasurer and Vice President, The Invesco Funds (2020-Present); formerly, Senior Vice President and Treasurer, Fidelity Investments (2008-2020). |
| | | |
Kelli Gallegos–1970 Invesco Capital Management LLC 11 Greenway Plaza, Suite 1000 Houston, TX 77046 | | Vice President and Treasurer | | Since 2018 | | Vice President, Invesco Advisers, Inc. (2020-Present); Principal Financial and Accounting Officer- Pooled Investments, Invesco Specialized Products, LLC (2018-Present); Vice President and Treasurer, Invesco Exchange-Traded Fund Trust, Invesco Exchange-Traded Fund Trust II, Invesco India Exchange-Traded Fund Trust, Invesco Actively Managed Exchange-Traded Fund Trust, Invesco Actively Managed Exchange-Traded Commodity Fund Trust and Invesco Exchange-Traded Self-Indexed Fund Trust (2018-Present); Principal Financial and Accounting Officer-Pooled Investments, Invesco Capital Management LLC (2018-Present); Vice President and Assistant Treasurer (2008-Present), The Invesco Funds; formerly, Principal Financial Officer (2016-2020) and Assistant Vice President (2008-2016), The Invesco Funds; Assistant Treasurer, Invesco Specialized Products, LLC (2018); Assistant Treasurer, Invesco Exchange-Traded Fund Trust, Invesco Exchange-Traded Fund Trust II, Invesco India Exchange-Traded Fund Trust and Invesco Actively Managed Exchange-Traded Fund Trust (2012-2018), Invesco Actively Managed Exchange-Traded Commodity Fund Trust (2014-2018) and Invesco Exchange-Traded Self-Indexed Fund Trust (2016-2018); and Assistant Treasurer, Invesco Capital Management LLC (2013-2018). |
| | | |
Adam Henkel–1980 Invesco Capital Management LLC 3500 Lacey Road, Suite 700 Downers Grove, IL 60515 | | Secretary | | Since 2020 | | Head of Legal and Secretary, Invesco Capital Management LLC and Invesco Specialized Products, LLC (2020-present); Secretary, Invesco Exchange-Traded Fund Trust, Invesco Exchange-Traded Fund Trust II, Invesco India Exchange- Traded Fund Trust, Invesco Actively Managed Exchange-Traded Fund Trust, Invesco Actively Managed Exchange-Traded Commodity Fund Trust and Invesco Exchange-Traded Self-Indexed Fund Trust (2020-Present); Assistant Secretary, Invesco Capital Markets, Inc. (2020-Present); Assistant Secretary, The Invesco Funds (2014-Present); Manager and Assistant Secretary, Invesco Indexing LLC (2020-Present); Assistant Secretary, Invesco Investment Advisers LLC (2020-Present); formerly, Assistant Secretary of Invesco Exchange-Traded Fund Trust, Invesco Exchange-Traded Fund Trust II, Invesco India Exchange-Traded Fund Trust, Invesco Actively Managed Exchange-Traded Fund Trust and Invesco Actively Managed Exchange-Traded Commodity Fund Trust (2014-2020); Chief Compliance Officer of Invesco Capital Management LLC (2017); Chief Compliance Officer of Invesco Exchange-Traded Fund Trust, Invesco Exchange-Traded Fund Trust II, Invesco India Exchange-Traded Fund Trust, Invesco Actively Managed Exchange-Traded Fund Trust and Invesco Actively Managed Exchange-Traded Commodity Fund Trust (2017); Senior Counsel, Invesco, Ltd. (2013-2020); Assistant Secretary, Invesco Specialized Products, LLC (2018-2020). |
| * | This is the date each Officer began serving the Trust in their current position. Each Officer serves an indefinite term, until his or her successor is elected. |
Trustees and Officers–(continued)
| | | | | | |
Name, Address and Year of Birth of Executive Officers | | Position(s)
Held with Trust | | Length of
Time
Served* | | Principal Occupation(s) During the Past 5 Years |
Peter Hubbard–1981 Invesco Capital Management LLC 3500 Lacey Road, Suite 700 Downers Grove, IL 60515 | | Vice President | | Since 2009 | | Vice President, Invesco Specialized Products, LLC (2018-Present); Vice President, Invesco Exchange-Traded Fund Trust, Invesco Exchange-Traded Fund Trust II, Invesco India Exchange-Traded Fund Trust, Invesco Actively Managed Exchange-Traded Fund Trust (2009-Present), Invesco Actively Managed Exchange-Traded Commodity Fund Trust (2014-Present) and Invesco Exchange-Traded Self-Indexed Fund Trust (2016-Present); Vice President and Director of Portfolio Management, Invesco Capital Management LLC (2010-Present); and Vice President, Invesco Advisers, Inc. (2020-Present); formerly, Vice President of Portfolio Management, Invesco Capital Management LLC (2008-2010); Portfolio Manager, Invesco Capital Management LLC (2007-2008); Research Analyst, Invesco Capital Management LLC (2005-2007); Research Analyst and Trader, Ritchie Capital, a hedge fund operator (2003-2005). |
| | | |
Sheri Morris–1964 Invesco Capital Management LLC 11 Greenway Plaza, Suite 1000 Houston, TX 77046 | | Vice President | | Since 2012 | | Head of Global Fund Services, Invesco Ltd. (2019-Present); Vice President, OppenheimerFunds, Inc. (2019-Present); President and Principal Executive Officer, The Invesco Funds (2016-Present); Senior Vice President, Invesco Advisers, Inc. (formerly known as Invesco Institutional (N.A.), Inc.) (registered investment adviser) (2020-Present); Director, Invesco Trust Company (2022-Present) and Vice President, Invesco Exchange-Traded Fund Trust, Invesco Exchange-Traded Fund Trust II, Invesco India Exchange-Traded Fund Trust, Invesco Actively Managed Exchange-Traded Fund Trust (2012-Present), Invesco Actively Managed Exchange-Traded Commodity Fund Trust (2014-Present) and Invesco Exchange-Traded Self-Indexed Fund Trust (2016-Present); formerly, Treasurer (2008-2020), Vice President and Principal Financial Officer, The Invesco Funds (2008-2016); Treasurer, Invesco Exchange-Traded Fund Trust, Invesco Exchange-Traded Fund Trust II, Invesco India Exchange-Traded Fund Trust and Invesco Actively Managed Exchange-Traded Fund Trust (2011-2013); Vice President, Invesco Aim Advisers, Inc., Invesco Aim Capital Management, Inc. and Invesco Aim Private Asset Management, Inc.; Treasurer, Assistant Vice President and Assistant Treasurer, The Invesco Funds and Assistant Vice President, Invesco Advisers, Inc., Invesco Aim Capital Management, Inc. and Invesco Aim Private Asset Management, Inc.; Vice President, Invesco Advisers, Inc. (2009-2020). |
| | | |
Rudolf E. Reitmann–1971 Invesco Capital Management LLC 3500 Lacey Road, Suite 700 Downers Grove, IL 60515 | | Vice President | | Since 2013 | | Head of Global Exchange Traded Funds Services, Invesco Specialized Products, LLC (2018-Present); Vice President, Invesco Exchange-Traded Fund Trust, Invesco Exchange-Traded Fund Trust II, Invesco India Exchange-Traded Fund Trust, Invesco Actively Managed Exchange-Traded Fund Trust (2013-Present), Invesco Actively Managed Exchange-Traded Commodity Fund Trust (2014-Present) and Invesco Exchange-Traded Self-Indexed Fund Trust (2016-Present); Head of Global Exchange Traded Funds Services, Invesco Capital Management LLC (2013-Present); Vice President, Invesco Capital Markets, Inc. (2018-Present). |
| * | This is the date each Officer began serving the Trust in their current position. Each Officer serves an indefinite term, until his or her successor is elected. |
Trustees and Officers–(continued)
| | | | | | |
Name, Address and Year of Birth of Executive Officers | | Position(s)
Held with Trust | | Length of
Time
Served* | | Principal Occupation(s) During the Past 5 Years |
Melanie Zimdars–1976 Invesco Capital Management LLC 3500 Lacey Road, Suite 700 Downers Grove, IL 60515 | | Chief Compliance Officer | | Since 2017 | | Chief Compliance Officer, Invesco Specialized Products, LLC (2018-Present); Chief Compliance Officer, Invesco Capital Management LLC (2017-Present); Chief Compliance Officer, Invesco Exchange-Traded Fund Trust, Invesco Exchange-Traded Fund Trust II, Invesco India Exchange-Traded Fund Trust, Invesco Actively Managed Exchange-Traded Fund Trust, Invesco Actively Managed Exchange-Traded Commodity Fund Trust and Invesco Exchange-Traded Self-Indexed Fund Trust (2017-Present); formerly, Vice President and Deputy Chief Compliance Officer, ALPS Holding, Inc. (2009-2017); Mutual Fund Treasurer/Chief Financial Officer, Wasatch Advisors, Inc. (2005-2008); Compliance Officer, U.S. Bancorp Fund Services, LLC (2001-2005). |
| * | This is the date each Officer began serving the Trust in their current position. Each Officer serves an indefinite term, until his or her successor is elected. |
Availability of Additional Information About the Trustees
The Statement of Additional Information includes additional information about the Trustees and is available, without charge, upon request at (800) 983-0903.
(This Page Intentionally Left Blank)
Proxy Voting Policies and Procedures
A description of the Trust’s proxy voting policies and procedures that the Funds use to determine how to vote proxies relating to portfolio securities is available, without charge and upon request, by calling (800) 983-0903. This information is also available on the Securities and Exchange Commission’s (the “Commission”) website at www.sec.gov.
Information regarding how each Fund voted proxies for portfolio securities, if applicable, during the most recent 12-month period ended June 30, is available, without charge and upon request, by (i) calling (800) 983-0903; or (ii) accessing the Trust’s Form N-PX on the Commission’s website at www.sec.gov.
Quarterly Portfolios
The Trust files its complete schedule of portfolio holdings for the Funds with the Commission for the first and third quarters of each fiscal year as an exhibit to its reports on Form N-PORT. The Forms N-PORT are available on the Commission’s website at www.sec.gov.
Frequency Distribution of Discounts and Premiums
A table showing the number of days the market price of each Fund’s shares was greater than the Fund’s net asset value, and the number of days it was less than the Fund’s net asset value (i.e., premium or discount) for the most recently completed calendar year, and the calendar quarters since that year end (or the life of the Fund, if shorter) may be found at the Fund’s website at www.invesco.com/ETFs.
| | | | | | |
| ©2022 Invesco Capital Management LLC | | | | | | |
| 3500 Lacey Road, Suite 700 | | | | | | |
| Downers Grove, IL 60515 | | P-PS-AR-6 | | invesco.com/ETFs | | |
Item 2. Code of Ethics.
The Registrant has adopted a Code of Ethics that applies to the Registrant’s principal executive officer and principal financial officer. This Code is filed as an exhibit to this report on Form N-CSR under Item 13(a)(1). No substantive amendments to this Code were made during the reporting period. There were no waivers for the fiscal year ended October 31, 2022.
Item 3. Audit Committee Financial Expert.
The Registrant’s Board of Trustees (the “Board”) has determined that the Registrant has four “audit committee financial experts” serving on its audit committee: Mr. Marc M. Kole, Ms. Joanne Pace, Mr. Gary R. Wicker and Mr. Donald H. Wilson. Each of these audit committee members is “independent,” meaning that he/she is not an “interested person” of the Registrant (as that term is defined in Section 2(a)(19) of the Investment Company Act of 1940, as amended) and he/she does not accept any consulting, advisory, or other compensatory fee from the Registrant (except in his/her capacity as a Board or committee member).
An “audit committee financial expert” is not an “expert” for any purpose, including for purposes of Section 11 of the Securities Act of 1933, as a result of being designated as an “audit committee financial expert.” Further, the designation of a person as an “audit committee financial expert” does not mean that a person has any greater duties, obligations, or liability than those imposed on a person without the “audit committee financial expert” designation. Similarly, the designation of a person as an “audit committee financial expert” does not affect the duties, obligations, or liability of any other member of the audit committee or Board.
Item 4. Principal Accountant Fees and Services.
(a) to (d)
Fees Billed by PwC to the Registrant
PricewaterhouseCoopers LLP (“PwC”), the Registrant’s independent registered public accounting firm, billed the Registrant aggregate fees for pre-approved services rendered to the Registrant for the last two fiscal years as shown in the following table. The Audit Committee pre-approved all audit and non-audit services provided to the Registrant.
| | | | |
| | | Fees Billed by PwC for Services Rendered
to the Registrant for Fiscal Year End 2022 | | Fees Billed by PwC for Services Rendered
to the Registrant for Fiscal Year End 2021 |
Audit Fees | | $ 310,620 | | $ 299,250 |
Audit-Related Fees | | $ 0 | | $ 0 |
Tax Fees(1) | | $ 185,668 | | $ 188,426 |
All Other Fees | | $ 0 | | $ 0 |
Total Fees | | $ 496,288 | | $ 487,676 |
| | (1) | Tax Fees for the fiscal years ended October 31, 2022 and 2021 include fees billed for preparation of U.S. Tax Returns and Taxable Income calculations, including excise and year-to-date estimates for various book-to-tax differences. |
Fees Billed by PwC Related to Invesco and Invesco Affiliates
PwC billed Invesco Capital Management LLC (“Invesco” or “Adviser”), the Registrant’s investment adviser, and any entity controlling, controlled by or under common control with Invesco that provides ongoing services to the Registrant (“Affiliates”), aggregate fees for pre-approved non-audit services rendered to Invesco and Affiliates for the last two fiscal years as shown in the following table. The Audit Committee pre-approved all non-audit services provided to Invesco and Affiliates that were required to be pre-approved.
| | | | |
| | | Fees Billed for Non- Audit Services Rendered to Invesco and Affiliates for Fiscal Year End 2022 That Were Required to be Pre-Approved by the Registrant’s Audit Committee | | Fees Billed for Non- Audit Services Rendered to Invesco and Affiliates for Fiscal Year End 2021 That Were Required to be Pre-Approved by the Registrant’s Audit Committee |
Audit-Related Fees(1) | | $ 760,000 | | $ 760,000 |
Tax Fees | | $ 0 | | $ 0 |
All Other Fees | | $ 0 | | $ 0 |
Total Fees | | $ 760,000 | | $ 760,000 |
| | (1) | Audit-Related Fees for the fiscal years ended 2022 and 2021 include fees billed related to reviewing controls at a service organization. |
(e)(1) Audit Committee Pre-Approval Policies and Procedures
Pre-Approval of Audit and Non-Audit Services Policies and Procedures
As Adopted by the Audit Committee of the Invesco ETFs
| | |
Applicable to | | Invesco Exchange-Traded Fund Trust, Invesco Exchange-Traded Fund Trust II, Invesco India Exchange-Traded Fund Trust, Invesco Actively Managed Exchange-Traded Fund Trust, Invesco Actively Managed Exchange-Traded Commodity Fund Trust and Invesco Exchange-Traded Self-Indexed Fund Trust (collectively the “Funds”) |
Risk Addressed by Policy | | Approval of Audit and Non-Audit Services |
| | |
Relevant Law and Other Sources | | Sarbanes-Oxley Act of 2002; Regulation S-X. |
Last Reviewed by Compliance for Accuracy | | June 15, 2018 |
Effective Date | | June 26, 2009 |
Amended Dates | | March 12, 2015 and June 15, 2018 |
Statement of Principles
Under the Sarbanes-Oxley Act of 2002 and rules adopted by the Securities and Exchange Commission (“SEC”) (“Rules”), the Audit Committee of the Funds’ (the “Audit Committee”) Board of Trustees (the “Board”) is responsible for the appointment, compensation and oversight of the work of independent accountants (an “Auditor”). As part of this responsibility and to assure that the Auditor’s independence is not impaired, the Audit Committee pre-approves the audit and non-audit services provided to the Funds by each Auditor, as well as all non-audit services provided by the Auditor to the Funds’ investment adviser and to affiliates of the adviser that provide ongoing services to the Funds (“Service Affiliates”) if the services directly impact the Funds’ operations or financial reporting. The SEC Rules also specify the types of services that an Auditor may not provide to its audit client. The following policies and procedures comply with the requirements for pre-approval and provide a mechanism by which management of the Funds may request and secure pre-approval of audit and non-audit services in an orderly manner with minimal disruption to normal business operations.
Proposed services either may be pre-approved without consideration of specific case-by-case services by the Audit Committee (“general pre-approval”) or require the specific pre-approval of the Audit Committee (“specific pre-approval”). As set forth in these policies and procedures, unless a type of service has received general pre-approval, it will require specific pre-approval by the Audit Committee. Additionally, any fees exceeding 110% of estimated pre-approved fee levels provided at the time the service was pre-approved will also require specific approval by the Audit Committee before payment is made. The Audit Committee will also consider the impact of additional fees on the Auditor’s independence when determining whether to approve any additional fees for previously pre-approved services.
The Audit Committee will annually review and generally pre-approve the services that may be provided by each Auditor without obtaining specific pre-approval from the Audit Committee. The term of any general pre-approval runs from the date of such pre-approval through June 30th of the following year, unless the Audit Committee considers a different period and states otherwise. The Audit Committee will add to or subtract from the list of general pre-approved services from time to time, based on subsequent determinations.
The purpose of these policies and procedures is to set forth the guidelines to assist the Audit Committee in fulfilling its responsibilities.
Delegation
The Chairman of the Audit Committee (or, in his or her absence, any member of the Audit Committee) may grant specific pre-approval for non-prohibited services. All such delegated pre-approvals shall be presented to the Audit Committee no later than the next Audit Committee meeting.
Audit Services
The annual Audit services engagement terms will be subject to specific pre-approval of the Audit Committee. Audit services include the annual financial statement audit and other procedures such as tax provision work that is required to be performed by the independent auditor to be able to form an opinion on the Funds’ financial statements. The Audit Committee will obtain, review and consider sufficient information concerning the proposed Auditor to make a reasonable evaluation of the Auditor’s qualifications and independence.
In addition to the annual Audit services engagement, the Audit Committee may grant either general or specific pre-approval of other Audit services, which are those services that only the independent auditor reasonably can provide. Other Audit services may include services such as issuing consents for the inclusion of audited financial statements with SEC registration statements, periodic reports and other documents filed with the SEC or other documents issued in connection with securities offerings.
Non-Audit Services
The Audit Committee may provide either general or specific pre-approval of any non-audit services to the Funds and its Service Affiliates if the Audit Committee believes that the provision of the service will not impair the independence of the Auditor, is consistent with the SEC’s Rules on auditor independence, and otherwise conforms to the Audit Committee’s general principles and policies as set forth herein.
Audit-Related Services
“Audit-related services” are assurance and related services that are reasonably related to the performance of the audit or review of the Funds’ financial statements or that are traditionally performed by the independent auditor. Audit-related services include, among others, accounting consultations related to accounting, financial reporting or disclosure matters not classified as “Audit services”; and assistance with understanding and implementing new accounting and financial reporting guidance from rulemaking authorities.
Tax Services
“Tax services” include, but are not limited to, the review and signing of the Funds’ federal tax returns, the review of required distributions by the Funds and consultations regarding tax matters such as the tax treatment of new investments or the impact of new regulations. The Audit Committee will scrutinize carefully the retention of the Auditor in connection with a transaction initially recommended by the Auditor, the major business purpose of which may be tax avoidance or the tax treatment of which may not be supported in the Internal Revenue Code and related regulations. The Audit Committee will consult with the Funds’ Treasurer (or his or her designee) and may consult with outside counsel or advisors as necessary to ensure the consistency of Tax services rendered by the Auditor with the foregoing policy.
No Auditor shall represent any Fund or any Service Affiliate before a tax court, district court or federal court of claims.
Under rules adopted by the Public Company Accounting Oversight Board and approved by the SEC, in connection with seeking Audit Committee pre-approval of permissible Tax services, the Auditor shall:
| | 1. | Describe in writing to the Audit Committee, which writing may be in the form of the proposed engagement letter: |
| | a. | The scope of the service, the fee structure for the engagement, and any side letter or amendment to the engagement letter, or any other agreement between the Auditor and the Fund, relating to the service; and |
| | b. | Any compensation arrangement or other agreement, such as a referral agreement, a referral fee or fee-sharing arrangement, between the Auditor and any person (other than the Fund) with respect to the promoting, marketing, or recommending of a transaction covered by the service; |
| | 2. | Discuss with the Audit Committee the potential effects of the services on the independence of the Auditor; and |
| | 3. | Document the substance of its discussion with the Audit Committee. |
All Other Auditor Services
The Audit Committee may pre-approve non-audit services classified as “All other services” that are not categorically prohibited by the SEC, as listed in Exhibit 1 to this policy.
Pre-Approval Fee Levels or Established Amounts
Pre-approval of estimated fees or established amounts for services to be provided by the Auditor under general or specific pre-approval policies will be set periodically by the Audit Committee. Any proposed fees exceeding 110% of the maximum estimated pre-approved fees or established amounts for pre-approved audit and non-audit services will be reported to the Audit Committee at the quarterly Audit Committee meeting and will require specific approval by the Audit Committee before payment is made. The Audit Committee will always factor in the overall relationship of fees for audit and non-audit services in determining whether to pre-approve any such services and in determining whether to approve any additional fees exceeding 110% of the maximum pre-approved fees or established amounts for previously pre-approved services.
Procedures
On an annual basis, the Auditor will submit to the Audit Committee for general pre-approval, a list of non-audit services that the Funds or Service Affiliates of the Funds may request from the Auditor. The list will describe the non-audit services in reasonable detail and will include an estimated range of fees and such other information as the Audit Committee may request.
Each request for services to be provided by the Auditor under the general pre-approval of the Audit Committee will be submitted to the Funds’ Treasurer (or his or her designee) and must include a detailed description of the services to be rendered. The Treasurer or his or her designee will ensure that such services are included within the list of services that have received the general pre-approval of the Audit Committee.
Each request to provide services that require specific approval by the Audit Committee shall be submitted to the Audit Committee jointly by the Funds’ Treasurer or his or her designee and the Auditor, and must include a joint statement that, in their view, such request is consistent with the pre-approval policies and procedures and the SEC Rules.
Each request to provide Tax services under either the general or specific pre-approval of the Audit Committee will describe in writing: (i) the scope of the service, the fee structure for the engagement, and any side letter or amendment to the engagement letter, or any other agreement between the Auditor and the audit client, relating to the service; and (ii) any compensation arrangement or other agreement between the Auditor and any person (other than the audit client) with respect to the promoting, marketing, or recommending of a transaction covered by the service. The Auditor will discuss with the Audit Committee the potential effects of the services on the Auditor’s independence and will document the substance of the discussion.
Non-audit services pursuant to the de minimis exception provided by the SEC Rules will be promptly brought to the attention of the Audit Committee for approval, including documentation that each of the conditions for this exception, as set forth in the SEC Rules, has been satisfied.
On at least an annual basis, the Auditor will prepare a summary of all the services provided to any entity in the investment company complex as defined in section 2-01(f)(14) of Regulation S-X in sufficient detail as to the nature of the engagement and the fees associated with those services.
The Audit Committee has designated the Funds’ Treasurer to monitor the performance of all services provided by the Auditor and to ensure such services are in compliance with these policies and procedures. The Funds’ Treasurer will report to the Audit Committee on a periodic basis as to the results of such monitoring. Both the Funds’ Treasurer and management will immediately report to the Chairman of the Audit Committee any breach of these policies and procedures that comes to the attention of the Funds’ Treasurer or senior management.
Exhibit 1 to Pre-Approval of Audit and Non-Audit Services Policies and Procedures Conditionally Prohibited Non-Audit Services (not prohibited if the Fund can reasonably conclude that the results of the service would not be subject to audit procedures in connection with the audit of the Fund’s financial statements)
| | • | | Bookkeeping or other services related to the accounting records or financial statements of the audit client |
| | • | | Financial information systems design and implementation |
| | • | | Appraisal or valuation services, fairness opinions, or contribution-in-kind reports |
| | • | | Internal audit outsourcing services |
Categorically Prohibited Non-Audit Services
| | • | | Broker-dealer, investment adviser, or investment banking services |
| | • | | Expert services unrelated to the audit |
| | • | | Any service or product provided for a contingent fee or a commission |
| | • | | Services related to marketing, planning, or opining in favor of the tax treatment of confidential transactions or aggressive tax position transactions, a significant purpose of which is tax avoidance |
| | • | | Tax services for persons in financial reporting oversight roles at the Fund |
| | • | | Any other service that the Public Company Oversight Board determines by regulation is impermissible. |
| | (e)(2) | There were no amounts that were pre-approved by the Audit Committee pursuant to the de minimus exception under Rule 2-01 of Regulation S-X. |
| | (g) | In addition to the amounts shown in the tables above, PwC billed Invesco and Affiliates aggregate fees of $7,434,000 for the fiscal year ended October 31, 2022 and $5,910,000 for the fiscal year ended October 31, 2021 for non-audit services not required to be pre-approved by the Registrant’s Audit Committee. In total, PwC billed the Registrant, Invesco and Affiliates aggregate non-audit fees of $8,379,668 for the fiscal year ended October 31, 2022 and $6,858,426 for the fiscal year ended October 31, 2021. |
| | (h) | With respect to the non-audit services above billed to Invesco and Affiliates that were not required to be pre-approved by the Registrant’s Audit Committee, the Audit Committee received information from PwC about such services, including by way of comparison, that PwC provided audit services to entities within the Investment Company Complex, as defined by Rule 2-01(f)(14) of Regulation S-X, of approximately $31 million and non-audit services of approximately $19 million for the fiscal year ended 2022. The Audit Committee considered this information in evaluating PwC’s independence. |
Pursuant to PCAOB Rule 3526, Communication with Audit Committees Concerning Independence, PwC advised the Registrant’s Audit Committee of the following matters identified since the previous annual Form N-CSR filing that may be reasonably thought to bear on PwC’s independence. PwC advised the Audit Committee that one PwC Partner held financial interests directly in investment companies within the complex that includes the Funds as well as all registered investment companies advised by the Adviser and its affiliates, including other subsidiaries of the Adviser’s parent company, Invesco Ltd. (collectively, the “Invesco Fund Complex”) that were inconsistent with the requirements of Rule 2-01(c)(1) of SEC Regulation S-X. In reporting the matter to the Audit Committee, PwC noted, among other things, that the impermissible holding was disposed of by the individual, the individual was not in the chain of command of the audit or the audit partners of the Funds, the financial interest was not material to the net worth of the individual or his or her respective immediate family members and the Funds’ audit engagement team was unaware of the impermissible holding until after the matter was confirmed to be an independence exception. In addition, PwC considered that the PwC Partner provided non-audit services that were not relied upon by the audit engagement team in the audits of the financial statements of the Funds. Based on the mitigating factors noted above, PwC advised the Audit Committee that it concluded that its objectivity and impartiality with respect to all issues encompassed within the audit engagement has not been impaired and it believes that a reasonable investor with knowledge of all relevant facts and circumstances for the violation would conclude that PwC is capable of exercising objective and impartial judgment on all issues encompassed within the audits of the financial statements of the Funds in the Registrant for the impacted periods.
Item 5. Audit Committee of Listed Registrants.
| | (a) | The Registrant has a separately designated Audit Committee established in accordance with Section 3(a)(58)(A) of the Securities Exchange Act of 1934, as amended, which consists solely of independent trustees. The Audit Committee members are Marc M. Kole, Joanne Pace, Gary R. Wicker, and Donald H. Wilson. |
Item 6. Schedule of Investments.
| (a) | The Schedules of Investments are included as a part of the report to shareholders filed under Item 1 of this Form N-CSR. |
Item 7. Disclosure of Proxy Voting Policies and Procedures for Closed-End Management Investment Companies.
Not applicable.
Item 8. Portfolio Managers of Closed-End Management Investment Companies.
Not applicable.
| Item 9. | Purchases of Equity Securities by Closed-End Management Investment Company and Affiliated Purchasers. |
Not applicable.
Item 10. Submission of Matters to a Vote of Security Holders.
There have been no material changes to the procedures by which shareholders may recommend nominees to the Board that would require disclosure herein.
Item 11. Controls and Procedures.
| | (a) | Based on their evaluation of the Registrant’s disclosure controls and procedures (as defined in Rule 30a-3(c) under the Investment Company Act of 1940) as of a date within 90 days of the filing date of this report, the Registrant’s President (principal executive officer) and Treasurer (principal financial officer) have concluded that such disclosure controls and procedures are effective. |
| | (b) | There were no changes in the Registrant’s internal control over financial reporting (as defined in Rule 30a-3(d) under the Investment Company Act of 1940) that occurred during the period covered by this report that has materially affected, or is reasonably likely to materially affect, the Registrant’s internal control over financial reporting. |
Item 12. Disclosure of Securities Lending Activities for Closed-End Management Investment Companies.
Not applicable.
Item 13. Exhibits.
SIGNATURES
Pursuant to the requirements of the Securities Exchange Act of 1934 and the Investment Company Act of 1940, the Registrant has duly caused this report to be signed on its behalf by the undersigned, thereunto duly authorized.
(Registrant) Invesco Actively Managed Exchange-Traded Fund Trust
| | |
| By: | | /s/ Anna Paglia |
|
| Name: Anna Paglia |
| Title: President |
|
| Date: January 5, 2023 |
Pursuant to the requirements of the Securities Exchange Act of 1934 and the Investment Company Act of 1940, this report has been signed below by the following persons on behalf of the Registrant and in the capacities and on the dates indicated.
| | |
By: | | /s/ Anna Paglia |
|
Name: Anna Paglia |
Title: President |
|
Date: January 5, 2023 |
| | |
| By: | | /s/ Kelli Gallegos |
|
| Name: Kelli Gallegos |
| Title: Treasurer |
|
| Date: January 5, 2023 |