UNITED STATES
SECURITIES AND EXCHANGE COMMISSION
WASHINGTON, D.C. 20549
FORM N-CSR
CERTIFIED SHAREHOLDER REPORT OF REGISTERED MANAGEMENT
INVESTMENT COMPANIES
Investment Company Act file number: 811-22143
WALTHAUSEN FUNDS
(Exact name of registrant as specified in charter)
2691 Route 9, Suite 102, Malta, NY 12020
(Address of principal executive offices) (Zip code)
John B. Walthausen
Walthausen Funds
2691 Route 9, Suite 102, Malta, NY 12020
(Name and address of agent for service)
Registrant’s telephone number, including area code: (518) 348-7217
Date of fiscal year end: January 31
Date of reporting period: July 31, 2018
Item 1. Reports to Stockholders.
WALTHAUSEN SMALL CAP VALUE FUND
TICKER WSCVX
For Investors Seeking Long-Term Capital Appreciation
SEMI-ANNUAL REPORT
July 31, 2018
Walthausen Small Cap Value Fund
Semi-Annual Report
July 31, 2018
Dear Fellow Shareholders,
The results for the first half of 2018 were uncharacteristically poor for the Small Cap Value Fund. Despite a robust return for small and micro-cap stocks overall, the Fund was disappoint-ingly behind its benchmark. At the midway point of the fiscal year, the portfolio appreciated 2.47%, falling well short of the 6.00% the Russell 2000 Value Index achieved. The causes of this underperformance were a combination of disappointing company selections along with sparse exposure to areas that performed well. We consistently search for companies that are generating good returns on capital, or are on a path to achieving those returns, and where we see that management has a well-developed strategy for building long term value without incurring excessive risks. Over the course of the first half of this year, these stocks were not rewarded. In fact, it was quite the opposite. Many of the leaders within our benchmark were companies we would choose not to consider as they do not possess the characteristics we typically seek.
We have written consistently over the past several quarters about our growing concern over rising risk due to speculation in the current market. In our view, there is broader risk building in equity markets that extends further than a few very popular growth stocks. Company management teams are in the unenviable position to exceed greater and greater expectations. As this expansion continues, we have seen a 180 degree turn from touting their strategies of lowering capital spending and debt repayment, to now increasing capital spending and becoming more aggressive with acquisitions. We are spending a great deal of time evaluating the merit of these deals to judge whether the projected synergies will live up to the hype. We keep in mind that the majority of acquisitions do not produce a good return.
Four stocks in particular hurt the first half performance. Halcon Resources Corporation (HK) is a well-positioned oil producer in the Permian Basin. The stock was hurt by a temporary shortage of pipeline capacity as the drilling in that basin accelerated quicker and was more productive than expected. That fast growth of production meant that the company, and others in the basin, will be selling petroleum at a discount well into next year. Investors were not pleased when management acquired more acreage, and with it more debt. We think that the extraordinary potential that horizontal drilling has shown in the Permian is in fact the key reason to stay with the stock. We believe that the current stock price does not reflect the value of the acreage.
Rogers Corporation (ROG) had been a great performer for us last year but some weaker revenue growth and higher costs hurt the stock. We had taken some profits when the stock was riding high. We waited for a favorable rebound in the stock price and exited the position.
Triumph Group Inc. (TGI) has been a frustrating situation. We can clearly see that there is a wealth of knowhow and good manufacturing skills in this aerospace supplier but that has been hidden by, in our view, excessive acquisitions and poor contracts under prior management. We believe that the current management group is moving to right the ship. Troubled old contracts have been restructured and they are well on the way to bringing r new programs to production. The backlog is growing and cash flow is looking more positive. Yet, the stock has kept moving down.
In the case of Orchid Paper Products (TIS), the startup of the new facility has been difficult and management launched it without adequate financing and are now in a difficult situation. We have exited the position.
As we look at our performance we see that the best performers were companies with management teams that are on the path to generating good return on invested capital. We have held these companies for a while as changes that we could see developing finally caused the stocks
2018 Semi-Annual Report 1
to begin to appreciate. Among these are SeaWorld (SEAS). We liked the value of their theme park properties but could see that the company was not being well managed. It has taken longer than expected but management is making more astute marketing decisions and paying better attention to operating costs.
The performance of Stoneridge Inc. (SRI) reflects a belated understanding by the market of the dramatic changes as the company has become a much more value added supplier to the truck and auto makers.
The contrarian aspect of our thinking indicates to us that a change is coming. This has been one of the longest periods of growth outperformance, and like all past cycles, will inevitably come to its end. Increasing expectations of growth rates inevitably fail to be met. History has shown that those companies that provide shareholder value through generating a return on capital above their cost of capital and generate excess free cash flow have offered an attractive opportunity over the long term.
Despite the first half’s disappointment, our strategy, and confidence in it, has not changed. Though chastened by the recent poor relative performance we are resolute in the experience and skill of our team, the application of our process, and the opportunities present within the portfolio today.
We thank you for your participation and partnership in our Fund.
Sincerely,
John B. Walthausen CFA
Past performance does not guarantee future results. The investment return and principal value of an investment in the Fund will fluctuate so that an investor’s shares, when redeemed, may be worth more or less than their original cost. Returns do not reflect the deduction of taxes that a shareholder would pay on Fund distributions or the redemption of Fund shares. Current performance may be higher or lower than the performance data quoted. Performance data current to the most recent month end are available by calling 1-888-925-8428.
The Fund’s prospectus contains important information about the Fund’s investment objectives, potential risks, management fees, charges and expenses, and other information and should be read and considered carefully before investing. To obtain a copy of the Fund’s prospectus, please visit our website at www.walthausenfunds.com or call 1-888-925-8428 and a copy will be sent to you free of charge. Distributed by Rafferty Capital Markets, LLC – Garden City, NY 11530.
2018 Semi-Annual Report 2
WALTHAUSEN SMALL CAP VALUE FUND (Unaudited)
PERFORMANCE INFORMATION
7/31/18 NAV $24.46
AVERAGE ANNUAL RATE OF RETURN (%) FOR THE PERIODS ENDED JULY 31, 2018
| | 1 Year(A) | | 3 Years(A) | | 5 Years(A) | | 10 Years(A) | |
| Walthausen Small Cap Value Fund | 11.78% | | 11.42% | | 8.86% | | 13.51% | |
| Russell 2000® Value Index(B) | 14.37% | | 12.92% | | 10.19% | | 9.52% | |
Annual Fund Operating Expense Ratio (from Prospectus dated June 1, 2018): 1.27%
The Fund’s expense ratio for the six months ended July 31, 2018 can be found in the financial highlights included in this report.
The Annual Fund Operating Expense Ratio reported above may not correlate to the expense ratio in the Fund’s financial highlights because of (a) the impact of breakpoints in expenses charged as described in Note 4 and (b) the financial highlights include only the direct operating expenses incurred by the Fund, not the indirect costs of investing in acquired funds.
(A)1 Year, 3 Years, 5 Years and 10 Years returns include change in share prices and in each case includes reinvestment of any dividends and capital gain distributions. The inception date of the Walthausen Small Cap Value Fund was February 1, 2008.
(B)The Russell 2000® Value Index (whose composition is different from that of the Fund) is an unmanaged index of small-capitalization stocks with lower price-to-book ratios and lower forecasted growth values than the total population of small-capitalization stocks.
PAST PERFORMANCE DOES NOT GUARANTEE FUTURE RESULTS. INVESTMENT RETURN AND PRINCIPAL VALUE WILL FLUCTUATE SO THAT SHARES, WHEN REDEEMED, MAY BE WORTH MORE OR LESS THAN THEIR ORIGINAL COST. RETURNS DO NOT REFLECT THE DEDUCTION OF TAXES THAT A SHAREHOLDER WOULD PAY ON FUND DISTRIBUTIONS OR THE REDEMPTION OF FUND SHARES. CURRENT PERFORMANCE MAY BE LOWER OR HIGHER THAN THE PERFORMANCE DATA QUOTED. TO OBTAIN PERFORMANCE DATA CURRENT TO THE MOST RECENT MONTH-END, PLEASE CALL 1-888-925-8428. THE FUND’S DISTRIBUTOR IS RAFFERTY CAPITAL MARKETS, LLC.
2018 Semi-Annual Report 3
WALTHAUSEN SMALL CAP VALUE FUND (Unaudited)
WALTHAUSEN SMALL CAP VALUE FUND
by Sectors as of July 31, 2018
(as a percentage of Net Assets)
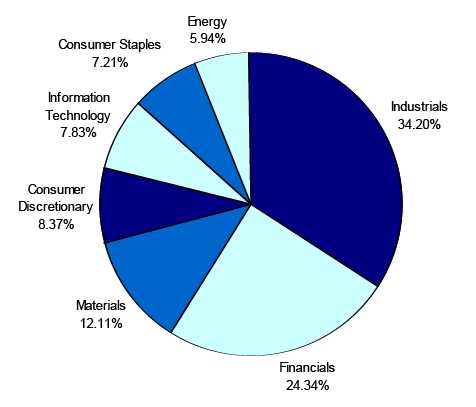
* Net Cash represents cash equivalents and other assets in excess of liabilities .
Availability of Quarterly Schedule of Investments
The Fund files its complete schedule of portfolio holdings with the Securities and Exchange Commission (“SEC”) for the first and third quarters of each fiscal year on Form N-Q. The Fund’s Form N-Q is available on the SEC’s website at http://www.sec.gov. The Fund’s Form N-Q may also be reviewed and copied at the SEC’s Public Reference Room in Washington, DC. Information on the operation of the Public Reference Room may be obtained by calling 1-800-SEC-0330.
Proxy Voting Guidelines
Walthausen & Co., LLC, the Fund’s investment advisor (“Advisor”), is responsible for exercising the voting rights associated with the securities held by the Fund. A description of the policies and procedures used by the Advisor in fulfilling this responsibility is available without charge on the Fund’s website at www.walthausenfunds.com. It is also included in the Fund’s Statement of Additional Information, which is available on the SEC’s website at http://www.sec.gov.
Information regarding how the Fund voted proxies, Form N-PX, relating to portfolio securities during the most recent 12-month period ended June 30th, is available without charge, upon request, by calling our toll free number (1-888-925-8428). This information is also available on the SEC’s website at http://www.sec.gov.
2018 Semi-Annual Report 4
EXPENSE EXAMPLE
(Unaudited)
As a shareholder of the Fund, you incur two types of costs: (1) transaction costs such as redemption fees, and (2) ongoing costs, including management fees, service fees, and other Fund expenses. This Example is intended to help you understand your ongoing costs (in dollars) of investing in the Fund and to compare these costs with the ongoing costs of investing in other mutual funds. The Example is based on an investment of $1,000 invested in the Fund on February 1, 2018 and held through July 31, 2018.
Actual Expenses
The first line of the table below provides information about actual account values and actual expenses. Additionally, although the Fund charges no sales load, you will be assessed fees for outgoing wire transfers, returned checks and stop payment orders at prevailing rates charged by Ultimus Fund Solutions, LLC, the Fund’s transfer agent. If shares are redeemed within 90 days of purchase from the Fund, the shares are subject to a 2% redemption fee. You will be charged an annual maintenance fee of $15 for each tax deferred account you have with the Fund (“IRA maintenance fees”). To the extent the Fund invests in shares of other investment companies as part of its investment strategy, you will indirectly bear your proportionate share of any fees and expenses charged by the underlying funds in which the Fund invests in addition to the expenses of the Fund. Actual expenses of the underlying funds are expected to vary among the various underlying funds. These expenses are not included in the example. The example includes management fees, service fees and other Fund expenses. However, the example does not include portfolio trading commissions and related expenses and other extraordinary expenses as determined under generally accepted accounting principles. You may use the information in this line, together with the amount you invested, to estimate the expenses that you paid over the period. Simply divide your account value by $1,000 (for example, an $8,600 account value divided by $1,000 = 8.6), then multiply the result by the number in the first line under the heading entitled “Expenses Paid During Period” to estimate the expenses you paid on your account during this period.
Hypothetical Example for Comparison Purposes
The second line of the table provides information about hypothetical account values and hypothetical expenses based on the Fund’s actual expense ratio and an assumed rate of return of 5% per year before expenses, which is not the Fund’s actual return. The hypothetical account values and expenses may not be used to estimate the actual ending account balance or expenses you paid for the period. You may use this information to compare the ongoing costs of investing in the Fund and other funds. To do so, compare this 5% hypothetical example with the 5% hypothetical examples that appear in the shareholder reports of the other funds.
Please note that the expenses shown in the table are meant to highlight your ongoing costs only and do not reflect any transactional costs, such as redemption fees, IRA maintenance fees described above or expenses of underlying funds. Therefore, the second line of the table is useful in comparing ongoing costs only, and will not help you determine the relative total costs of owning different funds. In addition, if these transactional costs were included, your costs would have been higher.
| | | | | | | Expenses Paid |
| | | Beginning | | Ending | | During the Period* |
| | | Account Value | | Account Value | | February 1, 2018 |
| | | February 1, 2018 | | July 31, 2018 | | to July 31, 2018 |
| |
| Actual | | $1,000.00 | | $1,024.72 | | $6.38 |
| |
| Hypothetical | | $1,000.00 | | $1,018.50 | | $6.36 |
| (5% annual return | | | | | | |
| before expenses) | | | | | | |
| * | Expenses are equal to the Fund’s annualized expense ratio of 1.27%, multiplied by the average account value over the period, multiplied by 181/365 (to reflect the one-half year period). |
| |
2018 Semi-Annual Report 5
| Walthausen Small Cap Value Fund | | | | |
| | | | Schedule of Investments |
| | | | July 31, 2018 (Unaudited) |
| Shares | | Fair Value | % of Net Assets |
| | | | | |
| COMMON STOCKS | | | | |
| | | | | |
| Agricultural Chemicals | | | | |
| 470,389 | American Vanguard Corporation | $ | 10,207,441 | 1.65 | % |
| Aircraft & Parts | | | | |
| 394,820 | Triumph Group, Inc. | | 8,231,997 | 1.33 | % |
| Canned, Fruits, Vegetables, Preserves, Jams & Jellies | | | | |
| 535,790 | Landec Corporation * | | 7,501,060 | 1.21 | % |
| Carpets & Rugs | | | | |
| 448,510 | Interface, Inc. | | 10,046,624 | 1.62 | % |
| Commercial Printing | | | | |
| 288,080 | Quad/Graphics, Inc. | | 5,922,925 | 0.96 | % |
| Computer Communications Equipment | | | | |
| 264,130 | Electronics for Imaging, Inc. * | | 9,012,116 | 1.46 | % |
| Construction Machinery & Equipment | | | | |
| 160,713 | Columbus McKinnon Corporation | | 6,614,947 | 1.07 | % |
| Crude Petroleum & Natural Gas | | | | |
| 1,949,740 | Halcón Resources Corporation * | | 7,623,483 | | |
| 393,780 | QEP Resources, Inc. * | | 4,091,374 | | |
| 143,600 | SilverBow Resources, Inc. * | | 4,375,492 | | |
| 389,470 | SM Energy Company | | 10,714,320 | | |
| | | | 26,804,669 | 4.33 | % |
| Electronic Components & Accessories | | | | |
| 432,749 | Vishay Intertechnology Inc. | | 10,818,725 | 1.75 | % |
| Fats & Oils | | | | | |
| 484,100 | Darling Ingredients Inc. * | | 9,725,569 | 1.57 | % |
| Fire, Marine & Casualty Insurance | | | | |
| 186,140 | The Navigators Group, Inc. | | 11,233,549 | 1.82 | % |
| Food and Kindred Products | | | | |
| 207,390 | The Hain Celestial Group, Inc. * | | 5,898,172 | 0.95 | % |
| Gaskets, Packaging & Sealing Devices & Rubber & Plastics Hose | | | | |
| 124,060 | EnPro Industries, Inc. | | 9,476,943 | 1.53 | % |
| General Building Contractors - Nonresidential Buildings | | | | |
| 400,230 | Tutor Perini Corporation * | | 7,404,255 | 1.20 | % |
| Greeting Cards | | | | |
| 222,233 | CSS Industries Inc. | | 3,544,616 | 0.57 | % |
| Guided Missiles & Space Vehicles & Parts | | | | |
| 234,004 | Aerojet Rocketdyne Holdings, Inc. * | | 7,885,935 | 1.27 | % |
| Heavy Construction Other Than Building Construction - Contractors | | | | |
| 1,742,696 | Great Lakes Dredge & Dock Corporation * | | 9,410,558 | | |
| 500,000 | Williams Industrial Services Group Inc. * | | 1,370,000 | | |
| | | | 10,780,558 | 1.74 | % |
| Household Furniture | | | | |
| 321,513 | Kimball International, Inc. - Class B | | 5,192,435 | 0.84 | % |
| Industrial Instruments For Measurement, Display, and Control | | | | |
| 87,910 | Esterline Technologies Corporation * | | 7,498,723 | 1.21 | % |
| Industrial Organic Chemicals | | | | |
| 986,990 | Nexeo Solutions, Inc. * | | 8,961,869 | 1.45 | % |
| Instruments for Measuring & Testing of Electricity & Electric Signals | | | | |
| 181,967 | Allied Motion Technologies, Inc. | | 8,348,646 | 1.35 | % |
| Life Insurance | | | | | |
| 114,789 | Primerica, Inc. | | 13,177,777 | 2.13 | % |
| Metal Cans | | | | | |
| 456,840 | Silgan Holdings Inc. | | 12,567,668 | 2.03 | % |
* Non-Income Producing Securities.
The accompanying notes are an integral part of these
financial statements. |
2018 Semi-Annual Report 6
| Walthausen Small Cap Value Fund | | | | |
| | | | Schedule of Investments |
| | | | July 31, 2018 (Unaudited) |
| Shares | | Fair Value | % of Net Assets |
| | | | | |
| COMMON STOCKS | | | | |
| | | | | |
| Metal Forgings & Stampings | | | | |
| 160,759 | Materion Corp. | $ | 10,079,589 | 1.63 | % |
| Millwood, Veneer, Plywood, & Structural Wood Members | | | | |
| 133,920 | Masonite International Corporation * | | 9,140,040 | 1.48 | % |
| Miscellaneous Electrical Machinery, Equipment & Supplies | | | | |
| 389,570 | Atkore International Group Inc. * | | 9,217,226 | 1.49 | % |
| Motor Vehicle Parts & Accessories | | | | |
| 390,510 | Stoneridge, Inc. * | | 13,277,340 | 2.15 | % |
| Motors & Generators | | | | |
| 106,400 | Regal Beloit Corporation | | 9,145,080 | 1.48 | % |
| National Commercial Banks | | | | |
| 100,191 | Camden National Corporation | | 4,618,805 | | |
| 109,028 | City Holding Company | | 8,774,573 | | |
| 129,600 | Community Bank System Inc. | | 8,197,200 | | |
| 312,970 | First Financial Bancorp | | 9,498,640 | | |
| 68,874 | Pinnacle Financial Partners, Inc. | | 4,304,625 | | |
| | | | 35,393,843 | 5.72 | % |
| Oil & Gas Field Services, NEC | | | | |
| 573,230 | Keane Group, Inc. * | | 8,088,275 | 1.31 | % |
| Operative Builders | | | | |
| 372,479 | M/I Homes, Inc. * | | 9,632,307 | 1.56 | % |
| Paper Mills | | | | | |
| 256,120 | Orchids Paper Products Company * | | 1,288,284 | 0.21 | % |
| Plastic Material, Synth Resin/Rubber, Cellulos (No Glass) | | | | |
| 478,520 | Rayonier Advanced Materials Inc. | | 8,632,501 | 1.40 | % |
| Plastics, Materials, Synth Resins & Nonvulcan Elastomers | | | | |
| 40,580 | Rogers Corporation * | | 4,730,411 | 0.76 | % |
| Printed Circuit Boards | | | | |
| 210,299 | Kimball Electronics, Inc. * | | 4,279,585 | 0.69 | % |
| Pulp Mills | | | | | |
| 601,311 | Mercer International Inc. (Canada) | | 10,793,532 | 1.74 | % |
| Pumps & Pumping Equipment | | | | |
| 218,940 | Ampco-Pittsburgh Corporation | | 2,309,817 | 0.37 | % |
| Railroad Equipment | | | | |
| 328,790 | Freightcar America, Inc. | | 6,020,145 | 0.97 | % |
| Refrigeration & Service Industry Machinery | | | | |
| 87,860 | Standex International Corporation | | 9,106,689 | 1.47 | % |
| Retail - Eating & Drinking Places | | | | |
| 510,560 | Cannae Holdings, Inc. * | | 9,317,720 | 1.51 | % |
| Rolling Drawing & Extruding of Nonferrous Metals | | | | |
| 274,740 | Global Brass and Copper Holdings, Inc. | | 9,052,683 | | |
| 90,240 | Kaiser Aluminum Corporation | | 10,072,589 | | |
| | | | 19,125,272 | 3.09 | % |
| Sanitary Services | | | | |
| 505,120 | Heritage-Crystal Clean, Inc. * | | 12,173,392 | 1.97 | % |
| Savings Institution, Federally Chartered | | | | |
| 274,073 | OceanFirst Financial Corp. | | 7,994,709 | 1.29 | % |
| Semiconductors & Related Devices | | | | |
| 841,555 | Amkor Technology, Inc. * | | 7,304,697 | | |
| 377,120 | Kulicke and Soffa Industries, Inc. (Singapore) | | 9,940,883 | | |
| | | | 17,245,580 | 2.79 | % |
* Non-Income Producing Securities.
The accompanying notes are an integral part of these
financial statements. |
2018 Semi-Annual Report 7
| Walthausen Small Cap Value Fund |
| | | | Schedule of Investments |
| | | | July 31, 2018 (Unaudited) |
| Shares | | Fair Value | | % of Net Assets |
| | | | | | |
| COMMON STOCKS | | | | | |
| |
| Services - Equipment Rental & Leasing, NEC | | | | | |
| 190,020 | McGrath RentCorp | $ | 11,283,388 | | | |
| 315,020 | Triton International Limited (Bermuda) | | 11,088,704 | | | |
| | | | 22,372,092 | | 3.62 | % |
| Services - Help Supply Services | | | | | |
| 145,890 | Kelly Services, Inc. - Class A | | 3,543,668 | | 0.57 | % |
| Services - Miscellaneous Amusement & Recreation | | | | | |
| 178,865 | SeaWorld Entertainment, Inc. * | | 3,809,824 | | 0.62 | % |
| Soap, Detergents, Cleaning Preparations, Perfumes, Cosmetics | | | | | |
| 74,583 | Stepan Company | | 6,531,979 | | 1.06 | % |
| State Commercial Banks | | | | | |
| 207,750 | Bryn Mawr Bank Corp. | | 10,148,588 | | | |
| 30,649 | First Financial Corporation | | 1,575,359 | | | |
| 143,900 | Great Southern Bancorp, Inc. | | 8,497,295 | | | |
| 179,699 | Heartland Financial USA, Inc. | | 10,557,316 | | | |
| 198,275 | Lakeland Financial Corporation | | 9,614,355 | | | |
| 266,247 | Southside Bancshares, Inc. | | 9,129,610 | | | |
| 211,790 | Stock Yards Bancorp, Inc. | | 8,079,789 | | | |
| 216,490 | TriCo Bancshares | | 8,404,142 | | | |
| | | | 66,006,454 | | 10.66 | % |
| Textile Mill Products | | | | | |
| 319,228 | Unifi, Inc. * | | 9,631,109 | | 1.56 | % |
| Truck & Bus Bodies | | | | | |
| 166,031 | Miller Industries, Inc. | | 4,325,108 | | 0.70 | % |
| Truck Trailers | | | | | | |
| 399,930 | Wabash National Corporation | | 7,918,614 | | 1.28 | % |
| Wholesale - Beer, Wine & Distilled Alcoholic Beverages | | | | | |
| 91,820 | MGP Ingredients, Inc. | | 7,535,667 | | 1.22 | % |
| Wholesale - Durable Goods | | | | | |
| 315,000 | School Specialty, Inc. * ** | | 5,997,600 | | 0.97 | % |
| Wholesale - Electrical Apparatus & Equipment, Wiring Supplies | | | | | |
| 330,120 | Houston Wire & Cable Company | | 2,640,960 | | 0.43 | % |
| Wholesale - Farm Product Raw Materials | | | | | |
| 296,617 | The Andersons, Inc. | | 10,455,749 | | 1.69 | % |
| Wood Household Furniture, (No Upholstered) | | | | | |
| 131,290 | Bassett Furniture Industries Inc. | | 3,282,250 | | 0.53 | % |
| Total for Common Stocks (Cost $440,679,383) | | 587,899,630 | | 95.03 | % |
| | | | | | |
| MONEY MARKET FUNDS | | | | | |
| 29,039,897 | Fidelity Investments Money Market Government Portfolio - | | | | | |
| | Class I 1.80% *** | | 29,039,897 | | 4.69 | % |
| | (Cost $29,039,897) | | | | | |
| Total Investment Securities | | 616,939,527 | | 99.72 | % |
| | (Cost $469,719,280) | | | | | |
| Other Assets in Excess of Liabilities | | 1,704,878 | | 0.28 | % |
| Net Assets | | $ | 618,644,405 | | 100.00 | % |
* Non-Income Producing Securities.
** Level 2 Security.
*** The yield rate shown represents the 7-day yield at July 31, 2018.
The accompanying notes are an integral part of these
financial statements. |
2018 Semi-Annual Report 8
| Walthausen Small Cap Value Fund | | | |
| |
| Statement of Assets and Liabilities (Unaudited) | | | |
| July 31, 2018 | | | |
| |
| Assets: | | | |
| Investment Securities at Fair Value | $ | 616,939,527 | |
| (Cost $469,719,280) | | | |
| Receivable for Securities Sold | | 2,517,729 | |
| Receivable for Shareholder Subscriptions | | 364,183 | |
| Receivable for Dividends | | 179,536 | |
| Total Assets | | 620,000,975 | |
| Liabilities: | | | |
| Payable for Shareholder Redemptions | | 699,897 | |
| Payable to Advisor for Management Fees (Note 4) | | 519,326 | |
| Payable to Advisor for Service Fees (Note 4) | | 137,347 | |
| Total Liabilities | | 1,356,570 | |
| Net Assets | $ | 618,644,405 | |
| |
| Net Assets Consist of: | | | |
| Paid In Capital | $ | 416,756,770 | |
| Accumulated Undistributed Net Investment Income (Loss) | | (1,083,505 | ) |
| Accumulated Undistributed Realized Gain (Loss) on Investments - Net | | 55,750,893 | |
| Unrealized Appreciation (Depreciation) in Value of Investments | | | |
| Based on Identified Cost - Net | | 147,220,247 | |
| Net Assets, for 25,296,928 Shares Outstanding | $ | 618,644,405 | |
| (Unlimited shares authorized) | | | |
| Net Asset Value and Offering Price Per Share | | | |
| ($618,644,405/25,296,928 shares) | $ | 24.46 | |
| Redemption Price Per Share ($24.46 * 0.98) (Note 2) | $ | 23.97 | |
| |
| Statement of Operations (Unaudited) | | | |
| For the six month period ended July 31, 2018 | | | |
| |
| Investment Income: | | | |
| Dividends (Net of foreign withholding tax of $0) | $ | 3,118,893 | |
| Total Investment Income | | 3,118,893 | |
| Expenses: | | | |
| Management Fees (Note 4) | | 2,985,135 | |
| Service Fees (Note 4) | | 794,893 | |
| Total Expenses | | 3,780,028 | |
| |
| Net Investment Income (Loss) | | (661,135 | ) |
| |
| Realized and Unrealized Gain (Loss) on Investments: | | | |
| Realized Gain (Loss) on Investments | | 43,612,736 | |
| Net Change in Unrealized Appreciation (Depreciation) on Investments | | (28,648,718 | ) |
| Net Realized and Unrealized Gain (Loss) on Investments | | 14,964,018 | |
| |
| Net Increase (Decrease) in Net Assets from Operations | $ | 14,302,883 | |
The accompanying notes are an integral part of these
financial statements. |
2018 Semi-Annual Report 9
| Walthausen Small Cap Value Fund |
| | |
| Statements of Changes in Net Assets | | (Unaudited) | | | | | | |
| | | 2/1/2018 | | | | 2/1/2017 | | |
| | | to | | | | to | | |
| | | 7/31/2018 | | | | 1/31/2018 | | |
| From Operations: | | | | | | | | |
| Net Investment Income (Loss) | $ | (661,135 | ) | | $ | (2,016,424 | ) | |
| Net Realized Gain (Loss) on Investments | | 43,612,736 | | | | 35,906,668 | | |
| Net Change in Unrealized Appreciation (Depreciation) on Investments | | (28,648,718 | ) | | | 44,298,472 | | |
| Net Increase (Decrease) in Net Assets from Operations | | 14,302,883 | | | | 78,188,716 | | |
| From Distributions to Shareholders: | | | | | | | | |
| Net Investment Income | | - | | | | - | | |
| Net Realized Gain from Investments | | - | | | | (30,699,526 | ) | |
| Change in Net Assets from Distributions | | - | | | | (30,699,526 | ) | |
| From Capital Share Transactions: | | | | | | | | |
| Proceeds From Sale of Shares | | 39,505,387 | | | | 86,138,498 | | |
| Proceeds From Redemption Fees (Note 2) | | 3,484 | | | | 22,756 | | |
| Shares Issued on Reinvestment of Dividends | | - | | | | 28,811,199 | | |
| Cost of Shares Redeemed | | (56,289,172 | ) | | | (146,914,608 | ) | |
| Net Increase (Decrease) from Shareholder Activity | | (16,780,301 | ) | | | (31,942,155 | ) | |
| | |
| Net Increase (Decrease) in Net Assets | | (2,477,418 | ) | | | 15,547,035 | | |
| | |
| Net Assets at Beginning of Period | | 621,121,823 | | | | 605,574,788 | | |
| Net Assets at End of Period (Including Accumulated Undistributed | | | | | | | | |
| Net Investment Income (Loss) of ($1,083,505) and ($422,370)) | $ | 618,644,405 | | | $ | 621,121,823 | | |
| | |
| Share Transactions: | | | | | | | | |
| Issued | | 1,671,961 | | | | 3,756,681 | | |
| Reinvested | | - | | | | 1,211,573 | | |
| Redeemed | | (2,394,133 | ) | | | (6,321,151 | ) | |
| Net Increase (Decrease) in Shares | | (722,172 | ) | | | (1,352,897 | ) | |
| Shares Outstanding Beginning of Period | | 26,019,100 | | | | 27,371,997 | | |
| Shares Outstanding End of Period | | 25,296,928 | | | | 26,019,100 | | |
The accompanying notes are an integral part of these
financial statements. |
2018 Semi-Annual Report 10
| Walthausen Small Cap Value Fund |
| | |
| Financial Highlights | | | | | | | | | | | | | | | | | | | | | | | | |
| Selected data for a share outstanding | | (Unaudited) | | | | | | | | | | | | | | | | | | | | | | |
| throughout the period: | | 2/1/2018 | | | | 2/1/2017 | | | | 2/1/2016 | | | | 2/1/2015 | | | | 2/1/2014 | | | | 2/1/2013 | | |
| | | to | | | | to | | | | to | | | | to | | | | to | | | | to | | |
| | | 7/31/2018 | | | | 1/31/2018 | | | | 1/31/2017 | | | | 1/31/2016 | | | | 1/31/2015 | | | | 1/31/2014 | | |
| Net Asset Value - | | | | | | | | | | | | | | | | | | | | | | | | |
| Beginning of Period | $ | 23.87 | | | $ | 22.12 | | | $ | 15.87 | | | $ | 20.88 | | | $ | 23.08 | | | $ | 20.04 | | |
| Net Investment Income (Loss) (a) | | (0.03 | ) | | | (0.07 | ) | | | (0.01 | ) | | | 0.06 | | | | (0.02 | ) | | | (0.06 | ) | |
| Net Gain (Loss) on Investments | | | | | | | | | | | | | | | | | | | | | | | | |
| (Realized and Unrealized) (b) | | 0.62 | | | | 2.99 | | | | 6.90 | | | | (3.25 | ) | | | 0.93 | | | | 4.29 | | |
| Total from Investment Operations | | 0.59 | | | | 2.92 | | | | 6.89 | | | | (3.19 | ) | | | 0.91 | | | | 4.23 | | |
| Distributions (From Net Investment Income) | | - | | | | - | | | | (0.01 | ) | | | (0.05 | ) | | | - | | | | - | | |
| Distributions (From Realized Capital Gains) | | - | | | | (1.17 | ) | | | (0.63 | ) | | | (1.77 | ) | | | (3.11 | ) | | | (1.19 | ) | |
| Total Distributions | | - | | | | (1.17 | ) | | | (0.64 | ) | | | (1.82 | ) | | | (3.11 | ) | | | (1.19 | ) | |
| Proceeds from Redemption Fees (Note 2) | | - | | + | | - | | + | | - | | + | | - | | + | | - | | + | | - | | + |
| Net Asset Value - | | | | | | | | | | | | | | | | | | | | | | | | |
| End of Period | $ | 24.46 | | | $ | 23.87 | | | $ | 22.12 | | | $ | 15.87 | | | $ | 20.88 | | | $ | 23.08 | | |
| Total Return (c) | | 2.47% | | * | | 13.22% | | | | 43.33% | | | | (16.27)% | | | | 3.23% | | | | 20.82 | % | |
| Ratios/Supplemental Data | | | | | | | | | | | | | | | | | | | | | | | | |
| Net Assets - End of Period (Thousands) | $ | 618,644 | | | $ | 621,122 | | | $ | 605,575 | | | $ | 494,712 | | | $ | 827,771 | | | $ | 831,568 | | |
| Ratio of Expenses to Average Net Assets | | 1.27% | | ** | | 1.26% | | | | 1.27% | | | | 1.25% | | | | 1.23% | | | | 1.24 | % | |
| Ratio of Net Investment Income (Loss) to | | | | | | | | | | | | | | | | | | | | | | | | |
| Average Net Assets | | -0.22% | | ** | | -0.32% | | | | -0.05% | | | | 0.27% | | | | -0.09% | | | | -0.24 | % | |
| Portfolio Turnover Rate | | 21.82% | | * | | 45.20% | | | | 39.17% | | | | 53.20% | | | | 69.42% | | | | 69.87 | % | |
+ Amount calculated is less than $0.005.
* Not Annualized.
** Annualized.
(a) Per share amounts were calculated using the average shares method.
(b) Realized and unrealized gains and losses per share in this caption are balancing amounts necessary
to reconcile the change in net asset value for the period and may not reconcile with the aggregate gains
and losses in the Statement of Operations due to share transactions for the period.
(c) Total return represents the rate that the investor would have earned or lost on an investment in the
assuming reinvestment of dividends and distributions. |
The accompanying notes are an integral part of these
financial statements. |
2018 Semi-Annual Report 11
NOTES TO FINANCIAL STATEMENTS
WALTHAUSEN SMALL CAP VALUE FUND
July 31, 2018
(Unaudited)
1.) ORGANIZATION
Walthausen Small Cap Value Fund (the “Fund”) was organized as a diversified series of the Walthausen Funds (the “Trust”) on January 14, 2008. The Trust is registered as an open-end investment company under the Investment Company Act of 1940, as amended (the “1940 Act”). The Trust was organized in Ohio as a business trust on October 10, 2007 and may offer an unlimited number of shares of beneficial interest in a number of separate series, each series representing a distinct fund with its own investment objectives and policies. The Fund commenced operations on February 1, 2008. As of July 31, 2018, there were two series authorized by the Trust. The Fund’s investment objective is to seek long-term capital appreciation. The investment advisor to the Fund is Walthausen & Co., LLC (the “Advisor”).
After December 31, 2012, the Fund closed to new investors. However, the Board of Trustees of the Trust (the “Board” or “Trustees”) approved the re-opening of the Fund to new investors and new accounts effective March 1, 2016.
2.) SIGNIFICANT ACCOUNTING POLICIES
The Fund is an investment company and accordingly follows the investment company accounting and reporting guidance of the Financial Accounting Standards Board (“FASB”) Accounting Standards Codification Topic 946 Financial Services - Investment Companies. The financial statements are prepared in conformity with accounting principles generally accepted in the United States of America (“GAAP”). The Fund follows the significant accounting policies described in this section.
SECURITY VALUATION
All investments in securities are recorded at their estimated fair value, as described in Note 3.
FEDERAL INCOME TAXES
The Fund’s policy is to continue to comply with the requirements of the Internal Revenue Code that are applicable to regulated investment companies and to distribute all of its taxable income to shareholders. Therefore, no federal income tax provision is required. It is the Fund’s policy to distribute annually, prior to the end of the calendar year, dividends sufficient to satisfy excise tax requirements of the Internal Revenue Code. This Internal Revenue Code requirement may cause an excess of distributions over the book year-end accumulated income. In addition, it is the Fund’s policy to distribute annually, after the end of the fiscal year, any remaining net investment income and net realized capital gains.
The Fund recognizes the tax benefits of certain tax positions only where the position is “more likely than not” to be sustained assuming examination by tax authorities. Management has analyzed the Fund’s tax positions, and has concluded that no liability for unrecognized tax benefits should be recorded related to uncertain tax positions taken on returns filed for the open tax years. The Fund identifies its major tax jurisdictions as U.S. Federal and State tax authorities; however, the Fund is not aware of any tax positions for which it is reasonably possible that the total amounts of unrecognized tax benefits will change materially in the next twelve months. The Fund recognizes interest and penalties, if any, related to unrecognized tax benefits as income tax expense in the Statement of Operations. During the six month period ended July 31, 2018, the Fund did not incur any interest or penalties.
2018 Semi-Annual Report 12
Notes to Financial Statements (Unaudited) - continued
SHARE VALUATION
The net asset value per share of the Fund is calculated daily by dividing the total value of the Fund’s assets, less liabilities, by the number of shares outstanding, rounded to the nearest cent. The offering and redemption price per share is equal to the net asset value per share, except that shares of the Fund are subject to a redemption fee of 2% if redeemed after holding them for 90 days or less. During the six month period ended July 31, 2018, proceeds from redemption fees amounted to $3,484.
DISTRIBUTIONS TO SHAREHOLDERS
Distributions to shareholders, which are determined in accordance with income tax regulations, are recorded on the ex-dividend date. The treatment for financial reporting purposes of distributions made to shareholders during the year from net investment income or net realized capital gains may differ from their ultimate treatment for federal income tax purposes. These differences are caused primarily by differences in the timing of the recognition of certain components of income, expense, or realized capital gain for federal income tax purposes. Where such differences are permanent in nature, they are reclassified in the components of the net assets based on their ultimate characterization for federal income tax purposes. Any such reclassifications will have no effect on net assets, results of operations, or net asset value per share of the Fund.
USE OF ESTIMATES
The financial statements are prepared in accordance with GAAP, which requires management to make estimates and assumptions that affect the reported amounts of assets and liabilities and disclosure of contingent assets and liabilities at the date of the financial statements and the reported amounts of increases and decreases in net assets from operations during the reporting period. Actual results could differ from those estimates.
OTHER
The Fund records security transactions based on the trade date for financial reporting purposes. Dividend income is recognized on the ex-dividend date. Interest income, if any, is recognized on an accrual basis. The Fund uses the specific identification method in computing gain or loss on the sale of investment securities. Withholding taxes on foreign dividends have been provided for in accordance with the Fund’s understanding of the applicable country’s tax rules and rates. The Fund may hold investments in master limited partnerships (“MLPs”). It is common for distributions from MLPs to exceed taxable earnings and profits resulting in the excess portion of such dividends to be designated as return of capital. Annually, income or loss from MLPs is reclassified upon receipt of the MLPs tax reporting document. For financial reporting purposes, management does not estimate the tax character of MLP distributions for which actual information has not been reported.
EXPENSES
Expenses incurred by the Trust that do not relate to a specific fund of the Trust are allocated to the individual funds based on each fund’s relative net assets or an appropriate basis.
3.) SECURITIES VALUATIONS
The Fund utilizes various methods to measure the fair value of its investments on a recurring basis. GAAP establishes a hierarchy that prioritizes inputs to valuation methods. The three levels of inputs are:
Level 1 - Unadjusted quoted prices in active markets for identical assets or liabilities that the Fund has the ability to access.
2018 Semi-Annual Report 13
Notes to Financial Statements (Unaudited) - continued
Level 2 - Observable inputs other than quoted prices included in level 1 that are observable for the asset or liability, either directly or indirectly. These inputs may include quoted prices for the identical instrument on an inactive market, prices for similar instruments, interest rates, prepayment speeds, credit risk, yield curves, default rates and similar data.
Level 3 - Unobservable inputs for the asset or liability, to the extent relevant observable inputs are not available, representing the Fund’s own assumptions about the assumptions a market participant would use in valuing the asset or liability, and would be based on the best information available.
The availability of observable inputs can vary from security to security and is affected by a wide variety of factors, including, for example, the type of security, whether the security is new and not yet established in the marketplace, the liquidity of markets, and other characteristics particular to the security. To the extent that valuation is based on models or inputs that are less observable or unobservable in the market, the determination of fair value requires more judgment. Accordingly, the degree of judgment exercised in determining fair value is greatest for instruments categorized as level 3.
The inputs used to measure fair value may fall into different levels of the fair value hierarchy. In such cases, for disclosure purposes, the level in the fair value hierarchy within which the fair value measurement falls in its entirety, is determined based on the lowest level input that is significant to the fair value measurement in its entirety.
FAIR VALUE MEASUREMENTS
A description of the valuation techniques applied to the Fund’s major categories of assets and liabilities measured at fair value on a recurring basis follows.
Equity securities (common stocks). Equity securities generally are valued by using market quotations, but may be valued on the basis of prices furnished by a pricing service when the Advisor believes such prices accurately reflect the fair value of such securities. Securities that are traded on any stock exchange or on the NASDAQ over-the-counter market are generally valued by the pricing service at the last quoted sale price. Lacking a last sale price, an equity security is generally valued by the pricing service at its last bid price. Generally, if the security is traded in an active market and is valued at the last sale price, the security is categorized as a level 1 security. When market quotations are not readily available, when the Advisor determines that the market quotation or the price provided by the pricing service does not accurately reflect the current fair value, or when restricted securities are being valued, such securities are valued as determined in good faith by the Advisor, subject to review of the Board and are categorized in level 2 or level 3, when appropriate.
Money market funds. Shares of money market funds are valued at the net asset value and are classified as level 1 of the fair value hierarchy.
In accordance with the Trust’s good faith pricing guidelines, the Advisor is required to consider all appropriate factors relevant to the value of securities for which it has determined other pricing sources are not available or reliable as described above. There is no single procedure for determining fair value, since fair value depends upon the circumstances of each individual case. As a general principle, the current fair value of an issue of securities being valued by the Advisor would appear to be the amount which the owner might reasonably expect to receive for them upon their current sale. Methods which are in accordance with this principle may, for example, be based on (i) a multiple of earnings; (ii) a discount from market of a similar freely traded security (including a
2018 Semi-Annual Report 14
Notes to Financial Statements (Unaudited) - continued
derivative security or a basket of securities traded on other markets, exchanges or among dealers); or (iii) yield to maturity with respect to debt issues, or a combination of these and other methods.
The following table summarizes the inputs used to value the Fund’s assets measured at fair value as of July 31, 2018:
| Valuation Inputs of Assets | | Level 1 | | Level 2 | | Level 3 | | Total |
| Common Stocks | | $581,902,030 | | $5,997,600 | | $0 | | $587,899,630 |
| Money Market Funds | | 29,039,897 | | 0 | | 0 | | 29,039,897 |
| Total | | $610,941,927 | | $5,997,600 | | $0 | | $616,939,527 |
Refer to the Fund’s Schedule of Investments for a listing of securities by industry. The Fund did not hold any level 3 assets during the six month period ended July 31, 2018.
The following table shows transfers between level 1 and level 2 of the fair value hierarchy:
| Transfers In | | Transfers Out |
| Level 1 | | Level 2 | | Level 1 | | Level 2 |
| – | | $5,997,600 | | $5,997,600 | | – |
Financial assets were transferred from level 1 to level 2 when the underlying position was no longer actively traded on July 31, 2018. It is the Fund’s policy to consider transfers into or out of the levels as of the end of the reporting period.
The Fund did not invest in any derivative instruments during the six month period ended July 31, 2018.
4.) INVESTMENT ADVISORY AGREEMENT AND RELATED PARTY TRANSACTIONS
The Trust, on behalf of the Fund, has entered into an investment advisory agreement (“Management Agreement”) with the Advisor. The Advisor manages the investment portfolio of the Fund, subject to policies adopted by the Board, and, at its own expense and without reimbursement from the Trust, furnishes office space and all necessary office facilities, equipment and executive personnel necessary for managing the Fund. For its services, the Advisor received an investment management fee equal to 1.00% of the average daily net assets of the Fund.
Under the terms of the Services Agreement between the Trust, on behalf of the Fund, and the Advisor (the “Services Agreement”), the Advisor is obligated to pay the operating expenses of the Fund excluding management fees, any 12b-1 fees, brokerage fees and commissions, taxes, borrowing costs (such as (a) interest and (b) dividend expenses on securities sold short), fees and expenses of acquired funds, extraordinary or non-recurring expenses as may arise, including litigation to which the Fund may be a party and indemnification of the Trust’s Trustees and officers. For its services, the Advisor receives service fees equal to an annual rate of 0.45% of the Fund’s average daily net assets up to $100 million, 0.25% of the Fund’s average daily net assets between $100 million and $500 million, and 0.15% of such assets in excess of $500 million.
For the six month period ended July 31, 2018, the Advisor earned management fees totaling $2,985,135, of which $519,326 was due to the Advisor at July 31, 2018. For the same period, the Advisor earned service fees of $794,893, of which $137,347 was due to the Advisor at July 31, 2018.
2018 Semi-Annual Report 15
Notes to Financial Statements (Unaudited) - continued
Certain officers and a shareholder of the Advisor are also officers and/or a Trustee of the Trust. These individuals may receive benefits from the Advisor resulting from management and services fees paid to the Advisor by the Fund.
The Trustees who are not interested persons of the Fund were each paid $2,000, for a total of $6,000, in Trustees’ fees plus travel and related expenses for the six month period ended July 31, 2018 for their services to the Fund. The Advisor pays these fees pursuant to the Services Agreement.
5.) PURCHASES AND SALES OF SECURITIES
For the six month period ended July 31, 2018, purchases and sales of investment securities other than U.S. Government obligations and short-term investments aggregated $127,131,888 and $178,277,948, respectively. Purchases and sales of U.S. Government obligations aggregated $0 and $0, respectively.
6.) CONTROL OWNERSHIP
The beneficial ownership, either directly or indirectly, of more than 25% of the voting securities of a fund creates a presumption of control of a fund, under Section 2(a)(9) of the 1940 Act. As of July 31, 2018, NFS, LLC located at 200 Liberty Street, New York, New York, for the benefit of its clients, held, in aggregate, 52.73% of the shares of the Fund, and therefore each may be deemed to control the Fund.
7.) TAX MATTERS
For Federal income tax purposes, the cost of investments owned at July 31, 2018 was $469,719,280. At July 31, 2018, the composition of unrealized appreciation (the excess of value over tax cost) and depreciation (the excess of tax cost over value) was as follows:
| | Appreciation | | (Depreciation) | | Net Appreciation (Depreciation) |
| | $165,974,372 | | ($18,754,125) | | $147,220,247 |
The tax character of distributions was as follows:
| | | Six Months Ended | | | Fiscal Year Ended |
| | | July 31, 2018 | | | January 31, 2018 |
| Ordinary Income . | | $ -0- | | | $ – |
| Long-Term Capital Gain | | -0- | | | 30,699,526 |
| | | $ -0- | | | $ 30,699,526 |
8.) SUBSEQUENT EVENTS
Subsequent events after the date of the Statement of Assets and Liabilities have been evaluated through the date the financial statements were issued. Management has concluded that there is no impact requiring adjustment to or disclosure in the financial statements.
2018 Semi-Annual Report 16
This page was intentionally left blank.
2018 Semi-Annual Report 17
This page was intentionally left blank.
2018 Semi-Annual Report 18
Board of Trustees
Edward A. LaVarnway
John P. Mastriani
Hany A. Shawky
John B. Walthausen
Investment Advisor and Administrator
Walthausen & Co., LLC
Legal Counsel
Thompson Hine LLP
Custodian
US Bank, N.A.
Dividend Paying Agent,
Shareholders' Servicing Agent,
Transfer Agent
Ultimus Fund Solutions, LLC
Sub-Administrator
Premier Fund Solutions, Inc.
Independent Registered Public Accounting Firm
Cohen & Company, Ltd.
Distributor
Rafferty Capital Markets, LLC |
This report is provided for the general information of the shareholders of the Walthausen
Small Cap Value Fund. This report is not intended for distribution to prospective
investors in the Fund, unless preceded or accompanied by an effective prospectus. |
WALTHAUSEN SMALL CAP VALUE FUND
2691 Route 9, Suite 102
Malta, NY 12020
WALTHAUSEN SELECT VALUE FUND
INSTITUTIONAL CLASS TICKER WSVIX
RETAIL CLASS TICKER WSVRX
R6 CLASS TICKER WRSIX
For Investors Seeking Long-Term Capital Appreciation
SEMI-ANNUAL REPORT
July 31, 2018
Walthausen Select Value Fund
Semi-Annual Report
July 31, 2018
Dear Fellow Shareholders,
For the six months ended July 31, 2018, the Select Value Fund was up 3.07% (Institutional Class) versus the Russell 2500 Value Index’s gain of 3.73%.
The economic environment has supported the long durations of both the record expansion and bull market. As with all bull markets, they eventually come to an end and the imbalances created by monetary and fiscal stimulus signals to us that risks have continued to escalate despite investor enthusiasm. While these imbalances may not be enough to cause credit to freeze and the economy to falter, companies may soon be unable to exceed the growing expectations investors are heaping on them. It is not possible to forecast what the trigger will be. That is always the surprise. Since we don’t know what and when, we focus consistently on companies that are generating good returns on capital, good excess free cash flow, and where we see that management has a well-developed strategy for building long term value without incurring excessive risks.
During the first half, we were underweight in Utilities, Healthcare and REITS, which hurt performance as all three sectors did well. The Industrial and Consumer Staples stocks both performed poorly overall, but despite the challenges to the sector, our selections there performed well. Two long term holdings, SeaWorld (SEAS) and Encompass Healthcare (EHC) led performance in the half. In the case of SeaWorld, we recognized the quality of their theme park properties and the potential for better margins. We could also see that there was a high probability that shareholder pressure would be effective in pushing for better results. It took longer than we expected but we are finally seeing those signs of improvement and a commitment to dramatically better results.
Encompass (formerly Health South) has been in our portfolio for a while. Management has shown steadily improving results in this rehabilitation health enterprise and it performed well.
Among the detractors, Goodyear Tire & Rubber Company (GT) and Rogers Corporation (ROG) were the most difficult. In the case of Goodyear, when we did our analysis, we saw that the company had been making good progress, had been achieving good returns but their earnings and stock price were depressed due to volatile raw material costs. We believed the stock would benefit from reduced raw material costs and higher margins on newer large rim size tires. After a few quarters, and more information, we concluded that the market had become more competitive with newer entrants possessing greater ability to control costs.
Rogers Corporation had been a great stock for the Fund. When last year’s run up reversed, and the company reported lackluster earnings, we exited the position. We concluded that we needed to step aside until we had clear proof that management had been strengthened.
Although we are disappointed with our relative performance trailing the benchmark at the midway point of the year, we are pleased with the trend the Fund has experienced over the past 12 months. We are aware of short term results, but focused on how a company can add value over a number of years. We follow a very consistent strategy and process, which leads us to companies where management teams can compound their return on cap-
2018 Semi-Annual Report 1
ital over time. In our experience, we have experienced that these types of companies offer the best chance of the long term capital appreciation that we seek. We are resolute in the experience and skill of our team, the application of our process, and the opportunities present within the portfolio today.
We thank you for your participation and partnership in our Fund.
John B. Walthausen CFA
Past performance does not guarantee future results. The investment return and principal value of an investment in the Fund will fluctuate so that an investor’s shares, when redeemed, may be worth more or less than their original cost. Returns do not reflect the deduction of taxes that a shareholder would pay on Fund distributions or the redemption of Fund sharesCurrent performance may be higher or lower than the performance data quoted. Performance data current to the most recent month end are available by calling 1-888-925-8428.
The Fund’s prospectus contains important information about the Fund’s investment objectives, potential risks, management fees, charges and expenses, and other information and should be read and considered carefully before investing. To obtain a copy of the Fund’s prospectus, please visit our website at www.walthausenfunds.com or call 1-888-925-8428 and a copy will be sent to you free of charge. Distributed by Rafferty Capital Markets, LLC –Garden City, NY 11530.
2018 Semi-Annual Report 2
WALTHAUSEN SELECT VALUE FUND (Unaudited)
PERFORMANCE INFORMATION
7/31/18 Institutional Class NAV $19.81
7/31/18 Retail Class NAV $19.55
7/31/18 R6 Class NAV $19.89
TOTAL ANNUAL RETURNS (%) AS OF JULY 31, 2018
| | | | | | | | Since | |
| | 1 Year(A) | | 3 Years(A) | | 5 Years(A) | | Inception(A) | |
| Walthausen Select Value Fund - Institutional Class | 16.03% | | 10.07% | | 8.82% | | 11.37% | |
| Walthausen Select Value Fund - Retail Class | 15.70% | | 9.76% | | 8.54% | | 11.08% | |
| Russell 2500® Value Index(B) | 12.83% | | 11.04% | | 9.99% | | 11.28% | |
| | | | Since | |
| | 1 Year(A) | | Inception(A) | |
| Walthausen Select Value Fund - R6 Class | 16.12% | | 22.71% | |
| Russell 2500® Value Index(B) | 12.83% | | 17.28% | |
Annual Fund Operating Expense Ratios (from 6/1/18 Prospectus): Institutional Class - Gross 1.36%, Net 1.11%
Retail Class - 1.36%
R6 Class - Gross 1.36%, Net 0.99%
The Advisor reimbursed and/or waived certain expenses of the Fund’s Institutional, Retail, and R6 Classes. Absent these arrangements, the performance of the Classes would have been lower.
The Fund’s expense ratio for the six month period ended July 31, 2018 can be found in the financial highlights included in this report.
The Annual Fund Operating Expense Ratios reported above may not correlate to the expense ratios in the Fund’s financial highlights because the financial highlights include only the direct operating expenses incurred by the Fund, not the indirect costs of investing in acquired funds.
(A)1 Year, 3 Years, 5 Years and Since Inception returns include change in share prices and in each case includes reinvestment of any dividends and capital gain distributions. The inception date of the Walthausen Select Value Fund Institutional and Retail Classes was December 27, 2010. Class R6 commenced operations on November 1, 2016.
(B)The Russell 2500® Value Index (whose composition is different from that of the Fund) measures the performance of the small to mid-cap value segment of the U.S. equity universe. It includes those Russell 2500 companies with lower price-to-book ratios and lower forecasted growth values. The Index is constructed to provide a comprehensive and unbiased barometer of the small to mid-cap value market. The Index is completely reconstituted annually to ensure larger stocks do not distort the performance and characteristics of the true small to mid-cap opportunity set and that the represented companies continue to reflect value characteristics.
PAST PERFORMANCE DOES NOT GUARANTEE FUTURE RESULTS. INVESTMENT RETURN AND PRINCIPAL VALUE WILL FLUCTUATE SO THAT SHARES, WHEN REDEEMED, MAY BE WORTH MORE OR LESS THAN THEIR ORIGINAL COST. RETURNS DO NOT REFLECT THE DEDUCTION OF TAXES THAT A SHAREHOLDER WOULD PAY ON FUND DISTRIBUTIONS OR THE REDEMPTION OF FUND SHARES. CURRENT PERFORMANCE MAY BE LOWER OR HIGHER THAN THE PERFORMANCE DATA QUOTED. TO OBTAIN PERFORMANCE DATA CURRENT TO THE MOST RECENT MONTH-END, PLEASE CALL 1-888-925-8428. THE FUND’S DISTRIBUTOR IS RAFFERTY CAPITAL MARKETS, LLC.
2018 Semi-Annual Report 3
WALTHAUSEN SELECT VALUE FUND (Unaudited)
WALTHAUSEN SELECT VALUE FUND
by Sectors as of July 31, 2018
(as a percentage of Net Assets)
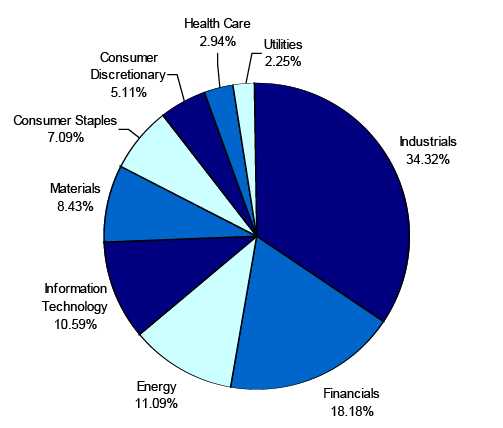
* Net Cash represents cash equivalents and liabilities in excess of other assets.
Availability of Quarterly Schedule of Investments
The Fund files its complete schedule of portfolio holdings with the Securities and Exchange Commission (“SEC”) for the first and third quarters of each fiscal year on Form N-Q. The Fund’s Form N-Q is available on the SEC’s website at http://www.sec.gov. The Fund’s Form N-Q may also be reviewed and copied at the SEC’s Public Reference Room in Washington, DC. Information on the operation of the Public Reference Room may be obtained by calling 1-800-SEC-0330.
Proxy Voting Guidelines
Walthausen & Co., LLC, the Fund’s investment advisor (“Advisor”), is responsible for exercising the voting rights associated with the securities held by the Fund. A description of the policies and procedures used by the Advisor in fulfilling this responsibility is available without charge on the Fund’s website at www.walthausenfunds.com. It is also included in the Fund’s Statement of Additional Information, which is available on the SEC’s website at http://www.sec.gov.
Information regarding how the Fund voted proxies, Form N-PX, relating to portfolio securities during the most recent 12-month period ended June 30th, is available without charge, upon request, by calling our toll free number (1-888-925-8428). This information is also available on the SEC’s website at http://www.sec.gov.
2018 Semi-Annual Report 4
EXPENSE EXAMPLE
(Unaudited)
As a shareholder of the Fund, you incur two types of costs: (1) transaction costs such as redemption fees and IRA maintenance fees, and (2) ongoing costs, including management fees, service fees and other Fund expenses. This Example is intended to help you understand your ongoing costs (in dollars) of investing in the Fund and to compare these costs with the ongoing costs of investing in other mutual funds. The Example is based on an investment of $1,000 invested in the Fund on February 1, 2018 and held through July 31, 2018.
Actual Expenses
The first line of the table below provides information about actual account values and actual expenses. Additionally, although the Fund charges no sales load, you will be assessed fees for outgoing wire transfers, returned checks and stop payment orders at prevailing rates charged by Ultimus Fund Solutions, LLC, the Fund’s transfer agent. If shares are redeemed within 90 days of purchase from the Fund, the shares are subject to a 2% redemption fee. You will be charged an annual maintenance fee of $15 for each tax deferred account you have with the Fund (“IRA maintenance fees”). To the extent the Fund invests in shares of other investment companies as part of its investment strategy, you will indirectly bear your proportionate share of any fees and expenses charged by the underlying funds in which the Fund invests in addition to the expenses of the Fund. Actual expenses of the underlying funds are expected to vary among the various underlying funds. These expenses are not included in the example. The example includes management fees, service fees and other Fund expenses. However, the example does not include portfolio trading commissions and related expenses and other extraordinary expenses as determined under generally accepted accounting principles. You may use the information in this line, together with the amount you invested, to estimate the expenses that you paid over the period. Simply divide your account value by $1,000 (for example, an $8,600 account value divided by $1,000 = 8.6), then multiply the result by the number in the first line under the heading entitled “Expenses Paid During Period” to estimate the expenses you paid on your account during this period.
Hypothetical Example for Comparison Purposes
The second line of the table provides information about hypothetical account values and hypothetical expenses based on the Fund’s actual expense ratio and an assumed rate of return of 5% per year before expenses, which is not the Fund’s actual return. The hypothetical account values and expenses may not be used to estimate the actual ending account balance or expenses you paid for the period. You may use this information to compare the ongoing costs of investing in the Fund and other funds. To do so, compare this 5% hypothetical example with the 5% hypothetical examples that appear in the shareholder reports of the other funds.
Please note that the expenses shown in the table are meant to highlight your ongoing costs only and do not reflect any transactional costs, such as redemption fees, IRA maintenance fees described above or expenses of underlying funds. Therefore, the second line of the table is useful in comparing ongoing costs only, and will not help you determine the relative total costs of owning different funds. In addition, if these transactional costs were included, your costs would have been higher.
| Institutional Class | | | | | | |
| | | | | | | Expenses Paid |
| | | Beginning | | Ending | | During the Period* |
| | | Account Value | | Account Value | | February 1, 2018 |
| | | February 1, 2018 | | July 31, 2018 | | to July 31 , 2018 |
| |
| Actual | | $1,000.00 | | $1,030.70 | | $5.54 |
| |
| Hypothetical | | $1,000.00 | | $1,019.34 | | $5.51 |
| (5% annual return | | | | | | |
| before expenses) | | | | | | |
| * | Expenses are equal to the Fund’s annualized expense ratio of 1.10%, multiplied by the aver- age account value over the period, multiplied by 181/365 (to reflect the one-half year period). |
| |
2018 Semi-Annual Report 5
| Retail Class | | | | | | |
| | | | | | | Expenses Paid |
| | | Beginning | | Ending | | During the Period* |
| | | Account Value | | Account Value | | February 1, 2018 |
| | | February 1, 2018 | | July 31, 2018 | | to July 31 , 2018 |
| |
| Actual | | $1,000.00 | | $1,028.95 | | $6.79 |
| |
| Hypothetical | | $1,000.00 | | $1,018.10 | | $6.76 |
| (5% annual return | | | | | | |
| before expenses) | | | | | | |
| * | Expenses are equal to the Fund’s annualized expense ratio of 1.35%, multiplied by the aver- age account value over the period, multiplied by 181/365 (to reflect the one-half year period). |
| |
| R6 Class | | | | | | |
| | | | | | | Expenses Paid |
| | | Beginning | | Ending | | During the Period* |
| | | Account Value | | Account Value | | February 1, 2018 |
| | | February 1, 2018 | | July 31, 2018 | | to July 31, 2018 |
| |
| Actual | | $1,000.00 | | $1,031.10 | | $4.94 |
| |
| Hypothetical** | | $1,000.00 | | $1,019.93 | | $4.91 |
| (5% annual return | | | | | | |
| before expenses) | | | | | | |
| * | Expenses are equal to the Fund’s annualized expense ratio of 0.98%, multiplied by the aver- age account value over the period, multiplied by 181/365 (to reflect the one-half year period). |
| |
2018 Semi-Annual Report 6
| Walthausen Select Value Fund | | | | |
| | | | Schedule of Investments |
| | | | July 31, 2018 (Unaudited) |
| Shares | | Fair Value | % of Net Assets |
| | | | | |
| COMMON STOCKS | | | | |
| | | | | |
| Aircraft & Parts | | | | |
| 63,420 | Triumph Group, Inc. | $ | 1,322,307 | 2.68 | % |
| Arrangement of Transportation of Freight & Cargo | | | | |
| 27,600 | Hub Group, Inc. - Class A * | | 1,280,640 | 2.60 | % |
| Books: Publishing or Publishing & Printing | | | | |
| 18,190 | John Wiley & Sons, Inc. - Class A | | 1,148,698 | 2.33 | % |
| Calculating & Accounting Machines (No Electronic Computers) | | | | |
| 40,118 | NCR Corporation * | | 1,120,095 | 2.27 | % |
| Computer Communications Equipment | | | | |
| 42,280 | Electronics For Imaging, Inc. * | | 1,442,594 | 2.93 | % |
| Converted Paper & Paperboard Products (No Containers/Boxes) | | | | |
| 10,900 | Avery Dennison Corp. | | 1,250,012 | 2.54 | % |
| Crude Petroleum & Natural Gas | | | | |
| 114,660 | Callon Petroleum Company * | | 1,233,742 | | |
| 21,640 | Energen Corporation * | | 1,605,255 | | |
| 24,130 | Whiting Petroleum Corporation * | | 1,198,054 | | |
| | | | 4,037,051 | 8.19 | % |
| Cutlery, Handtools & General Hardware | | | | |
| 19,830 | Simpson Manufacturing Co., Inc. | | 1,446,797 | 2.94 | % |
| Electrical Work | | | | |
| 18,240 | EMCOR Group, Inc. | | 1,403,568 | 2.85 | % |
| Electronic Components & Accessories | | | | |
| 48,330 | Vishay Intertechnology Inc. | | 1,208,250 | 2.45 | % |
| Fats & Oils | | | | | |
| 73,930 | Darling Ingredients Inc. * | | 1,485,254 | 3.01 | % |
| Fire, Marine & Casualty Insurance | | | | |
| 12,980 | American Financial Group | | 1,462,716 | | |
| 22,720 | AMERISAFE, Inc. | | 1,426,816 | | |
| | | | 2,889,532 | 5.86 | % |
| Heavy Construction Other than Building Construction - Contractors | | | | |
| 25,810 | Granite Construction Incorporated | | 1,392,449 | 2.83 | % |
| Life Insurance | | | | | |
| 13,490 | Primerica, Inc. | | 1,548,652 | 3.14 | % |
| Miscellaneous Industrial & Commercial Machinery & Equipment | | | | |
| 16,430 | Moog Inc. - Class A * | | 1,232,414 | 2.50 | % |
| Miscellaneous General Merchandise Stores | | | | |
| 4,540 | Casey's General Stores, Inc. | | 496,585 | 1.01 | % |
| Miscellaneous Products of Petroleum & Coal | | | | |
| 59,630 | Valvoline Inc. | | 1,347,042 | 2.73 | % |
| Motor Vehicles & Passenger Car Bodies | | | | |
| 18,550 | Oshkosh Corporation | | 1,395,888 | 2.83 | % |
| Oil & Gas Field Machinery & Equipment | | | | |
| 36,850 | Oil States International, Inc. * | | 1,286,065 | 2.61 | % |
| Operative Builders | | | | |
| 44,896 | M.D.C. Holdings, Inc. | | 1,303,780 | 2.65 | % |
| Plastics Products, NEC | | | | |
| 14,150 | AptarGroup, Inc. | | 1,449,384 | 2.94 | % |
| Poultry Slaughtering and Processing | | | | |
| 14,133 | Sanderson Farms, Inc. | | 1,425,030 | 2.89 | % |
| Pumps & Pumping Equipment | | | | |
| 23,650 | ITT Inc. | | 1,340,245 | 2.72 | % |
* Non-Income Producing Securities.
The accompanying notes are an integral part of these
financial statements. |
2018 Semi-Annual Report 7
| Walthausen Select Value Fund |
| | | Schedule of Investments |
| | | | July 31, 2018 (Unaudited) |
| Shares | | Fair Value | | % of Net Assets |
| | | | | | | |
| COMMON STOCKS | | | | | | |
| | | | | | | |
| Rolling Drawing & Extruding of Nonferrous Metals | | | | | | |
| 44,670 | Mueller Industries, Inc. | $ | 1,479,024 | | | 3.00 | % |
| Semiconductors & Related Devices | | | | | | |
| 151,220 | Amkor Technology, Inc. * | | 1,312,590 | | | 2.66 | % |
| Services - Equipment Rental & Leasing, NEC | | | | | | |
| 18,430 | McGrath RentCorp | | 1,094,373 | | | 2.22 | % |
| Services - Hospitals | | | | | | |
| 18,650 | Encompass Health Corporation | | 1,410,499 | | | 2.86 | % |
| Special Industry Machinery, NEC | | | | | | |
| 72,060 | Milacron Holdings Corp. * | | 1,502,451 | | | 3.05 | % |
| State Commercial Banks | | | | | | |
| 16,010 | Bank of Hawaii Corporation | | 1,288,645 | | | | |
| 23,421 | Commerce Bancshares, Inc. | | 1,564,523 | | | | |
| 59,780 | CVB Financial Corp. | | 1,429,938 | | | | |
| | | | 4,283,106 | | | 8.69 | % |
| Transportation Services | | | | | | |
| 19,270 | GATX Corporation | | 1,586,692 | | | 3.22 | % |
| Water Supply | | | | | | | |
| 17,950 | American States Water Company | | 1,079,154 | | | 2.19 | % |
| Total for Common Stocks (Cost $36,283,699) | | 48,000,221 | | | 97.39 | % |
| MONEY MARKET FUNDS | | | | | | |
| 1,765,075 | Fidelity Investments Money Market Government Portfolio - | | | | | | |
| | Class I 1.80% ** | | 1,765,075 | | | 3.58 | % |
| | (Cost $1,765,075) | | | | | | |
| Total Investment Securities | | 49,765,296 | | | 100.97 | % |
| | (Cost $38,048,774) | | | | | | |
| Liabilities in Excess of Other Assets | | (475,902 | ) | | -0.97 | % |
| Net Assets | | $ | 49,289,394 | | | 100.00 | % |
* Non-Income Producing Securities.
** The yield rate shown represents the 7-day yield at July 31, 2018. |
The accompanying notes are an integral part of these
financial statements. |
2018 Semi-Annual Report 8
| Walthausen Select Value Fund | | |
| |
| Statement of Assets and Liabilities (Unaudited) | | |
| July 31, 2018 | | |
| Assets: | | |
| Investment Securities at Fair Value | $ | 49,765,296 |
| (Cost $38,048,774) | | |
| Receivable for Dividends | | 13,594 |
| Receivable for Securities Sold | | 252,066 |
| Receivable for Shareholder Subscriptions | | 7,577 |
| Total Assets | | 50,038,533 |
| Liabilities: | | |
| Payable for Securities Purchased | | 496,990 |
| Payable for Shareholder Redemptions | | 191,802 |
| Payable to Advisor for Management Fees (Note 4) | | 48,106 |
| Payable to Advisor for Service Fees (Note 4) | | 12,241 |
| Total Liabilities | | 749,139 |
| Net Assets | $ | 49,289,394 |
| Net Assets Consist of: | | |
| Paid In Capital | $ | 25,820,355 |
| Accumulated Undistributed Net Investment Income (Loss) | | 42,055 |
| Accumulated Undistributed Realized Gain (Loss) on Investments - Net | | 11,710,462 |
| Unrealized Appreciation (Depreciation) in Value of Investments | | |
| Based on Identified Cost - Net | | 11,716,522 |
| Net Assets | $ | 49,289,394 |
| |
| Institutional Class | | |
| Net Assets | $ | 41,469,923 |
| Shares Outstanding | | |
| (Unlimited shares authorized) | | 2,093,489 |
| Net Asset Value and Offering Price Per Share | $ | 19.81 |
| Redemption Price Per Share ($19.81 x 0.98) (Note 2) | $ | 19.41 |
| |
| Retail Class | | |
| Net Assets | $ | 7,271,479 |
| Shares Outstanding | | |
| (Unlimited shares authorized) | | 372,006 |
| Net Asset Value and Offering Price Per Share | $ | 19.55 |
| Redemption Price Per Share ($19.55 x 0.98) (Note 2) | $ | 19.16 |
| |
| R6 Class | | |
| Net Assets | $ | 547,992 |
| Shares Outstanding | | |
| (Unlimited shares authorized) | | 27,549 |
| Net Asset Value and Offering Price Per Share | $ | 19.89 |
| Redemption Price Per Share ($19.89 x 0.98) (Note 2) | $ | 19.49 |
The accompanying notes are an integral part of these
financial statements. |
2018 Semi-Annual Report 9
| Walthausen Select Value Fund | | | |
| |
| Statement of Operations (Unaudited) | | | |
| For the six month period ended July 31, 2018 | | | |
| |
| Investment Income: | | | |
| Dividends (Net of foreign withholding tax of $0) | $ | 453,435 | |
| Interest | | - | |
| Total Investment Income | | 453,435 | |
| Expenses: | | | |
| Management Fees (Note 4) | | 321,206 | |
| Service Fees (Note 4) | | 160,604 | |
| Total Expenses | | 481,810 | |
| Less: Waived Service Fees (Note 4) | | (79,688 | ) |
| Net Expenses | | 402,122 | |
| Net Investment Income (Loss) | | 51,313 | |
| Realized and Unrealized Gain (Loss) on Investments: | | | |
| Net Realized Gain (Loss) on Investments | | 8,819,962 | |
| Net Change In Unrealized Appreciation (Depreciation) on Investments | | (7,022,663 | ) |
| Net Realized and Unrealized Gain (Loss) on Investments | | 1,797,299 | |
| Net Increase (Decrease) in Net Assets from Operations | $ | 1,848,612 | |
The accompanying notes are an integral part of these
financial statements. |
2018 Semi-Annual Report 10
| Walthausen Select Value Fund |
| | |
| Statements of Changes in Net Assets | | (Unaudited) | | | | | | |
| | | 2/1/2017 | | | | 2/1/2017 | | |
| | | to | | | | to | | |
| | | 1/31/2018 | | | | 1/31/2018 | | |
| From Operations: | | | | | | | | |
| Net Investment Income (Loss) | $ | 51,313 | | | $ | 351,381 | | |
| Net Realized Gain (Loss) on Investments | | 8,819,962 | | | | 10,131,936 | | |
| Net Change in Unrealized Appreciation (Depreciation) on Investments | | (7,022,663 | ) | | | 4,057,178 | | |
| Increase (Decrease) in Net Assets from Operations | | 1,848,612 | | | | 14,540,495 | | |
| From Distributions to Shareholders: | | | | | | | | |
| Net Investment Income | | | | | | | | |
| Institutional Class | | - | | | | (457,322 | ) | |
| Retail Class | | - | | | | (38,076 | ) | |
| R6 Class | | - | | | | (3,138 | ) | |
| Net Realized Gain from Investments | | | | | | | | |
| Institutional Class | | - | | | | (200,053 | ) | |
| Retail Class | | - | | | | (22,110 | ) | |
| R6 Class | | - | | | | (1,458 | ) | |
| Change in Net Assets from Distributions | | - | | | | (722,157 | ) | |
| From Capital Share Transactions: | | | | | | | | |
| Proceeds From Sale of Shares | | | | | | | | |
| Institutional Class | | 542,419 | | | | 49,288,539 | | |
| Retail Class | | 242,961 | | | | 596,452 | | |
| R6 Class | | 33,408 | | | | 507,392 | | |
| Proceeds From Redemption Fees (Note 2) | | | | | | | | |
| Institutional Class | | 918 | | | | 13,754 | | |
| Retail Class | | 115 | | | | 245 | | |
| R6 Class | | - | | | | - | | |
| Shares Issued on Reinvestment of Dividends | | | | | | | | |
| Institutional Class | | - | | | | 654,917 | | |
| Retail Class | | - | | | | 59,788 | | |
| R6 Class | | - | | | | 4,596 | | |
| Cost of Shares Redeemed | | | | | | | | |
| Institutional Class | | (29,646,313 | ) | | | (27,461,477 | ) | |
| Retail Class | | (1,615,710 | ) | | | (47,590,559 | ) | |
| R6 Class | | (25,039 | ) | | | (69,470 | ) | |
| Net Increase (Decrease) from Shareholder Activity | | (30,467,241 | ) | | | (23,995,823 | ) | |
| Net Increase (Decrease) in Net Assets | | (28,618,629 | ) | | | (10,177,485 | ) | |
| Net Assets at Beginning of Period | | 77,908,023 | | | | 88,085,508 | | |
| Net Assets at End of Period (Including Accumulated Undistributed | $ | 49,289,394 | | | $ | 77,908,023 | | |
| Net Investment Income (Loss) of $42,055 and ($9,258), respectively) | | | | | | | | |
| Share Transactions: | | | | | | | | |
| Issued | | | | | | | | |
| Institutional Class | | 29,023 | | | | 2,937,076 | | |
| Retail Class | | 13,008 | | | | 33,676 | | |
| R6 Class | | 1,784 | | | | 30,075 | | |
| Reinvested | | | | | | | | |
| Institutional Class | | - | | | | 34,929 | | |
| Retail Class | | - | | | | 3,227 | | |
| R6 Class | | - | | | | 244 | | |
| Redeemed | | | | | | | | |
| Institutional Class | | (1,522,604 | ) | | | (1,546,821 | ) | |
| Retail Class | | (84,714 | ) | | | (2,880,757 | ) | |
| R6 Class | | (1,353 | ) | | | (3,557 | ) | |
| Net Increase (Decrease) in Shares | | (1,564,856 | ) | | | (1,391,908 | ) | |
The accompanying notes are an integral part of these
financial statements. |
2018 Semi-Annual Report 11
| Walthausen Select Value Fund |
| |
| Financial Highlights - Institutional Class | | (Unaudited) | | | | | | | | | | | | | | | | | | | | | | |
| Selected data for a share outstanding throughout the period: | | 2/1/2018 | | | | 2/1/2017 | | | | 2/1/2016 | | | | 2/1/2015 | | | | 2/1/2014 | | | | 2/1/2013 | | |
| | | to | | | | to | | | | to | | | | to | | | | to | | | | to | | |
| | | 7/31/2018 | | | | 1/31/2018 | | | | 1/31/2017 | | | | 1/31/2016 | | | | 1/31/2015 | | | | 1/31/2014 | | |
| Net Asset Value - | | | | | | | | | | | | | | | | | | | | | | | | |
| Beginning of Period | $ | 19.22 | | | $ | 16.26 | | | $ | 13.19 | | | $ | 14.70 | | | $ | 15.19 | | | $ | 12.01 | | |
| Net Investment Income (Loss) (a) | | 0.02 | | | | 0.10 | | | | 0.06 | | | | 0.08 | | | | 0.17 | | | | (0.01 | ) | |
| Net Gain (Loss) on Investments (Realized and Unrealized) (b) | | 0.57 | | | | 3.02 | | | | 3.08 | | | | (1.42 | ) | | | 0.10 | | | | 3.54 | | |
| Total from Investment Operations | | 0.59 | | | | 3.12 | | | | 3.14 | | | | (1.34 | ) | | | 0.27 | | | | 3.53 | | |
| Distributions (From Net Investment Income) | | - | | | | (0.11 | ) | | | (0.07 | ) | | | (0.07 | ) | | | (0.14 | ) | | | - | | |
| Distributions (From Capital Gains) | | - | | | | (0.05 | ) | | | - | | | | (0.10 | ) | | | (0.62 | ) | | | (0.35 | ) | |
| Total Distributions | | - | | | | (0.16 | ) | | | (0.07 | ) | | | (0.17 | ) | | | (0.76 | ) | | | (0.35 | ) | |
| Proceeds from Redemption Fee (Note 2) | | - | | + | | - | | + | | - | | + | | - | | + | | - | | + | | - | | + |
| Net Asset Value - | | | | | | | | | | | | | | | | | | | | | | | | |
| End of Period | $ | 19.81 | | | $ | 19.22 | | | $ | 16.26 | | | $ | 13.19 | | | $ | 14.70 | | | $ | 15.19 | | |
| Total Return (c) | | 3.07% | | * | | 19.23% | | | | 23.78% | | | | (9.23)% | | | | 1.57% | | | | 29.31% | | |
| Ratios/Supplemental Data | | | | | | | | | | | | | | | | | | | | | | | | |
| Net Assets - End of Period (Thousands) | $ | 41,470 | | | $ | 68,955 | | | $ | 35,158 | | | $ | 48,191 | | | $ | 46,778 | | | $ | 30,600 | | |
| Before Reimbursement | | | | | | | | | | | | | | | | | | | | | | | | |
| Ratio of Expenses to Average Net Assets | | 1.35% | | ** | | 1.35% | | | | 1.42% | | | | 1.45% | | | | 1.45% | | | | 1.45% | | |
| Ratio of Net Investment Income (Loss) to Average Net Assets | | -0.08% | | ** | | 0.33% | | | | 0.19% | | | | 0.31% | | | | 0.83% | | | | -0.33% | | |
| After Reimbursement | | | | | | | | | | | | | | | | | | | | | | | | |
| Ratio of Expenses to Average Net Assets | | 1.10% | | ** | | 1.10% | | | | 1.17% | | | | 1.20% | | | | 1.20% | | | | 1.20% | | |
| Ratio of Net Investment Income (Loss) to Average Net Assets | | 0.17% | | ** | | 0.58% | | | | 0.44% | | | | 0.56% | | | | 1.08% | | | | -0.08% | | |
| Portfolio Turnover Rate | | 22.51% | | * | | 63.12% | | | | 62.38% | | | | 62.54% | | | | 75.83% | | | | 77.67% | | |
| Walthausen Select Value Fund |
| | |
| Financial Highlights - Retail Class | | (Unaudited) | | | | | | | | | | | | | | | | | | | | | | |
| Selected data for a share outstanding throughout the period: | | 2/1/2018 | | | | 2/1/2017 | | | | 2/1/2016 | | | | 2/1/2015 | | | | 2/1/2014 | | | | 2/1/2013 | | |
| | | to | | | | to | | | | to | | | | to | | | | to | | | | to | | |
| | | 7/31/2018 | | | | 1/31/2018 | | | | 1/31/2017 | | | | 1/31/2016 | | | | 1/31/2015 | | | | 1/31/2014 | | |
| Net Asset Value - | | | | | | | | | | | | | | | | | | | | | | | | |
| Beginning of Period | $ | 19.00 | | | $ | 16.10 | | | $ | 13.06 | | | $ | 14.57 | | | $ | 15.05 | | | $ | 11.94 | | |
| Net Investment Income (Loss) (a) | | (0.01 | ) | | | 0.03 | | | | 0.03 | | | | 0.05 | | | | 0.16 | | | | (0.05 | ) | |
| Net Gain (Loss) on Investments (Realized and Unrealized) (b) | | 0.56 | | | | 3.00 | | | | 3.04 | | | | (1.42 | ) | | | 0.09 | | | | 3.51 | | |
| Total from Investment Operations | | 0.55 | | | | 3.03 | | | | 3.07 | | | | (1.37 | ) | | | 0.25 | | | | 3.46 | | |
| Distributions (From Net Investment Income) | | - | | | | (0.08 | ) | | | (0.03 | ) | | | (0.04 | ) | | | (0.11 | ) | | | - | | |
| Distributions (From Capital Gains) | | - | | | | (0.05 | ) | | | - | | | | (0.10 | ) | | | (0.62 | ) | | | (0.35 | ) | |
| Total Distributions | | - | | | | (0.13 | ) | | | (0.03 | ) | | | (0.14 | ) | | | (0.73 | ) | | | (0.35 | ) | |
| Proceeds from Redemption Fee (Note 2) | | - | | + | | - | | + | | - | | + | | - | | + | | - | | + | | - | | + |
| Net Asset Value - | | | | | | | | | | | | | | | | | | | | | | | | |
| End of Period | $ | 19.55 | | | $ | 19.00 | | | $ | 16.10 | | | $ | 13.06 | | | $ | 14.57 | | | $ | 15.05 | | |
| Total Return (c) | | 2.89% | | * | | 18.87% | | | | 23.50% | | | | (9.50)% | | | | 1.46% | | | | 28.89% | | |
| Ratios/Supplemental Data | | | | | | | | | | | | | | | | | | | | | | | | |
| Net Assets - End of Period (Thousands) | $ | 7,271 | | | $ | 8,430 | | | $ | 52,922 | | | $ | 39,781 | | | $ | 26,091 | | | $ | 4,802 | | |
| Before Reimbursement | | | | | | | | | | | | | | | | | | | | | | | | |
| Ratio of Expenses to Average Net Assets | | 1.35% | | ** | | 1.35% | | | | 1.42% | | | | 1.45% | | | | 1.45% | | | | 1.47% | | |
| Ratio of Net Investment Income (Loss) to Average Net Assets | | -0.09% | | ** | | 0.16% | | | | 0.19% | | | | 0.31% | | | | 0.98% | | | | -0.37% | | |
| After Reimbursement | | | | | | | | | | | | | | | | | | | | | | | | |
| Ratio of Expenses to Average Net Assets | | 1.35% | | ** | | 1.35% | | | | 1.42% | | | | 1.45% | | | | 1.45% | | | | 1.45% | | |
| Ratio of Net Investment Income (Loss) to Average Net Assets | | -0.09% | | ** | | 0.16% | | | | 0.19% | | | | 0.31% | | | | 0.98% | | | | -0.35% | | |
| Portfolio Turnover Rate | | 22.51% | | * | | 63.12% | | | | 62.38% | | | | 62.54% | | | | 75.83% | | | | 77.67% | | |
* Not Annualized. ** Annualized.
+ Amount less than $0.005 per share.
(a) Per share amounts were calculated using the average shares method.
(b) Realized and unrealized gains and losses per share in this caption are balancing amounts necessary to reconcile
the change in net asset value for the period and may not reconcile with the aggregate gains and losses in the Statement
of Operations due to share transactions for the period.
(c) Total return represents the rate that the investor would have earned or lost on an investment in the Fund assuming
reinvestment of dividends. |
The accompanying notes are an integral part of these
financial statements. |
2018 Semi-Annual Report 12
| Walthausen Select Value Fund |
| | |
| Financial Highlights - R6 Class | | (Unaudited) | | | | | | | | | | |
| Selected data for a share outstanding throughout the period: | | 2/1/2018 | | | | 2/1/2017 | | | | 11/1/2016* | | |
| | | to | | | | to | | | | to | | |
| | | 7/31/2018 | | | | 1/31/2018 | | | | 1/31/2017 | | |
| Net Asset Value - | | | | | | | | | | | | |
| Beginning of Period | $ | 19.29 | | | $ | 16.30 | | | $ | 14.06 | | |
| Net Investment Income (Loss) (a) | | 0.03 | | | | 0.14 | | | | 0.03 | | |
| Net Gain (Loss) on Investments (Realized and Unrealized) (b) | | 0.57 | | | | 3.01 | | | | 2.24 | | |
| Total from Investment Operations | | 0.60 | | | | 3.15 | | | | 2.27 | | |
| Distributions (From Net Investment Income) | | - | | | | (0.11 | ) | | | (0.03 | ) | |
| Distributions (From Capital Gains) | | - | | | | (0.05 | ) | | | - | | |
| Total Distributions | | - | | | | (0.16 | ) | | | (0.03 | ) | |
| Proceeds from Redemption Fee (Note 2) | | - | | | | - | | | | - | | |
| Net Asset Value - | | | | | | | | | | | | |
| End of Period | $ | 19.89 | | | $ | 19.29 | | | $ | 16.30 | | |
| Total Return (c) | | 3.11% | | ** | | 19.32% | | | | 16.18 | % | ** |
| Ratios/Supplemental Data | | | | | | | | | | | | |
| Net Assets - End of Period (Thousands) | $ | 548 | | | $ | 523 | | | $ | 6 | | |
| Before Reimbursement | | | | | | | | | | | | |
| Ratio of Expenses to Average Net Assets | | 1.35% | | *** | | 1.35% | | | | 1.35 | % | *** |
| Ratio of Net Investment Income (Loss) to Average Net Assets | | -0.10% | | *** | | 0.37% | | | | 0.48 | % | *** |
| After Reimbursement | | | | | | | | | | | | |
| Ratio of Expenses to Average Net Assets | | 0.98% | | *** | | 0.98% | | | | 0.98 | % | *** |
| Ratio of Net Investment Income (Loss) to Average Net Assets | | 0.27% | | *** | | 0.74% | | | | 0.85 | % | *** |
| Portfolio Turnover Rate | | 22.51% | | ** | | 63.12% | | | | 62.38 | % | ** |
* Not Annualized.
** Annualized.
+ Amount less than $0.005 per share.
(a) Per share amounts were calculated using the average shares method.
(b) Realized and unrealized gains and losses per share in this caption are balancing amounts necessary to reconcile
the change in net asset value for the period and may not reconcile with the aggregate gains and losses in the
Statement of Operations due to share transactions for the period.
(c) Total return represents the rate that the investor would have earned or lost on an investment in the Fund assuming
reinvestment of dividends. |
The accompanying notes are an integral part of these
financial statements. |
2018 Semi-Annual Report 13
NOTES TO FINANCIAL STATEMENTS
WALTHAUSEN SELECT VALUE FUND
July 31, 2018
(UNAUDITED)
1.) ORGANIZATION
Walthausen Select Value Fund (the “Fund”) was organized as a diversified series of the Walthausen Funds (the “Trust”) on December 1, 2010. The Trust is registered as an open-end investment company under the Investment Company Act of 1940, as amended (the “1940 Act”). The Trust was organized in Ohio as a business trust on October 10, 2007 and may offer an unlimited number of shares of beneficial interest in a number of separate series, each series representing a distinct fund with its own investment objectives and policies. The Fund commenced operations on December 27, 2010. As of July 31, 2018, there were two series authorized by the Trust. Class R6 shares commenced operations on November 1, 2016. The Fund currently offers Institutional Class shares, Retail Class shares and R6 Class shares. Prior to January 30, 2013 the Institutional Class was named the Investor Class. The classes differ principally in their respective distribution expenses and arrangements. All classes of shares have identical rights to earnings, assets and voting privileges, except for class specific expenses and exclusive rights to vote on matters affecting only individual classes. Prior to June 1, 2013, Retail Class shares of the Fund were subject to Rule 12b-1 distribution fees. While the Fund does not currently charge any Rule 12b-1 distribution fees, the Fund does reserve the right to pay or accrue such fees upon notice to shareholders. The Fund’s investment objective is to seek long-term capital appreciation. The investment advisor to the Fund is Walthausen & Co., LLC (the “Advisor”).
2.) SIGNIFICANT ACCOUNTING POLICIES
The Fund is an investment company and accordingly follows the investment company accounting and reporting guidance of the Financial Accounting Standards Board (“FASB”) Accounting Standards Codification Topic 946 Financial Services - Investment Companies. The financial statements are prepared in conformity with accounting principles generally accepted in the United States of America (“GAAP”). The Fund follows the significant accounting policies described in this section.
SECURITY VALUATION
All investments in securities are recorded at their estimated fair value, as described in Note 3.
FEDERAL INCOME TAXES
The Fund’s policy is to continue to comply with the requirements of the Internal Revenue Code that are applicable to regulated investment companies and to distribute all of its taxable income to shareholders. Therefore, no federal income tax provision is required. It is the Fund’s policy to distribute annually, prior to the end of the calendar year, dividends sufficient to satisfy excise tax requirements of the Internal Revenue Code. This Internal Revenue Code requirement may cause an excess of distributions over the book year-end accumulated income. In addition, it is the Fund’s policy to distribute annually, after the end of the fiscal year, any remaining net investment income and net realized capital gains.
The Fund recognizes the tax benefits of certain tax positions only where the position is “more likely than not” to be sustained assuming examination by tax authorities. Management has analyzed the Fund’s tax positions, and has concluded that no liability for unrecognized tax benefits should be recorded related to uncertain tax positions taken on returns filed for the open tax years. The Fund identifies its major tax jurisdictions as U.S. Federal and State tax authorities; however, the Fund is not aware of any tax positions for which it is reasonably possible that the total amounts of unrecognized tax benefits will change materially in the next twelve months. The Fund recognizes interest and penalties, if any, related to unrecognized tax benefits as income tax expense in the Statement of Operations. During the six month period ended July 31, 2018, the Fund did not incur any interest or penalties.
SHARE VALUATION
The net asset value per share of the Fund is calculated daily by dividing the total value of the Fund’s assets, less liabilities, by the number of shares outstanding, rounded to the nearest cent. The offering and redemption price per share is equal to the net asset value per share, except that shares of the Fund are subject to a redemption fee of 2% if redeemed after holding them for 90 days or less. During the six month period ended July 31, 2018, proceeds from redemption fees amounted to $918, $115 and $0 for Institutional Class shares, Retail Class shares and R6 Class shares, respectively.
2018 Semi-Annual Report 14
Notes to Financial Statements (Unaudited) - continued
DISTRIBUTIONS TO SHAREHOLDERS
Distributions to shareholders, which are determined in accordance with income tax regulations, are recorded on the ex-dividend date. The Fund may utilize earnings and profits distributed to shareholders on redemptions of shares as part of the dividends paid deductions. The treatment for financial reporting purposes of distributions made to shareholders during the year from net investment income or net realized capital gains may differ from their ultimate treatment for federal income tax purposes. These differences are caused primarily by differences in the timing of the recognition of certain components of income, expense, or realized capital gain for federal income tax purposes. Where such differences are permanent in nature, they are reclassified in the components of the net assets based on their ultimate characterization for federal income tax purposes. Any such reclassifications will have no effect on net assets, results of operations, or net asset value per share of the Fund.
USE OF ESTIMATES
The financial statements are prepared in accordance with GAAP, which requires management to make estimates and assumptions that affect the reported amounts of assets and liabilities and disclosure of contingent assets and liabilities at the date of the financial statements and the reported amounts of increases and decreases in net assets from operations during the reporting period. Actual results could differ from those estimates.
OTHER
The Fund records security transactions based on the trade date for financial reporting purposes. Dividend income is recognized on the ex-dividend date. Interest income, if any, is recognized on an accrual basis. The Fund uses the specific identification method in computing gain or loss on the sale of investment securities. Withholding taxes on foreign dividends have been provided for in accordance with the Fund’s understanding of the applicable country’s tax rules and rates. The Fund may invest in real estate investment trusts (“REITs”) that pay distributions to their shareholders based on available funds from operations. It is common for these distributions to exceed the REITs taxable earnings and profits resulting in the excess portion of such distribution to be designated as return of capital. Distributions received from REITs are generally recorded as dividend income and, if necessary, are reclassified annually in accordance with tax information provided by the underlying REITs. Additionally, the Fund may hold investments in master limited partnerships (“MLPs”). It is common for distributions from MLPs to exceed taxable earnings and profits. In such instances, the excess portion of such distributions are classified as a return of capital. Annually, income or loss from each MLP is reclassified upon receipt of the MLP’s tax reporting document. For financial reporting purposes, management does not estimate the tax character of MLP distributions for which actual information has not been reported.
EXPENSES
Expenses incurred by the Trust that do not relate to a specific fund of the Trust are allocated to the individual funds based on each fund’s relative net assets or an appropriate basis.
Class specific expenses are borne by each specific class. Income, non-class specific expenses, and realized and unrealized gains/losses are allocated to the respective classes based on the basis of relative net assets.
3.) SECURITIES VALUATIONS
The Fund utilizes various methods to measure the fair value of its investments on a recurring basis. GAAP establishes a hierarchy that prioritizes inputs to valuation methods. The three levels of inputs are:
Level 1 - Unadjusted quoted prices in active markets for identical assets or liabilities that the Fund has the ability to access.
Level 2 - Observable inputs other than quoted prices included in level 1 that are observable for the asset or liability, either directly or indirectly. These inputs may include quoted prices for the identical instrument on an inactive market, prices for similar instruments, interest rates, prepayment speeds, credit risk, yield curves, default rates and similar data.
Level 3 - Unobservable inputs for the asset or liability, to the extent relevant observable inputs are not available, representing the Fund’s own assumptions about the assumptions a market participant would use in valuing the asset or liability, and would be based on the best information available.
The availability of observable inputs can vary from security to security and is affected by a wide variety of factors, including, for example, the type of security, whether the security is new and not
2018 Semi-Annual Report 15
Notes to Financial Statements (Unaudited) - continued
yet established in the marketplace, the liquidity of markets, and other characteristics particular to the security. To the extent that valuation is based on models or inputs that are less observable or unobservable in the market, the determination of fair value requires more judgment. Accordingly, the degree of judgment exercised in determining fair value is greatest for instruments categorized as level 3.
The inputs used to measure fair value may fall into different levels of the fair value hierarchy. In such cases, for disclosure purposes, the level in the fair value hierarchy within which the fair value measurement falls in its entirety, is determined based on the lowest level input that is significant to the fair value measurement in its entirety.
FAIR VALUE MEASUREMENTS
A description of the valuation techniques applied to the Fund’s major categories of assets and liabilities measured at fair value on a recurring basis follows.
Equity securities (common stocks). Equity securities generally are valued by using market quotations, but may be valued on the basis of prices furnished by a pricing service when the Advisor believes such prices accurately reflect the fair value of such securities. Securities that are traded on any stock exchange or on the NASDAQ over-the-counter market are generally valued by the pricing service at the last quoted sale price. Lacking a last sale price, an equity security is generally valued by the pricing service at its last bid price. Generally, if the security is traded in an active market and is valued at the last sale price, the security is categorized as a level 1 security. When market quotations are not readily available, when the Advisor determines that the market quotation or the price provided by the pricing service does not accurately reflect the current fair value, or when restricted securities are being valued, such securities are valued as determined in good faith by the Advisor, subject to review of the Board of Trustees (the “Trustees” or the “Board”) and are categorized in level 2 or level 3, when appropriate.
Money market funds. Shares of money market funds are valued at the net asset value and are classified as level 1 of the fair value hierarchy.
In accordance with the Trust’s good faith pricing guidelines, the Advisor is required to consider all appropriate factors relevant to the value of securities for which it has determined other pricing sources are not available or reliable as described above. There is no single procedure for determining fair value, since fair value depends upon the circumstances of each individual case. As a general principle, the current fair value of an issue of securities being valued by the Advisor would appear to be the amount which the owner might reasonably expect to receive for them upon their current sale. Methods which are in accordance with this principle may, for example, be based on (i) a multiple of earnings; (ii) a discount from market of a similar freely traded security (including a derivative security or a basket of securities traded on other markets, exchanges or among dealers); or (iii) yield to maturity with respect to debt issues, or a combination of these and other methods.
The following table summarizes the inputs used to value the Fund’s assets measured at fair value as of July 31, 2018:
| Valuation Inputs of Assets | | Level 1 | | Level 2 | | Level 3 | | Total |
| Common Stocks | | $48,000,221 | | $0 | | $0 | | $48,000,221 |
| Money Market Funds | | 1,765,075 | | 0 | | 0 | | 1,765,075 |
| Total | | $49,765,296 | | $0 | | $0 | | $49,765,296 |
Refer to the Fund’s Schedule of Investments for a listing of securities by industry. The Fund did not hold any level 2 or level 3 assets during the six month period ended July 31, 2018. There were no transfers into or out of the levels during the six month period ended July 31, 2018. It is the Fund’s policy to consider transfers into or out of the levels as of the end of the reporting period.
The Fund did not invest in any derivative instruments during the six month period ended July 31, 2018.
4.) INVESTMENT ADVISORY AGREEMENT AND RELATED PARTY TRANSACTIONS
The Trust, on behalf of the Fund, has entered into an investment advisory agreement (“Management Agreement”) with the Advisor. The Advisor manages the investment portfolio of the Fund, subject to policies adopted by the Trust’s Board of Trustees, and, at its own expense and without reimbursement from the Trust, furnishes office space and all necessary office facilities, equipment and executive personnel necessary for managing the Fund. For its services, the Advisor received an investment management fee equal to 0.90% of the average daily net assets of the
2018 Semi-Annual Report 16
Notes to Financial Statements (Unaudited) - continued
Fund. Prior to November 1, 2016, the Advisor received an investment management fee equal to 1.00% of the average daily net assets of the Fund. For the six month period ended July 31, 2018, the Advisor earned management fees totaling $321,206, of which $48,106 was due to the Advisor at July 31, 2018.
Under the terms of the Services Agreement between the Trust, on behalf of the Fund, and the Advisor (the “Services Agreement”), the Advisor renders administrative and supervisory services to the Fund, provides the services of a chief compliance officer and assumes and pays all ordinary expenses of the Fund, excluding management fees, any 12b-1 fees, brokerage fees and commissions, taxes, borrowing costs (such as (a) interest and (b) dividend expenses on securities sold short), fees and expenses of acquired funds, extraordinary or non-recurring expenses as may arise, including litigation to which the Fund may be a party and indemnification of the Trust’s Trustees and officers. For its services, the Advisor receives service fees equal to an annual rate of 0.45% of the Fund’s average daily net assets up to $100 million, 0.25% of the Fund’s average daily net assets between $100 million and $500 million, and 0.15% of such assets in excess of $500 million. The Advisor has contractually agreed to waive Services Agreement fees to the extent necessary to maintain total annual operating expenses of the Institutional Class Shares, excluding brokerage fees and commissions, taxes, borrowing costs (such as (a) interest and (b) dividend expenses on securities sold short), the cost of acquired funds and extraordinary expenses at 1.10% of its average daily net assets through May 31, 2018. The Advisor may not terminate the fee waiver before May 31, 2018. Prior to June 1, 2017 the Advisor had contractually agreed to waive, for the Institutional Class shares, 0.25% of the applicable Services Agreement fees for the class’ average daily net assets up to $100 million. Also, the Advisor has contractually agreed to waive Services Agreement fees to the extent necessary to maintain total annual operating expenses of the R6 Class Shares, excluding brokerage fees and commissions, taxes, borrowing costs (such as (a) interest and (b) dividend expenses on securities sold short), the cost of acquired funds and extraordinary expenses at 0.98% of its average daily net assets through May 31, 2019. The Advisor may not terminate the fee waiver before May 31, 2019.
For the six month period ended July 31, 2018, the Advisor earned service fees of $160,604, of which $12,241 was due to the Advisor at July 31, 2018. Service fees in the amounts of $78,739 and $949 were waived with no recapture provision for the six month period ended July 31, 2018 for the Institutional and R6 Classes, respectively.
Certain officers and a shareholder of the Advisor are also officers and/or a Trustee of the Trust. These individuals may receive benefits from the Advisor resulting from management and services fees paid to the Advisor by the Fund.
The Trustees who are not interested persons of the Fund were each paid $2,000, for a total of $6,000, in Trustees’ fees plus travel and related expenses for the six month period ended July 31, 2018 for their services to the Fund. The Advisor pays these fees pursuant to the Services Agreement.
5.) DISTRIBUTION AND SHAREHOLDER SERVICING PLAN
The Fund has adopted a Distribution Plan in accordance with Rule 12b-1 under the 1940 Act. Pursuant to the Distribution Plan, the Fund compensates the Advisor for services rendered and expenses borne in connection with brokerage platform fees. This Distribution Plan provides that the Fund may pay the annual rate of up to 0.25% of the average daily net assets of the Fund’s Retail Class shares. These activities include reimbursement to entities for providing distribution and shareholder servicing with respect to the Fund’s shares. Effective June 1, 2013, the Fund does not currently pay or accrue any distribution fees for Retail Class shares; however, the Fund reserves the right to pay or accrue such fees in the future upon notice to shareholders.
6.) PURCHASES AND SALES OF SECURITIES
For the six month period ended July 31, 2018, purchases and sales of investment securities other than U.S. Government obligations and short-term investments aggregated $15,603,478 and $50,555,830, respectively. Purchases and sales of U.S. Government obligations aggregated $0 and $0, respectively.
7.) CONTROL OWNERSHIP
The beneficial ownership, either directly or indirectly, of more than 25% of the voting securities of a fund creates a presumption of control of a fund under Section 2(a)(9) of the 1940 Act. As of July 31, 2018, NFS, LLC located in New York, New York, each for the benefit of its clients, held, in aggregate, 61.28% of the Fund shares, and therefore each may be deemed to control the Fund.
2018 Semi-Annual Report 17
Notes to Financial Statements (Unaudited) - continued
8.) TAX MATTERS
For Federal income tax purposes, the cost of investments owned at July 31, 2018 was $38,048,774. At July 31, 2018, the composition of unrealized appreciation (the excess of value over tax cost) and depreciation (the excess of tax cost over value) was as follows:
| | Appreciation | | (Depreciation) | | Net Appreciation (Depreciation) |
| | $12,416,865 | | ($700,343) | | $11,716,522 |
Distributions paid from Institutional Class:
| | | Six Months Ended | | | Fiscal Year Ended |
| | | July 31, 2018 | | | January 31, 2018 |
| Ordinary Income | | $ -0- | | | $ 372,352 |
| Long-Term Capital Gain | | -0- | | | 285,022 |
| | | $ -0- | | | $ 657,374 |
Distributions paid from Retail Class:
| | | Six Months Ended | | | Fiscal Year Ended |
| | | July 31, 2018 | | | January 31, 2018 |
| Ordinary Income | | $ -0- | | | $ 28,685 |
| Long-Term Capital Gain | | -0- | | | 31,501 |
| | | $ -0- | | | $ 60,186 |
Distributions paid from R6 Class:
| | | Six Months Ended | | | Fiscal Year Ended |
| | | July 31, 2018 | | | January 31, 2018 |
| Ordinary Income | | $ -0- | | | $ 2,519 |
| Long-Term Capital Gain | | -0- | | | 2,078 |
| | | $ -0- | | | $ 4,597 |
9.) SUBSEQUENT EVENTS
Subsequent events after the date of the Statement of Assets and Liabilities have been evaluated through the date the financial statements were issued. Management has concluded that there is no impact requiring adjustment to or disclosure in the financial statements.
2018 Semi-Annual Report 18
Board of Trustees
Edward A. LaVarnway
John P. Mastriani
Hany A. Shawky
John B. Walthausen
Investment Advisor and Administrator
Walthausen & Co., LLC
Legal Counsel
Thompson Hine LLP
Custodian
US Bank, N.A.
Dividend Paying Agent,
Shareholders' Servicing Agent,
Transfer Agent
Ultimus Fund Solutions, LLC
Sub-Administrator
Premier Fund Solutions, Inc.
Independent Registered Public Accounting Firm
Cohen & Company, Ltd.
Distributor
Rafferty Capital Markets, LLC |
This report is provided for the general information of the shareholders of the Walthausen
Select Value Fund. This report is not intended for distribution to prospective investors in
the Fund, unless preceded or accompanied by an effective prospectus. |
WALTHAUSEN SELECT VALUE FUND
2691 Route 9, Suite 102
Malta, NY 12020
Item 2. Code of Ethics. Not applicable.
Item 3. Audit Committee Financial Expert. Not applicable.
Item 4. Principal Accountant Fees and Services. Not applicable.
Item 5. Audit Committee of Listed Companies. Not applicable.
Item 6. Schedule of Investments. Not applicable. Schedule filed with Item 1.
Item 7. Disclosure of Proxy Voting Policies and Procedures for Closed-End Funds. Not applicable.
Item 8. Portfolio Managers of Closed End Funds. Not applicable.
Item 9. Purchases of Equity Securities by Closed-End Management Investment Companies and Affiliated Purchasers. Not applicable.
Item 10. Submission of Matters to a Vote of Security Holders.
The registrant has not adopted procedures by which shareholders may recommend nominees to the registrant’s board of trustees.
Item 11. Controls and Procedures.
(a) The Registrant’s president and chief financial officer concluded that the disclosure controls and procedures (as defined in Rule 30a-3(c) under the Investment Company Act of 1940 (the “Act”)) were effective as of a date within 90 days of the filing date of this report, based on the evaluation of these controls and procedures required by Rule 30a-3(b) under the Act.
(b) There were no changes in the registrant’s internal control over financial reporting (as defined in Rule 30a-3(d) under the Act) that occurred during the registrant’s second fiscal quarter of the period covered by this report that have materially affected, or are reasonably likely to materially affect, the registrant’s internal control over financial reporting.
Item 12. Exhibits.
(a)(1) Code of Ethics. Not applicable.
(a)(2) Certifications pursuant to Section 302 of the Sarbanes-Oxley Act of 2002. Filed herewith.
(a)(3) Not applicable.
(b) Certification pursuant to Section 906 of the Sarbanes-Oxley Act of 2002. Filed herewith.
Pursuant to the requirements of the Securities Exchange Act of 1934 and the Investment Company Act of 1940, the registrant has duly caused this report to be signed on its behalf by the undersigned, thereunto duly authorized.
By: /s/John B. Walthausen
John B. Walthausen
President
Date: Sept. 28, 2018 |
Pursuant to the requirements of the Securities Exchange Act of 1934 and the Investment Company Act of 1940, this report has been signed below by the following persons on behalf of the registrant and in the capacities and on the dates indicated.
By: /s/John B. Walthausen
John B. Walthausen
President
Date: Sept. 28, 2018 |
By: /s/Stanley M. Westhoff Jr.
Stanley M. Westhoff Jr.
Chief Financial Officer
Date: Sept. 28, 2018 |