UNITED STATES
SECURITIES AND EXCHANGE COMMISSION
WASHINGTON, D.C. 20549
FORM N-CSR
CERTIFIED SHAREHOLDER REPORT OF REGISTERED MANAGEMENT
INVESTMENT COMPANIES
Investment Company Act file number:811-22143
WALTHAUSEN FUNDS
(Exact name of registrant as specified in charter)
2691 Route 9, Suite 102, Malta, NY 12020
(Address of principal executive offices) (Zip code)
John B. Walthausen
Walthausen Funds
2691 Route 9, Suite 102, Malta, NY 12020
(Name and address of agent for service)
Registrant’s telephone number, including area code:(518) 348-7217
Date of fiscal year end:January 31
Date of reporting period:January 31, 2020
Form N-CSR is to be used by management investment companies to file reports with the Commission not later than 10 days after the transmission to stockholders of any report that is required to be transmitted to stockholders under Rule 30e-1 under the Investment Company Act of 1940 (17 CFR 270.30e -1). The Commission may use the information provided on Form N-CSR in its regulatory, disclosure review, inspection and policymaking roles.
A registrant is required to disclose the information specified by Form N-CSR, and the Commission will make this information public. A registrant is not required to respond to the collection of information contained in Form N-CSR unless the Form displays a currently valid Office of Management and Budget ("OMB") control number.
Item 1. Reports to Stockholders.
WALTHAUSENSMALLCAPVALUEFUND
INSTITUTIONALCLASSTICKERWFICX
INVESTORCLASSTICKERWSCVX
For Investors Seeking Long-Term Capital Appreciation
ANNUALREPORT
January 31, 2020
IMPORTANT NOTE:Beginning on January 1, 2021, as permitted by regulations adopted by the Securities
and Exchange Commission, paper copies of the Fund's shareholder reports will no longer be sent by mail,
unless you specifically request paper copies of the reports from the Fund or from your financial intermediary,
such as a broker-dealer or bank. Instead, the reports will be made available on a website, and you will be
notified by mail each time a report is posted and provided with a website link to access the report.
If you already elected to receive shareholder reports electronically, you will not be affected by this change
and you need not take any action. You may elect to receive shareholder reports and other communications
from the Fund or your financial intermediary electronically by calling or sending an email request.
You may elect to receive all future reports in paper free of charge. You can inform the Fund or your financial
intermediary that you wish to continue receiving paper copies of your shareholder reports by calling or send-
ing an email request. Your election to receive reports in paper will apply to all funds held with the fund com-
plex/your financial intermediary. |
Walthausen Small Cap Value Fund
Annual Report
January 31, 2020
Dear Shareholders:
Whatever happened to Small Cap Value?
You may have noticed. How could you fail to notice? If you haven’t noticed that investing in small cap value is a losing strategy, you are either blind or beyond stubborn!
We must ask, why is the world turned upside down? If you reviewed the academic literature, you would see that over any reasonable period (say 10 years) small cap has edged out large cap and value stocks have beaten growth stocks.
We, like our fellow small cap value practitioners, have developed convincing explanations of why this phenomenon is real and will persist. Ours goes like this:
Markets are emotional, wishing to chase the currently hot thing. That enthusiasm drives the price and value upward (currently toward large cap growth) into valuations which will result in disappointment of inflated expectations. As the now exciting company strives to achieve the growth and profit which their share price promises, managements will take increasing risks. In time, the company overreaches, and growth and earnings fall and investors become disenchanted.
Enthusiasm for exciting stocks pulls money away from areas of less enthusiasm and causes those stocks to retreat toward smaller cap ranges and lower valuation. Management teams in small cap value stocks recognize that they should not look to stock offerings to fund operations and growth; instead they need to concentrate internally on how to improve valuation by improving profitability. They tend to be more cautious in new products, acquisitions, etc. Though, of course, they disappoint often, because they make smaller bets and because the market expectations are not as inflated, the rewards versus the penalties are more favorable for the investor.
So, what has changed? As we look at the table for the one, three, five and ten-year results comparing the Russell Top 200 Growth Index to the Russell 2000 Value Index it is easy to despair.
| | Average Annual Total Returns as of 12/31/2019 | |
| |
| | 1 Year | | 3 Year | | 5 Year | | 10 Year | |
| Index Name | Return | | Return | | Return | | Return | |
| Russell Top 200® Growth Index* | 36.48% | | 21.44% | | 15.69% | | 15.58% | |
| Russell 2000® Value Index** | 22.39% | | 4.77% | | 6.99% | | 10.56% | |
* The Russell Top 200® Growth Index measures the performance of the especially large cap segment of the U.S. equity universe. It includes those Russell Top 200® Index companies with higher growth earning potential.
** The Russell 2000® Value Index measures the performance of the small cap value segment of the U.S. equity universe. It includes those Russell 2000® companies with lower price-to-book ratios and lower forecasted growth sales.
One cannot invest directly in an index.
This is a big shift. No wonder there is a noticeable shift in growth investing, away from value; but is it really unprecedented?
| | Cumulative Returns | |
| |
| Index Name | 1995-1999 | | 2000-2006 | | 2007-2013 | | 2014-2019 | |
| Russell Top 200® Growth Index* | 338.07% | | -36.59% | | 73.75% | | 135.35% | |
| Russell 2000® Value Index** | 85.35% | | 186.32% | | 44.47% | | 46.11% | |
2020 Annual Report 1
As you can see from the above table, the tug of war between growth and value can move in waves. First, there was with the Dot Com surge from 1994 to 1999. It was particularly devastating in 1998-1999 when small cap value was steamrolled. We must confess that as value became cheaper and small was sold down, our firm went deeper and our returns to our investors went negative. But then the reverse happened where growth fell right off the ledge in 2000. This new wave started out quite dramatically but the Russell 2000 Value beat the Russell Top 200 growth for 7 straight years, and it beat it very dramatically. In those years, the style flourished, not just against the market, but against our benchmark. The period from 2007 until 2013 seems to be the anomaly. The leadership between the two indices shifted almost every year, and though, in total, large growth beat small value, it was not by much. Then comes the present era. From 2014 through 2019, the Russell Top 200 Growth Stocks are leading strongly. The trend accelerated in the last three years and is continuing into 2020.
Now the question is, how much longer can it continue? We don’t really know. Generally, the end of an economic cycle seems to unhorse the leader. Many have speculated that the current economic cycle has extended for an unusually long time and therefore must be ripe to end. That is hard to disagree with, but then this cycle began in an unusually low spot, the recovery was sluggish, and now as we have reached apparent full employment, the Congress and the Federal Reserve are pushing the fiscal and monetary stimulus hard to sustain growth.
The lesson that I take away from this short study is that leadership does cycle, that small cap value is dormant not dead, and when leadership changes, no one will ring the bell, and it will be a violent shift. With that in mind we have not shifted our basic strategy of investing in companies that have the resources, skills and strategy to increase their value and are doing it in a methodical low risk manner.
We need to acknowledge that for the twelve months through January 31st, we returned a modest return for the Fund of 2.56%, falling short of the 4.38% gain for the Russell 2000 Value benchmark, and well below the Russell Top 200 Growth Index. Our shortfall versus the benchmark can be explained by underweight positions in the real estate investment trusts and utilities sectors while investors pursued those sectors to find income, and by an underweight in information technology stocks, a sector which has enough of an aroma of growth to attract investors. Though our selections held up okay against the benchmark, we were not pleased with some of our selections, where we frankly had stretched too hard with some turnaround companies in industries that were facing challenges. We have culled the portfolio and feel comfortable with the holdings.
Thank you for your continued support.
Sincerely,
| John B. Walthausen CFA | Gerard S. E. Heffernan, Jr. CFA |
PS. The last few weeks have seen the global stock markets fall sharply as investors react to the danger and uncertainty of a global epidemic. We cannot foresee what the full impact of the virus will be but we do note several important things. The selloff has been indiscriminate. This is giving us an opportunity to shed weaker holdings and upgrade the portfolio. We also can see that the selloff which has hit small cap value stocks particularly hard is opening up excellent price opportunities.
While we understand that periods such as this may be alarming to many, our many years of experience has taught us that these moments are where the seeds of opportunity are found and we are excited about the prospects of future harvests.
Past performance does not guarantee future results. The investment return and principal value of an investment in the Fund will fluctuate so that an investor’s shares, when redeemed, may be worth more or less than their original cost. Current performance may be higher or lower than the performance data quoted. Performance data current to the most recent month end are available by calling 1-888-925-8428.
The Fund’s prospectus contains important information about the Fund’s investment objectives, potential risks, management fees, charges and expenses, and other information and should be read and considered carefully before investing. To obtain a copy of the Fund’s prospectus, please visit our website at www.walthausenfunds.com or call 1-888-925-8428 and a copy will be sent to you free of charge. Distributed by Rafferty Capital Markets, LLC – Garden City, NY 11530.
2020 Annual Report 2
WALTHAUSEN SMALL CAP VALUE FUND(Unaudited)
PERFORMANCE INFORMATION
1/31/20 Investor Class NAV $18.80
1/31/20 Institutional Class NAV $18.83
AVERAGE ANNUAL RATE OF RETURN (%) FOR THE PERIODS ENDED JANUARY 31, 2020
| | 1 Year(A) | | 3 Years(A) | | 5 Years(A) | | 10 Years(A) | |
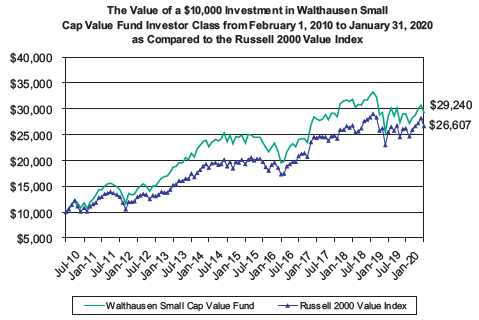
| Walthausen Small Cap Value Fund- Investor Class | 2.55% | | 1.38% | | 4.57% | | 11.33% | |
| Russell 2000® Value Index(B) | 4.38% | | 3.10% | | 6.71% | | 10.28% | |
| | | | Since | |
| | 1 Year(A) | | Inception(A) | |
| Walthausen Small Cap Value Fund - Institutional Class | 2.80% | | 13.78% | |
| Russell 2000® Value Index(B) | 4.38% | | 14.51% | |
Annual Fund Operating Expense Ratios (from 6/1/19 Prospectus:
| | Institutional Class - Gross 1.37%, Net 0.98%
Investor Class - Gross 1.27%, Net 1.21% |
The Advisor reimbursed and/or waived certain expenses of the Fund’s Institutional and Investor Classes. Absent that arrangement, the performance of the Classes would have been lower.
Each Class’s expense ratios for the fiscal year ended January 31, 2020 can be found in the financial highlights included in this report. Both share classes have a 2.00% redemption fee on shares redeemed within 90 days of purchase or less.
The Annual Fund Operating Expense Ratios reported above may not correlate to the expense ratios in the Fund’s financial highlights because (a) the financial highlights include only the direct operating expenses incurred by the Fund, not the indirect costs of investing in acquired funds; and (b) the impact of waivers and breakpoints in expenses charged and the application of waivers as described in Note 4.
(A)1 Year, 3 Years, 5 Years, 10 Years and Since Inception returns include change in share prices and in each case includes reinvestment of any dividends and capital gain distributions. The inception date of the Walthausen Small Cap Value Fund Investor Class was February 1, 2008. Institutional Class commenced operations on December 31, 2018.
(B)The Russell 2000® Value Index (whose composition is different from that of the Fund) is an unmanaged index of small-capitalization stocks with lower price-to-book ratios and lower forecasted growth values than the total population of small-capitalization stocks. Investors cannot directly invest in an index.
PASTPERFORMANCEDOESNOTGUARANTEEFUTURERESULTS. INVESTMENTRETURNANDPRINCIPALVALUEWILLFLUCTUATESOTHATSHARES, WHENREDEEMED, MAYBEWORTHMOREORLESSTHANTHEIRORIGINALCOST. RETURNSDONOTREFLECTTHEDEDUCTIONOFTAXESTHATA SHAREHOLDERWOULDPAYONFUNDDISTRIBUTIONSORTHEREDEMPTIONOFFUNDSHARES. CURRENTPERFORMANCEMAYBELOWERORHIGHERTHANTHEPERFORMANCEDATAQUOTED. TOOBTAINPERFORMANCEDATACURRENTTOTHEMOSTRECENTMONTH-END, PLEASECALL1-888-925-8428. THEFUND’SDISTRIBUTOR ISRAFFERTYCAPITALMARKETS, LLC.
2020 Annual Report 3
WALTHAUSEN SMALL CAP VALUE FUND(Unaudited)

2020 Annual Report 4
AVAILABILITY OF QUARTERLY SCHEDULE OF INVESTMENTS
(Unaudited)
The Fund files its complete schedule of portfolio holdings with the Securities and Exchange Commission (“SEC”) for the first and third quarters of each fiscal year on Form N-PORT. The Fund’s Form N-PORT is available on the SEC’s website at http://www.sec.gov.
PROXY VOTING GUIDELINES
(Unaudited)
Walthausen & Co., LLC, the Fund’s investment advisor (“Advisor”), is responsible for exercising the voting rights associated with the securities held by the Fund. A description of the policies and procedures used by the Advisor in fulfilling this responsibility is availablewithout charge on the Fund’s website at www.walthausenfunds.com. It is also included in the Fund’s Statement of Additional Information, which is available on the SEC’s website at http://www.sec.gov.
Information regarding how the Fund voted proxies, Form N-PX, relating to portfolio securities during the most recent 12-month period ended June 30th, is available without charge, upon request, by calling our toll free number (1-888-925-8428). This information is also available on the SEC’s website at http://www.sec.gov.
EXPENSE EXAMPLE
(Unaudited)
As a shareholder of the Fund, you incur two types of costs: (1) transaction costs such as redemption fees and IRA maintenance fees, and (2) ongoing costs, including management fees, service fees, and other Fund expenses. This Example is intended to help you understand your ongoing costs (in dollars) of investing in the Fund and to compare these costs with the ongoing costs of investing in other mutual funds. The Example is based on an investment of $1,000 invested in the Fund on August 1, 2019 and held through January 31, 2020.
Actual Expenses
The first line of each table below provides information about actual account values and actual expenses. Additionally, although the Fund charges no sales load, you will be assessed fees for outgoing wire transfers, returned checks and stop payment orders at prevailing rates charged by Ultimus Fund Solutions, LLC, the Fund’s transfer agent. If shares are redeemed within 90 days or less of purchase from the Fund, the shares are subject to a 2% redemption fee. You will be charged an annual maintenance fee of $15 for each tax deferred account you have with the Fund (“IRA maintenance fees”). To the extent the Fund invests in shares of other investment companies as part of its investment strategy, you will indirectly bear your proportionate share of any fees and expenses charged by the underlying funds in which the Fund invests in addition to the expenses of the Fund. Actual expenses of the underlying funds are expected to vary among the various underlying funds. These expenses are not included in the example. The example includes management fees, service fees and other Fund expenses. However, the example does not include portfolio trading commissions and related expenses and other extraordinary expenses as determined under generally accepted accounting principles. You may use the information in this line, together with the amount you invested, to estimate the expenses that you paid over the period. Simply divide your account value by $1,000 (for example, an $8,600 account value divided by $1,000 = 8.6), then multiply the result by the number in the first line under the heading entitled “Expenses Paid During Period” to estimate the expenses you paid on your account during this period.
Hypothetical Example for Comparison Purposes
The second line of each table provides information about hypothetical account values and hypothetical expenses based on the Fund’s actual expense ratio and an assumed rate of return of 5% per year before expenses, which is not the Fund’s actual return. The hypothetical account values and expenses may not be used to estimate the actual ending account balance or expenses you paid for the period. You may use this information to compare the ongoing costs of investing in the Fund and other funds. To do so, compare this 5% hypothetical example with the 5% hypothetical examples that appear in the shareholder reports of the other funds.
Please note that the expenses shown in the table are meant to highlight your ongoing costs only and do not reflect any transactional costs, such as redemption fees, IRA maintenance
2020 Annual Report 5
fees described above or expenses of underlying funds. Therefore, the second line of each table is useful in comparing ongoing costs only, and will not help you determine the relative total costs of owning different funds. In addition, if these transactional costs were included, your costs would have been higher.
| Investor Class | | | | | | |
| |
| | | | | | | Expenses Paid |
| | | Beginning | | Ending | | During the Period* |
| | | Account Value | | Account Value | | August 1, 2019 to |
| | | August 1, 2019 | | January 31, 2020 | | January 31, 2020 |
| |
| Actual | | $1,000.00 | | $1,007.24 | | $6.12 |
| |
| Hypothetical | | $1,000.00 | | $1,019.11 | | $6.16 |
| (5% annual return | | | | | | |
| before expenses) | | | | | | |
| * | Expenses are equal to the Fund’s annualized expense ratio of 1.21%, multiplied by the average account value over the period, multiplied by 184/365 (to reflect the one-half year period). |
| |
| Institutional Class | | | | | | |
| |
| | | | | | | Expenses Paid |
| | | Beginning | | Ending | | During the Period* |
| | | Account Value | | Account Value | | August 1, 2019 to |
| | | August 1, 2019 | | January 31, 2020 | | January 31, 2020 |
| |
| Actual | | $1,000.00 | | $1,008.54 | | $4.96 |
| |
| Hypothetical | | $1,000.00 | | $1,020.27 | | $4.99 |
| (5% annual return | | | | | | |
| before expenses) | | | | | | |
| * | Expenses are equal to the Fund’s annualized expense ratio of 0.98%, multiplied by the average account value over the period, multiplied by 184/365 (to reflect the one-half year period). |
| |
2020 Annual Report 6
| Walthausen Small Cap Value Fund | | | | |
| | | | Schedule of Investments |
| | | | January 31, 2020 |
| Shares | | Fair Value | % of Net Assets |
| COMMON STOCKS | | | | |
| | | | | |
| Aircraft & Parts | | | | |
| 152,530 | AAR CORP. | $ | 6,494,727 | 2.10 | % |
| Apparel & Other Finished Products of Fabrics & Similar Materials | | | | |
| 58,330 | G-III Apparel Group, Ltd. * | | 1,587,159 | 0.51 | % |
| Canned, Fruits, Vegetables, Preserves, Jams & Jellies | | | | |
| 774,970 | Landec Corporation * | | 8,679,664 | 2.80 | % |
| Construction - Special Trade Contractors | | | | |
| 433,800 | Ameresco, Inc. - Class A * | | 8,324,622 | 2.69 | % |
| Crude Petroleum & Natural Gas | | | | |
| 39,652 | Penn Virginia Corporation * | | 847,363 | 0.27 | % |
| Deep Sea Foreign Transportation of Freight | | | | |
| 23,890 | SEACOR Holdings Inc. * | | 898,025 | 0.29 | % |
| Electronic Components & Accessories | | | | |
| 192,959 | Vishay Intertechnology Inc. | | 3,915,138 | 1.26 | % |
| Electric, Gas & Sanitary Services | | | | |
| 1,502,200 | Atlantic Power Corporation * | | 3,590,258 | 1.16 | % |
| Electric Lighting & Wiring Equipment | | | | |
| 73,940 | AZZ Inc. | | 3,050,764 | 0.99 | % |
| Electromedical & Electrotherapeutic Apparatus | | | | |
| 75,530 | Natus Medical Incorporated * | | 2,363,334 | 0.76 | % |
| Fabricated Plate Work (Boiler Shops) | | | | |
| 212,320 | Mobile Mini, Inc. | | 8,862,237 | 2.86 | % |
| Farm Machinery & Equipment | | | | |
| 41,040 | Alamo Group Inc. | | 5,111,942 | 1.65 | % |
| Fats & Oils | | | | | |
| 352,760 | Darling Ingredients Inc. * | | 9,570,379 | 3.09 | % |
| Heavy Construction Other Than Building Construction - Contractors | | | | |
| 873,626 | Great Lakes Dredge & Dock Corporation * | | 9,146,864 | | |
| 434,350 | Williams Industrial Services Group Inc. * | | 582,029 | | |
| | | | 9,728,893 | 3.14 | % |
| Household Audio & Video Equipment | | | | |
| 110,370 | Universal Electronics Inc. * | | 5,466,626 | 1.77 | % |
| Household Furniture | | | | |
| 170,403 | Kimball International, Inc. - Class B | | 3,200,168 | 1.03 | % |
| Instruments for Measuring & Testing of Electricity & Electric Signals | | | | |
| 164,807 | Allied Motion Technologies, Inc. | | 7,554,753 | 2.44 | % |
| Life Insurance | | | | | |
| 60,489 | Primerica, Inc. | | 7,171,576 | 2.32 | % |
| Measuring & Controlling Devices, NEC | | | | |
| 61,040 | MTS Systems Corporation | | 3,094,118 | 1.00 | % |
| Metal Cans | | | | | |
| 153,750 | Silgan Holdings Inc. | | 4,744,725 | 1.53 | % |
| Metal Forgings & Stampings | | | | |
| 85,540 | Materion Corporation | | 4,644,822 | 1.50 | % |
| Millwood, Veneer, Plywood, & Structural Wood Members | | | | |
| 34,330 | Patrick Industries, Inc. | | 1,781,040 | 0.58 | % |
| Miscellaneous Electrical Machinery, Equipment & Supplies | | | | |
| 121,837 | Atkore International Group Inc. * | | 4,836,929 | 1.56 | % |
| Miscellaneous Primary Metal Products | | | | |
| 51,780 | DMC Global Inc. | | 2,165,957 | 0.70 | % |
* Non-Income Producing Securities.
The accompanying notes are an integral part of these
financial statements. |
2020 Annual Report 7
| Walthausen Small Cap Value Fund | | | | |
| | | | Schedule of Investments |
| | | | January 31, 2020 |
| Shares | | Fair Value | % of Net Assets |
| COMMON STOCKS | | | | |
| | | | | | |
| Mobile Homes | | | | | |
| 142,600 | Skyline Champion Corporation * | $ | 4,099,750 | 1.32 | % |
| Motor Vehicle Parts & Accessories | | | | |
| 60,158 | Lydall, Inc. * | | 1,229,630 | 0.40 | % |
| Motors & Generators | | | | |
| 39,110 | Regal Beloit Corporation | | 3,068,571 | 0.99 | % |
| National Commercial Banks | | | | |
| 120,291 | Camden National Corporation | | 5,684,953 | | |
| 66,578 | City Holding Company | | 5,038,623 | | |
| 80,290 | Community Bank System Inc. | | 5,320,818 | | |
| 134,760 | NBT Bancorp Inc. | | 5,092,580 | | |
| 91,804 | Pinnacle Financial Partners, Inc. | | 5,421,944 | | |
| | | | 26,558,918 | 8.57 | % |
| Oil, Gas Field Services, NBC | | | | |
| 451,030 | Select Energy Services, Inc. - Class A * | | 3,139,169 | 1.01 | % |
| Operative Builders | | | | |
| 186,619 | M/I Homes, Inc. * | | 8,284,017 | 2.67 | % |
| Ordnance & Accessories, (No Vehicles/Guided Missiles) | | | | |
| 512,833 | Vista Outdoor Inc. * | | 3,810,349 | 1.23 | % |
| Printed Circuit Boards | | | | |
| 210,299 | Kimball Electronics, Inc. * | | 3,402,638 | 1.10 | % |
| Pulp Mills | | | | | |
| 337,611 | Mercer International Inc. (Canada) | | 3,717,097 | 1.20 | % |
| Railroad Equipment | | | | |
| 200,000 | Freightcar America, Inc. | | 322,000 | 0.10 | % |
| Retail - Retail Stores, NEC | | | | |
| 109,990 | 1-800-Flowers.com, Inc. - Class A * | | 1,670,748 | 0.54 | % |
| Sanitary Services | | | | |
| 281,396 | Heritage-Crystal Clean, Inc. * | | 7,977,577 | 2.58 | % |
| Savings Institution, Federally Chartered | | | | |
| 213,683 | OceanFirst Financial Corp. | | 4,970,267 | 1.60 | % |
| Semiconductors & Related Devices | | | | |
| 279,350 | Kulicke and Soffa Industries, Inc. (Singapore) | | 7,232,372 | | |
| 109,150 | Ultra Clean Holdings, Inc. * | | 2,511,542 | | |
| | | | 9,743,914 | 3.15 | % |
| Services - Computer Integrated Systems Design | | | | |
| 446,980 | Allscripts Healthcare Solutions, Inc. * | | 3,835,088 | 1.24 | % |
| Services - Equipment Rental & Leasing, NEC | | | | |
| 110,363 | McGrath RentCorp | | 8,533,267 | 2.75 | % |
| Services - Help Supply Services | | | | |
| 319,420 | Kelly Services, Inc. - Class A | | 5,672,899 | 1.83 | % |
| Services - Miscellaneous Amusement & Recreation | | | | |
| 190,160 | SeaWorld Entertainment, Inc. * | | 6,552,914 | 2.11 | % |
| Services - Specialty Outpatient Facilities, NEC | | | | |
| 38,930 | BioTelemetry, Inc. * | | 1,904,456 | 0.61 | % |
| Services - To Dwellings & Other Buildings | | | | |
| 199,433 | ABM Industries Incorporated | | 7,606,375 | 2.45 | % |
| Soap, Detergents, Cleaning Preparations, Perfumes, Cosmetics | | | | |
| 33,603 | Stepan Company | | 3,314,936 | 1.07 | % |
* Non-Income Producing Securities.
The accompanying notes are an integral part of these
financial statements. |
2020 Annual Report 8
| Walthausen Small Cap Value Fund |
| | | | Schedule of Investments |
| | | | January 31, 2020 |
| Shares | | Fair Value | | % of Net Assets |
| COMMON STOCKS | | | | | |
| | | | | | |
| State Commercial Banks | | | | | |
| 100,580 | Bryn Mawr Bank Corp. | $ | 3,773,762 | | | |
| 131,430 | First Bancorp | | 4,663,136 | | | |
| 116,139 | First Financial Corporation | | 4,846,480 | | | |
| 88,050 | Great Southern Bancorp, Inc. | | 5,010,926 | | | |
| 122,099 | Heartland Financial USA, Inc. | | 5,971,862 | | | |
| 91,285 | Lakeland Financial Corporation | | 4,330,560 | | | |
| 124,680 | Stock Yards Bancorp, Inc. | | 4,830,103 | | | |
| 100,090 | TriCo Bancshares | | 3,643,276 | | | |
| | | | 37,070,105 | | 11.97 | % |
| Surety Insurance | | | | | |
| 158,862 | NMI Holdings, Inc. * | | 5,070,875 | | 1.64 | % |
| Title Insurance | | | | | | |
| 129,330 | Stewart Information Services Corporation | | 5,399,528 | | 1.74 | % |
| Truck & Bus Bodies | | | | | |
| 194,151 | Miller Industries, Inc. | | 6,680,736 | | 2.16 | % |
| Wholesale - Farm Product Raw Materials | | | | | |
| 70,020 | The Andersons, Inc. | | 1,583,852 | | 0.51 | % |
| Wholesale - Industrial Machinery & Equipment | | | | | |
| 84,070 | Systemax Inc. | | 1,988,256 | | 0.64 | % |
| Total for Common Stocks (Cost $223,511,970) | | 294,893,151 | | 95.18 | % |
| | | | | | |
| REAL ESTATE INVESTMENT TRUSTS | | | | | |
| 204,510 | Tanger Factory Outlet Centers, Inc. | | 2,991,981 | | | |
| 367,360 | UMH Properties, Inc. | | 5,804,288 | | | |
| | (Cost $8,243,215) | | 8,796,269 | | 2.84 | % |
| | | | | | |
| MONEY MARKET FUNDS | | | | | |
| 3,997,604 | Fidelity Investments Money Market Government Portfolio - | | | | | |
| | Class I 1.46% ** | | 3,997,604 | | 1.29 | % |
| | (Cost $3,997,604) | | | | | |
| Total Investment Securities | | 307,687,024 | | 99.31 | % |
| | (Cost $235,752,789) | | | | | |
| Other Assets in Excess of Liabilities | | 2,146,864 | | 0.69 | % |
| Net Assets | | $ | 309,833,888 | | 100.00 | % |
* Non-Income Producing Securities.
** The rate shown represents the 7-day yield at January 31, 2020. |
The accompanying notes are an integral part of these
financial statements. |
2020 Annual Report 9
| Walthausen Small Cap Value Fund | | | |
| |
| Statement of Assets and Liabilities | | | |
| January 31, 2020 | | | |
| Assets: | | | |
| Investment Securities at Fair Value | $ | 307,687,024 | |
| (Cost $235,752,789) | | | |
| Receivable for Dividends | | 276,266 | |
| Receivable for Securities Sold | | 3,156,708 | |
| Receivable for Shareholder Subscriptions | | 311,166 | |
| Total Assets | | 311,431,164 | |
| Liabilities: | | | |
| Payable for Securities Purchased | | 854,736 | |
| Payable for Shareholder Redemptions | | 415,134 | |
| Payable to Advisor for Management Fees (Note 4) | | 287,262 | |
| Payable to Advisor for Service Fees (Note 4) | | 40,144 | |
| Total Liabilities | | 1,597,276 | |
| Net Assets | $ | 309,833,888 | |
| Net Assets Consist of: | | | |
| Paid In Capital | $ | 251,659,895 | |
| Total Distributable Earnings | | 58,173,993 | |
| Net Assets | $ | 309,833,888 | |
| |
| Investor Class | | | |
| Net Assets | $ | 177,627,225 | |
| Shares Outstanding | | | |
| (Unlimited shares authorized) | | 9,448,358 | |
| Net Asset Value and Offering Price Per Share | $ | 18.80 | |
| Redemption Price Per Share ($18.80 x 0.98) (Note 2) | $ | 18.42 | |
| |
| Institutional Class | | | |
| Net Assets | $ | 132,206,663 | |
| Shares Outstanding | | | |
| (Unlimited shares authorized) | | 7,020,673 | |
| Net Asset Value and Offering Price Per Share | $ | 18.83 | |
| Redemption Price Per Share ($18.83 x 0.98) (Note 2) | $ | 18.45 | |
| |
| Statement of Operations | | | |
| For the fiscal year ended January 31, 2020 | | | |
| |
| Investment Income: | | | |
| Dividends (Net of foreign withholding tax of $0) | $ | 5,984,568 | |
| Total Investment Income | | 5,984,568 | |
| Expenses: | | | |
| Management Fees (Note 4) | | 3,825,006 | |
| Service Fees (Note 4) | | 1,156,203 | |
| Total Expenses | | 4,981,209 | |
| Less: Waived Management and Service Fees (Note 4) | | (558,855 | ) |
| Net Expenses | | 4,422,354 | |
| Net Investment Income (Loss) | | 1,562,214 | |
| Realized and Unrealized Gain (Loss) on Investments: | | | |
| Net Realized Gain (Loss) on Investments | | (5,454,423 | ) |
| Net Change In Unrealized Appreciation (Depreciation) on Investments | | 15,170,706 | |
| Net Realized and Unrealized Gain (Loss) on Investments | | 9,716,283 | |
| Net Increase (Decrease) in Net Assets from Operations | $ | 11,278,497 | |
The accompanying notes are an integral part of these
financial statements. |
2020 Annual Report 10
| Walthausen Small Cap Value Fund | | | | | | | | |
| |
| Statements of Changes in Net Assets | | | | | | | | |
| | | 2/1/2019 | | | | 2/1/2018 | | |
| | | to | | | | to | | |
| | | 1/31/2020 | | | | 1/31/2019 | | |
| From Operations: | | | | | | | | |
| Net Investment Income (Loss) | $ | 1,562,214 | | | $ | (502,939 | ) | |
| Net Realized Gain (Loss) on Investments | | (5,454,423 | ) | | | 51,713,894 | | |
| Net Change in Unrealized Appreciation (Depreciation) on Investments | | 15,170,706 | | | | (119,105,436 | ) | |
| Increase (Decrease) in Net Assets from Operations | | 11,278,497 | | | | (67,894,481 | ) | |
| From Distributions to Shareholders: | | | | | | | | |
| Investor Class | | (4,867,473 | ) | | | (54,779,694 | ) | |
| Institutional Class * | | (2,328,587 | ) | | | - | | |
| Change in Net Assets from Distributions | | (7,196,060 | ) | | | (54,779,694 | ) | |
| From Capital Share Transactions: | | | | | | | | |
| Proceeds From Sale of Shares | | | | | | | | |
| Investor Class | | 28,288,192 | | | | 91,033,171 | | |
| Institutional Class * | | 153,093,594 | | (a) | | 7,408,283 | | (b) |
| Proceeds From Redemption Fees (Note 2) | | | | | | | | |
| Investor Class | | 5,509 | | | | 13,910 | | |
| Institutional Class * | | 8,536 | | | | - | | |
| Shares Issued on Reinvestment of Dividends | | | | | | | | |
| Investor Class | | 4,600,838 | | | | 50,651,192 | | |
| Institutional Class * | | 2,299,930 | | | | - | | |
| Cost of Shares Redeemed | | | | | | | | |
| Investor Class | | (283,992,233 | ) | (a) | | (217,607,494 | ) | (b) |
| Institutional Class * | | (28,499,625 | ) | | | - | | |
| Net Increase (Decrease) from Shareholder Activity | | (124,195,259 | ) | | | (68,500,938 | ) | |
| Net Increase (Decrease) in Net Assets | | (120,112,822 | ) | | | (191,175,113 | ) | |
| Net Assets at Beginning of Period | | 429,946,710 | | | | 621,121,823 | | |
| Net Assets at End of Period | $ | 309,833,888 | | | $ | 429,946,710 | | |
| |
| Share Transactions: | | | | | | | | |
| Issued | | | | | | | | |
| Investor Class | | 1,489,321 | | | | 4,065,851 | | |
| Institutional Class * | | 7,990,740 | | (c) | | 413,961 | | (d) |
| Reinvested | | | | | | | | |
| Investor Class | | 231,198 | | | | 3,053,116 | | |
| Institutional Class * | | 115,458 | | | | - | | |
| Redeemed | | | | | | | | |
| Investor Class | | (14,843,932 | ) | (c) | | (10,566,296 | ) | (d) |
| Institutional Class * | | (1,499,486 | ) | | | - | | |
| Net Increase (Decrease) in Shares | | (6,516,701 | ) | | | (3,033,368 | ) | |
* Institutional Class commenced operations on December 31, 2018.
(a) Includes $83,222,311 of exchanges from Investor Class to Institutional Class.
(b) Includes $4,777,605 of exchanges from Investor Class to Institutional Class.
(c) Includes the exchange of 4,300,967 shares from Investor Class to 4,299,326 shares in Institutional Class.
(d) Includes the exchange of 271,764 shares from Investor Class to 271,918 shares in Institutional Class. |
The accompanying notes are an integral part of these
financial statements. |
2020 Annual Report 11
| Walthausen Small Cap Value Fund |
| | |
| Financial Highlights - Investor Class | | | | | | | | | | | | | | | | | | | | |
| Selected data for a share outstanding throughout the period: | | 2/1/2019 | | | | 2/1/2018 | | | | 2/1/2017 | | | | 2/1/2016 | | | | 2/1/2015 | | |
| | | to | | | | to | | | | to | | | | to | | | | to | | |
| | | 1/31/2020 | | | | 1/31/2019 | | | | 1/31/2018 | | | | 1/31/2017 | | | | 1/31/2016 | | |
| Net Asset Value - | | | | | | | | | | | | | | | | | | | | |
| Beginning of Period | $ | 18.71 | | | $ | 23.87 | | | $ | 22.12 | | | $ | 15.87 | | | $ | 20.88 | | |
| Net Investment Income (Loss)(a) | | 0.07 | | | | (0.02 | ) | | | (0.07 | ) | | | (0.01 | ) | | | 0.06 | | |
| Net Gain (Loss) on Investments (Realized and Unrealized)(b) | | 0.43 | | | | (2.74 | ) | | | 2.99 | | | | 6.90 | | | | (3.25 | ) | |
| Total from Investment Operations | | 0.50 | | | | (2.76 | ) | | | 2.92 | | | | 6.89 | | | | (3.19 | ) | |
| Distributions (From Net Investment Income) | | (0.02 | ) | | | - | | | | - | | | | (0.01 | ) | | | (0.05 | ) | |
| Distributions (From Capital Gains) | | (0.39 | ) | | | (2.40 | ) | | | (1.17 | ) | | | (0.63 | ) | | | (1.77 | ) | |
| Total Distributions | | (0.41 | ) | | | (2.40 | ) | | | (1.17 | ) | | | (0.64 | ) | | | (1.82 | ) | |
| Proceeds from Redemption Fee (Note 2) | | - | | + | | - | | + | | - | | + | | - | | + | | - | | + |
| Net Asset Value - | | | | | | | | | | | | | | | | | | | | |
| End of Period | $ | 18.80 | | | $ | 18.71 | | | $ | 23.87 | | | $ | 22.12 | | | $ | 15.87 | | |
| Total Return(c) | | 2.55% | | | | (10.27)% | | | | 13.22% | | | | 43.33% | | | | (16.27)% | | |
| Ratios/Supplemental Data | | | | | | | | | | | | | | | | | | | | |
| Net Assets - End of Period (Thousands) | $ | 177,627 | | | $ | 422,206 | | | $ | 621,122 | | | $ | 605,575 | | | $ | 494,712 | | |
| Before Reimbursement | | | | | | | | | | | | | | | | | | | | |
| Ratio of Expenses to Average Net Assets | | 1.30% | | | | 1.27% | | | | 1.26% | | | | 1.27% | | | | 1.25% | | |
| Ratio of Net Investment Income (Loss) to Average Net Assets | | 0.27% | | | | -0.09% | | | | -0.32% | | | | -0.05% | | | | 0.27% | | |
| After Reimbursement(d) | | | | | | | | | | | | | | | | | | | | |
| Ratio of Expenses to Average Net Assets | | 1.21% | | | | 1.27% | | | | 1.26% | | | | 1.27% | | | | 1.25% | | |
| Ratio of Net Investment Income (Loss) to Average Net Assets | | 0.36% | | | | -0.09% | | | | -0.32% | | | | -0.05% | | | | 0.27% | | |
| Portfolio Turnover Rate | | 56.71% | | | | 45.51% | | | | 45.20% | | | | 39.17% | | | | 53.20% | | |
+ Amount less than $0.005 per share.
(a) Per share amounts were calculated using the average shares method.
(b) Realized and unrealized gains and losses per share in this caption are balancing amounts necessary to reconcile
the change in net asset value for the period and may not reconcile with the aggregate gains and losses in the Statement
of Operations due to share transactions for the period.
(c) Total return represents the rate that the investor would have earned or lost on an investment in the Fund assuming
reinvestment of dividends.
(d) Effective December 31, 2018, the Advisor has agreed to waive a portion of its service fees and management fees
(See Note 4). |
The accompanying notes are an integral part of these
financial statements. |
2020 Annual Report 12
| Walthausen Small Cap Value Fund |
| | |
| Financial Highlights - Institutional Class | | | | | | | | |
| Selected data for a share outstanding throughout the period: | | 2/1/2019 | | | | 12/31/2018* | | |
| | | to | | | | to | | |
| | | 1/31/2020 | | | | 1/31/2019 | | |
| Net Asset Value - | | | | | | | | |
| Beginning of Period | $ | 18.70 | | | $ | 16.71 | | |
| Net Investment Income (Loss)(a) | | 0.11 | | | | - | | + |
| Net Gain (Loss) on Investments (Realized and Unrealized)(b) | | 0.43 | | | | 1.99 | | |
| Total from Investment Operations | | 0.54 | | | | 1.99 | | |
| Distributions (From Net Investment Income) | | (0.02 | ) | | | - | | |
| Distributions (From Capital Gains) | | (0.39 | ) | | | - | | |
| Total Distributions | | (0.41 | ) | | | - | | |
| Proceeds from Redemption Fee (Note 2) | | - | | + | | - | | |
| Net Asset Value - | | | | | | | | |
| End of Period | $ | 18.83 | | | $ | 18.70 | | |
| Total Return(c) | | 2.80% | | | | 11.91% | | ** |
| Ratios/Supplemental Data | | | | | | | | |
| Net Assets - End of Period (Thousands) | $ | 132,207 | | | $ | 7,741 | | |
| Before Reimbursement | | | | | | | | |
| Ratio of Expenses to Average Net Assets | | 1.30% | | | | 1.37% | | *** |
| Ratio of Net Investment Income (Loss) to Average Net Assets | | 0.23% | | | | -0.23% | | *** |
| After Reimbursement | | | | | | | | |
| Ratio of Expenses to Average Net Assets | | 0.98% | | | | 0.98% | | *** |
| Ratio of Net Investment Income (Loss) to Average Net Assets | | 0.55% | | | | 0.16% | | *** |
| Portfolio Turnover Rate | | 56.71% | | | | 45.51% | | ** |
* Commencement of Class.
** Not Annualized.
*** Annualized.
+ Amount less than $0.005 per share.
(a) Per share amounts were calculated using the average shares method.
(b) Realized and unrealized gains and losses per share in this caption are balancing amounts necessary to reconcile
the change in net asset value for the period and may not reconcile with the aggregate gains and losses in the
Statement of Operations due to share transactions for the period.
(c) Total return represents the rate that the investor would have earned or lost on an investment in the Fund assuming
reinvestment of dividends. |
The accompanying notes are an integral part of these
financial statements. |
2020 Annual Report 13
NOTES TOFINANCIALSTATEMENTS
WALTHAUSENSMALLCAPVALUEFUND
January 31, 2020
1.) ORGANIZATION
Walthausen Small Cap Value Fund (the “Fund”) was organized as a diversified series of the Walthausen Funds (the “Trust”) on January 14, 2008. The Trust is registered as an open-end investment company under the Investment Company Act of 1940, as amended (the “1940 Act”). The Trust was organized in Ohio as a business trust on October 10, 2007 and may offer an unlimited number of shares of beneficial interest in a number of separate series, each series representing a distinct fund with its own investment objectives and policies. The Fund currently offers Investor Class shares and Institutional Class shares. The Fund’s Investor Class shares commenced operations on February 1, 2008 and Institutional Class shares commenced operations on December 31, 2018. As of January 31, 2020, there are two series authorized by the Trust. All classes of shares have identical rights to earnings, assets and voting privileges, except for class specific expenses and exclusive rights to vote on matters affecting only individual classes. The classes differ principally in their respective distribution expenses and arrangements. The Fund’s investment objective is to seek long-term capital appreciation. The investment advisor to the Fund is Walthausen & Co., LLC (the “Advisor”).
2.) SIGNIFICANT ACCOUNTING POLICIES
The Fund is an investment company and accordingly follows the investment company accounting and reporting guidance of the Financial Accounting Standards Board (“FASB”) Accounting Standards Codification Topic 946Financial Services - Investment Companies. The financial statements are prepared in conformity with accounting principles generally accepted in the United States of America (“GAAP”). The Fund follows the significant accounting policies described in this section.
SECURITY VALUATION
All investments in securities are recorded at their estimated fair value, as described in Note 3.
FEDERAL INCOME TAXES
The Fund’s policy is to continue to comply with the requirements of the Internal Revenue Code that are applicable to regulated investment companies and to distribute all of its taxable income to shareholders. Therefore, no federal income tax provision is required. It is the Fund’s policy to distribute annually, prior to the end of the calendar year, dividends sufficient to satisfy excise tax requirements of the Internal Revenue Code. This Internal Revenue Code requirement may cause an excess of distributions over the book year-end accumulated income. In addition, it is the Fund’s policy to distribute annually, after the end of the fiscal year, any remaining net investment income and net realized capital gains.
The Fund recognizes the tax benefits of certain tax positions only where the position is “more likely than not” to be sustained assuming examination by tax authorities. Management has analyzed the Fund’s tax positions, and has concluded that no liability for unrecognized tax benefits should be recorded related to uncertain tax positions taken on returns filed for the open tax years. The Fund identifies its major tax jurisdictions as U.S. Federal and State tax authorities; however, the Fund is not aware of any tax positions for which it is reasonably possible that the total amounts of unrecognized tax benefits will change materially in the next twelve months. The Fund recognizes interest and penalties, if any, related to unrecognized tax benefits as income tax expense in the Statement of Operations. During the fiscal year ended January 31, 2020, the Fund did not incur any interest or penalties.
SHARE VALUATION
The net asset value per share of the Fund is calculated daily by dividing the total value of the Fund’s assets, less liabilities, by the number of shares outstanding, rounded to the nearest cent. The offering and redemption price per share is equal to the net asset value per share, except that shares of the Fund are subject to a redemption fee of 2% if redeemed after holding them for 90 days or less. During the fiscal year ended January 31, 2020, proceeds from redemption fees amounted to $5,509 and $8,536, respectively, for Investor Class and Institutional Class.
2020 Annual Report 14
Notes to Financial Statements - continued
DISTRIBUTIONS TO SHAREHOLDERS
Distributions to shareholders, which are determined in accordance with income tax regulations, are recorded on the ex-dividend date. The Fund may utilize earnings and profits distributed to shareholders on redemptions of shares as part of the dividends paid deductions. The treatment for financial reporting purposes of distributions made to shareholders during the year from net investment income or net realized capital gains may differ from their ultimate treatment for federal income tax purposes. These differences are caused primarily by differences in the timing of the recognition of certain components of income, expense, or realized capital gain for federal income tax purposes. Where such differences are permanent in nature, they are reclassified in the components of the net assets based on their ultimate characterization for federal income tax purposes. Any such reclassifications will have no effect on net assets, results of operations, or net asset value per share of the Fund.
USE OF ESTIMATES
The financial statements are prepared in accordance with GAAP, which requires management to make estimates and assumptions that affect the reported amounts of assets and liabilities and disclosure of contingent assets and liabilities at the date of the financial statements and the reported amounts of increases and decreases in net assets from operations during the reporting period. Actual results could differ from those estimates.
OTHER
The Fund records security transactions based on the trade date for financial reporting purposes. Dividend income is recognized on the ex-dividend date. Interest income, if any, is recognized on an accrual basis. The Fund uses the specific identification method in computing gain or loss on the sale of investment securities. Withholding taxes on foreign dividends have been provided for in accordance with the Fund’s understanding of the applicable country’s tax rules and rates. The Fund may hold investments in master limited partnerships (“MLPs”). It is common for distributions from MLPs to exceed taxable earnings and profits resulting in the excess portion of such dividends to be designated as return of capital. Annually, income or loss from MLPs is reclassified upon receipt of the MLPs tax reporting document. For financial reporting purposes, management does not estimate the tax character of MLP distributions for which actual information has not been reported.
EXPENSES
Expenses incurred by the Trust that do not relate to a specific fund of the Trust are allocated to the individual funds based on each fund’s relative net assets or an appropriate basis.
Class specific expenses are borne by each specific class. Income, non-class specific expenses, and realized and unrealized gains/losses are allocated to the respective classes based on the basis of relative net assets.
3.) SECURITIES VALUATIONS
The Fund utilizes various methods to measure the fair value of its investments on a recurring basis. GAAP establishes a hierarchy that prioritizes inputs to valuation methods. The three levels of inputs are:
Level 1 - Unadjusted quoted prices in active markets for identical assets or liabilities that the Fund has the ability to access.
Level 2 - Observable inputs other than quoted prices included in level 1 that are observable for the asset or liability, either directly or indirectly. These inputs may include quoted prices for the identical instrument on an inactive market, prices for similar instruments, interest rates, prepayment speeds, credit risk, yield curves, default rates and similar data.
Level 3 - Unobservable inputs for the asset or liability, to the extent relevant observable inputs are not available, representing the Fund’s own assumptions about the assumptions a market participant would use in valuing the asset or liability, and would be based on the best information available.
2020 Annual Report 15
Notes to Financial Statements - continued
The availability of observable inputs can vary from security to security and is affected by a wide variety of factors, including, for example, the type of security, whether the security is new and not yet established in the marketplace, the liquidity of markets, and other characteristics particular to the security. To the extent that valuation is based on models or inputs that are less observable or unobservable in the market, the determination of fair value requires more judgment. Accordingly, the degree of judgment exercised in determining fair value is greatest for instruments categorized as level 3.
The inputs used to measure fair value may fall into different levels of the fair value hierarchy. In such cases, for disclosure purposes, the level in the fair value hierarchy within which the fair value measurement falls in its entirety, is determined based on the lowest level input that is significant to the fair value measurement in its entirety.
FAIR VALUE MEASUREMENTS
A description of the valuation techniques applied to the Fund’s major categories of assets and liabilities measured at fair value on a recurring basis follows.
Equity securities (common stocks and real estate investment trusts). Equity securities generally are valued by using market quotations, but may be valued on the basis of prices furnished by a pricing service when the Advisor believes such prices accurately reflect the fair value of such securities. Securities that are traded on any stock exchange or on the NASDAQ over-the-counter market are generally valued by the pricing service at the last quoted sale price. Lacking a last sale price, an equity security is generally valued by the pricing service at its last bid price. Generally, if the security is traded in an active market and is valued at the last sale price, the security is categorized as a level 1 security, and if an equity security is valued by the pricing service at its last bid price, it is generally categorized as a level 2 security. When market quotations are not readily available, when the Advisor determines that the market quotation or the price provided by the pricing service does not accurately reflect the current fair value, or when restricted securities are being valued, such securities are valued as determined in good faith by the Advisor, subject to review of the Board and are categorized in level 2 or level 3, when appropriate.
Money market funds.Shares of money market funds are valued at the net asset value provided by the funds and are classified as level 1 of the fair value hierarchy.
In accordance with the Trust’s good faith pricing guidelines, the Advisor is required to consider all appropriate factors relevant to the value of securities for which it has determined other pricing sources are not available or reliable as described above. There is no single procedure for determining fair value, since fair value depends upon the circumstances of each individual case. As a general principle, the current fair value of an issue of securities being valued by the Advisor would appear to be the amount that the owner might reasonably expect to receive for them upon their current sale. Methods which are in accordance with this principle may, for example, be based on (i) a multiple of earnings; (ii) a discount from market of a similar freely traded security (including a derivative security or a basket of securities traded on other markets, exchanges or among dealers); or (iii) yield to maturity with respect to debt issues, or a combination of these and other methods.
The following table summarizes the inputs used to value the Fund’s assets measured at fair value as of January 31, 2020:
| Valuation Inputs of Assets | | Level 1 | | Level 2 | | Level 3 | | Total |
| Common Stocks | | $294,893,151 | | $0 | | $0 | | $294,893,151 |
| Real Estate Investment Trusts | | 8,796,269 | | 0 | | 0 | | 8,796,269 |
| Money Market Funds | | 3,997,604 | | 0 | | 0 | | 3,997,604 |
| Total | | $307,687,024 | | $0 | | $0 | | $307,687,024 |
Refer to the Fund’s Schedule of Investments for a listing of securities by industry. The Fund did not hold any level 3 assets during the fiscal year ended January 31, 2020.
The Fund did not invest in any derivative instruments during the fiscal year ended January 31, 2020.
2020 Annual Report 16
Notes to Financial Statements - continued
4.) INVESTMENT ADVISORY AGREEMENT AND RELATED PARTY TRANSACTIONS
The Trust, on behalf of the Fund, has entered into an investment advisory agreement (“Management Agreement”) with the Advisor. The Advisor manages the investment portfolio of the Fund, subject to policies adopted by the Board, and, at its own expense and without reimbursement from the Trust, furnishes office space and all necessary office facilities, equipment and executive personnel necessary for managing the Fund. For its services, the Advisor receives an investment management fee equal to 1.00% of the average daily net assets of the Fund.
Under the terms of the Services Agreement between the Trust, on behalf of the Fund, and the Advisor (the “Services Agreement”), the Advisor is obligated to pay the operating expenses of the Fund excluding management fees, any 12b-1 fees, brokerage fees and commissions, taxes, borrowing costs (such as (a) interest and (b) dividend expenses on securities sold short), fees and expenses of acquired funds, extraordinary or non-recurring expenses as may arise, including litigation to which the Fund may be a party and indemnification of the Trust’s Trustees and officers. For its services, the Advisor receives service fees equal to an annual rate of 0.45% of the Fund’s average daily net assets up to $100 million, 0.25% of the Fund’s average daily net assets between $100 million and $500 million, and 0.15% of such assets in excess of $500 million.
Effective December 31, 2018, the Advisor has contractually agreed to waive Services Agreement fees and Management fees to the extent necessary to maintain total annual operating expenses of the Investor Class Shares and Institutional Class Shares, excluding brokerage fees and commissions, taxes, borrowing costs (such as (a) interest and (b) dividend expenses on securities sold short), the cost of acquired funds and extraordinary expenses at 1.21% and 0.98% respectively, of its average daily net assets through May 31, 2020. The Advisor may not terminate the fee waiver before May 31, 2020.
For the fiscal year ended January 31, 2020, the Advisor earned management fees totaling $3,825,006, of which $287,262 was due to the Advisor at January 31, 2020. For the same period, the Advisor earned service fees of $1,156,203, of which $40,144 was due to the Advisor at January 31, 2020. Service and management fees in the amounts of $266,242 and $292,613 were waived with no recapture provision for the fiscal year ended January 31, 2020 for the Investor and Institutional Classes, respectively.
Certain officers and a shareholder of the Advisor are also officers and/or a Trustee of the Trust. These individuals may receive benefits from the Advisor resulting from management and services fees paid to the Advisor by the Fund.
The Trustees who are not interested persons of the Fund were each paid $4,000, for a total of $12,000, in Trustees’ fees plus travel and related expenses for the fiscal year ended January 31, 2020 for their services to the Fund. The Advisor pays these fees pursuant to the Services Agreement.
5.) PURCHASES AND SALES OF SECURITIES
For the fiscal year ended January 31, 2020, purchases and sales of investment securities other than U.S. Government obligations and short-term investments aggregated $210,861,167 and $337,581,971, respectively. Purchases and sales of U.S. Government obligations aggregated $0 and $0, respectively.
6.) CONTROL OWNERSHIP
The beneficial ownership, either directly or indirectly, of more than 25% of the voting securities of a fund creates a presumption of control of a fund, under Section 2(a)(9) of the 1940 Act. As of January 31, 2020, NFS, LLC located in New York, New York, for the benefit of its clients, held, in aggregate, 56.18% of the shares of the Fund, and therefore may be deemed to control the Fund.
7.) TAX MATTERS
For Federal income tax purposes, the cost of investments owned at January 31, 2020 was $236,615,144. At January 31, 2020, the composition of unrealized appreciation (the excess of value over tax cost) and depreciation (the excess of tax cost over value) was as follows:
| | Appreciation | | (Depreciation) | | Net Appreciation (Depreciation) |
| | $82,146,572 | | ($11,074,692) | | $71,071,880 |
2020 Annual Report 17
Notes to Financial Statements - continued
The tax character of distributions for Investor Class was as follows:
| | | Fiscal Year Ended | | Fiscal Year Ended |
| | | January 31, 2020 | | January 31, 2019 |
| Ordinary Income. | | $ 234,720 | | $ – |
| Long-Term Capital Gain | | 4,632,753 | | 54,779,694 |
| | | $ 4,867,473 | | $54,779,694 |
The tax character of distributions for Institutional Class was as follows:
| | | Fiscal Year Ended | December 31, 2018 thru |
| | | January 31, 2020 | January 31, 2019 |
| Ordinary Income. | | $ 138,426 | $ – |
| Long-Term Capital Gain | | 2,190,161 | – |
| | | $ 2,328,587 | $ – |
As of January 31, 2020, the components of distributable earnings (accumulated losses) on a tax basis were as follows:
| Accumulated undistributed net investment income | | $ 1,168,203 | |
| Accumulated losses | | (14,066,090 | ) |
| Unrealized appreciation on investments – net | | 71,071,880 | |
| | | $58,173,993 | |
The differences between book basis and tax basis are primarily attributable to the tax deferral of wash sales. As of January 31, 2020, the Fund deferred post-October losses of $1,131,429 which are included in accumulated losses. As of January 31, 2020, the Fund had available for federal tax purposes unused capital loss carryforward of $12,934,661, of which the entire amount is short-term with no expiration.
8.) SUBSEQUENT EVENTS
Subsequent events after the date of the Statement of Assets and Liabilities have been evaluated through the date the financial statements were issued. Management has concluded that there is no impact requiring adjustment to or disclosure in the financial statements.
2020 Annual Report 18
REPORT OF INDEPENDENT REGISTERED PUBLIC ACCOUNTING FIRM
To the Shareholders and Board of Trustees of
Walthausen Funds
Opinion on the Financial Statements
We have audited the accompanying statement of assets and liabilities, including the schedule of investments, of Walthausen Small Cap Value Fund (the “Fund”), a series of Walthausen Funds, as of January 31, 2020, and the related statement of operations for the year then ended, the statements of changes in net assets for each of the two years in the period then ended, including the related notes, and the financial highlights for each of the five years in the period then ended (collectively referred to as the "financial statements"). In our opinion, the financial statements present fairly, in all material respects, the financial position of the Fund as of January 31, 2020, the results of its operations for the year then ended, the changes in its net assets for each of the two years in the period then ended, and the financial highlights for each of the five years in the period then ended, in conformity with accounting principles generally accepted in the United States of America.
Basis for Opinion
These financial statements are the responsibility of the Fund's management. Our responsibility is to express an opinion on the Fund's financial statements based on our audits. We are a public accounting firm registered with the Public Company Accounting Oversight Board (United States) (“PCAOB”) and are required to be independent with respect to the Fund in accordance with the U.S. federal securities laws and the applicable rules and regulations of the Securities and Exchange Commission and the PCAOB.
We conducted our audits in accordance with the standards of the PCAOB. Those standards require that we plan and perform the audit to obtain reasonable assurance about whether the financial statements are free of material misstatement, whether due to error or fraud.
Our audits included performing procedures to assess the risks of material misstatement of the financial statements, whether due to error or fraud, and performing procedures that respond to those risks. Such procedures included examining, on a test basis, evidence regarding the amounts and disclosures in the financial statements. Our procedures included confirmation of securities owned as of January 31, 2020, by correspondence with the custodian and brokers or by other appropriate auditing procedures where replies from brokers or counterparties were not received. Our audits also included evaluating the accounting principles used and significant estimates made by management, as well as evaluating the overall presentation of the financial statements. We believe that our audits provide a reasonable basis for our opinion.
We have served as the auditor for the Walthausen Funds since 2008.

COHEN & COMPANY, LTD.
Cleveland, Ohio
March 27, 2020
2020 Annual Report 19
ADDITIONALINFORMATION
January 31, 2020
(UNAUDITED)
APPROVAL OF INVESTMENT ADVISORY AGREEMENT
On January 22, 2020, the Board of Trustees (the “Trustees” or the “Board”) considered the renewal of the Management Agreement (the “Agreement”) between the Trust and the Advisor (or “Management”), on behalf of the Walthausen Small Cap Value Fund (“Small Cap” or “Fund”). Legal Counsel reviewed the memorandum provided by them and explained that, in consideration of the continuance of the Agreement, the Board should review all information as is reasonably necessary to evaluate the terms of the contract and determine whether it is fair to the Fund and its shareholders. The Advisor had provided information to the Trustees it believed to be sufficient for evaluation of continuance of the Agreement.
In reviewing the Agreement, the Board of Trustees received materials from the Advisor addressing the following factors: (i) the investment performance of the Fund and the Advisor; (ii) the nature, extent and quality of the services provided by the Advisor to the Fund; (iii) the cost of the services provided and the profits realized by the Advisor and its affiliates from the relationship with the Fund; (iv) the extent to which economies of scale will be realized as each Fund grows; and (v) whether the fee levels reflect these economies of scale to the benefit of shareholders.
The Board met with representatives of the Advisor to discuss the terms of the Agreement. The Board reviewed the history of the Advisor, including background and investment management experience, as well as the Fund’s performance since inception, important factors relating to the Fund’s performance, the Advisor’s investment and research strategy, the Advisor’s strength of personnel, and expected expenses and revenue from the Fund.
As to the performance of Small Cap, the materials included information regarding the Fund’s performance compared to a peer group of similar funds as well as the overall Morningstar Small Value category and the Russell 2000® Value Index. The Trustees noted the Fund underperformed its index, Morningstar category average and peer group for the 1-year and 5-year periods ended December 31, 2019. The Trustees further noted that Small Cap outperformed its index, Morningstar category average and peer group for the 10-year period ended December 31, 2019. Additionally, the Trustees considered the Investor Class outperformed the index since inception through the period ended December 31, 2019. The Board found that the Fund’s long-term performance continued to be very strong and the Advisor consistently delivered a value oriented portfolio consistent with the Fund’s stated investment strategy. Based on this review, and the fact that the Advisor’s fundamental approach had produced good results over the long-term and short-term performance had improved, the Independent Trustees concluded that the performance of the Fund was acceptable.
As to the nature, extent and quality of the services provided by the Advisor, the Board analyzed the Advisor’s experience and capabilities. The Board discussed each portfolio manager’s background and investment management experience. The Board reviewed the key professionals servicing the Fund. The Board was pleased with the depth of the advisory team and its emphasis on a thoughtful and rigorous stock selection discipline. The representatives of the Advisor reviewed and discussed with the Board the Advisor’s ADV and the Rule 17j-1 Code of Ethics certifications. The Board discussed the quality of the Advisor’s compliance efforts. The Board also reviewed the Advisor’s financial condition. The Board concluded that the nature and extent of the services provided by the Advisor were consistent with their expectations. The Independent Trustees emphasized that they continued to be very pleased with the quality and value of the services provided by the Advisor, its emphasis on fundamental bottom-up research, its focus on compliance, and its dedication to the shareholders’ best interests.
As to the cost of the services provided and the profits realized by the Advisor and its affiliates from the relationship with the Fund, it was noted that the Advisor was paying substantially all ordinary operating expenses of the Fund pursuant to the Services Agreement. Additionally, the Advisor provided the Fund with officers, including the CCO, shareholder service support and office space. The Board discussed the fee schedule of the Services Agreement, including the breakpoints in the contract which serve to reduce fees as assets grow. The Board reviewed the revenue and expenses related to the Services Agreement noting that there had
2020 Annual Report 20
Additional Information (Unaudited) - continued
been a loss to the Advisor during the previous year. The Board discussed the contractual fee waivers currently in place. The Board reviewed a summary of the Advisor’s profitability resulting from the services provided to Small Cap under the Management Agreement. The analysis showed the net profits from portfolio advisory services as well as the net profits overall. As part of the discussion by the Trustees, it was noted that a portion of the amounts paid to broker dealers were allocated as sub-transfer agency/shareholder servicing services that were provided by the broker dealers to the shareholders of the Fund, pursuant to the Services Agreement between the Advisor and the Fund, while the balance of the compensation paid to the broker dealers was paid by the Advisor from its own legitimate profits. The Board concluded that the Advisor’s profitability was at an acceptable level, particularly in light of the extent and quality of the services being provided to the Fund.
Turning to the level of expenses, the Board reviewed comparative information for advisory fees and expense ratios based on publicly available data that was drawn from its peer group. The Board observed that the data showed the Fund’s management fee was above the peer group and the Morningstar Category average, but within the range of peer group and the Morningstar Category average. The Trustees noted that the net expense ratio of the Institutional Class was below the peer group and Morningstar category averages. The Trustees further noted that the net expense ratio of the Investor Class was above the peer group and slightly below the Morningstar category averages, but within the range of the peer group. The Trustees reviewed information regarding fees charged by the Advisor for other client relationships and considered the reasons for variation of fees among clients, as presented by the Advisor. The Trustees discussed the soft dollar benefits that the Advisor received from Fund trades. A representative of the Advisor represented that the expense waivers would be continued for an additional year. The Trustees concluded that when viewed in terms of the overall quality of services provided, the fees were not unreasonable.
As for potential economies of scale, the Board discussed and considered information regarding whether economies of scale had been realized with respect to the management of the Fund, whether the Fund had appropriately benefited from any economies of scale, and whether there is potential for realization of any further economies of scale. The Board noted that the Advisor agreed to breakpoints to the Services Agreement, therefore, as the Fund grows shareholders benefit from economies of scale. Additionally, the Trustees considered the waivers of the Services Agreement fees and management fees. The Trustees concluded that the breakpoints in the Services Agreement provide appropriate economies of scale to the shareholder. The Trustees considered the current size of the Fund. They concluded that breakpoints in the advisory fee were not necessary at this time.
The Independent Trustees met in executive session to discuss the continuation of the Agreement. The officers of the Trust were excused during this discussion.
Upon reconvening the meeting, the Independent Trustees reported that after further consideration, they were pleased to renew the Agreement. It was the consensus of the Trustees, including the Independent Trustees, that renewal of the Agreement would be in the best interests of the Fund and its shareholders.
2020 Annual Report 21
TRUSTEES AND OFFICERS
(Unaudited) |
The Board of Trustees supervises the business activities of the Trust. The names of the Trustees and executive officers of the Trust are shown below. Each Trustee serves until the Trustee sooner dies, resigns, retires or is removed. Officers hold office for one year and until their respective successors are chosen and qualified.
The Trustees and Officers of the Trust and their principal business activities during the past five years are:
Interested Trustees and Officers
| | | | Principal | Number of | Other |
| Name, Address(1), | Position | Length of | Occupation(s) | Portfolios | Directorships |
| and Year of Birth | with the | Time Served | During | Overseen | Held By |
| | Trust | | Past 5 Years | By Trustee | Trustee |
| |
| John B. Walthausen(2) | President | Since 2007 | Managing Director and Chief | 2 | None |
| Year of Birth: 1945 | and Trustee | | Investment Officer, Walthausen & | | |
| | | | Co., LLC (9/1/07 to Present). | | |
| |
| Mark L. Hodge | Secretary | Since 2008 | Chief Compliance Officer (2007 to | N/A | N/A |
| Year of Birth: 1958 | and Chief | | Present) and Managing Director | | |
| | Compliance | | (2013 to Present), Walthausen & | | |
| | Officer | | Co., LLC. | | |
| |
| Stanley M. Westhoff Jr. | Treasurer | Since 2011 | Equity Analyst (2007 to Present) | N/A | N/A |
| Year of Birth: 1969 | | | and Managing Director (2013 to | | |
| | | | Present), Walthausen & Co., | | |
| LLC. |
(1) The address of each Trustee and Officer is c/o Walthausen Funds, 2691 Route 9, Suite 102, Malta, NY 12020.
(2) John B. Walthausen is considered an "interested person" as defined in Section 2(a)(19) of the Investment Company Act of 1940, as amended, by virtue of his affiliation with the Advisor.
Independent Trustees
| | | | Principal | Number of | Other |
| Name, Address(1), | Position | Length of | Occupation(s) | Portfolios | Directorships |
| and Year of Birth | with the | Time Served | During | Overseen | Held By |
| | Trust | | Past 5 Years | By Trustee | Trustee |
| |
| Edward A. LaVarnway | Independent | Since 2008 | Retired as of 5/10/13. Executive | 2 | None |
| Year of Birth: 1951 | Trustee | | Director, Fredric Remington Art | | |
| | | | Museum (8/15/05 to 5/10/13). | | |
| |
| John P. Mastriani | Independent | Since | Executive Vice President of The Ayco | 2 | None |
| Year of Birth: 1952 | Trustee | July 2014 | Company, L.P. (“Ayco”) a Goldman | | |
| | | | Sachs Company that provides finan- | | |
| | | | cial consulting and education ser- | | |
| | | | vices, May 2012-March 2014. Senior | | |
| | | | Vice President of Ayco, December | | |
| | | | 2003-May 2012. | | |
| |
| Hany A. Shawky | Independent | Since 2009 | Professor of Finance at the University | 2 | None |
| Year of Birth: 1947 | Trustee | | at Albany, N.Y. (Oct. 2007 to Present). | | |
(1) The address of each Trustee is c/o Walthausen Funds, 2691 Route 9, Suite 102, Malta, NY 12020.
The Statement of Additional Information contains additional and more detailed information about the Trustees and is available without charge by calling the transfer agent at 1-888-925-8428.
2020 Annual Report 22
Board of Trustees
Edward A. LaVarnway
John P. Mastriani
Hany A. Shawky
John B. Walthausen
Investment Advisor and Administrator
Walthausen & Co., LLC
Legal Counsel
Thompson Hine LLP
Custodian
US Bank, N.A.
Dividend Paying Agent,
Shareholders' Servicing Agent,
Transfer Agent
Ultimus Fund Solutions, LLC
Sub-Administrator
Premier Fund Solutions, Inc.
Independent Registered Public Accounting Firm
Cohen & Company, Ltd.
Distributor
Rafferty Capital Markets, LLC |
This report is provided for the general information of the shareholders of the Walthausen
Small Cap Value Fund. This report is not intended for distribution to prospective
investors in the Fund, unless preceded or accompanied by an effective prospectus. |
WALTHAUSENSMALLCAPVALUEFUND
2691 Route 9, Suite 102
Malta, NY 12020
WALTHAUSENSELECTVALUEFUND
INSTITUTIONALCLASS TICKERWSVIX
RETAILCLASS TICKERWSVRX
R6CLASSTICKERWRSIX
For Investors Seeking Long-Term Capital Appreciation
ANNUALREPORT
January 31, 2020
IMPORTANT NOTE:Beginning on January 1, 2021, as permitted by regulations adopted by the Securities
and Exchange Commission, paper copies of the Fund's shareholder reports will no longer be sent by mail,
unless you specifically request paper copies of the reports from the Fund or from your financial intermediary,
such as a broker-dealer or bank. Instead, the reports will be made available on a website, and you will be
notified by mail each time a report is posted and provided with a website link to access the report.
If you already elected to receive shareholder reports electronically, you will not be affected by this change
and you need not take any action. You may elect to receive shareholder reports and other communications
from the Fund or your financial intermediary electronically by calling or sending an email request.
You may elect to receive all future reports in paper free of charge. You can inform the Fund or your financial
intermediary that you wish to continue receiving paper copies of your shareholder reports by calling or send-
ing an email request. Your election to receive reports in paper will apply to all funds held with the fund com-
plex/your financial intermediary. |
Walthausen Select Value Fund
Annual Report
January 31, 2020
Dear Shareholders:
For the fiscal year ended January 31, 2020, the Fund returned 13.00% (Retail Class), exceeding the Russell 2500 Value Index and Russell 2000 Value Index by 590 and 862 basis points respectively. According to Morningstar, this performance ranked the Fund in the top decile of all mutual funds in the small cap value category for this 12-month period. *
This past year was a continuation of the dominance of large cap and growth over small cap and value. We are beginning to feel like a boxer who has been wrongly instructed to block opponents’ punches with our face. But, alas, the best that we can do is to perform at a top level in the weight class for which we have trained, and that is small cap value. From a macro perspective, we had a lot to process over the past 12 months including the impeachment effort, trade tariffs and negotiations, gun violence, military strikes in the Mid-East and the citizen riots in Hong Kong. A busy year to say the least and plenty of reasons for the market to grow uncertain. But from uncertainty, opportunities develop, and that is what excites us and drives us when we arrive at our desk each morning. And, at some point, the market is going to realize that these continuing world macro headwinds are going to be inescapable challenges for the large world wide organizations and that opportunity will be found in those smaller companies that can often operate in an area that is somewhat protected from those macro head-winds. At some point value will again win out over a good story of future riches.
When looking at the results for the full year it is gratifying that the performance was broad based throughout the portfolio. Sector returns exceeded that of the Russell 2500 Value Index sectors in eight of the ten sectors where we had exposure. Of our top performers, two are a result of buyouts. Kemet Corp (KEM) and Electronics For Imaging (EFII) were both bought out at attractive premiums. While we do not make investment decisions based on the expectation of a buyout, it is always rewarding when your view of unrealized value is confirmed by someone with a significantly larger checkbook. The rest of the top five are McGrath RentCorp (MGRC), MDC Holdings (MDC), and Cavco Industries (CVCO). These companies make modular office/classroom space, single family site-built homes, and manufactured homes respectively. While their businesses are similar, their customer sets are not. All three are solely domestically focused and in all three cases trade / tariff issues have very little effect on their business.
The most challenged sector was energy which we have spoken to in past letters. We started the year owning several exploration and production ("E&P") companies, but as the year progressed, and we learned more of the current industry dynamics, we concluded that the challenges that these companies face are far greater than we initially thought. While there may be value in their reserves, that value most likely will not be recognized by the equity markets within an acceptable investment horizon. Of the bottom five performers for the year, Whiting Petroleum (WLL), Southwestern Energy (SWN), Callon Petroleum (CPE), Granite Construction (GVA), and Dave & Buster’s Entertainment (PLAY), three of the five are E&P companies. The three E&P companies, as well as GVA and PLAY have been sold out of the portfolio as we believe that the original investment thesis was found to be erroneous.
We are happy with how the portfolio is positioned going into the new year. All of the weighted average valuation statistics are at or below the Russell 2500 Value Index, while estimated earnings growth and profitability margins are all above the benchmark average; all of this while employing less leverage has us comfortable with our position. However, we are not resting, and the recent market volatility has us energetically sifting through the market looking to
2020 Annual Report 1
see if we can improve our position even further. Thank you for your continuing support and know that we are trying hard to perform even better.
Sincerely,
| John B. Walthausen CFA | Gerard S. E. Heffernan, Jr. CFA |
PS. The last few weeks have seen the global stock markets fall sharply as investors react to the danger and uncertainty of a global epidemic. We cannot foresee what the full impact of the virus will be but we do note several important things. The selloff has been indiscriminate. This is giving us an opportunity to shed weaker holdings and upgrade the portfolio. We also can see that the sell off which has hit small cap value stocks particularly hard is opening up excellent price opportunities.
While we understand that periods such as this may be alarming to many, our many years of experience has taught us that these moments are where the seeds of opportunity are found and we are excited about the prospects of future harvests.
Disclosures:
*For the 1 Year period ended January 31, 2020 the Morningstar Small Cap Value category consisted of 419 funds.
Portfolio weighting as of January 31, 2020 for individual securities referred to; KEM (previously sold), EFII (previously sold), MGRC - 3.4%, MDC - 3.1%, CVCO - 3.6%, WLL (previously sold), SWN (previously sold), CPE (previously sold), GVA (previously sold), PLAY (previously sold).
Weighted Average Valuation Statistics - Calculations that take into account the varying importance of numbers in a data set. Each number in the data set is multiplied by a predetermined weight before the final calculation is made.
Estimated Earnings Growth - Represents the projected one-year earnings growth rate of the stocks held in the portfolio.
Profitability Margins - Measures the ratio of the profit of the companies in the portfolio (sales minus all expenses) divided by their revenues.
Past performance does not guarantee future results. The investment return and principal value of an investment in the Fund will fluctuate so that an investor’s shares, when redeemed, may be worth more or less than their original cost. Current performance may be higher or lower than the performance data quoted. Performance data current to the most recent month end are available by calling 1-888-925-8428.
The Fund’s prospectus contains important information about the Fund’s investment objectives, potential risks, management fees, charges and expenses, and other information and should be read and considered carefully before investing. To obtain a copy of the Fund’s prospectus, please visit our website at www.walthausenfunds.com or call 1-888-925-8428 and a copy will be sent to you free of charge. Distributed by Rafferty Capital Markets, LLC – Garden City, NY 11530.
2020 Annual Report 2
WALTHAUSEN SELECT VALUE FUND(Unaudited)
PERFORMANCE INFORMATION
1/31/20 Institutional Class NAV $11.77
1/31/20 Retail Class NAV $11.62
1/31/20 R6 Class NAV $11.94
AVERAGE ANNUAL RATE OF RETURN (%) FOR THE PERIODS ENDED JANUARY 31, 2020
| | | | | | | | Since | |
| | 1 Year(A) | | 3 Years(A) | | 5 Years(A) | | Inception(A) | |
| Walthausen Select Value Fund - Institutional Class | 13.19% | | 7.84% | | 7.10% | | 9.65% | |
| Walthausen Select Value Fund - Retail Class | 13.00% | | 7.56% | | 6.82% | | 9.37% | |
| Russell 2500® Value Index(B) | 7.10% | | 4.63% | | 6.93% | | 9.26% | |
| | | | | | Since | |
| | 1 Year(A) | | 3 Years(A) | | Inception(A) | |
| Walthausen Select Value Fund - R6 Class | 13.36% | | 7.98% | | 12.42% | |
| Russell 2500® Value Index(B) | 7.10% | | 4.63% | | 8.73% | |
| | Annual Fund Operating Expense Ratios (from 6/1/19 Prospectus): Institutional Class - Gross 1.35%, Net 1.10%
Retail Class - 1.35%
R6 Class - Gross 1.35%, Net 0.98% |
The Advisor reimbursed and/or waived certain expenses of the Fund’s Institutional, Retail, and R6 Classes. Absent these arrangements, the performance of the Classes would have been lower. The Fund imposes a 2.00% redemption fee on all shares redeemed within 90 days of purchase or less.
Each Class’s expense ratio for the fiscal year ended January 31, 2020 can be found in the financial highlights included in this report.
The Annual Fund Operating Expense Ratios reported above may not correlate to the expense ratios in the Fund’s financial highlights because (a) the financial highlights include only the direct operating expenses incurred by the Fund, not the indirect costs of investing in acquired funds, and (b) the application of breakpoints of the Services Agreement (see Note 4).
(A)1 Year, 3 Years, 5 Years and Since Inception returns include change in share prices and in each case includes reinvestment of any dividends and capital gain distributions. The inception date of the Walthausen Select Value Fund Institutional and Retail Classes was December 27, 2010. Class R6 commenced operations on November 1, 2016.
(B)The Russell 2500® Value Index (whose composition is different from that of the Fund) measures the performance of the small to mid-cap value segment of the U.S. equity universe. It includes those Russell 2500 companies with lower price-to-book ratios and lower forecasted growth values. The Index is constructed to provide a comprehensive and unbiased barometer of the small to mid-cap value market. The Index is completely reconstituted annually to ensure larger stocks do not distort the performance and characteristics of the true small to mid-cap opportunity set and that the represented companies continue to reflect value characteristics. Investors cannot directly invest in an index.
PASTPERFORMANCEDOESNOTGUARANTEEFUTURERESULTS. INVESTMENTRETURNANDPRINCIPALVALUEWILLFLUCTUATESOTHATSHARES, WHENREDEEMED, MAYBEWORTHMOREORLESSTHANTHEIRORIGINALCOST. RETURNSDONOTREFLECTTHEDEDUCTIONOFTAXESTHATA SHAREHOLDERWOULDPAYONFUNDDISTRIBUTIONSORTHEREDEMPTIONOFFUNDSHARES. CURRENTPERFORMANCEMAYBELOWERORHIGHERTHANTHEPERFORMANCEDATAQUOTED. TOOBTAINPERFORMANCEDATACURRENTTOTHEMOSTRECENTMONTH-END, PLEASECALL1-888-925-8428. THEFUND’SDISTRIBUTORISRAFFERTYCAPITALMARKETS, LLC.
2020 Annual Report 3
WALTHAUSEN SELECT VALUE FUND(Unaudited)
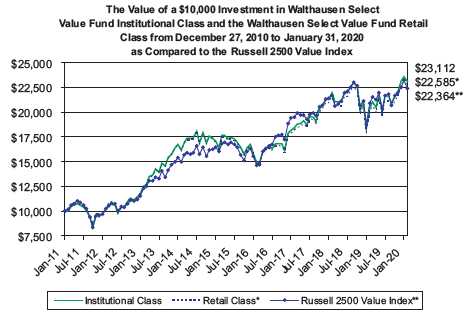

2020 Annual Report 4
Availability of Quarterly Schedule of Investments
(Unaudited)
The Fund files its complete schedule of portfolio holdings with the Securities and Exchange Commission (“SEC”) for the first and third quarters of each fiscal year on Form N-PORT. The Fund’s Form N-PORT is available on the SEC’s website at http://www.sec.gov.
Proxy Voting Guidelines
(Unaudited) |
Walthausen & Co., LLC, the Fund’s investment advisor (“Advisor”), is responsible for exercising the voting rights associated with the securities held by the Fund. A description of the policies and procedures used by the Advisor in fulfilling this responsibility is availablewithout charge on the Fund’s website at www.walthausenfunds.com. It is also included in the Fund’s Statement of Additional Information, which is available on the SEC’s website at http://www.sec.gov. Information regarding how the Fund voted proxies, Form N-PX, relating to portfolio securities during the most recent 12-month period ended June 30th, is available without charge, upon request, by calling our toll free number (1-888-925-8428). This information is also available on the SEC’s website at http://www.sec.gov.
EXPENSE EXAMPLE
(Unaudited) |
As a shareholder of the Fund, you incur two types of costs: (1) transaction costs such as redemption fees and IRA maintenance fees, and (2) ongoing costs, including management fees, service fees and other Fund expenses. This Example is intended to help you understand your ongoing costs (in dollars) of investing in the Fund and to compare these costs with the ongoing costs of investing in other mutual funds. The Example is based on an investment of $1,000 invested in the Fund on August 1, 2019 and held through January 31, 2020.
Actual Expenses
The first line of each table below provides information about actual account values and actual expenses. Additionally, although the Fund charges no sales load, you will be assessed fees for outgoing wire transfers, returned checks and stop payment orders at prevailing rates charged by Ultimus Fund Solutions, LLC, the Fund’s transfer agent. If shares are redeemed within 90 days or less of purchase from the Fund, the shares are subject to a 2% redemption fee. You will be charged an annual maintenance fee of $15 for each tax deferred account you have with the Fund (“IRA maintenance fees”). To the extent the Fund invests in shares of other investment companies as part of its investment strategy, you will indirectly bear your proportionate share of any fees and expenses charged by the underlying funds in which the Fund invests in addition to the expenses of the Fund. Actual expenses of the underlying funds are expected to vary among the various underlying funds. These expenses are not included in the example. The example includes management fees, service fees and other Fund expenses. However, the example does not include portfolio trading commissions and related expenses and other extraordinary expenses as determined under generally accepted accounting principles. You may use the information in this line, together with the amount you invested, to estimate the expenses that you paid over the period. Simply divide your account value by $1,000 (for example, an $8,600 account value divided by $1,000 = 8.6), then multiply the result by the number in the first line under the heading entitled “Expenses Paid During Period” to estimate the expenses you paid on your account during this period.
Hypothetical Example for Comparison Purposes
The second line of each table provides information about hypothetical account values and hypothetical expenses based on the Fund’s actual expense ratio and an assumed rate of return of 5% per year before expenses, which is not the Fund’s actual return. The hypothetical account values and expenses may not be used to estimate the actual ending account balance or expenses you paid for the period. You may use this information to compare the ongoing costs of investing in the Fund and other funds. To do so, compare this 5% hypothetical example with the 5% hypothetical examples that appear in the shareholder reports of the other funds.
Please note that the expenses shown in the table are meant to highlight your ongoing costs only and do not reflect any transactional costs, such as redemption fees, IRA maintenance fees described above or expenses of underlying funds. Therefore, the second line of the table is useful in comparing ongoing costs only, and will not help you determine the relative total costs of owning different funds. In addition, if these transactional costs were included, your costs would have been higher.
2020 Annual Report 5
| Institutional Class | | | | | | |
| | | | | | | Expenses Paid |
| | | Beginning | | Ending | | During the Period* |
| | | Account Value | | Account Value | | August 1, 2019 |
| | | August 1, 2019 | | January 31, 2020 | | January 31, 2020 |
| |
| Actual | | $1,000.00 | | $1,069.51 | | $5.74 |
| |
| Hypothetical | | $1,000.00 | | $1,019.66 | | $5.60 |
| (5% annual return | | | | | | |
| before expenses) | | | | | | |
| * | Expenses are equal to the Fund’s annualized expense ratio of 1.10%, multiplied by the aver- age account value over the period, multiplied by 184/365 (to reflect the one-half year period). |
| |
| Retail Class | | | | | | |
| | | | | | | Expenses Paid |
| | | Beginning | | Ending | | During the Period* |
| | | Account Value | | Account Value | | August 1, 2019 |
| | | August 1, 2019 | | January 31, 2020 | | January 31, 2020 |
| |
| Actual | | $1,000.00 | | $1,068.17 | | $7.04 |
| |
| Hypothetical | | $1,000.00 | | $1,018.40 | | $6.87 |
| (5% annual return | | | | | | |
| before expenses) | | | | | | |
| * | Expenses are equal to the Fund’s annualized expense ratio of 1.35%, multiplied by the aver- age account value over the period, multiplied by 184/365 (to reflect the one-half year period). |
| |
| R6 Class | | | | | | |
| | | | | | | Expenses Paid |
| | | Beginning | | Ending | | During the Period* |
| | | Account Value | | Account Value | | August 1, 2019 |
| | | August 1, 2019 | | January 31, 2020 | | January 31, 2020 |
| |
| Actual | | $1,000.00 | | $1,070.64 | | $5.11 |
| |
| Hypothetical | | $1,000.00 | | $1,020.27 | | $4.99 |
| (5% annual return | | | | | | |
| before expenses) | | | | | | |
| * | Expenses are equal to the Fund’s annualized expense ratio of 0.98%, multiplied by the aver- age account value over the period, multiplied by 184/365 (to reflect the one-half year period). |
| |
2020 Annual Report 6
| Walthausen Select Value Fund | | | | |
| | | | Schedule of Investments |
| | | | January 31, 2020 |
| Shares | | Fair Value | % of Net Assets |
| COMMON STOCKS | | | | |
| | | | | |
| Arrangement of Transportation of Freight & Cargo | | | | |
| 7,420 | Hub Group, Inc. - Class A * | $ | 392,295 | 3.33 | % |
| Calculating & Accounting Machines (No Electronic Computers) | | | | |
| 12,058 | NCR Corporation * | | 406,596 | 3.45 | % |
| Electrical Work | | | | |
| 3,910 | EMCOR Group, Inc. | | 321,285 | 2.72 | % |
| Fats & Oils | | | | | |
| 14,820 | Darling Ingredients Inc. * | | 402,067 | 3.41 | % |
| Fire, Marine & Casualty Insurance | | | | |
| 6,085 | AMERISAFE, Inc. | | 416,336 | 3.53 | % |
| Hotels & Motels | | | | |
| 10,150 | Wyndham Destinations, Inc. | | 492,579 | 4.18 | % |
| Life Insurance | | | | | |
| 1,610 | Primerica, Inc. | | 190,881 | 1.62 | % |
| Measuring & Controlling Devices, NEC | | | | |
| 3,140 | Onto Innovation Inc. * | | 119,132 | 1.01 | % |
| Miscellaneous General Merchandise Stores | | | | |
| 1,750 | Casey's General Stores, Inc. | | 281,505 | 2.39 | % |
| Miscellaneous Industrial & Commercial Machinery & Equipment | | | | |
| 4,695 | Moog Inc. - Class A | | 420,719 | 3.57 | % |
| Mobile Homes | | | | | |
| 1,890 | Cavco Industries, Inc. * | | 423,398 | 3.59 | % |
| Motor Vehicle Parts & Accessories | | | | |
| 3,550 | LCI Industries | | 383,293 | 3.25 | % |
| Motor Vehicles & Passenger Car Bodies | | | | |
| 3,520 | Oshkosh Corporation | | 302,861 | 2.57 | % |
| National Commercial Banks | | | | |
| 11,400 | PacWest Bancorp | | 399,570 | | |
| 17,990 | Sterling Bancorp | | 359,800 | | |
| | | | 759,370 | 6.43 | % |
| Operative Builders | | | | |
| 8,762 | M.D.C. Holdings, Inc. | | 369,231 | 3.13 | % |
| Poultry Slaughtering and Processing | | | | |
| 2,208 | Sanderson Farms, Inc. | | 304,019 | 2.58 | % |
| Pumps & Pumping Equipment | | | | |
| 4,440 | ITT Inc. | | 297,835 | 2.52 | % |
| Rolling Drawing & Extruding of Nonferrous Metals | | | | |
| 10,210 | Mueller Industries, Inc. | | 297,826 | 2.52 | % |
| Services - Equipment Rental & Leasing, NEC | | | | |
| 5,110 | McGrath RentCorp | | 395,105 | | |
| 4,630 | Triton International Limited (Bermuda) | | 173,856 | | |
| | | | 568,961 | 4.82 | % |
| Services - Help Supply Services | | | | |
| 4,810 | AMN Healthcare Services, Inc. * | | 324,098 | 2.75 | % |
| Services - Hospitals | | | | |
| 5,360 | Encompass Health Corporation | | 412,881 | 3.50 | % |
| State Commercial Banks | | | | |
| 3,625 | Bank of Hawaii Corporation | | 324,800 | | |
| 10,300 | Columbia Banking System, Inc. | | 398,610 | | |
| 13,610 | CVB Financial Corp. | | 282,680 | | |
| | | | 1,006,090 | 8.52 | % |
| Surety Insurance | | | | |
| 7,390 | Essent Group Ltd. (Bermuda) | | 366,618 | 3.11 | % |
* Non-Income Producing Securities.
The accompanying notes are an integral part of these
financial statements. |
2020 Annual Report 7
| Walthausen Select Value Fund |
| | | | Schedule of Investments |
| | | | January 31, 2020 |
| Shares | | | Fair Value | | | % of Net Assets |
| COMMON STOCKS | | | | | | |
| | | | | | | |
| Surgical & Medical Instruments & Apparatus | | | | | | |
| 11,200 | Merit Medical Systems, Inc. * | $ | 407,904 | | | 3.46 | % |
| Title Insurance | | | | | | | |
| 4,900 | First American Financial Corporation | | 303,702 | | | 2.57 | % |
| Transportation Services | | | | | | |
| 3,720 | GATX Corporation | | 283,203 | | | 2.40 | % |
| Water Supply | | | | | | | |
| 2,830 | American States Water Company | | 250,625 | | | 2.12 | % |
| Water Transportation | | | | | | |
| 5,440 | Kirby Corporation * | | 398,698 | | | 3.38 | % |
| Wholesale - Petroleum & Petroleum Products (No Bulk Stations) | | | | | | |
| 11,310 | World Fuel Services Corporation | | 442,447 | | | 3.75 | % |
| Total for Common Stocks (Cost $8,626,198) | | 11,346,455 | | | 96.18 | % |
| | | | | | | |
| REAL ESTATE INVESTMENT TRUSTS | | | | | | |
| 16,620 | Industrial Logistics Properties Trust | | 380,432 | | | 3.23 | % |
| | (Cost $356,374) | | | | | | |
| | | | | | | |
| MONEY MARKET FUNDS | | | | | | |
| 183,067 | Fidelity Investments Money Market Government Portfolio - | | | | | | |
| | Class I 1.46% ** | | 183,067 | | | 1.55 | % |
| | (Cost $183,067) | | | | | | |
| Total Investment Securities | | 11,909,954 | | | 100.96 | % |
| | (Cost $9,165,639) | | | | | | |
| Liabilities in Excess of Other Assets | | (112,707 | ) | | -0.96 | % |
| Net Assets | | $ | 11,797,247 | | | 100.00 | % |
| | * Non-Income Producing Securities.
** The rate shown represents the 7-day yield at January 31, 2020. |
The accompanying notes are an integral part of these
financial statements. |
2020 Annual Report 8
| Walthausen Select Value Fund |
| |
| Statement of Assets and Liabilities | | |
| January 31, 2020 | | |
| Assets: | | |
| Investment Securities at Fair Value | $ | 11,909,954 |
| (Cost $9,165,639) | | |
| Receivable for Dividends | | 8,206 |
| Receivable for Securities Sold | | 74,029 |
| Receivable for Shareholder Subscriptions | | 2,668 |
| Total Assets | | 11,994,857 |
| Liabilities: | | |
| Payable for Securities Purchased | | 181,527 |
| Payable for Shareholder Redemptions | | 4,134 |
| Payable to Advisor for Management Fees (Note 4) | | 9,274 |
| Payable to Advisor for Service Fees (Note 4) | | 2,675 |
| Total Liabilities | | 197,610 |
| Net Assets | $ | 11,797,247 |
| Net Assets Consist of: | | |
| Paid In Capital | $ | 8,893,355 |
| Total Distributable Earnings | | 2,903,892 |
| Net Assets | $ | 11,797,247 |
| |
| Institutional Class | | |
| Net Assets | $ | 8,534,220 |
| Shares Outstanding | | |
| (Unlimited shares authorized) | | 724,966 |
| Net Asset Value and Offering Price Per Share | $ | 11.77 |
| Redemption Price Per Share ($11.77 x 0.98) (Note 2) | $ | 11.53 |
| |
| Retail Class | | |
| Net Assets | $ | 2,950,966 |
| Shares Outstanding | | |
| (Unlimited shares authorized) | | 254,042 |
| Net Asset Value and Offering Price Per Share | $ | 11.62 |
| Redemption Price Per Share ($11.62 x 0.98) (Note 2) | $ | 11.39 |
| |
| R6 Class | | |
| Net Assets | $ | 312,061 |
| Shares Outstanding | | |
| (Unlimited shares authorized) | | 26,144 |
| Net Asset Value and Offering Price Per Share | $ | 11.94 |
| Redemption Price Per Share ($11.94 x 0.98) (Note 2) | $ | 11.70 |
The accompanying notes are an integral part of these
financial statements. |
2020 Annual Report 9
| Walthausen Select Value Fund | | | |
| |
| Statement of Operations | | | |
| For the fiscal year ended January 31, 2020 | | | |
| |
| Investment Income: | | | |
| Dividends (Net of foreign withholding tax of $0) | $ | 234,927 | |
| Total Investment Income | | 234,927 | |
| Expenses: | | | |
| Management Fees (Note 4) | | 107,944 | |
| Service Fees (Note 4) | | 53,973 | |
| Total Expenses | | 161,917 | |
| Less: Waived Service Fees (Note 4) | | (21,901 | ) |
| Net Expenses | | 140,016 | |
| Net Investment Income (Loss) | | 94,911 | |
| Realized and Unrealized Gain (Loss) on Investments: | | | |
| Net Realized Gain (Loss) on Investments | | 1,211,975 | |
| Net Change In Unrealized Appreciation (Depreciation) on Investments | | 239,842 | |
| Net Realized and Unrealized Gain (Loss) on Investments | | 1,451,817 | |
| Net Increase (Decrease) in Net Assets from Operations | $ | 1,546,728 | |
The accompanying notes are an integral part of these
financial statements. |
2020 Annual Report 10
| Walthausen Select Value Fund |
| | |
| Statements of Changes in Net Assets | | | | | | | | |
| | | 2/1/2019 | | | | 2/1/2018 | | |
| | | to | | | | to | | |
| | | 1/31/2020 | | | | 1/31/2019 | | |
| From Operations: | | | | | | | | |
| Net Investment Income (Loss) | $ | 94,911 | | | $ | 101,471 | | |
| Net Realized Gain (Loss) on Investments | | 1,211,975 | | | | 14,014,765 | | |
| Net Change in Unrealized Appreciation (Depreciation) on Investments | | 239,842 | | | | (16,234,712 | ) | |
| Increase (Decrease) in Net Assets from Operations | | 1,546,728 | | | | (2,118,476 | ) | |
| From Distributions to Shareholders: | | | | | | | | |
| Institutional Class | | (477,944 | ) | | | (4,448,601 | ) | |
| Retail Class | | (124,961 | ) | | | (1,759,084 | ) | |
| R6 Class | | (14,860 | ) | | | (176,983 | ) | |
| Change in Net Assets from Distributions | | (617,765 | ) | | | (6,384,668 | ) | |
| From Capital Share Transactions: | | | | | | | | |
| Proceeds From Sale of Shares | | | | | | | | |
| Institutional Class | | 1,938,489 | | | | 876,683 | | |
| Retail Class | | 216,505 | | | | 488,592 | | |
| R6 Class | | 77,033 | | | | 213,976 | | |
| Proceeds From Redemption Fees (Note 2) | | | | | | | | |
| Institutional Class | | - | | | | 941 | | |
| Retail Class | | 1,642 | | | | 176 | | |
| R6 Class | | - | | | | - | | |
| Shares Issued on Reinvestment of Dividends | | | | | | | | |
| Institutional Class | | 476,140 | | | | 4,355,801 | | |
| Retail Class | | 121,847 | | | | 1,745,847 | | |
| R6 Class | | 14,860 | | | | 176,982 | | |
| Cost of Shares Redeemed | | | | | | | | |
| Institutional Class | | (4,915,183 | ) | | | (57,736,751 | ) | |
| Retail Class | | (2,024,908 | ) | | | (4,031,767 | ) | |
| R6 Class | | (489,012 | ) | | | (44,488 | ) | |
| Net Increase (Decrease) from Shareholder Activity | | (4,582,587 | ) | | | (53,954,008 | ) | |
| Net Increase (Decrease) in Net Assets | | (3,653,624 | ) | | | (62,457,152 | ) | |
| Net Assets at Beginning of Period | | 15,450,871 | | | | 77,908,023 | | |
| Net Assets at End of Period | $ | 11,797,247 | | | $ | 15,450,871 | | |
| | |
| Share Transactions: | | | | | | | | |
| Issued | | | | | | | | |
| Institutional Class | | 163,497 | | | | 49,307 | | |
| Retail Class | | 18,816 | | | | 32,292 | | |
| R6 Class | | 6,790 | | | | 18,331 | | |
| Reinvested | | | | | | | | |
| Institutional Class | | 39,481 | | | | 447,208 | | |
| Retail Class | | 10,239 | | | | 183,580 | | |
| R6 Class | | 1,216 | | | | 18,041 | | |
| Redeemed | | | | | | | | |
| Institutional Class | | (431,392 | ) | | | (3,130,205 | ) | |
| Retail Class | | (178,042 | ) | | | (256,555 | ) | |
| R6 Class | | (42,454 | ) | | | (2,898 | ) | |
| Net Increase (Decrease) in Shares | | (411,849 | ) | | | (2,640,899 | ) | |
The accompanying notes are an integral part of these
financial statements. |
2020 Annual Report 11
| Walthausen Select Value Fund |
| | |
| Financial Highlights - Institutional Class | | | | | | | | | | | | | | | | | | | | |
| Selected data for a share outstanding throughout the period: | | 2/1/2019 | | | | 2/1/2018 | | | | 2/1/2017 | | | | 2/1/2016 | | | | 2/1/2015 | | |
| | | to | | | | to | | | | to | | | | to | | | | to | | |
| | | 1/31/2020 | | | | 1/31/2019 | | | | 1/31/2018 | | | | 1/31/2017 | | | | 1/31/2016 | | |
| Net Asset Value - | | | | | | | | | | | | | | | | | | | | |
| Beginning of Period | $ | 10.97 | | | $ | 19.22 | | | $ | 16.26 | | | $ | 13.19 | | | $ | 14.70 | | |
| Net Investment Income (Loss)(a) | | 0.10 | | | | 0.04 | | | | 0.10 | | | | 0.06 | | | | 0.08 | | |
| Net Gain (Loss) on Investments (Realized and Unrealized)(b) | | 1.36 | | | | (2.17 | ) | | | 3.02 | | | | 3.08 | | | | (1.42 | ) | |
| Total from Investment Operations | | 1.46 | | | | (2.13 | ) | | | 3.12 | | | | 3.14 | | | | (1.34 | ) | |
| Distributions (From Net Investment Income) | | (0.22 | ) | | | - | | | | (0.11 | ) | | | (0.07 | ) | | | (0.07 | ) | |
| Distributions (From Capital Gains) | | (0.44 | ) | | | (6.12 | ) | | | (0.05 | ) | | | - | | | | (0.10 | ) | |
| Total Distributions | | (0.66 | ) | | | (6.12 | ) | | | (0.16 | ) | | | (0.07 | ) | | | (0.17 | ) | |
| Proceeds from Redemption Fee (Note 2) | | - | | | | - | | + | | - | | + | | - | | + | | - | | + |
| Net Asset Value - | | | | | | | | | | | | | | | | | | | | |
| End of Period | $ | 11.77 | | | $ | 10.97 | | | $ | 19.22 | | | $ | 16.26 | | | $ | 13.19 | | |
| Total Return(c) | | 13.19% | | | | (7.07)% | | | | 19.23% | | | | 23.78% | | | | (9.23)% | | |
| Ratios/Supplemental Data | | | | | | | | | | | | | | | | | | | | |
| Net Assets - End of Period (Thousands) | $ | 8,534 | | | $ | 10,463 | | | $ | 68,955 | | | $ | 35,158 | | | $ | 48,191 | | |
| Before Reimbursement | | | | | | | | | | | | | | | | | | | | |
| Ratio of Expenses to Average Net Assets | | 1.35% | | | | 1.35% | | | | 1.35% | | | | 1.42% | | | | 1.45% | | |
| Ratio of Net Investment Income (Loss) to Average Net Assets | | 0.62% | | | | -0.03% | | | | 0.33% | | | | 0.19% | | | | 0.31% | | |
| After Reimbursement | | | | | | | | | | | | | | | | | | | | |
| Ratio of Expenses to Average Net Assets | | 1.10% | | | | 1.10% | | | | 1.10% | | | | 1.17% | | | | 1.20% | | |
| Ratio of Net Investment Income (Loss) to Average Net Assets | | 0.87% | | | | 0.22% | | | | 0.58% | | | | 0.44% | | | | 0.56% | | |
| Portfolio Turnover Rate | | 49.95% | | | | 39.38% | | | | 63.12% | | | | 62.38% | | | | 62.54% | | |
| Financial Highlights - Retail Class | | | | | | | | | | | | | | | | | | | | |
| Selected data for a share outstanding throughout the period: | | 2/1/2019 | | | | 2/1/2018 | | | | 2/1/2017 | | | | 2/1/2016 | | | | 2/1/2015 | | |
| | | to | | | | to | | | | to | | | | to | | | | to | | |
| | | 1/31/2020 | | | | 1/31/2019 | | | | 1/31/2018 | | | | 1/31/2017 | | | | 1/31/2016 | | |
| Net Asset Value - | | | | | | | | | | | | | | | | | | | | |
| Beginning of Period | $ | 10.71 | | | $ | 19.00 | | | $ | 16.10 | | | $ | 13.06 | | | $ | 14.57 | | |
| Net Investment Income (Loss)(a) | | 0.07 | | | | 0.01 | | | | 0.03 | | | | 0.03 | | | | 0.05 | | |
| Net Gain (Loss) on Investments (Realized and Unrealized)(b) | | 1.33 | | | | (2.18 | ) | | | 3.00 | | | | 3.04 | | | | (1.42 | ) | |
| Total from Investment Operations | | 1.40 | | | | (2.17 | ) | | | 3.03 | | | | 3.07 | | | | (1.37 | ) | |
| Distributions (From Net Investment Income) | | (0.06 | ) | | | - | | | | (0.08 | ) | | | (0.03 | ) | | | (0.04 | ) | |
| Distributions (From Capital Gains) | | (0.44 | ) | | | (6.12 | ) | | | (0.05 | ) | | | - | | | | (0.10 | ) | |
| Total Distributions | | (0.50 | ) | | | (6.12 | ) | | | (0.13 | ) | | | (0.03 | ) | | | (0.14 | ) | |
| Proceeds from Redemption Fee (Note 2) | | 0.01 | | | | - | | + | | - | | + | | - | | + | | - | | + |
| Net Asset Value - | | | | | | | | | | | | | | | | | | | | |
| End of Period | $ | 11.62 | | | $ | 10.71 | | | $ | 19.00 | | | $ | 16.10 | | | $ | 13.06 | | |
| Total Return(c) | | 13.00% | | | | (7.37)% | | | | 18.87% | | | | 23.50% | | | | (9.50)% | | |
| Ratios/Supplemental Data | | | | | | | | | | | | | | | | | | | | |
| Net Assets - End of Period (Thousands) | $ | 2,951 | | | $ | 4,318 | | | $ | 8,430 | | | $ | 52,922 | | | $ | 39,781 | | |
| Before Reimbursement | | | | | | | | | | | | | | | | | | | | |
| Ratio of Expenses to Average Net Assets | | 1.35% | | | | 1.35% | | | | 1.35% | | | | 1.42% | | | | 1.45% | | |
| Ratio of Net Investment Income (Loss) to Average Net Assets | | 0.58% | | | | 0.04% | | | | 0.16% | | | | 0.19% | | | | 0.31% | | |
| After Reimbursement | | | | | | | | | | | | | | | | | | | | |
| Ratio of Expenses to Average Net Assets | | 1.35% | | | | 1.35% | | | | 1.35% | | | | 1.42% | | | | 1.45% | | |
| Ratio of Net Investment Income (Loss) to Average Net Assets | | 0.58% | | | | 0.04% | | | | 0.16 | | | | 0.19% | | | | 0.31% | | |
| Portfolio Turnover Rate | | 49.95% | | | | 39.38% | | | | 63.12% | | | | 62.38% | | | | 62.54% | | |
| | + Amount less than $0.005 per share.
(a) Per share amounts were calculated using the average shares method.
(b) Realized and unrealized gains and losses per share in this caption are balancing amounts necessary to reconcile
the change in net asset value for the period and may not reconcile with the aggregate gains and losses in the Statement
of Operations due to share transactions for the period.
(c) Total return represents the rate that the investor would have earned or lost on an investment in the Fund assuming
reinvestment of dividends. |
The accompanying notes are an integral part of these
financial statements. |
2020 Annual Report 12
| Walthausen Select Value Fund |
| | |
| Financial Highlights - R6 Class | | | | | | | | | | | | | | | | |
| Selected data for a share outstanding throughout the period: | | 2/1/2019 | | | | 2/1/2018 | | | | 2/1/2017 | | | | 11/1/2016* | | |
| | | to | | | | to | | | | to | | | | to | | |
| | | 1/31/2020 | | | | 1/31/2019 | | | | 1/31/2018 | | | | 1/31/2017 | | |
| Net Asset Value - | | | | | | | | | | | | | | | | |
| Beginning of Period | $ | 11.06 | | | $ | 19.29 | | | $ | 16.30 | | | $ | 14.06 | | |
| Net Investment Income (Loss)(a) | | 0.12 | | | | 0.08 | | | | 0.14 | | | | 0.03 | | |
| Net Gain (Loss) on Investments (Realized and Unrealized)(b) | | 1.37 | | | | (2.19 | ) | | | 3.01 | | | | 2.24 | | |
| Total from Investment Operations | | 1.49 | | | | (2.11 | ) | | | 3.15 | | | | 2.27 | | |
| Distributions (From Net Investment Income) | | (0.17 | ) | | | - | | | | (0.11 | ) | | | (0.03 | ) | |
| Distributions (From Capital Gains) | | (0.44 | ) | | | (6.12 | ) | | | (0.05 | ) | | | - | | |
| Total Distributions | | (0.61 | ) | | | (6.12 | ) | | | (0.16 | ) | | | (0.03 | ) | |
| Proceeds from Redemption Fee (Note 2) | | - | | | | - | | | | - | | | | - | | |
| Net Asset Value - | | | | | | | | | | | | | | | | |
| End of Period | $ | 11.94 | | | $ | 11.06 | | | $ | 19.29 | | | $ | 16.30 | | |
| Total Return(c) | | 13.36% | | | | (6.91)% | | | | 19.32% | | | | 16.18% | | ** |
| Ratios/Supplemental Data | | | | | | | | | | | | | | | | |
| Net Assets - End of Period (Thousands) | $ | 312 | | | $ | 670 | | | $ | 523 | | | $ | 6 | | |
| Before Reimbursement | | | | | | | | | | | | | | | | |
| Ratio of Expenses to Average Net Assets | | 1.35% | | | | 1.35% | | | | 1.35% | | | | 1.35% | | *** |
| Ratio of Net Investment Income (Loss) to Average Net Assets | | 0.64% | | | | 0.08% | | | | 0.37% | | | | 0.48% | | *** |
| After Reimbursement | | | | | | | | | | | | | | | | |
| Ratio of Expenses to Average Net Assets | | 0.98% | | | | 0.98% | | | | 0.98% | | | | 0.98% | | *** |
| Ratio of Net Investment Income (Loss) to Average Net Assets | | 1.01% | | | | 0.45% | | | | 0.74% | | | | 0.85% | | *** |
| Portfolio Turnover Rate | | 49.95% | | | | 39.38% | | | | 63.12% | | | | 62.38% | | ** |
* Commencement of Class.
** Not Annualized.
*** Annualized.
+ Amount less than $0.005 per share.
(a) Per share amounts were calculated using the average shares method.
(b) Realized and unrealized gains and losses per share in this caption are balancing amounts necessary to reconcile
the change in net asset value for the period and may not reconcile with the aggregate gains and losses in the
Statement of Operations due to share transactions for the period.
(c) Total return represents the rate that the investor would have earned or lost on an investment in the Fund assuming
reinvestment of dividends. |
The accompanying notes are an integral part of these
financial statements. |
2020 Annual Report 13
NOTES TOFINANCIALSTATEMENTS
WALTHAUSENSELECTVALUEFUND
January 31, 2020
1.) ORGANIZATION
Walthausen Select Value Fund (the “Fund”) was organized as a diversified series of the Walthausen Funds (the “Trust”) on December 1, 2010. The Trust is registered as an open-end investment company under the Investment Company Act of 1940, as amended (the “1940 Act”). The Trust was organized in Ohio as a business trust on October 10, 2007 and may offer an unlimited number of shares of beneficial interest in a number of separate series, each series representing a distinct fund with its own investment objectives and policies. As of January 31, 2020, there are two series authorized by the Trust. The Fund currently offers Institutional Class shares, Retail Class shares and R6 Class shares. The Institutional Class and Retail Class commenced operations on December 27, 2010, and R6 Class shares commenced operations on November 1, 2016. Prior to January 30, 2013 the Institutional Class was named the Investor Class. All classes of shares have identical rights to earnings, assets and voting privileges, except for class specific expenses and exclusive rights to vote on matters affecting only individual classes. The classes differ principally in their respective distribution expenses and arrangements. Prior to June 1, 2013, Retail Class shares of the Fund were subject to Rule 12b-1 distribution fees. While the Fund does not currently charge any Rule 12b-1 distribution fees, the Fund does reserve the right to pay or accrue such fees upon notice to shareholders. The Fund’s investment objective is to seek long-term capital appreciation. The investment advisor to the Fund is Walthausen & Co., LLC (the “Advisor”).
2.) SIGNIFICANT ACCOUNTING POLICIES
The Fund is an investment company and accordingly follows the investment company accounting and reporting guidance of the Financial Accounting Standards Board (“FASB”) Accounting Standards Codification Topic 946Financial Services - Investment Companies. The financial statements are prepared in conformity with accounting principles generally accepted in the United States of America (“GAAP”). The Fund follows the significant accounting policies described in this section.
SECURITY VALUATION
All investments in securities are recorded at their estimated fair value, as described in Note 3.
FEDERAL INCOME TAXES
The Fund’s policy is to continue to comply with the requirements of the Internal Revenue Code that are applicable to regulated investment companies and to distribute all of its taxable income to shareholders. Therefore, no federal income tax provision is required. It is the Fund’s policy to distribute annually, prior to the end of the calendar year, dividends sufficient to satisfy excise tax requirements of the Internal Revenue Code. This Internal Revenue Code requirement may cause an excess of distributions over the book year-end accumulated income. In addition, it is the Fund’s policy to distribute annually, after the end of the fiscal year, any remaining net investment income and net realized capital gains.
The Fund recognizes the tax benefits of certain tax positions only where the position is “more likely than not” to be sustained assuming examination by tax authorities. Management has analyzed the Fund’s tax positions, and has concluded that no liability for unrecognized tax benefits should be recorded related to uncertain tax positions taken on returns filed for the open tax years. The Fund identifies its major tax jurisdictions as U.S. Federal and State tax authorities; however, the Fund is not aware of any tax positions for which it is reasonably possible that the total amounts of unrecognized tax benefits will change materially in the next twelve months. The Fund recognizes interest and penalties, if any, related to unrecognized tax benefits as income tax expense in the Statement of Operations. During the fiscal year ended January 31, 2020, the Fund did not incur any interest or penalties.
SHARE VALUATION
The net asset value per share of the Fund is calculated daily by dividing the total value of the Fund’s assets, less liabilities, by the number of shares outstanding, rounded to the nearest cent. The offering and redemption price per share is equal to the net asset value per share, except that shares of the Fund are subject to a redemption fee of 2% if redeemed after holding them for 90 days or less. During the fiscal year ended January 31, 2020, proceeds from redemption fees amounted to $0, $1,642 and $0 for Institutional Class shares, Retail Class shares and R6 Class shares, respectively.
2020 Annual Report 14
Notes to Financial Statements - continued
DISTRIBUTIONS TO SHAREHOLDERS
Distributions to shareholders, which are determined in accordance with income tax regulations, are recorded on the ex-dividend date. The Fund may utilize earnings and profits distributed to shareholders on redemptions of shares as part of the dividends paid deductions. The treatment for financial reporting purposes of distributions made to shareholders during the year from net investment income or net realized capital gains may differ from their ultimate treatment for federal income tax purposes. These differences are caused primarily by differences in the timing of the recognition of certain components of income, expense, or realized capital gain for federal income tax purposes. Where such differences are permanent in nature, they are reclassified in the components of the net assets based on their ultimate characterization for federal income tax purposes. Any such reclassifications will have no effect on net assets, results of operations, or net asset value per share of the Fund. For the fiscal year ended January 31, 2020, the following adjustments were recorded and primarily related to the use of equalization for tax purposes.
| Paid In Capital | | $135,449 | |
| Total Distributable Earnings | | ($135,449 | ) |
USE OF ESTIMATES
The financial statements are prepared in accordance with GAAP, which requires management to make estimates and assumptions that affect the reported amounts of assets and liabilities and disclosure of contingent assets and liabilities at the date of the financial statements and the reported amounts of increases and decreases in net assets from operations during the reporting period. Actual results could differ from those estimates.
OTHER
The Fund records security transactions based on the trade date for financial reporting purposes. Dividend income is recognized on the ex-dividend date. Interest income, if any, is recognized on an accrual basis. The Fund uses the specific identification method in computing gain or loss on the sale of investment securities. Withholding taxes on foreign dividends have been provided for in accordance with the Fund’s understanding of the applicable country’s tax rules and rates. The Fund may invest in real estate investment trusts (“REITs”) that pay distributions to their shareholders based on available funds from operations. It is common for these distributions to exceed the REITs taxable earnings and profits resulting in the excess portion of such distribution to be designated as return of capital. Distributions received from REITs are generally recorded as dividend income and, if necessary, are reclassified annually in accordance with tax information provided by the underlying REITs. Additionally, the Fund may hold investments in master limited partnerships (“MLPs”). It is common for distributions from MLPs to exceed taxable earnings and profits. In such instances, the excess portion of such distributions are classified as a return of capital. Annually, income or loss from each MLP is reclassified upon receipt of the MLP’s tax reporting document. For financial reporting purposes, management does not estimate the tax character of MLP distributions for which actual information has not been reported.
EXPENSES
Expenses incurred by the Trust that do not relate to a specific fund of the Trust are allocated to the individual funds based on each fund’s relative net assets or an appropriate basis.
Class specific expenses are borne by each specific class. Income, non-class specific expenses, and realized and unrealized gains/losses are allocated to the respective classes based on the basis of relative net assets.
3.) SECURITIES VALUATIONS
The Fund utilizes various methods to measure the fair value of its investments on a recurring basis. GAAP establishes a hierarchy that prioritizes inputs to valuation methods. The three levels of inputs are:
Level 1 - Unadjusted quoted prices in active markets for identical assets or liabilities that the Fund has the ability to access.
Level 2 - Observable inputs other than quoted prices included in level 1 that are observable for the asset or liability, either directly or indirectly. These inputs may include quoted prices for the identical instrument on an inactive market, prices for similar instruments, interest rates, prepayment speeds, credit risk, yield curves, default rates and similar data.
Level 3 - Unobservable inputs for the asset or liability, to the extent relevant observable inputs are not available, representing the Fund’s own assumptions about the assumptions a market participant would use in valuing the asset or liability, and would be based on the best information available.
2020 Annual Report 15
Notes to Financial Statements - continued
The availability of observable inputs can vary from security to security and is affected by a wide variety of factors, including, for example, the type of security, whether the security is new and not yet established in the marketplace, the liquidity of markets, and other characteristics particular to the security. To the extent that valuation is based on models or inputs that are less observable or unobservable in the market, the determination of fair value requires more judgment. Accordingly, the degree of judgment exercised in determining fair value is greatest for instruments categorized as level 3.
The inputs used to measure fair value may fall into different levels of the fair value hierarchy. In such cases, for disclosure purposes, the level in the fair value hierarchy within which the fair value measurement falls in its entirety, is determined based on the lowest level input that is significant to the fair value measurement in its entirety.
FAIR VALUE MEASUREMENTS
A description of the valuation techniques applied to the Fund’s major categories of assets and liabilities measured at fair value on a recurring basis follows.
Equity securities (common stocks). Equity securities generally are valued by using market quotations, but may be valued on the basis of prices furnished by a pricing service when the Advisor believes such prices accurately reflect the fair value of such securities. Securities that are traded on any stock exchange or on the NASDAQ over-the-counter market are generally valued by the pricing service at the last quoted sale price. Lacking a last sale price, an equity security is generally valued by the pricing service at its last bid price. Generally, if the security is traded in an active market and is valued at the last sale price, the security is categorized as a level 1 security, and if an equity security is valued by the pricing service at its last bid price, it is generally categorized as a level 2 security. When market quotations are not readily available, when the Advisor determines that the market quotation or the price provided by the pricing service does not accurately reflect the current fair value, or when restricted securities are being valued, such securities are valued as determined in good faith by the Advisor, subject to review of the Board of Trustees (the “Trustees” or the “Board”) and are categorized in level 2 or level 3, when appropriate.
Money market funds.Shares of money market funds are valued at the net asset value provided by the funds and are classified as level 1 of the fair value hierarchy.
In accordance with the Trust’s good faith pricing guidelines, the Advisor is required to consider all appropriate factors relevant to the value of securities for which it has determined other pricing sources are not available or reliable as described above. There is no single procedure for determining fair value, since fair value depends upon the circumstances of each individual case. As a general principle, the current fair value of an issue of securities being valued by the Advisor would appear to be the amount that the owner might reasonably expect to receive for them upon their current sale. Methods which are in accordance with this principle may, for example, be based on (i) a multiple of earnings; (ii) a discount from market of a similar freely traded security (including a derivative security or a basket of securities traded on other markets, exchanges or among dealers); or (iii) yield to maturity with respect to debt issues, or a combination of these and other methods.
The following table summarizes the inputs used to value the Fund’s assets measured at fair value as of January 31, 2020:
| Valuation Inputs of Assets | | Level 1 | | Level 2 | | Level 3 | | Total |
| Common Stocks | | $11,346,455 | | $0 | | $0 | | $11,346,455 |
| Real Estate Investment Trust | | 380,432 | | 0 | | 0 | | 380,432 |
| Money Market Funds | | 183,067 | | 0 | | 0 | | 183,067 |
| Total | | $11,909,954 | | $0 | | $0 | | $11,909,954 |
Refer to the Fund’s Schedule of Investments for a listing of securities by industry. The Fund did not hold any level 3 assets during the fiscal year ended January 31, 2020.
The Fund did not invest in any derivative instruments during the fiscal year ended January 31, 2020.
4.) INVESTMENT ADVISORY AGREEMENT AND RELATED PARTY TRANSACTIONS
The Trust, on behalf of the Fund, has entered into an investment advisory agreement (“Management Agreement”) with the Advisor. The Advisor manages the investment portfolio of the Fund, subject to policies adopted by the Trust’s Board of Trustees, and, at its own expense and without reimbursement from the Trust, furnishes office space and all necessary office facilities, equipment and executive personnel necessary for managing the Fund. For its services, the Advisor
2020 Annual Report 16
Notes to Financial Statements - continued
receives an investment management fee equal to 0.90% of the average daily net assets of the Fund. Prior to November 1, 2016, the Advisor received an investment management fee equal to 1.00% of the average daily net assets of the Fund. For the fiscal year ended January 31, 2020, the Advisor earned management fees totaling $107,944, of which $9,274 was due to the Advisor at January 31, 2020.
Under the terms of the Services Agreement between the Trust, on behalf of the Fund, and the Advisor (the “Services Agreement”), the Advisor renders administrative and supervisory services to the Fund, provides the services of a chief compliance officer and assumes and pays all ordinary expenses of the Fund, excluding management fees, any 12b-1 fees, brokerage fees and commissions, taxes, borrowing costs (such as (a) interest and (b) dividend expenses on securities sold short), fees and expenses of acquired funds, extraordinary or non-recurring expenses as may arise, including litigation to which the Fund may be a party and indemnification of the Trust’s Trustees and officers. For its services, the Advisor receives service fees equal to an annual rate of 0.45% of the Fund’s average daily net assets up to $100 million, 0.25% of the Fund’s average daily net assets between $100 million and $500 million, and 0.15% of such assets in excess of $500 million. The Advisor has contractually agreed to waive Services Agreement fees to the extent necessary to maintain total annual operating expenses of the Institutional Class Shares, excluding brokerage fees and commissions, taxes, borrowing costs (such as (a) interest and (b) dividend expenses on securities sold short), the cost of acquired funds and extraordinary expenses at 1.10% of its average daily net assets through May 31, 2020. The Advisor may not terminate the fee waiver before May 31, 2020. Prior to June 1, 2017 the Advisor had contractually agreed to waive, for the Institutional Class shares, 0.25% of the applicable Services Agreement fees for the class’ average daily net assets up to $100 million. Also, the Advisor has contractually agreed to waive Services Agreement fees to the extent necessary to maintain total annual operating expenses of the R6 Class Shares, excluding brokerage fees and commissions, taxes, borrowing costs (such as (a) interest and (b) dividend expenses on securities sold short), the cost of acquired funds and extraordinary expenses at 0.98% of its average daily net assets through May 31, 2020. The Advisor may not terminate the fee waiver before May 31, 2020.
For the fiscal year ended January 31, 2020, the Advisor earned service fees of $53,973, of which $2,675 was due to the Advisor at January 31, 2020. Service fees in the amounts of $20,802 and $1,099 were waived with no recapture provision for the fiscal year ended January 31, 2020 for the Institutional and R6 Classes, respectively.
Certain officers and a shareholder of the Advisor are also officers and/or a Trustee of the Trust. These individuals may receive benefits from the Advisor resulting from management and services fees paid to the Advisor by the Fund.
The Trustees who are not interested persons of the Fund were each paid $4,000, for a total of $12,000, in Trustees’ fees plus travel and related expenses for the fiscal year ended January 31, 2020 for their services to the Fund. The Advisor pays these fees pursuant to the Services Agreement.
5.) DISTRIBUTION AND SHAREHOLDER SERVICING PLAN
The Fund has adopted a Distribution Plan in accordance with Rule 12b-1 under the 1940 Act. Pursuant to the Distribution Plan, the Fund compensates the Advisor for services rendered and expenses borne in connection with brokerage platform fees. This Distribution Plan provides that the Fund may pay the annual rate of up to 0.25% of the average daily net assets of the Fund’s Retail Class shares. These activities include reimbursement to entities for providing distribution and shareholder servicing with respect to the Fund’s shares. Effective June 1, 2013, the Fund does not currently pay or accrue any distribution fees for Retail Class shares; however, the Fund reserves the right to pay or accrue such fees in the future upon notice to shareholders.
6.) PURCHASES AND SALES OF SECURITIES
For the fiscal year ended January 31, 2020, purchases and sales of investment securities other than U.S. Government obligations and short-term investments aggregated $5,878,059 and $10,812,441, respectively. Purchases and sales of U.S. Government obligations aggregated $0 and $0, respectively.
7.) CONTROL OWNERSHIP
The beneficial ownership, either directly or indirectly, of more than 25% of the voting securities of a fund creates a presumption of control of a fund under Section 2(a)(9) of the 1940 Act. As of January 31, 2020, NFS, LLC, located in New York, New York, for the benefit of its clients, held, in aggregate, 49.44% of the Fund shares, and therefore each may be deemed to control the Fund.
2020 Annual Report 17
Notes to Financial Statements - continued
8.) TAX MATTERS
For Federal income tax purposes, the cost of investments owned at January 31, 2020 was $9,255,827. At January 31, 2020, the composition of unrealized appreciation (the excess of value over tax cost) and depreciation (the excess of tax cost over value) was as follows:
| | Appreciation | | (Depreciation) | | Net Appreciation (Depreciation) |
| | $2,833,749 | | ($179,622) | | $2,654,127 |
Distributions paid from Institutional Class:
| | | Fiscal Year Ended | | Fiscal Year Ended |
| | | January 31, 2020 | | January 31, 2019 |
| Ordinary Income | | $ 174,768 | | $ 743,869 |
| Long-Term Capital Gain | | 303,176 | | 3,704,732 |
| | | $ 477,944 | | $ 4,448,601 |
Distributions paid from Retail Class:
| | | Fiscal Year Ended | | Fiscal Year Ended |
| | | January 31, 2020 | | January 31, 2019 |
| Ordinary Income | | $ 18,592 | | $ 294,144 |
| Long-Term Capital Gain | | 106,369 | | 1,464,940 |
| | | $ 124,961 | | $ 1,759,084 |
Distributions paid from R6 Class:
| | | Fiscal Year Ended | | Fiscal Year Ended |
| | | January 31, 2020 | | January 31, 2019 |
| Ordinary Income | | $ 4,637 | | $ 29,594 |
| Long-Term Capital Gain | | 10,223 | | 147,389 |
| | | $ 14,860 | | $ 176,983 |
As of January 31, 2020, the components of distributable earnings on a tax basis were as follows:
| Undistributed ordinary income | | $ 7,096 |
| Undistributed long-term capital gains | | 242,669 |
| Unrealized appreciation on investments – net | | 2,654,127 |
| | | $ 2,903,892 |
The differences between book basis and tax basis are primarily attributable to the tax deferral of wash sales.
9.) SUBSEQUENT EVENTS
Subsequent events after the date of the Statement of Assets and Liabilities have been evaluated through the date the financial statements were issued. Management has concluded that there is no impact requiring adjustment to or disclosure in the financial statements.
2020 Annual Report 18
REPORT OF INDEPENDENT REGISTERED PUBLIC ACCOUNTING FIRM
To the Shareholders and Board of Trustees of
Walthausen Funds
Opinion on the Financial Statements
We have audited the accompanying statement of assets and liabilities, including the schedule of investments, of Walthausen Select Value Fund (the “Fund”), a series of Walthausen Funds, as of January 31, 2020, and the related statement of operations for the year then ended, the statements of changes in net assets for each of the two years in the period then ended, including the related notes, and the financial highlights for each of the five years in the period then ended (collectively referred to as the "financial statements"). In our opinion, the financial statements present fairly, in all material respects, the financial position of the Fund as of January 31, 2020, the results of its operations for the year then ended, the changes in its net assets for each of the two years in the period then ended, and the financial highlights for each of the five years in the period then ended, in conformity with accounting principles generally accepted in the United States of America.
Basis for Opinion
These financial statements are the responsibility of the Fund's management. Our responsibility is to express an opinion on the Fund's financial statements based on our audits. We are a public accounting firm registered with the Public Company Accounting Oversight Board (United States) (“PCAOB”) and are required to be independent with respect to the Fund in accordance with the U.S. federal securities laws and the applicable rules and regulations of the Securities and Exchange Commission and the PCAOB.
We conducted our audits in accordance with the standards of the PCAOB. Those standards require that we plan and perform the audit to obtain reasonable assurance about whether the financial statements are free of material misstatement, whether due to error or fraud.
Our audits included performing procedures to assess the risks of material misstatement of the financial statements, whether due to error or fraud, and performing procedures that respond to those risks. Such procedures included examining, on a test basis, evidence regarding the amounts and disclosures in the financial statements. Our procedures included confirmation of securities owned as of January 31, 2020, by correspondence with the custodian and brokers or by other appropriate auditing procedures where replies from brokers or counterparties were not received. Our audits also included evaluating the accounting principles used and significant estimates made by management, as well as evaluating the overall presentation of the financial statements. We believe that our audits provide a reasonable basis for our opinion.
We have served as the auditor for the Walthausen Funds since 2008.

COHEN & COMPANY, LTD.
Cleveland, Ohio
March 27, 2020
2020 Annual Report 19
ADDITIONALINFORMATION
January 31, 2020
(UNAUDITED)
APPROVAL OF INVESTMENT ADVISORY AGREEMENT
On January 22, 2020, the Board of Trustees (the “Trustees” or the “Board”) considered the renewal of the Management Agreement (the “Agreement”) between the Trust and the Advisor (or “Management”), on behalf of the Walthausen Select Value Fund (“Select Value” or the “Fund”). Legal Counsel reviewed the memorandum provided by them and explained that, in consideration of the continuance of the Agreement, the Board should review all information as is reasonably necessary to evaluate the terms of the contract and determine whether it is fair to the Fund and its shareholders. The Advisor had provided information to the Trustees it believed to be sufficient for evaluation of continuance of the Agreement.
In reviewing the Agreement, the Board of Trustees received materials from the Advisor addressing the following factors: (i) the investment performance of the Fund and the Advisor; (ii) the nature, extent and quality of the services provided by the Advisor to the Fund; (iii) the cost of the services provided and the profits realized by the Advisor and its affiliates from the relationship with the Fund; (iv) the extent to which economies of scale will be realized as the Fund grows; and (v) whether the fee levels reflect these economies of scale to the benefit of shareholders.
The Board met with representatives of the Advisor to discuss the terms of the Agreement. The Board reviewed the history of the Advisor, including background and investment management experience, as well as the Fund’s performance since inception, important factors relating to the Fund’s performance, the Advisor’s investment and research strategy, the Advisor’s strength of personnel, and expected expenses and revenue from the Fund.
As to the performance of Select Value, the materials included information regarding the Fund’s performance compared to a peer group of similar funds as well as the overall Morningstar Small Value category and the Russell 2500® Value Index. The Trustees noted that the data showed that the Fund outperformed its peer group, category and its index for the 1-year period ended December 31, 2019. They also considered that the Fund lagged the index, but outperformed its peer group and category for the 5-year period ended December 31, 2019. The Trustees discussed that the Institutional Class outperformed the index since inception through December 31, 2019, with the Retail Class trailing slightly. The Board discussed the Advisor’s observations that it consistently delivered a value oriented portfolio consistent with the Fund’s stated investment strategy and that in the long-term, the value strategy could outperform growth. The Board considered the Fund’s performance along with the Advisor’s overall track record. After further discussion, the Independent Trustees concluded that overall they were pleased with the performance of the Advisor.
As to the nature, extent and quality of the services provided by the Advisor, the Board analyzed the Advisor’s experience and capabilities. The Board discussed each portfolio manager’s background and investment management experience. The Board reviewed the key professionals servicing the Fund. The Board was pleased with the depth of the advisory team and its emphasis on a thoughtful and rigorous stock selection discipline. The representatives of the Advisor reviewed and discussed with the Board the Advisor’s ADV and the Rule 17j-1 Code of Ethics certifications. The Board discussed the quality of the Advisor’s compliance efforts. The Board also reviewed the Advisor’s financial condition. The Board concluded that the nature and extent of the services provided by the Advisor were consistent with their expectations. The Independent Trustees emphasized that they continued to be very pleased with the quality and value of the services provided by the Advisor, its emphasis on fundamental bottom-up research, its focus on compliance, and its dedication to the shareholders’ best interests.
As to the cost of the services provided and the profits realized by the Advisor and its affiliates from the relationship with the Fund, it was noted that the Advisor was paying substantially all ordinary operating expenses of the Fund pursuant to the Services Agreement. Additionally, the Advisor provided the Fund with officers, including the CCO, shareholder servicing support and office space. The Board discussed the fee schedule of the Services Agreement, including the breakpoints in the contract which serve to reduce fees as assets grow. A representative of the Advisor reviewed the revenue and expenses related to the Services Agreement noting that there had been a loss to the Advisor during the previous year. The Board discussed the contractual fee waivers currently in place. A representative of the Advisor discussed the method in which payments to broker dealers had been allocated within the profitability analysis. He explained that only those payments to broker dealers that were deemed to be attributable to sub-transfer agency/shareholder servicing services
2020 Annual Report 20
Additional Information (Unaudited) - continued
had been reflected in the profitability analysis. He explained that any fees which were considered to be distribution related services had been paid by the Advisor from its own legitimate profits. The Board concluded that the Advisor’s profitability was at an acceptable level, particularly in light of the extent and quality of the services being provided to the Fund.
Turning to the level of expenses, the Board reviewed comparative data of advisory fees and expense ratios based on publicly available data that was drawn from its peer group, as well as Morningstar data. They discussed that Institutional Class net expense ratio was below the average net expense ratio for the peer group and the Morningstar category average, while Retail Class net expense ratio was above the average net expense ratios of the peer group and the Morningstar category average. The Retail Class net expense ratio was noted to be within the range of the peer group. Additionally, the Trustees noted that the management fee was slightly above the peer group average and above the Morningstar category average, but also within the range of the peer group and the Morningstar category. They considered the impact of fund size on expenses. The Trustees reviewed information regarding fees charged by the Advisor for other client relationships, which were equal to, or lower than the fees charged to the Fund. The Trustees discussed the soft dollar benefits that the Advisor received from Fund trades. A representative of the Advisor represented that the expense waivers would be continued for an additional year. The Trustees concluded that when viewed in terms of the overall quality of services provided, the fees were not unreasonable.
As for potential economies of scale, the Board discussed and considered information regarding whether economies of scale had been realized with respect to the management of the Fund, whether the Fund had appropriately benefited from any economies of scale, and whether there is potential for realization of any further economies of scale. The Trustees concluded that the breakpoints in the Services Agreement provide appropriate economies of scale to the shareholder as the Fund grows. They concluded that breakpoints in the advisory fee were not necessary at this time.
The Independent Trustees met in executive session to discuss the continuation of the Agreement. The officers of the Trust were excused during this discussion.
Upon reconvening the meeting, the Independent Trustees reported that after further consideration, they were pleased to renew the Agreement. It was the consensus of the Trustees, including the Independent Trustees, that renewal of the Agreement would be in the best interests of the Fund and its shareholders.
2020 Annual Report 21
TRUSTEES AND OFFICERS
(Unaudited) |
The Board of Trustees supervises the business activities of the Trust. The names of the Trustees and executive officers of the Trust are shown below. Each Trustee serves until the Trustee sooner dies, resigns, retires or is removed. Officers hold office for one year and until their respective successors are chosen and qualified.
The Trustees and Officers of the Trust and their principal business activities during the past five years are:
Interested Trustees and Officers
| | | | Principal | Number of | Other |
| Name, Address(1), | Position | Length of | Occupation(s) | Portfolios | Directorships |
| and Year of Birth | with the | Time Served | During | Overseen | Held By |
| | Trust | | Past 5 Years | By Trustee | Trustee |
| |
| John B. Walthausen(2) | President | Since 2007 | Managing Director and Chief | 2 | None |
| Year of Birth: 1945 | and Trustee | | Investment Officer, Walthausen & | | |
| | | | Co., LLC (9/1/07 to Present). | | |
| |
| Mark L. Hodge | Secretary | Since 2008 | Chief Compliance Officer (2007 to | N/A | N/A |
| Year of Birth: 1958 | and Chief | | Present) and Managing Director | | |
| | Compliance | | (2013 to Present), Walthausen & | | |
| | Officer | | Co., LLC. | | |
| |
| Stanley M. Westhoff Jr. | Treasurer | Since 2011 | Equity Analyst (2007 to Present) | N/A | N/A |
| Year of Birth: 1969 | | | and Managing Director (2013 to | | |
| | | | Present), Walthausen & Co., | | |
| LLC. |
(1) The address of each Trustee and Officer is c/o Walthausen Funds, 2691 Route 9, Suite 102, Malta, NY 12020.
(2) John B. Walthausen is considered an "interested person" as defined in Section 2(a)(19) of the Investment Company Act of 1940, as amended, by virtue of his affiliation with the Advisor.
Independent Trustees
| | | | Principal | Number of | Other |
| Name, Address(1), | Position | Length of | Occupation(s) | Portfolios | Directorships |
| and Year of Birth | with the | Time Served | During | Overseen | Held By |
| | Trust | | Past 5 Years | By Trustee | Trustee |
| |
| Edward A. LaVarnway | Independent | Since 2008 | Retired as of 5/10/13. Executive | 2 | None |
| Year of Birth: 1951 | Trustee | | Director, Fredric Remington Art | | |
| | | | Museum (8/15/05 to 5/10/13). | | |
| |
| John P. Mastriani | Independent | Since | Executive Vice President of The Ayco | 2 | None |
| Year of Birth: 1952 | Trustee | July 2014 | Company, L.P. (“Ayco”) a Goldman | | |
| | | | Sachs Company that provides finan- | | |
| | | | cial consulting and education ser- | | |
| | | | vices, May 2012-March 2014. Senior | | |
| | | | Vice President of Ayco, December | | |
| | | | 2003-May 2012. | | |
| |
| Hany A. Shawky | Independent | Since 2009 | Professor of Finance at the University | 2 | None |
| Year of Birth: 1947 | Trustee | | at Albany, N.Y. (Oct. 2007 to Present). | | |
(1) The address of each Trustee is c/o Walthausen Funds, 2691 Route 9, Suite 102, Malta, NY 12020.
The Statement of Additional Information contains additional and more detailed information about the Trustees and is available without charge by calling the transfer agent at 1-888-925-8428.
2020 Annual Report 22
Board of Trustees
Edward A. LaVarnway
John P. Mastriani
Hany A. Shawky
John B. Walthausen
Investment Advisor and Administrator
Walthausen & Co., LLC
Legal Counsel
Thompson Hine LLP
Custodian
US Bank, N.A.
Dividend Paying Agent,
Shareholders' Servicing Agent,
Transfer Agent
Ultimus Fund Solutions, LLC
Sub-Administrator
Premier Fund Solutions, Inc.
Independent Registered Public Accounting Firm
Cohen & Company, Ltd.
Distributor
Rafferty Capital Markets, LLC |
This report is provided for the general information of the shareholders of the Walthausen
Select Value Fund. This report is not intended for distribution to prospective investors in
the Fund, unless preceded or accompanied by an effective prospectus. |
WALTHAUSENSELECTVALUEFUND
2691 Route 9, Suite 102
Malta, NY 12020
Item 2. Code of Ethics.
The registrant has adopted a code of ethics that applies to the registrant’s principal executive officer and the principal financial officer. The registrant has not made any amendments to its code of ethics during the covered period. The registrant has not granted any waivers from any provisions of the code of ethics during the covered period. A copy of the registrant’s Code of Ethics is filed herewith.
Item 3. Audit Committee Financial Expert.
The registrant’s Board of Trustees has determined that John P. Mastriani is an audit committee financial expert. Mr. Mastriani is independent for purposes of this Item 3.
Item 4. Principal Accountant Fees and Services.
(a-d) The following table details the aggregate fees billed for each of the last two fiscal years for audit fees, audit-related fees, tax fees and other fees by the principal accountant to the registrant. The principal accountant has provided no services to the adviser or any entity controlled by, or under common control with the adviser that provides ongoing services to the registrant.
| | | FYE 1/31/20 | | FYE 1/31/19 |
| Audit Fees | | $26,500 | | $26,000 |
| Audit-Related Fees | | $1,200 | | $1,200 |
| Tax Fees | | $9,000 | | $12,000 |
| All Other Fees | | $1,090 | | $1,100 |
Nature of Audit-Related Fees: Consent Fee.
Nature of Tax Fees: preparation of Excise Tax Statement and 1120 RIC.
Nature of All Other Fees: Review of Semi-Annual Report
(e) (1) The audit committee approves all audit and non-audit related services and, therefore, has not adopted pre-approval policies and procedures described in paragraph (c)(7) of Rule 2-01 of Regulation S-X.
(e) (2) None of the services described in paragraph (b) through (d) of this Item were approved by the audit committee pursuant to paragraph (c)(7)(i)(C) of Rule 2-01 of Regulation S-X.
(f) All of the principal accountant’s hours spent on auditing the registrant’s financial statements were attributed to work performed by full-time permanent employees of the principal accountant.
(g) The following table indicates the aggregate non-audit fees billed by the registrant’s principal accountant for services to the registrant , the registrant’s investment adviser (not sub-adviser), and any entity controlling, controlled by, or under common control with the adviser that provides ongoing services to the registrant, for the last two years.
| Non-Audit Fees | | FYE 1/31/20 | | FYE 1/31/19 |
| Registrant | | $10,090 | | $13,100 |
| Registrant’s Investment Adviser | | $0 | | $0 |
(h) The principal accountant provided no services to the investment adviser or any entity controlling, controlled by, or under common control with the adviser that provides ongoing services to the registrant.
Item 5. Audit Committee of Listed Companies.Not applicable.
Item 6. Investments.
(a) Not applicable. Schedule filed with Item 1.
(b) Not applicable.
Item 7. Disclosure of Proxy Voting Policies and Procedures for Closed-End Management Investment Companies.Not applicable.
Item 8. Portfolio Managers of Closed End Management Investment Companies.Not applicable.
Item 9. Purchases of Equity Securities by Closed-End Management Investment Companies and Affiliated Purchasers.Not applicable.
Item 10. Submission of Matters to a Vote of Security Holders.
The registrant has not adopted procedures by which shareholders may recommend nominees to the registrant’s board of trustees.
Item 11. Controls and Procedures.
(a) The Registrant’s president and chief financial officer concluded that the disclosure controls and procedures (as defined in Rule 30a-3(c) under the Act (17 CFR 270.30a -3(c))) as of a date within 90 days of the filing date of the report that includes the disclosure required by this paragraph, based on the evaluation of these controls and procedures required by Rule 30a-3(b) under the Act (17 CFR 270.30a -3(b)) and Rules 13a-15(b) or 15d-15(b) under the Exchange Act (17 CFR 240.13a -15(b) or 240.15d -15(b)).
(b) There were no changes in the registrant’s internal control over financial reporting (as defined in Rule 30a-3(d) under the Act (17 CFR 270.30a -3(d)) that occurred during the period covered by this report that has materially affected, or is reasonably likely to materially affect, the registrant’s internal control over financial reporting.
Item 12. Disclosure of Securities Lending Activities for Closed-End Management Investment Companies.
Not applicable.
Item 13. Exhibits.
(a)(1) Code of Ethics. Filed herewith.
(a)(2) Certifications pursuant to Section 302 of the Sarbanes-Oxley Act of 2002.Filed herewith.
(a)(3)Not applicable.
(a)(4) Not applicable.
(b)Certification pursuant to Section 906 of the Sarbanes-Oxley Act of 2002.Filed herewith.
Pursuant to the requirements of the Securities Exchange Act of 1934 and the Investment Company Act of 1940, the registrant has duly caused this report to be signed on its behalf by the undersigned, thereunto duly authorized.
By:/s/John B. Walthausen
John B. Walthausen
President |
Pursuant to the requirements of the Securities Exchange Act of 1934 and the Investment Company Act of 1940, this report has been signed below by the following persons on behalf of the registrant and in the capacities and on the dates indicated.
By:/s/John B. Walthausen
John B. Walthausen
President |
By:/s/Stanley M. Westhoff Jr.
Stanley M. Westhoff Jr.
Chief Financial Officer |