UNITED STATES
SECURITIES AND EXCHANGE COMMISSION
WASHINGTON, D.C. 20549 |
CERTIFIED SHAREHOLDER REPORT OF REGISTERED MANAGEMENT
INVESTMENT COMPANIES
Investment Company Act file number: 811-22143
WALTHAUSEN FUNDS
(Exact name of registrant as specified in charter)
2691 Route 9, Suite 102, Malta, NY 12020
(Address of principal executive offices) (Zip code)
John B. Walthausen
Walthausen Funds
2691 Route 9, Suite 102, Malta, NY 12020
(Name and address of agent for service) |
Registrant’s telephone number, including area code: (518) 348-7217
Date of fiscal year end: January 31
Date of reporting period: January 31, 2021
Form N-CSR is to be used by management investment companies to file reports with the Commission not later than 10 days after the transmission to stockholders of any report that is required to be transmitted to stockholders under Rule 30e-1 under the Investment Company Act of 1940 (17 CFR 270.30e -1). The Commission may use the information provided on Form N-CSR in its regulatory, disclosure review, inspection and policymaking roles.
A registrant is required to disclose the information specified by Form N-CSR, and the Commission will make this information public. A registrant is not required to respond to the collection of information contained in Form N-CSR unless the Form displays a currently valid Office of Management and Budget ("OMB") control number.
Item 1. Reports to Stockholders.
WALTHAUSEN SMALL CAP VALUE FUND
INSTITUTIONAL CLASS TICKER WFICX
INVESTOR CLASS TICKER WSCVX
For Investors Seeking Long-Term Capital Appreciation
ANNUAL REPORT
January 31, 2021
IMPORTANT NOTE: Beginning on January 1, 2021, as permitted by regulations adopted by the Securities
and Exchange Commission, paper copies of the Fund’s shareholder reports will no longer be sent by mail,
unless you specifically request paper copies of the reports from the Fund or from your financial intermediary,
such as a broker-dealer or bank. Instead, the reports will be made available on a website, and you will be
notified by mail each time a report is posted and provided with a website link to access the report. If you
already elected to receive shareholder reports electronically, you will not be affected by this change and you
need not take any action. You may elect to receive shareholder reports and other communications from the
Fund or your financial intermediary electronically by calling or sending an email request. You may elect to
receive all future reports in paper, free of charge. You can inform the Fund or your financial intermediary that
you wish to continue receiving paper copies of your shareholder reports by calling or sending an email
request. Your election to receive reports in paper will apply to all funds held with the fund complex/your
financial intermediary. |
Walthausen Small Cap Value Fund
Annual Report
January 31, 2021 |
Dear Fellow Shareholders,
We are in a challenging time for investing. While we are gratified that there is strong evidence that small cap value stocks are starting to show good relative performance, we are in a very different time - a time of uncertain economic growth, extraordinary low interest rates and high stock prices.
As we look forward, there are three imponderables that we need to address. First is the pandemic. Is it coming to an end? The number of cases has come down dramatically from the highs of our dark winter and the pace of vaccination has picked up. These are all good things, but this is a pandemic. It is worldwide and vaccination has hardly begun in large parts of the world. The continued high levels of infection are allowing the virus to mutate. We can see that people are restless and that most people believe that life is quickly returning to normal. As skeptical investors, we are keeping our eye on how this develops.
The second imponderable it the business cycle. Did the meltdown of last March end the market and economic cycle? Has a new one begun? Certainly, the cycle which had begun in 2009 in the depths of the 2007-2009 Great Recession was already a long one, and economic growth seemed to be flagging. Our working assumption in late 2019 was that the market and the economy were being held together by exceptionally low interest rates and deep deficit spending by our government. We have observed a good number of cycles and have observed that they all end with a credit crunch and a market meltdown. Though these crises are painful, they are also healthy as the excesses which build up in every market cycle are excised for the system. Bad players are bankrupted, or reformed, and new rules are created. Everyone promises to do better. Then, we are back off to the races again. This meltdown was different. When the economy shutdown, Congress, the Federal Reserve Bank, the Treasury, banks and businesses all reacted quickly, flooding the country with liquidity. That worked spectacularly well! Companies drew down lines of credit expecting that credit would dry up and that delays in collection from customers would erode their cash balances. That never happened. The economy did slow down, and unemployment rose. The Payroll Protection Plan from the first stimulus act allowed most small businesses to weather the impact of a sudden shutdown. The public companies that we follow cut costs, refinanced debt and issued new stock. While some industries are under pressure, most of these companies are now stronger than they were a year ago. We must ask "Have the excesses been wrung out?" A market bounding higher, led by small stocks which generally lack either history of or prospect of real earnings argues that we are in a speculative fever that is more typical of the late stages of a cycle than the early stages.
The third imponderable is what will be the effect of the low interest rates and massive infusion of liquidity. We are already seeing the impact on prices, prices of stock, prices of commodities, prices of homes, etc. That inflation of costs plus the weakness of the dollar is adding to costs. We are hearing in our discussions with management that raw materials costs are up, costs of transportation is up and in some cases labor costs are up. This may not translate into worrying inflation of accelerating wage rate increases but we think this must be watched closely.
We do not know the answers to these questions but will closely follow developments. We will closely track how the companies that we own deal with these challenges.
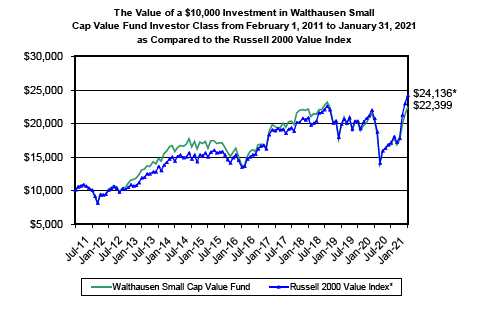
Our performance through the past fiscal year underperformed the Russell 2000 Value Index benchmark with a return of 10.0% versus the benchmark return of 16.4% . We also lagged more significantly behind the super large cap Russell 200 Growth Index which gained 34.7% over the same period. Throughout most of the year, we did okay versus our benchmark but a surge in speculative buying of marginal stocks late in the year, particularly in November, put us behind our benchmark.
2021 Annual Report 1
We believe that the portfolio is well positioned with well managed companies which will be able to navigate the challenges ahead and have the prospects for increased future prosperity.
Sincerely,
John B. Walthausen CFA
Past performance does not guarantee future results. The investment return and principal value of an investment in the Fund will fluctuate so that an investor’s shares, when redeemed, may be worth more or less than their original cost. Current performance may be higher or lower than the performance data quoted. Performance data current to the most recent month end are available by calling 1-888-925-8428.
The Fund’s prospectus contains important information about the Fund’s investment objectives, potential risks, management fees, charges and expenses, and other information and should be read and considered carefully before investing. To obtain a copy of the Fund’s prospectus, please visit our website at www.walthausenfunds.com or call 1-888-925-8428 and a copy will be sent to you free of charge. Distributed by Rafferty Capital Markets, LLC – Garden City, NY 11530.
2021 Annual Report 2
WALTHAUSEN SMALL CAP VALUE FUND (Unaudited)
PERFORMANCE INFORMATION
1/31/2021 Investor Class NAV $20.49
1/31/2021 Institutional Class NAV $20.53
AVERAGE ANNUAL RATE OF RETURN (%) FOR THE PERIODS ENDED JANUARY 31, 2021
| | 1 Year(A) | | 3 Years(A) | | 5 Years(A) | | 10 Years(A) | |
| Walthausen Small Cap Value Fund- Investor Class | 10.04% | | 0.42% | | 10.45% | | 8.40% | |
| Russell 2000® Value Index(B) | 16.42% | | 5.08% | | 12.34% | | 9.21% | |
| | | | Since | |
| | 1 Year(A) | | Inception(A) | |
| Walthausen Small Cap Value Fund - Institutional Class | 10.33% | | 12.11% | |
| Russell 2000® Value Index(B) | 16.42% | | 15.39% | |
Annual Fund Operating Expense Ratios (from 6/1/2020 Prospectus):
| | Institutional Class - Gross 1.30%, Net 0.98%
Investor Class - Gross 1.30%, Net 1.21% |
The Advisor reimbursed and/or waived certain expenses of the Fund’s Institutional and Investor Classes. Absent that arrangement, the performance of the Classes would have been lower.
Each Class’s expense ratios for the fiscal year ended January 31, 2021 can be found in the financial highlights included in this report. Both share classes have a 2.00% redemption fee on shares redeemed within 90 days of purchase or less.
The Annual Fund Operating Expense Ratios reported above may not correlate to the expense ratios in the Fund’s financial highlights because (a) the financial highlights include only the direct operating expenses incurred by the Fund, not the indirect costs of investing in acquired funds; and (b) the impact of waivers and breakpoints in expenses charged and the application of waivers as described in Note 4.
(A)1 Year, 3 Years, 5 Years, 10 Years and Since Inception returns include change in share prices and in each case includes reinvestment of any dividends and capital gain distributions. The inception date of the Walthausen Small Cap Value Fund Investor Class was February 1, 2008. Institutional Class commenced operations on December 31, 2018.
(B)The Russell 2000® Value Index (whose composition is different from that of the Fund) is an unmanaged index of small-capitalization stocks with lower price-to-book ratios and lower forecasted growth values than the total population of small-capitalization stocks. Investors cannot directly invest in an index.
PAST PERFORMANCE DOES NOT GUARANTEE FUTURE RESULTS. INVESTMENT RETURN AND PRINCIPAL VALUE WILL FLUCTUATE SO THAT SHARES, WHEN REDEEMED, MAY BE WORTH MORE OR LESS THAN THEIR ORIGINAL COST. RETURNS DO NOT REFLECT THE DEDUCTION OF TAXES THAT A SHAREHOLDER WOULD PAY ON FUND DISTRIBUTIONS OR THE REDEMPTION OF FUND SHARES. CURRENT PERFORMANCE MAY BE LOWER OR HIGHER THAN THE PERFORMANCE DATA QUOTED. TO OBTAIN PERFORMANCE DATA CURRENT TO THE MOST RECENT MONTH-END, PLEASE CALL 1-888-925-8428. THE FUND’S DISTRIBUTOR IS RAFFERTY CAPITAL MARKETS, LLC.
2021 Annual Report 3
WALTHAUSEN SMALL CAP VALUE FUND (Unaudited)
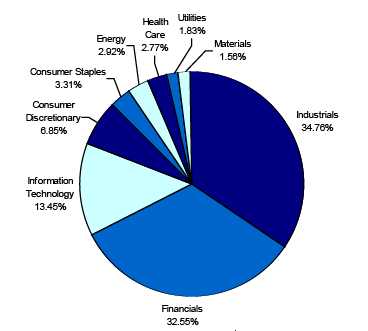
WALTHAUSEN SMALL CAP VALUE FUND
by Sectors as of January 31, 2021
(as a percentage of Common Stocks)
2021 Annual Report 4
AVAILABILITY OF QUARTERLY SCHEDULE OF INVESTMENTS
(Unaudited)
The Fund publicly files its complete schedule of portfolio holdings with the Securities and Exchange Commission (“SEC”) for the first and third quarters of each fiscal year on Form N-PORT. The Fund’s Form N-PORT is available on the SEC’s website at http://www.sec.gov.
PROXY VOTING GUIDELINES
(Unaudited) |
Walthausen & Co., LLC, the Fund’s investment advisor (“Advisor”), is responsible for exercising the voting rights associated with the securities held by the Fund. A description of the policies and procedures used by the Advisor in fulfilling this responsibility is available without charge on the Fund’s website at www.walthausenfunds.com. It is also included in the Fund’s Statement of Additional Information, which is available on the SEC’s website at http://www.sec.gov.
Information regarding how the Fund voted proxies, Form N-PX, relating to portfolio securities during the most recent 12-month period ended June 30th, is available without charge, upon request, by calling our toll free number (1-888-925-8428). This information is also available on the SEC’s website at http://www.sec.gov.
EXPENSE EXAMPLE
(Unaudited) |
As a shareholder of the Fund, you incur two types of costs: (1) transaction costs such as redemption fees and IRA maintenance fees, and (2) ongoing costs, including management fees, service fees, and other Fund expenses. This Example is intended to help you understand your ongoing costs (in dollars) of investing in the Fund and to compare these costs with the ongoing costs of investing in other mutual funds. The Example is based on an investment of $1,000 invested in the Fund on August 1, 2020 and held through January 31, 2021.
Actual Expenses
The first line of each table below provides information about actual account values and actual expenses. Additionally, although the Fund charges no sales load, you will be assessed fees for outgoing wire transfers, returned checks and stop payment orders at prevailing rates charged by Ultimus Fund Solutions, LLC, the Fund’s transfer agent. If shares are redeemed within 90 days or less of purchase from the Fund, the shares are subject to a 2% redemption fee. You will be charged an annual maintenance fee of $15 for each tax deferred account you have with the Fund (“IRA maintenance fees”). To the extent the Fund invests in shares of other investment companies as part of its investment strategy, you will indirectly bear your proportionate share of any fees and expenses charged by the underlying funds in which the Fund invests in addition to the expenses of the Fund. Actual expenses of the underlying funds are expected to vary among the various underlying funds. These expenses are not included in the example. The example includes management fees, service fees and other Fund expenses. However, the example does not include portfolio trading commissions and related expenses and other extraordinary expenses as determined under generally accepted accounting principles. You may use the information in this line, together with the amount you invested, to estimate the expenses that you paid over the period. Simply divide your account value by $1,000 (for example, an $8,600 account value divided by $1,000 = 8.6), then multiply the result by the number in the first line under the heading entitled “Expenses Paid During Period” to estimate the expenses you paid on your account during this period.
Hypothetical Example for Comparison Purposes
The second line of each table provides information about hypothetical account values and hypothetical expenses based on the Fund’s actual expense ratio and an assumed rate of return of 5% per year before expenses, which is not the Fund’s actual return. The hypothetical account values and expenses may not be used to estimate the actual ending account balance or expenses you paid for the period. You may use this information to compare the ongoing costs of investing in the Fund and other funds. To do so, compare this 5% hypothetical example with the 5% hypothetical examples that appear in the shareholder reports of the other funds.
Please note that the expenses shown in the table are meant to highlight your ongoing costs only and do not reflect any transactional costs, such as redemption fees, IRA maintenance fees described above or expenses of underlying funds. Therefore, the second line of each
2021 Annual Report 5
table is useful in comparing ongoing costs only, and will not help you determine the relative total costs of owning different funds. In addition, if these transactional costs were included, your costs would have been higher.
| Investor Class | | | | | | |
| |
| | | | | | | Expenses Paid |
| | | Beginning | | Ending | | During the Period* |
| | | Account Value | | Account Value | | August 1, 2020 to |
| | | August 1, 2020 | | January 31, 2021 | | January 31, 2021 |
| |
| Actual | | $1,000.00 | | $1,333.01 | | $7.10 |
| |
| Hypothetical | | $1,000.00 | | $1,019.05 | | $6.14 |
| (5% annual return | | | | | | |
| before expenses) | | | | | | |
| * | Expenses are equal to the Fund’s annualized expense ratio of 1.21%, multiplied by the average account value over the period, multiplied by 184/366 (to reflect the one-half year period). |
| |
| Institutional Class | | | | | | |
| |
| | | | | | | Expenses Paid |
| | | Beginning | | Ending | | During the Period* |
| | | Account Value | | Account Value | | August 1, 2020 to |
| | | August 1, 2020 | | January 31, 2021 | | January 31, 2021 |
| |
| Actual | | $1,000.00 | | $1,334.26 | | $5.75 |
| |
| Hypothetical | | $1,000.00 | | $1,020.21 | | $4.98 |
| (5% annual return | | | | | | |
| before expenses) | | | | | | |
| * | Expenses are equal to the Fund’s annualized expense ratio of 0.98%, multiplied by the average account value over the period, multiplied by 184/366 (to reflect the one-half year period). |
| |
2021 Annual Report 6
| Walthausen Small Cap Value Fund | | | | |
| | | | Schedule of Investments |
| | | | January 31, 2021 |
| Shares | | | Fair Value | % of Net Assets |
| COMMON STOCKS | | | | |
| Blankbooks, Looseleaf Binders & Bookbindg & Relatd Work | | | | |
| 109,480 | Deluxe Corporation | $ | 3,710,277 | 2.20 | % |
| Broadwoven Fabric Mils, Man Made Fiber & Silk | | | | |
| 34,370 | Albany International Corp. - Class A | | 2,389,402 | 1.42 | % |
| Canned, Fruits, Vegetables, Preserves, Jams & Jellies | | | | |
| 318,847 | Landec Corporation * | | 3,398,909 | 2.01 | % |
| Construction - Special Trade Contractors | | | | |
| 63,680 | Ameresco, Inc. - Class A * | | 3,571,811 | 2.12 | % |
| Crude Petroleum & Natural Gas | | | | |
| 166,390 | CNX Resources Corporation * | | 2,108,161 | | |
| 642,330 | Southwestern Energy Company * | | 2,421,584 | | |
| | | | 4,529,745 | 2.69 | % |
| Electric, Gas & Sanitary Services | | | | |
| 957,760 | Atlantic Power Corporation * | | 2,834,970 | 1.68 | % |
| Electric Lighting & Wiring Equipment | | | | |
| 76,730 | AZZ Inc. | | 3,651,581 | 2.16 | % |
| Electronic Components & Accessories | | | | |
| 112,969 | Vishay Intertechnology Inc. | | 2,434,481 | 1.44 | % |
| Electronic Connectors | | | | |
| 59,960 | Methode Electronics, Inc. - Class A | | 2,263,490 | 1.34 | % |
| Heavy Construction Other Than Building Construction - Contractors | | | | |
| 331,176 | Great Lakes Dredge & Dock Corporation * | | 4,513,929 | | |
| 383,305 | Williams Industrial Services Group Inc. * | | 1,268,740 | | |
| | | | 5,782,669 | 3.43 | % |
| Household Audio & Video Equipment | | | | |
| 156,610 | Knowles Corporation * | | 3,021,007 | 1.79 | % |
| Instruments for Measuring & Testing of Electricity & Electric Signals | | | | |
| 55,807 | Allied Motion Technologies, Inc. | | 2,525,267 | 1.50 | % |
| Mobile Homes | | | | | |
| 43,490 | Skyline Champion Corporation * | | 1,462,569 | 0.87 | % |
| Motor Vehicles & Passenger Car Bodies | | | | |
| 109,090 | The Shyft Group, Inc. | | 3,294,518 | 1.95 | % |
| National Commercial Banks | | | | |
| 82,521 | Camden National Corporation | | 3,098,664 | | |
| 47,938 | City Holding Company | | 3,310,119 | | |
| 50,220 | Community Bank System Inc. | | 3,256,767 | | |
| 89,050 | NBT Bancorp Inc. | | 2,939,540 | | |
| 51,584 | Pinnacle Financial Partners, Inc. | | 3,535,052 | | |
| | | | 16,140,142 | 9.57 | % |
| Office Furniture (No Wood) | | | | |
| 24,930 | HNI Corporation | | 804,242 | 0.48 | % |
| Operative Builders | | | | |
| 53,949 | M/I Homes, Inc. * | | 2,663,462 | 1.58 | % |
| Ordnance & Accessories, (No Vehicles/Guided Missiles) | | | | |
| 27,363 | Vista Outdoor Inc. * | | 798,179 | 0.47 | % |
| Plastic Materials, Synth Resins & Nonvulcan Elastomers | | | | |
| 14,790 | Rogers Corporation * | | 2,308,275 | 1.37 | % |
| Printed Circuit Boards | | | | |
| 158,670 | Kimball Electronics, Inc. * | | 3,041,704 | 1.80 | % |
| Pulp Mills | | | | | |
| 189,090 | Mercer International Inc. (Canada) | | 2,136,717 | 1.27 | % |
* Non-Income Producing Securities.
The accompanying notes are an integral part of these
financial statements. |
2021 Annual Report 7
| Walthausen Small Cap Value Fund | | | | |
| | | | Schedule of Investments |
| | | | January 31, 2021 |
| Shares | | Fair Value | % of Net Assets |
| COMMON STOCKS | | | | |
| Pumps & Pumping Equipment | | | | |
| 41,630 | Ampco-Pittsburgh Corporation * | $ | 269,762 | 0.16 | % |
| Refrigeration & Service Industry Machinery | | | | |
| 18,260 | Tennant Company | | 1,237,115 | 0.73 | % |
| Retail - Variety Stores | | | | |
| 57,320 | Big Lots, Inc. | | 3,420,858 | 2.03 | % |
| Sanitary Services | | | | |
| 124,166 | Heritage-Crystal Clean, Inc. * | | 2,694,402 | 1.60 | % |
| Savings Institution, Federally Chartered | | | | |
| 78,820 | OceanFirst Financial Corp. | | 1,431,371 | 0.85 | % |
| Semiconductors & Related Devices | | | | |
| 85,530 | Kulicke and Soffa Industries, Inc. (Singapore) | | 3,050,855 | | |
| 14,500 | OSI Systems, Inc. * | | 1,305,290 | | |
| | | | 4,356,145 | 2.58 | % |
| Services - Automotive Repair, Services & Parking | | | | |
| 83,350 | Monro, Inc. | | 4,873,474 | 2.89 | % |
| Services - Educational Services | | | | |
| 191,020 | Perdoceo Education Corporation * | | 2,259,767 | 1.34 | % |
| Services - Equipment Rental & Leasing, NEC | | | | |
| 45,963 | McGrath RentCorp | | 3,207,758 | | |
| 216,158 | Textainer Group Holdings Limited (Bermuda) * | | 3,914,621 | | |
| | | | 7,122,379 | 4.22 | % |
| Services - Engineering Services | | | | |
| 73,810 | VSE Corporation | | 2,553,826 | 1.51 | % |
| Services - Help Supply Services | | | | |
| 142,860 | Kelly Services, Inc. - Class A | | 2,788,627 | 1.65 | % |
| Services - Management Consulting Services | | | | |
| 108,632 | The Hackett Group, Inc. | | 1,479,568 | 0.88 | % |
| Services - To Dwellings & Other Buildings | | | | |
| 62,183 | ABM Industries Incorporated | | 2,284,603 | 1.35 | % |
| Special Industry Machinery, NEC | | | | |
| 56,500 | Axcelis Technologies, Inc. * | | 1,934,560 | 1.15 | % |
| State Commercial Banks | | | | |
| 107,280 | Bryn Mawr Bank Corp. | | 3,334,262 | | |
| 94,530 | First Bancorp | | 3,219,692 | | |
| 40,060 | First Financial Corporation | | 1,537,903 | | |
| 67,905 | Great Southern Bancorp, Inc. | | 3,338,889 | | |
| 73,320 | Heartland Financial USA, Inc. | | 3,127,831 | | |
| 59,905 | Lakeland Financial Corporation | | 3,516,424 | | |
| 85,440 | Seacoast Banking Corporation of Florida * | | 2,601,648 | | |
| 57,660 | Stock Yards Bancorp, Inc. | | 2,606,232 | | |
| 75,980 | TriCo Bancshares | | 2,834,054 | | |
| 47,200 | Washington Trust Bancorp, Inc. | | 2,056,976 | | |
| | | | 28,173,911 | 16.71 | % |
| Surety Insurance | | | | |
| 110,260 | NMI Holdings, Inc. - Class A * | | 2,338,615 | 1.39 | % |
| Surgical & Medical Instruments & Apparatus | | | | |
| 538,010 | Accuray Incorporated * | | 2,657,769 | | |
| 30,390 | NuVasive, Inc. * | | 1,633,159 | | |
| | | | 4,290,928 | 2.54 | % |
| Title Insurance | | | | | |
| 51,470 | Stewart Information Services Corporation | | 2,387,179 | 1.42 | % |
* Non-Income Producing Securities.
The accompanying notes are an integral part of these
financial statements. |
2021 Annual Report 8
| Walthausen Small Cap Value Fund |
| | | | Schedule of Investments |
| | | | January 31, 2021 |
| Shares | | Fair Value | | % of Net Assets |
| COMMON STOCKS | | | | | | |
| Truck & Bus Bodies | | | | | | |
| 68,041 | Miller Industries, Inc. | $ | 2,713,475 | | | 1.61 | % |
| Wholesale - Farm Product Raw Materials | | | | | | |
| 84,060 | The Andersons, Inc. | | 1,933,380 | | | 1.15 | % |
| Wholesale - Industrial Machinery & Equipment | | | | | | |
| 44,630 | Systemax Inc. | | 1,715,131 | | | 1.02 | % |
| Total for Common Stocks (Cost $111,075,303) | | 155,022,493 | | | 91.92 | % |
| REAL ESTATE INVESTMENT TRUSTS | | | | | | |
| 78,480 | EPR Properties | | 3,110,947 | | | | |
| 125,827 | Global Medical REIT Inc. | | 1,577,871 | | | | |
| 269,600 | UMH Properties, Inc. | | 3,963,120 | | | | |
| Total for Real Estate Investment Trusts (Cost $7,587,656) | | 8,651,938 | | | 5.13 | % |
| MONEY MARKET FUNDS | | | | | | |
| 5,998,234 | Fidelity Investments Money Market Government Portfolio - | | | | | | |
| | Class I 0.01% ** | | 5,998,234 | | | 3.56 | % |
| | (Cost $5,998,234) | | | | | | |
| Total Investment Securities | | 169,672,665 | | | 100.61 | % |
| | (Cost $124,661,193) | | | | | | |
| Liabilities in Excess of Other Assets | | (1,025,598 | ) | | -0.61 | % |
| Net Assets | | $ | 168,647,067 | | | 100.00 | % |
** The rate shown represents the 7-day yield at January 31, 2021.
The accompanying notes are an integral part of these
financial statements. |
2021 Annual Report 9
| Walthausen Small Cap Value Fund | | | |
| |
| Statement of Assets and Liabilities | | | |
| January 31, 2021 | | | |
| Assets: | | | |
| Investment Securities at Fair Value | $ | 169,672,665 | |
| (Cost $124,661,193) | | | |
| Receivable for Dividends | | 78,492 | |
| Receivable for Shareholder Subscriptions | | 59,769 | |
| Total Assets | | 169,810,926 | |
| Liabilities: | | | |
| Payable for Securities Purchased | | 764,189 | |
| Payable for Shareholder Redemptions | | 239,443 | |
| Payable to Advisor for Management Fees (Note 4) | | 145,189 | |
| Payable to Advisor for Service Fees (Note 4) | | 15,038 | |
| Total Liabilities | | 1,163,859 | |
| Net Assets | $ | 168,647,067 | |
| Net Assets Consist of: | | | |
| Paid In Capital | $ | 123,091,277 | |
| Total Distributable Earnings | | 45,555,790 | |
| Net Assets | $ | 168,647,067 | |
| |
| Investor Class | | | |
| Net Assets | $ | 71,784,122 | |
| Shares Outstanding | | | |
| (Unlimited shares authorized) | | 3,503,633 | |
| Net Asset Value and Offering Price Per Share | $ | 20.49 | |
| Redemption Price Per Share ($20.49 x 0.98) (Note 2) | $ | 20.08 | |
| |
| Institutional Class | | | |
| Net Assets | $ | 96,862,945 | |
| Shares Outstanding | | | |
| (Unlimited shares authorized) | | 4,718,194 | |
| Net Asset Value and Offering Price Per Share | $ | 20.53 | |
| Redemption Price Per Share ($20.53 x 0.98) (Note 2) | $ | 20.12 | |
| |
| Statement of Operations | | | |
| For the fiscal year ended January 31, 2021 | | | |
| |
| Investment Income: | | | |
| Dividends (Net of foreign withholding tax of $0) | $ | 2,901,427 | |
| Total Investment Income | | 2,901,427 | |
| Expenses: | | | |
| Management Fees (Note 4) | | 1,927,500 | |
| Service Fees (Note 4) | | 681,922 | |
| Total Expenses | | 2,609,422 | |
| Less: Waived Management and Service Fees (Note 4) | | (513,344 | ) |
| Net Expenses | | 2,096,078 | |
| Net Investment Income (Loss) | | 805,349 | |
| Realized and Unrealized Gain (Loss) on Investments: | | | |
| Net Realized Gain (Loss) on Investments | | 15,425,531 | |
| Net Change In Unrealized Appreciation (Depreciation) on Investments | | (26,922,763 | ) |
| Net Realized and Unrealized Gain (Loss) on Investments | | (11,497,232 | ) |
| Net Increase (Decrease) in Net Assets from Operations | $ | (10,691,883 | ) |
The accompanying notes are an integral part of these
financial statements. |
2021 Annual Report 10
| Walthausen Small Cap Value Fund | | | | | | | | |
| |
| Statements of Changes in Net Assets | | | | | | | | |
| | | 2/1/2020 | | | | 2/1/2019 | | |
| | | to | | | | to | | |
| | | 1/31/2021 | | | | 1/31/2020 | | |
| From Operations: | | | | | | | | |
| Net Investment Income (Loss) | $ | 805,349 | | | $ | 1,562,214 | | |
| Net Realized Gain (Loss) on Investments | | 15,425,531 | | | | (5,454,423 | ) | |
| Net Change in Unrealized Appreciation (Depreciation) on Investments | | (26,922,763 | ) | | | 15,170,706 | | |
| Increase (Decrease) in Net Assets from Operations | | (10,691,883 | ) | | | 11,278,497 | | |
| From Distributions to Shareholders: | | | | | | | | |
| Investor Class | | (714,630 | ) | | | (4,867,473 | ) | |
| Institutional Class | | (1,019,665 | ) | | | (2,328,587 | ) | |
| Change in Net Assets from Distributions | | (1,734,295 | ) | | | (7,196,060 | ) | |
| From Capital Share Transactions: | | | | | | | | |
| Proceeds From Sale of Shares | | | | | | | | |
| Investor Class | | 10,314,289 | | | | 28,288,192 | | |
| Institutional Class | | 44,157,560 | | (a) | | 153,093,594 | | (b) |
| Proceeds From Redemption Fees (Note 2) | | | | | | | | |
| Investor Class | | 5,255 | | | | 5,509 | | |
| Institutional Class | | 13,563 | | | | 8,536 | | |
| Shares Issued on Reinvestment of Dividends | | | | | | | | |
| Investor Class | | 704,612 | | | | 4,600,838 | | |
| Institutional Class | | 1,013,566 | | | | 2,299,930 | | |
| Cost of Shares Redeemed | | | | | | | | |
| Investor Class | | (101,165,845 | ) | (a) | | (283,992,233 | ) | (b) |
| Institutional Class | | (83,803,643 | ) | | | (28,499,625 | ) | |
| Net Increase (Decrease) from Shareholder Activity | | (128,760,643 | ) | | | (124,195,259 | ) | |
| Net Increase (Decrease) in Net Assets | | (141,186,821 | ) | | | (120,112,822 | ) | |
| Net Assets at Beginning of Period | | 309,833,888 | | | | 429,946,710 | | |
| Net Assets at End of Period | $ | 168,647,067 | | | $ | 309,833,888 | | |
| |
| Share Transactions: | | | | | | | | |
| Issued | | | | | | | | |
| Investor Class | | 690,760 | | | | 1,489,321 | | |
| Institutional Class | | 2,749,455 | | (c) | | 7,990,740 | | (d) |
| Reinvested | | | | | | | | |
| Investor Class | | 36,227 | | | | 231,198 | | |
| Institutional Class | | 52,004 | | | | 115,458 | | |
| Redeemed | | | | | | | | |
| Investor Class | | (6,671,712 | ) | (c) | | (14,843,932 | ) | (d) |
| Institutional Class | | (5,103,938 | ) | | | (1,499,486 | ) | |
| Net Increase (Decrease) in Shares | | (8,247,204 | ) | | | (6,516,701 | ) | |
* Institutional Class commenced operations on December 31, 2018.
(a) Includes $6,101,893 of exchanges from Investor Class to Institutional Class.
(b) Includes $83,222,311 of exchanges from Investor Class to Institutional Class.
(c) Includes the exchange of 394,918 shares from Investor Class to 393,630 shares of Institutional Class.
(d) Includes the exchange of 4,300,967 shares from Investor Class to 4,299,326 shares in Institutional Class. |
The accompanying notes are an integral part of these
financial statements. |
2021 Annual Report 11
| Walthausen Small Cap Value Fund |
| | |
| Financial Highlights - Investor Class | | | | | | | | | | | | | | | | | | | | |
| Selected data for a share outstanding throughout the period: | | 2/1/2020 | | | | 2/1/2019 | | | | 2/1/2018 | | | | 2/1/2017 | | | | 2/1/2016 | | |
| | | to | | | | to | | | | to | | | | to | | | | to | | |
| | | 1/31/2021 | | | | 1/31/2020 | | | | 1/31/2019 | | | | 1/31/2018 | | | | 1/31/2017 | | |
| Net Asset Value - | | | | | | | | | | | | | | | | | | | | |
| Beginning of Period | $ | 18.80 | | | $ | 18.71 | | | $ | 23.87 | | | $ | 22.12 | | | $ | 15.87 | | |
| Net Investment Income (Loss) (a) | | 0.05 | | | | 0.07 | | | | (0.02 | ) | | | (0.07 | ) | | | (0.01 | ) | |
| Net Gain (Loss) on Investments (Realized and Unrealized) (b) | | 1.83 | | | | 0.43 | | | | (2.74 | ) | | | 2.99 | | | | 6.90 | | |
| Total from Investment Operations | | 1.88 | | | | 0.50 | | | | (2.76 | ) | | | 2.92 | | | | 6.89 | | |
| Distributions (From Net Investment Income) | | (0.19 | ) | | | (0.02 | ) | | | - | | | | - | | | | (0.01 | ) | |
| Distributions (From Capital Gains) | | - | | | | (0.39 | ) | | | (2.40 | ) | | | (1.17 | ) | | | (0.63 | ) | |
| Total Distributions | | (0.19 | ) | | | (0.41 | ) | | | (2.40 | ) | | | (1.17 | ) | | | (0.64 | ) | |
| Proceeds from Redemption Fee (Note 2) | | - | | + | | - | | + | | - | | + | | - | | + | | - | | + |
| Net Asset Value - | | | | | | | | | | | | | | | | | | | | |
| End of Period | $ | 20.49 | | | $ | 18.80 | | | $ | 18.71 | | | $ | 23.87 | | | $ | 22.12 | | |
| Total Return (c) | | 10.04 | % | | | 2.55 | % | | | (10.27 | )% | | | 13.22 | % | | | 43.33 | % | |
| Ratios/Supplemental Data | | | | | | | | | | | | | | | | | | | | |
| Net Assets - End of Period (Thousands) | $ | 71,784 | | | $ | 177,627 | | | $ | 422,206 | | | $ | 621,122 | | | $ | 605,575 | | |
| Before Reimbursement | | | | | | | | | | | | | | | | | | | | |
| Ratio of Expenses to Average Net Assets | | 1.35 | % | | | 1.30 | % | | | 1.27 | % | | | 1.26 | % | | | 1.27 | % | |
| Ratio of Net Investment Income (Loss) to Average Net Assets | | 0.16 | % | | | 0.27 | % | | | -0.09 | % | | | -0.32 | % | | | -0.05 | % | |
| After Reimbursement (d) | | | | | | | | | | | | | | | | | | | | |
| Ratio of Expenses to Average Net Assets | | 1.21 | % | | | 1.21 | % | | | 1.27 | % | | | 1.26 | % | | | 1.27 | % | |
| Ratio of Net Investment Income (Loss) to Average Net Assets | | 0.30 | % | | | 0.36 | % | | | -0.09 | % | | | -0.32 | % | | | -0.05 | % | |
| Portfolio Turnover Rate | | 65.91 | % | | | 56.71 | % | | | 45.51 | % | | | 45.20 | % | | | 39.17 | % | |
+ Amount less than $0.005 per share.
(a) Per share amounts were calculated using the average shares method.
(b) Realized and unrealized gains and losses per share in this caption are balancing amounts necessary to reconcile
the change in net asset value for the period and may not reconcile with the aggregate gains and losses in the Statement
of Operations due to share transactions for the period.
(c) Total return represents the rate that the investor would have earned or lost on an investment in the Fund assuming
reinvestment of dividends.
(d) Effective December 31, 2018, the Advisor has agreed to waive a portion of its service fees and management fees
(See Note 4). |
The accompanying notes are an integral part of these
financial statements. |
2021 Annual Report 12
| Walthausen Small Cap Value Fund |
| | |
| Financial Highlights - Institutional Class | | | | | | | | | | | | |
| Selected data for a share outstanding throughout the period: | | 2/1/2020 | | | | 2/1/2019 | | | | 12/31/2018* | | |
| | | to | | | | to | | | | to | | |
| | | 1/31/2021 | | | | 1/31/2020 | | | | 1/31/2019 | | |
| Net Asset Value - | | | | | | | | | | | | |
| Beginning of Period | $ | 18.83 | | | $ | 18.70 | | | $ | 16.71 | | |
| Net Investment Income (Loss) (a) | | 0.09 | | | | 0.11 | | | | - | | + |
| Net Gain (Loss) on Investments (Realized and Unrealized) (b) | | 1.84 | | | | 0.43 | | | | 1.99 | | |
| Total from Investment Operations | | 1.93 | | | | 0.54 | | | | 1.99 | | |
| Distributions (From Net Investment Income) | | (0.23 | ) | | | (0.02 | ) | | | - | | |
| Distributions (From Capital Gains) | | - | | | | (0.39 | ) | | | - | | |
| Total Distributions | | (0.23 | ) | | | (0.41 | ) | | | - | | |
| Proceeds from Redemption Fee (Note 2) | | - | | + | | - | | + | | - | | |
| Net Asset Value - | | | | | | | | | | | | |
| End of Period | $ | 20.53 | | | $ | 18.83 | | | $ | 18.70 | | |
| Total Return (c) | | 10.33 | % | | | 2.80 | % | | | 11.91 | % | ** |
| Ratios/Supplemental Data | | | | | | | | | | | | |
| Net Assets - End of Period (Thousands) | $ | 96,863 | | | $ | 132,207 | | | $ | 7,741 | | |
| Before Reimbursement | | | | | | | | | | | | |
| Ratio of Expenses to Average Net Assets | | 1.35 | % | | | 1.30 | % | | | 1.37 | % | *** |
| Ratio of Net Investment Income (Loss) to Average Net Assets | | 0.15 | % | | | 0.23 | % | | | -0.23 | % | *** |
| After Reimbursement | | | | | | | | | | | | |
| Ratio of Expenses to Average Net Assets | | 0.98 | % | | | 0.98 | % | | | 0.98 | % | *** |
| Ratio of Net Investment Income (Loss) to Average Net Assets | | 0.52 | % | | | 0.55 | % | | | 0.16 | % | *** |
| Portfolio Turnover Rate | | 65.91 | % | | | 56.71 | % | | | 45.51 | % | ** |
| | * Commencement of Class.
** Not Annualized.
*** Annualized.
+ Amount less than $0.005 per share.
(a) Per share amounts were calculated using the average shares method.
(b) Realized and unrealized gains and losses per share in this caption are balancing amounts necessary to reconcile
the change in net asset value for the period and may not reconcile with the aggregate gains and losses in the
Statement of Operations due to share transactions for the period.
(c) Total return represents the rate that the investor would have earned or lost on an investment in the Fund assuming
reinvestment of dividends. |
The accompanying notes are an integral part of these
financial statements. |
2021 Annual Report 13
NOTES TO FINANCIAL STATEMENTS
WALTHAUSEN SMALL CAP VALUE FUND
January 31, 2021
1.) ORGANIZATION
Walthausen Small Cap Value Fund (the “Fund”) was organized as a diversified series of the Walthausen Funds (the “Trust”) on January 14, 2008. The Trust is registered as an open-end investment company under the Investment Company Act of 1940, as amended (the “1940 Act”). The Trust was organized in Ohio as a business trust on October 10, 2007 and may offer an unlimited number of shares of beneficial interest in a number of separate series, each series representing a distinct fund with its own investment objectives and policies. The Fund currently offers Investor Class shares and Institutional Class shares. The Fund’s Investor Class shares commenced operations on February 1, 2008 and Institutional Class shares commenced operations on December 31, 2018. As of January 31, 2021, there are two series authorized by the Trust. All classes of shares have identical rights to earnings, assets and voting privileges, except for class specific expenses and exclusive rights to vote on matters affecting only individual classes. The classes differ principally in their respective distribution expenses and arrangements. The Fund’s investment objective is to seek long-term capital appreciation. The investment advisor to the Fund is Walthausen & Co., LLC (the “Advisor”).
2.) SIGNIFICANT ACCOUNTING POLICIES
The Fund is an investment company and accordingly follows the investment company accounting and reporting guidance of the Financial Accounting Standards Board (“FASB”) Accounting Standards Codification Topic 946 Financial Services - Investment Companies. The financial statements are prepared in conformity with accounting principles generally accepted in the United States of America (“GAAP”). The Fund follows the significant accounting policies described in this section.
SECURITY VALUATION
All investments in securities are recorded at their estimated fair value, as described in Note 3.
FEDERAL INCOME TAXES
The Fund’s policy is to continue to comply with the requirements of the Internal Revenue Code that are applicable to regulated investment companies and to distribute all of its taxable income to shareholders. Therefore, no federal income tax provision is required. It is the Fund’s policy to distribute annually, prior to the end of the calendar year, dividends sufficient to satisfy excise tax requirements of the Internal Revenue Code. This Internal Revenue Code requirement may cause an excess of distributions over the book year-end accumulated income. In addition, it is the Fund’s policy to distribute annually, after the end of the fiscal year, any remaining net investment income and net realized capital gains.
The Fund recognizes the tax benefits of certain tax positions only where the position is “more likely than not” to be sustained assuming examination by tax authorities. Management has analyzed the Fund’s tax positions, and has concluded that no liability for unrecognized tax benefits should be recorded related to uncertain tax positions taken on returns filed for the open tax years. The Fund identifies its major tax jurisdictions as U.S. federal and state tax authorities; however, the Fund is not aware of any tax positions for which it is reasonably possible that the total amounts of unrecognized tax benefits will change materially in the next twelve months. The Fund recognizes interest and penalties, if any, related to unrecognized tax benefits as income tax expense in the Statement of Operations. During the fiscal year ended January 31, 2021, the Fund did not incur any interest or penalties.
SHARE VALUATION
The net asset value per share of the Fund is calculated daily by dividing the total value of the Fund’s assets, less liabilities, by the number of shares outstanding, rounded to the nearest cent. The offering and redemption price per share is equal to the net asset value per share, except that shares of the Fund are subject to a redemption fee of 2% if redeemed after holding them for 90 days or less. During the fiscal year ended January 31, 2021, proceeds from redemption fees amounted to $5,255 and $13,563, respectively, for Investor Class and Institutional Class.
DISTRIBUTIONS TO SHAREHOLDERS
Distributions to shareholders, which are determined in accordance with income tax regulations, are recorded on the ex-dividend date. The Fund may utilize earnings and profits distributed to
2021 Annual Report 14
Notes to Financial Statements - continued .
shareholders on redemptions of shares as part of the dividends paid deductions. The treatment for financial reporting purposes of distributions made to shareholders during the year from net investment income or net realized capital gains may differ from their ultimate treatment for federal income tax purposes. These differences are caused primarily by differences in the timing of the recognition of certain components of income, expense, or realized capital gain for federal income tax purposes. Where such differences are permanent in nature, they are reclassified in the components of the net assets based on their ultimate characterization for federal income tax purposes. Any such reclassifications will have no effect on net assets, results of operations, or net asset value per share of the Fund. For the fiscal year ended January 31, 2021, the following adjustments were recorded and primarily related to the use of equalization for tax purposes.
| Paid In Capital | | $192,025 | |
| Total Distributable Earnings | | ($192,025 | ) |
USE OF ESTIMATES
The financial statements are prepared in accordance with GAAP, which requires management to make estimates and assumptions that affect the reported amounts of assets and liabilities and disclosure of contingent assets and liabilities at the date of the financial statements and the reported amounts of increases and decreases in net assets from operations during the reporting period. Actual results could differ from those estimates.
OTHER
The Fund records security transactions based on the trade date for financial reporting purposes. Dividend income is recognized on the ex-dividend date. Interest income, if any, is recognized on an accrual basis. The Fund uses the specific identification method in computing gain or loss on the sale of investment securities. Withholding taxes on foreign dividends have been provided for in accordance with the Fund’s understanding of the applicable country’s tax rules and rates. The Fund may invest in real estate investment trusts (“REITs”) that pay distributions to their shareholders based on available funds from operations. It is common for these distributions to exceed the REITs taxable earnings and profits resulting in the excess portion of such distribution to be designated as return of capital. Distributions received from REITs are generally recorded as dividend income and, if necessary, are reclassified annually in accordance with tax information provided by the underlying REITs.
EXPENSES
Expenses incurred by the Trust that do not relate to a specific fund of the Trust are allocated to the individual funds based on each fund’s relative net assets or an appropriate basis.
Class specific expenses are borne by each specific class. Income, non-class specific expenses, and realized and unrealized gains/losses are allocated to the respective classes based on the basis of relative net assets.
3.) SECURITIES VALUATIONS
The Fund utilizes various methods to measure the fair value of its investments on a recurring basis. GAAP establishes a hierarchy that prioritizes inputs to valuation methods. The three levels of inputs are:
Level 1 - Unadjusted quoted prices in active markets for identical assets or liabilities that the Fund has the ability to access.
Level 2 - Observable inputs other than quoted prices included in level 1 that are observable for the asset or liability, either directly or indirectly. These inputs may include quoted prices for the identical instrument on an inactive market, prices for similar instruments, interest rates, prepayment speeds, credit risk, yield curves, default rates and similar data.
Level 3 - Unobservable inputs for the asset or liability, to the extent relevant observable inputs are not available, representing the Fund’s own assumptions about the assumptions a market participant would use in valuing the asset or liability, and would be based on the best information available.
The availability of observable inputs can vary from security to security and is affected by a wide variety of factors, including, for example, the type of security, whether the security is new and not yet established in the marketplace, the liquidity of markets, and other characteristics particular to the security. To the extent that valuation is based on models or inputs that are less observable or
2021 Annual Report 15
Notes to Financial Statements - continued
unobservable in the market, the determination of fair value requires more judgment. Accordingly, the degree of judgment exercised in determining fair value is greatest for instruments categorized as level 3.
The inputs used to measure fair value may fall into different levels of the fair value hierarchy. In such cases, for disclosure purposes, the level in the fair value hierarchy within which the fair value measurement falls in its entirety, is determined based on the lowest level input that is significant to the fair value measurement in its entirety.
FAIR VALUE MEASUREMENTS
A description of the valuation techniques applied to the Fund’s major categories of assets and liabilities measured at fair value on a recurring basis follows.
Equity securities (common stocks and real estate investment trusts). Equity securities generally are valued by using market quotations, but may be valued on the basis of prices furnished by a pricing service when the Advisor believes such prices accurately reflect the fair value of such securities. Securities that are traded on any stock exchange or on the NASDAQ over-the-counter market are generally valued by the pricing service at the last quoted sale price. Lacking a last sale price, an equity security is generally valued by the pricing service at its last bid price. Generally, if the security is traded in an active market and is valued at the last sale price, the security is categorized as a level 1 security, and if an equity security is valued by the pricing service at its last bid price, it is generally categorized as a level 2 security. When market quotations are not readily available, when the Advisor determines that the market quotation or the price provided by the pricing service does not accurately reflect the current fair value, or when restricted securities are being valued, such securities are valued as determined in good faith by the Advisor, subject to review of the Board of Trustees (the “Trustees” or the “Board”) and are categorized in level 2 or level 3, when appropriate.
Money market funds. Shares of money market funds are valued at the net asset value provided by the funds and are classified as level 1 of the fair value hierarchy.
In accordance with the Trust’s good faith pricing guidelines, the Advisor is required to consider all appropriate factors relevant to the value of securities for which it has determined other pricing sources are not available or reliable as described above. There is no single procedure for determining fair value, since fair value depends upon the circumstances of each individual case. As a general principle, the current fair value of an issue of securities being valued by the Advisor would appear to be the amount that the owner might reasonably expect to receive for them upon their current sale. Methods which are in accordance with this principle may, for example, be based on (i) a multiple of earnings; (ii) a discount from market of a similar freely traded security (including a derivative security or a basket of securities traded on other markets, exchanges or among dealers); or (iii) yield to maturity with respect to debt issues, or a combination of these and other methods.
The following table summarizes the inputs used to value the Fund’s assets measured at fair value as of January 31, 2021:
| Valuation Inputs of Assets | | Level 1 | | Level 2 | | Level 3 | | Total |
| Common Stocks | | $155,022,493 | | $0 | | $0 | | $155,022,493 |
| Real Estate Investment Trusts | | 8,651,938 | | 0 | | 0 | | 8,651,938 |
| Money Market Funds | | 5,998,234 | | 0 | | 0 | | 5,998,234 |
| Total | | $169,672,665 | | $0 | | $0 | | $169,672,665 |
Refer to the Fund’s Schedule of Investments for a listing of securities by industry. The Fund did not hold any level 3 assets during the fiscal year ended January 31, 2021.
The Fund did not invest in any derivative instruments during the fiscal year ended January 31, 2021.
4.) INVESTMENT ADVISORY AGREEMENT AND RELATED PARTY TRANSACTIONS
The Trust, on behalf of the Fund, has entered into an investment advisory agreement (“Management Agreement”) with the Advisor. The Advisor manages the investment portfolio of the Fund, subject to policies adopted by the Board, and, at its own expense and without reimbursement from the Trust, furnishes office space and all necessary office facilities, equipment and executive personnel necessary for managing the Fund. For its services, the Advisor receives an investment management fee equal to 1.00% of the average daily net assets of the Fund.
2021 Annual Report 16
Notes to Financial Statements - continued
Under the terms of the Services Agreement between the Trust, on behalf of the Fund, and the Advisor (the “Services Agreement”), the Advisor is obligated to pay the operating expenses of the Fund excluding management fees, any 12b-1 fees, brokerage fees and commissions, taxes, borrowing costs (such as (a) interest and (b) dividend expenses on securities sold short), fees and expenses of acquired funds, extraordinary or non-recurring expenses as may arise, including litigation to which the Fund may be a party and indemnification of the Trust’s Trustees and officers. For its services, the Advisor receives service fees equal to an annual rate of 0.45% of the Fund’s average daily net assets up to $100 million, 0.25% of the Fund’s average daily net assets between $100 million and $500 million, and 0.15% of such assets in excess of $500 million.
Effective December 31, 2018, the Advisor has contractually agreed to waive Services Agreement fees and Management fees to the extent necessary to maintain total annual operating expenses of the Investor Class Shares and Institutional Class Shares, excluding brokerage fees and commissions, taxes, borrowing costs (such as (a) interest and (b) dividend expenses on securities sold short), the cost of acquired funds and extraordinary expenses at 1.21% and 0.98% respectively, of its average daily net assets through May 31, 2021. The Advisor may not terminate the fee waiver before May 31, 2021.
For the fiscal year ended January 31, 2021, the Advisor earned management fees totaling $1,927,500, of which $145,189 was due to the Advisor at January 31, 2021. For the same period, the Advisor earned service fees of $681,922, of which $15,038 was due to the Advisor at January 31, 2021. Service and management fees in the amounts of $128,150 and $385,194 were waived with no recapture provision for the fiscal year ended January 31, 2021 for the Investor and Institutional Classes, respectively.
Certain officers and a shareholder of the Advisor are also officers and/or a Trustee of the Trust. These individuals may receive benefits from the Advisor resulting from management and services fees paid to the Advisor by the Fund.
The Trustees who are not interested persons of the Fund were each paid $4,000, for a total of $12,000, in Trustees’ fees plus travel and related expenses for the fiscal year ended January 31, 2021 for their services to the Fund. The Advisor pays these fees pursuant to the Services Agreement.
5.) PURCHASES AND SALES OF SECURITIES
For the fiscal year ended January 31, 2021, purchases and sales of investment securities other than U.S. Government obligations and short-term investments aggregated $126,257,856 and $254,227,745, respectively. Purchases and sales of U.S. Government obligations aggregated $0 and $0, respectively.
6.) CONTROL OWNERSHIP
The beneficial ownership, either directly or indirectly, of more than 25% of the voting securities of a fund creates a presumption of control of a fund, under Section 2(a)(9) of the 1940 Act. As of January 31, 2021, NFS, LLC located in New York, New York, for the benefit of its clients, held, in aggregate, 63.79% of the shares of the Fund, and therefore may be deemed to control the Fund.
7.) TAX MATTERS
For Federal income tax purposes, the cost of investments owned at January 31, 2021 was $126,182,233. At January 31, 2021, the composition of unrealized appreciation (the excess of value over tax cost) and depreciation (the excess of tax cost over value) was as follows:
| | Appreciation | | (Depreciation) | | Net Appreciation (Depreciation) |
| | $47,931,992 | | ($4,441,560) | | $43,490,432 |
The tax character of distributions for Investor Class was as follows:
| | | Fiscal Year Ended | | Fiscal Year Ended |
| | | January 31, 2021 | | January 31, 2020 |
| Ordinary Income . | | $ 714,630 | | $ 234,720 |
| Long-Term Capital Gain | | – | | 4,632,753 |
| | | $ 714,630 | | $ 4,867,473 |
2021 Annual Report 17
Notes to Financial Statements - continued
The tax character of distributions for Institutional Class was as follows:
| | | Fiscal Year Ended | | Fiscal Year Ended |
| | | January 31, 2021 | | January 31, 2020 |
| Ordinary Income . | | $ 1,019,665 | | $ 138,426 |
| Long-Term Capital Gain | | – | | 2,190,161 |
| | | $ 1,019,665 | | $ 2,328,587 |
As of January 31, 2021, the components of distributable earnings (accumulated losses) on a tax basis were as follows:
| Undistributed ordinary income | | $ 239,257 |
| Undistributed long-term capital gains | | 1,826,101 |
| Unrealized appreciation on investments – net | | 43,490,432 |
| | | $45,555,790 |
The differences between book basis and tax basis unrealized appreciation were primarily attributable to the tax deferral of wash sales. During the fiscal year ended January 31, 2021, the Fund utilized $12,934,661 of available capital loss carryforwards, of which the entire amount was short-term.
8.) CONCENTRATION OF SECTOR RISK
If the Fund has significant investments in the securities of issuers in industries within a particular sector, any development affecting that sector will have a greater impact on the value of the net assets of the Fund than would be the case if the Fund did not have significant investments in that sector. In addition, this may increase the risk of loss of an investment in the Fund and increase the volatility of the Fund’s NAV per share. From time to time, circumstances may affect a particular sector and the companies within such sector. For instance, economic or market factors, regulation or deregulation, and technological or other developments may negatively impact all companies in a particular sector and therefore the value of the Fund’s portfolio will be adversely affected. As of January 31, 2021, the Fund had 31.98% and 29.93% of the value of its net assets invested in stocks within the Industrials and Financials sectors, respectively.
9.) COVID-19 RISKS
Unexpected local, regional or global events, such as war; acts of terrorism; financial, political or social disruptions; natural, environmental or man-made disasters; the spread of infectious illnesses or other public health issues; and recessions and depressions could have a significant impact on the Fund and its investments and may impair market liquidity. Such events can cause investor fear, which can adversely affect the economies of nations, regions and the market in general, in ways that cannot necessarily be foreseen. An outbreak of infectious respiratory illness known as COVID-19, which is caused by a novel coronavirus (SARS-CoV-2), was first detected in China in December 2019 and subsequently spread globally. This coronavirus has resulted in, among other things, travel restrictions, closed international borders, enhanced health screenings at ports of entry and elsewhere, disruption of and delays in healthcare service preparation and delivery, prolonged quarantines, significant disruptions to business operations, market closures, cancellations and restrictions, supply chain disruptions, lower consumer demand, and significant volatility and declines in global financial markets, as well as general concern and uncertainty. The impact of COVID-19 has adversely affected, and other infectious illness outbreaks that may arise in the future could adversely affect, the economies of many nations and the entire global economy, individual issuers and capital markets in ways that cannot necessarily be foreseen. Public health crises caused by the COVID-19 outbreak may exacerbate other pre-existing political, social and economic risks in certain countries or globally.
10.) SUBSEQUENT EVENTS
Subsequent events after the date of the Statement of Assets and Liabilities have been evaluated through the date the financial statements were issued. Management has concluded that there is no impact requiring adjustment to or disclosure in the financial statements.
2021 Annual Report 18
REPORT OF INDEPENDENT REGISTERED PUBLIC ACCOUNTING FIRM
To the Shareholders and Board of Trustees of
Walthausen Funds
Opinion on the Financial Statements
We have audited the accompanying statement of assets and liabilities, including the schedule of investments, of Walthausen Small Cap Value Fund (the “Fund”), a series of Walthausen Funds as of January 31, 2021, the related statement of operations for the year then ended, the statements of changes in net assets for each of the two years in the period then ended, the related notes, and the financial highlights for each of the five years in the period then ended (collectively referred to as the “financial statements”). In our opinion, the financial statements present fairly, in all material respects, the financial position of the Fund as of January 31, 2021, the results of its operations for the year then ended, the changes in net assets for each of the two years in the period then ended, and the financial highlights for each of the five years in the period then ended, in conformity with accounting principles generally accepted in the United States of America.
Basis for Opinion
These financial statements are the responsibility of the Fund’s management. Our responsibility is to express an opinion on the Fund’s financial statements based on our audits. We are a public accounting firm registered with the Public Company Accounting Oversight Board (United States) (“PCAOB”) and are required to be independent with respect to the Fund in accordance with the U.S. federal securities laws and the applicable rules and regulations of the Securities and Exchange Commission and the PCAOB.
We conducted our audits in accordance with the standards of the PCAOB. Those standards require that we plan and perform the audit to obtain reasonable assurance about whether the financial statements are free of material misstatement whether due to error or fraud.
Our audits included performing procedures to assess the risks of material misstatement of the financial statements, whether due to error or fraud, and performing procedures that respond to those risks. Such procedures included examining, on a test basis, evidence regarding the amounts and disclosures in the financial statements. Our procedures included confirmation of securities owned as of January 31, 2021, by correspondence with the custodian and brokers. Our audits also included evaluating the accounting principles used and significant estimates made by management, as well as evaluating the overall presentation of the financial statements. We believe that our audits provide a reasonable basis for our opinion.
We have served as the auditor for the Walthausen Funds since 2008.

COHEN & COMPANY, LTD.
Cleveland, Ohio
March 24, 2021
2021 Annual Report 19
ADDITIONAL INFORMATION
January 31, 2021
(UNAUDITED) |
1.) APPROVAL OF INVESTMENT ADVISORY AGREEMENT
On January 20, 2021, the Board of Trustees (the “Trustees” or the “Board”) considered the renewal of the Management Agreement (the “Agreement”) between the Trust and the Advisor (or “Management”), on behalf of the Walthausen Small Cap Value Fund (“Small Cap” or “Fund”). Legal Counsel reviewed the memorandum provided by them and explained that, in consideration of the continuance of the Agreement, the Board should review all information as is reasonably necessary to evaluate the terms of the contract and determine whether it is fair to the Fund and its shareholders. The Advisor had provided information to the Trustees it believed to be sufficient for evaluation of continuance of the Agreement.
In reviewing the Agreement, the Board received materials from the Advisor addressing the following factors: (i) the investment performance of the Fund and the Advisor; (ii) the nature, extent and quality of the services provided by the Advisor to the Fund; (iii) the cost of the services provided and the profits realized by the Advisor and its affiliates from the relationship with the Fund; (iv) the extent to which economies of scale will be realized as each Fund grows; and (v) whether the fee levels reflect these economies of scale to the benefit of shareholders.
As to the performance of Small Cap, the materials included information regarding the Fund’s performance compared to a peer group of similar funds as well as the overall Morningstar Small Value category and the Russell 2000® Value Index. The Trustees noted the Fund’s Investor Class underperformed its index, Morningstar category average and peer group for the 1-year and 5-year periods ended December 31, 2020. The Trustees further noted that Small Cap’s Investor Class outperformed its Morningstar category average for the 10-year period ended December 31, 2020 and underperformed its index for the same period. Additionally, the Trustees considered the Fund’s Investor Class outperformed the index since inception through the period ended December 31, 2020. The Board found that the Fund’s long-term performance continued to be strong and the Advisor consistently delivered a value oriented portfolio consistent with the Fund’s stated investment strategy. Based on this review, and the fact that the Advisor’s fundamental approach had produced good results over the long-term, and short-term performance was reasonable given the volatility of the market in the past year, the Independent Trustees concluded that the performance of the Fund was acceptable.
As to the nature, extent and quality of the services provided by the Advisor, the Board discussed each portfolio manager’s background and investment management experience, observing that the many years of experience of each portfolio manager was a positive attribute. The Board reviewed the background of the other key professionals servicing the Fund. The Board expressed their satisfaction with the Advisor’s rigorous and disciplined stock selection process. The representatives of the Advisor reviewed and discussed with the Board the Advisor’s ADV and the Rule 17j-1 Code of Ethics certifications. The Board discussed the quality of the Advisor’s compliance efforts and the compliance resources of the firm. The Board noted that the Advisor had not experienced any material operational challenges as a result of the pandemic. The Board also reviewed the Advisor’s financial condition. The Board concluded that the nature and extent of the services provided by the Advisor were consistent with their expectations and of high quality.
As to the cost of the services provided and the profits realized by the Advisor and its affiliates from the relationship with the Fund, the Trustees considered all the services provided, including the Trust officer services, shareholder service support and office space. The Board discussed the fee schedule of the Services Agreement, including the breakpoints in the contract which reduce fees as assets grow. They discussed that the Advisor was paying substantially all ordinary operating expenses of the Fund pursuant to the Services Agreement. The Board reviewed the revenue and expenses related to the Services Agreement noting that there had been a loss to the Advisor during the previous year. The Board reviewed a summary of the Advisor’s profitability resulting from the services provided to Small Cap under the Management Agreement, noting net profits from portfolio advisory services as well as profits from the overall relationship. The Board concluded that the Advisor’s profitability was not unreasonable, particularly in light of the extent and quality of the services being provided to the Fund.
2021 Annual Report 20
Additional Information (Unaudited) - continued
Turning to the level of expenses, the Board reviewed comparative information for advisory fees and expense ratios based on publicly available data that was drawn from its peer group. The Board observed that the data showed the Fund’s management fee was above the peer group and the Morningstar Category average, but within the range of peer group and the Morningstar Category average. The Trustees noted that the net expense ratio of the Institutional Class was below the peer group and Morningstar category averages. The Trustees further noted that the net expense ratio of the Investor Class was above the peer group and slightly below the Morningstar category averages, but within the range of the peer group. The Trustees reviewed information regarding fees charged by the Advisor for other client relationships and considered the reasons for variation of fees among clients, as presented by the Advisor. The Trustees discussed the soft dollar benefits that the Advisor received from Fund trades. A representative of the Advisor represented that the expense waivers would be continued for an additional year. The Trustees concluded that when viewed in terms of the overall quality of services provided, the fees were not unreasonable.
As for potential economies of scale, the Board discussed and considered information regarding whether economies of scale had been realized with respect to the management of the Fund, whether the Fund had appropriately benefited from any economies of scale, and whether there is potential for realization of any further economies of scale. The Board noted that the Service Agreement included breakpoints to the fee, therefore, as the Fund grows shareholders benefit from economies of scale. The Trustees concluded that the breakpoints in the Services Agreement provide appropriate economies of scale to the shareholder. The Trustees considered the current size of the Fund. They concluded that breakpoints in the advisory fee were not necessary at this time.
The Independent Trustees met in executive session to discuss the continuation of the Agreement. The officers of the Trust were excused during this discussion.
Upon reconvening the meeting, the Independent Trustees reported that after further consideration, they were pleased to renew the Agreement. It was the consensus of the Trustees, including the Independent Trustees, that renewal of the Agreement would be in the best interests of the Fund and its shareholders.
2.) LIQUIDITY RISK MANAGEMENT PROGRAM
The Fund has adopted and implemented a written liquidity risk management program as required by Rule 22e-4 (the “Liquidity Rule”) under the 1940 Act. The program is reasonably designed to assess and manage the Fund’s liquidity risk, taking into consideration, among other factors, the Fund’s investment strategies and the liquidity of its portfolio investments during normal and reasonably foreseeable stressed conditions; its short and long-term cash flow projections; and its cash holdings and access to other funding sources.
During the fiscal year ended January 31, 2021, the Board and the Trust’s Liquidity Program Administrator reviewed a report from the Liquidity Program Administrator and the Fund’s investments; they determined that the Fund held adequate levels of cash and highly liquid investments to meet shareholder redemption activities in accordance with applicable requirements. Accordingly, the Board concluded that (i) the Fund’s liquidity risk management program is reasonably designed to prevent violations of the Liquidity Rule and (ii) the Fund’s liquidity risk management program has been effectively implemented.
2021 Annual Report 21
TRUSTEES AND OFFICERS
(Unaudited) |
The Board of Trustees supervises the business activities of the Trust. The names of the Trustees and executive officers of the Trust are shown below. Each Trustee serves until the Trustee sooner dies, resigns, retires or is removed. Officers hold office for one year and until their respective successors are chosen and qualified.
The Trustees and Officers of the Trust and their principal business activities during the past five years are:
Interested Trustees and Officers
| | | | Principal | Number of | Other |
| Name, Address(1), | Position | Length of | Occupation(s) | Portfolios | Directorships |
| and Year of Birth | with the | Time Served | During | Overseen | Held By |
| | Trust | | Past 5 Years | By Trustee | Trustee |
| |
| John B. Walthausen(2) | President | Since 2007 | Managing Director and Chief | 2 | None |
| Year of Birth: 1945 | and Trustee | | Investment Officer, Walthausen & | | |
| | | | Co., LLC (9/1/07 to Present). | | |
| |
| Mark L. Hodge | Secretary | Since 2008 | Chief Compliance Officer (2007 to | N/A | N/A |
| Year of Birth: 1958 | and Chief | | Present) and Managing Director | | |
| | Compliance | | (2013 to Present), Walthausen & | | |
| | Officer | | Co., LLC. | | |
| |
| Stanley M. Westhoff Jr. | Treasurer | Since 2011 | Equity Analyst (2007 to Present) | N/A | N/A |
| Year of Birth: 1969 | | | and Managing Director (2013 to | | |
| | | | Present), Walthausen & Co., | | |
| LLC. |
(1) The address of each Trustee and Officer is c/o Walthausen Funds, 2691 Route 9, Suite 102, Malta, NY 12020.
(2) John B. Walthausen is considered an "interested person" as defined in Section 2(a)(19) of the Investment Company Act of 1940, as amended, by virtue of his affiliation with the Advisor.
| | | | Principal | Number of | Other |
| Name, Address(1), | Position | Length of | Occupation(s) | Portfolios | Directorships |
| and Year of Birth | with the | Time Served | During | Overseen | Held By |
| | Trust | | Past 5 Years | By Trustee | Trustee |
| |
| Edward A. LaVarnway | Independent | Since 2008 | Retired as of 5/10/13. Executive | 2 | None |
| Year of Birth: 1951 | Trustee | | Director, Fredric Remington Art | | |
| | | | Museum (8/15/05 to 5/10/13). | | |
| |
| John P. Mastriani | Independent | Since | Executive Vice President of The Ayco | 2 | None |
| Year of Birth: 1952 | Trustee | July 2014 | Company, L.P. (“Ayco”) a Goldman | | |
| | | | Sachs Company that provides finan- | | |
| | | | cial consulting and education ser- | | |
| | | | vices, May 2012-March 2014. Senior | | |
| | | | Vice President of Ayco, December | | |
| | | | 2003-May 2012. | | |
| |
| Hany A. Shawky | Independent | Since 2009 | Professor of Finance at the University | 2 | None |
| Year of Birth: 1947 | Trustee | | at Albany, N.Y. (Oct. 2007 to Present). | | |
(1) The address of each Trustee is c/o Walthausen Funds, 2691 Route 9, Suite 102, Malta, NY 12020.
The Statement of Additional Information contains additional and more detailed information about the Trustees and is available without charge by calling the transfer agent at 1-888-925-8428.
2021 Annual Report 22
Board of Trustees
Edward A. LaVarnway
John P. Mastriani
Hany A. Shawky
John B. Walthausen
Investment Advisor and Administrator
Walthausen & Co., LLC
Legal Counsel
Thompson Hine LLP
Custodian
US Bank, N.A.
Dividend Paying Agent,
Shareholders' Servicing Agent,
Transfer Agent
Ultimus Fund Solutions, LLC
Sub-Administrator
Premier Fund Solutions, Inc.
Independent Registered Public Accounting Firm
Cohen & Company, Ltd.
Distributor
Rafferty Capital Markets, LLC |
This report is provided for the general information of the shareholders of the Walthausen
Small Cap Value Fund. This report is not intended for distribution to prospective
investors in the Fund, unless preceded or accompanied by an effective prospectus. |
WALTHAUSEN SMALL CAP VALUE FUND
2691 Route 9, Suite 102
Malta, NY 12020
WALTHAUSEN FOCUSED SMALL CAP VALUE FUND
INSTITUTIONAL CLASS TICKER WSVIX
For Investors Seeking Long-Term Capital Appreciation
ANNUAL REPORT
January 31, 2021
IMPORTANT NOTE: Beginning on January 1, 2021, as permitted by regulations adopted by the Securities
and Exchange Commission, paper copies of the Fund’s shareholder reports will no longer be sent by mail,
unless you specifically request paper copies of the reports from the Fund or from your financial intermediary,
such as a broker-dealer or bank. Instead, the reports will be made available on a website, and you will be
notified by mail each time a report is posted and provided with a website link to access the report. If you
already elected to receive shareholder reports electronically, you will not be affected by this change and you
need not take any action. You may elect to receive shareholder reports and other communications from the
Fund or your financial intermediary electronically by calling or sending an email request. You may elect to
receive all future reports in paper, free of charge. You can inform the Fund or your financial intermediary that
you wish to continue receiving paper copies of your shareholder reports by calling or sending an email
request. Your election to receive reports in paper will apply to all funds held with the fund complex/your
financial intermediary. |
Walthausen Focused Small Cap Value Fund
Annual Report
January 31, 2021 |
Dear Shareholders:
A year ago, I wrote of the myriad of issues that the market had to deal with and how investors odious view of small cap value continued. Well that changed quickly. By the end of March there was only one concern, the pandemic. While no one knew what to expect, everyone agreed it would be bad. The only question was, how bad. The news through the spring was horrific, though the public buckled down and flattened the curve through the summer. Market participants were starting to get a grip as to how the economy was playing out. Housing, ecommerce, and recreation products experienced very strong business trends. The hospitality, travel and physical retail businesses were decimated. As the weather started to cool, vaccines became the topic of the day. Originally thought to be at least an 18-month time line to get a vaccine to the public, discussion of availability by the holidays became more frequent. And then it happened. By the end of October, the market moved to accept that a vaccine would soon be available and the focus pivoted to positioning for a post-vaccine world.
The old adage, "Be careful of what you wish for" was apropos. We had long been discussing how the markets affinity for large cap investing and growth investing had gone too far. We discussed how despite the disparity in valuation to small cap value, investors' funds continued to flow away from us. We concluded that eventually the market would recognize the opportunity in small cap value and they would come our way. The challenge is that at inflection points, the market rarely acts in a measured and rational manner. When the market collectively determined it needed to position itself for a post-vaccine world, it also determined that small cap and value is where it needed to be. And in the final three months of the year, everything and anything that was small cap or value was being gobbled up. The problem is that when everyone moves at once, trading is often indiscriminate. Buy the discarded value names; buy the penny stocks; buy the highly leveraged stocks. And in three months, the Russell 2000 Value index rose over 35%, posting the largest three month return ever.
While happy that the market was once again interested in our universe, as discerning investors we were swamped by the market's wave to buy anything that fit a label of "small" or "value". This is not new to us as we have experienced market pivots previously. The severity of this market inflection was, however, a new, and quite painful experience. Despite the Fund gaining 22.7% in the last quarter of the year, we trailed our benchmark by 12.9% . This final quarter result put us back in the black for the year with a 2.7% return, but it was a hollow victory when the benchmark finished with a 16.4% return. As stated previously, managing through an inflection point is not new, and experience teaches us that over time the market sorts through what it owns, ridding itself of the questionable business and buying more of the quality businesses that we search out. But for right now, this initial step stings.
The consumer discretionary sector was the benchmark's second strongest sector for the last quarter, the strongest for the year, and the segment where we lost the most ground. Homebuilding, recreational equipment and home goods were all strong industries for the first three quarters of the year strongly supporting sectors results. The Fund was able to keep pace during this period with our ownership of MDC Holdings (MDC), a homebuilder and LCI Industries (LCII), a manufacturer of parts and components for the RV and boating industries. In the second half of the year, we added Tapestry, Inc. (TPR), the designer of higher-end handbags, seeing the valuation as overly discounted and believing that their Coach and Kate Spade brand names are enduring. Despite the strong returns of all three of these investments, our underweight position to a sector that gained nearly 60% in the last quarter was simply too much of a hill to climb, setting us back for the quarter and the year.
2021 Annual Report 1
Our next largest challenge for the year was within the information technology sector. At the beginning of the year, we owned NCR Corp. (NCR), a provider of ATMs, tellerless banking software and restaurant operating systems. When the pandemic began our initial thoughts were that the banks could be in for some sizable credit challenges and that the restaurants were doomed. Both of these scenarios were bad for NCR and we determined to sell out the position. Unfortunately, we did not come to this conclusion fast enough and the damage was done. The two holdings that we held through the year, Maximus, Inc., (MMS), a business process outsource provider for government services, and Onto Innovation, Inc., (ONTO), a developer of wafer fabrication equipment for the semiconductor industry, had respectable results and stock performance but it just wasn't enough to keep pace with the underperfor-mance of the balance of the sector, much of which was powered by software companies sporting valuations that are too high for us to stomach and more risky than most of their supporters are willing to let on.
During the end of the summer, we began to differ from the markets belief that the banks were in grave danger. By this time, we had a clearer view of how the pandemic was affecting the economy, recognizing that we could get a pretty clear view as to what percentage of each banks loan portfolio was at risk. The market, however, was in no mood to discern and was pricing nearly every bank at valuations similar to where they traded during the Great Financial Crisis (GFC) in 2007-2009. Given that we felt that we had a handle on the extent of the credit challenge, and that the banks were in a significantly stronger capital position today than the GFC period, we saw an opportunity. The portfolio went into the year owning four banks, sold one, CVB Financial Corp (CVBF), and bought four new positions, Hancock Whitney Corp (HWC), Independent Bancorp (INDB), WSFS Financial Corp (WSFS) and Webster Financial Corp (WBS). We currently have the highest financial sector weighting that we can remember and are quite excited about this opportunity.
Small cap investment cycles can last for several years and we believe that we have just marked the beginning of the next one. Trailing the benchmark as we did is unacceptable and we are working harder than ever to construct a winning portfolio. As mentioned previously, we have been through inflection points before and there is a messy period followed by a longer more constructive and rational investing environment. It's during this period when the market becomes more discerning and begins to seek the quality companies that we pride ourselves in owning. This is when we expect to differentiate ourselves. We are satisfied with how the Fund is positioned. The portfolio sports valuations consistent with its benchmark while having profitability return metrics that are superior, all the while employing less leverage. The future looks to be both stimulating and challenging. We are excited for the challenge. We thank you for the trust you are displaying by investing with us. Rest assured that we are working hard for you every day.
Sincerely,
John B. Walthausen CFA Gerard S. E. Heffernan, Jr. CFA
Past performance does not guarantee future results. The investment return and principal value of an investment in the Fund will fluctuate so that an investor’s shares, when redeemed, may be worth more or less than their original cost. Current performance may be higher or lower than the performance data quoted. Performance data current to the most recent month end are available by calling 1-888-925-8428.
The Fund’s prospectus contains important information about the Fund’s investment objectives, potential risks, management fees, charges and expenses, and other information and should be read and considered carefully before investing. To obtain a copy of the Fund’s prospectus, please visit our website at www.walthausenfunds.com or call 1-888-925-8428 and a copy will be sent to you free of charge. Distributed by Rafferty Capital Markets, LLC – Garden City, NY 11530.
2021 Annual Report 2
WALTHAUSEN FOCUSED SMALL CAP VALUE FUND (Unaudited)
PERFORMANCE INFORMATION
1/31/2021 Institutional Class NAV $11.77
AVERAGE ANNUAL RATE OF RETURN (%) FOR THE PERIODS ENDED JANUARY 31, 2021
| | 1 Year(A) | | 3 Years(A) | | 5 Years(A) | | 10 Years(A) | |
| Walthausen Focused Small Cap Value Fund | 2.67% | | 2.60% | | 9.77% | | 8.98% | |
| Russell 2000® Value Index(B) | 16.42% | | 5.08% | | 12.34% | | 9.21% | |
| Russell 2500® Value Index(C) | 11.25% | | 4.66% | | 11.31% | | 9.40% | |
Annual Fund Operating Expense Ratios (from 10/15/2020 Prospectus): Gross 1.05%, Net 0.85%
Effective May 15, 2020, Retail Class and R6 Class of the Fund were converted to Institutional Class Shares.
The Advisor reimbursed and/or waived certain expenses of the Fund’s Institutional Class. Absent these arrangements, the performance of the Class would have been lower.
The Fund’s expense ratio for the fiscal year ended January 31, 2021 can be found in the financial highlights included in this report.
The Annual Fund Operating Expense Ratios reported above may not correlate to the expense ratios in the Fund’s financial highlights because the financial highlights (a) include only the direct operating expenses incurred by the Fund, not the indirect costs of investing in acquired funds and (b) the Annual Fund Operating Expense Ratios reflect the contractual changes to the management and service fees, as well as waiver, which became effective October 15, 2020 (See Note 4).
(A)1 Year, 3 Years, 5 Years and 10 Years returns include changes in share prices and in each case includes reinvestment of any dividends and capital gain distributions. The inception date of the Walthausen Focused Small Cap Value Fund was December 27, 2010.
(B)The Russell 2000® Value Index (whose composition is different from that of the Fund) is an unmanaged index of small-capitalization stocks with lower price-to-book ratios and lower forecasted growth values than the total population of small-capitalization stocks. Investors cannot directly invest in an index.
(C)The Russell 2500® Value Index (whose composition is different from that of the Fund) measures the performance of the small to mid-cap value segment of the U.S. equity universe. It includes those Russell 2500 companies with lower price-to-book ratios and lower forecasted growth values. The Index is constructed to provide a comprehensive and unbiased barometer of the small to mid-cap value market. The Index is completely reconstituted annually to ensure larger stocks do not distort the performance and characteristics of the true small to mid-cap opportunity set and that the represented companies continue to reflect value characteristics. Investors cannot directly invest in an index.
PAST PERFORMANCE DOES NOT GUARANTEE FUTURE RESULTS. INVESTMENT RETURN AND PRINCIPAL VALUE WILL FLUCTUATE SO THAT SHARES, WHEN REDEEMED, MAY BE WORTH MORE OR LESS THAN THEIR ORIGINAL COST. RETURNS DO NOT REFLECT THE DEDUCTION OF TAXES THAT A SHAREHOLDER WOULD PAY ON FUND DISTRIBUTIONS OR THE REDEMPTION OF FUND SHARES. CURRENT PERFORMANCE MAY BE LOWER OR HIGHER THAN THE PERFORMANCE DATA QUOTED. TO OBTAIN PERFORMANCE DATA CURRENT TO THE MOST RECENT MONTH-END, PLEASE CALL 1-888-925-8428. THE FUND’S DISTRIBUTOR IS RAFFERTY CAPITAL MARKETS, LLC.
2021 Annual Report 3
WALTHAUSEN FOCUSED SMALL CAP VALUE FUND (Unaudited)
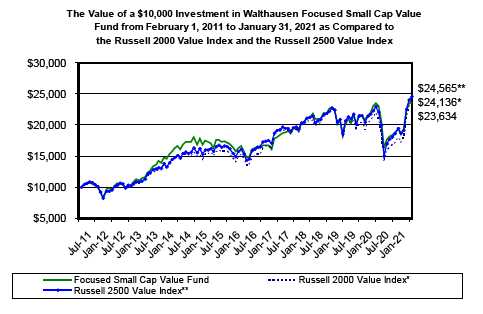
WALTHAUSEN FOCUSED SMALL CAP VALUE FUND
by Sectors as of January 31, 2021
(as a percentage of Common Stocks)

2021 Annual Report 4
EXPENSE EXAMPLE
(Unaudited) |
As a shareholder of the Fund, you incur two types of costs: (1) transaction costs such as IRA maintenance fees, and (2) ongoing costs, including management fees, service fees and other Fund expenses. This Example is intended to help you understand your ongoing costs (in dollars) of investing in the Fund and to compare these costs with the ongoing costs of investing in other mutual funds. The Example is based on an investment of $1,000 invested in the Fund on August 1, 2020 and held through January 31, 2021.
Actual Expenses
The first line of each table below provides information about actual account values and actual expenses. Additionally, although the Fund charges no sales load, you will be assessed fees for outgoing wire transfers, returned checks and stop payment orders at prevailing rates charged by Ultimus Fund Solutions, LLC, the Fund’s transfer agent. You will be charged an annual maintenance fee of $15 for each tax deferred account you have with the Fund (“IRA maintenance fees”). To the extent the Fund invests in shares of other investment companies as part of its investment strategy, you will indirectly bear your proportionate share of any fees and expenses charged by the underlying funds in which the Fund invests in addition to the expenses of the Fund. Actual expenses of the underlying funds are expected to vary among the various underlying funds. These expenses are not included in the example. The example includes management fees, service fees and other Fund expenses. However, the example does not include portfolio trading commissions and related expenses and other extraordinary expenses as determined under generally accepted accounting principles. You may use the information in this line, together with the amount you invested, to estimate the expenses that you paid over the period. Simply divide your account value by $1,000 (for example, an $8,600 account value divided by $1,000 = 8.6), then multiply the result by the number in the first line under the heading entitled “Expenses Paid During Period” to estimate the expenses you paid on your account during this period.
Hypothetical Example for Comparison Purposes
The second line of each table provides information about hypothetical account values and hypothetical expenses based on the Fund’s actual expense ratio and an assumed rate of return of 5% per year before expenses, which is not the Fund’s actual return. The hypothetical account values and expenses may not be used to estimate the actual ending account balance or expenses you paid for the period. You may use this information to compare the ongoing costs of investing in the Fund and other funds. To do so, compare this 5% hypothetical example with the 5% hypothetical examples that appear in the shareholder reports of the other funds.
Please note that the expenses shown in the table are meant to highlight your ongoing costs only and do not reflect any transactional costs, such as IRA maintenance fees described above or expenses of underlying funds. Therefore, the second line of the table is useful in comparing ongoing costs only, and will not help you determine the relative total costs of owning different funds. In addition, if these transactional costs were included, your costs would have been higher.
| | | | | | | Expenses Paid |
| | | Beginning | | Ending | | During the Period* |
| | | Account Value | | Account Value | | August 1, 2020 |
| | | August 1, 2020 | | January 31, 2021 | | January 31, 2021 |
| |
| Actual | | $1,000.00 | | $1,258.75 | | $5.34 |
| |
| Hypothetical | | $1,000.00 | | $1,020.41 | | $4.77 |
| (5% annual return | | | | | | |
| before expenses) | | | | | | |
| * | Expenses are equal to the Fund’s annualized expense ratio of 0.94%, multiplied by the aver- age account value over the period, multiplied by 184/366 (to reflect the one-half year period). |
| |
2021 Annual Report 5
| Walthausen Focused Small Cap Value Fund | | |
| | | | Schedule of Investments |
| | | | January 31, 2021 |
| Shares | | Fair Value | % of Net Assets | |
| COMMON STOCKS | | | | |
| Arrangement of Transportation of Freight & Cargo | | | | |
| 6,180 | Hub Group, Inc. - Class A * | $ | 325,253 | 2.86 | % |
| Electric & Other Services Combined | | | | |
| 5,070 | NorthWestern Corporation | | 276,163 | 2.43 | % |
| Electrical Work | | | | |
| 4,340 | EMCOR Group, Inc. | | 383,222 | 3.37 | % |
| Fire, Marine & Casualty Insurance | | | | |
| 7,240 | AXIS Capital Holdings Limited (Bermuda) | | 332,316 | | |
| 2,320 | The Hanover Insurance Group, Inc. | | 260,930 | | |
| | | | 593,246 | 5.21 | % |
| Leather & Leather Products | | | | |
| 11,940 | Tapestry, Inc. | | 377,543 | 3.32 | % |
| Life Insurance | | | | | |
| 1,960 | Primerica, Inc. | | 273,048 | 2.40 | % |
| Measuring & Controlling Devices, NEC | | | | |
| 7,630 | Onto Innovation Inc. * | | 412,402 | 3.63 | % |
| Miscellaneous General Merchandise Stores | | | | |
| 1,510 | Casey's General Stores, Inc. | | 283,095 | 2.49 | % |
| Miscellaneous Industrial & Commercial Machinery & Equipment | | | | |
| 3,905 | Moog Inc. - Class A | | 288,462 | 2.54 | % |
| Mobile Homes | | | | | |
| 1,410 | Cavco Industries, Inc. * | | 266,011 | 2.34 | % |
| Motor Vehicle Parts & Accessories | | | | |
| 2,200 | LCI Industries | | 284,636 | 2.50 | % |
| Motor Vehicles & Passenger Car Bodies | | | | |
| 1,800 | Oshkosh Corporation | | 164,862 | 1.45 | % |
| National Commercial Banks | | | | |
| 11,030 | PacWest Bancorp | | 332,996 | | |
| 19,790 | Sterling Bancorp | | 365,323 | | |
| 7,660 | Webster Financial Corporation | | 358,105 | | |
| 10,050 | WesBanco, Inc. | | 291,450 | | |
| 10,070 | WSFS Financial Corporation | | 432,708 | | |
| | | | 1,780,582 | 15.65 | % |
| Operative Builders | | | | |
| 2,872 | M.D.C. Holdings, Inc. | | 149,401 | 1.31 | % |
| Poultry Slaughtering and Processing | | | | |
| 2,128 | Sanderson Farms, Inc. | | 289,812 | 2.55 | % |
| Pumps & Pumping Equipment | | | | |
| 4,680 | ITT Inc. | | 349,643 | 3.07 | % |
| Rolling Drawing & Extruding of Nonferrous Metals | | | | |
| 9,200 | Mueller Industries, Inc. | | 314,180 | 2.76 | % |
| Services - Business Services, NEC | | | | |
| 4,140 | MAXIMUS, Inc. | | 310,748 | 2.73 | % |
| Services - Equipment Rental & Leasing, NEC | | | | |
| 4,990 | McGrath RentCorp | | 348,252 | | |
| 7,570 | Triton International Limited | | 350,794 | | |
| | | | 699,046 | 6.15 | % |
| Services - Hospitals | | | | |
| 4,690 | Encompass Health Corporation | | 377,076 | 3.31 | % |
| State Commercial Banks | | | | |
| 8,940 | Columbia Banking System, Inc. | | 344,369 | | |
| 10,790 | Hancock Whitney Corporation | | 368,371 | | |
| 4,830 | Independent Bank Corp. | | 362,636 | | |
| | | | 1,075,376 | 9.45 | % |
* Non-Income Producing Securities.
The accompanying notes are an integral part of these
financial statements. |
2021 Annual Report 6
| Walthausen Focused Small Cap Value Fund |
| | | | Schedule of Investments |
| | | | January 31, 2021 |
| Shares | | | Fair Value | | % of Net Assets | |
| COMMON STOCKS | | | | | |
| Surety Insurance | | | | | |
| 5,960 | Essent Group Ltd. (Bermuda) | $ | 249,307 | | 2.19 | % |
| Surgical & Medical Instruments & Apparatus | | | | | |
| 5,230 | Merit Medical Systems, Inc. * | | 283,205 | | 2.49 | % |
| Title Insurance | | | | | | |
| 3,890 | First American Financial Corporation | | 203,408 | | 1.79 | % |
| Transportation Services | | | | | |
| 1,330 | GATX Corporation | | 123,424 | | 1.09 | % |
| Wholesale - Petroleum & Petroleum Products (No Bulk Stations) | | | | | |
| 8,890 | World Fuel Services Corporation | | 271,945 | | 2.39 | % |
| Total for Common Stocks (Cost $8,025,975) | | 10,405,096 | | 91.47 | % |
| REAL ESTATE INVESTMENT TRUSTS | | | | | |
| 14,750 | Industrial Logistics Properties Trust | | 312,848 | | 2.75 | % |
| | (Cost $309,784) | | | | | |
| MONEY MARKET FUNDS | | | | | |
| 657,146 | Fidelity Investments Money Market Government Portfolio - | | | | | |
| | Class I 0.01% ** | | 657,146 | | 5.78 | % |
| | (Cost $657,146) | | | | | |
| Total Investment Securities | | 11,375,090 | | 100.00 | % |
| | (Cost $8,992,905) | | | | | |
| Other Assets in Excess of Liabilities | | 149 | | 0.00 | % |
| Net Assets | | $ | 11,375,239 | | 100.00 | % |
| | * Non-Income Producing Securities.
** The rate shown represents the 7-day yield at January 31, 2021. |
The accompanying notes are an integral part of these
financial statements. |
2021 Annual Report 7
| Walthausen Focused Small Cap Value Fund | | |
| |
| Statement of Assets and Liabilities | | | | |
| January 31, 2021 | | | | |
| Assets: | | | | |
| Investment Securities at Fair Value | $ | 11,375,090 | |
| (Cost $8,992,905) | | | | |
| Receivable for Dividends | | | 6,083 | |
| Receivable for Shareholder Subscriptions | | | 1,744 | |
| Total Assets | | | 11,382,917 | |
| Liabilities: | | | | |
| Payable for Shareholder Redemptions | | | 32 | |
| Payable to Advisor for Management Fees (Note 4) | | | 7,646 | |
| Total Liabilities | | | 7,678 | |
| Net Assets | $ | 11,375,239 | |
| Net Assets Consist of: | | | | |
| Paid In Capital | $ | 8,712,185 | |
| Total Distributable Earnings | | | 2,663,054 | |
| Net Assets | $ | 11,375,239 | |
| |
| Institutional Class | | | | |
| Net Assets | $ | 11,375,239 | |
| Shares Outstanding | | | | |
| (Unlimited shares authorized) | | | 966,706 | |
| Net Asset Value, Offering Price and Redemption Price Per Share | $ | 11.77 | |
| |
| Statement of Operations | | | | |
| For the fiscal year ended January 31, 2021 | | | | |
| |
| Investment Income: | | | | |
| Dividends (Net of foreign withholding tax of $0) | $ | 205,125 | |
| Total Investment Income | | | 205,125 | |
| Expenses: | | | | |
| Management Fees (Note 4) | | | 88,013 | |
| Service Fees (Note 4) | | | 36,772 | |
| Total Expenses | | | 124,785 | |
| Less: Waived Service Fees (Note 4) | | | (21,724 | ) |
| Net Expenses | | | 103,061 | |
| Net Investment Income (Loss) | | | 102,064 | |
| Realized and Unrealized Gain (Loss) on Investments: | | | | |
| Net Realized Gain (Loss) on Investments | | | 421,587 | |
| Net Change In Unrealized Appreciation (Depreciation) on Investments | | | (362,130 | ) |
| Net Realized and Unrealized Gain (Loss) on Investments | | | 59,457 | |
| Net Increase (Decrease) in Net Assets from Operations | $ | 161,521 | |
The accompanying notes are an integral part of these
financial statements. |
2021 Annual Report 8
| Walthausen Focused Small Cap Value Fund | | | | | |
| |
| Statements of Changes in Net Assets | | | | | | | |
| | | 2/1/2020 | | | | 2/1/2019 | |
| | | to | | | | to | |
| | | 1/31/2021 | | | | 1/31/2020 | |
| From Operations: | | | | | | | |
| Net Investment Income (Loss) | $ | 102,064 | | | $ | 94,911 | |
| Net Realized Gain (Loss) on Investments | | 421,587 | | | | 1,211,975 | |
| Net Change in Unrealized Appreciation (Depreciation) on Investments | | (362,130 | ) | | | 239,842 | |
| Increase (Decrease) in Net Assets from Operations | | 161,521 | | | | 1,546,728 | |
| From Distributions to Shareholders: | | | | | | | |
| Institutional Class | | (303,549 | ) | | | (477,944 | ) |
| Retail Class (a) | | - | | | | (124,961 | ) |
| R6 Class (b) | | - | | | | (14,860 | ) |
| Change in Net Assets from Distributions | | (303,549 | ) | | | (617,765 | ) |
| From Capital Share Transactions: | | | | | | | |
| Proceeds From Sale of Shares | | | | | | | |
| Institutional Class | | 5,970,440 | | (c) (d) | | 1,938,489 | |
| Retail Class (a) | | 67,731 | | | | 216,505 | |
| R6 Class (b) | | 5,027 | | | | 77,033 | |
| Proceeds From Redemption Fees (Note 2) | | | | | | | |
| Institutional Class | | 19 | | | | - | |
| Retail Class (a) | | 330 | | | | 1,642 | |
| R6 Class (b) | | - | | | | - | |
| Shares Issued on Reinvestment of Dividends | | | | | | | |
| Institutional Class | | 301,597 | | | | 476,140 | |
| Retail Class (a) | | - | | | | 121,847 | |
| R6 Class (b) | | - | | | | 14,860 | |
| Cost of Shares Redeemed | | | | | | | |
| Institutional Class | | (4,281,397 | ) | | | (4,915,183 | ) |
| Retail Class (a) | | (2,125,536 | ) | (c) | | (2,024,908 | ) |
| R6 Class (b) | | (218,191 | ) | (d) | | (489,012 | ) |
| Net Increase (Decrease) from Shareholder Activity | | (279,980 | ) | | | (4,582,587 | ) |
| Net Increase (Decrease) in Net Assets | | (422,008 | ) | | | (3,653,624 | ) |
| Net Assets at Beginning of Period | | 11,797,247 | | | | 15,450,871 | |
| Net Assets at End of Period | $ | 11,375,239 | | | $ | 11,797,247 | |
| |
| Share Transactions: | | | | | | | |
| Issued | | | | | | | |
| Institutional Class | | 622,158 | | (c) (d) | | 163,497 | |
| Retail Class (a) | | 7,562 | | | | 18,816 | |
| R6 Class (b) | | 534 | | | | 6,790 | |
| Reinvested | | | | | | | |
| Institutional Class | | 25,955 | | | | 39,481 | |
| Retail Class (a) | | - | | | | 10,239 | |
| R6 Class (b) | | - | | | | 1,216 | |
| Redeemed | | | | | | | |
| Institutional Class | | (406,372 | ) | | | (431,392 | ) |
| Retail Class (a) | | (261,604 | ) | (c) | | (178,042 | ) |
| R6 Class (b) | | (26,678 | ) | (d) | | (42,454 | ) |
| Net Increase (Decrease) in Shares | | (38,445 | ) | | | (411,849 | ) |
(a) Retail Class closed on May 15, 2020. Retail Class shares of record as of May 15, 2020, were
exchanged for Institutional Class shares effective May 15, 2020.
(b) R6 Class closed on May 15, 2020. R6 Class shares of record as of May 15, 2020, were exchanged
for Institutional Class shares effective May 15, 2020.
(c) Includes automatic conversion of Retail Class shares ($1,884,889 representing 234,329 shares) to
Institutional Class shares ($1,884,889 representing 231,160 shares).
(d) Includes automatic conversion of R6 Class shares ($181,806 representing 21,981 shares) to
Institutional Class shares ($181,806 representing 22,297 shares). |
The accompanying notes are an integral part of these
financial statements. |
2021 Annual Report 9
| Walthausen Focused Small Cap Value Fund |
| | |
| Financial Highlights - Institutional Class | | | | | | | | | | | | | | | | | | | | |
| Selected data for a share outstanding throughout the period: | | 2/1/2020 | | | | 2/1/2019 | | | | 2/1/2018 | | | | 2/1/2017 | | | | 2/1/2016 | | |
| | | to | | | | to | | | | to | | | | to | | | | to | | |
| | | 1/31/2021 | | | | 1/31/2020 | | | | 1/31/2019 | | | | 1/31/2018 | | | | 1/31/2017 | | |
| Net Asset Value - | | | | | | | | | | | | | | | | | | | | |
| Beginning of Period | $ | 11.77 | | | $ | 10.97 | | | $ | 19.22 | | | $ | 16.26 | | | $ | 13.19 | | |
| Net Investment Income (Loss) (a) | | 0.11 | | | | 0.10 | | | | 0.04 | | | | 0.10 | | | | 0.06 | | |
| Net Gain (Loss) on Investments (Realized and Unrealized) (b) | | 0.20 | | | | 1.36 | | | | (2.17 | ) | | | 3.02 | | | | 3.08 | | |
| Total from Investment Operations | | 0.31 | | | | 1.46 | | | | (2.13 | ) | | | 3.12 | | | | 3.14 | | |
| Distributions (From Net Investment Income) | | (0.06 | ) | | | (0.22 | ) | | | - | | | | (0.11 | ) | | | (0.07 | ) | |
| Distributions (From Capital Gains) | | (0.25 | ) | | | (0.44 | ) | | | (6.12 | ) | | | (0.05 | ) | | | - | | |
| Total Distributions | | (0.31 | ) | | | (0.66 | ) | | | (6.12 | ) | | | (0.16 | ) | | | (0.07 | ) | |
| Proceeds from Redemption Fee (Note 2) | | - | | + | | - | | | | - | | + | | - | | + | | - | | + |
| Net Asset Value - | | | | | | | | | | | | | | | | | | | | |
| End of Period | $ | 11.77 | | | $ | 11.77 | | | $ | 10.97 | | | $ | 19.22 | | | $ | 16.26 | | |
| Total Return (c) | | 2.67 | % | | | 13.19 | % | | | (7.07 | )% | | | 19.23 | % | | | 23.78 | % | |
| Ratios/Supplemental Data | | | | | | | | | | | | | | | | | | | | |
| Net Assets - End of Period (Thousands) | $ | 11,375 | | | $ | 8,534 | | | $ | 10,463 | | | $ | 68,955 | | | $ | 35,158 | | |
| Before Reimbursement | | | | | | | | | | | | | | | | | | | | |
| Ratio of Expenses to Average Net Assets | | 1.25 | % | | | 1.35 | % | | | 1.35 | % | | | 1.35 | % | | | 1.42 | % | |
| Ratio of Net Investment Income (Loss) to Average Net Assets | | 0.80 | % | | | 0.62 | % | | | -0.03 | % | | | 0.33 | % | | | 0.19 | % | |
| After Reimbursement | | | | | | | | | | | | | | | | | | | | |
| Ratio of Expenses to Average Net Assets | | 1.01 | % | | | 1.10 | % | | | 1.10 | % | | | 1.10 | % | | | 1.17 | % | |
| Ratio of Net Investment Income (Loss) to Average Net Assets | | 1.04 | % | | | 0.87 | % | | | 0.22 | % | | | 0.58 | % | | | 0.44 | % | |
| Portfolio Turnover Rate | | 72.53 | % | | | 49.95 | % | | | 39.38 | % | | | 63.12 | % | | | 62.38 | % | |
+ Amount less than $0.005 per share.
(a) Per share amounts were calculated using the average shares method.
(b) Realized and unrealized gains and losses per share in this caption are balancing amounts necessary to reconcile
the change in net asset value for the period and may not reconcile with the aggregate gains and losses in the Statement
of Operations due to share transactions for the period.
(c) Total return represents the rate that the investor would have earned or lost on an investment in the Fund assuming
reinvestment of dividends. |
The accompanying notes are an integral part of these
financial statements. |
2021 Annual Report 10
NOTES TO FINANCIAL STATEMENTS
WALTHAUSEN FOCUSED SMALL CAP VALUE FUND
January 31, 2021
1.) ORGANIZATION
Walthausen Focused Small Cap Value Fund (the “Fund”) was organized as a diversified series of the Walthausen Funds (the “Trust”) on December 1, 2010. The Trust is registered as an open-end investment company under the Investment Company Act of 1940, as amended (the “1940 Act”). The Trust was organized in Ohio as a business trust on October 10, 2007 and may offer an unlimited number of shares of beneficial interest in a number of separate series, each series representing a distinct fund with its own investment objectives and policies. Prior to October 15, 2020 the Fund was named Walthausen Select Value Fund. As of January 31, 2021, there are two series authorized by the Trust. The Fund currently offers Institutional Class shares. Retail Class shares were offered from December 27, 2010 through May 15, 2020. Retail Class shares of record as of May 15, 2020, were exchanged for Institutional Class shares effective May 15, 2020. R6 Class shares were offered from November 1, 2016 through May 15, 2020. R6 Class shares of record as of May 15, 2020, were exchanged for Institutional Class shares effective May 15, 2020. The Fund may offer Retail Class and R6 Class shares in the future with approval from the Board of Trustees (the “Trustees” or the “Board”) and notification to shareholders. The Institutional Class commenced operations on December 27, 2010. Prior to January 30, 2013 the Institutional Class was named the Investor Class. The Fund’s investment objective is to seek long-term capital appreciation. The investment advisor to the Fund is Walthausen & Co., LLC (the “Advisor”).
2.) SIGNIFICANT ACCOUNTING POLICIES
The Fund is an investment company and accordingly follows the investment company accounting and reporting guidance of the Financial Accounting Standards Board (“FASB”) Accounting Standards Codification Topic 946 Financial Services - Investment Companies. The financial statements are prepared in conformity with accounting principles generally accepted in the United States of America (“GAAP”). The Fund follows the significant accounting policies described in this section.
SECURITY VALUATION
All investments in securities are recorded at their estimated fair value, as described in Note 3.
FEDERAL INCOME TAXES
The Fund’s policy is to continue to comply with the requirements of the Internal Revenue Code that are applicable to regulated investment companies and to distribute all of its taxable income to shareholders. Therefore, no federal income tax provision is required. It is the Fund’s policy to distribute annually, prior to the end of the calendar year, dividends sufficient to satisfy excise tax requirements of the Internal Revenue Code. This Internal Revenue Code requirement may cause an excess of distributions over the book year-end accumulated income. In addition, it is the Fund’s policy to distribute annually, after the end of the fiscal year, any remaining net investment income and net realized capital gains.
The Fund recognizes the tax benefits of certain tax positions only where the position is “more likely than not” to be sustained assuming examination by tax authorities. Management has analyzed the Fund’s tax positions, and has concluded that no liability for unrecognized tax benefits should be recorded related to uncertain tax positions taken on returns filed for the open tax years. The Fund identifies its major tax jurisdictions as U.S. Federal and State tax authorities; however, the Fund is not aware of any tax positions for which it is reasonably possible that the total amounts of unrecognized tax benefits will change materially in the next twelve months. The Fund recognizes interest and penalties, if any, related to unrecognized tax benefits as income tax expense in the Statement of Operations. During the fiscal year ended January 31, 2021, the Fund did not incur any interest or penalties.
SHARE VALUATION
The net asset value (“NAV”) per share of the Fund is calculated daily by dividing the total value of the Fund’s assets, less liabilities, by the number of shares outstanding, rounded to the nearest cent. The offering and redemption price per share is equal to the NAV per share. Prior to October 15, 2020, shares of the Fund were subject to a redemption fee of 2% if redeemed after holding them for 90 days or less. During the fiscal year ended January 31, 2021, proceeds from redemption fees amounted to $19, $330 and $0 for Institutional Class shares, Retail Class shares and R6 Class shares, respectively.
DISTRIBUTIONS TO SHAREHOLDERS
Distributions to shareholders, which are determined in accordance with income tax regulations, are recorded on the ex-dividend date. The Fund may utilize earnings and profits distributed to share-
2021 Annual Report 11
Notes to Financial Statements - continued
holders on redemptions of shares as part of the dividends paid deduction. The treatment for financial reporting purposes of distributions made to shareholders during the year from net investment income or net realized capital gains may differ from their ultimate treatment for federal income tax purposes. These differences are caused primarily by differences in the timing of the recognition of certain components of income, expense, or realized capital gain for federal income tax purposes. Where such differences are permanent in nature, they are reclassified in the components of the net assets based on their ultimate characterization for federal income tax purposes. Any such reclassifications will have no effect on net assets, results of operations, or NAV per share of the Fund. For the fiscal year ended January 31, 2021, the following adjustments were recorded and primarily related to the use of equalization for tax purposes.
| Paid In Capital | | $98,810 | |
| Total Distributable Earnings | | ($98,810 | ) |
USE OF ESTIMATES
The financial statements are prepared in accordance with GAAP, which requires management to make estimates and assumptions that affect the reported amounts of assets and liabilities and disclosure of contingent assets and liabilities at the date of the financial statements and the reported amounts of increases and decreases in net assets from operations during the reporting period. Actual results could differ from those estimates.
OTHER
The Fund records security transactions based on the trade date for financial reporting purposes. Dividend income is recognized on the ex-dividend date. Interest income, if any, is recognized on an accrual basis. The Fund uses the specific identification method in computing gain or loss on the sale of investment securities. Withholding taxes on foreign dividends have been provided for in accordance with the Fund’s understanding of the applicable country’s tax rules and rates. The Fund may invest in real estate investment trusts (“REITs”) that pay distributions to their shareholders based on available funds from operations. It is common for these distributions to exceed the REITs taxable earnings and profits resulting in the excess portion of such distribution to be designated as return of capital. Distributions received from REITs are generally recorded as dividend income and, if necessary, are reclassified annually in accordance with tax information provided by the underlying REITs.
EXPENSES
Expenses incurred by the Trust that do not relate to a specific fund of the Trust are allocated to the individual funds based on each fund’s relative net assets or an appropriate basis.
Class specific expenses are borne by each specific class. Income, non-class specific expenses, and realized and unrealized gains/losses are allocated to the respective classes based on the basis of relative net assets.
3.) SECURITIES VALUATIONS
The Fund utilizes various methods to measure the fair value of its investments on a recurring basis. GAAP establishes a hierarchy that prioritizes inputs to valuation methods. The three levels of inputs are:
Level 1 - Unadjusted quoted prices in active markets for identical assets or liabilities that the Fund has the ability to access.
Level 2 - Observable inputs other than quoted prices included in level 1 that are observable for the asset or liability, either directly or indirectly. These inputs may include quoted prices for the identical instrument on an inactive market, prices for similar instruments, interest rates, prepayment speeds, credit risk, yield curves, default rates and similar data.
Level 3 - Unobservable inputs for the asset or liability, to the extent relevant observable inputs are not available, representing the Fund’s own assumptions about the assumptions a market participant would use in valuing the asset or liability, and would be based on the best information available.
The availability of observable inputs can vary from security to security and is affected by a wide variety of factors, including, for example, the type of security, whether the security is new and not yet established in the marketplace, the liquidity of markets, and other characteristics particular to the security. To the extent that valuation is based on models or inputs that are less observable or unobservable in the market, the determination of fair value requires more judgment. Accordingly, the degree of judgment exercised in determining fair value is greatest for instruments categorized as level 3.
2021 Annual Report 12
Notes to Financial Statements - continued
The inputs used to measure fair value may fall into different levels of the fair value hierarchy. In such cases, for disclosure purposes, the level in the fair value hierarchy within which the fair value measurement falls in its entirety, is determined based on the lowest level input that is significant to the fair value measurement in its entirety.
FAIR VALUE MEASUREMENTS
A description of the valuation techniques applied to the Fund’s major categories of assets and liabilities measured at fair value on a recurring basis follows.
Equity securities (common stocks including real estate investment trusts). Equity securities generally are valued by using market quotations, but may be valued on the basis of prices furnished by a pricing service when the Advisor believes such prices accurately reflect the fair value of such securities. Securities that are traded on any stock exchange or on the NASDAQ over-the-counter market are generally valued by the pricing service at the last quoted sale price. Lacking a last sale price, an equity security is generally valued by the pricing service at its last bid price. Generally, if the security is traded in an active market and is valued at the last sale price, the security is categorized as a level 1 security, and if an equity security is valued by the pricing service at its last bid price, it is generally categorized as a level 2 security. When market quotations are not readily available, when the Advisor determines that the market quotation or the price provided by the pricing service does not accurately reflect the current fair value, or when restricted securities are being valued, such securities are valued as determined in good faith by the Advisor, subject to review of the Board and are categorized in level 2 or level 3, when appropriate.
Money market funds. Shares of money market funds are valued at the net asset value provided by the funds and are classified as level 1 of the fair value hierarchy.
In accordance with the Trust’s good faith pricing guidelines, the Advisor is required to consider all appropriate factors relevant to the value of securities for which it has determined other pricing sources are not available or reliable as described above. There is no single procedure for determining fair value, since fair value depends upon the circumstances of each individual case. As a general principle, the current fair value of an issue of securities being valued by the Advisor would appear to be the amount that the owner might reasonably expect to receive for them upon their current sale. Methods which are in accordance with this principle may, for example, be based on (i) a multiple of earnings; (ii) a discount from market of a similar freely traded security (including a derivative security or a basket of securities traded on other markets, exchanges or among dealers); or (iii) yield to maturity with respect to debt issues, or a combination of these and other methods.
The following table summarizes the inputs used to value the Fund’s assets measured at fair value as of January 31, 2021:
| Valuation Inputs of Assets | | Level 1 | | Level 2 | | Level 3 | | Total |
| Common Stocks | | $10,405,096 | | $0 | | $0 | | $10,405,096 |
| Real Estate Investment Trusts | | 312,848 | | 0 | | 0 | | 312,848 |
| Money Market Funds | | 657,146 | | 0 | | 0 | | 657,146 |
| Total | | $11,375,090 | | $0 | | $0 | | $11,375,090 |
Refer to the Fund’s Schedule of Investments for a listing of securities by industry. The Fund did not hold any level 3 assets during the fiscal year ended January 31, 2021.
The Fund did not invest in any derivative instruments during the fiscal year ended January 31, 2021.
4.) INVESTMENT ADVISORY AGREEMENT AND RELATED PARTY TRANSACTIONS
The Trust, on behalf of the Fund, has entered into an investment advisory agreement (“Management Agreement”) with the Advisor. The Advisor manages the investment portfolio of the Fund, subject to policies adopted by the Trust’s Board of Trustees, and, at its own expense and without reimbursement from the Trust, furnishes office space and all necessary office facilities, equipment and executive personnel necessary for managing the Fund. For its services, the Advisor receives an investment management fee equal to 0.85% of the average daily net assets of the Fund. Prior to October 15, 2020, the Advisor received an investment management fee equal to 0.90% of the average daily net assets of the Fund. For the fiscal year ended January 31, 2021, the Advisor earned management fees totaling $88,013, of which $7,646 was due to the Advisor at January 31, 2021.
Under the terms of the Services Agreement between the Trust, on behalf of the Fund, and the Advisor (the “Services Agreement”), the Advisor renders administrative and supervisory services to
2021 Annual Report 13
Notes to Financial Statements - continued
the Fund, provides the services of a chief compliance officer and assumes and pays all ordinary expenses of the Fund, excluding management fees, any 12b-1 fees, brokerage fees and commissions, taxes, borrowing costs (such as (a) interest and (b) dividend expenses on securities sold short), fees and expenses of acquired funds, extraordinary or non-recurring expenses as may arise, including litigation to which the Fund may be a party and indemnification of the Trust’s Trustees and officers. For its services, the Advisor receives service fees equal to an annual rate of 0.20% of the Fund’s average daily net assets. Prior to October 15, 2020, the Advisor received service fees equal to an annual rate of 0.45% of the Fund’s average daily net assets up to $100 million, 0.25% of the Fund’s average daily net assets between $100 million and $500 million, and 0.15% of such assets in excess of $500 million. The Advisor has contractually agreed to waive Services Agreement fees to the extent necessary to maintain total annual operating expenses of the Institutional Class Shares, excluding brokerage fees and commissions, taxes, borrowing costs (such as (a) interest and (b) dividend expenses on securities sold short), the cost of acquired funds and extraordinary expenses at 0.85% of its average daily net assets through October 31, 2025. The Advisor may not terminate the fee waiver before October 31, 2025. There is no recoupment provision for the waiver. Prior to October 15, 2020, the Advisor waived Services Agreement fees to the extent necessary to maintain total annual operating expenses of the Institutional Class Shares, excluding brokerage fees and commissions, taxes, borrowing costs (such as (a) interest and (b) dividend expenses on securities sold short), the cost of acquired funds and extraordinary expenses at 1.10% of its average daily net assets. Prior to June 1, 2017 the Advisor had contractually agreed to waive, for the Institutional Class shares, 0.25% of the applicable Services Agreement fees for the class’ average daily net assets up to $100 million. Also, the Advisor contractually agreed to waive Services Agreement fees to the extent necessary to maintain total annual operating expenses of the R6 Class Shares, excluding brokerage fees and commissions, taxes, borrowing costs (such as (a) interest and (b) dividend expenses on securities sold short), the cost of acquired funds and extraordinary expenses at 0.98% of its average daily net assets through May 15, 2020, the date outstanding shares were exchanged for Institutional Class shares.
For the fiscal year ended January 31, 2021, the Advisor earned service fees of $36,772, of which $0 was due to the Advisor at January 31, 2021. Service fees in the amount of $21,724 were waived with no recapture provision for the fiscal year ended January 31, 2021, of which $21,470 related to the Institutional Class and $254 related to the R6 Class.
Certain officers and a shareholder of the Advisor are also officers and/or a Trustee of the Trust. These individuals may receive benefits from the Advisor resulting from management and services fees paid to the Advisor by the Fund.
The Trustees who are not interested persons of the Fund were each paid $4,000, for a total of $12,000, in Trustees’ fees plus any travel and related expenses for the fiscal year ended January 31, 2021 for their services to the Fund. The Advisor pays these fees pursuant to the Services Agreement.
5.) DISTRIBUTION AND SHAREHOLDER SERVICING PLAN
The Fund has adopted a Distribution Plan in accordance with Rule 12b-1 under the 1940 Act. Pursuant to the Distribution Plan, the Fund compensates the Advisor for services rendered and expenses borne in connection with brokerage platform fees. This Distribution Plan provides that the Fund may pay the annual rate of up to 0.25% of the average daily net assets of the Fund’s Retail Class shares. These activities include reimbursement to entities for providing distribution and shareholder servicing with respect to the Fund’s shares. Effective May 15, 2020 Retail Class closed and its shares were exchanged for Institutional Class shares. Also as of June 1, 2013, the Fund does not currently pay or accrue any distribution fees; however, if the Fund resumes the offering of Retail Class, it reserves the right to pay or accrue such fees in the future upon notice to shareholders.
6.) PURCHASES AND SALES OF SECURITIES
For the fiscal year ended January 31, 2021, purchases and sales of investment securities other than U.S. Government obligations and short-term investments aggregated $7,162,205 and $8,208,796, respectively. Purchases and sales of U.S. Government obligations aggregated $0 and $0, respectively.
7.) CONTROL OWNERSHIP
The beneficial ownership, either directly or indirectly, of more than 25% of the voting securities of a fund creates a presumption of control of a fund under Section 2(a)(9) of the 1940 Act. As of January 31, 2021, NFS, LLC, located in New York, New York, for the benefit of its clients, held, in aggregate, 56.21% of the Fund shares, and therefore may be deemed to control the Fund.
2021 Annual Report 14
Notes to Financial Statements - continued
8.) TAX MATTERS
For Federal income tax purposes, the cost of investments owned at January 31, 2021 was $9,096,143. At January 31, 2021, the composition of unrealized appreciation (the excess of value over tax cost) and depreciation (the excess of tax cost over value) was as follows:
| | Appreciation | | (Depreciation) | | Net Appreciation (Depreciation) |
| | $2,527,015 | | ($248,068) | | $2,278,947 |
The tax character of distributions from Institutional Class was as follows:
| | | Fiscal Year Ended | | Fiscal Year Ended |
| | | January 31, 2021 | | January 31, 2020 |
| Ordinary Income | | $ 60,906 | | $ 174,768 |
| Long-Term Capital Gain | | 242,643 | | 303,176 |
| | | $ 303,549 | | $ 477,944 |
The tax character of distributions from Retail Class was as follows:
| | Fiscal Year Ended | | Fiscal Year Ended |
| | January 31, 2021 | | January 31, 2020 |
| Ordinary Income | $ – | | $ 18,592 |
| Long-Term Capital Gain | – | | 106,369 |
| | $ – | | $ 124,961 |
The tax character of distributions from R6 Class was as follows:
| | Fiscal Year Ended | | Fiscal Year Ended |
| | January 31, 2021 | | January 31, 2020 |
| Ordinary Income | $ – | | $ 4,637 |
| Long-Term Capital Gain | – | | 10,223 |
| | $ – | | $ 14,860 |
As of January 31, 2021, the components of distributable earnings on a tax basis were as follows:
| Undistributed ordinary income | | $ 48,254 |
| Undistributed long-term capital gains | | 335,853 |
| Unrealized appreciation on investments – net | | 2,278,947 |
| | | $ 2,663,054 |
The differences between book basis and tax basis unrealized appreciation were primarily attributable to the tax deferral of wash sales.
9.) CONCENTRATION OF SECTOR RISK
If the Fund has significant investments in the securities of issuers in industries within a particular sector, any development affecting that sector will have a greater impact on the value of the net assets of the Fund than would be the case if the Fund did not have significant investments in that sector. In addition, this may increase the risk of loss of an investment in the Fund and increase the volatility of the Fund’s NAV per share. From time to time, circumstances may affect a particular sector and the companies within such sector. For instance, economic or market factors, regulation or deregulation, and technological or other developments may negatively impact all companies in a particular sector and therefore the value of the Fund’s portfolio will be adversely affected. As of January 31, 2021, the Fund had 36.70% of the value of its net assets invested in stocks within the Financials sector.
10.) COVID-19 RISKS
Unexpected local, regional or global events, such as war; acts of terrorism; financial, political or social disruptions; natural, environmental or man-made disasters; the spread of infectious illnesses or other public health issues; and recessions and depressions could have a significant impact on the Fund and its investments and may impair market liquidity. Such events can cause investor fear, which can adversely affect the economies of nations, regions and the market in general, in ways that cannot necessarily be foreseen. An outbreak of infectious respiratory illness known as COVID-19, which is caused by a novel coronavirus (SARS-CoV-2), was first detected in China in December 2019 and subsequently spread globally. This coronavirus has resulted in, among other things, travel restrictions, closed international borders, enhanced health screenings at ports of entry and elsewhere, disruption of and delays in healthcare service preparation and delivery, prolonged quaran-
2021 Annual Report 15
Notes to Financial Statements - continued
tines, significant disruptions to business operations, market closures, cancellations and restrictions, supply chain disruptions, lower consumer demand, and significant volatility and declines in global financial markets, as well as general concern and uncertainty. The impact of COVID-19 has adversely affected, and other infectious illness outbreaks that may arise in the future could adversely affect, the economies of many nations and the entire global economy, individual issuers and capital markets in ways that cannot necessarily be foreseen. Public health crises caused by the COVID-19 outbreak may exacerbate other pre-existing political, social and economic risks in certain countries or globally. The duration of the COVID-19 outbreak and its effects cannot be determined with certainty.
11.) SUBSEQUENT EVENTS
Subsequent events after the date of the Statement of Assets and Liabilities have been evaluated through the date the financial statements were issued. Management has concluded that there is no impact requiring adjustment to or disclosure in the financial statements.
2021 Annual Report 16
REPORT OF INDEPENDENT REGISTERED PUBLIC ACCOUNTING FIRM
To the Shareholders and Board of Trustees of
Walthausen Funds
Opinion on the Financial Statements
We have audited the accompanying statement of assets and liabilities, including the schedule of investments, of Walthausen Focused Small Cap Value Fund (the “Fund”), a series of Walthausen Funds as of January 31, 2021, the related statement of operations for the year then ended, the statements of changes in net assets for each of the two years in the period then ended, the related notes, and the financial highlights for each of the five years in the period then ended (collectively referred to as the “financial statements”). In our opinion, the financial statements present fairly, in all material respects, the financial position of the Fund as of January 31, 2021, the results of its operations for the year then ended, the changes in net assets for each of the two years in the period then ended, and the financial highlights for each of the five years in the period then ended, in conformity with accounting principles generally accepted in the United States of America.
Basis for Opinion
These financial statements are the responsibility of the Fund’s management. Our responsibility is to express an opinion on the Fund’s financial statements based on our audits. We are a public accounting firm registered with the Public Company Accounting Oversight Board (United States) (“PCAOB”) and are required to be independent with respect to the Fund in accordance with the U.S. federal securities laws and the applicable rules and regulations of the Securities and Exchange Commission and the PCAOB.
We conducted our audits in accordance with the standards of the PCAOB. Those standards require that we plan and perform the audit to obtain reasonable assurance about whether the financial statements are free of material misstatement whether due to error or fraud.
Our audits included performing procedures to assess the risks of material misstatement of the financial statements, whether due to error or fraud, and performing procedures that respond to those risks. Such procedures included examining, on a test basis, evidence regarding the amounts and disclosures in the financial statements. Our procedures included confirmation of securities owned as of January 31, 2021, by correspondence with the custodian. Our audits also included evaluating the accounting principles used and significant estimates made by management, as well as evaluating the overall presentation of the financial statements. We believe that our audits provide a reasonable basis for our opinion.
We have served as the auditor for the Walthausen Funds since 2008.

COHEN & COMPANY, LTD.
Cleveland, Ohio
March 24, 2021
2021 Annual Report 17
ADDITIONAL INFORMATION
January 31, 2021
(UNAUDITED) |
1.) APPROVAL OF INVESTMENT ADVISORY AGREEMENT
On January 20, 2021, the Board of Trustees (the “Trustees” or the “Board”) considered the renewal of the Management Agreement (the “Agreement”) between the Trust and the Advisor (or “Management”), on behalf of the Walthausen Focused Small Cap Value Fund (“Focused” or the “Fund”). Legal Counsel reviewed the memorandum provided by them and explained that, in consideration of the continuance of the Agreement, the Board should review all information as is reasonably necessary to evaluate the terms of the contract and determine whether it is fair to the Fund and its shareholders. The Advisor had provided information to the Trustees it believed to be sufficient for evaluation of continuance of the Agreement.
In reviewing the Agreement, the Board of Trustees received materials from the Advisor addressing the following factors: (i) the investment performance of the Fund and the Advisor; (ii) the nature, extent and quality of the services provided by the Advisor to the Fund; (iii) the cost of the services provided and the profits realized by the Advisor and its affiliates from the relationship with the Fund; (iv) the extent to which economies of scale will be realized as the Fund grows; and (v) whether the fee levels reflect these economies of scale to the benefit of shareholders.
As to the performance of Focused, the materials included information regarding the Fund’s performance compared to a peer group of similar funds as well as the overall Morningstar Small Value category and the Russell 2500® Value Index. The Trustees noted that the data showed that the Fund underperformed its peer group, category and its index for the 1-year period ended December 31, 2020. They also considered that the Fund lagged the index, but outperformed its peer group and category for the 5-year period ended December 31, 2020. They also noted that the Fund lagged the index, but outperformed its peer group and category for the 10-year period ended December 31, 2020. The Trustees discussed that the Institutional Class underperformed the index since inception through December 31, 2020. The Board discussed the Advisor’s observations that it consistently delivered a value oriented portfolio consistent with the Fund’s stated investment strategy and that in the long-term, the value strategy could outperform growth. The Board considered the Fund’s performance along with the Advisor’s overall track record. After further discussion, the Independent Trustees concluded that overall they were pleased with the performance of the Fund based on the value strategy.
As to the nature, extent and quality of the services provided by the Advisor, the Board discussed each portfolio manager’s background and investment management experience, observing that the many years of experience of each portfolio manager was a positive attribute. The Board reviewed the background of the other key professionals servicing the Fund. The Board expressed their satisfaction with the Advisor’s rigorous and disciplined stock selection process. The representatives of the Advisor reviewed and discussed with the Board the Advisor’s ADV and the Rule 17j-1 Code of Ethics certifications. The Board discussed the quality of the Advisor’s compliance efforts and the compliance resources of the firm. The Board noted that the Advisor had not experienced any material operational challenges as a result of the pandemic. The Board also reviewed the Advisor’s financial condition. The Board concluded that the nature and extent of the services provided by the Advisor were consistent with their expectations and of high quality.
As to the cost of the services provided and the profits realized by the Advisor and its affiliates from the relationship with the Fund, the Trustees considered all the services provided, including the Trust officer services, shareholder service support and office space. They discussed that the Advisor was paying substantially all ordinary operating expenses of the Fund pursuant to the Services Agreement. The Board noted that effective October 15, 2020, the Service Agreement fee was reduced to 0.20% of the average daily net assets of the Fund. A representative of the Advisor reviewed the revenue and expenses related to the Services Agreement noting that there had been a loss to the Advisor during the previous year. The Board concluded that the Advisor’s profitability was not unreasonable, particularly in light of the extent and quality of the services being provided to the Fund.
Turning to the level of expenses, the Board reviewed comparative data of advisory fees and expense ratios based on publicly available data that was drawn from its peer group, as well as Morningstar data. The Trustees considered that effective October 15, 2020, the Advisor contractually agreed to reduce its management fee to 0.85% of average daily net assets of the Fund. They discussed that Institutional Class’ net expense ratio was below the average net expense ratio for the
2021 Annual Report 18
Additional Information (Unaudited) - continued
peer group and the Morningstar category average. Additionally, the Trustee noted that the management fee was the same as the peer group average and above the Morningstar category average, but within the range of the Morningstar category. They considered the impact of fund size on expenses. The Trustees reviewed information regarding fees charged by the Advisor for other client relationships, which ranged from greater than to lower than the fees charged to the Fund based on a breakpoint structure for the other accounts. The Trustees discussed the soft dollar benefits that the Advisor received from Fund trades. A representative of the Advisor represented that the expense waivers would be continued through October 31, 2025. The Trustees concluded that when viewed in terms of the overall quality of services provided, the fees were not unreasonable.
As for potential economies of scale, the Board discussed and considered information regarding whether economies of scale had been realized with respect to the management of Focused, whether the Fund had appropriately benefited from any economies of scale, and whether there is potential for realization of any further economies of scale. The Trustees considered that effective October 15, 2020, the Advisor contractually agreed to reduce its fees and implemented a waiver which would be continued through October 31, 2025. They concluded that breakpoints in the advisory fee were not necessary at this time.
The Independent Trustees met in executive session to discuss the continuation of the Agreement. The officers of the Trust were excused during this discussion.
Upon reconvening the meeting, the Independent Trustees reported that after further consideration, they were pleased to renew the Agreement. It was the consensus of the Trustees, including the Independent Trustees, that renewal of the Agreement would be in the best interests of the Fund and its shareholders.
2.) AVAILABILITY OF QUARTERLY SCHEDULE OF INVESTMENTS
The Fund files its complete schedule of portfolio holdings with the Securities and Exchange Commission (“SEC”) for the first and third quarters of each fiscal year on Form N-PORT. The Fund’s Form N-PORT is available on the SEC’s website at http://www.sec.gov.
3.) PROXY VOTING GUIDELINES
The Advisor, is responsible for exercising the voting rights associated with the securities held by the Fund. A description of the policies and procedures used by the Advisor in fulfilling this responsibility is available without charge on the Fund’s website at www.walthausenfunds.com. It is also included in the Fund’s Statement of Additional Information, which is available on the SEC’s website at http://www.sec.gov.
Information regarding how the Fund voted proxies, Form N-PX, relating to portfolio securities during the most recent 12-month period ended June 30th, is available without charge, upon request, by calling our toll free number (1-888-925-8428). This information is also available on the SEC’s web-site at http://www.sec.gov.
4.) LIQUIDITY RISK MANAGEMENT PROGRAM
The Fund has adopted and implemented a written liquidity risk management program as required by Rule 22e-4 (the “Liquidity Rule”) under the 1940 Act. The program is reasonably designed to assess and manage the Fund’s liquidity risk, taking into consideration, among other factors, the Fund’s investment strategies and the liquidity of its portfolio investments during normal and reasonably foreseeable stressed conditions; its short and long-term cash flow projections; and its cash holdings and access to other funding sources.
During the fiscal year ended January 31, 2021, the Board and the Trust’s Liquidity Program Administrator reviewed a report from the Liquidity Program Administrator and the Fund’s investments; they determined that the Fund held adequate levels of cash and highly liquid investments to meet shareholder redemption activities in accordance with applicable requirements. Accordingly, the Board and Committee concluded that (i) the Fund’s liquidity risk management program is reasonably designed to prevent violations of the Liquidity Rule and (ii) the Fund’s liquidity risk management program has been effectively implemented.
2021 Annual Report 19
TRUSTEES AND OFFICERS
(Unaudited) |
The Board of Trustees supervises the business activities of the Trust. The names of the Trustees and executive officers of the Trust are shown below. Each Trustee serves until the Trustee sooner dies, resigns, retires or is removed. Officers hold office for one year and until their respective successors are chosen and qualified.
The Trustees and Officers of the Trust and their principal business activities during the past five years are:
Interested Trustees and Officers
| | | | Principal | Number of | Other |
| Name, Address(1), | Position | Length of | Occupation(s) | Portfolios | Directorships |
| and Year of Birth | with the | Time Served | During | Overseen | Held By |
| | Trust | | Past 5 Years | By Trustee | Trustee |
| |
| John B. Walthausen(2) | President | Since 2007 | Managing Director and Chief | 2 | None |
| Year of Birth: 1945 | and Trustee | | Investment Officer, Walthausen & | | |
| | | | Co., LLC (9/1/07 to Present). | | |
| |
| Mark L. Hodge | Secretary | Since 2008 | Chief Compliance Officer (2007 to | N/A | N/A |
| Year of Birth: 1958 | and Chief | | Present) and Managing Director | | |
| | Compliance | | (2013 to Present), Walthausen & | | |
| | Officer | | Co., LLC. | | |
| |
| Stanley M. Westhoff Jr. | Treasurer | Since 2011 | Equity Analyst (2007 to Present) | N/A | N/A |
| Year of Birth: 1969 | | | and Managing Director (2013 to | | |
| | | | Present), Walthausen & Co., | | |
| LLC. |
(1) The address of each Trustee and Officer is c/o Walthausen Funds, 2691 Route 9, Suite 102, Malta, NY 12020.
(2) John B. Walthausen is considered an "interested person" as defined in Section 2(a)(19) of the Investment Company Act of 1940, as amended, by virtue of his affiliation with the Advisor.
| | | | Principal | Number of | Other |
| Name, Address(1), | Position | Length of | Occupation(s) | Portfolios | Directorships |
| and Year of Birth | with the | Time Served | During | Overseen | Held By |
| | Trust | | Past 5 Years | By Trustee | Trustee |
| |
| Edward A. LaVarnway | Independent | Since 2008 | Retired as of 5/10/13. Executive | 2 | None |
| Year of Birth: 1951 | Trustee | | Director, Fredric Remington Art | | |
| | | | Museum (8/15/05 to 5/10/13). | | |
| |
| John P. Mastriani | Independent | Since | Executive Vice President of The Ayco | 2 | None |
| Year of Birth: 1952 | Trustee | July 2014 | Company, L.P. (“Ayco”) a Goldman | | |
| | | | Sachs Company that provides finan- | | |
| | | | cial consulting and education ser- | | |
| | | | vices, May 2012-March 2014. Senior | | |
| | | | Vice President of Ayco, December | | |
| | | | 2003-May 2012. | | |
| |
| Hany A. Shawky | Independent | Since 2009 | Professor of Finance at the University | 2 | None |
| Year of Birth: 1947 | Trustee | | at Albany, N.Y. (Oct. 2007 to Present). | | |
(1) The address of each Trustee is c/o Walthausen Funds, 2691 Route 9, Suite 102, Malta, NY 12020.
The Statement of Additional Information contains additional and more detailed information about the Trustees and is available without charge by calling the transfer agent at 1-888-925-8428.
2021 Annual Report 20
Board of Trustees
Edward A. LaVarnway
John P. Mastriani
Hany A. Shawky
John B. Walthausen
Investment Advisor and Administrator
Walthausen & Co., LLC
Legal Counsel
Thompson Hine LLP
Custodian
US Bank, N.A.
Dividend Paying Agent,
Shareholders' Servicing Agent,
Transfer Agent
Ultimus Fund Solutions, LLC
Sub-Administrator
Premier Fund Solutions, Inc.
Independent Registered Public Accounting Firm
Cohen & Company, Ltd.
Distributor
Rafferty Capital Markets, LLC |
This report is provided for the general information of the shareholders of the Walthausen
Focused Small Cap Value Fund. This report is not intended for distribution to prospec-
tive investors in the Fund, unless preceded or accompanied by an effective prospectus. |
WALTHAUSEN FOCUSED SMALL CAP VALUE FUND
2691 Route 9, Suite 102
Malta, NY 12020
Item 2. Code of Ethics.
The registrant has adopted a code of ethics that applies to the registrant’s principal executive officer and the principal financial officer. The registrant has not made any amendments to its code of ethics during the covered period. The registrant has not granted any waivers from any provisions of the code of ethics during the covered period. A copy of the registrant’s Code of Ethics is filed herewith.
Item 3. Audit Committee Financial Expert.
The registrant’s Board of Trustees has determined that John P. Mastriani is an audit committee financial expert. Mr. Mastriani is independent for purposes of this Item 3.
Item 4. Principal Accountant Fees and Services.
(a-d) The following table details the aggregate fees billed for each of the last two fiscal years for audit fees, audit-related fees, tax fees and other fees by the principal accountant to the registrant. The principal accountant has provided no services to the adviser or any entity controlled by, or under common control with the adviser that provides ongoing services to the registrant.
| | | FYE 1/31/2021 | | FYE 1/31/2020 |
| Audit Fees | | $26,500 | | $26,500 |
| Audit-Related Fees | | $1,500 | | $1,200 |
| Tax Fees | | $12,000 | | $9,000 |
| All Other Fees | | $800 | | $1,090 |
Nature of Audit-Related Fees: Consent Fee.
Nature of Tax Fees: preparation of Excise Tax Statement, 1120 RIC, and review of year end dividend calculation.
Nature of All Other Fees: Review of Semi-Annual Report
(e) (1) The audit committee approves all audit and non-audit related services and, therefore, has not adopted pre-approval policies and procedures described in paragraph (c)(7) of Rule 2-01 of Regulation S-X.
(e) (2) None of the services described in paragraph (b) through (d) of this Item were approved by the audit committee pursuant to paragraph (c)(7)(i)(C) of Rule 2-01 of Regulation S-X.
(f) All of the principal accountant’s hours spent on auditing the registrant’s financial statements were attributed to work performed by full-time permanent employees of the principal accountant.
(g) The following table indicates the aggregate non-audit fees billed by the registrant’s principal accountant for services to the registrant , the registrant’s investment adviser (not sub-adviser), and any entity controlling, controlled by, or under common control with the adviser that provides ongoing services to the registrant, for the last two years.
| Non-Audit Fees | | FYE 1/31/2021 | | FYE 1/31/2020 |
| Registrant | | $12,800 | | $10,090 |
| Registrant’s Investment Adviser | | $0 | | $0 |
(h) The principal accountant provided no services to the investment adviser or any entity controlling, controlled by, or under common control with the adviser that provides ongoing services to the registrant.
Item 5. Audit Committee of Listed Companies. Not applicable.
Item 6. Investments.
(a) Not applicable. Schedule filed with Item 1.
(b) Not applicable.
Item 7. Disclosure of Proxy Voting Policies and Procedures for Closed-End Management Investment Companies. Not applicable.
Item 8. Portfolio Managers of Closed End Management Investment Companies. Not applicable.
Item 9. Purchases of Equity Securities by Closed-End Management Investment Companies and Affiliated Purchasers. Not applicable.
Item 10. Submission of Matters to a Vote of Security Holders.
The registrant has not adopted procedures by which shareholders may recommend nominees to the registrant’s board of trustees.
Item 11. Controls and Procedures.
(a) The Registrant’s president and chief financial officer concluded that the disclosure controls and procedures (as defined in Rule 30a-3(c) under the Act (17 CFR 270.30a -3(c))) as of a date within 90 days of the filing date of the report that includes the disclosure required by this paragraph, based on the evaluation of these controls and procedures required by Rule 30a-3(b) under the Act (17 CFR 270.30a -3(b)) and Rules 13a-15(b) or 15d-15(b) under the Exchange Act (17 CFR 240.13a -15(b) or 240.15d -15(b)).
(b) There were no changes in the registrant’s internal control over financial reporting (as defined in Rule 30a-3(d) under the Act (17 CFR 270.30a -3(d)) that occurred during the period covered by this report that has materially affected, or is reasonably likely to materially affect, the registrant’s internal control over financial reporting.
Item 12. Disclosure of Securities Lending Activities for Closed-End Management Investment Companies.
Not applicable.
Item 13. Exhibits.
(a)(1) Code of Ethics. Filed herewith.
(a)(2) Certifications pursuant to Section 302 of the Sarbanes-Oxley Act of 2002. Filed herewith.
(a)(3) Not applicable.
(a)(4) Not applicable.
(b) Certification pursuant to Section 906 of the Sarbanes-Oxley Act of 2002. Filed herewith.
Pursuant to the requirements of the Securities Exchange Act of 1934 and the Investment Company Act of 1940, the registrant has duly caused this report to be signed on its behalf by the undersigned, thereunto duly authorized.
By: /s/ John B. Walthausen
John B. Walthausen
President |
Pursuant to the requirements of the Securities Exchange Act of 1934 and the Investment Company Act of 1940, this report has been signed below by the following persons on behalf of the registrant and in the capacities and on the dates indicated.
By: /s/ John B. Walthausen
John B. Walthausen
President |
By: /s/ Stanley M. Westhoff Jr.
Stanley M. Westhoff Jr.
Chief Financial Officer |