UNITED STATES
SECURITIES AND EXCHANGE COMMISSION
Washington, D.C. 20549
FORM N-CSR
CERTIFIED SHAREHOLDER REPORT OF REGISTERED MANAGEMENT
INVESTMENT COMPANIES
Investment Company Act file number 811-22147
Invesco India Exchange-Traded Fund Trust
(Exact name of registrant as specified in charter)
3500 Lacey Road
Downers Grove, IL 60515
(Address of principal executive offices) (Zip code)
Brian Hartigan
President
3500 Lacey Road
Downers Grove, IL 60515
(Name and address of agent for service)
Registrant’s telephone number, including area code: 800-983-0903
Date of fiscal year end: October 31
Date of reporting period: October 31, 2023
Form N-CSR is to be used by management investment companies to file reports with the Commission not later than 10 days after the transmission to stockholders of any report that is required to be transmitted to stockholders under Rule 30e-1 under the Investment Company Act of 1940 (17 CFR 270.30e-1). The Commission may use the information provided on Form N-CSR in its regulatory, disclosure review, inspection, and policymaking roles.
A registrant is required to disclose the information specified by Form N-CSR, and the Commission will make this information public. A registrant is not required to respond to the collection of information contained in Form N-CSR unless the Form displays a currently valid Office of Management and Budget (“OMB”) control number. Please direct comments concerning the accuracy of the information collection burden estimate and any suggestions for reducing the burden to Secretary, Securities and Exchange Commission, 450 Fifth Street, NW, Washington, DC 20549-0609. The OMB has reviewed this collection of information under the clearance requirements of 44 U.S.C. § 3507.
Item 1. Reports to Stockholders.
| (a) | The Registrant’s annual report transmitted to shareholders pursuant to Rule 30e-1 under the Investment Company Act of 1940 is as follows: |
| | | | |

| | | | Invesco Annual Report to Shareholders October 31, 2023 PIN Invesco India ETF |
Table of Contents
The Market Environment
Global Equity
Global equity markets posted gains in November 2022, after better inflation data sparked a rally. However, investor sentiment worsened in December after central banks signaled continued interest rate hikes into 2023, as inflation remained above target levels. International stocks outperformed US stocks, led by results in the UK and the rest of Europe. Emerging market equities also posted gains for the fourth quarter of 2022, driven by China, which eased its zero-COVID-19 policy and started to reopen.
During the fiscal year ended October 31, 2023, interest in India was high as global investors looked for alternatives to China amidst pressure from the US and other developed countries to reshore more of their production and decouple from existing supply chains. Overall, growth was stable, and the Purchasing Managers’ Index, which is designed to provide insight into business conditions and includes individual measures of business output, remained above the neutral threshold of 50, representing growth or expansion. Still, struggles with inflation are ongoing, and rising oil prices coupled with stronger-than-expected monsoon rains rised prices on food and goods, though the Reserve Bank of India has so far been patient on interest rate policy. Global challenges also remain from a strong US dollar and tight monetary policy in developed markets. After a difficult spring driven by inflation and oil prices, moderation of energy costs and the decision by the Reserve Bank of India to forego consecutive rate hikes, Indian markets began to rally. In the latter half of the fiscal year, Indian markets outperformed global and emerging market equities, which was further helped by increasing Indian economic growth.
For the first half of 2023, global equity markets continued to deliver gains amid continued interest rate increases, volatility and a banking crisis. The largest shock came in March 2023 as the failure of two US regional banks, Silicon Valley Bank and Signature Bank, along with the subsequent UBS takeover of Credit Suisse, led to a selloff in US and European financial stocks. Optimism about AI (Artificial Intelligence) boosted technology stocks during the second quarter of 2023. Emerging market equities also posted gains for the first half of 2023, but within the region, China’s equities declined due to weaker-than-expected economic data, real estate developer debt issues and geopolitical concerns.
The global equity rally in the first half of 2023 came to an end in the third quarter as global equity markets declined. Concerns about a slowing global economy and interest rates staying “higher for longer” hampered stock returns. During the quarter, value stocks outperformed growth stocks. Energy was the best performing sector, ending the quarter in positive territory, boosted by rising oil prices as Russia and the Organization of Petroleum Exporting Countries (OPEC) cut
supplies. Developed global equities underperformed emerging market equities. Within emerging markets, China’s equities were weighed down by concerns in the real estate sector, but positive performance in the United Arab Emirates, Turkey and India offset those results.
Global equity markets continued their decline in October 2023, but growth stocks managed to outperform value stocks. Despite higher rates and increased market volatility, both developed market equities and emerging market equities finished the fiscal year ended October 31, 2023, in positive territory.
| | |
| PIN | | Management’s Discussion of Fund Performance |
| | Invesco India ETF (PIN) |
As an index fund, the Invesco India ETF (the “Fund”) is passively managed and seeks to track the investment results (before fees and expenses) of the FTSE India Quality and Yield Select Index (the “Index”). The Fund generally will invest at least 90% of its total assets in the securities that comprise the Index, as well as American depositary receipts (“ADRs”) and global depositary receipts (“GDRs”) that represent securities in the Index.
Strictly in accordance with its guidelines and mandated procedures, FTSE International Limited (the “Index Provider”) compiles, maintains, and calculates the Index, which is a modified market capitalization-weighted index of equity securities that are traded on the National Stock Exchange of India Limited. The Index Provider screens each constituent of the Index to identify those securities that exhibit relatively high yield and high quality pursuant to the Index methodology. Eligible securities ranked in the top 90% based on a company’s trailing 12-month dividend yield are included in the Index. The Index Provider also calculates each security’s quality score by evaluating each security’s: (i) profitability, which is calculated using a company’s return on assets, change in asset turnover, and accruals; and (ii) leverage, which is calculated as the ratio of operating cash flow to total debt. Eligible securities ranked in the top 90% by quality are included in the Index. The Fund generally invests in all of the securities comprising the Index in proportion to their weightings in the Index.
For the fiscal year ended October 31, 2023, on a market price basis, the Fund returned 6.76%. On a net asset value (“NAV”) basis, the Fund returned 7.35%. During the same time period, the Index returned 9.47%. During the fiscal year, the Fund fully replicated the components of the Index; therefore, the Fund’s performance, on a NAV basis, differed from the return of the Index primarily due to the fees and expenses that the Fund incurred during the period, as well as the timing of India capital gains taxes alongside strong market returns.
During this same time period, the MSCI India Index (Net) (the “Benchmark Index”) returned 4.16%. The Benchmark Index is an unmanaged index weighted by market capitalization based on the average performance of approximately 122 securities. The Benchmark Index was selected for its recognition in the marketplace, and its performance comparison is a useful measure for investors as a representation of the Indian equity market.
The performance of the Fund differed from the Benchmark Index in part because the Index utilizes a quality and yield selection and weighting methodology, whereas the Benchmark Index utilizes a market capitalization weighting methodology.
Relative to the Benchmark Index, the Fund was most overweight in the materials sector and most underweight in the financials sector during the fiscal year ended October 31, 2023. The majority of the Fund’s outperformance relative to the Benchmark Index during the period can be attributed to the Fund’s security
selection in and underweight allocation to the utilities sector, followed by security selection in the financials sector.
For the fiscal year ended October 31, 2023, the financials sector contributed most significantly to the Fund’s return, followed by the industrials sector. There were no sectors that detracted from the Fund’s performance.
Positions that contributed most significantly to the Fund’s return for the fiscal year ended October 31, 2023, included Larsen & Toubro Ltd., an industrials company (portfolio average weight of 2.11%), and Housing Development Finance Corp., a financials company (no longer held at fiscal year-end). Positions that detracted most significantly from the Fund’s return included Infosys Ltd., an information technology company (portfolio average weight of 6.55%), and HDFC Bank Ltd., a financials company (portfolio average weight of 0.87%).
| | | | |
Sector Breakdown
(% of the Fund’s Net Assets)
as of October 31, 2023 | |
| Financials | | | 17.93 | |
| Information Technology | | | 14.90 | |
| Consumer Discretionary | | | 12.54 | |
| Energy | | | 12.23 | |
| Materials | | | 11.02 | |
| Industrials | | | 8.74 | |
| Consumer Staples | | | 8.15 | |
| Health Care | | | 5.88 | |
| Utilities | | | 4.14 | |
| Communication Services | | | 3.55 | |
| Real Estate | | | 0.81 | |
| Money Market Funds Plus Other Assets Less Liabilities | | | 0.11 | |
|
Top Ten Fund Holdings*
(% of the Fund’s Net Assets)
as of October 31, 2023 | |
| Security | | | | |
| Reliance Industries Ltd. | | | 9.19 | |
| HDFC Bank Ltd. | | | 6.77 | |
| Infosys Ltd. | | | 5.73 | |
| Tata Consultancy Services Ltd. | | | 4.11 | |
| Hindustan Unilever Ltd. | | | 2.63 | |
| Bharti Airtel Ltd. | | | 2.53 | |
| Larsen & Toubro Ltd. | | | 2.41 | |
| Bajaj Finance Ltd. | | | 2.19 | |
| ICICI Bank Ltd. | | | 1.72 | |
| Maruti Suzuki India Ltd. | | | 1.64 | |
| Total | | | 38.92 | |
| * | Excluding money market fund holdings. |
Invesco India ETF (PIN) (continued)
Growth of a $10,000 Investment
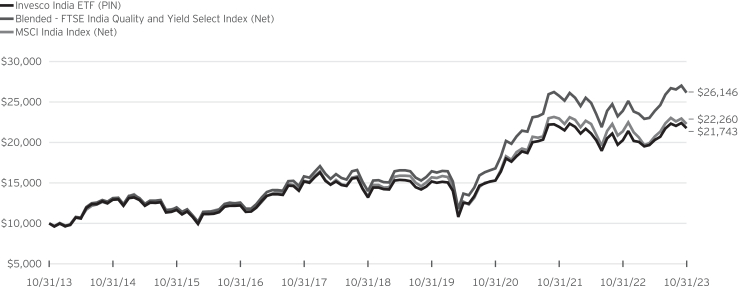
Fund Performance History as of October 31, 2023
| | | | | | | | | | | | | | | | | | | | | | | | | | | | | | | | | | | | | | | | |
| | | 1 Year | | | 3 Years Average
Annualized | | | 3 Years Cumulative | | | 5 Years Average
Annualized | | | 5 Years Cumulative | | | 10 Years Average
Annualized | | | 10 Years Cumulative | | | | | | Fund Inception | |
| Index | | | | | Average
Annualized | | | Cumulative | |
| Blended—FTSE India Quality and Yield Select Index | | | 9.47 | % | | | 15.93 | % | | | 55.79 | % | | | 13.36 | % | | | 87.18 | % | | | 10.09 | % | | | 161.46 | % | | | | | | | 4.97 | % | | | 113.56 | % |
| MSCI India Index (Net) | | | 4.16 | | | | 13.36 | | | | 45.68 | | | | 10.77 | | | | 66.77 | | | | 8.33 | | | | 122.60 | | | | | | | | 4.17 | | | | 89.65 | |
| Fund | | | | | | | | | | | | | | | | | | | | | | | | | | | | | | | | | | | | | | | | |
| NAV Return | | | 7.35 | | | | 12.51 | | | | 42.43 | | | | 10.51 | | | | 64.81 | | | | 8.08 | | | | 117.43 | | | | | | | | 2.99 | | | | 58.64 | |
| Market Price Return | | | 6.76 | | | | 12.88 | | | | 43.82 | | | | 10.64 | | | | 65.80 | | | | 8.20 | | | | 119.84 | | | | | | | | 2.83 | | | | 54.79 | |
Fund Inception: March 5, 2008
Performance quoted above represents past performance. Past performance is not a guarantee of future results and current performance may be higher or lower than performance quoted. Investment returns and principal value will fluctuate, and shares of the Fund (“Fund Shares”), when redeemed or sold, may be worth more or less than their original cost. Fund performance reflects any applicable fee waivers and/or expense reimbursements. Had the adviser not waived fees and/or reimbursed expenses currently or in the past, returns would have been lower. See the current prospectus for more information.
According to the Fund’s current prospectus, the Fund’s expense ratio of 0.78% is expressed as a unitary management fee to cover operating expenses and expenses incurred in connection with managing the portfolio. NAV and Market Price returns assume that dividends and capital gain distributions have been reinvested in the Fund at NAV and Market Price, respectively. The returns shown in the table above do not reflect the deduction of taxes that a shareholder would pay on Fund distributions or the redemption or sale of Fund Shares. See invesco.com/ETFs to find the most recent month-end performance numbers.
Performance results for the indexes are based upon a hypothetical investment in their respective constituent securities. The returns of an index do not represent Fund returns. An investor cannot invest directly in an index. The indexes do not charge management fees or brokerage expenses, and no such fees or expenses were deducted from the hypothetical performance shown. In addition, the results actual investors might have achieved would have differed from those shown because of differences in the timing, amounts of their investments, and fees and expenses associated with an investment in the Fund.
Notes Regarding Indexes and Fund Performance History:
| - | Average Annualized and Cumulative Inception returns for the Fund and indexes are based on the inception date of the Fund. |
| - | Net returns reflect reinvested dividends net of withholding taxes. |
| - | The Blended-FTSE India Quality and Yield Select Index (Net) is comprised of the performance of the Indus India Index, the Fund’s previous underlying index, from Fund inception through the conversion date, June 21, 2019, followed by the performance of the Index, starting from the conversion date through October 31, 2023. |
Invesco India ETF (PIN)
October 31, 2023
Schedule of Investments(a)
| | | | | | | | |
| | | Shares | | Value | |
|
Common Stocks & Other Equity Interests-99.89%(b) | |
|
Communication Services-3.55% | |
Bharti Airtel Ltd. | | | 396,756 | | | $ | 4,357,424 | |
Bharti Airtel Ltd. | | | 25,352 | | | | 163,606 | |
Info Edge India Ltd. | | | 13,087 | | | | 641,982 | |
Sun TV Network Ltd. | | | 14,417 | | | | 109,774 | |
Tata Communications Ltd. | | | 19,503 | | | | 389,609 | |
Zee Entertainment Enterprises Ltd.(c) | | | 141,989 | | | | 442,038 | |
| | | | | | | | |
| | | | | | | 6,104,433 | |
| | | | | | | | |
|
Consumer Discretionary-12.54% | |
Bajaj Auto Ltd. | | | 11,626 | | | | 742,038 | |
Balkrishna Industries Ltd. | | | 13,803 | | | | 423,380 | |
Bata India Ltd. | | | 10,967 | | | | 206,283 | |
Bharat Forge Ltd. | | | 43,101 | | | | 527,692 | |
Bosch Ltd. | | | 1,485 | | | | 346,926 | |
Dixon Technologies India Ltd.(d) | | | 6,097 | | | | 373,588 | |
Eicher Motors Ltd. | | | 23,778 | | | | 941,181 | |
Exide Industries Ltd. | | | 78,276 | | | | 240,115 | |
Hero MotoCorp Ltd. | | | 22,366 | | | | 829,631 | |
Indian Hotels Co. Ltd. (The) | | | 141,684 | | | | 652,444 | |
Jubilant Foodworks Ltd. | | | 61,974 | | | | 372,884 | |
Mahindra & Mahindra Ltd. | | | 160,621 | | | | 2,813,900 | |
Maruti Suzuki India Ltd. | | | 22,649 | | | | 2,827,033 | |
MRF Ltd. | | | 463 | | | | 602,242 | |
Page Industries Ltd. | | | 982 | | | | 446,028 | |
Rajesh Exports Ltd.(c) | | | 23,170 | | | | 124,854 | |
Relaxo Footwears Ltd. | | | 12,282 | | | | 132,469 | |
Samvardhana Motherson International Ltd. | | | 408,538 | | | | 451,185 | |
Sona Blw Precision Forgings Ltd.(d) | | | 60,479 | | | | 393,345 | |
Tata Motors Ltd. | | | 315,328 | | | | 2,380,902 | |
Tata Motors Ltd., Class A | | | 65,293 | | | | 329,450 | |
Titan Co. Ltd. | | | 71,244 | | | | 2,729,364 | |
Trent Ltd. | | | 31,039 | | | | 803,276 | |
Tube Investments of India Ltd. | | | 17,159 | | | | 649,232 | |
TVS Motor Co. Ltd. | | | 40,438 | | | | 772,637 | |
UNO Minda Ltd. | | | 28,552 | | | | 199,826 | |
Vedant Fashions Ltd. | | | 10,368 | | | | 160,908 | |
Whirlpool of India Ltd. | | | 5,203 | | | | 102,624 | |
| | | | | | | | |
| | | | | | | 21,575,437 | |
| | | | | | | | |
|
Consumer Staples-8.15% | |
Britannia Industries Ltd. | | | 20,359 | | | | 1,082,398 | |
Colgate-Palmolive (India) Ltd. | | | 22,724 | | | | 576,924 | |
Dabur India Ltd. | | | 98,951 | | | | 628,585 | |
Emami Ltd. | | | 35,696 | | | | 218,613 | |
Hindustan Unilever Ltd. | | | 151,767 | | | | 4,527,923 | |
ITC Ltd. | | | 510,651 | | | | 2,627,506 | |
Marico Ltd. | | | 88,729 | | | | 571,802 | |
Nestle India Ltd. | | | 6,146 | | | | 1,788,966 | |
Tata Consumer Products Ltd. | | | 104,256 | | | | 1,127,600 | |
Varun Beverages Ltd. | | | 79,734 | | | | 870,326 | |
| | | | | | | | |
| | | | | | | 14,020,643 | |
| | | | | | | | |
Energy-12.23% | | | | | | | | |
Bharat Petroleum Corp. Ltd. | | | 170,903 | | | | 716,896 | |
Coal India Ltd. | | | 387,984 | | | | 1,464,398 | |
Hindustan Petroleum Corp. Ltd.(c) | | | 103,922 | | | | 309,174 | |
Indian Oil Corp. Ltd. | | | 701,697 | | | | 755,983 | |
| | | | | | | | |
| | | Shares | | Value | |
|
Energy-(continued) | |
Oil & Natural Gas Corp. Ltd. | | | 663,601 | | | $ | 1,483,680 | |
Oil India Ltd. | | | 56,508 | | | | 202,831 | |
Petronet LNG Ltd. | | | 128,402 | | | | 307,824 | |
Reliance Industries Ltd. | | | 575,184 | | | | 15,805,708 | |
| | | | | | | | |
| | | | | | | 21,046,494 | |
| | | | | | | | |
|
Financials-17.93% | |
AU Small Finance Bank Ltd.(d) | | | 55,939 | | | | 449,548 | |
Bajaj Finance Ltd. | | | 41,894 | | | | 3,770,139 | |
Bajaj Finserv Ltd. | | | 65,363 | | | | 1,232,189 | |
Bajaj Holdings & Investment Ltd. | | | 4,573 | | | | 380,436 | |
Bandhan Bank Ltd.(d) | | | 135,134 | | | | 347,578 | |
Bank of Baroda | | | 177,070 | | | | 417,267 | |
Cholamandalam Investment and Finance Co. Ltd. | | | 68,821 | | | | 940,083 | |
Federal Bank Ltd. | | | 297,338 | | | | 502,297 | |
HDFC Asset Management Co.
Ltd.(d) | | | 17,210 | | | | 565,131 | |
HDFC Bank Ltd. | | | 656,348 | | | | 11,639,591 | |
ICICI Bank Ltd. | | | 269,040 | | | | 2,957,836 | |
ICICI Lombard General Insurance Co. Ltd.(d) | | | 41,201 | | | | 679,832 | |
IDBI Bank Ltd. | | | 96,951 | | | | 72,022 | |
Kotak Mahindra Bank Ltd. | | | 17,019 | | | | 355,552 | |
L&T Finance Holdings Ltd. | | | 142,999 | | | | 228,431 | |
LIC Housing Finance Ltd. | | | 51,570 | | | | 284,426 | |
Mahindra & Mahindra Financial Services Ltd. | | | 101,374 | | | | 298,733 | |
Muthoot Finance Ltd. | | | 18,303 | | | | 285,497 | |
Nippon Life India Asset Management Ltd.(d) | | | 24,362 | | | | 114,541 | |
Piramal Enterprises Ltd. | | | 21,575 | | | | 252,744 | |
Power Finance Corp. Ltd. | | | 248,627 | | | | 736,396 | |
REC Ltd. | | | 213,529 | | | | 737,591 | |
SBI Cards & Payment Services Ltd. | | | 49,585 | | | | 444,372 | |
Shriram Finance Ltd. | | | 47,846 | | | | 1,080,287 | |
State Bank of India | | | 305,584 | | | | 2,075,734 | |
| | | | | | | | |
| | | | | | | 30,848,253 | |
| | | | | | | | |
|
Health Care-5.88% | |
Alkem Laboratories Ltd. | | | 4,238 | | | | 189,448 | |
Apollo Hospitals Enterprise Ltd. | | | 16,977 | | | | 982,809 | |
Aurobindo Pharma Ltd. | | | 45,382 | | | | 463,038 | |
Cipla Ltd. | | | 87,541 | | | | 1,261,720 | |
Divi’s Laboratories Ltd. | | | 21,816 | | | | 887,838 | |
Dr Lal PathLabs Ltd.(d) | | | 5,965 | | | | 173,321 | |
Dr. Reddy’s Laboratories Ltd. | | | 20,702 | | | | 1,334,623 | |
GlaxoSmithKline Pharmaceuticals Ltd. | | | 7,264 | | | | 124,182 | |
Glenmark Pharmaceuticals Ltd. | | | 25,803 | | | | 231,738 | |
Ipca Laboratories Ltd. | | | 23,377 | | | | 276,213 | |
Laurus Labs Ltd.(d) | | | 66,405 | | | | 288,522 | |
Lupin Ltd. | | | 41,117 | | | | 557,132 | |
Sun Pharmaceutical Industries Ltd. | | | 186,124 | | | | 2,433,553 | |
Syngene International Ltd.(d) | | | 27,880 | | | | 227,805 | |
Torrent Pharmaceuticals Ltd. | | | 16,661 | | | | 385,064 | |
Zydus Lifesciences Ltd. | | | 43,408 | | | | 299,027 | |
| | | | | | | | |
| | | | | | | 10,116,033 | |
| | | | | | | | |
|
Industrials-8.74% | |
3M India Ltd. | | | 482 | | | | 172,302 | |
See accompanying Notes to Financial Statements which are an integral part of the financial statements.
Invesco India ETF (PIN)–(continued)
October 31, 2023
| | | | | | | | |
| | | Shares | | Value | |
|
Industrials-(continued) | |
ABB India Ltd. | | | 9,070 | | | $ | 447,657 | |
Adani Enterprises Ltd. | | | 60,011 | | | | 1,653,931 | |
Adani Ports & Special Economic Zone Ltd. | | | 143,785 | | | | 1,355,236 | |
AIA Engineering Ltd. | | | 6,647 | | | | 280,665 | |
Ashok Leyland Ltd. | | | 245,242 | | | | 493,967 | |
Astral Ltd. | | | 20,353 | | | | 452,425 | |
Bharat Electronics Ltd. | | | 611,509 | | | | 978,679 | |
CG Power and Industrial Solutions Ltd. | | | 109,462 | | | | 512,873 | |
Container Corp. of India Ltd. | | | 47,005 | | | | 388,534 | |
Cummins India Ltd. | | | 23,125 | | | | 465,659 | |
Havells India Ltd. | | | 41,153 | | | | 615,945 | |
Hindustan Aeronautics Ltd.(d) | | | 32,460 | | | | 710,751 | |
Indian Railway Catering & Tourism Corp. Ltd. | | | 51,498 | | | | 411,539 | |
L&T Technology Services Ltd.(d) | | | 4,502 | | | | 226,385 | |
Larsen & Toubro Ltd. | | | 117,905 | | | | 4,147,908 | |
Polycab India Ltd. | | | 8,163 | | | | 482,581 | |
Schaeffler India Ltd. | | | 6,920 | | | | 234,166 | |
Siemens Ltd. | | | 15,241 | | | | 609,750 | |
Voltas Ltd. | | | 39,253 | | | | 394,846 | |
| | | | | | | | |
| | | | | | | 15,035,799 | |
| | | | | | | | |
|
Information Technology-14.90% | |
Coforge Ltd. | | | 9,962 | | | | 596,371 | |
HCL Technologies Ltd. | | | 180,888 | | | | 2,772,238 | |
Honeywell Automation India Ltd. | | | 378 | | | | 163,431 | |
Infosys Ltd. | | | 599,794 | | | | 9,857,920 | |
LTIMindtree Ltd.(d) | | | 15,701 | | | | 954,294 | |
Mphasis Ltd. | | | 13,911 | | | | 354,781 | |
Oracle Financial Services Software Ltd. | | | 3,924 | | | | 182,755 | |
Persistent Systems Ltd. | | | 8,577 | | | | 634,601 | |
Tata Consultancy Services Ltd. | | | 174,704 | | | | 7,068,736 | |
Tata Elxsi Ltd. | | | 5,870 | | | | 537,600 | |
Tech Mahindra Ltd. | | | 103,830 | | | | 1,413,124 | |
Wipro Ltd. | | | 240,415 | | | | 1,102,472 | |
| | | | | | | | |
| | | | | | | 25,638,323 | |
| | | | | | | | |
|
Materials-11.02% | |
Aarti Industries Ltd. | | | 33,862 | | | | 184,828 | |
Ambuja Cements Ltd. | | | 125,178 | | | | 638,153 | |
APL Apollo Tubes Ltd. | | | 29,247 | | | | 549,856 | |
Asian Paints Ltd. | | | 77,177 | | | | 2,776,875 | |
Bayer CropScience Ltd. | | | 2,199 | | | | 129,965 | |
Berger Paints India Ltd. | | | 49,917 | | | | 334,903 | |
Castrol India Ltd. | | | 82,670 | | | | 135,187 | |
Coromandel International Ltd. | | | 18,630 | | | | 233,382 | |
Dalmia Bharat Ltd. | | | 14,084 | | | | 355,954 | |
Deepak Nitrite Ltd. | | | 11,861 | | | | 283,031 | |
Gujarat Fluorochemicals Ltd. | | | 6,779 | | | | 225,829 | |
Hindalco Industries Ltd. | | | 241,153 | | | | 1,330,909 | |
Hindustan Zinc Ltd. | | | 39,637 | | | | 140,702 | |
Jindal Steel & Power Ltd. | | | 66,708 | | | | 507,809 | |
JSW Steel Ltd. | | | 171,909 | | | | 1,520,383 | |
Kansai Nerolac Paints Ltd. | | | 34,494 | | | | 130,546 | |
Linde India Ltd. | | | 3,653 | | | | 263,023 | |
Investment Abbreviations:
REIT-Real Estate Investment Trust
INR-Indian Rupee
| | | | | | | | |
| | | Shares | | | Value | |
|
Materials-(continued) | |
NMDC Ltd. | | | 196,672 | | | $ | 364,248 | |
PI Industries Ltd. | | | 13,833 | | | | 565,100 | |
Pidilite Industries Ltd. | | | 26,028 | | | | 768,410 | |
Shree Cement Ltd. | | | 2,313 | | | | 712,719 | |
Solar Industries India Ltd. | | | 4,160 | | | | 274,831 | |
SRF Ltd. | | | 24,195 | | | | 637,954 | |
Steel Authority of India Ltd. | | | 247,527 | | | | 249,285 | |
Supreme Industries Ltd. | | | 10,939 | | | | 568,801 | |
Tata Steel Ltd. | | | 1,395,214 | | | | 1,989,961 | |
UltraTech Cement Ltd. | | | 19,578 | | | | 1,980,462 | |
UPL Ltd. | | | 90,211 | | | | 585,633 | |
Vedanta Ltd. | | | 201,787 | | | | 524,955 | |
| | | | | | | | |
| | | | | | | 18,963,694 | |
| | | | | | | | |
|
Real Estate-0.81% | |
DLF Ltd. | | | 106,160 | | | | 718,497 | |
Embassy Office Parks REIT | | | 104,259 | | | | 390,269 | |
Oberoi Realty Ltd. | | | 20,066 | | | | 274,231 | |
| | | | | | | | |
| | | | | | | 1,382,997 | |
| | | | | | | | |
|
Utilities-4.14% | |
Adani Total Gas Ltd. | | | 47,448 | | | | 321,587 | |
GAIL (India) Ltd. | | | 451,109 | | | | 647,470 | |
Gujarat Gas Ltd. | | | 34,217 | | | | 168,108 | |
Indraprastha Gas Ltd. | | | 59,921 | | | | 275,176 | |
JSW Energy Ltd. | | | 65,385 | | | | 302,977 | |
NHPC Ltd. | | | 390,778 | | | | 235,615 | |
NTPC Ltd. | | | 809,983 | | | | 2,293,981 | |
Power Grid Corp. of India Ltd. | | | 717,120 | | | | 1,741,149 | |
Tata Power Co. Ltd. (The) | | | 283,206 | | | | 814,153 | |
Torrent Power Ltd. | | | 36,999 | | | | 323,024 | |
| | | | | | | | |
| | | | | | | 7,123,240 | |
| | | | | | | | |
Total Common Stocks & Other Equity Interests
(Cost $163,676,164) | | | | 171,855,346 | |
| | | | | | | | |
| | |
| | | Principal
Amount | | | | |
|
Non-U.S. Dollar Denominated Bonds & Notes-0.00%(e) | |
|
Consumer Staples-0.00% | |
Britannia Industries Ltd., Series N3, 5.50%, 06/03/2024
(Cost $6,124) | | | INR 445,614 | | | | 5,281 | |
| | | | | | | | |
| | |
| | | Shares | | | | |
Money Market Funds-0.69% | |
Invesco Government & Agency Portfolio, Institutional Class,
5.27%(f)(g)
(Cost $1,186,438) | | | 1,186,438 | | | | 1,186,438 | |
| | | | | | | | |
TOTAL INVESTMENTS IN SECURITIES-100.58%
(Cost $164,868,726) | | | | 173,047,065 | |
OTHER ASSETS LESS LIABILITIES-(0.58)% | | | | (1,002,615 | ) |
| | | | | | | | |
NET ASSETS-100.00% | | | | | | $ | 172,044,450 | |
| | | | | | | | |
See accompanying Notes to Financial Statements which are an integral part of the financial statements.
Invesco India ETF (PIN)–(continued)
October 31, 2023
Notes to Schedule of Investments:
| (a) | Industry and/or sector classifications used in this report are generally according to the Global Industry Classification Standard, which was developed by and is the exclusive property and a service mark of MSCI Inc. and Standard & Poor’s. |
| (b) | Country of issuer and/or credit risk exposure listed in Common Stocks & Other Equity Interests has been determined to be India unless otherwise noted. |
| (c) | Non-income producing security. |
| (d) | Security purchased or received in a transaction exempt from registration under the Securities Act of 1933, as amended (the “1933 Act”). The security may be resold pursuant to an exemption from registration under the 1933 Act, typically to qualified institutional buyers. The aggregate value of these securities at October 31, 2023 was $5,504,641, which represented 3.20% of the Fund’s Net Assets. |
| (e) | Foreign denominated security. Principal amount is denominated in the currency indicated. |
| (f) | Affiliated holding. Affiliated holdings are investments in entities which are under common ownership or control of Invesco Ltd. or are investments in entities in which the Fund owns 5% or more of the outstanding voting securities. The table below shows the Fund’s transactions in, and earnings from, its investments in affiliates for the fiscal year ended October 31, 2023. |
| | | | | | | | | | | | | | | | | | | | | | | | | | | | |
| | | Value
October 31, 2022 | | | Purchases
at Cost | | | Proceeds
from Sales | | | Change in
Unrealized
Appreciation | | | Realized
Gain | | | Value
October 31, 2023 | | | Dividend
Income | |
Investments in Affiliated Money Market Funds: | | | | | | | | | | | | | | | | | | | | | | | | | | | | |
Invesco Government & Agency Portfolio, Institutional Class | | | $1,199,581 | | | | $10,191,284 | | | | $(10,204,427) | | | | $- | | | | $- | | | | $1,186,438 | | | | $45,557 | |
| (g) | The rate shown is the 7-day SEC standardized yield as of October 31, 2023. |
See accompanying Notes to Financial Statements which are an integral part of the financial statements.
Statement of Assets and Liabilities
October 31, 2023
| | | | | | | | | | | | |
| | | Invesco India ETF
(PIN) | |
Assets: | | | | | | | | | | | | |
Unaffiliated investments in securities, at value | | | | | | $ | 171,860,627 | | | | | |
Affiliated investments in securities, at value | | | | | | | 1,186,438 | | | | | |
Foreign currencies, at value | | | | | | | 1,146,113 | | | | | |
Receivable for: | | | | | | | | | | | | |
Dividends and interest | | | | | | | 123,455 | | | | | |
Fund shares sold | | | | | | | 9,028 | | | | | |
Foreign tax reclaims | | | | | | | 303,724 | | | | | |
| | | | | | | | | | | | |
| | | |
Total assets | | | | | | | 174,629,385 | | | | | |
| | | | | | | | | | | | |
| | | |
Liabilities: | | | | | | | | | | | | |
Payable for: | | | | | | | | | | | | |
Investments purchased | | | | | | | 643,647 | | | | | |
Accrued unitary management fees | | | | | | | 106,517 | | | | | |
Accrued tax expenses | | | | | | | 1,834,771 | | | | | |
| | | | | | | | | | | | |
| | | |
Total liabilities | | | | | | | 2,584,935 | | | | | |
| | | | | | | | | | | | |
Net Assets | | | | | | $ | 172,044,450 | | | | | |
| | | | | | | | | | | | |
| | | |
Net assets consist of: | | | | | | | | | | | | |
Shares of beneficial interest | | | | | | $ | 167,068,270 | | | | | |
Distributable earnings | | | | | | | 4,976,180 | | | | | |
| | | | | | | | | | | | |
Net Assets | | | | | | $ | 172,044,450 | | | | | |
| | | | | | | | | | | | |
Shares outstanding (unlimited amount authorized, $ 0.01 par value) | | | | | | | 7,540,000 | | | | | |
Net asset value | | | | | | $ | 22.82 | | | | | |
| | | | | | | | | | | | |
Market price | | | | | | $ | 22.82 | | | | | |
| | | | | | | | | | | | |
Unaffiliated investments in securities, at cost | | | | | | $ | 163,682,288 | | | | | |
| | | | | | | | | | | | |
Affiliated investments in securities, at cost | | | | | | $ | 1,186,438 | | | | | |
| | | | | | | | | | | | |
Foreign currencies, at cost | | | | | | $ | 1,146,265 | | | | | |
| | | | | | | | | | | | |
See accompanying Notes to Financial Statements which are an integral part of the financial statements.
Statement of Operations
For the year ended October 31, 2023
| | | | | | | | | | |
| | | Invesco India ETF
(PIN) | |
| | | |
Investment income: | | | | | | | | | | |
Unaffiliated interest income | | | | $ | 297 | | | | | |
Unaffiliated dividend income | | | | | 1,834,411 | | | | | |
Affiliated dividend income | | | | | 45,557 | | | | | |
Foreign withholding tax | | | | | (433,373 | ) | | | | |
| | | | | | | | | | |
| | | |
Total investment income | | | | | 1,446,892 | | | | | |
| | | | | | | | | | |
| | | |
Expenses: | | | | | | | | | | |
Unitary management fees | | | | | 862,688 | | | | | |
| | | | | | | | | | |
Less: Waivers | | | | | (915 | ) | | | | |
| | | | | | | | | | |
| | | |
Net expenses | | | | | 861,773 | | | | | |
| | | | | | | | | | |
| | | |
Net investment income | | | | | 585,119 | | | | | |
| | | | | | | | | | |
| | | |
Realized and unrealized gain (loss) from: | | | | | | | | | | |
Net realized gain (loss) from: | | | | | | | | | | |
Unaffiliated investment securities (net of foreign taxes of $1,120,484) | | | | | 4,379,340 | | | | | |
Foreign currencies | | | | | (182,488 | ) | | | | |
| | | | | | | | | | |
| | | |
Net realized gain | | | | | 4,196,852 | | | | | |
| | | | | | | | | | |
| | | |
Change in net unrealized appreciation of: | | | | | | | | | | |
Unaffiliated investment securities (net of change of deferred foreign taxes of $140,226) | | | | | 1,396,744 | | | | | |
Foreign currencies | | | | | 399 | | | | | |
| | | | | | | | | | |
| | | |
Change in net unrealized appreciation | | | | | 1,397,143 | | | | | |
| | | | | | | | | | |
| | | |
Net realized and unrealized gain | | | | | 5,593,995 | | | | | |
| | | | | | | | | | |
| | | |
Net increase in net assets resulting from operations | | | | $ | 6,179,114 | | | | | |
| | | | | | | | | | |
See accompanying Notes to Financial Statements which are an integral part of the financial statements.
Statement of Changes in Net Assets
For the years ended October 31, 2023 and 2022
| | | | | | | | | | | | |
| | | Invesco India ETF (PIN) | |
| | | | | | | | | | |
| | | 2023 | | | | | �� | 2022 | |
Operations: | | | | | | | | | | | | |
Net investment income | | $ | 585,119 | | | | | | | $ | 488,767 | |
Net realized gain | | | 4,196,852 | | | | | | | | 11,256,525 | |
Change in net unrealized appreciation (depreciation) | | | 1,397,143 | | | | | | | | (21,846,323 | ) |
| | | | | | | | | | | | |
Net increase (decrease) in net assets resulting from operations | | | 6,179,114 | | | | | | | | (10,101,031 | ) |
| | | | | | | | | | | | |
| | | |
Distributions to Shareholders from: | | | | | | | | | | | | |
Distributable earnings | | | (13,080,061 | ) | | | | | | | (6,889,923 | ) |
| | | | | | | | | | | | |
| | | |
Shareholder Transactions: | | | | | | | | | | | | |
Proceeds from shares sold | | | 81,974,809 | | | | | | | | 20,729,135 | |
Value of shares repurchased | | | - | | | | | | | | (27,817,123 | ) |
Transaction fees | | | 225,110 | | | | | | | | 154,234 | |
| | | | | | | | | | | | |
Net increase (decrease) in net assets resulting from share transactions | | | 82,199,919 | | | | | | | | (6,933,754 | ) |
| | | | | | | | | | | | |
Net increase (decrease) in net assets | | | 75,298,972 | | | | | | | | (23,924,708 | ) |
| | | | | | | | | | | | |
| | | |
Net assets: | | | | | | | | | | | | |
Beginning of year | | | 96,745,478 | | | | | | | | 120,670,186 | |
| | | | | | | | | | | | |
End of year | | $ | 172,044,450 | | | | | | | $ | 96,745,478 | |
| | | | | | | | | | | | |
| | | |
Changes in Shares Outstanding: | | | | | | | | | | | | |
Shares sold | | | 3,560,000 | | | | | | | | 810,000 | |
Shares repurchased | | | - | | | | | | | | (1,140,000 | ) |
Shares outstanding, beginning of year | | | 3,980,000 | | | | | | | | 4,310,000 | |
| | | | | | | | | | | | |
Shares outstanding, end of year | | | 7,540,000 | | | | | | | | 3,980,000 | |
| | | | | | | | | | | | |
See accompanying Notes to Financial Statements which are an integral part of the financial statements.
Financial Highlights
Invesco India ETF (PIN)
| | | | | | | | | | | | | | | | | | | | |
| | | Years Ended October 31, | |
| | | | |
| | | | | |
| | | 2023 | | | 2022 | | | 2021 | | | 2020 | | | 2019 | |
| | | | | |
Per Share Operating Performance: | | | | | | | | | | | | | | | | | | | | |
Net asset value at beginning of year | | $ | 24.31 | | | $ | 28.00 | | | $ | 19.68 | | | $ | 25.25 | | | $ | 22.24 | |
| | | | | | | | | | | | | | | | | | | | |
Net investment income(a) | | | 0.12 | | | | 0.12 | | | | 0.11 | | | | 0.11 | | | | 0.24 | |
Net realized and unrealized gain (loss) on investments | | | 1.43 | | | | (2.25 | ) | | | 8.45 | | | | (0.06 | ) | | | 3.02 | |
| | | | | | | | | | | | | | | | | | | | |
| | | | | |
Total from investment operations. | | | 1.55 | | | | (2.13 | ) | | | 8.56 | | | | 0.05 | | | | 3.26 | |
| | | | | | | | | | | | | | | | | | | | |
Distributions to shareholders from: | | | | | | | | | | | | | | | | | | | | |
Net investment income | | | (0.10 | ) | | | (0.11 | ) | | | (0.26 | ) | | | (0.07 | ) | | | (0.28 | ) |
Net realized gains | | | (2.99 | ) | | | (1.49 | ) | | | - | | | | (5.48 | ) | | | - | |
Return of capital | | | - | | | | - | | | | - | | | | (0.10 | ) | | | - | |
| | | | | | | | | | | | | | | | | | | | |
| | | | | |
Total distributions | | | (3.09 | ) | | | (1.60 | ) | | | (0.26 | ) | | | (5.65 | ) | | | (0.28 | ) |
| | | | | | | | | | | | | | | | | | | | |
| | | | | |
Transaction fees(a) | | | 0.05 | | | | 0.04 | | | | 0.02 | | | | 0.03 | | | | 0.03 | |
| | | | | | | | | | | | | | | | | | | | |
| | | | | |
Net asset value at end of year | | $ | 22.82 | | | $ | 24.31 | | | $ | 28.00 | | | $ | 19.68 | | | $ | 25.25 | |
| | | | | | | | | | | | | | | | | | | | |
| | | | | |
Market price at end of year(b) | | $ | 22.82 | | | $ | 24.42 | | | $ | 28.08 | | | $ | 19.46 | | | $ | 25.12 | |
| | | | | | | | | | | | | | | | | | | | |
Net Asset Value Total Return(c) | | | 7.35 | % | | | (7.63 | )% | | | 43.64 | % | | | 0.75 | % | | | 14.85 | % |
Market Price Total Return(c) | | | 6.76 | % | | | (7.53 | )% | | | 45.68 | % | | | 0.08 | % | | | 15.19 | % |
Ratios/Supplemental Data: | | | | | | | | | | | | | | | | | | | | |
Net assets at end of year (000’s omitted) | | $ | 172,044 | | | $ | 96,745 | | | $ | 120,670 | | | $ | 91,491 | | | $ | 132,566 | |
Ratio to average net assets of: | | | | | | | | | | | | | | | | | | | | |
Expenses | | | 0.78 | % | | | 0.78 | % | | | 0.78 | % | | | 0.78 | % | | | 0.85 | % |
Net investment income | | | 0.53 | % | | | 0.46 | % | | | 0.45 | % | | | 0.60 | % | | | 0.98 | % |
Portfolio turnover rate(d) | | | 35 | % | | | 38 | % | | | 36 | % | | | 42 | % | | | 160 | % |
| (a) | Based on average shares outstanding. |
| (b) | The mean between the last bid and ask prices. |
| (c) | Net asset value total return is calculated assuming an initial investment made at the net asset value at the beginning of the period, reinvestment of all dividends and distributions at net asset value during the period, and redemption at net asset value on the last day of the period. Net asset value total return includes adjustments in accordance with accounting principles generally accepted in the United States of America and as such, the net asset value for financial reporting purposes and the returns based upon those net asset values may differ from the net asset value and returns for shareholder transactions. Market price total return is calculated assuming an initial investment made at the market price at the beginning of the period, reinvestment of all dividends and distributions at market price during the period, and sale at the market price on the last day of the period. Total investment returns calculated for a period of less than one year are not annualized. |
| (d) | Portfolio turnover rate is not annualized for periods less than one year, if applicable, and does not include securities received or delivered from processing creations or redemptions. |
See accompanying Notes to Financial Statements which are an integral part of the financial statements.
Notes to Financial Statements
Invesco India Exchange-Traded Fund Trust
October 31, 2023
NOTE 1–Organization
Invesco India Exchange-Traded Fund Trust (the “Trust”) was organized as a Massachusetts business trust and is authorized to have multiple series of portfolios. The Trust is an open-end management investment company registered under the Investment Company Act of 1940, as amended (the “1940 Act”). This report includes Invesco India ETF (PIN) (the “Fund”). Prior to March 25, 2019, the Fund invested substantially all of its assets in Invesco Mauritius PIN, a wholly-owned subsidiary organized in Mauritius (the “Subsidiary”) to gain exposure to Indian equity securities. Effective March 25, 2019, the Subsidiary liquidated and ceased operations. For the period November 1, 2018 through March 25, 2019, the Financial Highlights report the operations of the Fund and the Subsidiary on a consolidated basis.
The Fund represents a separate series of the Trust. The shares of the Fund are referred to herein as “Shares” or “Fund’s Shares.” The Fund’s Shares are listed on NYSE Arca, Inc.
The market price of a Share may differ to some degree from the Fund’s net asset value (“NAV”). Unlike conventional mutual funds, the Fund issues and redeems Shares on a continuous basis, at NAV, only in a large specified number of Shares, each called a “Creation Unit.” Creation Units are issued and redeemed principally in exchange for the deposit or delivery of cash. Except when aggregated in Creation Units by authorized participants (“APs”), Shares are not individually redeemable securities of the Fund.
The investment objective of the Fund is to seek to track the investment results (before fees and expenses) of the FTSE India Quality and Yield Select Index (the “Underlying Index”).
NOTE 2–Significant Accounting Policies
The following is a summary of the significant accounting policies followed by the Fund in preparation of its financial statements.
The Fund is an investment company and accordingly follows the investment company accounting and reporting guidance in accordance with Financial Accounting Standards Board Accounting Standards Codification Topic 946, Financial Services–Investment Companies.
| A. | Security Valuation - Securities, including restricted securities, are valued according to the following policies: |
A security listed or traded on an exchange is generally valued at its trade price or official closing price that day as of the close of the exchange where the security is principally traded or, lacking any trades or official closing price on a particular day, the security may be valued at the closing bid or ask price on that day. Securities traded in the over-the-counter market are valued based on prices furnished by independent pricing services or market makers. When such securities are valued using prices provided by an independent pricing service they may be considered fair valued. Futures contracts are valued at the daily settlement price set by an exchange on which they are principally traded. Where a final settlement price exists, exchange-traded options are valued at the final settlement price from the exchange where the option principally trades. Where a final settlement price does not exist, exchange-traded options are valued at the mean between the last bid and ask price generally from the exchange where the option principally trades.
Securities of investment companies that are not exchange-traded (e.g., open-end mutual funds) are valued using such company’s end-of-business-day NAV per share.
Deposits, other obligations of U.S. and non-U.S. banks and financial institutions are valued at their daily account value.
Fixed income securities (including convertible debt securities) generally are valued on the basis of prices provided by independent pricing services. Prices provided by the pricing service may be determined without exclusive reliance on quoted prices, and may reflect appropriate factors such as institution-size trading in similar groups of securities, developments related to specific securities, dividend rate (for unlisted equities), yield (for debt obligations), quality, type of issue, coupon rate (for debt obligations), maturity (for debt obligations), individual trading characteristics and other market data. Securities with a demand feature exercisable within one to seven days are valued at par. Pricing services generally value debt obligations assuming orderly transactions of institutional round lot size, but the Fund may hold or transact in the same securities in smaller, odd lot sizes. Odd lots often trade at lower prices than institutional round lots, and their value may be adjusted accordingly. Debt obligations are subject to interest rate and credit risks. In addition, all debt obligations involve some risk of default with respect to interest and/or principal payments.
Foreign securities’ (including foreign exchange contracts’) prices are converted into U.S. dollar amounts using the applicable exchange rates as of the close of the London world markets. If market quotations are available and reliable for foreign exchange-traded equity securities, the securities will be valued at the market quotations. Invesco Capital Management LLC (the “Adviser”) may use various pricing services to obtain market quotations as well as fair value prices. Because trading hours for certain foreign securities end before the close of the New York Stock Exchange (“NYSE”), closing market quotations may become not representative of market value in the Adviser’s judgment (“unreliable”). If, between the time trading ends on a particular security and the close of the customary trading session on the NYSE, a significant event occurs that makes the
closing price of the security unreliable, the Adviser may fair value the security. If the event is likely to have affected the closing price of the security, the security will be valued at fair value in good faith in accordance with Board-approved policies and related Adviser procedures (“Valuation Procedures”). Adjustments to closing prices to reflect fair value may also be based on a screening process of an independent pricing service to indicate the degree of certainty, based on historical data, that the closing price in the principal market where a foreign security trades is not the current value as of the close of the NYSE. Foreign securities’ prices meeting the degree of certainty that the price is not reflective of current value will be priced at the indication of fair value from the independent pricing service. Multiple factors may be considered by the independent pricing service in determining adjustments to reflect fair value and may include information relating to sector indices, American depositary receipts and domestic and foreign index futures. Foreign securities may have additional risks including exchange rate changes, the potential for sharply devalued currencies and high inflation, political and economic upheaval, the relative lack of issuer information, relatively low market liquidity and the potential lack of strict financial and accounting controls and standards.
Unlisted securities will be valued using prices provided by independent pricing services or by another method that the Adviser, in its judgment, believes better reflects the security’s fair value in accordance with the Valuation Procedures.
Securities for which market prices are not provided by any of the above methods may be valued based upon quotes furnished by independent sources. The mean between the last bid and ask prices may be used to value debt obligations, including corporate loans, and unlisted equity securities.
Securities for which market quotations are not readily available are fair valued by the Adviser in accordance with the Valuation Procedures. If a fair value price provided by a pricing service is unreliable, the Adviser will fair value the security using the Valuation Procedures. Issuer-specific events, market trends, bid/ask quotes of brokers and information providers and other market data may be reviewed in the course of making a good faith determination of a security’s fair value.
The Fund may invest in securities that are subject to interest rate risk, meaning the risk that the prices will generally fall as interest rates rise and, conversely, the prices will generally rise as interest rates fall. Specific securities differ in their sensitivity to changes in interest rates depending on their individual characteristics. Changes in interest rates may result in increased market volatility, which may affect the value and/or liquidity of certain Fund investments.
Valuations change in response to many factors, including the historical and prospective earnings of the issuer, the value of the issuer’s assets, general market conditions which are not specifically related to the particular issuer, such as real or perceived adverse economic conditions, changes in the general outlook for revenues or corporate earnings, changes in interest or currency rates, regional or global instability, natural or environmental disasters, widespread disease or other public health issues, war, acts of terrorism, significant governmental actions or adverse investor sentiment generally and market liquidity. Because of the inherent uncertainties of valuation, the values reflected in the financial statements may materially differ from the value received upon actual sale of those investments.
The price the Fund could receive upon the sale of any investment may differ from the Adviser’s valuation of the investment, particularly for securities that are valued using a fair valuation technique. When fair valuation techniques are applied, the Adviser uses available information, including both observable and unobservable inputs and assumptions, to determine a methodology that will result in a valuation that the Adviser believes approximates market value. Fund securities that are fair valued may be subject to greater fluctuation in their value from one day to the next than would be the case if market quotations were used. Because of the inherent uncertainties of valuation, and the degree of subjectivity in such decisions, the Fund could realize a greater or lesser than expected gain or loss upon the sale of the investment.
| B. | Investment Transactions and Investment Income - Investment transactions are accounted for on a trade date basis. Realized gains and losses from the sale or disposition of securities are computed on the specific identified cost basis. Interest income is recorded on an accrual basis from settlement date and includes coupon interest and amortization of premium and accretion of discount on debt securities as applicable. Pay-in-kind interest income and non-cash dividend income received in the form of securities in-lieu of cash are recorded at the fair value of the securities received. Dividend income (net of withholding tax, if any) is recorded on the ex-dividend date. Realized gains, dividends and interest received by the Fund may give rise to withholding and other taxes imposed by foreign countries. Tax conventions between certain countries and the United States may reduce or eliminate such taxes. |
The Fund may periodically participate in litigation related to the Fund’s investments. As such, the Fund may receive proceeds from litigation settlements. Any proceeds received are included in the Statement of Operations as realized gain (loss) for investments no longer held and as unrealized gain (loss) for investments still held.
Brokerage commissions and mark ups are considered transaction costs and are recorded as an increase to the cost basis of securities purchased and/or a reduction of proceeds on a sale of securities. Such transaction costs are included in the determination of net realized and unrealized gain (loss) from investment securities reported in the Statement of Operations and the Statement of Changes in Net Assets and the net realized and unrealized gains (losses) on securities per share in the Financial Highlights. Transaction costs are included in the calculation of the Fund’s NAV and, accordingly, they reduce the Fund’s total returns. These transaction costs are not considered operating expenses and are not reflected in net investment income reported in the Statement of Operations and the Statement of Changes in Net Assets, or the net investment income per share and the ratios of expenses and net investment income reported in the Financial Highlights, nor are they limited by any expense limitation arrangements between the Fund and the Adviser.
| C. | Country Determination - For the purposes of presentation in the Schedule of Investments, the Adviser may determine the country in which an issuer is located and/or credit risk exposure based on various factors. These factors include whether the Fund’s Underlying Index has made a country determination and may include the laws of the country under which the issuer is organized, where the issuer maintains a principal office, the country in which the issuer derives 50% or more of its total revenues, the country that has the primary market for the issuer’s securities and its “country of risk” as determined by a third party service provider, as well as other criteria. Among the other criteria that may be evaluated for making this determination are the country in which the issuer maintains 50% or more of its assets, the type of security, financial guarantees and enhancements, the nature of the collateral and the sponsor organization. Country of issuer and/or credit risk exposure has been determined to be India, unless otherwise noted. |
| D. | Dividends and Distributions to Shareholders - The Fund declares and pays dividends from net investment income, if any, to its shareholders quarterly and records such dividends on the ex-dividend date. Generally, the Fund distributes net realized taxable capital gains, if any, annually in cash and records them on the ex-dividend date. Such distributions on a tax basis are determined in conformity with federal income tax regulations, which may differ from accounting principles generally accepted in the United States of America (“GAAP”). Distributions in excess of tax basis earnings and profits, if any, are reported in such Fund’s financial statements as a tax return of capital at fiscal year-end. |
| E. | Taxes - The Fund intends to comply with the provisions of the Internal Revenue Code of 1986, as amended (the “Internal Revenue Code”), applicable to regulated investment companies and to distribute substantially all of the Fund’s taxable earnings to its shareholders. As such, the Fund will not be subject to federal income taxes on otherwise taxable income (including net realized gains) that is distributed to the shareholders. Therefore, no provision for federal income taxes is recorded in the financial statements. Under the applicable foreign tax laws, a withholding tax may be imposed on interest, dividends and capital gains at various rates. |
The Fund recognizes the tax benefits of uncertain tax positions only when the position is more likely than not to be sustained. Management has analyzed the Fund’s uncertain tax positions and concluded that no liability for unrecognized tax benefits should be recorded related to uncertain tax positions. Management is not aware of any tax positions for which it is reasonably possible that the total amounts of unrecognized tax benefits will change materially in the next 12 months.
Income and capital gain distributions are determined in accordance with federal income tax regulations, which may differ from GAAP. These differences are primarily due to differing book and tax treatments for in-kind transactions, losses deferred due to wash sales and passive foreign investment company adjustments, if any.
The Fund files U.S. federal tax returns and tax returns in certain other jurisdictions. Generally, the Fund is subject to examinations by such taxing authorities for up to three years after the filing of the return for the tax period.
The Fund is subject to a 15% short-term capital gains tax in India on the sale of shares of Indian resident companies. Additionally, the Fund is subject to a 10% long-term capital gains tax in India on the sale of shares of Indian resident companies purchased after April 1, 2018. Withholding tax rates on dividends and interest received from Indian resident companies vary from 20% to 25% for dividends and 5% to 40% for interest. Changes in the Indian tax law could reduce the return to the Fund on its investments and the return received by Fund shareholders.
| F. | Foreign Withholding Taxes - The Fund is subject to foreign withholding tax imposed by certain foreign countries in which the Fund may invest. Withholding taxes are incurred on certain foreign dividends and are accrued at the time the dividend is recognized based on applicable foreign tax laws. The Fund may file withholding tax refunds in certain jurisdictions to seek to recover a portion of amounts previously withheld. The Fund will record a receivable for such tax refunds based on several factors including; an assessment of a jurisdiction’s legal obligation to pay reclaims, administrative practices and payment history. Any receivables recorded will be shown under receivables for Foreign tax reclaims on the Statement of Assets and Liabilities. There is no guarantee that the Fund will receive refunds applied for in a timely manner or at all. |
As a result of recent court rulings in certain countries across the European Union, tax refunds for previously withheld taxes on dividends earned in those countries have been received by investment companies. Any tax refund payments are reflected as Foreign withholding tax claims in the Statement of Operations, and any related interest is included in Unaffiliated interest income. The Fund may incur fees paid to third party providers that assist in the recovery of the tax reclaims. These fees are excluded from the unitary management fee and are reflected on the Statement of Operations as Professional fees, if any. In the event tax refunds received by the Fund during the fiscal year exceed the foreign withholding taxes paid by the Fund for the year, and the Fund previously passed foreign tax credits on to its shareholders, the Fund intends to enter into a closing agreement with the Internal Revenue Service in order to pay the associated liability on behalf of the Fund’s shareholders. For the fiscal year ended October 31, 2023, the Fund did not enter into any closing agreements.
| G. | Expenses -The Fund has agreed to pay an annual unitary management fee to the Adviser. Out of the unitary management fee, the Adviser pays for substantially all expenses of the Fund, including the costs of transfer agency, custody, fund administration, legal, audit and other services, except for distribution fees, if any, brokerage expenses, taxes, interest, acquired fund fees and expenses, if any, litigation expenses and other extraordinary expenses, including proxy expenses |
| | (except for such proxies related to: (i) changes to the Investment Advisory Agreement, (ii) the election of any Board member who is an “interested person” of the Trust or the Adviser (an “Interested Trustee”), or (iii) any other matters that directly benefit the Adviser). |
To the extent the Fund invests in other investment companies, the expenses shown in the accompanying financial statements reflect the expenses of the Fund and do not include any expenses of the investment companies in which it invests. The effects of such investment companies’ expenses are included in the realized and unrealized gain or loss on the investments in the investment companies.
| H. | Accounting Estimates - The preparation of the financial statements in accordance with GAAP requires management to make estimates and assumptions that affect the reported amounts and disclosures in the financial statements, including estimates and assumptions related to taxation. Actual results could differ from these estimates. In addition, the Fund monitors for material events or transactions that may occur or become known after the period-end date and before the date the financial statements are released to print. |
| I. | Indemnifications - Under the Trust’s organizational documents, its Officers and Trustees are indemnified against certain liabilities arising out of the performance of their duties to the Trust. Each Board member who is not an “interested person” (as defined in the 1940 Act) of the Trust or the Adviser (each, an “Independent Trustee”) is also indemnified against certain liabilities arising out of the performance of their duties to the Trust pursuant to an Indemnification Agreement between such trustee and the Trust. Additionally, in the normal course of business, the Trust enters into contracts with service providers that contain general indemnification clauses. The Trust’s maximum exposure under these arrangements is unknown, as this would involve future claims that may be made against the Trust that have not yet occurred. The risk of material loss as a result of such indemnification claims is considered remote. |
| J. | Foreign Currency Translations - Foreign currency is valued at the close of the NYSE based on quotations posted by banks and major currency dealers. Portfolio securities and other assets and liabilities denominated in foreign currencies are translated into U.S. dollar amounts at the date of valuation. Purchases and sales of portfolio securities (net of foreign taxes withheld on disposition) and income items denominated in foreign currencies are translated into U.S. dollar amounts on the respective dates of such transactions. The Fund does not separately account for the portion of the results of operations resulting from changes in foreign exchange rates on investments and the fluctuations arising from changes in market prices of securities held. The combined results of changes in foreign exchange rates and the fluctuation of market prices on investments (net of estimated foreign tax withholding) are included with the net realized and unrealized gain or loss from investments in the Statement of Operations. Reported net realized foreign currency gains or losses arise from (1) sales of foreign currencies, (2) currency gains or losses realized between the trade and settlement dates on securities transactions, and (3) the difference between the amounts of dividends, interest, and foreign withholding taxes recorded on the Fund’s books and the U.S. dollar equivalent of the amounts actually received or paid. Net unrealized foreign currency gains and losses arise from changes in the fair values of assets and liabilities, other than investments in securities at fiscal period-end, resulting from changes in exchange rates. |
The Fund may invest in foreign securities, which may be subject to foreign taxes on income, gains on investments or currency repatriation, a portion of which may be recoverable. Foreign taxes, if any, are recorded based on the tax regulations and rates that exist in the foreign markets in which the Fund invests.
AP Concentration Risk. Only APs may engage in creation or redemption transactions directly with the Fund. The Fund has a limited number of institutions that may act as APs, and such APs have no obligation to submit creation or redemption orders. Consequently, there is no assurance that APs will establish or maintain an active trading market for the Shares. This risk may be heightened to the extent that securities held by the Fund are traded outside a collateralized settlement system. In that case, APs may be required to post collateral on certain trades on an agency basis (i.e., on behalf of other market participants), which only a limited number of APs may be able to do. In addition, to the extent that APs exit the business or are unable to proceed with creation and/or redemption orders with respect to the Fund and no other AP is able to step forward to create or redeem Creation Units, this may result in a significantly diminished trading market for Fund Shares, and Shares may be more likely to trade at a premium or discount to the Fund’s NAV and to face trading halts and/or delisting. Investments in non-U.S. securities, which may have lower trading volumes or could experience extended market closures or trading halts, may increase the risk that APs may not be able to effectively create or redeem Creation Units or the risk that the Shares may be halted and/or delisted.
Cash Transaction Risk. Most exchange-traded funds (“ETFs”) generally make in-kind redemptions to avoid being taxed at the fund level on gains on the distributed portfolio securities. However, unlike most ETFs, the Fund currently intends to effect creations and redemptions principally for cash, rather than principally in-kind, because of the nature of the Fund’s investments. As such, the Fund may be required to sell portfolio securities to obtain the cash needed to distribute redemption proceeds. Therefore, the Fund may recognize a capital gain on these sales that might not have been incurred if the Fund had made a redemption in-kind. This may decrease the tax efficiency of the Fund compared to ETFs that utilize an in-kind redemption process and there may be a substantial difference in the after-tax rate of return between the Fund and conventional ETFs.
Currency Risk. Because the Fund’s NAV is determined in U.S. dollars, the Fund’s NAV could decline if the Indian rupee in which the Fund invests depreciates against the U.S. dollar, even if the value of its holdings, measured in rupees, increases. Generally, an increase in the value of the U.S. dollar against a foreign currency will reduce the value of a security denominated in that foreign currency, thereby decreasing the Fund’s overall NAV. Exchange rates may be volatile and may change quickly and unpredictably in response to both global economic developments and economic conditions, causing an adverse impact on the Fund. As a result, investors have the potential for losses regardless of the length of time they intend to hold Shares.
Equity Risk. Equity risk is the risk that the value of equity securities, including common stocks, may fall due to both changes in general economic conditions that impact the market as a whole, as well as factors that directly relate to a specific company or its industry. Such general economic conditions include changes in interest rates, periods of market turbulence or instability, or general and prolonged periods of economic decline and cyclical change. It is possible that a drop in the stock market may depress the price of most or all of the common stocks that the Fund holds. In addition, equity risk includes the risk that investor sentiment toward one or more industries will become negative, resulting in those investors exiting their investments in those industries, which could cause a reduction in the value of companies in those industries more broadly. The value of a company’s common stock may fall solely because of factors, such as an increase in production costs that negatively impact other companies in the same region, industry or sector of the market. A company’s common stock also may decline significantly in price over a short period of time due to factors specific to that company, including decisions made by its management or lower demand for the company’s products or services. For example, an adverse event, such as an unfavorable earnings report or the failure to make anticipated dividend payments, may depress the value of common stock.
Index Risk. Unlike many investment companies that are “actively managed”, the Fund does not utilize an investing strategy that seeks returns in excess of its Underlying Index. Therefore, the Fund would not necessarily buy or sell a security unless that security is added or removed, respectively, from its Underlying Index, even if that security generally is underperforming. Additionally, the Fund rebalances its portfolio in accordance with its Underlying Index, and, therefore, any changes to the Underlying Index’s rebalance schedule will result in corresponding changes to the Fund’s rebalance schedule. Further, unlike with an actively managed fund, the Adviser does not use techniques or defensive strategies designed to lessen the impact of periods of market volatility or market decline. This means that, based on certain market and economic conditions, the Fund’s performance could be lower than other types of funds with investment advisers that actively manage their portfolio assets to take advantage of market opportunities or defend against market events.
Indian Securities Risk. Investment in Indian securities involves risks in addition to those associated with investments in securities of issuers in more developed countries, which may adversely affect the value of the Fund’s assets. Such heightened risks include, among others, political and legal uncertainty, greater government control over the economy, currency fluctuations or blockage and the risk of nationalization or expropriation of assets. In addition, religious and border disputes persist in India. Moreover, India has experienced civil unrest and hostilities with neighboring countries, including Pakistan, and the Indian government has confronted separatist movements in several Indian states.
The securities market of India is considered an emerging market that is characterized by a small number of listed companies that have significantly smaller market capitalizations, greater price volatility and substantially less liquidity than companies in more developed markets. These factors, coupled with restrictions on foreign investment and other factors, limit the supply of securities available for investment. This will affect the rate at which the Fund is able to invest in securities of Indian companies, the purchase and sale prices for such securities, and the timing of purchases and sales. Certain restrictions on foreign investment may decrease the liquidity of the Fund’s portfolio, subject the Fund to higher transaction costs, or inhibit the Fund’s ability to track the Underlying Index. The Fund’s investments in securities of issuers located or operating in India, as well as its ability to track the Underlying Index, also may be limited or prevented, at times, due to the limits on foreign ownership imposed by the Reserve Bank of India and/or by the Securities and Exchange Board of India (“SEBI”).
Market Risk. Securities in the Underlying Index are subject to market fluctuations. You should anticipate that the value of the Shares will decline, more or less, in correlation with any decline in value of the securities in the Underlying Index. Additionally, natural or environmental disasters, widespread disease or other public health issues, war, military conflicts, acts of terrorism, economic crises or other events could result in increased premiums or discounts to the Fund’s NAV.
Non-Correlation Risk. The Fund’s return may not match the return of its Underlying Index for a number of reasons. For example, the Fund incurs operating expenses not applicable to the Underlying Index, and incurs costs in buying and selling securities, especially when rebalancing the Fund’s securities holdings to reflect changes in the composition of its Underlying Index. Because the Fund issues and redeems Creation Units principally for cash, the Fund will incur higher costs in buying and selling securities than if it issued and redeemed Creation Units in-kind. Additionally, the Fund’s use of a representative sampling approach may cause the Fund not to be as well-correlated with the return of its Underlying Index as would be the case if the Fund purchased all of the securities in its Underlying Index in the proportions represented in the Underlying Index. In addition, the performance of the Fund and its Underlying Index may vary due to asset valuation differences and differences between the Fund’s portfolio and its Underlying Index resulting from legal restrictions, costs or liquidity constraints.
Non-Diversified Fund Risk. Because the Fund is non-diversified and can invest a greater portion of its assets in securities of individual issuers than can a diversified fund, changes in the market value of a single investment could cause greater fluctuations in Share price than would occur in a diversified fund. This may increase the Fund’s volatility and cause the performance of a relatively small number of issuers to have a greater impact on the Fund’s performance.
Regulatory Risk. The Fund is registered as a foreign portfolio investor (“FPI”) with SEBI in order to have the ability to make and dispose of investments in Indian securities. There can be no assurance that the Fund will qualify or continue to qualify as a FPI under the SEBI FPI Regulations, 2019, or that the Indian regulatory authorities will continue to grant such registrations, and the loss of such registrations could adversely impact the ability of the Fund to make and dispose of investments in India. Investments by FPIs in Indian securities are also subject to certain limits and restrictions under applicable law, and the application of such limits and restrictions could adversely impact the ability of the Fund to make investments in India.
Small- and Mid-Capitalization Company Risk. Investing in securities of small- and mid-capitalization companies involves greater risk than customarily is associated with investing in larger, more established companies. These companies’ securities may be more volatile and less liquid than those of more established companies. These securities may have returns that vary, sometimes significantly, from the overall securities market. Often small- and mid-capitalization companies and the industries in which they focus are still evolving and, as a result, they may be more sensitive to changing market conditions.
Valuation Risk. Financial information related to securities of non-U.S. issuers may be less reliable than information related to securities of U.S. issuers, which may make it difficult to obtain a current price for a non-U.S. security held by the Fund. In certain circumstances, market quotations may not be readily available for some Fund securities, and those securities may be fair valued. The value established for a security through fair valuation may be different from what would be produced if the security had been valued using market quotations. Fund securities that are valued using techniques other than market quotations, including “fair valued” securities, may be subject to greater fluctuations in their value from one day to the next than would be the case if market quotations were used. In addition, there is no assurance that the Fund could sell a portfolio security for the value established for it at any time, and it is possible that the Fund would incur a loss because a security is sold at a discount to its established value.
NOTE 3–Investment Advisory Agreement and Other Agreements
The Trust has entered into an Investment Advisory Agreement with the Adviser on behalf of the Fund, pursuant to which the Adviser has overall responsibility for the selection and ongoing monitoring of the Fund’s investments, managing the Fund’s business affairs and providing certain clerical, bookkeeping and other administrative services.
Pursuant to the Investment Advisory Agreement, the Fund accrues daily and pays monthly to the Adviser an annual unitary management fee of 0.78% of the Fund’s average daily net assets. Out of the unitary management fee, the Adviser pays for substantially all expenses of the Fund, including the costs of transfer agency, custody, fund administration, legal, audit and other services, except for distribution fees, if any, brokerage expenses, taxes, interest, acquired fund fees and expenses, if any, litigation expenses and other extraordinary expenses, including proxy expenses (except for such proxies related to: (i) changes to the Investment Advisory Agreement, (ii) the election of an Interested Trustee, or (iii) any other matters that directly benefit the Adviser).
Through at least August 31, 2025, the Adviser has contractually agreed to waive the management fee payable by the Fund in an amount equal to the lesser of: (i) 100% of the net advisory fees earned by the Adviser or an affiliate of the Adviser that are attributable to the Fund’s investments in money market funds that are managed by affiliates of the Adviser and other funds (including ETFs) managed by the Adviser or affiliates of the Adviser or (ii) the management fee available to be waived. There is no guarantee that the Adviser will extend the waiver of these fees past that date.
For the fiscal year ended October 31, 2023, the Adviser waived fees of $915.
The Trust has entered into a Distribution Agreement with Invesco Distributors, Inc. (the “Distributor”), which serves as the distributor of Creation Units for the Fund. The Distributor does not maintain a secondary market in the Shares. The Fund is not charged any fees pursuant to the Distribution Agreement. The Distributor is an affiliate of the Adviser.
The Adviser has entered into a licensing agreement on behalf of the Fund with FTSE International Ltd. (the “Licensor”). The Underlying Index name trademark is owned by the Licensor. The trademark has been licensed to the Adviser for use by the Fund. The Fund is entitled to use the Underlying Index pursuant to the Trust’s sub-licensing agreement with the Adviser. The Fund is not sponsored, endorsed, sold or promoted by the Licensor, and the Licensor makes no representation regarding the advisability of investing in the Fund. The Fund is not a party to the licensing agreement.
The Trust has entered into service agreements whereby The Bank of New York Mellon, a wholly-owned subsidiary of The Bank of New York Mellon Corporation, serves as the administrator, custodian, fund accountant and transfer agent for the Fund.
NOTE 4–Additional Valuation Information
GAAP defines fair value as the price that would be received to sell an asset or paid to transfer a liability in an orderly transaction between market participants at the measurement date, under current market conditions. GAAP establishes a hierarchy that prioritizes the inputs to valuation methods, giving the highest priority to readily available unadjusted quoted prices in an active market for identical assets (Level 1) and the lowest priority to significant unobservable inputs (Level 3), generally when market prices are not readily available. Based on the valuation inputs, the securities or other investments are tiered into one of three levels. Changes in valuation methods may result in transfers in or out of an investment’s assigned level:
| | |
| Level 1 – | | Prices are determined using quoted prices in an active market for identical assets. |
| | |
| |
| Level 2 – | | Prices are determined using other significant observable inputs. Observable inputs are inputs that other market participants may use in pricing a security. These may include quoted prices for similar securities, interest rates, prepayment speeds, credit risk, yield curves, loss severities, default rates, discount rates, volatilities and others. |
| |
| Level 3 – | | Prices are determined using significant unobservable inputs. In situations where quoted prices or observable inputs are unavailable (for example, when there is little or no market activity for an investment at the end of the period), unobservable inputs may be used. Unobservable inputs reflect the Adviser’s assumptions about the factors market participants would use in determining fair value of the securities or instruments and would be based on the best available information. |
The following is a summary of the tiered valuation input levels, as of October 31, 2023. The level assigned to the securities valuations may not be an indication of the risk or liquidity associated with investing in those securities. Because of the inherent uncertainties of valuation, the values reflected in the financial statements may materially differ from the value received upon actual sale of those investments.
| | | | | | | | | | | | | | | | | | | | |
| | | Level 1 | | Level 2 | | Level 3 | | Total |
| | | | |
Investments in Securities | | | | | | | | | | | | | | | | | | | | |
| | | | |
Common Stocks & Other Equity Interests | | | $ | 171,855,346 | | | | $ | - | | | | $ | - | | | | $ | 171,855,346 | |
| | | | |
Non-U.S. Dollar Denominated Bonds & Notes | | | | - | | | | | 5,281 | | | | | - | | | | | 5,281 | |
| | | | |
Money Market Funds | | | | 1,186,438 | | | | | - | | | | | - | | | | | 1,186,438 | |
| | | | | | | | | | | | | | | | | | | | |
| | | | |
Total Investments | | | $ | 173,041,784 | | | | $ | 5,281 | | | | $ | - | | | | $ | 173,047,065 | |
| | | | | | | | | | | | | | | | | | | | |
NOTE 5–Distributions to Shareholders and Tax Components of Net Assets
Tax Character of Distributions to Shareholders Paid During the Fiscal Years Ended October 31, 2023 and 2022:
| | | | | | | | |
| | | 2023 | | | 2022 | |
Ordinary income* | | $ | 156,992 | | | $ | - | |
Long-term capital gain | | | 12,923,069 | | | | 6,889,923 | |
| * | Includes short-term capital gain distributions, if any. |
Tax Components of Net Assets at Fiscal Year-End:
| | | | | | | | |
Undistributed long-term capital gains | | | | | | $ | 3,270,862 | |
Net unrealized appreciation – investments | | | | | | | 3,540,331 | |
Net unrealized appreciation (depreciation) – foreign currencies and foreign taxes | | | | | | | (1,835,013 | ) |
Shares of beneficial interest | | | | | | | 167,068,270 | |
| | | | | | | | |
Total net assets | | | | | | $ | 172,044,450 | |
| | | | | | | | |
Capital loss carryforwards are calculated and reported as of a specific date. Results of transactions and other activity after that date may affect the amount of capital loss carryforwards actually available for the Fund to utilize. The ability to utilize capital loss carryforwards in the future may be limited under the Internal Revenue Code and related regulations based on the results of future transactions.
The Fund does not have a capital loss carryforward as of October 31, 2023.
NOTE 6–Investment Transactions
For the fiscal year ended October 31, 2023, the cost of securities purchased and the proceeds from sales of securities (other than short-term securities, U.S. Government obligations, money market funds and in-kind transactions, if any) were $108,907,695 and $39,588,320, respectively.
As of October 31, 2023, the aggregate cost of investments, including any derivatives, on a tax basis includes adjustments for financial reporting purposes as of the most recently completed federal income tax reporting period-end:
| | | | |
Aggregate unrealized appreciation of investments | | $ | 13,201,776 | |
| |
Aggregate unrealized (depreciation) of investments | | | (9,661,445 | ) |
| | | | |
Net unrealized appreciation of investments | | $ | 3,540,331 | |
| | | | |
Cost of investments for tax purposes is $169,506,734.
NOTE 7–Reclassification of Permanent Differences
Primarily as a result of differing book/tax treatment of foreign capital gain taxes, net operating losses, distributions, foreign currency and taxable spinoffs, undistributed net investment income (loss) was increased by $1,398,273 and undistributed net realized gain (loss) was decreased by $1,398,273. These reclassifications had no effect on the net assets or the distributable earnings of the Fund.
NOTE 8–Trustees’ and Officer’s Fees
The Adviser, as a result of the Fund’s unitary management fee, pays remuneration to the Independent Trustees and an Officer of the Trust on behalf of the Fund. The Interested Trustee does not receive any Trustees’ fees.
The Trust has adopted a deferred compensation plan (the “Plan”). Under the Plan, each Independent Trustee who has executed a Deferred Fee Agreement (a “Participating Trustee”) may defer receipt of all or a portion of their compensation (“Deferral Fees”). Such Deferral Fees are deemed to be invested in select Invesco ETFs. The Deferral Fees payable to a Participating Trustee are valued as of the date such Deferral Fees would have been paid to a Participating Trustee. The value increases with contributions or with increases in the value of the Shares selected, and the value decreases with distributions or with declines in the value of the Shares selected. Obligations under the Plan represent unsecured claims against the general assets of the Fund.
NOTE 9–Capital
Shares are issued and redeemed by the Fund only in Creation Units consisting of a specified number of Shares as set forth in the Fund’s prospectus. Only APs are permitted to purchase or redeem Creation Units from the Fund. Such transactions are principally permitted in exchange for the deposit or delivery of cash. The Fund also reserves the right to permit or require Creation Units to be issued in exchange for the deposit or delivery of a basket of securities (“Deposit Securities”). However, cash in an amount equivalent to the value of certain securities may be substituted, generally when the securities are not available in sufficient quantity for delivery, not eligible for trading by the AP or as a result of other market circumstances.
To the extent that the Fund permits transactions in exchange for Deposit Securities, the Fund may issue Shares in advance of receipt of Deposit Securities subject to various conditions, including a requirement to maintain on deposit with the Trust cash at least equal to 105% of the market value of the missing Deposit Securities. In accordance with the Trust’s Participant Agreement, Creation Units will be issued to an AP, notwithstanding the fact that the corresponding Deposit Securities have not been received in part or in whole, in reliance on the undertaking of the AP to deliver the missing Deposit Securities as soon as possible, which undertaking shall be secured by the AP’s delivery and maintenance of collateral consisting of cash in the form of U.S. dollars in immediately available funds having a value (marked-to-market daily) at least equal to 105%, which the Adviser may change from time to time, of the value of the missing Deposit Securities.
Certain transaction fees may be charged by the Fund for creations and redemptions, which are treated as increases in capital.
Transactions in the Fund’s Shares are disclosed in detail in the Statement of Changes in Net Assets.
Report of Independent Registered Public Accounting Firm
To the Board of Trustees of Invesco India Exchange-Traded Fund Trust and Shareholders of Invesco India ETF
Opinion on the Financial Statements
We have audited the accompanying statement of assets and liabilities, including the schedule of investments, of Invesco India ETF (constituting Invesco India Exchange-Traded Fund Trust, referred to hereafter as the “Fund”) as of October 31, 2023, the related statement of operations for the year ended October 31, 2023, the statement of changes in net assets for each of the two years in the period ended October 31, 2023, including the related notes, and the financial highlights for each of the five years in the period ended October 31, 2023 (collectively referred to as the “financial statements”). In our opinion, the financial statements present fairly, in all material respects, the financial position of the Fund as of October 31, 2023, the results of its operations for the year then ended, the changes in its net assets for each of the two years in the period ended October 31, 2023 and the financial highlights for each of the five years in the period ended October 31, 2023, in conformity with accounting principles generally accepted in the United States of America.
Basis for Opinion
These financial statements are the responsibility of the Fund’s management. Our responsibility is to express an opinion on the Fund’s financial statements based on our audits. We are a public accounting firm registered with the Public Company Accounting Oversight Board (United States) (“PCAOB”) and are required to be independent with respect to the Fund in accordance with the U.S. federal securities laws and the applicable rules and regulations of the Securities and Exchange Commission and the PCAOB.
We conducted our audits of these financial statements in accordance with the standards of the PCAOB. Those standards require that we plan and perform the audit to obtain reasonable assurance about whether the financial statements are free of material misstatement, whether due to error or fraud.
Our audits included performing procedures to assess the risks of material misstatement of the financial statements, whether due to error or fraud, and performing procedures that respond to those risks. Such procedures included examining, on a test basis, evidence regarding the amounts and disclosures in the financial statements. Our audits also included evaluating the accounting principles used and significant estimates made by management, as well as evaluating the overall presentation of the financial statements. Our procedures included confirmation of securities owned as of October 31, 2023 by correspondence with the custodian, transfer agent and brokers; when replies were not received from brokers, we performed other auditing procedures. We believe that our audits provide a reasonable basis for our opinion.
/s/ PricewaterhouseCoopers LLP
Chicago, Illinois
December 21, 2023
We have served as the auditor of one or more of the investment companies in the Invesco group of investment companies since at least 1995. We have not been able to determine the specific year we began serving as auditor.
Calculating your ongoing Fund expenses
Example
As a shareholder of the Invesco India ETF (the “Fund”), you incur a unitary management fee. In addition to the unitary management fee, a shareholder may pay distribution fees, if any, brokerage expenses, taxes, interest, acquired fund fees and expenses, if any, litigation expenses and other extraordinary expenses, including proxy expenses (except for such proxies related to: (i) changes to the Investment Advisory Agreement, (ii) the election of an Interested Trustee, or (iii) any other matters that directly benefit the Adviser). The expense example below is intended to help you understand your ongoing costs (in dollars) of investing in the Fund and to compare these costs with the ongoing costs of investing in other funds.
The example is based on an investment of $1,000 invested at the beginning of the period and held for the entire period May 1, 2023 through October 31, 2023.
Actual Expenses
The first line in the following table provides information about actual account values and actual expenses. You may use the information in this line, together with the amount you invested, to estimate the expenses that you paid over the period. Simply divide your account value by $1,000 (for example, an $8,600 account value divided by $1,000 = 8.6), then multiply the result by the number in the first line under the heading “Expenses Paid During the Six-Month Period” to estimate the expenses you paid on your account during this period.
Hypothetical Example for Comparison Purposes
The second line in the following table provides information about hypothetical account values and hypothetical expenses based on the Fund’s actual expense ratio and an assumed annualized rate of return of 5% per year before expenses, which is not the Fund’s actual return. The hypothetical account values and expenses may not be used to estimate the actual ending account balance or expenses you paid for the period. You may use this information to compare the ongoing costs of investing in the Fund and other funds. To do so, compare this 5% hypothetical example with the 5% hypothetical examples that appear in the shareholder reports of the other funds.
Please note that the expenses shown in the table are meant to highlight your ongoing costs only, and do not reflect any transaction costs, such as sales charges and brokerage commissions. Therefore, the second line in the table is useful in comparing ongoing costs only, and will not help you determine the relative total costs of owning different funds. In addition, if these transaction costs were included, your costs would have been higher.
| | | | | | | | | | | | | | | | |
| | | Beginning
Account Value
May 1, 2023 | | | Ending Account Value
October 31, 2023 | | | Annualized
Expense Ratio
Based on the
Six-Month Period | | | Expenses Paid
During the
Six-Month Period(1) | |
| | | | |
Invesco India ETF (PIN) | | | | | | | | | | | | | | | | |
| | | | |
Actual | | | $1,000.00 | | | | $1,070.60 | | | | 0.78% | | | | $4.07 | |
| | | | |
Hypothetical (5% return before expenses) | | | 1,000.00 | | | | 1,021.27 | | | | 0.78 | | | | 3.97 | |
| (1) | Expenses are calculated using the annualized expense ratio, which represents the ongoing expenses as a percentage of net assets for the six-month period ended October 31, 2023. Expenses are calculated by multiplying the Fund’s annualized expense ratio by the average account value for the period, then multiplying the result by 184/365. Expense ratios for the most recent six-month period may differ from expense ratios based on the annualized data in the Financial Highlights. |
Tax Information
Form 1099-DIV, Form 1042-S and other year–end tax information provide shareholders with actual calendar year amounts that should be included in their tax returns. Shareholders should consult their tax advisers.
The following distribution information is being provided as required by the Internal Revenue Code or to meet a specific state’s requirement.
The Fund designates the following amounts or, if subsequently determined to be different, the maximum amount allowable for its fiscal year ended October 31, 2023:
| | | | |
| |
Qualified Business Income* | | | 0% | |
| |
Qualified Dividend Income* | | | 100% | |
| |
Corporate Dividends Received Deduction* | | | 0% | |
| |
U.S. Treasury Obligations* | | | 0% | |
| |
Business Interest Income* | | | 3% | |
| |
Long Term Capital Gains | | $ | 12,923,069 | |
| |
Qualified Short Term Gains* | | | 156,992 | |
* The above percentages are based on ordinary income dividends paid to shareholders during the Fund’s fiscal year.
Trustees and Officers
The Independent Trustees of the Trust, their term of office and length of time served, their principal business occupations during at least the past five years, the number of portfolios in the Fund Complex (as defined below) overseen by each Independent Trustee and the other directorships, if any, held by each Independent Trustee are shown below.
As of November 28, 2023
| | | | | | | | | | |
Name, Address and Year of
Birth of Independent Trustees | | Position(s)
Held
with Trust | | Term of
Office
and
Length of
Time
Served* | | Principal
Occupation(s) During the Past 5 Years | | Number of
Portfolios
in Fund
Complex**
Overseen by
Independent
Trustees | | Other
Directorships
Held by
Independent
Trustees During
the Past 5 Years |
| | | | | |
Ronn R. Bagge–1958 c/o Invesco Capital Management LLC 3500 Lacey Road Suite 700 Downers Grove, IL 60515 | | Vice Chair of the Board; Chair of the Nominating and Governance Committee and Trustee | | Vice Chair since 2018; Chair of the Nominating and Governance Committee and Trustee since 2008 | | Founder and Principal, YQA Capital Management LLC (1998-Present); formerly, Owner/CEO of Electronic Dynamic Balancing Co., Inc. (high-speed rotating equipment service provider). | | 213 | | Chair (since 2021) and member (since 2017) of the Joint Investment Committee, Mission Aviation Fellowship and MAF Foundation; Trustee, Mission Aviation Fellowship (2017-Present). |
| | | | | |
Todd J. Barre–1957 c/o Invesco Capital Management LLC 3500 Lacey Road Suite 700 Downers Grove, IL 60515 | | Trustee | | Since 2010 | | Formerly, Assistant Professor of Business, Trinity Christian College (2010-2016); Vice President and Senior Investment Strategist (2001-2008), Director of Open Architecture and Trading (2007-2008), Head of Fundamental Research (2004-2007) and Vice President and Senior Fixed Income Strategist (1994-2001), BMO Financial Group/Harris Private Bank. | | 213 | | None. |
| * | This is the date the Independent Trustee began serving the Trust. Each Independent Trustee serves an indefinite term, until his or her successor is elected. |
| ** | Fund Complex includes all open- and closed-end funds (including all of their portfolios) advised by the Adviser and any affiliated person of the Adviser. |
Trustees and Officers–(continued)
| | | | | | | | | | |
Name, Address and Year of Birth of Independent Trustees | | Position(s) Held with Trust | | Term of Office and Length of Time Served* | | Principal Occupation(s) During the Past 5 Years | | Number of Portfolios in Fund Complex** Overseen by Independent Trustees | | Other Directorships Held by Independent Trustees During the Past 5 Years |
| | | | | |
Edmund P. Giambastiani, Jr.–1948 c/o Invesco Capital Management LLC 3500 Lacey Road Suite 700 Downers Grove, IL 60515 | | Trustee | | Since 2019 | | President, Giambastiani Group LLC (national security and energy consulting) (2007-Present); Director, First Eagle Alternative Credit LLC (2020-Present); Advisory Board Member, Massachusetts Institute of Technology Lincoln Laboratory (federally-funded research development) (2010-Present); Defense Advisory Board Member, Lawrence Livermore National Laboratory (2013-Present); formerly, Director, The Boeing Company (2009-2021); Trustee, MITRE Corporation (federally funded research development) (2008-2020); Director, THL Credit, Inc. (alternative credit investment manager) (2016-2020); Chair (2015-2016), Lead Director (2011-2015) and Director (2008-2011), Monster Worldwide, Inc. (career services); United States Navy, career nuclear submarine officer (1970-2007); Seventh Vice Chairman of the Joint Chiefs of Staff (2005- 2007); first NATO Supreme Allied Commander Transformation (2003-2005); Commander, U.S. Joint Forces Command (2002-2005). | | 213 | | Trustee, U.S. Naval Academy Foundation Athletic & Scholarship Program (2010- Present); formerly, Trustee, certain funds of the Oppenheimer Funds complex (2013-2019); Advisory Board Member, Maxwell School of Citizenship and Public Affairs of Syracuse University (2012-2016). |
| * | This is the date the Independent Trustee began serving the Trust. Each Independent Trustee serves an indefinite term, until his or her successor is elected. |
| ** | Fund Complex includes all open- and closed-end funds (including all of their portfolios) advised by the Adviser and any affiliated person of the Adviser. |
Trustees and Officers–(continued)
| | | | | | | | | | |
Name, Address and Year of Birth of Independent Trustees | | Position(s) Held with Trust | | Term of Office and Length of Time Served* | | Principal Occupation(s) During the Past 5 Years | | Number of Portfolios in Fund Complex** Overseen by Independent Trustees | | Other Directorships Held by Independent Trustees During the Past 5 Years |
| | | | | |
Victoria J. Herget–1951 c/o Invesco Capital Management LLC 3500 Lacey Road Suite 700 Downers Grove, IL 60515 | | Trustee | | Since 2019 | | Formerly, Managing Director (1993-2001), Principal (1985-1993), Vice President (1978-1985) and Assistant Vice President (1973-1978), Zurich Scudder Investments (investment adviser) (and its predecessor firms). | | 213 | | Trustee Emerita (2017-Present), Trustee (2000-2017) and Chair (2010-2017), Newberry Library; Trustee, Chikaming Open Lands (2014-Present); Member (2002- Present), Rockefeller Trust Committee; formerly, Trustee, Mather LifeWays (2001-2021); Trustee, certain funds in the Oppenheimer Funds complex (2012-2019); Board Chair (2008-2015) and Director (2004-2018), United Educators Insurance Company; Independent Director, First American Funds (2003-2011); Trustee (1992-2007), Chair of the Board of Trustees (1999-2007), Investment Committee Chair (1994-1999) and Investment Committee member (2007-2010), Wellesley College; Trustee, BoardSource (2006-2009); Trustee, Chicago City Day School (1994-2005). |
| * | This is the date the Independent Trustee began serving the Trust. Each Independent Trustee serves an indefinite term, until his or her successor is elected. |
| ** | Fund Complex includes all open- and closed-end funds (including all of their portfolios) advised by the Adviser and any affiliated person of the Adviser. |
Trustees and Officers–(continued)
| | | | | | | | | | |
Name, Address and Year of Birth of Independent Trustees | | Position(s) Held with Trust | | Term of Office and Length of Time Served* | | Principal Occupation(s) During the Past 5 Years | | Number of Portfolios in Fund Complex** Overseen by Independent Trustees | | Other Directorships Held by Independent Trustees During the Past 5 Years |
| | | | | |
Marc M. Kole–1960 c/o Invesco Capital Management LLC 3500 Lacey Road Suite 700 Downers Grove, IL 60515 | | Chair of the Audit Committee and Trustee | | Chair of the Audit Committee and Trustee since 2008 | | Formerly, Managing Director of Finance (2020-2021) and Senior Director of Finance (2015-2020), By The Hand Club for Kids (not-for-profit); Chief Financial Officer, Hope Network (social services) (2008-2012); Assistant Vice President and Controller, Priority Health (health insurance) (2005-2008); Regional Chief Financial Officer, United Healthcare (2005); Chief Accounting Officer, Senior Vice President of Finance, Oxford Health Plans (2000-2004); Audit Partner, Arthur Andersen LLP (1996-2000). | | 213 | | Formerly, Treasurer (2018-2021), Finance Committee Member (2015-2021) and Audit Committee Member (2015), Thornapple Evangelical Covenant Church; Board and Finance Committee Member (2009-2017) and Treasurer (2010-2015, 2017), NorthPointe Christian Schools. |
| | | | | |
Yung Bong Lim–1964 c/o Invesco Capital Management LLC 3500 Lacey Road Suite 700 Downers Grove, IL 60515 | | Chair of the Investment Oversight Committee and Trustee | | Chair of the Investment Oversight Committee since 2014; Trustee since 2013 | | Managing Partner, RDG Funds LLC (real estate) (2008-Present); formerly, Managing Director, Citadel LLC (1999-2007). | | 213 | | Board Director, Beacon Power Services, Corp. (2019-Present); formerly, Advisory Board Member, Performance Trust Capital Partners, LLC (2008-2020). |
| * | This is the date the Independent Trustee began serving the Trust. Each Independent Trustee serves an indefinite term, until his or her successor is elected. |
| ** | Fund Complex includes all open- and closed-end funds (including all of their portfolios) advised by the Adviser and any affiliated person of the Adviser. |
Trustees and Officers–(continued)
| | | | | | | | | | |
Name, Address and Year of Birth of Independent Trustees | | Position(s) Held with Trust | | Term of Office and Length of Time Served* | | Principal Occupation(s) During the Past 5 Years | | Number of Portfolios in Fund Complex** Overseen by Independent Trustees | | Other Directorships Held by Independent Trustees During the Past 5 Years |
| | | | | |
Joanne Pace–1958 c/o Invesco Capital Management LLC 3500 Lacey Road Suite 700 Downers Grove, IL 60515 | | Trustee | | Since 2019 | | Formerly, Senior Advisor, SECOR Asset Management, LP (2010-2011); Managing Director and Chief Operating Officer, Morgan Stanley Investment Management (2006-2010); Partner and Chief Operating Officer, FrontPoint Partners, LLC (alternative investments) (2005-2006); Managing Director (2003-2005), Global Head of Human Resources and member of Executive Board and Operating Committee (2004-2005), Global Head of Operations and Product Control (2003-2004), Credit Suisse (investment banking); Managing Director (1997-2003), Controller and Principal Accounting Officer (1999-2003), Chief Financial Officer (temporary assignment) for the Oversight Committee, Long Term Capital Management (1998-1999), Morgan Stanley. | | 213 | | Board Director, Horizon Blue Cross Blue Shield of New Jersey (2012- Present); Governing Council Member (2016-Present) and Chair of Education Committee (2017-2021), Independent Directors Council (IDC); Council Member, New York-Presbyterian Hospital’s Leadership Council on Children’s and Women’s Health (2012-Present); formerly, Advisory Board Director, The Alberleen Group LLC (2012-2021); Board Member, 100 Women in Finance (2015-2020); Trustee, certain funds in the Oppenheimer Funds complex (2012-2019); Lead Independent Director and Chair of the Audit and Nominating Committee of The Global Chartist Fund, LLC, Oppenheimer Asset Management (2011-2012); Board Director, Managed Funds Association (2008-2010); Board Director (2007-2010) and Investment Committee Chair (2008-2010), Morgan Stanley Foundation. |
| * | This is the date the Independent Trustee began serving the Trust. Each Independent Trustee serves an indefinite term, until his or her successor is elected. |
| ** | Fund Complex includes all open- and closed-end funds (including all of their portfolios) advised by the Adviser and any affiliated person of the Adviser. |
Trustees and Officers–(continued)
| | | | | | | | | | |
Name, Address and Year of Birth of Independent Trustees | | Position(s) Held with Trust | | Term of Office and Length of Time Served* | | Principal Occupation(s) During the Past 5 Years | | Number of Portfolios in Fund Complex** Overseen by Independent Trustees | | Other Directorships Held by Independent Trustees During the Past 5 Years |
| | | | | |
Gary R. Wicker–1961 c/o Invesco Capital Management LLC 3500 Lacey Road Suite 700 Downers Grove, IL 60515 | | Trustee | | Since 2013 | | Senior Vice President of Global Finance and Chief Financial Officer, RBC Ministries (publishing company) (2013-Present); formerly, Executive Vice President and Chief Financial Officer, Zondervan Publishing (a division of Harper Collins/NewsCorp) (2007-2012); Senior Vice President and Group Controller (2005- 2006), Senior Vice President and Chief Financial Officer (2003-2004), Chief Financial Officer (2001-2003), Vice President, Finance and Controller (1999-2001) and Assistant Controller (1997-1999), divisions of The Thomson Corporation (information services provider); Senior Audit Manager (1994-1997), PricewaterhouseCoopers LLP. | | 213 | | Board Member and Treasurer, Our Daily Bread Ministries Canada (2015- Present); Board and Finance Committee Member, West Michigan Youth For Christ (2010- Present). |
| | | | | |
Donald H. Wilson–1959 c/o Invesco Capital Management LLC 3500 Lacey Road Suite 700 Downers Grove, IL 60515 | | Chair of the Board and Trustee | | Chair since 2012; Trustee since 2008 | | Chair, President and Chief Executive Officer, McHenry Bancorp Inc. and McHenry Savings Bank (subsidiary) (2018-Present); formerly, Chair and Chief Executive Officer, Stone Pillar Advisors, Ltd. (2010-2017); President and Chief Executive Officer, Stone Pillar Investments, Ltd. (advisory services to the financial sector) (2016-2018); Chair, President and Chief Executive Officer, Community Financial Shares, Inc. and Community Bank–Wheaton/Glen Ellyn (subsidiary) (2013-2015); Chief Operating Officer, AMCORE Financial, Inc. (bank holding company) (2007-2009); Executive Vice President and Chief Financial Officer, AMCORE Financial, Inc. (2006-2007); Senior Vice President and Treasurer, Marshall & Ilsley Corp. (bank holding company) (1995-2006). | | 213 | | Director, Penfield Children’s Center (2004-Present); Board Chair, Gracebridge Alliance, Inc. (2015-Present). |
| * | This is the date the Independent Trustee began serving the Trust. Each Independent Trustee serves an indefinite term, until his or her successor is elected. |
| ** | Fund Complex includes all open- and closed-end funds (including all of their portfolios) advised by the Adviser and any affiliated person of the Adviser. |
Trustees and Officers–(continued)
The executive officers of the Trust, their term of office and length of time served, and their principal business occupations during at least the past five years are shown below:
| | | | | | |
Name, Address and Year of Birth of Executive Officers | | Position(s) Held with Trust | | Length of Time Served* | | Principal Occupation(s) During the Past 5 Years |
| | | |
Brian Hartigan–1978 Invesco Capital Management LLC 3500 Lacey Road Suite 700 Downers Grove, IL 60515 | | President and Principal Executive Officer | | Since 2023 | | President and Principal Executive Officer, Invesco Exchange-Traded Fund Trust, Invesco Exchange-Traded Fund Trust II, Invesco India Exchange-Traded Fund Trust, Invesco Actively Managed Exchange-Traded Fund Trust, Invesco Actively Managed Exchange-Traded Commodity Fund Trust and Invesco Exchange-Traded Self-Indexed Fund Trust (2023-Present); Managing Director and Global Head of ETFs, Indexed Strategies, SMAs and Model Portfolios, Chief Executive Officer and Principal Executive Officer, Invesco Capital Management LLC (2023-Present); Chief Executive Officer, Manager and Principal Executive Officer, Invesco Specialized Products, LLC (2023-Present); Director, Co-Chief Executive Officer and Co-President, Invesco Capital Markets, Inc. (2020-Present); Manager and President, Invesco Investment Advisers LLC (2020-Present); formerly, Global Head of ETF Investments and Indexed Strategy (2020-2023); Global Head of ETF Investments (2017-2020); Head of Investments-PowerShares (2015-2017) and Executive Director, Product Development, Invesco Capital Markets, Inc. (2010-2015). |
| | | |
Adrien Deberghes–1967 Invesco Capital Management LLC 11 Greenway Plaza Houston, TX 77046 | | Vice President | | Since 2020 | | Vice President, Invesco Exchange-Traded Fund Trust, Invesco Exchange-Traded Fund Trust II, Invesco India Exchange-Traded Fund Trust, Invesco Actively Managed Exchange-Traded Fund Trust, Invesco Actively Managed Exchange- Traded Commodity Fund Trust and Invesco Exchange-Traded Self-Indexed Fund Trust (2020-Present); Head of the Fund Office of the CFO, Fund Administration and Vice President, Invesco Advisers, Inc. (2020-Present); Principal Financial Officer, Treasurer (2020-Present) and Senior Vice President (2023-Present), The Invesco Funds; formerly, Vice President, The Invesco Funds (2020-2023); Senior Vice President and Treasurer, Fidelity Investments (2008-2020). |
| | | |
Kelli Gallegos–1970 Invesco Capital Management LLC 11 Greenway Plaza Houston, TX 77046 | | Vice President and Treasurer | | Since 2018 | | Vice President, Invesco Advisers, Inc. (2020-Present); Principal Financial and Accounting Officer- Pooled Investments, Invesco Specialized Products, LLC (2018-Present); Vice President and Treasurer, Invesco Exchange-Traded Fund Trust, Invesco Exchange-Traded Fund Trust II, Invesco India Exchange-Traded Fund Trust, Invesco Actively Managed Exchange-Traded Fund Trust, Invesco Actively Managed Exchange-Traded Commodity Fund Trust and Invesco Exchange-Traded Self-Indexed Fund Trust (2018-Present); Principal Financial and Accounting Officer-Pooled Investments, Invesco Capital Management LLC (2018-Present); Vice President and Assistant Treasurer (2008-Present), The Invesco Funds; formerly, Principal Financial Officer (2016-2020) and Assistant Vice President (2008-2016), The Invesco Funds; Assistant Treasurer, Invesco Specialized Products, LLC (2018); Assistant Treasurer, Invesco Exchange-Traded Fund Trust, Invesco Exchange-Traded Fund Trust II, Invesco India Exchange- Traded Fund Trust and Invesco Actively Managed Exchange-Traded Fund Trust (2012-2018), Invesco Actively Managed Exchange-Traded Commodity Fund Trust (2014-2018) and Invesco Exchange-Traded Self-Indexed Fund Trust (2016-2018); and Assistant Treasurer, Invesco Capital Management LLC (2013-2018). |
| * | This is the date each Officer began serving the Trust in their current position. Each Officer serves an indefinite term, until his or her successor is elected. |
Trustees and Officers–(continued)
| | | | | | |
Name, Address and Year of Birth of Executive Officers | | Position(s) Held with Trust | | Length of Time Served* | | Principal Occupation(s) During the Past 5 Years |
| | | |
Adam Henkel–1980 Invesco Capital Management LLC 3500 Lacey Road Suite 700 Downers Grove, IL 60515 | | Secretary | | Since 2020 | | Head of Legal and Secretary, Invesco Capital Management LLC and Invesco Specialized Products, LLC (2020-present); Secretary, Invesco Exchange-Traded Fund Trust, Invesco Exchange-Traded Fund Trust II, Invesco India Exchange- Traded Fund Trust, Invesco Actively Managed Exchange-Traded Fund Trust, Invesco Actively Managed Exchange-Traded Commodity Fund Trust and Invesco Exchange-Traded Self-Indexed Fund Trust (2020-Present); Assistant Secretary, Invesco Capital Markets, Inc. (2020-Present); Assistant Secretary, The Invesco Funds (2014-Present); Manager (2020-Present) and Secretary (2022-Present), Invesco Indexing LLC; Assistant Secretary, Invesco Investment Advisers LLC (2020-Present); formerly, Assistant Secretary of Invesco Exchange-Traded Fund Trust, Invesco Exchange-Traded Fund Trust II, Invesco India Exchange-Traded Fund Trust, Invesco Actively Managed Exchange-Traded Fund Trust and Invesco Actively Managed Exchange-Traded Commodity Fund Trust (2014-2020); Chief Compliance Officer of Invesco Capital Management LLC (2017); Chief Compliance Officer of Invesco Exchange-Traded Fund Trust, Invesco Exchange-Traded Fund Trust II, Invesco India Exchange-Traded Fund Trust, Invesco Actively Managed Exchange-Traded Fund Trust and Invesco Actively Managed Exchange-Traded Commodity Fund Trust (2017); Senior Counsel, Invesco, Ltd. (2013-2020); Assistant Secretary, Invesco Specialized Products, LLC (2018-2020). |
| | | |
Peter Hubbard–1981 Invesco Capital Management LLC 3500 Lacey Road Suite 700 Downers Grove, IL 60515 | | Vice President | | Since 2009 | | Vice President, Invesco Specialized Products, LLC (2018-Present); Vice President, Invesco Exchange-Traded Fund Trust, Invesco Exchange-Traded Fund Trust II, Invesco India Exchange-Traded Fund Trust, Invesco Actively Managed Exchange-Traded Fund Trust (2009-Present), Invesco Actively Managed Exchange-Traded Commodity Fund Trust (2014-Present) and Invesco Exchange-Traded Self-Indexed Fund Trust (2016-Present); Vice President and Director of Portfolio Management, Invesco Capital Management LLC (2010-Present); Vice President, Invesco Advisers, Inc. (2020-Present); formerly, Vice President of Portfolio Management, Invesco Capital Management LLC (2008-2010); Portfolio Manager, Invesco Capital Management LLC (2007- 2008); Research Analyst, Invesco Capital Management LLC (2005-2007); Research Analyst and Trader, Ritchie Capital, a hedge fund operator (2003-2005). |
| | | |
Rudolf E. Reitmann–1971 Invesco Capital Management LLC 3500 Lacey Road Suite 700 Downers Grove, IL 60515 | | Vice President | | Since 2013 | | Head of Global Exchange Traded Funds Services, Invesco Specialized Products, LLC (2018-Present); Vice President, Invesco Exchange-Traded Fund Trust, Invesco Exchange-Traded Fund Trust II, Invesco India Exchange-Traded Fund Trust, Invesco Actively Managed Exchange-Traded Fund Trust (2013-Present), Invesco Actively Managed Exchange-Traded Commodity Fund Trust (2014- Present) and Invesco Exchange-Traded Self-Indexed Fund Trust (2016-Present); Head of Global Exchange Traded Funds Services, Invesco Capital Management LLC (2013-Present); Vice President, Invesco Capital Markets, Inc. (2018-Present). |
| * | This is the date each Officer began serving the Trust in their current position. Each Officer serves an indefinite term, until his or her successor is elected. |
Trustees and Officers–(continued)
| | | | | | |
Name, Address and Year of Birth of Executive Officers | | Position(s) Held with Trust | | Length of Time Served* | | Principal Occupation(s) During the Past 5 Years |
| | | |
Melanie Zimdars–1976 Invesco Capital Management LLC 3500 Lacey Road Suite 700 Downers Grove, IL 60515 | | Chief Compliance Officer | | Since 2017 | | Chief Compliance Officer, Invesco Specialized Products, LLC (2018-Present); Chief Compliance Officer, Invesco Capital Management LLC (2017-Present); Chief Compliance Officer, Invesco Exchange-Traded Fund Trust, Invesco Exchange-Traded Fund Trust II, Invesco India Exchange-Traded Fund Trust, Invesco Actively Managed Exchange-Traded Fund Trust, Invesco Actively Managed Exchange-Traded Commodity Fund Trust and Invesco Exchange-Traded Self-Indexed Fund Trust (2017-Present); formerly, Vice President and Deputy Chief Compliance Officer, ALPS Holding, Inc. (2009-2017); Mutual Fund Treasurer/ Chief Financial Officer, Wasatch Advisors, Inc. (2005-2008); Compliance Officer, U.S. Bancorp Fund Services, LLC (2001-2005). |
| * | This is the date each Officer began serving the Trust in their current position. Each Officer serves an indefinite term, until his or her successor is elected. |
Availability of Additional Information About the Trustees
The Statement of Additional Information includes additional information about the Trustees and is available, without charge, upon request at (800) 983-0903.
(This Page Intentionally Left Blank)
(This Page Intentionally Left Blank)
Proxy Voting Policies and Procedures
A description of the Trust’s proxy voting policies and procedures that the Fund uses to determine how to vote proxies relating to portfolio securities is available, without charge and upon request, by calling (800) 983-0903. This information is also available on the Securities and Exchange Commission’s (the “Commission”) website at www.sec.gov.
Information regarding how the Fund voted proxies for portfolio securities, if applicable, during the most recent 12-month period ended June 30, is available, without charge and upon request, by (i) calling (800) 983-0903; or (ii) accessing the Trust’s Form N-PX on the Commission’s website at www.sec.gov.
Quarterly Portfolios
The Trust files its complete schedule of portfolio holdings for the Fund with the Commission for the first and third quarters of each fiscal year as an exhibit to its reports on Form N-PORT. The Forms N-PORT are available on the Commission’s website at www.sec.gov.
Frequency Distribution of Discounts and Premiums
A table showing the number of days the market price of the Fund’s shares was greater than the Fund’s net asset value, and the number of days it was less than the Fund’s net asset value (i.e., premium or discount) for the most recently completed calendar year, and the calendar quarters since that year end (or the life of the Fund, if shorter) may be found at the Fund’s website at www.invesco.com/ETFs.
| | | | |
©2023 Invesco Capital Management LLC 3500 Lacey Road, Suite 700 | | | | |
| Downers Grove, IL 60515 | | P-PIN-AR-1 | | invesco.com/ETFs |
Item 2. Code of Ethics.
The Registrant has adopted a Code of Ethics that applies to the Registrant’s principal executive officer and principal financial officer. This Code is filed as an exhibit to this report on Form N-CSR under Item 13(a)(1). No substantive amendments to this Code were made during the reporting period. There were no waivers for the fiscal year ended October 31, 2023.
Item 3. Audit Committee Financial Expert.
The Registrant’s Board of Trustees (the “Board”) has determined that the Registrant has four “audit committee financial experts” serving on its audit committee: Mr. Marc M. Kole, Ms. Joanne Pace, Mr. Gary R. Wicker and Mr. Donald H. Wilson. Each of these audit committee members is “independent,” meaning that he/she is not an “interested person” of the Registrant (as that term is defined in Section 2(a)(19) of the Investment Company Act of 1940, as amended) and he/she does not accept any consulting, advisory, or other compensatory fee from the Registrant (except in his/her capacity as a Board or committee member).
An “audit committee financial expert” is not an “expert” for any purpose, including for purposes of Section 11 of the Securities Act of 1933, as a result of being designated as an “audit committee financial expert.” Further, the designation of a person as an “audit committee financial expert” does not mean that a person has any greater duties, obligations, or liability than those imposed on a person without the “audit committee financial expert” designation. Similarly, the designation of a person as an “audit committee financial expert” does not affect the duties, obligations, or liability of any other member of the audit committee or Board.
Item 4. Principal Accountant Fees and Services.
(a) to (d)
Fees Billed by PwC to the Registrant
PricewaterhouseCoopers LLP (“PwC”), the Registrant’s independent registered public accounting firm, billed the Registrant aggregate fees for pre-approved services rendered to the Registrant for the last two fiscal years as shown in the following table. The Audit Committee pre-approved all audit and non-audit services provided to the Registrant.
| | | | |
| | | Fees Billed by PwC for Services Rendered to the Registrant for Fiscal Year End 2023 | | Fees Billed by PwC for Services Rendered to the Registrant for Fiscal Year End 2022 |
Audit Fees | | $ 31,650 | | $ 30,320 |
Audit-Related Fees | | $ 0 | | $ 0 |
Tax Fees(1) | | $ 13,400 | | $ 13,262 |
All Other Fees | | $ 0 | | $ 0 |
Total Fees | | $ 45,050 | | $ 43,582 |
| | (1) | Tax Fees for the fiscal years ended 2023 and 2022 include fees billed for preparation of U.S. Tax Returns and Taxable Income calculations, including excise and year-to-date estimates for various book-to-tax differences. |
Fees Billed by PwC Related to Invesco and Affiliates
PwC billed Invesco Capital Management LLC (“Invesco” or “Adviser”), the Registrant’s investment adviser, and any entity controlling, controlled by or under common control with Invesco that provides ongoing services to the Registrant (“Affiliates”), aggregate fees for pre-approved non-audit services rendered to Invesco and Affiliates for the last two fiscal years as shown in the following table. The Audit Committee pre-approved all non-audit services provided to Invesco and Affiliates that were required to be pre-approved.
| | | | | | | | | | |
| | | Fees Billed for Non-
Audit Services
Rendered to
Invesco and
Affiliates for Fiscal
Year End 2023 That
Were Required to be Pre-Approved by the Registrant’s Audit Committee | | Fees Billed for Non-
Audit Services
Rendered to
Invesco and
Affiliates for Fiscal
Year End 2022 That
Were Required to be Pre-Approved by the Registrant’s Audit Committee |
Audit-Related Fees(1) | | $ 1,067,000 | | $ 760,000 |
Tax Fees | | $ 0 | | $ 0 |
All Other Fees | | $ 0 | | $ 0 |
Total Fees | | $ 1,067,000 | | $ 760,000 |
| | (1) | Audit-Related Fees for the fiscal years ended 2023 and 2022 include fees billed related to reviewing controls at a service organization. |
(e)(1) Audit Committee Pre-Approval Policies and Procedures
Pre-Approval of Audit and Non-Audit Services Policies and Procedures
As Adopted by the Audit Committee of the Invesco ETFs
| | |
| Applicable to | | Invesco Exchange-Traded Fund Trust, Invesco Exchange-Traded Fund Trust II, Invesco India Exchange-Traded Fund Trust, Invesco Actively Managed Exchange-Traded Fund Trust, Invesco Actively Managed Exchange-Traded Commodity Fund Trust and Invesco Exchange-Traded Self-Indexed Fund Trust (collectively the “Funds”) |
Risk Addressed by Policy | | Approval of Audit and Non-Audit Services |
Relevant Law and Other Sources | | Sarbanes-Oxley Act of 2002; Regulation S-X. |
| | |
Last Reviewed by Compliance for Accuracy | | June 15, 2018 |
Effective Date | | June 26, 2009 |
Amended Dates | | March 12, 2015 and June 15, 2018 |
Statement of Principles
Under the Sarbanes-Oxley Act of 2002 and rules adopted by the Securities and Exchange Commission (“SEC”) (“Rules”), the Audit Committee of the Funds’ (the “Audit Committee”) Board of Trustees (the “Board”) is responsible for the appointment, compensation and oversight of the work of independent accountants (an “Auditor”). As part of this responsibility and to assure that the Auditor’s independence is not impaired, the Audit Committee pre-approves the audit and non-audit services provided to the Funds by each Auditor, as well as all non-audit services provided by the Auditor to the Funds’ investment adviser and to affiliates of the adviser that provide ongoing services to the Funds (“Service Affiliates”) if the services directly impact the Funds’ operations or financial reporting. The SEC Rules also specify the types of services that an Auditor may not provide to its audit client. The following policies and procedures comply with the requirements for pre-approval and provide a mechanism by which management of the Funds may request and secure pre-approval of audit and non-audit services in an orderly manner with minimal disruption to normal business operations.
Proposed services either may be pre-approved without consideration of specific case-by-case services by the Audit Committee (“general pre-approval”) or require the specific pre-approval of the Audit Committee (“specific pre-approval”). As set forth in these policies and procedures, unless a type of service has received general pre-approval, it will require specific pre-approval by the Audit Committee. Additionally, any fees exceeding 110% of estimated pre-approved fee levels provided at the time the service was pre-approved will also require specific approval by the Audit Committee before payment is made. The Audit Committee will also consider the impact of additional fees on the Auditor’s independence when determining whether to approve any additional fees for previously pre-approved services.
The Audit Committee will annually review and generally pre-approve the services that may be provided by each Auditor without obtaining specific pre-approval from the Audit Committee. The term of any general pre-approval runs from the date of such pre-approval through June 30th of the following year, unless the Audit Committee considers a different period and states otherwise. The Audit Committee will add to or subtract from the list of general pre-approved services from time to time, based on subsequent determinations.
The purpose of these policies and procedures is to set forth the guidelines to assist the Audit Committee in fulfilling its responsibilities.
Delegation
The Chairman of the Audit Committee (or, in his or her absence, any member of the Audit Committee) may grant specific pre-approval for non-prohibited services. All such delegated pre-approvals shall be presented to the Audit Committee no later than the next Audit Committee meeting.
Audit Services
The annual Audit services engagement terms will be subject to specific pre-approval of the Audit Committee. Audit services include the annual financial statement audit and other procedures such as tax provision work that is required to be performed by the independent auditor to be able to form an opinion on the Funds’ financial statements. The Audit Committee will obtain, review and consider sufficient information concerning the proposed Auditor to make a reasonable evaluation of the Auditor’s qualifications and independence.
In addition to the annual Audit services engagement, the Audit Committee may grant either general or specific pre-approval of other Audit services, which are those services that only the independent auditor reasonably can provide. Other Audit services may include services such as issuing consents for the inclusion of audited financial statements with SEC registration statements, periodic reports and other documents filed with the SEC or other documents issued in connection with securities offerings.
Non-Audit Services
The Audit Committee may provide either general or specific pre-approval of any non-audit services to the Funds and its Service Affiliates if the Audit Committee believes that the provision of the service will not impair the independence of the Auditor, is consistent with the SEC’s Rules on auditor independence, and otherwise conforms to the Audit Committee’s general principles and policies as set forth herein.
Audit-Related Services
“Audit-related services” are assurance and related services that are reasonably related to the performance of the audit or review of the Funds’ financial statements or that are traditionally performed by the independent auditor. Audit-related services include, among others, accounting consultations related to accounting, financial reporting or disclosure matters not classified as “Audit services”; and assistance with understanding and implementing new accounting and financial reporting guidance from rulemaking authorities.
Tax Services
“Tax services” include, but are not limited to, the review and signing of the Funds’ federal tax returns, the review of required distributions by the Funds and consultations regarding tax matters such as the tax treatment of new investments or the impact of new regulations. The Audit Committee will scrutinize carefully the retention of the Auditor in connection with a transaction initially recommended by the Auditor, the major business purpose of which may be tax avoidance or the tax treatment of which may not be supported in the Internal Revenue Code and related regulations. The Audit Committee will consult with the Funds’ Treasurer (or his or her designee) and may consult with outside counsel or advisors as necessary to ensure the consistency of Tax services rendered by the Auditor with the foregoing policy.
No Auditor shall represent any Fund or any Service Affiliate before a tax court, district court or federal court of claims.
Under rules adopted by the Public Company Accounting Oversight Board and approved by the SEC, in connection with seeking Audit Committee pre-approval of permissible Tax services, the Auditor shall:
| | 1. | Describe in writing to the Audit Committee, which writing may be in the form of the proposed engagement letter: |
| | a. | The scope of the service, the fee structure for the engagement, and any side letter or amendment to the engagement letter, or any other agreement between the Auditor and the Fund, relating to the service; and |
| | b. | Any compensation arrangement or other agreement, such as a referral agreement, a referral fee or fee-sharing arrangement, between the Auditor and any person (other than the Fund) with respect to the promoting, marketing, or recommending of a transaction covered by the service; |
| | 2. | Discuss with the Audit Committee the potential effects of the services on the independence of the Auditor; and |
| | 3. | Document the substance of its discussion with the Audit Committee. |
All Other Auditor Services
The Audit Committee may pre-approve non-audit services classified as “All other services” that are not categorically prohibited by the SEC, as listed in Exhibit 1 to this policy.
Pre-Approval Fee Levels or Established Amounts
Pre-approval of estimated fees or established amounts for services to be provided by the Auditor under general or specific pre-approval policies will be set periodically by the Audit Committee. Any proposed fees exceeding 110% of the maximum estimated pre-approved fees or established amounts for pre-approved audit and non-audit services will be reported to the Audit Committee at the quarterly Audit Committee meeting and will require specific approval by the Audit Committee before payment is made. The Audit Committee will always factor in the overall relationship of fees for audit and non-audit services in determining whether to pre-approve any such services and in determining whether to approve any additional fees exceeding 110% of the maximum pre-approved fees or established amounts for previously pre-approved services.
Procedures
On an annual basis, the Auditor will submit to the Audit Committee for general pre-approval, a list of non-audit services that the Funds or Service Affiliates of the Funds may request from the Auditor. The list will describe the non-audit services in reasonable detail and will include an estimated range of fees and such other information as the Audit Committee may request.
Each request for services to be provided by the Auditor under the general pre-approval of the Audit Committee will be submitted to the Funds’ Treasurer (or his or her designee) and must include a detailed description of the services to be rendered. The Treasurer or his or her designee will ensure that such services are included within the list of services that have received the general pre-approval of the Audit Committee.
Each request to provide services that require specific approval by the Audit Committee shall be submitted to the Audit Committee jointly by the Funds’ Treasurer or his or her designee and the Auditor, and must include a joint statement that, in their view, such request is consistent with the pre-approval policies and procedures and the SEC Rules.
Each request to provide Tax services under either the general or specific pre-approval of the Audit Committee will describe in writing: (i) the scope of the service, the fee structure for the engagement, and any side letter or amendment to the engagement letter, or any other agreement between the Auditor and the audit client, relating to the service; and (ii) any compensation arrangement or other agreement between the Auditor and any person (other than the audit client) with respect to the promoting, marketing, or recommending of a transaction covered by the service. The Auditor will discuss with the Audit Committee the potential effects of the services on the Auditor’s independence and will document the substance of the discussion.
Non-audit services pursuant to the de minimis exception provided by the SEC Rules will be promptly brought to the attention of the Audit Committee for approval, including documentation that each of the conditions for this exception, as set forth in the SEC Rules, has been satisfied.
On at least an annual basis, the Auditor will prepare a summary of all the services provided to any entity in the investment company complex as defined in section 2-01(f)(14) of Regulation S-X in sufficient detail as to the nature of the engagement and the fees associated with those services.
The Audit Committee has designated the Funds’ Treasurer to monitor the performance of all services provided by the Auditor and to ensure such services are in compliance with these policies and procedures. The Funds’ Treasurer will report to the Audit Committee on a periodic basis as to the results of such monitoring. Both the Funds’ Treasurer and management will immediately report to the Chairman of the Audit Committee any breach of these policies and procedures that comes to the attention of the Funds’ Treasurer or senior management.
Exhibit 1 to Pre-Approval of Audit and Non-Audit Services Policies and Procedures
Conditionally Prohibited Non-Audit Services (not prohibited if the Fund can reasonably conclude that the results of the service would not be subject to audit procedures in connection with the audit of the Fund’s financial statements)
| | • | | Bookkeeping or other services related to the accounting records or financial statements of the audit client |
| | • | | Financial information systems design and implementation |
| | • | | Appraisal or valuation services, fairness opinions, or contribution-in-kind reports |
| | • | | Internal audit outsourcing services |
Categorically Prohibited Non-Audit Services
| | • | | Broker-dealer, investment adviser, or investment banking services |
| | • | | Expert services unrelated to the audit |
| | • | | Any service or product provided for a contingent fee or a commission |
| | • | | Services related to marketing, planning, or opining in favor of the tax treatment of confidential transactions or aggressive tax position transactions, a significant purpose of which is tax avoidance |
| | • | | Tax services for persons in financial reporting oversight roles at the Fund |
| | • | | Any other service that the Public Company Oversight Board determines by regulation is impermissible. |
| (e)(2) | There were no amounts that were pre-approved by the Audit Committee pursuant to the de minimis exception under Rule 2-01 of Regulation S-X. |
| | (g) | In addition to the amounts shown in the tables above, PwC billed Invesco and Affiliates aggregate fees of $6,507,000 for the fiscal year ended October 31, 2023 and $6,370,000 for the fiscal year ended October 31, 2022 for non-audit services not required to be pre-approved by the Registrant’s Audit Committee. In total, PwC billed the Registrant, Invesco and Affiliates aggregate non-audit fees of $7,587,400 for the fiscal year ended October 31, 2023 and $7,143,262 for the fiscal year ended October 31, 2022. |
| | (h) | With respect to the non-audit services above billed to Invesco and Affiliates that were not required to be pre-approved by the Registrant’s Audit Committee, the Audit Committee received information from PwC about such services, including by way of comparison, that PwC provided audit services to entities within the Investment Company Complex, as defined by Rule 2-01(f)(14) of Regulation S-X, of approximately $33 million and non-audit services of approximately $19 million for the fiscal year ended 2023. The Audit Committee considered this information in evaluating PwC’s independence. |
Item 5. Audit Committee of Listed Registrants.
| | (a) | The Registrant has a separately designated Audit Committee established in accordance with Section 3(a)(58)(A) of the Securities Exchange Act of 1934, as amended, which consists solely of independent trustees. The Audit Committee members are Marc M. Kole, Joanne Pace, Gary R. Wicker, and Donald H. Wilson. |
Item 6. Schedule of Investments.
| (a) | The Schedules of Investments are included as a part of the report to shareholders filed under Item 1 of this Form N-CSR. |
Item 7. Disclosure of Proxy Voting Policies and Procedures for Closed-End Management Investment Companies.
Not applicable.
Item 8. Portfolio Managers of Closed-End Management Investment Companies.
Not applicable.
| Item 9. | Purchases of Equity Securities by Closed-End Management Investment Company and Affiliated Purchasers. |
Not applicable.
Item 10. Submission of Matters to a Vote of Security Holders.
There have been no material changes to the procedures by which shareholders may recommend nominees to the Board that would require disclosure herein.
Item 11. Controls and Procedures.
| | (a) | Based on their evaluation of the Registrant’s disclosure controls and procedures (as defined in Rule 30a-3(c) under the Investment Company Act of 1940) as of a date within 90 days of the filing date of this report, the Registrant’s President (principal executive officer) and Treasurer (principal financial officer) have concluded that such disclosure controls and procedures are effective. |
| | (b) | There were no changes in the Registrant’s internal control over financial reporting (as defined in Rule 30a-3(d) under the Investment Company Act of 1940) that occurred during the period covered by this report that has materially affected, or is reasonably likely to materially affect, the Registrant’s internal control over financial reporting. |
| Item 12. | Disclosure of Securities Lending Activities for Closed-End Management Investment Companies. |
Not applicable.
Item 13. Exhibits.
SIGNATURES
Pursuant to the requirements of the Securities Exchange Act of 1934 and the Investment Company Act of 1940, the Registrant has duly caused this report to be signed on its behalf by the undersigned, thereunto duly authorized.
(Registrant): Invesco India Exchange-Traded Fund Trust
| | |
| By: /s/ Brian Hartigan |
| |
| Name: | | Brian Hartigan |
| Title: | | President |
| |
| Date: | | January 3, 2024 |
Pursuant to the requirements of the Securities Exchange Act of 1934 and the Investment Company Act of 1940, this report has been signed below by the following persons on behalf of the Registrant and in the capacities and on the dates indicated.
| | |
| By: /s/ Brian Hartigan |
| |
| Name: | | Brian Hartigan |
| Title: | | President |
| |
| Date: | | January 3, 2024 |
| | |
| By: /s/ Kelli Gallegos |
| |
| Name: | | Kelli Gallegos |
| Title: | | Treasurer |
| |
| Date: | | January 3, 2024 |