Exhibit 99.2

CONFIDENTIAL Q4 and Year End 2019 Financial Results Supplementary Presentation February 28, 2020
Cautionary Note Regarding Forward - Looking Statements 2 To the extent any statements made in this presentation contain information that is not historical, these statements are forward - looking statements or forward - looking information, as applicable, within the meaning of Section 27 A of the U . S . Securities Act of 1933 , as amended, and Section 21 E of the U . S . Securities Exchange Act of 1934 , as amended, and under Canadian securities law (collectively “ forward - looking statements”) . Forward - looking statements can generally be identified by the use of words such as “should,” “intend,” “may,” “expect,” “believe,” “anticipate,” “estimate,” “continue,” “plan,” “project,” “will,” “could,” “would,” “target,” “potential” and other similar expressions . In addition, any statements that refer to expectations, projections or other characterizations of future events or circumstances are forward - looking statements . Although Atlantic Power Corporation (“AT”, “Atlantic Power” or the “Company”) believes that the expectations reflected in such forward - looking statements are reasonable, such statements involve risks and uncertainties and should not be read as guarantees of future performance or result s, and will not necessarily be accurate indications of whether or not or the times at or by which such performance or results will be achieved . Please refer to the factors discussed under “Risk Factors” and “Forward - Looking Information” in the Company’s periodic reports as filed with the Securities and Exchange Commission from time to time for a detailed discussion of the risks and uncertainties affecting the Company, including, without limitation, the outcome or impact of the Company’s business strategy to increase the intrinsic value of the Company on a per - share basis through disciplined management of its balance sheet and cost structure and investment of its discretionary cash in a combination of organic and external growth projects, acquisitions, and repurchases of debt and equity securities ; the Company’s ability to enter into new PPAs on favorable terms or at all after the expiration of existing agreements, and the outcome or impact on the Company’s business of any such actions . Although the forward - looking statements contained in this presentation are based upon what are believed to be reasonable assumptions, investors cannot be assured that actual results will be consistent with these forward - looking statements, and the differences may be material . These forward - looking statements are made as of the date of this presentation and, except as expressly required by applicable law, the Company assumes no obligation to update or revise them to reflect new events or circumstances . The Company’s ability to achieve its longer - term goals, including those described in this presentation, is based on significant assumptions relating to and including, among other things, the general conditions of the markets in which it operates, revenues, internal and external growth opportunities, its ability to sell assets at favorable prices or at all and general financial market and interest rate conditions . The Company’s actual results may differ, possibly materially and adversely, from these goals . Disclaimer – Non - GAAP Measures Project Adjusted EBITDA is not a measure recognized under GAAP and does not have a standardized meaning prescribed by GAAP, and is therefore unlikely to be comparable to similar measures presented by other companies . Investors are cautioned that the Company may calculate this non - GAAP measure in a manner that is different from other companies . The most directly comparable GAAP measure is Project income (loss) . Project Adjusted EBITDA is defined as Project income (loss) plus interest, taxes, depreciation and amortization, impairment charges, insurance loss (gain), other (income) expenses, and changes in the fair value of derivative instruments . Management uses Project Adjusted EBITDA at the project level to provide comparative information about project performance and believes such information is helpful to investors . A reconciliation of Project Adjusted EBITDA to Project income (loss) and to Net income (loss) on a consolidated basis is provided on page 38 . Leverage ratio • Consolidated debt to Adjusted EBITDA , calculated for the trailing four quarters . • Consolidated debt includes both long - term debt and the current portion of long - term debt at APLP Holdings, specifically the amount outstanding under the Term Loan and the amount borrowed under the revolver, if any, the Medium Term Notes, and consolidated project debt (Cadillac ) . • Adjusted EBITDA is calculated as the Consolidated Net Income of APLP Holdings plus the sum of consolidated interest expense, tax expense, depreciation and amortization expense, and other non - cash charges, minus non - cash gains . The Consolidated Net Income includes an allocation of the majority of Atlantic Power G&A expense . It also excludes earnings attributable to equity - owned projects but includes cash distributions received from those projects . Reference to “ Cdn $ ” and “Canadian dollars” are to the lawful currency of Canada and references to “ $ ”, “US $ ” and “U . S . dollars” are to the lawful currency of the United States . All dollar amounts herein are in U . S . dollars and approximate, unless otherwise indicated .
3 • Highlights • Operations Review • Commercial Update • Financial Results • Liquidity and Debt Repayment Profile • 2020 Guidance • Appendix Q4 and Full Year 2019 Supplementary Presentation
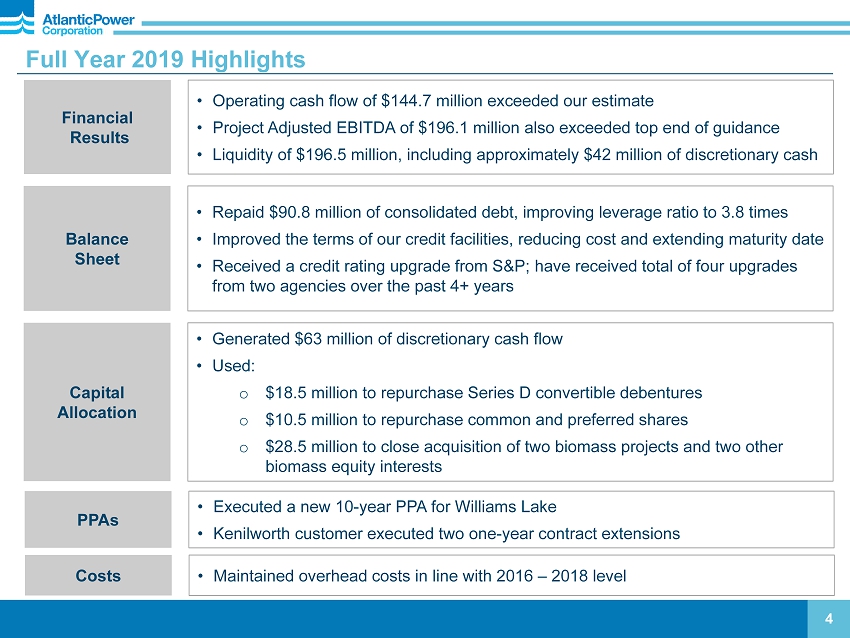
Full Year 2019 Highlights 4 Financial Results • Operating cash flow of $144.7 million exceeded our estimate • Project Adjusted EBITDA of $196.1 million also exceeded top end of guidance • Liquidity of $196.5 million, including approximately $42 million of discretionary cash Balance Sheet • Repaid $90.8 million of consolidated debt, improving leverage ratio to 3.8 times • Improved the terms of our credit facilities, reducing cost and extending maturity date • Received a credit rating upgrade from S&P; have received total of four upgrades from two agencies over the past 4+ years Capital Allocation • Generated $63 million of discretionary cash flow • Used: o $18.5 million to repurchase Series D convertible debentures o $10.5 million to repurchase common and preferred shares o $28.5 million to close acquisition of two biomass projects and two other biomass equity interests PPAs • Executed a new 10 - year PPA for Williams Lake • Kenilworth customer executed two one - year contract extensions Costs • Maintained overhead costs in line with 2016 – 2018 level

1.67 0.69 1.16 1.65 3.60 FY 2015 FY 2016 FY 2017 FY 2018 FY 2019 383.9 317.8 462.3 603.6 180.4 166.9 1,026.6 1,088.3 Q4 2018 Q4 2019 Q4 2018 Q4 2019 Q4 2018 Q4 2019 Q4 2018 Q4 2019 Q4 2019 Operational Performance: Higher generation due to acquisitions and higher dispatch at Frederickson and Manchief 5 Q4 2019 Q4 2018 Solid Fuel 83.0% 94.6% Natural Gas 96.0% 98.3% Hydro 89.8% 98.0% Total 90.4% 97.5% Aggregate Power Generation Q4 2019 vs. Q4 2018 (Net GWh) Solid Fuel Natural Gas Hydroelectric Total (17.2%) 30.6% (7.5)% 6.0% Lower availability factor: Generation drivers: + Acquisitions of Allendale, Dorchester, Craven and Grayling + Frederickson higher dispatch + Manchief higher dispatch + Curtis Palmer higher water flows - Williams Lake voluntary curtailment (rebuilding fuel inventory) - Cadillac fire and extended outage - Mamquam lower water flows - Cadillac fire and extended outage - Moresby Lake extended outage (transformer) - Piedmont maintenance outage - Kenilworth later fall outage in 2019 + Oxnard gas turbine repairs in prior period Safety: Total Recordable Incident Rate TRIR, generation companies (Bureau of Labor Statistics): FY 2015 1.4, FY 2016 1.0, FY 2017 1.5, FY 2018 1.1 Industry average Availability Hydro generation Curtis Palmer Mamquam +14% vs Q4 2018 - 31% vs Q4 2018 +28% vs long - term avg. - 5% vs long - term avg. Note: See new Reportable Segments, pages 9 and 30
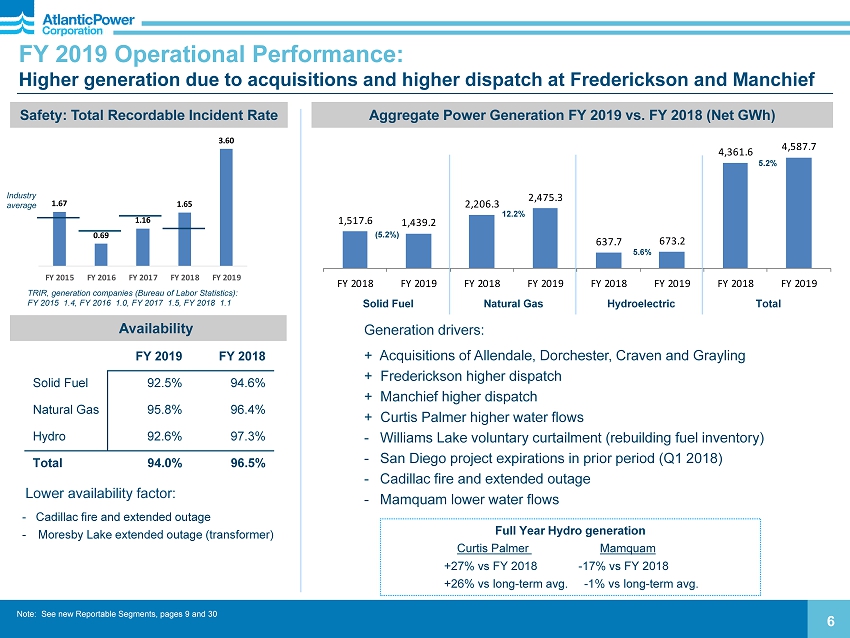
1,517.6 1,439.2 2,206.3 2,475.3 637.7 673.2 4,361.6 4,587.7 FY 2018 FY 2019 FY 2018 FY 2019 FY 2018 FY 2019 FY 2018 FY 2019 FY 2019 Operational Performance: Higher generation due to acquisitions and higher dispatch at Frederickson and Manchief 6 FY 2019 FY 2018 Solid Fuel 92.5% 94.6% Natural Gas 95.8% 96.4% Hydro 92.6% 97.3% Total 94.0% 96.5% Aggregate Power Generation FY 2019 vs. FY 2018 (Net GWh) Solid Fuel Natural Gas Hydroelectric Total (5.2%) 12.2% 5.6% 5.2% Lower availability factor: Generation drivers: + Acquisitions of Allendale, Dorchester, Craven and Grayling + Frederickson higher dispatch + Manchief higher dispatch + Curtis Palmer higher water flows - Williams Lake voluntary curtailment (rebuilding fuel inventory) - San Diego project expirations in prior period (Q1 2018) - Cadillac fire and extended outage - Mamquam lower water flows - Cadillac fire and extended outage - Moresby Lake extended outage (transformer) Safety: Total Recordable Incident Rate TRIR, generation companies (Bureau of Labor Statistics): FY 2015 1.4, FY 2016 1.0, FY 2017 1.5, FY 2018 1.1 Availability Full Year Hydro generation Curtis Palmer Mamquam +27% vs FY 2018 - 17% vs FY 2018 +26% vs long - term avg. - 1% vs long - term avg. 1.67 0.69 1.16 1.65 3.60 FY 2015 FY 2016 FY 2017 FY 2018 FY 2019 Industry average Note: See new Reportable Segments, pages 9 and 30

Operations Update 7 • Work continuing on replacement of damaged components and reconstruction of the plant • Sourced turbine and generator from an identical plant in Maine to reduce lead time • Repairs on track for a targeted return to service in Q3 2020 • Received initial insurance recovery of $11.3 million in December 2019 Cadillac (Michigan) Williams Lake (British Columbia) • Returned to operation in late December; running at ~50MW • Continuing to focus on building fuel inventory o Short - term arrangements for traditional sources of fiber, including with new suppliers o Purchased and deployed new mobile fuel grinder o Availability and cost of fuel challenging, but to date are in line with expectations • Targeting continued operation into April • May – July outage (freshet months) o Replacement of cooling tower o Other maintenance o Continue to build fuel inventory • Estimate breakeven EBITDA in 2020 due to maintenance and reduced level of operations

Commercial Updates 8 Manchief (Colorado) • May 2019 agreement to sell Manchief to Public Service Co. of Colorado ( PSCo ), the customer under the PPA, for $45.2 million in May 2022 following expiration of the PPA • Federal Energy Regulatory Commission approved the transaction in October 2019 • Earlier this month, the Colorado Public Utilities Commission approved PSCo’s application for a Certificate of Public Convenience and Necessity and cost recovery, which was required for acquisition • All regulatory approvals required for the sale have been received Oxnard (California) • PPA with Southern California Edison (SCE) expires in May 2020 • Oxnard was not selected in recent capacity solicitations • Pursuing alternative offtake structures o Reliability Must Run (RMR) contract with California Independent System Operator (CAISO) o Evaluating potential to sell into Resource Adequacy (RA) market or to Community Choice Aggregators (CCA) • We own and control Oxnard site Calstock (Ontario) • Remain engaged with government but expect plant to cease operations at the end of PPA term (June 2020) • No policy or market mechanism in place to continue biomass operations
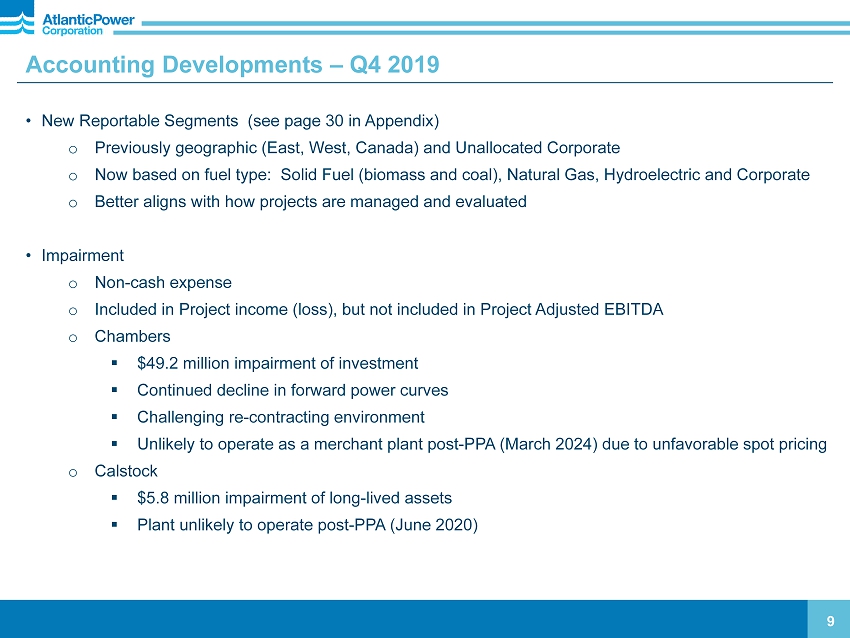
Accounting Developments – Q4 2019 9 • New Reportable Segments (see page 30 in Appendix) o Previously geographic (East, West, Canada) and Unallocated Corporate o Now based on fuel type: Solid Fuel (biomass and coal), Natural Gas, Hydroelectric and Corporate o Better aligns with how projects are managed and evaluated • Impairment o N on - cash expense o Included in Project income (loss), but not included in Project Adjusted EBITDA o Chambers ▪ $49.2 million impairment of investment ▪ Continued decline in forward power curves ▪ Challenging re - contracting environment ▪ Unlikely to operate as a merchant plant post - PPA (March 2024) due to unfavorable spot pricing o Calstock ▪ $5.8 million impairment of long - lived assets ▪ Plant unlikely to operate post - PPA (June 2020)

Accounting Developments – Q4 2019, continued 10 • Cadillac o Received initial insurance recovery of $11.3 million ▪ Amount was net of $1 million property deductible (recorded in Q3 2019) and 45 - day business interruption deductible of approximately $1.4 million (Q4 2019) ▪ Included in investing cash flows ▪ Not allocated between property and business interruption insurance; we estimate $2.0 million was for business interruption ▪ Entire amount recorded as a reduction to insurance receivable o Recoveries under business interruption insurance considered gain contingencies ▪ Change from what we had expected at time of Q3 2019 call ▪ Q4 2019 EBITDA impact approximately $2.0 million ▪ Expect to record to earnings when claim is settled (after plant returns to operation) ▪ Thus, project income and EBITDA for Cadillac is expected to be shifted into 2H 2020 (after claim is settled)
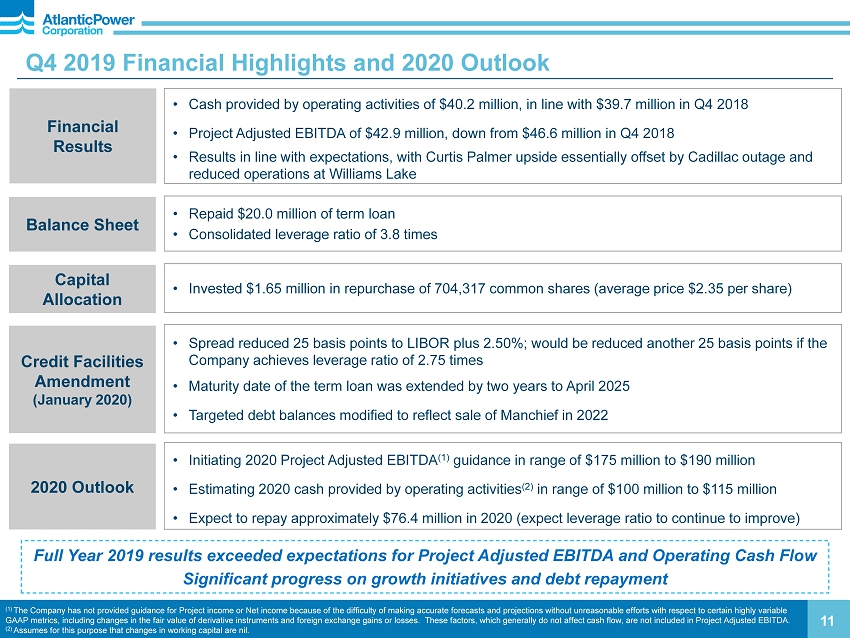
Q4 2019 Financial Highlights and 2020 Outlook 11 Financial Results • Cash provided by operating activities of $40.2 million, in line with $39.7 million in Q4 2018 • Project Adjusted EBITDA of $42.9 million, down from $46.6 million in Q4 2018 • Results in line with expectations, with Curtis Palmer upside essentially offset by Cadillac outage and reduced operations at Williams Lake Balance Sheet • Repaid $20.0 million of term loan • Consolidated leverage ratio of 3.8 times Capital Allocation • Invested $1.65 million in repurchase of 704,317 common shares (average price $2.35 per share) Full Year 2019 results exceeded expectations for Project Adjusted EBITDA and Operating Cash Flow Significant progress on growth initiatives and debt repayment 2020 Outlook • Initiating 2020 Project Adjusted EBITDA (1) guidance in range of $175 million to $190 million • Estimating 2020 cash provided by operating activities (2) in range of $100 million to $115 million • Expect to repay approximately $76.4 million in 2020 (expect leverage ratio to continue to improve) (1) The Company has not provided guidance for Project income or Net income because of the difficulty of making accurate forecasts and project ion s without unreasonable efforts with respect to certain highly variable GAAP metrics, including changes in the fair value of derivative instruments and foreign exchange gains or losses. These fact ors , which generally do not affect cash flow, are not included in Project Adjusted EBITDA. (2) Assumes for this purpose that changes in working capital are nil . Credit Facilities Amendment (January 2020) • Spread reduced 25 basis points to LIBOR plus 2.50%; would be reduced another 25 basis points if the Company achieves leverage ratio of 2.75 times • Maturity date of the term loan was extended by two years to April 2025 • Targeted debt balances modified to reflect sale of Manchief in 2022

Q4 2019 Project Adjusted EBITDA (1) (bridge vs 2018 actual) ($ millions) 12 $46.6 $42.9 Q4 2018 Q4 2019 Curtis Palmer Higher water flows 1.4 Nipigon Mostly due to contractual price escalation 0.8 Williams Lake Voluntary curtailment and additional maintenance (2.4) Cadillac Outage impact and deductible; expect to recover business interruption losses once rebuild is complete ($2 million) (3.8) (1.8) Oxnard Outage and GT repairs In prior period 1.3 Mamquam, Moresby Lake Mamquam lower water f lows; Moresby Lake main transformer failure (May 2019) Voluntary curtailment at Williams Lake and insurance deductibles related to the fire at Cadillac, mostly offset by higher water flows at Curtis Palmer and capacity rate escalation at Nipigon 0.7 All others (0.5) Frederickson Higher dispatch and fewer maintenance projects (1) See Appendix for discussion of non - GAAP disclosures. 0.7 Acquisitions Allendale Dorchester Craven Grayling
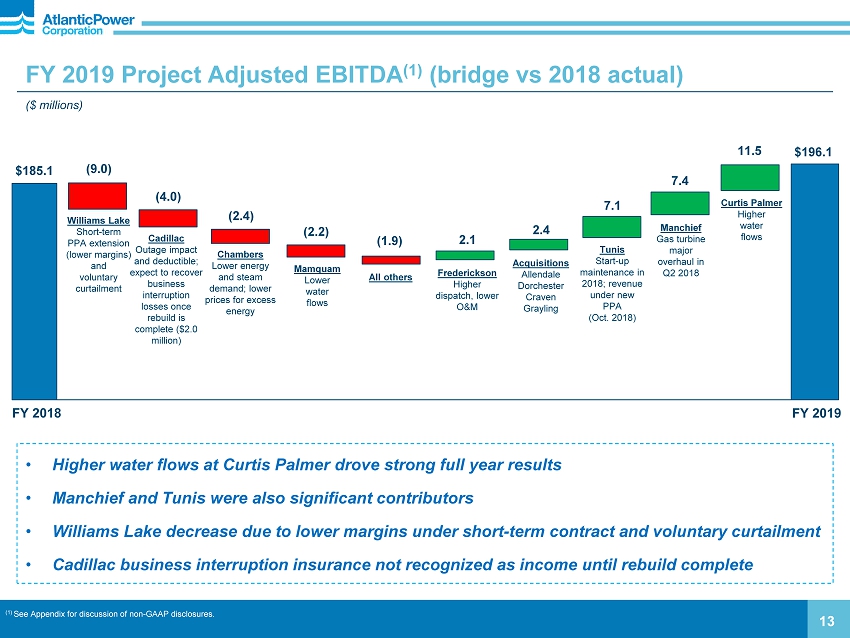
FY 2019 Project Adjusted EBITDA (1) (bridge vs 2018 actual) ($ millions) 13 $185.1 $196.1 FY 2018 FY 2019 Curtis Palmer Higher w ater flows 11.5 Manchief Gas turbine major overhaul in Q2 2018 7.1 Chambers Lower energy and steam demand; lower prices for excess energy (2.4) Williams Lake Short - term PPA extension (lower margins) and voluntary curtailment (9.0) (4.0) Tunis Start - up maintenance in 2018; revenue under new PPA (Oct. 2018) 7.4 Cadillac Outage impact and deductible; expect to recover business interruption losses once rebuild is complete ($2.0 million) • Higher water flows at Curtis Palmer drove strong full year results • Manchief and Tunis were also significant contributors • Williams Lake decrease due to lower margins under short - term contract and voluntary curtailment • Cadillac business interruption insurance not recognized as income until rebuild complete (1.9) All others 2.1 Frederickson Higher dispatch, lower O&M (2.2) Mamquam Lower water flows (1) See Appendix for discussion of non - GAAP disclosures. 2.4 Acquisitions Allendale Dorchester Craven Grayling
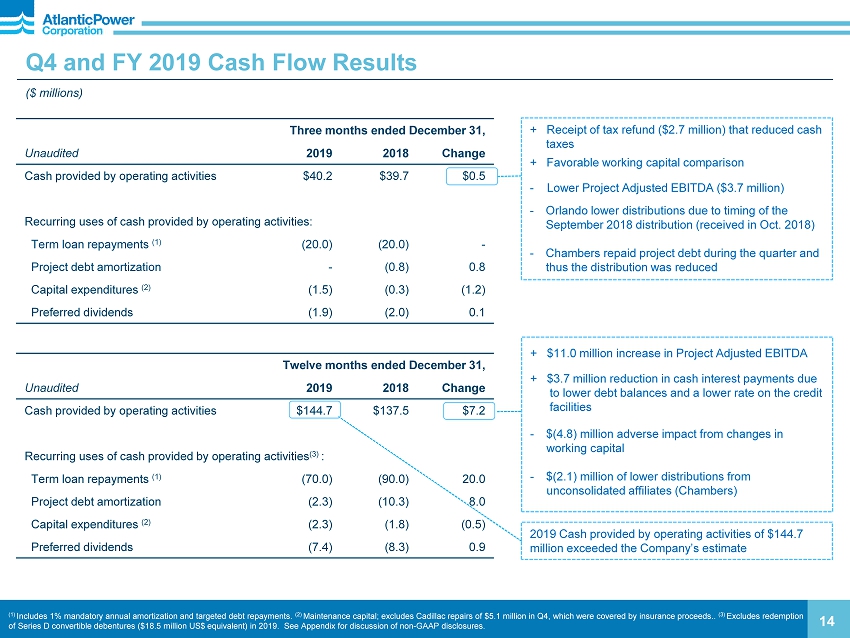
Three months ended December 31, Unaudited 2019 2018 Change Cash provided by operating activities $40.2 $39.7 $0.5 Recurring uses of cash provided by operating activities: Term loan repayments (1) (20.0) (20.0) - Project debt amortization - (0.8) 0.8 Capital expenditures (2) (1.5) (0.3) (1.2) Preferred dividends (1.9) (2.0) 0.1 Q4 and FY 2019 Cash Flow Results ($ millions) 14 + Receipt of tax refund ($2.7 million) that reduced cash taxes + Favorable working capital comparison - Lower Project Adjusted EBITDA ($3.7 million) - Orlando lower distributions due to timing of the September 2018 distribution (received in Oct. 2018) - Chambers repaid project debt during the quarter and thus the distribution was reduced (1) Includes 1% mandatory annual amortization and targeted debt repayments. (2) Maintenance capital; excludes Cadillac repairs of $5.1 million in Q4, which were covered by insurance proceeds.. (3) Excludes redemption of Series D convertible debentures ($18.5 million US$ equivalent) in 2019. See Appendix for discussion of non - GAAP disclosures. Twelve months ended December 31, Unaudited 2019 2018 Change Cash provided by operating activities $144.7 $137.5 $7.2 Recurring uses of cash provided by operating activities (3) : Term loan repayments (1) (70.0) ( 9 0.0) 20.0 Project debt amortization (2.3) (10.3) 8.0 Capital expenditures (2) (2.3) (1.8) (0.5) Preferred dividends (7.4) (8.3) 0.9 + $11.0 million increase in Project Adjusted EBITDA + $3.7 million reduction in cash interest payments due to lower debt balances and a lower rate on the credit facilities - $(4.8) million adverse impact from changes in working capital - $(2.1) million of lower distributions from unconsolidated affiliates (Chambers) 2019 Cash provided by operating activities of $144.7 million exceeded the Company’s estimate
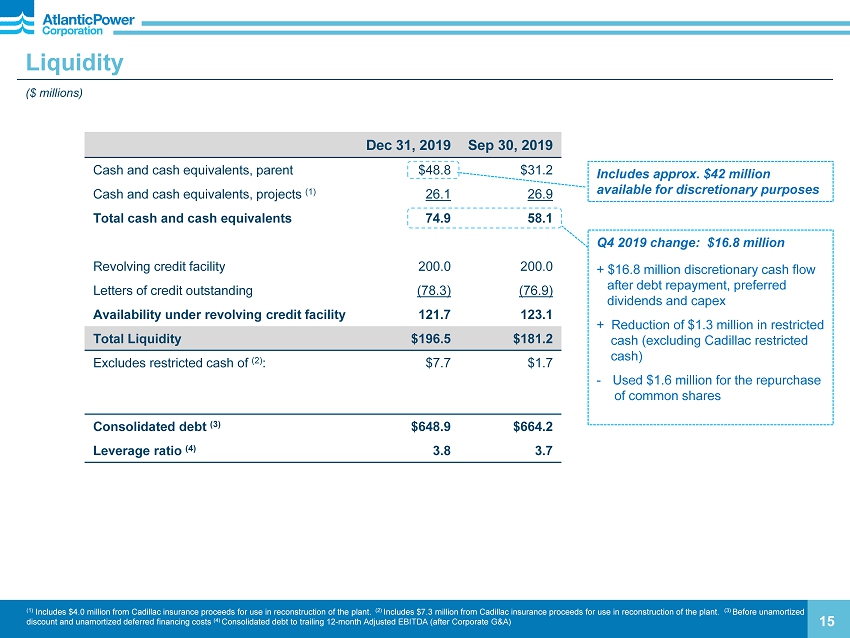
Liquidity ($ millions) 15 Dec 31, 2019 Sep 30, 2019 Cash and cash equivalents, parent $48.8 $31.2 Cash and cash equivalents, projects (1) 26.1 26.9 Total cash and cash equivalents 74.9 58.1 Revolving credit facility 200.0 200.0 Letters of credit outstanding (78.3) (76.9) Availability under revolving credit facility 121.7 123.1 Total Liquidity $196.5 $181.2 Excludes restricted cash of (2) : $7.7 $1.7 Consolidated debt (3) $648.9 $664.2 Leverage ratio (4) 3.8 3.7 (1) Includes $4.0 million from Cadillac insurance proceeds for use in reconstruction of the plant. (2) Includes $7.3 million from Cadillac insurance proceeds for use in reconstruction of the plant. (3) Before unamortized discount and unamortized deferred financing costs (4) Consolidated debt to trailing 12 - month Adjusted EBITDA (after Corporate G&A) Q4 2019 change: $16.8 million + $16.8 million discretionary cash flow after debt repayment, preferred dividends and capex + Reduction of $1.3 million in restricted cash (excluding Cadillac restricted cash ) - Used $1.6 million for the repurchase of common shares Includes approx. $42 million available for discretionary purposes
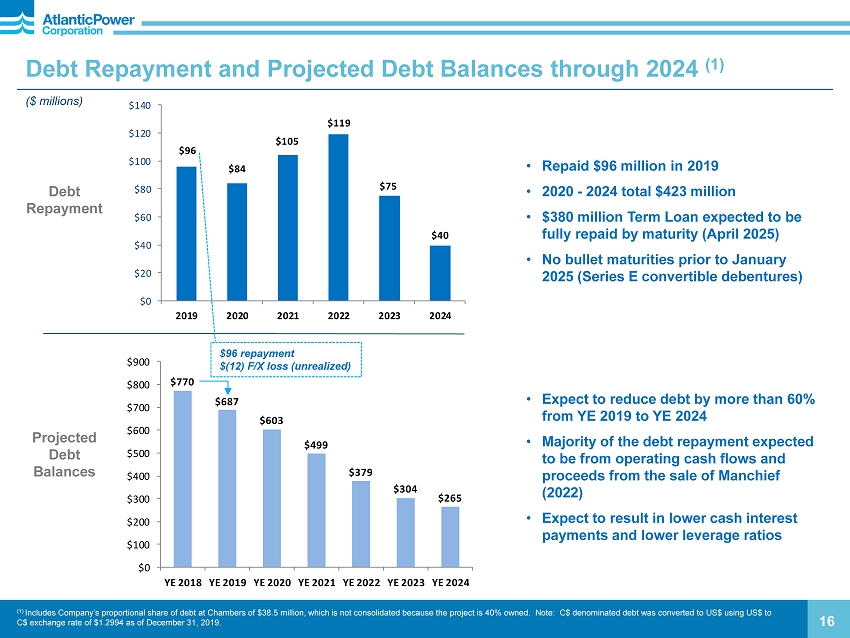
$96 $84 $105 $119 $75 $40 $0 $20 $40 $60 $80 $100 $120 $140 2019 2020 2021 2022 2023 2024 $770 $687 $603 $499 $379 $304 $265 $0 $100 $200 $300 $400 $500 $600 $700 $800 $900 YE 2018 YE 2019 YE 2020 YE 2021 YE 2022 YE 2023 YE 2024 Debt Repayment and Projected Debt Balances through 2024 (1) ($ millions ) 16 16 (1) Includes Company’s proportional share of debt at Chambers of $38.5 million, which is not consolidated because the project is 40% owned. Note: C$ denominated debt was converted to US$ using US$ to C$ exchange rate of $1.2994 as of December 31, 2019. • Expect to reduce debt by more than 60% from YE 2019 to YE 2024 • M ajority of the debt repayment expected to be from operating cash flows and proceeds from the sale of Manchief (2022) • Expect to result in lower cash interest payments and lower leverage ratios • Repaid $96 million in 2019 • 2020 - 2024 total $423 million • $380 million Term Loan expected to be fully repaid by maturity (April 2025) • No bullet maturities prior to January 2025 (Series E convertible debentures) Projected Debt Balances Debt Repayment $96 repayment $(12) F/X loss (unrealized)

2020 Project Adjusted EBITDA (1) Guidance (bridge vs 2019 actual) ($ millions) 17 $196 $190 $175 FY 2019 Actual FY 2020 Guidance Acquisitions Full year impact of: Allendale Dorchester Craven Grayling +4 All others ( 1) Moresby Lake Transformer failure in May 2019 +2 Curtis Palmer Assume average water flows (12) Nipigon Rate escalation +3 Calstock PPA expiry June 2020 (1) The Company has not provided guidance for Project income or Net income because of the difficulty of making accurate forecasts and pr ojections without unreasonable efforts with respect to certain highly variable components of these comparable GAAP metrics, including changes in the fair value of derivative instruments an d f oreign exchange gains or losses. These factors, which generally do not affect cash flow, are not included in Project Adjusted EBITDA . See Appendix for discussion of non - GAAP disclosures. (5) Initiating guidance of $175 million to $190 million Morris Major maintenance (4) Oxnard PPA expiry May 2020 (3) 2020 Guidance Consistent with Initial 2019 Guidance ($175 million to $190 million) - Assumes average water flows at Curtis Palmer - PPA expirations at Calstock and Oxnard - Morris maintenance outage + Biomass acquisitions Cadillac Business interruption insurance deductible in Q4 2019; Timing of BI recognition +3
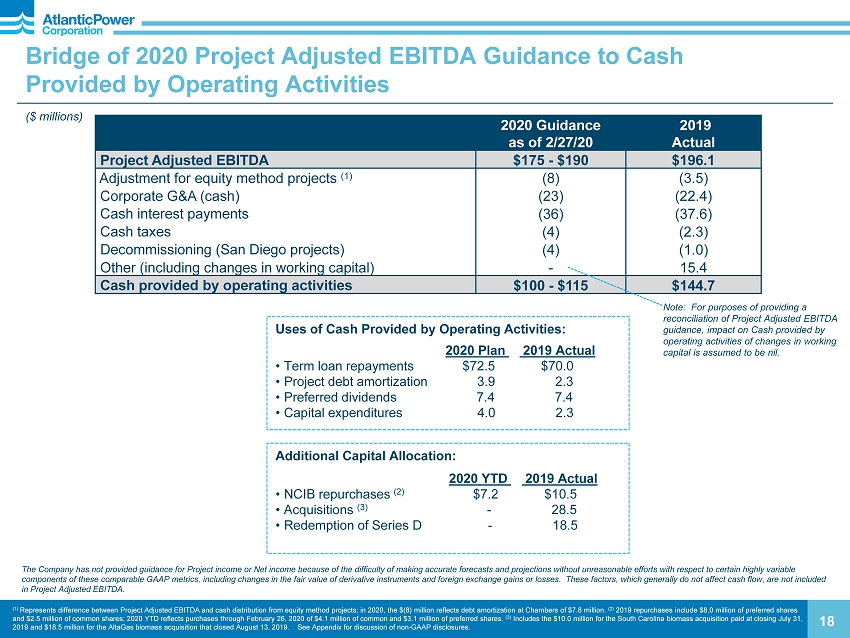
Bridge of 2020 Project Adjusted EBITDA Guidance to Cash Provided by Operating Activities ($ millions ) 18 18 The Company has not provided guidance for Project income or Net income because of the difficulty of making accurate forecasts an d projections without unreasonable efforts with respect to certain highly variable components of these comparable GAAP metrics, including changes in the fair value of derivative instruments and foreign exchan ge gains or losses. These factors, which generally do not affect cash flow, are not included in Project Adjusted EBITDA. 2020 Guidance as of 2/27/20 2019 Actual Project Adjusted EBITDA $175 - $190 $196.1 Adjustment for equity method projects (1) (8) (3.5) Corporate G&A (cash) (23) (22.4) Cash interest payments (36) (37.6) Cash taxes (4) (2.3) Decommissioning (San Diego projects) (4) (1.0) Other (including changes in working capital) - 15.4 Cash provided by operating activities $100 - $115 $144.7 Note: For purposes of providing a reconciliation of Project Adjusted EBITDA guidance, impact on Cash provided by operating activities of changes in working capital is assumed to be nil. (1) Represents difference between Project Adjusted EBITDA and cash distribution from equity method projects; in 2020, the $(8) million reflects debt amortization at Chambers of $7.8 million. (2 ) 2019 repurchases include $8.0 million of preferred shares and $2.5 million of common shares; 2020 YTD reflects purchases through February 26, 2020 of $4.1 million of common and $3.1 m ill ion of preferred shares. (3 ) Includes the $10.0 million for the South Carolina biomass acquisition paid at closing July 31, 2019 and $18.5 million for the AltaGas biomass acquisition that closed August 13, 2019. See Appendix for discussion of non - GA AP disclosures. Uses of Cash Provided by Operating Activities: 2020 Plan 2019 Actual • Term loan repayments $72.5 $70.0 • Project debt amortization 3.9 2.3 • Preferred dividends 7.4 7.4 • Capital expenditures 4.0 2.3 Additional Capital Allocation: 2020 YTD 2019 Actual • NCIB repurchases (2) $7.2 $10.5 • Acquisitions (3) - 28.5 • Redemption of Series D - 18.5

Tax Update NOL Expiration by Year (As of 12/31/19 $ millions) Pre - Tax Reform U.S. Canada 2029 $0.0 $27.3 2030 41.1 0.0 2031 25.8 0.0 2032 13.4 5.8 2033 20.6 23.5 2034 122.3 9.1 2035 154.1 0.0 2036 17.0 20.3 2037 16.7 8.9 2038 0.0 10.1 2039 0.0 6.9 Total $411.0 $111.9 • As of December 31, 2019, the Company had U.S. and Canadian NOLs scheduled to expire per the table (right) that can be utilized to offset future taxable income in their respective tax jurisdictions. • NOLs represent potential future tax savings of approximately $105.7 million in the U.S. under the revised U.S. Federal corporate tax rate of 21% and $30.2 million in Canada. • Although these NOLs are expected to be available as a future benefit: » Some of the NOLs are subject to limitations on their use » Pre - Tax Reform NOLs, as detailed in the chart, can be used to offset 100% of taxable income and retain a 2 - year carryback and a 20 - year carryforward period » Post - Tax Reform NOLs are limited to offset 80% of taxable income, have no carryback feature but have an unlimited carryforward period. The Company has no Post - Tax Reform NOLs. Net Operating Losses Other Impacts of Recent U.S. Tax Legislation • Repeal of the Alternative Minimum Tax (AMT) will result in cash tax savings » De minimis amount of AMT credits that are 50% refundable in 2018 - 2020; any remaining credits are fully refundable in 2021 » First refund of $2.7 million was received in Q4 2019; we expect to receive $1.3 million in 2020 • Business Interest Expense Limitation » Net business interest deductions in excess of 30% of EBITDA (EBIT after 2021) are disallowed . However, disallowed deductions will be carried forward indefinitely to be used at a future date. 19 Valuation Allowance (VA) • A VA must be established against deferred tax assets when it is more likely than not that the asset will not be realized. During 2019, the Company recorded a reduction of $2.2 million to its existing U.S. VA’s and an increase of $7.9 million to its existing Canadian VA’s. • At December 31, 2019, the Company had VA’s in the U.S. and Canada of $53.2 million and $92.2 million, respectively, totaling $145.4 million. » The Company had disallowed interest expense of $37.9 million in 2018 and estimates utilizing $1.1 million of that carryforward on 2019 return and the remainder by 2022. • The Company does not anticipate paying any significant Federal cash taxes in either the U.S. or Canada for FY 2019 or FY 2020.

Appendix 20 TABLE OF CONTENTS Page Power Projects, PPA Expiration Dates 21 Capital Structure Information 22 - 29 Project Information – Segments, Earnings/Cash Flow Diversification and PPA Term 30 - 32 Supplemental Financial Information Q4 2019 Results Summary 33 - 34 Project Income by Project 35 Project Adjusted EBITDA by Project 36 Cash Distributions from Projects 37 Non - GAAP Disclosures 38 - 40
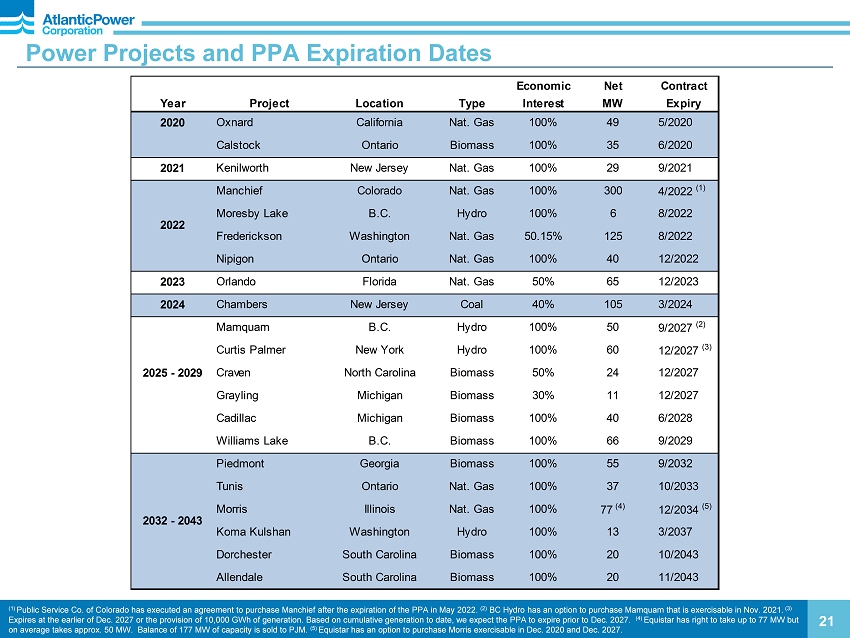
Power Projects and PPA Expiration Dates 21 (1) Public Service Co. of Colorado has executed an agreement to purchase Manchief after the expiration of the PPA in May 2022. (2) BC Hydro has an option to purchase Mamquam that is exercisable in Nov. 2021. (3) Expires at the earlier of Dec. 2027 or the provision of 10,000 GWh of generation . Based on cumulative generation to date, we expect the PPA to expire prior to Dec. 2027 . (4) Equistar has right to take up to 77 MW but on average takes approx. 50 MW. Balance of 177 MW of capacity is sold to PJM. (5) Equistar has an option to purchase Morris exercisable in Dec. 2020 and Dec. 2027. Economic Net Contract Year Project Location Type Interest MW Expiry 2020 Oxnard California Nat. Gas 100% 49 5/2020 Calstock Ontario Biomass 100% 35 6/2020 2021 Kenilworth New Jersey Nat. Gas 100% 29 9/2021 Manchief Colorado Nat. Gas 100% 300 4/2022 (1) Moresby Lake B.C. Hydro 100% 6 8/2022 Frederickson Washington Nat. Gas 50.15% 125 8/2022 Nipigon Ontario Nat. Gas 100% 40 12/2022 2023 Orlando Florida Nat. Gas 50% 65 12/2023 2024 Chambers New Jersey Coal 40% 105 3/2024 Mamquam B.C. Hydro 100% 50 9/2027 (2) Curtis Palmer New York Hydro 100% 60 12/2027 (3) 2025 - 2029 Craven North Carolina Biomass 50% 24 12/2027 Grayling Michigan Biomass 30% 11 12/2027 Cadillac Michigan Biomass 100% 40 6/2028 Williams Lake B.C. Biomass 100% 66 9/2029 Piedmont Georgia Biomass 100% 55 9/2032 Tunis Ontario Nat. Gas 100% 37 10/2033 Morris Illinois Nat. Gas 100% 77 (4) 12/2034 (5) Koma Kulshan Washington Hydro 100% 13 3/2037 Dorchester South Carolina Biomass 100% 20 10/2043 Allendale South Carolina Biomass 100% 20 11/2043 2022 2032 - 2043
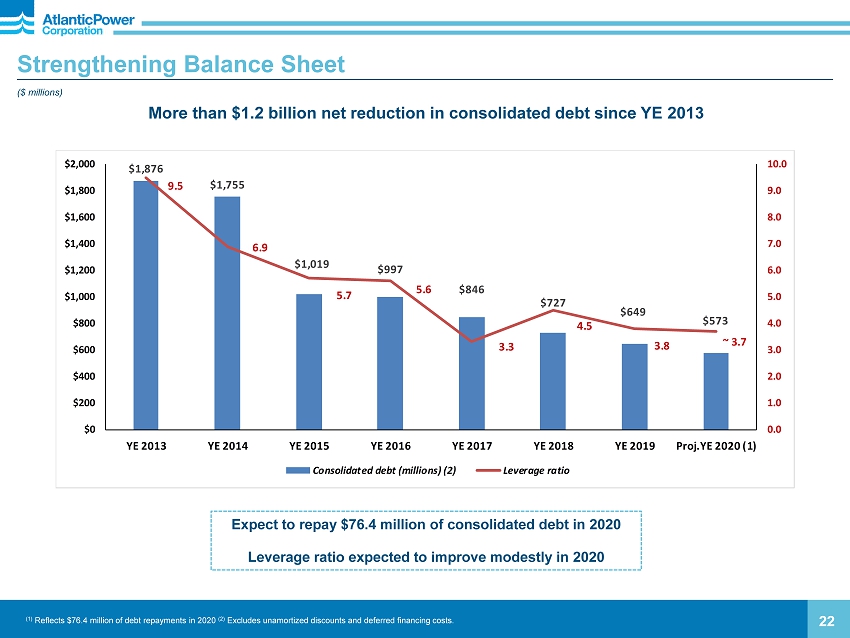
$1,876 $1,755 $1,019 $997 $846 $727 $649 $573 9.5 6.9 5.7 5.6 3.3 4.5 3.8 3.7 0.0 1.0 2.0 3.0 4.0 5.0 6.0 7.0 8.0 9.0 10.0 $0 $200 $400 $600 $800 $1,000 $1,200 $1,400 $1,600 $1,800 $2,000 YE 2013 YE 2014 YE 2015 YE 2016 YE 2017 YE 2018 YE 2019 Proj.YE 2020 (1) Consolidated debt (millions) (2) Leverage ratio 22 (1) Reflects $76.4 million of debt repayments in 2020 (2) Excludes unamortized discounts and deferred financing costs. Strengthening Balance Sheet ($ millions) ~ 3.7 More than $1.2 billion net reduction in consolidated debt since YE 2013 Expect to repay $76.4 million of consolidated debt in 2020 Leverage ratio expected to improve modestly in 2020
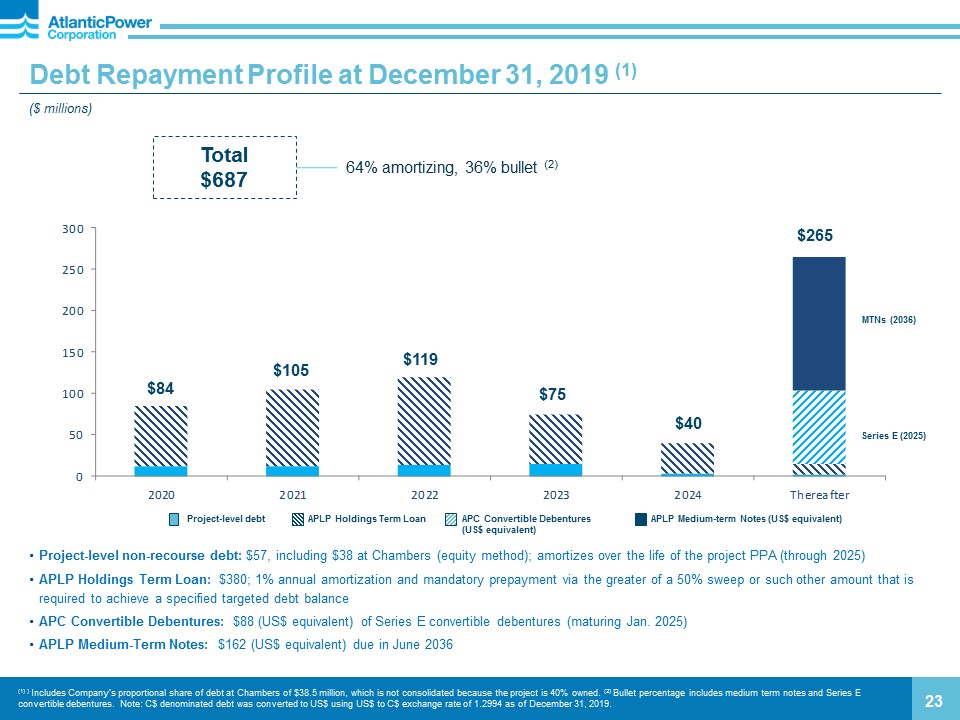
0 50 100 150 200 250 300 2020 2021 2022 2023 2024 Thereafter Debt Repayment Profile at December 31, 2019 (1) ($ millions) 23 (1) ) Includes Company’s proportional share of debt at Chambers of $38.5 million, which is not consolidated because the project is 40% owned. (2) Bullet percentage includes medium term notes and Series E convertible debentures. Note : C$ denominated debt was converted to US$ using US$ to C$ exchange rate of 1.2994 as of December 31, 2019. • Project - level non - recourse debt: $57, including $38 at Chambers (equity method); amortizes over the life of the project PPA (through 2025) • APLP Holdings Term Loan: $380; 1% annual amortization and mandatory prepayment via the greater of a 50% sweep or such other amount that is required to achieve a specified targeted debt balance • APC Convertible Debentures: $88 (US$ equivalent) of Series E convertible debentures (maturing Jan. 2025) • APLP Medium - Term Notes: $162 (US$ equivalent) due in June 2036 Total $687 $84 $105 $265 $119 APLP Holdings Term Loan Project - level debt APLP Medium - term Notes (US$ equivalent) APC Convertible Debentures (US$ equivalent) 64% amortizing, 36% bullet (2) $75 $40 Series E (2025) MTNs (2036)
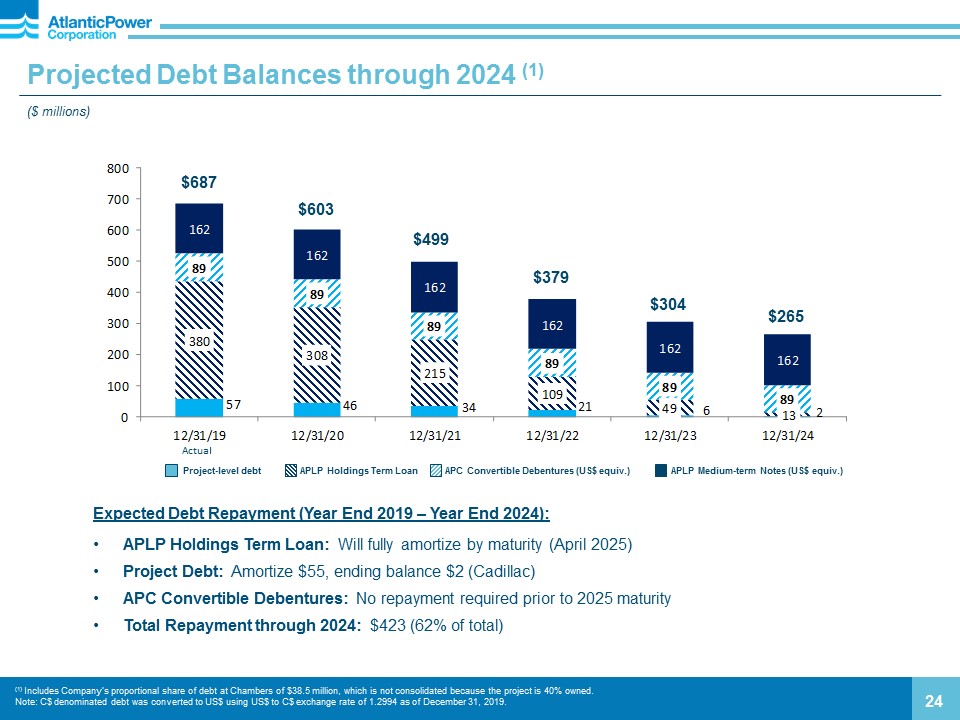
57 46 34 21 6 2 380 308 215 109 49 13 89 89 89 89 89 89 162 162 162 162 162 162 0 100 200 300 400 500 600 700 800 12/31/19 12/31/20 12/31/21 12/31/22 12/31/23 12/31/24 24 Expected Debt Repayment (Year End 2019 – Year End 2024): • APLP Holdings Term Loan: Will fully amortize by maturity (April 2025) • Project Debt: Amortize $55, ending balance $2 (Cadillac) • APC Convertible Debentures: No repayment required prior to 2025 maturity • Total Repayment through 2024: $423 (62% of total) Projected Debt Balances through 2024 (1) ($ millions ) APLP Holdings Term Loan Project - level debt APLP Medium - term Notes (US$ equiv.) APC Convertible Debentures (US$ equiv.) $687 $379 $304 $603 $499 Actual (1) Includes Company’s proportional share of debt at Chambers of $38.5 million, which is not consolidated because the project is 40% owned. Note : C$ denominated debt was converted to US$ using US$ to C$ exchange rate of 1.2994 as of December 31, 2019. $265

$130 $127 $100 $71 $72 $41 $38 $42 $0 $20 $40 $60 $80 $100 $120 $140 $160 $180 2013 2014 2015 2016 2017 2018 2019 Refinancing Transaction Costs Cash Interest Payments $53.8 $45.4 $31.9 $22.8 $22.2 $23.9 $23.9 $0.0 $10.0 $20.0 $30.0 $40.0 $50.0 $60.0 2013 2014 2015 2016 2017 2018 2019 25 Reducing Cash Interest Payments and Corporate Overhead ($ millions ) Cash Interest Payments (1) Corporate Overhead Expense Reduction has been driven by debt repayment as well as re - pricings of our term loan and revolver Projected to decline to $36 million in 2020 (1) Includes consolidated debt only Combined interest and overhead reduction of $110 million annually from 2014 levels $89 $21 Overhead expense stable 2016 - 2019

Capitalization ($ millions) 26 Dec. 31, 2019 Dec. 31, 2018 Long - term d ebt, incl. current portion (1) APLP Medium - Term Notes (2) $161.7 $154.0 Revolving credit facility - - Term Loan 380.0 450.0 P roject - level debt (non - recourse) 18.8 21.0 Convertible debentures (2) 88.5 102.4 Total long - term debt, incl. current portion $649.0 83% $727.4 79% Preferred shares (3) 182.7 23% 199.3 22% Common equity (4) (45.0) (6)% (6.9) (1)% Total shareholders equity $137.7 17% $192.4 21% Total capitalization $786.7 100% $919.8 100% (1) Debt balances are shown before unamortized discount and unamortized deferred financing costs. (2) Period - over - period change due to F/X impacts. (3) Par value of preferred shares was approximately $143 million and $149 million at December 31, 2019 and December 31, 2018, respectively. (4) Common equity includes other comprehensive loss and retained deficit. Note: Table is p resented on a consolidated basis and excludes equity method projects
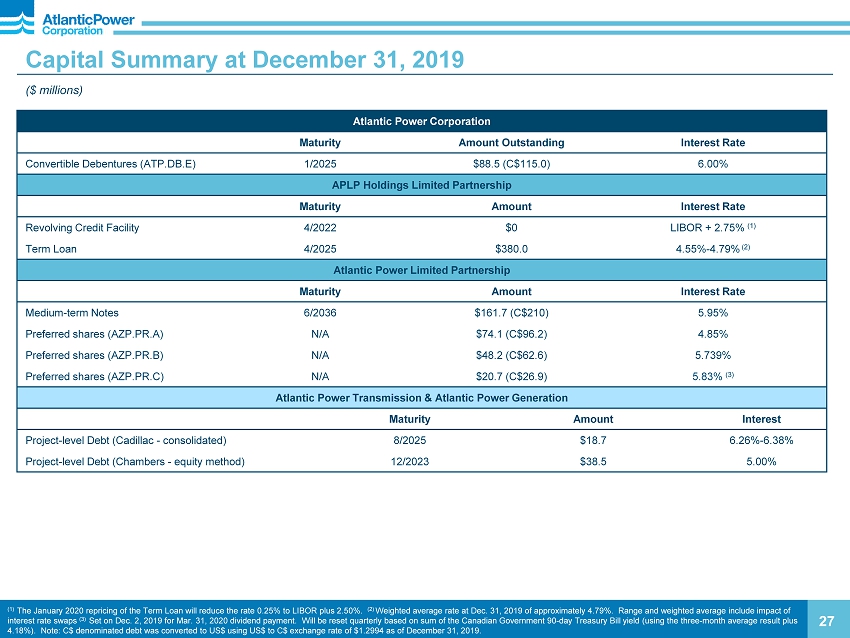
Capital Summary at December 31, 2019 ($ millions) (1) The January 2020 repricing of the Term Loan will reduce the rate 0.25% to LIBOR plus 2.50%. (2) Weighted average rate at Dec. 31, 2019 of approximately 4.79%. Range and weighted average include impact of interest rate swaps (3) Set on Dec. 2, 2019 for Mar. 31, 2020 dividend payment. Will be reset quarterly based on sum of the Canadian Government 90 - day Treasury Bill yield (using the three - month average result plus 4.18 %). Note: C$ denominated debt was converted to US$ using US$ to C$ exchange rate of $1.2994 as of December 31, 2019. 27 Atlantic Power Corporation Maturity Amount Outstanding Interest Rate Convertible Debentures (ATP.DB.E) 1/2025 $88.5 (C$115.0) 6.00% APLP Holdings Limited Partnership Maturity Amount Interest Rate Revolving Credit Facility 4/2022 $0 LIBOR + 2.75% (1) Term Loan 4/2025 $380.0 4.55% - 4.79% (2) Atlantic Power Limited Partnership Maturity Amount Interest Rate Medium - term Notes 6/2036 $161.7 (C$210) 5.95% Preferred shares (AZP.PR.A) N/A $74.1 (C$96.2) 4.85% Preferred shares (AZP.PR.B) N/A $48.2 (C$62.6) 5.739% Preferred shares (AZP.PR.C) N/A $ 20.7 (C$26.9) 5.83% (3) Atlantic Power Transmission & Atlantic Power Generation Maturity Amount Interest Project - level Debt (Cadillac - consolidated) 8/2025 $18.7 6.26% - 6.38% Project - level Debt (Chambers - equity method) 12/2023 $38.5 5.00%
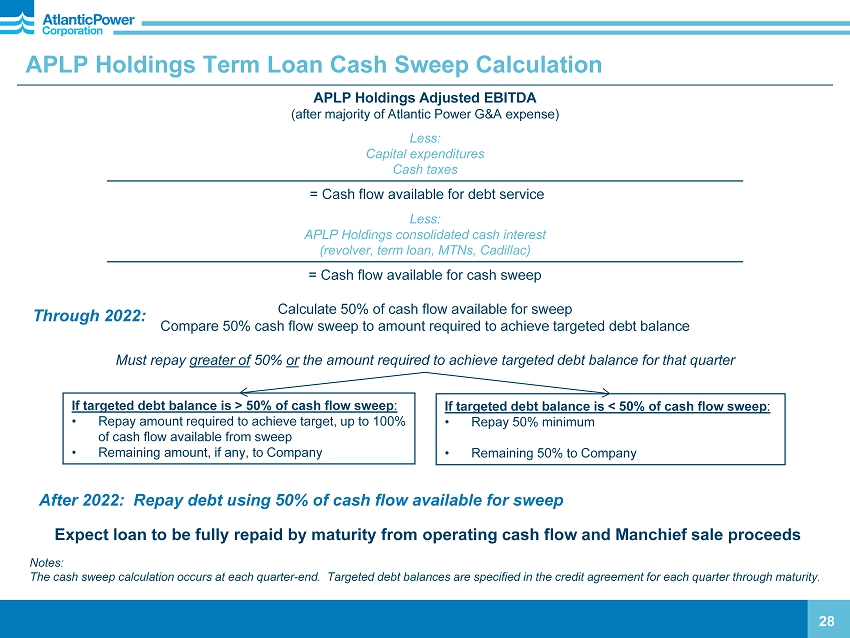
APLP Holdings Term Loan Cash Sweep Calculation 28 APLP Holdings Adjusted EBITDA ( after majority of Atlantic Power G&A expense) Less: Capital expenditures Cash taxes = Cash flow available for debt service Less: APLP Holdings consolidated cash interest (revolver, term loan, MTNs, Cadillac) = Cash flow available for cash sweep Calculate 50% of cash flow available for sweep Compare 50% cash flow sweep to amount required to achieve targeted debt balance Must repay greater of 50% or the amount required to achieve targeted debt balance for that quarter If targeted debt balance is > 50% of cash flow sweep : • Repay amount required to achieve target, up to 100% of cash flow available from sweep • Remaining amount, if any, to Company If targeted debt balance is < 50% of cash flow sweep : • Repay 50% minimum • Remaining 50% to Company Expect loan to be fully repaid by maturity from operating cash flow and Manchief sale proceeds Notes: The cash sweep calculation occurs at each quarter - end. Targeted debt balances are specified in the credit agreement for each qu arter through maturity. Through 2022: After 2022: Repay debt using 50% of cash flow available for sweep
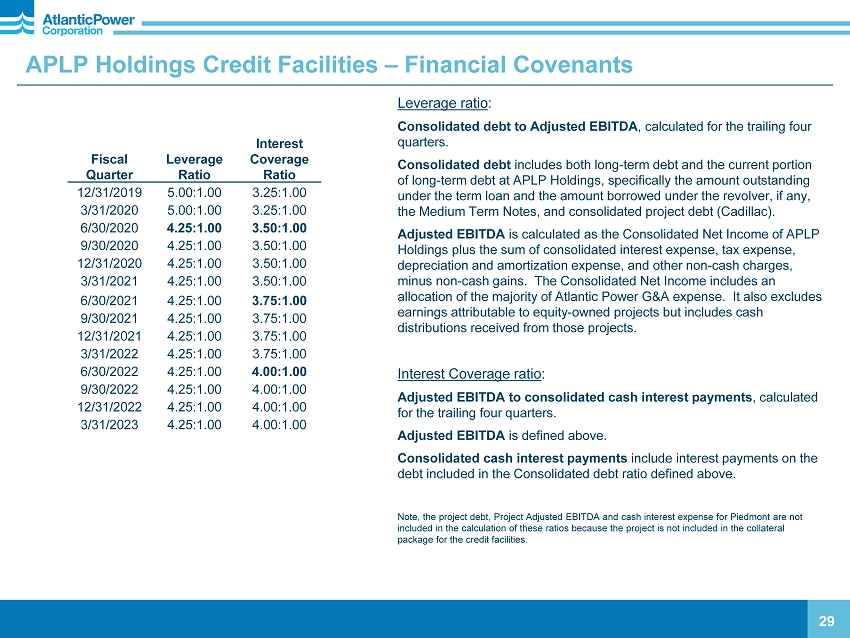
APLP Holdings Credit Facilities – Financial Covenants 29 Leverage ratio : Consolidated debt to Adjusted EBITDA , calculated for the trailing four quarters. Consolidated debt includes both long - term debt and the current portion of long - term debt at APLP Holdings, specifically the amount outstanding under the term loan and the amount borrowed under the revolver, if any, the Medium Term Notes, and consolidated project debt (Cadillac ). Adjusted EBITDA is calculated as the Consolidated Net Income of APLP Holdings plus the sum of consolidated interest expense, tax expense, depreciation and amortization expense, and other non - cash charges, minus non - cash gains. The Consolidated Net Income includes an allocation of the majority of Atlantic Power G&A expense. It also excludes earnings attributable to equity - owned projects but includes cash distributions received from those projects. Interest Coverage ratio : Adjusted EBITDA to consolidated cash interest payments , calculated for the trailing four quarters. Adjusted EBITDA is defined above. Consolidated cash interest payments include interest payments on the debt included in the Consolidated debt ratio defined above. Note, the project debt, Project Adjusted EBITDA and cash interest expense for Piedmont are not included in the calculation of these ratios because the project is not included in the collateral package for the credit facilities. Fiscal Quarter Leverage Ratio Interest Coverage Ratio 12/31/2019 5.00:1.00 3.25:1.00 3/31/2020 5.00:1.00 3.25:1.00 6/30/2020 4.25:1.00 3.50:1.00 9/30/2020 4.25:1.00 3.50:1.00 12/31/2020 4.25:1.00 3.50:1.00 3/31/2021 4.25:1.00 3.50:1.00 6/30/2021 4.25:1.00 3.75:1.00 9/30/2021 4.25:1.00 3.75:1.00 12/31/2021 4.25:1.00 3.75:1.00 3/31/2022 4.25:1.00 3.75:1.00 6/30/2022 4.25:1.00 4.00:1.00 9/30/2022 4.25:1.00 4.00:1.00 12/31/2022 4.25:1.00 4.00:1.00 3/31/2023 4.25:1.00 4.00:1.00

Allendale Allendale Cadillac Cadillac Chambers Calstock Craven Chambers Curtis Palmer Craven Dorchester Dorchester Grayling Grayling Kenilworth Piedmont Morris Williams Lake Orlando Piedmont Frederickson Kapuskasing Frederickson Kenilworth Koma Kulshan Manchief Manchief Morris Naval Station Naval Station North Island Nipigon NTC / MCRD North Bay Oxnard North Island NTC / MCRD Calstock Orlando Kapuskasing Oxnard Mamquam Tunis Moresby Lake Nipigon Curtis Palmer North Bay Koma Kulshan Tunis Mamquam Williams Lake Moresby Lake Unallocated Corporate Corporate Solid Fuel Natural Gas Hydro East West Canada Previous Segments New Segments Change to Reportable Segments 30
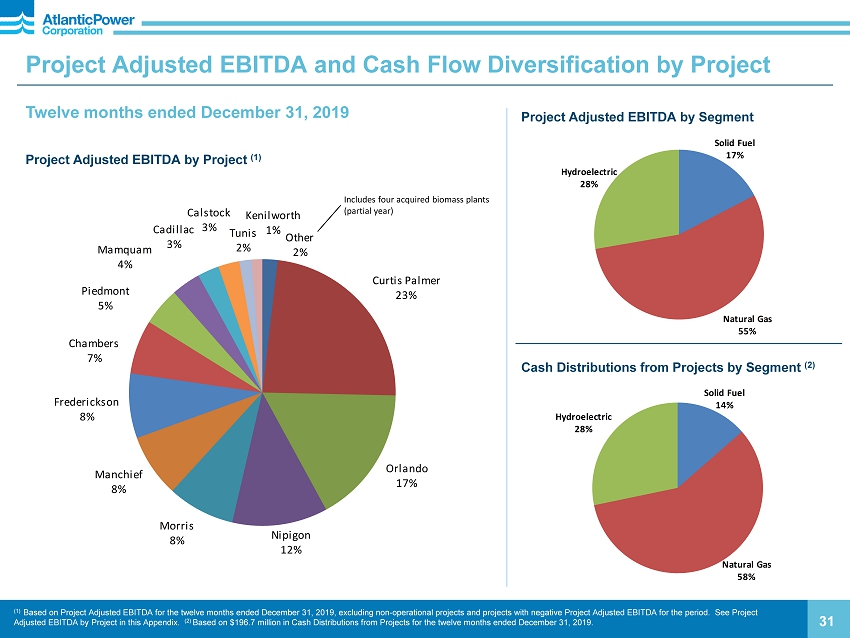
Solid Fuel 17% Natural Gas 55% Hydroelectric 28% Other 2% Curtis Palmer 23% Orlando 17% Nipigon 12% Morris 8% Manchief 8% Frederickson 8% Chambers 7% Piedmont 5% Mamquam 4% Cadillac 3% Calstock 3% Tunis 2% Kenilworth 1% Twelve months ended December 31, 2019 Project Adjusted EBITDA by Project (1) 31 Project Adjusted EBITDA and Cash Flow Diversification by Project (1) Based on Project Adjusted EBITDA for the twelve months ended December 31, 2019, excluding non - operational projects and projects with negative Project Adjusted EBITDA for the period. See Project Adjusted EBITDA by Project in this Appendix. (2) Based on $196.7 million in Cash Distributions from Projects for the twelve months ended December 31, 2019. Cash Distributions from Projects by Segment (2) Project Adjusted EBITDA by Segment I ncludes four acquired biomass plants (partial year) Solid Fuel 14% Natural Gas 58% Hydroelectric 28%
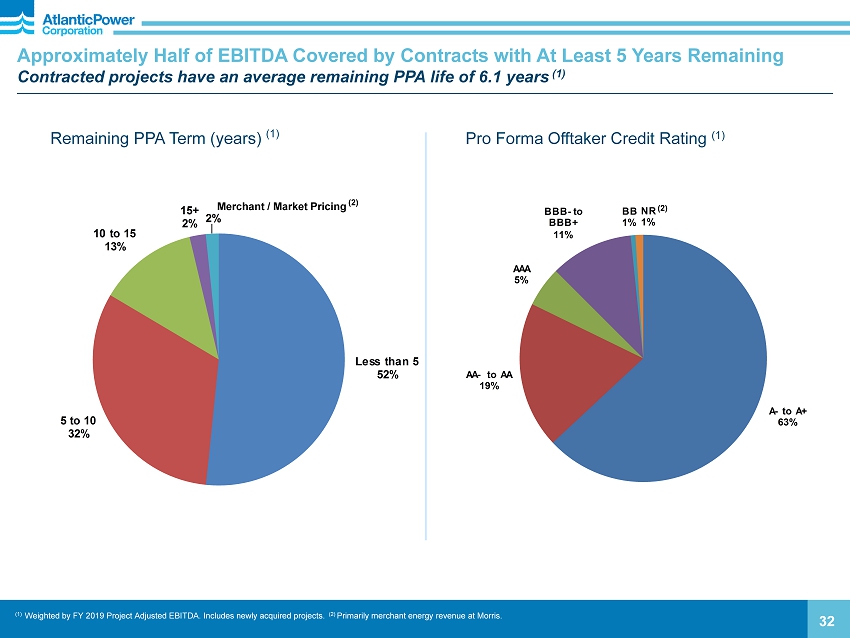
Less than 5 52% 5 to 10 32% 10 to 15 13% 15+ 2% 2% A - to A+ 63% AA - to AA 19% AAA 5% BBB - to BBB+ 11% BB 1% NR 1% Remaining PPA Term (years) (1) 32 (1) Weighted by FY 2019 Project Adjusted EBITDA. Includes newly acquired projects. (2) Primarily merchant energy revenue at Morris. Pro Forma Offtaker Credit Rating (1) Approximately Half of EBITDA Covered by Contracts with A t Least 5 Years Remaining Contracted projects have an average remaining PPA life of 6.1 years (1 ) (2) Merchant / Market Pricing (2)

33 Summary of Financial and Operating Results ($ millions, unaudited) (1) See non - GAAP disclosures in this Appendix. (1) 2019 2018 2019 2018 Project revenue $66.2 $70.7 $281.6 $282.3 Project (loss) income (33.4) 20.1 46.8 88.2 Net (loss) income attributable to Atlantic Power Corporation (65.3) 24.7 (42.6) 36.8 Cash provided by operating activities 40.2 39.7 144.7 137.5 Cash provided by (used in) investing activities 6.3 (0.1) (21.7) (17.0) Cash used in financing activities (23.7) (27.1) (110.8) (135.0) Project Adjusted EBITDA 42.9 46.6 196.1 185.1 Operating Results Aggregate power generation (net GWh) 1,088.3 1,026.6 4,587.7 4,361.6 Weighted average availability 90.4% 97.5% 94.0% 96.5% December 31,December 31, Three months ended Twelve months ended
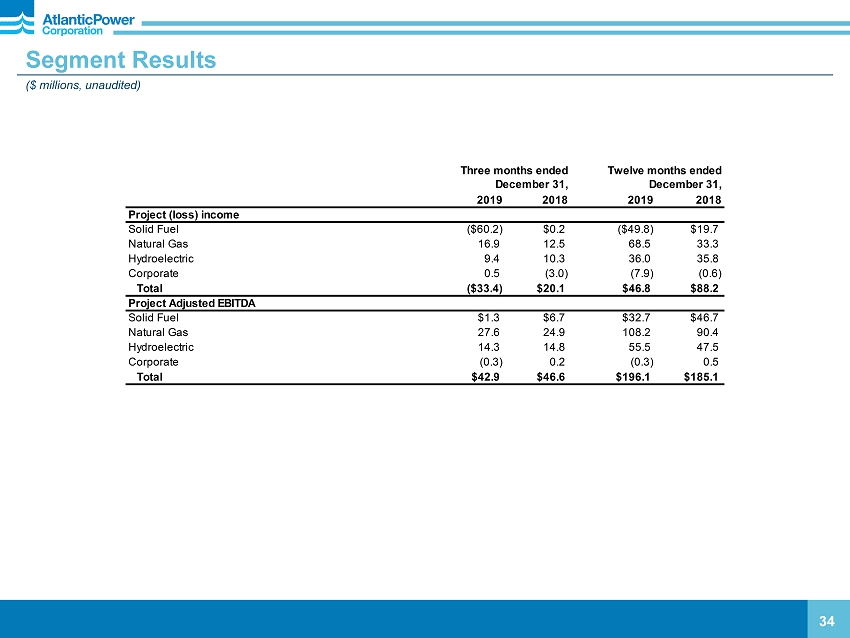
34 Segment Results ($ millions, unaudited) 2019 2018 2019 2018 Project (loss) income Solid Fuel ($60.2) $0.2 ($49.8) $19.7 Natural Gas 16.9 12.5 68.5 33.3 Hydroelectric 9.4 10.3 36.0 35.8 Corporate 0.5 (3.0) (7.9) (0.6) Total ($33.4) $20.1 $46.8 $88.2 Project Adjusted EBITDA Solid Fuel $1.3 $6.7 $32.7 $46.7 Natural Gas 27.6 24.9 108.2 90.4 Hydroelectric 14.3 14.8 55.5 47.5 Corporate (0.3) 0.2 (0.3) 0.5 Total $42.9 $46.6 $196.1 $185.1 December 31, December 31, Three months ended Twelve months ended

Project Income (Loss) by Project ($ millions, unaudited) 35 (1) Unconsolidated entities for which the results of operations are reflected in equity earnings of unconsolidated affiliates. (2) Consolidated as of July 27, 2018; equity investment prior to that date. Three months ended Twelve months ended December 31, December 31, 2019 2018 2019 2018 Solid Fuel Allendale $0.1 - $0.8 - Cadillac (2.8) $0.6 (2.3) $1.9 Calstock (5.1) 0.2 (2.7) 3.4 Dorchester (0.3) - 0.2 - Piedmont (2.1) (1.3) 2.1 2.9 Williams Lake (1.9) 0.5 (2.8) 6.1 Chambers (1) (48.6) 0.2 (46.0) 5.5 Craven (1) (0.0) - 0.2 - Grayling (1) 0.5 - 0.8 - Total (60.2) 0.2 (49.8) 19.7 Natural Gas Kapuskasing (0.1) 0.0 (0.3) (0.4) Kenilworth 0.1 (0.1) (0.1) (0.7) Manchief 0.9 1.0 4.6 (2.9) Morris 3.1 3.6 10.2 10.5 Naval Station (0.1) (0.9) (0.8) (2.7) Naval Training Center (0.1) (1.3) (0.8) (2.8) Nipigon 5.7 4.8 22.2 5.2 North Bay (0.1) 0.0 (0.3) (0.2) North Island (0.0) (1.7) (0.6) (3.1) Oxnard (2.3) (3.1) (4.1) (2.2) Tunis 0.5 0.0 2.1 (4.3) Frederickson (1) 2.6 1.9 9.1 6.9 Orlando (1) 6.7 8.1 27.5 29.9 Total 16.9 12.5 68.5 33.3 Hydroelectric Curtis Palmer 9.6 8.1 32.4 20.9 Koma Kulshan (2) (0.1) 0.5 (0.1) 7.8 Mamquam 0.9 1.8 5.6 7.8 Moresby Lake (0.9) (0.1) (1.9) (0.7) Total 9.4 10.3 36.0 35.8 Totals Consolidated projects 5.0 12.9 63.1 46.5 Equity method projects (38.8) 10.2 (8.5) 42.3 Corporate 0.5 (3.0) (7.9) (0.6) Total Project (Loss) Income ($33.4) $20.1 $46.8 $88.2

36 Project Adjusted EBITDA by Project ($ millions, unaudited) (1) Unconsolidated entities for which the results of operations are reflected in equity earnings of unconsolidated affiliates. (2) Consolidated as of July 27, 2018; equity investment prior to that date. Three months ended December 31, December 31, December 31, 2019 2018 2019 2018 2019 2018 2019 2018 Solid Fuel Allendale $0.2 - $0.9 - Total Project Adjusted EBITDA $42.9 $46.6 $196.1 $185.1 Cadillac (1.9) $1.9 3.3 $7.3 Depreciation and amortization 20.3 21.8 80.7 99.7 Calstock 1.2 0.7 5.2 5.5 Interest expense, net 0.4 0.8 2.5 3.4 Dorchester (0.2) - 0.2 - Change in fair value of derivative instruments 0.6 1.3 8.9 (2.2) Piedmont (0.3) 0.5 9.4 10.2 Impairment 55.0 - 55.0 - Williams Lake (1.4) 1.0 (1.0) 8.0 Insurance loss - - 1.0 - Chambers (1) 3.0 2.6 13.4 15.8 Other expense (income), net - 2.5 1.2 (4.0) Craven (1) 0.1 - 0.4 - Project income ($33.4) $20.1 $46.8 $88.2 Grayling (1) 0.6 - 0.9 - Administration 6.6 5.9 23.9 23.9 Total 1.3 6.7 32.7 46.7 Interest expense, net 11.0 12.0 44.0 52.7 Natural Gas Foreign exchange loss (gain) 4.8 (13.7) 11.9 (22.8) Kapuskasing (0.1) 0.0 (0.3) (0.4) Other expense (income), net 0.3 (3.4) 1.0 (3.0) Kenilworth 0.7 0.6 2.6 2.0 (Loss) income from operations before income taxes (56.1) 19.2 (34.0) 37.4 Manchief 3.7 3.8 15.6 8.2 Income tax expense (benefit) 7.3 (7.5) 9.8 0.2 Morris 4.4 5.2 16.7 17.7 Net (loss) income ($63.4) $26.7 ($43.8) $37.2 Naval Station (0.1) (0.1) (0.4) (0.8) Net income (loss) attributable to preferred share Naval Training Center (0.0) (0.2) (0.2) (1.1) dividends of a subsidiary company 1.9 2.0 (1.2) 0.4 Nipigon 7.5 6.0 23.6 23.2 North Bay (0.1) 0.0 (0.3) (0.2) ($65.3) $24.7 ($42.6) $36.8 North Island (0.1) (0.4) (0.4) (1.0) Oxnard (1.3) (2.0) (0.0) 2.1 Tunis 0.7 0.3 3.1 (4.0) Frederickson (1) 4.1 3.5 15.2 13.1 Orlando (1) 8.0 8.2 33.0 31.4 Total 27.6 24.9 108.2 90.4 Hydroelectric Curtis Palmer 13.4 12.0 47.8 36.3 Koma Kulshan (2) 0.3 0.5 1.4 1.4 Mamquam 1.3 2.2 7.2 9.5 Moresby Lake (0.7) 0.1 (1.0) 0.3 Total 14.3 14.8 55.5 47.5 Totals Consolidated projects 27.4 32.2 133.5 124.3 Equity method projects 15.8 14.2 62.9 60.3 Corporate (0.3) 0.2 (0.3) 0.5 Total Project Adjusted EBITDA $42.9 $46.6 $196.1 $185.1 Twelve months ended Atlantic Power Corporation Net (loss) income attributable to Three months ended Twelve months ended December 31,
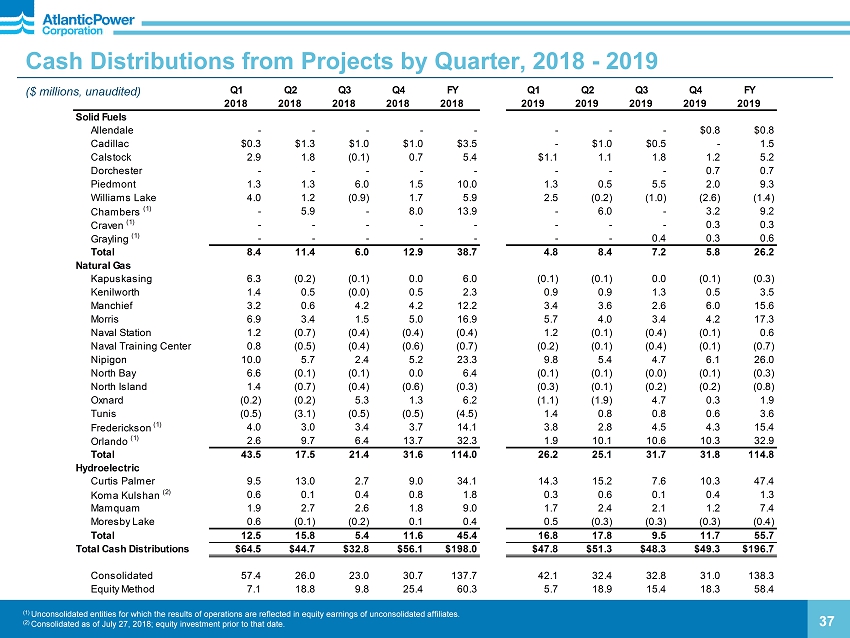
37 Cash Distributions from Projects by Quarter, 2018 - 2019 ($ millions, unaudited) (1) Unconsolidated entities for which the results of operations are reflected in equity earnings of unconsolidated affiliates. (2) Consolidated as of July 27, 2018; equity investment prior to that date. Q1 Q2 Q3 Q4 FY Q1 Q2 Q3 Q4 FY 2018 2018 2018 2018 2018 2019 2019 2019 2019 2019 Solid Fuels Allendale - - - - - - - - $0.8 $0.8 Cadillac $0.3 $1.3 $1.0 $1.0 $3.5 - $1.0 $0.5 - 1.5 Calstock 2.9 1.8 (0.1) 0.7 5.4 $1.1 1.1 1.8 1.2 5.2 Dorchester - - - - - - - - 0.7 0.7 Piedmont 1.3 1.3 6.0 1.5 10.0 1.3 0.5 5.5 2.0 9.3 Williams Lake 4.0 1.2 (0.9) 1.7 5.9 2.5 (0.2) (1.0) (2.6) (1.4) Chambers (1) - 5.9 - 8.0 13.9 - 6.0 - 3.2 9.2 Craven (1) - - - - - - - - 0.3 0.3 Grayling (1) - - - - - - - 0.4 0.3 0.6 Total 8.4 11.4 6.0 12.9 38.7 4.8 8.4 7.2 5.8 26.2 Natural Gas Kapuskasing 6.3 (0.2) (0.1) 0.0 6.0 (0.1) (0.1) 0.0 (0.1) (0.3) Kenilworth 1.4 0.5 (0.0) 0.5 2.3 0.9 0.9 1.3 0.5 3.5 Manchief 3.2 0.6 4.2 4.2 12.2 3.4 3.6 2.6 6.0 15.6 Morris 6.9 3.4 1.5 5.0 16.9 5.7 4.0 3.4 4.2 17.3 Naval Station 1.2 (0.7) (0.4) (0.4) (0.4) 1.2 (0.1) (0.4) (0.1) 0.6 Naval Training Center 0.8 (0.5) (0.4) (0.6) (0.7) (0.2) (0.1) (0.4) (0.1) (0.7) Nipigon 10.0 5.7 2.4 5.2 23.3 9.8 5.4 4.7 6.1 26.0 North Bay 6.6 (0.1) (0.1) 0.0 6.4 (0.1) (0.1) (0.0) (0.1) (0.3) North Island 1.4 (0.7) (0.4) (0.6) (0.3) (0.3) (0.1) (0.2) (0.2) (0.8) Oxnard (0.2) (0.2) 5.3 1.3 6.2 (1.1) (1.9) 4.7 0.3 1.9 Tunis (0.5) (3.1) (0.5) (0.5) (4.5) 1.4 0.8 0.8 0.6 3.6 Frederickson (1) 4.0 3.0 3.4 3.7 14.1 3.8 2.8 4.5 4.3 15.4 Orlando (1) 2.6 9.7 6.4 13.7 32.3 1.9 10.1 10.6 10.3 32.9 Total 43.5 17.5 21.4 31.6 114.0 26.2 25.1 31.7 31.8 114.8 Hydroelectric Curtis Palmer 9.5 13.0 2.7 9.0 34.1 14.3 15.2 7.6 10.3 47.4 Koma Kulshan (2) 0.6 0.1 0.4 0.8 1.8 0.3 0.6 0.1 0.4 1.3 Mamquam 1.9 2.7 2.6 1.8 9.0 1.7 2.4 2.1 1.2 7.4 Moresby Lake 0.6 (0.1) (0.2) 0.1 0.4 0.5 (0.3) (0.3) (0.3) (0.4) Total 12.5 15.8 5.4 11.6 45.4 16.8 17.8 9.5 11.7 55.7 Total Cash Distributions $64.5 $44.7 $32.8 $56.1 $198.0 $47.8 $51.3 $48.3 $49.3 $196.7 Consolidated 57.4 26.0 23.0 30.7 137.7 42.1 32.4 32.8 31.0 138.3 Equity Method 7.1 18.8 9.8 25.4 60.3 5.7 18.9 15.4 18.3 58.4

Non - GAAP Disclosures Project Adjusted EBITDA is not a measure recognized under GAAP and does not have a standardized meaning prescribed by GAAP, and is therefore unlikely to be comparable to similar measures presented by other companies . Investors are cautioned that the Company may calculate this non - GAAP measure in a manner that is different from other companies . The most directly comparable GAAP measure is Project income (loss) . Project Adjusted EBITDA is defined as project income (loss) plus interest, taxes, depreciation and amortization (including non - cash impairment charges) and changes in the fair value of derivative instruments . Management uses Project Adjusted EBITDA at the project level to provide comparative information about project performance and believes such information is helpful to investors . A reconciliation of Project Adjusted EBITDA to Project income (loss) and to Net income (loss) by segment and on a consolidated basis is provided on pages 39 - 40 . 38 2019 2018 2019 2018 Net (loss) income attributable to Atlantic Power Corporation ($65.3) $24.7 ($42.6) $36.8 Net income (loss) attributable to preferred share dividends of a subsidiary company 1.9 2.0 (1.2) 0.4 Net (loss) income ($63.4) $26.7 ($43.8) $37.2 Income tax expense (benefit) 7.3 (7.5) 9.8 0.2 (Loss) income from operations before income taxes (56.1) 19.2 (34.0) 37.4 Administration 6.6 5.9 23.9 23.9 Interest expense, net 11.0 12.0 44.0 52.7 Foreign exchange loss (gain) 4.8 (13.7) 11.9 (22.8) Other expense (income), net 0.3 (3.4) 1.0 (3.0) Project (loss) income ($33.4) $20.1 $46.8 $88.2 Reconciliation to Project Adjusted EBITDA Depreciation and amortization $20.3 $21.8 $80.7 $99.7 Interest expense, net 0.4 0.8 2.5 3.4 Change in the fair value of derivative instruments 0.6 1.3 8.9 (2.2) Impairment 55.0 - 55.0 - Insurance loss - - 1.0 - Other expense (income), net - 2.5 1.2 (4.0) Project Adjusted EBITDA $42.9 $46.6 $196.1 $185.1 December 31, December 31, Three months ended Twelve months ended

39 Reconciliation of Net Income ( L oss) to Project Adjusted EBITDA by Segment ($ millions) Three months ended December 31, 2019 Solid Fuel Natural Gas Hydroelectric Corporate Consolidated Net (loss) income attributable to Atlantic Power Corporation ($60.2) $16.9 $9.4 ($31.4) ($65.3) Net income attributable to preferred share dividends of a subsidiary company - - - 1.9 1.9 Net (loss) income (60.2) 16.9 9.4 (29.5) (63.4) Income tax expense - - - 7.3 7.3 Net (loss) income before income taxes (60.2) 16.9 9.4 (22.2) (56.1) Administration - - - 6.6 6.6 Interest expense, net - - - 11.0 11.0 Foreign exchange loss - - - 4.8 4.8 Other expense, net - - - 0.3 0.3 Project (loss) income (60.2) 16.9 9.4 0.5 (33.4) Depreciation and amortization 6.1 9.3 4.9 - 20.3 Interest expense, net 0.4 - - - 0.4 Change in fair value of derivative instruments - 1.4 - (0.8) 0.6 Impairment 55.0 - - - 55.0 Insurance loss - - - - - Other expense, net - - - - - Project Adjusted EBITDA $1.3 $27.6 $14.3 ($0.3) $42.9 Three months ended December 31, 2018 Solid Fuel Natural Gas Hydroelectric Corporate Consolidated Net income attributable to Atlantic Power Corporation $0.2 $12.5 $10.3 $1.7 $24.7 Net income attributable to preferred share dividends of a subsidiary company - - - 2.0 2.0 Net income 0.2 12.5 10.3 3.7 26.7 Income tax benefit - - - (7.5) (7.5) Income (loss) before income taxes 0.2 12.5 10.3 (3.8) 19.2 Administration - - - 5.9 5.9 Interest expense, net - - - 12.0 12.0 Foreign exchange gain - - - (13.7) (13.7) Other income, net - - - (3.4) (3.4) Project income (loss) 0.2 12.5 10.3 (3.0) 20.1 Depreciation and amortization 5.8 11.1 5.0 0.0 21.8 Interest expense, net 0.8 - - 0.0 0.8 Change in fair value of derivative instruments - (1.8) - 3.1 1.3 Other expense (income), net - 3.1 (0.5) (0.1) 2.5 Project Adjusted EBITDA $6.7 $24.9 $14.8 $0.2 $46.6
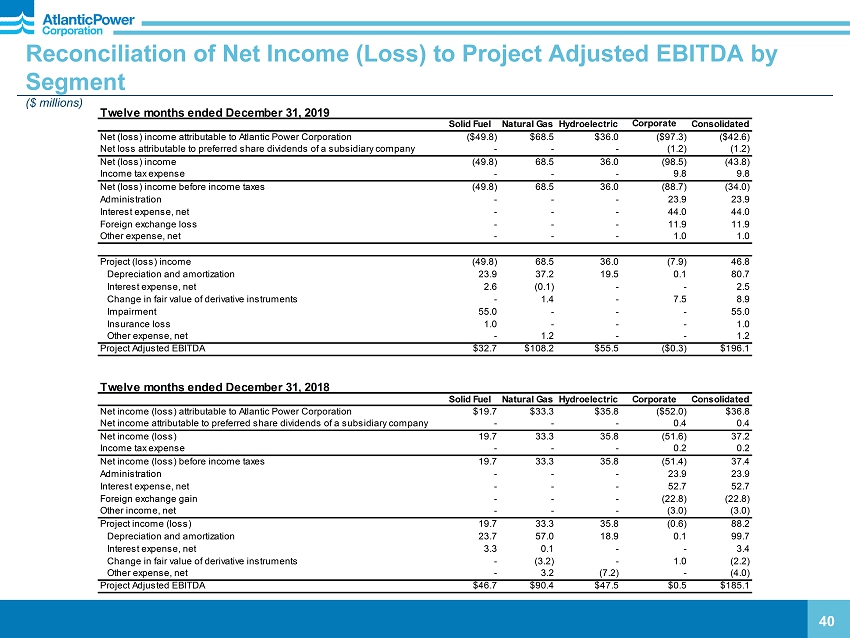
40 Reconciliation of Net Income ( L oss) to Project Adjusted EBITDA by Segment ($ millions) Twelve months ended December 31, 2019 Solid Fuel Natural Gas Hydroelectric Corporate Consolidated Net (loss) income attributable to Atlantic Power Corporation ($49.8) $68.5 $36.0 ($97.3) ($42.6) Net loss attributable to preferred share dividends of a subsidiary company - - - (1.2) (1.2) Net (loss) income (49.8) 68.5 36.0 (98.5) (43.8) Income tax expense - - - 9.8 9.8 Net (loss) income before income taxes (49.8) 68.5 36.0 (88.7) (34.0) Administration - - - 23.9 23.9 Interest expense, net - - - 44.0 44.0 Foreign exchange loss - - - 11.9 11.9 Other expense, net - - - 1.0 1.0 Project (loss) income (49.8) 68.5 36.0 (7.9) 46.8 Depreciation and amortization 23.9 37.2 19.5 0.1 80.7 Interest expense, net 2.6 (0.1) - - 2.5 Change in fair value of derivative instruments - 1.4 - 7.5 8.9 Impairment 55.0 - - - 55.0 Insurance loss 1.0 - - - 1.0 Other expense, net - 1.2 - - 1.2 Project Adjusted EBITDA $32.7 $108.2 $55.5 ($0.3) $196.1 Twelve months ended December 31, 2018 Solid Fuel Natural Gas Hydroelectric Corporate Consolidated Net income (loss) attributable to Atlantic Power Corporation $19.7 $33.3 $35.8 ($52.0) $36.8 Net income attributable to preferred share dividends of a subsidiary company - - - 0.4 0.4 Net income (loss) 19.7 33.3 35.8 (51.6) 37.2 Income tax expense - - - 0.2 0.2 Net income (loss) before income taxes 19.7 33.3 35.8 (51.4) 37.4 Administration - - - 23.9 23.9 Interest expense, net - - - 52.7 52.7 Foreign exchange gain - - - (22.8) (22.8) Other income, net - - - (3.0) (3.0) Project income (loss) 19.7 33.3 35.8 (0.6) 88.2 Depreciation and amortization 23.7 57.0 18.9 0.1 99.7 Interest expense, net 3.3 0.1 - - 3.4 Change in fair value of derivative instruments - (3.2) - 1.0 (2.2) Other expense, net - 3.2 (7.2) - (4.0) Project Adjusted EBITDA $46.7 $90.4 $47.5 $0.5 $185.1