UNITED STATES SECURITIES AND EXCHANGE COMMISSION
Washington, D.C. 20549
FORM 10-K
| (Mark One) | |
| [ ü ] | ANNUAL REPORT PURSUANT TO SECTION 13 or 15(d) OF THE
SECURITIES EXCHANGE ACT OF 1934 | |
| | For the fiscal year ended JULY 1, 2007 | |
| | OR | |
| [ ] | TRANSITION REPORT PURSUANT TO SECTION 13 or 15(d) OF THE
SECURITIES EXCHANGE ACT OF 1934 | |
| | For the transition period from ____________ to ____________ | |
| | | |
Commission file number 1-1370
| BRIGGS & STRATTON CORPORATION | |
(Exact name of registrant as specified in its charter) |
| A Wisconsin Corporation | | | | 39-0182330 | |
(State or other jurisdiction of | | (I.R.S. Employer |
incorporation or organization) | | Identification No.) |
| | |
12301 WEST WIRTH STREET | | |
| WAUWATOSA, WISCONSIN | | | | 53222 | |
(Address of principal executive offices) | | (Zip Code) |
| | |
Registrant’s telephone number, including area code: 414-259-5333 |
|
Securities registered pursuant to Section 12(b) of the Act: | | |
| | | | | | | | | | |
| Title of Each Class | | | | Name of Each Exchange on Which Registered | |
Common Stock (par value $0.01 per share) | | New York Stock Exchange |
Common Share Purchase Rights | | New York Stock Exchange |
Securities registered pursuant to Section 12(g) of the Act: NONE
Indicate by check mark if the registrant is a well-known seasoned issuer, as defined in Rule 405 of the Securities Act.
Yes ü No
Indicate by check mark if the registrant is not required to file reports pursuant to Section 13 or Section 15(d) of the Act.
Yes No ü
Indicate by check mark whether the registrant (1) has filed all reports required to be filed by Section 13 or 15(d) of the Securities Exchange Act of 1934 during the preceding 12 months (or for such shorter period that the registrant was required to file such reports), and (2) has been subject to such filing requirements for the past 90 days. Yes ü No
Indicate by check mark if disclosure of delinquent filers pursuant to Item 405 of Regulation S-K is not contained herein and will not be contained, to the best of registrant’s knowledge, in definitive proxy or information statements incorporated by reference in Part III of this Form 10-K or any amendment to this Form 10-K. [ ü ]
Indicate by check mark whether the registrant is a large accelerated filer, an accelerated filer, or a non-accelerated filer. See definition of “accelerated filer and large accelerated filer” in Rule 12b-2 of the Exchange Act. (Check one):
Large accelerated filer ü Accelerated filer Non-accelerated filer
Indicate by check mark whether the registrant is a shell company (as defined in Rule 12b-2 of the Act). Yes No ü
The aggregate market value of Common Stock held by non affiliates of the registrant was approximately $1.27 billion based on the reported last sale price of such securities as of December 31, 2006, the last business day of the most recently completed second fiscal quarter.
Number of Shares of Common Stock Outstanding at August 20, 2007: 49,706,060.
| DOCUMENTS INCORPORATED BY REFERENCE | |
| | Part of Form 10-K Into Which Portions |
| Document | | | | of Document are Incorporated | |
Proxy Statement for Annual Meeting | | |
on October 17, 2007 | | Part III |
| | | | | | |
The Exhibit Index is located on page 57.
BRIGGS & STRATTON CORPORATION
FISCAL 2007 FORM 10-K
TABLE OF CONTENTS
Cautionary Statement on Forward-Looking Statements
This release contains certain forward-looking statements that involve risks and uncertainties that could cause actual results to differ materially from those projected in the forward-looking statements. The words “anticipate”, “believe”, “estimate”, “expect”, “forecast”, “intend”, “may”, “objective”, “plan”, “project”, “seek”, “think”, “will”, and similar expressions are intended to identify forward-looking statements. The forward-looking statements are based on the Company’s current views and assumptions and involve risks and uncertainties that include, among other things, the ability to successfully forecast demand for our products and appropriately adjust our manufacturing and inventory levels; changes in our operating expenses; changes in interest rates; the effects of weather on the purchasing patterns of consumers and original equipment manufacturers (OEMs); actions of engine manufacturers and OEMs with whom we compete; the seasonal nature of our business; changes in laws and regulations, including environmental, tax, pension funding and accounting standards; work stoppages or other consequences of any deterioration in our employee relations; work stoppages by other unions that affect the ability of suppliers or customers to manufacture; acts of war or terrorism that may disrupt our business operations or those of our customers and suppliers; changes in customer and OEM demand; changes in prices of raw materials and parts that we purchase; changes in domestic economic conditions, including housing starts and changes in consumer disposable income; changes in foreign economic conditions, including currency rate fluctuations; the actions of customers of our OEM customers; the ability to bring new productive capacity on line efficiently and with good quality; the ability to successfully realize the maximum market value of assets that may require disposal if products or production methods change; new facts that come to light in the future course of litigation proceedings which could affect our assessment of those matters; and other factors that may be disclosed from time to time in our SEC filings or otherwise, including the factors discussed in Item 1A, Risk Factors, of the Company’s Annual Report on Form 10-K and in its periodic reports on Form 10-Q. Some or all of the factors may be beyond our control. We caution you that any forward-looking statement reflects only our belief at the time the statement is made. We undertake no obligation to update any forward-looking statement to reflect events or circumstances after the date on which the statement is made.
PART I
ITEM 1. BUSINESS
Briggs & Stratton is the world’s largest producer of air cooled gasoline engines for outdoor power equipment. Briggs & Stratton designs, manufactures, markets and services these products for original equipment manufacturers (OEMs) worldwide. These engines are aluminum alloy gasoline engines with displacements ranging from 31 cubic centimeters to 993 cubic centimeters.
Additionally, through its wholly owned subsidiary, Briggs & Stratton Power Products Group, LLC, Briggs & Stratton is a leading designer, manufacturer and marketer of generators (portable and home standby), pressure washers, air compressors, snow throwers, lawn and garden powered equipment (riding and walk behind mowers, tillers, chipper/shredders, leaf blowers and vacuums) and related accessories.
Briggs & Stratton conducts its operations in two reportable segments: Engines and Power Products. Further information about Briggs & Stratton’s business segments is contained in Note 6 of the Notes to Consolidated Financial Statements.
The Company’s Internet address is www.briggsandstratton.com. The Company makes available free of charge (other than an investor’s own Internet access charges) through its Internet website the Company’s Annual Report on Form 10-K, quarterly reports on Form 10-Q, current reports on Form 8-K, and amendments to those reports filed or furnished pursuant to Section 13(a) or 15(d) of the Securities Exchange Act of 1934, as soon as reasonably practicable after it electronically files such material with, or furnishes such material to, the Securities and Exchange Commission. Charters of the Audit, Compensation, Nominating and Governance Committees; Corporate Governance Guidelines and code of business conduct and ethics contained in the Briggs & Stratton Business Integrity Manual are available on the Company’s website and are available in print to any shareholder upon request to the Corporate Secretary.
Engines
General
Briggs & Stratton’s Engines Segment’s engines are used primarily by the lawn and garden equipment industry, which accounted for 84% of the segment’s fiscal 2007 engine sales to OEMs. Major lawn and garden equipment applications include walk-behind lawn mowers, riding lawn mowers, garden tillers and snow throwers. The remaining 16% of engine sales to OEMs in fiscal 2007 were for use on products for industrial, construction, agricultural and other consumer applications, that include generators, pumps and pressure washers. Many retailers specify Briggs & Stratton’s engines on the powered equipment they sell, and the Briggs & Stratton name is often featured prominently on a product despite the fact that the engine is only a component.
In fiscal 2007, approximately 28% of Briggs & Stratton’s Engines Segment net sales were derived from sales in international markets, primarily to customers in Europe. Briggs & Stratton serves its key international markets through its European regional office in Switzerland, its distribution center in the Netherlands and sales and service subsidiaries and offices in Australia, Austria, Brazil, Canada, China, the Czech Republic, England, France, Germany, Italy, Japan, Mexico, New Zealand, Poland, Russia, South Africa, Spain, Sweden and United Arab Emirates. Briggs & Stratton is a leading supplier of gasoline engines in developed countries where there is an established lawn and garden equipment market. Briggs & Stratton also exports engines to developing nations where its engines are used in agricultural, marine, construction and other applications. More detailed information about our foreign operations is in Note 6 of the Notes to Consolidated Financial Statements.
Briggs & Stratton engines are sold primarily by its worldwide sales force through direct calls on customers. Briggs & Stratton’s marketing staff and engineers in the United States provide support and technical assistance to its sales force.
Briggs & Stratton also manufactures replacement engines and service parts and sells them to sales and service distributors. Briggs & Stratton owns its principal international distributors. In the United States the distributors are independently owned and operated. These distributors supply service parts and replacement engines directly to independently owned, authorized service dealers throughout the world. These distributors and service dealers implement Briggs & Stratton’s commitment to reliability and service.
1
Customers
Briggs & Stratton’s engine sales are made primarily to OEMs. Briggs & Stratton’s three largest external engine customers in fiscal years 2007, 2006 and 2005 were Husqvarna Outdoor Products Group (HOP), MTD Products Inc. (MTD) and John Deere Power Products. Sales to the top three customers combined were 54%, 51% and 45% of Engines Segment net sales in fiscal 2007, 2006 and 2005, respectively. Under purchasing plans available to all of its gasoline engine customers, Briggs & Stratton typically enters into annual engine supply arrangements.
Briggs & Stratton believes that in fiscal 2007 more than 80% of all lawn and garden powered equipment sold in the United States was sold through mass merchandisers such as Sears Holdings Corporation (Sears), The Home Depot, Inc. (The Home Depot), Wal-Mart Stores, Inc. (Wal-Mart) and Lowe’s Companies, Inc. (Lowe’s). Given the buying power of the mass merchandisers, Briggs & Stratton, through its customers, has continued to experience pricing pressure. Briggs & Stratton expects that this pricing trend will continue in the foreseeable future. Briggs & Stratton believes that a similar trend has developed for its products in industrial and consumer applications outside of the lawn and garden market.
Competition
Briggs & Stratton’s major domestic competitors in engine manufacturing are Honda Motor Co., Ltd. (Honda), Kawasaki Heavy Industries, Ltd. (Kawasaki), Kohler Co. (Kohler), and Tecumseh Products Company (Tecumseh). Several Japanese and Chinese small engine manufacturers, of which Honda and Kawasaki are the largest, compete directly with Briggs & Stratton in world markets in the sale of engines to other OEMs and indirectly through their sale of end products.
Briggs & Stratton believes it has a significant share of the worldwide market for engines that power outdoor equipment.
Briggs & Stratton believes the major areas of competition from all engine manufacturers include product quality, brand strength, price, timely delivery and service. Other factors affecting competition are short-term market share objectives, short-term profit objectives, exchange rate fluctuations, technology, product support and distribution strength. Briggs & Stratton believes its product value and service reputation have given it strong brand name recognition and enhance its competitive position.
Seasonality of Demand
Sales of engines to lawn and garden OEMs are highly seasonal because of consumer buying patterns. The majority of lawn and garden equipment is sold during the spring and summer months when most lawn care and gardening activities are performed. Sales of lawn and garden equipment are also influenced by weather conditions. Engine sales in Briggs & Stratton’s fiscal third quarter have historically been the highest, while sales in the first fiscal quarter have historically been the lowest.
In order to efficiently use its capital investments and meet seasonal demand for engines, Briggs & Stratton pursues a relatively balanced production schedule throughout the year. The schedule is adjusted to reflect changes in estimated demand, customer inventory levels and other matters outside the control of Briggs & Stratton. Accordingly, inventory levels generally increase during the first and second fiscal quarters in anticipation of customer demand. Inventory levels begin to decrease as sales increase in the third fiscal quarter. This seasonal pattern results in high inventories and low cash flow for Briggs & Stratton in the second and the beginning of the third fiscal quarters. The pattern results in higher cash flow in the latter portion of the third fiscal quarter and in the fourth fiscal quarter as inventories are liquidated and receivables are collected.
Manufacturing
Briggs & Stratton manufactures engines and parts at the following locations: Auburn, Alabama; Statesboro, Georgia; Murray, Kentucky; Poplar Bluff and Rolla, Missouri; Wauwatosa, Wisconsin; Chongqing, China; and Ostrava, Czech Republic. Briggs & Stratton has a parts distribution center in Menomonee Falls, Wisconsin.
In April 2007, the Company announced that it would be discontinuing operations at our Rolla, Missouri facility in October 2007. Engine manufacturing performed in Rolla will be moving to the Chongqing, China and Poplar Bluff, Missouri plants.
Briggs & Stratton manufactures a majority of the structural components used in its engines, including aluminum die castings, carburetors and ignition systems. Briggs & Stratton purchases certain parts such as
2
piston rings, spark plugs, valves, ductile and grey iron castings, zinc die castings and plastic components, some stampings and screw machine parts and smaller quantities of other components. Raw material purchases consist primarily of aluminum and steel. Briggs & Stratton believes its sources of supply are adequate.
Briggs & Stratton has joint ventures with Daihatsu Motor Company for the manufacture of engines in Japan, with Starting Industrial of Japan for the production of rewind starters in the United States, and The Toro Company for the manufacture of two-cycle engines in China.
Briggs & Stratton has a strategic relationship with Mitsubishi Heavy Industries (MHI) for the global distribution of air cooled gasoline engines manufactured by MHI in Japan under Briggs & Stratton’s Vanguard™ brand.
Power Products
General
Briggs & Stratton Power Products Group, LLC’s (BSPPG) principal product lines include portable and standby generators, pressure washers, air compressors, snow throwers and lawn and garden powered equipment. BSPPG sells its products through multiple channels of retail distribution, including consumer home centers, warehouse clubs, mass merchants and independent dealers. BSPPG product lines are marketed under various brands including Briggs & Stratton, Craftsman®, Ferris, Giant Vac, Murray, Simplicity, Snapper and Troy-Bilt®.
BSPPG has a network of independent dealers worldwide for the sale and service of snow throwers and lawn and garden powered equipment.
To support its international business, BSPPG has leveraged the existing Briggs & Stratton worldwide distribution network.
Customers
Historically, BSPPG’s major customers have been Lowe’s, The Home Depot and Sears. Other U.S. retail customers include Tractor Supply Inc., True Value Company, W.W. Grainger, Wal-Mart and Menards.
Competition
The principal competitive factors in the power products industry include price, service, product performance, technical innovation and delivery. BSPPG has various competitors, depending on the type of equipment. Primary competitors include: Honda (portable generators, pressure washers and lawn and garden equipment), Coleman Powermate Corporation (portable generators), Generac Power Systems, Inc. (“Generac”) (standby generators), DeVilbiss Air Power Company, a Division of Black & Decker (pressure washers), Alfred Karcher GmbH & Co. (pressure washers), John Deere (commercial and consumer lawn mowers), MTD (lawn mowers), the Toro Company (commercial and consumer lawn mowers), and Scag Power Equipment, a Division of Metalcraft of Mayville, Inc. (commercial lawn mowers).
BSPPG believes it has a significant share of the North American market for portable generators and consumer pressure washers.
Seasonality of Demand
Sales of BSPPG’s products are subject to seasonal patterns. Due to seasonal and regional weather factors, sales of pressure washers and lawn and garden powered equipment are typically higher during the fiscal third and fourth quarters than at other times of the year. Sales of portable generators and snow throwers are typically higher during the first and second fiscal quarters.
Manufacturing
BSPPG’s manufacturing facilities are located in Jefferson, Watertown and Port Washington, Wisconsin; McDonough, Georgia; Munnsville, New York; Newbern, Tennessee; and Qingpu, China. BSPPG also purchases certain powered equipment under contract manufacturing agreements.
BSPPG plans to close its Port Washington, Wisconsin manufacturing facility during the second quarter of fiscal 2009. Production will move to the McDonough, Georgia facility.
3
BSPPG manufactures core components for its products, where such integration improves operating profitability by providing lower costs.
BSPPG purchases engines from its parent, Briggs & Stratton, as well as from Generac, Honda, Kawasaki and Kohler. BSPPG has not experienced any difficulty obtaining necessary engines or other purchased components.
BSPPG assembles products for the international markets at its U.S. and China locations and through contract manufacturing agreements with other OEMs.
Consolidated
General Information
Briggs & Stratton holds patents on features incorporated in its products; however, the success of Briggs & Stratton’s business is not considered to be primarily dependent upon patent protection. The Company owns several trademarks which it believes significantly affect a consumer’s choice of outdoor powered equipment and therefore create value. Licenses, franchises and concessions are not a material factor in Briggs & Stratton’s business.
For the fiscal years ended July 1, 2007, July 2, 2006 and July 3, 2005, Briggs & Stratton spent approximately $25.7 million, $28.8 million and $33.5 million, respectively, on research activities relating to the development of new products or the improvement of existing products.
The average number of persons employed by Briggs & Stratton during fiscal 2007 was 7,666. Employment ranged from a high of 8,439 in July 2006 to a low of 7,235 in October 2006.
Export Sales
Export sales for fiscal 2007, 2006 and 2005 were $490.7 million (23% of net sales), $527.0 million (21% of net sales) and $477.4 million (18% of net sales), respectively. These sales were principally to customers in European countries. Refer to Note 6 of the Notes to Consolidated Financial Statements for financial information about geographic areas. Also, refer to Item 7A of this Form 10-K and Note 13 of the Notes to Consolidated Financial Statements for information about Briggs & Stratton’s foreign exchange risk management.
ITEM 1A. RISK FACTORS
In addition to the risks referred to elsewhere in this Annual Report on Form 10-K, the following risks, among others, may have affected, and in the future could affect, the Company and its subsidiaries’ business, financial condition or results of operations. Additional risks not discussed or not presently known to the Company or that the Company currently deems insignificant may also impact its business and stock price.
Demand for products fluctuates significantly due to seasonality. In addition, changes in the weather and consumer disposable income impact demand.
Sales of our products are subject to seasonal and consumer buying patterns. Consumer demand in our markets can be reduced by unfavorable weather, a reduction in disposable income, and other factors. We manufacture throughout the year although our sales are concentrated in the second half of our fiscal year. This operating method requires us to anticipate demand of our customers many months in advance. If we overestimate or underestimate demand during a given year, we may not be able to adjust our production quickly enough to avoid excess or insufficient inventories, and that may in turn limit our ability to maximize our potential sales.
We have only a limited ability to pass through cost increases in our raw materials to our customers during the year.
We generally enter into annual purchasing plans with our largest customers, so our ability to raise our prices during a particular year to reflect increased raw materials costs is limited.
4
A significant portion of our net sales comes from major customers and the loss of any of these customers would negatively impact our financial results.
In fiscal 2007, our three largest customers accounted for 36% of our consolidated net sales. The loss of a significant portion of the business of one or more of these key customers would significantly impact our net sales and profitability.
Changes in environmental or other laws could require extensive changes in our operations or to our products.
Our operations and products are subject to a variety of foreign, federal, state and local laws and regulations governing, among other things, emissions to air, discharges to water, noise, the generation, handling, storage, transportation, treatment and disposal of waste and other materials and health and safety matters. New engine emission regulations are being phased in through 2008 by the federal government and the State of California. We do not expect these changes to have a material adverse effect on us, but we cannot be certain that these or other proposed changes in applicable laws or regulations will not adversely affect our business or financial condition in the future.
Foreign economic conditions and currency rate fluctuations can reduce our sales.
In fiscal 2007, we derived approximately 23% of our consolidated net sales from international markets, primarily Europe. Weak economic conditions in Europe could reduce our sales and currency fluctuations could adversely affect our sales or profit levels in U.S. dollar terms.
Actions of our competitors could reduce our sales or profits.
Our markets are highly competitive and we have a number of significant competitors in each market. Competitors may reduce their costs, lower their prices or introduce innovative products that could hurt our sales or profits. In addition, our competitors may focus on reducing our market share to improve their results.
Disruptions caused by labor disputes or organized labor activities could harm our business.
A portion of our workforce is currently represented by labor unions. In addition, we may from time to time experience union organizing activities in our non-union facilities. Disputes with the current labor union or new union organizing activities could lead to work slowdowns or stoppages and make it difficult or impossible for us to meet scheduled delivery times for product shipments to our customers, which could result in loss of business. In addition, union activity could result in higher labor costs, which could harm our financial condition, results of operations and competitive position.
As of July 1, 2007, we had approximately $384.0 million of long-term debt. In addition, we have the ability to incur additional borrowings on our revolving credit facility. This level of debt could adversely affect our operating flexibility and put us at a competitive disadvantage.
Our level of debt and the limitations imposed on us by the indentures for the notes and our other credit agreements could have important consequences, including the following:
• we will have to use a portion of our cash flow from operations for debt service rather than for our operations;
• we may not be able to obtain additional debt financing for future working capital, capital expenditures or other corporate purposes or may have to pay more for such financing;
• some or all of the debt under our current or future revolving credit facilities will be at a variable interest rate, making us more vulnerable to increases in interest rates;
• we could be less able to take advantage of significant business opportunities, such as acquisition opportunities, and to react to changes in market or industry conditions;
• we will be more vulnerable to general adverse economic and industry conditions; and
• we may be disadvantaged compared to competitors with less leverage.
The terms of the indentures for the senior notes do not fully prohibit us from incurring substantial additional debt in the future and our revolving credit facilities permit additional borrowings, subject to certain conditions. If new debt is added to our current debt levels, the related risks we now face could intensify.
We expect to obtain the money to pay our expenses and to pay the principal and interest on the outstanding 8.875% senior notes, the 7.25% senior notes, the variable rate term notes, the credit facilities and other debt primarily from our operations. Our ability to meet our expenses thus depends on our future performance,
5
which will be affected by financial, business, economic and other factors. We will not be able to control many of these factors, such as economic conditions in the markets where we operate and pressure from competitors. We cannot be certain that the money we earn will be sufficient to allow us to pay principal and interest on our debt and meet our other obligations. If we do not have enough money, we may be required to refinance all or part of our existing debt, sell assets or borrow more money. We cannot guarantee that we will be able to do so on terms acceptable to us. In addition, the terms of existing or future debt agreements, including the revolving credit facilities and our indentures, may restrict us from adopting any of these alternatives.
We are restricted by the terms of the outstanding senior notes and our other debt, which could adversely affect us.
The indentures relating to the senior notes and our revolving credit agreements each include a number of financial and operating restrictions, which may prevent us from capitalizing on business opportunities and taking some corporate actions. These covenants could adversely affect us by limiting our ability to plan for or react to market conditions or to meet our capital needs. These covenants include, among other things, restrictions on our ability to:
• pay dividends or make distributions in respect of our capital stock or to make certain other restricted payments;
• incur indebtedness or issue preferred shares;
• create liens;
• make loans or investments;
• enter into sale and leaseback transactions;
• agree to payment restrictions affecting our restricted subsidiaries;
• consolidate, merge, sell or lease all or substantially all of our assets;
• enter into transactions with affiliates; and
• dispose of assets or the proceeds of sales of our assets.
In addition, our revolving credit facility contains financial covenants that, among other things, require us to maintain a minimum interest coverage ratio and impose a maximum leverage ratio.
Our failure to comply with restrictive covenants under the indentures governing the senior notes and our revolving credit facilities could trigger prepayment obligations.
Our failure to comply with the restrictive covenants described above could result in an event of default, which, if not cured or waived, could result in us being required to repay these borrowings before their due date. If we are forced to refinance these borrowings on less favorable terms, our results of operations and financial condition could be adversely affected by increased costs and rates.
ITEM 1B. UNRESOLVED STAFF COMMENTS
None.
ITEM 2. PROPERTIES
The corporate offices and one of Briggs & Stratton’s engine manufacturing facilities are located in Wauwatosa, Wisconsin. Briggs & Stratton also has engine manufacturing facilities in Auburn, Alabama; Statesboro, Georgia; Murray, Kentucky; Poplar Bluff, Missouri; Ostrava, Czech Republic and Chongqing, China. These are owned facilities containing approximately 3.1 million square feet of office and production area. The Company currently leases an engine manufacturing facility in Rolla, Missouri, which contains approximately 404,000 square feet. Briggs & Stratton also leases warehouse space in the localities of its engine manufacturing facilities, except China, totaling approximately 619,750 square feet. Additionally, a service parts distribution center consisting of approximately 335,400 square feet is leased in Menomonee Falls, Wisconsin.
BSPPG maintains office space and manufacturing facilities in Brookfield, Jefferson, Watertown and Port Washington, Wisconsin; McDonough, Georgia; Newbern, Tennessee; Munnsville, New York and Qingpu, China. Of these, the domestic facilities, except Brookfield, Wisconsin, are owned and contain approximately
6
1.5 million square feet. The Brookfield, Wisconsin office space is leased and contains approximately 26,000 square feet. BSPPG also leases warehouse space in Jefferson, Watertown and Fort Atkinson, Wisconsin; McDonough, Georgia; Grand Prairie, Texas; Greenville, Ohio; Reno, Nevada; and Sherrill and Hamilton, New York totaling approximately 1.8 million square feet. Additionally, the Qingpu, China facility is leased and contains approximately 131,000 square feet.
Briggs & Stratton leases approximately 290,000 square feet of space to house its foreign sales and service operations.
As Briggs & Stratton’s business is seasonal, additional warehouse space may be leased when inventory levels are at their peak. Briggs & Stratton’s owned properties are well maintained. Briggs & Stratton believes that its owned and leased facilities are adequate to perform its operations in a reasonable manner.
ITEM 3. LEGAL PROCEEDINGS
Briggs & Stratton is subject to various unresolved legal actions that arise in the normal course of its business. These actions typically relate to product liability (including asbestos-related liability), patent and trademark matters, and disputes with customers, suppliers, distributors and dealers, competitors and employees.
On June 3, 2004, eight individuals who claim to have purchased lawnmowers in Illinois and Minnesota filed a lawsuit (Ronnie Phillips et al. v. Sears Roebuck Corporation et al., No. 04-L-334 (20th Judicial Circuit, St. Clair County, IL)) against the Company and other defendants alleging that the horsepower labels on the products they purchased were inaccurate. The plaintiffs have amended their complaint several times and currently seek an injunction, compensatory and punitive damages, and attorneys’ fees under various federal and state laws including the Racketeer Influenced and Corrupt Organization Act on behalf of all persons in the United States who, beginning January 1, 1994 through the present, purchased a lawnmower containing a two-stroke or four-stroke gasoline combustion engine up to 30 horsepower that was manufactured or sold by the defendants. On May 31, 2006, the defendants removed the case to the U.S. District Court for the Southern District of Illinois (No. 06-412-DRH). The defendants subsequently filed cross claims against each other for indemnification and contribution and filed a motion to dismiss the amended complaint. On March 30, 2007, the Court issued an order granting the defendants’ motion to dismiss the amended complaint in its entirety, but the order permits the plaintiffs to refile a complaint after amending several claims. An opinion of the Court providing more detail concerning its order is expected but has not yet been filed. Two defendants, MTD Products, Inc. and American Honda Motor Company, have notified the Court that they have reached a settlement with the putative plaintiff class, but neither defendant’s agreement has yet been approved by the Court.
Although it is not possible to predict with certainty the outcome of these unresolved legal actions or the range of possible loss, Briggs & Stratton believes the range of possible losses for these unresolved legal actions will not have a material effect on its financial position.
ITEM 4. SUBMISSION OF MATTERS TO A VOTE OF SECURITY HOLDERS
No matters were submitted to a vote of security holders, through the solicitation of proxies or otherwise, during the three months ended July 1, 2007.
7
Executive Officers of the Registrant
| Name, Age, Position | | | | Business Experience for Past Five Years | |
| | |
JOHN S. SHIELY, 55
Chairman, President and Chief Executive Officer
(1)(2)(3) | | Mr. Shiely was elected to his current position effective January 2003, after serving as President and Chief Executive Officer since July 2001 and President and Chief Operating Officer since August 1994. |
| | |
TODD J. TESKE, 42
Executive Vice President and Chief
Operating Officer | | Mr. Teske was elected to his current position effective September 2005 after serving as Senior Vice President and President – Briggs & Stratton Power Products Group, LLC since September 2003. He previously served as Vice President and President – Briggs & Stratton Power Products Group, LLC since February 2003. He also served as Vice President – Corporate Development from March 2001 after serving as Controller since October 1998. |
| | |
JAMES E. BRENN, 59
Senior Vice President and Chief Financial Officer | | Mr. Brenn was elected to his current position in October 1998, after serving as Vice President and Controller since November 1988. He also served as Treasurer from November 1999 until January 2000. |
| | |
DAVID G. DEBAETS, 44
Vice President – North American Operations
(Engine Power Products Group) | | Mr. DeBaets was elected to his current position effective September 2007. He has served as Vice President and General Manager – Large Engine Division since April 2000. He also served as Vice President and General Manager –Die Cast Components from May 1996 to April 2000. |
| | |
MARK R. HAZELTINE, 64
Vice President and
Sales Manager – Consumer Products | | Mr. Hazeltine was elected to his current position in May 2002, after serving as Vice President and Sales Manager –Consumer Lawn & Garden since July 1999. He also served as Sales Manager from February 1995 to June 1999. |
| | |
ROBERT F. HEATH, 59
Secretary | | Mr. Heath was elected to his current position in January 2002. He served as Assistant Secretary from January 2001 to December 2001. In addition, Mr. Heath is Vice President and General Counsel and has served in these positions since January 2001. He also served as General Counsel since December 1997. |
| | |
HAROLD L. REDMAN, 43
Vice President and President –
Home Power Products Group | | Mr. Redman was elected to his current position effective September 2006. He has served as Vice President and President – Home Power Products since May 2006. He also served as Senior Vice President – Sales & Marketing –Simplicity Manufacturing, Inc. since July 1995. |
| | |
WILLIAM H. REITMAN, 51
Senior Vice President – Sales &
Customer Support | | Mr. Reitman was elected to his current position effective September 2007, after serving as Senior Vice President – Sales & Marketing since May 2006, and Vice President –Sales & Marketing since October 2004. He also served as Vice President – Marketing since November 1995. |
8
DAVID J. RODGERS, 36
Controller | | Mr. Rodgers was elected as an executive officer in September 2007 and has served as Controller since December 2006. He was previously employed by Roundy’s Supermarkets, Inc. as Vice President – Controller from September 2005 to November 2006 and Vice President – Retail Controller from May 2003 to August 2005. He also was previously employed by Arthur Andersen LLP and Deloitte & Touche LLP. |
| | |
THOMAS R. SAVAGE, 59
Senior Vice President – Administration | | Mr. Savage was elected to his current position effective July 1997, after serving as Vice President – Administration and General Counsel since November 1994. He also served as Secretary from November 1999 to June 2000. |
| | |
MICHAEL D. SCHOEN, 47
Senior Vice President and President –
International Power Products Group | | Mr. Schoen was elected to his current position effective September 2005 after serving as Vice President – International Group since July 2001. He was elected an executive officer in August 2000, after serving as Vice President – Operations Support since July 1999. He previously held the position of Vice President – International Operations since July 1996. |
| | |
VINCENT R. SHIELY, 47
Senior Vice President and President –
Yard Power Products Group (3) | | Mr. Shiely was elected to his current position effective May 2006, after serving as Vice President and President – Home Power Products Group since September 2005. He also served as Vice President and General Manager –Home Power Products Division October 2004 to September 2005. He previously served as Vice President and General Manager – Engine Products Group since September 2002. He has also served as Vice President and General Manager – Business Units since December 2001, and as Vice President and General Manager – Electrical Products Division since October 1998. |
| | |
CARITA R. TWINEM, 52
Treasurer | | Ms. Twinem was elected to her current position in February 2000. In addition, Ms. Twinem is Tax Director and has served in this position since July 1994. |
| | |
JOSEPH C. WRIGHT, 48
Senior Vice President and President –
Engine Power Products Group | | Mr. Wright was elected to his current position in May 2006 after serving as Vice President and President – Yard Power Products Group since September 2005. He also served as Vice President and General Manager – Lawn and Garden Division from September 2004 to September 2005. He was elected an executive officer effective September 2002. He previously served as Vice President and General Manager – Small Engine Division since July 1997. |
(1) Officer is also a Director of Briggs & Stratton. (2) Member of the Board of Directors Executive Committee.
(3) John S. Shiely and Vincent R. Shiely are brothers.
Officers are elected annually and serve until they resign, die, are removed, or a different person is appointed to the office.
9
PART II
ITEM 5. MARKET FOR THE REGISTRANT’S COMMON EQUITY, RELATED STOCKHOLDER MATTERS AND ISSUER PURCHASES OF EQUITY SECURITIES
Briggs & Stratton common stock and its common share purchase rights are traded on the NYSE under the symbol “BGG”. Information required by this Item is incorporated by reference from the “Quarterly Financial Data, Dividend and Market Information” (unaudited) on page 52.
Changes in Securities, Use of Proceeds and Issuer Purchases of Equity Securities
Briggs & Stratton did not make any purchases of equity securities registered by the company pursuant to Section 12 of the Exchange Act during the fourth quarter of fiscal 2007.
Five-year Stock Performance Graph
The chart below is a comparison of the cumulative return over the last five fiscal years had $100 been invested at the close of business on June 30, 2001 in each of Briggs & Stratton common stock, the Standard & Poor’s (S&P) Smallcap 600 Index and the S&P Machinery Index.
FIVE YEAR CUMULATIVE TOTAL RETURN COMPARISON*
Briggs & Stratton versus Published Indices
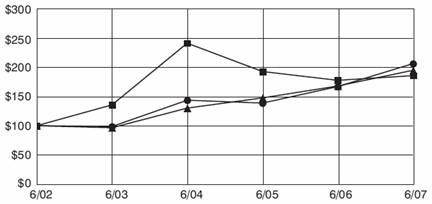
| | 6/02 | | 6/03 | | 6/04 | | 6/05 | | 6/06 | | 6/07 | |
n | Briggs & Stratton | | 100.00 | | 135.83 | | 242.40 | | 193.44 | | 178.24 | | 186.34 | |
| S&P Smallcap 600 | | 100.00 | | 96.42 | | 130.41 | | 147.95 | | 168.55 | | 195.58 | |
• | S&P Machinery (diversified) | | 100.00 | | 98.61 | | 143.97 | | 139.05 | | 167.53 | | 207.08 | |
* | Total return calculation is based on compounded monthly returns with reinvested dividends. | | | |
10
ITEM 6. SELECTED FINANCIAL DATA
Fiscal Year | 2007 | | 2006 | | 2005 | | 2004 | | 2003 | |
(dollars in thousands, except per share data) | | | | | | | | | | |
| | | | | | | | | | |
SUMMARY OF OPERATIONS (1) (2) | | | | | | | | | | |
NET SALES | $ | 2,157,233 | | $ | 2,542,171 | | $ | 2,654,875 | | $ | 1,947,364 | | $ | 1,657,633 | |
GROSS PROFIT ON SALES | 287,132 | | 491,684 | | 504,891 | | 439,872 | | 328,079 | |
PROVISION (CREDIT) FOR INCOME TAXES | (7,465) | | 50,020 | | 57,548 | | 68,890 | | 37,940 | |
INCOME BEFORE EXTRAORDINARY GAIN | 146 | | 102,346 | | 116,767 | | 136,114 | | 80,638 | |
INCOME BEFORE EXTRAORDINARY GAIN PER SHARE OF COMMON STOCK: | 0.00 | | 1.99 | | 2.27 | | 3.01 | | 1.86 | |
Basic Earnings | 0.00 | | 1.98 | | 2.25 | | 2.77 | | 1.74 | |
Diluted Earnings | | | | | | | | | | |
PER SHARE OF COMMON STOCK: | .88 | | .88 | | .68 | | .66 | | .64 | |
Cash Dividends | $ | 17.09 | | $ | 19.33 | | $ | 17.22 | | $ | 16.03 | | $ | 11.83 | |
Shareholders’ Investment | | | | | | | | | | |
WEIGHTED AVERAGE NUMBER OF SHARES OF COMMON STOCK OUTSTANDING (in 000’s) | 49,715 | | 51,479 | | 51,472 | | 45,286 | | 43,279 | |
DILUTED NUMBER OF SHARES OF COMMON STOCK OUTSTANDING (in 000’s) | 49,827 | | 51,594 | | 51,954 | | 50,680 | | 48,959 | |
| | | | | | | | | | |
OTHER DATA (1) (2) | $ | 846,054 | | $ | 987,206 | | $ | 889,186 | | $ | 817,595 | | $ | 514,987 | |
SHAREHOLDERS’ INVESTMENT | 384,048 | | 383,324 | | 486,321 | | 360,562 | | 503,397 | |
LONG-TERM DEBT | 2,379 | | 1,385 | | 1,988 | | - | | | - | | |
CAPITAL LEASES | 1,887,168 | | 1,944,200 | | 1,998,968 | | 1,637,153 | | 1,475,193 | |
TOTAL ASSETS | 1,006,402 | | 1,008,164 | | 1,005,644 | | 867,987 | | 876,664 | |
PLANT AND EQUIPMENT | 388,318 | | 430,288 | | 447,255 | | 356,542 | | 370,784 | |
PLANT AND EQUIPMENT, NET OF RESERVES | 70,379 | | 72,734 | | 66,348 | | 59,816 | | 58,325 | |
PROVISION FOR DEPRECIATION | 68,000 | | 69,518 | | 86,075 | | 52,962 | | 40,154 | |
EXPENDITURES FOR PLANT AND EQUIPMENT | $ | 526,623 | | $ | 688,506 | | $ | 766,537 | | $ | 681,432 | | $ | 505,752 | |
WORKING CAPITAL | 2.1 to 1 | | 3.0 to 1 | | 3.2 to 1 | | 3.3 to 1 | | 2.7 to 1 | |
Current Ratio | 7,260 | | 8,701 | | 9,073 | | 7,732 | | 7,249 | |
NUMBER OF EMPLOYEES AT YEAR-END | 3,693 | | 3,874 | | 4,058 | | 4,230 | | 4,503 | |
NUMBER OF SHAREHOLDERS AT YEAR-END | | | | | | | | | | |
QUOTED MARKET PRICE: | | | | | | | | | | |
High | $ | 33.07 | | $ | 40.38 | | $ | 44.50 | | $ | 44.22 | | $ | 25.75 | |
Low | $ | 24.29 | | $ | 30.01 | | $ | 30.83 | | $ | 24.68 | | $ | 15.38 | |
| | | | | | | | | | | | | | | | | |
(1) The amounts include the acquisitions of Simplicity Manufacturing, Inc. since July 7, 2004 and certain assets of Murray, Inc. since February 11, 2005. See Note 3 of the Notes to Consolidated Financial Statements for additional information.
(2) Share data adjusted for effect of 2-for-1 stock split effective October 29, 2004.
11
ITEM 7. MANAGEMENT’S DISCUSSION AND ANALYSIS OF FINANCIAL CONDITION AND RESULTS OF OPERATIONS
Results of Operations
FISCAL 2007 COMPARED TO FISCAL 2006
Net Sales
Fiscal 2007 consolidated net sales were approximately $2.16 billion, a decrease of $385 million compared to the previous year. The decrease is primarily due to lower sales volumes in both segments.
Engines Segment net sales were $1.45 billion compared to $1.65 billion in the prior year, a decrease of $201.2 million or 12%. The decrease is primarily the result of a 12% decrease in engine unit shipments between years. The shipment decline is due to a 66% reduction of engine shipments for portable generators caused by a lack of events, such as hurricanes, that cause power outages. The reminder of the decrease is due to lower retail demand for lawn and garden equipment in the U.S. along with a smaller market share in Europe. Unfavorable weather conditions and various economic factors contributed to difficult market conditions for lawn and garden products. Pricing improvements and the impact of favorable Euro exchange rates in fiscal 2007 were almost entirely offset by an unfavorable mix shift to smaller displacement, lower priced engines.
Power Products Segment net sales were $890.4 million in fiscal 2007 compared to $1.19 billion in fiscal 2006, a decrease of $295.6 million or 25%. Approximately $113.0 million of the decrease was the result of the anticipated reduction of Murray branded lawn and garden product sold to retailers. Excluding Murray branded product, lawn and garden equipment sales were comparable between years. The remainder of the net sales decrease was primarily due to a 58% reduction of portable generator unit shipments because of no landed hurricane activity in fiscal 2007 and lower pre-hurricane season sales. These sales decreases were partially offset by an increase in pressure washer unit shipments compared to the same period in the prior year and the introduction of new air compressor and home standby generator products.
Gross Profit
Consolidated gross profit was $287.1 million in fiscal 2007 compared to $491.7 million in fiscal 2006, a decrease of $204.6 million or 42%. In fiscal 2007, the Company recorded impairment charges of $43.1 million ($26.2 million, net of taxes) related to write-downs of assets primarily associated with the announced rationalization of two manufacturing plants. The remainder of the decrease is the result of lower sales and production volumes in both segments.
Engines Segment gross margins decreased to $208.4 million in fiscal 2007 from $381.9 million in fiscal 2006, a decrease of $173.5 million. Engines Segment gross profit margins decreased to 14.4% in fiscal 2007 from 23.2% in fiscal 2006. Approximately $33.9 million of the decline is attributable to expense incurred with the write-down of assets primarily associated with the rationalization of a major operating plant in the United States. The balance of the reduction resulted primarily from lower sales and production volumes, and increased costs for raw materials. Lower unit sales negatively impacted fiscal 2007 margins by approximately $70.0 million. Pricing improvements and the impact of favorable Euro exchange rates in fiscal 2007 were almost entirely offset by an unfavorable mix shift to smaller displacement, lower priced engines. Raw material cost increases primarily related to aluminum, steel, and zinc also negatively impacted margins. Engine production volumes decreased 18.9% in fiscal 2007 compared to fiscal 2006 reducing fixed cost absorption by approximately $45.0 million. In addition, fiscal 2006 included gains of approximately $12.2 million associated with certain asset sales that were not recurring in fiscal 2007.
The Power Products Segment gross margins decreased to $80.8 million in fiscal 2007 from $113.2 million in fiscal 2006, a decrease of $32.4 million. The Power Products Segment margin decreased to 9.1% in fiscal 2007 from 9.5% in fiscal 2006. Asset impairment charges of $9.2 million primarily related to the write-down of assets associated with a plan to close the Port Washington manufacturing facility by October 2008 accounted for a gross profit margin decline of approximately 1.0%. Portable generator production volume declines of 65% offset by increased production of pressure washers decreased fixed cost absorption by approximately $13.6 million. These declines were offset by a decrease of $19 million of 2006 expenses associated with the wind down of operations at the Murray, Inc. operating facility and the write-off of excess inventory related to Murray product.
12
Engineering, Selling, General and Administrative Costs
Engineering, selling, general and administrative costs decreased to $265.6 million in fiscal 2007 from $315.7 million in fiscal 2006, a decrease of $50.1 million. Engineering, selling, general and administrative costs as a percent of sales decreased to 12.3% in fiscal 2007 from 12.4% in fiscal 2006.
The decrease in engineering, selling, general and administrative expenses is due to planned reductions in salaries and benefits of $14 million, reduced professional services and legal fees of $21 million and reduced selling, marketing and advertising expenses of $12 million.
Interest Expense
Interest expense increased $1.6 million in fiscal 2007 compared to fiscal 2006. The increase is attributable to higher average borrowings between years to support higher average working capital requirements.
Other Income
Other income decreased $3.7 million in fiscal 2007 as compared to fiscal 2006. The decrease in other income is due to lower dividends received as well as the Company’s portion of lower earnings at its joint venture investments.
Provision for Income Taxes
The effective tax rate was 102% for fiscal 2007 and 33% for fiscal 2006. The fiscal 2007 effective tax rate results primarily from our ability to exclude from taxable income a portion of the distributions received from investments and the benefit from the research credit and the production activities deduction.
FISCAL 2006 COMPARED TO FISCAL 2005
Net Sales
Fiscal 2006 consolidated net sales were approximately $2.5 billion, a decrease of $113 million compared to the previous year. The decrease is primarily due to lower sales volumes in both segments.
Engines Segment net sales were $1.6 billion versus $1.7 billion in the prior year, a decrease of $91 million or 5%. The decrease is primarily the result of a 7% decrease in engine unit shipments between years. The shipment decline is attributable to softer retail demand for lawn and garden equipment and efforts by retailers and OEMs to control inventory levels in the wake of reduced demand. This unit shipment decline was partially offset by $30 million from a price increase implemented in the beginning of the fiscal year, as well as a favorable mix of engine unit shipments.
Power Products net sales were $1.2 billion in both fiscal 2006 and 2005. Lower volumes in fiscal 2006 of $105 million for pressure washer and lawn and garden equipment sales were almost fully offset by $75 million of increased volume and pricing on generators as well as $23 million from a favorable mix of lawn and garden product. Management believes the decline in volume of lawn and garden and pressure washer sales is attributable to lower consumer discretionary spending, which resulted in lower demand at retailers.
Gross Profit
Consolidated gross profit decreased $13 million in fiscal 2006. The decrease is primarily the result of the volume decreases noted above offset by pricing improvements in both segments.
Engines Segment margins increased from 21% in fiscal 2005 to 23% in fiscal 2006. The increase in margin is attributable to the price increase discussed above as well as $13 million in gains on the sale of operating assets. In addition, ongoing cost reduction programs contributed $8 million to the margin. These positive margin enhancers were enough to overcome the impact of a 4% production volume decline, a mix of product that favored lower margin units and other manufacturing cost increases.
The Power Products Segment margin decreased to 10% in fiscal 2006 from 11% in fiscal 2005. The decline is primarily attributable to $19 million in losses associated with the wind down of operations at the Murray, Inc. operating facility and the write-off of excess inventory related to Murray product. Partially offsetting these losses was $16 million in pricing improvements, primarily on generators.
Engineering, Selling, General and Administrative Costs
Engineering, selling, general and administrative costs increased $2 million between years. Excluding the impact of the $39 million write-off of the Murray, Inc. trade receivable that occurred in fiscal 2005 the category increased $41 million between years.
13
Increases in this category in fiscal 2006 as compared to fiscal 2005 included: $9 million from the expensing of stock based compensation in fiscal 2006, $12 million in increased legal fees associated with litigation, $9 million associated with increased information technology spending, and $2 million from increased engineering costs associated with new product development in the Power Products Segment. Planned increases of $9.0 million in selling and advertising costs also contributed to the year over year increase in this category.
Interest Expense
Interest expense increased $5 million in fiscal 2006 compared to fiscal 2005. The increase is attributable to higher borrowings between years associated with the term notes used for the Murray, Inc. asset acquisition in February 2005.
Other Income
Other income decreased $2 million in fiscal 2006 as compared to fiscal 2005. The decrease is attributed primarily to higher deferred financing expenses. Deferred financing expense increased as a result of the acceleration of debt repayments and the write-off of associated deferred financing costs.
Provision for Income Taxes
The effective tax rate was approximately 33% in both fiscal 2006 and fiscal 2005.
Liquidity and Capital Resources
FISCAL YEARS 2007, 2006 AND 2005
Cash flows from operating activities were $88 million, $155 million and $149 million in fiscal 2007, 2006 and 2005, respectively.
The fiscal 2007 cash flows from operating activities were $67 million less than the prior year. The primary reason for the decrease is due to net income being lower by $102 million in fiscal 2007 compared to fiscal 2006. The decrease in net income was partially offset by non-cash impairment charges of $43 million in fiscal 2007. In addition, higher fourth quarter sales within our Engines Segment increased working capital requirements for accounts receivable by $54 million partially offset by higher accounts payable and accrued liabilities.
The fiscal 2006 cash flows from operating activities were $6 million higher than the prior year. The primary reason for the increase is lower working capital requirements in fiscal 2006. Lower fourth quarter sales in fiscal 2006 resulted in higher inventory levels offset by lower receivables and accrued liabilities including rebates, incentive compensation and income taxes. The reduction in net income between years was more than offset by a series of increased non-cash items in fiscal 2006 including non-cash pension charges, stock compensation expense, gains on fixed asset sales, the deferred tax credit, and the elimination of the extraordinary gain.
The fiscal 2005 cash flows from operations were $98 million higher than the prior year. Fiscal 2005 did not experience the significant increase in inventories experienced in 2004, resulting in a $141 million improvement in cash flows in fiscal 2005. During fiscal 2004, inventories for engines and power products were increased to what management believes were a more normal level. Accordingly, no such incremental inventory build-up was required in fiscal 2005. Offsetting the favorable impact of inventory levels on cash flows was a $27 million reduction in accounts payable and accrued liabilities between years. The decrease is primarily attributable to a $19 million reduction in incentive compensation accruals between years and $5 million in lower rebate accruals.
Cash used in investing activities was $67 million, $55 million and $437 million in fiscal 2007, 2006 and 2005, respectively. These cash flows include capital expenditures of $68 million, $70 million and $86 million in fiscal 2007, 2006 and 2005, respectively. The capital expenditures relate primarily to reinvestment in equipment, capacity additions and new products. During fiscal 2007, we increased our Engines Segment capacity by opening a new plant in Ostrava, Czech Republic which accounted for $15 million of capital expenditures. This new plant began production in December 2006. In addition, the Power Products Segment is adding lawn and garden product capacity with a new plant in Newbern, Tennessee that accounted for $6 million of capital expenditures in fiscal 2007. This plant is expected to begin production in the second quarter of fiscal 2008.
In fiscal 2006, Briggs & Stratton received $12 million in cash from the sale of certain operating assets. In addition, Briggs & Stratton received $6 million as a refund of a portion of the cash paid for certain assets of Murray, Inc. in fiscal 2005.
In fiscal 2005, cash used in investing activities also includes $232 million in cash paid for the Simplicity acquisition and $123 million for the acquisition of certain Murray assets.
14
Briggs & Stratton used cash of $89 million and $169 million in financing activities in fiscal 2007 and fiscal 2006, respectively. Briggs & Stratton provided cash from financing activities of $106 million in fiscal 2005.
In fiscal 2007, Briggs & Stratton repurchased $48.2 million of its common shares outstanding as part of a $120 million share repurchase program authorized by the Board of Directors in fiscal 2007. In addition, the Company paid common stock dividends of $44 million in fiscal 2007.
In fiscal 2006, the Company paid off $104 million of its long term debt, including $90 million of its term notes due in fiscal 2008. In addition, Briggs & Stratton repurchased $35 million of its common shares in fiscal 2006.
Early in fiscal 2005, the Company used its available cash to finance the acquisition of Simplicity. To finance the acquisition of the Murray assets, the Company issued $125 million in term notes in fiscal 2005. The Company incurred $1 million in fees in fiscal 2005 negotiating the term notes and an amendment to its revolving credit facility.
The Company received $4 million, $12 million, and $20 million in fiscal years 2007, 2006 and 2005, respectively, from the exercise of stock options. The stock option activity is a direct reflection of the market value of the Company’s stock and option strike prices that encourage the exercise of the options.
Future Liquidity and Capital Resources
At the end of fiscal 2007, the Company had no borrowings outstanding under its $350 million revolving credit facility that was to expire in May 2009. On July 12, 2007, the Company entered into a $500 million amended and restated multicurrency credit agreement. The Amended Credit Agreement (“Revolver”) provides a revolving credit facility for up to $500 million in revolving loans, including up to $25 million in swing-line loans. The Company will use proceeds of the Revolver to, among other things, pay off amounts outstanding under the Company’s Term Loan Agreement dated February 11, 2005 with various financial institutions. The Revolver will also be used to fund seasonal working capital requirements and other financing needs. At any time during the term of the Revolver, the Company may, so long as no event of default has occurred and is continuing and certain other conditions are satisfied, elect to increase the maximum amount available under the Revolver from $500 million by up to an amount not to exceed $250 million through, at the Company’s election, increases of commitments by existing lenders and/or the addition of new lenders. The Revolver has a term of five years and all outstanding borrowings on the Revolver will be due and payable on July 12, 2012.
On August 10, 2006, Briggs & Stratton announced its intent to initiate repurchases of up to $120 million of its common stock through open market transactions during fiscal 2007 and fiscal 2008. The timing and amount of actual purchases will depend upon certain governing loan covenants. As of August 30, 2007, approximately $48.2 million of common stock has been repurchased under this plan.
Briggs & Stratton expects capital expenditures to be approximately $80 million in fiscal 2008. These anticipated expenditures reflect our plans to continue to reinvest in equipment, new products, and capacity enhancements.
Management believes that available cash, the credit facility, cash generated from future operations, existing lines of credit and access to debt markets will be adequate to fund Briggs & Stratton’s capital requirements for the foreseeable future.
Financial Strategy
Management believes that the value of Briggs & Stratton is enhanced if the capital invested in operations yields a cash return that is greater than the cost of capital. Consequently, management’s first priority is to reinvest capital into physical assets and products that maintain or grow the global cost leadership and market positions that Briggs & Stratton has achieved, and drive the economic value of the Company. Management’s next financial objective is to identify strategic acquisitions or alliances that enhance revenues and provide a superior economic return. Several successful joint ventures and the acquisition of Generac Portable Products, Inc. and Simplicity are examples of our successful execution of this strategy. Finally, management believes that when capital cannot be invested for returns greater than the cost of capital, we should return capital to the capital providers through dividends and/or stock buy-backs.
Off-Balance Sheet Arrangements
Briggs & Stratton has no off-balance sheet arrangements or significant guarantees to third parties not fully recorded in our Balance Sheets or fully disclosed in our Notes to Consolidated Financial Statements. Briggs & Stratton’s significant contractual obligations include our debt agreements and certain employee benefit plans.
15
Briggs & Stratton is subject to financial and operating restrictions in addition to certain financial covenants under its domestic debt agreements. As is fully disclosed in Note 8 of the Notes to Consolidated Financial Statements, these restrictions could limit our ability to: pay dividends; incur further indebtedness; create liens; enter into sale and/or leaseback transactions; consolidate, sell or lease all or substantially all of our assets; and dispose of assets or the proceeds of our assets. We believe we will remain in compliance with these covenants in fiscal 2008. Briggs & Stratton has obligations concerning certain employee benefits including its pension plans, postretirement benefit obligations and deferred compensation arrangements. All of these obligations are recorded on our Balance Sheets and disclosed more fully in the Notes to Consolidated Financial Statements.
Contractual Obligations
A summary of the Company’s expected payments for significant contractual obligations as of July 1, 2007 is as follows (in thousands):
| | | Total | | | | 2008 | | | 2009-2010 | | 2011-2012 | | Thereafter | |
Long-Term Debt | | $ | 386,139 | | $ | 116,139 | | $ | - | | $ | 270,000 | | $ | - | |
Interest on Long-Term Debt | | 89,658 | | 24,760 | | 47,925 | | 16,973 | | - | |
Capital Leases | | 2,892 | | 1,222 | | 755 | | 782 | | 133 | |
Operating Leases | | 49,473 | | 14,161 | | 19,289 | | 9,700 | | 6,323 | |
Consulting Agreement | | 153 | | 153 | | - | | - | | - | |
| | $ | 528,315 | | $ | 156,435 | | $ | 67,969 | | $ | 297,455 | | $ | 6,456 | |
| | | | | | | | | | | | | | | | | | | | |
Other Matters
Labor Agreement
Briggs & Stratton has collective bargaining agreements with its unions. These agreements expire at various times ranging from 2007-2011.
Emissions
The U.S. Environmental Protection Agency (EPA) has developed national emission standards under a two-phase process for small air cooled engines. Briggs & Stratton currently has a complete product offering that complies with the EPA’s Phase II engine emission standards.
The EPA issued proposed Phase III standards to further reduce engine exhaust emissions and to control evaporative emissions from small off-road engines and equipment they are used in. The proposed standards are similar to those adopted by the California Air Resources Board (CARB). The proposed Phase III program would require some evaporative controls in 2007 and go into full effect in 2011 for Class II engines (225 cubic centimeter displacement and larger) and 2012 for Class I engines (less than 225 cubic centimeter displacement). Briggs & Stratton does not believe compliance with the new standards will have a material adverse effect on its financial position or results of operations.
CARB’s Tier 3 regulation requires additional reductions to engine exhaust emissions and new controls on evaporative emissions from small engines. The Tier 3 regulation is phased in between 2006 and 2008 depending upon the size of the engine and type of control. While Briggs & Stratton believes the cost of the regulation may increase engine costs per unit, Briggs & Stratton does not believe the regulation will have a material effect on its financial condition or results of operations. This assessment is based on a number of factors, including revisions the CARB made to its adopted regulation from the proposal published in September 2003 in response to recommendations from Briggs & Stratton and others in the regulated category and intention to pass increased costs associated with the regulation on to consumers.
The European Commission adopted an engine emission Directive regulating exhaust emissions from engines manufactured by Briggs & Stratton. The Directive parallels the regulations previously promulgated by the U.S. EPA. Stage 1 was effective in February 2004 and Stage 2 phases in between calendar years 2005 and 2007, with some limited extensions available for specific size and type engines until 2010. Briggs & Stratton’s full European product line has been compliant with Stage 1 since 2004. Briggs & Stratton has certified the majority of its Class 2 engines to be compliant with the Stage 2 standards and intends to have a full European product line compliant with Stage 2 before the end of calendar year 2007. Briggs & Stratton does not believe compliance with the Directive will have a material adverse effect on its financial position or results of operations.
16
Critical Accounting Policies
Briggs & Stratton’s critical accounting policies are more fully described in Note 2 and Note 14 of the Notes to Consolidated Financial Statements. As discussed in Note 2, the preparation of financial statements in conformity with accounting principles generally accepted in the U.S. (“GAAP”) requires management to make estimates and assumptions about future events that affect the amounts reported in the financial statements and accompanying notes. Future events and their effects cannot be determined with absolute certainty. Therefore, the determination of estimates requires the exercise of judgment. Actual results inevitably will differ from those estimates, and such differences may be material to the financial statements.
The most significant accounting estimates inherent in the preparation of our financial statements include estimates as to the recovery of accounts receivable and inventory reserves, as well as those used in the determination of liabilities related to customer rebates, pension obligations, postretirement benefits, warranty, product liability, litigation and taxation.
The reserves for customer rebates, warranty, product liability, inventory and doubtful accounts are fact specific and take into account such factors as specific customer situations, historical experience, and current and expected economic conditions.
The Company’s estimate of income taxes payable, deferred income taxes, and the effective tax rate is based on a complex analysis of many factors including interpretations of Federal, state and foreign income tax laws, the difference between tax and financial reporting bases of assets and liabilities, estimates of amounts currently due or owed in various jurisdictions, and current accounting standards. We review and update our estimates on a quarterly basis as facts and circumstances change and actual results are known. In addition, Federal, state and foreign taxing authorities periodically review the Company’s estimates and interpretation of income tax laws. Adjustments to the effective income tax rate and recorded tax related assets and liabilities may occur in future periods if actual results differ significantly from original estimates and interpretations.
The pension benefit obligation and related pension expense or income are calculated in accordance with Statement of Financial Accounting Standard (SFAS) No.158, “Employer’s Accounting for Defined Benefit Pension and Other Postretirement Plans - an amendment of FASB Statements No. 87, 88, 106 and 132 (R)”, and are impacted by certain actuarial assumptions, including the discount rate and the expected rate of return on plan assets. These rates are evaluated on an annual basis considering such factors as market interest rates and historical asset performance. Actuarial valuations at July 1, 2007 used a discount rate of 6.35% and an expected rate of return on plan assets of 8.75%. Our discount rate was selected using a methodology that matches plan cash flows with a selection of Moody’s Aa or higher rated bonds, resulting in a discount rate that better matches a bond yield curve with comparable cash flows. A 0.25% decrease in the discount rate would increase annual pension expense by approximately $0.1 million. A 0.25% decrease in the expected return on plan assets would increase our annual pension expense by approximately $2.0 million. In estimating the expected return on plan assets, the Company considers the historical returns on plan assets, adjusted for forward looking considerations, including inflation assumptions and active management of the plan’s invested assets. Changes in the discount rate and return on assets can have a significant effect on the funded status of our pension plans, stockholders’ equity and expense. We cannot predict these changes in discount rates or investment returns and, therefore, cannot reasonably estimate whether the impact in subsequent years will be significant.
The funded status of the Company’s pension plan is the difference between the projected benefit obligation and the fair value of its plan assets. The projected benefit obligation is the actuarial present value of all benefits expected to be earned by the employees’ service adjusted for future potential wage increases. At July 1, 2007 the fair value of plan assets exceeded the projected benefit obligation by approximately $63 million.
The other postretirement benefits obligation and related expense or income are also calculated in accordance with SFAS No. 158, “Employer’s Accounting for Defined Benefit Pension and Other Postretirement Plans – an amendment of FASB Statements No. 87, 88, 106 and 132 (R)” and are impacted by certain actuarial assumptions, including the health care trend rate. An increase of one percentage point in health care costs would increase the accumulated postretirement benefit obligation by $11.5 million and would increase the service and interest cost by $0.9 million. A corresponding decrease of one percentage point, would decrease the accumulated postretirement benefit by $10.8 million and decrease the service and interest cost by $0.8 million.
For pension and postretirement benefits, actuarial gains and losses are accounted for in accordance with GAAP. Refer to Note 14 of the Notes to the Consolidated Financial Statements for additional discussion.
17
New Accounting Pronouncements
In February 2007, the FASB issued SFAS No. 159, “The Fair Value Option for Financial Assets and Financial Liabilities – Including an Amendment of FASB Statement No. 115,” (SFAS 159). This standard permits an entity to choose to measure many financial instruments and certain other items at fair value. The fair value option permits a company to choose to measure eligible items at fair value at specified election dates. A company will report unrealized gains and losses on items for which the fair value option has been elected in earnings after adoption. Statement 159 is effective for fiscal years beginning after November 15, 2007. At this time, the impact of adoption of SFAS 159 on our consolidated financial position is being assessed.
In September 2006, the FASB issued SFAS No. 157, “Fair Value Measurements,” (SFAS 157), which defines fair value, establishes a framework for measuring fair value and expands disclosures about fair value measurements. SFAS 157 is effective for fiscal years beginning after November 15, 2007. At this time, the impact of adoption of SFAS 157 on our consolidated financial position is being assessed.
In September 2006, the FASB issued SFAS No. 158, “Employers’ Accounting for Defined Benefit Pension and Other Postretirement Plans - an amendment of FASB Statements No. 87, 88, 106, and 132(R),” (SFAS 158). SFAS 158 requires recognition of the overfunded or underfunded status of a postretirement benefit plan in the statement of financial position, as well as recognition of changes in that funded status through comprehensive income in the year in which they occur. SFAS 158 also requires a change in the measurement of a plan’s assets and benefit obligations as of the end date of the employer’s fiscal year. SFAS 158 is effective for fiscal years ending after December 15, 2006, except for the measurement date provisions, which are effective for fiscal years ending after December 15, 2008. See Note 14 – Pension and Other Postretirement Benefits in the Notes to Consolidated Financial Statements for further discussion regarding the Company’s adoption of SFAS 158 in its 2007 fiscal year.
In June 2006, the FASB issued FASB Interpretation No. 48 Accounting for Uncertainty in Income Taxes (FIN 48) an interpretation of FASB Statement No. 109 (SFAS 109). This interpretation clarifies the accounting for uncertainty in income taxes recognized in a company’s financial statements in accordance with SFAS 109. FIN48 details how companies should recognize, measure, present and disclose uncertain tax positions that have been or expect to be taken. As such, financial statements will reflect expected future tax consequences of uncertain tax positions presuming the taxing authorities’ full knowledge of the position and all relevant facts. FIN48 is effective for public companies for annual periods that begin after December 15, 2006. Briggs & Stratton Corporation is required to and intends to adopt the provisions of FIN 48 as of July 2, 2007. The cumulative effect of adoption will be recorded as an adjustment to the opening balance of retained earnings for fiscal 2008. We have evaluated the impact of FIN 48 and do not expect it to have a material impact on our financial condition or results of operations.
In November 2004, the FASB issued SFAS No. 151, “Inventory Costs – an amendment of ARB No. 43, Chapter 4,” (SFAS No. 151). SFAS No. 151 seeks to clarify the accounting for abnormal amounts of idle facility expense, freight, handling costs and wasted material (spoilage) in the determination of inventory carrying costs. The statement requires such costs to be treated as a current period expense. This statement became effective for the company on July 2, 2006. The adoption of SFAS No. 151 did not have a material impact on the Consolidated Financial Statements.
18
ITEM 7A. QUANTITATIVE AND QUALITATIVE DISCLOSURES ABOUT MARKET RISK
Briggs & Stratton is exposed to market risk from changes in foreign exchange and interest rates. To reduce the risk from changes in foreign exchange rates, Briggs & Stratton uses financial instruments. Briggs & Stratton does not hold or issue financial instruments for trading purposes.
Foreign Currency
Briggs & Stratton’s earnings are affected by fluctuations in the value of the U.S. dollar against various currencies, with the Japanese Yen and the Euro as the most significant. The Yen is used to purchase engines from Briggs & Stratton’s joint venture. Briggs & Stratton purchases components in Euros from third parties and receives Euros for certain products sold to European customers. Briggs & Stratton’s foreign subsidiaries’ earnings are also influenced by fluctuations of the local currency against the U.S. dollar as these subsidiaries previously purchased inventory from the parent in U.S. dollars. Starting mid-year of fiscal 2007, subsidiaries make these purchases in Euros. Forward foreign exchange contracts are used to partially hedge against the earnings effects of such fluctuations. At July 1, 2007, Briggs & Stratton had the following forward foreign exchange contracts outstanding with the Fair Value (Gains) Losses shown (in thousands):
Hedge | | Notional | | Fair Market | | Conversion | | (Gain) Loss | |
Currency | | | | Value | | | | Value | | | | Currency | | | at Fair Value | |
Japanese Yen | | 2,300,000 | | | $ | 18,998 | | | U.S. | | $ | 229 | | |
Euro | | 38,000 | | | $ | 51,590 | | | U.S. | | $ | 206 | | |
Australian Dollars | | 4,471 | | | $ | 3,790 | | | U.S. | | $ | 211 | | |
| | | | | | | | | | | | | | | | | | | | |
All of the above contracts expire within twelve months.
Fluctuations in currency exchange rates may also impact the shareholders’ investment in Briggs & Stratton. Amounts invested in Briggs & Stratton’s non-U.S. subsidiaries and joint ventures are translated into U.S. dollars at the exchange rates in effect at fiscal year-end. The resulting cumulative translation adjustments are recorded in Shareholders’ Investment as Accumulated Other Comprehensive Income. The cumulative translation adjustments component of Shareholders’ Investment increased $4.3 million during the year. Using the year-end exchange rates, the total amount invested in non-U.S. subsidiaries on July 1, 2007 was approximately $86 million.
Interest Rates
Briggs & Stratton is exposed to interest rate fluctuations on its borrowings, depending on general economic conditions.
On July 1, 2007, Briggs & Stratton had the following short-term loans outstanding (in thousands):
| | | | Weighted Average | |
Currency | | | | | Amount | | | | Interest Rate | | |
U.S. Dollars | | $ 3,000 | | 7.05% | |
| | | | | | | | | | | |
This loan has a variable interest rate. Assuming borrowings are outstanding for an entire year, an increase (decrease) of one percentage point in the weighted average interest rate, would increase (decrease) interest expense by $30 thousand.
Long-term loans, net of unamortized discount, consisted of the following (in thousands):
Description | | | | | Amount | | | | Maturity | | |
7.25% | Senior Notes | | $ | 81,139 | | | 2007 | |
8.875% | Senior Notes | | $ | 267,909 | | | 2011 | |
Variable Rate Term Notes | | $ | 35,000 | | | 2008 | |
| | | | | | | | | | | | | | |
The Senior Notes carry fixed rates of interest and are therefore not subject to market fluctuation. The Variable Rate Term Note is subject to interest rate fluctuations, therefore an increase (decrease) of one percentage point in the weighted average interest rate would increase (decrease) interest expense by $350 thousand.
19
ITEM 8. FINANCIAL STATEMENTS AND SUPPLEMENTARY DATA
Consolidated Balance Sheets
AS OF JULY 1, 2007 AND JULY 2, 2006 |
(in thousands) |
ASSETS | | | 2007 | | | | 2006 | | |
CURRENT ASSETS: | | | | | |
Cash and Cash Equivalents | | $ | 29,469 | | $ | 95,091 | |
Receivables, Less Reserves of $4,102 and $4,851, Respectively | | 327,475 | | 273,502 | |
Inventories: | | | | | |
Finished Products and Parts | | 345,763 | | 364,711 | |
Work in Process | | 199,215 | | 188,358 | |
Raw Materials | | 7,804 | | 8,946 | |
Total Inventories | | 552,782 | | 562,015 | |
Deferred Income Tax Asset | | 55,520 | | 49,960 | |
Prepaid Expenses and Other Current Assets | | 30,547 | | 43,020 | |
Total Current Assets | | 995,793 | | 1,023,588 | |
GOODWILL | | 250,107 | | 251,885 | |
OTHER INTANGIBLE ASSETS, Net | | 92,556 | | 94,596 | |
INVESTMENTS | | 47,326 | | 48,917 | |
PREPAID PENSION | | 103,247 | | 75,789 | |
DEFERRED LOAN COSTS, Net | | 3,135 | | 4,308 | |
OTHER LONG-TERM ASSETS, Net | | 6,686 | | 6,765 | |
PLANT AND EQUIPMENT: | | | | | |
Land and Land Improvements | | 18,039 | | 17,956 | |
Buildings | | 142,873 | | 130,044 | |
Machinery and Equipment | | 814,037 | | 830,537 | |
Construction in Progress | | 31,453 | | 29,627 | |
| | 1,006,402 | | 1,008,164 | |
| | | | | |
Less - Accumulated Depreciation | | 618,084 | | 577,876 | |
Total Plant and Equipment, Net | | 388,318 | | 430,288 | |
| | $ | 1,887,168 | | $ | 1,936,136 | |
| | | | | | | | | | | | |
The accompanying Notes to Consolidated Financial Statements are an integral part of these statements.
20
AS OF JULY 1, 2007 AND JULY 2, 2006 |
(in thousands, except per share data) |
LIABILITIES AND SHAREHOLDERS’ INVESTMENT | | | 2007 | | | | | 2006 | | | |
CURRENT LIABILITIES: | | | | | | | |
Accounts Payable | | $ | 179,476 | | | $ | 161,291 | | |
Short-term Debt | | 3,000 | | | 3,474 | | |
Current Maturities on Long-term Debt | | 116,139 | | | - | | |
Accrued Liabilities: | | | | | | | |
Wages and Salaries | | 27,901 | | | 32,743 | | |
Warranty | | 37,353 | | | 32,555 | | |
Accrued Postretirement Health Care Obligation | | 37,504 | | | 26,000 | | |
Other | | 67,797 | | | 66,405 | | |
Total Accrued Liabilities | | 170,555 | | | 157,703 | | |
Total Current Liabilities | | 469,170 | | | 322,468 | | |
DEFERRED INCOME TAX LIABILITY | | 37,300 | | | 94,798 | | |
ACCRUED PENSION COST | | 39,438 | | | 25,587 | | |
ACCRUED WARRANTY | | 17,213 | | | 20,678 | | |
ACCRUED EMPLOYEE BENEFITS | | 20,072 | | | 16,267 | | |
ACCRUED POSTRETIREMENT HEALTH CARE OBLIGATION | | 186,868 | | | 84,136 | | |
LONG-TERM DEBT | | 267,909 | | | 383,324 | | |
OTHER LONG-TERM LIABILITIES | | 3,144 | | | 1,672 | | |
COMMITMENTS AND CONTINGENCIES | | | | | | | |
SHAREHOLDERS’ INVESTMENT: | | | | | | | |
Common Stock - | | | | | | | |
Authorized 120,000 Shares $.01 Par Value,
Issued 57,854 Shares | | 579 | | | 579 | | |
Additional Paid-In Capital | | 73,149 | | | 65,126 | | |
Retained Earnings | | 1,042,673 | | | 1,086,397 | | |
Accumulated Other Comprehensive Income (Loss) | | (56,510 | ) | | 4,960 | | |
Treasury Stock at cost,
8,222 Shares in 2007 and 6,654 Shares in 2006 | | (213,837 | ) | | (169,856 | ) | |
Total Shareholders’ Investment | | 846,054 | | | 987,206 | | |
| | $ | 1,887,168 | | | $ | 1,936,136 | | |
| | | | | | | | | | | | | |
The accompanying Notes to Consolidated Financial Statements are an integral part of these statements.
21
Consolidated Statements of Earnings
FOR THE FISCAL YEARS ENDED JULY 1, 2007, JULY 2, 2006 AND JULY 3, 2005 |
(in thousands, except per share data) |
| | | 2007 | | | | | 2006 | | | | | 2005 | | | |
NET SALES | | $ | 2,157,233 | | | $ | 2,542,171 | | | $ | 2,654,875 | | |
COST OF GOODS SOLD | | 1,827,013 | | | 2,050,487 | | | 2,149,984 | | |
IMPAIRMENT CHARGE | | 43,088 | | | - | | | - | | |
Gross Profit | | 287,132 | | | 491,684 | | | 504,891 | | |
ENGINEERING, SELLING, GENERAL AND ADMINISTRATIVE EXPENSES | | 265,596 | | | 315,718 | | | 314,123 | | |
Income from Operations | | 21,536 | | | 175,966 | | | 190,768 | | |
INTEREST EXPENSE | | (43,691 | ) | | (42,091 | ) | | (36,883 | ) | |
OTHER INCOME, Net | | 14,836 | | | 18,491 | | | 20,430 | | |
Income (Loss) Before Provision (Credit) for Income Taxes | | (7,319 | ) | | 152,366 | | | 174,315 | | |
PROVISION (CREDIT) FOR INCOME TAXES | | (7,465 | ) | | 50,020 | | | 57,548 | | |
Income Before Extraordinary Item | | 146 | | | 102,346 | | | 116,767 | | |
EXTRAORDINARY GAIN - NEGATIVE GOODWILL | | - | | | - | | | 19,800 | | |
NET INCOME | | $ | 146 | | | $ | 102,346 | | | $ | 136,567 | | |
EARNINGS PER SHARE DATA | | | | | | | | | | |
Weighted Average Shares Outstanding | | 49,715 | | | 51,479 | | | 51,472 | | |
Income Before Extraordinary Item | | $ | 0.00 | | | $ | 1.99 | | | $ | 2.27 | | |
Extraordinary Gain | | - | | | - | | | .38 | | |
Basic Earnings Per Share | | $ | 0.00 | | | $ | 1.99 | | | $ | 2.65 | | |
Diluted Average Shares Outstanding | | 49,827 | | | 51,594 | | | 51,954 | | |
Income Before Extraordinary Item | | $ | 0.00 | | | $ | 1.98 | | | $ | 2.25 | | |
Extraordinary Gain | | - | | | - | | | .38 | | |
Diluted Earnings Per Share | | $ | 0.00 | | | $ | 1.98 | | | $ | 2.63 | | |
| | | | | | | | | | | | | | | | | | | |
The accompanying Notes to Consolidated Financial Statements are an integral part of these statements.
22
Consolidated Statements of Shareholders’ Investment
FOR THE FISCAL YEARS ENDED JULY 1, 2007, JULY 2, 2006 AND JULY 3, 2005 |
(in thousands, except per share data) |
| | | | | | | | Accumulated | | | | | |
| | | | Additional | | | | Other Com- | | | | | |
| | Common | | Paid-In | | Retained | | prehensive | | Treasury | | Comprehensive | |
| | Stock | | | Capital | | | Earnings | | | Income (Loss) | | | Stock | | | Income | | |
BALANCES, JUNE 27, 2004 | | $ | 289 | | $ | 47,167 | | $ | 927,766 | | $ | 4,028 | | $ | (161,655 | ) | | |
Comprehensive Income: | | | | | | | | | | | | | |
Net Income | | - | | - | | 136,567 | | - | | - | | $ | 136,567 | |
Foreign Currency Translation Adjustments | | - | | - | | - | | 881 | | - | | 881 | |
Unrealized Gain on Derivatives | | - | | - | | - | | 419 | | - | | 419 | |
Minimum Pension Liability Adjustment, net of tax of $(34,306) | | - | | - | | - | | (53,659 | ) | - | | (53,659 | ) |
Total Comprehensive Income | | - | | - | | - | | - | | - | | $ | 84,208 | |
Cash Dividends Paid ($0.68* per share) | | - | | - | | (35,004 | ) | - | | - | | | |
Stock Option Activity, net of tax | | - | | 6,990 | | - | | - | | 14,752 | | | |
Restricted Stock | | - | | (690 | ) | - | | - | | 688 | | | |
Amortization of Unearned Compensation | | - | | 511 | | - | | - | | - | | | |
Stock Split | | 290 | | (290 | ) | - | | - | | - | | | |
Deferred Stock | | - | | 3 | | - | | - | | - | | | |
Shares Issued to Directors | | - | | 117 | | - | | - | | 16 | | | |
BALANCES, JULY 3, 2005 | | $ | 579 | | $ | 53,808 | | $ | 1,029,329 | | $ | (48,331 | ) | $ | (146,199 | ) | | |
Comprehensive Income: | | | | | | | | | | | | | |
Net Income | | - | | - | | 102,346 | | - | | - | | $ | 102,346 | |
Foreign Currency Translation Adjustments | | - | | - | | - | | 1,785 | | - | | 1,785 | |
Unrealized Loss on Derivatives | | - | | - | | - | | (1,255 | ) | - | | (1,255 | ) |
Minimum Pension Liability Adjustment, net of tax of $(33,733) | | - | | - | | - | | 52,761 | | - | | 52,761 | |
Total Comprehensive Income | | - | | - | | - | | - | | - | | $ | 155,637 | |
Cash Dividends Paid ($0.88 per share) | | - | | - | | (45,278 | ) | - | | - | | | |
Purchase of Common Stock for Treasury | | - | | - | | - | | - | | (34,919 | ) | | |
Stock Option Activity, net of tax | | - | | 10,455 | | - | | - | | 10,254 | | | |
Restricted Stock | | - | | (1,059 | ) | - | | - | | 925 | | | |
Amortization of Unearned Compensation | | - | | 1,276 | | - | | - | | - | | | |
Deferred Stock | | - | | 605 | | - | | - | | - | | | |
Shares Issued to Directors | | - | | 41 | | - | | - | | 83 | | | |
BALANCES, JULY 2, 2006 | | $ | 579 | | $ | 65,126 | | $ | 1,086,397 | | $ | 4,960 | | $ | (169,856 | ) | | |
Comprehensive Income: | | | | | | | | | | | | | |
Net Income | | - | | - | | 146 | | - | | - | | $ | 146 | |
Foreign Currency Translation Adjustments | | - | | - | | - | | 4,275 | | - | | 4,275 | |
Unrealized Loss on Derivatives | | - | | - | | - | | (765 | ) | - | | (765 | ) |
Minimum Pension Liability Adjustment, net of tax of $(1,218) | | - | | - | | - | | (1,904 | ) | - | | (1,904 | ) |
Total Comprehensive Income | | - | | - | | - | | - | | - | | $ | 1,752 | |
Cash Dividends Paid ($0.88 per share) | | - | | - | | (43,870 | ) | - | | - | | | |
Purchase of Common Stock for Treasury | | - | | - | | - | | - | | (48,232 | ) | | |
Stock Option Activity, net of tax | | - | | 7,226 | | - | | - | | 3,725 | | | |
Restricted Stock | | - | | (559 | ) | - | | - | | 436 | | | |
Amortization of Unearned Compensation | | - | | 1,023 | | - | | - | | - | | | |
Deferred Stock | | - | | 326 | | - | | - | | - | | | |
Shares Issued to Directors | | - | | 7 | | - | | - | | 90 | | | |
Adjustment to Initially Apply SFAS 158, net of tax of $(40,328) | | - | | - | | - | | (63,076 | ) | - | | | |
BALANCES, JULY 1, 2007 | | $ | 579 | | $ | 73,149 | | $ | 1,042,673 | | $ | (56,510 | ) | $ | (213,837 | ) | | |
| | | | | | | | | | | | | | | | | | | | | | | | |
* Share data adjusted for effect of 2-for-1 stock split effective October 29, 2004.
The accompanying Notes to Consolidated Financial Statements are an integral part of these statements.
23
Consolidated Statements of Cash Flows
FOR THE FISCAL YEARS ENDED JULY 1, 2007, JULY 2, 2006 AND JULY 3, 2005 |
(in thousands) |
| | | 2007 | | | | | 2006 | | | | | 2005 | | |
CASH FLOWS FROM OPERATING ACTIVITIES: | | | | | | | | | |
Net Income | | $ | 146 | | | $ | 102,346 | | | $ | 136,567 | |
Adjustments to Reconcile Net Income to Net Cash Provided by Operating Activities: | | | | | | | | | |
Extraordinary Gain | | - | | | - | | | (19,800 | ) |
Depreciation and Amortization | | 74,314 | | | 77,234 | | | 72,793 | |
Stock Compensation Expense | | 8,484 | | | 9,999 | | | 1,268 | |
Impairment Charge | | 43,088 | | | - | | | - | |
Earnings of Unconsolidated Affiliates, Net of Dividends | | 1,576 | | | 459 | | | 678 | |
(Gain) Loss on Disposition of Plant and Equipment | | 2,939 | | | (11,139 | ) | | 2,418 | |
Provision for Deferred Income Taxes | | (21,513 | ) | | (10,438 | ) | | (3,896 | ) |
Change in Operating Assets and Liabilities, Net of Effects of Acquisition: | | | | | | | | | |
(Increase) Decrease in Receivables | | (53,972 | ) | | 87,284 | | | (26,892 | ) |
(Increase) Decrease in Inventories | | 7,732 | | | (92,350 | ) | | 12,784 | |
(Increase) Decrease in Prepaid Expenses and Other Current Assets | | 11,558 | | | (12,302 | ) | | 2,650 | |
Increase (Decrease) in Accounts Payable, Accrued Liabilities and Income Taxes | | 16,418 | | | (7,695 | ) | | (27,734 | ) |
Change in Accrued/Prepaid Pension | | 1,830 | | | 10,847 | | | (1,050 | ) |
Other, Net | | (4,761 | ) | | 363 | | | (1,289 | ) |
Net Cash Provided by Operating Activities | | 87,839 | | | 154,608 | | | 148,497 | |
CASH FLOWS FROM INVESTING ACTIVITIES: | | | | | | | | | |
Additions to Plant and Equipment | | (68,000 | ) | | (69,518 | ) | | (86,075 | ) |
Proceeds Received on Disposition of Plant and Equipment | | 599 | | | 11,518 | | | 1,940 | |
Proceeds Received on Sale of Certain Assets of a Subsidiary | | - | | | - | | | 4,050 | |
Refund of Cash Paid for Acquisition | | - | | | 6,347 | | | - | |
Cash Paid for Acquisitions, Net of Cash Acquired | | - | | | - | | | (355,094 | ) |
Other, Net | | - | | | (3,400 | ) | | (1,500 | ) |
Net Cash Used by Investing Activities | | (67,401 | ) | | (55,053 | ) | | (436,679 | ) |
CASH FLOWS FROM FINANCING ACTIVITIES: | | | | | | | | | |
Net (Repayments) Borrowings on Loans and Notes Payable | | (473 | ) | | 3,031 | | | (2,684 | ) |
Net (Repayments) Borrowings on Long-Term Debt | | - | | | (103,826 | ) | | 125,000 | |
Issuance Cost of Debt | | - | | | - | | | (925 | ) |
Cash Dividends Paid | | (43,870 | ) | | (45,278 | ) | | (35,004 | ) |
Stock Option Exercise Proceeds and Tax Benefits | | 3,694 | | | 12,457 | | | 20,139 | |
Treasury Stock Purchases | | (48,232 | ) | | (34,919 | ) | | - | |
Net Cash (Used) Provided by Financing Activities | | (88,881 | ) | | (168,535 | ) | | 106,526 | |
EFFECT OF FOREIGN CURRENCY EXCHANGE RATE CHANGES ON CASH AND CASH EQUIVALENTS | | 2,821 | | | 2,498 | | | 835 | |
NET DECREASE IN CASH AND CASH EQUIVALENTS | | (65,622 | ) | | (66,482 | ) | | (180,821 | ) |
CASH AND CASH EQUIVALENTS: | | | | | | | | | |
Beginning of Year | | 95,091 | | | 161,573 | | | 342,394 | |
End of Year | | $ | 29,469 | | | $ | 95,091 | | | $ | 161,573 | |
SUPPLEMENTAL DISCLOSURE OF CASH FLOW INFORMATION: | | | | | | | | | |
Interest Paid | | $ | 43,169 | | | $ | 40,503 | | | $ | 36,357 | |
Income Taxes Paid | | $ | 12,342 | | | $ | 75,347 | | | $ | 66,410 | |
| | | | | | | | | | | | | | | | | | |
The accompanying Notes to Consolidated Financial Statements are an integral part of these statements.
24
Notes to Consolidated Financial Statements
FOR THE FISCAL YEARS ENDED JULY 1, 2007, JULY 2, 2006 AND JULY 3, 2005 |
(1) Nature of Operations:
Briggs & Stratton (the “Company”) is a U.S. based producer of air cooled gasoline engines and engine powered outdoor equipment. The engines are sold worldwide, primarily to original equipment manufacturers of lawn and garden equipment and other gasoline engine powered equipment. The Company’s wholly owned subsidiary, Briggs & Stratton Power Products Group, LLC (“BSPPG”), is a designer, manufacturer and marketer of a wide range of outdoor power equipment and related accessories. BSPPG’s products are sold primarily in the U.S.
(2) Summary of Significant Accounting Policies:
Fiscal Year: The Company’s fiscal year consists of 52 or 53 weeks, ending on the Sunday nearest the last day of June in each year. Therefore, the 2007 fiscal year was 52 weeks long, the 2006 fiscal year was 52 weeks long and the 2005 fiscal year was 53 weeks long. All references to years relate to fiscal years rather than calendar years.
Principles of Consolidation: The consolidated financial statements include the accounts of the Company and its majority owned domestic and foreign subsidiaries after elimination of intercompany accounts and transactions.
Accounting Estimates: The preparation of financial statements in conformity with accounting principles generally accepted in the United States requires management to make estimates and assumptions that affect the reported amounts of assets and liabilities and disclosure of contingent assets and liabilities at the date of the financial statements and the reported amounts of revenues and expenses during the reporting period. Actual results may differ from those estimates.
Cash and Cash Equivalents: This caption includes cash, commercial paper and certificates of deposit. The Company considers all highly liquid investments purchased with an original maturity of three months or less to be cash equivalents. At July 2, 2007, $16.2 million of book overdrafts are included in accounts payable.
Receivables: Receivables are recorded at the original carrying value less reserves for estimated uncollectible accounts.
Inventories: Inventories are stated at cost, which does not exceed market. The last-in, first-out (LIFO) method was used for determining the cost of approximately 50% of total inventories at July 1, 2007 and 53% of total inventories at July 2, 2006. The cost for the remaining inventories was determined using the first-in, first-out (FIFO) method. During fiscal 2007, a reduction in inventory quantities resulted in a liquidation of LIFO inventories carried at lower costs prevailing in prior years. The liquidation of these inventories increased cost of goods sold by $92 thousand in 2007. There was no such reduction of inventory in fiscal 2006 or 2005. If the FIFO inventory valuation method had been used exclusively, inventories would have been $63.3 million and $56.8 million higher in 2007 and 2006, respectively. The LIFO inventory adjustment was determined on an overall basis, and accordingly, each class of inventory reflects an allocation based on the FIFO amounts.
Goodwill and Other Intangible Assets: Goodwill reflects the cost of acquisitions in excess of the fair values assigned to identifiable net assets acquired. Other Intangible Assets reflect identifiable intangible assets that arose from purchase acquisitions. Other Intangible Assets are comprised of trademarks, patents and customer relationships. Goodwill and trademarks, which are considered to have indefinite lives are not amortized; however, both must be tested for impairment annually. Amortization is recorded on a straight line basis for other intangible assets with finite lives. Patents have been assigned an estimated weighted average useful life of thirteen years. The customer relationships have been assigned an estimated useful life of twenty-five years. The Company is subject to financial statement risk in the event that goodwill and intangible assets become impaired. The Company performed the required impairment tests in fiscal 2007, 2006 and 2005, and found no impairment of the assets.
Investments: This caption represents the Company’s investment in its 30% and 50% owned joint ventures and preferred stock in a privately held foundry business. The investments in the joint ventures are accounted for under the equity method.
25
Deferred Loan Costs: Expenses associated with the issuance of debt instruments are capitalized and are being amortized over the terms of the respective financing arrangement using the straight-line method over periods ranging from three to ten years. Accumulated amortization related to outstanding debt instruments amounted to $12.3 million as of July 1, 2007 and $10.4 million as of July 2, 2006.
Plant and Equipment and Depreciation: Plant and equipment are stated at cost and depreciation is computed using the straight-line method at rates based upon the estimated useful lives of the assets, as follows:
| Useful Life Range (In Years) | | |
Software | 3 - 10 | | |
Land Improvements | 20 - 40 | | |
Buildings | 20 - 50 | | |
Machinery & Equipment | 3 - 20 | | |
| | | | |
Expenditures for repairs and maintenance are charged to expense as incurred. Expenditures for major renewals and betterments, which significantly extend the useful lives of existing plant and equipment, are capitalized and depreciated. Upon retirement or disposition of plant and equipment, the cost and related accumulated depreciation are removed from the accounts, and any resulting gain or loss is recognized in cost of goods sold.
Impairment of Long-Lived Assets: Property, plant and equipment and other long-term assets are reviewed for impairment whenever events or changes in circumstances indicate that the carrying amount may not be recoverable. If the sum of the expected undiscounted cash flows is less than the carrying value of the related asset or group of assets, a loss is recognized for the difference between the fair value and carrying value of the asset or group of assets. There were no adjustments to the carrying value of long-lived assets in fiscal 2006 or 2005. Refer to Note 18 of the Notes to Consolidated Financial Statements for impairment charges recognized in fiscal 2007.
Warranty: The Company recognizes the cost associated with its standard warranty on engines and power products at the time of sale. The amount recognized is based on historical failure rates and current claim cost experience. The following is a reconciliation of the changes in accrued warranty costs for fiscal 2007 and 2006 (in thousands):
| | | 2007 | | | | 2006 | | |
Balance, Beginning of Period | | $ | 53,233 | | $ | 59,625 | |
Payments | | (34,046 | ) | (36,733 | ) |
Provision for Current Year Warranties | | 35,372 | | 34,056 | |
Credit for Prior Years Warranties | | 7 | | (3,715 | ) |
Balance, End of Period | | $ | 54,566 | | $ | 53,233 | |
| | | | | | | | | | | | |
Deferred Revenue on Sale of Plant and Equipment: During fiscal 2006, a pre-tax gain of $6.1 million was recorded as the Company ceased its involvement in its Menomonee Falls, Wisconsin facility sold in 1997. The terms and conditions of the sales contract were such that the Company continued to own and occupy a portion of the warehouse until the fourth quarter of fiscal 2006. Under the provisions of SFAS No. 66, “Accounting for Sales of Real Estate,” the Company accounted for the agreement as a financing transaction while it remained involved with the facility. Under this method, the cash received in fiscal 1997 was reflected as deferred revenue and the assets and the accumulated depreciation remained on the Company’s books until its involvement in the facility ceased. Depreciation expense, imputed interest expense, and imputed fair value lease income on the non-Briggs & Stratton occupied portion of the building were recorded and added to deferred revenue up until the fourth quarter of fiscal 2006.
Revenue Recognition: Net sales include sales of engines, power products, and related service parts and accessories, net of allowances for cash discounts, customer volume rebates and discounts, and advertising allowances. In accordance with Staff Accounting Bulletin No. 104, “Revenue Recognition,” as amended, the Company recognizes revenue when all of the following criteria are met: persuasive evidence of an
26
arrangement exists, delivery has occurred, the price is fixed or determinable, and collectibility is reasonably assured. This is generally upon shipment, except for certain international shipments, where revenue is recognized when the customer receives the product.
Included in net sales are costs associated with programs under which Briggs & Stratton shares the expense of financing certain dealer and distributor inventories, referred to as floor plan expense. This represents interest for a pre-established length of time based on a variable rate from a contract with a third party financing source for dealer and distributor inventory purchases. Sharing the cost of these financing arrangements is used by Briggs & Stratton as a marketing incentive for customers to buy inventory. The financing costs included in net sales in fiscal 2007, 2006 and 2005 were $13.1 million, $12.7 million and $10.6 million, respectively.
The Company also offers a variety of customer rebates and sales incentives. The Company records estimates for rebates and incentives at the time of sale, as a reduction in net sales.
Income Taxes: The Provision (Credit) for Income Taxes includes Federal, state and foreign income taxes currently payable and those deferred because of temporary differences between the financial statement and tax bases of assets and liabilities. The Deferred Income Tax Asset represents temporary differences relating to current assets and current liabilities, and the Deferred Income Tax Liability represents temporary differences relating to noncurrent assets and liabilities.
Retirement Plans: The Company has noncontributory, defined benefit retirement plans and postretirement benefit plans covering certain employees. Retirement benefits represent a form of deferred compensation, which are subject to change due to changes in assumptions. Management reviews underlying assumptions on an annual basis. Refer to Note 14 of the Notes to Consolidated Financial Statements.
Research and Development Costs: Expenditures relating to the development of new products and processes, including significant improvements and refinements to existing products, are expensed as incurred. The amounts charged against income were $25.7 million in fiscal 2007, $28.8 million in fiscal 2006 and $33.5 million in fiscal 2005.
Advertising Costs: Advertising costs, included in Engineering, Selling, General and Administrative Expenses in the accompanying Consolidated Statements of Earnings, are expensed as incurred. These expenses totaled $31.5 million in fiscal 2007, $33.4 million in fiscal 2006 and $35.8 million in fiscal 2005.
The Company reports co-op advertising expense as a reduction in net sales. Co-op advertising expense reported as a reduction in net sales totaled $11.4 million in fiscal 2007, $20.2 million in fiscal 2006 and $23.6 million in fiscal 2005.
Shipping and Handling Fees and Costs: Revenue received from shipping and handling fees is reflected in net sales. Shipping fee revenue for fiscal 2007, 2006 and 2005 was $4.3 million, $4.5 million and $4.1 million, respectively. Shipping and handling costs are included in cost of goods sold.
Foreign Currency Translation: Foreign currency balance sheet accounts are translated into dollars at the rates of exchange in effect at fiscal year-end. Income and expenses incurred in a foreign currency are translated at the average rates of exchange in effect during the year. The related translation adjustments are made directly to a separate component of Shareholders’ Investment.
Earnings Per Share: Basic earnings per share, for each period presented, is computed by dividing net income by the weighted average number of shares of common stock outstanding during the period. Diluted earnings per share, for each period presented, is computed reflecting the potential dilution that would occur if options or other contracts to issue common stock were exercised or converted into common stock at the beginning of the period.
The shares outstanding used to compute diluted earnings per share for fiscal 2007 and 2006 excludes outstanding options to purchase 2,722,091 and 1,434,193 shares of common stock, respectively, with weighted average exercise prices of $35.64 and $37.21, respectively. The fiscal 2005 diluted earnings per share calculation includes all options outstanding as of July 3, 2005. For fiscal 2007 and 2006, the options are excluded because their exercise prices are greater than the average market price of the common shares, and their inclusion in the computation would be antidilutive.
27
Information on earnings per share is as follows (in thousands):
| | Fiscal Year Ended | |
| | July 1, 2007 | | July 2, 2006 | | July 3, 2005 | | |
Net Income Before Extraordinary Gain Used in Basic Earnings Per Share | | $ | 146 | | | $ | 102,346 | | | $ | 116,767 | | |
Extraordinary Gain Used in Basic and Diluted Earnings Per Share | | $ | - | | | $ | - | | | $ | 19,800 | | |
Net Income Used in Basic and Diluted Earnings Per Share | | $ | 146 | | | $ | 102,346 | | | $ | 136,567 | | |
Average Shares of Common Stock Outstanding | | | 49,715 | | | | 51,479 | | | | 51,472 | | |
Incremental Common Shares Applicable to Common Stock Options Based | | | | | | | | | | | | | |
on the Common Stock Average Market Price During the Period | | | 16 | | | | 42 | | | | 446 | | |
Incremental Common Shares Applicable to Deferred and Restricted Common | | | | | | | | | | | | | |
Stock Based on the Common Stock Average Market Price During the Period | | | 96 | | | | 73 | | | | 36 | | |
Diluted Average Common Shares Outstanding | | | 49,827 | | | | 51,594 | | | | 51,954 | | |
Comprehensive Income: Comprehensive income is a more inclusive financial reporting method that includes disclosure of financial information that historically has not been recognized in the calculation of net income. The Company has chosen to report Comprehensive Income and Accumulated Other Comprehensive Income (Loss) which encompasses net income, unrealized gain (loss) on marketable securities, cumulative translation adjustments, unrealized gain (loss) on derivatives and minimum pension liability adjustments in the Consolidated Statements of Shareholders’ Investment. For the year ended July 1, 2007, the Company’s implementation of SFAS No. 158 affected Accumulated Other Comprehensive Income by recognizing the funded status of the Company’s defined benefit pension and other postretirement plans. Information on Accumulated Other Comprehensive Income (Loss) is as follows (in thousands):
| | | | | | Minimum | | Unrecognized | | Accumulated | |
| | Cumulative | | Unrealized | | Pension | | Pension and | | Other | |
| | Translation | | Gain (Loss) on | | Liability | | Postretirement | | Comprehensive | |
| | | Adjustments | | | | Derivatives | | | | Adjustment | | | | Obligation | | | | Income (Loss) | |
Balance at June 27, 2004 | | | $ | 4,858 | | | | $ | 500 | | | | $ | (1,330 | ) | | | $ | - | | | | $ | 4,028 | | |
Fiscal Year Change | | | 881 | | | | 419 | | | | (53,659 | ) | | | - | | | | (52,359 | ) | |
Balance at July 3, 2005 | | | 5,739 | | | | 919 | | | | (54,989 | ) | | | - | | | | (48,331 | ) | |
Fiscal Year Change | | | 1,785 | | | | (1,255 | ) | | | 52,761 | | | | - | | | | 53,291 | | |
Balance at July 2, 2006 | | | 7,524 | | | | (336 | ) | | | (2,228 | ) | | | - | | | | 4,960 | | |
Fiscal Year Change | | | 4,275 | | | | (765 | ) | | | 2,228 | | | | (67,208 | ) | | | (61,470 | ) | |
Balance at July 1, 2007 | | | $ | 11,799 | | | | $ | (1,101 | ) | | | $ | - | | | | $ | (67,208 | ) | | | $ | (56,510 | ) | |
Derivatives: Derivatives are recorded on the Balance Sheets as assets or liabilities, measured at fair value. Briggs & Stratton enters into derivative contracts designated as cash flow hedges to manage currency and certain material exposures. These instruments generally do not have a maturity of more than twelve months.
Changes in the fair value of cash flow hedges to manage its foreign currency exposure are recorded on the Consolidated Statements of Earnings or as a component of Accumulated Other Comprehensive Income. The amounts included in Accumulated Other Comprehensive Income will be reclassified into income when the forecasted transactions occur. These forecasted transactions represent the exporting of products for which Briggs & Stratton will receive foreign currency and the importing of products for which it will be required to pay in a foreign currency. Changes in the fair value of all derivatives deemed to be ineffective would be recorded as either income or expense in the accompanying Consolidated Statements of Earnings.
Briggs & Stratton manages its exposure to fluctuation in the cost of natural gas used by its operating facilities through participation in a third party managed dollar cost averaging program linked to NYMEX futures. As a participant in the program, Briggs & Stratton hedges a minimum of 50% of its anticipated monthly natural gas usage along with a pool of other companies. Briggs & Stratton does not hold any actual futures contracts, and actual delivery of natural gas is not required of the participants in the program. Cash settlements occur on a monthly basis based on the difference between the average dollar price of the underlying NYMEX futures held by the third party and the actual price of natural gas paid by Briggs & Stratton in the period. The fair value of
28
the underlying NYMEX futures is reflected as an asset or liability on the accompanying Consolidated Condensed Balance Sheets. Changes in fair value are reflected as a Component of Accumulated Other Comprehensive Income, which are reclassified into the income statement as the monthly cash settlements occur and actual natural gas is consumed.
Briggs & Stratton manages its exposure to fluctuations in the cost of copper to be used in manufacturing by entering into forward purchase contracts designated as cash flow hedges. Briggs & Stratton hedges approximately 35% of its anticipated copper usage, and the fair value of outstanding future contracts is reflected as an asset or liability on the accompanying Consolidated Balance Sheets based on NYMEX prices. Changes in fair value are reflected as a component of Accumulated Other Comprehensive Income if the forward purchase contracts are deemed to be effective. Changes in the fair value of all derivatives deemed to be ineffective would be recorded as either income or expense in the accompanying Consolidated Statements of Earnings. Unrealized gains or losses associated with the forward purchase contracts are captured in inventory costs and are realized in the income statement when sales of inventory are made.
New Accounting Pronouncements: In February 2007, the FASB issued SFAS No. 159, “The Fair Value Option for Financial Assets and Financial Liabilities - Including an Amendment of FASB Statement No. 115,” (SFAS 159). This standard permits an entity to choose to measure many financial instruments and certain other items at fair value. The fair value option permits a company to choose to measure eligible items at fair value at specified election dates. A company will report unrealized gains and losses on items for which the fair value option has been elected in earnings after adoption. Statement 159 is effective for fiscal years beginning after November 15, 2007. At this time, the impact of adoption of SFAS 159 on our consolidated financial position is being assessed.
In September 2006, the FASB issued SFAS No. 157, “Fair Value Measurements,” (SFAS 157), which defines fair value, establishes a framework for measuring fair value and expands disclosures about fair value measurements. SFAS 157 is effective for fiscal years beginning after November 15, 2007. At this time, the impact of adoption of SFAS 157 on our consolidated financial position is being assessed.
In September 2006, the FASB issued SFAS No. 158, “Employers’ Accounting for Defined Benefit Pension and Other Postretirement Plans - an amendment of FASB Statements No. 87, 88, 106, and 132(R),” (SFAS 158). SFAS 158 requires recognition of the overfunded or underfunded status of a benefit postretirement plan in the statement of financial position, as well as recognition of changes in that funded status through comprehensive income in the year in which they occur. SFAS 158 also requires a change in the measurement of a plan’s assets and benefit obligations as of the end date of the employer’s fiscal year. SFAS 158 is effective for fiscal years ending after December 15, 2006, except for the measurement date provisions, which are effective for fiscal years ending after December 15, 2008. See Note 14 - Pension and Other Postretirement Benefits in the Notes to Consolidated Financial Statements for further discussion regarding the Company’s adoption of SFAS 158 in its 2007 fiscal year.
In June 2006, the FASB issued FASB Interpretation No. 48 Accounting for Uncertainty in Income Taxes (FIN 48) an interpretation of FASB Statement No. 109 (SFAS 109). This interpretation clarifies the accounting for uncertainty in income taxes recognized in a company’s financial statements in accordance with SFAS 109, Accounting for Income Taxes. FIN 48 details how companies should recognize, measure, present and disclose uncertain tax positions that have been or expect to be taken. As such, financial statements will reflect expected future tax consequences of uncertain tax positions presuming the taxing authorities’ full knowledge of the position and all relevant facts. FIN 48 is effective for public companies for annual periods that begin after December 15, 2006. Briggs & Stratton Corporation is required to and intends to adopt the provisions of FIN 48 as of July 2, 2007. The cumulative effect of adoption will be recorded as an adjustment to the opening balance of retained earnings for fiscal 2008. We have evaluated the impact of FIN 48 and do not expect it to have a material impact on our financial condition or results of operations.
In November 2004, the FASB issued SFAS No. 151, “Inventory Costs - an amendment of ARB No. 43, Chapter 4.” SFAS No. 151 seeks to clarify the accounting for abnormal amounts of idle facility expense, freight, handling costs and wasted material (spoilage) in the determination of inventory carrying costs. The statement requires such costs to be treated as a current period expense. This statement became effective for the company on July 2, 2006. The adoption of SFAS No. 151 did not have a material impact on the Consolidated Financial Statements.
29
Reclassification: Certain amounts in prior year financial statements have been reclassified to conform to current year presentation.
(3) Acquisitions:
On February 11, 2005, Briggs & Stratton Corporation and its subsidiaries, Briggs & Stratton Power Products Group, LLC and Briggs & Stratton Canada, Inc. acquired certain assets of Murray, Inc. and Murray Canada Co. (collectively “Murray”). The cash purchase price was $122.7 million, including direct acquisition costs of $1.8 million. Briggs & Stratton financed the acquisition through the issuance of $125 million variable rate Term Notes due February 11, 2008, with no prepayment penalty. The Term Notes have financial and operating restrictions consistent with other debt agreements, as disclosed in Note 8. The estimated fair value of Murray assets acquired exceeded the acquisition cost by $19.8 million, after all tax considerations, and this amount was recognized as an extraordinary gain in fiscal 2005.
On July 7, 2004, Briggs & Stratton and its subsidiary, Briggs & Stratton Power Products Group, LLC (“BSPPG”) acquired Simplicity Manufacturing, Inc. (“Simplicity”). Simplicity designs, manufactures and markets a wide variety of premium yard and garden tractors, lawn tractors, riding mowers, snow throwers, attachments, and other lawn and garden products like rototillers and chipper shredders. The purchase price included $250.2 million of cash, a $2.3 million liability for future tax benefits, and $135.3 million of liabilities assumed. The cash paid included $17.8 million of cash acquired and $9.4 million of direct acquisition costs.
(4) Goodwill and Other Intangible Assets:
The changes in the carrying amount of goodwill for the fiscal years ended July 1, 2007 and July 2, 2006 are as follows (in thousands):
| | | 2007 | | | | 2006 | | |
Beginning Goodwill Balance | | $ | 251,885 | | $ | 253,663 | |
Tax Benefit on Amortization | | (1,778 | ) | (1,778 | ) |
Ending Goodwill Balance | | $ | 250,107 | | $ | 251,885 | |
| | | | | | | | | | | |
The Company’s other intangible assets for the years ended July 1, 2007 and July 2, 2006 are as follows (in thousands):
| | 2007 | | 2006 | |
| | Gross | | | | | | Gross | | | | | |
| | Carrying | | Accumulated | | | | Carrying | | Accumulated | | | |
| | Amount | | Amortization | | | Net | | | Amount | | Amortization | | | Net | | |
Amortized Intangible Assets: | | | | | | | | | | | | | |
Patents | | $ | 13,281 | | $ | (3,488 | ) | | | $ | 9,793 | | $ | 13,281 | | $ | (2,203 | ) | | | $ | 11,078 | |
Customer Relationships | | 17,910 | | (2,149 | ) | | | 15,761 | | 17,910 | | (1,433 | ) | | | 16,477 | |
Miscellaneous | | 279 | | (277 | ) | | | 2 | | 279 | | (238 | ) | | | 41 | |
Total Amortized Intangible Assets | | 31,470 | | (5,914 | ) | | | 25,556 | | 31,470 | | (3,874 | ) | | | 27,596 | |
| | | | | | | | | | | | | | | | | |
Unamortized Intangible Assets: | | | | | | | | | | | | | | | | | |
Trademarks/Brand Names | | 67,000 | | - | | | | 67,000 | | 67,000 | | - | | | | 67,000 | |
Total Unamortized Intangible Assets | | 67,000 | | - | | | | 67,000 | | 67,000 | | - | | | | 67,000 | |
Total Intangible Assets | | $ | 98,470 | | $ | (5,914 | ) | | | $ | 92,556 | | $ | 98,470 | | $ | (3,874 | ) | | | $ | 94,596 | |
| | | | | | | | | | | | | | | | | | | | | | | | | | | |
Amortization expense of other intangible assets amounts to approximately $2,039,200, $1,850,000 and $1,850,000 in 2007, 2006, and 2005, respectively.
30
The estimated amortization expense of other intangible assets for the next five years is (in thousands):
2008 | | $ | 1,860 | |
2009 | | 1,860 | |
2010 | | 1,860 | |
2011 | | 1,860 | |
2012 | | 1,860 | |
| | $ | 9,300 | |
(5) Income Taxes:
The provision (credit) for income taxes on income before extraordinary gain consists of the following (in thousands):
Current | | | 2007 | | | | 2006 | | | | 2005 | | |
Federal | | $ | 11,861 | | $ | 51,743 | | $ | 51,144 | |
State | | 961 | | 7,796 | | 7,948 | |
Foreign | | 1,226 | | 919 | | 2,352 | |
| | 14,048 | | 60,458 | | 61,444 | |
Deferred | | (21,513 | ) | (10,438 | ) | (3,896 | ) |
| | $ | (7,465 | ) | $ | 50,020 | | $ | 57,548 | |
| | | | | | | | | | | | | | | | |
A reconciliation of the U.S. statutory tax rates to the effective tax rates on income before extraordinary gain follows:
| | | 2007 | | | | | 2006 | | | | 2005 | | |
U.S. Statutory Rate | | 35.0% | | | 35.0 | % | | 35.0 | % | |
State Taxes, Net of Federal Tax Benefit | | 14.4% | | | 2.6 | % | | 2.4 | % | |
Foreign Tax Benefits | | (6.0% | ) | | (0.1 | %) | | (0.8 | %) | |
Resolution of Prior Period Tax Matters | | - | | | (1.7 | %) | | - | | |
Benefit on Dividends Received | | 48.7% | | | (2.9 | %) | | (4.0 | %) | |
Other | | 9.9% | | | (0.1 | %) | | 0.4 | % | |
Effective Tax Rate | | 102.0% | | | 32.8 | % | | 33.0 | % | |
| | | | | | | | | | | | | | | |
The components of deferred income taxes were as follows (in thousands):
| | | 2007 | | | | 2006 | | |
Current Asset (Liability): | | | | | |
Difference Between Book and Tax Related to: | | | | | |
Inventory | | $ | 15,153 | | $ | 13,844 | |
Payroll Related Accruals | | 3,110 | | 3,190 | |
Warranty Reserves | | 14,670 | | 13,097 | |
Workers Compensation Accruals | | 2,971 | | 3,000 | |
Other Accrued Liabilities | | 23,765 | | 18,749 | |
Pension Cost | | 977 | | 1,424 | |
Miscellaneous | | (5,126 | ) | (3,344 | ) |
Deferred Income Tax Asset | | $ | 55,520 | | $ | 49,960 | |
| | | | | | | | | | |
31
| | | 2007 | | | | 2006 | | |
Long-Term Liability (Asset): | | | | | |
Difference Between Book and Tax Related to: | | | | | |
Pension Cost | | $ | 34,114 | | $ | 29,557 | |
Accumulated Depreciation | | 48,198 | | 69,318 | |
Intangibles | | 64,952 | | 61,630 | |
Accrued Employee Benefits | | (24,165 | ) | (18,507 | ) |
Postretirement Health Care Obligation | | (72,558 | ) | (32,462 | ) |
Warranty | | (6,712 | ) | (8,064 | ) |
Miscellaneous | | (6,529 | ) | (6,674 | ) |
Deferred Income Tax Liability | | $ | 37,300 | | $ | 94,798 | |
| | | | | | | | | | |
The Company has not recorded deferred income taxes applicable to undistributed earnings of foreign subsidiaries that are indefinitely reinvested in foreign operations. These undistributed earnings amounted to approximately $6.5 million at July 1, 2007. If these earnings were remitted to the U.S., they would be subject to U.S. income tax. However, this tax would be less than the U.S. statutory income tax because of available foreign tax credits.
(6) Segment and Geographic Information and Significant Customers:
The Company has concluded that it operates two reportable business segments that are managed separately based on fundamental differences in their operations. Summarized segment data is as follows (in thousands):
| | | 2007 | | | | 2006 | | | | 2005 | | |
NET SALES: | | | | | | | |
Engines | | $ | 1,447,051 | | $ | 1,648,224 | | $ | 1,739,184 | |
Power Products | | 890,376 | | 1,186,025 | | 1,193,616 | |
Eliminations | | (180,194 | ) | (292,078 | ) | (277,925 | ) |
| | $ | 2,157,233 | | $ | 2,542,171 | | $ | 2,654,875 | |
GROSS PROFIT ON SALES: | | | | | | | |
Engines | | $ | 208,444 | | $ | 381,932 | | $ | 372,162 | |
Power Products | | 80,759 | | 113,166 | | 133,888 | |
Eliminations | | (2,071 | ) | (3,414 | ) | (1,159 | ) |
| | $ | 287,132 | | $ | 491,684 | | $ | 504,891 | |
INCOME FROM OPERATIONS: | | | | | | | |
Engines | | $ | 15,493 | | $ | 149,760 | | $ | 142,653 | |
Power Products | | 6,358 | | 29,620 | | 49,274 | |
Eliminations | | (315 | ) | (3,414 | ) | (1,159 | ) |
| | $ | 21,536 | | $ | 175,966 | | $ | 190,768 | |
ASSETS: | | | | | | | |
Engines | | $ | 1,183,720 | | $ | 1,174,569 | | $ | 1,297,789 | |
Power Products | | 1,180,992 | | 1,148,279 | | 877,933 | |
Eliminations | | (477,544 | ) | (378,648 | ) | (176,754 | ) |
| | $ | 1,887,168 | | $ | 1,944,200 | | $ | 1,998,968 | |
CAPITAL EXPENDITURES: | | | | | | | |
Engines | | $ | 45,848 | | $ | 54,208 | | $ | 67,802 | |
Power Products | | 22,152 | | 15,310 | | 18,273 | |
| | $ | 68,000 | | $ | 69,518 | | $ | 86,075 | |
| | | | | | | | | | | | | | | | |
32
DEPRECIATION & AMORTIZATION: | | | | | | | |
Engines | | $ | 54,757 | | $ | 59,053 | | $ | 59,069 | |
Power Products | | 19,557 | | 18,181 | | 13,724 | |
| | $ | 74,314 | | $ | 77,234 | | $ | 72,793 | |
Information regarding the Company’s geographic sales by the location in which the sales originate is as follows (in thousands):
| | | 2007 | | | | 2006 | | | | 2005 | | |
United States | | $ | 1,960,471 | | $ | 2,353,010 | | $ | 2,481,374 | |
All Other Countries | | 196,762 | | 189,161 | | 173,501 | |
Total | | $ | 2,157,233 | | $ | 2,542,171 | | $ | 2,654,875 | |
| | | | | | | | | | | | | | | | |
Sales to the following customers in the Company’s Engines Segment amount to greater than or equal to 10% of consolidated net sales, respectively:
| | 2007 | | | | 2006 | | | | 2005 | | | |
Customer: | | | Net Sales | | | % | | | | | Net Sales | | | % | | | | | Net Sales | | | % | | |
HOP | | $ | 443,393 | | | 21 | % | | $ | 407,964 | | | 16 | % | | $ | 374,941 | | | 14 | % |
MTD | | 206,291 | | | 10 | % | | 230,123 | | | 9 | % | | 316,911 | | | 12 | % |
| | $ | 649,684 | | | 31 | % | | $ | 638,087 | | | 25 | % | | $ | 691,852 | | | 26 | % |
| | | | | | | | | | | | | | | | | | | | | | | | | | | | | | |
(7) Leases:
The Company leases certain facilities, vehicles, and equipment under both capital and operating leases. Assets held under capital leases are included in Plant and Equipment and are charged to depreciation and interest over the life of the lease. Related liabilities are included in Other Accrued Liabilities and Other Long-Term Liabilities. Operating leases are not capitalized and lease payments are expensed over the life of the lease. Terms of the leases, including purchase options, renewals, and maintenance costs, vary by lease. Rental expense for fiscal 2007, 2006 and 2005 was $22.5 million, $18.9 million and $16.1 million, respectively.
Future minimum lease commitments for all non-cancelable leases as of July 1, 2007 are as follows (in thousands):
Fiscal Year | | | | Operating | | Capital | |
2008 | | $ | 14,161 | | $ | 1,221 | |
2009 | | 10,435 | | 375 | |
2010 | | 8,854 | | 381 | |
2011 | | 5,975 | | 388 | |
2012 | | 3,725 | | 395 | |
Thereafter | | 6,323 | | 132 | |
Total future minimum lease commitments | | $ | 49,473 | | 2,892 | |
Less: Interest | | | | 513 | |
Present value of minimum capital lease payments | | | | $ | 2,379 | |
(8) Indebtedness:
On August 8, 2006, the Company amended its unsecured five-year $350 million revolving credit facility (the credit facility) that expires in May 2009 to allow repurchases of its common stock for aggregate consideration not to exceed $120 million during the period from August 10, 2006 through February 8, 2008. There were no borrowings under the credit facility as of July 1, 2007 or July 2, 2006.
Borrowings under the credit facility by the Company bear interest at a rate per annum equal to, at its option, either:
(1) a 1, 2, 3 or 6 month LIBOR rate plus a margin varying from 0.50% to 2.00%, depending upon the rating of the Company’s long-term debt by Standard & Poor’s Rating group, a division of McGraw-Hill Companies (S&P) and Moody’s Investors Service, Inc. (Moody’s); or
33
(2) the higher of (a) the federal funds rate plus 0.50% or (b) the bank’s prime rate.
In addition, the Company is subject to a 0.10% to 0.375% commitment fee and a 0.50% to 2.00% letter of credit fee, depending on the Company’s long-term credit ratings.
The lines of credit available to the Company in foreign countries are in connection with short-term borrowings and bank overdrafts used in the normal course of business. These amounts total $15.0 million, expire at various times throughout fiscal 2008 and are renewable. None of these arrangements had material commitment fees or compensating balance requirements. Borrowings using these lines of credit are included in short-term debt. Outstanding balances are as follows (in thousands):
| | | 2007 | | | | 2006 | | |
Balance at Fiscal Year-End | | $ | 3,000 | | $ | 3,474 | |
Weighted Average Interest Rate at Fiscal Year-End | | 7.05 | % | 6.38 | % |
| | | | | | | | | | | |
The Long-Term Debt and Current Maturities on Long-Term Debt captions consist of the following (in thousands):
| | | 2007 | | | | 2006 | | |
| | | | | |
7.25% Senior Notes Due 2007, Net of Unamortized Discount of $36 in 2007 and $202 in 2006 | | $ | 81,139 | | $ | 80,973 | |
8.875% Senior Notes Due 2011, Net of Unamortized Discount of $2,091 in 2007 and $2,649 in 2006 | | 267,909 | | 267,351 | |
Variable Rate Term Notes Due 2008 | | 35,000 | | 35,000 | |
Total Long-Term Debt | | $ | 384,048 | | $ | 383,324 | |
| | | | | | | | | | | |
On July 12, 2007, the Company entered into a $500 million amended and restated multicurrency credit agreement. See further discussion in Note 19 of the Notes to Consolidated Financial Statements.
On August 8, 2006, the Company amended its unsecured three-year $125 million term loan agreement (the term loan) that expires on February 11, 2008 to allow a repurchase of its common stock for aggregate consideration not to exceed $120 million during the period from August 10, 2006 through February 8, 2008. The Company prepaid $90 million of the term loan in the fourth quarter of fiscal 2006. The Company is required to repay the aggregate principal balance of the term loan on February 11, 2008 (maturity date).
Borrowings under the term loan by the Company bear interest at a rate per annum equal to, at its option, either:
(1) a 1, 2, 3 or 6 month LIBOR rate plus a margin varying from 0.50% to 1.75%, depending upon the rating of the Company’s long-term debt by S&P and Moody’s; or
(2) the higher of (a) the federal funds rate plus 0.50% or (b) the bank’s prime rate.
In May 2001, the Company issued $275 million of 8.875% Senior Notes due March 15, 2011. No principal payments are due before the maturity date; however, the Company repurchased $5.0 million of the bonds in the second quarter of fiscal year 2006 after receiving unsolicited offers from bondholders.
In May 1997, the Company issued $100 million of 7.25% Senior Notes due September 15, 2007. No principal payments are due before the maturity date; however, the Company repurchased $10.0 million of the bonds in the fourth quarter of fiscal year 2002 and $8.825 million in the fourth quarter of fiscal year 2006 after receiving unsolicited offers from bondholders.
The separate indentures provided for the 7.25% Senior Notes and the 8.875% Senior Notes and the Credit Agreements for the term loan and the credit facility (collectively, the “Domestic Indebtedness”) each include a number of financial and operating restrictions. These covenants include restrictions on the Company’s ability to: pay dividends; repurchase shares; incur indebtedness; create liens; enter into sale and leaseback transactions; consolidate, merge, sell or lease all or substantially all of its assets; and dispose of assets or the proceeds of sales of its assets. The credit facility contains financial covenants that require the Company to maintain a minimum interest coverage ratio and net worth and impose a maximum leverage ratio. As of July 1, 2007, the Company was in compliance with these covenants.
34
Additionally, under the terms of the indentures and Credit Agreements governing the Domestic Indebtedness, BSPPG and its wholly owned subsidiary, Simplicity became joint and several guarantors of amounts outstanding under the Domestic Indebtedness. Refer to Note 16 of the Notes to Consolidated Financial Statements for subsidiary guarantor financial information.
(9) Other Income:
The components of other income (expense) are as follows (in thousands):
| | | 2007 | | | | 2006 | | | | 2005 | | |
Interest Income | | $ | 1,916 | | $ | 2,856 | | $ | 1,155 | |
Income on Preferred Stock | | 10,000 | | 12,000 | | 12,492 | |
Equity in Earnings from Unconsolidated Affiliates | | 3,303 | | 4,174 | | 5,289 | |
Deferred Financing Costs | | (1,173 | ) | (1,708 | ) | (1,233 | ) |
Other Items | | 790 | | 1,169 | | 2,727 | |
Total | | $ | 14,836 | | $ | 18,491 | | $ | 20,430 | |
| | | | | | | | | | | | | | | | | | |
(10) Commitments and Contingencies:
Product and general liability claims arise against the Company from time to time in the ordinary course of business. The Company is generally self-insured for claims up to $2.0 million per claim. Accordingly, a reserve is maintained for the estimated costs of such claims. On July 1, 2007 and July 2, 2006 the reserve for product and general liability claims (which includes asbestos-related liabilities) was $7.2 million and $7.3 million, respectively. Because there is inherent uncertainty as to the eventual resolution of unsettled claims, no reasonable range of possible losses can be determined. Management does not anticipate that these claims, excluding the impact of insurance proceeds and reserves, will have a material adverse effect on the financial condition or results of operations of the Company.
In October 1998, the Company joined seventeen other companies in guaranteeing a $17.9 million letter of credit issued as a guarantee of certain City of Milwaukee Revenue Bonds used to develop a residential rental property. The Revenue Bonds were issued on behalf of a not-for-profit organization established to manage the project and rental property post construction. The revenues from the rental property are used to fund operating expenses and all debt service requirements. The Company’s share of the guarantee and the maximum exposure to the Company under the agreement is $1.8 million. The letter of credit and underlying guarantee expires August 15, 2008. Management believes the likelihood is remote that material payments will be required under this guarantee. Accordingly, no liability has been reflected in the accompanying Consolidated Balance Sheets related to this item.
Certain independent dealers and distributors finance inventory purchases through a third party financing company. Briggs & Stratton has indemnified the third party finance company against credit default. The Company’s maximum exposure under this agreement due to customer credit default in a fiscal year is $1.6 million. In fiscal 2007 and fiscal 2006, the third party financing company provided financing for $289.1 million and $294.4 million of Briggs & Stratton product, respectively. As of July 1, 2007 and July 2, 2006 there were $184.7 million and $180.3 million in receivables outstanding under this arrangement. Briggs & Stratton made no payments under this indemnity agreement in fiscal 2007 and fiscal 2006.
Certain of the Company’s vendors in Asia require their customers to obtain letters of credit, payable upon shipment of the product. At the end of fiscal 2007, the Company had three letters of credit issued by Bank of America, totaling $14.1 million. At July 2, 2006, the Company held two letters of credit from Bank of America, totaling $7.5 million. The products ordered typically arrive in partial shipments spanning several months, with payment initiated at the time the vendor provides documentation to the bank of the quantity and occurrence of shipment.
On June 3, 2004, eight individuals who claim to have purchased lawnmowers in Illinois and Minnesota filed a lawsuit (Ronnie Phillips et al. v. Sears Roebuck Corporation et al., No. 04-L-334 (20th Judicial Circuit, St. Clair County, IL)) against the Company and other defendants alleging that the horsepower labels on the products
35
they purchased were inaccurate. The plaintiffs have amended their complaint several times and currently seek an injunction, compensatory and punitive damages, and attorneys’ fees under various federal and state laws including the Racketeer Influenced and Corrupt Organization Act on behalf of all persons in the United States who, beginning January 1, 1994 through the present, purchased a lawnmower containing a two-stroke or four-stroke gasoline combustion engine up to 30 horsepower that was manufactured by the defendants. On May 31, 2006, the defendants removed the case to the U.S. District Court for the Southern District of Illinois (No. 06-412-DRH). The defendants subsequently filed cross claims against each other for indemnification and contribution, and filed a motion to dismiss the amended complaint. On March 30, 2007, the Court issued an order granting the defendants’ motion to dismiss the amended complaint in its entirety, but the order permits the plaintiffs to refile a complaint after amending several claims. An opinion of the Court providing more detail concerning its order is expected but has not yet been filed. Two defendants, MTD Products, Inc. and American Honda Motor Company, have notified the Court that they have reached a settlement with the putative plaintiff class, but neither defendant’s agreement has yet been approved by the Court. Although it is not possible to predict with certainty the outcome of these unresolved legal actions or the range of possible loss, Briggs & Stratton believes these unresolved legal actions will not have a material effect on its financial position.
(11) Stock Incentives:
Effective October 20, 2004, Briggs & Stratton adopted an Incentive Compensation Plan under which 4,000,000 shares of common stock (8,000,000 shares as a result of the 2-for-1 stock split) were reserved for future issuance. Briggs & Stratton previously had a Stock Incentive Plan under which 5,361,935 shares of common stock were reserved for issuance. The adoption of the Incentive Compensation Plan reduced the number of shares available for future issuance under the Stock Incentive Plan to zero. However, as of July 1, 2007, there were 2,444,978 outstanding option and restricted stock awards granted under the Stock Incentive Plan that are or may become exercisable in the future. In accordance with both plans, Briggs & Stratton can issue eligible employees stock options, stock appreciation rights, restricted stock, deferred stock and cash bonus awards subject to certain annual limitations. The plans also allow Briggs & Stratton to issue directors non-qualified stock options and directors’ fees in stock.
Effective July 4, 2005, Briggs & Stratton’s stock based compensation plans are accounted for under Statement of Financial Accounting Standards (“ SFAS”) No. 123(R), “Share Based Payment” using the modified prospective method. During fiscal 2007 and 2006, Briggs & Stratton recognized stock based compensation expense of approximately $8.5 million and $10.0 million, respectively. Prior to July 4, 2005, the plans were accounted for according to Accounting Principles Board Opinion No. 25, “Accounting for Stock Issued to Employees.” Had compensation cost for the plans been determined consistent with SFAS No. 123(R), Briggs & Stratton’s net income and earnings per share would have been reduced to the following pro forma amounts for the fiscal year ended July 3, 2005 (in thousands, except per share data):
All share data is adjusted for the effect of the 2-for-1 stock split effective October 29, 2004.
| | | 2005 | | |
Net income as reported (in thousands): | | $ | 136,567 | |
Basic EPS: | | | |
Deduct employee compensation expense determined under a fair value based method, net of related tax effects | | (5,837 | ) |
Income Available to Common Stockholders: | | 130,730 | |
Diluted EPS: | | | |
Add reduction in interest expense related to convertible debt | | - | |
Income Available to Common Stockholders: | | $ | 130,730 | |
| | | | | | |
36
Basic Earnings Per Share: | | | |
As Reported | | $ | 2.65 | |
Pro Forma | | $ | 2.54 | |
Diluted Earnings Per Share: | | | |
As Reported | | $ | 2.63 | |
Pro Forma | | $ | 2.52 | |
| | | | | |
On the grant date, the exercise price of each stock option issued exceeds the market value of the stock. The fair value of each option is estimated using the Black-Scholes option pricing model, and the assumptions are based on historical data and standard industry valuation practices and methodology. The assumptions used to determine fair value are as follows:
| | | 2007 | | | | 2006 | | | | 2005 | | |
Options Granted During Grant Date Fair Value | | $ | 5.46 | | $ | 7.37 | | $ | 12.12 | |
(Since options are only granted once per year, the grant date fair value equals the
weighted average grant date fair value.) | | | | | | | |
Assumptions: | | | | | | | |
Risk-free Interest Rate | | 5.0% | | 4.3% | | 4.2% | |
Expected Volatility | | 27.4% | | 25.1% | | 28.4% | |
Expected Dividend Yield | | 3.2% | | 1.9% | | 1.9% | |
Expected Term (In Years) | | 5.0 | | 5.0 | | 10.0 | |
| | | | | | | | | | | | | | | | |
Information on the options outstanding is as follows:
| | | | | | Wtd. Avg. | | Aggregate | |
| | | | | | Remaining | | Intrinsic | |
| | | | Wtd. Avg. | | Contractual | | Value | |
| | Shares | | Ex. Price | | | Term | | | (in thousands) | |
Balance, June 27, 2004 | | 2,498,290 | | $ | 28.27 | | | | | | |
| | | | | | | | | | | |
Granted During the Year | | 1,149,340 | | | 36.68 | | | | | | |
Exercised During the Year | | (622,262 | ) | | 32.67 | | | | | | |
Expired During the Year | | (18,200 | ) | | 37.27 | | | | | | |
Balance, July 3, 2005 | | 3,007,168 | | $ | 30.52 | | | | | | |
| | | | | | | | | | | |
Granted During the Year | | 355,123 | | | 38.83 | | | | | | |
Exercised During the Year | | (418,858 | ) | | 26.92 | | | | | | |
Expired During the Year | | - | | | - | | | | | | |
Balance, July 2, 2006 | | 2,943,433 | | $ | 32.05 | | | | | | |
| | | | | | | | | | | |
Granted During the Year | | 554,020 | | | 29.87 | | | | | | |
Exercised During the Year | | (143,332 | ) | | 23.36 | | | | | | |
Expired During the Year | | (24,442 | ) | | 33.26 | | | | | | |
Balance, July 1, 2007 | | 3,329,679 | | $ | 32.05 | | | 4.97 | | $ | 6,400 | |
Exercisable, July 1, 2007 | | 1,365,908 | | $ | 27.54 | | | 4.07 | | $ | 5,490 | |
| | | | | | | | | | | | | | |
37
The total intrinsic value of options exercised during the fiscal years ended 2007, 2006 and 2005, was $0.8 million, $3.4 million and $3.3 million, respectively, and the total fair value of options exercised during fiscal 2007 was $4.1 million. The exercise of options resulted in cash receipts of $3.3 million, $11.3 million and $20.0 million in fiscal 2007, 2006 and 2005, respectively.
Grant Summary | |
Fiscal | | Grant | | Date | | Expiration | | Exercise | | Options | |
Year | | | | | Date | | | Exercisable | | | Date | | | | Price | | | Outstanding | |
2001 | | 8-3-00 | | 8-3-03 | | 8-3-07 | | 23.11 | | 40,948 | |
2002 | | 8-7-01 | | 8-7-04 | | 8-7-08 | | 24.60 | | 286,180 | |
2003 | | 8-13-02 | | 8-13-05 | | 8-13-09 | | 23.35 | | 280,460 | |
2004 | | 8-15-03 | | 8-15-06 | | 8-15-13 | | 30.44 | | 758,320 | |
2005 | | 8-13-04 | | 8-13-07 | | 8-13-14 | | 36.68 | | 1,079,070 | |
2006 | | 8-16-05 | | 8-16-08 | | 8-16-10 | | 38.83 | | 345,881 | |
2007 | | 8-15-06 | | 8-15-09 | | 8-15-11 | | 29.87 | | 538,820 | |
| | | | | | | | | | | | | | | | | | | |
Below is a summary of the status of the Company’s nonvested shares as of July 1, 2007, and changes during the year then ended:
| | Deferred Stock | | Restricted Stock | | Stock Options | |
| | | Shares | | | Wtd. Avg.
Grant Date
Fair Value | | | Shares | | | Wtd. Avg.
Grant Date
Fair Value | | | Shares | | | Wtd. Avg.
Grant Date
Fair Value | |
Nonvested shares, July 2, 2006 | | 28,905 | | | $ | 35.45 | | | 127,574 | | $ | 32.11 | | 2,192,513 | | $ | 32.69 | |
Granted | | 735 | | | 27.59 | | | 21,425 | | 29.24 | | 554,020 | | 27.59 | |
Cancelled | | - | | | - | | | (4,772 | ) | 33.42 | | (24,442 | ) | 30.38 | |
Vested | | - | | | - | | | (12,000 | ) | 26.79 | | (758,320 | ) | 28.49 | |
Nonvested shares, July 1, 2007 | | 29,640 | | | 35.26 | | | 132,227 | | 32.08 | | 1,963,771 | | 32.90 | |
| | | | | | | | | | | | | | | | | | | | | | | |
As of July 1, 2007, there was $3.7 million of total unrecognized compensation cost related to nonvested share-based compensation. That cost is expected to be recognized over a weighted average period of 1.7 years. The total fair value of shares vested during fiscal 2007 was $21.3 million.
Under the plans, the Company has issued restricted stock to certain employees. During fiscal years 2007, 2006 and 2005, the Company has issued 21,425, 42,574 and 26,000 shares, respectively. The restricted stock vests on the fifth anniversary date of the issue provided the recipient is still employed by the Company. The aggregate market value on the date of issue is approximately $0.6 million, $1.5 million and $1.0 million in fiscal 2007, 2006 and 2005, respectively, and has been recorded within the Shareholders’ Investment section of the Consolidated Balance Sheets, and is being amortized over the five-year vesting period.
Under the plans, the Company may also issue stock to its directors in lieu of directors fees. The Company has issued 3,497, 3,477 and 3,463 shares in fiscal 2007, 2006 and 2005, respectively, under this provision of the plans.
Under the Incentive Compensation Plan, the Company may also issue deferred stock to its officers and key employees. The Company has issued 735 and 27,905 shares in fiscal 2007 and 2006, respectively, under this provision. The aggregate market value on the date of issue was approximately $20,000 and $990,000, respectively. Expense is recognized ratably over the five-year vesting period.
38
The following table summarizes the components of the Company’s stock-based compensation programs recorded as expense:
| | | 2007 | | | | 2006 | | | | 2005 | |
Stock Options: | | | | | | |
Pretax compensation expense | | $ | 7,258 | | $ | 8,252 | | $ | 754 | |
Tax benefit | | (2,831 | ) | (3,218 | ) | (294 | ) |
Stock option expense, net of tax | | $ | 4,427 | | $ | 5,034 | | $ | 460 | |
Restricted Stock: | | | | | | | |
Pretax compensation expense | | $ | 900 | | $ | 1,142 | | $ | 511 | |
Tax benefit | | (351 | ) | (445 | ) | (199 | ) |
Restricted stock expense, net of tax | | $ | 549 | | $ | 697 | | $ | 312 | |
Deferred Stock: | | | | | | | |
Pretax compensation expense | | $ | 326 | | $ | 605 | | $ | 3 | |
Tax benefit | | (127 | ) | (236 | ) | (1 | ) |
Deferred stock expense, net of tax | | $ | 199 | | $ | 369 | | $ | 2 | |
Total Stock-Based Compensation: | | | | | | | |
Pretax compensation expense | | $ | 8,484 | | $ | 9,999 | | $ | 1,268 | |
Tax benefit | | (3,309 | ) | (3,899 | ) | (494 | ) |
Total stock-based compensation, net of tax | | $ | 5,175 | | $ | 6,100 | | $ | 774 | |
| | | | | | | | | | | | | | | |
(12) Shareholder Rights Agreement:
On August 6, 1996, the Board of Directors declared a dividend distribution of one common stock purchase right (a right) for each share of the Company’s common stock outstanding on August 19, 1996. Each right would entitle shareowners to buy one-half of one share of the Company’s common stock at an exercise price of $160.00 per full common share ($80.00 per full common share after taking into consideration the effect of a 2-for-1 stock split effective October 29, 2004), subject to adjustment. The rights agreement relating to the rights was amended by the Board of Directors on August 9, 2006 to extend the term of the rights agreement by three years to October 18, 2009, to increase from 15 percent to 20 percent or more the percentage of outstanding shares that a person or group must acquire or attempt to acquire in order for the rights to become exercisable, and to add a qualifying offer clause that permits shareholders to vote to redeem the rights in certain circumstances. Shareholders ratified the amended rights agreement at their annual meeting on October 18, 2006.
(13) Foreign Exchange Risk Management:
The Company enters into forward exchange contracts to hedge purchases and sales that are denominated in foreign currencies. The terms of these currency derivatives do not exceed twelve months, and the purpose is to protect the Company from the risk that the eventual dollars being transferred will be adversely affected by changes in exchange rates.
The Company has forward foreign currency exchange contracts to purchase Japanese Yen. These contracts are used to hedge the commitments to purchase engines from the Company’s Japanese joint venture. The Company also has forward contracts to sell foreign currency. These contracts are used to hedge foreign currency collections on sales of inventory. The Company’s foreign currency forward contracts are carried at fair value based on current exchange rates.
The Company has the following forward currency contracts outstanding at the end of fiscal 2007:
| | | | In Millions | | | | | |
Hedge | | Notional | | Contract | | Fair Market | | (Gain)/Loss | | Conversion | | Latest | |
Currency | | | Contract | | Value | | Value | | Value | | at Fair Value | | Currency | | Expiration Date | |
Japanese Yen | | Buy | | 2,300.0 | | | 19.2 | | | 19.0 | | | .2 | | | U.S. | | March 2008 | |
Euro | | Sell | | 38.0 | | | 51.4 | | | 51.6 | | | .2 | | | U.S. | | March 2008 | |
Australian Dollar | | Sell | | 4.5 | | | 3.6 | | | 3.8 | | | .2 | | | U.S. | | October 2007 | |
| | | | | | | | | | | | | | | | | | | | | |
39
The Company had the following forward currency contracts outstanding at the end of fiscal 2006:
| | | | In Millions | | | | | |
Hedge | | Notional | | Contract | | Fair Market | | (Gain)/Loss | | Conversion | | Latest | |
Currency | | | Contract | | Value | | Value | | Value | | at Fair Value | | Currency | | Expiration Date | |
Japanese Yen | | Buy | | 1,650.0 | | | 14.4 | | | 14.6 | | | (.2 | ) | | U.S. | | January 2007 | |
Euro | | Sell | | 81.0 | | | 103.8 | | | 104.8 | | | 1.0 | | | U.S. | | May 2007 | |
Australian Dollar | | Sell | | 4.2 | | | 3.2 | | | 3.1 | | | (.1 | ) | | U.S. | | December 2006 | |
| | | | | | | | | | | | | | | | | | | | | |
The Company continuously evaluates the effectiveness of its hedging program by evaluating its foreign exchange contracts compared to the anticipated underlying transactions. The Company did not have any ineffective hedges in fiscal 2007 or 2006.
(14) Employee Benefit Costs:
Retirement Plan and Other Postretirement Benefits
The prior accounting for defined pension and other postretirement plans allowed for delayed recognition of changes in plan assets and benefit obligations and recognition of a liability that may have been significantly less than the underfunded status of the plans or an asset for plans that may have been overfunded. The following table illustrates the incremental effect of applying SFAS 158 for pension, postretirement and postemployment benefits on individual line items in the Company’s Consolidated Balance Sheets as of July 1, 2007 (in millions):
| | Before
Application of | | SFAS 158
Adjustments
Increase | | After
Application of |
| | | SFAS 158 | | | | (Decrease) | | | | SFAS 158 | |
Other assets | | | | | | | | | | | | |
Other intangible assets, net | | | $ | 94 | | | | $ | (1 | ) | | | $ | 93 | |
Prepaid pension | | | 76 | | | | 27 | | | | 103 | |
| | | | | | | | | | | | |
Total assets | | | 1,861 | | | | 26 | | | | 1,887 | |
| | | | | | | | | | | | |
Long-term liabilities | | | | | | | | | | | | |
Deferred income tax liability | | | 79 | | | | (42 | ) | | | 37 | |
Accrued pension cost | | | 27 | | | | 12 | | | | 39 | |
Accrued employee benefits | | | 17 | | | | 3 | | | | 20 | |
Accrued postretirement health care obligation | | | 69 | | | | 118 | | | | 187 | |
| | | | | | | | | | | | |
Shareholders’ equity | | | | | | | | | | | | |
Accumulated other comprehensive income (loss), net of tax: | | | | | | | | | | | | |
Defined benefit plans | | | | | | | | | | | | |
Minimum Pension Liability | | | (2 | ) | | | 2 | | | | - | |
Prior service cost | | | - | | | | (9 | ) | | | (9 | ) |
Net actuarial loss | | | - | | | | (58 | ) | | | (58 | ) |
| | | | | | | | | | | | |
Shareholders’ equity | | | 911 | | | | (65 | ) | | | 846 | |
| | | | | | | | | | | | |
Total liabilities and shareholders’ equity | | | 1,861 | | | | 26 | | | | 1,887 | |
| | | | | | | | | | | | | | | |
The amounts in accumulated other comprehensive income that are expected to be recognized as components of net periodic benefit cost during the next fiscal year are as follows (in thousands):
| | | | Other |
| | Pension | | Postretirement |
| | | Plans | | | | Plans | |
Prior service credit (cost) | | | $ | (3,290 | ) | | | $ | 850 | |
Net actuarial gain (loss) | | | 3,560 | | | | (11,077 | ) |
| | | | | | | | | | |
40
The Company has noncontributory, defined benefit retirement plans and other postretirement benefit plans covering certain employees. The Company uses a June 30 measurement date for all of its plans. The following provides a reconciliation of obligations, plan assets and funded status of the plans for the two years indicated (in thousands):
| | Pension Benefits | | Other Postretirement Benefits | |
| | | 2007 | | | | 2006 | | | | 2007 | | | | 2006 | | |
Actuarial Assumptions: | | | | | | | | | |
Discounted Rate Used to Determine Present Value of Projected Benefit Obligation | | 6.35% | | 6.35% | | 6.09% | | 6.09% | |
Expected Rate of Future Compensation Level Increases | | 3.0-5.0% | | 3.0-5.0% | | n/a | | n/a | |
Expected Long-Term Rate of Return on Plan Assets | | 8.75% | | 8.75% | | n/a | | n/a | |
Change in Benefit Obligations: | | | | | | | | | |
Projected Benefit Obligation at Beginning of Year | | $ | 949,634 | | $ | 1,032,014 | | $ | 276,952 | | $ | 305,091 | |
Service Cost | | 13,324 | | 15,430 | | 1,777 | | 3,031 | |
Interest Cost | | 57,940 | | 52,595 | | 16,007 | | 15,025 | |
Plan Amendments | | - | | | 3,881 | | - | | | (6,970 | ) |
Plan Participant Contributions | | - | | | - | | | 1,696 | | 3,558 | |
Actuarial (Gain) Loss | | 38,877 | | (88,200 | ) | (17,830 | ) | (13,551 | ) |
Benefits Paid | | (73,303 | ) | (66,086 | ) | (35,057 | ) | (29,232 | ) |
Projected Benefit Obligation at End of Year | | $ | 986,472 | | $ | 949,634 | | $ | 243,545 | | $ | 276,952 | |
Change in Plan Assets: | | | | | | | | | |
Fair Value of Plan Assets at Beginning of Year | | $ | 945,203 | | $ | 917,443 | | $ | - | | | $ | - | | |
Actual Return on Plan Assets | | 167,244 | | 92,112 | | - | | | | |
Plan Participant Contributions | | - | | | - | | | 1,696 | | 3,558 | |
Employer Contributions | | 9,737 | | 1,734 | | 33,361 | | 25,674 | |
Benefits Paid | | (73,303 | ) | (66,086 | ) | (35,057 | ) | (29,232 | ) |
Fair Value of Plan Assets at End of Year | | $ | 1,048,881 | | $ | 945,203 | | $ | - | | | $ | - | | |
Funded Status: | | | | | | | | | |
Plan Assets (Less Than) in Excess of Projected Benefit Obligation | | $ | 62,409 | | $ | (4,431 | ) | $ | (243,545 | ) | $ | (276,952 | ) |
Remaining Unrecognized Net Obligation | | - | | | 57 | | - | | | 89 | |
Unrecognized Net (Gain) Loss | | - | | | 33,740 | | - | | | 157,711 | |
Minimum Pension Liability | | - | | | (4,192 | ) | - | | | - | | |
Unrecognized Prior Service Cost | | - | | | 23,628 | | - | | | (6,362 | ) |
Net Amount Recognized at End of Year | | $ | 62,409 | | $ | 48,802 | | $ | (243,545 | ) | $ | (125,514 | ) |
Amounts Recognized on the Balance Sheets: | | | | | | | | | |
Prepaid Pension | | $ | 103,247 | | $ | 75,789 | | $ | - | | | $ | - | | |
Accrued Pension Cost | | | (39,438 | ) | | (25,587 | ) | | - | | | | - | | |
Accrued Wages and Salaries | | (1,400 | ) | (1,400 | ) | - | | | | |
Accrued Postretirement Health Care Obligation | | - | | | - | | | (186,868 | ) | (84,136 | ) |
Accrued Liabilities | | - | | | - | | | (37,504 | ) | (26,000 | ) |
Accrued Employee Benefits | | - | | | - | | | (19,173 | ) | (15,378 | ) |
Net Amount Recognized at End of Year | | $ | 62,409 | | $ | 48,802 | | $ | (243,545 | ) | $ | (125,514 | ) |
Amounts Recognized in Accumulated Other Comprehensive Income (Loss): | | | | | | | | | |
Minimum Pension Liability | | - | | | (2,228 | ) | | | - | | |
Transition assets (obligation) | | - | | | - | | (56 | ) | | - | | |
Net Actuarial Gain (Loss) | | $ | 19,282 | | $ | - | | | $ | (77,179 | ) | $ | - | | |
Prior Service (Credit) Cost | | (12,406 | ) | - | | | 3,363 | | - | | |
Net Amount Recognized at End of Year | | $ | 6,876 | | $ | (2,228 | ) | $ | (73,872 | ) | $ | - | | |
| | | | | | | | | | | | | | | | | | | | | | | | |
41
The accumulated benefit obligation for all defined benefit pension plans was $933 million and $898 million at June 30, 2007 and 2006, respectively.
The following table summarizes the plans’ income and expense for the three years indicated (in thousands):
| | Pension Benefits | | Other Postretirement Benefits | |
| | | 2007 | | | | 2006 | | | | 2005 | | | | 2007 | | | | 2006 | | | | 2005 | | |
Components of Net Periodic Expense (Income): | | | | | | | | | | | | | |
Service Cost-Benefits Earned During the Year | | $ | 13,324 | | $ | 15,430 | | $ | 12,993 | | $ | 1,777 | | $ | 3,031 | | $ | 2,734 | |
Interest Cost on Projected Benefit Obligation | | 57,940 | | 52,595 | | 54,448 | | 16,007 | | 15,025 | | 16,703 | |
Expected Return on Plan Assets | | (68,394 | ) | (68,998 | ) | (70,806 | ) | - | | - | | - | |
Amortization of: | | | | | | | | | | | | | |
Transition Obligation (Asset) | | 8 | | 8 | | 8 | | 46 | | 46 | | 46 | |
Prior Service Cost | | 3,290 | | 3,292 | | 3,140 | | (849 | ) | (629 | ) | 31 | |
Actuarial Loss (Gain) | | 5,398 | | 10,254 | | 772 | | 13,337 | | 15,793 | | 14,249 | |
Net Periodic Expense | | $ | 11,566 | | $ | 12,581 | | $ | 555 | | $ | 30,318 | | $ | 33,266 | | $ | 33,763 | |
| | | | | | | | | | | | | | | | | | | | | | | | | | | | | | | |
Significant assumptions used in determining net periodic benefit cost for the fiscal years indicated are as follows:
| | Pension Benefits | | Other Postretirement Benefits | |
| | | 2007 | | | | 2006 | | | | 2005 | | | | 2007 | | | | 2006 | | | | 2005 | | |
| | | | | | | | | | | | | |
Discount Rate | | 6.35% | | 5.25% | | 6.25% | | 6.09 | % | | 5.25 | % | | 6.25 | % | |
Expected Return on Plan Assets | | 8.75% | | 8.75% | | 8.75% | | n/a | | | n/a | | | n/a | | |
Compensation Increase Rate | | 3.0-5.0% | | 3.0-5.0% | | 3.0-5.0% | | n/a | | | n/a | | | n/a | | |
| | | | | | | | | | | | | | | | | | | | | | | | | | | | |
An additional pension obligation is required when the accumulated benefit obligation exceeds the sum of the fair value of plan assets and the accrued pension expense. At July 1, 2007, the Company’s additional pension obligation was $6.7 million, of which $4.1 million was included as a reduction in accumulated other comprehensive income, net of tax benefit of $2.6 million. At July 2, 2006, the Company’s additional pension obligation was $4.2 million, of which $2.2 million was included as a reduction in accumulated other comprehensive income, net of tax benefit of $1.4 million, and $0.5 million was included as an intangible asset as part of the other assets in the Consolidated Balance Sheet.
The “Other Postretirement Benefit” plans are essentially unfunded.
For measurement purposes a 9% annual rate of increase in the per capita cost of covered health care claims was assumed for Briggs & Stratton for the fiscal year 2007 decreasing gradually to 5% for the fiscal year 2011. In fiscal 2005, Briggs & Stratton acquired the liabilities associated with the Simplicity Post-Retirement Benefit Plan covering certain Port Washington, Wisconsin employees. For measurement purposes this plan also assumes a 9% annual rate of increase in the per capita cost decreasing gradually to 5% for the fiscal year 2011. The health care cost trend rate assumptions have a significant effect on the amounts reported. An increase of one percentage point, would increase the accumulated postretirement benefit by $11.5 million and would increase the service and interest cost by $0.9 million for fiscal 2007. A corresponding decrease of one percentage point, would decrease the accumulated postretirement benefit by $10.8 million and decrease the service and interest cost by $0.8 million for the fiscal year 2007.
Plan Assets
A Board of Directors appointed Investment Committee (“Committee”) manages the investment of the pension plan assets. The Committee has established and operates under an Investment Policy. It determines the asset allocation and target ranges based upon periodic asset/liability studies and capital market projections. The Committee retains external investment managers to invest the assets. The Investment Policy prohibits certain investment transactions, such as lettered stock, commodity contracts, margin transactions and short
42
selling, unless the Committee gives prior approval. Briggs & Stratton’s pension plans weighted-average asset allocations and target allocations at June 30, 2007, and 2006, by asset category are as follows:
| | | | Plan Assets at Year-end | |
| Asset Category | | | Target % | | 2007 | | 2006 | |
Cash | | 0%-2% | | 3 | % | | 0% | | |
Domestic Bonds | | 12%-30% | | 21 | % | | 14% | | |
Non-Investment Grade Bonds | | 0%-15% | | 0 | % | | 8% | | |
Non-US Bonds | | 0%-10% | | 0 | % | | 5% | | |
Domestic Equities | | 24%-46% | | 35 | % | | 38% | | |
Global & International Equities | | 8%-22% | | 19 | % | | 16% | | |
Alternative & Absolute Return | | 5%-25% | | 18 | % | | 15% | | |
Real Estate | | 4%-10% | | 4 | % | | 4% | | |
| | | | 100 | % | | 100% | | |
| | | | | | | | | | | |
The plan’s investment strategy is based on an expectation that, over time, equity securities will provide higher total returns than debt securities. The plan primarily minimizes the risk of large losses through diversification of investments by asset class, by investing in different types of styles within the classes and by using a number of different managers. The Committee monitors the asset allocation and investment performance monthly, with a more comprehensive quarterly review with its consultant.
The plan’s expected return on assets is based on management’s and the Committee’s expectations of long-term average rates of return to be achieved by the plan’s investments. These expectations are based on the plan’s historical returns and expected returns for the asset classes in which the plan is invested.
Contributions
The Company is not required to, nor intends to, make any contributions to the pension plans in fiscal 2008.
Estimated Future Benefit Payments
Projected benefit payments from the plans as of July 1, 2007 are estimated as follows (in thousands):
| | Pension Benefits | | Other Postretirement Benefits | |
Year Ending | | | Qualified | | Non-Qualified | | Retiree
Medical | | Retiree Life | | LTD | |
2008 | | $ | 71,723 | | $ | 1,664 | | $ | 27,581 | | $ | 1,147 | | $ | 108 | |
2009 | | 66,113 | | 1,658 | | 26,718 | | 1,177 | | 108 | |
2010 | | 66,680 | | 1,661 | | 24,548 | | 1,205 | | 107 | |
2011 | | 67,397 | | 2,330 | | 24,815 | | 1,231 | | 106 | |
2012 | | 67,968 | | 2,323 | | 23,212 | | 1,255 | | 95 | |
2013-2017 | | 353,276 | | 14,384 | | 83,729 | | 6,546 | | 307 | |
| | | | | | | | | | | | | | | | | |
Defined Contribution Plans
Employees of the Company may participate in various defined contribution savings plans that allow participants to contribute a portion of their earnings in accordance with plan specifications. A maximum of 1-1/2% or 3% of each participant’s salary, depending upon the participant’s group, is matched by the Company. For certain employees, this Company matching contribution is discretionary. The Company contributions totaled $6.1 million in 2007, $6.7 million in 2006 and $5.7 million in 2005.
Postemployment Benefits
The Company accrues the expected cost of postemployment benefits over the years that the employees render service. These benefits are substantially smaller amounts because they apply only to employees who permanently terminate employment prior to retirement. The items include disability payments, life insurance and medical benefits. These amounts are also discounted using an interest rate of 6.09% for fiscal years 2007 and 2006. Amounts are included in Accrued Employee Benefits in the Consolidated Balance Sheets.
43
(15) Disclosures About Fair Value of Financial Instruments:
The following methods and assumptions were used to estimate the fair value of each class of financial instruments for which it is practicable to estimate that value:
Cash and Cash Equivalents, Receivables, Accounts Payable, Domestic Notes Payable, Foreign Loans, Accrued Liabilities and Income Taxes Payable: The carrying amounts approximate fair market value because of the short maturity of these instruments.
Long-Term Debt: The fair market value of the Company’s long-term debt is estimated based on market quotations at year-end.
The estimated fair market values of the Company’s Long-Term Debt is (in thousands):
| | 2007 | | 2006 | |
| | Carrying | | Fair | | Carrying | | Fair | |
| | Amount | | | Value | | | Amount | | | Value | | |
Long-term Debt - | | | | | | | | | |
7.25% Notes Due 2007 | | $ | 81,139 | | $ | 83,124 | | $ | 80,973 | | $ | 83,672 | |
8.875% Notes Due 2011 | | $ | 267,909 | | $ | 287,868 | | $ | 267,351 | | $ | 298,007 | |
Variable Term Notes Due 2008 | | $ | 35,000 | | $ | 35,000 | | $ | 35,000 | | $ | 35,000 | |
| | | | | | | | | | | | | | | | | |
(16) Separate Financial Information of Subsidiary Guarantors of Indebtedness
In June of 1997, Briggs & Stratton issued $100 million of 7.25% senior notes, in May 2001, the Company issued $275 million of 8.875% senior notes and in February 2005, the Company issued $125 million of variable rate term notes. In addition, Briggs & Stratton had a $350 million revolving credit facility that was to expire in May 2009 used to finance seasonal working capital needs. On July 12, 2007, Briggs & Stratton entered into a $500 million amended and restated multicurrency credit agreement. See further discussion in Note 19 of the Notes to Consolidated Financial Statements.
Under the terms of Briggs & Stratton’s 8.875% senior notes, 7.25% senior notes, variable rate term notes and revolving credit agreement, (collectively, the “Domestic Indebtedness”), BSPPG and its wholly owned subsidiary Simplicity Manufacturing, Inc., are joint and several guarantors of the Domestic Indebtedness (the “Guarantor”). The guarantees are full and unconditional guarantees. Additionally, if at any time a domestic subsidiary of Briggs & Stratton constitutes a significant domestic subsidiary, then such domestic subsidiary will also become a guarantor of the Domestic Indebtedness. Currently all of the Domestic Indebtedness is unsecured. If Briggs & Stratton were to fail to make a payment of interest or principal on its due date, the Guarantor is obligated to pay the outstanding Domestic Indebtedness. Briggs & Stratton had the following outstanding amounts related to the guaranteed debt (in thousands):
| | July 1, 2007 | | | |
| | Carrying | | Maximum | |
| | Amount | | Guarantee | |
8.875% Senior Notes, due March 15, 2011 | | $ | 267,909 | | $ | 270,000 | |
Variable Rate Term Notes, due February 11, 2008 | | $ | 35,000 | | $ | 35,000 | |
7.25% Senior Notes, due September 15, 2007 | | $ | 81,139 | | $ | 81,175 | |
Revolving Credit Facility, expiring May 2009 | | $ | - | | $ | 350,000 | |
44
The following condensed supplemental consolidating financial information reflects the summarized financial information of Briggs & Stratton, its Guarantors and Non-Guarantor Subsidiaries (in thousands):
BALANCE SHEET: | | Briggs & Stratton | | Guarantor | | Non-Guarantor | | | | | |
As of July 1, 2007 | | | Corporation | | Subsidiaries | | Subsidiaries | | Eliminations | | Consolidated | |
Current Assets | | | $ | 566,656 | | | | $ | 833,255 | | | | $ | 176,817 | | | $ | (580,935 | ) | | $ | 995,793 | | |
Investment in Subsidiary | | | 793,747 | | | | - | | | | - | | | (793,747 | ) | | - | | |
Noncurrent Assets | | | 418,213 | | | | 438,506 | | | | 34,656 | | | - | | | 891,375 | | |
| | | $ | 1,778,616 | | | | $ | 1,271,761 | | | | $ | 211,473 | | | $ | (1,374,682 | ) | | $ | 1,887,168 | | |
| | | | | | | | | | | | | | | | | | | |
Current Liabilities | | | $ | 443,188 | | | | $ | 449,475 | | | | $ | 140,043 | | | $ | (563,536 | ) | | $ | 469,170 | | |
Long-Term Debt | | | 267,909 | | | | - | | | | - | | | - | | | 267,909 | | |
Other Long-Term Obligations | | | 204,066 | | | | 99,571 | | | | 398 | | | - | | | 304,035 | | |
Shareholders’ Equity | | | 863,453 | | | | 722,715 | | | | 71,032 | | | (811,146 | ) | | 846,054 | | |
| | | $ | 1,778,616 | | | | $ | 1,271,761 | | | | $ | 211,473 | | | $ | (1,374,682 | ) | | $ | 1,887,168 | | |
| | | | | | | | | | | | | | | | | | | |
As of July 2, 2006 | | | | | | | | | | | | | | | | | | | | |
Current Assets | | | $ | 529,870 | | | | $ | 693,450 | | | | $ | 191,913 | | | $ | (391,645 | ) | | $ | 1,023,588 | | |
Investment in Subsidiary | | | 794,317 | | | | - | | | | - | | | (794,317 | ) | | - | | |
Noncurrent Assets | | | 451,150 | | | | 442,853 | | | | 18,545 | | | - | | | 912,548 | | |
| | | $ | 1,775,337 | | | | $ | 1,136,303 | | | | $ | 210,458 | | | $ | (1,185,962 | ) | | $ | 1,936,136 | | �� |
| | | | | | | | | | | | | | | | | | | |
Current Liabilities | | | $ | 247,291 | | | | $ | 314,349 | | | | $ | 137,325 | | | $ | (376,497 | ) | | $ | 322,468 | | |
Long-Term Debt | | | 383,324 | | | | - | | | | - | | | - | | | 383,324 | | |
Other Long-Term Obligations | | | 142,368 | | | | 100,428 | | | | 342 | | | - | | | 243,138 | | |
Shareholders’ Equity | | | 1,002,354 | | | | 721,526 | | | | 72,791 | | | (809,465 | ) | | 987,206 | | |
| | | $ | 1,775,337 | | | | $ | 1,136,303 | | | | $ | 210,458 | | | $ | (1,185,962 | ) | | $ | 1,936,136 | | |
| | | | | | | | | | | | | | | | | | | | | | | | | | |
45
STATEMENT OF EARNINGS: | | Briggs & Stratton | | Guarantor | | Non-Guarantor | | | | | |
For the Fiscal Year Ended July 1, 2007 | | Corporation | | Subsidiaries | | Subsidiaries | | Eliminations | | Consolidated | |
Net Sales | | | $ | 1,397,336 | | | | $ | 861,835 | | | | $ | 196,762 | | | $ | (298,700 | ) | | $ | 2,157,233 | | |
Cost of Goods Sold | | | 1,175,437 | | | | 782,465 | | | | 163,635 | | | (294,524 | ) | | 1,827,013 | | |
Impairment Charge | | | 33,900 | | | | 7,907 | | | | 1,281 | | | - | | | 43,088 | | |
Gross Profit | | | 187,999 | | | | 71,463 | | | | 31,846 | | | (4,176 | ) | | 287,132 | | |
Engineering, Selling, General and Administrative Expenses | | | 164,352 | | | | 74,502 | | | | 26,742 | | | - | | | 265,596 | | |
|
Income (Loss) from Operations | | | 23,647 | | | | (3,039 | ) | | | 5,104 | | | (4,176 | ) | | 21,536 | | |
Interest Expense | | | (45,877 | ) | | | (122 | ) | | | (284 | ) | | 2,592 | | | (43,691 | ) | |
Other Income (Expense), Net | | | 12,352 | | | | 3,143 | | | | (948 | ) | | 289 | | | 14,836 | | |
Income (Loss) Before Provision for Income Taxes | | | (9,878 | ) | | | (18 | ) | | | 3,872 | | | (1,295 | ) | | (7,319 | ) | |
Provision (Credit) for Income Taxes | | | (10,076 | ) | | | (318 | ) | | | 1,226 | | | 1,703 | | | (7,465 | ) | |
Net Income | | | $ | 198 | | | | $ | 300 | | | | $ | 2,646 | | | $ | (2,998 | ) | | $ | 146 | | |
| | | | | | | | | | | | | | | | | | | |
For the Fiscal Year Ended July 2, 2006 | | | | | | | | | | | | | | | | | | | |
Net Sales | | | $ | 1,611,327 | | | | $ | 1,160,175 | | | | $ | 189,160 | | | $ | (418,491 | ) | | $ | 2,542,171 | | |
Cost of Goods Sold | | | 1,254,911 | | | | 1,052,361 | | | | 156,079 | | | (412,864 | ) | | 2,050,487 | | |
Gross Profit | | | 356,416 | | | | 107,814 | | | | 33,081 | | | (5,627 | ) | | 491,684 | | |
Engineering, Selling, General and Administrative Expenses | | | 201,926 | | | | 81,852 | | | | 31,940 | | | - | | | 315,718 | | |
|
Income from Operations | | | 154,490 | | | | 25,962 | | | | 1,141 | | | (5,627 | ) | | 175,966 | | |
Interest Expense | | | (45,143 | ) | | | (52 | ) | | | (206 | ) | | 3,310 | | | (42,091 | ) | |
Other Income (Expense), Net | | | 31,977 | | | | 4,761 | | | | (919 | ) | | (17,328 | ) | | 18,491 | | |
Income Before Provision for Income Taxes | | | 141,324 | | | | 30,671 | | | | 16 | | | (19,645 | ) | | 152,366 | | |
Provision for Income Taxes | | | 46,354 | | | | 10,123 | | | | 919 | | | (7,376 | ) | | 50,020 | | |
Net Income (Loss) | | | $ | 94,970 | | | | $ | 20,548 | | | | $ | (903 | ) | | $ | (12,269 | ) | | $ | 102,346 | | |
| | | | | | | | | | | | | | | | | | | |
For the Fiscal Year Ended July 3, 2005 | | | | | | | | | | | | | | | | | | | |
Net Sales | | | $ | 1,687,476 | | | | $ | 1,240,377 | | | | $ | 173,501 | | | $ | (446,479 | ) | | $ | 2,654,875 | | |
Cost of Goods Sold | | | 1,341,686 | | | | 1,112,885 | | | | 139,269 | | | (443,856 | ) | | 2,149,984 | | |
Gross Profit | | | 345,790 | | | | 127,492 | | | | 34,232 | | | (2,623 | ) | | 504,891 | | |
Engineering, Selling, General and Administrative Expenses | | | 200,086 | | | | 80,888 | | | | 33,149 | | | - | | | 314,123 | | |
|
Income from Operations | | | 145,704 | | | | 46,604 | | | | 1,083 | | | (2,623 | ) | | 190,768 | | |
Interest Expense | | | (36,352 | ) | | | (31 | ) | | | (109 | ) | | (391 | ) | | (36,883 | ) | |
Other Income (Expense), Net | | | 64,312 | | | | 844 | | | | 1,227 | | | (45,953 | ) | | 20,430 | | |
Income Before Provision for Income Taxes | | | 173,664 | | | | 47,417 | | | | 2,201 | | | (48,967 | ) | | 174,315 | | |
Provision for Income Taxes | | | 59,046 | | | | 18,099 | | | | 2,352 | | | (21,949 | ) | | 57,548 | | |
Income (Loss) Before Extraordinary Item | | | 114,618 | | | | 29,318 | | | | (151 | ) | | (27,018 | ) | | 116,767 | | |
Extraordinary Gain | | | - | | | | 19,800 | | | | - | | | - | | | 19,800 | | |
Net Income (Loss) | | | $ | 114,618 | | | | $ | 49,118 | | | | $ | (151 | ) | | $ | (27,018 | ) | | $ | 136,567 | | |
46
STATEMENT OF CASH FLOWS: | | Briggs & Stratton | | Guarantor | | Non-Guarantor | | | | | |
For the Fiscal Year Ended July 1, 2007 | | Corporation | | Subsidiaries | | Subsidiaries | | Eliminations | | Consolidated | |
CASH FLOWS FROM OPERATING ACTIVITIES: | | | | | | | | | | | | | | | | | | | |
Net Income (Loss) | | | $ | 198 | | | | $ | 300 | | | | $ | 2,646 | | | $ | (2,998 | ) | | $ | 146 | | |
Adjustments to Reconcile Net Income to Net Cash Provided by (Used by) | | | | | | | | | | | | | | | | | | | |
Operating Activities: | | | | | | | | | | | | | | | | | | | |
Depreciation and Amortization | | | 52,681 | | | | 19,347 | | | | 2,286 | | | - | | | 74,314 | | |
Stock Compensation Expense | | | 8,484 | | | | - | | | | - | | | - | | | 8,484 | | |
Impairment Items | | | 33,900 | | | | 7,907 | | | | 1,281 | | | - | | | 43,088 | | |
Earnings of Unconsolidated Affiliates, Net of Dividends | | | (878 | ) | | | (175 | ) | | | (327 | ) | | 2,956 | | | 1,576 | | |
(Gain) Loss on Disposition of Plant and Equipment | | | 2,783 | | | | 75 | | | | 81 | | | - | | | 2,939 | | |
Provision for Deferred Income Taxes | | | (20,941 | ) | | | (514 | ) | | | (58 | ) | | - | | | (21,513 | ) | |
Change in Operating Assets and Liabilities: | | | | | | | | | | | | | | | | | | | |
(Increase) Decrease in Receivables | | | (108,828 | ) | | | (46,758 | ) | | | 4,970 | | | 96,644 | | | (53,972 | ) | |
(Increase) Decrease in Inventories | | | 26,367 | | | | (21,983 | ) | | | 1,097 | | | 2,251 | | | 7,732 | | |
(Increase) Decrease in Prepaid Expenses and Other Current Assets | | | 1,959 | | | | 9,081 | | | | 518 | | | - | | | 11,558 | | |
Increase (Decrease) in Accounts Payable, Accrued Liabilities and Income Taxes | | | 20,829 | | | | 88,184 | | | | (1,094 | ) | | (91,501 | ) | | 16,418 | | |
Change in Accrued/Prepaid Pension | | | 1,795 | | | | 35 | | | | - | | | - | | | 1,830 | | |
Other, Net | | | (4,276 | ) | | | (38 | ) | | | (445 | ) | | (2 | ) | | (4,761 | ) | |
Net Cash Provided by Operating Activities | | | 14,073 | | | | 55,461 | | | | 10,955 | | | 7,350 | | | 87,839 | | |
CASH FLOWS FROM INVESTING ACTIVITIES: | | | | | | | | | | | | | | | | | | | |
Additions to Plant and Equipment | | | (28,446 | ) | | | (22,038 | ) | | | (17,516 | ) | | - | | | (68,000 | ) | |
Proceeds Received on Disposition of Plant and Equipment | | | 487 | | | | 52 | | | | 60 | | | - | | | 599 | | |
Cash Investment in Subsidiary | | | 8,619 | | | | - | | | | 181 | | | (8,800 | ) | | - | | |
Net Cash Used by Investing Activities | | | (19,340 | ) | | | (21,986 | ) | | | (17,275 | ) | | (8,800 | ) | | (67,401 | ) | |
CASH FLOWS FROM FINANCING ACTIVITIES: | | | | | | | | | | | | | | | | | | | |
Net (Repayments) Borrowings on Loans and Notes Payable | | | 44,838 | | | | (42,071 | ) | | | 3,811 | | | (7,051 | ) | | (473 | ) | |
Cash Dividends Paid | | | (43,870 | ) | | | - | | | | (1,201 | ) | | 1,201 | | | (43,870 | ) | |
Capital Contributions Received | | | - | | | | 382 | | | | (7,682 | ) | | 7,300 | | | - | | |
Stock Option Exercise Proceeds and Tax Benefits | | | 3,694 | | | | - | | | | - | | | - | | | 3,694 | | |
Treasury Stock Repurchases | | | (48,232 | ) | | | - | | | | - | | | - | | | (48,232 | ) | |
Net Cash Used by Financing Activities | | | (43,570 | ) | | �� | (41,689 | ) | | | (5,072 | ) | | 1,450 | | | (88,881 | ) | |
EFFECT OF FOREIGN CURRENCY | | | | | | | | | | | | | | | | | | | |
EXCHANGE RATE CHANGES ON CASH AND CASH EQUIVALENTS | | | (1 | ) | | | - | | | | 2,822 | | | - | | | 2,821 | | |
| | | | | | | | | | | | | | | | | | | |
NET (DECREASE) INCREASE IN CASH AND CASH EQUIVALENTS | | | (48,838 | ) | | | (8,214 | ) | | | (8,570 | ) | | - | | | (65,622 | ) | |
Cash and Cash Equivalents, Beginning of Year | | | 57,623 | | | | 6,812 | | | | 30,656 | | | - | | | 95,091 | | |
Cash and Cash Equivalents, End of Year | | | $ | 8,785 | | | | $ | (1,402 | ) | | | $ | 22,086 | | | $ | - | | | $ | 29,469 | | |
47
STATEMENT OF CASH FLOWS: | | Briggs & Stratton | | Guarantor | | Non-Guarantor | | | | | |
For the Fiscal Year Ended July 2, 2006 | | Corporation | | Subsidiaries | | Subsidiaries | | Eliminations | | Consolidated | |
CASH FLOWS FROM OPERATING ACTIVITIES: | | | | | | | | | | | | | | | | | | | |
Net Income (Loss) | | | $ | 94,970 | | | | $ | 20,548 | | | | $ | (903 | ) | | $ | (12,269 | ) | | $ | 102,346 | | |
Adjustments to Reconcile Net Income to Net Cash Provided by (Used by) Operating Activities: | | | | | | | | | | | | | | | | | | | |
Depreciation and Amortization | | | 57,437 | | | | 18,030 | | | | 1,767 | | | - | | | 77,234 | | |
Stock Compensation Expense | | | 9,999 | | | | - | | | | - | | | - | | | 9,999 | | |
Earnings of Unconsolidated Affiliates, Net of Dividends | | | (4,802 | ) | | | - | | | | 58 | | | 5,203 | | | 459 | | |
(Gain) Loss on Disposition of Plant and Equipment | | | (12,059 | ) | | | 584 | | | | 336 | | | - | | | (11,139 | ) | |
Provision for Deferred Income Taxes | | | (11,477 | ) | | | 266 | | | | 773 | | | - | | | (10,438 | ) | |
Change in Operating Assets and Liabilities: | | | | | | | | | | | | | | | | | | | |
(Increase) Decrease in Receivables | | | 93,660 | | | | (225,177 | ) | | | 16,959 | | | 201,842 | | | 87,284 | | |
(Increase) Decrease in Inventories | | | (58,310 | ) | | | (31,992 | ) | | | (5,932 | ) | | 3,884 | | | (92,350 | ) | |
(Increase) Decrease in Prepaid Expenses and Other Current Assets | | | 3,161 | | | | (15,675 | ) | | | 212 | | | - | | | (12,302 | ) | |
Increase (Decrease) in Accounts Payable, Accrued Liabilities and Income Taxes | | | (26,673 | ) | | | 213,070 | | | | 887 | | | (194,979 | ) | | (7,695 | ) | |
Change in Accrued/Prepaid Pension | | | 10,813 | | | | 34 | | | | - | | | - | | | 10,847 | | |
Other, Net | | | 5,868 | | | | (5,370 | ) | | | (136 | ) | | 1 | | | 363 | | |
Net Cash Provided by (Used by) Operating Activities | | | 162,587 | | | | (25,682 | ) | | | 14,021 | | | 3,682 | | | 154,608 | | |
CASH FLOWS FROM INVESTING ACTIVITIES: | | | | | | | | | | | | | | | | | | | |
Additions to Plant and Equipment | | | (50,084 | ) | | | (14,745 | ) | | | (4,689 | ) | | - | | | (69,518 | ) | |
Proceeds Received on Disposition of Plant and Equipment | | | 11,420 | | | | 51 | | | | 47 | | | - | | | 11,518 | | |
Cash Investment in Subsidiary | | | (391 | ) | | | - | | | | 9 | | | 382 | | | - | | |
Refund of Cash Paid for Acquisition | | | - | | | | 6,347 | | | | - | | | - | | | 6,347 | | |
Other, Net | | | (3,400 | ) | | | - | | | | - | | | - | | | (3,400 | ) | |
Net Cash Used by Investing Activities | | | (42,455 | ) | | | (8,347 | ) | | | (4,633 | ) | | 382 | | | (55,053 | ) | |
CASH FLOWS FROM FINANCING ACTIVITIES: | | | | | | | | | | | | | | | | | | | |
Net (Repayments) Borrowings on Loans and Notes Payable | | | (33,977 | ) | | | 34,082 | | | | 9,308 | | | (6,382 | ) | | 3,031 | | |
Net Repayment on Long-Term Debt | | | (103,826 | ) | | | - | | | | - | | | - | | | (103,826 | ) | |
Cash Dividends Paid | | | (45,278 | ) | | | - | | | | (2,701 | ) | | 2,701 | | | (45,278 | ) | |
Capital Contributions Received | | | - | | | | 383 | | | | - | | | (383 | ) | | - | | |
Stock Option Exercise Proceeds and Tax Benefits | | | 12,457 | | | | - | | | | - | | | - | | | 12,457 | | |
Treasury Stock Repurchases | | | (34,919 | ) | | | - | | | | - | | | - | | | (34,919 | ) | |
Net Cash (Used by) Provided by Financing Activities | | | (205,543 | ) | | | 34,465 | | | | 6,607 | | | (4,064 | ) | | (168,535 | ) | |
EFFECT OF FOREIGN CURRENCY EXCHANGE RATE CHANGES ON CASH AND CASH EQUIVALENTS | | | - | | | | - | | | | 2,498 | | | - | | | 2,498 | | |
| | | | | | | | | | | | | | | | | | | |
NET (DECREASE) INCREASE IN CASH AND | | | | | | | | | | | | | | | | | | | |
CASH EQUIVALENTS | | | (85,411 | ) | | | 436 | | | | 18,493 | | | - | | | (66,482 | ) | |
Cash and Cash Equivalents, Beginning of Year | | | 143,034 | | | | 6,376 | | | | 12,163 | | | - | | | 161,573 | | |
Cash and Cash Equivalents, End of Year | | | $ | 57,623 | | | | $ | 6,812 | | | | $ | 30,656 | | | $ | - | | | $ | 95,091 | | |
48
STATEMENT OF CASH FLOWS: | | Briggs & Stratton | | Guarantor | | Non-Guarantor | | | | | |
For the Fiscal Year Ended July 3, 2005 | | Corporation | | Subsidiaries | | Subsidiaries | | Eliminations | | Consolidated | |
CASH FLOWS FROM OPERATING ACTIVITIES: | | | | | | | | | | | | | | | | | | | |
Net Income (Loss) | | | $ | 114,618 | | | | $ | 49,118 | | | | $ | (151 | ) | | $ | (27,018 | ) | | $ | 136,567 | | |
Adjustments to Reconcile Net Income to Net Cash Provided by (Used by) | | | | | | | | | | | | | | | | | | | |
Operating Activities: | | | | | | | | | | | | | | | | | | | |
Extraordinary Gain | | | - | | | | (19,800 | ) | | | - | | | - | | | (19,800 | ) | |
Depreciation and Amortization | | | 58,071 | | | | 13,693 | | | | 1,029 | | | - | | | 72,793 | | |
Stock Compensation Expense | | | 1,268 | | | | - | | | | - | | | - | | | 1,268 | | |
Earnings of Unconsolidated Affiliates, Net of Dividends | | | (17,090 | ) | | | - | | | | (745 | ) | | 18,513 | | | 678 | | |
Loss (Gain) on Disposition of Plant and Equipment | | | 2,702 | | | | 109 | | | | (393 | ) | | - | | | 2,418 | | |
Provision for Deferred Income Taxes | | | (4,829 | ) | | | 2,790 | | | | (1,857 | ) | | - | | | (3,896 | ) | |
Change in Operating Assets and Liabilities, Net of Effects of Acquisition: | | | | | | | | | | | | | | | | | | | |
(Increase) Decrease in Receivables | | | (91,296 | ) | | | 23,037 | | | | 67,106 | | | (25,739 | ) | | (26,892 | ) | |
(Increase) Decrease in Inventories | | | (16,956 | ) | | | 34,470 | | | | (6,740 | ) | | 2,010 | | | 12,784 | | |
(Increase) Decrease in Prepaid Expenses and Other Current Assets | | | (218 | ) | | | 4,184 | | | | (1,316 | ) | | - | | | 2,650 | | |
Increase (Decrease) in Accounts Payable, Accrued Liabilities and Income Taxes | | | (30,142 | ) | | | 25,720 | | | | (61,468 | ) | | 38,217 | | | (27,673 | ) | |
Change in Accrued/Prepaid Pension | | | (1,056 | ) | | | 6 | | | | - | | | - | | | (1,050 | ) | |
Other, Net | | | 3,942 | | | | (5,214 | ) | | | 29 | | | (46 | ) | | (1,289 | ) | |
Net Cash Provided by (Used by) Operating Activities | | | 19,014 | | | | 128,113 | | | | (4,506 | ) | | 5,937 | | | 148,558 | | |
| | | | | | | | | | | | | | | | | | | |
CASH FLOWS FROM INVESTING ACTIVITIES: | | | | | | | | | | | | | | | | | | | |
Additions to Plant and Equipment | | | (60,117 | ) | | | (17,206 | ) | | | (8,752 | ) | | - | | | (86,075 | ) | |
Proceeds Received on Disposition of Plant and Equipment | | | 908 | | | | 16 | | | | 1,016 | | | - | | | 1,940 | | |
Proceeds Received on Sale of Certain Assets of a Subsidiary | | | - | | | | - | | | | 4,050 | | | - | | | 4,050 | | |
Cash Investment in Subsidiary | | | (375,799 | ) | | | - | | | | (14,069 | ) | | 389,868 | | | - | | |
Cash Paid for Acquisitions, Net of Cash Acquired | | | (719 | ) | | | (337,713 | ) | | | (16,662 | ) | | - | | | (355,094 | ) | |
Other, Net | | | (1,500 | ) | | | - | | | | - | | | - | | | (1,500 | ) | |
Net Cash Used by Investing Activities | | | (437,227 | ) | | | (354,903 | ) | | | (34,417 | ) | | 389,868 | | | (436,679 | ) | |
| | | | | | | | | | | | | | | | | | | |
CASH FLOWS FROM FINANCING ACTIVITIES: | | | | | | | | | | | | | | | | | | | |
Net Borrowings (Repayments) on Loans and Notes Payable | | | 125,289 | | | | (125,434 | ) | | | 9,937 | | | (12,476 | ) | | (2,684 | ) | |
Net Borrowings on Long-Term Debt | | | 125,000 | | | | - | | | | - | | | - | | | 125,000 | | |
Issuance Cost of Debt | | | (925 | ) | | | - | | | | - | | | - | | | (925 | ) | |
Cash Dividends Paid | | | (35,065 | ) | | | - | | | | (6,539 | ) | | 6,539 | | | (35,065 | ) | |
Capital Contributions Received | | | - | | | | 354,593 | | | | 35,275 | | | (389,868 | ) | | - | | |
Stock Option Exercise Proceeds and Tax Benefits | | | 20,139 | | | | - | | | | - | | | - | | | 20,139 | | |
Net Cash Provided by Financing Activities | | | 234,438 | | | | 229,159 | | | | 38,673 | | | (395,805 | ) | | 106,465 | | |
| | | | | | | | | | | | | | | | | | | |
EFFECT OF FOREIGN CURRENCY EXCHANGE RATE CHANGES ON CASH AND CASH EQUIVALENTS | | | - | | | | - | | | | 835 | | | - | | | 835 | | |
| | | | | | | | | | | | | | | | | | | |
NET (DECREASE) INCREASE IN CASH AND CASH EQUIVALENTS | | | (183,775 | ) | | | 2,369 | | | | 585 | | | - | | | (180,821 | ) | |
Cash and Cash Equivalents, Beginning of Year | | | 326,809 | | | | 4,007 | | | | 11,578 | | | - | | | 342,394 | | |
| | | $ | 143,034 | | | | $ | 6,376 | | | | $ | 12,163 | | | $ | - | | | $ | 161,573 | | |
49
(17) Reduction in Force
Briggs & Stratton recorded an expense of approximately $4.1 million associated with a worldwide employee reduction during the year ended July 2, 2006. The amount recorded represents expected expenditures for severance and other related employee separation costs associated with the reduction. As of the year ended July 2, 2006, a reserve of $0.4 million remained. No reserve remained as of the year ended July 1, 2007.
(18) Impairment and Disposal Charges
Impairment charges were recognized in the Consolidated Statements of Earnings for $43.1 million pretax ($26.2 million after tax) during fiscal 2007, of which $33.9 and $9.2 million were recognized in the Engines and Power Products Segments, respectively. The Engines Segment $33.9 million charge was primarily for the write-down of assets of the Rolla, Missouri (Rolla) engine manufacturing facility that will be closing in fiscal 2008. The $9.2 million recognized in the Power Products Segment primarily relates to the closure of the Port Washington, Wisconsin production facility expected to be completed in the second quarter of fiscal 2009. For each segment, it was determined that the carrying value of the assets exceeded the undiscounted cash flows. The impairment was computed as the difference between estimated fair value and the carrying value of the assets. Fair value was determined based on market prices for comparable assets.
Additionally, a liability was recorded within costs of goods sold to accrue for severance payments to be paid to the employees of the Rolla facility upon its close. Accrued severance at July 1, 2007 was approximately $1.1 million. Severance payments are contingent upon an employee working through the scheduled end date, and will continue to accrue until the plant closes.
(19) Subsequent Events
On July 12, 2007, the Company entered into a $500 million amended and restated multicurrency credit agreement. The Amended Credit Agreement (“Revolver��) provides a revolving credit facility for up to $500 million in revolving loans, including up to $25 million in swing-line loans. The Company will use proceeds of the Revolver to, among other things; pay off amounts outstanding under the Company’s Term Loan Agreement dated February 11, 2005 with various financial institutions. The Revolver has a term of five years and all outstanding borrowings on the Revolver will be due and payable on July 12, 2012. The Revolver contains covenants that the Company considers usual and customary for an agreement of this type, including a Maximum Total Leverage Ratio and Minimum Interest Coverage Ratio, but does not contain a Minimum Net Worth Covenant. Certain of the Company’s subsidiaries are required to be guarantors of the Company’s obligations under the Revolver. At any time during the term of the Revolver, the Company may, so long as no event of default has occurred and is continuing and certain other conditions are satisfied, elect to increase the maximum amount available under the Revolver from $500 million by up to an amount not to exceed $250 million through, at the Company’s election, increases of commitments by existing lenders and/or the addition of new lenders.
50
Report of Independent Registered Public Accounting Firm
To the Board of Directors and Shareholders of Briggs & Stratton Corporation:
In our opinion, the consolidated financial statements listed in the index appearing under Item 15(a)(1) present fairly, in all material respects, the financial position of Briggs & Stratton Corporation and its subsidiaries at July 1, 2007 and July 2, 2006, and the results of their operations and their cash flows for each of the three years in the period ended July 1, 2007 in conformity with accounting principles generally accepted in the United States of America. In addition, in our opinion, the financial statement schedule listed in the index appearing under Item 15(a)(2) presents fairly, in all material respects, the information set forth therein when read in conjunction with the related consolidated financial statements. Also in our opinion, the Company maintained, in all material respects, effective internal control over financial reporting as of July 1, 2007, based on criteria established in Internal Control - Integrated Framework issued by the Committee of Sponsoring Organizations of the Treadway Commission (COSO). The Company’s management is responsible for these financial statements and financial statement schedule, for maintaining effective internal control over financial reporting and for its assessment of the effectiveness of internal control over financial reporting, included in the accompanying Management’s Report on Internal Control over Financial Reporting appearing under Item 9A. Our responsibility is to express opinions on these financial statements, on the financial statement schedule, and on the Company’s internal control over financial reporting based on our integrated audits. We conducted our audits in accordance with the standards of the Public Company Accounting Oversight Board (United States). Those standards require that we plan and perform the audits to obtain reasonable assurance about whether the financial statements are free of material misstatement and whether effective internal control over financial reporting was maintained in all material respects. Our audits of the financial statements included examining, on a test basis, evidence supporting the amounts and disclosures in the financial statements, assessing the accounting principles used and significant estimates made by management, and evaluating the overall financial statement presentation. Our audit of internal control over financial reporting included obtaining an understanding of internal control over financial reporting, assessing the risk that a material weakness exists, and testing and evaluating the design and operating effectiveness of internal control based on the assessed risk. Our audits also included performing such other procedures as we considered necessary in the circumstances. We believe that our audits provide a reasonable basis for our opinions.
As discussed in Notes 2 and 14 to the consolidated financial statements, the Company changed its method of accounting for its defined benefit pension and other postretirement plans in 2007.
A company’s internal control over financial reporting is a process designed to provide reasonable assurance regarding the reliability of financial reporting and the preparation of financial statements for external purposes in accordance with generally accepted accounting principles. A company’s internal control over financial reporting includes those policies and procedures that (i) pertain to the maintenance of records that, in reasonable detail, accurately and fairly reflect the transactions and dispositions of the assets of the company; (ii) provide reasonable assurance that transactions are recorded as necessary to permit preparation of financial statements in accordance with generally accepted accounting principles, and that receipts and expenditures of the company are being made only in accordance with authorizations of management and directors of the company; and (iii) provide reasonable assurance regarding prevention or timely detection of unauthorized acquisition, use, or disposition of the company’s assets that could have a material effect on the financial statements.
Because of its inherent limitations, internal control over financial reporting may not prevent or detect misstatements. Also, projections of any evaluation of effectiveness to future periods are subject to the risk that controls may become inadequate because of changes in conditions, or that the degree of compliance with the policies or procedures may deteriorate.
PricewaterhouseCoopers LLP
Milwaukee, Wisconsin
August 30, 2007
51
Quarterly Financial Data, Dividend and Market Information (Unaudited)
| | | In Thousands | |
| Quarter | | | | Net | | | | Gross | | | Net Income | |
| Ended | | | | Sales | | | | Profit | | | | (Loss) | | |
Fiscal 2007 | | | | | | | | |
September | | $ | 338,249 | | $ | 44,362 | | $ | (18,038 | ) |
December | | 423,059 | | 67,364 | | (5,910 | ) |
March | | 717,053 | | 85,212 | | 7,770 | |
June | | 678,872 | | 90,194 | | 16,324 | |
Total | | $ | 2,157,233 | | $ | 287,132 | | $ | 146 | |
Fiscal 2006 | | | | | | | | |
September | | $ | 511,709 | | $ | 81,308 | | $ | 4,727 | |
December | | 574,313 | | 117,352 | | 21,818 | |
March | | 800,194 | | 180,933 | | 60,008 | |
June | | 655,955 | | 112,091 | | 15,793 | |
Total | | $ | 2,542,171 | | $ | 491,684 | | $ | 102,346 | |
| | | | | | | | | | | | | | | | | | | | | | | |
| | Per Share of Common Stock | |
| | | | | | Market Price Range | |
| | Net | | | | on New York | |
| Quarter | | | Income | | Dividends | | Stock Exchange | |
| Ended | | | (Loss) | | | Declared | | | | High | | | | Low | | |
Fiscal 2007 | | | | | | | | | | |
September | | $ | (.36) | | | $ | .22 | | | $31.49 | | $24.60 | |
December | | (.12) | | .22 | | | 29.06 | | 24.79 | |
March | | .15 | | .22 | | | 31.45 | | 26.88 | |
June | | .32 | | | .22 | | | 33.06 | | 28.50 | |
Total | | $ | .00 | | | $ | .88 | | | | | | |
Fiscal 2006 | | | | | | | | | | |
September | | $ | .09 | | | $ | .22 | | | $37.99 | | $33.25 | |
December | | .42 | | .22 | | | 40.38 | | 31.02 | |
March | | 1.16 | | .22 | | | 40.21 | | 33.40 | |
June | | .31 | | | .22 | | | 38.19 | | 30.01 | |
Total | | $ | 1.98 | | | $ | .88 | | | | | | |
| | | | | | | | | | | | | | | | | | | | | | | | |
The number of record holders of Briggs & Stratton Corporation Common Stock on August 20, 2007 was 3,671.
Net Income per share of Common Stock represents Diluted Earnings per Share.
(1) Refer to Note 2 of the Notes to Consolidated Financial Statements, for information about Diluted Earnings per Share. Amounts may not total because of differing numbers of shares outstanding at the end of each quarter.
52
ITEM 9. CHANGES IN AND DISAGREEMENTS WITH ACCOUNTANTS ON ACCOUNTING AND FINANCIAL DISCLOSURE
None.
ITEM 9A. CONTROLS AND PROCEDURES
Disclosure Controls and Procedures
The Company’s management, with the participation of the Company’s Chief Executive Officer and Chief Financial Officer, have evaluated the effectiveness of the Company’s disclosure controls and procedures (as such term is defined in Rules 13a-15(e) and 15d-15(e) under the Securities Exchange Act of 1934, as amended (“the Exchange Act”)) as of the end of the period covered by this report. Based on such evaluation, the Company’s Chief Executive Officer and Chief Financial Officer have concluded that, as of the end of such period, the Company’s disclosure controls and procedures are effective in recording, processing, summarizing, and reporting, on a timely basis, information required to be disclosed by the Company in the reports that it files or submits under the Exchange Act.
Management’s Report on Internal Control Over Financial Reporting
The Company’s management is responsible for establishing and maintaining adequate internal control over financial reporting, as such term is defined in Exchange Act Rule 13a-15(f). The Company’s management, with the participation of the Company’s Chief Executive Officer and Chief Financial Officer, has evaluated the effectiveness of the Company’s internal control over financial reporting based on the framework in Internal Control-Integrated Framework issued by the Committee of Sponsoring Organizations of the Treadway Commission. Based on this evaluation, the Company’s management has concluded that, as of the end of the period covered by this report, the Company’s internal controls over financial reporting were effective.
Because of its inherent limitations, internal control over financial reporting may not prevent or detect misstatements. Also, projections of any evaluation of the effectiveness to future periods are subject to the risk that the controls may become inadequate because of changes in conditions, or that the degree of compliance with the policies or procedures may deteriorate.
PricewaterhouseCoopers LLP, an independent registered public accounting firm, who has audited the Company’s consolidated financial statements and the effectiveness of internal controls over financial reporting as of July 1, 2007, as stated in their report which is included herein.
Changes in Internal Control Over Financial Reporting
There has not been any change in the Company’s internal control over financial reporting during the fourth fiscal quarter that has materially affected, or is reasonably likely to materially affect, the Company’s internal control over financial reporting.
ITEM 9B. OTHER INFORMATION
None.
PART III
ITEM 10. DIRECTORS, EXECUTIVE OFFICERS AND CORPORATE GOVERNANCE
(a) Executive Officers. Reference is made to “Executive Officers of Registrant” in Part I after Item 4.
(b) Directors. The information required by this Item is in Briggs & Stratton’s definitive Proxy Statement, prepared for the 2007 Annual Meeting of Shareholders, under the caption “Election of Directors”, and is incorporated herein by reference.
(c) Section 16 Compliance. The information required by this Item is in Briggs & Stratton’s definitive Proxy Statement, prepared for the 2007 Annual Meeting of Shareholders, under the caption “Section 16(a) Beneficial Ownership Reporting Compliance”, and is incorporated herein by reference.
53
(d) Audit Committee Financial Expert. The information required by this Item is in Briggs & Stratton’s definitive Proxy Statement, prepared for the 2007 Annual Meeting of Shareholders, under the caption “Corporate Governance – Audit Committee”, and is incorporated herein by reference.
(e) Identification of Audit Committee. The information required by this Item is in Briggs & Stratton’s definitive Proxy Statement, prepared for the 2007 Annual Meeting of Shareholders, under the caption “Corporate Governance – Audit Committee”, and is incorporated herein by reference.
(f) Code of Ethics. Briggs & Stratton has adopted a written code of ethics, referred to as the Briggs & Stratton Business Integrity Manual applicable to all directors, officers and employees, which includes provisions related to accounting and financial matters applicable to the Principal Executive Officer, Principal Financial Officer, Principal Accounting Officer and Controller. The Briggs & Stratton Business Integrity Manual is available on the Company’s corporate website at www.briggsandstratton.com. If the Company makes any substantive amendment to, or grants any waiver of, the code of ethics for any director or officer, Briggs & Stratton will disclose the nature of such amendment or waiver on its corporate website or in a Current Report on Form 8-K.
ITEM 11. EXECUTIVE COMPENSATION
The information in Briggs & Stratton’s definitive Proxy Statement, prepared for the 2007 Annual Meeting of Shareholders, concerning this item, under the captions “Compensation Committee Report”, “Compensation Discussion and Analysis”, “Compensation Tables”, “Agreements with Executives”, and “Director Compensation” is incorporated herein by reference.
ITEM 12. SECURITY OWNERSHIP OF CERTAIN BENEFICIAL OWNERS AND MANAGEMENT AND RELATED STOCKHOLDER MATTERS
The information in Briggs & Stratton’s definitive Proxy Statement, prepared for the 2007 Annual Meeting of Shareholders, concerning this item, under the captions “Security Ownership of Certain Beneficial Owners”, “Security Ownership of Directors and Executive Officers” and “Equity Compensation Plan Information” is incorporated herein by reference.
ITEM 13. CERTAIN RELATIONSHIPS AND RELATED TRANSACTIONS, AND DIRECTOR INDEPENDENCE
The information in Briggs & Stratton’s definitive Proxy Statement, prepared for the 2007 Annual Meeting of Shareholders, concerning this item, under the captions “Corporate Governance – Director Independence” and “Corporate Governance – Audit Committee” is incorporated herein by reference.
ITEM 14. PRINCIPAL ACCOUNTANT FEES AND SERVICES
The information required by this Item is in Briggs & Stratton’s definitive Proxy Statement, prepared for the 2007 Annual Meeting of Shareholders, under the captions “Independent Auditors Fees” and “Corporate Governance – Audit Committee”, and is incorporated herein by reference.
PART IV
ITEM 15. EXHIBITS AND FINANCIAL STATEMENT SCHEDULES
(a) 1. | Financial Statements |
| |
| The following financial statements are included under the caption “Financial Statements and Supplementary Data” in Part II, Item 8 and are incorporated herein by reference: |
Consolidated Balance Sheets, July 1, 2007 and July 2, 2006
For the Fiscal Years Ended July 1, 2007, July 2, 2006 and July 3, 2005:
Consolidated Statements of Earnings
Consolidated Statements of Shareholders’ Investment
54
Consolidated Statements of Cash Flows
Notes to Consolidated Financial Statements
Report of Independent Registered Public Accounting Firm
2. Financial Statement Schedules
Schedule II – Valuation and Qualifying Accounts
All other financial statement schedules provided for in the applicable accounting regulations of the Securities and Exchange Commission are not required under the related instructions.
3. Exhibits
Refer to the Exhibit Index incorporated herein by reference. Each management contract or compensatory plan or arrangement required to be filed as an exhibit to this report is identified in the Exhibit Index by an asterisk following the Exhibit Number.
BRIGGS & STRATTON CORPORATION AND SUBSIDIARIES
SCHEDULE II – VALUATION AND QUALIFYING ACCOUNTS
FOR FISCAL YEARS ENDED JULY 1, 2007, JULY 2, 2006 AND JULY 3, 2005
Reserve for | | Balance | | Additions | | | | Adjustment | | Balance | |
Doubtful Accounts | | Beginning | | Charged | | Charges to | | Related to | | End of | |
| Receivable | | | | of Year | | | | to Earnings | | | | Reserve, Net | | | | Acquisitions | | | | Year | | |
2007 | | $ | 4,851,000 | | 1,872,000 | | | (2,621,000) | | | - | | $ | 4,102,000 | |
2006 | | $ | 5,461,000 | | 4,321,000 | | | (4,931,000) | | | - | | $ | 4,851,000 | |
2005 | | $ | 1,584,000 | | 39,681,000 | * | | (39,382,000) | * | | 3,578,000 | | $ | 5,461,000 | |
| | | | | | | | | | | | | | | | | | | | | | | | | | |
* Reflects the write-off of a trade receivable of Murray, Inc.
55
SIGNATURES
Pursuant to the requirements of Section 13 or 15(d) of the Securities Exchange Act of 1934, the registrant has duly caused this report to be signed on its behalf by the undersigned, thereunto duly authorized.
| BRIGGS & STRATTON CORPORATION |
| |
| |
| By | /s/ James E. Brenn |
| | James E. Brenn |
August 30, 2007 | | Senior Vice President and |
| | Chief Financial Officer |
Pursuant to the requirements of the Securities Exchange Act of 1934, this report has been signed below by the following persons on behalf of the registrant and in the capacities and on the dates indicated.*
/s/ John S. Shiely | | /s/ David L. Burner |
John S. Shiely | | David L. Burner |
Chairman, President and Chief Executive | | Director |
Officer and Director (Principal Executive | | |
Officer) | | |
| | /s/ Mary K. Bush |
| | Mary K. Bush |
/s/ James E. Brenn | | Director |
James E. Brenn | | |
Senior Vice President and Chief Financial | | |
Officer (Principal Financial Officer) | | /s/ Keith R. McLoughlin |
| | Keith R. McLoughlin |
/s/ David J. Rodgers | | Director |
David J. Rodgers | | |
Controller (Principal Accounting Officer) | | /s/ Robert J. O’Toole |
| | Robert J. O’Toole |
/s/ William F. Achtmeyer | | Director |
William F. Achtmeyer | | |
Director | | /s/ Charles I. Story |
| | Charles I. Story |
/s/ Michael E. Batten | | Director |
Michael E. Batten | | |
Director | | /s/ Brian C. Walker |
| | Brian C. Walker |
| | Director |
| | |
| | |
| | |
| | *Each signature affixed as of |
| | August 30, 2007. |
56
BRIGGS & STRATTON CORPORATION
(Commission File No. 1-1370)
EXHIBIT INDEX
2007 ANNUAL REPORT ON FORM 10-K
Exhibit | | |
Number | | Document Description |
3.1 | | Articles of Incorporation. |
| | (Filed as Exhibit 3.2 to the Company’s Report on Form 10-Q for the quarter ended October 2, 1994 and incorporated by reference herein.) |
| | |
3.1(a) | | Amendment to Articles of Incorporation. |
| | (Filed as Exhibit 3.1 to the Company’s Report on Form 10-Q for the quarter ended September 26, 2004 and incorporated by reference herein.) |
| | |
3.2 | | Bylaws, as amended and restated April 18, 2007. |
| | (Filed as Exhibit 3.2 to the Company’s Report on Form 8-K dated April 18, 2007 and incorporated by reference herein.) |
| | |
4.0 | | Rights Agreement dated as of August 7, 1996, as amended through August 9, 2006, between Briggs & Stratton Corporation and National City Bank which includes the form of Right Certificate as Exhibit A and the Summary of Rights to Purchase Common Shares as Exhibit B. |
| | (Filed as Exhibit 4.1 to the Company’s Registration Statement on Form 8-A/A dated as of August 15, 2006 and incorporated by reference herein.) |
| | |
4.1 | | Indenture dated as of June 4, 1997 between Briggs & Stratton Corporation and Bank One, N.A., as Trustee. |
| | (Filed as Exhibit 4.1 to the Company’s Report on Form 8-K dated May 30, 1997 and incorporated by reference herein.) |
| | |
4.2 | | Form of 7-1/4% Note due September 15, 2007 of Briggs & Stratton Corporation issued pursuant to the Indenture dated as of June 4, 1997 between Briggs & Stratton Corporation and Bank One, N.A., as Trustee. |
| | (Filed as Exhibit 4.2 to the Company’s Report on Form 8-K dated May 30, 1997 and incorporated by reference herein.) |
| | |
4.3 | | Resolutions of the Board of Directors of Briggs & Stratton Corporation authorizing the public offering of debt securities of Briggs & Stratton Corporation in an aggregate principal amount of up to $175,000,000. |
| | (Filed as Exhibit 4.3 to the Company’s Report on Form 8-K dated May 30, 1997 and incorporated by reference herein.) |
| | |
4.4 | | Actions of the Authorized Officers of Briggs & Stratton Corporation authorizing the issuance of $100,000,000 aggregate principal amount of 7-1/4% Notes due September 15, 2007. |
| | (Filed as Exhibit 4.4 to the Company’s Report on Form 8-K dated May 30, 1997 and incorporated by reference herein.) |
| | |
4.5 | | Officers’ Certificate and Company Order of Briggs & Stratton Corporation executed in conjunction with the issuance of $100,000,000 aggregate principal amount of 7-1/4% Notes due September 15, 2007. |
| | (Filed as Exhibit 4.5 to the Company’s Report on Form 8-K dated May 30, 1997 and incorporated by reference herein.) |
| | |
4.6 | | Indenture dated as of May 14, 2001 between Briggs & Stratton Corporation, the Guarantors listed on Schedule I thereto and Bank One, N.A., as Trustee, providing for 8.875% Senior Notes due March 15, 2011 (including form of Note, form of Notation of Guarantee and other exhibits). |
| | (Filed as Exhibit 4.9 to the Company’s Registration Statement on Form S-3 filed on July 3, 2001, Registration No. 333-64490, and incorporated herein by reference.) |
57
Exhibit | | |
Number | | Document Description |
4.7 | | Form of Supplemental Indenture dated as of May 15, 2001 between Subsequent Guarantors (Generac Portable Products, Inc., GPPD, Inc., GPPW, Inc. and Generac Portable Products, LLC), Briggs & Stratton Corporation, and Bank One, N.A., as Trustee. |
| | (Filed as Exhibit 4.10 to the Company’s Registration Statement on Form S-3 filed on July 3, 2001, Registration No. 333-64490, and incorporated herein by reference.) |
| | |
4.8 | | First Supplemental Indenture dated as of May 14, 2001 between Briggs & Stratton Corporation and Bank One, N.A., as Trustee under the Indenture dated as of June 4, 1997. |
| | (Filed as Exhibit 4.12 to the Company’s Registration Statement on Form S-3 filed on July 3, 2001, Registration No. 333-64490, and incorporated herein by reference.) |
| | |
4.9 | | Form of Indenture Supplement to Add a Subsidiary Guarantor dated as of May 15, 2001 among each Subsidiary Guarantor (Generac Portable Products, Inc., GPPD, Inc., GPPW, Inc. and Generac Portable Products, LLC), Briggs & Stratton Corporation, and Bank One, N.A., as Trustee. |
| | (Filed as Exhibit 4.13 to the Company’s Registration Statement on Form S-3 filed on July 3, 2001, Registration No. 333-64490, and incorporated herein by reference.) |
| | |
10.0* | | Form of Officer Employment Agreement. |
| | (Filed as Exhibit 10.0 to the Company’s Report on Form 10-Q for the quarter ended March 29, 1998 and incorporated by reference herein.) |
| | |
10.1* | | Amended and Restated Supplemental Executive Retirement Plan. |
| | (Filed as Exhibit 10.1 to the Company’s Report on Form 10-Q for the quarter ended March 31, 2002 and incorporated by reference herein.) |
| | |
10.1 (a)* | | Amendment to Supplemental Executive Retirement Plan. |
| | (Filed as Exhibit 10.1 (a) to the Company’s Report on Form 10-K for fiscal year ended June 29, 2003 and incorporated by reference herein.) |
| | |
10.2* | | Amended and Restated Economic Value Added Incentive Compensation Plan. (Filed herewith.) |
| | |
10.3* | | Form of Change of Control Employment Agreements. |
| | (Filed as Exhibit 10.4 to the Company’s Annual Report on Form 10-K for fiscal year ended June 27, 1993 and incorporated by reference herein.) |
| | |
10.3 (a)* | | Amendment to Change in Control Employment Agreements. |
| | (Filed as Exhibit 10.3 (a) to the Company’s Report on Form 10-K for fiscal year ended June 27, 2004 and incorporated by reference herein.) |
| | |
10.4* | | Trust Agreement with an independent trustee to provide payments under various compensation agreements with Company employees upon the occurrence of a change in control. |
| | (Filed as Exhibit 10.5 (a) to the Company’s Annual Report on Form 10-K for fiscal year ended July 2, 1995 and incorporated by reference herein.) |
| | |
10.4 (a)* | | Amendment to Trust Agreement with an independent trustee to provide payments under various compensation agreements with Company employees. |
| | (Filed as Exhibit 10.5 (b) to the Company’s Annual Report on Form 10-K for fiscal year ended July 2, 1995 and incorporated by reference herein.) |
| | |
10.5* | | 1999 Amended and Restated Stock Incentive Plan. |
| | (Filed as Exhibit A to the Company’s 1999 Annual Meeting Proxy Statement and incorporated by reference herein.) |
58
Exhibit | | |
Number | | Document Description |
10.5 (a)* | | Amendment to Stock Incentive Plan. |
| | (Filed as Exhibit 10.2 to the Company’s Report on Form 10-Q for the quarter ended March 30, 2003 and incorporated by reference herein.) |
| | |
10.5 (b)* | | Amendment to Stock Incentive Plan. |
| | (Filed as Exhibit 10.5 (c) to the Company’s Report on Form 10-K for fiscal year ended June 27, 2004 and incorporated by reference herein.) |
| | |
10.5 (c)* | | 2004 Amended and Restated Briggs & Stratton Corporate Incentive Compensation Plan. |
| | (Filed as Exhibit B to the Company’s 2004 Annual Meeting Proxy Statement and incorporated by reference herein.) |
| | |
10.5 (d)* | | Amended and Restated Briggs & Stratton Corporation Incentive Compensation Plan as Modified October 29, 2004. |
| | (Filed as Exhibit 10.5 to the Company’s Report on Form 10-Q for quarter ended September 26, 2004 and incorporated by reference herein.) |
| | |
10.6* | | Premium Option and Stock Award Program. |
| | (Filed as Exhibit 10.1 to the Company’s Report on Form 8-K dated August 9, 2005 and incorporated by reference herein.) |
| | |
10.6 (a)* | | Form of Stock Option Agreement under the Premium Option and Stock Award Program. |
| | (Filed as Exhibit 10.6 (a) to the Company’s Report on Form 10-K for fiscal year ended July 3, 2005 and incorporated by reference herein.) |
| | |
10.6 (b)* | | Amended and Restated Form of Stock Option Agreement under the Premium Option and Stock Award Program. |
| | (Filed as Exhibit 10.6 (a) to the Company’s Report on Form 10-Q for quarter ended April 2, 2006 and incorporated by reference herein.) |
| | |
10.6 (c)* | | Form of Restricted Stock Award Agreement under the Premium Option and Restricted Stock Program. |
| | (Filed as Exhibit 10.6 (b) to the Company’s Report on Form 10-K for fiscal year ended June 27, 2004 and incorporated by reference herein.) |
| | |
10.6 (d)* | | Amended Form of Restricted Stock Award Agreement Under the Premium Option and Stock Award Program. |
| | (Filed as Exhibit 10.6 (c) to the Company’s Report on Form 10-K for fiscal year ended July 3, 2005 and incorporated by reference herein.) |
| | |
10.6 (e)* | | Form of Deferred Stock Award Agreement Under the Premium Option and Stock Award Program. |
| | (Filed as Exhibit 10.6 (d) to the Company’s Report on Form 10-K for fiscal year ended July 3, 2005 and incorporated by reference herein.) |
| | |
10.11* | | Amended and Restated Deferred Compensation Plan for Directors. |
| | (Filed as Exhibit 10.11 to the Company’s Report on Form 10-K for fiscal year ended June 27, 2004 and incorporated by reference herein.) |
| | |
10.12* | | Amended and Restated Director’s Premium Option and Stock Grant Program. |
| | (Filed as Exhibit 10.12 to the Company’s Report on Form 10-K for fiscal year ended July 3, 2005 and incorporated by reference herein.) |
| | |
10.12 (a)* | | Form of Director’s Stock Option Agreement under the Director’s Premium Option and Stock Grant Program. |
| | (Filed as Exhibit 10.12 (a) to the Company’s Report on Form 10-Q for quarter ended April 2, 2006 and incorporated by reference herein.) |
| | |
10.14* | | Executive Life Insurance Plan. |
| | (Filed as Exhibit 10.17 to the Company’s Annual Report on Form 10-K for fiscal year ended June 27, 1999 and incorporated by reference herein.) |
59
Exhibit | | |
Number | | Document Description |
10.14(a)* | | Amendment to Executive Life Insurance Program. |
| | (Filed as Exhibit 10.14 (a) to the Company’s Report on Form 10-K for fiscal year ended June 29, 2003 and incorporated by reference herein.) |
| | |
10.14 (b)* | | Amendment to Executive Life Insurance Plan. |
| | (Filed as Exhibit 10.14 (b) to the Company’s Report on Form 10-K for fiscal year ended June 27, 2004 and incorporated by reference herein.) |
| | |
10.15* | | Key Employees Savings and Investment Plan. |
| | (Filed as Exhibit 10.18 to the Company’s Annual Report on Form 10-K for fiscal year ended June 27, 1999 and incorporated by reference herein.) |
| | |
10.15 (a)* | | Amendment to Key Employees Savings and Investment Plan. |
| | (Filed as Exhibit 10.1 to the Company’s Report on Form 10-Q for the quarter ended December 31, 2000 and incorporated by reference herein.) |
| | |
10.15 (b)* | | Amendment to Key Employee Savings and Investment Plan. |
| | (Filed as Exhibit 10.1 to the Company’s Report on Form 10-Q for the quarter ended March 30, 2003 and incorporated by reference herein.) |
| | |
10.15 (c)* | | Amendment to Key Employee Savings and Investment Plan. |
| | (Filed as Exhibit 10.15 to the Company’s Report on Form 10-Q for the quarter ended October 1, 2006 and incorporated by reference herein.) |
| | |
10.16* | | Consultant Reimbursement Arrangement. |
| | (Filed as Exhibit 10.19 to the Company’s Annual Report on Form 10-K for fiscal year ended June 27, 1999 and incorporated by reference herein.) |
| | |
10.17* | | Briggs & Stratton Product Program. |
| | (Filed as Exhibit 10.18 to the Company’s Annual Report on Form 10-K for fiscal year ended June 30, 2002 and incorporated by reference herein.) |
| | |
10.19 | | Retention and Consulting Agreement entered into on September 12, 2005 between Briggs & Stratton Corporation and Mark R. Hazeltine. |
| | (Filed as Exhibit 10.1 to the Company’s Report on Form 8-K dated September 12, 2005 and incorporated by reference herein.) |
| | |
10.20 | | Asset Purchase Agreement, dated January 25, 2005, by and among Briggs & Stratton Power Products Group, LLC, Briggs & Stratton Canada Inc., Murray, Inc. and Murray Canada Co. |
| | (Filed as Exhibit 10.1 to the Company’s Report on Form 8-K dated January 25, 2005 and incorporated by reference herein.) |
| | |
10.21 | | Transition Supply Agreement, dated February 11, 2005, between Briggs & Stratton Power Products Group, LLC and Murray, Inc. |
| | (Form of Transition Supply Agreement filed as Exhibit 10.2 to the Company’s Report on Form 8-K dated January 25, 2005 and incorporated by reference herein.) |
| | |
10.22 | | Term Loan Agreement, dated February 11, 2005, among Briggs & Stratton Corporation and LaSalle Bank N.A., as syndication agent, and Bank of America, N.A., as administrative agent. |
| | (Filed as Exhibit 10.1 to the Company’s Report on Form 8-K dated February 11, 2005 and incorporated by reference herein.) |
| | |
10.22 (a) | | Term Loan Agreement Amendment, dated March 18, 2005, among Briggs & Stratton Corporation, various financial institutions and Bank of America, N.A., as administrative agent. |
| | (Filed as Exhibit 10.1 to the Company’s Report on Form 8-K dated March 18, 2005 and incorporated by reference herein.) |
60
Exhibit | | |
Number | | Document Description |
10.22 (b) | | Term Loan Agreement Amendment, dated August 8, 2006, among Briggs & Stratton Corporation, various financial institutions and Bank of America, N.A., as administrative agent. |
| | (Filed as Exhibit 10.22 (b) to the Company’s Report on Form 10-K dated September 1, 2006.) |
| | |
10.23 | | Multicurrency Credit Agreement, dated May 28, 2004, among Briggs & Stratton Corporation, the financial institutions party hereto, and LaSalle Bank National Association, M&I Marshall & Ilsley Bank and U.S. Bank National Association, as co-documentation agents, and Bank of America, N.A., as administrative agent, issuing bank and swing line bank. |
| | (Filed as Exhibit 10.2 to the Company’s Report on Form 8-K dated March 18, 2005 and incorporated by reference herein.) |
| | |
10.23 (a) | | Multicurrency Credit Agreement Amendment, dated March 18, 2005, among Briggs & Stratton Corporation, various financial institutions and Bank of America, N.A., as administrative agent. |
| | (Filed as Exhibit 10.3 to the Company’s Report on Form 8-K dated March 18, 2005 and incorporated by reference herein.) |
| | |
10.23 (b) | | Multicurrency Credit Agreement Amendment, dated August 8, 2006, among Briggs & Stratton Corporation, various financial institutions and Bank of America, N.A., as administrative agent. |
| | (Filed as Exhibit 10.23 (b) to the Company’s Report on Form 10-K for fiscal year ended July 2, 2006 and incorporated by reference herein.) |
| | |
10.23 (c) | | Amended and Restated Multicurrency Credit Agreement, dated July 12, 2007, among Briggs & Stratton Corporation, the financial institutions party hereto, and J.P. Morgan Chase Bank, N.A., La Salle Bank National Association, M&I Marshall & Ilsley Bank, U.S. Bank, National Association, as co-documentation agents, and Bank of America, N.A., as administrative agent, issuing bank and swing line bank, and Banc of America Securities LLC, lead arranger and book manager. |
| | (Filed as Exhibit 4.1 to the Company’s Report on Form 8-K dated July 12, 2007 and incorporated by reference herein.) |
| | |
12 | | Computation of Ratio of Earnings to Fixed Charges. |
| | (Filed herewith.) |
| | |
21 | | Subsidiaries of the Registrant. |
| | (Filed herewith.) |
| | |
23.1 | | Consent of PricewaterhouseCoopers LLP, an Independent Registered Public Accounting Firm. |
| | (Filed herewith.) |
| | |
31.1 | | Certification of Principal Executive Officer pursuant to Section 302 of the Sarbanes-Oxley Act of 2002. |
| | (Filed herewith.) |
| | |
31.2 | | Certification of Principal Financial Officer pursuant to Section 302 of the Sarbanes-Oxley Act of 2002. |
| | (Filed herewith.) |
| | |
32.1 | | Certification of the Chief Executive Officer pursuant to Section 906 of the Sarbanes-Oxley Act of 2002. |
| | (Furnished herewith.) |
61
Exhibit | | |
Number | | Document Description |
32.2 | | Certification of the Chief Financial Officer pursuant to Section 906 of the Sarbanes-Oxley Act of 2002. |
| | (Furnished herewith.) |
* Management contracts and executive compensation plans and arrangements required to be filed as exhibits pursuant to Item 15(a)(3) of Form 10-K.
62