UNITED STATES
SECURITIES AND EXCHANGE COMMISSION
WASHINGTON, D.C. 20549
___________________________________________________________
FORM 6-K
___________________________________________________________
Report of Foreign Private Issuer
Pursuant to Rule 13a-16 or 15d-16 of
the Securities Exchange Act of 1934
For the quarterly period ended March 31, 2017
Commission file number 1-33867
___________________________________________________________
TEEKAY TANKERS LTD.
(Exact name of Registrant as specified in its charter)
___________________________________________________________
4th Floor, Belvedere Building, 69 Pitts Bay Road, Hamilton, HM 08, Bermuda
(Address of principal executive offices)
___________________________________________________________
Indicate by check mark whether the registrant files or will file annual reports under cover Form 20-F or Form 40-F.
Form 20-F ý Form 40-F ¨
Indicate by check mark if the registrant is submitting the Form 6-K in paper as permitted by Regulation S-T Rule 101(b)(1).
Yes ¨ No ý
Indicate by check mark if the registrant is submitting the Form 6-K in paper as permitted by Regulation S-T Rule 101(b)(7).
Yes ¨ No ý
TEEKAY TANKERS LTD.
REPORT ON FORM 6-K FOR THE QUARTERLY PERIOD ENDED MARCH 31, 2017
INDEX
| PAGE | ||
| Item 1. | ||
| Item 2. | ||
| Item 3. | ||
PART I – FINANCIAL INFORMATION
ITEM 1 — FINANCIAL STATEMENTS
TEEKAY TANKERS LTD. AND SUBSIDIARIES
UNAUDITED CONSOLIDATED STATEMENTS OF INCOME
(in thousands of U.S. dollars, except share and per share amounts)
| Three Months Ended | Three Months Ended | ||||||
| March 31, 2017 | March 31, 2016 | ||||||
| $ | $ | ||||||
| REVENUES | |||||||
Net pool revenues (note 10a) | 45,452 | 110,806 | |||||
Time-charter revenues (note 10a) | 30,330 | 22,987 | |||||
| Voyage charter revenues | 39,344 | 20,549 | |||||
Other revenues (note 3) | 9,970 | 10,608 | |||||
| Total revenues | 125,096 | 164,950 | |||||
Voyage expenses (note 10a) | (24,447 | ) | (12,823 | ) | |||
Vessel operating expenses (note 10a) | (44,138 | ) | (45,073 | ) | |||
| Time-charter hire expense | (13,627 | ) | (20,716 | ) | |||
| Depreciation and amortization | (24,909 | ) | (27,067 | ) | |||
General and administrative expenses (note 10a) | (4,536 | ) | (5,433 | ) | |||
Loss on sale of vessels (note 11) | (4,427 | ) | — | ||||
| Income from operations | 9,012 | 53,838 | |||||
| Interest expense | (7,306 | ) | (8,271 | ) | |||
| Interest income | 79 | 26 | |||||
Realized and unrealized gain (loss) on derivative instruments (note 6) | 461 | (7,781 | ) | ||||
Equity income (note 4) | 2,011 | 3,814 | |||||
Other expense (note 7) | (1,429 | ) | (2,646 | ) | |||
| Net income | 2,828 | 38,980 | |||||
Per common share amounts (note 12) | |||||||
| - Basic earnings per share | 0.02 | 0.25 | |||||
| - Diluted earnings per share | 0.02 | 0.25 | |||||
| - Cash dividends declared | 0.03 | — | |||||
Weighted-average number of Class A and Class B common stock outstanding (note 12) | |||||||
| - Basic | 164,352,065 | 156,083,657 | |||||
| - Diluted | 164,504,564 | 156,492,737 | |||||
Related party transactions (note 10) | |||||||
The accompanying notes are an integral part of the unaudited consolidated financial statements.
1
TEEKAY TANKERS LTD. AND SUBSIDIARIES
UNAUDITED CONSOLIDATED BALANCE SHEETS
(in thousands of U.S. dollars)
| As at | As at | |||||
| March 31, 2017 | December 31, 2016 | |||||
| $ | $ | |||||
| ASSETS | ||||||
| Current | ||||||
| Cash and cash equivalents | 47,564 | 68,108 | ||||
| Restricted cash | 1,089 | 750 | ||||
Pool receivable from affiliates, net (note 10b) | 22,075 | 24,598 | ||||
| Accounts receivable | 22,797 | 30,247 | ||||
Vessels held for sale (note 11) | 7,500 | 33,802 | ||||
Due from affiliates (note 10b) | 37,869 | 41,420 | ||||
Current portion of derivative assets (note 6) | 459 | 875 | ||||
| Prepaid expenses | 15,858 | 15,684 | ||||
| Total current assets | 155,211 | 215,484 | ||||
| Vessels and equipment At cost, less accumulated depreciation of $476.8 million (2016 - $459.3 million) | 1,574,375 | 1,605,372 | ||||
Investment in and advances to equity accounted investments (note 4) | 83,284 | 81,273 | ||||
Derivative assets (note 6) | 4,434 | 4,538 | ||||
Intangible assets At cost, less accumulated amortization of $5.7 million (2016 - $4.8 million) | 16,843 | 17,658 | ||||
| Goodwill | 8,059 | 8,059 | ||||
| Other non-current assets | 37 | 41 | ||||
| Total assets | 1,842,243 | 1,932,425 | ||||
| LIABILITIES AND EQUITY | ||||||
| Current | ||||||
| Accounts payable | 10,695 | 12,265 | ||||
| Accrued liabilities | 24,206 | 27,224 | ||||
Current portion of long-term debt (note 5) | 155,050 | 171,019 | ||||
Current portion of derivative liabilities (note 6) | 481 | 1,108 | ||||
| Deferred revenue | 4,673 | 4,394 | ||||
Due to affiliates (note 10b) | 10,085 | 20,912 | ||||
| Total current liabilities | 205,190 | 236,922 | ||||
Long-term debt (note 5) | 690,304 | 761,997 | ||||
Other long-term liabilities (note 7) | 14,333 | 12,882 | ||||
| Total liabilities | 909,827 | 1,011,801 | ||||
Commitments and contingencies (notes 4, 5 and 6) | ||||||
| Equity | ||||||
Common stock and additional paid-in capital (300.0 million shares authorized, 142.2 million Class A and 23.2 million Class B shares issued and outstanding as of March 31, 2017 and 136.1 million Class A and 23.2 million Class B shares issued and outstanding as of December 31, 2016) (note 9) | 1,117,232 | 1,103,304 | ||||
| Accumulated deficit | (184,816 | ) | (182,680 | ) | ||
| Total equity | 932,416 | 920,624 | ||||
| Total liabilities and equity | 1,842,243 | 1,932,425 | ||||
The accompanying notes are an integral part of the unaudited consolidated financial statements.
2
TEEKAY TANKERS LTD. AND SUBSIDIARIES
UNAUDITED CONSOLIDATED STATEMENTS OF CASH FLOWS
(in thousands of U.S. dollars)
| Three Months Ended | Three Months Ended | |||||
| March 31, 2017 | March 31, 2016 | |||||
| $ | $ | |||||
| Cash and cash equivalents provided by (used for) | ||||||
| OPERATING ACTIVITIES | ||||||
| Net income | 2,828 | 38,980 | ||||
| Non-cash items: | ||||||
| Depreciation and amortization | 24,909 | 27,067 | ||||
Loss on sale of vessels (note 11) | 4,427 | — | ||||
| Unrealized gain on derivative instruments | (121 | ) | (1,812 | ) | ||
| Equity income | (2,011 | ) | (3,814 | ) | ||
| Other | 2,897 | 3,517 | ||||
| Change in operating assets and liabilities | (3,366 | ) | (5,531 | ) | ||
| Expenditures for dry docking | (780 | ) | (2,187 | ) | ||
| Net operating cash flow | 28,783 | 56,220 | ||||
| FINANCING ACTIVITIES | ||||||
| Proceeds from long-term debt, net of issuance costs | 682 | 848,989 | ||||
| Repayments of long-term debt | (29,085 | ) | (36,574 | ) | ||
| Prepayment of long-term debt | (60,078 | ) | (890,091 | ) | ||
| Cash dividends paid | (4,964 | ) | (18,724 | ) | ||
| Proceeds from equity offerings, net of offering costs (note 9) | 13,565 | — | ||||
| Other | (213 | ) | (499 | ) | ||
| Net financing cash flow | (80,093 | ) | (96,899 | ) | ||
| INVESTING ACTIVITIES | ||||||
Proceeds from sale of vessels (note 11) | 32,626 | — | ||||
| Expenditures for vessels and equipment | (1,860 | ) | (2,364 | ) | ||
Return of capital from Teekay Tanker Operations Ltd. (note 4c) | — | 15,000 | ||||
| Net investing cash flow | 30,766 | 12,636 | ||||
| Decrease in cash and cash equivalents | (20,544 | ) | (28,043 | ) | ||
| Cash and cash equivalents, beginning of the period | 68,108 | 96,417 | ||||
| Cash and cash equivalents, end of the period | 47,564 | 68,374 | ||||
The accompanying notes are an integral part of the unaudited consolidated financial statements.
3
TEEKAY TANKERS LTD. AND SUBSIDIARIES
UNAUDITED CONSOLIDATED STATEMENT OF CHANGES IN EQUITY
(in thousands of U.S. dollars, except share amounts)
Common Stock and Additional Paid-in Capital | |||||||||||||||
Thousands of Common Stock # | Class A $ | Class B $ | Accumulated Deficit $ | Total $ | |||||||||||
| Balance as at December 31, 2016 | 159,304 | 1,040,669 | 62,635 | (182,680 | ) | 920,624 | |||||||||
| Net income | — | — | — | 2,828 | 2,828 | ||||||||||
Proceeds from issuance of Class A common stock (note 9) | 5,955 | 13,521 | — | — | 13,521 | ||||||||||
| Dividends declared | — | — | — | (4,964 | ) | (4,964 | ) | ||||||||
Equity-based compensation (note 9) | 160 | 407 | — | — | 407 | ||||||||||
| Balance as at March 31, 2017 | 165,419 | 1,054,597 | 62,635 | (184,816 | ) | 932,416 | |||||||||
The accompanying notes are an integral part of the unaudited consolidated financial statements.
4
TEEKAY TANKERS LTD. AND SUBSIDIARIES
NOTES TO THE UNAUDITED CONSOLIDATED FINANCIAL STATEMENTS
(all tabular amounts stated in thousands of U.S. dollars, other than share or per share data)
| 1. | Basis of Presentation |
The unaudited interim consolidated financial statements (or consolidated financial statements) have been prepared in conformity with United States generally accepted accounting principles (or GAAP). These consolidated financial statements include the accounts of Teekay Tankers Ltd. and its wholly-owned subsidiaries and equity accounted investments (collectively the Company). The preparation of consolidated financial statements in conformity with GAAP requires management to make estimates and assumptions that affect the amounts reported in the consolidated financial statements and accompanying notes. Actual results could differ from those estimates.
Certain information and footnote disclosures required by GAAP for complete annual financial statements have been omitted and, therefore, these consolidated financial statements should be read in conjunction with the Company’s audited consolidated financial statements filed on Form 20-F for the year ended December 31, 2016. In the opinion of management, these consolidated financial statements reflect all adjustments, consisting solely of a normal recurring nature, necessary to present fairly, in all material respects, the Company’s consolidated financial position, results of operations, and cash flows for the interim periods presented. The results of operations for the interim periods presented are not necessarily indicative of those for a full fiscal year. Significant intercompany balances and transactions have been eliminated upon consolidation.
| 2. | Accounting Pronouncements |
In May 2014, the Financial Accounting Standards Board (or FASB) issued Accounting Standards Update 2014-09, Revenue from Contracts with Customers, (or ASU 2014-09). ASU 2014-09 will require an entity to recognize revenue when it transfers promised goods or services to customers in an amount that reflects the consideration to which the entity expects to be entitled in exchange for those goods or services. This update creates a five-step model that requires entities to exercise judgment when considering the terms of the contract(s) which include (i) identifying the contract(s) with the customer, (ii) identifying the separate performance obligations in the contract, (iii) determining the transaction price, (iv) allocating the transaction price to the separate performance obligations, and (v) recognizing revenue as each performance obligation is satisfied. ASU 2014-09 is effective for the Company January 1, 2018 and shall be applied, at the Company’s option, retrospectively to each period presented or as a cumulative-effect adjustment as of the date of adoption. The Company expects that the adoption of ASU 2014-09 may result in a change in the method of recognizing revenue from voyage charters, whereby the Company’s method of determining proportional performance will change from discharge-to-discharge to load-to-discharge. This would result in no revenue being recognized from discharge of the prior voyage to loading of the current voyage and all revenue being recognized from loading of the current voyage to discharge of the current voyage. This change would result in revenue being recognized later in the voyage which may cause additional volatility in revenue and earnings between periods. The Company is in the process of validating aspects of its preliminary assessment of ASU 2014-09, determining the transitional impact and completing other items required for the adoption of ASU 2014-09.
In February 2016, the FASB issued Accounting Standards Update 2016-02, Leases (or ASU 2016-02). ASU 2016-02 establishes a right-of-use model that requires a lessee to record a right of use asset and a lease liability on the balance sheet for all leases with terms longer than 12 months. Leases will be classified as either finance or operating, with classification affecting the pattern of expense recognition in the income statement. The Company expects to adopt ASU 2016-02 effective January 1, 2018. A modified retrospective transition approach is required for lessees for capital and operating leases existing at, or entered into after, the beginning of the earliest comparative period presented in the financial statements, with certain practical expedients available. The Company expects that the adoption of ASU 2016-02 will result in a change in accounting method for the lease portion of the daily charter hire for the Company’s chartered-in vessels accounted for as operating leases with firm periods of greater than one year. Under ASU 2016-02, the Company will recognize a right of use asset and a lease liability on the balance sheet for these charters, whereas currently no right of use asset or lease liability is recognized. This will have the result of increasing the Company’s assets and liabilities. The pattern of expense recognition of chartered-in vessels is expected to remain substantially unchanged, unless the right of use asset becomes impaired. The Company is in the process of validating aspects of its preliminary assessment of ASU 2016-02, determining the transitional impact and completing other items required for the adoption of ASU 2016-02.
In March 2016, the FASB issued Accounting Standards Update 2016-09, Improvements to Employee Share-Based Payment Accounting (or ASU 2016-09). ASU 2016-09 simplifies aspects of accounting for share-based payment transactions, including the income tax consequences, classification of awards as either equity or liabilities and classification on the statement of cash flows. ASU 2016-09 is effective for the Company January 1, 2017. The impact of adopting this new accounting guidance resulted in a change in presentation of cash payments for tax withholdings on share settled equity awards from an operating cash outflow to financing cash outflow on the Company's statements of cash flows, and this change was applied retrospectively.
In June 2016, the FASB issued Accounting Standards Update 2016-13, Financial Instruments - Credit Losses: Measurement of Credit Losses on Financial Instruments. This update replaces the incurred loss impairment methodology with a methodology that reflects expected credit losses and requires consideration of a broader range of reasonable and supportable information to inform credit loss estimates. This update is effective for the Company January 1, 2020, with a modified-retrospective approach. The Company is currently evaluating the effect of adopting this new guidance.
In August 2016, the FASB issued Accounting Standards Update 2016-15, Statement of Cash Flows: Classification of Certain Cash Receipts and Cash Payments, which, among other things, provides guidance on two acceptable approaches of classifying distributions received from equity method investees in the statement of cash flows. This update is effective for the Company January 1, 2018, with a retrospective approach. The Company is currently evaluating the effect of adopting this new guidance.
5
| 3. | Segment Reporting |
The Company has two reportable segments, its conventional tanker segment and its ship-to-ship transfer segment. The Company’s conventional tanker segment consists of the operation of all of its tankers, including those employed on full service lightering contracts. The Company’s ship-to-ship transfer segment consists of the Company’s lightering support services, including those provided to the Company’s conventional tanker segment as part of full service lightering operations, as well as consultancy, liquefied natural gas (LNG) terminal management and other related services. Segment results are evaluated based on income from operations. The accounting policies applied to the reportable segments are the same as those used in the preparation of the Company’s consolidated financial statements.
The following tables include results for the Company’s revenues and income from vessel operations by segment for the three months ended March 31, 2017 and March 31, 2016.
| Three Months Ended March 31, 2017 | ||||||||||||||||
| Conventional Tanker Segment | Ship-to-Ship Transfer Segment | Inter-segment Adjustment (1) | Total | |||||||||||||
| $ | $ | $ | $ | |||||||||||||
Revenues (2) | 115,166 | 12,888 | (2,958 | ) | 125,096 | |||||||||||
| Voyage expenses | (27,405 | ) | — | 2,958 | (24,447 | ) | ||||||||||
| Vessel operating expenses | (34,081 | ) | (10,057 | ) | — | (44,138 | ) | |||||||||
| Time-charter hire expense | (12,134 | ) | (1,493 | ) | — | (13,627 | ) | |||||||||
| Depreciation and amortization | (23,629 | ) | (1,280 | ) | — | (24,909 | ) | |||||||||
| General and administrative expenses | (3,570 | ) | (966 | ) | — | (4,536 | ) | |||||||||
| Loss on sale of vessels | (4,427 | ) | — | — | (4,427 | ) | ||||||||||
Income (loss) from operations (3) | 9,920 | (908 | ) | — | 9,012 | |||||||||||
| Equity income | 2,011 | — | — | 2,011 | ||||||||||||
| (1) | The ship-to-ship transfer segment provides lightering support services to the conventional tanker segment for full service lightering operations and the pricing for such services was based on actual costs incurred per voyage. |
| (2) | Revenues, net of the inter-segment adjustment, earned from the ship-to-ship transfer segment are reflected in Other Revenues in the Company's consolidated statements of income. |
| (3) | Includes direct general and administrative expenses and indirect general and administrative expenses (allocated to each segment based on estimated use of corporate resources). |
| Three Months Ended March 31, 2016 | ||||||||||||||||
| Conventional Tanker Segment | Ship-to-Ship Transfer Segment | Inter-segment Adjustment (1) | Total | |||||||||||||
| $ | $ | $ | $ | |||||||||||||
Revenues (2) | 155,565 | 10,086 | (701 | ) | 164,950 | |||||||||||
| Voyage expenses | (13,258 | ) | (266 | ) | 701 | (12,823 | ) | |||||||||
| Vessel operating expenses | (37,508 | ) | (7,565 | ) | — | (45,073 | ) | |||||||||
| Time-charter hire expense | (20,430 | ) | (286 | ) | — | (20,716 | ) | |||||||||
| Depreciation and amortization | (25,954 | ) | (1,113 | ) | — | (27,067 | ) | |||||||||
| General and administrative expenses | (4,771 | ) | (662 | ) | — | (5,433 | ) | |||||||||
Income from operations (3) | 53,644 | 194 | — | 53,838 | ||||||||||||
| Equity income | 3,814 | — | — | 3,814 | ||||||||||||
| (1) | The ship-to-ship transfer segment provides lightering support services to the conventional tanker segment for full service lightering operations and the pricing for such services was based on estimated costs incurred per voyage. |
6
TEEKAY TANKERS LTD. AND SUBSIDIARIES
NOTES TO THE UNAUDITED CONSOLIDATED FINANCIAL STATEMENTS
(all tabular amounts stated in thousands of U.S. dollars, other than share or per share data)
| (2) | Revenues, net of the inter-segment adjustment, earned from the ship-to-ship transfer segment are reflected in Other Revenues in the Company's consolidated statements of income. |
| (3) | Includes direct general and administrative expenses and indirect general and administrative expenses (allocated to each segment based on estimated use of corporate resources). |
A reconciliation of total segment assets to total assets presented in the accompanying consolidated balance sheets is as follows:
| As at | As at | ||||
| March 31, 2017 | December 31, 2016 | ||||
| $ | $ | ||||
| Conventional Tanker Segment | 1,754,302 | 1,822,654 | |||
| Ship-to-Ship Transfer Segment | 40,377 | 41,663 | |||
| Cash and cash equivalents | 47,564 | 68,108 | |||
| Consolidated total assets | 1,842,243 | 1,932,425 | |||
| 4. | Investments in and Advances to Equity Accounted Investments |
| As at March 31, 2017 | As at December 31, 2016 | |||||
| $ | $ | |||||
| High-Q Joint Venture | 22,818 | 22,025 | ||||
| Tanker Investments Ltd. | 48,043 | 47,710 | ||||
| Teekay Tanker Operations Ltd. | 12,423 | 11,538 | ||||
| Total | 83,284 | 81,273 | ||||
| a. | The Company has a joint venture arrangement with Wah Kwong Maritime Transport Holdings Limited (or Wah Kwong), whereby the Company has a 50% economic interest in the High-Q joint venture, which is jointly controlled by the Company and Wah Kwong. The High-Q joint venture owns one Very Large Crude Carrier (or VLCC), which is trading on a fixed time charter-out contract expiring in 2018. Under this contract, the vessel earns a fixed daily rate and an additional amount if the daily rate of any sub-charter earned exceeds a certain threshold. |
As at March 31, 2017, the High-Q joint venture has a loan outstanding with a financial institution with a balance of $47.0 million (December 31, 2016 – $48.5 million). The loan is secured by a first-priority mortgage on the VLCC owned by the High-Q joint venture and 50% of the outstanding loan balance is guaranteed by the Company. The High-Q joint venture has an interest rate swap agreement with an outstanding notional amount of $47.0 million that expires in June 2018, 50% of which is guaranteed by the Company. The remaining 50% is guaranteed by the High-Q joint venture partner. The interest rate swap exchanges a receipt of floating interest based on 3-months LIBOR for a payment of a fixed rate of 1.47% every three months.
| b. | In January 2014, the Company and Teekay Corporation (or Teekay) formed Tanker Investments Ltd. (or TIL), which owns and operates conventional tankers. In January 2014, the Company purchased 2.5 million shares of TIL common stock for $25.0 million and received a stock purchase warrant entitling it to purchase up to 750,000 additional shares of common stock of TIL (see note 6). The stock purchase warrant is a derivative asset which had an estimated fair value of $0.2 million as at March 31, 2017 (December 31, 2016 - $0.3 million). The Company also received one preferred share which entitles the Company to elect one board member of TIL. The preferred share does not give the Company a right to any dividends or distributions of TIL. The Company accounts for its investment in TIL using the equity method. |
In 2016, TIL repurchased 3.3 million of its own shares on the open market. The common shares were repurchased at a weighted average price of NOK 80.2 per share, or a gross purchase price of $31.8 million. As of March 31, 2017, the Company’s ownership interest in TIL was 11.3% (December 31, 2016 - 11.3%).
| c. | In August 2014, the Company purchased from Teekay a 50% interest in Teekay Tanker Operations Ltd. (or TTOL), which owns conventional tanker commercial management and technical management operations, including direct ownership in five commercially managed revenue sharing arrangements, for an aggregate price of approximately $23.7 million, including working capital of $6.7 million. The Company accounts for its ownership interest in TTOL using the equity method. In January 2016, the Company received $15.0 million as a return of capital from TTOL. |
7
TEEKAY TANKERS LTD. AND SUBSIDIARIES
NOTES TO THE UNAUDITED CONSOLIDATED FINANCIAL STATEMENTS
(all tabular amounts stated in thousands of U.S. dollars, other than share or per share data)
| 5. | Long-Term Debt |
| As at | As at | ||||
| March 31, 2017 | December 31, 2016 | ||||
| $ | $ | ||||
| Revolving credit facilities due through 2021 | 404,521 | 466,195 | |||
| Term loans due through 2021 | 448,659 | 475,466 | |||
| Total principal | 853,180 | 941,661 | |||
| Less: unamortized discount and debt issuance costs | (7,826 | ) | (8,645 | ) | |
| Total debt | 845,354 | 933,016 | |||
| Less: current portion | (155,050 | ) | (171,019 | ) | |
| Non-current portion of long-term debt | 690,304 | 761,997 | |||
As at March 31, 2017, the Company had two revolving credit facilities (or the Revolvers), which, as at such date, provided for aggregate borrowings of up to $443.2 million, of which $38.7 million was undrawn (December 31, 2016 - $500.5 million, of which $34.3 million was undrawn). Interest payments are based on LIBOR plus margins, which, at March 31, 2017, the margins ranged between 0.45% and 2.00% (December 31, 2016: 0.45% and 2.00%). The total amount available under the Revolvers reduces by $10.9 million (remainder of 2017), $67.3 million (2018), $nil (2019), $nil (2020) and $365.0 million (2021). As at March 31, 2017, the Company also had two term loans outstanding, which totaled $448.7 million (December 31, 2016 - $475.5 million). Interest payments on the term loans are based on LIBOR plus margins, which, at March 31, 2017 the margins ranged from 0.30% to 2.00% (December 31, 2016 - 0.30% to 2.00%). The term loan repayments are made in quarterly or semi-annual payments. One term loan also has a balloon or bullet repayment due at maturity in 2021. These revolving credit facilities and term loans are further described below.
In January 2016, the Company entered into a $894.4 million long-term debt facility (or the 2016 Debt Facility), consisting of both a term loan and a revolving credit component, which are both scheduled to mature in January 2021. In January 2016, $845.8 million of the 2016 Debt Facility was used to repay the Company’s two bridge loan facilities, which matured in late January 2016, and a portion of the Company’s corporate revolving credit facility, which was scheduled to mature in 2017. As at March 31, 2017, the corporate revolving credit facility had no outstanding balance (December 31, 2016 - $55.1 million). The 2016 Debt Facility is collateralized by 36 of the Company’s vessels, together with other related security. The 2016 Debt Facility also requires that the Company maintain a minimum hull coverage ratio of 125% of the total outstanding drawn balance for the facility period. Such requirement is assessed on a semi-annual basis with reference to vessel valuations compiled by one or more agreed upon third parties. Should the ratio drop below the required amount, the lender may request that the Company either prepay a portion of the loan in the amount of the shortfall or provide additional collateral in the amount of the shortfall, at the Company’s option. As at March 31, 2017, this ratio was 127% (December 31, 2016 - 140%). The vessel values used in this ratio are appraised values prepared by the Company based on second-hand sale and purchase market data. A decline in the tanker market could negatively affect the ratio. In addition, the Company is required to maintain a minimum liquidity (cash, cash equivalents and undrawn committed revolving credit lines with at least six months to maturity) of $35.0 million and at least 5.0% of the Company’s total consolidated debt.
The Company’s remaining revolver is collateralized by three of the Company’s vessels, together with other related security. The revolver requires that the Company’s applicable subsidiary to maintain a minimum hull coverage ratio of 105% of the total outstanding drawn balance for the facility period. Such requirement is assessed on an annual basis, with reference to vessel valuations compiled by an agreed upon third party. Should the ratio drop below the required amount, the lender may request that the Company either prepay a portion of the loan in the amount of the shortfall or provide additional collateral in the amount of the shortfall, at the Company’s option. As at March 31, 2017, such revolver, with a minimum hull coverage ratio requirement, had an outstanding balance of $70.4 million (December 31, 2016 - $72.0 million) and a hull coverage ratio of 111% (December 31, 2016 - 117%). The vessel values used in this ratio are appraised values prepared by the Company based on second-hand sale and purchase market data. A decline in the tanker market could negatively affect the ratio. The revolver is also guaranteed by Teekay and contains covenants that require Teekay to maintain the greater of free cash (cash and cash equivalents and undrawn committed revolving credit lines with at least six months to maturity) of $50.0 million and at least 5.0% of Teekay’s total consolidated debt which has recourse to Teekay.
The Company’s remaining term loan is collateralized by two of the Company’s vessels, together with other related security. The term loan is guaranteed by Teekay and contains covenants that require Teekay to maintain the greater of (a) free cash (cash and cash equivalents) of at least $50.0 million and (b) an aggregate of free cash and undrawn committed revolving credit lines with at least six months to maturity of at least 5.0% of Teekay’s total consolidated debt which has recourse to Teekay.
As at March 31, 2017, the Company was in compliance with all covenants in respect of the Revolvers and term loans. Teekay has also advised the Company that Teekay is in compliance with all covenants relating to the revolving credit facilities and term loans to which the Company is a party.
8
TEEKAY TANKERS LTD. AND SUBSIDIARIES
NOTES TO THE UNAUDITED CONSOLIDATED FINANCIAL STATEMENTS
(all tabular amounts stated in thousands of U.S. dollars, other than share or per share data)
The weighted-average effective interest rate on the Company’s long-term debt as at March 31, 2017 was 2.8% (December 31, 2016 - 2.4%). This rate does not reflect the effect of the Company’s interest rate swap agreements (see note 6).
The aggregate annual long-term principal repayments required to be made by the Company under the Revolvers and term loans subsequent to March 31, 2017 are $90.5 million (remaining 2017), $174.5 million (2018), $108.9 million (2019), $108.9 million (2020) and $370.4 million (2021).
| 6. | Derivative Instruments |
Interest rate swap agreements
The Company uses derivatives in accordance with its overall risk management policies. The Company enters into interest rate swap agreements which exchange a receipt of floating interest for a payment of fixed interest to reduce the Company’s exposure to interest rate variability on its outstanding floating-rate debt. The Company has not designated, for accounting purposes, its interest rate swaps as cash flow hedges of its U.S. Dollar LIBOR-denominated borrowings.
As at March 31, 2017, the Company was committed to the following interest rate swap agreements:
| Interest Rate | Notional Amount | Fair Value / Carrying Amount of Asset | Remaining Term | Fixed Interest Rate | |||||||||
| Index | $ | $ | (years) | (%) (1) | |||||||||
| LIBOR-Based Debt: | |||||||||||||
| U.S. Dollar-denominated interest rate swaps | LIBOR | 173,555 | 743 | 3.8 | 1.46 | ||||||||
| U.S. Dollar-denominated interest rate swaps | LIBOR | 150,000 | 1,778 | 3.8 | 1.55 | ||||||||
| U.S. Dollar-denominated interest rate swaps | LIBOR | 50,000 | 1,324 | 3.8 | 1.16 | ||||||||
| (1) | Excludes the margin the Company pays on its variable-rate debt, which, as of March 31, 2017, ranged from 0.30% to 2.00%. |
The Company is potentially exposed to credit loss in the event of non-performance by the counterparty to the interest rate swap agreements in the event that the fair value results in an asset being recorded. In order to minimize counterparty risk, the Company only enters into interest rate swap agreements with counterparties that are rated A– or better by Standard & Poor’s or A3 or better by Moody’s at the time transactions are entered into.
Stock purchase warrant
The Company has a stock purchase warrant entitling it to purchase up to 750,000 shares of common stock of TIL at a fixed price of $10 per share. Alternatively, if the shares of TIL’s common stock trade on a national securities exchange or over-the-counter market denominated in Norwegian Kroner, the Company may also exercise the stock purchase warrant at 61.67 Norwegian Kroner (or NOK) per share. The stock purchase warrant expires on January 23, 2019. For purposes of vesting, the stock purchase warrant is divided into four equally sized tranches. If the shares of TIL’s common stock trade on a national securities exchange or over-the-counter market denominated in Norwegian Kroner, each tranche will vest and become exercisable when and if the fair market value of a share of the TIL common stock equals or exceeds 77.08 NOK, 92.50 NOK, 107.91 NOK and 123.33 NOK, respectively, for such tranche for any ten consecutive trading days, subject to certain trading value requirements. As at March 31, 2017, the first two tranches had vested.
Time-charter swap agreement
Effective June 1, 2016, the Company entered into a time-charter swap agreement for 55% of two Aframax equivalent vessels. Under such agreement, the Company will receive $27,776 per day, less a 1.25% brokerage commission, and pay 55% of the net revenue distribution of two Aframax equivalent vessels employed in the Company’s Aframax revenue sharing arrangement, less $500 per day, for a period of 11 months plus an additional two months at the counterparty’s option. The purpose of the agreement is to reduce the Company’s exposure to spot tanker market rate variability for certain of its vessels that are employed in the Aframax revenue sharing arrangement. The Company has not designated, for accounting purposes, the time-charter swap as a cash flow hedge.
Forward freight agreements
The Company uses forward freight agreements (or FFAs) in non-hedge-related transactions to increase or decrease its exposure to spot market rates, within defined limits. Net gains and losses from FFAs are recorded within realized and unrealized gain (loss) on derivative instruments in the Company's consolidated statements of income.
9
TEEKAY TANKERS LTD. AND SUBSIDIARIES
NOTES TO THE UNAUDITED CONSOLIDATED FINANCIAL STATEMENTS
(all tabular amounts stated in thousands of U.S. dollars, other than share or per share data)
The following table presents the location and fair value amounts of derivative instruments, segregated by type of contract, on the Company’s consolidated balance sheets.
| Current portion of derivative assets | Derivative assets | Accrued liabilities | Current portion of derivative liabilities | ||||||||
| $ | $ | $ | $ | ||||||||
| As at March 31, 2017 | |||||||||||
| Interest rate swap agreements | 57 | 4,268 | (183 | ) | (480 | ) | |||||
| Stock purchase warrant | — | 166 | — | — | |||||||
| Time-charter swap agreement | 402 | — | (587 | ) | — | ||||||
| Forward freight agreements | — | — | (7 | ) | (1 | ) | |||||
| 459 | 4,434 | (777 | ) | (481 | ) | ||||||
| As at December 31, 2016 | |||||||||||
| Interest rate swap agreements | — | 4,251 | (254 | ) | (1,108 | ) | |||||
| Stock purchase warrant | — | 287 | — | — | |||||||
| Time-charter swap agreement | 875 | — | (667 | ) | — | ||||||
| 875 | 4,538 | (921 | ) | (1,108 | ) | ||||||
Realized and unrealized gains (losses) relating to the interest rate swaps, stock purchase warrant, time-charter swap and freight forward agreements are recognized in earnings and reported in realized and unrealized gain (loss) on derivative instruments in the Company’s consolidated statements of income as follows:
| Three Months Ended | Three Months Ended | ||||||||||||
| March 31, 2017 | March 31, 2016 | ||||||||||||
| Realized gains (losses) | Unrealized gains (losses) | Total | Realized gains (losses) | Unrealized gains (losses) | Total | ||||||||
| $ | $ | $ | $ | $ | $ | ||||||||
| Interest rate swap agreements | (439 | ) | 702 | 263 | (9,593 | ) | 3,923 | (5,670 | ) | ||||
| Stock purchase warrant | — | (121 | ) | (121 | ) | — | (2,111 | ) | (2,111 | ) | |||
| Time-charter swap agreement | 746 | (473 | ) | 273 | — | — | — | ||||||
| Forward freight agreements | 33 | 13 | 46 | — | — | — | |||||||
| 340 | 121 | 461 | (9,593 | ) | 1,812 | (7,781 | ) | ||||||
| 7. | Other Expense |
The components of other expense are as follows:
| Three Months Ended March 31, | |||||||
| 2017 | 2016 | ||||||
| $ | $ | ||||||
| Freight tax provision | (1,488 | ) | (2,477 | ) | |||
| Foreign exchange gain (loss) | 60 | (163 | ) | ||||
| Other expense | (1 | ) | (6 | ) | |||
| Total | (1,429 | ) | (2,646 | ) | |||
10
TEEKAY TANKERS LTD. AND SUBSIDIARIES
NOTES TO THE UNAUDITED CONSOLIDATED FINANCIAL STATEMENTS
(all tabular amounts stated in thousands of U.S. dollars, other than share or per share data)
The following reflects the changes in the Company’s unrecognized tax benefits, recorded in other long-term liabilities, from December 31, 2016 to March 31, 2017:
| 2017 | |||
| $ | |||
| Balance of unrecognized tax benefits as at January 1 | 12,882 | ||
| Increases for positions related to the current period | 1,652 | ||
| Changes for positions taken in prior periods | — | ||
| Decreases related to statute of limitations | (201 | ) | |
| Balance of unrecognized tax benefits as at March 31 | 14,333 | ||
The majority of the net increase for positions for the three months ended March 31, 2017 relates to potential tax on freight income.
The Company does not presently anticipate its uncertain tax positions will significantly increase or decrease in the next 12 months; however, actual developments could differ from those currently expected.
| 8. | Financial Instruments |
| a. | Fair Value Measurements |
For a description of how the Company estimates fair value and for a description of the fair value hierarchy levels, see note 13 to the Company’s audited consolidated financial statements filed with its Annual Report on the Form 20-F for the year ended December 31, 2016.
The Company has entered into a time-charter swap agreement for 55% of two Aframax equivalent vessels (see note 6). The fair value of this derivative agreement is the estimated amount that the Company would receive or pay to terminate the agreement at the reporting date, based on the present value of the Company’s projection of future Aframax spot market tanker rates, which have been derived from current Aframax spot market tanker rates and estimated future rates, as well as an estimated discount rate.
The following table includes the estimated fair value and carrying value of those assets and liabilities that are measured at fair value on a recurring and non-recurring basis as well as the estimated fair value of the Company’s financial instruments that are not accounted for at the fair value on a recurring basis.
| March 31, 2017 | December 31, 2016 | |||||||||||||
Fair Value Hierarchy Level | Carrying Amount Asset / (Liability) $ | Fair Value Asset / (Liability) $ | Carrying Amount Asset / (Liability) $ | Fair Value Asset / (Liability) $ | ||||||||||
| Recurring: | ||||||||||||||
| Cash and cash equivalents and restricted cash | Level 1 | 48,653 | 48,653 | 68,858 | 68,858 | |||||||||
Derivative instruments (note 6) | ||||||||||||||
Interest rate swap agreements (1) | Level 2 | 3,845 | 3,845 | 3,143 | 3,143 | |||||||||
Time-charter swap agreement (1) | Level 3 | 402 | 402 | 875 | 875 | |||||||||
| Stock purchase warrant | Level 3 | 166 | 166 | 287 | 287 | |||||||||
| Non-Recurring: | ||||||||||||||
Vessels held for sale (note 11) | Level 2 | 7,500 | 7,500 | 33,802 | 33,802 | |||||||||
| Other: | ||||||||||||||
| Advances to equity accounted investments | Note (2) | 10,480 | Note (2) | 10,480 | Note (2) | |||||||||
| Long-term debt, including current portion | Level 2 | (845,354 | ) | (832,913 | ) | (933,016 | ) | (923,306 | ) | |||||
| (1) | The fair value of the Company’s interest rate swap agreements, time-charter swap agreement and forward freight agreements at March 31, 2017 excludes accrued interest expense which is recorded in accrued liabilities on the unaudited consolidated balance sheets. |
| (2) | The advances to equity accounted investments together with the Company’s investments in the equity accounted investments form the net aggregate carrying value of the Company’s interests in the equity accounted investments in these consolidated financial statements. The fair values of the individual components of such aggregate interests as at March 31, 2017 and December 31, 2016 were not determinable. |
11
TEEKAY TANKERS LTD. AND SUBSIDIARIES
NOTES TO THE UNAUDITED CONSOLIDATED FINANCIAL STATEMENTS
(all tabular amounts stated in thousands of U.S. dollars, other than share or per share data)
Changes in fair value during the three months ended March 31, 2017 for the Company’s time-charter swap agreement, which is described below and is measured at fair value on the recurring basis using significant unobservable inputs (Level 3), are as follows:
| Three Months Ended | ||
| March 31, 2017 | ||
| $ | ||
| Fair value asset - beginning of the period | 875 | |
| Settlements | (746) | |
| Realized and unrealized gain | 273 | |
| Fair value asset - at the end of the period | 402 | |
The estimated fair value of the time-charter swap agreement as of March 31, 2017 is based upon an estimated average daily tanker rate of approximately $14,500 over the remaining duration of the contract. In developing and evaluating this estimate, the Company considers the current tanker market fundamentals as well as the short and long-term outlook. A higher or lower average daily tanker rate would result in a higher or lower fair value liability or a lower or higher fair value asset. A higher or lower discount rate would result in a lower or higher fair value asset or liability.
During January 2014, the Company received a stock purchase warrant entitling it to purchase up to 750,000 shares of the common stock of TIL (see note 4b). The estimated fair value of the stock purchase warrant was determined using a Monte-Carlo simulation and is based, in part, on the historical price of common shares of TIL, the risk-free interest rate, vesting conditions and the historical volatility of comparable companies. The estimated fair value of the stock purchase warrant as of March 31, 2017 is based on the weighted average historical volatility of comparable companies of 35.86%. A higher or lower volatility would result in a higher or lower fair value of this derivative asset.
Changes in fair value during the three months ended March 31, 2017 and 2016 for the TIL stock purchase warrant, which is measured at fair value on a recurring basis using significant unobservable inputs (Level 3), are as follows:
| Three Months Ended | ||||||
| March 31, 2017 | March 31, 2016 | |||||
| $ | $ | |||||
| Fair value at the beginning of the period | 287 | 5,164 | ||||
| Unrealized loss included in earnings | (121 | ) | (2,111 | ) | ||
| Fair value at the end of the period | 166 | 3,053 | ||||
| b. | Financing Receivables |
The following table contains a summary of the Company’s financing receivables by type and the method by which the Company monitors the credit quality of its financing receivables on a quarterly basis.
| March 31, 2017 | December 31, 2016 | |||||||
| Class of Financing Receivable | Credit Quality Indicator | Grade | $ | $ | ||||
| Advances to equity accounted investments | Other internal metrics | Performing | 10,480 | 10,480 | ||||
| Total | 10,480 | 10,480 | ||||||
| 9. | Capital Stock and Stock-Based Compensation |
The authorized capital stock of the Company at March 31, 2017 and December 31, 2016 was 100,000,000 shares of preferred stock, with a par value of $0.01 per share, 200,000,000 shares of Class A common stock, with a par value of $0.01 per share, and 100,000,000 shares of Class B common stock, with a par value of $0.01 per share. A share of Class A common stock entitles the holder to one vote per share while a share of Class B common stock entitles the holder to five votes per share, subject to a 49% aggregate Class B common stock voting power maximum. As of March 31, 2017, the Company had 142.2 million shares of Class A common stock (December 31, 2016 – 136.1 million), 23.2 million shares of Class B common stock (December 31, 2016 – 23.2 million) and no shares of preferred stock (December 31, 2016 – nil) issued and outstanding.
During March 2017, 0.4 million stock options with an exercise price of $2.23 per share were granted to the Company’s non-management directors as part of their annual compensation for 2017. These stock options have a ten-year term and vest immediately. During March 2016, a total of 9,358 shares of Class A common stock with an aggregate value of $35.0 thousand and 0.3 million stock options with an exercise price of $3.74 per share were granted to non-management directors of the Company. These shares of Class A common stock and stock options were issued under the Teekay Tankers Ltd. 2007 Long-Term Incentive Plan and distributed to the directors.
12
TEEKAY TANKERS LTD. AND SUBSIDIARIES
NOTES TO THE UNAUDITED CONSOLIDATED FINANCIAL STATEMENTS
(all tabular amounts stated in thousands of U.S. dollars, other than share or per share data)
In November 2015, the Company re-launched a continuous offering program (or COP) under which the Company may issue new common stock at market prices up to a maximum aggregate amount of $80.0 million. The Company sold 3,800,000 shares of Class A common stock under the COP during the three months ended March 31, 2017 for net proceeds of $8.5 million.
In January 2017, the Company issued 2,155,172 shares of Class A common stock in a private placement to Teekay at a price of $2.32 per share for gross proceeds of $5.0 million. The gross proceeds from the issuance were used for general corporate purposes, including strengthening the Company’s liquidity position and delevering its balance sheet.
The Company also grants stock options and restricted stock units as incentive-based compensation under the Teekay Tankers Ltd. 2007 Long-Term Incentive Plan to certain employees of Teekay subsidiaries that provide services to the Company. The Company measures the cost of such awards using the grant date fair value of the award and recognizes that cost, net of estimated forfeitures, over the requisite service period. The requisite service period consists of the period from the grant date of the award to the earlier of the date of vesting or the date the recipient becomes eligible for retirement. For stock-based compensation awards subject to graded vesting, the Company calculates the value for the award as if it was one single award with one expected life and amortizes the calculated expense for the entire award on a straight-line basis over the requisite service period. The compensation cost of the Company‘s stock-based compensation awards is reflected in general and administrative expenses in the Company’s consolidated statements of income.
During March 2017, the Company granted 0.5 million stock options with an exercise price of $2.23 per share to an officer of the Company and certain employees of Teekay subsidiaries that provide services to the Company. During March 2016, the Company granted 0.2 million stock options with an exercise price of $3.74 per share to an officer of the Company. Each stock option has a ten-year term and vests equally over three years from the grant date.
The weighted-average fair value of the stock options granted in 2017 to non-management directors and to an officer was $0.67 (2016 - $0.87) per option, estimated on the grant date using the Black-Scholes option pricing model. The following assumptions were used in computing the fair value of the stock options granted: expected volatility of 50.2% (2016 - 51.3%); expected life of five years (2016 - five years); dividend yield of 5.0% (2016 - 7.8%); and risk-free interest rate of 2.1% (2016 - 1.2%). The expected life of the stock options granted was estimated using the historical exercise behavior of employees of Teekay that receive stock options from Teekay. The expected volatility was based on historical volatility as calculated using historical data during the five years prior to the grant date.
During March 2017, the Company also granted 0.4 million (2016 - 0.3 million) restricted stock units to an officer of the Company and certain employees of Teekay subsidiaries that provide services to the Company with an aggregate fair value of $0.9 million (2016 - $1.0 million). Each restricted stock unit is equal to one share of the Company’s common stock plus reinvested distributions from the grant date to the vesting date. The restricted stock units vest equally over three years from the grant date. Any portion of a restricted stock unit award that is not vested on the date of the recipient’s termination of service is cancelled, unless their termination arises as a result of the recipient’s retirement and, in this case, the restricted stock unit award will continue to vest in accordance with the vesting schedule. Upon vesting, the value of the restricted stock unit awards, net of withholding taxes, is paid to each recipient in the form of common stock.
During the three months ended March 31, 2017 and 2016, the Company recorded $0.4 million and $0.8 million, respectively, of expenses related to the restricted stock units and stock options. During the three months ended March 31, 2017, a total of 0.2 million restricted stock units (2016 - 0.3 million) with a market value of $0.6 million (2016 - $1.0 million) vested and was paid to the grantees by issuing 0.2 million shares (2016 - 0.2 million) of Class A common stock, net of withholding taxes.
| 10. | Related Party Transactions |
Management Fee - Related and Other
| a. | Teekay, and its wholly-owned subsidiary and the Company's manager, Teekay Tankers Management Services Ltd. (or the Manager), provide commercial, technical, strategic and administrative services to the Company pursuant to a long-term management agreement. In addition, certain of the Company’s vessels participate in revenue sharing arrangements that are managed in whole or in part by subsidiaries of Teekay (collectively the Pool Managers). For additional information about these arrangements, please read “Item 7 – Major Shareholders and Related Party Transactions – Related Party Transactions” in our Annual Report on Form 20-F for the year ended December 31, 2016. Amounts received and paid by the Company for such related party transactions for the periods indicated were as follows: |
13
TEEKAY TANKERS LTD. AND SUBSIDIARIES
NOTES TO THE UNAUDITED CONSOLIDATED FINANCIAL STATEMENTS
(all tabular amounts stated in thousands of U.S. dollars, other than share or per share data)
| Three Months Ended | ||||
| March 31, 2017 | March 31, 2016 | |||
| $ | $ | |||
Time-charter revenues (i) | — | 2,535 | ||
Pool management fees and commissions (ii) | (1,736 | ) | (3,136 | ) |
Commercial management fees (iii) | (707 | ) | (340 | ) |
Vessel operating expenses - technical management fee (iv) | (2,226 | ) | (2,311 | ) |
Strategic and administrative service fees (v) | (2,664 | ) | (2,215 | ) |
| Lay-up service revenues | 6 | — | ||
LNG terminal services revenue (vi) | 84 | — | ||
| (i) | The Company chartered-out the Navigator Spirit to Teekay under a fixed-rate time-charter contract, which was scheduled to expire in July 2016. On May 18, 2016, the contract was transferred to the Americas Spirit, and subsequently expired on July 15, 2016. |
| (ii) | The Company’s share of the Pool Managers’ fees are reflected as a reduction to net pool revenues from affiliates on the Company’s consolidated statements of income. The Company is entitled to a share of the Pool Managers' fees due to its 50% ownership interest in TTOL (see note 4(c)). |
| (iii) | The Manager’s commercial management fees for vessels on time charter-out contracts and spot-traded vessels not included in the pool, which are reflected in voyage expenses on the Company’s consolidated statements of income. |
| (iv) | The cost of ship management services provided by the Manager has been presented as vessel operating expenses on the Company's consolidated statements of income. |
| (v) | The Manager's strategic and administrative service fees have been presented in general and administrative fees on the Company's consolidated statements of income. The Company's executive officers are employees of Teekay or subsidiaries thereof, and their compensation (other than any awards under the Company's long-term incentive plan described in note 9) is set and paid by Teekay or such other subsidiaries. The Company reimburses Teekay for time spent by its executive officers on the Company's management matters through the strategic portion of the management fee. |
| (vi) | In November 2016, the Company's ship-to-ship transfer business signed an operational and maintenance subcontract with Teekay LNG Bahrain Operations L.L.C., an entity wholly owned by Teekay LNG Partners L.P. (or TGP) (which is controlled by Teekay), for the Bahrain LNG Import Terminal (or the Terminal). The Terminal is owned by Bahrain LNG W.I.L., a joint venture for which Teekay LNG Operating L.L.C., an entity wholly owned by TGP, has a 30% interest. |
| b. | The Manager and other subsidiaries of Teekay collect revenues and remit payments for expenses incurred by the Company’s vessels. Such amounts, which are presented on the Company’s consolidated balance sheets in due from affiliates or due to affiliates, are without interest or stated terms of repayment. The amounts owing from the Pool Managers for monthly distributions are reflected in the consolidated balance sheets as pool receivable from affiliates, are without interest and are repayable upon the terms contained within the applicable pool agreement. The Company had also advanced $32.8 million and $35.7 million as at March 31, 2017 and December 31, 2016, respectively, to the Pool Managers for working capital purposes. These amounts, which are reflected in the consolidated balance sheets in due from affiliates, are without interest and are repayable when applicable vessels leave the pools. |
| 11. | Sales of Vessels |
The Company’s consolidated statements of income for the three months ended March 31, 2017 includes an aggregate loss on sale of vessels of $4.4 million relating to one Aframax tanker and two Suezmax tankers. The Aframax tanker was classified as held for sale at March 31, 2017 and was written down to its agreed sales price. The Company incurred a loss on sale of the Aframax tanker of $2.6 million in the three months ended March 31, 2017.
In January 2017, one Suezmax tanker was sold and delivered to its buyer. The Company recognized a loss on sale of the vessel of $0.3 million for the three months ended March 31, 2017. The vessel was previously written down to its agreed sales price of $16.9 million in the three months ended December 31, 2016.
In February 2017, the date of delivery of the other Suezmax tanker to its new owner was extended, and as a result, the sales price was reduced by $1.3 million. The vessel sale was completed in March 2017, and the Company recognized a loss on sale of the vessel of $1.5 million in the three months ended March 31, 2017.
14
TEEKAY TANKERS LTD. AND SUBSIDIARIES
NOTES TO THE UNAUDITED CONSOLIDATED FINANCIAL STATEMENTS
(all tabular amounts stated in thousands of U.S. dollars, other than share or per share data)
| 12. | Earnings Per Share |
Basic earnings per share is computed based on the weighted average number of shares of common stock outstanding during the period. Diluted earnings per share is computed based on the weighted average number of shares of common stock plus the effect of dilutive potential common stock outstanding during the period using the treasury stock method. The components of basic earnings per share and diluted earnings per share are as follows:
| Three Months Ended | |||||
| March 31, 2017 | March 31, 2016 | ||||
| $ | $ | ||||
| Net income | 2,828 | 38,980 | |||
| Weighted average number of common shares – basic | 164,352,065 | 156,083,657 | |||
| Dilutive effect of stock-based awards | 152,499 | 409,080 | |||
| Weighted average number of common shares – diluted | 164,504,564 | 156,492,737 | |||
| Earnings per common share: | |||||
| – Basic | 0.02 | 0.25 | |||
| – Diluted | 0.02 | 0.25 | |||
Stock-based awards, which have an anti-dilutive effect on the calculation of diluted earnings per common share, are excluded from this calculation. For the three months ended March 31, 2017, none of the restricted stock units (2016 - nil) had an anti-dilutive effect on the calculation of diluted earnings per common share. For the three months ended March 31, 2017 and 2016, options to acquire 1.1 million and 0.2 million shares of the Company’s Class A common stock, respectively, had an anti-dilutive effect on the calculation of diluted earnings per common share. In periods where a loss attributable to shareholders has been incurred, all stock-based awards are anti-dilutive.
| 13. | Shipbuilding Contracts |
In April 2013, four special purpose subsidiary companies of the Company entered into agreements with STX Offshore & Shipbuilding Co., Ltd (or STX) of South Korea to construct four, fuel-efficient 113,000 dead-weight tonne Long Range 2 (or LR2) product tanker newbuildings. At the same time, the Company entered an Option Agreement with STX allowing the Company to order up to an additional 12 vessels. In February and March 2014, the Company and its subsidiaries commenced legal proceedings against STX for having repudiated the four firm shipbuilding contracts and the Option Agreement. In November 2014, the Company, on behalf of the subsidiaries, placed $0.6 million in an escrow account as cash security in respect of STX's legal costs relating to the arbitration proceedings. Please see note 22 to the Company's audited consolidated financial statements filed with its Annual Report on the Form 20-F for the year ended December 31, 2016.
On February 15, 2016, the Company’s subsidiaries had successfully obtained an English Court Order requiring STX to pay a total of $32.4 million in respect of the four firm shipbuilding contracts. As a result, the Company’s subsidiaries have exercised their rights under English law to seek the assistance of the English court in the enforcement of the arbitration awards. The Company and its subsidiaries are also pursuing other routes to enforce the awards against STX. Additionally, the $0.6 million cash deposit was refunded to the Company in March 2016.
STX has filed for bankruptcy protection and as of December 31, 2016, all Korean enforcement actions are stayed. STX has had that protection recognized in England and Wales. The Company will not be in a position to take any further action on enforcement and recognition of its award in the UK or Korea while the bankruptcy protection remains in place. No amounts have been recorded as receivable in respect of these awards due to uncertainty of their collection.
The Option Agreement case has gone through trial and, despite finding that the Company had valid option agreements, the judgment was ruled against the Company due to uncertainty of delivery dates. The Company does not plan to appeal this ruling.
| 14. | Liquidity |
Management is required to assess if the Company will have sufficient liquidity to continue as a going concern for the one-year period following the issuance of its financial statements. The Company has a portion of a loan facility that is maturing in the first quarter of 2018 and expects that spot tanker rates in 2017 will be lower than those of 2016, resulting in lower cash flow from vessel operations.
Based on these factors, over the one-year period following the issuance of these financial statements, the Company expects it will need to obtain additional sources of financing, in addition to amounts generated from operations, to meet its minimum liquidity requirements under its financial covenants. These anticipated sources of financing include the refinancing of the loan facility maturing in the first quarter of 2018 as well as obtaining other debt financing.
15
TEEKAY TANKERS LTD. AND SUBSIDIARIES
NOTES TO THE UNAUDITED CONSOLIDATED FINANCIAL STATEMENTS
(all tabular amounts stated in thousands of U.S. dollars, other than share or per share data)
The Company is actively pursuing the alternatives described above, which it considers probable of completion based on the Company’s history of being able to refinance loan facilities for similar types of vessels and Teekay Tankers’ history of being able to obtain additional debt financing for existing vessels.
Based on the Company’s liquidity at the date these consolidated financial statements were issued, the liquidity it expects to generate from operations over the following year, and by incorporating the Company’s plans to raise additional liquidity that it considers probable of completion, the Company estimates that it will have sufficient liquidity to continue as a going concern for at least the one-year period following the issuance of these consolidated financial statements.
| 15. | Subsequent Events |
| a. | In March 2017, the Company entered into an agreement to sell one Aframax tanker, the Kyeema Spirit, for $7.5 million (see note 11). The sale was completed in June 2017. The vessel was classified as held for sale on the consolidated balance sheet as at March 31, 2017 and its net book value was written down to its sales price in the first quarter of 2017. As a result, there is no gain or loss on the sale of this vessel expected for the quarter ended June 30, 2017. |
| b. | In May 2017, the Company entered into a merger agreement with TIL to acquire all of the remaining issued and outstanding shares of TIL, which owns 18 mid-size conventional tankers, in a share-for-share exchange transaction, at an exchange ratio of 3.3 Class A common shares of the Company for each common share of TIL. The transaction is subject to customary closing conditions, approval by the shareholders of TIL, and approval by the Company's shareholders of an increase in the authorized number of its Class A common shares to permit the issuance of Class A common shares as merger consideration. The Company expects to complete the merger in the third quarter of 2017. |
| c. | In May 2017, the Company completed the acquisition, from Teekay, of the remaining 50% interest in TTOL (see also note 4c) for $27.1 million plus working capital. As compensation, the Company issued approximately 13.8 million shares of the Company's Class B common shares to Teekay. |
16
ITEM 2 – MANAGEMENT’S DISCUSSION AND ANALYSIS OF FINANCIAL CONDITION AND RESULTS OF OPERATIONS
The following Management’s Discussion and Analysis of Financial Condition and Results of Operations should be read in conjunction with the consolidated financial statements and accompanying notes contained in Item 1 – Financial Statements of this Report on Form 6-K and with our audited consolidated financial statements contained in Item 18 – Financial Statements and Management’s Discussion and Analysis of Financial Condition and Results of Operations in Item 5 – Operating and Financial Review and Prospects of our Annual Report on Form 20-F for the year ended December 31, 2016.
OVERVIEW
Our business is to own and operate crude oil and product tankers and we employ a chartering strategy that seeks to capture upside opportunities in the tanker spot market while using fixed-rate time charters to reduce downside risks. As an adjacency to these core competencies, we also provide full service lightering and lightering support services in our ship-to-ship transfer business (or STS). As at March 31, 2017, our fleet consisted of 55 vessels, including nine in-chartered vessels, four STS support vessels and one 50%-owned Very Large Crude Carrier (or VLCC). The following table summarizes our fleet as at March 31, 2017:
Owned Vessels (1) | Chartered-in Vessels | Total | ||
| Fixed-rate: | ||||
| Suezmax Tankers | 5 | — | 5 | |
| Aframax Tankers | 6 | — | 6 | |
LR2 Product Tanker (2) | 2 | 1 | 3 | |
VLCC Tanker (3) | 1 | — | 1 | |
Total Fixed-Rate Fleet (4) | 14 | 1 | 15 | |
| Spot-rate: | ||||
| Suezmax Tankers | 15 | — | 15 | |
Aframax Tankers (5) | 8 | 5 | 13 | |
| LR2 Product Tankers | 5 | — | 5 | |
Total Spot Fleet (6) | 28 | 5 | 33 | |
| STS Support Vessels | 4 | 3 | 7 | |
| Total Teekay Tankers Fleet | 46 | 9 | 55 | |
| 1. | Vessels owned by Tanker Investments Ltd. (or TIL), in which we have a minority equity interest, are excluded from the fleet list. |
| 2. | Long Range 2 (or LR2) product tankers. One LR2 tanker that was time-chartered in for a period of 24 months was subsequently redelivered to its owner in April 2017. |
| 3. | VLCC owned through a 50/50 joint venture. |
| 4. | Six time charter-out contracts are scheduled to expire in 2017, eight in 2018 and one in 2019. |
| 5. | Five Aframax tankers are currently time-chartered in for initial periods ranging from 12 to 60 months, with four of these periods ending in 2017 and one in 2021; some of these contracts include options to extend at escalating rates. |
| 6. | A total of 21 of our owned vessels and four of our in-chartered vessels operated in the spot market in revenue sharing arrangements as at March 31, 2017, a majority of which are managed in whole or in part by subsidiaries of Teekay Corporation (or Teekay). As at March 31, 2017, the four vessel class pooling arrangements in which we participate were comprised of a total of 26 Suezmax tankers, 30 modern Aframax tankers, three Aframax tankers over 15-years-old and 11 LR2 tankers (of which 10 LR2 tankers are cross-trading in the Aframax revenue sharing arrangement). Each pooling arrangement we participate in also includes vessels owned by other revenue sharing members. |
SIGNIFICANT DEVELOPMENTS IN 2017
Merger Agreement with Tanker Investments Ltd. (TIL)
In May 2017, we entered into a merger agreement with TIL to acquire all of the remaining issued and outstanding shares of TIL, which owns 18 mid-size conventional tankers, in a share-for-share exchange transaction, at an exchange ratio of 3.3 of our Class A common shares for each common share of TIL. The transaction is subject to customary closing conditions, approval by the shareholders of TIL, and approval by our
17
shareholders of an increase in the authorized number of our Class A common shares to permit the issuance of Class A common shares as merger consideration. We expect to complete the merger in the third quarter of 2017.
Acquisition of Remaining 50% Interest of Teekay Tanker Operations Ltd.
On May 31, 2017, we completed the acquisition from Teekay the remaining 50% interest in TTOL for $27.1 million plus working capital, in exchange for our issuance of approximately 13.8 million shares of our Class B common shares to Teekay.
Time Charter-Out Vessels
In April 2017, we entered into a time charter-out contract for one Suezmax tanker, with a daily rate of $21,000. The contract has a firm period of 12 months and commenced its contract in April 2017.
During the three months ended March 31, 2017, we entered into a time charter-out contract for one Suezmax tanker, with a daily rate of $22,000. The contract has a firm period of 12 months and commenced its contract in February 2017.
Time Chartered-in Vessels
We redelivered one in-chartered Aframax tanker back to its owner in March 2017.
Vessel Sales
In March 2017, we agreed to sell an Aframax tanker, the Kyeema Spirit, which was completed in early-June 2017. The vessel was written down to its agreed sales price, resulting in a loss on sale of the vessel of $2.6 million recognized in the first quarter of 2017.
In January and March 2017, we completed the sales of two Suezmax tankers, the Ganges Spirit and Yamuna Spirit, for an aggregate sales price of $32.6 million. We recognized a loss on sale of the vessels of $1.8 million in the three months ended March 31, 2017.
Continuous Offering Program and Private Placement
In January 2017, we re-opened our continuous offering program (or COP) under which we may issue shares of our Class A common stock at market prices up to a maximum aggregate amount of $80.0 million. As at March 31, 2017, we sold 3.8 million shares under this COP for net proceeds of $8.5 million, net of issuance costs. We also issued approximately 2.2 million new shares of Class A common stock to Teekay in a private placement for gross proceeds of $5.0 million, and the price per share was set to equal the weighted-average price of the Company's Class A common stock for the ten trading days ending on the date of issuance.
RESULTS OF OPERATIONS
There are a number of factors that should be considered when evaluating our historical financial performance and assessing our future prospects, and we use a variety of financial and operational terms and concepts when analyzing our results of operations. These can be found in Item 5 – Operating and Financial Review and Prospects in our Annual Report on Form 20-F for the year ended December 31, 2016.
In accordance with GAAP, we report gross revenues in our consolidated statements of income and include voyage expenses among our operating expenses. However, ship-owners base economic decisions regarding the deployment of their vessels upon anticipated “time-charter equivalent” (or TCE) rates, which represent net revenues (or revenue less voyage expenses) divided by revenue days, and industry analysts typically measure bulk shipping freight rates in terms of TCE rates. This is because under time charter-out contracts the customer usually pays the voyage expenses, while under voyage charters the ship-owner usually pays the voyage expenses, which typically are added to the hire rate at an approximate cost. Accordingly, the discussion of revenue below focuses on net revenues (a non-GAAP financial measure) and TCE rates where applicable.
18
Summary
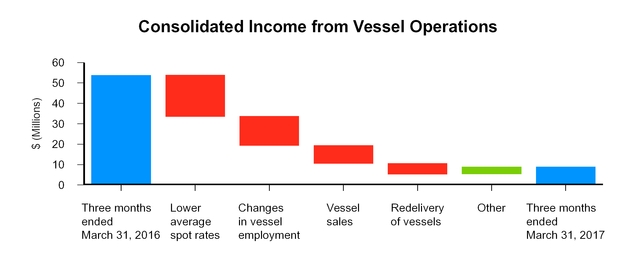
Our consolidated income from vessel operations decreased to $9.0 million for the three months ended March 31, 2017, compared to $53.8 million in the same period last year. The primary reasons for this decrease are as follows:
| • | a net decrease of $20.2 million primarily due to lower average realized spot TCE rates earned by our Suezmax, Aframax, LR2 product and MR product tankers, partially offset by higher average rates earned on our out-chartered Aframax tankers; |
| • | a net decrease of $14.2 million primarily due to various vessel employment changes in response to changing tanker market rates; |
| • | a decrease of $8.9 million due to lower operating income and losses on sales as a result of the sales of the Ganges Spirit, Yamuna Spirit, Teesta Spirit and Hugli Spirit during the first quarter of 2017 and the second half of 2016; and |
| • | a net decrease of $5.2 million due to the redeliveries of nine in-chartered vessels to their owners at various times during 2016. |
We manage our business and analyze and report our results of operations on the basis of two reportable segments: the conventional tanker segment and the STS transfer segment. Please read “Item 1 - Financial Statements: Note 3 - Segment Reporting.”
Details of the changes to our results of operations for each of our segments for the three months ended March 31, 2017, compared to the three months ended March 31, 2016 are provided below.
Three Months Ended March 31, 2017 versus Three Months Ended March 31, 2016
Conventional Tanker Segment
Our conventional tanker segment consists of conventional crude oil and product tankers that (i) are subject to long-term, fixed-rate time-charter contracts (which have an original term of one year or more), (ii) operate in the spot tanker market, or (iii) are subject to time-charters that are priced on a spot market basis or are short-term, fixed-rate contracts (which have original terms of less than one year), including those employed on full service lightering contracts.
The following table presents our operating results for the three months ended March 31, 2017 and 2016, and compares net revenues, a non-GAAP financial measure, for those periods to revenues, the most directly comparable GAAP financial measure:
19
| Three Months Ended March 31, | ||||||||
| (in thousands of U.S. dollars) | 2017 | 2016 | % Change | |||||
| Revenues | 115,166 | 155,565 | (26.0 | )% | ||||
Less: Voyage expenses (1) | (27,405 | ) | (13,258 | ) | 106.7 | % | ||
| Net revenues | 87,761 | 142,307 | (38.3 | )% | ||||
| Vessel operating expenses | (34,081 | ) | (37,508 | ) | (9.1 | )% | ||
| Time-charter hire expense | (12,134 | ) | (20,430 | ) | (40.6 | )% | ||
| Depreciation and amortization | (23,629 | ) | (25,954 | ) | (9.0 | )% | ||
| General and administrative expenses | (3,570 | ) | (4,771 | ) | (25.2 | )% | ||
| Loss on sale of vessels | (4,427 | ) | — | 100.0 | % | |||
| Income from operations | 9,920 | 53,644 | (81.5 | )% | ||||
| Equity income | 2,011 | 3,814 | (47.3 | )% | ||||
| (1) | Includes $3.0 million and $0.7 million of voyage expenses for the three months ended March 31, 2017 and 2016, respectively, relating to lightering support services which the STS transfer segment provided to the conventional tanker segment for full service lightering operations. |
Tanker Market
Although we recorded stronger average spot tanker rates in our Aframax and LR2 product tanker fleets and rates similar for our Suezmax tanker in the first quarter of 2017, compared with rates for the fourth quarter 2016, the tanker market experienced downward pressure over the course of the first quarter due to heavy refinery maintenance, OPEC supply cuts and higher tanker fleet growth. However, changing trade patterns due to OPEC production cuts have provided support for mid-sized spot tanker rates, as a decline in Middle Eastern oil exports resulted in ton-mile intensive Atlantic Basin to Asia oil movements.
Since the start of 2017 OPEC has implemented 1.2 million barrels per day (mb/d) of oil production cuts in an effort to rebalance oil prices. Compliance with these cuts by OPEC members was 92% as of March 2017, with most cuts coming from Saudi Arabia. While OPEC cuts are negative for overall oil volumes available for transport, the mid-sized segments have found some support from increased ton-mile demand as Asian buyers look to Atlantic Basin supply to replace reduced OPEC barrels. For the first four months of 2017, U.S. crude exports averaged 0.4 mb/d higher year-on-year, and reached 1.0 mb/d by mid-March 2017. Overall, U.S. crude volumes are increasingly moving to Asian and European buyers, which is supportive of mid-sized tanker demand. In February 2017, China imported 0.3 mb/d of U.S. crude, overtaking Canada as the largest importer of U.S. crude.
In addition to these positive trade fundamentals, global oil demand growth remains robust with forecast growth of approximately 1.3 mb/d in 2017 according to the IEA. This growth is expected to provide further support for mid-sized tanker rates during an otherwise challenging freight rate environment.
In 2017, we anticipate high tanker fleet growth to present headwinds to the crude spot tanker market. During the first four months of 2017, the world tanker fleet grew by 12.1 million deadweight tons (mdwt), or 2.2%. Total tanker fleet growth for 2017 is forecast to be 24.1 mdwt, or approximately 4.3%, which is slightly lower than 2016 but consistent with the ten-year average. Mid-size tanker fleet growth is expected to be around 10.7 mdwt, or approximately 5.6%, for 2017. After two years of record low scrapping, we believe that scrapping has the potential to ramp up in the near-term given the current weakness in spot tanker rates combined with an aging fleet across all segments. New regulations, including ballast water management, may also increase scrapping in the medium-term.
Overall, we expect 2017 to be a year of softer tanker rates compared to 2016. However, growing crude oil supply in the Atlantic moving long-haul to Asia is expected to provide some underlying support to help offset the negative fundamentals of lower OPEC supply and a period of higher fleet growth. We anticipate this near-term dip in the market cycle to be relatively short-term in nature, as a lack of new tanker ordering in the mid-sized segments and increased scrapping due to regulatory changes, as well as a more balanced oil market, is expected to lead to a renewed market upturn in 2018.
Fleet and TCE Rates
As at March 31, 2017, we owned 41 double-hulled conventional oil and product tankers and we time chartered-in five Aframax tankers and one LR2 vessel from third parties. We also owned a 50% interest in one VLCC, the results of which are included in equity income.
The following table highlights the operating performance of our time-charter vessels and spot vessels trading in revenue sharing arrangements, on voyage charters and in full service lightering measured in net voyage revenue per revenue day, or TCE rates, before related-party pool management fees, related-party commissions and off-hire bunker expenses:
20
| Conventional Tanker Segment | ||||||||||||||||||
| Three Months Ended March 31, 2017 | ||||||||||||||||||
| Revenues | Voyage Expenses (1) | Adjustments (2) | TCE Revenues | Revenue Days | Average TCE per Revenue Day (2) | |||||||||||||
| (in thousands) | (in thousands) | (in thousands) | (in thousands) | |||||||||||||||
| Voyage-charter contracts - Suezmax | $29,959 | ($2,658 | ) | $1,234 | $28,535 | 1,305 | $21,868 | |||||||||||
Voyage-charter contracts - Aframax (3) | $46,774 | ($23,801 | ) | $881 | $23,854 | 1,264 | $18,874 | |||||||||||
| Voyage-charter contracts - LR2 | $8,047 | ($48 | ) | $255 | $8,254 | 450 | $18,354 | |||||||||||
| Voyage-charter contracts - MR | $17 | — | ($17 | ) | — | — | — | |||||||||||
| Time charter-out contracts - Suezmax | $12,631 | ($404 | ) | $169 | $12,396 | 485 | $25,566 | |||||||||||
| Time charter-out contracts - Aframax | $12,206 | ($311 | ) | $238 | $12,133 | 531 | $22,851 | |||||||||||
| Time charter-out contracts - LR2 | $5,493 | ($183 | ) | $39 | $5,349 | 270 | $19,809 | |||||||||||
| Total | $115,127 | ($27,405 | ) | $2,799 | $90,521 | 4,305 | $21,030 | |||||||||||
| (1) | Includes $3.0 million of inter-segment voyage expenses relating to lightering support services provided by the STS transfer segment for the three months ended March 31, 2017. |
| (2) | Average TCE per Revenue Day excludes a total of $2.4 million in pool management fees and commissions payable for commercial management for our vessels and $0.4 million in off-hire bunker and other expenses, all of which are included as part of the adjustments. |
| (3) | Includes $27.2 million of revenues and $20.4 million of voyage expenses related to the full service lightering business, which includes $3.0 million of inter-segment voyage expenses referenced in note 1 above relating to the full service lightering business by the STS transfer segment for the three months ended March 31, 2017. |
| Three Months Ended March 31, 2016 | ||||||||||||||||||
Revenues (1) | Voyage Expenses (2) | Adjustments (3) | TCE Revenues | Revenue Days | Average TCE per Revenue Day (3) | |||||||||||||
| (in thousands) | (in thousands) | (in thousands) | (in thousands) | |||||||||||||||
| Voyage-charter contracts - Suezmax | $60,852 | ($832 | ) | $1,275 | $61,295 | 1,696 | $36,145 | |||||||||||
Voyage-charter contracts - Aframax (4) | $51,607 | ($11,956 | ) | $1,351 | $41,002 | 1,522 | $26,938 | |||||||||||
| Voyage-charter contracts - LR2 | $15,625 | $27 | $440 | $16,092 | 679 | $23,687 | ||||||||||||
| Voyage-charter contracts - MR | $3,270 | ($4 | ) | $121 | $3,387 | 182 | $18,609 | |||||||||||
| Time charter-out contracts - Suezmax | $6,157 | ($160 | ) | $85 | $6,082 | 189 | $32,106 | |||||||||||
| Time charter-out contracts - Aframax | $14,484 | ($249 | ) | $175 | $14,410 | 633 | $22,768 | |||||||||||
| Time charter-out contracts - LR2 | $2,364 | ($84 | ) | $30 | $2,310 | 91 | $25,388 | |||||||||||
| Time charter-out contracts - MR | ($18 | ) | — | $18 | — | — | — | |||||||||||
Total (1) | $154,341 | ($13,258 | ) | $3,495 | $144,578 | 4,992 | $28,959 | |||||||||||
| (1) | Excludes $1.2 million of in-process revenue contract revenue for the three months ended March 31, 2016. |
| (2) | Includes $0.7 million of inter-segment voyage expenses relating to lightering support services provided by the STS transfer segment for the three months ended March 31, 2016. |
| (3) | Average TCE per Revenue Day excludes a total of $3.6 million in pool management fees and commissions payable for commercial management for our vessels and $0.2 million in other revenue, partially offset by off-hire bunker expense, all of which are included as part of the adjustments. |
| (4) | Includes $11.7 million of revenues and $9.0 million of voyage expenses related to the full service lightering business, which includes $0.7 million inter-segment voyage expenses referenced in note 2 above relating to the full service lightering business by the STS transfer segment for the three months ended March 31, 2016. |
Net Revenues. Net revenues was $87.8 million for the three months ended March 31, 2017, compared to $142.3 million for the same period in the prior year. The decrease was primarily related to:
| • | a net decrease of $23.1 million for the three months ended March 31, 2017 primarily due to the redeliveries of nine in-chartered tankers to their owners at various times during 2016 and the sale of two Suezmax tankers and two MR product tankers in 2016 and 2017, partially offset by the addition of two Aframax in-chartered tankers that were delivered to us during late 2016; |
| • | a decrease of $21.0 million for the three months ended March 31, 2017 due to lower average realized rates earned by our Suezmax, Aframax, LR2 and MR tankers; |
21
| • | a net decrease of $14.2 million for the three months ended March 31, 2017 due to various vessel employment changes in response to changing tanker market rates; |
| • | a decrease of $1.2 million for the three months ended March 31, 2017 due to in-process revenue contract amortization that we recognized in revenue in the first quarter of 2016; and |
| • | a decrease of $0.9 million for the three months ended March 31, 2017 due to one additional calendar day in the first quarter of 2016 as 2016 was a leap year; |
partially offset by
| • | an increase of $4.2 million for the three months ended March 31, 2017 due to an increase in the number of voyages related to our full service lightering operations; |
| • | a net increase of $1.2 million for the three months ended March 31, 2017 due to fewer off-hire days in the three months ended March 31, 2017 compared to the same period in the prior year; and |
| • | an increase of $0.8 million for the three months ended March 31, 2017 due to higher average rates earned on our out-chartered Aframax tankers. |
Vessel Operating Expenses. Vessel operating expenses were $34.1 million for the three months ended March 31, 2017, compared to $37.5 million for the same period in the prior year. The changes in vessel operating expenses were primarily due to:
| • | a decrease of $2.3 million for the three months ended March 31, 2017, primarily due to the sale of two MR tankers in the second half of 2016 and two Suezmax tankers in the first quarter of 2017; |
| • | a decrease of $0.6 million for the three months ended March 31, 2017, due to lower crew costs incurred resulting from a change in crew performance initiatives; and |
| • | a decrease of $0.3 million for the three months ended March 31, 2017, due to lower transition costs relating to the 12 vessels acquired in the second half of 2015. |
Time-charter Hire Expense. Time-charter hire expense decreased to $12.1 million for the three months ended March 31, 2017, compared to $20.4 million for the same period in the prior year. The decrease is primarily due to seven Aframax tankers and two LR2 product tankers redelivering back to their respective owners in 2016 and lower average time-charter rates resulting in a lower profit share component for one Aframax tanker. The decrease was partially offset by the addition of three Aframax tankers we in-chartered in 2016 and one Aframax tanker we in-chartered in the first quarter of 2017.
Depreciation and Amortization. Depreciation and amortization expense was $23.6 million for the three months ended March 31, 2017, compared to $26.0 million for the same period in the prior year. The decrease primarily relates to the sales of two MR tankers in 2016 and two Suezmax tankers in the first quarter of 2017. The decrease was partially offset by the depreciation of various upgrades, capital expenditures and dry dock expenditures which were incurred in 2016.
General and Administrative Expenses. General and administrative expenses were $3.6 million for the three months ended March 31, 2017, compared to $4.8 million for the same period in the prior year. The decrease is primarily due to higher legal expenses incurred in the three months ended March 31, 2016 related to the STX arbitration and financing activities.
Loss on Sale of Vessels. Loss on sale of vessels of $4.4 million for the three months ended March 31, 2017 relates to the sale of two Suezmax tankers in the first quarter of 2017 and one held for sale Aframax tanker which was written down to the agreed sales price. Please refer to Item 1 – Financial Statements: Note 11 – Sale of Vessels.
Equity Income.
| Three Months Ended | ||||||
| March 31, 2017 | March 31, 2016 | |||||
| (in thousands of U.S. dollars) | $ | $ | ||||
| High-Q joint venture | 793 | 329 | ||||
| Tanker Investments Ltd. | 333 | 2,080 | ||||
| Teekay Tanker Operations Ltd. | 885 | 1,405 | ||||
| Total equity income | 2,011 | 3,814 | ||||
Equity income was $2.0 million for the three months ended March 31, 2017, compared to $3.8 million for the same period in the prior year. The changes were primarily due to:
22
| • | a decrease of $2.2 million for the three months ended March 31, 2017, primarily due to lower equity earnings from our 11.3% interest in TIL and our 50% interest in Teekay Tankers Operations Ltd. (TTOL) resulting from overall lower average realized spot tanker rates earned; |
partially offset by
| • | an increase of $0.5 million from our High-Q joint venture primarily due to a higher unrealized gain on derivatives recognized in the three months ended March 31, 2017 compared to the same period of the prior year. |
Please refer to Item 1 – Financial Statements: Note 4 – Investments in and Advances to Equity Accounted Investments.
The High-Q joint venture has an interest rate swap agreement which exchanges a receipt of floating interest for a payment of fixed interest to reduce the joint venture’s exposure to interest rate variability on its outstanding floating rate debt. Our proportionate share of realized and unrealized gains or losses relating to this instrument has been included in the equity income from the High-Q joint venture.
Ship-to-ship Transfer Segment
Our STS transfer segment consists of our lightering support services (including those services provided to our conventional tanker segment as part of full service lightering operations), consultancy, and LNG terminal management and other related services.
| Three Months Ended March 31, | ||||||||
| (in thousands of U.S. dollars) | 2017 | 2016 | % Change | |||||
Revenues (1) | 12,888 | 10,086 | 27.8 | % | ||||
| Less: Voyage expenses | — | (266 | ) | (100.0 | )% | |||
| Net revenues | 12,888 | 9,820 | 31.2 | % | ||||
| Vessel operating expenses | (10,057 | ) | (7,565 | ) | 32.9 | % | ||
| Time-charter hire expense | (1,493 | ) | (286 | ) | 422.0 | % | ||
| Depreciation and amortization | (1,280 | ) | (1,113 | ) | 15.0 | % | ||
| General and administrative expenses | (966 | ) | (662 | ) | 45.9 | % | ||
| (Loss) income from operations | (908 | ) | 194 | (568.0 | )% | |||
| (1) | Includes $3.0 million and $0.7 million of revenues for the three months ended March 31, 2017 and 2016, respectively, relating to lightering support services which the STS transfer segment provided to the conventional tanker segment for full service lightering operations. |
Net Revenues. Net revenues was $12.9 million for the three months ended March 31, 2017, compared to $9.8 million for the same period in the prior year. The increase is primarily due to an increase in the number voyages related to our lightering support service operations.
Vessel Operating Expenses. Vessel operating expenses were $10.1 million for the three months ended March 31, 2017, compared to $7.6 million for the same period in the prior year. The changes in vessel operating expenses were primarily due to:
| • | an increase of $1.7 million primarily due to the increase in lightering support operations for the three months ended March 31, 2017; and |
| • | an increase of $0.5 million due to the timing of expenditures. |
Time-charter Hire Expense. Time-charter hire expense increased to $1.5 million for the three months ended March 31, 2017, compared to $0.3 million for the same period in the prior year. This is primarily due to the addition of STS support vessels which we chartered-in to support our lightering operations.
Other Operating Results
The following table compares our other operating results for the three months ended March 31, 2017 and 2016:
23
| Three Months Ended | ||||||
| March 31, 2017 | March 31, 2016 | |||||
| (in thousands of U.S. dollars) | $ | $ | ||||
| Interest expense | (7,306 | ) | (8,271 | ) | ||
| Interest income | 79 | 26 | ||||
| Realized and unrealized gain (loss) on derivative instruments | 461 | (7,781 | ) | |||
| Other expense | (1,429 | ) | (2,646 | ) | ||
Interest expense. Interest expense was $7.3 million for the three months ended March 31, 2017, compared to $8.3 million for the same period in the prior year. The decrease in interest expense was primarily due to expenses incurred in the three months ended March 31, 2016 related to the refinancing of our debt facilities.
Realized and unrealized gain (loss) on derivative instruments. Realized and unrealized gains on interest rate swaps were $0.3 million for the three months ended March 31, 2017, compared to realized and unrealized losses of $5.7 million for the same period in the prior year. In February 2016, we entered into a total of nine new interest rate swaps. Four of the interest rate swaps have notional amounts of $50.0 million each, with fixed rates of 1.462%, and commenced in the fourth quarter of 2016. The remaining five interest rate swaps commenced in the first quarter of 2016, of which one swap has a notional amount of $75.0 million, one swap has a notional amount of $50.0 million, and three swaps have notional amounts of $25.0 million each, with fixed-rates of 1.549%, 1.155% and 1.549%, respectively.
As at March 31, 2017, we had interest rate swap agreements with aggregate outstanding notional amounts of $373.6 million and with a weighted-average fixed rate of 1.5%.
The changes in the fair value of the interest rate swaps resulted in unrealized gains of $0.7 million and $3.9 million for the three months ended March 31, 2017 and 2016, respectively, and were primarily due to the nine interest rate swaps we entered into in the first quarter of 2016, partially offset by the termination of an existing interest rate swap in the first quarter of 2016.
Effective June 1, 2016, we also entered into a time-charter swap for 55% of two Aframax equivalent vessels. Under such agreement, we will receive $27,776 per day, less a 1.25% brokerage commission, and pay 55% of the net revenue distribution of two Aframax equivalent vessels employed in our Aframax revenue sharing arrangement, less $500 per day, for a period of 11 months plus an additional two months at the counterparty's option. As at March 31, 2017, the time-charter swap had a fair value of $0.4 million (December 31, 2016 - $0.9 million) which resulted in an unrealized loss of $0.5 million and a realized gain of $0.7 million in the three months ended March 31, 2017.
In addition to the interest rate swaps and time-charter swap, we have a stock purchase warrant entitling us to purchase up to 750,000 shares of common stock of TIL. The stock purchase warrant had a fair value of $0.2 million as at March 31, 2017 (December 31, 2016 - $0.3 million) and we recognized an unrealized loss of $0.1 million in the three months ended March 31, 2017, compared to an unrealized loss of $2.1 million in the three months ended March 31, 2016. Please refer to Item 1 – Financial Statements: Note 6 – Derivative Instruments.
Other expense. Other expense was $1.4 million for the three months ended March 31, 2017, compared to $2.6 million for the same period in the prior year. The decrease in other expenses for the three months ended March 31, 2017 is primarily due to a decrease in our estimated freight tax expense as a result of the trading patterns of our fleet.
Net income. As a result of the foregoing factors, we recorded net income of $2.8 million for the three months ended March 31, 2017, compared to net income of $39.0 million for the same period in the prior year.
Liquidity and Capital Resources
Liquidity and Cash Needs
Our primary sources of liquidity are cash and cash equivalents, cash flows provided by our operations, our undrawn credit facilities, proceeds from sales of vessels, and capital raised through financing transactions. As at March 31, 2017, our total consolidated cash and cash equivalents was $47.6 million, compared to $68.1 million at December 31, 2016. Our cash balance as at March 31, 2017 decreased primarily as a result of repayments of our long-term debt and dividends paid on our shares of common stock, which were partially offset by cash flow from our operations, proceeds received from the sales of the two Suezmax tankers and proceeds we received from the sale of our common stock through the continuous offering program and a private placement to Teekay.
Our total consolidated liquidity, including cash and undrawn credit facilities, was $86.3 million as at March 31, 2017, compared to $102.4 million as at December 31, 2016. We anticipate that our primary sources of funds for our short-term liquidity needs will be cash flows from operations, existing cash and cash equivalents and undrawn long-term borrowings, refinancing existing loans and proceeds of new financings or equity issuances, which we believe will be sufficient to meet our existing liquidity needs for at least the next 12 months. Please read "Item 1 - Financial Statements: Note 14 - Liquidity" for information about required funding over the next 12 months.
Our short-term liquidity requirements are for the payment of operating expenses, dry-docking expenditures, debt servicing costs, dividends on our shares of common stock, scheduled repayments and prepayments of long-term debt, as well as funding our other working capital requirements. Our short-term charters and spot market tanker operations contribute to the volatility of our net operating cash flow, and thus impact our ability to generate sufficient cash flows to meet our short-term liquidity needs. Historically, the tanker industry has been cyclical, experiencing volatility
24
in profitability and asset values resulting from changes in the supply of, and demand for, vessel capacity. In addition, tanker spot markets historically have exhibited seasonal variations in-charter rates. Tanker spot markets are typically stronger in the winter months as a result of increased oil consumption in the northern hemisphere and unpredictable weather patterns that tend to disrupt vessel scheduling.
Commencing with the dividend paid in the first quarter of 2016, we adopted a dividend policy under which quarterly dividends are expected to range from 30% to 50% of our quarterly adjusted net income, subject to the discretion of our Board of Directors, with a minimum quarterly dividend of $0.03 per share. Adjusted net income is a non-GAAP measure which excludes specific items affecting net income that are typically excluded by securities analysts in their published estimates of our financial results. Specific items affecting net income include foreign exchange gain or losses, unrealized gains or losses on derivative instruments and gains or losses on sale of vessels.
Our long-term capital needs are primarily for capital expenditures and debt repayment. Generally, we expect that our long-term sources of funds will be cash balances, long-term bank borrowings and other debt or equity financings, which include equity issuances from our continuous offering program. We expect that we will rely upon external financing sources, including bank borrowings and the issuance of debt and equity securities, to fund acquisitions and expansion capital expenditures, including opportunities we may pursue to purchase additional vessels from Teekay or third parties.
In January and March 2017, we completed the sales of two Suezmax tankers for an aggregate sales price of $32.6 million. We used the proceeds from these sales to repay a portion of one of our corporate revolving credit facilities. As at March 31, 2017, the revolving credit facility was fully repaid. In March 2017, we also agreed to sell one Aframax tanker for a sales price of $7.5 million. The sale of the vessel was completed in June 2017 and the proceeds was used to repay a portion of our main corporate revolving facility.
Our revolving credit facilities and term loans are described in note 5 to our interim unaudited consolidated financial statements included in Item 1 - Financial Statements of this Report. Our revolving credit facilities and term loans contain covenants and other restrictions that we believe are typical of debt financing collateralized by vessels, including those that restrict the relevant subsidiaries from: incurring or guaranteeing additional indebtedness; making certain negative pledges or granting certain liens; and selling, transferring, assigning or conveying assets. In the future, some of the covenants and restrictions in our financing agreements could restrict the use of cash generated by ship-owning subsidiaries in a manner that could adversely affect our ability to pay dividends on our common stock. However, we currently do not expect that these covenants will have such an effect. Our revolving credit facilities and term loans require us to maintain financial covenants, which are described in further detail in note 5 of our interim unaudited consolidated financial statements. Should we not meet these financial covenants, the lender may declare our obligations under the agreements immediately due and payable and terminate any further loan commitments, which would significantly affect our short-term liquidity requirements. As at March 31, 2017, we were in compliance with all covenants relating to our revolving credit facilities and term loans. Teekay has also advised us that they are in compliance with all covenants relating to the credit facilities and term loans to which we are party.
Cash Flows
The following table summarizes our sources and uses of cash for the periods presented:
| Three Months Ended | ||||||
| March 31, 2017 | March 31, 2016 | |||||
| (in thousands of U.S. dollars) | $ | $ | ||||
| Net cash flow provided by operating activities | 28,783 | 56,220 | ||||
| Net cash flow used for financing activities | (80,093 | ) | (96,899 | ) | ||
| Net cash flow provided by investing activities | 30,766 | 12,636 | ||||
Operating Cash Flows
Net cash flow provided by operating activities primarily reflect fluctuations in spot tanker rates, changes in interest rates, fluctuations in working capital balances, the timing and the amount of dry-docking expenditures, repairs and maintenance activities, and the effect on our operations of vessel additions and dispositions. Our exposure to the spot tanker market has contributed significantly to fluctuations in operating cash flows historically as a result of highly cyclical spot tanker rates.
Net cash flow provided by operating activities decreased by $27.4 million for the three months ended March 31, 2017 compared to the same period in 2016. This increase was primarily due to:
| • | a net decrease of $31.0 million in operating earnings, primarily as a result of lower realized average spot tanker rates earned and a decrease in our fleet size due to the sale of two MR tankers and two Suezmax tankers in 2016 and 2017, respectively; |
partially offset by
| • | a $2.2 million decrease in operating cash outflows primarily due to the timing of the settlement of operating assets and liabilities; and |
| • | a $1.4 million decrease in operating cash outflows relating to lower expenditures on dry-docking activities during the three months ended March 31, 2017, compared to the same period in 2016. |
25
Financing Cash Flows
Net cash flow used for financing activities in the three months ended March 31, 2017 decreased by $16.8 million compared to the same period in 2016 primarily as a result of:
| • | a decrease in cash outflows of $13.8 million due to the additional cash dividends paid during the three months ended March 31, 2016, as a result of the change in our dividend policy, partially offset by the dividends paid on the increase in the number of our shares of outstanding Class A and B common stock from issuances of our shares in 2016 and early 2017; and |
| • | an increase of $13.6 million in cash inflows from proceeds received from share issuances under our continuous offering program (or COP) which we relaunched in November 2016 and the proceeds received from an issuance of 2.2 million shares of our Class A common stock to Teekay; |
partially offset by
| • | a net increase in cash outflows of $10.8 million due to the repayments and prepayments on our current term loans and revolving credit facilities, partially offset by the 2016 refinancing of our long-term debt facilities. |
Investing Cash Flows
Net cash flow provided by investing activities in the three months ended March 31, 2017 increased by $18.1 million compared to the same period in 2016 primarily due to:
| • | an increase of $32.6 million in cash inflows related to the sale of two Suezmax tankers during the three months ended March 31, 2017; and |
| • | a decrease of $0.5 million in cash outflows due to fewer capital expenditures for the fleet during the three months ended March 31, 2017, compared to the same period in 2016; |
partially offset by
| • | a decrease of $15.0 million in cash inflows primarily related to the return of capital in 2016 from our investment in TTOL. |
Contractual Obligations and Contingencies
The following table summarizes our long-term contractual obligations as at March 31, 2017:
| Remainder of | |||||||||||||||||
| (in millions of U.S. dollars) | Total | 2017 | 2018 | 2019 | 2020 | 2021 | |||||||||||
| U.S. Dollar-Denominated Obligations | |||||||||||||||||
Scheduled repayments of revolving facilities, term loans and other debt (1) | 421.6 | 90.5 | 110.7 | 108.9 | 108.9 | 2.6 | |||||||||||
Repayments at maturity of revolving facilities, term loans and other debt (1) | 431.6 | — | 63.8 | — | — | 367.8 | |||||||||||
Chartered-in vessels (operating leases) (2) | 44.5 | 17.5 | 9.0 | 8.3 | 8.3 | 1.4 | |||||||||||
| Total | 897.7 | 108.0 | 183.5 | 117.2 | 117.2 | 371.8 | |||||||||||
| (1) | Excludes expected interest payments of $17.1 million (remaining in 2017), $19.5 million (2018), $15.8 million (2019), $12.7 million (2020) and $5.5 million (2021). Expected interest payments are based on the existing interest rates for variable-rate loans at LIBOR plus margins that range from 0.30% to 2.00% at March 31, 2017. The expected interest payments do not reflect the effect of related interest rate swaps that we have used to hedge certain of our floating-rate debt. |
| (2) | Excludes payments required if we execute all options to extend the terms of in-chartered leases signed as of March 31, 2017. If we exercise all options to extend the terms of signed in-chartered leases, we would expect total payments of $21.1 million (remaining in 2017), $16.6 million (2018), $8.3 million (2019), $8.3 million (2020), and $1.4 million (2021). |
Critical Accounting Estimates
We prepare our consolidated financial statements in accordance with GAAP, which require us to make estimates in the application of our accounting policies based on our best assumptions, judgments and opinions. On a regular basis, management reviews the accounting policies, assumptions, estimates and judgments to ensure that our consolidated financial statements are presented fairly and in accordance with GAAP. However, because future events and their effects cannot be determined with certainty, actual results could differ from our assumptions and
26
estimates, and such differences could be material. Accounting estimates and assumptions that we consider to be the most critical to an understanding of our financial statements because they inherently involve significant judgments and uncertainties are discussed in this section and Item 5 – Operating and Financial Review and Prospects in our Annual Report on Form 20-F for the year ended December 31, 2016. There have been no significant changes to these estimates and assumptions in the three months ended March 31, 2017.
FORWARD-LOOKING STATEMENTS
This Report on Form 6-K for the three months ended March 31, 2017 contains certain forward-looking statements (as such term is defined in Section 27A of the Securities Act of 1933 as amended, and Section 21E of the Securities Exchange Act of 1934, as amended) concerning future events and our operations, performance and financial condition, including, in particular, statements regarding:
| • | the timing and certainty of our future growth prospects and opportunities, including any future vessel acquisitions; |
| • | our financial position and ability to take advantage of growth opportunities in the global conventional tanker market; |
| • | the crude oil and refined product tanker market fundamentals, including the balance of supply and demand in the tanker market, estimated growth in the world tanker fleet, estimated growth in global oil demand and crude oil tanker demand, and changes in spot tanker rates; |
| • | the expected delivery dates for our tankers in-chartered, out-chartered, and pending sale; |
| • | expected contract commencement and termination dates; |
| • | future oil prices and production; |
| • | tanker fleet utilization, including our ability to secure new fixed-rate time charter-out agreements; |
| • | our ability to obtain the required approvals for and complete the merger with TIL in the third quarter of 2017; |
| • | our ability to successfully integrate TIL and realize the expected benefits and synergies from the combined company; |
| • | the effectiveness of our chartering strategy in capturing upside opportunities and reducing downside risks, including our ability to take advantage of a tanker market recovery; |
| • | our ability to generate surplus cash flow and pay dividends from our existing vessel fleet or from any potential vessel acquisitions; |
| • | the expected range of our quarterly adjusted net income to be paid as quarterly dividends; |
| • | meeting our going concern requirements and our liquidity needs, including anticipated funds and sources of financing for liquidity and capital expenditure needs and the sufficiency of cash flows, and our expectation that we will have sufficient liquidity for at least a one-year period; |
| • | our ability to refinance existing debt obligations, to raise additional debt and capital to fund capital expenditures and negotiate extensions or redeployments of existing assets; |
| • | our compliance with, and the effect on our business and operating results of, covenants under our term loans and credit facilities; |
| • | our expectations regarding payments made on behalf of our co-obligors in connection with the loan arrangements in which certain other subsidiaries of Teekay are also borrowers; |
| • | continued material variations in the period-to-period fair value of our derivative instruments; |
| • | our expectations regarding uncertain tax positions; |
| • | the outcome of legal action against STX; and |
| • | our hedging activities relating to foreign exchange, interest rate and spot market risks. |
Forward-looking statements include, without limitation, any statement that may predict, forecast, indicate or imply future results, performance or achievements, and may contain the words “believe”, “anticipate”, “expect”, “estimate”, “project”, “will be”, “will continue”, “will likely result”, or words or phrases of similar meanings. These statements involve known and unknown risks and are based upon a number of assumptions and estimates that are inherently subject to significant uncertainties and contingencies, many of which are beyond our control. Actual results may differ materially from those expressed or implied by such forward-looking statements, which involve risks and uncertainties. Important factors that could cause actual results to differ materially include, but are not limited to: spot tanker market rate fluctuations; changes in vessel values; changes in the production of or demand for oil; changes in trading patterns significantly affecting overall vessel tonnage requirements; greater or lower than expected levels of tanker scrapping; greater or lower anticipated levels of vessel newbuilding orders; changes in applicable industry laws and regulations and the timing of implementation of new laws and regulations; the potential for early termination of short- or medium-term contracts and our potential inability to renew or replace short- or medium- term contracts; our potential inability to implement our growth strategy; competitive factors in the markets in which we operate; loss of any customer, time-charter or vessel; our potential inability to refinance existing debt obligations or meet our going concern requirements and liquidity needs; changes in interest rates and the capital markets; future issuances of our common stock; changes in our costs, such as the cost of crews, dry-docking expenses and associated off-hire days; dry docking delays; the outcome of legal action involving STX; increased costs; failure to satisfy the closing conditions of the merger with TIL, including obtaining the required approvals from our and TIL shareholders and relevant regulatory authorities; failure to successfully integrate TIL into our company and realize the expected benefits and synergies from the combined company; and other factors detailed from time to time in our periodic reports filed with the SEC, including our Annual Report on Form 20-F for the year ended December 31, 2016. We do not intend to release publicly any
27
updates or revisions to any forward-looking statements contained herein to reflect any change in our expectations with respect thereto or any change in events, conditions or circumstances on which any such statement is based.
28
TEEKAY TANKERS LTD. AND SUBSIDIARIES
MARCH 31, 2017
PART I – FINANCIAL INFORMATION
ITEM 3 – QUANTITATIVE AND QUALITATIVE DISCLOSURES ABOUT MARKET RISK
We are exposed to market risk from foreign currency fluctuations, changes in interest rates, changes in spot tanker market rates and changes in the stock price of TIL. We have not used foreign currency forward contracts to manage foreign currency fluctuation, but we may do so in the future. We use interest rate swaps to manage interest rate risks. We do not use foreign currency forward contracts or interest rate swaps for trading or speculative purposes.
Foreign Currency Fluctuation Risk
Our primary economic environment is the international shipping market. This market utilizes the U.S. dollar as its functional currency. Consequently, virtually all our revenues and the majority of our operating costs are in U.S. dollars. We incur certain voyage expenses, vessel operating expenses, dry-docking expenditures and general and administrative expenses in foreign currencies, the most significant of which are the Euro, Singaporean Dollar, Canadian Dollar and British Pound. There is a risk that currency fluctuations will have a negative effect on the value of cash flows. As at March 31, 2017, we had not entered into forward contracts as a hedge against changes in foreign exchange rates.
Interest Rate Risk
We are exposed to the impact of interest rate changes primarily through our floating-rate borrowings that require us to make interest payments based on LIBOR. Significant increases in interest rates could adversely affect our operating margins, results of operations and our ability to repay debt. We use interest rate swaps to reduce our exposure to changes in interest rates. The principal objective of these contracts is to minimize the risks and costs associated with our floating-rate debt.
In order to minimize counterparty risk, we only enter into derivative transactions with counterparties that are rated A- or better by Standard & Poor’s or A3 or better by Moody’s at the time of the transactions. In addition, to the extent possible and practical, interest rate swaps are entered into with different counterparties to reduce concentration risk.
The table below provides information about our financial instruments at March 31, 2017, that are sensitive to changes in interest rates, including our debt and interest rate swaps. For long-term debt, the table presents principal cash flows and related weighted-average interest rates by expected maturity dates. For the interest rate swaps, the table presents their notional amounts and weighted-average interest rates by their expected contractual maturity dates.
| Expected Maturity Date | |||||||||||||||
Remainder of 2017 | 2018 | 2019 | 2020 | 2021 | Total | Fair Value Asset/(Liability) | Rate (1) | ||||||||
| (in millions of U.S. dollars, except percentages) | |||||||||||||||
| Long-Term Debt: | |||||||||||||||
| Variable rate | 90.5 | 174.5 | 108.9 | 108.9 | 370.4 | 853.2 | (832.9 | ) | 2.8% | ||||||
| Interest Rate Swaps | |||||||||||||||
U.S. Dollar-denominated interest rate swaps (2) | 34.7 | 46.3 | 46.3 | 46.3 | — | 173.6 | 0.7 | 1.5% | |||||||
U.S. Dollar-denominated interest rate swaps (2) | — | — | — | — | 150.0 | 150.0 | 1.8 | 1.6% | |||||||
U.S. Dollar-denominated interest rate swaps (2) | — | — | — | — | 50.0 | 50.0 | 1.3 | 1.2% | |||||||
| (1) | Rate refers to the weighted-average effective interest rate for our long-term debt, including the margin we pay on our variable-rate. |
| (2) | Interest payments on U.S. Dollar-denominated debt and interest rate swaps are based on LIBOR. The average variable rate paid to us under our interest rate swaps is set quarterly at the six-month and three-month LIBOR, respectively. |
Spot Tanker Market Rate Risk
We are exposed to fluctuations in spot tanker market rates which can adversely affect our revenues. To reduce our exposure, we use FFAs in non-hedge-related transactions to increase or decrease our exposure to spot market rates, within defined limits. Net gains and losses from FFAs are recorded within realized and unrealized gain (loss) on derivative instruments in our consolidated statements of income.
In the second quarter of 2016, we also entered into a time-charter swap agreement for 55% of two Aframax equivalent vessels for a period of 11 months plus an additional two months at the counterparty’s option. The fair value of this derivative agreement is the estimated amount that we would receive or pay to terminate the agreement at the reporting date, based on the present value of our projection of future Aframax spot market tanker rates, which have been derived from current Aframax spot market tanker rates and estimated future rates. As at March 31, 2017, the fair value of the time-charter swap agreement was positive $0.4 million.
29
Equity Price Risk
We are exposed to the changes in the stock price of TIL. We have a stock purchase warrant entitling us to purchase up to 750,000 shares of common stock of TIL at a fixed price of $10.0 per share. Alternatively, if the shares of TIL’s common stock trade on a National Stock Exchange or over-the counter market denominated in Norwegian Kroner (or NOK), we may also exercise the stock purchase warrant at 61.67 NOK per share. The stock purchase warrant vests in four equally sized tranches. Each tranche will vest and become exercisable when and if the fair market value of a share of the common stock equals or exceeds 77.08 NOK, 92.50 NOK, 107.91 NOK and 123.33 NOK, respectively, for such tranche for any ten consecutive trading days. The stock purchase warrant was scheduled to expire on January 23, 2019; however, upon completing the merger with TIL, the stock purchase warrant will be terminated.
30
TEEKAY TANKERS LTD. AND SUBSIDIARIES
MARCH 31, 2017
PART II – OTHER INFORMATION
Item 1 – Legal Proceedings
None.
Item 1A – Risk Factors
In addition to the other information set forth in this Report on Form 6-K, you should carefully consider the risk factors discussed in Part I, “Item 3. Key Information—Risk Factors” in our Annual Report on Form 20-F for the year ended December 31, 2016, which could materially affect our business, financial condition or results of operations.
Item 2 – Unregistered Sales of Equity Securities and Use of Proceeds
In January 2017, we issued approximately 2.2 million shares of Class A common stock in a private placement to Teekay at a price of $2.32 per share for gross proceeds of $5.0 million. The gross proceeds from the issuance were used for general corporate purposes, including strengthening our liquidity position and delevering our balance sheet (Please refer to Item 1 - Financial Statements: Note 9 - Capital Stock and Stock-Based Compensation).
Item 3 – Defaults Upon Senior Securities
None.
Item 4 – Mine Safety Disclosures
None.
Item 5 – Other Information
None.
Item 6 – Exhibits
None.
THIS REPORT ON FORM 6-K IS HEREBY INCORPORATED BY REFERENCE INTO THE FOLLOWING REGISTRATION STATEMENTS OF THE COMPANY.
REGISTRATION STATEMENT ON FORM S-8 (FILE NO. 333-148055) FILED WITH THE SEC ON DECEMBER 13, 2007.
REGISTRATION STATEMENT ON FORM S-8 (FILE NO. 333-194404) FILED WITH THE SEC ON MARCH 7, 2014.
REGISTRATION STATEMENT ON FORM F-3 (FILE NO. 333-196915) FILED WITH THE SEC ON JUNE 20, 2014.
REGISTRATION STATEMENT ON FORM F-3 (FILE NO. 333-205643) FILED WITH THE SEC ON JULY 13, 2015.
REGISTRATION STATEMENT ON FORM F-3 (FILE NO. 333-206495) FILED WITH THE SEC ON AUGUST 21, 2015, AS AMENDED.
31
SIGNATURE
Pursuant to the requirements of the Securities Exchange Act of 1934, the registrant has duly caused this report to be signed on its behalf by the undersigned, thereunto duly authorized.
| TEEKAY TANKERS LTD. | |||||
| Date: | June 13, 2017 | By: | /s/ Vincent Lok | ||
Vincent Lok Chief Financial Officer (Principal Financial and Accounting Officer) | |||||
32