|

Exhibit (c)(8)
Project Pony
Prepared for Board of Directors July 27, 2016
|
Executive Summary
• There are significant benefits to having an MLP:
- Mid and high-growth MLPs generally trade at higher cash flow multiples than midstream corporations, including TransCanada
- An MLP provides an additional vehicle to support financing requirements
- Having an MLP can also enhance TransCanada’s acquisition opportunity set, particularly for smaller M&A opportunities in the U.S.
• As a result of the Columbia acquisition, TransCanada currently has two publicly traded MLPs: TC PipeLines, LP (“TCP”) and Columbia Pipeline Partners LP (“CPPL”)
- Preferred outcome is to retain only one MLP, which will allow TransCanada to capture the benefits described above
- Having two MLPs engaged in the same line of business (FERC-regulated natural gas transportation) adds unnecessary complexity to the corporate structure and may confuse investors on go-forward plan to support the MLPs
• The objective of getting back to a single MLP structure could be accomplished in one of two ways:
1. TransCanada buys in the public float of one of TCP or CPPL, leaving the other MLP outstanding
2. TCP and CPPL merge to form a single MLP (with either TCP or CPPL as the acquiring entity)
Each of these potential options was reviewed to determine which is likely to be the most attractive to TransCanada
2 TransCanada Date: July 27, 2016
|
Summary Conclusions
A buy-in of CPPL has a number of potential benefits:
• Accretion: Buy-in of CPPL is accretive option to TransCanada’s earnings, and near-term neutral to cash flow
• Financing Capacity: Retain sizable public float in TCP
• Cost of Capital: 25% top-tier IDR splits benefit long-term cost of capital for the MLP
• Credit Ratings: Near-term neutral for credit assuming buy-in is all equity financed, with modest reduction in structural subordination
• MLP Growth Potential: Increases TCP backlog of drop-down assets
• Tax Impact: Basis step-up as well as incremental depreciation from acquired assets
• M&A Capacity: Retention of the larger MLP is supportive of sizable M&A
• Other:
- Provides flexibility to restructure OpCo
- Ease of execution:
- Smaller up front purchase price than TCP buy-in
- Avoid dual-party merger negotiation
- Pro forma MLP sized appropriately for growth and capital markets access
A buy-in of CPPL appears to be the most attractive option for TransCanada
3 TransCanada Date: July 27, 2016
|
Situational Overview
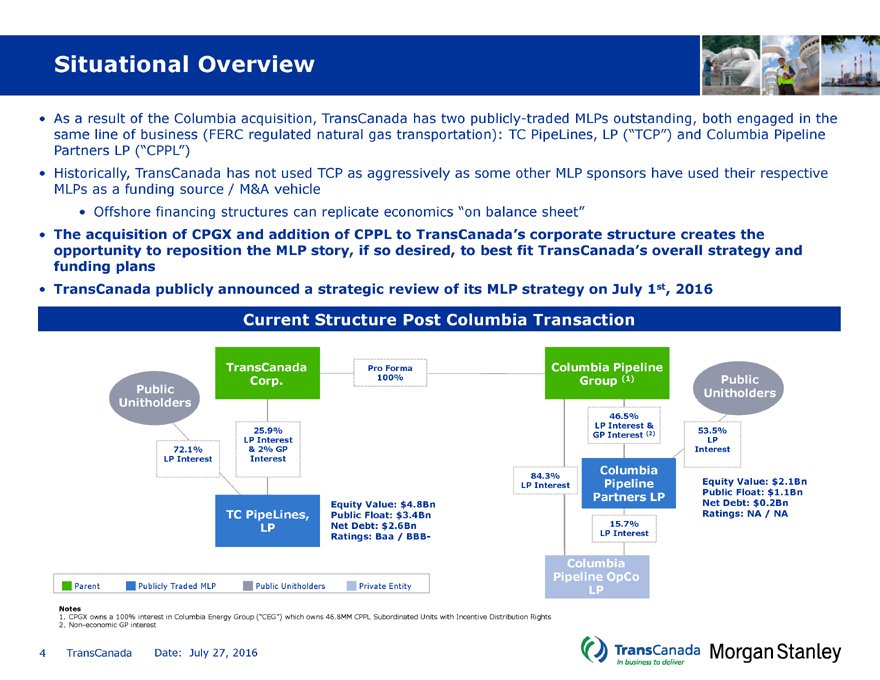
• As a result of the Columbia acquisition, TransCanada has two publicly-traded MLPs outstanding, both engaged in the same line of business (FERC regulated natural gas transportation): TC PipeLines, LP (“TCP”) and Columbia Pipeline Partners LP (“CPPL”)
• Historically, TransCanada has not used TCP as aggressively as some other MLP sponsors have used their respective MLPs as a funding source / M&A vehicle
• Offshore financing structures can replicate economics “on balance sheet”
• The acquisition of CPGX and addition of CPPL to TransCanada’s corporate structure creates the opportunity to reposition the MLP story, if so desired, to best fit TransCanada’s overall strategy and funding plans
• TransCanada publicly announced a strategic review of its MLP strategy on July 1st, 2016
Current Structure Post Columbia Transaction
TransCanadaPro FormaColumbia Pipeline
Corp.100%Group (1)Public
Public Unitholders
Unitholders
46.5%
LP Interest &
25.9%53.5%
GP Interest (2)
LP InterestLP
72.1% & 2% GPInterest
LP Interest Interest
84.3%Columbia
LP InterestPipelineEquity Value: $2.1Bn
Partners LPPublic Float: $1.1Bn
Equity Value: $4.8BnNet Debt: $0.2Bn
TC PipeLines,Public Float: $3.4BnRatings: NA / NA
LPNet Debt: $2.6Bn15.7%
Ratings: Baa / BBB-LP Interest
Columbia
Pipeline OpCo
Parent Publicly Traded MLP Public UnitholdersPrivate EntityLP
Notes
1. CPGX owns a 100% interest in Columbia Energy Group (“CEG”) which owns 46.8MM CPPL Subordinated Units with Incentive Distribution Rights
2. Non-economic GP interest
4 TransCanada Date: July 27, 2016
|

TransCanada, TCP, and CPPL Market DataData (1)
Ticker
TRP
TCP
Valuation (CMM)$
Equity Value
48,954
4,832
CPPL’s significantly public smaller float is
2,080
than TCP’s, reducing
Public Float
48,954
3,362
funding capacity but
1,113
increasing flexibility
Plus: Net Debt
42,055
2,633
to buy-in public float
212
Plus: Pref. Equity
3,017
124
—
Plus: Minority Interest
1,653
—
—
Aggregate Value
95,679
7,588
2,293
Trading Metrics
TCP is >3x the size
Adj. AV / 2016E EBITDA (x) (2)
13.2x
TransCanada
14.2x
of CPPL today,
16.0x
currently
with larger
Adj. AV / 2017E EBITDA (x) (2)
12.0x
trades at
11.6x
associated
14.6x
lower
financing and
P / 2016E DCFPS (x)
12.0x
than multiples the two
13.5x
drop-down
19.1x
capacity as a
MLPs
result
P / 2017E DCFPS (x)
9.5x
11.9x
13.2x
Current Yield (%)
3.7%
6.5%
4.7%
Cash Payout Ratio (%)
44.3%
89.4%
85.2%
Total Return (%) (3)
13.2%
12.2%
25.7%
2017E Capital Expenditure (CMM) 8,943$
10
558
Credit Metrics
Credit Ratings (4)
A3 / A-
Baa2 / BBB-
NR / NR
Net Debt / ‘16E EBITDA
6.6x
4.9x
1.5x
Notes
1. All market data as of July 14, 2016 with 1.30 USD/CAD exchange rate; forecasts based on equity research consensus estimates
2. Equity value is adjusted for GP value by grossing up by cash flow attributable to the GP
3. Implied total return defined as the addition of current yield and expected average annual per-share / unit distribution growth
4. Reflects TCPL’s current rating
5 TransCanada Date: July 27, 2016
|
Objectives and Key MLP Decision Variables
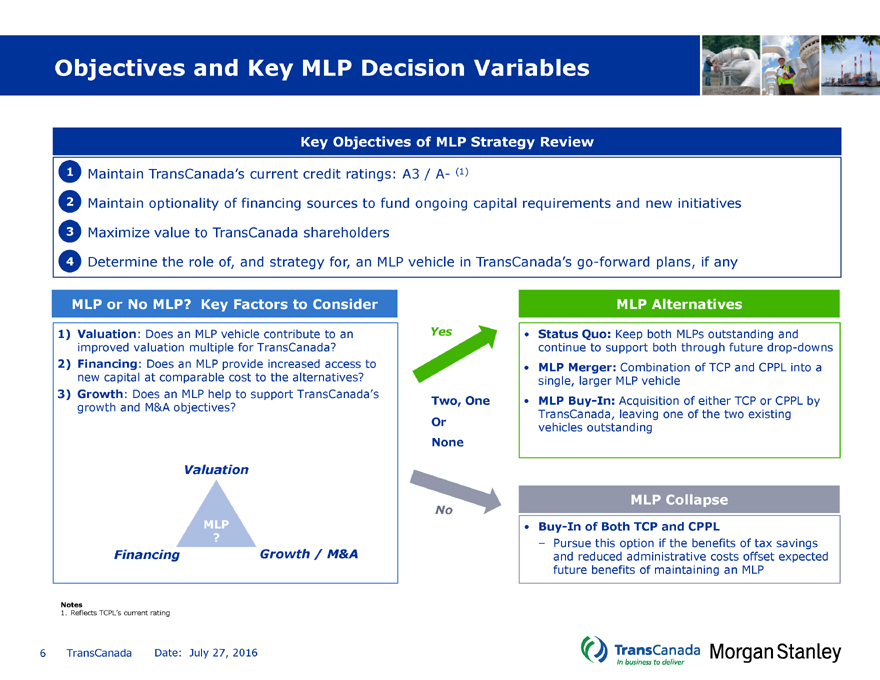
Key Objectives of MLP Strategy Review
1 Maintain TransCanada’s current credit ratings: A3 / A- (1)
2 Maintain optionality of financing sources to fund ongoing capital requirements and new initiatives
3 Maximize value to TransCanada shareholders
4 Determine the role of, and strategy for, an MLP vehicle in TransCanada’s go-forward plans, if any
MLP or No MLP? Key Factors to Consider
1) Valuation: Does an MLP vehicle contribute to an improved valuation multiple for TransCanada?
2) Financing: Does an MLP provide increased access to new capital at comparable cost to the alternatives?
3) Growth: Does an MLP help to support TransCanada’s growth and M&A objectives?
MLP Alternatives
• Status Quo: Keep both MLPs outstanding and continue to support both through future drop-downs
• MLP Merger: Combination of TCP and CPPL into a single, larger MLP vehicle
• MLP Buy-In: Acquisition of either TCP or CPPL by TransCanada, leaving one of the two existing vehicles outstanding
Yes
Two, One Or None
No
MLP Collapse
• Buy-In of Both TCP and CPPL
– Pursue this option if the benefits of tax savings and reduced administrative costs offset expected future benefits of maintaining an MLP
Notes
1. Reflects TCPL’s current rating
6 TransCanada Date: July 27, 2016
|
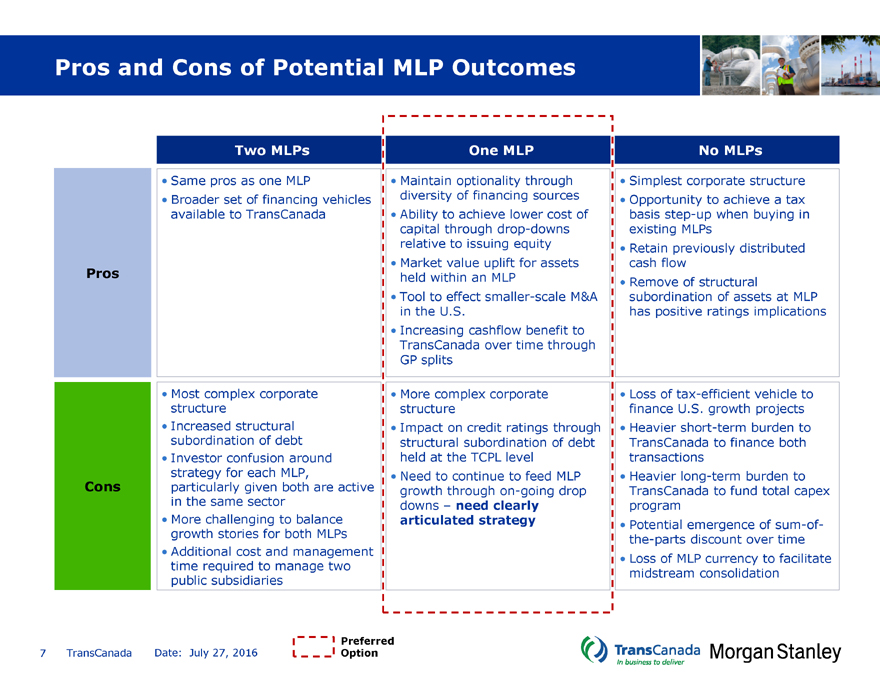
Pros and Cons of Potential MLP Outcomes
Two MLPs One MLPNo MLPs
• Same pros as one MLP • Maintain optionality through• Simplest corporate structure
• Broader set of financing vehicles diversity of financing sources• Opportunity to achieve a tax
available to TransCanada • Ability to achieve lower cost ofbasis step-up when buying in
capital through drop-downsexisting MLPs
relative to issuing equity• Retain previously distributed
• Market value uplift for assetscash flow
Pros held within an MLP• Remove of structural
• Tool to effect smaller-scale M&Asubordination of assets at MLP
in the U.S.has positive ratings implications
• Increasing cashflow benefit to
TransCanada over time through
GP splits
• Most complex corporate • More complex corporate• Loss of tax-efficient vehicle to
structure structurefinance U.S. growth projects
• Increased structural • Impact on credit ratings through• Heavier short-term burden to
subordination of debt structural subordination of debtTransCanada to finance both
• Investor confusion around held at the TCPL leveltransactions
strategy for each MLP, • Need to continue to feed MLP• Heavier long-term burden to
Cons particularly given both are active growth through on-going dropTransCanada to fund total capex
in the same sector downs – need clearlyprogram
• More challenging to balance articulated strategy• Potential emergence of sum-of-
growth stories for both MLPs the-parts discount over time
• Additional cost and management • Loss of MLP currency to facilitate
time required to manage two midstream consolidation
public subsidiaries
7 TransCanada Date: July 27, 2016
Preferred Option
|
Preferred Outcome: One MLP
• An MLP provides potential benefits to TransCanada’s valuation, ability to finance its capital program and provides incremental smaller-scale M&A optionality
• MLPs have historically traded at higher multiples relative to corporations
• MLPs have been a large source of capital for the midstream sector, and tap into a different investor base than TransCanada
• Financing through drop-downs provides TransCanada with a lower-cost source of capital relative to raising common equity
• MLPs have been the dominant acquirers of midstream assets in the U.S. – an MLP vehicle would provide TransCanada with the opportunity to continue to be active in smaller scale transactions which would be less material for the parent company
• A structure with a single MLP vehicle outstanding is well understood by the market and has been accepted by TransCanada shareholders over a long period of time
• It will be critical to communicate clearly to the market what the go-forward drop down strategy and positioning for the vehicle will be, in order to maximize the value TransCanada is able to realize from having an MLP
8 TransCanada Date: July 27, 2016
|
Preferred Outcome: One MLP
• The majority of the benefits of having an MLP can be captured through a single vehicle
• Two MLPs increases the complexity of the corporate structure while also creating potential for confusion amongst the target investor bases
• Both MLPs comprised of FERC-regulated natural gas pipelines
• In most previous situations where companies have had two MLPs outstanding for a period of time in a similar sector, the MLPs have ultimately been collapsed into a single vehicle
• Dual MLP ownership structures typically involve different underlying asset bases –target different strategies / investors
Keeping Two Similar MLP Vehicles Adds Complexity and Provides Limited Incremental Benefit
9 TransCanada Date: July 27, 2016
|
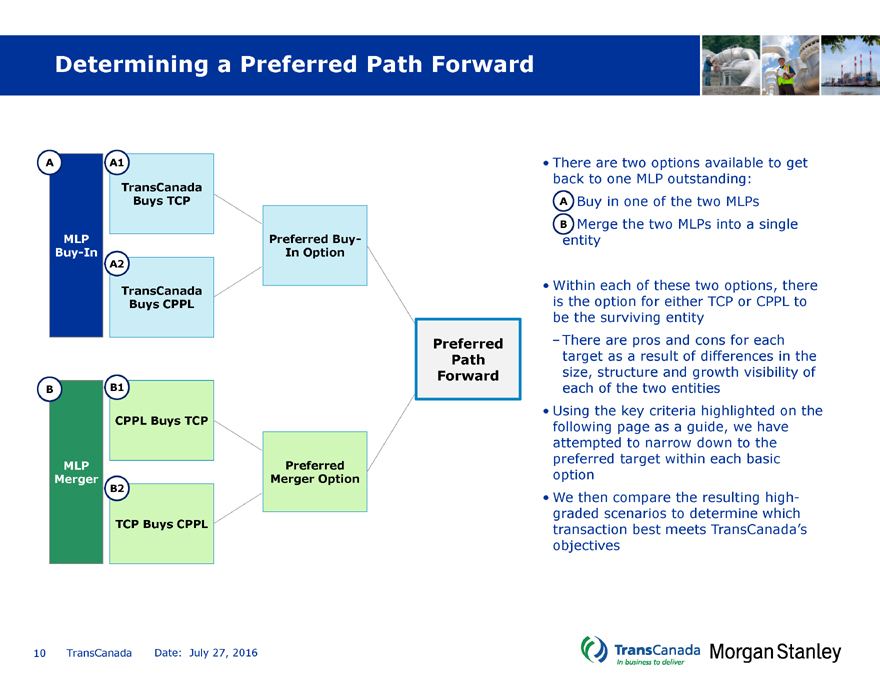
Determining a Preferred Path Forward
A A1
TransCanada
Buys TCP
MLP Preferred Buy-
Buy-In In Option
A2
TransCanada
Buys CPPL
Preferred
Path
Forward
B B1
CPPL Buys TCP
MLP Preferred
Merger Merger Option
B2
TCP Buys CPPL
• There are two options available to get back to one MLP outstanding:
–A Buy in one of the two MLPs
–B Merge the two MLPs into a single entity
• Within each of these two options, there is the option for either TCP or CPPL to be the surviving entity
–There are pros and cons for each target as a result of differences in the size, structure and growth visibility of each of the two entities
• Using the key criteria highlighted on the following page as a guide, we have attempted to narrow down to the preferred target within each basic option
• We then compare the resulting high-graded scenarios to determine which transaction best meets TransCanada’s objectives
10 TransCanada Date: July 27, 2016
|
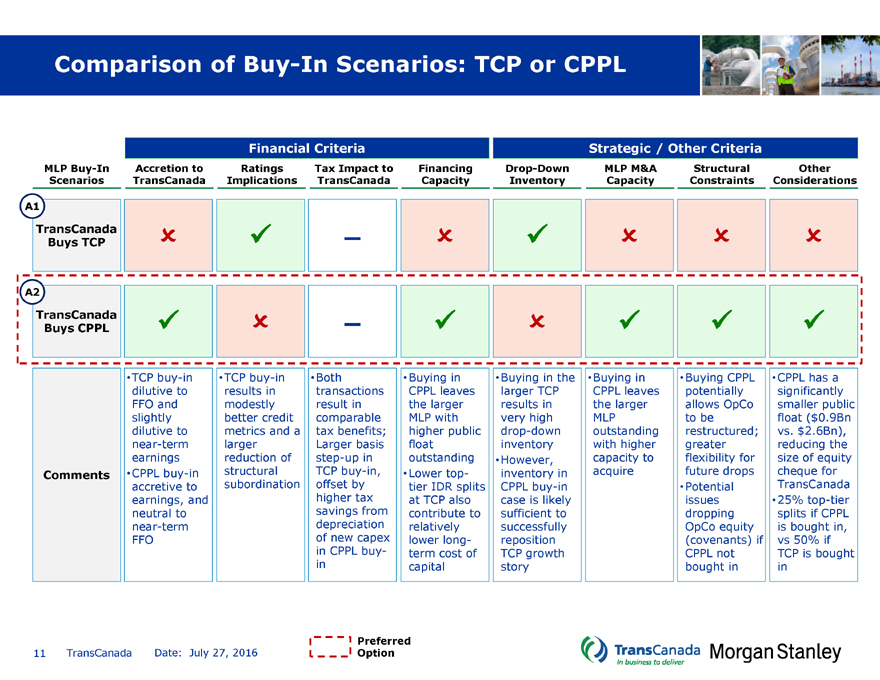
Comparison of Buy-In Scenarios: TCP or CPPL
Financial CriteriaStrategic / Other Criteria
MLP Buy-In Accretion to RatingsTax Impact toFinancingDrop-DownMLP M&AStructuralOther
Scenarios TransCanada ImplicationsTransCanadaCapacityInventoryCapacityConstraintsConsiderations
A1
TransCanada ?ü–?ü???
Buys TCP
A2
TransCanada ü ?–ü?üüü
Buys CPPL
• TCP buy-in • TCP buy-in• Both• Buying in• Buying in the• Buying in• Buying CPPL• CPPL has a
dilutive to results intransactionsCPPL leaveslarger TCPCPPL leavespotentiallysignificantly
FFO and modestlyresult inthe largerresults inthe largerallows OpCosmaller public
slightly better creditcomparableMLP withvery highMLPto befloat ($0.9Bn
dilutive to metrics and atax benefits;higher publicdrop-downoutstandingrestructured;vs. $2.6Bn),
near-term largerLarger basisfloatinventorywith highergreaterreducing the
earnings reduction ofstep-up inoutstanding• However,capacity toflexibility forsize of equity
Comments • CPPL buy-in structuralTCP buy-in,• Lower top-inventory inacquirefuture dropscheque for
accretive to subordinationoffset bytier IDR splitsCPPL buy-in• PotentialTransCanada
earnings, and higher taxat TCP alsocase is likelyissues• 25% top-tier
neutral to savings fromcontribute tosufficient todroppingsplits if CPPL
near-term depreciationrelativelysuccessfullyOpCo equityis bought in,
FFO of new capexlower long-reposition(covenants) ifvs 50% if
in CPPL buy-term cost ofTCP growthCPPL notTCP is bought
incapitalstorybought inin
11 TransCanada Date: July 27, 2016
|
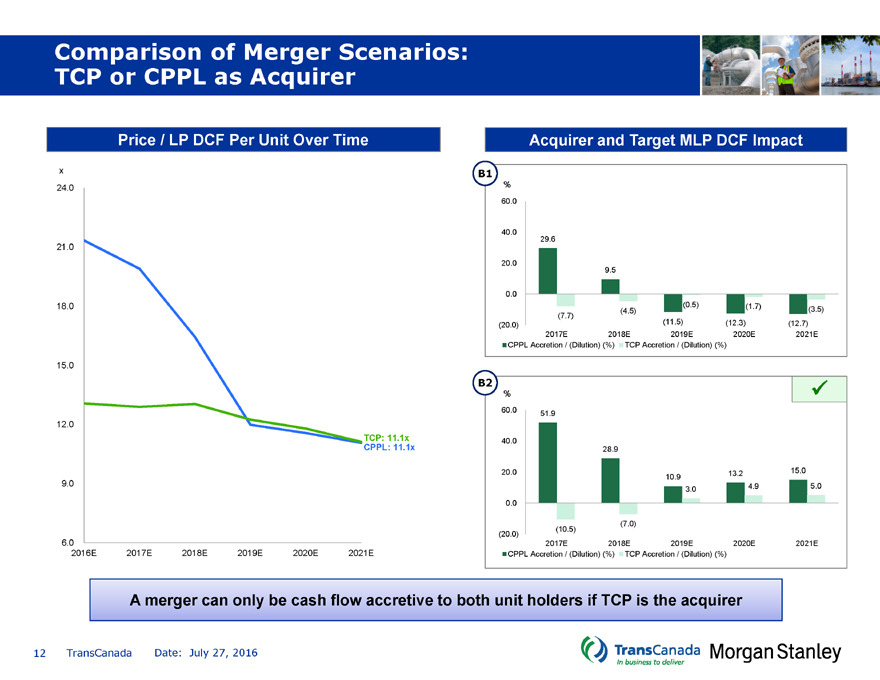
Comparison of Merger Scenarios: TCP or CPPL as Acquirer
Price / LP DCF Per Unit Over Time
Acquirer and Target MLP DCF Impact
x B1
24.0 %
60.0
40.0
29.6
21.0
20.0
9.5
0.0
18.0 (4.5)(0.5)(1.7)(3.5)
(7.7)
(20.0)(11.5)(12.3)(12.7)
2017E2018E2019E2020E2021E
CPPL Accretion / (Dilution) (%) TCP Accretion / (Dilution) (%)
15.0
B2%ü
60.051.9
12.0
TCP: 11.1x40.0
CPPL: 11.1x28.9
20.013.215.0
10.9
9.0 3.04.95.0
0.0
(7.0)
(20.0)(10.5)
6.0 2017E2018E2019E2020E2021E
2016E 2017E 2018E2019E2020E2021ECPPL Accretion / (Dilution) (%) TCP Accretion / (Dilution) (%)
A merger can only be cash flow accretive to both unit holders if TCP is the acquirer
12 TransCanada Date: July 27, 2016
|

Comparison of High-Graded Scenarios: Buy-In of CPPL vs. Merger
Financial CriteriaStrategic / Other Criteria
High-Graded Accretion to RatingsTax Impact toFinancingDrop-DownMLP M&AStructuralOther
Scenarios TransCanada ImplicationsTransCanadaCapacityInventoryCapacityConstraintsConsiderations
A2
TransCanada ü –ü?ü?üü
Buys CPPL
B2
TCP Buys ? –?ü?ü??
CPPL
• CPPL buy-in • Neither• Some tax• Merger• Buy-in of• Merger• Buying CPPL• CPPL buy-in
highly alternativesavings forresults in aCPPLresults in apotentiallyavoids dual-
accretive to has a materialTransCanadalarger MLPincreaseslarger MLPallows OpCoparty merger
earnings, and impact onfrom buy-inwith a higherdrop-downwith higherto benegotiations
neutral to credit metrics(step-up andpublic floatinventory ofcapacity torestructured;
near-term • ModestincrementalTCPacquiregreater
FFO reduction indepreciation)• No change inflexibility for
Comments • CPPL merger structural• No taxaggregatefuture drops
into TCP is subordinationimpact todrop-down• Potential
less accretive in buy-in ofTransCanadainventory in aissues
to earnings CPPLin mergermergerdropping
than a buy-in scenarioscenarioOpCo equity
and neutral (covenants) if
to FFO CPPL not
bought in
13 TransCanada Date: July 27, 2016
|
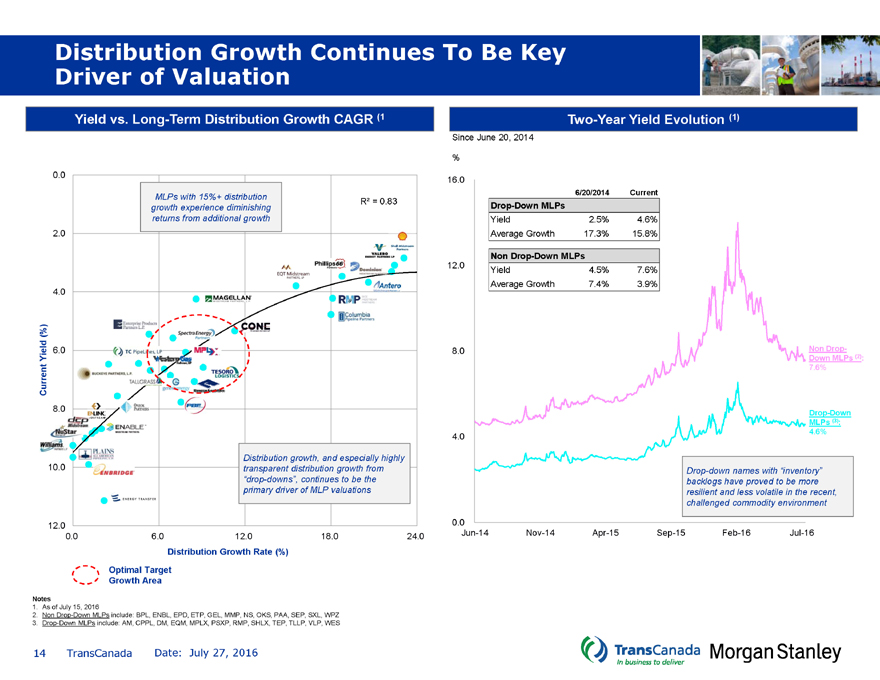
Distribution Growth Continues To Be Key Driver of Valuation
Yield vs. Long-Term Distribution Growth CAGR (1
Two-Year Yield Evolution (1)
Since June 20, 2014
0.0 16.0
MLPs with 15%+ distribution 6/20/2014Current
R² = 0.83
growth experience diminishing Drop-Down MLPs
returns from additional growth Yield2.5%4.6%
2.0 Average Growth17.3%15.8%
Non Drop-Down MLPs
12.0Yield4.5%7.6%
Average Growth7.4%3.9%
4.0
(%)
6.0 8.0Non Drop-
Yield Down MLPs (2):
7.6%
Current
8.0 Drop-Down
MLPs (3):
4.04.6%
Distribution growth, and especially highly
10.0 transparent distribution growth fromDrop-down names with “inventory”
“drop-downs”, continues to be thebacklogs have proved to be more
primary driver of MLP valuationsresilient and less volatile in the recent,
challenged commodity environment
12.0 0.0
0.0 6.0 12.018.024.0Jun-14Nov-14Apr-15Sep-15Feb-16Jul-16
Distribution Growth Rate (%)
Optimal Target
Growth Area
Notes
1. As of July 15, 2016
2. Non Drop-Down MLPs include: BPL, ENBL, EPD, ETP, GEL, MMP, NS, OKS, PAA, SEP, SXL, WPZ
3. Drop-Down MLPs include: AM, CPPL, DM, EQM, MPLX, PSXP, RMP, SHLX, TEP, TLLP, VLP, WES
14 TransCanada Date: July 27, 2016
|
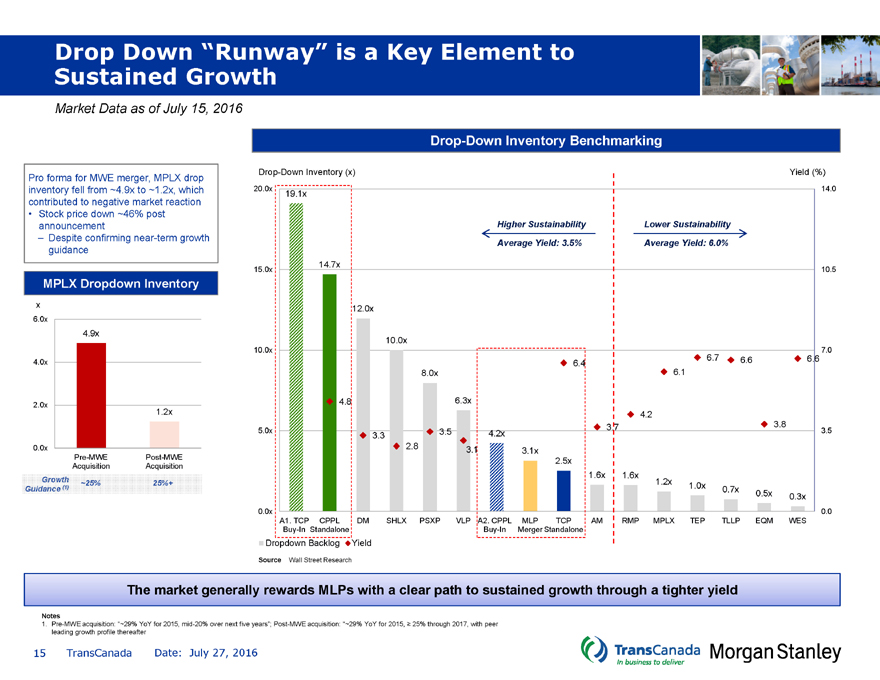
Drop Down “Runway” is a Key Element to Sustained Growth
Market Data as of July 15, 2016
Drop-Down Inventory Benchmarking
Pro forma for MWE merger, MPLX drop Drop-Down Inventory (x) Yield (%)
inventory fell from ~4.9x to ~1.2x, which 20.0x 19.1x14.0
contributed to negative market reaction
• Stock price down ~46% post
announcement Higher SustainabilityLower Sustainability
– Despite confirming near-term growth Average Yield: 3.5%Average Yield: 6.0%
guidance
14.7x
15.0x10.5
MPLX Dropdown Inventory
x 12.0x
6.0x
4.9x
10.0x
10.0x7.0
4.0x 6.46.76.66.6
8.0x6.1
2.0x 4.86.3x
1.2x 4.2
3.73.8
5.0x3.33.54.2x3.5
0.0x 2.83.13.1x
Pre-MWE Post-MWE 2.5x
Acquisition Acquisition
1.6x1.6x
1.2x 1.0x
0.7x
0.5x0.3x
0.0x0.0
A1. TCP CPPLDMSHLX PSXPVLP A2. CPPLMLP TCPAMRMPMPLX TEP TLLPEQMWES
Buy-In StandaloneBuy-InMerger Standalone
Dropdown BacklogYield
SourceWall Street Research
The market generally rewards MLPs with a clear path to sustained growth through a tighter yield
Notes
1. Pre-MWE acquisition: “~29% YoY for 2015, mid-20% over next five years”; Post-MWE acquisition: “~29% YoY for 2015, ? 25% through 2017, with peer leading growth profile thereafter
15 TransCanada Date: July 27, 2016
|
Required Approvals and Process Considerations
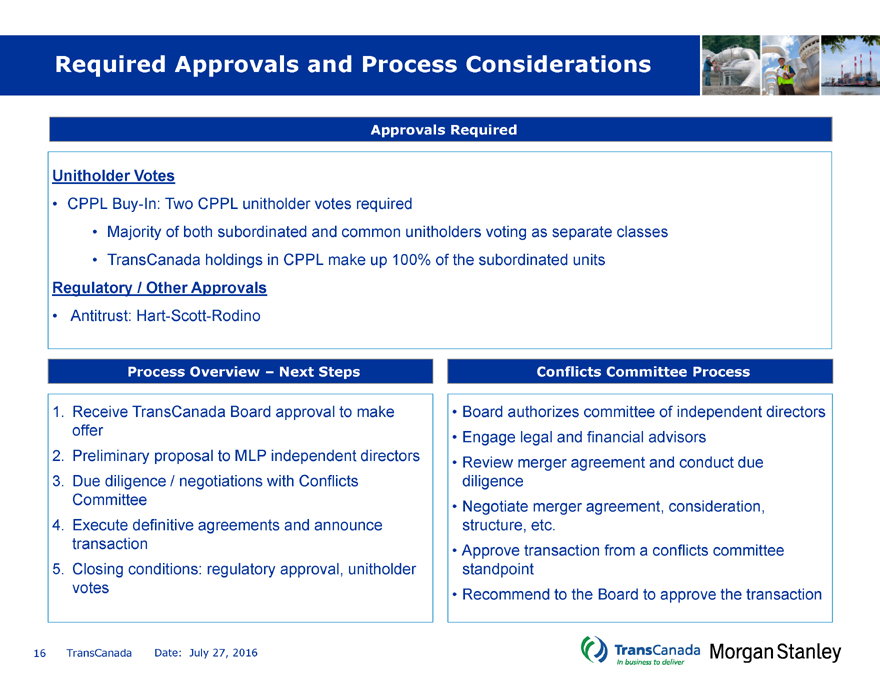
Approvals Required
Unitholder Votes
CPPL Buy-In: Two CPPL unitholder votes required
• Majority of both subordinated and common unitholders voting as separate classes
• TransCanada holdings in CPPL make up 100% of the subordinated units
Regulatory / Other Approvals
Antitrust: Hart-Scott-Rodino
Process Overview – Next StepsConflicts Committee Process
1. Receive TransCanada Board approval to make • Board authorizes committee of independent directors
offer • Engage legal and financial advisors
2. Preliminary proposal to MLP independent directors • Review merger agreement and conduct due
3. Due diligence / negotiations with Conflicts diligence
Committee • Negotiate merger agreement, consideration,
4. Execute definitive agreements and announce structure, etc.
transaction • Approve transaction from a conflicts committee
5. Closing conditions: regulatory approval, unitholder standpoint
votes • Recommend to the Board to approve the transaction
16 TransCanada Date: July 27, 2016
|
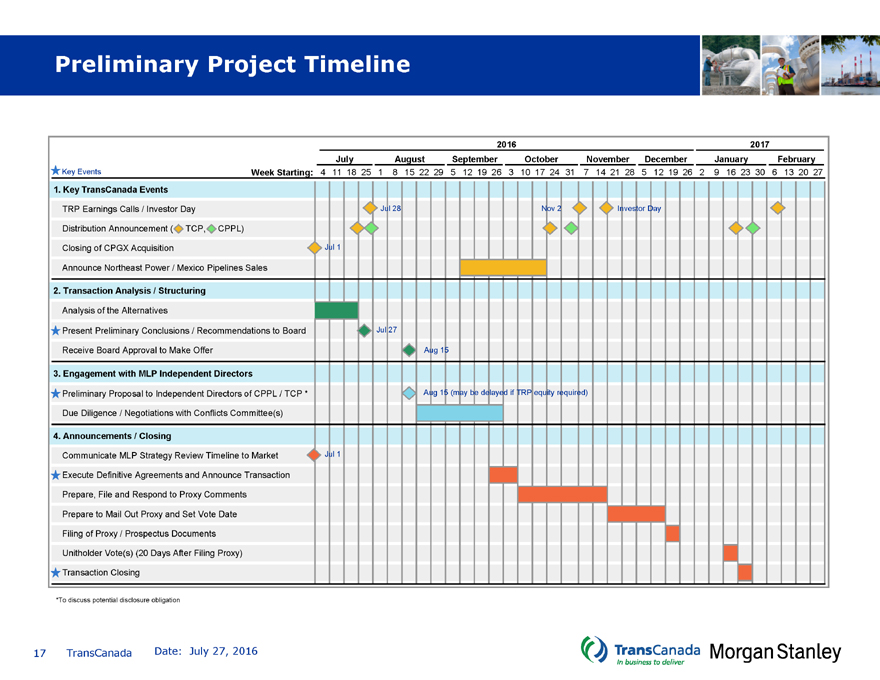
Preliminary Project Timeline
20162017
JulyAugustSeptemberOctoberNovember DecemberJanuaryFebruary
Key Events Week Starting: 4 11 18 251 8 15 22 295 12 19 26 310 17 24 317 14 21 28 5 12 19 2629 16 23 306 13 20 27
1. Key TransCanada Events
TRP Earnings Calls / Investor Day Jul 28Nov 2Investor Day
Distribution Announcement ( TCP, CPPL)
Closing of CPGX Acquisition Jul 1
Announce Northeast Power / Mexico Pipelines Sales
2. Transaction Analysis / Structuring
Analysis of the Alternatives
Present Preliminary Conclusions / Recommendations to Board Jul 27
Receive Board Approval to Make Offer Aug 15
3. Engagement with MLP Independent Directors
Preliminary Proposal to Independent Directors of CPPL / TCP * Aug 15 (may be delayed if TRP equity required)
Due Diligence / Negotiations with Conflicts Committee(s)
4. Announcements / Closing
Communicate MLP Strategy Review Timeline to Market Jul 1
Execute Definitive Agreements and Announce Transaction
Prepare, File and Respond to Proxy Comments
Prepare to Mail Out Proxy and Set Vote Date
Filing of Proxy / Prospectus Documents
Unitholder Vote(s) (20 Days After Filing Proxy)
Transaction Closing
*To discuss potential disclosure obligation
17 TransCanada Date: July 27, 2016
|
Appendix: Supplemental Materials
18 TransCanada Date: July 27, 2016
|
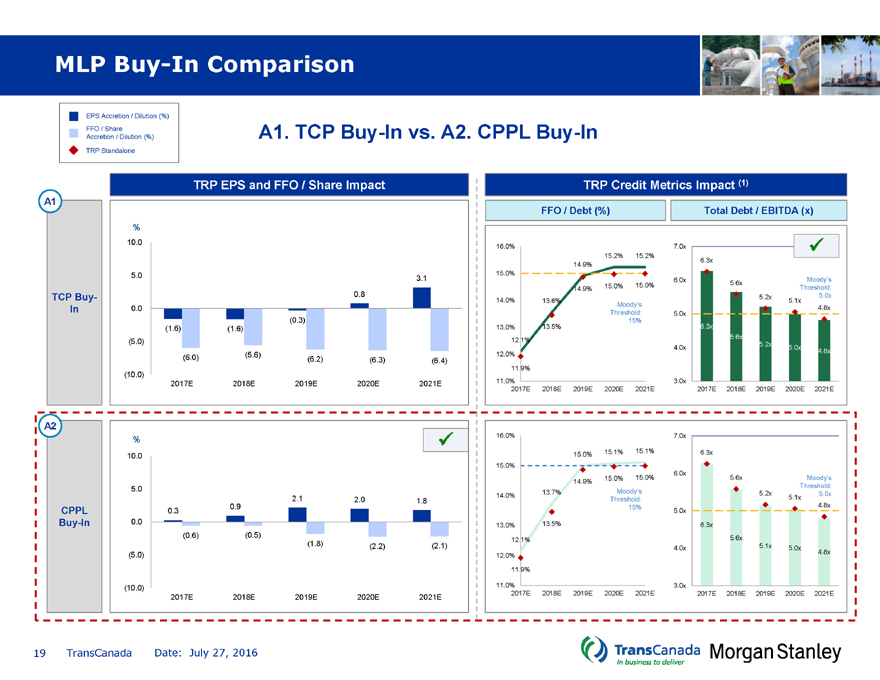
MLP Buy-In Comparison
EPS Accretion / Dilution (%)
FFO / Share
Accretion / Dilution (%)
TRP Standalone
A1. TCP Buy-In vs. A2. CPPL Buy-In
TRP EPS and FFO / Share ImpactTRP Credit Metrics Impact (1)
A1
FFO / Debt (%)Total Debt / EBITDA (x)
%
10.0 16.0%7.0xü
15.2% 15.2%
14.9%6.3x
5.0 15.0%
3.16.0x5.6xMoody’s
14.9%15.0% 15.0%Threshold:
TCP Buy- 0.85.2x5.0x
14.0%13.6%5.1x
In 0.0 Moody’s4.8x
Threshold:5.0x
(0.3)15%
(1.6)(1.6)13.0%13.5%6.3x
5.6x
(5.0) 12.1%5.2x
4.0x5.0x
(6.0)(5.6)(6.2)(6.3)(6.4)12.0%4.8x
11.9%
(10.0)
2017E2018E2019E2020E2021E11.0%3.0x
2017E2018E2019E2020E 2021E2017E 2018E 2019E 2020E 2021E
A2
% ü16.0%7.0x
10.0 15.0%15.1% 15.1%6.3x
15.0%
6.0x
14.9%15.0% 15.0%5.6xMoody’s
5.0 Moody’sThreshold:
14.0%13.7%5.2x5.0x
2.12.01.8Threshold:5.1x
CPPL 0.30.915%5.0x4.8x
Buy-In 0.0 13.0%13.5%6.3x
(0.6)(0.5)12.1%5.6x
(1.8)(2.2)(2.1)4.0x5.1x5.0x
(5.0) 12.0%4.8x
11.9%
(10.0) 11.0%3.0x
2017E2018E2019E2020E2021E2017E2018E2019E2020E 2021E2017E 2018E 2019E 2020E 2021E
19 TransCanada Date: July 27, 2016
|
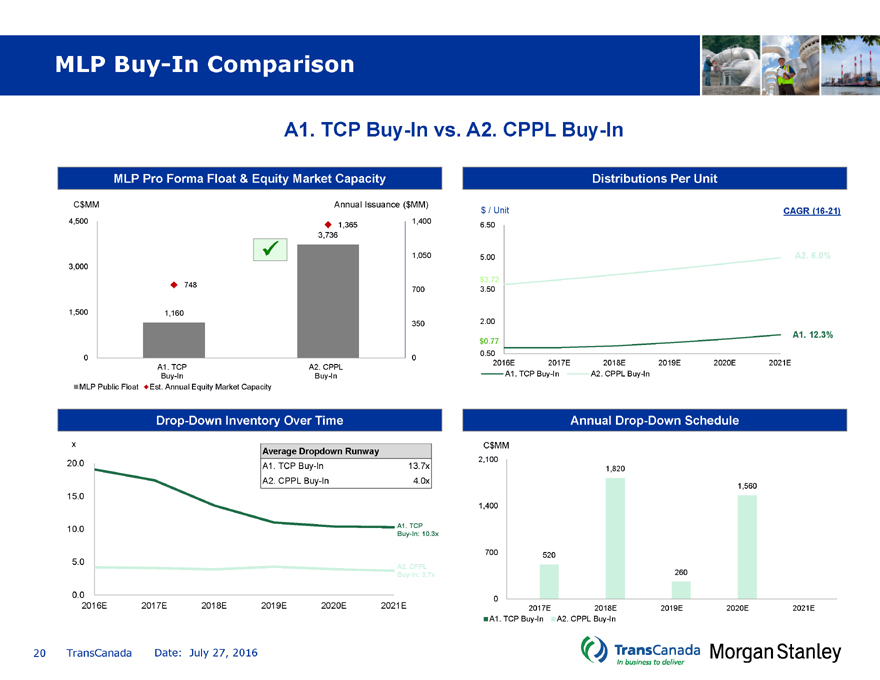
MLP Buy-In Comparison
A1. TCP Buy-In vs. A2. CPPL Buy-In
MLP Pro Forma Float & Equity Market Capacity Distributions Per Unit
C$MM Annual Issuance ($MM)$ / UnitCAGR (16-21)
4,500 1,400
1,3656.50
3,736
ü1,0505.00A2. 6.0%
3,000
$3.72
7487003.50
1,500 1,160
3502.00
A1. 12.3%
$0.77
0 00.50
A1. TCP A2. CPPL2016E2017E2018E2019E2020E2021E
Buy-In Buy-InA1. TCP Buy-InA2. CPPL Buy-In
MLP Public Float Est. Annual Equity Market Capacity
Drop-Down Inventory Over Time Annual Drop-Down Schedule
x C$MM
Average Dropdown Runway
20.0 A1. TCP Buy-In13.7x2,1001,820
A2. CPPL Buy-In4.0x1,560
15.0
1,400
10.0 A1. TCP
Buy-In: 10.3x
700520
5.0 A2. CPPL
Buy-In: 3.7x260
0.0 0
2016E 2017E 2018E2019E2020E2021E2017E2018E2019E2020E2021E
A1. TCP Buy-In A2. CPPL Buy-In
20 TransCanada Date: July 27, 2016
|
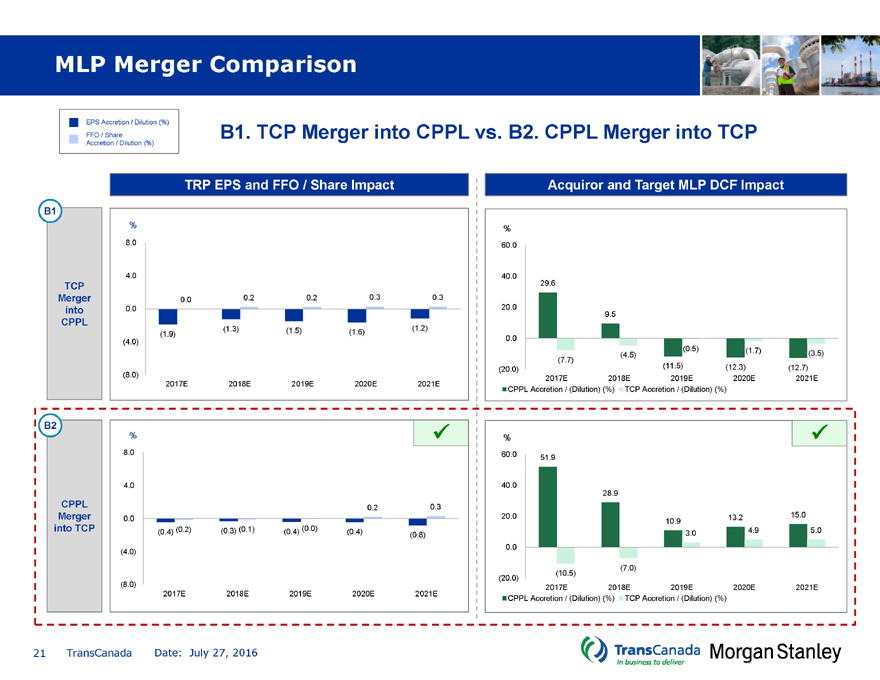
MLP Merger Comparison
EPS Accretion / Dilution (%)
FFO / Share
Accretion / Dilution (%)
B1. TCP Merger into CPPL vs. B2. CPPL Merger into TCP
TRP EPS and FFO / Share ImpactAcquiror and Target MLP DCF Impact
B1
% %
8.0 60.0
4.0 40.0
TCP 29.6
Merger 0.00.20.20.30.3
into 0.0 20.09.5
CPPL
(1.9)(1.3)(1.5)(1.6)(1.2)
(4.0) 0.0
(0.5)(1.7)
(7.7)(4.5)(3.5)
(20.0)(11.5)(12.3)(12.7)
(8.0) 2017E2018E2019E2020E2021E
2017E2018E2019E2020E2021ECPPL Accretion / (Dilution) (%) TCP Accretion / (Dilution) (%)
B2
% ü%ü
8.0 60.051.9
4.0 40.0
28.9
CPPL 0.20.3
Merger 0.0 20.013.215.0
10.9
into TCP (0.4) (0.2)(0.3) (0.1)(0.4) (0.0)(0.4)(0.8)3.04.95.0
(4.0) 0.0
(7.0)
(20.0)(10.5)
(8.0) 2017E2018E2019E2020E2021E
2017E2018E2019E2020E2021ECPPL Accretion / (Dilution) (%) TCP Accretion / (Dilution) (%)
21 TransCanada Date: July 27, 2016
|
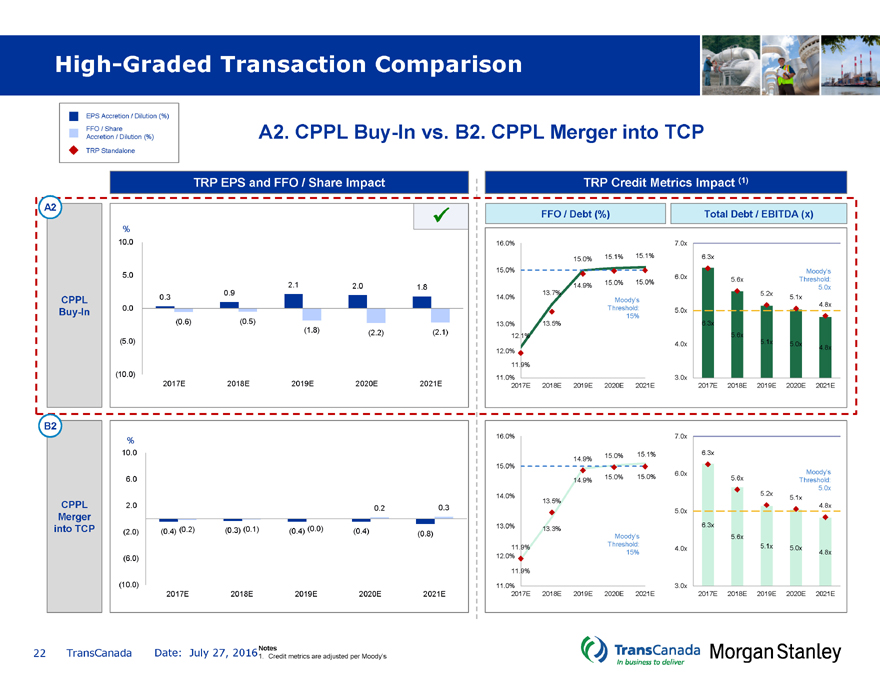
High-Graded Transaction Comparison
EPS Accretion / Dilution (%) FFO / Share Accretion / Dilution (%)
TRP Standalone
A2. CPPL Buy-In vs. B2. CPPL Merger into TCP
TRP EPS and FFO / Share ImpactTRP Credit Metrics Impact (1)
A2 üFFO / Debt (%)Total Debt / EBITDA (x)
%
10.0 16.0%7.0x
15.0% 15.1% 15.1%6.3x
15.0%Moody’s
5.0 6.0x5.6xThreshold:
2.12.01.814.9% 15.0% 15.0%5.0x
0.913.7%5.2x
CPPL 0.314.0%Moody’s5.1x
Buy-In 0.0 Threshold:5.0x4.8x
15%
(0.6)(0.5)13.0%13.5%6.3x
(1.8)(2.2)(2.1)5.6x
12.1%
(5.0) 4.0x5.1x5.0x
12.0%4.8x
11.9%
(10.0) 11.0%3.0x
2017E2018E2019E2020E2021E2017E 2018E2019E 2020E 2021E2017E2018E 2019E 2020E 2021E
B2
% 16.0%7.0x
10.0 15.0% 15.1%6.3x
14.9%
15.0%
6.0xMoody’s
6.0 14.9% 15.0% 15.0%5.6xThreshold:
5.0x
14.0%5.2x5.1x
CPPL 2.0 0.20.313.5%4.8x
5.0x
Merger
into TCP (2.0) (0.4) (0.2)(0.3) (0.1)(0.4) (0.0)(0.4)(0.8)13.0%13.3%6.3x
Moody’s5.6x
11.9%Threshold:4.0x5.1x5.0x
(6.0) 12.0%15%4.8x
11.9%
(10.0) 11.0%3.0x
2017E2018E2019E2020E2021E2017E 2018E2019E 2020E 2021E2017E2018E 2019E 2020E 2021E
22 TransCanada Date: July 27, 2016Notes
1. Credit metrics are adjusted per Moody’s
|
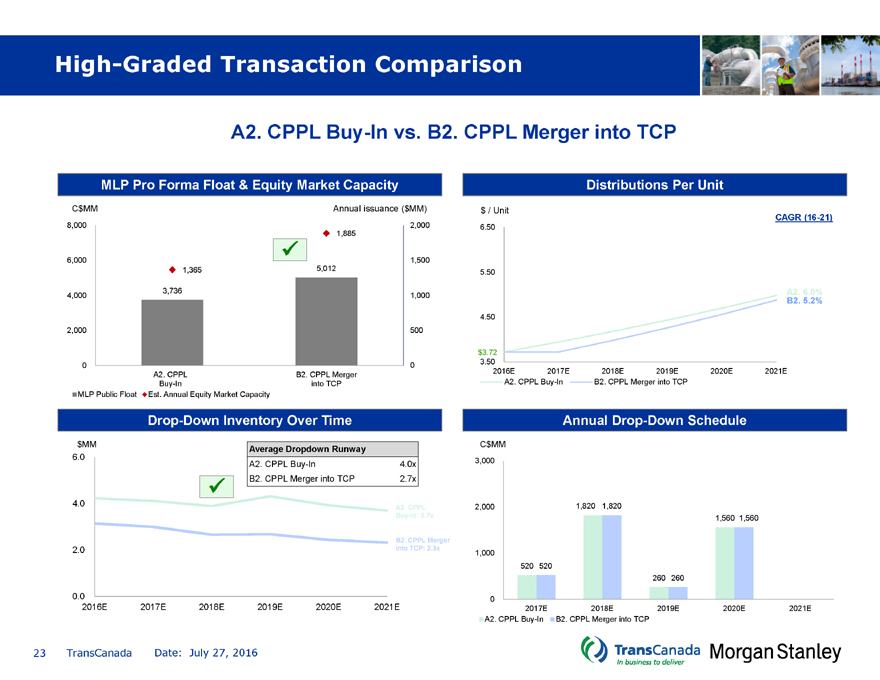
High-Graded Transaction Comparison
A2. CPPL Buy-In vs. B2. CPPL Merger into TCP
MLP Pro Forma Float & Equity Market Capacity Distributions Per Unit
C$MM Annual issuance ($MM)$ / Unit
CAGR (16-21)
8,000 2,0006.50
1,885
ü
6,000 1,500
1,3655,0125.50
4,000 3,736 1,000A2. 6.0%
B2. 5.2%
4.50
2,000 500
$3.72
0 03.50
A2. CPPL B2. CPPL Merger2016E2017E2018E2019E2020E2021E
Buy-In into TCPA2. CPPL Buy-InB2. CPPL Merger into TCP
MLP Public Float Est. Annual Equity Market Capacity
Drop-Down Inventory Over Time Annual Drop-Down Schedule
$MM C$MM
Average Dropdown Runway
6.0
A2. CPPL Buy-In4.0x3,000
üB2. CPPL Merger into TCP2.7x
4.0 A2. CPPL2,0001,820 1,820
Buy-In: 3.7x1,560 1,560
B2. CPPL Merger
2.0 into TCP: 2.3x1,000
520 520
260 260
0.0 0
2016E 2017E 2018E2019E2020E2021E2017E2018E2019E2020E2021E
A2. CPPL Buy-In B2. CPPL Merger into TCP
23 TransCanada Date: July 27, 2016
|
Drop-Downs are Competitive with TransCanada’s Other Available Sources of Capital
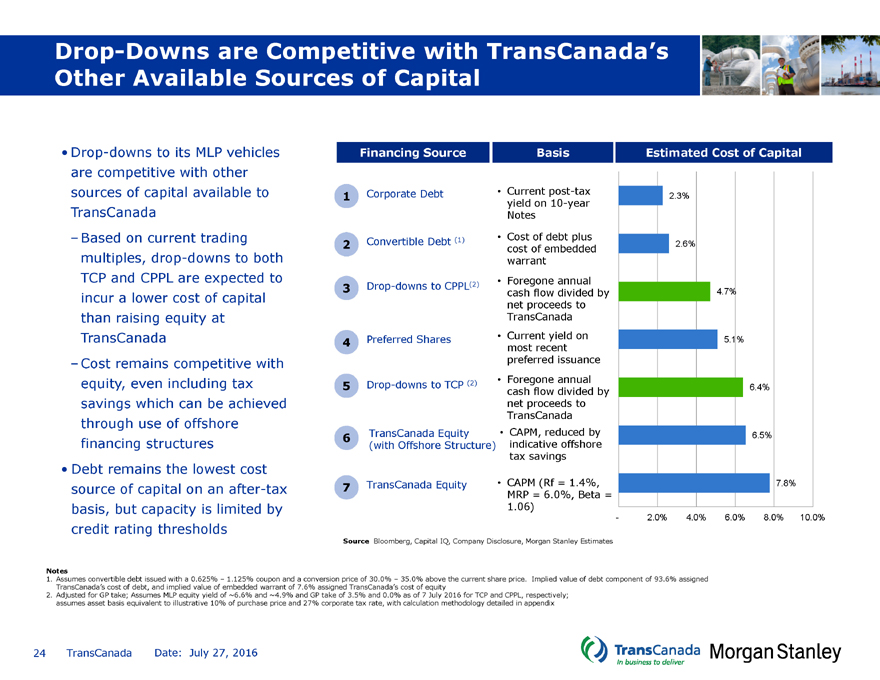
• Drop-downs to its MLP vehicles Financing SourceBasisEstimated Cost of Capital
are competitive with other
sources of capital available to 1 Corporate Debt•Current post-tax2.3%
yield on 10-year
TransCanada Notes
– Based on current trading 2 Convertible Debt (1)•Cost of debt plus2.6%
cost of embedded
multiples, drop-downs to both warrant
TCP and CPPL are expected to •Foregone annual
3 Drop-downs to CPPL(2)
incur a lower cost of capital cash flow divided by4.7%
net proceeds to
than raising equity at TransCanada
TransCanada 4 Preferred Shares•most Current recent yield on5.1%
– Cost remains competitive with preferred issuance
equity, even including tax 5 Drop-downs to TCP (2)•Foregone annual6.4%
cash flow divided by
savings which can be achieved net proceeds to
through use of offshore TransCanada
financing structures 6 (with TransCanada Offshore Equity Structure) • indicative CAPM, reduced offshore by6.5%
tax savings
• Debt remains the lowest cost
source of capital on an after-tax 7 TransCanada Equity•MRP CAPM = (Rf 6.0%, = 1.4%, Beta =7.8%
basis, but capacity is limited by 1.06)
-2.0% 4.0%6.0%8.0% 10.0%
credit rating thresholds
Source Bloomberg, Capital IQ, Company Disclosure, Morgan Stanley Estimates
Notes
1. Assumes convertible debt issued with a 0.625% – 1.125% coupon and a conversion price of 30.0% – 35.0% above the current share price. Implied value of debt component of 93.6% assigned TransCanada’s cost of debt, and implied value of embedded warrant of 7.6% assigned TransCanada’s cost of equity
2. Adjusted for GP take; Assumes MLP equity yield of ~6.6% and ~4.9% and GP take of 3.5% and 0.0% as of 7 July 2016 for TCP and CPPL, respectively; assumes asset basis equivalent to illustrative 10% of purchase price and 27% corporate tax rate, with calculation methodology detailed in appendix
24 TransCanada Date: July 27, 2016
|
TransCanada’s Historical Use of TCP has Been Inconsistent
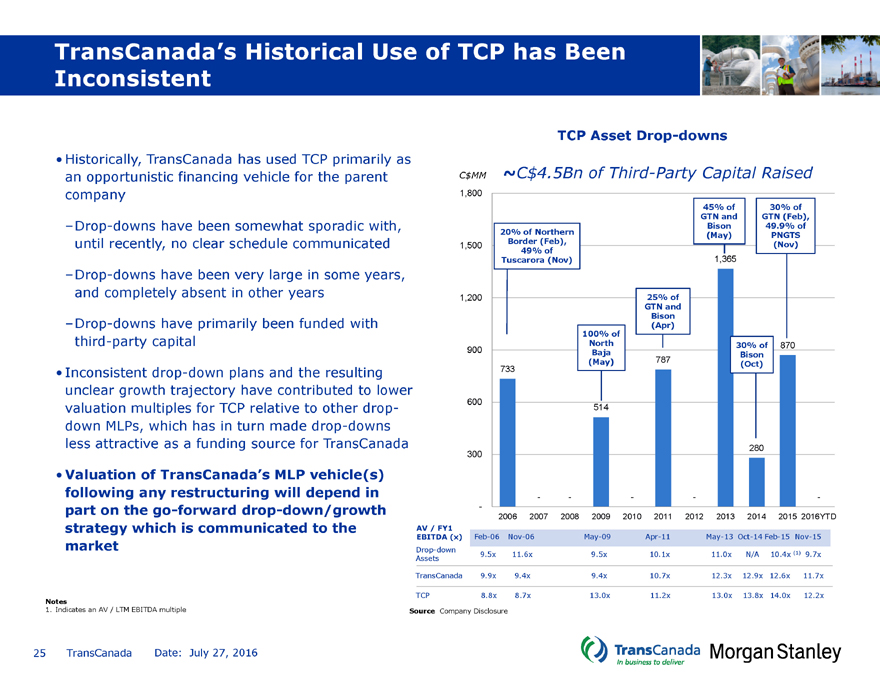
• Historically, TransCanada has used TCP primarily as an opportunistic financing vehicle for the parent company
–Drop-downs have been somewhat sporadic with, until recently, no clear schedule communicated
–Drop-downs have been very large in some years, and completely absent in other years
–Drop-downs have primarily been funded with third-party capital
• Inconsistent drop-down plans and the resulting unclear growth trajectory have contributed to lower valuation multiples for TCP relative to other drop-down MLPs, which has in turn made drop-downs less attractive as a funding source for TransCanada
• Valuation of TransCanada’s MLP vehicle(s) following any restructuring will depend in part on the go-forward drop-down/growth strategy which is communicated to the market
Notes
1. Indicates an AV / LTM EBITDA multiple
TCP Asset Drop-downs
$$CC MM ~ 4.5Bn of Third-Party Capital Raised
1,800
45% of30% of
GTN andGTN (Feb),
Bison49.9% of
20% of Northern(May)PNGTS
1,500 Border (Feb), (Nov)
49% of
Tuscarora (Nov)1,365
1,200 25% of
GTN and
Bison
(Apr)
100% of
North30% of870
900 BajaBison
(May)787(Oct)
733
600 514
280
300
—---
-
2006 2007 20082009 20102011 2012201320142015 2016YTD
AV / FY1
EBITDA (x) Feb-06 Nov-06 May-09 Apr-11May-13 Oct-14 Feb-15 Nov-15
Drop-down
Assets 9.5x 11.6x 9.5x10.1x11.0x N/A 10.4x (1) 9.7x
TransCanada 9.9x 9.4x9.4x10.7x12.3x 12.9x 12.6x 11.7x
TCP 8.8x 8.7x13.0x11.2x13.0x 13.8x 14.0x 12.2x
Source Company Disclosure
25 TransCanada Date: July 27, 2016
|
Having an MLP Adds an Incremental Source of Equity Capacity Given Limited Overlap Between Parent and MLP
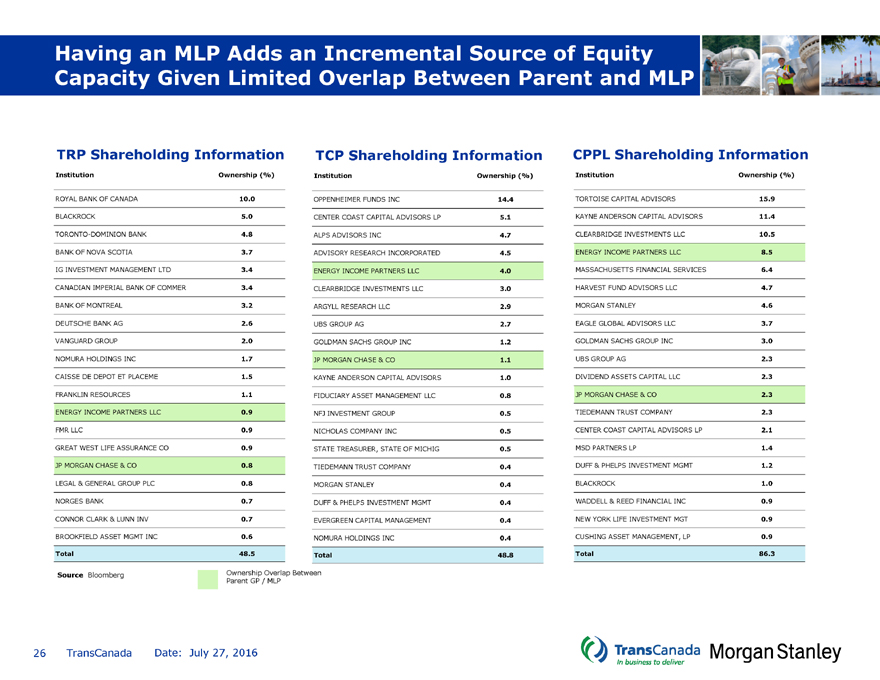
TRP Shareholding Information TCP Shareholding Information CPPL Shareholding Information
Institution Ownership (%) InstitutionOwnership (%)InstitutionOwnership (%)
ROYAL BANK OF CANADA 10.0 OPPENHEIMER FUNDS INC14.4TORTOISE CAPITAL ADVISORS15.9
BLACKROCK 5.0 CENTER COAST CAPITAL ADVISORS LP5.1KAYNE ANDERSON CAPITAL ADVISORS11.4
TORONTO-DOMINION BANK 4.8 ALPS ADVISORS INC4.7CLEARBRIDGE INVESTMENTS LLC10.5
BANK OF NOVA SCOTIA 3.7 ADVISORY RESEARCH INCORPORATED4.5ENERGY INCOME PARTNERS LLC8.5
IG INVESTMENT MANAGEMENT LTD 3.4 ENERGY INCOME PARTNERS LLC4.0MASSACHUSETTS FINANCIAL SERVICES6.4
CANADIAN IMPERIAL BANK OF COMMER 3.4 CLEARBRIDGE INVESTMENTS LLC3.0HARVEST FUND ADVISORS LLC4.7
BANK OF MONTREAL 3.2 ARGYLL RESEARCH LLC2.9MORGAN STANLEY4.6
DEUTSCHE BANK AG 2.6 UBS GROUP AG2.7EAGLE GLOBAL ADVISORS LLC3.7
VANGUARD GROUP 2.0 GOLDMAN SACHS GROUP INC1.2GOLDMAN SACHS GROUP INC3.0
NOMURA HOLDINGS INC 1.7 JP MORGAN CHASE & CO1.1UBS GROUP AG2.3
CAISSE DE DEPOT ET PLACEME 1.5 KAYNE ANDERSON CAPITAL ADVISORS1.0DIVIDEND ASSETS CAPITAL LLC2.3
FRANKLIN RESOURCES 1.1 FIDUCIARY ASSET MANAGEMENT LLC0.8JP MORGAN CHASE & CO2.3
ENERGY INCOME PARTNERS LLC 0.9 NFJ INVESTMENT GROUP0.5TIEDEMANN TRUST COMPANY2.3
FMR LLC 0.9 NICHOLAS COMPANY INC0.5CENTER COAST CAPITAL ADVISORS LP2.1
GREAT WEST LIFE ASSURANCE CO 0.9 STATE TREASURER, STATE OF MICHIG0.5MSD PARTNERS LP1.4
JP MORGAN CHASE & CO 0.8 TIEDEMANN TRUST COMPANY0.4DUFF & PHELPS INVESTMENT MGMT1.2
LEGAL & GENERAL GROUP PLC 0.8 MORGAN STANLEY0.4BLACKROCK1.0
NORGES BANK 0.7 DUFF & PHELPS INVESTMENT MGMT0.4WADDELL & REED FINANCIAL INC0.9
CONNOR CLARK & LUNN INV 0.7 EVERGREEN CAPITAL MANAGEMENT0.4NEW YORK LIFE INVESTMENT MGT0.9
BROOKFIELD ASSET MGMT INC 0.6 NOMURA HOLDINGS INC0.4CUSHING ASSET MANAGEMENT, LP0.9
Total 48.5 Total48.8Total86.3
Source Bloomberg Ownership Overlap Between
Parent GP / MLP
26 TransCanada Date: July 27, 2016
|
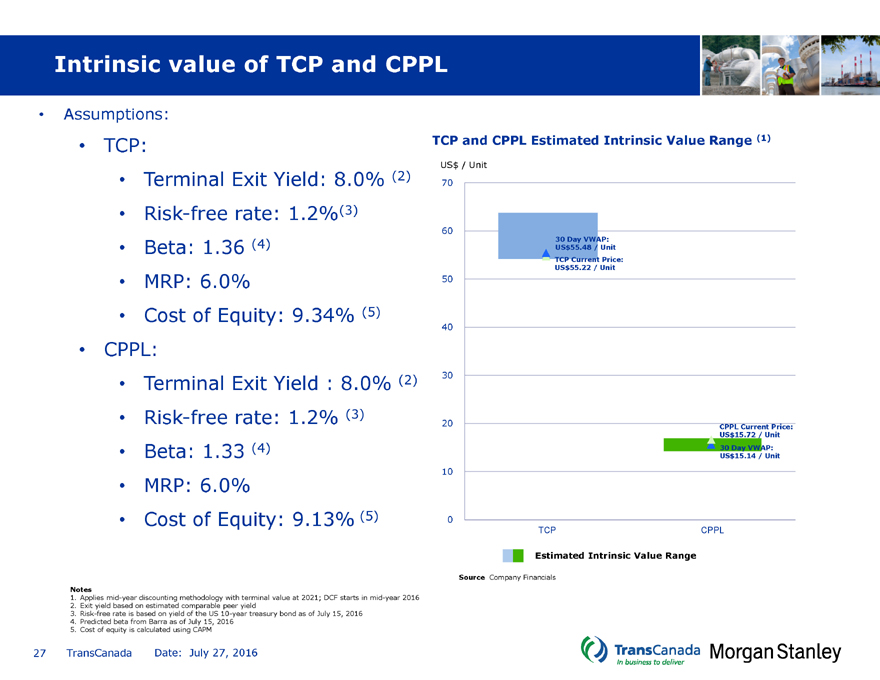
Intrinsic value of TCP and CPPL
Assumptions:
TCP:TCP and CPPL Estimated Intrinsic Value Range (1)
$US / Unit
• Terminal Exit Yield: 8.0% (2)70
• Risk-free rate: 1.2%(3)
60
30 Day VWAP:
• Beta: 1.36$US(4) 55.48 / Unit
TCP Current Price:
$US 55.22 / Unit
• MRP: 6.0%50
• Cost of Equity: 9.34% (5)
40
CPPL:
• Terminal Exit Yield : 8.0% (2)30
• Risk-free rate: 1.2% (3)20
CPPL Current Price:
$US 15.72 / Unit
• Beta: 1.33 (4)30 Day VWAP:
$US 15.14 / Unit
10
• MRP: 6.0%
• Cost of Equity: 9.13% (5)0
TCPCPPL
Estimated Intrinsic Value Range
Source Company Financials
Notes
1. Applies mid-year discounting methodology with terminal value at 2021; DCF starts in mid-year 2016
2. Exit yield based on estimated comparable peer yield
3. Risk-free rate is based on yield of the US 10-year treasury bond as of July 15, 2016
4. Predicted beta from Barra as of July 15, 2016
5. Cost of equity is calculated using CAPM
27 TransCanada Date: July 27, 2016
|
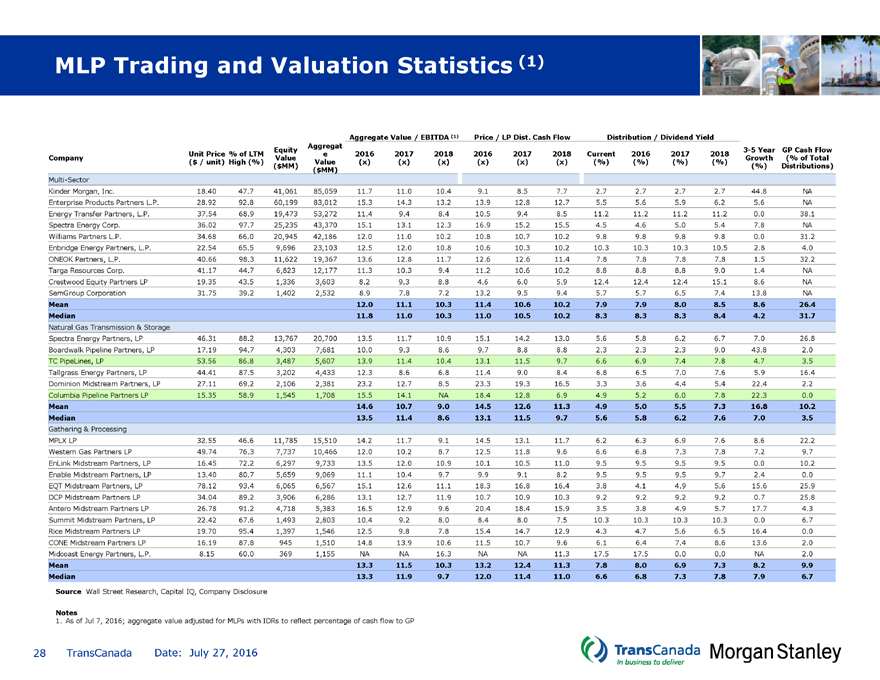
MLP Trading and Valuation Statistics (1)
Aggregate Value / EBITDA (1)Price / LP Dist. Cash FlowDistribution / Dividend Yield
Aggregat
Equity3-5 YearGP Cash Flow
Unit Price % of LTM e201620172018201620172018Current201620172018
Company ValueGrowth (% of Total
($ / unit) High (%) Value(x)(x)(x)(x)(x)(x)(%)(%)(%)(%)
($MM)(%)Distributions)
($MM)
Multi-Sector
Kinder Morgan, Inc. 18.40 47.741,06185,05911.711.010.49.18.57.72.72.72.72.744.8NA
Enterprise Products Partners L.P. 28.92 92.860,19983,01215.314.313.213.912.812.75.55.65.96.25.6NA
Energy Transfer Partners, L.P. 37.54 68.919,47353,27211.49.48.410.59.48.511.211.211.211.20.038.1
Spectra Energy Corp. 36.02 97.725,23543,37015.113.112.316.915.215.54.54.65.05.47.8NA
Williams Partners L.P. 34.68 66.020,94542,18612.011.010.210.810.710.29.89.89.89.80.031.2
Enbridge Energy Partners, L.P. 22.54 65.59,69623,10312.512.010.810.610.310.210.310.310.310.52.84.0
ONEOK Partners, L.P. 40.66 98.311,62219,36713.612.811.712.612.611.47.87.87.87.81.532.2
Targa Resources Corp. 41.17 44.76,82312,17711.310.39.411.210.610.28.88.88.89.01.4NA
Crestwood Equity Partners LP 19.35 43.51,3363,6038.29.38.84.66.05.912.412.412.415.18.6NA
SemGroup Corporation 31.75 39.21,4022,5328.97.87.213.29.59.45.75.76.57.413.8NA
Mean 12.011.110.311.410.610.27.97.98.08.58.626.4
Median 11.811.010.311.010.510.28.38.38.38.44.231.7
Natural Gas Transmission & Storage
Spectra Energy Partners, LP 46.31 88.213,76720,70013.511.710.915.114.213.05.65.86.26.77.026.8
Boardwalk Pipeline Partners, LP 17.19 94.74,3037,68110.09.38.69.78.88.82.32.32.39.043.82.0
TC PipeLines, LP 53.56 86.83,4875,60713.911.410.413.111.59.76.66.97.47.84.73.5
Tallgrass Energy Partners, LP 44.41 87.53,2024,43312.38.66.811.49.08.46.86.57.07.65.916.4
Dominion Midstream Partners, LP 27.11 69.22,1062,38123.212.78.523.319.316.53.33.64.45.422.42.2
Columbia Pipeline Partners LP 15.35 58.91,5451,70815.514.1NA18.412.86.94.95.26.07.822.30.0
Mean 14.610.79.014.512.611.34.95.05.57.316.810.2
Median 13.511.48.613.111.59.75.65.86.27.67.03.5
Gathering & Processing
MPLX LP 32.55 46.611,78515,51014.211.79.114.513.111.76.26.36.97.68.622.2
Western Gas Partners LP 49.74 76.37,73710,46612.010.28.712.511.89.66.66.87.37.87.29.7
EnLink Midstream Partners, LP 16.45 72.26,2979,73313.512.010.910.110.511.09.59.59.59.50.010.2
Enable Midstream Partners, LP 13.40 80.75,6599,06911.110.49.79.99.18.29.59.59.59.72.40.0
EQT Midstream Partners, LP 78.12 93.46,0656,56715.112.611.118.316.816.43.84.14.95.615.625.9
DCP Midstream Partners LP 34.04 89.23,9066,28613.112.711.910.710.910.39.29.29.29.20.725.8
Antero Midstream Partners LP 26.78 91.24,7185,38316.512.99.620.418.415.93.53.84.95.717.74.3
Summit Midstream Partners, LP 22.42 67.61,4932,80310.49.28.08.48.07.510.310.310.310.30.06.7
Rice Midstream Partners LP 19.70 95.41,3971,54612.59.87.815.414.712.94.34.75.66.516.40.0
CONE Midstream Partners LP 16.19 87.89451,51014.813.910.611.510.79.66.16.47.48.613.62.0
Midcoast Energy Partners, L.P. 8.15 60.03691,155NANA16.3NANA11.317.517.50.00.0NA2.0
Mean 13.311.510.313.212.411.37.88.06.97.38.29.9
Median 13.311.99.712.011.411.06.66.87.37.87.96.7
Source Wall Street Research, Capital IQ, Company Disclosure
Notes
1. As of Jul 7, 2016; aggregate value adjusted for MLPs with IDRs to reflect percentage of cash flow to GP
28 TransCanada Date: July 27, 2016
|

MLP Trading and Valuation Statistics (Cont’d) (1)
Aggregate Value / EBITDA (1)Price / LP Dist. Cash FlowDistribution / Dividend Yield
Aggregat
Equity3-5 YearGP Cash Flow
Unit Price % of LTM e201620172018201620172018Current201620172018
Company ValueGrowth (% of Total
($ / unit) High (%) Value(x)(x)(x)(x)(x)(x)(%)(%)(%)(%)
($MM)(%)Distributions)
($MM)
Crude Oil & Petroleum Products
Plains All American Pipeline, L.P. 26.83 60.610,67122,07013.011.810.610.910.110.410.410.410.410.40.036.4
Magellan Midstream Partners LP 74.18 95.816,89720,48917.315.915.019.017.116.04.34.54.85.38.80.0
Sunoco Logistics Partners L.P. 27.87 72.18,24114,20014.911.910.114.811.410.27.07.17.88.69.840.1
Buckeye Partners, L.P. 69.15 90.39,01013,14313.312.612.112.712.412.67.07.07.37.63.90.0
NuStar Energy L.P. 48.24 79.93,7576,83312.611.911.210.810.110.09.19.19.19.20.813.0
Mean 14.212.811.813.612.211.87.67.67.98.24.617.9
Median 13.311.911.212.711.410.47.07.17.88.63.913.0
Pure-Play GPs (2)
Energy Transfer Equity, L.P. 15.28 46.215,96422,71013.311.410.511.59.69.07.57.57.58.27.3NA
ONEOK Inc. 46.99 96.39,87311,37714.514.114.114.517.117.25.25.25.25.44.5NA
Western Gas Equity Partners, LP 37.51 61.08,2128,23721.418.915.421.418.915.44.54.85.36.513.7NA
Plains GP Holdings, L.P. 9.90 37.26,1786,765NANANA10.310.310.29.39.39.39.40.3NA
EQT GP Holdings, LP 25.28 71.96,7296,72940.628.722.340.628.722.32.12.53.54.527.7NA
Tallgrass Energy GP, LP 23.10 66.03,6323,77911.010.05.625.921.617.33.63.94.45.114.7NA
EnLink Midstream, LLC 15.51 50.12,7922,80113.612.712.013.514.613.76.66.66.66.91.9NA
NuStar GP Holdings, LLC 24.66 65.51,0591,08616.015.415.211.611.611.48.88.88.88.80.0NA
Mean 18.615.913.618.716.514.66.06.16.36.88.8NA
Median 14.514.114.114.015.814.65.95.95.96.75.9NA
Source Wall Street Research, Capital IQ, Company Disclosure
Notes
1. As of Jul 7, 2016; aggregate value adjusted for MLPs with IDRs to reflect percentage of cash flow to GP
2. Pure-Play GPs defined as general partners that derive the majority of cash flows through IDRs and / or LP unit ownership. Pure-Play GPs are displayed on a deconsolidated basis
29 TransCanada Date: July 27, 2016