|

Exhibit (c)(9)
Project Pony
Prepared for Board of Directors
September 7, 2016
|
Situational Overview
Management has completed a comprehensive strategic
review of its MLP interests in TC PipeLines, LP and Columbia
Pipeline Partners LP (“CPPL”)
Recommendation: Buyback CPPL
Transaction Structure
Reverse triangular merger
All cash offer expected
Offer expected to be made by the end of September
2 |
| TransCanada Date: September 7, 2016 |
|
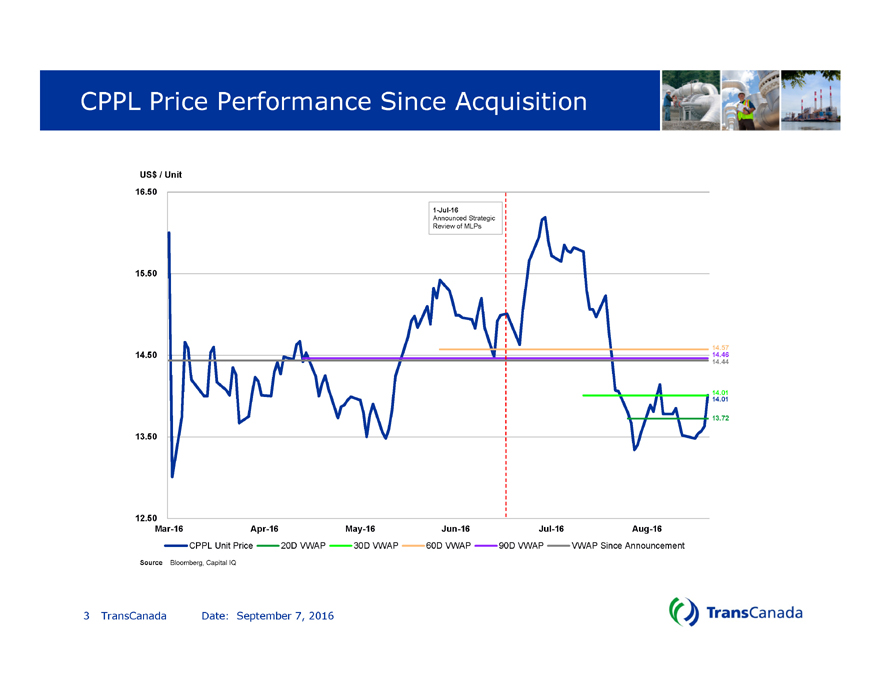
CPPL Price Performance Since Acquisition
US$ / Unit16.5015.50
16.50
Mar-16 Apr-16 May-16 Jun-16 Jul-16 Aug-16
CPPL Unit Price 20D VWAP 30D VWAP 60D VWAP 90D VWAP VWAP Since Announcement
US$ / Unit
13.72
14.57
14.01
14.46
1-Jul-16
Announced Strategic
Review of MLP14.5013.50Source Bloomberg, Capital IQ
3 |
| TransCanada Date: September 7, 2016 |
|
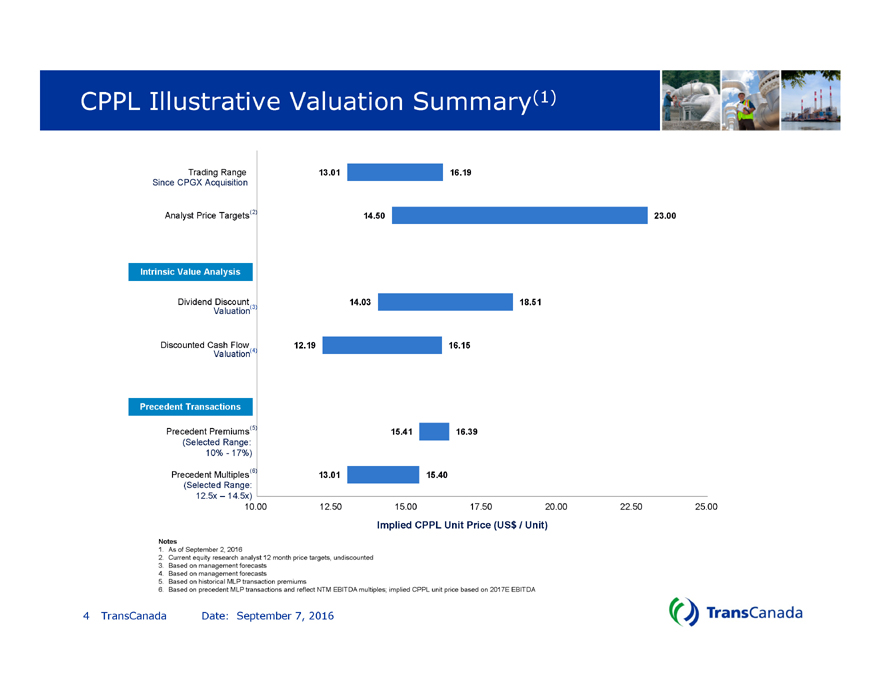
CPPL Illustrative Valuation Summary(1)
13.01
14.50
14.03
12.19
15.41
13.01
16.19
23.00
18.51
16.15
16.39
15.40
10.00 12.50 15.00 17.50 20.00 22.50 25.00
Trading Range
Analyst Price Targets
Dividend Discount
Discounted Cash Flow
Precedent Premiums
Precedent Multiples
Implied CPPL Unit Price (US$ / Unit)
Since CPGX Acquisition
(Selected Range:
10%—17%)
(Selected Range:
12.5x – 14.5x)
(6) |
|
Intrinsic Value Analysis
Precedent Transactions
(5) |
|
(4) |
|
(3) |
|
(2) |
|
Valuation
Valuation
Notes
1. As of September 2, 2016
2. Current equity research analyst 12 month price targets, undiscounted
3. Based on management forecasts
4. Based on management forecasts
5. Based on historical MLP transaction premiums
6. Based on precedent MLP transactions and reflect NTM EBITDA multiples; implied CPPL unit price based on 2017E EBITDA
4 |
| TransCanada Date: September 7, 2016 |
|
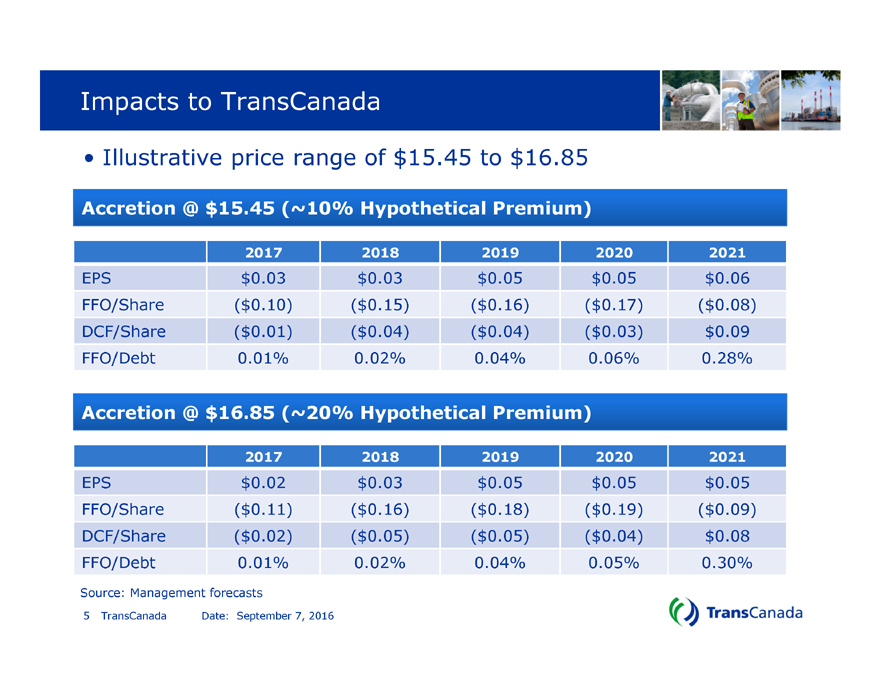
Impacts to TransCanada
Illustrative price range of $15.45 to $16.85
2017 2018 2019 2020 2021
EPS $0.03 $0.03 $0.05 $0.05 $0.06
FFO/Share ($0.10) ($0.15) ($0.16) ($0.17) ($0.08)
DCF/Share ($0.01) ($0.04) ($0.04) ($0.03) $0.09
FFO/Debt 0.01% 0.02% 0.04% 0.06% 0.28%
Accretion @ $15.45 (~10% Hypothetical Premium)
2017 2018 2019 2020 2021
EPS $0.02 $0.03 $0.05 $0.05 $0.05
FFO/Share ($0.11) ($0.16) ($0.18) ($0.19) ($0.09)
DCF/Share ($0.02) ($0.05) ($0.05) ($0.04) $0.08
FFO/Debt 0.01% 0.02% 0.04% 0.05% 0.30%
Source: Management forecasts
5 |
| TransCanada Date: September 7, 2016 |
|
Timing and Next Steps
Offer will be submitted in September at Management’s discretion
CPPL will form a Conflicts Committee and engage legal and financial
advisors
Transaction announcement to occur once equity funding needs are
determined (dependent on proceeds from divestiture program)
Management will come back to Board before a deal is agreed upon
Closing conditions include HSR and CPPL public unitholder vote
6 |
| TransCanada Date: September 7, 2016 |
|
Appendix
7 |
| TransCanada Date: September 7, 2016 |
|
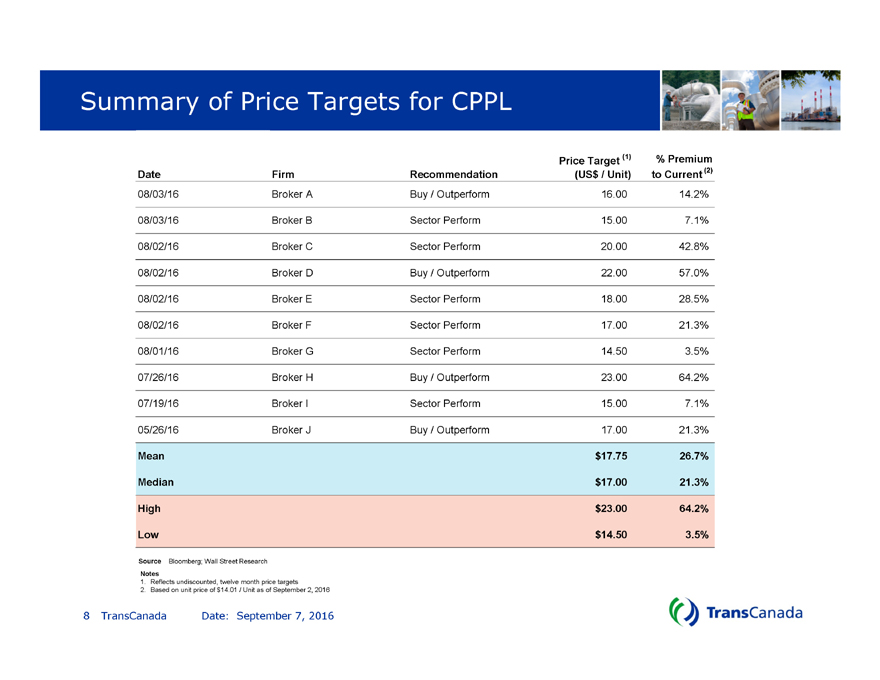
Summary of Price Targets for CPPL
Date Firm Recommendation
Price Target (1)
(US$ / Unit)
% Premium
to Current (2)
08/03/16 Broker A Buy / Outperform 16.00 14.2%
08/03/16 Broker B Sector Perform 15.00 7.1%
08/02/16 Broker C Sector Perform 20.00 42.8%
08/02/16 Broker D Buy / Outperform 22.00 57.0%
08/02/16 Broker E Sector Perform 18.00 28.5%
08/02/16 Broker F Sector Perform 17.00 21.3%
08/01/16 Broker G Sector Perform 14.50 3.5%
07/26/16 Broker H Buy / Outperform 23.00 64.2%
07/19/16 Broker I Sector Perform 15.00 7.1%
05/26/16 Broker J Buy / Outperform 17.00 21.3%
Mean $17.75 26.7%
Median $17.00 21.3%
High $23.00 64.2%
Low $14.50 3.5%
Source Bloomberg; Wall Street Research
Notes
1. Reflects undiscounted, twelve month price targets
2. Based on unit price of $14.01 / Unit as of September 2, 2016
8 |
| TransCanada Date: September 7, 2016 |
|
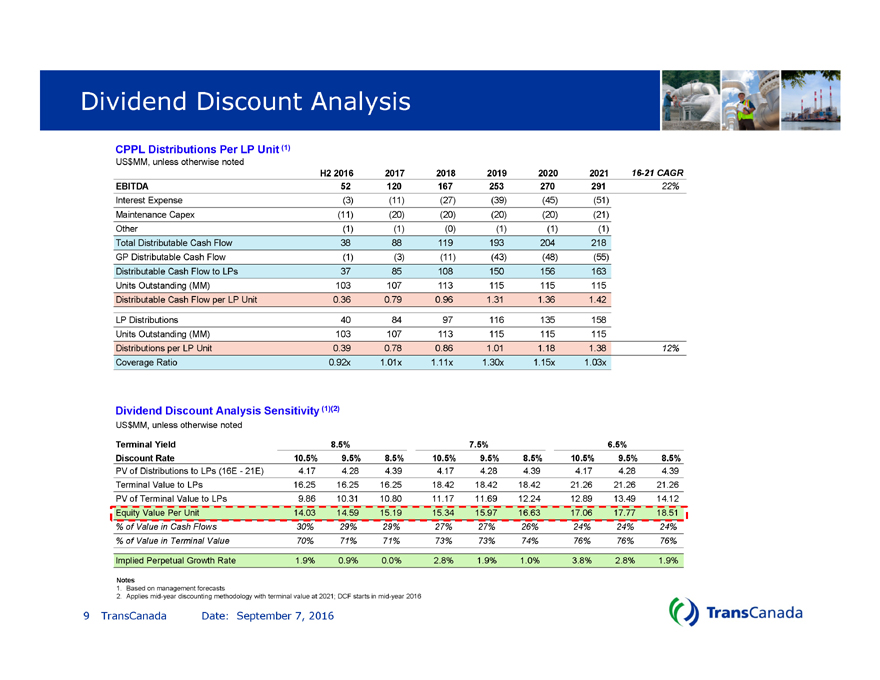
Dividend Discount Analysis
CPPL Distributions Per LP Unit (1)
US$MM, unless otherwise noted
H2 2016 2017 2018 2019 2020 2021 16-21 CAGR
EBITDA 52 120 167 253 270 291 22%
Interest Expense (3) (11) (27) (39) (45) (51)
Maintenance Capex (11) (20) (20) (20) (20) (21)
Other (1) (1) (0) (1) (1) (1)
Total Distributable Cash Flow 38 88 119 193 204 218
GP Distributable Cash Flow (1) (3) (11) (43) (48) (55)
Distributable Cash Flow to LPs 37 85 108 150 156 163
Units Outstanding (MM) 103 107 113 115 115 115
Distributable Cash Flow per LP Unit 0.36 0.79 0.96 1.31 1.36 1.42
LP Distributions 40 84 97 116 135 158
Units Outstanding (MM) 103 107 113 115 115 115
Distributions per LP Unit 0.39 0.78 0.86 1.01 1.18 1.38 12%
Coverage Ratio 0.92x 1.01x 1.11x 1.30x 1.15x 1.03x
Dividend Discount Analysis Sensitivity (1)(2)
US$MM, unless otherwise noted
Terminal Yield 8.5% 7.5% 6.5%
Discount Rate 10.5% 9.5% 8.5% 10.5% 9.5% 8.5% 10.5% 9.5% 8.5%
PV of Distributions to LPs (16E—21E) 4.17 4.28 4.39 4.17 4.28 4.39 4.17 4.28 4.39
Terminal Value to LPs 16.25 16.25 16.25 18.42 18.42 18.42 21.26 21.26 21.26
PV of Terminal Value to LPs 9.86 10.31 10.80 11.17 11.69 12.24 12.89 13.49 14.12
Equity Value Per Unit 14.03 14.59 15.19 15.34 15.97 16.63 17.06 17.77 18.51
% of Value in Cash Flows 30% 29% 29% 27% 27% 26% 24% 24% 24%
% of Value in Terminal Value 70% 71% 71% 73% 73% 74% 76% 76% 76%
Implied Perpetual Growth Rate 1.9% 0.9% 0.0% 2.8% 1.9% 1.0% 3.8% 2.8% 1.9%
Notes
1. Based on management forecasts
2. Applies mid-year discounting methodology with terminal value at 2021; DCF starts in mid-year 2016
9 TransCanada Date: September 7, 2016
|
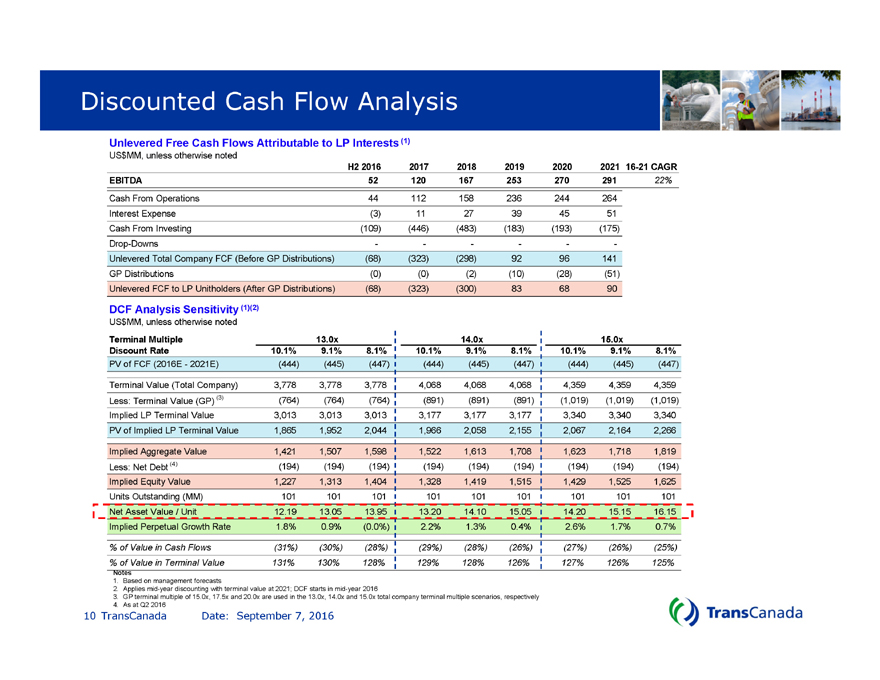
Discounted Cash Flow
Unlevered Free Cash Flows Attributable to LP Interests (1)Analysis
US$MM, unless otherwise noted
Terminal Multiple 13.0x 14.0x 15.0x
Discount Rate 10.1% 9.1% 8.1% 10.1% 9.1% 8.1% 10.1% 9.1% 8.1%
PV of FCF (2016E—2021E) (444) (445) (447) (444) (445) (447) (444) (445) (447)
Terminal Value (Total Company) 3,778 3,778 3,778 4,068 4,068 4,068 4,359 4,359 4,359
Less: Terminal Value (GP) (3) (764) (764) (764) (891) (891) (891) (1,019) (1,019) (1,019)
Implied LP Terminal Value 3,013 3,013 3,013 3,177 3,177 3,177 3,340 3,340 3,340
PV of Implied LP Terminal Value 1,865 1,952 2,044 1,966 2,058 2,155 2,067 2,164 2,266
Implied Aggregate Value 1,421 1,507 1,598 1,522 1,613 1,708 1,623 1,718 1,819
Less: Net Debt (4) (194) (194) (194) (194) (194) (194) (194) (194) (194)
Implied Equity Value 1,227 1,313 1,404 1,328 1,419 1,515 1,429 1,525 1,625
Units Outstanding (MM) 101 101 101 101 101 101 101 101 101
Net Asset Value / Unit 12.19 13.05 13.95 13.20 14.10 15.05 14.20 15.15 16.15
Implied Perpetual Growth Rate 1.8% 0.9% (0.0%) 2.2% 1.3% 0.4% 2.6% 1.7% 0.7%
% of Value in Cash Flows (31%) (30%) (28%) (29%) (28%) (26%) (27%) (26%) (25%)
% of Value in Terminal Value 131% 130% 128% 129% 128% 126% 127% 126% 125%
DCF Analysis Sensitivity (1)(2)
Notes
1. Based on management forecasts
2. Applies mid-year discounting with terminal value at 2021; DCF starts in mid-year 2016
3. GP terminal multiple of 15.0x, 17.5x and 20.0x are used in the 13.0x, 14.0x and 15.0x total company terminal multiple scenarios, respectively
4. As at Q2 2016
US$MM, unless otherwise noted
H2 2016 2017 2018 2019 2020 2021 16-21 CAGR
EBITDA 52 120 167 253 270 291 22%
Cash From Operations 44 112 158 236 244 264
Interest Expense (3) 11 27 39 45 51
Cash From Investing (109) (446) (483) (183) (193) (175)
Drop-Downs — — —
Unlevered Total Company FCF (Before GP Distributions) (68) (323) (298) 92 96 141
GP Distributions (0) (0) (2) (10) (28) (51)
Unlevered FCF to LP Unitholders (After GP Distributions) (68) (323) (300) 83 68 90
10 TransCanada Date: September 7, 2016
|
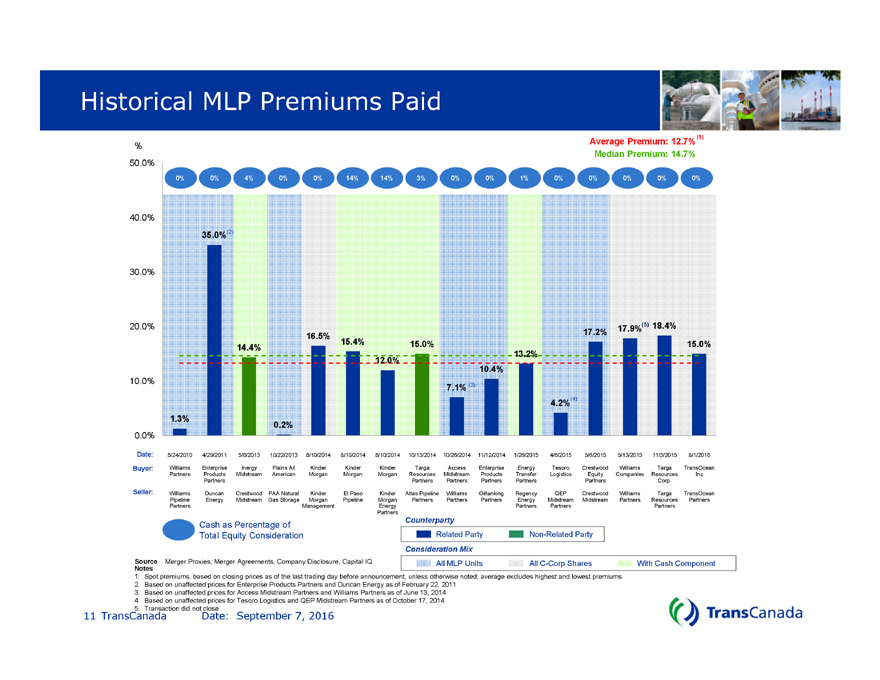
Historical MLP Premiums Paid
Notes
1. Spot premiums, based on closing prices as of the last trading day before announcement, unless otherwise noted; average excludes highest and lowest premiums
2. Based on unaffected prices for Enterprise Products Partners and Duncan Energy as of February 22, 2011
3. Based on unaffected prices for Access Midstream Partners and Williams Partners as of June 13, 2014
4. Based on unaffected prices for Tesoro Logistics and QEP Midstream Partners as of October 17, 2014
5. Transaction did not close
Average Premium: 12.7%
Date:
Buyer:
Seller:
Median Premium: 14.7%
All MLP Units All C-Corp Shares With Cash Component
Consideration Mix
Cash as Percentage of
Total Equity Consideration
(2) |
|
(3) |
|
0% 0% 4% 0% 0% 14% 14% 3% 0% 0% 1% 0% 0% 0% 0% 0%
Related Party Non-Related Party
Counterparty
Source Merger Proxies, Merger Agreements, Company Disclosure, Capital IQ
1.3% 35.0% 14.4% 0.2% 16.5% 15.4% 12.0% 15.0% 7.1% 10.4% 13.2% 4.2% 17.2% 17.9% 18.4% 15.0% 0.0% 10.0%
20.0% 30.0% 40.0% 50.0% 5/24/2010 Williams Partners Williams Pipeline Partners 4/29/2011 Enterprise Products Partners Duncan Energy
5/6/2013 Inergy Midstream Crestwood Midstream 10/22/2013 Plains All American PAA Natural Gas Storage 8/10/2014 Kinder Morgan Kinder
Morgan Management 8/10/2014 Kinder Morgan El Paso Pipeline 8/10/2014 Kinder Morgan Kinder Morgan Energy Partners 10/13/2014
Targa Resources Partners Atlas Pipeline Partners 10/26/2014 Access Midstream Partners Williams Parthers 11/12/2014 Enterprise Products
Partners Oiltanking Partners 1/26/2015 Energy Transfer Partners Regency Energy Partners 4/6/2015 Tesoro Logistics QEP Midstream
Partners 5/6/2015 Crestwood Equity Partners Crestwood Midstream 5/13/2015 Williams Companies Williams Partners 11/3/2015 Targa
Resources Corp. Targa Resources Partners 8/1/2016 TransOcean Inc TransOcean 11 TransCanada Date: September 7, 2016
|
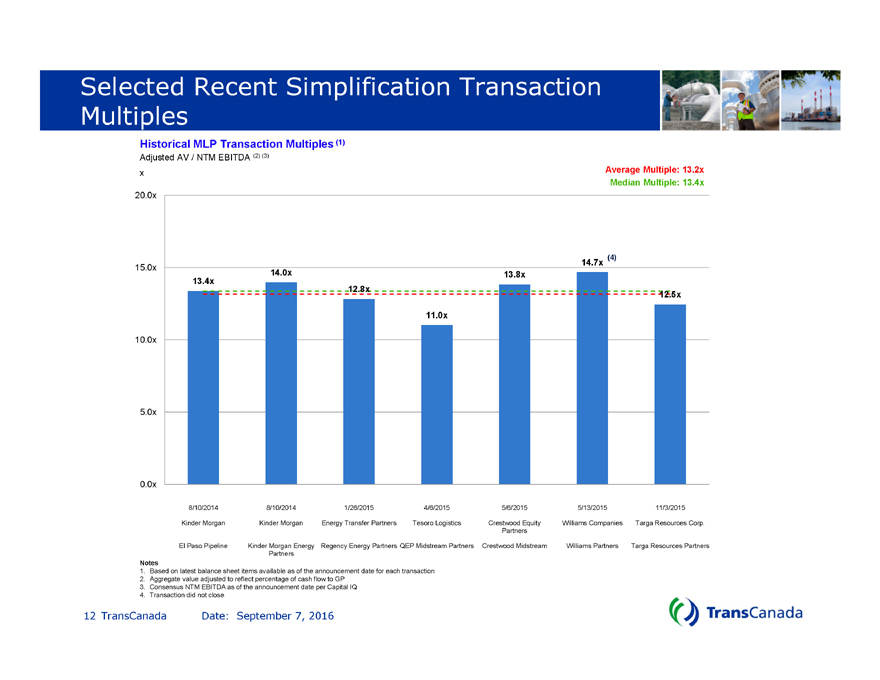
Selected Recent Simplification Transaction
Multiples
13.4x
14.0x
12.8x
11.0x
13.8x
14.7x
12.5x
0.0x
5.0x
10.0x
15.0x
20.0x
8/10/2014
Kinder Morgan
El Paso Pipeline
8/10/2014
Kinder Morgan
Kinder Morgan Energy
Partners
1/26/2015
Energy Transfer Partners
Regency Energy Partners
4/6/2015
Tesoro Logistics
QEP Midstream Partners
5/6/2015
Crestwood Equity
Partners
Crestwood Midstream
5/13/2015
Williams Companies
Williams Partners
11/3/2015
Targa Resources Corp.
Targa Resources Partners
Historical MLP Transaction Multiples (1)
Adjusted AV / NTM EBITDA (2) (3)
x
Notes
1. Based on latest balance sheet items available as of the announcement date for each transaction
2. Aggregate value adjusted to reflect percentage of cash flow to GP
3. Consensus NTM EBITDA as of the announcement date per Capital IQ
4. Transaction did not close
Average Multiple: 13.2x
Median Multiple: 13.4x
12 TransCanada Date: September 7, 2016