2009 Outlook Call
January 9, 2009
The following information contains forward-looking statements, including forward-looking statements
within the meaning of the Private Securities Litigation Reform Act of 1995. Such forward-looking
statements include, but are not limited to, statements concerning Colfax's plans, objectives,
expectations and intentions and other statements that are not historical or current facts. Forward-
looking statements are based on Colfax's current expectations and involve risks and uncertainties that
could cause actual results to differ materially from those expressed or implied in such forward-looking
statements. Factors that could cause Colfax's results to differ materially from current expectations
include, but are not limited to factors detailed in Colfax's reports filed with the U.S. Securities and
Exchange Commission as well as its Registration Statement on Form S-1 under the caption “Risk
Factors”. In addition, these statements are based on a number of assumptions that are subject to
change. This presentation speaks only as of this date. Colfax disclaims any duty to update the
information herein.
Forward-Looking Statements
1
Net sales of approximately $605 million, an increase of 19% (organic growth of
14%)
14%)
Fourth quarter net sales of approximately $159 million, an increase of 11% (organic growth
of 18%)
of 18%)
Orders of approximately $670 million, an increase of 15% (organic growth of 7%)
Fourth quarter orders of approximately $127 million, a decline of 19% (organic decline of
16%)
16%)
Backlog of approximately $331 million at 12/31/08
Strong balance sheet and cash flow
IPO in May – net proceeds of $193 million
Strong performance in 2008
2008 Highlights
(All 2008 financial numbers are estimates)
2
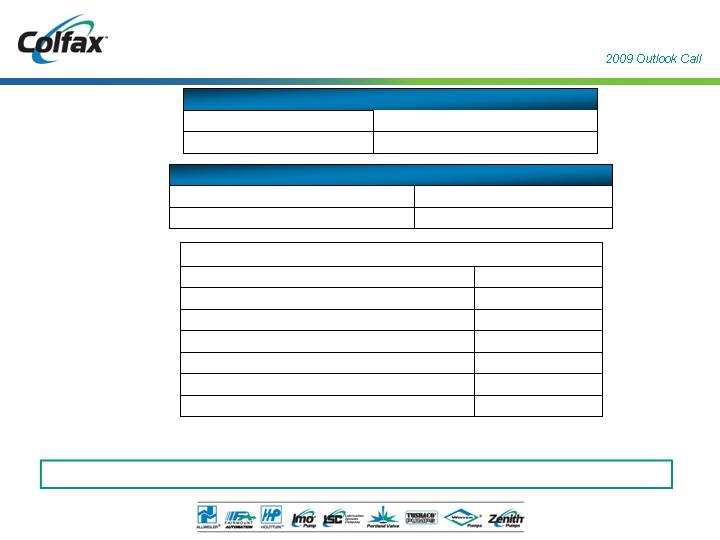
Adjusted EPS for 2009 of $1.10 to $1.17
2009 Outlook Summary
$585 million
to
$570 million
2009 Total
3%
to
1%
2009 Organic growth (1)
Revenue Range
$2.5 million
Incremental public company costs
43.3 million
Outstanding shares
$8 million
Interest expense
32%
Tax rate
$1.41
Euro
$7 million
Asbestos liability and defense (income) costs
$12 million
Asbestos coverage litigation
Assumptions
$1.17
to
$1.10
2009 Adjusted net income per share (2)
$0.87
to
$0.80
2009 Net income per share
EPS Range
(1)
Excludes impact of foreign exchange rate fluctuations and acquisitions
(2)
Excludes impact of asbestos coverage litigation and asbestos liability and defense (income) costs
(See Appendix for Non-GAAP reconciliation)
3
Strong Financial Condition
Debt to adjusted EBITDA < 1 times as of the end of the third quarter
(covenant – 3.25 to 1.00)
Fixed charge coverage > 6 times as of the end of the third quarter
(covenant – 1.5 to 1.0)
Approximately $133 million available on revolver at year end (expires in 2013)
Approximately $25 million in cash as of 1/8/09
Strong balance sheet and credit availability provide flexibility
4
Market Trends
International trade and demand for bulk commodities and oil continuing to
drive new ship construction
drive new ship construction
Aging fleet, environmental regulations requiring ship owners to upgrade or
replace ships
replace ships
Local presence required to effectively serve customers and capture
aftermarket business
aftermarket business
Declining orders and risk of potential cancellations / project delays
Our Plan for 2009
Expand sales of high spec marine vessels such as FPSOs and bitumen tankers
Focus on developing and expanding sales of new products such as Optiline,
which eliminates seal leakage
which eliminates seal leakage
Increase aftermarket sales; foremarket sales have been robust over the last 5
years
years
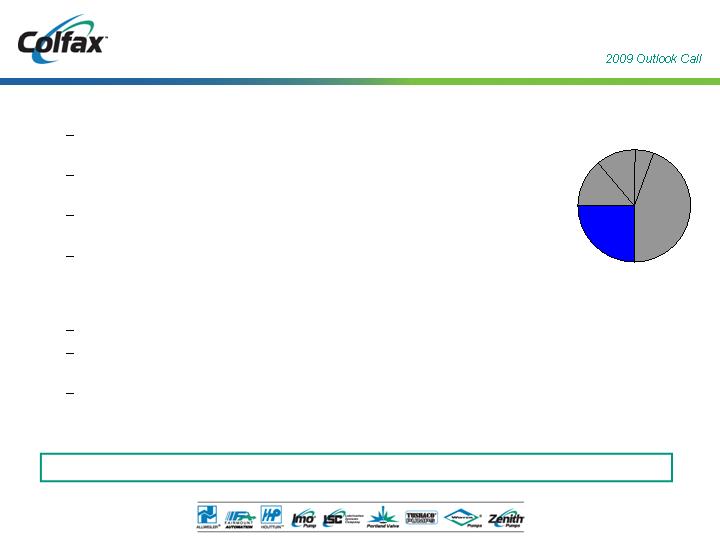
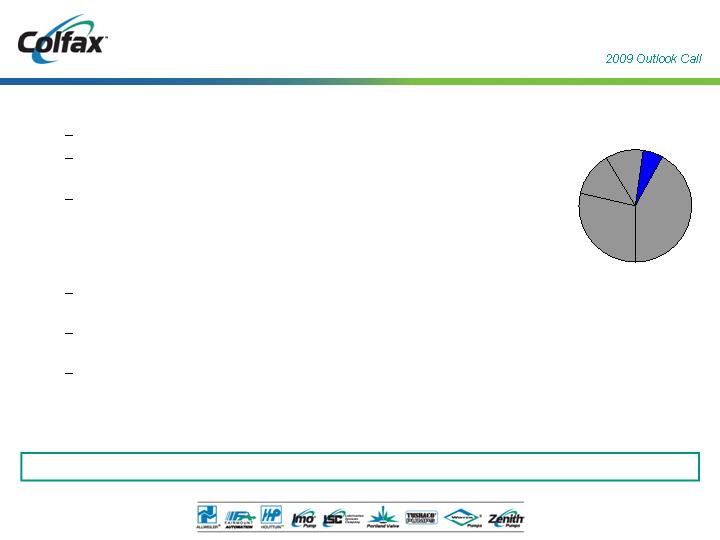
Colfax Estimated
08 Sales Split
08 Sales Split
24%
Comm.
Marine
Comm.
Marine
Commercial Marine Market Perspective
Executing strategies to drive profitable sales growth
5
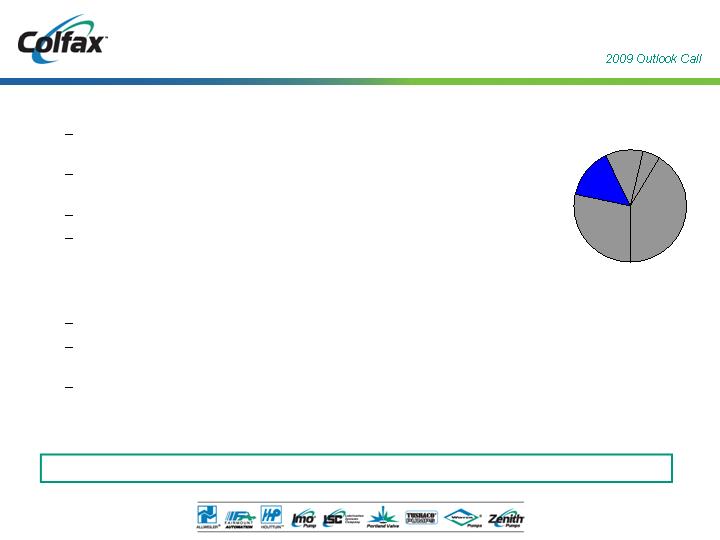
Colfax Estimated
08 Sales Split
08 Sales Split
15%
O&G
O&G
Market Trends
Capacity constraints and global demand spurring heavy oil exploration,
transport and processing
transport and processing
Customers focusing more on “total cost of ownership” to reduce downtime
and increase efficiency
and increase efficiency
Application expertise critical to winning large project orders
Volatile oil prices and economic downturn resulting in project delays
Our Plan for 2009
Support and expand customer base globally
Open sales and engineering office in Bahrain to support growth in exploration
of heavy oil fields in the Middle East
of heavy oil fields in the Middle East
Focus on providing system solutions which offer total savings of ownership
when considering capital, energy and maintenance costs over several years
when considering capital, energy and maintenance costs over several years
Oil & Gas Market Perspective
Strong product portfolio capable of solving needs of evolving oil & gas market
6
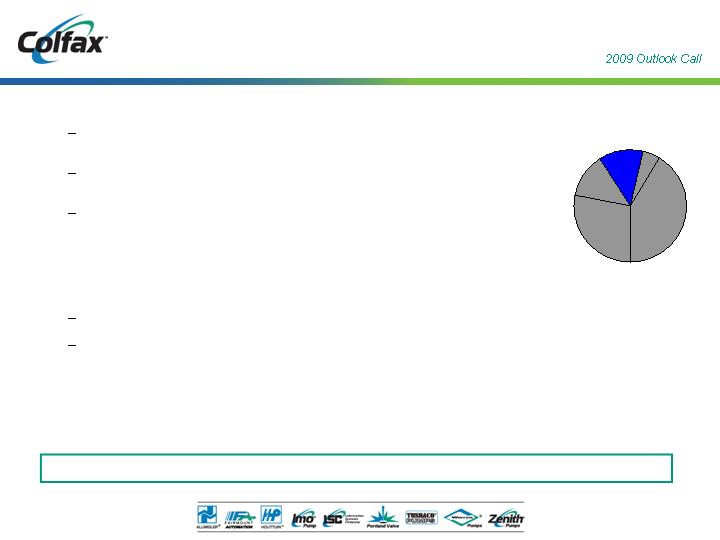
Colfax Estimated
08 Sales Split
08 Sales Split
13%
Power
Gen.
Power
Gen.
Market Trends
Economic growth in Asia and Middle East driving investment in energy
infrastructure projects
infrastructure projects
Aging power infrastructure in mature markets creating upgrade projects to
increase efficiency and lower operating costs
increase efficiency and lower operating costs
Multiple forms of power generation (gas, coal, hydro, nuclear) being
employed to satisfy growing global demand
employed to satisfy growing global demand
Our Plan for 2009
Support and expand customer base including OEMs and end users
Participate in developing energy infrastructure projects in less developed
countries such as Iraq
countries such as Iraq
Power Generation Market Perspective
Leading supplier of lubrication solutions to power generation OEMs
7
Developing innovative fluid handling products and systems to drive future growth
Colfax Estimated
08 Sales Split
08 Sales Split
6%
Navy
Navy
Market Trends
New ships replacing older decommissioned vessels in the U.S.
Sovereign navies around the world expanding fleets to address heightened
national security level concerns
national security level concerns
Increased demand for integrated fluid handling systems and solutions to
reduce operating costs
reduce operating costs
Our Plan for 2009
Support U.S. Navy expansion programs including plans for 8 new submarines
over the next 10 years
over the next 10 years
Develop innovative control solutions for mission and safety critical processes
and machinery in harsh environments
and machinery in harsh environments
Continue to develop Smart Valve technology which reduces operating costs
and improves efficiency
and improves efficiency
Global Navy Market Perspective
8
Leading supplier of highly engineered fluid handling products and systems with global reach
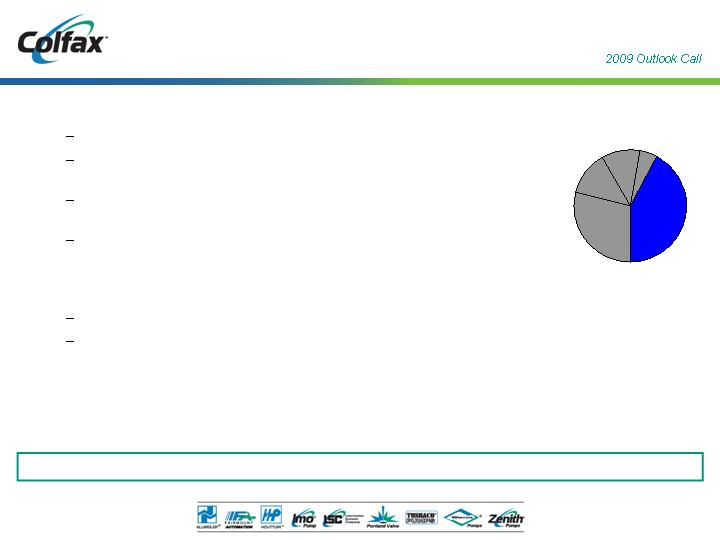
Colfax Estimated
08 Sales Split
08 Sales Split
42%
General
Industrial
General
Industrial
Market Trends
Global economic development driving increased capital investment
Developing regions embracing engineered products and solutions that
reduce costs and increase efficiency
reduce costs and increase efficiency
Global footprint and channel optimization required to cover broad end
market applications
market applications
Uncertain economy impacting some end markets
Our Plan for 2009
Continue to expand and diversify customer base
Develop solutions that improve efficiency
General Industrial Perspective
9
2009 Priorities
Continue to invest in our growth initiatives, breakthrough opportunities are critical
to our future growth
to our future growth
Pursue acquisitions that will support organic growth initiatives, strengthen
relationships with channel partners and customers, and solidify our competitive
position in targeted end markets
relationships with channel partners and customers, and solidify our competitive
position in targeted end markets
Maintain profitability by reducing operating expenses and controlling costs
throughout businesses
throughout businesses
Well positioned to execute long-term strategies
10
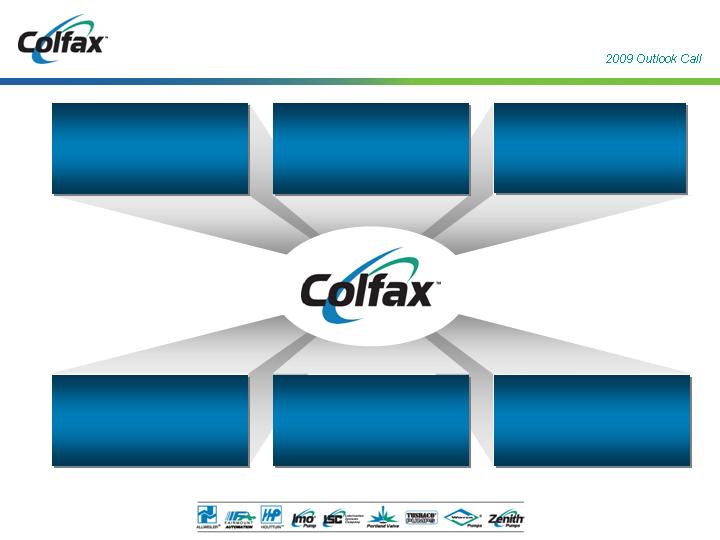
Well Positioned for the Future
Leading Brand Names
Generating Aftermarket
Generating Aftermarket
Sales and Services
Experienced Management
Team in Place to Grow
Organically and Through
Strategic Acquisitions
Team in Place to Grow
Organically and Through
Strategic Acquisitions
Global Leader in Specialty
Fluid Handling Products
Fluid Handling Products
Proven Application
Expertise in Solving
Critical Customer Needs
Serving Growing
Infrastructure Driven End
Markets
Infrastructure Driven End
Markets
Strong Financial Condition
11

Appendix
12

Disclaimer
Colfax has provided financial information that has not been prepared in accordance with GAAP. These
non-GAAP financial measures are adjusted net income per share, organic sales growth and organic
order growth. Adjusted net income per share excludes asbestos liability and defense costs
(income) and asbestos coverage litigation expense. Organic sales growth and organic order growth
exclude the impact of acquisitions and foreign exchange rate fluctuations. These non-GAAP financial
measures assist Colfax in comparing its operating performance on a consistent basis.
Non-GAAP financial measures should not be considered in isolation from, or as a substitute for,
financial information calculated in accordance with GAAP. Investors are encouraged to review the
reconciliation of these non-GAAP measures to their most directly comparable GAAP financial
measures.
financial information calculated in accordance with GAAP. Investors are encouraged to review the
reconciliation of these non-GAAP measures to their most directly comparable GAAP financial
measures.
13

| (amounts in dollars) | ||||||||
| (preliminary unaudited) | ||||||||
| EPS Range | ||||||||
| Projected net income per share - fully diluted | $ | 0.80 | $ | 0.87 | ||||
| Asbestos coverage litigation | 0.28 | 0.28 | ||||||
| Asbestos liability and defense costs | 0.16 | 0.16 | ||||||
| Income tax benefit at 32% | (0.14 | ) | (0.14 | ) | ||||
| Projected adjusted net income per share - fully diluted | $ | 1.10 | $ | 1.17 | ||||


| (amounts in millions) | ||||||||||||||||
| (preliminary unaudited) | ||||||||||||||||
| Sales | Orders | |||||||||||||||
| $ | % | $ | % | |||||||||||||
| Three Months Ended December 31, 2007 | $ | 144 | $ | 156 | ||||||||||||
| Components of Growth: | ||||||||||||||||
| Organic Growth from Existing Businesses | 25 | 18 | % | (25 | ) | -16 | % | |||||||||
| Acquisitions | 1 | 1 | % | 3 | 2 | % | ||||||||||
| Foreign Currency Translation | (11 | ) | -8 | % | (8 | ) | -5 | % | ||||||||
| Total Growth | 15 | 11 | % | (29 | ) | -19 | % | |||||||||
| Three Months Ended December 31, 2008 | $ | 159 | $ | 127 | ||||||||||||
| Sales | Orders | |||||||||||||||
$ | % | $ | % | |||||||||||||
| Twelve Months Ended December 31, 2007 | $ | 506 | $ | 582 | ||||||||||||
| Components of Growth: | ||||||||||||||||
| Organic Growth from Existing Businesses | 69 | 14 | % | 41 | 7 | % | ||||||||||
| Acquisitions | 6 | 1 | % | 12 | 2 | % | ||||||||||
| Foreign Currency Translation | 24 | 5 | % | 35 | 6 | % | ||||||||||
| Total Growth | 98 | 19 | % | 89 | 15 | % | ||||||||||
| Twelve Months Ended December 31, 2008 | $ | 605 | $ | 670 | ||||||||||||
