Exhibit 99.2
February 20, 2009
Q4 2008 Earnings Call

The following information contains forward-looking statements, including forward-looking statements
within the meaning of the Private Securities Litigation Reform Act of 1995. Such forward-looking
statements include, but are not limited to, statements concerning Colfax's plans, objectives,
expectations and intentions and other statements that are not historical or current facts. Forward-
looking statements are based on Colfax's current expectations and involve risks and uncertainties that
could cause actual results to differ materially from those expressed or implied in such forward-looking
statements. Factors that could cause Colfax's results to differ materially from current expectations
include, but are not limited to factors detailed in Colfax's reports filed with the U.S. Securities and
Exchange Commission as well as its Registration Statement on Form S-1 under the caption “Risk
Factors”. In addition, these statements are based on a number of assumptions that are subject to
change. This presentation speaks only as of this date. Colfax disclaims any duty to update the
information herein.
Forward-Looking Statements
1
Adjusted net income of $17.5 million (40 cents per share), an increase of 19.1%
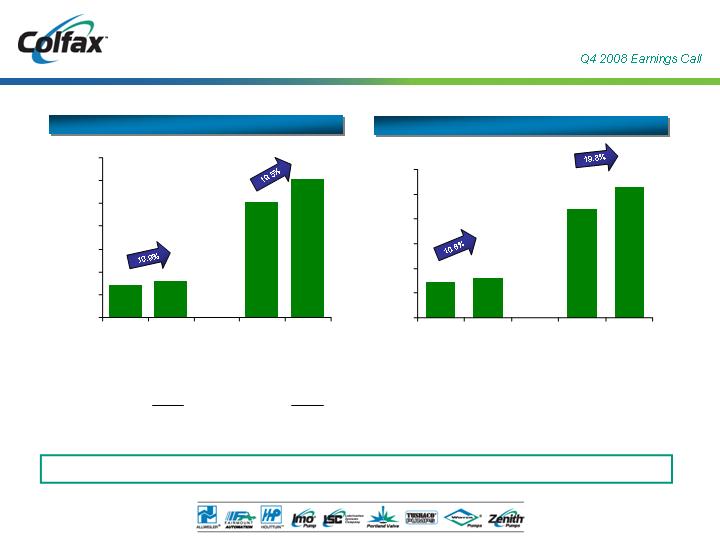
Net sales of $159.3 million, an increase of 10.9% (organic growth of 19.1%)
Adjusted operating income of $28.6 million, an increase of 14.9%
Adjusted EBITDA of $32.1 million, an increase of 10.8%
Fourth quarter orders of $126.3 million, a decrease of 19.3% (organic decrease of
15.8%)
Record backlog of $337.3 million
Strong performance in 2008
Q4 2008 Highlights
2

Adjusted net income of $53.7 million ($1.22 per share), an increase of 32.8%
Net sales of $604.9 million, an increase of 19.5% (organic growth of 13.9%)
Adjusted operating income of $90.8 million, an increase of 24.5%
Adjusted EBITDA of $105.6 million, an increase of 19.8%
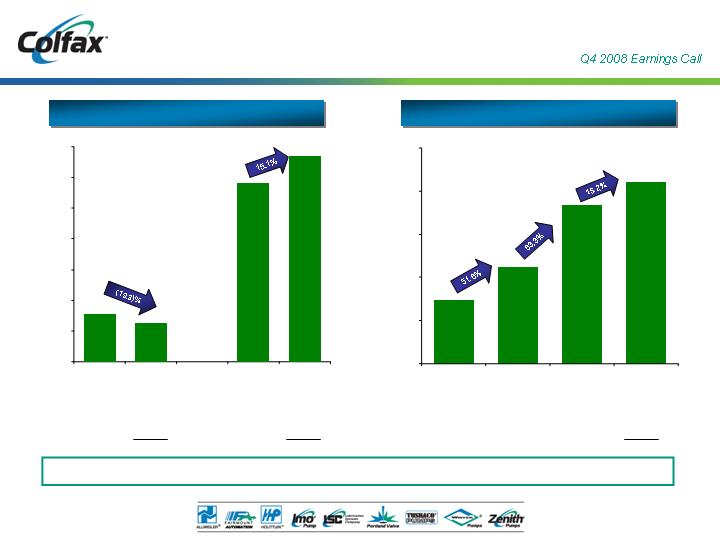
Orders of $669.2 million, an increase of 15.1% (organic growth of 7.0%)
Strong performance in 2008
2008 Highlights
3
____________________
Note: Dollars in millions.
2008
2007
Q4 2008
Q4 2007
$700.0
$600.0
$500.0
$400.0
$300.0
$200.0
$100.0
$0.0
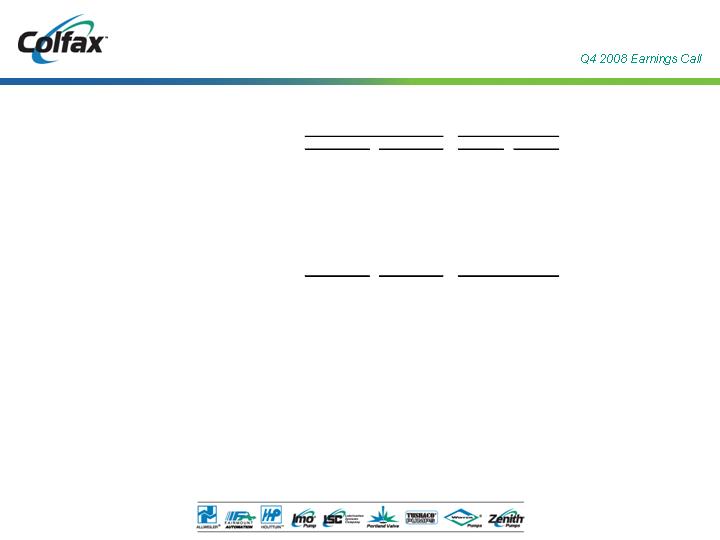
$669.2
$581.5
$126.3
$156.5
Orders
Backlog
Steady backlog growth
Orders and Backlog
15.2%
(5.0)%
--
5.2%
--
15.0%
--
15.1%
(19.3)%
Total Growth
6.1%
--
(5.5)%
--
FX Translation
2.0%
--
2.0%
--
Acquisitions
7.0%
--
(15.8)%
--
Existing
Businesses
$179.3
$292.8
$337.3
$118.3
$0.0
$80.0
$160.0
$240.0
$320.0
$400.0
2005
2006
2007
2008
4
2008
2007
-
Q4 2008
Q4 2007
$700.0
$600.0
$500.0
$400.0
$300.0
$200.0
$100.0
$0.0
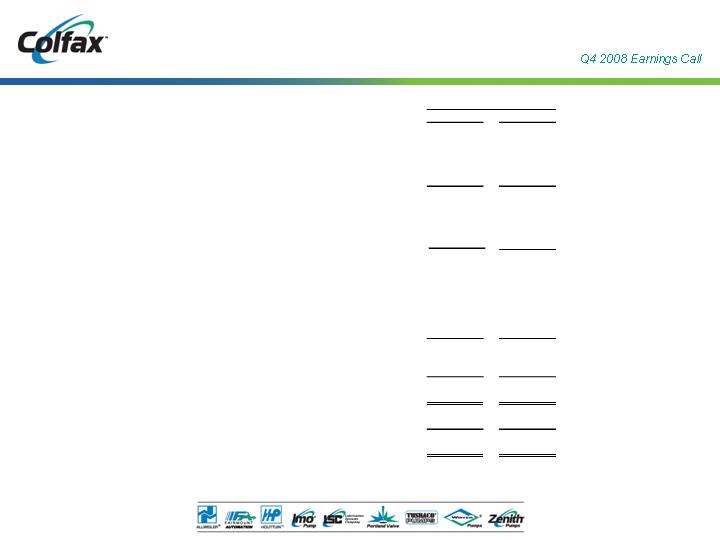
$604.9
$506.3
$159.3
$143.7
Consistent track record of profitable sales growth
Revenue and Adjusted EBITDA
(1)
Refer to Appendix for Non-GAAP reconciliation.
__________________
Note: Dollars in millions.
19.5%
10.9%
Total Growth
4.5%
--
(8.8)%
--
FX Translation
1.1%
--
0.6%
--
Acquisitions
13.9%
--
19.1%
--
Existing
Businesses
-
17.5%
17.4%
20.1%
20.1%
% Margin
Revenue
Adjusted EBITDA (1)
$28.9
$32.1
$88.2
$105.6
$0.0
$20.0
$40.0
$60.0
$80.0
$100.0
$120.0
Q4 2007
Q4 2008
-
2007
2008
5
Well positioned in five attractive and diverse end markets
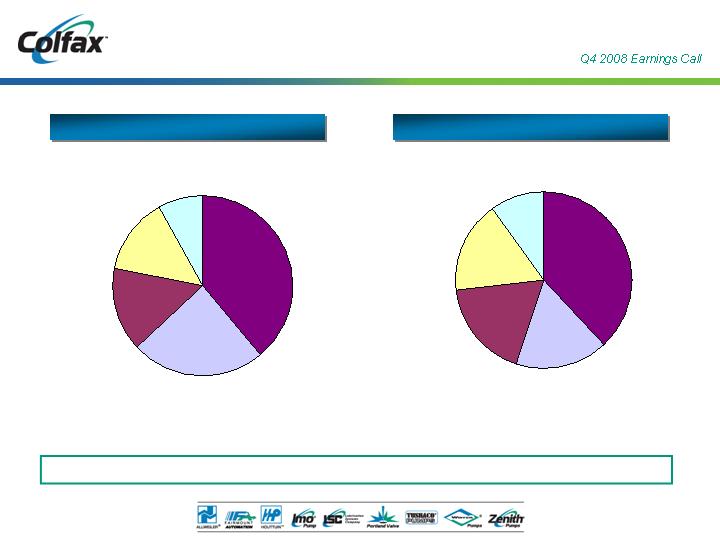
Q4 2008 Sales and Orders by End Market
Q4 2008 Orders: $126.3 million
Q4 2008 Sales: $159.3 million
8%
Global Navy
39%
Industrial
General
24%
Marine
Commercial
15%
Oil & Gas
14%
Generation
Power
Oil & Gas
18%
Commercial
Marine
17%
General
Industrial
38%
Global Navy
10%
Power
Generation
17%
6
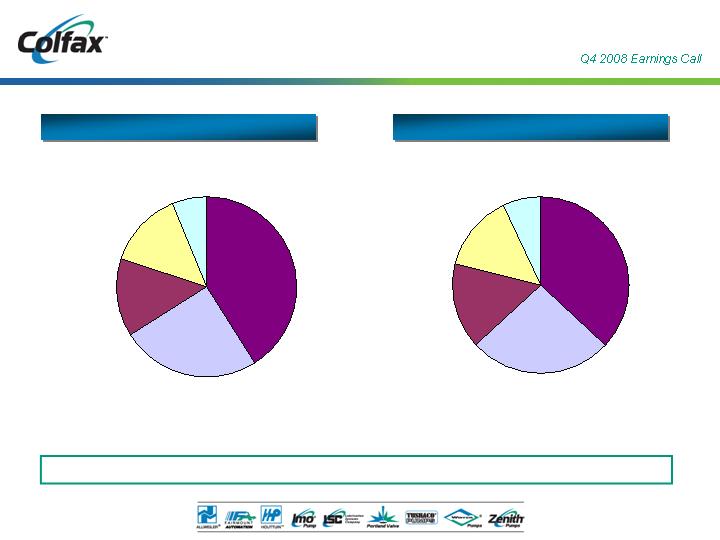
2008 Sales: $604.9 million
2008 Sales and Orders by End Market
Well positioned in five attractive and diverse end markets
2008 Orders: $669.2 million
14%
Generation
Power
6%
Global Navy
41%
Industrial
General
14%
Oil & Gas
25%
Marine
Commercial
Commercial
Marine
26%
Oil & Gas
16%
General
Industrial
37%
Global Navy
7%
Power
Generation
14%
7
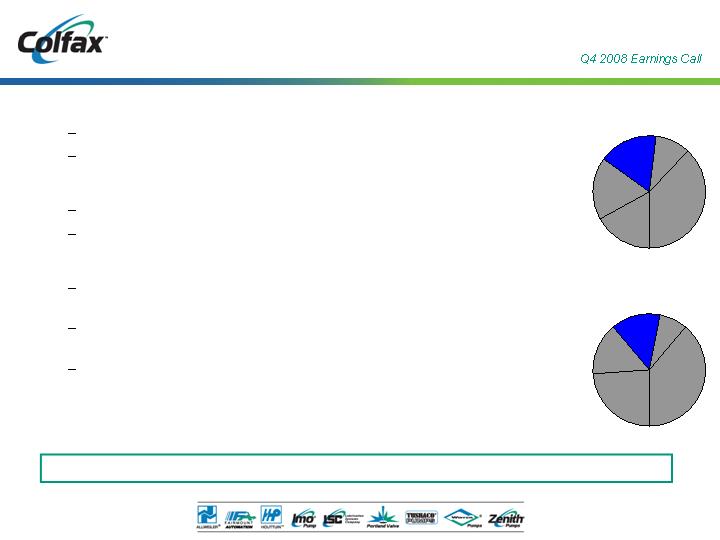
Q4 2008 Year-Over-Year Results
Orders down 62.5% year-over-year (-58.2% organic growth)
Sales up 21.4% year-over-year (34.4% organic growth)
2008 Year-Over-Year Results
Orders up 4.9% year-over-year (-2.4% organic growth)
Sales up 24.1% year-over-year (17.1% organic growth)
Market Trends
International trade and demand for bulk commodities and oil continuing to drive
new ship construction
Aging fleet, environmental regulations requiring ship owners to upgrade or
replace ships
Local presence required to effectively serve customers and capture aftermarket
business
Declining orders and risk of potential cancellations/project delays
Executing strategies to drive profitable sales growth
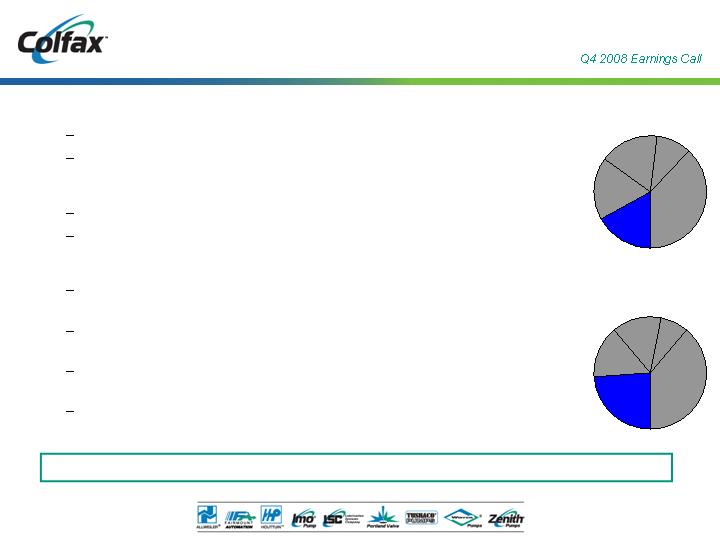
Colfax Q4 08
Orders Split
17%
Comm.
Marine
Colfax Q4 08
Sales Split
24%
Comm.
Marine
Commercial Marine Market Perspective
8
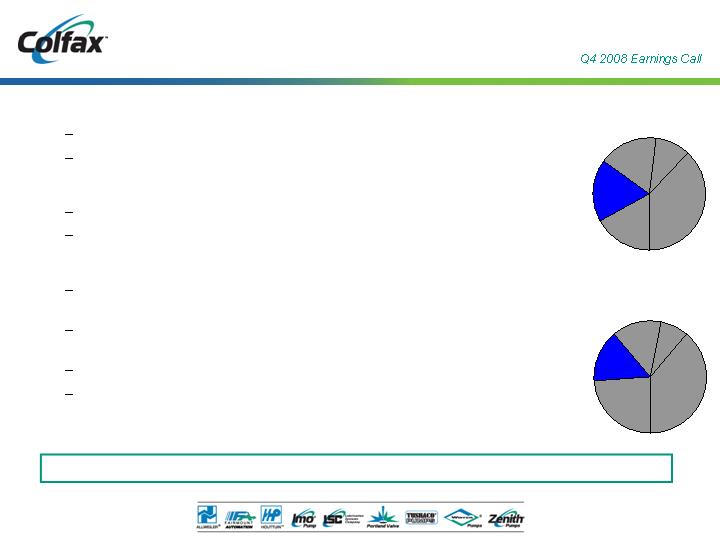
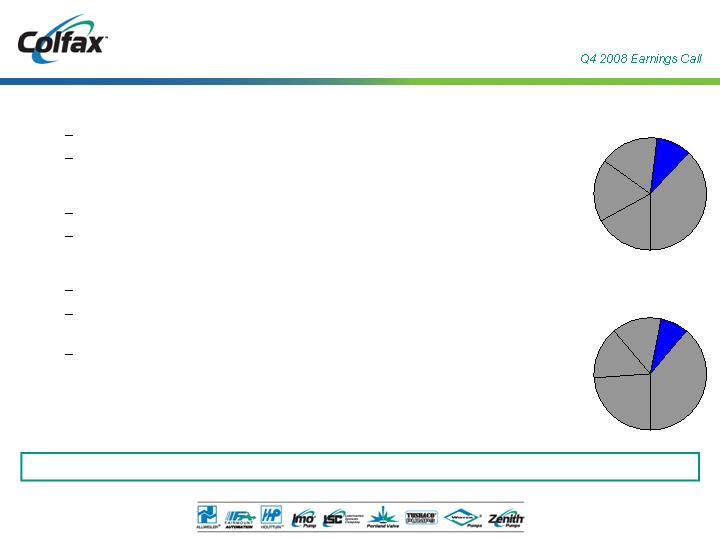
Strong product portfolio capable of solving needs of evolving oil & gas market
Colfax Q4 08
Orders Split
18%
O&G
Colfax Q4 08
Sales Split
15%
O&G
Q4 2008 Year-Over-Year Results
Orders up 35.8% year-over-year (37.2% organic growth)
Sales up 8.9% year-over-year (10.7% organic growth)
2008 Year-Over-Year Results
Orders up 38.2% year-over-year (33.6% organic growth)
Sales up 4.9% year-over-year (2.1% organic growth)
Market Trends
Capacity constraints and global demand spurring heavy oil exploration,
transport and processing
Customers focusing more on “total cost of ownership” to reduce downtime and
increase efficiency
Application expertise critical to winning large project orders
Volatile oil prices and economic downturn resulting in project delays
Oil & Gas Market Perspective
9
Leading supplier of lubrication solutions to power generation OEMs
Colfax Q4 08
Orders Split
17%
Power
Gen.
Colfax Q4 08
Sales Split
14%
Power
Gen.
Q4 2008 Year-Over-Year Results
Orders up 50.0% year-over-year (59.2% organic growth)
Sales down 8.4% year-over-year (-2.8% organic growth)
2008 Year-Over-Year Results
Orders up 17.6% year-over-year (12.9% organic growth)
Sales up 25.5% year-over-year (21.3% organic growth)
Market Trends
Economic growth in Asia and Middle East driving investment in energy
infrastructure projects
Aging power infrastructure in mature markets creating upgrade projects to
increase efficiency and lower operating costs
Multiple forms of power generation (gas, coal, hydro, nuclear) being employed
to satisfy growing global demand
Power Generation Market Perspective
10
Developing innovative fluid handling products and systems to drive future growth
Colfax Q4 08
Orders Split
10%
Navy
Colfax Q4 08
Sales Split
8%
Navy
Q4 2008 Year-Over-Year Results
Orders up 84.7% year-over-year (38.3% organic growth)
Sales up 26.9% year-over-year (20.1% organic growth)
YTD 2008 Year-Over-Year Results
Orders up 58.0% year-over-year (22.1% organic growth)
Sales up 11.1% year-over-year (-2.3% organic growth)
Market Trends
New ships replacing older decommissioned vessels in the U.S.
Sovereign navies around the world expanding fleets to address heightened
national security level concerns
Increased demand for integrated fluid handling systems and solutions to reduce
operating costs
Global Navy Market Perspective
11
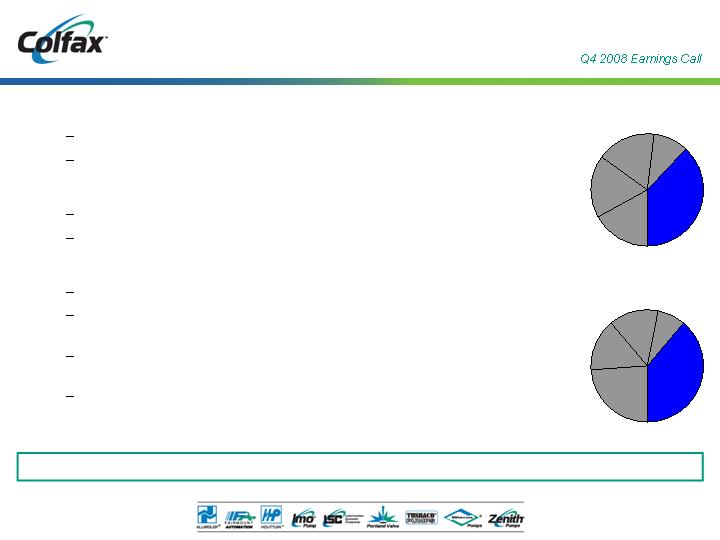
Leading supplier of highly engineered fluid handling products and systems with global reach
Colfax Q4 08
Orders Split
Colfax Q4 08
Sales Split
39%
General
Industrial
Q4 2008 Year-Over-Year Results
Orders down 22.2% year-over-year (-14.7% organic growth)
Sales up 11.0% year-over-year (22.8% organic growth)
2008 Year-Over-Year Results
Orders up 8.4% year-over-year (1.0% organic growth)
Sales up 21.9% year-over-year (16.9% organic growth)
Market Trends
Global economic development driving increased capital investment
Developing regions embracing engineered products and solutions that reduce
costs and increase efficiency
Global footprint and channel optimization required to cover broad end market
applications
Uncertain economy impacting some end markets
38%
General
Industrial
General Industrial Perspective
12
Refer to Appendix for Non-GAAP reconciliation.
__________________
Note: Dollars in millions.
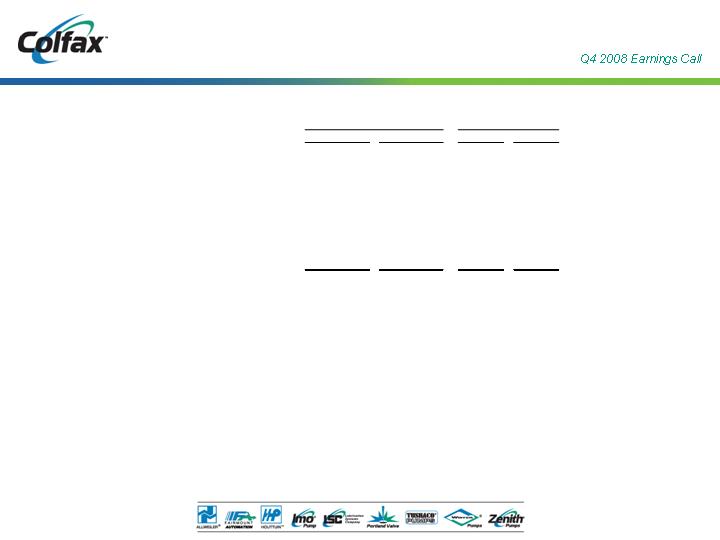
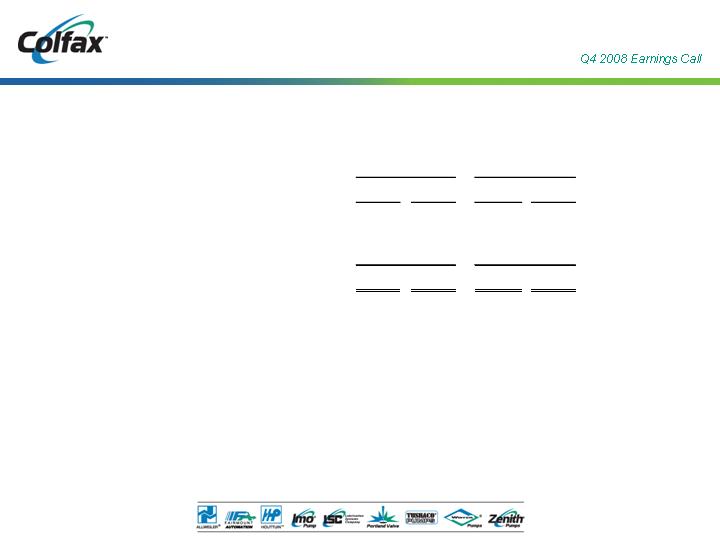
Income Statement Summary
Three Months Ended
Delta
12/31/2008
12/31/2007
$
%
Orders
$ 126.3
$ 156.5
$ (30.2)
-19.3%
Sales
$ 159.3
$ 143.7
$ 15.6
10.9%
Gross Profit
$ 57.8
$ 49.2
$ 8.5
17.4%
% of Sales
36.3%
34.2%
SG&A Expense
$ 27.7
$ 23.2
$ 4.5
19.4%
R&D Expense
1.4
1.1
0.3
31.2%
Operating Expenses
$ 29.1
$ 24.3
$ 4.8
19.9%
% of Sales
18.3%
16.9%
Adjusted Operating Income
$ 28.6
$ 24.9
$ 3.7
14.9%
% of Sales
18.0%
17.3%
Adusted EBITDA
$ 32.1
$ 28.9
$ 3.1
10.8%
% of Sales
20.1%
20.1%
Adjusted Net Income
$ 17.5
$ 14.7
$ 2.8
19.1%
% of Sales
11.0%
10.2%
13
Refer to Appendix for Non-GAAP reconciliation.
__________________
Note: Dollars in millions.
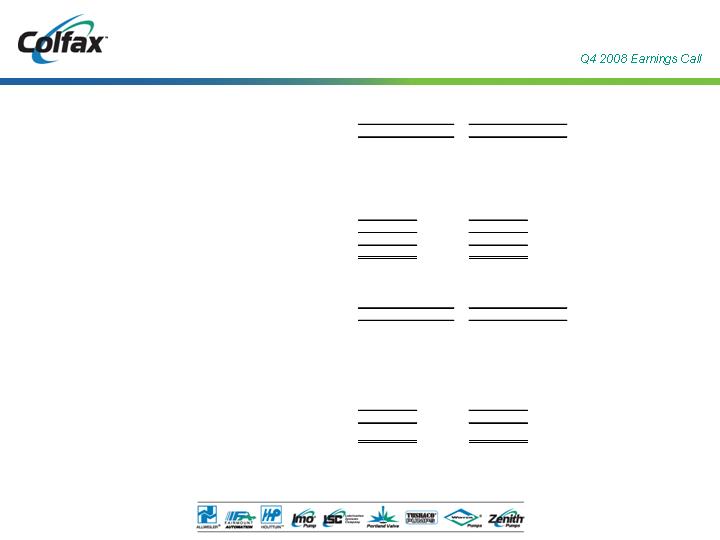
Income Statement Summary
Delta
12/31/2008
12/31/2007
$
%
Orders
$ 669.2
$ 581.5
$ 87.7
15.1%
Sales
$ 604.9
$ 506.3
$ 98.6
19.5%
Gross Profit
$ 217.2
$ 175.6
$ 41.6
23.7%
% of Sales
35.9%
34.7%
Adjusted SG&A Expense
$ 120.5
$ 98.5
$ 22.0
22.4%
R&D Expense
5.9
4.2
1.7
40.7%
Operating Expenses
$ 126.4
$ 102.7
$ 23.7
23.1%
% of Sales
20.9%
20.3%
Adjusted Operating Income
$ 90.8
$ 72.9
$ 17.9
24.5%
% of Sales
15.0%
14.4%
Adusted EBITDA
$ 105.6
$ 88.2
$ 17.4
19.8%
% of Sales
17.5%
17.4%
Adjusted Net Income
$ 53.7
$ 40.4
$ 13.2
32.8%
% of Sales
8.9%
8.0%
Year Ended
14
____________________
Note: Dollars in millions.
Statement of Cash Flows Summary
(Preliminary & Unaudited)
Year Ended
December 31,
2008
2007
Net (Loss) Income
(0.6)
$
64.9
$
Non-Cash Expenses
18.4
39.0
Change in Working Capital and Accrued Liabilities
(27.7)
3.3
Other
(21.6)
(32.7)
Total Operating Activities
(31.5)
$
74.5
$
Capital Expenditures
(20.1)
$
(13.6)
$
Acquisitions
(0.4)
(33.0)
Proceeds from Sale of Fixed Assets
-
0.1
Total Investing Activities
(20.5)
$
(46.5)
$
Net Borrowings
(110.3)
$
14.7
$
Proceeds from IPO, Net of Offering Costs
193.0
-
Dividends Paid
(38.5)
-
Common Stock Repurchases
(5.7)
-
Other
(3.7)
(3.0)
Total Financing Activities
34.8
$
11.7
$
Effect of Exchange Rates on Cash
(2.1)
0.8
(Decrease) Increase in Cash
(19.3)
40.5
Cash Beginning of Period
48.1
7.6
Cash End of Period
28.8
$
48.1
$
15
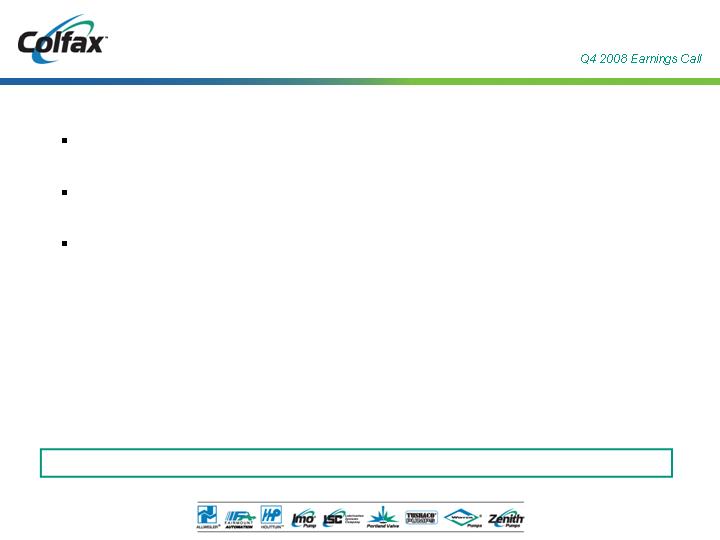
Strong Financial Condition(1)
Debt to adjusted EBITDA < 1 times
Approximately $130 million available on revolver (expires in 2013)
Approximately $29 million in cash
Strong balance sheet and credit availability provide flexibility
(1) As of FYE 2008
16
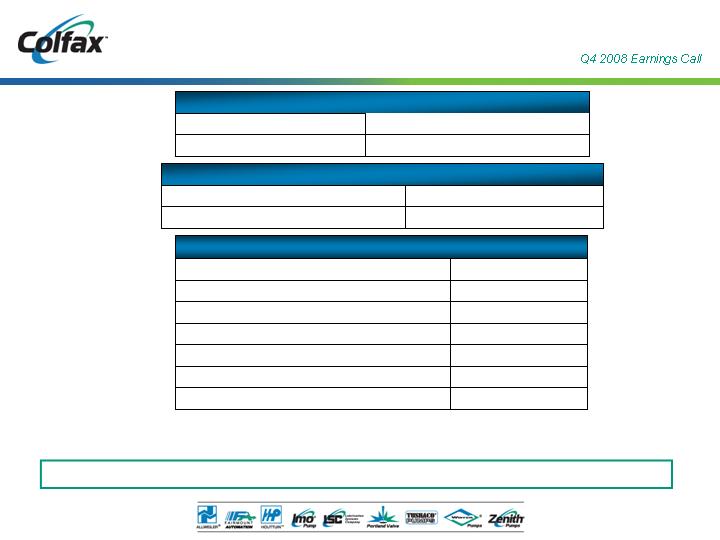
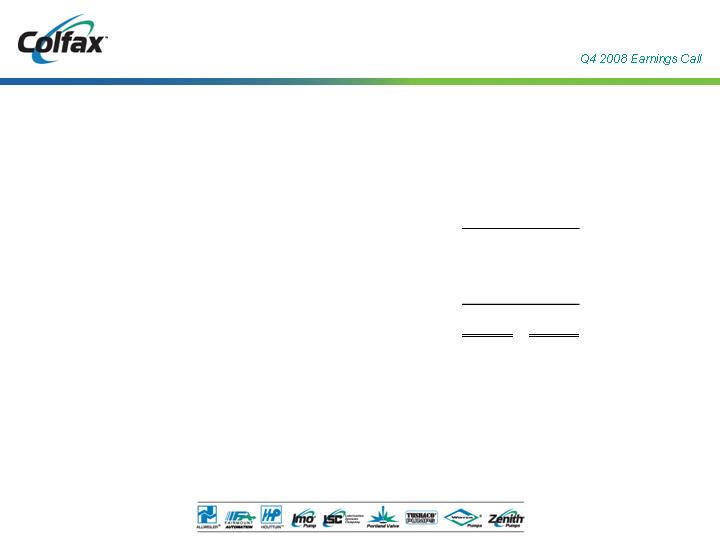
Adjusted EPS for 2009 of $1.10 to $1.17
2009 Outlook Summary
$585 million
to
$570 million
2009 Total
3%
to
1%
2009 Organic growth (1)
Revenue Range
$1.17
to
$1.10
2009 Adjusted net income per share (2)
$0.87
to
$0.80
2009 Net income per share
EPS Range
(1) Excludes impact of foreign exchange rate fluctuations and acquisitions
(2) Excludes impact of asbestos coverage litigation and asbestos liability and defense costs
(See Appendix for Non-GAAP reconciliation)
$2.5 million
Incremental public company costs
43.3 million
Outstanding shares
$8 million
Interest expense
32%
Tax rate
$1.41
Euro
$7 million
Asbestos liability and defense costs
$12 million
Asbestos coverage litigation
Assumptions
17
Well Positioned for the Future
Leading Brand Names
Generating Aftermarket
Sales and Services
Experienced Management
Team in Place to Grow
Organically and Through
Strategic Acquisitions
Global Leader in Specialty
Fluid Handling Products
Proven Application
Expertise in Solving
Critical Customer Needs
Serving Fast
Growing Infrastructure
Driven End Markets
CBS-Driven Culture Focused
on Profitable Sales Growth
18
Appendix
19

Adjusted net income, adjusted net income per share, adjusted operating income, EBITDA, adjusted EBITDA, adjusted
selling, general and administrative expenses, organic sales growth and organic order growth are non-GAAP financial
measures. Adjusted net income, adjusted net income per share, adjusted operating income and adjusted EBITDA
exclude asbestos liability and defense cost (income) and asbestos coverage litigation expense, certain legacy legal
charges, certain due diligence costs, as well as one time initial public offering-related costs. Adjusted selling, general
and administrative expenses exclude certain legacy legal charges and certain due diligence costs. Adjusted net income
also reflects interest expense as if the initial public offering (IPO) had occurred at the beginning of 2007 and presents
income taxes at an effective tax rate of 34%. Adjusted net income per share assumes the 44,006,026 shares outstanding
at the closing of the IPO to be outstanding since January 1, 2007. Projected adjusted net income per share excludes
asbestos coverage litigation and asbestos liability and defense costs, and presents income tax benefit at 32%. Organic
sales growth and organic order growth exclude the impact of acquisitions and foreign exchange rate fluctuations. These
non-GAAP financial measures assist Colfax in comparing its operating performance on a consistent basis because,
among other things, they remove the impact of changes in our capital structure and asset base, non-recurring items
such as IPO-related costs, legacy asbestos issues (except in the case of EBITDA) and items outside the control of its
operating management team.
Sales and order information by end market are estimates. We periodically update our customer groupings in order to
refine these estimates. During the fourth quarter of 2008, reclassifications of previously reported amounts were made to
conform to current period presentation. No changes have been made to total sales or orders.
Disclaimer
20
____________________
Note: Dollars in thousands.
Non-GAAP Reconciliation
December 31,
December 31,
December 31,
December 31,
2008
2007
2008
2007
EBITDA
Net income (loss)
10,379
$
28,992
$
(571)
$
64,882
$
Interest expense
2,138
4,830
11,822
19,246
Provision for income taxes
9,210
17,715
5,438
39,147
Depreciation and amortization
3,443
4,034
14,788
15,239
EBITDA
25,170
$
55,571
$
31,477
$
138,514
$
EBITDA margin
15.8%
38.7%
5.2%
27.4%
Adjusted EBITDA
Net income (loss)
10,379
$
28,992
$
(571)
$
64,882
$
Interest expense
2,138
4,830
11,822
19,246
Provision for income taxes
9,210
17,715
5,438
39,147
Depreciation and amortization
3,443
4,034
14,788
15,239
IPO-related costs
-
-
57,017
-
Legacy legal adjustment
-
-
4,131
-
Due diligence costs
-
-
582
-
Asbestos liability and defense (income) costs
1,978
(31,946)
(4,771)
(63,978)
Asbestos coverage litigation expense
4,905
5,314
17,162
13,632
Adjusted EBITDA
32,053
$
28,939
$
105,598
$
88,168
$
Adjusted EBITDA margin
20.1%
20.1%
17.5%
17.4%
Three Months Ended
Year Ended
21
____________________
Note: Dollars in thousands, except per share amounts.
Non-GAAP Reconciliation
December 31,
December 31,
December 31,
December 31,
2008
2007
2008
2007
Adjusted Net Income and Adjusted Earnings per Share
Net income (loss)
10,379
$
28,992
$
(571)
$
64,882
$
IPO-related costs
-
-
57,017
-
Legacy legal adjustment
-
-
4,131
-
Due diligence costs
-
-
582
-
Asbestos liability and defense (income) costs
1,978
(31,946)
(4,771)
(63,978)
Asbestos coverage litigation expense
4,905
5,314
17,162
13,632
Interest adjustment to effect IPO at beginning of period
-
2,143
2,302
7,536
Tax adjustment to 34% effective rate
210
10,161
(22,201)
18,333
Adjusted net income
17,472
$
14,664
$
53,651
$
40,405
$
Adjusted net income margin
11.0%
10.2%
8.9%
8.0%
Shares outstanding at closing of IPO
44,006,026
44,006,026
44,006,026
44,006,026
Adjusted net income per share
0.40
$
0.33
$
1.22
$
0.92
$
Net income (loss) per share-basic
and diluted in accordance with GAAP
0.24
$
0.77
$
(0.11)
$
1.79
$
Adjusted Operating Income
Operating income
21,727
$
51,537
$
16,689
$
123,275
$
IPO-related costs
-
-
57,017
-
Legacy legal adjustment
-
-
4,131
-
Due diligence costs
-
-
582
-
Asbestos liability and defense (income) costs
1,978
(31,946)
(4,771)
(63,978)
Asbestos coverage litigation expense
4,905
5,314
17,162
13,632
Adjusted operating income
28,610
$
24,905
$
90,810
$
72,929
$
Adjusted operating income margin
18.0%
17.3%
15.0%
14.4%
Three Months Ended
Year Ended
22
____________________
Note: Dollars in thousands.
Non-GAAP Reconciliation
December 31,
December 31,
December 31,
December 31,
2008
2007
2008
2007
Adjusted SG&A Expense
Selling, general and administrative expenses
27,718
$
23,223
$
125,234
$
98,500
$
Legacy legal adjustment
-
-
4,131
-
Due diligence costs
-
-
582
-
Adjusted selling, general and administrative expenses
27,718
$
23,223
$
120,521
$
98,500
$
Three Months Ended
Year Ended
23
____________________
Note: Dollars in millions.
Sales & Order Growth
$
%
$
%
Three Months Ended December 31, 2007
143.7
$
156.5
$
Components of Growth:
Organic growth from existing businesses
27.4
19.1%
(24.7)
(15.8%)
Acquisitions
0.8
0.6%
3.1
2.0%
Foreign currency translation
(12.6)
(8.8%)
(8.6)
(5.5%)
Total Growth
15.6
10.9%
(30.2)
(19.3%)
Three Months Ended December 31, 2008
159.3
$
126.3
$
$
%
$
%
Year Ended December 31, 2007
506.3
$
581.5
$
Components of Growth:
Organic growth from existing businesses
70.2
13.9%
40.9
7.0%
Acquisitions
5.5
1.1%
11.7
2.0%
Foreign currency translation
22.9
4.5%
35.1
6.1%
Total Growth
98.6
19.5%
87.7
15.1%
Year Ended December 31, 2008
604.9
$
669.2
$
Sales
Orders
Sales
Orders
24
Non-GAAP Reconciliation
Projected 2009 net income per share - fully diluted
0.80
$
0.87
$
Asbestos coverage litigation
0.28
0.28
Asbestos liability and defense costs
0.16
0.16
Income tax benefit at 32%
(0.14)
(0.14)
Projected 2009 adjusted net income per share - fully diluted
$ 1.10
$ 1.17
EPS Range
25