Technical Report Summary
of the
2023 Estimated Resources and Reserves at Intrepid Potash-Wendover
Prepared for:
Intrepid Potash–Wendover, LLC
Report Date:
February 14, 2024
Effective Date:
December 31, 2023
Prepared by:
660 Rood Avenue, Suite A
Grand Junction, Colorado 81501
| | | | | |
2023 Estimated Resources and Reserves at Intrepid Potash-Wendover
Prepared for Intrepid Potash, Inc.
February 14, 2024 | ii |
Date and Signature Page
This report titled “Technical Report Summary of the 2023 Estimated Resources and Reserves at Intrepid Potash-Wendover” is effective as of December 31, 2023, and was prepared and signed by RESPEC Company, LLC, acting as a Qualified Person Firm.
Signed and Dated February 14, 2024.
Signed RESPEC Company, LLC
Susan B Patton, PE
Principal
On behalf of RESPEC Company, LLC
| | | | | |
2023 Estimated Resources and Reserves at Intrepid Potash-Wendover
Prepared for Intrepid Potash, Inc.
February 14, 2024 | iii |
Technical Report Summary
of the
2023 Estimated Resources and Reserves at Intrepid Potash-Wendover
Table of Contents
| | | | | |
2023 Estimated Resources and Reserves at Intrepid Potash-Wendover
Prepared for Intrepid Potash, Inc.
February 14, 2024 | iv |
| | | | | |
2023 Estimated Resources and Reserves at Intrepid Potash-Wendover
Prepared for Intrepid Potash, Inc.
February 14, 2024 | v |
| | | | | |
2023 Estimated Resources and Reserves at Intrepid Potash-Wendover
Prepared for Intrepid Potash, Inc.
February 14, 2024 | vi |
| | | | | |
2023 Estimated Resources and Reserves at Intrepid Potash-Wendover
Prepared for Intrepid Potash, Inc.
February 14, 2024 | vii |
List of Tables
| | | | | |
2023 Estimated Resources and Reserves at Intrepid Potash-Wendover
Prepared for Intrepid Potash, Inc.
February 14, 2024 | viii |
List of Figures
| | | | | |
2023 Estimated Resources and Reserves at Intrepid Potash-Wendover
Prepared for Intrepid Potash, Inc.
February 14, 2024 | ix |
List of Abbreviations
| | | | | |
| ° | degree |
| % | percent |
| APR | Annual Percentage Rate |
| BLM | United States Bureau of Land Management |
| BSF | Bonneville Salt Flats |
| CFR | Code of Federal Regulations |
| CMC | carboxy-methyl cellulose |
| EOY | end of year |
| ft | feet or foot |
ft2 | square foot |
| gpd | gallons per day |
| I-80 | Interstate 80 |
| Intrepid | Intrepid Potash, Inc. |
| Intrepid-Wendover | Intrepid Potash–Wendover, LLC |
| IRR | Internal Rate of Return |
| K | potassium |
| KCl | sylvite or potassium chloride |
lb/ft3 | pounds per cubic foot |
| M | million |
| Mg | magnesium |
MgCl2 | magnesium chloride |
MgCl2•KCl•6H2O | carnallite |
| MOP | Muriate of Potash |
| MSL | mean sea level |
| MRS | metal recovery salt |
| Mt | million tons |
| Na | sodium |
| NaCl | sodium chloride or halite |
| NPV | Net Present Value |
| NaCl | halite |
| % | percent |
| QP | Qualified Person |
| RESPEC | RESPEC Company, LLC |
| SEC | United States Securities Exchange Commission |
| SME | Society for Mining, Metallurgy & Exploration |
| | | | | |
2023 Estimated Resources and Reserves at Intrepid Potash-Wendover
Prepared for Intrepid Potash, Inc.
February 14, 2024 | x |
| | | | | |
| SOE | Statement of Earnings |
| t | ton |
| tpd | tons per day |
| tpy | tons per year |
| UPRR | Union Pacific Railroad |
| YPB | years before present |
| | | | | |
2023 Estimated Resources and Reserves at Intrepid Potash-Wendover
Prepared for Intrepid Potash, Inc.
February 14, 2024 | 1 |
1.0Executive Summary
RESPEC Company, LLC (RESPEC) was commissioned by Intrepid Potash, Inc. (Intrepid) to prepare the 2023 Technical Report Summary (TRS) filed as Exhibit 96.3 with the Intrepid Potash 10-K for End of Year (EOY) 2023 for the Intrepid Potash–Wendover, LLC (Intrepid-Wendover) property. See Table 2-1 for previous TRS filings for the property. Resources and reserves are estimated according to United States (US) Securities and Exchange Commission (SEC) S-K 1300 regulations.
1.1Property Description and Ownership
Intrepid-Wendover owns 57,534 acres located in Township 1 North, Range 18 West; Township 1 South, Ranges 17, 18 and 19 West; Township 2 South, Ranges 18 and 19 West; and Township 3 South, Ranges 18 and 19 West. Approximately 34,070 acres owned by the U.S. Bureau of Land Management (BLM) and the State of Utah are leased to Intrepid-Wendover.
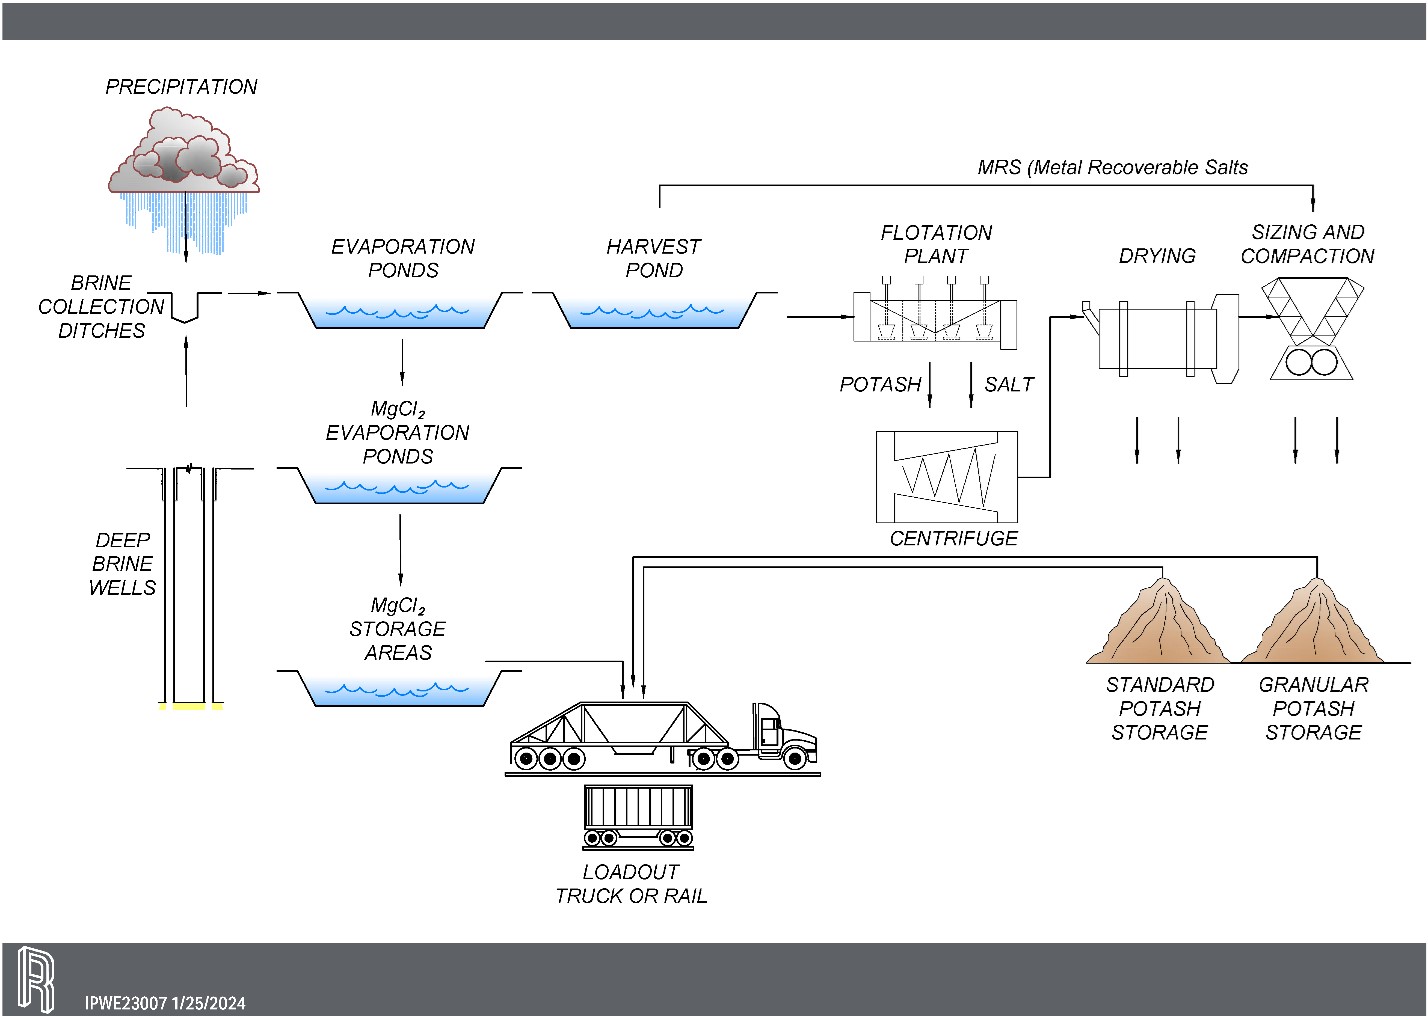
Potash at Intrepid-Wendover is produced through solar evaporation of naturally occurring brines collected from the sedimentary basin adjacent to the processing facility via brine collection ditches and extraction wells. The potash content of the collected brine is concentrated by solar evaporation to the point that solids are precipitated and can be collected. Harvested salts are hauled to the processing facility, where they are dried, sized, and stored for shipment. Potash, metal recovery salt (MRS), halite (NaCl), and magnesium chloride (MgCl2) are shipped by both truck and rail via Interstate 80 (I-80) and the Union Pacific Railroad (UPRR) link.
1.2Geology and Mineralization
Intrepid’s Wendover operation is located near the Nevada–Utah border along the western edge of Utah’s Great Salt Lake Desert and is situated within the Bonneville Salt Flats (BSF). The BSF is an enclosed sub-basin that contains 150 square miles of salt crust.
Intrepid’s Wendover operation produces potash by transporting subsurface potassium-rich brines to the surface where they are exposed to western Utah’s arid climate. The aqueous portion of the brine is removed through evaporation, allowing the evaporite minerals to precipitate and be collected for further processing. Because potash is derived from subsurface brines, the mineral deposit is best represented by characteristics of the aquifer(s) containing the brine.
1.3Status of Exploration, Development, and Operations
The property has been in continuous operation by Intrepid-Wendover since 2004. Brine sampling is an integral part of the mine operations.
1.4Mineral Resource Estimates
The ore resource model created from the database brine sampling data beginning in 2007 serves as the basis for this evaluation. The sampling data includes brine samples from the
| | | | | |
2023 Estimated Resources and Reserves at Intrepid Potash-Wendover
Prepared for Intrepid Potash, Inc.
February 14, 2024 | 2 |
active mining horizon. The resources reported, exclusive of mineral reserves effective December 31, 2023, are shown in Table 1-1.
Table 1-1. K2O Brine Mineral Resource Estimate effective December 31, 2023
| | | | | | | | | | | | | | | | | |
Wendover - K2O Brine Mineral Resource Estimate effective December 31, 2023 based on $450/Product Ton Mine Site |
| Resources | | |
| K2O Brine1 (Mt) | Grade (%K2O) | Contained K2O2 (Mt) | Cutoff3 (%K2O) | Processing Recovery
(%) |
| Measured Mineral Resources | | | | | |
| Indicated Mineral Resources | 175 | 0.5 | 0.9 | 0.23 | 85 |
| Measured + Indicated Mineral Resources | 175 | 0.5 | 0.9 | | |
| Inferred Mineral Resources | 1,358 | 0.5 | 6.8 | 0.23 | 85 |
1K2O Brine is the recovered KCl bearing brine in solution at average concentrations by weight. |
2Contained K2O is calculated by multiplying K2O Brine by the Grade. |
3Solution mining resource cutoff is the grade at which production covers operating costs. |
| Mineral Resources were prepared by RESPEC, a qualified firm for the estimate and independent of Intrepid Potash, for EOY 2023. |
| Mineral Resources are reported exclusive of Mineral Reserves, on a 100% basis. |
Mineral Resources are reported using Inverse Distance Squared (ID2) estimation methods. |
Mt = million tons, % = percent, K2O = potassium oxide |
1.5Mineral Reserve Estimates
Table 1-2 shows the estimated reserve summaries for EOY 2023 with reserves reported exclusive of mineral resources.
Table 1-2. Potash Mineral Reserves effective December 31, 2023
| | | | | | | | | | | | | | | | | |
| Wendover - Potash Mineral Reserves effective December 31, 2023 based on $360/Product Ton Mine Site |
| Reserves | | |
| Brine1 (Mt) | In-Situ Grade2 (%K2O) | Product3 (Mt) | Brine Cutoff Grade4 (%K2O) | Processing Recovery
(%) |
| Proven Mineral Reserves | | | | | |
| Probable Mineral Reserves | 832 | 0.5 | 1.7 | 0.29 | 85 |
| Total Mineral Reserves | 832 | 0.5 | 1.7 | | |
1Brine advanced through the pond system. |
2In-situ grade is the amount of K2O contained in the brine. |
3Potash Product tons are calculated by multiplying Brine by: the In-Situ Grade divided by 63.17% K2O/KCl conversion factor, an overall pond recovery factor of 30%, processing recovery of 85%, a handling loss factor of 97%, and a product purity factor of 105%. |
4Solution mining reserve cutoff is the grade at which production covers operating costs. |
| Mineral Reserves were prepared by RESPEC, a qualified firm for the estimate and independent of Intrepid Potash, for EOY 2023. |
| Mineral Reserves are reported exclusive of Mineral Resources, on a 100% basis. |
Mt = million tons, % = percent, K2O = potassium oxide |
| | | | | |
2023 Estimated Resources and Reserves at Intrepid Potash-Wendover
Prepared for Intrepid Potash, Inc.
February 14, 2024 | 3 |
1.6Summary of Capital and Operating Cost Estimates
Operating cost per potash product ton from brine mining is estimated at $286/t for the next 5 years with a credit for the byproducts of $94/ton for an estimated potash operating cost of $192/ton.
No major capital investment is necessary to complete the mine plan. For brine storage and management of pond flows, an investment of approximately $5M in Year 10 and 20 of the plan is included for primary pond work. New deep brine well construction is planned for year 3 of the 25-year plan.
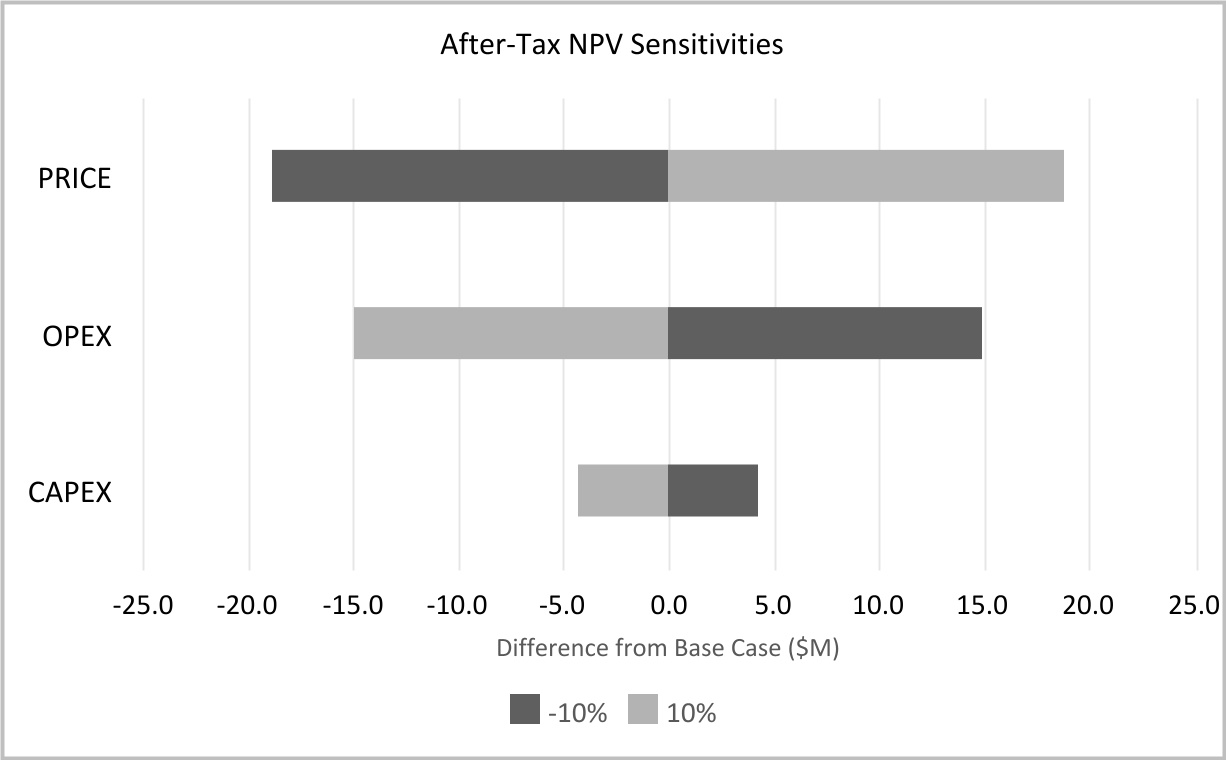
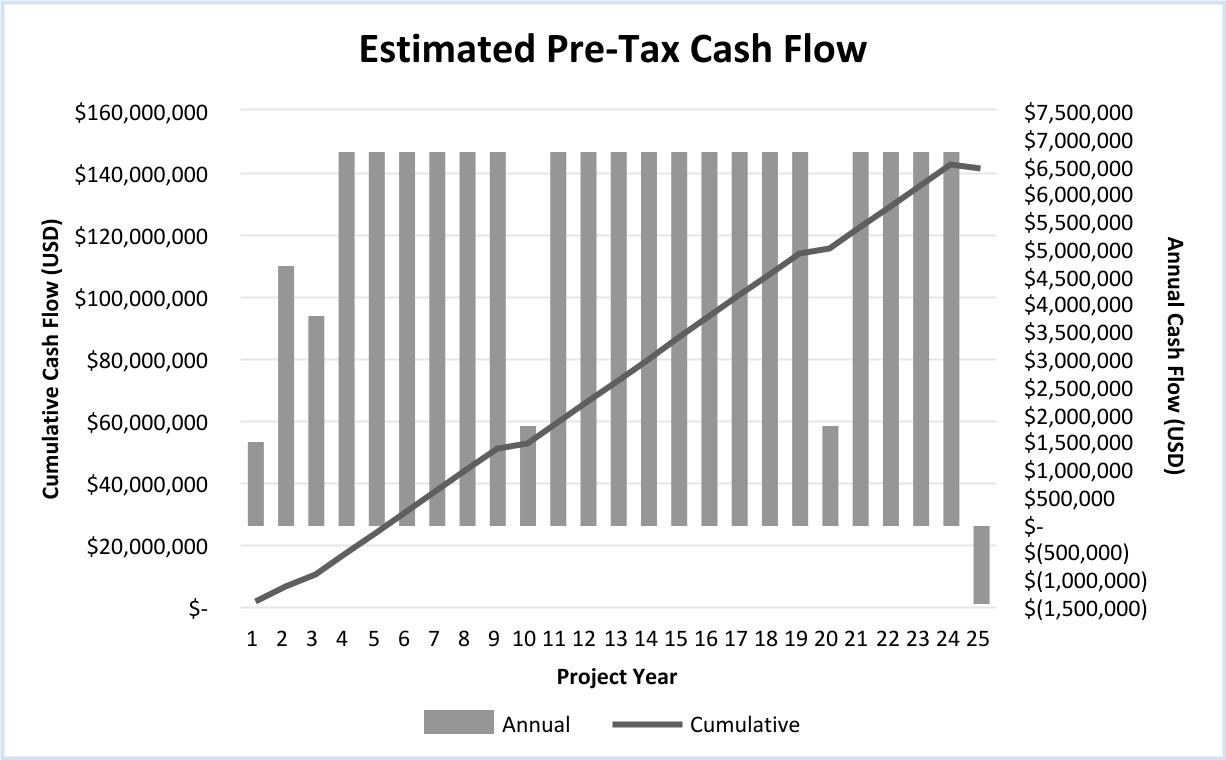
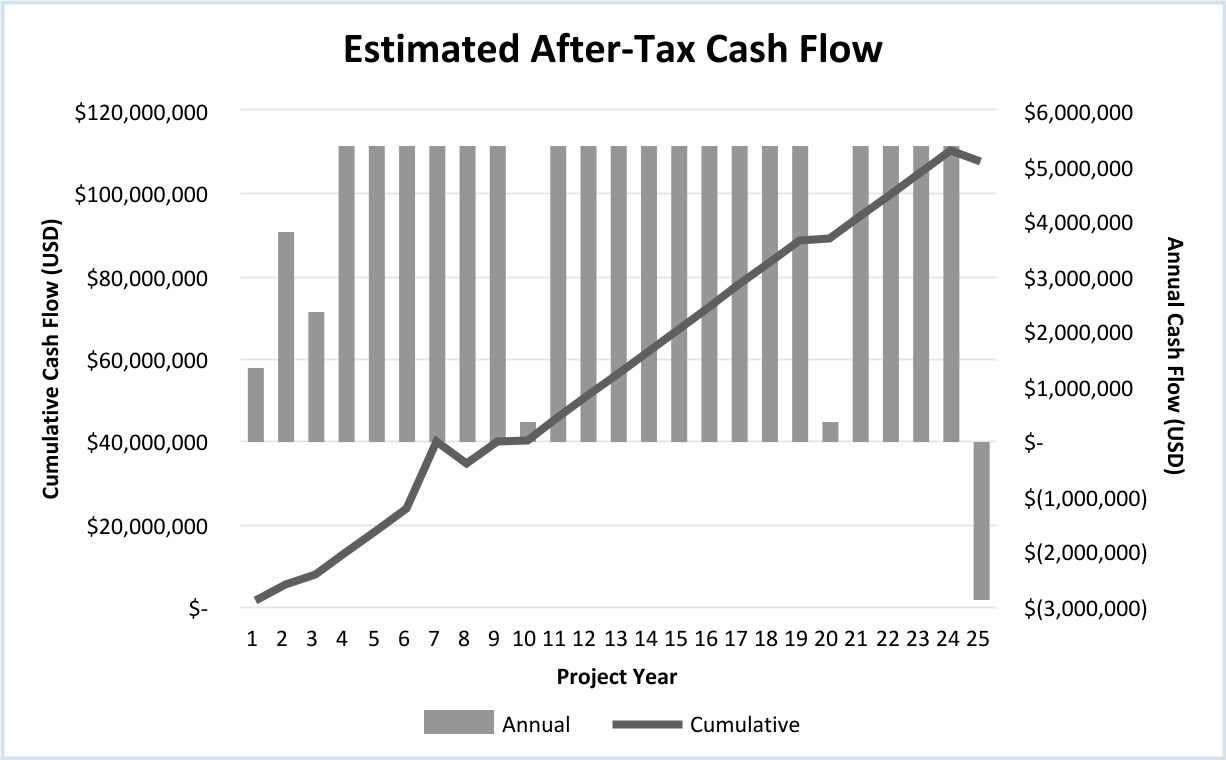
1.7Economic Analysis
The Net Present Value (NPV) at 8% Annual Percentage Rate (APR) for the before- and after-tax estimated cash flow is positive. The sensitivity to product price and operating cost for an 8% APR was evaluated. Varying costs and sales price plus and minus 10% the NPV remains positive.
1.8Permitting Requirements
The mine is in operation and necessary state and federal operating permits are in place.
1.9Conclusions and Recommendations
Estimates are dependent on data obtained from the natural environment. Although the mine has been in operation for many years, factors such as extended drought or natural disasters could influence the estimates. The general spacing between collection ditches is about 2,600 feet (ft), which may require a period of at least 100 years for the ditches to capture all the potash brine between the ditches. A future mining plan with optimized ditch spacing could affect the recovery factor and reserve estimation.
| | | | | |
2023 Estimated Resources and Reserves at Intrepid Potash-Wendover
Prepared for Intrepid Potash, Inc.
February 14, 2024 | 4 |
2.0Introduction
2.1Purpose and Basis of Report
This document was prepared to report the Intrepid-Wendover mineral resources in terms of in-situ brine tons and mineral reserves in terms of saleable product at Intrepid-Wendover under the SEC S-K 1300 rules (2018). The Society for Mining, Metallurgy & Exploration (SME) Guide for Reporting Exploration Information, Mineral Resources and Mineral Reserves (SME 2017) (The SME Guide) supplements the modifying factors used to convert mineral resources to mineral reserves. Previous TRS’s filed for the property are listed in Table 2-1.
2.2Terms of Reference
According to 17 Code of Federal Regulations (CFR) § 229.1301 (2021), the following definitions are included for reference:
An inferred mineral resource is that part of a mineral resource for which quantity and grade or quality are estimated on the basis of limited geological evidence and sampling. An inferred mineral resource has the lowest level of geological confidence of all mineral resources, which prevents the application of the modifying factors in a manner useful for evaluation of economic viability. An inferred mineral resource, therefore, may not be converted to a mineral reserve.
An indicated mineral resource is that part of a mineral resource for which quantity and grade or quality are estimated on the basis of adequate geological evidence and sampling. An indicated mineral resource has a lower level of confidence than the level of confidence of a measured mineral resource and may only be converted to a probable mineral reserve. As used in this subpart, the term adequate geological evidence means evidence that is sufficient to establish geological and grade or quality continuity with reasonable certainty.
A measured mineral resource is that part of a mineral resource for which quantity and grade or quality are estimated on the basis of conclusive geological evidence and sampling. As used in this subpart, the term conclusive geological evidence means evidence that is sufficient to test and confirm geological and grade or quality continuity.
Modifying factors are the factors that a qualified person must apply to indicated and measured mineral resources and then evaluate in order to establish the economic viability of mineral reserves. A qualified person must apply and evaluate modifying factors to convert measured and indicated mineral resources to proven and probable mineral reserves. These factors include but are not restricted to mining; processing; metallurgical; infrastructure; economic; marketing; legal; environmental compliance; plans, negotiations, or agreements with local individuals or groups; and governmental factors.
| | | | | |
2023 Estimated Resources and Reserves at Intrepid Potash-Wendover
Prepared for Intrepid Potash, Inc.
February 14, 2024 | 5 |
A probable mineral reserve is the economically mineable part of an indicated and, in some cases, a measured mineral resource.
A proven mineral reserve is the economically mineable part of a measured mineral resource. For a proven mineral reserve, the qualified person has a high degree of confidence in the results obtained from the application of the modifying factors and in the estimates of tonnage and grade or quality. A proven mineral reserve can only result from conversion of a measured mineral resource.
Throughout the report, reserves are presented in tons of potassium chloride (KCl).
2.3Personal Inspection
Personal inspection of the properties has occurred over the years by the QP. The most recent inspection of the property took place on May 19, 2021. The inspection included the Intrepid-Wendover potash plant, evaporation ponds, wellheads, and ditches.
2.4Sources of Information
Previously completed reserve estimations and analyses under SEC Guide 7 (SEC 2008) for this property and the TRS under S-K 1300 rules are listed in Table 2-1. Intrepid provided Statements of Earnings (SOE), permitting documentation, and production and monitoring data.
Table 2-1. Summary of Reserve Reports by QP
| | | | | | | | |
| | |
| Effective EOY | Title | Reference |
| | |
| 2007 | Potash Resource Estimation for Intrepid Potash–Wendover LLC | Agapito 2007a |
| 2007 | Determination of Estimated Probable Reserves at Intrepid Potash–Wendover, LLC | Agapito 2007b |
| 2009 | Determination of Estimated Probable Potash Reserves at Intrepid Potash–Wendover, LLC | Agapito 2010 |
| 2012 | Determination of Estimated Probable Potash Reserves at Intrepid Potash–Wendover, LLC | Agapito 2013 |
| 2015 | 2015 Determination of Estimated Probable Potash Reserves at Intrepid Potash–Wendover, LLC | Agapito 2016 |
| 2018 | 2018 Determination of Estimated Probable Reserves at Intrepid Potash–Wendover, LLC | Agapito 2019 |
| 2021 | Technical Report Summary, 2021 Estimated Resources and Reserves at Intrepid Potash-Wendover | Agapito 2022 |
| 2021 | Technical Report Summary, REVISED 2021 Estimated Resources and Reserves at Intrepid Potash-Wendover | RESPEC 2023 |
| | |
| | | | | |
2023 Estimated Resources and Reserves at Intrepid Potash-Wendover
Prepared for Intrepid Potash, Inc.
February 14, 2024 | 6 |
3.0Property Description
3.1 Location and Area of the Property
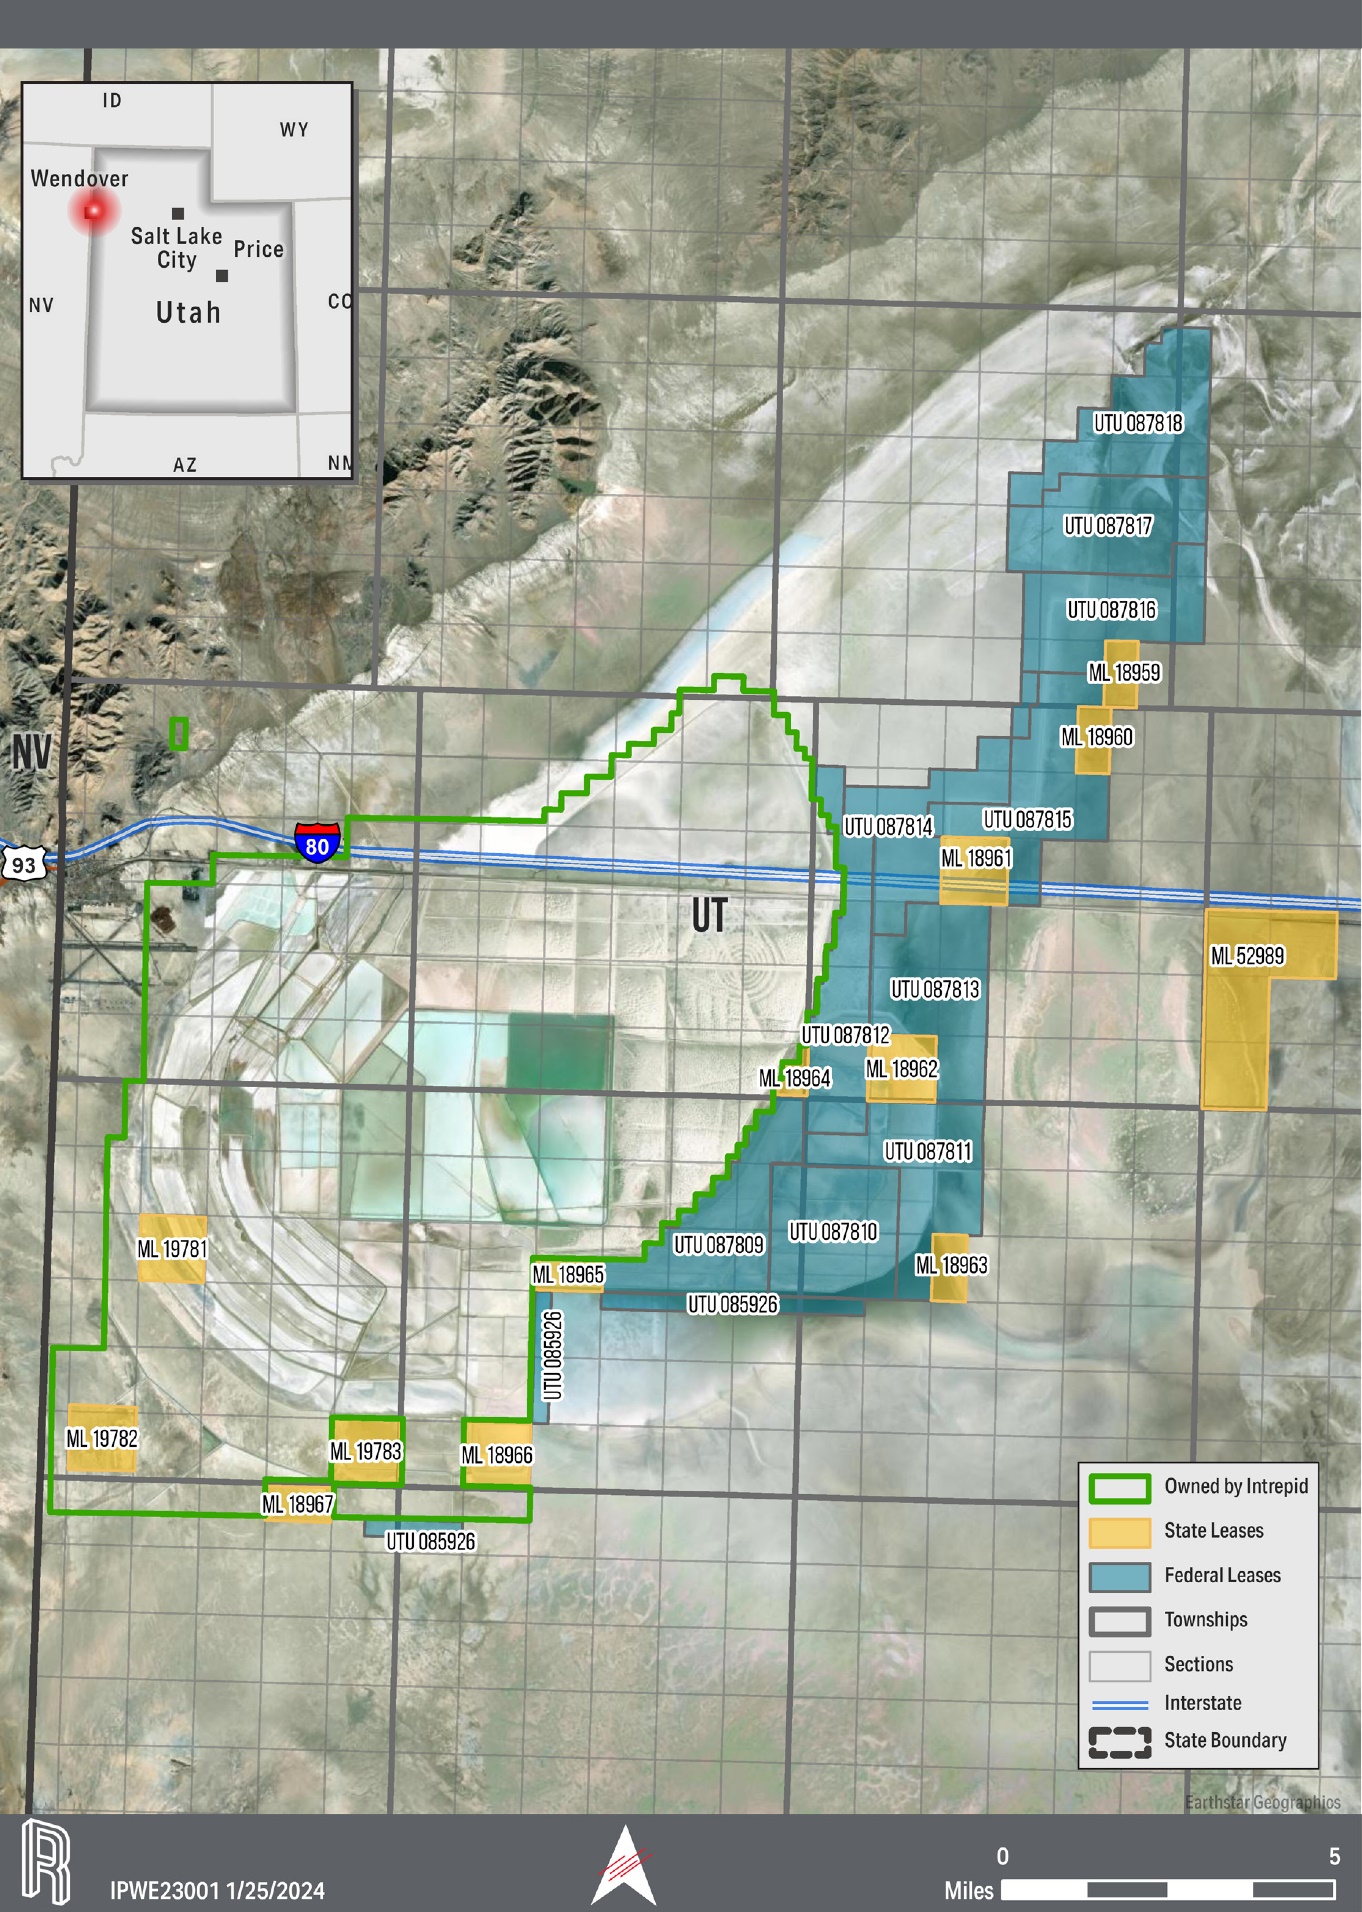
The Intrepid-Wendover potash operation is located in the westernmost part of Tooele County, Utah. The plant facilities and offices are located approximately 3 miles east of Wendover, Utah, on old US Highway 40. The site is approximately 3 miles east of the Nevada border and is primarily located south of I-80, although portions of the site are located north of I-80. The area of the Intrepid-Wendover mine operation is shown on Figure 3-1.
The facility, collection ditches, and evaporation systems cover approximately 91,604 acres (approximately 141 square miles). The majority of the ditch collection system is located to the south and east of the processing facilities.
3.2Mineral Rights
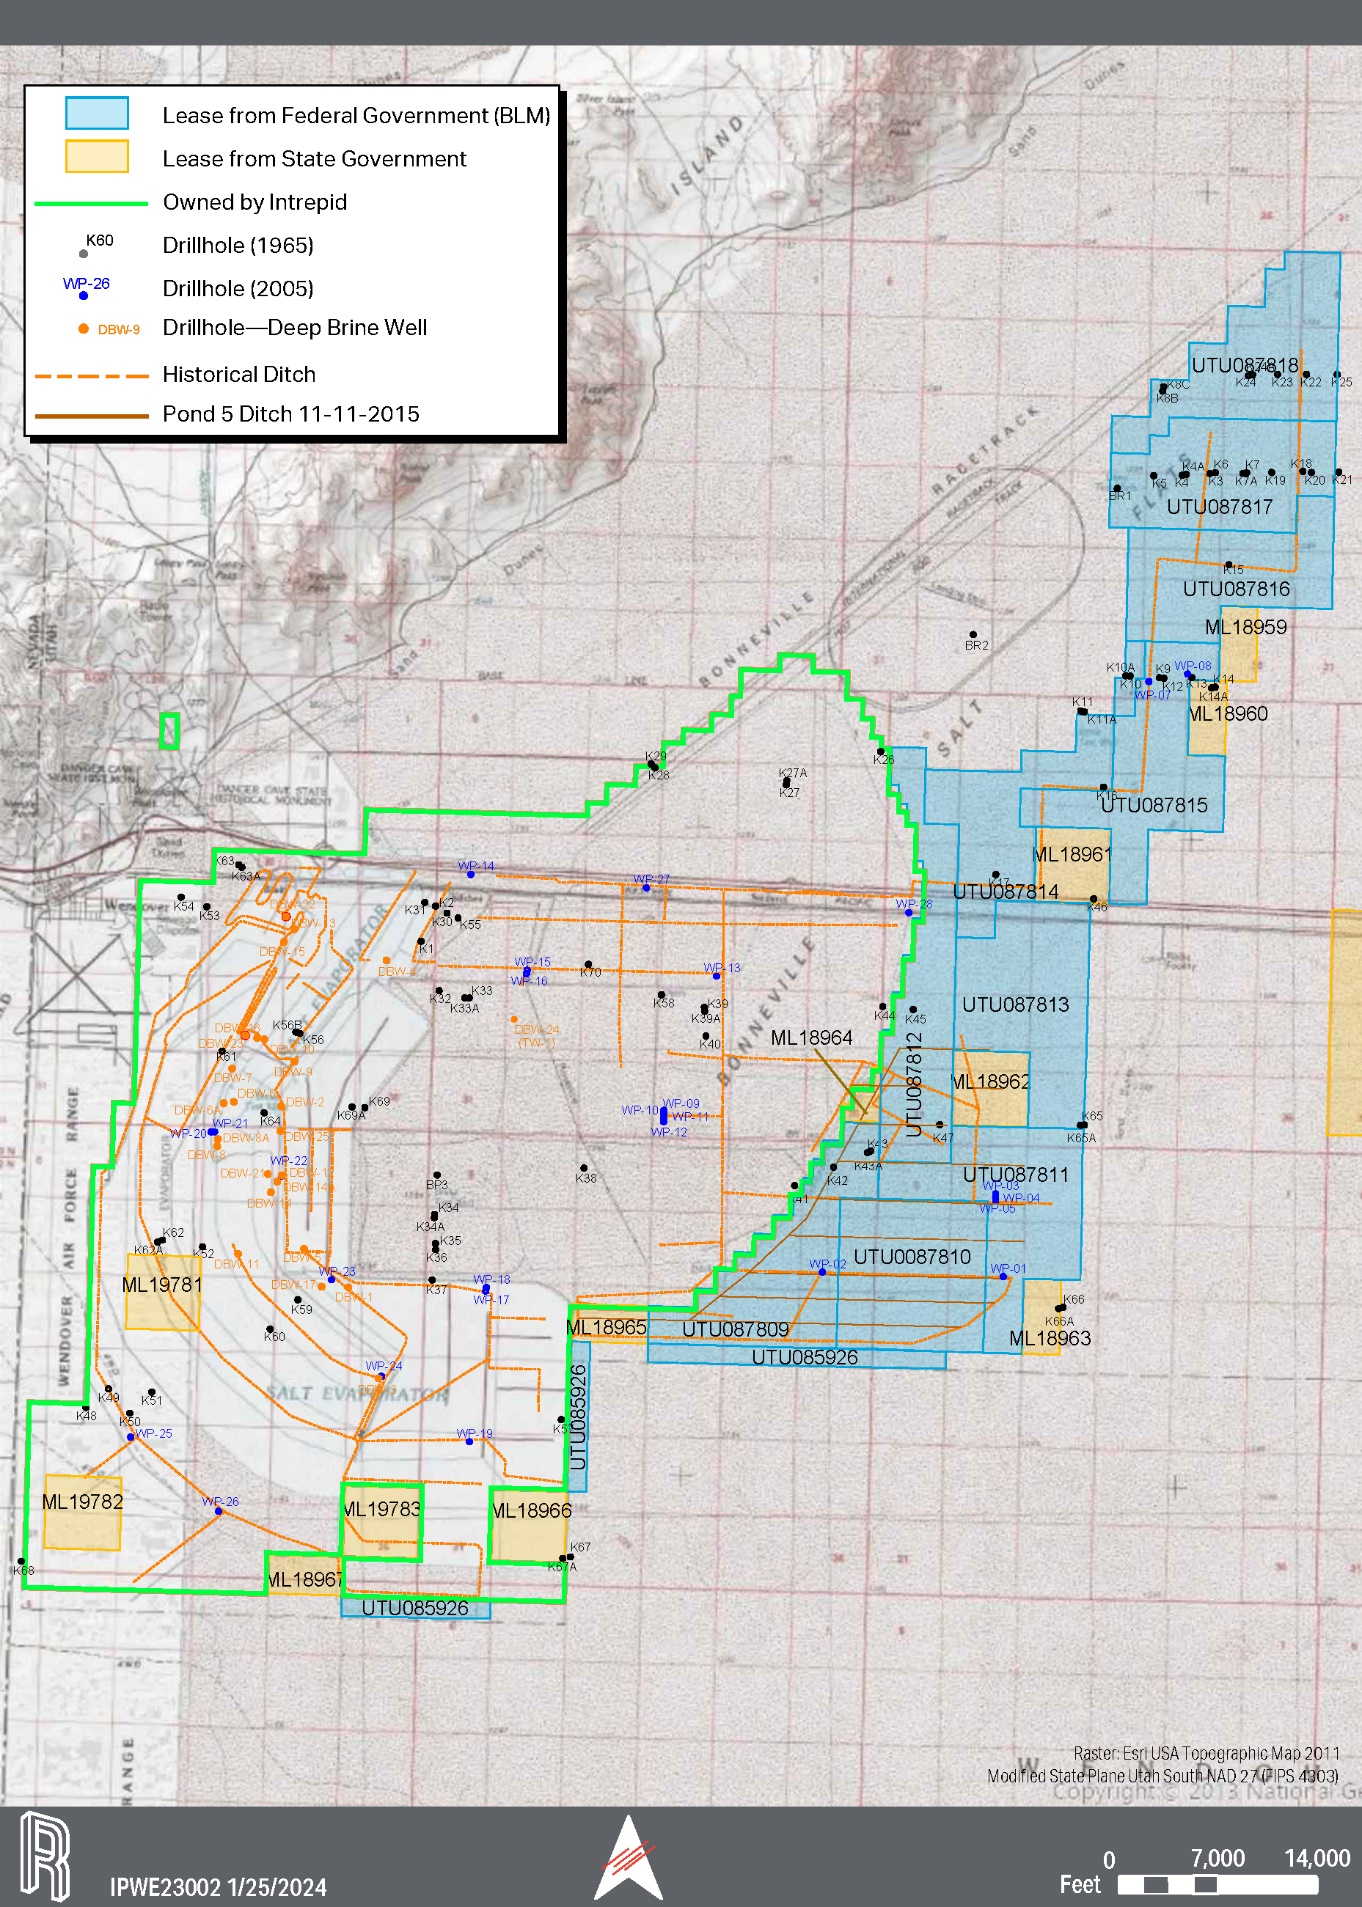
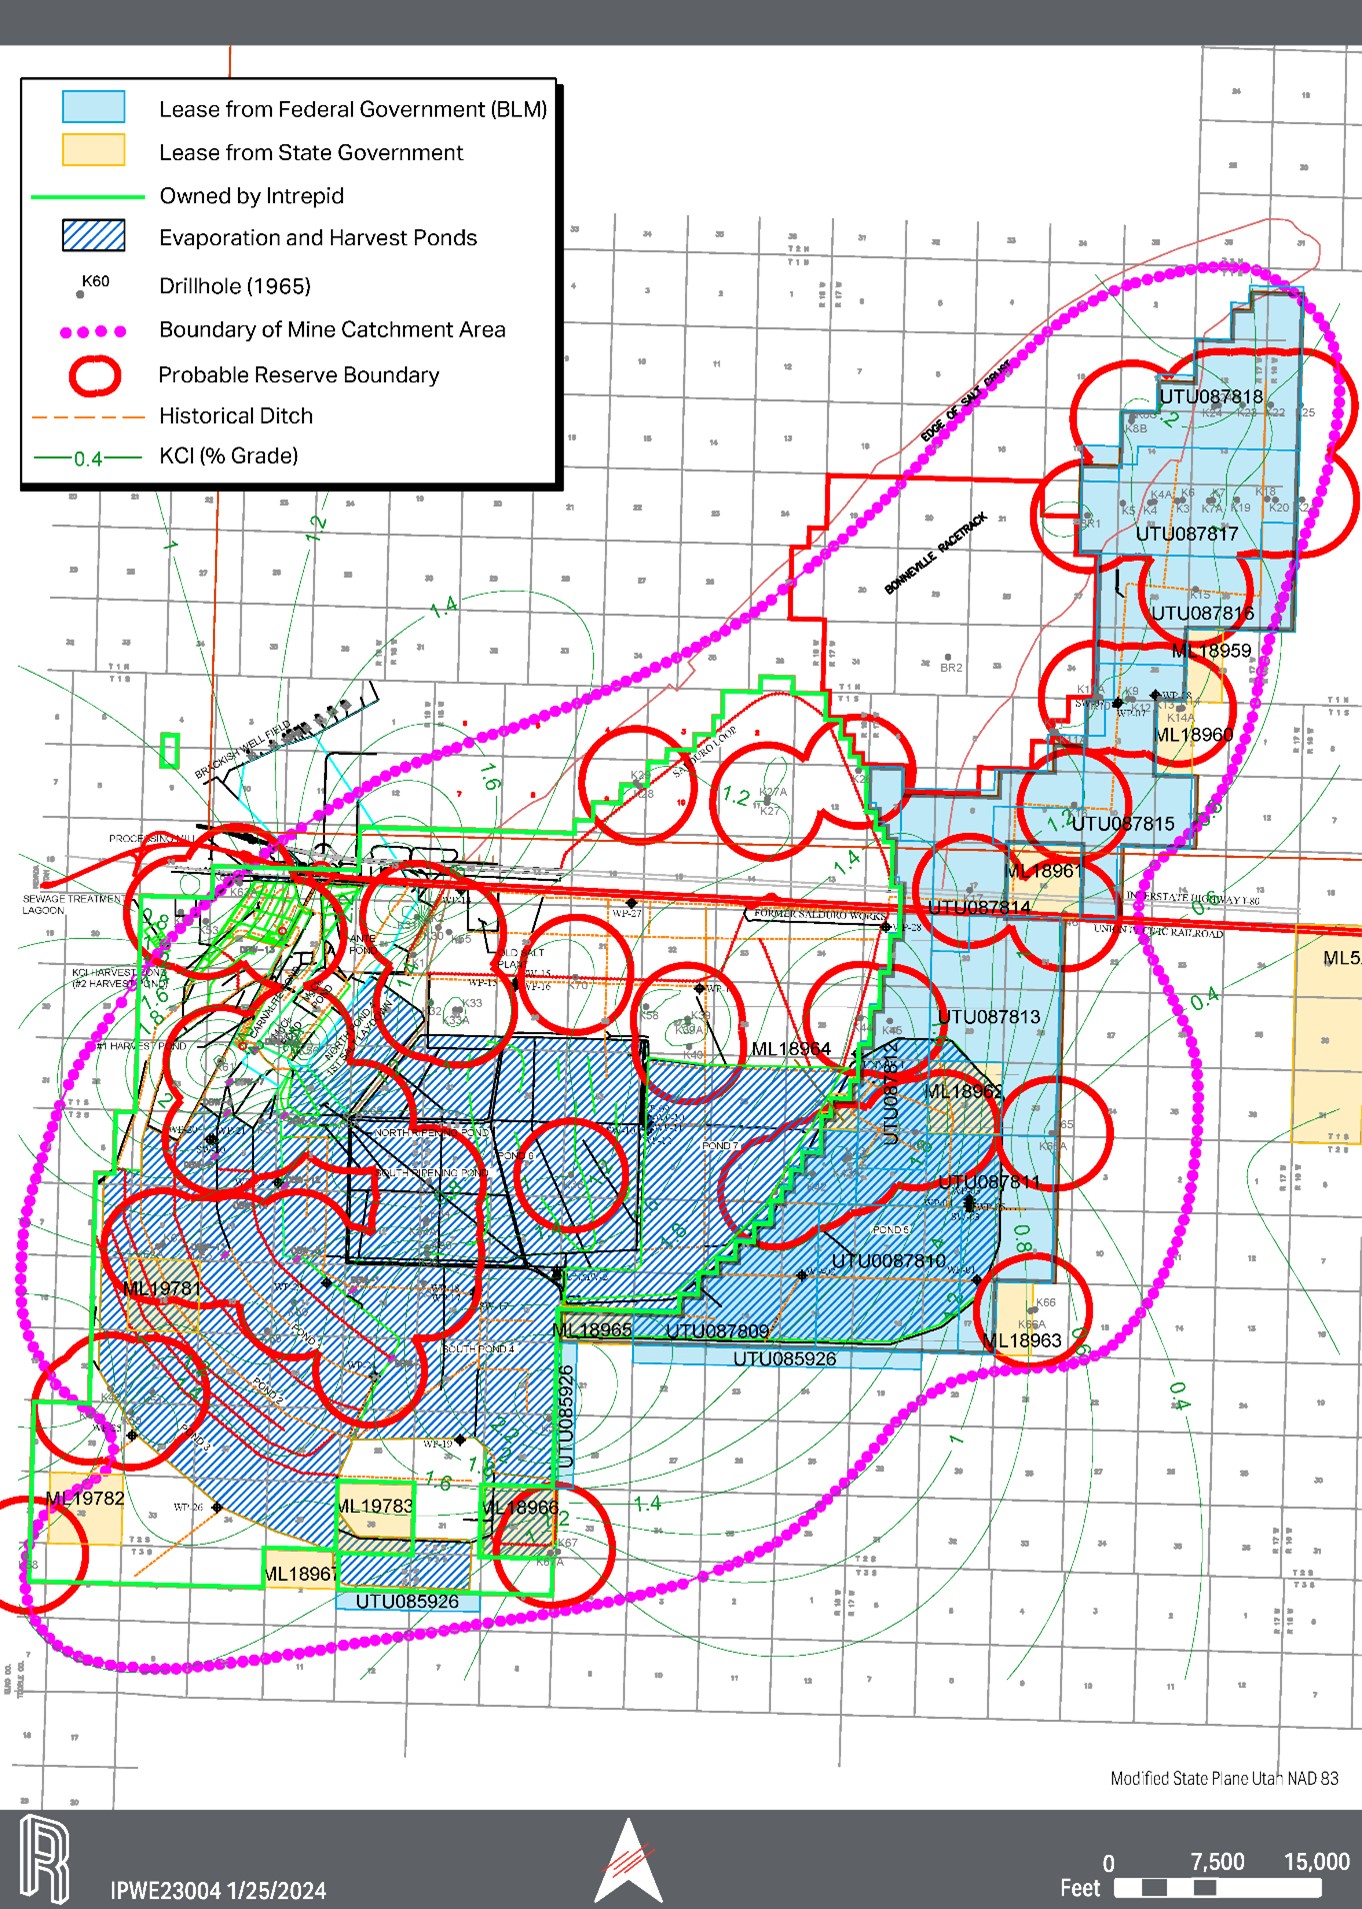
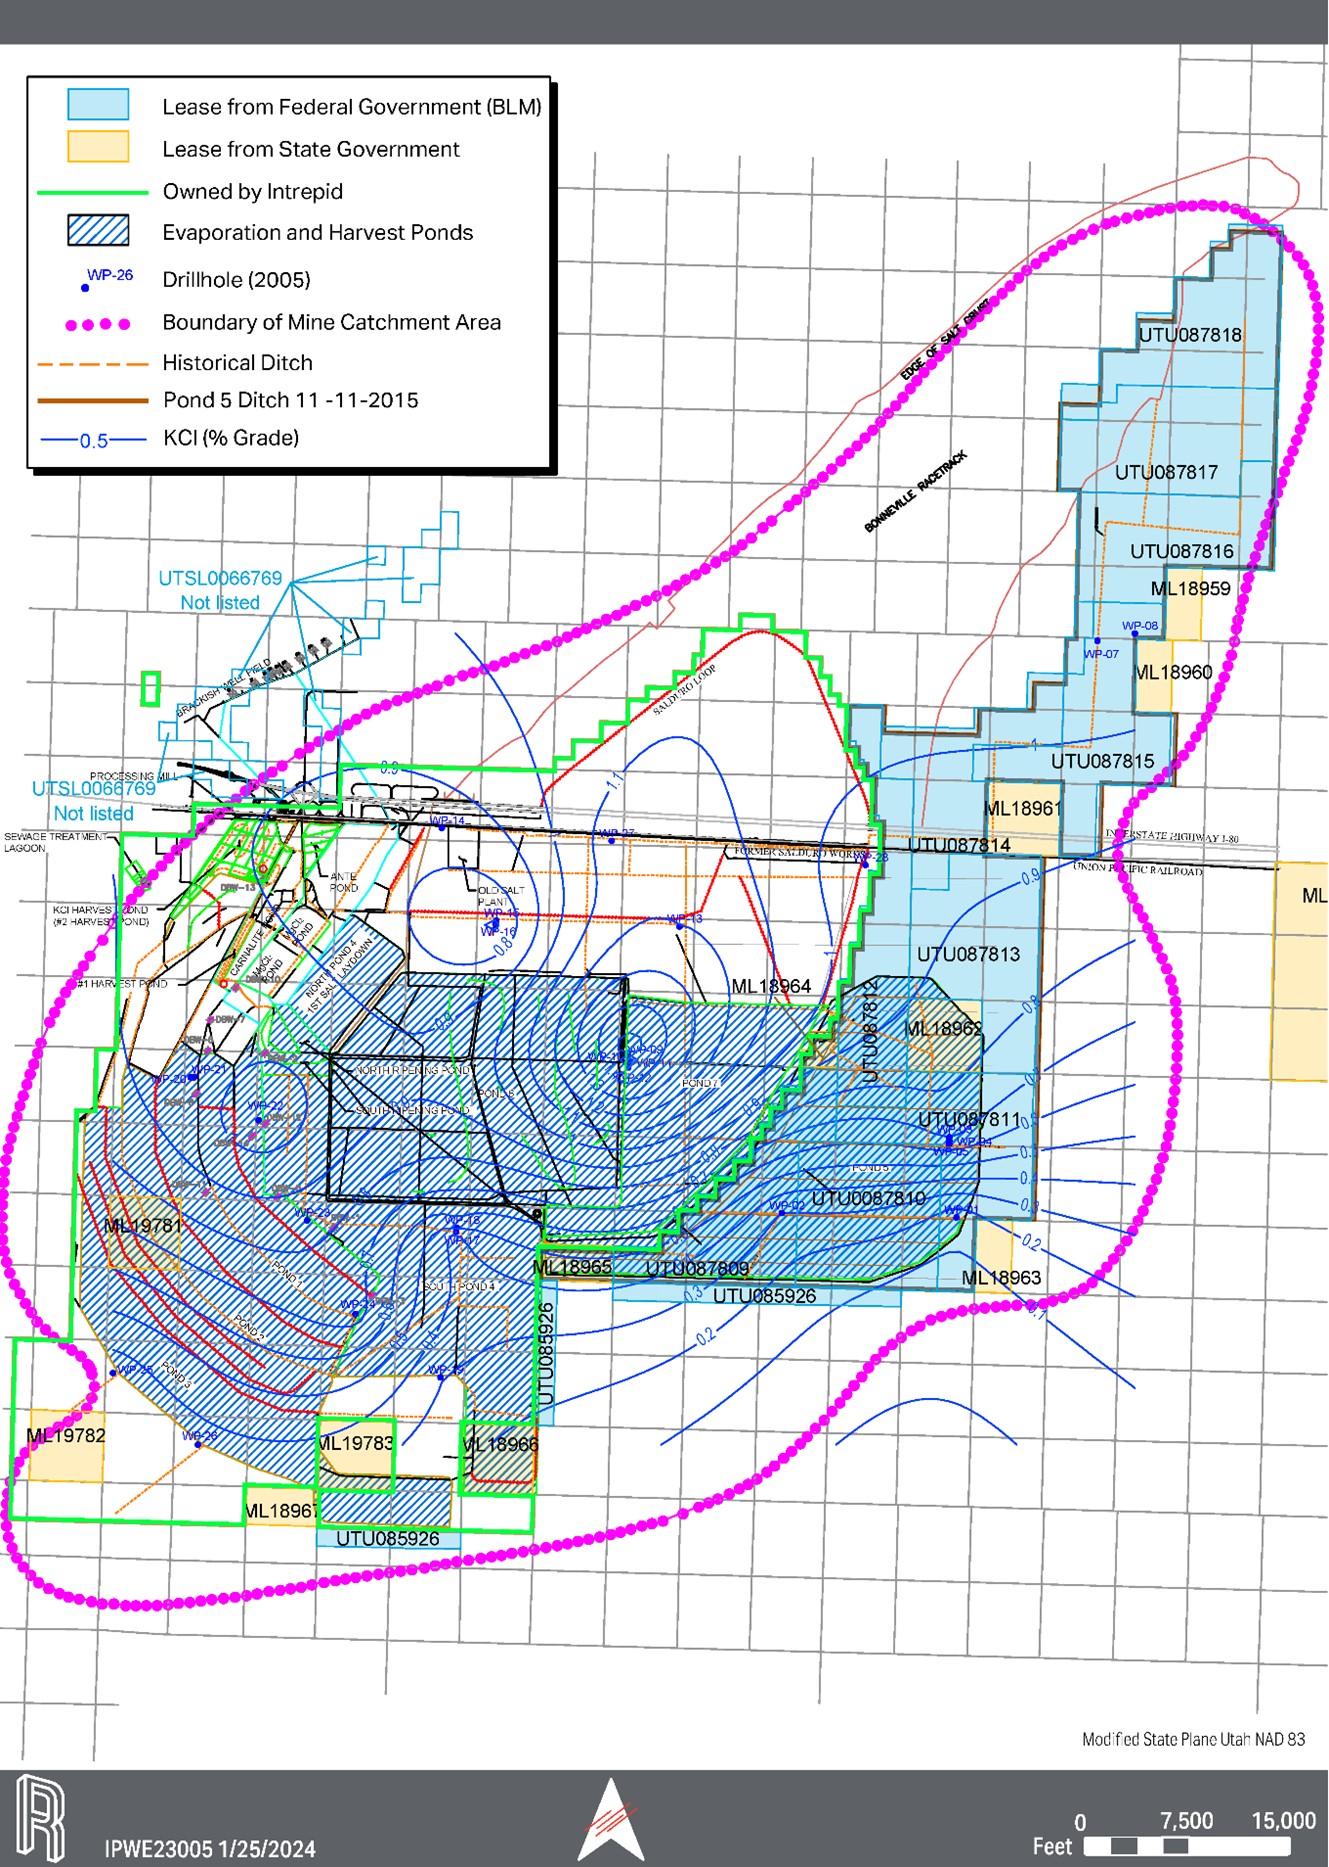
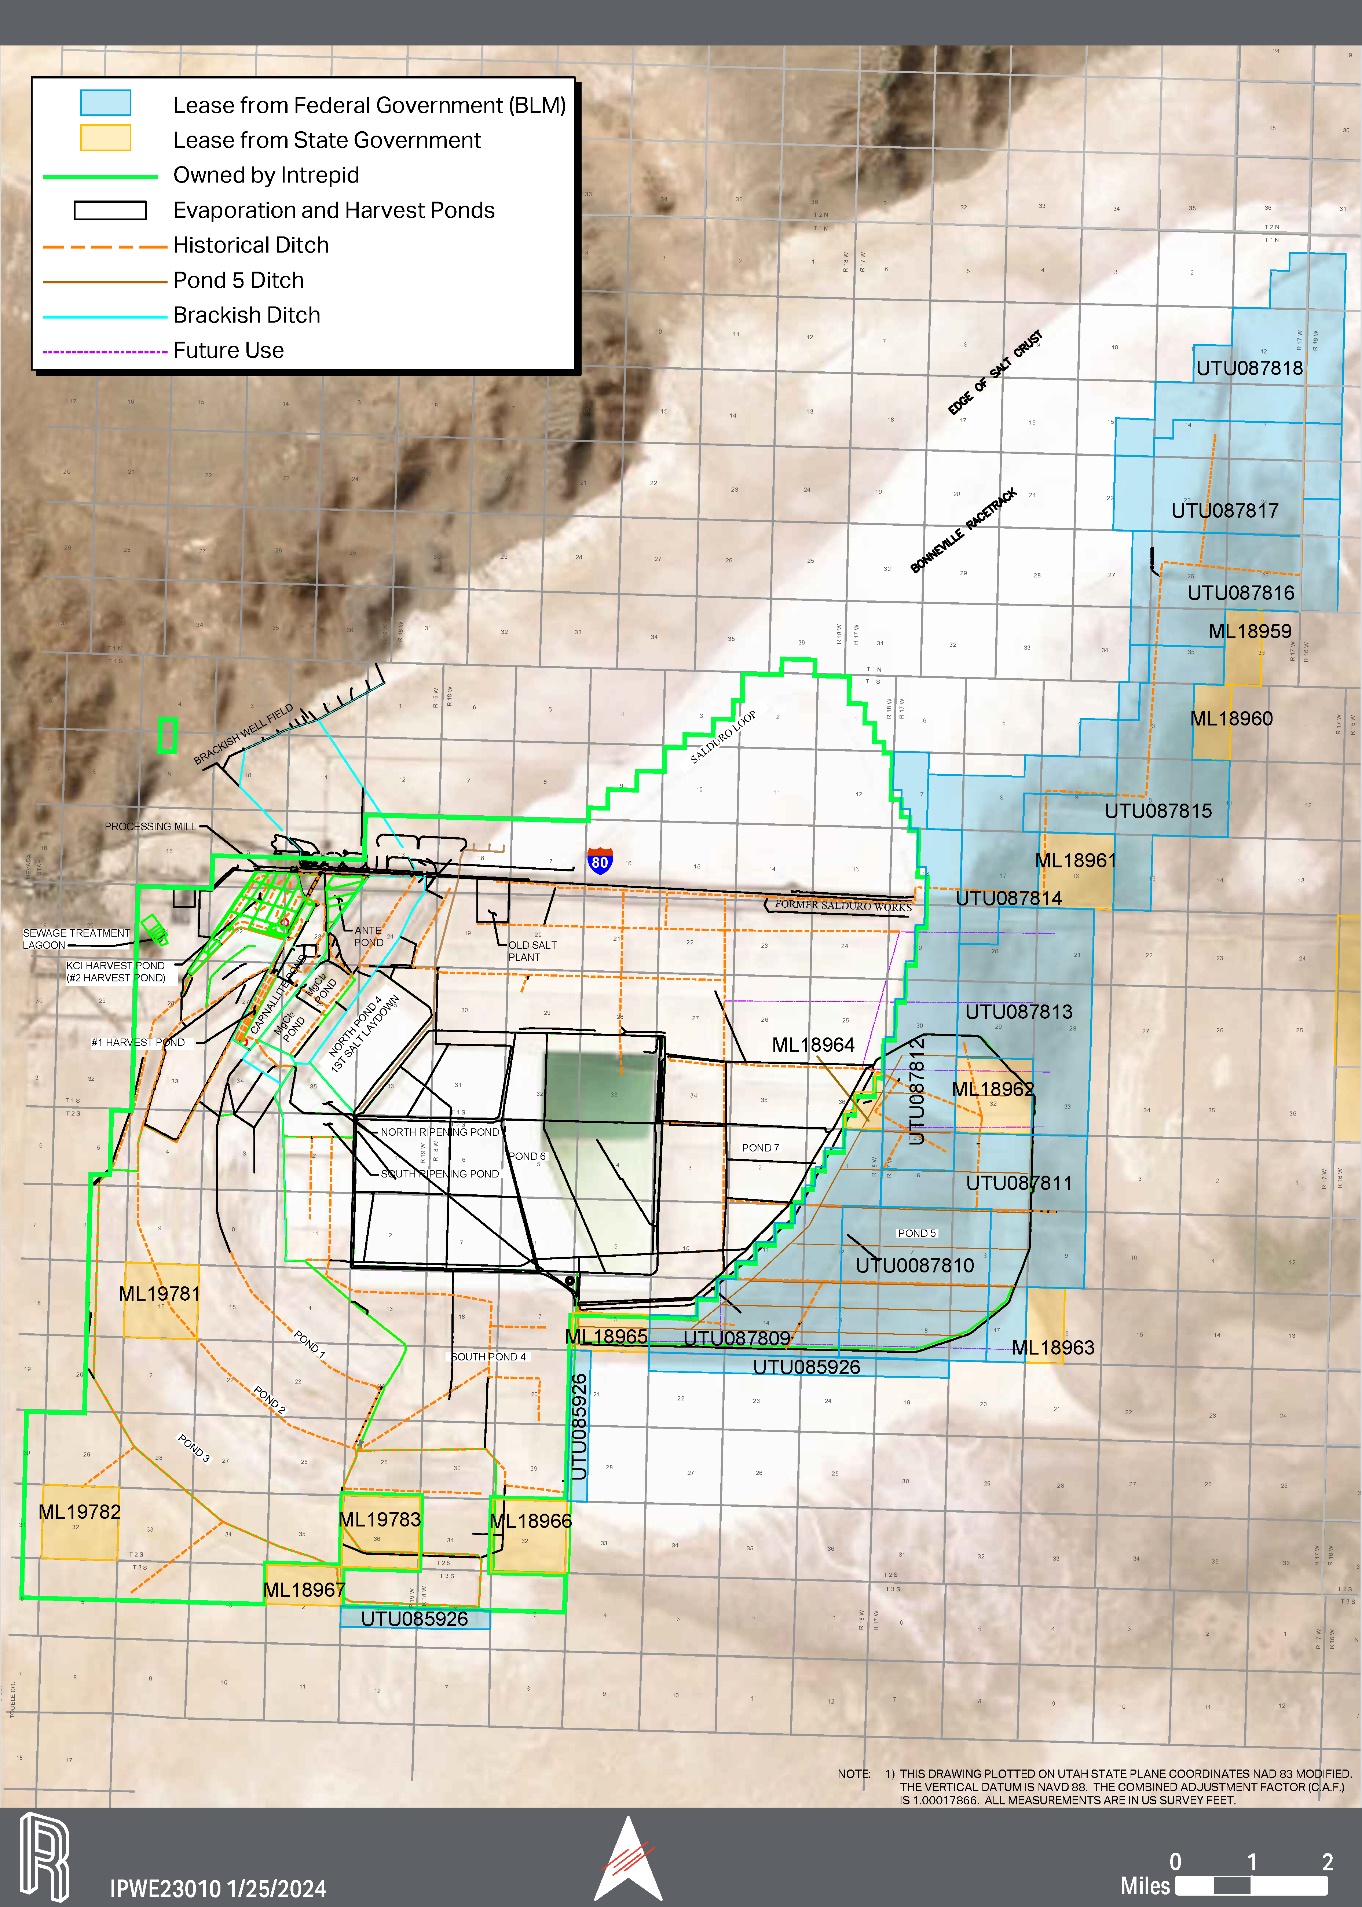
Intrepid-Wendover owns 57,534 acres located in Township 1 North, Range 18 West; Township 1 South, Ranges 17, 18 and 19 West; Township 2 South, Ranges 18 and 19 West; and Township 3 South, Ranges 18 and 19 West. The site boundaries, property ownership, the former and active evaporation ponds, harvest ponds, process facility location; roads, the general distribution of the ditches, and all drillholes and wells are shown on Figure 3-2.
Approximately 34,070 acres owned by the BLM and the State of Utah are leased to Intrepid-Wendover, excluding lands used for highway and utility purposes. The State of Utah owns several state land trust sections within the site boundaries. Intrepid-Wendover holds leases from the federal government that include 25,972 acres adjoining the Intrepid-Wendover property to the east. Intrepid-Wendover also leases 8,098 acres of property from the State of Utah under special use and mineral leases. The state leases are interspersed among the Intrepid-Wendover property and the federal leases. Table 3-1 provides a description of each of the federal and state leases held by Intrepid-Wendover.
3.3Significant Encumbrances
The reclamation bond of $8.9M in place for Intrepid-Wendover is calculated to cover the cost of site reclamation. The bond will be updated in 2024.
| | | | | |
2023 Estimated Resources and Reserves at Intrepid Potash-Wendover
Prepared for Intrepid Potash, Inc.
February 14, 2024 | 7 |
Figure 3-1. Location and Lease Area of Intrepid-Wendover Mine Operation
| | | | | |
2023 Estimated Resources and Reserves at Intrepid Potash-Wendover
Prepared for Intrepid Potash, Inc.
February 14, 2024 | 8 |
Figure 3-2. Sample Locations Intrepid-Wendover Mine Operation
| | | | | |
2023 Estimated Resources and Reserves at Intrepid Potash-Wendover
Prepared for Intrepid Potash, Inc.
February 14, 2024 | 9 |
Table 3-1. Property Lease Details, Intrepid-Wendover
| | | | | | | | | | | | | | | | | | | | | | | | | | |
| | | | | | | | |
| Privately Owned Lands | | | | | | Acres | |
| Intrepid Lands | | | | | | 57,534 | |
State of Utah Land Lease Number | Lessee | Lease Type | Mine | Date | Readjustment Due | Rental Period | Acres (SITLA) | Rental Amount |
| ML-18959 | Intrepid Potash | Potash | Wendover | 1961 | 1/1/2034 | 1/1/2024–12/31/2024 | 320 | $3,200 | |
| ML-18960 | Intrepid Potash | Potash | Wendover | 1961 | 1/1/2034 | 1/1/2024–12/31/2024 | 318 | $3,190 | |
| ML-18961 | Intrepid Potash | Potash | Wendover | 1961 | 1/1/2034 | 9/30/2023–9/02/2024 | 640 | $6,400 | |
| ML-18962 | Intrepid Potash | Potash | Wendover | 1961 | 1/1/2034 | 1/1/2024–12/31/2024 | 640 | $6,400 | |
| ML-18963 | Intrepid Potash | Potash | Wendover | 1961 | 1/1/2034 | 1/1/2024–12/31/2024 | 320 | $3,200 | |
| ML-18964 | Intrepid Potash | Potash | Wendover | 1961 | 1/1/2034 | 1/1/2024–12/31/2024 | 160 | $1,600 | |
| ML-18965 | Intrepid Potash | Potash | Wendover | 1961 | 1/1/2034 | 1/1/2024–12/31/2024 | 320 | $3,200 | |
| ML-18966 | Intrepid Potash | Potash | Wendover | 1961 | 1/1/2034 | 1/1/2024–12/31/2024 | 640 | $6,400 | |
| ML-18967 | Intrepid Potash | Potash | Wendover | 1961 | 1/1/2034 | 1/1/2024–12/31/2024 | 320 | $3,200 | |
| ML-19781 | Intrepid Potash | Potash | Wendover | 1962 | 1/1/2034 | 1/1/2024–12/31/2024 | 640 | $6,400 | |
| ML-19782 | Intrepid Potash | Potash | Wendover | 1962 | 1/1/2034 | 1/1/2024–12/31/2024 | 640 | $6,400 | |
| ML-19783 | Intrepid Potash | Potash | Wendover | 1962 | 1/1/2034 | 1/1/2024–12/31/2024 | 640 | $6,400 | |
| ML-52989 | Intrepid Potash | Potash | Wendover | 2014 | 12/1/2024 | 12/1/2023–11/30/2024 | 2,500 | $22,509 | |
| | | | | | | 8,098 | |
| Royalty on all state leases is 4% of the gross value of leased substances, 1/1/2023-12/31/2023 - 4.5%, 1/1/2024 through the end of term - 5% |
Land Lease Number | Lessee | Lease Type | Mine | Date | Royalty Rate | Readjustment Due | Acres (BLM) | Amount Paid |
| UTU-087811 | Intrepid Wendover Potash LLC | Potash | Wendover | 1963 | 30% | 1/1/2043 | 2,551 | $2,551 |
| UTU-087813 | Intrepid Wendover Potash LLC | Potash | Wendover | 1963 | 30% | 1/1/2043 | 2,560 | $2,560 |
| UTU-087815 | Intrepid Wendover Potash LLC | Potash | Wendover | 1963 | 30% | 1/1/2043 | 2,558 | $2,559 |
| UTU-087817 | Intrepid Wendover Potash LLC | Potash | Wendover | 1963 | 30% | 1/1/2043 | 2,519 | $2,519 |
| UTU-087810 | Intrepid Wendover Potash LLC | Potash | Wendover | 1963 | 30% | 1/1/2043 | 2,527 | $2,529 |
| UTU-087812 | Intrepid Wendover Potash LLC | Potash | Wendover | 1963 | 30% | 1/1/2043 | 2,489 | $2,490 |
| UTU-087814 | Intrepid Wendover Potash LLC | Potash | Wendover | 1963 | 30% | 1/1/2043 | 2,120 | $2,120 |
| UTU-087816 | Intrepid Wendover Potash LLC | Potash | Wendover | 1963 | 30% | 1/1/2043 | 2,319 | $2,319 |
| UTU-087818 | Intrepid Wendover Potash LLC | Potash | Wendover | 1963 | 30% | 1/1/2043 | 2,557 | $2,557 |
| UTU-087809 | Intrepid Wendover Potash LLC | Potash | Wendover | 1963 | 30% | 1/1/2043 | 2,500 | $2,501 |
| UTU-085926 | Intrepid Wendover Potash LLC | Potash | Wendover | 2015 | 30% | 6/1/2035 | 1,272 | $1,273 |
| | | | | | | 25,972 | |
| Royalty on all federal leases is 3% gross value at point of shipment |
| | | | | |
2023 Estimated Resources and Reserves at Intrepid Potash-Wendover
Prepared for Intrepid Potash, Inc.
February 14, 2024 | 10 |
4.0Accessibility
4.1Topography, Elevation, and Vegetation
The topography of the area is flat at an approximate elevation of 4,215-ft mean sea level (MSL). Vegetation is sparse.
4.2Property Access
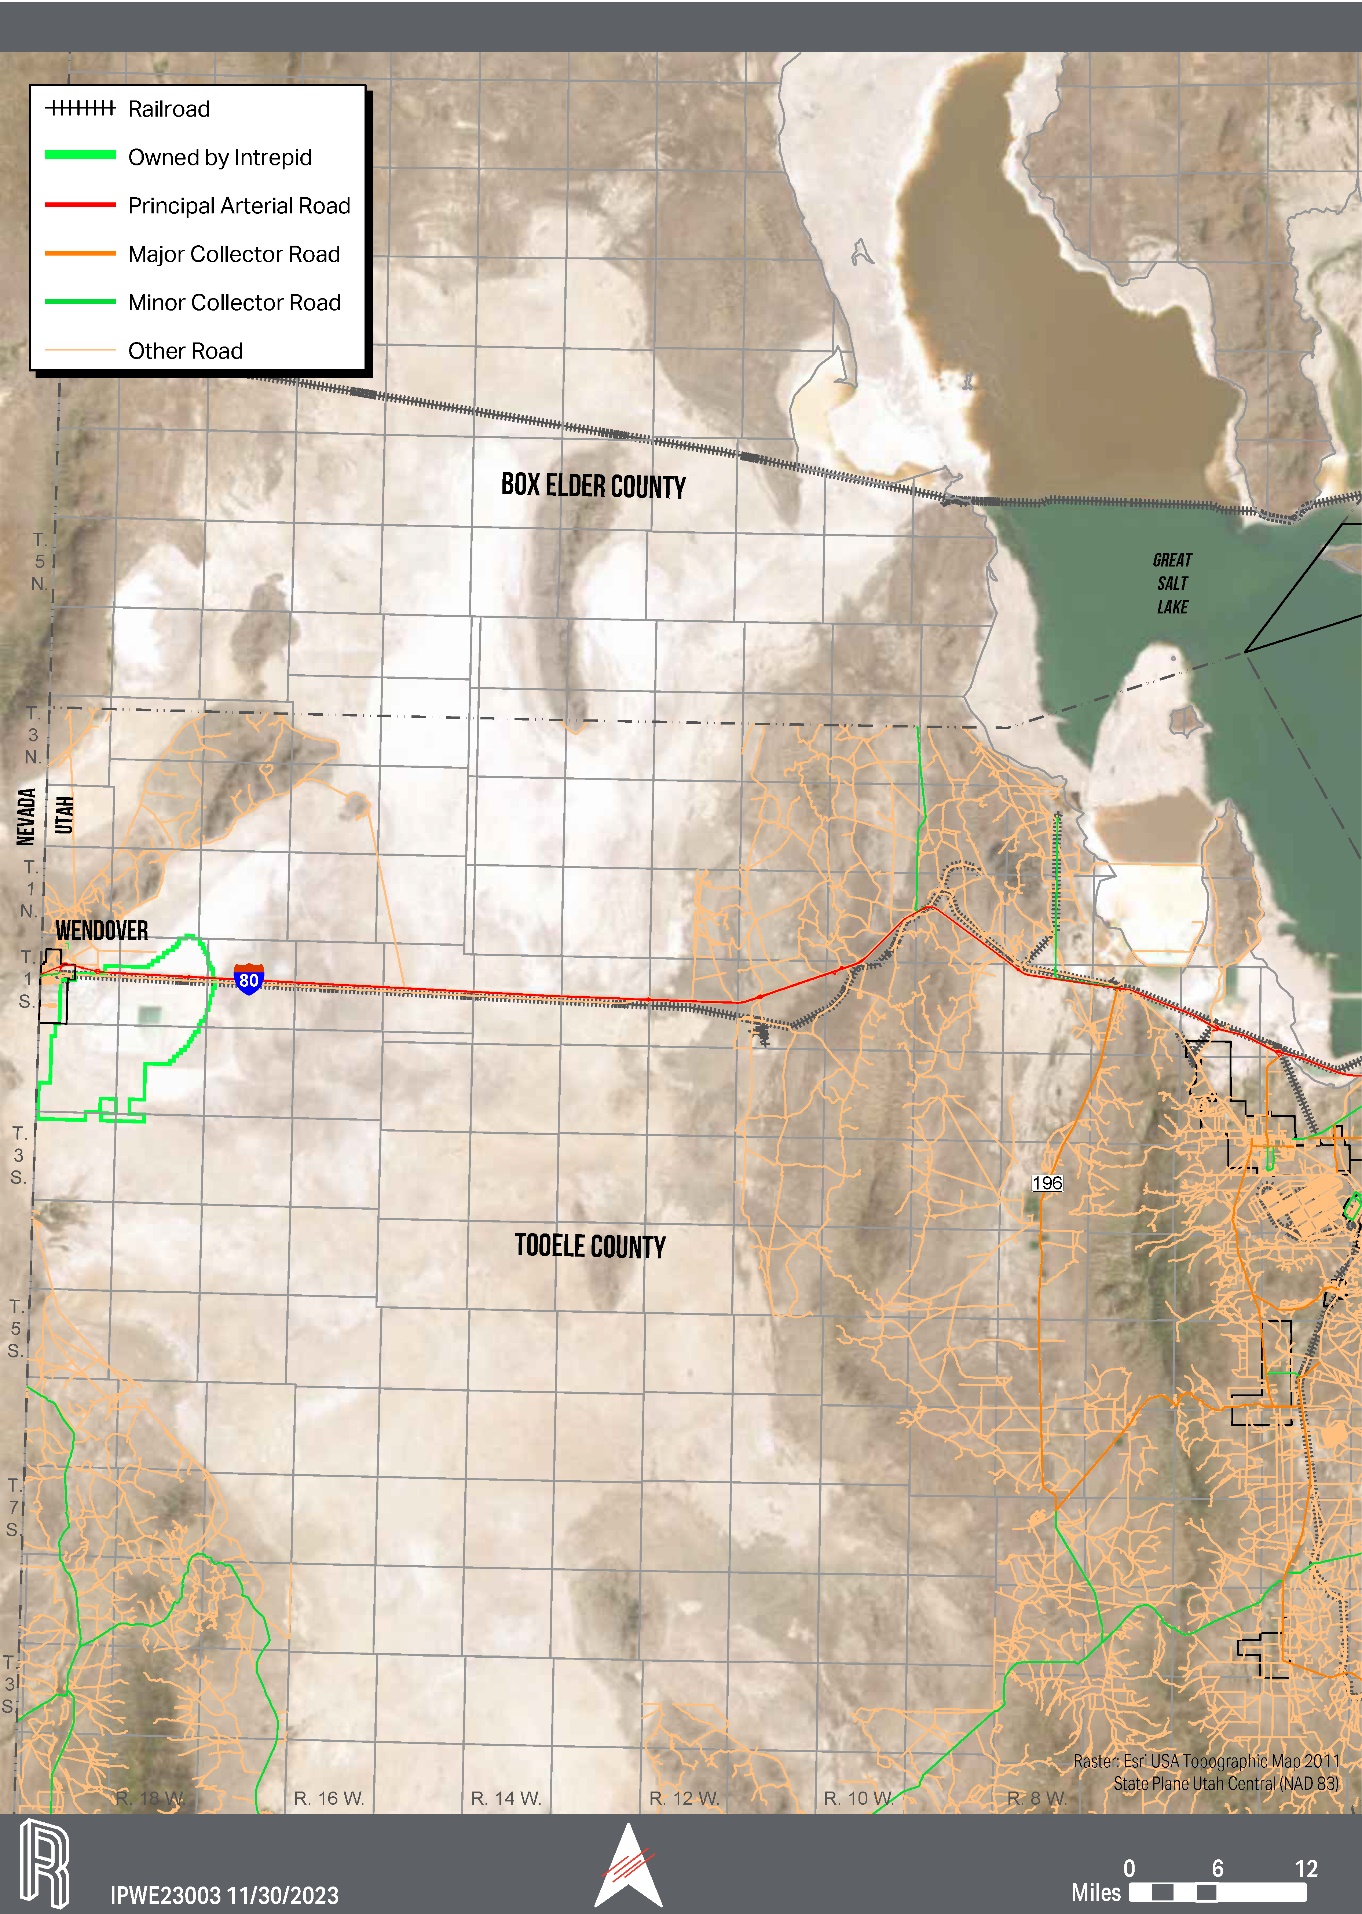
The Wendover potash operation is located in the westernmost part of Tooele County, Utah, on the BSF. The plant facilities and offices are located approximately 3 miles east of Wendover, Utah, on old U.S. Highway 40. The site is located approximately 3 miles east of the Nevada border and is primarily located south of I-80, although portions of the site are located north of I-80. The area of the Intrepid mine operation is shown on Figure 4-1.
4.3Climate
The climate in western Utah is arid with low precipitation and low relative humidity. Average annual rainfall is 5 inches and average evaporation is 80 inches. Variation from these averages is the primary cause of fluctuations in plant production.
4.4Infrastructure Availability
All infrastructure for the operation is located approximately 3 miles east of Wendover, Utah, on old US Highway 40. US I-80 bisects the property as shown on Figure 4-1.
| | | | | |
2023 Estimated Resources and Reserves at Intrepid Potash-Wendover
Prepared for Intrepid Potash, Inc.
February 14, 2024 | 11 |
Figure 4-1. Mine Location showing Property Access
| | | | | |
2023 Estimated Resources and Reserves at Intrepid Potash-Wendover
Prepared for Intrepid Potash, Inc.
February 14, 2024 | 12 |
5.0History
The Bonneville area was recognized in the early 1900s as a source for potash. The original operation was known as the Salduro Works, which operated until 1918 and then closed due to a decline in potash demand. The original Salduro Works was responsible for acquiring lands on which a system of collection ditches was constructed. In the mid-1930s, Bonneville Limited acquired more land to the west of the original property and constructed primary harvest ponds and additional infrastructure to support the mining operations. Between 1961 and 1963, various potash leases were acquired from the federal and state governments. Kaiser Aluminum & Chemical Corporation acquired Bonneville Limited in 1963. The property, including the ponds, processing operation, and lease land, was acquired by Reilly Industries, Inc. from Kaiser Aluminum & Chemical Corporation in 1988. Intrepid-Wendover acquired the property from Reilly Industries, Inc. in April 2004.
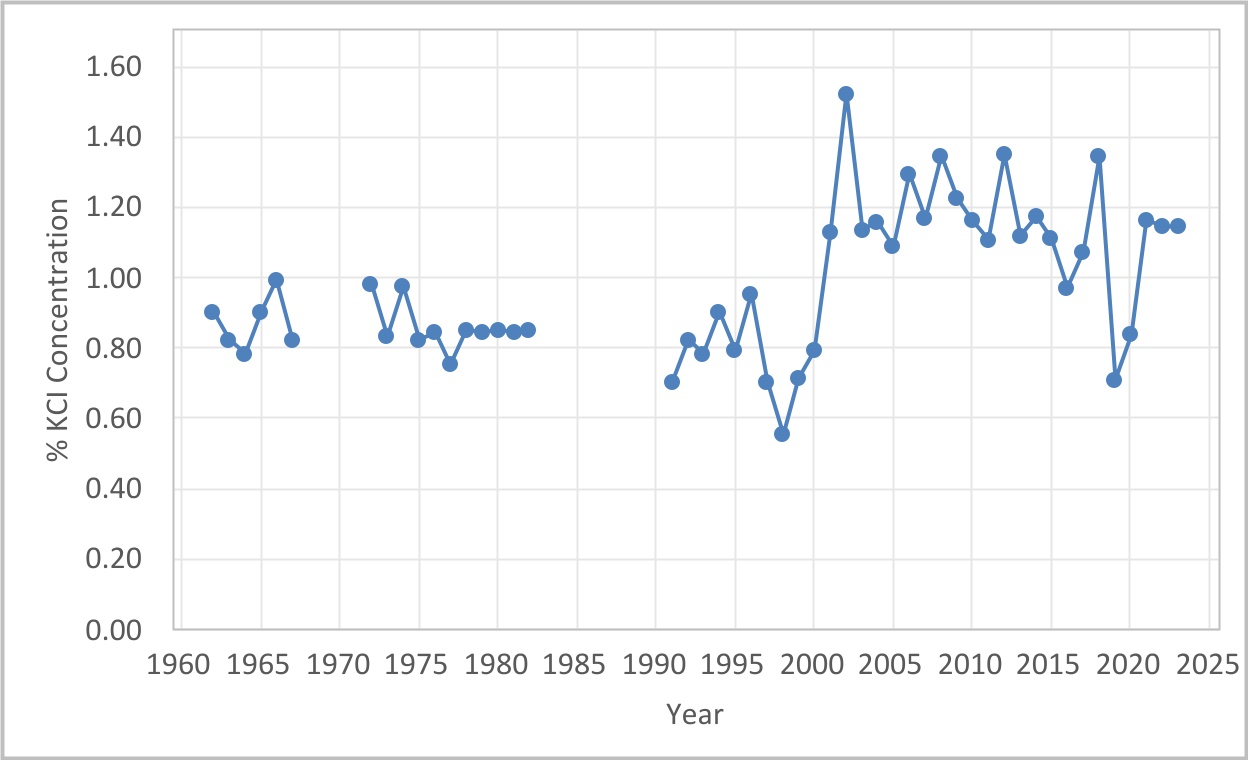
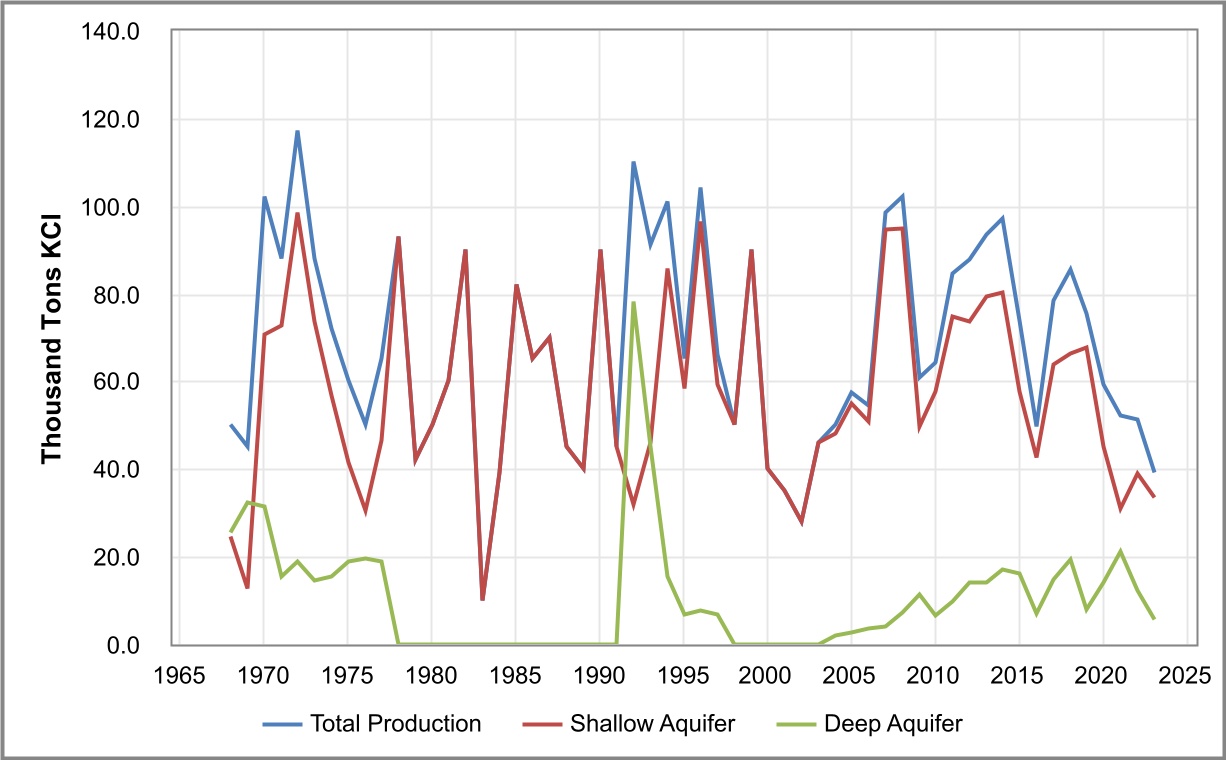
Figure 5-1 shows the KCl historical brine concentration pumped into the primary pond. Gaps in the figure are due to inadequate pumping data collection. Figure 5-2 shows the production history for the shallow-brine and deep-brine aquifers from 1968 to 2023.
Figure 5-1. Brine Concentration Pumped into Primary Pond 1960–2023
| | | | | |
2023 Estimated Resources and Reserves at Intrepid Potash-Wendover
Prepared for Intrepid Potash, Inc.
February 14, 2024 | 13 |
Figure 5-2. Historical KCl Production at Intrepid-Wendover, 1968–2023
6.0Geologic Setting
6.1Regional, Local, and Property Geology
Intrepid’s Wendover operation is located near the Nevada–Utah border along the western edge of Utah’s Great Salt Lake Desert and is situated within the BSF. The BSF is an enclosed sub-basin that contains 150 square miles of salt crust. The average elevation on the playa is about 4,215 ft above MSL with very little to no relief recorded across the site (Lines 1979).
6.1.1Regional Geology
The BSF and the associated potash-bearing brines occur within the Lake Bonneville basin which is part of the larger Basin and Range physiographic province. The Basin and Range province is generally characterized by north-trending ranges and basins developed over the last 20 million years. As the region experienced extension in a generally east–west direction, the brittle upper crust thinned and broke into north-trending blocks, which then either rotated or differentially subsided to produce the basins and ranges. Thinning of the crust was coupled with regional subsidence that in turn, produced the Lake Bonneville basin.
The Lake Bonneville basin has been an area of restricted internal drainage for the last 15 million years, allowing lakes of varying size to exist throughout all or most of this history. However, Lake Bonneville was the youngest and deepest of the large Quaternary lakes to form
| | | | | |
2023 Estimated Resources and Reserves at Intrepid Potash-Wendover
Prepared for Intrepid Potash, Inc.
February 14, 2024 | 14 |
within the basin in response to cyclical climate changes. Based on oxygen isotope analyses and carbon dating of sediment core, along with chronologically relatable topographic markers, Lake Bonneville is believed to have existed between 45,000 and 10,000 years before present (YBP) (Oviatt et al. 1992). At the lake’s maximum extent, it covered nearly 20,000 square miles and was more than 9,880 ft deep. The lake reached its geomorphological highstand and began spilling over Red Rock Pass, Idaho, approximately 16,000 YBP. Catastrophic failure of unconsolidated material at Red Rock Pass released a deluge of floodwaters into the Snake River drainage of Idaho at roughly 14,500 YBP. Following this event, typically referred to as the Bonneville Flood Event, Lake Bonneville continued to outflow through Red Rock Pass until 14,000–13,000 YBP. With the termination of the last major ice age, lake levels declined substantially. Ten-thousand YBP is generally considered to mark the end of Lake Bonneville and the birth of its successor, Great Salt Lake (Currey et al. 1984). With the advent of a hotter, drier regional climate beginning roughly 8,000 YBP, the remnants of Lake Bonneville gradually disappeared primarily through evaporation.
The mountain ranges in the western part of the Great Salt Lake Desert are composed mainly of limestone, dolomite, shale, and quartzite of Paleozoic age. Because of block faulting and basin fill, the Paleozoic rocks are several-thousand feet below the land surface in the centers of the basin. The lower part of the fill underlying the BSF is composed mainly of extrusive volcanic rocks and associated sandstone, claystone, ash, and conglomerates of Tertiary age. The upper part of the fill is composed mainly of claystone, limestone, and gypsum of Quaternary age. Most of the sedimentary rocks that fill the basins are of fluvial or lacustrine origin, and much of the deposition took place in basins that predate Lake Bonneville (Lines 1979).
6.1.2Local Geology
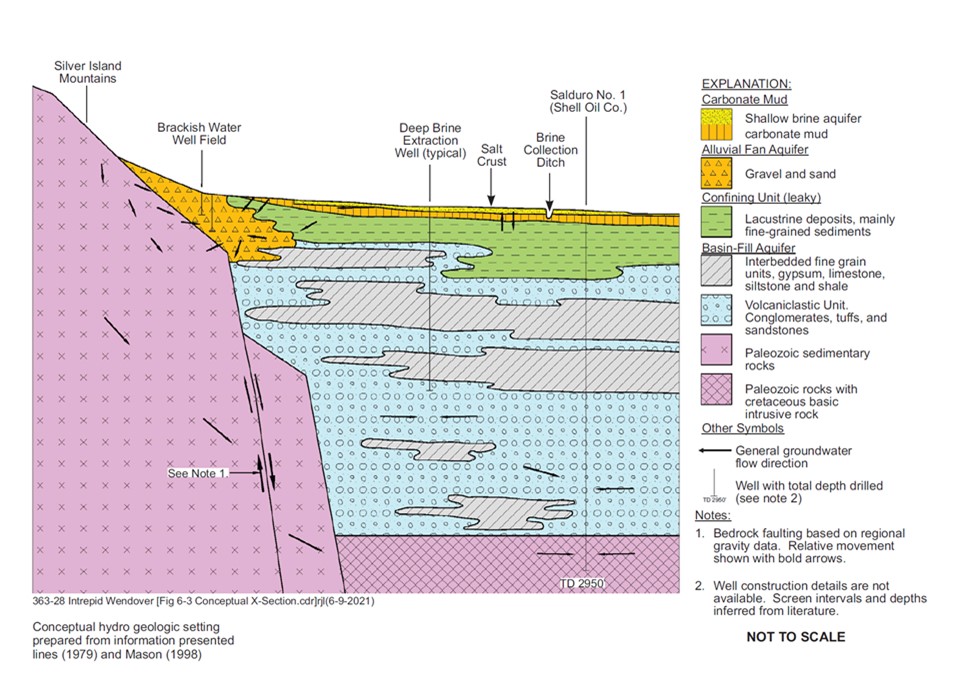
The modern Lake Bonneville basin interior is extremely dry, mostly devoid of vegetation, and exhibits very little topographic relief. The lithology of the interior, away from what once were islands and shoreline, is predominantly composed of lacustrine deposits and evaporite minerals, occasionally interbedded with layers of fluvial or fine-grained eolian sediments. Sand and gravel occur more often with increased proximity to the ancient shoreline. Igneous, metamorphic, and sedimentary rocks ranging in age from Cambrian to late-Tertiary form the barren slopes and mountain ranges surrounding the basin and provide eroded detrital material often deposited as alluvial fans (Figure 6-1).
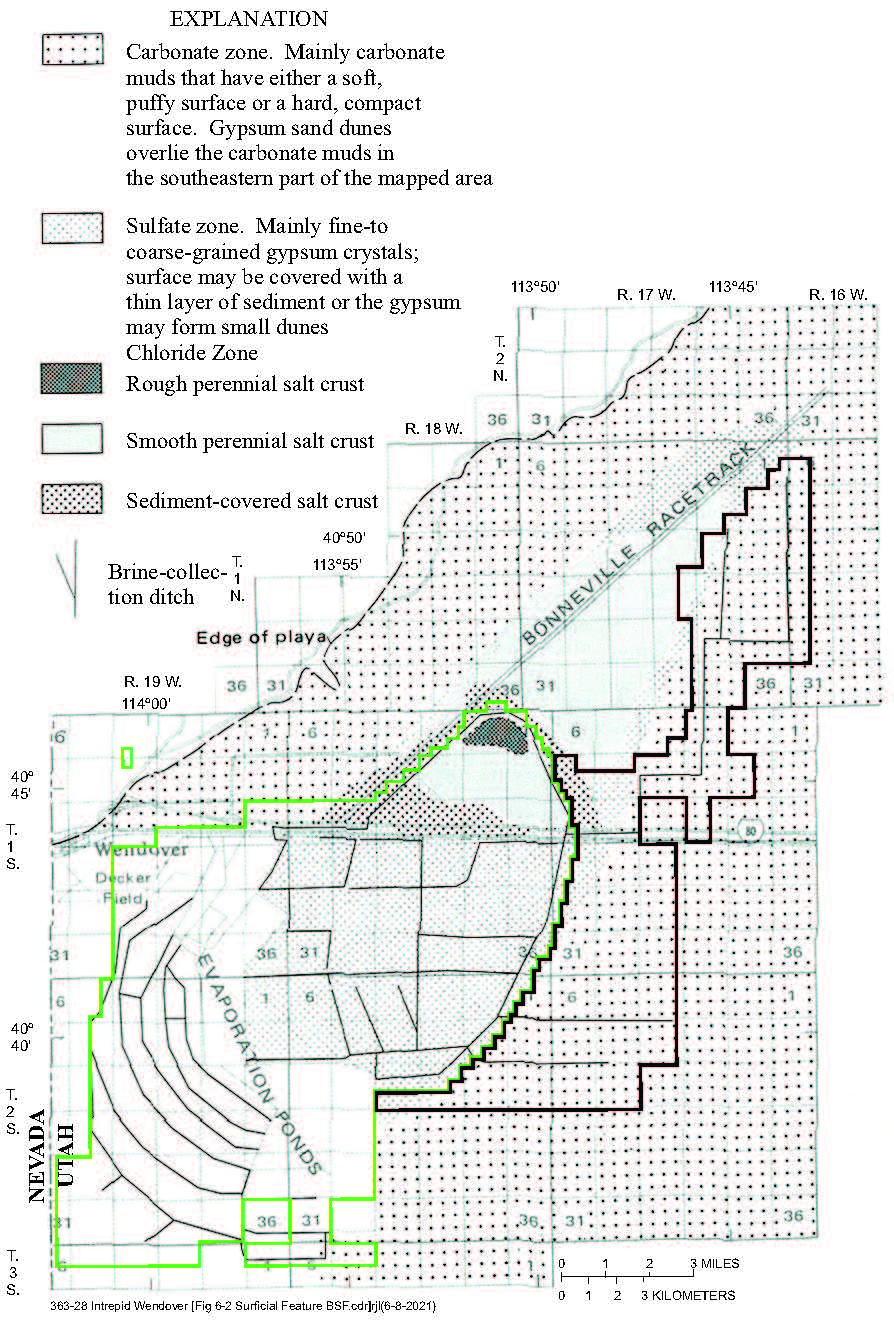
All deposits exposed at the surface of the Bonneville and Pilot Valley playas were deposited by Lake Bonneville or by more recent, very minor lacustrine events. The local surface geology consists of evaporite mineral deposits. Evaporite minerals on the surface of the BSF are concentrated in three lateral zones (Figure 6-2): (1) a carbonate zone composed mainly of authigenic clay-sized carbonate minerals, (2) a sulfate zone composed mainly of authigenic gypsum, and (3) a chloride zone composed of crystalline halite referred to as ‘the salt crust’ (Lines 1979).
| | | | | |
2023 Estimated Resources and Reserves at Intrepid Potash-Wendover
Prepared for Intrepid Potash, Inc.
February 14, 2024 | 15 |
The upper 20 ft of the Lake Bonneville deposits underlying the two playas is composed mainly of dark-gray to dark-brown carbonate muds comprised of clay-size calcite, aragonite, and dolomites. Interbedded with the carbonate muds are gypsum evaporite deposits and the crystalline salt crust (Turk 1969). Underlying the carbonate mud layer are lacustrine deposits (0-200 ft thick), mainly composed of fine-grained sediments. When laterally extensive, these lacustrine deposits serve as a confining unit for meteoric fluids. However, the lacustrine deposits often intermingle with alluvial fan-deposited sand and gravel shed from the Silver Mountains to the northwest. Below the lacustrine and alluvial fan deposits, is a relatively thick sequence of volcaniclastics, conglomerates, tuffs, and sandstones known as the Salt Lake Formation (0–500 ft thick). The Salt Lake Formation is late-Miocene to Pliocene in age and formed through the shedding and reworking of sediments from the adjacent mountains as valley fill into the down-dropping graben of the western Great Salt Lake Desert. Interbedded within this layer are fine-grained units predominantly composed of gypsum, limestone, siltstone, and shale. Figure 6-3 illustrates the conceptual stratigraphic setting.
6.1.3Property Geology
Intrepid’s Wendover operations are situated in the western portion of the Great Salt Lake Desert, which itself is located within the Bonneville Lake basin. Because the basin is closed topographically and has no outlet, loss of water is ultimately through evaporation. The Wendover property produces potash from beneath an area termed the BSF. The BSF was formed through the prolonged accumulation of evaporite minerals in conjunction with periodic lacustrine events. Within the property boundary, surface topography is extremely low relief and predominantly composed of evaporitic ‘salt crust.’
| | | | | |
2023 Estimated Resources and Reserves at Intrepid Potash-Wendover
Prepared for Intrepid Potash, Inc.
February 14, 2024 | 16 |
Figure 6-1. Geology of the BSF and Pilot Valley Region (after Lines 1979)
| | | | | |
2023 Estimated Resources and Reserves at Intrepid Potash-Wendover
Prepared for Intrepid Potash, Inc.
February 14, 2024 | 17 |
Figure 6-2. Salt Crust and Other Geomorphic Features on the BSF, Fall of 1975 (after Lines 1979)
| | | | | |
2023 Estimated Resources and Reserves at Intrepid Potash-Wendover
Prepared for Intrepid Potash, Inc.
February 14, 2024 | 18 |
Figure 6-3. Conceptual Stratigraphic Column
Intrepid-Wendover produces potash from the rich saline brines that exist in the subsurface. There are three aquifers known to exist beneath the BSF. These aquifers are, in descending order, the shallow-brine aquifer, the alluvial-fan aquifer, and the deep-brine aquifer. Intrepid produces potash from both the shallow-brine aquifer and the deep-brine aquifer.
6.2Significant Mineralized Zones
The zones of mineralization at Wendover are defined by the presence of potash-rich brines. These brines are known to occur in two out of three local aquifers: the shallow-brine aquifer and the deep-brine aquifer. The third aquifer, which is not potash-bearing and occurs stratigraphically between the other two, is the alluvial-fan aquifer. A cross section is included in Figure 6-4.
The shallow-brine aquifer is a near-surface aquifer and serves as the primary source of potash-rich brine. It is contained in the highly permeable salt and gypsum crust and underlying fractured carbonate muds. The alluvial-fan aquifer, the middle of the three, resides in the sand and gravel interbedded with the lacustrine sediments remnant of Lake Bonneville that underlie the playa deposits of the BSF. The alluvial-fan aquifer is brackish, yet is not a source of potassium salts. The deep-brine aquifer exists within the volcaniclastics and conglomerates of the Salt Lake Formation. This aquifer typically occurs at depths greater than 250–300 ft.
6.3Mineral Deposit
Intrepid’s Wendover operation produces potash by transporting subsurface potassium-rich brines to the surface where they are exposed to western Utah’s arid climate. The aqueous portion of the brine is removed through evaporation, allowing the evaporite minerals to precipitate and be collected for further processing. Because the potash is derived from subsurface brines, the mineral deposit is best represented by characteristics of the aquifer(s) containing the brine.
| | | | | |
2023 Estimated Resources and Reserves at Intrepid Potash-Wendover
Prepared for Intrepid Potash, Inc.
February 14, 2024 | 19 |
Figure 6-4. Typical Cross Section of the Brines
The shallow-brine aquifer, as it is called, exists within the near-surface carbonate mud layer. The carbonate mud transitions to the less-permeable lacustrine deposits at 20–30 ft depth. Brine extraction involves excavating a network of ditches, which allow the natural inflow of aquifer fluids, thereby exposing the brine to dry atmospheric conditions.
| | | | | |
2023 Estimated Resources and Reserves at Intrepid Potash-Wendover
Prepared for Intrepid Potash, Inc.
February 14, 2024 | 20 |
7.0Exploration
7.1Exploration Other than Drilling
KCl grade monitored from 92 shallow brine wells during the period 1965–1967 by Turk (1969) is included in Table 7-1. A total of 27 monitoring wells were drilled in October 2005 and have been sampled at least yearly to evaluate brine quality in the shallow-brine aquifer. Table 7-2 lists the maximum KCl grade in each shallow aquifer monitoring well for the time period of July 2016 to July 2020.
7.2Drilling Exploration
No traditional drilling exploration has taken place.
7.3Characterization of Hydrology Data
Groundwater occurs in three distinct aquifers in much of the western Great Salt Lake Desert: (1) the deep-brine aquifer, (2) the alluvial-fan aquifer, and (3) the shallow-brine aquifer.
The most extensive aquifer, the deep-brine aquifer, yields brine to wells on the BSF from conglomerate in the lower part of the basin fill. The deep-brine aquifer consists of as much as 840 ft of conglomerate, is confined by its upper few hundred feet of relatively impermeable, lacustrine deposits, and thus, hydraulic connection between the aquifer and playa surfaces is poor (Lines 1979). Aquifer tests indicate that the transmissivity of the deep-brine aquifer in the area of the potash operation averages 13,000 square feet per day (ft2/day), and the storage coefficient is about 4×10⁻⁴. Pumping tests indicate the deep-brine aquifer as a quasi-infinite reservoir. The amount of recharge to the deep-brine aquifer cannot be determined from available data, while discharge is mainly from the well. Concentration of KCl in the deep-brine aquifer ranges from 0.36% to 0.47%, and MgCl2 from 0.43% to 0.69%. Composition of the brine is relatively constant throughout the aquifer.
The alluvial-fan aquifer is composed of sand and gravel alluvial fans along the flanks of the Silver Island Mountains and the Pilot Range. The alluvial fans are interbedded with fine-grained lacustrine deposits which act as confining layers to the alluvial-fan aquifer. The degree of hydraulic connection between the deep-brine aquifer and the alluvial-fan aquifer is unknown. The degree of connection probably varies, as it is dependent on the continuity between the sand and gravel of the alluvial fans and the conglomerates in the basin fill (Lines 1979). No economically mineable potash is contained in the alluvial-fan aquifer.
The shallow-brine aquifer consists of both the near-surface carbonate muds and the crystalline halite and gypsum deposits on the surface of the playas. Sand and gravel of the alluvial fans are interbedded with the near-surface carbonate muds of the playas, and hydraulic connection is good. The average thickness of the shallow-brine aquifer is reported to be about 18 ft (Turk 1969; Shaw Environmental, Inc. 2006).
| | | | | |
2023 Estimated Resources and Reserves at Intrepid Potash-Wendover
Prepared for Intrepid Potash, Inc.
February 14, 2024 | 21 |
Table 7-1. Shallow-Brine Aquifer Sampling by Turk (1969)
| | | | | | | | | | | | | | | | | | | | | | | |
| | | | | | | |
| Well No. | Eastings | Northings | Date | Depth Interval (ft) | Sampling Method | Specific Gravity | KCl % |
| K1 | 962,676 | 7,442,619 | 7/30/1965 | 0–15.75 | P | 1.2140 | 1.41 |
| K2 | 963,693 | 7,445,090 | 7/30/1965 | 0–20.0 | BP | 1.2135 | 1.34 |
| K3 | 1,018,182 | 7,475,549 | 10/4/1965 | 0–24.4 | PT | 1.2015 | 1.15 |
| K4 | 1,016,238 | 7,475,425 | 9/28/1965 | 0–30.0 | PT | 1.2020 | 1.06 |
| K4A | 1,016,528 | 7,475,487 | 11/9/1965 | 0–23.0 | BP | 1.1950 | 1.07 |
| K5 | 1,014,232 | 7,475,384 | 10/10/1966 | 0–25.0 | P-10 | 1.2000 | 1.27 |
| K6 | 1,018,575 | 7,475,611 | 7/27/1965 | 0–23.0 | BP | 1.2040 | 1.04 |
| K7 | 1,020,772 | 7,475,591 | 6/18/1965 | 0–25.0 | PT | 1.2035 | 1.48 |
| K7A | 1,020,510 | 7,475,560 | 9/2/1965 | 0–25.0 | BP |
| 1.03 |
| K8B | 1,014,864 | 7,481,350 | 11/7/1965 | 0–23.0 | PT-120 | 1.2035 | 1.18 |
| K8C | 1,014,932 | 7,481,655 | 10/4/1965 | 0–23.0 | PT | 1.2040 | 1.18 |
| K9 | 1,014,631 | 7,461,172 | 8/23/1966 | 0–25.0 | P-10 | 1.2000 | 1.26 |
| K10 | 1,012,262 | 7,461,310 | 9/9/1967 | 0–25.0 | P-10 | 1.1975 | 1.32 |
| K10A | 1,012,578 | 7,461,290 | 11/9/1965 | 0–23.0 | B | 1.1990 | 1.03 |
| K11 | 1,009,097 | 7,458,833 | 10/19/1965 | 0–4.3 | BP | 1.2005 | 1.30 |
| K11A | 1,009,356 | 7,458,772 | 7/30/1965 | 0–25.0 | BP | 1.1990 | 1.17 |
| K12 | 1,014,947 | 7,461,132 | 11/15/1965 | 0–25.0 | PT |
| 1.10 |
| K13 | 1,016,921 | 7,461,172 | 6/9/1966 | – |
| 1.1920 | 1.18 |
| K14 | 1,018,551 | 7,460,504 | 6/9/1966 | – | BP | 1.1935 | 1.03 |
| K14A | 1,018,311 | 7,460,452 | 8/15/1966 | 0–23.0 | PT-120 | 1.1960 | 1.12 |
| K15 | 1,019,524 | 7,469,125 | 7/30/1965 | 0–25.0 | BP | 1.2055 | 1.10 |
| K16 | 1,010,705 | 7,453,473 | 9/30/1965 | 0–25.0 | PT | 1.2020 | 1.24 |
| K17 | 1,003,115 | 7,447,319 | 10/5/1965 | 0–22.0 | PT-50 | 1.1990 | 1.37 |
| K18 | 1,024,728 | 7,475,692 | 11/16/1965 | 0–23.0 | PT |
| 0.71 |
| K19 | 1,022,538 | 7,475,621 | 11/16/1965 | 0–23.0 | PT-60 |
| 0.64 |
| K20 | 1,025,326 | 7,475,621 | 11/16/1965 | 0–23.0 | PT |
| 0.69 |
| K21 | 1,027,262 | 7,475,634 | 9/2/1965 | 0–23.0 | B |
| 0.67 |
| K22 | 1,024,985 | 7,482,526 | 9/15/1967 | 0–25.0 | B | 1.1970 | 0.72 |
| K23 | 1,022,944 | 7,482,518 | 10/19/1965 | 0–3.6 | BP | 1.2020 | 1.21 |
| K24 | 1,020,889 | 7,482,429 | 7/26/1965 | 0–23.0 | BP | 1.1995 | 1.25 |
| K24A | 1,021,199 | 7,482,503 | 10/22/1965 | 0–4.8 | BP | 1.1970 | 1.26 |
| K25 | 1,027,139 | 7,482,509 | 8/14/1966 | 0–23.0 | PT-90 | 1.1940 | 0.74 |
| K26 | 995,027 | 7,455,969 | 8/6/1967 | 0–23.0 | P-10 | 1.2035 | 1.36 |
| K27 | 988,378 | 7,453,641 | 11/8/1965 | 0–23.0 | B | 1.2100 | 1.04 |
| K27A | 988,405 | 7,453,922 | 10/28/1965 | 5.5–9.7 | BP | 1.2005 | 1.43 |
| K28 | 979,130 | 7,454,831 | 9/30/1965 | 0–23.0 | PT-50 | 1.2005 | 1.07 |
| | | | | |
2023 Estimated Resources and Reserves at Intrepid Potash-Wendover
Prepared for Intrepid Potash, Inc.
February 14, 2024 | 22 |
Table 7-1. Shallow-Brine Aquifer Sampling by Turk (1969) (continued)
| | | | | | | | | | | | | | | | | | | | | | | |
| | | | | | | |
| Well No. | Eastings | Northings | Date | Depth Interval (ft) | Sampling Method | Specific Gravity | KCl % |
| K29 | 978,860 | 7,455,100 | 7/26/1965 | 0–23.0 | BP | 1.2095 | 1.26 |
| K30 | 964,500 | 7,444,599 | 10/7/1966 | 0–22.0 | P-10 | 1.2060 | 1.36 |
| K31 | 962,939 | 7,445,353 | 6/30/1965 | 0–9.5 | BP | 1.2230 | 3.28 |
| K32 | 963,939 | 7,439,141 | 8/10/1965 | 0–23.0 | BP | 1.1855 | 0.95 |
| K33 | 965,742 | 7,438,629 | 6/15/1966 | 0–23.0 | BP | 1.2060 | 1.40 |
| K33A | 966,064 | 7,438,629 | 10/9/1965 | 15.0–19.4 | BP | 1.2045 | 1.23 |
| K34 | 963,621 | 7,423,385 | 9/11/1965 | 0–23.0 | PT-60 | 1.1990 | 0.93 |
| K34A | 963,601 | 7,423,162 | 10/19/1965 | 0–1.5 | BP | 1.2095 | 0.87 |
| K35 | 963,695 | 7,421,346 | 7/27/1965 | 0–23.0 | BP | 1.2060 | 1.28 |
| K36 | 963,695 | 7,420,909 | 11/6/1965 | 0–23.0 | PT-60 | 1.2080 | 1.81 |
| K37 | 963,459 | 7,418,772 | 10/11/1966 | 0–23.0 | P-10 | 1.2095 | 1.90 |
| K38 | 974,143 | 7,426,651 | 10/11/1966 | 0–23.0 | P-10 | 1.2060 | 0.99 |
| K39 | 982,608 | 7,437,966 | 11/10/1965 | 0–23.0 | PT-120 | 1.2055 | 1.35 |
| K39A | 982,633 | 7,437,696 | 10/29/1965 | 0–23.0 | B | 1.2070 | 0.78 |
| K40 | 982,719 | 7,435,951 | 11/10/1965 | 0–23.0 | PT-60 | 1.2070 | 1.26 |
| K41 | 988,959 | 7,425,422 | 10/11/1966 | 0–23.0 | P-10 | 1.1980 | 2.14 |
| K42 | 991,700 | 7,426,716 | 9/3/1965 | 0–23.0 | BP | 1.2065 | 2.22 |
| K43 | 994,313 | 7,427,862 | 9/3/1965 | 0–23.0 | BP | 1.2055 | 2.02 |
| K43A | 994,083 | 7,427,734 | 9/3/1965 | 0–23.0 | BP | 1.2050 | 1.85 |
| K44 | 995,160 | 7,438,027 | 9/3/1965 | 0–23.0 | BP | 1.2060 | 2.02 |
| K45 | 997,308 | 7,437,814 | 10/11/1966 | 0–23.0 | P-10 | 1.2020 | 1.93 |
| K46 | 1,010,010 | 7,445,601 | 11/5/1965 | 0–23.0 | PT | 1.1845 | 0.77 |
| K47 | 999,172 | 7,429,709 | 11/2/1965 | 5.5–10.5 | BP | 1.2070 | 1.97 |
| K48 | 939,092 | 7,409,800 | 8/6/1967 | 0–23.0 | P-10 | 1.0990 | 0.67 |
| K49 | 940,671 | 7,411,111 | 6/1/1966 | 0–23.0 | BP | 1.1140 | 0.69 |
| K50 | 942,174 | 7,409,400 | 8/24/1966 | 0–23.0 | PT | 1.2045 | 1.64 |
| K51 | 943,715 | 7,410,883 | 6/15/1966 | 0–23.0 | BP | 1.1715 | 1.60 |
| K52 | 947,297 | 7,421,114 | 11/8/1965 | 0–23.0 | PT-60 | 1.2030 | 0.85 |
| K53 | 947,587 | 7,445,048 | 9/15/1967 | 0–23.0 | P-10 | 1.1360 | 0.73 |
| K54 | 945,787 | 7,445,723 | 11/6/1965 | 0–23.0 | PT-60 | 1.0785 | 0.64 |
| K55 | 965,272 | 7,444,266 | 7/28/1965 | 0–23.0 | BP | 1.2085 | 1.26 |
| K56 | 954,139 | 7,436,134 | 5/10/1966 | 0–23.0 | B | 1.2230 | 3.52 |
| K56B | 953,860 | 7,436,227 | 9/15/1965 | 0–23.0 | PT | 1.1935 | 1.76 |
| K57 | 972,539 | 7,408,947 | 10/23/1965 | 0–4.0 | BP | 1.2095 | 2.65 |
| K58 | 979,590 | 7,438,848 | 8/24/1966 | 0–23.0 | PT | 1.2010 | 1.46 |
| | | | | |
2023 Estimated Resources and Reserves at Intrepid Potash-Wendover
Prepared for Intrepid Potash, Inc.
February 14, 2024 | 23 |
Table 7-1. Shallow-Brine Aquifer Sampling by Turk (1969) (concluded)
| | | | | | | | | | | | | | | | | | | | | | | |
| | | | | | | |
| Well No. | Eastings | Northings | Date | Depth Interval (ft) | Sampling Method | Specific Gravity | KCl % |
| K59 | 954,000 | 7,417,382 | 8/16/1965 | 0–23.0 | BP | 1.2115 | 1.00 |
| K60 | 952,053 | 7,415,308 | 8/16/1965 | 0–23.0 | BP | 1.2095 | 0.71 |
| K61 | 948,662 | 7,434,882 | 8/24/1966 | 0–23.0 | PT | 1.2235 | 2.92 |
| K62 | 944,462 | 7,421,578 | 10/7/1965 | 10.0–15.0 | BP | 1.2060 | 1.17 |
| K62A | 944,133 | 7,421,447 | 10/7/1965 | 0–23.0 | PT | 1.2105 | 1.02 |
| K63 | 949,842 | 7,448,000 | 10/27/1965 | 5.5–10.5 | BP | 1.1105 | 0.69 |
| K63A | 950,056 | 7,447,821 | 11/22/1965 | 0–19.0 | PT | 1.1010 | 0.61 |
| K64 | 951,631 | 7,430,545 | 11/15/1965 | 0–19.0 | PT-60 | - | 1.43 |
| K65 | 1,009,347 | 7,429,688 | 8/8/1966 | 0–19.0 | PT-420 | 1.1355 | 0.31 |
| K65A | 1,009,080 | 7,429,673 | 6/24/1966 | 0–19.0 | B | 1.1350 | 0.30 |
| K66 | 1,007,859 | 7,416,856 | 8/10/1966 | 0–19.0 | PT-420 | 1.1870 | 0.75 |
| K66A | 1,007,538 | 7,416,760 | 6/28/1966 | 0–19.0 | BP | 1.1915 | 0.78 |
| K67 | 973,182 | 7,399,280 | 7/3/1966 | 0–19.0 | B | 1.1685 | 0.70 |
| K67A | 972,645 | 7,399,180 | 7/3/1966 | 0–19.0 | B | 1.1710 | 0.70 |
| K68 | 934,533 | 7,398,971 | 8/16/1966 | 0–19.0 | PT-360 | 1.1255 | 1.23 |
| K69 | 958,717 | 7,430,910 | 9/12/1967 | 0–21.0 | PT-240 | 1.1875 | 0.73 |
| K69A | 957,814 | 7,430,955 | 9/13/1967 | 0–10.2 | PT-80 | 1.1885 | 0.76 |
| K70 | 974,455 | 7,440,995 | 9/5/1967 | 0–21.0 | PT-420 | 1.1995 | 0.86 |
| BR1 | 1,011,668 | 7,474,495 | 7/21/1965 | 0–5.5 | P | 1.2035 | 1.42 |
| BR2 | 1,001,536 | 7,464,213 | 7/21/1965 | 0–5.5 | P | 1.2115 | 1.23 |
| BP3 | 963,804 | 7,426,164 | 7/23/1965 | 0–5.5 | BP | 1.2095 | 0.60 |
| B = Bailed | P = Pumped | P-10 = Pumped 10 minutes |
| BP = Bailed or pumped | PT = Pumping Test | |
| | | | | | | |
| | | | | | | |
| | | | | |
2023 Estimated Resources and Reserves at Intrepid Potash-Wendover
Prepared for Intrepid Potash, Inc.
February 14, 2024 | 24 |
Table 7-2. Shallow Well Monitoring Data, June 2016 to July 2020
| | | | | | | | | | | | | | | | | | | | | | | | | | |
| | | | | | | | |
Well Designation | Eastings | Northings | Elevation (top
of casing, ft) | KCl %
2016 | KCl %
2017 | KCl %
2018 | KCl %
2019 | KCl %
2020 |
| WP-01 | 1,003,634 | 7,419,012 | 4,225 | 0.56 | 0.14 | 0.14 | n/a | 0.14 |
| WP-02 | 990,917 | 7,419,329 | 4,225 | 0.16 | 0.28 | 0.42 | n/a | 0.29 |
| WP-03 | 1,003,107 | 7,424,842 | 4,224 | 0.57 | 0.60 | 0.75 | n/a | 0.74 |
| WP-04 | 1,003,104 | 7,424,592 | 4,224 | 0.50 | 0.61 | 0.69 | n/a | 0.57 |
| WP-05 | 1,003,104 | 7,424,344 | 4,224 | 0.72 | 0.61 | 0.59 | n/a | 0.65 |
| WP-07 | 1,013,890 | 7,460,902 | 4,220 | 0.75 | n/a | n/a | n/a | n/a |
| WP-08 | 1,016,618 | 7,461,428 | 4,220 | 1.00 | 0.90 | 0.94 | 0.99 | 1.09 |
| WP-09 | 979,750 | 7,430,719 | 4,218 | 1.18 | 1.26 | 1.43 | 1.43 | 1.60 |
| WP-10 | 979,747 | 7,430,466 | 4,219 | 0.99 | 0.11 | 1.03 | 1.03 | 1.15 |
| WP-11 | 979,746 | 7,430,170 | 4,218 | 1.25 | 1.25 | 1.26 | 1.39 | 1.41 |
| WP-12 | 979,744 | 7,429,917 | 4,218 | 1.36 | 1.39 | 1.41 | 1.39 | 1.51 |
| WP-13 | 983,472 | 7,440,160 | 4,218 | 0.94 | 0.94 | 1.05 | 0.95 | 1.20 |
| WP-14 | 966,171 | 7,447,321 | 4,218 | 1.05 | 0.98 | 0.96 | 0.88 | n/a |
| WP-15 | 970,135 | 7,440,579 | 4,218 | 0.65 | 0.66 | 0.79 | 0.57 | 0.71 |
| WP-16 | 970,084 | 7,440,336 | 4,217 | 0.58 | 0.60 | 0.67 | 0.58 | 0.67 |
| WP-17 | 967,219 | 7,417,997 | 4,221 | 0.69 | 0.23 | 0.14 | 0.04 | 0.36 |
| WP-18 | 967,269 | 7,418,241 | 4,220 | 0.78 | 0.27 | 0.14 | 0.10 | 0.56 |
| WP-19 | 966,072 | 7,407,393 | 4,222 | 0.21 | 0.28 | 0.26 | n/a | 0.30 |
| WP-20 | 947,890 | 7,429,196 | 4,220 | n/a | 0.88 | 0.83 | n/a | 0.97 |
| WP-21 | 948,141 | 7,429,202 | 4,220 | n/a | 0.95 | 0.80 | 0.80 | 0.94 |
| WP-22 | 952,839 | 7,426,086 | 4,221 | 0.54 | 0.61 | 0.68 | 0.73 | 1.08 |
| WP-23 | 959,883 | 7,411,991 | 4,221 | 0.72 | 0.76 | 0.68 | 0.73 | 0.75 |
| WP-24 | 959,883 | 7,411,991 | 4,221 | 0.24 | 0.10 | 0.10 | 0.16 | 0.14 |
| WP-25 | 942,234 | 7,407,710 | 4,223 | 0.16 | 0.38 | 0.40 | n/a | 0.34 |
| WP-26 | 948,418 | 7,402,492 | 4,222 | 0.17 | 0.50 | 0.40 | n/a | 0.36 |
| WP-27 | 978,531 | 7,446,381 | 4,216 | 0.94 | 1.07 | 1.01 | 1.10 | 1.15 |
| WP-28 | 997,008 | 7,444,633 | 4,225 | 0.83 | 0.87 | 0.00 | 0.67 | 0.92 |
| | | | | | | | |
It is believed that most potash dissolved in the shallow-brine aquifer was from the clay underneath the salt crust (Nolan 1927; Turk 1969). The ultimate source of potash was brought to the Bonneville Basin by slow, lateral subsurface water inflow from adjacent sediments during long-term geologic time. Davis (1967) studied the lateral inflow through the periphery of the salt flats and found that fluid gradients there were less than 0.1 ft per mile. Even if the area had
| | | | | |
2023 Estimated Resources and Reserves at Intrepid Potash-Wendover
Prepared for Intrepid Potash, Inc.
February 14, 2024 | 25 |
a transmissivity of 10,000 gallons per day per foot (gpd/ft), only 1,000 gallons per day per mile (gpd/mile) would have moved through the periphery of the salt flats.
Recharge to the shallow-brine aquifer is largely from local rainfall. Brine levels change seasonally induced by brine production. Turk (1969) found that during the period of 1965–1968, more than a 3-ft variation in brine levels occurred at some point on the salt flats. However, during each winter for which there were records, the brine level recovered to the surface. In drier years, the brine level may not recover completely, but winter precipitation can supply significant additional recharge during wet years. Infiltration capacity tests on the playa surface and hydrographs of observation wells indicate that rainfalls in excess of 0.1 inch during the summer and 0.05 inch during the winter recharge the area of thickest salt crust; only high rainfall will recharge very moist clay surfaces.
7.4Characterization of Geotechnical Data
No geotechnical data is applicable to support this mining method.
| | | | | |
2023 Estimated Resources and Reserves at Intrepid Potash-Wendover
Prepared for Intrepid Potash, Inc.
February 14, 2024 | 26 |
8.0Sample Preparation
Intrepid-Wendover has internal quality assurance and quality control procedures for sample collection. During the evaporation season, daily brine samples are collected at brine advancement points. Brackish ponds and transfer pumps are sampled weekly. Samples are evaluated at the on-site lab with full analysis capabilities, including X-ray fluorescence (XRF).
In the qualified person’s opinion, the sample preparation, security, and laboratory analytical procedures are conventional industry practice and are adequate for the reporting of resources and reserves.
| | | | | |
2023 Estimated Resources and Reserves at Intrepid Potash-Wendover
Prepared for Intrepid Potash, Inc.
February 14, 2024 | 27 |
9.0Data Verification
9.1Data Verification Procedure
The site has been producing for many years. Mining and processing of the brine to successfully marketed products is verification of the deposit data.
9.2Limitations on Verification
There are no limitations on the verification.
9.3Adequacy of the Data
It is the opinion of the Qualified Person (QP) that the data is adequate for the determination of resources and reserves. The brines have historically and continue to be mined with plans based on the data.
| | | | | |
2023 Estimated Resources and Reserves at Intrepid Potash-Wendover
Prepared for Intrepid Potash, Inc.
February 14, 2024 | 28 |
10.0Mineral Processing and Metallurgical Testing
Intrepid-Wendover has a long history of processing potash on site. Recovery estimates are based on past plant performance, current performance, and anticipated future performance based on laboratory or metallurgical testing of the anticipated plant feed. Over time, the appropriate capital modifications to the plants have been made to accommodate changes in ore feed and market requirements.
10.1Adequacy of the Data
It is the opinion of the QP that the data is adequate for the determination of resources and reserves. The deposit has historically and continues to be processed into product that is successfully sold on a commercial scale.
| | | | | |
2023 Estimated Resources and Reserves at Intrepid Potash-Wendover
Prepared for Intrepid Potash, Inc.
February 14, 2024 | 29 |
11.0Mineral Resource Estimates
This Technical Report Summary provides a mineral resource estimate and classification of resources. Mineral resources that are not mineral reserves do not meet the threshold for reserve modifying factors, such as estimated economic viability, that would allow for conversion to mineral reserves.
According to 17 CFR § 229.1301 (2021), the following definitions of mineral resource categories are included for reference:
An inferred mineral resource is that part of a mineral resource for which quantity and grade or quality are estimated on the basis of limited geological evidence and sampling. An inferred mineral resource has the lowest level of geological confidence of all mineral resources, which prevents the application of the modifying factors in a manner useful for evaluation of economic viability. An inferred mineral resource, therefore, may not be converted to a mineral reserve.
An indicated mineral resource is that part of a mineral resource for which quantity and grade or quality are estimated on the basis of adequate geological evidence and sampling. An indicated mineral resource has a lower level of confidence than the level of confidence of a measured mineral resource and may only be converted to a probable mineral reserve. As used in this subpart, the term adequate geological evidence means evidence that is sufficient to establish geological and grade or quality continuity with reasonable certainty.
A measured mineral resource is that part of a mineral resource for which quantity and grade or quality are estimated on the basis of conclusive geological evidence and sampling. As used in this subpart, the term conclusive geological evidence means evidence that is sufficient to test and confirm geological and grade or quality continuity.
11.1Key Assumptions, Parameters, and Methods
The estimating method for potash resources in the shallow-brine aquifer is based on KCl brine concentration, porosity, and aquifer thickness from historical reports. The brine-monitoring data were compiled to form the database that serves as the basis for estimating the resources.
An analysis was conducted to determine the economic cutoff brine grade. The basis of the analysis averaged costs based on statements or earnings provided by Intrepid and the forecasted long-term sale price of $450/t, 25% greater than the product sales price for the reserve estimate. Intrepid has a long history of sales and marketing of their products. Sales are managed for all properties through the corporate office. Intrepid provided the historical demand and sales pricing through their SOE from 2012 to 2023. Forward-looking pricing was provided by Intrepid marketing (See Section 16).
| | | | | |
2023 Estimated Resources and Reserves at Intrepid Potash-Wendover
Prepared for Intrepid Potash, Inc.
February 14, 2024 | 30 |
Table 11-1 lists the production cost, sales revenue, and the calculated cutoff brine grade. The cutoff grade of the brine pumped into the primary pond is estimated to be 0.41 wt% KCl. The brine pumped into the primary pond was assumed to have a grade of 0.79% KCl based on the KCl grade in the mine plan.
Table 11-1. Resource Analysis to Estimate Cutoff KCl Grade
| | | | | |
| |
| 5-Yr Basis (2024-2028) | |
| Total Production Costs ($M) | 91.5 |
Net Revenue from byproducts ($M) | (30.0) |
| Total Cost ($M) | 61.5 |
| |
| |
| Potash Product | |
| Price per ton less shipping ($) | 420 | |
| Production (t) | 320,000 |
| |
| Net potash sales ($M) | 134.4 | |
| |
| Cutoff Analysis | |
| Cutoff production (t) | 146,286 |
| Average grade pumped into primary pond (% KCl) based on 25 year mine plan | 0.79 | |
| Cutoff grade (% KCl) | 0.36 | |
Cutoff grade (% K2O) | 0.23 | |
11.2Mineral Resource Estimate
Resources are estimated by shallow- and deep-brine aquifers. Because of the unconventional nature of the deposit, no measured resources are estimated.
11.2.1Potash Resources in the Shallow-Brine Aquifer
The potash indicated mineral resource in the shallow-brine aquifer was estimated from the difference of the KCl grade monitored from 92 wells during the period 1965–1967 and the current monitoring data with consideration of the cutoff grade derived from cost data sourced from operations data.
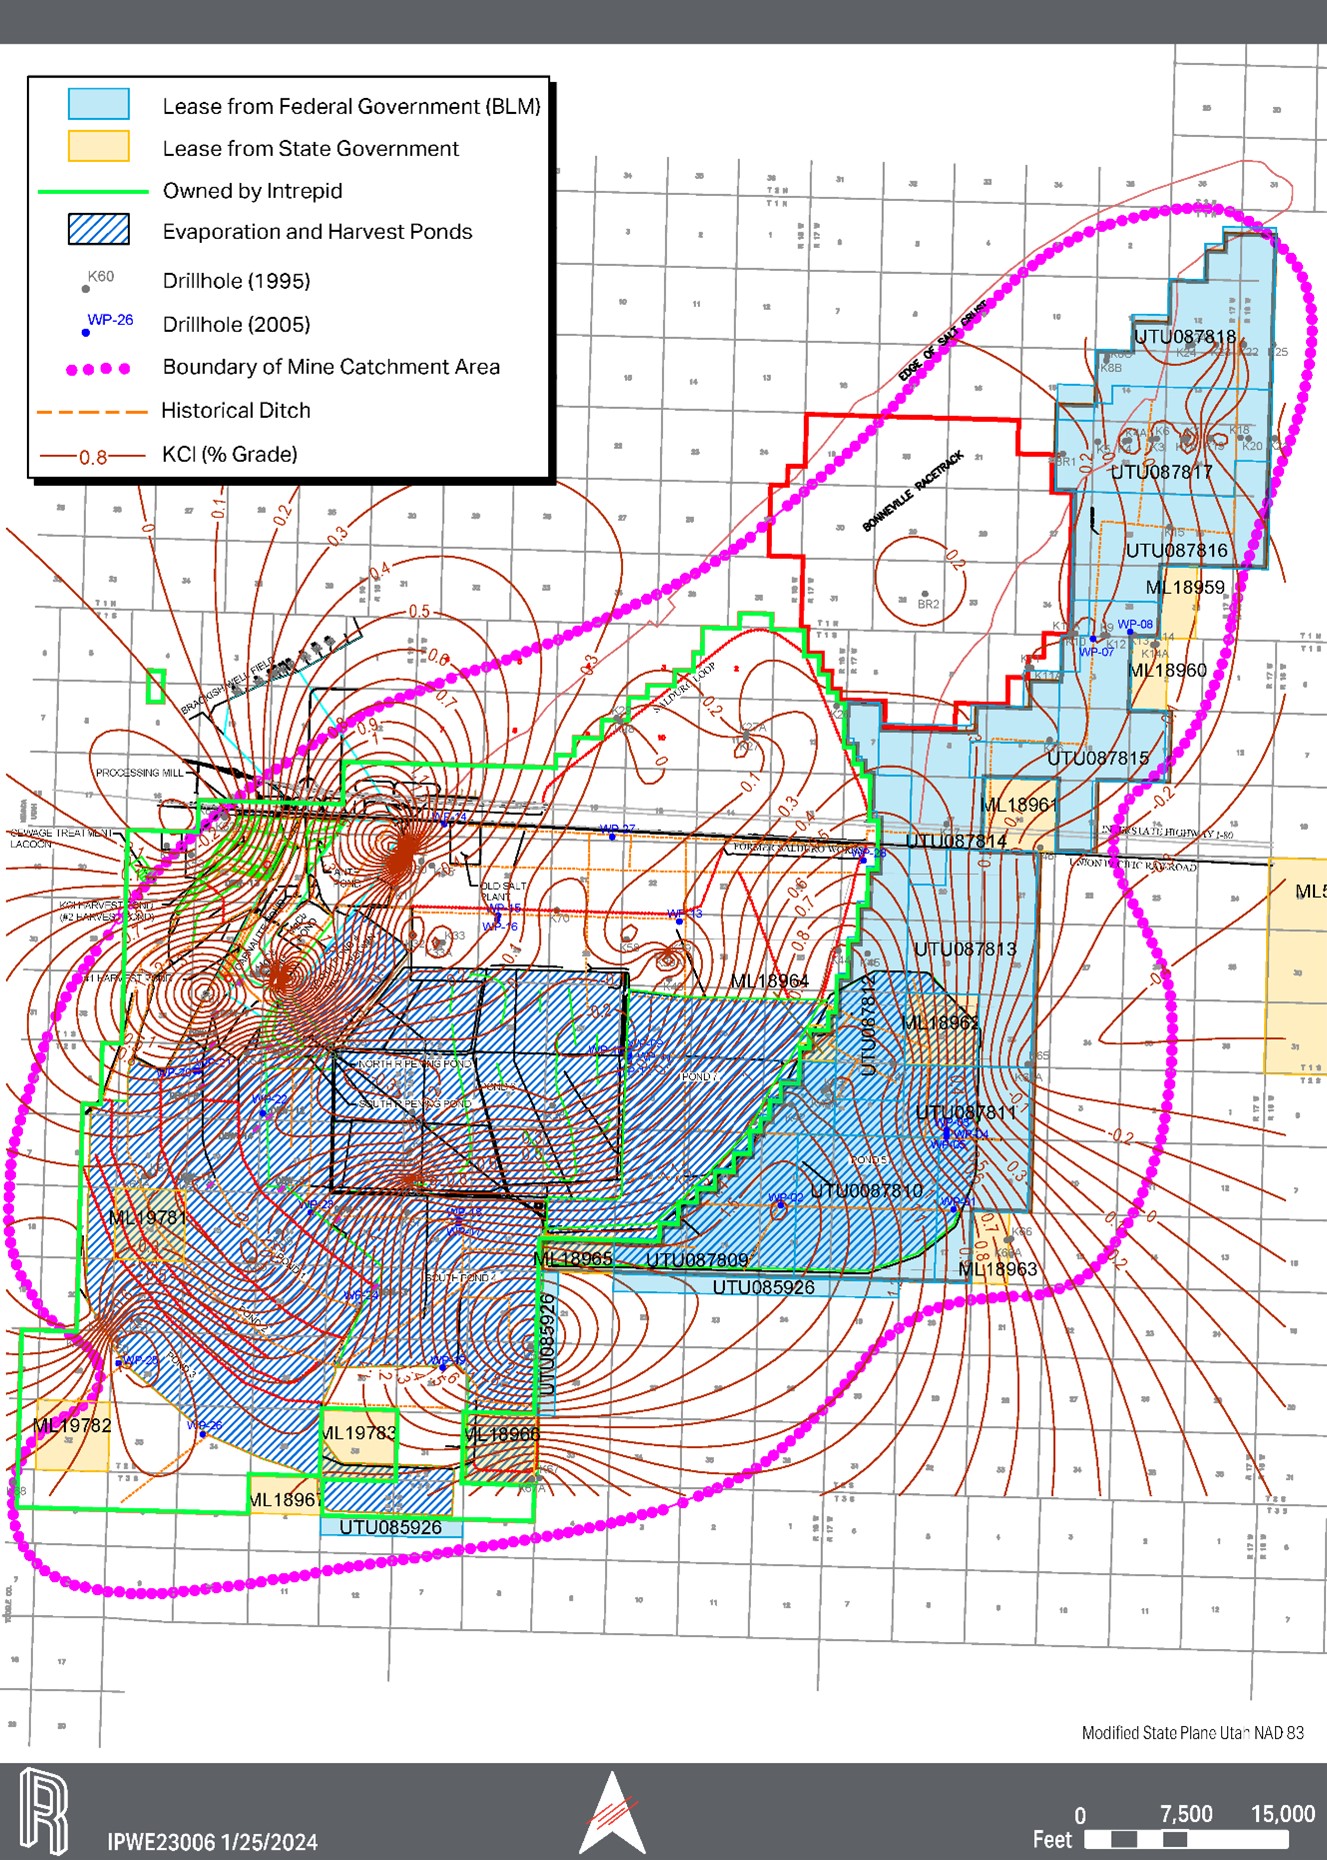
The general distribution of KCl in the shallow-aquifer brine during the period 1965–1967 studied by Turk (1969), in which data were mapped based on brine samples collected from 92 monitoring wells, was mapped in Figure 11-1. The data shows that brine quality at each point fluctuates over time, which is likely due to precipitation and evaporation within the Lake Bonneville basin. In order to minimize the number of anomalously low values caused by dilution from antecedent rainfall, only the maximum concentration measured at each well during that
| | | | | |
2023 Estimated Resources and Reserves at Intrepid Potash-Wendover
Prepared for Intrepid Potash, Inc.
February 14, 2024 | 31 |
period was used in this estimate. The analysis shows that the area controlled by the 92 monitoring wells is 78.8 square miles, and the average KCl grade throughout the 92 monitoring well control area is 1.26%. Although the current ditch system collects brine from most of the 141-square-mile mining area, there is no systematic monitoring of brine quality across the entire area. For estimation of mineral resources, the actual monitoring well catchment area of 78.8 square miles is utilized.
One important parameter to determine potash content of the shallow-brine aquifer is porosity, which is represented as the non-solid fraction of geologic material in an aquifer. The total porosity of the shallow-brine aquifer averages about 0.45 according to numerous wet and dry bulk density measurements by the Utah State Highway Department (Kaiser Aluminum & Chemical Corporation 1974; Turk 1969). Thus, the brine content in the shallow-brine aquifer is estimated to be about 250 billion gallons, based on the ditch catchment area of 141 square miles, thickness of 18 ft, and porosity (0.45) of the aquifer.
According to Turk (1969), the effective porosity of the shallow-brine aquifer averages about 0.1. The brine from effective porosity represents the static free-draining portion of the brine from total porosity prior to extraction. It does not consider the impact of any groundwater recharge or solute transport which increases the amount of extractable brine above the static free-draining component over time. Therefore, the mineral resource is not calculated based on the effective porosity.
The maximum KCl grade in each of the 27 monitoring wells drilled in October 2005 was mapped with the Kriging gridding method with default linear variogram in the software, Surfer, version 15.4.354 (Golden Software, LLC 2018). The maximum KCl grade in each well that was mapped with the Kriging gridding method is shown in Figure 11-2.
The average KCl grade estimated over the 141-square-mile ditch catchment area was 1.32% for the 1965–1967 data. The average KCl grade estimated over the 141-square-mile ditch catchment area was 0.78% for the 2020 data. The calculated difference in brine concentration through the catchment area (Figure 11-3) indicates that after 57 years of mining, the average KCl grade has declined by 0.54%; this is equivalent to 3.644 Mt of KCl depletion over the ditch catchment area using a 60% recovery factor in the ponds.
There is no change in trend of KCl grade to the primary pond or in potash production. Figure 11-4 shows the average brine grade as it was pumped to the primary pond for years 1962 to 2023. The brine grade has held steady at about 0.97% for 60 years without declining. Annual production of KCl from the shallow-brine aquifer varies from year to year. Figure 11-5 shows the KCl production history of the shallow- and deep-brine aquifers between 1968 and 2023. The average yearly production (67,800 t) was close to the median yearly production (65,000 t), indicating that there has been no clear declining trend for KCl production from 1968 to 2023.
| | | | | |
2023 Estimated Resources and Reserves at Intrepid Potash-Wendover
Prepared for Intrepid Potash, Inc.
February 14, 2024 | 32 |
Figure 11-1. Isoconcentration Map of KCl in Shallow-Brine Aquifer 1965–1967
| | | | | |
2023 Estimated Resources and Reserves at Intrepid Potash-Wendover
Prepared for Intrepid Potash, Inc.
February 14, 2024 | 33 |
Figure 11-2. Isoconcentration Map of KCl in Shallow-Brine Aquifer 2021
| | | | | |
2023 Estimated Resources and Reserves at Intrepid Potash-Wendover
Prepared for Intrepid Potash, Inc.
February 14, 2024 | 34 |
Figure 11-3. Isoconcentration Map of KCl Depletion in Shallow-Brine Aquifer between 1967 and 2021
| | | | | |
2023 Estimated Resources and Reserves at Intrepid Potash-Wendover
Prepared for Intrepid Potash, Inc.
February 14, 2024 | 35 |
Figure 11-4. Brine Concentration Pumped into Primary Pond 1960–2023
Figure 11-5. Historical KCl Production at Intrepid-Wendover, 1968–2023
| | | | | |
2023 Estimated Resources and Reserves at Intrepid Potash-Wendover
Prepared for Intrepid Potash, Inc.
February 14, 2024 | 36 |
Table 11-2 shows the shallow-brine aquifer potash resource estimate and its calculation methodology.
Table 11-2. Shallow-Brine Aquifer KCl Resource Estimate
| | | | | | | | |
| | |
| Parameters | Calculation | Results |
| | |
92 drillhole control indicated area (ft2) (A) | | 2,152,518,168 |
92 drillhole control inferred area (ft2) (Q) | | 2,915,597,689 |
Average thickness (ft) (B) | | 18 |
| Porosity (C) | | 0.45 |
Average grade (1967) (% KCl) (D) | | 1.26 |
Brine density (lb/ft3) (E) | | 72.4 |
Cutoff grade (% KCl) (F) | | 0.36 |
Recovery factor (G) | | 60% |
Product purity (H) | | 95% |
| Plant efficiency | | 85% |
| Product per year (tpy) (I) | | 70,000 |
| | |
| Resource Calculation (in thousand tons) | | |
In-place KCl in 1967 (J) | J=A*B*C*D/100*E/2000000 | 7,960 |
KCl depletion from 1967 to 2023 (K) |
| 2,029 |
| KCl under cutoff grade (L) | L=(J-K)/D*F | 1,692 |
Remaining in-place KCl above cutoff grade (M) | M=J-K-L | 4,238 |
| Recoverable KCl (N) | N=M*G | 2,543 |
| 25-year plan (P) | | 1,720 |
Indicated resource exclusive of reserve (O) | O=M-(P/G) | 1,372 |
Inferred resource (R) | R= Q*B*C*D/100*E/2000000 | 10,772 |
| | |
Note that brine quality does fluctuate with time; therefore, both isoconcentration maps in Figures 11-1 and 11-2 must be considered approximations of the actual conditions.
11.2.2Potash Resources in the Deep-Brine Aquifer
Wells drilled into the deep-brine aquifer have been used to add brine to the collection ditches and to offset the fluctuations of brine availability within the brine collection system. Production of the deep-brine wells started in 1948. Brine from the deep-brine aquifer is typically 10% to 20% of the KCl produced. Annual KCl production from the deep-brine aquifer on one occasion reached as high as 78,000 t. As shown in Table 11-3, approximately 575,400 t of KCl have been produced from the deep-brine aquifer from 1968 to 2023.
| | | | | |
2023 Estimated Resources and Reserves at Intrepid Potash-Wendover
Prepared for Intrepid Potash, Inc.
February 14, 2024 | 37 |
Table 11-3. Historical Deep Well and Shallow Aquifer Production, 1968–2023
| | | | | | | | | | | |
| | | |
Full Calendar Year1 | KCl Production (kt) | Deep Aquifer KCl Production (kt) | Shallow Aquifer KCl Production (kt) |
| 1968 | 50.0 | 25.5 | 24.5 |
| 1969 | 45.0 | 32.3 | 12.7 |
| 1970 | 102.0 | 31.5 | 70.6 |
| 1971 | 88.0 | 15.3 | 72.7 |
| 1972 | 117.0 | 18.7 | 98.3 |
| 1973 | 88.0 | 14.5 | 73.6 |
| 1974 | 72.0 | 15.3 | 56.7 |
| 1975 | 60.0 | 18.7 | 41.3 |
| 1976 | 50.0 | 19.6 | 30.5 |
| 1977 | 65.0 | 18.7 | 46.3 |
| 1978 | 93.0 | 0.0 | 93.0 |
| 1979 | 42.0 | 0.0 | 42.0 |
| 1980 | 50.0 | 0.0 | 50.0 |
| 1981 | 60.0 | 0.0 | 60.0 |
| 1982 | 90.0 | 0.0 | 90.0 |
| 1983 | 10.0 | 0.0 | 10.0 |
| 1984 | 39.0 | 0.0 | 39.0 |
| 1985 | 82.0 | 0.0 | 82.0 |
| 1986 | 65.0 | 0.0 | 65.0 |
| 1987 | 70.0 | 0.0 | 70.0 |
| 1988 | 45.0 | 0.0 | 45.0 |
| 1989 | 40.0 | 0.0 | 40.0 |
| 1990 | 90.0 | 0.0 | 90.0 |
| 1991 | 45.0 | 0.0 | 45.0 |
| 1992 | 110.0 | 78.2 | 31.8 |
| 1993 | 91.0 | 45.1 | 46.0 |
| 1994 | 101.0 | 15.3 | 85.7 |
| 1995 | 65.0 | 6.8 | 58.2 |
| 1996 | 104.0 | 7.7 | 96.4 |
| 1997 | 66.0 | 6.8 | 59.2 |
| 1998 | 50.0 | 0.0 | 50.0 |
| 1999 | 90.0 | 0.0 | 90.0 |
| 2000 | 40.0 | 0.0 | 40.0 |
| 2001 | 35.0 | 0.0 | 35.0 |
| 2002 | 28.0 | 0.0 | 28.0 |
| 2003 | 46.0 | 0.0 | 46.0 |
| 2004 | 50.0 | 2.0 | 48.0 |
| 2005 | 57.4 | 2.6 | 54.8 |
| 2006 | 54.4 | 3.6 | 50.8 |
| 2007 | 98.5 | 4.1 | 94.4 |
| 2008 | 101.9 | 7.2 | 94.7 |
| | | | | |
2023 Estimated Resources and Reserves at Intrepid Potash-Wendover
Prepared for Intrepid Potash, Inc.
February 14, 2024 | 38 |
| | | | | | | | | | | |
| Table 11-3 (continued) Historical Deep Well and Shallow Aquifer Production, 1968–2023 |
| | | |
Full Calendar Year1 | KCl Production (kt) | Deep Aquifer KCl Production (kt) | Shallow Aquifer KCl Production (kt) |
| 2009 | 60.7 | 11.2 | 49.5 |
| 2010 | 64.1 | 6.5 | 57.6 |
| 2011 | 84.4 | 9.7 | 74.6 |
| 2012 | 87.6 | 14.1 | 73.5 |
| 2013 | 93.5 | 14.1 | 79.3 |
| 2014 | 97.0 | 16.9 | 80.1 |
| 2015 | 73.7 | 16.1 | 57.5 |
| 2016 | 49.5 | 7.0 | 42.5 |
| 2017 | 78.4 | 14.7 | 63.7 |
| 2018 | 85.5 | 19.2 | 66.2 |
| 2019 | 75.4 | 7.9 | 67.6 |
| 2020 | 59.1 | 14.1 | 45.0 |
| 2021 | 52.0 | 21.0 | 31.0 |
| 2022 | 51.2 | 7.7 | 43.5 |
| 2023 | 39.1 | 5.9 | 33.2 |
| Total | 3,797.2 | 575.4 | 3,221.9 |
The potash resource estimate for the deep-brine aquifer in this report was based on current deep well draw-down, pumping rates, and historical brine concentration variations. The estimated resource for the deep-brine aquifer was classified as indicated resource due to hydrogeologic uncertainty of the aquifer.
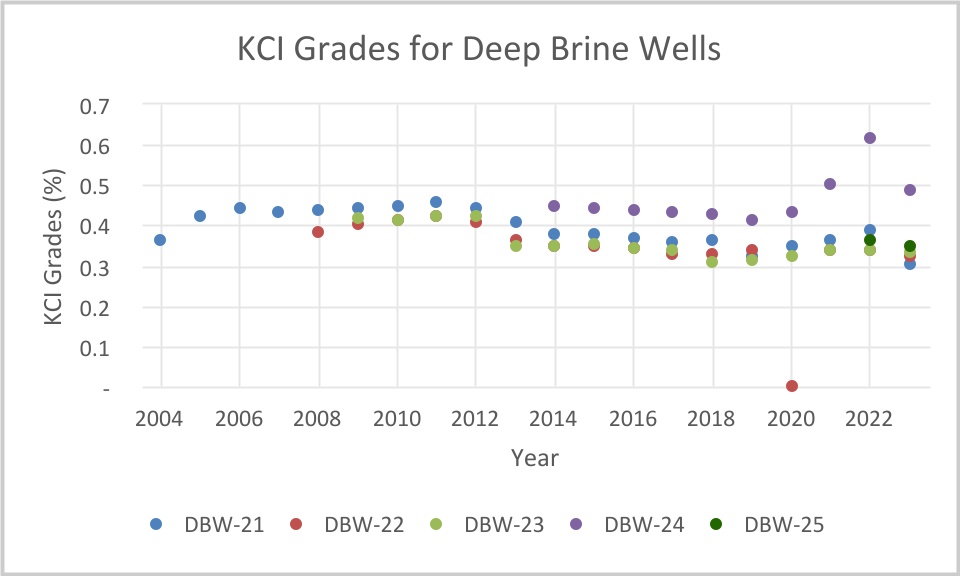
Currently five deep wells, DBW-21, DBW-22, DBW-23, DBW-24 (previously named Test Well 1), and DBW-25 are being used at Intrepid-Wendover to aid in brine collection. The location of DBW-22 is close to DBW-13, where an aquifer of 254 vertical feet was encountered. DBW-23 is located near DBW-16 and DBW-10 where transmissivity ranges from 75,000 to 118,000 gpd/ft and the aquifer thickness is 48 ft. The aquifer thickness is approximately 88 ft at DBW-24.
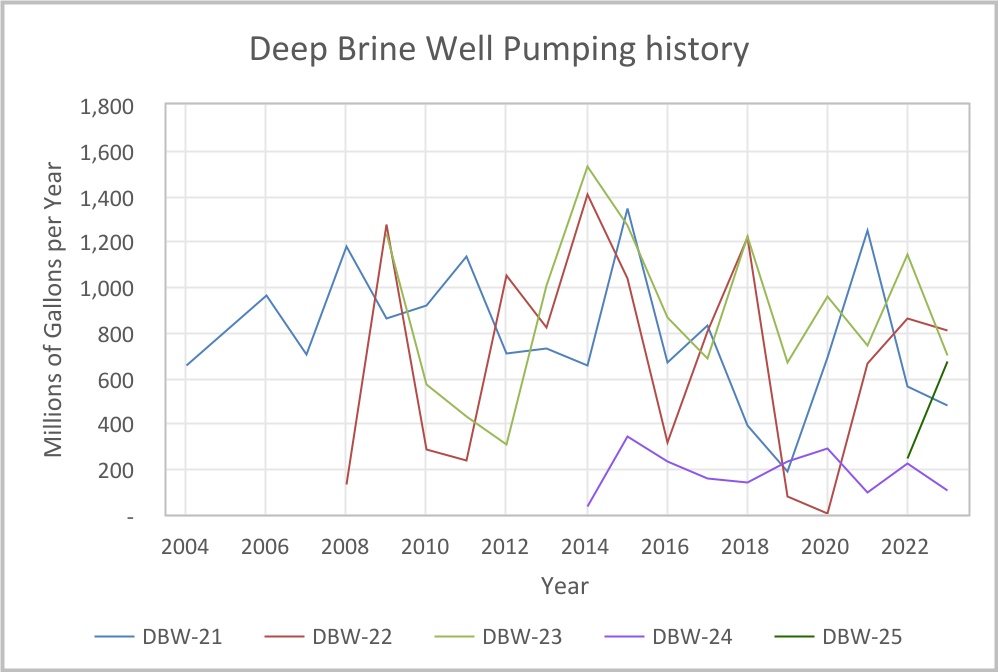
DBW-21 pumped at about 782M gallons per year from 2004 to 2023; DBW-22 pumped at about 684M gallons per year from 2008 to 2023; DBW-23 pumped at about 885M gallons per year from 2009 to 2023; DBW-24 pumped at about 183M gallons per year from 2014 to 2023; and DBW-25 pumped at about 456M gallons per year from 2022 to 2023. Typically the deep-well brine combines with the shallow-aquifer brine in the main collection ditch leading to the primary pond. The brine concentration produced from all deep wells is about 0.42% KCl by weight from 1967 to 2023.
Typically, the deep-brine wells were constructed to a depth of 1,000 to 1,500 ft with a useful life expectancy of approximately 15-20 years with maintenance of the pumps every 2-4
| | | | | |
2023 Estimated Resources and Reserves at Intrepid Potash-Wendover
Prepared for Intrepid Potash, Inc.
February 14, 2024 | 39 |
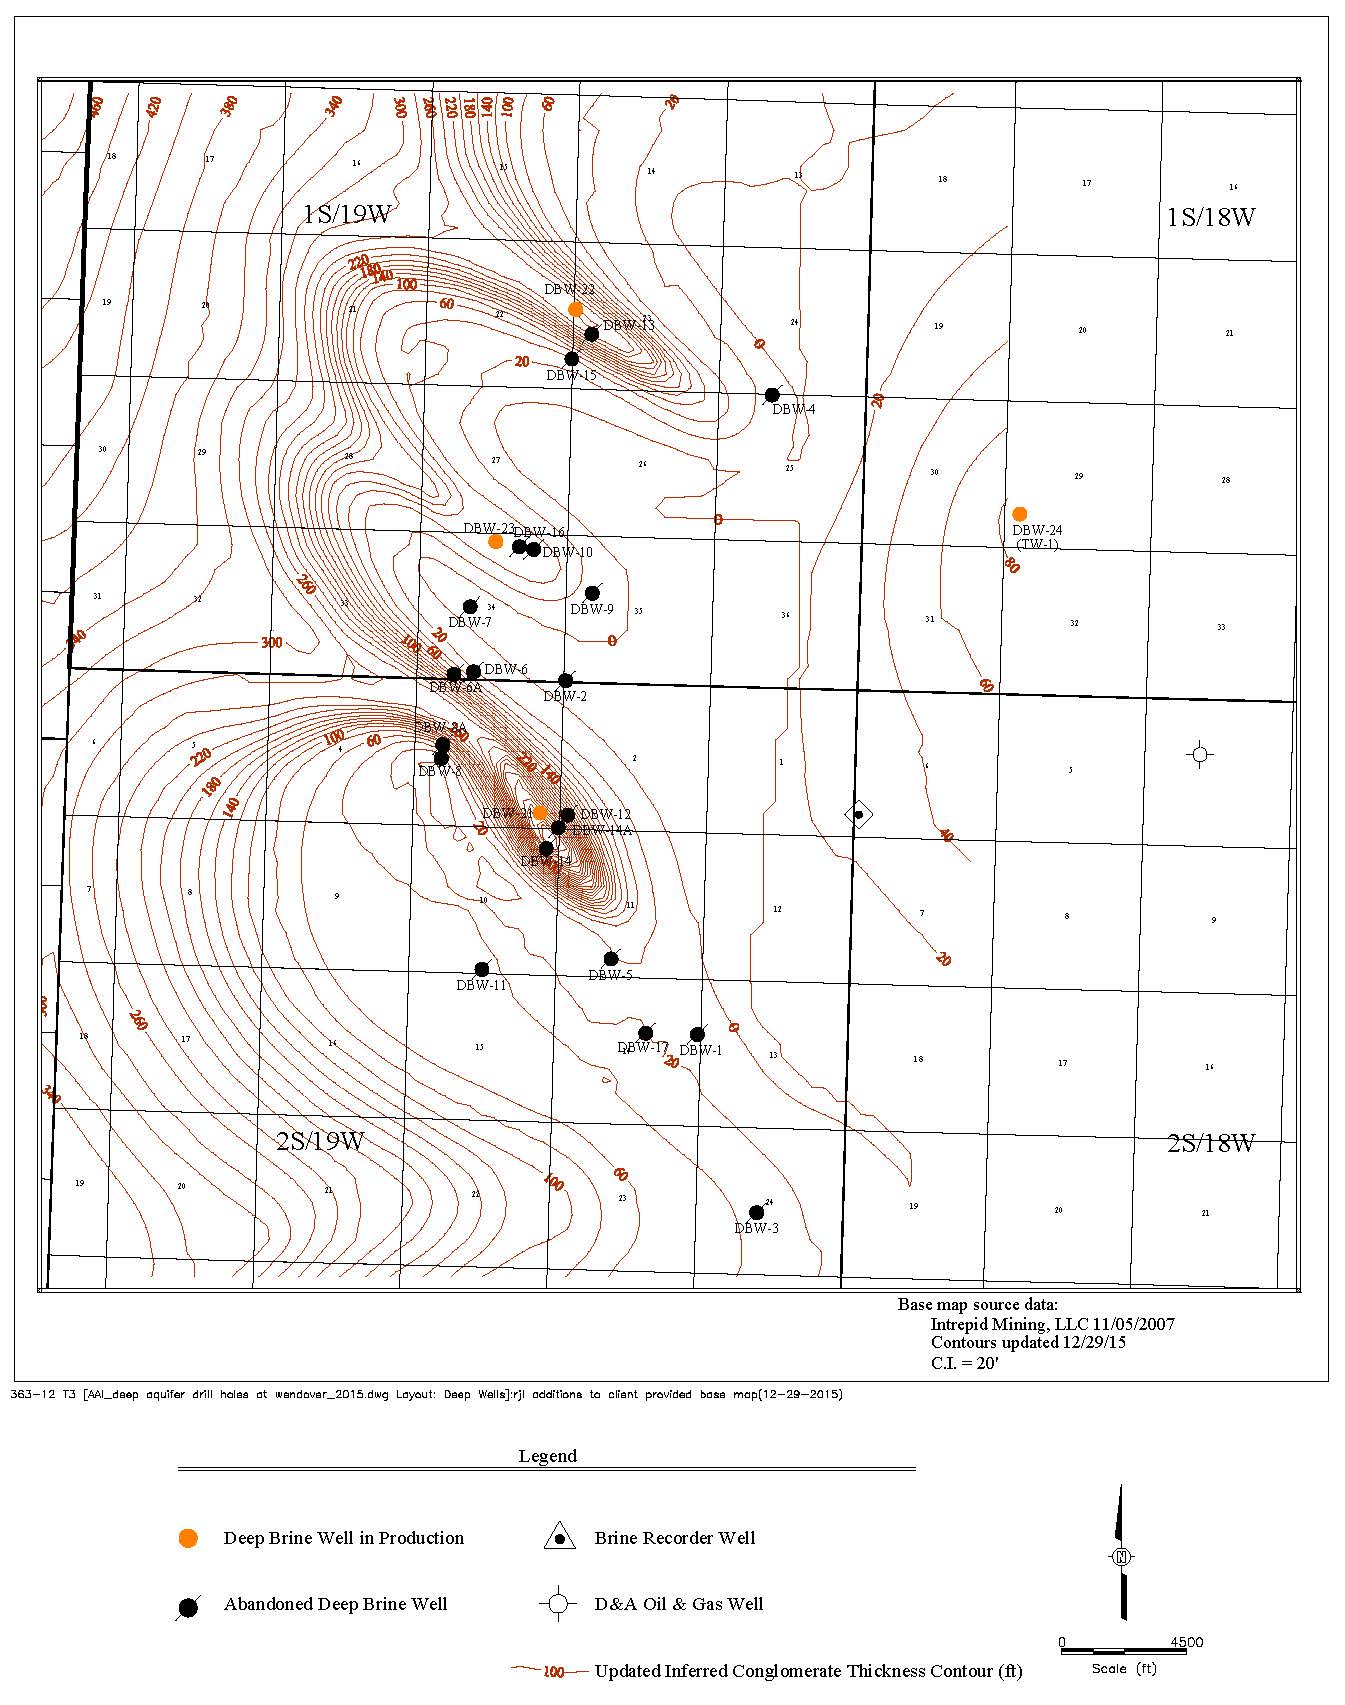
years. The deep-brine wells that are currently abandoned, out of service, or idle include DBW-1 through DBW-17. Figure 11-6 shows the location of the active and abandoned deep wells. A plot of the inferred conglomerate thickness contour is also shown in Figure 11-6.
Figure 11-7 shows the brine well pump history at DBW-21, DBW-22, DBW-23, DBW-24, and DBW-25 up to 2023. Reliable draw-down data are not available in these wells. However, relatively constant pump rates indicate no or slow draw-downs in these wells. Since 2016, flows are monitored by monthly totalizer readings for each well. Figure 11-8 shows KCl grade in the deep-brine aquifer from 1967 to 2023. With the exception of some apparently abnormal data, the KCl brine grade from the deep-brine aquifer has remained constant since 1967. However, there is a slight downward trend in the deep-brine aquifer KCl grade beginning in 2007 (Figure 11-8). This could be due to the lifespan of the currently producing wells of 10 or more years. Figure 11-9 shows KCl grades in the four deep-brine wells that have been monitored since pumping commenced. Over the pumping life of these five wells, KCl brine grades have been relatively constant.
| | | | | |
2023 Estimated Resources and Reserves at Intrepid Potash-Wendover
Prepared for Intrepid Potash, Inc.
February 14, 2024 | 40 |
Figure 11-6. Deep-Brine Well Locations Thickness Isopach of Deep-Brine Aquifer
| | | | | |
2023 Estimated Resources and Reserves at Intrepid Potash-Wendover
Prepared for Intrepid Potash, Inc.
February 14, 2024 | 41 |
Figure 11-7. DBW-21, DBW-22, DBW-23, DBW-24, and DBW-25 Pump History
Figure 11-8. Historical KCl Grade at Deep-Brine Aquifer
| | | | | |
2023 Estimated Resources and Reserves at Intrepid Potash-Wendover
Prepared for Intrepid Potash, Inc.
February 14, 2024 | 42 |
*One outlier greater than 1.2% grade has been removed from the figure.
Figure 11-9. KCl Grades at DBW-21, DBW-22, DBW-23, DBW-24, and DBW-25
Based on well draw-down, pumping rates, and KCl grade records, the deep-brine aquifer is expected to be relied upon to support production of 8,000 tpy of Muriate of Potash (MOP) for at least 25 years. Higher production rates occurred when deep brines were pumped from multiple wells. When three or four wells are pumping at the same time, the production rate has reached more than 14,000 tpy since 2012 (Table 11-3).
11.3Qualified Persons Opinion – Further Work
The QP is of the opinion that no further work is needed to determine the resource.
11.4Resource Statement
Table 11-4 shows the summary of the mineral resources for Intrepid-Wendover effective December 31, 2023, exclusive of mineral reserves.
11.5Discussion
Historical production data shows that total production for the shallow-brine aquifer from 1968 to 2023 was 3.222 Mt. The isoconcentration maps indicate a resource depletion greater than the recorded production from 1968 to 2021. This may be because the recovery factor of 60% used in the KCl depletion calculation is overestimated. It should be noted that the 27 wells drilled in 2005 are a limited sample of the “resource”; therefore, referring these 27 wells across the 137-square-mile catchment area could generate misleading results. Moreover, the estimation errors of the mining catchment area, the variability of the estimated porosity and thickness of the shallow-brine aquifer, and the KCl grade estimations, etc., could all impact the estimate.
| | | | | |
2023 Estimated Resources and Reserves at Intrepid Potash-Wendover
Prepared for Intrepid Potash, Inc.
February 14, 2024 | 43 |
Table 11-4. K2O Brine Mineral Resource Estimate effective December 31, 2023
| | | | | | | | | | | | | | | | | |
Wendover - K2O Brine Mineral Resource Estimate effective December 31, 2023 based on $450/Product Ton Mine Site |
| Resources | | |
| K2O Brine1 (Mt) | Grade
(%K2O) | Contained K2O2 (Mt) | Cutoff3 (%K2O) | Processing Recovery
(%) |
| Measured Mineral Resources | | | | | |
| Indicated Mineral Resources | 175 | 0.5 | 0.9 | 0.23 | 85 |
| Measured + Indicated Mineral Resources | 175 | 0.5 | 0.9 | | |
| Inferred Mineral Resources | 1,358 | 0.5 | 6.8 | 0.23 | 85 |
1K2O Brine is the recovered KCl bearing brine in solution at average concentrations by weight. |
2Contained K2O is calculated by multiplying K2O Brine by the Grade. |
3Solution mining resource cutoff is the grade at which production covers operating costs. |
| Mineral Resources were prepared by RESPEC, a qualified firm for the estimate and independent of Intrepid Potash, for EOY 2023. |
| Mineral Resources are reported exclusive of Mineral Reserves, on a 100% basis. |
Mineral Resources are reported using Inverse Distance Squared (ID2) estimation methods. |
Mt = million tons, % = percent, K2O = potassium oxide |
| | | | | |
2023 Estimated Resources and Reserves at Intrepid Potash-Wendover
Prepared for Intrepid Potash, Inc.
February 14, 2024 | 44 |
12.0Mineral Reserve Estimates
Mineral Reserves at Intrepid-Wendover have been determined by applying current economic criteria that are valid for the Intrepid-Wendover Mine. These criteria limitations have been applied to the resource model to determine which part of the Measured and Indicated Mineral Resource is economically extractable.
12.1Key Assumptions, Parameters, and Methods
The factors influencing the determination of the mineable reserves based on economic success of potash mining at Intrepid-Wendover are:
•KCl grade of the aquifer
•Thickness of the aquifer
•Geometry of the aquifer
•Presence of geologic anomalies that distort the aquifer
•Hydrogeological properties of the aquifer
•Impurities that impact solubility or the surface concentration, separation, crystallization, or packaging process
•Cost of Goods Sold
•Price of the final product
These factors can be grouped as geologic, operational, processing, and cost factors. At Intrepid-Wendover, the infrastructure is mature and the processing and cost factors are well understood. Costs are expected to remain constant with respect to the determination of the reserves. Geologic factors relate to the reserve (grade and thickness), bed geometry (dip and undulations), and geologic anomalies (faults, salt horses, and unknowns). Mining factors include the product concentration and the productivity of the wells (life of wells and total production per well). Additionally, reserves are also estimated using the experience gained from potash mining in the shallow- and deep-brine aquifers to date and the established mining costs and sales.
The long-term product sale price selected for this analysis of cutoff grade is $360/t. Intrepid has a long history of sales and marketing of their products. Refer to Section 16 for the market discussion.
An economic cutoff has been evaluated for estimating reserves as included in Table 12-1.
| | | | | |
2023 Estimated Resources and Reserves at Intrepid Potash-Wendover
Prepared for Intrepid Potash, Inc.
February 14, 2024 | 45 |
Table 12-1. Reserve Cutoff Cost Estimate
| | | | | |
| 5-Yr Basis (2024-2028) | Value |
| |
| Total Production Costs ($M) | 91.5 |
| Net Revenue from byproducts ($M) | (30.0) |
| |
| Total Cost ($M) | 61.5 |
| |
| Potash | |
| |
| Price per ton less shipping ($) | 330 |
| Production (tons) | 320,000 |
| Net potash sales ($) | 105,600,000 |
| |
| Cutoff Analysis | |
| |
| Cutoff production (t) | 186,000 |
| Average grade pumped into primary pond (% KCl) based on data from 27 wells | 0.79 |
| Cutoff grade (% KCl) | 0.46 |
Cutoff grade (% K2O) | 0.29 |
12.2Mineral Reserves Estimate
The extent to which Intrepid-Wendover’s potassium resources can be converted to reserves and ultimately economically extracted is a function of:
•The tonnage of potassium-rich mineralized brine within effective porosity
•The tonnage of potassium-rich mineralized brine within the total porosity
•The level of recharge from surface water inflow and rainfall
•The extent to which the recharge can liberate the potassium-rich mineral salts contained within the retained porosity into effective porosity over continued production cycles
12.2.1Mineral Reserve Estimates for the Shallow-Brine Aquifer
It should be noted that not all the potash contained in the shallow-brine aquifer with grades above the cutoff grade could be recovered based on the current mining plan. A portion of the brine from total porosity, in addition to the brine from effective porosity, is considered to be extractable depending on the transient groundwater flow and transport conditions affecting the brine level during extraction. For a conservative estimate, an overall recovery factor of 60% was applied to the reserve estimate for the shallow-brine aquifer on a gross scale. The rationale behind this factor is due to the uncertainty of the recovery of KCl leakage from the unlined pond system and ditch plans.
According to the production records from 1990 to 2005, only a portion of the potash in the captured brine was harvested as the final product. The overall efficiency, which is the
| | | | | |
2023 Estimated Resources and Reserves at Intrepid Potash-Wendover
Prepared for Intrepid Potash, Inc.
February 14, 2024 | 46 |
percentage ratio between KCl produced and estimated KCl pumped into the primary pond (based on the known brine flow to the ponds and the KCl grade of that brine), was 34% on average from 1990 to 2005. The low overall efficiency indicates that a large percentage of the KCl introduced into the evaporation ponds remained in the pond system or leaked back into the shallow-brine aquifer. Portions of the “KCl loss” to the pond system and shallow-brine aquifer could be recovered in subsequent years and ultimately sold as product.
The brine-collection ditch capture zone analysis conducted by Shaw Environmental, Inc. (2006) shows that the capture zone for each ditch appears to range between 250 and 500 ft laterally from the ditch. Outside the ditch catchment zone, groundwater in the shallow-brine aquifer is estimated to flow at a maximum rate of 13 ft/year. The general spacing between ditches is about 2,600 ft, which may require a period of at least 100 years for the ditches to capture all the potash brine between the ditches.
Total KCl content over the reserve area (the area of influence of the 92 monitoring wells or 78.8 square miles) was estimated based on 1965–1967 KCl brine grades, average porosity (0.45), and thickness (18 ft) of the shallow-brine aquifer. KCl depletion since 1968 over the 92 drillhole control area was estimated using the KCl production from 1968 to 2023 over the 137-square-mile ditch catchment area and applying a product purity of 95% and process efficiency of 85%. The KCl reserve was adjusted to account for the KCl depletion, the KCl tons below the cutoff grade, and an overall recovery factor of 30%. The total MOP reserve for the shallow-brine aquifer is 1.55 Mt.
12.2.2Mineral Reserve Estimates for the Deep-Brine Aquifer
Based on well draw-down, pumping rates, and KCl grade records, the deep-brine aquifer can be relied upon to support production of 8,000 tpy of MOP for over 25 years.
12.3Qualified Persons Opinion – Further Work
The current mineral reserve estimation for the deep-brine aquifer is based on the production history and aquifer grades. The QP believes that these estimates are conservative and reliable, and no further work is recommended at this time.
12.4Reserve Summary
Table 12-2 shows the summary of the mineral reserves at Intrepid-Wendover. The mineral reserve statement is presented in accordance with the S-K 1300 Rules.
| | | | | |
2023 Estimated Resources and Reserves at Intrepid Potash-Wendover
Prepared for Intrepid Potash, Inc.
February 14, 2024 | 47 |
Table 12-2. Potash Mineral Reserves effective December 31, 2023
| | | | | | | | | | | | | | | | | |
| Wendover - Potash Mineral Reserves effective December 31, 2023 based on $360/Product Ton Mine Site |
| Reserves | | |
| Brine1 (Mt) | In-Situ Grade2 (%K2O) | Product3 (Mt) | Brine Cutoff Grade4 (%K2O) | Processing Recovery
(%) |
| Proven Mineral Reserves | | | | | |
| Probable Mineral Reserves | 832 | 0.5 | 1.7 | 0.29 | 85 |
| Total Mineral Reserves | 832 | 0.5 | 1.7 | | |
1Brine advanced through the pond system. |
2In-situ grade is the amount of K2O contained in the brine. |
3Potash Product tons are calculated by multiplying Brine by: the In-Situ Grade divided by 63.17% K2O/KCl conversion factor, an overall pond recovery factor of 30%, processing recovery of 85%, a handling loss factor of 97%, and a product purity factor of 105%. |
4Solution mining reserve cutoff is the grade at which production covers operating costs. |
| Mineral Reserves were prepared by RESPEC, a qualified firm for the estimate and independent of Intrepid Potash, for EOY 2023. |
| Mineral Reserves are reported exclusive of Mineral Resources, on a 100% basis. |
Mt = million tons, % = percent, K2O = potassium oxide |
| | | | | |
2023 Estimated Resources and Reserves at Intrepid Potash-Wendover
Prepared for Intrepid Potash, Inc.
February 14, 2024 | 48 |
13.0Mining Methods
Potash at Intrepid-Wendover is produced through solar evaporation of naturally occurring brines collected from the sedimentary basin adjacent to the processing facility via brine collection ditches and extraction wells. The potash content of the collected brine is concentrated by solar evaporation to the point that solids are precipitated and can be collected. Harvested solid salts are hauled to the processing facility, where they are dried, sized, and stored for shipment. Potash, MRS, NaCl, and MgCl2 are shipped by both truck and rail via I-80 and the UPRR.
Brines from the shallow-brine aquifer, drained by gravity, are gathered by a system of collection ditches, which are approximately 20 to 30 ft deep by 9 to 40 ft wide. The total collection ditch system covers a length of 117 miles and annually collects approximately 3.4 billion gallons of brine from the shallow-brine aquifer. Brines pumped from the deep-brine aquifer are used to augment the shallow brine to the collection system.
Collected brines are pumped into a primary pond, and solar energy is utilized to heat the brine so that evaporation may proceed. As the brine is concentrated to a point just short of potash precipitation in the primary pond network, the brine is then transferred into a harvest pond for selective precipitation of the potash crude salt.
As water evaporation continues in the harvest pond, sylvinite, a physical mixture of NaCl and KCl, is precipitated to the pond floor until the brine concentrates to a point where carnallite and other salts start to precipitate. The extra brine is then removed from the harvest pond and transferred to carnallite ponds. The layer of sylvinite salts at the harvest pond floor is mechanically removed with scrapers and hauled to the flotation mill for beneficiation.
Grinding and flotation processes are used to concentrate KCl. The concentrate is then leached with freshwater to remove most of the remaining NaCl. The leached product is filtered and dried. A part of the dried product is compacted to produce a coarse grade of potash. MgCl2 brine, MRS, and salt are retrieved as by-products.
13.1Relevant Hydrogeology
Groundwater occurs in three distinct aquifers in much of the western Great Salt Lake Desert: (1) the deep-brine aquifer, (2) the alluvial-fan aquifer, and (3) the shallow-brine aquifer. Inferred subsurface stratigraphic relationships are shown diagrammatically in Figure 13-1.
| | | | | |
2023 Estimated Resources and Reserves at Intrepid Potash-Wendover
Prepared for Intrepid Potash, Inc.
February 14, 2024 | 49 |
Figure 13-1. Intrepid-Wendover Hydrogeologic Setting (after Lines 1979 and Mason 1998)
The most extensive aquifer, the deep-brine aquifer, yields brine to wells on the BSF from conglomerate in the lower part of the basin fill. The deep-brine aquifer consists of as much as 840 ft of conglomerate confined by an upper few hundred feet of relatively impermeable lacustrine deposits. Thus, hydraulic connection between the aquifer and playa surfaces is poor (Lines 1979). Aquifer tests indicate that the transmissivity of the deep-brine aquifer in the area of the potash operation averages 13,000 ft2/day and the storage coefficient is about 4×10⁻⁴. Pumping tests indicate the deep-brine aquifer is a quasi-infinite reservoir. The amount of recharge to the deep-brine aquifer cannot be determined from available data. Discharge is mainly from the wells. Concentration of KCl in the deep-brine aquifer ranges from 0.36% to 0.47%, and MgCl2 from 0.43% to 0.69%. Composition of the brine is relatively constant throughout the aquifer.
The alluvial-fan aquifer is composed of sand and gravel alluvial fans along the flanks of the Silver Island Mountains and the Pilot Range. The alluvial fans are interbedded with fine-grained lacustrine deposits which act as confining layers to the alluvial-fan aquifer. The degree of hydraulic connection between the deep-brine aquifer and the alluvial-fan aquifer is unknown. The degree of connection likely varies, as it is dependent on the continuity between the sand and gravel of the alluvial fans and the conglomerates in the basin fill (Lines 1979). No economic mineable potash is contained in the alluvial-fan aquifer.
| | | | | |
2023 Estimated Resources and Reserves at Intrepid Potash-Wendover
Prepared for Intrepid Potash, Inc.
February 14, 2024 | 50 |
The shallow-brine aquifer consists of both the near-surface carbonate muds and the crystalline halite and gypsum deposits on the surface of the playas. The shallow-brine aquifer yields brine to collection ditches and is the main source of KCl for Intrepid’s potash operation on the BSF. Sand and gravel of the alluvial fans are interbedded with the near-surface carbonate muds of the playas, and hydraulic connection is good. The average thickness of the shallow-brine aquifer is reported to be about 18 ft (Turk 1969; Shaw Environmental, Inc. 2006).
It is believed that most potash dissolved in the shallow-brine aquifer was from the clay underneath the salt crust (Nolan 1927; Turk 1969). The ultimate source of potash was brought to the Bonneville Basin by slow, lateral subsurface water inflow from adjacent sediments during long-term geologic time. Davis (1967) studied the lateral inflow through the periphery of the salt flats and found that fluid gradients there were less than 0.1 ft per mile. Even if the area had a transmissivity of 10,000 gpd/ft, only 1,000 gpd/mile would have moved through the periphery of the salt flats. Thus, the amount of lateral inflow is insignificant compared with the brine extraction rates.
Recharge to the shallow-brine aquifer is largely from local rainfall. Brine levels change seasonally and are influenced by brine production. Turk (1969) found that during the period of 1965–1968, more than a 3-ft variation in brine levels occurred throughout the salt flats. However, during each winter for which there were records, the brine level recovered to the surface. In drier years, the brine level may not recover completely, but winter precipitation can supply significant additional recharge during wet years. Infiltration capacity tests on the playa surface and hydrographs of observation wells indicate that rainfall in excess of 0.1 inch during the summer and 0.05 inch during the winter recharge the area of thickest salt crust; only high rainfall will recharge very moist clay surfaces. Turk (1969) examined daily rainfall records in the salt flats from 1966 to 1967 and found that the rainfall available for recharge averages about 2.3 inches per year, roughly half of the total precipitation. A simple water budget study from the period 1990–2006 can verify that rainfall recharge is sufficient for the shallow-brine aquifer to remain at a constant brine level. Average annual rainfall during this period was 4.75 inches; therefore, rechargeable rainfall in the mining area is estimated at more than 7.5 billion gallons. Pumping records for that period show that the annual brine extracted from the shallow-brine aquifer was about 3.4 billion gallons, 55% less than rainfall recharge.
13.2Production Rates, Expected Mine Life, and Mining Dilution and Recovery Factors
Since 1968, approximately 67,000 t of KCl, 31,000 t of NaCl, and 156,000 t of MgCl2 were produced each year. The life expectancy is greater than 25 years. The final mine outline is shown in Figure 13-2. The production schedule is included in Table 13-1.
13.3Equipment Fleet and Personnel Required
The predominant equipment to move the salt from the evaporation ponds to processing plant are scrapers. Personnel requirements are minimal (59 personnel) when compared to conventional mining.
| | | | | |
2023 Estimated Resources and Reserves at Intrepid Potash-Wendover
Prepared for Intrepid Potash, Inc.
February 14, 2024 | 51 |
Figure 13-2. Final Mine Outline
| | | | | |
2023 Estimated Resources and Reserves at Intrepid Potash-Wendover
Prepared for Intrepid Potash, Inc.
February 14, 2024 | 52 |
Table 13-1. Mine Production Schedule Calendar
| | | | | | | | | | | | | | | | | | | | | | | |
| | A | B | C | D | E | F |
| | Brine Volume (Million Gallons) | Brine Grade
(%K2O) | K2O
(Tons) | Product KCl
(Tons) | Handling Losses (Tons) | MOP
(Tons) |
| 2024 | Year 1 | 4,500 | 0.5 | | 27,800 | 46,300 | 1,300 | 45,000 |
| 2025 | Year 2 | 6,500 | 0.5 | | 40,100 | 66,800 | 1,800 | 65,000 |
| 2026 | Year 3 | 7,000 | 0.5 | | 43,200 | 72,000 | 2,000 | 70,000 |
| 2027 | Year 4 | 7,000 | 0.5 | | 43,200 | 72,000 | 2,000 | 70,000 |
| 2028 | Year 5 | 7,000 | 0.5 | | 43,200 | 72,000 | 2,000 | 70,000 |
| 2029 | Year 6 | 7,000 | 0.5 | | 43,200 | 72,000 | 2,000 | 70,000 |
| 2030 | Year 7 | 7,000 | 0.5 | | 43,200 | 72,000 | 2,000 | 70,000 |
| 2031 | Year 8 | 7,000 | 0.5 | | 43,200 | 72,000 | 2,000 | 70,000 |
| 2032 | Year 9 | 7,000 | 0.5 | | 43,200 | 72,000 | 2,000 | 70,000 |
| 2033 | Year 10 | 7,000 | 0.5 | | 43,200 | 72,000 | 2,000 | 70,000 |
| 2034 | Year 11 | 7,000 | 0.5 | | 43,200 | 72,000 | 2,000 | 70,000 |
| 2035 | Year 12 | 7,000 | 0.5 | | 43,200 | 72,000 | 2,000 | 70,000 |
| 2036 | Year 13 | 7,000 | 0.5 | | 43,200 | 72,000 | 2,000 | 70,000 |
| 2037 | Year 14 | 7,000 | 0.5 | | 43,200 | 72,000 | 2,000 | 70,000 |
| 2038 | Year 15 | 7,000 | 0.5 | | 43,200 | 72,000 | 2,000 | 70,000 |
| 2039 | Year 16 | 7,000 | 0.5 | | 43,200 | 72,000 | 2,000 | 70,000 |
| 2040 | Year 17 | 7,000 | 0.5 | | 43,200 | 72,000 | 2,000 | 70,000 |
| 2041 | Year 18 | 7,000 | 0.5 | | 43,200 | 72,000 | 2,000 | 70,000 |
| 2042 | Year 19 | 7,000 | 0.5 | | 43,200 | 72,000 | 2,000 | 70,000 |
| 2043 | Year 20 | 7,000 | 0.5 | | 43,200 | 72,000 | 2,000 | 70,000 |
| 2044 | Year 21 | 7,000 | 0.5 | | 43,200 | 72,000 | 2,000 | 70,000 |
| 2045 | Year 22 | 7,000 | 0.5 | | 43,200 | 72,000 | 2,000 | 70,000 |
| 2046 | Year 23 | 7,000 | 0.5 | | 43,200 | 72,000 | 2,000 | 70,000 |
| 2047 | Year 24 | 7,000 | 0.5 | | 43,200 | 72,000 | 2,000 | 70,000 |
| 2048 | Year 25 | 7,000 | 0.5 | | 43,200 | 72,000 | 2,000 | 70,000 |
| *Numbers rounded for clarity |
| Sylvinite brine density - 1.16 |
| Overall pond recovery - 30% |
| KCl plant recovery - 85% |
| Product purity - 95% |
| Pure KCl equates to 63.17% K2O by mass |
| Handling losses - 3% |
| C = A*1,000,000*1.16*8.34/2000*(B/100)*0.85*0.3 |
| D = C/0.6317/0.95 |
| E = D*0.03 |
| F = D-E |
| | | | | |
2023 Estimated Resources and Reserves at Intrepid Potash-Wendover
Prepared for Intrepid Potash, Inc.
February 14, 2024 | 53 |
14.0Processing and Recovery Methods
The potash content of the collected brine is concentrated by solar evaporation to the point that solids are precipitated and can be collected. Harvested solid salts are hauled to the potash processing facility, where they are dried, sized, and stored for shipment as potash, MRS, and NaCl. MgCl2-rich brines are transferred to the MgCl2 ponds and processed in the Carnallite Plant.
14.1Process Description
The Intrepid-Wendover potash plant processes a nominal 7 billion gallons per year of deep-well and near-surface brines. The combined brines are estimated to contain 0.8–0.9 wt% KCl, 18 wt% NaCl, 4.2 wt% MgCl2 and all brines are near-saturated with gypsum (CaSO4) at 0.5–0.6 wt%. The simplified process flow chart is shown in Figure 14-1.
Figure 14-1. Simplified Process Flow Chart
The first step in processing is the solar evaporation in the pond system (Figure 14-2). The Intrepid-Wendover operation production is weather-dependent, most specifically rainfall. Anecdotally a wet winter increases potash production but produces diluted MgCl2, which limits
| | | | | |
2023 Estimated Resources and Reserves at Intrepid Potash-Wendover
Prepared for Intrepid Potash, Inc.
February 14, 2024 | 54 |
production of Road Saver brine. The annual precipitation ranges from 1.6 inches to 10.4 inches with an average of 4.8 inches. Low rainfall levels result in a drop in the lake brine level and result in low flows of brine
Pond operation is challenging. Primary Pond 6, for example, is large providing 7,800 acres for evaporation. Initially when flooded with weak brine, the large pond area allows rapid concentration of the weak brine. Once concentration is reached, the challenge is to not over-concentrate. The operators manage the concentration of KCl by controlling the path of the brine through Primary Pond 6 and therefore, reducing evaporation time. Primary Ponds have a service life of approximately 10 – 20 years due to salt deposition. New Primary Ponds are constructed as necessary to allow for sufficient brine storage and evaporation to support the 25 year mine plan.
The plant data and mass balance vary with the weather, but clearly the pond berms are very permeable, and 65–70% of the KCl pumped into the Primary Pond returns to the lake via leakage. With a mill recovery of 85%, it is estimated that only 30% of the KCl entering the Primary Pond is recovered as final product. Leakage becomes more costly as the brine concentrates. The downstream ponds have clay berms, and Harvest Pond 2 has a liner.
As brine advances towards the Harvest ponds, KCl and MgCl2 concentrations increase, while NaCl is being deposited. Initially halite and gypsum precipitate. By the time the brine has reached the Harvest ponds, the MgCl2 concentration has increased to 5.5%, KCl has climbed to 4.5%, and NaCl has fallen to 6.4%. During preliminary evaporation, almost 3.5 Mt of halite have been removed from the brine. In the Harvest ponds, KCl falls to 3%, NaCl to 1.5%, and MgCl2 rises to 21%. Approximately 265,000 t of crystal are harvested at 28% KCl. The harvesting is conducted for up to 10 months out of the year and 5 days per week, which matches the mill operating schedule.
The brine leaving the Harvest ponds is delivered to the Carnallite ponds. The brine concentrates to about 26% MgCl2, which results in the co-crystallization of halite and carnallite (MgCl2•KCl•6H2O). The crystal production is near 180,000 tpy, including 38,000 tpy of contained KCl. The KCl is separated from the MgCl2 by leaching with a near KCl-saturated combination of mill brine and brackish water. The KCl/NaCl crystal is separated by screening and is either dissolved and returned to the Harvest pond area or is used to create an excavation bed for the next Harvest season. The brine from the Carnallite dissolution step is recycled to the Carnallite ponds. The MgCl2 brine leaving the Carnallite ponds is either returned to the lake via ditch or is forwarded to the MgCl2 ponds to be further concentrated by evaporation and is shipped by truck or rail carloads.
The harvested crystal is delivered to an agitated slurry pit where it is re-pulped in double-saturated brine and pumped to the processing facility. The crystals are statically screened with the oversize processed through a crusher. The screened crystal is combined with reagents and fed to flotation cells.
| | | | | |
2023 Estimated Resources and Reserves at Intrepid Potash-Wendover
Prepared for Intrepid Potash, Inc.
February 14, 2024 | 55 |
The rougher flotation concentrate is sent to the agitated leach tank. The leached solids are at a product grade of 95% KCl with 60.5% K2O. The solids are dried, sampled, and conveyed to storage bins prior to the granulation circuit. The dried product is granulated and sent to the final product storage. The product is shipped to market in trucks or rail cars. Typical KCl production is 50,000 to 80,000 tpy.
Figure 14-2. Solar Evaporation Pond Layout
14.2Energy, Water, Process Materials, and Personnel Requirements
Brackish water consumption is estimated at 3.5 billion gallons per year. Solar plants typically have low energy requirements. Process materials are readily available within the greater Salt Lake City area, and personnel are sourced locally and trained as needed.
| | | | | |
2023 Estimated Resources and Reserves at Intrepid Potash-Wendover
Prepared for Intrepid Potash, Inc.
February 14, 2024 | 56 |
15.0Infrastructure
A robust set of infrastructure is in place for Intrepid-Wendover. Propane, electricity, and water have historically been readily available and are expected to continue into the future. The layout of the infrastructure is shown in Figure 15-1.
| | | | | |
2023 Estimated Resources and Reserves at Intrepid Potash-Wendover
Prepared for Intrepid Potash, Inc.
February 14, 2024 | 57 |
Figure 15-1. Layout of the Infrastructure
| | | | | |
2023 Estimated Resources and Reserves at Intrepid Potash-Wendover
Prepared for Intrepid Potash, Inc.
February 14, 2024 | 58 |
16.0Market Studies
Price projections are based on a combination of historic pricing trends and expectations of future potash consumption and production. Intrepid uses a variety of sources including, but not limited to, industry reports, company announcements, third-party market studies, and internal estimates when establishing a forecasted price. Intrepid compares its historic realized pricing to widely available benchmark prices, specifically the Midwest Warehouse potash price and the U.S. New Orleans Louisiana (“NOLA”) Barge Market potash price, to establish a historic price differential which it uses when analyzing future price expectations.
| | | | | |
2023 Estimated Resources and Reserves at Intrepid Potash-Wendover
Prepared for Intrepid Potash, Inc.
February 14, 2024 | 59 |
17.0Environmental Studies, Permitting, and Plans
17.1Environmental Studies
An Environmental Assessment for the Intrepid Potash-Wendover Mine and Reclamation Plan Modification was conducted by the BLM (2012).
17.2Waste and Tailings Disposal, Site Monitoring, and Water Management during and after Mine Closure
In a voluntary effort to enhance the salt crust on the BSF, Intrepid-Wendover participates in a salt laydown project by pumping brine north of I-80. There is no tailings disposal on site. Surface and groundwater monitoring follows a state-approved plan.
17.3Permitting Status and Reclamation Bonds
The permitting status and reclamation bond are listed in Table 17-1.
17.4Agreements with Local Individuals
There are no specific agreements in place with local individuals.
17.5Closure Plans
Closure activities include the requirements of filling ditches, removing berms, facility removal, resurveying public lands, and plugging wells.
17.6Adequacy of Current Plans and Compliance
Intrepid-Wendover is in operation and in adherence with local, state, and federal regulations. It is the opinion of the QP that the current plans for environmental compliance, permitting, and addressing issues with local groups are adequate.
| | | | | |
2023 Estimated Resources and Reserves at Intrepid Potash-Wendover
Prepared for Intrepid Potash, Inc.
February 14, 2024 | 60 |
Table 17-1. Permitting Status
| | | | | | | | | | | | | | | | | | | | |
| | | | | | |
| Common Name | Issuing Agency | Permit ID | Effective Date | Expiration Date | Bond Value | Note |
| Air Permit | Utah Division of Air Quality | Approval Order #:
DAQ-2019-009605
(DAQE-AN107420014-19) | 22-Jul-19 | None | | |
| Storm Water Pollution Prevention Plan | Utah Division of Water Quality | Permit No.: UTR262329 | 1-Jan-23 | 31-Dec-28 | | The renewal process takes place every 5 years. |
| Spill Response Plan | Self-Issued | | Amended 20-Apr-2012 | Next Review due March 2025 | | Prepared by Hill West Environmental, February 2010. |
| Fugitive Dust Control Plan (FDCP) | Utah Division of Air Quality | | 29-Jun-15 | None | | |
| Solid and Hazardous Waste Management Plan | Self-Issued | | Dec-12 | None | | [Not a permit, IPW is a Very Small Quantity Generator] |
| Mine and Reclamation Plan | Utah Division of Oil Gas and Mining | Notice of Intentions to Revise Mining Operations, File No.: M-0450002 | 11-Dec-14 | LOM with periodic reviews every 5 years. Next review due 2024. | $8,904,000 | |
| XRF license | Utah Division of Waste Management and Radiation Control | X-Ray
Registration No. 3084 | 31-Dec-21 | 4-Apr-2024 | | Division to inspect every 5 years. |
| | | | | | |
| | | | | |
2023 Estimated Resources and Reserves at Intrepid Potash-Wendover
Prepared for Intrepid Potash, Inc.
February 14, 2024 | 61 |
18.0Capital and Operating Costs
18.1Capital Cost Estimate
Major capital has been allocated to the 25 year mine plan. This includes a new DBW in year 3 ($3M) and the addition of Primary Ponds in years 10 and 20 ($5M each). Reclamation costs are included as capital in Year 25 of $8.2M.
18.2Operating Cost Estimate
The operating cost at Intrepid-Wendover based on historic actual expenses, is estimated to be $286/t as shown in Table 18-1. The largest operating cost is labor at 40% of the annual operating cost. Natural gas, electricity, and fuel represents less than 14% of the total operating cost.
Table 18-1. Operating Cost Estimate (next 5 years)
| | | | | | | | |
| | |
| Cost Category | Cost ($/Product Ton) | Cost Distribution |
| Labor | $113 | 40% |
| Maintenance Supplies | $29 | 10% |
| Energy and Fuels | $40 | 14% |
| Operating Supplies | $43 | 15% |
| Other (Leases, Property Taxes, Insurance, etc.) | $31 | 11% |
| Subtotal | $256 | 89% |
| Warehouse and Handling | $23 | 8% |
| Royalties | $7 | 2% |
| Environmental remediation and other non-inventory costs | $1 | 0.40% |
| Operating Cost | $286 | 100% |
| Less by product revenues | $(94) | |
| Cost of Goods Sold | $192 | |
18.3Accuracy Discussion
Operating costs, including warehouse, handling and royalty expenses are based on historical actual expenses. Because the costs are based on historical actual expenses, the cost estimates are at an accuracy of at least +/- 15%. Capital costs are based on actual bids or recent purchases of capital items plus an inflation factor. The capital costs estimates are at an accuracy of at least +/- 25% and contingency levels are less than 25%.
The reclamation costs are based on the most recent bonding estimates and the asset retirement obligations.
| | | | | |
2023 Estimated Resources and Reserves at Intrepid Potash-Wendover
Prepared for Intrepid Potash, Inc.
February 14, 2024 | 62 |
19.0Economic Analysis
To evaluate the viability of mining the Intrepid-Wendover mines reserves, an economic analysis was conducted. Annual revenue and production cost schedules were used to build a projected cash flow to accompany the mine plan. The costs and sales price parameters were assumed to be in constant US dollars.
19.1Key Assumptions, Parameters, and Methods
The property has a long history of operation at this location. The assumption list for the economic analysis is shown in Table 19-1.
Table 19-1. Economic Analysis Assumptions
| | | | | |
| |
| Parameter | Assumption |
| Potash Sale Price (mine site) | $360/t |
| Shipping Potash | $30/t |
| Potash Production Target | 70,000 tpy |
| Interest Rate | 0–12% APR |
| Income Taxes (State and Federal) | 26% |
19.2Economic Analysis
For a property in operation, economic viability may be implied. The pre-tax cash flow was developed using the production plan continuing as currently operating in Table 19-2. The after-tax cash flow is listed in Table 19-3. The cashflows are shown graphically in Figures 19-1 and 19-2 for pre- and after-tax, respectively. Annual ore production, ore grade and tons of product produced used in both the pre-tax and after-tax cash flow analyses are taken from the annual life of mine production schedule as shown in Section 13: Mining Methods included in this Technical Report Summary. The annual life of mine production schedule provides the calculation of product tons resulting from tons of ore mined and the associated grade of ore mined.
19.3Sensitivity Analysis
NPV sensitivity analyses were run using variants in commodity price and operating costs for the pre-tax cash flow. The results of the sensitivity analysis are shown graphically for pre-tax and after-tax evaluations in Figures 19-1 and 19-2, respectively.
| | | | | |
2023 Estimated Resources and Reserves at Intrepid Potash-Wendover
Prepared for Intrepid Potash, Inc.
February 14, 2024 | 63 |
19.4Discussion
The property has consistently operated at a profit and is expected to continue to operate at a profit.
Table 19-2. Estimated Pre-Tax Cash Flow
| | | | | | | | | | | | | | | | | |
| Five-Year Periods |
| Item | 2024 - 2028 | 2029 - 2033 | 2034 - 2038 | 2039 - 2043 | 2044 - 2048 |
| | | | | |
| Tons of product production | 320,000 | 350,000 | 350,000 | 350,000 | 350,000 |
| | | | | |
| Potash Sales price per ton mine site | $360 | | $360 | | $360 | | $360 | | $360 | |
| Transportation cost per ton | $30 | | $30 | | $30 | | $30 | | $30 | |
| Net sales price per ton | $330 | | $330 | | $330 | | $330 | | $330 | |
| | | | | |
| Period net revenue | $105,600,000 | | $115,500,000 | | $115,500,000 | | $115,500,000 | | $115,500,000 | |
| | | | | |
| Cost per product ton, excluding depreciation | $256 | | $240 | | $240 | | $240 | | $240 | |
| Warehouse & Handling per product ton | $23 | | $22 | | $22 | | $22 | | $22 | |
| Royalties per product ton | $7 | | $7 | | $7 | | $7 | | $7 | |
| Environmental remediation and other non-inventory costs | $1 | | $1 | | $1 | | $1 | | $1 | |
| Less byproduct revenues | ($94) | | ($86) | | ($86) | | ($86) | | ($86) | |
| Operating costs per production ton, excluding depreciation | $192 | | $183 | | $183 | | $183 | | $183 | |
| | | | | |
| Less period operating costs, excluding depreciation | ($61,521,487) | | ($64,058,631) | | ($64,058,631) | | ($64,058,631) | | ($64,058,631) | |
| Less period capital | ($20,500,000) | | ($22,500,000) | | ($17,500,000) | | ($22,500,000) | | ($17,500,000) | |
| Less period remediation | - | | - | | - | | - | | ($8,212,250) | |
| Estimated period pre-tax cashflow | $23,578,513 | | $28,941,369 | | $33,941,369 | | $28,941,369 | | $25,729,119 | |
| | | | | |
2023 Estimated Resources and Reserves at Intrepid Potash-Wendover
Prepared for Intrepid Potash, Inc.
February 14, 2024 | 64 |
Table 19-3. Estimated After-Tax Cash Flow
| | | | | | | | | | | | | | | | | |
| Five-Year Periods |
| Item | 2024 - 2028 | 2029 - 2033 | 2034 - 2038 | 2039 - 2043 | 2044 - 2048 |
| | | | | |
| Tons of product production | 320,000 | 350,000 | 350,000 | 350,000 | 350,000 |
| | | | | |
| Potash Sales price per ton mine site | $360 | | $360 | | $360 | | $360 | | $360 | |
| Transportation cost per ton | $30 | | $30 | | $30 | | $30 | | $30 | |
| Net sales price per ton | $330 | | $330 | | $330 | | $330 | | $330 | |
| | | | | |
| Period net revenue | $105,600,000 | | $115,500,000 | | $115,500,000 | | $115,500,000 | | $115,500,000 | |
| | | | | |
| Cost per product ton, excluding depreciation | $256 | | $240 | | $240 | | $240 | | $240 | |
| Warehouse & Handling per product ton | $23 | | $22 | | $22 | | $22 | | $22 | |
| Royalties per product ton | $7 | | $7 | | $7 | | $7 | | $7 | |
| Environmental remediation and other non-inventory costs | $1 | | $1 | | $1 | | $1 | | $1 | |
| Depreciation and Depletion | $74 | | $69 | | $69 | | $69 | | $69 | |
| Less byproduct revenues | ($94) | | ($86) | | ($86) | | ($86) | | ($86) | |
| Total Operating Costs | $266 | | $252 | | $252 | | $252 | | $252 | |
| | | | | |
| Total operating costs | ($85,266,074) | | ($88,184,891) | | ($88,184,891) | | ($88,184,891) | | ($88,184,891) | |
| | | | | |
| Estimated Pre-tax Income | $20,333,926 | | $27,315,109 | | $27,315,109 | | $27,315,109 | | $27,315,109 | |
| | | | | |
| Estimated Taxes at 26% | ($5,286,821) | | ($7,101,928) | | ($7,101,928) | | ($7,101,928) | | ($7,101,928) | |
| Estimated After Tax Income | $15,047,106 | | $20,213,181 | | $20,213,181 | | $20,213,181 | | $20,213,181 | |
| | | | | |
| Add back Depreciation and Depletion | $23,744,587 | | $24,126,260 | | $24,126,260 | | $24,126,260 | | $24,126,260 | |
| Less period Capital | ($20,500,000) | | ($22,500,000) | | ($17,500,000) | | ($22,500,000) | | ($17,500,000) | |
| Less period Remediation | - | | - | | - | | - | | ($8,212,250) | |
| After-Tax Cash Flow | $18,291,693 | | $21,839,441 | | $26,839,441 | | $21,839,441 | | $18,627,191 | |
| | | | | |
2023 Estimated Resources and Reserves at Intrepid Potash-Wendover
Prepared for Intrepid Potash, Inc.
February 14, 2024 | 65 |
Table 19-4. NPV Pre-Tax Estimate
| | | | | |
| |
| Interest Rate | NPV |
| (% APR) | ($M) |
| 0 | $141 |
| 5 | $79 |
| 8 | $59 |
| 10 | $49 |
| 12 | $42 |
Table 19-5. NPV After-Tax Estimate
| | | | | |
| |
| Interest Rate | NPV |
| (% APR) | ($M) |
| 0 | $107 |
| 5 | $60 |
| 8 | $45 |
| 10 | $38 |
| 12 | $33 |
| | | | | |
2023 Estimated Resources and Reserves at Intrepid Potash-Wendover
Prepared for Intrepid Potash, Inc.
February 14, 2024 | 66 |
Figure 19-1. Pre-Tax NPV Sensitivities (APR 8%)
Figure 19-2. After-Tax NPV Sensitivities (APR 8%)
| | | | | |
2023 Estimated Resources and Reserves at Intrepid Potash-Wendover
Prepared for Intrepid Potash, Inc.
February 14, 2024 | 67 |
Figure 19-3. Estimated Pre-Tax Cash Flow
Figure 19-4. Estimated After-Tax Cash Flow
| | | | | |
2023 Estimated Resources and Reserves at Intrepid Potash-Wendover
Prepared for Intrepid Potash, Inc.
February 14, 2024 | 68 |
20.0Adjacent Properties
Adjacent properties are not applicable at Intrepid-Wendover.
| | | | | |
2023 Estimated Resources and Reserves at Intrepid Potash-Wendover
Prepared for Intrepid Potash, Inc.
February 14, 2024 | 69 |
21.0Other Relevant Data and Information
No additional information is provided.
| | | | | |
2023 Estimated Resources and Reserves at Intrepid Potash-Wendover
Prepared for Intrepid Potash, Inc.
February 14, 2024 | 70 |
22.0Interpretation and Conclusions
Estimates are dependent on data obtained from the natural environment. Although the mine has been in operation for many years, factors such as extended drought or natural disasters could influence the estimates. The general spacing between collection ditches is about 2,600 ft, which may require a period of at least 100 years for the ditches to capture all the potash brine between the ditches. A future mining plan with optimized ditch spacing could affect the recovery factor and reserve estimation.
| | | | | |
2023 Estimated Resources and Reserves at Intrepid Potash-Wendover
Prepared for Intrepid Potash, Inc.
February 14, 2024 | 71 |
23.0Recommendations
No further work is recommended.
| | | | | |
2023 Estimated Resources and Reserves at Intrepid Potash-Wendover
Prepared for Intrepid Potash, Inc.
February 14, 2024 | 72 |
24.0References
Agapito (2007a), “Potash Resource Estimation for Intrepid Potash–Wendover, LLC,” report to Intrepid Potash, 363-10, November, 40 pp.
Agapito (2007b), “Determination of Estimated Probable Reserves at Intrepid Potash–Wendover, LLC,” report to Intrepid Potash, 363-10, November, 40 pp.
Agapito (2010), “Determination of Estimated Probable Potash Reserves at Intrepid Potash–Wendover, LLC,” repot to Intrepid Potash, 363-12, February, 47 pp.
Agapito (2013), “Determination of Estimated Probable Potash Reserves at Intrepid Potash–Wendover, LLC,” report to Intrepid Potash, 363-13, February, 53 pp.
Agapito (2016), “2015 Determination of Estimated Probable Potash Reserves at Intrepid Potash–Wendover, LLC,” report to Intrepid Potash, 363-19, January 22, 66 pp.
Agapito (2019), “2018 Determination of Estimated Probable Reserves at Intrepid Potash–Wendover, LLC,” report to Intrepid Potash, 363-22, January, 65 pp.
Agapito (2021), “Technical Report Summary of 2021 Estimated Resources and Reserves at Intrepid Potash-Wendover, report to Intrepid Potash, 363-28, February, 78 pp.
CFR (2021), “Disclosure by Registrants Engaged in Mining Operations,” § 229.1301, last amended September 1.
Currey, D. R., C. G. Oviatt, and J. E. Czarnomski (1984), “Late Quaternary Geology of Lake Bonneville and Lake Waring,” Geology of Northwest Utah, Southern Idaho, and Northeast Nevada, G. J. Kearns and R. L. Kearns, Jr., (Editors), Utah Geological Association, Publication 13, pp. 227–237.
Davis, S. N. (1967), “Supplementary Report on Brine Production at Bonneville, Utah,” C. E. Bradberry and Associates, Consulting Engineering, private report to Kaiser Aluminum and Chemical Corporation.
Kaiser Aluminum & Chemical Corporation (1974), “Production Plan for Pond System V at Kaiser Aluminum & Chemical Corporation Bonneville Division Wendover, Utah,” submitted to United States Department of the Interior, May 2.
Lines, G. C. (1979), “Hydrology and Surface Morphology of the Bonneville Salt Flats and Pilot Valley Playa, Utah,” United States Government Printing Office, Washington.
Mason (1998), “Hydrology of the Bonneville Salt Flats, Northwestern Utah, and Simulation of Ground-Water Flow and Solute Transport in the Shallow-Brine Aquifer,” U.S. Geological Survey Professional Paper 1585, 120 pp.
| | | | | |
2023 Estimated Resources and Reserves at Intrepid Potash-Wendover
Prepared for Intrepid Potash, Inc.
February 14, 2024 | 73 |
Nolan, T. B. (1927), “Potash Brines in the Great Salt Lake Desert, Utah,” U.S. Geologic Survey Bulletin 795-B.
Oviatt, C. G., D. R. Currey, and D. Sack (1992), “Radiocarbon Chronology of Lake Bonneville, Eastern Great Basin, USA, Palaeogeogr. Palaeoclimatol. Palaeoecol. 99:225–241.
RESPEC (2023) Technical Report Summary of REVISED 2021 Estimated Resources and Reserves at Intrepid Potash-Wendover, report to Intrepid Potash, 82 pp.
SEC (2008), “Industry Guides,” OMB Number 3235-0069, 33 pp.
Shaw Environmental, Inc. (2006), “Mine and Reclamation Plan Intrepid Potash-Wendover, LLC Potash Mine,” submitted to Bureau of Land Management State Office-Utah on Behalf of Intrepid Potash-Wendover, LLC, June 15.
SME (2017), “A Guide for Reporting Exploration Information, Minerals Resources, and Mineral Reserves,” July 17, 97 pp.
Turk, L. J. (1969), “Hydrogeology of the Bonneville Salt Flats, Utah: Ph.D. Dissertation,” Stanford University.
US Department of Interior Bureau of Land Management, (2012), Environmental Assessment UT-020-2006-002 “Intrepid Potash Mine and Reclamation Plan (Modification), August 12.
| | | | | |
2023 Estimated Resources and Reserves at Intrepid Potash-Wendover
Prepared for Intrepid Potash, Inc.
February 14, 2024 | 74 |
25.0Reliance on Information
The QP relied on information provided by Intrepid and Intrepid-Wendover.