[Letterhead of Wachtell, Lipton, Rosen & Katz]
June 18, 2008
H. Roger Schwall
Division of Corporate Finance
Securities and Exchange Commission
100 F Street, N.E.
Washington, D.C. 20549-7010
| Re: | Noranda Aluminum Holding Corporation |
Registration Statement on Form S-1
Filed May 8, 2008
File No. 333-150760
Dear Mr. Schwall:
As indicated in our letter dated June 18, 2008, we are writing on behalf of Noranda Aluminum Holding Corporation (the “Company”) in response to the Staff of the Securities and Exchange Commission’s letter (the “Comment Letter”) dated June 6, 2008, regarding the Company’s Registration Statement on Form S-1 (the “Registration Statement”). The Company is submitting the enclosed materials in response to comment no. 13 set forth in the Comment Letter.
For your convenience, comment no. 13 is set forth below in bold, followed by the responses that are being provided on behalf of the Company and references to the enclosed supplemental information from third parties sources that the Company uses to support certain statements in the Registration Statement.
June 18, 2008
Page 2
| 13. | We note a number of statements throughout this section and other sections of the registration statement for which you provide no objective, third-party support. Please provide for all unsupported statements a reference to a source that supports the statement. The following are some examples of unsupported statements: |
| • | We are a leading North American vertically integrated producer of value-added primary aluminum product and high quality rolled aluminum coils” on page 1; |
| • | “Our upstream business currently produces approximately 571 million pounds (259,000 metric tons) of primary aluminum annually, accounting for approximately 10% of total United States primary aluminum production” on page 1; |
| • | “Our downstream business, consisting of four rolling mill facilities with a combined annual production capacity of approximately 495 million pounds, is one of the largest aluminum foil producers in North America” on page 1; |
| • | “We own and operate one of the most modern and widest rolling mills in the world” on page 2; |
| • | “New Madrid has a secure supply of alumina from Gramercy at a net cost...50% below recent spot market prices…Gramercy has a secure long-term supply of bauxite from St. Ann whose cash cost is approximately 45% below current contracted market prices…” on page 4; |
| • | “Our downstream business’s largest rolling mill, the Huntingdon-West facility, is recognized as the fastest widest and most modern rolling facility in North America” on page 4; and |
| • | “The use of joint labor management safety team at each of our manufacturing facilities has led to a safety record which places us in the top quartile of domestic aluminum producers” on page 5. |
“We are a leading North American vertically integrated producer of value-added primary aluminum product and high quality rolled aluminum coils.”
The Company respectfully advises the Staff that the Company believes the statement, “we are a leading North American vertically integrated producer of value-added primary aluminum products and high quality rolled aluminum coils” to be true based on the following smelter statistics provided by Brook Hunt, a leading international mining and metals consulting firm: (i) the Company’s smelter in New Madrid ranks 4th (out of 14) among United States smelters in primary aluminum production; (ii) the Company’s New Madrid smelter ranks 3rd (out of 14) among United States smelters in cash costs; and (iii) the Company’s primary aluminum production accounts for approximately 10% of the United States production.
“Our upstream business currently produces approximately 571 million pounds (259,000 metric tons) of primary aluminum annually, accounting for approximately 10% of total United States primary aluminum production.”
June 18, 2008
Page 3
Please seeAttachment No. 1 containing data from Brook Hunt supporting the statement that the upstream business accounts for “approximately 10% of total United States primary aluminum production.”
“Our downstream business, consisting of four rolling mill facilities with a combined annual production capacity of approximately 495 million pounds, is one of the largest aluminum foil producers in North America.”
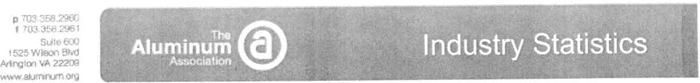
Please seeAttachment No. 2 containing data from The Aluminum Association Industry Statistics supporting the statement, “one of the largest foil producers in North America.” According to these statistics, we are one of five companies that account for approximately 97% of total industry foil production, supporting our statement that we are “one of the largest foil producers in North America.”
“We own and operate one of the most modern and widest rolling mills in the world.”
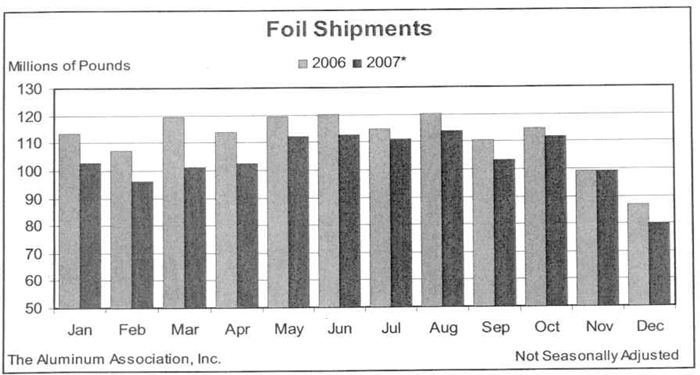
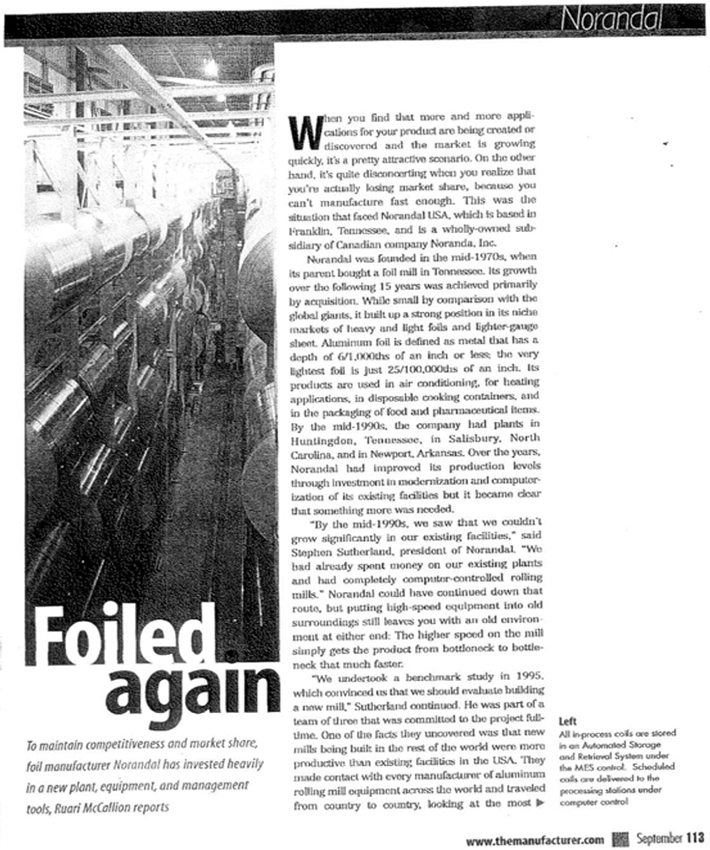
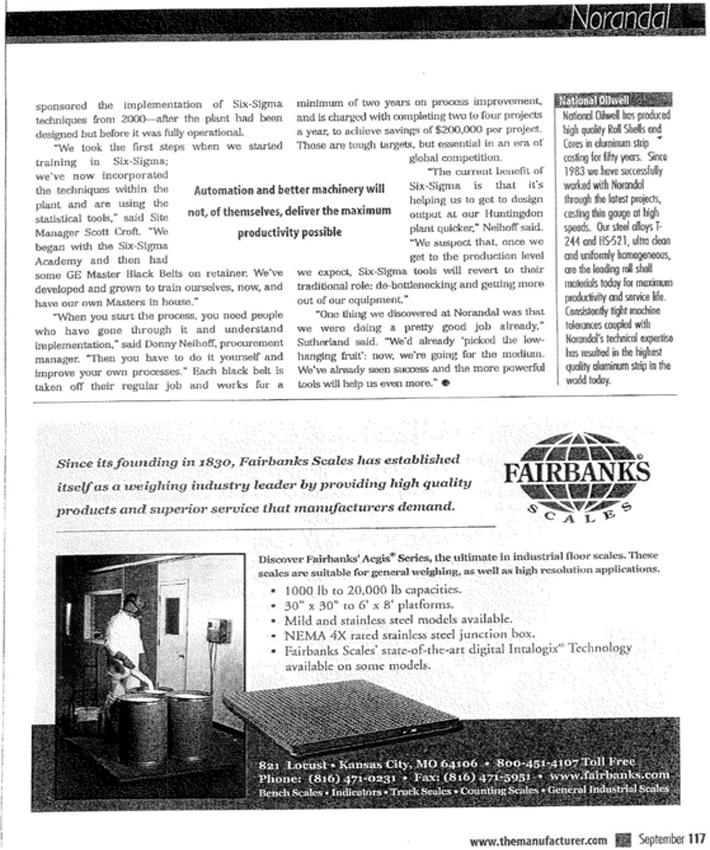
The Company respectfully advises the Staff that it has revised its disclosure to refer to Huntingdon-West as “one of the most modern rolling mills in the world.” Please seeAttachment No. 3 containing an article from “The Manufacturer,” stating “The most advanced machinery available was built to [the Company]’s specifications by manufacturers in France and Germany.” Thus, when the Huntingdon-West facility was built, according to “The Manufacturer,” it was the most modern facility. No rolling mill facilities have been built in North America since Huntingdon-West; therefore, it remains “the most modern rolling facility in North America.”
“New Madrid has a secure supply of alumina from Gramercy at a net cost...50% below recent spot market prices…Gramercy has a secure long-term supply of bauxite from St. Ann whose cash cost is approximately 45% below current contracted market prices…”
The Company respectfully advises the Staff that it has revised the above disclosure to read as follows: “New Madrid has a secure supply of alumina from Gramercy at a net cost...significantly below recent spot market prices…Gramercy has a secure long-term supply of bauxite from St. Ann whose cash cost is significantly below current contracted market prices…”
Please see theAttachment No. 4 containing data from industry sources regarding spot market prices.
“The use of joint labor management safety team at each of our manufacturing facilities has led to a safety record which places us in the top quartile of domestic aluminum producers.”
The Company respectfully advises the Staff that it has revised the above disclosure to read as follows: “For the two year period ending December 31, 2007, the number of reportable incidents for our consolidated company decreased by more than 40%.”
June 18, 2008
Page 4
Please see the chart below containing data pertaining to the number of reportable incidents at the Company for 2005 and 2007:
| 2005 | 2007 | |||
NEW MADRID | ||||
Incident | 88 | 40 | ||
Hours | 2,298,862 | 2,252,576 | ||
NORANDAL | ||||
Incident | 22 | 22 | ||
Hours | 1,766,657 | 1,708,675 | ||
Total Incident | 110 | 62 | ||
Total Hours | 4,065,519 | 3,961,251 | ||
RIF | 5.41 | 3.13 |
* * * * *
Should you have any questions in connection with the enclosed materials, please contact the undersigned at (212) 403-1000.
| Sincerely, |
/s/ Andrew J. Nussbaum |
cc: Alan K. Brown (Noranda Aluminum Holding Corporation)
ATTACHMENT NO. 1
Source: Brook Hunt
Rank | Name | Country | Production (kt/a)| | ||||
| 1 | Warrick | USA | 267.0 | ||||
| 2 | Rockdale | USA | 267.0 | ||||
| 3 | Hannibal | USA | 260.0 | ||||
| 4 | New Madrid | USA | 250.0 | (a) | |||
| 5 | Hawesville | USA | 244.0 | ||||
| 6 | Mount Holly | USA | 228.0 | ||||
| 7 | Alcoa | USA | 220.0 | ||||
| 8 | Sebree | USA | 196.0 | ||||
| 9 | Ferndale | USA | 185.0 | ||||
| 10 | Ravenswood | USA | 170.0 | ||||
| 11 | Massena West | USA | 138.0 | ||||
| 12 | Massena East | USA | 123.0 | ||||
| 13 | Wenatchee | USA | 110.0 | ||||
| 14 | Columbia Falls | USA | 68.0 | ||||
| Total | 2726.0 | ||||||
| New Madrid | 250.0 | ||||||
| Total Production | 2726.0 | ||||||
| New Madrid % of US Production | 9.1709 | % | |||||
| (a) | Our actual production is 259. The difference is not material to the calculation. |
Flexed 2008 Aluminium Smelters League ranked on Cash Cost (C1) ($/t)
| Using Scenario - 2007 Scenario | ||||||||||||||||||||||||
Rank | Name | Country | Production (kt/a)| | Cumulative Production | % Lower | Centile | Average Delivered Alumina Cost ($/t) | Other Raw Materials Cost ($/t) | Total Energy Cost ($/t) | Labour Cost ($/t) | Total Other Costs ($/t) | Cash Cost (C1) ($/t) | ||||||||||||
| 1 | Zhaofeng | China | 190.0 | 190 | 0.0 | 0.5 | 308 | 142 | 628 | 13 | 83 | 1174 | ||||||||||||
| 2 | Khakas | Russia | 300.0 | 490 | 0.5 | 0.7 | 693 | 148 | 209 | 32 | 110 | 1192 | ||||||||||||
| 3 | Nanshan | China | 350.0 | 840 | 1.2 | 0.8 | 386 | 147 | 579 | 17 | 69 | 1198 | ||||||||||||
| 4 | Shanxi Huaze | China | 280.0 | 1120 | 2.0 | 0.7 | 416 | 137 | 561 | 12 | 77 | 1204 | ||||||||||||
| 5 | Angul | India | 359.0 | 1479 | 2.7 | 0.9 | 365 | 203 | 369 | 67 | 207 | 1212 | ||||||||||||
| 6 | Mozal | Mozambique | 564.0 | 2043 | 3.5 | 1.3 | 645 | 153 | 242 | 60 | 125 | 1225 | ||||||||||||
| 7 | Pavlodar | Kazakhstan | 88.0 | 2131 | 4.9 | 0.2 | 375 | 465 | 184 | 51 | 160 | 1235 | ||||||||||||
| 8 | Irkutsk (P) | Russia | 133.0 | 2264 | 5.1 | 0.3 | 536 | 394 | 177 | 49 | 110 | 1267 | ||||||||||||
| 9 | Pingguo | China | 165.0 | 2429 | 5.4 | 0.4 | 327 | 129 | 692 | 27 | 96 | 1272 | ||||||||||||
| 10 | Nag Hammadi (P) | Egypt | 270.0 | 2699 | 5.8 | 0.6 | 694 | 164 | 288 | 31 | 102 | 1279 | ||||||||||||
| 11 | Sayansk | Russia | 533.0 | 3232 | 6.5 | 1.3 | 696 | 119 | 187 | 48 | 232 | 1281 | ||||||||||||
| 12 | Grande Baie | Canada | 207.0 | 3439 | 7.7 | 0.5 | 603 | 177 | 116 | 233 | 162 | 1291 | ||||||||||||
| 13 | Ikot Abasi | Nigeria | 98.0 | 3537 | 8.2 | 0.2 | 639 | 195 | 300 | 82 | 75 | 1291 | ||||||||||||
| 14 | Oman Project | Oman | 128.0 | 3665 | 8.5 | 0.3 | 654 | 160 | 252 | 147 | 84 | 1297 | ||||||||||||
| 15 | Alba | Bahrain | 860.0 | 4525 | 8.8 | 2.1 | 669 | 172 | 264 | 112 | 80 | 1297 | ||||||||||||
| 16 | Alma | Canada | 415.0 | 4940 | 10.8 | 1.0 | 595 | 168 | 331 | 125 | 89 | 1308 | ||||||||||||
| 17 | Puerto Madryn | Argentina | 390.0 | 5330 | 11.8 | 0.9 | 620 | 172 | 326 | 57 | 134 | 1309 | ||||||||||||
| 18 | Chiping Xinfa | China | 360.0 | 5690 | 12.7 | 0.9 | 363 | 161 | 699 | 15 | 84 | 1323 | ||||||||||||
| 19 | Hillside | South Africa | 710.0 | 6400 | 13.6 | 1.7 | 591 | 141 | 464 | 49 | 86 | 1331 | ||||||||||||
| 20 | Kuala Tanjung | Indonesia | 254.0 | 6654 | 15.3 | 0.6 | 646 | 170 | 258 | 80 | 185 | 1340 | ||||||||||||
| 21 | Renukoot | India | 369.0 | 7023 | 15.9 | 0.9 | 475 | 225 | 492 | 49 | 125 | 1365 | ||||||||||||
| 22 | Dubal | United Arab Emirates | 935.0 | 7958 | 16.8 | 2.2 | 622 | 165 | 344 | 114 | 125 | 1369 | ||||||||||||
| 23 | Krasnoyarsk | Russia | 985.0 | 8943 | 19.0 | 2.4 | 677 | 209 | 217 | 50 | 221 | 1375 | ||||||||||||
| 24 | Henan Wanji | China | 350.0 | 9293 | 21.4 | 0.8 | 330 | 148 | 803 | 16 | 81 | 1377 | ||||||||||||
| 25 | Dunkerque | France | 260.0 | 9553 | 22.2 | 0.6 | 616 | 148 | 322 | 133 | 161 | 1380 | ||||||||||||
| 26 | Bratsk | Russia | 1000.0 | 10553 | 22.8 | 2.4 | 680 | 206 | 198 | 63 | 244 | 1391 | ||||||||||||
| 27 | Korba (P) | India | 260.0 | 10813 | 25.2 | 0.6 | 485 | 235 | 535 | 48 | 91 | 1394 | ||||||||||||
| 28 | Laterrière | Canada | 228.0 | 11041 | 25.9 | 0.5 | 602 | 332 | 110 | 182 | 177 | 1403 | ||||||||||||
| 29 | Venalum | Venezuela | 440.0 | 11481 | 26.4 | 1.1 | 596 | 173 | 347 | 101 | 230 | 1446 | ||||||||||||
| 30 | Aluminio | Brazil | 480.0 | 11961 | 27.5 | 1.1 | 501 | 217 | 441 | 105 | 189 | 1452 | ||||||||||||
| 31 | Guizhou | China | 480.0 | 12441 | 28.6 | 1.1 | 365 | 132 | 824 | 13 | 131 | 1466 | ||||||||||||
| 32 | Jharsuguda | India | 30.0 | 12471 | 29.7 | 0.1 | 485 | 235 | 586 | 64 | 110 | 1479 | ||||||||||||
| 33 | Mosjøen (P) | Norway | 188.0 | 12659 | 29.8 | 0.4 | 567 | 174 | 458 | 149 | 135 | 1483 | ||||||||||||
| 34 | Tomago | Australia | 550.0 | 13209 | 30.3 | 1.3 | 604 | 145 | 440 | 131 | 169 | 1489 | ||||||||||||
| 35 | Sunndalsøra (P) | Norway | 360.0 | 13569 | 31.6 | 0.9 | 604 | 156 | 439 | 129 | 168 | 1495 | ||||||||||||
| 36 | Beauharnois | Canada | 52.0 | 13621 | 32.4 | 0.1 | 611 | 222 | 148 | 312 | 204 | 1497 | ||||||||||||
| 37 | Kandalaksha | Russia | 75.0 | 13696 | 32.6 | 0.2 | 500 | 342 | 315 | 93 | 250 | 1499 | ||||||||||||
| 38 | Edéa | Cameroon | 95.0 | 13791 | 32.7 | 0.2 | 618 | 222 | 358 | 97 | 206 | 1502 | ||||||||||||
| 39 | Portland | Australia | 365.0 | 14156 | 33.0 | 0.9 | 630 | 163 | 360 | 167 | 184 | 1504 | ||||||||||||
| 40 | Boyne Island | Australia | 560.0 | 14716 | 33.8 | 1.3 | 617 | 158 | 384 | 164 | 188 | 1511 | ||||||||||||
| 41 | Shawinigan | Canada | 99.0 | 14815 | 35.2 | 0.2 | 605 | 216 | 148 | 347 | 201 | 1518 | ||||||||||||
| 42 | Alouette | Canada | 570.0 | 15385 | 35.4 | 1.4 | 623 | 168 | 483 | 130 | 116 | 1520 | ||||||||||||
| 43 | Bayside (P) | South Africa | 112.0 | 15497 | 36.8 | 0.3 | 594 | 184 | 473 | 83 | 207 | 1541 | ||||||||||||
| 44 | Weiqiao | China | 430.0 | 15927 | 37.1 | 1.0 | 403 | 140 | 910 | 13 | 78 | 1545 | ||||||||||||
| 45 | Fjardaal | Iceland | 340.0 | 16267 | 38.1 | 0.8 | 651 | 475 | 288 | 72 | 73 | 1559 | ||||||||||||
| 46 | Alcasa | Venezuela | 185.0 | 16452 | 38.9 | 0.4 | 594 | 166 | 362 | 211 | 237 | 1570 | ||||||||||||
| 47 | Deschambault | Canada | 250.0 | 16702 | 39.3 | 0.6 | 594 | 168 | 505 | 157 | 160 | 1585 | ||||||||||||
| 48 | Årdal (P) | Norway | 180.0 | 16882 | 39.9 | 0.4 | 611 | 199 | 344 | 242 | 190 | 1587 | ||||||||||||
| 49 | Irkutsk (S) | Russia | 299.0 | 17181 | 40.4 | 0.7 | 538 | 395 | 208 | 195 | 253 | 1590 | ||||||||||||
| 50 | Grundartangi | Iceland | 260.0 | 17441 | 41.1 | 0.6 | 663 | 372 | 307 | 89 | 168 | 1598 | ||||||||||||
| 51 | Hawesville | USA | 244.0 | 17685 | 41.7 | 0.6 | 532 | 209 | 508 | 226 | 125 | 1599 | ||||||||||||
| 52 | Jonquière (P) | Canada | 165.0 | 17850 | 42.3 | 0.4 | 676 | 182 | 135 | 394 | 216 | 1603 | ||||||||||||
| 53 | Uralsk | Russia | 135.0 | 17985 | 42.7 | 0.3 | 459 | 209 | 570 | 102 | 265 | 1605 | ||||||||||||
| 54 | Novokuznetsk | Russia | 320.0 | 18305 | 43.0 | 0.8 | 654 | 205 | 346 | 113 | 290 | 1608 | ||||||||||||
| 55 | Point Henry | Australia | 190.0 | 18495 | 43.8 | 0.5 | 602 | 165 | 380 | 227 | 236 | 1610 | ||||||||||||
| 56 | Wenatchee | USA | 110.0 | 18605 | 44.2 | 0.3 | 610 | 211 | 333 | 260 | 197 | 1611 | ||||||||||||
| 76 | New Madrid | USA | 250.0 | 18855 | 44.5 | 0.6 | 534 | 180 | 540 | 207 | 153 | 1614 | ||||||||||||
Flexed 2008 Aluminium Smelters League ranked on Cash Cost (C1) ($/t)
| ||||||||||||||||||||||||
| Using Scenario - 2007 Scenario | ||||||||||||||||||||||||
Rank | Name | Country | Production (kt/a)| | Cumulative Production | % Lower | Centile | Average Delivered Alumina Cost ($/t) | Other Raw Materials Cost ($/t) | Total Energy Cost ($/t) | Labour Cost ($/t) | Total Other Costs ($/t) | Cash Cost (C1) ($/t) | ||||||||||||
| 57 | Tursunzade | Tajikistan | 425.0 | 19030 | 44.5 | 1.0 | 662 | 356 | 339 | 72 | 185 | 1614 | ||||||||||||
| 58 | Ziar Nad Hronom (P) | Slovak Republic | 158.0 | 19188 | 45.5 | 0.4 | 754 | 178 | 471 | 85 | 136 | 1624 | ||||||||||||
| 59 | Bell Bay | Australia | 178.0 | 19366 | 45.9 | 0.4 | 651 | 172 | 365 | 254 | 191 | 1633 | ||||||||||||
| 60 | Hirakud | India | 140.0 | 19506 | 46.3 | 0.3 | 432 | 251 | 710 | 93 | 157 | 1644 | ||||||||||||
| 61 | Tongchuan Xinguang | China | 240.0 | 19746 | 46.6 | 0.6 | 874 | 142 | 543 | 13 | 75 | 1647 | ||||||||||||
| 62 | Podgorica | Montenegro | 120.0 | 19866 | 47.2 | 0.3 | 792 | 177 | 438 | 95 | 149 | 1651 | ||||||||||||
| 63 | Nadvoitsy | Russia | 80.0 | 19946 | 47.5 | 0.2 | 571 | 369 | 350 | 89 | 275 | 1654 | ||||||||||||
| 64 | Baie Comeau North (P) | Canada | 278.0 | 20224 | 47.7 | 0.7 | 599 | 380 | 366 | 150 | 159 | 1654 | ||||||||||||
| 65 | São Luis (Alumar) | Brazil | 464.0 | 20688 | 48.4 | 1.1 | 571 | 162 | 568 | 117 | 238 | 1656 | ||||||||||||
| 66 | Tiwai Point | New Zealand | 355.0 | 21043 | 49.5 | 0.8 | 653 | 152 | 514 | 127 | 221 | 1667 | ||||||||||||
| 67 | Massena West | USA | 138.0 | 21181 | 50.3 | 0.3 | 609 | 180 | 408 | 283 | 194 | 1673 | ||||||||||||
| 68 | Bayside (S) | South Africa | 86.0 | 21267 | 50.6 | 0.2 | 594 | 205 | 466 | 108 | 300 | 1673 | ||||||||||||
| 69 | Zhengzhou | China | 58.0 | 21325 | 50.8 | 0.1 | 419 | 169 | 893 | 38 | 154 | 1674 | ||||||||||||
| 70 | Lista | Norway | 94.0 | 21419 | 51.0 | 0.2 | 567 | 193 | 474 | 218 | 222 | 1674 | ||||||||||||
| 71 | Sebree | USA | 196.0 | 21615 | 51.2 | 0.5 | 585 | 174 | 495 | 243 | 177 | 1674 | ||||||||||||
| 72 | Becancour | Canada | 408.0 | 22023 | 51.7 | 1.0 | 608 | 168 | 507 | 201 | 189 | 1674 | ||||||||||||
| 73 | St-Jean-De-Maurienne | France | 140.0 | 22163 | 52.7 | 0.3 | 666 | 172 | 409 | 268 | 161 | 1675 | ||||||||||||
| 74 | Kurri Kurri | Australia | 165.0 | 22328 | 53.0 | 0.4 | 594 | 158 | 481 | 242 | 204 | 1679 | ||||||||||||
| 75 | Kitimat (S) | Canada | 240.0 | 22568 | 53.4 | 0.6 | 605 | 178 | 180 | 507 | 213 | 1682 | ||||||||||||
| 77 | Husnes | Norway | 164.0 | 22982 | 54.6 | 0.4 | 631 | 376 | 375 | 188 | 118 | 1687 | ||||||||||||
| 78 | Baie Comeau South (S) | Canada | 162.0 | 23144 | 54.9 | 0.4 | 599 | 209 | 390 | 286 | 205 | 1689 | ||||||||||||
| 79 | Warrick | USA | 267.0 | 23411 | 55.3 | 0.6 | 585 | 200 | 417 | 305 | 186 | 1692 | ||||||||||||
| 80 | Mostar | Bosnia-Herzegovina | 135.0 | 23546 | 56.0 | 0.3 | 641 | 185 | 658 | 69 | 140 | 1694 | ||||||||||||
| 81 | Massena East | USA | 123.0 | 23669 | 56.3 | 0.3 | 609 | 214 | �� | 448 | 254 | 176 | 1700 | |||||||||||
| 82 | Shanxi Huasheng | China | 220.0 | 23889 | 56.6 | 0.5 | 868 | 142 | 603 | 15 | 77 | 1705 | ||||||||||||
| 83 | Bogoslovsk | Russia | 190.0 | 24079 | 57.1 | 0.5 | 451 | 208 | 625 | 141 | 284 | 1709 | ||||||||||||
| 84 | Straumsvik | Iceland | 178.0 | 24257 | 57.6 | 0.4 | 616 | 510 | 245 | 145 | 202 | 1718 | ||||||||||||
| 85 | Linyi Huayu | China | 110.0 | 24367 | 58.0 | 0.3 | 883 | 165 | 579 | 19 | 73 | 1719 | ||||||||||||
| 86 | Lianhai | China | 390.0 | 24757 | 58.3 | 0.9 | 889 | 142 | 596 | 17 | 82 | 1725 | ||||||||||||
| 87 | Karmøy (P) | Norway | 170.0 | 24927 | 59.2 | 0.4 | 586 | 397 | 365 | 221 | 158 | 1726 | ||||||||||||
| 88 | Talum | Slovenia | 87.0 | 25014 | 59.6 | 0.2 | 537 | 159 | 704 | 232 | 94 | 1726 | ||||||||||||
| 89 | Zouping | China | 140.0 | 25154 | 59.8 | 0.3 | 905 | 158 | 590 | 17 | 74 | 1744 | ||||||||||||
| 90 | Distomon | Greece | 166.0 | 25320 | 60.1 | 0.4 | 562 | 169 | 430 | 396 | 188 | 1746 | ||||||||||||
| 91 | Longquan (Yichuan) | China | 550.0 | 25870 | 60.5 | 1.3 | 898 | 139 | 581 | 11 | 122 | 1752 | ||||||||||||
| 92 | Shanxi Guanlu | China | 117.0 | 25987 | 61.9 | 0.3 | 900 | 142 | 619 | 19 | 74 | 1754 | ||||||||||||
| 93 | Alcoa | USA | 220.0 | 26207 | 62.1 | 0.5 | 591 | 168 | 541 | 284 | 172 | 1756 | ||||||||||||
| 94 | Belém (Albrás) | Brazil | 465.0 | 26672 | 62.7 | 1.1 | 596 | 176 | 647 | 128 | 215 | 1763 | ||||||||||||
| 95 | Karmøy (S) | Norway | 120.0 | 26792 | 63.8 | 0.3 | 586 | 195 | 396 | 359 | 227 | 1764 | ||||||||||||
| 96 | Ferndale | USA | 185.0 | 26977 | 64.1 | 0.4 | 596 | 208 | 553 | 238 | 170 | 1765 | ||||||||||||
| 97 | Jiaozuo Wanfang (P) | China | 380.0 | 27357 | 64.5 | 0.9 | 887 | 138 | 652 | 13 | 77 | 1766 | ||||||||||||
| 98 | Volkhov | Russia | 24.0 | 27381 | 65.4 | 0.1 | 628 | 393 | 383 | 72 | 303 | 1779 | ||||||||||||
| 99 | Lochaber | United Kingdom | 46.0 | 27427 | 65.5 | 0.1 | 597 | 511 | 144 | 276 | 253 | 1781 | ||||||||||||
| 100 | Sanmenxia Tianyuan | China | 100.0 | 27527 | 65.6 | 0.2 | 901 | 154 | 610 | 32 | 86 | 1783 | ||||||||||||
| 101 | Korba (S) | India | 100.0 | 27627 | 65.8 | 0.2 | 643 | 292 | 624 | 105 | 122 | 1786 | ||||||||||||
| 102 | Sichuan Qiya (Emeishan) | China | 150.0 | 27777 | 66.1 | 0.4 | 904 | 278 | 484 | 15 | 107 | 1788 | ||||||||||||
| 103 | Slatina | Romania | 275.0 | 28052 | 66.4 | 0.7 | 675 | 173 | 647 | 123 | 172 | 1789 | ||||||||||||
| 104 | Lynemouth | United Kingdom | 177.0 | 28229 | 67.1 | 0.4 | 586 | 166 | 608 | 221 | 211 | 1792 | ||||||||||||
| 105 | Shangqiu | China | 200.0 | 28429 | 67.5 | 0.5 | 897 | 149 | 609 | 15 | 131 | 1800 | ||||||||||||
| 106 | San Ciprián | Spain | 234.0 | 28663 | 68.0 | 0.6 | 619 | 175 | 543 | 237 | 229 | 1804 | ||||||||||||
| 107 | Gongyi (Zhongfu) | China | 308.0 | 28971 | 68.5 | 0.7 | 911 | 145 | 635 | 12 | 104 | 1808 | ||||||||||||
| 108 | Shenhuo | China | 385.0 | 29356 | 69.3 | 0.9 | 940 | 144 | 655 | 10 | 64 | 1813 | ||||||||||||
| 109 | Volgograd | Russia | 160.0 | 29516 | 70.2 | 0.4 | 600 | 228 | 635 | 74 | 275 | 1813 | ||||||||||||
| 110 | Keao | China | 140.0 | 29656 | 70.6 | 0.3 | 952 | 142 | 572 | 17 | 129 | 1813 | ||||||||||||
| 111 | Chuangyuan | China | 277.0 | 29933 | 70.9 | 0.7 | 897 | 145 | 635 | 16 | 133 | 1826 | ||||||||||||
| 112 | Mount Holly | USA | 228.0 | 30161 | 71.6 | 0.5 | 618 | 174 | 669 | 194 | 171 | 1826 | ||||||||||||
| 113 | Porto Vesme | Italy | 150.0 | 30311 | 72.1 | 0.4 | 595 | 182 | 610 | 223 | 225 | 1836 | ||||||||||||
| 114 | Høyanger (P) | Norway | 56.0 | 30367 | 72.5 | 0.1 | 564 | 400 | 427 | 234 | 210 | 1836 | ||||||||||||
Flexed 2008 Aluminium Smelters League ranked on Cash Cost (C1) ($/t)
| ||||||||||||||||||||||||
| Using Scenario - 2007 Scenario | ||||||||||||||||||||||||
Rank | Name | Country | Production (kt/a)| | Cumulative Production | % Lower | Centile | Average Delivered Alumina Cost ($/t) | Other Raw Materials Cost ($/t) | Total Energy Cost ($/t) | Labour Cost ($/t) | Total Other Costs ($/t) | Cash Cost (C1) ($/t) | ||||||||||||
| 115 | Norf | Germany | 225.0 | 30592 | 72.6 | 0.5 | 607 | 182 | 590 | 251 | 212 | 1841 | ||||||||||||
| 116 | Qinghai Qiaotou | China | 350.0 | 30942 | 73.1 | 0.8 | 977 | 150 | 587 | 14 | 115 | 1843 | ||||||||||||
| 117 | Kambara | Japan | 6.5 | 30949 | 74.0 | 0.0 | 636 | 176 | 293 | 587 | 153 | 1845 | ||||||||||||
| 118 | Xinwang | China | 65.0 | 31014 | 74.0 | 0.2 | 963 | 144 | 592 | 24 | 128 | 1851 | ||||||||||||
| 119 | Seydisehir | Turkey | 63.0 | 31077 | 74.2 | 0.2 | 921 | 244 | 351 | 106 | 236 | 1858 | ||||||||||||
| 120 | Baotou East Hope | China | 465.0 | 31542 | 74.3 | 1.1 | 914 | 140 | 714 | 12 | 79 | 1859 | ||||||||||||
| 121 | Baihe | China | 110.0 | 31652 | 75.4 | 0.3 | 977 | 161 | 576 | 18 | 133 | 1864 | ||||||||||||
| 122 | Rockdale | USA | 267.0 | 31919 | 75.7 | 0.6 | 581 | 203 | 606 | 313 | 163 | 1866 | ||||||||||||
| 123 | Danjiang | China | 112.0 | 32031 | 76.3 | 0.3 | 919 | 287 | 575 | 26 | 63 | 1869 | ||||||||||||
| 124 | Houmei Hongjun | China | 370.0 | 32401 | 76.6 | 0.9 | 937 | 139 | 706 | 9 | 83 | 1874 | ||||||||||||
| 125 | Vlissingen | Netherlands | 240.0 | 32641 | 77.5 | 0.6 | 597 | 181 | 707 | 170 | 229 | 1885 | ||||||||||||
| 126 | Ravenswood | USA | 170.0 | 32811 | 78.0 | 0.4 | 609 | 170 | 588 | 328 | 194 | 1889 | ||||||||||||
| 127 | Ouro Preto | Brazil | 52.0 | 32863 | 78.4 | 0.1 | 611 | 194 | 540 | 320 | 228 | 1894 | ||||||||||||
| 128 | Qingtongxia (P) | China | 580.0 | 33443 | 78.6 | 1.4 | 907 | 144 | 756 | 12 | 79 | 1899 | ||||||||||||
| 129 | Qinghai & Haixing | China | 400.0 | 33843 | 80.0 | 1.0 | 923 | 170 | 687 | 18 | 102 | 1899 | ||||||||||||
| 130 | Datun | China | 110.0 | 33953 | 80.9 | 0.3 | 886 | 287 | 635 | 26 | 77 | 1911 | ||||||||||||
| 131 | Hamburg | Germany | 133.0 | 34086 | 81.2 | 0.3 | 504 | 191 | 764 | 242 | 210 | 1911 | ||||||||||||
| 132 | Lannemezan | France | 45.0 | 34131 | 81.5 | 0.1 | 601 | 376 | 536 | 209 | 190 | 1911 | ||||||||||||
| 133 | Mianchi Zhongmai | China | 130.0 | 34261 | 81.6 | 0.3 | 928 | 148 | 744 | 24 | 68 | 1913 | ||||||||||||
| 134 | Mettur Dam | India | 40.0 | 34301 | 81.9 | 0.1 | 516 | 298 | 829 | 107 | 163 | 1914 | ||||||||||||
| 135 | China Central Grid (P) | China | 1990.0 | 36291 | 82.0 | 4.8 | 916 | 146 | 746 | 19 | 94 | 1920 | ||||||||||||
| 136 | Santa Cruz (Valesul) | Brazil | 97.0 | 36388 | 86.8 | 0.2 | 684 | 202 | 595 | 198 | 247 | 1927 | ||||||||||||
| 137 | Yunnan (P) | China | 405.0 | 36793 | 87.0 | 1.0 | 906 | 130 | 796 | 14 | 93 | 1940 | ||||||||||||
| 138 | Sundsvall - Plant 1 (P) | Sweden | 67.0 | 36860 | 88.0 | 0.2 | 529 | 462 | 607 | 225 | 119 | 1943 | ||||||||||||
| 139 | Poços De Caldas | Brazil | 100.0 | 36960 | 88.1 | 0.2 | 490 | 215 | 798 | 196 | 248 | 1948 | ||||||||||||
| 140 | Sundsvall - Plant 2 (S) | Sweden | 50.0 | 37010 | 88.4 | 0.1 | 532 | 203 | 679 | 324 | 214 | 1951 | ||||||||||||
| 141 | Avilés | Spain | 86.0 | 37096 | 88.5 | 0.2 | 651 | 193 | 540 | 333 | 235 | 1951 | ||||||||||||
| 142 | Liancheng (P) | China | 270.0 | 37366 | 88.7 | 0.6 | 890 | 142 | 789 | 13 | 120 | 1955 | ||||||||||||
| 143 | Fusina 1 | Italy | 44.0 | 37410 | 89.3 | 0.1 | 611 | 200 | 605 | 337 | 218 | 1970 | ||||||||||||
| 144 | Shandong | China | 78.0 | 37488 | 89.4 | 0.2 | 465 | 292 | 1054 | 40 | 119 | 1971 | ||||||||||||
| 145 | Voerde | Germany | 86.0 | 37574 | 89.6 | 0.2 | 587 | 181 | 637 | 347 | 219 | 1973 | ||||||||||||
| 146 | Fushun (P) | China | 130.0 | 37704 | 89.8 | 0.3 | 898 | 149 | 813 | 22 | 99 | 1981 | ||||||||||||
| 147 | Columbia Falls | USA | 68.0 | 37772 | 90.1 | 0.2 | 722 | 214 | 662 | 255 | 140 | 1993 | ||||||||||||
| 148 | Zaporozhye | Ukraine | 115.0 | 37887 | 90.3 | 0.3 | 464 | 386 | 871 | 100 | 181 | 2002 | ||||||||||||
| 149 | China NW Grid (P) | China | 416.0 | 38303 | 90.6 | 1.0 | 916 | 280 | 690 | 25 | 94 | 2005 | ||||||||||||
| 150 | La Coruña | Spain | 82.0 | 38385 | 91.6 | 0.2 | 648 | 193 | 538 | 393 | 237 | 2009 | ||||||||||||
| 151 | Holyhead | United Kingdom | 146.0 | 38531 | 91.8 | 0.3 | 594 | 196 | 754 | 264 | 203 | 2011 | ||||||||||||
| 152 | Gansu Hualu (Baiyin) | China | 142.0 | 38673 | 92.1 | 0.3 | 902 | 154 | 807 | 17 | 132 | 2012 | ||||||||||||
| 153 | Aratu | Brazil | 59.0 | 38732 | 92.5 | 0.1 | 812 | 209 | 561 | 205 | 230 | 2016 | ||||||||||||
| 154 | China South Grid (P) | China | 580.0 | 39312 | 92.6 | 1.4 | 916 | 280 | 713 | 21 | 94 | 2022 | ||||||||||||
| 155 | China East Grid (P) | China | 218.0 | 39530 | 94.0 | 0.5 | 916 | 280 | 726 | 24 | 94 | 2039 | ||||||||||||
| 156 | China North Grid (P) | China | 755.0 | 40285 | 94.5 | 1.8 | 916 | 280 | 732 | 21 | 94 | 2042 | ||||||||||||
| 157 | Zunyi | China | 110.0 | 40395 | 96.3 | 0.3 | 877 | 278 | 779 | 17 | 131 | 2082 | ||||||||||||
| 158 | Baotou (P) | China | 365.0 | 40760 | 96.6 | 0.9 | 917 | 148 | 895 | 15 | 120 | 2095 | ||||||||||||
| 159 | Sichuan Meishan | China | 250.0 | 41010 | 97.5 | 0.6 | 918 | 148 | 940 | 12 | 101 | 2120 | ||||||||||||
| 160 | Guangyuan Qimingxing | China | 120.0 | 41130 | 98.1 | 0.3 | 893 | 283 | 922 | 17 | 77 | 2191 | ||||||||||||
| 161 | Baise Yinhai | China | 110.0 | 41240 | 98.3 | 0.3 | 943 | 287 | 812 | 19 | 142 | 2203 | ||||||||||||
| 162 | Hannibal | USA | 260.0 | 41500 | 98.6 | 0.6 | 633 | 432 | 793 | 238 | 162 | 2259 | ||||||||||||
| 163 | Delfzijl | Netherlands | 115.0 | 41615 | 99.2 | 0.3 | 613 | 511 | 663 | 290 | 208 | 2285 | ||||||||||||
| 164 | Essen | Germany | 155.0 | 41770 | 99.5 | 0.4 | 647 | 476 | 736 | 247 | 206 | 2312 | ||||||||||||
| 165 | Konin | Poland | 55.0 | 41825 | 99.9 | 0.1 | 813 | 185 | 960 | 226 | 175 | 2359 | ||||||||||||
| Totals / Weighted Averages | 41824.5 | 683 | 196 | 519 | 102 | 148 | 1648 | |||||||||||||||||
ATTACHMENT NO. 2
| Nicholas A. Adams, Jr. | Henry F. Sattlethight | |||
| V.P., Statistics & Business Information | Manager, Statistical Programs | |||
| Tel: 1-703-358-2984 | Tel: 1-703-358-2985 | |||
| Fax: 1-703-358-2986 | Fax: 1-703-358-2986 | |||
E-mail:nadams@aluminum.org
| E-mail:hsattlethight@aluminum.org
|
SHIPMENTS OF ALUMINUM FOIL
| Report for December 2007 | Issued: January 18, 2008 |
Based on Aluminum Association surveys, estimated shipments ofAluminum Foilby U.S. and Canadian producers totaled 79.8 million pounds in December 2007, off 7.9 percent from the December 2006 total of 86.7 million pounds. Compared to the previous month, shipments decreased 19.5 percent from the November 2007 total of 99.2 million pounds. Year-to-date shipments for 2007 totaled 1,247.1 million pounds, down 6.9 percent from the year-to-date 2006 total of 1,339.5 million pounds.
Participating companies accounted for approximately 97 percent of the estimated industry total.
Producer Shipments | Dec | % Chng Dec/Dec | Nov. | % Chng Dec/Nov | Year-t o-Date | % Chng 07/06 | ||||||||||
| (Millions of Pounds) | 2007* | 2006 | 2007* | 2007* | 2006 | |||||||||||
Total Foil | 79.8 | 86.7 | -7.9 | 99.2 | -19.5 | 1,247.1 | 1,339.5 | -6.9 | ||||||||
| (*) | Preliminary |
This report is available on The Aluminum Association’s web site: www.aluminum.org.
The Association estimates total industry shipments based on reports by its members of their shipments for the latest month. The Association expands these data to total industry utilizing an expansion ratio that attempts to reflect the relationship of reporters to the total industry. While the Association believes that its statistical procedures and methods are reliable, it does not warrant the accuracy or completeness of the data. All data contained herein are subject to revision. ©The Aluminum Association, Inc.
REPORTING COMPANIES
Report Received (Date) | Participating Companies | |||||
| January 16, 2008 | Alcoa Inc. | |||||
| January 16, 2008 | Aleris International Inc. | |||||
| January 9, 2008 | JW Aluminum | |||||
| January 10, 2008 | Norandal U.S.A. | |||||
| January 3, 2008 | Novelis Corporation | |||||
| Due Association: | January 15, 2008 | |||||
| Last Report Received: | January 16, 2008 |
U.S. and Canadian Gross Shipments of Aluminum Foil
(Figures in Thousands of Pounds)
| F-1 Report: December | Issued: January 18, 2008 |
| 2007 | 2006 | |||||||
| Industry(1) | Association | Industry(1) | Association | |||||
January | 103,043 | 99,889 | 113,700 | 110,220 | ||||
February | 96,079 | 93,138 | 107,035 | 103,759 | ||||
March | 101,187 | 98,090 | 119,523 | 115,865 | ||||
QTR Total | 300,309 | 291,117 | 340,258 | 329,844 | ||||
April | 102,647 | 99,505 | 113,948 | 110,460 | ||||
May | 112,123 | 108,691 | 119,620 | 115,959 | ||||
June | 112,657 | 109,209 | 120,319 | 116,636 | ||||
QTR Total | 327,427 | 317,405 | 353,887 | 343,055 | ||||
July | 111,113 | 107,712 | 114,574 | 111,067 | ||||
August | 113,870 | 110,385 | 120,300 | 116,618 | ||||
September | 103,543 | 100,374 | 110,327 | 106,950 | ||||
QTR Total | 328,526 | 318,471 | 345,201 | 334,635 | ||||
October | 111,718 | 108,299 | 114,577 | 111,070 | ||||
November | 99,244 | 96,206 | 98,956 | 95,927 | ||||
December | 79,849 | 77,405 | 86,661 | 84,009 | ||||
QTR Total | 290,811 | 281,910 | 300,194 | 291,006 | ||||
Total Year | 1,247,073 | 1,208,903 | 1,339,540 | 1,298,540 | ||||
| (1) | Estimated by The Aluminum Association based on survey results. |
This report is based on information provided by members which is aggregated by the Association. If is not intended to represent shipments by the total industry. While the Association believes that its statistical procedures and methods are reliable, it does not warrant the accuracy of completeness of the data. All data contained herein are subject to revision.
U.S. and Canadian Shipments of Aluminum Foil
Apparent Demand and Domestic Consumption
(Figures in Thousands of Pounds)
| Producer(1) Net Shipments | Imports(2) | Apparent(3) Demand | Exports(2) | Total(4) | Import % Share of Domestic Markets | Export % Share of Producer Shipments | ||||||||
| 2006 | ||||||||||||||
January | 113,700 | 14,685 | 128,385 | 4,178 | 124,207 | 11.8 | 3.7 | |||||||
February | 107,035 | 12,857 | 119,892 | 4,257 | 115,635 | 11.1 | 4.0 | |||||||
March | 119,523 | 15,595 | 135,118 | 5,865 | 129,253 | 12.1 | 4.9 | |||||||
QTR Total | 340,258 | 43,137 | 383,395 | 14,300 | 369,095 | 11.7 | 4.2 | |||||||
April | 113,948 | 16,472 | 130,420 | 4,314 | 126,106 | 13.1 | 3.8 | |||||||
May | 119,620 | 18,735 | 138,355 | 6,022 | 132,333 | 14.2 | 5.0 | |||||||
June | 120,319 | 15,317 | 135,636 | 6,685 | 128,951 | 11.9 | 5.6 | |||||||
QTR Total | 353,887 | 50,524 | 404,411 | 17,021 | 387,390 | 13.0 | 4.8 | |||||||
July | 114,574 | 21,933 | 136,507 | 6,101 | 130,406 | 16.8 | 5.3 | |||||||
August | 120,300 | 16,095 | 136,395 | 6,051 | 130,344 | 12.3 | 5.0 | |||||||
September | 110,327 | 16,067 | 126,394 | 5,423 | 120,971 | 13.3 | 4.9 | |||||||
QTR Total | 345,201 | 54,095 | 399,296 | 17,575 | 381,721 | 14.2 | 5.1 | |||||||
October | 114,577 | 14,458 | 129,035 | 5,313 | 123,722 | 11.7 | 4.6 | |||||||
November | 98,956 | 16,576 | 115,532 | 5,742 | 109,790 | 15.1 | 5.8 | |||||||
December | 86,661 | 15,662 | 102,323 | 4,001 | 98,322 | 15.9 | 4.6 | |||||||
QTR Total | 300,194 | 46,696 | 346,890 | 15,056 | 331,834 | 14.1 | 5.0 | |||||||
YTD Total | 1,252,879 | 178,790 | 1,431,669 | 59,951 | 1,371,718 | 13.0 | 4.8 | |||||||
Total Year | 1,339,540 | 194,452 | 1,533,992 | 63,952 | 1,470,040 | 13.2 | 4.8 | |||||||
| 2007 | ||||||||||||||
January | 103,043 | 15,757 | 118,800 | 3,833 | 114,967 | 13.7 | 3.7 | |||||||
February | 96,079 | 14,613 | 110,692 | 4,822 | 105,870 | 13.8 | 5.0 | |||||||
March | 101,187 | 15,955 | 117,142 | 5,135 | 112,007 | 14.2 | 5.1 | |||||||
QTR Total | 300,309 | 46,325 | 346,634 | 13,790 | 332,844 | 13.9 | 4.6 | |||||||
April | 102,647 | 14,252 | 116,899 | 4,442 | 112,457 | 12.7 | 4.3 | |||||||
May | 112,123 | 15,355 | 127,478 | 5,772 | 121,706 | 12.6 | 5.1 | |||||||
June | 112,657 | 14,938 | 127,595 | 5,403 | 122,192 | 12.2 | 4.8 | |||||||
QTR Total | 327,427 | 44,545 | 371,972 | 15,617 | 356,355 | 12.5 | 4.8 | |||||||
July | 111,113 | 16,645 | 127,758 | 5,545 | 122,213 | 13.6 | 5.0 | |||||||
August | 113,870 | 14,096 | 127,966 | 5,744 | 122,222 | 11.5 | 5.0 | |||||||
September | 103,543 | 16,202 | 119,745 | 5,567 | 114,178 | 14.2 | 5.4 | |||||||
QTR Total | 328,526 | 46,943 | 375,469 | 16,856 | 358,613 | 13.1 | 5.1 | |||||||
October | 111,718 | 15,728 | 127,446 | 5,469 | 121,977 | 12.9 | 4.9 | |||||||
November | 99,244 | 15,960 | 115,204 | 4,155 | 111,049 | 14.4 | 4.2 | |||||||
December | ||||||||||||||
YTD Total | 1,167,224 | 169,501 | 1,336,725 | 55,887 | 1,280,838 | 13.2 | 4.8 | |||||||
| (1) | U.S. and Canadian producer shipments of aluminum foil estimated to 100% coverage. |
| (2) | Based on published government statistics derived from Customs documentation. Figures contain estimated adjustments to account for apparent misclassifications. Statistics net of U.S./Canada cross-border trade |
| (3) | Producer shipments less exports. |
| (4) | Apparent demand less exports. |
U.S. and Canadian New Orders of Aluminum Foil
Index: 2001 = 100
Month | Foil | |
| 2006 | ||
January | 122.16 | |
February | 117.85 | |
March | 131.88 | |
April | 114.39 | |
May | 126.93 | |
June | 118.94 | |
July | 107.18 | |
August | 125.97 | |
September | 120.12 | |
October | 118.16 | |
November | 90.26 | |
December | 89.28 | |
Total Year | 115.26 | |
| 2007 | ||
January | 115.48 | |
February | 107.21 | |
March | 104.30 | |
April | 110.60 | |
May | 117.17 | |
June | 112.99 | |
July | 111.54 | |
August | 111.59 | |
September | 92.90 | |
October | 98.34 | |
November | 101.55 | |
December | 90.90 | |
Total Year | 106.21 | |
Percent Change | ||
Curr Mo/Prev Mo | -10.5 | |
Curr Mo/Prev Yr | 1.8 | |
Curr YTD/Prev YTD | -7.8 | |
Based on responses received from participating companies.
ATTACHMENT NO. 3
ATTACHMENT NO. 4
April 2008 | Alumina | www.crumonitor.com |
CRU estimates on freight rates for bauxite and alumina on major trade routes (USS/tonne)
| 2005 | 2006 | 2007 | 2008 | ||||||||||||||||||||
| H1 | H2 | H1 | H2 | H1 | Dec | H2 | Feb | Q1 | Apr | ||||||||||||||
Alumina | Carib/Ven - NW Europe | 31.0 | 19.2 | 22.5 | 29.7 | 44.8 | 52.0 | 51.2 | 46.0 | 47.6 | 62.5 | ||||||||||||
W. Australia - China3 | 31.0 | 23.9 | 27.8 | 34.3 | 34.4 | 70.0 | 62.0 | 49.3 | 54.7 | 56.5 | |||||||||||||
Bauxite | Welpa - Porto Vesme | 30.6 | 16.1 | 18.8 | 26.8 | 38.8 | 64.5 | 59.8 | 36.0 | 39.1 | 42.5 | ||||||||||||
Guinea - Point Comfort | 14.4 | 9.4 | 13.8 | 18.7 | 22.7 | 32.5 | 33.8 | 25.0 | 27.3 | 29.0 | |||||||||||||
| May-08 | June-08 | Jul-08 | Oct-08 | Cur3 | ||||||||||||||||||
Freight futures1 | 6955 | 6923 | 6895 | 6521 | Baltic Dry Index | 5299 | 9854 | 8754 | 6849 | 6868 | 8350 |
Notes: CRU estimates are calculated from average of reported fixtures and market contacts. Freight rates are not necessarily comparable within each other within each trade route, as they may differ, for example, by size of vessel used. NW Europe includes Norway and UK. 1. Freight Futures is an implied futures Paramex index. 2. Baltic Dry Index (BDI) is the current closing price 25th Feb 2008. 3 Represents an freight rates from Bunbury for a 25-30,000 vessel.
Caustic soda price developments (US$/dry metric tonne, fob)
| 2006 | 2007 | 2008 | |||||||||||||||||||
| Q4 | Q1 | Q2 | Q3 | Q4 | Jan | Feb | Mar | Q1 | Apr | ||||||||||||
Contract | |||||||||||||||||||||
West Europe | 262 | 258 | 258 | 280 | 280 | 337 | 337 | 337 | 337 | 337 | |||||||||||
US Gulf | 350 | 255 | 255 | 337 | 337 | 410 | 410 | 410 | 410 | 410 | |||||||||||
Saudi Arabia | 255 | 265 | 265 | 270 | 270 | 300 | 300 | 300 | 300 | 300 | |||||||||||
Spot | |||||||||||||||||||||
West Europe | 303-323 | 295-320 | 280-320 | 290-325 | 315-335 | 325-355 | 355-365 | 380-395 | 325-395 | 410-420 | |||||||||||
US Gulf | 265-276 | 288-314 | 353-386 | 386-430 | 390-420 | 446-457 | 496-507 | 551-579 | 405-525 | 606-617 | |||||||||||
Data: British Sulphur Consultants industry price estimates.
CRU estimates of traded bauxite prices (fob,US$/tonne)
| Boke | Trombetas | Welpa | Guyana | India | Indonesia | |||||||||||||||||||
| Spot | Contract | Spot | Contract | Spot | Contract | Spot | Contract | Spot | Contract | Spot | Contract | |||||||||||||
2003 | ||||||||||||||||||||||||
H1 | 27.6 | 25.1 | 25.5 | 22.5 | n/a | 17.7 | n/a | 28.5 | n/a | 15-19 | n/a | 11-17 | ||||||||||||
H2 | 27.6 | 25.1 | 25.5 | 23.0 | n/a | 17.7 | n/a | 28.5 | n/a | 15-19 | n/a | 10-14 | ||||||||||||
2004 | ||||||||||||||||||||||||
H1 | 30.7 | 28.2 | n/a | 21-24 | n/a | 16-18 | n/a | 29.2 | n/a | 16-19 | n/a | 11-14 | ||||||||||||
H2 | 30.7 | 28.2 | n/a | 23-26 | n/a | 16-18 | n/a | 29.2 | n/a | 16-19 | n/a | 11-12 | ||||||||||||
2005 | ||||||||||||||||||||||||
H1 | 31.3 | 28.8 | n/a | 25-28 | n/a | 14-19 | n/a | 29.8 | n/a | 17-20 | n/a | 10-12 | ||||||||||||
H2 | 31.3 | 28.8 | n/a | 26-29 | n/a | 14-19 | n/a | 29.8 | n/a | 18-24 | n/a | 10-12 | ||||||||||||
2006 | ||||||||||||||||||||||||
H1 | 32.5 | 29-31 | n/a | 27-30 | n/a | 18-20 | n/a | 32.5 | n/a | 21-27 | n/a | 10-14 | ||||||||||||
H2 | 32.5 | 29-31 | n/a | 31-34 | n/a | 18-21 | n/a | 32.5 | n/a | 24-28 | n/a | 11-14 | ||||||||||||
2007 | ||||||||||||||||||||||||
H1 | n/a | 28-30 | n/a | 35-38 | n/a | 21-24 | n/a | 30.5 | n/a | 24-27 | n/a | 12-17 | ||||||||||||
H2 | n/a | 28-30 | n/a | 37-40 | n/a | 13-23 | n/a | 27.5 | n/a | 26-33 | n/a | 14-20 | ||||||||||||
2008 | ||||||||||||||||||||||||
H1 | n/a | 28-30 | n/a | 37-40 | n/a | 19-22 | n/a | 28.0 | n/a | 27-35 | n/a | 17-22 | ||||||||||||
Data: CRU: Industry contacts and estimates. Notes: Welpa price is a CRU estimate. Where possible the above estimates refer to bauxite on a dry metric tonne basis. Boke contract price refers to the discounted weighted average price. Changes may be made to historical data on receipt of new information.
 | ||||||
Chalco cuts spot alumina prices by 16.7%
 |
Chalco has cut alumina prices |
Aluminum Corp of China Ltd (Chalco), the world’s third-largest producer of alumina, has reduced spot alumina prices by 16.7%, the first reduction since December.
The move could hurt profits at Chalco, the top alumina supplier in China, but add profits of CNY1,400/t to smelters, aluminium smelter officials and analysts said.
“We want to release some stocks,” a Chalco source told Reuters. He did not provide Chalco’s alumina stock levels. “The move was also to follow market prices,” he said.
Chalco was offering spot alumina at CNY3,500/t (US$505.4) versus CNY4,200/T on Monday, it said on its website. It raised spot alumina prices 10.5% to CNY4,200 in mid-December last year. |  | |||
Prices of alumina, the raw material for the production of primary aluminium, have fallen more than 20% so far this year to around CNY3,500/t in China due to increased production by Chinese refineries, including Chalco.
China’s alumina production rose 19% on the year to 7.2Mt in the first four months of this year. Chalco said last week the group’s alumina production would be below 11Mt this year versus last year’s 10.2Mt.
About 2t of alumina are needed for production of 1t of primary aluminium in China.
“The extra profits could be short-lived. Aluminium prices may fall because demand is weakening,” said a trade manager at a large aluminium smelter in Henan province.
He said China’s tight credit conditions had cut aluminium end-users’ access to cash to buy the metal, which is used in construction, packaging and auto sectors.
Cash production costs in China are around CNY17,500-18,000/t, leaving margins of CNY500-1,000 for spot metal, which traded at about CNY18,500/t on Tuesday.
(Reuters, June 3)
Related articles:
Chalco’s 2007 profit results fail to impress
Chalco eyes Chinalco assets
| ||||||

Alumina Spot Price | $ | 505.40 | ||
Frt. to N. Madrid | $ | 45.00 | ||
| $ | 550.40 | |||
@50% = | $ | 275.20 | ||
YTD April Net Gramercy Cash Cost = | $ | 268.82 | ||
= | 49 | % | ||
 | ||||
| All Content © Mining Journal 2008, all rights reserved. Terms & Conditions Privacy Statement webmaster@mining-journal.com | ||||||