|
Exhibit 99.2 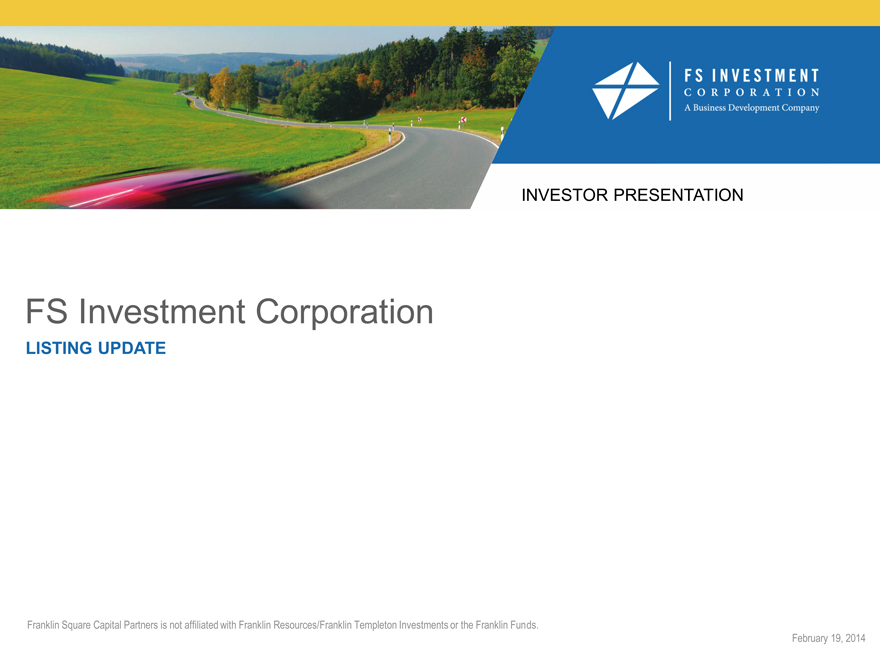
|
Exhibit 99.2
INVESTOR PRESENTATION
FS Investment Corporation
LISTING UPDATE
Franklin Square Capital Partners is not affiliated with Franklin Resources/Franklin Templeton Investments or the Franklin Funds.
February 19, 2014
Important considerations
An investment in the common stock of FS Investment Corporation (FSIC, we or us) involves a high degree of risk and may be considered speculative. The following are some of the risks an investment in our common stock involves; however, you should carefully consider all of the information found in the section of our Forms 10-Q and 10-K filings entitled “Risk Factors” and in our other public filings before deciding to invest in shares of our common stock.
An investment strategy focused primarily on privately held companies presents certain challenges, including the lack of available information about these companies.
Investing in middle-market companies involves a number of significant risks, any one of which could have a material adverse effect on our operating results.
A lack of liquidity in certain of our investments may adversely affect our business.
We are subject to financial market risks, including changes in interest rates, which may have a substantial negative impact on our investments.
We have borrowed funds to make investments, which increases the volatility of our investments and may increase the risks of investing in our securities.
We have limited operating history and are subject to the business risks and uncertainties associated with any new business.
Our distributions may be funded from unlimited amounts of offering proceeds or borrowings, which may constitute a return of capital and reduce the amount of capital available to us for investment.
This presentation is for informational purposes only and is not an offer to buy or the solicitation of an offer to sell any securities of FSIC. The tender offer will be made only pursuant to an offer to purchase, letter of transmittal and related materials (the Tender Materials) that FSIC intends to distribute to its stockholders and file with the Securities and Exchange Commission (SEC). The full details of the tender offer, including complete instructions on how to tender shares of common stock, will be included in the Tender Materials, which FSIC will distribute to stockholders and file with the SEC upon the commencement of the tender offer. Stockholders are urged to carefully read the Tender Materials when they become available because they will contain important information, including the terms and conditions of the tender offer. Stockholders may obtain free copies of the Tender Materials that FSIC files with the SEC at the SEC’s website at: www.sec.gov or by calling the information agent who will be identified in the
Tender Materials. In addition, stockholders may obtain free copies of FSIC’s filings with the SEC from FSIC’s website at: www.fsinvestmentcorp.com or by contacting FSIC at Cira Centre, 2929 Arch Street, Suite 675, Philadelphia, PA 19104 or by phone at (877) 628-8575.
Forward-Looking Statements
Some of the statements in this presentation constitute forward-looking statements because they relate to future events or the future performance or financial condition of FSIC. The forward-looking statements contained in this presentation may include statements as to: our future operating results; our business prospects and the prospects of our portfolio companies; the impact of the investments that we expect to make; the ability of our portfolio companies to achieve their objectives; our current and expected financings and investments; the adequacy of our cash resources, financing sources and working capital; the timing and amount of cash flows, distributions and dividends, if any, from our portfolio companies; our contractual arrangements and relationships with third parties; actual and potential conflicts of interest with FB Income Advisor, LLC (FB Advisor), FS Investment Advisor, LLC, FS Energy and Power Fund, FSIC II Advisor, LLC, FS Investment Corporation II, GSO / Blackstone Debt Funds Management LLC or any of their respective affiliates; the dependence of our future success on the general economy and its effect on the industries in which we may invest; our use of financial leverage; the ability of FB Advisor to locate suitable investments for us and to monitor and administer our investments; the ability of FB Advisor or its affiliates to attract and retain highly talented professionals; our ability to maintain our qualification as a regulated investment company (RIC) and as a business development company (BDC); the impact on our business of the Dodd-Frank Wall Street Reform and Consumer Protection Act and the rules and regulations issued thereunder; the effect of changes to tax legislation and our tax position; the tax status of the enterprises in which we invest; our ability to complete the listing of our shares of common stock on the New York Stock Exchange LLC (NYSE); our ability to complete the related tender offer; and the price at which shares of our common stock may trade on the NYSE, which may be higher or lower than the purchase price in the tender offer.
In addition, words such as “anticipate,” “believe,” “expect” and “intend” indicate a forward-looking statement, although not all forward-looking statements include these words. The forward-looking statements contained in this presentation involve risks and uncertainties. Our actual results could differ materially from those implied or expressed in the forward-looking statements for any reason. Factors that could cause actual results to differ materially include: changes in the economy; risks associated with possible disruption in our operations or the economy generally due to terrorism or natural disasters; and future changes in laws or regulations and conditions in our operating areas.
We have based the forward-looking statements included in this presentation on information available to us on the date of this presentation. Except as required by the federal securities laws, we undertake no obligation to revise or update any forward-looking statements, whether as a result of new information, future events or otherwise. You are advised to consult any additional disclosures that we may make directly to stockholders or through reports that we have filed and may file in the future with the Securities and Exchange Commission (SEC), including annual reports on Form 10-K, quarterly reports on Form 10-Q and current reports on Form 8-K. In addition, information related to past performance, while helpful as an evaluative tool, is not necessarily indicative of future results, the achievement of which cannot be assured.
Investors should not view the past performance of FSIC, or information about the market, as indicative of FSIC’s future results.
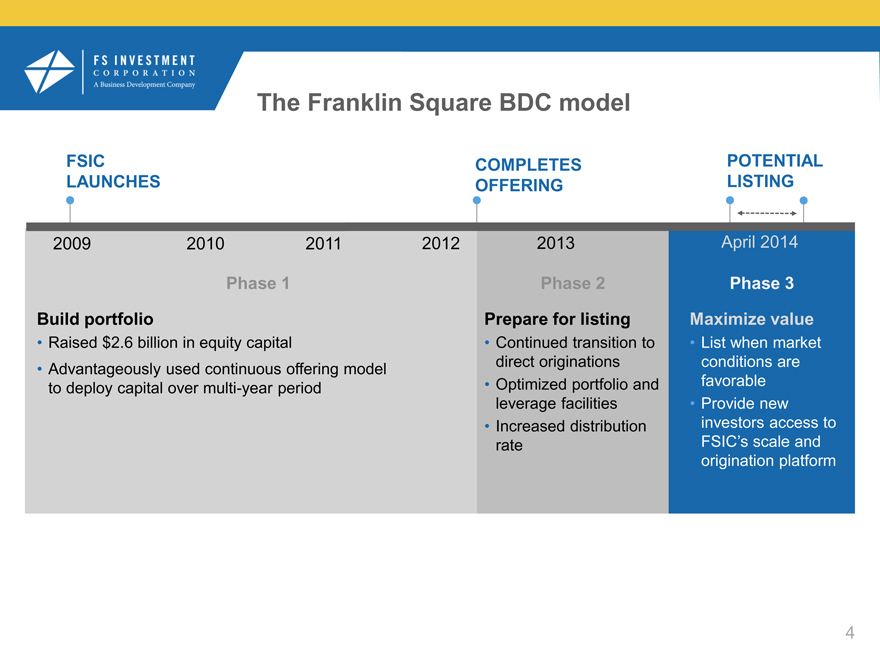
The Franklin Square BDC model
FSIC COMPLETES POTENTIAL
LAUNCHES OFFERING LISTING
2009 2010 2011 2012 2013 April 2014
Phase 1 Phase 2 Phase 3
Build portfolio Prepare for listing Maximize value
Raised $2.6 billion in equity capital Continued transition to List when market
Advantageously used continuous offering model direct originations conditions are
to deploy capital over multi-year period Optimized portfolio and favorable
leverage facilities Provide new
Increased distribution investors access to
rate FSIC’s scale and
origination platform
Why Franklin Square’s model is unique
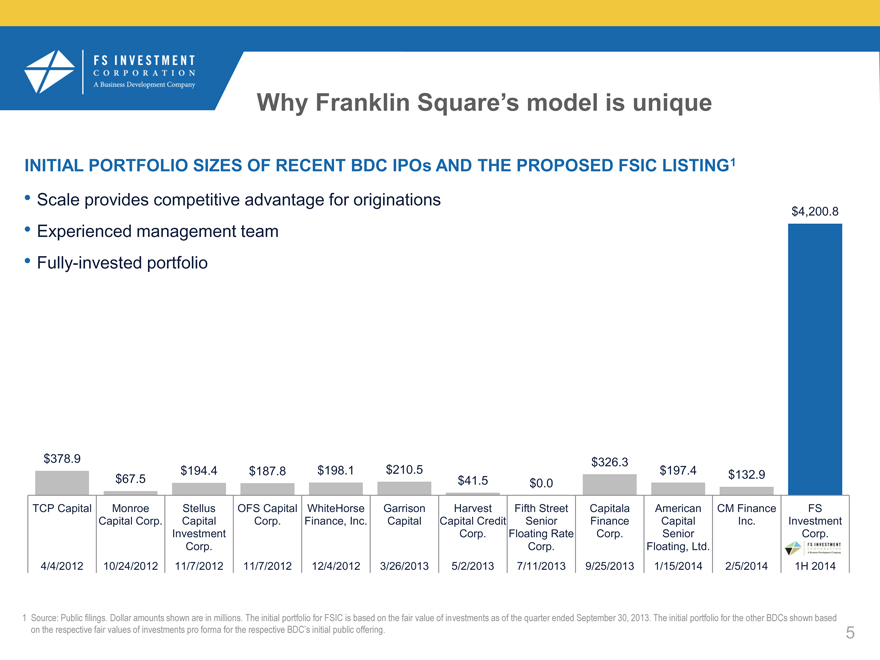
INITIAL PORTFOLIO SIZES OF RECENT BDC IPOs AND THE PROPOSED FSIC LISTING1
Scale provides competitive advantage for originations
Experienced management team
Fully-invested portfolio
$378.9 $326.3
$194.4 $187.8 $198.1 $210.5 $197.4 $132.9
$67.5 $41.5 $0.0
TCP Capital Monroe Stellus OFS Capital WhiteHorse Garrison Harvest Fifth Street Capitala American CM Finance FS
Capital Corp. Capital Corp. Finance, Inc. Capital Capital Credit Senior Finance Capital Inc. Investment
Investment Corp. Floating Rate Corp. Senior Corp.
Corp. Corp. Floating, Ltd.
4/4/2012 10/24/2012 11/7/2012 11/7/2012 12/4/2012 3/26/2013 5/2/2013 7/11/2013 9/25/2013 1/15/2014 2/5/2014 1H 2014
$4,200.8
Source: Public filings. Dollar amounts shown are in millions. The initial portfolio for FSIC is based on the fair value of investments as of the quarter ended September 30, 2013. The initial portfolio for the other BDCs shown based on the respective fair values of investments pro forma for the respective BDC’s initial public offering.
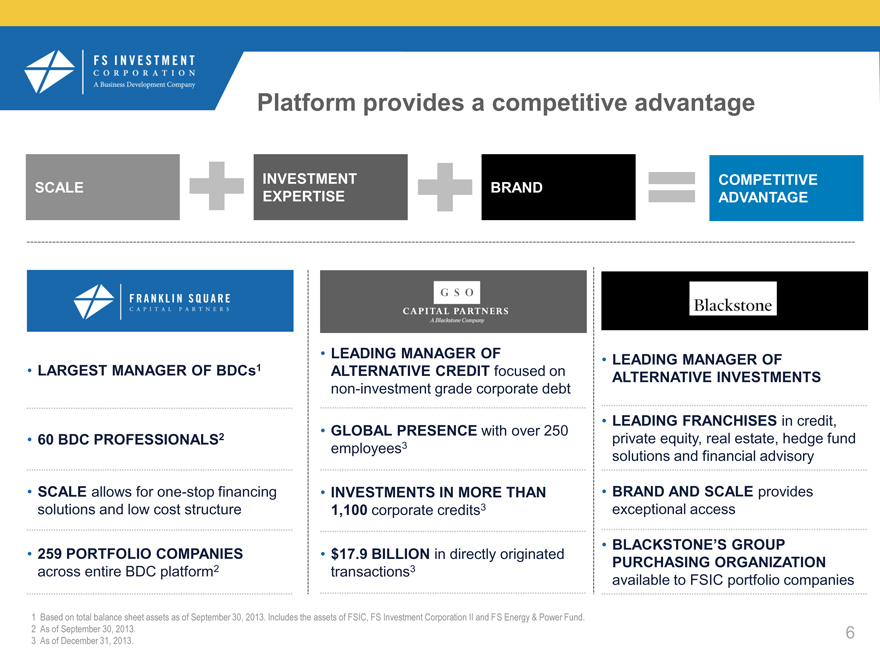
Platform provides a competitive advantage
INVESTMENT COMPETITIVE
SCALE BRAND
EXPERTISE ADVANTAGE
LEADING MANAGER OF LEADING MANAGER OF
LARGEST MANAGER OF BDCs1 ALTERNATIVE CREDIT focused on ALTERNATIVE INVESTMENTS
non-investment grade corporate debt
LEADING FRANCHISES in credit,
GLOBAL PRESENCE with over 250
60 BDC PROFESSIONALS2 private equity, real estate, hedge fund
employees3 solutions and financial advisory
SCALE allows for one-stop financing INVESTMENTS IN MORE THAN BRAND AND SCALE provides
solutions and low cost structure 1,100 corporate credits3 exceptional access
BLACKSTONE’S GROUP
259 PORTFOLIO COMPANIES $17.9 BILLION in directly originated PURCHASING ORGANIZATION
across entire BDC platform2 transactions3 available to FSIC portfolio companies
1Based on total balance sheet assets as of September 30, 2013. Includes the assets of FSIC, FS Investment Corporation II and FS Energy & Power Fund.
2 As of September 30, 2013.
3 As of December 31, 2013.
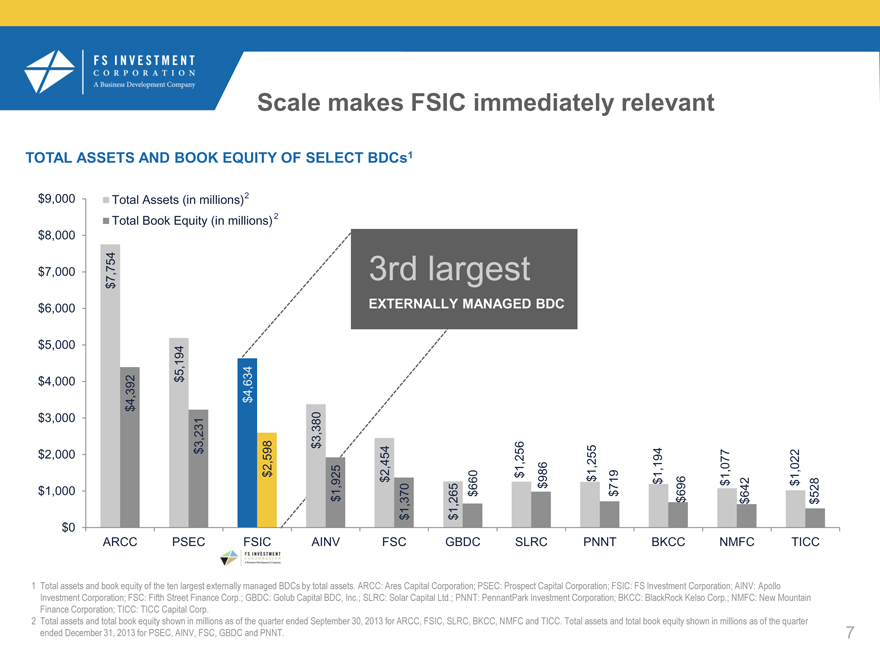
Scale makes FSIC immediately relevant
TOTAL ASSETS AND BOOK EQUITY OF SELECT BDCs1
$9,000 Total Assets (in millions)2
Total Book Equity (in millions) 2
$8,000
$7,000 7,754 3rd largest
$
$6,000 EXTERNALLY MANAGED BDC
$5,000
5,194
$4,000 $
4,392 $ 4,634
$
$3,000 3,231 3,380
$
$2,000 $
$ 2,598 2,454 $ 1,256 1,255 1,194 1,077 1,022
$
$1,000 1,925 $ $ 660 986 $ $ 719 $ 696 $ 642 $ 528
$ 1,370 1,265 $ $ $
$ $
$0
ARCC PSEC FSIC AINV FSC GBDC SLRC PNNT BKCC NMFC TICC
1 Total assets and book equity of the ten largest externally managed BDCs by total assets. ARCC: Ares Capital Corporation; PSEC: Prospect Capital Corporation; FSIC: FS Investment Corporation; AINV: Apollo Investment Corporation; FSC: Fifth Street Finance Corp.; GBDC: Golub Capital BDC, Inc.; SLRC: Solar Capital Ltd.; PNNT: PennantPark Investment Corporation; BKCC: BlackRock Kelso Corp.; NMFC: New Mountain Finance Corporation; TICC: TICC Capital Corp.
2 Total assets and total book equity shown in millions as of the quarter ended September 30, 2013 for ARCC, FSIC, SLRC, BKCC, NMFC and TICC. Total assets and total book equity shown in millions as of the quarter ended December 31, 2013 for PSEC, AINV, FSC, GBDC and PNNT.
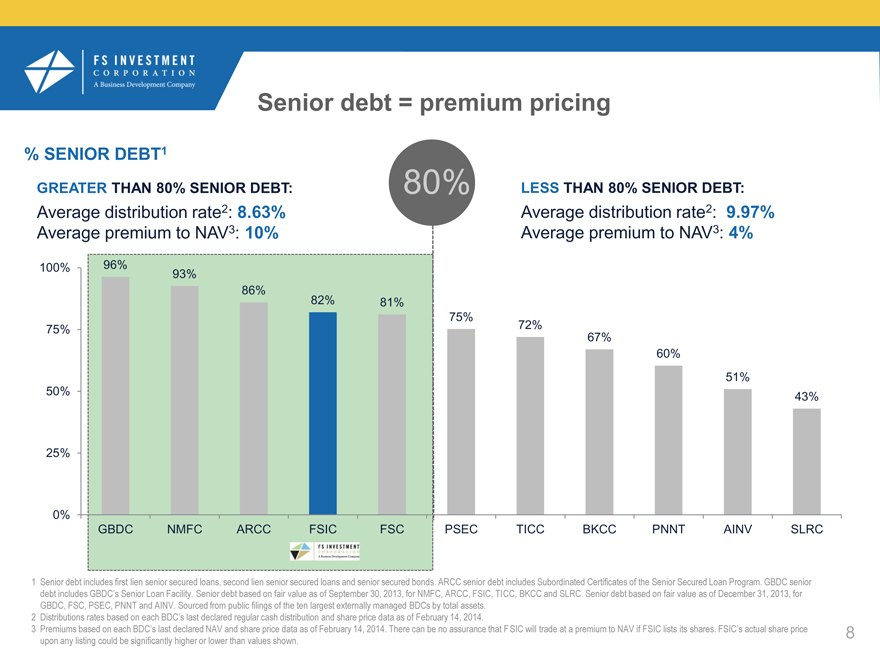
Senior debt = premium pricing
% SENIOR DEBT1
GREATER THAN 80% SENIOR DEBT: 80% LESS THAN 80% SENIOR DEBT:
Average distribution rate2: 8.63% Average distribution rate2: 9.97%
Average premium to NAV3: 10% Average premium to NAV3: 4%
100% 96% 93%
86%
82% 81%
75%
75% 72% 67%
60%
51%
50% 43%
25%
0%
GBDC NMFC ARCC FSIC FSC PSEC TICC BKCC PNNT AINV SLRC
1 Senior debt includes first lien senior secured loans, second lien senior secured loans and senior secured bonds. ARCC senior debt includes Subordinated Certificates of the Senior Secured Loan Program. GBDC senior debt includes GBDC’s Senior Loan Facility. Senior debt based on fair value as of September 30, 2013, for NMFC, ARCC, FSIC, TICC, BKCC and SLRC. Senior debt based on fair value as of December 31, 2013, for GBDC, FSC, PSEC, PNNT and AINV. Sourced from public filings of the ten largest externally managed BDCs by total assets.
2 Distributions rates based on each BDC’s last declared regular cash distribution and share price data as of February 14, 2014.
3 Premiums based on each BDC’s last declared NAV and share price data as of February 14, 2014. There can be no assurance that F SIC will trade at a premium to NAV if FSIC lists its shares. FSIC’s actual share price upon any listing could be significantly higher or lower than values shown.
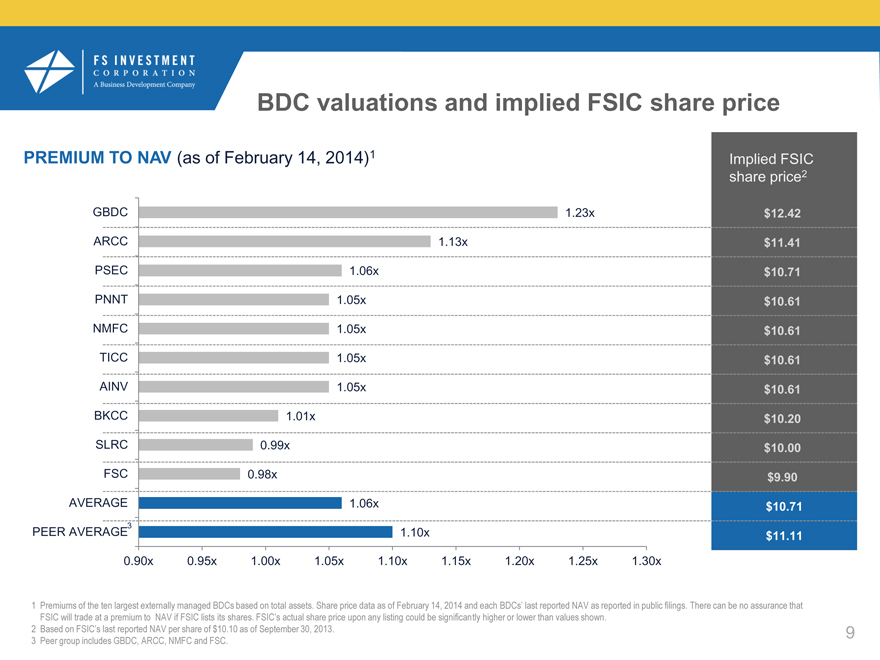
BDC valuations and implied FSIC share price
PREMIUM TO NAV (as of February 14, 2014)1 Implied FSIC
share price2
GBDC 1.23x $12.42
ARCC 1.13x $11.41
PSEC 1.06x $10.71
PNNT 1.05x $10.61
NMFC 1.05x $10.61
TICC 1.05x $10.61
AINV 1.05x $10.61
BKCC 1.01x $10.20
SLRC 0.99x $10.00
FSC 0.98x $9.90
AVERAGE 1.06x $10.71
PEER AVERAGE3 1.10x $11.11
0.90x 0.95x 1.00x 1.05x 1.10x 1.15x 1.20x 1.25x 1.30x
1 Premiums of the ten largest externally managed BDCs based on total assets. Share price data as of February 14, 2014 and each BDCs’ last reported NAV as reported in public filings. There can be no assurance that
FSIC will trade at a premium to NAV if FSIC lists its shares. FSIC’s actual share price upon any listing could be significantly higher or lower than values shown.
2 | | Based on FSIC’s last reported NAV per share of $10.10 as of September 30, 2013. |
3 | | Peer group includes GBDC, ARCC, NMFC and FSC. |
9
How FSIC continues to add value
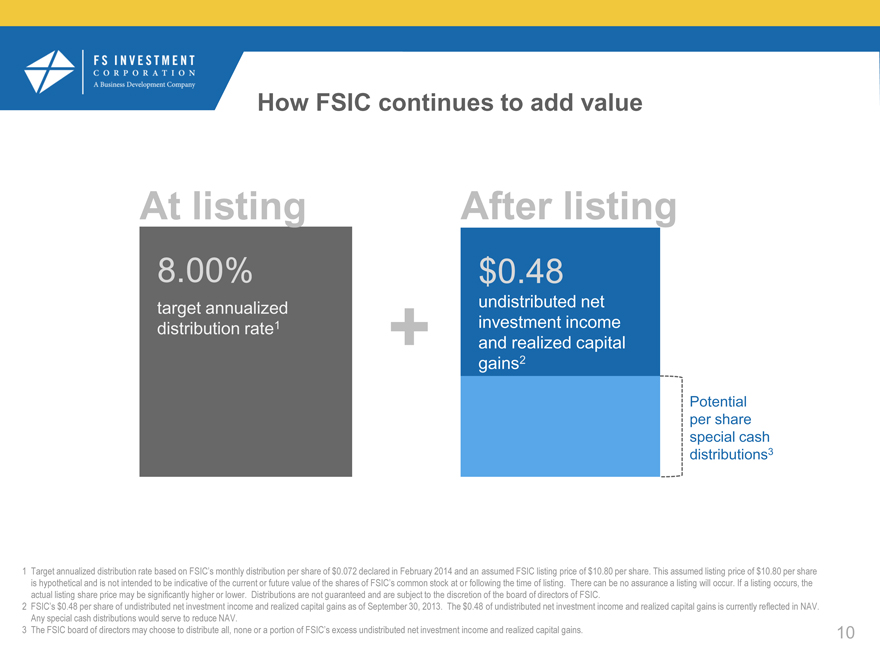
At listing After listing
8.00% $0.48
target annualized undistributed net
distribution rate1 investment income
+ and realized capital
gains2
Potential
per share
special cash
distributions3
1 Target annualized distribution rate based on FSIC’s monthly distribution per share of $0.072 declared in February 2014 and an assumed FSIC listing price of $10.80 per share. This assumed listing price of $10.80 per share is hypothetical and is not intended to be indicative of the current or future value of the shares of FSIC’s common stock at or following the time of listing. There can be no assurance a listing will occur. If a listing occurs, the actual listing share price may be significantly higher or lower. Distributions are not guaranteed and are subject to the discretion of the board of directors of FSIC.
2 FSIC’s $0.48 per share of undistributed net investment income and realized capital gains as of September 30, 2013. The $0.48 of undistributed net investment income and realized capital gains is currently reflected in NAV. Any special cash distributions would serve to reduce NAV.
3 The FSIC board of directors may choose to distribute all, none or a portion of FSIC’s excess undistributed net investment income and realized capital gains.
10
FSIC is an income solution
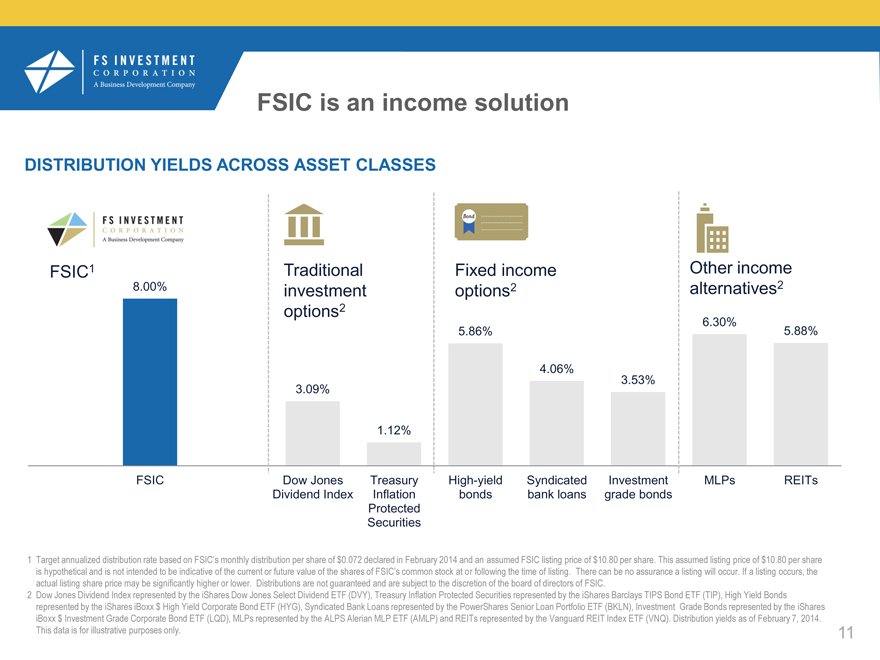
DISTRIBUTION YIELDS ACROSS ASSET CLASSES
FSIC1 Traditional Fixed income Other income
8.00% investment options2 alternatives2
options2
6.30%
5.86% 5.88%
4.06%
3.53%
3.09%
1.12%
FSIC Dow Jones Treasury High-yield Syndicated Investment MLPs REITs
Dividend Index Inflation bonds bank loans grade bonds
Protected
Securities
1 Target annualized distribution rate based on FSIC’s monthly distribution per share of $0.072 declared in February 2014 and an assumed FSIC listing price of $10.80 per share. This assumed listing price of $10.80 per share is hypothetical and is not intended to be indicative of the current or future value of the shares of FSIC’s common stock at or following the time of listing. There can be no assurance a listing will occur. If a listing occurs, the actual listing share price may be significantly higher or lower. Distributions are not guaranteed and are subject to the discretion of the board of directors of FSIC.
2 Dow Jones Dividend Index represented by the iShares Dow Jones Select Dividend ETF (DVY), Treasury Inflation Protected Securities represented by the iShares Barclays TIPS Bond ETF (TIP), High Yield Bonds represented by the iShares iBoxx $ High Yield Corporate Bond ETF (HYG), Syndicated Bank Loans represented by the PowerShares Senior Loan Portfolio ETF (BKLN), Investment Grade Bonds represented by the iShares iBoxx $ Investment Grade Corporate Bond ETF (LQD), MLPs represented by the ALPS Alerian MLP ETF (AMLP) and REITs represented by the Vanguard REIT Index ETF (VNQ). Distribution yields as of February 7, 2014. This data is for illustrative purposes only.
11
FSIC’s value proposition
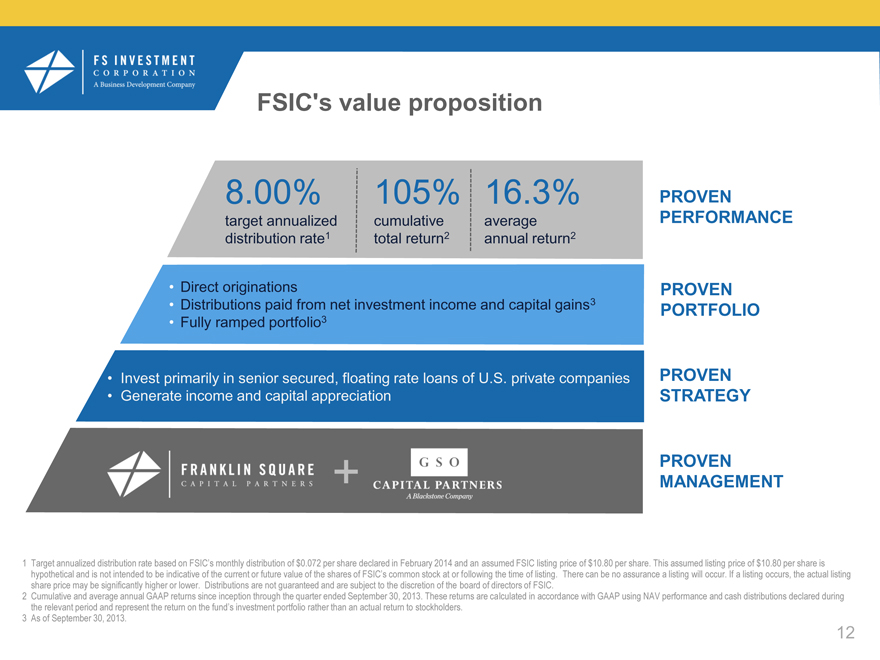
8.00% 105% 16.3% PROVEN
target annualized cumulative average PERFORMANCE
distribution rate1 total return2 annual return2
Direct originations PROVEN
Distributions paid from net investment income and capital gains3 PORTFOLIO
Fully ramped portfolio3
Invest primarily in senior secured, floating rate loans of U.S. private companies PROVEN
Generate income and capital appreciation STRATEGY
PROVEN
+ MANAGEMENT
1 Target annualized distribution rate based on FSIC’s monthly distribution of $0.072 per share declared in February 2014 and an assumed FSIC listing price of $10.80 per share. This assumed listing price of $10.80 per share is hypothetical and is not intended to be indicative of the current or future value of the shares of FSIC’s common stock at or following the time of listing. There can be no assurance a listing will occur. If a listing occurs, the actual listing share price may be significantly higher or lower. Distributions are not guaranteed and are subject to the discretion of the board of directors of FSIC.
2 Cumulative and average annual GAAP returns since inception through the quarter ended September 30, 2013. These returns are calculated in accordance with GAAP using NAV performance and cash distributions declared during the relevant period and represent the return on the fund’s investment portfolio rather than an actual return to stockholders.
3 As of September 30, 2013.
12
FSIC listing details
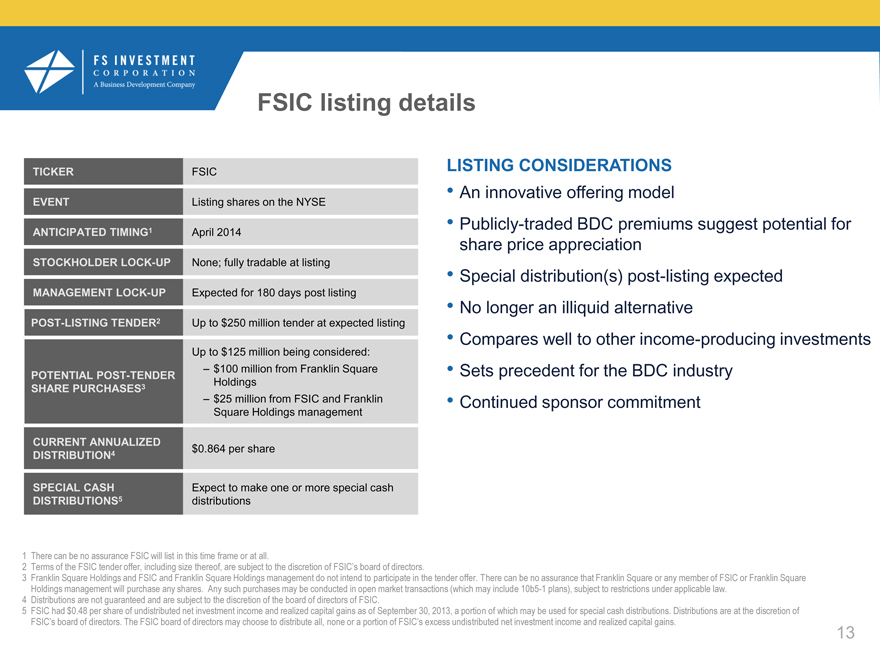
TICKER FSIC
EVENT Listing shares on the NYSE
ANTICIPATED TIMING1 April 2014
STOCKHOLDER LOCK-UP None; fully tradable at listing
MANAGEMENT LOCK-UP Expected for 180 days post listing
POST-LISTING TENDER2 Up to $250 million tender at expected listing
Up to $125 million being considered:
POTENTIAL POST-TENDER – $100 million from Franklin Square Holdings
SHARE PURCHASES3
– $25 million from FSIC and Franklin
Square Holdings management
CURRENT ANNUALIZED $0.864 per share
DISTRIBUTION4
SPECIAL CASH Expect to make one or more special cash
DISTRIBUTIONS5 distributions
LISTING CONSIDERATIONS
An innovative offering model
Publicly-traded BDC premiums suggest potential for share price appreciation
Special distribution(s) post-listing expected
No longer an illiquid alternative
Compares well to other income-producing investments
Sets precedent for the BDC industry
Continued sponsor commitment
1 There can be no assurance FSIC will list in this time frame or at all.
2 Terms of the FSIC tender offer, including size thereof, are subject to the discretion of FSIC’s board of directors.
3 Franklin Square Holdings and FSIC and Franklin Square Holdings management do not intend to participate in the tender offer. There can be no assurance that Franklin Square or any member of FSIC or Franklin Square Holdings management will purchase any shares. Any such purchases may be conducted in open market transactions (which may include 10b5-1 plans), subject to restrictions under applicable law.
4 Distributions are not guaranteed and are subject to the discretion of the board of directors of FSIC.
5 FSIC had $0.48 per share of undistributed net investment income and realized capital gains as of September 30, 2013, a portion of which may be used for special cash distributions. Distributions are at the discretion of
FSIC’s board of directors. The FSIC board of directors may choose to distribute all, none or a portion of FSIC’s excess undistributed net investment income and realized capital gains.
13
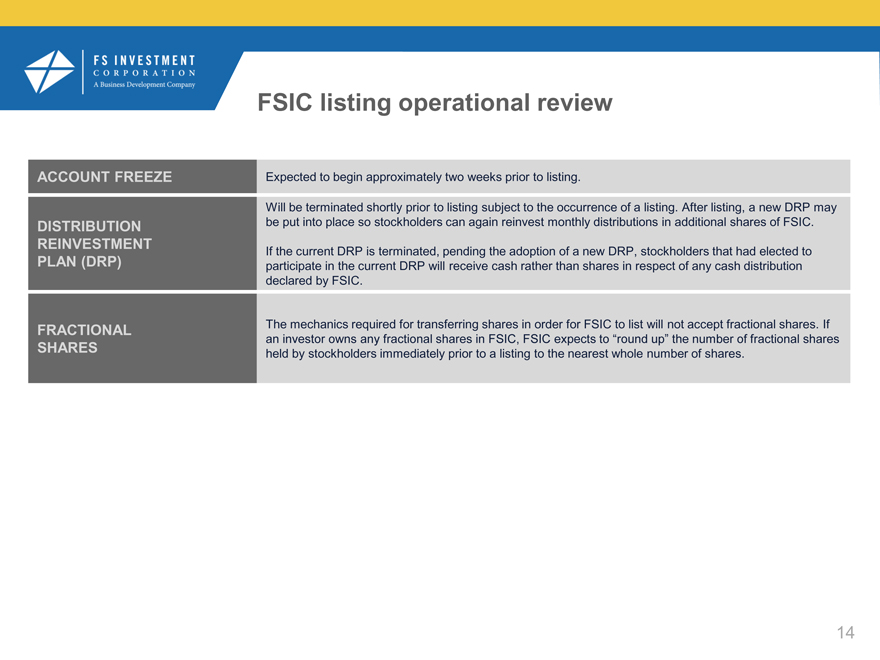
FSIC listing operational review
ACCOUNT FREEZE Expected to begin approximately two weeks prior to listing.
Will be terminated shortly prior to listing subject to the occurrence of a listing. After listing, a new DRP may
DISTRIBUTION be put into place so stockholders can again reinvest monthly distributions in additional shares of FSIC.
REINVESTMENT If the current DRP is terminated, pending the adoption of a new DRP, stockholders that had elected to
PLAN (DRP) participate in the current DRP will receive cash rather than shares in respect of any cash distribution
declared by FSIC.
FRACTIONAL The mechanics required for transferring shares in order for FSIC to list will not accept fractional shares. If
an investor owns any fractional shares in FSIC, FSIC expects to “round up” the number of fractional shares
SHARES held by stockholders immediately prior to a listing to the nearest whole number of shares.
14

