| OMB APPROVAL |
OMB Number: 3235-0570 Expires: August 31, 2011 Estimated average burden hours per response: 18.9 |
UNITED STATES
SECURITIES AND EXCHANGE COMMISSION
Washington, D.C. 20549
FORM N-CSR
CERTIFIED SHAREHOLDER REPORT OF REGISTERED
MANAGEMENT INVESTMENT COMPANIES
Investment Company Act file number ___811-22162________________________
The RAM Funds
(Exact name of registrant as specified in charter)
| 2331 Far Hills Avenue, Suite 200 Dayton, Ohio | 45419 |
| (Address of principal executive offices) | (Zip code) |
Tina H. Bloom, Esq.
Ultimus Fund Solutions, LLC 225 Pictoria Drive, Suite 450 Cincinnati, Ohio 45246
(Name and address of agent for service)
Registrant's telephone number, including area code: (937) 643-1000
Date of fiscal year end: November 30, 2009
Date of reporting period: November 30, 2009
Form N-CSR is to be used by management investment companies to file reports with the Commission not later than 10 days after the transmission to stockholders of any report that is required to be transmitted to stockholders under Rule 30e-1 under the Investment Company Act of 1940 (17 CFR 270.30e-1). The Commission may use the information provided on Form N-CSR in its regulatory, disclosure review, inspection, and policymaking roles.
A registrant is required to disclose the information specified by Form N-CSR, and the Commission will make this information public. A registrant is not required to respond to the collection of information contained in Form N-CSR unless the Form displays a currently valid Office of Management and Budget ("OMB") control number. Please direct comments concerning the accuracy of the information collection burden estimate and any suggestions for reducing the burden to Secretary, Securities and Exchange Commission, 450 Fifth Street, NW, Washington, DC 20549-0609. The OMB has reviewed this collection of information under the clearance requirements of 44 U.S.C. § 3507.
Item 1. Reports to Stockholders.
| The RAM Funds The RAM Small/Mid Cap Fund The RAM Small Cap Fund Annual Report November 30, 2009 Investment Adviser Riazzi Asset Management, LLC Dayton, OH |
The RAM Funds
November 30, 2009
The year 2009 seems headed into the record books as one of the most volatile markets since the Great Depression. Since the March 9th bottom, major market indexes have bounced at a pace never before seen. Arguably the most significant fundamental improvement since the market lows has been in the credit markets. Spreads across all investment grades have contracted to pre-Lehman collapse levels, saving leveraged institutions and our economy from a complete meltdown.
A broad sampling of economic indicators, as well, has exhibited signs of improvement either in the form of decelerating rate of decline or bouncing off an albeit depressed base. Despite improvement, the economic reality during the past twelve months has tracked our outlook fairly closely:
| o | The housing market continues to be plagued by high inventory, falling prices, and foreclosures |
| o | Consumer credit is contracting |
| o | Consumer spending has improved but remains anemic |
| o | Unemployment continues to rise |
| o | Cost cutting has trumped business investment |
| o | China’s stimulus program has reignited infrastructure spending |
| o | Oil has rebounded to our near-term projected fair value of $60-80 |
Our portfolios are comprised of businesses which we believe offer compelling risk/reward opportunities. We also believe they are positioned to take advantage of our economic outlook. In that regard, we have seen both positive and negative influences during the past year.
Since the inception date of December 22, 2008, through November 30, 2009, the RAM Small/Mid Cap Fund (the “SMID Fund”) returned 27.55%, excluding the impact of sales charges, versus 26.42% for the Russell 2500 Value Index and the RAM Small Cap Fund (the “Small Cap Fund”) returned 17.60%, excluding the impact of sales charges, versus 18.46% for the Russell 2000 Value Index. Two of the Funds’ best performers for the year were Consumer Discretionary holdings, Hanesbrands and Jarden. Our underweight to the Consumer Discretionary sector, however, was a detractor versus the benchmark for both funds. Energy was the largest positive contributor for both funds due to our overweight and had a more meaningful impact in the Small/Mid Cap Fund due to security selection. Infrastructure-related names such as Helix in the Small Cap Fund and McDermott International in the Small/Mid Cap Fund
1
posted stellar gains for the year. Our underweighted position in Financials, specifically our lack of exposure to banks or credit, contributed significantly to performance. Healthcare REITs provided the largest benefit to performance in the Financials sector for both the Small/Mid Cap Fund and the Small Cap Fund.
Information Technology was the largest detractor from performance in both the SMID Fund and the Small Cap Fund, due to our underweight position in the sector and results from holdings such as Cogent Systems and Interdigital.
Looking forward to 2010 our optimism remains tempered, but we do see some bright spots. Corporate earnings are likely to “appear” better than last year as a result of not only easy year over year sales and earnings comparisons, but also the result of much lower operating costs as companies reduced payrolls, inventories, and capital expenditures. Emerging markets look to continue their unabated economic recovery which should continue to put pressure on commodities markets – particularly crude oil. As the developed world begins its slow recovery, the amount of spare oil production capacity will decline and prices will rise. Finally, the “rise of populism” seems to have lost some of its luster since the recession began, which may foretell a more business accommodating environment in 2010 and beyond.
Negatively speaking, we remain concerned about the U.S. consumer in general (high debt levels, lack of job opportunities) but even more so, the likely impact on the wealthy U.S. consumer – the main driver of discretionary spending. Increased taxes, declines in stock market wealth and corporate profits, and a lack of investment opportunities can all negatively impact the desire for the well-to-do to part with their money. Further, we will watch with a keen eye the ability for the Federal Reserve to manage a soft recovery within the scope of their dual mandates (stable prices i.e. low inflation and full employment) -all herculean tasks to say the least. Finally, we are not convinced that the banking system should be taken off the respirator yet, given growing – not shrinking – delinquent loans that should be foreclosed upon and a large volume of loans which will need to be refinanced during 2010 and shortly thereafter.
We reiterate our stance that stabilization of the housing market is critical to a robust U.S. economic recovery and an improvement in consumer sentiment and spending. While this could be a multi-year process, fiscal stimulus in the near-term may bridge the gap.
Our portfolios are structured with one eye on current economic weakness and another on the eventual recovery. More specifically, we have increased our exposure to investments in businesses that we believe are recession resistant such as economic consulting, consumer staples, insurance providers, and pawnshop operators.
Last year at this time, we believed that 2009 would likely be a volatile year – we were clearly right. But we also thought 2009 would be the year when economic rationality would reign true resulting in a wide dispersion between the performance of sectors and industries. While 2009 is best summarized by a new found investor admiration for risky assets, we don’t believe that all industries will have equally impressive performance throughout 2010 as the effect of broad economic stimulus plans wear off. Instead, we are of the opinion 2010 will likely begin a multi-year period when an investment process, such as our own, that integrates a macroeconomic overlay into security selection will prove especially effective in generating investment returns.
2
We thank you for your continued support.
Michelle Stevens, CFA John Riazzi, CFA
The Letter to Shareholders seeks to describe some of the Adviser’s current opinions and views of the financial markets. Although the Adviser believes it has a reasonable basis for any opinions or views expressed, actual results may differ, sometimes significantly so, from those expected or expressed.
Past performance is not predictive of future performance. Investment results and principal value will fluctuate so that shares, when redeemed, may be worth more or less than their original cost. Fee waivers have positively impacted each Fund’s performance over the relevant periods and without such waivers, Fund performance would have been lower. For each Fund’s current expense ratio information please see the Financial Highlights table included in this Report. Current performance may be higher or lower than the performance data quoted Performance data current to the most recent month-end, are available by calling 1-888-884-8099. An investor should consider the investment objectives, risks, charges and expenses of the Fund carefully before investing. The Funds prospectus contains this and other important information. To obtain a copy of the Funds prospectus please visit www.theramfunds.com or call 1-888-884-8099 and a copy will be sent to you free of charge. Please read the prospectus carefully before you invest. The RAM Funds are distributed by Ultimus Fund Distributors, LLC.
3
THE RAM SMALL/MID CAP FUND
CLASS A (Unaudited)
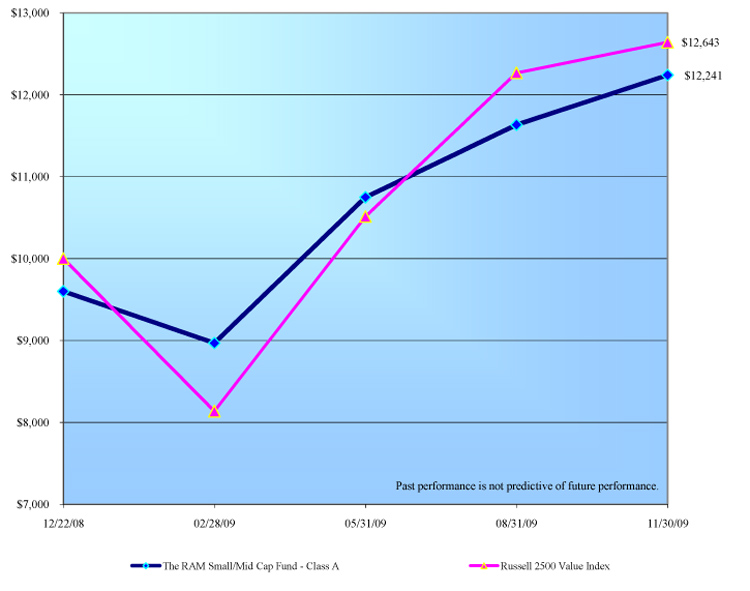
Comparison of the Change in Value of a $10,000 Investment in The
RAM Small/Mid Cap Fund - Class A(a) versus the Russell 2500 Value Index
Total Return (b) | |||
| (for period ended November 30, 2009) | |||
| Since Inception* | |||
The RAM Small/Mid Cap Fund - Class A(a) | 22.41% | ||
| Russell 2500 Value Index | 26.42% | ||
(a) The change in value of the initial $10,000 investment shown in the line graph and the total return in the above table reflect the maximum front-end sales load of 4.00%.
(b) The return shown does not reflect the deduction of taxes a shareholder would pay on Fund distributions, if any, or the redemption of Fund shares.
* Commencement of operations was December 22, 2008.
4
THE RAM SMALL/MID CAP FUND
CLASS I (Unaudited)
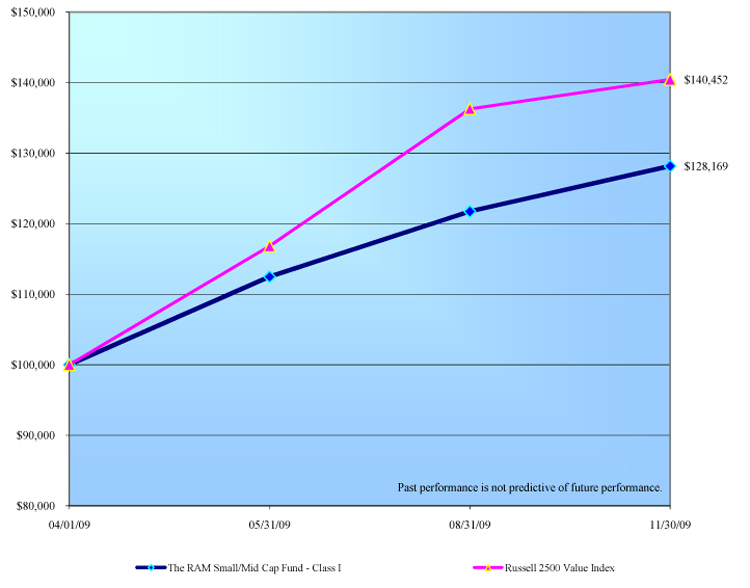
Comparison of the Change in Value of a $100,000 Investment in The
RAM Small/Mid Cap Fund - Class I versus the Russell 2500 Value Index
Total Return (a) | |||
| (for period ended November 30, 2009) | |||
| Since Inception* | |||
| The RAM Small/Mid Cap Fund - Class I | 28.17% | ||
| Russell 2500 Value Index | 40.45% | ||
(a) The return shown does not reflect the deduction of taxes a shareholder would pay on Fund distributions, if any, or the redemption of Fund shares.
* Commencement of operations was April 1, 2009.
5
THE RAM SMALL CAP FUND
(Unaudited)
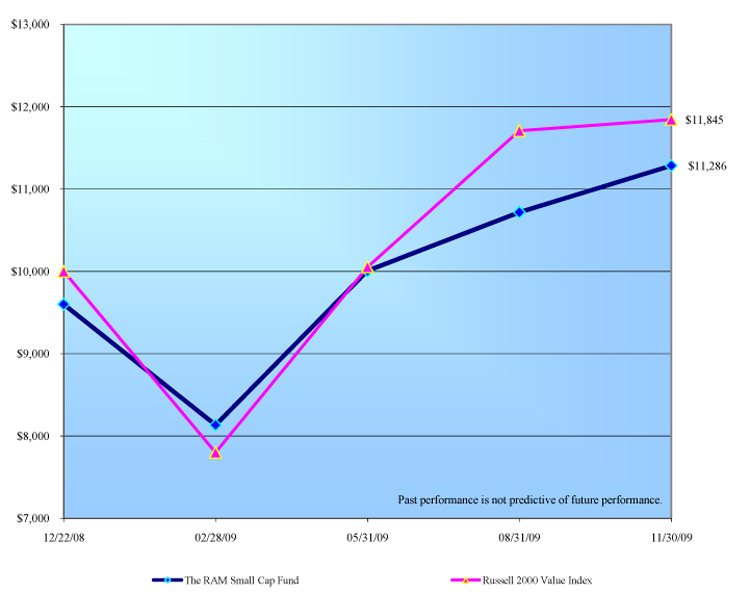
Comparison of the Change in Value of a $10,000 Investment in The
RAM Small Cap Fund(a) versus the Russell 2000 Value Index
Total Return (b) | |||
| (for period ended November 30, 2009) | |||
| Since Inception* | |||
The RAM Small Cap Fund(a) | 12.86% | ||
| Russell 2000 Value Index | 18.46% | ||
(a) The change in value of the initial $10,000 investment shown in the line graph and the total return in the above table reflect the maximum front-end sales load of 4.00%.
(b) The return shown does not reflect the deduction of taxes a shareholder would pay on Fund distributions, if any, or the redemption of Fund shares.
* Commencement of operations was December 22, 2008.
6
| The RAM Small/Mid Cap Fund | |||||||||
| Supplementary Portfolio Information | |||||||||
| November 30, 2009 (Unaudited) | |||||||||
| TEN LARGEST EQUITY HOLDINGS | |||||||||
| % of | |||||||||
| Company | Net Assets | ||||||||
| McDermott International, Inc. | 3.9% | ||||||||
| Aegean Marine Petroleum Network, Inc. | 3.9% | ||||||||
| Lender Processing Services, Inc. | 3.6% | ||||||||
| LTC Properties, Inc. | 3.5% | ||||||||
| Omega Healthcare Investors, Inc. | 3.4% | ||||||||
| FTI Consulting, Inc. | 3.2% | ||||||||
| CMS Energy Corp. | 3.1% | ||||||||
| HCC Insurance Holdings, Inc. | 3.1% | ||||||||
| PetroHawk Energy Corp. | 3.1% | ||||||||
| EZCORP, Inc. - Class A | 3.0% | ||||||||
| ASSET ALLOCATION | |||||||||
| % of | |||||||||
| Sector | Net Assets | ||||||||
| Consumer Discretionary | 7.8% | ||||||||
| Consumer Staples | 4.7% | ||||||||
| Energy | 15.4% | ||||||||
| Financials | 21.8% | ||||||||
| Health Care | 2.1% | ||||||||
| Industrials | 22.2% | ||||||||
| Information Technology | 9.3% | ||||||||
| Materials | 2.7% | ||||||||
| Telecommunication Services | 2.1% | ||||||||
| Utilities | 7.4% | ||||||||
| Cash Equivalents, Other Assets and Liabilities | 4.5% | ||||||||
| 100.0% | |||||||||
7
| The RAM Small Cap Fund | |||||||||
| Supplementary Portfolio Information | |||||||||
| November 30, 2009 (Unaudited) | |||||||||
| TEN LARGEST EQUITY HOLDINGS | |||||||||
| % of | |||||||||
| Company | Net Assets | ||||||||
| FTI Consulting, Inc. | 4.7% | ||||||||
| EZCORP, Inc. - Class A | 4.3% | ||||||||
| Omega Healthcare Investors, Inc. | 3.9% | ||||||||
| Aegean Marine Petroleum Network, Inc. | 3.9% | ||||||||
| Hanesbrands, Inc. | 3.8% | ||||||||
| LTC Properties, Inc. | 3.5% | ||||||||
| John Wiley & Sons, Inc. - Class A | 3.3% | ||||||||
| Jarden Corp. | 3.1% | ||||||||
| Lender Processing Services, Inc. | 3.1% | ||||||||
| Capstead Mortgage Corp. | 3.0% | ||||||||
| ASSET ALLOCATION | |||||||||
| % of | |||||||||
| Sector | Net Assets | ||||||||
| Consumer Discretionary | 10.2% | ||||||||
| Consumer Staples | 4.9% | ||||||||
| Energy | 15.9% | ||||||||
| Financials | 26.3% | ||||||||
| Health Care | 1.8% | ||||||||
| Industrials | 16.8% | ||||||||
| Information Technology | 6.2% | ||||||||
| Materials | 2.3% | ||||||||
| Telecommunication Services | 2.7% | ||||||||
| Utilities | 1.6% | ||||||||
| Cash Equivalents, Other Assets and Liabilities | 11.3% | ||||||||
| 100.0% | |||||||||
8
| The RAM Small/Mid Cap Fund | ||||||||||
| Schedule of Investments | ||||||||||
| November 30, 2009 | ||||||||||
| COMMON STOCKS — 95.5% | Shares | Value | ||||||||
| Consumer Discretionary - 7.8% | ||||||||||
| Household Durables - 2.2% | ||||||||||
| Jarden Corp. | 6,614 | $ | 181,554 | |||||||
| Media - 2.7% | ||||||||||
| John Wiley & Sons, Inc. - Class A | 5,967 | 223,464 | ||||||||
| Textiles, Apparel & Luxury Goods - 2.9% | ||||||||||
| Hanesbrands, Inc.* | 10,137 | 243,389 | ||||||||
| Consumer Staples - 4.7% | ||||||||||
| Food Products - 2.9% | ||||||||||
| Dean Foods Co.* | 15,313 | 243,477 | ||||||||
| Personal Products - 1.8% | ||||||||||
| Chattem, Inc.* | 2,229 | 146,757 | ||||||||
| Energy - 15.4% | ||||||||||
| Energy Equipment & Services - 3.8% | ||||||||||
| Global Industries Ltd.* | 14,594 | 85,667 | ||||||||
| Superior Energy Services, Inc.* | 11,000 | 232,540 | ||||||||
| 318,207 | ||||||||||
| Oil, Gas & Consumable Fuels - 11.6% | ||||||||||
| Cabot Oil & Gas Corp. | 6,399 | 245,082 | ||||||||
| Holly Corp. | 6,111 | 155,525 | ||||||||
| Omega Navigation Enterprises, Inc. - Class A | 13,156 | 45,520 | ||||||||
| PetroHawk Energy Corp.* | 11,431 | 255,369 | ||||||||
| StealthGas, Inc. | 13,300 | 80,199 | ||||||||
| Swift Energy Co.* | 8,268 | 177,514 | ||||||||
| 959,209 | ||||||||||
| Financials - 21.8% | ||||||||||
| Consumer Finance - 5.1% | ||||||||||
| EZCORP, Inc. - Class A* | 16,823 | 248,476 | ||||||||
| First Cash Financial Services, Inc.* | 9,202 | 175,758 | ||||||||
| 424,234 | ||||||||||
| Insurance - 7.5% | ||||||||||
| Fidelity National Financial, Inc. - Class A | 11,143 | 154,776 | ||||||||
| HCC Insurance Holdings, Inc. | 9,778 | 255,499 | ||||||||
| PartnerRe Ltd. | 2,732 | 210,473 | ||||||||
| 620,748 | ||||||||||
| Real Estate Investment Trusts (REITs) - 9.2% | ||||||||||
| Annaly Capital Management, Inc. | 10,784 | 198,534 | ||||||||
| LTC Properties, Inc. | 11,215 | 288,338 | ||||||||
| Omega Healthcare Investors, Inc. | 15,457 | 279,617 | ||||||||
| 766,489 | ||||||||||
9
| The RAM Small/Mid Cap Fund | ||||||||||
| Schedule of Investments (Continued) | ||||||||||
| COMMON STOCKS — 95.5% (Continued) | Shares | Value | ||||||||
| Health Care - 2.1% | ||||||||||
| Pharmaceuticals - 2.1% | ||||||||||
| Warner Chilcott plc - Class A* | 6,974 | $ | 171,421 | |||||||
| Industrials - 22.2% | ||||||||||
| Commercial Services & Supplies - 2.7% | ||||||||||
| Republic Services, Inc. | 7,836 | 220,975 | ||||||||
| Construction & Engineering - 2.0% | ||||||||||
| KBR, Inc. | 8,771 | 163,404 | ||||||||
| Industrial Conglomerates - 3.9% | ||||||||||
| McDermott International, Inc.* | 15,529 | 325,177 | ||||||||
| Marine - 4.7% | ||||||||||
| Genco Shipping & Trading Ltd.* | 9,059 | 212,705 | ||||||||
| Navios Maritime Holdings, Inc. | 30,698 | 177,435 | ||||||||
| 390,140 | ||||||||||
| Professional Services - 5.0% | ||||||||||
| FTI Consulting, Inc.* | 5,751 | 266,041 | ||||||||
| Navigant Consulting, Inc.* | 11,431 | 151,461 | ||||||||
| 417,502 | ||||||||||
| Transportation Infrastructure - 3.9% | ||||||||||
| Aegean Marine Petroleum Network, Inc. | 12,006 | 322,721 | ||||||||
| Information Technology - 9.3% | ||||||||||
| Computers & Peripherals - 1.4% | ||||||||||
| Hypercom Corp.* | 38,032 | 115,617 | ||||||||
| Internet Software & Services - 2.0% | ||||||||||
| VeriSign, Inc.* | 7,477 | 167,784 | ||||||||
| IT Services - 5.9% | ||||||||||
| Lender Processing Services, Inc. | 7,189 | 300,357 | ||||||||
| Wright Express Corp.* | 6,542 | 190,830 | ||||||||
| 491,187 | ||||||||||
| Materials - 2.7% | ||||||||||
| Chemicals - 2.7% | ||||||||||
| Terra Industries, Inc. | 5,680 | 219,134 | ||||||||
| Telecommunication Services - 2.1% | ||||||||||
| Diversified Telecommunication Services - 2.1% | ||||||||||
| Frontier Communications Corp. | 21,496 | 169,818 | ||||||||
10
| The RAM Small/Mid Cap Fund | ||||||||||
| Schedule of Investments (Continued) | ||||||||||
| COMMON STOCKS — 95.5% (Continued) | Shares | Value | ||||||||
| Utilities - 7.4% | ||||||||||
| Electric Utilities - 4.3% | ||||||||||
| ALLETE, Inc. | 5,464 | $ | 182,716 | |||||||
| UIL Holdings Corp. | 6,470 | 174,431 | ||||||||
| 357,147 | ||||||||||
| Multi-Utilities - 3.1% | ||||||||||
| CMS Energy Corp. | 18,261 | 260,037 | ||||||||
Total Common Stocks (Cost $7,153,882) | $ | 7,919,592 | ||||||||
| MONEY MARKET FUNDS — 1.3% | Shares | Value | ||||||||
| AIM Short-Term Investments Trust (The) - Treasury | ||||||||||
Portfolio - Institutional Class, 0.05%(a) (Cost $110,760) | 110,760 | $ | 110,760 | |||||||
Total Investments at Value — 96.8% (Cost $7,264,642) | $ | 8,030,352 | ||||||||
| Other Assets in Excess of Liabilities — 3.2% | 267,256 | |||||||||
| Net Assets — 100.0% | $ | 8,297,608 | ||||||||
| * Non-income producing security. | ||||||||||
(a) The rate shown is the 7-day effective yield as of November 30, 2009. | ||||||||||
| See accompanying notes to financial statements. | ||||||||||
11
| The RAM Small Cap Fund | ||||||||||
| Schedule of Investments | ||||||||||
| November 30, 2009 | ||||||||||
| COMMON STOCKS — 88.7% | Shares | Value | ||||||||
| Consumer Discretionary - 10.2% | ||||||||||
| Household Durables - 3.1% | ||||||||||
| Jarden Corp. | 503 | $ | 13,807 | |||||||
| Media - 3.3% | ||||||||||
| John Wiley & Sons, Inc. - Class A | 400 | 14,980 | ||||||||
| Textiles, Apparel & Luxury Goods - 3.8% | ||||||||||
| Hanesbrands, Inc.* | 700 | 16,807 | ||||||||
| Consumer Staples - 4.9% | ||||||||||
| Food Products - 2.1% | ||||||||||
| Dean Foods Co.* | 580 | 9,222 | ||||||||
| Personal Products - 2.8% | ||||||||||
| Chattem, Inc.* | 190 | 12,510 | ||||||||
| Energy - 15.9% | ||||||||||
| Energy Equipment & Services - 8.3% | ||||||||||
| Global Industries Ltd.* | 1,100 | 6,457 | ||||||||
| Helix Energy Solutions Group, Inc.* | 656 | 7,715 | ||||||||
| Superior Energy Services, Inc.* | 500 | 10,570 | ||||||||
| Vantage Drilling Co.* | 7,500 | 12,375 | ||||||||
| 37,117 | ||||||||||
| Oil, Gas & Consumable Fuels - 7.6% | ||||||||||
| Comstock Resources, Inc.* | 150 | 5,570 | ||||||||
| Holly Corp. | 370 | 9,417 | ||||||||
| StealthGas, Inc. | 1,200 | 7,236 | ||||||||
| Swift Energy Co. * | 550 | 11,809 | ||||||||
| 34,032 | ||||||||||
| Financials - 26.3% | ||||||||||
| Capital Markets - 2.5% | ||||||||||
| Diamond Hill Investment Group, Inc. | 185 | 11,128 | ||||||||
| Consumer Finance - 7.3% | ||||||||||
| EZCORP, Inc. - Class A* | 1,311 | 19,363 | ||||||||
| First Cash Financial Services, Inc.* | 700 | 13,370 | ||||||||
| 32,733 | ||||||||||
| Insurance - 4.7% | ||||||||||
| American Safety Insurance Holdings Ltd.* | 539 | 8,101 | ||||||||
| Fidelity National Financial, Inc. - Class A | 200 | 2,778 | ||||||||
| HCC Insurance Holdings, Inc. | 380 | 9,929 | ||||||||
| 20,808 | ||||||||||
12
| The RAM Small Cap Fund | ||||||||||
| Schedule of Investments (Continued) | ||||||||||
| COMMON STOCKS — 88.7% (Continued) | Shares | Value | ||||||||
| Financials - 26.3% (Continued) | ||||||||||
| Real Estate Investment Trusts (REITs) - 11.8% | ||||||||||
| Capstead Mortgage Corp. | 950 | $ | 13,566 | |||||||
| LTC Properties, Inc. | 615 | 15,812 | ||||||||
| Omega Healthcare Investors, Inc. | 957 | 17,312 | ||||||||
| Parkway Properties, Inc. | 310 | 5,788 | ||||||||
| 52,478 | ||||||||||
| Health Care - 1.8% | ||||||||||
| Life Sciences Tools & Services - 1.8% | ||||||||||
| ICON plc - ADR* | 359 | 8,149 | ||||||||
| Industrials - 16.8% | ||||||||||
| Construction & Engineering - 1.8% | ||||||||||
| KBR, Inc. | 442 | 8,234 | ||||||||
| Marine - 4.0% | ||||||||||
| Genco Shipping & Trading Ltd.* | 378 | 8,875 | ||||||||
| Navios Maritime Holdings, Inc. | 1,546 | 8,936 | ||||||||
| 17,811 | ||||||||||
| Professional Services - 7.1% | ||||||||||
| FTI Consulting, Inc.* | 450 | 20,817 | ||||||||
| Navigant Consulting, Inc.* | 808 | 10,706 | ||||||||
| 31,523 | ||||||||||
| Transportation Infrastructure - 3.9% | ||||||||||
| Aegean Marine Petroleum Network, Inc. | 641 | 17,230 | ||||||||
| Information Technology - 6.2% | ||||||||||
| Electronic Equipment, Instruments & Components - 0.9% | ||||||||||
| I.D. Systems, Inc.* | 1,263 | 3,852 | ||||||||
| IT Services - 5.3% | ||||||||||
| Lender Processing Services, Inc. | 330 | 13,787 | ||||||||
| Wright Express Corp.* | 338 | 9,859 | ||||||||
| 23,646 | ||||||||||
| Materials - 2.3% | ||||||||||
| Chemicals - 2.3% | ||||||||||
| Terra Industries, Inc. | 265 | 10,224 | ||||||||
| Telecommunication Services - 2.7% | ||||||||||
| Diversified Telecommunication Services - 2.7% | ||||||||||
| Frontier Communications Corp. | 1,500 | 11,850 | ||||||||
13
| The RAM Small Cap Fund | ||||||||||
| Schedule of Investments (Continued) | ||||||||||
| COMMON STOCKS — 88.7% (Continued) | Shares | Value | ||||||||
| Utilities - 1.6% | ||||||||||
| Electric Utilities - 1.6% | ||||||||||
| UIL Holdings Corp. | 273 | $ | 7,360 | |||||||
Total Common Stocks (Cost $335,640) | $ | 395,501 | ||||||||
| MONEY MARKET FUNDS — 7.7% | Shares | Value | ||||||||
| AIM Short-Term Investments Trust (The) - Treasury | ||||||||||
Portfolio - Institutional Class, 0.05%(a) (Cost $34,066) | 34,066 | $ | 34,066 | |||||||
Total Investments at Value — 96.4% (Cost $369,706) | $ | 429,567 | ||||||||
| Other Assets in Excess of Liabilities — 3.6% | 16,260 | |||||||||
| Net Assets — 100.0% | $ | 445,827 | ||||||||
| ADR - American Depositary Receipt. | ||||||||||
| * Non-income producing security. | ||||||||||
(a) The rate shown is the 7-day effective yield as of November 30, 2009. | ||||||||||
| See accompanying notes to financial statements. | ||||||||||
14
| The RAM Funds | |||||||||
| Statements of Assets and Liabilities | |||||||||
| November 30, 2009 | |||||||||
| The RAM | The RAM | ||||||||
| Small/Mid Cap | Small Cap | ||||||||
| Fund | Fund | ||||||||
| ASSETS | |||||||||
| Investments in securities: | |||||||||
| At acquisition cost | $ | 7,264,642 | $ | 369,706 | |||||
| At value (Note 1) | $ | 8,030,352 | $ | 429,567 | |||||
| Receivable for investment securities sold | 126,613 | 8,241 | |||||||
| Receivable for capital shares sold | 133,971 | - | |||||||
| Receivable from Adviser (Note 2) | 6,311 | 7,346 | |||||||
| Dividends receivable | 3,800 | 1,859 | |||||||
| Other assets | 13,926 | 6,382 | |||||||
| TOTAL ASSETS | 8,314,973 | 453,395 | |||||||
| LIABILITIES | |||||||||
| Payable for capital shares redeemed | 4,318 | - | |||||||
| Payable to administrator (Note 2) | 6,800 | 4,600 | |||||||
| Accrued distribution fees (Note 2) | 659 | 170 | |||||||
| Other accrued expenses | 5,588 | 2,798 | |||||||
| TOTAL LIABILITIES | 17,365 | 7,568 | |||||||
| NET ASSETS | $ | 8,297,608 | $ | 445,827 | |||||
| Net assets consist of: | |||||||||
| Paid-in capital | $ | 7,433,275 | $ | 381,090 | |||||
| Accumulated undistributed net investment income | 20,661 | 3,463 | |||||||
| Accumulated undistributed net realized gains from security transactions | 77,962 | 1,413 | |||||||
| Net unrealized appreciation on investments | 765,710 | 59,861 | |||||||
| Net assets | $ | 8,297,608 | $ | 445,827 | |||||
| PRICING OF CLASS A SHARES | |||||||||
| Net assets applicable to Class A shares | $ | 1,857,247 | $ | 445,827 | |||||
| Shares of beneficial interest outstanding (unlimited | |||||||||
| number of shares authorized, no par value) | 146,001 | 37,961 | |||||||
| Net asset value and redemption price per share (Note 1) | $ | 12.72 | $ | 11.74 | |||||
| Maximum offering price per share (Note 1) | $ | 13.25 | $ | 12.23 | |||||
| PRICING OF CLASS I SHARES | |||||||||
| Net assets applicable to Class I shares | $ | 6,440,361 | |||||||
| Shares of beneficial interest outstanding (unlimited | |||||||||
| number of shares authorized, no par value) | 505,400 | ||||||||
| Net asset value, offering price and redemption price per share (Note 1) | $ | 12.74 | |||||||
| See accompanying notes to financial statements. | |||||||||
15
| The RAM Funds | |||||||||
| Statements of Operations | |||||||||
For the Period Ended November 30, 2009(a) | |||||||||
| The RAM | The RAM | ||||||||
| Small/Mid Cap | Small Cap | ||||||||
| Fund | Fund | ||||||||
| INVESTMENT INCOME | |||||||||
| Dividends | $ | 56,725 | $ | 7,878 | |||||
| EXPENSES | |||||||||
| Fund accounting fees (Note 2) | 26,095 | 22,667 | |||||||
| Administration fees (Note 2) | 18,116 | 18,116 | |||||||
| Transfer agent fees - Class A (Note 2) | 13,073 | 11,323 | |||||||
| Transfer agent fees - Class I (Note 2) | 11,000 | - | |||||||
| Custody and bank service fees | 24,936 | 7,747 | |||||||
| Investment advisory fees (Note 2) | 26,712 | 2,652 | |||||||
| Compliance service fees (Note 2) | 11,000 | 11,000 | |||||||
| Professional fees | 9,125 | 9,125 | |||||||
| Registration fees - Common | 5,819 | 4,369 | |||||||
| Registration fees - Class A | 1,250 | - | |||||||
| Registration fees - Class I | 2,163 | - | |||||||
| Insurance expense | 3,233 | 3,233 | |||||||
| Trustees' fees | 2,500 | 2,500 | |||||||
| Distribution expense - Class A (Note 2) | 2,488 | 780 | |||||||
| Other expenses | 12,443 | 8,479 | |||||||
| TOTAL EXPENSES | 169,953 | 101,991 | |||||||
| Fee reductions and expense reimbursements by the Adviser (Note 2): | |||||||||
| Common | (106,983) | (97,936) | |||||||
| Class A | (14,323) | - | |||||||
| Class I | (13,163) | - | |||||||
| NET EXPENSES | 35,484 | 4,055 | |||||||
| NET INVESTMENT INCOME | 21,241 | 3,823 | |||||||
| REALIZED AND UNREALIZED | |||||||||
| GAINS ON INVESTMENTS | |||||||||
| Net realized gains from security transactions | 77,962 | 1,413 | |||||||
| Net change in unrealized appreciation (depreciation) on investments | 765,710 | 59,861 | |||||||
| NET REALIZED AND UNREALIZED | |||||||||
| GAINS ON INVESTMENTS | 843,672 | 61,274 | |||||||
| NET INCREASE IN NET ASSETS FROM OPERATIONS | $ | 864,913 | $ | 65,097 | |||||
(a) Represents the period from the commencement of operations (December 22, 2008 for Class A shares and April 1, 2009 for Class I shares) through November 30, 2009. | |||||||||
| See accompanying notes to financial statements. | |||||||||
16
| The RAM Small/Mid Cap Fund | |||||
| Statement of Changes in Net Assets | |||||
| Period | |||||
| Ended | |||||
| November 30, | |||||
2009(a) | |||||
| FROM OPERATIONS | |||||
| Net investment income | $ | 21,241 | |||
| Net realized gains from security transactions | 77,962 | ||||
| Net change in unrealized appreciation (depreciation) on investments | 765,710 | ||||
| Net increase in net assets from operations | 864,913 | ||||
| FROM DISTRIBUTIONS TO SHAREHOLDERS | |||||
| From net investment income, Class A | (580) | ||||
| FROM CAPITAL SHARE TRANSACTIONS | |||||
| CLASS A | |||||
| Proceeds from shares sold | 1,794,799 | ||||
| Reinvestment of distributions to shareholders | 580 | ||||
| Payments for shares redeemed | (202,480) | ||||
| Net increase in net assets from Class A capital share transactions | 1,592,899 | ||||
| CLASS I | |||||
| Proceeds from shares sold | 6,354,450 | ||||
| Payments for shares redeemed | (514,074) | ||||
| Net increase in net assets from Class I capital share transactions | 5,840,376 | ||||
| TOTAL INCREASE IN NET ASSETS | 8,297,608 | ||||
| NET ASSETS | |||||
| Beginning of period | - | ||||
| End of period | $ | 8,297,608 | |||
| ACCUMULATED UNDISTRIBUTED NET INVESTMENT INCOME | $ | 20,661 | |||
| SUMMARY OF CAPITAL SHARE ACTIVITY | |||||
| CLASS A | |||||
| Shares sold | 163,895 | ||||
| Shares issued in reinvestment of distributions to shareholders | 55 | ||||
| Shares redeemed | (17,949) | ||||
| Net increase in shares outstanding | 146,001 | ||||
| Shares outstanding, beginning of period | - | ||||
| Shares outstanding, end of period | 146,001 | ||||
| CLASS I | |||||
| Shares sold | 546,906 | ||||
| Shares redeemed | (41,506) | ||||
| Net increase in shares outstanding | 505,400 | �� | |||
| Shares outstanding, beginning of period | - | ||||
| Shares outstanding, end of period | 505,400 | ||||
(a) Represents the period from the commencement of operations (December 22, 2008 for Class A shares and April 1, 2009 for Class I shares) through November 30, 2009. | |||||
| See accompanying notes to financial statements. | |||||
17
| The RAM Small Cap Fund | |||||
| Statement of Changes in Net Assets | |||||
| Period | |||||
| Ended | |||||
| November 30, | |||||
2009(a) | |||||
| FROM OPERATIONS | |||||
| Net investment income | $ | 3,823 | |||
| Net realized gains from security transactions | 1,413 | ||||
| Net change in unrealized appreciation (depreciation) on investments | 59,861 | ||||
| Net increase in net assets from operations | 65,097 | ||||
| FROM DISTRIBUTIONS TO SHAREHOLDERS | |||||
| From net investment income | (360) | ||||
| FROM CAPITAL SHARE TRANSACTIONS | |||||
| CLASS A | |||||
| Proceeds from shares sold | 380,770 | ||||
| Reinvestment of distributions to shareholders | 360 | ||||
| Payments for shares redeemed | (40) | ||||
| Net increase in net assets from capital share transactions | 381,090 | ||||
| TOTAL INCREASE IN NET ASSETS | 445,827 | ||||
| NET ASSETS | |||||
| Beginning of period | - | ||||
| End of period | $ | 445,827 | |||
| ACCUMULATED UNDISTRIBUTED NET INVESTMENT INCOME | $ | 3,463 | |||
| SUMMARY OF CAPITAL SHARE ACTIVITY | |||||
| CLASS A | |||||
| Shares sold | 37,931 | ||||
| Shares issued in reinvestment of distributions to shareholders | 34 | ||||
| Shares redeemed | (4) | ||||
| Net increase in shares outstanding | 37,961 | ||||
| Shares outstanding, beginning of period | - | ||||
| Shares outstanding, end of period | 37,961 | ||||
(a) Represents the period from the commencement of operations (December 22, 2008) through November 30, 2009. | |||||
| See accompanying notes to financial statements. | |||||
18
| The RAM Small/Mid Cap Fund - Class A | |||||
| Financial Highlights | |||||
| Per share data for a share outstanding throughout the period: | |||||
| Period | |||||
| Ended | |||||
| November 30, | |||||
2009(a) | |||||
| Net asset value at beginning of period | $ | 10.00 | |||
| Income from investment operations: | |||||
| Net investment income | 0.07 | ||||
| Net realized and unrealized gains on investments | 2.68 | ||||
| Total from investment operations | 2.75 | ||||
| Less distributions: | |||||
| From net investment income | (0.03) | ||||
| Net asset value at end of period | $ | 12.72 | |||
Total return (b) | 27.55% | (c) | |||
| Net assets at end of period (000's) | $ | 1,857 | |||
Ratio of net expenses to average net assets (d) | 1.30% | (e) | |||
| Ratio of net investment income to average net assets | 0.72% | (e) | |||
| Portfolio turnover rate | 35% | (c) | |||
| (a) | Represents the period from the commencement of operations (December 22, 2008) through November 30, 2009. | ||||
| (b) | Total return is a measure of the change in value of an investment in the Fund over the period covered, which assumes any dividends or capital gains distributions are reinvested in shares of the Fund. The return shown does not reflect the deduction of taxes a shareholder would pay on Fund distributions or the redemption of Fund shares. Total return shown does not include the effect of applicable sales loads. | ||||
| (c) | Not annualized. | ||||
| (d) | Absent fee reductions and expense reimbursements by the Adviser, the ratio of expenses to average net assets would have been 9.05%(e) (Note 2). | ||||
| (e) | Annualized. | ||||
| See accompanying notes to financial statements. | |||||
19
| The RAM Small/Mid Cap Fund - Class I | |||||
| Financial Highlights | |||||
| Per share data for a share outstanding throughout the period: | |||||
| Period | |||||
| Ended | |||||
| November 30, | |||||
2009(a) | |||||
| Net asset value at beginning of period | $ | 9.94 | |||
| Income from investment operations: | |||||
| Net investment income | 0.03 | ||||
| Net realized and unrealized gains on investments | 2.77 | ||||
| Total from investment operations | 2.80 | ||||
| Net asset value at end of period | $ | 12.74 | |||
Total return (b) | 28.17% | (c) | |||
| Net assets at end of period (000's) | $ | 6,440 | |||
Ratio of net expenses to average net assets (d) | 1.05% | (e) | |||
| Ratio of net investment income to average net assets | 0.65% | (e) | |||
| Portfolio turnover rate | 35% | (c) | |||
| (a) | Represents the period from the commencement of operations (April 1, 2009) through November 30, 2009. | ||||
| (b) | Total return is a measure of the change in value of an investment in the Fund over the period covered, which assumes any dividends or capital gains distributions are reinvested in shares of the Fund. The return shown does not reflect the deduction of taxes a shareholder would pay on Fund distributions or the redemption of Fund shares. | ||||
| (c) | Not annualized. | ||||
| (d) | Absent fee reductions and expense reimbursements by the Adviser, the ratio of expenses to average net assets would have been 3.67%(e) (Note 2). | ||||
| (e) | Annualized. | ||||
| See accompanying notes to financial statements. | |||||
20
| The RAM Small Cap Fund - Class A | |||||
| Financial Highlights | |||||
| Per share data for a share outstanding throughout the period: | |||||
| Period | |||||
| Ended | |||||
| November 30, | |||||
2009(a) | |||||
| Net asset value at beginning of period | $ | 10.00 | |||
| Income from investment operations: | |||||
| Net investment income | 0.11 | ||||
| Net realized and unrealized gains on investments | 1.65 | ||||
| Total from investment operations | 1.76 | ||||
| Less distributions: | |||||
| From net investment income | (0.02) | ||||
| Net asset value at end of period | $ | 11.74 | |||
Total return (b) | 17.60% | (c) | |||
| Net assets at end of period (000's) | $ | 446 | |||
Ratio of net expenses to average net assets (d) | 1.30% | (e) | |||
| Ratio of net investment income to average net assets | 1.22% | (e) | |||
| Portfolio turnover rate | 49% | (c) | |||
| (a) | Represents the period from the commencement of operations (December 22, 2008) through November 30, 2009. | ||||
| (b) | Total return is a measure of the change in value of an investment in the Fund over the period covered, which assumes any dividends or capital gains distributions are reinvested in shares of the Fund. The return shown does not reflect the deduction of taxes a shareholder would pay on Fund distributions or the redemption of Fund shares. Total return shown does not include the effect of applicable sales load. | ||||
| (c) | Not annualized. | ||||
| (d) | Absent fee reductions and expense reimbursements by the Adviser, the ratio of expenses to average net assets would have been 32.56%(e) (Note 2). | ||||
| (e) | Annualized. | ||||
| See accompanying notes to financial statements. | |||||
21
The RAM Funds
Notes to Financial Statements
November 30, 2009
1. Organization and Significant Accounting Policies
Organization
The RAM Small/Mid Cap Fund and The RAM Small Cap Fund (individually a “Fund,” collectively, the “Funds”) are each a diversified series of The RAM Funds (the “Trust”), an open-end management investment company established as an Ohio business trust under a Declaration of Trust dated December 20, 2007. Class A shares of each Fund commenced operations on December 22, 2008. Class I shares of The RAM Small/Mid Cap Fund commenced operations on April 1, 2009. As of November 30, 2009, Class I shares of The RAM Small Cap Fund have not commenced operations.
Each Fund seeks to achieve long-term capital appreciation.
Each Fund offers two classes of shares: Class A shares (sold subject to a maximum front-end sales load of 4% and a distribution fee of up to 0.25% of the average daily net assets attributable to Class A shares) and Class I shares (sold without any sales loads or distribution fees). Each class of shares represents an interest in the same assets of the Fund, has the same rights and is identical in all material respects except that: (1) Class A shares bear the expenses of distribution fees; (2) certain other class-specific expenses will be borne solely by the class to which such expenses are attributable; (3) each class has exclusive voting rights with respect to matters relating to its own distribution arrangements; and (4) Class I shares require an initial investment of $100,000.
The following is a summary of the Funds’ significant accounting policies:
Valuation of Securities
The Funds’ portfolio securities, such as common stocks and real estate investment trusts (“REITs”), are valued at market value as of the close of regular trading on the New York Stock Exchange (“NYSE”) (normally, 4:00 p.m. Eastern time) on each business day the NYSE is open. Securities listed on the NYSE or other exchanges are valued on the basis of their last sale prices on the exchanges on which they are primarily traded. If there are no sales on that day, the securities are valued at the closing bid price on the NYSE or other primary exchange for that day. NASDAQ listed securities are valued at the NASDAQ Official Closing Price. If there are no sales on that day, the securities are valued at the last bid price as reported by NASDAQ. Money market instruments have been determined by the Board of Trustees of the Trust to be represented at amortized cost which approximates fair value, absent unusual circumstances. Securities traded in the over-the-counter market are valued at the last sales price, if available, otherwise at the mean of the closing bid and ask prices. In the event that market quotations are not readily available, securities and other assets are valued at fair value as determined in good faith in accordance with procedures adopted by the Board of Trustees of the Trust. Debt securities will be valued at their current market value when available or at their fair value, which for securities with remaining maturities of 60 days or less, has been determined in good faith by the Board of Trustees to be represented by amortized cost which approximates fair value, absent unusual circumstances.
Accounting principles generally accepted in the United States (“GAAP”) establish a single authoritative definition of fair value, set out a framework for measuring fair value and require additional disclosures about fair value measurements.
Various inputs are used in determining the value of each Fund’s investments. These inputs are summarized in the three broad levels listed below:
Level 1 – quoted prices in active markets for identical securities
Level 2 – other significant observable inputs
Level 3 – significant unobservable inputs
22
The RAM Funds
Notes to Financial Statements (Continued)
The inputs or methodology used for valuing securities are not necessarily an indication of the risk associated with investing in those securities.
The following is a summary of the inputs used to value each Fund’s investments as of November 30, 2009 by security type, as required by GAAP:
| The RAM Small/Mid Cap Fund | Level 1 | Level 2 | Level 3 | Total | ||||||||||||
| Common Stocks (including REITs) | $ | 7,919,592 | $ | — | $ | — | $ | 7,919,592 | ||||||||
| Money Market Funds | — | 110,760 | — | 110,760 | ||||||||||||
| Total | $ | 7,919,592 | $ | 110,760 | $ | — | $ | 8,030,352 | ||||||||
| The RAM Small Cap Fund | Level 1 | Level 2 | Level 3 | Total | ||||||||||||
| Common Stocks (including REITs) | $ | 395,501 | $ | — | $ | — | $ | 395,501 | ||||||||
| Money Market Funds | — | 34,066 | — | 34,066 | ||||||||||||
| Total | $ | 395,501 | $ | 34,066 | $ | — | $ | 429,567 | ||||||||
See each respective Fund’s Schedule of Investments for a listing of common stocks valued using Level 1 inputs by industry type, as required by GAAP.
Share Valuation
The net asset value per share of each class of shares of each Fund is calculated daily by dividing the total value of the assets attributable to that class, less liabilities attributable to that class, by the number of shares of that class outstanding, rounded to the nearest cent. The maximum offering price per share of Class A shares of each Fund is equal to the net asset value per share plus a sales load equal to 4.17% of the net asset value (or 4% of the offering price). The offering price of Class I shares is equal to the net asset value per share. The redemption price per share of each class of shares of each Fund is equal to the net asset value per share.
Investment Income
Dividend income is recorded on the ex-dividend date. Interest income is recognized on the accrual basis. Discounts and premiums on fixed income securities purchased are amortized using the interest method.
Security Transactions
Security transactions are accounted for on the trade date. Gains and losses on securities sold are determined on a specific identification basis.
Distributions to Shareholders
Distributions to shareholders arising from net investment income and net realized capital gains, if any, are declared and paid annually by each Fund in December. The amount of distributions from net investment income and net realized gains are determined in accordance with federal income tax regulations which may differ from GAAP and are recorded on the ex-dividend date. During the period December 22, 2008 through November 30, 2009, The RAM Small/Mid Cap Fund and The RAM Small Cap Fund paid ordinary dividends of $580 and $360, respectively. On December 31, 2009, an ordinary dividend of $0.2667 and $0.2494 per share were declared for The RAM Small/Mid Cap Fund Class A and Class I shares, respectively. On December 31, 2009, an ordinary dividend of $0.2395 per share was declared for The RAM Small Cap Fund.
23
The RAM Funds
Notes to Financial Statements (Continued)
Allocations Between Classes
Investment income earned, realized capital gains and losses, and unrealized appreciation and depreciation are allocated daily to each class of shares based upon its proportionate share of total net assets of each Fund. Class specific expenses are charged directly to the class incurring the expense. Common expenses which are not attributable to a specific class are allocated daily to each class of shares based upon its proportionate share of total net assets of each Fund.
Common Expenses
Common expenses of the Trust are allocated among the Funds of the Trust based on relative net assets of each Fund or the nature of the services performed and the relative applicability to each Fund.
Estimates
The preparation of financial statements in conformity with GAAP requires management to make estimates and assumptions that affect the reported amounts of assets and liabilities and disclosures of contingent assets and liabilities at the date of the financial statements and the reported amounts of income and expenses during the reporting period. Actual results could differ from those estimates.
Federal Income Tax
It is each Fund’s policy to comply with the special provisions of Subchapter M of the Internal Revenue Code applicable to regulated investment companies. As provided therein, in any fiscal year in which a Fund so qualifies and distributes at least 90% of its taxable net income, the Fund (but not the shareholders) will be relieved of federal income tax on the income distributed. Accordingly, no provision for income taxes has been made.
In order to avoid imposition of the excise tax applicable to regulated investment companies, it is also each Fund’s intention to declare and pay as dividends in each calendar year at least 98% of its net investment income (earned during the calendar year) and 98% of its net realized capital gains (earned during the twelve months ended November 30) plus undistributed amounts from prior years.
The following information is computed on a tax basis for each item as of November 30, 2009:
The RAM Small/Mid Cap Fund | The RAM Small Cap Fund | |||||||
| Cost of portfolio investments | $ | 7,269,722 | $ | 369,943 | ||||
| Gross unrealized appreciation | $ | 950,650 | $ | 69,359 | ||||
| Gross unrealized depreciation | (190,020 | ) | (9,735 | ) | ||||
| Net unrealized appreciation | 760,630 | 59,624 | ||||||
| Undistributed ordinary income | 103,654 | 5,108 | ||||||
| Undistributed long-term gains | 49 | 5 | ||||||
| Distributable earnings | $ | 864,333 | $ | 64,737 | ||||
The difference between the federal income tax cost of portfolio investments and the financial statement cost for the Funds is due to timing differences in the recognition of capital gains or losses under income tax regulations and GAAP. These “book/tax” differences are temporary in nature and are due to the tax deferral of losses on wash sales.
24
The RAM Funds
Notes to Financial Statements (Continued)
Each Fund recognizes the tax benefits or expenses of uncertain tax positions only when the position is “more likely than not” to be sustained assuming examination by tax authorities. Management has reviewed each Fund’s tax positions taken on Federal income tax returns for the open tax year November 30, 2009, and concluded that no provision for unrecognized tax benefits or expenses is required in these financial statements.
2. Investment Advisory Agreement and Transactions with Related Parties
Certain Trustees and officers of the Trust are affiliated with Riazzi Asset Management, LLC (the “Adviser”), or with Ultimus Fund Solutions, LLC (“Ultimus”), the Funds’ administrator, transfer agent and fund accounting agent, and Ultimus Fund Distributors, LLC (the “Distributor”), the Funds’ principal underwriter.
Investment Advisory Agreement
Under the terms of an Investment Advisory Agreement between the Trust and the Adviser, the Adviser serves as the investment adviser to each Fund. For its services, each Fund pays the Adviser a monthly fee computed at the annual rate of 0.85% of its average daily net assets. The Adviser has contractually agreed for a period of three years from the Funds’ commencement of operations to reduce its investment advisory fees and to reimburse expenses to the extent necessary to limit annual ordinary operating expenses of The RAM Small/Mid Cap Fund’s Class A and Class I shares to 1.30% and 1.05%, respectively, of average daily net assets and to limit annual ordinary operating expenses of The Ram Small Cap Fund to 1.30% of average daily net assets. These contractual obligations expire on December 22, 2011. For the period ended November 30, 2009, the Adviser waived its entire investment advisory fee of $26,712 and reimbursed $80,271 of common expenses, $14,323 of Class A expenses and $13,163 of Class I expenses with respect to The RAM Small/Mid Cap Fund; and the Adviser waived its entire investment advisory fee of $2,652 and reimbursed $95,284 of expenses with respect to The RAM Small Cap Fund.
Any such fee reductions or expense reimbursements by the Adviser are subject to recovery by the Adviser for a period of three years after such fees and expenses were incurred, provided that the recovery does not cause the Funds’ ordinary operating expenses to exceed the foregoing expense limits. As of November 30, 2009, the Adviser may in the future recover fee reductions and expense reimbursements totaling $134,469 and $97,936 for The RAM Small/Mid Cap Fund and The RAM Small Cap Fund, respectively. The Adviser may recover these amounts no later than November 30, 2012.
Administration Agreement
Under the terms of an Administration Agreement, Ultimus supplies non-investment related administrative and compliance services for each Fund. Ultimus supervises the preparation of tax returns, reports to shareholders, reports to and filings with the Securities and Exchange Commission (“SEC”) and state securities commissions and materials for meetings of the Board of Trustees. For these services, Ultimus receives a monthly fee from each Fund at an annual rate of 0.15% of its average daily net assets up to $50 million; 0.125% of such assets between $50 million and $100 million; 0.10% of such assets between $100 million and $250 million; 0.075% of such assets between $250 million and $500 million; and 0.05% of such assets in excess of $500 million, subject to a minimum monthly fee of $2,000. The fee payable to Ultimus is discounted by 20% during the first year of each Fund’s operations and 15% during the second year of operations, or until such time as a Fund’s net assets reach $20 million, but in no event later than two years from the date of commencement of operations.
25
The RAM Funds
Notes to Financial Statements (Continued)
Accounting Services Agreement
Under the terms of an Accounting Services Agreement, Ultimus calculates the daily net asset value per share and maintains the financial books and records of each Fund. For these services, The RAM Small/Mid Cap Fund pays Ultimus a base fee per month, which was $2,500 per month until the commencement of operations of the Fund’s Class I shares on April 1, 2009 and has been $3,000 per month since April 1, 2009. The RAM Small/Mid Cap Fund also pays Ultimus an asset-based fee of 0.01% of average daily net assets. The RAM Small Cap Fund pays Ultimus a base fee of $2,500 per month plus an asset-based fee of 0.01% of average daily net assets. The base fee payable to Ultimus is discounted by 20% during the first year of each Fund’s operations and 15% during the second year of operations, or until such time as a Fund’s net assets reach $20 million, but in no event later than two years from the date of commencement of operations. In addition, the Funds pay all costs of external pricing services.
Transfer Agent and Shareholder Services Agreement
Under the terms of a Transfer Agent and Shareholder Services Agreement, Ultimus maintains the records of each shareholder's account, answers shareholders' inquiries concerning their accounts, processes purchases and redemptions of each Fund’s shares, acts as dividend and distribution disbursing agent and performs other shareholder service functions. For these services, Ultimus receives a monthly fee at an annual rate of $20 per shareholder account, subject to a monthly minimum fee of $1,500 for a share class with 100 or more shareholder accounts. For a share class with 25 accounts or less the minimum fee is $1,000 per month and the minimum fee is $1,250 for a share class with more than 25 but less than 100 shareholder accounts. In addition, the Funds reimburse Ultimus for out-of-pocket expenses including, but not limited to, postage and supplies.
Distribution Agreement
Under the terms of a Distribution Agreement, the Distributor provides distribution services to the Trust and serves as principal underwriter to the Funds. The Distributor is a wholly owned subsidiary of Ultimus. The Distributor receives annual compensation of $6,000 for such services. In addition, during the period December 22, 2008 through November 30, 2009, the Distributor earned $1,317 and $41 of underwriting commissions on the sale of Class A shares of The RAM Small/Mid Cap Fund and The RAM Small Cap Fund, respectively.
Plans of Distribution
The Trust has adopted a plan of distribution (the “Plan”) under which Class A shares of the Funds may directly incur or reimburse the Adviser or the Distributor for certain expenses related to the distribution of Class A shares. The annual limitation for payment of expenses pursuant to the Plan is 0.25% of each Fund’s average daily net assets attributable to Class A shares. During the period December 22, 2008, through November 30, 2009, the Class A shares of The RAM Small/Mid Cap Fund and The RAM Small Cap Fund incurred distribution related expenses of $2,488 and $780, respectively, under the Plan.
3. Beneficial Ownership of Fund Shares
The beneficial ownership, either directly or indirectly, of more than 25% of the voting securities of a fund creates a presumption of control of the Fund under Section 2(a)(9) of the Investment Company Act of 1940. As of November 30, 2009, Michelle E. Stevens owned 52.77% and John C. Riazzi owned 34.74% of the outstanding shares of The RAM Small Cap Fund.
26
The RAM Funds
Notes to Financial Statements (Continued)
4. Investment Transactions
During the period December 22, 2008 through November 30, 2009, cost of purchases and proceeds from sales and maturities of investment securities, other than short-term investments and U.S. government securities, amounted to $8,210,159 and $1,131,179, respectively, for The RAM Small/Mid Cap Fund and $482,961 and $148,292, respectively, for The RAM Small Cap Fund.
5. Contingencies and Commitments
The Funds indemnify the Trust's officers and Trustees for certain liabilities that might arise from their performance of their duties to the Funds. Additionally, in the normal course of business each Fund enters into contracts that contain a variety of representations and warranties and which provide general indemnifications. The Funds’ maximum exposure under these arrangements is unknown, as this would involve future claims that may be made against the Funds that have not yet occurred. However, based on experience, the Funds expect the risk of loss to be remote.
6. Recent Accounting Pronouncement
Effective July 1, 2009, the FASB Accounting Standards Codification (“Codification”) is the single source of authoritative nongovernmental GAAP. Rules and interpretive releases of the Securities and Exchange Commission (“SEC”) under authority of federal securities laws are also sources of authoritative GAAP for SEC registrants. Codification is effective for interim and annual periods ending after September 15, 2009. The Funds’ accounting policies were not affected by conversion to the Codification.
7. Subsequent Events
GAAP requires the Funds to recognize in the financial statements the effects of all subsequent events that provide additional evidence about conditions that existed as of the date of the Statements of Assets and Liabilities. For non-recognized subsequent events that must be disclosed to keep the financial statements from being misleading, the Funds are required to disclose the nature of the event as well as an estimate of its financial effect, or a statement that such an estimate cannot be made. In addition, GAAP requires the Funds to disclose the date through which subsequent events have been evaluated. Management has evaluated subsequent events through the issuance of these financial statements on January 25, 2010 and has noted no such events.
27
28
The RAM Funds
About Your Funds’ Expenses (Unaudited)
We believe it is important for you to understand the impact of ongoing costs on your investment. As a shareholder of the Funds, you incur two types of costs: (1) transaction costs, possibly including front-end sales loads and (2) ongoing costs, including management fees and other Fund expenses. The following examples are intended to help you understand your ongoing costs (in dollars) of investing in the Funds and to compare these costs with the ongoing costs of investing in other mutual funds.
A mutual fund’s ongoing costs are expressed as a percentage of its average net assets. This figure is known as the expense ratio. The ongoing costs reflected in the tables below are based on an investment of $1,000 made at the beginning of the period (June 1, 2009) and held until the end of the period (November 30, 2009).
The tables that follow illustrate each Fund’s costs in two ways:
Actual fund return – This section helps you to estimate the actual expenses that you paid over the period. The “Ending Account Value” shown is derived from each Fund’s actual return, and the third column shows the dollar amount of operating expenses that would have been paid by an investor who started with $1,000 in the Funds. You may use the information here, together with the amount you invested, to estimate the expenses that you paid over the period.
To do so, simply divide your account value by $1,000 (for example, an $8,600 account value divided by $1,000 = 8.6), then multiply the result by the number given for the Fund under the heading “Expenses Paid During Period.”
Hypothetical 5% return – This section is intended to help you compare the Funds’ ongoing costs with those of other mutual funds. It assumes that each Fund had an annual return of 5% before expenses during the period shown, but that the expense ratio is unchanged. In this case, because the return used is not the Funds’ actual return, the results do not apply to your investment. The example is useful in making comparisons because the SEC requires all mutual funds to calculate expenses based on a 5% return. You can assess each Fund’s ongoing costs by comparing this hypothetical example with the hypothetical examples that appear in shareholder reports of other funds.
Note that expenses shown in the table are meant to highlight and help you compare ongoing costs only. The calculations below assume no shares were bought or sold during the period. Your actual costs may have been higher or lower, depending on the amount of your investment and the timing of any purchases or redemptions.
More information about each Fund’s expenses, including annualized expense ratios, can be found in this report. For additional information on operating expenses and other shareholder costs, please refer to the Funds’ prospectus.
The RAM Small/Mid Cap Fund - Class A | Beginning Account Value June 1, 2009 | Ending Account Value November 30, 2009 | Expenses Paid During Period* | |||||||||
| Based on Actual Fund Return | $ | 1,000.00 | $ | 1,138.80 | $ | 6.97 | ||||||
| Based on Hypothetical 5% Return | $ | 1,000.00 | $ | 1,018.55 | $ | 6.58 | ||||||
| *Expenses are equal to The RAM Small/Mid Cap Fund – Class A’s annualized expense ratio of 1.30% for the period, multiplied by the average account value over the period, multiplied by 183/365 (to reflect the one-half year period). | ||||||||||||
29
The RAM Funds
About Your Funds’ Expenses (Unaudited) (Continued)
The RAM Small/Mid Cap Fund - Class I | Beginning Account Value June1, 2009 | Ending Account Value November 30, 2009 | Expenses Paid During Period* | |||||||||
| Based on Actual Fund Return | $ | 1,000.00 | $ | 1,139.50 | $ | 5.63 | ||||||
| Based on Hypothetical 5% Return | $ | 1,000.00 | $ | 1,019.80 | $ | 5.32 | ||||||
| *Expenses are equal to The RAM Small/Mid Cap Fund – Class I’s annualized expense ratio of 1.05% for the period, multiplied by the average account value over the period, multiplied by 183/365 (to reflect the one-half year period). | ||||||||||||
The RAM Small Cap Fund | Beginning Account Value June 1, 2009 | Ending Account Value November 30, 2009 | Expenses Paid During Period* | |||||||||
| Based on Actual Fund Return | $ | 1,000.00 | $ | 1,127.80 | $ | 6.93 | ||||||
| Based on Hypothetical 5% Return | $ | 1,000.00 | $ | 1,018.55 | $ | 6.58 | ||||||
| *Expenses are equal to The RAM Small Cap Fund's annualized expense ratio of 1.30% for the period, multiplied by the average account value over the period, multiplied by 183/365 (to reflect the one-half year period). | ||||||||||||
Other Information (Unaudited)
A description of the policies and procedures that the Funds use to vote proxies relating to portfolio securities is available without charge upon request by calling toll-free 1-888-884-8099, or on the SEC’s website at http://www.sec.gov. Information regarding how the Funds voted proxies relating to portfolio securities during the most recent 12-month period ended June 30 is also available without charge upon request by calling toll-free 1-888-884-8099, or on the SEC’s website at http://www.sec.gov.
The Trust files a complete listing of portfolio holdings for each of the Funds with the SEC as of the first and third quarters of each fiscal year on Form N-Q. These filings are available free of charge, upon request, by calling 1-888-884-8099. Furthermore, you may obtain a copy of these filings on the SEC's website at http://www.sec.gov. The Trust's Forms N-Q may also be reviewed and copied at the SEC's Public Reference Room in Washington, DC, and information on the operation of the Public Reference Room may be obtained by calling 1-800-SEC-0330.
30
The RAM Funds
Board of Trustees and Executive Officers (Unaudited)
The Board of Trustees has overall responsibility for management of the Trust's affairs. The Trustees serve during the lifetime of the Trust and until its termination, or until death, resignation, retirement or removal. The Trustees, in turn, elect the officers of the Trust to actively supervise its day-to-day operations. The officers have been elected for an annual term. The following are the Trustees and executive officers of the Trust:
| Name, Address and Age | Length of Time Served | Position(s) Held with Trust | Principal Occupation(s) During Past 5 Years and Directorships of Public Companies | Number of Funds in Trust Overseen by Trustee |
Interested Trustees: | ||||
*John C. Riazzi (age 47) | Since December 2007 | Trustee and Chief Compliance Officer | Founder, Managing Member and Chief Compliance Officer of Riazzi Asset Management, LLC (the Funds’ adviser); Principal and Managing Director at Transamerica Investment Management, LLC (an asset management firm) from 2001 until 2007. | 2 |
Independent Trustees: | ||||
John R. Kenney (age 71) | Since March 2008 | Trustee | Chairman and Chief Executive Officer of Clearwater Financial Marketing (a marketing and financial service firm) since 2006; Chairman and Chief Executive Officer of Great Companies, LLC (a money manager) from 2000-2006. | 2 |
James H. Miller, III (age 53) | Since March 2008 | Trustee | Chief Financial Officer of Riverain Group, Inc. (a family business) since 2000. | 2 |
| * | Mr. Riazzi, as an affiliated person of the Adviser, is considered an “interested person” of the Trust within the meaning of Section 2(a)(19) of the 1940 Act. |
31
The RAM Funds
Board of Trustees and Executive Officers (Continued)
| Name, Address and Age | Length of Time Served | Position(s) Held with Trust | Principal Occupation(s) During Past 5 Years and Directorships of Public Companies | |
Executive Officers: | ||||
Robert G. Dorsey (age 52) 225 Pictoria Drive, Suite 450 Cincinnati, Ohio 45246 | Since January 2008 | Vice President | Managing Director of Ultimus Fund Solutions, LLC and Ultimus Fund Distributors, LLC | |
Mark J. Seger (age 48) 225 Pictoria Drive, Suite 450 Cincinnati, Ohio 45246 | Since January 2008 | Treasurer | Managing Director of Ultimus Fund Solutions, LLC and Ultimus Fund Distributors, LLC | |
John F. Splain (age 53) 225 Pictoria Drive, Suite 450 Cincinnati, Ohio 45246 | Since January 2008 | Secretary | Managing Director of Ultimus Fund Solutions, LLC and Ultimus Fund Distributors, LLC | |
Additional information about members of the Board of Trustees and executive officers is available in the Statement of Additional Information (“SAI”). To obtain a free copy of the SAI, please call 1-866-420-3350.
32
Item 2. Code of Ethics.
As of the end of the period covered by this report, the registrant has adopted a code of ethics that applies to the registrant’s principal executive officer, principal financial officer, principal accounting officer or controller, or persons performing similar functions, regardless of whether these individuals are employed by the registrant or a third party. Pursuant to Item 12(a)(1), a copy of registrant’s code of ethics is filed as an exhibit to this Form N-CSR. During the period covered by this report, the code of ethics has not been amended, and the registrant has not granted any waivers, including implicit waivers, from the provisions of the code of ethics.
Item 3. Audit Committee Financial Expert.
The registrant’s board of trustees has determined that the registrant has at least one audit committee financial expert serving on its audit committee. The name of the audit committee financial expert is James H. Miller, III. Mr. Miller is “independent” for purposes of this Item.
Item 4. Principal Accountant Fees and Services.
| (a) | Audit Fees. The aggregate fees billed for professional services rendered by the principal accountant for the audit of the registrant’s annual financial statements or for services that are normally provided by the accountant in connection with statutory and regulatory filings or engagements were $23,000 with respect to the registrant’s fiscal year ended November 30, 2009. |
| (b) | Audit-Related Fees. No fees were billed in the last fiscal year for assurance and related services by the principal accountant that are reasonably related to the performance of the audit of the registrant’s financial statements and are not reported under paragraph (a) of this Item. |
| (c) | Tax Fees. The aggregate fees billed for professional services rendered by the principal accountant for tax compliance, tax advice, and tax planning were $4,000 with respect to the registrant’s fiscal year ended November 30, 2009. The services comprising these fees are the preparation of the registrant’s federal income and excise tax returns. |
| (d) | All Other Fees. No fees were billed in the last fiscal year for products and services provided by the principal accountant, other than the services reported in paragraphs (a) through (c) of this Item. |
| (e)(1) | The audit committee has not adopted pre-approval policies and procedures described in paragraph (c)(7) of Rule 2-01 of Regulation S-X. |
| (e)(2) | None of the services described in paragraph (b) through (d) of this Item were approved by the audit committee pursuant to paragraph (c)(7)(i)(C) of Rule 2-01 of Regulation S-X. |
| (f) | Less than 50% of hours expended on the principal accountant’s engagement to audit the registrant’s financial statements for the most recent fiscal year were attributed to work performed by persons other than the principal accountant’s full-time, permanent employees. |
| (g) | During the fiscal year ended November 30, 2009, aggregate non-audit fees of $4,000 were billed by the registrant’s principal accountant for services rendered to the registrant. No non-audit fees were billed in the last fiscal year by the registrant’s principal accountant for services rendered to the registrant’s investment adviser (not including any sub-adviser whose role is primarily portfolio management and is subcontracted with or overseen by another investment adviser), and any entity controlling, controlled by, or under common control with the adviser that provides ongoing services to the registrant. |
| (h) | The principal accountant has not provided any non-audit services to the registrant’s investment adviser (not including any sub-adviser whose role is primarily portfolio management and is subcontracted with or overseen by another investment adviser), and any entity controlling, controlled by, or under common control with the investment adviser that provides ongoing services to the registrant. |
Item 5. Audit Committee of Listed Registrants.
Not applicable
Item 6. Schedule of Investments.
| (a) | Not applicable [schedule filed with Item 1] |
| (b) | Not applicable |
Item 7. Disclosure of Proxy Voting Policies and Procedures for Closed-End Management Investment Companies.
Not applicable
Item 8. Portfolio Managers of Closed-End Management Investment Companies.
Not applicable
Item 9. Purchases of Equity Securities by Closed-End Management Investment Company and Affiliated Purchasers.
Not applicable
Item 10. Submission of Matters to a Vote of Security Holders.
The registrant’s Committee of Independent Trustees shall review shareholder recommendations to fill vacancies on the registrant’s board of trustees if such recommendations are submitted in writing, addressed to the Committee at the registrant’s offices and meet any minimum qualifications adopted by the Committee. The Committee may adopt, by resolution, a policy regarding its procedures for considering candidates for the board of trustees, including any recommended by shareholders.
Item 11. Controls and Procedures.
(a) Based on their evaluation of the registrant’s disclosure controls and procedures (as defined in Rule 30a-3(c) under the Investment Company Act of 1940) as of a date within 90 days of the filing date of this report, the registrant’s principal executive officer and principal financial officer have concluded that such disclosure controls and procedures are reasonably designed and are operating effectively to ensure that material information relating to the registrant, including its consolidated subsidiaries, is made known to them by others within those entities, particularly during the period in which this report is being prepared, and that the information required in filings on Form N-CSR is recorded, processed, summarized, and reported on a timely basis.
(b) There were no changes in the registrant’s internal control over financial reporting (as defined in Rule 30a-3(d) under the Investment Company Act of 1940) that occurred during the second fiscal quarter of the period covered by this report that have materially affected, or are reasonably likely to materially affect, the registrant’s internal control over financial reporting.
Item 12. Exhibits.
File the exhibits listed below as part of this Form. Letter or number the exhibits in the sequence indicated.
(a)(1) Any code of ethics, or amendment thereto, that is the subject of the disclosure required by Item 2, to the extent that the registrant intends to satisfy the Item 2 requirements through filing of an exhibit: Attached hereto
(a)(2) A separate certification for each principal executive officer and principal financial officer of the registrant as required by Rule 30a-2(a) under the Act (17 CFR 270.30a-2(a)): Attached hereto
(a)(3) Any written solicitation to purchase securities under Rule 23c-1 under the Act (17 CFR 270.23c-1) sent or given during the period covered by the report by or on behalf of the registrant to 10 or more persons: Not applicable
(b) Certifications required by Rule 30a-2(b) under the Act (17 CFR 270.30a-2(b)): Attached hereto
| Exhibit 99.CODE ETH | Code of Ethics |
| Exhibit 99.CERT | Certifications required by Rule 30a-2(a) under the Act |
| Exhibit 99.906CERT | Certifications required by Rule 30a-2(b) under the Act |
SIGNATURES
Pursuant to the requirements of the Securities Exchange Act of 1934 and the Investment Company Act of 1940, the registrant has duly caused this report to be signed on its behalf by the undersigned, thereunto duly authorized.
(Registrant) The RAM Funds
| By (Signature and Title)* | /s/ John C. Riazzi | |
| John C. Riazzi, President |
Date January 29, 2010
Pursuant to the requirements of the Securities Exchange Act of 1934 and the Investment Company Act of 1940, this report has been signed below by the following persons on behalf of the registrant and in the capacities and on the dates indicated.
| By (Signature and Title)* | /s/ John C. Riazzi | |
| John C. Riazzi, President |
Date January 29, 2010
| By (Signature and Title)* | /s/ Mark J. Seger | |
| Mark J. Seger, Treasurer |
Date _ January 29, 2010
* Print the name and title of each signing officer under his or her signature.