| OMB APPROVAL |
OMB Number: 3235-0570 Expires: August 31, 2011 Estimated average burden hours per response: 18.9 |
UNITED STATES
SECURITIES AND EXCHANGE COMMISSION
Washington, D.C. 20549
FORM N-CSR
CERTIFIED SHAREHOLDER REPORT OF REGISTERED
MANAGEMENT INVESTMENT COMPANIES
Investment Company Act file number 811-22162
The RAM Funds
(Exact name of registrant as specified in charter)
| 2331 Far Hills Avenue, Suite 200 Dayton, Ohio | 45419 |
| (Address of principal executive offices) | (Zip code) |
Tina H. Bloom, Esq.
Ultimus Fund Solutions, LLC 225 Pictoria Drive, Suite 450 Cincinnati, Ohio 45246
(Name and address of agent for service)
Registrant's telephone number, including area code: (937) 643-1000
Date of fiscal year end: November 30, 2010
Date of reporting period: November 30, 2010
Form N-CSR is to be used by management investment companies to file reports with the Commission not later than 10 days after the transmission to stockholders of any report that is required to be transmitted to stockholders under Rule 30e-1 under the Investment Company Act of 1940 (17 CFR 270.30e-1). The Commission may use the information provided on Form N-CSR in its regulatory, disclosure review, inspection, and policymaking roles.
A registrant is required to disclose the information specified by Form N-CSR, and the Commission will make this information public. A registrant is not required to respond to the collection of information contained in Form N-CSR unless the Form displays a currently valid Office of Management and Budget ("OMB") control number. Please direct comments concerning the accuracy of the information collection burden estimate and any suggestions for reducing the burden to Secretary, Securities and Exchange Commission, 450 Fifth Street, NW, Washington, DC 20549-0609. The OMB has reviewed this collection of information under the clearance requirements of 44 U.S.C. § 3507.
| Item 1. | Reports to Stockholders. |
The RAM Funds The RAM Small/Mid Cap Fund Annual Report November 30, 2010 Investment Adviser Riazzi Asset Management, LLC Dayton, OH |
The RAM Funds
January 14, 2011
The equity markets finished the year on an optimistic note as participants cheered the Federal Reserve’s monetary plans to provide a second round of economic stimulus. Despite signs of a slowdown in the economic recovery mid-year, market pundits were optimistic that accommodative monetary policy would reinvigorate the recovery, and perhaps help the ailing labor markets. In particular, further expansion of the monetary base was anticipated to be inflationary, and sectors poised to benefit from such an environment, such as commodity-related stocks and industrials, led the rally.
For the year, the RAM Small/Mid Cap Fund (the “Fund”) posted a solid absolute return, but failed to keep up with the heated pace of the benchmark. For the fiscal year ended November 30, 2010, the RAM Small/Mid Cap Fund (Class A) returned 10.18%, excluding the impact of sales charges, versus 23.75% for the Russell 2500 Value Index. Energy was the best performing sector for the Fund, with strong absolute and relative gains. McDermott, Swift and Superior Energy all rose in excess of 55% for the period. Financials also provided strong absolute and relative gains, aided in large part by big moves in alternative credit providers, EzCorp and First Cash Financial. The Fund had two positions bought out during the period at significant p remiums: Cogent and Gymboree.
Despite big moves in several other portfolio holdings such as KBR and Wright Express, we trailed due primarily to below benchmark returns in the Industrials sector. Our exposure in the Industrials sector has held back performance this year because of the less cyclical nature of the companies we own and disappointing revenue trends at consulting firms Navigant and FTI Consulting. Additionally, Dean Foods and Aegean Marine experienced deteriorating trends in their business models, and we exited both positions during the year.
Our macroeconomic outlook has not changed significantly. Improving credit conditions, a low interest rate environment and accommodative fiscal policy should remain supportive of the economic recovery. Optimal growth, we believe, will remain elusive due to structural headwinds including an impaired housing market, consumer deleveraging and stubbornly high unemployment. A second round of quantitative easing has reinvigorated the market in the near term but makes it difficult to determine whether the economy is self sustaining.
The Fund is positioned to take advantage of opportunities where we have identified profit potential unrecognized by the market. Specifically, we own holdings leveraged to the macro themes of energy infrastructure build-out, tight consumer credit and conscientious consumer spending. Beyond these broad themes we have identified companies that have specific catalysts for earnings growth, which importantly, are independent of a strong economic tailwind. In addition, our portfolio of high margin businesses with strong balance sheets makes both attractive acquirers and acquisition candidates.
1
In previous commentaries, we have discussed how our near-term underperformance relative to market indices can, in part, be traced to lower quality stocks outperforming the returns of higher quality stocks. Recessions have typically been followed by sustained low-quality rallies that far exceed the returns of high quality stocks often for as long as 12 to 16 months. However, the opposite tends to be true throughout the remainder of a market recovery and through bear markets. The result is that, over the longer term, high quality has typically outperformed low quality with less volatility and there has been a pronounced penalty to investors who overstay their exposure to lower quality stocks once the initial bear market rally concludes. Recent market behavior would suggest that we have reached that inflection point and that fundamentals have begun their return to favor.
As high quality managers, we look for stocks with strong earnings potential yet to be fully discovered or appreciated by the markets. This philosophy is core to us. We remain confident that over a full market cycle our stock selection process will yield superior returns for our clients.
Michelle Stevens, CFA John Riazzi, CFA
The Letter to Shareholders seeks to describe some of the Adviser’s current opinions and views of the financial markets. Although the Adviser believes it has a reasonable basis for any opinions or views expressed, actual results may differ, sometimes significantly so, from those expected or expressed.
Past performance is not predictive of future performance. Investment results and principal value will fluctuate so that shares, when redeemed, may be worth more or less than their original cost. Fee waivers have positively impacted the Fund’s performance over the relevant periods and without such waivers, Fund performance would have been lower. For information on the Fund’s current expense ratio please see the Financial Highlights table included in this Report. Current performance may be higher or lower than the performance data quoted. Performance data current to the most recent month-end, are available by calling 1-888-884-8099.
An investor should consider the investment objectives, risks, charges and expenses of the Fund carefully before investing. The Fund’s prospectus contains this and other important information. To obtain a copy of the Fund’s prospectus please visit www.theramfunds.com or call 1-888-884-8099 and a copy will be sent to you free of charge. Please read the prospectus carefully before you invest. The RAM Funds are distributed by Ultimus Fund Distributors, LLC.
2
THE RAM SMALL/MID CAP FUND
CLASS A (Unaudited)
Comparison of the Change in Value of a $10,000 Investment in The
RAM Small/Mid Cap Fund - Class A(a) versus the Russell 2500 Value Index
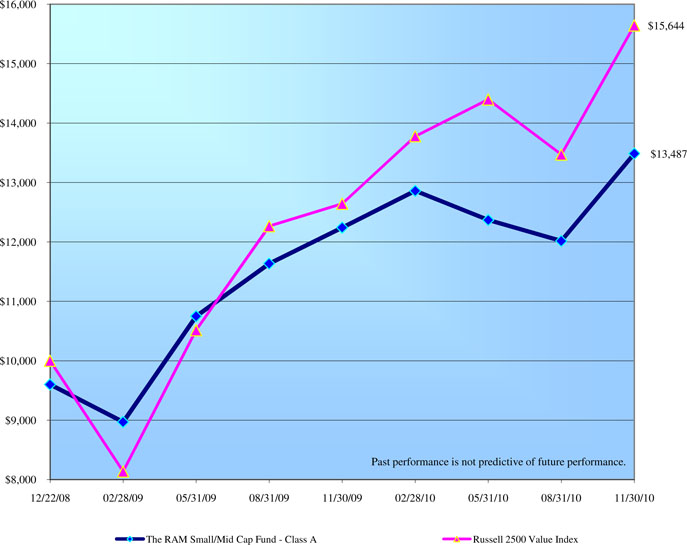
Average Annual Total Returns (b) | ||
| (for periods ended November 30, 2010) | ||
| One Year | Since Inception* | |
The RAM Small/Mid Cap Fund - Class A(a) | 5.78% | 16.68% |
| Russell 2500 Value Index | 23.75% | 25.95% |
| (a) | The change in value of the initial $10,000 investment shown in the line graph and the total return in the above table reflect the maximum front-end sales load of 4.00%. |
| (b) | The returns shown do not reflect the deduction of taxes a shareholder would pay on Fund distributions, if any, or the redemption of Fund shares. |
| * | Commencement of operations was December 22, 2008. |
3
THE RAM SMALL/MID CAP FUND
CLASS I (Unaudited)
Comparison of the Change in Value of a $100,000 Investment in The
RAM Small/Mid Cap Fund - Class I versus the Russell 2500 Value Index
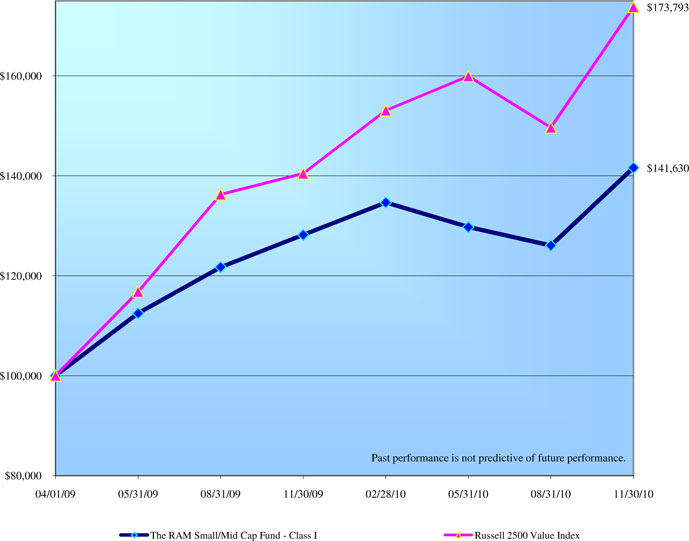
Average Annual Total Returns (a) | ||
| (for periods ended November 30, 2010) | ||
| One Year | Since Inception* | |
| The RAM Small/Mid Cap Fund - Class I | 10.50% | 23.24% |
| Russell 2500 Value Index | 23.75% | 39.35% |
| (a) | The returns shown do not reflect the deduction of taxes a shareholder would pay on Fund distributions, if any, or the redemption of Fund shares. |
| * | Commencement of operations was April 1, 2009. |
4
| The RAM Small/Mid Cap Fund |
| Portfolio Information |
| November 30, 2010 (Unaudited) |
| TEN LARGEST EQUITY HOLDINGS | ||
| % of | ||
| Company | Net Assets | |
| EZCORP, Inc. - Class A | 4.6% | |
| CMS Energy Corp. | 3.6% | |
| Omega Healthcare Investors, Inc. | 3.6% | |
| LTC Properties, Inc. | 3.3% | |
| Dollar Tree, Inc. | 3.2% | |
| Superior Energy Services, Inc. | 3.1% | |
| McDermott International, Inc. | 3.1% | |
| Wright Express Corp. | 3.1% | |
| HCC Insurance Holdings, Inc. | 3.0% | |
| ICU Medical, Inc. | 3.0% | |
| ASSET ALLOCATION | ||
| % of | ||
| Sector | Net Assets | |
| Consumer Discretionary | 16.6% | |
| Consumer Staples | 1.2% | |
| Energy | 13.8% | |
| Financials | 24.5% | |
| Health Care | 8.0% | |
| Industrials | 14.7% | |
| Information Technology | 10.4% | |
| Telecommunication Services | 2.1% | |
| Utilities | 5.7% | |
| Cash Equivalents, Other Assets and Liabilities | 3.0% | |
| 100.0% | ||
5
| The RAM Small/Mid Cap Fund | ||||||||
| Schedule of Investments | ||||||||
| November 30, 2010 | ||||||||
| COMMON STOCKS — 97.0% | Shares | Value | ||||||
| Consumer Discretionary - 16.6% | ||||||||
| Distributors - 1.5% | ||||||||
| LKQ Corp. * | 5,931 | $ | 127,961 | |||||
| Household Durables - 2.2% | ||||||||
| Jarden Corp. | 6,200 | 190,340 | ||||||
| Media - 1.9% | ||||||||
| John Wiley & Sons, Inc. - Class A | 3,841 | 159,401 | ||||||
| Multiline Retail - 4.8% | ||||||||
| Big Lots, Inc. * | 4,650 | 142,523 | ||||||
| Dollar Tree, Inc. * | 4,953 | 272,167 | ||||||
| 414,690 | ||||||||
| Specialty Retail - 4.2% | ||||||||
| Jo-Ann Stores, Inc. * | 3,841 | 186,058 | ||||||
| Rent-A-Center, Inc. | 6,402 | 178,232 | ||||||
| 364,290 | ||||||||
| Textiles, Apparel & Luxury Goods - 2.0% | ||||||||
| Hanesbrands, Inc. * | 6,268 | 170,176 | ||||||
| Consumer Staples - 1.2% | ||||||||
| Food Products - 1.2% | ||||||||
| Dean Foods Co. * | 14,355 | 104,361 | ||||||
| Energy - 13.8% | ||||||||
| Energy Equipment & Services - 10.0% | ||||||||
| Ensco plc - ADR | 3,437 | 162,914 | ||||||
| Helix Energy Solutions Group, Inc. * | 11,659 | 163,576 | ||||||
| McDermott International, Inc. * | 14,557 | 266,830 | ||||||
| Superior Energy Services, Inc. * | 8,020 | 267,788 | ||||||
| 861,108 | ||||||||
| Oil, Gas & Consumable Fuels - 3.8% | ||||||||
| PetroHawk Energy Corp. * | 8,020 | 142,997 | ||||||
| Swift Energy Co. * | 5,055 | 184,457 | ||||||
| 327,454 | ||||||||
| Financials - 24.5% | ||||||||
| Consumer Finance - 7.5% | ||||||||
| EZCORP, Inc. - Class A * | 15,770 | 396,773 | ||||||
| First Cash Financial Services, Inc. * | 8,626 | 248,343 | ||||||
| 645,116 | ||||||||
| Insurance - 4.6% | ||||||||
| Fidelity National Financial, Inc. - Class A | 10,446 | 141,021 | ||||||
| HCC Insurance Holdings, Inc. | 9,166 | 257,381 | ||||||
| 398,402 | ||||||||
| Real Estate Investment Trusts (REITs) - 10.9% | ||||||||
| Annaly Capital Management, Inc. | 10,109 | 183,883 | ||||||
| BioMed Realty Trust, Inc. | 9,233 | 162,778 | ||||||
6
| The RAM Small/Mid Cap Fund | ||||||||
| Schedule of Investments (Continued) | ||||||||
| COMMON STOCKS — 97.0% (Continued) | Shares | Value | ||||||
| Financials - 24.5% (Continued) | ||||||||
| Real Estate Investment Trusts (REITs) - 10.9% (Continued) | ||||||||
| LTC Properties, Inc. | 10,513 | $ | 283,746 | |||||
| Omega Healthcare Investors, Inc. | 14,490 | 305,884 | ||||||
| 936,291 | ||||||||
| Thrifts & Mortgage Finance - 1.5% | ||||||||
| Beneficial Mutual Bancorp, Inc. * | 16,107 | 125,151 | ||||||
| Health Care - 8.0% | ||||||||
| Health Care Equipment & Supplies - 4.3% | ||||||||
| CareFusion Corp. * | 5,055 | 115,608 | ||||||
| ICU Medical, Inc. * | 6,942 | 254,424 | ||||||
| 370,032 | ||||||||
| Life Sciences Tools & Services - 1.6% | ||||||||
| ICON plc - ADR * | 6,807 | 137,025 | ||||||
| Pharmaceuticals - 2.1% | ||||||||
| Warner Chilcott plc - Class A | 9,300 | 176,793 | ||||||
| Industrials - 14.7% | ||||||||
| Aerospace & Defense - 2.0% | ||||||||
| Triumph Group, Inc. | 2,022 | 170,111 | ||||||
| Commercial Services & Supplies - 2.4% | ||||||||
| Republic Services, Inc. | 7,346 | 206,716 | ||||||
| Construction & Engineering - 2.6% | ||||||||
| KBR, Inc. | 8,222 | 222,652 | ||||||
| Electrical Equipment - 2.0% | ||||||||
| Babcock & Wilcox Co. * | 7,278 | 176,783 | ||||||
| Marine - 1.7% | ||||||||
| Navios Maritime Holdings, Inc. | 28,777 | 150,791 | ||||||
| Professional Services - 4.0% | ||||||||
| FTI Consulting, Inc. * | 7,076 | 252,189 | ||||||
| Navigant Consulting, Inc. * | 10,716 | 89,157 | ||||||
| 341,346 | ||||||||
| Information Technology - 10.4% | ||||||||
| Internet Software & Services - 2.8% | ||||||||
| VeriSign, Inc. * | 7,009 | 240,479 | ||||||
| IT Services - 7.6% | ||||||||
| Fiserv, Inc. * | 3,370 | 186,361 | ||||||
| Lender Processing Services, Inc. | 6,739 | 207,359 | ||||||
| Wright Express Corp. * | 6,133 | 264,148 | ||||||
| 657,868 | ||||||||
7
| The RAM Small/Mid Cap Fund | ||||||||
| Schedule of Investments (Continued) | ||||||||
| COMMON STOCKS — 97.0% (Continued) | Shares | Value | ||||||
| Telecommunication Services - 2.1% | ||||||||
| Diversified Telecommunication Services - 2.1% | ||||||||
| Frontier Communications Corp. | 20,151 | $ | 183,374 | |||||
| Utilities - 5.7% | ||||||||
| Electric Utilities - 2.1% | ||||||||
| UIL Holdings Corp. | 6,065 | 178,129 | ||||||
| Multi-Utilities - 3.6% | ||||||||
| CMS Energy Corp. | 17,118 | 307,610 | ||||||
Total Common Stocks (Cost $7,451,038) | $ | 8,344,450 | ||||||
| MONEY MARKET FUNDS — 3.5% | Shares | Value | ||||||
| AIM Short-Term Investments Trust (The) - Treasury | ||||||||
Portfolio - Institutional Class, 0.06% (a) (Cost $305,144) | 305,144 | $ | 305,144 | |||||
Total Investments at Value — 100.5% (Cost $7,756,182) | $ | 8,649,594 | ||||||
| Liabilities in Excess of Other Assets — (0.5%) | (43,313 | ) | ||||||
| Net Assets — 100.0% | $ | 8,606,281 | ||||||
| ADR - American Depositary Receipt |
| * | Non-income producing security. |
| (a) | The rate shown is the 7-day effective yield as of November 30, 2010 . |
| See accompanying notes to financial statements. |
8
| The RAM Small/Mid Cap Fund | ||||
| Statement of Assets and Liabilities | ||||
| November 30, 2010 | ||||
| ASSETS | ||||
| Investments in securities: | ||||
| At acquisition cost | $ | 7,756,182 | ||
| At value (Note 1) | $ | 8,649,594 | ||
| Receivable for capital shares sold | 6,610 | |||
| Receivable from Adviser (Note 2) | 12,879 | |||
| Dividends receivable | 92 | |||
| Other assets | 8,180 | |||
| TOTAL ASSETS | 8,677,355 | |||
| LIABILITIES | ||||
| Payable for capital shares redeemed | 9,070 | |||
| Payable to administrator (Note 2) | 7,060 | |||
| Payable for securities purchased | 50,009 | |||
| Other accrued expenses | 4,935 | |||
| TOTAL LIABILITIES | 71,074 | |||
| NET ASSETS | $ | 8,606,281 | ||
| Net assets consist of: | ||||
| Paid-in capital | $ | 7,082,648 | ||
| Accumulated undistributed net investment income | 120,551 | |||
| Accumulated undistributed net realized gains from security transactions | 509,670 | |||
| Net unrealized appreciation on investments | 893,412 | |||
| Net assets | $ | 8,606,281 | ||
| PRICING OF CLASS A SHARES | ||||
| Net assets applicable to Class A shares | $ | 1,151,538 | ||
Shares of beneficial interest outstanding (unlimited number of shares authorized, no par value) | 83,779 | |||
| Net asset value and redemption price per share (Note 1) | $ | 13.74 | ||
| Maximum offering price per share (Note 1) | $ | 14.31 | ||
| PRICING OF CLASS I SHARES | ||||
| Net assets applicable to Class I shares | $ | 7,454,743 | ||
Shares of beneficial interest outstanding (unlimited number of shares authorized, no par value) | 539,412 | |||
| Net asset value, offering price and redemption price per share (Note 1) | $ | 13.82 | ||
| See accompanying notes to financial statements. | ||||
9
| The RAM Small/Mid Cap Fund | ||||
| Statement of Operations | ||||
| For the Year Ended November 30, 2010 | ||||
| INVESTMENT INCOME | ||||
| Dividends | $ | 280,122 | ||
| EXPENSES | ||||
| Investment advisory fees (Note 2) | 74,057 | |||
| Transfer agent fees - Class A (Note 2) | 15,000 | |||
| Transfer agent fees - Class I (Note 2) | 18,000 | |||
| Fund accounting fees (Note 2) | 31,191 | |||
| Professional fees | 22,424 | |||
| Compliance service fees (Note 2) | 22,000 | |||
| Registration fees - Common | 11,652 | |||
| Registration fees - Class A | 2,678 | |||
| Registration fees - Class I | 7,403 | |||
| Administration fees (Note 2) | 20,300 | |||
| Custody and bank service fees | 16,693 | |||
| Insurance expense | 5,104 | |||
| Distribution expense - Class A (Note 2) | 4,001 | |||
| Trustees' fees and expenses | 2,080 | |||
| Other expenses | 16,631 | |||
| TOTAL EXPENSES | 269,214 | |||
| Fee reductions and expense reimbursements by the Adviser (Note 2): | ||||
| Common | (130,649) | |||
| Class A | (17,678) | |||
| Class I | (25,403) | |||
| NET EXPENSES | 95,484 | |||
| NET INVESTMENT INCOME | 184,638 | |||
REALIZED AND UNREALIZED GAINS ON INVESTMENTS | ||||
| Net realized gains from security transactions | 513,422 | |||
| Net change in unrealized appreciation (depreciation) on investments | 127,702 | |||
NET REALIZED AND UNREALIZED GAINS ON INVESTMENTS | 641,124 | |||
NET INCREASE IN NET ASSETS FROM OPERATIONS | $ | 825,762 | ||
| See accompanying notes to financial statements. |
10
| The RAM Small/Mid Cap Fund | ||||||||
| Statements of Changes in Net Assets | ||||||||
| Year | Period | |||||||
| Ended | Ended | |||||||
| November 30, | November 30, | |||||||
| 2010 | 2009(a) | |||||||
| FROM OPERATIONS | ||||||||
| Net investment income | $ | 184,638 | $ | 21,241 | ||||
| Net realized gains from security transactions | 513,422 | 77,962 | ||||||
| Net change in unrealized appreciation (depreciation) on investments | 127,702 | 765,710 | ||||||
| Net increase in net assets from operations | 825,762 | 864,913 | ||||||
| FROM DISTRIBUTIONS TO SHAREHOLDERS | ||||||||
| From net investment income, Class A | (20,471 | ) | (580 | ) | ||||
| From net investment income, Class I | (64,277 | ) | - | |||||
| From net realized gains on investments, Class A | (17,972 | ) | - | |||||
| From net realized gains on investments, Class I | (63,742 | ) | - | |||||
| Decrease in net assets from distributions to shareholders | (166,462 | ) | (580 | ) | ||||
| FROM CAPITAL SHARE TRANSACTIONS | ||||||||
| CLASS A | ||||||||
| Proceeds from shares sold | 330,270 | 1,794,799 | ||||||
| Reinvestment of distributions to shareholders | 22,690 | 580 | ||||||
| Payments for shares redeemed | (1,161,296 | ) | (202,480 | ) | ||||
| Net increase (decrease) in net assets from Class A capital share transactions | (808,336 | ) | 1,592,899 | |||||
| CLASS I | ||||||||
| Proceeds from shares sold | 2,105,281 | 6,354,450 | ||||||
| Reinvestment of distributions to shareholders | 125,068 | - | ||||||
| Payments for shares redeemed | (1,772,640 | ) | (514,074 | ) | ||||
| Net increase in net assets from Class I capital share transactions | 457,709 | 5,840,376 | ||||||
| TOTAL INCREASE IN NET ASSETS | 308,673 | 8,297,608 | ||||||
| NET ASSETS | ||||||||
| Beginning of period | 8,297,608 | - | ||||||
| End of period | $ | 8,606,281 | $ | 8,297,608 | ||||
| ACCUMULATED UNDISTRIBUTED NET INVESTMENT INCOME | $ | 120,551 | $ | 20,661 | ||||
| SUMMARY OF CAPITAL SHARE ACTIVITY | ||||||||
| CLASS A | ||||||||
| Shares sold | 24,481 | 163,895 | ||||||
| Shares issued in reinvestment of distributions to shareholders | 1,705 | 55 | ||||||
| Shares redeemed | (88,408 | ) | (17,949 | ) | ||||
| Net increase (decrease) in shares outstanding | (62,222 | ) | 146,001 | |||||
| Shares outstanding, beginning of period | 146,001 | - | ||||||
| Shares outstanding, end of period | 83,779 | 146,001 | ||||||
| CLASS I | ||||||||
| Shares sold | 157,131 | 546,906 | ||||||
| Shares issued in reinvestment of distributions to shareholders | 9,361 | - | ||||||
| Shares redeemed | (132,480 | ) | (41,506 | ) | ||||
| Net increase in shares outstanding | 34,012 | 505,400 | ||||||
| Shares outstanding, beginning of period | 505,400 | - | ||||||
| Shares outstanding, end of period | 539,412 | 505,400 | ||||||
| (a) | Represents the period from the commencement of operations (December 22, 2008 for Class A shares and April 1, 2009 for Class I shares) through November 30, 2009. |
| See accompanying notes to financial statements. |
11
| The RAM Small/Mid Cap Fund - Class A | |||||||||
| Financial Highlights | |||||||||
| Per share data for a share outstanding throughout each period: | |||||||||
| Year | Period | ||||||||
| Ended | Ended | ||||||||
| November 30, | November 30, | ||||||||
| 2010 | 2009(a) | ||||||||
| Net asset value at beginning of period | $ | 12.72 | $ | 10.00 | |||||
| Income from investment operations: | |||||||||
| Net investment income | 0.29 | 0.07 | |||||||
| Net realized and unrealized gains on investments | 1.00 | 2.68 | |||||||
| Total from investment operations | 1.29 | 2.75 | |||||||
| Less distributions: | |||||||||
| From net investment income | (0.14 | ) | (0.03 | ) | |||||
| From net realized gains on investments | (0.13 | ) | - | ||||||
| Total distributions | (0.27 | ) | (0.03 | ) | |||||
| Net asset value at end of period | $ | 13.74 | $ | 12.72 | |||||
Total return (b) | 10.18% | 27.55% | (c) | ||||||
| Net assets at end of period (000's) | $ | 1,152 | $ | 1,857 | |||||
Ratio of net expenses to average net assets (d) | 1.30% | 1.30% | (e) | ||||||
| Ratio of net investment income to average net assets | 1.86% | 0.72% | (e) | ||||||
| Portfolio turnover rate | 49% | 35% | (c) | ||||||
| (a) | Represents the period from the commencement of operations (December 22, 2008) through November 30, 2009. | |||||
| (b) | Total return is a measure of the change in value of an investment in the Fund over the period covered, which assumes any dividends or capital gains distributions are reinvested in shares of the Fund. The returns shown do not reflect the deduction of taxes a shareholder would pay on Fund distributions or the redemption of Fund shares. Total returns shown do not include the effect of applicable sales loads. | |||||
| (c) | Not annualized. | |||||
| (d) | Absent fee reductions and expense reimbursements by the Adviser, the ratio of expenses to average net assets would have been 3.91% and 9.05%(e) for the periods ended November 30, 2010 and 2009, respectively (Note 2). | |||||
| (e) | Annualized. | |||||
| See accompanying notes to financial statements. | ||||||
12
| The RAM Small/Mid Cap Fund - Class I | |||||||||
| Financial Highlights | |||||||||
| Per share data for a share outstanding throughout each period: | |||||||||
| Year | Period | ||||||||
| Ended | Ended | ||||||||
| November 30, | November 30, | ||||||||
| 2010 | 2009(a) | ||||||||
| Net asset value at beginning of period | $ | 12.74 | $ | 9.94 | |||||
| Income from investment operations: | |||||||||
| Net investment income | 0.29 | 0.03 | |||||||
| Net realized and unrealized gains on investments | 1.04 | 2.77 | |||||||
| Total from investment operations | 1.33 | 2.80 | |||||||
| Less distributions: | |||||||||
| From net investment income | (0.12 | ) | - | ||||||
| From net realized gains on investments | (0.13 | ) | - | ||||||
| Total distributions | (0.25 | ) | - | ||||||
| Net asset value at end of period | $ | 13.82 | $ | 12.74 | |||||
Total return (b) | 10.50% | 28.17% | (c) | ||||||
| Net assets at end of period (000's) | $ | 7,455 | $ | 6,440 | |||||
Ratio of net expenses to average net assets (d) | 1.05% | 1.05% | (e) | ||||||
| Ratio of net investment income to average net assets | 2.18% | 0.65% | (e) | ||||||
| Portfolio turnover rate | 49% | 35% | (c) | ||||||
| (a) | Represents the period from the commencement of operations (April 1, 2009) through November 30, 2009. | ||||||
| (b) | Total return is a measure of the change in value of an investment in the Fund over the period covered, which assumes any dividends or capital gains distributions are reinvested in shares of the Fund. The returns shown do not reflect the deduction of taxes a shareholder would pay on Fund distributions or the redemption of Fund shares. | ||||||
| (c) | Not annualized. | ||||||
| (d) | Absent fee reductions and expense reimbursements by the Adviser, the ratio of expenses to average net assets would have been 2.91% and 3.67%(e) for the periods ended November 30, 2010 and 2009, respectively (Note 2). | ||||||
| (e) | Annualized. | ||||||
| See accompanying notes to financial statements. | |||||||
13
The RAM Small/Mid Cap Fund
Notes to Financial Statements
November 30, 2010
| 1. | Organization and Significant Accounting Policies |
Organization
The RAM Small/Mid Cap Fund (the “Fund”) is a diversified series of The RAM Funds (the “Trust”), an open-end management investment company established as an Ohio business trust under a Declaration of Trust dated December 20, 2007. Class A shares of the Fund commenced operations on December 22, 2008. Class I shares of the Fund commenced operations on April 1, 2009.
The Fund seeks to achieve long-term capital appreciation.
The Fund is authorized to issue two classes of shares: Class A shares (sold subject to a maximum front-end sales load of 4% and a distribution fee of up to 0.25% of the average daily net assets attributable to Class A shares) and Class I shares (sold without any sales loads or distribution fees). Each class of shares represents an interest in the same assets of the Fund, has the same rights and is identical in all material respects except that: (1) Class A shares bear the expenses of distribution fees; (2) certain other class-specific expenses will be borne solely by the class to which such expenses are attributable; (3) each class has exclusive voting rights with respect to matters relating to its own distribution arrangements; and (4) Class I shares require a higher minimum initial investment.
The following is a summary of the Fund’s significant accounting policies:
Valuation of Securities
The Fund’s portfolio securities, such as common stocks and shares of real estate investment trusts (“REITs”), are valued at market value as of the close of regular trading on the New York Stock Exchange (“NYSE”) (normally, 4:00 p.m. Eastern time) on each business day the NYSE is open. Securities listed on the NYSE or other exchanges are valued on the basis of their last sale prices on the exchanges on which they are primarily traded. If there are no sales on that day, the securities are valued at the closing bid price on the NYSE or other primary exchange for that day. NASDAQ listed securities are valued at the NASDAQ Official Closing Price. If there are no sales on that day, the securities are valued at the last bid price as reported by NASDAQ. Securi ties traded in the over-the-counter market are valued at the last sales price, if available, otherwise at the mean of the closing bid and ask prices. In the event that market quotations are not readily available, securities and other assets are valued at fair value as determined in good faith in accordance with procedures adopted by the Board of Trustees of the Trust and will be classified as Level 2 or 3 within the fair value hierarchy, depending on the inputs used. Debt securities will be valued at their current market value when available or at their fair value, which for securities with remaining maturities of 60 days or less, has been determined in good faith by the Board of Trustees to be represented by amortized cost which approximates fair value, absent unusual circumstances.
Accounting principles generally accepted in the United States (“GAAP”) establish a single authoritative definition of fair value, set out a framework for measuring fair value and require additional disclosures about fair value measurements.
Various inputs are used in determining the value of the Fund’s investments. These inputs are summarized in the three broad levels listed below:
Level 1 – quoted prices in active markets for identical securities
Level 2 – other significant observable inputs
Level 3 – significant unobservable inputs
14
The RAM Small/Mid Cap Fund
Notes to Financial Statements (Continued)
The inputs or methodology used for valuing securities are not necessarily an indication of the risks associated with investing in those securities. The inputs used to measure fair value may fall into different levels of the fair value hierarchy. In such cases, for disclosure purposes, the level of the fair value hierarchy within which the fair value measurement falls (in its entirety), is determined based on the lowest level input that is significant to the fair value measurement.
The following is a summaryThe following is a summary of the inputs used to value the Fund’s investments by security type as of November 30, 2010:
| Level 1 | Level 2 | Level 3 | Total | |||||||||||||
| Common Stocks (including REITs) | $ | 8,344,450 | $ | — | $ | — | $ | 8,344,450 | ||||||||
| Money Market Funds | 305,144 | — | — | 305,144 | ||||||||||||
| Total | $ | 8,649,594 | $ | — | $ | — | $ | 8,649,594 | ||||||||
See the Fund’s Schedule of Investments for a listing of common stocks valued using Level 1 inputs by industry type. During the year ended November 30, 2010, the Fund did not have any significant transfers in and out of Level 1 or Level 2. In addition, the Fund did not have any assets or liabilities that were measured at fair value on a recurring basis using significant unobservable inputs (Level 3) during the year ended or as of November 30, 2010.
Share Valuation
The net asset value per share of each class of shares of the Fund is calculated daily by dividing the total value of the assets attributable to that class, less liabilities attributable to that class, by the number of shares of that class outstanding, rounded to the nearest cent. The maximum offering price per share of Class A shares of the Fund is equal to the net asset value per share plus a sales load equal to 4.17% of the net asset value (or 4% of the offering price). The offering price of Class I shares is equal to the net asset value per share. The redemption price per share of each class of shares of the Fund is equal to the net asset value per share.
Investment Income
Dividend income is recorded on the ex-dividend date. Interest income is recognized on the accrual basis. Discounts and premiums on fixed income securities purchased are amortized using the interest method. Withholding taxes on foreign dividends have been provided for in accordance with the Fund’s understanding of the applicable country rules and rates.
Security Transactions
Security transactions are accounted for on the trade date. Gains and losses on securities sold are determined on a specific identification basis.
Distributions to Shareholders
Distributions to shareholders arising from net investment income and net realized capital gains, if any, are declared and paid annually in December. The amount of distributions from net investment income and net realized gains are determined in accordance with federal income tax regulations, which may differ from GAAP, and are recorded on the ex-dividend date. The tax character of distributions paid during the periods ended November 30, 2009 and November 30, 2010 was as follows:
15
The RAM Small/Mid Cap Fund
Notes to Financial Statements (Continued)
| Period Ended | Ordinary Income | Total Distributions | ||||||
| The RAM Small/Mid Cap Fund - Class A | ||||||||
| November 30, 2009 | $ | 580 | $ | 580 | ||||
| November 30, 2010 | $ | 38,443 | $ | 38,443 | ||||
| The RAM Small/Mid Cap Fund - Class I | ||||||||
| November 30, 2009 | $ | - | $ | - | ||||
| November 30, 2010 | $ | 128,019 | $ | 128,019 | ||||
On December 31, 2010, an ordinary dividend of $0.7720 and $0.7640 per share were declared for Class A and Class I, respectively. In addition, a long-term gain of $0.33753 was also declared on December 31, 2010.
Allocations Between Classes
Investment income earned, realized capital gains and losses, and unrealized appreciation and depreciation are allocated daily to each class of shares based upon its proportionate share of total net assets of the Fund. Class specific expenses are charged directly to the class incurring the expense. Common expenses which are not attributable to a specific class are allocated daily to each class of shares based upon its proportionate share of total net assets of the Fund.
Estimates
The preparation of financial statements in conformity with GAAP requires management to make estimates and assumptions that affect the reported amounts of assets and liabilities and disclosures of contingent assets and liabilities as of the date of the financial statements and the reported amounts of income and expenses during the reporting period. Actual results could differ from those estimates.
Federal Income Tax
It is the Fund’s policy to comply with the special provisions of Subchapter M of the Internal Revenue Code applicable to regulated investment companies. As provided therein, in any fiscal year in which a Fund so qualifies and distributes at least 90% of its taxable net income, the Fund (but not the shareholders) will be relieved of federal income tax on the income distributed. Accordingly, no provision for income taxes has been made.
In order to avoid imposition of the excise tax applicable to regulated investment companies, it is also the Fund’s intention to declare and pay as dividends in each calendar year at least 98% of its net investment income (earned during the calendar year) and 98% of its net realized capital gains (earned during the twelve months ended November 30) plus undistributed amounts from prior years.
16
The RAM Small/Mid Cap Fund
Notes to Financial Statements (Continued)
The following information is computed on a tax basis for each item as of November 30, 2010:
| Cost of portfolio investments | $ | 7,778,253 | ||
| Gross unrealized appreciation | $ | 1,401,164 | ||
| Gross unrealized depreciation | (529,823 | ) | ||
| Net unrealized appreciation | 871,341 | |||
| Undistributed ordinary income | 440,540 | |||
| Undistributed long-term gains | 211,752 | |||
| Distributable earnings | 1,523,633 |
The difference between the federal income tax cost of portfolio investments and the financial statement cost for the Fund is due to timing differences in the recognition of capital gains or losses under income tax regulations and GAAP. These “book/tax” differences are temporary in nature and are due to the tax deferral of losses on wash sales.
The Fund recognizes the tax benefits or expenses of uncertain tax positions only when the position is “more likely than not” to be sustained assuming examination by tax authorities. Management has reviewed the Fund’s tax positions taken on Federal income tax returns for all open tax years (tax years ended November 30, 2009 through November 30, 2010) and has concluded that no provision for unrecognized tax benefits or expenses is required as of or during the year ended November 30, 2010.
| 2. | Investment Advisory Agreement and Transactions with Related Parties |
Certain Trustees and officers of the Trust are affiliated with Riazzi Asset Management, LLC (the “Adviser”), or with Ultimus Fund Solutions, LLC (“Ultimus”), the Fund’s administrator, transfer agent and fund accounting agent, and Ultimus Fund Distributors, LLC (the “Distributor”), the Fund’s principal underwriter.
Investment Advisory Agreement
Under the terms of an Investment Advisory Agreement between the Trust and the Adviser, the Adviser serves as the investment adviser to the Fund. For its services, the Fund pays the Adviser a monthly fee computed at the annual rate of 0.85% of its average daily net assets. The Adviser has contractually agreed for a period of three years from the Fund’s commencement of operations to reduce its investment advisory fees and to reimburse other operating expenses to the extent necessary to limit annual ordinary operating expenses of the Fund’s Class A and Class I shares to 1.30% and 1.05%, respectively, of average daily net assets. These contractual obligations expire on April 1, 2012. For the year ended November 30, 2010, the Adviser waived its entire investment advisory fee of $74,057 and reimbursed $56,592 of common expenses, $17,678 of Class A expenses and $25,403 of Class I expenses. As of November 30, 2010, the Adviser owed the Fund $12,879.
Any such fee reductions or expense reimbursements by the Adviser are subject to recovery by the Adviser for a period of three years after such fees and expenses were incurred, provided that the recovery does not cause the Fund’s ordinary operating expenses to exceed the foregoing expense limits. As of November 30, 2010, the Adviser may in the future recover fee reductions and expense reimbursements totaling $308,199. The Adviser may recover these amounts no later than the dates as stated below:
17
The RAM Small/Mid Cap Fund
Notes to Financial Statements (Continued)
| November 30, | November 30, | |||
| 2012 | 2013 | |||
| $ 134,469 | $ 173,730 |
The President of the Trust is also a Principal of the Adviser. Additionally, this individual serves as Chief Compliance Officer of the Trust and of the Adviser. Effective April 1, 2010, the Trust pays the Adviser $48,000 annually for the services provided by the Chief Compliance Officer to the Trust. Prior to April 1, 2010, the Trust paid the Adviser $36,000 annually for these services.
Administration Agreement
Under the terms of an Administration Agreement, Ultimus supplies non-investment related administrative and compliance services for the Fund. Ultimus supervises the preparation of tax returns, reports to shareholders, reports to and filings with the Securities and Exchange Commission (“SEC”) and state securities commissions and materials for meetings of the Board of Trustees. For these services, Ultimus receives a monthly fee at an annual rate of 0.15% of the Fund’s average daily net assets up to $50 million; 0.125% of such assets between $50 million and $100 million; 0.10% of such assets between $100 million and $250 million; 0.075% of such assets between $250 million and $500 million; and 0.05% of such assets in excess of $500 million, subject to a minimum monthly fee of $2,000. The f ee payable to Ultimus is discounted by 20% during the first year of the Fund’s operations and 15% during the second year of operations, or until such time as the Fund’s net assets reach $20 million, but in no event later than two years from the date of commencement of operations.
Accounting Services Agreement
Under the terms of an Accounting Services Agreement, Ultimus calculates the daily net asset value per share and maintains the financial books and records of the Fund. For these services, the Fund pays Ultimus a base fee of $3,000 per month plus an asset-based fee of 0.01% of average daily net assets. The base fee payable to Ultimus is discounted by 20% during the first year of the Fund’s operations and 15% during the second year of operations, or until such time as the Fund’s net assets reach $20 million, but in no event later than two years from the date of commencement of operations. In addition, the Fund pays all costs of external pricing services.
Transfer Agent and Shareholder Services Agreement
Under the terms of a Transfer Agent and Shareholder Services Agreement, Ultimus maintains the records of each shareholder's account, answers shareholders' inquiries concerning their accounts, processes purchases and redemptions of the Fund’s shares, acts as dividend and distribution disbursing agent and performs other shareholder service functions. For these services, Ultimus receives a monthly fee at an annual rate of $20 per shareholder account, subject to a monthly minimum fee of $1,500 for a share class with 100 or more shareholder accounts. The monthly minimum fee is $1,000 for a share class with 25 accounts or less and is $1,250 for a share class with more than 25 but less than 100 shareholder accounts. In addition, the Fund reimburses Ultimus for out-of-pocket expenses including, but not li mited to, postage and supplies.
Distribution Agreement
Under the terms of a Distribution Agreement, the Distributor provides distribution services to the Trust and serves as principal underwriter to the Fund. The Distributor is a wholly owned subsidiary of Ultimus. The Distributor receives annual compensation of $6,000 for such services. In addition, during the year ended
18
The RAM Small/Mid Cap Fund
Notes to Financial Statements (Continued)
November 30, 2010, the Distributor earned $754 of underwriting commissions on the sale of Class A shares of the Fund.
Plans of Distribution
The Trust has adopted a plan of distribution (the “Plan”) under which Class A shares of the Fund may directly incur or reimburse the Adviser or the Distributor for certain expenses related to the distribution of Class A shares. The annual limitation for payment of expenses pursuant to the Plan is 0.25% of the Fund’s average daily net assets attributable to Class A shares. During the year ended November 30, 2010, Class A shares of the Fund incurred distribution related expenses of $4,001 under the Plan.
| 3. | Investment Transactions |
During the year ended November 30, 2010, cost of purchases and proceeds from sales and maturities of investment securities, other than short-term investments and U.S. government securities, amounted to $4,056,892 and $4,266,674, respectively.
| 4. | Contingencies and Commitments |
The Fund indemnifies the Trust's officers and Trustees for certain liabilities that might arise from their performance of their duties to the Fund. Additionally, in the normal course of business the Fund enters into contracts that contain a variety of representations and warranties and which provide general indemnifications. The Fund’s maximum exposure under these arrangements is unknown, as this would involve future claims that may be made against the Fund that have not yet occurred. However, based on experience, the Fund expects the risk of loss to be remote.
| 5. | Recent Accounting Pronouncement |
In January 2010, the Financial Accounting Standards Board (“FASB”) issued Accounting Standards Update (“ASU”) No. 2010-06 “Improving Disclosures about Fair Value Measurements.” ASU No. 2010-06 amends FASB Accounting Standards Codification Topic 820, Fair Value Measurements and Disclosures, to require additional disclosures regarding fair value measurements. Certain disclosures required by ASU No. 2010-06 are effective for interim and annual reporting periods beginning after December 15, 2009 and others for fiscal years beginning after December 15, 2010 and for interim periods within those fiscal years. Management has determined that ASU No. 2010-06 has no impact on the Fund’s financial statements or disclosures.
| 6. | Subsequent Events |
The Fund is required to recognize in the financial statements the effects of all subsequent events that provide additional evidence about conditions that existed as of the date of the Statements of Assets and Liabilities. For non-recognized subsequent events that must be disclosed to keep the financial statements from being misleading, the Fund is required to disclose the nature of the event as well as an estimate of its financial effect, or a statement that such an estimate cannot be made. Management has evaluated subsequent events through the issuance of these financial statements and has noted no such events.
19
| | Cohen Fund Audit Services, Ltd. 800 Westpoint Pkwy., Suite 1100 Westlake, OH 44145-1524 www.cohenfund.com | 440.835.8500 440.835.1093 fax |
REPORT OF INDEPENDENT REGISTERED PUBLIC ACCOUNTING FIRM
To The Shareholders and Board of Trustees
The RAM Funds
We have audited the accompanying statement of assets and liabilities, including the schedule of investments, of The RAM Funds, comprising The RAM Small/Mid Cap Fund (the "Fund") as of November 30, 2010, and the related statement of operations for the year then ended, and the statements of changes in net assets and the financial highlights for each of the two periods in the period then ended. These financial statements and financial highlights are the responsibility of Fund management. Our responsibility is to express an opinion on these financial statements and financial highlights based on our audits.
We conducted our audits in accordance with the standards of the Public Company Accounting Oversight Board (United States). Those standards require that we plan and perform the audit to obtain reasonable assurance about whether the financial statements and financial highlights are free of material misstatement. An audit includes examining, on a test basis, evidence supporting the amounts and disclosures in the financial statements. Our procedures included confirmation of securities owned as of November 30, 2010 by correspondence with the Fund's custodian and broker. An audit also includes assessing the accounting principles used and significant estimates made by management, as well as evaluating the overall financial statement presentation. We believe that our audits provide a reasonable basis for our opinion.
In our opinion, the financial statements and financial highlights referred to above present fairly, in all material respects, the financial position of The RAM Small/Mid Cap Fund as of November 30, 2010, and the results of its operations for the year then ended, and the changes in its net assets and the financial highlights for each of the two periods in the period then ended, in conformity with accounting principles generally accepted in the United States of America.

COHEN FUND AUDIT SERVICES, LTD.
Westlake, Ohio
January 25, 2011

20
The RAM Small/Mid Cap Fund
About Your Fund’s Expenses (Unaudited)
We believe it is important for you to understand the impact of costs on your investment. As a shareholder of the Fund, you incur two types of costs: (1) transaction costs, possibly including front-end sales loads, and (2) ongoing costs, including management fees and other Fund expenses. The following examples are intended to help you understand your ongoing costs (in dollars) of investing in the Fund and to compare these costs with the ongoing costs of investing in other mutual funds.
A mutual fund’s ongoing costs are expressed as a percentage of its average net assets. This figure is known as the expense ratio. The ongoing costs reflected in the tables below are based on an investment of $1,000 made at the beginning of the period (June 1, 2010) and held until the end of the period (November 30, 2010).
The table below illustrates the Fund’s ongoing costs in two ways:
Actual fund return – This section helps you to estimate the actual expenses that you paid over the period. The “Ending Account Value” shown is derived from the Fund’s actual return, and the third column shows the dollar amount of operating expenses that would have been paid by an investor who started with $1,000 in the Fund. You may use the information here, together with the amount you invested, to estimate the expenses that you paid over the period.
To do so, simply divide your account value by $1,000 (for example, an $8,600 account value divided by $1,000 = 8.6), then multiply the result by the number given for the Fund under the heading “Expenses Paid During Period.”
Hypothetical 5% return – This section is intended to help you compare the Fund’s ongoing costs with those of other mutual funds. It assumes that the Fund had an annual return of 5% before expenses during the period shown, but that the expense ratio is unchanged. In this case, because the return used is not the Fund’s actual return, the results do not apply to your investment. The example is useful in making comparisons because the SEC requires all mutual funds to calculate expenses based on a 5% return. You can assess the Fund’s ongoing costs by comparing this hypothetical example with the hypothetical examples that appear in shareholder reports of other funds.
Note that expenses shown in the table are meant to highlight and help you compare ongoing costs only. The calculations below assume no shares were bought or sold during the period. Your actual costs may have been higher or lower, depending on the amount of your investment and the timing of any purchases or redemptions.
More information about the Fund’s expenses, including historical expense ratios, can be found in this report. For additional information on operating expenses and other shareholder costs, please refer to the Fund’s prospectus.
| The RAM Small/Mid Cap Fund - Class A | Beginning Account Value June 1, 2010 | Ending Account Value November 30, 2010 | Expenses Paid During Period* | |||||||||
| Based on Actual Fund Return | $ | 1,000.00 | $ | 1,090.50 | $ | 6.81 | ||||||
| Based on Hypothetical 5% Return | $ | 1,000.00 | $ | 1,018.55 | $ | 6.58 | ||||||
* Expenses are equal to The RAM Small/Mid Cap Fund – Class A’s annualized expense ratio of 1.30% for the period, multiplied by the average account value over the period, multiplied by 183/365 (to reflect the one-half year period). | ||||||||||||
21
The RAM Small/Mid Cap Fund
About Your Fund’s Expenses (Unaudited) (Continued)
| The RAM Small/Mid Cap Fund - Class I | Beginning Account Value June 1, 2010 | Ending Account Value November 30, 2010 | Expenses Paid During Period* | |||||||||
| Based on Actual Fund Return | $ | 1,000.00 | $ | 1,091.60 | $ | 5.51 | ||||||
| Based on Hypothetical 5% Return | $ | 1,000.00 | $ | 1,019.80 | $ | 5.32 | ||||||
* Expenses are equal to The RAM Small/Mid Cap Fund – Class I’s annualized expense ratio of 1.05% for the period, multiplied by the average account value over the period, multiplied by 183/365 (to reflect the one-half year period). | ||||||||||||
Other Information (Unaudited)
A description of the policies and procedures that the Fund uses to vote proxies relating to portfolio securities is available without charge upon request by calling toll-free 1-888-884-8099, or on the SEC’s website at http://www.sec.gov. Information regarding how the Fund voted proxies relating to portfolio securities during the most recent 12-month period ended June 30 is also available without charge upon request by calling toll-free 1-888-884-8099, or on the SEC’s website at http://www.sec.gov.
The Trust files a complete listing of portfolio holdings for the Fund with the SEC as of the first and third quarters of each fiscal year on Form N-Q. These filings are available free of charge, upon request, by calling 1-888-884-8099. Furthermore, you may obtain a copy of these filings on the SEC's website at http://www.sec.gov. The Trust's Forms N-Q may also be reviewed and copied at the SEC's Public Reference Room in Washington, DC, and information on the operation of the Public Reference Room may be obtained by calling 1-800-SEC-0330.
22
The RAM Small/Mid Cap Fund
Board of Trustees and Executive Officers (Unaudited)
The Board of Trustees has overall responsibility for management of the Trust's affairs. The Trustees serve during the lifetime of the Trust and until its termination, or until death, resignation, retirement or removal. The Trustees, in turn, elect the officers of the Trust to actively supervise its day-to-day operations. The officers have been elected for an annual term. The following are the Trustees and executive officers of the Trust:
Name, Address and Age | Length of Time Served | Position(s) Held with Trust | Principal Occupation(s) During Past 5 Years and Directorships of Public Companies | Number of Funds in Trust Overseen by Trustee |
Interested Trustees: | ||||
*John C. Riazzi 2331 Far Hills Avenue Suite 200 Dayton, Ohio 45419 (age 48) | Since December 2007 | Trustee, President and Chief Compliance Officer | Founder, Managing Member and Chief Compliance Officer of Riazzi Asset Management, LLC (the Fund’s adviser) since 2007; Principal and Managing Director of Transamerica Investment Management, LLC (an asset management firm) from 2001 until 2007. | 1 |
Independent Trustees: | ||||
John R. Kenney 2331 Far Hills Avenue Suite 200 Dayton, Ohio 45419 (age 72) | Since March 2008 | Trustee | Chairman and Chief Executive Officer of Clearwater Financial Marketing (a marketing and financial service firm) since 2006; Chairman and Chief Executive Officer of Great Companies, LLC (a money manager) from 2000 until 2006. | 1 |
James H. Miller, III 2331 Far Hills Avenue Suite 200 Dayton, Ohio 45419 (age 54) | Since March 2008 | Trustee | Chief Financial Officer of Riverain Group, Inc. (a family business). | 1 |
| * | Mr. Riazzi, as an affiliated person of the Adviser, is considered an “interested person” of the Trust within the meaning of Section 2(a)(19) of the 1940 Act. |
23
The RAM Small/Mid Cap Fund
Board of Trustees and Executive Officers (Unaudited) (Continued)
| Name, Address and Age | Length of Time Served | Position(s) Held with Trust | Principal Occupation(s) During Past 5 Years | |
Executive Officers: | ||||
Michelle E. Stevens (age 41) 2331 Far Hills Avenue Suite 200 Dayton, Ohio 45419 | Since January 2010 | Vice President | Principal and Chief Investment Officer of Riazzi Asset Management, LLC; Principal, Portfolio Manager and Value Equity Chief Investment Officer of Transamerica Investment Management, LLC from 2001 until 2008. | |
Robert G. Dorsey (age 53) 225 Pictoria Drive Suite 450 Cincinnati, Ohio 45246 | Since January 2008 | Vice President | Managing Director of Ultimus Fund Solutions, LLC and Ultimus Fund Distributors, LLC | |
Mark J. Seger (age 49) 225 Pictoria Drive Suite 450 Cincinnati, Ohio 45246 | Since January 2008 | Treasurer | Managing Director of Ultimus Fund Solutions, LLC and Ultimus Fund Distributors, LLC | |
John F. Splain (age 54) 225 Pictoria Drive Suite 450 Cincinnati, Ohio 45246 | Since January 2008 | Secretary | Managing Director of Ultimus Fund Solutions, LLC and Ultimus Fund Distributors, LLC | |
Additional information about members of the Board of Trustees and executive officers is available in the Statement of Additional Information (“SAI”). To obtain a free copy of the SAI, please call 1-866-420-3350.
24
The RAM Small/Mid Cap Fund
Approval of Investment Advisory Agreement (Unaudited)
At an in-person meeting held on November 4, 2010, the Board of Trustees, including a majority of the Independent Trustees, approved the continuance for a one-year period of the Investment Advisory Agreement with the Adviser on behalf of the RAM Small/Mid-Cap Fund. Below is a discussion of the factors considered by the Board of Trustees along with the conclusions with respect thereto that formed the basis for the Board’s approval.
Approving the continuance of the Investment Advisory Agreement, the Trustees considered all information they deemed reasonably necessary to evaluate the terms of the Agreement. The principal areas of review by the Trustees were the nature, extent and quality of the services provided by the Adviser, the investment performance of the Small/Mid Cap Fund and the Adviser, the costs of the services provided and profits realized by the Adviser, and economies of scale. These matters were considered by the Independent Trustees consulting with experienced counsel for the Independent Trustees, who is independent of the Adviser.
Nature, Extent and Quality of the Services Provided by the Adviser
In considering the nature, extent, and quality of the services provided by the Adviser, the Trustees reviewed the responsibilities of the Adviser under the Investment Advisory Agreement. The Trustees reviewed the services the Adviser provides to the Small/Mid Cap Fund including, without limitation: the quality of its investment advisory services since the Fund’s commencement of operations (including research and recommendations with respect to portfolio securities); its process for formulating investment decisions and assuring compliance with the Fund’s investment objectives and limitations; and its efforts to promote and market the Fund and grow the Fund’s assets. The Trustees also evaluated the Adviser’s personnel, including the education and experience of the Adviser’s personnel. The Trustees noted that several of the officers of the Trust, including the principal executive officer and President, the Vice President and portfolio manager, and the Chief Compliance Officer of the Trust, are employees of the Adviser and serve the Trust without additional compensation. After reviewing the foregoing information and further information in the materials provided by the Adviser, the Board concluded, in light of all the facts and circumstances, that the nature, extent, and quality of the services the Adviser provides were satisfactory and adequate for the Small/Mid Cap Fund.
Investment Performance of the Small/Mid Cap Fund and the Adviser
In considering the investment performance of the Small/Mid Cap Fund and the Adviser, the Trustees compared the short-term and long-term performance of the Fund with the historical returns of its benchmark index (the Russell 2500 Value Index) and aggregated peer group data derived from the Morningstar database. The Trustees noted that the Small/Mid Cap Fund has generally underperformed its peer group and its benchmark. They considered that, based on representations by the Adviser, the performance differences can be attributed mainly to the down market in which the Small/Mid Cap Fund was started and to the high quality of the Fund’s holdings as compared to the higher risk, lower quality investments that have generally performed better since the Fund’s inception. The Independent Trustees also considered the consiste ncy of the Adviser’s management of the Small/Mid Cap Fund with the Fund’s investment objective and policies and the Adviser’s strategy for improving performance. After considerable discussion, the Independent Trustees concluded that, in light of all the facts and circumstances, the investment performance of the Small/Mid Cap Fund was improving, the Adviser’s long-term investment strategy is sound and the quality of services provided by the Adviser is satisfactory.
25
The RAM Small/Mid Cap Fund
Approval of Investment Advisory Agreement (Unaudited)
(Continued)
Costs of the Services Provided and Profits Realized by the Adviser
In considering the costs of the services provided and profits realized by the Adviser from its relationship with the Small/Mid Cap Fund, the Trustees considered, among other things: (1) the Adviser’s financial condition and the level of commitment to the Fund and the Adviser by the principals of the Adviser; (2) the asset levels of the Fund; (3) the overall expenses of the Fund in light of the Fund’s expense limitation arrangement with the Adviser; (4) the nature and frequency of advisory fee payments; (5) the Adviser’s staffing, personnel, and methods of operating; and (6) the Adviser’s compliance policies and procedures. The Trustees reviewed financial statements and other information communicated by the Adviser regarding its profits associated with managing the Small/Mid Cap Fund. The Trustees noted that the Adviser has not collected any of its investment advisory fees and has reimbursed the Small/Mid Cap Fund for a significant amount of other operating expenses since the inception of the Fund. The Trustees also considered potential benefits for the Adviser in managing the Small/Mid Cap Fund, including the advantage the Adviser derives from the existence of the Fund for the Adviser’s separate accounts and the fees earned from those accounts. The Trustees then compared the fees and expenses of the Small/Mid Cap Fund (including the investment advisory fee) to that of representative funds in its Morningstar category. The Trustees noted that the Small/Mid Cap Fund’s investment advisory fee was slightly higher in comparison to the average and median advisory fees of the funds in the Fund’s Morningstar category, although the Fund’s overall net expense ratio was generally lower than that of the average and median fund in its Morningstar category, after fee reductions and expense reimbursements. Following review of the foregoing comparisons and after further discussion on this point, the Board concluded that the investment advisory fee paid by the Small/Mid Cap Fund to the Adviser, in light of all the facts and circumstances, was fair and reasonable in relation to the nature and quality of the services the Adviser provides and that the fee reflects charges within a range of what would have been negotiated at arm’s length.
Economies of Scale
The Trustees determined that, based on current asset levels, it would not be relevant to consider the extent to which economies of scale would be realized as the Fund grows, and whether fee levels reflect these economies of scale. The Trustees determined further that it was not appropriate to introduce fee breakpoints at the present time. The Trustees observed, however, that if the Fund grows significantly in assets, it may become necessary for the Adviser to consider adding breakpoints to the investment advisory fee. The Trustees noted that the Small/Mid Cap Fund’s shareholders have benefited and would likely continue to benefit from expense limitation arrangement that is in place between the Adviser and the Fund. Following further discussion of the Small/Mid Cap Fund’s asset levels, expectations for growth, and fee levels , the Board determined that the Fund’s fee arrangements, in light of all the facts and circumstances, were fair and reasonable in relation to the nature and quality of the services provided by the Adviser.
26
| Item 2. | Code of Ethics. |
As of the end of the period covered by this report, the registrant has adopted a code of ethics that applies to the registrant’s principal executive officer, principal financial officer, principal accounting officer or controller, or persons performing similar functions, regardless of whether these individuals are employed by the registrant or a third party. Pursuant to Item 12(a)(1), a copy of registrant’s code of ethics is filed as an exhibit to this Form N-CSR. During the period covered by this report, the code of ethics has not been amended, and the registrant has not granted any waivers, including implicit waivers, from the provisions of the code of ethics.
| Item 3. | Audit Committee Financial Expert. |
The registrant’s board of trustees has determined that the registrant has at least one audit committee financial expert serving on its audit committee. The name of the audit committee financial expert is James H. Miller, III. Mr. Miller is “independent” for purposes of this Item.
| Item 4. | Principal Accountant Fees and Services. |
| (a) | Audit Fees. The aggregate fees billed for professional services rendered by the principal accountant for the audit of the registrant’s annual financial statements or for services that are normally provided by the accountant in connection with statutory and regulatory filings or engagements were $11,500 and $23,000 with respect to the registrant’s fiscal years ended November 30, 2010 and November 30, 2009, respectively. |
| (b) | Audit-Related Fees. No fees were billed in either of last two fiscal years for assurance and related services by the principal accountant that are reasonably related to the performance of the audit of the registrant’s financial statements and are not reported under paragraph (a) of this Item. |
| (c) | Tax Fees. The aggregate fees billed for professional services rendered by the principal accountant for tax compliance, tax advice, and tax planning were $2,000 and $4,000 with respect to the registrant’s fiscal years ended November 30, 2010 and November 30, 2009, respectively. The services comprising these fees are the preparation of the registrant’s federal income and excise tax returns. |
| (d) | All Other Fees. No fees were billed in either of the last two fiscal years for products and services provided by the principal accountant, other than the services reported in paragraphs (a) through (c) of this Item. |
| (e)(1) | The audit committee has not adopted pre-approval policies and procedures described in paragraph (c)(7) of Rule 2-01 of Regulation S-X. |
| (e)(2) | None of the services described in paragraph (b) through (d) of this Item were approved by the audit committee pursuant to paragraph (c)(7)(i)(C) of Rule 2-01 of Regulation S-X. |
| (f) | Less than 50% of hours expended on the principal accountant’s engagement to audit the registrant’s financial statements for the most recent fiscal year were attributed to work performed by persons other than the principal accountant’s full-time, permanent employees. |
| (g) | During the fiscal years ended November 30, 2010 and November 30, 2009, aggregate non-audit fees of $2,000 and $4,000, respectively, were billed by the registrant’s principal accountant for services rendered to the registrant. No non-audit fees were billed in either of the last two fiscal years by the registrant’s principal accountant for services rendered to the registrant’s investment adviser (not including any sub-adviser whose role is primarily portfolio management and is subcontracted with or overseen by another investment adviser), and any entity controlling, controlled by, or under common control with the adviser that provides ongoing services to the registrant. |
| (h) | The principal accountant has not provided any non-audit services to the registrant’s investment adviser (not including any sub-adviser whose role is primarily portfolio management and is subcontracted with or overseen by another investment adviser), and any entity controlling, controlled by, or under common control with the investment adviser that provides ongoing services to the registrant. |
| Item 5. | Audit Committee of Listed Registrants. |
Not applicable
| Item 6. | Schedule of Investments. |
| (a) | Not applicable [schedule filed with Item 1] |
| (b) | Not applicable |
| Item 7. | Disclosure of Proxy Voting Policies and Procedures for Closed-End Management Investment Companies. |
Not applicable
| Item 8. | Portfolio Managers of Closed-End Management Investment Companies. |
Not applicable
| Item 9. | Purchases of Equity Securities by Closed-End Management Investment Company and Affiliated Purchasers. |
Not applicable
| Item 10. | Submission of Matters to a Vote of Security Holders. |
The registrant’s Committee of Independent Trustees shall review shareholder recommendations to fill vacancies on the registrant’s board of trustees if such recommendations are submitted in writing, addressed to the Committee at the registrant’s offices and meet any minimum qualifications adopted by the Committee. The Committee may adopt, by resolution, a policy regarding its procedures for considering candidates for the board of trustees, including any recommended by shareholders.
| Item 11. | Controls and Procedures. |
(a) Based on their evaluation of the registrant’s disclosure controls and procedures (as defined in Rule 30a-3(c) under the Investment Company Act of 1940) as of a date within 90 days of the filing date of this report, the registrant’s principal executive officer and principal financial officer have concluded that such disclosure controls and procedures are reasonably designed and are operating effectively to ensure that material information relating to the registrant, including its consolidated subsidiaries, is made known to them by others within those entities, particularly during the period in which this report is being prepared, and that the information required in filings on Form N-CSR is recorded, processed, summarized, and reported on a timely basis.
(b) There were no changes in the registrant’s internal control over financial reporting (as defined in Rule 30a-3(d) under the Investment Company Act of 1940) that occurred during the second fiscal quarter of the period covered by this report that have materially affected, or are reasonably likely to materially affect, the registrant’s internal control over financial reporting.
| Item 12. | Exhibits. |
File the exhibits listed below as part of this Form. Letter or number the exhibits in the sequence indicated.
(a)(1) Any code of ethics, or amendment thereto, that is the subject of the disclosure required by Item 2, to the extent that the registrant intends to satisfy the Item 2 requirements through filing of an exhibit: Attached hereto
(a)(2) A separate certification for each principal executive officer and principal financial officer of the registrant as required by Rule 30a-2(a) under the Act (17 CFR 270.30a-2(a)): Attached hereto
(a)(3) Any written solicitation to purchase securities under Rule 23c-1 under the Act (17 CFR 270.23c-1) sent or given during the period covered by the report by or on behalf of the registrant to 10 or more persons: Not applicable
(b) Certifications required by Rule 30a-2(b) under the Act (17 CFR 270.30a-2(b)): Attached hereto
| Exhibit 99.CODE ETH | Code of Ethics |
| Exhibit 99.CERT | Certifications required by Rule 30a-2(a) under the Act |
| Exhibit 99.906CERT | Certifications required by Rule 30a-2(b) under the Act |
SIGNATURES
Pursuant to the requirements of the Securities Exchange Act of 1934 and the Investment Company Act of 1940, the registrant has duly caused this report to be signed on its behalf by the undersigned, thereunto duly authorized.
(Registrant) The RAM Funds
| By (Signature and Title)* | /s/ John C. Riazzi | ||
| John C. Riazzi, President | |||
| Date | January 27, 2011 | ||
Pursuant to the requirements of the Securities Exchange Act of 1934 and the Investment Company Act of 1940, this report has been signed below by the following persons on behalf of the registrant and in the capacities and on the dates indicated.
| By (Signature and Title)* | /s/ John C. Riazzi | ||
| John C. Riazzi, President | |||
| Date | January 27, 2011 | ||
| By (Signature and Title)* | /s/ Mark J. Seger | ||
| Mark J. Seger, Treasurer | |||
| Date | January 27, 2011 | ||
* Print the name and title of each signing officer under his or her signature.