UNITED STATES
SECURITIES AND EXCHANGE COMMISSION
Washington, D.C. 20549
FORM N-CSR
CERTIFIED SHAREHOLDER REPORT OF REGISTERED
MANAGEMENT INVESTMENT COMPANIES
Investment Company Act file number 811-22167
Allianz Funds Multi-Strategy Trust
(Exact name of registrant as specified in charter)
1633 Broadway, New York, New York 10019
(Address of principal executive offices) (Zip code)
Scott Whisten
1633 Broadway
New York, New York 10019
(Name and address of agent for service)
Registrant’s telephone number, including area code: 212-739-3367
Date of fiscal year end: September 30
Date of reporting period: September 30, 2018
Item 1. Report to Shareholders

Allianz Multi-Strategy Funds
SHARE CLASSES A, C, R, P, INSTITUTIONAL, R6, ADMINISTRATIVE
Annual Report
September 30, 2018
AllianzGI Retirement 2020 Fund
AllianzGI Retirement 2025 Fund
AllianzGI Retirement 2030 Fund
AllianzGI Retirement 2035 Fund
AllianzGI Retirement 2040 Fund
AllianzGI Retirement 2045 Fund
AllianzGI Retirement 2050 Fund
AllianzGI Retirement 2055 Fund
AllianzGI Multi Asset Income Fund (formerly AllianzGI Retirement Income Fund)
AllianzGI Global Allocation Fund
AllianzGI Best Styles Global Equity Fund
AllianzGI Best Styles International Equity Fund
AllianzGI Best Styles U.S. Equity Fund
AllianzGI Convertible Fund
AllianzGI Core Bond Fund
AllianzGI Core Plus Bond Fund
AllianzGI Emerging Markets Consumer Fund
AllianzGI Emerging Markets Debt Fund
AllianzGI Emerging Markets Small-Cap Fund
AllianzGI Europe Equity Dividend Fund
AllianzGI Global Dynamic Allocation Fund
AllianzGI Global High Yield Fund
AllianzGI Global Sustainability Fund
AllianzGI Global Water Fund
AllianzGI High Yield Bond Fund
AllianzGI International Growth Fund
AllianzGI International Small-Cap Fund
AllianzGI Micro Cap Fund
AllianzGI NFJ Emerging Markets Value Fund
AllianzGI NFJ International Small-Cap Value Fund
AllianzGI PerformanceFee Managed Futures Strategy Fund
AllianzGI PerformanceFee Structured US Equity Fund
AllianzGI PerformanceFee Structured US Fixed Income Fund
AllianzGI Preferred Securities and Income Fund
AllianzGI Real Estate Debt Fund
AllianzGI Short Duration High Income Fund
AllianzGI Short Term Bond Fund
AllianzGI Structured Return Fund
AllianzGI U.S. Equity Hedged Fund
AllianzGI Ultra Micro Cap Fund
This material is authorized for use only when preceded or accompanied by the current Allianz Multi-Strategy Funds, prospectus. Investors should consider the investment objectives, risks, charges and expenses of each Fund carefully before investing. This and other information is contained in the Funds’ prospectuses and summary prospectuses. Please read the prospectus carefully before you invest.

Receive this report electronically and eliminate paper mailings.
To enroll, go to us.allianzgi.com/edelivery.
Table of Contents
A Word About Risk: A fund may be subject to various risks as described in its prospectus. Some of those risks may include, but are not limited to, the following: derivatives risk, smaller company risk, non-US investment risk, focused investment risk and specific sector investment risks. Use of derivative instruments may involve certain costs and risks such as liquidity risk, interest rate risk, market risk, credit risk, counterparty risk, management risk and the risk that a fund is unable to close out a position when it is most advantageous to do so. Portfolios investing in derivatives could lose more than the principal amount invested in those instruments. Investing in foreign securities may entail risk due to foreign economic and political developments; this risk may be enhanced when investing in emerging markets. Smaller companies may be more volatile than larger companies and may entail more risk. Concentrating investments in individual sectors may add additional risk and additional volatility compared to a diversified equity portfolio. AllianzGI target-date funds seek to manage risk and return by blending two separately-managed portfolios: a return-generating portfolio for growth potential, and a defensive portfolio for principal protection. The balance grows increasingly defensive over time until the target date is reached, after which the Fund’s assets roll into a retirement income strategy. The principal values of the Funds are not guaranteed at any time, including the target date. Please refer to each Fund’s applicable current prospectus for complete details.
Letter from the President

Thomas J. Fuccillo
President & CEO
Dear Shareholder,
U.S. economic expansion accelerated during the twelve-month fiscal reporting period ended September 30, 2018. In contrast, economic growth overseas moderated. Against this backdrop, the overall U.S. equity market rallied sharply, whereas international equities generated mixed results. Elsewhere, the overall U.S. bond market posted a small decline during the reporting period.
12 Months in Review
For the 12-month period ended September 30, 2018, U.S. stocks, as measured by the Standard & Poor’s 500 Index, gained 17.91%. Two measures of stock performance in developed international and global markets, the MSCI EAFE (Europe, Australasia and Far East) Index (net) and the MSCI World Index (net), returned 2.74% and 11.24%, respectively, in dollar-denominated terms. Elsewhere, the MSCI Emerging Markets Index (net) returned -0.81%. With respect to bonds, the Bloomberg Barclays U.S. Credit Index returned -1.10%, whereas the Bloomberg Barclays Global High Yield Index rose 0.27%. The Bloomberg Barclays U.S. Government Bond Index returned 0.41%, while the broader bond market index, as measured by the Bloomberg Barclays U.S. Aggregate Bond Index, returned -1.22%.
Turning to the U.S. economy, gross domestic product (“GDP”), the value of goods and services produced in the country, which is the broadest measure of economic activity and the principal indicator of economic performance, expanded at an annual pace of 2.3% during the fourth quarter of 2017, 2.2% during the first quarter of 2018 and then accelerated to an annual pace of 4.2% during the second quarter of 2018 — the best reading since the third quarter of 2014. Finally, the Commerce Department’s initial reading — released after the reporting period had ended — showed that GDP grew at an annual pace of 3.5% during the third quarter of 2018.
After raising interest rates three times in 2017, the U.S. Federal Reserve (the “Fed”) again raised rates at its meetings in March, June and September 2018. The last hike pushed the federal funds rate to a range between 2.00% and 2.25%. At its meeting in September 2018, the Fed announced that it anticipated raising rates one more time before the end of the year.
| | | | | | |
| 2 | | September 30, 2018 | | | Annual Report | | |
Outlook
Economic growth in the U.S. accelerated during the second quarter of 2018, but the end of the economic cycle may be closer than anticipated by the consensus forecast. In our view, a pro-growth mix of economic policies has set conditions conducive to more rapid increases in consumer spending, business investment and labor compensation. Consumer spending is brisk and measures of business optimism seem to break records every month.
Looking ahead to the last few months of the year, however, these outcomes cannot be assured. Households and businesses may well rethink their spending plans over the months ahead as they evaluate the meaning of tax changes, government spending, economic policy adjustments and new risks to their well-being. If capital expenditures by businesses go to unproductive investment, productivity fails to accelerate and inflation-adjusted workers’ compensation does not increase, real economic growth could languish.
While Fed monetary policymakers will continue to base their interest-rate decisions on the flow of inflation, wage and labor market data, how the Fed implements monetary policy over the next several years may be at least as important as the timing and magnitude of its policy decisions.
Meanwhile, the interconnectedness of the U.S. economy to other countries remains intricate and deep. Even as trade relations deteriorate, we believe the forces of globalization and technological revolution promise to defeat the forces of nationalism, populism and withdrawal from multilateral arrangements. Even if U.S.-China and U.S.-European Union trade relations play out acrimoniously over the years ahead, for example, a complicated and extensive flow of goods, services, resources and intellectual property between the nations will continue based, for the time being, on a co-dependency built up over the last three decades.
On behalf of Allianz Global Investors U.S. LLC, the Funds’ investment manager, thank you for investing with us. We encourage you to consult with your financial advisor and to visit our website, us.allianzgi.com, for additional information. We remain dedicated to serving your investment needs.
Sincerely,

Thomas J. Fuccillo
President & Chief Executive Officer
Past performance is no guarantee of future results. Unless otherwise noted, index returns reflect the reinvestment of income dividends and capital gains, if any, but do not reflect fees, brokerage commissions or other expenses of investing. It is not possible to invest directly in an index.
Receive this report electronically and eliminate paper mailings.
To enroll, go to us.allianzgi.com/edelivery.
| | | | | | |
| | Annual Report | | | September 30, 2018 | | 3 |
Unaudited
AllianzGI Target-Date Funds*
For the period of October 1, 2017 through September 30, 2018, as provided by the Multi-Asset US Group.
Fund Insights
For the twelve-month period ended September 30, 2018, Class A shares at net asset value (“NAV”) of the AllianzGI Target-Date Funds (the “Funds”) returned between 2.56% and 7.19% with longer dated Funds posting more favorable results. In terms of relative performance, all strategies underperformed their respective benchmarks (Morningstar Lifetime Moderate series) for the twelve-month period.
Market Overview
At the start of the period, political developments in the U.S. and Japan helped drive returns for global equities. The passage of the Tax Cuts and Jobs Act in late December drove US equities on the hope that the lower corporate tax rate would result in higher capital investment and provide a further boost to economic growth. Japanese equities rallied after Prime Minister Shinzo Abe’s victory in snap elections in October was perceived as a mandate for him to continue with his market-friendly policies. However, political outcomes in the euro zone, including a failure to resolve the question of Catalonia’s secession from Spain and Angela Merkel’s failure to establish a coalition government by year-end, led to declines in European equities. Macroeconomic and policy uncertainty led to several new themes including (i) a re-emergence of volatility, (ii) renewed vigilance about the possibility of creeping inflation, and (iii) revised forecasts for the pace and magnitude of increases in the benchmark interest rate of the U.S. Federal Reserve.
In March, these factors, combined with the looming threat of a global trade war between the U.S. and its major trading partners weighed on markets. While the trade war rhetoric receded for the most part in April, it returned in late May with the U.S. administration imposing tariffs on steel and aluminum imports from the EU, Canada and Mexico. Since June, slower growth in world trade, among other factors, contributed to a loss in momentum in economic activity across advanced economies. The U.S., however, remained ahead of the pack of major economies in terms of growth.
Overall for the period, after touching peaks in January, most equity markets suffered corrections in February and March and then rallied to finish the period with strongly positive returns. Global equities returned more than 9.0% (MSCI ACWI) while U.S. equities (MSCI U.S.) returned nearly two times the global equity return. Among the worst performers for the period were equities in emerging markets—especially in local terms in markets where currencies depreciated strongly—as well as in Europe. Within the US, large cap stocks outperformed small cap stocks and growth outperformed value. US government bonds and global sovereign bonds each finished down. Monetary policy continued to tighten in developed economies. In total, the U.S. Federal Reserve raised rates four times, while the Bank of England raised rates twice. While rates remained on hold in other developed economies, the European Central Bank announced it would end its bond-buying program by the end of 2018 and the Bank of Japan gave itself more flexibility by expanding its target for the 10-year bond yield. In contrast, the central banks of several emerging markets countries raised rates as they sought to stem currency weakness.
Portfolio Review
U.S. equities were the most important contributor for the Funds’ performance during the reporting period. In addition, Asian and emerging market equities contributed positively. European equities, government bonds and corporate bonds, on the other hand, detracted from performance. Furthermore, selection in equities detracted from relative performance versus the benchmark.
At the end of the reporting period, the Funds were overweight U.S. equities and underweight emerging market equities. The Funds also were underweight U.S. government bonds.
Outlook
Recognizing that the expansion in global growth that started in mid-2016 may have peaked in some major economies, we are focused on the sources of further downside risks. Such risks include escalation in trade and diplomatic tensions between the U.S. and China, persistently higher oil prices, currency volatility weighing on vulnerable emerging markets and a more abrupt tightening in financial market conditions in major economies, among others.
We believe that U.S. equities remain the most attractive of developed market equities in the near term. In Europe, in light of the deteriorating macro backdrop, we continue to expect fiscal policy uncertainty in the periphery and the prospect of further tightening in monetary policy to weigh on European equities. We anticipate challenges for broad emerging markets equities and debt but see opportunities to differentiate within the asset class. The returns on fixed income assets in recent months have been almost invariably negative and we see limited prospect of a significant broad turnaround—especially given the trend of rising global inflation, rising interest rates globally and a still-healthy global growth dynamic. Again, however, opportunities exist to differentiate among sovereign bonds. We remain constructive on the U.S. dollar versus major developed currencies as of the end of the period.
* The “Target-Date Funds” are the AllianzGI Retirement 2020 Fund, the AllianzGI Retirement 2025 Fund, the AllianzGI Retirement 2030 Fund, the AllianzGI Retirement 2035 Fund, the AllianzGI Retirement 2040 Fund, the AllianzGI Retirement 2045 Fund, the AllianzGI Retirement 2050 Fund, and the AllianzGI Retirement 2055 Fund.
| | | | | | |
| 4 | | September 30, 2018 | | | Annual Report | | |
Unaudited
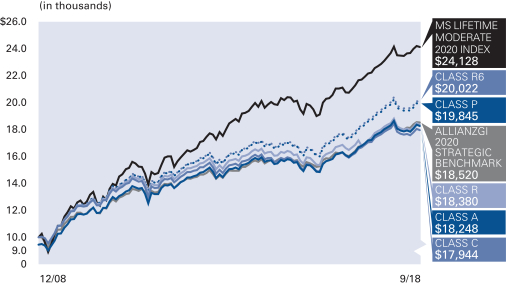
AllianzGI Retirement 2020 Fund
Average Annual Total Return for the period ended September 30, 2018
| | | | | | | | | | | | | | |
| | | | | 1 Year | | | 5 Year | | | Since Inception† | |
| | | AllianzGI Retirement 2020 Fund Class A | | | 2.56% | | | | 4.30% | | | | 6.98% | |
| | AllianzGI Retirement 2020 Fund Class A (adjusted) | | | –3.08% | | | | 3.13% | | | | 6.36% | |
| | | AllianzGI Retirement 2020 Fund Class C | | | 1.79% | | | | 3.53% | | | | 6.18% | |
| | AllianzGI Retirement 2020 Fund Class C (adjusted) | | | 0.80% | | | | 3.53% | | | | 6.18% | |
| | AllianzGI Retirement 2020 Fund Class R | | | 2.21% | | | | 3.55% | | | | 6.44% | |
| | AllianzGI Retirement 2020 Fund Class P | | | 2.87% | | | | 4.61% | | | | 7.28% | |
| | AllianzGI Retirement 2020 Fund Class R6 | | | 2.95% | | | | 4.71% | | | | 7.38% | |
| | | AllianzGI Retirement 2020 Fund Administrative Class | | | 2.61% | | | | 4.34% | | | | 7.03% | |
| | Morningstar Lifetime Moderate 2020 Index | | | 5.50% | | | | 6.03% | | | | 9.45% | |
| | AllianzGI 2020 Strategic Benchmark | | | 4.67% | | | | 4.70% | | | | 6.53% | |
| | | Lipper Mixed-Asset Target 2020 Funds Average | | | 4.44% | | | | 5.29% | | | | 8.43% | |
† The Fund began operations on December 29, 2008. Benchmark return comparisons began on the fund inception date. Lipper performance comparisons began on December 31, 2008.
Performance quoted represents past performance and is no guarantee of future results. Current performance may be lower or higher than performance shown. For performance current to the most recent month-end, visit our website at us.allianzgi.com. Investment return and the principal value will fluctuate. Shares may be worth more or less than original cost when redeemed. The adjusted returns take into account the maximum initial sales charge of 5.50% on Class A shares and the contingent deferred sales charge (CDSC) of 1% on Class C shares, which may apply to shares redeemed during the first year of ownership. Returns do not reflect deduction of taxes that a shareholder would pay on fund distributions or redemption of fund shares. See pages 111 and 112 for more information. The Fund’s gross expense ratios are 1.19% for Class A shares, 1.94% for Class C shares, 1.44% for Class R shares, 0.79% for Class P shares, 0.69% for Class R6 shares, and 1.04% for Administrative Class shares. These ratios do not include an expense reduction, contractually guaranteed through at least January 31, 2020. The Fund’s expense ratios net of this reduction are 0.95% for Class A shares, 1.70% for Class C shares, 1.30% for Class R shares, 0.65% for Class P shares, 0.55% for Class R6 shares and 0.90% for Administrative Class shares. Expense ratio information is as of the Fund’s current prospectus dated February 1, 2018, as further revised or supplemented from time to time.
Cumulative Returns Through September 30, 2018
Fund Allocation (as of September 30, 2018)
| | | | |
| AllianzGI Global Dynamic Allocation | | | 63.7% | |
| AllianzGI Advanced Core Bond | | | 17.5% | |
| AllianzGI Best Styles U.S. Equity | | | 6.1% | |
| Vanguard Mortgage-Backed Securities | | | 3.5% | |
| iShares TIPS Bond | | | 1.3% | |
| AllianzGI Short Duration High Income | | | 1.2% | |
| iShares U.S. Preferred Stock | | | 0.9% | |
| AllianzGI Emerging Markets Small-Cap | | | 0.9% | |
| Other | | | 0.9% | |
| Cash & Equivalents — Net | | | 4.0% | |
| | | | | | |
| | Annual Report | | | September 30, 2018 | | 5 |
Unaudited
AllianzGI Retirement 2020 Fund (cont’d)
| | | | | | | | | | | | |
| Shareholder Expense Example | | Actual Performance |
| | | Class A | | Class C | | Class R | | Class P | | Class R6 | | Administrative
Class |
| Beginning Account Value (4/1/18) | | $1,000.00 | | $1,000.00 | | $1,000.00 | | $1,000.00 | | $1,000.00 | | $1,000.00 |
| Ending Account Value (9/30/18) | | $1,018.10 | | $1,014.60 | | $1,016.30 | | $1,019.90 | | $1,020.40 | | $1,017.90 |
| Expenses Paid During Period | | $1.92 | | $5.66 | | $3.64 | | $0.35 | | $0.02 | | $1.62 |
| | | | | | | | | | | | | |
| | | Hypothetical Performance |
| | | (5% return before expenses) |
| | | Class A | | Class C | | Class R | | Class P | | Class R6 | | Administrative
Class |
| Beginning Account Value (4/1/18) | | $1,000.00 | | $1,000.00 | | $1,000.00 | | $1,000.00 | | $1,000.00 | | $1,000.00 |
| Ending Account Value (9/30/18) | | $1,023.16 | | $1,019.45 | | $1,021.46 | | $1,024.72 | | $1,025.05 | | $1,023.46 |
| Expenses Paid During Period | | $1.93 | | $5.67 | | $3.65 | | $0.36 | | $0.02 | | $1.62 |
For each class of the Fund, expenses (net of fee waiver and reimbursement, if any) are equal to the annualized expense ratio for the class (0.38% for Class A, 1.12% for Class C, 0.72% for Class R, 0.07% for Class P, less than 0.005% for Class R6 and 0.32% for Administrative Class), multiplied by the average account value over the period, multiplied by 183/365. These expenses do not include the expenses of the investment companies in which the Fund invests, which are indirectly borne by Fund shareholders.
| | | | | | |
| 6 | | September 30, 2018 | | | Annual Report | | |
Unaudited
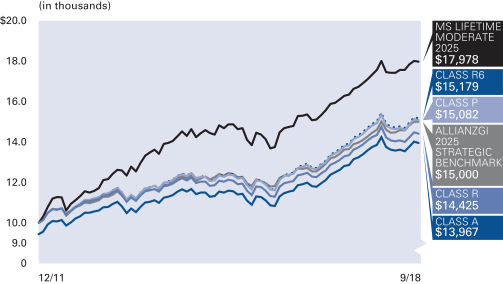
AllianzGI Retirement 2025 Fund
Average Annual Total Return for the period ended September 30, 2018
| | | | | | | | | | | | | | |
| | | | | 1 Year | | | 5 Year | | | Since Inception† | |
| | | AllianzGI Retirement 2025 Fund Class A | | | 4.30% | | | | 5.27% | | | | 5.93% | |
| | AllianzGI Retirement 2025 Fund Class A (adjusted) | | | –1.44% | | | | 4.08% | | | | 5.04% | |
| | AllianzGI Retirement 2025 Fund Class R | | | 3.94% | | | | 4.89% | | | | 5.54% | |
| | AllianzGI Retirement 2025 Fund Class P | | | 4.65% | | | | 5.59% | | | | 6.25% | |
| | AllianzGI Retirement 2025 Fund Class R6 | | | 4.73% | | | | 5.69% | | | | 6.35% | |
| | | AllianzGI Retirement 2025 Fund Administrative Class | | | 4.34% | | | | 5.30% | | | | 5.97% | |
| | Morningstar Lifetime Moderate 2025 Index | | | 6.34% | | | | 6.76% | | | | 9.03% | |
| | AllianzGI 2025 Strategic Benchmark | | | 6.34% | | | | 5.58% | | | | 6.16% | |
| | | Lipper Mixed-Asset Target 2025 Funds Average | | | 5.49% | | | | 6.13% | | | | 8.13% | |
† The Fund began operations on December 19, 2011. Benchmark return comparisons began on the fund inception date. Lipper performance comparisons began on December 31, 2011.
Performance quoted represents past performance and is no guarantee of future results. Current performance may be lower or higher than performance shown. For performance current to the most recent month-end, visit our website at us.allianzgi.com. Investment return and the principal value will fluctuate. Shares may be worth more or less than original cost when redeemed. The adjusted returns take into account the maximum initial sales charge of 5.50% on Class A shares. Returns do not reflect deduction of taxes that a shareholder would pay on fund distributions or redemption of fund shares. See pages 111 and 112 for more information. The Fund’s gross expense ratios are 1.23% for Class A shares, 1.48% for Class R shares, 0.83% for Class P shares, 0.73% for Class R6 shares and 1.08% for Administrative Class shares. These ratios do not include an expense reduction, contractually guaranteed through at least January 31, 2020. The Fund’s expense ratios net of this reduction are 0.95% for Class A shares, 1.30% for Class R shares, 0.65% for Class P shares, 0.55% for Class R6 shares and 0.90% for Administrative Class shares. Expense ratio information is as of the Fund’s current prospectus dated February 1, 2018, as further revised or supplemented from time to time.
Cumulative Returns Through September 30, 2018
Fund Allocation (as of September 30, 2018)
| | | | |
| AllianzGI Global Dynamic Allocation | | | 72.0% | |
| AllianzGI Advanced Core Bond | | | 13.4% | |
| AllianzGI Best Styles U.S. Equity | | | 9.5% | |
| AllianzGI Emerging Markets Small-Cap | | | 0.6% | |
| iShares TIPS Bond | | | 0.6% | |
| AllianzGI Short Duration High Income | | | 0.3% | |
| Cash & Equivalents — Net | | | 3.6% | |
| | | | | | |
| | Annual Report | | | September 30, 2018 | | 7 |
Unaudited
AllianzGI Retirement 2025 Fund (cont’d)
| | | | | | | | | | |
| Shareholder Expense Example | | Actual Performance |
| | | Class A | | Class R | | Class P | | Class R6 | | Administrative
Class |
| Beginning Account Value (4/1/18) | | $1,000.00 | | $1,000.00 | | $1,000.00 | | $1,000.00 | | $1,000.00 |
| Ending Account Value (9/30/18) | | $1,024.90 | | $1,023.40 | | $1,027.20 | | $1,027.70 | | $1,025.40 |
| Expenses Paid During Period | | $1.68 | | $3.45 | | $0.15 | | $0.01 | | $1.47 |
| | | | | | | | | | | |
| | | Hypothetical Performance |
| | | (5% return before expenses) |
| | | Class A | | Class R | | Class P | | Class R6 | | Administrative
Class |
| Beginning Account Value (4/1/18) | | $1,000.00 | | $1,000.00 | | $1,000.00 | | $1,000.00 | | $1,000.00 |
| Ending Account Value (9/30/18) | | $1,023.41 | | $1,021.66 | | $1,024.92 | | $1,025.06 | | $1,023.61 |
| Expenses Paid During Period | | $1.67 | | $3.45 | | $0.15 | | $0.01 | | $1.47 |
For each class of the Fund, expenses (net of fee waiver and reimbursement, if any) are equal to the annualized expense ratio for the class (0.33% for Class A, 0.68% for Class R, 0.03% for Class P, less than 0.005% for Class R6 and 0.29% for Administrative Class), multiplied by the average account value over the period, multiplied by 183/365. These expenses do not include the expenses of the investment companies in which the Fund invests, which are indirectly borne by Fund shareholders.
| | | | | | |
| 8 | | September 30, 2018 | | | Annual Report | | |
Unaudited
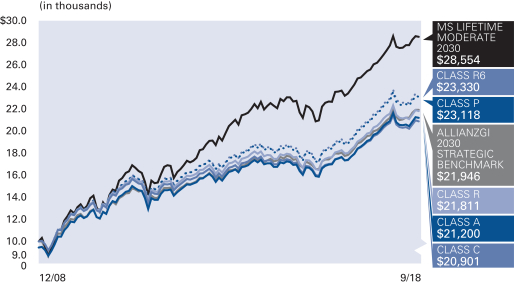
AllianzGI Retirement 2030 Fund
Average Annual Total Return for the period ended September 30, 2018
| | | | | | | | | | | | | | |
| | | | | 1 Year | | | 5 Year | | | Since Inception† | |
| | | AllianzGI Retirement 2030 Fund Class A | | | 5.40% | | | | 5.85% | | | | 8.64% | |
| | AllianzGI Retirement 2030 Fund Class A (adjusted) | | | –0.40% | | | | 4.66% | | | | 8.01% | |
| | | AllianzGI Retirement 2030 Fund Class C | | | 4.64% | | | | 5.05% | | | | 7.86% | |
| | AllianzGI Retirement 2030 Fund Class C (adjusted) | | | 3.64% | | | | 5.05% | | | | 7.86% | |
| | AllianzGI Retirement 2030 Fund Class R | | | 5.03% | | | | 5.47% | | | | 8.32% | |
| | AllianzGI Retirement 2030 Fund Class P | | | 5.72% | | | | 6.16% | | | | 8.97% | |
| | AllianzGI Retirement 2030 Fund Class R6 | | | 5.83% | | | | 6.26% | | | | 9.07% | |
| | | AllianzGI Retirement 2030 Fund Administrative Class | | | 5.48% | | | | 5.90% | | | | 8.73% | |
| | Morningstar Lifetime Moderate 2030 Index | | | 7.49% | | | | 7.56% | | | | 11.36% | |
| | AllianzGI 2030 Strategic Benchmark | | | 7.84% | | | | 6.37% | | | | 8.40% | |
| | | Lipper Mixed-Asset Target 2030 Funds Average | | | 6.67% | | | | 6.83% | | | | 10.05% | |
† The Fund began operations on December 29, 2008. Benchmark return comparisons began on the fund inception date. Lipper performance comparisons began on December 31, 2008.
Performance quoted represents past performance and is no guarantee of future results. Current performance may be lower or higher than performance shown. For performance current to the most recent month-end, visit our website at us.allianzgi.com. Investment return and the principal value will fluctuate. Shares may be worth more or less than original cost when redeemed. The adjusted returns take into account the maximum initial sales charge of 5.50% on Class A shares and the contingent deferred sales charge (CDSC) of 1% on Class C shares, which may apply to shares redeemed during the first year of ownership. Returns do not reflect deduction of taxes that a shareholder would pay on fund distributions or redemption of fund shares. See pages 111 and 112 for more information. The Fund’s gross expense ratios are 1.22% for Class A shares, 1.97% for Class C shares, 1.47% for Class R shares, 0.82% for Class P shares, 0.72% for Class R6 shares and 1.07% for Administrative Class shares. These ratios do not include an expense reduction, contractually guaranteed through at least January 31, 2020. The Fund’s expense ratios net of this reduction are 0.95% for Class A shares, 1.70% for Class C shares, 1.30% for Class R shares, 0.65% for Class P shares, 0.55% for Class R6 shares and 0.90% for Administrative Class shares. Expense ratio information is as of the Fund’s current prospectus dated February 1, 2018, as further revised or supplemented from time to time.
Cumulative Returns Through September 30, 2018
Fund Allocation (as of September 30, 2018)
| | | | |
| AllianzGI Global Dynamic Allocation | | | 70.0% | |
| AllianzGI Best Styles U.S. Equity | | | 12.9% | |
| AllianzGI Best Styles Global Equity | | | 9.2% | |
| AllianzGI Advanced Core Bond | | | 2.9% | |
| AllianzGI Emerging Markets Small-Cap | | | 1.3% | |
| iShares U.S. Preferred Stock | | | 0.2% | |
| iShares TIPS Bond | | | 0.2% | |
| Cash & Equivalents — Net | | | 3.3% | |
| | | | | | |
| | Annual Report | | | September 30, 2018 | | 9 |
Unaudited
AllianzGI Retirement 2030 Fund (cont’d)
| | | | | | | | | | | | |
| Shareholder Expense Example | | Actual Performance |
| | | Class A | | Class C | | Class R | | Class P | | Class R6 | | Administrative
Class |
| Beginning Account Value (4/1/18) | | $1,000.00 | | $1,000.00 | | $1,000.00 | | $1,000.00 | | $1,000.00 | | $1,000.00 |
| Ending Account Value (9/30/18) | | $1,030.30 | | $1,026.40 | | $1,028.00 | | $1,031.80 | | $1,032.10 | | $1,030.30 |
| Expenses Paid During Period | | $1.63 | | $5.44 | | $3.41 | | $0.10 | | $0.01 | | $1.37 |
| | | | | | | | | | | | | |
| | | Hypothetical Performance |
| | | (5% return before expenses) |
| | | Class A | | Class C | | Class R | | Class P | | Class R6 | | Administrative
Class |
| Beginning Account Value (4/1/18) | | $1,000.00 | | $1,000.00 | | $1,000.00 | | $1,000.00 | | $1,000.00 | | $1,000.00 |
| Ending Account Value (9/30/18) | | $1,023.46 | | $1,019.70 | | $1,021.71 | | $1,024.97 | | $1,025.06 | | $1,023.71 |
| Expenses Paid During Period | | $1.62 | | $5.42 | | $3.40 | | $0.10 | | $0.01 | | $1.37 |
For each class of the Fund, expenses (net of fee waiver and reimbursement, if any) are equal to the annualized expense ratio for the class (0.32% for Class A, 1.07% for Class C, 0.67% for Class R, 0.02% for Class P, less than 0.005% for Class R6 and 0.27% for Administrative Class), multiplied by the average account value over the period, multiplied by 183/365. These expenses do not include the expenses of the investment companies in which the Fund invests, which are indirectly borne by Fund shareholders.
| | | | | | |
| 10 | | September 30, 2018 | | | Annual Report | | |
Unaudited
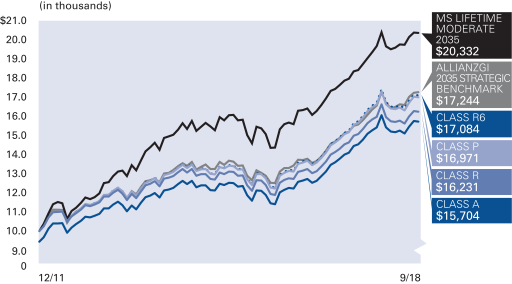
AllianzGI Retirement 2035 Fund
Average Annual Total Return for the period ended September 30, 2018
| | | | | | | | | | | | | | |
| | | | | 1 Year | | | 5 Year | | | Since Inception† | |
| | | AllianzGI Retirement 2035 Fund Class A | | | 6.27% | | | | 6.47% | | | | 7.78% | |
| | AllianzGI Retirement 2035 Fund Class A (adjusted) | | | 0.42% | | | | 5.27% | | | | 6.88% | |
| | AllianzGI Retirement 2035 Fund Class R | | | 5.92% | | | | 6.10% | | | | 7.41% | |
| | AllianzGI Retirement 2035 Fund Class P | | | 6.59% | | | | 6.79% | | | | 8.12% | |
| | AllianzGI Retirement 2035 Fund Class R6 | | | 6.68% | | | | 6.90% | | | | 8.21% | |
| | | AllianzGI Retirement 2035 Fund Administrative Class | | | 6.28% | | | | 6.52% | | | | 7.83% | |
| | Morningstar Lifetime Moderate 2035 Index | | | 8.65% | | | | 8.22% | | | | 11.03% | |
| | AllianzGI 2035 Strategic Benchmark | | | 9.17% | | | | 7.00% | | | | 8.37% | |
| | | Lipper Mixed-Asset Target 2035 Funds Average | | | 7.95% | | | | 7.70% | | | | 9.78% | |
† The Fund began operations on December 19, 2011. Benchmark return comparisons began on the fund inception date. Lipper performance comparisons began on December 31, 2011.
Performance quoted represents past performance and is no guarantee of future results. Current performance may be lower or higher than performance shown. For performance current to the most recent month-end, visit our website at us.allianzgi.com. Investment return and the principal value will fluctuate. Shares may be worth more or less than original cost when redeemed. The adjusted returns take into account the maximum initial sales charge of 5.50% on Class A shares. Returns do not reflect deduction of taxes that a shareholder would pay on fund distributions or redemption of fund shares. See pages 111 and 112 for more information. The Fund’s gross expense ratios are 1.15% for Class A shares, 1.40% for Class R shares, 0.75% for Class P shares, 0.65% for Class R6 shares and 1.00% for Administrative Class shares. These ratios do not include an expense reduction, contractually guaranteed through at least January 31, 2020. The Fund’s expense ratios net of this reduction are 0.95% for Class A shares, 1.30% for Class R shares, 0.65% for Class P shares, 0.55% for Class R6 shares and 0.90% for Administrative Class shares. Expense ratio information is as of the Fund’s current prospectus dated February 1, 2018, as further revised or supplemented from time to time.
Cumulative Returns Through September 30, 2018
Fund Allocation (as of September 30, 2018)
| | | | |
| AllianzGI Global Dynamic Allocation | | | 46.4% | |
| AllianzGI Best Styles Global Equity | | | 30.5% | |
| AllianzGI Best Styles U.S. Equity | | | 15.5% | |
| AllianzGI Advanced Core Bond | | | 2.4% | |
| AllianzGI Emerging Markets Small-Cap | | | 1.4% | |
| Cash & Equivalents — Net | | | 3.8% | |
| | | | | | |
| | Annual Report | | | September 30, 2018 | | 11 |
Unaudited
AllianzGI Retirement 2035 Fund (cont’d)
| | | | | | | | | | |
| Shareholder Expense Example | | Actual Performance |
| | | Class A | | Class R | | Class P | | Class R6 | | Administrative
Class |
| Beginning Account Value (4/1/18) | | $1,000.00 | | $1,000.00 | | $1,000.00 | | $1,000.00 | | $1,000.00 |
| Ending Account Value (9/30/18) | | $1,033.90 | | $1,032.00 | | $1,035.30 | | $1,035.80 | | $1,034.20 |
| Expenses Paid During Period | | $1.99 | | $3.77 | | $0.46 | | $0.02 | | $1.73 |
| | | | | | | | | | | |
| | | Hypothetical Performance |
| | | (5% return before expenses) |
| | | Class A | | Class R | | Class P | | Class R6 | | Administrative
Class |
| Beginning Account Value (4/1/18) | | $1,000.00 | | $1,000.00 | | $1,000.00 | | $1,000.00 | | $1,000.00 |
| Ending Account Value (9/30/18) | | $1,023.11 | | $1,021.36 | | $1,024.62 | | $1,025.05 | | $1,023.36 |
| Expenses Paid During Period | | $1.98 | | $3.75 | | $0.46 | | $0.02 | | $1.72 |
For each class of the Fund, expenses (net of fee waiver and reimbursement, if any) are equal to the annualized expense ratio for the class (0.39% for Class A, 0.74% for Class R, 0.09% for Class P, less than 0.004% for Class R6 and 0.34% for Administrative Class), multiplied by the average account value over the period, multiplied by 183/365. These expenses do not include the expenses of the investment companies in which the Fund invests, which are indirectly borne by Fund shareholders.
| | | | | | |
| 12 | | September 30, 2018 | | | Annual Report | | |
Unaudited
AllianzGI Retirement 2040 Fund
Average Annual Total Return for the period ended September 30, 2018
| | | | | | | | | | | | | | |
| | | | | 1 Year | | | 5 Year | | | Since Inception† | |
| | | AllianzGI Retirement 2040 Fund Class A | | | 6.78% | | | | 6.82% | | | | 9.97% | |
| | AllianzGI Retirement 2040 Fund Class A (adjusted) | | | 0.91% | | | | 5.62% | | | | 9.34% | |
| | | AllianzGI Retirement 2040 Fund Class C | | | 6.00% | | | | 6.03% | | | | 9.14% | |
| | AllianzGI Retirement 2040 Fund Class C (adjusted) | | | 5.00% | | | | 6.03% | | | | 9.14% | |
| | AllianzGI Retirement 2040 Fund Class R | | | 6.42% | | | | 6.45% | | | | 9.62% | |
| | AllianzGI Retirement 2040 Fund Class P | | | 7.11% | | | | 7.15% | | | | 10.28% | |
| | AllianzGI Retirement 2040 Fund Class R6 | | | 7.20% | | | | 7.25% | | | | 10.38% | |
| | | AllianzGI Retirement 2040 Fund Administrative Class | | | 6.82% | | | | 6.86% | | | | 10.02% | |
| | Morningstar Lifetime Moderate 2040 Index | | | 9.42% | | | | 8.60% | | | | 12.32% | |
| | AllianzGI 2040 Strategic Benchmark | | | 10.25% | | | | 7.40% | | | | 9.82% | |
| | | Lipper Mixed-Asset Target 2040 Funds Average | | | 8.46% | | | | 7.88% | | | | 10.99% | |
† The Fund began operations on December 29, 2008. Benchmark return comparisons began on the fund inception date. Lipper performance comparisons began on December 31, 2008.
Performance quoted represents past performance and is no guarantee of future results. Current performance may be lower or higher than performance shown. For performance current to the most recent month-end, visit our website at us.allianzgi.com. Investment return and the principal value will fluctuate. Shares may be worth more or less than original cost when redeemed. The adjusted returns take into account the maximum initial sales charge of 5.50% on Class A shares and the contingent deferred sales charge (CDSC) of 1% on Class C shares, which may apply to shares redeemed during the first year of ownership. Returns do not reflect deduction of taxes that a shareholder would pay on fund distributions or redemption of fund shares. See pages 111 and 112 for more information. The Fund’s gross expense ratios are 1.09% for Class A shares, 1.84% for Class C shares, 1.34% for Class R shares, 0.69% for Class P shares, 0.59% for Class R6 shares and 0.94% for Administrative Class shares. These ratios do not include an expense reduction, contractually guaranteed through at least January 31, 2020. The Fund’s expense ratios net of this reduction are 0.95% for Class A shares, 1.70% for Class C shares, 1.30% for Class R shares, 0.65% for Class P shares, 0.55% for Class R6 shares and 0.90% for Administrative Class shares. Expense ratio information is as of the Fund’s current prospectus dated February 1, 2018, as further revised or supplemented from time to time.
Cumulative Returns Through September 30, 2018
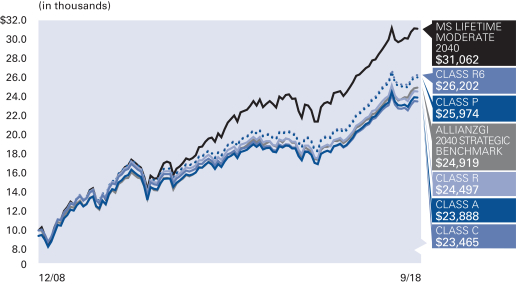
Fund Allocation (as of September 30, 2018)
| | | | |
| AllianzGI Best Styles Global Equity | | | 44.7% | |
| AllianzGI Global Dynamic Allocation | | | 32.6% | |
| AllianzGI Best Styles U.S. Equity | | | 18.0% | |
| AllianzGI Emerging Markets Small-Cap | | | 1.1% | |
| Cash & Equivalents — Net | | | 3.6% | |
| | | | | | |
| | Annual Report | | | September 30, 2018 | | 13 |
Unaudited
AllianzGI Retirement 2040 Fund (cont’d)
| | | | | | | | | | | | |
| Shareholder Expense Example | | Actual Performance |
| | | Class A | | Class C | | Class R | | Class P | | Class R6 | | Administrative
Class |
| Beginning Account Value (4/1/18) | | $1,000.00 | | $1,000.00 | | $1,000.00 | | $1,000.00 | | $1,000.00 | | $1,000.00 |
| Ending Account Value (9/30/18) | | $1,035.90 | | $1,032.20 | | $1,034.00 | | $1,037.50 | | $1,037.90 | | $1,036.40 |
| Expenses Paid During Period | | $2.25 | | $6.06 | | $4.03 | | $0.72 | | $0.20 | | $1.99 |
| | | | | | | | | | | | | |
| | | Hypothetical Performance |
| | | (5% return before expenses) |
| | | Class A | | Class C | | Class R | | Class P | | Class R6 | | Administrative
Class |
| Beginning Account Value (4/1/18) | | $1,000.00 | | $1,000.00 | | $1,000.00 | | $1,000.00 | | $1,000.00 | | $1,000.00 |
| Ending Account Value (9/30/18) | | $1,022.86 | | $1,019.10 | | $1,021.11 | | $1,024.37 | | $1,024.87 | | $1,023.11 |
| Expenses Paid During Period | | $2.23 | | $6.02 | | $4.00 | | $0.71 | | $0.20 | | $1.98 |
For each class of the Fund, expenses (net of fee waiver and reimbursement, if any) are equal to the annualized expense ratio for the class (0.44% for Class A, 1.19% for Class C, 0.79% for Class R, 0.14% for Class P, 0.04% for Class R6 and 0.39% for Administrative Class), multiplied by the average account value over the period, multiplied by 183/365. These expenses do not include the expenses of the investment companies in which the Fund invests, which are indirectly borne by Fund shareholders.
| | | | | | |
| 14 | | September 30, 2018 | | | Annual Report | | |
Unaudited
AllianzGI Retirement 2045 Fund
Average Annual Total Return for the period ended September 30, 2018
| | | | | | | | | | | | | | |
| | | | | 1 Year | | | 5 Year | | | Since Inception† | |
| | | AllianzGI Retirement 2045 Fund Class A | | | 6.96% | | | | 7.13% | | | | 8.82% | |
| | AllianzGI Retirement 2045 Fund Class A (adjusted) | | | 1.08% | | | | 5.93% | | | | 7.91% | |
| | AllianzGI Retirement 2045 Fund Class R | | | 6.61% | | | | 6.78% | | | | 8.45% | |
| | AllianzGI Retirement 2045 Fund Class P | | | 7.29% | | | | 7.48% | | | | 9.16% | |
| | AllianzGI Retirement 2045 Fund Class R6 | | | 7.42% | | | | 7.60% | | | | 9.26% | |
| | | AllianzGI Retirement 2045 Fund Administrative Class | | | 7.02% | | | | 7.20% | | | | 8.86% | |
| | Morningstar Lifetime Moderate 2045 Index | | | 9.69% | | | | 8.69% | | | | 11.56% | |
| | AllianzGI 2045 Strategic Benchmark | | | 10.82% | | | | 7.61% | | | | 9.51% | |
| | | Lipper Mixed-Asset Target 2045 Funds Average | | | 9.12% | | | | 8.39% | | | | 10.66% | |
† The Fund began operations on December 19, 2011. Benchmark return comparisons began on the fund inception date. Lipper performance comparisons began on December 31, 2011.
Performance quoted represents past performance and is no guarantee of future results. Current performance may be lower or higher than performance shown. For performance current to the most recent month-end, visit our website at us.allianzgi.com. Investment return and the principal value will fluctuate. Shares may be worth more or less than original cost when redeemed. The adjusted returns take into account the maximum initial sales charge of 5.50% on Class A shares. Returns do not reflect deduction of taxes that a shareholder would pay on fund distributions or redemption of fund shares. See pages 111 and 112 for more information. The Fund’s gross expense ratios are 1.06% for Class A shares, 1.31% for Class R shares, 0.66% for Class P shares, 0.56% for Class R6 shares and 0.91% for Administrative Class shares. These ratios do not include an expense reduction, contractually guaranteed through at least January 31, 2020. The Fund’s expense ratios net of this reduction are 0.95% for Class A shares, 1.30% for Class R shares, 0.65% for Class P shares, 0.55% for Class R6 shares and 0.90% for Administrative Class shares. Expense ratio information is as of the Fund’s current prospectus dated February 1, 2018, as further revised or supplemented from time to time.
Cumulative Returns Through September 30, 2018
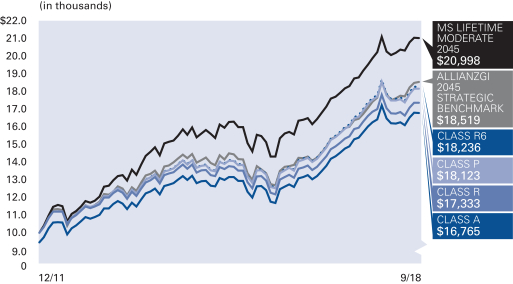
Fund Allocation (as of September 30, 2018)
| | | | |
| AllianzGI Best Styles Global Equity | | | 53.7% | |
| AllianzGI Global Dynamic Allocation | | | 21.8% | |
| AllianzGI Best Styles U.S. Equity | | | 18.9% | |
| AllianzGI Emerging Markets Small-Cap | | | 1.0% | |
| Cash & Equivalents — Net | | | 4.6% | |
| | | | | | |
| | Annual Report | | | September 30, 2018 | | 15 |
Unaudited
AllianzGI Retirement 2045 Fund (cont’d)
| | | | | | | | | | |
| Shareholder Expense Example | | Actual Performance |
| | | Class A | | Class R | | Class P | | Class R6 | | Administrative
Class |
| Beginning Account Value (4/1/18) | | $1,000.00 | | $1,000.00 | | $1,000.00 | | $1,000.00 | | $1,000.00 |
| Ending Account Value (9/30/18) | | $1,036.40 | | $1,035.20 | | $1,038.40 | | $1,038.80 | | $1,036.60 |
| Expenses Paid During Period | | $2.35 | | $4.13 | | $0.82 | | $0.31 | | $2.09 |
| | | | | | | | | | | |
| | | Hypothetical Performance |
| | | (5% return before expenses) |
| | | Class A | | Class R | | Class P | | Class R6 | | Administrative
Class |
| Beginning Account Value (4/1/18) | | $1,000.00 | | $1,000.00 | | $1,000.00 | | $1,000.00 | | $1,000.00 |
| Ending Account Value (9/30/18) | | $1,022.76 | | $1,021.01 | | $1,024.27 | | $1,024.77 | | $1,023.01 |
| Expenses Paid During Period | | $2.33 | | $4.10 | | $0.81 | | $0.30 | | $2.08 |
For each class of the Fund, expenses (net of fee waiver and reimbursement, if any) are equal to the annualized expense ratio for the class (0.46% for Class A, 0.81% for Class R, 0.16% for Class P, 0.06% for Class R6 and 0.41% for Administrative Class), multiplied by the average account value over the period, multiplied by 183/365. These expenses do not include the expenses of the investment companies in which the Fund invests, which are indirectly borne by Fund shareholders.
| | | | | | |
| 16 | | September 30, 2018 | | | Annual Report | | |
Unaudited
AllianzGI Retirement 2050 Fund
Average Annual Total Return for the period ended September 30, 2018
| | | | | | | | | | | | | | |
| | | | | 1 Year | | | 5 Year | | | Since Inception† | |
| | | AllianzGI Retirement 2050 Fund Class A | | | 7.07% | | | | 7.13% | | | | 10.39% | |
| | AllianzGI Retirement 2050 Fund Class A (adjusted) | | | 1.18% | | | | 5.92% | | | | 9.75% | |
| | | AllianzGI Retirement 2050 Fund Class C | | | 6.29% | | | | 6.34% | | | | 9.58% | |
| | AllianzGI Retirement 2050 Fund Class C (adjusted) | | | 5.29% | | | | 6.34% | | | | 9.58% | |
| | AllianzGI Retirement 2050 Fund Class R | | | 6.70% | | | | 6.75% | | | | 10.05% | |
| | AllianzGI Retirement 2050 Fund Class P | | | 7.40% | | | | 7.47% | | | | 10.71% | |
| | AllianzGI Retirement 2050 Fund Class R6 | | | 7.47% | | | | 7.57% | | | | 10.81% | |
| | | AllianzGI Retirement 2050 Fund Administrative Class | | | 7.11% | | | | 7.19% | | | | 10.46% | |
| | Morningstar Lifetime Moderate 2050 Index | | | 9.62% | | | | 8.62% | | | | 12.35% | |
| | AllianzGI 2050 Strategic Benchmark | | | 11.07% | | | | 7.69% | | | | 10.03% | |
| | | Lipper Mixed-Asset Target 2050+ Funds Average | | | 9.06% | | | | 8.27% | | | | 11.24% | |
† The Fund began operations on December 29, 2008. Benchmark return comparisons began on the fund inception date. Lipper performance comparisons began on December 31, 2008.
Performance quoted represents past performance and is no guarantee of future results. Current performance may be lower or higher than performance shown. For performance current to the most recent month-end, visit our website at us.allianzgi.com. Investment return and the principal value will fluctuate. Shares may be worth more or less than original cost when redeemed. The adjusted returns take into account the maximum initial sales charge of 5.50% on Class A shares and the contingent deferred sales charge (CDSC) of 1% on Class C shares, which may apply to shares redeemed during the first year of ownership. Returns do not reflect deduction of taxes that a shareholder would pay on fund distributions or redemption of fund shares. See pages 111 and 112 for more information. The Fund’s gross expense ratios are 1.05% for Class A shares, 1.80% for Class C shares, 1.30% for Class R shares, 0.65% for Class P shares, 0.55% for Class R6 shares and 0.90% for Administrative Class shares. These ratios do not include an expense reduction, contractually guaranteed through at least January 31, 2020. The Fund’s expense ratios net of this reduction are 0.95% for Class A shares, 1.70% for Class C shares, 1.30% for Class R shares, 0.65% for Class P shares, 0.55% for Class R6 shares and 0.90% for Administrative Class shares. Expense ratio information is as of the Fund’s current prospectus dated February 1, 2018, as further revised or supplemented from time to time.
Cumulative Returns Through September 30, 2018
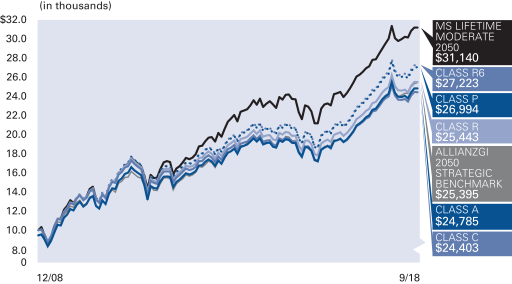
Fund Allocation (as of September 30, 2018)
| | | | |
| AllianzGI Best Styles Global Equity | | | 59.0% | |
| AllianzGI Best Styles U.S. Equity | | | 18.4% | |
| AllianzGI Global Dynamic Allocation | | | 17.4% | |
| AllianzGI Emerging Markets Small-Cap | | | 0.9% | |
| Cash & Equivalents — Net | | | 4.3% | |
| | | | | | |
| | Annual Report | | | September 30, 2018 | | 17 |
Unaudited
AllianzGI Retirement 2050 Fund (cont’d)
| | | | | | | | | | | | |
| Shareholder Expense Example | | Actual Performance |
| | | Class A | | Class C | | Class R | | Class P | | Class R6 | | Administrative
Class |
| Beginning Account Value (4/1/18) | | $1,000.00 | | $1,000.00 | | $1,000.00 | | $1,000.00 | | $1,000.00 | | $1,000.00 |
| Ending Account Value (9/30/18) | | $1,036.40 | | $1,032.90 | | $1,034.60 | | $1,038.00 | | $1,038.70 | | $1,036.80 |
| Expenses Paid During Period | | $2.50 | | $6.32 | | $4.28 | | $0.97 | | $0.46 | | $2.25 |
| | | | | | | | | | | | | |
| | | Hypothetical Performance |
| | | (5% return before expenses) |
| | | Class A | | Class C | | Class R | | Class P | | Class R6 | | Administrative
Class |
| Beginning Account Value (4/1/18) | | $1,000.00 | | $1,000.00 | | $1,000.00 | | $1,000.00 | | $1,000.00 | | $1,000.00 |
| Ending Account Value (9/30/18) | | $1,022.61 | | $1,018.85 | | $1,020.86 | | $1,024.12 | | $1,024.62 | | $1,022.86 |
| Expenses Paid During Period | | $2.48 | | $6.28 | | $4.26 | | $0.96 | | $0.46 | | $2.23 |
For each class of the Fund, expenses (net of fee waiver and reimbursement, if any) are equal to the annualized expense ratio for the class (0.49% for Class A, 1.24% for Class C, 0.84% for Class R, 0.19% for Class P, 0.09% for Class R6 and 0.44% for Administrative Class), multiplied by the average account value over the period, multiplied by 183/365. These expenses do not include the expenses of the investment companies in which the Fund invests, which are indirectly borne by Fund shareholders.
| | | | | | |
| 18 | | September 30, 2018 | | | Annual Report | | |
Unaudited
AllianzGI Retirement 2055 Fund
Average Annual Total Return for the period ended September 30, 2018
| | | | | | | | | | | | | | |
| | | | | 1 Year | | | 5 Year | | | Since Inception† | |
| | | AllianzGI Retirement 2055 Fund Class A | | | 7.19% | | | | 7.14% | | | | 8.97% | |
| | AllianzGI Retirement 2055 Fund Class A (adjusted) | | | 1.29% | | | | 5.93% | | | | 8.06% | |
| | AllianzGI Retirement 2055 Fund Class R | | | 6.86% | | | | 6.78% | | | | 8.60% | |
| | AllianzGI Retirement 2055 Fund Class P | | | 7.57% | | | | 7.48% | | | | 9.31% | |
| | AllianzGI Retirement 2055 Fund Class R6 | | | 7.62% | | | | 7.58% | | | | 9.41% | |
| | | AllianzGI Retirement 2055 Fund Administrative Class | | | 7.25% | | | | 7.19% | | | | 9.02% | |
| | Morningstar Lifetime Moderate 2055 Index | | | 9.48% | | | | 8.51% | | | | 11.39% | |
| | AllianzGI 2055 Strategic Benchmark | | | 11.07% | | | | 7.69% | | | | 9.58% | |
| | | Lipper Mixed-Asset Target 2055+ Funds Average | | | 9.55% | | | | 8.68% | | | | 11.03% | |
† The Fund began operations on December 19, 2011. Benchmark return comparisons began on the fund inception date. Lipper performance comparisons began on December 31, 2011.
Performance quoted represents past performance and is no guarantee of future results. Current performance may be lower or higher than performance shown. For performance current to the most recent month-end, visit our website at us.allianzgi.com. Investment return and the principal value will fluctuate. Shares may be worth more or less than original cost when redeemed. The adjusted returns take into account the maximum initial sales charge of 5.50% on Class A shares. Returns do not reflect deduction of taxes that a shareholder would pay on fund distributions or redemption of fund shares. See pages 111 and 112 for more information. The Fund’s gross expense ratios are 1.05% for Class A shares, 1.30% for Class R shares, 0.65% for Class P shares, 0.55% for Class R6 shares and 0.90% for Administrative Class shares. These ratios do not include an expense reduction, contractually guaranteed through at least January 31, 2020. The Fund’s expense ratios net of this reduction are 0.95% for Class A shares, 1.30% for Class R shares, 0.65% for Class P shares, 0.55% for Class R6 shares and 0.90% for Administrative Class shares. Expense ratio information is as of the Fund’s current prospectus dated February 1, 2018, as further revised or supplemented from time to time.
Cumulative Returns Through September 30, 2018
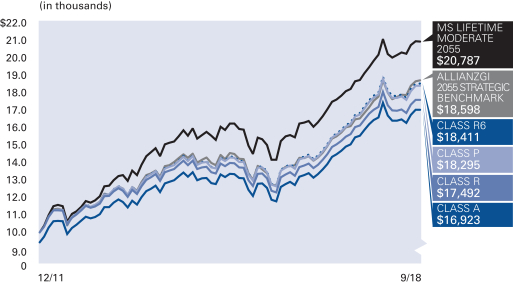
Fund Allocation (as of September 30, 2018)
| | | | |
| AllianzGI Best Styles Global Equity | | | 58.6% | |
| AllianzGI Best Styles U.S. Equity | | | 18.6% | |
| AllianzGI Global Dynamic Allocation | | | 17.4% | |
| AllianzGI Emerging Markets Small-Cap | | | 1.0% | |
| Cash & Equivalents — Net | | | 4.4% | |
| | | | | | |
| | Annual Report | | | September 30, 2018 | | 19 |
Unaudited
AllianzGI Retirement 2055 Fund (cont’d)
| | | | | | | | | | |
| Shareholder Expense Example | | Actual Performance |
| | | Class A | | Class R | | Class P | | Class R6 | | Administrative
Class |
| Beginning Account Value (4/1/18) | | $1,000.00 | | $1,000.00 | | $1,000.00 | | $1,000.00 | | $1,000.00 |
| Ending Account Value (9/30/18) | | $1,036.90 | | $1,035.40 | | $1,039.20 | | $1,039.00 | | $1,037.30 |
| Expenses Paid During Period | | $2.50 | | $4.29 | | $0.97 | | $0.46 | | $2.25 |
| | | | | | | | | | | |
| | | Hypothetical Performance |
| | | (5% return before expenses) |
| | | Class A | | Class R | | Class P | | Class R6 | | Administrative
Class |
| Beginning Account Value (4/1/18) | | $1,000.00 | | $1,000.00 | | $1,000.00 | | $1,000.00 | | $1,000.00 |
| Ending Account Value (9/30/18) | | $1,022.61 | | $1,020.86 | | $1,024.12 | | $1,024.62 | | $1,022.86 |
| Expenses Paid During Period | | $2.48 | | $4.26 | | $0.96 | | $0.46 | | $2.23 |
For each class of the Fund, expenses (net of fee waiver and reimbursement, if any) are equal to the annualized expense ratio for the class (0.49% for Class A, 0.84% for Class R, 0.19% for Class P, 0.09% for Class R6 and 0.44% for Administrative Class), multiplied by the average account value over the period, multiplied by 183/365. These expenses do not include the expenses of the investment companies in which the Fund invests, which are indirectly borne by Fund shareholders.
| | | | | | |
| 20 | | September 30, 2018 | | | Annual Report | | |
Unaudited
AllianzGI Multi Asset Income Fund (formerly AllianzGI Retirement Income Fund)
For the period of October 1, 2017 through September 30, 2018, as provided by the Multi-Asset US Group.
Fund Insights
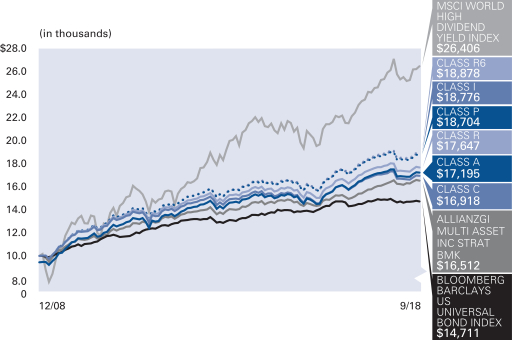
For the twelve-month period ended September 30, 2018, Class A shares at net asset value (“NAV”) of the AllianzGI Multi Asset Income Fund (the “Fund”) returned 0.12%, outperforming the Bloomberg Barclays U.S. Universal Bond Index (the “benchmark”), which returned -1.00%.
Market Overview
At the start of the period, political developments in the U.S. and Japan helped drive returns for global equities. The passage of the Tax Cuts and Jobs Act in late December drove US equities on the hope that the lower corporate tax rate would result in higher capital investment and provide a further boost to economic growth. Japanese equities rallied after Prime Minister Shinzo Abe’s victory in snap elections in October was perceived as a mandate for him to continue with his market-friendly policies. However, political outcomes in the euro zone, including a failure to resolve the question of Catalonia’s secession from Spain and Angela Merkel’s failure to establish a coalition government by year-end, led to declines in European equities. Macroeconomic and policy uncertainty led to several new themes including (i) a re-emergence of volatility, (ii) renewed vigilance about the possibility of creeping inflation, and (iii) revised forecasts for the pace and magnitude of increases in the benchmark interest rate of the U.S. Federal Reserve.
In March, these factors, combined with the looming threat of a global trade war between the U.S. and its major trading partners weighed on markets. While the trade war rhetoric receded for the most part in April, it returned in late May with the U.S. administration imposing tariffs on steel and aluminum imports from the EU, Canada and Mexico. Since June, slower growth in world trade, among other factors, contributed to a loss in momentum in economic activity across advanced economies. The U.S., however, remained ahead of the pack of major economies in terms of growth.
Overall for the period, after touching peaks in January, most equity markets suffered corrections in February and March and then rallied to finish the period with strongly positive returns. Global equities returned more than 9.0% (MSCI ACWI) while U.S. equities (MSCI U.S.) returned nearly two times the global equity return. Among the worst performers for the period were equities in emerging markets—especially in local terms in markets where currencies depreciated strongly—as well as in Europe. Within the US, large cap stocks outperformed small cap stocks and growth outperformed value. US government bonds and global sovereign bonds each finished down. Monetary policy continued to tighten in developed economies. In total, the U.S. Federal Reserve raised rates four times, while the Bank of England raised rates twice. While rates remained on hold in other developed economies, the European Central Bank announced it would end its bond-buying program by the end of 2018 and the Bank of Japan gave itself more flexibility by expanding its target for the 10-year bond yield. In contrast, the central banks of several emerging markets countries raised rates as they sought to stem currency weakness.
Portfolio Review
The positive contributors to performance were overweight positions in U.S. and Japanese equities, mortgage REITs, preferred securities and leveraged loans. The main detractors were underweight exposure in European equities in March and April 2018, an underweight and selection in U.S. high yield, an overweight and selection in emerging market debt, an overweight in master limited partnerships and opportunistic allocations to Italian government bonds. With core bond positions, the overall effect on active performance was slightly positive, as negative contributions from overweight positions in U.S. Treasuries were offset by positive contributions from underlying active strategies such as PIMCO Income, AllianzGI Real Estate Debt and AllianzGI Short Duration High Income. The Fund has met its objective of distributing an attractive level of income, having had a distribution yield of 7.3% over the last 12 months.
Outlook
Recognizing that the expansion in global growth that started in mid-2016 may have peaked in some major economies, we are focused on the sources of further downside risks. Such risks include escalation in trade and diplomatic tensions between the U.S. and China, persistently higher oil prices, currency volatility weighing on vulnerable emerging markets and a more abrupt tightening in financial market conditions in major economies, among others.
We believe that U.S. equities remain the most attractive of developed market equities in the near term. In Europe, in light of the deteriorating macro backdrop, we continue to expect fiscal policy uncertainty in the periphery and the prospect of further tightening in monetary policy to weigh on European equities. We anticipate challenges for broad emerging markets equities and debt but see opportunities to differentiate within the asset class. The returns on fixed income assets in recent months have been almost invariably negative and we see limited prospect of a significant broad turnaround—especially given the trend of rising global inflation, rising interest rates globally and a still-healthy global growth dynamic. Again, however, opportunities exist to differentiate among sovereign bonds. We remain constructive on the U.S. dollar versus major developed currencies as of the end of the period.
| | | | | | |
| | Annual Report | | | September 30, 2018 | | 21 |
Unaudited
AllianzGI Multi Asset Income Fund (formerly AllianzGI Retirement Income Fund) (cont’d)
Average Annual Total Return for the period ended September 30, 2018
| | | | | | | | | | | | | | |
| | | | | 1 Year | | | 5 Year | | | Since Inception† | |
| | | AllianzGI Multi Asset Income Fund Class A | | | 0.12% | | | | 3.61% | | | | 6.33% | |
| | AllianzGI Multi Asset Income Fund Class A (adjusted) | | | –5.39% | | | | 2.45% | | | | 5.71% | |
| | | AllianzGI Multi Asset Income Fund Class C | | | –0.64% | | | | 2.84% | | | | 5.54% | |
| | AllianzGI Multi Asset Income Fund Class C (adjusted) | | | –1.58% | | | | 2.84% | | | | 5.54% | |
| | AllianzGI Multi Asset Income Fund Class R | | | –0.20% | | | | 3.25% | | | | 5.99% | |
| | AllianzGI Multi Asset Income Fund Class P | | | 0.46% | | | | 3.93% | | | | 6.63% | |
| | AllianzGI Multi Asset Income Fund Institutional Class | | | 0.46% | | | | 3.97% | | | | 6.67% | |
| | AllianzGI Multi Asset Income Fund Class R6 | | | 0.56% | | | | 4.03% | | | | 6.73% | |
| | | AllianzGI Multi Asset Income Fund Administrative Class | | | 0.25% | | | | 3.46% | | | | 6.28% | |
| | Bloomberg Barclays U.S. Universal Bond Index | | | –1.00% | | | | 2.53% | | | | 4.04% | |
| | AllianzGI Multi Asset Income Strategic Benchmark | | | 2.71% | | | | 3.55% | | | | 5.28% | |
| | MSCI World High Dividend Yield Index | | | 4.80% | | | | 6.62% | | | | 10.47% | |
| | | Lipper Mixed-Asset Target Today Funds | | | 2.80% | | | | 3.82% | | | | 6.21% | |
† The Fund began operations on December 29, 2008. Benchmark return comparisons began on the fund inception date. Lipper performance comparisons began on December 31, 2008.
Performance quoted represents past performance and is no guarantee of future results. Current performance may be lower or higher than performance shown. For performance current to the most recent month-end, visit our website at us.allianzgi.com. Investment return and the principal value will fluctuate. Shares may be worth more or less than original cost when redeemed. The adjusted returns take into account the maximum initial sales charge of 5.50% on Class A shares and the contingent deferred sales charge (CDSC) of 1% on Class C shares, which may apply to shares redeemed during the first year of ownership. Returns do not reflect deduction of taxes that a shareholder would pay on fund distributions or redemption of fund shares. See pages 111 and 112 for more information. The Fund’s gross expense ratios are 1.20% for Class A shares, 1.95% for Class C shares, 1.45% for Class R shares, 0.80% for Class P shares, 0.75% for Institutional Class, 0.70% for Class R6 shares and 1.05% for Administrative Class shares. These ratios do not include an expense reduction, contractually guaranteed through at least January 31, 2020. The Fund’s expense ratios net of this reduction are 0.95% for Class A shares, 1.70% for Class C shares, 1.30% for Class R shares, 0.65% for Class P shares, 0.60% for Institutional Class, 0.55% for Class R6 shares and 0.90% for Administrative Class shares. Expense ratio information is as of the Fund’s current prospectus dated February 1, 2018, as further revised or supplemented from time to time.
| | | | | | |
| 22 | | September 30, 2018 | | | Annual Report | | |
Unaudited
AllianzGI Multi Asset Income Fund (formerly AllianzGI Retirement Income Fund) (cont’d)
Cumulative Returns Through September 30, 2018
Fund Allocation (as of September 30, 2018)
| | | | |
| PIMCO Income | | | 15.2% | |
| AllianzGI Short Duration High Income | | | 12.1% | |
| AllianzGI Real Estate Debt | | | 10.8% | |
| AllianzGI Europe Equity Dividend | | | 6.8% | |
| AllianzGI Emerging Markets Debt | | | 6.3% | |
| PIMCO Preferred and Capital Securities | | | 6.0% | |
| PIMCO Senior Floating Rate | | | 5.5% | |
| Vanguard Mortgage-Backed Securities | | | 4.0% | |
| Other | | | 29.7% | |
| Cash & Equivalents — Net | | | 3.6% | |
| | | | | | | | | | | | | | |
| Shareholder Expense Example | | Actual Performance |
| | | Class A | | Class C | | Class R | | Class P | | Institutional
Class | | Class R6 | | Administrative
Class |
| Beginning Account Value (4/1/18) | | $1,000.00 | | $1,000.00 | | $1,000.00 | | $1,000.00 | | $1,000.00 | | $1,000.00 | | $1,000.00 |
| Ending Account Value (9/30/18) | | $1,017.30 | | $1,014.00 | | $1,015.80 | | $1,019.20 | | $1,019.40 | | $1,019.60 | | $1,018.40 |
| Expenses Paid During Period | | $1.67 | | $5.45 | | $3.44 | | $0.15 | | $0.05 | | $0.01 | | $1.16 |
| | | | | | | | | | | | | | | |
| | | Hypothetical Performance |
| | | (5% return before expenses) |
| | | Class A | | Class C | | Class R | | Class P | | Institutional
Class | | Class R6 | | Administrative
Class |
| Beginning Account Value (4/1/18) | | $1,000.00 | | $1,000.00 | | $1,000.00 | | $1,000.00 | | $1,000.00 | | $1,000.00 | | $1,000.00 |
| Ending Account Value (9/30/18) | | $1,023.41 | | $1,019.65 | | $1,021.66 | | $1,024.92 | | $1,025.02 | | $1,025.06 | | $1,023.92 |
| Expenses Paid During Period | | $1.67 | | $5.47 | | $3.45 | | $0.15 | | $0.05 | | $0.01 | | $1.17 |
For each class of the Fund, expenses (net of fee waiver and reimbursement, if any) are equal to the annualized expense ratio for the class (0.33% for Class A, 1.08% for Class C, 0.68% for Class R, 0.03% for Class P, 0.01% for Institutional Class, less than 0.005% for Class R6 and 0.23% for Administrative Class), multiplied by the average account value over the period, multiplied by 183/365. These expenses do not include the expenses of the investment companies in which the Fund invests, which are indirectly borne by Fund shareholders.
| | | | | | |
| | Annual Report | | | September 30, 2018 | | 23 |
Unaudited
AllianzGI Global Allocation Fund
For the period of October 1, 2017 through September 30, 2018, as provided by the Multi-Asset US Group.
Fund Insights
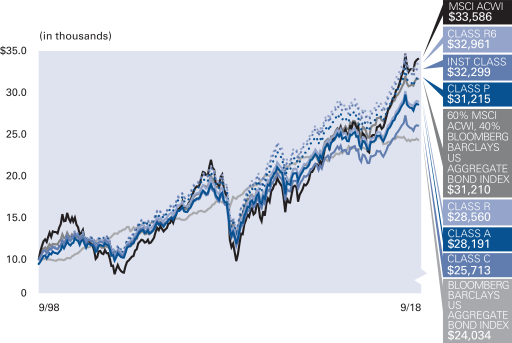
For the twelve-month period ended September 30, 2018, Class A shares at net asset value (“NAV”) of the AllianzGI Global Allocation Fund (the “Fund”) returned 2.62%, underperforming the 60% MSCI ACWI, 40% Barclays U.S. Aggregate Bond Index (the “benchmark”), which returned 5.35%.
Market Overview
At the start of the period, political developments in the U.S. and Japan helped drive returns for global equities. The passage of the Tax Cuts and Jobs Act in late December drove US equities on the hope that the lower corporate tax rate would result in higher capital investment and provide a further boost to economic growth. Japanese equities rallied after Prime Minister Shinzo Abe’s victory in snap elections in October was perceived as a mandate for him to continue with his market-friendly policies. However, political outcomes in the euro zone, including a failure to resolve the question of Catalonia’s secession from Spain and Angela Merkel’s failure to establish a coalition government by year-end, led to declines in European equities. Macroeconomic and policy uncertainty led to several new themes including (i) a re-emergence of volatility, (ii) renewed vigilance about the possibility of creeping inflation, and (iii) revised forecasts for the pace and magnitude of increases in the benchmark interest rate of the U.S. Federal Reserve.
In March, these factors, combined with the looming threat of a global trade war between the U.S. and its major trading partners weighed on markets. While the trade war rhetoric receded for the most part in April, it returned in late May with the U.S. administration imposing tariffs on steel and aluminum imports from the EU, Canada and Mexico. Since June, slower growth in world trade, among other factors, contributed to a loss in momentum in economic activity across advanced economies. The U.S., however, remained ahead of the pack of major economies in terms of growth.
Overall for the period, after touching peaks in January, most equity markets suffered corrections in February and March and then rallied to finish the period with strongly positive returns. Global equities returned more than 9.0% (MSCI ACWI) while U.S. equities (MSCI U.S.) returned nearly two times the global equity return. Among the worst performers for the period were equities in emerging markets—especially in local terms in markets where currencies depreciated strongly—as well as in Europe. Within the US, large cap stocks outperformed small cap stocks and growth outperformed value. US government bonds and global sovereign bonds each finished down. Monetary policy continued to tighten in developed economies. In total, the U.S. Federal Reserve raised rates four times, while the Bank of England raised rates twice. While rates remained on hold in other developed economies, the European Central Bank announced it would end its bond-buying program by the end of 2018 and the Bank of Japan gave itself more flexibility by expanding its target for the 10-year bond yield. In contrast, the central banks of several emerging markets countries raised rates as they sought to stem currency weakness.
Portfolio Review
The main contributors to performance for the period were allocations to equities, specifically equities in North America where the portfolio has an overweight. Selection effects in equities, however, were negative overall. The main detractor from performance was the Best Styles Global strategy, which was overweight the value factor and value underperformed for the period. This was partially offset by positive selection from the International Growth strategy, which contributed. Within the Opportunistic portion of the portfolio, a position in small cap U.S. equities added value helping to partially offset the negative effects from exposure to emerging market debt and managed futures (which was added as an opportunistic holding during the period). Allocation to U.S. government bonds and corporates also detracted. Finally, overall exposure to currencies detracted based on positions in the Canadian dollar, British pound and Japanese yen.
Outlook
Recognizing that the expansion in global growth that started in mid-2016 may have peaked in some major economies, we are focused on the sources of further downside risks. Such risks include escalation in trade and diplomatic tensions between the U.S. and China, persistently higher oil prices, currency volatility weighing on vulnerable emerging markets and a more abrupt tightening in financial market conditions in major economies, among others.
We believe that U.S. equities remain the most attractive of developed market equities in the near term. In Europe, in light of the deteriorating macro backdrop, we continue to expect fiscal policy uncertainty in the periphery and the prospect of further tightening in monetary policy to weigh on European equities. We anticipate challenges for broad emerging markets equities and debt but see opportunities to differentiate within the asset class. The returns on fixed income assets in recent months have been almost invariably negative and we see limited prospect of a significant broad turnaround—especially given the trend of rising global inflation, rising interest rates globally and a still-healthy global growth dynamic. Again, however, opportunities exist to differentiate among sovereign bonds. We remain constructive on the U.S. dollar versus major developed currencies as of the end of the period.
| | | | | | |
| 24 | | September 30, 2018 | | | Annual Report | | |
Unaudited
AllianzGI Global Allocation Fund (cont’d)
Average Annual Total Return for the period ended September 30, 2018
| | | | | | | | | | | | | | | | | | |
| | | | | 1 Year | | | 5 Year | | | 10 Year | | | Since Inception† | |
| | | AllianzGI Global Allocation Fund Class A | | | 2.62% | | | | 4.55% | | | | 6.39% | | | | 5.62% | |
| | AllianzGI Global Allocation Fund Class A (adjusted) | | | –3.03% | | | | 3.37% | | | | 5.79% | | | | 5.32% | |
| | | AllianzGI Global Allocation Fund Class C | | | 1.90% | | | | 3.78% | | | | 5.60% | | | | 4.84% | |
| | AllianzGI Global Allocation Fund Class C (adjusted) | | | 0.97% | | | | 3.78% | | | | 5.60% | | | | 4.84% | |
| | AllianzGI Global Allocation Fund Class R | | | 2.43% | | | | 4.37% | | | | 6.18% | | | | 5.39% | |
| | AllianzGI Global Allocation Fund Class P | | | 2.92% | | | | 4.83% | | | | 6.64% | | | | 5.86% | |
| | AllianzGI Global Allocation Fund Institutional Class | | | 2.92% | | | | 4.77% | | | | 6.68% | | | | 6.04% | |
| | | AllianzGI Global Allocation Fund Administrative Class | | | 2.68% | | | | 4.59% | | | | 6.43% | | | | 5.67% | |
| | AllianzGI Global Allocation Fund Class R6 | | | 2.95% | | | | 4.89% | | | | 6.79% | | | | 6.14% | |
| | 60% MSCI ACWI, 40% Bloomberg Barclays U.S. Aggregate Index | | | 5.35% | | | | 6.15% | | | | 6.73% | | | | 5.86% | |
| | MSCI ACWI | | | 9.77% | | | | 8.67% | | | | 8.19% | | | | 6.24% | |
| | Bloomberg Barclays U.S. Aggregate Bond Index | | | –1.22% | | | | 2.16% | | | | 3.77% | | | | 4.48% | |
| | | Lipper Alternative Global Macro Funds | | | 2.33% | | | | 2.69% | | | | 4.47% | | | | 5.38% | |
† The Fund began operations on September 30, 1998. Benchmark return comparisons began on the fund inception date. Lipper performance comparisons began on September 30, 1998.
Performance quoted represents past performance and is no guarantee of future results. Current performance may be lower or higher than performance shown. For performance current to the most recent month-end, visit our website at us.allianzgi.com. Investment return and the principal value will fluctuate. Shares may be worth more or less than original cost when redeemed. The adjusted returns take into account the maximum sales charge of 5.50% on Class A shares and the contingent deferred sales charge (CDSC) of 1% on Class C shares, which may apply to shares redeemed during the first year of ownership. Returns do not reflect deduction of taxes that a shareholder would pay on fund distributions or redemption of fund shares. See pages 111 and 112 for more information. The Fund’s gross expense ratios are 1.53% for Class A shares, 2.28% for Class C shares, 1.72% for Class R shares, 1.26% for Class P shares, 1.36% for Institutional Class shares, 1.21% for Class R6 shares and 1.47% for Administrative Class shares. These ratios do not include an expense reduction, contractually guaranteed through at least January 31, 2019. The Fund’s expense ratios net of this reduction are 1.01% for Class A shares, 1.78% for Class C shares, 1.21% for Class R shares, 0.81% for Class P shares, 0.81% for Institutional Class shares, 0.71% for Class R6 shares and 0.96% for Administrative Class shares. Expense ratio information is as of the Fund’s current prospectus dated February 1, 2018, as further revised or supplemented from time to time.
Cumulative Returns Through September 30, 2018
Fund Allocation (as of September 30, 2018)
| | | | |
| AllianzGI Best Styles Global Equity | | | 40.1% | |
| AllianzGI Advanced Core Bond | | | 24.7% | |
| AllianzGI Best Styles Global Managed Volatility | | | 11.0% | |
| AllianzGI International Growth | | | 5.7% | |
| AllianzGI Emerging Markets Debt | | | 4.4% | |
| AllianzGI PerformanceFee Managed Futures Strategy | | | 4.4% | |
| iShares iBoxx $ Investment Grade Corporate Bond | | | 3.1% | |
| iShares MBS | | | 2.0% | |
| Other | | | 2.4% | |
| Cash & Equivalents — Net | | | 2.2% | |
| | | | | | |
| | Annual Report | | | September 30, 2018 | | 25 |
Unaudited
AllianzGI Global Allocation Fund (cont’d)
| | | | | | | | | | | | | | |
| Shareholder Expense Example | | Actual Performance |
| | | Class A | | Class C | | Class R | | Class P | | Institutional
Class | | Class R6 | | Administrative
Class |
| Beginning Account Value (4/1/18) | | $1,000.00 | | $1,000.00 | | $1,000.00 | | $1,000.00 | | $1,000.00 | | $1,000.00 | | $1,000.00 |
| Ending Account Value (9/30/18) | | $1,008.00 | | $1,004.30 | | $1,006.60 | | $1,009.40 | | $1,009.30 | | $1,009.90 | | $1,008.10 |
| Expenses Paid During Period | | $2.92 | | $6.53 | | $4.02 | | $1.71 | | $1.31 | | $1.31 | | $2.57 |
| | | | | | | | | | | | | | | |
| | | Hypothetical Performance |
| | | (5% return before expenses) |
| | | Class A | | Class C | | Class R | | Class P | | Institutional
Class | | Class R6 | | Administrative
Class |
| Beginning Account Value (4/1/18) | | $1,000.00 | | $1,000.00 | | $1,000.00 | | $1,000.00 | | $1,000.00 | | $1,000.00 | | $1,000.00 |
| Ending Account Value (9/30/18) | | $1,022.16 | | $1,018.55 | | $1,021.06 | | $1,023.36 | | $1,023.76 | | $1,023.76 | | $1,022.51 |
| Expenses Paid During Period | | $2.94 | | $6.58 | | $4.05 | | $1.72 | | $1.32 | | $1.32 | | $2.59 |
For each class of the Fund, expenses (net of fee waiver and reimbursement, if any) are equal to the annualized expense ratio for the class (0.58% for Class A, 1.30% for Class C, 0.80% for Class R, 0.34% for Class P, 0.26% for Institutional Class, 0.26% for Class R6 and 0.51% for Administrative Class), multiplied by the average account value over the period, multiplied by 183/365. These expenses do not include the expenses of the investment companies in which the Fund invests, which are indirectly borne by Fund shareholders.
| | | | | | |
| 26 | | September 30, 2018 | | | Annual Report | | |
Unaudited
AllianzGI Best Styles Global Equity Fund
For the period of October 1, 2017 through September 30, 2018, as provided by Christian McCormick, Senior Product Specialist.
Fund Insights
For the twelve-month period ended September 30, 2018, the Class A shares at net asset value (“NAV”) of the AllianzGI Best Styles Global Equity Fund (the “Fund”) returned 5.33%, underperforming the MSCI ACWI (the “benchmark”), which returned 9.77%.
Market Overview
Global equity returned a solid 9.8% over the period as measured by the benchmark. However, there was significant regional dispersion and it was a tale of two halves. The last six months saw emerging markets underperform, affected by a strengthening U.S. dollar and by currency crises in Argentina, Turkey and Venezuela. U.S. equities delivered strong performance, surging to reach fresh highs, buoyed by robust U.S. economic data and continued earnings growth, despite the growing threat of an all-out trade war with China. As the third quarter came to an end, the U.S. signed a new trade agreement with Canada and Mexico and in addition to positive comments about Europe, the tone was that a major trade war would be confined to the U.S. and China.
Portfolio Review
The Fund implements a blend of the five investment styles that are well-diversified and successful over the long-term. This blend of investment styles includes: Value, Price Momentum, Earnings Change, Growth and Quality. Over the trailing twelve months, the style Value underperformed globally, driven primarily by significant underperformance in the U.S. market. The trend following styles of Price Momentum and Earnings Change did outperform, but Growth was the worst relative performer of our five target investment styles, and this mitigated the solid performance from Price Momentum and Earnings Change. Therefore we had a drag from Value with no offset from the trend following piece. In addition, the global markets took on a decidedly defensive tilt as Mega Cap, Quality and Low Risk stocks all outperformed.
The Fund’s strategy has only moderate leeway for sector and regional allocation with a maximum deviation of 3% vs. the benchmark for active weightings. The overall contribution from active country/sector allocation was benign as would be expected with our tight active collars.
The Fund holds a broad number of stocks to implement a well-diversified mix of investment styles and assigns a maximum active weighting of 1% to individual stocks. Therefore, we believe stock selection to be the biggest driver of relative returns and this was the case over the past twelve months. Stock selection in consumer discretionary and information technology stocks were significant detractors, especially U.S.-based companies. In particular, Netflix, Apple, Microsoft and Amazon detracted an aggregate 74 basis points from relative returns. There were no meaningful contributors. It was a difficult twelve-month period.
Outlook
We believe that the trade conflicts between Washington, Beijing and Brussels will continue to make headlines and may lead to unexpected twists and turns ahead of the U.S. mid-term elections. It is encouraging, however, that the U.S. and Mexico reached a preliminary agreement to the North-American Free Trade Agreement. While any tariffs will probably have a dampening effect, we believe global growth looks set to remain above potential for some time to come, as stronger U.S. growth should compensate for a slowdown in Europe, Japan and several emerging markets. From our vantage point, neither a significant decline in growth nor a recession is on the cards right now. This is an argument in favor of equity investments. Generally speaking, concerns about an escalating trade war are likely to weigh more on equities from export-oriented economies which are well integrated into global supply chains and less on U.S. equities. The European Central Bank and the U.S. Federal Reserve are likely to stick to their monetary policies.
| | | | | | |
| | Annual Report | | | September 30, 2018 | | 27 |
Unaudited
AllianzGI Best Styles Global Equity Fund (cont’d)
Average Annual Total Return for the period ended September 30, 2018
| | | | | | | | | | |
| | | | | 1 Year | | | Since Inception† | |
| | | AllianzGI Best Styles Global Equity Fund Class A | | | 5.33% | | | | 7.42% | |
| | AllianzGI Best Styles Global Equity Fund Class A (adjusted) | | | –0.46% | | | | 6.17% | |
| | | AllianzGI Best Styles Global Equity Fund Class C | | | 4.57% | | | | 6.68% | |
| | AllianzGI Best Styles Global Equity Fund Class C (adjusted) | | | 3.66% | | | | 6.68% | |
| | AllianzGI Best Styles Global Equity Fund Class P | | | 5.52% | | | | 7.65% | |
| | AllianzGI Best Styles Global Equity Fund Institutional Class | | | 5.63% | | | | 7.74% | |
| | AllianzGI Best Styles Global Equity Fund Class R6 | | | 5.61% | | | | 7.81% | |
| | MSCI ACWI | | | 9.77% | | | | 7.89% | |
| | | Lipper Global Multi-Cap Value Funds Average | | | 4.05% | | | | 5.62% | |
† The Fund began operations on December 2, 2013. Benchmark return comparisons began on the fund inception date. Lipper performance comparisons began on November 30, 2013.
Performance quoted represents past performance and is no guarantee of future results. Current performance may be lower or higher than performance shown. For performance current to the most recent month-end, visit our website at us.allianzgi.com. Investment return and the principal value will fluctuate. Shares may be worth more or less than original cost when redeemed. The adjusted returns take into account the maximum initial sales charge of 5.50% on Class A shares and the contingent deferred sales charge (CDSC) of 1% on Class C shares, which may apply to shares redeemed during the first year of ownership. Returns do not reflect deduction of taxes that a shareholder would pay on fund distributions or redemption of fund shares. See pages 111 and 112 for more information. The Fund’s gross expense ratios are 1.07% for Class A shares, 1.44% for Class C shares, 0.56% for Class P shares, 0.54% for Institutional Class shares and 0.43% for Class R6 shares. These ratios do not include an expense reduction, contractually guaranteed through at least January 31, 2019. The Funds expense ratios net of this reduction are 0.70% for Class A shares, 1.40% for Class C shares, 0.50% for Class P shares, 0.40% for Institutional Class shares and 0.40% for Class R6 shares. Expense ratio information is as of the Fund’s current prospectus dated February 1, 2018, as further revised or supplemented from time to time.
Cumulative Returns Through September 30, 2018
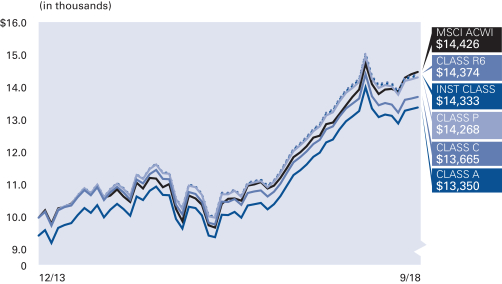
Country Allocation (as of September 30, 2018)
| | | | |
| United States | | | 55.9% | |
| Japan | | | 7.1% | |
| France | | | 4.9% | |
| United Kingdom | | | 4.6% | |
| China | | | 3.9% | |
| Canada | | | 3.4% | |
| Korea (Republic of) | | | 2.1% | |
| Germany | | | 1.7% | |
| Other | | | 16.1% | |
| Cash & Equivalents — Net | | | 0.3% | |
| | | | | | |
| 28 | | September 30, 2018 | | | Annual Report | | |
Unaudited
AllianzGI Best Styles Global Equity Fund (cont’d)
| | | | | | | | | | |
| Shareholder Expense Example | | Actual Performance |
| | | Class A | | Class C | | Class P | | Institutional
Class | | Class R6 |
| Beginning Account Value (4/1/18) | | $1,000.00 | | $1,000.00 | | $1,000.00 | | $1,000.00 | | $1,000.00 |
| Ending Account Value (9/30/18) | | $1,022.50 | | $1,018.70 | | $1,023.70 | | $1,023.90 | | $1,023.70 |
| Expenses Paid During Period | | $3.55 | | $7.08 | | $2.54 | | $2.03 | | $2.03 |
| | | | | | | | | | | |
| | | Hypothetical Performance |
| | | (5% return before expenses) |
| | | Class A | | Class C | | Class P | | Institutional
Class | | Class R6 |
| Beginning Account Value (4/1/18) | | $1,000.00 | | $1,000.00 | | $1,000.00 | | $1,000.00 | | $1,000.00 |
| Ending Account Value (9/30/18) | | $1,021.56 | | $1,018.05 | | $1,022.56 | | $1,023.06 | | $1,023.06 |
| Expenses Paid During Period | | $3.55 | | $7.08 | | $2.54 | | $2.03 | | $2.03 |
For each class of the Fund, expenses (net of fee waiver and reimbursement, if any) are equal to the annualized expense ratio for the class (0.70% for Class A, 1.40% for Class C, 0.50% for Class P, 0.40% for Institutional Class and 0.40% for Class R6), multiplied by the average account value over the period, multiplied by 183/365. These expenses do not include the expenses of the investment companies in which the Fund invests, which are indirectly borne by Fund shareholders.
| | | | | | |
| | Annual Report | | | September 30, 2018 | | 29 |
Unaudited
AllianzGI Best Styles International Equity Fund
For the period of October 1, 2017 through September 30, 2018, as provided by Christian McCormick, Senior Product Specialist.
Fund Insights
For the twelve-month period ended September 30, 2018, Class A shares at net asset value (“NAV”) of the AllianzGI Best Styles International Fund (the “Fund”) returned -0.28%, underperforming the MSCI EAFE Index (the “benchmark”), which returned 2.74%.
Market Overview
Euro-zone equities recorded moderate gains (in EUR terms). While returns were positive, the region lagged many other developed markets amid uncertainty over the impact of increased U.S. tariffs on trade. Political risk also weighed on sentiment as Italy’s new anti-establishment coalition government clashed with the EU over its spending and budget plans. While the quarter started with incipient signs that the slowdown in the euro-zone economy may have bottomed out, hopes of an imminent recovery were soon dashed. September’s flash euro-zone composite purchasing managers’ index fell to a four-month low, dragged lower by weaker manufacturing activity and stagnant exports. The survey also revealed that business optimism was hovering near two-year lows, while new orders fell to a two-year low and firms remained reluctant to take on new staff. Nevertheless, the European Central Bank confirmed it would continue with plans to halve its monthly bond purchases starting in October as the uncertainty surrounding the inflation outlook was “receding”. Despite stronger-than-expected economic data, UK shares were hit by Brexit-related uncertainty as Prime Minister Theresa May’s “Chequers proposals” received a cool response from EU leaders. Significant differences over the future trading relationship remain, making it appear increasingly unlikely that the EU and UK would be able to reach an agreement in time. Pacific ex-Japan equities ended the quarter broadly flat, although returns varied considerably on a country-by-country basis. While the rally in the U.S. market helped to support sentiment, this was offset by ongoing concerns about the impact of the trade war between the U.S. and China as well as further signs of slowing Chinese economic activity.
Portfolio Review
The Fund’s implements a blend of five investment styles that are well-diversified and successful over the long-term. This blend of investment styles includes Value, Price Momentum, Earnings Change, Growth and Quality. Over the trailing twelve months, the style Value outperformed, along with Earnings Change, but these were offset with underperformance from Price Momentum and Growth. International markets were defensive for most of the period as Quality, Low Risk and Mega Cap stocks all outperformed, although much of that was driven by the third quarter of 2018.
The Fund has only moderate leeway for sector and regional allocation with a maximum deviation of 3% vs. the benchmark for active weightings. The overall contribution from active country/sector allocation was benign as would be expected with our tight active collars. The Fund holds a broad number of stocks to implement a well-diversified mix of investment styles and assigns a maximum active weighting of 1% to individual stocks. Therefore, we believe stock selection to be the biggest driver of relative returns and this was the case over the past twelve months. Stock selection in the information technology and healthcare sectors were the largest detractors along with the Japan from a country context. Stock selection within the financials and Spain, were the biggest contributors, but could not overcome the negative contributors.
Outlook
We believe that the trade conflicts between Washington, Beijing and Brussels will continue to make headlines and may lead to unexpected twists and turns ahead of the U.S. mid-term elections. It is encouraging, however, that the U.S. and Mexico reached a preliminary agreement to the North-American Free Trade Agreement (NAFTA). While any tariffs will probably have a dampening effect, we believe global growth looks set to remain above potential for some time to come, as stronger U.S. growth should compensate for a slowdown in Europe, Japan and several emerging markets. From our vantage point, neither a significant decline in growth nor a recession is on the cards right now. This is an argument in favor of equity investments. Generally speaking, concerns about an escalating trade war are likely to weigh more on equities from export-oriented economies which are well integrated into global supply chains and less on U.S. equities. The European Central Bank and the U.S. Federal Reserve are likely to stick to their monetary policies.
| | | | | | |
| 30 | | September 30, 2018 | | | Annual Report | | |
Unaudited
AllianzGI Best Styles International Equity Fund (cont’d)
Average Annual Total Return for the period ended September 30, 2018
| | | | | | | | | | |
| | | | | 1 Year | | | Since Inception† | |
| | | AllianzGI Best Styles International Equity Fund Class A | | | –0.28% | | | | 4.19% | |
| | AllianzGI Best Styles International Equity Fund Class A (adjusted) | | | –5.77% | | | | 2.65% | |
| | | AllianzGI Best Styles International Equity Fund Class C | | | –0.97% | | | | 3.45% | |
| | AllianzGI Best Styles International Equity Fund Class C (adjusted) | | | –1.92% | | | | 3.45% | |
| | AllianzGI Best Styles International Equity Fund Class P | | | –0.14% | | | | 4.36% | |
| | AllianzGI Best Styles International Equity Fund Institutional Class | | | –0.01% | | | | 4.46% | |
| | AllianzGI Best Styles International Equity Fund Class R6 | | | –0.03% | | | | 4.51% | |
| | MSCI EAFE Index | | | 2.74% | | | | 5.14% | |
| | | Lipper International Multi-Cap Value Funds Average | | | –0.82% | | | | 3.39% | |
† The Fund began operations on December 9, 2014. Benchmark return comparisons began on the fund inception date. Lipper performance comparisons began on November 30, 2014.
Performance quoted represents past performance and is no guarantee of future results. Current performance may be lower or higher than performance shown. For performance current to the most recent month-end, visit our website at us.allianzgi.com. Investment return and the principal value will fluctuate. Shares may be worth more or less than original cost when redeemed. The adjusted returns take into account the maximum initial sales charge of 5.50% on Class A shares and the contingent deferred sales charge (CDSC) of 1% on Class C shares, which may apply to shares redeemed during the first year of ownership. Returns do not reflect deduction of taxes that a shareholder would pay on fund distributions or redemption of fund shares. See pages 111 and 112 for more information. The Fund’s gross expense ratios are 1.99% for Class A shares, 2.69% for Class C shares, 1.73% for Class P shares, 1.66% for Institutional Class shares and 1.50% for Class R6 shares. These ratios do not include an expense reduction, contractually guaranteed through at least January 31, 2019. The Fund’s expense ratios net of this reduction are 0.70% for Class A shares, 1.45% for Class C shares, 0.55% for Class P shares, 0.45% for Institutional Class shares and 0.45% for Class R6 shares. Expense ratio information is as of the Fund’s current prospectus dated February 1, 2018, as further revised or supplemented from time to time.
Cumulative Returns Through September 30, 2018

Country Allocation (as of September 30, 2018)
| | | | |
| Japan | | | 25.4% | |
| United Kingdom | | | 17.0% | |
| France | | | 11.1% | |
| Switzerland | | | 6.8% | |
| Germany | | | 5.6% | |
| Italy | | | 4.2% | |
| Hong Kong | | | 3.6% | |
| Spain | | | 2.7% | |
| Other | | | 22.9% | |
| Cash & Equivalents — Net | | | 0.7% | |
| | | | | | |
| | Annual Report | | | September 30, 2018 | | 31 |
Unaudited
AllianzGI Best Styles International Equity Fund (cont’d)
| | | | | | | | | | |
| Shareholder Expense Example | | Actual Performance |
| | | Class A | | Class C | | Class P | | Institutional
Class | | Class R6 |
| Beginning Account Value (4/1/18) | | $1,000.00 | | $1,000.00 | | $1,000.00 | | $1,000.00 | | $1,000.00 |
| Ending Account Value (9/30/18) | | $967.70 | | $964.80 | | $968.40 | | $969.10 | | $969.20 |
| Expenses Paid During Period | | $3.45 | | $7.14 | | $2.71 | | $2.22 | | $2.22 |
| | | | | | | | | | | |
| | | Hypothetical Performance |
| | | (5% return before expenses) |
| | | Class A | | Class C | | Class P | | Institutional
Class | | Class R6 |
| Beginning Account Value (4/1/18) | | $1,000.00 | | $1,000.00 | | $1,000.00 | | $1,000.00 | | $1,000.00 |
| Ending Account Value (9/30/18) | | $1,021.56 | | $1,017.80 | | $1,022.31 | | $1,022.81 | | $1,022.81 |
| Expenses Paid During Period | | $3.55 | | $7.33 | | $2.79 | | $2.28 | | $2.28 |
For each class of the Fund, expenses (net of fee waiver and reimbursement, if any) are equal to the annualized expense ratio for the class (0.70% for Class A, 1.45% for Class C, 0.55% for Class P, 0.45% for Institutional Class and 0.45% for Class R6), multiplied by the average account value over the period, multiplied by 183/365. These expenses do not include the expenses of the investment companies in which the Fund invests, which are indirectly borne by Fund shareholders.
| | | | | | |
| 32 | | September 30, 2018 | | | Annual Report | | |
Unaudited
AllianzGI Best Styles U.S. Equity Fund
For the period of October 1, 2017 through September 30, 2018, as provided by Christian McCormick, Senior Product Specialist.
Fund Insights
For the twelve-month period ended September, 2018, Class A shares at net asset value (“NAV”) of the AllianzGI Best Styles U.S. Equity Fund (the “Fund”) returned 16.96%, underperforming the S&P 500 Index (the “benchmark”), which returned 17.91%.
Market Overview
U.S. equities delivered robust gains during the reporting period of almost 18%. Positive economic data and corporate earnings growth propelled the market to its longest bull run in history, surpassing the previous record set between 1990 and 2000. Economic news was positive throughout the period and U.S. gross domestic product expanded at its fastest pace in nearly eight years, driven by strong consumer spending and very low unemployment. The positive momentum appeared to be continuing into the third quarter, with the unemployment rate dropping to 3.9% and wage growth accelerating to a year-on-year increase of 2.9%. Inflation also picked up, with headline inflation touching a six-and-a-half year high of 2.9%, before easing slightly in August. As was widely expected, the U.S. Federal Reserve (the “Fed”) raised rates by a further 25 basis points in September, its eighth increase in the current cycle, which took them to a range of 2.0% to 2.25%. The U.S. central bank dropped previous assurances that its policy was “accommodative” but continued to forecast that rates would be raised again in December this year, followed by three increases in 2019 and additional increases in 2020.
Portfolio Review
The Fund implements a blend of the five investment styles that are well-diversified and successful over the long-term. This blend of investment styles includes: Value, Price Momentum, Earnings Change, Growth and Quality. Over the trailing twelve months, the style Value significantly underperformed, which has become a recurring theme in the U.S., but Earnings Change and Price Momentum were well ahead. However, our measure of Growth did not do well as it focuses on historical earnings stability versus strong expected growth. In addition, smaller size companies were a slight drag over the period.
The Fund has only moderate leeway for sector allocation with a maximum deviation of 3% vs. the benchmark for active weightings. The overall contribution from active sector allocation was benign as would be expected with our tight active collars.
The Fund holds a broad number of stocks to implement a well-diversified mix of investment styles and assigns a maximum active weighting of 1% to individual stocks. Therefore, we expect stock selection to be the biggest driver of relative returns and this was the case over the past twelve months. It was over an uneventful twelve-months as contributors and detractors offset each other. Stock selection in energy was the top contributor while selection in consumer discretionary was the largest detractor.
Outlook
We believe that the trade conflicts between Washington, Beijing and Brussels will continue to make headlines and may lead to unexpected twists and turns ahead of the U.S. mid-term elections. It is encouraging, however, that the U.S. and Mexico reached a preliminary agreement to the North-American Free Trade Agreement (NAFTA). While any tariffs will probably have a dampening effect, we believe global growth looks set to remain above potential for some time to come, as stronger U.S. growth should compensate for a slowdown in Europe, Japan and several emerging markets. From our vantage point, neither a significant decline in growth nor a recession is on the cards right now. This is an argument in favor of equity investments. Generally speaking, concerns about an escalating trade war are likely to weigh more on equities from export-oriented economies which are well integrated into global supply chains and less on U.S. equities. The European Central Bank and the Fed are likely to stick to their monetary policies.
Average Annual Total Return for the period ended September 30, 2018
| | | | | | | | | | |
| | | | | 1 Year | | | Since Inception† | |
| | | AllianzGI Best Styles U.S. Equity Fund Class A | | | 16.96% | | | | 10.82% | |
| | AllianzGI Best Styles U.S. Equity Fund Class A (adjusted) | | | 10.53% | | | | 9.20% | |
| | | AllianzGI Best Styles U.S. Equity Fund Class C | | | 16.14% | | | | 10.01% | |
| | AllianzGI Best Styles U.S. Equity Fund Class C (adjusted) | | | 15.14% | | | | 10.01% | |
| | AllianzGI Best Styles U.S. Equity Fund Class P | | | 17.12% | | | | 10.98% | |
| | AllianzGI Best Styles U.S. Equity Fund Institutional Class | | | 17.17% | | | | 11.07% | |
| | AllianzGI Best Styles U.S. Equity Fund Class R6 | | | 17.25% | | | | 11.18% | |
| | S&P 500 Index | | | 17.91% | | | | 11.85% | |
| | | Lipper Multi-Cap Core Funds Average | | | 14.05% | | | | 8.98% | |
† The Fund began operations on December 1, 2014. Benchmark return comparisons began on the fund inception date. Lipper performance comparisons began on November 30, 2014.
Performance quoted represents past performance and is no guarantee of future results. Current performance may be lower or higher than performance shown. For performance current to the most recent month-end, visit our website at us.allianzgi.com. Investment return and the principal value will fluctuate. Shares may be worth more or less than original cost when redeemed. The adjusted returns take into account the maximum initial sales charge of 5.50% on Class A shares and the contingent deferred sales charge (CDSC) of 1% on Class C shares, which may apply to shares redeemed during the first year of ownership. Returns do not reflect deduction of taxes that a shareholder would pay on fund distributions or redemption of fund shares. See pages 111 and 112 for more information. The Fund’s gross expense ratios are 1.02% for Class A shares, 1.56% for Class C shares, 0.57% for Class P shares, 0.66% for Institutional Class shares and 0.56% for Class R6 shares. These ratios do not include an expense reduction, contractually guaranteed through at least January 31, 2019. The Fund’s expense ratios net of this reduction are 0.65% for Class A shares, 1.40% for Class C shares, 0.50% for Class P shares, 0.50% for Institutional Class shares and 0.40% for Class R6 shares. Expense ratio information is as of the Fund’s current prospectus dated February 1, 2018, as further revised or supplemented from time to time.
| | | | | | |
| | Annual Report | | | September 30, 2018 | | 33 |
Unaudited
AllianzGI Best Styles U.S. Equity Fund (cont’d)
Cumulative Returns Through September 30, 2018
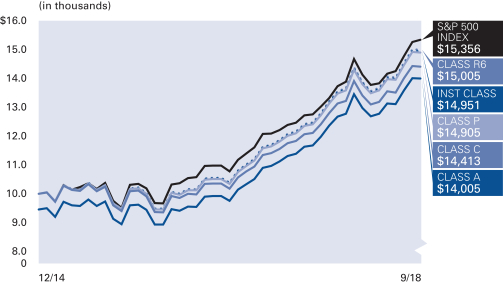
Industry Allocation (as of September 30, 2018)
| | | | |
| Software | | | 7.1% | |
| Health Care Providers & Services | | | 5.8% | |
| Technology Hardware, Storage & Peripherals | | | 5.6% | |
| Banks | | | 5.1% | |
| Pharmaceuticals | | | 4.4% | |
| Oil, Gas & Consumable Fuels | | | 4.4% | |
| Internet & Direct Marketing Retail | | | 4.2% | |
| Semiconductors & Semiconductor Equipment | | | 4.0% | |
| Other | | | 58.1% | |
| Cash & Equivalents — Net | | | 1.3% | |
| | | | | | | | | | |
| Shareholder Expense Example | | Actual Performance |
| | | Class A | | Class C | | Class P | | Institutional
Class | | Class R6 |
| Beginning Account Value (4/1/18) | | $1,000.00 | | $1,000.00 | | $1,000.00 | | $1,000.00 | | $1,000.00 |
| Ending Account Value (9/30/18) | | $1,104.00 | | $1,100.20 | | $1,104.50 | | $1,105.30 | | $1,105.40 |
| Expenses Paid During Period | | $3.43 | | $7.37 | | $2.64 | | $2.64 | | $2.11 |
| �� | | | | | | | | | | |
| | | Hypothetical Performance |
| | | (5% return before expenses) |
| | | Class A | | Class C | | Class P | | Institutional
Class | | Class R6 |
| Beginning Account Value (4/1/18) | | $1,000.00 | | $1,000.00 | | $1,000.00 | | $1,000.00 | | $1,000.00 |
| Ending Account Value (9/30/18) | | $1,021.81 | | $1,018.05 | | $1,022.56 | | $1,022.56 | | $1,023.06 |
| Expenses Paid During Period | | $3.29 | | $7.08 | | $2.54 | | $2.54 | | $2.03 |
For each class of the Fund, expenses (net of fee waiver and reimbursement, if any) are equal to the annualized expense ratio for the class (0.65% for Class A, 1.40% for Class C, 0.50% for Class P, 0.50% for Institutional Class and 0.40% for Class R6), multiplied by the average account value over the period, multiplied by 183/365.
| | | | | | |
| 34 | | September 30, 2018 | | | Annual Report | | |
Unaudited
AllianzGI Convertible Fund
For the period of October 1, 2017, through September 30, 2018, as provided by Doug Forsyth, CFA, Portfolio Manager.
Fund Insights
For the twelve-month period ended September 30, 2018, Class A shares at net asset value (“NAV”) of the AllianzGI Convertible Fund (the “Fund”) returned 16.83%, outperforming the ICE BofA Merrill Lynch All Convertibles Index (the “benchmark”), which returned 12.15%.
Market Overview
The convertible bond market ended the twelve-month period higher, benefiting from equity market strength, while contending with bouts of stock market volatility and rising interest rates.
Convertibles weathered the spike in equity volatility from late January through early February better than stocks, providing greater downside protection during the stock market correction.
The 10-year U.S. Treasury note yield climbed from 2.33% to 3.06% over the reporting period. Long duration fixed income was adversely impacted whereas convertible’s reduced interest-rate sensitivity provided portfolio diversification benefits as Treasuries and investment-grade corporate bonds finished lower.
Company fundamentals continued to improve throughout the period with most issuers reporting better-than-expected financial results and positive outlooks. Managements cited strengthening fundamentals, increasing demand, a more favorable regulatory environment and tax-reform benefits.
The majority of U.S. economic reports were supportive for the high yield market. They demonstrated labor market strength, the highest consumer confidence level in 18 years, record small business optimism and a new cyclical high in manufacturing.
Given the robust economic backdrop and positive outlook, the U.S. Federal Reserve (the “Fed”) continued to reduce its balance sheet and, as expected, raised rates. The Fed funds rate ended at a range of 2.00% to 2.25%. The Federal Open Market Committee decision, communication and policy outlook were generally in-line with expectations.
Overseas uncertainty and geopolitics had a greater influence on international markets compared to US markets. Emerging market stress, Brexit fears, Italian debt concerns, trade talk headlines and the implementation of tariffs on Chinese imports weighed more heavily on foreign investment sentiment. Investors gravitated to the relative strength and safe haven perception of U.S. investments.
Against this backdrop, convertible new issuance was solid, bringing the 2018 year-to-date total to $46.3 billion.
Portfolio Review
The Fund gained along with the market for the twelve-month period and outperformed its benchmark.
The attribution for the period included several positive single-name performers from a variety of industries. The majority of the portfolio’s issuers exceeded earnings expectations, which contributed to absolute performance during the reporting period.
Sector allocations that helped relative performance in the period included technology, healthcare and energy. Positive credit selection was the primary driver of relative performance in all three sectors. Additionally, portfolio overweights in both technology and healthcare were beneficial.
Sector allocations that hurt relative performance during the period included consumer discretionary, transportation and consumer staples. In consumer discretionary, the portfolio underperformed the peer group. In transportation, a portfolio overweight was the primary source of weakness. In consumer staples, issue selection and a portfolio underweight detracted.
Outlook
We believe the U.S. economy remains healthy. In our view, growth is supported by elevated consumer and business confidence, low unemployment, favorable lending conditions, government spending growth and tax cuts. In addition, corporate profits are estimated to grow significantly in 2018.
Convertible performance expectations should not deviate from their historical return profile of 1) delivering a compelling total return with less volatility than stocks and 2) providing fixed-income diversification benefits in rising interest-rate environments compared to U.S. Treasuries and investment-grade corporate bonds.
| | | | | | |
| | Annual Report | | | September 30, 2018 | | 35 |
Unaudited
AllianzGI Convertible Fund (cont’d)
Average Annual Total Return for the period ended September 30, 2018
| | | | | | | | | | | | | | | | | | |
| | | | | 1 Year | | | 5 Year | | | 10 Year | | | Since Inception† | |
| | | AllianzGI Convertible Fund Class A | | | 16.83% | | | | 8.77% | | | | 10.75% | | | | 10.20% | |
| | AllianzGI Convertible Fund Class A (adjusted) | | | 10.40% | | | | 7.54% | | | | 10.12% | | | | 9.96% | |
| | | AllianzGI Convertible Fund Class C | | | 15.90% | | | | 7.97% | | | | 9.94% | | | | 9.39% | |
| | AllianzGI Convertible Fund Class C (adjusted) | | | 14.95% | | | | 7.97% | | | | 9.94% | | | | 9.39% | |
| | AllianzGI Convertible Fund Class R | | | 16.59% | | | | 8.38% | | | | 10.40% | | | | 9.90% | |
| | AllianzGI Convertible Fund Class P | | | 17.08% | | | | 9.04% | | | | 11.00% | | | | 10.44% | |
| | AllianzGI Convertible Fund Institutional Class | | | 17.10% | | | | 9.10% | | | | 11.09% | | | | 10.55% | |
| | | AllianzGI Convertible Fund Administrative Class | | | 16.88% | | | | 8.85% | | | | 10.81% | | | | 10.22% | |
| | ICE BofA Merrill Lynch All Convertibles Index | | | 12.15% | | | | 9.31% | | | | 11.00% | | | | 8.48% | |
| | | Lipper Conv. Securities Funds Average | | | 10.69% | | | | 7.46% | | | | 8.91% | | | | 6.89% | |
† The Fund began operations on April 19, 1993. Benchmark return comparisons began on the fund inception date. Lipper performance comparisons began on April 30,1993.
Performance quoted represents past performance and is no guarantee of future results. Current performance may be lower or higher than performance shown. For performance current to the most recent month-end, visit our website at us.allianzgi.com. Investment return and the principal value will fluctuate. Shares may be worth more or less than original cost when redeemed. The adjusted returns take into account the maximum initial sales charge of 5.50% on Class A shares and the contingent deferred sales charge (CDSC) of 1% on Class C shares, which may apply to shares redeemed during the first year of ownership. Returns do not reflect deduction of taxes that a shareholder would pay on fund distributions or redemption of fund shares. See pages 111 and 112 for more information. The Fund’s expense ratios are 1.02% for Class A shares, 1.69% for Class C shares, 1.42% for Class R shares, 0.72% for Class P shares, 0.68% for Institutional Class shares and 0.89% for Administrative Class shares. Expense ratio information is as of the Fund’s current prospectus dated February 1, 2018, as further revised or supplemented from time to time.
Cumulative Returns Through September 30, 2018
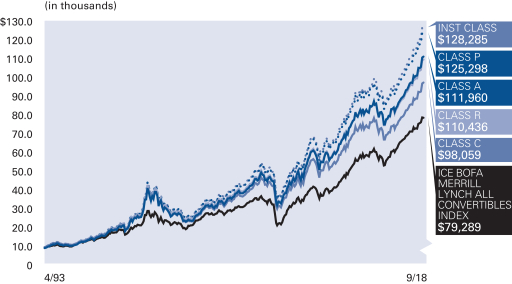
Industry Allocation (as of
September 30, 2018)
| | | | |
| Software | | | 13.3% | |
| Internet | | | 9.2% | |
| Semiconductors | | | 8.2% | |
| Biotechnology | | | 7.6% | |
| Pharmaceuticals | | | 6.8% | |
| Healthcare-Products | | | 5.5% | |
| Oil, Gas & Consumable Fuels | | | 4.2% | |
| Telecommunications | | | 3.9% | |
| Other | | | 37.7% | |
| Cash & Equivalents — Net | | | 3.6% | |
| | | | | | |
| 36 | | September 30, 2018 | | | Annual Report | | |
S&P Ratings* (as of September 30, 2018)
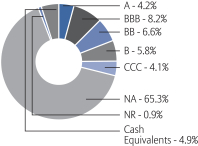
* As a percentage of total investments. Credit ratings refer to the underlying holdings of the Fund and are categorized from highest to lowest credit quality using ratings provided by S&P Global Ratings (“S&P”). S&P’s ratings have been selected for several reasons, including the portfolio managers’ usage of S&P ratings methodology among other credit quality information in managing the Fund, access to background information and other materials provided by S&P, as well as the Funds’ considerations of industry practice. The Fund also displays S&P credit ratings information in materials provided in client presentations. See “Important Information” for more detail on the selection of S&P for the Fund’s ratings presentation. Securities not rated by S&P and bonds that do not currently have a rating available are designated in the chart above as “NR” and “NA”, respectively.
Unaudited
AllianzGI Convertible Fund (cont’d)
| | | | | | | | | | | | |
| Shareholder Expense Example | | Actual Performance |
| | | Class A | | Class C | | Class R | | Class P | | Institutional
Class | | Administrative
Class |
| Beginning Account Value (4/1/18) | | $1,000.00 | | $1,000.00 | | $1,000.00 | | $1,000.00 | | $1,000.00 | | $1,000.00 |
| Ending Account Value (9/30/18) | | $1,100.80 | | $1,096.20 | | $1,100.70 | | $1,101.80 | | $1,101.90 | | $1,100.90 |
| Expenses Paid During Period | | $4.74 | | $8.99 | | $4.79 | | $3.90 | | $3.69 | | $4.90 |
| | | | | | | | | | | | | |
| | | Hypothetical Performance |
| | | (5% return before expenses) |
| | | Class A | | Class C | | Class R | | Class P | | Institutional
Class | | Administrative
Class |
| Beginning Account Value (4/1/18) | | $1,000.00 | | $1,000.00 | | $1,000.00 | | $1,000.00 | | $1,000.00 | | $1,000.00 |
| Ending Account Value (9/30/18) | | $1,020.56 | | $1,016.50 | | $1,020.51 | | $1,021.36 | | $1,021.56 | | $1,020.41 |
| Expenses Paid During Period | | $4.56 | | $8.64 | | $4.61 | | $3.75 | | $3.55 | | $4.71 |
For each class of the Fund, expenses are equal to the annualized expense ratio for the class (0.90% for Class A, 1.71% for Class C, 0.91% for Class R, 0.74% for Class P, 0.70% for Institutional Class and 0.93% for Administrative Class), multiplied by the average account value over the period, multiplied by 183/365.
| | | | | | |
| | Annual Report | | | September 30, 2018 | | 37 |
Unaudited
AllianzGI Core Bond Fund
From inception on May 30, 2018, through September 30, 2018, as provided by Carl W. Pappo Jr., CFA, Portfolio Manager.
Fund Insights
For the period from inception on May 30, 2018 through September 30, 2018, Institutional Class shares at net asset value (“NAV”) of the AllianzGI Core Bond Fund (the “Fund”) returned 0.13%, outperforming the Bloomberg Barclay’s U.S. Aggregate Bond Index (the “benchmark”), which returned -0.02%.
Market Overview
This past period was characterized by a moderate increase in interest rates, as the curve bear flattened, as the front end U.S. Treasury curve rose by 30 basis points and the longer end increased by 20 basis points. The increase in rates was partially offset by steady demand for spread product, as asset backed securities produced 30 basis points of excess returns and corporate bonds produced 168 basis points of excess returns. Higher overall yields contributed to a modest amount of demand for high quality assets, as they benefited from “all in yield investors” getting long. U.S. economic growth continued to show resiliency and further increases in the benchmark interest rate of the U.S. Federal Reserve (the “Fed”) were priced in during the third quarter. Two economic releases that contributed to this backdrop were the second quarter gross domestic product figures coming in above 4% and the July Core PCE going just above 2% in July (the first reading above 2% since 2012). The search for yield continues as investors continue to support spread sectors. The quarter saw $277 Billion in corporate new issuance price.
Portfolio Review
Absolute performance was barely positive this past period as a strong economy and the Fed rate increases have both factored into a moderate rise in interest rates. Moderate excess returns were achieved through overweights to structured assets, primarily high quality asset backed and small business association securities. In addition to benefiting from the carry advantage of our structured asset allocations, the strategy also added excess returns through security selection within our credit allocation.
Outlook
The flattening of the U.S. Treasury curve and recent increases in interest rates seems to be warranted as economic growth has picked up and the Fed has been signaling further tightening into 2019. We do not foresee any major changes in U.S. consumer demand or corporate fundamentals, both would appear to be steady but corporate fundamentals have been declining at a modest pace for a prolonged period. We believe valuations are stretched, demand has remained strong for spread sectors, and we are positioned conservatively with respect to credit risk. During the third quarter the Fund reduced its credit exposure by .5 years, this represented taking down its allocation to corporate bonds across the board. The Fund continues to favor financials and floating rate securities; in our view financials benefit from strong fundamentals and the rise in rates will be very supportive of financials top line and floaters will benefit as their coupons reset every three months. The Fund’s positioning in higher quality securities was increased during the third quarter as it purchased U.S. Treasuries (this allocation now represents 27% of the portfolio), and very high quality asset backed securities with the proceeds of its corporate bond sales.
Cumulative Total Return for the period ended September 30, 2018
| | | | | | |
| | | | | Since Inception† | |
| | AllianzGI Core Bond Fund Institutional Class | | | 0.13% | |
| | AllianzGI Core Bond Fund Class P | | | 0.11% | |
| | AllianzGI Core Bond Fund Class R6 | | | 0.15% | |
| | Bloomberg Barclays U.S. Aggregate Bond Index | | | –0.02% | |
| | | Lipper Core Bond Funds Average | | | –0.03% | |
† The Fund began operations on May 30, 2018. Benchmark return comparisons began on the fund inception date. Lipper performance comparisons began on May 31, 2018.
Performance quoted represents past performance and is no guarantee of future results. Current performance may be lower or higher than performance shown. For performance current to the most recent month-end, visit our website at us.allianzgi.com. Investment return and the principal value will fluctuate. Shares may be worth more or less than original cost when redeemed. Returns do not reflect deduction of taxes that a shareholder would pay on funds distributions or redemption of fund shares. See pages 111 and 112 for more information. The Fund’s gross expense ratios are 1.29% for Institutional Class shares, 1.34% for Class P shares and 1.24% for Class R6 shares. These ratios do not include an expense reduction, contractually guaranteed through at least January 31, 2022. The Fund’s expense ratios net of this reduction are 0.25% for Institutional Class shares, 0.30% for Class P shares and 0.20% for Class R6 shares. Expense ratio information is as of the Fund’s current prospectus dated March 7, 2018, as further revised or supplemented from time to time.
| | | | | | |
| 38 | | September 30, 2018 | | | Annual Report | | |
Unaudited
AllianzGI Core Bond Fund (cont’d)
Cumulative Returns Through September 30, 2018
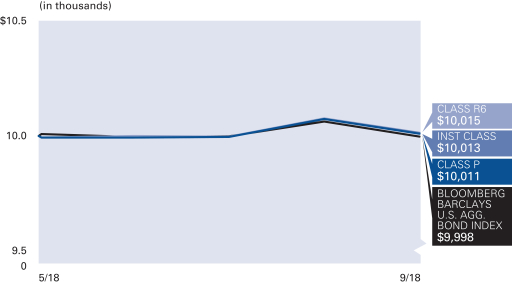
Asset Allocation (as of September 30, 2018)
| | | | |
| U.S. Government Agency Securities | | | 32.9% | |
| U.S. Treasury Obligations | | | 27.7% | |
| Asset-Backed Securities | | | 25.7% | |
| Corporate Bonds & Notes | | | 22.6% | |
| Mortgage-Backed Securities | | | 3.2% | |
| Sovereign Debt Obligations | | | 2.0% | |
| Cash & Equivalents — Net | | | –14.1% | |
Credit Ratings* (as of September 30, 2018)
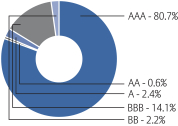
* As a percentage of total investments. Credit ratings apply to the credit worthiness of the issuers of the underlying securities and not to the Fund or its shares. Ratings are subject to change. Ratings are based off of the highest available rating from S&P Global Ratings (“S&P”), Moody’s and Fitch. Bonds not rated by the aforementioned agencies are “unrated”. Ratings are shown based on the S&P rating scale, which ranges from AAA (highest) to D (lowest). Where applicable, securities ratings of an agency other than S&P have been converted to the S&P equivalent. “NR” denotes securities that are not rated. Not rated securities do not necessarily indicate low quality. Ratings are relative, subjective and not absolute standards of quality, and represent the opinions of the independent Nationally Recognized Statistical Rating Organizations (NRSRO). The security’s credit rating does not eliminate risk. The Fund is not rated by an independent rating agency.
| | | | | | |
| Shareholder Expense Example | | Actual Performance |
| | | Class P | | Institutional
Class | | R6 |
| Beginning Account Value (5/30/18) | | $1,000.00 | | $1,000.00 | | $1,000.00 |
| Ending Account Value (9/30/18) | | $1,001.10 | | $1,001.30 | | $1,001.50 |
| Expenses Paid During Period | | $1.01 | | $0.84 | | $0.67 |
| | | | | | | |
| | | Hypothetical Performance |
| | | (5% return before expenses) |
| | | Class P | | Institutional
Class | | R6 |
| Beginning Account Value (4/1/18) | | $1,000.00 | | $1,000.00 | | $1,000.00 |
| Ending Account Value (9/30/18) | | $1,023.56 | | $1,023.82 | | $1,024.07 |
| Expenses Paid During Period | | $1.52 | | $1.27 | | $1.01 |
The Fund commenced operations on May 30, 2018. The Actual expense example is based on the period since inception; the Hypothetical expense example is based on the period beginning April 1, 2018. If the Hypothetical expense example had been based on the period since inception, the Ending Account Value and Expenses Paid During Period would have been: $1,015.84 and $1.02, respectively, for Class P; $1,016.01 and $0.85, respectively, for Institutional Class; $1,016.18 and $0.68, respectively, for Class R6.
For each class of the Fund, expenses (net of fee waiver and reimbursement, if any) are equal to the annualized expense ratio for the class (0.30% for Class P ,0.25% for Institutional Class and 0.20% for Class R6), multiplied by the average account value over the period, multiplied by 123/365 for the Actual example and 183/365 for the Hypothetical expense example.
| | | | | | |
| | Annual Report | | | September 30, 2018 | | 39 |
Unaudited
AllianzGI Core Plus Bond Fund
From inception on May 30, 2018, through September 30, 2018, as provided by Carl W. Pappo Jr., CFA, Portfolio Manager.
Fund Insights
For the period from inception on May 30, 2018 through September 30, 2018, Institutional Class shares at net asset value (“NAV”) of the AllianzGI Core Plus Bond Fund (the “Fund”) returned 0.20%, outperforming the Bloomberg Barclay’s U.S. Aggregate Bond Index (the “benchmark”), which returned -0.02%.
Market Overview
This past period was characterized by a steady increase in interest rates, as the curve bear flattened, the front end of the U.S. Treasury curve rose by 30 basis points and the longer end increase by 20 basis points. The increase in rates was partially offset by steady demand for spread product, as asset backed securities produced 30 basis points of excess returns and corporate bonds produced 168 basis points of excess returns. Higher overall yields contributed to a modest amount of demand for high quality assets, as the benefited from “all in yield investors” getting long. U.S. economic growth continued to show resiliency and further increases in the benchmark interest rate of the U.S. Federal Reserve (the “Fed”) were priced in during the third quarter. Two economic releases that contributed to this backdrop were the second quarter GDP figures coming in above 4% and the July Core PCE going just above 2% in July (the first reading above 2% since 2012). The search for yield continues as investors continue to support spread sectors, the quarter saw $277 Billion in corporate new issuance priced.
Portfolio Review
Absolute performance was barely positive this past period as a strong economy and the Fed rate increases have both factored into a moderate rise in interest rates. Moderate excess returns were achieved through overweights to structured assets, primarily high quality asset backed and small business association securities. In addition to benefiting from the carry advantage of our structured asset allocations, the strategy also added excess returns through security selection within our credit allocation.
Outlook
The flattening of the U.S. Treasury curve and recent increases in interest rates, seems to be warranted as economic growth has certainly picked up and the Fed has been signaling further tightening into 2019. We do not foresee any major changes in U.S. consumer demand or corporate fundamentals, both would appear to be steady but corporate fundamentals have been declining at a modest pace for a prolonged period. We believe valuations are stretched, although demand has still been strong for spread sectors, and we are positioned conservatively with respect to credit risk. During the third quarter the Fund reduced its credit exposure modestly, as the Fund added to its underweight in high yield, as valuations look stretched. The Fund continues to favor financials and floating rate securities; in our view financials benefit from strong fundamentals and the rise in rates will be very supportive of financials top line and floaters will benefit as their coupons reset every three months. The Fund’s positioning in higher quality securities was increased during the third quarter as it added U.S. Treasuries (this allocation now represents 22% of the portfolio), and very high quality asset backed securities with the proceeds of its corporate bond sales.
Cumulative Total Return for the period ended September 30, 2018
| | | | | | |
| | | | | Since Inception† | |
| | AllianzGI Core Plus Bond Fund Institutional Class | | | 0.20% | |
| | AllianzGI Core Plus Bond Fund Class P | | | 0.18% | |
| | AllianzGI Core Plus Bond Fund Class R6 | | | 0.22% | |
| | Bloomberg Barclays U.S. Aggregate Bond Index | | | –0.02% | |
| | | Lipper Core Plus Bond Funds Average | | | 0.18% | |
† The Fund began operations on May 30, 2018. Benchmark return comparisons began on the fund inception date. Lipper performance comparisons began on May 31, 2018.
Performance quoted represents past performance and is no guarantee of future results. Current performance may be lower or higher than performance shown. For performance current to the most recent month-end, visit our website at us.allianzgi.com. Investment return and the principal value will fluctuate. Shares may be worth more or less than original cost when redeemed. Returns do not reflect deduction of taxes that a shareholder would pay on funds distributions or redemption of fund shares. See pages 111 and 112 for more information. The Fund’s gross expense ratios are 1.21% for Institutional Class shares, 1.26% for Class P shares and 1.16% for Class R6 shares. These ratios do not include an expense reduction, contractually guaranteed through at least January 31, 2022. The Fund’s expense ratios net of this reduction are 0.30% for Institutional Class shares, 0.35% for Class P shares and 0.25% for Class R6 shares. Expense ratio information is as of the Fund’s current prospectus dated March 7, 2018, as further revised or supplemented from time to time.
| | | | | | |
| 40 | | September 30, 2018 | | | Annual Report | | |
Unaudited
AllianzGI Core Plus Bond Fund (cont’d)
Cumulative Returns Through September 30, 2018
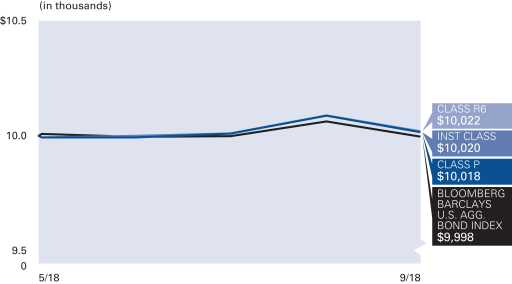
Asset Allocation (as of September 30, 2018)
| | | | |
| U.S. Government Agency Securities | | | 33.5% | |
| Corporate Bonds & Notes | | | 28.5% | |
| Asset-Backed Securities | | | 25.6% | |
| U.S. Treasury Obligations | | | 19.8% | |
| Mortgage-Backed Securities | | | 3.2% | |
| Sovereign Debt Obligations | | | 1.9% | |
| Cash & Equivalents — Net | | | –12.5% | |
Credit Ratings* (as of September 30, 2018)
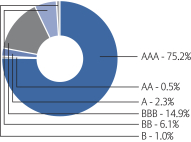
* As a percentage of total investments. Credit ratings apply to the credit worthiness of the issuers of the underlying securities and not to the Fund or its shares. Ratings are subject to change. Ratings are based off of the highest available rating from S&P Global Ratings (“S&P”), Moody’s and Fitch. Bonds not rated by the aforementioned agencies are “unrated”. Ratings are shown based on the S&P rating scale, which ranges from AAA (highest) to D (lowest). Where applicable, securities ratings of an agency other than S&P have been converted to the S&P equivalent. “NR” denotes securities that are not rated. Not rated securities do not necessarily indicate low quality. Ratings are relative, subjective and not absolute standards of quality, and represent the opinions of the independent Nationally Recognized Statistical Rating Organizations (NRSRO). The security’s credit rating does not eliminate risk. The Fund is not rated by an independent rating agency.
| | | | | | |
| Shareholder Expense Example | | Actual Performance |
| | | Class P | | Institutional
Class | | R6 |
| Beginning Account Value (5/30/18) | | $1,000.00 | | $1,000.00 | | $1,000.00 |
| Ending Account Value (9/30/18) | | $1,001.80 | | $1,002.00 | | $1,002.20 |
| Expenses Paid During Period | | $1.18 | | $1.01 | | $0.84 |
| | | | | | | |
| | | Hypothetical Performance |
| | | (5% return before expenses) |
| | | Class P | | Institutional
Class | | R6 |
| Beginning Account Value (4/1/18) | | $1,000.00 | | $1,000.00 | | $1,000.00 |
| Ending Account Value (9/30/18) | | $1,023.31 | | $1,023.56 | | $1,023.82 |
| Expenses Paid During Period | | $1.78 | | $1.52 | | $1.27 |
The Fund commenced operations on May 30, 2018. The Actual expense example is based on the period since inception; the Hypothetical expense example is based on the period beginning April 1, 2018. If the Hypothetical expense example had been based on the period since inception, the Ending Account Value and Expenses Paid During Period would have been: $1,015.67 and $1.19, respectively, for Class P; $1,015.84 and $1.02, respectively, for Institutional Class; $1,016.01 and $0.85, respectively, for Class R6.
For each class of the Fund, expenses (net of fee waiver and reimbursement, if any) are equal to the annualized expense ratio for the class (0.35% for Class P, 0.30% for Institutional Class and 0.25% for Class R6), multiplied by the average account value over the period, multiplied by 123/365 for the Actual example and 183/365 for the Hypothetical expense example.
| | | | | | |
| | Annual Report | | | September 30, 2018 | | 41 |
Unaudited
AllianzGI Emerging Markets Consumer Fund
For the period of October 1, 2017 through September 30, 2018, as provided by Lu Yu, CFA, CIPM, Portfolio Manager.
Fund Insights
For the twelve-month period ended September 30, 2018, Class A shares, at Net Asset Value (“NAV”) of the AllianzGI Emerging Markets Consumer Fund (the “Fund”) returned -7.04%, underperforming the MSCI Emerging Markets Index (the “benchmark”), which returned -0.81%.
Market Overview
Emerging market equities were impacted by moderating investor sentiment, which resulted in higher levels of asset class volatility.
The benchmark advanced in the initial four months of the reporting period, as positive momentum from 2017 spurred demand for the asset class, with projections of higher earnings growth and an attractive valuation level leading to an increase in asset flows. Performance reversed course beginning in February, as volatility increased amid apprehension over a global trade war, the impact from mounting geopolitical tensions in Russia, as well as concerns of rising inflation expectations which could lead the U.S. Federal Reserve to accelerate rate hikes. As a result, emerging market currencies broadly declined relative to the U.S. dollar and earnings estimates were subsequently lowered. These headwinds persisted throughout the remainder of the reporting period, with July being the only positive monthly performance to counteract this trend.
Country results were mixed, with 10 of 24 benchmark countries advancing. Qatar was the top performer with a greater than 25% advance due to energy demand, followed by a 15% advance in Thailand due to strong growth expectations. Meanwhile, Turkey retreated 41% as the lira came under renewed selling pressure after the U.S. imposed sanctions and market participants questioned the country’s central bank independence. Pakistan and the Philippines were lower by a more modest 20% and 15%, respectively. Sector results were led by energy stocks, which rallied nearly 27% due to global demand for oil and gas, followed by a 10% gain in health care and an 8% advance in materials. Conversely, real estate was lower by 15%, followed by declines in consumer discretionary and communication services sectors.
Portfolio Review
The Fund’s performance compared to its benchmark was primarily the result of sector allocation decisions, given the strategic focus on consumer-related segments which trailed their non-consumer-related counterparts during the reporting period.
The exclusion of the energy sector, the top benchmark performer, was the primary source of underperformance. A relative overweight allocation and stock selection in consumer discretionary names detracted from performance, as did bottom-up stockpicking in consumer staples and health care sectors. Conversely, bottom-up stock selection in financials and real estate was additive to performance relative to the benchmark index. From a country standpoint stockpicking in South Korea, China and Russia detracted from results. Meanwhile, emerging markets consumer-related stocks in the United States and Japan contributed to performance, as did an overweight allocation to Thailand and stock selection in Turkey.
Outlook
Emerging market sentiment has been challenged in recent months following uncertainty over global trade and rising currency pressures in light of a strengthening U.S. dollar. We view these headwinds as transitory in nature, although volatility may persist in the short-term until there is tariff and trade certainty. In our opinion, now may be an attractive buying opportunity for investors, as the price-to-earnings ratio is at its lowest level in three years and the asset class is projected to be back on pace for double-digit earnings growth in the next two calendar years. Longer-term, our belief in the consumer-related theme and benefits from rising wages, favorable demographics and an expanding middle class is unwavered.
We continue to construct our strategy on a bottom-up basis with conviction at the stock level. In addition, we apply a dual risk-budget, targeting a tracking error of 5-10% and lower forecast risk than the benchmark, which may help protect capital during inevitable down market periods and provide our clients with a greater level of return consistency. We believe investment results will be supported by earnings growth in consumer-related stocks and that our behavioral finance-focused investment process and focus on higher quality securities with attractive company fundamentals will be a driver of returns for the coming quarters.
| | | | | | |
| 42 | | September 30, 2018 | | | Annual Report | | |
Unaudited
AllianzGI Emerging Markets Consumer Fund (cont’d)
Average Annual Total Return for the period ended September 30, 2018
| | | | | | | | | | |
| | | | | 1 Year | | | Since Inception† | |
| | | AllianzGI Emerging Markets Consumer Fund Class A | | | –7.04% | | | | –0.24% | |
| | AllianzGI Emerging Markets Consumer Fund Class A (adjusted) | | | –12.15% | | | | –1.70% | |
| | AllianzGI Emerging Markets Consumer Fund Institutional Class | | | –6.69% | | | | 0.12% | |
| | MSCI Emerging Markets Index | | | –0.81% | | | | 4.10% | |
| | | Lipper Emerging Markets Funds Average | | | –3.96% | | | | 1.95% | |
† The Fund began operations on December 1, 2014. Benchmark return comparisons began on the fund inception date. Lipper performance comparisons began on November 30, 2014.
Performance quoted represents past performance and is no guarantee of future results. Current performance may be lower or higher than performance shown. For performance current to the most recent month-end, visit our website at us.allianzgi.com. Investment return and the principal value will fluctuate. Shares may be worth more or less than original cost when redeemed. The adjusted returns take into account the maximum initial sales charge of 5.50% on Class A shares. Returns do not reflect deduction of taxes that a shareholder would pay on fund distributions or redemption of fund shares. See pages 111 and 112 for more information. The Fund’s gross expense ratios are 16.84% for Class A shares and 1.64% for Institutional Class shares. These ratios do not include an expense reduction, contractually guaranteed through at least January 31, 2019. The Fund’s expense ratios net of this reduction are 1.55% for Class A shares and 1.20% for Institutional Class shares. Expense ratio information is as of the Fund’s current prospectus dated February 1, 2018, as further revised or supplemented from time to time.
Cumulative Returns Through September 30, 2018
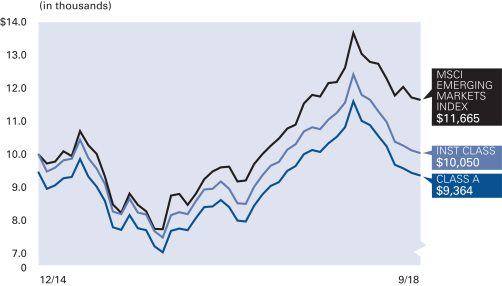
Country Allocation (as of September 30, 2018)
| | | | |
| China | | | 27.4% | |
| Korea (Republic of) | | | 14.3% | |
| Taiwan | | | 12.7% | |
| India | | | 8.5% | |
| United States | | | 8.3% | |
| Thailand | | | 6.3% | |
| Brazil | | | 4.0% | |
| Japan | | | 3.7% | |
| Other | | | 14.1% | |
| Cash & Equivalents — Net | | | 0.7% | |
| | | | | | |
| | Annual Report | | | September 30, 2018 | | 43 |
Unaudited
AllianzGI Emerging Markets Consumer Fund (cont’d)
| | | | |
| Shareholder Expense Example | | Actual Performance |
| | | Class A | | Institutional
Class |
| Beginning Account Value (4/1/18) | | $1,000.00 | | $1,000.00 |
| Ending Account Value (9/30/18) | | $859.40 | | $861.40 |
| Expenses Paid During Period | | $7.22 | | $5.60 |
| | | | | |
| | | Hypothetical Performance |
| | | (5% return before expenses) |
| | | Class A | | Institutional
Class |
| Beginning Account Value (4/1/18) | | $1,000.00 | | $1,000.00 |
| Ending Account Value (9/30/18) | | $1,017.30 | | $1,019.05 |
| Expenses Paid During Period | | $7.84 | | $6.07 |
For each class of the Fund, expenses (net of fee waiver and reimbursement, if any) are equal to the annualized expense ratio for the class (1.55% for Class A and 1.20% for Institutional Class), multiplied by the average account value over the period, multiplied by 183/365.
| | | | | | |
| 44 | | September 30, 2018 | | | Annual Report | | |
Unaudited
AllianzGI Emerging Markets Debt Fund
For the period of October 1, 2017 through September 30, 2018, as provided by the AllianzGI Emerging Markets Debt Team.
Fund Insights
For the twelve-month period ended September 30, 2018, Class A shares at net asset value (“NAV”) of the AllianzGI Emerging Markets Debt Fund (the “Fund”) returned -5.62%, underperforming the JPM EMBI Global Diversified USD* (the “benchmark”), which returned -1.92%.
Portfolio Review
Over the reporting period, the emerging markets hard currency sovereign and corporate debt significantly outperformed the local currency debt universe. The brunt of the losses in local currency markets stemmed from the foreign exchange component of the index. In local currency terms, the index was up 1.06%, whereas the US dollar based index returned -7.40%. During the reporting period, the Fund’s weightings were increasingly skewed toward hard currency assets. The Fund’s weighting to local currency markets began the reporting period at approximately 10.9% and closed the reporting period at 0.1% (source: BB Port and IPMS). These active efforts to reduce local currency exposure were made as the fund transitioned to being managed to a 100% EMBIG-D benchmark in the latter half of the reporting period. The Fund’s Local Currency and Foreign Exchange (“LCFX”) position did detract from performance during the period, however, as volatility stemming from Argentina and Turkey impaired liquidity, making it difficult to dispose of certain positions in the secondary market.
During the reporting period, rising rates and US Treasuries led to increased volatility and weakness in risk markets. The front end of the curve (2yr UST) rose by 134 basis points. The 5yr and 10yr treasuries rose by 102 basis points and 72 basis points, respectively. The 30yr part of the curve performed best, rising by 35 basis points through September 2018 end. Against this backdrop, the spread of the sovereign (EMBIG-D) index widened by 15 basis points, and the shorter duration corporate (CEMBI-BD) index widened by 50 basis points.
During the first six months of the reporting period, both hard and local currency saw inflows to their asset classes. Flows to the hard currency asset class were negative during each month of the second quarter 2018, and proved more volatile in the third quarter 2018, seeing inflows during July, outflows in August and inflows, again, in September. Outflows were retail driven and totalled -$2.7bn during the final six months of the reporting period. Local currency outflows (also retail driven) totalled -$3.1bn during the final six months of the reporting period. Sentiment and negative returns in the local currency market were driven by outsized down trades in Argentina (-62.1%) and Turkey (-49.4%) during the reporting period. Negative sentiment spilled over into the broader LCFX markets with Brazil (-16.5%), Uruguay (-15.3%) and Indonesia (-10.9%), being the next worst performers.
Oil (+43.7%) and iron ore (+6.7%) traded positively during the period, though copper (-5.1%) and Zinc (-16.8%) trended down. Brent closed September at US$82.72/bbl. Despite the strength in oil and iron ore, the Middle East and Latin America were the worst performing regions in the hard currency (EMBIG-D) index, followed by Asia and Europe. Zambia, Lebanon, and Turkey fared worst in CEEMEA. Venezuela, Argentina and Costa Rica were the worst performers in LATAM. Despite Zambia’s performance, Africa was the best performing region during the twelve-month period, declining by -0.5%, with Angola being the top performing country in the region.
On a return basis, corporate bonds fared better than sovereigns during the reporting period. However, corporates with hard currency liabilities versus local currency revenues were punished in geographies such as Turkey (-9.7%) and Argentina (-7.6%). Oil rich Iraq (+16.9%) provided the top returning corporates during the reporting period. While robust during the first quarter of 2018, corporate issuance took a pause from first quarter levels in the second quarter and third quarter 2018, owing to underlying volatility in the markets and seasonally light summer trends. Within the Fund, corporate positioning was reduced the final six months of the period as the fund transitioned to being managed to the EMBIG-D index, declining from a weighting of 44.3% at March 29, 2018 and closing September with a weight of 2.2% (sources: Bloomberg PORT and IPMS).
Within hard currency sovereigns, the investment grade component of the EMBIG-D outperformed riskier assets, returning a negative -0.80% during the twelve-month period ended September 29, 2018, whereas the high yield component returned a negative -3.17%. On a regional basis, the Middle East and Latin America were the worst performers (-3.1% a piece) followed by Asia and Europe (-1.1% each) and Africa (-0.5%).
Within the Fund’s sovereign holdings, during the first six months of the reporting period, CEEMEA provided the greatest source of Alpha with Nigeria, Ukraine and Egypt topping returns. The LATAM region yielded flat returns, with gains in quasi-sovereigns being effectively offset by losses in sovereigns. Argentina was the biggest drag on returns, as the pace of reforms slowed and investors, who were caught in crowded longs, reduced positions.
Within the Fund, in the closing six months of the reporting period, relative to the JPM EMBIG-D, top detractors from performance on a country basis included Argentina, Brazil, South Africa and Hungary. Top contributors on a country basis included Zambia, where we avoided exposure to the worst performing country in the index, and Angola where we were overweight the second best performer in Africa.
At the close of the reporting period (09/28/18) the Fund had an effective duration of 7.1yrs versus the benchmark at 6.6yrs. The portfolio yielded 5.70% versus the benchmark’s 5.77% and both the portfolio and benchmark had an average rating of BB+.
* Effective July 1, 2018, the JP Morgan Emerging Markets Bond Index Global Diversified (”JPM EMBI Global Diversified USD”) is the Fund’s primary benchmark.
| | | | | | |
| | Annual Report | | | September 30, 2018 | | 45 |
Unaudited
AllianzGI Emerging Markets Debt Fund (cont’d)
Average Annual Total Return for the period ended September 30, 2018
| | | | | | | | | | |
| | | | | 1 Year | | | Since Inception† | |
| | | AllianzGI Emerging Markets Debt Fund Class A | | | –5.62% | | | | 2.00% | |
| | AllianzGI Emerging Markets Debt Fund Class A (adjusted) | | | –9.16% | | | | 1.04% | |
| | AllianzGI Emerging Markets Debt Fund Class C | | | –6.30% | | | | 1.26% | |
| | | AllianzGI Emerging Markets Debt Fund Class C (adjusted) | | | –7.20% | | | | 1.26% | |
| | AllianzGI Emerging Markets Debt Fund Class P | | | –5.44% | | | | 2.16% | |
| | AllianzGI Emerging Markets Debt Fund Institutional Class | | | –5.34% | | | | 2.26% | |
| | JPM EMBI Global Diversified USD | | | –1.92% | | | | 4.15% | |
| | 40% JPM EMBI Global Diversified, 40% JPM CEMBI Broad Diversified, 20% JPM GBI-EM Index | | | –2.58% | | | | 2.76% | |
| | | Lipper Emerging Market Hard Currency Debt Funds Average | | | –4.01% | | | | 2.11% | |
† The Fund began operations on September 15, 2014. Benchmark return comparisons began on the fund inception date. Lipper performance comparisons began on September 30, 2014.
Performance quoted represents past performance and is no guarantee of future results. Current performance may be lower or higher than performance shown. For performance current to the most recent month-end, visit our website at us.allianzgi.com. Investment return and the principal value will fluctuate. Shares may be worth more or less than original cost when redeemed. The adjusted returns take into account the maximum initial sales charge of 3.75% on Class A shares and the contingent deferred sales charge (CDSC) of 1% on Class C shares, which may apply to shares redeemed during the first year of ownership. Returns do not reflect deduction of taxes that a shareholder would pay on fund distributions or redemption of fund shares. See pages 111 and 112 for more information. The Fund’s gross expense ratios are 1.51% for Class A shares, 2.26% for Class C shares, and 1.19% for Class P shares and 1.20% shares for Institutional Class shares. These ratios do not include an expense reduction, contractually guaranteed through at least January 31, 2020. The Fund’s expense ratios net of this reduction are 1.05% for Class A shares,1.80% for Class C shares, 0.90% for Class P shares and 0.80% for Institutional Class shares. Expense ratio information is as of the Fund’s current prospectus dated February 1, 2018, as further revised or supplemented from time to time.
Cumulative Returns Through September 30, 2018
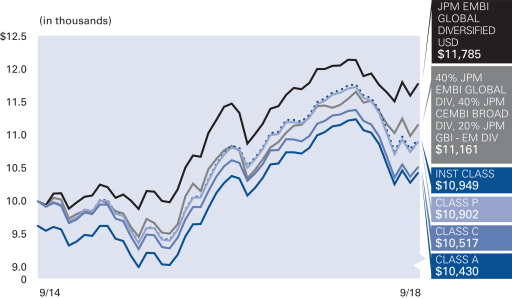
Country Allocation (as of September 30, 2018)
| | | | |
| Mexico | | | 5.7% | |
| Ukraine | | | 4.2% | |
| Indonesia | | | 4.0% | |
| Colombia | | | 3.7% | |
| Russian Federation | | | 3.4% | |
| Philippines | | | 3.3% | |
| Angola | | | 3.0% | |
| Kazakhstan | | | 2.8% | |
| Other | | | 64.0% | |
| Cash & Equivalents — Net | | | 5.9% | |
| | | | | | |
| 46 | | September 30, 2018 | | | Annual Report | | |
Unaudited
AllianzGI Emerging Markets Debt Fund (cont’d)
Moody’s Ratings* (as of September 30, 2018)

* As a percentage of total investments. Credit ratings refer to the underlying holdings of the Fund and are categorized from highest to lowest credit quality using ratings provided by Moody’s. Moody’s ratings have been selected for several reasons, including the access to information and materials provided by Moody’s, as well as the Fund’s consideration of industry practice. See “Important Information” for more detail on the selection of Moody’s for the Fund’s ratings presentation. Securities not rated by Moody’s and bonds that do not currently have a rating available are designated in the chart above as “NR” and “NA”, respectively.
| | | | | | |
| | Annual Report | | | September 30, 2018 | | 47 |
| | | | | | | | | | | | | | | | |
| Shareholder Expense Example | | Actual Performance | |
| | | Class A | | | Class C | | | Class P | | | Institutional
Class | |
| Beginning Account Value (4/1/18) | | | $1,000.00 | | | | $1,000.00 | | | | $1,000.00 | | | | $1,000.00 | |
| Ending Account Value (9/30/18) | | | $944.30 | | | | $941.60 | | | | $945.70 | | | | $946.40 | |
| Expenses Paid During Period | | | $5.85 | | | | $9.35 | | | | $4.88 | | | | $4.44 | |
| | | | | | | | | | | | | | | | |
| | | Hypothetical Performance | |
| | | (5% return before expenses) | |
| | | Class A | | | Class C | | | Class P | | | Institutional
Class | |
| Beginning Account Value (4/1/18) | | | $1,000.00 | | | | $1,000.00 | | | | $1,000.00 | | | | $1,000.00 | |
| Ending Account Value (9/30/18) | | | $1,019.05 | | | | $1,015.44 | | | | $1,020.05 | | | | $1,020.51 | |
| Expenses Paid During Period | | | $6.07 | | | | $9.70 | | | | $5.06 | | | | $4.61 | |
For each class of the Fund, expenses (net of fee waiver and reimbursement, if any) are equal to the annualized expense ratio for the class (1.20% for Class A, 1.92% for Class C, 1.00% for Class P and 0.91% for Institutional Class), multiplied by the average account value over the period, multiplied by 183/365.
Unaudited
AllianzGI Emerging Markets Small-Cap Fund
For the period of October 1, 2017 through September 30, 2018, as provided by Kunal Ghosh, Portfolio Manager.
Fund Insights
For the twelve-month period ended September 30, 2018, Class A shares, at net asset value (“NAV”), of the AllianzGI Emerging Markets Small-Cap Fund (the “Fund”) returned -2.72%, outperforming the MSCI Emerging Markets Small-Cap Index (the “benchmark”), which returned -4.20%.
Market Overview
Emerging market equities were impacted by moderating investor sentiment, which resulted in higher levels of asset class volatility, particularly for small-cap shares.
The benchmark advanced in the initial four months of the reporting period, as positive momentum from 2017 spurred demand for the asset class, with projections of higher earnings growth and an attractive valuation level leading to an increase in asset flows. Performance reversed course beginning in February, as volatility increased amid apprehension over a global trade war, the impact from mounting geopolitical tensions in Russia, as well as concerns of rising inflation expectations which could lead the U.S. Federal Reserve to accelerate rate hikes. As a result, emerging market currencies broadly declined relative to the US dollar and earnings estimates were subsequently lowered. These headwinds persisted throughout the remainder of the reporting period, with July being the only positive monthly performance to counteract this trend.
Country results were mostly lower, with 7 of 24 benchmark index countries advancing. South Korea was the top performer with a greater than 16% gain, followed by low-single-digit advances in Thailand and Taiwan. Meanwhile, Peru declined more than 41% due to stock-specific impacts as the country only has three small-cap names in the benchmark index, while Turkey retreated 34% as the lira came under renewed selling pressure after the U.S. imposed sanctions and market participants questioned the country’s central bank independence. Sectors were broadly lower, with health care the only sector to advance, posting a greater than 23% gain thanks to significant outperformance in life science tools & services and biotechnology industries. Meanwhile, communication services, utilities and industrials each posted double-digit losses for the reporting period.
Portfolio Review
The Fund outpaced its benchmark thanks to a combination of bottom-up stock selection and positive country and sector allocation decisions.
During the reporting period, consumer discretionary was the top performer, due primarily to selections in the textile, apparel & luxury goods industry, followed by bottom-up stock selection in information technology and financials sectors. Conversely, a relative underweight to the healthcare sector, by far the top benchmark performer, offset results as did selections in utilities. From a country standpoint, India contributed significantly to results thanks to strong stockpicking, followed by selections in Brazil and Russia. Meanwhile, more conservative stock selection in South Korea offset results as did an overweight allocation and selections within Poland.
Outlook
Emerging market sentiment has been challenged in recent months following uncertainty over global trade and rising currency pressures in light of a strengthening U.S. dollar. We view these headwinds as transitory in nature, although volatility may persist in the short-term until there is tariff and trade certainty. In our opinion, now may be an attractive buying opportunity for investors, as the price-to-earnings ratio is at its lowest level in three years and the asset class is projected to be back on pace for double-digit earnings growth in the next two calendar years. Furthermore, emerging market small-cap equities continue to remain attractive due to higher levels of asset class inefficiencies and greater alpha potential.
We continue to construct the Fund on a bottom-up basis with conviction at the stock level. In addition, we apply a dual risk-budget, targeting a tracking error of 4-6% and lower forecast risk than the benchmark, which may help protect capital during inevitable down market periods and provide our clients with a greater level of return consistency. We believe investment results will be supported by earnings growth and our behavioral finance-focused investment process and focus on higher quality securities with attractive company fundamentals will be a driver of returns for the coming quarters.
Average Annual Total Return for the period ended September 30, 2018
| | | | | | | | | | |
| | | | | 1 Year | | | Since Inception† | |
| | | AllianzGI Emerging Markets Small-Cap Fund Class A | | | –2.72% | | | | 5.08% | |
| | AllianzGI Emerging Markets Small-Cap Fund Class A (adjusted) | | | –8.07% | | | | 3.54% | |
| | AllianzGI Emerging Markets Small-Cap Fund Institutional Class | | | –2.38% | | | | 5.44% | |
| | MSCI Emerging Markets Small-Cap Index | | | –4.20% | | | | 2.57% | |
| | | Lipper Emerging Markets Funds Average | | | –3.96% | | | | 1.95% | |
† The Fund began operations on December 1, 2014. Benchmark return comparisons began on the fund inception date. Lipper performance comparisons began on November 30, 2014.
Performance quoted represents past performance and is no guarantee of future results. Current performance may be lower or higher than performance shown. For performance current to the most recent month-end, visit our website at us.allianzgi.com. Investment return and the principal value will fluctuate. Shares may be worth more or less than original cost when redeemed. The adjusted returns take into account the maximum initial sales charge of 5.50% on Class A shares. Returns do not reflect deduction of taxes that a shareholder would pay on fund distributions or redemption of fund shares. See pages 111 and 112 for more information. The Fund’s gross expense ratios are 15.72% for Class A shares and 3.38% for Institutional Class shares. These ratios do not include an expense reduction, contractually guaranteed through at least January 31, 2019. The Fund’s expense ratios net of this reduction are 1.85% for Class A shares and 1.50% for Institutional Class shares. Expense ratio information is as of the Fund’s current prospectus dated February 1, 2018, as further revised or supplemented from time to time.
| | | | | | |
| 48 | | September 30, 2018 | | | Annual Report | | |
Unaudited
AllianzGI Emerging Markets Small-Cap Fund (cont’d)
Cumulative Returns Through September 30, 2018
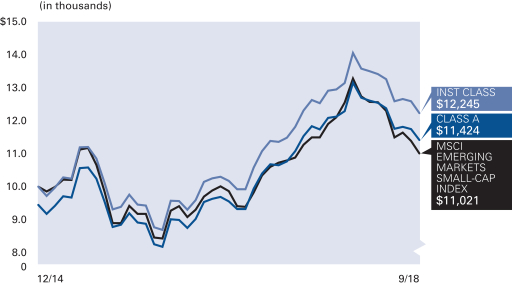
Country Allocation (as of September 30, 2018)
| | | | |
| Taiwan | | | 19.1% | |
| India | | | 15.6% | |
| Korea (Republic of) | | | 15.0% | |
| China | | | 10.8% | |
| Thailand | | | 7.8% | |
| Brazil | | | 5.6% | |
| Russian Federation | | | 4.4% | |
| Turkey | | | 3.5% | |
| Other | | | 17.1% | |
| Cash & Equivalents — Net | | | 1.1% | |
| | | | |
| Shareholder Expense Example | | Actual Performance |
| | | Class A | | Institutional
Class |
| Beginning Account Value (4/1/18) | | $1,000.00 | | $1,000.00 |
| Ending Account Value (9/30/18) | | $904.70 | | $905.80 |
| Expenses Paid During Period | | $8.83 | | $7.17 |
| | | | | |
| | | Hypothetical Performance |
| | | (5% return before expenses) |
| | | Class A | | Institutional
Class |
| Beginning Account Value (4/1/18) | | $1,000.00 | | $1,000.00 |
| Ending Account Value (9/30/18) | | $1,015.79 | | $1,017.55 |
| Expenses Paid During Period | | $9.35 | | $7.59 |
For each class of the Fund, expenses (net of fee waiver and reimbursement, if any) are equal to the annualized expense ratio for the class (1.85% for Class A and 1.50% for Institutional Class), multiplied by the average account value over the period, multiplied by 183/365.
| | | | | | |
| | Annual Report | | | September 30, 2018 | | 49 |
Unaudited
AllianzGI Europe Equity Dividend Fund
For the period of October 1, 2017 through September 30, 2018, as provided by Christian McCormick, Senior European Inter-Regional Product Specialist.
Fund Insights
For the twelve-month period ended September 30, 2018, Class A shares at net asset value (“NAV”) of the AllianzGI Europe Equity Dividend Fund (the “Fund”) returned -1.33%, underperforming the MSCI Europe Index (Net) (the “benchmark”), which returned -0.30%.
Market Overview
European equities closed the twelve-month period with modest gains (in EUR terms), although they lagged many other developed markets. European stocks reached a peak in mid-January, buoyed by broad optimism over the outlook for the global economy and company earnings. However, growing concerns over a trade dispute with the U.S. caused shares to suffer a sharp setback. While they later recovered some of these losses, European equities failed to regain January’s highs due in part to heightened political risks: Catalonia voted for independence from Spain and Italy’s elections resulted in an anti-establishment coalition government that potentially set it on a confrontational path with the EU.
The European economy ended 2017 on a strong note, but activity slowed sharply in 2018. September’s flash European composite purchasing managers’ index matched the 18-month low reached in May, dragged lower by weaker manufacturing activity and stagnant exports. The survey also revealed that business optimism was hovering near two-year lows, while new orders fell to a two-year low and firms remained reluctant to take on new staff. Headline inflation accelerated, rising to 2.1% in September compared to just 1.1% in February, but core inflation remained close to 1.0%. The European Central Bank (“ECB”) confirmed it would continue with plans to halve its monthly bond purchases starting in October as the uncertainty surrounding the inflation outlook was “receding” but stressed that interest rates would remain on hold until “at least Mid 2019”.
UK equities rallied (in GBP terms), delivering solid gains as a fall in the British pound boosted the overseas earnings of multinational companies. Economic data indicated that the economy was performing better than many had expected but sentiment towards UK assets continued to be affected by Brexit-related uncertainty, with Prime Minister Theresa May’s “Chequers proposals” receiving a cool response from EU leaders.
Portfolio Review
In this environment, the Fund gained in value and outperformed its market segment during the period. Stock selection was the main driver of the active performance. Strongest contributions came from selection within financials, communication services and energy.
Sector positioning resulted in a negative contribution mainly driven by the overweight in communication services and financials and the underweight in information technology. Positive contribution was achieved by the overweight in energy. Country positioning also had a negative impact on relative performance due to the overweight in Spain and Italy and the underweight in Sweden. Positive impacts were gained by the overweight in Norway and the underweight in Belgium and Germany. On single stock basis, the positions in Tui, BP, Scor, Fortum and Logista were the most meaningful contributors to performance. The overweight of ING, KPN, Imperial Brands, Atlantia and BT were the most significant detractors from performance.
In the recent months the Fund reduced its exposure to European banks where the environment remains unfavorable and in turn increased positions in Insurance and in particular reinsurance on expectations of better pricing and investment returns due to rising interest rates. In the third quarter 2018, we exited German specialty chemicals provider Evonik and mobile communications company Vodafone and significantly cut the Fund’s position in the Norwegian telecom incumbent Telenor—all on valuation grounds. The proceeds were used to add to Deutsche Telekom where we see operating upside both in Europe and in the U.S. The Fund sold its position in Atlantia due to low business visibility after the tragic Genoa bridge collapse. The Fund initiated a position in Standard Life Aberdeen, one of the UK’s largest active investment managers, and also bought shares of Anheuser-Busch Inbev, the largest brewer in the world. Sector-wise, exposure has increased in energy, real estate and consumer staples. Weights declined in consumer discretionary and industrials.
Outlook
European equity indices once again started to lag their U.S. counterparts over the course of the summer, and investors have been steadily moving away from Europe for most of the year. Yet Europe is a region with solid growth, strong macroeconomic data and many healthy companies trading at a discount—which, in our view, makes worries about Europe appear overdone.
However, although second quarter economic growth hit a soft patch, primarily due to France and Italy, Eurozone gross domestic product (“GDP”) growth is expected to remain above potential at around 2% this year. This should support local stock markets. Household consumption in the Eurozone—which accounts for well above 50% of GDP—is set to remain a key driver of Europe’s ongoing solid economic performance. Solid domestic demand has also shielded Europe from the impact of trade tensions so far.
Sentiment indicators in Europe recently started to stabilise following a period of a bit too much enthusiasm. With political and geopolitical issues taking their toll, business and consumer confidence moved lower but stayed solidly in expansionary territory. It appears that the moderation in sentiment reflects a growing sense of uncertainty and concerns over protectionism but not outright pessimism by businesses. The hiring activity of corporates remains strong, contradicting any bearish view.
Because Europe is a very open economy, we believe the region and its stock markets get hit hard when investors worry about global trade or emerging market issues. Yet some of the concerns around these issues appear overdone, with the market frequently deciding to shoot first and ask questions later.
We continue to believe that a dividend focussed approach to Europe has its attractions. Yields in Europe are high, confirming the discount applied to European stocks. In our view, there is an undue neglect of companies with well-supported dividend payments that even offer potential for growth. Modestly rising interest rates and a continued, gentle economic expansion make the value side of Europe appealing. Such an environment, in our view, typically translates into better earnings for example for Financials companies, many of which are strong dividend payers. Ongoing restructuring efforts by European energy companies can translate into strong cash generation and dividends.
While large parts of the global stock markets trade on elevated valuations despite recent volatility, we believe Europe remains attractively priced. Investors should of course be prepared for even more noise and volatility in the run-up to the mid-term elections in the U.S. We believe buying good European companies at good prices may be able to shield investors from some of this impact. In a world driven by high-tech flash, consider using Europe’s substance and value to balance an otherwise growth- and tech-biased portfolio.
| | | | | | |
| 50 | | September 30, 2018 | | | Annual Report | | |
Unaudited
AllianzGI Europe Equity Dividend Fund (cont’d)
Average Annual Total Return for the period ended September 30, 2018
| | | | | | | | | | |
| | | | | 1 Year | | | Since Inception† | |
| | | AllianzGI Europe Equity Dividend Fund Class A | | | –1.33% | | | | 3.79% | |
| | AllianzGI Europe Equity Dividend Fund Class A (adjusted) | | | –6.76% | | | | 2.20% | |
| | | AllianzGI Europe Equity Dividend Fund Class C | | | –2.00% | | | | 3.03% | |
| | AllianzGI Europe Equity Dividend Fund Class C (adjusted) | | | –2.96% | | | | 3.03% | |
| | AllianzGI Europe Equity Dividend Fund Class P | | | –1.17% | | | | 3.93% | |
| | AllianzGI Europe Equity Dividend Fund Institutional Class | | | –1.01% | | | | 4.07% | |
| | MSCI Europe Index (Net) | | | –0.30% | | | | 4.56% | |
| | | Lipper International Equity Income Funds Average | | | –0.72% | | | | 3.66% | |
† The Fund began operations on February 2, 2015. Benchmark return comparisons began on the fund inception date. Lipper performance comparisons began on January 31, 2015.
Performance quoted represents past performance and is no guarantee of future results. Current performance may be lower or higher than performance shown. For performance current to the most recent month-end, visit our website at us.allianzgi.com. Investment return and the principal value will fluctuate. Shares may be worth more or less than original cost when redeemed. The adjusted returns take into account the maximum initial sales charge of 5.50% on Class A shares and the contingent deferred sales charge (CDSC) of 1% on Class C shares, which may apply to shares redeemed during the first year of ownership. Returns do not reflect deduction of taxes that a shareholder would pay on fund distributions or redemption of fund shares. See pages 111 and 112 for more information. The Fund’s gross expense ratios are 5.63% for Class A shares, 6.66% for Class C shares, 5.31% for Class P shares and 5.69% for Institutional Class shares. These ratios do not include an expense reduction, contractually guaranteed through at least January 31, 2019. The Fund’s expense ratios net of this reduction are 1.20% for Class A shares, 1.95% for Class C shares, 1.05% for Class P shares and 0.95% for Institutional Class shares. Expense ratio information is as of the Fund’s current prospectus dated February 1, 2018, as further revised or supplemented from time to time.
Cumulative Returns Through September 30, 2018
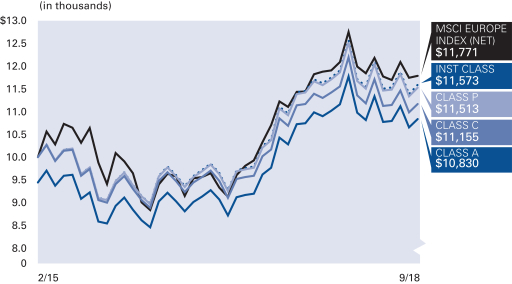
Country Allocation (as of September 30, 2018)
| | | | |
| United Kingdom | | | 34.6% | |
| France | | | 21.6% | |
| Germany | | | 12.6% | |
| Netherlands | | | 8.5% | |
| Spain | | | 7.8% | |
| Italy | | | 7.5% | |
| Switzerland | | | 4.4% | |
| Norway | | | 2.2% | |
| Other | | | 1.7% | |
| Cash & Equivalents — Net | | | –0.9% | |
| | | | | | |
| | Annual Report | | | September 30, 2018 | | 51 |
Unaudited
AllianzGI Europe Equity Dividend Fund (cont’d)
| | | | | | | | |
| Shareholder Expense Example | | Actual Performance |
| | | Class A | | Class C | | Class P | | Institutional
Class |
| Beginning Account Value (4/1/18) | | $1,000.00 | | $1,000.00 | | $1,000.00 | | $1,000.00 |
| Ending Account Value (9/30/18) | | $1,001.70 | | $998.40 | | $1,002.20 | | $1,003.20 |
| Expenses Paid During Period | | $6.02 | | $9.77 | | $5.27 | | $4.77 |
| | | | | | | | | |
| | | Hypothetical Performance |
| | | (5% return before expenses) |
| | | Class A | | Class C | | Class P | | Institutional
Class |
| Beginning Account Value (4/1/18) | | $1,000.00 | | $1,000.00 | | $1,000.00 | | $1,000.00 |
| Ending Account Value (9/30/18) | | $1,019.05 | | $1,015.29 | | $1,019.80 | | $1,020.31 |
| Expenses Paid During Period | | $6.07 | | $9.85 | | $5.32 | | $4.81 |
For each class of the Fund, expenses (net of fee waiver and reimbursement, if any) are equal to the annualized expense ratio for the class (1.20% for Class A, 1.95% for Class C, 1.05% for Class P and 0.95% for Institutional Class), multiplied by the average account value over the period, multiplied by 183/365.
| | | | | | |
| 52 | | September 30, 2018 | | | Annual Report | | |
Unaudited
AllianzGI Global Dynamic Allocation Fund
For the period of October 1, 2017 through September 30, 2018, as provided by the Multi-Asset US Group.
Fund Insights
For the twelve-month period ended September 30, 2018, Class A shares at net asset value of the AllianzGI Global Dynamic Allocation Fund (the “Fund”) returned 2.93% underperforming the MSCI ACWI (the “benchmark”), which returned 9.77%.
Market Overview
At the start of the period, political developments in the U.S. and Japan helped drive returns for global equities. The passage of the US tax reform in late December drove US equities on the hope that the lower corporate tax rate would result in higher capital investment and provide a further boost to economic growth. Japanese equities rallied after Prime Minister Shinzo Abe’s victory in snap elections in October was perceived as a mandate for him to continue with his market-friendly policies. However, political outcomes in the euro zone, including a failure to resolve the question of Catalonia’s secession from Spain and Angela Merkel’s failure to establish a coalition government by year-end, led to declines in European equities. Macroeconomic and policy uncertainty led to several new themes including (i) a re-emergence of volatility, (ii) renewed vigilance about the possibility of creeping inflation and (iii) revised forecasts for the pace and magnitude of Fed rate hikes.
In March, these factors, combined with the looming threat of a global trade war between the U.S. and its major trading partners weighed on markets. While the trade war rhetoric receded for the most part in April, it returned in late May with the U.S. administration imposing tariffs on steel and aluminum imports from the EU, Canada and Mexico. Since June, slower growth in world trade, among other factors, contributed to a loss in momentum in economic activity across advanced economies. The U.S., however, remained ahead of the pack of major economies in terms of growth.
Overall for the period, after touching peaks in January most equity markets suffered corrections in February and March and then rallied to finish the period with strongly positive returns. Global equities returned more than 9.0% (MSCI ACWI) while U.S. equities (MSCI U.S.) returned nearly two times the global equity return. Among the worst performers for the period were equities in emerging markets—especially in local terms in markets where currencies depreciated strongly—as well as in Europe. Within the US, large cap stocks outperformed small cap stocks and growth outperformed value. US government bonds and global sovereign bonds each finished down. Monetary policy continued to tighten in developed economies. In total, the U.S. Federal Reserve raised rates four times, while the Bank of England raised rates twice. While rates remained on hold in other developed economies, the European Central Bank announced it would end its bond-buying program by the end of 2018 and the Bank of Japan gave itself more flexibility by expanding its target for the 10-year bond yield. In contrast, several emerging markets raised rates as they sought to stem currency weakness.
Portfolio Review
The positive contributors to performance were overweight positions in U.S. and Japanese equities, mortgage REITs, preferred securities and leveraged loans. The main detractors were underweight exposure in European equities in March and April 2018, an underweight and selection in U.S. high yield, an overweight and selection in emerging market debt, an overweight in MLPs and opportunistic allocations to Italian government bonds. With core bond positions, the overall effect on active performance was slightly positive, as negative contributions from overweight positions in U.S. Treasuries were offset by positive contributions from underlying active strategies such as PIMCO Income, AllianzGI Real Estate Debt and AllianzGI Short Duration High Income. The Fund has met its objective of distributing an attractive level of income, having had a distribution yield of 7.3% over the last 12 months.
Outlook
Recognizing that the expansion in global growth that started in mid-2016 may have peaked in some major economies, we are focused on the sources of further downside risks. Such risks include escalation in trade and diplomatic tensions between the U.S. and China, persistently higher oil prices, currency volatility weighing on vulnerable emerging markets and a more abrupt tightening in financial market conditions in major economies, among others.
We believe that U.S. equities remain the most attractive of developed market equities in the near term. In Europe, in light of the deteriorating macro backdrop, we continue to expect fiscal policy uncertainty in the periphery and the prospect of further tightening in monetary policy to weigh on European equities. We anticipate challenges for broad emerging markets equities and debt but see opportunities to differentiate within the asset class. The returns to fixed income assets in recent months have been almost invariably negative and we see limited prospect of a significant broad turnaround—especially given the trend of rising global inflation, rising interest rates globally and a still-healthy global growth dynamic. Again, however, we believe opportunities exist to differentiate among sovereign bonds. We remain constructive on the U.S. dollar versus major developed currencies as of the end of the period.
| | | | | | |
| | Annual Report | | | September 30, 2018 | | 53 |
Unaudited
AllianzGI Global Dynamic Allocation Fund (cont’d)
Average Annual Total Return for the period ended September 30, 2018
| | | | | | | | | | | | | | |
| | | | | 1 Year | | | 5 Year | | | Since Inception† | |
| | | AllianzGI Global Dynamic Allocation Fund Class A | | | 2.93% | | | | 4.25% | | | | 9.26% | |
| | AllianzGI Global Dynamic Allocation Fund Class A (adjusted) | | | –2.73% | | | | 3.07% | | | | 8.61% | |
| | | AllianzGI Global Dynamic Allocation Fund Class C | | | 2.09% | | | | 3.44% | | | | 8.44% | |
| | AllianzGI Global Dynamic Allocation Fund Class C (adjusted) | | | 1.12% | | | | 3.44% | | | | 8.44% | |
| | AllianzGI Global Dynamic Allocation Fund Class R | | | 2.49% | | | | 3.94% | | | | 8.98% | |
| | AllianzGI Global Dynamic Allocation Fund Class P | | | 3.08% | | | | 4.42% | | | | 9.46% | |
| | AllianzGI Global Dynamic Allocation Fund Institutional Class | | | 3.18% | | | | 4.52% | | | | 9.57% | |
| | AllianzGI Global Dynamic Allocation Fund Class R6 | | | 3.19% | | | | 4.60% | | | | 9.67% | |
| | | AllianzGI Global Dynamic Allocation Fund Administrative Class | | | 2.93% | | | | 4.26% | | | | 9.30% | |
| | MSCI ACWI | | | 9.77% | | | | 8.67% | | | | 11.95% | |
| | Bloomberg Barclays U.S. Aggregate Bond Index | | | –1.22% | | | | 2.16% | | | | 3.43% | |
| | 60% MSCI ACWI, 40% Bloomberg Barclays US Aggregate Bond Index | | | 5.35% | | | | 6.15% | | | | 8.71% | |
| | | Lipper Alternative Global Macro Funds Average | | | 2.33% | | | | 2.69% | | | | 6.11% | |
† The Fund began operations on April 27, 2009. Benchmark return comparisons began on the fund inception date. Lipper performance comparisons began on April 30, 2009.
Performance quoted represents past performance and is no guarantee of future results. Current performance may be lower or higher than performance shown. For performance current to the most recent month-end, visit our website at us.allianzgi.com. Investment return and the principal value will fluctuate. Shares may be worth more or less than original cost when redeemed. The adjusted returns take into account the maximum initial sales charge of 5.50% on Class A shares and the contingent deferred sales charge (CDSC) of 1% on Class C shares, which may apply to shares redeemed during the first year of ownership. Returns do not reflect deduction of taxes that a shareholder would pay on fund distributions or redemption of fund shares. See pages 111 and 112 for more information. The Fund’s gross expense ratios are 1.38% for Class A shares, 2.11% for Class C shares, 1.73% for Class R shares, 1.14% for Class P shares, 1.06% for Institutional Class shares, 1.02% for Class R6 shares and 1.28% for Administrative Class shares. These ratios do not include an expense reduction, contractually guaranteed through at least January 31, 2019. The Fund’s expense ratios net of this reduction are 1.00% for Class A shares, 1.77% for Class C shares, 1.37% for Class R shares, 0.83% for Class P shares, 0.73% for Institutional Class shares, 0.73% for Class R6 shares and 0.98% for Administrative Class shares. Expense ratio information is as of the Fund’s current prospectus dated February 1, 2018, as further revised or supplemented from time to time.
Cumulative Returns Through September 30, 2018
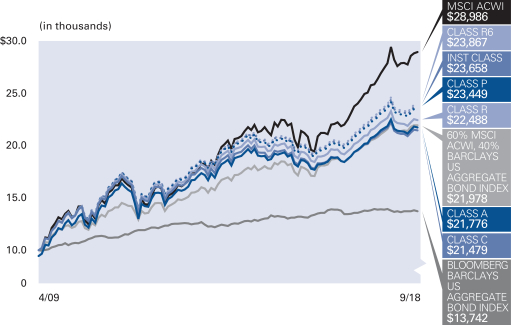
Country Allocation (as of September 30, 2018 )
| | | | |
| United States | | | 54.5% | |
| Japan | | | 6.4% | |
| Canada | | | 4.2% | |
| United Kingdom | | | 3.8% | |
| China | | | 3.1% | |
| France | | | 2.9% | |
| Germany | | | 2.2% | |
| Korea (Republic of) | | | 2.2% | |
| Other | | | 21.0% | |
| Cash & Equivalents — Net | | | –0.3% | |
| | | | | | |
| 54 | | September 30, 2018 | | | Annual Report | | |
Unaudited
AllianzGI Global Dynamic Allocation Fund (cont’d)
| | | | | | | | | | | | | | |
| Shareholder Expense Example | | Actual Performance |
| | | Class A | | Class C | | Class R | | Class P | | Institutional
Class | | Class R6 | | Administrative
Class |
| Beginning Account Value (4/1/18) | | $1,000.00 | | $1,000.00 | | $1,000.00 | | $1,000.00 | | $1,000.00 | | $1,000.00 | | $1,000.00 |
| Ending Account Value (9/30/18) | | $1,015.10 | | $1,011.40 | | $1,013.20 | | $1,015.70 | | $1,016.60 | | $1,016.60 | | $1,015.60 |
| Expenses Paid During Period | | $4.90 | | $8.77 | | $6.76 | | $4.04 | | $3.54 | | $3.54 | | $4.80 |
| | | | | | | | | | | | | | | |
| | | Hypothetical Performance |
| | | (5% return before expenses) |
| | | Class A | | Class C | | Class R | | Class P | | Institutional
Class | | Class R6 | | Administrative
Class |
| Beginning Account Value (4/1/18) | | $1,000.00 | | $1,000.00 | | $1,000.00 | | $1,000.00 | | $1,000.00 | | $1,000.00 | | $1,000.00 |
| Ending Account Value (9/30/18) | | $1,020.21 | | $1,016.34 | | $1,018.35 | | $1,021.06 | | $1,021.56 | | $1,021.56 | | $1,020.31 |
| Expenses Paid During Period | | $4.91 | | $8.80 | | $6.78 | | $4.05 | | $3.55 | | $3.55 | | $4.81 |
For each class of the Fund, expenses (net of fee waiver and reimbursement, if any) are equal to the annualized expense ratio for the class (0.97% for Class A, 1.74% for Class C, 1.34% for Class R, 0.80% for Class P, 0.70% for Institutional Class, 0.70% for Class R6 and 0.95% for Administrative Class), multiplied by the average account value over the period, multiplied by 183/365. These expenses do not include the expenses of the investment companies in which the Fund invests, which are indirectly borne by Fund shareholders.
| | | | | | |
| | Annual Report | | | September 30, 2018 | | 55 |
Unaudited
AllianzGI Global High Yield Fund
For the period of October 1, 2017 through September 30, 2018, as provided by David Newman, Portfolio Manager.
Fund Insights
For the twelve-month period ended September 30, 2018, Institutional Class shares at net asset value (“NAV”) of the AllianzGI Global High Yield Fund (the “Fund”) returned 1.32%, underperforming the ICE BofA Merrill Lynch Global High Yield Constrained Index USD Hedged (the “benchmark”), which returned 2.09%.
Market Overview
The reporting period was marked with bouts of volatility primarily due to geopolitics (trade wars, the Italian election and a variety of idiosyncratic emerging market stories), concerns about flattening global yield curves and rising U.S. interest rates. The eventual passage of the tax bill in late December fueled a rally into the early 1st quarter of 2018. However, the optimism came to an abrupt halt in February when higher than expected wage and inflation data led to fears of a more aggressive interest rate hiking policy by the U.S. Federal Reserve (the “Fed”). Market volatility surged again in the latter half of March as the equity market priced in the potential impact of a trade war resulting from President Trump’s rhetoric on the imposition of tariffs, and this trade friction continued to be a source of volatility through the remainder of the period as additional tariffs were announced and the level of rhetoric ratcheted higher. During May, renewed political risks in Italy caused Euro peripheral bond markets to sell off with 2 year Italian yields briefly touching 2.77%, their highest levels since 2012, while 10 year Italian yields hit 3.16% before the market subsequently stabilised following the decision by Italy’s populist Five Star and the right-wing League to form a coalition government. Although there were four interest rate hikes by the Fed during the twelve-month reporting period, these were widely anticipated and long term rates generally remained in the 2.8-3.0% range after an initial move higher early in the period.
In this environment of rising rates, the global high yield market continued to be one of the top fixed income performers as fundamentals remained strong and companies continue to report solid earnings growth. By region, British Pound (“GBP”) denominated credit returned 4.18% (hedged to the U.S. dollar) and Euro (“EUR”)-denominated credit returned 3.34% (hedged to the U.S. dollar), outperforming the U.S. dollar credit return of 2.95% as yields rose in the U.S. and the market priced in additional Fed interest rate hikes for 2018 while the European Central Bank (“ECB”) and the Bank of England remained on hold. By contrast, emerging market issues produced a negative return of -1.56% as a strengthening USD and a variety of negative emerging market events (Turkey’s refinancing hurdles, Argentinian currency collapse and hawkish presidential polls in Brazil) reduced investor demand. The strength of the high yield market was also reflected as lower rated securities outperformed higher quality credits.
Portfolio Overview
In terms of the geographic selection within the portfolio, we have maintained a preference for EUR and GBP denominated holdings versus USD holdings which helped performance as financial conditions remain favorable in Europe due to the ECB maintaining a relatively accommodative monetary policy compared to the Fed. Specifically, European B rated issues in particular appear cheap compared to USD issues while GBP issuers trade cheap to EUR due to Brexit risks. However, during the third quarter we reduced our preference for EUR and GBP denominated holdings versus an underweight in USD holdings as the relative strength of the US economy, growing trade conflicts and Italian budget conflicts have been supportive of the US dollar and USD-denominated assets. Although, emerging market fundamentals are continuing to improve, we remain cautiously underweight in emerging markets at current levels, given the fundamental challenges and political uncertainty, which are likely to result in significant volatility.
Within credit ratings categories, an overweight position in B rated issues versus BB’s helped performance. We continue to maintain this exposure, as we view B’s to be sweet spot on the credit curve as it would benefit from a continuing global growth environment while providing a higher spread cushion in the event of rising interest rates when compared to BB which has a higher duration profile. However, during the most recent quarter we did reduce the size of our overweight in acknowledgement that the credit cycle may be peaking. During the period we moved from neutral to underweight among CCC issuers and have consistently been underweight in issuers rated below CCC.
In terms of sector allocations, our main overweights have been in leisure, capital goods and insurance, while our primary underweights have been in telecommunications, retail and media where underlying credit trends remain structurally challenged. Sector allocation had a positive contribution as overweights in consumer products and energy added value as oil prices recovered along with companies cutting costs to a much lower breakeven whereas our underweight in utilities and overweight in metals & mining detracted from performance.
Security selection among industries such as energy contributed positively to performance whereas issuer selection within cable/satellite, telecommunications and capital goods detracted performance. It is important to note that during a flat to rising interest rate environment, the higher carry sectors periodically outperform sectors with strong credit fundamentals. For example, wireless issuers performed well during the reporting period, as such, our underweight detracted from performance.
Outlook
As we enter the final quarter of the year, we believe the fundamentals of the high yield market remain positive. Expected default rates remain benign and below long term averages, while earnings momentum is strong and is supported by a growing global economy. However, we expect volatility to remain elevated due to the U.S. mid-term elections, Brexit negotiations, Italian politics taking the spotlight in Europe and on-going trade war rhetoric affecting sentiment. Against this backdrop we remain cautious and very selective in deploying credit risk. We prefer diversified non-cyclical businesses with stable operating profiles, and well-capitalised financials with prudent balance sheet management policies. We remain cautiously underweight in emerging markets at current levels, given the fundamental challenges and political uncertainty, although we do maintain a bias to reduce the underweight in countries where we have a positive view. Our base case scenario remains that we end the calendar year with a positive total return. However, the impact of a further quantitative easing unwind could potentially lead to short term spread widening which supports a conservative stance.
| | | | | | |
| 56 | | September 30, 2018 | | | Annual Report | | |
Unaudited
AllianzGI Global High Yield Fund (cont’d)
Average Annual Total Return for the period ended September 30, 2018
| | | | | | | | | | |
| | | | | 1 Year | | | Since Inception† | |
| | AllianzGI Global High Yield Fund Class P | | | 1.19% | | | | 2.91% | |
| | AllianzGI Global High Yield Fund Institutional Class | | | 1.32% | | | | 3.05% | |
| | ICE BofA Merrill Lynch Global High Yield Constrained Index USD Hedged | | | 2.09% | | | | 3.59% | |
| | | Lipper High Yield Funds Average | | | 2.27% | | | | 3.47% | |
† The Fund began operations on May 3, 2017. Benchmark return comparisons began on the fund inception date. Lipper performance comparisons began on April 30, 2017.
Performance quoted represents past performance and is no guarantee of future results. Current performance may be lower or higher than performance shown. For performance current to the most recent month-end, visit our website at us.allianzgi.com. Investment return and the principal value will fluctuate. Shares may be worth more or less than original cost when redeemed. Returns do not reflect deduction of taxes that a shareholder would pay on fund distributions or redemption of fund shares. See pages 111 and 112 for more information. The Fund’s gross expense ratios are 2.00% for Class P shares and 2.02% for Institutional Class shares. 2018, as further revised or supplemented from time to time. These ratios do not include an expense reduction, contractually guaranteed through at least January 31, 2019. The Fund’s expense ratios net of this reduction are 0.80% for Class P shares and 0.70% for Institutional Class shares. Expense ratio information is as of the Fund’s current prospectus dated February 1, 2018, as further revised or supplemented from time to time.
Cumulative Returns Through September 30, 2018
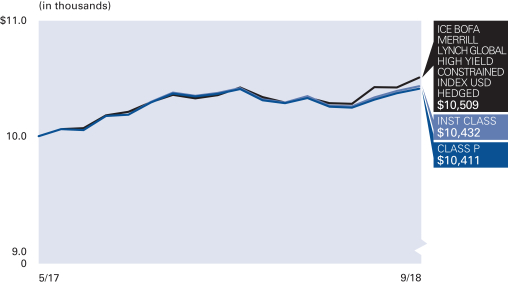
Country Allocation (as of September 30, 2018)
| | | | |
| United States | | | 57.2% | |
| United Kingdom | | | 6.8% | |
| Netherlands | | | 5.1% | |
| Canada | | | 4.5% | |
| Brazil | | | 3.8% | |
| France | | | 2.6% | |
| Italy | | | 2.4% | |
| Israel | | | 1.8% | |
| Other | | | 13.3% | |
| Cash & Equivalents — Net | | | 2.5% | |
Credit Ratings* (as of September 30, 2018)
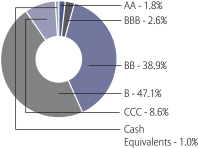
* As a percentage of total investments. Credit ratings apply to the credit worthiness of the issuers of the underlying securities and not to the Fund or its shares. Ratings are subject to change. Ratings are based off of the lowest available rating from S&P Global Ratings (“S&P”), Moody’s and Fitch. Bonds not rated by the aforementioned agencies are “unrated”. Ratings are shown based on the S&P rating scale, which ranges from AAA (highest) to D (lowest). Where applicable, securities ratings of an agency other than S&P have been converted to the S&P equivalent. “NR” denotes securities that are not rated. Not rated securities do not necessarily indicate low quality. Ratings are relative, subjective and not absolute standards of quality, and represent the opinions of the independent Nationally Recognized Statistical Rating Organizations (NRSRO). The security’s credit rating does not eliminate risk. The Fund is not rated by an independent rating agency. Previous shareholder reports for the Fund displayed bond ratings provided by S&P.
| | | | | | |
| | Annual Report | | | September 30, 2018 | | 57 |
Unaudited
AllianzGI Global High Yield Fund (cont’d)
| | | | |
| Shareholder Expense Example | | Actual Performance |
| | | Class P | | Institutional
Class |
| Beginning Account Value (4/1/18) | | $1,000.00 | | $1,000.00 |
| Ending Account Value (9/30/18) | | $1,012.40 | | $1,013.60 |
| Expenses Paid During Period | | $4.09 | | $3.58 |
| | | |
| | | Hypothetical Performance |
| | | (5% return before expenses) |
| | | Class P | | Institutional
Class |
| Beginning Account Value (4/1/18) | | $1,000.00 | | $1,000.00 |
| Ending Account Value (9/30/18) | | $1,021.01 | | $1,021.51 |
| Expenses Paid During Period | | $4.10 | | $3.60 |
For each class of the Fund, expenses (net of fee waiver and reimbursement, if any) are equal to the annualized expense ratio for the class (0.81% for Class P and 0.71% for Institutional Class), multiplied by the average account value over the period, multiplied 183/365.
| | | | | | |
| 58 | | September 30, 2018 | | | Annual Report | | |
Unaudited
AllianzGI Global Sustainability Fund
For the period of October 1, 2017 through September 30, 2018, as provided by the Global Equity Team.
Fund Insights
For the twelve-month period ended September 30, 2018, Class A shares at net asset value (“NAV”) of the AllianzGI Global Sustainability Fund (the”Fund”) returned 12.23%, outperforming the MSCI ACWI (the “benchmark”), which returned 9.77%.
Market Overview
Global equities have rallied strongly over the past twelve months. However, the MSCI World Index has yet to reach the dizzying heights attained in January after equities surged and subsequently corrected. Indeed, it is only since July that the index has managed to remain consistently above its December 2017 levels.
U.S. stocks have led the advance, surging to reach fresh highs, as tax cuts buoyed both economic activity and corporate earnings growth. Asian equities have also delivered robust gains, but returns in Europe and the emerging markets were more modest. This has been the result of both President Trump’s trade disputes and the regions’ diverging economic performance.
In terms of sectors, technology, consumer discretionary and energy stocks outperformed, while higher yielding, more defensive sectors, such as consumer staples, telecoms and utilities, lagged. The year has also seen a notable divergence among the popular FAANG stocks. While Apple and Amazon have become the first two companies to reach market capitalizations of 1 trillion USD, Netflix and social media stocks, like Facebook and Twitter, have underperformed peers.
Oil prices rallied, with Brent crude rising to a four-year high of over 82 USD a barrel. Industrials metals, such as copper, weakened, touching one-year lows, amid concerns that the trade war would exacerbate the slowdown in China. Gold prices also eased.
Portfolio Review
As is the strategy’s intention, stock selection has been the key driver of performance over the period, particularly in the information technology sector. Stock picking in health care has detracted from returns.
Visa has made the largest positive contribution to performance. The payments company has recorded three progressive quarters of revenue growth, coming in at 15% year on year in Q3 2018. This has been driven by impressive growth in the company’s international segment, as well as strong pricing power. Consequently, Visa has raised its forecast for full-year, earnings-per-share growth to over 30%. Lastly, shares in the company have been boosted by news that it is developing an online shopping button to simplify transactions and compete directly against the likes of Paypal. Overall, the company remains a core holding that continues to benefit from consumer spending trends and increased traction.
Microsoft has also boosted returns, thanks to consistently strong results. From a product standpoint, the company continues to introduce new products which deliver more value for customers and capture value for Microsoft. Management also has a considered approach towards balancing shareholder returns and pursuing prudent acquisitions, as it demonstrated with the acquisition of Bonsai AI, an industrial artificial intelligence start-up in June.
Covestro has been the biggest detractor for the Fund. The manufacturer of specialty plastics has been hit by concerns that it is ramping up capital expenditure at the same time that its key polyurethane products, MDI and TDI, are experiencing a pricing decline. And, while Asia and America appear to be posting solid growth, investor concerns are likely to increase as economic indicators show signs of slowing down. Even so, the company is still likely to post volume growth rather than an outright recession. More broadly, the industry’s oligopolistic market structure and move towards more value-add and high margin applications means pricing should remain resilient. In addition to Covestro’s ongoing share buybacks, the company looks overly discounted relative to peers.
Inditex has also eroded returns. The fashion retailer has struggled against severe currency headwinds as well as an unfavorable retail environment over the past twelve months. However, Inditex’s lower than expected cost growth suggests that they are not seeing margin pressure from the growth of online sales. Moreover, currency aside, the company continues to grow earnings at around 17%. The company still has plenty of room for growth and is well positioned for the long term.
Outlook
We believe that markets appear firmly set on the divergent paths established earlier this year. Yet there are signs of movement within this divergence.
In the U.S., market sentiment, in our view, is unerringly positive. September saw yet another record high for the S&P 500 index. But thanks to President Trump’s fiscal stimulus, this economic supremacy has coincided with progressive trade confrontation. We expect this rhetoric to ratchet up further until after November’s mid-term elections.
Equities in sectors heavily reliant on U.S. imports or with a large exposure to Chinese manufacturing like Autos and IT Hardware, are already suffering. In addition, European stocks are reflecting softer PMI numbers, which slipped to 53.2 in September from 54.6 in August. And, as Argentina and Turkey have shown, a strengthening U.S. dollar is putting still more pressure on vulnerable emerging-markets.
These dynamics are complicated further by rising inflation and expectations of tighter monetary policy. In the U.S., this is being driven by strong economic growth, with a fourth rate rise expected before the end of the year. Elsewhere, tariffs and rising oil prices are having the same effect.
As long-term investors, we buy companies on the basis of their ability to outgrow markets over the long-term, regardless of short-term economic cycles. However, there are companies in the portfolio which are more likely to outperform in a more reflationary, value-driven environment. As such, we are starting to reduce some of our best performing positions in favor of the latter.
| | | | | | |
| | Annual Report | | | September 30, 2018 | | 59 |
Unaudited
AllianzGI Global Sustainability Fund (cont’d)
Average Annual Total Return for the period ended September 30, 2018
| | | | | | | | | | |
| | | | | 1 Year | | | Since Inception† | |
| | | AllianzGI Global Sustainability Fund Class A | | | 12.23% | | | | 8.76% | |
| | AllianzGI Global Sustainability Fund Class A (adjusted) | | | 6.06% | | | | 7.16% | |
| | AllianzGI Global Sustainability Fund Class P | | | 12.44% | | | | 8.93% | |
| | AllianzGI Global Sustainability Fund Institutional Class | | | 12.52% | | | | 9.03% | |
| | MSCI ACWI | | | 9.77% | | | | 8.13% | |
| | Dow Jones Sustainability World Total Return Index | | | 7.49% | | | | 7.50% | |
| | | Lipper Global Large-Cap Growth Funds Average | | | 14.18% | | | | 9.27% | |
† The Fund began operations on December 9, 2014. Benchmark return comparisons began on the fund inception date. Lipper performance comparisons began on November 30, 2014.
Performance quoted represents past performance and is no guarantee of future results. Current performance may be lower or higher than performance shown. For performance current to the most recent month-end, visit our website at us.allianzgi.com. Investment return and the principal value will fluctuate. Shares may be worth more or less than original cost when redeemed. The adjusted returns take into account the maximum initial sales charge of 5.50% on Class A shares. Returns do not reflect deduction of taxes that a shareholder would pay on fund distributions or redemption of fund shares. See pages 111 and 112 for more information. The Fund’s gross expense ratios are 7.55% for Class A shares, 1.62% for Class P shares and 1.63% for Institutional Class shares. These ratios do not include an expense reduction, contractually guaranteed through at least January 31, 2019. The Fund’s expense ratios net of this reduction are 1.09% for Class A shares, 0.94% for Class P shares and 0.84% for Institutional Class shares. Expense ratio information is as of the Fund’s current prospectus dated February 1, 2018, as further revised or supplemented from time to time.
Cumulative Returns Through September 30, 2018
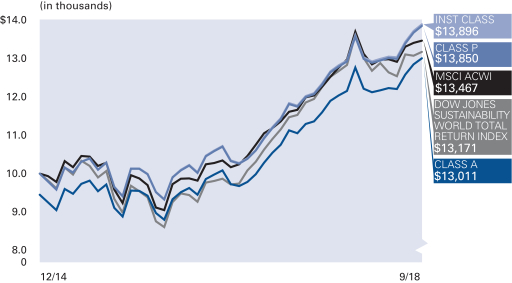
Country Allocation (as of September 30, 2018)
| | | | |
| United States | | | 51.3% | |
| United Kingdom | | | 13.6% | |
| Germany | | | 8.7% | |
| Japan | | | 5.0% | |
| Sweden | | | 4.6% | |
| Spain | | | 4.4% | |
| Switzerland | | | 2.9% | |
| France | | | 2.7% | |
| Other | | | 5.5% | |
| Cash & Equivalents — Net | | | 1.3% | |
| | | | | | |
| 60 | | September 30, 2018 | | | Annual Report | | |
Unaudited
AllianzGI Global Sustainability Fund (cont’d)
| | | | | | |
| Shareholder Expense Example | | Actual Performance |
| | | Class A | | Class P | | Institutional
Class |
| Beginning Account Value (4/1/18) | | $1,000.00 | | $1,000.00 | | $1,000.00 |
| Ending Account Value (9/30/18) | | $1,073.40 | | $1,074.20 | | $1,075.30 |
| Expenses Paid During Period | | $5.67 | | $4.89 | | $4.37 |
| | | | | | | |
| | | Hypothetical Performance |
| | | (5% return before expenses) |
| | | Class A | | Class P | | Institutional
Class |
| Beginning Account Value (4/1/18) | | $1,000.00 | | $1,000.00 | | $1,000.00 |
| Ending Account Value (9/30/18) | | $1,019.60 | | $1,020.36 | | $1,020.86 |
| Expenses Paid During Period | | $5.52 | | $4.76 | | $4.26 |
For each class of the Fund, expenses (net of fee waiver and reimbursement, if any) are equal to the annualized expense ratio for the class (1.09% for Class A, 0.94% for Class P and 0.84% for Institutional Class), multiplied by the average account value over the period, multiplied by 183/365.
| | | | | | |
| | Annual Report | | | September 30, 2018 | | 61 |
Unaudited
AllianzGI Global Water Fund
For the period of October 1, 2017 through September 30, 2018, as provided by Andreas Fruschki, CFA, Portfolio Manager.
Fund Insights
For the twelve-month period ended September 30, 2018, Class A shares at net asset value (“NAV”) of the AllianzGI Global Water Fund (the “Fund”) returned 3.05%, underperforming the S&P Global Water Index (the “benchmark”), which returned 4.37%.
Market Overview
During the first half of the reporting period we saw water investments trail the broad equity market. This was largely due to weakening in the industrial sector caused by late cycle concerns and worsening trade tensions and the fact that opportunities in the water space tend to be concentrated within the industrials and utilities sectors. The market shifted during the second half of the reporting period and we saw water investments recover on the back of regained strength in the industrials sector. The trade war concerns that had plagued the sector lessened as investors become more comfortable with evaluating trade war consequences. Water management remains one of the key environmental topics, which continues to drive demand for related technologies. Companies offering these technologies are well positioned to adjust prices in the trade-related inflationary environment. In addition, the critical social need for adequate water continues to support demand.
Portfolio Review
The Global Water strategy performed in line with that of the benchmark gross of fees. Sector allocation was positive for performance against the benchmark, specifically the overweight to industrials and underweight to utilities. Stock selection detracted from returns, particularly picks within the industrials sector.
On an absolute basis, Tetra Tech, leading environmental consulting company, was the largest contributor to returns. The company benefitted from increased spending on infrastructure and storm restorations from governments globally.
In contrast, French utility company Veolia was the largest absolute detractor from results during the period. Shares pulled back due to concerns around economic indicators in Europe, and politically induced volatility in their recycling export market.
Outlook
We continue to see water scarcity and climate issues globally, supporting the thesis around water infrastructure and technology development across users and value chain. We believe this supports the compelling opportunity for alpha generation.
Appetite for corporate responsibility also requires measures to improve the environmental footprint of corporates, including enhancing water efficiency and improving the wastewater management practices. This increased focus further supports demand for water related technologies.
In our view, the water-infrastructure theme remains intact and continues to gain support. We have seen a continued shift toward technology enhanced networks in developed countries with accommodative regulation, particularly in the U.S. In emerging markets, especially China, the demand for infrastructure, clean water and proper sanitation, continues to remain strong.
Demand for water efficiency and water quality also remains solid. In our opinion, consumers are looking for control over the quality of water, and both agricultural and industrial users are taking ownership of the management of water resources they use and produce. We expect demand for water efficiency and quality equipment to continue to expand despite the uncertain economic and political environment as a result of the secular nature of the theme and the environmental and social need for investments in the space.
In order to capitalize on these opportunities, we invest in companies that offer solutions for the water-resource and water-quality management, and those that benefit from investments in water infrastructure and contribute to improving water efficiency across all users. We seek to invest, under normal circumstances, at least 80% of the Fund’s net assets in equities that are substantially engaged in water-related activities that offer a positive contribution to the enhancement of water resource management practices. With this, the Fund aims to provide investors with the purest exposure to the water theme.
| | | | | | |
| 62 | | September 30, 2018 | | | Annual Report | | |
Unaudited
AllianzGI Global Water Fund (cont’d)
Average Annual Total Return for the period ended September 30, 2018
| | | | | | | | | | | | | | | | | | |
| | | | | 1 Year | | | 5 Year | | | 10 Year | | | Since Inception† | |
| | | AllianzGI Global Water Fund Class A | | | 3.05% | | | | 6.69% | | | | 7.49% | | | | 5.21% | |
| | AllianzGI Global Water Fund Class A (adjusted) | | | –2.62% | | | | 5.49% | | | | 6.88% | | | | 4.64% | |
| | | AllianzGI Global Water Fund Class C | | | 2.35% | | | | 5.89% | | | | 6.67% | | | | 4.41% | |
| | AllianzGI Global Water Fund Class C (adjusted) | | | 1.35% | | | | 5.89% | | | | 6.67% | | | | 4.41% | |
| | AllianzGI Global Water Fund Class P | | | 3.40% | | | | 6.98% | | | | 7.75% | | | | 5.46% | |
| | AllianzGI Global Water Fund Institutional Class | | | 3.36% | | | | 7.00% | | | | 7.82% | | | | 5.53% | |
| | S&P Global Water Index | | | 4.37% | | | | 8.94% | | | | 9.31% | | | | 7.22% | |
| | MSCI ACWI | | | 9.77% | | | | 8.67% | | | | 8.19% | | | | 5.78% | |
| | | Lipper Global Natural Resources Funds Average | | | 6.86% | | | | –1.69% | | | | –0.59% | | | | –3.03% | |
† The Fund began operations on March 31, 2008. Benchmark return comparisons began on the fund inception date. Lipper performance comparisons began on March 31, 2008.
Performance quoted represents past performance and is no guarantee of future results. Current performance may be lower or higher than performance shown. For performance current to the most recent month-end, visit our website at us.allianzgi.com. Investment return and the principal value will fluctuate. Shares may be worth more or less than original cost when redeemed. The adjusted returns take into account the maximum initial sales charge of 5.50% on Class A shares and the contingent deferred sales charge (CDSC) of 1% on Class C shares, which may apply to shares redeemed during the first year of ownership. Returns do not reflect deduction of taxes that a shareholder would pay on fund distributions or redemption of fund shares. See pages 111 and 112 for more information. The Fund’s gross expense ratios are 1.44% for Class A shares, 2.19% for Class C shares 1.16% for Class P shares and 1.15% for Institutional Class shares. These ratios do not include an expense reduction contractually guaranteed through at least January 31, 2019. The Fund’s expense ratios net of this reduction are 1.22% for Class A shares, 1.97% for Class C shares, 0.94% for Class P shares, and 0.93% for Institutional Class shares. Expense ratio information is as of the Fund’s current prospectus dated February 1, 2018, as further revised or supplemented from time to time.
Cumulative Returns Through September 30, 2018
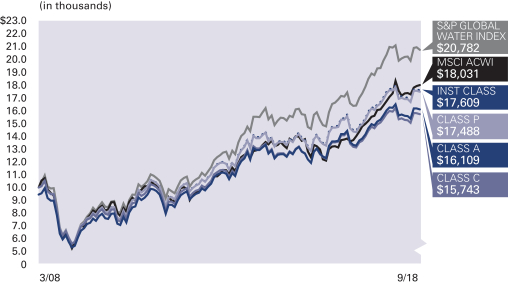
Country Allocation (as of September 30, 2018)
| | | | |
| United States | | | 56.1% | |
| United Kingdom | | | 8.5% | |
| France | | | 6.8% | |
| Switzerland | | | 6.5% | |
| Sweden | | | 4.6% | |
| Austria | | | 3.8% | |
| Japan | | | 3.3% | |
| China | | | 2.7% | |
| Other | | | 4.5% | |
| Cash & Equivalents — Net | | | 3.2% | |
| | | | | | |
| | Annual Report | | | September 30, 2018 | | 63 |
Unaudited
AllianzGI Global Water Fund (cont’d)
| | | | | | | | |
| Shareholder Expense Example | | Actual Performance |
| | | Class A | | Class C | | Class P | | Institutional
Class |
| Beginning Account Value (4/1/18) | | $1,000.00 | | $1,000.00 | | $1,000.00 | | $1,000.00 |
| Ending Account Value (9/30/18) | | $1,025.10 | | $1,021.40 | | $1,027.00 | | $1,026.80 |
| Expenses Paid During Period | | $6.09 | | $9.83 | | $4.78 | | $4.78 |
| | | | | | | | | |
| | | Hypothetical Performance |
| | | (5% return before expenses) |
| | | Class A | | Class C | | Class P | | Institutional
Class |
| Beginning Account Value (4/1/18) | | $1,000.00 | | $1,000.00 | | $1,000.00 | | $1,000.00 |
| Ending Account Value (9/30/18) | | $1,019.05 | | $1,015.34 | | $1,020.36 | | $1,020.36 |
| Expenses Paid During Period | | $6.07 | | $9.80 | | $4.76 | | $4.76 |
For each class of the Fund, expenses (net of fee waiver and reimbursement, if any) are equal to the annualized expense ratio for the class (1.20% for Class A, 1.94% for Class C, 0.94% for Class P and 0.94% for Institutional Class), multiplied by the average account value over the period, multiplied by 183/365.
| | | | | | |
| 64 | | September 30, 2018 | | | Annual Report | | |
Unaudited
AllianzGI High Yield Bond Fund
For the period of October 1, 2017 through September 30, 2018, as provided by Doug Forsyth, Portfolio Manager.
Fund Insights
For the twelve-month period ended September 30, 2018, Class A shares at net asset value (“NAV”), of the AllianzGI High Yield Bond Fund (the “Fund”) returned 0.67%, underperforming the ICE BoA Merrill Lynch High Yield Master II Index (the “benchmark”), which returned 2.94%.
Market Overview
The high-yield bond market advanced alongside stocks while contending with bouts of equity market volatility and rising interest rates over the reporting period.
High yield weathered the spike in equity volatility from late January through early February better than stocks, providing greater downside protection during the stock market correction.
The 10-year U.S. Treasury note yield climbed from 2.33% to 3.06% over the reporting period. Long duration fixed income was adversely impacted whereas high-yield spreads provided some cushion to absorb the move. High yield’s reduced interest-rate sensitivity provided portfolio diversification benefits as Treasuries and investment-grade corporate bonds finished lower.
Credit fundamentals for high yield companies continued to improve throughout the period with most issuers reporting better-than-expected financial results and positive outlooks. Managements cited strengthening fundamentals, increasing demand, a more favorable regulatory environment and tax-reform benefits.
The majority of U.S. economic reports were supportive for the high yield market. They demonstrated labor market strength, the highest consumer confidence level in 18 years, record small business optimism and a new cyclical high in manufacturing.
Given the robust economic backdrop and positive outlook, the U.S. Federal Reserve (the “Fed”) continued to reduce its balance sheet and, as expected, raised rates. The Fed funds rate ended at a range of 2.00% to 2.25%. The FOMC’s decision, communication and policy outlook were generally in-line with expectations.
Overseas angst and geopolitics had a greater influence on international markets compared to U.S. markets. Emerging market stress, Brexit fears, Italian debt concerns, trade talk headlines and the implementation of tariffs on Chinese imports weighed more heavily on foreign investment sentiment. Investors gravitated to the relative strength and safe haven perception of US investments.
Against this backdrop, CCC rated bonds returned 7.7%, significantly outperforming the 3.9% and 0.9% returns for B rated and BB rated bonds, respectively. CCC rated bonds rallied with stocks, but did not surrender gains when the equity market corrected. Strength in the riskiest, most distressed credits was partially attributable to continued demand by yield-motivated investors. BB rated issues, which have lower yields and tighter spreads, were influenced by the move higher in Treasury yields.
Portfolio Review
The Fund finished higher but lagged the benchmark return.
Performance dispersion among credit-quality subcategories weighed on relative performance. The Fund’s credit allocation, specifically an underweight in CCC rated bonds was a headwind as the lowest quality, highest risk issues outperformed higher quality bonds.
Industry allocations that helped relative performance during the period included automotive, telecommunications—wireless and retail. Positive credit selection was the primary driver of relative performance in all three industries. Additionally, portfolio underweights in both telecommunications—wireless and retail were beneficial.
Industry allocations that negatively impacted relative performance during the reporting period included printing & publishing, energy and support-services. In printing & publishing, a relative overweight was beneficial, but portfolio underperformance was offsetting. In energy, a portfolio underweight and issue selection detracted. In support-services, credit selection weighed on relative performance.
Outlook
We believe the U.S. economy remains healthy. In our view, growth is supported by elevated consumer and business confidence, low unemployment, favorable lending conditions, government spending growth and tax cuts. In addition, corporate profits are estimated to grow significantly in 2018.
High-yield bond performance expectations should not deviate from their historical return profile of delivering a compelling total return with less volatility than stocks and providing fixed-income diversification benefits in rising interest-rate environments compared to U.S. Treasuries and investment-grade corporate bonds.
| | | | | | |
| | Annual Report | | | September 30, 2018 | | 65 |
Unaudited
AllianzGI High Yield Bond Fund (cont’d)
Average Annual Total Return for the period ended September 30, 2018
| | | | | | | | | | | | | | | | | | |
| | | | | 1 Year | | | 5 Year | | | 10 Year | | | Since Inception† | |
| | | AllianzGI High Yield Bond Fund Class A | | | 0.67% | | | | 3.32% | | | | 7.45% | | | | 7.00% | |
| | AllianzGI High Yield Bond Fund Class A (adjusted) | | | –3.10% | | | | 2.53% | | | | 7.04% | | | | 6.81% | |
| | AllianzGI High Yield Bond Fund Class C | | | 0.02% | | | | 2.64% | | | | 6.71% | | | | 6.23% | |
| | | AllianzGI High Yield Bond Fund Class C (adjusted) | | | –0.93% | | | | 2.64% | | | | 6.71% | | | | 6.23% | |
| | AllianzGI High Yield Bond Fund Class R | | | 0.33% | | | | 2.87% | | | | 7.10% | | | | 6.69% | |
| | AllianzGI High Yield Bond Fund Class P | | | 0.94% | | | | 3.67% | | | | 7.74% | | | | 7.22% | |
| | AllianzGI High Yield Bond Fund Institutional Class | | | 1.03% | | | | 3.68% | | | | 7.86% | | | | 7.46% | |
| | | AllianzGI High Yield Bond Fund Administrative Class | | | 0.83% | | | | 3.24% | | | | 7.43% | | | | 6.99% | |
| | ICE BofA Merrill Lynch High Yield Master II Index | | | 2.94% | | | | 5.54% | | | | 9.38% | | | | 7.09% | |
| | | Lipper High Yield Funds Average | | | 2.27% | | | | 4.28% | | | | 7.64% | | | | 5.79% | |
† The Fund began operations on July 31, 1996. Benchmark return comparisons began on the fund inception date. Lipper performance comparisons began on July 31, 1996.
Performance quoted represents past performance and is no guarantee of future results. Current performance may be lower or higher than performance shown. For performance current to the most recent month-end, visit our website at us.allianzgi.com. Investment return and the principal value will fluctuate. Shares may be worth more or less than original cost when redeemed. The adjusted returns take into account the maximum initial sales charge of 3.75% on Class A shares and the contingent deferred sales charge (CDSC) of 1% on Class C shares, which may apply to shares redeemed during the first year of ownership. Returns do not reflect deduction of taxes that a shareholder would pay on fund distributions or redemption of fund shares. See pages 111 and 112 for more information. The Fund’s expense ratios are 1.09% for Class A shares, 1.70% for Class C shares, 1.44% for Class R shares, 0.67% for Class P shares, 0.69% for Institutional Class shares and 0.86% for Administrative Class shares. Expense ratio information is as of the Fund’s current prospectus dated February 1, 2018, as further revised or supplemented from time to time.
Cumulative Returns Through September 30, 2018
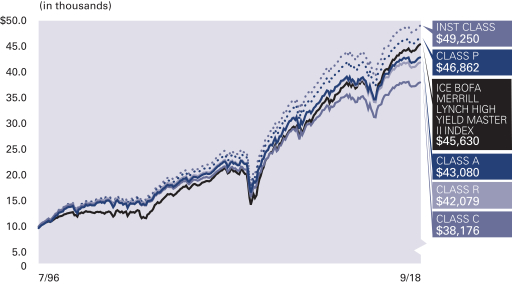
Industry Allocation (as of September 30, 2018)
| | | | |
| Telecommunications | | | 9.0% | |
| Oil, Gas & Consumable Fuels | | | 8.9% | |
| Media | | | 8.3% | |
| Diversified Financial Services | | | 5.5% | |
| Healthcare-Services | | | 4.9% | |
| Chemicals | | | 4.4% | |
| Commercial Services | | | 4.4% | |
| Entertainment | | | 3.8% | |
| Other | | | 46.7% | |
| Cash & Equivalents — Net | | | 4.1% | |
| | | | | | |
| 66 | | September 30, 2018 | | | Annual Report | | |
Unaudited
AllianzGI High Yield Bond Fund (cont’d)
S&P Ratings* (as of September 30, 2018)
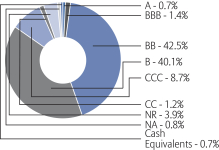
* As a percentage of total investments. Securities ratings refer to the underlying holdings of the Fund and are categorized from highest to lowest credit quality using ratings provided by S&P Global Ratings (“S&P”). S&P’s ratings have been selected for several reasons, including the portfolio managers’ usage of S&P ratings methodology among other credit quality information in managing the Fund, access to background information and other materials provided by S&P, as well as the Funds’ considerations of industry practice. The Fund also displays S&P credit ratings information in materials provided in client presentations. Previous shareholder reports for the Fund displayed bond ratings provided by Moody’s. See “Important Information” for more detail on the selection of S&P for the Fund’s ratings presentation. Securities not rated by S&P and bonds that do not currently have a rating available are designated in the chart above as “NR” and “NA”, respectively.
| | | | | | | | | | | | |
| Shareholder Expense Example | | Actual Performance |
| | | Class A | | Class C | | Class R | | Class P | | Institutional
Class | | Administrative
Class |
| Beginning Account Value (4/1/18) | | $1,000.00 | | $1,000.00 | | $1,000.00 | | $1,000.00 | | $1,000.00 | | $1,000.00 |
| Ending Account Value (9/30/18) | | $1,026.00 | | $1,022.50 | | $1,024.70 | | $1,027.40 | | $1,027.00 | | $1,027.20 |
| Expenses Paid During Period | | $5.08 | | $8.52 | | $6.45 | | $3.71 | | $3.71 | | $4.42 |
| | | | | | | | | | | | | |
| | | Hypothetical Performance |
| | | (5% return before expenses) |
| | | Class A | | Class C | | Class R | | Class P | | Institutional
Class | | Administrative
Class |
| Beginning Account Value (4/1/18) | | $1,000.00 | | $1,000.00 | | $1,000.00 | | $1,000.00 | | $1,000.00 | | $1,000.00 |
| Ending Account Value (9/30/18) | | $1,020.05 | | $1,016.65 | | $1,018.70 | | $1,021.41 | | $1,021.41 | | $1,020.71 |
| Expenses Paid During Period | | $5.06 | | $8.49 | | $6.43 | | $3.70 | | $3.70 | | $4.41 |
For each class of the Fund, expenses are equal to the annualized expense ratio for the class (1.00% for Class A, 1.68% for Class C, 1.27% for Class R, 0.73% for Class P, 0.73% for Institutional Class and 0.87% for Administrative Class), multiplied by the average account value over the period, multiplied by 183/365.
| | | | | | |
| | Annual Report | | | September 30, 2018 | | 67 |
Unaudited
AllianzGI International Growth Fund
For the period of October 1, 2017 through September 30, 2018 as provided by Laura Villani, Product Specialist Associate, Equities.
Fund Insights
For the twelve-month period ended September 30, 2018, Class A shares at net asset value (“NAV”) of the AllianzGI International Growth Fund (the “Fund”) returned 4.32%, outperforming the MSCI ACWI ex USA Index (the “benchmark”), which returned 1.76%.
Market Overview
Global equities rose steadily from September 2017 through January 2018, boosted by optimism over the health of the global economy and by expectations that tax reforms would help to lift U.S. company profits. However, signs of rising inflationary pressures and higher bond yields led to a sharp correction in February 2018. While stocks later recovered these losses, the Trump administration’s decision to impose tariffs on a raft of imports led to escalating fears of a global trade war. In the second half of the reporting period, economic data highlighted the divergence in major economies, with strong momentum in the U.S. contrasting with lackluster growth in Europe and slowing growth in China.
Emerging market equities initially outperformed developed markets, but were challenged in the second half of the period by the strength of the U.S. dollar; higher U.S. interest rates; fears of a global trade war; and currency crises in Argentina, Turkey and Venezuela.
European equities delivered gains, although lagged many other developed markets amid heightened political risks and fears over the impact of increased U.S. tariffs on trade, particularly affecting the German market. Additionally, the strong euro early in the year and geopolitical issues in Italy contributed to lagging European performance.
UK equities outperformed Europe, as the fall in the British pound boosted the overseas earnings of multinational companies. Economic data indicated that the economy was performing better than many had expected, but sentiment towards UK assets continued to be affected by Brexit-related uncertainty.
Equity markets in Pacific ex Japan advanced, however regional performance was skewed by strong returns from one of the region’s largest markets, Australia, which was considered a safe haven in 2018. In Japan, solid returns were driven by Prime Minister Shinzo Abe’s decisive victory in October’s snap election, the weaker yen providing a lift to exporters in the third quarter, and positive economic news.
Portfolio Review
The Fund’s strategy takes a bottom-up approach to identifying structural growth, rather than chasing growth momentum. We believe that our focus on high quality businesses, displaying long term structural growth independently of the wider market, should shelter us to some extent from uncertainty in the markets.
During the period, the Fund saw a positive contribution particularly from stock selection, but also from sector allocation. The underweights of the consumer discretionary and real estate sectors, along with the overweight to healthcare, contributed positively to active outperformance. Stock selection within information technology was especially strong. From a country perspective, the underweights of Belgium, South Korea and Italy were helpful. Stock selection in Denmark excelled. As pure bottom-up investors however, the sector and country attributions are merely an indirect result of the stock selection.
Monotaro, a Japanese online marketplace supplying machine tools and parts, was the top contributor providing an active contribution of 123 basis points, followed by Ambu, Sartorius Stedim Biotech, Constellation Software, and LG Household & Healthcare (between 54 and 108 basis points each). Monotaro is expected to maintain its 25-30% year-over-year sales growth, being well positioned in its small to medium-sized target market, and driven by both increasing order size and new customers.
Meanwhile Weibo, taking advantage of China’s advertising boom in social media, live video and broadcasting, was the lead detractor, subtracting 78 basis points from relative performance on worries of a slowing China economy. British American Tobacco and Odontoprev also detracted from relative performance.
Outlook
While global growth remains solid in absolute terms, we are increasingly conscious that the cyclical peak is behind us, with momentum gradually fading globally from strong levels. We do not believe we are approaching a recession in the coming quarters as cyclical data remains healthy, but do expect a continuation of the recent elevated volatility typical of late-cycle markets. In the short-term, as we enter third quarter results season, our expectation is for the market to return to fundamental analysis, with corporate results, rather than top down factors driving volatility. Bottom-up stock selection will therefore be crucial, becoming a key source of alpha in a volatile or sideways moving market.
In recent months we have seen several sharp market rotations. The corresponding multiple contraction in quality/ growth names, typically create interesting opportunities for us long term, as we seek to capitalize on the widening disconnect between short-term driven selling (often accelerated by passive/quant trading flows), and long term fundamentals. Recent volatility has therefore allowed us to be marginally more active than typical (albeit still at low levels with turnover below 17%), as the upside potential in certain names has increased. As ever, we remain true to process/style, viewing the immediate aftermath of these rotations as some of the most interesting opportunities for our approach.
Recent volatility is undoubtedly painful in the short term, but we believe it creates the opportunities that allow us to differentiate long term.
| | | | | | |
| 68 | | September 30, 2018 | | | Annual Report | | |
Unaudited
AllianzGI International Growth Fund (cont’d)
Average Annual Total Return for the period ended September 30, 2018
| | | | | | | | | | |
| | | | | 1 Year | | | Since Inception† | |
| | | AllianzGI International Growth Fund Class A | | | 4.32% | | | | 9.32% | |
| | AllianzGI International Growth Fund Class A (adjusted) | | | –1.42% | | | | 7.64% | |
| | AllianzGI International Growth Fund Institutional Class | | | 4.54% | | | | 9.59% | |
| | MSCI ACWI ex USA Index | | | 1.76% | | | | 5.35% | |
| | MSCI ACWI ex USA Growth Index | | | 3.08% | | | | 6.49% | |
| | | Lipper International Multi-Cap Growth Funds Average | | | 2.90% | | | | 6.35% | |
† The Fund began operations on February 2, 2015. Benchmark return comparisons began on the fund inception date. Lipper performance comparisons began on January 31, 2015.
Performance quoted represents past performance and is no guarantee of future results. Current performance may be lower or higher than performance shown. For performance current to the most recent month-end, visit our website at us.allianzgi.com. Investment return and the principal value will fluctuate. Shares may be worth more or less than original cost when redeemed. The adjusted returns take into account the maximum initial sales charge of 5.50% on Class A Shares. Returns do not reflect deduction of taxes that a shareholder would pay on fund distributions or redemption of fund shares. See pages 111 and 112 for more information. The Fund’s gross expense ratios are 1.82% for Class A shares and 1.49% for Institutional Class shares. These ratios do not include an expense reduction, contractually guaranteed through at least January 31, 2019. The Fund’s expense ratios net of this reduction are 1.05% for Class A shares and 0.80% for Institutional Class shares. Expense ratio information is as of the Fund’s current prospectus dated February 1, 2018, as further revised or supplemented from time to time.
Cumulative Returns Through September 30, 2018
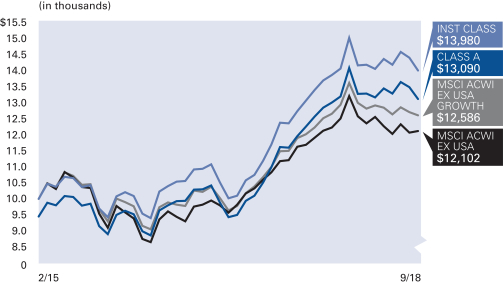
Country Allocation (as of September 30, 2018)
| | | | |
China | | | 13.7% | |
Germany | | | 12.2% | |
Canada | | | 10.3% | |
United Kingdom | | | 9.2% | |
Denmark | | | 8.7% | |
Sweden | | | 7.9% | |
Japan | | | 6.4% | |
Hong Kong | | | 3.8% | |
Other | | | 26.3% | |
Cash & Equivalents — Net | | | 1.5% | |
| | | | | | |
| | Annual Report | | | September 30, 2018 | | 69 |
Unaudited
AllianzGI International Growth Fund (cont’d)
| | | | |
| Shareholder Expense Example | | Actual Performance |
| | | Class A | | Institutional
Class |
| Beginning Account Value (4/1/18) | | $1,000.00 | | $1,000.00 |
| Ending Account Value (9/30/18) | | $986.80 | | $987.60 |
| Expenses Paid During Period | | $5.24 | | $4.00 |
| | | | | |
| | | Hypothetical Performance |
| | | (5% return before expenses) |
| | | Class A | | Institutional
Class |
| Beginning Account Value (4/1/18) | | $1,000.00 | | $1,000.00 |
| Ending Account Value (9/30/18) | | $1,019.79 | | $1,021.05 |
| Expenses Paid During Period | | $5.33 | | $4.06 |
For each class of the Fund, expenses (net of fee waiver and reimbursement, if any) are equal to the annualized expense ratio for the class (1.05% for Class A and 0.80% for Institutional Class), multiplied by the average account value over the period, multiplied by 183/365.
| | | | | | |
| 70 | | September 30, 2018 | | | Annual Report | | |
Unaudited
AllianzGI International Small-Cap Fund
For the period of October 1, 2017 through September 30, 2018, as provided by Alexandra Russo, Product Specialist.
Fund Insights
For the twelve-month period ended September 30, 2018, Class A shares at net asset value (“NAV”) of the AllianzGI International Small-Cap Fund (the “Fund”) returned 6.88%, outperforming the MSCI World ex USA Small Cap Index (the “benchmark”), which returned 3.42%.
Market Overview
Global equities rallied strongly over the twelve-month period, overcoming sharp corrections at the start of 2018 caused by escalating fears of a global trade war. U.S. stocks led the advance, surging to reach fresh highs, as tax cuts buoyed both U.S. economic activity and corporate earnings growth. Asian equities also delivered robust gains, but returns in Europe and emerging markets were more modest.
European equities closed the twelve-month period with modest gains, although they lagged many other developed markets. European stocks reached a peak in mid-January, buoyed by broad optimism over the outlook for the global economy and company earnings. However, growing concerns over a trade dispute with the U.S. caused shares to suffer a sharp setback. While they later recovered some of these losses, European equities failed to regain January’s highs due in part to heightened political risks: Catalonia voted for independence from Spain and Italy’s elections resulted in an anti-establishment coalition government that potentially set it on a confrontational path with the European Union (“EU”). UK equities rallied, delivering solid gains as a fall in the British pound boosted the overseas earnings of multinational companies. Economic data indicated that the economy was performing better than many had expected but sentiment towards UK assets continued to be affected by Brexit-related uncertainty, with Prime Minister Theresa May’s “Chequers proposals” receiving a cool response from EU leaders.
Pacific ex Japan equities ended the twelve-month period with strong gains. By the end of September, the U.S. administration had imposed tariffs on around half of all Chinese imports, prompting tit-for-tat moves from China on U.S. imports. Australian equities lagged many other markets throughout the first half of the review period, but made steady gains in the second half. The market was seen as a relative safe haven and hence benefited from increased flows out of many of Asia’s emerging markets. Chinese equities rallied strongly throughout the final quarter of 2017, reaching a peak in mid-January. However, shares failed to recover from the setback in global markets in February and March, continuing to weaken owing to concerns over the trade war with the U.S. Economic data indicated that economic momentum in China was slowing. The Association of Southeast Asian Nations (“ASEAN”) markets delivered mixed returns. While Thailand held up the best, Singapore and Malaysia also gained. However, Indonesia delivered flat returns while the Philippines was the weakest market.
Japanese equities also posted strong gains over the twelve months. Shares surged in the final quarter of 2017 following Shinzo Abe’s landslide victory in October’s snap election in which he won over two-thirds of available seats. Having reached a peak in mid-January, Japanese equities joined in the global equity sell-off in February and March caused by escalating fears of a global trade war, with the strength of the yen adding to exporters’ problems. As the yen weakened in the third quarter, shares rebounded once more, closing in on the peak reached in January. Japan’s economy registered a shock contraction in the first quarter of 2018. This was the first time the economy had contracted since 2015 and ended the longest unbroken streak of economic expansion since 1989. However, the economy rebounded at an annualized rate of 3.0% in the second quarter and headline inflation hit a six-month high in August.
Portfolio Specifics
The Fund strongly outperformed its benchmark in the last twelve-months. Furthermore, all three small-cap markets showed absolute gains; Japanese small-caps posted the strongest gains followed by small-cap from Asia ex Japan and the European region. All sleeve portfolios (Europe, Japan and Asia ex Japan) closed the year well ahead of their respective local indices. Relative performance was strongest in the European sleeve portfolio followed by the Asia ex Japan and the Japanese sleeve portfolios. On overall portfolio level, sector positioning did not result in a meaningful contribution to active performance as the positive impact from the overweight in healthcare and information technology and the underweight in consumer discretionary was counterweighed by the negative impact of being overweight materials and financials. Stock selection contributed very positively. Selection was most successful within healthcare, materials and industrials. On a single stock basis, the positions in Sartorius Stedim Biotech, KH Neochem and Ambu were the most positive contributors. On the other hand, the positions in Screen Holdings, Morinaga Milk and NetEnt were the most significant detractors.
Outlook
The trade conflicts between Washington, Beijing and Brussels will continue to make headlines and may lead to unexpected twists and turns ahead of the U.S. mid-term elections. It is encouraging, however, that the U.S. and Mexico reached a preliminary agreement in their negotiations about amendments to the North American Free Trade Agreement (“NAFTA”). At the moment, it is difficult to gauge the impact of protectionist measures on the real economy, as import tariffs will not be implemented in full until the third quarter. While any tariffs will probably have a dampening effect, we believe global growth looks set to remain above potential for some time to come, as stronger U.S. growth should compensate for a slowdown in Europe, Japan and several emerging markets. From our vantage point, neither a significant decline in growth nor a recession is on the cards right now. This is an argument in favor of equity investments. In our opinion, concerns about an escalating trade war are likely to weigh more on equities from export-oriented economies which are well integrated into global supply chains and less on U.S. equities. The European Central Bank and the U.S. Federal Reserve are likely to stick to their monetary policies. All this might result in higher volatility and more divergence between the different stock exchanges and companies—in short, a good environment for active asset managers.
| | | | | | |
| | Annual Report | | | September 30, 2018 | | 71 |
Unaudited
AllianzGI International Small-Cap Fund (cont’d)
Average Annual Total Return for the period ended September 30, 2018
| | | | | | | | | | | | | | | | | | |
| | | | | 1 Year | | | 5 Year | | | 10 Year | | | Since Inception† | |
| | | AllianzGI International Small-Cap Fund Class A | | | 6.88% | | | | 7.60% | | | | 9.93% | | | | 11.79% | |
| | AllianzGI International Small-Cap Fund Class A (adjusted) | | | 0.99% | | | | 6.39% | | | | 9.31% | | | | 11.49% | |
| | | AllianzGI International Small-Cap Fund Class C | | | 5.99% | | | | 6.78% | | | | 9.09% | | | | 10.96% | |
| | AllianzGI International Small-Cap Fund Class C (adjusted) | | | 4.99% | | | | 6.78% | | | | 9.09% | | | | 10.96% | |
| | AllianzGI International Small-Cap Fund Class R | | | 6.51% | | | | 7.30% | | | | 9.63% | | | | 11.51% | |
| | AllianzGI International Small-Cap Fund Class P | | | 7.02% | | | | 7.77% | | | | 10.14% | | | | 12.10% | |
| | AllianzGI International Small-Cap Fund Institutional Class | | | 7.09% | | | | 7.84% | | | | 10.24% | | | | 12.19% | |
| | AllianzGI International Small-Cap Fund Class R6 | | | 7.14% | | | | 7.93% | | | | 10.35% | | | | 12.30% | |
| | MSCI World ex USA Small Cap Index | | | 3.42% | | | | 7.07% | | | | 9.04% | | | | 7.92% | |
| | MSCI EAFE Small Cap Index | | | 3.73% | | | | 7.96% | | | | 9.68% | | | | 8.08% | |
| | | Lipper International Small/Mid-Cap Growth Funds Average | | | 3.15% | | | | 6.78% | | | | 9.04% | | | | 8.84% | |
† The Fund began operations on December 31, 1997. Benchmark return and Lipper performance comparisons began on the fund inception date.
Performance quoted represents past performance and is no guarantee of future results. Current performance may be lower or higher than performance shown. For performance current to the most recent month-end, visit our website at us.allianzgi.com. Investment return and the principal value will fluctuate. Shares may be worth more or less than original cost when redeemed. The adjusted returns take into account the maximum initial sales charge of 5.50% on Class A shares and the contingent deferred sales charge (CDSC) of 1% on Class C shares, which may apply to shares redeemed during the first year of ownership. Returns do not reflect deduction of taxes that a shareholder would pay on fund distributions or redemption of fund shares. See pages 111 and 112 for more information. The Fund’s gross expense ratios are 1.93% for Class A shares, 2.50% for Class C shares, 2.11% for Class R shares, 1.42% for Class P shares, 1.43% for Institutional Class shares and 1.42% for Class R6 shares. These ratios do not include expense reductions, contractually guaranteed through at least January 31, 2019. The Fund’s expense ratios net of this reduction are 1.25% for Class A shares, 2.08% for Class C shares, 1.59% for Class R shares, 1.10% for Class P shares, 1.04% for Institutional Class shares and 1.00% for Class R6 shares. Expense ratio information is as of the Fund’s current prospectus dated February 1, 2018, as further revised or supplemented from time to time.
Cumulative Returns Through September 30, 2018
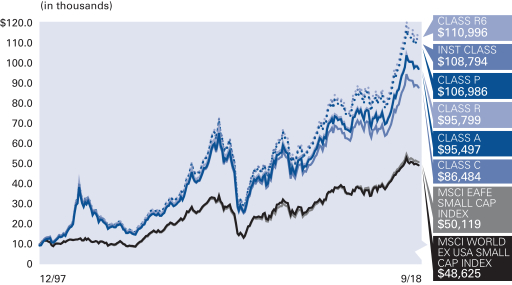
Country Allocation (as of September 30, 2018)
| | | | |
| Japan | | | 36.2% | |
| United Kingdom | | | 15.9% | |
| Germany | | | 8.9% | |
| Switzerland | | | 8.1% | |
| France | | | 7.9% | |
| Austria | | | 6.6% | |
| Australia | | | 5.4% | |
| Denmark | | | 4.8% | |
| Other | | | 21.5% | |
| Cash & Equivalents — Net | | | –15.3% | |
| | | | | | |
| 72 | | September 30, 2018 | | | Annual Report | | |
Unaudited
AllianzGI International Small-Cap Fund (cont’d)
| | | | | | | | | | | | |
| Shareholder Expense Example | | Actual Performance |
| | | Class A | | Class C | | Class R | | Class P | | Institutional
Class | | Class R6 |
| Beginning Account Value (4/1/18) | | $1,000.00 | | $1,000.00 | | $1,000.00 | | $1,000.00 | | $1,000.00 | | $1,000.00 |
| Ending Account Value (9/30/18) | | $965.50 | | $961.40 | | $963.70 | | $966.10 | | $966.40 | | $966.60 |
| Expenses Paid During Period | | $6.16 | | $10.23 | | $7.83 | | $5.42 | | $5.13 | | $4.93 |
| | | | | | | | | | | | | |
| | | Hypothetical Performance |
| | | (5% return before expenses) |
| | | Class A | | Class C | | Class R | | Class P | | Institutional
Class | | Class R6 |
| Beginning Account Value (4/1/18) | | $1,000.00 | | $1,000.00 | | $1,000.00 | | $1,000.00 | | $1,000.00 | | $1,000.00 |
| Ending Account Value (9/30/18) | | $1,018.80 | | $1,014.64 | | $1,017.10 | | $1,019.55 | | $1,019.85 | | $1,020.05 |
| Expenses Paid During Period | | $6.33 | | $10.50 | | $8.04 | | $5.57 | | $5.27 | | $5.06 |
For each class of the Fund, expenses (net of fee waiver and reimbursement, if any) are equal to the annualized expense ratio for the class (1.25% for Class A, 2.08% for Class C, 1.59% for Class R, 1.10% for Class P, 1.04% for Institutional Class and 1.00% for Class R6), multiplied by the average account value over the period, multiplied by 183/365.
| | | | | | |
| | Annual Report | | | September 30, 2018 | | 73 |
Unaudited
AllianzGI Micro Cap Fund
For the period of October 1, 2017 through September 30, 2018, as provided by Robert Marren, Portfolio Manager.
Fund Insights
For the twelve-month period ended September 30, 2018, Class A shares at net asset value (“NAV”) of the AllianzGI Micro Cap Fund (the “Fund”) returned 11.03%, underperforming the Russell Microcap Growth Index (the “benchmark”), which returned 15.38%.
Market Environment
U.S. equities delivered gains over the period. Solid corporate earnings growth helped propel the market to its longest bull run in history, surpassing the previous record set between 1990 and 2000. Economic news continued to show strength. U.S. second-quarter GDP expanded at an annualized rate of 4.2%, the fastest pace in nearly four years. As expected, the U.S. Federal Reserve (the “Fed”) increased interest rates by 25 basis points for the third time this year, noting stronger labor markets and improved economic activity.
Against this market backdrop, the Russell Microcap index returned 13.56% and underperformed the Russell 2000 by 1.59%. Within the micro-cap universe, growth stocks outperformed value by 3.4%. Specific to the benchmark, sector performance was broadly positive. Consumer staples, communication services, and health care were the strongest performing sectors. In contrast, the consumer discretionary sector had the weakest performance, followed by materials and industrials.
Portfolio Review
The Fund underperformed its benchmark over the twelve-month period. From an attribution perspective, security selection drove relative underperformance whereas asset weighting effects were offsetting. Stock picking detracted from the consumer discretionary, materials and financials sectors. Conversely, positive security selection in the information technology, health care and energy sectors were partially offsetting. Separately, an underweight in consumer discretionary helped returns but was balanced by an underweight in healthcare that tempered performance.
A top contributor, Tabula Rasa Healthcare Inc. develops healthcare software primarily used to personalize medication regimens for the elderly, ensuring that patients take the right drugs at the right time. Shares rallied on strong earnings and guidance that topped analyst expectations. The largest absolute detractor was Nutrisystems Inc., which provides low-calorie nutritionally-balanced weight management products. The stock was lower on disappointing 2018 guidance due to overspending on television ads with weak viewership.
Outlook
Looking forward, we maintain the view that the current expansion will continue at a moderate pace. The overall economic fundamentals appear solid. From our bottom-up research and conversations with companies, we found that executive management teams across multiple industries remain upbeat. However, the Trump administration’s aggressive focus on revising trade agreements and retaliatory responses from other countries can elevate market volatility. Given the ongoing uncertainty, we are closely monitoring the situation.
On the monetary policy front, the Fed stated in its September 2018 meeting that the central bank will continue the path of monetary policy normalization, with one additional rate hike projected for the rest of 2018 and further rate increases in 2019. Overall, we welcome the return to a more normalized rate environment, which should encourage price discovery based on company fundamentals and can be favorable for active management.
While small-cap equity absolute valuations currently trade at the higher end of historical ranges, relative valuations remain attractive against larger-cap equities. In addition, small-cap equities continue to exhibit stronger growth potential. In our opinion, these factors should support small-cap returns going forward.
Ultimately, we believe that company-specific results will dictate performance. We continue to uncover exciting, new, positive change-based opportunities within the small-cap investment universe.
| | | | | | |
| 74 | | September 30, 2018 | | | Annual Report | | |
Unaudited
AllianzGI Micro Cap Fund (cont’d)
Average Annual Total Return for the period ended September 30, 2018
| | | | | | | | | | | | | | | | | | |
| | | | | 1 Year | | | 5 Year | | | 10 Year | | | Since Inception† | |
| | | AllianzGI Micro Cap Fund Class A | | | 11.03% | | | | 10.59% | | | | 11.62% | | | | 11.43% | |
| | AllianzGI Micro Cap Fund Class A (adjusted) | | | 4.93% | | | | 9.35% | | | | 10.99% | | | | 11.16% | |
| | AllianzGI Micro Cap Fund Class P | | | 11.10% | | | | 10.71% | | | | 11.78% | | | | 11.64% | |
| | AllianzGI Micro Cap Fund Institutional Class | | | 11.04% | | | | 10.68% | | | | 11.84% | | | | 11.73% | |
| | Russell Microcap Growth Index | | | 15.38% | | | | 9.42% | | | | 11.38% | | | | 7.31% | |
| | | Lipper Small-Cap Growth Funds Average | | | 27.32% | | | | 11.94% | | | | 12.82% | | | | 8.74% | |
† The Fund began operations on July 12, 1995. Benchmark return comparisons began on the fund inception date. Lipper performance comparisons began on June 30, 1995.
Performance quoted represents past performance and is no guarantee of future results. Current performance may be lower or higher than performance shown. For performance current to the most recent month-end, visit our website at us.allianzgi.com. Investment return and the principal value will fluctuate. Shares may be worth more or less than original cost when redeemed. The adjusted returns take into account the maximum initial sales charge of 5.50% on Class A shares. Returns do not reflect deduction of taxes that a shareholder would pay on fund distributions or redemption of fund shares. See pages 111 and 112 for more information. The Fund’s gross expense ratios are 1.98% for Class A shares, 1.69% for Class P shares and 1.73% for Institutional Class shares. This ratio does not include an expense reduction, contractually guaranteed through at least January 31, 2020. The Fund’s expense ratios net of this reduction are 1.42% for Class A shares, 1.34% for Class P shares and 1.34% for Institutional Class shares. Expense ratio information is as of the Fund’s current prospectus dated February 1, 2018, as further revised or supplemented from time to time.
Cumulative Returns Through September 30, 2018
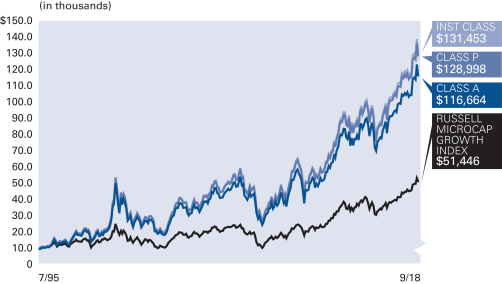
Industry Allocation (as of September 30, 2018)
| | | | |
| Healthcare Equipment & Supplies | | | 15.5% | |
| Biotechnology | | | 13.2% | |
| Software | | | 9.0% | |
| Banks | | | 7.0% | |
| Pharmaceuticals | | | 4.7% | |
| Healthcare Providers & Services | | | 4.4% | |
| Machinery | | | 4.0% | |
| Oil, Gas & Consumable Fuels | | | 3.7% | |
| Other | | | 36.8% | |
| Cash & Equivalents — Net | | | 1.7% | |
| | | | | | |
| | Annual Report | | | September 30, 2018 | | 75 |
Unaudited
AllianzGI Micro Cap Fund (cont’d)
| | | | | | |
| Shareholder Expense Example | | Actual Performance |
| | | Class A | | Class P | | Institutional
Class |
| Beginning Account Value (4/1/18) | | $1,000.00 | | $1,000.00 | | $1,000.00 |
| Ending Account Value (9/30/18) | | $1,112.40 | | $1,112.40 | | $1,112.40 |
| Expenses Paid During Period | | $8.05 | | $7.57 | | $7.63 |
| | | | | | | |
| | | Hypothetical Performance |
| | | (5% return before expenses) |
| | | Class A | | Class P | | Institutional
Class |
| Beginning Account Value (4/1/18) | | $1,000.00 | | $1,000.00 | | $1,000.00 |
| Ending Account Value (9/30/18) | | $1,017.45 | | $1,017.90 | | $1,017.85 |
| Expenses Paid During Period | | $7.69 | | $7.23 | | $7.28 |
For each class of the Fund, expenses (net of fee waiver and reimbursement, if any) are equal to the annualized expense ratio for the class (1.52% for Class A, 1.43% for Class P and 1.44% for Institutional Class), multiplied by the average account value over the period, multiplied by 183/365.
| | | | | | |
| 76 | | September 30, 2018 | | | Annual Report | | |
Unaudited
AllianzGI NFJ Emerging Markets Value Fund
For the period of October 1, 2017, through September 30, 2018, as provided by the Value Equity, US team.
Fund Insights
For the twelve-month period ended September 30, 2018, the Class A shares at net asset Value (“NAV”) of the AllianzGI NFJ Emerging Markets Value Fund returned -4.36%, underperforming the MSCI Emerging Markets Index (the “benchmark”), which returned -0.81%.
Market Overview
It was a volatile twelve-month period for emerging market equities, which closed the period with moderate gains overall. Initially, emerging market stocks rallied sharply, outperforming developed markets as they were buoyed by optimism over the health of the global economy and the prospects for global trade, as well as a weak tone to the U.S. dollar. However, that position reversed following the setback in global equity markets in February and March. With the U.S. dollar strengthening and U.S. bond yields rising, many emerging markets were exposed to higher debt servicing costs. Fears of a global trade war also weighed on sentiment, as did currency crises in Argentina, Turkey and Venezuela. On a regional level, Eastern European equities performed the best, followed by Latin America and then Asia. Chinese equities rallied strongly throughout the final quarter of 2017, reaching a peak in mid-January. However, shares failed to recover from the setback in global markets in February and March, continuing to weaken owing to concerns over the trade war with the U.S. By the end of September, the U.S. administration had imposed tariffs on around half of all Chinese imports, prompting tit-for-tat moves from China on U.S. imports. Chinese authorities announced a package of tax cuts and infrastructure spending, as well as cuts to banks’ reserve requirement ratio, to counteract the impact of falling exports. Russian equities were standout performers over the period, boosted by rising oil prices, which reached a four-year high, and by Standard & Poor’s decision to raise the country’s credit rating to investment-grade status. In contrast, Turkey was among the weakest markets as the lira plunged amid concerns about the central bank’s independence.
Portfolio Review
Relative performance results over the reporting period were due to negative stock selection, though country allocations detracted to a lesser degree; sector allocations, conversely, contributed somewhat. Robust selection across the information technology and consumer discretionary sectors aided returns, while selection was negative across materials and healthcare. The Fund’s underweight in communication services and overweight in energy contributed to performance results. In contrast, an underweight in information technology and overweight in industrials detracted from the Fund’s relative returns. Selection by country was somewhat negative due to holdings based in China and South Korea, which failed to keep pace with benchmark shares. Conversely, selection was positive across South Africa and Mexico. Country allocations were also negative, and driven by the Fund’s overweight positions in Singapore and Hong Kong. This was only somewhat offset by an underweight in China and overweight in Cyprus, which boosted relative results.
Outlook
Ever since the global financial crisis, loosening money policy has been a major force behind exchanges drifting higher. More recently, we have seen this trend begin to abate in certain major financial centers, resulting in a global decoupling of country returns across the marketplace. However, no nation wants to give up opportunities for economic expansion. As a result, many countries are turning to fiscal measures to continue where monetary policies have left off. Smaller, more fragile economies with less flexibility like Turkey, Argentina and South Africa have already seen their stock markets plummet in the face of what appears to be a tougher economic climate. In China, the Communist Party has moved to put a floor on Chinese growth to cushion the blow of increasing tariffs from the United States, including the introduction of new infrastructure development packages, tax cuts for corporations, looser lending terms and the lowering of interest rates.
In response to these shifting market dynamics, we expect greater inflation in certain parts of the world, higher interest rates globally, tighter credit conditions, and heightened volatility. We believe that this environment could lead to a market where value stocks will be favored over their growth counterparts. Finally, consistently investing at that intersection between value and dividends has been crucial to the strength of our long-term performance results, and we believe this disciplined process will help us continue that trend as we look to future market environments.
| | | | | | |
| | Annual Report | | | September 30, 2018 | | 77 |
Unaudited
AllianzGI NFJ Emerging Markets Value Fund (cont’d)
Average Annual Total Return for the period ended September 30, 2018
| | | | | | | | | | | | | | |
| | | | | 1 Year | | | 5 Year | | | Since Inception† | |
| | | AllianzGI NFJ Emerging Markets Value Fund Class A | | | –4.36% | | | | 4.79% | | | | 4.38% | |
| | AllianzGI NFJ Emerging Markets Value Fund Class A (adjusted) | | | –9.62% | | | | 3.61% | | | | 3.37% | |
| | | AllianzGI NFJ Emerging Markets Value Fund Class C | | | –5.08% | | | | 4.00% | | | | 3.60% | |
| | AllianzGI NFJ Emerging Markets Value Fund Class C (adjusted) | | | –6.02% | | | | 4.00% | | | | 3.60% | |
| | AllianzGI NFJ Emerging Markets Value Fund Class P | | | –4.30% | | | | 4.95% | | | | 4.54% | |
| | AllianzGI NFJ Emerging Markets Value Fund Institutional Class | | | –4.12% | | | | 5.06% | | | | 4.65% | |
| | MSCI Emerging Markets Index | | | –0.81% | | | | 3.61% | | | | 2.49% | |
| | | Lipper Emerging Markets Funds Average | | | –3.96% | | | | 2.51% | | | | 1.79% | |
† The Fund began operations on December 18, 2012. Benchmark return comparisons began on the fund inception date. Lipper performance comparisons began on December 31, 2012.
Performance quoted represents past performance and is no guarantee of future results. Current performance may be lower or higher than performance shown. For performance current to the most recent month-end, visit our website at us.allianzgi.com. Investment return and the principal value will fluctuate. Shares may be worth more or less than original cost when redeemed. The adjusted returns take into account the maximum initial sales charge of 5.50% on Class A shares and the contingent deferred sales charge (CDSC) of 1% on Class C shares, which may apply to shares redeemed during the first year of ownership. Returns do not reflect deduction of taxes that a shareholder would pay on fund distributions or redemption of fund shares. See pages 111 and 112 for more information. The Fund’s gross expense ratios are 3.33% for Class A shares, 4.01% for Class C shares, 3.01% for Class P shares and 2.88% for Institutional Class shares. These ratios do not include an expense reduction, contractually guaranteed through at least January 31, 2019. The Fund’s expense ratios net of this reduction are 1.15% for Class A shares, 1.90% for Class C shares, 0.99% for Class P shares and 0.90% for Institutional Class shares. Expense ratio information is as of the Fund’s current prospectus dated February 1, 2018, as further revised or supplemented from time to time.
Cumulative Returns Through September 30, 2018
Country Allocation (as of September 30, 2018)
| | | | |
| China | | | 27.2% | |
| Korea (Republic of) | | | 13.6% | |
| Taiwan | | | 10.9% | |
| India | | | 10.7% | |
| Brazil | | | 6.4% | |
| Mexico | | | 5.2% | |
| Hong Kong | | | 4.9% | |
| South Africa | | | 4.7% | |
| Other | | | 14.4% | |
| Cash & Equivalents — Net | | | 2.0% | |
| | | | | | |
| 78 | | September 30, 2018 | | | Annual Report | | |
Unaudited
AllianzGI NFJ Emerging Markets Value Fund (cont’d)
| | | | | | | | |
| Shareholder Expense Example | | Actual Performance |
| | | Class A | | Class C | | Class P | | Institutional
Class |
| Beginning Account Value (4/1/18) | | $1,000.00 | | $1,000.00 | | $1,000.00 | | $1,000.00 |
| Ending Account Value (9/30/18) | | $874.10 | | $870.70 | | $874.30 | | $875.40 |
| Expenses Paid During Period | | $5.36 | | $8.91 | | $4.60 | | $4.23 |
| | | | | | | | | |
| | | Hypothetical Performance |
| | | (5% return before expenses) |
| | | Class A | | Class C | | Class P | | Institutional
Class |
| Beginning Account Value (4/1/18) | | $1,000.00 | | $1,000.00 | | $1,000.00 | | $1,000.00 |
| Ending Account Value (9/30/18) | | $1,019.35 | | $1,015.54 | | $1,020.16 | | $1,020.56 |
| Expenses Paid During Period | | $5.77 | | $9.60 | | $4.96 | | $4.56 |
For each class of the Fund, expenses (net of fee waiver and reimbursement, if any) are equal to the annualized expense ratio for the class (1.14% for Class A, 1.90% for Class C, 0.98% for Class P and 0.90% for Institutional Class), multiplied by the average account value over the period, multiplied by 183/365. These expenses do not include the expenses of the investment companies in which the Fund invests, which are indirectly borne by Fund shareholders.
| | | | | | |
| | Annual Report | | | September 30, 2018 | | 79 |
Unaudited
AllianzGI NFJ International Small-Cap Value Fund
For the period of October 1, 2017, through September 30, 2018, as provided by the Value Equity, US team.
Fund Insights
For the twelve-month period ended September 30, 2018, the Class A shares at net asset value (“NAV”) of the AllianzGI NFJ International Small-Cap Value Fund (the “Fund”) returned -3.05%, underperforming the MSCI World ex USA Small Cap Index (the “benchmark”), which returned 3.42%.
Market Overview
Global equities rallied strongly over the twelve-month period, overcoming sharp corrections at the start of 2018 caused by escalating fears of a global trade war. Asian equities generally delivered robust gains, boosted in part by strength from Australia, which lagged many other markets throughout the first half of the review period, but made steady gains in the second half. The market was seen as a relative safe haven and hence benefited from increased flows out of many of Asia’s emerging markets. Euro-zone stocks reached a peak in mid-January, buoyed by broad optimism over the outlook for the global economy and company earnings. However, growing concerns over a trade dispute with the U.S. caused shares to suffer a sharp setback. While they later recovered some of these losses, euro-zone equities failed to regain January’s highs due in part to heightened political risks: Catalonia voted for independence from Spain and Italy’s elections resulted in an anti-establishment coalition government that potentially set it on a confrontational path with the EU. In terms of sectors, more defensively positioned areas of the market, including health care and consumer staples, performed well. Energy was the second-strongest performer in the benchmark as oil prices rallied and Brent crude rose to a four-year high of over $82 a barrel amid concerns that U.S. sanctions against Iran would curtail supply as well as the refusal of many oil-producing nations to increase production. Information technology also performed well over the period. In contrast, materials, financials and consumer discretionary equities in the benchmark posted negative total returns.
Portfolio Review
Relative performance results over the reporting period were due to negative stock selection and sector allocations, though country allocations also detracted to a lesser degree over the reporting period. Positive selection across the utilities and energy sectors was overwhelmed by holdings in the information technology and real estate sectors, which failed to keep pace with benchmark shares. The Fund’s underweight exposures in information technology and healthcare detracted from performance, while an underweight in consumer discretionary modestly contributed over the reporting period. Selection by country was negative due to holdings based in Japan and the UK; these negative results were only partially offset by strength across the Fund’s Australian and French-based names. The Fund’s overweight exposures in Argentina and Mexico contributed to relative results. In contrast, overweight positions in Hong Kong and China dampened performance over the twelve-month period.
Outlook
Ever since the global financial crisis, loosening money policy has been a major force behind exchanges drifting higher. More recently, we have seen this trend begin to abate in certain major financial centers, resulting in a global decoupling of country returns across the marketplace. However, no nation wants to give up opportunities for economic expansion. As a result, many countries are turning to fiscal measures to continue where monetary policies have left off. In Europe, Theresa May has signaled austerity is over and the Italians, despite defying the broader European Union, are making commitments to increase spending. Additionally, tax policies favorable for small business have become law in Australia, France, the United States and several other countries. In our opinion, these types of actions will be important for spurring continued economic growth, albeit at the cost of accumulating ever more debt.
In response to these shifting market dynamics, we expect greater inflation in certain parts of the world, higher interest rates globally, tighter credit conditions, and heightened volatility. We believe that this environment could lead to a market where value stocks will be favored over their growth counterparts. Finally, consistently investing at that intersection between value and dividends has been crucial to the strength of our long-term performance results, and we believe this disciplined process will help us continue that trend as we look to future market environments.
| | | | | | |
| 80 | | September 30, 2018 | | | Annual Report | | |
Unaudited
AllianzGI NFJ International Small-Cap Value Fund (cont’d)
Average Annual Total Return for the period ended September 30, 2018
| | | | | | | | | | | | | | |
| | | | | 1 Year | | | 5 Year | | | Since Inception† | |
| | | AllianzGI NFJ International Small-Cap Value Class A | | | –3.05% | | | | 4.79% | | | | 9.24% | |
| | AllianzGI NFJ International Small-Cap Value Class A (adjusted) | | | –8.38% | | | | 3.61% | | | | 8.27% | |
| | | AllianzGI NFJ International Small-Cap Value Class C | | | –3.76% | | | | 4.02% | | | | 8.45% | |
| | AllianzGI NFJ International Small-Cap Value Class C (adjusted) | | | –4.72% | | | | 4.02% | | | | 8.45% | |
| | AllianzGI NFJ International Small-Cap Value Class P | | | –2.79% | | | | 4.98% | | | | 9.44% | |
| | AllianzGI NFJ International Small-Cap Value Institutional Class | | | –2.75% | | | | 5.08% | | | | 9.54% | |
| | AllianzGI NFJ International Small-Cap Value Class R6 | | | –2.67% | | | | 5.17% | | | | 9.64% | |
| | MSCI World ex USA Small Cap Index | | | 3.42% | | | | 7.07% | | | | 11.67% | |
| | | Lipper International Small/Mid-Cap Core Funds Average | | | –0.01% | | | | 5.64% | | | | 10.08% | |
† The Fund began operations on June 1, 2012. Benchmark return comparisons began on the fund inception date. Lipper performance comparisons began on May 31, 2012.
Performance quoted represents past performance and is no guarantee of future results. Current performance may be lower or higher than performance shown. For performance current to the most recent month-end, visit our website at us.allianzgi.com. Investment return and the principal value will fluctuate. Shares may be worth more or less than original cost when redeemed. The adjusted returns take into account the maximum initial sales charge of 5.50% on Class A shares and the contingent deferred sales charge (CDSC) of 1% on Class C shares, which may apply to shares redeemed during the first year of ownership. Returns do not reflect deduction of taxes that a shareholder would pay on fund distributions or redemption of fund shares. See pages 111 and 112 for more information. The Fund’s gross expense ratios are 7.02% for Class A shares, 7.31% for Class C shares, 6.63% for Class P shares, 6.32% for Institutional Class shares and 6.18% for Class R6 shares. These ratios do not include an expense reduction, contractually guaranteed through at least January 31, 2019. The Fund’s expense ratios net of this reduction are 1.30% for Class A shares, 2.05% for Class C shares, 1.05% for Class P shares, 0.99% for Institutional Class shares and 0.95% for Class R6 shares. Expense ratio information is as of the Fund��s current prospectus dated February 1, 2018, as further revised or supplemented from time to time.
Cumulative Returns Through September 30, 2018
Country Allocation (as of September 30, 2018)
| | | | |
| United Kingdom | | | 24.3% | |
| Japan | | | 17.4% | |
| Australia | | | 6.0% | |
| Hong Kong | | | 5.4% | |
| Singapore | | | 5.4% | |
| China | | | 4.3% | |
| Spain | | | 4.2% | |
| Canada | | | 4.1% | |
| Other | | | 28.2% | |
| Cash & Equivalents — Net | | | 0.7% | |
| | | | | | |
| | Annual Report | | | September 30, 2018 | | 81 |
Unaudited
AllianzGI NFJ International Small-Cap Value Fund (cont’d)
| | | | | | | | | | |
| Shareholder Expense Example | | Actual Performance |
| | | Class A | | Class C | | Class P | | Institutional
Class | | Class R6 |
| Beginning Account Value (4/1/18) | | $1,000.00 | | $1,000.00 | | $1,000.00 | | $1,000.00 | | $1,000.00 |
| Ending Account Value (9/30/18) | | $950.30 | | $946.60 | | $951.60 | | $951.70 | | $952.30 |
| Expenses Paid During Period | | $6.36 | | $10.00 | | $5.14 | | $4.84 | | $4.65 |
| | | | | | | | | | | |
| | | Hypothetical Performance |
| | | (5% return before expenses) |
| | | Class A | | Class C | | Class P | | Institutional
Class | | Class R6 |
| Beginning Account Value (4/1/18) | | $1,000.00 | | $1,000.00 | | $1,000.00 | | $1,000.00 | | $1,000.00 |
| Ending Account Value (9/30/18) | | $1,018.55 | | $1,014.79 | | $1,019.80 | | $1,020.10 | | $1,020.31 |
| Expenses Paid During Period | | $6.58 | | $10.35 | | $5.32 | | $5.01 | | $4.81 |
For each class of the Fund, expenses (net of fee waiver and reimbursement, if any) are equal to the annualized expense ratio for the class (1.30% for Class A, 2.05% for Class C, 1.05% for Class P, 0.99% for Institutional Class and 0.95% for Class R6), multiplied by the average account value over the period, multiplied by 183/365.
| | | | | | |
| 82 | | September 30, 2018 | | | Annual Report | | |
Unaudited
AllianzGI PerformanceFee Managed Futures Strategy Fund
From inception on December 18, 2017 through September 30, 2018, as provided by the Multi-Asset US Group.
Fund Insights
For the period from inception on December 18, 2017 through September 30, 2018, Institutional Class shares at net asset value (“NAV”) of the AllianzGI PerformanceFee Managed Futures Strategy Fund (the “Fund”) returned -4.10%, underperforming the ICE BofA Merrill Lynch 3-Month U.S. Treasury Bill (the “benchmark”), which returned 1.36%.
Market Overview
At the start of the period, political developments in the U.S. and Japan helped drive returns for global equities. The passage of the Tax Cuts and Jobs Act in late December drove U.S. equities on the hope that the lower corporate tax rate would result in higher capital investment and provide a further boost to economic growth. Japanese equities rallied after Prime Minister Shinzo Abe’s victory in snap elections in October was perceived as a mandate for him to continue with his market-friendly policies. However, political outcomes in the euro zone, including a failure to resolve the question of Catalonia’s secession from Spain and Angela Merkel’s failure to establish a coalition government by year-end, led to declines in European equities. Macroeconomic and policy uncertainty led to several new themes including: (i) a re-emergence of volatility, (ii) renewed vigilance about the possibility of creeping inflation and (iii) revised forecasts for the pace and magnitude of Fed rate hikes.
In March, these factors, combined with the looming threat of a global trade war between the U.S. and its major trading partners weighed on markets. While the trade war rhetoric receded for the most part in April, it returned in late May with the U.S. administration imposing tariffs on steel and aluminum imports from the EU, Canada and Mexico. Since June, slower growth in world trade, among other factors, contributed to a loss in momentum in economic activity across advanced economies. The U.S., however, remained ahead of the pack of major economies in terms of growth.
Overall for the period, after touching peaks in January most equity markets suffered corrections in February and March and then rallied to finish the period with strongly positive returns. Global equities returned more than 9.0% (MSCI ACWI) while U.S. equities (MSCI U.S.) returned nearly two times the global equity return. Among the worst performers for the period were equities in emerging markets—especially in markets where currencies depreciated strongly—as well as in Europe. Within the U.S., large-cap stocks outperformed small-cap stocks and growth outperformed value. U.S. government bonds and global sovereign bonds each finished down. Monetary policy continued to tighten in developed economies. In total, the U.S. Federal Reserve raised rates four times, while the Bank of England raised rates twice. While rates remained on hold in other developed economies, the European Central Bank announced it would end its bond-buying program by the end of 2018 and the Bank of Japan gave itself more flexibility by expanding its target for the 10-year bond yield. In contrast, several emerging markets raised rates as they sought to stem currency weakness.
Portfolio Review
The main positive contributors to performance during the period since inception were long positions in U.S. equity, precious metals, and WTI crude oil, and shorts in soft commodities—particularly coffee and sugar. By far the main detractors were 10-year bond futures such as hard duration in the U.S. and other developed countries, and emerging markets credit. However, European and Japanese equities and shorts in volatility futures were also significant detractors.
At the end of the reporting period, the Fund’s notable long exposures included global equities (mainly North America), select international bonds, high yield bonds, and energy. Key short positions included U.S. Treasuries, international currencies (relative to the U.S. dollar), and metals, both precious and industrial.
Outlook
Recognizing that the expansion in global growth that started in mid-2016 may have peaked in some major economies, we are focused on the sources of further downside risks. Such risks include escalation in trade and diplomatic tensions between the U.S. and China, persistently higher oil prices, currency volatility weighing on vulnerable emerging markets and a more abrupt tightening in financial market conditions in major economies, among others.
We believe that U.S. equities remain the most attractive of developed market equities in the near term. In Europe, in light of the deteriorating macroeconomic backdrop, we continue to expect fiscal policy uncertainty in the periphery and the prospect of further tightening in monetary policy to weigh on European equities. We anticipate challenges for broad emerging markets equities and debt but see opportunities to differentiate within the asset class. The returns to fixed income assets in recent months have been almost invariably negative and we see limited prospect of a significant broad turnaround—especially given the trend of rising global inflation, rising interest rates globally and a still-healthy global growth dynamic. Again, however, opportunities exist to differentiate among sovereign bonds. We remain constructive on the U.S. dollar versus major developed currencies as of the end of the period.
| | | | | | |
| | Annual Report | | | September 30, 2018 | | 83 |
Unaudited
AllianzGI PerformanceFee Managed Futures Strategy Fund (cont’d)
Cumulative Total Return for the period ended September 30, 2018
| | | | | | |
| | | | | Since Inception† | |
| | AllianzGI PerformanceFee Managed Futures Strategy Fund Institutional Class | | | –4.10% | |
| | AllianzGI PerformanceFee Managed Futures Strategy Fund Class P | | | –4.00% | |
| | AllianzGI PerformanceFee Managed Futures Strategy Fund Class R6 | | | –3.90% | |
| | ICE BofA Merrill Lynch 3-Month U.S. Treasury Bill | | | 1.36% | |
| | | Lipper Alternative Managed Futures | | | –3.85% | |
† The Fund began operations on December 18, 2017. Benchmark return comparisons began on the fund inception date. Lipper performance comparisons began on December 31, 2017.
Performance quoted represents past performance and is no guarantee of future results. Current performance may be lower or higher than performance shown. For performance current to the most recent month-end, visit our website at us.allianzgi.com. Investment return and the principal value will fluctuate. Shares may be worth more or less than original cost when redeemed. Returns do not reflect deduction of taxes that a shareholder would pay on funds distributions or redemption of fund shares. See pages 111 and 112 for more information. The Fund’s gross expense ratios are 5.49% for Institutional Class shares, 5.54% for Class P shares and 5.44% for Class R6 shares. These ratios do not include an expense reduction, contractually guaranteed through at least January 31, 2019. The Fund’s expense ratios net of this reduction are 0.94% for Institutional Class shares, 0.99% for Class P shares and 0.89% for Class R6 shares. Expense ratio information is as of the Fund’s current prospectus dated February 1, 2018, as further revised or supplemented from time to time.
Cumulative Returns Through September 30, 2018
Asset Allocation (as of September 30, 2018)
| | | | |
| U.S. Treasury Obligations | | | 85.1% | |
| Cash & Equivalents — Net | | | 14.9% | |
| | | | | | |
| 84 | | September 30, 2018 | | | Annual Report | | |
Unaudited
AllianzGI PerformanceFee Managed Futures Strategy Fund (cont’d)
| | | | | | |
| Shareholder Expense Example | | Actual Performance |
| | | Class P | | Institutional
Class | | R6 |
| Beginning Account Value (4/1/18) | | $1,000.00 | | $1,000.00 | | $1,000.00 |
| Ending Account Value (9/30/18) | | $995.90 | | $994.80 | | $996.90 |
| Expenses Paid During Period | | $0.95 | | $0.70 | | $0.45 |
| | | | | | | |
| | | Hypothetical Performance |
| | | (5% return before expenses) |
| | | Class P | | Institutional
Class | | R6 |
| Beginning Account Value (4/1/18) | | $1,000.00 | | $1,000.00 | | $1,000.00 |
| Ending Account Value (9/30/18) | | $1,024.12 | | $1,024.37 | | $1,024.62 |
| Expenses Paid During Period | | $0.96 | | $0.71 | | $0.46 |
For each class of the Fund, expenses (net of fee waiver and reimbursement, if any) are equal to the annualized expense ratio for the class (0.19% for Class P, 0.14% for Institutional Class and 0.09% for Class R6), multiplied by the average account value over the period, multiplied by 183/365. These expenses do not include the expenses of the investment companies in which the Fund invests, which are indirectly borne by Fund shareholders.
| | | | | | |
| | Annual Report | | | September 30, 2018 | | 85 |
Unaudited
AllianzGI PerformanceFee Structured US Equity Fund
From inception on December 18, 2017 through September 30, 2018, as provided by Greg Tournant and Stephen Bond-Nelson, Co-Portfolio Managers.
Fund Insights
For the period from inception on December 18, 2017 through September 30, 2018, Institutional Class shares at net asset value (“NAV”) of the AllianzGI PerformanceFee Structured US Equity Fund (the “Fund”) returned 11.30%, outperforming the S&P 500 Index (the “benchmark”), which returned 9.94%.
Market Overview
The Fund delivered above-target excess returns in the second and third quarters, helping lift its outperformance closer to its targeted annual range following a choppy start to the year.
The benchmark, which underlies the majority of the Fund’s option positions, has returned 10.56% year-to-date, despite a significant equity market correction in February.
In February, the benchmark came off 15 consecutive months of gains, including a 6.6% and 5.7% rally in the fourth quarter of 2017 and January 2018, respectively. At the equity market’s peak on January 26th, the CBOE Volatility Index (“VIX”), a fear gauge that measures the implied volatility of at-the-money benchmark options, stood at 11, far below its historical average. This is the volatility environment in which Structured U.S. Equity’s option positions had been built.
Then came the week of February 5th. On this day alone, the benchmark fell 4.1%, while the VIX rose from 17 to 38. This 115% increase was easily the largest one-day percentage move in more than 30 years, and headlines emerged about short-volatility strategies that had collapsed outright. Over the course of the week, from the high of February 2nd to the low of February 9th, the benchmark dropped 10.2%, a challenging environment for the strategy’s option portfolio.
Following the correction, the benchmark picked up steam in the second and third quarters, finishing the quarters up 3.43% and 7.71%, respectively. The relatively benign environment enabled us to successfully hold all our range-bound spreads to expiration, with no restructuring of any option portfolio positions.
Portfolio Review
In response to February’s market correction, we implemented our restructuring methodology per Structured U.S. Equity’s risk management. The Fund restructured all of the option portfolio’s range-bound spreads, lowering the breakevens of our statistical zones by 12% to 14% from their original levels. At the same time, the surge in volatility enabled us to harvest gains from our hedging positions—long benchmark puts and long VIX calls—as well as from many of our directional spreads. These gains were not enough to fully offset the restructuring costs, but our first order of business, moving all our strikes out of the way of the market’s descent, was accomplished.
The VIX’s record-setting surge on February 5th belied the implied volatility and rising equity market environment that followed. While a rising market can dampen our excess return potential because it typically keeps implied volatility levels down, in the second and third quarters we were able to capitalize nicely on the index’s ascent by realizing substantial gains on upside directional spreads. These gains enabled the option portfolio to perform ahead of target in the second and third quarter despite a low average VIX level of 14.
(Note that having the VIX at 14 is better than a VIX at 11, which was the level one year prior. This modest two-point increase in the year-over-year average VIX allowed us to build range-bound spread profit zones approximately 1.5% wider, allowing for more statistical safety in the event of an equity-market decline.)
When volatility is low, Structured U.S. Equity’s expected outperformance would typically be limited to its targeted rate, but not greater. This is because we always prioritize preserving our risk profile. Even if outperformance is behind schedule for the year, we still will not reach for a faster recovery by tightening our range-bound profit zones to collect more option premium. We believe that taking on greater risk in a low-volatility environment would be short-sighted and imprudent.
Instead, we aim to make the most of the market conditions we are given, which in this case was a steadily rising equity market. We always have long directional call spreads in the option portfolio to benefit from upside moves, but realizing gains on them can be sporadic and lumpy. Sometimes the rate of ascent is too slow for the positions to be profitable; other times it can be too fast and overshoot our zones.
Outlook
Our ability to deliver above-target gains in the second and third quarters of 2018 without increasing our risk profile underscores a key strength of structured alpha. We have many different types of positions in the portfolio at all times, and while we never know which ones are going to work best in a particular period, we believe the interaction among the positions across different market conditions maximizes the portfolio’s likelihood of success.
| | | | | | |
| 86 | | September 30, 2018 | | | Annual Report | | |
Unaudited
AllianzGI PerformanceFee Structured US Equity Fund (cont’d)
Cumulative Total Return for the period ended September 30, 2018
| | | | | | |
| | | | | Since Inception† | |
| | AllianzGI PerformanceFee Structured US Equity Fund Institutional Class | | | 11.30% | |
| | AllianzGI PerformanceFee Structured US Equity Fund Class P | | | 11.30% | |
| | AllianzGI PerformanceFee Structured US Equity Fund Class R6 | | | 11.30% | |
| | S&P 500 Index | | | 9.94% | |
| | | Lipper Large-Cap Core Funds | | | 8.83% | |
† The Fund began operations on December 18, 2017. Benchmark return comparisons began on the fund inception date. Lipper performance comparisons began on December 31, 2017.
Performance quoted represents past performance and is no guarantee of future results. Current performance may be lower or higher than performance shown. For performance current to the most recent month-end, visit our website at us.allianzgi.com. Investment return and the principal value will fluctuate. Shares may be worth more or less than original cost when redeemed. Returns do not reflect deduction of taxes that a shareholder would pay on fund distributions or redemption of fund shares. See pages 111 and 112 for more information. The Fund’s gross expense ratios are 4.07% for Institutional Class shares, 4.12% for Class P shares and 4.02% for Class R6 shares. These ratios do not include an expense reduction, contractually guaranteed through at least January 31, 2019. The Fund’s expense ratios net of this reduction are 0.65% for Institutional Class shares, 0.65% for Class P shares and 0.65% for Class R6 shares. Expense ratio information is as of the Fund’s current prospectus dated February 1, 2018, as further revised or supplemented from time to time.
Cumulative Returns Through September 30, 2018
Asset Allocation (as of September 30, 2018)
| | | | |
| Exchange-Traded Funds | | | 98.7% | |
| Cash & Equivalents — Net | | | 1.3% | |
| | | | | | |
| | Annual Report | | | September 30, 2018 | | 87 |
Unaudited
AllianzGI PerformanceFee Structured US Equity Fund (cont’d)
| | | | | | |
| Shareholder Expense Example | | Actual Performance |
| | | Class P | | Institutional
Class | | R6 |
| Beginning Account Value (4/1/18) | | $1,000.00 | | $1,000.00 | | $1,000.00 |
| Ending Account Value (9/30/18) | | $1,140.40 | | $1,140.40 | | $1,140.40 |
| Expenses Paid During Period | | $4.83 | | $3.33 | | $4.51 |
| | | | | | | |
| | | Hypothetical Performance |
| | | (5% return before expenses) |
| | | Class P | | Institutional
Class | | R6 |
| Beginning Account Value (4/1/18) | | $1,000.00 | | $1,000.00 | | $1,000.00 |
| Ending Account Value (9/30/18) | | $1,020.56 | | $1,021.96 | | $1,020.86 |
| Expenses Paid During Period | | $4.56 | | $3.14 | | $4.26 |
For each class of the Fund, expenses (net of fee waiver and reimbursement, if any) are equal to the annualized expense ratio for the class (0.90% for Class P, 0.62% for Institutional Class and 0.84% for Class R6), multiplied by the average account value over the period, multiplied by 183/365. These expenses do not include the expenses of the investment companies in which the Fund invests, which are indirectly borne by Fund shareholders.
| | | | | | |
| 88 | | September 30, 2018 | | | Annual Report | | |
Unaudited
AllianzGI PerformanceFee Structured US Fixed Income Fund
From inception on December 18, 2017 through September 30, 2018, as provided by Greg Tournant and Stephen Bond-Nelson, Co-Portfolio Managers.
Fund Insights
For the period from inception on December 18, 2017, through September 30, 2018, Institutional Class shares at net asset value (“NAV”) of the AllianzGI PerformanceFee Structured US Fixed Income Fund (the “Fund”) returned -0.70%, outperforming the Bloomberg Barclays U.S. Aggregate Bond Index (the “benchmark”), which returned -1.53%.
Market Overview
The Fund delivered above-target excess returns in the second and third quarters, helping lift year-to-date outperformance closer to its targeted annual range following a choppy start to the year.
With bonds negative year-to-date, the benchmark, which underlies the majority of the portfolio’s option positions, has returned 10.56%, despite a significant equity market correction in February.
In February, the benchmark came off 15 consecutive months of gains, including a 6.6% and 5.7% rally in the fourth quarter of 2017 and January 2018, respectively. At the equity market’s peak on January 26th, the CBOE Volatility Index (“VIX”), a fear gauge that measures the implied volatility of at-the-money benchmark options, stood at 11, far below its historical average. This is the volatility environment in which the Fund’s option positions had been built.
Then came the week of February 5th. On this day alone, the benchmark fell 4.1%, while the VIX rose from 17 to 38. This 115% increase was easily the largest one-day percentage move in more than 30 years and headlines emerged about short-volatility strategies that had collapsed outright. Over the course of the week, from the high of February 2nd to the low of February 9th, the benchmark dropped 10.2%, a challenging environment for the strategy’s option portfolio.
Following the correction, the benchmark picked up steam in the second and third quarters, finishing the quarters up 3.43% and 7.71%, respectively. The relatively benign environment enabled us to successfully hold all our range-bound spreads to expiration, with no restructuring of any option portfolio positions.
Portfolio Review
In response to February’s market correction, we implemented our restructuring methodology per the Fund’s risk management. We restructured all of the option portfolio’s range-bound spreads, lowering the breakevens of our statistical zones by 12% to 14% from their original levels. At the same time, the surge in volatility enabled us to harvest gains from our hedging positions—long benchmark puts and long VIX calls—as well as from many of our directional spreads. These gains were not enough to fully offset the restructuring costs, but our first order of business, moving all our strikes out of the way of the market’s descent, was accomplished.
The VIX’s record-setting surge on February 5th belied the implied volatility and rising equity market environment that followed. While a rising market can dampen our excess return potential because it typically keeps implied volatility levels down, in the second and third quarters we were able to capitalize nicely on VIX’s ascent by realizing substantial gains on upside directional spreads. These gains enabled the option portfolio to perform ahead of target in the second and third quarter despite a low average VIX level of 14.
(Note that having the VIX at 14 is better than a VIX at 11, which was the level one year prior. This modest two-point increase in the year-over-year average VIX allowed us to build range-bound spread profit zones approximately 1.5% wider, allowing for more statistical safety in the event of an equity-market decline.)
When volatility is low, the Fund’s expected outperformance would typically be limited to its targeted rate, but not greater. This is because we always prioritize preserving our risk profile. Even if outperformance is behind schedule for the year, we still will not reach for a faster recovery by tightening our range-bound profit zones to collect more option premium. We believe that taking on greater risk in a low-volatility environment would be short-sighted and imprudent.
Instead, we aim to make the most of the market conditions we are given, which in this case was a steadily rising equity market. We always have long directional call spreads in the option portfolio to benefit from upside moves, but realizing gains on them can be sporadic and lumpy. Sometimes the rate of ascent is too slow for the positions to be profitable; other times it can be too fast and overshoot our zones.
Outlook
Our ability to deliver above-target gains in the second and third quarters of 2018 without increasing our risk profile underscores a key strength of structured alpha. We have many different types of positions in the portfolio at all times, and while we never know which ones are going to work best in a particular period, we believe the interaction among the positions across different market conditions maximizes the portfolio’s likelihood of success.
| | | | | | |
| | Annual Report | | | September 30, 2018 | | 89 |
Unaudited
AllianzGI PerformanceFee Structured US Fixed Income Fund (cont’d)
Cumulative Total Return for the period ended September 30, 2018
| | | | | | |
| | | | | Since Inception† | |
| | AllianzGI PerformanceFee Structured US Fixed Income Fund Institutional Class | | | –0.70% | |
| | AllianzGI PerformanceFee Structured US Fixed Income Fund Class P | | | –0.70% | |
| | AllianzGI PerformanceFee Structured US Fixed Income Fund Class R6 | | | –0.70% | |
| | Bloomberg Barclays U.S. Aggregate Bond Index | | | –1.53% | |
| | | Lipper General Bond Funds Average | | | –0.92% | |
† The Fund began operations on December 18, 2017. Benchmark return comparisons began on the fund inception date. Lipper performance comparisons began on December 31, 2017.
Performance quoted represents past performance and is no guarantee of future results. Current performance may be lower or higher than performance shown. For performance current to the most recent month-end, visit our website at us.allianzgi.com. Investment return and the principal value will fluctuate. Shares may be worth more or less than original cost when redeemed. Returns do not reflect deduction of taxes that a shareholder would pay on fund distributions or redemption of fund shares. See pages 111 and 112 for more information. The Fund’s gross expense ratios are 3.77% for Institutional Class shares, 3.82% for Class P shares and 3.72% for Class R6 shares. These ratios do not include an expense reduction, contractually guaranteed through at least January 31, 2019. The Fund’s expense ratios net of this reduction are 0.35% for Institutional Class shares, 0.35% for Class P shares and 0.35% for Class R6 shares. Expense ratio information is as of the Fund’s current prospectus dated February 1, 2018, as further revised or supplemented from time to time.
Cumulative Returns Through September 30, 2018
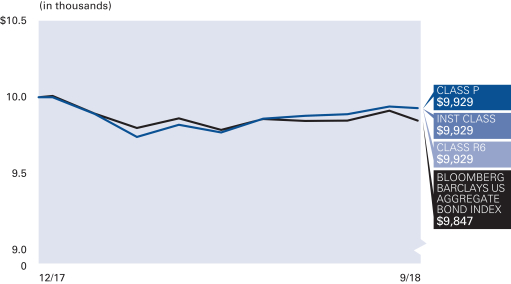
Asset Allocation (as of September 30, 2018)
| | | | |
| Exchange-Traded Funds | | | 99.6% | |
| Cash & Equivalents — Net | | | 0.4% | |
| | | | | | |
| 90 | | September 30, 2018 | | | Annual Report | | |
Unaudited
AllianzGI PerformanceFee Structured US Fixed Income Fund (cont’d)
| | | | | | |
| Shareholder Expense Example | | Actual Performance |
| | | Class P | | Institutional
Class | | R6 |
| Beginning Account Value (4/1/18) | | $1,000.00 | | $1,000.00 | | $1,000.00 |
| Ending Account Value (9/30/18) | | $1,011.20 | | $1,011.20 | | $1,011.20 |
| Expenses Paid During Period | | $2.37 | | $1.97 | | $2.37 |
| | | |
| | | Hypothetical Performance |
| | | (5% return before expenses) |
| | | Class P | | Institutional
Class | | R6 |
| Beginning Account Value (4/1/18) | | $1,000.00 | | $1,000.00 | | $1,000.00 |
| Ending Account Value (9/30/18) | | $1,022.71 | | $1,023.11 | | $1,022.71 |
| Expenses Paid During Period | | $2.38 | | $1.98 | | $2.38 |
For each class of the Fund, expenses (net of fee waiver and reimbursement, if any) are equal to the annualized expense ratio for the class (0.47% for Class P, 0.39% for Institutional Class and 0.47% for Class R6), multiplied by the average account value over the period, multiplied by 183/365. These expenses do not include the expenses of the investment companies in which the Fund invests, which are indirectly borne by Fund shareholders.
| | | | | | |
| | Annual Report | | | September 30, 2018 | | 91 |
Unaudited
AllianzGI Preferred Securities and Income Fund
From inception on May 30, 2018 through September 30, as provided by Carl W. Pappo Jr., CFA, Portfolio Manager.
Fund Insights
For the period from inception on May 30, 2018 through September 30, 2018, Institutional Class shares at net asset value (“NAV”) of the AllianzGI Preferred Securities and Income Fund (the “Fund”) returned 1.76%, outperforming the ICE BofA Merrill Lynch Fixed Rate Preferred Securities Index (the “benchmark”), which returned 1.16%.
Market Overview
The current period has been characterized by a steady increase in interest rates, as U.S. economic growth continued to show resiliency and further increases in the benchmark interest rate of the U.S. Federal Reserve. were priced in during the third quarter. Two economic releases that contributed to this backdrop were the second quarter gross domestic product figures coming in above 4% and the July Core PCE going just above 2% in July (the first reading above 2% since 2012). Overall demand for high quality spread product helped support the preferred market. Credit spreads broadly continued to tighten, as prices held steady absorbing the rise in Treasury yields. Our customized preferred index suggests that the Preferred to senior spread levels compressed 17 basis points over the time horizon.
Portfolio Review
Absolute performance for the preferred market has been positive since the May 30, 2018 inception date. Trends in the various segments of the market varied dramatically over the same horizon: the $25 retail market outperformed during the summer, recovering from a weak start to the year, as the ETF funds that dominate the $25 market received net inflows, and the market experienced some call activity, driving a supply squeeze that drove prices higher. This trend reversed itself in September, when ETFs saw net redemptions, and net new supply rose to meet the summer demand. In contrast, the $1000 market saw supply early in the period, as some issuers refinanced $25 called securities in the $1000 market. Then as interest rates rose throughout the third quarter, the variable rate coupon structure of the $1000 market helped it outperform the $25 market, where more fixed coupon structures prevail. The reversal of the relative performance of the market segments contributed to the outperformance of the Fund relative to its benchmark, as the Fund is underweight $25 issues relative to the 62% composition of the benchmark. The Fund outperformed its Index by 60 basis points (1.76% vs 1.16%) for the period. In addition, our higher allocation to floating-rate and fixed-to-float coupons relative to fixed-rate coupons also contributed to returns.
Outlook
Economic growth has certainly picked up and the U.S. Federal Reserve has been signaling further tightening into 2019. We expect preferreds’ high income rates, wider yield spreads relative to senior corporate bonds, and variable structures will help cushion the impact of rising rates. We continue to favor financials and floating rate securities; financials benefit from strong fundamentals and the rise in rates will be very supportive of financials top line and floaters will benefit as their coupons reset every three months.
| | | | | | |
| 92 | | September 30, 2018 | | | Annual Report | | |
Unaudited
AllianzGI Preferred Securities and Income Fund (cont’d)
Cumulative Total Return for the period ended September 30, 2018
| | | | | | |
| | | | | Since Inception† | |
| | AllianzGI Preferred Securities and Income Fund Institutional Class | | | 1.76% | |
| | AllianzGI Preferred Securities and Income Fund Class P | | | 1.74% | |
| | AllianzGI Preferred Securities and Income Fund Class R6 | | | 1.78% | |
| | ICE BofA Merrill Lynch Fixed Rate Preferred Securities Index | | | 1.16% | |
| | S&P 500 Financials Index | | | 1.48% | |
| | | Lipper Flexible Income Funds Average | | | 1.34% | |
† The Fund began operations on May 30, 2018. Benchmark return comparisons began on the fund inception date. Lipper performance comparisons began on May 31, 2018.
Performance quoted represents past performance and is no guarantee of future results. Current performance may be lower or higher than performance shown. For performance current to the most recent month-end, visit our website at us.allianzgi.com. Investment return and the principal value will fluctuate. Shares may be worth more or less than original cost when redeemed. Returns do not reflect deduction of taxes that a shareholder would pay on funds distributions or redemption of fund shares. See pages 111 and 112 for more information. The Fund’s gross expense ratios are 2.06% for Institutional Class shares, 2.11% for Class P shares and 2.01% for Class R6 shares. These ratios do not include an expense reduction, contractually guaranteed through at least January 31, 2022. The Fund’s expense ratios net of this reduction are 0.55% for Institutional Class shares, 0.60% for Class P shares and 0.50% for Class R6 shares. Expense ratio information is as of the Fund’s current prospectus dated March 7, 2018, as further revised or supplemented from time to time.
Cumulative Returns Through September 30, 2018
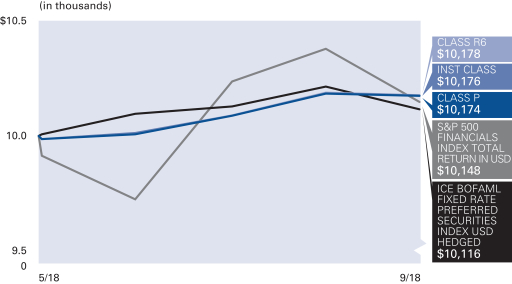
Asset Allocation (as of September 30, 2018)
| | | | |
| Banks | | | 56.7% | |
| Insurance | | | 10.0% | |
| Electric Utilities | | | 8.2% | |
| Miscellaneous Manufacturing | | | 5.9% | |
| Diversified Financial Services | | | 3.8% | |
| Mining | | | 3.5% | |
| Pipelines | | | 3.5% | |
| Media | | | 2.2% | |
| Capital Markets | | | 2.0% | |
| Cash & Equivalents — Net | | | 4.2% | |
Credit Ratings* (as of September 30, 2018)
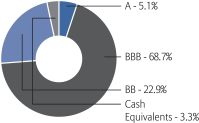
* As a percentage of total investments. Credit ratings apply to the credit worthiness of the issuers of the underlying securities and not to the Fund or its shares. Ratings are subject to change. Ratings are based off of the highest available rating from S&P Global Ratings (“S&P”), Moody’s and Fitch. Bonds not rated by the aforementioned agencies are “unrated”. Ratings are shown based on the S&P rating scale, which ranges from AAA (highest) to D (lowest). Where applicable, securities ratings of an agency other than S&P have been converted to the S&P equivalent. “NR” denotes securities that are not rated. Not rated securities do not necessarily indicate low quality. Ratings are relative, subjective and not absolute standards of quality, and represent the opinions of the independent Nationally Recognized Statistical Rating Organizations (NRSRO). The security’s credit rating does not eliminate risk. The Fund is not rated by an independent rating agency.
| | | | | | |
| | Annual Report | | | September 30, 2018 | | 93 |
Unaudited
AllianzGI Preferred Securities and Income Fund (cont’d)
| | | | | | | | | | | | |
| Shareholder Expense Example | | Actual Performance | |
| | | Class P | | | Institutional
Class | | | R6 | |
| Beginning Account Value (5/30/18) | | | $1,000.00 | | | | $1,000.00 | | | | $1,000.00 | |
| Ending Account Value (9/30/18) | | | $1,017.40 | | | | $1,017.60 | | | | $1,017.80 | |
| Expenses Paid During Period | | | $2.04 | | | | $1.90 | | | | $1.70 | |
| | | | | | | | | | | | |
| | | Hypothetical Performance | |
| | | (5% return before expenses) | |
| | | Class P | | | Institutional
Class | | | R6 | |
| Beginning Account Value (4/1/18) | | | $1,000.00 | | | | $1,000.00 | | | | $1,000.00 | |
| Ending Account Value (9/30/18) | | | $1,022.06 | | | | $1,022.26 | | | | $1,022.56 | |
| Expenses Paid During Period | | | $3.04 | | | | $2.84 | | | | $2.54 | |
*The Fund commenced operations on May 30, 2018. The Actual expense example is based on the period since inception; the Hypothetical expense example is based on the period beginning April 1, 2018. If the Hypothetical expense example had been based on the period since inception, the Ending Account Value and Expenses Paid During Period would have been: $1,014.83 and $2.04, respectively, for Class P; $1,014.96 and $1.90, respectively, for Institutional Class; $1,015.16 and $1.70, respectively, for Class R6.
For each class of the Fund, expenses (net of fee waiver and reimbursement, if any) are equal to the annualized expense ratio for the class (0.60% for Class P, 0.56% for Institutional Class and 0.50% for Class R6), multiplied by the average account value over the period, multiplied by 123/365 for the Actual example and 183/365 for the Hypothetical expense example.
| | | | | | |
| 94 | | September 30, 2018 | | | Annual Report | | |
Unaudited
AllianzGI Real Estate Debt Fund
From inception on December 27, 2017 through September 30, 2018, as provided by Malie Conway and Jonathan Yip, CFA, Co-Lead Portfolio Managers.
Fund Insights
For the period from inception on December 27, 2017 through September 30, 2018, Institutional Class shares at net asset value (“NAV”) of the AllianzGI Real Estate Debt Fund (the “Fund”) returned 1.25%, performing in line with the ICE BofA Merrill Lynch 3-Month US Treasury Bill Index (the “benchmark”), which returned 1.28%.
Market Overview
The reporting period was marked with bouts of volatility primarily due to geopolitics (trade wars, the Italian election, and a variety of idiosyncratic emerging market stories), concerns about flattening global yield curves and rising U.S. interest rates. The eventual passage of the tax bill in late December fueled a rally into the early 1st quarter of 2018. However, the optimism came to an abrupt halt in February when higher than expected wage and inflation data led to fears of a more aggressive interest rate hiking policy by the U.S. Federal Reserve (the “Fed”). Market volatility surged again in the latter half of March as the equity market priced in the potential impact of a trade war resulting from President Trump’s rhetoric on the imposition of tariffs, and this trade friction continued to be a source of volatility through the remainder of the period as additional tariffs were announced and the level of rhetoric ratcheted higher. During May, renewed political risks in Italy caused euro-peripheral bond markets to sell off with 2-year Italian yields briefly touching 2.77%, their highest levels since 2012, while 10-year Italian yields hit 3.16% before the market subsequently stabilised following the decision by Italy’s populist Five Star and the right-wing League to form a coalition government. Although there were four interest rate hikes by the Fed during the reporting period, these were widely anticipated and long term rates generally remained in the 2.8-3.0% range after an initial move higher early in the period.
The fundamentals of the U.S. residential market remains solid as home prices have continued to rise, inventories remain low, consumer confidence is strong, and credit remains readily available. The National Association of Home Builders Market Index remains firmly in growth territory although it is below the 30 year peak it reached at the end of last year. Similarly, commercial real estate continues to show solid and fairly stable trends with institutional investor demand for real estate remaining strong in 2018. While commercial real estate mortgage delinquencies are gradually trending higher with loan seasoning, the overall rate remains low. Although the strong economy should continue to support both residential and commercial real estate prices, we have recently seen a moderation in the growth rate of their prices.
In Europe, macroeconomic trends have also been supportive of the commercial and residential mortgage markets. Although the European Central Bank (“ECB”) confirmed that it will end its bond buying program by the end of the year, at the same time it also signaled that they are likely to keep rate increases on hold through much of 2019. We believe that this gradual removal of accommodation will cause more volatility across risk assets although we see a lower impact for asset backed markets where ECB intervention has been less direct than corporate credit. We also continue to like the structural improvement story in certain peripheral housing markets, namely Spain and Portugal. In the UK, residential mortage-backed securities (“RMBS”) prime supply has ramped up as banks revive programs in the wake of the Bank of England’s expired Term Funding Scheme (“TFS”) which allowed cheap funding to be passed on to UK borrowers. This has presented opportunities for diversification including access to UK prime issuers via U.S. dollar (“USD”)-denominated securities. Within the investment grade credit markets, securitized products significantly outperformed both corporate and government-related issues over the period.
Portfolio Overview
From December 27, 2017 through September 30, 2018, the Fund produced a positive return of 1.25% which compares favorably to other fixed income benchmarks such as the Barclays U.S. Aggregate Bond Index which returned -1.53% over the same period.
Despite the rise in yields, the Fund performed in-line with expectations due to its product design of having the majority of its investment in floating rate notes whose coupon reset periodically and are tied to LIBOR. During the period, 3 month LIBOR increased from 1.69% at the end of December 31, 2017 to end at 2.40%. Fixed rate notes represented an additional 25.5% with the residual in cash and cash equivalents.
Geographic exposure continues to be more weighted toward USD denominated holdings versus EUR and GBP due to more compelling valuations as well as a more robust deal flow in the U.S. Commercial and residential real estate holdings in the U.S. continue to exhibit solid fundamentals. In Europe, we are more focused on residential mortgage backed securities which offer compelling risk-adjusted returns for short dated floating rate notes while supply in commercial real estate mortgage backed securities remain fairly limited and concentrated in certain jurisdictions such as Italy, which are less preferable.
While we continue to have exposure across the capital structure, we have generally preferred being more weighted in higher rated securities due to the flatter credit curve, which made valuations for subordinated lower-rated tranches less attractive. In terms of sector allocation, we continue to favor office and industrial sectors while we are more selective in the hotel space. We remain cautious on the retail property investments particularly in the U.S. where the sector continues to face challenges from growing e-commerce sector.
Outlook
The outlook for credit markets continues to be cautious as political events including the U.S. mid-term elections could result in heightened volatility. We remain selective and prefer a more defensive positioning and as a result our focus will be higher up in the capital structure and also higher up in quality. In the more challenging environment, the fund should continue to see stable carry and benefit from floating rate note exposure as well as its focus on shorter duration product which should generate attractive risk-adjusted returns.
| | | | | | |
| | Annual Report | | | September 30, 2018 | | 95 |
Unaudited
AllianzGI Real Estate Debt Fund (cont’d)
Cumulative Total Return for the period ended September 30, 2018
| | | | | | |
| | | | | Since Inception† | |
| | AllianzGI Real Estate Debt Fund Institutional Class | | | 1.25% | |
| | AllianzGI Real Estate Debt Fund Class P | | | 1.18% | |
| | ICE BofA Merrill Lynch 3-Month US Treasury Bill Index | | | 1.28% | |
| | | Lipper U.S. Mortgage Funds Average | | | –0.75% | |
† The Fund began operations on December 27, 2017. Benchmark return comparisons began on the fund inception date. Lipper performance comparisons began on December 31, 2017.
Performance quoted represents past performance and is no guarantee of future results. Current performance may be lower or higher than performance shown. For performance current to the most recent month-end, visit our website at us.allianzgi.com. Investment return and the principal value will fluctuate. Shares may be worth more or less than original cost when redeemed. Returns do not reflect deduction of taxes that a shareholder would pay on fund distributions or redemption of fund shares. See pages 111 and 112 for more information. The Fund’s gross expense ratios are 3.55 % for Class P shares and 3.45% for Institutional Class shares. These ratios do not include an expense reduction contractually guaranteed through at least January 31, 2019. The Fund’s expense ratios net of this reduction are 0.68% for Class P shares and 0.58% for Institutional Class shares. Expense ratio information is as of the Fund’s current prospectus dated February 1, 2018, as further revised or supplemented from time to time.
Cumulative Returns Through September 30, 2018
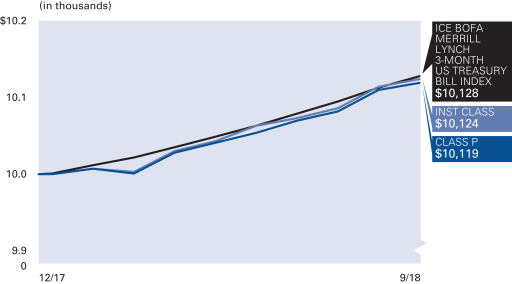
Asset Allocation (as of September 30, 2018)
| | | | |
| Mortgage-Backed Securities | | | 77.5% | |
| U.S. Treasury Obligations | | | 7.8% | |
| Corporate Bonds & Notes | | | 6.2% | |
| U.S. Government Agency Securities | | | 5.1% | |
| Asset-Backed Securities | | | 3.3% | |
| Cash & Equivalents — Net | | | 0.1% | |
Credit Ratings* (as of September 30, 2018)

* As a percentage of total investments. Credit ratings apply to the credit worthiness of the issuers of the underlying securities and not to the Fund or its shares. Ratings are subject to change. Ratings are derived from a weighted average credit rating based on ratings assigned by Fitch, Moody’s, Kroll, Morningstar, DBRS and S&P. Ratings are shown based on the S&P rating scale, which ranges from AAA (highest) to D (lowest). Where applicable, securities ratings of an agency other than S&P have been converted to the S&P equivalent. “NR” denotes securities that are not rated. Not rated securities do not necessarily indicate low quality. Ratings are relative, subjective and not absolute standards of quality, and represent the opinions of the independent Nationally Recognized Statistical Rating Organizations (NRSRO). The security’s credit rating does not eliminate risk. The Fund is not rated by an independent rating agency.
| | | | | | |
| 96 | | September 30, 2018 | | | Annual Report | | |
Unaudited
AllianzGI Real Estate Debt Fund (cont’d)
| | | | |
| Shareholder Expense Example | | Actual Performance |
| | | Class P | | Institutional
Class |
| Beginning Account Value (4/1/18) | | $1,000.00 | | $1,000.00 |
| Ending Account Value (9/30/18) | | $1,009.10 | | $1,009.40 |
| Expenses Paid During Period | | $3.42 | | $2.92 |
| | | | | |
| | | Hypothetical Performance |
| | | (5% return before expenses) |
| | | Class P | | Institutional
Class |
| Beginning Account Value (4/1/18) | | $1,000.00 | | $1,000.00 |
| Ending Account Value (9/30/18) | | $1,021.66 | | $1,022.16 |
| Expenses Paid During Period | | $3.45 | | $2.94 |
For each class of the Fund, expenses (net of fee waiver and reimbursement, if any) are equal to the annualized expense ratio for the class (0.68% for Class P and 0.58% for Institutional Class), multiplied by the average account value over the period, multiplied by 183/365.
| | | | | | |
| | Annual Report | | | September 30, 2018 | | 97 |
Unaudited
AllianzGI Short Duration High Income Fund
For the period of October 1, 2017, through September 30, 2018, as provided by Doug Forsyth, Portfolio Manager.
Fund Insights
For the twelve-month period ended September 30, 2018, Class A shares at net asset value (“NAV”) of the AllianzGI Short Duration High Income Fund (the “Fund”) returned 2.95%, outperforming the ICE BofA Merrill Lynch 1-3 Year BB U.S. Cash Pay High Yield Index (the “benchmark”), which returned 2.15%.
Market Overview
The high-yield bond market advanced alongside stocks while contending with bouts of equity market volatility and rising interest rates over the reporting period.
High-yield bonds weathered the spike in equity volatility better than stocks from late January through early February better than stocks, providing greater downside protection during the stock market correction.
The 10-year U.S. Treasury note yield climbed from 2.33% to 3.06% over the reporting period. Long-duration fixed income was adversely impacted whereas high-yield coupons provided some cushion to absorb the move. The high-yield market’s reduced interest-rate sensitivity provided portfolio diversification benefits as Treasuries and investment-grade corporate bonds finished lower.
Credit fundamentals for high-yield companies continued to improve throughout the period with most issuers reporting better-than-expected financial results and positive outlooks. Management cited strengthening fundamentals, increasing demand, a more favorable regulatory environment and tax-reform benefits.
The majority of U.S. economic reports supported the high-yield bond market. They demonstrated labor market strength, the highest consumer confidence level in 18 years, record small business optimism, and a new cyclical high in manufacturing.
Given the robust economic backdrop and positive outlook, the U.S. Federal Reserve (the “Fed”) continued to reduce its balance sheet and, as expected, raised rates. The Federal Funds rate ended at a range of 2.00% to 2.25%. The Federal Open Market Committee decision, communication and policy outlook were generally in-line with expectations.
Overseas angst and geopolitics had a greater influence on international markets compared to U.S. markets. Emerging market stress, Brexit fears, Italian debt concerns, trade talk headlines and the implementation of tariffs on Chinese imports weighed more heavily on foreign investment sentiment. Investors gravitated to the relative strength and safe haven perception of U.S. investments.
Against this backdrop, CCC-rated bonds returned 7.7%, significantly outperforming the 3.9% and 0.9% returns for B-rated and BB-rated bonds, respectively. CCC-rated bonds rallied with stocks, but did not surrender gains when the equity market corrected. Strength in the riskiest, most distressed credits was partially attributable to continued demand by yield-motivated investors. BB-rated issues, which have lower yields and tighter spreads, were influenced by the move higher in Treasury yields.
Portfolio Review
The Fund’s positive performance contrasted with losses and greater volatility recorded by the 10-year U.S. Treasury note and U.S. core fixed income investment strategy.
Performance in the reporting period benefited from industry weightings and active credit selection. Industry weightings that benefited performance include retail, chemicals and healthcare. Only one industry, trucking & delivery, detracted from performance in the period but the impact was negligible.
Since inception, the Fund’s strategy remains U.S.-centric with non-domestic exposure and trade risk more limited versus the broader markets. Auto parts currently represent just over 1.0% of portfolio holdings. The portfolio continued to stay up in quality with average credit quality at B1/BB-. Emphasis remains on credit quality, liquidity and minimizing premiums paid. As a complement and diversifier of investment assets, the strategy remains highly liquid. Average duration in the portfolio continues to remain low and well below the average yield and coupon.
Outlook
The Fund continues to perform within expectations to protect client capital, lower interest rate sensitivity, provide reasonable income, and to produce lower or negative correlations to riskier assets without compromising on credit quality or liquidity.
The investment team continues to invest capital prudently to defend and evaluate credit risk while minimizing interest rate risk as the Fed continues to move ahead with tightening and policy normalization.
| | | | | | |
| 98 | | September 30, 2018 | | | Annual Report | | |
Unaudited
AllianzGI Short Duration High Income Fund (cont’d)
Average Annual Total Return for the period ended September 30, 2018
| | | | | | | | | | | | | | |
| | | | | 1 Year | | | 5 Year | | | Since Inception† | |
| | | AllianzGI Short Duration High Income Fund Class A | | | 2.95% | | | | 3.94% | | | | 4.84% | |
| | AllianzGI Short Duration High Income Fund Class A (adjusted) | | | 0.64% | | | | 3.46% | | | | 4.50% | |
| | | AllianzGI Short Duration High Income Fund Class C | | | 2.74% | | | | 3.68% | | | | 4.52% | |
| | AllianzGI Short Duration High Income Fund Class C (adjusted) | | | 1.76% | | | | 3.68% | | | | 4.52% | |
| | AllianzGI Short Duration High Income Fund Class P | | | 3.21% | | | | 4.16% | | | | 5.04% | |
| | AllianzGI Short Duration High Income Fund Institutional Class | | | 3.26% | | | | 4.23% | | | | 5.13% | |
| | AllianzGI Short Duration High Income Fund Class R6 | | | 3.29% | | | | 4.25% | | | | 5.15% | |
| | ICE BofA Merrill Lynch 1-3 Year BB U.S. Cash Pay High Yield Index | | | 2.15% | | | | 3.80% | | | | 5.28% | |
| | | Lipper High Yield Funds Average | | | 2.27% | | | | 4.28% | | | | 6.47% | |
† The Fund began operations on October 3, 2011. Benchmark return comparisons began on the fund inception date. Lipper performance comparisons began on September 30, 2011.
Performance quoted represents past performance and is no guarantee of future results. Current performance may be lower or higher than performance shown. For performance current to the most recent month-end, visit our website at us.allianzgi.com. Investment return and the principal value will fluctuate. Shares may be worth more or less than original cost when redeemed. The adjusted returns take into account the maximum initial sales charge of 2.25% on Class A shares and the contingent deferred sales charge (CDSC) of 1% on Class C shares, which may apply to shares redeemed during the first year of ownership. Returns do not reflect deduction of taxes that a shareholder would pay on fund distributions or redemption of fund shares. See pages 111 and 112 for more information. The Fund’s gross expense ratios are 0.89% for Class A shares, 1.12% for Class C shares, 0.63% for Class P shares, 0.59% for Institutional Class shares and 0.56% for Class R6 shares. Expense ratio information is as of the Fund’s current prospectus dated February 1, 2018, as further revised or supplemented from time to time.
Cumulative Returns Through September 30, 2018

Industry Allocation (as of September 30, 2018)
| | | | |
| Retail | | | 10.2% | |
| Telecommunications | | | 8.0% | |
| Media | | | 7.6% | |
| Commercial Services & Supplies | | | 6.5% | |
| Home Builders | | | 6.1% | |
| Real Estate | | | 5.8% | |
| Healthcare-Services | | | 4.7% | |
| Commercial Services | | | 4.3% | |
| Other | | | 42.1% | |
| Cash & Equivalents — Net | | | 4.7% | |
S&P Ratings* (as of September 30, 2018)
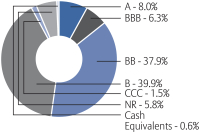
* As a percentage of total investments. Bond ratings refer to the underlying holdings of the Fund and are categorized from highest to lowest credit quality using ratings provided by S&P Global Ratings (“S&P”). S&P’s ratings have been selected for several reasons, including the portfolio managers’ usage of S&P ratings methodology among other credit quality information in managing the Fund, access to background information and other materials provided by S&P, as well as the Funds’ considerations of industry practice. The Fund also displays S&P credit ratings information in materials provided in client presentations. Previous shareholder reports for the Fund displayed bond ratings provided by Moody’s. See “Important Information” for more detail on the selection of S&P for the Fund’s ratings presentation. Bonds not rated by S&P and bonds that do not currently have a rating available are designated in the chart above as “NR” and “NA”, respectively.
| | | | | | |
| | Annual Report | | | September 30, 2018 | | 99 |
Unaudited
AllianzGI Short Duration High Income Fund (cont’d)
| | | | | | | | | | |
| Shareholder Expense Example | | Actual Performance |
| | | Class A | | Class C | | Class P | | Institutional
Class | | Class R6 |
| Beginning Account Value (4/1/18) | | $1,000.00 | | $1,000.00 | | $1,000.00 | | $1,000.00 | | $1,000.00 |
| Ending Account Value (9/30/18) | | $1,025.20 | | $1,024.30 | | $1,026.60 | | $1,026.70 | | $1,026.40 |
| Expenses Paid During Period | | $4.57 | | $5.63 | | $3.35 | | $3.10 | | $2.79 |
| | | | | | | | | | | |
| | | Hypothetical Performance |
| | | (5% return before expenses) |
| | | Class A | | Class C | | Class P | | Institutional
Class | | Class R6 |
| Beginning Account Value (4/1/18) | | $1,000.00 | | $1,000.00 | | $1,000.00 | | $1,000.00 | | $1,000.00 |
| Ending Account Value (9/30/18) | | $1,020.56 | | $1,019.50 | | $1,021.76 | | $1,022.01 | | $1,022.31 |
| Expenses Paid During Period | | $4.56 | | $5.62 | | $3.35 | | $3.09 | | $2.79 |
For each class of the Fund, expenses (net of fee waiver and reimbursement, if any) are equal to the annualized expense ratio for the class (0.90% for Class A, 1.11% for Class C, 0.66% for Class P, 0.61% for Institutional Class and 0.55% for Class R6), multiplied by the average account value over the period, multiplied by 183/365.
| | | | | | |
| 100 | | September 30, 2018 | | | Annual Report | | |
Unaudited
AllianzGI Short Term Bond Fund
From inception on August 23, 2018, through September 30, 2018, as provided by Doug Forsyth, Portfolio Manager.
Fund Insights
For the period from inception on August 23, 2018 through September 30, 2018, Class A shares at net asset value (“NAV”), of the AllianzGI Short Term Bond Fund (the “Fund”) returned 0.13%, outperforming the Bloomberg Barclays U.S. Government/Credit 1-3 Year Index (the “benchmark”), which returned -0.05%.
Market Overview
Short-maturity U.S. Treasuries and investment grade corporate securities produced a slightly positive return over the trailing twelve-month period ending September 2018 and provided resiliency in the face of a rising interest rate environment.
The 10-year U.S. Treasury note yield widened from 2.33% to 3.06% over the reporting period. Longer duration fixed income was adversely impacted whereas short-term fixed income held up better and provided portfolio diversification benefits as U.S. core fixed income finished lower.
U.S. corporations reported better-than-expected financial results and positive outlooks. Managements cited strengthening fundamentals, increasing demand, favorable regulatory environment and tax-reform benefits. While all high grade credit quality subcategories finished higher over the reporting period, this environment favored lower rated credits over higher rated credits.
The majority of U.S. economic reports were supportive for credit markets, including labor market strength, the highest consumer confidence level in 18 years, record small business optimism, and a new cyclical high in manufacturing.
Given the robust economic backdrop and positive outlook, the U.S. Federal Reserve (the “Fed”) continued to reduce its balance sheet and, as expected, raised rates. The Federal Funds rate ended the period at a range of 2.00% to 2.25%. The FOMC’s decision, communication and policy outlook were generally in-line with expectations.
Overseas angst and geopolitics had a greater influence on international markets compared to U.S. markets. Emerging market stress, Brexit fears, Italian debt concerns, trade risk including the implementation of U.S. tariffs on Chinese imports weighed more heavily on foreign investment performance and sentiment. Investors gravitated to the relative strength and safe haven perception of U.S. investments.
Portfolio Review
The Fund’s active management allows the strategy to reduce volatility that may increase over time with the passive index. Positive performance of the Fund contrasted with losses recorded by the short-term bond category. The greatest contributor to Fund performance was exposure to corporate credit, specifically high yield bonds. Securitized debt weights had no impact on performance and government bond holdings had a negligible adverse impact.
Industry weights that benefited performance included support-services, retail and healthcare. In contrast, gaming, banking and consumer goods modestly detracted from absolute performance.
Outlook
Traditional fixed income may no longer deliver the interest rate risk/reward outcomes from the past. The Fund continues to perform within expectations to deliver attractive income while taking minimal interest rate risk and seeking to maintain capital.
The investment team continues to invest capital prudently to defend and evaluate credit risk while minimizing rate risk as the Fed continues to move ahead with policy normalization.
Cumulative Total Return for the period ended September 30, 2018
| | | | | | |
| | | | | Since Inception† | |
| | | AllianzGI Short Term Bond Fund Class A | | | 0.13% | |
| | AllianzGI Short Term Bond Fund Class A (adjusted) | | | –2.12% | |
| | AllianzGI Short Term Bond Fund Class P | | | 0.13% | |
| | AllianzGI Short Term Bond Fund Institutional Class | | | 0.13% | |
| | Bloomberg Barclays U.S. Government/Credit 1-3 Year Index | | | –0.05% | |
| | | Lipper Short Investment Grade Debt Funds Average | | | 0.05% | |
† The Fund began operations on August 23, 2018. Benchmark return comparisons began on the fund inception date. Lipper performance comparisons began on August 31, 2018.
Performance quoted represents past performance and is no guarantee of future results. Current performance may be lower or higher than performance shown. For performance current to the most recent month-end, visit our website at us.allianzgi.com. Investment return and the principal value will fluctuate. Shares may be worth more or less than original cost when redeemed. The adjusted returns take into account the maximum sales charge of 2.25% on Class A shares. Returns do not reflect deduction of taxes that a shareholder would pay on funds distributions or redemption of fund shares. See pages 111 and 112 for more information. The Fund’s gross expense ratios are 1.52% for Class A shares, 1.37% for Class P shares and 1.27% for Institutional Class shares. These ratios do not include an expense reduction, contractually guaranteed through at least January 31, 2022. The Fund’s expense ratios net of this reduction are 0.64% for Class A shares, 0.49% for Class P shares, 0.39% for Institutional Class shares. Expense ratio information is as of the Fund’s current prospectus dated June 14, 2018, as further revised or supplemented from time to time.
| | | | | | |
| | Annual Report | | | September 30, 2018 | | 101 |
Unaudited
AllianzGI Short Term Bond Fund (cont’d)
Cumulative Returns Through September 30, 2018
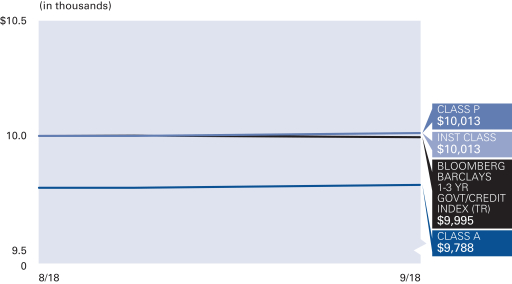
Asset Allocation (as of September 30, 2018)
| | | | |
| Corporate Bonds & Notes | | | 75.4% | |
| U.S. Treasury Obligations | | | 15.4% | |
| U.S. Government Agency Securities | | | 7.7% | |
Cash & Equivalents — Net | | | 1.5% | |
* As a percentage of total investments. Bond ratings refer to the underlying holdings of the Fund and are categorized from highest to lowest credit quality using ratings provided by S&P Global Ratings (“S&P”). S&P’s ratings have been selected for several reasons, including the portfolio managers’ usage of S&P ratings methodology among other credit quality information in managing the Fund, access to background information and other materials provided by S&P, as well as the Funds’ considerations of industry practice. The Fund also displays S&P credit ratings information in materials provided in client presentations. See “Important Information” for more detail on the selection of S&P for the Fund’s ratings presentation. Bonds not rated by S&P and bonds that do not currently have a rating available are designated in the chart above as “NR” and “NA”, respectively.
Credit Ratings* (as of September 30, 2018)
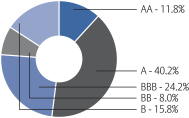
| | | | | | |
| Shareholder Expense Example | | Actual Performance |
| | | Class A | | Class P | | Institutional
Class |
| Beginning Account Value (8/23/18) | | $1,000.00 | | $1,000.00 | | $1,000.00 |
| Ending Account Value (9/30/18) | | $1,001.30 | | $1,001.30 | | $1,001.30 |
| Expenses Paid During Period | | $0.67 | | $0.51 | | $0.41 |
| | | | | | | |
| | | Hypothetical Performance |
| | | (5% return before expenses) |
| | | Class A | | Class P | | Institutional
Class |
| Beginning Account Value (4/1/18) | | $1,000.00 | | $1,000.00 | | $1,000.00 |
| Ending Account Value (9/30/18) | | $1,021.86 | | $1,022.61 | | $1,023.11 |
| Expenses Paid During Period | | $3.24 | | $2.48 | | $1.98 |
* The Fund commenced operations on August 23, 2018. The Actual expense example is based on the period since inception; the Hypothetical expense example is based on the period beginning April 1, 2018. If the Hypothetical expense example had been based on the period since inception, the Ending Account Value and Expenses Paid During Period would have been: $1,004.54 and $0.67, respectively, for Class A; $1,004.70 and $0.51, respectively, for Class P; $1,004.80 and $0.41, respectively, for Institutional Class.
For each class of the Fund, expenses (net of fee waiver and reimbursement, if any) are equal to the annualized expense ratio for the class (0.64% for Class A, 0.49% for Class P and 0.39% for Institutional Class), multiplied by the average account value over the period, multiplied by 38/365 for the Actual example and 183/365 for the Hypothetical expense example.
| | | | | | |
| 102 | | September 30, 2018 | | | Annual Report | | |
Unaudited
AllianzGI Structured Return Fund
For the period of October 1, 2017 through September 30, 2018, as provided by Greg Tournant and Stephen Bond-Nelson, Co-Portfolio Managers.
Fund Insights
For the twelve-month period ended September 30, 2018, Class A shares at net asset value (“NAV”) of the AllianzGI Structured Return Fund (the “Fund”) returned 3.16%, outperforming the ICE BofA Merrill Lynch 3-Month U.S. Treasury Bill (the “benchmark”), which returned 1.59%.
Market Overview
The S&P 500 Index, which underlies the portfolio’s option positions, finished the twelve-month period positive, returning 17.91%, despite a significant equity market correction in February.
In February, the S&P 500 had been coming off 15 consecutive months of gains, including a 6.6% and 5.7% rally in the fourth quarter of 2017 and January 2018, respectively. At the equity market’s peak on January 26th, the CBOE Volatility Index (“VIX”), a fear gauge that measures the implied volatility of at-the-money S&P 500 options, stood at 11, far below its historical average. This is the volatility environment in which the Fund’s positions had been built.
Then came the week of February 5th. On this day alone, the S&P 500 Index fell 4.1%, while the VIX rose from 17 to 38. This 115% increase was easily the largest one-day percentage move in more than 30 years, and headlines emerged about short-volatility strategies that had collapsed outright. Over the course of the week, from the high of February 2nd to the low of February 9th, the S&P 500 dropped 10.2%, a challenging environment for the strategy’s option portfolio.
Following the correction, the S&P 500 picked up steam in the second and third quarters, finishing the quarters up 3.43% and 7.71%, respectively. The relatively benign environment enabled us to successfully hold all our range-bound spreads to expiration, with no restructuring of any portfolio positions.
Portfolio Review
In response to February’s market correction, we implemented our restructuring methodology per the Fund’s risk management. We restructured all of the option portfolio’s range-bound spreads, lowering the breakevens of our statistical zones by 12% to 14% from their original levels. At the same time, the surge in volatility enabled us to harvest gains from our hedging positions—long S&P 500 puts and long VIX calls—as well as from many of our directional spreads. These gains were not enough to fully offset the restructuring costs, but our first order of business, moving all our strikes out of the way of the market’s descent, was accomplished.
The VIX’s record-setting surge on February 5th belied the implied volatility and rising equity market environment that followed. While a rising market can dampen our return potential because it typically keeps implied volatility levels down, in the second and third quarters we were able to capitalize nicely on the index’s ascent by realizing substantial gains on upside directional spreads. These gains enabled the portfolio to perform ahead of target in the second and third quarter despite a low average VIX level of 14.
(Note that having the VIX at 14 is better than a VIX at 11, which was the level one year prior. This modest two-point increase in the year-over-year average VIX allowed us to build range-bound spread profit zones approximately 1.5% wider, allowing for more statistical safety in the event of an equity-market decline.)
When volatility is low, the Fund’s expected excess return would typically be limited to its targeted rate, but not greater- as we will always prioritize preserving our risk profile. Even if performance is behind schedule for the year, we still will not reach for a faster recovery by tightening our range-bound profit zones to collect more option premium. We believe that taking on greater risk in a low-volatility environment would be short-sighted and imprudent.
Instead, we aim to make the most of the market conditions we are given, which in this case was a steadily rising equity market. We always have long directional call spreads in the portfolio to benefit from upside moves, but realizing gains on them can be sporadic and lumpy. Sometimes the rate of ascent is too slow for the positions to be profitable; other times it can be too fast and overshoot our zones.
Outlook
The Fund’s ability to deliver above-target gains in the second and third quarters of 2018 without increasing its risk profile underscores a key strength of the Fund. We have many different types of positions in the Fund at all times, and while we never know which ones are going to work best in a particular period, we believe the interaction among the positions across different market conditions maximizes the portfolio’s likelihood of success.
| | | | | | |
| | Annual Report | | | September 30, 2018 | | 103 |
Unaudited
AllianzGI Structured Return Fund (cont’d)
Average Annual Total Return for the period ended September 30, 2018
| | | | | | | | | | | | | | |
| | | | | 1 Year | | | 5 Year | | | Since Inception† | |
| | | AllianzGI Structured Return Fund Class A | | | 3.16% | | | | 4.21% | | | | 4.31% | |
| | AllianzGI Structured Return Fund Class A (adjusted) | | | –2.51% | | | | 3.04% | | | | 3.30% | |
| | | AllianzGI Structured Return Fund Class C | | | 2.34% | | | | 3.41% | | | | 3.51% | |
| | AllianzGI Structured Return Fund Class C (adjusted) | | | 1.35% | | | | 3.41% | | | | 3.51% | |
| | AllianzGI Structured Return Fund Class P | | | 3.40% | | | | 4.39% | | | | 4.49% | |
| | AllianzGI Structured Return Fund Institutional Class | | | 3.45% | | | | 4.46% | | | | 4.57% | |
| | AllianzGI Structured Return Fund Class R6 | | | 3.47% | | | | 4.55% | | | | 4.66% | |
| | ICE BofA Merrill Lynch 3-Month U.S. Treasury Bill | | | 1.59% | | | | 0.52% | | | | 0.46% | |
| | | Lipper Absolute Return Funds Average | | | 0.97% | | | | 2.34% | | | | 2.60% | |
† The Fund began operations on December 3, 2012. Benchmark return comparisons began on the fund inception date. Lipper performance comparisons began on November 30, 2012.
Performance quoted represents past performance and is no guarantee of future results. Current performance may be lower or higher than performance shown. For performance current to the most recent month-end, visit our website at us.allianzgi.com. Investment return and the principal value will fluctuate. Shares may be worth more or less than original cost when redeemed. The adjusted returns take into account the maximum initial sales charge of 5.50% on Class A shares and the contingent deferred sales charge (CDSC) of 1% on Class C shares, which may apply to shares redeemed during the first year of ownership. Returns do not reflect deduction of taxes that a shareholder would pay on fund distributions or redemption of fund shares. See pages 111 and 112 for more information. The Fund’s gross expense ratios are 1.24% for Class A shares, 1.96% for Class C shares, 0.92% for Class P shares, 0.96% for Institutional Class shares and 0.85% for Class R6 shares. These ratios do not include an expense reduction, contractually guaranteed through at least January 31, 2019. The Fund’s expense ratios net of this reduction are 1.07% for Class A shares, 1.86% for Class C shares, 0.86% for Class P shares, 0.78% for Institutional Class shares and 0.76% for Class R6 shares. Expense ratio information is as of the Fund’s current prospectus dated February 1, 2018, as further revised or supplemented from time to time.
Cumulative Returns Through September 30, 2018
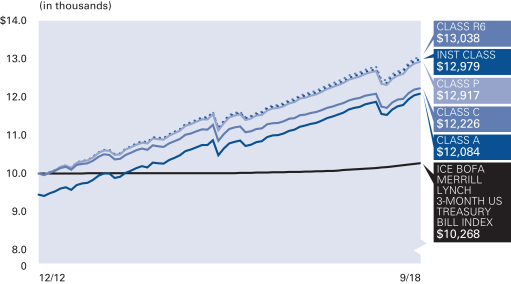
Asset Allocation (as of September 30, 2018)
| | | | |
| Exchange-Traded Funds | | | 82.2% | |
| Cash & Equivalents — Net | | | 17.8% | |
| | | | | | |
| 104 | | September 30, 2018 | | | Annual Report | | |
Unaudited
AllianzGI Structured Return Fund (cont’d)
| | | | | | | | | | |
| Shareholder Expense Example | | Actual Performance |
| | | Class A | | Class C | | Class P | | Institutional
Class | | Class R6 |
| Beginning Account Value (4/1/18) | | $1,000.00 | | $1,000.00 | | $1,000.00 | | $1,000.00 | | $1,000.00 |
| Ending Account Value (9/30/18) | | $1,048.00 | | $1,043.50 | | $1,048.70 | | $1,049.50 | | $1,049.10 |
| Expenses Paid During Period | | $5.03 | | $9.07 | | $3.95 | | $3.55 | | $3.44 |
| | | | | | | | | | | |
| | | Hypothetical Performance |
| | | (5% return before expenses) |
| | | Class A | | Class C | | Class P | | Institutional
Class | | Class R6 |
| Beginning Account Value (4/1/18) | | $1,000.00 | | $1,000.00 | | $1,000.00 | | $1,000.00 | | $1,000.00 |
| Ending Account Value (9/30/18) | | $1,020.16 | | $1,016.19 | | $1,021.21 | | $1,021.61 | | $1,021.71 |
| Expenses Paid During Period | | $4.96 | | $8.95 | | $3.90 | | $3.50 | | $3.40 |
For each class of the Fund, expenses (net of fee waiver and reimbursement, if any) are equal to the annualized expense ratio for the class (0.98% for Class A, 1.77% for Class C, 0.77% for Class P, 0.69% for Institutional Class and 0.67% for Class R6), multiplied by the average account value over the period, multiplied by 183/365. These expenses do not include the expenses of the investment companies in which the Fund invests, which are indirectly borne by Fund shareholders.
| | | | | | |
| | Annual Report | | | September 30, 2018 | | 105 |
Unaudited
AllianzGI U.S. Equity Hedged Fund
For the period of October 1, 2017 through September 30, 2018, as provided by Greg Tournant and Stephen Bond-Nelson, Co-Portfolio Managers.
Fund Insights
For the twelve-month period ended September 30, 2018, Class A shares of the AllianzGI U.S. Equity Hedged Fund (the “Fund”) returned 8.08%, underperforming the S&P 500 Index (the “benchmark”), which returned 17.91%.
Market Overview
The benchmark returned 10.56% year-to-date, despite a significant equity market correction in February. In February, the benchmark had been coming off 15 consecutive months of gains, including a 6.6% and 5.7% rally in the fourth quarter of 2017 and January 2018, respectively. At the equity market’s peak on January 26th, the CBOE Volatility Index (“VIX”), a fear gauge that measures the implied volatility of at-the-money benchmark options, stood at 11, far below its historical average. This is the volatility environment in which Structured US Equity’s option positions had been built.
Then came the week of February 5th. On this day alone, the benchmark fell 4.1%, while the VIX rose from 17 to 38. This 115% increase was easily the largest one-day percentage move in more than 30 years, and headlines emerged about short-volatility strategies that had collapsed outright. Over the course of the week, from the high of February 2nd to the low of February 9th, the benchmark dropped 10.2%.
Following the correction, the benchmark picked up steam in the second and third quarters, finishing the quarters up 3.43% and 7.71%, respectively.
Portfolio Review
While the fund generated positive performance in the second and third quarters, it was challenged by a whipsawing equity market environment at the start of the year.
In the first week of February, the benchmark declined over 10%, marking the first equity market correction in two years. The fund’s long put positions, laddered into the portfolio with a one-year duration at position inception, helped cushion the portfolio against the equity market decline. If the benchmark continued to fall over subsequent days and weeks, these long put positions would have been able to further benefit the portfolio.
A few weeks later, the benchmark rebounded, causing us to incur some losses on some of our short calls. These shorter-duration positions, designed to help offset the cost of our hedging, were written in a low VIX environment, and were therefore unable to accommodate the rapid equity market ascent. For the month of February, the Fund returned -4.87%, while the benchmark returned -3.69%.
March was a similarly challenging month, as the benchmark continued to vacillate, reaching some of the strikes of our short calls, while the VIX remained relatively muted. The VIX remained in the high-teens throughout most of the month, despite intra-day benchmark Index movements of up to 3.5%.
In the second and third quarters, the benchmark climbed, posting gains of 3.43% and 7.71%, respectively. The Fund’s short calls, which were written between 2% of 4% out-of-the money, were largely able to accommodate the Index’s steady climb. The Fund captured the majority of the equity market ascent, returning 2.22% and 5.34% in the second and third quarters, respectively.
Outlook
Looking ahead, we believe the Fund is well positioned to help smooth potential future equity market volatility, while continually mitigating downside risk. Additionally, as demonstrated in the second and third quarters of 2018, we believe the Fund is able to meaningfully participate in the upside in a steadily rising equity market environment.
Until the markets undergo a longer-lasting, more significant period of decline, the Fund will not have an opportunity to demonstrate the full scope of its benefit. Regardless of the future market environment, the fund has shown it can provide capital appreciation and a reassuring risk profile.
| | | | | | |
| 106 | | September 30, 2018 | | | Annual Report | | |
Unaudited
AllianzGI U.S. Equity Hedged Fund (cont’d)
Average Annual Total Return for the period ended September 30, 2018
| | | | | | | | | | | | | | |
| | | | | 1 Year | | | 5 Year | | | Since Inception† | |
| | | AllianzGI U.S. Equity Hedged Fund Class A | | | 8.08% | | | | 6.31% | | | | 7.10% | |
| | AllianzGI U.S. Equity Hedged Fund Class A (adjusted) | | | 2.13% | | | | 5.12% | | | | 6.06% | |
| | | AllianzGI U.S. Equity Hedged Fund Class C | | | 7.29% | | | | 5.52% | | | | 6.32% | |
| | AllianzGI U.S. Equity Hedged Fund Class C (adjusted) | | | 6.29% | | | | 5.52% | | | | 6.32% | |
| | AllianzGI U.S. Equity Hedged Fund Class P | | | 8.22% | | | | 6.46% | | | | 7.26% | |
| | AllianzGI U.S. Equity Hedged Fund Institutional Class | | | 8.36% | | | | 6.58% | | | | 7.37% | |
| | S&P 500 Index | | | 17.91% | | | | 13.95% | | | | 15.66% | |
| | | Lipper Alternative Long/Short Equity Funds Average | | | 5.94% | | | | 5.56% | | | | 6.79% | |
† The Fund began operations on December 3, 2012. Benchmark return comparisons began on the fund inception date. Lipper performance comparisons began on November 30, 2012.
Performance quoted represents past performance and is no guarantee of future results. Current performance may be lower or higher than performance shown. For performance current to the most recent month-end, visit our website at us.allianzgi.com. Investment return and the principal value will fluctuate. Shares may be worth more or less than original cost when redeemed. The adjusted returns take into account the maximum initial sales charge of 5.50% on Class A shares and the contingent deferred sales charge (CDSC) of 1% on Class C shares, which may apply to shares redeemed during the first year of ownership. Returns do not reflect deduction of taxes that a shareholder would pay on fund distributions or redemption of fund shares. See pages 111 and 112 for more information. The Fund’s gross expense ratios are 8.34% for Class A shares, 6.66% for Class C shares, 5.67% for Class P shares and 5.20% for Institutional Class shares. These ratios do not include an expense reduction, contractually guaranteed through at least January 31, 2019. The Fund’s expense ratios net of this reduction are 1.33% on prospectus for Class A shares, 2.08% for Class C shares, 1.18% for Class P shares and 1.08% for Institutional Class shares. Expense ratio information is as of the Fund’s current prospectus dated February 1, 2018, as further revised or supplemented from time to time.
Cumulative Returns Through September 30, 2018
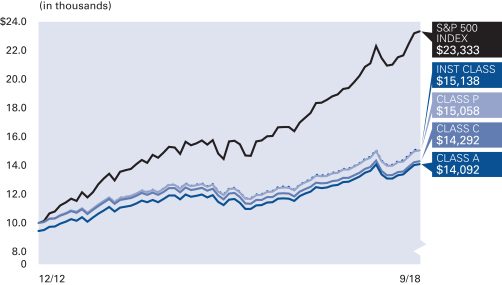
Asset Allocation (as of September 30, 2018)
| | | | |
| Exchange-Traded Funds | | | 97.8% | |
| Cash & Equivalents-Net | | | 2.2% | |
| | | | | | |
| | Annual Report | | | September 30, 2018 | | 107 |
Unaudited
AllianzGI U.S. Equity Hedged Fund (cont’d)
| | | | | | | | |
| Shareholder Expense Example | | Actual Performance |
| | | Class A | | Class C | | Class P | | Institutional
Class |
| Beginning Account Value (4/1/18) | | $1,000.00 | | $1,000.00 | | $1,000.00 | | $1,000.00 |
| Ending Account Value (9/30/18) | | $1,076.80 | | $1,073.00 | | $1,077.30 | | $1,078.00 |
| Expenses Paid During Period | | $6.51 | | $10.39 | | $5.73 | | $5.21 |
| | | |
| | | Hypothetical Performance |
| | | (5% return before expenses) |
| | | Class A | | Class C | | Class P | | Institutional
Class |
| Beginning Account Value (4/1/18) | | $1,000.00 | | $1,000.00 | | $1,000.00 | | $1,000.00 |
| Ending Account Value (9/30/18) | | $1,018.80 | | $1,015.04 | | $1,019.55 | | $1,020.05 |
| Expenses Paid During Period | | $6.33 | | $10.10 | | $5.57 | | $5.06 |
For each class of the Fund, expenses (net of fee waiver and reimbursement, if any) are equal to the annualized expense ratio for the class (1.25% for Class A, 2.00% for Class C, 1.10% for Class P and 1.00% for Institutional Class), multiplied by the average account value over the period, multiplied by 183/365. These expenses do not include the expenses of the investment companies in which the Fund invests, which are indirectly borne by Fund shareholders.
| | | | | | |
| 108 | | September 30, 2018 | | | Annual Report | | |
Unaudited
AllianzGI Ultra Micro Cap Fund
For the period of October 1, 2017 through September 30, 2018, as provided by Robert Marren, Portfolio Manager.
Fund Insights
For the twelve-month period ended September 30, 2018, Class A shares at net asset value (“NAV”) of the AllianzGI Ultra Micro Cap Fund (the “Fund”) returned 13.62%, underperforming the Russell Microcap Growth Index (the “benchmark”), which returned 15.38%.
Market Environment
U.S. equities delivered gains over the period. Solid corporate earnings growth helped propel the market to its longest bull run in history, surpassing the previous record set between 1990 and 2000. Economic news continued to show strength. U.S. second-quarter gross domestic product expanded at an annualized rate of 4.2%, the fastest pace in nearly four years. As expected, the U.S. Federal Reserve (the “Fed”) increased interest rates by 25 basis points for the third time this year, noting stronger labor markets and improved economic activity.
Against this market backdrop, the Russell Microcap Index returned 13.56% and underperformed the Russell 2000 by 1.59%. Within the micro-cap universe, growth stocks outperformed value by 3.4%. Specific to the benchmark, sector performance was broadly positive. Consumer staples, communication services, and health care were the strongest performing sectors. In contrast, the consumer discretionary sector had the weakest performance, followed by materials and industrials.
Portfolio Review
The Fund underperformed its benchmark over the reporting period. From an attribution perspective, asset weighting effects drove relative underperformance while positive security selection was partially offsetting. An overweight to industrials detracted from returns while the underweight to consumer discretionary was partially offsetting. Stock picking in the health care, industrials and communication services sectors were additive to performance. On balance, security selection was challenged in the information technology, financials and materials sectors.
A top contributor, Tabula Rasa Healthcare Inc. develops healthcare software primarily used to personalize medication regimens for the elderly, ensuring that patients take the right drugs at the right time. Shares rallied on strong earnings and guidance that topped analyst expectations. The largest absolute detractor was Impinj Inc., which supplies radio frequency identification systems to enhance inventory management. The stock fell after the company posted earnings forecasts below consensus due to pricing pressure from competition.
Outlook
Looking forward, we maintain the view that the current expansion will continue at a moderate pace. The overall economic fundamentals appear solid. From our bottom-up research and conversations with companies, we found that executive management teams across multiple industries remain upbeat. However, the Trump administration’s aggressive focus on revising trade agreements and retaliatory responses from other countries can elevate market volatility. Given the ongoing uncertainty, we maintain close observations on the situation.
On the monetary policy front, the Fed stated in the September meeting that the central bank will continue the path of monetary policy normalization, with a projected one additional rate hike for the rest of 2018 and further rate increases in 2019. Overall, we welcome the return to a more normalized rate environment, which should encourage price discovery based on company fundamentals and can be favorable for active management.
While small-cap equity absolute valuations currently trade at the higher end of historical ranges, relative valuations remain attractive against larger-cap equities. In addition, small-cap equities continue to exhibit stronger growth potential. These factors should support small-cap returns going forward.
Ultimately, we believe that company-specific results will dictate performance. We continue to uncover exciting, new positive change-based opportunities within the small cap investment universe.
Average Annual Total Return for the period ended September 30, 2018
| | | | | | | | | | | | | | | | | | |
| | | | | 1 Year | | | 5 Year | | | 10 Year | | | Since Inception† | |
| | | AllianzGI Ultra Micro Cap Fund Class A | | | 13.62% | | | | 7.76% | | | | 14.56% | | | | 12.25% | |
| | AllianzGI Ultra Micro Cap Fund Class A (adjusted) | | | 7.37% | | | | 6.55% | | | | 13.91% | | | | 11.66% | |
| | AllianzGI Ultra Micro Cap Fund Class P | | | 13.98% | | | | 8.06% | | | | 14.86% | | | | 12.54% | |
| | AllianzGI Ultra Micro Cap Fund Institutional Class | | | 13.95% | | | | 8.02% | | | | 14.90% | | | | 12.59% | |
| | Russell Microcap Growth Index | | | 15.38% | | | | 9.42% | | | | 11.38% | | | | 9.31% | |
| | | Lipper Small-Cap Growth Funds Average | | | 27.32% | | | | 11.94% | | | | 12.82% | | | | 10.68% | |
† The Fund began operations on January 28, 2008. Benchmark return comparisons began on the fund inception date. Lipper performance comparisons began on January 31, 2008.
Performance quoted represents past performance and is no guarantee of future results. Current performance may be lower or higher than performance shown. For performance current to the most recent month-end, visit our website at us.allianzgi.com. Investment return and the principal value will fluctuate. Shares may be worth more or less than original cost when redeemed. The adjusted returns take into account the maximum initial sales charge of 5.50% on Class A shares. Returns do not reflect deduction of taxes that a shareholder would pay on fund distributions or redemption of fund shares. See pages 111 and 112 for more information. The Fund’s gross expense ratios are 2.00% for Class A shares, 1.67% for Class P shares and 1.72% for Institutional Class shares. These ratios do not include an expense reduction contractually guaranteed through at least January 31, 2020. The Fund’s expense ratios net of this reduction are 1.86% for Class A share, 1.57% for Class P shares, and 1.54% for Institutional Class shares. Expense ratio information is as of the Fund’s current prospectus dated February 1, 2018, as further revised or supplemented from time to time.
| | | | | | |
| | Annual Report | | | September 30, 2018 | | 109 |
Unaudited
AllianzGI Ultra Micro Cap Fund (cont’d)
Cumulative Returns Through September 30, 2018
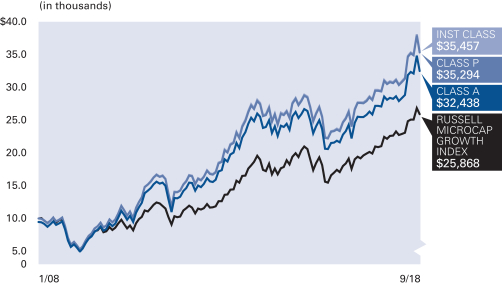
Industry Allocation (as of September 30, 2018)
| | | | |
| Healthcare Equipment & Supplies | | | 16.6% | |
| Biotechnology | | | 13.0% | |
| Banks | | | 8.8% | |
| Software | | | 7.2% | |
| Machinery | | | 4.5% | |
| Healthcare Providers & Services | | | 3.8% | |
| Pharmaceuticals | | | 3.7% | |
| Healthcare Technology | | | 3.5% | |
| Other | | | 36.1% | |
| Cash & Equivalents — Net | | | 2.8% | |
| | | | | | |
| Shareholder Expense Example | | Actual Performance |
| | | Class A | | Class P | | Institutional
Class |
| Beginning Account Value (4/1/18) | | $1,000.00 | | $1,000.00 | | $1,000.00 |
| Ending Account Value (9/30/18) | | $1,146.40 | | $1,147.80 | | $1,147.60 |
| Expenses Paid During Period | | $10.38 | | $8.83 | | $8.67 |
| | | | | | | |
| | | Hypothetical Performance |
| | | (5% return before expenses) |
| | | Class A | | Class P | | Institutional
Class |
| Beginning Account Value (4/1/18) | | $1,000.00 | | $1,000.00 | | $1,000.00 |
| Ending Account Value (9/30/18) | | $1,015.39 | | $1,016.85 | | $1,017.00 |
| Expenses Paid During Period | | $9.75 | | $8.29 | | $8.14 |
For each class of the Fund, expenses (net of fee waiver and reimbursement, if any) are equal to the annualized expense ratio for the class (1.93% for Class A, 1.64% for Class P and 1.61% for Institutional Class), multiplied by the average account value over the period, multiplied by 183/365.
| | | | | | |
| 110 | | September 30, 2018 | | | Annual Report | | |
Unaudited
Important Information
The inception date on each Fund Summary page is the inception date of the Fund’s oldest share class or classes. The AllianzGI Global Allocation Fund reorganized on May 4, 2009 when its predecessor merged into the Trust. The Global Allocation Fund’s shares were first offered in 9/98. On April 12, 2010, the following funds reorganized when their predecessors merged into series of the Trust (including fund’s inception date): AllianzGI Convertible Fund (4/93), AllianzGI High Yield Bond Fund (7/96), AllianzGI International Small-Cap Fund (12/97), AllianzGI Micro Cap Fund (7/95), AllianzGI Ultra Micro Cap Fund (1/08). For each of the reorganized funds, Institutional Class is the oldest share class, except that for AllianzGI International Small-Cap Fund, the oldest share class of the predecessor fund merged into Class P.
The Target-Date Funds are designed to offer individual investors comprehensive asset allocation strategies tailored to the approximate date when they expect to begin withdrawing assets. The target date included in the Fund’s name does not necessarily represent the specific year an investor will begin withdrawing assets. It is intended only as a general guide. Each Fund follows a target asset allocation schedule that changes over time to help reduce portfolio risk, increasing its exposure to conservative investments as the target date approaches. The principal value of a Fund is not guaranteed at any time, including the target date. A Fund’s shareholders may experiences losses, including losses near, at or after the target year indicated in the Fund’s name.
Returns measure performance from the inception of the oldest share class to the present, so some returns predate the inception of the actual share class. Those returns are calculated by adjusting the returns of the oldest share class to reflect the indicated share class’s different operating expenses. Total return performance assumes that all dividend and capital gain distributions were reinvested on the payable date.
Class A shares are subject to an initial sales charge. Class C shares are subject to a 1% contingent deferred sales charge (“CDSC”) for shares redeemed in the first year. Class R shares are generally available only to 401(k) plans, 457 plans, employer sponsored 403(b) plans, profit sharing and money purchase pension plans, defined benefit plans, non-qualified deferred compensation plans and healthcare benefit funding plans. Class P shares are offered primarily through certain asset allocation, wrap fee and other similar programs offered by broker-dealers and other intermediaries. Institutional Class shares are offered primarily for direct investment by investors such as pension and profit sharing plans, employee benefit trusts, endowments, foundations, corporations and high net worth individuals. Administrative Class shares are offered primarily through employee benefit plan alliances, broker-dealers and other intermediaries. Class R6 shares are offered primarily for 401(k) plans, 457 plans, employer sponsored 403(b) plans, profit sharing and money purchase pension plans, defined benefit plans, non-qualified deferred compensation plans, healthcare benefit funding plans and other specified benefit plans and accounts whereby the plan or the plan’s broker, dealer or other financial Intermediary has an agreement with the Distributor or the Investment Manager to utilize Class R6 shares In certain Investment products or programs.
Class D and Class B shares were converted into Class A shares on November 13, 2015 and December 4, 2015, respectively.
The Lipper Averages are calculated by Lipper, Inc. They are based on the total return performance, with distributions reinvested and
operating expenses deducted, of funds included by Lipper in the stated category. Lipper does not take into account sales charges.
The Cumulative Returns charts for each Fund assume the initial investment was made on the first day of the Fund’s initial fiscal year. The charts reflect any sales load that would have applied at the time of purchase or any CDSC that would have applied if a full redemption occurred on the last business day of the most recent fiscal year. Results assume that all dividends and capital gain distributions were reinvested. They do not take into account the effect of taxes. The benchmark cumulative return began on the last day of the month of the respective Fund’s inception date.
“Cash & Equivalents—Net” in the Allocation Summaries may be comprised of cash, repurchase agreements, U.S. Treasury Bills, options purchased, options written and other assets net of other liabilities including net unrealized appreciation (depreciation) on futures contracts, forward foreign currency contracts and swap agreements, as applicable.
Proxy Voting
The Funds’ Investment Manager has adopted written proxy voting policies and procedures (the “Proxy Policy”) as required by Rule 206(4)-6 under the Investment Advisers Act of 1940. The Proxy Policy has been adopted by Allianz Funds Multi-Strategy Trust (the “Trust”) as the policies and procedures that the Investment Manager will use when voting proxies on behalf of the Funds. Copies of the written Proxy Policy and the factors that the Investment Manager may consider in determining how to vote proxies for each Fund, and information about how each Fund voted proxies relating to portfolio securities held during the most recent twelve-month period ended June 30, are available without charge, upon request, by calling 1-800-988-8380 (retail classes: A, C & R) or 1-800-498-5413 (Class P, R6, Institutional & Administrative classes), on the Allianz Global Investors Distributors LLC’s website at us.allianzgi.com, and on the Securities and Exchange Commission’s (“SEC”) website at http://www.sec.gov.
Form N-Q
The Trust files complete schedules of each Fund’s portfolio holdings with the SEC on Form N-Q for the first and third quarters of each fiscal year, which are available on the SEC’s website at http://www.sec.gov. A copy of the Trust’s Form N-Q is available without charge, upon request, by calling 1-800-988-8380 (retail classes: A, C & R) or 1-800-498-5413 (Class P, R6, Institutional & Administrative classes). In addition, the Trust’s Form N-Q may be reviewed and copied at the SEC’s Public Reference Room in Washington, DC. Information on the operation of the Public Reference Room may be obtained by calling 1-800-SEC-0330.
The following disclosure provides important information regarding each Fund’s Shareholder Expense Example, which appears on each Fund Summary page in this Annual Report. Please refer to this information when reviewing the Shareholder Expense Example for a Fund.
Shareholder Expense Example
Shareholders of a Fund incur two types of costs: (1) transaction costs; and (2) ongoing costs, including investment management fees; distribution and/or service (12b-1) fees and other Fund expenses. The
| | | | | | |
| | Annual Report | | | September 30, 2018 | | 111 |
Unaudited
Important Information (cont’d)
Shareholder Expense Example is intended to help shareholders understand ongoing costs (in dollars) of investing in a Fund and to compare these costs with the ongoing costs of investing in other mutual funds. The Shareholder Expense Example is based on an investment of $1,000.00 invested at the beginning of the period, as indicated, and held for the entire period through September 30, 2018.
Actual Expenses
The information in the table under the heading “Actual Performance” provides information about actual account values and actual expenses. You may use the information in these columns, together with the amount you invested, to estimate the expenses that you paid over the period. Simply divide your account value by $1,000.00 (for example, an $8,600.00 account value divided by $1,000.00 = 8.6), then multiply the result by the number in the appropriate column for your share class, in the row entitled “Expenses Paid During Period”, to estimate the expenses you paid on your account during this period.
Hypothetical Example for Comparison Purposes
The information in the table under the heading “Hypothetical Performance (5% return before expenses)” provides information about hypothetical account values and hypothetical expenses based on a Fund’s actual expense ratio and an assumed rate of return of 5% per year before expenses, which is not the Fund’s actual return. The hypothetical account values and expenses may not be used to estimate the actual ending account balance or expenses you paid for the period. You may use this information to compare the ongoing costs of investing in a Fund and other funds. To do so, compare this 5% hypothetical example with the 5% hypothetical examples that appear in the shareholder reports of other funds.
Please note that the expenses shown in the table are meant to highlight your ongoing costs only and do not reflect any transactional costs. Therefore, the information under the heading “Hypothetical Performance (5% return before expenses)” is useful in comparing ongoing costs only, and will not help you determine the relative total costs of owning different funds. In addition, if these transactional costs were included, your costs would have been higher.
Shareholders may be subject to an annual fee of $15 for any accounts, including fiduciary accounts, with balances that fall below $1,000. This fee is not included in the shareholder expense example. If you are subject to the fee, keep it in mind when you are estimating the ongoing expenses of investing in the Funds and when comparing the expenses of these Funds with other funds.
Credit Ratings
Credit ratings apply to the underlying holdings of a Fund and not the Fund itself and are divided into categories ranging from highest to lowest credit quality.
With respect to AllianzGI Core Bond Fund, AllianzGI Core Plus Bond Fund and AllianzGI Preferred Securities and Income Fund, the presentation of credit ratings information in this report use the highest available rating provided by S&P, Moody’s or Fitch to ensure the quality of the portfolios.
With respect to AllianzGI Emerging Markets Debt Fund, presentations of credit ratings information in this report use ratings provided by Moody’s because of, among other reasons, the access to background information and other materials provided by Moody’s, as well as the Funds’ considerations of industry practice. With respect to AllianzGI Convertible Fund, AllianzGI High Yield Bond Fund, AllianzGI Short Duration High Income Fund and AllianzGI Short Term Bond Fund, presentations of credit ratings information in this report use ratings provided by S&P because of, among other reasons, the applicable portfolio managers’ usage of S&P ratings methodology among other credit quality information in managing the respective portfolios, access to background information and other materials provided by S&P, as well as the Funds’ considerations of industry practice. The Funds also display S&P credit ratings information in materials provided in client presentations.
With respect to AllianzGI Global High Yield Fund, the presentation of credit ratings information in this report uses the lowest available rating provided by S&P, Moody’s or Fitch to ensure the most conservative presentation of the quality of the portfolio. With respect to AllianzGI Real Estate Debt Fund, the presentation of credit ratings information in this report uses ratings provided by Fitch, Moody’s, Kroll, Morningstar, DBRS and S&P to ensure that each security in the portfolio has at least one rating from a major credit rating agency. This methodology is intended to narrow the universe of securities that are designated “unrated” and to capture variations in ratings among rating agencies.
Except for the methodologies described above for AllianzGI Global High Yield Fund and AllianzGI Real Estate Debt Fund, securities not rated by Moody’s or S&P, or securities that do not have a rating available from Moody’s or S&P are designated as “NR” and “NA”, respectively. Credit quality ratings assigned by a rating agency are subjective opinions, not statements of fact, and are subject to change periodically, even as frequently as daily. Ratings assigned by Moody’s, S&P or another rating agency are not absolute standards of credit quality and do not evaluate market risk. Rating agencies may fail to make timely changes in credit ratings, and an issuer’s current financial condition may be better or worse than a rating indicates. In formulating investment decisions for the applicable Funds, Allianz Global Investors U.S. LLC develops its own analysis of the credit quality and risks associated with individual debt instruments, rather than relying exclusively on rating agencies or third-party research.
All the information on the Fund Summary pages, including Fund Insights, Average Annual Total Return Tables, Cumulative Return Charts, Shareholder Expense Examples and Allocation/Credit Rating Summaries is unaudited.
Allianz Global Investors Distributors LLC, 1633 Broadway, New York, NY, 10019, us.allianzgi.com, 1-800-988-8380 (retail classes: A, C & R) or 1-800-498-5413 (Class P, R6, Institutional & Administrative classes).
| | | | | | |
| 112 | | September 30, 2018 | | | Annual Report | | |
Unaudited
Benchmark Descriptions
Unless otherwise noted, index returns reflect the reinvestment of income dividends and capital gains, if any, but do not reflect fees, brokerage commissions or other expenses of investing. It is not possible to invest directly in an index.
Prior to November 1, 2006, performance data for the MSCI Indices was calculated gross of dividend tax withholding. Performance data presently shown for the Indices is net of dividend tax withholding. This recalculation results in lower performance for the Indices.
| | |
| Index | | Description |
| AllianzGI 2020 Strategic Benchmark, AllianzGI 2025 Strategic Benchmark, AllianzGI 2030 Strategic Benchmark, AllianzGI 2035 Strategic Benchmark, AllianzGI 2040 Strategic Benchmark, AllianzGI 2045 Strategic Benchmark, AllianzGI 2050 Strategic Benchmark and AllianzGI 2055 Strategic Benchmark | | The AllianzGI 2020 Strategic Benchmark, AllianzGI 2025 Strategic Benchmark, AllianzGI 2030 Strategic Benchmark, AllianzGI 2035 Strategic Benchmark, AllianzGI 2040 Strategic Benchmark, AllianzGI 2045 Strategic Benchmark, AllianzGI 2050 Strategic Benchmark and AllianzGI 2055 Strategic Benchmark each represents the performance of a custom blended index developed by AllianzGI U.S., it is comprised of three underlying indices: MSCI USA Index, MSCI ACWI ex USA Index and Bloomberg Barclays U.S. Aggregate Bond Index. The strategic weights to these indices reflect the glidepath which starts with a 93% weight to the Equity Indices, becoming more conservative to end 5 years past the target retirement date with 30% weight to the equity indices. |
| |
| AllianzGI Multi Asset Income Strategic Benchmark | | The AllianzGI Multi Asset Income Strategic Benchmark represents the performance of a custom blended index developed by the Adviser it is comprised of three underlying indices: 20% MSCI USA Index, 10% MSCI ACWI ex USA Index and 70% Bloomberg Barclays US Aggregate Bond Index. |
| |
| Bloomberg Barclays Global High Yield Index | | The Bloomberg Barclays Global High Yield Index is a multi-currency flagship measure of the global high yield debt market. The index represents the union of the U.S. High Yield, the Pan-European High Yield, and Emerging Markets (EM) Hard Currency High Yield Indices. |
| |
| Bloomberg Barclays U.S. Aggregate Bond Index | | The Bloomberg Barclays U.S. Aggregate Bond Index represents securities that are SEC-registered, taxable, and U.S. dollar denominated. The index covers the U.S. investment grade fixed rate bond market, with index components for government and corporate securities, mortgage pass-through securities, and asset-backed securities. |
| |
| Bloomberg Barclays U.S. Credit Index | | The Bloomberg Barclays U.S. Credit Index is the credit component of the U.S. Government/Credit Index. It includes publicly issued U.S. corporate and specified foreign debentures and secured notes that meet the specified maturity, liquidity and quality requirements. To qualify, bonds must be SEC-registered. |
| |
| Bloomberg Barclays U.S. Government Bond Index | | The Bloomberg Barclays U.S. Bond Index is a market capitalization-weighted index, meaning the securities in the index are weighted according to the market size of each bond type. Most U.S. traded investment grade bonds are represented. |
| |
| Bloomberg Barclays U.S. Government/Credit 1-3 Year Index | | The Bloomberg Barclays U.S. Government/Credit 1-3 Year Index is the 1-3 Year component of the U.S. Government/Credit index. The Government Index includes treasuries and agencies. The Credit Index includes publicly issued U.S. corporate and foreign debentures and secured notes that meet specified maturity, liquidity, and quality requirements. |
| |
| Bloomberg Barclays U.S. TIPS Index | | The Bloomberg Barclays U.S. Treasury U.S. TIPS Index consists of Inflation-Protection securities issued by the U.S. Treasury. |
| |
| Bloomberg Barclays U.S. Universal Bond Index | | The Bloomberg Barclays U.S. Universal Bond Index represents the union of the U.S. Aggregate Index, the U.S. High-Yield Corporate Index, the 144A Index, the Eurodollar Index, the Emerging Markets Index, and the non-ERISA portion of the CMBS Index. Municipal debt, private placements, and non-dollar-denominated issues are excluded from the Universal Index. The only constituent of the index that includes floating-rate debt is the Emerging Markets Index. |
| |
| Dow Jones Sustainability World Total Return Index | | The Dow Jones Sustainability World Total Return Index tracks the performance of the top 10% of the 2500 largest companies in the S&P Global Broad Market Index that are the world’s sustainability leaders based on economic, environmental and social criteria. |
| |
| ICE BofA Merrill Lynch 0-3 Month US Treasury Bill Index | | The ICE BofA Merrill Lynch 0-3 Month US Treasury Bill Index is a subset of ICE BofA Merrill Lynch US Treasury Bill Index including all securities with a remaining term to final maturity less than 3 months. |
| | | | | | |
| | Annual Report | | | September 30, 2018 | | 113 |
Unaudited
Benchmark Descriptions (cont’d)
| | |
| Index | | Description |
| ICE BofA Merrill Lynch 1-3 Year BB U.S. Cash Pay High Yield Index | | The ICE BofA Merrill Lynch 1-3 Year BB U.S. Cash Pay High Yield Index is a subset of the ICE BofA Merrill Lynch U.S. Cash Pay High Yield Index, including all securities with a remaining term to final maturity less than 3 years and rated BB1 through BB3, inclusive. The ICE BofA Merrill Lynch US Cash Pay High Yield Index tracks the performance of U.S. dollar-denominated below investment grade corporate debt, currently in a coupon paying period, that is publicly issued in the U.S. domestic market. |
| |
| ICE BofA Merrill Lynch 3-Month U.S. Treasury Bill Index | | The ICE BofA Merrill Lynch 3-Month U.S. Treasury Bill Index tracks the performance of the 3-month U.S. Treasury markets. |
| |
| ICE BofA Merrill Lynch All Convertibles Index | | The ICE BofA Merrill Lynch All Convertibles Index is a widely used, unmanaged index that measures the performance of U.S. dollar-denominated convertible securities not currently in bankruptcy with a total market value greater than $50 million at issuance. |
| |
| ICE BofA Merrill Lynch Fixed Rate Preferred Securities Index | | The ICE BofA Merrill Lynch Fixed Rate Preferred Securities Index tracks the performance of fixed rate US dollar denominated preferred securities issued in the US domestic market. |
| |
| ICE BofA Merrill Lynch Global High Yield Constrained Index | | The ICE BofA Merrill Lynch Global High Yield Constrained Index contains all securities in the ICE BofA Merrill Lynch Global High Yield Index USD but caps issuer exposure at 2%. The ICE BofA Merrill Lynch Global High Yield Index tracks the performance of below investment grade corporate debt publicly issued in the major domestic or eurobond markets. |
| |
| ICE BofA Merrill Lynch High Yield Master II Index | | The ICE BofA Merrill Lynch High Yield Master II Index is an unmanaged index consisting of US dollar-denominated bonds that are issued in countries having a BBB3 or higher debt rating with at least one year remaining until maturity. All bonds must have a credit rating below investment grade but not in default. |
| |
| ICE BofA Merrill Lynch US Treasury Bill Index | | The ICE BofA Merrill Lynch US Treasury Bill Index tracks the performance of US dollar denominated US Treasury Bills publicly issued in the US domestic market. |
| |
| JP Morgan Corporate Emerging Markets Broad Diversified Index (CEMBI-BD) | | The JP Morgan Corporate Emerging Markets Broad Diversified Index (CEMBI-BD) tracks total returns of US dollar-denominated debt instruments issued by corporate entities in emerging market countries. Two variations are available: CEMBI Broad and CEMBI. The CEMBI Broad is the most comprehensive corporate benchmark followed by the CEMBI, which consists of an investable universe of corporate bonds. Both indices are also available in Diversified versions. |
| |
| JP Morgan Emerging Markets Bond Index Global Diversified (EMBI Global Diversified) | | The JP Morgan Emerging Markets Bond Index Global Diversified (EMBI Global Diversified) is a uniquely-weighted version of the EMBI Global. It limits the weights of those index countries with larger debt stocks by only including specified portions of these countries’ eligible current face amounts of debt outstanding. The countries covered in the EMBI Global Diversified are identical to those covered by the EMBI Global. |
| |
| JP Morgan Government Bond Index-Emerging Markets (GBI-EM) | | The JP Morgan Government Bond Index-Emerging Markets (GBI-EM) is the first comprehensive, global local emerging markets index, and consists of regularly traded, liquid fixed-rate, domestic currency government bonds to which international investors can gain exposure. Variations of the index are available to allow investors to select the most appropriate benchmark for their objectives. |
| |
Morningstar Lifetime Moderate 2020, Morningstar Lifetime Moderate 2025, Morningstar Lifetime Moderate 2030, Morningstar Lifetime Moderate 2035, Morningstar Lifetime Moderate 2040, Morningstar Lifetime Moderate 2045, Morningstar Lifetime Moderate 2050 and Morningstar Lifetime Moderate 2055 | | The Morningstar Lifetime Moderate 2020, Morningstar Lifetime Moderate 2025, Morningstar Lifetime Moderate 2030, Morningstar Lifetime Moderate 2035, Morningstar Lifetime Moderate 2040, Morningstar Lifetime Moderate 2045, Morningstar Lifetime Moderate 2050 and Morningstar Lifetime Moderate 2055 Indices each represents a portfolio of global equities, bonds and traditional inflation hedges such as commodities and TIPS. The portfolio is held in proportions appropriate for a U.S. investor’s investment horizon until retirement. The moderate risk profile is for investors who are comfortable with average exposure to equity market volatility. |
| |
| MSCI ACWI ex USA Growth Index | | The MSCI ACWI ex USA Growth Index captures large and mid-cap securities exhibiting overall growth style characteristics across developed and emerging markets, excluding the United States. |
| | | | | | |
| 114 | | September 30, 2018 | | | Annual Report | | |
Unaudited
Benchmark Descriptions (cont’d)
| | |
| Index | | Description |
| MSCI ACWI ex USA Index | | The MSCI ACWI ex USA Index captures large and mid cap representation across Developed Markets countries (excluding the U.S.) and Emerging Markets countries. The index covers approximately 85% of the global equity opportunity set outside the US. |
| |
MSCI All Country World Index
(Also known as: MSCI AC World Index and MSCI ACWI) | | The MSCI All Country World Index (ACWI) captures large and mid cap representation across the Developed Markets and Emerging Markets countries. The index covers approximately 85% of the global investable equity opportunity set. |
| |
MSCI EAFE Index | | The MSCI EAFE Index is an equity index which captures large and mid cap representation across Developed Markets countries around the world, excluding the US and Canada. |
| |
| MSCI EAFE Small Cap Index | | The MSCI EAFE Small Cap Index is an equity index which captures small cap representation across Developed Markets countries around the world, excluding the US and Canada. |
| |
| MSCI Emerging Markets Index | | The MSCI Emerging Markets Index captures large and mid cap representation across Emerging Markets countries. The index covers approximately 85% of the free float-adjusted market capitalization in each country. |
| |
| MSCI Emerging Markets Small-Cap Index | | The MSCI Emerging Markets Small-Cap Index includes small cap representation across 23 Emerging Markets countries. The index covers approximately 14% of the free float-adjusted market capitalization in each country. The Small cap segment tends to capture more local economic and sector characteristics relative to larger Emerging Markets capitalization segments. |
| |
| MSCI Europe Index (Net) | | The MSCI Europe Index (Net) captures large and mid cap representation across Developed Markets countries in Europe. The index covers approximately 85% of the free float-adjusted market capitalization across the European Developed Markets equity universe. |
| |
| MSCI World ex USA Small Cap Index | | The MSCI World ex USA Small Cap Index captures small cap representation across 23 of 24 Developed Markets countries (excluding the United States). |
| |
MSCI World High Dividend Yield Index | | The MSCI World High Dividend Yield Index is based on the MSCI World Index, its parent index, and includes large and mid cap stocks across 23 Developed Markets countries. The index is designed to reflect the performance of equities in the parent index (excluding REITs) with higher dividend income and quality characteristics than average dividend yields that are both sustainable and persistent. The index also applies quality screens and reviews 12-month past performance to omit stocks with potentially deteriorating fundamentals that could force them to cut or reduce dividends. Performance data shown for the index is net of dividend tax withholding. |
| |
| MSCI World Index | | The MSCI World Index captures large and mid cap representation across Developed Markets countries. The index covers approximately 85% of the free float-adjusted market capitalization in each country. |
| |
| Russell 2000 Index | | The Russell 2000 Index measures the performance of the small cap segment of the U.S. equity universe. The Russell 2000 Index is a subset of the Russell 3000 Index representing approximately 10% of total market capitalization of that index. It includes approximately 2000 of the smallest securities based on a combination of their market cap and current index membership. |
| |
| Russell Microcap Growth Index | | The Russell Microcap Growth Index measures the performance of the microcap growth segment of the US equity market. It includes those Russell Microcap Index companies with higher price-to-book ratios and higher forecasted growth values. |
| |
| Russell Microcap Index | | The Russell Microcap Index measures the performance of the microcap segment of the U.S. equity market. It makes up less than 3% of the U.S. equity market. |
| |
| S&P 500 Financials Index | | The S&P 500 Financials Index comprises those companies included in the S&P 500 that are classified as members of the GICS® financials sector. |
| |
| S&P 500 Index | | The Standard & Poor’s 500 Index is an unmanaged index of large capitalization common stocks. |
| | | | | | |
| | Annual Report | | | September 30, 2018 | | 115 |
Unaudited
Benchmark Descriptions (cont’d)
| | |
| Index | | Description |
| S&P Global Water Index | | The Standard & Poor’s Global Water Index is comprised of 50 of the largest publicly traded companies in water-related businesses that meet specific investability requirements. This index is designed to provide liquid exposure to the leading publicly-listed companies in the global water industry, from both developed markets and emerging markets. |
| |
| USD Overnight LIBOR | | USD Overnight LIBOR (London Inter-Bank Offered Rate) Index is the average interest rate at which leading banks in London borrow U.S. dollar funds from one another with a maturity of one day (overnight). |
| | | | | | |
| 116 | | September 30, 2018 | | | Annual Report | | |
Schedule of Investments
September 30, 2018
AllianzGI Retirement 2020 Fund
| | | | | | | | |
| | | Shares | | | Value | |
| Mutual Funds (a)—89.4% | |
AllianzGI Advanced Core Bond | | | 426,219 | | | | $6,086,401 | |
AllianzGI Best Styles U.S. Equity (c) | | | 103,732 | | | | 2,122,354 | |
AllianzGI Emerging Markets Small-Cap (b) | | | 19,019 | | | | 312,868 | |
AllianzGI Global Dynamic Allocation (c) | | | 1,098,692 | | | | 22,138,654 | |
AllianzGI Short Duration High Income (c) | | | 28,447 | | | | 423,579 | |
| | | | | | | | |
Total Mutual Funds
(cost—$28,869,398) | | | | | | | 31,083,856 | |
| | | | | | | | |
| | | | | | | | |
| Exchange-Traded Funds—6.6% | |
iShares Floating Rate Bond | | | 5,515 | | | | 281,375 | |
iShares TIPS Bond | | | 4,110 | | | | 454,648 | |
iShares U.S. Preferred Stock | | | 8,490 | | | | 315,234 | |
Vanguard Intermediate-Term Corporate Bond | | | 422 | | | | 35,250 | |
Vanguard Mortgage-Backed Securities | | | 24,060 | | | | 1,227,060 | |
| | | | | | | | |
Total Exchange-Traded Funds
(cost—$2,326,989) | | | | 2,313,567 | |
| | | | | | | | |
| | | | | | | | |
| | | Principal
Amount
(000s) | | | Value | |
| Repurchase Agreements—2.6% | |
State Street Bank and Trust Co., dated 9/28/18, 0.42%, due 10/1/18, proceeds $892,031; collateralized by U.S. Treasury Notes, 2.00%, due 11/30/20, valued at $914,412 including accrued interest | |
(cost—$892,000) | | | $892 | | | | $892,000 | |
| | | | | | | | |
| |
Total Investments
(cost—$32,088,387)—98.6% | | | | 34,289,423 | |
| | | | | | | | |
| | |
Other assets less liabilities (d)—1.4% | | | | | | | 470,488 | |
| | | | | | | | |
| | |
| Net Assets—100.0% | | | | | | | $34,759,911 | |
| | | | | | | | |
Notes to Schedule of Investments:
(a) Affiliated fund.
(b) Institutional Class share.
(c) Class R6 share.
(d) Includes net unrealized appreciation (depreciation) of other financial instruments as follows:
| | | | | | | | | | | | | | | | | | | | | | |
| Futures contracts outstanding at September 30, 2018: | |
Type | | Contracts | | | Expiration
Date | | | Notional Amount
(000s) | | | Market
Value
(000s) | | | Unrealized
Appreciation
(Depreciation) | |
Long position contracts: | | | | | | | | | | | | | | | | | |
| | 10-Year Ultra U.S. Treasury Bond | | | 8 | | | | 12/19/18 | | | $ | 800 | | | $ | 1,008 | | | $ | (13,515 | ) |
| | E-mini S&P 500 Index | | | 8 | | | | 12/21/18 | | | | — | (f) | | | 1,167 | | | | 9,082 | |
| | Euro-Bund 10-Year Bond | | | 2 | | | | 12/6/18 | | | EUR | 200 | | | | 369 | | | | (2,963 | ) |
| | | | | | | | | | | | | | | | | | | | | | |
| | | | | | | | | | | | | $ | (7,396 | ) |
| | | | | | | | | | | | | | | | | | | | | | |
| | | | | |
Short position contracts: | | | | | | | | | | | | | | | | | | | | |
| | Australian Dollar | | | (1 | ) | | | 12/17/18 | | | $ | (100 | ) | | $ | (72 | ) | | $ | (1,123 | ) |
| | Euro STOXX 50 Index | | | (1 | ) | | | 12/21/18 | | | EUR | (— | )(f) | | | (39 | ) | | | (489 | ) |
| | FTSE 100 Index | | | (1 | ) | | | 12/21/18 | | | GBP | (— | )(f) | | | (97 | ) | | | (1,970 | ) |
| | Japanese Yen | | | (1 | ) | | | 12/17/18 | | | $ | (1 | ) | | | (111 | ) | | | 2,104 | |
| | Mini MSCI Emerging Markets Index | | | (10 | ) | | | 12/21/18 | | | | (1 | ) | | | (525 | ) | | | (11,073 | ) |
| | MSCI EAFE Index | | | (6 | ) | | | 12/21/18 | | | | (— | )(f) | | | (593 | ) | | | (3,103 | ) |
| | | | | | | | | | | | | | | | | | | | | | |
| | | | | | | | | | | | | $ | (15,654 | ) |
| | | | | | | | | | | | | | | | | | | | | | |
| | | | | | | | | | | | | $ | (23,050 | ) |
| | | | | | | | | | | | | | | | | | | | | | |
(e) At September 30, 2018, the Fund pledged $463,433 in cash as collateral for futures contracts.
(f) Notional amount rounds to less than 500.
Glossary:
EAFE—Europe, Australasia and Far East
EUR—Euro
FTSE—Financial Times Stock Exchange
GBP—British Pound
MSCI—Morgan Stanley Capital International
TIPS—Treasury Inflation Protected Securities
| | | | | | | | |
| See accompanying Notes to Financial Statements | | | September 30, 2018 | | | Annual Report | | | 117 | |
Schedule of Investments
September 30, 2018
AllianzGI Retirement 2025 Fund
| | | | | | | | |
| | | Shares | | | Value | |
| Mutual Funds (a)—95.8% | |
AllianzGI Advanced Core Bond | | | 476,845 | | | | $6,809,345 | |
AllianzGI Best Styles U.S. Equity (c) | | | 236,678 | | | | 4,842,433 | |
AllianzGI Emerging Markets Small-Cap (b) | | | 20,421 | | | | 335,926 | |
AllianzGI Global Dynamic Allocation (c) | | | 1,816,697 | | | | 36,606,454 | |
AllianzGI Short Duration High Income (c) | | | 8,971 | | | | 133,580 | |
| | | | | | | | |
Total Mutual Funds (cost—$44,645,876) | | | | | | | 48,727,738 | |
| | | | | | | | |
| | | | | | | | |
| Exchange-Traded Funds—0.6% | |
iShares TIPS Bond
(cost—$306,211) | | | 2,723 | | | | 301,218 | |
| | | | | | | | |
| | | | | | | | |
| | | Principal
Amount
(000s) | | | Value | |
| Repurchase Agreements—2.2% | |
State Street Bank and Trust Co., dated 9/28/18, 0.42%, due 10/1/18, proceeds $1,117,039; collateralized by U.S. Treasury Notes, 2.00%, due 11/30/20, valued at $1,141,779 including accrued interest | |
(cost—$1,117,000) | | | $1,117 | | | | 1,117,000 | |
| | | | | | | | |
| |
Total Investments
(cost—$46,069,087)—98.6% | | | | 50,145,956 | |
| | | | | | | | |
| | |
Other assets less liabilities (d)—1.4% | | | | | | | 713,448 | |
| | | | | | | | |
| | |
| Net Assets—100.0% | | | | | | | $50,859,404 | |
| | | | | | | | |
Notes to Schedule of Investments:
(a) Affiliated fund.
(b) Institutional Class share.
(c) Class R6 share.
(d) Includes net unrealized appreciation (depreciation) of other financial instruments as follows:
| | | | | | | | | | | | | | | | | | | | | | |
| Futures contracts outstanding at September 30, 2018: | |
| Type | | Contracts | | | Expiration
Date | | | Notional
Amount
(000s) | | | Market
Value
(000s) | | | Unrealized
Appreciation
(Depreciation) | |
Long position contracts: | | | | | | | | | | | | | | | | | | | | |
| | E-mini Russell 2000 Index | | | 2 | | | | 12/21/18 | | | $ | — | (f) | | $ | 170 | | | $ | (865 | ) |
| | E-mini S&P 500 Index | | | 19 | | | | 12/21/18 | | | | 1 | | | | 2,773 | | | | 21,570 | |
| | Euro-Bund 10-Year Bond | | | 1 | | | | 12/6/18 | | | EUR | 100 | | | | 184 | | | | (663 | ) |
| | SPI 200 Index | | | 1 | | | | 12/20/18 | | | AUD | — | (f) | | | 112 | | | | (3 | ) |
| | | | | | | | | | | | | | | | | | | | | | |
| | | | | | | | | | | | | | | | | | | | $ | 20,039 | |
| | | | | | | | | | | | | | | | | | | | | | |
Short position contracts: | | | | | | | | | | | | | | | | | | | | |
| | 10-Year U.S. Treasury Note | | | (5 | ) | | | 12/19/18 | | | $ | (500 | ) | | $ | (630 | ) | | $ | 7,522 | |
| | Australian Dollar | | | (2 | ) | | | 12/17/18 | | | | (200 | ) | | | (145 | ) | | | (2,245 | ) |
| | Euro STOXX 50 Index | | | (4 | ) | | | 12/21/18 | | | EUR | (— | )(f) | | | (157 | ) | | | (1,957 | ) |
| | FTSE 100 Index | | | (2 | ) | | | 12/21/18 | | | GBP | (— | )(f) | | | (195 | ) | | | (4,715 | ) |
| | Japanese Yen | | | (1 | ) | | | 12/17/18 | | | $ | (1 | ) | | | (111 | ) | | | 2,104 | |
| | Mini MSCI Emerging Markets Index | | | (11 | ) | | | 12/21/18 | | | | (1 | ) | | | (577 | ) | | | (12,180 | ) |
| | | | | | | | | | | | | | | | | | | | | | |
| | | | | | | | | | | | | $ | (11,471 | ) |
| | | | | | | | | | | | | | | | | | | | | | |
| | | | | | | | | | | | | $ | 8,568 | |
| | | | | | | | | | | | | | | | | | | | | | |
(e) At September 30, 2018, the Fund pledged $727,726 in cash as collateral for futures contracts.
(f) Notional amount rounds to less than 500.
Glossary:
AUD—Australian Dollar
EUR—Euro
FTSE—Financial Times Stock Exchange
GBP—British Pound
MSCI—Morgan Stanley Capital International
TIPS—Treasury Inflation Protected Securities
| | | | | | |
| 118 | | Annual Report | | | September 30, 2018 | | | See accompanying Notes to Financial Statements |
Schedule of Investments
September 30, 2018
AllianzGI Retirement 2030 Fund
| | | | | | | | |
| | | Shares | | | Value | |
| Mutual Funds (a)—96.3% | |
AllianzGI Advanced Core Bond | | | 124,264 | | | | $1,774,485 | |
AllianzGI Best Styles Global Equity (c) | | | 320,304 | | | | 5,534,847 | |
AllianzGI Best Styles U.S. Equity (c) | | | 382,195 | | | | 7,819,716 | |
AllianzGI Emerging Markets Small-Cap (b) | | | 46,319 | | | | 761,941 | |
AllianzGI Global Dynamic Allocation (c) | | | 2,095,488 | | | | 42,224,079 | |
| | | | | | | | |
| Total Mutual Funds (cost—$51,999,074) | | | | | | | 58,115,068 | |
| | | | | | | | |
| | | | | | | | |
| Exchange-Traded Funds—0.4% | |
iShares TIPS Bond | | | 1,062 | | | | 117,479 | |
iShares U.S. Preferred Stock | | | 3,172 | | | | 117,776 | |
| | | | | | | | |
| Total Exchange-Traded Funds (cost—$239,329) | | | | 235,255 | |
| | | | | | | | |
| | | | | | | | |
| | | Principal
Amount
(000s) | | | Value | |
| Repurchase Agreements—1.9% | |
State Street Bank and Trust Co., dated 9/28/18, 0.42%, due 10/1/18, proceeds $1,169,041; collateralized by U.S. Treasury Notes, 2.00%, due 11/30/20, valued at $1,196,149 including accrued interest | |
(cost—$1,169,000) | | | $1,169 | | | $ | 1,169,000 | |
| | | | | | | | |
| |
| Total Investments (cost—$53,407,403)—98.6% | | | | 59,519,323 | |
| | | | | | | | |
| | |
| Other assets less liabilities (d)—1.4% | | | | | | | 823,149 | |
| | | | | | | | |
| |
| Net Assets—100.0% | | | | $60,342,472 | |
| | | | | | | | |
Notes to Schedule of Investments:
(a) Affiliated fund.
(b) Institutional Class share.
(c) Class R6 share.
(d) Includes net unrealized appreciation (depreciation) of other financial instruments as follows:
| | | | | | | | | | | | | | | | | | | | | | |
| Futures contracts outstanding at September 30, 2018: | |
| Type | | Contracts | | | Expiration
Date | | | Notional
Amount
(000s) | | | Market
Value
(000s) | | | Unrealized
Appreciation
(Depreciation) | |
Long position contracts: | |
| | E-mini Russell 2000 Index | | | 4 | | | | 12/21/18 | | | $ | — | (f) | | $ | 340 | | | $ | (1,729 | ) |
| | E-mini S&P 500 Index | | | 25 | | | | 12/21/18 | | | | 1 | | | | 3,649 | | | | 26,431 | |
| | SPI 200 Index | | | 2 | | | | 12/20/18 | | | AUD | — | (f) | | | 224 | | | | (5 | ) |
| | | | | | | | | | | | | | | | | | | | | | |
| | | | | | | | | | | | | $ | 24,697 | |
| | | | | | | | | | | | | | | | | | | | | | |
Short position contracts: | |
| | 10-Year U.S. Treasury Note | | | (1 | ) | | | 12/19/18 | | | $ | (100 | ) | | $ | (126 | ) | | $ | 1,678 | |
| | Australian Dollar | | | (2 | ) | | | 12/17/18 | | | | (200 | ) | | | (144 | ) | | | (2,245 | ) |
| | Euro STOXX 50 Index | | | (11 | ) | | | 12/21/18 | | | EUR | (— | )(f) | | | (432 | ) | | | (5,381 | ) |
| | FTSE 100 Index | | | (5 | ) | | | 12/21/18 | | | GBP | (— | )(f) | | | (488 | ) | | | (11,380 | ) |
| | Japanese Yen | | | (1 | ) | | | 12/17/18 | | | $ | (1 | ) | | | (111 | ) | | | 2,103 | |
| | Mini MSCI Emerging Markets Index | | | (24 | ) | | | 12/21/18 | | | | (1 | ) | | | (1,260 | ) | | | (26,575 | ) |
| | | | | | | | | | | | | | | | | | | | | | |
| | | | | | | | | | | | | $ | (41,800 | ) |
| | | | | | | | | | | | | | | | | | | | | | |
| | | | | | | | | | | | | $ | (17,103 | ) |
| | | | | | | | | | | | | | | | | | | | | | |
(e) At September 30, 2018, the Fund pledged $770,595 in cash as collateral for futures contracts.
(f) Notional amount rounds to less than 500.
Glossary:
AUD—Australian Dollar
EUR—Euro
FTSE—Financial Times Stock Exchange
GBP—British Pound
MSCI—Morgan Stanley Capital International
TIPS—Treasury Inflation Protected Securities
| | | | | | | | |
| See accompanying Notes to Financial Statements | | | September 30, 2018 | | | Annual Report | | | 119 | |
Schedule of Investments
September 30, 2018
AllianzGI Retirement 2035 Fund
| | | | | | | | |
| | | Shares | | | Value | |
| Mutual Funds (a)—96.2% | |
AllianzGI Advanced Core Bond | | | 75,328 | | | | $1,075,689 | |
AllianzGI Best Styles Global Equity (c) | | | 785,946 | | | | 13,581,150 | |
AllianzGI Best Styles U.S. Equity (c) | | | 335,873 | | | | 6,871,953 | |
AllianzGI Emerging Markets Small-Cap (b) | | | 38,066 | | | | 626,182 | |
AllianzGI Global Dynamic Allocation (c) | | | 1,023,206 | | | | 20,617,594 | |
| | | | | | | | |
| Total Mutual Funds (cost—$37,852,919) | | | | | | | 42,772,568 | |
| | | | | | | | |
| | | | | | | | |
| | | Principal
Amount
(000s) | | | Value | |
| Repurchase Agreements—2.0% | |
State Street Bank and Trust Co., dated 9/28/18, 0.42%, due 10/1/18, proceeds $873,031; collateralized by U.S. Treasury Notes, 2.00%, due 11/30/20, valued at $894,640 including accrued interest | |
(cost—$873,000) | | | $873 | | | $ | 873,000 | |
| | | | | | | | |
| |
| Total Investments (cost—$38,725,919)—98.2% | | | | 43,645,568 | |
| | | | | | | | |
| | |
| Other assets less liabilities (d)—1.8% | | | | | | | 808,384 | |
| | | | | | | | |
| | |
| Net Assets—100.0% | | | | | | | $44,453,952 | |
| | | | | | | | |
Notes to Schedule of Investments:
(a) Affiliated fund.
(b) Institutional Class share.
(c) Class R6 share.
(d) Includes net unrealized appreciation (depreciation) of other financial instruments as follows:
| | | | | | | | | | | | | | | | | | | | | | |
| Futures contracts outstanding at September 30, 2018: | |
| Type | | Contracts | | | Expiration
Date | | | Notional
Amount
(000s) | | | Market
Value
(000s) | | | Unrealized
Appreciation
(Depreciation) | |
Long position contracts: | |
| | E-mini Russell 2000 Index | | | 7 | | | | 12/21/18 | | | $ | — | (f) | | $ | 595 | | | $ | (3,026 | ) |
| | E-mini S&P 500 Index | | | 22 | | | | 12/21/18 | | | | 1 | | | | 3,211 | | | | 23,025 | |
| | SPI 200 Index | | | 3 | | | | 12/20/18 | | | AUD | — | (f) | | | 336 | | | | (8 | ) |
| | | | | | | | | | | | | | | | | | | | | | |
| | | | | | | | | | | | | $ | 19,991 | |
| | | | | | | | | | | | | | | | | | | | | | |
Short position contracts: | |
| | Australian Dollar | | | (2 | ) | | | 12/17/18 | | | $ | (200 | ) | | $ | (144 | ) | | $ | (2,245 | ) |
| | Euro STOXX 50 Index | | | (15 | ) | | | 12/21/18 | | | EUR | (— | )(f) | | | (590 | ) | | | (7,338 | ) |
| | FTSE 100 Index | | | (7 | ) | | | 12/21/18 | | | GBP | (— | )(f) | | | (683 | ) | | | (16,095 | ) |
| | Japanese Yen | | | (1 | ) | | | 12/17/18 | | | $ | (1 | ) | | | (111 | ) | | | 2,103 | |
| | Mini MSCI Emerging Markets Index | | | (26 | ) | | | 12/21/18 | | | | (1 | ) | | | (1,365 | ) | | | (26,669 | ) |
| | | | | | | | | | | | | | | | | | | | | | |
| | | | | | | | | | | | | | | | | | | | $ | (50,244 | ) |
| | | | | | | | | | | | | | | |
| | | | | | | | | | | | | | | | | | | | $ | (30,253 | ) |
| | | | | | | | | | | | | | | |
(e) At September 30, 2018, the Fund pledged $789,225 in cash as collateral for futures contracts.
(f) Notional amount rounds to less than 500.
Glossary:
AUD—Australian Dollar
EUR—Euro
FTSE—Financial Times Stock Exchange
GBP—British Pound
MSCI—Morgan Stanley Capital International
| | | | | | |
| 120 | | Annual Report | | | September 30, 2018 | | | See accompanying Notes to Financial Statements |
Schedule of Investments
September 30, 2018
AllianzGI Retirement 2040 Fund
| | | | | | | | |
| | | Shares | | | Value | |
| Mutual Funds (a)—96.4% | |
AllianzGI Best Styles Global Equity (c) | | | 1,212,410 | | | | $20,950,442 | |
AllianzGI Best Styles U.S. Equity (c) | | | 412,917 | | | | 8,448,286 | |
AllianzGI Emerging Markets Small-Cap (b) | | | 32,334 | | | | 531,896 | |
AllianzGI Global Dynamic Allocation (c) | | | 757,081 | | | | 15,255,190 | |
| | | | | | | | |
| Total Mutual Funds (cost—$39,661,175) | | | | | | | 45,185,814 | |
| | | | | | | | |
| | | | | | | | |
| | | Principal
Amount
(000s) | | | Value | |
| Repurchase Agreements—1.7% | |
State Street Bank and Trust Co., dated 9/28/18, 0.42%, due 10/1/18, proceeds $805,028; collateralized by U.S. Treasury Notes, 2.00%, due 11/30/20, valued at $825,442 including accrued interest | |
(cost—$805,000) | | | $805 | | | $ | 805,000 | |
| | | | | | | | |
| |
| Total Investments (cost—$40,466,175)—98.1% | | | | 45,990,814 | |
| | | | | | | | |
| | |
| Other assets less liabilities (d)—1.9% | | | | | | | 868,483 | |
| | | | | | | | |
| |
| Net Assets—100.0% | | | | $46,859,297 | |
| | | | | | | | |
Notes to Schedule of Investments:
(a) Affiliated fund.
(b) Institutional Class share.
(c) Class R6 share.
(d) Includes net unrealized appreciation (depreciation) of other financial instruments as follows:
| | | | | | | | | | | | | | | | | | | | | | |
| Futures contracts outstanding at September 30, 2018: | |
| Type | | Contracts | | | Expiration
Date | | | Notional
Amount
(000s) | | | Market
Value
(000s) | | | Unrealized
Appreciation
(Depreciation) | |
Long position contracts: | |
| | E-mini Russell 2000 Index | | | 9 | | | | 12/21/18 | | | $ | — | (f) | | $ | 765 | | | $ | (3,890 | ) |
| | E-mini S&P 500 Index | | | 26 | | | | 12/21/18 | | | | 1 | | | | 3,795 | | | | 25,616 | |
| | SPI 200 Index | | | 5 | | | | 12/20/18 | | | AUD | — | (f) | | | 560 | | | | (14 | ) |
| | | | | | | | | | | | | | | | | | | | | | |
| | | | | | | | | | | | | $ | 21,712 | |
| | | | | | | | | | | | | | | | | | | | | | |
Short position contracts: | |
| | Australian Dollar | | | (1 | ) | | | 12/17/18 | | | $ | (100 | ) | | $ | (72 | ) | | $ | (1,123 | ) |
| | Euro STOXX 50 Index | | | (20 | ) | | | 12/21/18 | | | EUR | (— | )(f) | | | (786 | ) | | | (9,784 | ) |
| | FTSE 100 Index | | | (10 | ) | | | 12/21/18 | | | GBP | (— | )(f) | | | (976 | ) | | | (23,549 | ) |
| | Japanese Yen | | | (1 | ) | | | 12/17/18 | | | $ | (1 | ) | | | (111 | ) | | | 2,104 | |
| | Mini MSCI Emerging Markets Index | | | (29 | ) | | | 12/21/18 | | | | (1 | ) | | | (1,522 | ) | | | (31,046 | ) |
| | | | | | | | | | | | | | | | | | | | | | |
| | | | | | | | | | | | | | | | | | | | $ | (63,398 | ) |
| | | | | | | | | | | | | | | |
| | | | | | | | | | | | | | | | | | | | $ | (41,686 | ) |
| | | | | | | | | | | | | | | |
(e) At September 30, 2018, the Fund pledged $922,251 in cash as collateral for futures contracts.
(f) Notional amount rounds to less than 500.
Glossary:
AUD—Australian Dollar
EUR—Euro
FTSE—Financial Times Stock Exchange
GBP—British Pound
MSCI—Morgan Stanley Capital International
| | | | | | | | |
| See accompanying Notes to Financial Statements | | | September 30, 2018 | | | Annual Report | | | 121 | |
Schedule of Investments
September 30, 2018
AllianzGI Retirement 2045 Fund
| | | | | | | | |
| | | Shares | | | Value | |
| Mutual Funds (a)—95.4% | |
AllianzGI Best Styles Global Equity (c) | | | 966,481 | | | | $16,700,795 | |
AllianzGI Best Styles U.S. Equity (c) | | | 286,563 | | | | 5,863,076 | |
AllianzGI Emerging Markets Small-Cap (b) | | | 19,083 | | | | 313,909 | |
AllianzGI Global Dynamic Allocation (c) | | | 336,945 | | | | 6,789,450 | |
| | | | | | | | |
Total Mutual Funds
(cost—$26,066,782) | | | | | | | 29,667,230 | |
| | | | | | | | |
| | | | | | | | |
| | | Principal
Amount
(000s) | | | Value | |
| Repurchase Agreements—2.3% | |
State Street Bank and Trust Co., dated 9/28/18, 0.42%, due 10/1/18, proceeds $715,025; collateralized by Fannie Mae, 1.375%, due 10/7/21, valued at $730,782 including accrued interest | |
(cost—$715,000) | | | $715 | | | $ | 715,000 | |
| | | | | | | | |
| |
Total Investments
(cost—$26,781,782)—97.7% | | | | 30,382,230 | |
| | | | | | | | |
| | |
| Other assets less liabilities (d)—2.3% | | | | | | | 718,191 | |
| | | | | | | | |
| | |
| Net Assets—100.0% | | | | | | | $31,100,421 | |
| | | | | | | | |
Notes to Schedule of Investments:
(a) Affiliated fund.
(b) Institutional Class share.
(c) Class R6 share.
(d) Includes net unrealized appreciation (depreciation) of other financial instruments as follows:
| | | | | | | | | | | | | | | | | | | | | | |
| Futures contracts outstanding at September 30, 2018: | |
Type | | Contracts | | | Expiration
Date | | | Notional
Amount
(000s) | | | Market
Value
(000s) | | | Unrealized
Appreciation
(Depreciation) | |
Long position contracts: | | | | | | | | | | | | | | | | | | | | |
| | E-mini Russell 2000 Index | | | 7 | | | | 12/21/18 | | | $ | — | (f) | | $ | 595 | | | $ | (3,026 | ) |
| | E-mini S&P 500 Index | | | 18 | | | | 12/21/18 | | | | 1 | | | | 2,627 | | | | 16,535 | |
| | SPI 200 Index | | | 4 | | | | 12/20/18 | | | AUD | — | (f) | | | 448 | | | | (11 | ) |
| | | | | | | | | | | | | | | | | | | | | | |
| | | | | | | | | | | | | | | | | | | | $ | 13,498 | |
| | | | | | | | | | | | | | | | | | | | | | |
| | | | | |
Short position contracts: | | | | | | | | | | | | | | | | | | | | |
| | Australian Dollar | | | (1 | ) | | | 12/17/18 | | | $ | (100 | ) | | $ | (72 | ) | | $ | (1,123 | ) |
| | Euro STOXX 50 Index | | | (16 | ) | | | 12/21/18 | | | EUR | (— | )(f) | | | (629 | ) | | | (7,827 | ) |
| | FTSE 100 Index | | | (7 | ) | | | 12/21/18 | | | GBP | (— | )(f) | | | (683 | ) | | | (16,871 | ) |
| | Japanese Yen | | | (1 | ) | | | 12/17/18 | | | $ | (1 | ) | | | (111 | ) | | | 2,104 | |
| | Mini MSCI Emerging Markets Index | | | (21 | ) | | | 12/21/18 | | | | (1 | ) | | | (1,102 | ) | | | (21,133 | ) |
| | | | | | | | | | | | | | | | | | | | | | |
| | | | | | | | | | | | | | | | | | | | $ | (44,850 | ) |
| | | | | | | | | | | | | | | | | | | | | | |
| | | | | | | | | | | | | | | | | | | | $ | (31,352 | ) |
| | | | | | | | | | | | | | | | | | | | | | |
(e) At September 30, 2018, the Fund pledged $698,450 in cash as collateral for futures contracts.
(f) Notional amount rounds to less than 500.
Glossary:
AUD—Australian Dollar
EUR—Euro
FTSE—Financial Times Stock Exchange
GBP—British Pound
MSCI—Morgan Stanley Capital International
| | | | | | |
| 122 | | Annual Report | | | September 30, 2018 | | | See accompanying Notes to Financial Statements |
Schedule of Investments
September 30, 2018
AllianzGI Retirement 2050 Fund
| | | | | | | | |
| | | Shares | | | Value | |
| Mutual Funds (a)—95.7% | |
AllianzGI Best Styles Global Equity (c) | | | 1,125,860 | | | | $19,454,855 | |
AllianzGI Best Styles U.S. Equity (c) | | | 296,860 | | | | 6,073,759 | |
AllianzGI Emerging Markets Small-Cap (b) | | | 18,341 | | | | 301,714 | |
AllianzGI Global Dynamic Allocation (c) | | | 285,158 | | | | 5,745,930 | |
| | | | | | | | |
Total Mutual Funds
(cost—$28,008,364) | | | | | | | 31,576,258 | |
| | | | | | | | |
| | | | | | | | |
| | | Principal
Amount
(000s) | | | Value | |
| Repurchase Agreements—2.2% | |
State Street Bank and Trust Co., dated 9/28/18, 0.42%, due 10/1/18, proceeds $714,025; collateralized by U.S. Treasury Notes, 2.00%, due 11/30/20, valued at $731,529 including accrued interest | |
(cost—$714,000) | | | $714 | | | $ | 714,000 | |
| | | | | | | | |
| |
Total Investments
(cost—$28,722,364)—97.9% | | | | 32,290,258 | |
| | | | | | | | |
| | |
| Other assets less liabilities (d)—2.1% | | | | | | | 692,367 | |
| | | | | | | | |
| | |
| Net Assets—100.0% | | | | | | | $32,982,625 | |
| | | | | | | | |
Notes to Schedule of Investments:
(a) Affiliated fund.
(b) Institutional Class share.
(c) Class R6 share.
(d) Includes net unrealized appreciation (depreciation) of other financial instruments as follows:
| | | | | | | | | | | | | | | | | | | | | | |
| Futures contracts outstanding at September 30, 2018: | |
Type | | Contracts | | | Expiration
Date | | | Notional
Amount
(000s) | | | Market
Value
(000s) | | | Unrealized
Appreciation
(Depreciation) | |
Long position contracts: | | | | | | | | | | | | | | | | | | | | |
| | E-mini Russell 2000 Index | | | 8 | | | | 12/21/18 | | | $ | — | (f) | | $ | 680 | | | $ | (3,458 | ) |
| | E-mini S&P 500 Index | | | 19 | | | | 12/21/18 | | | | 1 | | | | 2,773 | | | | 19,620 | |
| | SPI 200 Index | | | 4 | | | | 12/20/18 | | | AUD | — | (f) | | | 448 | | | | (11 | ) |
| | | | | | | | | | | | | | | | | | | | | | |
| | | | | | | | | | | | | | | | | | | | $ | 16,151 | |
| | | | | | | | | | | | | | | | | | | | | | |
| | | | | |
Short position contracts: | | | | | | | | | | | | | | | | | | | | |
| | Australian Dollar | | | (1 | ) | | | 12/17/18 | | | $ | (100 | ) | | $ | (72 | ) | | $ | (1,123 | ) |
| | Euro STOXX 50 Index | | | (18 | ) | | | 12/21/18 | | | EUR | (— | )(f) | | | (708 | ) | | | (8,806 | ) |
| | FTSE 100 Index | | | (8 | ) | | | 12/21/18 | | | GBP | (— | )(f) | | | (780 | ) | | | (18,841 | ) |
| | Japanese Yen | | | (1 | ) | | | 12/17/18 | | | $ | (1 | ) | | | (111 | ) | | | 2,104 | |
| | Mini MSCI Emerging Markets Index | | | (22 | ) | | | 12/21/18 | | | | (1 | ) | | | (1,155 | ) | | | (22,240 | ) |
| | | | | | | | | | | | | | | | | | | | | | |
| | | | | | | | | | | | | | | | | | | | $ | (48,906 | ) |
| | | | | | | | | | | | | | | | | | | | | | |
| | | | | | | | | | | | | | | | | | | | $ | (32,755 | ) |
| | | | | | | | | | | | | | | | | | | | | | |
(e) At September 30, 2018, the Fund pledged $673,065 in cash as collateral for futures contracts.
(f) Notional amount rounds to less than 500.
Glossary:
AUD—Australian Dollar
EUR—Euro
FTSE—Financial Times Stock Exchange
GBP—British Pound
MSCI—Morgan Stanley Capital International
| | | | | | | | |
| See accompanying Notes to Financial Statements | | | September 30, 2018 | | | Annual Report | | | 123 | |
Schedule of Investments
September 30, 2018
AllianzGI Retirement 2055 Fund
| | | | | | | | |
| | | Shares | | | Value | |
| Mutual Funds (a)—95.6% | |
AllianzGI Best Styles Global Equity (c) | | | 545,905 | | | | $9,433,238 | |
AllianzGI Best Styles U.S. Equity (c) | | | 146,450 | | | | 2,996,373 | |
AllianzGI Emerging Markets Small-Cap (b) | | | 9,619 | | | | 158,231 | |
AllianzGI Global Dynamic Allocation (c) | | | 138,453 | | | | 2,789,818 | |
| | | | | | | | |
Total Mutual Funds
(cost—$13,849,629) | | | | | | | 15,377,660 | |
| | | | | | | | |
| | | | | | | | |
| | | Principal
Amount
(000s) | | | Value | |
| Repurchase Agreements—1.9% | |
State Street Bank and Trust Co., dated 9/28/18, 0.42%, due 10/1/18, proceeds $307,011; collateralized by Fannie Mae, 1.375%, due 10/7/21, valued at $317,313 including accrued interest | |
(cost—$307,000) | | | $307 | | | $ | 307,000 | |
| | | | | | | | |
| |
Total Investments
(cost—$14,156,629)—97.5% | | | | 15,684,660 | |
| | | | | | | | |
| | |
| Other assets less liabilities (d)—2.5% | | | | | | | 407,405 | |
| | | | | | | | |
| | |
| Net Assets—100.0% | | | | | | | $16,092,065 | |
| | | | | | | | |
Notes to Schedule of Investments:
(a) Affiliated fund.
(b) Institutional Class share.
(c) Class R6 share.
(d) Includes net unrealized appreciation (depreciation) of other financial instruments as follows:
| | | | | | | | | | | | | | | | | | | | | | |
| Futures contracts outstanding at September 30, 2018: | |
Type | | Contracts | | | Expiration
Date | | | Notional
Amount
(000s) | | | Market
Value
(000s) | | | Unrealized
Appreciation
(Depreciation) | |
Long position contracts: | | | | | | | | | | | | | | | | | | | | |
| | E-mini Russell 2000 Index | | | 4 | | | | 12/21/18 | | | $ | — | (f) | | $ | 340 | | | $ | (1,729 | ) |
| | E-mini S&P 500 Index | | | 9 | | | | 12/21/18 | | | | — | (f) | | | 1,314 | | | | 10,217 | |
| | SPI 200 Index | | | 2 | | | | 12/20/18 | | | AUD | — | (f) | | | 224 | | | | (5 | ) |
| | | | | | | | | | | | | | | | | | | | | | |
| | | | | | | | | | | | | | | | | | | | $ | 8,483 | |
| | | | | | | | | | | | | | | | | | | | | | |
| | | | | |
Short position contracts: | | | | | | | | | | | | | | | | | | | | |
| | Australian Dollar | | | (1 | ) | | | 12/17/18 | | | $ | (100 | ) | | $ | (72 | ) | | $ | (1,123 | ) |
| | Euro STOXX 50 Index | | | (9 | ) | | | 12/21/18 | | | EUR | (— | )(f) | | | (354 | ) | | | (4,403 | ) |
| | FTSE 100 Index | | | (4 | ) | | | 12/21/18 | | | GBP | (— | )(f) | | | (390 | ) | | | (9,417 | ) |
| | Japanese Yen | | | (1 | ) | | | 12/17/18 | | | $ | (1 | ) | | | (111 | ) | | | 2,104 | |
| | Mini MSCI Emerging Markets Index | | | (11 | ) | | | 12/21/18 | | | | (1 | ) | | | (577 | ) | | | (11,115 | ) |
| | | | | | | | | | | | | | | | | | | | | | |
| | | | | | | | | | | | | | | | | | | | $ | (23,954 | ) |
| | | | | | | | | | | | | | | | | | | | | | |
| | | | | | | | | | | | | | | | | | | | $ | (15,471 | ) |
| | | | | | | | | | | | | | | | | | | | | | |
(e) At September 30, 2018, the Fund pledged $412,092 in cash as collateral for futures contracts.
(f) Notional amount rounds to less than 500.
Glossary:
AUD—Australian Dollar
EUR—Euro
FTSE—Financial Times Stock Exchange
GBP—British Pound
MSCI—Morgan Stanley Capital International
| | | | | | |
| 124 | | Annual Report | | | September 30, 2018 | | | See accompanying Notes to Financial Statements |
Schedule of Investments
September 30, 2018
AllianzGI Multi Asset Income Fund
| | | | | | | | |
| | | Shares | | | Value | |
| Mutual Funds—71.4% | |
AllianzGI Emerging Markets Debt (a)(b) | | | 171,246 | | | | $2,265,579 | |
AllianzGI Europe Equity Dividend (a)(b) | | | 158,389 | | | | 2,458,202 | |
AllianzGI Global High Yield (a)(b) | | | 85,737 | | | | 1,271,475 | |
AllianzGI High Yield Bond (a)(b) | | | 91,229 | | | | 782,746 | |
AllianzGI Real Estate Debt (a)(b) | | | 262,318 | | | | 3,921,656 | |
AllianzGI Short Duration High Income (a)(c) | | | 294,668 | | | | 4,387,608 | |
Harvest Asian Bond (b) | | | 110,055 | | | | 1,045,520 | |
PIMCO Income (a)(b) | | | 462,156 | | | | 5,495,035 | |
PIMCO Preferred and Capital Security (a)(b) | | | 214,451 | | | | 2,163,806 | |
PIMCO Senior Floating Rate (a)(b) | | | 200,647 | | | | 1,988,416 | |
| | | | | | | | |
| Total Mutual Funds (cost—$25,900,195) | | | | | | | 25,780,043 | |
| | | | | | | | |
| | | | | | | | |
| Common Stock—13.3% | |
| Equity Real Estate Investment Trusts (REITs)—7.4% | |
American Tower Corp. | | | 1,139 | | | | 165,497 | |
Apple Hospitality REIT, Inc. | | | 6,400 | | | | 111,936 | |
AvalonBay Communities, Inc. | | | 701 | | | | 126,986 | |
Crown Castle International Corp. | | | 1,402 | | | | 156,085 | |
Digital Realty Trust, Inc. | | | 1,586 | | | | 178,393 | |
Equinix, Inc. | | | 260 | | | | 112,551 | |
Gaming and Leisure Properties, Inc. | | | 3,171 | | | | 111,778 | |
| | | | | | | | |
| | | Shares | | | Value | |
Hospitality Properties Trust | | | 3,928 | | | $ | 113,283 | |
Iron Mountain, Inc. | | | 3,160 | | | | 109,083 | |
Lexington Realty Trust | | | 12,395 | | | | 102,878 | |
Medical Properties Trust, Inc. | | | 7,613 | | | | 113,510 | |
Omega Healthcare Investors, Inc. | | | 3,440 | | | | 112,729 | |
Prologis, Inc. | | | 1,710 | | | | 115,921 | |
Public Storage | | | 530 | | | | 106,864 | |
Sabra Health Care REIT, Inc. | | | 4,909 | | | | 113,496 | |
Senior Housing Properties Trust | | | 6,532 | | | | 114,702 | |
Simon Property Group, Inc. | | | 1,040 | | | | 183,820 | |
Spirit Realty Capital, Inc. | | | 13,600 | | | | 109,616 | |
STAG Industrial, Inc. | | | 3,828 | | | | 105,270 | |
Uniti Group, Inc. | | | 5,492 | | | | 110,664 | |
Welltower, Inc. | | | 1,724 | | | | 110,888 | |
WP Carey, Inc. | | | 1,719 | | | | 110,549 | |
| | | | | | | | |
| | | | | | | 2,696,499 | |
| | | | | | | | |
| Mortgage Real Estate Investment Trusts (REITs)—5.9% | |
AGNC Investment Corp. | | | 19,109 | | | | 356,001 | |
Annaly Capital Management, Inc. | | | 27,821 | | | | 284,609 | |
Hannon Armstrong Sustainable Infrastructure Capital, Inc. | | | 13,529 | | | | 290,467 | |
Ladder Capital Corp. | | | 16,739 | | | | 283,559 | |
New Residential Investment Corp. | | | 19,717 | | | | 351,357 | |
Starwood Property Trust, Inc. | | | 13,100 | | | | 281,912 | |
Two Harbors Investment Corp. | | | 18,478 | | | | 275,876 | |
| | | | | | | | |
| | | | | | | 2,123,781 | |
| | | | | | | | |
| Total Common Stock (cost—$4,570,591) | | | | | | | 4,820,280 | |
| | | | | | | | |
| | | | | | | | |
| | | | | | | | |
| | | Shares | | | Value | |
| Exchange-Traded Funds—11.7% | |
Alerian | | | 133,859 | | | $ | 1,429,614 | |
Invesco Senior Loan | | | 33,650 | | | | 779,671 | |
iShares Emerging Markets Dividend | | | 14,720 | | | | 572,755 | |
Vanguard Mortgage-Backed Securities | | | 28,444 | | | | 1,450,644 | |
| | | | | | | | |
Total Exchange-Traded Funds
(cost—$4,174,949) | | | | 4,232,684 | |
| | | | | | | | |
| | | | | | | | |
| | | Principal
Amount
(000s) | | | | |
| Repurchase Agreements—0.8% | |
State Street Bank and Trust Co., dated 9/28/18, 0.42%, due 10/1/18, proceeds $298,010; collateralized by U.S. Treasury Notes, 2.00%, due 11/30/20, valued at $306,451 including accrued interest | |
(cost—$298,000) | | | $298 | | | | 298,000 | |
| | | | | | | | |
| |
Total Investments
(cost—$34,943,735)—97.2% | | | | 35,131,007 | |
| | | | | | | | |
| | |
| Other assets less liabilities (d)—2.8% | | | | | | | 998,183 | |
| | | | | | | | |
| | |
| Net Assets—100.0% | | | | | | | $36,129,190 | |
| | | | | | | | |
Notes to Schedule of Investments:
(a) Affiliated fund.
(b) Institutional Class share.
(c) Class R6 share.
(d) Includes net unrealized appreciation (depreciation) of other financial instruments as follows:
| | | | | | | | | | | | | | | | | | | | | | |
| Futures contracts outstanding at September 30, 2018: | |
| Type | | Contracts | | | Expiration
Date | | | Notional
Amount
(000s) | | | Market
Value
(000s) | | | Unrealized
Appreciation
(Depreciation) | |
Long position contracts: | |
| | 5-Year U.S. Treasury Note | | | 18 | | | | 12/31/18 | | | $ | 1,800 | | | $ | 2,025 | | | $ | (13,672 | ) |
| | 10-Year Ultra U.S. Treasury Bond | | | 50 | | | | 12/19/18 | | | | 5,000 | | | | 6,300 | | | | (72,669 | ) |
| | E-mini Russell 2000 Index | | | 4 | | | | 12/21/18 | | | | — | (f) | | | 340 | | | | (4,839 | ) |
| | E-mini S&P 500 Index | | | 32 | | | | 12/21/18 | | | | 2 | | | | 4,670 | | | | 36,328 | |
| | Euro-Bund 10-Year Bond | | | 6 | | | | 12/6/18 | | | EUR | 600 | | | | 1,106 | | | | (13,801 | ) |
| | Nikkei 225 Index | | | 5 | | | | 12/13/18 | | | $ | — | (f) | | | 605 | | | | 14,325 | |
| | SPI 200 Index | | | 5 | | | | 12/20/18 | | | AUD | — | (f) | | | 560 | | | | 5,769 | |
| | U.S. Ultra Treasury Bond | | | 25 | | | | 12/19/18 | | | $ | 2,500 | | | | 3,857 | | | | (50,360 | ) |
| | United Kingdom Government 10-Year Gilt | | | 4 | | | | 12/27/18 | | | GBP | 400 | | | | 630 | | | | (6,680 | ) |
| | | | | | | | | | | | | | | | | | | | | | |
| | | | | | | | | | | | | | | | | | | | $ | (105,599 | ) |
| | | | | | | | | | | | | | | | | | | | | | |
Short position contracts: | |
| | 2-Year U.S. Treasury Note | | | (40 | ) | | | 12/31/18 | | | $ | (8,000 | ) | | $ | (8,429 | ) | | $ | 19,933 | |
| | Dow Jones U.S. Real Estate Index | | | (27 | ) | | | 12/21/18 | | | | (3 | ) | | | (859 | ) | | | 19,380 | |
| | Euro Currency | | | (5 | ) | | | 12/17/18 | | | | (625 | ) | | | (730 | ) | | | (544 | ) |
| | Euro STOXX 50 Index | | | (24 | ) | | | 12/21/18 | | | EUR | (— | )(f) | | | (944 | ) | | | (11,741 | ) |
| | | | | | | | | | | | | | | | | | | | | | |
| | | | | | | | | | | | | $ | 27,028 | |
| | | | | | | | | | | | | | | |
| | | | | | | | | | | | | $ | (78,571 | ) |
| | | | | | | | | | | | | | | |
| | | | | | | | |
| See accompanying Notes to Financial Statements | | | September 30, 2018 | | | Annual Report | | | 125 | |
Schedule of Investments
September 30, 2018
(e) At September 30, 2018, the Fund pledged $961,653 in cash as collateral for futures contracts.
(f) Notional amount rounds to less than 500.
Glossary:
AUD—Australian Dollar
EUR—Euro
GBP—British Pound
REIT—Real Estate Investment Trust
AllianzGI Global Allocation Fund
| | | | | | | | |
| | | Shares | | | Value | |
| Mutual Funds (a)- 91.7% | |
AllianzGI Advanced Core Bond | | | 5,710,066 | | | | $81,539,738 | |
AllianzGI Best Styles Global Equity (c) | | | 7,672,411 | | | | 132,579,267 | |
AllianzGI Best Styles Global Managed Volatility | | | 2,016,670 | | | | 36,521,892 | |
AllianzGI Emerging Markets Debt (b) | | | 1,102,849 | | | | 14,590,689 | |
AllianzGI Emerging Markets Small-Cap (b) | | | 273,550 | | | | 4,499,894 | |
AllianzGI International Growth (b) | | | 1,021,708 | | | | 18,717,685 | |
AllianzGI PerformanceFee Managed Futures Strategy (c)(d) | | | 1,500,000 | | | | 14,415,000 | |
| | | | | | | | |
| Total Mutual Funds (cost—$277,357,687) | | | | | | | 302,864,165 | |
| | | | | | | | |
| | | | | | | | |
| Exchange-Traded Funds—6.1% | |
iShares iBoxx $ High Yield Corporate Bond | | | 38,742 | | | | 3,348,858 | |
iShares iBoxx $ Investment Grade Corporate Bond | | | 87,950 | | | | 10,108,094 | |
iShares MBS | | | 65,470 | | | | 6,765,015 | |
| | | | | | | | |
Total Exchange-Traded Funds
(cost—$20,903,965) | | | | | | | 20,221,967 | |
| | | | | | | | |
| | | | | | | | |
| | | Principal
Amount
(000s) | | | Value | |
| Repurchase Agreements—1.4% | |
State Street Bank and Trust Co., dated 9/28/18, 0.42%, due 10/1/18, proceeds $4,752,166; collateralized by Fannie Mae, 1.50%, due 6/22/20, valued at $4,851,940 including accrued interest | |
(cost—$4,752,000) | | | $4,752 | | | $ | 4,752,000 | |
| | | | | | | | |
| |
| Total Investments (cost—$303,013,652)—99.2% | | | | 327,838,132 | |
| | | | | | | | |
| | |
Other assets less liabilities (e)—0.8% | | | | | | | 2,669,926 | |
| | | | | | | | |
| | |
| Net Assets—100.0% | | | | | | | $330,508,058 | |
| | | | | | | | |
Notes to Schedule of Investments:
(a) Affiliated fund.
(b) Institutional Class share.
(c) Class R6 share.
(d) Non-income producing.
(e) Includes net unrealized appreciation (depreciation) of other financial instruments as follows:
| | | | | | | | | | | | | | | | | | | | | | |
| Futures contracts outstanding at September 30, 2018: | |
| Type | | Contracts | | | Expiration
Date | | | Notional
Amount
(000s) | | | Market
Value
(000s) | | | Unrealized
Appreciation
(Depreciation) | |
Long position contracts: | |
| | 2-Year U.S. Treasury Note | | | 34 | | | | 12/31/18 | | | $ | 6,800 | | | $ | 7,165 | | | $ | (17,057 | ) |
| | 10-Year U.S. Treasury Note | | | 102 | | | | 12/19/18 | | | | 10,200 | | | | 12,116 | | | | (81,967 | ) |
| | E-mini Russell 2000 Index | | | 65 | | | | 12/21/18 | | | | 3 | | | | 5,527 | | | | (28,096 | ) |
| | E-mini S&P 500 Index | | | 183 | | | | 12/21/18 | | | | 9 | | | | 26,709 | | | | 186,563 | |
| | U.S. Ultra Treasury Bond | | | 42 | | | | 12/19/18 | | | | 4,200 | | | | 6,480 | | | | (80,268 | ) |
| | | | | | | | | | | | | | | | | | | | | | |
| | | | | | | | | | | | | | | | | | | | $ | (20,825 | ) |
| | | | | | | | | | | | | | | | | | | | | | |
Short position contracts: | |
| | Euro Currency | | | (67 | ) | | | 12/17/18 | | | $ | (8,375 | ) | | $ | (9,784 | ) | | $ | 34,971 | |
| | Mini MSCI Emerging Markets Index | | | (92 | ) | | | 12/21/18 | | | | (5 | ) | | | (4,828 | ) | | | (101,869 | ) |
| | | | | | | | | | | | | | | | | | | | | | |
| | | | | | | | | | | | | | | | | | | | $ | (66,898 | ) |
| | | | | | | | | | | | | | | | | | | | | | |
| | | | | | | | | | | | | | | | | | | | $ | (87,723 | ) |
| | | | | | | | | | | | | | | | | | | | | | |
(f) At September 30, 2018, the Fund pledged $3,154,165 in cash as collateral for futures contracts.
Glossary:
MBS—Mortgage-Backed Securities
MSCI—Morgan Stanley Capital International
| | | | | | |
| 126 | | Annual Report | | | September 30, 2018 | | | See accompanying Notes to Financial Statements |
Schedule of Investments
September 30, 2018
AllianzGI Best Styles Global Equity Fund
| | | | | | | | |
| | | Shares | | | Value | |
| Common Stock—98.9% | |
| Australia—1.3% | |
Alumina Ltd. | | | 103,111 | | | | $206,411 | |
Aristocrat Leisure Ltd. | | | 29,565 | | | | 607,175 | |
BHP Billiton Ltd. | | | 52,795 | | | | 1,315,170 | |
BlueScope Steel Ltd. | | | 42,948 | | | | 526,746 | |
Flight Centre Travel Group Ltd. | | | 14,590 | | | | 560,282 | |
National Australia Bank Ltd. | | | 56,621 | | | | 1,136,724 | |
Qantas Airways Ltd. | | | 136,980 | | | | 583,843 | |
Rio Tinto Ltd. | | | 10,838 | | | | 616,384 | |
Treasury Wine Estates Ltd. | | | 22,881 | | | | 288,802 | |
Westpac Banking Corp. | | | 61,140 | | | | 1,229,566 | |
| | | | | | | | |
| | | | | | | 7,071,103 | |
| | | | | | | | |
| Austria—0.6% | |
Austria Technologie & Systemtechnik AG | | | 6,383 | | | | 147,345 | |
Erste Group Bank AG | | | 23,097 | | | | 958,913 | |
EVN AG | | | 15,600 | | | | 305,407 | |
OMV AG | | | 10,655 | | | | 597,735 | |
Raiffeisen Bank International AG | | | 10,445 | | | | 300,623 | |
voestalpine AG | | | 13,469 | | | | 615,265 | |
| | | | | | | | |
| | | | | | | 2,925,288 | |
| | | | | | | | |
| Belgium—0.0% | |
Recticel S.A. | | | 15,205 | | | | 167,011 | |
| | | | | | | | |
| Bermuda—0.1% | |
Bank of NT Butterfield & Son Ltd. | | | 6,457 | | | | 334,860 | |
| | | | | | | | |
| Brazil—0.7% | |
Engie Brasil Energia S.A. | | | 67,500 | | | | 593,010 | |
Fibria Celulose S.A. | | | 27,900 | | | | 521,724 | |
JBS S.A. | | | 133,400 | | | | 309,837 | |
Petroleo Brasileiro S.A. | | | 87,300 | | | | 523,772 | |
Sao Martinho S.A. | | | 138,700 | | | | 629,182 | |
Smiles Fidelidade S.A. | | | 5,900 | | | | 67,202 | |
Vale S.A. | | | 86,519 | | | | 1,281,541 | |
| | | | | | | | |
| | | | | | | 3,926,268 | |
| | | | | | | | |
| Canada—3.4% | |
Atco Ltd., Class I | | | 18,501 | | | | 540,714 | |
BRP, Inc. | | | 13,834 | | | | 648,939 | |
Canadian Apartment Properties REIT | | | 11,302 | | | | 417,290 | |
Canadian Imperial Bank of Commerce | | | 14,098 | | | | 1,321,009 | |
Canadian Tire Corp., Ltd., Class A | | | 3,284 | | | | 384,780 | |
Chorus Aviation, Inc. | | | 12,075 | | | | 72,077 | |
Cogeco Communications, Inc. | | | 9,743 | | | | 488,036 | |
Colliers International Group, Inc. | | | 4,626 | | | | 358,326 | |
Dream Global Real Estate Investment Trust REIT | | | 22,444 | | | | 258,037 | |
Dream Industrial Real Estate Investment Trust REIT | | | 26,259 | | | | 205,534 | |
Exchange Income Corp. | | | 9,638 | | | | 246,761 | |
Fairfax Financial Holdings Ltd. | | | 1,431 | | | | 777,447 | |
Fortis, Inc. | | | 13,181 | | | | 427,376 | |
Genworth MI Canada, Inc. | | | 8,627 | | | | 284,461 | |
George Weston Ltd. | | | 12,776 | | | | 967,065 | |
Husky Energy, Inc. | | | 27,627 | | | | 485,101 | |
Industrial Alliance Insurance & Financial Services, Inc. | | | 12,737 | | | | 509,322 | |
Killam Apartment REIT | | | 30,375 | | | | 379,320 | |
Laurentian Bank of Canada | | | 10,348 | | | | 341,288 | |
| | | | | | | | |
| | | Shares | | | Value | |
Linamar Corp. | | | 7,826 | | | $ | 360,566 | |
Loblaw Cos., Ltd. | | | 20,473 | | | | 1,051,824 | |
Magellan Aerospace Corp. | | | 20,868 | | | | 293,233 | |
Magna International, Inc. | | | 8,401 | | | | 441,302 | |
Manulife Financial Corp. | | | 56,912 | | | | 1,017,379 | |
Martinrea International, Inc. | | | 22,134 | | | | 226,027 | |
Methanex Corp. | | | 6,471 | | | | 510,807 | |
National Bank of Canada | | | 14,804 | | | | 739,369 | |
Northview Apartment Real Estate Investment Trust REIT | | | 16,295 | | | | 323,465 | |
Power Corp. of Canada | | | 18,629 | | | | 404,699 | |
Russel Metals, Inc. | | | 14,345 | | | | 297,639 | |
Teck Resources Ltd., Class B | | | 20,387 | | | | 491,346 | |
Toronto-Dominion Bank | | | 23,249 | | | | 1,412,778 | |
Transcontinental, Inc., Class A | | | 53,535 | | | | 949,136 | |
West Fraser Timber Co., Ltd. | | | 5,431 | | | | 309,087 | |
| | | | | | | | |
| | | | | | | 17,941,540 | |
| | | | | | | | |
| China—3.9% | |
Agile Group Holdings Ltd. | | | 156,909 | | | | 222,354 | |
Agricultural Bank of China Ltd., Class H | | | 850,000 | | | | 416,858 | |
Alibaba Group Holding Ltd. ADR (e) | | | 17,296 | | | | 2,849,689 | |
Anhui Conch Cement Co., Ltd., Class H | | | 73,500 | | | | 441,360 | |
Bank of China Ltd., Class H | | | 2,427,000 | | | | 1,072,352 | |
Bank of Communications Co., Ltd., Class H | | | 377,961 | | | | 283,011 | |
Beijing Enterprises Holdings Ltd. | | | 109,000 | | | | 610,895 | |
BOC Aviation Ltd. (a) | | | 79,600 | | | | 617,548 | |
China CITIC Bank Corp., Ltd., Class H | | | 832,000 | | | | 531,302 | |
China Construction Bank Corp., Class H | | | 1,606,188 | | | | 1,403,969 | |
China Lumena New Materials Corp. (c)(d)(e) | | | 60,228 | | | | 1,154 | |
China Shenhua Energy Co., Ltd., Class H | | | 164,500 | | | | 374,642 | |
China Yuchai International Ltd. | | | 11,447 | | | | 197,690 | |
China Zhongwang Holdings Ltd. | | | 390,000 | | | | 190,579 | |
CITIC Ltd. | | | 301,000 | | | | 448,315 | |
Country Garden Holdings Co., Ltd. | | | 214,000 | | | | 269,679 | |
Country Garden Services Holdings Co., Ltd. (e) | | | 24,597 | | | | 41,529 | |
CSPC Pharmaceutical Group Ltd. | | | 158,000 | | | | 334,207 | |
Fosun International Ltd. | | | 141,000 | | | | 248,450 | |
Guangzhou Automobile Group Co., Ltd., Class H | | | 283,991 | | | | 313,775 | |
Hua Hong Semiconductor Ltd. (a) | | | 223,000 | | | | 478,048 | |
Industrial & Commercial Bank of China Ltd., Class H | | | 1,637,000 | | | | 1,195,162 | |
Jiangsu Expressway Co., Ltd., Class H | | | 234,000 | | | | 300,167 | |
Kingboard Holdings Ltd. | | | 65,500 | | | | 213,216 | |
Ping An Insurance Group Co. of China Ltd., Class H | | | 109,000 | | | | 1,104,192 | |
Shanghai Industrial Holdings Ltd. | | | 152,000 | | | | 336,305 | |
| | | | | | | | |
| | |
| | | Shares | | | Value | |
Sinotrans Ltd., Class H | | | 214,000 | | | $ | 87,037 | |
Sinotruk Hong Kong Ltd. | | | 159,000 | | | | 346,901 | |
SSY Group Ltd. | | | 302,000 | | | | 292,388 | |
Tencent Holdings Ltd. | | | 84,019 | | | | 3,430,565 | |
Uni-President China Holdings Ltd. | | | 521,000 | | | | 554,525 | |
Want Want China Holdings Ltd. | | | 457,000 | | | | 384,434 | |
Weichai Power Co., Ltd., Class H | | | 315,000 | | | | 389,953 | |
Yangtze Optical Fibre and Cable Joint Stock Ltd. Co., Class H (a)(e) | | | 77,500 | | | | 240,093 | |
Yuzhou Properties Co., Ltd. | | | 472,708 | | | | 191,705 | |
Zhongsheng Group Holdings Ltd. | | | 122,500 | | | | 297,327 | |
| | | | | | | | |
| | | | | | | 20,711,376 | |
| | | | | | | | |
| Finland—0.3% | |
Cramo Oyj | | | 6,383 | | | | 143,997 | |
Finnair Oyj | | | 13,151 | | | | 109,429 | |
Stora Enso Oyj, Class R | | | 27,449 | | | | 524,170 | |
UPM-Kymmene Oyj | | | 21,728 | | | | 852,149 | |
| | | | | | | | |
| | | | | | | 1,629,745 | |
| | | | | | | | |
| France—4.9% | |
Aeroports de Paris | | | 2,693 | | | | 606,332 | |
ArcelorMittal | | | 25,006 | | | | 776,343 | |
AXA S.A. | | | 57,456 | | | | 1,539,573 | |
BNP Paribas S.A. | | | 17,145 | | | | 1,049,902 | |
Bouygues S.A. | | | 19,829 | | | | 857,811 | |
Cie Generale des Etablissements Michelin SCA | | | 9,403 | | | | 1,122,302 | |
CNP Assurances | | | 25,929 | | | | 625,036 | |
Coface S.A. | | | 15,991 | | | | 151,686 | |
Credit Agricole S.A. | | | 31,895 | | | | 458,490 | |
Derichebourg S.A. | | | 21,233 | | | | 113,307 | |
Eiffage S.A. | | | 8,035 | | | | 897,588 | |
Engie S.A. | | | 76,034 | | | | 1,119,391 | |
Faurecia S.A. | | | 8,403 | | | | 505,355 | |
Ipsen S.A. | | | 1,915 | | | | 322,396 | |
Jacquet Metal Service S.A. | | | 9,684 | | | | 231,437 | |
Kaufman & Broad S.A. | | | 6,512 | | | | 305,596 | |
Kering S.A. | | | 2,235 | | | | 1,198,754 | |
Klepierre S.A. REIT | | | 18,400 | | | | 653,837 | |
L’Oreal S.A. | | | 4,098 | | | | 987,976 | |
LVMH Moet Hennessy Louis Vuitton S.A. | | | 3,676 | | | | 1,298,992 | |
Metropole Television S.A. | | | 24,611 | | | | 496,071 | |
Neopost S.A. | | | 9,854 | | | | 299,525 | |
Orange S.A. | | | 73,220 | | | | 1,165,049 | |
Pernod Ricard S.A. | | | 5,684 | | | | 932,220 | |
Peugeot S.A. | | | 30,249 | | | | 815,989 | |
Renault S.A. | | | 5,725 | | | | 495,224 | |
Sanofi | | | 21,042 | | | | 1,880,043 | �� |
STMicroelectronics NV | | | 20,325 | | | | 372,000 | |
Total S.A. | | | 37,981 | | | | 2,469,553 | |
Unibail-Rodamco-Westfield | | | 2,894 | | | | 582,986 | |
Vinci S.A. | | | 13,811 | | | | 1,313,976 | |
| | | | | | | | |
| | | | | | | 25,644,740 | |
| | | | | | | | |
| Germany—1.6% | |
Aroundtown S.A. | | | 39,238 | | | | 349,577 | |
Bayer AG | | | 17,180 | | | | 1,523,878 | |
Bayerische Motoren Werke AG | | | 4,517 | | | | 406,940 | |
Covestro AG (a) | | | 9,322 | | | | 754,590 | |
Deutsche Lufthansa AG | | | 21,986 | | | | 539,623 | |
Deutsche Pfandbriefbank AG (a) | | | 21,744 | | | | 325,042 | |
Fresenius SE & Co. KGaA | | | 8,069 | | | | 591,702 | |
HeidelbergCement AG | | | 8,104 | | | | 632,985 | |
| | | | | | | | |
| See accompanying Notes to Financial Statements | | | September 30, 2018 | | | Annual Report | | | 127 | |
Schedule of Investments
September 30, 2018
| | | | | | | | |
| | | Shares | | | Value | |
HelloFresh SE (e) | | | 19,586 | | | $ | 249,689 | |
METRO AG | | | 20,704 | | | | 324,286 | |
S&T AG | | | 12,322 | | | | 360,149 | |
SAP SE | | | 10,794 | | | | 1,327,268 | |
Siltronic AG | | | 2,111 | | | | 258,155 | |
Talanx AG (e) | | | 14,373 | | | | 546,122 | |
| | | | | | | | |
| | | | | | | 8,190,006 | |
| | | | | | | | |
| Greece—0.0% | |
FF Group (c)(d)(e) | | | 19,365 | | | | 42,719 | |
| | | | | | | | |
| Hong Kong—1.0% | |
AIA Group Ltd. | | | 199,600 | | | | 1,779,816 | |
CK Asset Holdings Ltd. | | | 94,500 | | | | 708,390 | |
Hang Seng Bank Ltd. | | | 28,100 | | | | 762,465 | |
Health & Happiness H&H International Holdings Ltd. (e) | | | 39,500 | | | | 238,034 | |
Hysan Development Co., Ltd. | | | 111,000 | | | | 560,557 | |
IT Ltd. | | | 438,000 | | | | 234,009 | |
Johnson Electric Holdings Ltd. | | | 136,000 | | | | 384,018 | |
Kerry Properties Ltd. | | | 73,257 | | | | 248,748 | |
VSTECS Holdings Ltd. | | | 220,000 | | | | 113,435 | |
| | | | | | | | |
| | | | | | | 5,029,472 | |
| | | | | | | | |
| Hungary—0.1% | |
Magyar Telekom Telecommunications PLC | | | 286,755 | | | | 411,733 | |
| | | | | | | | |
| Indonesia—0.4% | |
Bank Negara Indonesia Persero Tbk PT | | | 1,053,445 | | | | 523,132 | |
Bank Tabungan Negara Persero Tbk PT | | | 1,423,900 | | | | 251,155 | |
Gudang Garam Tbk PT | | | 65,500 | | | | 325,415 | |
Indika Energy Tbk PT | | | 488,300 | | | | 91,726 | |
Indo Tambangraya Megah Tbk PT | | | 156,400 | | | | 271,317 | |
Medco Energi Internasional Tbk PT (e) | | | 4,096,100 | | | | 274,907 | |
Mitra Adiperkasa Tbk PT | | | 5,153,200 | | | | 285,413 | |
United Tractors Tbk PT | | | 138,900 | | | | 307,529 | |
| | | | | | | | |
| | | | | | | 2,330,594 | |
| | | | | | | | |
| Israel—0.2% | |
Bank Leumi Le-Israel BM | | | 45,817 | | | | 301,950 | |
First International Bank of Israel Ltd. | | | 13,998 | | | | 315,903 | |
Harel Insurance Investments & Financial Services Ltd. | | | 24,265 | | | | 186,480 | |
Hilan Ltd. | | | 13,889 | | | | 345,797 | |
| | | | | | | | |
| | | | | | | 1,150,130 | |
| | | | | | | | |
| Italy—1.4% | |
Amplifon SpA | | | 17,442 | | | | 386,702 | |
ASTM SpA | | | 7,442 | | | | 160,423 | |
Cementir Holding SpA | | | 21,925 | | | | 153,053 | |
CNH Industrial NV | | | 107,569 | | | | 1,290,873 | |
DeA Capital SpA | | | 203,834 | | | | 299,973 | |
Enav SpA (a) | | | 53,340 | | | | 259,723 | |
Enel SpA | | | 317,754 | | | | 1,624,207 | |
Immobiliare Grande Distribuzione SIIQ SpA REIT | | | 26,173 | | | | 201,109 | |
Intesa Sanpaolo SpA | | | 294,651 | | | | 750,751 | |
Iren SpA | | | 87,670 | | | | 214,955 | |
La Doria SpA | | | 11,816 | | | | 155,099 | |
Mediobanca Banca di Credito Finanziario SpA | | | 33,911 | | | | 337,474 | |
Moncler SpA | | | 13,251 | | | | 570,156 | |
Sesa SpA | | | 9,060 | | | | 287,650 | |
| | | | | | | | |
| | | Shares | | | Value | |
Telecom Italia SpA (e) | | | 1,078,474 | | | $ | 651,919 | |
| | | | | | | | |
| | | | | | | 7,344,067 | |
| | | | | | | | |
| Japan—7.1% | |
AGC, Inc. | | | 10,600 | | | | 439,925 | |
Aisin Seiki Co., Ltd. | | | 11,700 | | | | 570,016 | |
Asahi Group Holdings Ltd. | | | 24,800 | | | | 1,076,004 | |
Canon, Inc. | | | 28,100 | | | | 891,038 | |
Chubu Electric Power Co., Inc. | | | 45,900 | | | | 695,290 | |
Daiwa House Industry Co., Ltd. | | | 14,646 | | | | 434,017 | |
Don Quijote Holdings Co., Ltd. | | | 11,000 | | | | 556,640 | |
Exedy Corp. | | | 5,926 | | | | 196,410 | |
Fast Retailing Co., Ltd. | | | 1,700 | | | | 861,218 | |
Hitachi Ltd. | | | 24,600 | | | | 836,194 | |
Honda Motor Co., Ltd. | | | 66,300 | | | | 1,996,707 | |
Iida Group Holdings Co., Ltd. | | | 48,400 | | | | 860,185 | |
ITOCHU Corp. | | | 59,923 | | | | 1,096,776 | |
JFE Holdings, Inc. | | | 18,400 | | | | 422,095 | |
JVC Kenwood Corp. | | | 110,200 | | | | 309,292 | |
JXTG Holdings, Inc. | | | 81,800 | | | | 618,718 | |
Kaga Electronics Co., Ltd. | | | 8,200 | | | | 170,779 | |
Kansai Electric Power Co., Inc. | | | 44,100 | | | | 665,646 | |
Keyence Corp. | | | 1,800 | | | | 1,045,596 | |
Kose Corp. | | | 3,200 | | | | 609,745 | |
Mazda Motor Corp. | | | 54,800 | | | | 658,696 | |
Mitsubishi Chemical Holdings Corp. | | | 53,594 | | | | 512,925 | |
Mitsubishi Corp. | | | 61,500 | | | | 1,894,368 | |
Mitsubishi UFJ Financial Group, Inc. | | | 195,615 | | | | 1,215,295 | |
Mitsui & Co., Ltd. | | | 101,900 | | | | 1,810,830 | |
Mitsui Sugar Co., Ltd. | | | 16,100 | | | | 461,983 | |
Nidec Corp. | | | 4,200 | | | | 603,942 | |
Nippon Road Co., Ltd. | | | 3,700 | | | | 214,245 | |
Nippon Telegraph & Telephone Corp. | | | 20,348 | | | | 918,312 | |
Nissan Motor Co., Ltd. | | | 130,541 | | | | 1,221,541 | |
Nomura Real Estate Holdings, Inc. | | | 11,743 | | | | 236,889 | |
Pola Orbis Holdings, Inc. | | | 24,500 | | | | 894,817 | |
Shin-Etsu Chemical Co., Ltd. | | | 13,500 | | | | 1,193,511 | |
Shiseido Co., Ltd. | | | 17,100 | | | | 1,324,360 | |
SoftBank Group Corp. | | | 19,300 | | | | 1,928,061 | |
Sojitz Corp. | | | 88,016 | | | | 317,607 | |
Sony Corp. | | | 23,600 | | | | 1,434,588 | |
Sumitomo Electric Industries Ltd. | | | 70,100 | | | | 1,099,986 | |
Sumitomo Rubber Industries Ltd. | | | 37,100 | | | | 557,104 | |
Teijin Ltd. | | | 19,100 | | | | 366,315 | |
Tokyo Century Corp. | | | 11,200 | | | | 695,641 | |
Toyota Motor Corp. | | | 42,649 | | | | 2,657,150 | |
Toyota Tsusho Corp. | | | 12,200 | | | | 460,632 | |
| | | | | | | | |
| | | | | | | 37,031,089 | |
| | | | | | | | |
| Korea (Republic of)—1.9% | |
Dongwon Industries Co., Ltd. | | | 2,076 | | | | 559,698 | |
GS Holdings Corp. | | | 5,690 | | | | 282,672 | |
Hana Financial Group, Inc. | | | 11,387 | | | | 457,220 | |
HDC Hyundai Development Co-Engineering & Construction (e) | | | 1 | | | | 46 | |
Industrial Bank of Korea | | | 24,383 | | | | 335,095 | |
ING Life Insurance Korea Ltd. (a) | | | 15,680 | | | | 482,074 | |
KB Financial Group, Inc. | | | 13,482 | | | | 656,627 | |
| | | | | | | | |
| | | Shares | | | Value | |
KT Corp. ADR | | | 13,138 | | | $ | 195,099 | |
LG Corp. | | | 3,888 | | | | 254,489 | |
LG Electronics, Inc. | | | 9,262 | | | | 592,681 | |
LG Uplus Corp. | | | 17,746 | | | | 292,786 | |
Lotte Chemical Corp. | | | 780 | | | | 195,474 | |
OCI Co., Ltd. | | | 2,593 | | | | 257,088 | |
POSCO | | | 2,108 | | | | 559,562 | |
Samsung Electronics Co., Ltd. GDR | | | 1,938 | | | | 2,029,086 | |
Shinhan Financial Group Co., Ltd. | | | 19,646 | | | | 793,865 | |
Shinsegae, Inc. | | | 1,734 | | | | 566,893 | |
SK Hynix, Inc. | | | 12,764 | | | | 844,439 | |
SK Telecom Co., Ltd. | | | 1,989 | | | | 504,281 | |
Woori Bank | | | 22,136 | | | | 337,070 | |
| | | | | | | | |
| | | | | | | 10,196,245 | |
| | | | | | | | |
| Malaysia—0.5% | |
AirAsia Group Bhd. | | | 305,900 | | | | 233,502 | |
CIMB Group Holdings Bhd. | | | 379,500 | | | | 550,967 | |
Genting Bhd. | | | 167,800 | | | | 316,626 | |
Hong Leong Bank Bhd. | | | 118,800 | | | | 590,822 | |
Hong Leong Financial Group Bhd. | | | 67,900 | | | | 316,496 | |
Tenaga Nasional Bhd. | | | 218,700 | | | | 817,715 | |
| | | | | | | | |
| | | | | | | 2,826,128 | |
| | | | | | | | |
| Mexico—0.2% | |
Banco del Bajio S.A. (a) | | | 59,200 | | | | 146,149 | |
Grupo Financiero Banorte S.A.B de C.V., Class O | | | 85,600 | | | | 619,244 | |
Ternium S.A. ADR | | | 17,835 | | | | 540,222 | |
| | | | | | | | |
| | | | | | | 1,305,615 | |
| | | | | | | | |
| Netherlands—1.3% | |
ABN AMRO Group NV (a) | | | 23,179 | | | | 631,259 | |
Aegon NV | | | 69,015 | | | | 447,945 | |
AerCap Holdings NV (e) | | | 8,753 | | | | 503,472 | |
AMG Advanced Metallurgical Group NV | | | 4,116 | | | | 191,147 | |
ASML Holding NV | | | 10,142 | | | | 1,904,207 | |
ASR Nederland NV | | | 8,937 | | | | 425,991 | |
Koninklijke Ahold Delhaize NV | | | 57,544 | | | | 1,320,205 | |
Koninklijke DSM NV | | | 4,697 | | | | 497,475 | |
Koninklijke Volkerwessels NV | | | 7,579 | | | | 159,273 | |
NN Group NV | | | 19,425 | | | | 866,986 | |
| | | | | | | | |
| | | | | | | 6,947,960 | |
| | | | | | | | |
| New Zealand—0.1% | |
Air New Zealand Ltd. | | | 251,572 | | | | 515,440 | |
Summerset Group Holdings Ltd. | | | 38,100 | | | | 197,200 | |
| | | | | | | | |
| | | | | | | 712,640 | |
| | | | | | | | |
| Norway—0.7% | |
Austevoll Seafood ASA | | | 22,600 | | | | 311,333 | |
B2Holding ASA | | | 72,607 | | | | 144,247 | |
Equinor ASA | | | 34,244 | | | | 962,813 | |
Komplett Bank ASA (e) | | | 62,726 | | | | 141,810 | |
Norsk Hydro ASA | | | 126,148 | | | | 756,492 | |
Norwegian Finans Holding ASA (e) | | | 26,484 | | | | 323,684 | |
Salmar ASA | | | 7,148 | | | | 357,092 | |
Selvaag Bolig ASA | | | 59,599 | | | | 283,674 | |
Sparebank 1 Nord Norge | | | 31,643 | | | | 268,135 | |
| | | | | | | | |
| | | | | | | 3,549,280 | |
| | | | | | | | |
| Peru—0.0% | |
Ferreycorp SAA | | | 164,086 | | | | 116,704 | |
| | | | | | | | |
| Philippines—0.2% | |
Globe Telecom, Inc. | | | 6,335 | | | | 257,949 | |
Metro Pacific Investments Corp. | | | 1,714,000 | | | | 150,545 | |
| | | | | | |
| 128 | | Annual Report | | | September 30, 2018 | | | See accompanying Notes to Financial Statements |
Schedule of Investments
September 30, 2018
| | | | | | | | |
| | | Shares | | | Value | |
San Miguel Corp. | | | 48,130 | | | $ | 151,014 | |
Vista Land & Lifescapes, Inc. | | | 2,079,900 | | | | 234,436 | |
| | | | | | | | |
| | | | | | | 793,944 | |
| | | | | | | | |
| Portugal—0.1% | |
REN - Redes Energeticas Nacionais SGPS S.A. | | | 92,606 | | | | 261,418 | |
| | | | | | | | |
| Russian Federation—0.1% | |
Magnitogorsk Iron & Steel
Works PJSC GDR | | | 28,096 | | | | 290,513 | |
| | | | | | | | |
| Singapore—0.3% | |
DBS Group Holdings Ltd. | | | 51,800 | | | | 988,196 | |
United Overseas Bank Ltd. | | | 32,100 | | | | 634,566 | |
| | | | | | | | |
| | | | | | | 1,622,762 | |
| | | | | | | | |
| South Africa—0.5% | |
Astral Foods Ltd. | | | 29,852 | | | | 520,527 | |
Fortress REIT Ltd., Class A REIT | | | 232,243 | | | | 276,582 | |
Naspers Ltd., Class N | | | 5,792 | | | | 1,247,301 | |
Nedbank Group Ltd. | | | 32,109 | | | | 600,656 | |
| | | | | | | | |
| | | | | | | 2,645,066 | |
| | | | | | | | |
| Spain—1.0% | |
ACS Actividades de Construccion y Servicios S.A. | | | 13,892 | | | | 590,032 | |
Banco Santander S.A. | | | 257,081 | | | | 1,287,116 | |
CaixaBank S.A. | | | 107,114 | | | | 487,146 | |
International Consolidated Airlines Group S.A. | | | 61,642 | | | | 529,925 | |
Repsol S.A. | | | 72,396 | | | | 1,441,211 | |
Telefonica S.A. | | | 85,376 | | | | 673,475 | |
| | | | | | | | |
| | | | | | | 5,008,905 | |
| | | | | | | | |
| Sweden—0.8% | |
Ahlsell AB (a) | | | 25,778 | | | | 144,269 | |
Dios Fastigheter AB | | | 46,468 | | | | 297,283 | |
Hemfosa Fastigheter AB | | | 25,155 | | | | 347,244 | |
Inwido AB | | | 33,190 | | | | 249,784 | |
Klovern AB, Class B | | | 183,704 | | | | 241,468 | |
Sandvik AB | | | 42,432 | | | | 751,227 | |
Swedbank AB, Class A | | | 35,030 | | | | 866,367 | |
Volvo AB, Class B | | | 73,821 | | | | 1,301,976 | |
| | | | | | | | |
| | | | | | | 4,199,618 | |
| | | | | | | | |
| Switzerland—1.2% | |
Lonza Group AG (e) | | | 2,752 | | | | 941,452 | |
Novartis AG | | | 33,910 | | | | 2,918,920 | |
Straumann Holding AG | | | 489 | | | | 368,395 | |
Swatch Group AG | | | 12,969 | | | | 1,010,125 | |
Swiss Life Holding AG (e) | | | 2,273 | | | | 861,856 | |
| | | | | | | | |
| | | | | | | 6,100,748 | |
| | | | | | | | |
| Taiwan—1.4% | |
Chailease Holding Co., Ltd. | | | 49,980 | | | | 174,929 | |
China Development Financial Holding Corp. | | | 1,899,000 | | | | 708,542 | |
Formosa Chemicals & Fibre Corp. | | | 105,000 | | | | 440,018 | |
Grand Pacific Petrochemical | | | 296,000 | | | | 294,534 | |
Great Wall Enterprise Co., Ltd. | | | 264,290 | | | | 326,646 | |
Hon Hai Precision Industry Co., Ltd. | | | 483,000 | | | | 1,252,505 | |
Lien Hwa Industrial Corp. | | | 243,100 | | | | 281,024 | |
Nanya Technology Corp. | | | 196,000 | | | | 374,280 | |
Pou Chen Corp. | | | 421,000 | | | | 444,510 | |
Powertech Technology, Inc. | | | 52,000 | | | | 141,677 | |
| | | | | | | | |
| | | Shares | | | Value | |
President Chain Store Corp. | | | 30,000 | | | $ | 352,221 | |
Taiwan Semiconductor Manufacturing Co., Ltd. ADR | | | 33,259 | | | | 1,468,718 | |
Tripod Technology Corp. | | | 76,000 | | | | 207,450 | |
Yuanta Financial Holding Co., Ltd. | | | 1,468,000 | | | | 773,858 | |
| | | | | | | | |
| | | | | | | 7,240,912 | |
| | | | | | | | |
| Thailand—0.7% | |
Banpu PCL (c)(d) | | | 378,600 | | | | 223,653 | |
CP ALL PCL (c)(d) | | | 327,700 | | | | 699,305 | |
Electricity Generating PCL (c)(d) | | | 83,900 | | | | 611,690 | |
Kiatnakin Bank PCL (c)(d) | | | 339,100 | | | | 789,253 | |
PTT Global Chemical PCL (c)(d) | | | 276,900 | | | | 695,825 | |
Thanachart Capital PCL (c)(d) | | | 159,700 | | | | 265,426 | |
Tisco Financial Group PCL (c)(d) | | | 96,700 | | | | 250,482 | |
| | | | | | | | |
| | | | | | | 3,535,634 | |
| | | | | | | | |
| Turkey—0.2% | |
Akbank T.A.S. | | | 217,763 | | | | 249,433 | |
Eregli Demir ve Celik Fabrikalari TAS | | | 121,203 | | | | 221,147 | |
TAV Havalimanlari Holding AS | | | 50,295 | | | | 260,155 | |
Tekfen Holding AS | | | 77,656 | | | | 277,612 | |
Turkiye Vakiflar Bankasi Tao | | | 141,375 | | | | 88,525 | |
Yatas Yatak ve Yorgan Sanayi ve Ticaret AS (e) | | | 48,820 | | | | 35,127 | |
| | | | | | | | |
| | | | | | | 1,131,999 | |
| | | | | | | | |
| United Arab Emirates—0.2% | |
Aldar Properties PJSC | | | 1,154,171 | | | | 575,043 | |
DP World Ltd. | | | 17,421 | | | | 332,741 | |
| | | | | | | | |
| | | | | | | 907,784 | |
| | | | | | | | |
| United Kingdom—4.6% | |
3i Group PLC | | | 35,897 | | | | 439,554 | |
Anglo American PLC | | | 54,529 | | | | 1,219,866 | |
Aviva PLC | | | 121,876 | | | | 777,626 | |
BP PLC | | | 316,457 | | | | 2,425,560 | |
British American Tobacco PLC | | | 40,782 | | | | 1,901,277 | |
Diageo PLC | | | 40,288 | | | | 1,427,326 | |
easyJet PLC | | | 15,561 | | | | 266,282 | |
EI Group PLC (e) | | | 138,056 | | | | 297,984 | |
Ferrexpo PLC | | | 44,793 | | | | 116,498 | |
GVC Holdings PLC | | | 49,581 | | | | 593,312 | |
HSBC Holdings PLC | | | 127,703 | | | | 1,114,257 | |
J Sainsbury PLC | | | 87,576 | | | | 366,899 | |
Keller Group PLC | | | 37,415 | | | | 495,470 | |
Legal & General Group PLC | | | 247,124 | | | | 843,630 | |
Lloyds Banking Group PLC | | | 1,453,119 | | | | 1,117,575 | |
Morgan Sindall Group PLC | | | 17,267 | | | | 296,177 | |
National Express Group PLC | | | 152,711 | | | | 776,653 | |
Nomad Foods Ltd. (e) | | | 11,710 | | | | 237,245 | |
Plus500 Ltd. | | | 12,753 | | | | 220,640 | |
Renewables Infrastructure Group Ltd. | | | 127,774 | | | | 187,192 | |
Rio Tinto PLC | | | 27,291 | | | | 1,376,601 | |
Royal Dutch Shell PLC, Class A | | | 18,868 | | | | 646,441 | |
Royal Dutch Shell PLC, Class B | | | 82,339 | | | | 2,882,404 | |
Segro PLC REIT | | | 73,147 | | | | 608,678 | |
Softcat PLC | | | 19,909 | | | | 206,475 | |
Taylor Wimpey PLC | | | 157,918 | | | | 352,978 | |
| | | | | | | | |
| | | Shares | | | Value | |
TUI AG | | | 34,486 | | | $ | 661,532 | |
Vesuvius PLC | | | 38,406 | | | | 322,544 | |
Vodafone Group PLC | | | 820,086 | | | | 1,757,134 | |
| | | | | | | | |
| | | | | | | 23,935,810 | |
| | | | | | | | |
| United States—55.9% | |
Abbott Laboratories | | | 34,746 | | | | 2,548,967 | |
AbbVie, Inc. | | | 29,932 | | | | 2,830,969 | |
Abercrombie & Fitch Co., Class A | | | 11,433 | | | | 241,465 | |
ABIOMED, Inc. (e) | | | 1,765 | | | | 793,809 | |
ACCO Brands Corp. | | | 21,042 | | | | 237,775 | |
Adobe Systems, Inc. (e) | | | 9,222 | | | | 2,489,479 | |
AES Corp. | | | 44,993 | | | | 629,902 | |
Aflac, Inc. | | | 28,485 | | | | 1,340,789 | |
Agilent Technologies, Inc. | | | 11,487 | | | | 810,293 | |
Air Lease Corp. | | | 6,149 | | | | 282,116 | |
Align Technology, Inc. (e) | | | 3,019 | | | | 1,181,093 | |
Allstate Corp. | | | 15,055 | | | | 1,485,928 | |
Ally Financial, Inc. | | | 14,636 | | | | 387,122 | |
Alphabet, Inc., Class A (e) | | | 2,591 | | | | 3,127,544 | |
Alphabet, Inc., Class C (e) | | | 2,771 | | | | 3,307,105 | |
Amazon.com, Inc. (e) | | | 4,489 | | | | 8,991,467 | |
American Equity Investment Life Holding Co. | | | 12,987 | | | | 459,220 | |
American Express Co. | | | 13,003 | | | | 1,384,689 | |
Ameriprise Financial, Inc. | | | 5,063 | | | | 747,603 | |
AMETEK, Inc. | | | 17,015 | | | | 1,346,227 | |
Antero Resources Corp. (e) | | | 32,281 | | | | 571,697 | |
Anthem, Inc. | | | 7,597 | | | | 2,081,958 | |
Apple, Inc. | | | 50,687 | | | | 11,442,083 | |
Applied Materials, Inc. | | | 21,138 | | | | 816,984 | |
Archer-Daniels-Midland Co. | | | 28,495 | | | | 1,432,444 | |
Arrow Electronics, Inc. (e) | | | 4,561 | | | | 336,237 | |
At Home Group, Inc. (e) | | | 8,346 | | | | 263,149 | |
AT&T, Inc. | | | 138,095 | | | | 4,637,230 | |
Athene Holding Ltd., Class A (e) | | | 23,580 | | | | 1,218,143 | |
Bank of America Corp. | | | 126,623 | | | | 3,730,314 | |
Baxter International, Inc. | | | 19,061 | | | | 1,469,412 | |
Becton Dickinson and Co. | | | 6,288 | | | | 1,641,168 | |
Best Buy Co., Inc. | | | 11,410 | | | | 905,498 | |
BGC Partners, Inc., Class A | | | 32,762 | | | | 387,247 | |
Bio-Techne Corp. | | | 1,388 | | | | 283,305 | |
Boeing Co. | | | 9,024 | | | | 3,356,026 | |
BorgWarner, Inc. | | | 9,367 | | | | 400,720 | |
Boston Scientific Corp. (e) | | | 19,372 | | | | 745,822 | |
Broadridge Financial Solutions, Inc. | | | 10,772 | | | | 1,421,365 | |
Bunge Ltd. | | | 16,076 | | | | 1,104,582 | |
Cactus, Inc., Class A (e) | | | 9,240 | | | | 353,707 | |
Caterpillar, Inc. | | | 8,537 | | | | 1,301,807 | |
CDW Corp. | | | 13,670 | | | | 1,215,536 | |
Celanese Corp. | | | 4,019 | | | | 458,166 | |
Centene Corp. (e) | | | 4,361 | | | | 631,386 | |
CenterPoint Energy, Inc. | | | 45,747 | | | | 1,264,905 | |
Central Garden & Pet Co., Class A (e) | | | 6,867 | | | | 227,572 | |
Charles River Laboratories International, Inc. (e) | | | 2,182 | | | | 293,566 | |
Chemours Co. | | | 7,357 | | | | 290,160 | |
Chevron Corp. | | | 29,613 | | | | 3,621,078 | |
Cigna Corp. | | | 4,683 | | | | 975,235 | |
Cisco Systems, Inc. | | | 69,808 | | | | 3,396,159 | |
Citigroup, Inc. | | | 37,497 | | | | 2,690,035 | |
Citizens Financial Group, Inc. | | | 19,364 | | | | 746,869 | |
Cognizant Technology Solutions Corp., Class A | | | 13,209 | | | | 1,019,074 | |
Comcast Corp., Class A | | | 79,254 | | | | 2,806,384 | |
CONSOL Energy, Inc. (e) | | | 6,354 | | | | 259,307 | |
Constellation Brands, Inc., Class A | | | 6,721 | | | | 1,449,182 | |
CVS Health Corp. | | | 47,521 | | | | 3,740,853 | |
| | | | | | | | |
| See accompanying Notes to Financial Statements | | | September 30, 2018 | | | Annual Report | | | 129 | |
Schedule of Investments
September 30, 2018
| | | | | | | | |
| | | Shares | | | Value | |
Danaher Corp. | | | 15,774 | | | $ | 1,714,003 | |
Deere & Co. | | | 7,893 | | | | 1,186,555 | |
Donegal Group, Inc., Class A | | | 18,354 | | | | 260,810 | |
DowDuPont, Inc. | | | 21,117 | | | | 1,358,034 | |
Duke Energy Corp. | | | 12,632 | | | | 1,010,813 | |
Eastman Chemical Co. | | | 12,588 | | | | 1,204,923 | |
Eaton Corp. PLC | | | 17,116 | | | | 1,484,471 | |
Edison International | | | 12,091 | | | | 818,319 | |
Electro Scientific Industries, Inc. (e) | | | 13,381 | | | | 233,498 | |
Eli Lilly & Co. | | | 29,867 | | | | 3,205,028 | |
Encompass Health Corp. | | | 4,541 | | | | 353,971 | |
Entergy Corp. | | | 15,756 | | | | 1,278,284 | |
EOG Resources, Inc. | | | 13,943 | | | | 1,778,709 | |
Estee Lauder Cos., Inc., Class A | | | 6,143 | | | | 892,701 | |
Exelon Corp. | | | 37,944 | | | | 1,656,635 | |
Exxon Mobil Corp. | | | 44,275 | | | | 3,764,260 | |
Facebook, Inc., Class A (e) | | | 27,321 | | | | 4,493,212 | |
FedEx Corp. | | | 5,810 | | | | 1,398,990 | |
Fidelity National Information Services, Inc. | | | 9,715 | | | | 1,059,615 | |
FLIR Systems, Inc. | | | 10,743 | | | | 660,372 | |
Ford Motor Co. | | | 116,914 | | | | 1,081,454 | |
Fortinet, Inc. (e) | | | 7,896 | | | | 728,564 | |
Freeport-McMoRan, Inc. | | | 52,915 | | | | 736,577 | |
Garmin Ltd. | | | 10,057 | | | | 704,493 | |
Gates Industrial Corp. PLC (e) | | | 36,888 | | | | 719,316 | |
General Motors Co. | | | 67,378 | | | | 2,268,617 | |
Global Brass & Copper Holdings, Inc. | | | 5,808 | | | | 214,315 | |
Goldman Sachs Group, Inc. | | | 5,418 | | | | 1,214,932 | |
Goodyear Tire & Rubber Co. | | | 24,837 | | | | 580,937 | |
Haemonetics Corp. (e) | | | 3,389 | | | | 388,312 | |
Hartford Financial Services Group, Inc. | | | 14,615 | | | | 730,165 | |
HCA Healthcare, Inc. | | | 11,767 | | | | 1,637,025 | |
HEICO Corp., Class A | | | 7,458 | | | | 563,079 | |
Herbalife Nutrition Ltd. (e) | | | 11,326 | | | | 617,833 | |
Hewlett Packard Enterprise Co. | | | 59,173 | | | | 965,112 | |
Hill-Rom Holdings, Inc. | | | 3,366 | | | | 317,750 | |
HollyFrontier Corp. | | | 10,970 | | | | 766,803 | |
Home Depot, Inc. | | | 18,774 | | | | 3,889,034 | |
Honeywell International, Inc. | | | 12,762 | | | | 2,123,597 | |
Horizon Pharma PLC (e) | | | 17,835 | | | | 349,209 | |
HP, Inc. | | | 89,594 | | | | 2,308,837 | |
Humana, Inc. | | | 3,636 | | | | 1,230,859 | |
ICU Medical, Inc. (e) | | | 865 | | | | 244,579 | |
Illumina, Inc. (e) | | | 3,689 | | | | 1,354,084 | |
Intel Corp. | | | 84,773 | | | | 4,008,915 | |
Inter Parfums, Inc. | | | 5,569 | | | | 358,922 | |
Intuit, Inc. | | | 2,129 | | | | 484,135 | |
Intuitive Surgical, Inc. (e) | | | 3,768 | | | | 2,162,832 | |
IQVIA Holdings, Inc. (e) | | | 5,978 | | | | 775,586 | |
Jacobs Engineering Group, Inc. | | | 6,958 | | | | 532,287 | |
JB Hunt Transport Services, Inc. | | | 5,373 | | | | 639,065 | |
Johnson & Johnson | | | 38,682 | | | | 5,344,692 | |
Jones Lang LaSalle, Inc. | | | 4,113 | | | | 593,588 | |
JPMorgan Chase & Co. | | | 43,192 | | | | 4,873,785 | |
Kohl’s Corp. | | | 7,311 | | | | 545,035 | |
Korn/Ferry International | | | 3,757 | | | | 184,995 | |
Laboratory Corp. of America Holdings (e) | | | 5,321 | | | | 924,151 | |
Lam Research Corp. | | | 4,987 | | | | 756,528 | |
Lamb Weston Holdings, Inc. | | | 11,383 | | | | 758,108 | |
Las Vegas Sands Corp. | | | 11,826 | | | | 701,637 | |
Lear Corp. | | | 4,499 | | | | 652,355 | |
| | | | | | | | |
| | | Shares | | | Value | |
Lennar Corp., Class A | | | 9,368 | | | $ | 437,392 | |
Lululemon Athletica, Inc. (e) | | | 3,926 | | | | 637,936 | |
Macy’s, Inc. | | | 25,515 | | | | 886,136 | |
Magellan Health, Inc. (e) | | | 6,179 | | | | 445,197 | |
ManTech International Corp., Class A | | | 9,307 | | | | 589,133 | |
Marathon Petroleum Corp. | | | 14,494 | | | | 1,159,085 | |
Mastercard, Inc., Class A | | | 12,775 | | | | 2,843,843 | |
MCBC Holdings, Inc. (e) | | | 12,300 | | | | 441,324 | |
McDonald’s Corp. | | | 12,364 | | | | 2,068,374 | |
McGrath RentCorp | | | 4,782 | | | | 260,476 | |
McKesson Corp. | | | 9,186 | | | | 1,218,523 | |
MDC Holdings, Inc. | | | 11,141 | | | | 329,551 | |
Mercer International, Inc. | | | 28,751 | | | | 483,017 | |
Merck & Co., Inc. | | | 46,021 | | | | 3,264,730 | |
Merit Medical Systems, Inc. (e) | | | 5,184 | | | | 318,557 | |
Michael Kors Holdings Ltd. (e) | | | 8,911 | | | | 610,938 | |
Micron Technology, Inc. (e) | | | 26,029 | | | | 1,177,292 | |
Microsoft Corp. | | | 89,287 | | | | 10,211,754 | |
MKS Instruments, Inc. | | | 3,604 | | | | 288,861 | |
Mondelez International, Inc., Class A | | | 31,240 | | | | 1,342,070 | |
Morgan Stanley | | | 27,121 | | | | 1,263,025 | |
NetApp, Inc. | | | 9,089 | | | | 780,654 | |
Netflix, Inc. (e) | | | 6,395 | | | | 2,392,561 | |
New Residential Investment Corp. REIT | | | 11,975 | | | | 213,395 | |
Nexeo Solutions, Inc. (e) | | | 66,895 | | | | 819,464 | |
Norfolk Southern Corp. | | | 6,245 | | | | 1,127,222 | |
Northern Trust Corp. | | | 7,346 | | | | 750,247 | |
Northrop Grumman Corp. | | | 3,419 | | | | 1,085,088 | |
NVIDIA Corp. | | | 8,266 | | | | 2,322,911 | |
O’Reilly Automotive, Inc. (e) | | | 2,515 | | | | 873,510 | |
Occidental Petroleum Corp. | | | 20,984 | | | | 1,724,255 | |
ON Semiconductor Corp. (e) | | | 26,125 | | | | 481,484 | |
Oracle Corp. | | | 46,361 | | | | 2,390,373 | |
Oshkosh Corp. | | | 2,390 | | | | 170,264 | |
Owens Corning | | | 7,416 | | | | 402,466 | |
PACCAR, Inc. | | | 12,426 | | | | 847,329 | |
PBF Energy, Inc., Class A | | | 5,756 | | | | 287,282 | |
Penn Virginia Corp. (e) | | | 3,620 | | | | 291,555 | |
PepsiCo, Inc. | | | 21,151 | | | | 2,364,682 | |
PerkinElmer, Inc. | | | 2,530 | | | | 246,093 | |
Pfizer, Inc. | | | 93,335 | | | | 4,113,273 | |
PG&E Corp. | | | 12,088 | | | | 556,169 | |
Phillips 66 | | | 8,009 | | | | 902,774 | |
Polaris Industries, Inc. | | | 5,796 | | | | 585,106 | |
Procter & Gamble Co. | | | 29,005 | | | | 2,414,086 | |
Progressive Corp. | | | 14,867 | | | | 1,056,152 | |
Prudential Financial, Inc. | | | 10,359 | | | | 1,049,574 | |
PulteGroup, Inc. | | | 27,088 | | | | 670,970 | |
PVH Corp. | | | 5,637 | | | | 813,983 | |
Quest Diagnostics, Inc. | | | 5,828 | | | | 628,899 | |
RadNet, Inc. (e) | | | 40,900 | | | | 615,545 | |
Ready Capital Corp. | | | 12,764 | | | | 212,521 | |
Reinsurance Group of America, Inc. | | | 9,014 | | | | 1,303,064 | |
Reliance Steel & Aluminum Co. | | | 2,302 | | | | 196,338 | |
Robert Half International, Inc. | | | 8,133 | | | | 572,401 | |
Ross Stores, Inc. | | | 15,219 | | | | 1,508,203 | |
Royal Caribbean Cruises Ltd. | | | 4,297 | | | | 558,352 | |
Rudolph Technologies, Inc. (e) | | | 8,644 | | | | 211,346 | |
SCANA Corp. | | | 15,130 | | | | 588,406 | |
Schweitzer-Mauduit International, Inc. | | | 7,172 | | | | 274,759 | |
Seagate Technology PLC | | | 12,301 | | | | 582,452 | |
SMART Global Holdings, Inc. (e) | | | 5,161 | | | | 148,327 | |
| | | | | | | | |
| | | Shares | | | Value | |
SP Plus Corp. (e) | | | 8,617 | | | $ | 314,520 | |
SS&C Technologies Holdings, Inc. | | | 22,168 | | | | 1,259,807 | |
State Street Corp. | | | 9,326 | | | | 781,332 | |
STERIS PLC | | | 4,629 | | | | 529,558 | |
Stoneridge, Inc. (e) | | | 13,107 | | | | 389,540 | |
Synovus Financial Corp. | | | 5,577 | | | | 255,371 | |
T Rowe Price Group, Inc. | | | 7,380 | | | | 805,748 | |
Target Corp. | | | 15,986 | | | | 1,410,125 | |
TE Connectivity Ltd. | | | 9,623 | | | | 846,150 | |
Teleflex, Inc. | | | 2,113 | | | | 562,248 | |
Texas Instruments, Inc. | | | 25,440 | | | | 2,729,458 | |
Thermo Fisher Scientific, Inc. | | | 8,831 | | | | 2,155,470 | |
Tiffany & Co. | | | 5,614 | | | | 724,038 | |
Toll Brothers, Inc. | | | 9,489 | | | | 313,422 | |
Total System Services, Inc. | | | 7,569 | | | | 747,363 | |
Tower International, Inc. | | | 9,675 | | | | 292,669 | |
TransUnion | | | 10,900 | | | | 802,022 | |
Triton International Ltd. | | | 6,012 | | | | 200,019 | |
Tyson Foods, Inc., Class A | | | 19,617 | | | | 1,167,800 | |
Union Pacific Corp. | | | 12,433 | | | | 2,024,465 | |
UnitedHealth Group, Inc. | | | 14,619 | | | | 3,889,239 | |
Unum Group | | | 17,059 | | | | 666,495 | |
Valero Energy Corp. | | | 8,016 | | | | 911,820 | |
Verizon Communications, Inc. | | | 66,666 | | | | 3,559,298 | |
Verso Corp., Class A (e) | | | 11,270 | | | | 379,461 | |
VF Corp. | | | 17,081 | | | | 1,596,219 | |
Viacom, Inc. | | | 21,432 | | | | 723,544 | |
Virtu Financial, Inc., Class A | | | 10,169 | | | | 207,956 | |
Visa, Inc., Class A | | | 26,486 | | | | 3,975,284 | |
Vishay Intertechnology, Inc. | | | 14,755 | | | | 300,264 | |
Vistra Energy Corp. (e) | | | 48,494 | | | | 1,206,531 | |
Walgreens Boots Alliance, Inc. | | | 20,435 | | | | 1,489,711 | |
Walmart, Inc. | | | 25,435 | | | | 2,388,601 | |
WellCare Health Plans, Inc. (e) | | | 1,309 | | | | 419,521 | |
Wells Fargo & Co. | | | 31,127 | | | | 1,636,035 | |
Western Digital Corp. | | | 5,293 | | | | 309,852 | |
Willscot Corp. (e) | | | 20,237 | | | | 347,065 | |
Xcerra Corp. (e) | | | 26,884 | | | | 383,635 | |
Xenia Hotels & Resorts, Inc. REIT | | | 9,499 | | | | 225,126 | |
Zebra Technologies Corp., Class A (e) | | | 2,226 | | | | 393,624 | |
Zoetis, Inc. | | | 11,714 | | | | 1,072,534 | |
Zumiez, Inc. (e) | | | 11,455 | | | | 301,839 | |
| | | | | | | | |
| | | | | | | 293,560,757 | |
| | | | | | | | |
| Total Common Stock (cost—$463,867,368) | | | | | | | 518,772,183 | |
| | | | | | | | |
| | | | | | | | |
| Exchange-Traded Funds—0.5% | |
iShares Core MSCI EAFE | | | 12,387 | | | | 793,759 | |
iShares Core MSCI Emerging Markets | | | 10,188 | | | | 527,535 | |
iShares Core S&P 500 | | | 3,617 | | | | 1,058,804 | |
| | | | | | | | |
Total Exchange-Traded Funds
(cost—$2,357,855) | | | | 2,380,098 | |
| | | | | | | | |
| | | | | | | | |
| Preferred Stock—0.3% | |
| Germany—0.1% | |
Sixt SE | | | 5,631 | | | | 448,137 | |
| | | | | | | | |
| Korea (Republic of)—0.2% | |
Samsung Electronics Co., Ltd. | | | 37,695 | | | | 1,285,673 | |
| | | | | | | | |
| Total Preferred Stock (cost—$1,270,696) | | | | 1,733,810 | |
| | | | | | | | |
| | | | | | | | |
| | | | | | |
| 130 | | Annual Report | | | September 30, 2018 | | | See accompanying Notes to Financial Statements |
Schedule of Investments
September 30, 2018
| | | | | | | | |
| | | Principal
Amount
(000s) | | | Value | |
| Repurchase Agreements—0.0% | |
State Street Bank and Trust Co., dated 9/28/18, 0.42%, due 10/1/18, proceeds $135,005; collateralized by U.S. Treasury Notes, 2.00%, due 11/30/20, valued at $138,397 including accrued interest | |
(cost—$135,000) | | | $135 | | | $ | 135,000 | |
| | | | | | | | |
| |
| Total Investments (cost—$467,630,919) (b)—99.7% | | | | 523,021,091 | |
| | | | | | | | |
| |
| Other assets less liabilities (f)—0.3% | | | | 1,787,687 | |
| | | | | | | | |
| |
| Net Assets—100.0% | | | | $524,808,778 | |
| | | | | | | | |
Notes to Schedule of Investments:
(a) 144A—Exempt from registration under Rule 144A of the Securities Act of 1933. These securities may be resold in transactions exempt from registration, typically only to qualified institutional buyers. Securities with an aggregate value of $4,078,795, representing 0.8% of net assets.
(b) Securities with an aggregate value of $187,720,259, representing 35.8% of net assets, were valued utilizing modeling tools provided by a third-party vendor. See Note 1(a) and Note 1(b) in the Notes to Financial Statements.
(c) Fair-Valued—Securities with an aggregate value of $3,579,507, representing 0.7% of net assets. See Note 1(a) and Note 1(b) in the Notes to Financial Statements.
(d) Level 3 security. See Note 1(a) and Note 1(b) in the Notes to Financial Statements.
(e) Non-income producing.
(f) Includes net unrealized appreciation (depreciation) of other financial instruments as follows:
| | | | | | | | | | | | | | | | | | | | | | |
| Futures contracts outstanding at September 30, 2018: | |
| Type | | Contracts | | | Expiration
Date | | | Notional
Amount
(000s) | | | Market
Value
(000s) | | | Unrealized
Depreciation | |
Long position contracts: | |
| | Mini MSCI Emerging Markets Index | | | 13 | | | | 12/21/18 | | | $ | 1 | | | $ | 682 | | | $ | (4,709 | ) |
| | MSCI EAFE Index | | | 7 | | | | 12/21/18 | | | | — | (h) | | | 692 | | | | (9,396 | ) |
| | | | | | | | | | | | | | | | | | | | | | |
| | | | | | | | | | | | | $ | (14,105 | ) |
| | | | | | | | | | | | | | | | | | | | | | |
(g) At September 30, 2018, the Fund pledged $366,436 in cash as collateral for futures contracts.
(h) Notional amount rounds to less than 500.
Glossary:
ADR—American Depositary Receipt
EAFE—Europe, Australasia and Far East
GDR—Global Depositary Receipt
MSCI—Morgan Stanley Capital International
REIT—Real Estate Investment Trust
The industry classification of portfolio holdings and other assets less liabilities shown as a percentage of net assets were as follows:
| | | | |
Banks | | | 9.2% | |
Oil, Gas & Consumable Fuels | | | 5.9% | |
Pharmaceuticals | | | 4.7% | |
Insurance | | | 4.4% | |
Technology Hardware, Storage & Peripherals | | | 4.0% | |
Software | | | 3.7% | |
Semiconductors & Semiconductor Equipment | | | 3.6% | |
Healthcare Providers & Services | | | 3.1% | |
Healthcare Equipment & Supplies | | | 2.9% | |
Internet & Direct Marketing Retail | | | 2.8% | |
Interactive Media & Services | | | 2.7% | |
Food & Staples Retailing | | | 2.4% | |
Metals & Mining | | | 2.4% | |
Diversified Telecommunication Services | | | 2.4% | |
Automobiles | | | 2.3% | |
IT Services | | | 2.3% | |
Food Products | | | 2.1% | |
Specialty Retail | | | 1.9% | |
Electric Utilities | | | 1.9% | |
Chemicals | | | 1.7% | |
Machinery | | | 1.7% | |
Trading Companies & Distributors | | | 1.7% | |
Electronic Equipment, Instruments & Components | | | 1.6% | |
Textiles, Apparel & Luxury Goods | | | 1.6% | |
Capital Markets | | | 1.5% | |
Beverages | | | 1.4% | |
Auto Components | | | 1.4% | |
Life Sciences Tools & Services | | | 1.3% | |
Hotels, Restaurants & Leisure | | | 1.2% | |
Household Durables | | | 1.2% | |
Real Estate Management & Development | | | 1.2% | |
| | | | |
Construction & Engineering | | | 1.1% | |
Media | | | 1.1% | |
Personal Products | | | 1.1% | |
Aerospace & Defense | | | 1.0% | |
Multi-Line Retail | | | 0.9% | |
Road & Rail | | | 0.9% | |
Wireless Telecommunication Services | | | 0.8% | |
Industrial Conglomerates | | | 0.8% | |
Equity Real Estate Investment Trusts (REITs) | | | 0.8% | |
Multi-Utilities | | | 0.8% | |
Electrical Equipment | | | 0.7% | |
Communications Equipment | | | 0.7% | |
Paper & Forest Products | | | 0.6% | |
Independent Power Producers & Energy Traders | | | 0.6% | |
Airlines | | | 0.6% | |
Biotechnology | | | 0.5% | |
Household Products | | | 0.5% | |
Exchange-Traded Funds | | | 0.5% | |
Tobacco | | | 0.4% | |
Transportation Infrastructure | | | 0.4% | |
Commercial Services & Supplies | | | 0.4% | |
Consumer Finance | | | 0.4% | |
Leisure Equipment & Products | | | 0.3% | |
Professional Services | | | 0.3% | |
Air Freight & Logistics | | | 0.3% | |
Diversified Financial Services | | | 0.3% | |
Construction Materials | | | 0.2% | |
Building Products | | | 0.2% | |
Thrifts & Mortgage Finance | | | 0.1% | |
Commercial Services | | | 0.1% | |
Energy Equipment & Services | | | 0.1% | |
Mortgage Real Estate Investment Trusts (REITs) | | | 0.0% | |
Advertising | | | 0.0% | |
Repurchase Agreements | | | 0.0% | |
Other assets less liabilities | | | 0.3% | |
| | | | |
| | | 100.0% | |
| | | | |
| | | | | | | | |
| See accompanying Notes to Financial Statements | | | September 30, 2018 | | | Annual Report | | | 131 | |
Schedule of Investments
September 30, 2018
AllianzGI Best Styles International Equity Fund
| | | | | | | | |
| | | Shares | | | Value | |
| Common Stock—97.3% | |
| Australia—2.6% | |
Alumina Ltd. | | | 22,152 | | | | $44,345 | |
Aristocrat Leisure Ltd. | | | 3,501 | | | | 71,900 | |
Australian Pharmaceutical Industries Ltd. | | | 36,421 | | | | 45,393 | |
Caltex Australia Ltd. | | | 1,924 | | | | 41,566 | |
Crown Resorts Ltd. | | | 3,011 | | | | 29,778 | |
CSR Ltd. | | | 5,947 | | | | 16,201 | |
GrainCorp Ltd., Class A | | | 2,617 | | | | 14,942 | |
Macquarie Group Ltd. | | | 1,173 | | | | 106,706 | |
Metcash Ltd. | | | 11,047 | | | | 23,935 | |
Orora Ltd. | | | 20,131 | | | | 48,279 | |
OZ Minerals Ltd. | | | 1,444 | | | | 9,734 | |
Qantas Airways Ltd. | | | 19,559 | | | | 83,365 | |
Saracen Mineral Holdings Ltd. (e) | | | 9,428 | | | | 12,718 | |
Sims Metal Management Ltd. | | | 4,351 | | | | 39,770 | |
South32 Ltd. | | | 15,607 | | | | 43,860 | |
Treasury Wine Estates Ltd. | | | 2,486 | | | | 31,378 | |
| | | | | | | | |
| | | | | | | 663,870 | |
| | | | | | | | |
| Austria—1.2% | |
Erste Group Bank AG | | | 1,828 | | | | 75,892 | |
Lenzing AG | | | 117 | | | | 12,226 | |
Mayr Melnhof Karton AG | | | 307 | | | | 38,594 | |
OMV AG | | | 2,203 | | | | 123,586 | |
Telekom Austria AG (e) | | | 282 | | | | 2,184 | |
voestalpine AG | | | 1,245 | | | | 56,872 | |
| | | | | | | | |
| | | | | | | 309,354 | |
| | | | | | | | |
| Belgium—0.5% | |
Euronav NV | | | 2,702 | | | | 23,335 | |
KBC Group NV | | | 235 | | | | 17,474 | |
UCB S.A. | | | 947 | | | | 85,101 | |
| | | | | | | | |
| | | | | | | 125,910 | |
| | | | | | | | |
| Brazil—0.3% | |
Banco Santander Brasil S.A. ADR | | | 3,762 | | | | 33,143 | |
Vale S.A. | | | 2,597 | | | | 38,468 | |
| | | | | | | | |
| | | | | | | 71,611 | |
| | | | | | | | |
| Canada—0.4% | |
Canfor Corp. (e) | | | 731 | | | | 13,628 | |
Toronto-Dominion Bank | | | 1,411 | | | | 85,789 | |
| | | | | | | | |
| | | | | | | 99,417 | |
| | | | | | | | |
| China—0.6% | |
Agricultural Bank of China Ltd., Class H | | | 98,000 | | | | 48,061 | |
China Mengniu Dairy Co., Ltd. (e) | | | 9,000 | | | | 29,920 | |
China Petroleum & Chemical Corp. ADR | | | 363 | | | | 36,460 | |
China Resources Beer Holdings Co., Ltd. | | | 6,000 | | | | 24,061 | |
Kingboard Chemical Holdings Ltd. | | | 3,000 | | | | 9,765 | |
| | | | | | | | |
| | | | | | | 148,267 | |
| | | | | | | | |
| Denmark—1.0% | |
Alm Brand A/S | | | 7,920 | | | | 67,657 | |
Danske Bank A/S | | | 3,914 | | | | 102,596 | |
Dfds A/S (e) | | | 299 | | | | 14,788 | |
Rockwool International A/S, Class B | | | 41 | | | | 17,543 | |
Schouw & Co. A/S | | | 250 | | | | 20,734 | |
Topdanmark A/S | | | 474 | | | | 21,664 | |
| | | | | | | | |
| | | | | | | 244,982 | |
| | | | | | | | |
| | | | | | | | |
| | | Shares | | | Value | |
| Finland—0.7% | |
Cramo Oyj | | | 530 | | | $ | 11,957 | |
Nokia Oyj | | | 2,033 | | | | 11,296 | |
UPM-Kymmene Oyj | | | 3,961 | | | | 155,346 | |
| | | | | | | | |
| | | | | | | 178,599 | |
| | | | | | | | |
| France—11.1% | |
Aeroports de Paris | | | 148 | | | | 33,322 | |
Airbus SE | | | 216 | | | | 27,107 | |
Alten S.A. | | | 543 | | | | 55,860 | |
Amundi S.A. (a) | | | 795 | | | | 59,536 | |
ArcelorMittal | | | 2,474 | | | | 76,736 | |
Arkema S.A. | | | 122 | | | | 15,119 | |
Atos SE | | | 618 | | | | 73,534 | |
AXA S.A. | | | 1,642 | | | | 43,999 | |
BNP Paribas S.A. | | | 4,533 | | | | 277,586 | |
Bouygues S.A. | | | 2,769 | | | | 119,788 | |
Casino Guichard Perrachon S.A. | | | 963 | | | | 40,529 | |
Christian Dior SE | | | 145 | | | | 62,153 | |
Cie de Saint-Gobain | | | 1,633 | | | | 70,384 | |
Dassault Aviation S.A. | | | 18 | | | | 33,313 | |
Eiffage S.A. | | | 635 | | | | 70,936 | |
Engie S.A. | | | 9,458 | | | | 139,243 | |
Faurecia S.A. | | | 992 | | | | 59,659 | |
ICADE REIT | | | 406 | | | | 37,522 | |
Ipsen S.A. | | | 192 | | | | 32,324 | |
Kaufman & Broad S.A. | | | 340 | | | | 15,956 | |
LVMH Moet Hennessy Louis Vuitton SE | | | 172 | | | | 60,780 | |
Orange S.A. | | | 4,509 | | | | 71,745 | |
Peugeot S.A. | | | 6,736 | | | | 181,708 | |
Rubis SCA | | | 309 | | | | 16,736 | |
Safran S.A. | | | 1,004 | | | | 140,584 | |
Sanofi | | | 3,845 | | | | 343,540 | |
SCOR SE | | | 328 | | | | 15,207 | |
Societe Generale S.A. | | | 4,740 | | | | 203,537 | |
STMicroelectronics NV | | | 2,618 | | | | 47,916 | |
Total S.A. | | | 2,114 | | | | 137,454 | |
Ubisoft Entertainment S.A. (e) | | | 1,039 | | | | 112,192 | |
Veolia Environnement S.A. | | | 2,116 | | | | 42,224 | |
Vinci S.A. | | | 1,312 | | | | 124,823 | |
Wendel S.A. | | | 161 | | | | 23,989 | |
| | | | | | | | |
| | | | | | | 2,867,041 | |
| | | | | | | | |
| Germany—5.1% | |
Adidas AG | | | 217 | | | | 53,069 | |
BASF SE | | | 783 | | | | 69,478 | |
Bayer AG | | | 2,938 | | | | 260,603 | |
Bayerische Motoren Werke AG | | | 1,238 | | | | 111,532 | |
Covestro AG (a) | | | 1,644 | | | | 133,077 | |
Deutsche Lufthansa AG | | | 2,983 | | | | 73,214 | |
Deutsche Post AG | | | 3,400 | | | | 120,885 | |
Deutsche Telekom AG | | | 2,814 | | | | 45,302 | |
E.ON SE | | | 15,321 | | | | 155,903 | |
Kloeckner & Co. SE | | | 1,902 | | | | 21,962 | |
Linde AG | | | 148 | | | | 30,567 | |
Merck KGaA | | | 1,003 | | | | 103,631 | |
Rheinmetall AG | | | 278 | | | | 29,059 | |
Siltronic AG | | | 454 | | | | 55,520 | |
Wuestenrot & Wuerttembergische AG | | | 2,698 | | | | 61,483 | |
| | | | | | | | |
| | | | | | | 1,325,285 | |
| | | | | | | | |
| Greece—0.5% | |
Hellenic Petroleum S.A. | | | 8,372 | | | | 73,027 | |
Mytilineos Holdings S.A. | | | 5,418 | | | | 53,796 | |
| | | | | | | | |
| | | | | | | 126,823 | |
| | | | | | | | |
| | | | | | | | |
| | | Shares | | | Value | |
| Hong Kong—3.6% | |
AIA Group Ltd. | | | 29,000 | | | $ | 258,591 | |
BOC Hong Kong Holdings Ltd. | | | 16,500 | | | | 78,314 | |
CK Asset Holdings Ltd. | | | 19,000 | | | | 142,428 | |
CK Hutchison Holdings Ltd. | | | 12,420 | | | | 142,963 | |
Henderson Land Development Co., Ltd. | | | 6,600 | | | | 33,146 | |
Hongkong Land Holdings Ltd. | | | 4,000 | | | | 26,493 | |
I-CABLE Communications Ltd. (e) | | | 2,808 | | | | 63 | |
Jardine Matheson Holdings Ltd. | | | 500 | | | | 31,369 | |
Kerry Properties Ltd. | | | 3,000 | | | | 10,187 | |
Man Wah Holdings Ltd. | | | 70,800 | | | | 42,383 | |
Shun Tak Holdings Ltd. | | | 112,000 | | | | 39,055 | |
Sino Land Co., Ltd. | | | 8,000 | | | | 13,706 | |
WH Group Ltd. (a) | | | 109,500 | | | | 76,875 | |
Wheelock & Co., Ltd. | | | 3,000 | | | | 18,036 | |
Xinyi Glass Holdings Ltd. | | | 8,000 | | | | 10,086 | |
| | | | | | | | |
| | | | | | | 923,695 | |
| | | | | | | | |
| Hungary—0.1% | |
OTP Bank PLC | | | 773 | | | | 28,646 | |
| | | | | | | | |
| Ireland—0.3% | |
CRH PLC | | | 2,085 | | | | 68,233 | |
Kingspan Group PLC | | | 377 | | | | 17,640 | |
| | | | | | | | |
| | | | | | | 85,873 | |
| | | | | | | | |
| Israel—0.2% | |
Israel Discount Bank Ltd., Class A | | | 16,619 | | | | 55,333 | |
| | | | | | | | |
| Italy—4.2% | |
A2A SpA | | | 23,808 | | | | 41,289 | |
Assicurazioni Generali SpA | | | 3,692 | | | | 63,576 | |
Enel SpA | | | 40,959 | | | | 209,363 | |
Eni SpA | | | 12,794 | | | | 241,161 | |
ERG SpA | | | 544 | | | | 11,070 | |
EXOR NV | | | 457 | | | | 30,491 | |
Fiat Chrysler Automobiles NV | | | 9,372 | | | | 163,907 | |
Fiat Chrysler Automobiles NV | | | 2,951 | | | | 51,672 | |
Fincantieri SpA (e) | | | 23,774 | | | | 38,492 | |
Hera SpA | | | 7,857 | | | | 24,434 | |
Intesa Sanpaolo SpA | | | 26,648 | | | | 67,897 | |
Recordati SpA | | | 1,298 | | | | 43,890 | |
Societa Cattolica di Assicurazioni SC | | | 7,555 | | | | 64,853 | |
Telecom Italia SpA | | | 39,550 | | | | 21,217 | |
| | | | | | | | |
| | | | | | | 1,073,312 | |
| | | | | | | | |
| Japan—25.4% | |
Aeon Fantasy Co., Ltd. | | | 200 | | | | 7,452 | |
AGC, Inc. | | | 2,200 | | | | 91,305 | |
Aisin Seiki Co., Ltd. | | | 1,500 | | | | 73,079 | |
Alfresa Holdings Corp. | | | 2,900 | | | | 77,679 | |
ANA Holdings, Inc. | | | 3,200 | | | | 111,791 | |
AOI Electronics Co., Ltd. | | | 1,400 | | | | 47,760 | |
Aoyama Trading Co., Ltd. | | | 300 | | | | 9,214 | |
Asahi Group Holdings Ltd. | | | 1,400 | | | | 60,742 | |
Asahi Kasei Corp. | | | 11,300 | | | | 171,332 | |
Astellas Pharma, Inc. | | | 8,100 | | | | 141,450 | |
Bandai Namco Holdings, Inc. | | | 500 | | | | 19,425 | |
Brother Industries Ltd. | | | 1,200 | | | | 23,694 | |
Dai-ichi Life Holdings, Inc. | | | 5,900 | | | | 122,987 | |
Daiwa House Industry Co., Ltd. | | | 3,100 | | | | 91,865 | |
Denso Corp. | | | 1,600 | | | | 84,525 | |
Disco Corp. | | | 400 | | | | 66,985 | |
Doutor Nichires Holdings Co., Ltd. | | | 500 | | | | 9,285 | |
Fancl Corp. | | | 1,300 | | | | 63,837 | |
| | | | | | |
| 132 | | Annual Report | | | September 30, 2018 | | | See accompanying Notes to Financial Statements |
Schedule of Investments
September 30, 2018
| | | | | | | | |
| | | Shares | | | Value | |
FUJIFILM Holdings Corp. | | | 4,000 | | | $ | 179,956 | |
H2O Retailing Corp. | | | 800 | | | | 13,161 | |
Heiwado Co., Ltd. | | | 1,700 | | | | 45,653 | |
Hitachi Ltd. | | | 4,800 | | | | 163,160 | |
Hokuhoku Financial Group, Inc. | | | 1,900 | | | | 26,702 | |
Honda Motor Co., Ltd. | | | 3,900 | | | | 117,453 | |
Hosiden Corp. | | | 3,200 | | | | 31,342 | |
Idemitsu Kosan Co., Ltd. | | | 800 | | | | 42,356 | |
Japan Airlines Co., Ltd. | | | 2,200 | | | | 79,073 | |
Kajima Corp. | | | 3,500 | | | | 50,892 | |
Kamigumi Co., Ltd. | | | 500 | | | | 11,021 | |
Kinden Corp. | | | 3,500 | | | | 56,045 | |
Kirin Holdings Co., Ltd. | | | 3,600 | | | | 92,333 | |
Komeri Co., Ltd. | | | 300 | | | | 7,012 | |
Kurita Water Industries Ltd. | | | 900 | | | | 26,219 | |
KYORIN Holdings, Inc. | | | 1,300 | | | | 26,866 | |
Macnica Fuji Electronics Holdings, Inc. | | | 700 | | | | 12,363 | |
Marubeni Corp. | | | 17,500 | | | | 160,048 | |
Matsumotokiyoshi Holdings Co., Ltd. | | | 1,000 | | | | 41,008 | |
Megmilk Snow Brand Co., Ltd. | | | 1,500 | | | | 38,561 | |
MINEBEA MITSUMI, Inc. | | | 3,000 | | | | 54,377 | |
Mitsubishi Chemical Holdings Corp. | | | 14,600 | | | | 139,730 | |
Mitsubishi Corp. | | | 8,100 | | | | 249,502 | |
Mitsubishi Gas Chemical Co., Inc. | | | 2,100 | | | | 44,705 | |
Mitsubishi Tanabe Pharma Corp. | | | 1,600 | | | | 26,779 | |
Mitsui & Co., Ltd. | | | 10,500 | | | | 186,592 | |
Mizuho Financial Group, Inc. | | | 102,500 | | | | 178,637 | |
Morinaga Milk Industry Co., Ltd. | | | 1,600 | | | | 43,467 | |
NH Foods Ltd. | | | 300 | | | | 11,083 | |
Nintendo Co., Ltd. | | | 300 | | | | 109,150 | |
Nippon Electric Glass Co., Ltd. | | | 2,400 | | | | 75,446 | |
Nippon Flour Mills Co., Ltd. | | | 4,900 | | | | 86,371 | |
Nippon Telegraph & Telephone Corp. | | | 2,600 | | | | 117,339 | |
Nippon Television Holdings, Inc. | | | 2,700 | | | | 46,771 | |
Nishimatsu Construction Co., Ltd. | | | 800 | | | | 20,255 | |
Nissan Motor Co., Ltd. | | | 17,500 | | | | 163,757 | |
Nisshin Oillio Group Ltd. | | | 2,000 | | | | 58,696 | |
Nisshin Seifun Group, Inc. | | | 1,500 | | | | 32,896 | |
Nomura Holdings, Inc. | | | 7,300 | | | | 34,817 | |
Obayashi Corp. | | | 8,300 | | | | 78,612 | |
Okinawa Cellular Telephone Co. | | | 1,800 | | | | 65,112 | |
Okumura Corp. | | | 700 | | | | 21,969 | |
ORIX Corp. | | | 5,900 | | | | 95,531 | |
Pola Orbis Holdings, Inc. | | | 800 | | | | 29,218 | |
Prima Meat Packers Ltd. | | | 1,400 | | | | 33,012 | |
Rohm Co., Ltd. | | | 900 | | | | 65,844 | |
Seino Holdings Co., Ltd. | | | 2,300 | | | | 34,753 | |
Sekisui Chemical Co., Ltd. | | | 6,200 | | | | 114,334 | |
Shin-Etsu Chemical Co., Ltd. | | | 800 | | | | 70,727 | |
Shindengen Electric Manufacturing Co., Ltd. | | | 500 | | | | 23,900 | |
Shionogi & Co., Ltd. | | | 1,800 | | | | 117,665 | |
Shiseido Co., Ltd. | | | 800 | | | | 61,958 | |
SoftBank Group Corp. | | | 700 | | | | 69,930 | |
Sojitz Corp. | | | 12,000 | | | | 43,302 | |
Sompo Holdings, Inc. | | | 3,400 | | | | 144,870 | |
Sony Corp. | | | 3,700 | | | | 224,914 | |
Sumitomo Corp. | | | 10,200 | | | | 169,985 | |
Sumitomo Electric Industries Ltd. | | | 3,100 | | | | 48,644 | |
Sumitomo Forestry Co., Ltd. | | | 400 | | | | 6,954 | |
Sushiro Global Holdings Ltd. | | | 400 | | | | 23,686 | |
Taisei Corp. | | | 2,000 | | | | 91,167 | |
| | | | | | | | |
| | | Shares | | | Value | |
Takeda Pharmaceutical Co., Ltd. | | | 4,600 | | | $ | 196,687 | |
THK Co., Ltd. | | | 1,100 | | | | 27,991 | |
Tohoku Electric Power Co., Inc. | | | 1,400 | | | | 19,042 | |
Tokyo Broadcasting System Holdings, Inc. | | | 500 | | | | 10,412 | |
Tokyo Electron Ltd. | | | 1,000 | | | | 137,820 | |
Toppan Printing Co., Ltd. | | | 1,500 | | | | 24,082 | |
Toyoda Gosei Co., Ltd. | | | 500 | | | | 12,348 | |
Toyota Motor Corp. | | | 2,700 | | | | 168,217 | |
Tsumura & Co. | | | 400 | | | | 13,816 | |
Ulvac, Inc. | | | 700 | | | | 26,275 | |
USS Co., Ltd. | | | 1,700 | | | | 31,558 | |
Valor Holdings Co., Ltd. | | | 1,700 | | | | 39,306 | |
Warabeya Nichiyo Holdings Co., Ltd. | | | 2,200 | | | | 38,902 | |
| | | | | | | | |
| | | | | | | 6,558,544 | |
| | | | | | | | |
| Korea (Republic of)—1.3% | |
Asiana Airlines, Inc. (e) | | | 3,147 | | | | 12,385 | |
Douzone Bizon Co., Ltd. | | | 317 | | | | 17,457 | |
Industrial Bank of Korea | | | 2,208 | | | | 30,344 | |
LG Electronics, Inc. | | | 1,290 | | | | 82,548 | |
POSCO | | | 138 | | | | 36,632 | |
Samsung Electronics Co., Ltd. GDR | | | 70 | | | | 73,343 | |
SK Hynix, Inc. | | | 472 | | | | 31,227 | |
SK Innovation Co., Ltd. | | | 125 | | | | 24,230 | |
SK Telecom Co., Ltd. | | | 140 | | | | 35,495 | |
| | | | | | | | |
| | | | | | | 343,661 | |
| | | | | | | | |
| Malaysia—0.2% | |
CIMB Group Holdings Bhd. | | | 26,100 | | | | 37,893 | |
| | | | | | | | |
| Mexico—0.2% | |
Wal-Mart de Mexico S.A.B de C.V. | | | 20,400 | | | | 61,885 | |
| | | | | | | | |
| Netherlands—2.7% | |
Aalberts Industries NV | | | 728 | | | | 31,004 | |
AerCap Holdings NV (e) | | | 957 | | | | 55,047 | |
ASR Nederland NV | | | 1,397 | | | | 66,589 | |
BE Semiconductor Industries NV | | | 2,163 | | | | 45,642 | |
ING Groep NV | | | 6,665 | | | | 86,506 | |
Koninklijke DSM NV | | | 1,355 | | | | 143,512 | |
Koninklijke KPN NV | | | 21,056 | | | | 55,546 | |
Koninklijke Philips NV | | | 733 | | | | 33,411 | |
Unilever NV | | | 3,357 | | | | 186,733 | |
| | | | | | | | |
| | | | | | | 703,990 | |
| | | | | | | | |
| New Zealand—0.6% | |
Air New Zealand Ltd. | | | 24,662 | | | | 50,529 | |
Fonterra Co-operative Group Ltd. UNIT | | | 17,136 | | | | 55,540 | |
New Zealand Refining Co., Ltd. | | | 29,024 | | | | 49,454 | |
| | | | | | | | |
| | | | | | | 155,523 | |
| | | | | | | | |
| Norway—2.0% | |
Austevoll Seafood ASA | | | 2,179 | | | | 30,017 | |
Equinor ASA | | | 8,179 | | | | 229,963 | |
Grieg Seafood ASA | | | 728 | | | | 9,622 | |
Norsk Hydro ASA | | | 10,347 | | | | 62,050 | |
Orkla ASA | | | 3,848 | | | | 32,512 | |
SpareBank 1 SR Bank ASA | | | 5,431 | | | | 66,054 | |
Telenor ASA | | | 4,383 | | | | 85,712 | |
| | | | | | | | |
| | | | | | | 515,930 | |
| | | | | | | | |
| Portugal—0.3% | |
Galp Energia SGPS S.A. | | | 4,474 | | | | 88,710 | |
| | | | | | | | |
| Russian Federation—0.4% | |
Novolipetsk Steel PJSC GDR | | | 2,884 | | | | 77,622 | |
X5 Retail Group NV GDR | | | 1,425 | | | | 32,241 | |
| | | | | | | | |
| | | | | | | 109,863 | |
| | | | | | | | |
| | | | | | | | |
| | | Shares | | | Value | |
| Singapore—1.9% | |
DBS Group Holdings Ltd. | | | 8,800 | | | $ | 167,879 | |
Oversea-Chinese Banking Corp., Ltd. | | | 21,100 | | | | 176,558 | |
QAF Ltd. | | | 64,800 | | | | 35,546 | |
Singapore Airlines Ltd. | | | 2,300 | | | | 16,383 | |
UOL Group Ltd. | | | 2,200 | | | | 11,095 | |
Venture Corp., Ltd. | | | 6,100 | | | | 78,658 | |
| | | | | | | | |
| | | | | | | 486,119 | |
| | | | | | | | |
| Spain—2.7% | |
Banco Santander S.A. | | | 14,735 | | | | 73,773 | |
Banco Santander S.A. | | | 3,591 | | | | 18,057 | |
Cia de Distribucion Integral Logista Holdings S.A. | | | 839 | | | | 21,555 | |
CIE Automotive S.A. | | | 1,985 | | | | 61,936 | |
Ence Energia y Celulosa S.A. | | | 2,534 | | | | 25,683 | |
Endesa S.A. | | | 1,812 | | | | 39,084 | |
Global Dominion Access S.A. (a)(e) | | | 1,304 | | | | 7,931 | |
International Consolidated Airlines Group S.A. | | | 13,235 | | | | 113,779 | |
International Consolidated Airlines Group S.A. | | | 3,918 | | | | 33,611 | |
Mapfre S.A. | | | 5,645 | | | | 17,657 | |
Melia Hotels International S.A. | | | 3,837 | | | | 42,885 | |
Red Electrica Corp. S.A. | | | 2,212 | | | | 46,243 | |
Repsol S.A. | | | 10,342 | | | | 205,881 | |
| | | | | | | | |
| | | | | | | 708,075 | |
| | | | | | | | |
| Sweden—2.0% | |
Boliden AB | | | 933 | | | | 25,948 | |
Electrolux AB, Ser. B | | | 3,258 | | | | 71,771 | |
Loomis AB, Class B | | | 773 | | | | 24,872 | |
Nobina AB (a) | | | 11,074 | | | | 79,115 | |
SAS AB (e) | | | 5,875 | | | | 14,180 | |
Svenska Cellulosa AB SCA, Class B | | | 8,431 | | | | 95,349 | |
Volvo AB, Class B | | | 11,532 | | | | 203,389 | |
| | | | | | | | |
| | | | | | | 514,624 | |
| | | | | | | | |
| Switzerland—6.8% | |
Adecco Group AG | | | 1,894 | | | | 99,562 | |
Baloise Holding AG | | | 785 | | | | 119,626 | |
Bobst Group S.A. | | | 565 | | | | 44,100 | |
Flughafen Zurich AG | | | 262 | | | | 52,940 | |
Lonza Group AG (e) | | | 174 | | | | 59,525 | |
Nestle S.A. | | | 3,167 | | | | 263,610 | |
Novartis AG | | | 3,183 | | | | 273,988 | |
OC Oerlikon Corp. AG (e) | | | 4,600 | | | | 63,216 | |
Pargesa Holding S.A. | | | 325 | | | | 26,112 | |
Partners Group Holding AG | | | 201 | | | | 159,336 | |
Roche Holding AG | | | 879 | | | | 212,556 | |
Sunrise Communications Group AG (a)(e) | | | 504 | | | | 45,672 | |
Swiss Life Holding AG (e) | | | 238 | | | | 90,243 | |
Zurich Insurance Group AG | | | 733 | | | | 231,118 | |
| | | | | | | | |
| | | | | | | 1,741,604 | |
| | | | | | | | |
| Taiwan—1.1% | |
China Development Financial Holding Corp. | | | 101,000 | | | | 37,684 | |
Compeq Manufacturing Co., Ltd. | | | 18,000 | | | | 14,197 | |
Formosa Chemicals & Fibre Corp. | | | 22,000 | | | | 92,194 | |
Formosa Plastics Corp. | | | 17,000 | | | | 65,123 | |
HannStar Display Corp. | | | 140,000 | | | | 34,518 | |
Mitac Holdings Corp. (e) | | | 19,545 | | | | 18,187 | |
Nan Ya Plastics Corp. | | | 8,000 | | | | 22,211 | |
| | | | | | | | |
| | | | | | | 284,114 | |
| | | | | | | | |
| | | | | | | | |
| See accompanying Notes to Financial Statements | | | September 30, 2018 | | | Annual Report | | | 133 | |
Schedule of Investments
September 30, 2018
| | | | | | | | |
| | | Shares | | | Value | |
| Thailand—0.2% | |
Kiatnakin Bank PCL (c)(d) | | | 10,900 | | | $ | 25,370 | |
PTT PCL (c)(d) | | | 19,800 | | | | 33,240 | |
| | | | | | | | |
| | | | | | | 58,610 | |
| | | | | | | | |
| Turkey—0.1% | |
Pegasus Hava Tasimaciligi AS (e) | | | 3,437 | | | | 15,362 | |
| | | | | | | | |
| United Kingdom—17.0% | |
3i Group PLC | | | 4,178 | | | | 51,159 | |
Anglo American PLC | | | 4,078 | | | | 91,229 | |
AstraZeneca PLC | | | 1,341 | | | | 104,523 | |
Barratt Developments PLC | | | 5,353 | | | | 39,532 | |
Bellway PLC | | | 1,534 | | | | 60,205 | |
Berkeley Group Holdings PLC | | | 1,836 | | | | 87,957 | |
BP PLC | | | 36,858 | | | | 282,507 | |
British American Tobacco PLC | | | 1,239 | | | | 57,763 | |
Carnival PLC | | | 2,228 | | | | 138,237 | |
Centrica PLC | | | 26,952 | | | | 54,415 | |
Coca-Cola HBC AG (e) | | | 3,598 | | | | 122,581 | |
Compass Group PLC | | | 6,519 | | | | 144,939 | |
Computacenter PLC | | | 727 | | | | 11,988 | |
Dart Group PLC | | | 4,276 | | | | 51,971 | |
Direct Line Insurance Group PLC | | | 21,725 | | | | 91,697 | |
Dixons Carphone PLC | | | 12,009 | | | | 26,473 | |
Electrocomponents PLC | | | 9,945 | | | | 93,036 | |
Experian PLC | | | 3,509 | | | | 90,041 | |
Firstgroup PLC (e) | | | 9,880 | | | | 11,700 | |
Galliford Try PLC | | | 943 | | | | 12,402 | |
Glencore PLC | | | 34,894 | | | | 150,417 | |
Hansteen Holdings PLC REIT | | | 12,829 | | | | 16,220 | |
Highland Gold Mining Ltd. | | | 12,810 | | | | 24,403 | |
HSBC Holdings PLC | | | 25,434 | | | | 221,921 | |
IG Group Holdings PLC | | | 2,503 | | | | 20,634 | |
Inchcape PLC | | | 1,905 | | | | 16,588 | |
Legal & General Group PLC | | | 47,910 | | | | 163,555 | |
Lloyds Banking Group PLC | | | 119,855 | | | | 92,179 | |
Man Group PLC | | | 14,742 | | | | 33,818 | |
National Express Group PLC | | | 16,032 | | | | 81,535 | |
OneSavings Bank PLC | | | 10,539 | | | | 55,777 | |
Persimmon PLC | | | 3,492 | | | | 107,509 | |
Plus500 Ltd. | | | 1,827 | | | | 31,609 | |
Rio Tinto PLC | | | 5,061 | | | | 255,285 | |
Royal Dutch Shell PLC, Class A | | | 14,811 | | | | 507,846 | |
Royal Dutch Shell PLC, Class A | | | 3,789 | | | | 129,816 | |
Royal Dutch Shell PLC, Class B | | | 3,555 | | | | 124,448 | |
Smith & Nephew PLC | | | 5,561 | | | | 101,458 | |
SSE PLC | | | 3,128 | | | | 46,713 | |
Standard Life Aberdeen PLC | | | 15,520 | | | | 61,841 | |
Tate & Lyle PLC | | | 2,467 | | | | 21,938 | |
Taylor Wimpey PLC | | | 33,958 | | | | 75,903 | |
TESCO PLC | | | 54,945 | | | | 171,786 | |
TUI AG | | | 5,963 | | | | 114,386 | |
TUI AG | | | 1,015 | | | | 19,504 | |
Vodafone Group PLC | | | 28,417 | | | | 60,887 | |
WPP PLC | | | 4,483 | | | | 65,652 | |
| | | | | | | | |
| | | | | | | 4,397,983 | |
| | | | | | | | |
Total Common Stock
(cost—$23,785,434) | | | | 25,110,508 | |
| | | | | | | | |
| | | | | | | | |
| Exchange-Traded Funds—1.5% | |
iShares Core MSCI EAFE
(cost—$388,245) | | | 5,898 | | | | 377,944 | |
| | | | | | | | |
| | | | | | | | |
| | | | | | | | |
| | | Shares | | | Value | |
| Preferred Stock—0.5% | |
| Germany—0.5% | |
Porsche Automobil Holding SE | | | 574 | | | $ | 38,640 | |
Volkswagen AG | | | 517 | | | | 90,792 | |
| | | | | | | | |
Total Preferred Stock
(cost—$119,658) | | | | 129,432 | |
| | | | | | | | |
| | | | | | | | |
| | | Principal
Amount
(000s) | | | | |
| Repurchase Agreements—0.4% | |
State Street Bank and Trust Co., dated 9/28/18, 0.42%, due 10/1/18, proceeds $112,004; collateralized by U.S. Treasury Notes, 2.00%, due 11/30/20, valued at $118,626 including accrued interest
| |
(cost—$112,000) | | | $112 | | | | 112,000 | |
| | | | | | | | |
| |
Total Investments
(cost—$24,405,337) (b)—99.7% | | | | 25,729,884 | |
| | | | | | | | |
Other assets less liabilities—0.3% | | | | 70,338 | |
| | | | | | | | |
| | |
| Net Assets—100.0% | | | | | | | $25,800,222 | |
| | | | | | | | |
Notes to Schedule of Investments:
(a) 144A—Exempt from registration under Rule 144A of the Securities Act of 1933. These securities may be resold in transactions exempt from registration, typically only to qualified institutional buyers. Securities with an aggregate value of $402,206, representing 1.6% of net assets.
(b) Securities with an aggregate value of $24,591,973, representing 95.3% of net assets, were valued utilizing modeling tools provided by a third-party vendor. See Note 1(a) and Note 1(b) in the Notes to Financial Statements.
(c) Fair-Valued—Securities with an aggregate value of $58,610, representing 0.2% of net assets. See Note 1(a) and Note 1(b) in the Notes to Financial Statements.
(d) Level 3 security. See Note 1(a) and Note 1(b) in the Notes to Financial Statements.
(e) Non-income producing.
Glossary:
ADR—American Depositary Receipt
EAFE—Europe, Australasia, and Far East
GDR—Global Depositary Receipt
MSCI—Morgan Stanley Capital International
REIT—Real Estate Investment Trust
UNIT—More than one class of securities traded together
The industry classification of portfolio holdings and other assets less liabilities shown as a percentage of net assets were as follows:
| | | | |
Oil, Gas & Consumable Fuels | | | 9.3% | |
Banks | | | 9.0% | |
Pharmaceuticals | | | 7.7% | |
Insurance | | | 6.4% | |
Automobiles | | | 4.1% | |
Metals & Mining | | | 4.1% | |
Chemicals | | | 3.9% | |
Food Products | | | 3.6% | |
Household Durables | | | 3.6% | |
Trading Companies & Distributors | | | 3.5% | |
Airlines | | | 2.5% | |
Construction & Engineering | | | 2.5% | |
Hotels, Restaurants & Leisure | | | 2.3% | |
Semiconductors & Semiconductor Equipment | | | 2.1% | |
Electronic Equipment, Instruments & Components | | | 2.0% | |
Machinery | | | 1.9% | |
Capital Markets | | | 1.8% | |
Multi-Utilities | | | 1.8% | |
Food & Staples Retailing | | | 1.8% | |
Diversified Telecommunication Services | | | 1.7% | |
Exchange-Traded Funds | | | 1.5% | |
Electric Utilities | | | 1.4% | |
Auto Components | | | 1.4% | |
Real Estate Management & Development | | | 1.3% | |
Personal Products | | | 1.3% | |
Beverages | | | 1.3% | |
Industrial Conglomerates | | | 1.1% | |
Technology Hardware, Storage & Peripherals | | | 1.1% | |
Diversified Financial Services | | | 1.0% | |
Software | | | 0.9% | |
Wireless Telecommunication Services | | | 0.9% | |
Road & Rail | | | 0.8% | |
Aerospace & Defense | | | 0.8% | |
Building Products | | | 0.8% | |
Paper & Forest Products | | | 0.8% | |
Professional Services | | | 0.7% | |
Textiles, Apparel & Luxury Goods | | | 0.7% | |
IT Services | | | 0.6% | |
Air Freight & Logistics | | | 0.5% | |
Healthcare Equipment & Supplies | | | 0.5% | |
Healthcare Providers & Services | | | 0.5% | |
Media | | | 0.5% | |
Transportation Infrastructure | | | 0.4% | |
Household Products | | | 0.4% | |
Containers & Packaging | | | 0.3% | |
Construction Materials | | | 0.3% | |
Specialty Retail | | | 0.3% | |
Life Sciences Tools & Services | | | 0.2% | |
Tobacco | | | 0.2% | |
Thrifts & Mortgage Finance | | | 0.2% | |
Equity Real Estate Investment Trusts (REITs) | | | 0.2% | |
Commercial Services & Supplies | | | 0.2% | |
Auto Manufacturers | | | 0.1% | |
Leisure Equipment & Products | | | 0.1% | |
Gas Utilities | | | 0.1% | |
Distributors | | | 0.1% | |
Marine | | | 0.1% | |
Multi-Line Retail | | | 0.1% | |
Communications Equipment | | | 0.0% | |
Independent Power Producers & Energy Traders | | | 0.0% | |
Repurchase Agreements | | | 0.4% | |
Other assets less liabilities | | | 0.3% | |
| | | | |
| | | 100.0% | |
| | | | |
| | | | | | |
| 134 | | Annual Report | | | September 30, 2018 | | | See accompanying Notes to Financial Statements |
Schedule of Investments
September 30, 2018
AllianzGI Best Styles U.S. Equity Fund
| | | | | | | | |
| | | Shares | | | Value | |
| Common Stock—98.7% | |
| Aerospace & Defense—2.0% | |
Boeing Co. | | | 3,453 | | | | $1,284,171 | |
Huntington Ingalls Industries, Inc. | | | 920 | | | | 235,594 | |
Northrop Grumman Corp. | | | 1,512 | | | | 479,863 | |
| | | | | | | | |
| | | | | | | 1,999,628 | |
| | | | | | | | |
| Air Freight & Logistics—0.4% | |
Atlas Air Worldwide Holdings, Inc. (a) | | | 704 | | | | 44,880 | |
FedEx Corp. | | | 1,566 | | | | 377,077 | |
| | | | | | | | |
| | | | | | | 421,957 | |
| | | | | | | | |
| Airlines—0.6% | | | | | | | | |
Allegiant Travel Co. | | | 771 | | | | 97,763 | |
Delta Air Lines, Inc. | | | 6,524 | | | | 377,283 | |
SkyWest, Inc. | | | 1,747 | | | | 102,898 | |
WestJet Airlines Ltd. | | | 679 | | | | 10,782 | |
| | | | | | | | |
| | | | | | | 588,726 | |
| | | | | | | | |
| Auto Components—0.4% | | | | | | | | |
Lear Corp. | | | 1,532 | | | | 222,140 | |
Magna International, Inc. | | | 3,274 | | | | 171,982 | |
| | | | | | | | |
| | | | | | | 394,122 | |
| | | | | | | | |
| Automobiles—0.5% | | | | | | | | |
General Motors Co. | | | 15,892 | | | | 535,084 | |
| | | | | | | | |
| Banks—5.1% | | | | | | | | |
Bank of America Corp. | | | 41,627 | | | | 1,226,331 | |
Bank of Nova Scotia | | | 2,755 | | | | 164,214 | |
Bank of NT Butterfield & Son Ltd. | | | 846 | | | | 43,874 | |
Cadence BanCorp | | | 7,455 | | | | 194,725 | |
Citizens Financial Group, Inc. | | | 9,278 | | | | 357,852 | |
Comerica, Inc. | | | 4,602 | | | | 415,100 | |
Cullen/Frost Bankers, Inc. | | | 2,118 | | | | 221,204 | |
JPMorgan Chase & Co. | | | 11,009 | | | | 1,242,256 | |
Laurentian Bank of Canada | | | 2,195 | | | | 72,393 | |
Regions Financial Corp. | | | 21,240 | | | | 389,754 | |
Synovus Financial Corp. | | | 4,764 | | | | 218,144 | |
Umpqua Holdings Corp. | | | 9,747 | | | | 202,738 | |
Wells Fargo & Co. | | | 6,157 | | | | 323,612 | |
| | | | | | | | |
| | | | | | | 5,072,197 | |
| | | | | | | | |
| Beverages—1.3% | | | | | | | | |
Coca-Cola Co. | | | 711 | | | | 32,841 | |
Constellation Brands, Inc., Class A | | | 2,268 | | | | 489,026 | |
Keurig Dr Pepper, Inc. | | | 4,431 | | | | 102,666 | |
PepsiCo, Inc. | | | 6,138 | | | | 686,229 | |
| | | | | | | | |
| | | | | | | 1,310,762 | |
| | | | | | | | |
| Biotechnology—2.7% | | | | | | | | |
AbbVie, Inc. | | | 10,465 | | | | 989,780 | |
Amgen, Inc. | | | 4,806 | | | | 996,236 | |
Biogen, Inc. (a) | | | 87 | | | | 30,738 | |
Gilead Sciences, Inc. | | | 8,464 | | | | 653,505 | |
Myriad Genetics, Inc. (a) | | | 277 | | | | 12,742 | |
| | | | | | | | |
| | | | | | | 2,683,001 | |
| | | | | | | | |
| Capital Markets—2.0% | | | | | | | | |
Apollo Investment Corp. | | | 9,727 | | | | 52,915 | |
Bank of New York Mellon Corp. | | | 5,189 | | | | 264,587 | |
BlackRock, Inc. | | | 704 | | | | 331,816 | |
E*TRADE Financial Corp. (a) | | | 5,753 | | | | 301,400 | |
Interactive Brokers Group, Inc., Class A | | | 1,693 | | | | 93,640 | |
Morgan Stanley | | | 9,953 | | | | 463,511 | |
S&P Global, Inc. | | | 881 | | | | 172,139 | |
T Rowe Price Group, Inc. | | | 2,892 | | | | 315,748 | |
| | | | | | | | |
| | | | | | | 1,995,756 | |
| | | | | | | | |
| | | | | | | | |
| | | Shares | | | Value | |
| Chemicals—1.4% | | | | | | | | |
Air Products & Chemicals, Inc. | | | 2,764 | | | $ | 461,726 | |
Celanese Corp. | | | 914 | | | | 104,196 | |
Eastman Chemical Co. | | | 1,500 | | | | 143,580 | |
Huntsman Corp. | | | 1,674 | | | | 45,583 | |
LyondellBasell Industries NV, Class A | | | 4,277 | | | | 438,435 | |
Trinseo S.A. | | | 270 | | | | 21,141 | |
Westlake Chemical Corp. | | | 2,427 | | | | 201,708 | |
| | | | | | | | |
| | | | | | | 1,416,369 | |
| | | | | | | | |
| Commercial Services & Supplies—0.9% | |
Brady Corp., Class A | | | 666 | | | | 29,137 | |
Copart, Inc. (a) | | | 4,749 | | | | 244,716 | |
KAR Auction Services, Inc. | | | 4,114 | | | | 245,565 | |
McGrath RentCorp | | | 688 | | | | 37,475 | |
Transcontinental, Inc., Class A | | | 2,489 | | | | 44,128 | |
Waste Management, Inc. | | | 3,288 | | | | 297,104 | |
| | | | | | | | |
| | | | | | | 898,125 | |
| | | | | | | | |
| Communications Equipment—1.7% | |
Cisco Systems, Inc. | | | 29,193 | | | | 1,420,240 | |
Juniper Networks, Inc. | | | 10,225 | | | | 306,443 | |
| | | | | | | | |
| | | | | | | 1,726,683 | |
| | | | | | | | |
| Construction & Engineering—0.0% | |
WSP Global, Inc. | | | 278 | | | | 15,214 | |
| | | | | | | | |
| Consumer Finance—1.2% | | | | | | | | |
Capital One Financial Corp. | | | 4,623 | | | | 438,861 | |
Discover Financial Services | | | 5,098 | | | | 389,742 | |
Green Dot Corp., Class A (a) | | | 1,524 | | | | 135,362 | |
Santander Consumer USA Holdings, Inc. | | | 11,645 | | | | 233,366 | |
World Acceptance Corp. (a) | | | 119 | | | | 13,609 | |
| | | | | | | | |
| | | | | | | 1,210,940 | |
| | | | | | | | |
| Containers & Packaging—0.3% | |
CCL Industries, Inc., Class B | | | 1,683 | | | | 75,860 | |
Graphic Packaging Holding Co. | | | 14,624 | | | | 204,882 | |
| | | | | | | | |
| | | | | | | 280,742 | |
| | | | | | | | |
| Diversified Consumer Services—0.1% | |
H&R Block, Inc. | | | 4,003 | | | | 103,077 | |
| | | | | | | | |
| Diversified Financial Services—1.3% | |
Berkshire Hathaway, Inc., Class B (a) | | | 5,446 | | | | 1,166,043 | |
Jefferies Financial Group, Inc. | | | 4,040 | | | | 88,718 | |
| | | | | | | | |
| | | | | | | 1,254,761 | |
| | | | | | | | |
| Diversified Telecommunication Services—2.8% | |
AT&T, Inc. | | | 48,282 | | | | 1,621,310 | |
CenturyLink, Inc. | | | 2,102 | | | | 44,562 | |
Verizon Communications, Inc. | | | 21,474 | | | | 1,146,497 | |
| | | | | | | | |
| | | | | | | 2,812,369 | |
| | | | | | | | |
| Electric Utilities—2.8% | | | | | | | | |
American Electric Power Co., Inc. | | | 6,366 | | | | 451,222 | |
Duke Energy Corp. | | | 4,010 | | | | 320,880 | |
Emera, Inc. | | | 744 | | | | 23,132 | |
Entergy Corp. | | | 4,068 | | | | 330,037 | |
Exelon Corp. | | | 11,361 | | | | 496,021 | |
NextEra Energy, Inc. | | | 3,623 | | | | 607,215 | |
PG&E Corp. | | | 4,472 | | | | 205,757 | |
Portland General Electric Co. | | | 2,014 | | | | 91,859 | |
PPL Corp. | | | 9,555 | | | | 279,579 | |
| | | | | | | | |
| | | | | | | 2,805,702 | |
| | | | | | | | |
| Electrical Equipment—0.4% | |
AMETEK, Inc. | | | 3,299 | | | | 261,017 | |
Regal Beloit Corp. | | | 1,222 | | | | 100,754 | |
| | | | | | | | |
| | | | | | | 361,771 | |
| | | | | | | | |
| | | | | | | | |
| | | Shares | | | Value | |
| Electronic Equipment, Instruments & Components—0.2% | |
Arrow Electronics, Inc. (a) | | | 2,161 | | | $ | 159,309 | |
| | | | | | | | |
| Energy Equipment & Services—0.0% | |
Nordic American Offshore Ltd. | | | 282 | | | | 274 | |
| | | | | | | | |
| Equity Real Estate Investment Trusts (REITs)—1.7% | |
Apple Hospitality REIT, Inc. | | | 4,679 | | | | 81,836 | |
Brixmor Property Group, Inc. | | | 6,517 | | | | 114,113 | |
Canadian Apartment Properties | | | 1,118 | | | | 41,279 | |
CubeSmart | | | 4,451 | | | | 126,987 | |
Dream Global Real Estate Investment Trust | | | 4,708 | | | | 54,127 | |
Extra Space Storage, Inc. | | | 3,059 | | | | 265,032 | |
Gaming and Leisure Properties, Inc. | | | 6,045 | | | | 213,086 | |
Hospitality Properties Trust | | | 3,355 | | | | 96,758 | |
LaSalle Hotel Properties | | | 3,229 | | | | 111,691 | |
Life Storage, Inc. | | | 2,142 | | | | 203,833 | |
Monmouth Real Estate Investment Corp. | | | 948 | | | | 15,851 | |
National Storage Affiliates Trust | | | 2,620 | | | | 66,653 | |
Ramco-Gershenson Properties Trust | | | 2,742 | | | | 37,291 | |
Spirit Realty Capital, Inc. | | | 13,834 | | | | 111,502 | |
STORE Capital Corp. | | | 2,936 | | | | 81,591 | |
Xenia Hotels & Resorts, Inc. | | | 2,452 | | | | 58,112 | |
| | | | | | | | |
| | | | | | | 1,679,742 | |
| | | | | | | | |
| Food & Staples Retailing—2.4% | |
Costco Wholesale Corp. | | | 2,612 | | | | 613,507 | |
CVS Health Corp. | | | 7,759 | | | | 610,789 | |
Empire Co., Ltd. | | | 3,515 | | | | 64,060 | |
George Weston Ltd. | | | 657 | | | | 49,731 | |
Kroger Co. | | | 12,395 | | | | 360,818 | |
SpartanNash Co. | | | 531 | | | | 10,652 | |
Walmart, Inc. | | | 7,463 | | | | 700,850 | |
| | | | | | | | |
| | | | | | | 2,410,407 | |
| | | | | | | | |
| Food Products—0.9% | |
Archer-Daniels-Midland Co. | | | 8,320 | | | | 418,247 | |
Kraft Heinz Co. | | | 2,936 | | | | 161,803 | |
Tyson Foods, Inc., Class A | | | 6,010 | | | | 357,775 | |
| | | | | | | | |
| | | | | | | 937,825 | |
| | | | | | | | |
| Gas Utilities—0.3% | |
Atmos Energy Corp. | | | 2,650 | | | | 248,861 | |
| | | | | | | | |
| Healthcare Equipment & Supplies—2.8% | |
Abbott Laboratories | | | 12,623 | | | | 926,023 | |
Align Technology, Inc. (a) | | | 998 | | | | 390,438 | |
CONMED Corp. | | | 738 | | | | 58,464 | |
Cutera, Inc. (a) | | | 1,108 | | | | 36,065 | |
Danaher Corp. | | | 3,760 | | | | 408,562 | |
IntriCon Corp. (a) | | | 777 | | | | 43,667 | |
Medtronic PLC | | | 7,119 | | | | 700,296 | |
Merit Medical Systems, Inc. (a) | | | 335 | | | | 20,586 | |
STERIS PLC | | | 2,099 | | | | 240,126 | |
| | | | | | | | |
| | | | | | | 2,824,227 | |
| | | | | | | | |
| Healthcare Providers & Services—5.8% | |
Aetna, Inc. | | | 808 | | | | 163,903 | |
AmerisourceBergen Corp. | | | 3,999 | | | | 368,788 | |
Anthem, Inc. | | | 2,433 | | | | 666,764 | |
BioTelemetry, Inc. (a) | | | 396 | | | | 25,522 | |
Cardinal Health, Inc. | | | 6,880 | | | | 371,520 | |
Centene Corp. (a) | | | 3,180 | | | | 460,400 | |
Chemed Corp. | | | 659 | | | | 210,603 | |
Cigna Corp. | | | 1,299 | | | | 270,517 | |
| | | | | | | | |
| See accompanying Notes to Financial Statements | | | September 30, 2018 | | | Annual Report | | | 135 | |
Schedule of Investments
September 30, 2018
| | | | | | | | |
| | | Shares | | | Value | |
Encompass Health Corp. | | | 2,571 | | | $ | 200,409 | |
Express Scripts Holding Co. (a) | | | 3,805 | | | | 361,513 | |
Humana, Inc. | | | 1,258 | | | | 425,858 | |
Laboratory Corp. of America Holdings (a) | | | 598 | | | | 103,861 | |
Patterson Cos., Inc. | | | 9,387 | | | | 229,512 | |
Quest Diagnostics, Inc. | | | 3,171 | | | | 342,183 | |
UnitedHealth Group, Inc. | | | 5,765 | | | | 1,533,721 | |
Universal Health Services, Inc., Class B | | | 728 | | | | 93,067 | |
| | | | | | | | |
| | | | | | | 5,828,141 | |
| | | | | | | | |
| Hotels, Restaurants & Leisure—0.9% | |
BJ’s Restaurants, Inc. | | | 2,105 | | | | 151,981 | |
Brinker International, Inc. | | | 897 | | | | 41,917 | |
Carnival Corp. | | | 1,932 | | | | 123,204 | |
Restaurant Brands International, Inc. | | | 4,616 | | | | 273,636 | |
Royal Caribbean Cruises Ltd. | | | 2,327 | | | | 302,370 | |
| | | | | | | | |
| | | | | | | 893,108 | |
| | | | | | | | |
| Household Products—0.5% | |
Procter & Gamble Co. | | | 5,789 | | | | 481,818 | |
| | | | | | | | |
| Independent Power Producers & Energy Traders—0.2% | |
AES Corp. | | | 15,501 | | | | 217,014 | |
Capital Power Corp. | | | 1,368 | | | | 30,195 | |
| | | | | | | | |
| | | | | | | 247,209 | |
| | | | | | | | |
| Insurance—3.3% | |
Aflac, Inc. | | | 10,168 | | | | 478,608 | |
Allstate Corp. | | | 3,846 | | | | 379,600 | |
American Equity Investment Life Holding Co. | | | 3,559 | | | | 125,846 | |
AmTrust Financial Services, Inc. | | | 2,020 | | | | 29,330 | |
CNA Financial Corp. | | | 1,356 | | | | 61,901 | |
Fairfax Financial Holdings Ltd. | | | 235 | | | | 127,673 | |
Loews Corp. | | | 6,479 | | | | 325,440 | |
Manulife Financial Corp. | | | 1,521 | | | | 27,190 | |
Old Republic International Corp. | | | 8,540 | | | | 191,125 | |
Power Corp. of Canada | | | 3,728 | | | | 80,988 | |
Principal Financial Group, Inc. | | | 5,411 | | | | 317,031 | |
Progressive Corp. | | | 7,206 | | | | 511,914 | |
Prudential Financial, Inc. | | | 4,913 | | | | 497,785 | |
Torchmark Corp. | | | 290 | | | | 25,140 | |
Universal Insurance Holdings, Inc. | | | 3,359 | | | | 163,080 | |
| | | | | | | | |
| | | | | | | 3,342,651 | |
| | | | | | | | |
| Interactive Media & Services—3.7% | |
Alphabet, Inc., Class A (a) | | | 982 | | | | 1,185,353 | |
Alphabet, Inc., Class C (a) | | | 1,055 | | | | 1,259,111 | |
Facebook, Inc., Class A (a) | | | 7,470 | | | | 1,228,516 | |
| | | | | | | | |
| | | | | | | 3,672,980 | |
| | | | | | | | |
| Internet & Direct Marketing Retail—4.2% | |
Amazon.com, Inc. (a) | | | 1,809 | | | | 3,623,427 | |
Netflix, Inc. (a) | | | 1,477 | | | | 552,590 | |
| | | | | | | | |
| | | | | | | 4,176,017 | |
| | | | | | | | |
| IT Services—3.9% | |
Amdocs Ltd. | | | 1,498 | | | | 98,838 | |
Black Knight, Inc. (a) | | | 2,360 | | | | 122,602 | |
Broadridge Financial Solutions, Inc. | | | 1,206 | | | | 159,132 | |
CACI International, Inc., Class A (a) | | | 838 | | | | 154,318 | |
DXC Technology Co. | | | 2,408 | | | | 225,196 | |
International Business Machines Corp. | | | 2,747 | | | | 415,374 | |
Mastercard, Inc., Class A | | | 4,748 | | | | 1,056,952 | |
PayPal Holdings, Inc. (a) | | | 10,330 | | | | 907,387 | |
Visa, Inc., Class A | | | 5,149 | | | | 772,813 | |
| | | | | | | | |
| | | | | | | 3,912,612 | |
| | | | | | | | |
| | | | | | | | |
| | | Shares | | | Value | |
| Life Sciences Tools & Services—0.0% | |
PerkinElmer, Inc. | | | 474 | | | $ | 46,106 | |
| | | | | | | | |
| Machinery—1.0% | |
American Railcar Industries, Inc. | | | 1,061 | | | | 48,912 | |
Caterpillar, Inc. | | | 1,728 | | | | 263,503 | |
Ingersoll-Rand PLC | | | 3,898 | | | | 398,765 | |
PACCAR, Inc. | | | 4,882 | | | | 332,904 | |
| | | | | | | | |
| | | | | | | 1,044,084 | |
| | | | | | | | |
| Media—1.2% | |
Cogeco Communications, Inc. | | | 593 | | | | 29,704 | |
Comcast Corp., Class A | | | 25,882 | | | | 916,482 | |
Walt Disney Co. | | | 2,043 | | | | 238,908 | |
| | | | | | | | |
| | | | | | | 1,185,094 | |
| | | | | | | | |
| Metals & Mining—0.7% | |
IAMGOLD Corp. (a) | | | 3,004 | | | | 11,047 | |
Nucor Corp. | | | 6,046 | | | | 383,619 | |
OceanaGold Corp. | | | 9,229 | | | | 27,866 | |
Reliance Steel & Aluminum Co. | | | 1,622 | | | | 138,340 | |
Teck Resources Ltd., Class B | | | 5,067 | | | | 122,120 | |
| | | | | | | | |
| | | | | | | 682,992 | |
| | | | | | | | |
| Mortgage Real Estate Investment Trusts (REITs)—1.4% | |
AGNC Investment Corp. | | | 11,752 | | | | 218,940 | |
Annaly Capital Management, Inc. | | | 26,393 | | | | 269,996 | |
Anworth Mortgage Asset Corp. | | | 5,962 | | | | 27,604 | |
Arbor Realty Trust, Inc. | | | 7,055 | | | | 80,991 | |
ARMOUR Residential REIT, Inc. | | | 8,739 | | | | 196,191 | |
Chimera Investment Corp. | | | 6,470 | | | | 117,301 | |
Invesco Mortgage Capital, Inc. | | | 2,674 | | | | 42,303 | |
Ladder Capital Corp. | | | 3,838 | | | | 65,016 | |
MFA Financial, Inc. | | | 27,464 | | | | 201,860 | |
New York Mortgage Trust, Inc. | | | 2,737 | | | | 16,641 | |
Two Harbors Investment Corp. | | | 13,594 | | | | 202,958 | |
| | | | | | | | |
| | | | | | | 1,439,801 | |
| | | | | | | | |
| Multi-Line Retail—1.1% | |
Kohl’s Corp. | | | 3,617 | | | | 269,647 | |
Macy’s, Inc. | | | 6,826 | | | | 237,067 | |
Target Corp. | | | 6,220 | | | | 548,666 | |
| | | | | | | | |
| | | | | | | 1,055,380 | |
| | | | | | | | |
| Multi-Utilities—1.6% | |
Algonquin Power & Utilities Corp. | | | 3,997 | | | | 41,342 | |
Ameren Corp. | | | 5,456 | | | | 344,928 | |
CenterPoint Energy, Inc. | | | 10,261 | | | | 283,717 | |
MDU Resources Group, Inc. | | | 3,741 | | | | 96,106 | |
NorthWestern Corp. | | | 2,109 | | | | 123,714 | |
Public Service Enterprise Group, Inc. | | | 5,468 | | | | 288,656 | |
Vectren Corp. | | | 1,367 | | | | 97,727 | |
WEC Energy Group, Inc. | | | 5,542 | | | | 369,984 | |
| | | | | | | | |
| | | | | | | 1,646,174 | |
| | | | | | | | |
| Oil, Gas & Consumable Fuels—4.4% | |
ARC Resources Ltd. | | | 5,019 | | | | 55,955 | |
Canadian Natural Resources Ltd. | | | 3,103 | | | | 101,379 | |
Chevron Corp. | | | 2,480 | | | | 303,254 | |
EOG Resources, Inc. | | | 3,273 | | | | 417,537 | |
Exxon Mobil Corp. | | | 9,785 | | | | 831,921 | |
Husky Energy, Inc. | | | 2,042 | | | | 35,855 | |
Marathon Petroleum Corp. | | | 8,154 | | | | 652,075 | |
Occidental Petroleum Corp. | | | 7,829 | | | | 643,309 | |
Suncor Energy, Inc. | | | 10,308 | | | | 398,865 | |
Valero Energy Corp. | | | 6,813 | | | | 774,979 | |
WildHorse Resource Development Corp. (a) | | | 6,064 | | | | 143,353 | |
| | | | | | | | |
| | | | | | | 4,358,482 | |
| | | | | | | | |
| | | | | | | | |
| | | Shares | | | Value | |
| Paper & Forest Products—0.3% | |
Domtar Corp. | | | 1,908 | | | $ | 99,540 | |
Louisiana-Pacific Corp. | | | 7,154 | | | | 189,510 | |
| | | | | | | | |
| | | | | | | 289,050 | |
| | | | | | | | |
| Personal Products—0.5% | |
Estee Lauder Cos., Inc., Class A | | | 3,421 | | | | 497,140 | |
| | | | | | | | |
| Pharmaceuticals—4.4% | |
Allergan PLC | | | 2,028 | | | | 386,294 | |
Bausch Health Cos., Inc. (a) | | | 2,492 | | | | 63,995 | |
Johnson & Johnson | | | 12,023 | | | | 1,661,218 | |
Merck & Co., Inc. | | | 4,378 | | | | 310,575 | |
Pfizer, Inc. | | | 36,678 | | | | 1,616,400 | |
Zoetis, Inc. | | | 3,997 | | | | 365,965 | |
| | | | | | | | |
| | | | | | | 4,404,447 | |
| | | | | | | | |
| Professional Services—0.3% | |
FTI Consulting, Inc. (a) | | | 1,979 | | | | 144,843 | |
Insperity, Inc. | | | 1,365 | | | | 161,002 | |
Navigant Consulting, Inc. | | | 436 | | | | 10,054 | |
| | | | | | | | |
| | | | | | | 315,899 | |
| | | | | | | | |
| Real Estate Management & Development—0.1% | |
Jones Lang LaSalle, Inc. | | | 413 | | | | 59,604 | |
| | | | | | | | |
| Road & Rail—1.7% | |
Avis Budget Group, Inc. (a) | | | 6,010 | | | | 193,161 | |
Hertz Global Holdings, Inc. (a) | | | 10,723 | | | | 175,107 | |
Kansas City Southern | | | 2,042 | | | | 231,318 | |
Ryder System, Inc. | | | 2,631 | | | | 192,247 | |
Union Pacific Corp. | | | 5,862 | | | | 954,509 | |
| | | | | | | | |
| | | | | | | 1,746,342 | |
| | | | | | | | |
| Semiconductors & Semiconductor Equipment—4.0% | |
Applied Materials, Inc. | | | 2,211 | | | | 85,455 | |
Cabot Microelectronics Corp. | | | 1,235 | | | | 127,415 | |
Cirrus Logic, Inc. (a) | | | 319 | | | | 12,313 | |
Intel Corp. | | | 17,948 | | | | 848,761 | |
KLA-Tencor Corp. | | | 3,260 | | | | 331,575 | |
Lam Research Corp. | | | 2,429 | | | | 368,479 | |
Micron Technology, Inc. (a) | | | 6,504 | | | | 294,176 | |
NVIDIA Corp. | | | 3,137 | | | | 881,560 | |
ON Semiconductor Corp. (a) | | | 11,289 | | | | 208,056 | |
Rudolph Technologies, Inc. (a) | | | 1,092 | | | | 26,699 | |
Texas Instruments, Inc. | | | 6,802 | | | | 729,787 | |
Xcerra Corp. (a) | | | 4,552 | | | | 64,957 | |
| | | | | | | | |
| | | | | | | 3,979,233 | |
| | | | | | | | |
| Software—7.1% | |
Adobe Systems, Inc. (a) | | | 3,692 | | | | 996,655 | |
Alteryx, Inc., Class A (a) | | | 2,088 | | | | 119,455 | |
Dell Technologies, Inc., Class V (a) | | | 3,309 | | | | 321,370 | |
Intuit, Inc. | | | 1,339 | | | | 304,489 | |
Microsoft Corp. | | | 35,481 | | | | 4,057,962 | |
Oracle Corp. | | | 11,092 | | | | 571,904 | |
Salesforce.com, Inc. (a) | | | 2,243 | | | | 356,704 | |
Take-Two Interactive Software, Inc. (a) | | | 2,577 | | | | 355,600 | |
| | | | | | | | |
| | | | | | | 7,084,139 | |
| | | | | | | | |
| Specialty Retail—2.5% | |
American Eagle Outfitters, Inc. | | | 2,536 | | | | 62,969 | |
Buckle, Inc. | | | 2,945 | | | | 67,882 | |
Burlington Stores, Inc. (a) | | | 1,257 | | | | 204,790 | |
Home Depot, Inc. | | | 5,620 | | | | 1,164,183 | |
MarineMax, Inc. (a) | | | 2,087 | | | | 44,349 | |
O’Reilly Automotive, Inc. (a) | | | 1,171 | | | | 406,712 | |
Ross Stores, Inc. | | | 5,054 | | | | 500,851 | |
Tailored Brands, Inc. | | | 1,982 | | | | 49,927 | |
| | | | | | | | |
| | | | | | | 2,501,663 | |
| | | | | | | | |
| Technology Hardware, Storage & Peripherals—5.6% | |
Apple, Inc. | | | 20,171 | | | | 4,553,401 | |
Hewlett Packard Enterprise Co. | | | 23,723 | | | | 386,922 | |
| | | | | | |
| 136 | | Annual Report | | | September 30, 2018 | | | See accompanying Notes to Financial Statements |
Schedule of Investments
September 30, 2018
| | | | | | | | |
| | |
| | | Shares | | | Value | |
HP, Inc. | | | 20,219 | | | $ | 521,044 | |
NetApp, Inc. | | | 2,131 | | | | 183,032 | |
| | | | | | | | |
| | | | | | | 5,644,399 | |
| | | | | | | | |
| Textiles, Apparel & Luxury Goods—0.5% | |
Deckers Outdoor Corp. (a) | | | 1,611 | | | | 191,032 | |
PVH Corp. | | | 1,927 | | | | 278,259 | |
| | | | | | | | |
| | | | | | | 469,291 | |
| | | | | | | | |
| Thrifts & Mortgage Finance—0.1% | |
Genworth MI Canada, Inc. | | | 2,481 | | | | 81,807 | |
| | | | | | | | |
| Tobacco—0.5% | |
Altria Group, Inc. | | | 4,981 | | | | 300,404 | |
British American Tobacco PLC ADR | | | 4,476 | | | | 208,716 | |
| | | | | | | | |
| | | | | | | 509,120 | |
| | | | | | | | |
| Trading Companies & Distributors—0.6% | |
Aircastle Ltd. | | | 3,249 | | | | 71,186 | |
Finning International, Inc. | | | 1,874 | | | | 45,775 | |
HD Supply Holdings, Inc. (a) | | | 2,362 | | | | 101,070 | |
MSC Industrial Direct Co., Inc., Class A | | | 1,371 | | | | 120,799 | |
United Rentals, Inc. (a) | | | 464 | | | | 75,910 | |
WW Grainger, Inc. | | | 440 | | | | 157,260 | |
| | | | | | | | |
| | | | | | | 572,000 | |
| | | | | | | | |
| Wireless Telecommunication Services—0.4% | |
Rogers Communications, Inc., Class B | | | 1,465 | | | | 75,345 | |
T-Mobile U.S., Inc. (a) | | | 4,420 | | | | 310,196 | |
| | | | | | | | |
| | | | | | | 385,541 | |
| | | | | | | | |
Total Common Stock
(cost—$81,946,164) | | | | 98,699,955 | |
| | | | | | | | |
| | | | | | | | |
| | | Principal
Amount
(000s) | | | | |
| Repurchase Agreements—1.2% | |
State Street Bank and Trust Co., dated 9/28/18, 0.42%, due 10/1/18, proceeds $1,166,041; collateralized by U.S. Treasury Notes, 2.00%, due 9/30/20, valued at $1,192,286 including accrued interest | |
(cost—$1,166,000) | | | $1,166 | | | | 1,166,000 | |
| | | | | | | | |
| |
Total Investments
(cost—$83,112,164)—99.9% | | | | 99,865,955 | |
| | | | | | | | |
| |
Other assets less liabilities—0.1% | | | | 80,758 | |
| | | | | | | | |
| |
| Net Assets—100.0% | | | | $99,946,713 | |
| | | | | | | | |
Notes to Schedule of Investments:
(a) Non-income producing.
Glossary:
ADR—American Depositary Receipt
REIT—Real Estate Investment Trust
AllianzGI Convertible Fund
| | | | | | | | |
| | | Principal
Amount
(000s) | | | Value | |
| Convertible Bonds & Notes—83.6% | |
| Aerospace & Defense—0.4% | |
Aerojet Rocketdyne Holdings, Inc., | |
2.25%, 12/15/23 | | | $1,595 | | | | $2,280,523 | |
| | | | | | | | |
| Apparel & Textiles—0.2% | |
Iconix Brand Group, Inc., | |
5.75%, 8/15/23 | | | 2,340 | | | | 1,205,100 | |
| | | | | | | | |
| Auto Manufacturers—1.6% | |
Navistar International Corp., | |
4.75%, 4/15/19 | | | 4,995 | | | | 5,073,641 | |
Tesla, Inc., | | | | | | | | |
0.25%, 3/1/19 | | | 1,825 | | | | 1,813,955 | |
2.375%, 3/15/22 | | | 1,875 | | | | 1,917,375 | |
| | | | | | | | |
| | | | | | | 8,804,971 | |
| | | | | | | | |
| Biotechnology—7.6% | |
Alder Biopharmaceuticals, Inc., | |
2.50%, 2/1/25 | | | 2,135 | | | | 2,289,606 | |
AMAG Pharmaceuticals, Inc., | |
3.25%, 6/1/22 | | | 2,505 | | | | 2,635,337 | |
BioMarin Pharmaceutical, Inc., | |
0.599%, 8/1/24 | | | 5,820 | | | | 6,217,226 | |
1.50%, 10/15/20 | | | 600 | | | | 722,762 | |
Exact Sciences Corp., | |
1.00%, 1/15/25 | | | 3,535 | | | | 4,376,772 | |
Illumina, Inc., | |
zero coupon, 8/15/23 (a)(b) | | | 4,110 | | | | 4,556,568 | |
0.50%, 6/15/21 | | | 2,775 | | | | 4,197,457 | |
Intercept Pharmaceuticals, Inc., | |
3.25%, 7/1/23 | | | 3,560 | | | | 3,615,625 | |
Ligand Pharmaceuticals, Inc. (a)(b), | |
0.75%, 5/15/23 | | | 4,350 | | | | 5,305,991 | |
Medicines Co., | |
2.75%, 7/15/23 | | | 1,370 | | | | 1,249,317 | |
PTC Therapeutics, Inc., | |
3.00%, 8/15/22 | | | 3,350 | | | | 3,862,674 | |
Retrophin, Inc., | |
2.50%, 9/15/25 | | | 2,790 | | | | 2,872,012 | |
| | | | | | | | |
| | | | | | | 41,901,347 | |
| | | | | | | | |
| Building Materials—0.5% | |
Patrick Industries, Inc. (a)(b), | |
1.00%, 2/1/23 | | | 3,085 | | | | 2,923,281 | |
| | | | | | | | |
| Commercial Services—2.4% | |
Euronet Worldwide, Inc., | |
1.50%, 10/1/44 | | | 3,870 | | | | 5,398,921 | |
Square, Inc. (a)(b), | |
0.50%, 5/15/23 | | | 5,465 | | | | 7,754,922 | |
| | | | | | | | |
| | | | | | | 13,153,843 | |
| | | | | | | | |
| Computers—2.4% | |
Lumentum Holdings, Inc., | |
0.25%, 3/15/24 | | | 2,880 | | | | 3,461,838 | |
Nutanix, Inc. (a)(b), | |
zero coupon, 1/15/23 | | | 2,520 | | | | 2,794,887 | |
Pure Storage, Inc. (a)(b), | |
0.125%, 4/15/23 | | | 3,810 | | | | 4,422,846 | |
Vocera Communications, Inc. (a)(b), | |
1.50%, 5/15/23 | | | 2,175 | | | | 2,746,509 | |
| | | | | | | | |
| | | | | | | 13,426,080 | |
| | | | | | | | |
| Diversified Financial Services—0.5% | |
Encore Capital Europe Finance Ltd., | |
4.50%, 9/1/23 | | | 1,860 | | | | 1,907,575 | |
Encore Capital Group, Inc., | |
3.25%, 3/15/22 | | | 820 | | | | 819,679 | |
| | | | | | | | |
| | | | | | | 2,727,254 | |
| | | | | | | | |
| | | | | | | | |
| | | Principal
Amount
(000s) | | | Value | |
| Electric Utilities—0.8% | |
NRG Energy, Inc. (a)(b), | |
2.75%, 6/1/48 | | $ | 4,045 | | | $ | 4,268,438 | |
| | | | | | | | |
| Electronics—0.9% | |
II-VI, Inc., | |
0.25%, 9/1/22 | | | 4,135 | | | | 4,868,623 | |
| | | | | | | | |
| Energy-Alternate Sources—0.9% | |
NextEra Energy Partners L.P. (a)(b), | |
1.50%, 9/15/20 | | | 4,500 | | | | 4,626,063 | |
| | | | | | | | |
| Engineering & Construction—0.5% | |
Dycom Industries, Inc., | |
0.75%, 9/15/21 | | | 2,555 | | | | 2,846,495 | |
| | | | | | | | |
| Entertainment—1.6% | |
Live Nation Entertainment, Inc. (a)(b), | |
2.50%, 3/15/23 | | | 5,445 | | | | 5,896,875 | |
Marriott Vacations Worldwide Corp., | |
1.50%, 9/15/22 | | | 2,840 | | | | 2,872,396 | |
| | | | | | | | |
| | | | 8,769,271 | |
| | | | | | | | |
| Equity Real Estate Investment Trusts (REITs)—0.2% | |
Extra Space Storage L.P. (a)(b), | |
3.125%, 10/1/35 | | | 1,200 | | | | 1,273,116 | |
| | | | | | | | |
| Healthcare-Products—3.6% | |
Insulet Corp. (a)(b), | |
1.375%, 11/15/24 | | | 5,280 | | | | 6,688,472 | |
NuVasive, Inc., | |
2.25%, 3/15/21 | | | 3,345 | | | | 4,246,056 | |
Wright Medical Group NV, | |
2.25%, 11/15/21 | | | 450 | | | | 651,158 | |
Wright Medical Group, Inc. (a)(b), | |
1.625%, 6/15/23 | | | 7,837 | | | | 8,321,914 | |
| | | | | | | | |
| | | | | | | 19,907,600 | |
| | | | | | | | |
| Healthcare-Services—2.0% | |
Anthem, Inc., | |
2.75%, 10/15/42 | | | 1,885 | | | | 7,124,175 | |
Teladoc Health, Inc. (a)(b), | |
1.375%, 5/15/25 | | | 2,275 | | | | 3,916,865 | |
| | | | | | | | |
| | | | 11,041,040 | |
| | | | | | | | |
| Insurance—0.8% | |
AXA S.A. (a)(b), | |
7.25%, 5/15/21 | | | 4,230 | | | | 4,544,408 | |
| | | | | | | | |
| Internet—9.2% | |
Altaba, Inc., | |
zero coupon, 12/1/18 | | | 3,800 | | | | 4,838,301 | |
Booking Holdings, Inc., | |
0.35%, 6/15/20 | | | 2,560 | | | | 3,891,451 | |
Ctrip.com International Ltd., | |
1.00%, 7/1/20 | | | 3,165 | | | | 3,105,036 | |
Etsy, Inc. (a)(b), | |
zero coupon, 3/1/23 | | | 865 | | | | 1,314,041 | |
IAC FinanceCo., Inc. (a)(b), | |
0.875%, 10/1/22 | | | 2,775 | | | | 4,131,331 | |
Okta, Inc. (a)(b), | |
0.25%, 2/15/23 | | | 1,585 | | | | 2,457,075 | |
Palo Alto Networks, Inc., | |
zero coupon, 7/1/19 | | | 500 | | | | 1,018,718 | |
0.75%, 7/1/23 (a)(b) | | | 8,300 | | | | 8,716,619 | |
Q2 Holdings, Inc. (a)(b), | |
0.75%, 2/15/23 | | | 2,275 | | | | 2,694,339 | |
RingCentral, Inc. (a)(b), | |
zero coupon, 3/15/23 | | | 2,715 | | | | 3,417,962 | |
Twilio, Inc. (a)(b), | |
0.25%, 6/1/23 | | | 2,140 | | | | 2,887,624 | |
| | | | | | | | |
| See accompanying Notes to Financial Statements | | | September 30, 2018 | | | Annual Report | | | 137 | |
Schedule of Investments
September 30, 2018
| | | | | | | | |
| | | Principal
Amount
(000s) | | | Value | |
Twitter, Inc. (a)(b), | |
0.25%, 6/15/24 | | $ | 3,530 | | | $ | 3,100,148 | |
Wix.com Ltd. (a)(b), | |
zero coupon, 7/1/23 | | | 3,040 | | | | 3,244,486 | |
Zendesk, Inc. (a)(b), | |
0.25%, 3/15/23 | | | 3,220 | | | | 4,064,162 | |
Zillow Group, Inc., | |
1.50%, 7/1/23 | | | 2,080 | | | | 1,926,080 | |
| | | | | | | | |
| | | | | | | 50,807,373 | |
| | | | | | | | |
| Iron/Steel—1.1% | |
Allegheny Technologies, Inc., | |
4.75%, 7/1/22 | | | 1,300 | | | | 2,814,591 | |
Cleveland-Cliffs, Inc., | |
1.50%, 1/15/25 | | | 1,850 | | | | 3,040,168 | |
| | | | | | | | |
| | | | | | | 5,854,759 | |
| | | | | | | | |
| IT Services—0.3% | |
GS Finance Corp. (Fidelity National Information Services, Inc.) (d)(f), | |
zero coupon, 6/5/23 | | | 1,565 | | | | 1,866,247 | |
| | | | | | | | |
| Lodging—0.9% | |
Caesars Entertainment Corp., | |
5.00%, 10/1/24 | | | 3,015 | | | | 4,917,727 | |
| | | | | | | | |
| Machinery-Diversified—1.0% | |
Chart Industries, Inc. (a)(b), | |
1.00%, 11/15/24 | | | 3,895 | | | | 5,560,307 | |
| | | | | | | | |
| Media—3.7% | |
DISH Network Corp., | |
2.375%, 3/15/24 | | | 3,325 | | | | 2,959,529 | |
3.375%, 8/15/26 | | | 6,805 | | | | 6,507,390 | |
Liberty Media Corp., | |
1.00%, 1/30/23 | | | 3,845 | | | | 4,502,849 | |
2.125%, 3/31/48 (a)(b) | | | 6,690 | | | | 6,622,177 | |
| | | | | | | | |
| | | | | | | 20,591,945 | |
| | | | | | | | |
| Oil, Gas & Consumable Fuels—3.1% | |
Ensco Jersey Finance Ltd., | |
3.00%, 1/31/24 | | | 3,990 | | | | 3,982,626 | |
Oasis Petroleum, Inc., | |
2.625%, 9/15/23 | | | 3,315 | | | | 4,459,318 | |
Oil States International, Inc. (a)(b), | |
1.50%, 2/15/23 | | | 2,865 | | | | 3,044,017 | |
Transocean, Inc., | |
0.50%, 1/30/23 | | | 3,710 | | | | 5,509,395 | |
| | | | | | | | |
| | | | | | | 16,995,356 | |
| | | | | | | | |
| Pharmaceuticals—6.8% | |
DexCom, Inc., | |
0.75%, 5/15/22 | | | 3,155 | | | | 4,854,756 | |
Herbalife Nutrition Ltd. (a)(b), | |
2.625%, 3/15/24 | | | 4,395 | | | | 4,721,786 | |
Horizon Pharma Investment Ltd., | |
2.50%, 3/15/22 | | | 5,550 | | | | 5,603,574 | |
Jazz Investments I Ltd., | |
1.50%, 8/15/24 | | | 7,425 | | | | 7,569,335 | |
Neurocrine Biosciences, Inc., | |
2.25%, 5/15/24 | | | 3,270 | | | | 5,582,152 | |
Sarepta Therapeutics, Inc. (a)(b), | |
1.50%, 11/15/24 | | | 2,525 | | | | 5,826,437 | |
Supernus Pharmaceuticals, Inc. (a)(b), | |
0.625%, 4/1/23 | | | 2,735 | | | | 3,071,993 | |
| | | | | | | | |
| | | | | | | 37,230,033 | |
| | | | | | | | |
| Pipelines—1.2% | |
Cheniere Energy, Inc., | |
4.25%, 3/15/45 | | | 8,180 | | | | 6,602,274 | |
| | | | | | | | |
| Retail—1.0% | |
RH (a)(b), | |
zero coupon, 6/15/23 | | | 5,535 | | | | 5,235,534 | |
| | | | | | | | |
| | | | | | | | |
| | | Principal
Amount
(000s) | | | Value | |
| Semiconductors—8.2% | |
Advanced Micro Devices, Inc., | |
2.125%, 9/1/26 | | $ | 840 | | | $ | 3,263,023 | |
Cree, Inc. (a)(b), | |
0.875%, 9/1/23 | | | 3,865 | | | | 3,555,657 | |
Cypress Semiconductor Corp. (a)(b), | |
2.00%, 2/1/23 | | | 3,065 | | | | 3,048,142 | |
Intel Corp., | | | | | | | | |
3.25%, 8/1/39 | | | 2,095 | | | | 4,814,572 | |
Microchip Technology, Inc., | | | | | | | | |
1.625%, 2/15/27 | | | 12,080 | | | | 12,904,146 | |
Micron Technology, Inc., Ser. G, | |
3.00%, 11/15/43 | | | 4,990 | | | | 7,745,553 | |
Novellus Systems, Inc., | |
2.625%, 5/15/41 | | | 425 | | | | 1,949,143 | |
ON Semiconductor Corp., | |
1.625%, 10/15/23 | | | 2,425 | | | | 2,730,339 | |
Synaptics, Inc., | |
0.50%, 6/15/22 | | | 3,895 | | | | 3,735,395 | |
Teradyne, Inc., | |
1.25%, 12/15/23 | | | 1,160 | | | | 1,509,684 | |
| | | | | | | | |
| | | | | | | 45,255,654 | |
| | | | | | | | |
| Software—13.3% | |
Akamai Technologies, Inc. (a)(b), | |
0.125%, 5/1/25 | | | 3,165 | | | | 3,120,446 | |
Alteryx, Inc. (a)(b), | |
0.50%, 6/1/23 | | | 2,130 | | | | 3,026,430 | |
Atlassian, Inc. (a)(b), | |
0.625%, 5/1/23 | | | 3,770 | | | | 4,942,700 | |
Avaya Holdings Corp. (a)(b), | |
2.25%, 6/15/23 | | | 2,670 | | | | 2,722,970 | |
Citrix Systems, Inc., | |
0.50%, 4/15/19 | | | 2,495 | | | | 3,838,293 | |
Coupa Software, Inc. (a)(b), | |
0.375%, 1/15/23 | | | 1,200 | | | | 2,192,504 | |
DocuSign, Inc. (a)(b), | |
0.50%, 9/15/23 | | | 4,160 | | | | 4,153,760 | |
Envestnet, Inc., | | | | | | | | |
1.75%, 12/15/19 | | | 985 | | | | 1,083,823 | |
1.75%, 6/1/23 (a)(b) | | | 2,870 | | | | 3,093,008 | |
Evolent Health, Inc., | |
2.00%, 12/1/21 | | | 1,605 | | | | 2,160,036 | |
Five9, Inc. (a)(b), | |
0.125%, 5/1/23 | | | 2,060 | | | | 2,491,152 | |
Guidewire Software, Inc., | |
1.25%, 3/15/25 | | | 2,240 | | | | 2,404,860 | |
MINDBODY, Inc. (a)(b), | |
0.375%, 6/1/23 | | | 2,630 | | | | 2,722,050 | |
MongoDB, Inc. (a)(b), | |
0.75%, 6/15/24 | | | 1,615 | | | | 2,146,296 | |
New Relic, Inc. (a)(b), | |
0.50%, 5/1/23 | | | 3,180 | | | | 3,397,242 | |
Nice Systems, Inc., | |
1.25%, 1/15/24 | | | 1,720 | | | | 2,467,125 | |
PROS Holdings, Inc., | |
2.00%, 6/1/47 | | | 2,535 | | | | 2,490,054 | |
Rapid7, Inc. (a)(b), | |
1.25%, 8/1/23 | | | 2,875 | | | | 3,178,313 | |
RealPage, Inc., | |
1.50%, 11/15/22 | | | 2,645 | | | | 4,334,531 | |
ServiceNow, Inc., | |
zero coupon, 6/1/22 | | | 4,835 | | | | 7,232,396 | |
Splunk, Inc. (a)(b), | |
0.50%, 9/15/23 | | | 3,885 | | | | 4,029,693 | |
Workday, Inc. (a)(b), | |
0.25%, 10/1/22 | | | 5,055 | | | | 5,859,614 | |
| | | | | | | | |
| | | | | | | 73,087,296 | |
| | | | | | | | |
| Telecommunications—3.9% | |
Ciena Corp., | |
3.75%, 10/15/18 | | | 1,600 | | | | 2,474,320 | |
| | | | | | | | |
| | | Principal
Amount
(000s) | | | Value | |
GCI Liberty, Inc. (a)(b), | |
1.75%, 9/30/46 | | $ | 5,115 | | | $ | 5,647,200 | |
GDS Holdings Ltd. (a)(b), | |
2.00%, 6/1/25 | | | 990 | | | | 914,613 | |
Infinera Corp., | |
2.125%, 9/1/24 | | | 2,480 | | | | 2,515,734 | |
Intelsat S.A. (a)(b), | |
4.50%, 6/15/25 | | | 1,175 | | | | 2,180,213 | |
InterDigital, Inc., | |
1.50%, 3/1/20 | | | 1,850 | | | | 2,174,035 | |
Viavi Solutions, Inc., | |
1.00%, 3/1/24 | | | 5,335 | | | | 5,774,721 | |
| | | | | | | | |
| | | | | | | 21,680,836 | |
| | | | | | | | |
| Transportation—3.0% | |
Air Transport Services Group, Inc., | |
1.125%, 10/15/24 | | | 2,840 | | | | 2,722,424 | |
Atlas Air Worldwide Holdings, Inc., | |
1.875%, 6/1/24 | | | 2,170 | | | | 2,624,682 | |
Echo Global Logistics, Inc., | |
2.50%, 5/1/20 | | | 5,605 | | | | 5,955,711 | |
Greenbrier Cos., Inc., | |
2.875%, 2/1/24 | | | 4,515 | | | | 5,361,752 | |
| | | | | | | | |
| | | | | | | 16,664,569 | |
| | | | | | | | |
Total Convertible Bonds & Notes
(cost—$405,801,101) | | | | 460,917,363 | |
| | | | | | | | �� |
| | | | | | | | |
| | | Shares | | | | |
| Convertible Preferred Stock—12.6% | |
| Banks—2.8% | |
Bank of America Corp., Ser. L (c), | | | | | |
7.25% | | | 5,310 | | | | 6,872,467 | |
Wells Fargo & Co., Ser. L (c), | | | | | |
7.50% | | | 6,575 | | | | 8,487,536 | |
| | | | | | | | |
| | | | | | | 15,360,003 | |
| | | | | | | | |
| Chemicals—1.3% | |
International Flavors & Fragrances, Inc. (e), | |
6.00%, 9/15/21 | | | 128,650 | | | | 6,997,273 | |
| | | | | | | | |
| Diversified Financial Services—0.4% | |
AMG Capital Trust II, | | | | | | | | |
5.15%, 10/15/37 | | | 33,325 | | | | 1,920,993 | |
| | | | | | | | |
| Electric Utilities—1.3% | |
NextEra Energy, Inc., | |
6.123%, 9/1/19 | | | 123,735 | | | | 7,046,708 | |
| | | | | | | | |
| Electronics—1.0% | |
Fortive Corp., Ser. A, | |
5.00%, 7/1/21 | | | 5,030 | | | | 5,369,367 | |
| | | | | | | | |
| Equity Real Estate Investment Trusts (REITs)—0.9% | |
Crown Castle International Corp., Ser. A, | |
6.875%, 8/1/20 | | | 4,705 | | | | 5,083,093 | |
| | | | | | | | |
| Hand/Machine Tools—0.9% | |
Stanley Black & Decker, Inc., | |
5.375%, 5/15/20 | | | 45,305 | | | | 5,032,026 | |
| | | | | | | | |
| Healthcare-Products—1.9% | |
Becton Dickinson and Co., Ser. A, | |
6.125%, 5/1/20 | | | 160,905 | | | | 10,554,580 | |
| | | | | | | | |
| Insurance—0.7% | |
Assurant, Inc., Ser. D, | |
6.50%, 3/15/21 | | | 34,260 | | | | 3,856,306 | |
| | | | | | | | |
| | | | | | |
| 138 | | Annual Report | | | September 30, 2018 | | | See accompanying Notes to Financial Statements |
Schedule of Investments
September 30, 2018
| | | | | | | | |
| | |
| | | Shares | | | Value | |
| Metal Fabricate/Hardware—0.5% | |
Rexnord Corp., Ser. A, | |
5.75%, 11/15/19 | | | 46,150 | | | $ | 2,999,750 | |
| | | | | | | | |
| Oil, Gas & Consumable Fuels—0.9% | |
Hess Corp., | |
8.00%, 2/1/19 | | | 60,360 | | | | 4,797,413 | |
| | | | | | | | |
Total Convertible Preferred Stock
(cost—$59,822,085) | | | | 69,017,512 | |
| | | | | | | | |
| | | | | | | | |
| Common Stock—0.2% | |
| Oil, Gas & Consumable Fuels—0.2% | |
WPX Energy, Inc. (e) (cost—$519,338) | | | 50,063 | | | | 1,007,268 | |
| | | | | | | | |
| | | | | | | | |
| | | Principal
Amount
(000s) | | | | |
| Repurchase Agreements—4.9% | |
State Street Bank and Trust Co., dated 9/28/18, 0.42%, due 10/1/18, proceeds $27,206,952; collateralized by U.S. Treasury Notes, 2.00%, due 11/30/20, valued at $27,753,625 including accrued interest | |
(cost—$27,206,000) | | | $27,206 | | | | 27,206,000 | |
| | | | | | | | |
| |
Total Investments
(cost—$493,348,524)—101.3% | | | | 558,148,143 | |
| | | | | | | | |
| | |
| Liabilities in excess of other assets—(1.3)% | | | | | | | (6,920,804 | ) |
| | | | | | | | |
| | |
| Net Assets—100.0% | | | | | | | $551,227,339 | |
| | | | | | | | |
Notes to Schedule of Investments:
(a) Private Placement—Restricted as to resale and may not have a readily available market. Securities with an aggregate value of $202,573,197, representing 36.7% of net assets.
(b) 144A—Exempt from registration under Rule 144A of the Securities Act of 1933. These securities may be resold in transactions exempt from registration, typically only to qualified institutional buyers. Securities with an aggregate value of $202,573,197, representing 36.7% of net assets.
(c) Perpetual maturity. The date shown, if any, is the next call date.
(d) Level 3 security. See Note 1(a) and Note 1(b) in the Notes to Financial Statements.
(e) Non-income producing.
(f) Securities exchangeable or convertible into securities of an entity different than the issuer or structured by the issuer to provide exposure to securities of an entity different than the issuer (synthetic convertible securities). Such entity is identified in the parenthetical.
Glossary:
REIT—Real Estate Investment Trust
AllianzGI Core Bond Fund
| | | | | | | | |
| | | Principal
Amount
(000s) | | | Value | |
| U.S. Government Agency Securities—32.9% | |
Fannie Mae, MBS, | | | | | | | | |
3.00%, 10/16/33 TBA, 15 Year (c) | | | $550 | | | | $543,286 | |
3.00%, 7/1/47 Pool, 30 Year | | | 1,024 | | | | 980,523 | |
3.50%, 11/13/48 TBA, 30 Year (c) | | | 1,600 | | | | 1,572,954 | |
4.00%, 11/13/48 TBA, 30 Year (c) | | | 1,130 | | | | 1,139,497 | |
4.50%, 11/1/47 Pool, 30 Year | | | 1,408 | | | | 1,454,129 | |
Ginnie Mae, MBS, TBA, 30 Year (c), | |
4.00%, 11/19/48 | | | 495 | | | | 502,763 | |
4.50%, 11/19/48 | | | 1,170 | | | | 1,208,391 | |
United States Small Business Administration, ABS, | |
2.79%, 11/1/37
Series 2017-20, Class K1 | | | 453 | | | | 433,942 | |
2.98%, 7/1/37
Series 2018-20, Class G1 | | | 323 | | | | 312,415 | |
3.50%, 5/1/38
Series 2018-20, Class E1 | | | 450 | | | | 448,701 | |
3.53%, 9/1/38
Series 2018-20, Class I1 | | | 427 | | | | 426,532 | |
3.54%, 7/1/38
Series 2018-20, Class G1 | | | 205 | | | | 204,700 | |
3.58%, 8/1/38
Series 2018-20, Class H1 | | | 245 | | | | 245,050 | |
3.60%, 6/1/38
Series 2018-20, Class F1 | | | 191 | | | | 191,402 | |
| | | | | | | | |
Total U.S. Government Agency Securities
(cost—$9,696,709) | | | | 9,664,285 | |
| | | | | | | | |
| | | | | | | | |
| U.S. Treasury Obligations—27.7% | |
U.S. Treasury Bonds, | | | | | | | | |
3.125%, 5/15/48 | | | 1,333 | | | | 1,314,671 | |
4.50%, 5/15/38 | | | 670 | | | | 803,948 | |
U.S. Treasury Notes, | | | | | | | | |
2.625%, 8/31/20 | | | 563 | | | | 561,065 | |
2.75%, 9/15/21 | | | 1,104 | | | | 1,100,119 | |
2.75%, 8/31/23 | | | 1,470 | | | | 1,457,252 | |
2.75%, 8/31/25 | | | 1,297 | | | | 1,276,126 | |
2.875%, 8/15/28 | | | 1,559 | | | | 1,535,859 | |
3.125%, 5/15/19 | | | 99 | | | | 99,402 | |
| | | | | | | | |
Total U.S. Treasury Obligations
(cost—$8,184,068) | | | | 8,148,442 | |
| | | | | | | | |
| | | | | | | | |
| Asset-Backed Securities—25.7% | |
Ally Auto Receivables Trust, Series 2018-3, Class A3,
| | | | | | | | |
3.00%, 1/17/23 | | | 627 | | | | 626,175 | |
American Express Credit Account Master Trust, 1 mo. LIBOR + 0.380%, Series 2017-5, Class A (e), | | | | | | | | |
2.538%, 2/18/25 | | | 547 | | | | 549,823 | |
Avery Point VI CLO Ltd., 3 mo. LIBOR + 1.050%, Series 2015-6A, Class AR (a)(b)(e), | | | | | | | | |
3.263%, 8/5/27 | | | 340 | | | | 340,086 | |
BA Credit Card Trust, 1 mo. LIBOR + 0.380%, Series 2014-A1, Class A (e), | | | | | | | | |
2.538%, 6/15/21 | | | 601 | | | | 601,619 | |
BMW Vehicle Owner Trust, Series 2018-A, Class A4, | | | | | | | | |
2.51%, 6/25/24 | | | 361 | | | | 355,166 | |
| | | | | | | | |
| | | Principal
Amount
(000s) | | | Value | |
Chase Issuance Trust, Series 2016-A2, Class A, | | | | | | | | |
1.37%, 6/15/21 | | $ | 260 | | | $ | 257,545 | |
Chase Issuance Trust, Series 2016-A4, Class A4, | | | | | | | | |
1.49%, 7/15/22 | | | 360 | | | | 350,345 | |
Citibank Credit Card Issuance Trust, 1 mo. LIBOR + 0.330%, Series 2018-A2, Class A2 (e), | | | | | | | | |
2.495%, 1/20/25 | | | 505 | | | | 505,676 | |
Ford Credit Auto Owner Trust, | |
1.58%, 8/15/20
Series 2015-B, Class A4 | | | 215 | | | | 213,936 | |
3.16%, 10/15/23
Series 2018-A, Class A4 | | | 493 | | | | 493,358 | |
GM Financial Consumer Automobile, Series 2017-1A, Class A3 (a)(b), | | | | | | | | |
1.78%, 10/18/21 | | | 500 | | | | 494,614 | |
Honda Auto Receivables Owner Trust, Series 2018-3, Class A4, | | | | | | | | |
3.07%, 11/21/24 | | | 340 | | | | 338,335 | |
Hyundai Auto Receivables Trust, Series 2017-B, Class A3, | | | | | | | | |
1.77%, 1/18/22 | | | 696 | | | | 685,876 | |
John Deere Owner Trust, Series 2018-B, Class A4, | | | | | | | | |
3.23%, 6/16/25 | | | 257 | | | | 255,931 | |
Nissan Auto Receivables Owner Trust, Series 2016-C, Class A4, | | | | | | | | |
1.38%, 1/17/23 | | | 485 | | | | 472,371 | |
Toyota Auto Receivables Owner Trust, Series 2018-B, Class A4, | | | | | | | | |
3.11%, 11/15/23 | | | 500 | | | | 498,978 | |
Volvo Financial Equipment Master Owner Trust, 1 mo. LIBOR + 0.520%, Series 2018-A, Class A (a)(b)(e), | | | | | | | | |
2.678%, 7/17/23 | | | 515 | | | | 517,333 | |
| | | | | | | | |
Total Asset-Backed Securities
(cost—$7,564,911) | | | | 7,557,167 | |
| | | | | | | | |
| | | | | | | | |
| Corporate Bonds & Notes—22.6% | |
| Aerospace & Defense—1.9% | |
L3 Technologies, Inc.,
| | | | | | | | |
3.95%, 5/28/24 | | | 255 | | | | 251,806 | |
Northrop Grumman Corp.,
| | | | | | | | |
2.93%, 1/15/25 | | | 205 | | | | 194,827 | |
United Technologies Corp.,
| | | | | | | | |
3.95%, 8/16/25 | | | 122 | | | | 121,507 | |
| | | | | | | | |
| | | | | | | 568,140 | |
| | | | | | | | |
| Banks—6.2% | |
Citigroup, Inc., (converts to FRN on 1/10/27) (e),
| | | | | | | | |
3.887%, 1/10/28 | | | 180 | | | | 174,917 | |
First Maryland Capital II, 3 mo. LIBOR + 0.850% (e),
| | | | | | | | |
3.193%, 2/1/27 | | | 415 | | | | 391,137 | |
| | | | | | | | |
| See accompanying Notes to Financial Statements | | | September 30, 2018 | | | Annual Report | | | 139 | |
Schedule of Investments
September 30, 2018
| | | | | | | | |
| | | Principal
Amount
(000s) | | | Value | |
JPMorgan Chase & Co. (e), | | | | | | | | |
3 mo. LIBOR + 0.950%, 3.299%, 2/2/37 | | $ | 185 | | | $ | 164,419 | |
3 mo. LIBOR + 2.470%, 5.809%, 1/30/19 (d) | | | 290 | | | | 291,341 | |
State Street Corp., 3 mo. LIBOR + 1.00% (e),
| |
3.334%, 6/15/47 | | | 220 | | | | 196,680 | |
SunTrust Capital I, 3 mo. LIBOR + 0.670%, Ser. A (e),
| |
2.98%, 5/15/27 | | | 450 | | | | 419,456 | |
Synovus Financial Corp.,
| | | | | | | | |
3.125%, 11/1/22 | | | 190 | | | | 182,715 | |
| | | | | | | | |
| | | | | | | 1,820,665 | |
| | | | | | | | |
| Diversified Financial Services—0.3% | |
High Street Funding Trust I (a)(b),
| |
4.111%, 2/15/28 | | | 100 | | | | 97,931 | |
| | | | | | | | |
| Electric Utilities—2.7% | |
Alabama Power Co.,
| | | | | | | | |
2.80%, 4/1/25 | | | 130 | | | | 121,747 | |
Duke Energy Florida LLC,
| | | | | | | | |
3.20%, 1/15/27 | | | 110 | | | | 105,893 | |
Duke Energy Progress LLC,
| | | | | | | | |
4.10%, 3/15/43 | | | 95 | | | | 93,312 | |
PacifiCorp,
| | | | | | | | |
4.125%, 1/15/49 | | | 50 | | | | 49,205 | |
Pennsylvania Electric Co. (a)(b),
| |
3.25%, 3/15/28 | | | 30 | | | | 27,966 | |
Sempra Energy,
| | | | | | | | |
3.55%, 6/15/24 | | | 170 | | | | 166,413 | |
Southern Co.,
| | | | | | | | |
3.25%, 7/1/26 | | | 35 | | | | 32,699 | |
Toledo Edison Co.,
| | | | | | | | |
6.15%, 5/15/37 | | | 120 | | | | 144,447 | |
Virginia Electric & Power Co., Ser. B,
| |
3.80%, 9/15/47 | | | 50 | | | | 46,230 | |
| | | | | | | | |
| | | | | | | 787,912 | |
| | | | | | | | |
| Food & Beverage—0.4% | |
Anheuser-Busch InBev Finance, Inc.,
| |
4.90%, 2/1/46 | | | 70 | | | | 70,593 | |
Kroger Co.,
| | | | | | | | |
3.875%, 10/15/46 | | | 40 | | | | 33,507 | |
| | | | | | | | |
| | | | | | | 104,100 | |
| | | | | | | | |
| Healthcare-Products—0.5% | |
Becton Dickinson and Co.,
| | | | | | | | |
3.363%, 6/6/24 | | | 150 | | | | 144,994 | |
| | | | | | | | |
| Healthcare-Services—1.0% | |
Cigna Corp.,
| | | | | | | | |
3.25%, 4/15/25 | | | 135 | | | | 127,812 | |
Halfmoon Parent, Inc. (a)(b),
| | | | | | | | |
4.125%, 11/15/25 | | | 170 | | | | 169,716 | |
| | | | | | | | |
| | | | | | | 297,528 | |
| | | | | | | | |
| Insurance—0.9% | |
Massachusetts Mutual Life Insurance Co. (a)(b),
| |
5.375%, 12/1/41 | | | 50 | | | | 56,195 | |
MetLife, Inc. (a)(b),
| | | | | | | | |
9.25%, 4/8/38 | | | 75 | | | | 101,000 | |
Northwestern Mutual Life Insurance Co. (a)(b),
| |
3.85%, 9/30/47 | | | 50 | | | | 45,960 | |
Teachers Insurance & Annuity Assoc. of America (a)(b),
| |
4.27%, 5/15/47 | | | 50 | | | | 48,439 | |
| | | | | | | | |
| | | | | | | 251,594 | |
| | | | | | | | |
| | | | | | | | |
| | | Principal
Amount
(000s) | | | Value | |
| Internet—0.2% | |
Amazon.com, Inc.,
| | | | | | | | |
4.05%, 8/22/47 | | $ | 55 | | | $ | 54,094 | |
| | | | | | | | |
| Media—1.6% | |
21st Century Fox America, Inc.,
| |
6.20%, 12/15/34 | | | 112 | | | | 137,985 | |
Charter Communications Operating LLC, | |
4.50%, 2/1/24 | | | 278 | | | | 279,632 | |
6.384%, 10/23/35 | | | 45 | | | | 48,545 | |
| | | | | | | | |
| | | | | | | 466,162 | |
| | | | | | | | |
| Mining—0.3% | |
BHP Billiton Finance USA Ltd., (converts to FRN on 10/20/25) (a)(b)(e),
| |
6.75%, 10/19/75 | | | 85 | | | | 93,223 | |
| | | | | | | | |
| Miscellaneous Manufacturing—1.1% | |
General Electric Co., 3 mo. LIBOR+ 3.330%, Ser. D (d)(e),
| |
5.00%, 1/21/21 | | | 325 | | | | 317,062 | |
| | | | | | | | |
| Oil, Gas & Consumable Fuels—1.9% | |
Boston Gas Co. (a)(b),
| | | | | | | | |
3.15%, 8/1/27 | | | 160 | | | | 151,003 | |
Cenovus Energy, Inc.,
| | | | | | | | |
6.75%, 11/15/39 | | | 60 | | | | 67,806 | |
Cimarex Energy Co.,
| | | | | | | | |
4.375%, 6/1/24 | | | 140 | | | | 141,619 | |
Hess Corp.,
| | | | | | | | |
7.30%, 8/15/31 | | | 70 | | | | 81,106 | |
NiSource, Inc.,
| | | | | | | | |
3.49%, 5/15/27 | | | 120 | | | | 113,742 | |
| | | | | | | | |
| | | | | | | 555,276 | |
| | | | | | | | |
| Pharmaceuticals—0.9% | |
AbbVie, Inc.,
| | | | | | | | |
3.60%, 5/14/25 | | | 145 | | | | 140,388 | |
CVS Health Corp.,
| | | | | | | | |
5.05%, 3/25/48 | | | 120 | | | | 122,591 | |
| | | | | | | | |
| | | | | | | 262,979 | |
| | | | | | | | |
| Pipelines—1.1% | |
El Paso Natural Gas Co. LLC,
| | | | | | | | |
8.375%, 6/15/32 | | | 55 | | | | 70,017 | |
Enterprise Products Operating LLC, Ser. E, (converts to FRN on 8/16/27) (e),
| |
5.25%, 8/16/77 | | | 95 | | | | 89,063 | |
Kinder Morgan Energy Partners L.P.,
| |
5.40%, 9/1/44 | | | 60 | | | | 61,444 | |
Plains All American Pipeline L.P.,
| |
5.15%, 6/1/42 | | | 120 | | | | 113,214 | |
| | | | | | | | |
| | | | | | | 333,738 | |
| | | | | | | | |
| Semiconductors—0.6% | |
Broadcom Corp.,
| | | | | | | | |
3.875%, 1/15/27 | | | 175 | | | | 165,270 | |
| | | | | | | | |
| Software—0.6% | |
Microsoft Corp.,
| | | | | | | | |
2.875%, 2/6/24 | | | 180 | | | | 176,011 | |
| | | | | | | | |
| Transportation—0.4% | |
Union Pacific Corp.,
| | | | | | | | |
3.25%, 1/15/25 | | | 130 | | | | 126,519 | |
| | | | | | | | |
Total Corporate Bonds & Notes
(cost—$6,665,683) | | | | 6,623,198 | |
| | | | | | | | |
| | | | | | | | |
| | | | | | | | |
| | | Principal
Amount
(000s) | | | Value | |
| Mortgage-Backed Securities—3.2% | |
Wells Fargo Commercial Mortgage Trust, | |
3.166%, 2/15/48 Series 2015-C26, Class A4 | | $ | 450 | | | $ | 437,298 | |
3.635%, 1/15/59
Series 2016-NXS5, Class A6 | | | 510 | | | | 507,121 | |
| | | | | | | | |
| Total Mortgage-Backed Securities (cost—$950,294) | | | | 944,419 | |
| | | | | | | | |
| | | | | | | | |
| Sovereign Debt Obligations—2.0% | |
| Supranational—2.0% | |
European Investment Bank,
| | | | | | | | |
2.25%, 3/15/22 | | | 210 | | | | 204,611 | |
Inter-American Development Bank,
| |
1.25%, 9/14/21 | | | 315 | | | | 299,562 | |
International Bank for Reconstruction & Development, Ser. GDIF,
| |
1.375%, 5/24/21 | | | 70 | | | | 67,216 | |
| | | | | | | | |
Total Sovereign Debt Obligations
(cost—$575,191) | | | | 571,389 | |
| | | | | | | | |
| |
Total Investments
(cost—$33,636,856)—114.1% | | | | 33,508,900 | |
| | | | | | | | |
| |
Liabilities in excess of other assets (f)—(14.1)% | | | | (4,132,413 | ) |
| | | | | | | | |
| | |
| Net Assets-100.0% | | | | | | | $29,376,487 | |
| | | | | | | | |
Notes to Schedule of Investments:
(a) Private Placement—Restricted as to resale and may not have a readily available market. Securities with an aggregate value of $2,143,466, representing 7.3% of net assets.
(b) 144A—Exempt from registration under Rule 144A of the Securities Act of 1933. These securities may be resold in transactions exempt from registration, typically only to qualified institutional buyers. Securities with an aggregate value of $2,143,466, representing 7.3% of net assets.
(c) When-issued or delayed-delivery. To be settled/delivered after September 30, 2018.
(d) Perpetual maturity. The date shown, if any, is the next call date.
(e) Variable or Floating Rate Security—Securities with an interest rate that changes periodically. The interest rate disclosed reflects the rate in effect on September 30, 2018.
| | | | | | |
| 140 | | Annual Report | | | September 30, 2018 | | | See accompanying Notes to Financial Statements |
Schedule of Investments
September 30, 2018
(f) Includes net unrealized appreciation (depreciation) of other financial instruments as follows:
| | | | | | | | | | | | | | | | | | | | | | |
| Futures contracts outstanding at September 30, 2018: | |
| Type | | Contracts | | | Expiration
Date | | | Notional
Amount
(000s) | | | Market
Value
(000s) | | | Unrealized
Appreciation
(Depreciation) | |
Long position contracts: | | | | | | | | | | | | | | | | | | | | |
| | 2-Year U.S. Treasury Note | | | 3 | | | | 12/31/18 | | | $ | 600 | | | $ | 632 | | | $ | (380 | ) |
| | 5-Year U.S. Treasury Note | | | 12 | | | | 12/31/18 | | | | 1,200 | | | | 1,350 | | | | (10,935 | ) |
| | U.S. Long Bond | | | 6 | | | | 12/19/18 | | | | 600 | | | | 843 | | | | (24,166 | ) |
| | U.S. Ultra Treasury Bond | | | 1 | | | | 12/19/18 | | | | 100 | | | | 154 | | | | (2,002 | ) |
| | | | | | | | | | | | | | | | | | | | | | |
| | | | | | | | | | | | | | | | | | | | $ | (37,483 | ) |
| | | | | | | | | | | | | | | | | | | | | | |
| | | | |
Short position contracts: | | | | | | | | | | | | | | | | | |
| | 10-Year U.S. Treasury Note | | | (7 | ) | | | 12/19/18 | | | $ | (700 | ) | | $ | (831 | ) | | $ | 8,846 | |
| | 10-Year Ultra U.S. Treasury Bond | | | (9 | ) | | | 12/19/18 | | | | (900 | ) | | | (1,134 | ) | | | 18,828 | |
| | | | | | | | | | | | | | | | | | | | | | |
| | | | | | | | | | | | | | | | | | | | $ | 27,674 | |
| | | | | | | | | | | | | | | | | | | | | | |
| | | | | | | | | | | | | | | | | | | | $ | (9,809 | ) |
| | | | | | | | | | | | | | | | | | | | | | |
| | | | | | | | | | | | | | | | | | | | | | | | | | | | | | | | |
| Credit default swaps agreements outstanding at September 30, 2018: | |
Centrally cleared buy protection swap agreements: | |
Broker (Exchange)/
Reference Debt Issuer | | Notional
Amount
(000s)(1) | | | Implied
Credit
Spread | | | Termination
Date | | | Fixed Deal
Pay Rate | | | Payment
Frequency | | | Value(2) | | | Upfront
Premiums
Received | | | Unrealized
Depreciation | |
Goldman Sachs (ICE): | | | | | | | | | | | | | | | | | | | | | | | | | | | | | | | | |
CDX.NA.IG.31 | | $ | 1,495 | | | | 0.596 | % | | | 12/20/23 | | | | (1.00 | )% | | | Quarterly | | | $ | (29,151 | ) | | $ | (27,084 | ) | | $ | (2,067 | ) |
Verizon Communications, Inc. | | | 200 | | | | 0.522 | % | | | 6/20/23 | | | | (1.00 | )% | | | Quarterly | | | | (4,474 | ) | | | (2,492 | ) | | | (1,982 | ) |
| | | | | | | | | | | | | | | | | | | | | | | $ | (33,625 | ) | | $ | (29,576 | ) | | $ | (4,049 | ) |
|
Centrally cleared sell protection swap agreements: | |
Broker (Exchange)/
Referenced Debt Issuer | | Notional
Amount
(000s)(1) | | | Implied
Credit
Spread | | | Termination
Date | | | Fixed Deal
Received
Rate | | | Payment
Frequency | | | Value(2) | | | Upfront
Premiums
Paid | | | Unrealized
Appreciation | |
Goldman Sachs (ICE): | | | | | | | | | | | | | | | | | | | | | | | | | | | | | | | | |
CVS Health Corp. | | $ | 200 | | | | 0.571 | % | | | 6/20/23 | | | | 1.00 | % | | | Quarterly | | | $ | 4,061 | | | $ | 2,679 | | | $ | 1,382 | |
(1) This represents the maximum potential amount the Fund could be required to make available as a seller of credit protection or receive as a buyer of credit protection if a credit event occurs as defined under the terms of that particular swap agreement.
(2) The quoted market prices and resulting values for credit default swap agreements serve as an indicator of the status at September 30, 2018 of the payment/performance risk and represent the likelihood of an expected liability (or profit) for the credit derivative should the notional amount of the swap agreement have been closed/sold as of the period end. Increasing market values, in absolute terms when compared to the notional amount of the swap, represent a deterioration of the referenced entity’s credit soundness and a greater likelihood or risk of default or other credit event occurring as defined under the terms of the agreement.
(g) At September 30, 2018, the Fund pledged $103,666 in cash as collateral for futures contracts. The Fund also held U.S. Treasury Obligations valued at $499,345 as collateral for swap contracts. Securities held as collateral will not be pledged and are not reflected in the Schedule of Investments.
Glossary:
CDX—Credit Derivatives Index
CLO—Collateralized Loan Obligation
FRN—Floating Rate Note
ICE—Intercontinental Exchange
LIBOR—London Inter-Bank Offered Rate
MBS—Mortgage-Backed Securities
TBA—To Be Announced
| | | | | | | | |
| See accompanying Notes to Financial Statements | | | September 30, 2018 | | | Annual Report | | | 141 | |
Schedule of Investments
September 30, 2018
AllianzGI Core Plus Bond Fund
| | | | | | | | |
| | | Principal
Amount
(000s) | | | Value | |
| U.S. Government Agency Securities—33.5% | |
Fannie Mae, MBS, | | | | | | | | |
3.00%, 10/16/33 TBA, 15 Year (c) | | | $785 | | | | $775,418 | |
3.00%, 7/1/47 Pool, 30 Year | | | 1,390 | | | | 1,331,687 | |
3.50%, 11/13/48 TBA, 30 Year (c) | | | 2,265 | | | | 2,226,713 | |
4.00%, 11/13/48 TBA, 30 Year (c) | | | 1,570 | | | | 1,583,195 | |
4.50%, 11/1/47 Pool, 30 Year | | | 1,898 | | | | 1,960,518 | |
Ginnie Mae, MBS, TBA, 30 Year (c), | |
4.00%, 11/19/48 | | | 685 | | | | 695,743 | |
4.50%, 11/19/48 | | | 1,660 | | | | 1,714,469 | |
United States Small Business Administration, ABS, | |
2.79%, 11/1/37 Series 2017-20, Class K1 | | | 619 | | | | 592,588 | |
2.98%, 7/1/37 Series 2018-20, Class G1 | | | 516 | | | | 499,315 | |
3.50%, 5/1/38 Series 2018-20, Class E1 | | | 440 | | | | 438,730 | |
3.53%, 9/1/38 Series 2018-20, Class I1 | | | 587 | | | | 586,357 | |
3.54%, 7/1/38 Series 2018-20, Class G1 | | | 285 | | | | 284,583 | |
3.58%, 8/1/38 Series 2018-20, Class H1 | | | 365 | | | | 365,074 | |
3.60%, 6/1/38 Series 2018-20, Class F1 | | | 370 | | | | 370,778 | |
| | | | | | | | |
Total U.S. Government Agency Securities (cost—$13,469,976) | | | | 13,425,168 | |
| | | | | | | | |
| | | | | | | | |
| Corporate Bonds & Notes—28.5% | |
| Aerospace & Defense—2.1% | |
L3 Technologies, Inc., | | | | | | | | |
3.95%, 5/28/24 | | | 345 | | | | 340,678 | |
Northrop Grumman Corp., | | | | | | | | |
2.93%, 1/15/25 | | | 290 | | | | 275,609 | |
United Technologies Corp., | | | | | | | | |
3.95%, 8/16/25 | | | 234 | | | | 233,055 | |
| | | | | | | | |
| | | | | | | 849,342 | |
| | | | | | | | |
| Banks—8.7% | |
Bank of America Corp., Ser. FF, (converts to FRN on 3/15/28) (d)(e), | |
5.875%, 3/15/28 | | | 360 | | | | 360,675 | |
Citigroup, Inc., Ser. P, (converts to FRN on 5/15/25) (d)(e), | |
5.95%, 5/15/25 | | | 350 | | | | 353,500 | |
Citizens Financial Group, Inc., Ser. B, (converts to FRN on 7/6/23) (d)(e), | |
6.00%, 7/6/23 | | | 140 | | | | 143,150 | |
First Maryland Capital II, 3 mo. LIBOR + 0.850% (e), | |
3.193%, 2/1/27 | | | 560 | | | | 527,800 | |
JPMorgan Chase & Co. (e), | |
3 mo. LIBOR + 0.950%, 3.299%, 2/2/37 | | | 290 | | | | 257,737 | |
3 mo. LIBOR + 2.470%, 5.809%, 10/30/18 (d) | | | 400 | | | | 401,850 | |
Popular, Inc., | |
6.125%, 9/14/23 | | | 450 | | | | 456,696 | |
State Street Corp., 3 mo. LIBOR + 1.00% (e), | |
3.334%, 6/15/47 | | | 275 | | | | 245,850 | |
SunTrust Capital I, 3 mo. LIBOR + 0.670%, Ser. A (e), | |
2.98%, 5/15/27 | | | 560 | | | | 521,990 | |
Synovus Financial Corp., | |
3.125%, 11/1/22 | | | 210 | | | | 201,948 | |
| | | | | | | | |
| | | | | | | 3,471,196 | |
| | | | | | | | |
| | | | | | | | |
| | | Principal
Amount
(000s) | | | Value | |
| Diversified Financial Services—0.4% | |
High Street Funding Trust I (a)(b), | |
4.111%, 2/15/28 | | $ | 150 | | | $ | 146,897 | |
| | | | | | | | |
| Electric Utilities—3.1% | |
Alabama Power Co., | |
2.80%, 4/1/25 | | | 210 | | | | 196,668 | |
Duke Energy Florida LLC, | |
3.20%, 1/15/27 | | | 170 | | | | 163,653 | |
Duke Energy Progress LLC, | |
4.10%, 3/15/43 | | | 50 | | | | 49,112 | |
PacifiCorp, | |
4.125%, 1/15/49 | | | 50 | | | | 49,205 | |
Pennsylvania Electric Co. (a)(b), | |
3.25%, 3/15/28 | | | 50 | | | | 46,609 | |
Sempra Energy, | |
3.55%, 6/15/24 | | | 230 | | | | 225,146 | |
Southern Co., | | | | | | | | |
3.25%, 7/1/26 | | | 245 | | | | 228,894 | |
Toledo Edison Co., | | | | | | | | |
6.15%, 5/15/37 | | | 160 | | | | 192,596 | |
Virginia Electric & Power Co., Ser. B, | |
3.80%, 9/15/47 | | | 80 | | | | 73,969 | |
| | | | | | | | |
| | | | | | | 1,225,852 | |
| | | | | | | | |
| Food & Beverage—0.3% | |
Anheuser-Busch InBev Finance, Inc., | |
4.90%, 2/1/46 | | | 60 | | | | 60,508 | |
Kroger Co., | | | | | | | | |
3.875%, 10/15/46 | | | 60 | | | | 50,260 | |
| | | | | | | | |
| | | | | | | 110,768 | |
| | | | | | | | |
| Healthcare-Products—0.5% | |
Becton Dickinson and Co., | | | | | | | | |
3.363%, 6/6/24 | | | 230 | | | | 222,323 | |
| | | | | | | | |
| Healthcare-Services—1.1% | |
Cigna Corp., | | | | | | | | |
3.25%, 4/15/25 | | | 210 | | | | 198,819 | |
Halfmoon Parent, Inc. (a)(b), | | | | | | | | |
4.125%, 11/15/25 | | | 235 | | | | 234,607 | |
| | | | | | | | |
| | | | | | | 433,426 | |
| | | | | | | | |
| Insurance—1.1% | |
Massachusetts Mutual Life Insurance Co. (a)(b), | |
5.375%, 12/1/41 | | | 80 | | | | 89,911 | |
MetLife, Inc. (a)(b), | | | | | | | | |
9.25%, 4/8/38 | | | 140 | | | | 188,533 | |
Northwestern Mutual Life Insurance Co. (a)(b), | |
3.85%, 9/30/47 | | | 80 | | | | 73,537 | |
Teachers Insurance & Annuity Assoc. of America (a)(b), | |
4.27%, 5/15/47 | | | 80 | | | | 77,503 | |
| | | | | | | | |
| | | | | | | 429,484 | |
| | | | | | | | |
| Internet—0.2% | |
Amazon.com, Inc., | | | | | | | | |
4.05%, 8/22/47 | | | 70 | | | | 68,847 | |
| | | | | | | | |
| Media—2.3% | |
21st Century Fox America, Inc., | | | | | |
6.20%, 12/15/34 | | | 154 | | | | 189,729 | |
Charter Communications Operating LLC, | |
4.50%, 2/1/24 | | | 355 | | | | 357,084 | |
6.384%, 10/23/35 | | | 185 | | | | 199,574 | |
NBCUniversal Enterprise, Inc. (a)(b)(d), | |
5.25%, 3/19/21 | | | 160 | | | | 162,280 | |
| | | | | | | | |
| | | | | | | 908,667 | |
| | | | | | | | |
| Mining—0.4% | |
BHP Billiton Finance USA Ltd., (converts to FRN on 10/20/25) (a)(b)(e), | |
6.75%, 10/19/75 | | | 130 | | | | 142,576 | |
| | | | | | | | |
| | | | | | | | |
| | | Principal
Amount
(000s) | | | Value | |
| Miscellaneous Manufacturing—1.2% | |
General Electric Co., 3 mo. LIBOR+ 3.33%, Ser. D (d)(e), | |
5.00%, 1/21/21 | | $ | 505 | | | $ | 492,665 | |
| | | | | | | | |
| Oil, Gas & Consumable Fuels—1.7% | |
Boston Gas Co. (a)(b), | | | | | | | | |
3.15%, 8/1/27 | | | 160 | | | | 151,003 | |
Cenovus Energy, Inc., | | | | | | | | |
6.75%, 11/15/39 | | | 90 | | | | 101,709 | |
Cimarex Energy Co., | | | | | | | | |
4.375%, 6/1/24 | | | 150 | | | | 151,735 | |
Hess Corp., | | | | | | | | |
7.30%, 8/15/31 | | | 110 | | | | 127,453 | |
NiSource, Inc., | | | | | | | | |
3.49%, 5/15/27 | | | 170 | | | | 161,134 | |
| | | | | | | | |
| | | | | | | 693,034 | |
| | | | | | | | |
| Pharmaceuticals—2.6% | |
AbbVie, Inc., | |
3.60%, 5/14/25 | | | 200 | | | | 193,639 | |
CVS Health Corp., | |
5.05%, 3/25/48 | | | 205 | | | | 209,426 | |
Teva Pharmaceutical Finance Netherlands III BV, | |
2.80%, 7/21/23 | | | 720 | | | | 641,700 | |
| | | | | | | | |
| | | | | | | 1,044,765 | |
| | | | | | | | |
| Pipelines—1.4% | |
El Paso Natural Gas Co. LLC, | |
8.375%, 6/15/32 | | | 70 | | | | 89,113 | |
Enterprise Products Operating LLC, Ser. E, (converts to FRN on 8/16/27) (e), | |
5.25%, 8/16/77 | | | 140 | | | | 131,250 | |
Kinder Morgan Energy Partners L.P., | |
5.40%, 9/1/44 | | | 85 | | | | 87,045 | |
Plains All American Pipeline L.P., | |
5.15%, 6/1/42 | | | 135 | | | | 127,366 | |
6.125%, 11/15/22, Ser. B (converts to FRN on 11/15/22) (d)(e) | | | 150 | | | | 146,438 | |
| | | | | | | | |
| | | | | | | 581,212 | |
| | | | | | | | |
| Semiconductors—0.5% | |
Broadcom Corp., | |
3.875%, 1/15/27 | | | 235 | | | | 221,935 | |
| | | | | | | | |
| Software—0.6% | |
Microsoft Corp., | |
2.875%, 2/6/24 | | | 240 | | | | 234,682 | |
| | | | | | | | |
| Transportation—0.3% | |
Union Pacific Corp., | |
3.25%, 1/15/25 | | | 140 | | | | 136,252 | |
| | | | | | | | |
Total Corporate Bonds & Notes (cost—$11,448,953) | | | | 11,413,923 | |
| | | | | | | | |
| | | | | | | | |
| Asset-Backed Securities—25.6% | |
Ally Auto Receivables Trust, Series 2018-3, Class A3, | |
3.00%, 1/17/23 | | | 602 | | | | 601,208 | |
American Express Credit Account Master Trust, 1 mo. LIBOR + 0.380%, Series 2017-5, Class A (e), | |
2.538%, 2/18/25 | | | 778 | | | | 782,015 | |
Avery Point VI CLO Ltd., 3 mo. LIBOR + 1.050%, Series 2015-6A, Class AR (a)(b)(e), | |
3.263%, 8/5/27 | | | 470 | | | | 470,118 | |
BA Credit Card Trust, 1 mo. LIBOR + 0.380%, Series 2014-A1, Class A (e), | |
2.538%, 6/15/21 | | | 969 | | | | 969,998 | |
BMW Vehicle Owner Trust, Series 2018-A, Class A4, | |
2.51%, 6/25/24 | | | 585 | | | | 575,547 | |
| | | | | | |
| 142 | | Annual Report | | | September 30, 2018 | | | See accompanying Notes to Financial Statements |
Schedule of Investments
September 30, 2018
| | | | | | | | |
| | | Principal
Amount
(000s) | | | Value | |
Chase Issuance Trust, Series 2016-A2, Class A, | |
1.37%, 6/15/21 | | $ | 50 | | | $ | 49,528 | |
Chase Issuance Trust, Series 2016-A4, Class A4, | |
1.49%, 7/15/22 | | | 580 | | | | 564,445 | |
Citibank Credit Card Issuance Trust, 1 mo. LIBOR + 0.330%, Series 2018-A2, Class A2 (e), | |
2.495%, 1/20/25 | | | 700 | | | | 700,937 | |
Ford Credit Auto Owner Trust, | |
1.58%, 8/15/20 Series 2015-B, Class A4 | | | 344 | | | | 343,005 | |
3.16%, 10/15/23 Series 2018-A, Class A4 | | | 673 | | | | 673,488 | |
GM Financial Consumer Automobile, Series 2017-1A, Class A3 (a)(b), | |
1.78%, 10/18/21 | | | 800 | | | | 791,382 | |
Honda Auto Receivables Owner Trust, Series 2018-3, Class A4, | |
3.07%, 11/21/24 | | | 470 | | | | 467,699 | |
Hyundai Auto Receivables Trust, Series 2017-B, Class A3, | |
1.77%, 1/18/22 | | | 794 | | | | 782,450 | |
John Deere Owner Trust, Series 2018-B, Class A4, | |
3.23%, 6/16/25 | | | 353 | | | | 351,532 | |
Nissan Auto Receivables Owner Trust, Series 2016-C, Class A4, | |
1.38%, 1/17/23 | | | 776 | | | | 755,794 | |
Toyota Auto Receivables Owner Trust, Series 2018-B, Class A4, | |
3.11%, 11/15/23 | | | 675 | | | | 673,620 | |
Volvo Financial Equipment Master Owner Trust, 1 mo. LIBOR + 0.520%, Series 2018-A, Class A (a)(b)(e), | |
2.678%, 7/17/23 | | | 705 | | | | 708,194 | |
| | | | | | | | |
Total Asset-Backed Securities (cost—$10,274,489) | | | | 10,260,960 | |
| | | | | | | | |
| | | | | | | | |
| U.S. Treasury Obligations—19.8% | |
U.S. Treasury Bonds, | | | | | | | | |
3.125%, 5/15/48 | | | 1,588 | | | | 1,566,165 | |
4.50%, 5/15/38 | | | 211 | | | | 253,183 | |
U.S. Treasury Notes, | | | | | | | | |
2.625%, 8/31/20 | | | 821 | | | | 818,178 | |
| | | | | | | | |
| | | Principal
Amount
(000s) | | | Value | |
2.75%, 9/15/21 | | $ | 758 | | | $ | 755,335 | |
2.75%, 8/31/23 | | | 1,350 | | | | 1,338,293 | |
2.75%, 8/31/25 | | | 1,655 | | | | 1,628,365 | |
2.875%, 8/15/28 | | | 1,622 | | | | 1,597,923 | |
| | | | | | | | |
Total U.S. Treasury Obligations (cost—$7,988,508) | | | | 7,957,442 | |
| | | | | | | | |
| | | | | | | | |
| Mortgage-Backed Securities—3.2% | |
Wells Fargo Commercial Mortgage Trust, | | | | | | | | |
3.166%, 2/15/48 Series 2015-C26, Class A4 | | | 625 | | | | 607,358 | |
3.635%, 1/15/59 Series 2016-NXS5, Class A6 | | | 705 | | | | 701,020 | |
| | | | | | | | |
Total Mortgage-Backed Securities (cost—$1,316,516) | | | | 1,308,378 | |
| | | | | | | | |
| | | | | | | | |
| Sovereign Debt Obligations—1.9% | |
| Supranational—1.9% | |
European Investment Bank, | | | | | | | | |
2.25%, 3/15/22 | | | 230 | | | | 224,098 | |
Inter-American Development Bank, | | | | | | | | |
1.25%, 9/14/21 | | | 260 | | | | 247,258 | |
International Bank for Reconstruction & Development, Ser. GDIF, | | | | | | | | |
1.375%, 5/24/21 | | | 290 | | | | 278,467 | |
| | | | | | | | |
Total Sovereign Debt Obligations (cost—$755,181) | | | | 749,823 | |
| | | | | | | | |
| |
Total Investments (cost—$45,253,623)—112.5% | | | | 45,115,694 | |
| | | | | | | | |
| |
Liabilities in excess of other assets (f)—(12.5)% | | | | (5,020,388 | ) |
| | | | | | | | |
| |
| Net Assets—100.0% | | | | $40,095,306 | |
| | | | | | | | |
Notes to Schedule of Investments:
(a) Private Placement—Restricted as to resale and may not have a readily available market. Securities with an aggregate value of $3,283,150, representing 8.2% of net assets.
(b) 144A—Exempt from registration under Rule 144A of the Securities Act of 1933. These securities may be resold in transactions exempt from registration, typically only to qualified institutional buyers. Securities with an aggregate value of $3,283,150, representing 8.2% of net assets.
(c) When-issued or delayed-delivery. To be settled/delivered after September 30, 2018.
(d) Perpetual maturity. The date shown, if any, is the next call date.
(e) Variable or Floating Rate Security—Securities with an interest rate that changes periodically. The interest rate disclosed reflects the rate in effect on September 30, 2018.
(f) Includes net unrealized appreciation (depreciation) of other financial instruments as follows:
| | | | | | | | | | | | | | | | | | | | | | |
| Futures contracts outstanding at September 30, 2018: | |
Type | | Contracts | | | Expiration
Date | | | Notional
Amount
(000s) | | | Market
Value
(000s) | | | Unrealized
Appreciation
(Depreciation) | |
Long position contracts: | | | | | | | | | | | | | | | | | | | | |
| | 2-Year U.S. Treasury Note | | | 2 | | | | 12/31/18 | | | $ | 400 | | | $ | 421 | | | $ | 59 | |
| | 5-Year U.S. Treasury Note | | | 9 | | | | 12/31/18 | | | | 900 | | | | 1,012 | | | | (4,138 | ) |
| | U.S. Long Bond | | | 13 | | | | 12/19/18 | | | | 1,300 | | | | 1,827 | | | | (41,972 | ) |
| | U.S. Ultra Treasury Bond | | | 4 | | | | 12/19/18 | | | | 400 | | | | 617 | | | | (3,820 | ) |
| | | | | | | | | | | | | | | | | | | | | | |
| | | | | | | | | | | | | $ | (49,871 | ) |
| | | | | | | | | | | | | | | | | | | | | | |
Short position contracts: | | | | | | | | | | | | | | | | | | | | |
| | 10-Year U.S. Treasury Note | | | (10 | ) | | | 12/19/18 | | | $ | (1,000 | ) | | $ | (1,188 | ) | | $ | 13,482 | |
| | 10-Year Ultra U.S. Treasury Bond | | | (14 | ) | | | 12/19/18 | | | | (1,400 | ) | | | (1,764 | ) | | | 8,147 | |
| | | | | | | | | | | | | | | | | | | | | | |
| | | | | | | | | | | | | $ | 21,629 | |
| | | | | | | | | | | | | | | | | | | | | | |
| | | | | | | | | | | | | $ | (28,242 | ) |
| | | | | | | | | | | | | | | | | | | | | | |
| | | | | | | | |
| See accompanying Notes to Financial Statements | | | September 30, 2018 | | | Annual Report | | | 143 | |
Schedule of Investments
September 30, 2018
| | | | | | | | | | | | | | | | | | | | | | | | | | | | | | | | |
| Credit default swaps agreements outstanding at September 30, 2018: | |
Centrally cleared buy protection swap agreements: | |
Broker (Exchange)/
Reference Debt Issuer | | Notional
Amount
(000s)(1) | | | Implied
Credit
Spread | | | Termination
Date | | | Fixed Deal
Pay Rate | | | Payment
Frequency | | | Value(2) | | | Upfront
Premiums
Received | | | Unrealized
Depreciation | |
Goldman Sachs (ICE): | |
CDX.NA.HY.31 Index | | $ | 1,600 | | | | 3.319 | % | | | 12/20/23 | | | | (5.00 | )% | | | Quarterly | | | $ | (118,089 | ) | | $ | (114,880 | ) | | $ | (3,209 | ) |
Verizon Communications, Inc. | | | 300 | | | | 0.522 | % | | | 6/20/23 | | | | (1.00 | )% | | | Quarterly | | | | (7,344 | ) | | | (3,738 | ) | | | (3,606 | ) |
| | | | | | | | | | | | | | | | | | | | | | | | |
| | | | | | | | | | | | | | | | | | | | | | $ | (125,433 | ) | | $ | (118,618 | ) | | $ | (6,815 | ) |
| | | | | | | | | | | | | | | | | | | | | | | | |
|
Centrally cleared sell protection swap agreements: | |
Broker (Exchange)/
Referenced Debt Issuer | | Notional
Amount
(000s)(1) | | | Implied
Credit
Spread | | | Termination
Date | | | Fixed Deal
Received
Rate | | | Payment
Frequency | | | Value(2) | | | Upfront
Premiums
Paid | | | Unrealized
Appreciation | |
Goldman Sachs (ICE): | |
CVS Health Corp. | | $ | 300 | | | | 0.571 | % | | | 6/20/23 | | | | 1.00 | % | | | Quarterly | | | $ | 6,091 | | | $ | 4,018 | | | $ | 2,073 | |
(1) This represents the maximum potential amount the Fund could be required to make available as a seller of credit protection or receive as a buyer of credit protection if a credit event occurs as defined under the terms of that particular swap agreement.
(2) The quoted market prices and resulting values for credit default swap agreements serve as an indicator of the status at September 30, 2018 of the payment/performance risk and represent the likelihood of an expected liability (or profit) for the credit derivative should the notional amount of the swap agreement have been closed/sold as of the period end. Increasing market values, in absolute terms when compared to the notional amount of the swap, represent a deterioration of the referenced entity’s credit soundness and a greater likelihood or risk of default or other credit event occurring as defined under the terms of the agreement.
(g) At September 30, 2018, the Fund pledged $192,769 in cash as collateral for futures contracts. The Fund also held U.S. Treasury Obligations valued at $998,690 as collateral for swap contracts. Securities held as collateral will not be pledged and are not reflected in the Schedule of Investments.
Glossary:
CDX—Credit Derivatives Index
CLO—Collateralized Loan Obligation
FRN—Floating Rate Note
ICE—Intercontinental Exchange
LIBOR—London Inter-Bank Offered Rate
MBS—Mortgage-Backed Securities
TBA—To Be Announced
| | | | | | |
| 144 | | Annual Report | | | September 30, 2018 | | | See accompanying Notes to Financial Statements |
Schedule of Investments
September 30, 2018
AllianzGI Emerging Markets Consumer Fund
| | | | | | | | |
| | | Shares | | | Value | |
| Common Stock—98.8% | |
| Australia—0.3% | |
Cochlear Ltd. | | | 777 | | | | $112,662 | |
| | | | | | | | |
| Brazil—3.5% | |
Ambev S.A. | | | 56,500 | | | | 256,580 | |
Banco Santander Brasil S.A. ADR | | | 24,185 | | | | 213,070 | |
Estacio Participacoes S.A. | | | 58,200 | | | | 360,134 | |
JBS S.A. | | | 48,600 | | | | 112,879 | |
Porto Seguro S.A. | | | 26,200 | | | | 384,642 | |
SLC Agricola S.A. | | | 5,400 | | | | 81,551 | |
Tim Participacoes S.A. | | | 45,100 | | | | 130,993 | |
| | | | | | | | |
| | | | | | | 1,539,849 | |
| | | | | | | | |
| China—27.4% | |
Alibaba Group Holding Ltd. ADR (e) | | | 8,825 | | | | 1,454,007 | |
Autohome, Inc. ADR | | | 6,480 | | | | 501,617 | |
Baidu, Inc. ADR (e) | | | 990 | | | | 226,393 | |
China Merchants Bank Co., Ltd., Class H | | | 271,500 | | | | 1,097,831 | |
China Mobile Ltd. | | | 67,000 | | | | 658,733 | |
China Vanke Co., Ltd., Class H | | | 321,400 | | | | 1,059,573 | |
Guangzhou Baiyunshan Pharmaceutical Holdings Co., Ltd., Class H | | | 96,000 | | | | 341,459 | |
Hengan International Group Co., Ltd. | | | 39,000 | | | | 358,412 | |
Luye Pharma Group Ltd. (a) | | | 352,000 | | | | 315,149 | |
New Oriental Education & Technology Group, Inc. ADR | | | 6,540 | | | | 484,025 | |
Ping An Insurance Group Co. of China Ltd., Class H | | | 215,000 | | | | 2,177,993 | |
Tencent Holdings Ltd. | | | 73,200 | | | | 2,988,817 | |
Wuxi Biologics Cayman, Inc. (a)(e) | | | 7,500 | | | | 75,897 | |
Zhongsheng Group Holdings Ltd. | | | 55,500 | | | | 134,707 | |
| | | | | | | | |
| | | | | | | 11,874,613 | |
| | | | | | | | |
| France—1.0% | |
Essilor Luxottica S.A. | | | 3,000 | | | | 444,059 | |
| | | | | | | | |
| Greece—0.2% | |
OPAP S.A. | | | 8,990 | | | | 94,377 | |
| | | | | | | | |
| Hong Kong—1.3% | |
Galaxy Entertainment Group Ltd. | | | 69,000 | | | | 435,878 | |
Melco Resorts & Entertainment Ltd. ADR | | | 5,405 | | | | 114,316 | |
| | | | | | | | |
| | | | | | | 550,194 | |
| | | | | | | | |
| India—8.5% | |
HDFC Bank Ltd. ADR | | | 16,765 | | | | 1,577,586 | |
Hindustan Unilever Ltd. | | | 34,299 | | | | 759,925 | |
Housing Development Finance Corp., Ltd. | | | 18,925 | | | | 456,923 | |
Jubilant Foodworks Ltd. | | | 42,566 | | | | 729,580 | |
Mahindra & Mahindra Ltd. | | | 14,294 | | | | 170,508 | |
| | | | | | | | |
| | | | | | | 3,694,522 | |
| | | | | | | | |
| Indonesia—0.3% | |
Charoen Pokphand Indonesia Tbk PT | | | 364,000 | | | | 123,974 | |
| | | | | | | | |
| Japan—3.7% | |
Astellas Pharma, Inc. | | | 7,000 | | | | 122,241 | |
Shiseido Co., Ltd. | | | 2,500 | | | | 193,620 | |
Suzuki Motor Corp. | | | 9,200 | | | | 527,262 | |
Terumo Corp. | | | 12,800 | | | | 757,555 | |
| | | | | | | | |
| | | | | | | 1,600,678 | |
| | | | | | | | |
| | | | | | | | |
| | | Shares | | | Value | |
| Korea (Republic of)—14.3% | |
Com2uS Corp. | | | 604 | | | $ | 79,794 | |
F&F Co., Ltd. | | | 793 | | | | 60,263 | |
Fila Korea Ltd. | | | 14,715 | | | | 595,291 | |
Hotel Shilla Co., Ltd. | | | 2,255 | | | | 220,501 | |
KB Financial Group, Inc. | | | 18,636 | | | | 907,647 | |
Pearl Abyss Corp. (e) | | | 1,060 | | | | 204,232 | |
Samsung Electronics Co., Ltd. | | | 87,723 | | | | 3,671,282 | |
SK Telecom Co., Ltd. | | | 1,831 | | | | 464,222 | |
| | | | | | | | |
| | | | | | | 6,203,232 | |
| | | | | | | | |
| Malaysia—3.0% | |
Public Bank Bhd. | | | 218,500 | | | | 1,319,685 | |
| | | | | | | | |
| Mexico—2.9% | |
Banco Santander Mexico S.A. Institucion de Banca Multiple Grupo Financiero Santand ADR | | | 11,100 | | | | 86,136 | |
Grupo Financiero Banorte S.A.B de C.V., Class O | | | 126,700 | | | | 916,568 | |
Wal-Mart de Mexico S.A.B de C.V. | | | 87,800 | | | | 266,346 | |
| | | | | | | | |
| | | | | | | 1,269,050 | |
| | | | | | | | |
| Netherlands—0.6% | |
Koninklijke Philips NV | | | 5,419 | | | | 247,006 | |
| | | | | | | | |
| Philippines—0.2% | |
Ayala Land, Inc. | | | 88,800 | | | | 65,823 | |
Jollibee Foods Corp. | | | 8,840 | | | | 42,031 | |
| | | | | | | | |
| | | | | | | 107,854 | |
| | | | | | | | |
| Poland—0.2% | |
Dino Polska S.A. (a)(e) | | | 2,557 | | | | 69,044 | |
| | | | | | | | |
| Russian Federation—2.9% | |
Mail.Ru Group Ltd. GDR (e) | | | 4,172 | | | | 112,727 | |
Mobile TeleSystems PJSC ADR | | | 134,375 | | | | 1,146,219 | |
| | | | | | | | |
| | | | | | | 1,258,946 | |
| | | | | | | | |
| South Africa—0.5% | |
Astral Foods Ltd. | | | 12,970 | | | | 226,157 | |
| | | | | | | | |
| Taiwan—12.7% | |
Cathay Financial Holding Co., Ltd. | | | 864,000 | | | | 1,484,875 | |
Chlitina Holding Ltd. | | | 49,000 | | | | 370,392 | |
CTBC Financial Holding Co., Ltd. | | | 2,570,000 | | | | 1,934,995 | |
Eclat Textile Co., Ltd. | | | 26,000 | | | | 321,754 | |
First Financial Holding Co., Ltd. | | | 970,601 | | | | 661,013 | |
Grape King Bio Ltd. | | | 18,000 | | | | 126,457 | |
Ruentex Industries Ltd. | | | 43,000 | | | | 85,438 | |
Shin Kong Financial Holding Co., Ltd. | | | 966,724 | | | | 378,070 | |
Uni-President Enterprises Corp. | | | 55,000 | | | | 143,495 | |
| | | | | | | | |
| | | | | | | 5,506,489 | |
| | | | | | | | |
| Thailand—6.3% | |
Advanced Info Service PCL (c)(d) | | | 222,300 | | | | 1,381,905 | |
Bangkok Dusit Medical Services PCL (c)(d) | | | 632,800 | | | | 498,932 | |
Home Product Center PCL (c)(d) | | | 802,700 | | | | 392,398 | |
Land & Houses PCL (c)(d) | | | 568,200 | | | | 202,050 | |
Thanachart Capital PCL (c)(d) | | | 169,400 | | | | 281,548 | |
| | | | | | | | |
| | | | | | | 2,756,833 | |
| | | | | | | | |
| | | | | | | | |
| | | Shares | | | Value | |
| Turkey—0.7% | |
Turk Hava Yollari AO (e) | | | 93,052 | | | $ | 293,499 | |
| | | | | | | | |
| United States—8.3% | |
Mastercard, Inc., Class A | | | 7,785 | | | | 1,733,019 | |
Sabre Corp. | | | 9,100 | | | | 237,328 | |
Thermo Fisher Scientific, Inc. | | | 2,070 | | | | 505,245 | |
Visa, Inc., Class A | | | 3,700 | | | | 555,333 | |
Western Union Co. | | | 29,200 | | | | 556,552 | |
| | | | | | | | |
| | | | | | | 3,587,477 | |
| | | | | | | | |
Total Common Stock
(cost—$39,709,667) | | | | 42,880,200 | |
| | | | | | | | |
| | | | | | | | |
| Preferred Stock—0.5% | |
| Brazil—0.5% | |
Itau Unibanco Holding S.A. (cost—$267,470) | | | 20,000 | | | | 218,544 | |
| | | | | | | | |
| | | | | | | | |
| | | Principal
Amount
(000s) | | | | |
| Repurchase Agreements—0.2% | |
State Street Bank and Trust Co., dated 9/28/18, 0.42%, due 10/1/18, proceeds $106,004; collateralized by U.S. Treasury Notes, 2.00%, due 11/30/20, valued at $108,741 including accrued interest | |
(cost—$106,000) | | | $106 | | | | 106,000 | |
| | | | | | | | |
| |
Total Investments
(cost—$40,083,137) (b)—99.5% | | | | 43,204,744 | |
| | | | | | | | |
| | |
| Other assets less liabilities—0.5% | | | | | | | 197,209 | |
| | | | | | | | |
| |
| Net Assets—100.0% | | | | $43,401,953 | |
| | | | | | | | |
Notes to Schedule of Investments:
(a) 144A—Exempt from registration under Rule 144A of the Securities Act of 1933. These securities may be resold in transactions exempt from registration, typically only to qualified institutional buyers. Securities with an aggregate value of $460,090, representing 1.1% of net assets.
(b) Securities with an aggregate value of $27,883,944, representing 64.2% of net assets, were valued utilizing modeling tools provided by a third-party vendor. See Note 1(a) and Note 1(b) in the Notes to Financial Statements.
(c) Fair-Valued—Securities with an aggregate value of $2,756,833, representing 6.4% of net assets. See Note 1(a) and Note 1(b) in the Notes to Financial Statements.
(d) Level 3 security. See Note 1(a) and Note 1(b) in the Notes to Financial Statements.
(e) Non-income producing.
Glossary:
ADR—American Depositary Receipt
GDR—Global Depositary Receipt
| | | | | | | | |
| See accompanying Notes to Financial Statements | | | September 30, 2018 | | | Annual Report | | | 145 | |
Schedule of Investments
September 30, 2018
The industry classification of portfolio holdings and other assets less liabilities shown as a percentage of net assets were as follows:
| | | | |
Banks | | | 21.2% | |
Insurance | | | 10.2% | |
Interactive Media & Services | | | 8.8% | |
Wireless Telecommunication Services | | | 8.7% | |
Technology Hardware, Storage & Peripherals | | | 8.5% | |
IT Services | | | 7.1% | |
Healthcare Equipment & Supplies | | | 3.6% | |
Internet & Direct Marketing Retail | | | 3.3% | |
Hotels, Restaurants & Leisure | | | 3.3% | |
Real Estate Management & Development | | | 3.1% | |
Textiles, Apparel & Luxury Goods | | | 2.4% | |
Personal Products | | | 2.4% | |
Diversified Consumer Services | | | 1.9% | |
Pharmaceuticals | | | 1.8% | |
Household Products | | | 1.8% | |
Specialty Retail | | | 1.7% | |
Automobiles | | | 1.6% | |
Food Products | | | 1.6% | |
Life Sciences Tools & Services | | | 1.3% | |
Healthcare Providers & Services | | | 1.1% | |
Thrifts & Mortgage Finance | | | 1.1% | |
Food & Staples Retailing | | | 0.8% | |
Airlines | | | 0.7% | |
Beverages | | | 0.6% | |
Entertainment | | | 0.5% | |
Software | | | 0.2% | |
Repurchase Agreements | | | 0.2% | |
Other assets less liabilities | | | 0.5% | |
| | | | |
| | | 100.0% | |
| | | | |
AllianzGI Emerging Markets Debt Fund
| | | | | | | | |
| | | Principal
Amount
(000s) | | | Value | |
| Sovereign Debt Obligations—81.0% | |
| Angola—3.0% | |
Angolan Government International Bond, | |
8.25%, 5/9/28 (a)(b) | | | $200 | | | | $207,421 | |
9.50%, 11/12/25 | | | 300 | | | | 341,786 | |
| | | | | | | | |
| | | | | | | 549,207 | |
| | | | | | | | |
| Argentina—1.1% | |
Argentine Republic Government International Bond, | |
7.125%, 7/6/36 | | | 250 | | | | 201,187 | |
| | | | | | | | |
| Azerbaijan—0.7% | |
Republic of Azerbaijan International Bond, | |
3.50%, 9/1/32 | | | 150 | | | | 128,320 | |
| | | | | | | | |
| Bahrain—1.0% | |
Bahrain Government International Bond, | |
7.50%, 9/20/47 | | | 200 | | | | 193,501 | |
| | | | | | | | |
| Belarus—1.0% | |
Republic of Belarus International Bond (a)(b), | |
6.20%, 2/28/30 | | | 200 | | | | 194,118 | |
| | | | | | | | |
| Brazil—2.7% | |
Brazilian Government International Bond, | |
2.625%, 1/5/23 | | | 350 | | | | 321,377 | |
5.625%, 2/21/47 | | | 200 | | | | 178,125 | |
| | | | | | | | |
| | | | | | | 499,502 | |
| | | | | | | | |
| Chile—1.1% | |
Chile Government International Bond, | |
3.125%, 3/27/25 | | | 200 | | | | 194,605 | |
| | | | | | | | |
| Colombia—3.7% | |
Colombia Government International Bond, | |
2.625%, 3/15/23 | | | 200 | | | | 190,477 | |
3.875%, 4/25/27 | | | 300 | | | | 291,781 | |
5.00%, 6/15/45 | | | 200 | | | | 200,643 | |
| | | | | | | | |
| | | | | | | 682,901 | |
| | | | | | | | |
| Costa Rica—1.4% | |
Costa Rica Government International Bond, | |
4.375%, 4/30/25 | | | 300 | | | | 261,375 | |
| | | | | | | | |
| Dominican Republic—2.2% | |
Dominican Republic International Bond, | |
5.95%, 1/25/27 | | | 200 | | | | 204,329 | |
6.50%, 2/15/48 | | | 200 | | | | 197,123 | |
| | | | | | | | |
| | | | | | | 401,452 | |
| | | | | | | | |
| Ecuador—2.1% | |
Ecuador Government International Bond (a)(b), | |
8.875%, 10/23/27 | | | 400 | | | | 383,600 | |
| | | | | | | | |
| Egypt—2.5% | |
Egypt Government International Bond, | |
6.875%, 4/30/40 | | | 300 | | | | 268,183 | |
Egypt Government International Bond (a)(b), | |
6.125%, 1/31/22 | | | 200 | | | | 200,642 | |
| | | | | | | | |
| | | | | | | 468,825 | |
| | | | | | | | |
| Ghana—1.1% | |
Ghana Government International Bond, | |
7.625%, 5/16/29 | | | 200 | | | | 200,992 | |
| | | | | | | | |
| Guatemala—0.8% | |
Guatemala Government Bond (a)(b), | |
4.50%, 5/3/26 | | | 150 | | | | 144,495 | |
| | | | | | | | |
| Honduras—0.8% | |
Honduras Government International Bond (a)(b), | |
6.25%, 1/19/27 | | | 150 | | | | 154,613 | |
| | | | | | | | |
| | | | | | | | |
| | | Principal
Amount
(000s) | | | Value | |
| Hungary—1.9% | |
Hungary Government International Bond,
| |
5.375%, 3/25/24 | | $ | 200 | | | $ | 214,626 | |
7.625%, 3/29/41 | | | 100 | | | | 139,823 | |
| | | | | | | | |
| | | | | | | 354,449 | |
| | | | | | | | |
| Indonesia—2.5% | |
Indonesia Government International Bond,
| |
3.50%, 1/11/28 | | | 300 | | | | 279,626 | |
4.625%, 4/15/43 | | | 200 | | | | 189,303 | |
| | | | | | | | |
| | | | | | | 468,929 | |
| | | | | | | | |
| Iraq—1.3% | |
Iraq International Bond, | |
5.80%, 1/15/28 | | | 250 | | | | 238,255 | |
| | | | | | | | |
| Ivory Coast—2.1% | |
Ivory Coast Government International Bond, | |
6.375%, 3/3/28 | | | 400 | | | | 387,465 | |
| | | | | | | | |
| Jamaica—1.2% | |
Jamaica Government International Bond, | |
6.75%, 4/28/28 | | | 200 | | | | 219,656 | |
| | | | | | | | |
| Jordan—2.1% | |
Jordan Government International Bond, | |
5.75%, 1/31/27 | | | 400 | | | | 380,188 | |
| | | | | | | | |
| Kenya—1.1% | |
Kenya Government International Bond, | |
7.25%, 2/28/28 | | | 200 | | | | 195,668 | |
| | | | | | | | |
| Kuwait—1.1% | |
Kuwait International Government Bond, | |
3.50%, 3/20/27 | | | 200 | | | | 196,318 | |
| | | | | | | | |
| Lebanon—2.1% | |
Lebanon Government International Bond, | |
6.20%, 2/26/25 | | | 300 | | | | 239,437 | |
Lebanon Government International Bond, | |
6.20%, 2/26/25 | | | 190 | | | | 151,644 | |
| | | | | | | | |
| | | | | | | 391,081 | |
| | | | | | | | |
| Malaysia—2.6% | |
Malaysia Sukuk Global Bhd, | | | | | | | | |
3.179%, 4/27/26 | | | 500 | | | | 477,645 | |
| | | | | | | | |
| Mexico—5.7% | |
Mexico Government International Bond, | |
3.60%, 1/30/25 | | | 850 | | | | 827,625 | |
4.60%, 1/23/46 | | | 250 | | | | 234,083 | |
| | | | | | | | |
| | | | | | | 1,061,708 | |
| | | | | | | | |
| Mongolia—1.1% | |
Mongolia Government International Bond (a)(b), | |
5.625%, 5/1/23 | | | 200 | | | | 194,987 | |
| | | | | | | | |
| Nigeria—1.0% | |
Nigeria Government International Bond (a)(b), | |
7.625%, 11/28/47 | | | 200 | | | | 192,270 | |
| | | | | | | | |
| Pakistan—1.5% | |
Pakistan Government International Bond, | |
6.875%, 12/5/27 | | | 300 | | | | 285,588 | |
| | | | | | | | |
| Panama—2.4% | |
Panama Government International Bond, | |
4.30%, 4/29/53 | | | 200 | | | | 192,427 | |
Panama Government International Bond, | |
3.75%, 3/16/25 | | | 250 | | | | 249,013 | |
| | | | | | | | |
| | | | | | | 441,440 | |
| | | | | | | | |
| Paraguay—1.1% | |
Paraguay Government International Bond, | |
5.00%, 4/15/26 | | | 200 | | | | 203,983 | |
| | | | | | | | |
| | | | | | |
| 146 | | Annual Report | | | September 30, 2018 | | | See accompanying Notes to Financial Statements |
Schedule of Investments
September 30, 2018
| | | | | | | | |
| | | Principal
Amount
(000s) | | | Value | |
| Peru—2.6% | |
Peruvian Government International Bond, | |
4.125%, 8/25/27 | | $ | 300 | | | $ | 309,721 | |
5.625%, 11/18/50 | | | 150 | | | | 178,290 | |
| | | | | | | | |
| | | | | | | 488,011 | |
| | | | | | | | |
| Philippines—3.3% | |
Philippine Government International Bond, | |
3.00%, 2/1/28 | | | 450 | | | | 420,365 | |
3.95%, 1/20/40 | | | 200 | | | | 193,816 | |
| | | | | | | | |
| | | | | | | 614,181 | |
| | | | | | | | |
| Poland—1.6% | |
Republic of Poland Government International Bond, | |
3.25%, 4/6/26 | | | 300 | | | | 291,799 | |
| | | | | | | | |
| Romania—0.6% | |
Romanian Government International Bond, | |
6.125%, 1/22/44 | | | 100 | | | | 113,256 | |
| | | | | | | | |
| Russian Federation—3.4% | |
Russian Federation Bond, | |
4.875%, 9/16/23 | | | 400 | | | | 412,675 | |
5.625%, 4/4/42 | | | 200 | | | | 209,354 | |
| | | | | | | | |
| | | | | | | 622,029 | |
| | | | | | | | |
| Saudi Arabia—1.6% | |
Saudi Government International Bond, | |
3.625%, 3/4/28 | | | 300 | | | | 286,782 | |
| | | | | | | | |
| Senegal—1.0% | |
Senegal Government International Bond (a)(b), | |
6.25%, 5/23/33 | | | 200 | | | | 187,488 | |
| | | | | | | | |
| South Africa—1.0% | |
Republic of South Africa Government International Bond, | |
4.85%, 9/27/27 | | | 200 | | | | 188,939 | |
| | | | | | | | |
| Sri Lanka—1.0% | |
Sri Lanka Government International Bond (a)(b), | |
6.20%, 5/11/27 | | | 200 | | | | 189,465 | |
| | | | | | | | |
| Turkey—2.2% | |
Turkey Government International Bond, | |
4.875%, 4/16/43 | | | 550 | | | | 403,617 | |
| | | | | | | | |
| Ukraine—4.2% | |
Ukraine Government International Bond, | |
7.75%, 9/1/26 | | | 200 | | | | 188,765 | |
Ukraine Government International Bond, | |
7.75%, 9/1/21 | | | 200 | | | | 202,204 | |
7.75%, 9/1/23 (a)(b) | | | 400 | | | | 393,892 | |
| | | | | | | | |
| | | | | | | 784,861 | |
| | | | | | | | |
| Uruguay—1.9% | |
Uruguay Government International Bond, | |
4.375%, 10/27/27 | | | 200 | | | | 203,746 | |
5.10%, 6/18/50 | | | 150 | | | | 153,339 | |
| | | | | | | | |
| | | | | | | 357,085 | |
| | | | | | | | |
| Venezuela—0.6% | |
Venezuela Government International Bond (c), | |
7.00%, 3/31/38 | | | 200 | | | | 53,795 | |
9.25%, 9/15/27 | | | 225 | | | | 62,647 | |
| | | | | | | | |
| | | | | | | 116,442 | |
| | | | | | | | |
| Total Sovereign Debt Obligations (cost—$15,117,206) | | | | 14,992,278 | |
| | | | | | | | |
| | | | | | | | |
| Corporate Bonds & Notes—13.1% | |
| Chile—1.6% | |
Corp. Nacional del Cobre de Chile, | |
3.625%, 8/1/27 | | | 300 | | | | 287,150 | |
| | | | | | | | |
| | | | | | | | |
| | | Principal
Amount
(000s) | | | Value | |
| China—2.0% | |
Sinopec Group Overseas Development 2015 Ltd., | |
3.25%, 4/28/25 | | $ | 200 | | | $ | 188,801 | |
State Grid Overseas Investment 2016 Ltd. (a)(b), | |
2.875%, 5/18/26 | | | 200 | | | | 184,033 | |
| | | | | | | | |
| | | | | | | 372,834 | |
| | | | | | | | |
| El Salvador—1.3% | |
AES El Salvador Trust II, | |
6.75%, 3/28/23 | | | 250 | | | | 236,565 | |
| | | | | | | | |
| Hong Kong—2.1% | |
Chinalco Capital Holdings Ltd., | |
4.00%, 8/25/21 | | | 200 | | | | 194,430 | |
CNAC HK Finbridge Co., Ltd., | |
4.625%, 3/14/23 | | | 200 | | | | 201,561 | |
| | | | | | | | |
| | | | | | | 395,991 | |
| | | | | | | | |
| India—1.1% | |
Export-Import Bank of India, | |
4.00%, 1/14/23 | | | 200 | | | | 198,046 | |
| | | | | | | | |
| Indonesia—1.5% | |
Perusahaan Listrik Negara PT, | |
4.125%, 5/15/27 | | | 300 | | | | 283,312 | |
| | | | | | | | |
| Kazakhstan—2.8% | |
KazMunayGas National Co. JSC (a)(b), | |
5.75%, 4/19/47 | | | 350 | | | | 346,079 | |
Nostrum Oil & Gas Finance BV (a)(b), | |
7.00%, 2/16/25 | | | 200 | | | | 176,740 | |
| | | | | | | | |
| | | | | | | 522,819 | |
| | | | | | | | |
| Venezuela—0.7% | |
Petroleos de Venezuela S.A. (c), | |
6.00%, 5/16/24 | | | 550 | | | | 123,035 | |
| | | | | | | | |
| Total Corporate Bonds & Notes (cost—$2,456,869) | | | | | | | 2,419,752 | |
| | | | | | | | |
| | | | | | | | |
| Repurchase Agreements—5.0% | |
State Street Bank and Trust Co., dated 9/28/18, 0.42%, due 10/1/18, proceeds $933,033; collateralized by U.S. Treasury Notes, 2.00%, due 9/30/20, valued at $953,829 including accrued interest | |
(cost—$933,000) | | | 933 | | | | 933,000 | |
| | | | | | | | |
| |
| Total Investments (cost—$18,507,075)—99.1% | | | | 18,345,030 | |
| | | | | | | | |
| |
| Other assets less liabilities—0.9% | | | | 167,525 | |
| | | | | | | | |
| |
| Net Assets—100.0% | | | | $18,512,555 | |
| | | | | | | | |
Notes to Schedule of Investments:
(a) Private Placement—Restricted as to resale and may not have a readily available market. Securities with an aggregate value of $3,149,843, representing 17.0% of net assets.
(b) 144A—Exempt from registration under Rule 144A of the Securities Act of 1933. These securities may be resold in transactions exempt from registration, typically only to qualified institutional buyers. Securities with an aggregate value of $3,149,843, representing 17.0% of net assets.
(c) In default.
The industry classification of portfolio holdings and other assets less liabilities shown as a percentage of net assets were as follows:
| | | | |
Sovereign Debt Obligations | | | 81.0% | |
Oil, Gas & Consumable Fuels | | | 4.5% | |
Electric Utilities | | | 3.8% | |
Mining | | | 2.6% | |
Chemicals | | | 1.1% | |
Banks | | | 1.1% | |
Repurchase Agreements | | | 5.0% | |
Other assets less liabilities | | | 0.9% | |
| | | | |
| | | 100.0% | |
| | | | |
| | | | | | | | |
| See accompanying Notes to Financial Statements | | | September 30, 2018 | | | Annual Report | | | 147 | |
Schedule of Investments
September 30, 2018
AllianzGI Emerging Markets Small-Cap Fund
| | | | | | | | |
| | | Shares | | | Value | |
| Common Stock—95.4% | |
| Brazil—5.0% | |
Fibria Celulose S.A. | | | 5,800 | | | | $108,459 | |
IRB Brasil Resseguros S.A. | | | 16,600 | | | | 273,135 | |
Porto Seguro S.A. | | | 8,400 | | | | 123,320 | |
| | | | | | | | |
| | | | | | | 504,914 | |
| | | | | | | | |
| China—10.8% | |
Anton Oilfield Services Group (e) | | | 444,000 | | | | 73,829 | |
China Lilang Ltd. | | | 27,000 | | | | 25,212 | |
Guangzhou Baiyunshan Pharmaceutical Holdings Co., Ltd., Class H | | | 50,000 | | | | 177,843 | |
Jiangsu Expressway Co., Ltd., Class H | | | 62,000 | | | | 79,531 | |
Lee & Man Paper Manufacturing Ltd. | | | 166,000 | | | | 153,710 | |
Powerlong Real Estate Holdings Ltd. | | | 55,000 | | | | 23,419 | |
Tianjin Zhongxin Pharmaceutical Group Corp., Ltd. | | | 26,400 | | | | 25,872 | |
Towngas China Co., Ltd. (e) | | | 328,495 | | | | 286,714 | |
West China Cement Ltd. | | | 758,000 | | | | 142,281 | |
Yuexiu Property Co., Ltd. | | | 300,000 | | | | 53,543 | |
Yuexiu Real Estate Investment Trust REIT | | | 77,000 | | | | 50,490 | |
| | | | | | | | |
| | | | | | | 1,092,444 | |
| | | | | | | | |
| Czech Republic—0.8% | |
Philip Morris CR AS | | | 80 | | | | 53,512 | |
Unipetrol AS (c)(d)(e) | | | 1,340 | | | | 22,945 | |
| | | | | | | | |
| | | | | | | 76,457 | |
| | | | | | | | |
| Greece—3.2% | |
Hellenic Petroleum S.A. | | | 2,580 | | | | 22,505 | |
Motor Oil Hellas Corinth Refineries S.A. | | | 7,849 | | | | 205,044 | |
Mytilineos Holdings S.A. | | | 1,970 | | | | 19,560 | |
OPAP S.A. | | | 7,302 | | | | 76,656 | |
| | | | | | | | |
| | | | | | | 323,765 | |
| | | | | | | | |
| Hong Kong—3.0% | |
Johnson Electric Holdings Ltd. | | | 11,500 | | | | 32,472 | |
K Wah International Holdings Ltd. | | | 134,000 | | | | 63,410 | |
Luk Fook Holdings International Ltd. | | | 45,000 | | | | 156,579 | |
Xinyi Glass Holdings Ltd. | | | 44,000 | | | | 55,473 | |
| | | | | | | | |
| | | | | | | 307,934 | |
| | | | | | | | |
| India—15.6% | |
Bajaj Holdings & Investment Ltd. | | | 781 | | | | 33,214 | |
Bata India Ltd. | | | 18,072 | | | | 243,138 | |
Glenmark Pharmaceuticals Ltd. | | | 21,448 | | | | 186,476 | |
Gujarat Narmada Valley Fertilizers & Chemicals Ltd. | | | 17,064 | | | | 83,038 | |
Jubilant Foodworks Ltd. | | | 6,746 | | | | 115,626 | |
Mphasis Ltd. | | | 20,171 | | | | 325,928 | |
NIIT Technologies Ltd. | | | 6,952 | | | | 105,513 | |
Phillips Carbon Black Ltd. (e) | | | 60,835 | | | | 172,639 | |
WNS Holdings Ltd. ADR (e) | | | 6,200 | | | | 314,650 | |
| | | | | | | | |
| | | | | | | 1,580,222 | |
| | | | | | | | |
| Indonesia—3.4% | |
Bukit Asam Tbk PT | | | 919,400 | | | | 266,295 | |
Indo Tambangraya Megah Tbk PT | | | 47,000 | | | | 81,534 | |
| | | | | | | | |
| | | | | | | 347,829 | |
| | | | | | | | |
| | | | | | | | |
| | | Shares | | | Value | |
| Korea (Republic of)—15.0% | |
Dong-A ST Co., Ltd. | | | 534 | | | $ | 51,736 | |
F&F Co., Ltd. | | | 3,294 | | | | 250,323 | |
Fila Korea Ltd. | | | 8,527 | | | | 344,957 | |
Hotel Shilla Co., Ltd. | | | 290 | | | | 28,357 | |
Jeju Air Co., Ltd. | | | 922 | | | | 31,173 | |
Korea Gas Corp. (e) | | | 1,943 | | | | 106,263 | |
LF Corp. | | | 5,778 | | | | 135,694 | |
LOTTE Fine Chemical Co., Ltd. | | | 3,541 | | | | 165,645 | |
LOTTE Himart Co., Ltd. | | | 3,856 | | | | 231,894 | |
Macquarie Korea Infrastructure Fund | | | 12,796 | | | | 104,975 | |
Samchully Co., Ltd. | | | 403 | | | | 37,778 | |
Unid Co., Ltd. | | | 955 | | | | 39,130 | |
| | | | | | | | |
| | | | | | | 1,527,925 | |
| | | | | | | | |
| Malaysia—2.8% | |
AirAsia Group Bhd. | | | 34,700 | | | | 26,488 | |
Hong Leong Financial Group Bhd. | | | 5,800 | | | | 27,035 | |
Malaysia Airports Holdings Bhd. | | | 41,000 | | | | 88,145 | |
Padini Holdings Bhd. | | | 21,600 | | | | 30,689 | |
Supermax Corp. Bhd. | | | 27,200 | | | | 21,302 | |
Top Glove Corp. Bhd. | | | 34,500 | | | | 88,822 | |
| | | | | | | | |
| | | | | | | 282,481 | |
| | | | | | | | |
| Mexico—0.5% | |
Qualitas Controladora S.A.B. de C.V. | | | 19,900 | | | | 52,892 | |
| | | | | | | | |
| Poland—0.7% | |
Dino Polska S.A. (a)(e) | | | 1,774 | | | | 47,901 | |
Energa S.A. | | | 12,119 | | | | 25,704 | |
| | | | | | | | |
| | | | | | | 73,605 | |
| | | | | | | | |
| Russian Federation—1.5% | |
Magnitogorsk Iron & Steel Works PJSC GDR | | | 11,141 | | | | 115,198 | |
PIK Group PJSC (c)(d) | | | 7,478 | | | | 39,676 | |
| | | | | | | | |
| | | | | | | 154,874 | |
| | | | | | | | |
| South Africa—2.4% | |
AECI Ltd. | | | 9,421 | | | | 69,772 | |
Astral Foods Ltd. | | | 10,232 | | | | 178,414 | |
| | | | | | | | |
| | | | | | | 248,186 | |
| | | | | | | | |
| Taiwan—19.1% | |
Aten International Co., Ltd. | | | 19,000 | | | | 50,896 | |
Bioteque Corp. | | | 38,000 | | | | 120,718 | |
Cheng Loong Corp. | | | 82,000 | | | | 66,074 | |
Chipbond Technology Corp. | | | 132,000 | | | | 254,654 | |
Coretronic Corp. | | | 56,000 | | | | 98,860 | |
Darfon Electronics Corp. | | | 22,000 | | | | 32,184 | |
Elan Microelectronics Corp. | | | 33,000 | | | | 54,977 | |
Eva Airways Corp. (e) | | | 121,800 | | | | 59,227 | |
Farglory Land Development Co., Ltd. | | | 18,000 | | | | 18,921 | |
Feng Hsin Steel Co., Ltd. | | | 11,000 | | | | 21,827 | |
Formosa Advanced Technologies Co., Ltd. | | | 31,000 | | | | 34,112 | |
Gigabyte Technology Co., Ltd. | | | 35,000 | | | | 55,223 | |
Grand Pacific Petrochemical | | | 280,000 | | | | 278,614 | |
Greatek Electronics, Inc. | | | 24,000 | | | | 39,658 | |
Huaku Development Co., Ltd. | | | 22,000 | | | | 48,178 | |
ITE Technology, Inc. | | | 41,000 | | | | 45,349 | |
Novatek Microelectronics Corp. | | | 32,000 | | | | 157,915 | |
Radiant Opto-Electronics Corp. | | | 31,000 | | | | 70,008 | |
Shinkong Synthetic Fibers Corp. | | | 74,000 | | | | 30,406 | |
| | | | | | | | |
| | | Shares | | | Value | |
Sinmag Equipment Corp. | | | 4,140 | | | $ | 18,779 | |
SinoPac Financial Holdings Co., Ltd. | | | 323,340 | | | | 118,038 | |
Syncmold Enterprise Corp. | | | 59,000 | | | | 110,712 | |
Taishin Financial Holding Co., Ltd. | | | 268,394 | | | | 129,615 | |
Tripod Technology Corp. | | | 9,000 | | | | 24,566 | |
| | | | | | | | |
| | | | | | | 1,939,511 | |
| | | | | | | | |
| Thailand—7.8% | |
Bangchak Corp., PCL NVDR | | | 26,900 | | | | 29,326 | |
Erawan Group PCL (c)(d) | | | 107,500 | | | | 26,929 | |
Home Product Center PCL (c)(d) | | | 539,400 | | | | 263,685 | |
KGI Securities Thailand PCL (c)(d) | | | 281,700 | | | | 39,377 | |
Quality Houses PCL (c)(d) | | | 2,801,700 | | | | 299,625 | |
Thanachart Capital PCL (c)(d) | | | 78,600 | | | | 130,635 | |
| | | | | | | | |
| | | | | | | 789,577 | |
| | | | | | | | |
| Turkey—3.5% | |
Anadolu Cam Sanayii AS | | | 55,195 | | | | 30,106 | |
Soda Sanayii AS | | | 146,256 | | | | 167,829 | |
Trakya Cam Sanayii AS | | | 226,131 | | | | 160,735 | |
| | | | | | | | |
| | | | | | | 358,670 | |
| | | | | | | | |
| United Arab Emirates—0.3% | |
RAK Properties PJSC | | | 197,158 | | | | 32,207 | |
| | | | | | | | |
Total Common Stock
(cost—$8,659,646) | | | | 9,693,493 | |
| | | | | | | | |
| | | | | | | | |
| Preferred Stock—3.5% | |
| Brazil—0.6% | |
Cia Ferro Ligas da Bahia—FERBASA | | | 13,000 | | | | 62,255 | |
| | | | | | | | |
| Russian Federation—2.9% | |
Surgutneftegas PJSC (c)(d) | | | 504,659 | | | | 292,702 | |
| | | | | | | | |
Total Preferred Stock
(cost—$308,754) | | | | 354,957 | |
| | | | | | | | |
| | | | | | | | |
| | | Principal
Amount
(000s) | | | | |
| Repurchase Agreements—2.8% | |
State Street Bank and Trust Co., dated 9/28/18, 0.42%, due 10/1/18, proceeds $289,010; collateralized by U.S. Treasury Notes, 2.00%, due 11/30/20, valued at $296,566 including accrued interest
| |
(cost—$289,000) | | | $289 | | | | 289,000 | |
| | | | | | | | |
| |
Total Investments
(cost—$9,257,400) (b)—101.7% | | | | 10,337,450 | |
| | | | | | | | |
| | |
| Liabilities in excess of other assets—(1.7)% | | | | | | | (172,434 | ) |
| | | | | | | | |
| | |
| Net Assets—100.0% | | | | | | | $10,165,016 | |
| | | | | | | | |
| | | | | | |
| 148 | | Annual Report | | | September 30, 2018 | | | See accompanying Notes to Financial Statements |
Schedule of Investments
September 30, 2018
Notes to Schedule of Investments:
(a) 144A—Exempt from registration under Rule 144A of the Securities Act of 1933. These securities may be resold in transactions exempt from registration, typically only to qualified institutional buyers. Security with a value of $47,901, representing 0.5% of net assets.
(b) Securities with an aggregate value of $7,203,957, representing 70.9% of net assets, were valued utilizing modeling tools provided by a third-party vendor. See Note 1(a) and Note 1(b) in the Notes to Financial Statements.
(c) Fair-Valued—Securities with an aggregate value of $1,115,574, representing 11.0% of net assets. See Note 1(a) and Note 1(b) in the Notes to Financial Statements.
(d) Level 3 security. See Note 1(a) and Note 1(b) in the Notes to Financial Statements.
(e) Non-income producing.
Glossary:
ADR—American Depositary Receipt
GDR—Global Depositary Receipt
NVDR—Non-Voting Depository Receipt
REIT—Real Estate Investment Trust
| | | | |
The industry classification of portfolio holdings and liabilities in excess of other assets shown as a percentage of net assets were as follows: | |
Chemicals | | | 10.1% | |
Textiles, Apparel & Luxury Goods | | | 9.8% | |
Oil, Gas & Consumable Fuels | | | 8.8% | |
Specialty Retail | | | 7.0% | |
Semiconductors & Semiconductor Equipment | | | 6.5% | |
IT Services | | | 6.3% | |
Insurance | | | 4.4% | |
Pharmaceuticals | | | 4.3% | |
Gas Utilities | | | 4.2% | |
Banks | | | 4.0% | |
Home Builders | | | 2.9% | |
Paper & Forest Products | | | 2.6% | |
Real Estate Management & Development | | | 2.4% | |
Healthcare Equipment & Supplies | | | 2.3% | |
Hotels, Restaurants & Leisure | | | 2.2% | |
Food Products | | | 1.8% | |
Transportation Infrastructure | | | 1.7% | |
Building Products | | | 1.6% | |
Capital Markets | | | 1.4% | |
Construction Materials | | | 1.4% | |
Technology Hardware, Storage & Peripherals | | | 1.4% | |
Metals & Mining | | | 1.4% | |
Machinery | | | 1.3% | |
Electronic Equipment, Instruments & Components | | | 1.2% | |
Airlines | | | 1.2% | |
Software | | | 1.0% | |
Containers & Packaging | | | 0.9% | |
Energy Equipment & Services | | | 0.7% | |
Iron/Steel | | | 0.6% | |
Auto Components | | | 0.5% | |
Tobacco | | | 0.5% | |
Equity Real Estate Investment Trusts (REITs) | | | 0.5% | |
Food & Staples Retailing | | | 0.5% | |
Household Durables | | | 0.4% | |
Diversified Financial Services | | | 0.3% | |
Electrical Equipment | | | 0.3% | |
Electric Utilities | | | 0.3% | |
Industrial Conglomerates | | | 0.2% | |
Repurchase Agreements | | | 2.8% | |
Liabilities in excess of other assets | | | (1.7)% | |
| | | | |
| | | 100.0% | |
| | | | |
AllianzGI Europe Equity Dividend Fund
| | | | | | | | |
| | | Shares | | | Value | |
| Common Stock—100.9% | |
| Belgium—1.2% | |
Anheuser-Busch InBev NV | | | 954 | | | | $83,509 | |
| | | | | | | | |
| Finland—0.5% | |
Fortum Oyj | | | 1,245 | | | | 31,201 | |
| | | | | | | | |
| France—21.6% | |
AXA S.A. | | | 1,870 | | | | 50,108 | |
Coface S.A. | | | 1,160 | | | | 11,003 | |
Eutelsat Communications S.A. | | | 4,550 | | | | 107,496 | |
Klepierre S.A. REIT | | | 3,125 | | | | 111,046 | |
Sanofi | | | 2,120 | | | | 189,416 | |
SCOR SE | | | 6,835 | | | | 316,881 | |
SES S.A. | | | 8,624 | | | | 189,244 | |
Total S.A. | | | 4,540 | | | | 295,194 | |
Unibail-Rodamco-Westfield | | | 1,162 | | | | 234,081 | |
| | | | | | | | |
| | | | | | | 1,504,469 | |
| | | | | | | | |
| Germany—12.6% | |
1&1 Drillisch AG | | | 1,086 | | | | 52,792 | |
Daimler AG | | | 2,950 | | | | 185,916 | |
Deutsche Telekom AG | | | 5,760 | | | | 92,728 | |
Muenchener Rueckversicherungs-Gesellschaft AG in Muenchen | | | 1,690 | | | | 373,298 | |
ProSiebenSat.1 Media SE | | | 3,000 | | | | 77,724 | |
Telefonica Deutschland Holding AG | | | 23,020 | | | | 97,244 | |
| | | | | | | | |
| | | | | | | 879,702 | |
| | | | | | | | |
| Italy—7.5% | |
Enel SpA | | | 43,150 | | | | 220,562 | |
Eni SpA | | | 16,030 | | | | 302,159 | |
| | | | | | | | |
| | | | | | | 522,721 | |
| | | | | | | | |
| Netherlands—8.5% | |
ABN AMRO Group NV (a) | | | 4,276 | | | | 116,453 | |
ING Groep NV | | | 17,330 | | | | 224,928 | |
Koninklijke KPN NV | | | 79,570 | | | | 209,907 | |
PostNL NV | | | 10,990 | | | | 39,326 | |
| | | | | | | | |
| | | | | | | 590,614 | |
| | | | | | | | |
| Norway—2.2% | |
Telenor ASA | | | 7,917 | | | | 154,822 | |
| | | | | | | | |
| Spain—7.8% | |
Banco Santander S.A. | | | 16,360 | | | | 81,909 | |
Cia de Distribucion Integral Logista Holdings S.A. | | | 8,973 | | | | 230,527 | |
Ferrovial S.A. | | | 6,635 | | | | 137,299 | |
Iberdrola S.A. | | | 12,612 | | | | 92,633 | |
| | | | | | | | |
| | | | | | | 542,368 | |
| | | | | | | | |
| Switzerland—4.4% | |
LafargeHolcim Ltd. (c) | | | 1,040 | | | | 51,487 | |
Swiss Re AG | | | 2,793 | | | | 257,337 | |
| | | | | | | | |
| | | | | | | 308,824 | |
| | | | | | | | |
| United Kingdom—34.6% | |
Ashmore Group PLC | | | 24,079 | | | | 113,952 | |
BHP Billiton PLC | | | 9,589 | | | | 209,247 | |
BP PLC | | | 39,260 | | | | 300,918 | |
British American Tobacco PLC | | | 3,500 | | | | 163,172 | |
BT Group PLC | | | 67,010 | | | | 196,697 | |
GlaxoSmithKline PLC | | | 8,069 | | | | 161,821 | |
IG Group Holdings PLC | | | 6,852 | | | | 56,487 | |
Imperial Brands PLC | | | 6,630 | | | | 230,710 | |
ITV PLC | | | 101,050 | | | | 207,392 | |
Lloyds Banking Group PLC | | | 115,970 | | | | 89,191 | |
Royal Dutch Shell PLC, Class A | | | 10,002 | | | | 342,681 | |
Standard Life Aberdeen PLC | | | 27,480 | | | | 109,498 | |
| | | | | | | | |
| See accompanying Notes to Financial Statements | | | September 30, 2018 | | | Annual Report | | | 149 | |
Schedule of Investments
September 30, 2018
| | | | | | | | |
| | | Shares | | | Value | |
Tate & Lyle PLC | | | 11,103 | | | $ | 98,733 | |
TUI AG | | | 6,623 | | | | 127,268 | |
| | | | | | | | |
| | | | | | | 2,407,767 | |
| | | | | | | | |
| |
Total Investments
(cost—$6,910,492) (b)—100.9% | | | | 7,025,997 | |
| | | | | | | | |
| | |
| Liabilities in excess of other assets—(0.9)% | | | | | | | (61,988 | ) |
| | | | | | | | |
| | |
| Net Assets—100.0% | | | | | | | $6,964,009 | |
| | | | | | | | |
Notes to Schedule of Investments:
(a) 144A—Exempt from registration under Rule 144A of the Securities Act of 1933. These securities may be resold in transactions exempt from registration, typically only to qualified institutional buyers. Security with a value of $116,453, representing 1.7% of net assets.
(b) Securities with an aggregate value of $6,836,753, representing 98.2% of net assets, were valued utilizing modeling tools provided by a third-party vendor. See Note 1(a) and Note 1(b) in the Notes to Financial Statements.
(c) Non-income producing.
Glossary:
REIT—Real Estate Investment Trust
| | | | |
The industry classification of portfolio holdings and liabilities in excess of other assets shown as a percentage of net assets were as follows: | |
Oil, Gas & Consumable Fuels | | | 17.8% | |
Insurance | | | 14.5% | |
Diversified Telecommunication Services | | | 10.8% | |
Media | | | 8.3% | |
Banks | | | 7.4% | |
Tobacco | | | 5.7% | |
Pharmaceuticals | | | 5.0% | |
Equity Real Estate Investment Trusts (REITs) | | | 5.0% | |
Electric Utilities | | | 4.9% | |
Air Freight & Logistics | | | 3.9% | |
Metals & Mining | | | 3.0% | |
Automobiles | | | 2.7% | |
Capital Markets | | | 2.4% | |
Construction & Engineering | | | 2.0% | |
Hotels, Restaurants & Leisure | | | 1.8% | |
Diversified Financial Services | | | 1.6% | |
Food Products | | | 1.4% | |
Beverages | | | 1.2% | |
Wireless Telecommunication Services | | | 0.8% | |
Construction Materials | | | 0.7% | |
Liabilities in excess of other assets | | | (0.9)% | |
| | | | |
| | | 100.0% | |
| | | | |
AllianzGI Global Dynamic Allocation Fund
| | | | | | | | |
| | | Shares | | | Value | |
| Common Stock—59.9% | |
| Australia—0.4% | |
Abacus Property Group REIT | | | 24,925 | | | | $61,463 | |
BlueScope Steel Ltd. | | | 11,262 | | | | 138,126 | |
Breville Group Ltd. | | | 1,323 | | | | 12,492 | |
Brickworks Ltd. | | | 2,992 | | | | 37,879 | |
Cochlear Ltd. | | | 554 | | | | 80,328 | |
Elders Ltd. | | | 7,988 | | | | 40,921 | |
Metcash Ltd. | | | 47,137 | | | | 102,129 | |
Qantas Airways Ltd. | | | 29,605 | | | | 126,184 | |
Regis Resources Ltd. | | | 15,795 | | | | 42,494 | |
Rio Tinto Ltd. | | | 2,313 | | | | 131,546 | |
St. Barbara Ltd. | | | 16,786 | | | | 42,371 | |
Stockland REIT | | | 800 | | | | 2,403 | |
Vicinity Centres REIT | | | 1,738 | | | | 3,297 | |
Wesfarmers Ltd. | | | 3,306 | | | | 119,047 | |
| | | | | | | | |
| | | | | | | 940,680 | |
| | | | | | | | |
| Austria—0.3% | |
Austria Technologie & Systemtechnik AG | | | 1,363 | | | | 31,464 | |
Erste Group Bank AG | | | 7,041 | | | | 292,320 | |
EVN AG | | | 4,031 | | | | 78,916 | |
Flughafen Wien AG | | | 322 | | | | 13,105 | |
OMV AG | | | 2,555 | | | | 143,333 | |
POLYTEC Holding AG | | | 2,054 | | | | 26,151 | |
Raiffeisen Bank International AG | | | 2,232 | | | | 64,240 | |
S IMMO AG | | | 2,128 | | | | 42,496 | |
Telekom Austria AG (j) | | | 3,344 | | | | 25,897 | |
| | | | | | | | |
| | | | | | | 717,922 | |
| | | | | | | | |
| Belgium—0.0% | |
Elia System Operator S.A. | | | 629 | | | | 40,521 | |
Recticel S.A. | | | 3,249 | | | | 35,687 | |
| | | | | | | | |
| | | | | | | 76,208 | |
| | | | | | | | |
| Bermuda—0.0% | |
Bank of NT Butterfield & Son Ltd. | | | 1,338 | | | | 69,389 | |
| | | | | | | | |
| Brazil—0.4% | |
Cia de Saneamento Basico do Estado de Sao Paulo (j) | | | 6,700 | | | | 39,136 | |
Fibria Celulose S.A. | | | 7,700 | | | | 143,988 | |
MRV Engenharia e Participacoes S.A. | | | 15,600 | | | | 47,474 | |
Qualicorp Consultoria e Corretora de Seguros S.A. | | | 10,500 | | | | 42,847 | |
Smiles Fidelidade S.A. | | | 1,200 | | | | 13,668 | |
Suzano Papel e Celulose S.A. | | | 14,900 | | | | 177,389 | |
Vale S.A. | | | 20,745 | | | | 307,280 | |
| | | | | | | | |
| | | | | | | 771,782 | |
| | | | | | | | |
| Canada—2.4% | |
Aecon Group, Inc. | | | 489 | | | | 6,144 | |
AGF Management Ltd., Class B | | | 7,791 | | | | 36,854 | |
Agnico Eagle Mines Ltd. | | | 2,427 | | | | 82,901 | |
Artis Real Estate Investment Trust REIT | | | 523 | | | | 4,758 | |
Baytex Energy Corp. (j) | | | 1,346 | | | | 3,908 | |
BCE, Inc. | | | 2,661 | | | | 107,808 | |
Bonavista Energy Corp. | | | 3,032 | | | | 3,498 | |
BRP, Inc. | | | 2,849 | | | | 133,644 | |
Canadian Apartment Properties REIT | | | 2,410 | | | | 88,981 | |
Canadian Imperial Bank of Commerce | | | 3,410 | | | | 319,523 | |
Canadian Natural Resources Ltd. | | | 5,807 | | | | 189,723 | |
| | | | | | |
| 150 | | Annual Report | | | September 30, 2018 | | | See accompanying Notes to Financial Statements |
Schedule of Investments
September 30, 2018
| | | | | | | | |
| | | Shares | | | Value | |
Canadian Tire Corp., Ltd., Class A | | | 1,111 | | | $ | 130,174 | |
Canfor Pulp Products, Inc. | | | 534 | | | | 10,112 | |
Cascades, Inc. | | | 2,172 | | | | 21,205 | |
Chorus Aviation, Inc. | | | 4,609 | | | | 27,512 | |
Cogeco Communications, Inc. | | | 2,543 | | | | 127,381 | |
Colliers International Group, Inc. | | | 986 | | | | 76,375 | |
Constellation Software, Inc. | | | 54 | | | | 39,711 | |
Corus Entertainment, Inc., Class B | | | 13,997 | | | | 45,405 | |
Crescent Point Energy Corp. | | | 346 | | | | 2,197 | |
Dollarama, Inc. | | | 1,607 | | | | 50,624 | |
Dream Global Real Estate Investment Trust REIT | | | 10,243 | | | | 117,763 | |
Dream Industrial Real Estate Investment Trust REIT | | | 5,600 | | | | 43,832 | |
ECN Capital Corp. | | | 1,240 | | | | 3,619 | |
Exchange Income Corp. | | | 3,541 | | | | 90,660 | |
Fairfax Financial Holdings Ltd. | | | 272 | | | | 147,775 | |
Fortis, Inc. | | | 2,562 | | | | 83,069 | |
Genworth MI Canada, Inc. | | | 2,539 | | | | 83,719 | |
George Weston Ltd. | | | 1,561 | | | | 118,158 | |
Husky Energy, Inc. | | | 5,892 | | | | 103,457 | |
Industrial Alliance Insurance & Financial Services, Inc. | | | 2,401 | | | | 96,010 | |
Intact Financial Corp. | | | 360 | | | | 29,934 | |
Killam Apartment REIT | | | 7,135 | | | | 89,101 | |
Laurentian Bank of Canada | | | 3,533 | | | | 116,522 | |
Linamar Corp. | | | 2,171 | | | | 100,024 | |
Loblaw Cos., Ltd. | | | 3,847 | | | | 197,644 | |
Magna International, Inc. | | | 1,835 | | | | 96,392 | |
Manulife Financial Corp. | | | 9,807 | | | | 175,314 | |
Martinrea International, Inc. | | | 7,956 | | | | 81,245 | |
Methanex Corp. | | | 1,380 | | | | 108,934 | |
National Bank of Canada | | | 2,856 | | | | 142,640 | |
Northview Apartment Real Estate Investment Trust REIT | | | 3,393 | | | | 67,353 | |
NorthWest Healthcare Properties Real Estate Investment Trust REIT | | | 9,038 | | | | 78,439 | |
Power Corp. of Canada | | | 6,096 | | | | 132,430 | |
Restaurant Brands International, Inc. | | | 2,702 | | | | 160,175 | |
Royal Bank of Canada | | | 3,133 | | | | 251,145 | |
Saputo, Inc. | | | 1,487 | | | | 44,231 | |
Teck Resources Ltd., Class B | | | 4,348 | | | | 104,791 | |
TMX Group Ltd. | | | 3,233 | | | | 216,985 | |
Toronto-Dominion Bank | | | 4,368 | | | | 265,431 | |
TransCanada Corp. | | | 3,803 | | | | 153,869 | |
Transcontinental, Inc., Class A | | | 9,307 | | | | 165,006 | |
Valener, Inc. | | | 739 | | | | 10,922 | |
West Fraser Timber Co., Ltd. | | | 1,158 | | | | 65,904 | |
| | | | | | | | |
| | | | | | | 5,250,931 | |
| | | | | | | | |
| China—2.9% | |
AAC Technologies Holdings, Inc. | | | 3,400 | | | | 35,109 | |
Agile Group Holdings Ltd. | | | 35,091 | | | | 49,727 | |
Agricultural Bank of China Ltd., Class H | | | 203,000 | | | | 99,555 | |
Alibaba Group Holding Ltd. ADR (j) | | | 2,790 | | | | 459,680 | |
Anhui Conch Cement Co., Ltd., Class H | | | 15,500 | | | | 93,076 | |
Bank of China Ltd., Class H | | | 546,000 | | | | 241,246 | |
Bank of Communications Co., Ltd., Class H | | | 117,039 | | | | 87,637 | |
Beijing Enterprises Holdings Ltd. | | | 23,500 | | | | 131,707 | |
| | | | | | | | |
| | | Shares | | | Value | |
BOC Aviation Ltd. (b) | | | 32,000 | | | $ | 248,261 | |
BYD Electronic International Co., Ltd. | | | 41,818 | | | | 61,400 | |
China CITIC Bank Corp., Ltd., Class H | | | 218,000 | | | | 139,211 | |
China Construction Bank Corp., Class H | | | 513,064 | | | | 448,469 | |
China Dongxiang Group Co., Ltd. | | | 43,117 | | | | 7,203 | |
China Everbright Greentech Ltd. (b) | | | 35,000 | | | | 29,844 | |
China Evergrande Group (j) | | | 15,483 | | | | 43,227 | |
China Huarong Asset Management Co., Ltd., Class H (b) | | | 804,000 | | | | 147,774 | |
China Lumena New Materials Corp. (e)(f)(j) | | | 1,772 | | | | 34 | |
China Mobile Ltd. | | | 27,500 | | | | 270,376 | |
China Petroleum & Chemical Corp., Class H | | | 223,800 | | | | 224,863 | |
China Southern Airlines Co., Ltd., Class H | | | 57,154 | | | | 36,429 | |
China Water Affairs Group Ltd. | | | 64,000 | | | | 71,597 | |
China Yuchai International Ltd. | | | 3,015 | | | | 52,069 | |
China Zhongwang Holdings Ltd. | | | 114,800 | | | | 56,099 | |
Chongqing Rural Commercial Bank Co., Ltd., Class H | | | 6,488 | | | | 3,541 | |
CITIC Ltd. | | | 64,000 | | | | 95,323 | |
Country Garden Holdings Co., Ltd. | | | 45,000 | | | | 56,708 | |
Country Garden Services Holdings Co., Ltd. (j) | | | 5,172 | | | | 8,732 | |
CSPC Pharmaceutical Group Ltd. | | | 32,000 | | | | 67,688 | |
EVA Precision Industrial Holdings Ltd. | | | 20,236 | | | | 1,783 | |
Fosun International Ltd. | | | 30,000 | | | | 52,862 | |
Guangzhou Automobile Group Co., Ltd., Class H | | | 88,809 | | | | 98,123 | |
Guangzhou R&F Properties Co., Ltd., Class H | | | 2,881 | | | | 5,286 | |
Haier Electronics Group Co., Ltd. | | | 42,000 | | | | 113,708 | |
Hopewell Highway Infrastructure Ltd. | | | 21,000 | | | | 11,025 | |
Hua Hong Semiconductor Ltd. (b) | | | 51,000 | | | | 109,330 | |
Industrial & Commercial Bank of China Ltd., Class H | | | 406,000 | | | | 296,418 | |
Jiangsu Expressway Co., Ltd., Class H | | | 55,189 | | | | 70,795 | |
Jiayuan International Group Ltd. | | | 20,000 | | | | 34,235 | |
Ju Teng International Holdings Ltd. | | | 4,744 | | | | 1,199 | |
Kingboard Holdings Ltd. | | | 14,000 | | | | 45,573 | |
Lee & Man Paper Manufacturing Ltd. | | | 48,517 | | | | 44,925 | |
Longfor Group Holdings Ltd. | | | 14,845 | | | | 38,267 | |
Nexteer Automotive Group Ltd. | | | 39,000 | | | | 61,752 | |
Orient Securities Co., Ltd., Class H (b) | | | 21,600 | | | | 13,861 | |
Ping An Insurance Group Co. of China Ltd., Class H | | | 27,000 | | | | 273,515 | |
Postal Savings Bank of China Co., Ltd., Class H (b) | | | 90,000 | | | | 56,556 | |
Shanghai Industrial Holdings Ltd. | | | 43,000 | | | | 95,139 | |
| | | | | | | | |
| | | Shares | | | Value | |
Shenzhen Expressway Co., Ltd., Class H | | | 64,274 | | | $ | 64,542 | |
Sihuan Pharmaceutical Holdings Group Ltd. | | | 185,000 | | | | 37,795 | |
Sinopec Shanghai Petrochemical Co., Ltd., Class H | | | 91,380 | | | | 55,732 | |
Sinopharm Group Co., Ltd., Class H | | | 15,921 | | | | 77,893 | |
Sinotrans Ltd., Class H | | | 45,000 | | | | 18,302 | |
Sinotruk Hong Kong Ltd. | | | 33,500 | | | | 73,089 | |
Tencent Holdings Ltd. | | | 22,281 | | | | 909,752 | |
Tianneng Power International Ltd. | | | 78,342 | | | | 69,256 | |
Tong Ren Tang Technologies Co., Ltd., Class H | | | 2,726 | | | | 3,994 | |
Want Want China Holdings Ltd. | | | 97,000 | | | | 81,598 | |
Weichai Power Co., Ltd., Class H | | | 67,000 | | | | 82,942 | |
XTEP International Holdings Ltd. | | | 7,651 | | | | 4,420 | |
Yum China Holdings, Inc. | | | 2,047 | | | | 71,870 | |
Yuzhou Properties Co., Ltd. | | | 133,088 | | | | 53,973 | |
YY, Inc. ADR (j) | | | 657 | | | | 49,222 | |
| | | | | | | | |
| | | | | | | 6,345,317 | |
| | | | | | | | |
| Colombia—0.1% | |
Bancolombia S.A. | | | 12,731 | | | | 137,073 | |
Corp. Financiera Colombiana S.A. (j) | | | 346 | | | | 2,569 | |
| | | | | | | | |
| | | | | | | 139,642 | |
| | | | | | | | |
| Czech Republic—0.1% | |
CEZ AS | | | 1,419 | | | | 36,287 | |
O2 Czech Republic AS | | | 1,665 | | | | 19,432 | |
Philip Morris CR AS | | | 93 | | | | 62,207 | |
| | | | | | | | |
| | | | | | | 117,926 | |
| | | | | | | | |
| Denmark—0.1% | |
Solar A/S, Class B | | | 111 | | | | 6,947 | |
Spar Nord Bank A/S | | | 377 | | | | 3,496 | |
Topdanmark A/S | | | 1,203 | | | | 54,982 | |
William Demant Holding A/S (j) | | | 2,700 | | | | 101,354 | |
| | | | | | | | |
| | | | | | | 166,779 | |
| | | | | | | | |
| Finland—0.3% | |
Cramo Oyj | | | 1,938 | | | | 43,720 | |
Elisa Oyj | | | 1,831 | | | | 77,624 | |
Finnair Oyj | | | 2,810 | | | | 23,382 | |
Metsa Board Oyj | | | 429 | | | | 4,335 | |
Neste Oyj | | | 1,391 | | | | 114,654 | |
Oriola Oyj, Class B | | | 700 | | | | 2,296 | |
Stora Enso Oyj, Class R | | | 8,051 | | | | 153,743 | |
UPM-Kymmene Oyj | | | 5,669 | | | | 222,332 | |
| | | | | | | | |
| | | | | | | 642,086 | |
| | | | | | | | |
| France—2.6% | |
Air France-KLM (j) | | | 6,444 | | | | 67,162 | |
AKWEL | | | 1,628 | | | | 34,340 | |
APERAM S.A. | | | 51 | | | | 2,333 | |
ArcelorMittal | | | 6,246 | | | | 193,915 | |
Atos SE | | | 1,917 | | | | 228,098 | |
AXA S.A. | | | 14,844 | | | | 397,755 | |
Beneteau S.A. | | | 1,793 | | | | 28,826 | |
BioMerieux | | | 842 | | | | 70,282 | |
Boiron S.A. | | | 31 | | | | 2,088 | |
Bouygues S.A. | | | 6,399 | | | | 276,823 | |
Capgemini SE | | | 1,008 | | | | 126,905 | |
Cegereal S.A. REIT | | | 793 | | | | 34,066 | |
Cie Generale des Etablissements Michelin SCA | | | 2,044 | | | | 243,963 | |
| | | | | | | | |
| See accompanying Notes to Financial Statements | | | September 30, 2018 | | | Annual Report | | | 151 | |
Schedule of Investments
September 30, 2018
| | | | | | | | |
| | | Shares | | | Value | |
CNP Assurances | | | 6,732 | | | $ | 162,279 | |
Coface S.A. | | | 3,416 | | | | 32,403 | |
Derichebourg S.A. | | | 4,537 | | | | 24,211 | |
Eiffage S.A. | | | 2,917 | | | | 325,858 | |
Engie S.A. | | | 17,107 | | | | 251,854 | |
Faurecia S.A. | | | 1,794 | | | | 107,891 | |
Interparfums S.A. | | | 999 | | | | 51,093 | |
Klepierre S.A. REIT | | | 3,928 | | | | 139,580 | |
L’Oreal S.A. | | | 1,022 | | | | 246,391 | |
LVMH Moet Hennessy Louis Vuitton SE | | | 912 | | | | 322,274 | |
Metropole Television S.A. | | | 5,408 | | | | 109,006 | |
Nexity S.A. | | | 322 | | | | 17,797 | |
Orange S.A. | | | 17,649 | | | | 280,824 | |
Orpea | | | 457 | | | | 59,121 | |
Peugeot S.A. | | | 7,196 | | | | 194,117 | |
Renault S.A. | | | 1,527 | | | | 132,089 | |
Rubis SCA | | | 80 | | | | 4,333 | |
Sanofi | | | 4,942 | | | | 441,554 | |
SCOR SE | | | 1,870 | | | | 86,696 | |
SEB S.A. | | | 19 | | | | 3,232 | |
STMicroelectronics NV | | | 4,337 | | | | 79,378 | |
Total S.A. | | | 7,680 | | | | 499,359 | |
Vinci S.A. | | | 5,986 | | | | 569,507 | |
| | | | | | | | |
| | | | | | | 5,847,403 | |
| | | | | | | | |
| Germany—0.7% | |
Bayer AG | | | 1,347 | | | | 119,480 | |
Bayerische Motoren Werke AG | | | 1,321 | | | | 119,010 | |
Covestro AG (b) | | | 2,079 | | | | 168,289 | |
Deutsche Lufthansa AG | | | 7,221 | | | | 177,232 | |
Deutsche Post AG | | | 7,349 | | | | 261,289 | |
Fraport AG Frankfurt Airport Services Worldwide | | | 1,468 | | | | 129,598 | |
Fresenius SE & Co. KGaA | | | 568 | | | | 41,652 | |
Hella GmbH & Co. KGaA | | | 605 | | | | 33,717 | |
Rheinmetall AG | | | 518 | | | | 54,146 | |
Rhoen Klinikum AG | | | 147 | | | | 3,779 | |
Siemens AG | | | 1,408 | | | | 180,032 | |
Sixt SE | | | 37 | | | | 4,596 | |
Stroeer SE & Co. KGaA | | | 580 | | | | 33,134 | |
TAG Immobilien AG | | | 3,162 | | | | 75,339 | |
Talanx AG (j) | | | 4,693 | | | | 178,317 | |
WCM Beteiligungs & Grundbesitz AG (j) | | | 1,866 | | | | 8,449 | |
Wuestenrot & Wuerttembergische AG | | | 1,560 | | | | 35,550 | |
| | | | | | | | |
| | | | | | | 1,623,609 | |
| | | | | | | | |
| Greece—0.1% | |
FF Group (e)(f)(j) | | | 4,956 | | | | 10,933 | |
Hellenic Petroleum S.A. | | | 4,186 | | | | 36,514 | |
JUMBO S.A. | | | 6,391 | | | | 94,979 | |
Motor Oil Hellas Corinth Refineries S.A. | | | 3,327 | | | | 86,913 | |
Mytilineos Holdings S.A. | | | 3,431 | | | | 34,067 | |
| | | | | | | | |
| | | | | | | 263,406 | |
| | | | | | | | |
| Hong Kong—0.7% | |
AIA Group Ltd. | | | 40,600 | | | | 362,027 | |
Cathay Pacific Airways Ltd. | | | 1,543 | | | | 2,326 | |
CK Hutchison Holdings Ltd. | | | 1,297 | | | | 14,929 | |
CLP Holdings Ltd. | | | 28,781 | | | | 337,046 | |
Dah Sing Banking Group Ltd. | | | 1,623 | | | | 3,259 | |
Fairwood Holdings Ltd. | | | 3,500 | | | | 12,241 | |
Global Brands Group Holding Ltd. (j) | | | 614,000 | | | | 32,060 | |
Hang Seng Bank Ltd. | | | 1,300 | | | | 35,274 | |
IT Ltd. | | | 114,000 | | | | 60,907 | |
Johnson Electric Holdings Ltd. | | | 34,000 | | | | 96,005 | |
Kerry Properties Ltd. | | | 17,243 | | | | 58,550 | |
Link REIT | | | 18,492 | | | | 182,071 | |
| | | | | | | | |
| | | Shares | | | Value | |
Minth Group Ltd. | | | 13,315 | | | $ | 54,779 | |
Regal Hotels International Holdings Ltd. | | | 38,000 | | | | 20,824 | |
Swire Pacific Ltd., Class A | | | 5,656 | | | | 61,942 | |
VSTECS Holdings Ltd. | | | 46,000 | | | | 23,718 | |
WH Group Ltd. (b) | | | 114,000 | | | | 80,034 | |
Xinyi Glass Holdings Ltd. | | | 44,292 | | | | 55,842 | |
Yue Yuen Industrial Holdings Ltd. | | | 698 | | | | 1,941 | |
| | | | | | | | |
| | | | | | | 1,495,775 | |
| | | | | | | | |
| Hungary—0.2% | |
Magyar Telekom Telecommunications PLC | | | 87,892 | | | | 126,198 | |
MOL Hungarian Oil & Gas PLC | | | 6,618 | | | | 71,282 | |
OTP Bank PLC | | | 4,055 | | | | 150,273 | |
Richter Gedeon Nyrt | | | 2,101 | | | | 39,292 | |
| | | | | | | | |
| | | | | | | 387,045 | |
| | | | | | | | |
| India—0.0% | |
Genpact Ltd. | | | 1,385 | | | | 42,395 | |
| | | | | | | | |
| Indonesia—0.3% | |
Bank Negara Indonesia Persero Tbk PT | | | 257,655 | | | | 127,949 | |
Bank Tabungan Negara Persero Tbk PT | | | 343,400 | | | | 60,571 | |
Gudang Garam Tbk PT | | | 13,900 | | | | 69,057 | |
Indo Tambangraya Megah Tbk PT | | | 33,400 | | | | 57,941 | |
Indofood Sukses Makmur Tbk PT | | | 115,479 | | | | 45,726 | |
Telekomunikasi Indonesia Persero Tbk PT | | | 1,306,806 | | | | 319,874 | |
Unilever Indonesia Tbk PT | | | 23,400 | | | | 73,852 | |
| | | | | | | | |
| | | | | | | 754,970 | |
| | | | | | | | |
| Ireland—0.0% | |
Irish Residential Properties REIT PLC | | | 5,191 | | | | 8,908 | |
Origin Enterprises PLC | | | 2,219 | | | | 14,608 | |
| | | | | | | | |
| | | | | | | 23,516 | |
| | | | | | | | |
| Israel—0.3% | |
B Communications Ltd. (j) | | | 1,705 | | | | 16,805 | |
Bank Hapoalim BM | | | 15,345 | | | | 112,365 | |
Bank Leumi Le-Israel BM | | | 26,242 | | | | 172,944 | |
First International Bank of Israel Ltd. | | | 3,430 | | | | 77,407 | |
Harel Insurance Investments & Financial Services Ltd. | | | 5,173 | | | | 39,755 | |
Hilan Ltd. | | | 2,961 | | | | 73,721 | |
Ituran Location and Control Ltd. | | | 2,028 | | | | 69,763 | |
Jerusalem Oil Exploration (j) | | | 877 | | | | 53,906 | |
Mizrahi Tefahot Bank Ltd. | | | 3,334 | | | | 58,384 | |
Shufersal Ltd. | | | 3,759 | | | | 24,034 | |
| | | | | | | | |
| | | | | | | 699,084 | |
| | | | | | | | |
| Italy—0.6% | |
Amplifon SpA | | | 4,460 | | | | 98,881 | |
ASTM SpA | | | 1,590 | | | | 34,275 | |
Cementir Holding SpA | | | 4,685 | | | | 32,705 | |
Enel SpA | | | 66,773 | | | | 341,312 | |
Fila SpA | | | 543 | | | | 11,033 | |
Intesa Sanpaolo SpA | | | 66,054 | | | | 168,301 | |
Iren SpA | | | 18,717 | | | | 45,892 | |
La Doria SpA | | | 2,524 | | | | 33,131 | |
Maire Tecnimont SpA | | | 7,699 | | | | 34,541 | |
Mediobanca Banca di Credito Finanziario SpA | | | 7,246 | | | | 72,110 | |
Prima Industrie SpA | | | 831 | | | | 28,153 | |
| | | | | | | | |
| | | Shares | | | Value | |
Snam SpA | | | 18,546 | | | $ | 77,123 | |
Societa Iniziative Autostradali e Servizi SpA | | | 3,584 | | | | 52,917 | |
Telecom Italia SpA (j) | | | 269,183 | | | | 162,716 | |
Unipol Gruppo SpA | | | 15,252 | | | | 67,788 | |
| | | | | | | | |
| | | | | | | 1,260,878 | |
| | | | | | | | |
| Japan—6.2% | |
ADEKA Corp. | | | 26 | | | | 446 | |
AGC, Inc. | | | 2,200 | | | | 91,305 | |
Aida Engineering Ltd. | | | 142 | | | | 1,269 | |
Aisin Seiki Co., Ltd. | | | 3,200 | | | | 155,902 | |
ANA Holdings, Inc. | | | 3,745 | | | | 130,830 | |
Aoyama Trading Co., Ltd. | | | 111 | | | | 3,409 | |
Asahi Group Holdings Ltd. | | | 2,400 | | | | 104,129 | |
Astellas Pharma, Inc. | | | 11,892 | | | | 207,670 | |
Bandai Namco Holdings, Inc. | | | 2,000 | | | | 77,702 | |
BML, Inc. | | | 518 | | | | 15,764 | |
Brother Industries Ltd. | | | 5,500 | | | | 108,598 | |
Canon, Inc. | | | 12,010 | | | | 380,831 | |
Chubu Electric Power Co., Inc. | | | 11,500 | | | | 174,201 | |
Concordia Financial Group Ltd. | | | 16,000 | | | | 78,425 | |
Daiichi Sankyo Co., Ltd. | | | 3,347 | | | | 145,085 | |
Daito Pharmaceutical Co., Ltd. | | | 152 | | | | 4,706 | |
Daiwa House Industry Co., Ltd. | | | 3,454 | | | | 102,355 | |
DCM Holdings Co., Ltd. | | | 5,325 | | | | 48,384 | |
Denso Corp. | | | 2,600 | | | | 137,353 | |
Doutor Nichires Holdings Co., Ltd. | | | 1,851 | | | | 34,373 | |
DTS Corp. | | | 399 | | | | 15,885 | |
DyDo Group Holdings, Inc. | | | 326 | | | | 16,325 | |
EDION Corp. | | | 2,473 | | | | 27,651 | |
Eizo Corp. | | | 1,500 | | | | 67,806 | |
Electric Power Development Co., Ltd. | | | 9,100 | | | | 251,886 | |
EPS Holdings, Inc. | | | 700 | | | | 14,918 | |
Exedy Corp. | | | 2,074 | | | | 68,740 | |
FANUC Corp. | | | 800 | | | | 150,506 | |
Fuji Oil Holdings, Inc. | | | 2,016 | | | | 63,569 | |
Fuji Soft, Inc. | | | 272 | | | | 13,764 | |
FUJIFILM Holdings Corp. | | | 3,121 | | | | 140,411 | |
Fukuoka Financial Group, Inc. | | | 2,800 | | | | 77,001 | |
Fukuyama Transporting Co., Ltd. | | | 345 | | | | 14,920 | |
Furukawa Electric Co., Ltd. | | | 1,200 | | | | 39,931 | |
Gecoss Corp. | | | 5,200 | | | | 55,879 | |
Geo Holdings Corp. | | | 536 | | | | 8,106 | |
Goldcrest Co., Ltd. | | | 3,200 | | | | 52,252 | |
Hankyu Hanshin Holdings, Inc. | | | 1,870 | | | | 66,317 | |
Hitachi Ltd. | | | 6,400 | | | | 217,546 | |
Hogy Medical Co., Ltd. | | | 278 | | | | 9,583 | |
Honda Motor Co., Ltd. | | | 15,500 | | | | 466,802 | |
Honeys Holdings Co., Ltd. | | | 39 | | | | 351 | |
Iida Group Holdings Co., Ltd. | | | 12,900 | | | | 229,264 | |
ITOCHU Corp. | | | 21,877 | | | | 400,417 | |
Japan Airlines Co., Ltd. | | | 6,837 | | | | 245,736 | |
JFE Holdings, Inc. | | | 4,000 | | | | 91,760 | |
JXTG Holdings, Inc. | | | 20,500 | | | | 155,058 | |
Kagome Co., Ltd. | | | 1,800 | | | | 52,000 | |
Kajima Corp. | | | 6,000 | | | | 87,243 | |
Kamei Corp. | | | 3,000 | | | | 42,333 | |
Keyence Corp. | | | 300 | | | | 174,266 | |
Komatsu Ltd. | | | 5,000 | | | | 152,154 | |
Konica Minolta, Inc. | | | 9,100 | | | | 96,842 | |
Kyokuto Kaihatsu Kogyo Co., Ltd. | | | 2,700 | | | | 42,783 | |
Kyowa Exeo Corp. | | | 2,400 | | | | 70,245 | |
Kyudenko Corp. | | | 1,300 | | | | 51,592 | |
| | | | | | |
| 152 | | Annual Report | | | September 30, 2018 | | | See accompanying Notes to Financial Statements |
Schedule of Investments
September 30, 2018
| | | | | | | | |
| | | Shares | | | Value | |
LaSalle Logiport REIT | | | 35 | | | $ | 32,191 | |
Marubeni Corp. | | | 24,000 | | | | 219,495 | |
Mazda Motor Corp. | | | 14,800 | | | | 177,896 | |
Mitsubishi Chemical Holdings Corp. | | | 11,506 | | | | 110,119 | |
Mitsubishi Corp. | | | 14,300 | | | | 440,479 | |
Mitsubishi Gas Chemical Co., Inc. | | | 271 | | | | 5,769 | |
Mitsubishi Tanabe Pharma Corp. | | | 6,586 | | | | 110,228 | |
Mitsubishi UFJ Financial Group, Inc. | | | 43,885 | | | | 272,644 | |
Mitsuboshi Belting Ltd. | | | 71 | | | | 1,874 | |
Mitsui & Co., Ltd. | | | 20,800 | | | | 369,630 | |
Mitsui Sugar Co., Ltd. | | | 3,500 | | | | 100,431 | |
NEC Networks & System Integration Corp. | | | 765 | | | | 17,741 | |
NET One Systems Co., Ltd. | | | 2,900 | | | | 69,623 | |
Nichias Corp. | | | 1,198 | | | | 31,164 | |
Nidec Corp. | | | 1,100 | | | | 158,175 | |
Nihon Unisys Ltd. | | | 3,021 | | | | 77,926 | |
Nintendo Co., Ltd. | | | 400 | | | | 145,533 | |
Nippon Road Co., Ltd. | | | 800 | | | | 46,323 | |
Nippon Telegraph & Telephone Corp. | | | 13,608 | | | | 614,134 | |
Nissan Motor Co., Ltd. | | | 30,059 | | | | 281,278 | |
Nisshin Oillio Group Ltd. | | | 692 | | | | 20,309 | |
Nomura Real Estate Holdings, Inc. | | | 3,157 | | | | 63,685 | |
NS United Kaiun Kaisha Ltd. | | | 1,900 | | | | 43,762 | |
NTT Data Corp. | | | 8,215 | | | | 113,722 | |
NTT DOCOMO, Inc. | | | 12,543 | | | | 337,125 | |
Obayashi Corp. | | | 5,027 | | | | 47,612 | |
ORIX Corp. | | | 11,701 | | | | 189,458 | |
Pacific Industrial Co., Ltd. | | | 224 | | | | 3,712 | |
Prima Meat Packers Ltd. | | | 2,892 | | | | 68,192 | |
Raito Kogyo Co., Ltd. | | | 1,663 | | | | 23,783 | |
Recruit Holdings Co., Ltd. | | | 4,300 | | | | 143,626 | |
Rohm Co., Ltd. | | | 1,600 | | | | 117,056 | |
Rohto Pharmaceutical Co., Ltd. | | | 1,900 | | | | 66,764 | |
S Foods, Inc. | | | 772 | | | | 33,402 | |
Sanyo Special Steel Co., Ltd. | | | 182 | | | | 4,440 | |
Sawai Pharmaceutical Co., Ltd. | | | 925 | | | | 49,934 | |
Sekisui House Ltd. | | | 4,200 | | | | 64,047 | |
Senko Group Holdings Co., Ltd. | | | 1,796 | | | | 14,945 | |
Shibaura Electronics Co., Ltd. | | | 200 | | | | 9,338 | |
Shin-Etsu Chemical Co., Ltd. | | | 3,000 | | | | 265,225 | |
SoftBank Group Corp. | | | 5,800 | | | | 579,417 | |
Sojitz Corp. | | | 17,884 | | | | 64,535 | |
Sony Corp. | | | 5,900 | | | | 358,647 | |
Stella Chemifa Corp. | | | 1,511 | | | | 55,253 | |
Sumitomo Dainippon Pharma Co., Ltd. | | | 4,468 | | | | 102,614 | |
Sumitomo Electric Industries Ltd. | | | 17,500 | | | | 274,604 | |
Takasago Thermal Engineering Co., Ltd. | | | 397 | | | | 7,183 | |
Takeda Pharmaceutical Co., Ltd. | | | 3,843 | | | | 164,319 | |
Teijin Ltd. | | | 4,000 | | | | 76,715 | |
Toho Co., Ltd. | | | 2,000 | | | | 62,816 | |
Tokyo Electron Ltd. | | | 500 | | | | 68,910 | |
Toray Industries, Inc. | | | 4,826 | | | | 36,210 | |
Toshiba Plant Systems & Services Corp. | | | 2,000 | | | | 42,747 | |
Towa Pharmaceutical Co., Ltd. | | | 138 | | | | 10,231 | |
Toyota Motor Corp. | | | 10,151 | | | | 632,435 | |
Toyota Tsusho Corp. | | | 2,600 | | | | 98,168 | |
Tv Tokyo Holdings Corp. | | | 266 | | | | 6,577 | |
Unipres Corp. | | | 317 | | | | 6,164 | |
| | | | | | | | |
| | | Shares | | | Value | |
Wacoal Holdings Corp. | | | 298 | | | $ | 8,549 | |
West Japan Railway Co. | | | 1,301 | | | | 90,692 | |
Yakult Honsha Co., Ltd. | | | 1,200 | | | | 98,413 | |
Yamaha Motor Co., Ltd. | | | 2,900 | | | | 81,324 | |
Yomiuri Land Co., Ltd. | | | 900 | | | | 36,033 | |
Yorozu Corp. | | | 259 | | | | 4,003 | |
Yoshinoya Holdings Co., Ltd. | | | 1,475 | | | | 23,391 | |
Yurtec Corp. | | | 132 | | | | 1,107 | |
| | | | | | | | |
| | | | | | | 13,688,426 | |
| | | | | | | | |
| Korea (Republic of)—1.4% | |
CJ Hello Co., Ltd. | | | 889 | | | | 8,175 | |
Daekyo Co., Ltd. | | | 777 | | | | 5,099 | |
DGB Financial Group, Inc. | | | 12,331 | | | | 112,808 | |
Easy Bio, Inc. | | | 559 | | | | 3,893 | |
GS Holdings Corp. | | | 1,215 | | | | 60,360 | |
Hana Financial Group, Inc. | | | 2,429 | | | | 97,531 | |
Hansol Paper Co., Ltd. | | | 477 | | | | 8,685 | |
Hanwha Chemical Corp. | | | 4,949 | | | | 86,095 | |
HDC Holdings Co., Ltd. | | | 757 | | | | 15,632 | |
HDC Hyundai Development Co-Engineering & Construction (j) | | | 1,058 | | | | 48,548 | |
Hyundai Department Store Co., Ltd. | | | 793 | | | | 71,063 | |
Hyundai Engineering Plastics Co., Ltd. | | | 864 | | | | 4,510 | |
Hyundai Steel Co. | | | 1,889 | | | | 96,238 | |
Industrial Bank of Korea | | | 5,202 | | | | 71,491 | |
KB Financial Group, Inc. | | | 2,880 | | | | 140,267 | |
KC Co., Ltd. | | | 70 | | | | 1,316 | |
KC Tech Co., Ltd. | | | 103 | | | | 1,375 | |
KT Corp. | | | 221 | | | | 6,008 | |
KT&G Corp. | | | 853 | | | | 79,975 | |
Kukdo Chemical Co., Ltd. | | | 130 | | | | 6,375 | |
LG Corp. | | | 831 | | | | 54,393 | |
LG Electronics, Inc. | | | 1,946 | | | | 124,526 | |
LG Uplus Corp. | | | 5,641 | | | | 93,069 | |
Lotte Chemical Corp. | | | 167 | | | | 41,852 | |
LS Corp. | | | 973 | | | | 60,069 | |
Macquarie Korea Infrastructure Fund | | | 4,385 | | | | 35,973 | |
OCI Co., Ltd. | | | 553 | | | | 54,828 | |
POSCO | | | 1,132 | | | | 300,486 | |
S-Oil Corp. | | | 1,011 | | | | 124,880 | |
Samjin Pharmaceutical Co., Ltd. | | | 320 | | | | 16,789 | |
Samsung Electronics Co., Ltd. | | | 4,250 | | | | 177,866 | |
Samsung Electronics Co., Ltd. GDR | | | 569 | | | | 595,743 | |
Shinhan Financial Group Co., Ltd. | | | 4,196 | | | | 169,554 | |
SK Innovation Co., Ltd. | | | 855 | | | | 165,733 | |
SK Telecom Co., Ltd. | | | 604 | | | | 153,135 | |
Ubiquoss Holdings, Inc. (j) | | | 442 | | | | 2,623 | |
Ubiquoss, Inc. | | | 140 | | | | 4,973 | |
Woori Bank | | | 7,482 | | | | 113,930 | |
| | | | | | | | |
| | | | | | | 3,215,866 | |
| | | | | | | | |
| Malaysia—0.3% | |
AirAsia Group Bhd. | | | 65,300 | | | | 49,845 | |
Ann Joo Resources Bhd. | | | 32,300 | | | | 13,810 | |
CIMB Group Holdings Bhd. | | | 95,200 | | | | 138,214 | |
Genting Bhd. | | | 36,500 | | | | 68,873 | |
Genting Malaysia Bhd. | | | 64,400 | | | | 77,633 | |
Hong Leong Financial Group Bhd. | | | 14,500 | | | | 67,587 | |
KNM Group Bhd. (j) | | | 31,700 | | | | 1,187 | |
Malayan Banking Bhd. | | | 41,200 | | | | 97,443 | |
Maxis Bhd. | | | 3,200 | | | | 4,515 | |
MISC Bhd. | | | 17,300 | | | | 25,336 | |
Public Bank Bhd. | | | 10,300 | | | | 62,209 | |
Supermax Corp. Bhd. | | | 20,100 | | | | 15,742 | |
Tenaga Nasional Bhd. | | | 26,500 | | | | 99,083 | |
VS Industry Bhd. | | | 70,375 | | | | 29,421 | |
| | | | | | | | |
| | | | | | | 750,898 | |
| | | | | | | | |
| | | | | | | | |
| | | Shares | | | Value | |
| Mexico—0.3% | |
Alfa S.A.B de C.V., Class A | | | 62,800 | | | $ | 80,740 | |
Banco del Bajio S.A. (b) | | | 12,600 | | | | 31,106 | |
El Puerto de Liverpool S.A.B de C.V. | | | 9,800 | | | | 73,634 | |
Grupo Aeroportuario del Pacifico S.A.B de C.V. ADR | | | 47 | | | | 5,132 | |
Grupo Financiero Banorte S.A.B de C.V., Class O | | | 13,900 | | | | 100,555 | |
Grupo Lala S.A.B de C.V. | | | 4,496 | | | | 5,141 | |
Industrias Bachoco S.A.B de C.V. ADR | | | 1,280 | | | | 69,030 | |
Macquarie Mexico Real Estate Management S.A. de C.V. REIT (j) | | | 62,700 | | | | 75,150 | |
Wal-Mart de Mexico S.A.B de C.V. | | | 51,200 | | | | 155,318 | |
| | | | | | | | |
| | | | | | | 595,806 | |
| | | | | | | | |
| Morocco—0.0% | |
Douja Promotion Groupe Addoha S.A. | | | 3,431 | | | | 5,372 | |
| | | | | | | | |
| Netherlands—0.9% | |
ABN AMRO Group NV (b) | | | 5,801 | | | | 157,985 | |
Aegon NV | | | 14,747 | | | | 95,716 | |
AerCap Holdings NV (j) | | | 2,098 | | | | 120,677 | |
AMG Advanced Metallurgical Group NV | | | 879 | | | | 40,821 | |
ASML Holding NV | | | 1,326 | | | | 248,963 | |
ASR Nederland NV | | | 5,685 | | | | 270,981 | |
BE Semiconductor Industries NV | | | 1,542 | | | | 32,538 | |
ING Groep NV | | | 19,773 | | | | 256,636 | |
Koninklijke Ahold Delhaize NV | | | 14,337 | | | | 328,927 | |
Koninklijke DSM NV | | | 1,223 | | | | 129,532 | |
Koninklijke Volkerwessels NV | | | 2,060 | | | | 43,291 | |
NN Group NV | | | 6,660 | | | | 297,252 | |
Signify NV (b) | | | 1,865 | | | | 48,275 | |
Vastned Retail NV REIT | | | 232 | | | | 8,835 | |
| | | | | | | | |
| | | | | | | 2,080,429 | |
| | | | | | | | |
| New Zealand—0.2% | |
Air New Zealand Ltd. | | | 80,996 | | | | 165,951 | |
Arvida Group Ltd. | | | 9,216 | | | | 8,247 | |
Auckland International Airport Ltd. | | | 12,629 | | | | 61,102 | |
Fonterra Co-operative Group Ltd. UNIT | | | 2,607 | | | | 8,450 | |
Kiwi Property Group Ltd. REIT | | | 1,590 | | | | 1,466 | |
Metlifecare Ltd. | | | 25,550 | | | | 110,030 | |
Oceania Healthcare Ltd. | | | 38,432 | | | | 30,818 | |
Summerset Group Holdings Ltd. | | | 16,553 | | | | 85,676 | |
Tourism Holdings Ltd. | | | 3,164 | | | | 12,040 | |
| | | | | | | | |
| | | | | | | 483,780 | |
| | | | | | | | |
| Norway—0.4% | |
Austevoll Seafood ASA | | | 5,188 | | | | 71,469 | |
Avance Gas Holding Ltd. (b)(j) | | | 97 | | | | 242 | |
B2Holding ASA | | | 15,516 | | | | 30,825 | |
Evry AS (b) | | | 10,544 | | | | 41,457 | |
Leroy Seafood Group ASA | | | 6,270 | | | | 51,169 | |
Marine Harvest ASA | | | 705 | | | | 16,336 | |
Norsk Hydro ASA | | | 26,959 | | | | 161,670 | |
Norwegian Finans Holding ASA (j) | | | 6,317 | | | | 77,206 | |
Orkla ASA | | | 4,764 | | | | 40,251 | |
Salmar ASA | | | 2,412 | | | | 120,496 | |
Sparebank 1 Nord Norge | | | 7,721 | | | | 65,426 | |
SpareBank 1 SMN | | | 7,418 | | | | 82,869 | |
Telenor ASA | | | 8,132 | | | | 159,026 | |
| | | | | | | | |
| | | | | | | 918,442 | |
| | | | | | | | |
| | | | | | | | |
| See accompanying Notes to Financial Statements | | | September 30, 2018 | | | Annual Report | | | 153 | |
Schedule of Investments
September 30, 2018
| | | | | | | | |
| | | Shares | | | Value | |
| Peru—0.0% | |
Ferreycorp SAA | | | 34,967 | | | $ | 24,870 | |
Volcan Cia Minera SAA, Class B | | | 76,624 | | | | 17,857 | |
| | | | | | | | |
| | | | | | | 42,727 | |
| | | | | | | | |
| Philippines—0.2% | |
Bloomberry Resorts Corp. | | | 101,900 | | | | 16,535 | |
Cebu Air, Inc. | | | 28,120 | | | | 36,432 | |
DMCI Holdings, Inc. | | | 437,900 | | | | 92,220 | |
Filinvest Land, Inc. | | | 828,000 | | | | 21,914 | |
Globe Telecom, Inc. | | | 2,315 | | | | 94,262 | |
San Miguel Corp. | | | 10,250 | | | | 32,161 | |
Vista Land & Lifescapes, Inc. | | | 443,200 | | | | 49,955 | |
| | | | | | | | |
| | | | | | | 343,479 | |
| | | | | | | | |
| Poland—0.0% | |
Asseco Poland S.A. | | | 501 | | | | 6,476 | |
Ciech S.A. | | | 570 | | | | 7,321 | |
Polski Koncern Naftowy Orlen S.A. | | | 3,189 | | | | 87,414 | |
| | | | | | | | |
| | | | | | | 101,211 | |
| | | | | | | | |
| Russian Federation—0.0% | |
Magnitogorsk Iron & Steel Works PJSC GDR | | | 7,225 | | | | 74,707 | |
PhosAgro PJSC GDR | | | 1,266 | | | | 17,192 | |
Surgutneftegas PJSC ADR | | | 669 | | | | 2,762 | |
| | | | | | | | |
| | | | | | | 94,661 | |
| | | | | | | | |
| Singapore—0.5% | |
Accordia Golf Trust UNIT | | | 12,500 | | | | 4,983 | |
Asian Pay Television Trust UNIT | | | 118,900 | | | | 28,301 | |
Bumitama Agri Ltd. | | | 107,400 | | | | 52,684 | |
DBS Group Holdings Ltd. | | | 12,900 | | | | 246,095 | |
Fortune Real Estate Investment Trust REIT | | | 11,000 | | | | 13,045 | |
Frasers Logistics & Industrial Trust REIT | | | 55,700 | | | | 43,576 | |
Genting Singapore Ltd. | | | 86,500 | | | | 67,049 | |
Keppel DC REIT | | | 13,600 | | | | 13,618 | |
Mapletree Industrial Trust REIT | | | 9,000 | | | | 13,040 | |
Oversea-Chinese Banking Corp., Ltd. | | | 27,800 | | | | 232,622 | |
QAF Ltd. | | | 50,100 | | | | 27,482 | |
SATS Ltd. | | | 14,100 | | | | 53,830 | |
Sheng Siong Group Ltd. | | | 23,700 | | | | 19,409 | |
Singapore Airlines Ltd. | | | 18,000 | | | | 128,219 | |
Sino Grandness Food Industry Group Ltd. (j) | | | 25,900 | | | | 3,789 | |
United Overseas Bank Ltd. | | | 6,800 | | | | 134,425 | |
Venture Corp., Ltd. | | | 4,400 | | | | 56,737 | |
Yanlord Land Group Ltd. | | | 48,500 | | | | 52,502 | |
| | | | | | | | |
| | | | | | | 1,191,406 | |
| | | | | | | | |
| South Africa—0.2% | |
Fortress REIT Ltd., Class A REIT | | | 49,467 | | | | 58,911 | |
Harmony Gold Mining Co., Ltd. | | | 5,863 | | | | 9,613 | |
Naspers Ltd., Class N | | | 1,465 | | | | 315,486 | |
| | | | | | | | |
| | | | | | | 384,010 | |
| | | | | | | | |
| Spain—0.8% | |
ACS Actividades de Construccion y Servicios S.A. | | | 3,141 | | | | 133,407 | |
Amadeus IT Group S.A. | | | 3,321 | | | | 307,820 | |
Banco Santander S.A. | | | 53,686 | | | | 268,787 | |
CaixaBank S.A. | | | 28,033 | | | | 127,492 | |
Ebro Foods S.A. | | | 2,800 | | | | 61,113 | |
Ercros S.A. | | | 9,151 | | | | 53,165 | |
Inmobiliaria Colonial Socimi S.A. REIT | | | 410 | | | | 4,252 | |
| | | | | | | | |
| | | Shares | | | Value | |
International Consolidated Airlines Group S.A. | | | 16,982 | | | $ | 145,991 | |
Lar Espana Real Estate Socimi S.A. REIT | | | 137 | | | | 1,395 | |
Papeles y Cartones de Europa S.A. | | | 3,787 | | | | 73,397 | |
Repsol S.A. | | | 16,513 | | | | 328,730 | |
Telefonica S.A. | | | 19,791 | | | | 156,118 | |
| | | | | | | | |
| | | | | | | 1,661,667 | |
| | | | | | | | |
| Sweden—0.6% | |
Ahlsell AB (b) | | | 8,242 | | | | 46,127 | |
BillerudKorsnas AB | | | 199 | | | | 2,568 | |
Bravida Holding AB (b) | | | 9,507 | | | | 77,895 | |
Dios Fastigheter AB | | | 9,921 | | | | 63,470 | |
Hemfosa Fastigheter AB | | | 5,370 | | | | 74,129 | |
Holmen AB, Class B | | | 3,188 | | | | 82,880 | |
Klovern AB, Class B | | | 45,445 | | | | 59,735 | |
Pandox AB | | | 2,211 | | | | 39,607 | |
Peab AB | | | 211 | | | | 1,929 | |
Sandvik AB | | | 10,617 | | | | 187,966 | |
Scandic Hotels Group AB (b) | | | 5,709 | | | | 64,039 | |
Swedbank AB, Class A | | | 9,375 | | | | 231,864 | |
Volvo AB, Class B | | | 18,295 | | | | 322,668 | |
| | | | | | | | |
| | | | | | | 1,254,877 | |
| | | | | | | | |
| Switzerland—0.8% | |
Allreal Holding AG (j) | | | 229 | | | | 36,747 | |
Baloise Holding AG | | | 480 | | | | 73,147 | |
Banque Cantonale Vaudoise | | | 41 | | | | 30,377 | |
Barry Callebaut AG | | | 36 | | | | 68,171 | |
BKW AG | | | 145 | | | | 9,201 | |
Bobst Group S.A. | | | 1,000 | | | | 78,053 | |
Cembra Money Bank AG | | | 50 | | | | 4,526 | |
Intershop Holding AG | | | 17 | | | | 8,574 | |
Landis+Gyr Group AG (j) | | | 860 | | | | 57,470 | |
Nestle S.A. | | | 1,391 | | | | 115,782 | |
Novartis AG | | | 8,366 | | | | 720,132 | |
Partners Group Holding AG | | | 163 | | | | 129,213 | |
Schweiter Technologies AG | | | 8 | | | | 9,684 | |
Siegfried Holding AG (j) | | | 47 | | | | 21,856 | |
Straumann Holding AG | | | 141 | | | | 106,224 | |
Swiss Life Holding AG (j) | | | 779 | | | | 295,375 | |
Swiss Re AG | | | 1,124 | | | | 103,561 | |
| | | | | | | | |
| | | | | | | 1,868,093 | |
| | | | | | | | |
| Taiwan—1.1% | |
Accton Technology Corp. | | | 19,000 | | | | 52,948 | |
Arcadyan Technology Corp. | | | 4,000 | | | | 7,109 | |
Asia Vital Components Co., Ltd. | | | 12,000 | | | | 10,707 | |
AU Optronics Corp. | | | 143,000 | | | | 60,306 | |
Chailease Holding Co., Ltd. | | | 11,220 | | | | 39,270 | |
Chin-Poon Industrial Co., Ltd. | | | 7,000 | | | | 8,630 | |
China Airlines Ltd. | | | 56,000 | | | | 16,962 | |
China Metal Products | | | 8,000 | | | | 8,093 | |
China Motor Corp. (j) | | | 10,000 | | | | 8,398 | |
Chunghwa Telecom Co., Ltd. | | | 66,000 | | | | 237,728 | |
E Ink Holdings, Inc. | | | 56,000 | | | | 57,522 | |
Elite Material Co., Ltd. | | | 11,000 | | | | 30,970 | |
Farglory Land Development Co., Ltd. | | | 18,000 | | | | 18,921 | |
First Financial Holding Co., Ltd. | | | 202,161 | | | | 137,679 | |
Formosa Petrochemical Corp. | | | 42,000 | | | | 203,583 | |
Formosa Plastics Corp. | | | 9,000 | | | | 34,477 | |
General Interface Solution Holding Ltd. | | | 11,000 | | | | 46,357 | |
Getac Technology Corp. | | | 18,000 | | | | 23,515 | |
Gintech Energy Corp. (e)(f)(j) | | | 6,000 | | | | 2,868 | |
| | | | | | | | |
| | | Shares | | | Value | |
Grand Pacific Petrochemical | | | 84,000 | | | $ | 83,584 | |
Hon Hai Precision Industry Co., Ltd. | | | 128,000 | | | | 331,927 | |
Huaku Development Co., Ltd. | | | 16,000 | | | | 35,038 | |
King Yuan Electronics Co., Ltd. | | | 28,000 | | | | 18,677 | |
King’s Town Bank Co., Ltd. | | | 40,000 | | | | 40,205 | |
LCY Chemical Corp. | | | 24,000 | | | | 40,784 | |
Long Chen Paper Co., Ltd. | | | 43,000 | | | | 29,768 | |
Nanya Technology Corp. | | | 13,000 | | | | 24,825 | |
Pou Chen Corp. | | | 99,000 | | | | 104,528 | |
Powertech Technology, Inc. | | | 34,000 | | | | 92,635 | |
Qisda Corp. | | | 63,000 | | | | 41,076 | |
Sercomm Corp. | | | 11,000 | | | | 18,010 | |
Sinbon Electronics Co., Ltd. | | | 13,000 | | | | 36,251 | |
Sitronix Technology Corp. | | | 3,000 | | | | 8,241 | |
Syncmold Enterprise Corp. | | | 14,000 | | | | 26,271 | |
Taiwan Business Bank (j) | | | 217,744 | | | | 79,144 | |
Taiwan Cooperative Financial Holding Co., Ltd. | | | 64,890 | | | | 39,523 | |
Taiwan Hon Chuan Enterprise Co., Ltd. | | | 5,000 | | | | 8,367 | |
TXC Corp. | | | 15,000 | | | | 16,800 | |
United Integrated Services Co., Ltd. | | | 20,000 | | | | 38,574 | |
Wistron Corp. | | | 38,086 | | | | 24,808 | |
Wistron NeWeb Corp. | | | 5,250 | | | | 12,751 | |
WT Microelectronics Co., Ltd. | | | 6,707 | | | | 9,366 | |
Yageo Corp. | | | 2,511 | | | | 37,706 | |
Yuanta Financial Holding Co., Ltd. | | | 317,000 | | | | 167,107 | |
| | | | | | | | |
| | | | | | | 2,372,009 | |
| | | | | | | | |
| Thailand—0.6% | |
Bangchak Corp. PCL (e)(f) | | | 56,500 | | | | 61,596 | |
Bangkok Bank PCL | | | 11,400 | | | | 76,853 | |
Banpu PCL (e)(f) | | | 161,400 | | | | 95,345 | |
Electricity Generating PCL (e)(f) | | | 23,000 | | | | 167,686 | |
Intouch Holdings PCL | | | 25,300 | | | | 42,236 | |
Kiatnakin Bank PCL (e)(f) | | | 100,600 | | | | 234,146 | |
PTT Global Chemical PCL (e)(f) | | | 47,100 | | | | 118,358 | |
PTT PCL (e)(f) | | | 143,000 | | | | 240,067 | |
Siam Cement PCL (e)(f) | | | 13,500 | | | | 186,307 | |
Sri Trang Agro-Industry PCL (e)(f) | | | 8,200 | | | | 4,160 | |
Thai Oil PCL (e)(f) | | | 3,600 | | | | 9,857 | |
Thanachart Capital PCL (e)(f) | | | 43,800 | | | | 72,797 | |
Tisco Financial Group PCL (e)(f) | | | 44,000 | | | | 113,973 | |
| | | | | | | | |
| | | | | | | 1,423,381 | |
| | | | | | | | |
| Turkey—0.2% | |
Akbank T.A.S. | | | 56,083 | | | | 64,239 | |
Dogus Otomotiv Servis ve Ticaret AS | | | 909 | | | | 813 | |
Emlak Konut Gayrimenkul Yatirim Ortakligi AS REIT | | | 83,530 | | | | 24,707 | |
Eregli Demir ve Celik Fabrikalari TAS | | | 25,934 | | | | 47,319 | |
Soda Sanayii AS | | | 106,116 | | | | 121,768 | |
TAV Havalimanlari Holding AS | | | 10,694 | | | | 55,316 | |
Tekfen Holding AS | | | 16,616 | | | | 59,400 | |
Tofas Turk Otomobil Fabrikasi AS | | | 15,853 | | | | 56,074 | |
Tupras Turkiye Petrol Rafinerileri AS | | | 58 | | | | 1,288 | |
Turkiye Halk Bankasi AS | | | 32,412 | | | | 35,931 | |
Turkiye Vakiflar Bankasi Tao | | | 39,830 | | | | 24,940 | |
| | | | | | |
| 154 | | Annual Report | | | September 30, 2018 | | | See accompanying Notes to Financial Statements |
Schedule of Investments
September 30, 2018
| | | | | | | | |
| | | Shares | | | Value | |
Yatas Yatak ve Yorgan Sanayi ve Ticaret AS (j) | | | 10,405 | | | $ | 7,487 | |
| | | | | | | | |
| | | | | | | 499,282 | |
| | | | | | | | |
| United Kingdom—2.9% | |
3i Group PLC | | | 8,560 | | | | 104,816 | |
Anglo American PLC | | | 12,270 | | | | 274,492 | |
Aviva PLC | | | 28,816 | | | | 183,860 | |
Bellway PLC | | | 2,026 | | | | 79,514 | |
Berkeley Group Holdings PLC | | | 1,337 | | | | 64,051 | |
Biffa PLC (b) | | | 16,942 | | | | 55,647 | |
BP PLC | | | 69,829 | | | | 535,221 | |
British American Tobacco PLC | | | 7,322 | | | | 341,355 | |
British American Tobacco PLC ADR | | | 4,557 | | | | 212,493 | |
BT Group PLC | | | 46,773 | | | | 137,295 | |
Burford Capital Ltd. | | | 2,224 | | | | 56,288 | |
Carnival PLC | | | 3,000 | | | | 186,136 | |
Central Asia Metals PLC | | | 8,818 | | | | 27,380 | |
Compass Group PLC | | | 7,759 | | | | 172,508 | |
Costain Group PLC | | | 6,064 | | | | 32,959 | |
easyJet PLC | | | 3,319 | | | | 56,795 | |
EI Group PLC (j) | | | 37,830 | | | | 81,653 | |
Equiniti Group PLC (b) | | | 9,227 | | | | 31,948 | |
Ferrexpo PLC | | | 9,554 | | | | 24,848 | |
Firstgroup PLC (j) | | | 69,732 | | | | 82,580 | |
Gamma Communications PLC | | | 2,555 | | | | 28,506 | |
HSBC Holdings PLC | | | 35,404 | | | | 308,913 | |
J Sainsbury PLC | | | 28,329 | | | | 118,684 | |
Johnson Service Group PLC | | | 5,867 | | | | 10,311 | |
JPJ Group PLC (j) | | | 7,484 | | | | 74,053 | |
Keller Group PLC | | | 10,963 | | | | 145,178 | |
Legal & General Group PLC | | | 52,714 | | | | 179,955 | |
Lloyds Banking Group PLC | | | 334,787 | | | | 257,480 | |
Micro Focus International PLC | | | 162 | | | | 3,013 | |
Morgan Sindall Group PLC | | | 3,892 | | | | 66,759 | |
National Express Group PLC | | | 29,915 | | | | 152,141 | |
Nomad Foods Ltd. (j) | | | 2,497 | | | | 50,589 | |
Plus500 Ltd. | | | 2,720 | | | | 47,059 | |
Primary Health Properties PLC REIT | | | 4,727 | | | | 7,028 | |
Reach PLC | | | 3,803 | | | | 3,331 | |
Renewables Infrastructure Group Ltd. | | | 27,255 | | | | 39,929 | |
Rio Tinto PLC | | | 6,110 | | | | 308,198 | |
Robert Walters PLC | | | 2,852 | | | | 25,278 | |
Royal Dutch Shell PLC, Class A | | | 5,860 | | | | 200,771 | |
Royal Dutch Shell PLC, Class A | | | 16,913 | | | | 579,921 | |
Royal Dutch Shell PLC, Class B | | | 18,364 | | | | 642,860 | |
Safestore Holdings PLC REIT | | | 5,621 | | | | 38,071 | |
Schroders PLC | | | 1,204 | | | | 39,904 | |
SIG PLC | | | 20,896 | | | | 34,523 | |
Softcat PLC | | | 4,246 | | | | 44,035 | |
Stock Spirits Group PLC | | | 11,397 | | | | 29,264 | |
Taylor Wimpey PLC | | | 38,774 | | | | 86,668 | |
TUI AG | | | 7,356 | | | | 141,107 | |
Virgin Money Holdings UK PLC | | | 906 | | | | 4,519 | |
Watkin Jones PLC | | | 15,706 | | | | 40,083 | |
| | | | | | | | |
| | | | | | | 6,449,970 | |
| | | | | | | | |
| United States—29.8% | |
3M Co. | | | 628 | | | | 132,326 | |
Aaron’s, Inc. | | | 1,421 | | | | 77,388 | |
Abbott Laboratories | | | 6,245 | | | | 458,133 | |
AbbVie, Inc. | | | 6,999 | | | | 661,965 | |
Accenture PLC, Class A | | | 833 | | | | 141,777 | |
ACCO Brands Corp. | | | 5,102 | | | | 57,653 | |
| | | | | | | | |
| | | Shares | | | Value | |
Activision Blizzard, Inc. | | | 1,520 | | | $ | 126,449 | |
Adobe Systems, Inc. (j) | | | 1,180 | | | | 318,541 | |
Advanced Energy Industries, Inc. (j) | | | 1,225 | | | | 63,271 | |
Aetna, Inc. | | | 399 | | | | 80,937 | |
Aflac, Inc. | | | 7,392 | | | | 347,941 | |
AG Mortgage Investment Trust, Inc. REIT | | | 6,861 | | | | 124,733 | |
Agilent Technologies, Inc. | | | 3,775 | | | | 266,288 | |
AGNC Investment Corp. REIT | | | 11,166 | | | | 208,023 | |
Air Lease Corp. | | | 2,180 | | | | 100,018 | |
Alaska Air Group, Inc. | | | 1,211 | | | | 83,389 | |
Alcoa Corp. (j) | | | 2,520 | | | | 101,808 | |
Align Technology, Inc. (j) | | | 1,204 | | | | 471,029 | |
Allison Transmission Holdings, Inc. | | | 3,130 | | | | 162,791 | |
Allstate Corp. | | | 2,246 | | | | 221,680 | |
Ally Financial, Inc. | | | 3,701 | | | | 97,891 | |
Alphabet, Inc., Class A (j) | | | 347 | | | | 418,857 | |
Alphabet, Inc., Class C (j) | | | 337 | | | | 402,199 | |
Altria Group, Inc. | | | 8,335 | | | | 502,684 | |
Amazon.com, Inc. (j) | | | 605 | | | | 1,211,815 | |
Amdocs Ltd. | | | 1,479 | | | | 97,584 | |
Ameren Corp. | | | 1,467 | | | | 92,744 | |
American Electric Power Co., Inc. | | | 1,201 | | | | 85,127 | |
American Equity Investment Life Holding Co. | | | 2,733 | | | | 96,639 | |
American Financial Group, Inc. | | | 494 | | | | 54,819 | |
Ameriprise Financial, Inc. | | | 986 | | | | 145,593 | |
AmerisourceBergen Corp. | | | 2,098 | | | | 193,478 | |
Amgen, Inc. | | | 2,005 | | | | 415,616 | |
Andeavor | | | 1,286 | | | | 197,401 | |
Annaly Capital Management, Inc. REIT | | | 36,557 | | | | 373,974 | |
Antero Resources Corp. (j) | | | 4,279 | | | | 75,781 | |
Anthem, Inc. | | | 1,808 | | | | 495,482 | |
Anworth Mortgage Asset Corp. REIT | | | 7,680 | | | | 35,558 | |
Apollo Commercial Real Estate Finance, Inc. REIT | | | 1,868 | | | | 35,249 | |
Apollo Investment Corp. | | | 906 | | | | 4,929 | |
Apple, Inc. | | | 10,607 | | | | 2,394,424 | |
Applied Materials, Inc. | | | 4,290 | | | | 165,808 | |
Archer-Daniels-Midland Co. | | | 3,502 | | | | 176,046 | |
Ares Commercial Real Estate Corp. REIT | | | 1,466 | | | | 20,480 | |
ARMOUR Residential REIT, Inc. | | | 1,081 | | | | 24,268 | |
Arrow Electronics, Inc. (j) | | | 1,049 | | | | 77,332 | |
ASGN, Inc. (j) | | | 64 | | | | 5,052 | |
AT&T, Inc. | | | 32,463 | | | | 1,090,108 | |
Athene Holding Ltd., Class A (j) | | | 4,084 | | | | 210,979 | |
Atmos Energy Corp. | | | 629 | | | | 59,069 | |
Automatic Data Processing, Inc. | | | 2,980 | | | | 448,967 | |
AutoZone, Inc. (j) | | | 179 | | | | 138,850 | |
AvalonBay Communities, Inc. REIT | | | 375 | | | | 67,931 | |
Avery Dennison Corp. | | | 484 | | | | 52,441 | |
Bank of America Corp. | | | 26,148 | | | | 770,320 | |
Bank of New York Mellon Corp. | | | 3,768 | | | | 192,130 | |
Baxter International, Inc. | | | 3,676 | | | | 283,383 | |
Becton Dickinson and Co. | | | 983 | | | | 256,563 | |
Bemis Co., Inc. | | | 10 | | | | 486 | |
Berkshire Hathaway, Inc., Class B (j) | | | 84 | | | | 17,985 | |
Berry Global Group, Inc. (j) | | | 1,229 | | | | 59,471 | |
Best Buy Co., Inc. | | | 1,502 | | | | 119,199 | |
BGC Partners, Inc., Class A | | | 7,546 | | | | 89,194 | |
Bio-Techne Corp. | | | 691 | | | | 141,040 | |
| | | | | | | | |
| | | Shares | | | Value | |
BlackRock, Inc. | | | 350 | | | $ | 164,965 | |
Blackstone Mortgage Trust, Inc., Class A REIT | | | 1,301 | | | | 43,597 | |
Blucora, Inc. (j) | | | 4,313 | | | | 173,598 | |
Boeing Co. | | | 1,387 | | | | 515,825 | |
BorgWarner, Inc. | | | 1,997 | | | | 85,432 | |
Bristol-Myers Squibb Co. | | | 2,297 | | | | 142,598 | |
Brixmor Property Group, Inc. REIT | | | 256 | | | | 4,483 | |
Broadcom, Inc. | | | 1,010 | | | | 249,197 | |
Broadridge Financial Solutions, Inc. | | | 943 | | | | 124,429 | |
Burlington Stores, Inc. (j) | | | 149 | | | | 24,275 | |
CA, Inc. | | | 1,262 | | | | 55,717 | |
Cambrex Corp. (j) | | | 115 | | | | 7,866 | |
Camping World Holdings, Inc., Class A | | | 1,996 | | | | 42,555 | |
Capitol Federal Financial, Inc. | | | 2,232 | | | | 28,436 | |
Capstead Mortgage Corp. REIT | | | 2,436 | | | | 19,269 | |
Caterpillar, Inc. | | | 1,653 | | | | 252,066 | |
Celanese Corp. | | | 810 | | | | 92,340 | |
Centene Corp. (j) | | | 1,597 | | | | 231,214 | |
CenterPoint Energy, Inc. | | | 7,702 | | | | 212,960 | |
Central Garden & Pet Co., Class A (j) | | | 2,214 | | | | 73,372 | |
Charles River Laboratories International, Inc. (j) | | | 728 | | | | 97,945 | |
Chatham Lodging Trust REIT | | | 3,180 | | | | 66,430 | |
Chemours Co. | | | 1,888 | | | | 74,463 | |
Chevron Corp. | | | 4,453 | | | | 544,513 | |
Children’s Place, Inc. | | | 894 | | | | 114,253 | |
Chimera Investment Corp. REIT | | | 5,353 | | | | 97,050 | |
Chubb Ltd. | | | 399 | | | | 53,322 | |
Cigna Corp. | | | 974 | | | | 202,835 | |
Cisco Systems, Inc. | | | 16,154 | | | | 785,892 | |
Citigroup, Inc. | | | 6,307 | | | | 452,464 | |
Citizens Financial Group, Inc. | | | 3,823 | | | | 147,453 | |
Clorox Co. | | | 747 | | | | 112,356 | |
CME Group, Inc. | | | 610 | | | | 103,828 | |
CMS Energy Corp. | | | 1,353 | | | | 66,297 | |
CNA Financial Corp. | | | 777 | | | | 35,470 | |
Coca-Cola Co. | | | 4,998 | | | | 230,858 | |
Cognizant Technology Solutions Corp., Class A | | | 4,107 | | | | 316,855 | |
Colgate-Palmolive Co. | | | 736 | | | | 49,275 | |
Comcast Corp., Class A | | | 13,265 | | | | 469,714 | |
CONSOL Energy, Inc. (j) | | | 1,354 | | | | 55,257 | |
Consolidated Edison, Inc. | | | 3,087 | | | | 235,199 | |
Constellation Brands, Inc., Class A | | | 1,033 | | | | 222,735 | |
Cooper Cos., Inc. | | | 708 | | | | 196,222 | |
Cooper-Standard Holdings, Inc. (j) | | | 545 | | | | 65,389 | |
Copa Holdings S.A., Class A | | | 310 | | | | 24,750 | |
Crawford & Co., Class A | | | 6,758 | | | | 60,822 | |
Cummins, Inc. | | | 672 | | | | 98,159 | |
CVS Health Corp. | | | 8,797 | | | | 692,500 | |
Danaher Corp. | | | 2,121 | | | | 230,468 | |
Darden Restaurants, Inc. | | | 1,365 | | | | 151,774 | |
Deciphera Pharmaceuticals, Inc. (j) | | | 808 | | | | 31,286 | |
Deere & Co. | | | 1,382 | | | | 207,756 | |
Dell Technologies, Inc., Class V (j) | | | 548 | | | | 53,222 | |
Delta Air Lines, Inc. | | | 1,842 | | | | 106,523 | |
Dime Community Bancshares, Inc. | | | 279 | | | | 4,980 | |
Dollar Tree, Inc. (j) | | | 559 | | | | 45,586 | |
Dominion Energy, Inc. | | | 60 | | | | 4,217 | |
Donegal Group, Inc., Class A | | | 1,812 | | | | 25,749 | |
DowDuPont, Inc. | | | 3,650 | | | | 234,731 | |
DR Horton, Inc. | | | 2,356 | | | | 99,376 | |
| | | | | | | | |
| See accompanying Notes to Financial Statements | | | September 30, 2018 | | | Annual Report | | | 155 | |
Schedule of Investments
September 30, 2018
| | | | | | | | |
| | | Shares | | | Value | |
DTE Energy Co. | | | 614 | | | $ | 67,006 | |
Duke Energy Corp. | | | 3,126 | | | | 250,143 | |
DXC Technology Co. | | | 1,131 | | | | 105,771 | |
Dynex Capital, Inc. REIT | | | 17,742 | | | | 113,194 | |
E*TRADE Financial Corp. (j) | | | 1,541 | | | | 80,733 | |
Eastman Chemical Co. | | | 2,230 | | | | 213,456 | |
eBay, Inc. (j) | | | 5,171 | | | | 170,746 | |
Edison International | | | 2,752 | | | | 186,255 | |
Eli Lilly & Co. | | | 471 | | | | 50,543 | |
Ennis, Inc. | | | 938 | | | | 19,182 | |
Ensco PLC, Class A | | | 782 | | | | 6,600 | |
Entergy Corp. | | | 2,690 | | | | 218,240 | |
Enviva Partners L.P. (j) | | | 505 | | | | 16,059 | |
Equinix, Inc. REIT | | | 7 | | | | 3,030 | |
Equity LifeStyle Properties, Inc. REIT | | | 653 | | | | 62,982 | |
Essent Group Ltd. (j) | | | 2,386 | | | | 105,580 | |
Essex Property Trust, Inc. REIT | | | 341 | | | | 84,128 | |
Estee Lauder Cos., Inc., Class A | | | 1,164 | | | | 169,152 | |
Everest Re Group Ltd. | | | 526 | | | | 120,175 | |
Evergy, Inc. | | | 1,137 | | | | 62,444 | |
Exelon Corp. | | | 5,488 | | | | 239,606 | |
Express Scripts Holding Co. (j) | | | 992 | | | | 94,250 | |
Exxon Mobil Corp. | | | 8,786 | | | | 746,986 | |
Facebook, Inc., Class A (j) | | | 5,348 | | | | 879,532 | |
Federal Agricultural Mortgage Corp., Class C | | | 128 | | | | 9,239 | |
FedEx Corp. | | | 1,340 | | | | 322,659 | |
Fidelity National Information Services, Inc. | | | 1,301 | | | | 141,900 | |
First American Financial Corp. | | | 1,114 | | | | 57,471 | |
First NBC Bank Holding Co. (j) | | | 1,041 | | | | 37 | |
Ford Motor Co. | | | 14,617 | | | | 135,207 | |
FTI Consulting, Inc. (j) | | | 680 | | | | 49,769 | |
Gaming and Leisure Properties, Inc. REIT | | | 1,505 | | | | 53,051 | |
Gap, Inc. | | | 2,802 | | | | 80,838 | |
Garmin Ltd. | | | 934 | | | | 65,427 | |
General Mills, Inc. | | | 1,528 | | | | 65,582 | |
General Motors Co. | | | 11,841 | | | | 398,686 | |
German American Bancorp, Inc. | | | 67 | | | | 2,364 | |
Gilead Sciences, Inc. | | | 300 | | | | 23,163 | |
Global Brass & Copper Holdings, Inc. | | | 1,340 | | | | 49,446 | |
Goldman Sachs Group, Inc. | | | 919 | | | | 206,077 | |
Granite Point Mortgage Trust, Inc. REIT | | | 160 | | | | 3,085 | |
Hamilton Beach Brands Holding Co., Class A | | | 2,937 | | | | 64,438 | |
Hartford Financial Services Group, Inc. | | | 1,186 | | | | 59,253 | |
Hawkins, Inc. | | | 820 | | | | 33,989 | |
Healthcare Services Group, Inc. | | | 615 | | | | 24,981 | |
Hershey Co. | | | 478 | | | | 48,756 | |
Hewlett Packard Enterprise Co. | | | 10,717 | | | | 174,794 | |
Hill-Rom Holdings, Inc. | | | 825 | | | | 77,880 | |
Home Depot, Inc. | | | 4,718 | | | | 977,334 | |
Hooker Furniture Corp. | | | 1,061 | | | | 35,862 | |
Horizon Pharma PLC (j) | | | 462 | | | | 9,046 | |
HP, Inc. | | | 14,399 | | | | 371,062 | |
Humana, Inc. | | | 616 | | | | 208,528 | |
Huntington Ingalls Industries, Inc. | | | 933 | | | | 238,923 | |
Illumina, Inc. (j) | | | 630 | | | | 231,248 | |
Ingredion, Inc. | | | 2,659 | | | | 279,089 | |
Insight Enterprises, Inc. (j) | | | 12 | | | | 649 | |
Intel Corp. | | | 17,473 | | | | 826,298 | |
Intuitive Surgical, Inc. (j) | | | 1,368 | | | | 785,232 | |
| | | | | | | | |
| | | Shares | | | Value | |
Invesco Ltd. | | | 257 | | | $ | 5,880 | |
Invesco Mortgage Capital, Inc. REIT | | | 6,262 | | | | 99,065 | |
IQVIA Holdings, Inc. (j) | | | 1,111 | | | | 144,141 | |
Jacobs Engineering Group, Inc. | | | 1,127 | | | | 86,216 | |
Janus Henderson Group PLC | | | 2,964 | | | | 79,909 | |
Jefferies Financial Group, Inc. | | | 3,905 | | | | 85,754 | |
JetBlue Airways Corp. (j) | | | 2,879 | | | | 55,737 | |
John B Sanfilippo & Son, Inc. | | | 57 | | | | 4,069 | |
Johnson & Johnson | | | 11,769 | | | | 1,626,123 | |
Jones Lang LaSalle, Inc. | | | 661 | | | | 95,396 | |
JPMorgan Chase & Co. | | | 8,823 | | | | 995,587 | |
Kansas City Southern | | | 1,153 | | | | 130,612 | |
Kellogg Co. | | | 315 | | | | 22,056 | |
Kimberly-Clark Corp. | | | 922 | | | | 104,776 | |
Kohl’s Corp. | | | 1,185 | | | | 88,342 | |
Korn/Ferry International | | | 801 | | | | 39,441 | |
Laboratory Corp. of America Holdings (j) | | | 2,231 | | | | 387,480 | |
Lam Research Corp. | | | 1,659 | | | | 251,670 | |
Lamb Weston Holdings, Inc. | | | 1,844 | | | | 122,810 | |
Las Vegas Sands Corp. | | | 2,241 | | | | 132,959 | |
Lear Corp. | | | 727 | | | | 105,415 | |
Legg Mason, Inc. | | | 2,584 | | | | 80,698 | |
Leidos Holdings, Inc. | | | 1,817 | | | | 125,664 | |
Lennar Corp., Class A | | | 1,997 | | | | 93,240 | |
LHC Group, Inc. (j) | | | 1,644 | | | | 169,316 | |
Lincoln National Corp. | | | 2,047 | | | | 138,500 | |
Macy’s, Inc. | | | 3,876 | | | | 134,613 | |
Magellan Health, Inc. (j) | | | 870 | | | | 62,684 | |
Manhattan Associates, Inc. (j) | | | 85 | | | | 4,641 | |
ManpowerGroup, Inc. | | | 958 | | | | 82,350 | |
Marathon Petroleum Corp. | | | 2,480 | | | | 198,326 | |
Marsh & McLennan Cos., Inc. | | | 482 | | | | 39,871 | |
Marvell Technology Group Ltd. | | | 180 | | | | 3,474 | |
Masimo Corp. (j) | | | 867 | | | | 107,976 | |
Mastercard, Inc., Class A | | | 2,774 | | | | 617,520 | |
Maxim Integrated Products, Inc. | | | 1,447 | | | | 81,596 | |
MCBC Holdings, Inc. (j) | | | 2,622 | | | | 94,077 | |
McDonald’s Corp. | | | 5,430 | | | | 908,385 | |
McKesson Corp. | | | 1,722 | | | | 228,423 | |
MDC Holdings, Inc. | | | 2,375 | | | | 70,253 | |
MedEquities Realty Trust, Inc. REIT | | | 2,170 | | | | 21,092 | |
Mercer International, Inc. | | | 4,271 | | | | 71,753 | |
Merck & Co., Inc. | | | 7,409 | | | | 525,594 | |
Merit Medical Systems, Inc. (j) | | | 1,530 | | | | 94,019 | |
Mettler-Toledo International, Inc. (j) | | | 390 | | | | 237,502 | |
MFA Financial, Inc. REIT | | | 5,882 | | | | 43,233 | |
Micron Technology, Inc. (j) | | | 4,476 | | | | 202,449 | |
Microsoft Corp. | | | 16,002 | | | | 1,830,149 | |
Mid-America Apartment Communities, Inc. REIT | | | 472 | | | | 47,285 | |
MKS Instruments, Inc. | | | 679 | | | | 54,422 | |
Mohawk Industries, Inc. (j) | | | 327 | | | | 57,339 | |
Molson Coors Brewing Co., Class B | | | 1,697 | | | | 104,366 | |
Mondelez International, Inc., Class A | | | 5,725 | | | | 245,946 | |
Morgan Stanley | | | 4,451 | | | | 207,283 | |
Morningstar, Inc. | | | 74 | | | | 9,317 | |
Motorola Solutions, Inc. | | | 346 | | | | 45,028 | |
New Residential Investment Corp. REIT | | | 2,868 | | | | 51,108 | |
Nexeo Solutions, Inc. (j) | | | 10,834 | | | | 132,716 | |
NextEra Energy, Inc. | | | 1,319 | | | | 221,064 | |
Northfield Bancorp, Inc. | | | 664 | | | | 10,571 | |
Northrop Grumman Corp. | | | 1,214 | | | | 385,287 | |
NVIDIA Corp. | | | 1,546 | | | | 434,457 | |
| | | | | | | | |
| | | Shares | | | Value | |
NVR, Inc. (j) | | | 12 | | | $ | 29,650 | |
ON Semiconductor Corp. (j) | | | 4,404 | | | | 81,166 | |
Oracle Corp. | | | 12,205 | | | | 629,290 | |
Orchid Island Capital, Inc. REIT | | | 4,056 | | | | 29,406 | |
Oritani Financial Corp. | | | 1,427 | | | | 22,190 | |
Orthofix Medical, Inc. (j) | | | 956 | | | | 55,266 | |
Oshkosh Corp. | | | 509 | | | | 36,261 | |
Owens Corning | | | 1,694 | | | | 91,933 | |
PACCAR, Inc. | | | 2,354 | | | | 160,519 | |
Park Hotels & Resorts, Inc. REIT | | | 1,392 | | | | 45,685 | |
Parker-Hannifin Corp. | | | 406 | | | | 74,676 | |
Paychex, Inc. | | | 1,023 | | | | 75,344 | |
PBF Energy, Inc., Class A | | | 1,227 | | | | 61,240 | |
Penn Virginia Corp. (j) | | | 2,514 | | | | 202,478 | |
PepsiCo, Inc. | | | 7,111 | | | | 795,010 | |
PerkinElmer, Inc. | | | 539 | | | | 52,429 | |
Perspecta, Inc. | | | 850 | | | | 21,862 | |
PetMed Express, Inc. | | | 813 | | | | 26,837 | |
Pfizer, Inc. | | | 16,529 | | | | 728,433 | |
PG&E Corp. | | | 3,187 | | | | 146,634 | |
Phibro Animal Health Corp., Class A | | | 1,042 | | | | 44,702 | |
Phillips 66 | | | 1,469 | | | | 165,586 | |
Pinnacle Foods, Inc. | | | 2,679 | | | | 173,626 | |
Pinnacle West Capital Corp. | | | 614 | | | | 48,617 | |
PNC Financial Services Group, Inc. | | | 1,699 | | | | 231,387 | |
PPL Corp. | | | 2,526 | | | | 73,911 | |
Principal Financial Group, Inc. | | | 2,058 | | | | 120,578 | |
Procter & Gamble Co. | | | 9,750 | | | | 811,492 | |
Progressive Corp. | | | 4,663 | | | | 331,260 | |
Prudential Financial, Inc. | | | 1,805 | | | | 182,883 | |
PVH Corp. | | | 887 | | | | 128,083 | |
QCR Holdings, Inc. | | | 406 | | | | 16,585 | |
Quest Diagnostics, Inc. | | | 1,783 | | | | 192,404 | |
Raymond James Financial, Inc. | | | 1,341 | | | | 123,439 | |
Ready Capital Corp. | | | 2,721 | | | | 45,305 | |
Regeneron Pharmaceuticals, Inc. (j) | | | 448 | | | | 181,010 | |
Regions Financial Corp. | | | 14,517 | | | | 266,387 | |
Reinsurance Group of America, Inc. | | | 747 | | | | 107,986 | |
Reliance Steel & Aluminum Co. | | | 554 | | | | 47,251 | |
Republic Services, Inc. | | | 3,365 | | | | 244,501 | |
Royal Caribbean Cruises Ltd. | | | 1,337 | | | | 173,730 | |
Rudolph Technologies, Inc. (j) | | | 2,029 | | | | 49,609 | |
S&P Global, Inc. | | | 423 | | | | 82,650 | |
Sanderson Farms, Inc. | | | 792 | | | | 81,869 | |
Santander Consumer USA Holdings, Inc. | | | 369 | | | | 7,395 | |
Schweitzer-Mauduit International, Inc. | | | 1,649 | | | | 63,173 | |
Seaboard Corp. | | | 15 | | | | 55,651 | |
SMART Global Holdings, Inc. (j) | | | 1,023 | | | | 29,401 | |
Southern Co. | | | 3,092 | | | | 134,811 | |
SP Plus Corp. (j) | | | 812 | | | | 29,638 | |
Speedway Motorsports, Inc. | | | 3,832 | | | | 68,401 | |
Spirit AeroSystems Holdings, Inc., Class A | | | 1,453 | | | | 133,197 | |
Stanley Black & Decker, Inc. | | | 1,296 | | | | 189,786 | |
State Street Corp. | | | 1,763 | | | | 147,704 | |
Stoneridge, Inc. (j) | | | 2,765 | | | | 82,176 | |
Stryker Corp. | | | 1,778 | | | | 315,915 | |
SunTrust Banks, Inc. | | | 1,463 | | | | 97,714 | |
Superior Industries International, Inc. | | | 3,587 | | | | 61,158 | |
Sykes Enterprises, Inc. (j) | | | 1,758 | | | | 53,601 | |
SYNNEX Corp. | | | 333 | | | | 28,205 | |
| | | | | | |
| 156 | | Annual Report | | | September 30, 2018 | | | See accompanying Notes to Financial Statements |
Schedule of Investments
September 30, 2018
| | | | | | | | |
| | | Shares | | | Value | |
Sysco Corp. | | | 2,786 | | | $ | 204,074 | |
T-Mobile U.S., Inc. (j) | | | 670 | | | | 47,021 | |
Target Corp. | | | 7,789 | | | | 687,068 | |
Teleflex, Inc. | | | 653 | | | | 173,757 | |
Tenneco, Inc. | | | 1,049 | | | | 44,205 | |
Teradyne, Inc. | | | 827 | | | | 30,582 | |
Texas Instruments, Inc. | | | 5,763 | | | | 618,312 | |
Thermo Fisher Scientific, Inc. | | | 1,532 | | | | 373,931 | |
Thor Industries, Inc. | | | 991 | | | | 82,947 | |
Toll Brothers, Inc. | | | 2,023 | | | | 66,820 | |
Total System Services, Inc. | | | 1,496 | | | | 147,715 | |
Tower International, Inc. | | | 2,305 | | | | 69,726 | |
TransUnion | | | 1,002 | | | | 73,727 | |
Travelers Cos., Inc. | | | 1,163 | | | | 150,853 | |
Trinseo S.A. | | | 1,428 | | | | 111,812 | |
Triton International Ltd. | | | 1,282 | | | | 42,652 | |
Two Harbors Investment Corp. REIT | | | 4,723 | | | | 70,514 | |
Tyson Foods, Inc., Class A | | | 3,625 | | | | 215,796 | |
UnitedHealth Group, Inc. | | | 4,422 | | | | 1,176,429 | |
Unum Group | | | 5,817 | | | | 227,270 | |
Vail Resorts, Inc. | | | 212 | | | | 58,177 | |
Valero Energy Corp. | | | 3,154 | | | | 358,767 | |
Venator Materials PLC (j) | | | 2,225 | | | | 20,025 | |
Verizon Communications, Inc. | | | 11,948 | | | | 637,904 | |
Versum Materials, Inc. | | | 1,038 | | | | 37,378 | |
Visa, Inc., Class A | | | 1,804 | | | | 270,762 | |
Vishay Intertechnology, Inc. | | | 3,818 | | | | 77,696 | |
Walmart, Inc. | | | 6,734 | | | | 632,390 | |
Waste Management, Inc. | | | 6,700 | | | | 605,412 | |
Waterstone Financial, Inc. | | | 720 | | | | 12,348 | |
WEC Energy Group, Inc. | | | 3,077 | | | | 205,421 | |
Weight Watchers International, Inc. (j) | | | 995 | | | | 71,630 | |
Weis Markets, Inc. | | | 969 | | | | 42,055 | |
WellCare Health Plans, Inc. (j) | | | 270 | | | | 86,532 | |
Wells Fargo & Co. | | | 3,409 | | | | 179,177 | |
Werner Enterprises, Inc. | | | 1,726 | | | | 61,014 | |
Western Asset Mortgage Capital Corp. REIT | | | 4,189 | | | | 41,974 | |
Western Digital Corp. | | | 1,276 | | | | 74,697 | |
Windstream Holdings, Inc. (j) | | | 294 | | | | 1,441 | |
Wynn Resorts Ltd. | | | 579 | | | | 73,568 | |
Xcel Energy, Inc. | | | 4,361 | | | | 205,883 | |
Xcerra Corp. (j) | | | 5,732 | | | | 81,796 | |
Xenia Hotels & Resorts, Inc. REIT | | | 2,025 | | | | 47,993 | |
Xerox Corp. | | | 2,807 | | | | 75,733 | |
Xylem, Inc. | | | 818 | | | | 65,334 | |
Zebra Technologies Corp., Class A (j) | | | 196 | | | | 34,659 | |
Zoetis, Inc. | | | 2,000 | | | | 183,120 | |
| | | | | | | | |
| | | | | | | 66,274,618 | |
| | | | | | | | |
Total Common Stock (cost—$115,105,421) | | | | 133,337,153 | |
| | | | | | | | |
| | | | | | | | |
| | | Principal
Amount
(000s) | | | | |
| Corporate Bonds & Notes—14.8% | |
| Australia—0.2% | |
Westpac Banking Corp., | |
2.80%, 1/11/22 | | | $100 | | | | 97,781 | |
3.40%, 1/25/28 | | | 250 | | | | 238,666 | |
| | | | | | | | |
| | | | | | | 336,447 | |
| | | | | | | | |
| | | | | | | | |
| | | Principal
Amount
(000s) | | | Value | |
| Canada—1.6% | |
Bank of Montreal, | |
1.90%, 8/27/21 | | $ | 400 | | | $ | 384,618 | |
2.10%, 6/15/20 | | | 350 | | | | 344,502 | |
Bank of Nova Scotia, | |
1.85%, 4/14/20 | | | 1,000 | | | | 981,769 | |
1.875%, 4/26/21 | | | 98 | | | | 94,746 | |
2.15%, 7/14/20 | | | 350 | | | | 344,360 | |
Nutrien Ltd., | |
4.00%, 12/15/26 | | | 100 | | | | 96,815 | |
Royal Bank of Canada, | |
1.875%, 2/5/20 | | | 39 | | | | 38,412 | |
2.125%, 3/2/20 | | | 300 | | | | 296,834 | |
2.30%, 3/22/21 | | | 300 | | | | 293,626 | |
Toronto-Dominion Bank, | |
1.80%, 7/13/21 | | | 400 | | | | 385,485 | |
1.90%, 10/24/19 | | | 200 | | | | 198,016 | |
2.25%, 3/15/21 (a)(b) | | | 200 | | | | 195,449 | |
| | | | | | | | |
| | | | | | | 3,654,632 | |
| | | | | | | | |
| China—0.2% | |
CNOOC Nexen Finance 2014 ULC, | |
4.25%, 4/30/24 | | | 300 | | | | 303,007 | |
State Grid Overseas Investment 2016 Ltd. (a)(b), | |
3.75%, 5/2/23 | | | 200 | | | | 200,193 | |
| | | | | | | | |
| | | | | | | 503,200 | |
| | | | | | | | |
| France—0.3% | |
Dexia Credit Local S.A. (a)(b), | |
3.25%, 9/26/23 | | | 250 | | | | 248,911 | |
Orange S.A., | | | | | | | | |
1.625%, 11/3/19 | | | 350 | | | | 344,787 | |
| | | | | | | | |
| | | | | | | 593,698 | |
| | | | | | | | |
| Germany—1.2% | |
Bayer U.S. Finance II LLC (a)(b), | |
3.50%, 6/25/21 | | | 350 | | | | 349,177 | |
BMW U.S. Capital LLC (a)(b), | |
3.45%, 4/12/23 | | | 150 | | | | 148,681 | |
Daimler Finance North America LLC (a)(b), | |
2.30%, 2/12/21 | | | 350 | | | | 340,801 | |
Deutsche Bank AG, | | | | | | | | |
2.85%, 5/10/19 | | | 350 | | | | 349,314 | |
Deutsche Telekom International Finance BV (a)(b), | |
4.75%, 6/21/38 | | | 150 | | | | 148,358 | |
KFW, | | | | | | | | |
1.25%, 9/30/19 | | | 400 | | | | 394,279 | |
1.50%, 4/20/20 | | | 550 | | | | 538,550 | |
2.75%, 7/15/20 | | | 300 | | | | 299,230 | |
Landwirtschaftliche Rentenbank, Ser. 37, | |
2.50%, 11/15/27 | | | 200 | | | | 188,865 | |
| | | | | | | | |
| | | | | | | 2,757,255 | |
| | | | | | | | |
| Kazakhstan—0.1% | |
KazMunayGas National Co. JSC (a)(b), | |
4.75%, 4/24/25 | | | 200 | | | | 202,615 | |
| | | | | | | | |
| Korea (Republic of)—0.2% | |
Kia Motors Corp. (a)(b), | | | | | | | | |
3.50%, 10/25/27 | | | 350 | | | | 325,519 | |
| | | | | | | | |
| Netherlands—0.2% | |
ING Groep NV, | | | | | | | | |
4.10%, 10/2/23 | | | 200 | | | | 200,059 | |
Shell International Finance BV, | |
2.125%, 5/11/20 | | | 350 | | | | 345,555 | |
| | | | | | | | |
| | | | | | | 545,614 | |
| | | | | | | | |
| New Zealand—0.1% | |
BNZ International Funding Ltd. (a)(b), | |
3.375%, 3/1/23 | | | 250 | | | | 244,635 | |
| | | | | | | | |
| Norway—0.1% | |
Equinor ASA, | | | | | | | | |
2.65%, 1/15/24 | | | 200 | | | | 191,947 | |
| | | | | | | | |
| | | | | | | | |
| | | Principal
Amount
(000s) | | | Value | |
| Spain—0.2% | |
Banco Bilbao Vizcaya Argentaria S.A., | |
3.00%, 10/20/20 | | $ | 400 | | | $ | 395,044 | |
| | | | | | | | |
| Switzerland—0.4% | |
Glencore Funding LLC (a)(b), | |
3.00%, 10/27/22 | | | 350 | | | | 335,836 | |
Novartis Capital Corp., | | | | | | | | |
1.80%, 2/14/20 | | | 300 | | | | 295,542 | |
Tyco Electronics Group S.A., | |
3.45%, 8/1/24 | | | 200 | | | | 195,587 | |
| | | | | | | | |
| | | | | | | 826,965 | |
| | | | | | | | |
| United Kingdom—0.9% | |
Barclays PLC, | | | | | | | | |
2.75%, 11/8/19 | | | 350 | | | | 348,596 | |
4.375%, 1/12/26 | | | 200 | | | | 193,878 | |
4.95%, 1/10/47 | | | 200 | | | | 185,214 | |
BP Capital Markets PLC, | | | | | | | | |
2.315%, 2/13/20 | | | 300 | | | | 297,383 | |
CBS Corp. (a)(b), | | | | | | | | |
3.70%, 6/1/28 | | | 250 | | | | 234,596 | |
Diageo Capital PLC, | | | | | | | | |
3.00%, 5/18/20 | | | 200 | | | | 199,604 | |
Lloyds Banking Group PLC, | | | | | | | | |
4.05%, 8/16/23 | | | 200 | | | | 198,708 | |
Unilever Capital Corp., | | | | | | | | |
1.80%, 5/5/20 | | | 350 | | | | 343,427 | |
| | | | | | | | |
| | | | | | | 2,001,406 | |
| | | | | | | | |
| United States—9.1% | |
Abbott Laboratories, | | | | | | | | |
4.90%, 11/30/46 | | | 200 | | | | 217,393 | |
Allstate Corp., | | | | | | | | |
3.28%, 12/15/26 | | | 400 | | | | 384,855 | |
American Honda Finance Corp., | |
1.95%, 7/20/20 | | | 200 | | | | 196,464 | |
2.00%, 2/14/20 | | | 300 | | | | 295,969 | |
2.60%, 11/16/22 | | | 100 | | | | 96,877 | |
Apple, Inc., | | | | | | | | |
1.90%, 2/7/20 | | | 350 | | | | 345,913 | |
3.85%, 8/4/46 | | | 200 | | | | 191,586 | |
Bank of America Corp., | | | | | | | | |
4.00%, 4/1/24 | | | 200 | | | | 201,770 | |
5.625%, 7/1/20 | | | 300 | | | | 312,336 | |
Bank of New York Mellon Corp., | |
2.60%, 2/7/22 | | | 300 | | | | 292,712 | |
Cargill, Inc. (a)(b), | | | | | | | | |
3.05%, 4/19/21 | | | 200 | | | | 198,538 | |
3.25%, 3/1/23 | | | 50 | | | | 49,296 | |
Caterpillar Financial Services Corp., | |
2.10%, 1/10/20 | | | 350 | | | | 346,370 | |
3.15%, 9/7/21 | | | 100 | | | | 99,922 | |
3.45%, 5/15/23 | | | 150 | | | | 150,326 | |
Citigroup, Inc., | | | | | | | | |
2.45%, 1/10/20 | | | 500 | | | | 495,922 | |
8.125%, 7/15/39 | | | 250 | | | | 359,976 | |
CNH Industrial Capital LLC, | |
4.875%, 4/1/21 | | | 350 | | | | 358,969 | |
Colgate-Palmolive Co., | | | | | | | | |
2.25%, 11/15/22 | | | 100 | | | | 96,352 | |
3.70%, 8/1/47 | | | 100 | | | | 95,062 | |
Comcast Corp., | | | | | | | | |
2.75%, 3/1/23 | | | 200 | | | | 193,380 | |
Commonwealth Edison Co., | |
2.55%, 6/15/26 | | | 200 | | | | 184,043 | |
Consolidated Edison Co. of New York, Inc., | |
4.50%, 5/15/58 | | | 50 | | | | 49,515 | |
CRH America Finance, Inc. (a)(b), | |
3.95%, 4/4/28 | | | 200 | | | | 193,996 | |
CSX Corp., | | | | | | | | |
2.60%, 11/1/26 | | | 50 | | | | 45,572 | |
| | | | | | | | |
| See accompanying Notes to Financial Statements | | | September 30, 2018 | | | Annual Report | | | 157 | |
Schedule of Investments
September 30, 2018
| | | | | | | | |
| | | Principal
Amount
(000s) | | | Value | |
CVS Health Corp., | | | | | | | | |
4.10%, 3/25/25 | | $ | 200 | | | $ | 199,324 | |
Discovery Communications LLC, | |
3.80%, 3/13/24 | | | 200 | | | | 196,421 | |
Dow Chemical Co., | | | | | | | | |
7.375%, 11/1/29 | | | 400 | | | | 501,611 | |
Duke Energy Carolinas LLC, | |
2.50%, 3/15/23 | | | 100 | | | | 96,142 | |
Ecolab, Inc., | | | | | | | | |
2.375%, 8/10/22 | | | 100 | | | | 95,958 | |
Energy Transfer Partners L.P., Ser. 30Y, | |
6.00%, 6/15/48 | | | 50 | | | | 53,304 | |
FedEx Corp., | | | | | | | | |
3.40%, 2/15/28 | | | 50 | | | | 47,936 | |
4.10%, 4/15/43 | | | 300 | | | | 275,453 | |
Fifth Third Bancorp, | | | | | | | | |
2.60%, 6/15/22 | | | 350 | | | | 337,155 | |
Florida Power & Light Co., | |
3.70%, 12/1/47 | | | 100 | | | | 93,461 | |
3.95%, 3/1/48 | | | 150 | | | | 147,278 | |
Ford Motor Co., | | | | | | | | |
5.291%, 12/8/46 | | | 150 | | | | 133,531 | |
Ford Motor Credit Co. LLC, | |
2.681%, 1/9/20 | | | 350 | | | | 346,456 | |
General Dynamics Corp., | | | | | | | | |
3.375%, 5/15/23 | | | 100 | | | | 99,907 | |
General Electric Co., | | | | | | | | |
5.50%, 1/8/20 | | | 300 | | | | 308,722 | |
General Mills, Inc., | | | | | | | | |
2.60%, 10/12/22 | | | 100 | | | | 95,934 | |
General Motors Co., | | | | | | | | |
5.15%, 4/1/38 | | | 150 | | | | 139,770 | |
General Motors Financial Co., Inc., | |
2.65%, 4/13/20 | | | 350 | | | | 346,519 | |
4.35%, 4/9/25 | | | 100 | | | | 98,252 | |
Georgia Power Co., Ser. C, | |
2.00%, 9/8/20 | | | 200 | | | | 195,216 | |
Goldman Sachs Group, Inc., | |
2.55%, 10/23/19 | | | 400 | | | | 398,488 | |
6.00%, 6/15/20, Ser. D | | | 300 | | | | 313,339 | |
Harley-Davidson Financial Services, Inc., Ser. SR (a)(b), | |
3.55%, 5/21/21 | | | 150 | | | | 149,493 | |
Home Depot, Inc., | | | | | | | | |
2.00%, 4/1/21 | | | 200 | | | | 195,127 | |
International Business Machines Corp., | |
1.90%, 1/27/20 | | | 350 | | | | 345,428 | |
International Paper Co., | | | | | | | | |
4.35%, 8/15/48 | | | 100 | | | | 91,729 | |
John Deere Capital Corp., | | | | | | | | |
1.95%, 6/22/20 | | | 250 | | | | 245,647 | |
2.65%, 6/24/24 | | | 200 | | | | 190,687 | |
3.05%, 1/6/28 | | | 150 | | | | 142,017 | |
Johnson & Johnson, | | | | | | | | |
1.95%, 11/10/20 | | | 100 | | | | 98,007 | |
JPMorgan Chase & Co., | | | | | | | | |
3.625%, 5/13/24 | | | 400 | | | | 397,007 | |
4.40%, 7/22/20 | | | 300 | | | | 306,368 | |
Kellogg Co., | | | | | | | | |
3.25%, 5/14/21 | | | 150 | | | | 149,489 | |
3.40%, 11/15/27 | | | 100 | | | | 93,138 | |
Keurig Dr. Pepper, Inc., | | | | | | | | |
4.42%, 12/15/46 | | | 250 | | | | 228,516 | |
Kinder Morgan, Inc., | | | | | | | | |
3.15%, 1/15/23 | | | 350 | | | | 340,891 | |
Kraft Heinz Foods Co., | | | | | | | | |
4.00%, 6/15/23 | | | 100 | | | | 100,286 | |
5.375%, 2/10/20 | | | 350 | | | | 359,825 | |
Kroger Co., | | | | | | | | |
4.65%, 1/15/48 | | | 150 | | | | 141,868 | |
Merck & Co., Inc., | | | | | | | | |
1.85%, 2/10/20 | | | 350 | | | | 345,398 | |
| | | | | | | | |
| | | Principal
Amount
(000s) | | | Value | |
MetLife, Inc., | | | | | | | | |
5.70%, 6/15/35 | | $ | 100 | | | $ | 114,614 | |
Morgan Stanley, | | | | | | | | |
2.50%, 4/21/21 | | | 400 | | | | 390,718 | |
2.80%, 6/16/20 | | | 350 | | | | 347,452 | |
3.625%, 1/20/27 | | | 200 | | | | 191,984 | |
4.375%, 1/22/47 | | | 50 | | | | 48,795 | |
Nestle Holdings, Inc. (a)(b), | |
3.50%, 9/24/25 | | | 150 | | | | 149,045 | |
Northrop Grumman Corp., | |
2.08%, 10/15/20 | | | 350 | | | | 342,251 | |
Nucor Corp., | | | | | | | | |
4.40%, 5/1/48 | | | 50 | | | | 49,157 | |
Oracle Corp., | | | | | | | | |
2.625%, 2/15/23 | | | 350 | | | | 339,535 | |
3.85%, 7/15/36 | | | 200 | | | | 193,052 | |
PACCAR Financial Corp., | | | | | | | | |
2.30%, 8/10/22 | | | 50 | | | | 47,982 | |
Pacific Gas & Electric Co., | | | | | | | | |
4.00%, 12/1/46 | | | 300 | | | | 262,057 | |
Pfizer, Inc., | | | | | | | | |
3.60%, 9/15/28 | | | 100 | | | | 98,823 | |
Philip Morris International, Inc., | |
2.00%, 2/21/20 | | | 300 | | | | 295,812 | |
2.375%, 8/17/22 | | | 100 | | | | 95,983 | |
Phillips 66, | | | | | | | | |
4.875%, 11/15/44 | | | 150 | | | | 155,702 | |
PPL Electric Utilities Corp., | |
4.15%, 6/15/48 | | | 50 | | | | 49,732 | |
Procter & Gamble Co., | | | | | | | | |
1.90%, 10/23/20 | | | 100 | | | | 97,875 | |
State Street Corp., | | | | | | | | |
2.55%, 8/18/20 | | | 350 | | | | 347,488 | |
Thermo Fisher Scientific, Inc., | |
4.10%, 8/15/47 | | | 100 | | | | 93,724 | |
Toyota Motor Credit Corp., | |
1.90%, 4/8/21 | | | 200 | | | | 193,990 | |
1.95%, 4/17/20 | | | 350 | | | | 345,168 | |
United Parcel Service, Inc., | |
2.05%, 4/1/21 | | | 350 | | | | 340,874 | |
United Technologies Corp., | |
1.90%, 5/4/20 | | | 350 | | | | 343,048 | |
3.35%, 8/16/21 | | | 100 | | | | 99,877 | |
Verizon Communications, Inc., | |
4.125%, 8/15/46 | | | 200 | | | | 179,724 | |
Walmart, Inc., | | | | | | | | |
3.125%, 6/23/21 | | | 350 | | | | 350,993 | |
Walt Disney Co., | | | | | | | | |
2.30%, 2/12/21 | | | 250 | | | | 245,545 | |
Wells Fargo & Co., | | | | | | | | |
3.00%, 2/19/25 | | | 150 | | | | 142,252 | |
Wells Fargo Bank N.A., | | | | | | | | |
2.15%, 12/6/19 | | | 500 | | | | 495,404 | |
| | | | | | | | |
| | | | | | | 20,342,868 | |
| | | | | | | | |
Total Corporate Bonds & Notes (cost—$33,786,771) | | | | 32,921,845 | |
| | | | | | | | |
| | | | | | | | |
| U.S. Government Agency Securities (c)—7.0% | |
Fannie Mae, MBS, TBA, | | | | | | | | |
2.50%, 10/16/33, 15 Year | | | 470 | | | | 453,523 | |
3.00%, 10/16/33, 15 Year | | | 470 | | | | 464,263 | |
3.00%, 10/11/48, 30 Year | | | 1,370 | | | | 1,311,096 | |
3.50%, 10/16/33, 15 Year | | | 370 | | | | 371,930 | |
3.50%, 10/11/48, 30 Year | | | 1,760 | | | | 1,732,106 | |
4.00%, 10/11/48, 30 Year | | | 1,270 | | | | 1,282,469 | |
4.50%, 10/11/48, 30 Year | | | 540 | | | | 557,149 | |
5.00%, 10/11/48, 30 Year | | | 380 | | | | 398,970 | |
Freddie Mac, MBS, TBA, | | | | | | | | |
2.50%, 10/16/33, 15 Year | | | 340 | | | | 327,899 | |
3.00%, 10/16/33, 15 Year | | | 300 | | | | 295,608 | |
3.00%, 10/11/48, 30 Year | | | 940 | | | | 899,297 | |
| | | | | | | | |
| | | Principal
Amount
(000s) | | | Value | |
3.50%, 10/16/33, 15 Year | | $ | 200 | | | $ | 201,053 | |
3.50%, 10/11/48, 30 Year | | | 1,190 | | | | 1,170,988 | |
4.00%, 10/11/48, 30 Year | | | 750 | | | | 757,347 | |
4.50%, 10/11/48, 30 Year | | | 330 | | | | 340,661 | |
5.00%, 10/11/48, 30 Year | | | 240 | | | | 252,037 | |
Ginnie Mae, MBS, TBA, 30 Year, | |
3.00%, 10/18/48 | | | 1,310 | | | | 1,268,832 | |
3.50%, 10/18/48 | | | 1,730 | | | | 1,720,370 | |
4.00%, 10/18/48 | | | 960 | | | | 976,294 | |
4.50%, 10/18/48 | | | 680 | | | | 702,950 | |
| | | | | | | | |
Total U.S. Government Agency Securities (cost—$15,582,047) | | | | 15,484,842 | |
| | | | | | | | |
| | | | | | | | |
| U.S. Treasury Obligations—6.3% | |
U.S. Treasury Bonds, | | | | | | | | |
2.25%, 8/15/46 | | | 380 | | | | 313,589 | |
2.75%, 11/15/47 | | | 180 | | | | 164,644 | |
3.125%, 2/15/43 | | | 1,356 | | | | 1,339,262 | |
4.375%, 5/15/41 | | | 1,191 | | | | 1,419,430 | |
4.50%, 2/15/36 | | | 430 | | | | 510,289 | |
5.25%, 2/15/29 | | | 310 | | | | 370,208 | |
6.875%, 8/15/25 | | | 75 | | | | 92,977 | |
U.S. Treasury Notes, | | | | | | | | |
1.125%, 9/30/21 | �� | | 1,400 | | | | 1,330,000 | |
1.375%, 9/30/23 (g) | | | 2,400 | | | | 2,225,437 | |
1.50%, 8/15/26 | | | 250 | | | | 223,379 | |
1.75%, 11/30/19 | | | 350 | | | | 346,281 | |
2.00%, 7/31/22 | | | 1,400 | | | | 1,353,516 | |
2.125%, 1/31/21 | | | 750 | | | | 737,754 | |
2.25%, 11/15/27 | | | 480 | | | | 449,363 | |
2.75%, 8/15/21 | | | 1,650 | | | | 1,644,328 | |
2.75%, 4/30/23 | | | 1,000 | | | | 992,109 | |
2.875%, 5/15/28 | | | 450 | | | | 443,320 | |
| | | | | | | | |
Total U.S. Treasury Obligations (cost—$14,412,163) | | | | 13,955,886 | |
| | | | | | | | |
| | | | | | | | |
| | | Shares | | | | |
| Exchange-Traded Funds—6.0% | |
Invesco Senior Loan | | | 192,790 | | | | 4,466,944 | |
Schwab U.S. TIPS | | | 165,460 | | | | 8,928,222 | |
| | | | | | | | |
Total Exchange-Traded Funds (cost—$13,543,896) | | | | 13,395,166 | |
| | | | | | | | |
| | | | | | | | |
| | | Principal
Amount
(000s) | | | | |
| Sovereign Debt Obligations—4.0% | |
| Argentina—0.2% | |
Argentine Republic Government International Bond, | |
4.625%, 1/11/23 | | | $150 | | | | 127,125 | |
6.25%, 4/22/19 | | | 300 | | | | 300,919 | |
| | | | | | | | |
| | | | | | | 428,044 | |
| | | | | | | | |
| Canada—0.2% | |
Export Development Canada, | |
2.50%, 1/24/23 | | | 200 | | | | 195,303 | |
Province of Quebec Canada, | |
2.875%, 10/16/24 | | | 200 | | | | 195,783 | |
| | | | | | | | |
| | | | | | | 391,086 | |
| | | | | | | | |
| Chile—0.1% | |
Chile Government International Bond, | |
3.86%, 6/21/47 | | | 200 | | | | 190,904 | |
| | | | | | | | |
| Croatia—0.1% | |
Croatia Government International Bond, | |
6.75%, 11/5/19 | | | 300 | | | | 311,037 | |
| | | | | | | | |
| | | | | | |
| 158 | | Annual Report | | | September 30, 2018 | | | See accompanying Notes to Financial Statements |
Schedule of Investments
September 30, 2018
| | | | | | | | |
| | | Principal
Amount
(000s) | | | Value | |
| Finland—0.2% | |
Nordic Investment Bank, | | | | | | | | |
1.25%, 8/2/21 | | $ | 500 | | | $ | 476,012 | |
| | | | | | | | |
| Germany—0.2% | |
FMS Wertmanagement AoeR, | |
1.75%, 1/24/20 | | | 500 | | | | 493,050 | |
| | | | | | | | |
| Indonesia—0.2% | |
Indonesia Government International Bond, | |
11.625%, 3/4/19 | | | 300 | | | | 311,206 | |
| | | | | | | | |
| Japan—0.2% | |
Japan Bank for International Cooperation, | |
1.50%, 7/21/21 | | | 300 | | | | 286,087 | |
2.125%, 7/21/20 | | | 200 | | | | 196,578 | |
| | | | | | | | |
| | | | | | | 482,665 | |
| | | | | | | | |
| Korea (Republic of)—0.4% | |
Export-Import Bank of Korea, | |
1.75%, 5/26/19 | | | 500 | | | | 496,346 | |
2.50%, 11/1/20 | | | 200 | | | | 196,539 | |
Korea Development Bank, | | | | | | | | |
3.00%, 1/13/26 | | | 100 | | | | 93,900 | |
| | | | | | | | |
| | | | | | | 786,785 | |
| | | | | | | | |
| Latvia—0.2% | |
Latvia Government International Bond, | |
2.75%, 1/12/20 | | | 500 | | | | 496,620 | |
| | | | | | | | |
| Mexico—0.2% | |
Mexico Government International Bond, | |
4.125%, 1/21/26 | | | 300 | | | | 298,053 | |
4.60%, 2/10/48 | | | 200 | | | | 188,461 | |
| | | | | | | | |
| | | | | | | 486,514 | |
| | | | | | | | |
| Panama—0.1% | |
Panama Government International Bond, | |
7.125%, 1/29/26 | | | 150 | | | | 178,729 | |
| | | | | | | | |
| Poland—0.2% | |
Poland Government International Bond, | |
6.375%, 7/15/19 | | | 500 | | | | 513,960 | |
| | | | | | | | |
| Sri Lanka—0.1% | |
Sri Lanka Government International Bond (a)(b), | |
5.75%, 4/18/23 | | | 200 | | | | 195,842 | |
| | | | | | | | |
| Supranational—0.6% | |
Corp. Andina de Fomento, | | | | | | | | |
2.20%, 7/18/20 | | | 350 | | | | 342,740 | |
Council of Europe Development Bank, | |
1.625%, 3/16/21 | | | 500 | | | | 483,946 | |
European Investment Bank, | |
2.875%, 9/15/20 | | | 500 | | | | 499,651 | |
| | | | | | | | |
| | | | | | | 1,326,337 | |
| | | | | | | | |
| Sweden—0.5% | |
Kommuninvest I Sverige AB (a)(b), | |
2.75%, 10/22/20 | | | 350 | | | | 348,327 | |
Svensk Exportkredit AB, | | | | | | | | |
1.75%, 5/18/20 | | | 350 | | | | 343,383 | |
2.875%, 5/22/21 | | | 350 | | | | 348,696 | |
| | | | | | | | |
| | | | | | | 1,040,406 | |
| | | | | | | | |
| | | | | | | | |
| | | Principal
Amount
(000s) | | | Value | |
| United States—0.3% | |
Inter-American Development Bank, | |
3.20%, 8/7/42 | | $ | 180 | | | $ | 174,015 | |
International Finance Corp., | |
1.75%, 9/16/19 | | | 500 | | | | 495,497 | |
| | | | | | | | |
| | | | | | | 669,512 | |
| | | | | | | | |
| Uruguay—0.0% | |
Uruguay Government International Bond, | |
4.975%, 4/20/55 | | | 50 | | | | 50,092 | |
| | | | | | | | |
Total Sovereign Debt Obligations (cost—$9,055,408) | | | | 8,828,801 | |
| | | | | | | | |
| | | | | | | | |
| | | Shares | | | | |
| Mutual Funds—2.0% | |
AllianzGI International Growth (h)(i)
(cost—$4,470,226) | | | 240,206 | | | | 4,400,566 | |
| | | | | | | | |
| | | | | | | | |
| Preferred Stock—0.3% | |
| Brazil—0.0% | |
Cia Paranaense de Energia | | | 4,300 | | | | 22,796 | |
| | | | | | | | |
| Colombia—0.0% | |
Avianca Holdings S.A. | | | 35,036 | | | | 25,011 | |
Banco Davivienda S.A. | | | 6,393 | | | | 73,795 | |
Grupo Aval Acciones y Valores S.A. | | | 9,215 | | | | 3,623 | |
| | | | | | | | |
| | | | | | | 102,429 | |
| | | | | | | | |
| Germany—0.1% | |
Henkel AG & Co. KGaA | | | 1,049 | | | | 122,996 | |
| | | | | | | | |
| Korea (Republic of)—0.2% | |
Samsung Electronics Co., Ltd. | | | 13,200 | | | | 450,216 | |
| | | | | | | | |
Total Preferred Stock (cost—$609,198) | | | | 698,437 | |
| | | | | | | | |
| | | | | | | | |
| | | Principal
Amount
(000s) | | | | |
| Repurchase Agreements—4.0% | |
State Street Bank and Trust Co., dated 9/28/18, 0.42%, due 10/1/18, proceeds $8,982,314; collateralized by U.S. Treasury Notes, 2.00%, due 9/30/20, valued at $9,165,702 including accrued interest | |
(cost—$8,982,000) | | | $8,982 | | | | 8,982,000 | |
| | | | | | | | |
| |
Total Investments (cost—$215,547,130) (d)—104.3% | | | | 232,004,696 | |
| | | | | | | | |
| |
| Liabilities in excess of other assets (k)—(4.3)% | | | | (9,575,347 | ) |
| | | | | | | | |
| |
| Net Assets—100.0% | | | | $222,429,349 | |
| | | | | | | | |
Notes to Schedule of Investments:
(a) Private Placement—Restricted as to resale and may not have a readily available market. Securities with an aggregate value of $4,259,308, representing 1.9% of net assets.
(b) 144A—Exempt from registration under Rule 144A of the Securities Act of 1933. These securities may be resold in transactions exempt from registration, typically only to qualified institutional buyers. Securities with an aggregate value of $5,667,978, representing 2.5% of net assets.
(c) When-issued or delayed-delivery. To be settled/delivered after September 30, 2018.
(d) Securities with an aggregate value of $55,895,020, representing 25.1% of net assets, were valued utilizing modeling tools provided by a third-party vendor. See Note 1(a) and Note 1(b) in the Notes to Financial Statements.
(e) Fair-Valued—Securities with an aggregate value of $1,318,127, representing 0.6% of net assets. See Note 1(a) and Note 1(b) in the Notes to Financial Statements.
(f) Level 3 security. See Note 1(a) and Note 1(b) in the Notes to Financial Statements.
(g) All or partial amount segregated for the benefit of the counterparty as collateral for when-issued or delayed deliver securities.
(h) Affiliated fund.
(i) Institutional Class share.
(j) Non-income producing.
| | | | | | | | |
| See accompanying Notes to Financial Statements | | | September 30, 2018 | | | Annual Report | | | 159 | |
Schedule of Investments
September 30, 2018
(k) Includes net unrealized appreciation (depreciation) of other financial instruments as follows:
| | | | | | | | | | | | | | | | | | | | | | |
| Futures contracts outstanding at September 30, 2018: | |
Type | | Contracts | | | Expiration
Date | | | Notional
Amount
(000s) | | | Market
Value
(000s) | | | Unrealized
Appreciation
(Depreciation) | |
Long position contracts: | | | | | | | | | | | | | | | | | | | | |
| | 5-Year U.S. Treasury Note | | | 24 | | | | 12/31/18 | | | $ | 2,400 | | | $ | 2,700 | | | $ | (18,229 | ) |
| | 10-Year Ultra U.S. Treasury Bond | | | 44 | | | | 12/19/18 | | | | 4,400 | | | | 5,544 | | | | (26,893 | ) |
| | Dow Jones U.S. Real Estate Index | | | 208 | | | | 12/21/18 | | | | 21 | | | | 6,614 | | | | (152,304 | ) |
| | E-mini Russell 2000 Index | | | 52 | | | | 12/21/18 | | | | 3 | | | | 4,422 | | | | (22,477 | ) |
| | E-mini S&P 500 Index | | | 64 | | | | 12/21/18 | | | | 3 | | | | 9,341 | | | | 72,656 | |
| | Euro-Bund 10-Year Bond | | | 45 | | | | 12/6/18 | | | EUR | 4,500 | | | | 8,296 | | | | (103,505 | ) |
| | Nikkei 225 Index | | | 60 | | | | 12/13/18 | | | $ | — | (m) | | | 7,256 | | | | 167,225 | |
| | SPI 200 Index | | | 60 | | | | 12/20/18 | | | AUD | 2 | | | | 6,716 | | | | (163 | ) |
| | U.S. Ultra Treasury Bond | | | 72 | | | | 12/19/18 | | | $ | 7,200 | | | | 11,108 | | | | (87,841 | ) |
| | United Kingdom Government 10-Year Gilt | | | 54 | | | | 12/27/18 | | | GBP | 5,400 | | | | 8,512 | | | | (96,513 | ) |
| | | | | | | | | | | | | | | | | | | | | | |
| | | | | | | | | | | | | $ | (268,044 | ) |
| | | | | | | | | | | | | | | | | | | | | | |
Short position contracts: | | | | | | | | | | | | | | | | | | | | |
| | 2-Year U.S. Treasury Note | | | (59 | ) | | | 12/31/18 | | | $ | (11,800 | ) | | $ | (12,433 | ) | | $ | 36,776 | |
| | Euro Currency | | | (31 | ) | | | 12/17/18 | | | | (3,875 | ) | | | (4,527 | ) | | | (3,376 | ) |
| | Mini MSCI Emerging Markets Index | | | (127 | ) | | | 12/21/18 | | | | (6 | ) | | | (6,666 | ) | | | (111,358 | ) |
| | MSCI EAFE Index | | | (147 | ) | | | 12/21/18 | | | | (7 | ) | | | (14,520 | ) | | | (67,324 | ) |
| | | | | | | | | | | | | | | | | | | | | | |
| | | | | | | | | | | | | $ | (145,282 | ) |
| | | | | | | | | | | | | | | | | | | | | | |
| | | | | | | | | | | | | $ | (413,326 | ) |
| | | | | | | | | | | | | | | | | | | | | | |
(l) At September 30, 2018, the Fund pledged $5,109,391 in cash as collateral for futures contracts.
(m) Notional amount rounds to less than 500.
Glossary:
ADR—American Depositary Receipt
AUD—Australian Dollar
GBP—British Pound
EAFE—Europe, Australasia and Far East
EUR—Euro
GDR—Global Depositary Receipt
MBS—Mortgage-Backed Securities
MSCI—Morgan Stanley Capital International
REIT—Real Estate Investment Trust
TBA—To Be Announced
TIPS—Treasury Inflation Protected Securities
UNIT—More than one class of securities traded together
| | | | | | |
| 160 | | Annual Report | | | September 30, 2018 | | | See accompanying Notes to Financial Statements |
Schedule of Investments
September 30, 2018
The industry classification of portfolio holdings and liabilities in excess of other assets shown as a percentage of net assets were as follows:
| | | | |
Banks | | | 9.4% | |
U.S. Government Agency Securities | | | 7.0% | |
U.S. Treasury Obligations | | | 6.3% | |
Exchange-Traded Funds | | | 6.0% | |
Oil, Gas & Consumable Fuels | | | 4.2% | |
Sovereign Debt Obligations | | | 4.0% | |
Pharmaceuticals | | | 3.2% | |
Insurance | | | 3.1% | |
Technology Hardware, Storage & Peripherals | | | 2.5% | |
Mutual Funds | | | 2.0% | |
Banking | | | 2.0% | |
Healthcare Providers & Services | | | 2.0% | |
Electric Utilities | | | 2.0% | |
Diversified Telecommunication Services | | | 1.9% | |
IT Services | | | 1.9% | |
Semiconductors & Semiconductor Equipment | | | 1.8% | |
Healthcare Equipment & Supplies | | | 1.8% | |
Software | | | 1.7% | |
Auto Manufacturers | | | 1.4% | |
Chemicals | | | 1.4% | |
Food Products | | | 1.4% | |
Hotels, Restaurants & Leisure | | | 1.3% | |
Automobiles | | | 1.3% | |
Food & Staples Retailing | | | 1.2% | |
Metals & Mining | | | 1.2% | |
Interactive Media & Services | | | 1.2% | |
Capital Markets | | | 1.2% | |
Machinery | | | 1.1% | |
Trading Companies & Distributors | | | 1.1% | |
Construction & Engineering | | | 1.0% | |
Aerospace & Defense | | | 1.0% | |
Auto Components | | | 1.0% | |
Media | | | 0.9% | |
Internet & Direct Marketing Retail | | | 0.8% | |
Specialty Retail | | | 0.8% | |
Airlines | | | 0.8% | |
Household Durables | | | 0.8% | |
Equity Real Estate Investment Trusts (REITs) | | | 0.8% | |
Life Sciences Tools & Services | | | 0.7% | |
Electronic Equipment, Instruments & Components | | | 0.7% | |
Wireless Telecommunication Services | | | 0.7% | |
Food & Beverage | | | 0.7% | |
Beverages | | | 0.7% | |
Mortgage Real Estate Investment Trusts (REITs) | | | 0.6% | |
Real Estate Management & Development | | | 0.6% | |
Tobacco | | | 0.6% | |
Household Products | | | 0.6% | |
Commercial Services & Supplies | | | 0.6% | |
Biotechnology | | | 0.6% | |
Multi-Line Retail | | | 0.6% | |
Multi-Utilities | | | 0.5% | |
Paper & Forest Products | | | 0.5% | |
Communications Equipment | | | 0.5% | |
Industrial Conglomerates | | | 0.5% | |
Machinery-Diversified | | | 0.4% | |
| | | | |
Transportation | | | 0.3% | |
Telecommunications | | | 0.3% | |
Diversified Financial Services | | | 0.3% | |
Consumer Products | | | 0.3% | |
Road & Rail | | | 0.3% | |
Textiles, Apparel & Luxury Goods | | | 0.3% | |
Air Freight & Logistics | | | 0.3% | |
Machinery-Construction & Mining | | | 0.3% | |
Transportation Infrastructure | | | 0.2% | |
Retail | | | 0.2% | |
Agriculture | | | 0.2% | |
Independent Power Producers & Energy Traders | | | 0.2% | |
Personal Products | | | 0.2% | |
Professional Services | | | 0.2% | |
Electrical Equipment | | | 0.2% | |
Pipelines | | | 0.2% | |
Construction Materials | | | 0.2% | |
Mining | | | 0.2% | |
Leisure Equipment & Products | | | 0.2% | |
Healthcare-Products | | | 0.1% | |
Miscellaneous Manufacturing | | | 0.1% | |
Thrifts & Mortgage Finance | | | 0.1% | |
Building Products | | | 0.1% | |
Containers & Packaging | | | 0.1% | |
Electronics | | | 0.1% | |
Building Materials | | | 0.1% | |
Computers | | | 0.1% | |
Gas Utilities | | | 0.1% | |
Consumer Finance | | | 0.1% | |
Water Utilities | | | 0.1% | |
Commercial Services | | | 0.0% | |
Diversified Consumer Services | | | 0.0% | |
Marine | | | 0.0% | |
Iron/Steel | | | 0.0% | |
Advertising | | | 0.0% | |
Energy Equipment & Services | | | 0.0% | |
Distributors | | | 0.0% | |
Repurchase Agreements | | | 4.0% | |
Liabilities in excess of other assets | | | (4.3)% | |
| | | | |
| | | 100.0% | |
| | | | |
AllianzGI Global High Yield Fund
| | | | | | | | |
| | | Principal
Amount
(000s) | | | Value | |
| Corporate Bonds & Notes—95.1% | |
| Australia—0.6% | |
Nufarm Australia Ltd. (a)(b), | |
5.75%, 4/30/26 | | | $150 | | | | $142,313 | |
| | | | | | | | |
| Belgium—0.6% | |
Nyrstar Netherlands Holdings BV, | |
6.875%, 3/15/24 | | € | 150 | | | | 132,336 | |
| | | | | | | | |
| Brazil—3.8% | |
Banco do Brasil S.A., (converts to FRN on 4/15/24) (a)(b)(c)(e), | |
6.25%, 4/15/24 | | | $200 | | | | 153,500 | |
Petrobras Global Finance BV, | |
4.375%, 5/20/23 | | | 250 | | | | 238,075 | |
4.75%, 1/14/25 | | € | 100 | | | | 120,054 | |
5.299%, 1/27/25 | | | $50 | | | | 46,825 | |
5.999%, 1/27/28 | | | 100 | | | | 92,450 | |
Vale S.A., | |
3.75%, 1/10/23 | | € | 150 | | | | 192,096 | |
| | | | | | | | |
| | | | | | | 843,000 | |
| | | | | | | | |
| Canada—4.5% | |
Cott Holdings, Inc. (a)(b), | |
5.50%, 4/1/25 | | | $250 | | | | 244,687 | |
Northwest Acquisitions ULC (a)(b), | |
7.125%, 11/1/22 | | | 150 | | | | 153,750 | |
Precision Drilling Corp., | |
7.75%, 12/15/23 | | | 100 | | | | 106,250 | |
Ritchie Bros Auctioneers, Inc. (a)(b), | |
5.375%, 1/15/25 | | | 150 | | | | 150,675 | |
Rockpoint Gas Storage Canada Ltd. (a)(b), | |
7.00%, 3/31/23 | | | 150 | | | | 153,000 | |
Superior Plus L.P. (a)(b), | |
7.00%, 7/15/26 | | | 100 | | | | 101,250 | |
Teck Resources Ltd. (a)(b), | |
8.50%, 6/1/24 | | | 80 | | | | 87,660 | |
| | | | | | | | |
| | | | | | | 997,272 | |
| | | | | | | | |
| Chile—1.1% | |
VTR Finance BV, | |
6.875%, 1/15/24 | | | 250 | | | | 255,312 | |
| | | | | | | | |
| China—0.9% | |
Country Garden Holdings Co., Ltd., | |
3.875%, 11/20/18 | | | 200 | | | | 199,539 | |
| | | | | | | | |
| Colombia—0.9% | |
Millicom International Cellular S.A., | |
6.00%, 3/15/25 | | | 200 | | | | 201,375 | |
| | | | | | | | |
| France—2.6% | |
Altice France S.A., | |
5.625%, 5/15/24 | | € | 100 | | | | 121,553 | |
Banijay Group SAS (a)(b), | |
4.00%, 7/1/22 | | | 100 | | | | 120,574 | |
BNP Paribas S.A., (converts to FRN on 3/30/21) (a)(b)(c)(e), | |
7.625%, 3/30/21 | | | $200 | | | | 210,500 | |
Paprec Holding S.A. (a)(b), | |
4.00%, 3/31/25 | | € | 100 | | | | 117,213 | |
| | | | | | | | |
| | | | | | | 569,840 | |
| | | | | | | | |
| Germany—1.6% | |
Blitz F18-674 GmbH (a)(b), | |
6.00%, 7/30/26 | | | 100 | | | | 117,495 | |
DEMIRE Deutsche Mittelstand Real Estate AG, | |
2.875%, 7/15/22 | | | 200 | | | | 237,777 | |
| | | | | | | | |
| | | | | | | 355,272 | |
| | | | | | | | |
| Ghana—0.9% | |
Tullow Oil PLC (a)(b), | |
7.00%, 3/1/25 | | | $200 | | | | 195,250 | |
| | | | | | | | |
| | | | | | | | |
| See accompanying Notes to Financial Statements | | | September 30, 2018 | | | Annual Report | | | 161 | |
Schedule of Investments
September 30, 2018
| | | | | | | | |
| | | Principal
Amount
(000s) | | | Value | |
| Greece—0.6% | |
Crystal Almond SARL, | |
10.00%, 11/1/21 | | € | 100 | | | $ | 126,014 | |
| | | | | | | | |
| Ireland—0.9% | |
Ardagh Packaging Finance PLC, | |
4.625%, 5/15/23 | | | $200 | | | | 198,750 | |
| | | | | | | | |
| Israel—1.8% | |
Teva Pharmaceutical Finance Netherlands II BV, | |
3.25%, 4/15/22 | | € | 100 | | | | 121,170 | |
Teva Pharmaceutical Finance Netherlands III BV, | |
2.80%, 7/21/23 | | | $300 | | | | 267,375 | |
| | | | | | | | |
| | | | | | | 388,545 | |
| | | | | | | | |
| Italy—2.4% | |
Assicurazioni Generali SpA, (converts to FRN on 6/8/28) (e), | |
5.00%, 6/8/48 | | € | 100 | | | | 121,112 | |
Cooperativa Muratori & Cementisti-CMC di Ravenna (a)(b), | |
6.00%, 2/15/23 | | | 100 | | | | 65,116 | |
Fiat Chrysler Automobiles NV, | |
5.25%, 4/15/23 | | | $250 | | | | 255,552 | |
Telecom Italia Finance S.A., | |
7.75%, 1/24/33 | | € | 50 | | | | 79,944 | |
| | | | | | | | |
| | | | | | | 521,724 | |
| | | | | | | | |
| Luxembourg—1.0% | |
Altice Luxembourg S.A., | |
6.25%, 2/15/25 | | | 100 | | | | 108,793 | |
Arena Luxembourg Finance Sarl, | |
2.875%, 11/1/24 | | | 100 | | | | 116,657 | |
| | | | | | | | |
| | | | | | | 225,450 | |
| | | | | | | | |
| Netherlands—5.1% | |
de Volksbank NV, (converts to FRN on 11/5/20) (e), | |
3.75%, 11/5/25 | | | 100 | | | | 122,938 | |
Eagle Intermediate Global Holding BV, | |
5.375%, 5/1/23 | | | 100 | | | | 113,987 | |
InterXion Holding NV (a)(b), | |
4.75%, 6/15/25 | | | 200 | | | | 244,317 | |
IPD 3 BV (a)(b), | |
4.50%, 7/15/22 | | | 100 | | | | 118,810 | |
Nostrum Oil & Gas Finance BV, | |
8.00%, 7/25/22 | | | $200 | | | | 190,883 | |
Selecta Group BV, 3 mo. EURIBOR + 5.375% (e), | |
5.375%, 2/1/24 | | € | 100 | | | | 116,470 | |
Sunshine Mid BV (a)(b), | |
6.50%, 5/15/26 | | | 100 | | | | 113,681 | |
United Group BV (a)(b), | |
4.875%, 7/1/24 | | | 100 | | | | 119,855 | |
| | | | | | | | |
| | | | | | | 1,140,941 | |
| | | | | | | | |
| Norway—0.7% | |
Aker BP ASA (a)(b), | |
5.875%, 3/31/25 | | | $150 | | | | 155,438 | |
| | | | | | | | |
| Romania—1.1% | |
Digi Communications NV, | |
5.00%, 10/15/23 | | € | 200 | | | | 244,822 | |
| | | | | | | | |
| Spain—0.8% | |
Grifols S.A. (a)(b), | |
3.20%, 5/1/25 | | | 150 | | | | 176,963 | |
| | | | | | | | |
| Sweden—0.5% | |
Perstorp Holding AB, 3 mo. EURIBOR + 4.250% (e), | |
4.25%, 9/15/22 | | | 100 | | | | 117,237 | |
| | | | | | | | |
| United Arab Emirates—0.5% | |
Shelf Drilling Holdings Ltd. (a)(b), | |
8.25%, 2/15/25 | | | $100 | | | | 103,375 | |
| | | | | | | | |
| | | | | | | | |
| | | Principal
Amount
(000s) | | | Value | |
| United Kingdom—6.8% | |
Algeco Scotsman Global Finance 2 PLC (a)(b), | |
10.00%, 8/15/23 | | | $200 | | | $ | 206,000 | |
Aston Martin Capital Holdings Ltd., | |
5.75%, 4/15/22 | | £ | 100 | | | | 133,733 | |
CPUK Finance Ltd. (a)(b), | |
4.875%, 8/28/25 | | | 100 | | | | 130,316 | |
HBOS Capital Funding L.P., (converts to FRN on 11/30/18) (c)(e), | |
6.461%, 11/30/18 | | | 50 | | | | 65,614 | |
Hiscox Ltd., (converts to FRN on 11/24/25) (e), | |
6.125%, 11/24/45 | | | 100 | | | | 139,483 | |
Iceland Bondco PLC, | |
6.75%, 7/15/24 | | | 100 | | | | 135,938 | |
KCA Deutag UK Finance PLC (a)(b), | |
7.25%, 5/15/21 | | | $200 | | | | 189,500 | |
Miller Homes Group Holdings PLC, | |
5.50%, 10/15/24 | | £ | 100 | | | | 132,219 | |
Pinewood Finco PLC, | |
3.75%, 12/1/23 | | | 100 | | | | 130,785 | |
Pinnacle Bidco PLC (a)(b), | |
6.375%, 2/15/25 | | | 100 | | | | 134,397 | |
TVL Finance PLC, | |
8.50%, 5/15/23 | | | 80 | | | | 111,490 | |
| | | | | | | | |
| | | | | | | 1,509,475 | |
| | | | | | | | |
| United States—55.4% | |
AES Corp., | |
6.00%, 5/15/26 | | | $200 | | | | 211,750 | |
AK Steel Corp., | |
6.375%, 10/15/25 | | | 150 | | | | 143,438 | |
Alcoa Nederland Holding BV (a)(b), | |
6.75%, 9/30/24 | | | 200 | | | | 212,500 | |
Ball Corp., | |
4.875%, 3/15/26 | | | 100 | | | | 100,201 | |
Boyne USA, Inc. (a)(b), | |
7.25%, 5/1/25 | | | 100 | | | | 106,250 | |
BWX Technologies, Inc. (a)(b), | |
5.375%, 7/15/26 | | | 100 | | | | 100,625 | |
California Resources Corp. (a)(b), | |
8.00%, 12/15/22 | | | 100 | | | | 95,625 | |
Calumet Specialty Products Partners L.P., | |
7.625%, 1/15/22 | | | 100 | | | | 100,750 | |
Catalent Pharma Solutions, Inc., | |
4.75%, 12/15/24 | | € | 170 | | | | 208,274 | |
CCO Holdings LLC (a)(b), | |
4.00%, 3/1/23 | | | $100 | | | | 95,980 | |
5.375%, 5/1/25 | | | 100 | | | | 99,500 | |
5.75%, 2/15/26 | | | 100 | | | | 100,625 | |
Centene Corp., | |
6.125%, 2/15/24 | | | 150 | | | | 158,250 | |
CenturyLink, Inc., | |
6.45%, 6/15/21, Ser. S | | | 50 | | | | 52,063 | |
7.50%, 4/1/24, Ser. Y | | | 100 | | | | 107,125 | |
Cheniere Corpus Christi Holdings LLC, | |
5.875%, 3/31/25 | | | 100 | | | | 105,250 | |
Clearway Energy Operating LLC (a)(b), | |
5.75%, 10/15/25 | | | 150 | | | | 151,688 | |
CNX Midstream Partners L.P. (a)(b), | |
6.50%, 3/15/26 | | | 100 | | | | 99,750 | |
Commercial Metals Co., | |
4.875%, 5/15/23 | | | 100 | | | | 99,660 | |
CommScope Technologies LLC (a)(b), | |
5.00%, 3/15/27 | | | 20 | | | | 19,300 | |
6.00%, 6/15/25 | | | 150 | | | | 155,550 | |
Crown European Holdings S.A., | |
3.375%, 5/15/25 | | € | 200 | | | | 240,911 | |
CSC Holdings LLC (a)(b), | |
10.875%, 10/15/25 | | | $250 | | | | 290,937 | |
CyrusOne L.P., | |
5.00%, 3/15/24 | | | 100 | | | | 102,125 | |
5.375%, 3/15/27 | | | 100 | | | | 102,500 | |
| | | | | | | | |
| | | Principal
Amount
(000s) | | | Value | |
DCP Midstream Operating L.P. (a)(b), | |
6.75%, 9/15/37 | | $ | 100 | | | $ | 107,500 | |
Denbury Resources, Inc. (a)(b), | |
9.25%, 3/31/22 | | | 100 | | | | 108,375 | |
DISH DBS Corp., | |
5.125%, 5/1/20 | | | 100 | | | | 101,250 | |
7.75%, 7/1/26 | | | 50 | | | | 47,563 | |
Dole Food Co., Inc. (a)(b), | |
7.25%, 6/15/25 | | | 100 | | | | 98,000 | |
Eldorado Resorts, Inc., | |
6.00%, 4/1/25 | | | 150 | | | | 152,437 | |
Encompass Health Corp., | |
5.125%, 3/15/23 | | | 150 | | | | 151,125 | |
Energizer Gamma Acquisition, Inc. (a)(b), | |
6.375%, 7/15/26 | | | 150 | | | | 155,437 | |
EP Energy LLC, | |
6.375%, 6/15/23 | | | 100 | | | | 67,250 | |
Exela Intermediate LLC (a)(b), | |
10.00%, 7/15/23 | | | 100 | | | | 107,125 | |
Federal-Mogul LLC, | |
4.875%, 4/15/22 | | € | 100 | | | | 121,268 | |
First Data Corp. (a)(b), | |
5.375%, 8/15/23 | | | $150 | | | | 152,662 | |
First Quality Finance Co., Inc. (a)(b), | |
4.625%, 5/15/21 | | | 200 | | | | 200,750 | |
5.00%, 7/1/25 | | | 50 | | | | 46,875 | |
Five Point Operating Co. L.P. (a)(b), | |
7.875%, 11/15/25 | | | 150 | | | | 151,837 | |
Freeport-McMoRan, Inc., | |
3.875%, 3/15/23 | | | 150 | | | | 145,488 | |
Genesis Energy L.P., | |
6.25%, 5/15/26 | | | 50 | | | | 47,750 | |
6.50%, 10/1/25 | | | 150 | | | | 147,188 | |
Graham Holdings Co. (a)(b), | |
5.75%, 6/1/26 | | | 150 | | | | 153,937 | |
HCA, Inc., | |
5.25%, 4/15/25 | | | 150 | | | | 154,687 | |
5.50%, 6/15/47 | | | 100 | | | | 101,500 | |
Holly Energy Partners L.P. (a)(b), | |
6.00%, 8/1/24 | | | 150 | | | | 154,125 | |
Huntsman International LLC, | |
4.25%, 4/1/25 | | € | 100 | | | | 134,215 | |
International Game Technology PLC, | |
4.75%, 2/15/23 | | | 200 | | | | 251,258 | |
IQVIA, Inc., | |
2.875%, 9/15/25 | | | 100 | | | | 114,787 | |
Itron, Inc. (a)(b), | |
5.00%, 1/15/26 | | | $150 | | | | 144,375 | |
Jack Ohio Finance LLC (a)(b), | |
10.25%, 11/15/22 | | | 100 | | | | 110,270 | |
Jagged Peak Energy LLC (a)(b), | |
5.875%, 5/1/26 | | | 100 | | | | 99,750 | |
Kennedy-Wilson, Inc., | |
5.875%, 4/1/24 | | | 50 | | | | 49,500 | |
Kraton Polymers LLC (b), | |
5.25%, 5/15/26 | | € | 100 | | | | 119,252 | |
Kronos International, Inc., | |
3.75%, 9/15/25 | | | 200 | | | | 224,729 | |
Level 3 Financing, Inc., | |
5.375%, 8/15/22 | | | $100 | | | | 101,250 | |
Levi Strauss & Co., | |
3.375%, 3/15/27 | | € | 100 | | | | 120,108 | |
Matthews International Corp. (a)(b), | |
5.25%, 12/1/25 | | | $150 | | | | 145,500 | |
Meredith Corp. (a)(b), | |
6.875%, 2/1/26 | | | 100 | | | | 102,750 | |
MGM Resorts International, | |
5.75%, 6/15/25 | | | 150 | | | | 151,050 | |
Moss Creek Resources Holdings, Inc. (a)(b), | |
7.50%, 1/15/26 | | | 50 | | | | 50,188 | |
MSCI, Inc. (a)(b), | |
5.375%, 5/15/27 | | | 100 | | | | 102,250 | |
| | | | | | |
| 162 | | Annual Report | | | September 30, 2018 | | | See accompanying Notes to Financial Statements |
Schedule of Investments
September 30, 2018
| | | | | | | | |
| | | Principal
Amount
(000s) | | | Value | |
NGPL PipeCo LLC (a)(b), | |
7.768%, 12/15/37 | | $ | 150 | | | $ | 184,188 | |
Party City Holdings, Inc. (a)(b), | |
6.625%, 8/1/26 | | | 100 | | | | 101,500 | |
Pilgrim’s Pride Corp. (a)(b), | |
5.75%, 3/15/25 | | | 180 | | | | 174,150 | |
PulteGroup, Inc., | |
5.00%, 1/15/27 | | | 100 | | | | 95,125 | |
Pyxus International, Inc., | |
9.875%, 7/15/21 | | | 170 | | | | 165,962 | |
Reynolds Group Issuer, Inc. (a)(b), | |
7.00%, 7/15/24 | | | 100 | | | | 101,938 | |
Seagate HDD Cayman, | |
4.875%, 3/1/24 | | | 100 | | | | 98,655 | |
Service Corp. International, | |
4.625%, 12/15/27 | | | 100 | | | | 96,000 | |
SESI LLC, | |
7.75%, 9/15/24 | | | 100 | | | | 102,375 | |
Shea Homes L.P. (a)(b), | |
5.875%, 4/1/23 | | | 150 | | | | 148,688 | |
Silgan Holdings, Inc., | |
3.25%, 3/15/25 | | € | 100 | | | | 120,029 | |
Six Flags Entertainment Corp. (a)(b), | |
4.875%, 7/31/24 | | | $100 | | | | 98,200 | |
Springleaf Finance Corp., | |
6.875%, 3/15/25 | | | 200 | | | | 200,400 | |
Sprint Capital Corp., | |
8.75%, 3/15/32 | | | 100 | | | | 112,719 | |
Sprint Communications, Inc., | |
6.00%, 11/15/22 | | | 50 | | | | 51,125 | |
Sprint Corp., | |
7.875%, 9/15/23 | | | 100 | | | | 107,986 | |
Stevens Holding Co., Inc. (a)(b), | |
6.125%, 10/1/26 | | | 50 | | | | 50,938 | |
Sunoco L.P. (a)(b), | |
5.875%, 3/15/28 | | | 150 | | | | 144,375 | |
Tallgrass Energy Partners L.P. (a)(b), | |
5.50%, 9/15/24 | | | 50 | | | | 51,188 | |
5.50%, 1/15/28 | | | 250 | | | | 252,812 | |
Tenet Healthcare Corp., | |
4.625%, 7/15/24 | | | 100 | | | | 97,450 | |
TerraForm Power Operating LLC (a)(b), | |
4.25%, 1/31/23 | | | 50 | | | | 49,000 | |
6.625%, 6/15/25 (d) | | | 100 | | | | 106,375 | |
Transocean, Inc., | |
6.80%, 3/15/38 | | | 100 | | | | 87,000 | |
Trident Merger Sub, Inc. (a)(b), | |
6.625%, 11/1/25 | | | 75 | | | | 71,250 | |
Universal Hospital Services, Inc., | |
7.625%, 8/15/20 | | | 100 | | | | 100,490 | |
Vantiv LLC (a)(b), | |
3.875%, 11/15/25 | | £ | 100 | | | | 127,733 | |
Verscend Escrow Corp. (a)(b), | |
9.75%, 8/15/26 | | | $100 | | | | 103,375 | |
Viking Cruises Ltd. (a)(b), | |
5.875%, 9/15/27 | | | 150 | | | | 146,745 | |
| | | | | | | | |
| | | Principal
Amount
(000s) | | | Value | |
Vistra Operations Co. LLC (a)(b), | |
5.50%, 9/1/26 | | $ | 100 | | | $ | 101,250 | |
Voya Financial, Inc., (converts to FRN on 1/23/28) (a)(b)(e), | |
4.70%, 1/23/48 | | | 170 | | | | 151,725 | |
Warrior Met Coal, Inc. (a)(b), | |
8.00%, 11/1/24 | | | 100 | | | | 102,750 | |
Waste Pro USA, Inc. (a)(b), | |
5.50%, 2/15/26 | | | 150 | | | | 147,000 | |
WellCare Health Plans, Inc. (a)(b), | |
5.375%, 8/15/26 | | | 200 | | | | 204,000 | |
WildHorse Resource Development Corp., | |
6.875%, 2/1/25 | | | 100 | | | | 103,750 | |
Windstream Services LLC (a)(b), | |
6.375%, 8/1/23 | | | 100 | | | | 54,000 | |
Wynn Las Vegas LLC (a)(b), | |
5.25%, 5/15/27 | | | 130 | | | | 120,900 | |
| | | | | | | | |
| | | | | | | 12,289,134 | |
| | | | | | | | |
Total Corporate Bonds & Notes
(cost—$21,353,904) | | | | 21,089,377 | |
| | | | | | | | |
| | | | | | | | |
| Sovereign Debt Obligations—0.6% | |
| Turkey—0.6% | |
Turkey Government International Bond,
4.875%, 4/16/43 (cost—$140,047) | | | 200 | | | | 146,770 | |
| | | | | | | | |
| | | | | | | | |
| Short-Term Investments—2.8% | |
| U.S. Treasury Obligations—1.8% | |
U.S. Treasury Bills (f),
1.952%, 10/11/18 (cost—$399,787) | | | 400 | | | | 399,787 | |
| | | | | | | | |
| Repurchase Agreements—1.0% | |
State Street Bank and Trust Co., dated 9/28/18, 0.42%, due 10/1/18, proceeds $214,007; collateralized by U.S. Treasury Notes, 1.75%, due 11/30/21, valued at $218,390 including accrued interest
| |
(cost—$214,000) | | | 214 | | | | 214,000 | |
| | | | | | | | |
| Total Short-Term Investments (cost—$613,787) | | | | 613,787 | |
| | | | | | | | |
| |
| Total Investments (cost—$22,107,738)—98.5% | | | | 21,849,934 | |
| | | | | | | | |
| |
Other assets less
liabilities (g)—1.5% | | | | 328,707 | |
| | | | | | | | |
| | |
| Net Assets—100.0% | | | | | | | $22,178,641 | |
| | | | | | | | |
Notes to Schedule of Investments:
(a) Private Placement—Restricted as to resale and may not have a readily available market. Securities with an aggregate value of $10,219,751, representing 46.1% of net assets.
(b) 144A—Exempt from registration under Rule 144A of the Securities Act of 1933. These securities may be resold in transactions exempt from registration, typically only to qualified institutional buyers. Securities with an aggregate value of $10,339,003, representing 46.6% of net assets.
(c) Perpetual maturity. The date shown, if any, is the next call date.
(d) Step Bond—Coupon is a fixed rate for an initial period then resets at a specific date and rate.
(e) Variable or Floating Rate Security—Securities with an interest rate that changes periodically. The interest rate disclosed reflects the rate in effect on September 30, 2018.
(f) Rates reflect the effective yields at purchase date.
(g) Includes net unrealized appreciation (depreciation) of other financial instruments as follows:
| | | | | | | | | | | | | | | | | | | | | | |
| Futures contracts outstanding at September 30, 2018: | |
| Type | | Contracts | | | Expiration
Date | | | Notional
Amount
(000s) | | | Market
Value
(000s) | | | Unrealized
Appreciation
(Depreciation) | |
Long position contracts: | | | | | |
| | 5-Year U.S. Treasury Note | | | 4 | | | | 12/31/18 | | | $ | 400 | | | $ | 450 | | | $ | (3,467 | ) |
Short position contracts: | | | | | |
| | E-mini S&P 500 Index | | | (3 | ) | | | 12/21/18 | | | $ | (— | )(i) | | $ | (438 | ) | | $ | 3,081 | |
| | | | | | | | | | | | | | | | | | | | | | |
| | | | | | | | | | | | | $ | (386 | ) |
| | | | | | | | | | | | | | | | | | | | | | |
| | | | | | | | |
| See accompanying Notes to Financial Statements | | | September 30, 2018 | | | Annual Report | | | 163 | |
Schedule of Investments
September 30, 2018
| | | | | | | | | | | | | | | | | | |
| Forward foreign currency contracts outstanding at September 30, 2018: | |
| Description | | Counterparty | | U.S.$ Value on
Origination Date | | | U.S.$ Value
September 30, 2018 | | | Unrealized
Appreciation | | | Unrealized
Depreciation | |
Purchased: | |
416,963 British Pound settling 11/21/18 | | JPMorgan Chase | | $ | 547,147 | | | $ | 544,668 | | | $ | — | | | $ | (2,479 | ) |
148,905 Euro settling 11/21/18 | | JPMorgan Chase | | | 173,870 | | | | 173,563 | | | | — | | | | (307 | ) |
50,000 Euro settling 11/21/18 | | JPMorgan Chase | | | 58,130 | | | | 58,280 | | | | 150 | | | | — | |
Sold: | |
1,364,517 British Pound settling 11/21/18 | | Goldman Sachs | | | 1,785,442 | | | | 1,782,433 | | | | 3,009 | | | | — | |
4,849,381 Euro settling 11/21/18 | | Goldman Sachs | | | 5,664,393 | | | | 5,652,436 | | | | 11,957 | | | | — | |
| | | | | | | | | | | | | | | | | | |
| | | $ | 15,116 | | | $ | (2,786 | ) |
| | | | | | | | | | | | | | | | | | |
(h) At September 30, 2018, the Fund pledged $20,719 in cash as collateral for futures contracts.
(i) Notional amount rounds to less than 500.
Glossary:
£—British Pound
€—Euro
EURIBOR—Euro Inter-Bank Offered Rate
FRN—Floating Rate Note
MSCI—Morgan Stanley Capital International
The industry classification of portfolio holdings and other assets less liabilities shown as a percentage of net assets were as follows:
| | | | |
Oil, Gas & Consumable Fuels | | | 12.0% | |
Media | | | 7.7% | |
Telecommunications | | | 5.3% | |
Pipelines | | | 5.2% | |
Commercial Services | | | 4.5% | |
Entertainment | | | 3.9% | |
Pharmaceuticals | | | 3.5% | |
Food & Beverage | | | 3.5% | |
Containers & Packaging | | | 3.4% | |
Chemicals | | | 3.3% | |
Mining | | | 3.3% | |
Software | | | 2.8% | |
Healthcare-Services | | | 2.5% | |
Banks | | | 2.5% | |
Lodging | | | 2.2% | |
Electric Utilities | | | 2.1% | |
Real Estate | | | 2.0% | |
Iron/Steel | | | 2.0% | |
Insurance | | | 1.9% | |
U.S. Treasury Obligations | | | 1.8% | |
Auto Manufacturers | | | 1.8% | |
Home Builders | | | 1.7% | |
Diversified Financial Services | | | 1.5% | |
Healthcare Providers & Services | | | 1.4% | |
Leisure | | | 1.3% | |
Environmental Services | | | 1.2% | |
Consumer Products | | | 1.1% | |
Storage/Warehousing | | | 0.9% | |
Computers | | | 0.9% | |
Equity Real Estate Investment Trusts (REITs) | | | 0.9% | |
Real Estate Management & Development | | | 0.9% | |
Machinery-Diversified | | | 0.8% | |
Tobacco | | | 0.7% | |
Electrical Equipment | | | 0.7% | |
Energy-Alternate Sources | | | 0.7% | |
Sovereign Debt Obligations | | | 0.6% | |
Electronics | | | 0.6% | |
Auto Components | | | 0.5% | |
Apparel & Textiles | | | 0.5% | |
Internet | | | 0.5% | |
Textiles | | | 0.5% | |
Coal | | | 0.5% | |
Retail | | | 0.5% | |
Machinery-Construction & Mining | | | 0.4% | |
Healthcare-Products | | | 0.4% | |
Holding Companies-Diversified | | | 0.3% | |
Engineering & Construction | | | 0.3% | |
Repurchase Agreements | | | 1.0% | |
Other assets less liabilities | | | 1.5% | |
| | | | |
| | | 100.0% | |
| | | | |
| | | | | | |
| 164 | | Annual Report | | | September 30, 2018 | | | See accompanying Notes to Financial Statements |
Schedule of Investments
September 30, 2018
AllianzGI Global Sustainability Fund
| | | | | | | | |
| | | Shares | | | Value | |
| Common Stock—98.7% | |
| Australia—1.5% | |
Australia & New Zealand Banking Group Ltd. | | | 29,098 | | | | $592,338 | |
| | | | | | | | |
| Canada—1.1% | |
Gibson Energy, Inc. | | | 27,296 | | | | 431,529 | |
| | | | | | | | |
| Denmark—1.3% | |
Novo Nordisk A/S, Class B | | | 11,363 | | | | 534,800 | |
| | | | | | | | |
| France—2.7% | |
Bureau Veritas S.A. | | | 20,092 | | | | 518,821 | |
Credit Agricole S.A. | | | 39,446 | | | | 567,036 | |
| | | | | | | | |
| | | | | | | 1,085,857 | |
| | | | | | | | |
| Germany—8.7% | |
Adidas AG | | | 3,401 | | | | 831,747 | |
Covestro AG (a) | | | 5,110 | | | | 413,640 | |
Fresenius SE & Co. KGaA | | | 8,388 | | | | 615,094 | |
Muenchener Rueckversicherungs-Gesellschaft AG in Muenchen | | | 3,544 | | | | 782,821 | |
SAP SE | | | 6,956 | | | | 855,335 | |
| | | | | | | | |
| | | | | | | 3,498,637 | |
| | | | | | | | |
| Japan—5.0% | |
Daikin Industries Ltd. | | | 7,600 | | | | 1,011,587 | |
Keyence Corp. | | | 1,700 | | | | 987,507 | |
| | | | | | | | |
| | | | | | | 1,999,094 | |
| | | | | | | | |
| Korea (Republic of)—1.6% | |
Samsung Electronics Co., Ltd. GDR | | | 604 | | | | 632,846 | |
| | | | | | | | |
| Spain—4.4% | |
Amadeus IT Group S.A. | | | 13,598 | | | | 1,260,384 | |
Industria de Diseno Textil S.A. | | | 17,191 | | | | 519,367 | |
| | | | | | | | |
| | | | | | | 1,779,751 | |
| | | | | | | | |
| Sweden—4.6% | |
Assa Abloy AB, Class B | | | 30,807 | | | | 617,492 | |
Atlas Copco AB, Class A | | | 25,225 | | | | 725,425 | |
Skandinaviska Enskilda Banken AB, Class A | | | 44,479 | | | | 495,855 | |
| | | | | | | | |
| | | | | | | 1,838,772 | |
| | | | | | | | |
| Switzerland—2.9% | |
Roche Holding AG | | | 3,362 | | | | 812,983 | |
UBS Group AG (c) | | | 22,569 | | | | 356,334 | |
| | | | | | | | |
| | | | | | | 1,169,317 | |
| | | | | | | | |
| United Kingdom—13.6% | |
AstraZeneca PLC | | | 9,734 | | | | 758,707 | |
Prudential PLC | | | 45,052 | | | | 1,032,955 | |
Reckitt Benckiser Group PLC | | | 10,272 | | | | 938,347 | |
Royal Dutch Shell PLC, Class B | | | 33,087 | | | | 1,158,262 | |
Unilever PLC | | | 14,743 | | | | 809,893 | |
Vodafone Group PLC | | | 190,420 | | | | 407,998 | |
WPP PLC | | | 24,636 | | | | 360,784 | |
| | | | | | | | |
| | | | | | | 5,466,946 | |
| | | | | | | | |
| United States—51.3% | |
Accenture PLC, Class A | | | 5,047 | | | | 858,999 | |
Adobe Systems, Inc. (c) | | | 3,818 | | | | 1,030,669 | |
Agilent Technologies, Inc. | | | 13,977 | | | | 985,938 | |
Alphabet, Inc., Class A (c) | | | 655 | | | | 790,637 | |
American Express Co. | | | 9,230 | | | | 982,903 | |
Apple, Inc. | | | 5,524 | | | | 1,246,988 | |
Citigroup, Inc. | | | 13,123 | | | | 941,444 | |
Colgate-Palmolive Co. | | | 8,289 | | | | 554,949 | |
Eaton Corp. PLC | | | 7,058 | | | | 612,140 | |
Ecolab, Inc. | | | 4,671 | | | | 732,319 | |
EOG Resources, Inc. | | | 7,273 | | | | 927,817 | |
| | | | | | | | |
| | | Shares | | | Value | |
Estee Lauder Cos., Inc., Class A | | | 5,167 | | | $ | 750,868 | |
International Flavors & Fragrances, Inc. | | | 6,746 | | | | 938,504 | |
Intuit, Inc. | | | 4,707 | | | | 1,070,372 | |
Johnson & Johnson | | | 5,575 | | | | 770,298 | |
Microsoft Corp. | | | 14,093 | | | | 1,611,816 | |
Mondelez International, Inc., Class A | | | 12,676 | | | | 544,561 | |
S&P Global, Inc. | | | 5,250 | | | | 1,025,797 | |
Schlumberger Ltd. | | | 6,834 | | | | 416,327 | |
Starbucks Corp. | | | 13,720 | | | | 779,845 | |
UnitedHealth Group, Inc. | | | 3,266 | | | | 868,887 | |
Visa, Inc., Class A | | | 10,027 | | | | 1,504,952 | |
Xylem, Inc. | | | 8,783 | | | | 701,498 | |
| | | | | | | | |
| | | | | | | 20,648,528 | |
| | | | | | | | |
Total Common Stock
(cost—$33,399,568) | | | | 39,678,415 | |
| | | | | | | | |
| | | | | | | | |
| | | Principal
Amount
(000s) | | | | |
| Repurchase Agreements—1.3% | |
State Street Bank and Trust Co., dated 9/28/18, 0.42%, due 10/1/18, proceeds $521,018; collateralized by U.S. Treasury Notes, 2.00%, due 11/30/20, valued at $533,819 including accrued interest | |
(cost—$521,000) | | | $521 | | | | 521,000 | |
| | | | | | | | |
| |
Total Investments
(cost—$33,920,568) (b)—100.0% | | | | 40,199,415 | |
| | | | | | | | |
| |
Other assets less
liabilities—0.0% | | | | 13,910 | |
| | | | | | | | |
| | |
| Net Assets—100.0% | | | | | | | $40,213,325 | |
| | | | | | | | |
Notes to Schedule of Investments:
(a) 144A—Exempt from registration under Rule 144A of the Securities Act of 1933. These securities may be resold in transactions exempt from registration, typically only to qualified institutional buyers. Security with a value of $413,640, representing 1.0% of net assets.
(b) Securities with an aggregate value of $18,598,358, representing 46.2% of net assets, were valued utilizing modeling tools provided by a third-party vendor. See Note 1(a) and Note 1(b) in the Notes to Financial Statements.
(c) Non-income producing.
Glossary:
GDR—Global Depositary Receipt
The industry classification of portfolio holdings and other assets less liabilities shown as a percentage of net assets were as follows:
| | | | |
Software | | | 11.4% | |
IT Services | | | 9.0% | |
Pharmaceuticals | | | 7.2% | |
Banks | | | 6.5% | |
Oil, Gas & Consumable Fuels | | | 6.3% | |
Chemicals | | | 5.2% | |
Technology Hardware, Storage & Peripherals | | | 4.7% | |
Insurance | | | 4.5% | |
Building Products | | | 4.0% | |
Personal Products | | | 3.9% | |
Household Products | | | 3.7% | |
Healthcare Providers & Services | | | 3.7% | |
Machinery | | | 3.5% | |
Capital Markets | | | 3.4% | |
Electronic Equipment, Instruments & Components | | | 2.5% | |
Life Sciences Tools & Services | | | 2.4% | |
Consumer Finance | | | 2.4% | |
Textiles, Apparel & Luxury Goods | | | 2.1% | |
Interactive Media & Services | | | 2.0% | |
Hotels, Restaurants & Leisure | | | 1.9% | |
Electrical Equipment | | | 1.5% | |
Food Products | | | 1.4% | |
Specialty Retail | | | 1.3% | |
Professional Services | | | 1.3% | |
Energy Equipment & Services | | | 1.0% | |
Wireless Telecommunication Services | | | 1.0% | |
Media | | | 0.9% | |
Repurchase Agreements | | | 1.3% | |
Other assets less liabilities | | | 0.0% | |
| | | | |
| | | 100.0% | |
| | | | |
| | | | | | | | |
| See accompanying Notes to Financial Statements | | | September 30, 2018 | | | Annual Report | | | 165 | |
Schedule of Investments
September 30, 2018
AllianzGI Global Water Fund
| | | | | | | | |
| | | Shares | | | Value | |
| Common Stock—96.8% | |
| Austria—3.8% | |
ANDRITZ AG | | | 426,683 | | | | $24,886,432 | |
| | | | | | | | |
| Canada—1.9% | |
Stantec, Inc. | | | 497,861 | | | | 12,384,372 | |
| | | | | | | | |
| China—2.7% | |
Beijing Enterprises Water Group Ltd. (b) | | | 20,000,000 | | | | 10,662,311 | |
China Everbright International Ltd. | | | 8,639,000 | | | | 7,458,809 | |
| | | | | | | | |
| | | | | | | 18,121,120 | |
| | | | | | | | |
| Finland—2.1% | |
Uponor Oyj | | | 613,171 | | | | 8,010,708 | |
Wartsila Oyj Abp | | | 321,087 | | | | 6,248,265 | |
| | | | | | | | |
| | | | | | | 14,258,973 | |
| | | | | | | | |
| France—6.8% | |
Suez | | | 495,674 | | | | 7,050,913 | |
Veolia Environnement S.A. | | | 1,907,334 | | | | 38,060,135 | |
| | | | | | | | |
| | | | | | | 45,111,048 | |
| | | | | | | | |
| Germany—0.5% | |
GEA Group AG | | | 98,136 | | | | 3,493,059 | |
| | | | | | | | |
| Japan—3.3% | |
Kubota Corp. | | | 535,200 | | | | 9,092,609 | |
Kurita Water Industries Ltd. | | | 439,600 | | | | 12,806,551 | |
| | | | | | | | |
| | | | | | | 21,899,160 | |
| | | | | | | | |
| Sweden—4.6% | |
Alfa Laval AB | | | 1,123,760 | | | | 30,407,043 | |
| | | | | | | | |
| Switzerland—6.5% | |
Belimo Holding AG | | | 643 | | | | 3,076,100 | |
Geberit AG | | | 86,904 | | | | 40,335,767 | |
| | | | | | | | |
| | | | | | | 43,411,867 | |
| | | | | | | | |
| United Kingdom—8.5% | |
Halma PLC | | | 1,305,968 | | | | 24,587,282 | |
Pennon Group PLC | | | 1,596,004 | | | | 14,832,906 | |
Severn Trent PLC | | | 696,553 | | | | 16,790,346 | |
| | | | | | | | |
| | | | | | | 56,210,534 | |
| | | | | | | | |
| United States—56.1% | |
American Water Works Co., Inc. | | | 787,092 | | | | 69,240,483 | |
AO Smith Corp. | | | 101,870 | | | | 5,436,802 | |
Aqua America, Inc. | | | 819,855 | | | | 30,252,649 | |
Badger Meter, Inc. | | | 83,487 | | | | 4,420,637 | |
Danaher Corp. | | | 424,734 | | | | 46,151,596 | |
IDEX Corp. | | | 286,883 | | | | 43,221,793 | |
Itron, Inc. (b) | | | 167,280 | | | | 10,739,376 | |
Masco Corp. | | | 162,625 | | | | 5,952,075 | |
Mueller Water Products, Inc., Class A | | | 1,602,839 | | | | 18,448,677 | |
PerkinElmer, Inc. | | | 181,665 | | | | 17,670,555 | |
Rexnord Corp. (b) | | | 225,000 | | | | 6,930,000 | |
Tetra Tech, Inc. | | | 320,000 | | | | 21,856,000 | |
Waste Management, Inc. | | | 162,078 | | | | 14,645,368 | |
Watts Water Technologies, Inc., Class A | | | 162,177 | | | | 13,460,691 | |
Xylem, Inc. | | | 799,392 | | | | 63,847,439 | |
| | | | | | | | |
| | | | | | | 372,274,141 | |
| | | | | | | | |
Total Common Stock
(cost—$529,529,433) | | | | 642,457,749 | |
| | | | | | | | |
| | | | | | | | |
| | | Principal
Amount
(000s) | | | Value | |
| Repurchase Agreements—1.5% | |
State Street Bank and Trust Co., dated 9/28/18, 0.42%, due 10/1/18, proceeds $9,725,340; collateralized by U.S. Treasury Notes, 2.00%, due 5/31/21, valued at $9,922,682 including accrued interest | |
(cost—$9,725,000) | | | $9,725 | | | $ | 9,725,000 | |
| | | | | | | | |
| |
Total Investments
(cost—$539,254,433) (a)—98.3% | | | | 652,182,749 | |
| | | | | | | | |
| |
Other assets less
liabilities—1.7% | | | | 11,007,614 | |
| | | | | | | | |
| | |
| Net Assets—100.0% | | | | | | | $663,190,363 | |
| | | | | | | | |
Notes to Schedule of Investments:
(a) Securities with an aggregate value of $254,723,136, representing 38.4% of net assets, were valued utilizing modeling tools provided by a third-party vendor. See Note 1(a) and Note 1(b) in the Notes to Financial Statements.
(b) Non-income producing.
The industry classification of portfolio holdings and other assets less liabilities shown as a percentage of net assets were as follows:
| | | | |
Machinery | | | 35.0% | |
Water Utilities | | | 21.4% | |
Building Products | | | 9.5% | |
Healthcare Equipment & Supplies | | | 6.9% | |
Multi-Utilities | | | 6.8% | |
Commercial Services & Supplies | | | 6.6% | |
Electronic Equipment, Instruments & Components | | | 6.0% | |
Life Sciences Tools & Services | | | 2.7% | |
Professional Services | | | 1.9% | |
Repurchase Agreements | | | 1.5% | |
Other assets less liabilities | | | 1.7% | |
| | | | |
| | | 100.0% | |
| | | | |
AllianzGI High Yield Bond Fund
| | | | | | | | |
| | | Principal
Amount
(000s) | | | Value | |
| Corporate Bonds & Notes—92.2% | |
| Aerospace & Defense—1.8% | |
Kratos Defense & Security Solutions, Inc. (a)(b), | |
6.50%, 11/30/25 | | | $1,030 | | | | $1,062,497 | |
TransDigm, Inc., | |
6.50%, 5/15/25 | | | 1,420 | | | | 1,450,175 | |
Triumph Group, Inc., | |
7.75%, 8/15/25 | | | 855 | | | | 832,556 | |
| | | | | | | | |
| | | | | | | 3,345,228 | |
| | | | | | | | |
| Auto Components—1.3% | |
American Axle & Manufacturing, Inc., | |
6.625%, 10/15/22 | | | 1,383 | | | | 1,414,117 | |
Delphi Technologies PLC (a)(b), | |
5.00%, 10/1/25 | | | 925 | | | | 872,969 | |
| | | | | | | | |
| | | | | | | 2,287,086 | |
| | | | | | | | |
| Auto Manufacturers—0.7% | |
Navistar International Corp. (a)(b), | |
6.625%, 11/1/25 | | | 1,305 | | | | 1,363,725 | |
| | | | | | | | |
| Banks—1.2% | |
CIT Group, Inc., | |
6.125%, 3/9/28 | | | 920 | | | | 963,700 | |
Royal Bank of Scotland Group PLC, | |
5.125%, 5/28/24 | | | 1,300 | | | | 1,302,267 | |
| | | | | | | | |
| | | | | | | 2,265,967 | |
| | | | | | | | |
| Building Materials—0.7% | |
Builders FirstSource, Inc. (a)(b), | |
5.625%, 9/1/24 | | | 1,265 | | | | 1,220,725 | |
| | | | | | | | |
| Chemicals—4.4% | |
Chemours Co., | |
7.00%, 5/15/25 | | | 780 | | | | 831,082 | |
Kraton Polymers LLC (a)(b), | |
7.00%, 4/15/25 | | | 1,275 | | | | 1,316,438 | |
Olin Corp., | |
5.00%, 2/1/30 | | | 1,440 | | | | 1,351,800 | |
Platform Specialty Products Corp. (a)(b), | |
6.50%, 2/1/22 | | | 905 | | | | 928,756 | |
PQ Corp. (a)(b), | |
5.75%, 12/15/25 | | | 1,450 | | | | 1,442,750 | |
Trinseo Materials Operating SCA (a)(b), | |
5.375%, 9/1/25 | | | 1,095 | | | | 1,058,372 | |
Tronox Finance PLC (a)(b), | |
5.75%, 10/1/25 | | | 1,115 | | | | 1,036,950 | |
| | | | | | | | |
| | | | | | | 7,966,148 | |
| | | | | | | | |
| Commercial Services—4.4% | |
Ashtead Capital, Inc. (a)(b), | |
5.25%, 8/1/26 | | | 500 | | | | 505,938 | |
Cardtronics, Inc., | |
5.125%, 8/1/22 | | | 905 | | | | 895,226 | |
Cenveo Corp. (a)(b)(c)(d)(e)(f), | |
6.00%, 5/15/24
(cost—$2,872,505; purchased 3/22/12-3/11/16) | | | 2,299 | | | | 126,445 | |
Gartner, Inc. (a)(b), | |
5.125%, 4/1/25 | | | 1,440 | | | | 1,451,333 | |
KAR Auction Services, Inc. (a)(b), | |
5.125%, 6/1/25 | | | 1,195 | | | | 1,162,137 | |
Live Nation Entertainment, Inc. (a)(b), | |
5.625%, 3/15/26 | | | 720 | | | | 729,000 | |
RR Donnelley & Sons Co., | |
7.00%, 2/15/22 | | | 693 | | | | 717,255 | |
United Rentals North America, Inc., | |
4.625%, 10/15/25 | | | 630 | | | | 612,675 | |
5.50%, 7/15/25 | | | 1,750 | | | | 1,791,562 | |
| | | | | | | | |
| | | | | | | 7,991,571 | |
| | | | | | | | |
| | | | | | |
| 166 | | Annual Report | | | September 30, 2018 | | | See accompanying Notes to Financial Statements |
Schedule of Investments
September 30, 2018
| | | | | | | | |
| | | Principal
Amount
(000s) | | | Value | |
| Computers—1.2% | |
Dell International LLC (a)(b), | | | | | |
7.125%, 6/15/24 | | $ | 930 | | | $ | 999,085 | |
Harland Clarke Holdings Corp. (a)(b), | |
9.25%, 3/1/21 | | | 1,170 | | | | 1,111,500 | |
| | | | | | | | |
| | | | | | | 2,110,585 | |
| | | | | | | | |
| Distribution/Wholesale—1.8% | |
H&E Equipment Services, Inc., | | | | | |
5.625%, 9/1/25 | | | 1,480 | | | | 1,480,000 | |
HD Supply, Inc. (a)(b), | | | | | |
5.75%, 4/15/24 | | | 825 | | | | 869,344 | |
Univar USA, Inc. (a)(b), | | | | | |
6.75%, 7/15/23 | | | 885 | | | | 918,187 | |
| | | | | | | | |
| | | | | | | 3,267,531 | |
| | | | | | | | |
| Diversified Financial Services—5.5% | |
Ally Financial, Inc., | | | | | |
5.75%, 11/20/25 | | | 420 | | | | 435,225 | |
Community Choice Financial Issuer LLC (a)(b), | |
9.00%, 9/6/20 | | | 2,000 | | | | 2,004,800 | |
Community Choice Financial, Inc., | | | | | |
10.75%, 5/1/19 | | | 2,615 | | | | 2,052,775 | |
Navient Corp., | | | | | | | | |
6.625%, 7/26/21 | | | 1,050 | | | | 1,097,250 | |
7.25%, 9/25/23 | | | 1,105 | | | | 1,176,825 | |
Springleaf Finance Corp., | | | | | |
5.625%, 3/15/23 | | | 610 | | | | 609,237 | |
8.25%, 10/1/23 | | | 1,170 | | | | 1,295,775 | |
Travelport Corporate Finance PLC (a)(b), | |
6.00%, 3/15/26 | | | 1,415 | | | | 1,440,711 | |
| | | | | | | | |
| | | | | | | 10,112,598 | |
| | | | | | | | |
| Electric Utilities—0.8% | |
NRG Energy, Inc. (a)(b), | | | | | | | | |
5.75%, 1/15/28 | | | 1,355 | | | | 1,371,937 | |
| | | | | | | | |
| Electronic Equipment, Instruments & Components—0.7% | |
Energizer Holdings, Inc. (a)(b), | |
5.50%, 6/15/25 | | | 1,350 | | | | 1,346,625 | |
| | | | | | | | |
| Engineering & Construction—1.6% | |
AECOM, | | | | | | | | |
5.875%, 10/15/24 | | | 1,000 | | | | 1,064,140 | |
TopBuild Corp. (a)(b), | | | | | | | | |
5.625%, 5/1/26 | | | 750 | | | | 735,000 | |
Tutor Perini Corp. (a)(b), | |
6.875%, 5/1/25 | | | 1,170 | | | | 1,205,100 | |
| | | | | | | | |
| | | | | | | 3,004,240 | |
| | | | | | | | |
| Entertainment—3.8% | |
AMC Entertainment Holdings, Inc., | |
6.125%, 5/15/27 | | | 1,090 | | | | 1,049,942 | |
Cedar Fair L.P., | | | | | | | | |
5.375%, 6/1/24 | | | 970 | | | | 970,000 | |
5.375%, 4/15/27 | | | 405 | | | | 394,875 | |
Delta Merger Sub, Inc. (a)(b), | |
6.00%, 9/15/26 | | | 1,045 | | | | 1,060,675 | |
International Game Technology PLC (a)(b), | |
6.25%, 1/15/27 | | | 535 | | | | 543,025 | |
6.50%, 2/15/25 | | | 855 | | | | 891,337 | |
Scientific Games International, Inc. (a)(b), | |
5.00%, 10/15/25 | | | 755 | | | | 719,138 | |
Stars Group Holdings BV (a)(b), | |
7.00%, 7/15/26 | | | 1,325 | | | | 1,370,302 | |
| | | | | | | | |
| | | | | | | 6,999,294 | |
| | | | | | | | |
| | | | | | | | |
| | | Principal
Amount
(000s) | | | Value | |
| Equity Real Estate Investment Trusts (REITs)—1.1% | |
CyrusOne L.P., | |
5.00%, 3/15/24 | | $ | 710 | | | $ | 725,088 | |
5.375%, 3/15/27 | | | 480 | | | | 492,000 | |
Equinix, Inc., | |
5.375%, 5/15/27 | | | 765 | | | | 768,182 | |
| | | | | | | | |
| | | | | | | 1,985,270 | |
| | | | | | | | |
| Food & Beverage—0.7% | |
Post Holdings, Inc. (a)(b), | |
5.75%, 3/1/27 | | | 1,250 | | | | 1,232,812 | |
| | | | | | | | |
| Food Service—0.8% | |
Aramark Services, Inc. (a)(b), | |
5.00%, 2/1/28 | | | 1,415 | | | | 1,390,237 | |
| | | | | | | | |
| Healthcare Providers & Services—1.2% | |
HCA, Inc., | | | | | | | | |
5.375%, 9/1/26 | | | 545 | | | | 552,902 | |
Tenet Healthcare Corp., | |
5.125%, 5/1/25 | | | 500 | | | | 493,750 | |
WellCare Health Plans, Inc. (a)(b), | |
5.375%, 8/15/26 | | | 1,050 | | | | 1,071,000 | |
| | | | | | | | |
| | | | | | | 2,117,652 | |
| | | | | | | | |
| Healthcare-Products—1.9% | |
Becton Dickinson and Co., | |
2.894%, 6/6/22 | | | 230 | | | | 223,589 | |
Hill-Rom Holdings, Inc. (a)(b), | |
5.00%, 2/15/25 | | | 985 | | | | 968,088 | |
Hologic, Inc. (a)(b), | |
4.625%, 2/1/28 | | | 585 | | | | 551,362 | |
Teleflex, Inc., | |
5.25%, 6/15/24 | | | 1,705 | | | | 1,762,203 | |
| | | | | | | | |
| | | | | | | 3,505,242 | |
| | | | | | | | |
| Healthcare-Services—4.9% | |
Centene Corp. (a)(b), | |
5.375%, 6/1/26 | | | 1,380 | | | | 1,417,950 | |
Charles River Laboratories International, Inc. (a)(b), | |
5.50%, 4/1/26 | | | 1,130 | | | | 1,149,775 | |
Community Health Systems, Inc., | |
6.25%, 3/31/23 | | | 400 | | | | 381,500 | |
DaVita, Inc., | |
5.125%, 7/15/24 | | | 1,310 | | | | 1,270,700 | |
Encompass Health Corp., | |
5.75%, 11/1/24 | | | 1,375 | | | | 1,398,939 | |
HCA, Inc., | |
7.50%, 2/15/22 | | | 1,600 | | | | 1,756,000 | |
Tenet Healthcare Corp., | |
8.125%, 4/1/22 | | | 1,580 | | | | 1,670,929 | |
| | | | | | | | |
| | | | | | | 9,045,793 | |
| | | | | | | | |
| Home Builders—0.7% | |
Lennar Corp., | |
5.875%, 11/15/24 | | | 1,180 | | | | 1,233,100 | |
| | | | | | | | |
| Insurance—0.6% | |
CNO Financial Group, Inc., | |
5.25%, 5/30/25 | | | 985 | | | | 1,012,088 | |
| | | | | | | | |
| Internet—2.8% | |
Match Group, Inc. (a)(b), | |
5.00%, 12/15/27 | | | 1,445 | | | | 1,445,144 | |
Netflix, Inc., | |
5.875%, 2/15/25 | | | 1,150 | | | | 1,191,688 | |
Symantec Corp. (a)(b), | |
5.00%, 4/15/25 | | | 1,000 | | | | 993,496 | |
Zayo Group LLC (a)(b), | |
5.75%, 1/15/27 | | | 1,505 | | | | 1,511,772 | |
| | | | | | | | |
| | | | | | | 5,142,100 | |
| | | | | | | | |
| | | | | | | | |
| | | Principal
Amount
(000s) | | | Value | |
| Iron/Steel—1.3% | |
AK Steel Corp., | |
7.00%, 3/15/27 | | $ | 655 | | | $ | 632,075 | |
7.50%, 7/15/23 | | | 515 | | | | 544,613 | |
United States Steel Corp., | |
6.875%, 8/15/25 | | | 1,225 | | | | 1,257,156 | |
| | | | | | | | |
| | | | | | | 2,433,844 | |
| | | | | | | | |
| Lodging—2.8% | |
Hilton Domestic Operating Co., Inc. (a)(b), | |
5.125%, 5/1/26 | | | 995 | | | | 993,756 | |
Hilton Worldwide Finance LLC, | |
4.625%, 4/1/25 | | | 575 | | | | 566,088 | |
MGM Resorts International, | |
6.625%, 12/15/21 | | | 1,000 | | | | 1,062,000 | |
Wyndham Hotels & Resorts, Inc. (a)(b), | |
5.375%, 4/15/26 | | | 1,515 | | | | 1,509,319 | |
Wynn Las Vegas LLC (a)(b), | |
5.50%, 3/1/25 | | | 990 | | | | 959,062 | |
| | | | | | | | |
| | | | | | | 5,090,225 | |
| | | | | | | | |
| Machinery-Construction & Mining—0.7% | |
Terex Corp. (a)(b), | |
5.625%, 2/1/25 | | | 1,260 | | | | 1,253,700 | |
| | | | | | | | |
| Machinery-Diversified—0.6% | |
Mueller Water Products, Inc. (a)(b), | |
5.50%, 6/15/26 | | | 760 | | | | 765,700 | |
Tennant Co., | |
5.625%, 5/1/25 | | | 275 | | | | 279,813 | |
| | | | | | | | |
| | | | | | | 1,045,513 | |
| | | | | | | | |
| Media—4.9% | |
CCO Holdings LLC, | |
5.125%, 5/1/27 (a)(b) | | | 310 | | | | 294,689 | |
5.75%, 1/15/24 | | | 1,245 | | | | 1,268,344 | |
Clear Channel Worldwide Holdings, Inc., Ser. B, | |
6.50%, 11/15/22 | | | 1,345 | | | | 1,379,123 | |
CSC Holdings LLC, | |
6.75%, 11/15/21 | | | 860 | | | | 908,375 | |
DISH DBS Corp., | |
5.875%, 7/15/22 | | | 1,035 | | | | 1,013,653 | |
Gray Television, Inc. (a)(b), | |
5.875%, 7/15/26 | | | 1,180 | | | | 1,172,625 | |
LIN Television Corp., | |
5.875%, 11/15/22 | | | 585 | | | | 596,700 | |
LiveStyle, Inc. (a)(b)(c)(e)(f)(h), | |
9.625%, 2/1/19 | | | | | | | | |
(cost—$2,763,169; purchased 1/31/14-2/3/14) | | | 2,761 | | | | 55 | |
Meredith Corp. (a)(b), | |
6.875%, 2/1/26 | | | 1,000 | | | | 1,027,500 | |
Nexstar Broadcasting, Inc. (a)(b), | |
5.625%, 8/1/24 | | | 1,315 | | | | 1,290,344 | |
Sirius XM Radio, Inc. (a)(b), | |
5.00%, 8/1/27 | | | — | | | | — | |
| | | | | | | | |
| | | | | | | 8,951,408 | |
| | | | | | | | |
| Metal Fabricate/Hardware—0.8% | |
Park-Ohio Industries, Inc., | |
6.625%, 4/15/27 | | | 1,500 | | | | 1,545,000 | |
| | | | | | | | |
| Mining—3.6% | |
Alcoa Nederland Holding BV (a)(b), | |
6.125%, 5/15/28 | | | 495 | | | | 509,850 | |
6.75%, 9/30/24 | | | 875 | | | | 929,688 | |
Constellium NV (a)(b), | |
6.625%, 3/1/25 | | | 1,045 | | | | 1,065,900 | |
Freeport-McMoRan, Inc., | |
3.55%, 3/1/22 | | | 1,210 | | | | 1,179,750 | |
3.875%, 3/15/23 | | | 675 | | | | 654,696 | |
Hudbay Minerals, Inc. (a)(b), | |
7.625%, 1/15/25 | | | 930 | | | | 964,875 | |
| | | | | | | | |
| See accompanying Notes to Financial Statements | | | September 30, 2018 | | | Annual Report | | | 167 | |
Schedule of Investments
September 30, 2018
| | | | | | | | |
| | | Principal
Amount
(000s) | | | Value | |
Joseph T. Ryerson & Son, Inc. (a)(b), | |
11.00%, 5/15/22 | | $ | 1,235 | | | $ | 1,350,954 | |
| | | | | | | | |
| | | | | | | 6,655,713 | |
| | | | | | | | |
| Miscellaneous Manufacturing—0.4% | |
Koppers, Inc. (a)(b), | |
6.00%, 2/15/25 | | | 790 | | | | 791,975 | |
| | | | | | | | |
| Oil, Gas & Consumable Fuels—8.9% | |
AmeriGas Partners L.P., | |
5.875%, 8/20/26 | | | 1,505 | | | | 1,501,237 | |
Callon Petroleum Co., | |
6.125%, 10/1/24 | | | 1,000 | | | | 1,022,500 | |
Calumet Specialty Products Partners L.P., | |
6.50%, 4/15/21 | | | 1,380 | | | | 1,380,000 | |
Carrizo Oil & Gas, Inc., | |
6.25%, 4/15/23 | | | 1,215 | | | | 1,246,894 | |
Chesapeake Energy Corp., | |
8.00%, 1/15/25 | | | 660 | | | | 682,770 | |
Continental Resources, Inc., | |
5.00%, 9/15/22 | | | 612 | | | | 620,943 | |
CVR Refining LLC, | |
6.50%, 11/1/22 | | | 1,110 | | | | 1,132,200 | |
Ensco PLC, | |
5.20%, 3/15/25 | | | 305 | | | | 266,494 | |
7.75%, 2/1/26 | | | 1,030 | | | | 1,026,138 | |
EP Energy LLC, | |
9.375%, 5/1/20 | | | 510 | | | | 508,725 | |
Noble Holding International Ltd., | |
7.75%, 1/15/24 | | | 925 | | | | 922,688 | |
Oasis Petroleum, Inc., | |
6.875%, 3/15/22 | | | 1,000 | | | | 1,018,730 | |
Range Resources Corp., | |
4.875%, 5/15/25 | | | 1,145 | | | | 1,089,181 | |
SM Energy Co., | |
6.625%, 1/15/27 | | | 930 | | | | 962,550 | |
Sunoco L.P. (a)(b), | |
5.50%, 2/15/26 | | | 990 | | | | 958,815 | |
5.875%, 3/15/28 | | | 650 | | | | 625,625 | |
Transocean, Inc. (a)(b), | |
7.50%, 1/15/26 | | | 1,235 | | | | 1,278,225 | |
| | | | | | | | |
| | | | | | | 16,243,715 | |
| | | | | | | | |
| Paper & Forest Products—0.6% | |
Mercer International, Inc., | |
5.50%, 1/15/26 | | | 1,050 | | | | 1,031,625 | |
| | | | | | | | |
| Pharmaceuticals—2.3% | |
Bausch Health Cos, Inc. (a)(b), | |
6.125%, 4/15/25 | | | 1,390 | | | | 1,325,434 | |
7.50%, 7/15/21 | | | 720 | | | | 735,300 | |
Endo Finance LLC (a)(b), | |
5.375%, 1/15/23 | | | 1,025 | | | | 907,125 | |
Horizon Pharma, Inc., | |
6.625%, 5/1/23 | | | 1,255 | | | | 1,286,375 | |
| | | | | | | | |
| | | | | | | 4,254,234 | |
| | | | | | | | |
| Pipelines—1.5% | |
Cheniere Energy Partners L.P. (a)(b), | |
5.625%, 10/1/26 | | | 1,240 | | | | 1,250,478 | |
Crestwood Midstream Partners L.P., | |
5.75%, 4/1/25 | | | 1,420 | | | | 1,455,500 | |
| | | | | | | | |
| | | | | | | 2,705,978 | |
| | | | | | | | |
| Real Estate—1.9% | |
Iron Mountain, Inc. (a)(b), | |
4.875%, 9/15/27 | | | 985 | | | | 907,431 | |
Kennedy-Wilson, Inc., | |
5.875%, 4/1/24 | | | 1,180 | | | | 1,168,200 | |
Uniti Group L.P., | |
8.25%, 10/15/23 | | | 1,500 | | | | 1,440,000 | |
| | | | | | | | |
| | | | | | | 3,515,631 | |
| | | | | | | | |
| | | | | | | | |
| | | Principal
Amount
(000s) | | | Value | |
| Retail—2.7% | |
1011778 BC ULC (a)(b), | |
5.00%, 10/15/25 | | $ | 1,110 | | | $ | 1,065,611 | |
Conn’s, Inc., | |
7.25%, 7/15/22 | | | 1,595 | | | | 1,591,012 | |
KFC Holding Co. (a)(b), | |
4.75%, 6/1/27 | | | 730 | | | | 703,538 | |
Men’s Wearhouse, Inc., | |
7.00%, 7/1/22 | | | 681 | | | | 703,133 | |
Party City Holdings, Inc. (a)(b), | |
6.625%, 8/1/26 | | | 900 | | | | 913,500 | |
| | | | | | | | |
| | | | | | | 4,976,794 | |
| | | | | | | | |
| Semiconductors—2.0% | |
Advanced Micro Devices, Inc., | |
7.50%, 8/15/22 | | | 983 | | | | 1,109,601 | |
Amkor Technology, Inc., | |
6.375%, 10/1/22 | | | 500 | | | | 510,685 | |
Entegris, Inc. (a)(b), | |
4.625%, 2/10/26 | | | 390 | | | | 372,898 | |
Qorvo, Inc., | |
7.00%, 12/1/25 | | | 875 | | | | 950,469 | |
Sensata Technologies BV (a)(b), | |
5.625%, 11/1/24 | | | 750 | | | | 777,187 | |
| | | | | | | | |
| | | | | | | 3,720,840 | |
| | | | | | | | |
| Software—3.2% | |
Camelot Finance S.A. (a)(b), | |
7.875%, 10/15/24 | | | 1,045 | | | | 1,044,248 | |
First Data Corp. (a)(b), | |
5.75%, 1/15/24 | | | 860 | | | | 874,190 | |
7.00%, 12/1/23 | | | 945 | | | | 986,344 | |
j2 Cloud Services LLC (a)(b), | |
6.00%, 7/15/25 | | | 1,275 | | | | 1,313,250 | |
MSCI, Inc. (a)(b), | | | | | | | | |
5.375%, 5/15/27 | | | 965 | | | | 986,712 | |
Rackspace Hosting, Inc. (a)(b), | |
8.625%, 11/15/24 | | | 615 | | | | 600,394 | |
| | | | | | | | |
| | | | | | | 5,805,138 | |
| | | | | | | | |
| Telecommunications—9.0% | |
CenturyLink, Inc., Ser. Y, | |
7.50%, 4/1/24 | | | 1,560 | | | | 1,671,150 | |
Cincinnati Bell, Inc. (a)(b), | |
7.00%, 7/15/24 | | | 1,380 | | | | 1,273,050 | |
CommScope Technologies LLC (a)(b), | |
6.00%, 6/15/25 | | | 1,000 | | | | 1,037,000 | |
Consolidated Communications, Inc., | |
6.50%, 10/1/22 | | | 1,325 | | | | 1,258,750 | |
Frontier Communications Corp., | |
10.50%, 9/15/22 | | | 1,135 | | | | 1,012,272 | |
GTT Communications, Inc. (a)(b), | |
7.875%, 12/31/24 | | | 900 | | | | 879,750 | |
Hughes Satellite Systems Corp., | |
6.625%, 8/1/26 | | | 1,315 | | | | 1,275,550 | |
Intelsat Jackson Holdings S.A., | |
5.50%, 8/1/23 | | | 1,300 | | | | 1,201,850 | |
Level 3 Financing, Inc., | |
5.375%, 5/1/25 | | | 1,325 | | | | 1,328,312 | |
Sprint Communications, Inc., | |
11.50%, 11/15/21 | | | 1,750 | | | | 2,060,625 | |
Sprint Corp., | |
7.625%, 3/1/26 | | | 1,065 | | | | 1,129,699 | |
T-Mobile USA, Inc., | |
4.50%, 2/1/26 | | | 315 | | | | 300,668 | |
4.75%, 2/1/28 | | | 705 | | | | 664,463 | |
Windstream Services LLC (a)(b), | |
6.375%, 8/1/23 | | | 2,677 | | | | 1,445,580 | |
| | | | | | | | |
| | | | | | | 16,538,719 | |
| | | | | | | | |
| Transportation—0.4% | |
XPO Logistics, Inc. (a)(b), | |
6.125%, 9/1/23 | | | 580 | | | | 603,200 | |
| | | | | | | | |
| | | Principal
Amount
(000s) | | | Value | |
6.50%, 6/15/22 | | $ | 159 | | | $ | 164,764 | |
| | | | | | | | |
| | | | | | | 767,964 | |
| | | | | | | | |
Total Corporate Bonds & Notes
(cost—$173,935,439) | | | | 168,645,570 | |
| | | | | | | | |
| | | | | | | | |
| | | Shares | | | | |
| Preferred Stock (a)(d)(e)(g)(h)—3.4% | |
| Media—3.4% | |
LiveStyle, Inc., Ser. A | | | 2,672 | | | | 363,526 | |
LiveStyle, Inc., Ser. B | | | 57,581 | | | | 5,758,100 | |
| | | | | | | | |
Total Preferred Stock
(cost—$5,907,093) | | | | 6,121,626 | |
| | | | | | | | |
| Common Stock (a)(d)(e)(g)—0.3% | |
| Advertising—0.3% | |
Affinion Group Holdings, Inc., Class A (f) | |
(cost—$769,740; purchased 11/4/15) | | | 43,401 | | | | 489,129 | |
| | | | | | | | |
| Aerospace & Defense—0.0% | |
Erickson, Inc. | | | 2,675 | | | | 88,382 | |
| | | | | | | | |
| Media—0.0% | |
LiveStyle, Inc.(h) | | | 67,983 | | | | 7 | |
| | | | | | | | |
Total Common Stock (cost—$2,260,807) | | | | 577,518 | |
| | | | | | | | |
| | | | | | | | |
| | | Units | | | | |
| Warrants (d)(e)(g)—0.0% | |
| Commercial Services—0.0% | |
Cenveo, Inc., strike price $12.00, expires 6/10/24, (b) | | | 243,090 | | | | 3 | |
| | | | | | | | |
| Media—0.0% | |
LiveStyle, Inc., expires 11/30/21, Ser. C, (a)(h) | | | 14,500 | | | | 1 | |
| | | | | | | | |
Total Warrants
(cost—$67,409) | | | | 4 | |
| | | | | | | | |
| | | | | | | | |
| | | Principal
Amount
(000s) | | | | |
| Repurchase Agreements—0.7% | |
State Street Bank and Trust Co., dated 9/28/18, 0.42%, due 10/1/18, proceeds $1,315,046; collateralized by Fannie Mae, 1.375%, due 10/7/21, valued at $1,341,369 including accrued interest | |
(cost—$1,315,000) | | | $1,315 | | | | 1,315,000 | |
| | | | | | | | |
| |
Total Investments
(cost—$183,485,748)—96.6% | | | | 176,659,718 | |
| | | | | | | | |
| |
Other assets less
liabilities—3.4% | | | | 6,163,134 | |
| | | | | | | | |
| |
| Net Assets—100.0% | | | | $182,822,852 | |
| | | | | | | | |
| | | | | | |
| 168 | | Annual Report | | | September 30, 2018 | | | See accompanying Notes to Financial Statements |
Schedule of Investments
September 30, 2018
Notes to Schedule of Investments:
(a) Private Placement—Restricted as to resale and may not have a readily available market. Securities with an aggregate value of $87,205,224, representing 47.7% of net assets.
(b) 144A—Exempt from registration under Rule 144A of the Securities Act of 1933. These securities may be resold in transactions exempt from registration, typically only to qualified institutional buyers. Securities with an aggregate value of $80,506,080, representing 44.0% of net assets.
(c) In default.
(d) Fair-Valued—Securities with an aggregate value of $6,825,593, representing 3.7% of net assets. See Note 1(a) and Note 1(b) in the Notes to Financial Statements.
(e) Level 3 security. See Note 1(a) and Note 1(b) in the Notes to Financial Statements.
(f) Restricted. The aggregate cost of such securities is $6,405,414. The aggregate value is $615,629, representing 0.3% of net assets.
(g) Non-income producing.
(h) A member of the Fund’s portfolio management team is a member of the board of directors of LiveStyle, Inc. The Fund’s aggregate value of investments in LiveStyle, Inc. represents 3.4% of net assets.
Glossary:
MSCI—Morgan Stanley Capital International
REIT—Real Estate Investment Trust
AllianzGI International Growth Fund
| | | | | | | | |
| | | Shares | | | Value | |
| Common Stock—98.5% | |
| Australia—1.1% | |
CSL Ltd. | | | 2,112 | | | | $306,872 | |
| | | | | | | | |
| Brazil—2.9% | |
Lojas Renner S.A. | | | 22,723 | | | | 174,422 | |
Odontoprev S.A. | | | 52,293 | | | | 165,870 | |
Raia Drogasil S.A. | | | 16,288 | | | | 292,120 | |
WEG S.A. | | | 39,227 | | | | 191,834 | |
| | | | | | | | |
| | | | | | | 824,246 | |
| | | | | | | | |
| Canada—10.3% | |
Alimentation Couche-Tard, Inc., Class B | | | 15,908 | | | | 795,739 | |
Canadian National Railway Co. | | | 4,666 | | | | 418,681 | |
Constellation Software, Inc. | | | 858 | | | | 630,967 | |
Restaurant Brands International, Inc. | | | 12,292 | | | | 727,823 | |
Shopify, Inc., Class A (c) | | | 2,323 | | | | 382,040 | |
| | | | | | | | |
| | | | | | | 2,955,250 | |
| | | | | | | | |
| China—13.7% | |
Alibaba Group Holding Ltd. ADR (c) | | | 7,778 | | | | 1,281,503 | |
Baidu, Inc. ADR (c) | | | 3,340 | | | | 763,791 | |
Tencent Holdings Ltd. | | | 30,357 | | | | 1,239,502 | |
Weibo Corp. ADR (c) | | | 8,756 | | | | 640,326 | |
| | | | | | | | |
| | | | | | | 3,925,122 | |
| | | | | | | | |
| Denmark—8.7% | |
Ambu A/S, Class B | | | 25,318 | | | | 607,682 | |
Coloplast A/S, Class B | | | 4,052 | | | | 413,934 | |
DSV A/S | | | 7,815 | | | | 710,153 | |
Novo Nordisk A/S, Class B | | | 16,255 | | | | 765,043 | |
| | | | | | | | |
| | | | | | | 2,496,812 | |
| | | | | | | | |
| France—2.4% | |
Dassault Systemes SE | | | 1,484 | | | | 222,062 | |
Legrand S.A. | | | 3,157 | | | | 230,196 | |
Sartorius Stedim Biotech | | | 1,712 | | | | 235,732 | |
| | | | | | | | |
| | | | | | | 687,990 | |
| | | | | | | | |
| Germany—12.2% | |
Bechtle AG | | | 3,872 | | | | 393,059 | |
Fresenius SE & Co. KGaA | | | 7,687 | | | | 563,690 | |
Infineon Technologies AG | | | 37,909 | | | | 862,652 | |
SAP SE | | | 8,456 | | | | 1,039,780 | |
Scout24 AG (a) | | | 7,691 | | | | 358,224 | |
Zalando SE (a)(c) | | | 7,381 | | | | 286,813 | |
| | | | | | | | |
| | | | | | | 3,504,218 | |
| | | | | | | | |
| Hong Kong—3.8% | |
AIA Group Ltd. | | | 120,723 | | | | 1,076,477 | |
| | | | | | | | |
| India—3.0% | |
HDFC Bank Ltd. | | | 13,475 | | | | 372,662 | |
HDFC Bank Ltd. ADR | | | 5,170 | | | | 486,497 | |
| | | | | | | | |
| | | | | | | 859,159 | |
| | | | | | | | |
| Indonesia—1.8% | |
Ace Hardware Indonesia Tbk PT | | | 2,762,410 | | | | 266,944 | |
Bank Central Asia Tbk PT | | | 147,948 | | | | 239,639 | |
| | | | | | | | |
| | | | | | | 506,583 | |
| | | | | | | | |
| Ireland—3.1% | |
Kingspan Group PLC | | | 9,996 | | | | 466,091 | |
Ryanair Holdings PLC ADR (c) | | | 4,399 | | | | 422,480 | |
| | | | | | | | |
| | | | | | | 888,571 | |
| | | | | | | | |
| Japan—6.4% | |
Hoshizaki Corp. | | | 3,659 | | | | 378,723 | |
| | | | | | | | |
| | | Shares | | | Value | |
Keyence Corp. | | | 994 | | | $ | 577,401 | |
MonotaRO Co., Ltd. | | | 20,396 | | | | 575,291 | |
Sundrug Co., Ltd. | | | 8,244 | | | | 294,167 | |
| | | | | | | | |
| | | | | | | 1,825,582 | |
| | | | | | | | |
| Korea (Republic of)—1.3% | |
LG Household & Health Care Ltd. | | | 316 | | | | 363,437 | |
| | | | | | | | |
| Mexico—0.8% | |
Fomento Economico Mexicano S.A.B de C.V. UNIT | | | 23,002 | | | | 227,562 | |
| | | | | | | | |
| Netherlands—1.8% | |
ASML Holding NV | | | 2,760 | | | | 518,203 | |
| | | | | | | | |
| New Zealand—0.9% | |
Mainfreight Ltd. | | | 13,099 | | | | 262,256 | |
| | | | | | | | |
| Philippines—1.1% | |
Jollibee Foods Corp. | | | 31,972 | | | | 152,015 | |
Universal Robina Corp. | | | 65,639 | | | | 175,373 | |
| | | | | | | | |
| | | | | | | 327,388 | |
| | | | | | | | |
| South Africa—1.9% | |
PSG Group Ltd. | | | 33,252 | | | | 538,681 | |
| | | | | | | | |
| Spain—1.3% | |
Amadeus IT Group S.A. | | | 4,085 | | | | 378,634 | |
| | | | | | | | |
| Sweden—7.9% | |
AddTech AB, Class B | | | 12,568 | | | | 267,758 | |
Assa Abloy AB, Class B | | | 21,252 | | | | 425,972 | |
Atlas Copco AB, Class A | | | 14,512 | | | | 417,339 | |
Hexagon AB, Class B | | | 6,958 | | | | 407,368 | |
Hexpol AB | | | 39,430 | | | | 433,892 | |
Trelleborg AB, Class B | | | 14,737 | | | | 299,875 | |
| | | | | | | | |
| | | | | | | 2,252,204 | |
| | | | | | | | |
| Switzerland—2.9% | |
Cie Financiere Richemont S.A. | | | 3,488 | | | | 284,378 | |
Partners Group Holding AG | | | 439 | | | | 348,003 | |
VAT Group AG (a)(c) | | | 1,723 | | | | 193,249 | |
| | | | | | | | |
| | | | | | | 825,630 | |
| | | | | | | | |
| United Kingdom—9.2% | |
ASOS PLC (c) | | | 5,461 | | | | 409,500 | |
British American Tobacco PLC | | | 11,886 | | | | 554,131 | |
DCC PLC | | | 5,486 | | | | 497,590 | |
Reckitt Benckiser Group PLC | | | 8,051 | | | | 735,459 | |
Unilever PLC | | | 7,724 | | | | 424,311 | |
| | | | | | | | |
| | | | | | | 2,620,991 | |
| | | | | | | | |
Total Common Stock
(cost—$24,314,950) | | | | 28,171,868 | |
| | | | | | | | |
| | | | | | | | |
| | | Principal
Amount
(000s) | | | | |
| Repurchase Agreements—2.9% | |
State Street Bank and Trust Co., dated 9/28/18, 0.42%, due 10/1/18, proceeds $837,029; collateralized by Fannie Mae, 1.375%, due 10/7/21, valued at $855,784 including accrued interest | |
(cost—$837,000) | | | $837 | | | | 837,000 | |
| | | | | | | | |
| |
Total Investments
(cost—$25,151,950) (b)—101.4% | | | | 29,008,868 | |
| | | | | | | | |
| |
Liabilities in excess of
other assets—(1.4)% | | | | (398,831 | ) |
| | | | | | | | |
| |
| Net Assets—100.0% | | | | $28,610,037 | |
| | | | | | | | |
| | | | | | | | |
| See accompanying Notes to Financial Statements | | | September 30, 2018 | | | Annual Report | | | 169 | |
Schedule of Investments
September 30, 2018
Notes to Schedule of Investments:
(a) 144A—Exempt from registration under Rule 144A of the Securities Act of 1933. These securities may be resold in transactions exempt from registration, typically only to qualified institutional buyers. Securities with an aggregate value of $838,286, representing 2.9% of net assets.
(b) Securities with an aggregate value of $19,837,178, representing 69.3% of net assets, were valued utilizing modeling tools provided by a third-party vendor. See Note 1(a) and Note 1(b) in the Notes to Financial Statements.
(c) Non-income producing.
Glossary:
ADR—American Depositary Receipt
UNIT—More than one class of securities traded together
The industry classification of portfolio holdings and liabilities in excess of other assets shown as a percentage of net assets were as follows:
| | | | |
Interactive Media & Services | | | 10.5% | |
Internet & Direct Marketing Retail | | | 6.9% | |
Software | | | 6.6% | |
Machinery | | | 5.2% | |
Food & Staples Retailing | | | 4.8% | |
Semiconductors & Semiconductor Equipment | | | 4.8% | |
Healthcare Equipment & Supplies | | | 4.4% | |
IT Services | | | 4.0% | |
Road & Rail | | | 4.0% | |
Banks | | | 3.8% | |
Insurance | | | 3.8% | |
Electronic Equipment, Instruments & Components | | | 3.4% | |
Building Products | | | 3.1% | |
Hotels, Restaurants & Leisure | | | 3.1% | |
Trading Companies & Distributors | | | 3.0% | |
Personal Products | | | 2.8% | |
Pharmaceuticals | | | 2.7% | |
Household Products | | | 2.6% | |
Healthcare Providers & Services | | | 2.6% | |
Tobacco | | | 1.9% | |
Diversified Financial Services | | | 1.9% | |
Industrial Conglomerates | | | 1.7% | |
Chemicals | | | 1.5% | |
Airlines | | | 1.5% | |
Capital Markets | | | 1.2% | |
Biotechnology | | | 1.1% | |
Textiles, Apparel & Luxury Goods | | | 1.0% | |
Specialty Retail | | | 0.9% | |
Air Freight & Logistics | | | 0.9% | |
Electrical Equipment | | | 0.8% | |
Beverages | | | 0.8% | |
Food Products | | | 0.6% | |
Multi-Line Retail | | | 0.6% | |
Repurchase Agreements | | | 2.9% | |
Liabilities in excess of other assets | | | (1.4)% | |
| | | | |
| | | 100.0% | |
| | | | |
AllianzGI International Small-Cap Fund
| | | | | | | | |
| | | Shares | | | Value | |
| Common Stock—113.8% | |
| Australia—5.4% | |
ALS Ltd. | | | 119,600 | | | | $771,779 | |
Beach Energy Ltd. | | | 659,027 | | | | 1,020,279 | |
Boral Ltd. | | | 266,863 | | | | 1,332,110 | |
Challenger Ltd. | | | 117,940 | | | | 954,298 | |
Downer EDI Ltd. | | | 242,019 | | | | 1,379,998 | |
Eclipx Group Ltd. | | | 279,324 | | | | 518,696 | |
GUD Holdings Ltd. | | | 53,610 | | | | 560,122 | |
Santos Ltd. | | | 244,629 | | | | 1,284,347 | |
| | | | | | | | |
| | | | | | | 7,821,629 | |
| | | | | | | | |
| Austria—6.6% | |
ANDRITZ AG | | | 46,578 | | | | 2,716,678 | |
Schoeller-Bleckmann Oilfield Equipment AG | | | 18,569 | | | | 2,029,758 | |
UNIQA Insurance Group AG | | | 255,756 | | | | 2,553,799 | |
Wienerberger AG | | | 92,719 | | | | 2,317,889 | |
| | | | | | | | |
| | | | | | | 9,618,124 | |
| | | | | | | | |
| China—1.2% | |
Angel Yeast Co., Ltd., Class A | | | 167,450 | | | | 717,842 | |
China Everbright Greentech Ltd. (a) | | | 775,235 | | | | 661,034 | |
Zhejiang Dingli Machinery Co., Ltd., Class A | | | 42,324 | | | | 333,340 | |
| | | | | | | | |
| | | | | | | 1,712,216 | |
| | | | | | | | |
| Denmark—4.8% | |
Ambu A/S, Class B | | | 76,333 | | | | 1,832,144 | |
FLSmidth & Co. A/S | | | 38,082 | | | | 2,368,040 | |
SimCorp A/S | | | 31,553 | | | | 2,729,512 | |
| | | | | | | | |
| | | | | | | 6,929,696 | |
| | | | | | | | |
| Finland—2.4% | |
Huhtamaki Oyj | | | 50,661 | | | | 1,622,836 | |
Outotec Oyj (c) | | | 285,775 | | | | 1,869,154 | |
| | | | | | | | |
| | | | | | | 3,491,990 | |
| | | | | | | | |
| France—7.9% | |
APERAM S.A. | | | 47,488 | | | | 2,172,309 | |
Ingenico Group S.A. | | | 30,492 | | | | 2,318,343 | |
Korian S.A. | | | 39,060 | | | | 1,422,452 | |
Nexity S.A. | | | 46,524 | | | | 2,571,351 | |
Sartorius Stedim Biotech | | | 21,514 | | | | 2,962,340 | |
| | | | | | | | |
| | | | | | | 11,446,795 | |
| | | | | | | | |
| Germany—7.4% | |
Aareal Bank AG | | | 61,850 | | | | 2,578,928 | |
Bechtle AG | | | 29,974 | | | | 3,042,755 | |
CANCOM SE | | | 60,904 | | | | 2,748,227 | |
Hella GmbH & Co. KGaA | | | 41,924 | | | | 2,336,432 | |
| | | | | | | | |
| | | | | | | 10,706,342 | |
| | | | | | | | |
| Hong Kong—2.6% | |
Johnson Electric Holdings Ltd. | | | 457,000 | | | | 1,290,412 | |
Melco International Development Ltd. | | | 415,000 | | | | 826,167 | |
Sa Sa International Holdings Ltd. | | | 1,262,000 | | | | 699,284 | |
Techtronic Industries Co., Ltd. | | | 163,000 | | | | 1,039,726 | |
| | | | | | | | |
| | | | | | | 3,855,589 | |
| | | | | | | | |
| Indonesia—0.6% | |
Jasa Marga Persero Tbk PT | | | 2,840,300 | | | | 851,293 | |
| | | | | | | | |
| Italy—3.1% | |
Buzzi Unicem SpA | | | 99,901 | | | | 2,071,479 | |
De’ Longhi SpA | | | 76,084 | | | | 2,384,779 | |
| | | | | | | | |
| | | | | | | 4,456,258 | |
| | | | | | | | |
| Japan—36.2% | |
Arata Corp. | | | 18,600 | | | | 932,703 | |
COMSYS Holdings Corp. | | | 153,300 | | | | 4,540,128 | |
| | | | | | | | |
| | | Shares | | | Value | |
Gunma Bank Ltd. | | | 514,273 | | | $ | 2,647,197 | |
Ichigo, Inc. | | | 527,200 | | | | 1,976,636 | |
Itochu Techno-Solutions Corp. | | | 109,200 | | | | 2,372,387 | |
Japan Lifeline Co., Ltd. | | | 27,300 | | | | 577,105 | |
KH Neochem Co., Ltd. | | | 106,100 | | | | 4,130,918 | |
Link And Motivation, Inc. | | | 47,700 | | | | 594,055 | |
Lion Corp. | | | 151,400 | | | | 3,362,537 | |
Maruwa Co., Ltd. | | | 32,500 | | | | 2,169,077 | |
Mitsubishi UFJ Lease & Finance Co., Ltd. | | | 555,900 | | | | 3,271,768 | |
Miura Co., Ltd. | | | 97,800 | | | | 3,030,016 | |
Nichirei Corp. | | | 24,000 | | | | 636,720 | |
Nippon Carbon Co., Ltd. | | | 20,200 | | | | 1,397,937 | |
Nippon Shinyaku Co., Ltd. | | | 36,700 | | | | 2,407,590 | |
Nippon Thompson Co., Ltd. | | | 134,800 | | | | 895,965 | |
Okamura Corp. | | | 255,500 | | | | 3,416,881 | |
Pigeon Corp. | | | 67,000 | | | | 3,775,750 | |
Rengo Co., Ltd. | | | 422,600 | | | | 3,603,616 | |
Rohto Pharmaceutical Co., Ltd. | | | 99,500 | | | | 3,496,317 | |
Sanyo Special Steel Co., Ltd. | | | 23,300 | | | | 568,439 | |
Start Today Co., Ltd. | | | 18,000 | | | | 544,494 | |
Ube Industries Ltd. | | | 73,000 | | | | 1,986,088 | |
| | | | | | | | |
| | | | | | | 52,334,324 | |
| | | | | | | | |
| Netherlands—1.8% | |
ASR Nederland NV | | | 54,068 | | | | 2,577,203 | |
| | | | | | | | |
| Norway—2.0% | |
Elkem ASA (a)(c) | | | 583,187 | | | | 2,911,148 | |
| | | | | | | | |
| Philippines—0.1% | |
Integrated Micro-Electronics, Inc. | | | 900,000 | | | | 203,887 | |
| | | | | | | | |
| Singapore—0.4% | |
Venture Corp., Ltd. | | | 43,900 | | | | 566,077 | |
| | | | | | | | |
| Spain—1.5% | |
Unicaja Banco S.A. (a) | | | 1,360,113 | | | | 2,215,967 | |
| | | | | | | | |
| Sweden—4.0% | |
AAK AB | | | 206,670 | | | | 3,577,351 | |
Fastighets AB Balder, Class B (c) | | | 80,202 | | | | 2,223,795 | |
| | | | | | | | |
| | | | | | | 5,801,146 | |
| | | | | | | | |
| Switzerland—8.1% | |
ams AG (c) | | | 32,562 | | | | 1,832,743 | |
Galenica AG (a)(c) | | | 47,895 | | | | 2,732,260 | |
Georg Fischer AG | | | 1,812 | | | | 2,052,395 | |
Interroll Holding AG | | | 1,513 | | | | 2,948,839 | |
OC Oerlikon Corp. AG (c) | | | 154,545 | | | | 2,123,859 | |
| | | | | | | | |
| | | | | | | 11,690,096 | |
| | | | | | | | |
| Taiwan—1.8% | |
ASPEED Technology, Inc. | | | 25,000 | | | | 499,394 | |
Chipbond Technology Corp. | | | 377,000 | | | | 727,307 | |
Ennoconn Corp. | | | 70,063 | | | | 642,500 | |
Faraday Technology Corp. | | | 412,000 | | | | 735,283 | |
| | | | | | | | |
| | | | | | | 2,604,484 | |
| | | | | | | | |
| United Kingdom—15.9% | |
ASOS PLC (c) | | | 33,767 | | | | 2,532,064 | |
Auto Trader Group PLC (a) | | | 499,924 | | | | 2,908,181 | |
Genus PLC | | | 76,380 | | | | 2,375,841 | |
HomeServe PLC | | | 202,140 | | | | 2,696,518 | |
Intermediate Capital Group PLC | | | 200,763 | | | | 2,847,481 | |
RPC Group PLC | | | 213,028 | | | | 2,206,094 | |
Senior PLC | | | 717,484 | | | | 2,915,880 | |
Spectris PLC | | | 52,887 | | | | 1,633,555 | |
Tullow Oil PLC (c) | | | 844,498 | | | | 2,880,717 | |
| | | | | | | | |
| | | | | | | 22,996,331 | |
| | | | | | | | |
Total Common Stock
(cost—$136,908,647) | | | | 164,790,595 | |
| | | | | | | | |
| | | | | | |
| 170 | | Annual Report | | | September 30, 2018 | | | See accompanying Notes to Financial Statements |
Schedule of Investments
September 30, 2018
| | | | | | | | |
| | | Shares | | | Value | |
| Preferred Stock—1.5% | |
| Germany—1.5% | |
Jungheinrich AG
(cost—$1,829,522) | | | 57,095 | | | $ | 2,172,920 | |
| | | | | | | | |
| | | | | | | | |
| | | Principal
Amount
(000s) | | | | |
| Repurchase Agreements—0.8% | |
State Street Bank and Trust Co., dated 9/28/18, 0.42%, due 10/1/18, proceeds $1,105,039; collateralized by U.S. Treasury Notes, 1.75%, due 11/30/21, valued at $1,130,775 including accrued interest | |
(cost—$1,105,000) | | | $1,105 | | | | 1,105,000 | |
| | | | | | | | |
| |
Total Investments
(cost—$139,843,169) (b)—116.1% | | | | 168,068,515 | |
| | | | | | | | |
| |
| Liabilities in excess of other assets—(16.1)% | | | | (23,356,544 | ) |
| | | | | | | | |
| |
| Net Assets—100.0% | | | | $144,711,971 | |
| | | | | | | | |
Notes to Schedule of Investments:
(a) 144A—Exempt from registration under Rule 144A of the Securities Act of 1933. These securities may be resold in transactions exempt from registration, typically only to qualified institutional buyers. Securities with an aggregate value of $11,428,590, representing 7.9% of net assets.
(b) Securities with an aggregate value of $166,759,628, representing 115.2% of net assets, were valued utilizing modeling tools provided by a third-party vendor. See Note 1(a) and Note 1(b) in the Notes to Financial Statements.
(c) Non-income producing.
The industry classification of portfolio holdings and liabilities in excess of other assets shown as a percentage of net assets were as follows:
| | | | |
Machinery | | | 11.2% | |
Chemicals | | | 6.2% | |
Pharmaceuticals | | | 6.0% | |
IT Services | | | 5.6% | |
Commercial Services & Supplies | | | 5.2% | |
Containers & Packaging | | | 5.1% | |
Household Products | | | 4.9% | |
Construction & Engineering | | | 4.8% | |
Electronic Equipment, Instruments & Components | | | 4.8% | |
Diversified Financial Services | | | 4.3% | |
Construction Materials | | | 3.9% | |
Oil, Gas & Consumable Fuels | | | 3.6% | |
Insurance | | | 3.5% | |
Food Products | | | 3.4% | |
Banks | | | 3.4% | |
Real Estate Management & Development | | | 3.3% | |
Healthcare Equipment & Supplies | | | 3.3% | |
Metals & Mining | | | 3.2% | |
Semiconductors & Semiconductor Equipment | | | 2.6% | |
Household Durables | | | 2.4% | |
Internet & Direct Marketing Retail | | | 2.1% | |
Aerospace & Defense | | | 2.0% | |
Interactive Media & Services | | | 2.0% | |
Auto Components | | | 2.0% | |
Capital Markets | | | 2.0% | |
Software | | | 1.9% | |
Electrical Equipment | | | 1.9% | |
Thrifts & Mortgage Finance | | | 1.8% | |
Biotechnology | | | 1.6% | |
Energy Equipment & Services | | | 1.4% | |
Healthcare Providers & Services | | | 1.4% | |
Professional Services | | | 0.9% | |
Distributors | | | 0.6% | |
Transportation Infrastructure | | | 0.6% | |
Hotels, Restaurants & Leisure | | | 0.6% | |
Specialty Retail | | | 0.5% | |
Independent Power Producers & Energy Traders | | | 0.5% | |
Technology Hardware, Storage & Peripherals | | | 0.4% | |
Consumer Finance | | | 0.4% | |
Repurchase Agreements | | | 0.8% | |
Liabilities in excess of other assets | | | (16.1)% | |
| | | | |
| | | 100.0% | |
| | | | |
AllianzGI Micro Cap Fund
| | | | | | | | |
| | | Shares | | | Value | |
| Common Stock—98.3% | |
| Air Freight & Logistics—0.9% | |
Echo Global Logistics, Inc. (a) | | | 8,301 | | | | $256,916 | |
| | | | | | | | |
| Auto Components—0.6% | |
Modine Manufacturing Co. (a) | | | 11,645 | | | | 173,511 | |
| | | | | | | | |
| Banks—7.0% | |
Carolina Financial Corp. | | | 5,762 | | | | 217,343 | |
Equity Bancshares, Inc., Class A (a) | | | 7,080 | | | | 277,961 | |
First Foundation, Inc. (a) | | | 14,515 | | | | 226,724 | |
First Internet Bancorp | | | 5,292 | | | | 161,141 | |
Franklin Financial Network, Inc. (a) | | | 6,025 | | | | 235,578 | |
National Commerce Corp. (a) | | | 4,461 | | | | 184,239 | |
Preferred Bank | | | 3,882 | | | | 227,097 | |
Triumph Bancorp, Inc. (a) | | | 5,696 | | | | 217,587 | |
Veritex Holdings, Inc. (a) | | | 8,851 | | | | 250,129 | |
| | | | | | | | |
| | | | | | | 1,997,799 | |
| | | | | | | | |
| Beverages—2.1% | |
MGP Ingredients, Inc. | | | 4,332 | | | | 342,141 | |
Primo Water Corp. (a) | | | 14,290 | | | | 257,935 | |
| | | | | | | | |
| | | | | | | 600,076 | |
| | | | | | | | |
| Biotechnology—13.2% | |
Abeona Therapeutics, Inc. (a) | | | 6,176 | | | | 79,053 | |
Adamas Pharmaceuticals, Inc. (a) | | | 3,317 | | | | 66,406 | |
Albireo Pharma, Inc. (a) | | | 2,168 | | | | 71,457 | |
Audentes Therapeutics, Inc. (a) | | | 3,362 | | | | 133,102 | |
BioCryst Pharmaceuticals, Inc. (a) | | | 15,483 | | | | 118,135 | |
BioSpecifics Technologies Corp. (a) | | | 3,155 | | | | 184,536 | |
Cara Therapeutics, Inc. (a) | | | 6,010 | | | | 143,940 | |
Corbus Pharmaceuticals Holdings, Inc. (a) | | | 8,035 | | | | 60,664 | |
CytomX Therapeutics, Inc. (a) | | | 5,969 | | | | 110,427 | |
Fate Therapeutics, Inc. (a) | | | 8,304 | | | | 135,272 | |
Flexion Therapeutics, Inc. (a) | | | 7,507 | | | | 140,456 | |
GlycoMimetics, Inc. (a) | | | 6,760 | | | | 97,344 | |
Intellia Therapeutics, Inc. (a) | | | 4,937 | | | | 141,297 | |
Iovance Biotherapeutics, Inc. (a) | | | 10,638 | | | | 119,678 | |
Karyopharm Therapeutics, Inc. (a) | | | 6,358 | | | | 108,277 | |
Kindred Biosciences, Inc. (a) | | | 13,719 | | | | 191,380 | |
Kura Oncology, Inc. (a) | | | 5,266 | | | | 92,155 | |
La Jolla Pharmaceutical Co. (a) | | | 4,875 | | | | 98,134 | |
MacroGenics, Inc. (a) | | | 5,825 | | | | 124,888 | |
Pieris Pharmaceuticals, Inc. (a) | | | 9,695 | | | | 54,292 | |
Progenics Pharmaceuticals, Inc. (a) | | | 14,216 | | | | 89,134 | |
Rigel Pharmaceuticals, Inc. (a) | | | 28,087 | | | | 90,159 | |
Sangamo Therapeutics, Inc. (a) | | | 9,181 | | | | 155,618 | |
T2 Biosystems, Inc. (a) | | | 28,278 | | | | 210,671 | |
TG Therapeutics, Inc. (a) | | | 9,407 | | | | 52,679 | |
uniQure NV (a) | | | 3,024 | | | | 110,043 | |
Vanda Pharmaceuticals, Inc. (a) | | | 8,373 | | | | 192,160 | |
Veracyte, Inc. (a) | | | 17,661 | | | | 168,663 | |
Verastem, Inc. (a) | | | 14,112 | | | | 102,312 | |
Vericel Corp. (a) | | | 9,109 | | | | 128,892 | |
Viking Therapeutics, Inc. (a) | | | 8,056 | | | | 140,336 | |
Voyager Therapeutics, Inc. (a) | | | 4,824 | | | | 91,270 | |
| | | | | | | | |
| | | | | | | 3,802,830 | |
| | | | | | | | |
| Building Products—0.9% | |
PGT Innovations, Inc. (a) | | | 12,243 | | | | 264,449 | |
| | | | | | | | |
| | | | | | | | |
| See accompanying Notes to Financial Statements | | | September 30, 2018 | | | Annual Report | | | 171 | |
Schedule of Investments
September 30, 2018
| | | | | | | | |
| | | Shares | | | Value | |
| Chemicals—0.7% | |
American Vanguard Corp. | | | 10,803 | | | $ | 194,454 | |
| | | | | | | | |
| Construction & Engineering—2.6% | |
NV5 Global, Inc. (a) | | | 5,640 | | | | 488,988 | |
Sterling Construction Co., Inc. (a) | | | 17,260 | | | | 247,163 | |
| | | | | | | | |
| | | | | | | 736,151 | |
| | | | | | | | |
| Construction Materials—0.7% | |
U.S. Concrete, Inc. (a) | | | 4,474 | | | | 205,133 | |
| | | | | | | | |
| Diversified Consumer Services—0.6% | |
Carriage Services, Inc. | | | 8,259 | | | | 177,981 | |
| | | | | | | | |
| Diversified Telecommunication Services—0.9% | |
ORBCOMM, Inc. (a) | | | 23,895 | | | | 259,500 | |
| | | | | | | | |
| Electronic Equipment, Instruments & Components—0.8% | |
Mesa Laboratories, Inc. | | | 1,247 | | | | 231,468 | |
| | | | | | | | |
| Energy Equipment & Services—0.5% | |
Newpark Resources, Inc. (a) | | | 15,236 | | | | 157,693 | |
| | | | | | | | |
| Food Products—0.8% | |
John B Sanfilippo & Son, Inc. | | | 3,398 | | | | 242,549 | |
| | | | | | | | |
| Healthcare Equipment & Supplies—15.5% | |
Antares Pharma, Inc. (a) | | | 49,846 | | | | 167,483 | |
AxoGen, Inc. (a) | | | 10,518 | | | | 387,588 | |
Cerus Corp. (a) | | | 28,416 | | | | 204,879 | |
CryoLife, Inc. (a) | | | 10,520 | | | | 370,304 | |
CryoPort, Inc. (a) | | | 23,373 | | | | 299,408 | |
Cutera, Inc. (a) | | | 6,642 | | | | 216,197 | |
CytoSorbents Corp. (a) | | | 18,879 | | | | 243,539 | |
Heska Corp. (a) | | | 1,818 | | | | 205,998 | |
IntriCon Corp. (a) | | | 3,706 | | | | 208,277 | |
LeMaitre Vascular, Inc. | | | 11,433 | | | | 442,914 | |
OrthoPediatrics Corp. (a) | | | 7,337 | | | | 268,828 | |
Senseonics Holdings, Inc. (a) | | | 49,328 | | | | 235,295 | |
Sientra, Inc. (a) | | | 8,493 | | | | 202,813 | |
Surmodics, Inc. (a) | | | 5,714 | | | | 426,550 | |
Tactile Systems Technology, Inc. (a) | | | 7,884 | | | | 560,158 | |
| | | | | | | | |
| | | | | | | 4,440,231 | |
| | | | | | | | |
| Healthcare Providers & Services—4.4% | |
Addus HomeCare Corp. (a) | | | 3,877 | | | | 271,972 | |
BioTelemetry, Inc. (a) | | | 8,702 | | | | 560,844 | |
R1 RCM, Inc. (a) | | | 17,903 | | | | 181,894 | |
RadNet, Inc. (a) | | | 15,989 | | | | 240,634 | |
| | | | | | | | |
| | | | | | | 1,255,344 | |
| | | | | | | | |
| Healthcare Technology—3.6% | |
Tabula Rasa HealthCare, Inc. (a) | | | 7,135 | | | | 579,290 | |
Vocera Communications, Inc. (a) | | | 12,041 | | | | 440,460 | |
| | | | | | | | |
| | | | | | | 1,019,750 | |
| | | | | | | | |
| Hotels, Restaurants & Leisure—2.4% | |
Carrols Restaurant Group, Inc. (a) | | | 19,428 | | | | 283,649 | |
Century Casinos, Inc. (a) | | | 23,915 | | | | 178,406 | |
Golden Entertainment, Inc. (a) | | | 9,220 | | | | 221,372 | |
| | | | | | | | |
| | | | | | | 683,427 | |
| | | | | | | | |
| Household Durables—1.3% | |
LGI Homes, Inc. (a) | | | 5,078 | | | | 240,901 | |
Turtle Beach Corp. (a) | | | 6,447 | | | | 128,553 | |
| | | | | | | | |
| | | | | | | 369,454 | |
| | | | | | | | |
| Internet & Direct Marketing Retail—0.8% | |
Gaia, Inc., Class A (a) | | | 14,568 | | | | 224,347 | |
| | | | | | | | |
| | | | | | | | |
| | | Shares | | | Value | |
| IT Services—2.8% | |
Brightcove, Inc. (a) | | | 21,045 | | | $ | 176,778 | |
Carbonite, Inc. (a) | | | 10,259 | | | | 365,734 | |
Hackett Group, Inc. | | | 12,395 | | | | 249,759 | |
| | | | | | | | |
| | | | | | | 792,271 | |
| | | | | | | | |
| Leisure Equipment & Products—1.2% | |
MCBC Holdings, Inc. (a) | | | 9,382 | | | | 336,626 | |
| | | | | | | | |
| Life Sciences Tools & Services—2.3% | |
Codexis, Inc. (a) | | | 9,356 | | | | 160,455 | |
NeoGenomics, Inc. (a) | | | 32,353 | | | | 496,619 | |
| | | | | | | | |
| | | | | | | 657,074 | |
| | | | | | | | |
| Machinery—4.0% | |
Commercial Vehicle Group, Inc. (a) | | | 18,747 | | | | 171,723 | |
DMC Global, Inc. | | | 4,069 | | | | 166,015 | |
Kadant, Inc. | | | 3,304 | | | | 356,336 | |
Kornit Digital Ltd. (a) | | | 11,641 | | | | 254,938 | |
Spartan Motors, Inc. | | | 13,516 | | | | 199,361 | |
| | | | | | | | |
| | | | | | | 1,148,373 | |
| | | | | | | | |
| Media—0.6% | |
Cardlytics, Inc. (a) | | | 7,134 | | | | 178,635 | |
| | | | | | | | |
| Oil, Gas & Consumable Fuels—3.7% | |
Abraxas Petroleum Corp. (a) | | | 79,202 | | | | 184,541 | |
Evolution Petroleum Corp. | | | 23,435 | | | | 258,957 | |
Lonestar Resources U.S., Inc., Class A (a) | | | 22,439 | | | | 174,800 | |
Penn Virginia Corp. (a) | | | 3,536 | | | | 284,789 | |
Ring Energy, Inc. (a) | | | 16,305 | | | | 161,582 | |
| | | | | | | | |
| | | | | | | 1,064,669 | |
| | | | | | | | |
| Pharmaceuticals—4.7% | |
Amphastar Pharmaceuticals, Inc. (a) | | | 8,222 | | | | 158,191 | |
ANI Pharmaceuticals, Inc. (a) | | | 3,703 | | | | 209,368 | |
Assembly Biosciences, Inc. (a) | | | 2,676 | | | | 99,387 | |
Cymabay Therapeutics, Inc. (a) | | | 9,311 | | | | 103,166 | |
Endocyte, Inc. (a) | | | 9,557 | | | | 169,732 | |
Intersect ENT, Inc. (a) | | | 7,801 | | | | 224,279 | |
Omeros Corp. (a) | | | 5,616 | | | | 137,086 | |
Paratek Pharmaceuticals, Inc. (a) | | | 3,883 | | | | 37,665 | |
Revance Therapeutics, Inc. (a) | | | 4,074 | | | | 101,239 | |
WaVe Life Sciences Ltd. (a) | | | 2,373 | | | | 118,650 | |
| | | | | | | | |
| | | | | | | 1,358,763 | |
| | | | | | | | |
| Professional Services—1.8% | |
CRA International, Inc. | | | 4,671 | | | | 234,578 | |
Kforce, Inc. | | | 7,665 | | | | 288,204 | |
| | | | | | | | |
| | | | | | | 522,782 | |
| | | | | | | | |
| Road & Rail—0.6% | |
Daseke, Inc. (a) | | | 21,424 | | | | 171,821 | |
| | | | | | | | |
| Semiconductors & Semiconductor Equipment—2.5% | |
Axcelis Technologies, Inc. (a) | | | 7,796 | | | | 153,191 | |
AXT, Inc. (a) | | | 26,977 | | | | 192,886 | |
FormFactor, Inc. (a) | | | 14,943 | | | | 205,466 | |
Ichor Holdings Ltd. (a) | | | 8,262 | | | | 168,710 | |
| | | | | | | | |
| | | | | | | 720,253 | |
| | | | | | | | |
| Software—9.0% | |
Amber Road, Inc. (a) | | | 22,550 | | | | 216,931 | |
Asure Software, Inc. (a) | | | 15,592 | | | | 193,653 | |
Everbridge, Inc. (a) | | | 8,109 | | | | 467,403 | |
Instructure, Inc. (a) | | | 8,354 | | | | 295,732 | |
LivePerson, Inc. (a) | | | 16,011 | | | | 415,485 | |
Model N, Inc. (a) | | | 14,577 | | | | 231,045 | |
PROS Holdings, Inc. (a) | | | 6,694 | | | | 234,424 | |
Rosetta Stone, Inc. (a) | | | 12,118 | | | | 241,027 | |
| | | | | | | | |
| | | Shares | | | Value | |
Upland Software, Inc. (a) | | | 9,105 | | | $ | 294,182 | |
| | | | | | | | |
| | | | | | | 2,589,882 | |
| | | | | | | | |
| Technology Hardware, Storage & Peripherals—0.9% | |
USA Technologies, Inc. (a) | | | 37,699 | | | | 271,433 | |
| | | | | | | | |
| Thrifts & Mortgage Finance—1.7% | |
First Defiance Financial Corp. | | | 8,784 | | | | 264,486 | |
Meridian Bancorp, Inc. | | | 13,778 | | | | 234,226 | |
| | | | | | | | |
| | | | | | | 498,712 | |
| | | | | | | | |
| Wireless Telecommunication Services—2.2% | |
Boingo Wireless, Inc. (a) | | | 17,757 | | | | 619,719 | |
| | | | | | | | |
Total Common Stock
(cost—$20,259,249) | | | | 28,224,076 | |
| | | | | | | | |
| | | | | | | | |
| | | Principal
Amount
(000s) | | | | |
| Repurchase Agreements—1.7% | |
State Street Bank and Trust Co., dated 9/28/18, 0.42%, due 10/1/18, proceeds $489,017; collateralized by U.S. Treasury Notes, 2.00%, due 11/30/20, valued at $499,219 including accrued interest | |
(cost—$489,000) | | | $489 | | | | 489,000 | |
| | | | | | | | |
| |
Total Investments
(cost—$20,748,249)—100.0% | | | | 28,713,076 | |
| | | | | | | | |
| |
Liabilities in excess of
other assets—(0.0)% | | | | (2,168 | ) |
| | | | | | | | |
| |
| Net Assets—100.0% | | | | $28,710,908 | |
| | | | | | | | |
Notes to Schedule of Investments:
(a) Non-income producing.
| | | | | | |
| 172 | | Annual Report | | | September 30, 2018 | | | See accompanying Notes to Financial Statements |
Schedule of Investments
September 30, 2018
AllianzGI NFJ Emerging Markets Value Fund
| | | | | | | | |
| | | Shares | | | Value | |
| Common Stock—93.1% | |
| Brazil—4.1% | |
Banco Santander Brasil S.A. UNIT | | | 122,400 | | | | $1,082,295 | |
Cia de Locacao das Americas | | | 159,200 | | | | 1,060,400 | |
Energisa S.A. UNIT | | | 130,900 | | | | 997,985 | |
IRB Brasil Resseguros S.A. | | | 79,600 | | | | 1,309,732 | |
Vale S.A. ADR | | | 79,059 | | | | 1,173,236 | |
| | | | | | | | |
| | | | | | | 5,623,648 | |
| | | | | | | | |
| Chile—0.8% | |
Banco Santander Chile | | | 14,085,410 | | | | 1,125,402 | |
| | | | | | | | |
| China—27.2% | |
Agricultural Bank of China Ltd., Class H | | | 2,174,000 | | | | 1,066,175 | |
Anhui Conch Cement Co., Ltd., Class H | | | 177,500 | | | | 1,065,869 | |
ANTA Sports Products Ltd. | | | 192,000 | | | | 916,576 | |
Bank of China Ltd., Class H | | | 2,161,000 | | | | 954,822 | |
Baoshan Iron & Steel Co., Ltd., Class A | | | 648,639 | | | | 739,930 | |
China Construction Bank Corp., Class H | | | 1,148,000 | | | | 1,003,467 | |
China Meidong Auto Holdings Ltd. | | | 2,346,000 | | | | 1,101,057 | |
China Merchants Bank Co., Ltd., Class H | | | 277,600 | | | | 1,122,496 | |
China Petroleum & Chemical Corp., Class H | | | 1,182,000 | | | | 1,187,613 | |
China Travel International Investment Hong Kong Ltd. | | | 2,584,000 | | | | 830,889 | |
China Water Affairs Group Ltd. | | | 884,000 | | | | 988,933 | |
CNOOC Ltd. | | | 668,000 | | | | 1,322,724 | |
Consun Pharmaceutical Group Ltd. | | | 1,057,000 | | | | 840,576 | |
Country Garden Holdings Co., Ltd. | | | 711,000 | | | | 895,988 | |
ENN Energy Holdings Ltd. | | | 106,000 | | | | 921,523 | |
Focus Media Information Technology Co., Ltd., Class A | | | 768,060 | | | | 947,761 | |
Geely Automobile Holdings Ltd. | | | 387,000 | | | | 770,695 | |
Guangdong Provincial Expressway Development Co., Ltd., Class B | | | 1,147,387 | | | | 899,588 | |
Industrial & Commercial Bank of China Ltd., Class H | | | 1,421,000 | | | | 1,037,462 | |
Inner Mongolia Yili Industrial Group Co., Ltd., Class A | | | 260,600 | | | | 973,626 | |
Jiangsu Yanghe Brewery Joint-Stock Co., Ltd. | | | 62,306 | | | | 1,158,398 | |
JNBY Design Ltd. | | | 480,500 | | | | 851,087 | |
Kweichow Moutai Co., Ltd., Class A | | | 10,400 | | | | 1,103,708 | |
Lee & Man Paper Manufacturing Ltd. | | | 1,044,000 | | | | 966,705 | |
Longfor Group Holdings Ltd. | | | 379,500 | | | | 978,267 | |
| | | | | | | | |
| | | Shares | | | Value | |
Midea Group Co., Ltd., Class A (c)(d) | | | 157,414 | | | $ | 921,981 | |
Ping An Insurance Group Co of China Ltd. | | | 162,000 | | | | 1,612,573 | |
Qingdao Haier Co., Ltd., Class A | | | 380,100 | | | | 912,534 | |
Qingdao Port International Co., Ltd., Class H (a)(e) | | | 1,324,000 | | | | 940,914 | |
Shengyi Technology Co., Ltd., Class A | | | 668,605 | | | | 1,023,564 | |
Shenzhen Expressway Co., Ltd., Class H | | | 1,146,000 | | | | 1,150,779 | |
Shenzhen International Holdings Ltd. | | | 474,000 | | | | 976,673 | |
Sinopec Shanghai Petrochemical Co., Ltd., Class H | | | 1,684,000 | | | | 1,027,068 | |
Tencent Holdings Ltd. | | | 29,000 | | | | 1,184,094 | |
Tencent Holdings Ltd. ADR | | | 26,700 | | | | 1,090,428 | |
Wanhua Chemical Group Co., Ltd., Class A | | | 163,500 | | | | 1,009,924 | |
Wuliangye Yibin Co., Ltd., Class A | | | 107,900 | | | | 1,064,949 | |
| | | | | | | | |
| | | | | | | 37,561,416 | |
| | | | | | | | |
| Hong Kong—4.9% | |
AIA Group Ltd. | | | 138,000 | | | | 1,230,534 | |
BOC Hong Kong Holdings Ltd. | | | 206,500 | | | | 980,114 | |
HKBN Ltd. | | | 663,000 | | | | 1,135,729 | |
Sands China Ltd. | | | 201,200 | | | | 906,107 | |
Techtronic Industries Co., Ltd. | | | 165,000 | | | | 1,052,484 | |
Xin Point Holdings Ltd. | | | 1,002,000 | | | | 387,670 | |
Xinyi Glass Holdings Ltd. | | | 836,000 | | | | 1,053,999 | |
| | | | | | | | |
| | | | | | | 6,746,637 | |
| | | | | | | | |
| Hungary—0.8% | |
MOL Hungarian Oil & Gas PLC | | | 99,503 | | | | 1,071,740 | |
| | | | | | | | |
| India—10.7% | |
Cyient Ltd. | | | 98,737 | | | | 1,021,995 | |
GAIL India Ltd. | | | 183,858 | | | | 963,895 | |
HCL Technologies Ltd. | | | 80,333 | | | | 1,203,499 | |
HDFC Bank Ltd. | | | 33,016 | | | | 913,084 | |
Hexaware Technologies Ltd. | | | 160,482 | | | | 942,397 | |
Housing Development Finance Corp., Ltd. | | | 32,256 | | | | 778,785 | |
Indiabulls Housing Finance Ltd. | | | 52,896 | | | | 624,204 | |
Infosys Ltd. | | | 118,747 | | | | 1,195,608 | |
Larsen & Toubro Infotech Ltd. (a) | | | 44,481 | | | | 1,196,878 | |
Mphasis Ltd. | | | 69,830 | | | | 1,128,332 | |
NIIT Technologies Ltd. | | | 58,291 | | | | 884,705 | |
Reliance Industries Ltd. | | | 82,379 | | | | 1,425,926 | |
Sonata Software Ltd. | | | 175,817 | | | | 890,566 | |
Tech Mahindra Ltd. | | | 108,603 | | | | 1,119,227 | |
Yes Bank Ltd. | | | 196,425 | | | | 499,279 | |
| | | | | | | | |
| | | | | | | 14,788,380 | |
| | | | | | | | |
| Indonesia—0.8% | |
Bank Rakyat Indonesia Persero Tbk PT | | | 4,923,800 | | | | 1,040,490 | |
| | | | | | | | |
| Korea (Republic of)—11.0% | |
Com2uS Corp. | | | 7,387 | | | | 975,885 | |
Dentium Co., Ltd. | | | 13,389 | | | | 1,213,854 | |
| | | | | | | | |
| | | Shares | | | Value | |
F&F Co., Ltd. | | | 13,628 | | | $ | 1,035,641 | |
Hana Financial Group, Inc. | | | 26,276 | | | | 1,055,055 | |
Hyundai Marine & Fire Insurance Co., Ltd. | | | 32,731 | | | | 1,237,273 | |
Industrial Bank of Korea | | | 72,068 | | | | 990,428 | |
Kginicis Co., Ltd. | | | 65,172 | | | | 1,077,581 | |
Korean Reinsurance Co. | | | 97,669 | | | | 920,221 | |
LEENO Industrial, Inc. | | | 22,056 | | | | 1,311,316 | |
Macquarie Korea Infrastructure Fund | | | 110,316 | | | | 905,004 | |
Samsung Electronics Co., Ltd. | | | 34,578 | | | | 1,447,119 | |
SK Holdings Co., Ltd. | | | 3,771 | | | | 975,807 | |
SK Hynix, Inc. | | | 17,111 | | | | 1,132,027 | |
Tokai Carbon Korea Co., Ltd. | | | 17,136 | | | | 947,065 | |
| | | | | | | | |
| | | | | | | 15,224,276 | |
| | | | | | | | |
| Malaysia—0.8% | |
Serba Dinamik Holdings Bhd. | | | 1,215,700 | | | | 1,119,006 | |
| | | | | | | | |
| Mexico—5.2% | |
Banco del Bajio S.A. (a) | | | 507,600 | | | | 1,253,132 | |
Bolsa Mexicana de Valores S.A.B de C.V. | | | 614,000 | | | | 1,256,282 | |
Grupo Aeroportuario del Centro Norte S.A.B de C.V. | | | 190,600 | | | | 1,362,229 | |
Grupo Financiero Banorte S.A.B de C.V., Class O | | | 153,335 | | | | 1,109,249 | |
Mexichem S.A.B de C.V. | | | 337,300 | | | | 1,154,794 | |
Prologis Property Mexico S.A. de C.V. REIT | | | 533,546 | | | | 1,080,264 | |
| | | | | | | | |
| | | | | | | 7,215,950 | |
| | | | | | | | |
| Norway—0.6% | |
Bakkafrost P/F | | | 14,683 | | | | 895,728 | |
| | | | | | | | |
| Peru—0.7% | |
Credicorp Ltd. | | | 4,101 | | | | 914,851 | |
| | | | | | | | |
| Russian Federation—4.3% | |
Gazprom Neft PJSC ADR | | | 44,935 | | | | 1,289,230 | |
Lukoil PJSC (c)(d) | | | 17,726 | | | | 1,358,698 | |
Moscow Exchange MICEX-RTS PJSC (c)(d)(e) | | | 688,495 | | | | 1,018,972 | |
Tatneft PJSC (c)(d) | | | 106,181 | | | | 1,353,808 | |
TCS Group Holding PLC GDR | | | 52,972 | | | | 979,982 | |
| | | | | | | | |
| | | | | | | 6,000,690 | |
| | | | | | | | |
| Singapore—1.2% | |
China Sunsine Chemical Holdings Ltd. | | | 890,800 | | | | 683,975 | |
DBS Group Holdings Ltd. | | | 53,100 | | | | 1,012,996 | |
| | | | | | | | |
| | | | | | | 1,696,971 | |
| | | | | | | | |
| South Africa—4.7% | |
Astral Foods Ltd. | | | 54,229 | | | | 945,588 | |
JSE Ltd. | | | 83,830 | | | | 943,686 | |
Mondi Ltd. | | | 43,142 | | | | 1,184,763 | |
Naspers Ltd., Class N | | | 6,049 | | | | 1,302,645 | |
Naspers Ltd., Class N ADR | | | 24,900 | | | | 1,065,471 | |
Santam Ltd. | | | 46,149 | | | | 1,072,668 | |
| | | | | | | | |
| | | | | | | 6,514,821 | |
| | | | | | | | |
| Taiwan—10.9% | |
Ardentec Corp. | | | 925,000 | | | | 1,105,500 | |
Catcher Technology Co., Ltd. | | | 98,000 | | | | 1,077,302 | |
Chroma ATE, Inc. | | | 180,000 | | | | 863,448 | |
Getac Technology Corp. | | | 741,000 | | | | 968,019 | |
Greatek Electronics, Inc. | | | 588,000 | | | | 971,628 | |
ITEQ Corp. | | | 511,000 | | | | 987,648 | |
| | | | | | | | |
| See accompanying Notes to Financial Statements | | | September 30, 2018 | | | Annual Report | | | 173 | |
Schedule of Investments
September 30, 2018
| | | | | | | | |
| | | Shares | | | Value | |
Novatek Microelectronics Corp. | | | 209,000 | | | $ | 1,031,383 | |
On-Bright Electronics, Inc. | | | 109,000 | | | | 655,899 | |
Powertech Technology, Inc. | | | 347,000 | | | | 945,424 | |
Taiwan Semiconductor Manufacturing Co., Ltd. | | | 178,178 | | | | 1,520,488 | |
Taiwan Semiconductor Manufacturing Co., Ltd. ADR | | | 27,169 | | | | 1,199,783 | |
Taiwan Union Technology Corp. | | | 292,000 | | | | 970,862 | |
Tripod Technology Corp. | | | 373,000 | | | | 1,018,140 | |
Wiwynn Corp. | | | 82,118 | | | | 770,651 | |
WT Microelectronics Co., Ltd. | | | 689,543 | | | | 962,943 | |
| | | | | | | | |
| | | | | | | 15,049,118 | |
| | | | | | | | |
| Thailand—2.4% | |
PTT Global Chemical PCL NVDR | | | 441,500 | | | | 1,109,450 | |
PTT PCL NVDR | | | 677,700 | | | | 1,137,714 | |
Tisco Financial Group PCL NVDR | | | 440,100 | | | | 1,139,990 | |
| | | | | | | | |
| | | | | | | 3,387,154 | |
| | | | | | | | |
| Turkey—0.6% | |
Trakya Cam Sanayii AS | | | 1,152,934 | | | | 819,509 | |
| | | | | | | | |
| United Arab Emirates—0.8% | |
Dubai Islamic Bank PJSC | | | 734,569 | | | | 1,075,969 | |
| | | | | | | | |
| United States—0.6% | |
Citigroup, Inc. | | | 12,400 | | | | 889,576 | |
| | | | | | | | |
Total Common Stock
(cost—$133,347,890) | | | | 128,761,332 | |
| | | | | | | | |
| | | | | | | | |
| Preferred Stock—4.9% | |
| Brazil—2.3% | |
Banco do Estado do Rio Grande do Sul S.A., Class B | | | 271,600 | | | | 1,007,433 | |
Itausa - Investimentos Itau S.A. | | | 415,020 | | | | 1,037,923 | |
Petroleo Brasileiro S.A. | | | 223,600 | | | | 1,167,677 | |
| | | | | | | | |
| | | | | | | 3,213,033 | |
| | | | | | | | |
| Korea (Republic of)—2.6% | |
LG Household & Health Care Ltd. | | | 1,626 | | | | 1,178,548 | |
Samsung Electronics Co., Ltd. | | | 37,925 | | | | 1,293,517 | |
SK Innovation Co., Ltd. | | | 8,843 | | | | 1,084,445 | |
| | | | | | | | |
| | | | | | | 3,556,510 | |
| | | | | | | | |
Total Preferred Stock
(cost—$7,045,720) | | | | 6,769,543 | |
| | | | | | | | |
| |
Total Investments
(cost—$140,393,610) (b)—98.0% | | | | 135,530,875 | |
| | | | | | | | |
| |
Other assets less
liabilities—2.0% | | | | 2,728,477 | |
| | | | | | | | |
| |
| Net Assets—100.0% | | | | $138,259,352 | |
| | | | | | | | |
Notes to Schedule of Investments:
(a) 144A—Exempt from registration under Rule 144A of the Securities Act of 1933. These securities may be resold in transactions exempt from registration, typically only to qualified institutional buyers. Securities with an aggregate value of $3,390,924, representing 2.5% of net assets.
(b) Securities with an aggregate value of $102,297,236, representing 74.0% of net assets, were valued utilizing modeling tools provided by a third-party vendor. See Note 1(a) and Note 1(b) in the Notes to Financial Statements.
(c) Fair-Valued—Securities with an aggregate value of $4,653,459, representing 3.4% of net assets. See Note 1(a) and Note 1(b) in the Notes to Financial Statements.
(d) Level 3 security. See Note 1(a) and Note 1(b) in the Notes to Financial Statements.
(e) Non-income producing.
Glossary:
ADR—American Depositary Receipt
GDR—Global Depositary Receipt
NVDR—Non-Voting Depository Receipt
REIT—Real Estate Investment Trust
UNIT—More than one class of securities traded together
The industry classification of portfolio holdings and other assets less liabilities shown as a percentage of net assets were as follows:
| | | | |
Banks | | | 16.8% | |
Oil, Gas & Consumable Fuels | | | 9.0% | |
Semiconductors & Semiconductor Equipment | | | 7.8% | |
IT Services | | | 6.3% | |
Insurance | | | 5.3% | |
Technology Hardware, Storage & Peripherals | | | 4.7% | |
Electronic Equipment, Instruments & Components | | | 4.2% | |
Transportation Infrastructure | | | 3.9% | |
Chemicals | | | 3.6% | |
Capital Markets | | | 3.0% | |
Beverages | | | 2.4% | |
Household Durables | | | 2.1% | |
Software | | | 2.1% | |
Food Products | | | 2.0% | |
Textiles, Apparel & Luxury Goods | | | 2.0% | |
Media | | | 1.7% | |
Interactive Media & Services | | | 1.6% | |
Paper & Forest Products | | | 1.6% | |
Metals & Mining | | | 1.4% | |
Gas Utilities | | | 1.4% | |
Real Estate Management & Development | | | 1.4% | |
Hotels, Restaurants & Leisure | | | 1.3% | |
Auto Components | | | 1.0% | |
Thrifts & Mortgage Finance | | | 1.0% | |
Healthcare Equipment & Supplies | | | 0.9% | |
Personal Products | | | 0.8% | |
Diversified Telecommunication Services | | | 0.8% | |
Energy Equipment & Services | | | 0.8% | |
Specialty Retail | | | 0.8% | |
Equity Real Estate Investment Trusts (REITs) | | | 0.8% | |
Construction Materials | | | 0.8% | |
Road & Rail | | | 0.8% | |
Electric Utilities | | | 0.7% | |
Water Utilities | | | 0.7% | |
Industrial Conglomerates | | | 0.7% | |
Pharmaceuticals | | | 0.6% | |
Building Products | | | 0.6% | |
Automobiles | | | 0.6% | |
Other assets less liabilities | | | 2.0% | |
| | | | |
| | | 100.0% | |
| | | | |
| | | | | | |
| 174 | | Annual Report | | | September 30, 2018 | | | See accompanying Notes to Financial Statements |
Schedule of Investments
September 30, 2018
AllianzGI NFJ International Small-Cap Value Fund
| | | | | | | | |
| | | Shares | | | Value | |
| Common Stock—99.3% | | | | | | | | |
| Australia—6.0% | |
Beach Energy Ltd. | | | 31,700 | | | | $49,077 | |
CSR Ltd. | | | 7,380 | | | | 20,105 | |
Hansen Technologies Ltd. | | | 9,500 | | | | 25,611 | |
Northern Star Resources Ltd. | | | 6,500 | | | | 39,023 | |
Pendal Group Ltd. | | | 4,000 | | | | 25,402 | |
Regis Resources Ltd. | | | 8,500 | | | | 22,868 | |
Sandfire Resources NL | | | 5,700 | | | | 30,578 | |
| | | | | | | | |
| | | | | | | 212,664 | |
| | | | | | | | |
| Austria—1.6% | |
Mayr Melnhof Karton AG | | | 233 | | | | 29,291 | |
Oesterreichische Post AG | | | 630 | | | | 26,341 | |
| | | | | | | | |
| | | | | | | 55,632 | |
| | | | | | | | |
| Belgium—1.1% | |
Befimmo S.A. REIT | | | 697 | | | | 39,775 | |
| | | | | | | | |
| Canada—4.1% | |
BRP, Inc. | | | 670 | | | | 31,429 | |
Canfor Pulp Products, Inc. | | | 1,875 | | | | 35,507 | |
Enerplus Corp. | | | 2,650 | | | | 32,724 | |
Martinrea International, Inc. | | | 2,505 | | | | 25,580 | |
Transcontinental, Inc., Class A | | | 1,158 | | | | 20,530 | |
| | | | | | | | |
| | | | | | | 145,770 | |
| | | | | | | | |
| China—4.3% | |
BOC Aviation Ltd. (a) | | | 4,700 | | | | 36,463 | |
China Water Affairs Group Ltd. | | | 32,000 | | | | 35,799 | |
Gemdale Properties & Investment Corp. Ltd. | | | 296,000 | | | | 26,801 | |
Lee & Man Paper Manufacturing Ltd. | | | 30,000 | | | | 27,779 | |
Road King Infrastructure Ltd. | | | 15,000 | | | | 25,688 | |
| | | | | | | | |
| | | | | | | 152,530 | |
| | | | | | | | |
| Finland—0.6% | |
Terveystalo Oyj (a)(c) | | | 2,400 | | | | 22,276 | |
| | | | | | | | |
| France—4.1% | |
Alten S.A. | | | 320 | | | | 32,919 | |
Euronext NV (a) | | | 743 | | | | 48,819 | |
Gaztransport Et Technigaz S.A. | | | 484 | | | | 36,695 | |
Metropole Television S.A. | | | 1,447 | | | | 29,167 | |
| | | | | | | | |
| | | | | | | 147,600 | |
| | | | | | | | |
| Hong Kong—5.4% | |
CITIC Telecom International Holdings Ltd. | | | 123,000 | | | | 41,905 | |
Dah Sing Financial Holdings Ltd. | | | 4,800 | | | | 30,706 | |
Giordano International Ltd. | | | 54,000 | | | | 27,074 | |
Johnson Electric Holdings Ltd. | | | 10,500 | | | | 29,649 | |
NagaCorp Ltd. | | | 28,000 | | | | 29,291 | |
Xinyi Glass Holdings Ltd. | | | 28,000 | | | | 35,301 | |
| | | | | | | | |
| | | | | | | 193,926 | |
| | | | | | | | |
| Israel—1.7% | |
Israel Chemicals Ltd. (c) | | | 4,800 | | | | 28,944 | |
Israel Discount Bank Ltd., Class A | | | 9,500 | | | | 31,630 | |
| | | | | | | | |
| | | | | | | 60,574 | |
| | | | | | | | |
| Italy—1.0% | |
A2A SpA | | | 21,021 | | | | 36,455 | |
| | | | | | | | |
| Japan—17.4% | |
Cosmo Energy Holdings Co., Ltd. | | | 800 | | | | 32,941 | |
| | | | | | | | |
| | | Shares | | | Value | |
Daito Pharmaceutical Co., Ltd. | | | 935 | | | $ | 28,946 | |
Hamakyorex Co., Ltd. | | | 900 | | | | 32,675 | |
Haseko Corp. | | | 2,700 | | | | 35,067 | |
Hioki EE Corp. | | | 850 | | | | 27,747 | |
Horiba Ltd. | | | 400 | | | | 21,202 | |
Invesco Office J-Reit, Inc. REIT | | | 236 | | | | 33,687 | |
Invincible Investment Corp. REIT | | | 67 | | | | 28,003 | |
Iwatani Corp. | | | 800 | | | | 28,456 | |
JCU Corp. | | | 1,100 | | | | 26,523 | |
Kyosan Electric Manufacturing Co., Ltd. | | | 4,500 | | | | 23,989 | |
Maruwa Co., Ltd. | | | 385 | | | | 25,695 | |
Medipal Holdings Corp. | | | 1,900 | | | | 39,694 | |
Meidensha Corp. | | | 1,600 | | | | 26,188 | |
Morita Holdings Corp. | | | 1,440 | | | | 32,585 | |
Nitta Corp. | | | 775 | | | | 29,536 | |
NSD Co., Ltd. | | | 1,380 | | | | 30,640 | |
One REIT, Inc. REIT | | | 14 | | | | 30,274 | |
T-Gaia Corp. | | | 1,100 | | | | 28,729 | |
Towa Pharmaceutical Co., Ltd. | | | 520 | | | | 38,551 | |
V Technology Co., Ltd. | | | 145 | | | | 21,751 | |
| | | | | | | | |
| | | | | | | 622,879 | |
| | | | | | | | |
| Korea (Republic of)—0.9% | |
Huchems Fine Chemical Corp. | | | 1,463 | | | | 32,901 | |
| | | | | | | | |
| Mexico—3.1% | |
Bolsa Mexicana de Valores S.A.B de C.V. | | | 18,700 | | | | 38,261 | |
Grupo Aeroportuario del Centro Norte S.A.B. de C.V. ADR | | | 800 | | | | 45,560 | |
Ternium S.A. ADR | | | 900 | | | | 27,261 | |
| | | | | | | | |
| | | | | | | 111,082 | |
| | | | | | | | |
| New Zealand—0.9% | |
Summerset Group Holdings Ltd. | | | 6,200 | | | | 32,090 | |
| | | | | | | | |
| Norway—2.2% | |
Atea ASA | | | 1,400 | | | | 22,706 | |
Bakkafrost P/F | | | 450 | | | | 27,452 | |
Ocean Yield ASA | | | 3,650 | | | | 29,873 | |
| | | | | | | | |
| | | | | | | 80,031 | |
| | | | | | | | |
| Peru—0.7% | |
Cia de Minas Buenaventura SAA ADR | | | 1,900 | | | | 25,479 | |
| | | | | | | | |
| Philippines—0.7% | |
DMCI Holdings, Inc. | | | 124,500 | | | | 26,219 | |
| | | | | | | | |
| Portugal—0.8% | |
Semapa-Sociedade de Investimento e Gestao | | | 1,400 | | | | 27,834 | |
| | | | | | | | |
| Russian Federation—0.8% | |
TCS Group Holding PLC GDR | | | 1,500 | | | | 27,750 | |
| | | | | | | | |
| Singapore—5.4% | |
China Sunsine Chemical Holdings Ltd. | | | 26,000 | | | | 19,963 | |
HRnetgroup Ltd. | | | 61,100 | | | | 39,331 | |
Mapletree Commercial Trust REIT | | | 26,900 | | | | 31,681 | |
Mapletree Industrial Trust REIT | | | 19,500 | | | | 28,253 | |
Parkway Life Real Estate Investment Trust REIT | | | 13,500 | | | | 26,654 | |
Sheng Siong Group Ltd. | | | 55,200 | | | | 45,205 | |
| | | | | | | | |
| | | | | | | 191,087 | |
| | | | | | | | |
| | | | | | | | |
| | | Shares | | | Value | |
| South Africa—2.0% | |
Astral Foods Ltd. | | | 1,500 | | | $ | 26,156 | |
JSE Ltd. | | | 2,000 | | | | 22,514 | |
Reunert Ltd. | | | 4,500 | | | | 24,185 | |
| | | | | | | | |
| | | | | | | 72,855 | |
| | | | | | | | |
| Spain—4.2% | |
Cia de Distribucion Integral Logista Holdings S.A. | | | 1,257 | | | | 32,294 | |
CIE Automotive S.A. | | | 868 | | | | 27,083 | |
Grupo Catalana Occidente S.A. | | | 707 | | | | 30,782 | |
Lar Espana Real Estate Socimi S.A. REIT | | | 3,562 | | | | 36,270 | |
Melia Hotels International S.A. | | | 2,200 | | | | 24,589 | |
| | | | | | | | |
| | | | | | | 151,018 | |
| | | | | | | | |
| Sweden—2.5% | |
Concentric AB | | | 1,700 | | | | 27,353 | |
Loomis AB, Class B | | | 1,024 | | | | 32,949 | |
Stillfront Group AB (c) | | | 1,339 | | | | 28,180 | |
| | | | | | | | |
| | | | | | | 88,482 | |
| | | | | | | | |
| Switzerland—1.8% | |
Cembra Money Bank AG | | | 411 | | | | 37,204 | |
Georg Fischer AG | | | 25 | | | | 28,317 | |
| | | | | | | | |
| | | | | | | 65,521 | |
| | | | | | | | |
| Taiwan—0.9% | | | | | | | | |
Grand Pacific Petrochemical | | | 31,000 | | | | 30,847 | |
| | | | | | | | |
| United Kingdom—24.3% | | | | | | | | |
Begbies Traynor Group PLC | | | 35,700 | | | | 34,201 | |
Brewin Dolphin Holdings PLC | | | 5,700 | | | | 25,438 | |
Britvic PLC | | | 3,500 | | | | 35,628 | |
Charter Court Financial Services Group PLC (a)(c) | | | 7,200 | | | | 31,419 | |
Computacenter PLC | | | 1,925 | | | | 31,743 | |
Consort Medical PLC | | | 2,310 | | | | 35,829 | |
Equiniti Group PLC (a) | | | 9,800 | | | | 33,932 | |
Forterra PLC (a) | | | 7,300 | | | | 24,834 | |
Georgia Capital PLC (c) | | | 741 | | | | 10,775 | |
Hays PLC | | | 13,100 | | | | 34,775 | |
Hill & Smith Holdings PLC | | | 1,708 | | | | 21,921 | |
Howden Joinery Group PLC | | | 4,500 | | | | 27,480 | |
J D Wetherspoon PLC | | | 1,730 | | | | 29,449 | |
Johnson Service Group PLC | | | 16,400 | | | | 28,823 | |
Morgan Advanced Materials PLC | | | 8,100 | | | | 35,072 | |
OneSavings Bank PLC | | | 5,900 | | | | 31,226 | |
PayPoint PLC | | | 2,134 | | | | 25,812 | |
Plus500 Ltd. | | | 1,400 | | | | 24,221 | |
Redde PLC | | | 12,500 | | | | 31,705 | |
Redrow PLC | | | 3,700 | | | | 28,122 | |
RPC Group PLC | | | 3,850 | | | | 39,870 | |
Savills PLC | | | 2,200 | | | | 22,395 | |
Sirius Real Estate Ltd. | | | 49,400 | | | | 39,732 | |
Spectris PLC | | | 835 | | | | 25,791 | |
Spirent Communications PLC | | | 17,959 | | | | 31,601 | |
Synthomer PLC | | | 5,154 | | | | 36,331 | |
Tullow Oil PLC (c) | | | 9,400 | | | | 32,065 | |
Tyman PLC | | | 6,600 | | | | 30,109 | |
XP Power Ltd. | | | 680 | | | | 26,235 | |
| | | | | | | | |
| | | | | | | 866,534 | |
| | | | | | | | |
| United States—0.8% | | | | | | | | |
Travelport Worldwide Ltd. | | | 1,700 | | | | 28,679 | |
| | | | | | | | |
| |
Total Investments
(cost—$3,279,231) (b)—99.3% | | | | 3,548,490 | |
| | | | | | | | |
| |
Other assets less
liabilities—0.7% | | | | 23,794 | |
| | | | | | | | |
| | |
| Net Assets—100.0% | | | | | | | $3,572,284 | |
| | | | | | | | |
| | | | | | | | |
| See accompanying Notes to Financial Statements | | | September 30, 2018 | | | Annual Report | | | 175 | |
Schedule of Investments
September 30, 2018
Notes to Schedule of Investments:
(a) 144A—Exempt from registration under Rule 144A of the Securities Act of 1933. These securities may be resold in transactions exempt from registration, typically only to qualified institutional buyers. Securities with an aggregate value of $197,743, representing 5.5% of net assets.
(b) Securities with an aggregate value of $2,520,482, representing 70.6% of net assets, were valued utilizing modeling tools provided by a third-party vendor. See Note 1(a) and Note 1(b) in the Notes to Financial Statements.
(c) Non-income producing.
Glossary:
ADR—American Depositary Receipt
GDR—Global Depositary Receipt
REIT—Real Estate Investment Trust
The industry classification of portfolio holdings and other assets less liabilities shown as a percentage of net assets were as follows:
| | | | |
Equity Real Estate Investment Trusts (REITs) | | | 7.1% | |
Oil, Gas & Consumable Fuels | | | 5.1% | |
Machinery | | | 5.0% | |
Chemicals | | | 4.9% | |
Capital Markets | | | 4.8% | |
Metals & Mining | | | 4.7% | |
IT Services | | | 4.2% | |
Electronic Equipment, Instruments & Components | | | 4.1% | |
Professional Services | | | 3.0% | |
Commercial Services & Supplies | | | 3.0% | |
Healthcare Providers & Services | | | 2.6% | |
Trading Companies & Distributors | | | 2.6% | |
Paper & Forest Products | | | 2.5% | |
Banks | | | 2.5% | |
Real Estate Management & Development | | | 2.5% | |
Auto Components | | | 2.5% | |
Hotels, Restaurants & Leisure | | | 2.3% | |
Containers & Packaging | | | 1.9% | |
Pharmaceuticals | | | 1.9% | |
Road & Rail | | | 1.8% | |
Household Durables | | | 1.8% | |
Thrifts & Mortgage Finance | | | 1.8% | |
Air Freight & Logistics | | | 1.6% | |
Software | | | 1.6% | |
Electrical Equipment | | | 1.6% | |
Specialty Retail | | | 1.6% | |
Food Products | | | 1.5% | |
Industrial Conglomerates | | | 1.4% | |
Transportation Infrastructure | | | 1.3% | |
Food & Staples Retailing | | | 1.3% | |
Construction Materials | | | 1.3% | |
Diversified Telecommunication Services | | | 1.2% | |
Consumer Finance | | | 1.0% | |
Multi-Utilities | | | 1.0% | |
Healthcare Equipment & Supplies | | | 1.0% | |
Water Utilities | | | 1.0% | |
Beverages | | | 1.0% | |
Communications Equipment | | | 0.9% | |
Leisure Equipment & Products | | | 0.9% | |
Insurance | | | 0.9% | |
Building Products | | | 0.8% | |
Energy Equipment & Services | | | 0.8% | |
Media | | | 0.8% | |
Entertainment | | | 0.8% | |
Real Estate | | | 0.7% | |
Diversified Financial Services | | | 0.7% | |
Other assets less liabilities | | | 0.7% | |
| | | | |
| | | 100.0% | |
| | | | |
| | | | | | |
| 176 | | Annual Report | | | September 30, 2018 | | | See accompanying Notes to Financial Statements |
Consolidated Schedule of Investments
September 30, 2018
AllianzGI PerformanceFee Managed Futures Strategy Fund
| | | | | | | | |
| | | Principal
Amount
(000s) | | | Value | |
| U.S. Treasury Obligations—85.1% | |
U.S. Treasury Notes, | | | | | | | | |
0.75%, 2/15/19 | | | $2,000 | | | | $1,988,437 | |
0.875%, 4/15/19 | | | 2,000 | | | | 1,983,906 | |
1.00%, 3/15/19 | | | 2,000 | | | | 1,987,500 | |
1.125%, 1/31/19 | | | 2,000 | | | | 1,992,344 | |
1.125%, 2/28/19 | | | 2,000 | | | | 1,990,313 | |
1.25%, 3/31/19 | | | 2,000 | | | | 1,988,750 | |
1.25%, 4/30/19 | | | 1,500 | | | | 1,490,039 | |
| | | | | | | | |
Total U.S. Treasury Obligations
(cost—$13,434,220) | | | | 13,421,289 | |
| | | | | | | | |
| | | | | | | | |
| | | Principal
Amount
(000s) | | | Value | |
| Repurchase Agreements—2.8% | |
State Street Bank and Trust Co., dated 9/28/18, 0.42%, due 10/1/18, proceeds $445,016; collateralized by U.S. Treasury Notes, 1.75%, due 11/30/21, valued at $456,192 including accrued interest
(cost—$445,000) | | $ | 445 | | | $ | 445,000 | |
| | | | | | | | |
| | | | | | | | |
| | | | | | Value | |
| |
Total Investments
(cost—$13,879,220)—87.9% | | | $ | 13,866,289 | |
| | | | | | | | |
| |
Other assets less
liabilities (a)—12.1% | | | | 1,912,752 | |
| | | | | | | | |
| | |
| Net Assets—100.0% | | | | | | | $15,779,041 | |
| | | | | | | | |
Notes to Consolidated Schedule of Investments:
(a) Includes net unrealized appreciation (depreciation) of other financial instruments as follows:
| | | | | | | | | | | | | | | | | | | | | | |
| Futures contracts outstanding at September 30, 2018: | |
| Type | | | | Contracts | | | Expiration
Date | | | Notional
Amount
(000s) | | | Market
Value
(000s) | | | Unrealized
Appreciation
(Depreciation) | |
Long position contracts: | | | | | | | | | | | | | | | | | | | | |
| | 5-Year U.S. Treasury Note | | | 10 | | | | 12/31/18 | | | $ | 1,000 | | | $ | 1,125 | | | $ | (9,861 | ) |
| | 10-Year Japanese Government Bond | | | 2 | | | | 12/13/18 | | | JPY | 200,000 | | | | 2,642 | | | | (2,649 | ) |
| | Aluminum† | | | 5 | | | | 10/15/18 | | | $ | — | (c) | | | 257 | | | | (6,644 | ) |
| | Aluminum† | | | 5 | | | | 11/19/18 | | | | — | (c) | | | 259 | | | | 2,506 | |
| | Australia Government 10-Year Bond | | | 13 | | | | 12/17/18 | | | AUD | 1,300 | | | | 1,211 | | | | (10,339 | ) |
| | BIST 30 Index | | | 9 | | | | 10/31/18 | | | TRY | 1 | | | | 19 | | | | 48 | |
| | Cattle Feeder† | | | 4 | | | | 3/28/19 | | | $ | 200 | | | | 307 | | | | 2,772 | |
| | E-mini S&P 500 Index | | | 24 | | | | 12/21/18 | | | | 1 | | | | 3,503 | | | | 25,849 | |
| | Euro-Bund 10-Year Bond | | | 3 | | | | 12/6/18 | | | EUR | 300 | | | | 553 | | | | (4,009 | ) |
| | Euro-OAT | | | 3 | | | | 12/6/18 | | | | 300 | | | | 526 | | | | (3,626 | ) |
| | FTSE 100 Index | | | 5 | | | | 12/21/18 | | | GBP | — | (c) | | | 488 | | | | 14,264 | |
| | FTSE/JSE Top 40 Index | | | 1 | | | | 12/20/18 | | | ZAR | — | (c) | | | 35 | | | | (702 | ) |
| | FTSE/MIB Index | | | 1 | | | | 12/21/18 | | | EUR | — | (c) | | | 120 | | | | (5,307 | ) |
| | IBEX 35 Index | | | 1 | | | | 10/19/18 | | | | — | (c) | | | 109 | | | | (1,442 | ) |
| | Lean Hogs† | | | 7 | | | | 4/12/19 | | | $ | 280 | | | | 196 | | | | 263 | |
| | Low Sulphur Casoil† | | | 6 | | | | 12/12/18 | | | | 1 | | | | 433 | | | | 27,209 | |
| | Mini DAX European Index | | | 2 | | | | 12/21/18 | | | EUR | — | (c) | | | 142 | | | | 1,420 | |
| | MSCI Taiwan Index | | | 8 | | | | 10/30/18 | | | $ | 1 | | | | 328 | | | | 592 | |
| | Natural Gas† | | | 11 | | | | 12/27/18 | | | | 110 | | | | 349 | | | | (3,434 | ) |
| | Nickel† | | | 2 | | | | 10/15/18 | | | | — | (c) | | | 150 | | | | (20,044 | ) |
| | Nickel† | | | 3 | | | | 11/19/18 | | | | — | (c) | | | 226 | | | | (8,092 | ) |
| | Nickel† | | | 1 | | | | 12/17/18 | | | | — | (c) | | | 75 | | | | (1,930 | ) |
| | SPI 200 Index | | | 4 | | | | 12/20/18 | | | AUD | — | (c) | | | 448 | | | | 1,796 | |
| | TOPIX Index | | | 10 | | | | 12/13/18 | | | JPY | 100 | | | | 1,600 | | | | 60,161 | |
| | Toronto S&P 60 Index | | | 3 | | | | 12/20/18 | | | CAD | 1 | | | | 441 | | | | 200 | |
| | United Kingdom Government 10-Year Gilt | | | 3 | | | | 12/27/18 | | | GBP | 300 | | | | 473 | | | | (4,515 | ) |
| | WTI Crude Oil† | | | 5 | | | | 12/19/18 | | | $ | 5 | | | | 364 | | | | 18,333 | |
| | | | | | | | | | | | | | | | | | | | | | |
| | | | | | | | | | | | | | | | | | | | $ | 72,819 | |
| | | | | | | | | | | | | | | | | | | | | | |
Short position contracts: | | | | | | | | | | | | | | | | | | | | |
| | 10-Year U.S. Treasury Note | | | (37 | ) | | | 12/19/18 | | | $ | (3,700 | ) | | $ | (4,395 | ) | | $ | (8,739 | ) |
| | Aluminum† | | | (5 | ) | | | 10/15/18 | | | | (— | )(c) | | | (257 | ) | | | 217 | |
| | Aluminum† | | | (5 | ) | | | 11/19/18 | | | | (— | )(c) | | | (259 | ) | | | 4,831 | |
| | Aluminum† | | | (6 | ) | | | 12/17/18 | | | | (— | )(c) | | | (311 | ) | | | (390 | ) |
| | Arabica Coffee† | | | (14 | ) | | | 7/19/19 | | | | (525 | ) | | | (581 | ) | | | (6,262 | ) |
| | Australian Dollar | | | (12 | ) | | | 12/17/18 | | | | (1,200 | ) | | | (867 | ) | | | (3,912 | ) |
| | British Pound | | | (26 | ) | | | 12/17/18 | | | | (1,625 | ) | | | (2,127 | ) | | | 11,593 | |
| | Canada Government 10-Year Bond | | | (5 | ) | | | 12/18/18 | | | CAD | (500 | ) | | | (513 | ) | | | (1,120 | ) |
| | Canadian Dollar | | | (14 | ) | | | 12/18/18 | | | $ | (1,400 | ) | | | (1,085 | ) | | | (9,207 | ) |
| | CBOE Volatility Index | | | (11 | ) | | | 11/21/18 | | | | (11 | ) | | | (165 | ) | | | 340 | |
| | Cocoa† | | | (5 | ) | | | 7/16/19 | | | | (— | )(c) | | | (106 | ) | | | 4,600 | |
| | Copper† | | | (5 | ) | | | 5/29/19 | | | | (125 | ) | | | (354 | ) | | | (8,575 | ) |
| | | | | | | | |
| See accompanying Notes to Financial Statements | | | September 30, 2018 | | | Annual Report | | | 177 | |
Consolidated Schedule of Investments
September 30, 2018
| | | | | | | | | | | | | | | | | | | | | | |
| Futures contracts outstanding at September 30, 2018: | |
| Type | | | | Contracts | | | Expiration
Date | | | Notional
Amount
(000s) | | | Market
Value
(000s) | | | Unrealized
Appreciation
(Depreciation) | |
Short position contracts (continued): | | | | | | | | | | | | | | | | | | | | |
| | Corn† | | | (23 | ) | | | 5/14/19 | | | $ | (115 | ) | | $ | (432 | ) | | $ | 9,243 | |
| | Euro Currency | | | (17 | ) | | | 12/17/18 | | | | (2,125 | ) | | | (2,482 | ) | | | 15,842 | |
| | Gold 100 Oz.† | | | (7 | ) | | | 4/26/19 | | | | (1 | ) | | | (845 | ) | | | 6,702 | |
| | Japanese Yen | | | (41 | ) | | | 12/17/18 | | | | (51 | ) | | | (4,538 | ) | | | 57,066 | |
| | New Zealand Dollar | | | (13 | ) | | | 12/17/18 | | | | (1,300 | ) | | | (862 | ) | | | (8,535 | ) |
| | Nickel† | | | (2 | ) | | | 10/15/18 | | | | (— | )(c) | | | (150 | ) | | | 15,655 | |
| | Nickel† | | | (3 | ) | | | 11/19/18 | | | | (— | )(c) | | | (226 | ) | | | 1,963 | |
| | Nickel† | | | (2 | ) | | | 12/17/18 | | | | (— | )(c) | | | (151 | ) | | | 188 | |
| | Platinum† | | | (9 | ) | | | 1/29/19 | | | | (— | )(c) | | | (370 | ) | | | 16,137 | |
| | Silver† | | | (8 | ) | | | 5/29/19 | | | | (40 | ) | | | (596 | ) | | | (19,901 | ) |
| | Soybean† | | | (12 | ) | | | 3/14/19 | | | | (60 | ) | | | (524 | ) | | | 3,426 | |
| | Sugar No. 11† | | | (39 | ) | | | 9/30/19 | | | | (4,368 | ) | | | (513 | ) | | | 2,029 | |
| | Wheat† | | | (2 | ) | | | 5/14/19 | | | | (10 | ) | | | (55 | ) | | | 1,694 | |
| | | | | | | | | | | | | | | | | | | | | | |
| | | | | | | | | | | | | | | | | | | | $ | 84,885 | |
| | | | | | | | | | | | | | | | | | | | | | |
| | | | | | | | | | | | | | | | | | | | $ | 157,704 | |
| | | | | | | | | | | | | | | | | | | | | | |
† All or a portion of this security is owned by AllianzGI PerformanceFee Managed Futures Strategy Offshore Fund Ltd., which is a wholly-owned subsidiary of the Fund.
| | | | | | | | | | | | | | | | | | | | | | | | | | | | | | | | |
| Credit default swaps agreements outstanding at September 30, 2018: | |
Centrally cleared buy protection swap agreements: | |
Broker (Exchange)/
Reference Debt Isser | | Notional
Amount
(000s)(1) | | | Implied
Credit
Spread | | | Termination
Date | | | Fixed Deal
Pay Rate | | | Payment
Frequency | | | Value(2) | | | Upfront
Premiums
Paid | | | Unrealized
Depreciation | |
Goldman Sachs (ICE): | | | | | | | | | | | | | | | | | | | | | | | | | | | | | | | | |
CDX.EM.30 Index | | $ | 1,200 | | | | 1.94 | % | | | 12/20/23 | | | | (1.00 | )% | | | Quarterly | | | $ | 49,925 | | | $ | 52,980 | | | $ | (3,055 | ) |
|
Centrally cleared sell protection swap agreements: | |
Broker (Exchange)/
Referenced Debt Issuer | | Notional
Amount
(000s)(1) | | | Implied
Credit
Spread | | | Termination
Date | | | Fixed Deal
Received Rate | | | Payment
Frequency | | | Value(2) | | | Upfront
Premiums
Paid | | | Unrealized
Appreciation | |
Goldman Sachs (ICE): | | | | | | | | | | | | | | | | | | | | | | | | | | | | | | | | |
CDX.NA.HY.30 Index | | $ | 3,144 | | | | 3.06 | % | | | 6/20/23 | | | | 5.00 | % | | | Quarterly | | | $ | 249,117 | | | $ | 217,330 | | | $ | 31,787 | |
(1) This represents the maximum potential amount the Fund could be required to make available as a seller of credit protection or receive as a buyer of credit protection if a credit event occurs as defined under the terms of that particular swap agreement.
(2) The quoted market prices and resulting values for credit default swap agreements serve as an indicator of the status at September 30, 2018 of the payment/performance risk and represent the likelihood of an expected liability (or profit) for the credit derivative should the notional amount of the swap agreement have been closed/sold as of the period end. Increasing market values, in absolute terms when compared to the notional amount of the swap, represent a deterioration of the referenced entity’s credit soundness and a greater likelihood or risk of default or other credit event occurring as defined under the terms of the agreement.
(b) At September 30, 2018, the Fund pledged $1,472,488 in cash as collateral for futures contracts and $258,732 in cash as collateral for swaps contracts.
(c) Notional amount rounds to less than 500.
Glossary:
AUD—Australian Dollar
BIST—Borsa Istanbul
CAD—Canadian Dollar
CBOE—Chicago Board Options Exchange
CDX—Credit Derivatives Index
EUR—Euro
FTSE—Financial Times Stock Exchange
GBP—British Pound
ICE—Intercontinental Exchange
JPY—Japanese Yen
JSE—Johannesburg Stock Exchange Limited
MSCI—Morgan Stanley Capital International
OAT—Obligations Assimilables du Trésor
TOPIX—Tokyo Stock Price Index
TRY—Turkish Lira
WTI—West Texas Intermediate
ZAR—South African Rand
| | | | | | |
| 178 | | Annual Report | | | September 30, 2018 | | | See accompanying Notes to Financial Statements |
Schedule of Investments
September 30, 2018
AllianzGI PerformanceFee Structured US Equity Fund
| | | | | | | | |
| | | Shares | | | Value | |
| Exchange-Traded Funds—98.7% | |
iShares Core S&P 500 (a)
(cost—$77,950,647) | | | 280,271 | | | | $82,043,730 | |
| | | | | | | | |
Total Options Purchased—0.4%
(cost—$439,082) (b)(c)(d) | | | | 300,315 | |
| | | | | | | | |
| |
Total Investments, before
options written
(cost—$78,389,729)—99.1% | | | | 82,344,045 | |
| | | | | | | | |
Total Options Written—(0.5)%
(premiums received—
$804,779) (b)(c)(d) | | | | (451,184 | ) |
| | | | | | | | |
| | | | | | |
| | | | | Value | |
| |
Total Investments, net of options written
(cost—$77,584,950)—98.6% | | $ | 81,892,861 | |
| | | | | | |
| |
Other assets less
other liabilities—1.4% | | | 1,182,347 | |
| | | | | | |
| |
| Net Assets—100.0% | | | $83,075,208 | |
| | | | | | |
Notes to Schedule of Investments:
(a) All or partial amount segregated for the benefit of the counterparty as collateral for options written.
(b) Non-income producing.
(c) Exchange traded-Chicago Board Options Exchange.
(d) Exchange traded option contracts outstanding at September 30, 2018:
| | | | | | | | | | | | | | | | | | | | | | | | | | | | |
| Options purchased contracts outstanding at September 30, 2018: | | | | | | | | | | |
| Description | | Exercise
Price | | | Expiration
Date | | | Number of
Contracts | | | Notional
Amount | | | Market Value | | | Cost | | | Unrealized Appreciation (Depreciation) | |
Call options: | | | | | | | | | | | | | | | | | | | | | | | | | | | | |
iPATH S&P 500 VIX Short-Term | | | 40.00 USD | | | | 10/19/18 | | | | 37 | | | $ | 3,700 | | | $ | 647 | | | $ | 4,535 | | | $ | (3,888 | ) |
iPATH S&P 500 VIX Short-Term | | | 42.00 USD | | | | 10/19/18 | | | | 32 | | | | 3,200 | | | | 496 | | | | 4,339 | | | | (3,843 | ) |
iPATH S&P 500 VIX Short-Term | | | 36.00 USD | | | | 11/16/18 | | | | 43 | | | | 4,300 | | | | 4,278 | | | | 4,927 | | | | (649 | ) |
Nasdaq 100 Stock Index | | | 7,450.00 USD | | | | 11/16/18 | | | | 1 | | | | 100 | | | | 30,515 | | | | 20,594 | | | | 9,921 | |
Nasdaq 100 Stock Index | | | 7,550.00 USD | | | | 11/16/18 | | | | 1 | | | | 100 | | | | 23,315 | | | | 19,083 | | | | 4,232 | |
Nasdaq 100 Stock Index | | | 9,000.00 USD | | | | 11/16/18 | | | | 8 | | | | 800 | | | | 560 | | | | 754 | | | | (194 | ) |
Nasdaq 100 Stock Index | | | 9,000.00 USD | | | | 10/19/18 | | | | 3 | | | | 300 | | | | 120 | | | | 304 | | | | (184 | ) |
Nasdaq 100 Stock Index | | | 7,650.00 USD | | | | 12/21/18 | | | | 1 | | | | 100 | | | | 24,175 | | | | 19,199 | | | | 4,976 | |
Nasdaq 100 Stock Index | | | 9,900.00 USD | | | | 12/21/18 | | | | 2 | | | | 200 | | | | 130 | | | | 38 | | | | 92 | |
Russell 2000 Index | | | 1,750.00 USD | | | | 10/31/18 | | | | 1 | | | | 100 | | | | 490 | | | | 3,262 | | | | (2,772 | ) |
Russell 2000 Index | | | 2,000.00 USD | | | | 10/31/18 | | | | 7 | | | | 700 | | | | 158 | | | | 274 | | | | (116 | ) |
Russell 2000 Index | | | 1,700.00 USD | | | | 11/30/18 | | | | 2 | | | | 200 | | | | 7,510 | | | | 8,353 | | | | (843 | ) |
Russell 2000 Index | | | 2,450.00 USD | | | | 11/30/18 | | | | 15 | | | | 1,500 | | | | 337 | | | | 229 | | | | 108 | |
Russell 2000 Index | | | 1,700.00 USD | | | | 12/21/18 | | | | 3 | | | | 300 | | | | 13,605 | | | | 13,199 | | | | 406 | |
Russell 2000 Index | | | 1,990.00 USD | | | | 10/5/18 | | | | 4 | | | | 400 | | | | 10 | | | | 85 | | | | (75 | ) |
Russell 2000 Index | | | 1,970.00 USD | | | | 10/12/18 | | | | 1 | | | | 100 | | | | 5 | | | | 21 | | | | (16 | ) |
Russell 2000 Index | | | 1,980.00 USD | | | | 10/12/18 | | | | 4 | | | | 400 | | | | 20 | | | | 65 | | | | (45 | ) |
Russell 2000 Index | | | 1,710.00 USD | | | | 10/19/18 | | | | 2 | | | | 200 | | | | 2,640 | | | | 5,748 | | | | (3,108 | ) |
Russell 2000 Index | | | 2,100.00 USD | | | | 10/19/18 | | | | 6 | | | | 600 | | | | 30 | | | | 67 | | | | (37 | ) |
Russell 2000 Index | | | 2,500.00 USD | | | | 10/19/18 | | | | 4 | | | | 400 | | | | 20 | | | | 25 | | | | (5 | ) |
Russell 2000 Index | | | 1,980.00 USD | | | | 10/26/18 | | | | 2 | | | | 200 | | | | 15 | | | | 32 | | | | (17 | ) |
Russell 2000 Index | | | 1,800.00 USD | | | | 10/31/18 | | | | 1 | | | | 100 | | | | 78 | | | | 986 | | | | (908 | ) |
Russell 2000 Index | | | 1,755.00 USD | | | | 11/16/18 | | | | 2 | | | | 200 | | | | 1,710 | | | | 3,235 | | | | (1,525 | ) |
Russell 2000 Index | | | 2,200.00 USD | | | | 11/16/18 | | | | 6 | | | | 600 | | | | 45 | | | | 70 | | | | (25 | ) |
Russell 2000 Index | | | 2,500.00 USD | | | | 11/16/18 | | | | 9 | | | | 900 | | | | 45 | | | | 81 | | | | (36 | ) |
Russell 2000 Index | | | 1,790.00 USD | | | | 11/30/18 | | | | 3 | | | | 300 | | | | 1,425 | | | | 6,092 | | | | (4,667 | ) |
Russell 2000 Index | | | 2,400.00 USD | | | | 11/30/18 | | | | 6 | | | | 600 | | | | 135 | | | | 37 | | | | 98 | |
Russell 2000 Index | | | 2,350.00 USD | | | | 12/21/18 | | | | 3 | | | | 300 | | | | 30 | | | | 34 | | | | (4 | ) |
Russell 2000 Index | | | 1,770.00 USD | | | | 12/31/18 | | | | 3 | | | | 300 | | | | 4,575 | | | | 6,599 | | | | (2,024 | ) |
Russell 2000 Index | | | 2,000.00 USD | | | | 12/31/18 | | | | 3 | | | | 300 | | | | 105 | | | | 124 | | | | (19 | ) |
S&P 500 Index | | | 2,905.00 USD | | | | 10/19/18 | | | | 1 | | | | 100 | | | | 3,005 | | | | 1,575 | | | | 1,430 | |
S&P 500 Index | | | 3,000.00 USD | | | | 10/19/18 | | | | 4 | | | | 400 | | | | 610 | | | | 3,722 | | | | (3,112 | ) |
S&P 500 Index | | | 3,600.00 USD | | | | 10/19/18 | | | | 4 | | | | 400 | | | | 10 | | | | 56 | | | | (46 | ) |
S&P 500 Index | | | 2,900.00 USD | | | | 10/31/18 | | | | 1 | | | | 100 | | | | 4,165 | | | | 2,343 | | | | 1,822 | |
S&P 500 Index | | | 2,900.00 USD | | | | 11/16/18 | | | | 1 | | | | 100 | | | | 5,225 | | | | 2,923 | | | | 2,302 | |
S&P 500 Index | | | 2,900.00 USD | | | | 11/30/18 | | | | 1 | | | | 100 | | | | 5,995 | | | | 3,466 | | | | 2,529 | |
S&P 500 Index | | | 2,925.00 USD | | | | 10/5/18 | | | | 2 | | | | 200 | | | | 1,510 | | | | 1,975 | | | | (465 | ) |
S&P 500 Index | | | 3,400.00 USD | | | | 10/5/18 | | | | 4 | | | | 400 | | | | 10 | | | | 25 | | | | (15 | ) |
S&P 500 Index | | | 3,300.00 USD | | | | 10/10/18 | | | | 6 | | | | 600 | | | | 15 | | | | 67 | | | | (52 | ) |
S&P 500 Index | | | 2,945.00 USD | | | | 10/12/18 | | | | 2 | | | | 200 | | | | 1,090 | | | | 4,065 | | | | (2,975 | ) |
S&P 500 Index | | | 3,300.00 USD | | | | 10/12/18 | | | | 2 | | | | 200 | | | | 5 | | | | 22 | | | | (17 | ) |
| | | | | | | | |
| See accompanying Notes to Financial Statements | | | September 30, 2018 | | | Annual Report | | | 179 | |
Schedule of Investments
September 30, 2018
| | | | | | | | | | | | | | | | | | | | | | | | | | | | |
| Options purchased contracts outstanding at September 30, 2018 (continued): | | | | | | | | | | |
| Description | | Exercise
Price | | | Expiration
Date | | | Number of
Contracts | | | Notional
Amount | | | Market Value | | | Cost | | | Unrealized Appreciation (Depreciation) | |
Call options (continued): | | | | | | | | | | | | | | | | | | | | | | | | | | | | |
S&P 500 Index | | | 3,200.00 USD | | | | 10/17/18 | | | | 2 | | | $ | 200 | | | $ | 5 | | | $ | 53 | | | $ | (48 | ) |
S&P 500 Index | | | 3,300.00 USD | | | | 10/17/18 | | | | 2 | | | | 200 | | | | 5 | | | | 32 | | | | (27 | ) |
S&P 500 Index | | | 2,900.00 USD | | | | 10/19/18 | | | | 1 | | | | 100 | | | | 3,355 | | | | 1,670 | | | | 1,685 | |
S&P 500 Index | | | 3,300.00 USD | | | | 10/26/18 | | | | 2 | | | | 200 | | | | 5 | | | | 32 | | | | (27 | ) |
S&P 500 Index | | | 2,975.00 USD | | | | 11/2/18 | | | | 1 | | | | 100 | | | | 730 | | | | 1,106 | | | | (376 | ) |
S&P 500 Index | | | 3,400.00 USD | | | | 11/2/18 | | | | 2 | | | | 200 | | | | 5 | | | | 22 | | | | (17 | ) |
S&P 500 Index | | | 2,975.00 USD | | | | 11/9/18 | | | | 1 | | | | 100 | | | | 1,120 | | | | 1,532 | | | | (412 | ) |
S&P 500 Index | | | 3,400.00 USD | | | | 11/9/18 | | | | 2 | | | | 200 | | | | 5 | | | | 22 | | | | (17 | ) |
S&P 500 Index | | | 3,700.00 USD | | | | 11/16/18 | | | | 4 | | | | 400 | | | | 10 | | | | 45 | | | | (35 | ) |
S&P 500 Index | | | 2,950.00 USD | | | | 11/23/18 | | | | 2 | | | | 200 | | | | 5,250 | | | | 5,005 | | | | 245 | |
S&P 500 Index | | | 3,400.00 USD | | | | 11/23/18 | | | | 4 | | | | 400 | | | | 20 | | | | 105 | | | | (85 | ) |
S&P 500 Index | | | 3,500.00 USD | | | | 11/30/18 | | | | 4 | | | | 400 | | | | 10 | | | | 65 | | | | (55 | ) |
S&P 500 Index | | | 2,970.00 USD | | | | 12/21/18 | | | | 2 | | | | 200 | | | | 6,410 | | | | 6,005 | | | | 405 | |
S&P 500 Index | | | 3,700.00 USD | | | | 12/21/18 | | | | 4 | | | | 400 | | | | 10 | | | | 65 | | | | (55 | ) |
S&P 500 Index | | | 2,970.00 USD | | | | 12/31/18 | | | | 2 | | | | 200 | | | | 7,390 | | | | 6,935 | | | | 455 | |
S&P 500 Index | | | 3,500.00 USD | | | | 12/31/18 | | | | 4 | | | | 400 | | | | 30 | | | | 145 | | | | (115 | ) |
| | | | | | | | | | | | | | | | | | | | |
| Total call options | | | | | | | | | | | $ | 163,224 | | | $ | 165,469 | | | $ | (2,245 | ) |
| | | | | | | | | | | | | | | | | | | | |
|
Put options: | |
Nasdaq 100 Stock Index | | | 4,200.00 USD | | | | 10/19/18 | | | | 1 | | | $ | 100 | | | $ | 3 | | | $ | 37 | | | $ | (34 | ) |
Nasdaq 100 Stock Index | | | 4,000.00 USD | | | | 11/16/18 | | | | 2 | | | | 200 | | | | 60 | | | | 295 | | | | (235 | ) |
Nasdaq 100 Stock Index | | | 7,100.00 USD | | | | 11/16/18 | | | | 1 | | | | 100 | | | | 4,860 | | | | 21,253 | | | | (16,393 | ) |
Nasdaq 100 Stock Index | | | 7,350.00 USD | | | | 11/16/18 | | | | 1 | | | | 100 | | | | 8,505 | | | | 17,373 | | | | (8,868 | ) |
Nasdaq 100 Stock Index | | | 7,250.00 USD | | | | 12/21/18 | | | | 1 | | | | 100 | | | | 11,555 | | | | 20,237 | | | | (8,682 | ) |
Nasdaq 100 Stock Index | | | 3,700.00 USD | | | | 10/19/18 | | | | 4 | | | | 400 | | | | 160 | | | | 110 | | | | 50 | |
Nasdaq 100 Stock Index | | | 4,500.00 USD | | | | 10/19/18 | | | | 2 | | | | 200 | | | | 5 | | | | 43 | | | | (38 | ) |
Nasdaq 100 Stock Index | | | 4,600.00 USD | | | | 10/19/18 | | | | 4 | | | | 400 | | | | 30 | | | | 58 | | | | (28 | ) |
Nasdaq 100 Stock Index | | | 2,600.00 USD | | | | 12/21/18 | | | | 1 | | | | 100 | | | | 57 | | | | 81 | | | | (24 | ) |
Russell 2000 Index | | | 850.00 USD | | | | 10/19/18 | | | | 9 | | | | 900 | | | | 23 | | | | 171 | | | | (148 | ) |
Russell 2000 Index | | | 1,690.00 USD | | | | 10/31/18 | | | | 2 | | | | 200 | | | | 3,880 | | | | 8,480 | | | | (4,600 | ) |
Russell 2000 Index | | | 800.00 USD | | | | 11/30/18 | | | | 3 | | | | 300 | | | | 75 | | | | 69 | | | | 6 | |
Russell 2000 Index | | | 1,620.00 USD | | | | 11/30/18 | | | | 1 | | | | 100 | | | | 1,440 | | | | 4,021 | | | | (2,581 | ) |
Russell 2000 Index | | | 500.00 USD | | | | 12/21/18 | | | | 3 | | | | 300 | | | | 15 | | | | 49 | | | | (34 | ) |
Russell 2000 Index | | | 1,150.00 USD | | | | 10/5/18 | | | | 1 | | | | 100 | | | | 3 | | | | 17 | | | | (14 | ) |
Russell 2000 Index | | | 1,185.00 USD | | | | 10/5/18 | | | | 3 | | | | 300 | | | | 8 | | | | 94 | | | | (86 | ) |
Russell 2000 Index | | | 1,000.00 USD | | | | 10/19/18 | | | | 10 | | | | 1,000 | | | | 25 | | | | 95 | | | | (70 | ) |
Russell 2000 Index | | | 1,680.00 USD | | | | 10/19/18 | | | | 2 | | | | 200 | | | | 2,240 | | | | 6,013 | | | | (3,773 | ) |
Russell 2000 Index | | | 900.00 USD | | | | 10/31/18 | | | | 2 | | | | 200 | | | | 50 | | | | 62 | | | | (12 | ) |
Russell 2000 Index | | | 1,000.00 USD | | | | 11/2/18 | | | | 18 | | | | 1,800 | | | | 135 | | | | 254 | | | | (119 | ) |
Russell 2000 Index | | | 850.00 USD | | | | 11/16/18 | | | | 2 | | | | 200 | | | | 15 | | | | 32 | | | | (17 | ) |
Russell 2000 Index | | | 1,680.00 USD | | | | 11/16/18 | | | | 2 | | | | 200 | | | | 4,600 | | | | 4,707 | | | | (107 | ) |
Russell 2000 Index | | | 1,690.00 USD | | | | 11/30/18 | | | | 2 | | | | 200 | | | | 6,210 | | | | 6,291 | | | | (81 | ) |
Russell 2000 Index | | | 1,620.00 USD | | | | 12/21/18 | | | | 3 | | | | 300 | | | | 5,940 | | | | 12,017 | | | | (6,077 | ) |
Russell 2000 Index | | | 650.00 USD | | | | 12/31/18 | | | | 2 | | | | 200 | | | | 15 | | | | 42 | | | | (27 | ) |
Russell 2000 Index | | | 1,670.00 USD | | | | 12/31/18 | | | | 2 | | | | 200 | | | | 6,710 | | | | 7,159 | | | | (449 | ) |
S&P 500 Index | | | 2,725.00 USD | | | | 11/16/18 | | | | 1 | | | | 100 | | | | 1,045 | | | | 4,806 | | | | (3,761 | ) |
S&P 500 Index | | | 2,725.00 USD | | | | 11/30/18 | | | | 1 | | | | 100 | | | | 1,455 | | | | 5,348 | | | | (3,893 | ) |
S&P 500 Index | | | 1,800.00 USD | | | | 10/1/18 | | | | 8 | | | | 800 | | | | 20 | | | | 93 | | | | (73 | ) |
S&P 500 Index | | | 2,630.00 USD | | | | 10/1/18 | | | | 1 | | | | 100 | | | | 5 | | | | 361 | | | | (356 | ) |
S&P 500 Index | | | 2,685.00 USD | | | | 10/1/18 | | | | 2 | | | | 200 | | | | 15 | | | | 485 | | | | (470 | ) |
S&P 500 Index | | | 2,705.00 USD | | | | 10/1/18 | | | | 2 | | | | 200 | | | | 15 | | | | 555 | | | | (540 | ) |
S&P 500 Index | | | 2,795.00 USD | | | | 10/1/18 | | | | 2 | | | | 200 | | | | 45 | | | | 3,026 | | | | (2,981 | ) |
S&P 500 Index | | | 2,825.00 USD | | | | 10/1/18 | | | | 2 | | | | 200 | | | | 60 | | | | 2,854 | | | | (2,794 | ) |
S&P 500 Index | | | 1,800.00 USD | | | | 10/3/18 | | | | 8 | | | | 800 | | | | 20 | | | | 173 | | | | (153 | ) |
S&P 500 Index | | | 2,625.00 USD | | | | 10/3/18 | | | | 1 | | | | 100 | | | | 27 | | | | 381 | | | | (354 | ) |
S&P 500 Index | | | 2,695.00 USD | | | | 10/3/18 | | | | 2 | | | | 200 | | | | 75 | | | | 482 | | | | (407 | ) |
S&P 500 Index | | | 2,705.00 USD | | | | 10/3/18 | | | | 2 | | | | 200 | | | | 85 | | | | 512 | | | | (427 | ) |
| | | | | | |
| 180 | | Annual Report | | | September 30, 2018 | | | See accompanying Notes to Financial Statements |
Schedule of Investments
September 30, 2018
| | | | | | | | | | | | | | | | | | | | | | | | | | | | |
| Options purchased contracts outstanding at September 30, 2018 (continued): | | | | | | | | | | |
| Description | | Exercise
Price | | | Expiration
Date | | | Number of
Contracts | | | Notional
Amount | | | Market Value | | | Cost | | | Unrealized Appreciation (Depreciation) | |
Put options (continued): | | | | | | | | | | | | | | | | | | | | | | | | | | | | |
S&P 500 Index | | | 2,815.00 USD | | | | 10/3/18 | | | | 2 | | | $ | 200 | | | $ | 170 | | | $ | 2,980 | | | $ | (2,810 | ) |
S&P 500 Index | | | 2,825.00 USD | | | | 10/3/18 | | | | 2 | | | | 200 | | | | 195 | | | | 2,725 | | | | (2,530 | ) |
S&P 500 Index | | | 1,500.00 USD | | | | 10/5/18 | | | | 69 | | | | 6,900 | | | | 172 | | | | 1,277 | | | | (1,105 | ) |
S&P 500 Index | | | 1,550.00 USD | | | | 10/5/18 | | | | 58 | | | | 5,800 | | | | 145 | | | | 1,019 | | | | (874 | ) |
S&P 500 Index | | | 1,600.00 USD | | | | 10/5/18 | | | | 19 | | | | 1,900 | | | | 47 | | | | 410 | | | | (363 | ) |
S&P 500 Index | | | 1,750.00 USD | | | | 10/5/18 | | | | 13 | | | | 1,300 | | | | 32 | | | | 211 | | | | (179 | ) |
S&P 500 Index | | | 1,900.00 USD | | | | 10/5/18 | | | | 7 | | | | 700 | | | | 18 | | | | 117 | | | | (99 | ) |
S&P 500 Index | | | 2,615.00 USD | | | | 10/5/18 | | | | 1 | | | | 100 | | | | 42 | | | | 391 | | | | (349 | ) |
S&P 500 Index | | | 2,695.00 USD | | | | 10/5/18 | | | | 2 | | | | 200 | | | | 145 | | | | 473 | | | | (328 | ) |
S&P 500 Index | | | 2,720.00 USD | | | | 10/5/18 | | | | 2 | | | | 200 | | | | 165 | | | | 233 | | | | (68 | ) |
S&P 500 Index | | | 2,815.00 USD | | | | 10/5/18 | | | | 2 | | | | 200 | | | | 325 | | | | 2,866 | | | | (2,541 | ) |
S&P 500 Index | | | 2,840.00 USD | | | | 10/5/18 | | | | 2 | | | | 200 | | | | 450 | | | | 2,855 | | | | (2,405 | ) |
S&P 500 Index | | | 1,800.00 USD | | | | 10/8/18 | | | | 7 | | | | 700 | | | | 18 | | | | 117 | | | | (99 | ) |
S&P 500 Index | | | 2,690.00 USD | | | | 10/8/18 | | | | 2 | | | | 200 | | | | 190 | | | | 189 | | | | 1 | |
S&P 500 Index | | | 2,705.00 USD | | | | 10/8/18 | | | | 2 | | | | 200 | | | | 205 | | | | 551 | | | | (346 | ) |
S&P 500 Index | | | 2,810.00 USD | | | | 10/8/18 | | | | 2 | | | | 200 | | | | 425 | | | | 3,120 | | | | (2,695 | ) |
S&P 500 Index | | | 2,830.00 USD | | | | 10/8/18 | | | | 2 | | | | 200 | | | | 540 | | | | 3,230 | | | | (2,690 | ) |
S&P 500 Index | | | 2,600.00 USD | | | | 10/10/18 | | | | 1 | | | | 100 | | | | 87 | | | | 431 | | | | (344 | ) |
S&P 500 Index | | | 2,690.00 USD | | | | 10/10/18 | | | | 2 | | | | 200 | | | | 270 | | | | 592 | | | | (322 | ) |
S&P 500 Index | | | 2,700.00 USD | | | | 10/10/18 | | | | 2 | | | | 200 | | | | 285 | | | | 620 | | | | (335 | ) |
S&P 500 Index | | | 2,810.00 USD | | | | 10/10/18 | | | | 2 | | | | 200 | | | | 620 | | | | 2,968 | | | | (2,348 | ) |
S&P 500 Index | | | 2,820.00 USD | | | | 10/10/18 | | | | 2 | | | | 200 | | | | 776 | | | | 3,425 | | | | (2,649 | ) |
S&P 500 Index | | | 1,300.00 USD | | | | 10/12/18 | | | | 58 | | | | 5,800 | | | | 145 | | | | 876 | | | | (731 | ) |
S&P 500 Index | | | 1,350.00 USD | | | | 10/12/18 | | | | 28 | | | | 2,800 | | | | 70 | | | | 408 | | | | (338 | ) |
S&P 500 Index | | | 1,400.00 USD | | | | 10/12/18 | | | | 29 | | | | 2,900 | | | | 72 | | | | 604 | | | | (532 | ) |
S&P 500 Index | | | 1,450.00 USD | | | | 10/12/18 | | | | 14 | | | | 1,400 | | | | 35 | | | | 191 | | | | (156 | ) |
S&P 500 Index | | | 1,500.00 USD | | | | 10/12/18 | | | | 9 | | | | 900 | | | | 23 | | | | 150 | | | | (127 | ) |
S&P 500 Index | | | 1,550.00 USD | | | | 10/12/18 | | | | 57 | | | | 5,700 | | | | 142 | | | | 912 | | | | (770 | ) |
S&P 500 Index | | | 2,690.00 USD | | | | 10/12/18 | | | | 4 | | | | 400 | | | | 690 | | | | 1,350 | | | | (660 | ) |
S&P 500 Index | | | 2,810.00 USD | | | | 10/12/18 | | | | 4 | | | | 400 | | | | 1,580 | | | | 6,242 | | | | (4,662 | ) |
S&P 500 Index | | | 2,835.00 USD | | | | 10/12/18 | | | | 2 | | | | 200 | | | | 1,040 | | | | 3,643 | | | | (2,603 | ) |
S&P 500 Index | | | 2,680.00 USD | | | | 10/15/18 | | | | 1 | | | | 100 | | | | 187 | | | | 362 | | | | (175 | ) |
S&P 500 Index | | | 2,700.00 USD | | | | 10/15/18 | | | | 1 | | | | 100 | | | | 207 | | | | 391 | | | | (184 | ) |
S&P 500 Index | | | 2,725.00 USD | | | | 10/15/18 | | | | 2 | | | | 200 | | | | 475 | | | | 762 | | | | (287 | ) |
S&P 500 Index | | | 2,800.00 USD | | | | 10/15/18 | | | | 2 | | | | 200 | | | | 810 | | | | 3,687 | | | | (2,877 | ) |
S&P 500 Index | | | 2,835.00 USD | | | | 10/15/18 | | | | 2 | | | | 200 | | | | 1,170 | | | | 2,208 | | | | (1,038 | ) |
S&P 500 Index | | | 2,630.00 USD | | | | 10/17/18 | | | | 1 | | | | 100 | | | | 177 | | | | 341 | | | | (164 | ) |
S&P 500 Index | | | 2,680.00 USD | | | | 10/17/18 | | | | 2 | | | | 200 | | | | 445 | | | | 485 | | | | (40 | ) |
S&P 500 Index | | | 2,715.00 USD | | | | 10/17/18 | | | | 2 | | | | 200 | | | | 540 | | | | 555 | | | | (15 | ) |
S&P 500 Index | | | 2,800.00 USD | | | | 10/17/18 | | | | 2 | | | | 200 | | | | 990 | | | | 3,520 | | | | (2,530 | ) |
S&P 500 Index | | | 2,825.00 USD | | | | 10/17/18 | | | | 2 | | | | 200 | | | | 1,250 | | | | 2,370 | | | | (1,120 | ) |
S&P 500 Index | | | 1,500.00 USD | | | | 10/19/18 | | | | 76 | | | | 7,600 | | | | 190 | | | | 1,240 | | | | (1,050 | ) |
S&P 500 Index | | | 1,675.00 USD | | | | 10/19/18 | | | | 9 | | | | 900 | | | | 23 | | | | 105 | | | | (82 | ) |
S&P 500 Index | | | 1,800.00 USD | | | | 10/19/18 | | | | 64 | | | | 6,400 | | | | 160 | | | | 949 | | | | (789 | ) |
S&P 500 Index | | | 2,680.00 USD | | | | 10/19/18 | | | | 1 | | | | 100 | | | | 247 | | | | 341 | | | | (94 | ) |
S&P 500 Index | | | 2,695.00 USD | | | | 10/19/18 | | | | 2 | | | | 200 | | | | 535 | | | | 585 | | | | (50 | ) |
S&P 500 Index | | | 2,815.00 USD | | | | 10/19/18 | | | | 2 | | | | 200 | | | | 1,250 | | | | 3,289 | | | | (2,039 | ) |
S&P 500 Index | | | 2,835.00 USD | | | | 10/19/18 | | | | 2 | | | | 200 | | | | 1,550 | | | | 2,204 | | | | (654 | ) |
S&P 500 Index | | | 2,890.00 USD | | | | 10/19/18 | | | | 1 | | | | 100 | | | | 1,545 | | | | 3,053 | | | | (1,508 | ) |
S&P 500 Index | | | 1,800.00 USD | | | | 10/22/18 | | | | 32 | | | | 3,200 | | | | 160 | | | | 653 | | | | (493 | ) |
S&P 500 Index | | | 2,830.00 USD | | | | 10/22/18 | | | | 2 | | | | 200 | | | | 1,650 | | | | 2,762 | | | | (1,112 | ) |
S&P 500 Index | | | 2,860.00 USD | | | | 10/22/18 | | | | 2 | | | | 200 | | | | 2,290 | | | | 2,055 | | | | 235 | |
S&P 500 Index | | | 2,720.00 USD | | | | 10/24/18 | | | | 2 | | | | 200 | | | | 790 | | | | 762 | | | | 28 | |
S&P 500 Index | | | 2,830.00 USD | | | | 10/24/18 | | | | 2 | | | | 200 | | | | 2,007 | | | | 2,805 | | | | (798 | ) |
S&P 500 Index | | | 2,845.00 USD | | | | 10/24/18 | | | | 2 | | | | 200 | | | | 2,331 | | | | 2,806 | | | | (475 | ) |
S&P 500 Index | | | 800.00 USD | | | | 10/26/18 | | | | 1 | | | | 100 | | | | 3 | | | | 7 | | | | (4 | ) |
S&P 500 Index | | | 1,300.00 USD | | | | 10/26/18 | | | | 4 | | | | 400 | | | | 10 | | | | 66 | | | | (56 | ) |
| | | | | | | | |
| See accompanying Notes to Financial Statements | | | September 30, 2018 | | | Annual Report | | | 181 | |
Schedule of Investments
September 30, 2018
| | | | | | | | | | | | | | | | | | | | | | | | | | | | |
| Options purchased contracts outstanding at September 30, 2018 (continued): | | | | | | | | | | |
| Description | | Exercise
Price | | | Expiration
Date | | | Number of
Contracts | | | Notional
Amount | | | Market Value | | | Cost | | | Unrealized Appreciation (Depreciation) | |
Put options (continued): | | | | | | | | | | | | | | | | | | | | | | | | | | | | |
S&P 500 Index | | | 1,500.00 USD | | | | 10/26/18 | | | | 3 | | | $ | 300 | | | $ | 8 | | | $ | 47 | | | $ | (39 | ) |
S&P 500 Index | | | 1,700.00 USD | | | | 10/26/18 | | | | 58 | | | | 5,800 | | | | 290 | | | | 1,102 | | | | (812 | ) |
S&P 500 Index | | | 1,750.00 USD | | | | 10/26/18 | | | | 28 | | | | 2,800 | | | | 140 | | | | 520 | | | | (380 | ) |
S&P 500 Index | | | 2,835.00 USD | | | | 10/26/18 | | | | 2 | | | | 200 | | | | 2,130 | | | | 3,008 | | | | (878 | ) |
S&P 500 Index | | | 2,850.00 USD | | | | 10/26/18 | | | | 2 | | | | 200 | | | | 2,470 | | | | 2,369 | | | | 101 | |
S&P 500 Index | | | 1,800.00 USD | | | | 10/29/18 | | | | 60 | | | | 6,000 | | | | 450 | | | | 1,505 | | | | (1,055 | ) |
S&P 500 Index | | | 2,840.00 USD | | | | 10/29/18 | | | | 2 | | | | 200 | | | | 2,370 | | | | 2,650 | | | | (280 | ) |
S&P 500 Index | | | 2,860.00 USD | | | | 10/29/18 | | | | 2 | | | | 200 | | | | 2,890 | | | | 2,613 | | | | 277 | |
S&P 500 Index | | | 1,200.00 USD | | | | 10/31/18 | | | | 2 | | | | 200 | | | | 5 | | | | 12 | | | | (7 | ) |
S&P 500 Index | | | 1,300.00 USD | | | | 10/31/18 | | | | 4 | | | | 400 | | | | 10 | | | | 84 | | | | (74 | ) |
S&P 500 Index | | | 1,400.00 USD | | | | 10/31/18 | | | | 4 | | | | 400 | | | | 10 | | | | 86 | | | | (76 | ) |
S&P 500 Index | | | 1,500.00 USD | | | | 10/31/18 | | | | 4 | | | | 400 | | | | 10 | | | | 66 | | | | (56 | ) |
S&P 500 Index | | | 2,650.00 USD | | | | 10/31/18 | | | | 1 | | | | 100 | | | | 365 | | | | 423 | | | | (58 | ) |
S&P 500 Index | | | 2,725.00 USD | | | | 10/31/18 | | | | 1 | | | | 100 | | | | 540 | | | | 4,072 | | | | (3,532 | ) |
S&P 500 Index | | | 2,845.00 USD | | | | 10/31/18 | | | | 2 | | | | 200 | | | | 2,710 | | | | 3,194 | | | | (484 | ) |
S&P 500 Index | | | 2,905.00 USD | | | | 10/31/18 | | | | 1 | | | | 100 | | | | 2,595 | | | | 4,153 | | | | (1,558 | ) |
S&P 500 Index | | | 1,300.00 USD | | | | 11/2/18 | | | | 1 | | | | 100 | | | | 3 | | | | 17 | | | | (14 | ) |
S&P 500 Index | | | 2,840.00 USD | | | | 11/2/18 | | | | 1 | | | | 100 | | | | 1,415 | | | | 1,345 | | | | 70 | |
S&P 500 Index | | | 2,850.00 USD | | | | 11/2/18 | | | | 2 | | | | 200 | | | | 3,110 | | | | 2,851 | | | | 259 | |
S&P 500 Index | | | 2,845.00 USD | | | | 11/5/18 | | | | 2 | | | | 200 | | | | 3,130 | | | | 3,086 | | | | 44 | |
S&P 500 Index | | | 1,300.00 USD | | | | 11/9/18 | | | | 1 | | | | 100 | | | | 3 | | | | 17 | | | | (14 | ) |
S&P 500 Index | | | 2,840.00 USD | | | | 11/9/18 | | | | 1 | | | | 100 | | | | 1,925 | | | | 1,826 | | | | 99 | |
S&P 500 Index | | | 1,300.00 USD | | | | 11/16/18 | | | | 12 | | | | 1,200 | | | | 60 | | | | 199 | | | | (139 | ) |
S&P 500 Index | | | 1,425.00 USD | | | | 11/16/18 | | | | 6 | | | | 600 | | | | 45 | | | | 101 | | | | (56 | ) |
S&P 500 Index | | | 2,865.00 USD | | | | 11/16/18 | | | | 1 | | | | 100 | | | | 2,675 | | | | 3,600 | | | | (925 | ) |
S&P 500 Index | | | 2,905.00 USD | | | | 11/16/18 | | | | 1 | | | | 100 | | | | 3,725 | | | | 5,203 | | | | (1,478 | ) |
S&P 500 Index | | | 2,850.00 USD | | | | 11/23/18 | | | | 1 | | | | 100 | | | | 2,635 | | | | 3,403 | | | | (768 | ) |
S&P 500 Index | | | 2,870.00 USD | | | | 11/30/18 | | | | 1 | | | | 100 | | | | 3,455 | | | | 4,470 | | | | (1,015 | ) |
S&P 500 Index | | | 2,850.00 USD | | | | 12/21/18 | | | | 1 | | | | 100 | | | | 4,015 | | | | 4,813 | | | | (798 | ) |
S&P 500 Index | | | 2,850.00 USD | | | | 12/31/18 | | | | 1 | | | | 100 | | | | 4,305 | | | | 5,103 | | | | (798 | ) |
| | | | | | | | | | | | | | | | | | | | |
| Total put options | | | | | | | | | | | $ | 137,091 | | | $ | 273,613 | | | $ | (136,522 | ) |
| | | | | | | | | | | | | | | | | | | | |
| Total options purchased contracts | | | | | | | | | | | $ | 300,315 | | | $ | 439,082 | | | $ | (138,767 | ) |
| | | | | | | | | | | | | | | | | | | | |
| | | | | | | | | | | | | | | | | | | | | | | | | | | | |
| Options written contracts outstanding at September 30, 2018: | | | | | | | | | | |
| Description | | Exercise
Price | | | Expiration
Date | | | Number of
Contracts | | | Notional
Amount | | | Market
Value | | | Premiums
Received | | | Unrealized
Appreciation
(Depreciation) | |
| | | | | | | |
Call options: | | | | | | | | | | | | | | | | | | | | | | | | | | | | |
CBOE SPX Volatility Index | | | 25.00 USD | | | | 11/21/18 | | | | (37 | ) | | $ | (3,700 | ) | | $ | (2,035 | ) | | $ | (2,420 | ) | | $ | 385 | |
CBOE SPX Volatility Index | | | 23.00 USD | | | | 10/17/18 | | | | (42 | ) | | | (4,200 | ) | | | (945 | ) | | | (2,890 | ) | | | 1,945 | |
CBOE SPX Volatility Index | | | 24.00 USD | | | | 10/17/18 | | | | (66 | ) | | | (6,600 | ) | | | (1,320 | ) | | | (3,682 | ) | | | 2,362 | |
CBOE SPX Volatility Index | | | 25.00 USD | | | | 10/17/18 | | | | (149 | ) | | | (14,900 | ) | | | (2,980 | ) | | | (8,535 | ) | | | 5,555 | |
CBOE SPX Volatility Index | | | 26.00 USD | | | | 10/17/18 | | | | (63 | ) | | | (6,300 | ) | | | (1,103 | ) | | | (3,303 | ) | | | 2,200 | |
CBOE SPX Volatility Index | | | 27.00 USD | | | | 10/17/18 | | | | (67 | ) | | | (6,700 | ) | | | (1,005 | ) | | | (4,097 | ) | | | 3,092 | |
CBOE SPX Volatility Index | | | 28.00 USD | | | | 10/17/18 | | | | (33 | ) | | | (3,300 | ) | | | (495 | ) | | | (1,729 | ) | | | 1,234 | |
CBOE SPX Volatility Index | | | 26.00 USD | | | | 11/21/18 | | | | (80 | ) | | | (8,000 | ) | | | (4,200 | ) | | | (4,343 | ) | | | 143 | |
CBOE SPX Volatility Index | | | 27.00 USD | | | | 11/21/18 | | | | (31 | ) | | | (3,100 | ) | | | (1,395 | ) | | | (1,718 | ) | | | 323 | |
CBOE SPX Volatility Index | | | 28.00 USD | | | | 11/21/18 | | | | (37 | ) | | | (3,700 | ) | | | (1,665 | ) | | | (2,605 | ) | | | 940 | |
CBOE SPX Volatility Index | | | 29.00 USD | | | | 11/21/18 | | | | (91 | ) | | | (9,100 | ) | | | (3,640 | ) | | | (5,780 | ) | | | 2,140 | |
CBOE SPX Volatility Index | | | 30.00 USD | | | | 11/21/18 | | | | (20 | ) | | | (2,000 | ) | | | (750 | ) | | | (1,228 | ) | | | 478 | |
CBOE SPX Volatility Index | | | 29.00 USD | | | | 12/19/18 | | | | (37 | ) | | | (3,700 | ) | | | (2,128 | ) | | | (2,273 | ) | | | 145 | |
iPATH S&P 500 VIX Short-Term | | | 47.00 USD | | | | 10/5/18 | | | | (37 | ) | | | (3,700 | ) | | | (74 | ) | | | (2,087 | ) | | | 2,013 | |
iPATH S&P 500 VIX Short-Term | | | 34.00 USD | | | | 10/19/18 | | | | (37 | ) | | | (3,700 | ) | | | (1,351 | ) | | | (1,903 | ) | | | 552 | |
iPATH S&P 500 VIX Short-Term | | | 50.00 USD | | | | 10/19/18 | | | | (60 | ) | | | (6,000 | ) | | | (450 | ) | | | (4,360 | ) | | | 3,910 | |
iPATH S&P 500 VIX Short-Term | | | 52.00 USD | | | | 10/19/18 | | | | (37 | ) | | | (3,700 | ) | | | (1,850 | ) | | | (2,346 | ) | | | 496 | |
| | | | | | |
| 182 | | Annual Report | | | September 30, 2018 | | | See accompanying Notes to Financial Statements |
Schedule of Investments
September 30, 2018
| | | | | | | | | | | | | | | | | | | | | | | | | | | | |
| Options written contracts outstanding at September 30, 2018 (continued): | | | | | | | | | | |
| Description | | Exercise
Price | | | Expiration
Date | | | Number of
Contracts | | | Notional
Amount | | | Market
Value | | | Premiums
Received | | | Unrealized
Appreciation
(Depreciation) | |
Call options (continued): | | | | | | | | | | | | | | | | | | | | | | | | | | | | |
iPATH S&P 500 VIX Short-Term | | | 58.00 USD | | | | 10/19/18 | | | | (32 | ) | | $ | (3,200 | ) | | $ | (192 | ) | | $ | (2,061 | ) | | $ | 1,869 | |
iPATH S&P 500 VIX Short-Term | | | 40.00 USD | | | | 10/26/18 | | | | (8 | ) | | | (800 | ) | | | (268 | ) | | | (331 | ) | | | 63 | |
iPATH S&P 500 VIX Short-Term | | | 36.00 USD | | | | 11/2/18 | | | | (37 | ) | | | (3,700 | ) | | | (2,331 | ) | | | (2,642 | ) | | | 311 | |
iPATH S&P 500 VIX Short-Term | | | 41.00 USD | | | | 11/16/18 | | | | (25 | ) | | | (2,500 | ) | | | (1,913 | ) | | | (1,861 | ) | | | (52 | ) |
iPATH S&P 500 VIX Short-Term | | | 42.00 USD | | | | 11/16/18 | | | | (62 | ) | | | (6,200 | ) | | | (4,154 | ) | | | (4,292 | ) | | | 138 | |
iPATH S&P 500 VIX Short-Term | | | 45.00 USD | | | | 11/16/18 | | | | (56 | ) | | | (5,600 | ) | | | (3,304 | ) | | | (3,808 | ) | | | 504 | |
iPATH S&P 500 VIX Short-Term | | | 46.00 USD | | | | 11/16/18 | | | | (25 | ) | | | (2,500 | ) | | | (1,325 | ) | | | (1,735 | ) | | | 410 | |
iPATH S&P 500 VIX Short-Term | | | 50.00 USD | | | | 11/16/18 | | | | (43 | ) | | | (4,300 | ) | | | (2,064 | ) | | | (1,953 | ) | | | (111 | ) |
iPATH S&P 500 VIX Short-Term | | | 53.00 USD | | | | 11/16/18 | | | | (37 | ) | | | (3,700 | ) | | | (1,425 | ) | | | (3,129 | ) | | | 1,704 | |
Nasdaq 100 Stock Index | | | 7,800.00 USD | | | | 11/16/18 | | | | (2 | ) | | | (200 | ) | | | (18,010 | ) | | | (13,995 | ) | | | (4,015 | ) |
Nasdaq 100 Stock Index | | | 7,850.00 USD | | | | 11/16/18 | | | | (3 | ) | | | (300 | ) | | | (20,955 | ) | | | (18,352 | ) | | | (2,603 | ) |
Nasdaq 100 Stock Index | | | 8,200.00 USD | | | | 11/16/18 | | | | (4 | ) | | | (400 | ) | | | (2,360 | ) | | | (8,694 | ) | | | 6,334 | |
Nasdaq 100 Stock Index | | | 8,050.00 USD | | | | 10/19/18 | | | | (3 | ) | | | (300 | ) | | | (480 | ) | | | (5,932 | ) | | | 5,452 | |
Nasdaq 100 Stock Index | | | 8,150.00 USD | | | | 11/16/18 | | | | (1 | ) | | | (100 | ) | | | (935 | ) | | | (1,304 | ) | | | 369 | |
Nasdaq 100 Stock Index | | | 8,000.00 USD | | | | 12/21/18 | | | | (2 | ) | | | (200 | ) | | | (15,560 | ) | | | (12,637 | ) | | | (2,923 | ) |
Nasdaq 100 Stock Index | | | 8,300.00 USD | | | | 12/21/18 | | | | (1 | ) | | | (100 | ) | | | (1,845 | ) | | | (2,180 | ) | | | 335 | |
Russell 2000 Index | | | 1,800.00 USD | | | | 10/19/18 | | | | (4 | ) | | | (400 | ) | | | (120 | ) | | | (1,306 | ) | | | 1,186 | |
Russell 2000 Index | | | 1,810.00 USD | | | | 10/31/18 | | | | (2 | ) | | | (200 | ) | | | (115 | ) | | | (2,319 | ) | | | 2,204 | |
Russell 2000 Index | | | 1,820.00 USD | | | | 10/31/18 | | | | (1 | ) | | | (100 | ) | | | (45 | ) | | | (922 | ) | | | 877 | |
Russell 2000 Index | | | 1,770.00 USD | | | | 11/30/18 | | | | (6 | ) | | | (600 | ) | | | (4,980 | ) | | | (8,462 | ) | | | 3,482 | |
Russell 2000 Index | | | 1,770.00 USD | | | | 12/21/18 | | | | (6 | ) | | | (600 | ) | | | (8,040 | ) | | | (9,435 | ) | | | 1,395 | |
Russell 2000 Index | | | 1,835.00 USD | | | | 10/5/18 | | | | (4 | ) | | | (400 | ) | | | (20 | ) | | | (382 | ) | | | 362 | |
Russell 2000 Index | | | 1,820.00 USD | | | | 10/12/18 | | | | (4 | ) | | | (400 | ) | | | (50 | ) | | | (354 | ) | | | 304 | |
Russell 2000 Index | | | 1,830.00 USD | | | | 10/12/18 | | | | (1 | ) | | | (100 | ) | | | (12 | ) | | | (105 | ) | | | 93 | |
Russell 2000 Index | | | 1,770.00 USD | | | | 10/19/18 | | | | (6 | ) | | | (600 | ) | | | (450 | ) | | | (4,227 | ) | | | 3,777 | |
Russell 2000 Index | | | 1,790.00 USD | | | | 10/19/18 | | | | (3 | ) | | | (300 | ) | | | (120 | ) | | | (2,290 | ) | | | 2,170 | |
Russell 2000 Index | | | 1,810.00 USD | | | | 10/19/18 | | | | (4 | ) | | | (400 | ) | | | (100 | ) | | | (1,774 | ) | | | 1,674 | |
Russell 2000 Index | | | 1,815.00 USD | | | | 10/19/18 | | | | (3 | ) | | | (300 | ) | | | (67 | ) | | | (289 | ) | | | 222 | |
Russell 2000 Index | | | 1,820.00 USD | | | | 10/19/18 | | | | (3 | ) | | | (300 | ) | | | (67 | ) | | | (235 | ) | | | 168 | |
Russell 2000 Index | | | 1,800.00 USD | | | | 10/26/18 | | | | (3 | ) | | | (300 | ) | | | (165 | ) | | | (382 | ) | | | 217 | |
Russell 2000 Index | | | 1,805.00 USD | | | | 10/26/18 | | | | (3 | ) | | | (300 | ) | | | (150 | ) | | | (307 | ) | | | 157 | |
Russell 2000 Index | | | 1,810.00 USD | | | | 10/26/18 | | | | (3 | ) | | | (300 | ) | | | (135 | ) | | | (337 | ) | | | 202 | |
Russell 2000 Index | | | 1,785.00 USD | | | | 10/31/18 | | | | (12 | ) | | | (1,200 | ) | | | (1,470 | ) | | | (1,469 | ) | | | (1 | ) |
Russell 2000 Index | | | 1,795.00 USD | | | | 10/31/18 | | | | (4 | ) | | | (400 | ) | | | (350 | ) | | | (540 | ) | | | 190 | |
Russell 2000 Index | | | 1,860.00 USD | | | | 10/31/18 | | | | (2 | ) | | | (200 | ) | | | (60 | ) | | | (437 | ) | | | 377 | |
Russell 2000 Index | | | 1,800.00 USD | | | | 11/16/18 | | | | (6 | ) | | | (600 | ) | | | (1,260 | ) | | | (2,690 | ) | | | 1,430 | |
Russell 2000 Index | | | 1,830.00 USD | | | | 11/16/18 | | | | (5 | ) | | | (500 | ) | | | (462 | ) | | | (2,237 | ) | | | 1,775 | |
Russell 2000 Index | | | 1,835.00 USD | | | | 11/16/18 | | | | (6 | ) | | | (600 | ) | | | (510 | ) | | | (1,784 | ) | | | 1,274 | |
Russell 2000 Index | | | 1,830.00 USD | | | | 11/30/18 | | | | (5 | ) | | | (500 | ) | | | (788 | ) | | | (3,238 | ) | | | 2,450 | |
Russell 2000 Index | | | 1,840.00 USD | | | | 11/30/18 | | | | (15 | ) | | | (1,500 | ) | | | (1,838 | ) | | | (8,128 | ) | | | 6,290 | |
Russell 2000 Index | | | 1,830.00 USD | | | | 12/31/18 | | | | (6 | ) | | | (600 | ) | | | (2,370 | ) | | | (3,638 | ) | | | 1,268 | |
S&P 500 Index | | | 2,970.00 USD | | | | 10/19/18 | | | | (3 | ) | | | (300 | ) | | | (1,035 | ) | | | (1,400 | ) | | | 365 | |
S&P 500 Index | | | 2,980.00 USD | | | | 10/19/18 | | | | (3 | ) | | | (300 | ) | | | (742 | ) | | | (1,282 | ) | | | 540 | |
S&P 500 Index | | | 2,990.00 USD | | | | 10/19/18 | | | | (2 | ) | | | (200 | ) | | | (380 | ) | | | (655 | ) | | | 275 | |
S&P 500 Index | | | 3,000.00 USD | | | | 10/31/18 | | | | (3 | ) | | | (300 | ) | | | (878 | ) | | | (1,220 | ) | | | 342 | |
S&P 500 Index | | | 3,000.00 USD | | | | 11/16/18 | | | | (3 | ) | | | (300 | ) | | | (2,235 | ) | | | (1,813 | ) | | | (422 | ) |
S&P 500 Index | | | 3,000.00 USD | | | | 11/30/18 | | | | (3 | ) | | | (300 | ) | | | (3,525 | ) | | | (2,449 | ) | | | (1,076 | ) |
S&P 500 Index | | | 3,025.00 USD | | | | 10/1/18 | | | | (1 | ) | | | (100 | ) | | | (2 | ) | | | (174 | ) | | | 172 | |
S&P 500 Index | | | 2,975.00 USD | | | | 10/5/18 | | | | (6 | ) | | | (600 | ) | | | (135 | ) | | | (1,875 | ) | | | 1,740 | |
S&P 500 Index | | | 3,025.00 USD | | | | 10/10/18 | | | | (2 | ) | | | (200 | ) | | | (35 | ) | | | (187 | ) | | | 152 | |
S&P 500 Index | | | 3,030.00 USD | | | | 10/10/18 | | | | (4 | ) | | | (400 | ) | | | (40 | ) | | | (530 | ) | | | 490 | |
S&P 500 Index | | | 3,010.00 USD | | | | 10/12/18 | | | | (6 | ) | | | (600 | ) | | | (285 | ) | | | (3,525 | ) | | �� | 3,240 | |
S&P 500 Index | | | 3,030.00 USD | | | | 10/12/18 | | | | (2 | ) | | | (200 | ) | | | (60 | ) | | | (245 | ) | | | 185 | |
S&P 500 Index | | | 3,025.00 USD | | | | 10/17/18 | | | | (2 | ) | | | (200 | ) | | | (130 | ) | | | (287 | ) | | | 157 | |
S&P 500 Index | | | 3,030.00 USD | | | | 10/17/18 | | | | (2 | ) | | | (200 | ) | | | (115 | ) | | | (235 | ) | | | 120 | |
S&P 500 Index | | | 3,075.00 USD | | | | 10/19/18 | | | | (4 | ) | | | (400 | ) | | | (130 | ) | | | (910 | ) | | | 780 | |
S&P 500 Index | | | 3,040.00 USD | | | | 10/26/18 | | | | (2 | ) | | | (200 | ) | | | (185 | ) | | | (275 | ) | | | 90 | |
S&P 500 Index | | | 3,045.00 USD | | | | 10/26/18 | | | | (2 | ) | | | (200 | ) | | | (165 | ) | | | (279 | ) | | | 114 | |
| | | | | | | | |
| See accompanying Notes to Financial Statements | | | September 30, 2018 | | | Annual Report | | | 183 | |
Schedule of Investments
September 30, 2018
| | | | | | | | | | | | | | | | | | | | | | | | | | | | |
| Options written contracts outstanding at September 30, 2018 (continued): | | | | | | | | | | |
| Description | | Exercise
Price | | | Expiration
Date | | | Number of
Contracts | | | Notional
Amount | | | Market
Value | | | Premiums
Received | | | Unrealized
Appreciation
(Depreciation) | |
Call options (continued): | | | | | | | | | | | | | | | | | | | | | | | | | | | | |
S&P 500 Index | | | 3,035.00 USD | | | | 11/2/18 | | | | (3 | ) | | $ | (300 | ) | | $ | (457 | ) | | $ | (745 | ) | | $ | 288 | |
S&P 500 Index | | | 3,035.00 USD | | | | 11/9/18 | | | | (3 | ) | | | (300 | ) | | | (780 | ) | | | (1,198 | ) | | | 418 | |
S&P 500 Index | | | 3,040.00 USD | | | | 11/16/18 | | | | (4 | ) | | | (400 | ) | | | (1,220 | ) | | | (1,810 | ) | | | 590 | |
S&P 500 Index | | | 3,060.00 USD | | | | 11/23/18 | | | | (6 | ) | | | (600 | ) | | | (1,590 | ) | | | (1,814 | ) | | | 224 | |
S&P 500 Index | | | 3,040.00 USD | | | | 11/30/18 | | | | (4 | ) | | | (400 | ) | | | (2,060 | ) | | | (2,710 | ) | | | 650 | |
S&P 500 Index | | | 3,100.00 USD | | | | 12/21/18 | | | | (6 | ) | | | (600 | ) | | | (2,250 | ) | | | (2,444 | ) | | | 194 | |
S&P 500 Index | | | 3,100.00 USD | | | | 12/31/18 | | | | (6 | ) | | | (600 | ) | | | (2,910 | ) | | | (3,104 | ) | | | 194 | |
| | | | | | | | | | | | | | | | | | | | |
| Total call options | | | | | | | | | | | $ | (149,595 | ) | | $ | (228,658 | ) | | $ | 79,063 | |
| | | | | | | | | | | | | | | | | | | | |
| | | | | | | |
Put options: | | | | | | | | | | | | | | | | | | | | | | | | | | | | |
Nasdaq 100 Stock Index | | | 6,600.00 USD | | | | 10/19/18 | | | | (1 | ) | | $ | (100 | ) | | $ | (360 | ) | | $ | (3,547 | ) | | $ | 3,187 | |
Nasdaq 100 Stock Index | | | 6,800.00 USD | | | | 11/16/18 | | | | (2 | ) | | | (200 | ) | | | (5,190 | ) | | | (27,595 | ) | | | 22,405 | |
Nasdaq 100 Stock Index | | | 7,000.00 USD | | | | 11/16/18 | | | | (2 | ) | | | (200 | ) | | | (7,830 | ) | | | (18,895 | ) | | | 11,065 | |
Nasdaq 100 Stock Index | | | 6,600.00 USD | | | | 10/12/18 | | | | (1 | ) | | | (100 | ) | | | (172 | ) | | | (1,867 | ) | | | 1,695 | |
Nasdaq 100 Stock Index | | | 6,550.00 USD | | | | 10/19/18 | | | | (2 | ) | | | (200 | ) | | | (590 | ) | | | (4,124 | ) | | | 3,534 | |
Nasdaq 100 Stock Index | | | 6,825.00 USD | | | | 10/26/18 | | | | (1 | ) | | | (100 | ) | | | (1,015 | ) | | | (2,854 | ) | | | 1,839 | |
Nasdaq 100 Stock Index | | | 7,025.00 USD | | | | 10/26/18 | | | | (1 | ) | | | (100 | ) | | | (1,650 | ) | | | (2,983 | ) | | | 1,333 | |
Nasdaq 100 Stock Index | | | 7,050.00 USD | | | | 10/26/18 | | | | (1 | ) | | | (100 | ) | | | (1,865 | ) | | | (2,993 | ) | | | 1,128 | |
Nasdaq 100 Stock Index | | | 7,000.00 USD | | | | 10/31/18 | | | | (1 | ) | | | (100 | ) | | | (1,970 | ) | | | (1,947 | ) | | | (23 | ) |
Nasdaq 100 Stock Index | | | 6,725.00 USD | | | | 11/16/18 | | | | (2 | ) | | | (200 | ) | | | (4,470 | ) | | | (6,395 | ) | | | 1,925 | |
Nasdaq 100 Stock Index | | | 6,975.00 USD | | | | 12/21/18 | | | | (2 | ) | | | (200 | ) | | | (14,580 | ) | | | (27,152 | ) | | | 12,572 | |
Russell 2000 Index | | | 1,510.00 USD | | | | 10/19/18 | | | | (2 | ) | | | (200 | ) | | | (160 | ) | | | (1,255 | ) | | | 1,095 | |
Russell 2000 Index | | | 1,600.00 USD | | | | 10/31/18 | | | | (4 | ) | | | (400 | ) | | | (1,840 | ) | | | (8,283 | ) | | | 6,443 | |
Russell 2000 Index | | | 1,520.00 USD | | | | 11/30/18 | | | | (2 | ) | | | (200 | ) | | | (1,100 | ) | | | (4,005 | ) | | | 2,905 | |
Russell 2000 Index | | | 1,640.00 USD | | | | 10/5/18 | | | | (6 | ) | | | (600 | ) | | | (555 | ) | | | (4,297 | ) | | | 3,742 | |
Russell 2000 Index | | | 1,600.00 USD | | | | 10/12/18 | | | | (1 | ) | | | (100 | ) | | | (127 | ) | | | (551 | ) | | | 424 | |
Russell 2000 Index | | | 1,520.00 USD | | | | 10/19/18 | | | | (1 | ) | | | (100 | ) | | | (90 | ) | | | (647 | ) | | | 557 | |
Russell 2000 Index | | | 1,560.00 USD | | | | 10/19/18 | | | | (1 | ) | | | (100 | ) | | | (132 | ) | | | (593 | ) | | | 461 | |
Russell 2000 Index | | | 1,570.00 USD | | | | 10/19/18 | | | | (2 | ) | | | (200 | ) | | | (295 | ) | | | (925 | ) | | | 630 | |
Russell 2000 Index | | | 1,575.00 USD | | | | 10/19/18 | | | | (2 | ) | | | (200 | ) | | | (315 | ) | | | (835 | ) | | | 520 | |
Russell 2000 Index | | | 1,610.00 USD | | | | 10/19/18 | | | | (2 | ) | | | (200 | ) | | | (520 | ) | | | (1,921 | ) | | | 1,401 | |
Russell 2000 Index | | | 1,615.00 USD | | | | 10/19/18 | | | | (2 | ) | | | (200 | ) | | | (570 | ) | | | (1,081 | ) | | | 511 | |
Russell 2000 Index | | | 1,625.00 USD | | | | 10/19/18 | | | | (4 | ) | | | (400 | ) | | | (1,360 | ) | | | (6,734 | ) | | | 5,374 | |
Russell 2000 Index | | | 1,650.00 USD | | | | 10/19/18 | | | | (7 | ) | | | (700 | ) | | | (3,955 | ) | | | (7,682 | ) | | | 3,727 | |
Russell 2000 Index | | | 1,530.00 USD | | | | 10/31/18 | | | | (2 | ) | | | (200 | ) | | | (415 | ) | | | (1,020 | ) | | | 605 | |
Russell 2000 Index | | | 1,590.00 USD | | | | 11/2/18 | | | | (2 | ) | | | (200 | ) | | | (900 | ) | | | (1,265 | ) | | | 365 | |
Russell 2000 Index | | | 1,600.00 USD | | | | 11/2/18 | | | | (4 | ) | | | (400 | ) | | | (2,040 | ) | | | (2,805 | ) | | | 765 | |
Russell 2000 Index | | | 1,620.00 USD | | | | 11/2/18 | | | | (3 | ) | | | (300 | ) | | | (2,025 | ) | | | (2,086 | ) | | | 61 | |
Russell 2000 Index | | | 1,600.00 USD | | | | 11/16/18 | | | | (2 | ) | | | (200 | ) | | | (1,710 | ) | | | (1,735 | ) | | | 25 | |
Russell 2000 Index | | | 1,620.00 USD | | | | 11/16/18 | | | | (2 | ) | | | (200 | ) | | | (2,150 | ) | | | (2,015 | ) | | | (135 | ) |
Russell 2000 Index | | | 1,630.00 USD | | | | 11/16/18 | | | | (4 | ) | | | (400 | ) | | | (4,880 | ) | | | (5,428 | ) | | | 548 | |
Russell 2000 Index | | | 1,600.00 USD | | | | 11/30/18 | | | | (2 | ) | | | (200 | ) | | | (2,340 | ) | | | (2,627 | ) | | | 287 | |
Russell 2000 Index | | | 1,610.00 USD | | | | 11/30/18 | | | | (2 | ) | | | (200 | ) | | | (2,600 | ) | | | (3,262 | ) | | | 662 | |
Russell 2000 Index | | | 1,550.00 USD | | | | 12/21/18 | | | | (6 | ) | | | (600 | ) | | | (6,390 | ) | | | (14,924 | ) | | | 8,534 | |
Russell 2000 Index | | | 1,610.00 USD | | | | 12/31/18 | | | | (2 | ) | | | (200 | ) | | | (3,990 | ) | | | (4,420 | ) | | | 430 | |
Russell 2000 Index | | | 1,620.00 USD | | | | 12/31/18 | | | | (2 | ) | | | (200 | ) | | | (4,350 | ) | | | (4,781 | ) | | | 431 | |
S&P 500 Index | | | 2,620.00 USD | | | | 10/5/18 | | | | (2 | ) | | | (200 | ) | | | (85 | ) | | | (835 | ) | | | 750 | |
S&P 500 Index | | | 2,650.00 USD | | | | 10/5/18 | | | | (1 | ) | | | (100 | ) | | | (52 | ) | | | (1,207 | ) | | | 1,155 | |
S&P 500 Index | | | 2,700.00 USD | | | | 10/19/18 | | | | (5 | ) | | | (500 | ) | | | (1,375 | ) | | | (3,992 | ) | | | 2,617 | |
S&P 500 Index | | | 2,725.00 USD | | | | 10/19/18 | | | | (6 | ) | | | (600 | ) | | | (1,890 | ) | | | (6,187 | ) | | | 4,297 | |
S&P 500 Index | | | 2,620.00 USD | | | | 10/31/18 | | | | (2 | ) | | | (200 | ) | | | (630 | ) | | | (4,997 | ) | | | 4,367 | |
S&P 500 Index | | | 2,620.00 USD | | | | 11/16/18 | | | | (2 | ) | | | (200 | ) | | | (1,250 | ) | | | (6,101 | ) | | | 4,851 | |
S&P 500 Index | | | 2,620.00 USD | | | | 11/30/18 | | | | (2 | ) | | | (200 | ) | | | (1,770 | ) | | | (6,988 | ) | | | 5,218 | |
S&P 500 Index | | | 2,735.00 USD | | | | 10/1/18 | | | | (1 | ) | | | (100 | ) | | | (15 | ) | | | (568 | ) | | | 553 | |
S&P 500 Index | | | 2,740.00 USD | | | | 10/1/18 | | | | (4 | ) | | | (400 | ) | | | (60 | ) | | | (3,719 | ) | | | 3,659 | |
S&P 500 Index | | | 2,765.00 USD | | | | 10/1/18 | | | | (4 | ) | | | (400 | ) | | | (70 | ) | | | (3,367 | ) | | | 3,297 | |
S&P 500 Index | | | 2,755.00 USD | | | | 10/3/18 | | | | (4 | ) | | | (400 | ) | | | (220 | ) | | | (3,583 | ) | | | 3,363 | |
S&P 500 Index | | | 2,765.00 USD | | | | 10/3/18 | | | | (4 | ) | | | (400 | ) | | | (240 | ) | | | (3,228 | ) | | | 2,988 | |
S&P 500 Index | | | 2,600.00 USD | | | | 10/5/18 | | | | (1 | ) | | | (100 | ) | | | (37 | ) | | | (953 | ) | | | 916 | |
S&P 500 Index | | | 2,610.00 USD | | | | 10/5/18 | | | | (1 | ) | | | (100 | ) | | | (40 | ) | | | (923 | ) | | | 883 | |
| | | | | | |
| 184 | | Annual Report | | | September 30, 2018 | | | See accompanying Notes to Financial Statements |
Schedule of Investments
September 30, 2018
| | | | | | | | | | | | | | | | | | | | | | | | | | | | |
| Options written contracts outstanding at September 30, 2018 (continued): | | | | | | | | | | |
| Description | | Exercise
Price | | | Expiration
Date | | | Number of
Contracts | | | Notional
Amount | | | Market
Value | | | Premiums
Received | | | Unrealized
Appreciation
(Depreciation) | |
Put options (continued): | | | | | | | | | | | | | | | | | | | | | | | | | | | | |
S&P 500 Index | | | 2,755.00 USD | | | | 10/5/18 | | | | (4 | ) | | $ | (400 | ) | | $ | (400 | ) | | $ | (3,419 | ) | | $ | 3,019 | |
S&P 500 Index | | | 2,780.00 USD | | | | 10/5/18 | | | | (4 | ) | | | (400 | ) | | | (470 | ) | | | (3,449 | ) | | | 2,979 | |
S&P 500 Index | | | 2,750.00 USD | | | | 10/8/18 | | | | (4 | ) | | | (400 | ) | | | (520 | ) | | | (3,800 | ) | | | 3,280 | |
S&P 500 Index | | | 2,765.00 USD | | | | 10/8/18 | | | | (2 | ) | | | (200 | ) | | | (285 | ) | | | (1,888 | ) | | | 1,603 | |
S&P 500 Index | | | 2,770.00 USD | | | | 10/8/18 | | | | (2 | ) | | | (200 | ) | | | (295 | ) | | | (1,958 | ) | | | 1,663 | |
S&P 500 Index | | | 2,705.00 USD | | | | 10/10/18 | | | | (14 | ) | | | (1,400 | ) | | | (2,065 | ) | | | (9,624 | ) | | | 7,559 | |
S&P 500 Index | | | 2,710.00 USD | | | | 10/10/18 | | | | (1 | ) | | | (100 | ) | | | (150 | ) | | | (937 | ) | | | 787 | |
S&P 500 Index | | | 2,725.00 USD | | | | 10/10/18 | | | | (2 | ) | | | (200 | ) | | | (325 | ) | | | (1,555 | ) | | | 1,230 | |
S&P 500 Index | | | 2,750.00 USD | | | | 10/10/18 | | | | (4 | ) | | | (400 | ) | | | (750 | ) | | | (3,571 | ) | | | 2,821 | |
S&P 500 Index | | | 2,760.00 USD | | | | 10/10/18 | | | | (4 | ) | | | (400 | ) | | | (736 | ) | | | (4,149 | ) | | | 3,413 | |
S&P 500 Index | | | 2,590.00 USD | | | | 10/12/18 | | | | (1 | ) | | | (100 | ) | | | (105 | ) | | | (968 | ) | | | 863 | |
S&P 500 Index | | | 2,600.00 USD | | | | 10/12/18 | | | | (1 | ) | | | (100 | ) | | | (110 | ) | | | (981 | ) | | | 871 | |
S&P 500 Index | | | 2,650.00 USD | | | | 10/12/18 | | | | (1 | ) | | | (100 | ) | | | (142 | ) | | | (1,006 | ) | | | 864 | |
S&P 500 Index | | | 2,660.00 USD | | | | 10/12/18 | | | | (2 | ) | | | (200 | ) | | | (295 | ) | | | (2,075 | ) | | | 1,780 | |
S&P 500 Index | | | 2,680.00 USD | | | | 10/12/18 | | | | (2 | ) | | | (200 | ) | | | (330 | ) | | | (1,805 | ) | | | 1,475 | |
S&P 500 Index | | | 2,700.00 USD | | | | 10/12/18 | | | | (1 | ) | | | (100 | ) | | | (183 | ) | | | (908 | ) | | | 725 | |
S&P 500 Index | | | 2,710.00 USD | | | | 10/12/18 | | | | (9 | ) | | | (900 | ) | | | (1,733 | ) | | | (6,963 | ) | | | 5,230 | |
S&P 500 Index | | | 2,725.00 USD | | | | 10/12/18 | | | | (2 | ) | | | (200 | ) | | | (415 | ) | | | (1,801 | ) | | | 1,386 | |
S&P 500 Index | | | 2,730.00 USD | | | | 10/12/18 | | | | (14 | ) | | | (1,400 | ) | | | (2,975 | ) | | | (9,568 | ) | | | 6,593 | |
S&P 500 Index | | | 2,740.00 USD | | | | 10/12/18 | | | | (7 | ) | | | (700 | ) | | | (1,593 | ) | | | (5,477 | ) | | | 3,884 | |
S&P 500 Index | | | 2,750.00 USD | | | | 10/12/18 | | | | (8 | ) | | | (800 | ) | | | (1,940 | ) | | | (7,605 | ) | | | 5,665 | |
S&P 500 Index | | | 2,760.00 USD | | | | 10/12/18 | | | | (4 | ) | | | (400 | ) | | | (1,030 | ) | | | (4,038 | ) | | | 3,008 | |
S&P 500 Index | | | 2,740.00 USD | | | | 10/15/18 | | | | (4 | ) | | | (400 | ) | | | (1,030 | ) | | | (4,723 | ) | | | 3,693 | |
S&P 500 Index | | | 2,760.00 USD | | | | 10/15/18 | | | | (14 | ) | | | (1,400 | ) | | | (4,130 | ) | | | (8,798 | ) | | | 4,668 | |
S&P 500 Index | | | 2,770.00 USD | | | | 10/15/18 | | | | (14 | ) | | | (1,400 | ) | | | (4,410 | ) | | | (8,189 | ) | | | 3,779 | |
S&P 500 Index | | | 2,780.00 USD | | | | 10/15/18 | | | | (4 | ) | | | (400 | ) | | | (1,380 | ) | | | (2,571 | ) | | | 1,191 | |
S&P 500 Index | | | 2,690.00 USD | | | | 10/17/18 | | | | (1 | ) | | | (100 | ) | | | (233 | ) | | | (662 | ) | | | 429 | |
S&P 500 Index | | | 2,700.00 USD | | | | 10/17/18 | | | | (1 | ) | | | (100 | ) | | | (248 | ) | | | (621 | ) | | | 373 | |
S&P 500 Index | | | 2,725.00 USD | | | | 10/17/18 | | | | (8 | ) | | | (800 | ) | | | (2,280 | ) | | | (5,035 | ) | | | 2,755 | |
S&P 500 Index | | | 2,740.00 USD | | | | 10/17/18 | | | | (4 | ) | | | (400 | ) | | | (1,260 | ) | | | (4,409 | ) | | | 3,149 | |
S&P 500 Index | | | 2,750.00 USD | | | | 10/17/18 | | | | (8 | ) | | | (800 | ) | | | (2,680 | ) | | | (4,971 | ) | | | 2,291 | |
S&P 500 Index | | | 2,770.00 USD | | | | 10/17/18 | | | | (4 | ) | | | (400 | ) | | | (1,540 | ) | | | (2,843 | ) | | | 1,303 | |
S&P 500 Index | | | 2,650.00 USD | | | | 10/19/18 | | | | (4 | ) | | | (400 | ) | | | (850 | ) | | | (3,166 | ) | | | 2,316 | |
S&P 500 Index | | | 2,735.00 USD | | | | 10/19/18 | | | | (6 | ) | | | (600 | ) | | | (2,010 | ) | | | (6,980 | ) | | | 4,970 | |
S&P 500 Index | | | 2,740.00 USD | | | | 10/19/18 | | | | (9 | ) | | | (900 | ) | | | (3,105 | ) | | | (5,627 | ) | | | 2,522 | |
S&P 500 Index | | | 2,745.00 USD | | | | 10/19/18 | | | | (3 | ) | | | (300 | ) | | | (1,080 | ) | | | (4,030 | ) | | | 2,950 | |
S&P 500 Index | | | 2,750.00 USD | | | | 10/19/18 | | | | (8 | ) | | | (800 | ) | | | (3,000 | ) | | | (4,971 | ) | | | 1,971 | |
S&P 500 Index | | | 2,755.00 USD | | | | 10/19/18 | | | | (4 | ) | | | (400 | ) | | | (1,540 | ) | | | (3,994 | ) | | | 2,454 | |
S&P 500 Index | | | 2,760.00 USD | | | | 10/19/18 | | | | (16 | ) | | | (1,600 | ) | | | (6,320 | ) | | | (9,030 | ) | | | 2,710 | |
S&P 500 Index | | | 2,780.00 USD | | | | 10/19/18 | | | | (4 | ) | | | (400 | ) | | | (1,860 | ) | | | (2,579 | ) | | | 719 | |
S&P 500 Index | | | 2,790.00 USD | | | | 10/19/18 | | | | (2 | ) | | | (200 | ) | | | (1,010 | ) | | | (2,695 | ) | | | 1,685 | |
S&P 500 Index | | | 2,770.00 USD | | | | 10/22/18 | | | | (4 | ) | | | (400 | ) | | | (1,940 | ) | | | (3,295 | ) | | | 1,355 | |
S&P 500 Index | | | 2,780.00 USD | | | | 10/22/18 | | | | (8 | ) | | | (800 | ) | | | (4,200 | ) | | | (4,627 | ) | | | 427 | |
S&P 500 Index | | | 2,790.00 USD | | | | 10/22/18 | | | | (24 | ) | | | (2,400 | ) | | | (13,680 | ) | | | (13,906 | ) | | | 226 | |
S&P 500 Index | | | 2,805.00 USD | | | | 10/22/18 | | | | (4 | ) | | | (400 | ) | | | (2,580 | ) | | | (2,470 | ) | | | (110 | ) |
S&P 500 Index | | | 2,775.00 USD | | | | 10/24/18 | | | | (4 | ) | | | (400 | ) | | | (2,447 | ) | | | (3,590 | ) | | | 1,143 | |
S&P 500 Index | | | 2,785.00 USD | | | | 10/24/18 | | | | (4 | ) | | | (400 | ) | | | (2,669 | ) | | | (3,290 | ) | | | 621 | |
S&P 500 Index | | | 2,660.00 USD | | | | 10/26/18 | | | | (3 | ) | | | (300 | ) | | | (975 | ) | | | (2,451 | ) | | | 1,476 | |
S&P 500 Index | | | 2,710.00 USD | | | | 10/26/18 | | | | (1 | ) | | | (100 | ) | | | (425 | ) | | | (639 | ) | | | 214 | |
S&P 500 Index | | | 2,725.00 USD | | | | 10/26/18 | | | | (1 | ) | | | (100 | ) | | | (460 | ) | | | (589 | ) | | | 129 | |
S&P 500 Index | | | 2,750.00 USD | | | | 10/26/18 | | | | (15 | ) | | | (1,500 | ) | | | (8,025 | ) | | | (9,747 | ) | | | 1,722 | |
S&P 500 Index | | | 2,755.00 USD | | | | 10/26/18 | | | | (1 | ) | | | (100 | ) | | | (555 | ) | | | (589 | ) | | | 34 | |
S&P 500 Index | | | 2,765.00 USD | | | | 10/26/18 | | | | (15 | ) | | | (1,500 | ) | | | (8,925 | ) | | | (10,010 | ) | | | 1,085 | |
S&P 500 Index | | | 2,770.00 USD | | | | 10/26/18 | | | | (7 | ) | | | (700 | ) | | | (4,305 | ) | | | (4,182 | ) | | | (123 | ) |
S&P 500 Index | | | 2,780.00 USD | | | | 10/26/18 | | | | (4 | ) | | | (400 | ) | | | (2,660 | ) | | | (3,769 | ) | | | 1,109 | |
S&P 500 Index | | | 2,790.00 USD | | | | 10/26/18 | | | | (7 | ) | | | (700 | ) | | | (5,005 | ) | | | (4,343 | ) | | | (662 | ) |
S&P 500 Index | | | 2,795.00 USD | | | | 10/26/18 | | | | (4 | ) | | | (400 | ) | | | (2,980 | ) | | | (2,830 | ) | | | (150 | ) |
S&P 500 Index | | | 2,770.00 USD | | | | 10/29/18 | | | | (8 | ) | | | (800 | ) | | | (5,240 | ) | | | (4,699 | ) | | | (541 | ) |
S&P 500 Index | | | 2,775.00 USD | | | | 10/29/18 | | | | (22 | ) | | | (2,200 | ) | | | (14,850 | ) | | | (15,302 | ) | | | 452 | |
| | | | | | | | |
| See accompanying Notes to Financial Statements | | | September 30, 2018 | | | Annual Report | | | 185 | |
Schedule of Investments
September 30, 2018
| | | | | | | | | | | | | | | | | | | | | | | | | | | | |
| Options written contracts outstanding at September 30, 2018 (continued): | | | | | | | | | | |
| Description | | Exercise
Price | | | Expiration
Date | | | Number of
Contracts | | | Notional
Amount | | | Market
Value | | | Premiums
Received | | | Unrealized
Appreciation
(Depreciation) | |
Put options (continued): | | | | | | | | | | | | | | | | | | | | | | | | | | | | |
S&P 500 Index | | | 2,785.00 USD | | | | 10/29/18 | | | | (4 | ) | | $ | (400 | ) | | $ | (2,940 | ) | | $ | (3,243 | ) | | $ | 303 | |
S&P 500 Index | | | 2,805.00 USD | | | | 10/29/18 | | | | (4 | ) | | | (400 | ) | | | (3,420 | ) | | | (3,267 | ) | | | (153 | ) |
S&P 500 Index | | | 2,695.00 USD | | | | 10/31/18 | | | | (3 | ) | | | (300 | ) | | | (1,365 | ) | | | (4,302 | ) | | | 2,937 | |
S&P 500 Index | | | 2,700.00 USD | | | | 10/31/18 | | | | (2 | ) | | | (200 | ) | | | (930 | ) | | | (1,423 | ) | | | 493 | |
S&P 500 Index | | | 2,710.00 USD | | | | 10/31/18 | | | | (2 | ) | | | (200 | ) | | | (990 | ) | | | (2,240 | ) | | | 1,250 | |
S&P 500 Index | | | 2,730.00 USD | | | | 10/31/18 | | | | (3 | ) | | | (300 | ) | | | (1,665 | ) | | | (3,889 | ) | | | 2,224 | |
S&P 500 Index | | | 2,755.00 USD | | | | 10/31/18 | | | | (1 | ) | | | (100 | ) | | | (655 | ) | | | (689 | ) | | | 34 | |
S&P 500 Index | | | 2,775.00 USD | | | | 10/31/18 | | | | (2 | ) | | | (200 | ) | | | (1,510 | ) | | | (1,538 | ) | | | 28 | |
S&P 500 Index | | | 2,785.00 USD | | | | 10/31/18 | | | | (4 | ) | | | (400 | ) | | | (3,260 | ) | | | (3,967 | ) | | | 707 | |
S&P 500 Index | | | 2,795.00 USD | | | | 10/31/18 | | | | (3 | ) | | | (300 | ) | | | (2,655 | ) | | | (3,442 | ) | | | 787 | |
S&P 500 Index | | | 2,805.00 USD | | | | 10/31/18 | | | | (2 | ) | | | (200 | ) | | | (1,910 | ) | | | (4,015 | ) | | | 2,105 | |
S&P 500 Index | | | 2,735.00 USD | | | | 11/2/18 | | | | (5 | ) | | | (500 | ) | | | (3,200 | ) | | | (4,637 | ) | | | 1,437 | |
S&P 500 Index | | | 2,775.00 USD | | | | 11/2/18 | | | | (2 | ) | | | (200 | ) | | | (1,670 | ) | | | (1,559 | ) | | | (111 | ) |
S&P 500 Index | | | 2,790.00 USD | | | | 11/2/18 | | | | (4 | ) | | | (400 | ) | | | (3,740 | ) | | | (3,443 | ) | | | (297 | ) |
S&P 500 Index | | | 2,785.00 USD | | | | 11/5/18 | | | | (4 | ) | | | (400 | ) | | | (3,860 | ) | | | (3,739 | ) | | | (121 | ) |
S&P 500 Index | | | 2,700.00 USD | | | | 11/9/18 | | | | (4 | ) | | | (400 | ) | | | (3,100 | ) | | | (3,050 | ) | | | (50 | ) |
S&P 500 Index | | | 2,730.00 USD | | | | 11/9/18 | | | | (6 | ) | | | (600 | ) | | | (5,430 | ) | | | (5,588 | ) | | | 158 | |
S&P 500 Index | | | 2,770.00 USD | | | | 11/9/18 | | | | (2 | ) | | | (200 | ) | | | (2,330 | ) | | | (2,169 | ) | | | (161 | ) |
S&P 500 Index | | | 2,700.00 USD | | | | 11/16/18 | | | | (2 | ) | | | (200 | ) | | | (1,830 | ) | | | (2,559 | ) | | | 729 | |
S&P 500 Index | | | 2,730.00 USD | | | | 11/16/18 | | | | (2 | ) | | | (200 | ) | | | (2,150 | ) | | | (2,392 | ) | | | 242 | |
S&P 500 Index | | | 2,805.00 USD | | | | 11/16/18 | | | | (2 | ) | | | (200 | ) | | | (3,440 | ) | | | (5,715 | ) | | | 2,275 | |
S&P 500 Index | | | 2,600.00 USD | | | | 11/23/18 | | | | (4 | ) | | | (400 | ) | | | (2,660 | ) | | | (3,494 | ) | | | 834 | |
S&P 500 Index | | | 2,775.00 USD | | | | 11/23/18 | | | | (2 | ) | | | (200 | ) | | | (3,230 | ) | | | (4,215 | ) | | | 985 | |
S&P 500 Index | | | 2,700.00 USD | | | | 11/30/18 | | | | (2 | ) | | | (200 | ) | | | (2,570 | ) | | | (3,452 | ) | | | 882 | |
S&P 500 Index | | | 2,750.00 USD | | | | 12/21/18 | | | | (2 | ) | | | (200 | ) | | | (4,800 | ) | | | (5,815 | ) | | | 1,015 | |
S&P 500 Index | | | 2,750.00 USD | | | | 12/31/18 | | | | (2 | ) | | | (200 | ) | | | (5,310 | ) | | | (6,335 | ) | | | 1,025 | |
| | | | | | | | | | | | | | | | | | | | |
| Total put options | | | | | | | | | | | $ | (301,589 | ) | | $ | (576,121 | ) | | $ | 274,532 | |
| | | | | | | | | | | | | | | | | | | | |
| Total options written contracts | | | | | | | | | | | $ | (451,184 | ) | | $ | (804,779 | ) | | $ | 353,595 | |
| | | | | | | | | | | | | | | | | | | | |
(e) At September 30, 2018, the Fund pledged $662,782 in cash as collateral for options written.
Glossary:
CBOE—Chicago Board Options Exchange
VIX—Volatility Index
| | | | | | |
| 186 | | Annual Report | | | September 30, 2018 | | | See accompanying Notes to Financial Statements |
Schedule of Investments
September 30, 2018
AllianzGI PerformanceFee Structured US Fixed Income Fund
| | | | | | | | |
| | | Shares | | | Value | |
| Exchange-Traded Funds—99.6% | |
iShares Core U.S. Aggregate Bond (a)
(cost—$25,743,779) | | | 235,721 | | | | $24,873,280 | |
| | | | | | | | |
| |
| Total Options Purchased —0.1% (cost—$64,552) (b)(c)(d) | | | | 37,583 | |
| | | | | | | | |
| |
Total Investments, before
options written
(cost—$25,808,331)—99.7% | | | | 24,910,863 | |
| | | | | | | | |
| | | | | | | | |
| | | | | | Value | |
| |
Total Options Written —(0.2)%
(premiums received—$116,394) (b)(c)(d) | | | $ | (60,653 | ) |
| | | | | | | | |
| |
Total Investments, net of
options written
(cost—$25,691,937)—99.5% | | | | 24,850,210 | |
| | | | | | | | |
| | |
Other assets less
other liabilities—0.5% | | | | | | | 128,183 | |
| | | | | | | | |
| |
| Net Assets—100.0% | | | | $24,978,393 | |
| | | | | | | | |
Notes to Schedule of Investments:
(a) All or partial amount segregated for the benefit of the counterparty as collateral for options written.
(b) Non-income producing.
(c) Exchange traded-Chicago Board Options Exchange.
(d) Exchange traded option contracts outstanding at September 30, 2018:
| | | | | | | | | | | | | | | | | | | | | | | | | | | | |
| Options purchased contracts outstanding at September 30, 2018: | | | | | | | | | | |
| Description | | Exercise
Price | | | Expiration
Date | | | Number of
Contracts | | | Notional
Amount | | | Market
Value | | | Cost | | | Unrealized
Appreciation
(Depreciation) | |
Call options: | | | | | | | | | | | | | | | | | | | | | | | | | | | | |
iPATH S&P 500 VIX Short-Term | | | 40.00 USD | | | | 10/19/18 | | | | 7 | | | $ | 700 | | | $ | 122 | | | $ | 858 | | | $ | (736 | ) |
iPATH S&P 500 VIX Short-Term | | | 42.00 USD | | | | 10/19/18 | | | | 6 | | | | 600 | | | | 93 | | | | 813 | | | | (720 | ) |
iPATH S&P 500 VIX Short-Term | | | 36.00 USD | | | | 11/16/18 | | | | 7 | | | | 700 | | | | 696 | | | | 801 | | | | (105 | ) |
Russell 2000 Index | | | 1,700.00 USD | | | | 11/30/18 | | | | 1 | | | | 100 | | | | 3,755 | | | | 4,177 | | | | (422 | ) |
Russell 2000 Index | | | 2,450.00 USD | | | | 11/30/18 | | | | 6 | | | | 600 | | | | 135 | | | | 83 | | | | 52 | |
Russell 2000 Index | | | 1,990.00 USD | | | | 10/5/18 | | | | 1 | | | | 100 | | | | 3 | | | | 22 | | | | (19 | ) |
Russell 2000 Index | | | 2,100.00 USD | | | | 10/19/18 | | | | 2 | | | | 200 | | | | 10 | | | | 22 | | | | (12 | ) |
Russell 2000 Index | | | 2,200.00 USD | | | | 11/16/18 | | | | 1 | | | | 100 | | | | 7 | | | | 11 | | | | (4 | ) |
Russell 2000 Index | | | 2,500.00 USD | | | | 11/16/18 | | | | 1 | | | | 100 | | | | 5 | | | | 11 | | | | (6 | ) |
Russell 2000 Index | | | 1,790.00 USD | | | | 11/30/18 | | | | 2 | | | | 200 | | | | 950 | | | | 4,061 | | | | (3,111 | ) |
Russell 2000 Index | | | 2,400.00 USD | | | | 11/30/18 | | | | 1 | | | | 100 | | | | 22 | | | | 6 | | | | 16 | |
S&P 500 Index | | | 2,900.00 USD | | | | 11/16/18 | | | | 1 | | | | 100 | | | | 5,225 | | | | 2,923 | | | | 2,302 | |
S&P 500 Index | | | 3,300.00 USD | | | | 10/10/18 | | | | 1 | | | | 100 | | | | 3 | | | | 12 | | | | (9 | ) |
S&P 500 Index | | | 3,200.00 USD | | | | 10/17/18 | | | | 2 | | | | 200 | | | | 5 | | | | 53 | | | | (48 | ) |
S&P 500 Index | | | 3,700.00 USD | | | | 11/16/18 | | | | 1 | | | | 100 | | | | 3 | | | | 12 | | | | (9 | ) |
S&P 500 Index | | | 3,500.00 USD | | | | 11/30/18 | | | | 1 | | | | 100 | | | | 3 | | | | 17 | | | | (14 | ) |
| | | | | | | | | | | | | | | | | | | | |
| Total call options | | | | | | | | | | | $ | 11,037 | | | $ | 13,882 | | | $ | (2,845 | ) |
| | | | | | | | | | | | | | | | | | | | |
| | | | | | | |
Put options: | | | | | | | | | | | | | | | | | | | | | | | | | | | | |
Nasdaq 100 Stock Index | | | 3,700.00 USD | | | | 10/19/18 | | | | 2 | | | $ | 200 | | | $ | 80 | | | $ | 63 | | | $ | 17 | |
Russell 2000 Index | | | 850.00 USD | | | | 10/19/18 | | | | 2 | | | | 200 | | | | 5 | | | | 33 | | | | (28 | ) |
Russell 2000 Index | | | 800.00 USD | | | | 11/30/18 | | | | 3 | | | | 300 | | | | 75 | | | | 69 | | | | 6 | |
Russell 2000 Index | | | 1,620.00 USD | | | | 11/30/18 | | | | 1 | | | | 100 | | | | 1,440 | | | | 4,021 | | | | (2,581 | ) |
Russell 2000 Index | | | 1,000.00 USD | | | | 10/19/18 | | | | 3 | | | | 300 | | | | 8 | | | | 35 | | | | (27 | ) |
Russell 2000 Index | | | 1,690.00 USD | | | | 11/30/18 | | | | 2 | | | | 200 | | | | 6,210 | | | | 6,291 | | | | (81 | ) |
S&P 500 Index | | | 2,725.00 USD | | | | 11/16/18 | | | | 1 | | | | 100 | | | | 1,045 | | | | 4,806 | | | | (3,761 | ) |
S&P 500 Index | | | 1,800.00 USD | | | | 10/1/18 | | | | 1 | | | | 100 | | | | 3 | | | | 12 | | | | (9 | ) |
S&P 500 Index | | | 2,685.00 USD | | | | 10/1/18 | | | | 1 | | | | 100 | | | | 8 | | | | 243 | | | | (235 | ) |
S&P 500 Index | | | 2,795.00 USD | | | | 10/1/18 | | | | 1 | | | | 100 | | | | 22 | | | | 1,513 | | | | (1,491 | ) |
S&P 500 Index | | | 1,800.00 USD | | | | 10/3/18 | | | | 1 | | | | 100 | | | | 3 | | | | 22 | | | | (19 | ) |
S&P 500 Index | | | 2,705.00 USD | | | | 10/3/18 | | | | 1 | | | | 100 | | | | 42 | | | | 256 | | | | (214 | ) |
S&P 500 Index | | | 2,825.00 USD | | | | 10/3/18 | | | | 1 | | | | 100 | | | | 97 | | | | 1,362 | | | | (1,265 | ) |
S&P 500 Index | | | 1,500.00 USD | | | | 10/5/18 | | | | 11 | | | | 1,100 | | | | 27 | | | | 199 | | | | (172 | ) |
S&P 500 Index | | | 1,550.00 USD | | | | 10/5/18 | | | | 10 | | | | 1,000 | | | | 25 | | | | 176 | | | | (151 | ) |
S&P 500 Index | | | 1,600.00 USD | | | | 10/5/18 | | | | 6 | | | | 600 | | | | 15 | | | | 128 | | | | (113 | ) |
S&P 500 Index | | | 1,750.00 USD | | | | 10/5/18 | | | | 2 | | | | 200 | | | | 5 | | | | 32 | | | | (27 | ) |
S&P 500 Index | | | 1,900.00 USD | | | | 10/5/18 | | | | 1 | | | | 100 | | | | 3 | | | | 17 | | | | (14 | ) |
S&P 500 Index | | | 2,720.00 USD | | | | 10/5/18 | | | | 1 | | | | 100 | | | | 82 | | | | 272 | | | | (190 | ) |
S&P 500 Index | | | 2,840.00 USD | | | | 10/5/18 | | | | 1 | | | | 100 | | | | 225 | | | | 1,427 | | | | (1,202 | ) |
S&P 500 Index | | | 1,800.00 USD | | | | 10/8/18 | | | | 1 | | | | 100 | | | | 3 | | | | 17 | | | | (14 | ) |
S&P 500 Index | | | 2,705.00 USD | | | | 10/8/18 | | | | 1 | | | | 100 | | | | 102 | | | | 275 | | | | (173 | ) |
S&P 500 Index | | | 2,830.00 USD | | | | 10/8/18 | | | | 1 | | | | 100 | | | | 270 | | | | 1,615 | | | | (1,345 | ) |
| | | | | | | | |
| See accompanying Notes to Financial Statements | | | September 30, 2018 | | | Annual Report | | | 187 | |
Schedule of Investments
September 30, 2018
| | | | | | | | | | | | | | | | | | | | | | | | | | | | |
| Options purchased contracts outstanding at September 30, 2018 (continued): | | | | | | | | | | |
| Description | | Exercise
Price | | | Expiration
Date | | | Number of
Contracts | | | Notional
Amount | | | Market
Value | | | Cost | | | Unrealized
Appreciation
(Depreciation) | |
Put options (continued): | | | | | | | | | | | | | | | | | | | | | | | | | | | | |
S&P 500 Index | | | 2,700.00 USD | | | | 10/10/18 | | | | 1 | | | $ | 100 | | | $ | 142 | | | $ | 310 | | | $ | (168 | ) |
S&P 500 Index | | | 2,820.00 USD | | | | 10/10/18 | | | | 1 | | | | 100 | | | | 388 | | | | 1,713 | | | | (1,325 | ) |
S&P 500 Index | | | 1,300.00 USD | | | | 10/12/18 | | | | 8 | | | | 800 | | | | 20 | | | | 121 | | | | (101 | ) |
S&P 500 Index | | | 1,350.00 USD | | | | 10/12/18 | | | | 4 | | | | 400 | | | | 10 | | | | 58 | | | | (48 | ) |
S&P 500 Index | | | 1,400.00 USD | | | | 10/12/18 | | | | 3 | | | | 300 | | | | 8 | | | | 60 | | | | (52 | ) |
S&P 500 Index | | | 1,450.00 USD | | | | 10/12/18 | | | | 2 | | | | 200 | | | | 5 | | | | 27 | | | | (22 | ) |
S&P 500 Index | | | 1,500.00 USD | | | | 10/12/18 | | | | 1 | | | | 100 | | | | 3 | | | | 17 | | | | (14 | ) |
S&P 500 Index | | | 1,550.00 USD | | | | 10/12/18 | | | | 8 | | | | 800 | | | | 20 | | | | 128 | | | | (108 | ) |
S&P 500 Index | | | 2,690.00 USD | | | | 10/12/18 | | | | 1 | | | | 100 | | | | 172 | | | | 337 | | | | (165 | ) |
S&P 500 Index | | | 2,810.00 USD | | | | 10/12/18 | | | | 1 | | | | 100 | | | | 395 | | | | 1,730 | | | | (1,335 | ) |
S&P 500 Index | | | 2,680.00 USD | | | | 10/15/18 | | | | 1 | | | | 100 | | | | 187 | | | | 362 | | | | (175 | ) |
S&P 500 Index | | | 2,700.00 USD | | | | 10/15/18 | | | | 1 | | | | 100 | | | | 207 | | | | 391 | | | | (184 | ) |
S&P 500 Index | | | 2,800.00 USD | | | | 10/15/18 | | | | 1 | | | | 100 | | | | 405 | | | | 1,843 | | | | (1,438 | ) |
S&P 500 Index | | | 2,680.00 USD | | | | 10/17/18 | | | | 1 | | | | 100 | | | | 222 | | | | 242 | | | | (20 | ) |
S&P 500 Index | | | 2,800.00 USD | | | | 10/17/18 | | | | 1 | | | | 100 | | | | 495 | | | | 1,760 | | | | (1,265 | ) |
S&P 500 Index | | | 1,500.00 USD | | | | 10/19/18 | | | | 10 | | | | 1,000 | | | | 25 | | | | 158 | | | | (133 | ) |
S&P 500 Index | | | 1,675.00 USD | | | | 10/19/18 | | | | 1 | | | | 100 | | | | 3 | | | | 12 | | | | (9 | ) |
S&P 500 Index | | | 1,800.00 USD | | | | 10/19/18 | | | | 8 | | | | 800 | | | | 20 | | | | 119 | | | | (99 | ) |
S&P 500 Index | | | 2,695.00 USD | | | | 10/19/18 | | | | 1 | | | | 100 | | | | 267 | | | | 292 | | | | (25 | ) |
S&P 500 Index | | | 2,815.00 USD | | | | 10/19/18 | | | | 1 | | | | 100 | | | | 625 | | | | 1,644 | | | | (1,019 | ) |
S&P 500 Index | | | 1,800.00 USD | | | | 10/22/18 | | | | 4 | | | | 400 | | | | 20 | | | | 82 | | | | (62 | ) |
S&P 500 Index | | | 2,830.00 USD | | | | 10/22/18 | | | | 1 | | | | 100 | | | | 825 | | | | 1,381 | | | | (556 | ) |
S&P 500 Index | | | 2,720.00 USD | | | | 10/24/18 | | | | 1 | | | | 100 | | | | 395 | | | | 381 | | | | 14 | |
S&P 500 Index | | | 2,830.00 USD | | | | 10/24/18 | | | | 1 | | | | 100 | | | | 1,003 | | | | 1,402 | | | | (399 | ) |
S&P 500 Index | | | 1,500.00 USD | | | | 10/26/18 | | | | 1 | | | | 100 | | | | 3 | | | | 16 | | | | (13 | ) |
S&P 500 Index | | | 1,700.00 USD | | | | 10/26/18 | | | | 8 | | | | 800 | | | | 40 | | | | 153 | | | | (113 | ) |
S&P 500 Index | | | 1,750.00 USD | | | | 10/26/18 | | | | 4 | | | | 400 | | | | 20 | | | | 74 | | | | (54 | ) |
S&P 500 Index | | | 2,835.00 USD | | | | 10/26/18 | | | | 1 | | | | 100 | | | | 1,065 | | | | 1,504 | | | | (439 | ) |
S&P 500 Index | | | 1,800.00 USD | | | | 10/29/18 | | | | 8 | | | | 800 | | | | 60 | | | | 201 | | | | (141 | ) |
S&P 500 Index | | | 2,860.00 USD | | | | 10/29/18 | | | | 1 | | | | 100 | | | | 1,445 | | | | 1,307 | | | | 138 | |
S&P 500 Index | | | 1,300.00 USD | | | | 10/31/18 | | | | 2 | | | | 200 | | | | 5 | | | | 43 | | | | (38 | ) |
S&P 500 Index | | | 1,500.00 USD | | | | 10/31/18 | | | | 1 | | | | 100 | | | | 3 | | | | 17 | | | | (14 | ) |
S&P 500 Index | | | 2,845.00 USD | | | | 10/31/18 | | | | 1 | | | | 100 | | | | 1,355 | | | | 1,597 | | | | (242 | ) |
S&P 500 Index | | | 2,850.00 USD | | | | 11/2/18 | | | | 1 | | | | 100 | | | | 1,555 | | | | 1,425 | | | | 130 | |
S&P 500 Index | | | 2,845.00 USD | | | | 11/5/18 | | | | 1 | | | | 100 | | | | 1,565 | | | | 1,543 | | | | 22 | |
S&P 500 Index | | | 1,300.00 USD | | | | 11/16/18 | | | | 5 | | | | 500 | | | | 25 | | | | 83 | | | | (58 | ) |
S&P 500 Index | | | 1,425.00 USD | | | | 11/16/18 | | | | 3 | | | | 300 | | | | 23 | | | | 51 | | | | (28 | ) |
S&P 500 Index | | | 2,905.00 USD | | | | 11/16/18 | | | | 1 | | | | 100 | | | | 3,725 | | | | 5,202 | | | | (1,477 | ) |
| | | | | | | | | | | | | | | | | | | | | | | | | | | | |
| Total put options | | | | | | | | | | | $ | 26,546 | | | $ | 50,670 | | | $ | (24,124 | ) |
| | | | | | | | | | | | | | | | | | | | | | | | | | | | |
| Total options purchased contracts | | | | | | | | | | | $ | 37,583 | | | $ | 64,552 | | | $ | (26,969 | ) |
| | | | | | | | | | | | | | | | | | | | | | | | | | | | |
| | | | | | | | | | | | | | | | | | | | | | | | | | | | |
| Options written contracts outstanding at September 30, 2018: | | | | | | | | | | |
| Description | | Exercise
Price | | | Expiration
Date | | | Number of
Contracts | | | Notional
Amount | | | Market
Value | | | Premiums
Received | | | Unrealized
Appreciation
(Depreciation) | |
Call options: | | | | | | | | | | | | | | | | | | | | | | | | | | | | |
CBOE SPX Volatility Index | | | 25.00 USD | | | | 11/21/18 | | | | (6 | ) | | $ | (600 | ) | | $ | (330 | ) | | $ | (393 | ) | | $ | 63 | |
CBOE SPX Volatility Index | | | 23.00 USD | | | | 10/17/18 | | | | (8 | ) | | | (800 | ) | | | (180 | ) | | | (550 | ) | | | 370 | |
CBOE SPX Volatility Index | | | 24.00 USD | | | | 10/17/18 | | | | (11 | ) | | | (1,100 | ) | | | (220 | ) | | | (616 | ) | | | 396 | |
CBOE SPX Volatility Index | | | 25.00 USD | | | | 10/17/18 | | | | (22 | ) | | | (2,200 | ) | | | (440 | ) | | | (1,222 | ) | | | 782 | |
CBOE SPX Volatility Index | | | 26.00 USD | | | | 10/17/18 | | | | (12 | ) | | | (1,200 | ) | | | (210 | ) | | | (629 | ) | | | 419 | |
CBOE SPX Volatility Index | | | 27.00 USD | | | | 10/17/18 | | | | (3 | ) | | | (300 | ) | | | (45 | ) | | | (166 | ) | | | 121 | |
CBOE SPX Volatility Index | | | 28.00 USD | | | | 10/17/18 | | | | (5 | ) | | | (500 | ) | | | (75 | ) | | | (261 | ) | | | 186 | |
CBOE SPX Volatility Index | | | 26.00 USD | | | | 11/21/18 | | | | (13 | ) | | | (1,300 | ) | | | (683 | ) | | | (706 | ) | | | 23 | |
CBOE SPX Volatility Index | | | 27.00 USD | | | | 11/21/18 | | | | (5 | ) | | | (500 | ) | | | (225 | ) | | | (277 | ) | | | 52 | |
CBOE SPX Volatility Index | | | 28.00 USD | | | | 11/21/18 | | | | (6 | ) | | | (600 | ) | | | (270 | ) | | | (423 | ) | | | 153 | |
CBOE SPX Volatility Index | | | 29.00 USD | | | | 11/21/18 | | | | (15 | ) | | | (1,500 | ) | | | (600 | ) | | | (937 | ) | | | 337 | |
| | | | | | |
| 188 | | Annual Report | | | September 30, 2018 | | | See accompanying Notes to Financial Statements |
Schedule of Investments
September 30, 2018
| | | | | | | | | | | | | | | | | | | | | | | | | | | | |
| Options written contracts outstanding at September 30, 2018 (continued): | | | | | | | | | | |
| Description | | Exercise
Price | | | Expiration
Date | | | Number of
Contracts | | | Notional
Amount | | | Market
Value | | | Premiums
Received | | | Unrealized
Appreciation
(Depreciation) | |
Call options (continued): | | | | | | | | | | | | | | | | | | | | | | | | | | | | |
CBOE SPX Volatility Index | | | 30.00 USD | | | | 11/21/18 | | | | (3 | ) | | $ | (300 | ) | | $ | (112 | ) | | $ | (184 | ) | | $ | 72 | |
CBOE SPX Volatility Index | | | 29.00 USD | | | | 12/19/18 | | | | (6 | ) | | | (600 | ) | | | (345 | ) | | | (369 | ) | | | 24 | |
iPATH S&P 500 VIX Short-Term | | | 47.00 USD | | | | 10/5/18 | | | | (6 | ) | | | (600 | ) | | | (12 | ) | | | (339 | ) | | | 327 | |
iPATH S&P 500 VIX Short-Term | | | 34.00 USD | | | | 10/19/18 | | | | (6 | ) | | | (600 | ) | | | (219 | ) | | | (309 | ) | | | 90 | |
iPATH S&P 500 VIX Short-Term | | | 50.00 USD | | | | 10/19/18 | | | | (10 | ) | | | (1,000 | ) | | | (75 | ) | | | (709 | ) | | | 634 | |
iPATH S&P 500 VIX Short-Term | | | 52.00 USD | | | | 10/19/18 | | | | (7 | ) | | | (700 | ) | | | (350 | ) | | | (444 | ) | | | 94 | |
iPATH S&P 500 VIX Short-Term | | | 58.00 USD | | | | 10/19/18 | | | | (6 | ) | | | (600 | ) | | | (36 | ) | | | (387 | ) | | | 351 | |
iPATH S&P 500 VIX Short-Term | | | 40.00 USD | | | | 10/26/18 | | | | (1 | ) | | | (100 | ) | | | (33 | ) | | | (41 | ) | | | 8 | |
iPATH S&P 500 VIX Short-Term | | | 36.00 USD | | | | 11/2/18 | | | | (6 | ) | | | (600 | ) | | | (378 | ) | | | (428 | ) | | | 50 | |
iPATH S&P 500 VIX Short-Term | | | 41.00 USD | | | | 11/16/18 | | | | (4 | ) | | | (400 | ) | | | (306 | ) | | | (298 | ) | | | (8 | ) |
iPATH S&P 500 VIX Short-Term | | | 42.00 USD | | | | 11/16/18 | | | | (10 | ) | | | (1,000 | ) | | | (670 | ) | | | (692 | ) | | | 22 | |
iPATH S&P 500 VIX Short-Term | | | 45.00 USD | | | | 11/16/18 | | | | (9 | ) | | | (900 | ) | | | (531 | ) | | | (612 | ) | | | 81 | |
iPATH S&P 500 VIX Short-Term | | | 46.00 USD | | | | 11/16/18 | | | | (4 | ) | | | (400 | ) | | | (212 | ) | | | (278 | ) | | | 66 | |
iPATH S&P 500 VIX Short-Term | | | 50.00 USD | | | | 11/16/18 | | | | (7 | ) | | | (700 | ) | | | (336 | ) | | | (318 | ) | | | (18 | ) |
iPATH S&P 500 VIX Short-Term | | | 53.00 USD | | | | 11/16/18 | | | | (6 | ) | | | (600 | ) | | | (231 | ) | | | (507 | ) | | | 276 | |
Russell 2000 Index | | | 1,800.00 USD | | | | 10/19/18 | | | | (1 | ) | | | (100 | ) | | | (30 | ) | | | (326 | ) | | | 296 | |
Russell 2000 Index | | | 1,770.00 USD | | | | 11/30/18 | | | | (3 | ) | | | (300 | ) | | | (2,490 | ) | | | (4,231 | ) | | | 1,741 | |
Russell 2000 Index | | | 1,835.00 USD | | | | 10/5/18 | | | | (1 | ) | | | (100 | ) | | | (5 | ) | | | (95 | ) | | | 90 | |
Russell 2000 Index | | | 1,810.00 USD | | | | 10/19/18 | | | | (1 | ) | | | (100 | ) | | | (25 | ) | | | (443 | ) | | | 418 | |
Russell 2000 Index | | | 1,815.00 USD | | | | 10/19/18 | | | | (2 | ) | | | (200 | ) | | | (45 | ) | | | (193 | ) | | | 148 | |
Russell 2000 Index | | | 1,830.00 USD | | | | 11/16/18 | | | | (1 | ) | | | (100 | ) | | | (92 | ) | | | (447 | ) | | | 355 | |
Russell 2000 Index | | | 1,835.00 USD | | | | 11/16/18 | | | | (1 | ) | | | (100 | ) | | | (85 | ) | | | (297 | ) | | | 212 | |
Russell 2000 Index | | | 1,830.00 USD | | | | 11/30/18 | | | | (1 | ) | | | (100 | ) | | | (158 | ) | | | (648 | ) | | | 490 | |
Russell 2000 Index | | | 1,840.00 USD | | | | 11/30/18 | | | | (6 | ) | | | (600 | ) | | | (735 | ) | | | (3,869 | ) | | | 3,134 | |
S&P 500 Index | | | 3,000.00 USD | | | | 11/16/18 | | | | (3 | ) | | | (300 | ) | | | (2,235 | ) | | | (1,813 | ) | | | (422 | ) |
S&P 500 Index | | | 3,030.00 USD | | | | 10/10/18 | | | | (1 | ) | | | (100 | ) | | | (10 | ) | | | (132 | ) | | | 122 | |
S&P 500 Index | | | 3,025.00 USD | | | | 10/17/18 | | | | (2 | ) | | | (200 | ) | | | (130 | ) | | | (287 | ) | | | 157 | |
S&P 500 Index | | | 3,040.00 USD | | | | 11/16/18 | | | | (1 | ) | | | (100 | ) | | | (305 | ) | | | (452 | ) | | | 147 | |
S&P 500 Index | | | 3,040.00 USD | | | | 11/30/18 | | | | (1 | ) | | | (100 | ) | | | (515 | ) | | | (677 | ) | | | 162 | |
| | | | | | | | | | | | | | | | | | | | |
| Total call options | | | | | | | | | | | $ | (13,984 | ) | | $ | (26,005 | ) | | $ | 12,021 | |
| | | | | | | | | | | | | | | | | | | | |
| | | | | | | |
Put options: | | | | | | | | | | | | | | | | | | | | | | | | | | | | |
Nasdaq 100 Stock Index | | | 6,550.00 USD | | | | 10/19/18 | | | | (1 | ) | | $ | (100 | ) | | $ | (295 | ) | | $ | (2,248 | ) | | $ | 1,953 | |
Nasdaq 100 Stock Index | | | 6,725.00 USD | | | | 11/16/18 | | | | (1 | ) | | | (100 | ) | | | (2,235 | ) | | | (3,298 | ) | | | 1,063 | |
Russell 2000 Index | | | 1,520.00 USD | | | | 11/30/18 | | | | (2 | ) | | | (200 | ) | | | (1,100 | ) | | | (4,005 | ) | | | 2,905 | |
Russell 2000 Index | | | 1,520.00 USD | | | | 10/19/18 | | | | (1 | ) | | | (100 | ) | | | (90 | ) | | | (647 | ) | | | 557 | |
Russell 2000 Index | | | 1,570.00 USD | | | | 10/19/18 | | | | (1 | ) | | | (100 | ) | | | (147 | ) | | | (462 | ) | | | 315 | |
Russell 2000 Index | | | 1,610.00 USD | | | | 10/19/18 | | | | (1 | ) | | | (100 | ) | | | (260 | ) | | | (961 | ) | | | 701 | |
Russell 2000 Index | | | 1,615.00 USD | | | | 10/19/18 | | | | (1 | ) | | | (100 | ) | | | (285 | ) | | | (541 | ) | | | 256 | |
Russell 2000 Index | | | 1,650.00 USD | | | | 10/19/18 | | | | (1 | ) | | | (100 | ) | | | (565 | ) | | | (1,097 | ) | | | 532 | |
Russell 2000 Index | | | 1,620.00 USD | | | | 11/16/18 | | | | (1 | ) | | | (100 | ) | | | (1,075 | ) | | | (1,007 | ) | | | (68 | ) |
Russell 2000 Index | | | 1,600.00 USD | | | | 11/30/18 | | | | (2 | ) | | | (200 | ) | | | (2,340 | ) | | | (2,627 | ) | | | 287 | |
Russell 2000 Index | | | 1,610.00 USD | | | | 11/30/18 | | | | (2 | ) | | | (200 | ) | | | (2,600 | ) | | | (3,262 | ) | | | 662 | |
S&P 500 Index | | | 2,620.00 USD | | | | 11/16/18 | | | | (2 | ) | | | (200 | ) | | | (1,250 | ) | | | (6,101 | ) | | | 4,851 | |
S&P 500 Index | | | 2,740.00 USD | | | | 10/1/18 | | | | (2 | ) | | | (200 | ) | | | (30 | ) | | | (1,859 | ) | | | 1,829 | |
S&P 500 Index | | | 2,765.00 USD | | | | 10/3/18 | | | | (2 | ) | | | (200 | ) | | | (120 | ) | | | (1,614 | ) | | | 1,494 | |
S&P 500 Index | | | 2,610.00 USD | | | | 10/5/18 | | | | (1 | ) | | | (100 | ) | | | (40 | ) | | | (923 | ) | | | 883 | |
S&P 500 Index | | | 2,780.00 USD | | | | 10/5/18 | | | | (2 | ) | | | (200 | ) | | | (235 | ) | | | (1,725 | ) | | | 1,490 | |
S&P 500 Index | | | 2,765.00 USD | | | | 10/8/18 | | | | (1 | ) | | | (100 | ) | | | (142 | ) | | | (944 | ) | | | 802 | |
S&P 500 Index | | | 2,770.00 USD | | | | 10/8/18 | | | | (1 | ) | | | (100 | ) | | | (147 | ) | | | (978 | ) | | | 831 | |
S&P 500 Index | | | 2,705.00 USD | | | | 10/10/18 | | | | (2 | ) | | | (200 | ) | | | (295 | ) | | | (1,375 | ) | | | 1,080 | |
S&P 500 Index | | | 2,760.00 USD | | | | 10/10/18 | | | | (2 | ) | | | (200 | ) | | | (368 | ) | | | (2,075 | ) | | | 1,707 | |
S&P 500 Index | | | 2,710.00 USD | | | | 10/12/18 | | | | (1 | ) | | | (100 | ) | | | (192 | ) | | | (749 | ) | | | 557 | |
S&P 500 Index | | | 2,730.00 USD | | | | 10/12/18 | | | | (2 | ) | | | (200 | ) | | | (425 | ) | | | (1,367 | ) | | | 942 | |
S&P 500 Index | | | 2,740.00 USD | | | | 10/12/18 | | | | (1 | ) | | | (100 | ) | | | (228 | ) | | | (783 | ) | | | 555 | |
S&P 500 Index | | | 2,750.00 USD | | | | 10/12/18 | | | | (2 | ) | | | (200 | ) | | | (485 | ) | | | (2,169 | ) | | | 1,684 | |
S&P 500 Index | | | 2,740.00 USD | | | | 10/15/18 | | | | (2 | ) | | | (200 | ) | | | (515 | ) | | | (2,362 | ) | | | 1,847 | |
S&P 500 Index | | | 2,760.00 USD | | | | 10/15/18 | | | | (2 | ) | | | (200 | ) | | | (590 | ) | | | (1,257 | ) | | | 667 | |
S&P 500 Index | | | 2,770.00 USD | | | | 10/15/18 | | | | (2 | ) | | | (200 | ) | | | (630 | ) | | | (1,170 | ) | | | 540 | |
| | | | | | | | |
| See accompanying Notes to Financial Statements | | | September 30, 2018 | | | Annual Report | | | 189 | |
Schedule of Investments
September 30, 2018
| | | | | | | | | | | | | | | | | | | | | | | | | | | | |
| Options written contracts outstanding at September 30, 2018 (continued): | | | | | | | | | | |
| Description | | Exercise
Price | | | Expiration
Date | | | Number of
Contracts | | | Notional
Amount | | | Market
Value | | | Premiums
Received | | | Unrealized
Appreciation
(Depreciation) | |
Put options (continued): | | | | | | | | | | | | | | | | | | | | | | | | | | | | |
S&P 500 Index | | | 2,690.00 USD | | | | 10/17/18 | | | | (1 | ) | | $ | (100 | ) | | $ | (233 | ) | | $ | (662 | ) | | $ | 429 | |
S&P 500 Index | | | 2,725.00 USD | | | | 10/17/18 | | | | (1 | ) | | | (100 | ) | | | (285 | ) | | | (630 | ) | | | 345 | |
S&P 500 Index | | | 2,740.00 USD | | | | 10/17/18 | | | | (2 | ) | | | (200 | ) | | | (630 | ) | | | (2,204 | ) | | | 1,574 | |
S&P 500 Index | | | 2,750.00 USD | | | | 10/17/18 | | | | (1 | ) | | | (100 | ) | | | (335 | ) | | | (621 | ) | | | 286 | |
S&P 500 Index | | | 2,650.00 USD | | | | 10/19/18 | | | | (1 | ) | | | (100 | ) | | | (213 | ) | | | (792 | ) | | | 579 | |
S&P 500 Index | | | 2,735.00 USD | | | | 10/19/18 | | | | (1 | ) | | | (100 | ) | | | (335 | ) | | | (1,163 | ) | | | 828 | |
S&P 500 Index | | | 2,740.00 USD | | | | 10/19/18 | | | | (1 | ) | | | (100 | ) | | | (345 | ) | | | (622 | ) | | | 277 | |
S&P 500 Index | | | 2,745.00 USD | | | | 10/19/18 | | | | (1 | ) | | | (100 | ) | | | (360 | ) | | | (1,343 | ) | | | 983 | |
S&P 500 Index | | | 2,750.00 USD | | | | 10/19/18 | | | | (1 | ) | | | (100 | ) | | | (375 | ) | | | (621 | ) | | | 246 | |
S&P 500 Index | | | 2,755.00 USD | | | | 10/19/18 | | | | (2 | ) | | | (200 | ) | | | (770 | ) | | | (1,997 | ) | | | 1,227 | |
S&P 500 Index | | | 2,760.00 USD | | | | 10/19/18 | | | | (2 | ) | | | (200 | ) | | | (790 | ) | | | (1,129 | ) | | | 339 | |
S&P 500 Index | | | 2,770.00 USD | | | | 10/22/18 | | | | (2 | ) | | | (200 | ) | | | (970 | ) | | | (1,648 | ) | | | 678 | |
S&P 500 Index | | | 2,780.00 USD | | | | 10/22/18 | | | | (1 | ) | | | (100 | ) | | | (525 | ) | | | (578 | ) | | | 53 | |
S&P 500 Index | | | 2,790.00 USD | | | | 10/22/18 | | | | (3 | ) | | | (300 | ) | | | (1,710 | ) | | | (1,738 | ) | | | 28 | |
S&P 500 Index | | | 2,775.00 USD | | | | 10/24/18 | | | | (2 | ) | | | (200 | ) | | | (1,224 | ) | | | (1,795 | ) | | | 571 | |
S&P 500 Index | | | 2,750.00 USD | | | | 10/26/18 | | | | (2 | ) | | | (200 | ) | | | (1,070 | ) | | | (1,299 | ) | | | 229 | |
S&P 500 Index | | | 2,765.00 USD | | | | 10/26/18 | | | | (2 | ) | | | (200 | ) | | | (1,190 | ) | | | (1,352 | ) | | | 162 | |
S&P 500 Index | | | 2,770.00 USD | | | | 10/26/18 | | | | (1 | ) | | | (100 | ) | | | (615 | ) | | | (598 | ) | | | (17 | ) |
S&P 500 Index | | | 2,780.00 USD | | | | 10/26/18 | | | | (2 | ) | | | (200 | ) | | | (1,330 | ) | | | (1,885 | ) | | | 555 | |
S&P 500 Index | | | 2,790.00 USD | | | | 10/26/18 | | | | (1 | ) | | | (100 | ) | | | (715 | ) | | | (620 | ) | | | (95 | ) |
S&P 500 Index | | | 2,770.00 USD | | | | 10/29/18 | | | | (1 | ) | | | (100 | ) | | | (655 | ) | | | (587 | ) | | | (68 | ) |
S&P 500 Index | | | 2,775.00 USD | | | | 10/29/18 | | | | (3 | ) | | | (300 | ) | | | (2,025 | ) | | | (2,087 | ) | | | 62 | |
S&P 500 Index | | | 2,805.00 USD | | | | 10/29/18 | | | | (2 | ) | | | (200 | ) | | | (1,710 | ) | | | (1,634 | ) | | | (76 | ) |
S&P 500 Index | | | 2,710.00 USD | | | | 10/31/18 | | | | (1 | ) | | | (100 | ) | | | (495 | ) | | | (1,157 | ) | | | 662 | |
S&P 500 Index | | | 2,785.00 USD | | | | 10/31/18 | | | | (2 | ) | | | (200 | ) | | | (1,630 | ) | | | (1,984 | ) | | | 354 | |
S&P 500 Index | | | 2,735.00 USD | | | | 11/2/18 | | | | (1 | ) | | | (100 | ) | | | (640 | ) | | | (927 | ) | | | 287 | |
S&P 500 Index | | | 2,790.00 USD | | | | 11/2/18 | | | | (2 | ) | | | (200 | ) | | | (1,870 | ) | | | (1,722 | ) | | | (148 | ) |
S&P 500 Index | | | 2,785.00 USD | | | | 11/5/18 | | | | (2 | ) | | | (200 | ) | | | (1,930 | ) | | | (1,869 | ) | | | (61 | ) |
S&P 500 Index | | | 2,730.00 USD | | | | 11/9/18 | | | | (1 | ) | | | (100 | ) | | | (905 | ) | | | (931 | ) | | | 26 | |
S&P 500 Index | | | 2,805.00 USD | | | | 11/16/18 | | | | (2 | ) | | | (200 | ) | | | (3,440 | ) | | | (5,715 | ) | | | 2,275 | |
S&P 500 Index | | | 2,600.00 USD | | | | 11/23/18 | | | | (1 | ) | | | (100 | ) | | | (665 | ) | | | (873 | ) | | | 208 | |
| | | | | | | | | | | | | | | | | | | | |
| Total put options | | | | | | | | | | | $ | (46,669 | ) | | $ | (90,389 | ) | | $ | 43,720 | |
| | | | | | | | | | | | | | | | | | | | |
| Total options written contracts | | | | | | | | | | | $ | (60,653 | ) | | $ | (116,394 | ) | | $ | 55,741 | |
| | | | | | | | | | | | | | | | | | | | |
(e) At September 30, 2018, the Fund pledged $213,961 in cash as collateral for options written.
Glossary:
CBOE—Chicago Board Options Exchange
VIX—Volatility Index
| | | | | | |
| 190 | | Annual Report | | | September 30, 2018 | | | See accompanying Notes to Financial Statements |
Schedule of Investments
September 30, 2018
AllianzGI Preferred Securities and Income Fund
| | | | | | | | |
| | | Principal
Amount
(000s) | | | Value | |
| Corporate Bonds & Notes—90.0% | |
| Banks—52.9% | | | | | | | | |
Bank of America Corp., Ser. FF, (converts to FRN on 3/15/28) (c)(d), | | | | | | | | |
5.875%, 3/15/28 | | | $460 | | | | $460,862 | |
Bank of New York Mellon Corp., Ser. E, (converts to FRN on 6/20/20) (c)(d), | | | | | | | | |
4.95%, 6/20/20 | | | 200 | | | | 204,125 | |
Capital One Financial Corp., Ser. E, (converts to FRN on 6/1/20) (c)(d), | | | | | | | | |
5.55%, 6/1/20 | | | 200 | | | | 204,000 | |
Citigroup, Inc., Ser. P, (converts to FRN on 5/15/25) (c)(d), | | | | | | | | |
5.95%, 5/15/25 | | | 470 | | | | 474,700 | |
Citizens Financial Group, Inc., Ser. B, (converts to FRN on 7/6/23) (c)(d), | | | | | | | | |
6.00%, 7/6/23 | | | 355 | | | | 362,988 | |
Fifth Third Bancorp, (converts to FRN on 6/30/23) (c)(d), | | | | | | | | |
5.10%, 6/30/23 | | | 200 | | | | 196,500 | |
First Maryland Capital II, 3 mo. LIBOR + 0.850% (d), | | | | | | | | |
3.193%, 2/1/27 | | | 625 | | | | 589,062 | |
Huntington Bancshares, Inc., Ser. E, (converts to FRN on 4/15/23) (c)(d), | | | | | | | | |
5.70%, 4/15/23 | | | 235 | | | | 233,384 | |
JPMorgan Chase & Co., 3 mo. LIBOR + 0.950% (d), | | | | | | | | |
3.299%, 2/2/37 | | | 605 | | | | 537,694 | |
KeyCorp, Ser. D, (converts to FRN on 9/15/26) (c)(d), | | | | | | | | |
5.00%, 9/15/26 | | | 235 | | | | 230,888 | |
Lloyds Banking Group PLC, (converts to FRN on 6/27/24) (c)(d), | | | | | | | | |
7.50%, 6/27/24 | | | 225 | | | | 232,594 | |
Royal Bank of Scotland Group PLC, 3 mo. LIBOR + 1.550% (d), | | | | | | | | |
3.92%, 6/25/24 | | | 325 | | | | 327,328 | |
State Street Corp., Ser. F, (converts to FRN on 9/15/20) (c)(d), | | | | | | | | |
5.25%, 9/15/20 | | | 190 | | | | 194,631 | |
SunTrust Capital I, 3 mo. LIBOR + 0.670%, Ser. A (d), | | | | | | | | |
2.98%, 5/15/27 | | | 590 | | | | 549,954 | |
U.S. Bancorp, Ser. J, (converts to FRN on 4/15/27) (c)(d), | | | | | | | | |
5.30%, 4/15/27 | | | 590 | | | | 591,721 | |
Wells Fargo & Co., Ser. S, (converts to FRN on 6/15/24) (c)(d), | | | | | | | | |
5.90%, 6/15/24 | | | 790 | | | | 803,825 | |
| | | | | | | | |
| | | | | | | 6,194,256 | |
| | | | | | | | |
| Diversified Financial Services—3.8% | |
American Express Co., Ser. C, (converts to FRN on 3/15/20) (c)(d), | | | | | | | | |
4.90%, 3/15/20 | | | 235 | | | | 235,147 | |
| | | | | | | | |
| | | Principal
Amount
(000s) | | | Value | |
Discover Financial Services, Ser. C, (converts to FRN on 10/30/27) (c)(d), | | | | | | | | |
5.50%, 10/30/27 | | $ | 210 | | | $ | 207,637 | |
| | | | | | | | |
| | | | | | | 442,784 | |
| | | | | | | | |
| Electric Utilities—8.2% | | | | | | | | |
Emera, Inc., Ser. 16-A, (converts to FRN on 6/15/26) (d), | | | | | | | | |
6.75%, 6/15/76 | | | 270 | | | | 288,225 | |
NextEra Energy Capital Holdings, Inc., (converts to FRN on 12/1/27) (d), | | | | | | | | |
4.80%, 12/1/77 | | | 450 | | | | 424,185 | |
Southern California Edison Co., 3 mo. LIBOR + 4.199%, Ser. E, (converts to FRN on 2/1/22) (c)(d), | | | | | | | | |
6.25%, 2/1/22 | | | 240 | | | | 253,303 | |
| | | | | | | | |
| | | | | | | 965,713 | |
| | | | | | | | |
| Insurance—10.0% | | | | | | | | |
Lincoln National Corp., 3 mo. LIBOR + 2.358% (d), | | | | | | | | |
4.669%, 5/17/66 | | | 245 | | | | 230,683 | |
MetLife, Inc. (a)(b), | | | | | | | | |
9.25%, 4/8/38 | | | 175 | | | | 235,667 | |
Progressive Corp., Ser. B, (converts to FRN on 3/15/23) (c)(d), | | | | | | | | |
5.375%, 3/15/23 | | | 235 | | | | 234,647 | |
Prudential Financial, Inc., (converts to FRN on 9/15/28) (d), | | | | | | | | |
5.70%, 9/15/48 | | | 235 | | | | 234,343 | |
Voya Financial, Inc., (converts to FRN on 1/23/28) (a)(b)(d), | | | | | | | | |
4.70%, 1/23/48 | | | 260 | | | | 232,050 | |
| | | | | | | | |
| | | | | | | 1,167,390 | |
| | | | | | | | |
| Media—2.2% | | | | | | | | |
NBCUniversal Enterprise, Inc. (a)(b)(c), | | | | | | | | |
5.25%, 3/19/21 | | | 250 | | | | 253,563 | |
| | | | | | | | |
| Mining—3.5% | | | | | | | | |
BHP Billiton Finance USA Ltd., (converts to FRN on 10/20/25) (a)(b)(d), | | | | | | | | |
6.75%, 10/19/75 | | | 380 | | | | 416,761 | |
| | | | | | | | |
| Miscellaneous Manufacturing—5.9% | |
General Electric Co., 3 mo. LIBOR + 3.33%, Ser. D, (converts to FRN on 1/21/21) (c)(d), | | | | | | | | |
5.00%, 1/21/21 | | | 705 | | | | 687,780 | |
| | | | | | | | |
| Pipelines—3.5% | | | | | | | | |
Plains All American Pipeline L.P., Ser. B, (converts to FRN on 11/15/22) (c)(d), | | | | | | | | |
6.125%, 11/15/22 | | | 425 | | | | 414,906 | |
| | | | | | | | |
Total Corporate Bonds & Notes
(cost—$10,548,376) | | | | 10,543,153 | |
| | | | | | | | |
| | | | | | | | |
| | | | | | | | |
| | | Shares | | | Value | |
| Convertible Preferred Stock (c)(d)—5.8% | |
| Banks—3.8% | | | | | | | | |
Regions Financial Corp., Ser. B, (converts to FRN on 9/15/24), | | | | | | | | |
6.375%, 9/15/24 | | | 8,720 | | | $ | 231,167 | |
Synovus Financial Corp., Ser. D, (converts to FRN on 6/21/23), | | | | | | | | |
6.30%, 6/21/23 | | | 8,235 | | | | 215,922 | |
| | | | | | | | |
| | | | | | | 447,089 | |
| | | | | | | | |
| Capital Markets—2.0% | | | | | | | | |
State Street Corp., Ser. G, (converts to FRN on 3/15/26), | | | | | | | | |
5.35%, 3/15/26 | | | 9,120 | | | | 234,475 | |
| | | | | | | | |
Total Convertible Preferred Stock (cost—$679,473) | | | | 681,564 | |
| | | | | | | | |
| | | | | | | | |
| | | Principal
Amount
(000s) | | | | |
| Repurchase Agreements—3.3% | |
State Street Bank and Trust Co., dated 9/28/18, 0.42%, due 10/1/18, proceeds $388,014; collateralized by U.S. Treasury Notes, 1.75%, due 11/30/21, valued at $397,955 including accrued interest | |
(cost—$388,000) | | | $388 | | | | 388,000 | |
| | | | | | | | |
| |
Total Investments
(cost—$11,615,849)—99.1% | | | | 11,612,717 | |
| | | | | | | | |
| | |
Other assets less
liabilities—0.9% | | | | | | | 102,319 | |
| | | | | | | | |
| | |
| Net Assets—100.0% | | | | | | | $11,715,036 | |
| | | | | | | | |
Notes to Schedule of Investments:
(a) Private Placement—Restricted as to resale and may not have a readily available market. Securities with an aggregate value of $1,138,041, representing 9.7% of net assets.
(b) 144A—Exempt from registration under Rule 144A of the Securities Act of 1933. These securities may be resold in transactions exempt from registration, typically only to qualified institutional buyers. Securities with an aggregate value of $1,138,041, representing 9.7% of net assets.
(c) Perpetual maturity. The date shown, if any, is the next call date.
(d) Variable or Floating Rate Security—Securities with an interest rate that changes periodically. The interest rate disclosed reflects the rate in effect on September 30, 2018.
Glossary:
FRN—Floating Rate Note
LIBOR—London Inter-Bank Offered Rate
| | | | | | | | |
| See accompanying Notes to Financial Statements | | | September 30, 2018 | | | Annual Report | | | 191 | |
Schedule of Investments
September 30, 2018
AllianzGI Real Estate Debt Fund
| | | | | | | | | | | | |
| | | | | | Principal
Amount
(000s) | | | Value | |
| Mortgage-Backed Securities—77.5% | |
280 Park Avenue Mortgage Trust, 1 mo. LIBOR + 0.880%, Series 2017-280P, Class A (b)(c),
| |
3.038%, 9/15/34 | | | $ | | | | 200 | | | | $200,442 | |
ALBA PLC, 1 mo. GBP LIBOR + 1.250%, Series 2015-1, Class A (c),
| |
1.976%, 4/24/49 | | £ | | | | | 89 | | | | 116,942 | |
AOA Mortgage Trust, Series 2015-1177, Class B (a)(b), | |
3.11%, 12/13/29 | | | $ | | | | 100 | | | | 97,183 | |
Aventura Mall Trust, Series 2013-AVM, Class B (a)(b),
| |
3.867%, 12/5/32 | | | | | | | 100 | | | | 101,387 | |
Bancaja 10 FTA, 3 mo. EURIBOR + 0.120%, Class A2 (c), | |
zero coupon, 5/22/50 | | € | | | | | 102 | | | | 118,026 | |
Bancorp Commercial Mortgage Trust, 1 mo. LIBOR + 1.430%, Series 2016-CRE1, Class A (a)(b)(c),
| |
3.493%, 11/15/33 | | | $ | | | | 69 | | | | 69,332 | |
BBCMS Mortgage Trust (a)(b)(c), | |
1 mo. LIBOR + 0.722%, 2.88%, 3/15/37, Series 2018-TALL, Class A | | | | | | | 300 | | | | 300,352 | |
1 mo. LIBOR + 0.850%, 3.008%, 8/15/36, Series 2017-DELC, Class A | | | | | | | 150 | | | | 150,233 | |
1 mo. LIBOR + 1.030%, 3.188%, 8/15/36, Series 2017-DELC, Class B | | | | | | | 150 | | | | 150,235 | |
BHMS (a)(b)(c), | | | | | | | | | | | | |
1 mo. LIBOR + 1.250%, 3.408%, 7/15/35, Series 2018-ATLS, Class A | | | | | | | 100 | | | | 100,293 | |
1 mo. LIBOR + 1.900%, 4.058%, 7/15/35, Series 2018-ATLS, Class C | | | | | | | 100 | | | | 100,205 | |
BX Commercial Mortgage Trust, IO (a)(b)(c), | |
1 mo. LIBOR + 0.671%, 2.829%, 3/15/37, Series 2018-BA, Class A | | | | | | | 100 | | | | 100,117 | |
1 mo. LIBOR + 0.871%, 3.029%, 3/15/37, Series 2018-BA, Class B | | | | | | | 100 | | | | 100,147 | |
BX Trust (b)(c), | | | | | | | | | | | | |
1 mo. LIBOR + 0.800%, 2.958%, 5/15/35, Series 2018-GW, Class A (a) | | | | | | | 100 | | | | 99,871 | |
1 mo. LIBOR + 0.880%, 3.038%, 7/15/34, Series 2017-APPL, Class A | | | | | | | 181 | | | | 181,150 | |
1 mo. LIBOR + 1.150%, 3.308%, 7/15/34, Series 2017-APPL, Class B | | | | | | | 90 | | | | 90,632 | |
1 mo. LIBOR + 1.200%, 3.358%, 7/15/34, Series 2017-SLCT, Class B (a) | | | | | | | 178 | | | | 178,073 | |
1 mo. LIBOR + 1.770%, 3.928%, 5/15/35, Series 2018-GW, Class D (a) | | | | | | | 40 | | | | 40,301 | |
| | | | | | | | | | | | |
| | | |
| | | | | | Principal
Amount
(000s) | | | Value | |
Caesars Palace Las Vegas Trust, Series 2017-VICI, Class B (a)(b),
| |
3.835%, 10/15/34 | | | $ | | | | 150 | | | $ | 150,127 | |
CGDBB Commercial Mortgage Trust, IO (b)(c), | |
1 mo. LIBOR + 0.790%, 2.948%, 7/15/32, Series 2017-BC, Class A | | | | | | | 100 | | | | 100,230 | |
1 mo. LIBOR + 1.600%, 3.758%, 7/15/32, Series 2017-BC, Class D | | | | | | | 100 | | | | 100,128 | |
1 mo. LIBOR + 2.150%, 4.308%, 7/15/32, Series 2017-BC, Class E | | | | | | | 100 | | | | 100,104 | |
CHT COSMO Mortgage Trust (b)(c), | |
1 mo. LIBOR + 1.400%, 3.558%, 11/15/36, Series 2017-CSMO, Class B | | | | | | | 100 | | | | 100,313 | |
1 mo. LIBOR + 2.250%, 4.408%, 11/15/36, Series 2017-CSMO, Class D | | | | | | | 150 | | | | 150,618 | |
Citigroup Commercial Mortgage Trust, Series 2015-P1, Class A2,
| |
3.039%, 9/15/48 | | | | | | | 100 | | | | 99,873 | |
Cold Storage Trust (b)(c), | | | | | | | | | | | | |
1 mo. LIBOR + 1.250%, 3.408%, 4/15/36, Series 2017-ICE3, Class B | | | | | | | 140 | | | | 140,774 | |
1 mo. LIBOR + 1.350%, 3.508%, 4/15/36, Series 2017-ICE3, Class C | | | | | | | 100 | | | | 100,585 | |
COMM Mortgage Trust, | | | | | | | | | | | | |
2.84%, 4/10/47, Series 2014-LC15, Class A2 | | | | | | | 150 | | | | 149,978 | |
2.928%, 2/10/47, Series 2014-CR15, Class A2 | | | | | | | 100 | | | | 100,016 | |
1 mo. LIBOR + 0.800%, 2.933%, 8/13/27, Series 2014-PAT, Class A (a)(b)(c) | | | | | | | 100 | | | | 100,022 | |
1 mo. LIBOR + 0.850%, 2.983%, 2/13/32, Series 2014-TWC, Class A (a)(b)(c) | | | | | | | 100 | | | | 100,173 | |
3.012%, 5/10/47, Series 2014-CR17, Class A2 | | | | | | | 95 | | | | 94,995 | |
1 mo. LIBOR + 1.150%, 3.283%, 8/13/27, Series 2014-PAT, Class B (a)(b)(c) | | | | | | | 150 | | | | 150,033 | |
1 mo. LIBOR + 1.600%, 3.748%, 2/13/32, Series 2014-TWC, Class B (a)(b)(c) | | | | | | | 100 | | | | 100,274 | |
1 mo. LIBOR + 2.250%, 4.398%, 2/13/32, Series 2014-TWC, Class D (a)(b)(c) | | | | | | | 100 | | | | 100,723 | |
Core Industrial Trust, Series 2015-CALW, Class C (a)(b),
| |
3.555%, 2/10/34 | | | | | | | 200 | | | | 198,821 | |
Credit Suisse Mortgage Capital Certificates, Series 2015-GLPB, Class A (a)(b),
| |
3.639%, 11/15/34 | | | | | | | 200 | | | | 201,645 | |
| | | | | | | | | | | | |
| | | |
| | | | | | Principal
Amount
(000s) | | | Value | |
CWSF, 1 mo. LIBOR + 1.000%, Series 2018-TOP, Class A (a)(b)(c),
| |
3.063%, 8/15/35 | | | $ | | | | 200 | | | $ | 200,417 | |
DBCG Mortgage Trust (a)(b)(c), | |
1 mo. LIBOR + 0.700%, 2.858%, 6/15/34, Series 2017-BBG, Class A | | | | | | | 200 | | | | 200,398 | |
1 mo. LIBOR + 0.850%, 3.008%, 6/15/34, Series 2017-BBG, Class B | | | | | | | 100 | | | | 100,149 | |
DBGS Mortgage Trust, 1 mo. LIBOR + 0.830%, Series 2018-5BP, Class B (a)(b)(c),
| |
2.988%, 6/15/33 | | | | | | | 200 | | | | 199,016 | |
Dublin Bay Securities DAC, 3 mo. EURIBOR + 0.450%, Series 2018-1A, Class A (a)(b)(c),
| |
0.131%, 6/28/55 | | € | | | | | 200 | | | | 231,421 | |
Dutch Property Finance BV, 3 mo. EURIBOR + 0.680%, Series 2017-1, Class A (c),
| |
0.36%, 1/28/48 | | | | | | | 161 | | | | 187,541 | |
Exantas Capital Corp. Ltd., 1 mo. LIBOR + 0.830%, Series 2018-RSO6, Class A (b)(c),
| |
2.988%, 6/15/35 | | | $ | | | | 100 | | | | 100,044 | |
Fastnet Securities 13 DAC, 3 mo. EURIBOR + 0.350%, Class A (c),
| |
0.029%, 4/18/57 | | € | | | | | 217 | | | | 252,154 | |
FCT Credit Agricole Habitat, 3 mo. EURIBOR + 0.500%, Series 2018-1, Class A (c),
| |
0.179%, 4/27/53 | | | | | | | 200 | | | | 234,871 | |
Finsbury Square PLC, 3 mo. GBP LIBOR + 0.900%, Series 2016-2, Class A (c),
| |
1.705%, 8/16/58 | | £ | | | | | 79 | | | | 103,734 | |
Fondo de Titulizacion de Activos Santander Hipotecario 2, 3 mo. EURIBOR + 0.150%, Class A (c),
| |
zero coupon, 1/18/49 | | € | | | | | 106 | | | | 122,077 | |
GRACE Mortgage Trust, Series 2014-GRCE, Class F (a)(b),
| |
3.71%, 6/10/28 | | | $ | | | | 100 | | | | 98,194 | |
GS Mortgage Securities Corp. Trust (a)(b), | |
1 mo. LIBOR + 0.750%, 2.908%, 2/15/37,
Series 2018-CHILL, Class A (c) | | | | | | | 200 | | | | 200,354 | |
3.302%, 5/10/34, Series 2017-GPTX, Class C | | | | | | | 100 | | | | 98,022 | |
Hawksmoor Mortgages PLC, 3 mo. GBP LIBOR + 2.250%, Series 2016-1, Class C (c),
| |
3.056%, 5/25/53 | | £ | | | | | 100 | | | | 131,293 | |
Hilton Orlando Trust, 1 mo. LIBOR + 1.050%, Series 2018-ORL, Class B (b)(c), | |
3.208%, 12/15/34 | | | $ | | | | 182 | | | | 182,309 | |
Holmes Master Issuer PLC, 3 mo. LIBOR + 0.420%, Series 2018-2A, Class A2 (a)(b)(c),
| |
2.561%, 10/15/54 | | | | | | | 200 | | | | 199,441 | |
J.P. Morgan Chase Commercial Mortgage Securities Trust (b)(c), | |
1 mo. LIBOR + 0.910%, 3.068%, 6/15/35, Series 2018-PHH, Class A | | | | | | | 100 | | | | 100,237 | |
1 mo. LIBOR + 1.100%, 3.258%, 10/15/32, Series 2017-FL11, Class B (a) | | | | | | | 60 | | | | 60,087 | |
1 mo. LIBOR + 1.410%, 3.518%, 6/15/35, Series 2018-PHH, Class C | | | | | | | 50 | | | | 50,197 | |
| | | | | | |
| 192 | | Annual Report | | | September 30, 2018 | | | See accompanying Notes to Financial Statements |
Schedule of Investments
September 30, 2018
| | | | | | | | | | | | |
| | | | | | Principal
Amount
(000s) | | | Value | |
JPMBB Commercial Mortgage Securities Trust, Series 2013-C12, Class ASB,
| |
3.157%, 7/15/45 | | | $ | | | | 92 | | | $ | 92,248 | |
JPMorgan Chase Commercial Mortgage Securities Corp. (a)(b), | |
1 mo. LIBOR + 1.300%, 3.458%, 6/15/32, Series 2018-LAQ, Class B (c) | | | | | | | 150 | | | | 150,660 | |
4.128%, 7/5/31, Series 2018-AON, Class A | | | | | | | 100 | | | | 102,703 | |
4.767%, 7/5/31, Series 2018-AON, Class D | | | | | | | 100 | | | | 102,529 | |
JPMorgan Chase Commercial Mortgage Securities Trust, | |
2.379%, 10/15/45, Series 2012-C8, Class ASB | | | | | | | 84 | | | | 82,495 | |
2.554%, 4/15/46, Series 2013-LC11, Class ASB | | | | | | | 134 | | | | 131,979 | |
1 mo. LIBOR + 1.000%, 3.158%, 6/15/32, Series 2018-LAQ, Class A (a)(b)(c) | | | | | | | 100 | | | | 100,313 | |
3.742%, 9/5/32, Series 2015-UES, Class E (a)(b) | | | | | | | 100 | | | | 98,645 | |
4.675%, 7/5/32, Series 2012-HSBC, Class D (a)(b) | | | | | | | 150 | | | | 152,771 | |
London Wall Mortgage Capital PLC, 3 mo. GBP LIBOR + 0.850%, Series 2017-FL1, Class A (c),
| |
1.652%, 11/15/49 | | £ | | | | | 103 | | | | 134,142 | |
Lone Star Portfolio Trust, 1 mo. LIBOR + 2.600%, Series 2015-LSP, Class B (a)(b)(c),
| |
5.008%, 9/15/28 | | | $ | | | | 85 | | | | 85,571 | |
Lusitano Mortgages No 4 PLC, 3 mo. EURIBOR + 0.220%, Class A (c),
| |
zero coupon, 9/15/48 | | € | | | | | 161 | | | | 178,007 | |
Lusitano Mortgages No 5 PLC, 3 mo. EURIBOR + 0.260%, Class A (c),
| |
zero coupon, 7/15/59 | | | | | | | 112 | | | | 122,104 | |
Madrid RMBS II FTA, 3 mo. EURIBOR + 0.150%, Series 2006-2, Class A2 (c),
| |
zero coupon, 8/22/49 | | | | | | | 99 | | | | 113,839 | |
MBS Bancaja 4 FTA, 3 mo. EURIBOR + 0.150%, Class A2 (c),
| |
zero coupon, 7/23/50 | | | | | | | 68 | | | | 77,519 | |
Morgan Stanley Bank of America Merrill Lynch Trust, | |
3.194%, 10/15/47, Series 2014-C18, Class A2 | | | $ | | | | 95 | | | | 95,175 | |
3.669%, 2/15/47, Series 2014-C14, Class A3 | | | | | | | 150 | | | | 150,944 | |
Motel 6 Trust (b)(c), | | | | | | | | | | | | |
1 mo. LIBOR + 0.920%, 3.078%, 8/15/34, Series 2017-MTL6, Class A | | | | | | | 97 | | | | 97,094 | |
1 mo. LIBOR + 2.150%, 4.308%, 8/15/34, Series 2017-MTL6, Class D | | | | | | | 145 | | | | 145,899 | |
Paragon Mortgages No 25 PLC, 3 mo. GBP LIBOR + 0.65%, Class A (c),
| |
1.452%, 5/15/50 | | £ | | | | | 150 | | | | 193,500 | |
| | | | | | | | | | | | |
| | | | | | Principal
Amount
(000s) | | | Value | |
Residential Mortgage Securities 28 PLC, 3 mo. GBP LIBOR + 1.150%, Class A (c),
| |
1.947%, 6/15/46 | | £ | | | | | 121 | | | $ | 158,081 | |
Residential Mortgage Securities 29 PLC, 3 mo. GBP LIBOR + 1.400%, Class B (c),
| |
2.204%, 12/20/46 | | | | | | | 100 | | | | 130,832 | |
Residential Mortgage Securities 30 PLC, 3 mo. GBP LIBOR + 0.800%, Class A (c),
| |
1.604%, 3/20/50 | | | | | | | 83 | | | | 107,605 | |
Resource Capital Corp., Ltd., 1 mo. LIBOR + 0.800%, Series 2017-CRE5, Class A (a)(b)(c),
| |
2.958%, 7/15/34 | | | $ | | | | 55 | | | | 55,474 | |
Ripon Mortgages PLC, 3 mo. GBP LIBOR + 0.800%, Class A1 (c),
| |
1.605%, 8/20/56 | | £ | | | | | 173 | | | | 225,433 | |
RMAC Securities PLC, 3 mo. GBP LIBOR + 0.270%, Series 2006-NS4X, Class M1A (c),
| |
1.071%, 6/12/44 | | | | | | | 65 | | | | 79,409 | |
Slate PLC (c), | | | | | | | | | | | | |
3 mo. GBP LIBOR + 1.450%, 2.232%, 1/24/51, Class B | | | | | | | 100 | | | | 130,935 | |
3 mo. GBP LIBOR + 1.850%, 2.632%, 1/24/51, Class C | | | | | | | 100 | | | | 131,215 | |
VNDO Mortgage Trust (a)(b), | |
3.448%, 11/15/30, Series 2012-6AVE, Class C | | | $ | | | | 100 | | | | 98,281 | |
4.079%, 12/13/29, Series 2013-PENN, Class C | | | | | | | 150 | | | | 150,350 | |
Waldorf Astoria Boca Raton Trust (a)(b)(c), | |
1 mo. LIBOR + 1.350%, 3.508%, 6/15/29, Series 2016-BOCA, Class A | | | | | | | 100 | | | | 100,156 | |
1 mo. LIBOR + 2.050%, 4.208%, 6/15/29, Series 2016-BOCA, Class B | | | | | | | 55 | | | | 55,101 | |
Wells Fargo Commercial Mortgage Trust, Series 2015-NXS2, Class A2,
| |
3.02%, 7/15/58 | | | | | | | 130 | | | | 129,939 | |
WFCG Commercial Mortgage Trust, 1 mo. LIBOR + 1.472%, Series 2015-BXRP, Class B (a)(b)(c),
| |
3.63%, 11/15/29 | | | | | | | 80 | | | | 80,655 | |
WFRBS Commercial Mortgage Trust, Series 2013-C12, Class ASB,
| |
2.838%, 3/15/48 | | | | | | | 91 | | | | 90,585 | |
| | | | | | | | | | | | |
Total Mortgage-Backed Securities
(cost—$11,935,263) | | | | 11,818,497 | |
| | | | | | | | | | | | |
| | | | | | | | | | | | |
| Corporate Bonds & Notes—6.2% | |
| Real Estate—6.2% | |
DEMIRE Deutsche Mittelstand Real Estate AG,
| |
2.875%, 7/15/22 | | € | | | | | 100 | | | | 118,888 | |
Digital Stout Holding LLC,
| | | | | | | | | | | | |
4.25%, 1/17/25 | | £ | | | | | 100 | | | | 140,561 | |
Inmobiliaria Colonial Socimi S.A.,
| |
1.45%, 10/28/24 | | € | | | | | 100 | | | | 113,370 | |
Merlin Properties Socimi S.A.,
| |
1.75%, 5/26/25 | | | | | | | 100 | | | | 114,523 | |
SL Green Operating Partnership L.P.,
| |
3.25%, 10/15/22 | | | $ | | | | 100 | | | | 97,100 | |
Summit Germany Ltd. (a)(b),
| |
2.00%, 1/31/25 | | € | | | | | 100 | | | | 111,137 | |
Vonovia Finance BV, 3 mo. EURIBOR + 0.450% (c),
| |
0.131%, 12/22/22 | | | | | | | 100 | | | | 115,953 | |
| | | | | | | | | | | | |
| | | | | | Principal
Amount
(000s) | | | Value | |
Westfield America Management Ltd.,
| |
2.125%, 3/30/25 | | £ | | | | | 100 | | | $ | 127,779 | |
| | | | | | | | | | | | |
Total Corporate Bonds & Notes
(cost—$989,225) | | | | 939,311 | |
| | | | | | | | | | | | |
| | | | | | | | | | | | |
| U.S. Government Agency Securities (c)— 5.1% | |
Fannie Mae, MBS, | | | | | | | | | | | | |
1 mo. USD-LIBOR-BBA + 4.250%, 6.466%, 1/25/29, Series 2016-C04, Class 1M2 | | | $ | | | | 100 | | | | 112,922 | |
1 mo. USD-LIBOR-BBA + 4.300%, 6.516%, 2/25/25, Series 2015-C01, Class 1M2 | | | | | | | 33 | | | | 36,401 | |
1 mo. USD-LIBOR-BBA + 4.400%, 6.616%, 1/25/24, Series 2014-C01, Class M2 | | | | | | | 70 | | | | 79,777 | |
1 mo. USD-LIBOR-BBA + 5.000%, 7.216%, 7/25/25, Series 2015-C03, Class 1M2 | | | | | | | 37 | | | | 42,512 | |
1 mo. USD-LIBOR-BBA + 5.250%, 7.466%, 10/25/23, Series 2013-C01, Class M2 | | | | | | | 100 | | | | 115,107 | |
Freddie Mac, MBS, | | | | | | | | | | | | |
1 mo. USD-LIBOR-BBA + 0.200%, 2.314%, 2/25/23, Series KI02, Class A | | | | | | | 294 | | | | 294,498 | |
1 mo. USD-LIBOR-BBA + 2.600%, 4.816%, 12/25/27, Series 2015-DNA2, Class M2 | | | | | | | 91 | | | | 92,607 | |
| | | | | | | | | | | | |
Total U.S. Government Agency Securities
(cost—$772,086) | | | | 773,824 | |
| | | | | | | | | | | | |
| | | | | | | | | | | | |
| Asset-Backed Securities (b)— 3.3% | |
Invitation Homes Trust (a)(c), | |
1 mo. LIBOR + 1.080%, 3.238%, 6/17/37, Series 2018-SFR2, Class B | | | | | | | 100 | | | | 100,366 | |
1 mo. LIBOR + 1.800%, 3.958%, 12/17/36, Series 2017-SFR2, Class D | | | | | | | 200 | | | | 201,657 | |
Vantage Data Centers Issuer LLC, Series 2018-1A, Class A2,
| |
4.072%, 2/16/43 | | | | | | | 199 | | | | 199,162 | |
| | | | | | | | | | | | |
Total Asset-Backed Securities
(cost—$502,328) | | | | 501,185 | |
| | | | | | | | | | | | |
| U.S. Treasury Obligations—7.8% | |
U.S. Treasury Bills (d),
2.10%, 11/15/18
(cost—$1,196,901) | | | | | | | 1,200 | | | | 1,196,832 | |
| | | | | | | | | | | | |
| |
Total Investments
(cost-$15,395,803)—99.9% | | | | 15,229,649 | |
| | | | | | | | | | | | |
| | | |
| Other assets less liabilities (e)—0.1% | | | | | | | | | | | 17,524 | |
| | | | | | | | | | | | |
| |
| Net Assets—100.0% | | | | $15,247,173 | |
| | | | | | | | | | | | |
| | | | | | | | |
| See accompanying Notes to Financial Statements | | | September 30, 2018 | | | Annual Report | | | 193 | |
Schedule of Investments
September 30, 2018
Notes to Schedule of Investments:
(a) Private Placement—Restricted as to resale and may not have a readily available market. Securities with an aggregate value of $6,023,415, representing 39.5% of net assets.
(b) 144A—Exempt from registration under Rule 144A of the Securities Act of 1933. These securities may be resold in transactions exempt from registration, typically only to qualified institutional buyers. Securities with an aggregate value of $8,163,333, representing 53.5% of net assets.
(c) Variable or Floating Rate Security—Securities with an interest rate that changes periodically. The interest rate disclosed reflects the rate in effect on September 30, 2018.
(d) Rates reflect the effective yields at purchase date.
(e) Includes net unrealized appreciation (depreciation) of other financial instruments as follows:
| | | | | | | | | | | | | | | | | | | | | | |
| Futures contracts outstanding at September 30, 2018: | |
| Type | | Contracts | | | Expiration
Date | | | Notional
Amount
(000s) | | | Market
Value
(000s) | | | Unrealized
Appreciation
(Depreciation) | |
Long position contracts: | | | | | | | | | | | | | | | | | | | | |
| | 2-Year U.S. Treasury Note | | | 4 | | | | 12/31/18 | | | $ | 800 | | | $ | 843 | | | $ | (2,313 | ) |
| | | | | |
Short position contracts: | | | | | | | | | | | | | | | | | | | | |
| | 5-Year U.S. Treasury Note | | | (2 | ) | | | 12/31/18 | | | $ | (200 | ) | | $ | (225 | ) | | $ | 1,719 | |
| | | | | | | | | | | | | | | | | | | | | | |
| | | | | | | | | | | | | $ | (594 | ) |
| | | | | | | | | | | | | | | | | | | | | | |
| | | | | | | | | | | | | | | | | | |
| Forward foreign currency contracts outstanding at September 30, 2018: | |
| Description | | Counterparty | | U.S.$ Value on
Origination Date | | | U.S.$ Value
September 30, 2018 | | | Unrealized
Appreciation | | | Unrealized
Depreciation | |
Purchased: | |
235,000 British Pound settling 11/21/18 | | Citibank N.A. | | $ | 307,076 | | | $ | 306,975 | | | $ | — | | | $ | (101 | ) |
|
Sold: | |
569,457 British Pound settling 11/21/18 | | Barclays Bank PLC | | | 745,122 | | | | 743,867 | | | | 1,255 | | | | — | |
1,159,944 British Pound settling 11/21/18 | | Citibank N.A. | | | 1,517,728 | | | | 1,515,205 | | | | 2,523 | | | | — | |
1,907,491 Euro settling 11/21/18 | | Citibank N.A. | | | 2,229,153 | | | | 2,223,370 | | | | 5,783 | | | | — | |
| | | | | | | | | | | | | | | | | | |
| | | $ | 9,561 | | | $ | (101 | ) |
| | | | | | | | | | | | | | | | | | |
(f) At September 30, 2018, the Fund pledged $1,415 in cash as collateral for futures contracts.
Glossary:
€—Euro
£/GBP—British Pound
BBA—British Bankers’ Association
EURIBOR—Euro Inter-Bank Offered Rate
IO—Interest Only
LIBOR—London Inter-Bank Offered Rate
MBS—Mortgage-Backed Securities
| | | | | | |
| 194 | | Annual Report | | | September 30, 2018 | | | See accompanying Notes to Financial Statements |
Schedule of Investments
September 30, 2018
AllianzGI Short Duration High Income Fund
| | | | | | | | |
| | | Principal
Amount
(000s) | | | Value | |
| Corporate Bonds & Notes—85.5% | |
| Advertising—1.5% | |
Lamar Media Corp.,
| | | | | | | | |
5.00%, 5/1/23 | | | $14,803 | | | | $15,099,060 | |
Outfront Media Capital LLC,
| |
5.25%, 2/15/22 | | | 2,500 | | | | 2,540,625 | |
| | | | | | | | |
| | | | | | | 17,639,685 | |
| | | | | | | | |
| Auto Components—1.0% | |
Goodyear Tire & Rubber Co.,
| |
5.125%, 11/15/23 | | | 11,600 | | | | 11,629,000 | |
| | | | | | | | |
| Auto Manufacturers—0.6% | |
Ford Motor Credit Co. LLC,
| |
2.681%, 1/9/20 | | | 3,000 | | | | 2,969,622 | |
General Motors Financial Co., Inc., | |
3 mo. USD-LIBOR+ 0.930% (d),
| |
3.267%, 4/13/20 | | | 4,000 | | | | 4,026,398 | |
| | | | | | | | |
| | | | | | | 6,996,020 | |
| | | | | | | | |
| Banks—1.0% | |
CIT Group, Inc.,
| | | | | | | | |
5.00%, 8/15/22 | | | 10,722 | | | | 10,984,689 | |
| | | | | | | | |
| Biotechnology—0.6% | |
Amgen, Inc.,
| | | | | | | | |
4.10%, 6/15/21 | | | 6,260 | | | | 6,371,935 | |
| | | | | | | | |
| Coal—3.5% | |
Cloud Peak Energy Resources LLC,
| |
12.00%, 11/1/21 | | | 40,020 | | | | 40,419,800 | |
| | | | | | | | |
| Commercial Services—2.7% | |
APX Group, Inc.,
| | | | | | | | |
7.875%, 12/1/22 | | | 14,795 | | | | 15,127,887 | |
Herc Rentals, Inc. (a)(c), | |
7.50%, 6/1/22 | | | 8,550 | | | | 9,084,375 | |
7.75%, 6/1/24 | | | 5,779 | | | | 6,247,446 | |
| | | | | | | | |
| | | | | | | 30,459,708 | |
| | | | | | | | |
| Computers—0.3% | |
NCR Corp.,
| | | | | | | | |
5.875%, 12/15/21 | | | 3,461 | | | | 3,508,589 | |
| | | | | | | | |
| Consumer Finance—1.7% | |
Prime Security Services Borrower LLC (a)(c),
| |
9.25%, 5/15/23 | | | 17,698 | | | | 18,972,256 | |
| | | | | | | | |
| Containers & Packaging—3.4% | |
Berry Global, Inc.,
| | | | | | | | |
6.00%, 10/15/22 | | | 14,510 | | | | 14,999,712 | |
Owens-Brockway Glass Container, Inc. (a)(c),
| |
5.00%, 1/15/22 | | | 5,460 | | | | 5,528,250 | |
Reynolds Group Issuer, Inc., | |
5.125%, 7/15/23 (a)(c) | | | 1,500 | | | | 1,493,625 | |
5.75%, 10/15/20 | | | 1,938 | | | | 1,945,484 | |
3 mo. USD-LIBOR + 3.500%”, 5.839%, 7/15/21 (a)(c)(d) | | | 8,000 | | | | 8,130,000 | |
6.875%, 2/15/21 | | | 6,324 | | | | 6,403,360 | |
| | | | | | | | |
| | | | | | | 38,500,431 | |
| | | | | | | | |
| Diversified Financial Services—3.8% | |
Aircastle Ltd.,
| | | | | | | | |
6.25%, 12/1/19 | | | 4,125 | | | | 4,258,976 | |
Ally Financial, Inc., | | | | | | | | |
3.25%, 11/5/18 | | | 1,075 | | | | 1,075,000 | |
8.00%, 3/15/20 | | | 20,679 | | | | 21,071,389 | |
Fly Leasing Ltd.,
| | | | | | | | |
6.375%, 10/15/21 | | | 10,125 | | | | 10,454,062 | |
| | | | | | | | |
| | |
| | | Principal
Amount
(000s) | | | Value | |
International Lease Finance Corp.,
| |
6.25%, 5/15/19 | | $ | 6,295 | | | $ | 6,417,739 | |
| | | | | | | | |
| | | | | | | 43,277,166 | |
| | | | | | | | |
| Electric Utilities—2.0% | |
AES Corp.,
| | | | | | | | |
4.00%, 3/15/21 | | | 2,000 | | | | 2,000,000 | |
Calpine Corp. (a)(c),
| | | | | | | | |
6.00%, 1/15/22 | | | | | | | 21,439,428 | |
| | | | | | | | |
| | | | | | | 23,439,428 | |
| | | | | | | | |
| Entertainment—1.3% | |
International Game Technology PLC (a)(c),
| |
6.25%, 2/15/22 | | | 13,850 | | | | 14,404,000 | |
| | | | | | | | |
| Environmental Services—0.9% | |
Clean Harbors, Inc.,
| | | | | | | | |
5.125%, 6/1/21 | | | 9,949 | | | | 9,998,745 | |
| | | | | | | | |
| Equity Real Estate Investment Trusts (REITs)—2.8% | |
Equinix, Inc.,
| | | | | | | | |
5.375%, 4/1/23 | | | 20,284 | | | | 20,916,658 | |
SBA Communications Corp.,
| |
4.00%, 10/1/22 | | | 9,612 | | | | 9,479,835 | |
Starwood Property Trust, Inc. (a)(c),
| |
3.625%, 2/1/21 | | | 2,000 | | | | 1,970,000 | |
| | | | | | | | |
| | | | | | | 32,366,493 | |
| | | | | | | | |
| Food & Beverage—0.2% | |
Anheuser-Busch InBev Worldwide, Inc., 3 mo. LIBOR + 0.740% (d),
| |
3.077%, 1/12/24 | | | 2,000 | | | | 2,010,519 | |
| | | | | | | | |
| Healthcare-Products—0.7% | |
Fresenius U.S. Finance II, Inc. (a)(c),
| |
4.25%, 2/1/21 | | | 7,795 | | | | 7,837,362 | |
| | | | | | | | |
| Healthcare-Services—4.7% | |
DaVita, Inc.,
| | | | | | | | |
5.75%, 8/15/22 | | | 41,836 | | | | 42,760,576 | |
HCA, Inc.,
| | | | | | | | |
6.50%, 2/15/20 | | | 10,000 | | | | 10,411,250 | |
| | | | | | | | |
| | | | | | | 53,171,826 | |
| | | | | | | | |
| Holding Companies-Diversified—3.0% | |
Nielsen Co. Luxembourg Sarl (a)(c),
| |
5.50%, 10/1/21 | | | 21,848 | | | | 22,028,246 | |
Spectrum Brands Holdings, Inc.,
| |
7.75%, 1/15/22 | | | 12,000 | | | | 12,384,000 | |
| | | | | | | | |
| | | | | | | 34,412,246 | |
| | | | | | | | |
| Home Builders—6.1% | |
Brookfield Residential Properties, Inc. (a)(c),
| |
6.50%, 12/15/20 | | | 12,088 | | | | 12,163,550 | |
CalAtlantic Group, Inc.,
| | | | | | | | |
6.625%, 5/1/20 | | | 3,000 | | | | 3,172,500 | |
Lennar Corp.,
| | | | | | | | |
4.75%, 4/1/21 | | | 5,483 | | | | 5,567,329 | |
MDC Holdings, Inc.,
| | | | | | | | |
5.625%, 2/1/20 | | | 1,500 | | | | 1,537,500 | |
PulteGroup, Inc.,
| | | | | | | | |
4.25%, 3/1/21 | | | 12,356 | | | | 12,417,780 | |
Taylor Morrison Communities, Inc. (a)(c),
| |
5.25%, 4/15/21 | | | 17,806 | | | | 17,961,802 | |
TRI Pointe Group, Inc., | | | | | | | | |
4.375%, 6/15/19 | | | 3,000 | | | | 3,026,250 | |
4.875%, 7/1/21 | | | 13,599 | | | | 13,632,998 | |
| | | | | | | | |
| | | | | | | 69,479,709 | |
| | | | | | | | |
| | | | | | | | |
| | |
| | | Principal
Amount
(000s) | | | Value | |
| Industrial Conglomerates—0.4% | |
General Electric Co.,
| | | | | | | | |
4.625%, 1/7/21 | | $ | 4,343 | | | $ | 4,476,409 | |
| | | | | | | | |
| IT Services—2.9% | |
First Data Corp. (a)(c),
| | | | | | | | |
7.00%, 12/1/23 | | | 31,229 | | | | 32,595,269 | |
| | | | | | | | |
| Lodging—0.2% | |
MGM Resorts International,
| |
6.625%, 12/15/21 | | | 2,500 | | | | 2,655,000 | |
| | | | | | | | |
| Machinery-Diversified—1.7% | |
CNH Industrial Capital LLC,
| |
4.375%, 4/5/22 | | | 2,675 | | | | 2,708,237 | |
John Deere Capital Corp., | |
2.15%, 9/8/22 | | | 3,950 | | | | 3,767,135 | |
3 mo. LIBOR + 0.240%, 2.574%, 3/12/21 (d) | | | 2,000 | | | | 2,004,169 | |
3 mo. LIBOR + 0.480%, 2.807%, 9/8/22 (d) | | | 5,000 | | | | 5,015,088 | |
2.875%, 3/12/21 | | | 6,000 | | | | 5,959,675 | |
| | | | | | | | |
| | | | | | | 19,454,304 | |
| | | | | | | | |
| Media—7.6% | |
AMC Networks, Inc.,
| | | | | | | | |
4.75%, 12/15/22 | | | 1,899 | | | | 1,903,747 | |
CCO Holdings LLC,
| | | | | | | | |
5.25%, 9/30/22 | | | 22,365 | | | | 22,692,871 | |
DISH DBS Corp.,
| | | | | | | | |
5.125%, 5/1/20 | | | 12,250 | | | | 12,403,125 | |
DISH DBS Corp.,
| | | | | | | | |
7.875%, 9/1/19 | | | 8,773 | | | | 9,103,830 | |
Quebecor Media, Inc.,
| | | | | | | | |
5.75%, 1/15/23 | | | 1,038 | | | | 1,073,033 | |
Sinclair Television Group, Inc., | |
5.375%, 4/1/21 | | | 14,945 | | | | 14,982,362 | |
6.125%, 10/1/22 | | | 1,000 | | | | 1,022,500 | |
Univision Communications, Inc. (a)(c), | |
5.125%, 5/15/23 | | | 15,000 | | | | 14,400,000 | |
6.75%, 9/15/22 | | | 8,634 | | | | 8,849,850 | |
| | | | | | | | |
| | | | | | | 86,431,318 | |
| | | | | | | | |
| Miscellaneous Manufacturing—2.3% | |
General Electric Co.,
| | | | | | | | |
4.65%, 10/17/21 | | | 10,000 | | | | 10,338,767 | |
LSB Industries, Inc. (a)(c),
| |
9.625%, 5/1/23 | | | 15,100 | | | | 15,873,875 | |
| | | | | | | | |
| | | | | | | 26,212,642 | |
| | | | | | | | |
| Oil, Gas & Consumable Fuels—1.9% | |
Kinder Morgan Energy Partners L.P.,
| |
6.50%, 4/1/20 | | | 2,825 | | | | 2,953,009 | |
Laredo Petroleum, Inc.,
| | | | | | | | |
5.625%, 1/15/22 | | | 12,512 | | | | 12,480,720 | |
Murphy Oil USA, Inc.,
| | | | | | | | |
6.00%, 8/15/23 | | | 2,000 | | | | 2,065,000 | |
Sunoco L.P. (a)(c),
| | | | | | | | |
4.875%, 1/15/23 | | | 4,750 | | | | 4,714,375 | |
| | | | | | | | |
| | | | | | | 22,213,104 | |
| | | | | | | | |
| Pipelines—2.0% | |
Andeavor Logistics L.P., | | | | | | | | |
6.25%, 10/15/22 | | | 745 | | | | 769,523 | |
Kinder Morgan, Inc. (a)(c),
| |
5.00%, 2/15/21 | | | 5,000 | | | | 5,160,046 | |
MPLX L.P.,
| | | | | | | | |
5.50%, 2/15/23 | | | 5,000 | | | | 5,087,750 | |
Targa Resources Partners L.P.,
| |
5.25%, 5/1/23 | | | 11,625 | | | | 11,813,906 | |
| | | | | | | | |
| | | | | | | 22,831,225 | |
| | | | | | | | |
| | | | | | | | |
| See accompanying Notes to Financial Statements | | | September 30, 2018 | | | Annual Report | | | 195 | |
Schedule of Investments
September 30, 2018
| | | | | | | | |
| | |
| | | Principal
Amount
(000s) | | | Value | |
| Real Estate—5.8% | |
Iron Mountain, Inc., | | | | | | | | |
4.375%, 6/1/21 (a)(c) | | $ | 2,250 | | | $ | 2,261,250 | |
6.00%, 8/15/23 | | | 7,588 | | | | 7,801,450 | |
Realogy Group LLC (a)(c), | |
4.875%, 6/1/23 | | | 2,500 | | | | 2,353,125 | |
5.25%, 12/1/21 | | | 34,880 | | | | 35,098,000 | |
SBA Communications Corp.,
| |
4.875%, 7/15/22 | | | 18,167 | | | | 18,386,819 | |
| | | | | | | | |
| | | | | | | 65,900,644 | |
| | | | | | | | |
| Retail—10.2% | |
1011778 BC ULC (a)(c),
| | | | | | | | |
4.625%, 1/15/22 | | | 7,000 | | | | 7,043,750 | |
Dollar Tree, Inc.,
| | | | | | | | |
3.70%, 5/15/23 | | | 8,000 | | | | 7,904,836 | |
GameStop Corp. (a)(c), | | | | | | | | |
5.50%, 10/1/19 | | | 5,690 | | | | 5,697,113 | |
6.75%, 3/15/21 | | | 10,075 | | | | 10,341,987 | |
Group 1 Automotive, Inc. (a)(c),
| |
5.25%, 12/15/23 | | | 7,250 | | | | 7,177,500 | |
Group 1 Automotive, Inc.,
| | | | | | | | |
5.00%, 6/1/22 | | | 3,140 | | | | 3,140,000 | |
KGA Escrow LLC (a)(c),
| | | | | | | | |
7.50%, 8/15/23 | | | 7,000 | | | | 7,280,000 | |
Michaels Stores, Inc. (a)(c),
| |
5.875%, 12/15/20 | | | 11,580 | | | | 11,649,480 | |
Party City Holdings, Inc. (a)(c),
| |
6.125%, 8/15/23 | | | 33,089 | | | | 33,668,057 | |
Penske Automotive Group, Inc.,
| |
5.75%, 10/1/22 | | | 21,540 | | | | 21,981,678 | |
| | | | | | | | |
| | | | | | | 115,884,401 | |
| | | | | | | | |
| Telecommunications—8.0% | |
Hughes Satellite Systems Corp.,
| |
7.625%, 6/15/21 | | | 17,255 | | | | 18,683,369 | |
Sprint Communications, Inc. (a)(c), | |
7.00%, 3/1/20 | | | 4,750 | | | | 4,940,000 | |
9.00%, 11/15/18 | | | 24,811 | | | | 24,995,842 | |
T-Mobile USA, Inc., | | | | | | | | |
6.00%, 3/1/23 | | | 3,000 | | | | 3,099,750 | |
6.50%, 1/15/24 | | | 38,047 | | | | 39,616,439 | |
| | | | | | | | |
| | | | | | | 91,335,400 | |
| | | | | | | | |
| Transportation—0.7% | |
Penske Truck Leasing Co. L.P. (a)(c),
| |
2.70%, 3/14/23 | | | 9,075 | | | | 8,595,166 | |
| | | | | | | | |
Total Corporate Bonds & Notes
(cost—$979,633,968) | | | | 974,464,489 | |
| | | | | | | | |
| | | | | | | | |
| Senior Loans (a)(b)— 9.8% | |
| Commercial Services & Supplies—6.5% | |
APX Group, Inc., | | | | | | | | |
3 mo. LIBOR + 5.000%, 2018 Term Loan B, | |
7.323%, 2/2/24 | | | 48,000 | | | | 47,880,000 | |
Asurion LLC, | | | | | | | | |
1 mo. LIBOR + 2.750%, 5.242%, 8/4/22, 2017 Term Loan B4 | | | 8,778 | | | | 8,859,934 | |
1 mo. LIBOR + 6.000%, 8.742%, 8/4/25, 2017 2nd Lien Term Loan | | | 17,000 | | | | 17,504,730 | |
| | | | | | | | |
| | | | | | | 74,244,664 | |
| | | | | | | | |
| | | | | | | | |
| | |
| | | Principal
Amount
(000s) | | | Value | |
| Specialty Retail—3.3% | |
PetSmart, Inc., 1 mo. LIBOR + 3.000%, Term Loan B2, | |
5.12%, 3/11/22 | | $ | 42,862 | | | $ | 37,518,476 | |
| | | | | | | | |
Total Senior Loans
(cost—$115,091,403) | | | | 111,763,140 | |
| | | | | | | | |
| Repurchase Agreements—0.6% | |
State Street Bank and Trust Co., dated 9/28/18, 0.42%, due 10/1/18, proceeds $6,580,230; collateralized by U.S. Treasury Notes, 2.00%, due 11/30/20, valued at $6,712,275 including accrued interest | |
(cost—$6,580,000) | | | 6,580 | | | | 6,580,000 | |
| | | | | | | | |
| |
Total Investments
(cost—$1,101,305,371)—95.9% | | | | 1,092,807,629 | |
| | | | | | | | |
| | |
| Other assets less liabilities—4.1% | | | | | | | 46,306,615 | |
| | | | | | | | |
| |
| Net Assets—100.0% | | | | $1,139,114,244 | |
| | | | | | | | |
Notes to Schedule of Investments:
(a) Private Placement—Restricted as to resale and may not have a readily available market. Securities with an aggregate value of $501,718,165, representing 44.0% of net assets.
(b) These securities generally pay interest at rates which are periodically pre-determined by reference to a base lending rate plus a premium. These base lending rates are generally either the lending rate offered by one or more major European banks, such as the “LIBOR” or the prime rate offered by one or more major United States banks, or the certificate of deposit rate. These securities are generally considered to be restricted as the Fund is ordinarily contractually obligated to receive approval from the Agent bank and/or borrower prior to disposition. Remaining maturities of senior loans may be less than the stated maturities shown as a result of contractual or optional payments by the borrower. Such prepayments cannot be predicted with certainty. The interest rate disclosed reflects the rate in effect on September 30, 2018.
(c) 144A—Exempt from registration under Rule 144A of the Securities Act of 1933. These securities may be resold in transactions exempt from registration, typically only to qualified institutional buyers. Securities with an aggregate value of $389,955,025, representing 34.2% of net assets.
(d) Variable or Floating Rate Security—Securities with an interest rate that changes periodically. The interest rate disclosed reflects the rate in effect on September 30, 2018.
Glossary:
BBA —British Bankers’ Association
LIBOR—London Inter-Bank Offered Rate
AllianzGI Short Term Bond Fund
| | | | | | | | | | | | |
| | | | | | Principal
Amount
(000s) | | | Value | |
| Corporate Bonds & Notes—75.4% | |
| Aerospace & Defense—1.9% | |
Raytheon Co.,
| |
3.125%, 10/15/20 | | | $ | | | | 100 | | | | $100,024 | |
| | | | | | | | | | | | |
| Banks—5.9% | |
Barclays Bank PLC, 3 mo. USD-LIBOR + 0.460% (c),
| |
2.793%, 1/11/21 | | | | | | | 100 | | | | 100,153 | |
Citigroup, Inc.,
| |
4.50%, 1/14/22 | | | | | | | 100 | | | | 102,742 | |
JPMorgan Chase & Co.,
| |
4.40%, 7/22/20 | | | | | | | 100 | | | | 102,122 | |
| | | | | | | | | | | | |
| | | | | | | | | | | 305,017 | |
| | | | | | | | | | | | |
| Beverages—1.9% | |
Keurig Dr Pepper, Inc. (a)(b),
| |
4.057%, 5/25/23 | | | | | | | 100 | | | | 100,027 | |
| | | | | | | | | | | | |
| Biotechnology—2.0% | |
Amgen, Inc.,
| |
4.10%, 6/15/21 | | | | | | | 100 | | | | 101,788 | |
| | | | | | | | | | | | |
| Capital Markets—4.0% | |
Goldman Sachs Group, Inc.,
| |
5.25%, 7/27/21 | | | | | | | 100 | | | | 104,467 | |
Morgan Stanley,
| |
5.50%, 7/28/21 | | | | | | | 100 | | | | 105,261 | |
| | | | | | | | | | | | |
| | | | | | | | | | | 209,728 | |
| | | | | | | | | | | | |
| Commercial Services—6.0% | |
APX Group, Inc.,
| |
7.875%, 12/1/22 | | | | | | | 100 | | | | 102,250 | |
Herc Rentals, Inc. (a)(b),
| |
7.50%, 6/1/22 | | | | | | | 100 | | | | 106,250 | |
Waste Management, Inc.,
| |
4.75%, 6/30/20 | | | | | | | 100 | | | | 102,668 | |
| | | | | | | | | | | | |
| | | | | | | | | | | 311,168 | |
| | | | | | | | | | | | |
| Consumer Finance—2.1% | |
Prime Security Services Borrower LLC (a)(b),
| |
9.25%, 5/15/23 | | | | | | | 100 | | | | 107,200 | |
| | | | | | | | | | | | |
| Containers & Packaging—2.0% | |
Reynolds Group Issuer, Inc., 3 mo. USD-LIBOR + 3.500%” (a)(b)(c),
| |
5.839%, 7/15/21 | | | | | | | 100 | | | | 101,625 | |
| | | | | | | | | | | | |
| Diversified Financial Services—1.2% | |
AerCap Ireland Capital DAC,
| |
4.50%, 5/15/21 | | | | | | | 60 | | | | 60,913 | |
| | | | | | | | | | | | |
| Equity Real Estate Investment Trusts (REITs)—2.0% | |
ERP Operating L.P.,
| |
4.625%, 12/15/21 | | | | | | | 100 | | | | 103,194 | |
| | | | | | | | | | | | |
| Food & Beverage—1.9% | |
Anheuser-Busch InBev Finance, Inc.,
| |
3.30%, 2/1/23 | | | | | | | 100 | | | | 98,665 | |
| | | | | | | | | | | | |
| Food & Staples Retailing—1.9% | |
CVS Health Corp.,
| |
3.125%, 3/9/20 | | | | | | | 100 | | | | 100,029 | |
| | | | | | | | | | | | |
| Healthcare-Products—2.9% | |
Fresenius U.S. Finance II, Inc. (a)(b),
| |
4.50%, 1/15/23 | | | | | | | 50 | | | | 50,675 | |
Medtronic, Inc.,
| |
3.15%, 3/15/22 | | | | | | | 100 | | | | 99,399 | |
| | | | | | | | | | | | |
| | | | | | | | | | | 150,074 | |
| | | | | | | | | | | | |
| Healthcare-Services—4.0% | |
DaVita, Inc.,
| |
5.75%, 8/15/22 | | | | | | | 100 | | | | 102,210 | |
| | | | | | |
| 196 | | Annual Report | | | September 30, 2018 | | | See accompanying Notes to Financial Statements |
Schedule of Investments
September 30, 2018
| | | | | | | | | | | | |
| | | | | | Principal
Amount
(000s) | | | Value | |
HCA, Inc.,
| |
6.50%, 2/15/20 | | | $ | | | | 100 | | | $ | 104,113 | |
| | | | | | | | | | | | |
| | | | | | | | | | | 206,323 | |
| | | | | | | | | | | | |
| Industrial Conglomerates—1.3% | |
General Electric Co.,
| |
4.625%, 1/7/21 | | | | | | | 68 | | | | 70,089 | |
| | | | | | | | | | | | |
| Insurance—2.0% | |
MetLife, Inc.,
| |
4.75%, 2/8/21 | | | | | | | 100 | | | | 103,262 | |
| | | | | | | | | | | | |
| Internet Software & Services—2.0% | |
Equinix, Inc.,
| |
5.375%, 1/1/22 | | | | | | | 100 | | | | 103,500 | |
| | | | | | | | | | | | |
| IT Services—3.0% | |
First Data Corp. (a)(b),
| |
7.00%, 12/1/23 | | | | | | | 150 | | | | 156,563 | |
| | | | | | | | | | | | |
| Machinery-Diversified—1.9% | |
John Deere Capital Corp.,
| |
3.125%, 9/10/21 | | | | | | | 100 | | | | 99,769 | |
| | | | | | | | | | | | |
| Media—4.4% | |
Cox Communications, Inc. (a)(b),
| |
3.25%, 12/15/22 | | | | | | | 100 | | | | 97,160 | |
DISH DBS Corp.,
| |
7.875%, 9/1/19 | | | | | | | 100 | | | | 103,771 | |
Sinclair Television Group, Inc.,
| |
6.125%, 10/1/22 | | | | | | | 25 | | | | 25,562 | |
| | | | | | | | | | | | |
| | | | | | | | | | | 226,493 | |
| | | | | | | | | | | | |
| Oil, Gas & Consumable Fuels—9.9% | |
Buckeye Partners L.P.,
| |
5.50%, 8/15/19 | | | | | | | 100 | | | | 101,693 | |
Kinder Morgan Energy Partners L.P.,
| |
6.50%, 4/1/20 | | | | | | | 100 | | | | 104,531 | |
Occidental Petroleum Corp.,
| |
4.10%, 2/1/21 | | | | | | | 100 | | | | 101,718 | |
Sabine Pass Liquefaction LLC,
| |
5.625%, 2/1/21 | | | | | | | 100 | | | | 104,060 | |
Tallgrass Energy Partners L.P. (a)(b),
| |
4.75%, 10/1/23 | | | | | | | 100 | | | | 100,033 | |
| | | | | | | | | | | | |
| | | | | | | | | | | 512,035 | |
| | | | | | | | | | | | |
| Pharmaceuticals—1.9% | |
Pfizer, Inc.,
| | | | | | | | | | | | |
3.00%, 9/15/21 | | | | | | | 100 | | | | 99,992 | |
| | | | | | | | | | | | |
| Retail—2.9% | |
Dollar Tree, Inc.,
| |
3.70%, 5/15/23 | | | | | | | 50 | | | | 49,405 | |
GameStop Corp. (a)(b),
| |
6.75%, 3/15/21 | | | | | | | 100 | | | | 102,650 | |
| | | | | | | | | | | | |
| | | | | | | | | | | 152,055 | |
| | | | | | | | | | | | |
| Technology Hardware, Storage & Peripherals—2.0% | |
Apple, Inc., 3 mo. USD-LIBOR + 0.500% (c),
| |
2.841%, 2/9/22 | | | | | | | 100 | | | | 101,232 | |
| | | | | | | | | | | | |
| Telecommunications—4.4% | |
Hughes Satellite Systems Corp.,
| |
6.50%, 6/15/19 | | | | | | | 50 | | | | 51,100 | |
Sprint Spectrum Co. LLC (a)(b),
| |
3.36%, 9/20/21 | | | | | | | 75 | | | | 74,953 | |
T-Mobile USA, Inc.,
| |
6.00%, 3/1/23 | | | | | | | 100 | | | | 103,325 | |
| | | | | | | | | | | | |
| | | | | | | | | | | 229,378 | |
| | | | | | | | | | | | |
Total Corporate Bonds & Notes
(cost—$3,912,691) | | | | 3,910,143 | |
| | | | | | | | | | | | |
| | | | | | | | | | | | |
| | | | | | | | | | | | |
| | | | | | Principal
Amount
(000s) | | | Value | |
| U.S. Treasury Obligations—15.4% | |
U.S. Treasury Notes, | |
2.00%, 1/31/20 | | | $ | | | | 100 | | | $ | 99,070 | |
2.25%, 2/29/20 | | | | | | | 100 | | | | 99,328 | |
2.25%, 3/31/20 | | | | | | | 100 | | | | 99,266 | |
2.375%, 4/30/20 | | | | | | | 100 | | | | 99,391 | |
2.50%, 5/31/20 | | | | | | | 100 | | | | 99,531 | |
2.50%, 6/30/20 | | | | | | | 100 | | | | 99,508 | |
2.625%, 7/31/20 | | | | | | | 100 | | | | 99,695 | |
3.125%, 5/15/21 | | | | | | | 100 | | | | 100,648 | |
| | | | | | | | | | | | |
Total U.S. Treasury Obligations
(cost—$798,171) | | | | 796,437 | |
| | | | | | | | | | | | |
| | | | | | | | | | | | |
| U.S. Government Agency Securities—7.7% | |
Federal Home Loan Banks, | |
2.875%, 9/11/20 | | | | | | | 100 | | | | 100,075 | |
3.00%, 9/10/21 | | | | | | | 100 | | | | 100,262 | |
3.125%, 9/9/22 | | | | | | | 100 | | | | 100,605 | |
Freddie Mac,
| | | | | | | | | | | | |
2.50%, 4/23/20 | | | | | | | 100 | | | | 99,561 | |
| | | | | | | | | | | | |
Total U.S. Government Agency Securities
(cost—$401,874) | | | | 400,503 | |
| | | | | | | | | | | | |
| |
Total Investments
(cost—$5,112,736)—98.5% | | | | 5,107,083 | |
| | | | | | | | | | | | |
| | | |
| Other assets less liabilities—1.5% | | | | | | | | | | | 77,370 | |
| | | | | | | | | | | | |
| |
| Net Assets—100.0% | | | | $5,184,453 | |
| | | | | | | | | | | | |
Notes to Schedule of Investments:
(a) Private Placement—Restricted as to resale and may not have a readily available market. Securities with an aggregate value of $997,136, representing 19.2% of net assets.
(b) 144A—Exempt from registration under Rule 144A of the Securities Act of 1933. These securities may be resold in transactions exempt from registration, typically only to qualified institutional buyers. Securities with an aggregate value of $997,136, representing 19.2% of net assets.
(c) Variable or Floating Rate Security—Securities with an interest rate that changes periodically. The interest rate disclosed reflects the rate in effect on September 30, 2018.
Glossary:
LIBOR—London Inter-Bank Offered Rate
REIT—Real Estate Investment Trust
AllianzGI Structured Return Fund
| | | | | | | | |
| | |
Shares | | | Value | |
| Exchange-Traded Funds—82.2% | |
iShares Core S&P 500 (a)
| |
(cost—$549,118,298) | | | 1,893,000 | | | | $554,137,890 | |
| | | | | | | | |
| | | | | | | | |
| | | Principal
Amount
(000s) | | | | |
| Repurchase Agreements—11.0% | |
State Street Bank and Trust Co., dated 9/28/18, 0.42%, due 10/1/18, proceeds $74,367,603; collateralized by U.S. Treasury Notes, 1.625%, due 12/31/19, valued at $75,856,217 including accrued interest | |
(cost—$74,365,000) | | | $74,365 | | | | 74,365,000 | |
| | | | | | | | |
| |
| Total Options Purchased —0.3% (cost—$3,467,586) (b)(c)(d) | | | | 1,732,582 | |
| | | | | | | | |
| |
Total Investments, before
options written
(cost—$626,950,884)—93.5% | | | | 630,235,472 | |
| | | | | | | | |
| |
Total Options Written —(4.0)%
(premiums received—$28,103,668) (b)(c)(d) | | | | (26,906,483 | ) |
| | | | | | | | |
| |
Total Investments, net of
options written
(cost—$598,847,216)—89.5% | | | | 603,328,989 | |
| | | | | | | | |
| | |
| Other assets less other liabilities—10.5% | | | | | | | 70,755,343 | |
| | | | | | | | |
| |
| Net Assets—100.0% | | | | $674,084,332 | |
| | | | | | | | |
Notes to Schedule of Investments:
(a) All or partial amount segregated for the benefit of the counterparty as collateral for options written.
(b) Non-income producing.
(c) Exchange traded-Chicago Board Options Exchange.
| | | | | | | | |
| See accompanying Notes to Financial Statements | | | September 30, 2018 | | | Annual Report | | | 197 | |
Schedule of Investments
September 30, 2018
(d) Exchange traded option contracts outstanding at September 30, 2018:
| | | | | | | | | | | | | | | | | | | | | | | | | | | | |
| Options purchased contracts outstanding at September 30, 2018: | | | | | | | | | | |
| Description | | Exercise
Price | | | Expiration
Date | | | Number of
Contracts | | | Notional
Amount | | | Market
Value | | | Cost | | | Unrealized
Appreciation
(Depreciation) | |
| | | | | | | |
Call options: | | | | | | | | | | | | | | | | | | | | | | | | | | | | |
iPATH S&P 500 VIX Short-Term | | | 43.00 USD | | | | 10/19/18 | | | | 582 | | | $ | 58,200 | | | $ | 10,767 | | | $ | 74,254 | | | $ | (63,487 | ) |
iPATH S&P 500 VIX Short-Term | | | 40.00 USD | | | | 10/19/18 | | | | 680 | | | | 68,000 | | | | 11,900 | | | | 83,357 | | | | (71,457 | ) |
iPATH S&P 500 VIX Short-Term | | | 36.00 USD | | | | 11/16/18 | | | | 710 | | | | 71,000 | | | | 70,645 | | | | 83,485 | | | | (12,840 | ) |
S&P 500 Index | | | 3,000.00 USD | | | | 10/19/18 | | | | 50 | | | | 5,000 | | | | 7,625 | | | | 34,062 | | | | (26,437 | ) |
S&P 500 Index | | | 2,975.00 USD | | | | 10/1/18 | | | | 40 | | | | 4,000 | | | | 100 | | | | 22,249 | | | | (22,149 | ) |
S&P 500 Index | | | 3,075.00 USD | | | | 10/1/18 | | | | 40 | | | | 4,000 | | | | 100 | | | | 1,049 | | | | (949 | ) |
S&P 500 Index | | | 3,300.00 USD | | | | 10/1/18 | | | | 40 | | | | 4,000 | | | | 100 | | | | 449 | | | | (349 | ) |
S&P 500 Index | | | 2,975.00 USD | | | | 10/3/18 | | | | 40 | | | | 4,000 | | | | 200 | | | | 35,409 | | | | (35,209 | ) |
S&P 500 Index | | | 3,075.00 USD | | | | 10/3/18 | | | | 40 | | | | 4,000 | | | | 100 | | | | 1,249 | | | | (1,149 | ) |
S&P 500 Index | | | 3,300.00 USD | | | | 10/3/18 | | | | 40 | | | | 4,000 | | | | 100 | | | | 849 | | | | (749 | ) |
S&P 500 Index | | | 2,900.00 USD | | | | 10/5/18 | | | | 50 | | | | 5,000 | | | | 115,750 | | | | 63,012 | | | | 52,738 | |
S&P 500 Index | | | 3,000.00 USD | | | | 10/5/18 | | | | 50 | | | | 5,000 | | | | 375 | | | | 8,562 | | | | (8,187 | ) |
S&P 500 Index | | | 3,200.00 USD | | | | 10/5/18 | | | | 50 | | | | 5,000 | | | | 125 | | | | 712 | | | | (587 | ) |
S&P 500 Index | | | 3,300.00 USD | | | | 10/5/18 | | | | 466 | | | | 46,600 | | | | 1,165 | | | | 4,263 | | | | (3,098 | ) |
S&P 500 Index | | | 2,975.00 USD | | | | 10/8/18 | | | | 40 | | | | 4,000 | | | | 1,800 | | | | 14,849 | | | | (13,049 | ) |
S&P 500 Index | | | 3,075.00 USD | | | | 10/8/18 | | | | 40 | | | | 4,000 | | | | 100 | | | | 2,249 | | | | (2,149 | ) |
S&P 500 Index | | | 2,975.00 USD | | | | 10/10/18 | | | | 40 | | | | 4,000 | | | | 3,300 | | | | 18,049 | | | | (14,749 | ) |
S&P 500 Index | | | 3,075.00 USD | | | | 10/10/18 | | | | 40 | | | | 4,000 | | | | 200 | | | | 2,809 | | | | (2,609 | ) |
S&P 500 Index | | | 2,975.00 USD | | | | 10/12/18 | | | | 50 | | | | 5,000 | | | | 6,750 | | | | 44,812 | | | | (38,062 | ) |
S&P 500 Index | | | 3,300.00 USD | | | | 10/12/18 | | | | 398 | | | | 39,800 | | | | 995 | | | | 3,891 | | | | (2,896 | ) |
S&P 500 Index | | | 3,350.00 USD | | | | 10/12/18 | | | | 116 | | | | 11,600 | | | | 290 | | | | 1,303 | | | | (1,013 | ) |
S&P 500 Index | | | 2,975.00 USD | | | | 10/15/18 | | | | 40 | | | | 4,000 | | | | 6,800 | | | | 15,369 | | | | (8,569 | ) |
S&P 500 Index | | | 3,075.00 USD | | | | 10/15/18 | | | | 40 | | | | 4,000 | | | | 400 | | | | 2,849 | | | | (2,449 | ) |
S&P 500 Index | | | 3,000.00 USD | | | | 10/17/18 | | | | 50 | | | | 5,000 | | | | 5,750 | | | | 13,062 | | | | (7,312 | ) |
S&P 500 Index | | | 3,300.00 USD | | | | 10/19/18 | | | | 285 | | | | 28,500 | | | | 713 | | | | 2,980 | | | | (2,267 | ) |
S&P 500 Index | | | 3,325.00 USD | | | | 10/19/18 | | | | 238 | | | | 23,800 | | | | 595 | | | | 2,674 | | | | (2,079 | ) |
S&P 500 Index | | | 3,000.00 USD | | | | 10/22/18 | | | | 50 | | | | 5,000 | | | | 8,125 | | | | 16,912 | | | | (8,787 | ) |
S&P 500 Index | | | 3,100.00 USD | | | | 10/22/18 | | | | 50 | | | | 5,000 | | | | 1,125 | | | | 4,062 | | | | (2,937 | ) |
S&P 500 Index | | | 3,000.00 USD | | | | 10/24/18 | | | | 25 | | | | 2,500 | | | | 4,687 | | | | 8,280 | | | | (3,593 | ) |
S&P 500 Index | | | 3,000.00 USD | | | | 10/26/18 | | | | 50 | | | | 5,000 | | | | 11,000 | | | | 43,862 | | | | (32,862 | ) |
S&P 500 Index | | | 3,300.00 USD | | | | 10/26/18 | | | | 590 | | | | 59,000 | | | | 1,475 | | | | 7,023 | | | | (5,548 | ) |
S&P 500 Index | | | 2,990.00 USD | | | | 10/29/18 | | | | 50 | | | | 5,000 | | | | 16,750 | | | | 28,462 | | | | (11,712 | ) |
S&P 500 Index | | | 3,075.00 USD | | | | 10/29/18 | | | | 50 | | | | 5,000 | | | | 2,625 | | | | 4,712 | | | | (2,087 | ) |
S&P 500 Index | | | 2,990.00 USD | | | | 10/31/18 | | | | 50 | | | | 5,000 | | | | 19,750 | | | | 58,412 | | | | (38,662 | ) |
S&P 500 Index | | | 3,400.00 USD | | | | 10/31/18 | | | | 50 | | | | 5,000 | | | | 125 | | | | 812 | | | | (687 | ) |
S&P 500 Index | | | 3,025.00 USD | | | | 11/2/18 | | | | 50 | | | | 5,000 | | | | 9,375 | | | | 33,562 | | | | (24,187 | ) |
S&P 500 Index | | | 3,400.00 USD | | | | 11/2/18 | | | | 50 | | | | 5,000 | | | | 125 | | | | 1,012 | | | | (887 | ) |
S&P 500 Index | | | 2,975.00 USD | | | | 11/9/18 | | | | 50 | | | | 5,000 | | | | 56,000 | | | | 68,462 | | | | (12,462 | ) |
S&P 500 Index | | | 3,075.00 USD | | | | 11/9/18 | | | | 50 | | | | 5,000 | | | | 6,250 | | | | 10,962 | | | | (4,712 | ) |
S&P 500 Index | | | 3,000.00 USD | | | | 11/16/18 | | | | 50 | | | | 5,000 | | | | 37,250 | | | | 43,762 | | | | (6,512 | ) |
S&P 500 Index | | | 3,120.00 USD | | | | 11/16/18 | | | | 50 | | | | 5,000 | | | | 4,125 | | | | 5,662 | | | | (1,537 | ) |
S&P 500 Index | | | 3,025.00 USD | | | | 11/30/18 | | | | 60 | | | | 6,000 | | | | 42,000 | | | | 52,154 | | | | (10,154 | ) |
S&P 500 Index | | | 3,150.00 USD | | | | 11/30/18 | | | | 60 | | | | 6,000 | | | | 5,850 | | | | 8,654 | | | | (2,804 | ) |
S&P 500 Index | | | 3,050.00 USD | | | | 12/31/18 | | | | 50 | | | | 5,000 | | | | 55,250 | | | | 83,312 | | | | (28,062 | ) |
S&P 500 Index | | | 3,250.00 USD | | | | 12/31/18 | | | | 50 | | | | 5,000 | | | | 4,375 | | | | 7,562 | | | | (3,187 | ) |
| | | | | | | | | | | | | | | | | | | | |
| Total call options | | | | | | | | | | | $ | 533,007 | | | $ | 1,025,498 | | | $ | (492,491 | ) |
| | | | | | | | | | | | | | | | | | | | |
| | | | | | | |
Put options: | | | | | | | | | | | | | | | | | | | | | | | | | | | | |
S&P 500 Index | | | 1,800.00 USD | | | | 10/1/18 | | | | 120 | | | $ | 12,000 | | | $ | 300 | | | $ | 3,508 | | | $ | (3,208 | ) |
S&P 500 Index | | | 2,630.00 USD | | | | 10/1/18 | | | | 21 | | | | 2,100 | | | | 105 | | | | 7,586 | | | | (7,481 | ) |
S&P 500 Index | | | 2,775.00 USD | | | | 10/1/18 | | | | 60 | | | | 6,000 | | | | 1,050 | | | | 51,254 | | | | (50,204 | ) |
S&P 500 Index | | | 1,800.00 USD | | | | 10/3/18 | | �� | | 120 | | | | 12,000 | | | | 300 | | | | 3,508 | | | | (3,208 | ) |
S&P 500 Index | | | 2,625.00 USD | | | | 10/3/18 | | | | 21 | | | | 2,100 | | | | 578 | | | | 8,006 | | | | (7,428 | ) |
S&P 500 Index | | | 2,780.00 USD | | | | 10/3/18 | | | | 60 | | | | 6,000 | | | | 3,900 | | | | 49,454 | | | | (45,554 | ) |
S&P 500 Index | | | 1,600.00 USD | | | | 10/5/18 | | | | 400 | | | | 40,000 | | | | 1,000 | | | | 17,594 | | | | (16,594 | ) |
S&P 500 Index | | | 1,750.00 USD | | | | 10/5/18 | | | | 930 | | | | 93,000 | | | | 2,325 | | | | 27,484 | | | | (25,159 | ) |
S&P 500 Index | | | 1,800.00 USD | | | | 10/5/18 | | | | 464 | | | | 46,400 | | | | 1,160 | | | | 14,655 | | | | (13,495 | ) |
| | | | | | |
| 198 | | Annual Report | | | September 30, 2018 | | | See accompanying Notes to Financial Statements |
Schedule of Investments
September 30, 2018
| | | | | | | | | | | | | | | | | | | | | | | | | | | | |
| Options purchased contracts outstanding at September 30, 2018 (continued): | | | | | | | | | | |
| Description | | Exercise
Price | | | Expiration
Date | | | Number of
Contracts | | | Notional
Amount | | | Market
Value | | | Cost | | | Unrealized
Appreciation
(Depreciation) | |
Put options (continued): | | | | | | | | | | | | | | | | | | | | | | | | | | | | |
S&P 500 Index | | | 2,615.00 USD | | | | 10/5/18 | | | | 21 | | | $ | 2,100 | | | $ | 893 | | | $ | 8,216 | | | $ | (7,323 | ) |
S&P 500 Index | | | 2,750.00 USD | | | | 10/5/18 | | | | 234 | | | | 23,400 | | | | 22,815 | | | | 25,419 | | | | (2,604 | ) |
S&P 500 Index | | | 2,825.00 USD | | | | 10/5/18 | | | | 40 | | | | 4,000 | | | | 7,300 | | | | 20,969 | | | | (13,669 | ) |
S&P 500 Index | | | 1,800.00 USD | | | | 10/8/18 | | | | 120 | | | | 12,000 | | | | 300 | | | | 3,628 | | | | (3,328 | ) |
S&P 500 Index | | | 2,750.00 USD | | | | 10/8/18 | | | | 60 | | | | 6,000 | | | | 7,800 | | | | 53,474 | | | | (45,674 | ) |
S&P 500 Index | | | 2,825.00 USD | | | | 10/8/18 | | | | 40 | | | | 4,000 | | | | 10,300 | | | | 9,906 | | | | 394 | |
S&P 500 Index | | | 1,800.00 USD | | | | 10/10/18 | | | | 120 | | | | 12,000 | | | | 300 | | | | 4,348 | | | | (4,048 | ) |
S&P 500 Index | | | 2,600.00 USD | | | | 10/10/18 | | | | 19 | | | | 1,900 | | | | 1,662 | | | | 8,193 | | | | (6,531 | ) |
S&P 500 Index | | | 2,750.00 USD | | | | 10/10/18 | | | | 60 | | | | 6,000 | | | | 11,250 | | | | 60,274 | | | | (49,024 | ) |
S&P 500 Index | | | 2,825.00 USD | | | | 10/10/18 | | | | 30 | | | | 3,000 | | | | 10,950 | | | | 20,677 | | | | (9,727 | ) |
S&P 500 Index | | | 1,500.00 USD | | | | 10/12/18 | | | | 160 | | | | 16,000 | | | | 400 | | | | 4,197 | | | | (3,797 | ) |
S&P 500 Index | | | 1,600.00 USD | | | | 10/12/18 | | | | 614 | | | | 61,400 | | | | 1,535 | | | | 14,163 | | | | (12,628 | ) |
S&P 500 Index | | | 1,700.00 USD | | | | 10/12/18 | | | | 116 | | | | 11,600 | | | | 290 | | | | 3,623 | | | | (3,333 | ) |
S&P 500 Index | | | 1,750.00 USD | | | | 10/12/18 | | | | 812 | | | | 81,200 | | | | 2,030 | | | | 23,138 | | | | (21,108 | ) |
S&P 500 Index | | | 2,630.00 USD | | | | 10/12/18 | | | | 19 | | | | 1,900 | | | | 2,422 | | | | 8,003 | | | | (5,581 | ) |
S&P 500 Index | | | 2,775.00 USD | | | | 10/12/18 | | | | 75 | | | | 7,500 | | | | 21,750 | | | | 96,843 | | | | (75,093 | ) |
S&P 500 Index | | | 1,800.00 USD | | | | 10/15/18 | | | | 120 | | | | 12,000 | | | | 300 | | | | 6,088 | | | | (5,788 | ) |
S&P 500 Index | | | 2,700.00 USD | | | | 10/15/18 | | | | 19 | | | | 1,900 | | | | 3,942 | | | | 7,433 | | | | (3,491 | ) |
S&P 500 Index | | | 2,810.00 USD | | | | 10/15/18 | | | | 60 | | | | 6,000 | | | | 26,700 | | | | 124,934 | | | | (98,234 | ) |
S&P 500 Index | | | 1,800.00 USD | | | | 10/17/18 | | | | 140 | | | | 14,000 | | | | 350 | | | | 4,283 | | | | (3,933 | ) |
S&P 500 Index | | | 2,630.00 USD | | | | 10/17/18 | | | | 22 | | | | 2,200 | | | | 3,905 | | | | 7,507 | | | | (3,602 | ) |
S&P 500 Index | | | 2,825.00 USD | | | | 10/17/18 | | | | 70 | | | | 7,000 | | | | 43,750 | | | | 78,756 | | | | (35,006 | ) |
S&P 500 Index | | | 1,600.00 USD | | | | 10/19/18 | | | | 350 | | | | 35,000 | | | | 875 | | | | 11,207 | | | | (10,332 | ) |
S&P 500 Index | | | 1,750.00 USD | | | | 10/19/18 | | | | 589 | | | | 58,900 | | | | 1,472 | | | | 15,920 | | | | (14,448 | ) |
S&P 500 Index | | | 1,800.00 USD | | | | 10/19/18 | | | | 646 | | | | 64,600 | | | | 1,615 | | | | 10,487 | | | | (8,872 | ) |
S&P 500 Index | | | 1,850.00 USD | | | | 10/19/18 | | | | 472 | | | | 47,200 | | | | 2,360 | | | | 7,663 | | | | (5,303 | ) |
S&P 500 Index | | | 2,680.00 USD | | | | 10/19/18 | | | | 22 | | | | 2,200 | | | | 5,445 | | | | 7,507 | | | | (2,062 | ) |
S&P 500 Index | | | 2,750.00 USD | | | | 10/19/18 | | | | 75 | | | | 7,500 | | | | 28,125 | | | | 96,843 | | | | (68,718 | ) |
S&P 500 Index | | | 1,800.00 USD | | | | 10/22/18 | | | | 120 | | | | 12,000 | | | | 600 | | | | 4,648 | | | | (4,048 | ) |
S&P 500 Index | | | 2,800.00 USD | | | | 10/22/18 | | | | 60 | | | | 6,000 | | | | 37,200 | | | | 63,374 | | | | (26,174 | ) |
S&P 500 Index | | | 1,800.00 USD | | | | 10/24/18 | | | | 150 | | | | 15,000 | | | | 750 | | | | 2,981 | | | | (2,231 | ) |
S&P 500 Index | | | 2,825.00 USD | | | | 10/24/18 | | | | 75 | | | | 7,500 | | | | 65,250 | | | | 61,320 | | | | 3,930 | |
S&P 500 Index | | | 1,500.00 USD | | | | 10/26/18 | | | | 150 | | | | 15,000 | | | | 375 | | | | 4,310 | | | | (3,935 | ) |
S&P 500 Index | | | 1,600.00 USD | | | | 10/26/18 | | | | 290 | | | | 29,000 | | | | 725 | | | | 12,059 | | | | (11,334 | ) |
S&P 500 Index | | | 1,750.00 USD | | | | 10/26/18 | | | | 610 | | | | 61,000 | | | | 3,050 | | | | 12,225 | | | | (9,175 | ) |
S&P 500 Index | | | 1,800.00 USD | | | | 10/26/18 | | | | 1,044 | | | | 104,400 | | | | 5,220 | | | | 23,269 | | | | (18,049 | ) |
S&P 500 Index | | | 2,750.00 USD | | | | 10/26/18 | | | | 75 | | | | 7,500 | | | | 40,125 | | | | 118,218 | | | | (78,093 | ) |
S&P 500 Index | | | 1,800.00 USD | | | | 10/29/18 | | | | 150 | | | | 15,000 | | | | 1,125 | | | | 3,185 | | | | (2,060 | ) |
S&P 500 Index | | | 2,825.00 USD | | | | 10/29/18 | | | | 75 | | | | 7,500 | | | | 76,875 | | | | 73,218 | | | | 3,657 | |
S&P 500 Index | | | 1,500.00 USD | | | | 10/31/18 | | | | 125 | | | | 12,500 | | | | 313 | | | | 3,905 | | | | (3,592 | ) |
S&P 500 Index | | | 1,600.00 USD | | | | 10/31/18 | | | | 350 | | | | 35,000 | | | | 875 | | | | 11,844 | | | | (10,969 | ) |
S&P 500 Index | | | 2,645.00 USD | | | | 10/31/18 | | | | 20 | | | | 2,000 | | | | 7,100 | | | | 8,225 | | | | (1,125 | ) |
S&P 500 Index | | | 2,800.00 USD | | | | 10/31/18 | | | | 75 | | | | 7,500 | | | | 68,625 | | | | 190,143 | | | | (121,518 | ) |
S&P 500 Index | | | 1,500.00 USD | | | | 11/2/18 | | | | 125 | | | | 12,500 | | | | 313 | | | | 4,430 | | | | (4,117 | ) |
S&P 500 Index | | | 2,800.00 USD | | | | 11/2/18 | | | | 75 | | | | 7,500 | | | | 76,125 | | | | 199,068 | | | | (122,943 | ) |
S&P 500 Index | | | 1,500.00 USD | | | | 11/9/18 | | | | 150 | | | | 15,000 | | | | 750 | | | | 5,660 | | | | (4,910 | ) |
S&P 500 Index | | | 1,700.00 USD | | | | 11/9/18 | | | | 120 | | | | 12,000 | | | | 1,500 | | | | 4,348 | | | | (2,848 | ) |
S&P 500 Index | | | 2,750.00 USD | | | | 11/9/18 | | | | 75 | | | | 7,500 | | | | 76,875 | | | | 143,463 | | | | (66,588 | ) |
S&P 500 Index | | | 2,825.00 USD | | | | 11/16/18 | | | | 70 | | | | 7,000 | | | | 138,250 | | | | 165,636 | | | | (27,386 | ) |
S&P 500 Index | | | 2,775.00 USD | | | | 11/30/18 | | | | 75 | | | | 7,500 | | | | 142,875 | | | | 183,793 | | | | (40,918 | ) |
S&P 500 Index | | | 2,775.00 USD | | | | 12/31/18 | | | | 75 | | | | 7,500 | | | | 223,125 | | | | 216,018 | | | | 7,107 | |
| | | | | | | | | | | | | | | | | | | | |
| Total put options | | | | | | | | | | | $ | 1,199,575 | | | $ | 2,442,088 | | | $ | (1,242,513 | ) |
| | | | | | | | | | | | | | | | | | | | |
| Total options purchased contracts | | | | | | | | | | | $ | 1,732,582 | | | $ | 3,467,586 | | | $ | (1,735,004 | ) |
| | | | | | | | | | | | | | | | | | | | |
| | | | | | | | |
| See accompanying Notes to Financial Statements | | | September 30, 2018 | | | Annual Report | | | 199 | |
Schedule of Investments
September 30, 2018
| | | | | | | | | | | | | | | | | | | | | | | | | | | | |
| Options written contracts outstanding at September 30, 2018: | | | | | | | | | | |
| Description | | Exercise
Price | | | Expiration
Date | | | Number of
Contracts | | | Notional
Amount | | | Market
Value | | | Premiums
Received | | | Unrealized
Appreciation
(Depreciation) | |
| | | | | | | |
Call options: | | | | | | | | | | | | | | | | | | | | | | | | | | | | |
iPATH S&P 500 VIX Short-Term | | | 52.00 USD | | | | 10/19/18 | | | | (680 | ) | | $ | (68,000 | ) | | $ | (34,000 | ) | | $ | (43,122 | ) | | $ | 9,122 | |
iPATH S&P 500 VIX Short-Term | | | 59.00 USD | | | | 10/19/18 | | | | (582 | ) | | | (58,200 | ) | | | (3,783 | ) | | | (36,907 | ) | | | 33,124 | |
iPATH S&P 500 VIX Short-Term | | | 50.00 USD | | | | 11/16/18 | | | | (710 | ) | | | (71,000 | ) | | | (34,080 | ) | | | (34,375 | ) | | | 295 | |
S&P 500 Index | | | 3,025.00 USD | | | | 10/1/18 | | | | (80 | ) | | | (8,000 | ) | | | (200 | ) | | | (15,101 | ) | | | 14,901 | |
S&P 500 Index | | | 3,025.00 USD | | | | 10/3/18 | | | | (80 | ) | | | (8,000 | ) | | | (400 | ) | | | (25,661 | ) | | | 25,261 | |
S&P 500 Index | | | 2,750.00 USD | | | | 10/5/18 | | | | (234 | ) | | | (23,400 | ) | | | (3,878,550 | ) | | | (3,137,973 | ) | | | (740,577 | ) |
S&P 500 Index | | | 2,790.00 USD | | | | 10/5/18 | | | | (232 | ) | | | (23,200 | ) | | | (2,924,360 | ) | | | (2,692,826 | ) | | | (231,534 | ) |
S&P 500 Index | | | 2,950.00 USD | | | | 10/5/18 | | | | (100 | ) | | | (10,000 | ) | | | (12,250 | ) | | | (42,976 | ) | | | 30,726 | |
S&P 500 Index | | | 3,025.00 USD | | | | 10/8/18 | | | | (80 | ) | | | (8,000 | ) | | | (400 | ) | | | (8,701 | ) | | | 8,301 | |
S&P 500 Index | | | 3,025.00 USD | | | | 10/10/18 | | | | (80 | ) | | | (8,000 | ) | | | (1,400 | ) | | | (10,461 | ) | | | 9,061 | |
S&P 500 Index | | | 2,750.00 USD | | | | 10/12/18 | | | | (116 | ) | | | (11,600 | ) | | | (1,940,100 | ) | | | (1,625,017 | ) | | | (315,083 | ) |
S&P 500 Index | | | 2,780.00 USD | | | | 10/12/18 | | | | (116 | ) | | | (11,600 | ) | | | (1,599,060 | ) | | | (1,380,721 | ) | | | (218,339 | ) |
S&P 500 Index | | | 2,810.00 USD | | | | 10/12/18 | | | | (232 | ) | | | (23,200 | ) | | | (2,525,320 | ) | | | (2,450,761 | ) | | | (74,559 | ) |
S&P 500 Index | | | 3,025.00 USD | | | | 10/12/18 | | | | (50 | ) | | | (5,000 | ) | | | (1,750 | ) | | | (16,188 | ) | | | 14,438 | |
S&P 500 Index | | | 3,025.00 USD | | | | 10/15/18 | | | | (80 | ) | | | (8,000 | ) | | | (3,600 | ) | | | (10,221 | ) | | | 6,621 | |
S&P 500 Index | | | 2,770.00 USD | | | | 10/19/18 | | | | (117 | ) | | | (11,700 | ) | | | (1,752,075 | ) | | | (1,542,384 | ) | | | (209,691 | ) |
S&P 500 Index | | | 2,810.00 USD | | | | 10/19/18 | | | | (118 | ) | | | (11,800 | ) | | | (1,315,700 | ) | | | (1,307,412 | ) | | | (8,288 | ) |
S&P 500 Index | | | 2,830.00 USD | | | | 10/19/18 | | | | (238 | ) | | | (23,800 | ) | | | (2,209,830 | ) | | | (2,664,985 | ) | | | 455,155 | |
S&P 500 Index | | | 3,050.00 USD | | | | 10/19/18 | | | | (100 | ) | | | (10,000 | ) | | | (5,250 | ) | | | (27,376 | ) | | | 22,126 | |
S&P 500 Index | | | 3,050.00 USD | | | | 10/22/18 | | | | (100 | ) | | | (10,000 | ) | | | (5,750 | ) | | | (14,477 | ) | | | 8,727 | |
S&P 500 Index | | | 2,790.00 USD | | | | 10/26/18 | | | | (246 | ) | | | (24,600 | ) | | | (3,293,940 | ) | | | (3,313,223 | ) | | | 19,283 | |
S&P 500 Index | | | 2,820.00 USD | | | | 10/26/18 | | | | (244 | ) | | | (24,400 | ) | | | (2,587,620 | ) | | | (2,714,809 | ) | | | 127,189 | |
S&P 500 Index | | | 3,075.00 USD | | | | 10/26/18 | | | | (150 | ) | | | (15,000 | ) | | | (7,500 | ) | | | (37,165 | ) | | | 29,665 | |
S&P 500 Index | | | 3,040.00 USD | | | | 10/29/18 | | | | (100 | ) | | | (10,000 | ) | | | (10,000 | ) | | | (16,677 | ) | | | 6,677 | |
S&P 500 Index | | | 3,040.00 USD | | | | 10/31/18 | | | | (100 | ) | | | (10,000 | ) | | | (11,750 | ) | | | (44,476 | ) | | | 32,726 | |
S&P 500 Index | | | 3,075.00 USD | | | | 11/2/18 | | | | (100 | ) | | | (10,000 | ) | | | (7,250 | ) | | | (27,577 | ) | | | 20,327 | |
S&P 500 Index | | | 3,025.00 USD | | | | 11/9/18 | | | | (100 | ) | | | (10,000 | ) | | | (32,500 | ) | | | (50,177 | ) | | | 17,677 | |
S&P 500 Index | | | 3,060.00 USD | | | | 11/16/18 | | | | (100 | ) | | | (10,000 | ) | | | (21,000 | ) | | | (25,677 | ) | | | 4,677 | |
S&P 500 Index | | | 3,100.00 USD | | | | 11/30/18 | | | | (120 | ) | | | (12,000 | ) | | | (22,500 | ) | | | (29,612 | ) | | | 7,112 | |
S&P 500 Index | | | 3,150.00 USD | | | | 12/31/18 | | | | (100 | ) | | | (10,000 | ) | | | (24,750 | ) | | | (39,877 | ) | | | 15,127 | |
| | | | | | | | | | | | | | | | | | | | |
| Total call options | | | | | | | | | | | $ | (24,266,668 | ) | | $ | (23,386,915 | ) | | $ | (879,753 | ) |
| | | | | | | | | | | | | | | | | | | | |
| | | | | | | |
Put options: | | | | | | | | | | | | | | | | | | | | | | | | | | | | |
S&P 500 Index | | | 2,620.00 USD | | | | 10/5/18 | | | | (250 | ) | | $ | (25,000 | ) | | $ | (10,625 | ) | | $ | (267,216 | ) | | $ | 256,591 | |
S&P 500 Index | | | 2,700.00 USD | | | | 10/1/18 | | | | (60 | ) | | | (6,000 | ) | | | (450 | ) | | | (30,046 | ) | | | 29,596 | |
S&P 500 Index | | | 2,705.00 USD | | | | 10/3/18 | | | | (60 | ) | | | (6,000 | ) | | | (2,550 | ) | | | (30,046 | ) | | | 27,496 | |
S&P 500 Index | | | 2,550.00 USD | | | | 10/5/18 | | | | (60 | ) | | | (6,000 | ) | | | (1,800 | ) | | | (31,546 | ) | | | 29,746 | |
S&P 500 Index | | | 2,700.00 USD | | | | 10/5/18 | | | | (50 | ) | | | (5,000 | ) | | | (3,625 | ) | | | (27,340 | ) | | | 23,715 | |
S&P 500 Index | | | 2,775.00 USD | | | | 10/5/18 | | | | (40 | ) | | | (4,000 | ) | | | (4,500 | ) | | | (12,270 | ) | | | 7,770 | |
S&P 500 Index | | | 2,675.00 USD | | | | 10/8/18 | | | | (120 | ) | | | (12,000 | ) | | | (10,500 | ) | | | (66,332 | ) | | | 55,832 | |
S&P 500 Index | | | 2,775.00 USD | | | | 10/8/18 | | | | (40 | ) | | | (4,000 | ) | | | (6,200 | ) | | | (5,694 | ) | | | (506 | ) |
S&P 500 Index | | | 2,675.00 USD | | | | 10/10/18 | | | | (120 | ) | | | (12,000 | ) | | | (15,000 | ) | | | (73,052 | ) | | | 58,052 | |
S&P 500 Index | | | 2,775.00 USD | | | | 10/10/18 | | | | (30 | ) | | | (3,000 | ) | | | (6,750 | ) | | | (12,503 | ) | | | 5,753 | |
S&P 500 Index | | | 2,650.00 USD | | | | 10/12/18 | | | | (80 | ) | | | (8,000 | ) | | | (11,400 | ) | | | (83,101 | ) | | | 71,701 | |
S&P 500 Index | | | 2,700.00 USD | | | | 10/12/18 | | | | (150 | ) | | | (15,000 | ) | | | (27,375 | ) | | | (118,315 | ) | | | 90,940 | |
S&P 500 Index | | | 2,720.00 USD | | | | 10/12/18 | | | | (232 | ) | | | (23,200 | ) | | | (46,980 | ) | | | (151,074 | ) | | | 104,094 | |
S&P 500 Index | | | 2,800.00 USD | | | | 10/12/18 | | | | (232 | ) | | | (23,200 | ) | | | (82,360 | ) | | | (187,634 | ) | | | 105,274 | |
S&P 500 Index | | | 2,735.00 USD | | | | 10/15/18 | | | | (120 | ) | | | (12,000 | ) | | | (30,000 | ) | | | (142,052 | ) | | | 112,052 | |
S&P 500 Index | | | 2,770.00 USD | | | | 10/17/18 | | | | (140 | ) | | | (14,000 | ) | | | (53,900 | ) | | | (95,207 | ) | | | 41,307 | |
S&P 500 Index | | | 2,665.00 USD | | | | 10/19/18 | | | | (150 | ) | | | (15,000 | ) | | | (34,125 | ) | | | (118,465 | ) | | | 84,340 | |
S&P 500 Index | | | 2,670.00 USD | | | | 10/19/18 | | | | (100 | ) | | | (10,000 | ) | | | (23,500 | ) | | | (79,676 | ) | | | 56,176 | |
S&P 500 Index | | | 2,800.00 USD | | | | 10/19/18 | | | | (236 | ) | | | (23,600 | ) | | | (128,620 | ) | | | (230,989 | ) | | | 102,369 | |
S&P 500 Index | | | 2,830.00 USD | | | | 10/19/18 | | | | (236 | ) | | | (23,600 | ) | | | (172,280 | ) | | | (181,429 | ) | | | 9,149 | |
S&P 500 Index | | | 2,725.00 USD | | | | 10/22/18 | | | | (120 | ) | | | (12,000 | ) | | | (43,800 | ) | | | (72,452 | ) | | | 28,652 | |
S&P 500 Index | | | 2,765.00 USD | | | | 10/24/18 | | | | (150 | ) | | | (15,000 | ) | | | (79,500 | ) | | | (72,463 | ) | | | (7,037 | ) |
S&P 500 Index | | | 2,650.00 USD | | | | 10/26/18 | | | | (150 | ) | | | (15,000 | ) | | | (47,250 | ) | | | (137,065 | ) | | | 89,815 | |
S&P 500 Index | | | 2,670.00 USD | | | | 10/26/18 | | | | (145 | ) | | | (14,500 | ) | | | (50,025 | ) | | | (148,975 | ) | | | 98,950 | |
S&P 500 Index | | | 2,780.00 USD | | | | 10/26/18 | | | | (238 | ) | �� | | (23,800 | ) | | | (158,270 | ) | | | (177,885 | ) | | | 19,615 | |
| | | | | | |
| 200 | | Annual Report | | | September 30, 2018 | | | See accompanying Notes to Financial Statements |
Schedule of Investments
September 30, 2018
| | | | | | | | | | | | | | | | | | | | | | | | | | | | |
| Options written contracts outstanding at September 30, 2018 (continued): | | | | | | | | | | |
| Description | | Exercise
Price | | | Expiration
Date | | | Number of
Contracts | | | Notional
Amount | | | Market
Value | | | Premiums
Received | | | Unrealized
Appreciation
(Depreciation) | |
Put options (continued): | | | | | | | | | | | | | | | | | | | | | | | | | | | | |
S&P 500 Index | | | 2,810.00 USD | | | | 10/26/18 | | | | (244 | ) | | $ | (24,400 | ) | | $ | (206,180 | ) | | $ | (219,171 | ) | | $ | 12,991 | |
S&P 500 Index | | | 2,760.00 USD | | | | 10/29/18 | | | | (150 | ) | | | (15,000 | ) | | | (90,750 | ) | | | (85,315 | ) | | | (5,435 | ) |
S&P 500 Index | | | 2,640.00 USD | | | | 10/31/18 | | | | (100 | ) | | | (10,000 | ) | | | (34,500 | ) | | | (79,058 | ) | | | 44,558 | |
S&P 500 Index | | | 2,650.00 USD | | | | 10/31/18 | | | | (100 | ) | | | (10,000 | ) | | | (36,500 | ) | | | (60,876 | ) | | | 24,376 | |
S&P 500 Index | | | 2,700.00 USD | | | | 10/31/18 | | | | (150 | ) | | | (15,000 | ) | | | (69,750 | ) | | | (217,465 | ) | | | 147,715 | |
S&P 500 Index | | | 2,620.00 USD | | | | 11/2/18 | | | | (100 | ) | | | (10,000 | ) | | | (35,500 | ) | | | (78,876 | ) | | | 43,376 | |
S&P 500 Index | | | 2,690.00 USD | | | | 11/2/18 | | | | (150 | ) | | | (15,000 | ) | | | (74,250 | ) | | | (218,365 | ) | | | 144,115 | |
S&P 500 Index | | | 2,660.00 USD | | | | 11/9/18 | | | | (150 | ) | | | (15,000 | ) | | | (95,250 | ) | | | (176,585 | ) | | | 81,335 | |
S&P 500 Index | | | 2,730.00 USD | | | | 11/9/18 | | | | (120 | ) | | | (12,000 | ) | | | (108,600 | ) | | | (107,852 | ) | | | (748 | ) |
S&P 500 Index | | | 2,740.00 USD | | | | 11/9/18 | | | | (60 | ) | | | (6,000 | ) | | | (57,900 | ) | | | (59,926 | ) | | | 2,026 | |
S&P 500 Index | | | 2,650.00 USD | | | | 11/16/18 | | | | (100 | ) | | | (10,000 | ) | | | (71,500 | ) | | | (76,141 | ) | | | 4,641 | |
S&P 500 Index | | | 2,700.00 USD | | | | 11/16/18 | | | | (90 | ) | | | (9,000 | ) | | | (82,350 | ) | | | (79,089 | ) | | | (3,261 | ) |
S&P 500 Index | | | 2,750.00 USD | | | | 11/16/18 | | | | (140 | ) | | | (14,000 | ) | | | (169,400 | ) | | | (202,127 | ) | | | 32,727 | |
S&P 500 Index | | | 2,675.00 USD | | | | 11/30/18 | | | | (150 | ) | | | (15,000 | ) | | | (170,250 | ) | | | (221,715 | ) | | | 51,465 | |
S&P 500 Index | | | 2,675.00 USD | | | | 12/31/18 | | | | (150 | ) | | | (15,000 | ) | | | (285,750 | ) | | | (281,365 | ) | | | (4,385 | ) |
| | | | | | | | | | | | | | | | | | | | |
| Total put options | | | | | | | | | | | $ | (2,639,815 | ) | | $ | (4,716,753 | ) | | $ | 2,076,938 | |
| | | | | | | | | | | | | | | | | | | | |
| Total options written contracts | | | | | | | | | | | $ | (26,906,483 | ) | | $ | (28,103,668 | ) | | $ | 1,197,185 | |
| | | | | | | | | | | | | | | | | | | | |
(e) At September 30, 2018, the Fund pledged $6,472,095 in cash as collateral for options written.
Glossary:
VIX—Volatility Index
| | | | | | | | |
| See accompanying Notes to Financial Statements | | | September 30, 2018 | | | Annual Report | | | 201 | |
Schedule of Investments
September 30, 2018
AllianzGI U.S. Equity Hedged Fund
| | | | | | | | |
| | | Shares | | | Value | |
| Exchange-Traded Funds—97.8% | |
SPDR S&P 500 (a)
(cost—$2,171,085) | | | 9,850 | | | | $2,863,592 | |
| | | | | | | | |
| |
Total Options Purchased —1.1%
(cost—$72,180) (b)(c)(d) | | | | 32,317 | |
| | | | | | | | |
| |
Total Investments, before
options written
(cost—$2,243,265)—98.9% | | | | 2,895,909 | |
| | | | | | | | |
| | | | | | | | |
| | |
| | | | | | Value | |
| |
Total Options Written —(0.2)%
(premiums received—
$7,532) (b)(c)(d) | | | $ | (4,755 | ) |
| | | | | | | | |
| |
Total Investments, net of
options written
(cost—$2,235,733)—98.7% | | | | 2,891,154 | |
| | | | | | | | |
| | |
| Other assets less other liabilities—1.3% | | | | | | | 36,994 | |
| | | | | | | | |
| |
| Net Assets—100.0% | | | | $2,928,148 | |
| | | | | | | | |
Notes to Schedule of Investments:
(a) All or partial amount segregated for the benefit of the counterparty as collateral for options written.
(b) Non-income producing.
(c) Exchange traded-Chicago Board Options Exchange.
(d) Exchange traded option contracts outstanding at September 30, 2018:
| | | | | | | | | | | | | | | | | | | | | | | | | | | | |
| Options purchased contracts outstanding at September 30, 2018: | | | | | | | | | | |
| Description | | Exercise
Price | | | Expiration
Date | | | Number of
Contracts | | | Notional
Amount | | | Market
Value | | | Cost | | | Unrealized
(Depreciation) | |
| | | | | | | |
Call options: | | | | | | | | | | | | | | | | | | | | | | | | | | | | |
S&P 500 Index | | | 3,400.00 USD | | | | 10/26/18 | | | | 4 | | | $ | 400 | | | $ | 10 | | | $ | 53 | | | $ | (43 | ) |
S&P 500 Index | | | 3,400.00 USD | | | | 11/9/18 | | | | 5 | | | | 500 | | | | 12 | | | | 46 | | | | (34 | ) |
| | | | | | | | | | | | | | | | | | | | |
| Total call options | | | | | | | | | | | $ | 22 | | | $ | 99 | �� | | $ | (77 | ) |
| | | | | | | | | | | | | | | | | | | | |
| | | | | | | |
Put options: | | | | | | | | | | | | | | | | | | | | | | | | | | | | |
S&P 500 Index | | | 2,575.00 USD | | | | 9/20/19 | | | | 1 | | | $ | 100 | | | $ | 6,705 | | | $ | 6,821 | | | $ | (116 | ) |
S&P 500 Index | | | 2,575.00 USD | | | | 12/21/18 | | | | 1 | | | | 100 | | | | 1,115 | | | | 7,614 | | | | (6,499 | ) |
S&P 500 Index | | | 2,575.00 USD | | | | 1/18/19 | | | | 1 | | | | 100 | | | | 1,635 | | | | 8,133 | | | | (6,498 | ) |
S&P 500 Index | | | 2,400.00 USD | | | | 3/15/19 | | | | 1 | | | | 100 | | | | 1,675 | | | | 7,624 | | | | (5,949 | ) |
S&P 500 Index | | | 2,375.00 USD | | | | 4/18/19 | | | | 1 | | | | 100 | | | | 2,137 | | | | 7,884 | | | | (5,747 | ) |
S&P 500 Index | | | 2,375.00 USD | | | | 5/17/19 | | | | 1 | | | | 100 | | | | 2,582 | | | | 6,466 | | | | (3,884 | ) |
S&P 500 Index | | | 2,425.00 USD | | | | 6/21/19 | | | | 1 | | | | 100 | | | | 3,365 | | | | 6,693 | | | | (3,328 | ) |
S&P 500 Index | | | 2,450.00 USD | | | | 6/21/19 | | | | 1 | | | | 100 | | | | 3,590 | | | | 6,731 | | | | (3,141 | ) |
S&P 500 Index | | | 2,450.00 USD | | | | 7/19/19 | | | | 1 | | | | 100 | | | | 4,225 | | | | 6,832 | | | | (2,607 | ) |
S&P 500 Index | | | 2,500.00 USD | | | | 8/16/19 | | | | 1 | | | | 100 | | | | 5,266 | | | | 7,283 | | | | (2,017 | ) |
| | | | | | | | | | | | | | | | | | | | |
| Total put options | | | | | | | | | | | $ | 32,295 | | | $ | 72,081 | | | $ | (39,786 | ) |
| | | | | | | | | | | | | | | | | | | | |
| Total options purchased contracts | | | | | | | | | | | $ | 32,317 | | | $ | 72,180 | | | $ | (39,863 | ) |
| | | | | | | | | | | | | | | | | | | | |
| | | | | | | | | | | | | | | | | | | | | | | | | | | | |
| Options written contracts outstanding at September 30, 2018: | | | | | | | | | | |
| Description | | Exercise
Price | | | Expiration
Date | | | Number of
Contracts | | | Notional
Amount | | | Market
Value | | | Premiums
Received | | | Unrealized
Appreciation | |
| | | | | | | |
Call options: | | | | | | | | | | | | | | | | | | | | | | | | | | | | |
S&P 500 Index | | | 2,985.00 USD | | | | 10/26/18 | | | | (4 | ) | | $ | (400 | ) | | $ | (1,380 | ) | | $ | (3,623 | ) | | $ | 2,243 | |
S&P 500 Index | | | 2,995.00 USD | | | | 11/9/18 | | | | (5 | ) | | | (500 | ) | | | (3,375 | ) | | | (3,909 | ) | | | 534 | |
| | | | | | | | | | | | | | | | | | | | |
| Total options written contracts | | | | | | | | | | | $ | (4,755 | ) | | $ | (7,532 | ) | | $ | 2,777 | |
| | | | | | | | | | | | | | | | | | | | |
(e) At September 30, 2018, the Fund pledged $7,972 in cash as collateral for options written.
| | | | | | |
| 202 | | Annual Report | | | September 30, 2018 | | | See accompanying Notes to Financial Statements |
Schedule of Investments
September 30, 2018
AllianzGI Ultra Micro Cap Fund
| | | | | | | | |
| | | Shares | | | Value | |
| Common Stock—97.2% | |
| Aerospace & Defense—1.1% | |
Ducommun, Inc. (a) | | | 8,685 | | | | $354,696 | |
| | | | | | | | |
| Banks—8.8% | |
Atlantic Capital Bancshares, Inc. (a) | | | 16,698 | | | | 279,692 | |
Evans Bancorp, Inc. | | | 4,597 | | | | 215,829 | |
First Internet Bancorp | | | 6,674 | | | | 203,223 | |
Franklin Financial Network, Inc. (a) | | | 10,634 | | | | 415,789 | |
Heritage Commerce Corp. | | | 21,993 | | | | 328,136 | |
National Commerce Corp. (a) | | | 5,567 | | | | 229,917 | |
People’s Utah Bancorp | | | 8,468 | | | | 287,489 | |
Preferred Bank | | | 7,502 | | | | 438,867 | |
Triumph Bancorp, Inc. (a) | | | 8,035 | | | | 306,937 | |
Veritex Holdings, Inc. (a) | | | 10,015 | | | | 283,024 | |
| | | | | | | | |
| | | | | | | 2,988,903 | |
| | | | | | | | |
| Beverages—0.9% | |
Primo Water Corp. (a) | | | 16,709 | | | | 301,598 | |
| | | | | | | | |
| Biotechnology—13.0% | |
Abeona Therapeutics, Inc. (a) | | | 7,243 | | | | 92,710 | |
Adamas Pharmaceuticals, Inc. (a) | | | 5,045 | | | | 101,001 | |
Albireo Pharma, Inc. (a) | | | 2,642 | | | | 87,080 | |
Audentes Therapeutics, Inc. (a) | | | 4,038 | | | | 159,864 | |
BioCryst Pharmaceuticals, Inc. (a) | | | 18,162 | | | | 138,576 | |
BioSpecifics Technologies Corp. (a) | | | 4,005 | | | | 234,252 | |
Cara Therapeutics, Inc. (a) | | | 7,355 | | | | 176,152 | |
Corbus Pharmaceuticals Holdings, Inc. (a) | | | 10,930 | | | | 82,522 | |
CytomX Therapeutics, Inc. (a) | | | 6,841 | | | | 126,559 | |
Flexion Therapeutics, Inc. (a) | | | 8,049 | | | | 150,597 | |
GlycoMimetics, Inc. (a) | | | 7,563 | | | | 108,907 | |
Intellia Therapeutics, Inc. (a) | | | 5,722 | | | | 163,764 | |
Iovance Biotherapeutics, Inc. (a) | | | 12,592 | | | | 141,660 | |
Karyopharm Therapeutics, Inc. (a) | | | 6,405 | | | | 109,077 | |
Kindred Biosciences, Inc. (a) | | | 17,567 | | | | 245,060 | |
Kura Oncology, Inc. (a) | | | 6,225 | | | | 108,938 | |
La Jolla Pharmaceutical Co. (a) | | | 6,305 | | | | 126,920 | |
MacroGenics, Inc. (a) | | | 6,628 | | | | 142,104 | |
Pieris Pharmaceuticals, Inc. (a) | | | 12,103 | | | | 67,777 | |
Progenics Pharmaceuticals, Inc. (a) | | | 17,020 | | | | 106,715 | |
Rigel Pharmaceuticals, Inc. (a) | | | 32,586 | | | | 104,601 | |
Sangamo Therapeutics, Inc. (a) | | | 10,922 | | | | 185,128 | |
T2 Biosystems, Inc. (a) | | | 34,681 | | | | 258,374 | |
TG Therapeutics, Inc. (a) | | | 11,619 | | | | 65,066 | |
uniQure NV (a) | | | 3,536 | | | | 128,675 | |
Vanda Pharmaceuticals, Inc. (a) | | | 9,545 | | | | 219,058 | |
Veracyte, Inc. (a) | | | 21,157 | | | | 202,049 | |
Verastem, Inc. (a) | | | 16,888 | | | | 122,438 | |
Vericel Corp. (a) | | | 10,820 | | | | 153,103 | |
Viking Therapeutics, Inc. (a) | | | 9,495 | | | | 165,403 | |
Voyager Therapeutics, Inc. (a) | | | 5,401 | | | | 102,187 | |
| | | | | | | | |
| | | | | | | 4,376,317 | |
| | | | | | | | |
| Chemicals—0.8% | |
American Vanguard Corp. | | | 14,177 | | | | 255,186 | |
| | | | | | | | |
| Construction & Engineering—3.0% | |
NV5 Global, Inc. (a) | | | 8,356 | | | | 724,465 | |
Sterling Construction Co., Inc. (a) | | | 20,787 | | | | 297,670 | |
| | | | | | | | |
| | | | | | | 1,022,135 | |
| | | | | | | | |
| | | | | | | | |
| | |
| | | Shares | | | Value | |
| Construction Materials—0.7% | |
U.S. Concrete, Inc. (a) | | | 5,169 | | | $ | 236,999 | |
| | | | | | | | |
| Diversified Consumer Services—0.8% | |
Carriage Services, Inc. | | | 12,348 | | | | 266,099 | |
| | | | | | | | |
| Electronic Equipment, Instruments & Components—0.8% | |
Mesa Laboratories, Inc. | | | 1,494 | | | | 277,316 | |
| | | | | | | | |
| Entertainment—0.9% | |
Rosetta Stone, Inc. (a) | | | 15,311 | | | | 304,536 | |
| | | | | | | | |
| Food Products—0.9% | |
John B Sanfilippo & Son, Inc. | | | 4,251 | | | | 303,436 | |
| | | | | | | | |
| Healthcare Equipment & Supplies—16.6% | |
Antares Pharma, Inc. (a) | | | 59,393 | | | | 199,561 | |
AxoGen, Inc. (a) | | | 11,857 | | | | 436,931 | |
CryoLife, Inc. (a) | | | 11,967 | | | | 421,238 | |
CryoPort, Inc. (a) | | | 26,842 | | | | 343,846 | |
Cutera, Inc. (a) | | | 8,206 | | | | 267,105 | |
CytoSorbents Corp. (a) | | | 25,218 | | | | 325,312 | |
Heska Corp. (a) | | | 3,782 | | | | 428,538 | |
IntriCon Corp. (a) | | | 11,212 | | | | 630,114 | |
LeMaitre Vascular, Inc. | | | 13,598 | | | | 526,787 | |
OrthoPediatrics Corp. (a) | | | 8,745 | | | | 320,417 | |
Sientra, Inc. (a) | | | 19,715 | | | | 470,794 | |
Surmodics, Inc. (a) | | | 8,203 | | | | 612,354 | |
Tactile Systems Technology, Inc. (a) | | | 9,022 | | | | 641,013 | |
| | | | | | | | |
| | | | | | | 5,624,010 | |
| | | | | | | | |
| Healthcare Providers & Services—3.8% | |
Addus HomeCare Corp. (a) | | | 4,418 | | | | 309,923 | |
BioTelemetry, Inc. (a) | | | 10,283 | | | | 662,739 | |
RadNet, Inc. (a) | | | 19,824 | | | | 298,351 | |
| | | | | | | | |
| | | | | | | 1,271,013 | |
| | | | | | | | |
| Healthcare Technology—3.5% | |
Tabula Rasa HealthCare, Inc. (a) | | | 8,278 | | | | 672,091 | |
Vocera Communications, Inc. (a) | | | 14,318 | | | | 523,752 | |
| | | | | | | | |
| | | | | | | 1,195,843 | |
| | | | | | | | |
| Hotels, Restaurants & Leisure—2.7% | |
Carrols Restaurant Group, Inc. (a) | | | 26,133 | | | | 381,542 | |
Century Casinos, Inc. (a) | | | 28,561 | | | | 213,065 | |
Red Lion Hotels Corp. (a) | | | 26,221 | | | | 327,762 | |
| | | | | | | | |
| | | | | | | 922,369 | |
| | | | | | | | |
| Household Durables—1.3% | |
LGI Homes, Inc. (a) | | | 6,099 | | | | 289,336 | |
Turtle Beach Corp. (a) | | | 7,755 | | | | 154,635 | |
| | | | | | | | |
| | | | | | | 443,971 | |
| | | | | | | | |
| Internet & Direct Marketing Retail—1.2% | |
Gaia, Inc., Class A (a) | | | 17,496 | | | | 269,438 | |
RumbleON, Inc., Class B (a) | | | 11,762 | | | | 123,266 | |
| | | | | | | | |
| | | | | | | 392,704 | |
| | | | | | | | |
| IT Services—3.1% | |
Brightcove, Inc. (a) | | | 24,473 | | | | 205,573 | |
Carbonite, Inc. (a) | | | 11,168 | | | | 398,139 | |
Hackett Group, Inc. | | | 22,539 | | | | 454,161 | �� |
| | | | | | | | |
| | | | | | | 1,057,873 | |
| | | | | | | | |
| Leisure Equipment & Products—1.2% | |
MCBC Holdings, Inc. (a) | | | 11,250 | | | | 403,650 | |
| | | | | | | | |
| Life Sciences Tools & Services—2.9% | |
Codexis, Inc. (a) | | | 10,794 | | | | 185,117 | |
NeoGenomics, Inc. (a) | | | 39,130 | | | | 600,646 | |
Quanterix Corp. (a) | | | 9,381 | | | | 200,941 | |
| | | | | | | | |
| | | | | | | 986,704 | |
| | | | | | | | |
| | | | | | | | |
| | |
| | | Shares | | | Value | |
| Machinery—4.5% | |
Commercial Vehicle Group, Inc. (a) | | | 22,383 | | | $ | 205,028 | |
DMC Global, Inc. | | | 14,902 | | | | 608,002 | |
Manitex International, Inc. (a) | | | 27,404 | | | | 288,564 | |
Spartan Motors, Inc. | | | 15,558 | | | | 229,481 | |
Westport Fuel Systems, Inc. (a) | | | 59,112 | | | | 177,336 | |
| | | | | | | | |
| | | | | | | 1,508,411 | |
| | | | | | | | |
| Media—0.6% | |
Cardlytics, Inc. (a) | | | 8,707 | | | | 218,023 | |
| | | | | | | | |
| Metals & Mining—0.7% | |
Universal Stainless & Alloy Products, Inc. (a) | | | 9,562 | | | | 243,927 | |
| | | | | | | | |
| Oil, Gas & Consumable Fuels—3.4% | |
Evolution Petroleum Corp. | | | 28,367 | | | | 313,455 | |
Lonestar Resources U.S., Inc., Class A (a) | | | 33,622 | | | | 261,915 | |
Penn Virginia Corp. (a) | | | 3,998 | | | | 321,999 | |
Ring Energy, Inc. (a) | | | 24,429 | | | | 242,092 | |
| | | | | | | | |
| | | | | | | 1,139,461 | |
| | | | | | | | |
| Pharmaceuticals—3.7% | |
ANI Pharmaceuticals, Inc. (a) | | | 4,759 | | | | 269,074 | |
Assembly Biosciences, Inc. (a) | | | 3,067 | | | | 113,908 | |
Cymabay Therapeutics, Inc. (a) | | | 10,956 | | | | 121,393 | |
Endocyte, Inc. (a) | | | 10,421 | | | | 185,077 | |
Intersect ENT, Inc. (a) | | | 8,163 | | | | 234,686 | |
Paratek Pharmaceuticals, Inc. (a) | | | 5,481 | | | | 53,166 | |
Revance Therapeutics, Inc. (a) | | | 4,699 | | | | 116,770 | |
WaVe Life Sciences Ltd. (a) | | | 2,817 | | | | 140,850 | |
| | | | | | | | |
| | | | | | | 1,234,924 | |
| | | | | | | | |
| Professional Services—0.8% | |
CRA International, Inc. | | | 5,692 | | | | 285,852 | |
| | | | | | | | |
| Road & Rail—1.5% | |
Daseke, Inc. (a) | | | 25,606 | | | | 205,360 | |
USA Truck, Inc. (a) | | | 14,935 | | | | 302,135 | |
| | | | | | | | |
| | | | | | | 507,495 | |
| | | | | | | | |
| Semiconductors & Semiconductor Equipment—2.6% | |
Adesto Technologies Corp. (a) | | | 32,889 | | | | 195,690 | |
AXT, Inc. (a) | | | 34,850 | | | | 249,177 | |
FormFactor, Inc. (a) | | | 17,521 | | | | 240,914 | |
Ichor Holdings Ltd. (a) | | | 9,496 | | | | 193,908 | |
| | | | | | | | |
| | | | | | | 879,689 | |
| | | | | | | | |
| Software—7.2% | |
Amber Road, Inc. (a) | | | 29,188 | | | | 280,788 | |
Asure Software, Inc. (a) | | | 19,594 | | | | 243,357 | |
Datawatch Corp. (a) | | | 25,649 | | | | 298,811 | |
eGain Corp. (a) | | | 29,557 | | | | 239,412 | |
Fusion Connect, Inc. (a) | | | 52,202 | | | | 134,159 | |
Model N, Inc. (a) | | | 16,334 | | | | 258,894 | |
QAD, Inc., Class A | | | 7,078 | | | | 400,969 | |
Telaria, Inc. (a) | | | 61,940 | | | | 234,753 | |
Upland Software, Inc. (a) | | | 10,796 | | | | 348,819 | |
| | | | | | | | |
| | | | | | | 2,439,962 | |
| | | | | | | | |
| Technology Hardware, Storage & Peripherals—1.1% | |
USA Technologies, Inc. (a) | | | 51,401 | | | | 370,087 | |
| | | | | | | | |
| | | | | | | | |
| See accompanying Notes to Financial Statements | | | September 30, 2018 | | | Annual Report | | | 203 | |
Schedule of Investments
September 30, 2018
| | | | | | | | |
| | |
| | | Shares | | | Value | |
| Water Utilities—0.9% | |
AquaVenture Holdings Ltd. (a) | | | 16,867 | | | $ | 304,787 | |
| | | | | | | | |
| Wireless Telecommunication Services—2.2% | |
Boingo Wireless, Inc. (a) | | | 21,287 | | | | 742,916 | |
| | | | | | | | |
Total Common Stock
(cost—$21,627,393) | | | | 32,860,892 | |
| | | | | | | | |
| | | | | | | | |
| | | | | | | | |
| | | Principal
Amount
(000s) | | | | |
| Repurchase Agreements—3.4% | |
State Street Bank and Trust Co., dated 9/28/18, 0.42%, due 10/1/18, proceeds $1,147,040; collateralized by U.S. Treasury Notes, 2.00%, due 11/30/20, valued at $1,171,435 including accrued interest | |
(cost—$1,147,000) | | | $1,147 | | | $ | 1,147,000 | |
| | | | | | | | |
| |
Total Investments
(cost—$22,774,393)—100.6% | | | | 34,007,892 | |
| | | | | | | | |
| | |
Liabilities in excess of
other assets—(0.6)% | | | | | | | (205,832 | ) |
| | | | | | | | |
| | |
| Net Assets—100.0% | | | | | | | $33,802,060 | |
| | | | | | | | |
Notes to Schedule of Investments:
(a) Non-income producing.
| | | | | | |
| 204 | | Annual Report | | | September 30, 2018 | | | See accompanying Notes to Financial Statements |
(THIS PAGE INTENTIONALLY LEFT BLANK)
| | | | | | | | |
| See accompanying Notes to Financial Statements | | | September 30, 2018 | | | Annual Report | | | 205 | |
Statements of Assets and Liabilities
September 30, 2018
| | | | | | | | | | | | | | | | | | | | | | | | |
| | |
AllianzGI
Retirement
2020 | | | AllianzGI
Retirement
2025 | | | AllianzGI
Retirement
2030 | | | AllianzGI
Retirement
2035 | | | AllianzGI
Retirement
2040 | | | | |
| Assets: | | | | | | | | | | | | | | | | | | |
| Investments, at value | | $ | 2,313,567 | | | $ | 301,218 | | | $ | 235,255 | | | $ | — | | | $ | — | | | | | |
| Investments in Affiliates, at value | | | 31,083,856 | | | | 48,727,738 | | | | 58,115,068 | | | | 42,772,568 | | | | 45,185,814 | | | | | |
| Repurchase agreements, at value | | | 892,000 | | | | 1,117,000 | | | | 1,169,000 | | | | 873,000 | | | | 805,000 | | | | | |
| Cash | | | 249 | | | | 715 | | | | 536 | | | | 254 | | | | 941 | | | | | |
| Foreign currency, at value | | | — | | | | — | | | | — | | | | — | | | | — | | | | | |
| Deposits with brokers for derivatives collateral | | | 463,433 | | | | 727,726 | | | | 770,595 | | | | 789,225 | | | | 922,251 | | | | | |
| Receivable for Fund shares sold | | | 64,122 | | | | 5,171 | | | | 39,399 | | | | 7,728 | | | | 8,211 | | | | | |
| Receivable for variation margin on futures contracts | | | 11,093 | | | | 7,605 | | | | 16,941 | | | | 21,870 | | | | 28,109 | | | | | |
| Investments in Affiliated Funds — Trustees Deferred Compensation Plan (see Note 5) | | | 7,987 | | | | 9,658 | | | | 10,848 | | | | 8,677 | | | | 7,901 | | | | | |
| Dividends and interest receivable (net of foreign withholding taxes) | | | 31 | | | | 39 | | | | 41 | | | | 31 | | | | 28 | | | | | |
| Dividends receivable from Affiliates | | | — | | | | — | | | | — | | | | — | | | | — | | | | | |
| Tax reclaims receivable | | | — | | | | — | | | | — | | | | — | | | | — | | | | | |
| Receivable from Investment Manager | | | — | | | | 576 | | | | 657 | | | | — | | | | — | | | | | |
| Prepaid expenses and other assets | | | — | | | | — | | | | — | | | | — | | | | — | | | | | |
Total Assets | | | 34,836,338 | | | | 50,897,446 | | | | 60,358,340 | | | | 44,473,353 | | | | 46,958,255 | | | | | |
| Liabilities: | | | | | | | | | | | | | | | | | | |
| Payable for Fund shares redeemed | | | 66,514 | | | | 26,858 | | | | 2,659 | | | | 7,034 | | | | 86,612 | | | | | |
| Trustees Deferred Compensation Plan payable (see Note 5) | | | 7,987 | | | | 9,658 | | | | 10,848 | | | | 8,677 | | | | 7,901 | | | | | |
| Servicing fees payable | | | 837 | | | | 1,229 | | | | 1,413 | | | | 1,274 | | | | 763 | | | | | |
| Distribution fees payable | | | 629 | | | | 297 | | | | 948 | | | | 425 | | | | 470 | | | | | |
| Administration fees payable | | | 460 | | | | — | | | | — | | | | 1,991 | | | | 3,212 | | | | | |
| Payable for variation margin on futures contracts | | | — | | | | — | | | | — | | | | — | | | | — | | | | | |
| Payable for investments in Affiliates purchased | | | — | | | | — | | | | — | | | | — | | | | — | | | | | |
| Investment management fees payable | | | — | | | | — | | | | — | | | | — | | | | — | | | | | |
| Accrued expenses and other liabilities | | | — | | | | — | | | | — | | | | — | | | | — | | | | | |
Total Liabilities | | | 76,427 | | | | 38,042 | | | | 15,868 | | | | 19,401 | | | | 98,958 | | | | | |
| Net Assets | | $ | 34,759,911 | | | $ | 50,859,404 | | | $ | 60,342,472 | | | $ | 44,453,952 | | | $ | 46,859,297 | | | | | |
| Net Assets Consist of: | | | | |
| Paid-in-capital | | $ | 31,232,445 | | | $ | 44,603,104 | | | $ | 51,632,833 | | | $ | 36,680,789 | | | $ | 38,987,764 | | | | | |
| Total distributable earnings (loss) | | | 3,527,466 | | | | 6,256,300 | | | | 8,709,639 | | | | 7,773,163 | | | | 7,871,533 | | | | | |
| Net Assets | | $ | 34,759,911 | | | $ | 50,859,404 | | | $ | 60,342,472 | | | $ | 44,453,952 | | | $ | 46,859,297 | | | | | |
| Cost of Investments | | $ | 2,326,989 | | | $ | 306,211 | | | $ | 239,329 | | | $ | — | | | $ | — | | | | | |
| Cost of Investments in Affiliates | | $ | 28,869,398 | | | $ | 44,645,876 | | | $ | 51,999,074 | | | $ | 37,852,919 | | | $ | 39,661,175 | | | | | |
| Cost of Repurchase Agreements | | $ | 892,000 | | | $ | 1,117,000 | | | $ | 1,169,000 | | | $ | 873,000 | | | $ | 805,000 | | | | | |
| Cost of Foreign Currency | | $ | — | | | $ | — | | | $ | — | | | $ | — | | | $ | — | | | | | |
| | | | | | |
| 206 | | Annual Report | | | September 30, 2018 | | | See accompanying Notes to Financial Statements |
| | | | | | | | | | | | | | | | | | | | | | | | | | | | | | |
| | | | AllianzGI Retirement 2045 | | | AllianzGI
Retirement
2050 | | | AllianzGI
Retirement
2055 | | | AllianzGI
Multi Asset
Income | | | AllianzGI
Global
Allocation | | | AllianzGI Best Styles Global Equity | | | AllianzGI
Best Styles
International
Equity | |
| | | | | | | | | | | | | | | | | | | | | | | |
| | | | | $ | — | | | $ | — | | | $ | — | | | $ | 10,098,484 | | | $ | 20,221,967 | | | $ | 522,886,091 | | | $ | 25,617,884 | |
| | | | | | 29,667,230 | | | | 31,576,258 | | | | 15,377,660 | | | | 24,734,523 | | | | 302,864,165 | | | | — | | | | — | |
| | | | | | 715,000 | | | | 714,000 | | | | 307,000 | | | | 298,000 | | | | 4,752,000 | | | | 135,000 | | | | 112,000 | |
| | | | | | 707 | | | | 971 | | | | 233 | | | | 474 | | | | 426 | | | | 654 | | | | 262 | |
| | | | | | — | | | | — | | | | — | | | | — | | | | — | | | | 1,432,801 | | | | 39,032 | |
| | | | | | 698,450 | | | | 673,065 | | | | 412,092 | | | | 961,653 | | | | 3,154,165 | | | | 366,436 | | | | — | |
| | | | | | 3,627 | | | | 1,580 | | | | 10,919 | | | | 12,467 | | | | 32,179 | | | | 1,276,193 | | | | 5,722 | |
| | | | | | 21,453 | | | | 23,480 | | | | 11,784 | | | | 8,429 | | | | 68,443 | | | | — | | | | — | |
| | | | | | 4,932 | | | | 4,788 | | | | 2,229 | | | | 4,816 | | | | 58,484 | | | | 93,095 | | | | 5,239 | |
| | | | | | 25 | | | | 25 | | | | 11 | | | | 63,543 | | | | 166 | | | | 772,609 | | | | 85,784 | |
| | | | | | — | | | | — | | | | — | | | | 29,683 | | | | — | | | | — | | | | — | |
| | | | | | — | | | | — | | | | — | | | | — | | | | — | | | | 185,244 | | | | 57,832 | |
| | | | | | — | | | | — | | | | — | | | | 8,050 | | | | — | | | | — | | | | 10,699 | |
| | | | | | — | | | | — | | | | — | | | | 15 | | | | 54,630 | | | | 37,114 | | | | 17,507 | |
| | | | | 31,111,424 | | | | 32,994,167 | | | | 16,121,928 | | | | 36,220,137 | | | | 331,206,625 | | | | 527,185,237 | | | | 25,951,961 | |
| | | | | | | | | | | | | | | | | | | | | | | |
| | | | | | 2,395 | | | | 2,049 | | | | 25,275 | | | | 52,744 | | | | 415,822 | | | | 1,735,355 | | | | 9,867 | |
| | | | | | 4,932 | | | | 4,788 | | | | 2,229 | | | | 4,816 | | | | 58,484 | | | | 93,095 | | | | 5,239 | |
| | | | | | 466 | | | | 555 | | | | 329 | | | | 2,074 | | | | 12,521 | | | | 240 | | | | 109 | |
| | | | | | 277 | | | | 749 | | | | 321 | | | | 1,630 | | | | 15,152 | | | | 23 | | | | 57 | |
| | | | | | 2,655 | | | | 2,649 | | | | 1,365 | | | | — | | | | — | | | | — | | | | — | |
| | | | | | — | | | | — | | | | — | | | | — | | | | — | | | | 20,200 | | | | — | |
| | | | | | — | | | | — | | | | — | | | | 29,683 | | | | — | | | | — | | | | — | |
| | | | | | 278 | | | | 752 | | | | 344 | | | | — | | | | 41,654 | | | | 120,065 | | | | — | |
| | | | | | — | | | | — | | | | — | | | | — | | | | 154,934 | | | | 407,481 | | | | 136,467 | |
| | | | | | 11,003 | | | | 11,542 | | | | 29,863 | | | | 90,947 | | | | 698,567 | | | | 2,376,459 | | | | 151,739 | |
| | | | $ | 31,100,421 | | | $ | 32,982,625 | | | $ | 16,092,065 | | | $ | 36,129,190 | | | $ | 330,508,058 | | | $ | 524,808,778 | | | $ | 25,800,222 | |
| | | | | | | | | | | | | | | | | | | | | | | |
| | | | | $ | 26,035,128 | | | $ | 28,097,302 | | | $ | 14,070,772 | | | $ | 37,561,363 | | | $ | 292,726,909 | | | $ | 407,163,474 | | | $ | 23,906,851 | |
| | | | | | 5,065,293 | | | | 4,885,323 | | | | 2,021,293 | | | | (1,432,173 | ) | | | 37,781,149 | | | | 117,645,304 | | | | 1,893,371 | |
| | | | | $ | 31,100,421 | | | $ | 32,982,625 | | | $ | 16,092,065 | | | $ | 36,129,190 | | | $ | 330,508,058 | | | $ | 524,808,778 | | | $ | 25,800,222 | |
| | | | | $ | — | | | $ | — | | | $ | — | | | $ | 9,853,357 | | | $ | 20,903,965 | | | $ | 467,495,919 | | | $ | 24,293,337 | |
| | | | | $ | 26,066,782 | | | $ | 28,008,364 | | | $ | 13,849,629 | | | $ | 24,792,378 | | | $ | 277,357,687 | | | $ | — | | | $ | — | |
| | | | | $ | 715,000 | | | $ | 714,000 | | | $ | 307,000 | | | $ | 298,000 | | | $ | 4,752,000 | | | $ | 135,000 | | | $ | 112,000 | |
| | | | | $ | — | | | $ | — | | | $ | — | | | $ | — | | | $ | — | | | $ | 1,425,856 | | | $ | 39,502 | |
| | | | | | | | |
| See accompanying Notes to Financial Statements | | | September 30, 2018 | | | Annual Report | |
| 207
|
|
Statements of Assets and Liabilities (cont’d)
September 30, 2018
| | | | | | | | | | | | | | | | | | | | | | | | |
| | |
AllianzGI
Retirement
2020 | | | AllianzGI
Retirement
2025 | | | AllianzGI
Retirement
2030 | | | AllianzGI
Retirement
2035 | | | AllianzGI
Retirement
2040 | | | | |
| Net Assets: | | | | | | | | | | | | | | | | | | |
| Class A | | $ | 4,002,506 | | | $ | 6,445,007 | | | $ | 6,520,227 | | | $ | 6,257,140 | | | $ | 3,797,706 | | | | | |
| Class C | | | 422,969 | | | | — | | | | 865,232 | | | | — | | | | 110,098 | | | | | |
| Class R | | | 85,991 | | | | 237,135 | | | | 295,411 | | | | 614,425 | | | | 237,320 | | | | | |
| Class P | | | 12,932,097 | | | | 22,386,662 | | | | 27,035,026 | | | | 20,107,832 | | | | 17,741,743 | | | | | |
| Institutional Class | | | — | | | | — | | | | — | | | | — | | | | — | | | | | |
| Class R6 | | | 16,795,838 | | | | 21,598,822 | | | | 25,140,350 | | | | 17,113,121 | | | | 24,457,829 | | | | | |
| Administrative Class | | | 520,510 | | | | 191,778 | | | | 486,226 | | | | 361,434 | | | | 514,601 | | | | | |
| Shares Issued and Outstanding: | | | | | | | | | | | | | | | | | | |
| Class A | | | 197,127 | | | | 348,342 | | | | 290,193 | | | | 311,252 | | | | 162,634 | | | | | |
| Class C | | | 20,984 | | | | — | | | | 39,069 | | | | — | | | | 4,774 | | | | | |
| Class R | | | 4,307 | | | | 12,913 | | | | 13,180 | | | | 30,738 | | | | 10,256 | | | | | |
| Class P | | | 630,534 | | | | 1,209,444 | | | | 1,189,171 | | | | 994,489 | | | | 755,442 | | | | | |
| Institutional Class | | | — | | | | — | | | | — | | | | — | | | | — | | | | | |
| Class R6 | | | 817,337 | | | | 1,164,401 | | | | 1,101,935 | | | | 844,628 | | | | 1,038,539 | | | | | |
| Administrative Class | | | 25,462 | | | | 10,327 | | | | 21,362 | | | | 17,828 | | | | 22,039 | | | | | |
Net Asset Value and Redemption
Price Per Share:* | | | | | | | | | | | | | | | | | | |
| Class A | | $ | 20.30 | | | $ | 18.50 | | | $ | 22.47 | | | $ | 20.10 | | | $ | 23.35 | | | | | |
| Class C | | | 20.16 | | | | — | | | | 22.15 | | | | — | | | | 23.06 | | | | | |
| Class R | | | 19.97 | | | | 18.36 | | | | 22.41 | | | | 19.99 | | | | 23.14 | | | | | |
| Class P | | | 20.51 | | | | 18.51 | | | | 22.73 | | | | 20.22 | | | | 23.49 | | | | | |
| Institutional Class | | | — | | | | — | | | | — | | | | — | | | | — | | | | | |
| Class R6 | | | 20.55 | | | | 18.55 | | | | 22.81 | | | | 20.26 | | | | 23.55 | | | | | |
| Administrative Class | | | 20.44 | | | | 18.57 | | | | 22.76 | | | | 20.27 | | | | 23.35 | | | | | |
| * | Net asset value and redemption price per share may not recalculate exactly due to rounding. |
| | | | | | |
| 208 | | Annual Report | | | September 30, 2018 | | | See accompanying Notes to Financial Statements |
| | | | | | | | | | | | | | | | | | | | | | | | | | | | | | |
| | | | AllianzGI
Retirement
2045 | | | AllianzGI
Retirement
2050 | | | AllianzGI
Retirement
2055 | | | AllianzGI
Multi Asset
Income | | | AllianzGI
Global
Allocation | | | AllianzGI
Best Styles Global Equity | | | AllianzGI
Best Styles
International
Equity | |
| | | | | | | | | | | | | | | | | | | | | | | |
| | | | | $ | 2,387,458 | | | $ | 2,716,640 | | | $ | 1,697,135 | | | $ | 8,826,564 | | | $ | 40,974,000 | | | $ | 1,255,323 | | | $ | 504,294 | |
| | | | | | — | | | | 198,828 | | | | — | | | | 2,210,138 | | | | 26,220,109 | | | | 40,834 | | | | 102,820 | |
| | | | | | 151,348 | | | | 127,384 | | | | 112,412 | | | | 100,178 | | | | 34,689 | | | | — | | | | — | |
| | | | | | 13,742,107 | | | | 11,184,991 | | | | 5,865,313 | | | | 9,526,227 | | | | 4,291,836 | | | | 1,868,117 | | | | 113,599 | |
| | | | | | — | | | | — | | | | — | | | | 48,742 | | | | 6,652,117 | | | | 2,385,679 | | | | 865,988 | |
| | | | | | 14,204,936 | | | | 17,875,437 | | | | 8,054,447 | | | | 14,893,511 | | | | 252,313,112 | | | | 519,258,825 | | | | 24,213,521 | |
| | | | | 614,572 | | | | 879,345 | | | | 362,758 | | | | 523,830 | | | | 22,195 | | | | — | | | | — | |
| | | | | | | | | | | | | | | | | | | | | | | |
| | | | | | 116,558 | | | | 119,390 | | | | 86,220 | | | | 508,668 | | | | 3,571,182 | | | | 72,570 | | | | 33,678 | |
| | | | | | — | | | | 8,916 | | | | — | | | | 127,347 | | | | 2,246,644 | | | | 2,416 | | | | 6,950 | |
| | | | | | 7,465 | | | | 5,607 | | | | 5,735 | | | | 5,521 | | | | 3,059 | | | | — | | | | — | |
| | | | | | 668,712 | | | | 487,163 | | | | 295,216 | | | | 543,082 | | | | 377,148 | | | | 107,934 | | | | 7,568 | |
| | | | | | — | | | | — | | | | — | | | | 2,854 | | | | 581,038 | | | | 139,115 | | | | 57,503 | |
| | | | | | 688,930 | | | | 775,113 | | | | 403,491 | | | | 871,474 | | | | 22,472,077 | | | | 30,050,945 | | | | 1,604,286 | |
| | | | | 30,107 | | | | 38,532 | | | | 18,374 | | | | 29,667 | | | | 1,885 | | | | — | | | | — | |
| | | | | | | | | | | | | | | | | | | | | | | |
| | | | | $ | 20.48 | | | $ | 22.75 | | | $ | 19.68 | | | $ | 17.35 | | | $ | 11.47 | | | $ | 17.30 | | | $ | 14.97 | |
| | | | | | — | | | | 22.30 | | | | — | | | | 17.36 | | | | 11.67 | | | | 16.90 | | | | 14.80 | |
| | | | | | 20.28 | | | | 22.72 | | | | 19.60 | | | | 18.14 | | | | 11.34 | | | | — | | | | — | |
| | | | | | 20.55 | | | | 22.96 | | | | 19.87 | | | | 17.54 | | | | 11.38 | | | | 17.31 | | | | 15.01 | |
| | | | | | — | | | | — | | | | — | | | | 17.08 | | | | 11.45 | | | | 17.15 | | | | 15.06 | |
| | | | | | 20.62 | | | | 23.06 | | | | 19.96 | | | | 17.09 | | | | 11.23 | | | | 17.28 | | | | 15.09 | |
| | | | | | 20.41 | | | | 22.82 | | | | 19.74 | | | | 17.66 | | | | 11.77 | | | | — | | | | — | |
| | | | | | | | |
| See accompanying Notes to Financial Statements | | | September 30, 2018 | | | Annual Report | | | 209 | |
Statements of Assets and Liabilities (cont’d)
September 30, 2018
| | | | | | | | | | | | | | | | | | | | | | | | |
| | | AllianzGI
Best Styles
U.S. Equity | | | AllianzGI
Convertible | | | AllianzGI
Core Bond | | | AllianzGI
Core Plus Bond | | | AllianzGI
Emerging
Markets
Consumer | | | | |
| Assets: | | | | |
| Investments, at value | | $ | 98,699,955 | | | $ | 530,942,143 | | | $ | 33,508,900 | | | $ | 45,115,694 | | | $ | 43,098,744 | | | | | |
| Investments in Affiliates, at value | | | — | | | | — | | | | — | | | | — | | | | — | | | | | |
| Repurchase agreements, at value | | | 1,166,000 | | | | 27,206,000 | | | | — | | | | — | | | | 106,000 | | | | | |
| Cash | | | 2,109 | | | | — | | | | — | | | | — | | | | 4 | | | | | |
| Foreign currency, at value | | | 1,310 | | | | — | | | | — | | | | — | | | | 51,725 | | | | | |
| Unrealized appreciation of forward foreign currency contracts | | | — | | | | — | | | | — | | | | — | | | | — | | | | | |
| Dividends and interest receivable (net of foreign withholding taxes) | | | 95,419 | | | | 1,645,876 | | | | 154,500 | | | | 217,700 | | | | 61,739 | | | | | |
| Receivable for investments sold | | | — | | | | 2,488,472 | | | | 1,363,136 | | | | 2,121,838 | | | | 225,889 | | | | | |
| Receivable for TBA investments sold | | | — | | | | — | | | | 4,427,500 | | | | 6,225,589 | | | | — | | | | | |
| Deposits with brokers for derivatives collateral | | | — | | | | — | | | | 103,666 | | | | 192,769 | | | | — | | | | | |
| Receivable for Fund shares sold | | | 26,597 | | | | 1,402,322 | | | | 481,063 | | | | — | | | | — | | | | | |
| Receivable from Investment Manager | | | — | | | | — | | | | 25,551 | | | | 18,131 | | | | — | | | | | |
| Deferred offering costs | | | — | | | | — | | | | 80,343 | | | | 80,343 | | | | — | | | | | |
| Tax reclaims receivable | | | — | | | | — | | | | — | | | | — | | | | 1,686 | | | | | |
| Investments in Affiliated Funds — Trustees Deferred Compensation Plan (see Note 5) | | | 17,817 | | | | 127,064 | | | | 454 | | | | 673 | | | | 6,822 | | | | | |
| Receivable for variation margin on futures contracts | | | — | | | | — | | | | — | | | | — | | | | — | | | | | |
| Prepaid expenses and other assets | | | 72,491 | | | | 51,882 | | | | 4,477 | | | | 4,822 | | | | 9,022 | | | | | |
Total Assets | | | 100,081,698 | | | | 563,863,759 | | | | 40,149,590 | | | | 53,977,559 | | | | 43,561,631 | | | | | |
| Liabilities: | | | | |
| Payable for investments purchased | | | — | | | | 10,059,055 | | | | 1,111,690 | | | | 224,505 | | | | — | | | | | |
| Payable for Fund shares redeemed | | | 195 | | | | 394,671 | | | | — | | | | — | | | | 11,838 | | | | | |
| Payable for TBA investments purchased | | | — | | | | — | | | | 9,429,782 | | | | 13,270,940 | | | | — | | | | | |
| Payable to custodian for cash overdraft | | | — | | | | 1,347,357 | | | | 32,660 | | | | 90,383 | | | | — | | | | | |
| Payable for variation margin on centrally cleared swaps | | | — | | | | — | | | | 147 | | | | 5,167 | | | | — | | | | | |
| Payable for variation margin on futures contracts | | | — | | | | — | | | | 816 | | | | 3,261 | | | | — | | | | | |
| Investment management fees payable | | | 13,296 | | | | 228,237 | | | | — | | | | — | | | | 22,515 | | | | | |
| Distribution fees payable | | | 15 | | | | 30,101 | | | | — | | | | — | | | | — | | | | | |
| Servicing fees payable | | | 68 | | | | 21,713 | | | | — | | | | — | | | | 13 | | | | | |
| Swap premiums received | | | — | | | | — | | | | 26,897 | | | | 114,600 | | | | — | | | | | |
| Unrealized depreciation of forward foreign currency contracts | | | — | | | | — | | | | — | | | | — | | | | — | | | | | |
| Due to Investment Manager | | | — | | | | — | | | | 80,343 | | | | 80,343 | | | | — | | | | | |
| Trustees Deferred Compensation Plan payable (see Note 5) | | | 17,817 | | | | 127,064 | | | | 454 | | | | 673 | | | | 6,822 | | | | | |
| Accrued expenses and other liabilities | | | 103,594 | | | | 428,222 | | | | 90,314 | | | | 92,381 | | | | 118,490 | | | | | |
Total Liabilities | | | 134,985 | | | | 12,636,420 | | | | 10,773,103 | | | | 13,882,253 | | | | 159,678 | | | | | |
| Net Assets | | $ | 99,946,713 | | | $ | 551,227,339 | | | $ | 29,376,487 | | | $ | 40,095,306 | | | $ | 43,401,953 | | | | | |
| | | | | | |
| 210 | | Annual Report | | | September 30, 2018 | | | See accompanying Notes to Financial Statements |
| | | | | | | | | | | | | | | | | | | | | | | | | | | | | | |
| | | | AllianzGI
Emerging
Markets Debt | | | AllianzGI
Emerging
Markets
Small-Cap | | | AllianzGI
Europe Equity
Dividend | | | AllianzGI
Global Dynamic
Allocation | | | AllianzGI
Global High Yield | | | AllianzGI
Global
Sustainability | | | AllianzGI
Global Water | |
| | | | | | | | | | | | | | | | | | | | | | | |
| | | | | $ | 17,412,030 | | | $ | 10,048,450 | | | $ | 7,025,997 | | | $ | 218,622,130 | | | $ | 21,635,934 | | | $ | 39,678,415 | | | $ | 642,457,749 | |
| | | | | | — | | | | — | | | | — | | | | 4,400,566 | | | | — | | | | — | | | | — | |
| | | | | | 933,000 | | | | 289,000 | | | | — | | | | 8,982,000 | | | | 214,000 | | | | 521,000 | | | | 9,725,000 | |
| | | | | | — | | | | 775 | | | | 13,411 | | | | 662 | | | | 53,269 | | | | 389 | | | | 231 | |
| | | | | | 18,958 | | | | 35,206 | | | | 2,797 | | | | 336,813 | | | | 366,219 | | | | 4 | | | | 6 | |
| | | | |
|
— |
| | | — | | | | — | | | | — | | | | 15,116 | | | | — | | | | — | |
| | | | |
|
229,848 |
| | | 11,019 | | | | 11,742 | | | | 743,553 | | | | 350,161 | | | | 24,386 | | | | 582,498 | |
| | | | | | 319,003 | | | | — | | | | — | | | | — | | | | 50,188 | | | | — | | | | 10,797,271 | |
| | | | | | — | | | | — | | | | — | | | | — | | | | — | | | | — | | | | — | |
| | | | | | — | | | | — | | | | — | | | | 5,109,391 | | | | 20,719 | | | | — | | | | — | |
| | | | | | — | | | | 500 | | | | — | | | | — | | | | — | | | | 54,502 | | | | 481,875 | |
| | | | | | 8,875 | | | | — | | | | 7,757 | | | | — | | | | 2,830 | | | | — | | | | — | |
| | | | | | — | | | | — | | | | — | | | | — | | | | — | | | | — | | | | — | |
| | | | | | — | | | | — | | | | 13,884 | | | | 52,577 | | | | 1,831 | | | | 25,087 | | | | 820,947 | |
| | | | |
|
5,130 |
| | | 1,660 | | | | 1,117 | | | | 36,153 | | | | 2,624 | | | | 4,008 | | | | 92,256 | |
| | | | | | — | | | | — | | | | — | | | | 364,918 | | | | 354 | | | | — | | | | — | |
| | | | | | 39,446 | | | | 7,423 | | | | 16,409 | | | | 60,699 | | | | 15,860 | | | | 10,263 | | | | 46,157 | |
| | | | | | 18,966,290 | | | | 10,394,033 | | | | 7,093,114 | | | | 238,709,462 | | | | 22,729,105 | | | | 40,318,054 | | | | 665,003,990 | |
| | | | | | | | | | | | | | | | | | | | | | | |
| | | | | | — | | | | 103,836 | | | | 3,173 | | | | 199,995 | | | | 405,326 | | | | — | | | | — | |
| | | | | | — | | | | — | | | | — | | | | 32,900 | | | | — | | | | 366 | | | | 531,613 | |
| | | | | | — | | | | — | | | | — | | | | 15,582,047 | | | | — | | | | — | | | | — | |
| | | | | | 318,927 | | | | — | | | | — | | | | — | | | | — | | | | — | | | | — | |
| | | | |
|
— |
| | | — | | | | — | | | | — | | | | — | | | | — | | | | — | |
| | | | | | — | | | | — | | | | — | | | | — | | | | — | | | | — | | | | — | |
| | | | | | — | | | | 1,581 | | | | — | | | | 70,038 | | | | — | | | | 13,659 | | | | 361,244 | |
| | | | | | 25 | | | | — | | | | 37 | | | | 1,135 | | | | — | | | | — | | | | 46,725 | |
| | | | | | 33 | | | | 25 | | | | 65 | | | | 627 | | | | — | | | | 108 | | | | 47,782 | |
| | | | | | — | | | | — | | | | — | | | | — | | | | — | | | | — | | | | — | |
| | | | |
|
— |
| | | — | | | | — | | | | — | | | | 2,786 | | | | — | | | | — | |
| | | | | | — | | | | — | | | | — | | | | — | | | | — | | | | — | | | | — | |
| | | | |
|
5,130 |
| | | 1,660 | | | | 1,117 | | | | 36,153 | | | | 2,624 | | | | 4,008 | | | | 92,256 | |
| | | | | | 129,620 | | | | 121,915 | | | | 124,713 | | | | 357,218 | | | | 139,728 | | | | 86,588 | | | | 734,007 | |
| | | | | | 453,735 | | | | 229,017 | | | | 129,105 | | | | 16,280,113 | | | | 550,464 | | | | 104,729 | | | | 1,813,627 | |
| | | | | $ | 18,512,555 | | | $ | 10,165,016 | | | $ | 6,964,009 | | | $ | 222,429,349 | | | $ | 22,178,641 | | | $ | 40,213,325 | | | $ | 663,190,363 | |
| | | | | | | | |
| See accompanying Notes to Financial Statements | | | September 30, 2018 | | | Annual Report | | | 211 | |
Statements of Assets and Liabilities (cont’d)
September 30, 2018
| | | | | | | | | | | | | | | | | | | | | | | | |
| | | AllianzGI
Best Styles
U.S. Equity | | | AllianzGI
Convertible | | | AllianzGI
Core Bond | | | AllianzGI
Core Plus Bond | | | AllianzGI
Emerging
Markets
Consumer | | | | |
| Net Assets Consist of: | | | | | | | | | | | | | | | | | | |
| Paid-in-capital | | $ | 65,803,851 | | | $ | 416,017,826 | | | $ | 29,547,491 | | | $ | 40,300,744 | | | $ | 40,657,779 | | | | | |
| Total distributable earnings (loss) | | | 34,142,862 | | | | 135,209,513 | | | | (171,004 | ) | | | (205,438 | ) | | | 2,744,174 | | | | | |
| Net Assets | | $ | 99,946,713 | | | $ | 551,227,339 | | | $ | 29,376,487 | | | $ | 40,095,306 | | | $ | 43,401,953 | | | | | |
| Cost of Investments | | $ | 81,946,164 | | | $ | 466,142,524 | | | $ | 33,636,856 | | | $ | 45,253,623 | | | $ | 39,977,137 | | | | | |
| Cost of Investments in Affiliates | | $ | — | | | $ | — | | | $ | — | | | $ | — | | | $ | — | | | | | |
| Cost of Repurchase Agreements | | $ | 1,166,000 | | | $ | 27,206,000 | | | $ | — | | | $ | — | | | $ | 106,000 | | | | | |
| Cost of Foreign Currency | | $ | 1,297 | | | $ | — | | | $ | — | | | $ | — | | | $ | 51,300 | | | | | |
| Net Assets: | | | | | | | | | | | | | | | | | | |
| Class A | | $ | 351,772 | | | $ | 61,384,913 | | | $ | — | | | $ | — | | | $ | 69,396 | | | | | |
| Class C | | | 26,245 | | | | 53,461,014 | | | | — | | | | — | | | | — | | | | | |
| Class R | | | — | | | | 98,188 | | | | — | | | | — | | | | — | | | | | |
| Class P | | | 672,000 | | | | 102,411,913 | | | | 10,009 | | | | 10,020 | | | | — | | | | | |
| Institutional Class | | | 138,331 | | | | 332,874,058 | | | | 10,011 | | | | 10,022 | | | | 43,332,557 | | | | | |
| Class R6 | | | 98,758,365 | | | | — | | | | 29,356,467 | | | | 40,075,264 | | | | — | | | | | |
| Administrative Class | | | — | | | | 997,253 | | | | — | | | | — | | | | — | | | | | |
| Shares Issued and Outstanding: | | | | | | | | | | | | | | | | | | |
| Class A | | | 17,171 | | | | 1,872,648 | | | | — | | | | — | | | | 4,999 | | | | | |
| Class C | | | 1,314 | | | | 1,622,403 | | | | — | | | | — | | | | — | | | | | |
| Class R | | | — | | | | 2,895 | | | | — | | | | — | | | | — | | | | | |
| Class P | | | 33,114 | | | | 3,188,461 | | | | 671 | | | | 671 | | | | — | | | | | |
| Institutional Class | | | 6,795 | | | | 10,269,456 | | | | 672 | | | | 672 | | | | 3,084,705 | | | | | |
| Class R6 | | | 4,827,978 | | | | — | | | | 1,969,328 | | | | 2,685,396 | | | | — | | | | | |
| Administrative Class | | | — | | | | 30,726 | | | | — | | | | — | | | | — | | | | | |
Net Asset Value and Redemption
Price Per Share:* | | | | | | | | | | | | | | | | | | |
| Class A | | $ | 20.49 | | | $ | 32.78 | | | $ | — | | | $ | — | | | $ | 13.88 | | | | | |
| Class C | | | 19.98 | | | | 32.95 | | | | — | | | | — | | | | — | | | | | |
| Class R | | | — | | | | 33.92 | | | | — | | | | — | | | | — | | | | | |
| Class P | | | 20.29 | | | | 32.12 | | | | 14.91 | | | | 14.92 | | | | — | | | | | |
| Institutional Class | | | 20.36 | | | | 32.41 | | | | 14.91 | | | | 14.92 | | | | 14.05 | | | | | |
| Class R6 | | | 20.46 | | | | — | | | | 14.91 | | | | 14.92 | | | | — | | | | | |
| Administrative Class | | | — | | | | 32.46 | | | | — | | | | — | | | | — | | | | | |
| * | Net asset value and redemption price per share may not recalculate exactly due to rounding. |
| | | | | | |
| 212 | | Annual Report | | | September 30, 2018 | | | See accompanying Notes to Financial Statements |
| | | | | | | | | | | | | | | | | | | | | | | | | | | | | | |
| | | | AllianzGI
Emerging
Markets Debt | | | AllianzGI
Emerging
Markets
Small-Cap | | | AllianzGI
Europe Equity
Dividend | | | AllianzGI
Global Dynamic
Allocation | | | AllianzGI
Global High Yield | | | AllianzGI
Global
Sustainability | | | AllianzGI
Global Water | |
| | | | | | | | | | | | | | | | | | | | | | | |
| | | | | $ | 20,602,649 | | | $ | 9,052,738 | | | $ | 6,628,301 | | | $ | 197,396,174 | | | $ | 22,460,640 | | | $ | 32,242,813 | | | $ | 537,291,498 | |
| | | | | | (2,090,094 | ) | | | 1,112,278 | | | | 335,708 | | | | 25,033,175 | | | | (281,999 | ) | | | 7,970,512 | | | | 125,898,865 | |
| | | | | $ | 18,512,555 | | | $ | 10,165,016 | | | $ | 6,964,009 | | | $ | 222,429,349 | | | $ | 22,178,641 | | | $ | 40,213,325 | | | $ | 663,190,363 | |
| | | | | $ | 17,574,075 | | | $ | 8,968,400 | | | $ | 6,910,492 | | | $ | 202,094,904 | | | $ | 21,893,738 | | | $ | 33,399,568 | | | $ | 529,529,433 | |
| | | | | $ | — | | | $ | — | | | $ | — | | | $ | 4,470,226 | | | $ | — | | | $ | — | | | $ | — | |
| | | | | $ | 933,000 | | | $ | 289,000 | | | $ | — | | | $ | 8,982,000 | | | $ | 214,000 | | | $ | 521,000 | | | $ | 9,725,000 | |
| | | | | $ | 27,776 | | | $ | 35,073 | | | $ | 2,806 | | | $ | 334,367 | | | $ | 369,888 | | | $ | 4 | | | $ | 6 | |
| | | | | | | | | | | | | | | | | | | | | | | |
| | | | | $ | 134,812 | | | $ | 135,129 | | | $ | 293,046 | | | $ | 2,016,236 | | | $ | — | | | $ | 614,420 | | | $ | 172,373,859 | |
| | | | | | 45,510 | | | | — | | | | 67,804 | | | | 1,195,361 | | | | — | | | | — | | | | 83,155,771 | |
| | | | | | — | | | | — | | | | — | | | | 160,022 | | | | — | | | | — | | | | — | |
| | | | | | 10,903 | | | | — | | | | 11,518 | | | | 13,435,554 | | | | 10,417 | | | | 11,361,775 | | | | 243,339,039 | |
| | | | | | 18,321,330 | | | | 10,029,887 | | | | 6,591,641 | | | | 13,224,528 | | | | 22,168,224 | | | | 28,237,130 | | | | 164,321,694 | |
| | | | | | — | | | | — | | | | — | | | | 192,374,532 | | | | — | | | | — | | | | — | |
| | | | | | — | | | | — | | | | — | | | | 23,116 | | | | — | | | | — | | | | — | |
| | | | | | | | | | | | | | | | | | | | | | | |
| | | | | | 10,098 | | | | 8,136 | | | | 18,916 | | | | 99,868 | | | | — | | | | 31,566 | | | | 11,089,572 | |
| | | | | | 3,377 | | | | — | | | | 4,401 | | | | 61,099 | | | | — | | | | — | | | | 5,624,176 | |
| | | | | | — | | | | — | | | | — | | | | 8,011 | | | | — | | | | — | | | | — | |
| | | | | | 824 | | | | — | | | | 747 | | | | 669,298 | | | | 702 | | | | 577,200 | | | | 15,611,261 | |
| | | | | | 1,384,510 | | | | 609,661 | | | | 424,825 | | | | 653,907 | | | | 1,494,944 | | | | 1,431,739 | | | | 10,733,651 | |
| | | | | | — | | | | — | | | | — | | | | 9,547,454 | | | | — | | | | — | | | | — | |
| | | | | | — | | | | — | | | | — | | | | 1,147 | | | | — | | | | — | | | | — | |
| | | | | | | | | | | | | | | | | | | | | | | |
| | | | | $ | 13.35 | | | $ | 16.61 | | | $ | 15.49 | | | $ | 20.19 | | | $ | — | | | $ | 19.46 | | | $ | 15.54 | |
| | | | | | 13.48 | | | | — | | | | 15.41 | | | | 19.56 | | | | — | | | | — | | | | 14.79 | |
| | | | | | — | | | | — | | | | — | | | | 19.97 | | | | — | | | | — | | | | — | |
| | | | | | 13.24 | | | | — | | | | 15.41 | | | | 20.07 | | | | 14.84 | | | | 19.68 | | | | 15.59 | |
| | | | | | 13.23 | | | | 16.45 | | | | 15.52 | | | | 20.22 | | | | 14.83 | | | | 19.72 | | | | 15.31 | |
| | | | | | — | | | | — | | | | — | | | | 20.15 | | | | — | | | | — | | | | — | |
| | | | | | — | | | | — | | | | — | | | | 20.15 | | | | — | | | | — | | | | — | |
| | | | | | | | |
| See accompanying Notes to Financial Statements | | | September 30, 2018 | | | Annual Report | | | 213 | |
Statements of Assets and Liabilities† (cont’d)
September 30, 2018
| | | | | | | | | | | | | | | | | | | | | | | | |
| | |
AllianzGI High Yield Bond | | | AllianzGI
International
Growth | | | AllianzGI
International
Small-Cap | | | AllianzGI
Micro Cap | | | AllianzGI
NFJ Emerging
Markets Value | | | | |
| Assets: | | | | | | | | | | | | | | | | | | |
| Investments, at value | | $ | 175,344,718 | | | $ | 28,171,868 | | | $ | 166,963,515 | | | $ | 28,224,076 | | | $ | 135,530,875 | | | | | |
| Repurchase agreements, at value | | | 1,315,000 | | | | 837,000 | | | | 1,105,000 | | | | 489,000 | | | | — | | | | | |
| Cash | | | 11,725 | | | | 204 | | | | 677 | | | | 407 | | | | — | | | | | |
| Foreign currency, at value | | | — | | | | 103,440 | | | | 1,581,282 | | | | — | | | | 3,759,658 | | | | | |
| Unrealized appreciation of forward foreign currency contracts | | | — | | | | — | | | | — | | | | — | | | | — | | | | | |
| Dividends and interest receivable (net of foreign withholding taxes) | | | 2,924,150 | | | | 11,164 | | | | 296,764 | | | | 1,508 | | | | 177,229 | | | | | |
| Receivable for investments sold | | | 4,461,448 | | | | — | | | | 1,615,740 | | | | 131,810 | | | | 2,339,404 | | | | | |
| Swap premiums paid | | | — | | | | — | | | | — | | | | — | | | | — | | | | | |
| Deposits with brokers for derivatives collateral | | | — | | | | — | | | | — | | | | — | | | | — | | | | | |
| Receivable for Fund shares sold | | | 28,671 | | | | 5,000 | | | | 55,081 | | | | 1,245 | | | | 110,584 | | | | | |
| Receivable from Investment Manager | | | — | | | | 2,912 | | | | — | | | | — | | | | 15,483 | | | | | |
| Deferred offering costs | | | — | | | | — | | | | — | | | | — | | | | — | | | | | |
| Tax reclaims receivable | | | — | | | | 20,765 | | | | 213,020 | | | | — | | | | — | | | | | |
| Investments in Affiliated Funds — Trustees Deferred Compensation Plan (see Note 5) | | | 40,341 | | | | 2,964 | | | | 24,626 | | | | 5,071 | | | | 14,439 | | | | | |
| Receivable for principal paydowns | | | — | | | | — | | | | — | | | | — | | | | — | | | | | |
| Receivable for variation margin on futures contracts | | | — | | | | — | | | | — | | | | — | | | | — | | | | | |
| Prepaid expenses and other assets | | | 43,336 | | | | 10,827 | | | | 38,910 | | | | 15,788 | | | | 30,086 | | | | | |
Total Assets | | | 184,169,389 | | | | 29,166,144 | | | | 171,894,615 | | | | 28,868,905 | | | | 141,977,758 | | | | | |
| Liabilities: | | | | |
| Payable for investments purchased | | | 883,374 | | | | 463,019 | | | | 835,742 | | | | 22,154 | | | | 304,468 | | | | | |
| Payable for Fund shares redeemed | | | 100,388 | | | | 15 | | | | 25,984,302 | | | | 400 | | | | 138,311 | | | | | |
| Payable to custodian for cash overdraft | | | — | | | | — | | | | — | | | | — | | | | 2,884,965 | | | | | |
| Payable to custodian for foreign currency overdraft | | | — | | | | — | | | | — | | | | — | | | | — | | | | | |
| Payable for variation margin on centrally cleared swaps | | | — | | | | — | | | | — | | | | — | | | | — | | | | | |
| Payable for variation margin on futures contracts | | | — | | | | — | | | | — | | | | — | | | | — | | | | | |
| Options written, at value | | | — | | | | — | | | | — | | | | — | | | | — | | | | | |
| Investment management fees payable | | | 65,290 | | | | — | | | | 84,404 | | | | 17,035 | | | | — | | | | | |
| Distribution fees payable | | | 4,706 | | | | — | | | | 1,683 | | | | — | | | | 650 | | | | | |
| Servicing fees payable | | | 8,010 | | | | 200 | | | | 2,441 | | | | 479 | | | | 4,527 | | | | | |
| Unrealized depreciation of forward foreign currency contracts | | | — | | | | — | | | | — | | | | — | | | | — | | | | | |
| Due to Investment Manager | | | — | | | | — | | | | — | | | | — | | | | — | | | | | |
| Trustees Deferred Compensation Plan payable (see Note 5) | | | 40,341 | | | | 2,964 | | | | 24,626 | | | | 5,071 | | | | 14,439 | | | | | |
| Accrued expenses and other liabilities | | | 244,428 | | | | 89,909 | | | | 249,446 | | | | 112,858 | | | | 371,046 | | | | | |
Total Liabilities | | | 1,346,537 | | | | 556,107 | | | | 27,182,644 | | | | 157,997 | | | | 3,718,406 | | | | | |
| Net Assets | | $ | 182,822,852 | | | $ | 28,610,037 | | | $ | 144,711,971 | | | $ | 28,710,908 | | | $ | 138,259,352 | | | | | |
| | | | | | |
| 214 | | Annual Report | | | September 30, 2018 | | | See accompanying Notes to Financial Statements |
| | | | | | | | | | | | | | | | | | | | | | | | | | | | | | |
| | | | AllianzGI NFJ International
Small-Cap Value | | | AllianzGI
PerformanceFee
Managed
Futures Strategy† | | | AllianzGI
PerformanceFee
Structured US
Equity | | | AllianzGI
PerformanceFee
Structured US
Fixed Income | | | AllianzGI
Preferred
Securities
and Income | | | AllianzGI
Real Estate
Debt | | | AllianzGI
Short Duration
High Income | |
| | | | | | | | | | | | | | | | | | | | | | | |
| | | | | $ | 3,548,490 | | | $ | 13,421,289 | | | $ | 82,344,045 | | | $ | 24,910,863 | | | $ | 11,224,717 | | | $ | 15,229,649 | | | $ | 1,086,227,629 | |
| | | | | | — | | | | 445,000 | | | | — | | | | — | | | | 388,000 | | | | — | | | | 6,580,000 | |
| | | | | | 11,767 | | | | — | | | | 57,994 | | | | 83,178 | | | | 708 | | | | — | | | | 544 | |
| | | | | | 31,662 | | | | — | | | | — | | | | — | | | | — | | | | 269,759 | | | | — | |
| | | | |
|
— |
| | | — | | | | — | | | | — | | | | — | | | | 9,561 | | | | — | |
| | | | |
|
7,264 |
| | | 37,044 | | | | 358,054 | | | | — | | | | 134,867 | | | | 28,624 | | | | 18,690,775 | |
| | | | | | — | | | | — | | | | 81,879 | | | | 3,979 | | | | — | | | | 76,117 | | | | 23,810,393 | |
| | | | | | — | | | | 270,310 | | | | — | | | | — | | | | — | | | | — | | | | — | |
| | | | | | — | | | | 1,731,220 | | | | 662,782 | | | | 213,961 | | | | — | | | | 1,415 | | | | — | |
| | | | | | 11,171 | | | | — | | | | 325,000 | | | | — | | | | — | | | | 961,149 | | | | 7,216,926 | |
| | | | | | 8,447 | | | | 33,864 | | | | — | | | | — | | | | 37,758 | | | | 14,660 | | | | — | |
| | | | | | — | | | | 22,839 | | | | 22,051 | | | | 22,051 | | | | 80,343 | | | | 23,057 | | | | — | |
| | | | | | 3,142 | | | | — | | | | — | | | | — | | | | — | | | | — | | | | — | |
| | | | |
|
867 |
| | | 1,883 | | | | 1,517 | | | | 3,374 | | | | 183 | | | | 812 | | | | 196,471 | |
| | | | | | — | | | | — | | | | — | | | | — | | | | — | | | | 15,839 | | | | — | |
| | | | | | — | | | | — | | | | — | | | | — | | | | — | | | | 78 | | | | — | |
| | | | | | 32,397 | | | | 6,658 | | | | 21,798 | | | | 6,936 | | | | 4,266 | | | | 11,787 | | | | 91,136 | |
| | | | | 3,655,207 | | | | 15,970,107 | | | | 83,875,120 | | | | 25,244,342 | | | | 11,870,842 | | | | 16,642,507 | | | | 1,142,813,874 | |
| | | | | | | | | | | | | | | | | | | | | | | |
| | | | | | — | | | | — | | | | 11,852 | | | | 2,439 | | | | — | | | | 1,196,815 | | | | — | |
| | | | | | 1,496 | | | | — | | | | — | | | | — | | | | — | | | | — | | | | 2,287,893 | |
| | | | | | — | | | | 5,856 | | | | — | | | | — | | | | — | | | | 46,284 | | | | — | |
| | | | | | — | | | | 200 | | | | — | | | | — | | | | — | | | | — | | | | — | |
| | | | |
|
— |
| | | 1,456 | | | | — | | | | — | | | | — | | | | — | | | | — | |
| | | | | | — | | | | 2,726 | | | | — | | | | — | | | | — | | | | — | | | | — | |
| | | | | | — | | | | — | | | | 451,184 | | | | 60,653 | | | | — | | | | — | | | | — | |
| | | | | | — | | | | — | | | | 161,316 | | | | 23,727 | | | | — | | | | — | | | | 400,195 | |
| | | | | | 94 | | | | — | | | | — | | | | — | | | | — | | | | — | | | | 25,108 | |
| | | | | | 233 | | | | — | | | | — | | | | — | | | | — | | | | — | | | | 53,306 | |
| | | | |
|
— |
| | | — | | | | — | | | | — | | | | — | | | | 101 | | | | — | |
| | | | | | — | | | | 22,839 | | | | 22,051 | | | | 22,051 | | | | 80,343 | | | | 23,057 | | | | — | |
| | | | |
|
867 |
| | | 1,883 | | | | 1,517 | | | | 3,374 | | | | 183 | | | | 812 | | | | 196,471 | |
| | | | | | 80,233 | | | | 156,106 | | | | 151,992 | | | | 153,705 | | | | 75,280 | | | | 128,265 | | | | 736,657 | |
| | | | | | 82,923 | | | | 191,066 | | | | 799,912 | | | | 265,949 | | | | 155,806 | | | | 1,395,334 | | | | 3,699,630 | |
| | | | | $ | 3,572,284 | | | $ | 15,779,041 | | | $ | 83,075,208 | | | $ | 24,978,393 | | | $ | 11,715,036 | | | $ | 15,247,173 | | | $ | 1,139,114,244 | |
| | | | | | | | |
| See accompanying Notes to Financial Statements | | | September 30, 2018 | | | Annual Report | | | 215 | |
Statements of Assets and Liabilities† (cont’d)
September 30, 2018
| | | | | | | | | | | | | | | | | | | | | | | | |
| | |
AllianzGI High Yield Bond | | | AllianzGI
International
Growth | | | AllianzGI
International
Small-Cap | | | AllianzGI
Micro Cap | | | AllianzGI
NFJ Emerging
Markets Value | | | | |
| Net Assets Consist of: | | | | | | | | | | | | | | | | | | |
| Paid-in-capital | | $ | 218,505,475 | | | $ | 24,108,717 | | | $ | 102,468,174 | | | $ | 16,636,146 | | | $ | 151,499,161 | | | | | |
| Total distributable earnings (loss) | | | (35,682,623 | ) | | | 4,501,320 | | | | 42,243,797 | | | | 12,074,762 | | | | (13,239,809 | ) | | | | |
| Net Assets | | $ | 182,822,852 | | | $ | 28,610,037 | | | $ | 144,711,971 | | | $ | 28,710,908 | | | $ | 138,259,352 | | | | | |
| Cost of Investments | | $ | 182,170,748 | | | $ | 24,314,950 | | | $ | 138,738,169 | | | $ | 20,259,249 | | | $ | 140,393,610 | | | | | |
| Cost of Repurchase Agreements | | $ | 1,315,000 | | | $ | 837,000 | | | $ | 1,105,000 | | | $ | 489,000 | | | $ | — | | | | | |
| Cost of Foreign Currency | | $ | — | | | $ | 103,595 | | | $ | 1,580,522 | | | $ | — | | | $ | 3,760,675 | | | | | |
| Cost of Foreign Currency Overdraft due to Custodian | | $ | — | | | $ | — | | | $ | — | | | $ | — | | | $ | — | | | | | |
| Premiums Received for Options Written | | $ | — | | | $ | — | | | $ | — | | | $ | — | | | $ | — | | | | | |
| Net Assets: | | | | | | | | | | | | | | | | | | |
| Class A | | $ | 33,767,830 | | | $ | 1,182,948 | | | $ | 9,107,789 | | | $ | 2,569,743 | | | $ | 22,589,531 | | | | | |
| Class C | | | 8,543,955 | | | | — | | | | 2,610,497 | | | | — | | | | 1,196,495 | | | | | |
| Class R | | | 878,249 | | | | — | | | | 845,215 | | | | — | | | | — | | | | | |
| Class P | | | 17,535,077 | | | | — | | | | 48,829,285 | | | | 1,721,656 | | | | 3,312,099 | | | | | |
| Institutional Class | | | 122,077,374 | | | | 27,427,089 | | | | 49,443,021 | | | | 24,419,509 | | | | 111,161,227 | | | | | |
| Class R6 | | | — | | | | — | | | | 33,876,164 | | | | — | | | | — | | | | | |
| Administrative Class | | | 20,367 | | | | — | | | | — | | | | — | | | | — | | | | | |
| Shares Issued and Outstanding: | | | | | | | | | | | | | | | | | | |
| Class A | | | 3,788,242 | | | | 66,057 | | | | 211,382 | | | | 154,646 | | | | 1,396,421 | | | | | |
| Class C | | | 960,378 | | | | — | | | | 62,714 | | | | — | | | | 73,726 | | | | | |
| Class R | | | 102,848 | | | | — | | | | 20,172 | | | | — | | | | — | | | | | |
| Class P | | | 2,050,059 | | | | — | | | | 1,133,972 | | | | 102,897 | | | | 204,938 | | | | | |
| Institutional Class | | | 14,227,224 | | | | 1,496,830 | | | | 1,107,470 | | | | 1,451,644 | | | | 6,824,957 | | | | | |
| Class R6 | | | — | | | | — | | | | 758,866 | | | | — | | | | — | | | | | |
| Administrative Class | | | 2,412 | | | | — | | | | — | | | | — | | | | — | | | | | |
Net Asset Value and Redemption
Price Per Share:* | | | | | | | | | | | | | | | | | | |
| Class A | | $ | 8.91 | | | $ | 17.91 | | | $ | 43.09 | | | $ | 16.62 | | | $ | 16.18 | | | | | |
| Class C | | | 8.90 | | | | — | | | | 41.63 | | | | — | | | | 16.23 | | | | | |
| Class R | | | 8.54 | | | | — | | | | 41.90 | | | | — | | | | — | | | | | |
| Class P | | | 8.55 | | | | — | | | | 43.06 | | | | 16.73 | | | | 16.16 | | | | | |
| Institutional Class | | | 8.58 | | | | 18.32 | | | | 44.65 | | | | 16.82 | | | | 16.29 | | | | | |
| Class R6 | | | — | | | | — | | | | 44.64 | | | | — | | | | — | | | | | |
| Administrative Class | | | 8.44 | | | | — | | | | — | | | | — | | | | — | | | | | |
| † | Consolidated Statement of Assets and Liabilities for the AllianzGI PerformanceFee Managed Futures Strategy Fund. These financial statements are consolidated to include the accounts of AllianzGI PerformanceFee Managed Futures Strategy Offshore Fund Ltd., a wholly-owned subsidiary of the AllianzGI PerformanceFee Managed Futures Strategy Fund. See Note 14. |
| * | Net asset value and redemption price per share may not recalculate exactly due to rounding. |
| | | | | | |
| 216 | | Annual Report | | | September 30, 2018 | | | See accompanying Notes to Financial Statements |
| | | | | | | | | | | | | | | | | | | | | | | | | | | | | | |
| | | | AllianzGI NFJ
International
Small-Cap Value | | | AllianzGI
PerformanceFee
Managed
Futures Strategy† | | | AllianzGI
PerformanceFee
Structured US
Equity | | | AllianzGI
PerformanceFee
Structured US
Fixed Income | | | AllianzGI
Preferred
Securities
and Income | | | AllianzGI
Real Estate
Debt | | | AllianzGI
Short Duration
High Income | |
| | | | | | | | | | | | | | | | | | | | | | | |
| | | | | $ | 3,536,441 | | | $ | 16,365,173 | | | $ | 77,468,378 | | | $ | 25,171,008 | | | $ | 11,680,679 | | | $ | 15,286,370 | | | $ | 1,208,585,999 | |
| | | | | | 35,843 | | | | (586,132 | ) | | | 5,606,830 | | | | (192,615 | ) | | | 34,357 | | | | (39,197 | ) | | | (69,471,755 | ) |
| | | | | $ | 3,572,284 | | | $ | 15,779,041 | | | $ | 83,075,208 | | | $ | 24,978,393 | | | $ | 11,715,036 | | | $ | 15,247,173 | | | $ | 1,139,114,244 | |
| | | | | $ | 3,279,231 | | | $ | 13,434,220 | | | $ | 78,389,729 | | | $ | 25,808,331 | | | $ | 11,227,849 | | | $ | 15,395,803 | | | $ | 1,094,725,371 | |
| | | | | $ | — | | | $ | 445,000 | | | $ | — | | | $ | — | | | $ | 388,000 | | | $ | — | | | $ | 6,580,000 | |
| | | | | $ | 31,658 | | | $ | — | | | $ | — | | | $ | — | | | $ | — | | | $ | 272,336 | | | $ | — | |
| | | | | $ | — | | | $ | 374 | | | $ | — | | | $ | — | | | $ | — | | | $ | — | | | $ | — | |
| | | | $ | — | | | $ | — | | | $ | 804,779 | | | $ | 116,394 | | | $ | — | | | $ | — | | | $ | — | |
| | | | | | | | | | | | | | | | | | | | | | | |
| | | | | $ | 1,085,676 | | | $ | — | | | $ | — | | | $ | — | | | $ | — | | | $ | — | | | $ | 150,899,264 | |
| | | | | | 169,049 | | | | — | | | | — | | | | — | | | | — | | | | — | | | | 135,483,127 | |
| | | | | | — | | | | — | | | | — | | | | — | | | | — | | | | — | | | | — | |
| | | | | | 47,305 | | | | 9,606 | | | | 11,123 | | | | 9,923 | | | | 10,174 | | | | 10,119 | | | | 411,366,574 | |
| | | | | | 1,770,751 | | | | 515,384 | | | | 40,290,118 | | | | 10,022 | | | | 1,547,621 | | | | 15,237,054 | | | | 388,443,321 | |
| | | | | | 499,503 | | | | 15,253,674 | | | | 42,773,967 | | | | 24,958,448 | | | | 10,157,241 | | | | — | | | | 52,921,958 | |
| | | | | — | | | | — | | | | — | | | | — | | | | — | | | | — | | | | — | |
| | | | | | | | | | | | | | | | | | | | | | | |
| | | | | | 55,147 | | | | — | | | | — | | | | — | | | | — | | | | — | | | | 10,107,059 | |
| | | | | | 8,918 | | | | — | | | | — | | | | — | | | | — | | | | — | | | | 9,093,445 | |
| | | | | | — | | | | — | | | | — | | | | — | | | | — | | | | — | | | | — | |
| | | | | | 2,478 | | | | 1,000 | | | | 1,000 | | | | 1,000 | | | | 676 | | | | 677 | | | | 27,646,543 | |
| | | | | | 89,842 | | | | 53,700 | | | | 3,619,821 | | | | 1,010 | | | | 102,751 | | | | 1,018,939 | | | | 26,095,437 | |
| | | | | | 26,351 | | | | 1,586,664 | | | | 3,844,214 | | | | 2,515,332 | | | | 674,446 | | | | — | | | | 3,553,189 | |
| | | | | — | | | | — | | | | — | | | | — | | | | — | | | | — | | | | — | |
| | | | | | | | | | | | | | | | | | | | | | | |
| | | | | $ | 19.69 | | | $ | — | | | $ | — | | | $ | — | | | $ | — | | | $ | — | | | $ | 14.93 | |
| | | | | | 18.96 | | | | — | | | | — | | | | — | | | | — | | | | — | | | | 14.90 | |
| | | | | | — | | | | — | | | | — | | | | — | | | | — | | | | — | | | | — | |
| | | | | | 19.09 | | | | 9.61 | | | | 11.12 | | | | 9.92 | | | | 15.06 | | | | 14.95 | | | | 14.88 | |
| | | | | | 19.71 | | | | 9.60 | | | | 11.13 | | | | 9.92 | | | | 15.06 | | | | 14.95 | | | | 14.89 | |
| | | | | | 18.96 | | | | 9.61 | | | | 11.13 | | | | 9.92 | | | | 15.06 | | | | — | | | | 14.89 | |
| | | | | | — | | | | — | | | | — | | | | — | | | | — | | | | — | | | | — | |
| | | | | | | | |
| See accompanying Notes to Financial Statements | | | September 30, 2018 | | | Annual Report | | | 217 | |
Statements of Assets and Liabilities (cont’d)
September 30, 2018
| | | | | | | | | | | | | | | | |
| | | AllianzGI
Short Term
Bond | | | AllianzGI
Structured
Return | | | AllianzGI
U.S. Equity
Hedged | | | AllianzGI
Ultra Micro Cap | |
| Assets: | |
| Investments, at value | | $ | 5,107,083 | | | $ | 555,870,472 | | | $ | 2,895,909 | | | $ | 32,860,892 | |
| Repurchase agreements, at value | | | — | | | | 74,365,000 | | | | — | | | | 1,147,000 | |
| Cash | | | 51,621 | | | | 906 | | | | 7,290 | | | | 902 | |
| Dividends and interest receivable (net of foreign withholding taxes) | | | 49,940 | | | | 2,544,567 | | | | 13,028 | | | | 3,363 | |
| Receivable for investments sold | | | — | | | | 67,512,371 | | | | 3,909 | | | | 149,359 | |
| Deposits with brokers for derivatives collateral | | | — | | | | 6,472,095 | | | | 7,972 | | | | — | |
| Receivable for Fund shares sold | | | — | | | | 748,214 | | | | 54,179 | | | | 255 | |
| Receivable from Investment Manager | | | 54,713 | | | | — | | | | 6,769 | | | | — | |
| Deferred offering costs | | | 120,667 | | | | — | | | | — | | | | — | |
| Investments in Affiliated Funds — Trustees Deferred Compensation Plan (see Note 5) | | | 13 | | | | 76,390 | | | | 628 | | | | 6,339 | |
| Prepaid expenses and other assets | | | — | | | | 32,573 | | | | 11,201 | | | | 15,897 | |
Total Assets | | | 5,384,037 | | | | 707,622,588 | | | | 3,000,885 | | | | 34,184,007 | |
| Liabilities: | |
| Payable for investments purchased | | | — | | | | 5,406,017 | | | | 6,867 | | | | 175,943 | |
| Payable for Fund shares redeemed | | | — | | | | 362,198 | | | | — | | | | 38,616 | |
| Options written, at value | | | — | | | | 26,906,483 | | | | 4,755 | | | | — | |
| Investment management fees payable | | | — | | | | 269,493 | | | | — | | | | 20,528 | |
| Distribution fees payable | | | — | | | | 9,386 | | | | 127 | | | | — | |
| Servicing fees payable | | | 3 | | | | 23,366 | | | | 143 | | | | 1,693 | |
| Due to Investment Manager | | | 120,667 | | | | — | | | | — | | | | — | |
| Trustees Deferred Compensation Plan payable (see Note 5) | | | 13 | | | | 76,390 | | | | 628 | | | | 6,339 | |
| Accrued expenses and other liabilities | | | 78,901 | | | | 484,923 | | | | 60,217 | | | | 138,828 | |
Total Liabilities | | | 199,584 | | | | 33,538,256 | | | | 72,737 | | | | 381,947 | |
| Net Assets | | $ | 5,184,453 | | | $ | 674,084,332 | | | $ | 2,928,148 | | | $ | 33,802,060 | |
| Net Assets Consist of: | |
| Paid-in-capital | | $ | 5,175,997 | | | $ | 656,503,204 | | | $ | 2,995,387 | | | $ | 17,010,414 | |
| Total distributable earnings (loss) | | | 8,456 | | | | 17,581,128 | | | | (67,239 | ) | | | 16,791,646 | |
| Net Assets | | $ | 5,184,453 | | | $ | 674,084,332 | | | $ | 2,928,148 | | | $ | 33,802,060 | |
| Cost of Investments | | $ | 5,112,736 | | | $ | 552,585,884 | | | $ | 2,243,265 | | | $ | 21,627,393 | |
| Cost of Repurchase Agreements | | $ | — | | | $ | 74,365,000 | | | $ | — | | | $ | 1,147,000 | |
| Premiums Received for Options Written | | $ | — | | | $ | 28,103,668 | | | $ | 7,532 | | | $ | — | |
| | | | | | |
| 218 | | Annual Report | | | September 30, 2018 | | | See accompanying Notes to Financial Statements |
| | | | | | | | | | | | | | | | |
| | | AllianzGI
Short Term
Bond | | | AllianzGI
Structured
Return | | | AllianzGI
U.S. Equity
Hedged | | | AllianzGI
Ultra Micro Cap | |
| Net Assets: | |
| Class A | | $ | 10,014 | | | $ | 110,428,912 | | | $ | 544,161 | | | $ | 8,898,037 | |
| Class C | | | — | | | | 16,862,524 | | | | 229,815 | | | | — | |
| Class P | | | 10,015 | | | | 150,440,702 | | | | 69,230 | | | | 5,925,048 | |
| Institutional Class | | | 5,164,424 | | | | 345,453,414 | | | | 2,084,942 | | | | 18,978,975 | |
| Class R6 | | | — | | | | 50,898,780 | | | | — | | | | — | |
| Shares Issued and Outstanding: | |
| Class A | | | 667 | | | | 6,835,276 | | | | 28,738 | | | | 433,651 | |
| Class C | | | — | | | | 1,082,306 | | | | 12,704 | | | | — | |
| Class P | | | 667 | | | | 9,320,670 | | | | 3,706 | | | | 282,300 | |
| Institutional Class | | | 343,731 | | | | 21,170,580 | | | | 108,507 | | | | 902,008 | |
| Class R6 | | | — | | | | 3,133,893 | | | | — | | | | — | |
| Net Asset Value and Redemption Price Per Share:* | |
| Class A | | $ | 15.02 | | | $ | 16.16 | | | $ | 18.94 | | | $ | 20.52 | |
| Class C | | | — | | | | 15.58 | | | | 18.09 | | | | — | |
| Class P | | | 15.02 | | | | 16.14 | | | | 18.68 | | | | 20.99 | |
| Institutional Class | | | 15.02 | | | | 16.32 | | | | 19.21 | | | | 21.04 | |
| Class R6 | | | — | | | | 16.24 | | | | — | | | | — | |
| * | Net asset value and redemption price per share may not recalculate exactly due to rounding. |
| | | | | | | | |
| See accompanying Notes to Financial Statements | | | September 30, 2018 | | | Annual Report | | | 219 | |
Statements of Operations
Year ended September 30, 2018
| | | | | | | | | | | | | | | | | | | | | | | | |
| | | AllianzGI
Retirement
2020 | | | AllianzGI
Retirement
2025 | | | AllianzGI
Retirement
2030 | | | AllianzGI
Retirement
2035 | | | AllianzGI
Retirement
2040 | | | | |
| Investment Income: | | | | |
| Dividends from investments in Affiliates | | $ | 893,354 | | | $ | 1,149,218 | | | $ | 1,361,362 | | | $ | 1,311,906 | | | $ | 1,355,222 | | | | | |
| Contribution from Investment Manager (see Note 6) | | | 7,105 | | | | 16,470 | | | | 20,096 | | | | 1,636 | | | | — | | | | | |
| Dividends, net of foreign withholding taxes* | | | 93,339 | | | | 12,856 | | | | 2,955 | | | | 182 | | | | 200 | | | | | |
| Interest | | | 6,711 | | | | 8,777 | | | | 10,481 | | | | 8,527 | | | | 8,532 | | | | | |
| Miscellaneous | | | 10 | | | | 10 | | | | 10 | | | | 10 | | | | 10 | | | | | |
Total Investment Income | | | 1,000,519 | | | | 1,187,331 | | | | 1,394,904 | | | | 1,322,261 | | | | 1,363,964 | | | | | |
| Expenses: | | | | |
| Investment management | | | 24,559 | | | | 31,741 | | | | 36,521 | | | | 29,110 | | | | 27,119 | | | | | |
| Administration | | | 72,950 | | | | 86,893 | | | | 100,421 | | | | 85,440 | | | | 67,088 | | | | | |
| Distribution — Class C | | | 3,154 | | | | — | | | | 6,242 | | | | — | | | | 1,000 | | | | | |
| Distribution — Class R | | | 202 | | | | 603 | | | | 1,151 | | | | 1,782 | | | | 816 | | | | | |
| Servicing — Class A | | | 27,190 | | | | 19,845 | | | | 23,416 | | | | 22,516 | | | | 15,075 | | | | | |
| Servicing — Class C | | | 1,051 | | | | — | | | | 2,081 | | | | — | | | | 333 | | | | | |
| Servicing — Class R | | | 202 | | | | 603 | | | | 1,151 | | | | 1,782 | | | | 816 | | | | | |
| Administrative servicing — Class P | | | — | | | | — | | | | — | | | | — | | | | — | | | | | |
| Distribution and/or servicing — Administrative Class | | | 1,682 | | | | 726 | | | | 1,371 | | | | 945 | | | | 1,187 | | | | | |
| Sub-transfer agent — Class A | | | — | | | | — | | | | — | | | | — | | | | — | | | | | |
| Sub-transfer agent — Class C | | | — | | | | — | | | | — | | | | — | | | | — | | | | | |
| Sub-transfer agent — Class R | | | — | | | | — | | | | — | | | | — | | | | — | | | | | |
| Sub-transfer agent — Institutional Class | | | — | | | | — | | | | — | | | | — | | | | — | | | | | |
| Line of credit commitment | | | 1,314 | | | | 1,668 | | | | 1,905 | | | | 1,530 | | | | 1,408 | | | | | |
| Legal | | | 68 | | | | 83 | | | | 93 | | | | 74 | | | | 69 | | | | | |
| Trustees | | | — | | | | — | | | | — | | | | — | | | | — | | | | | |
| Custodian and accounting agent | | | — | | | | — | | | | — | | | | — | | | | — | | | | | |
| Shareholder communications | | | — | | | | — | | | | — | | | | — | | | | — | | | | | |
| Transfer agent | | | — | | | | — | | | | — | | | | — | | | | — | | | | | |
| Insurance | | | — | | | | — | | | | — | | | | — | | | | — | | | | | |
| Audit and tax services | | | — | | | | — | | | | — | | | | — | | | | — | | | | | |
| Registration | | | — | | | | — | | | | — | | | | — | | | | — | | | | | |
| Miscellaneous | | | 553 | | | | 679 | | | | 831 | | | | 780 | | | | 808 | | | | | |
Total Expenses | | | 132,925 | | | | 142,841 | | | | 175,183 | | | | 143,959 | | | | 115,719 | | | | | |
Less: Fee Waiver/Reimbursement from Investment Manager | | | (73,577 | ) | | | (106,499 | ) | | | (122,505 | ) | | | (72,267 | ) | | | (39,583 | ) | | | | |
Net Expenses | | | 59,348 | | | | 36,342 | | | | 52,678 | | | | 71,692 | | | | 76,136 | | | | | |
| Net Investment Income | | | 941,171 | | | | 1,150,989 | | | | 1,342,226 | | | | 1,250,569 | | | | 1,287,828 | | | | | |
| | | | | | |
| 220 | | Annual Report | | | September 30, 2018 | | | See accompanying Notes to Financial Statements |
| | | | | | | | | | | | | | | | | | | | | | | | | | | | | | |
| | | | AllianzGI
Retirement
2045 | | | AllianzGI
Retirement
2050 | | | AllianzGI
Retirement
2055 | | | AllianzGI
Multi Asset
Income | | | AllianzGI
Global
Allocation | | | AllianzGI
Best Styles
Global Equity | | | AllianzGI
Best Styles
International
Equity | |
| | | | | | | | | | | | | | | | | | | | | | | |
| | | | | $ | 888,484 | | | $ | 886,098 | | | $ | 427,296 | | | $ | 1,487,703 | | | $ | 9,225,695 | | | $ | — | | | $ | — | |
| | | | | | — | | | | — | | | | — | | | | 7,416 | | | | — | | | | — | | | | — | |
| | | | | | 150 | | | | 160 | | | | 82 | | | | 610,744 | | | | 514,625 | | | | 14,672,146 | | | | 867,553 | |
| | | | | | 5,951 | | | | 5,602 | | | | 3,120 | | | | 10,847 | | | | 78,935 | | | | 11,700 | | | | 555 | |
| | | | | | 10 | | | | 10 | | | | 10 | | | | 25 | | | | 977 | | | | 214 | | | | 10 | |
| | | | | 894,595 | | | | 891,870 | | | | 430,508 | | | | 2,116,735 | | | | 9,820,232 | | | | 14,684,060 | | | | 868,118 | |
| | | | | | | | | | | | | | | | | | | | | | | |
| | | | | | 17,231 | | | | 17,068 | | | | 8,479 | | | | 23,092 | | | | 2,469,098 | | | | 1,821,175 | | | | 79,920 | |
| | | | | | 45,195 | | | | 39,379 | | | | 21,291 | | | | 70,797 | | | | — | | | | — | | | | — | |
| | | | | | — | | | | 1,373 | | | | — | | | | 23,839 | | | | 235,672 | | | | 484 | | | | 855 | |
| | | | | | 492 | | | | 300 | | | | 274 | | | | 306 | | | | 74 | | | | — | | | | — | |
| | | | | | 11,469 | | | | 8,503 | | | | 5,668 | | | | 25,207 | | | | 111,913 | | | | 3,517 | | | | 1,296 | |
| | | | | | — | | | | 458 | | | | — | | | | 7,946 | | | | 78,557 | | | | 161 | | | | 285 | |
| | | | | | 492 | | | | 300 | | | | 274 | | | | 306 | | | | 74 | | | | — | | | | — | |
| | | | | | — | | | | — | | | | — | | | | — | | | | 2,688 | | | | 2,402 | | | | 112 | |
| | | | | | 1,484 | | | | 2,138 | | | | 890 | | | | 2,411 | | | | 65 | | | | — | | | | — | |
| | | | | | — | | | | — | | | | — | | | | — | | | | 26,040 | | | | 1,116 | | | | 139 | |
| | | | | | — | | | | — | | | | — | | | | — | | | | 15,618 | | | | 38 | | | | 69 | |
| | | | | | — | | | | — | | | | — | | | | — | | | | 6 | | | | — | | | | — | |
| | | | | | — | | | | — | | | | — | | | | — | | | | 3,514 | | | | 1,495 | | | | — | |
| | | | | | 889 | | | | 866 | | | | 426 | | | | 1,245 | | | | 9,338 | | | | 16,054 | | | | 707 | |
| | | | | | 43 | | | | 41 | | | | 18 | | | | 65 | | | | 28,779 | | | | 52,816 | | | | 19,082 | |
| | | | | | — | | | | — | | | | — | | | | — | | | | 42,212 | | | | 73,619 | | | | 3,172 | |
| | | | | | — | | | | — | | | | — | | | | — | | | | 27,510 | | | | 405,470 | | | | 151,392 | |
| | | | | | — | | | | — | | | | — | | | | — | | | | 36,419 | | | | 31,973 | | | | 10,095 | |
| | | | | | — | | | | — | | | | — | | | | — | | | | 69,442 | | | | 25,944 | | | | 4,931 | |
| | | | | | — | | | | — | | | | — | | | | — | | | | 15,344 | | | | 21,767 | | | | 5,722 | |
| | | | | | — | | | | — | | | | — | | | | — | | | | 42,465 | | | | 36,771 | | | | 37,804 | |
| | | | | | — | | | | — | | | | — | | | | — | | | | 94,647 | | | | 71,926 | | | | 69,888 | |
| | | | | | 562 | | | | 569 | | | | 204 | | | | 1,605 | | | | 13,677 | | | | 17,361 | | | | 4,964 | |
| | | | | | 77,857 | | | | 70,995 | | | | 37,524 | | | | 156,819 | | | | 3,323,152 | | | | 2,584,089 | | | | 390,433 | |
| | | | | | (15,532 | ) | | | (7,609 | ) | | | (4,108 | ) | | | (72,173 | ) | | | (1,854,308 | ) | | | (129,151 | ) | | | (267,293 | ) |
| | | | | | 62,325 | | | | 63,386 | | | | 33,416 | | | | 84,646 | | | | 1,468,844 | | | | 2,454,938 | | | | 123,140 | |
| | | | | | 832,270 | | | | 828,484 | | | | 397,092 | | | | 2,032,089 | | | | 8,351,388 | | | | 12,229,122 | | | | 744,978 | |
| | | | | | | | |
| See accompanying Notes to Financial Statements | | | September 30, 2018 | | | Annual Report | | | 221 | |
Statements of Operations (cont’d)
Year ended September 30, 2018
| | | | | | | | | | | | | | | | | | | | | | | | |
| | | AllianzGI
Retirement
2020 | | | AllianzGI
Retirement
2025 | | | AllianzGI
Retirement
2030 | | | AllianzGI
Retirement
2035 | | | AllianzGI
Retirement
2040 | | | | |
| Realized and Change in Unrealized Gain (Loss): | | | | |
| Net realized gain (loss) on: | | | | | | | | | | | | | | | | | | | | | | | | |
Investments | | $ | (111,898 | ) | | $ | (19,706 | ) | | $ | 12,250 | | | $ | 12,437 | | | $ | 13,251 | | | | | |
Investments in Affiliates | | | 951,821 | | | | 948,790 | | | | 933,202 | | | | 1,013,868 | | | | 291,268 | | | | | |
Futures contracts | | | 24,700 | | | | 413,423 | | | | 532,698 | | | | 405,137 | | | | 370,244 | | | | | |
Forward foreign currency contracts | | | — | | | | — | | | | — | | | | — | | | | — | | | | | |
Foreign currency transactions | | | (1,470 | ) | | | (5,760 | ) | | | (777 | ) | | | 5,319 | | | | 4,307 | | | | | |
| Net capital gain distributions received from underlying Affiliated funds | | | 1,390,219 | | | | 2,009,460 | | | | 2,973,019 | | | | 3,233,941 | | | | 3,594,785 | | | | | |
| Net capital gain distributions received from underlying funds | | | — | | | | — | | | | — | | | | — | | | | — | | | | | |
| Net change in unrealized appreciation/depreciation of: | | | | | | | | | | | | | | | | | | | | | | | | |
Investments | | | (36,496 | ) | | | (4,595 | ) | | | (15,772 | ) | | | (13,716 | ) | | | (16,863 | ) | | | | |
Investments in Affiliates | | | (1,878,479 | ) | | | (1,714,768 | ) | | | (1,827,628 | ) | | | (2,415,204 | ) | | | (1,876,458 | ) | | | | |
Futures contracts | | | 32,374 | | | | 17,491 | | | | (45,364 | ) | | | (38,703 | ) | | | (45,396 | ) | | | | |
Foreign currency transactions | | | (1,205 | ) | | | (4,505 | ) | | | (5,222 | ) | | | (5,773 | ) | | | (9,051 | ) | | | | |
| Net realized and change in unrealized gain (loss) | | | 369,566 | | | | 1,639,830 | | | | 2,556,406 | | | | 2,197,306 | | | | 2,326,087 | | | | | |
| Net Increase in Net Assets Resulting from Investment Operations | | $ | 1,310,737 | | | $ | 2,790,819 | | | $ | 3,898,632 | | | $ | 3,447,875 | | | $ | 3,613,915 | | | | | |
| *Foreign withholding taxes | | $ | — | | | $ | — | | | $ | — | | | $ | — | | | $ | — | | | | | |
| | | | | | |
| 222 | | Annual Report | | | September 30, 2018 | | | See accompanying Notes to Financial Statements |
| | | | | | | | | | | | | | | | | | | | | | | | | | | | | | |
| | | | AllianzGI
Retirement
2045 | | | AllianzGI
Retirement
2050 | | | AllianzGI
Retirement
2055 | | | AllianzGI
Multi Asset
Income | | | AllianzGI Global Allocation | | | AllianzGI
Best Styles
Global Equity | | | AllianzGI
Best Styles
International
Equity | |
| | | | | | | | | | | | | | | | | | | | | | | |
| | | | | | | | | | | | | | | | | | | | | | | | | | | | | | |
| | | | | $ | 10,662 | | | $ | 10,781 | | | $ | 5,446 | | | $ | (616,472 | ) | | $ | (2,933 | ) | | $ | 56,489,069 | | | $ | 1,660,562 | |
| | | | | | 83,709 | | | | (84,504 | ) | | | (166,989 | ) | | | (495,730 | ) | | | 1,006,557 | | | | — | | | | — | |
| | | | | | 213,536 | | | | 214,420 | | | | 109,774 | | | | 149,501 | | | | 2,346,917 | | | | 146,900 | | | | — | |
| | | | | | — | | | | — | | | | — | | | | (3,962 | ) | | | — | | | | (272,389 | ) | | | (12,874 | ) |
| | | | | | 3,358 | | | | 3,814 | | | | 1,129 | | | | 6,704 | | | | 29,794 | | | | 3,264 | | | | 6,072 | |
| | | | | | 2,415,540 | | | | 2,433,934 | | | | 1,177,491 | | | | 35,581 | | | | 17,757,144 | | | | — | | | | — | |
| | | | | | — | | | | — | | | | — | | | | 51,923 | | | | — | | | | — | | | | — | |
| | | | | | | | | | | | | | | | | | | | | | | | | | | | | | |
| | | | | | (13,133 | ) | | | (12,596 | ) | | | (6,377 | ) | | | 41,410 | | | | (777,630 | ) | | | (35,803,678 | ) | | | (2,357,166 | ) |
| | | | | | (1,166,242 | ) | | | (1,015,568 | ) | | | (376,947 | ) | | | (1,036,328 | ) | | | (18,695,291 | ) | | | — | | | | — | |
| | | | | | (28,463 | ) | | | (24,723 | ) | | | (11,149 | ) | | | (136,367 | ) | | | (19,433 | ) | | | (14,105 | ) | | | — | |
| | | | | | (4,280 | ) | | | (2,890 | ) | | | (3,985 | ) | | | (4,765 | ) | | | (12,540 | ) | | | 8,111 | | | | (2,711 | ) |
| | | | | | 1,514,687 | | | | 1,522,668 | | | | 728,393 | | | | (2,008,505 | ) | | | 1,632,585 | | | | 20,557,172 | | | | (706,117 | ) |
| | | | | $ | 2,346,957 | | | $ | 2,351,152 | | | $ | 1,125,485 | | | $ | 23,584 | | | $ | 9,983,973 | | | $ | 32,786,294 | | | $ | 38,861 | |
| | | | | $ | — | | | $ | — | | | $ | — | | | $ | 3,101 | | | $ | — | | | $ | 1,059,656 | | | $ | 95,239 | |
| | | | | | | | |
| See accompanying Notes to Financial Statements | | | September 30, 2018 | | | Annual Report | | | 223 | |
Statements of Operations (cont’d)
Year ended September 30, 2018
| | | | | | | | | | | | | | | | | | | | | | | | |
| | | AllianzGI
Best Styles
U.S. Equity | | | AllianzGI
Convertible | | | AllianzGI Core Bond (1) | | | AllianzGI Core Plus
Bond (1) | | | AllianzGI
Emerging
Markets
Consumer | | | | |
| Investment Income: | | | | | | | | | | | | | | | | | | |
| Interest, net of foreign withholding taxes* | | $ | 2,562 | | | $ | 6,563,031 | | | $ | 286,879 | | | $ | 426,500 | | | $ | 2,361 | | | | | |
| Dividends, net of foreign withholding taxes* | | | 2,416,590 | | | | 3,268,929 | | | | — | | | | — | | | | 1,231,109 | | | | | |
| Miscellaneous | | | 10 | | | | 25 | | | | — | | | | — | | | | 10 | | | | | |
Total Investment Income | | | 2,419,162 | | | | 9,831,985 | | | | 286,879 | | | | 426,500 | | | | 1,233,480 | | | | | |
| Expenses: | | | | | | | | | | | | | | | | | | |
| Investment management | | | 364,218 | | | | 2,835,219 | | | | 23,681 | | | | 40,520 | | | | 433,465 | | | | | |
| Distribution — Class C | | | 219 | | | | 360,450 | | | | — | | | | — | | | | — | | | | | |
| Distribution — Class R | | | — | | | | 214 | | | | — | | | | — | | | | — | | | | | |
| Servicing — Class A | | | 451 | | | | 166,839 | | | | — | | | | — | | | | 332 | | | | | |
| Servicing — Class C | | | 73 | | | | 120,150 | | | | — | | | | — | | | | — | | | | | |
| Servicing — Class R | | | — | | | | 214 | | | | — | | | | — | | | | — | | | | | |
| Administrative servicing — Class P | | | 286 | | | | 53,683 | | | | — | | | | — | | | | — | | | | | |
| Distribution and/or servicing — Administrative Class | | | — | | | | 2,401 | | | | — | | | | — | | | | — | | | | | |
| Sub-transfer agent — Class A | | | — | | | | 23,262 | | | | — | | | | — | | | | 196 | | | | | |
| Sub-transfer agent — Class C | | | 10 | | | | 28,904 | | | | — | | | | — | | | | — | | | | | |
| Sub-transfer agent — Class R | | | — | | | | — | | | | — | | | | — | | | | — | | | | | |
| Sub-transfer agent — Institutional Class | | | — | | | | 104,738 | | | | — | | | | — | | | | 8,221 | | | | | |
| Sub-transfer agent — Administrative Class | | | — | | | | 87 | | | | — | | | | — | | | | — | | | | | |
| Legal | | | 13,864 | | | | 34,670 | | | | 5,212 | | | | 8,000 | | | | 18,480 | | | | | |
| Trustees | | | 14,331 | | | | 57,115 | | | | 1,542 | | | | 2,294 | | | | 5,799 | | | | | |
| Audit and tax services | | | 43,547 | | | | 83,684 | | | | 52,222 | | | | 52,072 | | | | 46,405 | | | | | |
| Registration | | | 70,402 | | | | 84,193 | | | | 1,830 | | | | 1,832 | | | | 33,542 | | | | | |
| Custodian and accounting agent | | | 63,286 | | | | 125,369 | | | | 26,667 | | | | 23,724 | | | | 82,984 | | | | | |
| Shareholder communications | | | 14,846 | | | | 44,530 | | | | 7,704 | | | | 9,144 | | | | 13,424 | | | | | |
| Transfer agent | | | 7,519 | | | | 32,534 | | | | 1,591 | | | | 2,879 | | | | 3,214 | | | | | |
| Organizational | | | — | | | | — | | | | 30,000 | | | | 30,000 | | | | — | | | | | |
| Offering | | | — | | | | — | | | | 40,835 | | | | 40,835 | | | | — | | | | | |
| Insurance | | | 7,935 | | | | 23,952 | | | | 733 | | | | 791 | | | | 5,919 | | | | | |
| Line of credit commitment | | | 3,158 | | | | 12,768 | | | | 163 | | | | 255 | | | | 1,240 | | | | | |
| Miscellaneous | | | 5,754 | | | | 22,651 | | | | 1,950 | | | | 2,543 | | | | 9,126 | | | | | |
Total Expenses | | | 609,899 | | | | 4,217,627 | | | | 194,130 | | | | 214,889 | | | | 662,347 | | | | | |
Less: Fee Waiver/Reimbursement from Investment Manager | | | (119,713 | ) | | | — | | | | (175,017 | ) | | | (180,862 | ) | | | (82,270 | ) | | | | |
Net Expenses | | | 490,186 | | | | 4,217,627 | | | | 19,113 | | | | 34,027 | | | | 580,077 | | | | | |
| Net Investment Income | | | 1,928,976 | | | | 5,614,358 | | | | 267,766 | | | | 392,473 | | | | 653,403 | | | | | |
| | | | | | |
| 224 | | Annual Report | | | September 30, 2018 | | | See accompanying Notes to Financial Statements |
| | | | | | | | | | | | | | | | | | | | | | | | | | | | | | |
| | | | AllianzGI
Emerging
Markets Debt | | | AllianzGI
Emerging
Markets
Small-Cap | | | AllianzGI
Europe
Equity
Dividend | | | AllianzGI
Global
Dynamic
Allocation | | | AllianzGI
Global
High Yield | | | AllianzGI Global
Sustainability | | | AllianzGI
Global
Water | |
| | | | | | | | | | | | | | | | | | | | | | | |
| | | | | $ | 1,768,146 | | | $ | 386 | | | $ | 288 | | | $ | 1,735,983 | | | $ | 1,146,120 | | | $ | 3,217 | | | $ | 34,140 | |
| | | | | | — | | | | 327,977 | | | | 408,144 | | | | 4,809,369 | | | | — | | | | 602,145 | | | | 13,495,608 | |
| | | | | | 10 | | | | 10 | | | | 150 | | | | 100 | | | | 6,746 | | | | 10 | | | | 10 | |
| | | | | 1,768,156 | | | | 328,373 | | | | 408,582 | | | | 6,545,452 | | | | 1,152,866 | | | | 605,372 | | | | 13,529,758 | |
| | | | | | | | | | | | | | | | | | | | | | | |
| | | | | | 203,953 | | | | 133,038 | | | | 68,743 | | | | 1,933,968 | | | | 132,382 | | | | 241,550 | | | | 6,293,244 | |
| | | | | | 740 | | | | — | | | | 449 | | | | 10,104 | | | | — | | | | — | | | | 660,384 | |
| | | | | | — | | | | — | | | | — | | | | 375 | | | | — | | | | — | | | | — | |
| | | | | | 499 | | | | 452 | | | | 2,087 | | | | 5,723 | | | | — | | | | 1,256 | | | | 468,214 | |
| | | | | | 247 | | | | — | | | | 150 | | | | 3,368 | | | | — | | | | — | | | | 220,128 | |
| | | | | | — | | | | — | | | | — | | | | 375 | | | | — | | | | — | | | | — | |
| | | | | | — | | | | — | | | | 83 | | | | 14,771 | | | | — | | | | 75 | | | | 182,023 | |
| | | | | | — | | | | — | | | | — | | | | 58 | | | | — | | | | — | | | | — | |
| | | | | | 101 | | | | 633 | | | | 1,944 | | | | 1,873 | | | | — | | | | 267 | | | | 173,908 | |
| | | | | | 38 | | | | — | | | | 44 | | | | 1,204 | | | | — | | | | — | | | | 82,491 | |
| | | | | | — | | | | — | | | | — | | | | 251 | | | | — | | | | — | | | | — | |
| | | | | | 861 | | | | 1,703 | | | | 3,594 | | | | 8,894 | | | | 49 | | | | 7,952 | | | | 115,941 | |
| | | | | | — | | | | — | | | | — | | | | — | | | | — | | | | — | | | | — | |
| | | | | | 27,395 | | | | 12,781 | | | | 15,540 | | | | 36,185 | | | | 12,599 | | | | 13,987 | | | | 39,311 | |
| | | | | | 3,765 | | | | 1,303 | | | | 1,050 | | | | 32,013 | | | | 2,570 | | | | 3,574 | | | | 75,118 | |
| | | | | | 52,234 | | | | 50,558 | | | | 38,496 | | | | 35,745 | | | | 52,777 | | | | 36,508 | | | | 52,072 | |
| | | | | | 54,563 | | | | 32,894 | | | | 55,984 | | | | 94,743 | | | | 21,249 | | | | 45,294 | | | | 73,565 | |
| | | | | | 73,903 | | | | 80,576 | | | | 109,593 | | | | 309,101 | | | | 82,997 | | | | 54,549 | | | | 305,078 | |
| | | | | | 11,968 | | | | 12,869 | | | | 11,764 | | | | 28,070 | | | | 10,389 | | | | 11,638 | | | | 128,142 | |
| | | | | | 3,587 | | | | 1,924 | | | | 2,677 | | | | 17,569 | | | | 1,091 | | | | 2,929 | | | | 63,307 | |
| | | | | | — | | | | — | | | | — | | | | — | | | | — | | | | — | | | | — | |
| | | | | | — | | | | — | | | | — | | | | — | | | | 66,422 | | | | — | | | | — | |
| | | | | | 5,763 | | | | 4,982 | | | | 4,787 | | | | 11,543 | | | | 5,237 | | | | 5,439 | | | | 18,907 | |
| | | | | | 825 | | | | 293 | | | | 212 | | | | 7,215 | | | | 558 | | | | 706 | | | | 16,655 | |
| | | | | | 15,293 | | | | 5,727 | | | | 4,726 | | | | 16,999 | | | | 4,704 | | | | 4,712 | | | | 14,919 | |
| | | | | | 455,735 | | | | 339,733 | | | | 321,923 | | | | 2,570,147 | | | | 393,024 | | | | 430,436 | | | | 8,983,407 | |
| | | | | | (187,669 | ) | | | (172,437 | ) | | | (237,278 | ) | | | (594,413 | ) | | | (236,908 | ) | | | (172,992 | ) | | | (1,457,355 | ) |
| | | | | | 268,066 | | | | 167,296 | | | | 84,645 | | | | 1,975,734 | | | | 156,116 | | | | 257,444 | | | | 7,526,052 | |
| | | | | | 1,500,090 | | | | 161,077 | | | | 323,937 | | | | 4,569,718 | | | | 996,750 | | | | 347,928 | | | | 6,003,706 | |
| | | | | | | | |
| See accompanying Notes to Financial Statements | | | September 30, 2018 | | | Annual Report | | | 225 | |
Statements of Operations (cont’d)
Year ended September 30, 2018
| | | | | | | | | | | | | | | | | | | | | | | | |
| | | AllianzGI
Best Styles
U.S. Equity | | | AllianzGI
Convertible | | | AllianzGI Core Bond (1) | | | AllianzGI Core Plus
Bond (1) | | | AllianzGI
Emerging
Markets
Consumer | | | | |
| Realized and Change in Unrealized Gain (Loss): | | | | |
| Net realized gain (loss) on: | | | | | | | | | | | | | | | | | | | | | | | | |
Investments | | $ | 16,083,128 | | | $ | 78,472,127 | | | $ | (59,391 | ) | | $ | (68,177 | ) | | $ | 545,583 | | | | | |
Futures contracts | | | 49,376 | | | | — | | | | (22,491 | ) | | | (23,598 | ) | | | — | | | | | |
Swaps | | | — | | | | — | | | | 503 | | | | (34,479 | ) | | | — | | | | | |
Forward foreign currency contracts | | | — | | | | — | | | | — | | | | — | | | | (49,747 | ) | | | | |
Foreign currency transactions | | | 1,421 | | | | — | | | | — | | | | — | | | | (21,468 | ) | | | | |
| Payments from Affiliates (See Note 7) | | | — | | | | — | | | | — | | | | — | | | | — | | | | | |
| Net change in unrealized appreciation/depreciation of: | | | | | | | | | | | | | | | | | | | | | | | | |
Investments | | | 913,551 | | | | (5,947,265 | ) | | | (127,956 | ) | | | (137,929 | ) | | | (4,981,759 | ) | | | | |
Investments in Affiliates | | | — | | | | — | | | | — | | | | — | | | | — | | | | | |
Futures contracts | | | (4,403 | ) | | | — | | | | (9,809 | ) | | | (28,242 | ) | | | — | | | | | |
Swaps | | | — | | | | — | | | | (2,667 | ) | | | (4,742 | ) | | | — | | | | | |
Forward foreign currency contracts | | | — | | | | — | | | | — | | | | — | | | | (144 | ) | | | | |
Foreign currency transactions | | | 269 | | | | — | | | | — | | | | — | | | | 3,396 | | | | | |
| Net realized and change in unrealized gain (loss) | | | 17,043,342 | | | | 72,524,862 | | | | (221,811 | ) | | | (297,167 | ) | | | (4,504,139 | ) | | | | |
| Net Increase (Decrease) in Net Assets Resulting from Investment Operations | | $ | 18,972,318 | | | $ | 78,139,220 | | | $ | 45,955 | | | $ | 95,306 | | | $ | (3,850,736 | ) | | | | |
| *Foreign withholding taxes | | $ | 15,192 | | | $ | — | | | $ | — | | | $ | — | | | $ | 170,419 | | | | | |
| (1) | Commencement of operations was May 30, 2018. Information represents the period from May 30, 2018 through September 30, 2018. |
| | | | | | |
| 226 | | Annual Report | | | September 30, 2018 | | | See accompanying Notes to Financial Statements |
| | | | | | | | | | | | | | | | | | | | | | | | | | | | | | |
| | | | AllianzGI
Emerging
Markets Debt | | | AllianzGI
Emerging
Markets
Small-Cap | | | AllianzGI
Europe
Equity
Dividend | | | AllianzGI
Global
Dynamic
Allocation | | | AllianzGI
Global
High Yield | | | AllianzGI Global
Sustainability | | | AllianzGI
Global
Water | |
| | | | | | | | | | | | | | | | | | | | | | | |
| | | | | | | | | | | | | | | | | | | | | | | | | | | | | | |
| | | | | $ | (1,639,691 | ) | | $ | 222,364 | | | $ | 312,774 | | | $ | 5,411,839 | | | $ | (265,475 | ) | | $ | 1,375,040 | | | $ | 10,974,648 | |
| | | | | | 21,019 | | | | — | | | | — | | | | 1,451,395 | | | | (9,635 | ) | | | — | | | | — | |
| | | | | | — | | | | — | | | | — | | | | — | | | | — | | | | — | | | | — | |
| | | | | | (198,489 | ) | | | (13,289 | ) | | | (30 | ) | | | (57,281 | ) | | | (1,625,925 | ) | | | (2,252 | ) | | | (109,205 | ) |
| | | | | | 67,187 | | | | (8,420 | ) | | | (5,908 | ) | | | 54,245 | | | | 1,910,727 | | | | (1,210 | ) | | | (330,734 | ) |
| | | | | | — | | | | 6,843 | | | | — | | | | — | | | | — | | | | — | | | | — | |
| | | | |
|
|
| | | | | | | | | | | | | | | | | | | | | | | | |
| | | | | | (907,874 | ) | | | (543,192 | ) | | | (703,895 | ) | | | (2,522,994 | ) | | | (795,035 | ) | | | 1,986,440 | | | | 3,160,014 | |
| | | | | | — | | | | — | | | | — | | | | (69,660 | ) | | | — | | | | — | | | | — | |
| | | | | | — | | | | — | | | | — | | | | (601,266 | ) | | | 270 | | | | — | | | | — | |
| | | | | | — | | | | — | | | | — | | | | — | | | | — | | | | — | | | | — | |
| | | | | | 12,500 | | | | — | | | | — | | | | — | | | | 97,413 | | | | — | | | | — | |
| | | | | | (9,428 | ) | | | 423 | | | | (4,718 | ) | | | (10,900 | ) | | | (13,162 | ) | | | (553 | ) | | | (42,728 | ) |
| | | | | | (2,654,776 | ) | | | (335,271 | ) | | | (401,777 | ) | | | 3,655,378 | | | | (700,822 | ) | | | 3,357,465 | | | | 13,651,995 | |
| | | | | $ | (1,154,686 | ) | | $ | (174,194 | ) | | $ | (77,840 | ) | | $ | 8,225,096 | | | $ | 295,928 | | | $ | 3,705,393 | | | $ | 19,655,701 | |
| | | | | $ | 1,727 | | | $ | 45,045 | | | $ | 47,017 | | | $ | 283,090 | | | $ | — | | | $ | 32,781 | | | $ | 1,043,063 | |
| | | | | | | | |
| See accompanying Notes to Financial Statements | | | September 30, 2018 | | | Annual Report | | | 227 | |
Statements of Operations† (cont’d)
Year ended September 30, 2018
| | | | | | | | | | | | | | | | | | | | | | | | |
| | |
AllianzGI
High Yield
Bond | | | AllianzGI
International
Growth | | | AllianzGI
International
Small-Cap | | | AllianzGI
Micro Cap | | | AllianzGI
NFJ Emerging
Markets Value | | | | |
| Investment Income: | | | | | | | | | | | | | | | | | | |
| Interest | | $ | 12,903,969 | | | $ | 786 | | | $ | 14,059 | | | $ | 1,639 | | | $ | 12,063 | | | | | |
| Dividends, net of foreign withholding taxes* | | | 150,113 | | | | 237,635 | | | | 3,205,367 | | | | 67,149 | | | | 4,229,065 | | | | | |
| Miscellaneous | | | 15,854 | | | | 25 | | | | 10 | | | | 10 | | | | 10 | | | | | |
Total Investment Income | | | 13,069,936 | | | | 238,446 | | | | 3,219,436 | | | | 68,798 | | | | 4,241,138 | | | | | |
| Expenses: | | | | | | | | | | | | | | | | | | |
| Investment management | | | 1,048,832 | | | | 142,214 | | | | 1,826,248 | | | | 357,164 | | | | 1,090,230 | | | | | |
| Distribution — Class C | | | 75,371 | | | | — | | | | 24,476 | | | | — | | | | 7,245 | | | | | |
| Distribution — Class R | | | 2,201 | | | | — | | | | 1,196 | | | | — | | | | — | | | | | |
| Servicing — Class A | | | 100,587 | | | | 946 | | | | 31,976 | | | | 6,865 | | | | 99,640 | | | | | |
| Servicing — Class C | | | 25,124 | | | | — | | | | 8,159 | | | | — | | | | 2,415 | | | | | |
| Servicing — Class R | | | 2,201 | | | | — | | | | 1,196 | | | | — | | | | — | | | | | |
| Administrative servicing — Class P | | | 15,819 | | | | — | | | | 37,997 | | | | 1,315 | | | | 23,873 | | | | | |
| Distribution and/or servicing — Administrative Class | | | 1,541 | | | | — | | | | — | | | | — | | | | — | | | | | |
| Sub-transfer agent — Class A | | | 65,216 | | | | 93 | | | | 5,871 | | | | 1,378 | | | | 45,464 | | | | | |
| Sub-transfer agent — Class C | | | 7,246 | | | | — | | | | 1,739 | | | | — | | | | 579 | | | | | |
| Sub-transfer agent — Class R | | | 2,694 | | | | — | | | | 669 | | | | — | | | | — | | | | | |
| Sub-transfer agent — Institutional Class | | | 132,788 | | | | 747 | | | | 45,592 | | | | 27,391 | | | | 48,885 | | | | | |
| Legal | | | 22,299 | | | | 17,648 | | | | 22,097 | | | | 14,738 | | | | 15,480 | | | | | |
| Trustees | | | 24,007 | | | | 2,405 | | | | 21,578 | | | | 3,257 | | | | 15,614 | | | | | |
| Audit and tax services | | | 60,826 | | | | 37,629 | | | | 42,546 | | | | 38,545 | | | | 75,296 | | | | | |
| Registration | | | 82,241 | | | | 32,041 | | | | 83,572 | | | | 43,796 | | | | 71,317 | | | | | |
| Custodian and accounting agent | | | 50,500 | | | | 66,728 | | | | 162,267 | | | | 57,738 | | | | 348,937 | | | | | |
| Shareholder communications | | | 39,892 | | | | 13,013 | | | | 27,029 | | | | 12,479 | | | | 34,780 | | | | | |
| Transfer agent | | | 23,758 | | | | 1,913 | | | | 18,882 | | | | 4,890 | | | | 10,232 | | | | | |
| Organizational | | | — | | | | — | | | | — | | | | — | | | | — | | | | | |
| Offering | | | — | | | | — | | | | — | | | | — | | | | — | | | | | |
| Excise tax | | | — | | | | — | | | | — | | | | — | | | | 3,722 | | | | | |
| Insurance | | | 11,233 | | | | 5,484 | | | | 8,491 | | | | 5,635 | | | | 6,293 | | | | | |
| Line of credit commitment | | | 5,911 | | | | 532 | | | | 4,579 | | | | 774 | | | | 2,906 | | | | | |
| Miscellaneous | | | 16,184 | | | | 6,815 | | | | 11,914 | | | | 4,312 | | | | 7,270 | | | | | |
Total Expenses | | | 1,816,471 | | | | 328,208 | | | | 2,388,074 | | | | 580,277 | | | | 1,910,178 | | | | | |
Less: Fee Waiver/Reimbursement from Investment Manager | | | — | | | | (164,199 | ) | | | (391,423 | ) | | | (133,846 | ) | | | (634,068 | ) | | | | |
Net Expenses | | | 1,816,471 | | | | 164,009 | | | | 1,996,651 | | | | 446,431 | | | | 1,276,110 | | | | | |
| Net Investment Income (Loss) | | | 11,253,465 | | | | 74,437 | | | | 1,222,785 | | | | (377,633 | ) | | | 2,965,028 | | | | | |
| † | Consolidated Statement of Operations for the AllianzGI PerformanceFee Managed Futures Strategy Fund. These financial statements are consolidated to include the accounts of AllianzGI PerformanceFee Managed Futures Strategy Offshore Fund Ltd., a wholly-owned subsidiary of the AllianzGI PerformanceFee Managed Futures Strategy Fund. See Note 14. |
| (1) | Commencement of operations was December 18, 2017. Information represents the period from December 18, 2017 through September 30, 2018. |
| (2) | Commencement of operations was May 30, 2018. Information represents the period from May 30, 2018 through September 30, 2018. |
| (3) | Commencement of operations was December 27, 2017. Information represents the period from December 27, 2017 through September 30, 2018. |
| | | | | | |
| 228 | | Annual Report | | | September 30, 2018 | | | See accompanying Notes to Financial Statements |
| | | | | | | | | | | | | | | | | | | | | | | | | | | | | | |
| | | | AllianzGI NFJ International
Small-Cap Value | | | AllianzGI
PerformanceFee
Managed Futures
Strategy †(1) | | | AllianzGI
PerformanceFee
Structured US
Equity (1) | | | AllianzGI
PerformanceFee
Structured US
Fixed Income (1) | | | AllianzGI
Preferred
Securities and
Income (2) | | | AllianzGI
Real Estate
Debt (3) | | | AllianzGI
Short
Duration
High Income | |
| | | | | | | | | | | | | | | | | | | | | | | |
| | | | | $ | 194 | | | $ | 208,025 | | | $ | 1,667 | | | $ | 164 | | | $ | 172,452 | | | $ | 236,306 | | | $ | 60,566,986 | |
| | | | | | 121,507 | | | | 10,961 | | | | 716,954 | | | | 451,516 | | | | 12,718 | | | | — | | | | — | |
| | | | | | 10 | | | | 10 | | | | 1,678 | | | | 834 | | | | — | | | | 10 | | | | 176,632 | |
| | | | | | 121,711 | | | | 218,996 | | | | 720,299 | | | | 452,514 | | | | 185,170 | | | | 236,316 | | | | 60,743,618 | |
| | | | | | | | | | | | | | | | | | | | | | | |
| | | | | | 35,138 | | | | 91,087 | | | | 182,528 | | | | 58,063 | | | | 15,910 | | | | 43,110 | | | | 6,071,603 | |
| | | | | | 2,269 | | | | — | | | | — | | | | — | | | | — | | | | — | | | | 352,279 | |
| | | | | | — | | | | — | | | | — | | | | — | | | | — | | | | — | | | | — | |
| | | | | | 3,333 | | | | — | | | | — | | | | — | | | | — | | | | — | | | | 482,283 | |
| | | | | | 756 | | | | — | | | | — | | | | — | | | | — | | | | — | | | | 352,279 | |
| | | | | | — | | | | — | | | | — | | | | — | | | | — | | | | — | | | | — | |
| | | | | | 14 | | | | — | | | | — | | | | — | | | | — | | | | — | | | | 431,315 | |
| | | | | | — | | | | — | | | | — | | | | — | | | | — | | | | — | | | | — | |
| | | | | | 1,542 | | | | — | | | | — | | | | — | | | | — | | | | — | | | | 162,885 | |
| | | | | | 264 | | | | — | | | | — | | | | — | | | | — | | | | — | | | | 84,255 | |
| | | | | | — | | | | — | | | | — | | | | — | | | | — | | | | — | | | | — | |
| | | | | | 642 | | | | 2,262 | | | | 2,005 | | | | 4,000 | | | | — | | | | 10 | | | | 215,577 | |
| | | | | | 14,652 | | | | 14,301 | | | | 12,544 | | | | 12,374 | | | | 8,000 | | | | 8,535 | | | | 82,753 | |
| | | | | | 486 | | | | 16,432 | | | | 3,499 | | | | 2,115 | | | | 594 | | | | 1,092 | | | | 144,903 | |
| | | | | | 33,438 | | | | 63,960 | | | | 53,960 | | | | 58,960 | | | | 52,072 | | | | 52,072 | | | | 40,382 | |
| | | | | | 68,499 | | | | 5,050 | | | | 5,050 | | | | 5,048 | | | | 1,604 | | | | 6,409 | | | | 119,067 | |
| | | | | | 48,523 | | | | 80,383 | | | | 78,436 | | | | 78,436 | | | | 10,665 | | | | 60,734 | | | | 181,128 | |
| | | | | | 11,641 | | | | 25,433 | | | | 25,341 | | | | 24,227 | | | | 6,514 | | | | 39,898 | | | | 141,932 | |
| | | | | | 3,604 | | | | 2,499 | | | | 2,309 | | | | 2,717 | | | | 286 | | | | 744 | | | | 103,470 | |
| | | | | | — | | | | 109,551 | | | | 62,713 | | | | 62,713 | | | | 30,000 | | | | 41,211 | | | | — | |
| | | | | | — | | | | 82,685 | | | | 79,831 | | | | 79,831 | | | | 40,835 | | | | 73,100 | | | | — | |
| | | | | | — | | | | 378 | | | | 4,419 | | | | 243 | | | | — | | | | — | | | | — | |
| | | | | | 4,726 | | | | 684 | | | | 740 | | | | 730 | | | | 660 | | | | 671 | | | | 40,913 | |
| | | | | | 110 | | | | 198 | | | | 338 | | | | 315 | | | | 64 | | | | 153 | | | | 34,811 | |
| | | | | | 5,183 | | | | 32,611 | | | | 27,388 | | | | 26,970 | | | | 2,541 | | | | 6,825 | | | | 31,570 | |
| | | | | | 234,820 | | | | 527,514 | | | | 541,101 | | | | 416,742 | | | | 169,745 | | | | 334,564 | | | | 9,073,405 | |
| | | | |
|
(186,509 |
) | | | (515,506 | ) | | | (353,712 | ) | | | (358,055 | ) | | | (151,931 | ) | | | (278,716 | ) | | | — | |
| | | | | | 48,311 | | | | 12,008 | | | | 187,389 | | | | 58,687 | | | | 17,814 | | | | 55,848 | | | | 9,073,405 | |
| | | | | | 73,400 | | | | 206,988 | | | | 532,910 | | | | 393,827 | | | | 167,356 | | | | 180,468 | | | | 51,670,213 | |
| | | | | | | | |
| See accompanying Notes to Financial Statements | | | September 30, 2018 | | | Annual Report | | | 229 | |
Statements of Operations† (cont’d)
Year ended September 30, 2018
| | | | | | | | | | | | | | | | | | | | | | | | |
| | |
AllianzGI
High Yield
Bond | | | AllianzGI
International
Growth | | | AllianzGI
International
Small-Cap | | | AllianzGI
Micro Cap | | | AllianzGI
NFJ Emerging
Markets Value | | | | |
| Realized and Change in Unrealized Gain (Loss): | |
| Net realized gain (loss) on: | | | | | | | | | | | | | | | | | | | | | | | | |
Investments | | $ | 3,058,117 | | | $ | 610,876 | | | $ | 14,598,118 | | | $ | 4,944,670 | | | $ | (8,171,435 | ) | | | | |
Futures contracts | | | — | | | | — | | | | — | | | | — | | | | — | | | | | |
Options written | | | — | | | | — | | | | — | | | | — | | | | — | | | | | |
Swaps | | | — | | | | — | | | | — | | | | — | | | | — | | | | | |
Forward foreign currency contracts | | | — | | | | (5,058 | ) | | | (331,629 | ) | | | — | | | | (118,396 | ) | | | | |
Foreign currency transactions | | | — | | | | 2,538 | | | | 238,762 | | | | — | | | | (224,944 | ) | | | | |
| Payments from Affiliates (See Note 7) | | | — | | | | — | | | | — | | | | — | | | | — | | | | | |
| Net change in unrealized appreciation/depreciation of: | | | | | | | | | | | | | | | | | | | | | | | | |
Investments | | | (12,901,757 | ) | | | 56,388 | | | | (5,755,389 | ) | | | (1,574,344 | ) | | | (9,329,419 | ) | | | | |
Futures contracts | | | — | | | | — | | | | — | | | | — | | | | — | | | | | |
Options written | | | — | | | | — | | | | — | | | | — | | | | — | | | | | |
Swaps | | | — | | | | — | | | | — | | | | — | | | | — | | | | | |
Forward foreign currency contracts | | | — | | | | 69 | | | | 2,366 | | | | — | | | | 58 | | | | | |
Foreign currency transactions | | | — | | | | (780 | ) | | | (2,730 | ) | | | — | | | | (4,784 | ) | | | | |
| Net realized and change in unrealized gain (loss) | | | (9,843,640 | ) | | | 664,033 | | | | 8,749,498 | | | | 3,370,326 | | | | (17,848,920 | ) | | | | |
| Net Increase (Decrease) in Net Assets Resulting from Investment Operations | | $ | 1,409,825 | | | $ | 738,470 | | | $ | 9,972,283 | | | $ | 2,992,693 | | | $ | (14,883,892 | ) | | | | |
| * Foreign withholding taxes | | $ | — | | | $ | 26,737 | | | $ | 367,753 | | | $ | — | | | $ | 516,892 | | | | | |
| | | | | | |
| 230 | | Annual Report | | | September 30, 2018 | | | See accompanying Notes to Financial Statements |
| | | | | | | | | | | | | | | | | | | | | | | | | | | | | | |
| | | | AllianzGI
NFJ International
Small-Cap Value | | | AllianzGI
PerformanceFee
Managed Futures
Strategy †(1) | | | AllianzGI
PerformanceFee
Structured US
Equity (1) | | | AllianzGI
PerformanceFee
Structured US
Fixed Income (1) | | | AllianzGI
Preferred
Securities and
Income (2) | | | AllianzGI
Real Estate
Debt (3) | | | AllianzGI
Short
Duration
High Income | |
| | | | | | | | | | | | | | | | | | | | | | | |
| | | | | | | | | | | | | | | | | | | | | | | | | | | | | | |
| | | | | $ | 295,897 | | | $ | (58,955 | ) | | $ | (1,109,668 | ) | | $ | (456,428 | ) | | $ | 12,962 | | | $ | (71,159 | ) | | $ | 178,296 | |
| | | | | | — | | | | (866,356 | ) | | | — | | | | — | | | | — | | | | 2 | | | | — | |
| | | | | | — | | | | — | | | | 1,871,258 | | | | 711,470 | | | | — | | | | — | | | | — | |
| | | | | | — | | | | (25,074 | ) | | | — | | | | — | | | | — | | | | — | | | | — | |
| | | | | | (2,593 | ) | | | — | | | | — | | | | — | | | | — | | | | (676,399 | ) | | | — | |
| | | | | | 584 | | | | (15,931 | ) | | | — | | | | — | | | | — | | | | 895,105 | | | | — | |
| | | | | | 18 | | | | — | | | | — | | | | — | | | | — | | | | — | | | | — | |
| | | | | | | | | | | | | | | | | | | | | | | | | | | | | | |
| | | | | | (456,053 | ) | | | (12,931 | ) | | | 3,954,316 | | | | (897,468 | ) | | | (3,132 | ) | | | (166,154 | ) | | | (13,765,267 | ) |
| | | | | | — | | | | 157,704 | | | | — | | | | — | | | | — | | | | (594 | ) | | | — | |
| | | | | | — | | | | — | | | | 353,595 | | | | 55,741 | | | | — | | | | — | | | | — | |
| | | | | | — | | | | 28,732 | | | | — | | | | — | | | | — | | | | — | | | | — | |
| | | | | | — | | | | — | | | | — | | | | — | | | | — | | | | 9,460 | | | | — | |
| | | | | | (200 | ) | | | (687 | ) | | | — | | | | — | | | | — | | | | (3,969 | ) | | | — | |
| | | | | | (162,347 | ) | | | (793,498 | ) | | | 5,069,501 | | | | (586,685 | ) | | | 9,830 | | | | (13,708 | ) | | | (13,586,971 | ) |
| | | | |
$ |
(88,947 |
) | | $ | (586,510 | ) | | $ | 5,602,411 | | | $ | (192,858 | ) | | $ | 177,186 | | | $ | 166,760 | | | $ | 38,083,242 | |
| | | | | $ | 10,129 | | | $ | — | | | $ | — | | | $ | — | | | $ | — | | | $ | — | | | $ | — | |
| | | | | | | | |
| See accompanying Notes to Financial Statements | | | September 30, 2018 | | | Annual Report | | | 231 | |
Statements of Operations (cont’d)
Period or Year ended September 30, 2018
| | | | | | | | | | | | | | | | |
| | | AllianzGI
Short Term
Bond(1) | | | AllianzGI
Structured
Return | | | AllianzGI
U.S. Equity
Hedged | | | AllianzGI
Ultra
Micro Cap | |
| Investment Income: | | | | | | | | | | | | |
| Interest | | $ | 16,138 | | | $ | 188,280 | | | $ | 14 | | | $ | 1,818 | |
| Dividends | | | — | | | | 9,791,735 | | | | 47,667 | | | | 79,714 | |
| Miscellaneous | | | — | | | | 55,564 | | | | 123 | | | | 10 | |
Total Investment Income | | | 16,138 | | | | 10,035,579 | | | | 47,804 | | | | 81,542 | |
| Expenses: | | | | | | | | | | | | |
| Investment management | | | 1,578 | | | | 3,644,896 | | | | 18,312 | | | | 488,945 | |
| Distribution — Class C | | | — | | | | 131,612 | | | | 1,966 | | | | — | |
| Servicing — Class A | | | 3 | | | | 311,750 | | | | 1,367 | | | | 25,650 | |
| Servicing — Class C | | | — | | | | 43,871 | | | | 655 | | | | — | |
| Administrative servicing — Class P | | | — | | | | 72,381 | | | | 5 | | | | 3,213 | |
| Sub-transfer agent — Class A | | | — | | | | 108,539 | | | | 410 | | | | 9,258 | |
| Sub-transfer agent — Class C | | | — | | | | 9,900 | | | | 161 | | | | — | |
| Sub-transfer agent — Institutional Class | | | — | | | | 166,046 | | | | 1,148 | | | | 17,705 | |
| Legal | | | 1,667 | | | | 84,481 | | | | 27,883 | | | | 22,189 | |
| Trustees | | | 125 | | | | 72,729 | | | | 279 | | | | 3,958 | |
| Audit and tax services | | | 48,483 | | | | 37,723 | | | | 31,540 | | | | 38,784 | |
| Registration | | | 546 | | | | 107,653 | | | | 55,936 | | | | 45,008 | |
| Custodian and accounting agent | | | 12,000 | | | | 131,515 | | | | 29,910 | | | | 74,829 | |
| Shareholder communications | | | 16,025 | | | | 102,417 | | | | 8,856 | | | | 16,427 | |
| Transfer agent | | | 250 | | | | 64,717 | | | | 2,538 | | | | 6,437 | |
| Organizational | | | 35,000 | | | | — | | | | — | | | | — | |
| Offering | | | 14,022 | | | | — | | | | — | | | | — | |
| Excise tax | | | — | | | | — | | | | — | | | | 2,013 | |
| Recoupment | | | — | | | | 28,437 | | | | — | | | | — | |
| Insurance | | | — | | | | 16,731 | | | | 4,656 | | | | 5,790 | |
| Line of credit commitment | | | — | | | | 14,957 | | | | 66 | | | | 906 | |
| Miscellaneous | | | 955 | | | | 15,304 | | | | 4,630 | | | | 4,343 | |
Total Expenses | | | 130,654 | | | | 5,165,659 | | | | 190,318 | | | | 765,455 | |
Less: Fee Waiver/Reimbursement from Investment Manager | | | (128,601 | ) | | | (296,728 | ) | | | (160,088 | ) | | | (119,328 | ) |
Net Expenses | | | 2,053 | | | | 4,868,931 | | | | 30,230 | | | | 646,127 | |
| Net Investment Income (Loss) | | | 14,085 | | | | 5,166,648 | | | | 17,574 | | | | (564,585 | ) |
| Realized and Change in Unrealized Gain (Loss): | | | | | | | | | | | | |
| Net realized gain (loss) on: | | | | | | | | | | | | | | | | |
Investments | | | 21 | | | | 88,582,333 | | | | 135,264 | | | | 7,166,035 | |
Futures contracts | | | — | | | | 205,934 | | | | — | | | | — | |
Options written | | | — | | | | (73,861,139 | ) | | | (193,107 | ) | | | — | |
| Net change in unrealized appreciation/depreciation of: | | | | | | | | | | | | | | | | |
Investments | | | (5,653 | ) | | | (3,295,370 | ) | | | 263,910 | | | | (2,102,750 | ) |
Options written | | | — | | | | 4,365,061 | | | | (7,827 | ) | | | — | |
| Net realized and change in unrealized gain (loss) | | | (5,632 | ) | | | 15,996,819 | | | | 198,240 | | | | 5,063,285 | |
Net Increase in Net Assets Resulting from
Investment Operations | | $ | 8,453 | | | $ | 21,163,467 | | | $ | 215,814 | | | $ | 4,498,700 | |
| (1) | Commencement of operations was August 23, 2018. Information represents the period from August 23, 2018 through September 30, 2018. |
| | | | | | |
| 232 | | Annual Report | | | September 30, 2018 | | | See accompanying Notes to Financial Statements |
(THIS PAGE INTENTIONALLY LEFT BLANK)
| | | | | | | | |
| See accompanying Notes to Financial Statements | | | September 30, 2018 | | | Annual Report | | | 233 | |
Statements of Changes in Net Assets
| | | | | | | | | | | | | | | | | | | | |
| | | AllianzGI Retirement 2020 | | | AllianzGI Retirement 2025 | |
| | | | | | |
| | | Year ended
September 30, 2018 | | | Year ended
September 30, 2017 | | | Year ended
September 30, 2018 | | | Year ended
September 30, 2017 | | | | |
| Increase (Decrease) in Net Assets from: | | | | | | | | | | | | | | | |
| | | | | | |
Investment Operations: | | | | | | | | | | | | | | | | | | | | |
| Net investment income | | $ | 941,171 | | | $ | 677,592 | | | $ | 1,150,989 | | | $ | 514,767 | | | | | |
| Net realized gain | | | 2,253,372 | | | | 1,528,270 | | | | 3,346,207 | | | | 2,385,481 | | | | | |
| Net change in unrealized appreciation/depreciation | | | (1,883,806 | ) | | | 2,525,980 | | | | (1,706,377 | ) | | | 4,005,924 | | | | | |
| Net increase in net assets resulting from investment operations | | | 1,310,737 | | | | 4,731,842 | | | | 2,790,819 | | | | 6,906,172 | | | | | |
| Dividends and Distributions to Shareholders from: | | | | | | | | | | | | | | | |
| Net investment income: | | | | | | | | | | | | | | | | | | | | |
Class A | | | — | | | | (314,038 | ) | | | — | | | | (122,193 | ) | | | | |
Class C | | | — | | | | (8,548 | ) | | | — | | | | — | | | | | |
Class R | | | — | | | | (9,351 | ) | | | — | | | | (18,282 | ) | | | | |
Class P | | | — | | | | (724,018 | ) | | | — | | | | (951,555 | ) | | | | |
Class R6 | | | — | | | | (368,801 | ) | | | — | | | | (348,228 | ) | | | | |
Administrative Class | | | — | | | | (14,448 | ) | | | — | | | | (12,039 | ) | | | | |
| Net realized capital gains: | | | | | | | | | | | | | | | | | | | | |
Class A | | | — | | | | — | | | | — | | | | (5,755 | ) | | | | |
Class C | | | — | | | | — | | | | — | | | | — | | | | | |
Class R | | | — | | | | — | | | | — | | | | (754 | ) | | | | |
Class P | | | — | | | | — | | | | — | | | | (30,725 | ) | | | | |
Class R6 | | | — | | | | — | | | | — | | | | (10,972 | ) | | | | |
Administrative Class | | | — | | | | — | | | | — | | | | (496 | ) | | | | |
| Total distributions paid:* | | | | | | | | | | | | | | | | | | | | |
Class A | | | (429,547 | ) | | | — | | | | (358,300 | ) | | | — | | | | | |
Class C | | | (9,782 | ) | | | — | | | | — | | | | — | | | | | |
Class R | | | (2,388 | ) | | | — | | | | (8,559 | ) | | | — | | | | | |
Class P | | | (689,954 | ) | | | — | | | | (1,746,256 | ) | | | — | | | | | |
Class R6 | | | (642,466 | ) | | | — | | | | (988,834 | ) | | | — | | | | | |
Administrative Class | | | (21,720 | ) | | | — | | | | (12,408 | ) | | | — | | | | | |
| Total dividends and distributions to shareholders | | | (1,795,857 | ) | | | (1,439,204 | ) | | | (3,114,357 | ) | | | (1,500,999 | ) | | | | |
| Fund Share Transactions: | | | | | | | | | | | | | | | |
| Net proceeds from the sale of shares | | | 9,131,431 | | | | 13,960,071 | | | | 10,745,742 | | | | 17,262,317 | | | | | |
| Issued in reinvestment of dividends and distributions | | | 1,786,940 | | | | 1,435,552 | | | | 3,071,244 | | | | 1,486,604 | | | | | |
| Cost of shares redeemed | | | (28,559,874 | ) | | | (19,103,594 | ) | | | (28,406,764 | ) | | | (13,632,799 | ) | | | | |
| Net increase (decrease) from Fund share transactions | | | (17,641,503 | ) | | | (3,707,971 | ) | | | (14,589,778 | ) | | | 5,116,122 | | | | | |
| Total increase (decrease) in net assets | | | (18,126,623 | ) | | | (415,333 | ) | | | (14,913,316 | ) | | | 10,521,295 | | | | | |
| Net Assets: | | | | | | | | | | | | | | | |
| Beginning of year | | | 52,886,534 | | | | 53,301,867 | | | | 65,772,720 | | | | 55,251,425 | | | | | |
| End of year** | | $ | 34,759,911 | | | $ | 52,886,534 | | | $ | 50,859,404 | | | $ | 65,772,720 | | | | | |
| — | May reflect actual amounts rounding to less than $1. |
| * | Distributions from net investment income and net realized capital gains are combined for the year ended September 30, 2018. See Note 1 in the Notes to Financial Statements for more information regarding new accounting pronouncements. The dividends and distributions to shareholders for the year ended September 30, 2017 have not been reclassified to conform to the current year presentation. |
| ** | Net Assets - End of year includes undistributed (dividends in excess of) net investment income of $275,749 for AllianzGI Retirement 2020, $100,560 for AllianzGI Retirement 2025, $(17,043) for AllianzGI Retirement 2030, $(40,900) for AllianzGI Retirement 2035 and $(51,113) for AllianzGI Retirement 2040 as of September 30, 2017. |
| | | | | | |
| 234 | | Annual Report | | | September 30, 2018 | | | See accompanying Notes to Financial Statements |
| | | | | | | | | | | | | | | | | | | | | | | | | | |
| | | | AllianzGI Retirement 2030 | | | AllianzGI Retirement 2035 | | | AllianzGI Retirement 2040 | |
| | | | | | | |
| | | | Year ended
September 30, 2018 | | | Year ended
September 30, 2017 | | | Year ended
September 30, 2018 | | | Year ended
September 30, 2017 | | | Year ended
September 30, 2018 | | | Year ended
September 30, 2017 | |
| | | | | | | | | | | | | | | | | | | | |
| | | | | | | |
| | | | | | | | | | | | | | | | | | | | | | | | | | |
| | | | | $ | 1,342,226 | | | $ | 420,535 | | | $ | 1,250,569 | | | $ | 458,050 | | | $ | 1,287,828 | | | $ | 469,488 | |
| | | | | | 4,450,392 | | | | 2,619,216 | | | | 4,670,702 | | | | 1,847,947 | | | | 4,273,855 | | | | 1,400,334 | |
| | | | | | (1,893,986 | ) | | | 5,993,521 | | | | (2,473,396 | ) | | | 5,872,838 | | | | (1,947,768 | ) | | | 6,096,844 | |
| | | | | 3,898,632 | | | | 9,033,272 | | | | 3,447,875 | | | | 8,178,835 | | | | 3,613,915 | | | | 7,966,666 | |
| | | | | | | | | | | | | | | | | | | | |
| | | | | | | | | | | | | | | | | | | | | | | | | | |
| | | | | | — | | | | (128,753 | ) | | | — | | | | (167,435 | ) | | | — | | | | (72,361 | ) |
| | | | | | — | | | | (9,739 | ) | | | — | | | | — | | | | — | | | | (1,802 | ) |
| | | | | | — | | | | (42,799 | ) | | | — | | | | (30,051 | ) | | | — | | | | (33,676 | ) |
| | | | | | — | | | | (812,248 | ) | | | — | | | | (734,209 | ) | | | — | | | | (547,161 | ) |
| | | | | | — | | | | (420,128 | ) | | | — | | | | (241,355 | ) | | | — | | | | (408,413 | ) |
| | | | | | — | | | | (25,169 | ) | | | — | | | | (14,178 | ) | | | — | | | | (7,153 | ) |
| | | | | | | | | | | | | | | | | | | | | | | | | | |
| | | | | | — | | | | (27,656 | ) | | | — | | | | (43,348 | ) | | | — | | | | (72,948 | ) |
| | | | | | — | | | | (2,597 | ) | | | — | | | | — | | | | — | | | | (2,318 | ) |
| | | | | | — | | | | (8,838 | ) | | | — | | | | (8,219 | ) | | | — | | | | (30,988 | ) |
| | | | | | — | | | | (126,596 | ) | | | — | | | | (149,417 | ) | | | — | | | | (388,536 | ) |
| | | | | | — | | | | (63,529 | ) | | | — | | | | (46,996 | ) | | | — | | | | (280,126 | ) |
| | | | | | — | | | | (4,716 | ) | | | — | | | | (3,283 | ) | | | — | | | | (6,053 | ) |
| | | | | | | | | | | | | | | | | | | | | | | | | | |
| | | | | | (514,953 | ) | | | — | | | | (523,493 | ) | | | — | | | | (381,670 | ) | | | — | |
| | | | | | (36,934 | ) | | | — | | | | — | | | | — | | | | (7,750 | ) | | | — | |
| | | | | | (23,933 | ) | | | — | | | | (38,039 | ) | | | — | | | | (21,149 | ) | | | — | |
| | | | | | (2,107,251 | ) | | | — | | | | (2,042,424 | ) | | | — | | | | (1,569,715 | ) | | | — | |
| | | | | | (1,385,473 | ) | | | — | | | | (1,012,145 | ) | | | — | | | | (1,509,472 | ) | | | — | |
| | | | | | (25,075 | ) | | | — | | | | (14,933 | ) | | | — | | | | (26,411 | ) | | | — | |
| | | | | (4,093,619 | ) | | | (1,672,768 | ) | | | (3,631,034 | ) | | | (1,438,491 | ) | | | (3,516,167 | ) | | | (1,851,535 | ) |
| | | | | | | | | | | | | | | | | | | | |
| | | | | | 13,443,110 | | | | 19,651,781 | | | | 10,773,275 | | | | 14,086,259 | | | | 9,872,127 | | | | 15,052,248 | |
| | | | | | 4,047,095 | | | | 1,653,530 | | | | 3,582,038 | | | | 1,421,045 | | | | 3,407,291 | | | | 1,838,433 | |
| | | | | | (30,355,752 | ) | | | (17,363,253 | ) | | | (28,207,220 | ) | | | (14,404,979 | ) | | | (21,759,724 | ) | | | (10,458,454 | ) |
| | | | | | (12,865,547 | ) | | | 3,942,058 | | | | (13,851,907 | ) | | | 1,102,325 | | | | (8,480,306 | ) | | | 6,432,227 | |
| | | | | (13,060,534 | ) | | | 11,302,562 | | | | (14,035,066 | ) | | | 7,842,669 | | | | (8,382,558 | ) | | | 12,547,358 | |
| | | | | | | | | | | | | | | | | | | | |
| | | | | | 73,403,006 | | | | 62,100,444 | | | | 58,489,018 | | | | 50,646,349 | | | | 55,241,855 | | | | 42,694,497 | |
| | | | | $ | 60,342,472 | | | $ | 73,403,006 | | | $ | 44,453,952 | | | $ | 58,489,018 | | | $ | 46,859,297 | | | $ | 55,241,855 | |
| | | | | | | | |
| See accompanying Notes to Financial Statements | | | September 30, 2018 | | | Annual Report | | | 235 | |
Statements of Changes in Net Assets (cont’d)
| | | | | | | | | | | | | | | | | | | | |
| | | AllianzGI Retirement 2045 | | | AllianzGI Retirement 2050 | |
| | | | | | |
| | | Year ended
September 30, 2018 | | | Year ended
September 30, 2017 | | | Year ended
September 30, 2018 | | | Year ended
September 30, 2017 | | | | |
| Increase (Decrease) in Net Assets from: | | | | | | | | | | | | | | | |
| | | | | | |
Investment Operations: | | | | | | | | | | | | | | | | | | | | |
| Net investment income | | $ | 832,270 | | | $ | 294,229 | | | $ | 828,484 | | | $ | 292,375 | | | | | |
| Net realized gain (loss) | | | 2,726,805 | | | | 884,214 | | | | 2,578,445 | | | | 737,298 | | | | | |
| Net change in unrealized appreciation/depreciation | | | (1,212,118 | ) | | | 3,865,175 | | | | (1,055,777 | ) | | | 3,915,169 | | | | | |
Net increase in net assets resulting from investment operations | | | 2,346,957 | | | | 5,043,618 | | | | 2,351,152 | | | | 4,944,842 | | | | | |
| Dividends and Distributions to Shareholders from: | | | | | | | | | | | | | | | |
| Net investment income: | | | | | | | | | | | | | | | | | | | | |
Class A | | | — | | | | (66,804 | ) | | | — | | | | (38,744 | ) | | | | |
Class C | | | — | | | | — | | | | — | | | | (2,598 | ) | | | | |
Class R | | | — | | | | (13,061 | ) | | | — | | | | (16,335 | ) | | | | |
Class P | | | — | | | | (339,225 | ) | | | — | | | | (288,099 | ) | | | | |
Institutional Class | | | — | | | | — | | | | — | | | | — | | | | | |
Class R6 | | | — | | | | (221,167 | ) | | | — | | | | (298,199 | ) | | | | |
Administrative Class | | | — | | | | (13,206 | ) | | | — | | | | (15,717 | ) | | | | |
| Net realized capital gains: | | | | | | | | | | | | | | | | | | | | |
Class A | | | — | | | | (106,108 | ) | | | — | | | | (48,414 | ) | | | | |
Class C | | | — | | | | — | | | | — | | | | (4,166 | ) | | | | |
Class R | | | — | | | | (19,230 | ) | | | — | | | | (21,175 | ) | | | | |
Class P | | | — | | | | (390,158 | ) | | | — | | | | (291,835 | ) | | | | |
Class R6 | | | — | | | | (243,478 | ) | | | — | | | | (291,783 | ) | | | | |
Administrative Class | | | — | | | | (15,955 | ) | | | — | | | | (17,726 | ) | | | | |
| Total distributions paid:* | | | | | | | | | | | | | | | | | | | | |
Class A | | | (287,821 | ) | | | — | | | | (204,743 | ) | | | — | | | | | |
Class C | | | — | | | | — | | | | (10,589 | ) | | | — | | | | | |
Class R | | | (12,335 | ) | | | — | | | | (5,428 | ) | | | — | | | | | |
Class P | | | (1,018,130 | ) | | | — | | | | (836,401 | ) | | | — | | | | | |
Institutional Class | | | — | | | | — | | | | — | | | | — | | | | | |
Class R6 | | | (860,846 | ) | | | — | | | | (1,140,455 | ) | | | — | | | | | |
Administrative Class | | | (34,918 | ) | | | — | | | | (54,641 | ) | | | — | | | | | |
| Return of capital: | | | | | | | | | | | | | | | | | | | | |
Class A | | | — | | | | — | | | | — | | | | — | | | | | |
Class C | | | — | | | | — | | | | — | | | | — | | | | | |
Class R | | | — | | | | — | | | | — | | | | — | | | | | |
Class P | | | — | | | | — | | | | — | | | | — | | | | | |
Institutional Class | | | — | | | | — | | | | — | | | | — | | | | | |
Class R6 | | | — | | | | — | | | | — | | | | — | | | | | |
Administrative Class | | | — | | | | — | | | | — | | | | — | | | | | |
| Total dividends and distributions to shareholders | | | (2,214,050 | ) | | | (1,428,392 | ) | | | (2,252,257 | ) | | | (1,334,791 | ) | | | | |
| Fund Share Transactions: | | | | |
| Net proceeds from the sale of shares | | | 7,768,793 | | | | 9,936,787 | | | | 8,636,205 | | | | 10,942,394 | | | | | |
| Issued in reinvestment of dividends and distributions | | | 2,198,799 | | | | 1,426,631 | | | | 2,245,722 | | | | 1,332,075 | | | | | |
| Cost of shares redeemed | | | (12,717,410 | ) | | | (6,681,204 | ) | | | (10,614,909 | ) | | | (6,977,683 | ) | | | | |
| Net increase (decrease) from Fund share transactions | | | (2,749,818 | ) | | | 4,682,214 | | | | 267,018 | | | | 5,296,786 | | | | | |
| Total increase (decrease) in net assets | | | (2,616,911 | ) | | | 8,297,440 | | | | 365,913 | | | | 8,906,837 | | | | | |
| Net Assets: | | | | |
| Beginning of year | | | 33,717,332 | | | | 25,419,892 | | | | 32,616,712 | | | | 23,709,875 | | | | | |
End of year** | | $ | 31,100,421 | | | $ | 33,717,332 | | | $ | 32,982,625 | | | $ | 32,616,712 | | | | | |
| — | May reflect actual amounts rounding to less than $1. |
| * | Distributions from net investment income and net realized capital gains are combined for the year ended September 30, 2018. See Note 1 in the Notes to Financial Statements for more information regarding new accounting pronouncements. The dividends and distributions to shareholders for the year ended September 30, 2017 have not been reclassified to conform to the current year presentation. |
| ** | Net Assets - End of year includes undistributed (dividends in excess of) net investment income of $(38,330) for AllianzGI Retirement 2045, $(36,688) for AllianzGI Retirement 2050, $(16,130) for AllianzGI Retirement 2055, $372,613 for AllianzGI Multi Asset Income and $339,791 for AllianzGI Global Allocation as of September 30, 2017. |
| | | | | | |
| 236 | | Annual Report | | | September 30, 2018 | | | See accompanying Notes to Financial Statements |
| | | | | | | | | | | | | | | | | | | | | | | | | | |
| | | | AllianzGI Retirement 2055 | | | AllianzGI Multi Asset Income | | | AllianzGI Global Allocation | |
| | | | | | | |
| | | | Year ended
September 30, 2018 | | | Year ended
September 30, 2017 | | | Year ended
September 30, 2018 | | | Year ended
September 30, 2017 | | | Year ended
September 30, 2018 | | | Year ended
September 30, 2017 | |
| | | | | | | | | | | | | | | | | | | | |
| | | | | | | | | | | | | | | | | | | | |
| | | | | $ | 397,092 | | | $ | 99,776 | | | $ | 2,032,089 | | | $ | 2,731,650 | | | $ | 8,351,388 | | | $ | 8,696,193 | |
| | | | | | 1,126,851 | | | | 357,084 | | | | (872,455 | ) | | | 1,085,399 | | | | 21,137,479 | | | | 23,385,340 | |
| | | | | | (398,458 | ) | | | 1,557,701 | | | | (1,136,050 | ) | | | (459,088 | ) | | | (19,504,894 | ) | | | 19,235,026 | |
| | | | | 1,125,485 | | | | 2,014,561 | | | | 23,584 | | | | 3,357,961 | | | | 9,983,973 | | | | 51,316,559 | |
| | | | | | | | | | | | | | | | | | | | |
| | | | | | | | | | | | | | | | | | | | | | | | | | |
| | | | | | — | | | | (20,979 | ) | | | — | | | | (464,817 | ) | | | — | | | | (814,701 | ) |
| | | | | | — | | | | — | | | | — | | | | (109,153 | ) | | | — | | | | (342,699 | ) |
| | | | | | — | | | | (6,391 | ) | | | — | | | | (8,919 | ) | | | — | | | | (362 | ) |
| | | | | | — | | | | (91,959 | ) | | | — | | | | (802,502 | ) | | | — | | | | (66,393 | ) |
| | | | | | — | | | | — | | | | — | | | | — | | | | — | | | | (1,517,436 | ) |
| | | | | | — | | | | (79,203 | ) | | | — | | | | (1,059,163 | ) | | | — | | | | (8,106,799 | ) |
| | | | | | — | | | | (6,244 | ) | | | — | | | | (64,921 | ) | | | — | | | | (499 | ) |
| | | | | | | | | | | | | | | | | | | | | | | | | | |
| | | | | | — | | | | (23,081 | ) | | | — | | | | (51,561 | ) | | | — | | | | — | |
| | | | | | — | | | | — | | | | — | | | | (16,672 | ) | | | — | | | | — | |
| | | | | | — | | | | (7,752 | ) | | | — | | | | (2,534 | ) | | | — | | | | — | |
| | | | | | — | | | | (84,131 | ) | | | — | | | | (86,955 | ) | | | — | | | | — | |
| | | | | | — | | | | (70,689 | ) | | | — | | | | (96,314 | ) | | | — | | | | — | |
| | | | | | — | | | | (6,450 | ) | | | — | | | | (4,003 | ) | | | — | | | | — | |
| | | | | | | | | | | | | | | | | | | | | | | | | | |
| | | | | | (132,588 | ) | | | — | | | | (623,574 | ) | | | — | | | | (4,481,189 | ) | | | — | |
| | | | | | — | | | | — | | | | (181,761 | ) | | | — | | | | (2,929,681 | ) | | | — | |
| | | | | | (5,540 | ) | | | — | | | | (6,759 | ) | | | — | | | | (2,606 | ) | | | — | |
| | | | | | (419,135 | ) | | | — | | | | (863,845 | ) | | | — | | | | (367,341 | ) | | | — | |
| | | | | | — | | | | — | | | | (982 | ) | | | — | | | | (599,936 | ) | | | — | |
| | | | | | (461,056 | ) | | | — | | | | (1,255,713 | ) | | | — | | | | (27,424,554 | ) | | | — | |
| | | | | | (22,436 | ) | | | — | | | | (71,389 | ) | | | — | | | | (2,546 | ) | | | — | |
| | | | | | | | | | | | | | | | | | | | | | | | | | |
| | | | | | — | | | | — | | | | (60,720 | ) | | | — | | | | — | | | | — | |
| | | | | | — | | | | — | | | | (13,460 | ) | | | — | | | | — | | | | — | |
| | | | | | — | | | | — | | | | (621 | ) | | | — | | | | — | | | | — | |
| | | | | | — | | | | — | | | | (69,104 | ) | | | — | | | | — | | | | — | |
| | | | | | — | | | | — | | | | (365 | ) | | | — | | | | — | | | | — | |
| | | | | | — | | | | — | | | | (113,254 | ) | | | — | | | | — | | | | — | |
| | | | | | — | | | | — | | | | (3,579 | ) | | | — | | | | — | | | | — | |
| | | | | (1,040,755 | ) | | | (396,879 | ) | | | (3,265,126 | ) | | | (2,767,514 | ) | | | (35,807,853 | ) | | | (10,848,889 | ) |
| | | | | | | | | | | | | | | | | | | | |
| | | | | | 8,313,026 | | | | 7,237,690 | | | | 8,910,514 | | | | 13,306,288 | | | | 150,749,387 | | | | 125,983,370 | |
| | | | | | 1,036,298 | | | | 395,033 | | | | 3,223,840 | | | | 2,736,065 | | | | 34,449,467 | | | | 10,623,150 | |
| | | | | | (8,049,315 | ) | | | (2,665,826 | ) | | | (22,976,927 | ) | | | (17,509,593 | ) | | | (185,446,179 | ) | | | (314,160,178 | ) |
| | | | | | 1,300,009 | | | | 4,966,897 | | | | (10,842,573 | ) | | | (1,467,240 | ) | | | (247,325 | ) | | | (177,553,658 | ) |
| | | | | 1,384,739 | | | | 6,584,579 | | | | (14,084,115 | ) | | | (876,793 | ) | | | (26,071,205 | ) | | | (137,085,988 | ) |
| | | | | | | | | | | | | | | | | | | | |
| | | | | | 14,707,326 | | | | 8,122,747 | | | | 50,213,305 | | | | 51,090,098 | | | | 356,579,263 | | | | 493,665,251 | |
| | | | | $ | 16,092,065 | | | $ | 14,707,326 | | | $ | 36,129,190 | | | $ | 50,213,305 | | | $ | 330,508,058 | | | $ | 356,579,263 | |
| | | | | | | | |
| See accompanying Notes to Financial Statements | | | September 30, 2018 | | | Annual Report | | | 237 | |
Statements of Changes in Net Assets (cont’d)
| | | | | | | | | | | | | | | | | | | | |
| | | AllianzGI Best Styles Global Equity | | | AllianzGI Best Styles International Equity | | | | |
| | | | | | |
| | |
Year ended
September 30, 2018 | | | Year ended
September 30, 2017 | | | Year ended
September 30, 2018 | | | Year ended
September 30, 2017 | | | | |
| Increase (Decrease) in Net Assets from: | | | | | | | | | | | | | | | |
| | | | | | |
Investment Operations: | | | | | | | | | | | | | | | | | | | | |
| Net investment income | | $ | 12,229,122 | | | $ | 15,589,126 | | | $ | 744,978 | | | $ | 831,211 | | | | | |
| Net realized gain (loss) | | | 56,366,844 | | | | 61,691,991 | | | | 1,653,760 | | | | 1,114,879 | | | | | |
| Net change in unrealized appreciation/depreciation | | | (35,809,672 | ) | | | 62,269,728 | | | | (2,359,877 | ) | | | 4,666,207 | | | | | |
Net increase in net assets resulting from investment operations | | | 32,786,294 | | | | 139,550,845 | | | | 38,861 | | | | 6,612,297 | | | | | |
| Dividends and Distributions to Shareholders from: | | | | | | | | | | | | | | | |
| Net investment income: | | | | | | | | | | | | | | | | | | | | |
Class A | | | — | | | | — | | | | — | | | | (1,126 | ) | | | | |
Class C | | | — | | | | (119 | ) | | | — | | | | (1,403 | ) | | | | |
Class R | | | — | | | | — | | | | — | | | | — | | | | | |
Class P | | | — | | | | (44,546 | ) | | | — | | | | (898 | ) | | | | |
Institutional Class | | | — | | | | (36,578 | ) | | | — | | | | (3,340 | ) | | | | |
Class R6 | | | — | | | | (11,674,739 | ) | | | — | | | | (2,758,648 | ) | | | | |
Administrative Class | | | — | | | | — | | | | — | | | | — | | | | | |
| Net realized capital gains: | | | | | | | | | | | | | | | | | | | | |
Class A | | | — | | | | (8,143 | ) | | | — | | | | — | | | | | |
Class C | | | — | | | | (64 | ) | | | — | | | | — | | | | | |
Class P | | | — | | | | (18,098 | ) | | | — | | | | — | | | | | |
Institutional Class | | | — | | | | (13,368 | ) | | | — | | | | — | | | | | |
Class R6 | | | — | | | | (4,047,266 | ) | | | — | | | | — | | | | | |
| Total distributions paid:* | | | | | | | | | | | | | | | | | | | | |
Class A | | | (193,982 | ) | | | — | | | | (19,333 | ) | | | — | | | | | |
Class C | | | (7,589 | ) | | | — | | | | (4,603 | ) | | | — | | | | | |
Class R | | | — | | | | — | | | | — | | | | — | | | | | |
Class P | | | (392,718 | ) | | | — | | | | (5,511 | ) | | | — | | | | | |
Institutional Class | | | (324,963 | ) | | | — | | | | (4,124 | ) | | | — | | | | | |
Class R6 | | | (79,375,510 | ) | | | — | | | | (1,061,586 | ) | | | — | | | | | |
Administrative Class | | | — | | | | — | | | | — | | | | — | | | | | |
| Total dividends and distributions to shareholders | | | (80,294,762 | ) | | | (15,842,921 | ) | | | (1,095,157 | ) | | | (2,765,415 | ) | | | | |
| Fund Share Transactions: | | | | |
| Net proceeds from the sale of shares | | | 115,983,303 | | | | 241,623,115 | | | | 5,268,419 | | | | 6,699,316 | | | | | |
| Issued in reinvestment of dividends and distributions | | | 80,186,951 | | | | 15,823,164 | | | | 1,094,713 | | | | 2,765,415 | | | | | |
| Cost of shares redeemed | | | (225,064,420 | ) | | | (381,516,959 | ) | | | (6,010,737 | ) | | | (57,968,959 | ) | | | | |
| Net increase (decrease) from Fund share transactions | | | (28,894,166 | ) | | | (124,070,680 | ) | | | 352,395 | | | | (48,504,228 | ) | | | | |
| Total increase (decrease) in net assets | | | (76,402,634 | ) | | | (362,756 | ) | | | (703,901 | ) | | | (44,657,346 | ) | | | | |
| Net Assets: | | | | |
| Beginning of period | | | 601,211,412 | | | | 601,574,168 | | | | 26,504,123 | | | | 71,161,469 | | | | | |
End of period*** | | $ | 524,808,778 | | | $ | 601,211,412 | | | $ | 25,800,222 | | | $ | 26,504,123 | | | | | |
| — | May reflect actual amounts rounding to less than $1. |
| * | Distributions from net investment income and net realized capital gains are combined for the period ended September 30, 2018. See Note 1 in the Notes to Financial Statements for more information regarding new accounting pronouncements. The dividends and distributions to shareholders for the year ended September 30, 2017 have not been reclassified to conform to the current year presentation. |
| ** | Commencement of operations. |
| *** | Net Assets - End of period includes undistributed (dividends in excess of) net investment income of $15,647,459 for AllianzGI Best Styles Global Equity, $848,294 for AllianzGI Best Styles International Equity, $1,665,479 for AllianzGI Best Styles U.S. Equity and $12,648,203 for AllianzGI Convertible as of September 30, 2017. |
| | | | | | |
| 238 | | Annual Report | | | September 30, 2018 | | | See accompanying Notes to Financial Statements |
| | | | | | | | | | | | | | | | | | | | | | |
| | | | AllianzGI Best Styles U.S. Equity | | | AllianzGI Convertible | | | AllianzGI Core Bond | |
| | | | | | |
| | | | Year ended
September 30, 2018 | | | Year ended
September 30, 2017 | | | Year ended
September 30, 2018 | | | Year ended
September 30, 2017 | | | Period from
May 30, 2018**
through September 30, 2018 | |
| | | | | | | | | | | | | | | | | |
| | | | | | |
| | | | | | | | | | | | | | | | | |
| | | | | $ | 1,928,976 | | | $ | 1,972,846 | | | $ | 5,614,358 | | | $ | 16,495,219 | | | $ | 267,766 | |
| | | | | | 16,133,925 | | | | 6,912,312 | | | | 78,472,127 | | | | 225,191,544 | | | | (81,379 | ) |
| | | | | | 909,417 | | | | 12,166,518 | | | | (5,947,265 | ) | | | (99,079,360 | ) | | | (140,432 | ) |
| | | | | 18,972,318 | | | | 21,051,676 | | | | 78,139,220 | | | | 142,607,403 | | | | 45,955 | |
| | | | | | | | | | | | | | | | | |
| | | | | | | | | | | | | | | | | | | | | | |
| | | | | | — | | | | (7,605 | ) | | | — | | | | (3,826,287 | ) | | | — | |
| | | | | | — | | | | (148 | ) | | | — | | | | (1,127,814 | ) | | | — | |
| | | | | | — | | | | — | | | | — | | | | (16,881 | ) | | | — | |
| | | | | | — | | | | (820 | ) | | | — | | | | (2,494,302 | ) | | | — | |
| | | | | | — | | | | (1,298 | ) | | | — | | | | (27,101,588 | ) | | | — | |
| | | | | | — | | | | (1,625,434 | ) | | | — | | | | — | | | | — | |
| | | | | | — | | | | — | | | | — | | | | (38,602 | ) | | | — | |
| | | | | | | | | | | | | | | | | | | | | | |
| | | | | | — | | | | — | | | | — | | | | — | | | | — | |
| | | | | | — | | | | — | | | | — | | | | — | | | | — | |
| | | | | | — | | | | — | | | | — | | | | — | | | | — | |
| | | | | | — | | | | — | | | | — | | | | — | | | | — | |
| | | | | | — | | | | — | | | | — | | | | — | | | | — | |
| | | | | | | | | | | | | | | | | | | | | | |
| | | | | | (5,368 | ) | | | — | | | | (12,669,872 | ) | | | — | | | | — | |
| | | | | | (1,972 | ) | | | — | | | | (8,237,231 | ) | | | — | | | | — | |
| | | | | | — | | | | — | | | | (14,057 | ) | | | — | | | | — | |
| | | | | | (31,132 | ) | | | — | | | | (15,729,339 | ) | | | — | | | | (72 | ) |
| | | | | | (7,666 | ) | | | — | | | | (53,119,452 | ) | | | — | | | | (73 | ) |
| | | | | | (7,399,903 | ) | | | — | | | | — | | | | — | | | | (216,814 | ) |
| | | | | | — | | | | — | | | | (174,529 | ) | | | — | | | | — | |
| | | | | (7,446,041 | ) | | | (1,635,305 | ) | | | (89,944,480 | ) | | | (34,605,474 | ) | | | (216,959 | ) |
| | | | | | | | | | | | | | | | | |
| | | | | | 16,134,342 | | | | 68,128,385 | | | | 120,497,407 | | | | 68,306,058 | | | | 6,016,814 | |
| | | | | | 7,445,631 | | | | 1,634,905 | | | | 84,489,820 | | | | 17,841,764 | | | | 216,959 | |
| | | | | | (48,896,375 | ) | | | (76,517,718 | ) | | | (171,923,264 | ) | | | (1,172,762,231 | ) | | | (1,686,282 | ) |
| | | | | | (25,316,402 | ) | | | (6,754,428 | ) | | | 33,063,963 | | | | (1,086,614,409 | ) | | | 4,547,491 | |
| | | | | (13,790,125 | ) | | | 12,661,943 | | | | 21,258,703 | | | | (978,612,480 | ) | | | 4,376,487 | |
| | | | | | | | | | | | | | | | | |
| | | | | | 113,736,838 | | | | 101,074,895 | | | | 529,968,636 | | | | 1,508,581,116 | | | | 25,000,000 | |
| | | | | $ | 99,946,713 | | | $ | 113,736,838 | | | $ | 551,227,339 | | | $ | 529,968,636 | | | $ | 29,376,487 | |
| | | | | | | | |
| See accompanying Notes to Financial Statements | | | September 30, 2018 | | | Annual Report | | | 239 | |
Statements of Changes in Net Assets (cont’d)
| | | | | | | | | | | | | | | | |
| | | AllianzGI Core Plus Bond | | | AllianzGI Emerging Markets Consumer | | | | |
| | | | | |
| | | Period from
May 30, 2018**
through
September 30, 2018 | | | Year ended
September 30, 2018 | | | Year ended
September 30, 2017 | | | | |
| Increase (Decrease) in Net Assets from: | | | | | | | | | | | | |
| | | | | |
Investment Operations: | | | | | | | | | | | | | | | | |
| Net investment income | | $ | 392,473 | | | $ | 653,403 | | | $ | 617,137 | | | | | |
| Net realized gain (loss) | | | (126,254 | ) | | | 474,368 | | | | 2,951,588 | | | | | |
| Net change in unrealized appreciation/depreciation | | | (170,913 | ) | | | (4,978,507 | ) | | | 2,781,594 | | | | | |
| Net increase (decrease) in net assets resulting from investment operations | | | 95,306 | | | | (3,850,736 | ) | | | 6,350,319 | | | | | |
| Dividends and Distributions to Shareholders from: | | | | | | | | | | | | |
| Net investment income: | | | | | | | | | | | | | | | | |
Class A | | | — | | | | — | | | | (441 | ) | | | | |
Class C | | | — | | | | — | | | | — | | | | | |
Class P | | | — | | | | — | | | | — | | | | | |
Institutional Class | | | — | | | | — | | | | (458,572 | ) | | | | |
| Net realized capital gains: | | | | | | | | | | | | | | | | |
Class A | | | — | | | | — | | | | — | | | | | |
Class C | | | — | | | | — | | | | — | | | | | |
Class P | | | — | | | | — | | | | — | | | | | |
Institutional Class | | | — | | | | — | | | | — | | | | | |
| Total distributions paid:* | | | | | | | | | | | | | | | | |
Class A | | | — | | | | (8,911 | ) | | | — | | | | | |
Class C | | | — | | | | — | | | | — | | | | | |
Class P | | | (72 | ) | | | — | | | | — | | | | | |
Institutional Class | | | (74 | ) | | | (2,198,701 | ) | | | — | | | | | |
Class R6 | | | (300,598 | ) | | | — | | | | — | | | | | |
| Total dividends and distributions to shareholders | | | (300,744 | ) | | | (2,207,612 | ) | | | (459,013 | ) | | | | |
| Fund Share Transactions: | | | | | | | | | | | | |
| Net proceeds from the sale of shares | | | — | | | | 16,718,030 | | | | 9,259,598 | | | | | |
| Issued in reinvestment of dividends and distributions | | | 300,744 | | | | 1,373,525 | | | | 306,003 | | | | | |
| Cost of shares redeemed | | | — | | | | (12,272,896 | ) | | | (16,493,497 | ) | | | | |
| Net increase (decrease) from Fund share transactions | | | 300,744 | | | | 5,818,659 | | | | (6,927,896 | ) | | | | |
| Total increase (decrease) in net assets | | | 95,306 | | | | (239,689 | ) | | | (1,036,590 | ) | | | | |
| Net Assets: | | | | | | | | | | | | |
| Beginning of period | | | 40,000,000 | | | | 43,641,642 | | | | 44,678,232 | | | | | |
| End of period*** | | $ | 40,095,306 | | | $ | 43,401,953 | | | $ | 43,641,642 | | | | | |
| — | May reflect actual amounts rounding to less than $1. |
| * | Distributions from net investment income and net realized capital gains are combined for the period ended September 30, 2018. See Note 1 in the Notes to Financial Statements for more information regarding new accounting pronouncements. The dividends and distributions to shareholders for the year ended September 30, 2017 have not been reclassified to conform to the current year presentation. |
| ** | Commencement of operations. |
| *** | Net Assets - End of period includes undistributed (dividends in excess of) net investment income of $589,288 for AllianzGI Emerging Markets Consumer, $(132,774) for AllianzGI Emerging Markets Debt, $333,605 for AllianzGI Emerging Markets Small-Cap, and $102,994 for AllianzGI Europe Equity Dividend as of September 30, 2017. |
| | | | | | |
| 240 | | Annual Report | | | September 30, 2018 | | | See accompanying Notes to Financial Statements |
| | | | | | | | | | | | | | | | | | | | | | | | | | |
| | | | AllianzGI Emerging Markets Debt | | |
AllianzGI Emerging Markets Small-Cap | | | AllianzGI Europe Equity Dividend | |
| | | | | | | |
| | | |
Year ended
September 30, 2018 | | | Year ended
September 30, 2017 | | | Year ended
September 30, 2018 | | | Year ended
September 30, 2017 | | | Year ended
September 30, 2018 | | | Year ended
September 30, 2017 | |
| | | | | | | | | | | | | | | | | | | | |
| | | | | | | |
| | | | | | | | | | | | | | | | | | | | | | | | | | |
| | | | | $ | 1,500,090 | | | $ | 2,205,009 | | | $ | 161,077 | | | $ | 186,581 | | | $ | 323,937 | | | $ | 251,344 | |
| | | | | | (1,749,974 | ) | | | 1,722,429 | | | | 207,498 | | | | 1,743,176 | | | | 306,836 | | | | (33,022 | ) |
| | | | | | (904,802 | ) | | | (1,398,893 | ) | | | (542,769 | ) | | | 614,855 | | | | (708,613 | ) | | | 933,032 | |
| | | | | (1,154,686 | ) | | | 2,528,545 | | | | (174,194 | ) | | | 2,544,612 | | | | (77,840 | ) | | | 1,151,354 | |
| | | | | | | | | | | | | | | | | | | | |
| | | | | | | | | | | | | | | | | | | | | | | | | | |
| | | | | | — | | | | (7,943 | ) | | | — | | | | — | | | | — | | | | (24,388 | ) |
| | | | | | — | | | | (5,583 | ) | | | — | | | | — | | | | — | | | | (1,227 | ) |
| | | | | | — | | | | (725 | ) | | | — | | | | — | | | | — | | | | (1,844 | ) |
| | | | | | — | | | | (2,628,852 | ) | | | — | | | | (364,501 | ) | | | — | | | | (222,697 | ) |
| | | | | | | | | | | | | | | | | | | | | | | | | | |
| | | | | | — | | | | (139 | ) | | | — | | | | — | | | | — | | | | — | |
| | | | | | — | | | | (114 | ) | | | — | | | | — | | | | — | | | | — | |
| | | | | | — | | | | (12 | ) | | | — | | | | — | | | | — | | | | — | |
| | | | | | — | | | | (36,925 | ) | | | — | | | | — | | | | — | | | | — | |
| | | | | | | | | | | | | | | | | | | | | | | | | | |
| | | | | | (7,074 | ) | | | — | | | | (15,332 | ) | | | — | | | | (29,526 | ) | | | — | |
| | | | | | (3,645 | ) | | | — | | | | — | | | | — | | | | (1,767 | ) | | | — | |
| | | | | | (651 | ) | | | — | | | | — | | | | — | | | | (5,371 | ) | | | — | |
| | | | | | (1,642,180 | ) | | | — | | | | (758,248 | ) | | | — | | | | (307,662 | ) | | | — | |
| | | | | | — | | | | — | | | | — | | | | — | | | | — | | | | — | |
| | | | | (1,653,550 | ) | | | (2,680,293 | ) | | | (773,580 | ) | | | (364,501 | ) | | | (344,326 | ) | | | (250,156 | ) |
| | | | | | | | | | | | | | | | | | | | |
| | | | | | 3,072,025 | | | | 5,965,805 | | | | 1,293,864 | | | | 1,310,369 | | | | 586,351 | | | | 5,123,521 | |
| | | | | | 1,652,823 | | | | 2,679,340 | | | | 773,580 | | | | 364,501 | | | | 344,326 | | | | 250,156 | |
| | | | | | (19,981,883 | ) | | | (15,528,516 | ) | | | (2,409,769 | ) | | | (5,834,176 | ) | | | (3,881,147 | ) | | | (2,285,342 | ) |
| | | | | | (15,257,035 | ) | | | (6,883,371 | ) | | | (342,325 | ) | | | (4,159,306 | ) | | | (2,950,470 | ) | | | 3,088,335 | |
| | | | | (18,065,271 | ) | | | (7,035,119 | ) | | | (1,290,099 | ) | | | (1,979,195 | ) | | | (3,372,636 | ) | | | 3,989,533 | |
| | | | | | | | | | | | | | | | | | | | |
| | | | | | 36,577,826 | | | | 43,612,945 | | | | 11,455,115 | | | | 13,434,310 | | | | 10,336,645 | | | | 6,347,112 | |
| | | | | $ | 18,512,555 | | | $ | 36,577,826 | | | $ | 10,165,016 | | | $ | 11,455,115 | | | $ | 6,964,009 | | | $ | 10,336,645 | |
| | | | | | | | |
| See accompanying Notes to Financial Statements | | | September 30, 2018 | | | Annual Report | | | 241 | |
Statements of Changes in Net Assets (cont’d)
| | | | | | | | | | | | | | | | | | | | |
| | | AllianzGI Global Dynamic Allocation | | | AllianzGI Global High Yield | | | | |
| | | | | | |
| | | Year ended
September 30, 2018 | | | Year ended
September 30, 2017 | | | Year ended
September 30, 2018 | | | Period from
May 3, 2017**
through
September 30, 2017 | | | | |
| Increase (Decrease) in Net Assets from: | | | | |
| | | | | | |
Investment Operations: | | | | | | | | | | | | | | | | | | | | |
| Net investment income | | $ | 4,569,718 | | | $ | 3,697,905 | | | $ | 996,750 | | | $ | 360,997 | | | | | |
| Net realized gain (loss) | | | 6,860,198 | | | | 9,548,039 | | | | 9,692 | | | | (224,870 | ) | | | | |
| Net change in unrealized appreciation/depreciation | | | (3,204,820 | ) | | | 18,097,162 | | | | (710,514 | ) | | | 459,540 | | | | | |
Net increase in net assets resulting from investment operations | | | 8,225,096 | | | | 31,343,106 | | | | 295,928 | | | | 595,667 | | | | | |
| Dividends and Distributions to Shareholders from: | | | | |
| Net investment income: | | | | | | | | | | | | | | | | | | | | |
Class A | | | — | | | | (2 | ) | | | — | | | | — | | | | | |
Class C | | | — | | | | (2 | ) | | | — | | | | — | | | | | |
Class R | | | — | | | | — | | | | — | | | | — | | | | | |
Class P | | | — | | | | (58,830 | ) | | | — | | | | (51 | ) | | | | |
Institutional Class | | | — | | | | (21,336 | ) | | | — | | | | (117,951 | ) | | | | |
Class R6 | | | — | | | | (887,497 | ) | | | — | | | | — | | | | | |
Administrative Class | | | — | | | | — | | | | — | | | | — | | | | | |
| Net realized capital gains: | | | | | | | | | | | | | | | | | | | | |
Class A | | | — | | | | — | | | | — | | | | — | | | | | |
Class C | | | — | | | | — | | | | — | | | | — | | | | | |
Class P | | | — | | | | — | | | | — | | | | — | | | | | |
Institutional Class | | | — | | | | — | | | | — | | | | — | | | | | |
| Total distributions paid:* | | | | | | | | | | | | | | | | | | | | |
Class A | | | (109,050 | ) | | | — | | | | — | | | | — | | | | | |
Class C | | | (66,066 | ) | | | — | | | | — | | | | — | | | | | |
Class R | | | (6,210 | ) | | | — | | | | — | | | | — | | | | | |
Class P | | | (642,005 | ) | | | — | | | | (482 | ) | | | — | | | | | |
Institutional Class | | | (1,632,951 | ) | | | — | | | | (1,055,110 | ) | | | — | | | | | |
Class R6 | | | (12,155,278 | ) | | | — | | | | — | | | | — | | | | | |
Administrative Class | | | (1,099 | ) | | | — | | | | — | | | | — | | | | | |
| Total dividends and distributions to shareholders | | | (14,612,659 | ) | | | (967,667 | ) | | | (1,055,592 | ) | | | (118,002 | ) | | | | |
| Fund Share Transactions: | | | | |
| Net proceeds from the sale of shares | | | 27,831,298 | | | | 248,412,748 | | | | 703,903 | | | | 1,029,723 | | | | | |
| Issued in reinvestment of dividends and distributions | | | 14,610,041 | | | | 967,667 | | | | 1,055,592 | | | | 118,002 | | | | | |
| Cost of shares redeemed | | | (93,627,613 | ) | | | (53,095,861 | ) | | | (456,580 | ) | | | — | | | | | |
| Net increase (decrease) from Fund share transactions | | | (51,186,274 | ) | | | 196,284,554 | | | | 1,302,915 | | | | 1,147,725 | | | | | |
| Total increase (decrease) in net assets | | | (57,573,837 | ) | | | 226,659,993 | | | | 543,251 | | | | 1,625,390 | | | | | |
| Net Assets: | | | | |
| Beginning of period | | | 280,003,186 | | | | 53,343,193 | | | | 21,635,390 | | | | 20,010,000 | | | | | |
End of period*** | | $ | 222,429,349 | | | $ | 280,003,186 | | | $ | 22,178,641 | | | $ | 21,635,390 | | | | | |
| — | May reflect actual amounts rounding to less than $1. |
| * | Distributions from net investment income and net realized capital gains are combined for the period ended September 30, 2018. See Note 1 in the Notes to Financial Statements for more information regarding new accounting pronouncements. The dividends and distributions to shareholders for the year ended September 30, 2017 have not been reclassified to conform to the current year presentation. |
| ** | Commencement of operations. |
| *** | Net Assets - End of period includes undistributed (dividends in excess of) net investment income of $3,143,113 for AllianzGI Global Dynamic Allocation, $96,521 for AllianzGI Global High Yield, $260,165 for AllianzGI Global Sustainability, $3,485,468 for AllianzGI Global Water, and $(833,600) for AllianzGI High Yield Bond as of September 30, 2017. |
| | | | | | |
| 242 | | Annual Report | | | September 30, 2018 | | | See accompanying Notes to Financial Statements |
| | | | | | | | | | | | | | | | | | | | | | | | | | |
| | | | AllianzGI Global Sustainability | | | AllianzGI Global Water | | | AllianzGI High Yield Bond | |
| | | | | | | |
| | | | Year ended
September 30, 2018 | | | Year ended
September 30, 2017 | | | Year ended
September 30, 2018 | | | Year ended
September 30, 2017 | | | Year ended
September 30, 2018 | | | Year ended
September 30, 2017 | |
| | | | | | | | | | | | | | | | | | | | |
| | | | | | | |
| | | | | | | | | | | | | | | | | | | | |
| | | | | $ | 347,928 | | | $ | 278,971 | | | $ | 6,003,706 | | | $ | 3,968,672 | | | $ | 11,253,465 | | | $ | 18,226,931 | |
| | | | | | 1,371,578 | | | | 664,724 | | | | 10,534,709 | | | | 16,185,686 | | | | 3,058,117 | | | | 1,718,603 | |
| | | | | | 1,985,887 | | | | 2,748,428 | | | | 3,117,286 | | | | 28,457,574 | | | | (12,901,757 | ) | | | 5,111,712 | |
| | | | | 3,705,393 | | | | 3,692,123 | | | | 19,655,701 | | | | 48,611,932 | | | | 1,409,825 | | | | 25,057,246 | |
| | | | | | | | | | | | | | | | | | | | |
| | | | | | | | | | | | | | | | | | | | | | | | | | |
| | | | | | — | | | | (1,050 | ) | | | — | | | | (789,589 | ) | | | — | | | | (3,041,549 | ) |
| | | | | | — | | | | — | | | | — | | | | (64 | ) | | | — | | | | (603,972 | ) |
| | | | | | — | | | | — | | | | — | | | | — | | | | — | | | | (63,000 | ) |
| | | | | | — | | | | (86 | ) | | | — | | | | (754,192 | ) | | | — | | | | (2,935,892 | ) |
| | | | | | — | | | | (232,687 | ) | | | — | | | | (626,991 | ) | | | — | | | | (12,336,030 | ) |
| | | | | | — | | | | — | | | | — | | | | — | | | | — | | | | — | |
| | | | | | — | | | | — | | | | — | | | | — | | | | — | | | | (100,961 | ) |
| | | | | | | | | | | | | | | | | | | | | | | | | | |
| | | | | | — | | | | (240 | ) | | | — | | | | (1,387,866 | ) | | | — | | | | — | |
| | | | | | — | | | | — | | | | — | | | | (545,689 | ) | | | — | | | | — | |
| | | | | | — | | | | (20 | ) | | | — | | | | (783,556 | ) | | | — | | | | — | |
| | | | | | — | | | | (45,540 | ) | | | — | | | | (456,756 | ) | | | — | | | | — | |
| | | | | | | | | | | | | | | | | | | | | | | | | | |
| | | | | | (15,922 | ) | | | — | | | | (5,079,956 | ) | | | — | | | | (2,017,864 | ) | | | — | |
| | | | | | — | | | | — | | | | (2,305,188 | ) | | | — | | | | (440,655 | ) | | | — | |
| | | | | | — | | | | — | | | | — | | | | — | | | | (42,717 | ) | | | — | |
| | | | | | (2,224 | ) | | | — | | | | (7,193,391 | ) | | | — | | | | (1,334,908 | ) | | | — | |
| | | | | | (928,569 | ) | | | — | | | | (5,067,578 | ) | | | — | | | | (7,899,434 | ) | | | — | |
| | | | | | — | | | | — | | | | — | | | | — | | | | — | | | | — | |
| | | | | | — | | | | — | | | | — | | | | — | | | | (34,527 | ) | | | — | |
| | | | | (946,715 | ) | | | (279,623 | ) | | | (19,646,113 | ) | | | (5,344,703 | ) | | | (11,770,105 | ) | | | (19,081,404 | ) |
| | | | | | | | | | | | | | | | | | | | |
| | | | | | 13,840,851 | | | | 6,773,635 | | | | 179,152,410 | | | | 277,825,094 | | | | 49,525,342 | | | | 170,359,810 | |
| | | | | | 946,715 | | | | 279,623 | | | | 15,686,646 | | | | 4,160,836 | | | | 10,926,652 | | | | 18,212,460 | |
| | | | | | (4,414,256 | ) | | | (4,130,560 | ) | | | (164,700,507 | ) | | | (216,105,791 | ) | | | (131,007,714 | ) | | | (291,550,996 | ) |
| | | | | | 10,373,310 | | | | 2,922,698 | | | | 30,138,549 | | | | 65,880,139 | | | | (70,555,720 | ) | | | (102,978,726 | ) |
| | | | | 13,131,988 | | | | 6,335,198 | | | | 30,148,137 | | | | 109,147,368 | | | | (80,916,000 | ) | | | (97,002,884 | ) |
| | | | | | | | | | | | | | | | | | | | |
| | | | | | 27,081,337 | | | | 20,746,139 | | | | 633,042,226 | | | | 523,894,858 | | | | 263,738,852 | | | | 360,741,736 | |
| | | | | $ | 40,213,325 | | | $ | 27,081,337 | | | $ | 663,190,363 | | | $ | 633,042,226 | | | $ | 182,822,852 | | | $ | 263,738,852 | |
| | | | | | | | |
| See accompanying Notes to Financial Statements | | | September 30, 2018 | | | Annual Report | | | 243 | |
Statements of Changes in Net Assets (cont’d)
| | | | | | | | | | | | | | | | | | | | |
| | | AllianzGI International Growth | | | AllianzGI International Small-Cap | |
| | | | | | |
| | | Year ended
September 30, 2018 | | | Year ended
September 30, 2017 | | | Year ended
September 30, 2018 | | | Year ended
September 30, 2017 | | | | |
| Increase (Decrease) in Net Assets from: | | | | | | | | | | | | | | | |
| | | | | | |
Investment Operations: | | | | | | | | | | | | | | | | | | | | |
| Net investment income (loss) | | $ | 74,437 | | | $ | 136,923 | | | $ | 1,222,785 | | | $ | 713,604 | | | | | |
| Net realized gain (loss) | | | 608,356 | | | | 2,290,578 | | | | 14,505,251 | | | | 6,210,831 | | | | | |
| Net change in unrealized appreciation/depreciation | | | 55,677 | | | | 3,097,495 | | | | (5,755,753 | ) | | | 18,195,669 | | | | | |
| Net increase (decrease) in net assets resulting from investment operations | | | 738,470 | | | | 5,524,996 | | | | 9,972,283 | | | | 25,120,104 | | | | | |
| Dividends and Distributions to Shareholders from: | | | | | | | | | | | | | | | |
Net investment income: | | | | | | | | | | | | | | | | | | | | |
Class A | | | — | | | | (1 | ) | | | — | | | | (80,265 | ) | | | | |
Class C | | | — | | | | — | | | | — | | | | (18,676 | ) | | | | |
Class R | | | — | | | | — | | | | — | | | | (1,374 | ) | | | | |
Class P | | | — | | | | — | | | | — | | | | (403,029 | ) | | | | |
Institutional Class | | | — | | | | (29,197 | ) | | | — | | | | (225,723 | ) | | | | |
Class R6 | | | — | | | | — | | | | — | | | | (147,555 | ) | | | | |
| Net realized capital gains: | | | | | | | | | | | | | | | | | | | | |
Class A | | | — | | | | — | | | | — | | | | — | | | | | |
Class P | | | — | | | | — | | | | — | | | | — | | | | | |
Institutional Class | | | — | | | | — | | | | — | | | | — | | | | | |
| Total distributions paid:* | | | | | | | | | | | | | | | | | | | | |
Class A | | | (24,200 | ) | | | — | | | | (145,664 | ) | | | — | | | | | |
Class C | | | — | | | | — | | | | (56,178 | ) | | | — | | | | | |
Class R | | | — | | | | — | | | | (7,918 | ) | | | — | | | | | |
Class P | | | — | | | | — | | | | (1,624,283 | ) | | | — | | | | | |
Institutional Class | | | (2,304,442 | ) | | | — | | | | (1,826,435 | ) | | | — | | | | | |
Class R6 | | | — | | | | — | | | | (957,134 | ) | | | — | | | | | |
| Total dividends and distributions to shareholders | | | (2,328,642 | ) | | | (29,198 | ) | | | (4,617,612 | ) | | | (876,622 | ) | | | | |
| Fund Share Transactions: | | | | | | | | | | | | | | | |
| Net proceeds from the sale of shares | | | 10,731,231 | | | | 381,263 | | | | 92,571,678 | | | | 62,753,688 | | | | | |
| Issued in reinvestment of dividends and distributions | | | 2,328,642 | | | | 29,198 | | | | 4,554,911 | | | | 846,217 | | | | | |
| Cost of shares redeemed | | | (1,514,104 | ) | | | (15,688,736 | ) | | | (108,498,248 | ) | | | (38,748,657 | ) | | | | |
| Net increase (decrease) from Fund share transactions | | | 11,545,769 | | | | (15,278,275 | ) | | | (11,371,659 | ) | | | 24,851,248 | | | | | |
| Total increase (decrease) in net assets | | | 9,955,597 | | | | (9,782,477 | ) | | | (6,016,988 | ) | | | 49,094,730 | | | | | |
| Net Assets: | | | | | | | | | | | | | | | |
| Beginning of year | | | 18,654,440 | | | | 28,436,917 | | | | 150,728,959 | | | | 101,634,229 | | | | | |
| End of year** | | $ | 28,610,037 | | | $ | 18,654,440 | | | $ | 144,711,971 | | | $ | 150,728,959 | | | | | |
| — | May reflect actual amounts rounding to less than $1. |
| * | Distributions from net investment income and net realized capital gains are combined for the year ended September 30, 2018. See Note 1 in the Notes to Financial Statements for more information regarding new accounting pronouncements. The dividends and distributions to shareholders for the year ended September 30, 2017 have not been reclassified to conform to the current year presentation. |
| ** | Net Assets - End of year includes undistributed (dividends in excess of) net investment income of $100,639 for AllianzGI International Growth, $514,790 for AllianzGI International Small-Cap, $(320,339) for AllianzGI Micro Cap, $187,060 for AllianzGI NFJ Emerging Markets Value, and $45,940 for AllianzGI NFJ International Small-Cap Value as of September 30, 2017. |
| | | | | | |
| 244 | | Annual Report | | | September 30, 2018 | | | See accompanying Notes to Financial Statements |
| | | | | | | | | | | | | | | | | | | | | | | | | | |
| | | | AllianzGI Micro Cap | | | AllianzGI NFJ Emerging Markets Value | | | AllianzGI NFJ International Small-Cap Value | |
| | | | | | | |
| | | | Year ended
September 30, 2018 | | | Year ended
September 30, 2017 | | | Year ended
September 30, 2018 | | | Year ended
September 30, 2017 | | | Year ended
September 30, 2018 | | | Year ended
September 30, 2017 | |
| | | | | | | | | | | | | | | | | | | | |
| | | | | | | |
| | | | | | | | | | | | | | | | | | | | |
| | | | | $ | (377,633 | ) | | $ | (413,520 | ) | | $ | 2,965,028 | | | $ | 833,737 | | | $ | 73,400 | | | $ | 82,270 | |
| | | | | | 4,944,670 | | | | 4,445,191 | | | | (8,514,775 | ) | | | 2,010,346 | | | | 293,906 | | | | 190,218 | |
| | | | | | (1,574,344 | ) | | | 1,839,617 | | | | (9,334,145 | ) | | | 3,462,798 | | | | (456,253 | ) | | | 274,913 | |
| | | | | 2,992,693 | | | | 5,871,288 | | | | (14,883,892 | ) | | | 6,306,881 | | | | (88,947 | ) | | | 547,401 | |
| | | | | | | | | | | | | | | | | | | | |
| | | | | | | | | | | | | | | | | | | | | | | | | | |
| | | | | | — | | | | — | | | | — | | | | (140,853 | ) | | | — | | | | (52,747 | ) |
| | | | | | — | | | | — | | | | — | | | | (3,055 | ) | | | — | | | | (47,236 | ) |
| | | | | | — | | | | — | | | | — | | | | — | | | | — | | | | — | |
| | | | | | — | | | | — | | | | — | | | | (401,473 | ) | | | — | | | | (4,723 | ) |
| | | | | | — | | | | — | | | | — | | | | (373,904 | ) | | | — | | | | (86,365 | ) |
| | | | | | — | | | | — | | | | — | | | | — | | | | — | | | | (123,590 | ) |
| | | | | | | | | | | | | | | | | | | | | | | | | | |
| | | | | | — | | | | (308,525 | ) | | | — | | | | — | | | | — | | | | — | |
| | | | | | — | | | | (116,680 | ) | | | — | | | | — | | | | — | | | | — | |
| | | | | | — | | | | (2,920,919 | ) | | | — | | | | — | | | | — | | | | — | |
| | | | | | | | | | | | | | | | | | | | | | | | | | |
| | | | | | (154,402 | ) | | | — | | | | (522,767 | ) | | | — | | | | (27,432 | ) | | | — | |
| | | | | | — | | | | — | | | | (13,580 | ) | | | — | | | | (1 | ) | | | — | |
| | | | | | — | | | | — | | | | — | | | | — | | | | — | | | | — | |
| | | | | | (79,191 | ) | | | — | | | | (301,427 | ) | | | — | | | | (1,130 | ) | | | — | |
| | | | | | (1,524,827 | ) | | | — | | | | (2,287,173 | ) | | | — | | | | (48,804 | ) | | | — | |
| | | | | | — | | | | — | | | | — | | | | — | | | | (16,040 | ) | | | — | |
| | | | | (1,758,420 | ) | | | (3,346,124 | ) | | | (3,124,947 | ) | | | (919,285 | ) | | | (93,407 | ) | | | (314,661 | ) |
| | | | | | | | | | | | | | | | | | | | |
| | | | | | 5,896,483 | | | | 6,704,989 | | | | 211,942,922 | | | | 79,864,675 | | | | 995,577 | | | | 1,304,594 | |
| | | | | | 1,752,466 | | | | 3,336,639 | | | | 3,119,842 | | | | 919,174 | | | | 92,630 | | | | 313,688 | |
| | | | | | (12,755,413 | ) | | | (15,428,523 | ) | | | (124,690,909 | ) | | | (29,037,849 | ) | | | (1,925,226 | ) | | | (9,209,506 | ) |
| | | | | | (5,106,464 | ) | | | (5,386,895 | ) | | | 90,371,855 | | | | 51,746,000 | | | | (837,019 | ) | | | (7,591,224 | ) |
| | | | | (3,872,191 | ) | | | (2,861,731 | ) | | | 72,363,016 | | | | 57,133,596 | | | | (1,019,373 | ) | | | (7,358,484 | ) |
| | | | | | | | | | | | | | | | | | | | |
| | | | | | 32,583,099 | | | | 35,444,830 | | | | 65,896,336 | | | | 8,762,740 | | | | 4,591,657 | | | | 11,950,141 | |
| | | | | $ | 28,710,908 | | | $ | 32,583,099 | | | $ | 138,259,352 | | | $ | 65,896,336 | | | $ | 3,572,284 | | | $ | 4,591,657 | |
| | | | | | | | |
| See accompanying Notes to Financial Statements | | | September 30, 2018 | | | Annual Report | | | 245 | |
Statements of Changes in Net Assets† (cont’d)
| | | | | | | | | | | | |
| | | AllianzGI PerformanceFee
Managed Futures Strategy† | | | AllianzGI PerformanceFee
Structured US Equity | | | | |
| | | | |
| | | Period from
December 18, 2017**
through
September 30, 2018 | | | Period from
December 18, 2017**
through
September 30, 2018 | | | | |
| Increase (Decrease) in Net Assets from: | | | | | | | |
| | | | |
Investment Operations: | | | | | | | | | | | | |
| Net investment income | | $ | 206,988 | | | $ | 532,910 | | | | | |
| Net realized gain (loss) | | | (966,316 | ) | | | 761,590 | | | | | |
| Net change in unrealized appreciation/depreciation | | | 172,818 | | | | 4,307,911 | | | | | |
Net increase (decrease) in net assets resulting from investment operations | | | (586,510 | ) | | | 5,602,411 | | | | | |
| Dividends and Distributions to Shareholders from: | |
| Total distributions paid:* | | | | | | | | | | | | |
Class P | | | — | | | | — | | | | | |
Institutional Class | | | — | | | | — | | | | | |
Class R6 | | | — | | | | — | | | | | |
| Total dividends and distributions to shareholders | | | — | | | | — | | | | | |
| Fund Share Transactions: | |
| Net proceeds from the sale of shares | | | 16,781,222 | | | | 53,233,218 | | | | | |
| Issued in reinvestment of dividends and distributions | | | — | | | | — | | | | | |
| Cost of shares redeemed | | | (465,671 | ) | | | (760,421 | ) | | | | |
| Net increase from Fund share transactions | | | 16,315,551 | | | | 52,472,797 | | | | | |
| Total increase (decrease) in net assets | | | 15,729,041 | | | | 58,075,208 | | | | | |
| Net Assets: | |
| Beginning of period | | | 50,000 | | | | 25,000,000 | | | | | |
| End of period | | $ | 15,779,041 | | | $ | 83,075,208 | | | | | |
| — | May reflect actual amounts rounding to less than $1. |
| † | Consolidated Statement of Changes in Net Assets for the AllianzGI PerformanceFee Managed Futures Strategy Fund. These financial statements are consolidated to include the accounts of AllianzGI PerformanceFee Managed Futures Strategy Offshore Fund Ltd., a wholly-owned subsidiary of the AllianzGI PerformanceFee Managed Futures Strategy Fund. See Note 14. |
| * | Distributions from net investment income and net realized capital gains are combined for the period ended September 30, 2018. See Note 1 in the Notes to Financial Statements for more information regarding new accounting pronouncements. |
| ** | Commencement of operations. |
| | | | | | |
| 246 | | Annual Report | | | September 30, 2018 | | | See accompanying Notes to Financial Statements |
| | | | | | | | | | | | | | |
| | | | AllianzGI PerformanceFee
Structured US Fixed Income | | | AllianzGI Preferred
Securities and Income | | | AllianzGI Real Estate Debt | |
| | | | |
| | | | Period from
December 18, 2017**
through
September 30, 2018 | | | Period from
May 30, 2018**
through
September 30, 2018 | | | Period from
December 27, 2017**
through
September 30, 2018 | |
| | | | | | | | | | | |
| | | | |
| | | | | | | | | | | |
| | | | | $ | 393,827 | | | $ | 167,356 | | | $ | 180,468 | |
| | | | | | 255,042 | | | | 12,962 | | | | 147,549 | |
| | | | | | (841,727 | ) | | | (3,132 | ) | | | (161,257 | ) |
| | | | | (192,858 | ) | | | 177,186 | | | | 166,760 | |
| | | | | | | | | | | |
| | | | | | | | | | | |
| | | | | | — | | | | (134 | ) | | | (152 | ) |
| | | | | | — | | | | (5,686 | ) | | | (205,805 | ) |
| | | | | | — | | | | (137,009 | ) | | | — | |
| | | | | — | | | | (142,829 | ) | | | (205,957 | ) |
| | | | | | | | | | | |
| | | | | | 357,976 | | | | 1,537,850 | | | | 5,669,291 | |
| | | | | | — | | | | 142,829 | | | | 205,957 | |
| | | | | | (186,725 | ) | | | — | | | | (598,878 | ) |
| | | | | | 171,251 | | | | 1,680,679 | | | | 5,276,370 | |
| | | | | (21,607 | ) | | | 1,715,036 | | | | 5,237,173 | |
| | | | | | | | | | | |
| | | | | | 25,000,000 | | | | 10,000,000 | | | | 10,010,000 | |
| | | | | $ | 24,978,393 | | | $ | 11,715,036 | | | $ | 15,247,173 | |
| | | | | | | | |
| See accompanying Notes to Financial Statements | | | September 30, 2018�� | | | Annual Report | | | 247 | |
Statements of Changes in Net Assets (cont’d)
| | | | | | | | | | | | | | | | |
| | | AllianzGI Short
Duration High Income | | | AllianzGI Short
Term Bond | | | | |
| | | | | |
| | | Year ended
September 30, 2018 | | | Year ended
September 30, 2017 | | | Period from
August 23, 2018**
through
September 30, 2018 | | | | |
| Increase (Decrease) in Net Assets from: | | | | | | | | | | | | |
| | | | | |
Investment Operations: | | | | | | | | | | | | | | | | |
| Net investment income (loss) | | $ | 51,670,213 | | | $ | 64,867,227 | | | $ | 14,085 | | | | | |
| Net realized gain (loss) | | | 178,296 | | | | 2,643,778 | | | | 21 | | | | | |
| Net change in unrealized appreciation/depreciation | | | (13,765,267 | ) | | | 2,238,404 | | | | (5,653 | ) | | | | |
Net increase in net assets resulting from investment operations | | | 38,083,242 | | | | 69,749,409 | | | | 8,453 | | | | | |
| Dividends and Distributions to Shareholders from: | | | | | | | | | | | | |
| Net investment income: | | | | | | | | | | | | | | | | |
Class A | | | — | | | | (10,760,253 | ) | | | — | | | | | |
Class C | | | — | | | | (6,804,346 | ) | | | — | | | | | |
Class P | | | — | | | | (36,952,063 | ) | | | — | | | | | |
Institutional Class | | | — | | | | (23,289,155 | ) | | | — | | | | | |
Class R6 | | | — | | | | (2,094,252 | ) | | | — | | | | | |
| Net realized capital gains: | | | | | | | | | | | | | | | | |
Class A | | | — | | | | — | | | | — | | | | | |
Class C | | | — | | | | — | | | | — | | | | | |
Class P | | | — | | | | — | | | | — | | | | | |
Institutional Class | | | — | | | | — | | | | — | | | | | |
Class R6 | | | — | | | | — | | | | — | | | | | |
| Total distributions paid:* | | | | | | | | | | | | | | | | |
Class A | | | (8,845,482 | ) | | | — | | | | — | | | | | |
Class C | | | (6,148,766 | ) | | | — | | | | — | | | | | |
Class P | | | (20,419,332 | ) | | | — | | | | — | | | | | |
Institutional Class | | | (21,850,773 | ) | | | — | | | | — | | | | | |
Class R6 | | | (2,650,472 | ) | | | — | | | | — | | | | | |
| Total dividends and distributions to shareholders | | | (59,914,825 | ) | | | (79,900,069 | ) | | | — | | | | | |
| Fund Share Transactions: | | | | | | | | | | | | |
| Net proceeds from the sale of shares | | | 522,786,809 | | | | 1,246,095,121 | | | | 176,000 | | | | | |
| Issued in reinvestment of dividends and distributions | | | 51,809,934 | | | | 70,636,506 | | | | — | | | | | |
| Cost of shares redeemed | | | (1,090,598,869 | ) | | | (963,151,673 | ) | | | — | | | | | |
| Net increase (decrease) from Fund share transactions | | | (516,002,126 | ) | | | 353,579,954 | | | | 176,000 | | | | | |
| Total increase (decrease) in net assets | | | (537,833,709 | ) | | | 343,429,294 | | | | 184,453 | | | | | |
| Net Assets: | | | | | | | | | | | | |
| Beginning of period | | | 1,676,947,953 | | | | 1,333,518,659 | | | | 5,000,000 | | | | | |
| End of period*** | | $ | 1,139,114,244 | | | $ | 1,676,947,953 | | | $ | 5,184,453 | | | | | |
| — | May reflect actual amounts rounding to less than $1. |
| * | Distributions from net investment income and net realized capital gains are combined for the period ended September 30, 2018. See Note 1 in the Notes to Financial Statements for more information regarding new accounting pronouncements. The dividends and distributions to shareholders for the year ended September 30, 2017 have not been reclassified to conform to the current year presentation. |
| ** | Commencement of operations. |
| *** | Net Assets - End of period includes undistributed (dividends in excess of) net investment income of $(7,613,432) for AllianzGI Short Duration High Income, $3,003,084 for AllianzGI Structured Return, $31,566 for AllianzGI U.S. Equity Hedged, and $(549,213) for AllianzGI Ultra Micro Cap as of September 30, 2017. |
| | | | | | |
| 248 | | Annual Report | | | September 30, 2018 | | | See accompanying Notes to Financial Statements |
| | | | | | | | | | | | | | | | | | | | | | | | | | |
| | | |
AllianzGI Structured Return | | | AllianzGI U.S. Equity Hedged | | | AllianzGI Ultra Micro Cap | |
| | | | | | | |
| | | |
Year ended
September 30, 2018 | | | Year ended
September 30, 2017 | | | Year ended
September 30, 2018 | | | Year ended
September 30, 2017 | | | Year ended
September 30, 2018 | | | Year ended
September 30, 2017 | |
| | | | | | | | | | | | | | | | | | | | |
| | | | | | | |
| | | | | | | | | | | | | | | | | | | | | | | | | | |
| | | | | $ | 5,166,648 | | | $ | 3,156,737 | | | $ | 17,574 | | | $ | 31,993 | | | $ | (564,585 | ) | | $ | (730,174 | ) |
| | | | | | 14,927,128 | | | | 13,597,189 | | | | (57,843 | ) | | | 82,203 | | | | 7,166,035 | | | | 8,438,404 | |
| | | | | | 1,069,691 | | | | 4,469,662 | | | | 256,083 | | | | 339,772 | | | | (2,102,750 | ) | | | (1,019,739 | ) |
| | | | | 21,163,467 | | | | 21,223,588 | | | | 215,814 | | | | 453,968 | | | | 4,498,700 | | | | 6,688,491 | |
| | | | | | | | | | | | | | | | | | | | |
| | | | | | | | | | | | | | | | | | | | | | | | | | |
| | | | | | — | | | | (451,149 | ) | | | — | | | | (8,563 | ) | | | — | | | | — | |
| | | | | | — | | | | (9 | ) | | | — | | | | (2,502 | ) | | | — | | | | — | |
| | | | | | — | | | | (255,992 | ) | | | — | | | | (428 | ) | | | — | | | | — | |
| | | | | | — | | | | (445,419 | ) | | | — | | | | (46,862 | ) | | | — | | | | — | |
| | | | | | — | | | | (430,190 | ) | | | — | | | | — | | | | — | | | | — | |
| | | | | | | | | | | | | | | | | | | | | | | | | | |
| | | | | | — | | | | (2,431,302 | ) | | | — | | | | — | | | | — | | | | (1,391,792 | ) |
| | | | | | — | | | | (318,922 | ) | | | — | | | | — | | | | — | | | | — | |
| | | | | | — | | | | (667,014 | ) | | | — | | | | — | | | | — | | | | (447,225 | ) |
| | | | | | — | | | | (2,447,379 | ) | | | — | | | | — | | | | — | | | | (1,792,480 | ) |
| | | | | | — | | | | (836,738 | ) | | | — | | | | — | | | | — | | | | — | |
| | | | | | | | | | | | | | | | | | | | | | | | | | |
| | | | | | (5,460,806 | ) | | | — | | | | (8,868 | ) | | | — | | | | (2,712,561 | ) | | | — | |
| | | | | | (575,064 | ) | | | — | | | | (3,555 | ) | | | — | | | | — | | | | — | |
| | | | | | (6,165,655 | ) | | | — | | | | (409 | ) | | | — | | | | (922,434 | ) | | | — | |
| | | | | | (9,651,460 | ) | | | — | | | | (19,371 | ) | | | — | | | | (4,891,933 | ) | | | — | |
| | | | | | (1,367,964 | ) | | | — | | | | — | | | | — | | | | — | | | | — | |
| | | | | (23,220,949 | ) | | | (8,284,114 | ) | | | (32,203 | ) | | | (58,355 | ) | | | (8,526,928 | ) | | | (3,631,497 | ) |
| | | | | | | | | | | | | | | | | | | | |
| | | | | | 362,870,652 | | | | 403,391,041 | | | | 973,926 | | | | 390,793 | | | | 7,815,425 | | | | 6,945,592 | |
| | | | | | 23,050,743 | | | | 8,240,525 | | | | 32,203 | | | | 58,355 | | | | 8,438,235 | | | | 3,563,191 | |
| | | | | | (237,900,848 | ) | | | (172,783,052 | ) | | | (845,660 | ) | | | (3,912,329 | ) | | | (16,440,023 | ) | | | (23,708,498 | ) |
| | | | | | 148,020,547 | | | | 238,848,514 | | | | 160,469 | | | | (3,463,181 | ) | | | (186,363 | ) | | | (13,199,715 | ) |
| | | | | 145,963,065 | | | | 251,787,988 | | | | 344,080 | | | | (3,067,568 | ) | | | (4,214,591 | ) | | | (10,142,721 | ) |
| | | | | | | | | | | | | | | | | | | | |
| | | | | | 528,121,267 | | | | 276,333,279 | | | | 2,584,068 | | | | 5,651,636 | | | | 38,016,651 | | | | 48,159,372 | |
| | | | | $ | 674,084,332 | | | $ | 528,121,267 | | | $ | 2,928,148 | | | $ | 2,584,068 | | | $ | 33,802,060 | | | $ | 38,016,651 | |
| | | | | | | | |
| See accompanying Notes to Financial Statements | | | September 30, 2018 | | | Annual Report | | | 249 | |
Financial Highlights
For a Share Outstanding for the Period ended:^
| | | | | | | | | | | | | | | | | | | | | | | | | | | | |
| | | Net Asset
Value,
Beginning
of Period | | | Net
Investment
Income (a) | | | Net Realized
and Change
in Unrealized
Gain (Loss) | | | Total from
Investment
Operations | | |
Dividends
from Net
Investment
Income | | | Distributions
from Net
Realized Capital
Gains | | | | |
| AllianzGI Retirement 2020: | | | | | | | | | | | | | | | | | | | | | |
| Class A | | | | | | | | | | | | | | | | | | | | | | | | | | | | |
9/30/2018 | | $ | 20.42 | | | $ | 0.38 | | | $ | 0.15 | | | $ | 0.53 | | | $ | (0.65 | ) | | $ | — | | | | | |
9/30/2017 | | | 19.20 | | | | 0.20 | | | | 1.48 | | | | 1.68 | | | | (0.46 | ) | | | — | | | | | |
9/30/2016 | | | 18.09 | | | | 0.46 | | | | 1.23 | | | | 1.69 | | | | (0.58 | ) | | | — | | | | | |
12/1/2014 - 9/30/2015# | | | 19.72 | | | | 0.46 | | | | (1.45 | ) | | | (0.99 | ) | | | (0.56 | ) | | | (0.08 | ) | | | | |
11/30/2014 | | | 19.32 | | | | 0.41 | | | | 0.37 | | | | 0.78 | | | | (0.38 | ) | | | — | | | | | |
11/30/2013 | | | 19.15 | | | | 0.49 | | | | 0.21 | | | | 0.70 | | | | (0.48 | ) | | | (0.05 | ) | | | | |
| Class C | | | | | | | | | | | | | | | | | | | | | | | | | | | | |
9/30/2018 | | $ | 20.27 | | | $ | 0.16 | | | $ | 0.21 | | | $ | 0.37 | | | $ | (0.48 | ) | | $ | — | | | | | |
9/30/2017 | | | 19.10 | | | | 0.05 | | | | 1.50 | | | | 1.55 | | | | (0.38 | ) | | | — | | | | | |
9/30/2016 | | | 18.02 | | | | 0.31 | | | | 1.22 | | | | 1.53 | | | | (0.45 | ) | | | — | | | | | |
12/1/2014 - 9/30/2015# | | | 19.60 | | | | 0.36 | | | | (1.47 | ) | | | (1.11 | ) | | | (0.39 | ) | | | (0.08 | ) | | | | |
11/30/2014 | | | 19.16 | | | | 0.27 | | | | 0.35 | | | | 0.62 | | | | (0.18 | ) | | | — | | | | | |
11/30/2013 | | | 18.78 | | | | 0.31 | | | | 0.26 | | | | 0.57 | | | | (0.14 | ) | | | (0.05 | ) | | | | |
| Class R | | | | | | | | | | | | | | | | | | | | | | | | | | | | |
9/30/2018 | | $ | 20.09 | | | $ | 0.26 | | | $ | 0.19 | | | $ | 0.45 | | | $ | (0.57 | ) | | $ | — | | | | | |
9/30/2017 | | | 19.21 | | | | 0.32 | | | | 0.94 | | | | 1.26 | | | | (0.38 | ) | | | — | | | | | |
9/30/2016 | | | 18.10 | | | | 0.40 | | | | 1.22 | | | | 1.62 | | | | (0.51 | ) | | | — | | | | | |
12/1/2014 - 9/30/2015# | | | 19.70 | | | | 0.39 | | | | (1.43 | ) | | | (1.04 | ) | | | (0.48 | ) | | | (0.08 | ) | | | | |
11/30/2014 | | | 19.27 | | | | 0.35 | | | | 0.36 | | | | 0.71 | | | | (0.28 | ) | | | — | | | | | |
11/30/2013 | | | 19.14 | | | | 0.43 | | | | 0.21 | | | | 0.64 | | | | (0.46 | ) | | | (0.05 | ) | | | | |
| Class P | | | | | | | | | | | | | | | | | | | | | | | | | | | | |
9/30/2018 | | $ | 20.62 | | | $ | 0.39 | | | $ | 0.20 | | | $ | 0.59 | | | $ | (0.70 | ) | | $ | — | | | | | |
9/30/2017 | | | 19.41 | | | | 0.28 | | | | 1.48 | | | | 1.76 | | | | (0.55 | ) | | | — | | | | | |
9/30/2016 | | | 18.34 | | | | 0.52 | | | | 1.24 | | | | 1.76 | | | | (0.69 | ) | | | — | | | | | |
12/1/2014 - 9/30/2015# | | | 19.98 | | | | 0.46 | | | | (1.42 | ) | | | (0.96 | ) | | | (0.60 | ) | | | (0.08 | ) | | | | |
11/30/2014 | | | 19.53 | | | | 0.47 | | | | 0.38 | | | | 0.85 | | | | (0.40 | ) | | | — | | | | | |
11/30/2013 | | | 19.30 | | | | 0.47 | | | | 0.30 | | | | 0.77 | | | | (0.49 | ) | | | (0.05 | ) | | | | |
| Class R6 | | | | | | | | | | | | | | | | | | | | | | | | | | | | |
9/30/2018 | | $ | 20.66 | | | $ | 0.41 | | | $ | 0.20 | | | $ | 0.61 | | | $ | (0.72 | ) | | $ | — | | | | | |
9/30/2017 | | | 19.43 | | | | 0.26 | | | | 1.53 | | | | 1.79 | | | | (0.56 | ) | | | — | | | | | |
9/30/2016 | | | 18.37 | | | | 0.54 | | | | 1.23 | | | | 1.77 | | | | (0.71 | ) | | | — | | | | | |
12/1/2014 - 9/30/2015# | | | 20.01 | | | | 0.51 | | | | (1.45 | ) | | | (0.94 | ) | | | (0.62 | ) | | | (0.08 | ) | | | | |
11/30/2014 | | | 19.57 | | | | 0.51 | | | | 0.35 | | | | 0.86 | | | | (0.42 | ) | | | — | | | | | |
11/30/2013 | | | 19.32 | | | | 0.58 | | | | 0.21 | | | | 0.79 | | | | (0.49 | ) | | | (0.05 | ) | | | | |
| Administrative Class | | | | | | | | | | | | | | | | | | | | | | | | | | | | |
9/30/2018 | | $ | 20.56 | | | $ | 0.33 | | | $ | 0.21 | | | $ | 0.54 | | | $ | (0.66 | ) | | $ | — | | | | | |
9/30/2017 | | | 19.28 | | | | 0.24 | | | | 1.47 | | | | 1.71 | | | | (0.43 | ) | | | — | | | | | |
9/30/2016 | | | 18.22 | | | | 0.51 | | | | 1.18 | | | | 1.69 | | | | (0.63 | ) | | | — | | | | | |
12/1/2014 - 9/30/2015# | | | 19.84 | | | | 0.87 | | | | (1.86 | ) | | | (0.99 | ) | | | (0.55 | ) | | | (0.08 | ) | | | | |
11/30/2014 | | | 19.42 | | | | 0.43 | | | | 0.36 | | | | 0.79 | | | | (0.37 | ) | | | — | | | | | |
11/30/2013 | | | 19.25 | | | | 0.24 | | | | 0.47 | | | | 0.71 | | | | (0.49 | ) | | | (0.05 | ) | | | | |
| ^ | A — may reflect actual amounts rounding to less than $0.01 or 0.01%. |
| # | Fiscal year end changed from November 30th to September 30th. |
| (a) | Calculated on average shares outstanding during the period. |
| (b) | Total return is calculated assuming a purchase of a share on the first day of the period and a sale of a share on the last day of each period reported. Dividends and distributions, if any, are assumed, for purposes of this calculation, to be reinvested. Total return does not reflect sales charges and includes the effect of fee waivers and reimbursements. Total return may reflect adjustments to conform to U.S. GAAP. Total return for a period of less than one year is not annualized. |
| | | | | | |
| 250 | | Annual Report | | | September 30, 2018 | | | See accompanying Notes to Financial Statements |
| | | | | | | | | | | | | | | | | | | | | | | | | | | | | | | | | | |
| | | | Total
Dividends and
Distributions | | | Net Asset
Value, End
of Period | | | Total Return (b) | | | Net Assets,
End of Period
(000s) | | | Ratio of Expenses to
Average Net Assets with Fee Waiver/
Reimbursement (c) | | | Ratio of Expenses to
Average Net Assets without
Fee Waiver/
Reimbursement (c) | | | Ratio of Net
Investment
Income
to Average
Net Assets (c) | | | Portfolio
Turnover Rate | |
| | | | | | | | | | | | | | | | | | | | | | | | | | |
| | | | | | | | | | | | | | | | | | | | | | | | | | | | | | | | | | |
| | | | | $ | (0.65 | ) | | $ | 20.30 | | | | 2.56 | % | | $ | 4,002 | | | | 0.36 | % | | | 0.60 | % | | | 1.84 | % | | | 24 | % |
| | | | | | (0.46 | ) | | | 20.42 | | | | 9.02 | | | | 13,645 | | | | 0.36 | | | | 0.60 | | | | 1.04 | | | | 143 | |
| | | | | | (0.58 | ) | | | 19.20 | | | | 9.57 | | | | 12,715 | | | | 0.48 | | | | 0.60 | | | | 2.51 | | | | 106 | |
| | | | | | (0.64 | ) | | | 18.09 | | | | (5.13 | ) | | | 30,401 | | | | 0.47 | (d)(e) | | | 0.62 | (d)(e) | | | 2.93 | (d)(e) | | | 144 | |
| | | | | | (0.38 | ) | | | 19.72 | | | | 4.11 | | | | 34,624 | | | | 0.42 | | | | 0.60 | | | | 2.08 | | | | 89 | |
| | | | | | (0.53 | ) | | | 19.32 | | | | 3.75 | | | | 9,102 | | | | 0.40 | | | | 0.60 | | | | 2.60 | | | | 86 | |
| | | | | | | | | | | | | | | | | | | | | | | | | | | | | | | | | | |
| | | | | $ | (0.48 | ) | | $ | 20.16 | | | | 1.79 | % | | $ | 423 | | | | 1.11 | % | | | 1.35 | % | | | 0.79 | % | | | 24 | % |
| | | | | | (0.38 | ) | | | 20.27 | | | | 8.31 | | | | 454 | | | | 1.11 | | | | 1.35 | | | | 0.28 | | | | 143 | |
| | | | | | (0.45 | ) | | | 19.10 | | | | 8.68 | | | | 408 | | | | 1.23 | | | | 1.35 | | | | 1.71 | | | | 106 | |
| | | | | | (0.47 | ) | | | 18.02 | | | | (5.72 | ) | | | 327 | | | | 1.22 | (d)(e) | | | 1.37 | (d)(e) | | | 2.28 | (d)(e) | | | 144 | |
| | | | | | (0.18 | ) | | | 19.60 | | | | 3.29 | | | | 468 | | | | 1.17 | | | | 1.35 | | | | 1.39 | | | | 89 | |
| | | | | | (0.19 | ) | | | 19.16 | | | | 3.02 | | | | 438 | | | | 1.15 | | | | 1.35 | | | | 1.64 | | | | 86 | |
| | | | | | | | | | | | | | | | | | | | | | | | | | | | | | | | | | |
| | | | | $ | (0.57 | ) | | $ | 19.97 | | | | 2.21 | % | | $ | 86 | | | | 0.71 | % | | | 0.85 | % | | | 1.29 | % | | | 24 | % |
| | | | | | (0.38 | ) | | | 20.09 | | | | 6.70 | | | | 43 | | | | 0.71 | | | | 0.86 | | | | 1.71 | | | | 143 | |
| | | | | | (0.51 | ) | | | 19.21 | | | | 9.12 | | | | 649 | | | | 0.83 | | | | 0.85 | | | | 2.18 | | | | 106 | |
| | | | | | (0.56 | ) | | | 18.10 | | | | (5.39 | ) | | | 1,043 | | | | 0.82 | (d)(e) | | | 0.87 | (d)(e) | | | 2.49 | (d)(e) | | | 144 | |
| | | | | | (0.28 | ) | | | 19.70 | | | | 3.72 | | | | 1,008 | | | | 0.77 | | | | 0.85 | | | | 1.81 | | | | 89 | |
| | | | | | (0.51 | ) | | | 19.27 | | | | 3.40 | | | | 1,022 | | | | 0.75 | | | | 0.85 | | | | 2.26 | | | | 86 | |
| | | | | | | | | | | | | | | | | | | | | | | | | | | | | | | | | | |
| | | | | $ | (0.70 | ) | | $ | 20.51 | | | | 2.87 | % | | $ | 12,932 | | | | 0.06 | % | | | 0.20 | % | | | 1.92 | % | | | 24 | % |
| | | | | | (0.55 | ) | | | 20.62 | | | | 9.37 | | | | 20,137 | | | | 0.06 | | | | 0.20 | | | | 1.42 | | | | 143 | |
| | | | | | (0.69 | ) | | | 19.41 | | | | 9.88 | | | | 25,879 | | | | 0.18 | | | | 0.20 | | | | 2.82 | | | | 106 | |
| | | | | | (0.68 | ) | | | 18.34 | | | | (4.89 | ) | | | 21,193 | | | | 0.17 | (d)(e) | | | 0.22 | (d)(e) | | | 2.91 | (d)(e) | | | 144 | |
| | | | | | (0.40 | ) | | | 19.98 | | | | 4.43 | | | | 12,665 | | | | 0.12 | | | | 0.20 | | | | 2.38 | | | | 89 | |
| | | | | | (0.54 | ) | | | 19.53 | | | | 4.06 | | | | 7,643 | | | | 0.10 | | | | 0.20 | | | | 2.44 | | | | 86 | |
| | | | | | | | | | | | | | | | | | | | | | | | | | | | | | | | | | |
| | | | | $ | (0.72 | ) | | $ | 20.55 | | | | 2.95 | % | | $ | 16,796 | | | | — | %(f) | | | 0.10 | % | | | 2.00 | % | | | 24 | % |
| | | | | | (0.56 | ) | | | 20.66 | | | | 9.54 | | | | 17,943 | | | | — | (f) | | | 0.10 | | | | 1.31 | | | | 143 | |
| | | | | | (0.71 | ) | | | 19.43 | | | | 9.94 | | | | 13,274 | | | | 0.08 | | | | 0.10 | | | | 2.93 | | | | 106 | |
| | | | | | (0.70 | ) | | | 18.37 | | | | (4.82 | ) | | | 11,847 | | | | 0.07 | (d)(e) | | | 0.12 | (d)(e) | | | 3.22 | (d)(e) | | | 144 | |
| | | | | | (0.42 | ) | | | 20.01 | | | | 4.48 | | | | 5,574 | | | | 0.02 | | | | 0.10 | | | | 2.59 | | | | 89 | |
| | | | | | (0.54 | ) | | | 19.57 | | | | 4.19 | | | | 7,457 | | | | — | | | | 0.12 | | | | 3.00 | | | | 86 | |
| | | | | | | | | | | | | | | | | | | | | | | | | | | | | | | | | | |
| | | | | $ | (0.66 | ) | | $ | 20.44 | | | | 2.61 | % | | $ | 521 | | | | 0.31 | % | | | 0.45 | % | | | 1.61 | % | | | 24 | % |
| | | | | | (0.43 | ) | | | 20.56 | | | | 9.10 | | | | 665 | | | | 0.31 | | | | 0.45 | | | | 1.22 | | | | 143 | |
| | | | | | (0.63 | ) | | | 19.28 | | | | 9.55 | | | | 377 | | | | 0.43 | | | | 0.45 | | | | 2.76 | | | | 106 | |
| | | | | | (0.63 | ) | | | 18.22 | | | | (5.09 | ) | | | 1,747 | | | | 0.41 | (d)(e) | | | 0.46 | (d)(e) | | | 5.41 | (d)(e) | | | 144 | |
| | | | | | (0.37 | ) | | | 19.84 | | | | 4.15 | | | | 7,974 | | | | 0.37 | | | | 0.45 | | | | 2.19 | | | | 89 | |
| | | | | | (0.54 | ) | | | 19.42 | | | | 3.79 | | | | 7,210 | | | | 0.35 | | | | 0.45 | | | | 1.27 | | | | 86 | |
| | (c) | Does not include expenses of the investment companies in which the Fund invests. |
| | (d) | Annualized, unless otherwise noted. |
| | (e) | Certain expenses incurred by the Fund were not annualized. |
| | (f) | See Note 6 in the Notes to Financial Statements. |
| | | | | | | | |
| See accompanying Notes to Financial Statements | | | September 30, 2018 | | | Annual Report | | | 251 | |
Financial Highlights (cont’d)
For a Share Outstanding for the Period ended:^
| | | | | | | | | | | | | | | | | | | | | | | | | | | | |
| | | Net Asset
Value,
Beginning
of Period | | | Net
Investment
Income (a) | | |
Net Realized
and Change in
Unrealized
Gain (Loss) | | | Total from
Investment
Operations | | | Dividends
from Net
Investment
Income | | | Distributions
from Net
Realized Capital
Gains | | | | |
| AllianzGI Retirement 2025: | | | | | | | | | | | | | | | | | | | | | |
| Class A | | | | | | | | | | | | | | | | | | | | | | | | | | | | |
9/30/2018 | | $ | 18.54 | | | $ | 0.27 | | | $ | 0.52 | | | $ | 0.79 | | | $ | (0.61 | ) | | $ | (0.22 | ) | | | | |
9/30/2017 | | | 16.95 | | | | 0.10 | | | | 1.81 | | | | 1.91 | | | | (0.31 | ) | | | (0.01 | ) | | | | |
9/30/2016 | | | 15.89 | | | | 0.40 | | | | 1.16 | | | | 1.56 | | | | (0.50 | ) | | | — | | | | | |
12/1/2014 - 9/30/2015# | | | 17.30 | | | | 0.41 | | | | (1.31 | ) | | | (0.90 | ) | | | (0.50 | ) | | | (0.01 | ) | | | | |
11/30/2014 | | | 16.92 | | | | 0.37 | | | | 0.33 | | | | 0.70 | | | | (0.32 | ) | | | — | | | | | |
11/30/2013 | | | 16.63 | | | | 0.41 | | | | 0.32 | | | | 0.73 | | | | (0.40 | ) | | | (0.04 | ) | | | | |
| Class R | | | | | | | | | | | | | | | | | | | | | | | | | | | | |
9/30/2018 | | $ | 18.35 | | | $ | 0.18 | | | $ | 0.54 | | | $ | 0.72 | | | $ | (0.49 | ) | | $ | (0.22 | ) | | | | |
9/30/2017 | | | 16.89 | | | | 0.14 | | | | 1.69 | | | | 1.83 | | | | (0.36 | ) | | | (0.01 | ) | | | | |
9/30/2016 | | | 15.83 | | | | 0.34 | | | | 1.16 | | | | 1.50 | | | | (0.44 | ) | | | — | | | | | |
12/1/2014 - 9/30/2015# | | | 17.21 | | | | 0.34 | | | | (1.29 | ) | | | (0.95 | ) | | | (0.42 | ) | | | (0.01 | ) | | | | |
11/30/2014 | | | 16.84 | | | | 0.32 | | | | 0.32 | | | | 0.64 | | | | (0.27 | ) | | | — | | | | | |
11/30/2013 | | | 16.57 | | | | 0.48 | | | | 0.19 | | | | 0.67 | | | | (0.36 | ) | | | (0.04 | ) | | | | |
| Class P | | | | | | | | | | | | | | | | | | | | | | | | | | | | |
9/30/2018 | | $ | 18.54 | | | $ | 0.34 | | | $ | 0.52 | | | $ | 0.86 | | | $ | (0.67 | ) | | $ | (0.22 | ) | | | | |
9/30/2017 | | | 17.05 | | | | 0.16 | | | | 1.80 | | | | 1.96 | | | | (0.46 | ) | | | (0.01 | ) | | | | |
9/30/2016 | | | 16.01 | | | | 0.44 | | | | 1.19 | | | | 1.63 | | | | (0.59 | ) | | | — | | | | | |
12/1/2014 - 9/30/2015# | | | 17.43 | | | | 0.38 | | | | (1.24 | ) | | | (0.86 | ) | | | (0.55 | ) | | | (0.01 | ) | | | | |
11/30/2014 | | | 17.02 | | | | 0.40 | | | | 0.35 | | | | 0.75 | | | | (0.34 | ) | | | — | | | | | |
11/30/2013 | | | 16.67 | | | | 0.48 | | | | 0.31 | | | | 0.79 | | | | (0.40 | ) | | | (0.04 | ) | | | | |
| Class R6 | | | | | | | | | | | | | | | | | | | | | | | | | | | | |
9/30/2018 | | $ | 18.57 | | | $ | 0.35 | | | $ | 0.52 | | | $ | 0.87 | | | $ | (0.67 | ) | | $ | (0.22 | ) | | | | |
9/30/2017 | | | 17.07 | | | | 0.15 | | | | 1.83 | | | | 1.98 | | | | (0.47 | ) | | | (0.01 | ) | | | | |
9/30/2016 | | | 16.03 | | | | 0.45 | | | | 1.19 | | | | 1.64 | | | | (0.60 | ) | | | — | | | | | |
12/1/2014 - 9/30/2015# | | | 17.45 | | | | 0.45 | | | | (1.30 | ) | | | (0.85 | ) | | | (0.56 | ) | | | (0.01 | ) | | | | |
11/30/2014 | | | 17.04 | | | | 0.44 | | | | 0.33 | | | | 0.77 | | | | (0.36 | ) | | | — | | | | | |
11/30/2013 | | | 16.68 | | | | 0.50 | | | | 0.30 | | | | 0.80 | | | | (0.40 | ) | | | (0.04 | ) | | | | |
| Administrative Class | | | | | | | | | | | | | | | | | | | | | | | | | | | | |
9/30/2018 | | $ | 18.55 | | | $ | 0.28 | | | $ | 0.52 | | | $ | 0.80 | | | $ | (0.56 | ) | | $ | (0.22 | ) | | | | |
9/30/2017 | | | 17.00 | | | | 0.11 | | | | 1.81 | | | | 1.92 | | | | (0.36 | ) | | | (0.01 | ) | | | | |
9/30/2016 | | | 15.96 | | | | 0.41 | | | | 1.17 | | | | 1.58 | | | | (0.54 | ) | | | — | | | | | |
12/1/2014 - 9/30/2015# | | | 17.37 | | | | 1.16 | | | | (2.06 | ) | | | (0.90 | ) | | | (0.50 | ) | | | (0.01 | ) | | | | |
11/30/2014 | | | 16.98 | | | | 0.38 | | | | 0.33 | | | | 0.71 | | | | (0.32 | ) | | | — | | | | | |
11/30/2013 | | | 16.62 | | | | 0.20 | | | | 0.55 | | | | 0.75 | | | | (0.35 | ) | | | (0.04 | ) | | | | |
| ^ | A — may reflect actual amounts rounding to less than $0.01 or 0.01%. |
| # | Fiscal year end changed from November 30th to September 30th. |
| (a) | Calculated on average shares outstanding during the period. |
| (b) | Total return is calculated assuming a purchase of a share on the first day of the period and a sale of a share on the last day of each period reported. Dividends and distributions, if any, are assumed, for purposes of this calculation, to be reinvested. Total return does not reflect sales charges and includes the effect of fee waivers and reimbursements. Total return may reflect adjustments to conform to U.S. GAAP. Total return for a period of less than one year is not annualized. |
| (c) | Does not include expenses of the investment companies in which the Fund invests. |
| (d) | Annualized, unless otherwise noted. |
| (e) | Certain expenses incurred by the Fund were not annualized. |
| (f) | See Note 6 in the Notes to Financial Statements. |
| | | | | | |
| 252 | | Annual Report | | | September 30, 2018 | | | See accompanying Notes to Financial Statements |
| | | | | | | | | | | | | | | | | | | | | | | | | | | | | | | | | | |
| | | | Total
Dividends and
Distributions | | | Net Asset
Value, End
of Period | | | Total Return (b) | | | Net Assets,
End of Period
(000s) | | | Ratio of
Expenses to
Average Net
Assets with
Fee Waiver/
Reimbursement (c) | | | Ratio of
Expenses to
Average Net
Assets without
Fee Waiver/
Reimbursement (c) | | | Ratio of Net
Investment
Income
to Average
Net Assets (c) | | | Portfolio
Turnover Rate | |
| | | | | | | | | | | | | | | | | | | | | | | | | | |
| | | | | | | | | | | | | | | | | | | | | | | | | | | | | | | | | | |
| | | | | $ | (0.83 | ) | | $ | 18.50 | | | | 4.30 | % | | $ | 6,444 | | | | 0.32 | % | | | 0.60 | % | | | 1.48 | % | | | 19 | % |
| | | | | | (0.32 | ) | | | 18.54 | | | | 11.55 | | | | 7,843 | | | | 0.32 | | | | 0.60 | | | | 0.56 | | | | 129 | |
| | | | | | (0.50 | ) | | | 16.95 | �� | | | 10.02 | | | | 6,663 | | | | 0.48 | | | | 0.60 | | | | 2.48 | | | | 115 | |
| | | | | | (0.51 | ) | | | 15.89 | | | | (5.28 | ) | | | 26,916 | | | | 0.45 | (d)(e) | | | 0.62 | (d)(e) | | | 2.98 | (d)(e) | | | 147 | |
| | | | | | (0.32 | ) | | | 17.30 | | | | 4.22 | | | | 31,358 | | | | 0.41 | | | | 0.60 | | | | 2.16 | | | | 93 | |
| | | | | | (0.44 | ) | | | 16.92 | | | | 4.54 | | | | 13,058 | | | | 0.40 | | | | 0.60 | | | | 2.48 | | | | 76 | |
| | | | | | | | | | | | | | | | | | | | | | | | | | | | | | | | | | |
| | | | | $ | (0.71 | ) | | $ | 18.36 | | | | 3.94 | % | | $ | 237 | | | | 0.67 | % | | | 0.85 | % | | | 1.01 | % | | | 19 | % |
| | | | | | (0.37 | ) | | | 18.35 | | | | 11.11 | | | | 219 | | | | 0.67 | | | | 0.86 | | | | 0.79 | | | | 129 | |
| | | | | | (0.44 | ) | | | 16.89 | | | | 9.67 | | | | 835 | | | | 0.83 | | | | 0.85 | | | | 2.08 | | | | 115 | |
| | | | | | (0.43 | ) | | | 15.83 | | | | (5.59 | ) | | | 1,066 | | | | 0.80 | (d)(e) | | | 0.87 | (d)(e) | | | 2.43 | (d)(e) | | | 147 | |
| | | | | | (0.27 | ) | | | 17.21 | | | | 3.83 | | | | 1,004 | | | | 0.76 | | | | 0.85 | | | | 1.89 | | | | 93 | |
| | | | | | (0.40 | ) | | | 16.84 | | | | 4.16 | | | | 753 | | | | 0.75 | | | | 0.85 | | | | 2.88 | | | | 76 | |
| | | | | | | | | | | | | | | | | | | | | | | | | | | | | | | | | | |
| | | | | $ | (0.89 | ) | | $ | 18.51 | | | | 4.65 | % | | $ | 22,387 | | | | 0.02 | % | | | 0.20 | % | | | 1.85 | % | | | 19 | % |
| | | | | | (0.47 | ) | | | 18.54 | | | | 11.85 | | | | 36,000 | | | | 0.02 | | | | 0.20 | | | | 0.92 | | | | 129 | |
| | | | | | (0.59 | ) | | | 17.05 | | | | 10.43 | | | | 34,729 | | | | 0.18 | | | | 0.20 | | | | 2.70 | | | | 115 | |
| | | | | | (0.56 | ) | | | 16.01 | | | | (5.04 | ) | | | 29,233 | | | | 0.15 | (d)(e) | | | 0.22 | (d)(e) | | | 2.71 | (d)(e) | | | 147 | |
| | | | | | (0.34 | ) | | | 17.43 | | | | 4.49 | | | | 13,866 | | | | 0.11 | | | | 0.20 | | | | 2.32 | | | | 93 | |
| | | | | | (0.44 | ) | | | 17.02 | | | | 4.84 | | | | 4,336 | | | | 0.10 | | | | 0.20 | | | | 2.88 | | | | 76 | |
| | | | | | | | | | | | | | | | | | | | | | | | | | | | | | | | | | |
| | | | | $ | (0.89 | ) | | $ | 18.55 | | | | 4.73 | % | | $ | 21,599 | | | | — | %(f) | | | 0.10 | % | | | 1.89 | % | | | 19 | % |
| | | | | | (0.48 | ) | | | 18.57 | | | | 11.97 | | | | 20,971 | | | | — | (f) | | | 0.10 | | | | 0.87 | | | | 129 | |
| | | | | | (0.60 | ) | | | 17.07 | | | | 10.55 | | | | 12,439 | | | | 0.08 | | | | 0.10 | | | | 2.78 | | | | 115 | |
| | | | | | (0.57 | ) | | | 16.03 | | | | (4.97 | ) | | | 10,047 | | | | 0.05 | (d)(e) | | | 0.12 | (d)(e) | | | 3.25 | (d)(e) | | | 147 | |
| | | | | | (0.36 | ) | | | 17.45 | | | | 4.60 | | | | 6,745 | | | | 0.01 | | | | 0.10 | | | | 2.54 | | | | 93 | |
| | | | | | (0.44 | ) | | | 17.04 | | | | 4.93 | | | | 5,058 | | | | — | | | | 0.12 | | | | 3.02 | | | | 76 | |
| | | | | | | | | | | | | | | | | | | | | | | | | | | | | | | | | | |
| | | | | $ | (0.78 | ) | | $ | 18.57 | | | | 4.34 | % | | $ | 192 | | | | 0.27 | % | | | 0.45 | % | | | 1.48 | % | | | 19 | % |
| | | | | | (0.37 | ) | | | 18.55 | | | | 11.57 | | | | 740 | | | | 0.27 | | | | 0.45 | | | | 0.61 | | | | 129 | |
| | | | | | (0.54 | ) | | | 17.00 | | | | 10.12 | | | | 585 | | | | 0.43 | | | | 0.45 | | | | 2.56 | | | | 115 | |
| | | | | | (0.51 | ) | | | 15.96 | | | | (5.26 | ) | | | 1,165 | | | | 0.39 | (d)(e) | | | 0.46 | (d)(e) | | | 8.16 | (d)(e) | | | 147 | |
| | | | | | (0.32 | ) | | | 17.37 | | | | 4.26 | | | | 12,135 | | | | 0.36 | | | | 0.45 | | | | 2.23 | | | | 93 | |
| | | | | | (0.39 | ) | | | 16.98 | | | | 4.60 | | | | 10,606 | | | | 0.35 | | | | 0.45 | | | | 1.23 | | | | 76 | |
| | | | | | | | |
| See accompanying Notes to Financial Statements | | | September 30, 2018 | | | Annual Report | | | 253 | |
Financial Highlights (cont’d)
For a Share Outstanding for the Period ended:^
| | | | | | | | | | | | | | | | | | | | | | | | | | | | |
| | | Net Asset
Value,
Beginning
of Period | | | Net
Investment
Income
(Loss) (a) | | |
Net Realized
and Change in
Unrealized
Gain (Loss) | | | Total from
Investment
Operations | | | Dividends
from Net
Investment
Income | | | Distributions
from Net
Realized Capital
Gains | | | | |
| AllianzGI Retirement 2030: | | | | | | | | | | | | | | | | | | | | | |
| Class A | | | | | | | | | | | | | | | | | | | | | | | | | | | | |
9/30/2018 | | $ | 22.48 | | | $ | 0.35 | | | $ | 0.85 | | | $ | 1.20 | | | $ | (0.89 | ) | | $ | (0.32 | ) | | | | |
9/30/2017 | | | 20.14 | | | | 0.07 | | | | 2.70 | | | | 2.77 | | | | (0.35 | ) | | | (0.08 | ) | | | | |
9/30/2016 | | | 18.84 | | | | 0.44 | | | | 1.39 | | | | 1.83 | | | | (0.53 | ) | | | — | | | | | |
12/1/2014 - 9/30/2015# | | | 21.05 | | | | 0.50 | | | | (1.75 | ) | | | (1.25 | ) | | | (0.69 | ) | | | (0.27 | ) | | | | |
11/30/2014 | | | 20.66 | | | | 0.48 | | | | 0.38 | | | | 0.86 | | | | (0.47 | ) | | | — | | | | | |
11/30/2013 | | | 19.80 | | | | 0.52 | | | | 0.92 | | | | 1.44 | | | | (0.54 | ) | | | (0.04 | ) | | | | |
| Class C | | | | | | | | | | | | | | | | | | | | | | | | | | | | |
9/30/2018 | | $ | 22.17 | | | $ | 0.15 | | | $ | 0.87 | | | $ | 1.02 | | | $ | (0.72 | ) | | $ | (0.32 | ) | | | | |
9/30/2017 | | | 19.96 | | | | (0.09 | ) | | | 2.66 | | | | 2.57 | | | | (0.28 | ) | | | (0.08 | ) | | | | |
9/30/2016 | | | 18.70 | | | | 0.27 | | | | 1.41 | | | | 1.68 | | | | (0.42 | ) | | | — | | | | | |
12/1/2014 - 9/30/2015# | | | 20.83 | | | | 0.36 | | | | (1.72 | ) | | | (1.36 | ) | | | (0.50 | ) | | | (0.27 | ) | | | | |
11/30/2014 | | | 20.42 | | | | 0.33 | | | | 0.36 | | | | 0.69 | | | | (0.28 | ) | | | — | | | | | |
11/30/2013 | | | 19.53 | | | | 0.35 | | | | 0.93 | | | | 1.28 | | | | (0.35 | ) | | | (0.04 | ) | | | | |
| Class R | | | | | | | | | | | | | | | | | | | | | | | | | | | | |
9/30/2018 | | $ | 22.35 | | | $ | 0.30 | | | $ | 0.81 | | | $ | 1.11 | | | $ | (0.73 | ) | | $ | (0.32 | ) | | | | |
9/30/2017 | | | 20.11 | | | | 0.15 | | | | 2.54 | | | | 2.69 | | | | (0.37 | ) | | | (0.08 | ) | | | | |
9/30/2016 | | | 18.89 | | | | 0.36 | | | | 1.40 | | | | 1.76 | | | | (0.54 | ) | | | — | | | | | |
12/1/2014 - 9/30/2015# | | | 21.07 | | | | 0.42 | | | | (1.72 | ) | | | (1.30 | ) | | | (0.61 | ) | | | (0.27 | ) | | | | |
11/30/2014 | | | 20.65 | | | | 0.41 | | | | 0.37 | | | | 0.78 | | | | (0.36 | ) | | | — | | | | | |
11/30/2013 | | | 19.85 | | | | 0.46 | | | | 0.91 | | | | 1.37 | | | | (0.53 | ) | | | (0.04 | ) | | | | |
| Class P | | | | | | | | | | | | | | | | | | | | | | | | | | | | |
9/30/2018 | | $ | 22.72 | | | $ | 0.43 | | | $ | 0.85 | | | $ | 1.28 | | | $ | (0.95 | ) | | $ | (0.32 | ) | | | | |
9/30/2017 | | | 20.43 | | | | 0.15 | | | | 2.71 | | | | 2.86 | | | | (0.49 | ) | | | (0.08 | ) | | | | |
9/30/2016 | | | 19.14 | | | | 0.48 | | | | 1.44 | | | | 1.92 | | | | (0.63 | ) | | | — | | | | | |
12/1/2014 - 9/30/2015# | | | 21.37 | | | | 0.47 | | | | (1.69 | ) | | | (1.22 | ) | | | (0.74 | ) | | | (0.27 | ) | | | | |
11/30/2014 | | | 20.93 | | | | 0.51 | | | | 0.43 | | | | 0.94 | | | | (0.50 | ) | | | — | | | | | |
11/30/2013 | | | 20.02 | | | | 0.51 | | | | 1.00 | | | | 1.51 | | | | (0.56 | ) | | | (0.04 | ) | | | | |
| Class R6 | | | | | | | | | | | | | | | | | | | | | | | | | | | | |
9/30/2018 | | $ | 22.78 | | | $ | 0.44 | | | $ | 0.87 | | | $ | 1.31 | | | $ | (0.96 | ) | | $ | (0.32 | ) | | | | |
9/30/2017 | | | 20.48 | | | | 0.15 | | | | 2.73 | | | | 2.88 | | | | (0.50 | ) | | | (0.08 | ) | | | | |
9/30/2016 | | | 19.19 | | | | 0.50 | | | | 1.44 | | | | 1.94 | | | | (0.65 | ) | | | — | | | | | |
12/1/2014 - 9/30/2015# | | | 21.42 | | | | 0.54 | | | | (1.74 | ) | | | (1.20 | ) | | | (0.76 | ) | | | (0.27 | ) | | | | |
11/30/2014 | | | 20.98 | | | | 0.59 | | | | 0.36 | | | | 0.95 | | | | (0.51 | ) | | | — | | | | | |
11/30/2013 | | | 20.04 | | | | 0.62 | | | | 0.92 | | | | 1.54 | | | | (0.56 | ) | | | (0.04 | ) | | | | |
| Administrative Class | | | | | | | | | | | | | | | | | | | | | | | | | | | | |
9/30/2018 | | $ | 22.66 | | | $ | 0.33 | | | $ | 0.90 | | | $ | 1.23 | | | $ | (0.81 | ) | | $ | (0.32 | ) | | | | |
9/30/2017 | | | 20.34 | | | | 0.09 | | | | 2.72 | | | | 2.81 | | | | (0.41 | ) | | | (0.08 | ) | | | | |
9/30/2016 | | | 19.06 | | | | 0.45 | | | | 1.41 | | | | 1.86 | | | | (0.58 | ) | | | — | | | | | |
12/1/2014 - 9/30/2015# | | | 21.28 | | | | 1.21 | | | | (2.47 | ) | | | (1.26 | ) | | | (0.69 | ) | | | (0.27 | ) | | | | |
11/30/2014 | | | 20.87 | | | | 0.50 | | | | 0.38 | | | | 0.88 | | | | (0.47 | ) | | | — | | | | | |
11/30/2013 | | | 19.96 | | | | 0.26 | | | | 1.21 | | | | 1.47 | | | | (0.52 | ) | | | (0.04 | ) | | | | |
| ^ | A — may reflect actual amounts rounding to less than $0.01 or 0.01%. |
| # | Fiscal year end changed from November 30th to September 30th. |
| (a) | Calculated on average shares outstanding during the period. |
| (b) | Total return is calculated assuming a purchase of a share on the first day of the period and a sale of a share on the last day of each period reported. Dividends and distributions, if any, are assumed, for purposes of this calculation, to be reinvested. Total return does not reflect sales charges and includes the effect of fee waivers and reimbursements. Total return may reflect adjustments to conform to U.S. GAAP. Total return for a period of less than one year is not annualized. |
| (c) | Does not include expenses of the investment companies in which the Fund invests. |
| (d) | Annualized, unless otherwise noted. |
| (e) | Certain expenses incurred by the Fund were not annualized. |
| (f) | See Note 6 in the Notes to Financial Statements. |
| | | | | | |
| 254 | | Annual Report | | | September 30, 2018 | | | See accompanying Notes to Financial Statements |
| | | | | | | | | | | | | | | | | | | | | | | | | | | | | | | | | | |
| | | | Total
Dividends and
Distributions | | | Net Asset
Value, End
of Period | | | Total Return (b) | | | Net Assets,
End of Period
(000s) | | | Ratio of
Expenses to
Average Net Assets with
Fee Waiver/
Reimbursement (c) | | | Ratio of Expenses to
Average Net Assets without
Fee Waiver/
Reimbursement (c) | | | Ratio of Net
Investment
Income (Loss)
to Average
Net Assets (c) | | | Portfolio
Turnover Rate | |
| | | | | | | | | | | | | | | | | | | | | | | | | | |
| | | | | | | | | | | | | | | | | | | | | | | | | | | | | | | | | | |
| | | | | $ | (1.21 | ) | | $ | 22.47 | | | | 5.40 | % | | $ | 6,521 | | | | 0.32 | % | | | 0.60 | % | | | 1.58 | % | | | 16 | % |
| | | | | | (0.43 | ) | | | 22.48 | | | | 14.04 | | | | 9,633 | | | | 0.33 | | | | 0.60 | | | | 0.32 | | | | 125 | |
| | | | | | (0.53 | ) | | | 20.14 | | | | 9.91 | | | | 7,473 | | | | 0.47 | | | | 0.60 | | | | 2.26 | | | | 105 | |
| | | | | | (0.96 | ) | | | 18.84 | | | | (6.16 | ) | | | 22,695 | | | | 0.42 | (d)(e) | | | 0.62 | (d)(e) | | | 3.01 | (d)(e) | | | 147 | |
| | | | | | (0.47 | ) | | | 21.05 | | | | 4.26 | | | | 25,487 | | | | 0.39 | | | | 0.60 | | | | 2.28 | | | | 93 | |
| | | | | | (0.58 | ) | | | 20.66 | | | | 7.48 | | | | 10,080 | | | | 0.35 | | | | 0.60 | | | | 2.58 | | | | 79 | |
| | | | | | | | | | | | | | | | | | | | | | | | | | | | | | | | | | |
| | | | | $ | (1.04 | ) | | $ | 22.15 | | | | 4.64 | % | | $ | 865 | | | | 1.07 | % | | | 1.35 | % | | | 0.69 | % | | | 16 | % |
| | | | | | (0.36 | ) | | | 22.17 | | | | 13.11 | | | | 790 | | | | 1.08 | | | | 1.35 | | | | (0.42 | ) | | | 125 | |
| | | | | | (0.42 | ) | | | 19.96 | | | | 9.11 | | | | 696 | | | | 1.22 | | | | 1.35 | | | | 1.44 | | | | 105 | |
| | | | | | (0.77 | ) | | | 18.70 | | | | (6.72 | ) | | | 608 | | | | 1.17 | (d)(e) | | | 1.37 | (d)(e) | | | 2.19 | (d)(e) | | | 147 | |
| | | | | | (0.28 | ) | | | 20.83 | | | | 3.43 | | | | 680 | | | | 1.14 | | | | 1.35 | | | | 1.59 | | | | 93 | |
| | | | | | (0.39 | ) | | | 20.42 | | | | 6.63 | | | | 736 | | | | 1.10 | | | | 1.35 | | | | 1.77 | | | | 79 | |
| | | | | | | | | | | | | | | | | | | | | | | | | | | | | | | | | | |
| | | | | $ | (1.05 | ) | | $ | 22.41 | | | | 5.03 | % | | $ | 295 | | | | 0.67 | % | | | 0.85 | % | | | 1.36 | % | | | 16 | % |
| | | | | | (0.45 | ) | | | 22.35 | | | | 13.64 | | | | 500 | | | | 0.68 | | | | 0.86 | | | | 0.73 | | | | 125 | |
| | | | | | (0.54 | ) | | | 20.11 | | | | 9.48 | | | | 2,295 | | | | 0.82 | | | | 0.85 | | | | 1.87 | | | | 105 | |
| | | | | | (0.88 | ) | | | 18.89 | | | | (6.38 | ) | | | 1,445 | | | | 0.77 | (d)(e) | | | 0.87 | (d)(e) | | | 2.49 | (d)(e) | | | 147 | |
| | | | | | (0.36 | ) | | | 21.07 | | | | 3.85 | | | | 1,420 | | | | 0.74 | | | | 0.85 | | | | 1.94 | | | | 93 | |
| | | | | | (0.57 | ) | | | 20.65 | | | | 7.09 | | | | 1,199 | | | | 0.70 | | | | 0.85 | | | | 2.28 | | | | 79 | |
| | | | | | | | | | | | | | | | | | | | | | | | | | | | | | | | | | |
| | | | | $ | (1.27 | ) | | $ | 22.73 | | | | 5.72 | % | | $ | 27,035 | | | | 0.02 | % | | | 0.20 | % | | | 1.88 | % | | | 16 | % |
| | | | | | (0.57 | ) | | | 22.72 | | | | 14.34 | | | | 36,184 | | | | 0.03 | | | | 0.20 | | | | 0.70 | | | | 125 | |
| | | | | | (0.63 | ) | | | 20.43 | | | | 10.25 | | | | 33,628 | | | | 0.17 | | | | 0.20 | | | | 2.49 | | | | 105 | |
| | | | | | (1.01 | ) | | | 19.14 | | | | (5.91 | ) | | | 28,597 | | | | 0.12 | (d)(e) | | | 0.22 | (d)(e) | | | 2.80 | (d)(e) | | | 147 | |
| | | | | | (0.50 | ) | | | 21.37 | | | | 4.58 | | | | 17,741 | | | | 0.09 | | | | 0.20 | | | | 2.42 | | | | 93 | |
| | | | | | (0.60 | ) | | | 20.93 | | | | 7.77 | | | | 7,748 | | | | 0.05 | | | | 0.20 | | | | 2.54 | | | | 79 | |
| | | | | | | | | | | | | | | | | | | | | | | | | | | | | | | | | | |
| | | | | $ | (1.28 | ) | | $ | 22.81 | | | | 5.83 | % | | $ | 25,140 | | | | — | %(f) | | | 0.10 | % | | | 1.92 | % | | | 16 | % |
| | | | | | (0.58 | ) | | | 22.78 | | | | 14.44 | | | | 24,904 | | | | — | (f) | | | 0.10 | | | | 0.69 | | | | 125 | |
| | | | | | (0.65 | ) | | | 20.48 | | | | 10.34 | | | | 16,758 | | | | 0.07 | | | | 0.10 | | | | 2.54 | | | | 105 | |
| | | | | | (1.03 | ) | | | 19.19 | | | | (5.81 | ) | | | 12,883 | | | | 0.02 | (d)(e) | | | 0.12 | (d)(e) | | | 3.19 | (d)(e) | | | 147 | |
| | | | | | (0.51 | ) | | | 21.42 | | | | 4.63 | | | | 8,752 | | | | — | (f) | | | 0.10 | | | | 2.79 | | | | 93 | |
| | | | | | (0.60 | ) | | | 20.98 | | | | 7.87 | | | | 10,854 | | | | — | (f) | | | 0.12 | | | | 3.05 | | | | 79 | |
| | | | | | | | | | | | | | | | | | | | | | | | | | | | | | | | | | |
| | | | | $ | (1.13 | ) | | $ | 22.76 | | | | 5.48 | % | | $ | 486 | | | | 0.27 | % | | | 0.45 | % | | | 1.44 | % | | | 16 | % |
| | | | | | (0.49 | ) | | | 22.66 | | | | 14.09 | | | | 1,392 | | | | 0.28 | | | | 0.45 | | | | 0.44 | | | | 125 | |
| | | | | | (0.58 | ) | | | 20.34 | | | | 9.96 | | | | 1,250 | | | | 0.42 | | | | 0.45 | | | | 2.33 | | | | 105 | |
| | | | | | (0.96 | ) | | | 19.06 | | | | (6.11 | ) | | | 1,817 | | | | 0.36 | (d)(e) | | | 0.46 | (d)(e) | | | 7.07 | (d)(e) | | | 147 | |
| | | | | | (0.47 | ) | | | 21.28 | | | | 4.29 | | | | 9,586 | | | | 0.34 | | | | 0.45 | | | | 2.37 | | | | 93 | |
| | | | | | (0.56 | ) | | | 20.87 | | | | 7.55 | | | | 8,939 | | | | 0.30 | | | | 0.45 | | | | 1.29 | | | | 79 | |
| | | | | | | | |
| See accompanying Notes to Financial Statements | | | September 30, 2018 | | | Annual Report | | | 255 | |
Financial Highlights (cont’d)
For a Share Outstanding for the Period ended:^
| | | | | | | | | | | | | | | | | | | | | | | | | | | | |
| | | Net Asset
Value,
Beginning
of Period | | | Net
Investment
Income (a) | | |
Net Realized
and Change in
Unrealized
Gain (Loss) | | | Total from
Investment
Operations | | | Dividends
from Net
Investment
Income | | | Distributions
from Net
Realized Capital
Gains | | | | |
| AllianzGI Retirement 2035: | | | | | | | | | | | | | | | | | | | | | |
| Class A | | | | | | | | | | | | | | | | | | | | | | | | | | | | |
9/30/2018 | | $ | 20.05 | | | $ | 0.36 | | | $ | 0.88 | | | $ | 1.24 | | | $ | (0.94 | ) | | $ | (0.25 | ) | | | | |
9/30/2017 | | | 17.69 | | | | 0.12 | | | | 2.67 | | | | 2.79 | | | | (0.34 | ) | | | (0.09 | ) | | | | |
9/30/2016 | | | 16.52 | | | | 0.28 | | | | 1.32 | | | | 1.60 | | | | (0.43 | ) | | | — | | | | | |
12/1/2014 - 9/30/2015# | | | 18.49 | | | | 0.43 | | | | (1.58 | ) | | | (1.15 | ) | | | (0.61 | ) | | | (0.21 | ) | | | | |
11/30/2014 | | | 18.09 | | | | 0.41 | | | | 0.39 | | | | 0.80 | | | | (0.40 | ) | | | — | | | | | |
11/30/2013 | | | 16.94 | | | | 0.43 | | | | 1.20 | | | | 1.63 | | | | (0.42 | ) | | | (0.06 | ) | | | | |
| Class R | | | | | | | | | | | | | | | | | | | | | | | | | | | | |
9/30/2018 | | $ | 19.92 | | | $ | 0.28 | | | $ | 0.88 | | | $ | 1.16 | | | $ | (0.84 | ) | | $ | (0.25 | ) | | | | |
9/30/2017 | | | 17.62 | | | | 0.17 | | | | 2.55 | | | | 2.72 | | | | (0.33 | ) | | | (0.09 | ) | | | | |
9/30/2016 | | | 16.48 | | | | 0.22 | | | | 1.31 | | | | 1.53 | | | | (0.39 | ) | | | — | | | | | |
12/1/2014 - 9/30/2015# | | | 18.43 | | | | 0.30 | | | | (1.50 | ) | | | (1.20 | ) | | | (0.54 | ) | | | (0.21 | ) | | | | |
11/30/2014 | | | 18.00 | | | | 0.35 | | | | 0.38 | | | | 0.73 | | | | (0.30 | ) | | | — | | | | | |
11/30/2013 | | | 16.89 | | | | 0.41 | | | | 1.15 | | | | 1.56 | | | | (0.39 | ) | | | (0.06 | ) | | | | |
| Class P | | | | | | | | | | | | | | | | | | | | | | | | | | | | |
9/30/2018 | | $ | 20.16 | | | $ | 0.45 | | | $ | 0.86 | | | $ | 1.31 | | | $ | (1.00 | ) | | $ | (0.25 | ) | | | | |
9/30/2017 | | | 17.82 | | | | 0.17 | | | | 2.70 | | | | 2.87 | | | | (0.44 | ) | | | (0.09 | ) | | | | |
9/30/2016 | | | 16.67 | | | | 0.33 | | | | 1.33 | | | | 1.66 | | | | (0.51 | ) | | | — | | | | | |
12/1/2014 - 9/30/2015# | | | 18.65 | | | | 0.38 | | | | (1.50 | ) | | | (1.12 | ) | | | (0.65 | ) | | | (0.21 | ) | | | | |
11/30/2014 | | | 18.20 | | | | 0.43 | | | | 0.43 | | | | 0.86 | | | | (0.41 | ) | | | — | | | | | |
11/30/2013 | | | 16.99 | | | | 0.49 | | | | 1.20 | | | | 1.69 | | | | (0.42 | ) | | | (0.06 | ) | | | | |
| Class R6 | | | | | | | | | | | | | | | | | | | | | | | | | | | | |
9/30/2018 | | $ | 20.20 | | | $ | 0.44 | | | $ | 0.89 | | | $ | 1.33 | | | $ | (1.02 | ) | | $ | (0.25 | ) | | | | |
9/30/2017 | | | 17.86 | | | | 0.16 | | | | 2.73 | | | | 2.89 | | | | (0.46 | ) | | | (0.09 | ) | | | | |
9/30/2016 | | | 16.70 | | | | 0.33 | | | | 1.35 | | | | 1.68 | | | | (0.52 | ) | | | — | | | | | |
12/1/2014 - 9/30/2015# | | | 18.68 | | | | 0.48 | | | | (1.58 | ) | | | (1.10 | ) | | | (0.67 | ) | | | (0.21 | ) | | | | |
11/30/2014 | | | 18.23 | | | | 0.49 | | | | 0.38 | | | | 0.87 | | | | (0.42 | ) | | | — | | | | | |
11/30/2013 | | | 17.00 | | | | 0.54 | | | | 1.17 | | | | 1.71 | | | | (0.42 | ) | | | (0.06 | ) | | | | |
| Administrative Class | | | | | | | | | | | | | | | | | | | | | | | | | | | | |
9/30/2018 | | $ | 20.11 | | | $ | 0.26 | | | $ | 0.98 | | | $ | 1.24 | | | $ | (0.83 | ) | | $ | (0.25 | ) | | | | |
9/30/2017 | | | 17.77 | | | | 0.11 | | | | 2.70 | | | | 2.81 | | | | (0.38 | ) | | | (0.09 | ) | | | | |
9/30/2016 | | | 16.60 | | | | 0.29 | | | | 1.33 | | | | 1.62 | | | | (0.45 | ) | | | — | | | | | |
12/1/2014 - 9/30/2015# | | | 18.58 | | | | 1.63 | | | | (2.79 | ) | | | (1.16 | ) | | | (0.61 | ) | | | (0.21 | ) | | | | |
11/30/2014 | | | 18.15 | | | | 0.43 | | | | 0.39 | | | | 0.82 | | | | (0.39 | ) | | | — | | | | | |
11/30/2013 | | | 16.94 | | | | 0.22 | | | | 1.43 | | | | 1.65 | | | | (0.38 | ) | | | (0.06 | ) | | | | |
| ^ | A — may reflect actual amounts rounding to less than $0.01 or 0.01%. |
| # | Fiscal year end changed from November 30th to September 30th. |
| (a) | Calculated on average shares outstanding during the period. |
| (b) | Total return is calculated assuming a purchase of a share on the first day of the period and a sale of a share on the last day of each period reported. Dividends and distributions, if any, are assumed, for purposes of this calculation, to be reinvested. Total return does not reflect sales charges and includes the effect of fee waivers and reimbursements. Total return may reflect adjustments to conform to U.S. GAAP. Total return for a period of less than one year is not annualized. |
| (c) | Does not include expenses of the investment companies in which the Fund invests. |
| (d) | Annualized, unless otherwise noted. |
| (e) | Certain expenses incurred by the Fund were not annualized. |
| (f) | See Note 6 in the Notes to Financial Statements. |
| | | | | | |
| 256 | | Annual Report | | | September 30, 2018 | | | See accompanying Notes to Financial Statements |
| | | | | | | | | | | | | | | | | | | | | | | | | | | | | | | | | | |
| | | | Total
Dividends and
Distributions | | | Net Asset
Value, End
of Period | | | Total Return (b) | | | Net Assets,
End of Period
(000s) | | | Ratio of
Expenses to
Average Net
Assets with
Fee Waiver/
Reimbursement (c) | | | Ratio of
Expenses to
Average Net Assets
without Fee
Waiver/
Reimbursement (c) | | | Ratio of Net
Investment
Income
to Average
Net Assets (c) | | | Portfolio
Turnover Rate | |
| | | | | | | | | | | | | | | | | | | | | | | | | | |
| | | | | | | | | | | | | | | | | | | | | | | | | | | | | | | | | | |
| | | | | $ | (1.19 | ) | | $ | 20.10 | | | | 6.27 | % | | $ | 6,258 | | | | 0.39 | % | | | 0.60 | % | | | 1.81 | % | | | 19 | % |
| | | | | | (0.43 | ) | | | 20.05 | | | | 16.14 | | | | 8,683 | | | | 0.40 | | | | 0.60 | | | | 0.66 | | | | 122 | |
| | | | | | (0.43 | ) | | | 17.69 | | | | 9.83 | | | | 9,173 | | | | 0.50 | | | | 0.60 | | | | 1.66 | | | | 97 | |
| | | | | | (0.82 | ) | | | 16.52 | | | | (6.46 | ) | | | 19,205 | | | | 0.41 | (d)(e) | | | 0.61 | (d)(e) | | | 2.93 | (d)(e) | | | 138 | |
| | | | | | (0.40 | ) | | | 18.49 | | | | 4.49 | | | | 20,351 | | | | 0.39 | | | | 0.60 | | | | 2.27 | | | | 90 | |
| | | | | | (0.48 | ) | | | 18.09 | | | | 9.83 | | | | 6,939 | | | | 0.35 | | | | 0.60 | | | | 2.48 | | | | 67 | |
| | | | | | | | | | | | | | | | | | | | | | | | | | | | | | | | | | |
| | | | | $ | (1.09 | ) | | $ | 19.99 | | | | 5.92 | % | | $ | 614 | | | | 0.74 | % | | | 0.85 | % | | | 1.44 | % | | | 19 | % |
| | | | | | (0.42 | ) | | | 19.92 | | | | 15.74 | | | | 672 | | | | 0.75 | | | | 0.86 | | | | 0.92 | | | | 122 | |
| | | | | | (0.39 | ) | | | 17.62 | | | | 9.45 | | | | 1,575 | | | | 0.85 | | | | 0.85 | | | | 1.30 | | | | 97 | |
| | | | | | (0.75 | ) | | | 16.48 | | | | (6.76 | ) | | | 1,600 | | | | 0.76 | (d)(e) | | | 0.87 | (d)(e) | | | 2.07 | (d)(e) | | | 138 | |
| | | | | | (0.30 | ) | | | 18.43 | | | | 4.14 | | | | 1,089 | | | | 0.74 | | | | 0.85 | | | | 1.93 | | | | 90 | |
| | | | | | (0.45 | ) | | | 18.00 | | | | 9.46 | | | | 961 | | | | 0.70 | | | | 0.85 | | | | 2.38 | | | | 67 | |
| | | | | | | | | | | | | | | | | | | | | | | | | | | | | | | | | | |
| | | | | $ | (1.25 | ) | | $ | 20.22 | | | | 6.59 | % | | $ | 20,108 | | | | 0.09 | % | | | 0.20 | % | | | 2.24 | % | | | 19 | % |
| | | | | | (0.53 | ) | | | 20.16 | | | | 16.52 | | | | 32,371 | | | | 0.10 | | | | 0.20 | | | | 0.93 | | | | 122 | |
| | | | | | (0.51 | ) | | | 17.82 | | | | 10.13 | | | | 29,994 | | | | 0.20 | | | | 0.20 | | | | 1.96 | | | | 97 | |
| | | | | | (0.86 | ) | | | 16.67 | | | | (6.23 | ) | | | 26,729 | | | | 0.11 | (d)(e) | | | 0.21 | (d)(e) | | | 2.58 | (d)(e) | | | 138 | |
| | | | | | (0.41 | ) | | | 18.65 | | | | 4.84 | | | | 14,105 | | | | 0.09 | | | | 0.20 | | | | 2.32 | | | | 90 | |
| | | | | | (0.48 | ) | | | 18.20 | | | | 10.19 | | | | 5,333 | | | | 0.05 | | | | 0.20 | | | | 2.83 | | | | 67 | |
| | | | | | | | | | | | | | | | | | | | | | | | | | | | | | | | | | |
| | | | | $ | (1.27 | ) | | $ | 20.26 | | | | 6.68 | % | | $ | 17,113 | | | | — | %(f) | | | 0.10 | % | | | 2.21 | % | | | 19 | % |
| | | | | | (0.55 | ) | | | 20.20 | | | | 16.61 | | | | 15,879 | | | | — | (f) | | | 0.10 | | | | 0.86 | | | | 122 | |
| | | | | | (0.52 | ) | | | 17.86 | | | | 10.29 | | | | 9,265 | | | | 0.10 | | | | 0.10 | | | | 1.94 | | | | 97 | |
| | | | | | (0.88 | ) | | | 16.70 | | | | (6.15 | ) | | | 6,172 | | | | — | (d)(e) | | | 0.12 | (d)(e) | | | 3.22 | (d)(e) | | | 138 | |
| | | | | | (0.42 | ) | | | 18.68 | | | | 4.89 | | | | 6,587 | | | | — | (f) | | | 0.10 | | | | 2.66 | | | | 90 | |
| | | | | | (0.48 | ) | | | 18.23 | | | | 10.24 | | | | 5,850 | | | | — | (f) | | | 0.12 | | | | 3.10 | | | | 67 | |
| | | | | | | | | | | | | | | | | | | | | | | | | | | | | | | | | | |
| | | | | $ | (1.08 | ) | | $ | 20.27 | | | | 6.28 | % | | $ | 361 | | | | 0.34 | % | | | 0.45 | % | | | 1.31 | % | | | 19 | % |
| | | | | | (0.47 | ) | | | 20.11 | | | | 16.22 | | | | 884 | | | | 0.35 | | | | 0.45 | | | | 0.57 | | | | 122 | |
| | | | | | (0.45 | ) | | | 17.77 | | | | 9.93 | | | | 639 | | | | 0.45 | | | | 0.45 | | | | 1.74 | | | | 97 | |
| | | | | | (0.82 | ) | | | 16.60 | | | | (6.50 | ) | | | 719 | | | | 0.35 | (d)(e) | | | 0.46 | (d)(e) | | | 10.75 | (d)(e) | | | 138 | |
| | | | | | (0.39 | ) | | | 18.58 | | | | 4.60 | | | | 11,550 | | | | 0.34 | | | | 0.45 | | | | 2.33 | | | | 90 | |
| | | | | | (0.44 | ) | | | 18.15 | | | | 9.95 | | | | 10,427 | | | | 0.30 | | | | 0.45 | | | | 1.29 | | | | 67 | |
| | | | | | | | |
| See accompanying Notes to Financial Statements | | | September 30, 2018 | | | Annual Report | | | 257 | |
Financial Highlights (cont’d)
For a Share Outstanding for the Period ended:^
| | | | | | | | | | | | | | | | | | | | | | | | | | | | |
| | | Net Asset
Value,
Beginning
of Period | | | Net
Investment
Income (a) | | | Net Realized
and Change in
Unrealized
Gain (Loss) | | | Total from
Investment
Operations | | |
Dividends
from Net
Investment
Income | | | Distributions
from Net
Realized Capital
Gains | | | | |
| AllianzGI Retirement 2040: | | | | | | | | | | | | | | | | | | | | | |
| Class A | | | | | | | | | | | | | | | | | | | | | | | | | | | | |
9/30/2018 | | $ | 23.24 | | | $ | 0.49 | | | $ | 1.06 | | | $ | 1.55 | | | $ | (1.23 | ) | | $ | (0.21 | ) | | | | |
9/30/2017 | | | 20.51 | | | | 0.12 | | | | 3.35 | | | | 3.47 | | | | (0.37 | ) | | | (0.37 | ) | | | | |
9/30/2016 | | | 19.04 | | | | 0.27 | | | | 1.61 | | | | 1.88 | | | | (0.38 | ) | | | (0.03 | ) | | | | |
12/1/2014 - 9/30/2015# | | | 21.91 | | | | 0.49 | | | | (1.94 | ) | | | (1.45 | ) | | | (0.83 | ) | | | (0.59 | ) | | | | |
11/30/2014 | | | 21.45 | | | | 0.48 | | | | 0.50 | | | | 0.98 | | | | (0.51 | ) | | | (0.01 | ) | | | | |
11/30/2013 | | | 19.71 | | | | 0.49 | | | | 1.82 | | | | 2.31 | | | | (0.53 | ) | | | (0.04 | ) | | | | |
| Class C | | | | | | | | | | | | | | | | | | | | | | | | | | | | |
9/30/2018 | | $ | 22.97 | | | $ | 0.33 | | | $ | 1.03 | | | $ | 1.36 | | | $ | (1.06 | ) | | $ | (0.21 | ) | | | | |
9/30/2017 | | | 20.36 | | | | 0.01 | | | | 3.26 | | | | 3.27 | | | | (0.29 | ) | | | (0.37 | ) | | | | |
9/30/2016 | | | 18.94 | | | | 0.19 | | | | 1.54 | | | | 1.73 | | | | (0.28 | ) | | | (0.03 | ) | | | | |
12/1/2014 - 9/30/2015# | | | 21.68 | | | | 0.38 | | | | (1.94 | ) | | | (1.56 | ) | | | (0.59 | ) | | | (0.59 | ) | | | | |
11/30/2014 | | | 21.21 | | | | 0.33 | | | | 0.48 | | | | 0.81 | | | | (0.33 | ) | | | (0.01 | ) | | | | |
11/30/2013 | | | 19.53 | | | | 0.34 | | | | 1.80 | | | | 2.14 | | | | (0.42 | ) | | | (0.04 | ) | | | | |
| Class R | | | | | | | | | | | | | | | | | | | | | | | | | | | | |
9/30/2018 | | $ | 22.94 | | | $ | 0.50 | | | $ | 0.95 | | | $ | 1.45 | | | $ | (1.04 | ) | | $ | (0.21 | ) | | | | |
9/30/2017 | | | 20.37 | | | | 0.33 | | | | 3.01 | | | | 3.34 | | | | (0.40 | ) | | | (0.37 | ) | | | | |
9/30/2016 | | | 18.97 | | | | 0.18 | | | | 1.63 | | | | 1.81 | | | | (0.38 | ) | | | (0.03 | ) | | | | |
12/1/2014 - 9/30/2015# | | | 21.80 | | | | 0.42 | | | | (1.91 | ) | | | (1.49 | ) | | | (0.75 | ) | | | (0.59 | ) | | | | |
11/30/2014 | | | 21.31 | | | | 0.41 | | | | 0.49 | | | | 0.90 | | | | (0.40 | ) | | | (0.01 | ) | | | | |
11/30/2013 | | | 19.63 | | | | 0.44 | | | | 1.80 | | | | 2.24 | | | | (0.52 | ) | | | (0.04 | ) | | | | |
| Class P | | | | | | | | | | | | | | | | | | | | | | | | | | | | |
9/30/2018 | | $ | 23.36 | | | $ | 0.58 | | | $ | 1.05 | | | $ | 1.63 | | | $ | (1.29 | ) | | $ | (0.21 | ) | | | | |
9/30/2017 | | | 20.70 | | | | 0.23 | | | | 3.32 | | | | 3.55 | | | | (0.52 | ) | | | (0.37 | ) | | | | |
9/30/2016 | | | 19.26 | | | | 0.32 | | | | 1.65 | | | | 1.97 | | | | (0.50 | ) | | | (0.03 | ) | | | | |
12/1/2014 - 9/30/2015# | | | 22.15 | | | | 0.46 | | | | (1.87 | ) | | | (1.41 | ) | | | (0.89 | ) | | | (0.59 | ) | | | | |
11/30/2014 | | | 21.63 | | | | 0.50 | | | | 0.56 | | | | 1.06 | | | | (0.53 | ) | | | (0.01 | ) | | | | |
11/30/2013 | | | 19.82 | | | | 0.49 | | | | 1.90 | | | | 2.39 | | | | (0.54 | ) | | | (0.04 | ) | | | | |
| Class R6 | | | | | | | | | | | | | | | | | | | | | | | | | | | | |
9/30/2018 | | $ | 23.42 | | | $ | 0.55 | | | $ | 1.10 | | | $ | 1.65 | | | $ | (1.31 | ) | | $ | (0.21 | ) | | | | |
9/30/2017 | | | 20.75 | | | | 0.21 | | | | 3.37 | | | | 3.58 | | | | (0.54 | ) | | | (0.37 | ) | | | | |
9/30/2016 | | | 19.30 | | | | 0.33 | | | | 1.66 | | | | 1.99 | | | | (0.51 | ) | | | (0.03 | ) | | | | |
12/1/2014 - 9/30/2015# | | | 22.19 | | | | 0.53 | | | | (1.92 | ) | | | (1.39 | ) | | | (0.91 | ) | | | (0.59 | ) | | | | |
11/30/2014 | | | 21.66 | | | | 0.61 | | | | 0.47 | | | | 1.08 | | | | (0.54 | ) | | | (0.01 | ) | | | | |
11/30/2013 | | | 19.83 | | | | 0.60 | | | | 1.81 | | | | 2.41 | | | | (0.54 | ) | | | (0.04 | ) | | | | |
| Administrative Class | | | | | | | | | | | | | | | | | | | | | | | | | | | | |
9/30/2018 | | $ | 23.24 | | | $ | 0.42 | | | $ | 1.14 | | | $ | 1.56 | | | $ | (1.24 | ) | | $ | (0.21 | ) | | | | |
9/30/2017 | | | 20.57 | | | | 0.16 | | | | 3.32 | | | | 3.48 | | | | (0.44 | ) | | | (0.37 | ) | | | | |
9/30/2016 | | | 19.14 | | | | 0.31 | | | | 1.60 | | | | 1.91 | | | | (0.45 | ) | | | (0.03 | ) | | | | |
12/1/2014 - 9/30/2015# | | | 22.02 | | | | 1.71 | | | | (3.16 | ) | | | (1.45 | ) | | | (0.84 | ) | | | (0.59 | ) | | | | |
11/30/2014 | | | 21.53 | | | | 0.50 | | | | 0.49 | | | | 0.99 | | | | (0.49 | ) | | | (0.01 | ) | | | | |
11/30/2013 | | | 19.75 | | | | 0.26 | | | | 2.07 | | | | 2.33 | | | | (0.51 | ) | | | (0.04 | ) | | | | |
| ^ | A — may reflect actual amounts rounding to less than $0.01 or 0.01%. |
| # | Fiscal year end changed from November 30th to September 30th. |
| (a) | Calculated on average shares outstanding during the period. |
| (b) | Total return is calculated assuming a purchase of a share on the first day of the period and a sale of a share on the last day of each period reported. Dividends and distributions, if any, are assumed, for purposes of this calculation, to be reinvested. Total return does not reflect sales charges and includes the effect of fee waivers and reimbursements. Total return may reflect adjustments to conform to U.S. GAAP. Total return for a period of less than one year is not annualized. |
| | | | | | |
| 258 | | Annual Report | | | September 30, 2018 | | | See accompanying Notes to Financial Statements |
| | | | | | | | | | | | | | | | | | | | | | | | | | | | | | | | | | |
| | | | Total
Dividends and
Distributions | | | Net Asset
Value, End
of Period | | | Total Return (b) | | | Net Assets,
End of Period
(000s) | | | Ratio of
Expenses to
Average Net
Assets with
Fee Waiver/
Reimbursement (c) | | | Ratio of
Expenses to
Average Net
Assets without
Fee Waiver/
Reimbursement (c) | | | Ratio of Net
Investment
Income
to Average
Net Assets (c) | | | Portfolio
Turnover Rate | |
| | | | | | | | | | | | | | | | | | | | | | | | | | |
| | | | | | | | | | | | | | | | | | | | | | | | | | | | | | | | | | |
| | | | | $ | (1.44 | ) | | $ | 23.35 | | | | 6.78 | % | | $ | 3,797 | | | | 0.44 | % | | | 0.60 | % | | | 2.10 | % | | | 18 | % |
| | | | | | (0.74 | ) | | | 23.24 | | | | 17.46 | | | | 6,480 | | | | 0.46 | | | | 0.60 | | | | 0.57 | | | | 103 | |
| | | | | | (0.41 | ) | | | 20.51 | | | | 9.99 | | | | 4,106 | | | | 0.51 | | | | 0.60 | | | | 1.36 | | | | 101 | |
| | | | | | (1.42 | ) | | | 19.04 | | | | (6.99 | ) | | | 13,551 | | | | 0.37 | (d)(e) | | | 0.60 | (d)(e) | | | 2.87 | (d)(e) | | | 143 | |
| | | | | | (0.52 | ) | | | 21.91 | | | | 4.65 | | | | 16,631 | | | | 0.38 | | | | 0.60 | | | | 2.22 | | | | 84 | |
| | | | | | (0.57 | ) | | | 21.45 | | | | 12.11 | | | | 5,513 | | | | 0.35 | | | | 0.60 | | | | 2.40 | | | | 61 | |
| | | | | | | | | | | | | | | | | | | | | | | | | | | | | | | | | | |
| | | | | $ | (1.27 | ) | | $ | 23.06 | | | | 6.00 | % | | $ | 110 | | | | 1.19 | % | | | 1.35 | % | | | 1.42 | % | | | 18 | % |
| | | | | | (0.66 | ) | | | 22.97 | | | | 16.53 | | | | 139 | | | | 1.21 | | | | 1.36 | | | | 0.03 | | | | 103 | |
| | | | | | (0.31 | ) | | | 20.36 | | | | 9.20 | | | | 126 | | | | 1.26 | | | | 1.35 | | | | 0.99 | | | | 101 | |
| | | | | | (1.18 | ) | | | 18.94 | | | | (7.54 | ) | | | 202 | | | | 1.12 | (d)(e) | | | 1.35 | (d)(e) | | | 2.22 | (d)(e) | | | 143 | |
| | | | | | (0.34 | ) | | | 21.68 | | | | 3.90 | | | | 269 | | | | 1.13 | | | | 1.35 | | | | 1.51 | | | | 84 | |
| | | | | | (0.46 | ) | | | 21.21 | | | | 11.20 | | | | 317 | | | | 1.10 | | | | 1.35 | | | | 1.66 | | | | 61 | |
| | | | | | | | | | | | | | | | | | | | | | | | | | | | | | | | | | |
| | | | | $ | (1.25 | ) | | $ | 23.14 | | | | 6.42 | % | | $ | 237 | | | | 0.79 | % | | | 0.85 | % | | | 2.16 | % | | | 18 | % |
| | | | | | (0.77 | ) | | | 22.94 | | | | 16.98 | | | | 416 | | | | 0.81 | | | | 0.86 | | | | 1.55 | | | | 103 | |
| | | | | | (0.41 | ) | | | 20.37 | | | | 9.64 | | | | 1,648 | | | | 0.86 | | | | 0.86 | | | | 0.94 | | | | 101 | |
| | | | | | (1.34 | ) | | | 18.97 | | | | (7.22 | ) | | | 1,272 | | | | 0.72 | (d)(e) | | | 0.85 | (d)(e) | | | 2.48 | (d)(e) | | | 143 | |
| | | | | | (0.41 | ) | | | 21.80 | | | | 4.31 | | | | 1,343 | | | | 0.73 | | | | 0.85 | | | | 1.88 | | | | 84 | |
| | | | | | (0.56 | ) | | | 21.31 | | | | 11.70 | | | | 1,167 | | | | 0.70 | | | | 0.85 | | | | 2.15 | | | | 61 | |
| | | | | | | | | | | | | | | | | | | | | | | | | | | | | | | | | | |
| | | | | $ | (1.50 | ) | | $ | 23.49 | | | | 7.11 | % | | $ | 17,742 | | | | 0.14 | % | | | 0.20 | % | | | 2.47 | % | | | 18 | % |
| | | | | | (0.89 | ) | | | 23.36 | | | | 17.83 | | | | 24,077 | | | | 0.16 | | | | 0.21 | | | | 1.06 | | | | 103 | |
| | | | | | (0.53 | ) | | | 20.70 | | | | 10.36 | | | | 20,628 | | | | 0.21 | | | | 0.21 | | | | 1.61 | | | | 101 | |
| | | | | | (1.48 | ) | | | 19.26 | | | | (6.76 | ) | | | 16,997 | | | | 0.07 | (d)(e) | | | 0.20 | (d)(e) | | | 2.67 | (d)(e) | | | 143 | |
| | | | | | (0.54 | ) | | | 22.15 | | | | 4.99 | | | | 11,734 | | | | 0.08 | | | | 0.20 | | | | 2.27 | | | | 84 | |
| | | | | | (0.58 | ) | | | 21.63 | | | | 12.42 | | | | 4,704 | | | | 0.05 | | | | 0.20 | | | | 2.37 | | | | 61 | |
| | | | | | | | | | | | | | | | | | | | | | | | | | | | | | | | | | |
| | | | | $ | (1.52 | ) | | $ | 23.55 | | | | 7.20 | % | | $ | 24,458 | | | | 0.04 | % | | | 0.10 | % | | | 2.37 | % | | | 18 | % |
| | | | | | (0.91 | ) | | | 23.42 | | | | 17.95 | | | | 23,705 | | | | 0.06 | | | | 0.10 | | | | 0.98 | | | | 103 | |
| | | | | | (0.54 | ) | | | 20.75 | | | | 10.47 | | | | 15,812 | | | | 0.11 | | | | 0.11 | | | | 1.65 | | | | 101 | |
| | | | | | (1.50 | ) | | | 19.30 | | | | (6.67 | ) | | | 12,053 | | | | — | (d)(e)(f) | | | 0.10 | (d)(e) | | | 3.09 | (d)(e) | | | 143 | |
| | | | | | (0.55 | ) | | | 22.19 | | | | 5.09 | | | | 8,071 | | | | — | (f) | | | 0.10 | | | | 2.78 | | | | 84 | |
| | | | | | (0.58 | ) | | | 21.66 | | | | 12.51 | | | | 9,939 | | | | — | (f) | | | 0.12 | | | | 2.93 | | | | 61 | |
| | | | | | | | | | | | | | | | | | | | | | | | | | | | | | | | | | |
| | | | | $ | (1.45 | ) | | $ | 23.35 | | | | 6.82 | % | | $ | 515 | | | | 0.39 | % | | | 0.45 | % | | | 1.84 | % | | | 18 | % |
| | | | | | (0.81 | ) | | | 23.24 | | | | 17.52 | | | | 425 | | | | 0.41 | | | | 0.45 | | | | 0.73 | | | | 103 | |
| | | | | | (0.48 | ) | | | 20.57 | | | | 10.09 | | | | 374 | | | | 0.46 | | | | 0.46 | | | | 1.58 | | | | 101 | |
| | | | | | (1.43 | ) | | | 19.14 | | | | (7.00 | ) | | | 488 | | | | 0.32 | (d)(e) | | | 0.45 | (d)(e) | | | 9.63 | (d)(e) | | | 143 | |
| | | | | | (0.50 | ) | | | 22.02 | | | | 4.72 | | | | 5,278 | | | | 0.33 | | | | 0.45 | | | | 2.31 | | | | 84 | |
| | | | | | (0.55 | ) | | | 21.53 | | | | 12.13 | | | | 5,054 | | | | 0.30 | | | | 0.45 | | | | 1.27 | | | | 61 | |
| | (c) | Does not include expenses of the investment companies in which the Fund invests. |
| | (d) | Annualized, unless otherwise noted. |
| | (e) | Certain expenses incurred by the Fund were not annualized. |
| | (f) | See Note 6 in the Notes to Financial Statements. |
| | | | | | | | |
| See accompanying Notes to Financial Statements | | | September 30, 2018 | | | Annual Report | | | 259 | |
Financial Highlights (cont’d)
For a Share Outstanding for the Period ended:^
| | | | | | | | | | | | | | | | | | | | | | | | | | | | |
| | | Net Asset
Value,
Beginning
of Period | | | Net
Investment
Income (a) | | | Net Realized
and Change in
Unrealized Gain
(Loss) | | | Total from
Investment
Operations | | | Dividends
from Net
Investment
Income | | | Distributions
from Net
Realized Capital
Gains | | | | |
| AllianzGI Retirement 2045: | | | | | | | | | | | | | | | | | | | | | |
| Class A | | | | | | | | | | | | | | | | | | | | | | | | | | | | |
9/30/2018 | | $ | 20.36 | | | $ | 0.44 | | | $ | 0.95 | | | $ | 1.39 | | | $ | (1.12 | ) | | $ | (0.15 | ) | | | | |
9/30/2017 | | | 18.07 | | | | 0.13 | | | | 3.04 | | | | 3.17 | | | | (0.34 | ) | | | (0.54 | ) | | | | |
9/30/2016 | | | 16.71 | | | | 0.20 | | | | 1.54 | | | | 1.74 | | | | (0.34 | ) | | | (0.04 | ) | | | | |
12/1/2014 - 9/30/2015# | | | 19.09 | | | | 0.41 | | | | (1.75 | ) | | | (1.34 | ) | | | (0.70 | ) | | | (0.34 | ) | | | | |
11/30/2014 | | | 18.67 | | | | 0.41 | | | | 0.49 | | | | 0.90 | | | | (0.45 | ) | | | (0.03 | ) | | | | |
11/30/2013 | | | 17.02 | | | | 0.41 | | | | 1.79 | | | | 2.20 | | | | (0.46 | ) | | | (0.09 | ) | | | | |
| Class R | | | | | | | | | | | | | | | | | | | | | | | | | | | | |
9/30/2018 | | $ | 20.14 | | | $ | 0.40 | | | $ | 0.91 | | | $ | 1.31 | | | $ | (1.02 | ) | | $ | (0.15 | ) | | | | |
9/30/2017 | | | 17.97 | | | | 0.30 | | | | 2.78 | | | | 3.08 | | | | (0.37 | ) | | | (0.54 | ) | | | | |
9/30/2016 | | | 16.65 | | | | 0.13 | | | | 1.55 | | | | 1.68 | | | | (0.32 | ) | | | (0.04 | ) | | | | |
12/1/2014 - 9/30/2015# | | | 19.01 | | | | 0.36 | | | | (1.74 | ) | | | (1.38 | ) | | | (0.64 | ) | | | (0.34 | ) | | | | |
11/30/2014 | | | 18.57 | | | | 0.34 | | | | 0.49 | | | | 0.83 | | | | (0.36 | ) | | | (0.03 | ) | | | | |
11/30/2013 | | | 16.96 | | | | 0.38 | | | | 1.75 | | | | 2.13 | | | | (0.43 | ) | | | (0.09 | ) | | | | |
| Class P | | | | | | | | | | | | | | | | | | | | | | | | | | | | |
9/30/2018 | | $ | 20.42 | | | $ | 0.51 | | | $ | 0.95 | | | $ | 1.46 | | | $ | (1.18 | ) | | $ | (0.15 | ) | | | | |
9/30/2017 | | | 18.19 | | | | 0.21 | | | | 3.03 | | | | 3.24 | | | | (0.47 | ) | | | (0.54 | ) | | | | |
9/30/2016 | | | 16.84 | | | | 0.26 | | | | 1.56 | | | | 1.82 | | | | (0.43 | ) | | | (0.04 | ) | | | | |
12/1/2014 - 9/30/2015# | | | 19.24 | | | | 0.43 | | | | (1.74 | ) | | | (1.31 | ) | | | (0.75 | ) | | | (0.34 | ) | | | | |
11/30/2014 | | | 18.77 | | | | 0.40 | | | | 0.57 | | | | 0.97 | | | | (0.47 | ) | | | (0.03 | ) | | | | |
11/30/2013 | | | 17.06 | | | | 0.47 | | | | 1.79 | | | | 2.26 | | | | (0.46 | ) | | | (0.09 | ) | | | | |
| Class R6 | | | | | | | | | | | | | | | | | | | | | | | | | | | | |
9/30/2018 | | $ | 20.48 | | | $ | 0.50 | | | $ | 0.99 | | | $ | 1.49 | | | $ | (1.20 | ) | | $ | (0.15 | ) | | | | |
9/30/2017 | | | 18.25 | | | | 0.19 | | | | 3.07 | | | | 3.26 | | | | (0.49 | ) | | | (0.54 | ) | | | | |
9/30/2016 | | | 16.89 | | | | 0.22 | | | | 1.62 | | | | 1.84 | | | | (0.44 | ) | | | (0.04 | ) | | | | |
12/1/2014 - 9/30/2015# | | | 19.28 | | | | 0.65 | | | | (1.94 | ) | | | (1.29 | ) | | | (0.76 | ) | | | (0.34 | ) | | | | |
11/30/2014 | | | 18.80 | | | | 0.49 | | | | 0.49 | | | | 0.98 | | | | (0.47 | ) | | | (0.03 | ) | | | | |
11/30/2013 | | | 17.07 | | | | 0.52 | | | | 1.76 | | | | 2.28 | | | | (0.46 | ) | | | (0.09 | ) | | | | |
| Administrative Class | | | | | | | | | | | | | | | | | | | | | | | | | | | | |
9/30/2018 | | $ | 20.28 | | | $ | 0.42 | | | $ | 0.98 | | | $ | 1.40 | | | $ | (1.12 | ) | | $ | (0.15 | ) | | | | |
9/30/2017 | | | 18.10 | | | | 0.16 | | | | 3.01 | | | | 3.17 | | | | (0.45 | ) | | | (0.54 | ) | | | | |
9/30/2016 | | | 16.76 | | | | 0.22 | | | | 1.55 | | | | 1.77 | | | | (0.39 | ) | | | (0.04 | ) | | | | |
12/1/2014 - 9/30/2015# | | | 19.15 | | | | 1.22 | | | | (2.56 | ) | | | (1.34 | ) | | | (0.71 | ) | | | (0.34 | ) | | | | |
11/30/2014 | | | 18.71 | | | | 0.42 | | | | 0.49 | | | | 0.91 | | | | (0.44 | ) | | | (0.03 | ) | | | | |
11/30/2013 | | | 17.01 | | | | 0.22 | | | | 1.99 | | | | 2.21 | | | | (0.42 | ) | | | (0.09 | ) | | | | |
| ^ | A — may reflect actual amounts rounding to less than $0.01 or 0.01%. |
| # | Fiscal year end changed from November 30th to September 30th. |
| (a) | Calculated on average shares outstanding during the period. |
| (b) | Total return is calculated assuming a purchase of a share on the first day of the period and a sale of a share on the last day of each period reported. Dividends and distributions, if any, are assumed, for purposes of this calculation, to be reinvested. Total return does not reflect sales charges and includes the effect of fee waivers and reimbursements. Total return may reflect adjustments to conform to U.S. GAAP. Total return for a period of less than one year is not annualized. |
| (c) | Does not include expenses of the investment companies in which the Fund invests. |
| (d) | Annualized, unless otherwise noted. |
| (e) | Certain expenses incurred by the Fund were not annualized. |
| (f) | See Note 6 in the Notes to Financial Statements. |
| | | | | | |
| 260 | | Annual Report | | | September 30, 2018 | | | See accompanying Notes to Financial Statements |
| | | | | | | | | | | | | | | | | | | | | | | | | | | | | | | | | | |
| | | | Total
Dividends and
Distributions | | | Net Asset
Value, End
of Period | | | Total Return (b) | | | Net Assets,
End of Period
(000s) | | | Ratio of
Expenses to
Average Net
Assets with
Fee Waiver/
Reimbursement (c) | | | Ratio of
Expenses to
Average Net
Assets without
Fee Waiver/
Reimbursement (c) | | | Ratio of Net
Investment
Income
to Average
Net Assets (c) | | | Portfolio
Turnover Rate | |
| | | | | | | | | | | | | | | | | | | | | | | | | | |
| | | | | | | | | | | | | | | | | | | | | | | | | | | | | | | | | | |
| | | | | $ | (1.27 | ) | | $ | 20.48 | | | | 6.96 | % | | $ | 2,387 | | | | 0.47 | % | | | 0.60 | % | | | 2.16 | % | | | 22 | % |
| | | | | | (0.88 | ) | | | 20.36 | | | | 18.35 | | | | 4,630 | | | | 0.49 | | | | 0.60 | | | | 0.70 | | | | 97 | |
| | | | | | (0.38 | ) | | | 18.07 | | | | 10.55 | | | | 3,753 | | | | 0.51 | | | | 0.60 | | | | 1.17 | | | | 103 | |
| | | | | | (1.04 | ) | | | 16.71 | | | | (7.35 | ) | | | 10,022 | | | | 0.37 | (d)(e) | | | 0.61 | (d)(e) | | | 2.74 | (d)(e) | | | 149 | |
| | | | | | (0.48 | ) | | | 19.09 | | | | 4.89 | | | | 10,080 | | | | 0.37 | | | | 0.60 | | | | 2.17 | | | | 69 | |
| | | | | | (0.55 | ) | | | 18.67 | | | | 13.33 | | | | 4,313 | | | | 0.33 | | | | 0.60 | | | | 2.31 | | | | 51 | |
| | | | | | | | | | | | | | | | | | | | | | | | | | | | | | | | | | |
| | | | | $ | (1.17 | ) | | $ | 20.28 | | | | 6.61 | % | | $ | 151 | | | | 0.82 | % | | | 0.85 | % | | | 1.98 | % | | | 22 | % |
| | | | | | (0.91 | ) | | | 20.14 | | | | 17.94 | | | | 193 | | | | 0.84 | | | | 0.86 | | | | 1.64 | | | | 97 | |
| | | | | | (0.36 | ) | | | 17.97 | | | | 10.20 | | | | 625 | | | | 0.86 | | | | 0.86 | | | | 0.78 | | | | 103 | |
| | | | | | (0.98 | ) | | | 16.65 | | | | (7.59 | ) | | | 464 | | | | 0.72 | (d)(e) | | | 0.86 | (d)(e) | | | 2.38 | (d)(e) | | | 149 | |
| | | | | | (0.39 | ) | | | 19.01 | | | | 4.52 | | | | 449 | | | | 0.72 | | | | 0.85 | | | | 1.82 | | | | 69 | |
| | | | | | (0.52 | ) | | | 18.57 | | | | 12.94 | | | | 356 | | | | 0.68 | | | | 0.85 | | | | 2.17 | | | | 51 | |
| | | | | | | | | | | | | | | | | | | | | | | | | | | | | | | | | | |
| | | | | $ | (1.33 | ) | | $ | 20.55 | | | | 7.29 | % | | $ | 13,742 | | | | 0.17 | % | | | 0.20 | % | | | 2.49 | % | | | 22 | % |
| | | | | | (1.01 | ) | | | 20.42 | | | | 18.74 | | | | 15,458 | | | | 0.19 | | | | 0.21 | | | | 1.10 | | | | 97 | |
| | | | | | (0.47 | ) | | | 18.19 | | | | 10.95 | | | | 12,764 | | | | 0.21 | | | | 0.21 | | | | 1.49 | | | | 103 | |
| | | | | | (1.09 | ) | | | 16.84 | | | | (7.15 | ) | | | 10,650 | | | | 0.07 | (d)(e) | | | 0.21 | (d)(e) | | | 2.88 | (d)(e) | | | 149 | |
| | | | | | (0.50 | ) | | | 19.24 | | | | 5.26 | | | | 8,793 | | | | 0.07 | | | | 0.20 | | | | 2.10 | | | | 69 | |
| | | | | | (0.55 | ) | | | 18.77 | | | | 13.68 | | | | 2,286 | | | | 0.03 | | | | 0.20 | | | | 2.63 | | | | 51 | |
| | | | | | | | | | | | | | | | | | | | | | | | | | | | | | | | | | |
| | | | | $ | (1.35 | ) | | $ | 20.62 | | | | 7.42 | % | | $ | 14,205 | | | | 0.07 | % | | | 0.10 | % | | | 2.44 | % | | | 22 | % |
| | | | | | (1.03 | ) | | | 20.48 | | | | 18.82 | | | | 12,770 | | | | 0.09 | | | | 0.10 | | | | 1.01 | | | | 97 | |
| | | | | | (0.48 | ) | | | 18.25 | | | | 11.06 | | | | 7,919 | | | | 0.11 | | | | 0.11 | | | | 1.25 | | | | 103 | |
| | | | | | (1.10 | ) | | | 16.89 | | | | (7.02 | ) | | | 3,563 | | | | — | (d)(e)(f) | | | 0.10 | (d)(e) | | | 4.23 | (d)(e) | | | 149 | |
| | | | | | (0.50 | ) | | | 19.28 | | | | 5.33 | | | | 5,477 | | | | — | (f) | | | 0.10 | | | | 2.55 | | | | 69 | |
| | | | | | (0.55 | ) | | | 18.80 | | | | 13.80 | | | | 4,587 | | | | — | (f) | | | 0.12 | | | | 2.91 | | | | 51 | |
| | | | | | | | | | | | | | | | | | | | | | | | | | | | | | | | | | |
| | | | | $ | (1.27 | ) | | $ | 20.41 | | | | 7.02 | % | | $ | 615 | | | | 0.42 | % | | | 0.45 | % | | | 2.05 | % | | | 22 | % |
| | | | | | (0.99 | ) | | | 20.28 | | | | 18.40 | | | | 666 | | | | 0.44 | | | | 0.45 | | | | 0.85 | | | | 97 | |
| | | | | | (0.43 | ) | | | 18.10 | | | | 10.67 | | | | 359 | | | | 0.46 | | | | 0.46 | | | | 1.27 | | | | 103 | |
| | | | | | (1.05 | ) | | | 16.76 | | | | (7.37 | ) | | | 346 | | | | 0.32 | (d)(e) | | | 0.46 | (d)(e) | | | 7.95 | (d)(e) | | | 149 | |
| | | | | | (0.47 | ) | | | 19.15 | | | | 4.95 | | | | 1,763 | | | | 0.32 | | | | 0.45 | | | | 2.24 | | | | 69 | |
| | | | | | (0.51 | ) | | | 18.71 | | | | 13.40 | | | | 1,542 | | | | 0.28 | | | | 0.45 | | | | 1.23 | | | | 51 | |
| | | | | | | | |
| See accompanying Notes to Financial Statements | | | September 30, 2018 | | | Annual Report | | | 261 | |
Financial Highlights (cont’d)
For a Share Outstanding for the Period ended:^
| | | | | | | | | | | | | | | | | | | | | | | | | | | | |
| | | Net Asset
Value,
Beginning
of Period | | | Net
Investment
Income (a) | | | Net Realized
and Change in
Unrealized Gain
(Loss) | | | Total from
Investment
Operations | | | Dividends
from Net
Investment
Income | | | Distributions
from Net
Realized Capital
Gains | | | | |
| AllianzGI Retirement 2050: | | | | | | | | | | | | | | | | | | | | | |
| Class A | | | | | | | | | | | | | | | | | | | | | | | | | | | | |
9/30/2018 | | $ | 22.66 | | | $ | 0.45 | | | $ | 1.12 | | | $ | 1.57 | | | $ | (1.28 | ) | | $ | (0.20 | ) | | | | |
9/30/2017 | | | 20.10 | | | | 0.09 | | | | 3.46 | | | | 3.55 | | | | (0.44 | ) | | | (0.55 | ) | | | | |
9/30/2016 | | | 18.72 | | | | 0.20 | | | | 1.78 | | | | 1.98 | | | | (0.23 | ) | | | (0.37 | ) | | | | |
12/1/2014 - 9/30/2015# | | | 21.87 | | | | 0.44 | | | | (2.04 | ) | | | (1.60 | ) | | | (0.87 | ) | | | (0.68 | ) | | | | |
11/30/2014 | | | 21.55 | | | | 0.44 | | | | 0.58 | | | | 1.02 | | | | (0.57 | ) | | | (0.13 | ) | | | | |
11/30/2013 | | | 19.48 | | | | 0.42 | | | | 2.32 | | | | 2.74 | | | | (0.60 | ) | | | (0.07 | ) | | | | |
| Class C | | | | | | | | | | | | | | | | | | | | | | | | | | | | |
9/30/2018 | | $ | 22.25 | | | $ | 0.30 | | | $ | 1.08 | | | $ | 1.38 | | | $ | (1.13 | ) | | $ | (0.20 | ) | | | | |
9/30/2017 | | | 19.80 | | | | 0.01 | | | | 3.33 | | | | 3.34 | | | | (0.34 | ) | | | (0.55 | ) | | | | |
9/30/2016 | | | 18.52 | | | | 0.11 | | | | 1.71 | | | | 1.82 | | | | (0.17 | ) | | | (0.37 | ) | | | | |
12/1/2014 - 9/30/2015# | | | 21.62 | | | | 0.31 | | | | (2.03 | ) | | | (1.72 | ) | | | (0.70 | ) | | | (0.68 | ) | | | | |
11/30/2014 | | | 21.34 | | | | 0.30 | | | | 0.55 | | | | 0.85 | | | | (0.44 | ) | | | (0.13 | ) | | | | |
11/30/2013 | | | 19.25 | | | | 0.30 | | | | 2.27 | | | | 2.57 | | | | (0.41 | ) | | | (0.07 | ) | | | | |
| Class R | | | | | | | | | | | | | | | | | | | | | | | | | | | | |
9/30/2018 | | $ | 22.46 | | | $ | 0.31 | | | $ | 1.17 | | | $ | 1.48 | | | $ | (1.02 | ) | | $ | (0.20 | ) | | | | |
9/30/2017 | | | 19.99 | | | | 0.44 | | | | 3.00 | | | | 3.44 | | | | (0.42 | ) | | | (0.55 | ) | | | | |
9/30/2016 | | | 18.68 | | | | 0.15 | | | | 1.76 | | | | 1.91 | | | | (0.23 | ) | | | (0.37 | ) | | | | |
12/1/2014 - 9/30/2015# | | | 21.80 | | | | 0.37 | | | | (2.03 | ) | | | (1.66 | ) | | | (0.78 | ) | | | (0.68 | ) | | | | |
11/30/2014 | | | 21.46 | | | | 0.39 | | | | 0.53 | | | | 0.92 | | | | (0.45 | ) | | | (0.13 | ) | | | | |
11/30/2013 | | | 19.47 | | | | 0.37 | | | | 2.29 | | | | 2.66 | | | | (0.60 | ) | | | (0.07 | ) | | | | |
| Class P | | | | | | | | | | | | | | | | | | | | | | | | | | | | |
9/30/2018 | | $ | 22.86 | | | $ | 0.57 | | | $ | 1.09 | | | $ | 1.66 | | | $ | (1.36 | ) | | $ | (0.20 | ) | | | | |
9/30/2017 | | | 20.31 | | | | 0.25 | | | | 3.39 | | | | 3.64 | | | | (0.54 | ) | | | (0.55 | ) | | | | |
9/30/2016 | | | 18.97 | | | | 0.27 | | | | 1.80 | | | | 2.07 | | | | (0.36 | ) | | | (0.37 | ) | | | | |
12/1/2014 - 9/30/2015# | | | 22.14 | | | | 0.47 | | | | (2.04 | ) | | | (1.57 | ) | | | (0.92 | ) | | | (0.68 | ) | | | | |
11/30/2014 | | | 21.77 | | | | 0.45 | | | | 0.64 | | | | 1.09 | | | | (0.59 | ) | | | (0.13 | ) | | | | |
11/30/2013 | | | 19.64 | | | | 0.48 | | | | 2.35 | | | | 2.83 | | | | (0.63 | ) | | | (0.07 | ) | | | | |
| Class R6 | | | | | | | | | | | | | | | | | | | | | | | | | | | | |
9/30/2018 | | $ | 22.96 | | | $ | 0.57 | | | $ | 1.11 | | | $ | 1.68 | | | $ | (1.38 | ) | | $ | (0.20 | ) | | | | |
9/30/2017 | | | 20.39 | | | | 0.23 | | | | 3.45 | | | | 3.68 | | | | (0.56 | ) | | | (0.55 | ) | | | | |
9/30/2016 | | | 19.03 | | | | 0.30 | | | | 1.79 | | | | 2.09 | | | | (0.36 | ) | | | (0.37 | ) | | | | |
12/1/2014 - 9/30/2015# | | | 22.20 | | | | 0.57 | | | | (2.13 | ) | | | (1.56 | ) | | | (0.93 | ) | | | (0.68 | ) | | | | |
11/30/2014 | | | 21.80 | | | | 0.57 | | | | 0.55 | | | | 1.12 | | | | (0.59 | ) | | | (0.13 | ) | | | | |
11/30/2013 | | | 19.66 | | | | 0.55 | | | | 2.29 | | | | 2.84 | | | | (0.63 | ) | | | (0.07 | ) | | | | |
| Administrative Class | | | | | | | | | | | | | | | | | | | | | | | | | | | | |
9/30/2018 | | $ | 22.74 | | | $ | 0.49 | | | $ | 1.09 | | | $ | 1.58 | | | $ | (1.30 | ) | | $ | (0.20 | ) | | | | |
9/30/2017 | | | 20.20 | | | | 0.18 | | | | 3.40 | | | | 3.58 | | | | (0.49 | ) | | | (0.55 | ) | | | | |
9/30/2016 | | | 18.87 | | | | 0.24 | | | | 1.77 | | | | 2.01 | | | | (0.31 | ) | | | (0.37 | ) | | | | |
12/1/2014 - 9/30/2015# | | | 22.03 | | | | 0.80 | | | | (2.42 | ) | | | (1.62 | ) | | | (0.86 | ) | | | (0.68 | ) | | | | |
11/30/2014 | | | 21.69 | | | | 0.49 | | | | 0.54 | | | | 1.03 | | | | (0.56 | ) | | | (0.13 | ) | | | | |
11/30/2013 | | | 19.58 | | | | 0.22 | | | | 2.55 | | | | 2.77 | | | | (0.59 | ) | | | (0.07 | ) | | | | |
| ^ | A — may reflect actual amounts rounding to less than $0.01 or 0.01%. |
| # | Fiscal year end changed from November 30th to September 30th. |
| (a) | Calculated on average shares outstanding during the period. |
| (b) | Total return is calculated assuming a purchase of a share on the first day of the period and a sale of a share on the last day of each period reported. Dividends and distributions, if any, are assumed, for purposes of this calculation, to be reinvested. Total return does not reflect sales charges and includes the effect of fee waivers and reimbursements. Total return may reflect adjustments to conform to U.S. GAAP. Total return for a period of less than one year is not annualized. |
| | | | | | |
| 262 | | Annual Report | | | September 30, 2018 | | | See accompanying Notes to Financial Statements |
| | | | | | | | | | | | | | | | | | | | | | | | | | | | | | | | | | |
| | | | Total
Dividends and
Distributions | | | Net Asset
Value, End
of Period | | | Total Return (b) | | | Net Assets,
End of Period
(000s) | | | Ratio of
Expenses to
Average Net
Assets with
Fee Waiver/
Reimbursement (c) | | | Ratio of
Expenses to
Average Net
Assets without
Fee Waiver/
Reimbursement (c) | | | Ratio of Net
Investment
Income
to Average
Net Assets (c) | | | Portfolio
Turnover Rate | |
| | | | | | | | | | | | | | | | | | | | | | | | | | |
| | | | | | | | | | | | | | | | | | | | | | | | | | | | | | | | | | |
| | | | | $ | (1.48 | ) | | $ | 22.75 | | | | 7.07 | % | | $ | 2,717 | | | | 0.49 | % | | | 0.60 | % | | | 1.98 | % | | | 21 | % |
| | | | | | (0.99 | ) | | | 22.66 | | | | 18.45 | | | | 3,713 | | | | 0.50 | | | | 0.60 | | | | 0.41 | | | | 94 | |
| | | | | | (0.60 | ) | | | 20.10 | | | | 10.74 | | | | 1,633 | | | | 0.50 | | | | 0.60 | | | | 1.03 | | | | 89 | |
| | | | | | (1.55 | ) | | | 18.72 | | | | (7.79 | ) | | | 4,863 | | | | 0.34 | (d)(e) | | | 0.61 | (d)(e) | | | 2.62 | (d)(e) | | | 147 | |
| | | | | | (0.70 | ) | | | 21.87 | | | | 4.85 | | | | 4,772 | | | | 0.35 | | | | 0.60 | | | | 2.02 | | | | 78 | |
| | | | | | (0.67 | ) | | | 21.55 | | | | 14.50 | | | | 1,014 | | | | 0.30 | | | | 0.60 | | | | 2.08 | | | | 54 | |
| | | | | | | | | | | | | | | | | | | | | | | | | | | | | | | | | | |
| | | | | $ | (1.33 | ) | | $ | 22.30 | | | | 6.29 | % | | $ | 199 | | | | 1.24 | % | | | 1.35 | % | | | 1.36 | % | | | 21 | % |
| | | | | | (0.89 | ) | | | 22.25 | | | | 17.58 | | | | 175 | | | | 1.25 | | | | 1.35 | | | | 0.04 | | | | 94 | |
| | | | | | (0.54 | ) | | | 19.80 | | | | 9.96 | | | | 145 | | | | 1.25 | | | | 1.35 | | | | 0.56 | | | | 89 | |
| | | | | | (1.38 | ) | | | 18.52 | | | | (8.40 | ) | | | 148 | | | | 1.09 | (d)(e) | | | 1.36 | (d)(e) | | | 1.83 | (d)(e) | | | 147 | |
| | | | | | (0.57 | ) | | | 21.62 | | | | 4.08 | | | | 138 | | | | 1.10 | | | | 1.35 | | | | 1.38 | | | | 78 | |
| | | | | | (0.48 | ) | | | 21.34 | | | | 13.64 | | | | 119 | | | | 1.05 | | | | 1.35 | | | | 1.48 | | | | 54 | |
| | | | | | | | | | | | | | | | | | | | | | | | | | | | | | | | | | |
| | | | | $ | (1.22 | ) | | $ | 22.72 | | | | 6.70 | % | | $ | 128 | | | | 0.84 | % | | | 0.85 | % | | | 1.40 | % | | | 21 | % |
| | | | | | (0.97 | ) | | | 22.46 | | | | 17.99 | | | | 95 | | | | 0.85 | | | | 0.85 | | | | 2.13 | | | | 94 | |
| | | | | | (0.60 | ) | | | 19.99 | | | | 10.41 | | | | 740 | | | | 0.85 | | | | 0.85 | | | | 0.80 | | | | 89 | |
| | | | | | (1.46 | ) | | | 18.68 | | | | (8.07 | ) | | | 608 | | | | 0.69 | (d)(e) | | | 0.86 | (d)(e) | | | 2.20 | (d)(e) | | | 147 | |
| | | | | | (0.58 | ) | | | 21.80 | | | | 4.41 | | | | 584 | | | | 0.70 | | | | 0.85 | | | | 1.79 | | | | 78 | |
| | | | | | (0.67 | ) | | | 21.46 | | | | 14.11 | | | | 497 | | | | 0.65 | | | | 0.85 | | | | 1.85 | | | | 54 | |
| | | | | | | | | | | | | | | | | | | | | | | | | | | | | | | | | | |
| | | | | $ | (1.56 | ) | | $ | 22.96 | | | | 7.40 | % | | $ | 11,185 | | | | 0.19 | % | | | 0.20 | % | | | 2.51 | % | | | 21 | % |
| | | | | | (1.09 | ) | | | 22.86 | | | | 18.81 | | | | 11,758 | | | | 0.20 | | | | 0.20 | | | | 1.18 | | | | 94 | |
| | | | | | (0.73 | ) | | | 20.31 | | | | 11.12 | | | | 10,021 | | | | 0.20 | | | | 0.20 | | | | 1.42 | | | | 89 | |
| | | | | | (1.60 | ) | | | 18.97 | | | | (7.55 | ) | | | 7,750 | | | | 0.04 | (d)(e) | | | 0.21 | (d)(e) | | | 2.74 | (d)(e) | | | 147 | |
| | | | | | (0.72 | ) | | | 22.14 | | | | 5.13 | | | | 5,234 | | | | 0.05 | | | | 0.20 | | | | 2.06 | | | | 78 | |
| | | | | | (0.70 | ) | | | 21.77 | | | | 14.90 | | | | 1,397 | | | | — | | | | 0.20 | | | | 2.34 | | | | 54 | |
| | | | | | | | | | | | | | | | | | | | | | | | | | | | | | | | | | |
| | | | | $ | (1.58 | ) | | $ | 23.06 | | | | 7.47 | % | | $ | 17,875 | | | | 0.09 | % | | | 0.10 | % | | | 2.49 | % | | | 21 | % |
| | | | | | (1.11 | ) | | | 22.96 | | | | 18.96 | | | | 16,063 | | | | 0.10 | | | | 0.10 | | | | 1.07 | | | | 94 | |
| | | | | | (0.73 | ) | | | 20.39 | | | | 11.23 | | | | 10,525 | | | | 0.10 | | | | 0.10 | | | | 1.54 | | | | 89 | |
| | | | | | (1.61 | ) | | | 19.03 | | | | (7.49 | ) | | | 8,110 | | | | — | (d)(e)(f) | | | 0.10 | (d)(e) | | | 3.31 | (d)(e) | | | 147 | |
| | | | | | (0.72 | ) | | | 22.20 | | | | 5.27 | | | | 9,227 | | | | — | (f) | | | 0.10 | | | | 2.58 | | | | 78 | |
| | | | | | (0.70 | ) | | | 21.80 | | | | 14.94 | | | | 8,935 | | | | — | (f) | | | 0.12 | | | | 2.68 | | | | 54 | |
| | | | | | | | | | | | | | | | | | | | | | | | | | | | | | | | | | |
| | | | | $ | (1.50 | ) | | $ | 22.82 | | | | 7.11 | % | | $ | 879 | | | | 0.44 | % | | | 0.45 | % | | | 2.16 | % | | | 21 | % |
| | | | | | (1.04 | ) | | | 22.74 | | | | 18.54 | | | | 813 | | | | 0.45 | | | | 0.45 | | | | 0.86 | | | | 94 | |
| | | | | | (0.68 | ) | | | 20.20 | | | | 10.87 | | | | 646 | | | | 0.45 | | | | 0.45 | | | | 1.23 | | | | 89 | |
| | | | | | (1.54 | ) | | | 18.87 | | | | (7.80 | ) | | | 605 | | | | 0.29 | (d)(e) | | | 0.46 | (d)(e) | | | 4.66 | (d)(e) | | | 147 | |
| | | | | | (0.69 | ) | | | 22.03 | | | | 4.87 | | | | 1,245 | | | | 0.30 | | | | 0.45 | | | | 2.25 | | | | 78 | |
| | | | | | (0.66 | ) | | | 21.69 | | | | 14.66 | | | | 1,194 | | | | 0.25 | | | | 0.45 | | | | 1.07 | | | | 54 | |
| | (c) | Does not include expenses of the investment companies in which the Fund invests. |
| | (d) | Annualized, unless otherwise noted. |
| | (e) | Certain expenses incurred by the Fund were not annualized. |
| | (f) | See Note 6 in the Notes to Financial Statements. |
| | | | | | | | |
| See accompanying Notes to Financial Statements | | | September 30, 2018 | | | Annual Report | | | 263 | |
Financial Highlights (cont’d)
For a Share Outstanding for the Period ended:^
| | | | | | | | | | | | | | | | | | | | | | | | | | | | |
| | | Net Asset
Value,
Beginning
of Period | | | Net
Investment
Income (a) | | | Net Realized
and Change in
Unrealized
Gain (Loss) | | | Total from
Investment
Operations | | |
Dividends
from Net
Investment
Income | | | Distributions
from Net
Realized Capital
Gains | | | | |
| AllianzGI Retirement 2055: | | | | | | | | | | | | | | | | | | | | | |
| Class A | | | | | | | | | | | | | | | | | | | | | | | | | | | | |
9/30/2018 | | $ | 19.52 | | | $ | 0.39 | | | $ | 0.99 | | | $ | 1.38 | | | $ | (1.11 | ) | | $ | (0.11 | ) | | | | |
9/30/2017 | | | 17.17 | | | | 0.09 | | | | 2.95 | | | | 3.04 | | | | (0.33 | ) | | | (0.36 | ) | | | | |
9/30/2016 | | | 16.02 | | | | 0.17 | | | | 1.49 | | | | 1.66 | | | | (0.28 | ) | | | (0.23 | ) | | | | |
12/1/2014 - 9/30/2015# | | | 18.70 | | | | 0.33 | | | | (1.69 | ) | | | (1.36 | ) | | | (0.76 | ) | | | (0.56 | ) | | | | |
11/30/2014 | | | 18.51 | | | | 0.39 | | | | 0.50 | | | | 0.89 | | | | (0.49 | ) | | | (0.21 | ) | | | | |
11/30/2013 | | | 17.02 | | | | 0.26 | | | | 2.11 | | | | 2.37 | | | | (0.59 | ) | | | (0.29 | ) | | | | |
| Class R | | | | | | | | | | | | | | | | | | | | | | | | | | | | |
9/30/2018 | | $ | 19.37 | | | $ | 0.31 | | | $ | 1.00 | | | $ | 1.31 | | | $ | (0.97 | ) | | $ | (0.11 | ) | | | | |
9/30/2017 | | | 17.07 | | | | 0.29 | | | | 2.67 | | | | 2.96 | | | | (0.30 | ) | | | (0.36 | ) | | | | |
9/30/2016 | | | 15.97 | | | | 0.10 | | | | 1.48 | | | | 1.58 | | | | (0.25 | ) | | | (0.23 | ) | | | | |
12/1/2014 - 9/30/2015# | | | 18.63 | | | | 0.26 | | | | (1.66 | ) | | | (1.40 | ) | | | (0.70 | ) | | | (0.56 | ) | | | | |
11/30/2014 | | | 18.42 | | | | 0.30 | | | | 0.53 | | | | 0.83 | | | | (0.41 | ) | | | (0.21 | ) | | | | |
11/30/2013 | | | 16.97 | | | | 0.30 | | | | 2.00 | | | | 2.30 | | | | (0.56 | ) | | | (0.29 | ) | | | | |
| Class P | | | | | | | | | | | | | | | | | | | | | | | | | | | | |
9/30/2018 | | $ | 19.68 | | | $ | 0.48 | | | $ | 0.98 | | | $ | 1.46 | | | $ | (1.16 | ) | | $ | (0.11 | ) | | | | |
9/30/2017 | | | 17.32 | | | | 0.17 | | | | 2.94 | | | | 3.11 | | | | (0.39 | ) | | | (0.36 | ) | | | | |
9/30/2016 | | | 16.17 | | | | 0.20 | | | | 1.52 | | | | 1.72 | | | | (0.34 | ) | | | (0.23 | ) | | | | |
12/1/2014 - 9/30/2015# | | | 18.85 | | | | 0.35 | | | | (1.68 | ) | | | (1.33 | ) | | | (0.79 | ) | | | (0.56 | ) | | | | |
11/30/2014 | | | 18.61 | | | | 0.38 | | | | 0.57 | | | | 0.95 | | | | (0.50 | ) | | | (0.21 | ) | | | | |
11/30/2013 | | | 17.08 | | | | 0.34 | | | | 2.09 | | | | 2.43 | | | | (0.61 | ) | | | (0.29 | ) | | | | |
| Class R6 | | | | | | | | | | | | | | | | | | | | | | | | | | | | |
9/30/2018 | | $ | 19.77 | | | $ | 0.46 | | | $ | 1.01 | | | $ | 1.47 | | | $ | (1.17 | ) | | $ | (0.11 | ) | | | | |
9/30/2017 | | | 17.38 | | | | 0.17 | | | | 2.98 | | | | 3.15 | | | | (0.40 | ) | | | (0.36 | ) | | | | |
9/30/2016 | | | 16.22 | | | | 0.26 | | | | 1.48 | | | | 1.74 | | | | (0.35 | ) | | | (0.23 | ) | | | | |
12/1/2014 - 9/30/2015# | | | 18.90 | | | | 0.46 | | | | (1.78 | ) | | | (1.32 | ) | | | (0.80 | ) | | | (0.56 | ) | | | | |
11/30/2014 | | | 18.64 | | | | 0.47 | | | | 0.50 | | | | 0.97 | | | | (0.50 | ) | | | (0.21 | ) | | | | |
11/30/2013 | | | 17.09 | | | | 0.49 | | | | 1.96 | | | | 2.45 | | | | (0.61 | ) | | | (0.29 | ) | | | | |
| Administrative Class | | | | | | | | | | | | | | | | | | | | | | | | | | | | |
9/30/2018 | | $ | 19.56 | | | $ | 0.47 | | | $ | 0.92 | | | $ | 1.39 | | | $ | (1.10 | ) | | $ | (0.11 | ) | | | | |
9/30/2017 | | | 17.21 | | | | 0.14 | | | | 2.92 | | | | 3.06 | | | | (0.35 | ) | | | (0.36 | ) | | | | |
9/30/2016 | | | 16.08 | | | | 0.18 | | | | 1.49 | | | | 1.67 | | | | (0.31 | ) | | | (0.23 | ) | | | | |
12/1/2014 - 9/30/2015# | | | 18.76 | | | | 0.62 | | | | (1.98 | ) | | | (1.36 | ) | | | (0.76 | ) | | | (0.56 | ) | | | | |
11/30/2014 | | | 18.55 | | | | 0.38 | | | | 0.52 | | | | 0.90 | | | | (0.48 | ) | | | (0.21 | ) | | | | |
11/30/2013 | | | 17.03 | | | | 0.22 | | | | 2.16 | | | | 2.38 | | | | (0.57 | ) | | | (0.29 | ) | | | | |
| ^ | A — may reflect actual amounts rounding to less than $0.01 or 0.01%. |
| # | Fiscal year end changed from November 30th to September 30th. |
| (a) | Calculated on average shares outstanding during the period. |
| (b) | Total return is calculated assuming a purchase of a share on the first day of the period and a sale of a share on the last day of each period reported. Dividends and distributions, if any, are assumed, for purposes of this calculation, to be reinvested. Total return does not reflect sales charges and includes the effect of fee waivers and reimbursements. Total return may reflect adjustments to conform to U.S. GAAP. Total return for a period of less than one year is not annualized. |
| (c) | Does not include expenses of the investment companies in which the Fund invests. |
| (d) | Annualized, unless otherwise noted. |
| (e) | Certain expenses incurred by the Fund were not annualized. |
| (f) | See Note 6 in the Notes to Financial Statements. |
| | | | | | |
| 264 | | Annual Report | | | September 30, 2018 | | | See accompanying Notes to Financial Statements |
| | | | | | | | | | | | | | | | | | | | | | | | | | | | | | | | | | |
| | | | Total
Dividends and
Distributions | | | Net Asset
Value, End
of Period | | | Total Return (b) | | | Net Assets,
End of Period
(000s) | | | Ratio of
Expenses to
Average Net
Assets with
Fee Waiver/
Reimbursement (c) | | | Ratio of
Expenses to
Average Net
Assets without
Fee Waiver/
Reimbursement (c) | | | Ratio of Net
Investment
Income
to Average
Net Assets (c) | | | Portfolio
Turnover Rate | |
| | | | | | | | | | | | | | | | | | | | | | | | | | |
| | | | | | | | | | | | | | | | | | | | | | | | | | | | | | | | | | |
| | | | | $ | (1.22 | ) | | $ | 19.68 | | | | 7.19 | % | | $ | 1,697 | | | | 0.49 | % | | | 0.60 | % | | | 2.01 | % | | | 31 | % |
| | | | | | (0.69 | ) | | | 19.52 | | | | 18.34 | | | | 2,063 | | | | 0.50 | | | | 0.60 | | | | 0.48 | | | | 76 | |
| | | | | | (0.51 | ) | | | 17.17 | | | | 10.52 | | | | 1,036 | | | | 0.51 | | | | 0.60 | | | | 1.02 | | | | 92 | |
| | | | | | (1.32 | ) | | | 16.02 | | | | (7.75 | ) | | | 1,399 | | | | 0.34 | (d)(e) | | | 0.60 | (d)(e) | | | 2.26 | (d)(e) | | | 153 | |
| | | | | | (0.70 | ) | | | 18.70 | | | | 4.96 | | | | 1,089 | | | | 0.35 | | | | 0.60 | | | | 2.11 | | | | 74 | |
| | | | | | (0.88 | ) | | | 18.51 | | | | 14.59 | | | | 135 | | | | 0.30 | | | | 0.60 | | | | 1.52 | | | | 41 | |
| | | | | | | | | | | | | | | | | | | | | | | | | | | | | | | | | | |
| | | | | $ | (1.08 | ) | | $ | 19.60 | | | | 6.86 | % | | $ | 112 | | | | 0.84 | % | | | 0.85 | % | | | 1.58 | % | | | 31 | % |
| | | | | | (0.66 | ) | | | 19.37 | | | | 17.93 | | | | 91 | | | | 0.85 | | | | 0.85 | | | | 1.64 | | | | 76 | |
| | | | | | (0.48 | ) | | | 17.07 | | | | 10.06 | | | | 350 | | | | 0.86 | | | | 0.86 | | | | 0.64 | | | | 92 | |
| | | | | | (1.26 | ) | | | 15.97 | | | | (7.98 | ) | | | 217 | | | | 0.69 | (d)(e) | | | 0.85 | (d)(e) | | | 1.78 | (d)(e) | | | 153 | |
| | | | | | (0.62 | ) | | | 18.63 | | | | 4.61 | | | | 144 | | | | 0.70 | | | | 0.85 | | | | 1.61 | | | | 74 | |
| | | | | | (0.85 | ) | | | 18.42 | | | | 14.22 | | | | 72 | | | | 0.65 | | | | 0.85 | | | | 1.75 | | | | 41 | |
| | | | | | | | | | | | | | | | | | | | | | | | | | | | | | | | | | |
| | | | | $ | (1.27 | ) | | $ | 19.87 | | | | 7.57 | % | | $ | 5,865 | | | | 0.19 | % | | | 0.20 | % | | | 2.45 | % | | | 31 | % |
| | | | | | (0.75 | ) | | | 19.68 | | | | 18.69 | | | | 5,934 | | | | 0.20 | | | | 0.20 | | | | 0.95 | | | | 76 | |
| | | | | | (0.57 | ) | | | 17.32 | | | | 10.84 | | | | 3,457 | | | | 0.21 | | | | 0.21 | | | | 1.21 | | | | 92 | |
| | | | | | (1.35 | ) | | | 16.17 | | | | (7.51 | ) | | | 1,762 | | | | 0.04 | (d)(e) | | | 0.20 | (d)(e) | | | 2.42 | (d)(e) | | | 153 | |
| | | | | | (0.71 | ) | | | 18.85 | | | | 5.27 | | | | 1,362 | | | | 0.05 | | | | 0.20 | | | | 2.04 | | | | 74 | |
| | | | | | (0.90 | ) | | | 18.61 | | | | 14.88 | | | | 240 | | | | — | | | | 0.20 | | | | 1.96 | | | | 41 | |
| | | | | | | | | | | | | | | | | | | | | | | | | | | | | | | | | | |
| | | | | $ | (1.28 | ) | | $ | 19.96 | | | | 7.62 | % | | $ | 8,055 | | | | 0.09 | % | | | 0.10 | % | | | 2.35 | % | | | 31 | % |
| | | | | | (0.76 | ) | | | 19.77 | | | | 18.87 | | | | 6,215 | | | | 0.10 | | | | 0.10 | | | | 0.92 | | | | 76 | |
| | | | | | (0.58 | ) | | | 17.38 | | | | 10.91 | | | | 2,982 | | | | 0.11 | | | | 0.11 | | | | 1.60 | | | | 92 | |
| | | | | | (1.36 | ) | | | 16.22 | | | | (7.45 | ) | | | 2,591 | | | | — | (d)(e)(f) | | | 0.10 | (d)(e) | | | 3.09 | (d)(e) | | | 153 | |
| | | | | | (0.71 | ) | | | 18.90 | | | | 5.37 | | | | 4,934 | | | | — | (f) | | | 0.10 | | | | 2.52 | | | | 74 | |
| | | | | | (0.90 | ) | | | 18.64 | | | | 15.06 | | | | 4,388 | | | | — | (f) | | | 0.12 | | | | 2.77 | | | | 41 | |
| | | | | | | | | | | | | | | | | | | | | | | | | | | | | | | | | | |
| | | | | $ | (1.21 | ) | | $ | 19.74 | | | | 7.25 | % | | $ | 363 | | | | 0.44 | % | | | 0.45 | % | | | 2.39 | % | | | 31 | % |
| | | | | | (0.71 | ) | | | 19.56 | | | | 18.44 | | | | 404 | | | | 0.45 | | | | 0.45 | | | | 0.78 | | | | 76 | |
| | | | | | (0.54 | ) | | | 17.21 | | | | 10.54 | | | | 298 | | | | 0.46 | | | | 0.46 | | | | 1.10 | | | | 92 | |
| | | | | | (1.32 | ) | | | 16.08 | | | | (7.75 | ) | | | 216 | | | | 0.29 | (d)(e) | | | 0.45 | (d)(e) | | | 4.23 | (d)(e) | | | 153 | |
| | | | | | (0.69 | ) | | | 18.76 | | | | 5.00 | | | | 357 | | | | 0.30 | | | | 0.45 | | | | 2.06 | | | | 74 | |
| | | | | | (0.86 | ) | | | 18.55 | | | | 14.67 | | | | 221 | | | | 0.25 | | | | 0.45 | | | | 1.22 | | | | 41 | |
| | | | | | | | |
| See accompanying Notes to Financial Statements | | | September 30, 2018 | | | Annual Report | | | 265 | |
Financial Highlights (cont’d)
For a Share Outstanding for the Period ended:^
| | | | | | | | | | | | | | | | | | | | | | | | | | | | | | | | |
| | | Net Asset
Value,
Beginning
of Period | | | Net
Investment
Income (a) | | | Net Realized
and Change in
Unrealized
Gain (Loss) | | | Total from
Investment
Operations | | | Dividends
from Net
Investment
Income | | | Distributions
from Net
Realized Capital
Gains | | | Distributions
from Return
of Capital | | | | |
| AllianzGI Multi Asset Income: | | | | | | | | | | | | | | | | |
| Class A | | | | | | | | | | | | | | | | | | | | | | | | | | | | | | | | |
9/30/2018 | | $ | 18.53 | | | $ | 0.73 | | | $ | (0.71 | ) | | $ | 0.02 | | | $ | (0.85 | ) | | $ | (0.23 | ) | | $ | (0.12 | ) | | | | |
9/30/2017 | | | 18.31 | | | | 0.94 | | | | 0.22 | | | | 1.16 | | | | (0.85 | ) | | | (0.09 | ) | | | — | | | | | |
9/30/2016 | | | 17.34 | | | | 0.75 | | | | 1.09 | | | | 1.84 | | | | (0.80 | ) | | | (0.07 | ) | | | — | | | | | |
12/1/2014 - 9/30/2015# | | | 19.35 | | | | 0.48 | | | | (1.32 | ) | | | (0.84 | ) | | | (0.67 | ) | | | (0.50 | ) | | | — | | | | | |
11/30/2014 | | | 18.96 | | | | 0.42 | | | | 0.31 | | | | 0.73 | | | | (0.34 | ) | | | — | | | | — | | | | | |
11/30/2013 | | | 19.20 | | | | 0.50 | | | | 0.03 | | | | 0.53 | | | | (0.66 | ) | | | (0.08 | ) | | | (0.03 | ) | | | | |
| Class C | | | | | | | | | | | | | | | | | | | | | | | | | | | | | | | | |
9/30/2018 | | $ | 18.53 | | | $ | 0.62 | | | $ | (0.72 | ) | | $ | (0.10 | ) | | $ | (0.74 | ) | | $ | (0.23 | ) | | $ | (0.10 | ) | | | | |
9/30/2017 | | | 18.21 | | | | 0.80 | | | | 0.22 | | | | 1.02 | | | | (0.61 | ) | | | (0.09 | ) | | | — | | | | | |
9/30/2016 | | | 17.16 | | | | 0.66 | | | | 1.04 | | | | 1.70 | | | | (0.58 | ) | | | (0.07 | ) | | | — | | | | | |
12/1/2014 - 9/30/2015# | | | 19.14 | | | | 0.38 | | | | (1.33 | ) | | | (0.95 | ) | | | (0.53 | ) | | | (0.50 | ) | | | — | | | | | |
11/30/2014 | | | 18.76 | | | | 0.27 | | | | 0.31 | | | | 0.58 | | | | (0.20 | ) | | | — | | | | — | | | | | |
11/30/2013 | | | 18.99 | | | | 0.37 | | | | 0.01 | | | | 0.38 | | | | (0.50 | ) | | | (0.08 | ) | | | (0.03 | ) | | | | |
| Class R | | | | | | | | | | | | | | | | | | | | | | | | | | | | | | | | |
9/30/2018 | | $ | 19.31 | | | $ | 0.71 | | | $ | (0.74 | ) | | $ | (0.03 | ) | | $ | (0.80 | ) | | $ | (0.23 | ) | | $ | (0.11 | ) | | | | |
9/30/2017 | | | 18.97 | | | | 0.84 | | | | 0.30 | | | | 1.14 | | | | (0.71 | ) | | | (0.09 | ) | | | — | | | | | |
9/30/2016 | | | 17.92 | | | | 0.73 | | | | 1.11 | | | | 1.84 | | | | (0.72 | ) | | | (0.07 | ) | | | — | | | | | |
12/1/2014 - 9/30/2015# | | | 19.95 | | | | 0.44 | | | | (1.36 | ) | | | (0.92 | ) | | | (0.61 | ) | | | (0.50 | ) | | | — | | | | | |
11/30/2014 | | | 19.53 | | | | 0.36 | | | | 0.33 | | | | 0.69 | | | | (0.27 | ) | | | — | | | | — | | | | | |
11/30/2013 | | | 19.74 | | | | 0.46 | | | | 0.01 | | | | 0.47 | | | | (0.57 | ) | | | (0.08 | ) | | | (0.03 | ) | | | | |
| Class P | | | | | | | | | | | | | | | | | | | | | | | | | | | | | | | | |
9/30/2018 | | $ | 18.71 | | | $ | 0.82 | | | $ | (0.73 | ) | | $ | 0.09 | | | $ | (0.90 | ) | | $ | (0.23 | ) | | $ | (0.13 | ) | | | | |
9/30/2017 | | | 18.51 | | | | 0.99 | | | | 0.23 | | | | 1.22 | | | | (0.93 | ) | | | (0.09 | ) | | | — | | | | | |
9/30/2016 | | | 17.58 | | | | 0.83 | | | | 1.09 | | | | 1.92 | | | | (0.92 | ) | | | (0.07 | ) | | | — | | | | | |
12/1/2014 - 9/30/2015# | | | 19.61 | | | | 0.51 | | | | (1.31 | ) | | | (0.80 | ) | | | (0.73 | ) | | | (0.50 | ) | | | — | | | | | |
11/30/2014 | | | 19.20 | | | | 0.47 | | | | 0.34 | | | | 0.81 | | | | (0.40 | ) | | | — | | | | — | | | | | |
11/30/2013 | | | 19.44 | | | | 0.46 | | | | 0.13 | | | | 0.59 | | | | (0.72 | ) | | | (0.08 | ) | | | (0.03 | ) | | | | |
| Institutional Class | | | | | | | | | | | | | | | | | | | | | | | | | | | | | | | | |
2/1/2018* - 9/30/2018 | | $ | 17.87 | | | $ | 0.42 | | | $ | (0.64 | ) | | $ | (0.22 | ) | | $ | (0.44 | ) | | $ | — | | | $ | (0.13 | ) | | | | |
| Class R6 | | | | | | | | | | | | | | | | | | | | | | | | | | | | | | | | |
9/30/2018 | | $ | 18.26 | | | $ | 0.81 | | | $ | (0.71 | ) | | $ | 0.10 | | | $ | (0.91 | ) | | $ | (0.23 | ) | | $ | (0.13 | ) | | | | |
9/30/2017 | | | 18.08 | | | | 1.00 | | | | 0.21 | | | | 1.21 | | | | (0.94 | ) | | | (0.09 | ) | | | — | | | | | |
9/30/2016 | | | 17.21 | | | | 0.82 | | | | 1.07 | | | | 1.89 | | | | (0.95 | ) | | | (0.07 | ) | | | — | | | | | |
12/1/2014 - 9/30/2015# | | | 19.23 | | | | 0.56 | | | | (1.33 | ) | | | (0.77 | ) | | | (0.75 | ) | | | (0.50 | ) | | | — | | | | | |
11/30/2014 | | | 18.83 | | | | 0.49 | | | | 0.33 | | | | 0.82 | | | | (0.42 | ) | | | — | | | | — | | | | | |
11/30/2013 | | | 19.08 | | | | 0.56 | | | | 0.03 | | | | 0.59 | | | | (0.73 | ) | | | (0.08 | ) | | | (0.03 | ) | | | | |
| Administrative Class | | | | | | | | | | | | | | | | | | | | | | | | | | | | | | | | |
9/30/2018 | | $ | 18.82 | | | $ | 0.80 | | | $ | (0.75 | ) | | $ | 0.05 | | | $ | (0.86 | ) | | $ | (0.23 | ) | | $ | (0.12 | ) | | | | |
9/30/2017 | | | 18.61 | | | | 1.00 | | | | 0.19 | | | | 1.19 | | | | (0.89 | ) | | | (0.09 | ) | | | — | | | | | |
9/30/2016 | | | 17.60 | | | | 0.75 | | | | 0.94 | | | | 1.69 | | | | (0.61 | ) | | | (0.07 | ) | | | — | | | | | |
12/1/2014 - 9/30/2015# | | | 19.56 | | | | 1.70 | | | | (2.55 | ) | | | (0.85 | ) | | | (0.61 | ) | | | (0.50 | ) | | | — | | | | | |
11/30/2014 | | | 19.15 | | | | 0.43 | | | | 0.33 | | | | 0.76 | | | | (0.35 | ) | | | — | | | | — | | | | | |
11/30/2013 | | | 19.41 | | | | 0.22 | | | | 0.32 | | | | 0.54 | | | | (0.69 | ) | | | (0.08 | ) | | | (0.03 | ) | | | | |
| ^ | A — may reflect actual amounts rounding to less than $0.01 or 0.01%. |
| # | Fiscal year end changed from November 30th to September 30th. |
| * | Commencement of operations. |
| (a) | Calculated on average shares outstanding during the period. |
| (b) | Total return is calculated assuming a purchase of a share on the first day of the period and a sale of a share on the last day of each period reported. Dividends and distributions, if any, are assumed, for purposes of this calculation, to be reinvested. Total return does not reflect sales charges and includes the effect of fee waivers and reimbursements. Total return may reflect adjustments to conform to U.S. GAAP. Total return for a period of less than one year is not annualized. |
| | | | | | |
| 266 | | Annual Report | | | September 30, 2018 | | | See accompanying Notes to Financial Statements |
| | | | | | | | | | | | | | | | | | | | | | | | | | | | | | | | | | |
| | | | Total
Dividends and
Distributions | | | Net Asset
Value, End
of Period | | | Total Return (b) | | | Net Assets,
End of Period
(000s) | | | Ratio of
Expenses to
Average Net
Assets with
Fee Waiver/
Reimbursement (c) | | | Ratio of
Expenses to
Average Net
Assets without
Fee Waiver/
Reimbursement (c) | | | Ratio of Net
Investment
Income
to Average
Net Assets (c) | | | Portfolio
Turnover Rate | |
| | | | | | | | | | | | | | | | | | | | | | | | | | |
| | | | | | | | | | | | | | | | | | | | | | | | | | | | | | | | | | |
| | | | | $ | (1.20 | ) | | $ | 17.35 | | | | 0.12 | % | | $ | 8,826 | | | | 0.36 | % | | | 0.61 | % | | | 4.12 | % | | | 172 | % |
| | | | | | (0.94 | ) | | | 18.53 | | | | 6.55 | | | | 10,145 | | | | 0.35 | | | | 0.61 | | | | 5.12 | | | | 151 | |
| | | | | | (0.87 | ) | | | 18.31 | | | | 10.97 | | | | 10,140 | | | | 0.40 | | | | 0.60 | | | | 4.25 | | | | 116 | |
| | | | | | (1.17 | ) | | | 17.34 | | | | (4.53 | ) | | | 6,006 | | | | 0.44 | (d)(e) | | | 0.62 | (d)(e) | | | 3.15 | (d)(e) | | | 179 | |
| | | | | | (0.34 | ) | | | 19.35 | | | | 3.88 | | | | 6,324 | | | | 0.40 | | | | 0.60 | | | | 2.18 | | | | 101 | |
| | | | | | (0.77 | ) | | | 18.96 | | | | 2.78 | | | | 4,326 | | | | 0.39 | | | | 0.60 | | | | 2.64 | | | | 81 | |
| | | | | | | | | | | | | | | | | | | | | | | | | | | | | | | | | | |
| | | | | $ | (1.07 | ) | | $ | 17.36 | | | | (0.58 | )% | | $ | 2,210 | | | | 1.11 | % | | | 1.36 | % | | | 3.51 | % | | | 172 | % |
| | | | | | (0.70 | ) | | | 18.53 | | | | 5.78 | | | | 3,435 | | | | 1.10 | | | | 1.36 | | | | 4.37 | | | | 151 | |
| | | | | | (0.65 | ) | | | 18.21 | | | | 10.16 | | | | 3,361 | | | | 1.15 | | | | 1.35 | | | | 3.75 | | | | 116 | |
| | | | | | (1.03 | ) | | | 17.16 | | | | (5.16 | ) | | | 2,988 | | | | 1.19 | (d)(e) | | | 1.37 | (d)(e) | | | 2.49 | (d)(e) | | | 179 | |
| | | | | | (0.20 | ) | | | 19.14 | | | | 3.12 | | | | 3,984 | | | | 1.15 | | | | 1.35 | | | | 1.42 | | | | 101 | |
| | | | | | (0.61 | ) | | | 18.76 | | | | 2.03 | | | | 4,359 | | | | 1.14 | | | | 1.35 | | | | 1.99 | | | | 81 | |
| | | | | | | | | | | | | | | | | | | | | | | | | | | | | | | | | | |
| | | | | $ | (1.14 | ) | | $ | 18.14 | | | | (0.20 | )% | | $ | 100 | | | | 0.71 | % | | | 0.86 | % | | | 3.82 | % | | | 172 | % |
| | | | | | (0.80 | ) | | | 19.31 | | | | 6.17 | | | | 128 | | | | 0.70 | | | | 0.86 | | | | 4.38 | | | | 151 | |
| | | | | | (0.79 | ) | | | 18.97 | | | | 10.59 | | | | 519 | | | | 0.75 | | | | 0.85 | | | | 4.00 | | | | 116 | |
| | | | | | (1.11 | ) | | | 17.92 | | | | (4.83 | ) | | | 238 | | | | 0.79 | (d)(e) | | | 0.87 | (d)(e) | | | 2.78 | (d)(e) | | | 179 | |
| | | | | | (0.27 | ) | | | 19.95 | | | | 3.55 | | | | 215 | | | | 0.75 | | | | 0.85 | | | | 1.80 | | | | 101 | |
| | | | | | (0.68 | ) | | | 19.53 | | | | 2.46 | | | | 152 | | | | 0.74 | | | | 0.85 | | | | 2.36 | | | | 81 | |
| | | | | | | | | | | | | | | | | | | | | | | | | | | | | | | | | | |
| | | | | $ | (1.26 | ) | | $ | 17.54 | | | | 0.46 | % | | $ | 9,526 | | | | 0.06 | % | | | 0.21 | % | | | 4.56 | % | | | 172 | % |
| | | | | | (1.02 | ) | | | 18.71 | | | | 6.86 | | | | 14,507 | | | | 0.05 | | | | 0.21 | | | | 5.37 | | | | 151 | |
| | | | | | (0.99 | ) | | | 18.51 | | | | 11.32 | | | | 17,120 | | | | 0.10 | | | | 0.20 | | | | 4.63 | | | | 116 | |
| | | | | | (1.23 | ) | | | 17.58 | | | | (4.31 | ) | | | 5,450 | | | | 0.14 | (d)(e) | | | 0.22 | (d)(e) | | | 3.31 | (d)(e) | | | 179 | |
| | | | | | (0.40 | ) | | | 19.61 | | | | 4.23 | | | | 6,349 | | | | 0.11 | | | | 0.21 | | | | 2.39 | | | | 101 | |
| | | | | | (0.83 | ) | | | 19.20 | | | | 3.12 | | | | 4,427 | | | | 0.09 | (f) | | | 0.20 | | | | 2.42 | | | | 81 | |
| | | | | | | | | | | | | | | | | | | | | | | | | | | | | | | | | | |
| | | | | $ | (0.57 | ) | | $ | 17.08 | | | | (1.16 | )% | | $ | 49 | | | | 0.01 | %(d) | | | 0.15 | %(d) | | | 3.72 | % | | | 172 | % |
| | | | | | | | | | | | | | | | | | | | | | | | | | | | | | | | | | |
| | | | | $ | (1.27 | ) | | $ | 17.09 | | | | 0.56 | % | | $ | 14,894 | | | | — | %(f) | | | 0.11 | % | | | 4.60 | % | | | 172 | % |
| | | | | | (1.03 | ) | | | 18.26 | | | | 6.99 | | | | 20,448 | | | | — | (f) | | | 0.11 | | | | 5.54 | | | | 151 | |
| | | | | | (1.02 | ) | | | 18.08 | | | | 11.40 | | | | 19,128 | | | | — | | | | 0.10 | | | | 4.70 | | | | 116 | |
| | | | | | (1.25 | ) | | | 17.21 | | | | (4.23 | ) | | | 8,058 | | | | 0.04 | (d)(e) | | | 0.12 | (d)(e) | | | 3.69 | (d)(e) | | | 179 | |
| | | | | | (0.42 | ) | | | 19.23 | | | | 4.36 | | | | 9,496 | | | | — | (f) | | | 0.10 | | | | 2.56 | | | | 101 | |
| | | | | | (0.84 | ) | | | 18.83 | | | | 3.23 | | | | 9,487 | | | | — | (f) | | | 0.12 | | | | 2.96 | | | | 81 | |
| | | | | | | | | | | | | | | | | | | | | | | | | | | | | | | | | | |
| | | | | $ | (1.21 | ) | | $ | 17.66 | | | | 0.25 | % | | $ | 524 | | | | 0.31 | % | | | 0.46 | % | | | 4.36 | % | | | 172 | % |
| | | | | | (0.98 | ) | | | 18.82 | | | | 6.62 | | | | 1,550 | | | | 0.30 | | | | 0.46 | | | | 5.38 | | | | 151 | |
| | | | | | (0.68 | ) | | | 18.61 | | | | 9.87 | | | | 822 | | | | 0.35 | | | | 0.45 | | | | 4.13 | | | | 116 | |
| | | | | | (1.11 | ) | | | 17.60 | | | | (4.53 | ) | | | 24 | | | | 0.37 | (d)(e) | | | 0.45 | (d)(e) | | | 10.47 | (d)(e) | | | 179 | |
| | | | | | (0.35 | ) | | | 19.56 | | | | 3.97 | | | | 2,001 | | | | 0.35 | | | | 0.45 | | | | 2.20 | | | | 101 | |
| | | | | | (0.80 | ) | | | 19.15 | | | | 2.92 | | | | 2,461 | | | | 0.34 | | | | 0.45 | | | | 1.16 | | | | 81 | |
| | (c) | Does not include expenses of the investment companies in which the Fund invests. |
| | (d) | Annualized, unless otherwise noted. |
| | (e) | Certain expenses incurred by the Fund were not annualized. |
| | (f) | See Note 6 in the Notes to Financial Statements. |
| | | | | | | | |
| See accompanying Notes to Financial Statements | | | September 30, 2018 | | | Annual Report | | | 267 | |
Financial Highlights (cont’d)
For a Share Outstanding for the Period ended:^
| | | | | | | | | | | | | | | | | | | | | | | | | | | | |
| | | Net Asset
Value,
Beginning
of Period | | | Net
Investment
Income
(Loss) (a) | | |
Net Realized
and Change
in Unrealized
Gain (Loss) | | | Total from
Investment
Operations | | | Dividends
from Net
Investment
Income | | | Distributions
from Net
Realized Capital
Gains | | | | |
| AllianzGI Global Allocation: | | | | | | | | | | |
| Class A | | | | | | | | | | | | | | | | | | | | | | | | | | | | |
9/30/2018 | | $ | 12.34 | | | $ | 0.26 | | | $ | 0.07 | | | $ | 0.33 | | | $ | (0.55 | ) | | $ | (0.65 | ) | | | | |
9/30/2017 | | | 11.23 | | | | 0.20 | | | | 1.11 | | | | 1.31 | | | | (0.20 | ) | | | — | | | | | |
9/30/2016 | | | 10.98 | | | | 0.07 | | | | 0.63 | | | | 0.70 | | | | (0.05 | ) | | | (0.40 | ) | | | | |
12/1/2014 - 9/30/2015# | | | 12.18 | | | | 0.25 | | | | (0.89 | ) | | | (0.64 | ) | | | (0.42 | ) | | | (0.14 | ) | | | | |
11/30/2014 | | | 11.90 | | | | 0.30 | | | | 0.25 | | | | 0.55 | | | | (0.27 | ) | | | — | | | | | |
11/30/2013 | | | 11.07 | | | | 0.31 | | | | 0.95 | | | | 1.26 | | | | (0.43 | ) | | | — | | | | | |
| Class C | | | | | | | | | | | | | | | | | | | | | | | | | | | | |
9/30/2018 | | $ | 12.47 | | | $ | 0.19 | | | $ | 0.06 | | | $ | 0.25 | | | $ | (0.40 | ) | | $ | (0.65 | ) | | | | |
9/30/2017 | | | 11.32 | | | | 0.13 | | | | 1.12 | | | | 1.25 | | | | (0.10 | ) | | | — | | | | | |
9/30/2016 | | | 11.13 | | | | (0.01 | ) | | | 0.63 | | | | 0.62 | | | | (0.03 | ) | | | (0.40 | ) | | | | |
12/1/2014 - 9/30/2015# | | | 12.33 | | | | 0.18 | | | | (0.91 | ) | | | (0.73 | ) | | | (0.33 | ) | | | (0.14 | ) | | | | |
11/30/2014 | | | 12.04 | | | | 0.22 | | | | 0.24 | | | | 0.46 | | | | (0.17 | ) | | | — | | | | | |
11/30/2013 | | | 11.19 | | | | 0.23 | | | | 0.96 | | | | 1.19 | | | | (0.34 | ) | | | — | | | | | |
| Class R | | | | | | | | | | | | | | | | | | | | | | | | | | | | |
9/30/2018 | | $ | 12.22 | | | $ | 0.21 | | | $ | 0.10 | | | $ | 0.31 | | | $ | (0.54 | ) | | $ | (0.65 | ) | | | | |
9/30/2017 | | | 11.15 | | | | 0.18 | | | | 1.11 | | | | 1.29 | | | | (0.22 | ) | | | — | | | | | |
9/30/2016 | | | 10.93 | | | | 0.05 | | | | 0.62 | | | | 0.67 | | | | (0.05 | ) | | | (0.40 | ) | | | | |
12/1/2014 - 9/30/2015# | | | 12.13 | | | | 0.22 | | | | (0.88 | ) | | | (0.66 | ) | | | (0.40 | ) | | | (0.14 | ) | | | | |
11/30/2014 | | | 11.84 | | | | 0.28 | | | | 0.26 | | | | 0.54 | | | | (0.25 | ) | | | — | | | | | |
11/30/2013 | | | 11.02 | | | | 0.28 | | | | 0.95 | | | | 1.23 | | | | (0.41 | ) | | | — | | | | | |
| Class P | | | | | | | | | | | | | | | | | | | | | | | | | | | | |
9/30/2018 | | $ | 12.28 | | | $ | 0.27 | | | $ | 0.09 | | | $ | 0.36 | | | $ | (0.61 | ) | | $ | (0.65 | ) | | | | |
9/30/2017 | | | 11.24 | | | | 0.24 | | | | 1.11 | | | | 1.35 | | | | (0.31 | ) | | | — | | | | | |
9/30/2016 | | | 10.98 | | | | 0.12 | | | | 0.61 | | | | 0.73 | | | | (0.07 | ) | | | (0.40 | ) | | | | |
12/1/2014 - 9/30/2015# | | | 12.19 | | | | 0.25 | | | | (0.87 | ) | | | (0.62 | ) | | | (0.45 | ) | | | (0.14 | ) | | | | |
11/30/2014 | | | 11.90 | | | | 0.32 | | | | 0.26 | | | | 0.58 | | | | (0.29 | ) | | | — | | | | | |
11/30/2013 | | | 11.07 | | | | 0.32 | | | | 0.96 | | | | 1.28 | | | | (0.45 | ) | | | — | | | | | |
| Institutional Class | | | | | | | | | | | | | | | | | | | | | | | | | | | | |
9/30/2018 | | $ | 12.15 | | | $ | 0.28 | | | $ | 0.08 | | | $ | 0.36 | | | $ | (0.41 | ) | | $ | (0.65 | ) | | | | |
9/30/2017 | | | 11.11 | | | | 0.26 | | | | 1.05 | | | | 1.31 | | | | (0.27 | ) | | | — | | | | | |
9/30/2016 | | | 10.86 | | | | 0.10 | | | | 0.61 | | | | 0.71 | | | | (0.06 | ) | | | (0.40 | ) | | | | |
12/1/2014 - 9/30/2015# | | | 12.07 | | | | 0.25 | | | | (0.87 | ) | | | (0.62 | ) | | | (0.45 | ) | | | (0.14 | ) | | | | |
11/30/2014 | | | 11.78 | | | | 0.32 | | | | 0.27 | | | | 0.59 | | | | (0.30 | ) | | | — | | | | | |
11/30/2013 | | | 10.97 | | | | 0.32 | | | | 0.95 | | | | 1.27 | | | | (0.46 | ) | | | — | | | | | |
| Class R6 | | | | | | | | | | | | | | | | | | | | | | | | | | | | |
9/30/2018 | | $ | 12.13 | | | $ | 0.29 | | | $ | 0.07 | | | $ | 0.36 | | | $ | (0.61 | ) | | $ | (0.65 | ) | | | | |
9/30/2017 | | | 11.10 | | | | 0.23 | | | | 1.11 | | | | 1.34 | | | | (0.31 | ) | | | — | | | | | |
9/30/2016 | | | 10.85 | | | | 0.05 | | | | 0.67 | | | | 0.72 | | | | (0.07 | ) | | | (0.40 | ) | | | | |
9/8/2015* - 9/30/2015# | | | 11.01 | | | | 0.01 | | | | (0.13 | ) | | | (0.12 | ) | | | (0.04 | ) | | | — | | | | | |
| Administrative Class | | | | | | | | | | | | | | | | | | | | | | | | | | | | |
9/30/2018 | | $ | 12.64 | | | $ | 0.28 | | | $ | 0.07 | | | $ | 0.35 | | | $ | (0.57 | ) | | $ | (0.65 | ) | | | | |
9/30/2017 | | | 11.52 | | | | 0.22 | | | | 1.15 | | | | 1.37 | | | | (0.25 | ) | | | — | | | | | |
9/30/2016 | | | 11.25 | | | | 0.08 | | | | 0.64 | | | | 0.72 | | | | (0.05 | ) | | | (0.40 | ) | | | | |
12/1/2014 - 9/30/2015# | | | 12.47 | | | | 0.23 | | | | (0.89 | ) | | | (0.66 | ) | | | (0.42 | ) | | | (0.14 | ) | | | | |
11/30/2014 | | | 12.17 | | | | 0.30 | | | | 0.27 | | | | 0.57 | | | | (0.27 | ) | | | — | | | | | |
11/30/2013 | | | 11.30 | | | | 0.43 | | | | 0.85 | | | | 1.28 | | | | (0.41 | ) | | | — | | | | | |
| ^ | A — may reflect actual amounts rounding to less than $0.01 or 0.01%. |
| # | Fiscal year end changed from November 30th to September 30th. |
| * | Commencement of operations. |
| (a) | Calculated on average shares outstanding during the period. |
| | | | | | |
| 268 | | Annual Report | | | September 30, 2018 | | | See accompanying Notes to Financial Statements |
| | | | | | | | | | | | | | | | | | | | | | | | | | | | | | | | | | |
| | | | Total
Dividends and
Distributions | | | Net Asset
Value, End
of Period | | | Total Return (b) | | | Net Assets,
End of Period
(000s) | | | Ratio of
Expenses to
Average Net
Assets with
Fee Waiver/
Reimbursement (c) | | | Ratio of
Expenses to
Average Net
Assets without
Fee Waiver/
Reimbursement (c) | | | Ratio of Net
Investment
Income (Loss)
to Average
Net Assets (c) | | | Portfolio
Turnover Rate | |
| | | | | | | | | | | | | | | | | | | | | | | | | | |
| | | | | | | | | | | | | | | | | | | | | | | | | | | | | | | | | | |
| | | | | $ | (1.20 | ) | | $ | 11.47 | | | | 2.62 | % | | $ | 40,974 | | | | 0.59 | % | | | 1.12 | % | | | 2.24 | % | | | 17 | % |
| | | | | | (0.20 | ) | | | 12.34 | | | | 11.88 | | | | 47,170 | | | | 0.60 | | | | 1.12 | | | | 1.73 | | | | 15 | |
| | | | | | (0.45 | ) | | | 11.23 | | | | 6.55 | | | | 84,852 | | | | 0.60 | | | | 1.13 | | | | 0.68 | | | | 57 | |
| | | | | | (0.56 | ) | | | 10.98 | | | | (5.45 | ) | | | 88,132 | | | | 0.55 | (d)(e) | | | 1.30 | (d)(e) | | | 2.52 | (d)(e) | | | 113 | |
| | | | | | (0.27 | ) | | | 12.18 | | | | 4.62 | | | | 65,499 | | | | 0.40 | | | | 1.34 | | | | 2.48 | | | | 48 | |
| | | | | | (0.43 | ) | | | 11.90 | | | | 11.79 | | | | 69,565 | | | | 0.41 | | | | 1.36 | | | | 2.68 | | | | 45 | |
| | | | | | | | | | | | | | | | | | | | | | | | | | | | | | | | | | |
| | | | | $ | (1.05 | ) | | $ | 11.67 | | | | 1.90 | % | | $ | 26,220 | | | | 1.33 | % | | | 1.86 | % | | | 1.56 | % | | | 17 | % |
| | | | | | (0.10 | ) | | | 12.47 | | | | 11.09 | | | | 34,670 | | | | 1.35 | | | | 1.87 | | | | 1.12 | | | | 15 | |
| | | | | | (0.43 | ) | | | 11.32 | | | | 5.72 | | | | 46,387 | | | | 1.38 | | | | 1.90 | | | | (0.06 | ) | | | 57 | |
| | | | | | (0.47 | ) | | | 11.13 | | | | (6.07 | ) | | | 51,322 | | | | 1.29 | (d)(e) | | | 2.04 | (d)(e) | | | 1.78 | (d)(e) | | | 113 | |
| | | | | | (0.17 | ) | | | 12.33 | | | | 3.88 | | | | 62,275 | | | | 1.13 | | | | 2.08 | | | | 1.78 | | | | 48 | |
| | | | | | (0.34 | ) | | | 12.04 | | | | 10.81 | | | | 68,756 | | | | 1.14 | | | | 2.10 | | | | 1.98 | | | | 45 | |
| | | | | | | | | | | | | | | | | | | | | | | | | | | | | | | | | | |
| | | | | $ | (1.19 | ) | | $ | 11.34 | | | | 2.43 | % | | $ | 35 | | | | 0.80 | % | | | 1.32 | % | | | 1.85 | % | | | 17 | % |
| | | | | | (0.22 | ) | | | 12.22 | | | | 11.78 | | | | 24 | | | | 0.78 | | | | 1.31 | | | | 1.55 | | | | 15 | |
| | | | | | (0.45 | ) | | | 11.15 | | | | 6.25 | | | | 17 | | | | 0.81 | | | | 1.33 | | | | 0.45 | | | | 57 | |
| | | | | | (0.54 | ) | | | 10.93 | | | | (5.61 | ) | | | 16 | | | | 0.72 | (d)(e) | | | 1.50 | (d)(e) | | | 2.23 | (d)(e) | | | 113 | |
| | | | | | (0.25 | ) | | | 12.13 | | | | 4.57 | | | | 17 | | | | 0.56 | | | | 1.53 | | | | 2.32 | | | | 48 | |
| | | | | | (0.41 | ) | | | 11.84 | | | | 11.44 | | | | 17 | | | | 0.59 | | | | 1.54 | | | | 2.42 | | | | 45 | |
| | | | | | | | | | | | | | | | | | | | | | | | | | | | | | | | | | |
| | | | | $ | (1.26 | ) | | $ | 11.38 | | | | 2.92 | % | | $ | 4,292 | | | | 0.35 | % | | | 0.88 | % | | | 2.30 | % | | | 17 | % |
| | | | | | (0.31 | ) | | | 12.28 | | | | 12.31 | | | | 3,563 | | | | 0.32 | | | | 0.85 | | | | 2.05 | | | | 15 | |
| | | | | | (0.47 | ) | | | 11.24 | | | | 6.78 | | | | 1,901 | | | | 0.30 | | | | 0.83 | | | | 1.10 | | | | 57 | |
| | | | | | (0.59 | ) | | | 10.98 | | | | (5.30 | ) | | | 2,069 | | | | 0.33 | (d)(e) | | | 1.06 | (d)(e) | | | 2.52 | (d)(e) | | | 113 | |
| | | | | | (0.29 | ) | | | 12.19 | | | | 4.96 | | | | 2,139 | | | | 0.16 | | | | 1.12 | | | | 2.68 | | | | 48 | |
| | | | | | (0.45 | ) | | | 11.90 | | | | 11.92 | | | | 1,960 | | | | 0.19 | | | | 1.13 | | | | 2.81 | | | | 45 | |
| | | | | | | | | | | | | | | | | | | | | | | | | | | | | | | | | | |
| | | | | $ | (1.06 | ) | | $ | 11.45 | | | | 2.92 | % | | $ | 6,652 | | | | 0.33 | % | | | 0.86 | % | | | 2.43 | % | | | 17 | % |
| | | | | | (0.27 | ) | | | 12.15 | | | | 12.08 | | | | 6,871 | | | | 0.40 | | | | 0.95 | | | | 2.35 | | | | 15 | |
| | | | | | (0.46 | ) | | | 11.11 | | | | 6.72 | | | | 68,709 | | | | 0.40 | | | | 0.92 | | | | 0.89 | | | | 57 | |
| | | | | | (0.59 | ) | | | 10.86 | | | | (5.34 | ) | | | 74,024 | | | | 0.32 | (d)(e) | | | 1.07 | (d)(e) | | | 2.58 | (d)(e) | | | 113 | |
| | | | | | (0.30 | ) | | | 12.07 | | | | 5.01 | | | | 74,957 | | | | 0.16 | | | | 1.11 | | | | 2.69 | | | | 48 | |
| | | | | | (0.46 | ) | | | 11.78 | | | | 11.90 | | | | 68,675 | | | | 0.16 | | | | 1.11 | | | | 2.81 | | | | 45 | |
| | | | | | | | | | | | | | | | | | | | | | | | | | | | | | | | | | |
| | | | | $ | (1.26 | ) | | $ | 11.23 | | | | 2.95 | % | | $ | 252,313 | | | | 0.28 | % | | | 0.81 | % | | | 2.48 | % | | | 17 | % |
| | | | | | (0.31 | ) | | | 12.13 | | | | 12.40 | | | | 264,255 | | | | 0.28 | | | | 0.80 | | | | 1.99 | | | | 15 | |
| | | | | | (0.47 | ) | | | 11.10 | | | | 6.81 | | | | 291,767 | | | | 0.30 | | | | 0.83 | | | | 0.48 | | | | 57 | |
| | | | | | (0.04 | ) | | | 10.85 | | | | (1.14 | ) | | | 91,912 | | | | 0.30 | (d)(e) | | | 1.31 | (d)(e) | | | 2.07 | (d)(e) | | | 113 | |
| | | | | | | | | | | | | | | | | | | | | | | | | | | | | | | | | | |
| | | | | $ | (1.22 | ) | | $ | 11.77 | | | | 2.68 | % | | $ | 22 | | | | 0.53 | % | | | 1.06 | % | | | 2.28 | % | | | 17 | % |
| | | | | | (0.25 | ) | | | 12.64 | | | | 12.07 | | | | 26 | | | | 0.53 | | | | 1.06 | | | | 1.86 | | | | 15 | |
| | | | | | (0.45 | ) | | | 11.52 | | | | 6.58 | | | | 32 | | | | 0.56 | | | | 1.08 | | | | 0.67 | | | | 57 | |
| | | | | | (0.56 | ) | | | 11.25 | | | | (5.50 | ) | | | 27 | | | | 0.57 | (d)(e) | | | 1.23 | (d)(e) | | | 2.35 | (d)(e) | | | 113 | |
| | | | | | (0.27 | ) | | | 12.47 | | | | 4.68 | | | | 33 | | | | 0.41 | | | | 1.27 | | | | 2.45 | | | | 48 | |
| | | | | | (0.41 | ) | | | 12.17 | | | | 11.59 | | | | 24 | | | | 0.41 | | | | 1.48 | | | | 3.73 | | | | 45 | |
| | (b) | Total return is calculated assuming a purchase of a share on the first day of the period and a sale of a share on the last day of each period reported. Dividends and distributions, if any, are assumed, for purposes of this calculation, to be reinvested. Total return does not reflect sales charges and includes the effect of fee waivers and reimbursements. Total return may reflect adjustments to conform to U.S. GAAP. Total return for a period of less than one year is not annualized. |
| | (c) | Does not include expenses of the investment companies in which the Fund invests. |
| | (d) | Annualized, unless otherwise noted. |
| | (e) | Certain expenses incurred by the Fund were not annualized. |
| | | | | | | | |
| See accompanying Notes to Financial Statements | | | September 30, 2018 | | | Annual Report | | | 269 | |
Financial Highlights (cont’d)
For a Share Outstanding for the Period ended:^
| | | | | | | | | | | | | | | | | | | | | | | | | | | | |
| | |
Net Asset
Value,
Beginning
of Period | | | Net
Investment
Income (a) | | | Net Realized
and Change
in Unrealized
Gain (Loss) | | | Total from
Investment
Operations | | | Dividends
from Net
Investment
Income | | | Distributions
from Net
Realized Capital
Gains | | | | |
| AllianzGI Best Styles Global Equity: | | | | | | | | | | |
| Class A | | | | | | | | | | | | | | | | | | | | | | | | | | | | |
9/30/2018 | | $ | 18.83 | | | $ | 0.30 | | | $ | 0.68 | | | $ | 0.98 | | | $ | (0.62 | ) | | $ | (1.89 | ) | | | | |
9/30/2017 | | | 15.62 | | | | 0.19 | | | | 3.12 | | | | 3.31 | | | | — | | | | (0.10 | ) | | | | |
9/30/2016 | | | 14.60 | | | | 0.28 | | | | 0.89 | | | | 1.17 | | | | (0.15 | ) | | | — | | | | | |
12/1/2014 - 9/30/2015# | | | 16.57 | | | | 0.52 | | | | (1.65 | ) | | | (1.13 | ) | | | (0.43 | ) | | | (0.41 | ) | | | | |
9/2/2014* - 11/30/2014 | | | 16.51 | | | | 0.05 | | | | 0.01 | | | | 0.06 | | | | — | | | | — | | | | | |
| Class C | | | | | | | | | | | | | | | | | | | | | | | | | | | | |
9/30/2018 | | $ | 18.51 | | | $ | 0.16 | | | $ | 0.68 | | | $ | 0.84 | | | $ | (0.56 | ) | | $ | (1.89 | ) | | | | |
9/30/2017 | | | 15.61 | | | | 0.27 | | | | 2.91 | | | | 3.18 | | | | (0.18 | ) | | | (0.10 | ) | | | | |
4/26/2016* - 9/30/2016 | | | 15.29 | | | | 0.11 | | | | 0.21 | | | | 0.32 | | | | — | | | | — | | | | | |
| Class P | | | | | | | | | | | | | | | | | | | | | | | | | | | | |
9/30/2018 | | $ | 18.82 | | | $ | 0.32 | | | $ | 0.69 | | | $ | 1.01 | | | $ | (0.63 | ) | | $ | (1.89 | ) | | | | |
9/30/2017 | | | 15.79 | | | | 0.36 | | | | 3.01 | | | | 3.37 | | | | (0.24 | ) | | | (0.10 | ) | | | | |
9/30/2016 | | | 14.68 | | | | 0.32 | | | | 0.89 | | | | 1.21 | | | | (0.10 | ) | | | — | | | | | |
12/22/2014* - 9/30/2015# | | | 15.68 | | | | 0.27 | | | | (1.27 | ) | | | (1.00 | ) | | | — | | | | — | | | | | |
| Institutional Class | | | | | | | | | | | | | | | | | | | | | | | | | | | | |
9/30/2018 | | $ | 18.68 | | | $ | 0.35 | | | $ | 0.67 | | | $ | 1.02 | | | $ | (0.66 | ) | | $ | (1.89 | ) | | | | |
9/30/2017 | | | 15.68 | | | | 0.36 | | | | 3.01 | | | | 3.37 | | | | (0.27 | ) | | | (0.10 | ) | | | | |
9/30/2016 | | | 14.63 | | | | 0.37 | | | | 0.84 | | | | 1.21 | | | | (0.16 | ) | | | — | | | | | |
12/1/2014 - 9/30/2015# | | | 16.58 | | | | 0.28 | | | | (1.38 | ) | | | (1.10 | ) | | | (0.44 | ) | | | (0.41 | ) | | | | |
9/2/2014* - 11/30/2014 | | | 16.51 | | | | 0.06 | | | | 0.01 | | | | 0.07 | | | | — | | | | — | | | | | |
| Class R6 | | | | | | | | | | | | | | | | | | | | | | | | | | | | |
9/30/2018 | | $ | 18.79 | | | $ | 0.35 | | | $ | 0.67 | | | $ | 1.02 | | | $ | (0.64 | ) | | $ | (1.89 | ) | | | | |
9/30/2017 | | | 15.78 | | | | 0.37 | | | | 3.02 | | | | 3.39 | | | | (0.28 | ) | | | (0.10 | ) | | | | |
9/30/2016 | | | 14.70 | | | | 0.37 | | | | 0.86 | | | | 1.23 | | | | (0.15 | ) | | | — | | | | | |
12/1/2014 - 9/30/2015# | | | 16.58 | | | | 0.31 | | | | (1.40 | ) | | | (1.09 | ) | | | (0.38 | ) | | | (0.41 | ) | | | | |
12/2/2013* - 11/30/2014 | | | 15.00 | | | | 0.38 | | | | 1.20 | | | | 1.58 | | | | — | | | | — | | | | | |
| AllianzGI Best Styles International Equity: | | | | | | | | | | |
| Class A | | | | | | | | | | | | | | | | | | | | | | | | | | | | |
9/30/2018 | | $ | 15.71 | | | $ | 0.41 | | | $ | (0.43 | ) | | $ | (0.02 | ) | | $ | (0.72 | ) | | $ | — | | | | | |
9/30/2017 | | | 14.21 | | | | 0.38 | | | | 2.44 | | | | 2.82 | | | | (1.32 | ) | | | — | | | | | |
4/26/2016* - 9/30/2016 | | | 14.20 | | | | 0.23 | | | | (0.22 | ) | | | 0.01 | | | | — | | | | — | | | | | |
| Class C | | | | | | | | | | | | | | | | | | | | | | | | | | | | |
9/30/2018 | | $ | 15.58 | | | $ | 0.26 | | | $ | (0.39 | ) | | $ | (0.13 | ) | | $ | (0.65 | ) | | $ | — | | | | | |
9/30/2017 | | | 14.16 | | | | 0.27 | | | | 2.44 | | | | 2.71 | | | | (1.29 | ) | | | — | | | | | |
4/26/2016* - 9/30/2016 | | | 14.20 | | | | 0.17 | | | | (0.21 | ) | | | (0.04 | ) | | | — | | | | — | | | | | |
| Class P | | | | | | | | | | | | | | | | | | | | | | | | | | | | |
9/30/2018 | | $ | 15.74 | | | $ | 0.42 | | | $ | (0.42 | ) | | $ | — | | | $ | (0.73 | ) | | $ | — | | | | | |
9/30/2017 | | | 14.21 | | | | 0.35 | | | | 2.50 | | | | 2.85 | | | | (1.32 | ) | | | — | | | | | |
9/30/2016 | | | 13.83 | | | | 0.40 | | | | 0.23 | | | | 0.63 | | | | (0.12 | ) | | | (0.13 | ) | | | | |
12/9/2014* - 9/30/2015# | | | 15.00 | | | | 0.37 | | | | (1.53 | ) | | | (1.16 | ) | | | (0.01 | ) | | | — | | | | | |
| Institutional Class | | | | | | | | | | | | | | | | | | | | | | | | | | | | |
9/30/2018 | | $ | 15.76 | | | $ | 0.47 | | | $ | (0.45 | ) | | $ | 0.02 | | | $ | (0.72 | ) | | $ | — | | | | | |
9/30/2017 | | | 14.22 | | | | 0.38 | | | | 2.49 | | | | 2.87 | | | | (1.33 | ) | | | — | | | | | |
9/30/2016 | | | 13.84 | | | | 0.48 | | | | 0.16 | | | | 0.64 | | | | (0.13 | ) | | | (0.13 | ) | | | | |
12/9/2014* - 9/30/2015# | | | 15.00 | | | | 0.38 | | | | (1.53 | ) | | | (1.15 | ) | | | (0.01 | ) | | | — | | | | | |
| Class R6 | | | | | | | | | | | | | | | | | | | | | | | | | | | | |
9/30/2018 | | $ | 15.74 | | | $ | 0.44 | | | $ | (0.42 | ) | | $ | 0.02 | | | $ | (0.67 | ) | | $ | — | | | | | |
9/30/2017 | | | 14.20 | | | | 0.36 | | | | 2.51 | | | | 2.87 | | | | (1.33 | ) | | | — | | | | | |
9/30/2016 | | | 13.85 | | | | 0.45 | | | | 0.21 | | | | 0.66 | | | | (0.18 | ) | | | (0.13 | ) | | | | |
12/9/2014* - 9/30/2015# | | | 15.00 | | | | 0.40 | | | | (1.54 | ) | | | (1.14 | ) | | | (0.01 | ) | | | — | | | | | |
| ^ | A — may reflect actual amounts rounding to less than $0.01 or 0.01%. |
| # | Fiscal year end changed from November 30th to September 30th. |
| * | Commencement of operations. |
| (a) | Calculated on average shares outstanding during the period. |
| (b) | Total return is calculated assuming a purchase of a share on the first day of the period and a sale of a share on the last day of each period reported. Dividends and distributions, if any, are assumed, for purposes of this calculation, to be reinvested. Total return does not reflect sales charges and includes the effect of fee waivers and reimbursements. Total return may reflect adjustments to conform to U.S. GAAP. Total return for a period of less than one year is not annualized. |
| | | | | | |
| 270 | | Annual Report | | | September 30, 2018 | | | See accompanying Notes to Financial Statements |
| | | | | | | | | | | | | | | | | | | | | | | | | | | | | | | | | | |
| | | | Total
Dividends and
Distributions | | | Net Asset
Value, End
of Period | | | Total Return (b) | | | Net Assets,
End of Period
(000s) | | | Ratio of
Expenses to
Average Net
Assets with
Fee Waiver/
Reimbursement | | | Ratio of
Expenses to
Average Net
Assets without
Fee Waiver/
Reimbursement | | | Ratio of Net
Investment
Income
to Average
Net Assets | | | Portfolio
Turnover Rate | |
| | | | | | | | | | | | | | | | | | | | | | | | | | |
| | | | | | | | | | | | | | | | | | | | | | | | | | | | | | | | | | |
| | | | | $ | (2.51 | ) | | $ | 17.30 | | | | 5.33 | % | | $ | 1,255 | | | | 0.70 | %(c) | | | 0.75 | %(c) | | | 1.71 | %(c) | | | 87 | % |
| | | | | | (0.10 | ) | | | 18.83 | | | | 21.29 | | | | 1,317 | | | | 0.74 | (c) | | | 1.07 | (c) | | | 1.15 | (c) | | | 81 | (d) |
| | | | | | (0.15 | ) | | | 15.62 | | | | 8.09 | | | | 36,257 | | | | 0.75 | | | | 0.79 | | | | 1.88 | | | | 70 | |
| | | | | | (0.84 | ) | | | 14.60 | | | | (7.13 | ) | | | 32,383 | | | | 0.75 | (e)(f) | | | 1.22 | (e)(f) | | | 4.64 | (e)(f) | | | 35 | |
| | | | | | — | | | | 16.57 | | | | 0.36 | | | | 10 | | | | 0.75 | (e) | | | 2.53 | (e) | | | 1.31 | (e) | | | 76 | |
| | | | | | | | | | | | | | | | | | | | | | | | | | | | | | | | | | |
| | | | | $ | (2.45 | ) | | $ | 16.90 | | | | 4.57 | % | | $ | 41 | | | | 1.40 | %(c) | | | 1.49 | %(c) | | | 0.89 | %(c) | | | 87 | % |
| | | | | | (0.28 | ) | | | 18.51 | | | | 20.68 | | | | 102 | | | | 1.40 | (c) | | | 1.44 | (c) | | | 1.62 | (c) | | | 81 | (d) |
| | | | | | — | | | | 15.61 | | | | 2.09 | | | | 10 | | | | 1.49 | (e) | | | 1.49 | (e) | | | 1.68 | (e) | | | 70 | |
| | | | | | | | | | | | | | | | | | | | | | | | | | | | | | | | | | |
| | | | | $ | (2.52 | ) | | $ | 17.31 | | | | 5.52 | % | | $ | 1,868 | | | | 0.50 | %(c) | | | 0.52 | %(c) | | | 1.83 | %(c) | | | 87 | % |
| | | | | | (0.34 | ) | | | 18.82 | | | | 21.72 | | | | 2,835 | | | | 0.53 | (c) | | | 0.56 | (c) | | | 2.09 | (c) | | | 81 | (d) |
| | | | | | (0.10 | ) | | | 15.79 | | | | 8.28 | | | | 2,851 | | | | 0.60 | | | | 0.62 | | | | 2.13 | | | | 70 | |
| | | | | | — | | | | 14.68 | | | | (6.35 | ) | | | 4,069 | | | | 0.61 | (e)(f) | | | 0.69 | (e)(f) | | | 2.20 | (e)(f) | | | 35 | |
| | | | | | | | | | | | | | | | | | | | | | | | | | | | | | | | | | |
| | | | | $ | (2.55 | ) | | $ | 17.15 | | | | 5.63 | % | | $ | 2,386 | | | | 0.40 | %(c) | | | 0.49 | %(c) | | | 2.01 | %(c) | | | 87 | % |
| | | | | | (0.37 | ) | | | 18.68 | | | | 21.88 | | | | 2,323 | | | | 0.42 | (c) | | | 0.54 | (c) | | | 2.15 | (c) | | | 81 | (d) |
| | | | | | (0.16 | ) | | | 15.68 | | | | 8.31 | | | | 2,390 | | | | 0.50 | | | | 0.51 | | | | 2.44 | | | | 70 | |
| | | | | | (0.85 | ) | | | 14.63 | | | | (6.92 | ) | | | 366 | | | | 0.51 | (e)(f) | | | 0.68 | (e)(f) | | | 2.17 | (e)(f) | | | 35 | |
| | | | | | — | | | | 16.58 | | | | 0.42 | | | | 10 | | | | 0.50 | (e) | | | 2.27 | (e) | | | 1.56 | (e) | | | 76 | |
| | | | | | | | | | | | | | | | | | | | | | | | | | | | | | | | | | |
| | | | | $ | (2.53 | ) | | $ | 17.28 | | | | 5.61 | % | | $ | 519,259 | | | | 0.40 | %(c) | | | 0.42 | %(c) | | | 2.02 | %(c) | | | 87 | % |
| | | | | | (0.38 | ) | | | 18.79 | | | | 21.92 | | | | 594,634 | | | | 0.40 | (c) | | | 0.43 | (c) | | | 2.20 | (c) | | | 81 | (d) |
| | | | | | (0.15 | ) | | | 15.78 | | | | 8.41 | | | | 560,066 | | | | 0.40 | | | | 0.49 | | | | 2.42 | | | | 70 | |
| | | | | | (0.79 | ) | | | 14.70 | | | | (6.83 | ) | | | 250,203 | | | | 0.40 | (e)(f) | | | 0.70 | (e)(f) | | | 2.39 | (e)(f) | | | 35 | |
| | | | | — | | | | 16.58 | | | | 10.53 | | | | 33,422 | | | | 0.40 | (e) | | | 1.80 | (e) | | | 2.40 | (e) | | | 76 | |
| | | | | | | | | | | | | | | | | | | | | | | | | | |
| | | | | | | | | | | | | | | | | | | | | | | | | | | | | | | | | | |
| | | | | $ | (0.72 | ) | | $ | 14.97 | | | | (0.28 | )% | | $ | 504 | | | | 0.70 | %(c) | | | 1.71 | %(c) | | | 2.67 | %(c) | | | 55 | % |
| | | | | | (1.32 | ) | | | 15.71 | | | | 21.83 | | | | 506 | | | | 0.70 | (c) | | | 1.99 | (c) | | | 2.54 | (c) | | | 70 | |
| | | | | | — | | | | 14.21 | | | | 0.07 | | | | 12 | | | | 0.80 | (e) | | | 1.24 | (e) | | | 3.88 | (e) | | | 103 | |
| | | | | | | | | | | | | | | | | | | | | | | | | | | | | | | | | | |
| | | | | $ | (0.65 | ) | | $ | 14.80 | | | | (0.97 | )% | | $ | 103 | | | | 1.45 | %(c) | | | 2.55 | %(c) | | | 1.70 | %(c) | | | 55 | % |
| | | | | | (1.29 | ) | | | 15.58 | | | | 21.06 | | | | 146 | | | | 1.46 | (c) | | | 2.69 | (c) | | | 1.84 | (c) | | | 70 | |
| | | | | | — | | | | 14.16 | | | | (0.28 | ) | | | 15 | | | | 1.55 | (e) | | | 2.02 | (e) | | | 2.79 | (e) | | | 103 | |
| | | | | | | | | | | | | | | | | | | | | | | | | | | | | | | | | | |
| | | | | $ | (0.73 | ) | | $ | 15.01 | | | | (0.14 | )% | | $ | 113 | | | | 0.55 | %(c) | | | 1.56 | %(c) | | | 2.68 | %(c) | | | 55 | % |
| | | | | | (1.32 | ) | | | 15.74 | | | | 22.11 | | | | 119 | | | | 0.56 | (c) | | | 1.73 | (c) | | | 2.32 | (c) | | | 70 | |
| | | | | | (0.25 | ) | | | 14.21 | | | | 4.57 | | | | 10 | | | | 0.65 | | | | 0.97 | | | | 2.87 | | | | 103 | |
| | | | | | (0.01 | ) | | | 13.83 | | | | (7.74 | ) | | | 9 | | | | 0.65 | (e)(f) | | | 2.06 | (e)(f) | | | 2.99 | (e)(f) | | | 29 | |
| | | | | | | | | | | | | | | | | | | | | | | | | | | | | | | | | | |
| | | | | $ | (0.72 | ) | | $ | 15.06 | | | | (0.01 | )% | | $ | 866 | | | | 0.45 | %(c) | | | 1.34 | %(c) | | | 3.11 | %(c) | | | 55 | % |
| | | | | | (1.33 | ) | | | 15.76 | | | | 22.20 | | | | 90 | | | | 0.48 | (c) | | | 1.66 | (c) | | | 2.62 | (c) | | | 70 | |
| | | | | | (0.26 | ) | | | 14.22 | | | | 4.66 | | | | 36 | | | | 0.55 | | | | 1.01 | | | | 3.49 | | | | 103 | |
| | | | | | (0.01 | ) | | | 13.84 | | | | (7.66 | ) | | | 9 | | | | 0.55 | (e)(f) | | | 2.06 | (e)(f) | | | 3.09 | (e)(f) | | | 29 | |
| | | | | | | | | | | | | | | | | | | | | | | | | | | | | | | | | | |
| | | | | $ | (0.67 | ) | | $ | 15.09 | | | | (0.03 | )% | | $ | 24,214 | | | | 0.45 | %(c) | | | 1.46 | %(c) | | | 2.80 | %(c) | | | 55 | % |
| | | | | | (1.33 | ) | | | 15.74 | | | | 22.25 | | | | 25,643 | | | | 0.45 | (c) | | | 1.50 | (c) | | | 2.50 | (c) | | | 70 | |
| | | | | | (0.31 | ) | | | 14.20 | | | | 4.74 | | | | 71,088 | | | | 0.45 | | | | 0.99 | | | | 3.25 | | | | 103 | |
| | | | | | (0.01 | ) | | | 13.85 | | | | (7.59 | ) | | | 56,210 | | | | 0.45 | (e)(f) | | | 1.62 | (e)(f) | | | 3.31 | (e)(f) | | | 29 | |
| | (c) | Does not include expenses of the investment companies in which the Fund invests. |
| | (d) | Portfolio turnover rate excludes securities received or delivered from in-kind fund share transactions. |
| | (e) | Annualized, unless otherwise noted. |
| | (f) | Certain expenses incurred by the Fund were not annualized. |
| | | | | | | | |
| See accompanying Notes to Financial Statements | | | September 30, 2018 | | | Annual Report | | | 271 | |
Financial Highlights (cont’d)
For a Share Outstanding for the Period ended:^
| | | | | | | | | | | | | | | | | | | | | | | | | | | | |
| | |
Net Asset
Value,
Beginning
of Period | | | Net
Investment
Income (a) | | | Net Realized
and Change
in Unrealized
Gain (Loss) | | | Total from
Investment
Operations | | | Dividends
from Net
Investment
Income | | | Distributions
from Net
Realized Capital
Gains | | | | |
| AllianzGI Best Styles U.S. Equity: | | | | | | | | | | |
| Class A | | | | | | | | | | | | | | | | | | | | | | | | | | | | |
9/30/2018 | | $ | 18.42 | | | $ | 0.23 | | | $ | 2.81 | | | $ | 3.04 | | | $ | (0.13 | ) | | $ | (0.84 | ) | | | | |
9/30/2017 | | | 15.47 | | | | 0.25 | | | | 2.93 | | | | 3.18 | | | | (0.23 | ) | | | — | | | | | |
4/26/2016* - 9/30/2016 | | | 14.91 | | | | 0.11 | | | | 0.45 | | | | 0.56 | | | | — | | | | — | | | | | |
| Class C | | | | | | | | | | | | | | | | | | | | | | | | | | | | |
9/30/2018 | | $ | 18.24 | | | $ | 0.11 | | | $ | 2.74 | | | $ | 2.85 | | | $ | (0.27 | ) | | $ | (0.84 | ) | | | | |
9/30/2017 | | | 15.42 | | | | 0.12 | | | | 2.92 | | | | 3.04 | | | | (0.22 | ) | | | — | | | | | |
4/26/2016* - 9/30/2016 | | | 14.91 | | | | 0.06 | | | | 0.45 | | | | 0.51 | | | | — | | | | — | | | | | |
| Class P | | | | | | | | | | | | | | | | | | | | | | | | | | | | |
9/30/2018 | | $ | 18.45 | | | $ | 0.28 | | | $ | 2.77 | | | $ | 3.05 | | | $ | (0.37 | ) | | $ | (0.84 | ) | | | | |
9/30/2017 | | | 15.46 | | | | 0.28 | | | | 2.94 | | | | 3.22 | | | | (0.23 | ) | | | — | | | | | |
9/30/2016 | | | 14.19 | | | | 0.24 | | | | 1.30 | | | | 1.54 | | | | (0.22 | ) | | | (0.05 | ) | | | | |
12/1/2014* - 9/30/2015# | | | 15.00 | | | | 0.18 | | | | (0.97 | ) | | | (0.79 | ) | | | (0.02 | ) | | | — | | | | | |
| Institutional Class | | | | | | | | | | | | | | | | | | | | | | | | �� | | | | |
9/30/2018 | | $ | 18.48 | | | $ | 0.28 | | | $ | 2.78 | | | $ | 3.06 | | | $ | (0.34 | ) | | $ | (0.84 | ) | | | | |
9/30/2017 | | | 15.49 | | | | 0.28 | | | | 2.94 | | | | 3.22 | | | | (0.23 | ) | | | — | | | | | |
9/30/2016 | | | 14.20 | | | | 0.25 | | | | 1.32 | | | | 1.57 | | | | (0.23 | ) | | | (0.05 | ) | | | | |
12/1/2014* - 9/30/2015# | | | 15.00 | | | | 0.18 | | | | (0.96 | ) | | | (0.78 | ) | | | (0.02 | ) | | | — | | | | | |
| Class R6 | | | | | | | | | | | | | | | | | | | | | | | | | | | | |
9/30/2018 | | $ | 18.56 | | | $ | 0.31 | | | $ | 2.78 | | | $ | 3.09 | | | $ | (0.35 | ) | | $ | (0.84 | ) | | | | |
9/30/2017 | | | 15.53 | | | | 0.30 | | | | 2.97 | | | | 3.27 | | | | (0.24 | ) | | | — | | | | | |
9/30/2016 | | | 14.21 | | | | 0.27 | | | | 1.31 | | | | 1.58 | | | | (0.21 | ) | | | (0.05 | ) | | | | |
12/1/2014* - 9/30/2015# | | | 15.00 | | | | 0.20 | | | | (0.97 | ) | | | (0.77 | ) | | | (0.02 | ) | | | — | | | | | |
| ^ | A — may reflect actual amounts rounding to less than $0.01 or 0.01%. |
| * | Commencement of operations. |
| # | Fiscal year end changed from November 30th to September 30th. |
| (a) | Calculated on average shares outstanding during the period. |
| (b) | Total return is calculated assuming a purchase of a share on the first day of the period and a sale of a share on the last day of each period reported. Dividends and distributions, if any, are assumed, for purposes of this calculation, to be reinvested. Total return does not reflect sales charges and includes the effect of fee waivers and reimbursements. Total return may reflect adjustments to conform to U.S. GAAP. Total return for a period of less than one year is not annualized. |
| (c) | Portfolio turnover rate excludes securities received or delivered from in-kind fund share transactions. |
| (d) | Annualized, unless otherwise noted. |
| (e) | Certain expenses incurred by the Fund were not annualized. |
| | | | | | |
| 272 | | Annual Report | | | September 30, 2018 | | | See accompanying Notes to Financial Statements |
| | | | | | | | | | | | | | | | | | | | | | | | | | | | | | | | | | |
| | | | Total
Dividends and
Distributions | | | Net Asset
Value, End
of Period | | | Total Return (b) | | | Net Assets,
End of Period
(000s) | | | Ratio of
Expenses to
Average Net
Assets with
Fee Waiver/
Reimbursement | | | Ratio of
Expenses to
Average Net
Assets without
Fee Waiver/
Reimbursement | | | Ratio of Net
Investment
Income
to Average
Net Assets | | | Portfolio
Turnover Rate | |
| | | | | | | | | | | | | | | | | | | | | | | | | | |
| | | | | | | | | | | | | | | | | | | | | | | | | | | | | | | | | | |
| | | | | $ | (0.97 | ) | | $ | 20.49 | | | | 16.96 | % | | $ | 353 | | | | 0.65 | % | | | 0.76 | % | | | 1.17 | % | | | 80 | % |
| | | | | | (0.23 | ) | | | 18.42 | | | | 20.80 | | | | 46 | | | | 0.68 | | | | 1.02 | | | | 1.49 | | | | 55 | (c) |
| | | | | | — | | | | 15.47 | | | | 3.76 | | | | 47 | | | | 0.75 | (d) | | | 0.93 | (d) | | | 1.75 | (d) | | | 64 | |
| | | | | | | | | | | | | | | | | | | | | | | | | | | | | | | | | | |
| | | | | $ | (1.11 | ) | | $ | 19.98 | | | | 16.14 | % | | $ | 26 | | | | 1.40 | % | | | 1.53 | % | | | 0.58 | % | | | 80 | % |
| | | | | | (0.22 | ) | | | 18.24 | | | | 19.92 | | | | 20 | | | | 1.42 | | | | 1.56 | | | | 0.74 | | | | 55 | (c) |
| | | | | | — | | | | 15.42 | | | | 3.42 | | | | 10 | | | | 1.50 | (d) | | | 1.61 | (d) | | | 0.88 | (d) | | | 64 | |
| | | | | | | | | | | | | | | | | | | | | | | | | | | | | | | | | | |
| | | | | $ | (1.21 | ) | | $ | 20.29 | | | | 17.12 | % | | $ | 672 | | | | 0.50 | % | | | 0.56 | % | | | 1.43 | % | | | 80 | % |
| | | | | | (0.23 | ) | | | 18.45 | | | | 21.07 | | | | 476 | | | | 0.51 | | | | 0.57 | | | | 1.62 | | | | 55 | (c) |
| | | | | | (0.27 | ) | | | 15.46 | | | | 10.95 | | | | 54 | | | | 0.60 | | | | 0.71 | | | | 1.63 | | | | 64 | |
| | | | | | (0.02 | ) | | | 14.19 | | | | (5.27 | ) | | | 25 | | | | 0.60 | (d)(e) | | | 1.32 | (d)(e) | | | 1.40 | (d)(e) | | | 51 | |
| | | | | | | | | | | | | | | | | | | | | | | | | | | | | | | | | | |
| | | | | $ | (1.18 | ) | | $ | 20.36 | | | | 17.17 | % | | $ | 138 | | | | 0.50 | % | | | 0.51 | % | | | 1.45 | % | | | 80 | % |
| | | | | | (0.23 | ) | | | 18.48 | | | | 21.04 | | | | 121 | | | | 0.50 | | | | 0.66 | | | | 1.64 | | | | 55 | (c) |
| | | | | | (0.28 | ) | | | 15.49 | | | | 11.20 | | | | 86 | | | | 0.50 | | | | 0.75 | | | | 1.72 | | | | 64 | |
| | | | | | (0.02 | ) | | | 14.20 | | | | (5.20 | ) | | | 1,771 | | | | 0.50 | (d)(e) | | | 1.45 | (d)(e) | | | 1.51 | (d)(e) | | | 51 | |
| | | | | | | | | | | | | | | | | | | | | | | | | | | | | | | | | | |
| | | | | $ | (1.19 | ) | | $ | 20.46 | | | | 17.25 | % | | $ | 98,758 | | | | 0.40 | % | | | 0.50 | % | | | 1.59 | % | | | 80 | % |
| | | | | | (0.24 | ) | | | 18.56 | | | | 21.26 | | | | 113,074 | | | | 0.40 | | | | 0.56 | | | | 1.78 | | | | 55 | (c) |
| | | | | | (0.26 | ) | | | 15.53 | | | | 11.23 | | | | 100,878 | | | | 0.40 | | | | 0.62 | | | | 1.80 | | | | 64 | |
| | | | | | (0.02 | ) | | | 14.21 | | | | (5.12 | ) | | | 86,456 | | | | 0.40 | (d)(e) | | | 0.74 | (d)(e) | | | 1.63 | (d)(e) | | | 51 | |
| | | | | | | | |
| See accompanying Notes to Financial Statements | | | September 30, 2018 | | | Annual Report | | | 273 | |
Financial Highlights (cont’d)
For a Share Outstanding for the Period ended:^
| | | | | | | | | | | | | | | | | | | | | | | | | | | | |
| | | Net Asset
Value,
Beginning
of Period | | | Net
Investment
Income (a) | | | Net Realized
and Change in
Unrealized Gain
(Loss) | | | Total from
Investment
Operations | | | Dividends
from Net
Investment
Income | | |
Distributions
from Net
Realized Capital
Gains | | | | |
| AllianzGI Convertible: | | | | | | | | | | | | | | | | | | | | | |
| Class A | | | | | | | | | | | | | | | | | | | | | | | | | | | | |
9/30/2018 | | $ | 34.27 | | | $ | 0.32 | | | $ | 4.58 | | | $ | 4.90 | | | $ | (1.30 | ) | | $ | (5.09 | ) | | | | |
9/30/2017 | | | 31.02 | | | | 0.38 | | | | 3.64 | | | | 4.02 | | | | (0.77 | ) | | | — | | | | | |
9/30/2016 | | | 32.13 | | | | 0.64 | | | | 1.29 | | | | 1.93 | | | | (0.53 | ) | | | (2.51 | ) | | | | |
12/1/2014 - 9/30/2015# | | | 36.54 | | | | 0.31 | | | | (1.88 | ) | | | (1.57 | ) | | | (0.55 | ) | | | (2.29 | ) | | | | |
11/30/2014 | | | 34.91 | | | | 0.39 | | | | 2.81 | | | | 3.20 | | | | (0.73 | ) | | | (0.84 | ) | | | | |
11/30/2013 | | | 28.27 | | | | 0.54 | | | | 6.59 | | | | 7.13 | | | | (0.49 | ) | | | — | | | | | |
| Class C | | | | | | | | | | | | | | | | | | | | | | | | | | | | |
9/30/2018 | | $ | 34.36 | | | $ | 0.08 | | | $ | 4.59 | | | $ | 4.67 | | | $ | (0.99 | ) | | $ | (5.09 | ) | | | | |
9/30/2017 | | | 31.19 | | | | 0.17 | | | | 3.65 | | | | 3.82 | | | | (0.65 | ) | | | — | | | | | |
9/30/2016 | | | 32.20 | | | | 0.42 | | | | 1.30 | | | | 1.72 | | | | (0.22 | ) | | | (2.51 | ) | | | | |
12/1/2014 - 9/30/2015# | | | 36.55 | | | | 0.10 | | | | (1.88 | ) | | | (1.78 | ) | | | (0.28 | ) | | | (2.29 | ) | | | | |
11/30/2014 | | | 34.93 | | | | 0.13 | | | | 2.80 | | | | 2.93 | | | | (0.47 | ) | | | (0.84 | ) | | | | |
11/30/2013 | | | 28.30 | | | | 0.30 | | | | 6.60 | | | | 6.90 | | | | (0.27 | ) | | | — | | | | | |
| Class R | | | | | | | | | | | | | | | | | | | | | | | | | | | | |
9/30/2018 | | $ | 34.19 | | | $ | 0.27 | | | $ | 4.70 | | | $ | 4.97 | | | $ | (0.15 | ) | | $ | (5.09 | ) | | | | |
9/30/2017 | | | 30.97 | | | | 0.26 | | | | 3.64 | | | | 3.90 | | | | (0.68 | ) | | | — | | | | | |
9/30/2016 | | | 32.08 | | | | 0.52 | | | | 1.27 | | | | 1.79 | | | | (0.39 | ) | | | (2.51 | ) | | | | |
12/1/2014 - 9/30/2015# | | | 36.45 | | | | 0.20 | | | | (1.87 | ) | | | (1.67 | ) | | | (0.41 | ) | | | (2.29 | ) | | | | |
11/30/2014 | | | 34.87 | | | | 0.26 | | | | 2.81 | | | | 3.07 | | | | (0.65 | ) | | | (0.84 | ) | | | | |
11/30/2013 | | | 28.20 | | | | 0.34 | | | | 6.61 | | | | 6.95 | | | | (0.28 | ) | | | — | | | | | |
| Class P | | | | | | | | | | | | | | | | | | | | | | | | | | | | |
9/30/2018 | | $ | 33.95 | | | $ | 0.38 | | | $ | 4.50 | | | $ | 4.88 | | | $ | (1.62 | ) | | $ | (5.09 | ) | | | | |
9/30/2017 | | | 30.84 | | | | 0.48 | | | | 3.61 | | | | 4.09 | | | | (0.98 | ) | | | — | | | | | |
9/30/2016 | | | 32.07 | | | | 0.72 | | | | 1.27 | | | | 1.99 | | | | (0.71 | ) | | | (2.51 | ) | | | | |
12/1/2014 - 9/30/2015# | | | 36.47 | | | | 0.39 | | | | (1.87 | ) | | | (1.48 | ) | | | (0.63 | ) | | | (2.29 | ) | | | | |
11/30/2014 | | | 34.84 | | | | 0.47 | | | | 2.80 | | | | 3.27 | | | | (0.80 | ) | | | (0.84 | ) | | | | |
11/30/2013 | | | 28.20 | | | | 0.63 | | | | 6.55 | | | | 7.18 | | | | (0.54 | ) | | | — | | | | | |
| Institutional Class | | | | | | | | | | | | | | | | | | | | | | | | | | | | |
9/30/2018 | | $ | 33.89 | | | $ | 0.40 | | | $ | 4.52 | | | $ | 4.92 | | | $ | (1.31 | ) | | $ | (5.09 | ) | | | | |
9/30/2017 | | | 30.76 | | | | 0.49 | | | | 3.61 | | | | 4.10 | | | | (0.97 | ) | | | — | | | | | |
9/30/2016 | | | 32.02 | | | | 0.74 | | | | 1.26 | | | | 2.00 | | | | (0.75 | ) | | | (2.51 | ) | | | | |
12/1/2014 - 9/30/2015# | | | 36.42 | | | | 0.40 | | | | (1.86 | ) | | | (1.46 | ) | | | (0.65 | ) | | | (2.29 | ) | | | | |
11/30/2014 | | | 34.80 | | | | 0.50 | | | | 2.79 | | | | 3.29 | | | | (0.83 | ) | | | (0.84 | ) | | | | |
11/30/2013 | | | 28.16 | | | | 0.61 | | | | 6.59 | | | | 7.20 | | | | (0.56 | ) | | | — | | | | | |
| Administrative Class | | | | | | | | | | | | | | | | | | | | | | | | | | | | |
9/30/2018 | | $ | 34.08 | | | $ | 0.33 | | | $ | 4.54 | | | $ | 4.87 | | | $ | (1.40 | ) | | $ | (5.09 | ) | | | | |
9/30/2017 | | | 30.96 | | | | 0.42 | | | | 3.62 | | | | 4.04 | | | | (0.92 | ) | | | — | | | | | |
9/30/2016 | | | 32.14 | | | | 0.66 | | | | 1.29 | | | | 1.95 | | | | (0.62 | ) | | | (2.51 | ) | | | | |
12/1/2014 - 9/30/2015# | | | 36.54 | | | | 0.33 | | | | (1.88 | ) | | | (1.55 | ) | | | (0.56 | ) | | | (2.29 | ) | | | | |
11/30/2014 | | | 34.84 | | | | 0.43 | | | | 2.79 | | | | 3.22 | | | | (0.68 | ) | | | (0.84 | ) | | | | |
11/30/2013 | | | 28.20 | | | | 0.53 | | | | 6.59 | | | | 7.12 | | | | (0.48 | ) | | | — | | | | | |
| ^ | A — may reflect actual amounts rounding to less than $0.01 or 0.01%. |
| # | Fiscal year end changed from November 30th to September 30th. |
| (a) | Calculated on average shares outstanding during the period. |
| (b) | Total return is calculated assuming a purchase of a share on the first day of the period and a sale of a share on the last day of each period reported. Dividends and distributions, if any, are assumed, for purposes of this calculation, to be reinvested. Total return does not reflect sales charges and includes the effect of fee waivers and reimbursements. Total return may reflect adjustments to conform to U.S. GAAP. Total return for a period of less than one year is not annualized. |
| | | | | | |
| 274 | | Annual Report | | | September 30, 2018 | | | See accompanying Notes to Financial Statements |
| | | | | | | | | | | | | | | | | | | | | | | | | | | | | | |
| | | |
Total
Dividends and
Distributions | | | Net Asset
Value, End
of Period | | | Total Return (b) | | | Net Assets,
End of Period
(000s) | | | Ratio of
Expenses to
Average
Net Assets | | | Ratio of Net
Investment
Income
to Average
Net Assets | | | Portfolio
Turnover Rate | |
| | | | | | | | | | | | | | | | | | | | | | | |
| | | | | | | | | | | | | | | | | | | | | | | | | | | | | | |
| | | | | $ | (6.39 | ) | | $ | 32.78 | | | | 16.83 | % | | $ | 61,385 | | | | 0.96 | % | | | 1.02 | % | | | 133 | % |
| | | | | | (0.77 | ) | | | 34.27 | | | | 13.14 | | | | 76,586 | | | | 1.02 | | | | 1.19 | | | | 124 | (c) |
| | | | | | (3.04 | ) | | | 31.02 | | | | 6.42 | | | | 259,711 | | | | 0.99 | | | | 2.12 | | | | 101 | |
| | | | | | (2.84 | ) | | | 32.13 | | | | (4.56 | ) | | | 465,080 | | | | 0.98 | (d)(e) | | | 1.08 | (d)(e) | | | 73 | |
| | | | | | (1.57 | ) | | | 36.54 | (f) | | | 9.47 | (f) | | | 483,863 | | | | 0.97 | | | | 1.09 | | | | 94 | |
| | | | | | (0.49 | ) | | | 34.91 | | | | 25.49 | | | | 319,778 | | | | 0.96 | | | | 1.67 | | | | 81 | |
| | | | | | | | | | | | | | | | | | | | | | | | | | | | | | |
| | | | | $ | (6.08 | ) | | $ | 32.95 | | | | 15.90 | % | | $ | 53,461 | | | | 1.73 | % | | | 0.24 | % | | | 133 | % |
| | | | | | (0.65 | ) | | | 34.36 | | | | 12.41 | | | | 48,905 | | | | 1.69 | | | | 0.51 | | | | 124 | (c) |
| | | | | | (2.73 | ) | | | 31.19 | | | | 5.65 | | | | 67,423 | | | | 1.71 | | | | 1.40 | | | | 101 | |
| | | | | | (2.57 | ) | | | 32.20 | | | | (5.11 | ) | | | 101,326 | | | | 1.71 | (d)(e) | | | 0.34 | (d)(e) | | | 73 | |
| | | | | | (1.31 | ) | | | 36.55 | (f) | | | 8.66 | (f) | | | 127,201 | | | | 1.70 | | | | 0.36 | | | | 94 | |
| | | | | | (0.27 | ) | | | 34.93 | | | | 24.55 | | | | 113,799 | | | | 1.70 | | | | 0.94 | | | | 81 | |
| | | | | | | | | | | | | | | | | | | | | | | | | | | | | | |
| | | | | $ | (5.24 | ) | | $ | 33.92 | | | | 16.59 | % | | $ | 98 | | | | 1.17 | % | | | 0.81 | % | | | 133 | % |
| | | | | | (0.68 | ) | | | 34.19 | | | | 12.79 | | | | 114 | | | | 1.42 | | | | 0.82 | | | | 124 | (c) |
| | | | | | (2.90 | ) | | | 30.97 | | | | 5.95 | | | | 1,145 | | | | 1.43 | | | | 1.73 | | | | 101 | |
| | | | | | (2.70 | ) | | | 32.08 | | | | (4.82 | ) | | | 1,592 | | | | 1.36 | (d)(e) | | | 0.70 | (d)(e) | | | 73 | |
| | | | | | (1.49 | ) | | | 36.45 | (f) | | | 9.10 | (f) | | | 1,440 | | | | 1.30 | | | | 0.74 | | | | 94 | |
| | | | | | (0.28 | ) | | | 34.87 | | | | 24.86 | | | | 394 | | | | 1.51 | | | | 1.06 | | | | 81 | |
| | | | | | | | | | | | | | | | | | | | | | | | | | | | | | |
| | | | | $ | (6.71 | ) | | $ | 32.12 | | | | 17.08 | % | | $ | 102,412 | | | | 0.74 | % | | | 1.24 | % | | | 133 | % |
| | | | | | (0.98 | ) | | | 33.95 | | | | 13.52 | | | | 80,392 | | | | 0.72 | | | | 1.49 | | | | 124 | (c) |
| | | | | | (3.22 | ) | | | 30.84 | | | | 6.67 | | | | 88,900 | | | | 0.73 | | | | 2.38 | | | | 101 | |
| | | | | | (2.92 | ) | | | 32.07 | | | | (4.32 | ) | | | 160,998 | | | | 0.69 | (d)(e) | | | 1.36 | (d)(e) | | | 73 | |
| | | | | | (1.64 | ) | | | 36.47 | (f) | | | 9.71 | (f) | | | 224,860 | | | | 0.74 | | | | 1.32 | | | | 94 | |
| | | | | | (0.54 | ) | | | 34.84 | | | | 25.76 | | | | 251,377 | | | | 0.75 | | | | 1.96 | | | | 81 | |
| | | | | | | | | | | | | | | | | | | | | | | | | | | | | | |
| | | | | $ | (6.40 | ) | | $ | 32.41 | | | | 17.10 | % | | $ | 332,874 | | | | 0.71 | % | | | 1.27 | % | | | 133 | % |
| | | | | | (0.97 | ) | | | 33.89 | | | | 13.58 | | | | 322,732 | | | | 0.68 | | | | 1.54 | | | | 124 | (c) |
| | | | | | (3.26 | ) | | | 30.76 | | | | 6.73 | | | | 1,089,974 | | | | 0.67 | | | | 2.47 | | | | 101 | |
| | | | | | (2.94 | ) | | | 32.02 | | | | (4.27 | ) | | | 1,428,098 | | | | 0.66 | (d)(e) | | | 1.40 | (d)(e) | | | 73 | |
| | | | | | (1.67 | ) | | | 36.42 | (f) | | | 9.79 | (f) | | | 1,781,193 | | | | 0.65 | | | | 1.41 | | | | 94 | |
| | | | | | (0.56 | ) | | | 34.80 | | | | 25.88 | | | | 1,583,824 | | | | 0.65 | | | | 1.93 | | | | 81 | |
| | | | | | | | | | | | | | | | | | | | | | | | | | | | | | |
| | | | | $ | (6.49 | ) | | $ | 32.46 | | | | 16.88 | % | | $ | 997 | | | | 0.93 | % | | | 1.05 | % | | | 133 | % |
| | | | | | (0.92 | ) | | | 34.08 | | | | 13.30 | | | | 1,240 | | | | 0.89 | | | | 1.32 | | | | 124 | (c) |
| | | | | | (3.13 | ) | | | 30.96 | | | | 6.52 | | | | 1,428 | | | | 0.90 | | | | 2.20 | | | | 101 | |
| | | | | | (2.85 | ) | | | 32.14 | | | | (4.49 | ) | | | 1,998 | | | | 0.89 | (d)(e) | | | 1.15 | (d)(e) | | | 73 | |
| | | | | | (1.52 | ) | | | 36.54 | (f) | | | 9.57 | (f) | | | 3,783 | | | | 0.89 | | | | 1.22 | | | | 94 | |
| | | | | | (0.48 | ) | | | 34.84 | | | | 25.55 | | | | 12,951 | | | | 0.90 | | | | 1.65 | | | | 81 | |
| | (c) | Portfolio turnover rate excludes securities received or delivered from in-kind fund share transactions. |
| | (d) | Annualized, unless otherwise noted. |
| | (e) | Certain expenses incurred by the Fund were not annualized. |
| | (f) | Payments from Affiliates increased the end of period net asset value and total return by less than $0.01 and 0.01%, respectively. |
| | | | | | | | |
| See accompanying Notes to Financial Statements | | | September 30, 2018 | | | Annual Report | | | 275 | |
Financial Highlights (cont’d)
For a Share Outstanding for the Period ended:
| | | | | | | | | | | | | | | | | | | | | | | | | | | | | | | | |
| | | Net Asset
Value,
Beginning
of Period | | | Net
Investment
Income (a) | | | Net Realized
and Change in
Unrealized Gain
(Loss) | | | Total from
Investment
Operations
Income | | | Dividends
from Net
Investment
Income | | | Net Asset
Value, End
of Period | | | Total Return (b) | | | | |
| AllianzGI Core Bond: | | | | | | | | | | | | | | | | | | | | | | | | |
| Class P | | | | | | | | | | | | | | | | | | | | | | | | | | | | | | | | |
5/30/2018* - 9/30/2018 | | $ | 15.00 | | | $ | 0.14 | | | $ | (0.12 | ) | | $ | 0.02 | | | $ | (0.11 | ) | | $ | 14.91 | | | | 0.11 | % | | | | |
| Institutional Class | | | | | | | | | | | | | | | | | | | | | | | | | | | | | | | | |
5/30/2018* - 9/30/2018 | | $ | 15.00 | | | $ | 0.14 | | | $ | (0.12 | ) | | $ | 0.02 | | | $ | (0.11 | ) | | $ | 14.91 | | | | 0.13 | % | | | | |
| Class R6 | | | | | | | | | | | | | | | | | | | | | | | | | | | | | | | | |
5/30/2018* - 9/30/2018 | | $ | 15.00 | | | $ | 0.14 | | | $ | (0.12 | ) | | $ | 0.02 | | | $ | (0.11 | ) | | $ | 14.91 | | | | 0.15 | % | | | | |
| AllianzGI Core Plus Bond: | | | | | | | | | | | | | | | | | | | | | | | | |
| Class P | | | | | | | | | | | | | | | | | | | | | | | | | | | | | | | | |
5/30/2018* - 9/30/2018 | | $ | 15.00 | | | $ | 0.14 | | | $ | (0.11 | ) | | $ | 0.03 | | | $ | (0.11 | ) | | $ | 14.92 | | | | 0.18 | % | | | | |
| Institutional Class | | | | | | | | | | | | | | | | | | | | | | | | | | | | | | | | |
5/30/2018* - 9/30/2018 | | $ | 15.00 | | | $ | 0.14 | | | $ | (0.11 | ) | | $ | 0.03 | | | $ | (0.11 | ) | | $ | 14.92 | | | | 0.20 | % | | | | |
| Class R6 | | | | | | | | | | | | | | | | | | | | | | | | | | | | | | | | |
5/30/2018* - 9/30/2018 | | $ | 15.00 | | | $ | 0.15 | | | $ | (0.12 | ) | | $ | 0.03 | | | $ | (0.11 | ) | | $ | 14.92 | | | | 0.22 | % | | | | |
| * | Commencement of operations. |
| (a) | Calculated on average shares outstanding during the period. |
| (b) | Total return is calculated assuming a purchase of a share on the first day of the period and a sale of a share on the last day of each period reported. Dividends and distributions, if any, are assumed, for purposes of this calculation, to be reinvested. Total return does not reflect sales charges and includes the effect of fee waivers and reimbursements. Total return may reflect adjustments to conform to U.S. GAAP. Total return for a period of less than one year is not annualized. |
| (c) | Annualized, unless otherwise noted. |
| (d) | Certain expenses incurred by the Fund were not annualized. |
| | | | | | |
| 276 | | Annual Report | | | September 30, 2018 | | | See accompanying Notes to Financial Statements |
| | | | | | | | | | | | | | | | | | | | | | |
| | | | Net Assets,
End of Period
(000s) | | | Ratio of
Expenses to
Average Net
Assets with
Fee Waiver/
Reimbursement (c)(d) | | | Ratio of
Expenses to
Average Net
Assets without
Fee Waiver/
Reimbursement (c)(d) | | | Ratio of Net
Investment
Income
to Average
Net Assets (c)(d) | | | Portfolio
Turnover Rate | |
| | | | | | | | | | | | | | | | | |
| | | | | | | | | | | | | | | | | | | | | | |
| | | | | $ | 10 | | | | 0.30 | % | | | 1.45 | % | | | 2.71 | % | | | 305 | % |
| | | | | | | | | | | | | | | | | | | | | | |
| | | | | $ | 10 | | | | 0.25 | % | | | 1.45 | % | | | 2.76 | % | | | 305 | % |
| | | | | | | | | | | | | | | | | | | | | | |
| | | | $ | 29,356 | | | | 0.20 | % | | | 1.47 | % | | | 2.83 | % | | | 305 | % |
| | | | | | | | | | | | | | | | | |
| | | | | | | | | | | | | | | | | | | | | | |
| | | | | $ | 10 | | | | 0.35 | % | | | 1.19 | % | | | 2.81 | % | | | 302 | % |
| | | | | | | | | | | | | | | | | | | | | | |
| | | | | $ | 10 | | | | 0.30 | % | | | 1.19 | % | | | 2.86 | % | | | 302 | % |
| | | | | | | | | | | | | | | | | | | | | | |
| | | | | $ | 40,075 | | | | 0.25 | % | | | 1.19 | % | | | 2.91 | % | | | 302 | % |
| | | | | | | | |
| See accompanying Notes to Financial Statements | | | September 30, 2018 | | | Annual Report | | | 277 | |
Financial Highlights (cont’d)
For a Share Outstanding for the Period ended:^
| | | | | | | | | | | | | | | | | | | | | | | | | | | | |
| | | Net Asset
Value,
Beginning
of Period | | | Net
Investment
Income (a) | | | Net Realized
and Change in
Unrealized Gain
(Loss) | | | Total from
Investment
Operations | | |
Dividends
from Net
Investment
Income | | | Distributions
from Net
Realized Capital
Gains | | | | |
| AllianzGI Emerging Markets Consumer: | | | | | | | | | | | | | | | | | | | | | |
| Class A | | | | | | | | | | | | | | | | | | | | | | | | | | | | |
9/30/2018 | | $ | 15.76 | | | $ | 0.11 | | | $ | (1.11 | ) | | $ | (1.00 | ) | | $ | (0.26 | ) | | $ | (0.62 | ) | | | | |
9/30/2017 | | | 13.60 | | | | 0.21 | | | | 2.07 | | | | 2.28 | | | | (0.12 | ) | | | — | | | | | |
9/30/2016 | | | 12.24 | | | | 0.11 | | | | 1.31 | | | | 1.42 | | | | (0.06 | ) | | | — | | | | | |
12/1/2014* - 9/30/2015# | | | 15.00 | | | | 0.13 | | | | (2.89 | ) | | | (2.76 | ) | | | — | | | | — | | | | | |
| Institutional Class | | | | | | | | | | | | | | | | | | | | | | | | | | | | |
9/30/2018 | | $ | 15.86 | | | $ | 0.21 | | | $ | (1.17 | ) | | $ | (0.96 | ) | | $ | (0.23 | ) | | $ | (0.62 | ) | | | | |
9/30/2017 | | | 13.68 | | | | 0.22 | | | | 2.11 | | | | 2.33 | | | | (0.15 | ) | | | — | | | | | |
9/30/2016 | | | 12.28 | | | | 0.19 | | | | 1.28 | | | | 1.47 | | | | (0.07 | ) | | | — | | | | | |
12/1/2014* - 9/30/2015# | | | 15.00 | | | | 0.13 | | | | (2.85 | ) | | | (2.72 | ) | | | — | | | | — | | | | | |
| AllianzGI Emerging Markets Debt: | | | | | | | | | | | | | | | | | | | | | |
| Class A | | | | | | | | | | | | | | | | | | | | | | | | | | | | |
9/30/2018 | | $ | 14.87 | | | $ | 0.71 | | | $ | (1.52 | ) | | $ | (0.81 | ) | | $ | (0.60 | ) | | $ | (0.11 | ) | | | | |
9/30/2017 | | | 14.89 | | | | 0.75 | | | | 0.16 | | | | 0.91 | | | | (0.91 | ) | | | (0.02 | ) | | | | |
9/30/2016 | | | 13.51 | | | | 0.71 | | | | 1.32 | | | | 2.03 | | | | (0.65 | ) | | | — | | | | | |
12/1/2014 - 9/30/2015# | | | 14.92 | | | | 0.47 | | | | (1.35 | ) | | | (0.88 | ) | | | (0.53 | ) | | | — | | | | | |
9/15/2014* - 11/30/2014 | | | 15.00 | | | | 0.11 | | | | (0.19 | ) | | | (0.08 | ) | | | — | | | | — | | | | | |
| Class C | | | | | | | | | | | | | | | | | | | | | | | | | | | | |
9/30/2018 | | $ | 14.95 | | | $ | 0.64 | | | $ | (1.56 | ) | | $ | (0.92 | ) | | $ | (0.44 | ) | | $ | (0.11 | ) | | | | |
9/30/2017 | | | 14.96 | | | | 0.64 | | | | 0.17 | | | | 0.81 | | | | (0.80 | ) | | | (0.02 | ) | | | | |
9/30/2016 | | | 13.51 | | | | 0.61 | | | | 1.32 | | | | 1.93 | | | | (0.48 | ) | | | — | | | | | |
12/1/2014 - 9/30/2015# | | | 14.90 | | | | 0.39 | | | | (1.36 | ) | | | (0.97 | ) | | | (0.42 | ) | | | — | | | | | |
9/15/2014* - 11/30/2014 | | | 15.00 | | | | 0.09 | | | | (0.19 | ) | | | (0.10 | ) | | | — | | | | — | | | | | |
| Class P | | | | | | | | | | | | | | | | | | | | | | | | | | | | |
9/30/2018 | | $ | 14.84 | | | $ | 0.75 | | | $ | (1.53 | ) | | $ | (0.78 | ) | | $ | (0.71 | ) | | $ | (0.11 | ) | | | | |
9/30/2017 | | | 14.90 | | | | 0.77 | | | | 0.16 | | | | 0.93 | | | | (0.97 | ) | | | (0.02 | ) | | | | |
9/30/2016 | | | 13.51 | | | | 0.70 | | | | 1.35 | | | | 2.05 | | | | (0.66 | ) | | | — | | | | | |
12/1/2014 - 9/30/2015# | | | 14.92 | | | | 0.49 | | | | (1.34 | ) | | | (0.85 | ) | | | (0.56 | ) | | | — | | | | | |
9/15/2014* - 11/30/2014 | | | 15.00 | | | | 0.12 | | | | (0.20 | ) | | | (0.08 | ) | | | — | | | | — | | | | | |
| Institutional Class | | | | | | | | | | | | | | | | | | | | | | | | | | | | |
9/30/2018 | | $ | 14.83 | | | $ | 0.77 | | | $ | (1.55 | ) | | $ | (0.78 | ) | | $ | (0.71 | ) | | $ | (0.11 | ) | | | | |
9/30/2017 | | | 14.88 | | | | 0.79 | | | | 0.16 | | | | 0.95 | | | | (0.98 | ) | | | (0.02 | ) | | | | |
9/30/2016 | | | 13.51 | | | | 0.72 | | | | 1.34 | | | | 2.06 | | | | (0.69 | ) | | | — | | | | | |
12/1/2014 - 9/30/2015# | | | 14.93 | | | | 0.50 | | | | (1.35 | ) | | | (0.85 | ) | | | (0.57 | ) | | | — | | | | | |
9/15/2014* - 11/30/2014 | | | 15.00 | | | | 0.12 | | | | (0.19 | ) | | | (0.07 | ) | | | — | | | | — | | | | | |
| ^ | A — may reflect actual amounts rounding to less than $0.01 or 0.01%. |
| # | Fiscal year end changed from November 30th to September 30th. |
| * | Commencement of operations. |
| (a) | Calculated on average shares outstanding during the period. |
| (b) | Total return is calculated assuming a purchase of a share on the first day of the period and a sale of a share on the last day of each period reported. Dividends and distributions, if any, are assumed, for purposes of this calculation, to be reinvested. Total return does not reflect sales charges and includes the effect of fee waivers and reimbursements. Total return may reflect adjustments to conform to U.S. GAAP. Total return for a period of less than one year is not annualized. |
| (c) | Annualized, unless otherwise noted. |
| (d) | Certain expenses incurred by the Fund were not annualized. |
| | | | | | |
| 278 | | Annual Report | | | September 30, 2018 | | | See accompanying Notes to Financial Statements |
| | | | | | | | | | | | | | | | | | | | | | | | | | | | | | | | | | |
| | | | Total
Dividends and
Distributions | | | Net Asset
Value, End
of Period | | | Total Return (b) | | | Net Assets,
End of Period
(000s) | | | Ratio of
Expenses to
Average Net
Assets with
Fee Waiver/
Reimbursement | | | Ratio of Expenses to
Average Net
Assets without
Fee Waiver/
Reimbursement | | | Ratio of Net
Investment
Income
to Average
Net Assets | | | Portfolio
Turnover Rate | |
| | | | | | | | | | | | | | | | | | | | | | | | | | |
| | | | | | | | | | | | | | | | | | | | | | | | | | | | | | | | | | |
| | | | | $ | (0.88 | ) | | $ | 13.88 | | | | (7.04 | )% | | $ | 69 | | | | 1.55 | % | | | 1.78 | % | | | 0.68 | % | | | 115 | % |
| | | | | | (0.12 | ) | | | 15.76 | | | | 16.97 | | | | 155 | | | | 1.55 | | | | 16.84 | | | | 1.47 | | | | 122 | |
| | | | | | (0.06 | ) | | | 13.60 | | | | 11.67 | | | | 48 | | | | 1.58 | | | | 38.88 | | | | 0.90 | | | | 91 | |
| | | | | | — | | | | 12.24 | | | | (18.40 | ) | | | 37 | | | | 1.65 | (c)(d) | | | 9.30 | (c)(d) | | | 1.15 | (c)(d) | | | 77 | |
| | | | | | | | | | | | | | | | | | | | | | | | | | | | | | | | | | |
| | | | | $ | (0.85 | ) | | $ | 14.05 | | | | (6.69 | )% | | $ | 43,333 | | | | 1.20 | % | | | 1.37 | % | | | 1.36 | % | | | 115 | % |
| | | | | | (0.15 | ) | | | 15.86 | | | | 17.37 | | | | 43,487 | | | | 1.20 | | | | 1.64 | | | | 1.55 | | | | 122 | |
| | | | | | (0.07 | ) | | | 13.68 | | | | 12.06 | | | | 44,630 | | | | 1.22 | | | | 2.04 | | | | 1.49 | | | | 91 | |
| | | | | — | | | | 12.28 | | | | (18.13 | ) | | | 15,591 | | | | 1.30 | (c)(d) | | | 3.55 | (c)(d) | | | 1.14 | (c)(d) | | | 77 | |
| | | | | | | | | | | | | | | | | | | | | | | | | | |
| | | | | | | | | | | | | | | | | | | | | | | | | | | | | | | | | | |
| | | | | $ | (0.71 | ) | | $ | 13.35 | | | | (5.62 | )% | | $ | 135 | | | | 1.20 | % | | | 1.89 | % | | | 4.89 | % | | | 127 | % |
| | | | | | (0.93 | ) | | | 14.87 | | | | 6.41 | | | | 140 | | | | 1.20 | | | | 1.66 | | | | 5.05 | | | | 118 | |
| | | | | | (0.65 | ) | | | 14.89 | | | | 15.39 | | | | 175 | | | | 1.20 | �� | | | 1.68 | | | | 5.01 | | | | 123 | |
| | | | | | (0.53 | ) | | | 13.51 | | | | (6.00 | ) | | | 9 | | | | 1.23 | (c)(d) | | | 2.32 | (c)(d) | | | 3.97 | (c)(d) | | | 125 | |
| | | | | | — | | | | 14.92 | | | | (0.53 | ) | | | 10 | | | | 1.20 | (c) | | | 2.51 | (c) | | | 3.65 | (c) | | | 27 | |
| | | | | | | | | | | | | | | | | | | | | | | | | | | | | | | | | | |
| | | | | $ | (0.55 | ) | | $ | 13.48 | | | | (6.30 | )% | | $ | 46 | | | | 1.95 | % | | | 2.68 | % | | | 4.41 | % | | | 127 | % |
| | | | | | (0.82 | ) | | | 14.95 | | | | 5.64 | | | | 113 | | | | 1.95 | | | | 2.41 | | | | 4.33 | | | | 118 | |
| | | | | | (0.48 | ) | | | 14.96 | | | | 14.56 | | | | 109 | | | | 1.95 | | | | 2.34 | | | | 4.28 | | | | 123 | |
| | | | | | (0.42 | ) | | | 13.51 | | | | (6.61 | ) | | | 9 | | | | 1.98 | (c)(d) | | | 3.06 | (c)(d) | | | 3.23 | (c)(d) | | | 125 | |
| | | | | | — | | | | 14.90 | | | | (0.67 | ) | | | 10 | | | | 1.95 | (c) | | | 3.25 | (c) | | | 2.90 | (c) | | | 27 | |
| | | | | | | | | | | | | | | | | | | | | | | | | | | | | | | | | | |
| | | | | $ | (0.82 | ) | | $ | 13.24 | | | | (5.44 | )% | | $ | 11 | | | | 1.04 | % | | | 1.68 | % | | | 5.27 | % | | | 127 | % |
| | | | | | (0.99 | ) | | | 14.84 | | | | 6.55 | | | | 12 | | | | 1.05 | | | | 1.34 | | | | 5.26 | | | | 118 | |
| | | | | | (0.66 | ) | | | 14.90 | | | | 15.57 | | | | 11 | | | | 1.05 | | | | 1.40 | | | | 5.02 | | | | 123 | |
| | | | | | (0.56 | ) | | | 13.51 | | | | (5.86 | ) | | | 10 | | | | 1.08 | (c)(d) | | | 2.06 | (c)(d) | | | 4.12 | (c)(d) | | | 125 | |
| | | | | | — | | | | 14.92 | | | | (0.53 | ) | | | 10 | | | | 1.05 | (c) | | | 2.25 | (c) | | | 3.80 | (c) | | | 27 | |
| | | | | | | | | | | | | | | | | | | | | | | | | | | | | | | | | | |
| | | | | $ | (0.82 | ) | | $ | 13.23 | | | | (5.40 | )% | | $ | 18,321 | | | | 0.95 | % | | | 1.61 | % | | | 5.34 | % | | | 127 | % |
| | | | | | (1.00 | ) | | | 14.83 | | | | 6.73 | | | | 36,313 | | | | 0.95 | | | | 1.35 | | | | 5.35 | | | | 118 | |
| | | | | | (0.69 | ) | | | 14.88 | | | | 15.67 | | | | 43,318 | | | | 0.95 | | | | 1.40 | | | | 5.15 | | | | 123 | |
| | | | | | (0.57 | ) | | | 13.51 | | | | (5.82 | ) | | | 28,557 | | | | 0.97 | (c)(d) | | | 2.07 | (c)(d) | | | 4.22 | (c)(d) | | | 125 | |
| | | | | | — | | | | 14.93 | | | | (0.47 | ) | | | 29,856 | | | | 0.95 | (c) | | | 2.28 | (c) | | | 3.91 | (c) | | | 27 | |
| | | | | | | | |
| See accompanying Notes to Financial Statements | | | September 30, 2018 | | | Annual Report | | | 279 | |
Financial Highlights (cont’d)
For a Share Outstanding for the Period ended:^
| | | | | | | | | | | | | | | | | | | | | | | | | | | | |
| | | Net Asset
Value,
Beginning
of Period | | | Net
Investment
Income (a) | | | Net Realized
and Change
in Unrealized
Gain (Loss) | | | Total from
Investment
Operations | | |
Dividends
from Net
Investment
Income | | | Distributions
from Net
Realized Capital
Gains | | | | |
| AllianzGI Emerging Markets Small-Cap: | | | | |
| Class A | | | | | | | | | | | | | | | | | | | | | | | | | | | | |
9/30/2018 | | $ | 18.36 | | | $ | 0.16 | | | $ | (0.59 | ) | | $ | (0.43 | ) | | $ | (0.85 | ) | | $ | (0.47 | ) | | | | |
9/30/2017 | | | 15.15 | | | | 0.23 | | | | 2.98 | | | | 3.21 | | | | — | | | | — | | | | | |
9/30/2016 | | | 14.04 | | | | 0.16 | | | | 1.16 | | | | 1.32 | | | | (0.21 | ) | | | — | | | | | |
12/1/2014* - 9/30/2015# | | | 15.00 | | | | 0.26 | | | | (1.22 | ) | | | (0.96 | ) | | | — | | | | — | | | | | |
| Institutional Class | | | | | | | | | | | | | | | | | | | | | | | | | | | | |
9/30/2018 | | $ | 18.04 | | | $ | 0.26 | | | $ | (0.62 | ) | | $ | (0.36 | ) | | $ | (0.76 | ) | | $ | (0.47 | ) | | | | |
9/30/2017 | | | 15.30 | | | | 0.24 | | | | 2.95 | | | | 3.19 | | | | (0.45 | ) | | | — | | | | | |
9/30/2016 | | | 14.08 | | | | 0.30 | | | | 1.06 | | | | 1.36 | | | | (0.14 | ) | | | — | | | | | |
12/1/2014* - 9/30/2015# | | | 15.00 | | | | 0.22 | | | | (1.14 | ) | | | (0.92 | ) | | | — | | | | — | | | | | |
| AllianzGI Europe Equity Dividend: | | | | | | | | | | | | | | | | | | | | | |
| Class A | | | | | | | | | | | | | | | | | | | | | | | | | | | | |
9/30/2018 | | $ | 16.24 | | | $ | 0.54 | | | $ | (0.75 | ) | | $ | (0.21 | ) | | $ | (0.54 | ) | | $ | — | | | | | |
9/30/2017 | | | 14.32 | | | | 0.48 | | | | 2.06 | | | | 2.54 | | | | (0.62 | ) | | | — | | | | | |
9/30/2016 | | | 13.59 | | | | 0.53 | | | | 0.60 | | | | 1.13 | | | | (0.40 | ) | | | — | | | | | |
2/2/2015* - 9/30/2015# | | | 15.00 | | | | 0.37 | | | | (1.78 | ) | | | (1.41 | ) | | | — | | | | — | | | | | |
| Class C | | | | | | | | | | | | | | | | | | | | | | | | | | | | |
9/30/2018 | | $ | 16.19 | | | $ | 0.45 | | | $ | (0.77 | ) | | $ | (0.32 | ) | | $ | (0.46 | ) | | $ | — | | | | | |
9/30/2017 | | | 14.24 | | | | 0.50 | | | | 1.91 | | | | 2.41 | | | | (0.46 | ) | | | — | | | | | |
9/30/2016 | | | 13.52 | | | | 0.43 | | | | 0.60 | | | | 1.03 | | | | (0.31 | ) | | | — | | | | | |
2/2/2015* - 9/30/2015# | | | 15.00 | | | | 0.28 | | | | (1.76 | ) | | | (1.48 | ) | | | — | | | | — | | | | | |
| Class P | | | | | | | | | | | | | | | | | | | | | | | | | | | | |
9/30/2018 | | $ | 16.35 | | | $ | 0.61 | | | $ | (0.80 | ) | | $ | (0.19 | ) | | $ | (0.75 | ) | | $ | — | | | | | |
9/30/2017 | | | 14.37 | | | | 0.46 | | | | 2.11 | | | | 2.57 | | | | (0.59 | ) | | | — | | | | | |
9/30/2016 | | | 13.60 | | | | 0.44 | | | | 0.72 | | | | 1.16 | | | | (0.39 | ) | | | — | | | | | |
2/2/2015* - 9/30/2015# | | | 15.00 | | | | 0.40 | | | | (1.80 | ) | | | (1.40 | ) | | | — | | | | — | | | | | |
| Institutional Class | | | | | | | | | | | | | | | | | | | | | | | | | | | | |
9/30/2018 | | $ | 16.37 | | | $ | 0.62 | | | $ | (0.78 | ) | | $ | (0.16 | ) | | $ | (0.69 | ) | | $ | — | | | | | |
9/30/2017 | | | 14.34 | | | | 0.58 | | | | 2.01 | | | | 2.59 | | | | (0.56 | ) | | | — | | | | | |
9/30/2016 | | | 13.61 | | | | 0.55 | | | | 0.62 | | | | 1.17 | | | | (0.44 | ) | | | — | | | | | |
2/2/2015* - 9/30/2015# | | | 15.00 | | | | 0.39 | | | | (1.78 | ) | | | (1.39 | ) | | | — | | | | — | | | | | |
| ^ | A — may reflect actual amounts rounding to less than $0.01 or 0.01%. |
| # | Fiscal year end changed from November 30th to September 30th. |
| * | Commencement of operations. |
| (a) | Calculated on average shares outstanding during the period. |
| (b) | Total return is calculated assuming a purchase of a share on the first day of the period and a sale of a share on the last day of each period reported. Dividends and distributions, if any, are assumed, for purposes of this calculation, to be reinvested. Total return does not reflect sales charges and includes the effect of fee waivers and reimbursements. Total return may reflect adjustments to conform to U.S. GAAP. Total return for a period of less than one year is not annualized. |
| (c) | Annualized, unless otherwise noted. |
| (d) | Certain expenses incurred by the Fund were not annualized. |
| (e) | Payments from Affiliates increased the end of period net asset value (“NAV”) and total return by $0.01 and 0.06%, respectively, for Class A and $0.01 and 0.05%, respectively, for Institutional Class. If the Affiliates had not made these payments, the end of year NAV and total return would have been $16.60 and (2.78)%, respectively, for Class A and $16.44 and (2.43)%, respectively, for Institutional Class. |
| | | | | | |
| 280 | | Annual Report | | | September 30, 2018 | | | See accompanying Notes to Financial Statements |
| | | | | | | | | | | | | | | | | | | | | | | | | | | | | | | | | | |
| | | | Total Dividends
and Distributions | | | Net Asset
Value, End
of Period | | | Total Return (b) | | | Net Assets,
End of Period
(000s) | | | Ratio of
Expenses to
Average Net
Assets with
Fee Waiver/
Reimbursement | | | Ratio of
Expenses to
Average Net
Assets without
Fee Waiver/
Reimbursement | | | Ratio of Net
Investment
Income
to Average
Net Assets | | | Portfolio
Turnover Rate | |
| | | | | | | | | | | | | | | | | | | | | | | | | | |
| | | | | | | | | | | | | | | | | | | | | | | | | | | | | | | | | | |
| | | | | $ | (1.32 | ) | | $ | 16.61 | (e) | | | (2.72 | )%(e) | | $ | 135 | | | | 1.85 | % | | | 3.71 | % | | | 0.90 | % | | | 119 | % |
| | | | | | — | | | | 18.36 | | | | 21.19 | | | | 204 | | | | 1.85 | | | | 15.72 | | | | 1.39 | | | | 121 | |
| | | | | | (0.21 | ) | | | 15.15 | | | | 9.54 | | | | 67 | | | | 1.85 | | | | 6.84 | | | | 1.14 | | | | 147 | |
| | | | | | — | | | | 14.04 | | | | (6.39 | ) | | | 621 | | | | 1.85 | (c)(d) | | | 9.40 | (c)(d) | | | 2.12 | (c)(d) | | | 103 | |
| | | | | | | | | | | | | | | | | | | | | | | | | | | | | | | | | | |
| | | | | $ | (1.23 | ) | | $ | 16.45 | (e) | | | (2.38 | )%(e) | | $ | 10,030 | | | | 1.50 | % | | | 3.05 | % | | | 1.46 | % | | | 119 | % |
| | | | | | (0.45 | ) | | | 18.04 | | | | 21.69 | | | | 11,251 | | | | 1.50 | | | | 3.38 | | | | 1.47 | | | | 121 | |
| | | | | | (0.14 | ) | | | 15.30 | | | | 9.80 | | | | 13,367 | | | | 1.50 | | | | 4.72 | | | | 2.08 | | | | 147 | |
| | | | | | — | | | | 14.08 | | | | (6.11 | ) | | | 7,921 | | | | 1.50 | (c)(d) | | | 7.77 | (c)(d) | | | 1.78 | (c)(d) | | | 103 | |
| | | | | | | | | | | | | | | | | | | | | | | | | | |
| | | | | | | | | | | | | | | | | | | | | | | | | | | | | | | | | | |
| | | | | $ | (0.54 | ) | | $ | 15.49 | | | | (1.33 | )% | | $ | 293 | | | | 1.20 | % | | | 4.31 | % | | | 3.31 | % | | | 57 | % |
| | | | | | (0.62 | ) | | | 16.24 | | | | 18.19 | | | | 1,475 | | | | 1.21 | | | | 5.64 | | | | 3.08 | | | | 71 | |
| | | | | | (0.40 | ) | | | 14.32 | | | | 8.45 | | | | 49 | | | | 1.21 | | | | 10.11 | | | | 3.81 | | | | 35 | |
| | | | | | — | | | | 13.59 | | | | (9.40 | ) | | | 9 | | | | 1.20 | (c)(d) | | | 11.69 | (c)(d) | | | 3.86 | (c)(d) | | | 16 | |
| | | | | | | | | | | | | | | | | | | | | | | | | | | | | | | | | | |
| | | | | $ | (0.46 | ) | | $ | 15.41 | | | | (2.00 | )% | | $ | 68 | | | | 1.95 | % | | | 4.69 | % | | | 2.83 | % | | | 57 | % |
| | | | | | (0.46 | ) | | | 16.19 | | | | 17.25 | | | | 59 | | | | 1.99 | | | | 6.70 | | | | 3.33 | | | | 71 | |
| | | | | | (0.31 | ) | | | 14.24 | | | | 7.70 | | | | 15 | | | | 1.96 | | | | 11.04 | | | | 3.10 | | | | 35 | |
| | | | | | — | | | | 13.52 | | | | (9.87 | ) | | | 11 | | | | 1.95 | (c)(d) | | | 11.78 | (c)(d) | | | 2.93 | (c)(d) | | | 16 | |
| | | | | | | | | | | | | | | | | | | | | | | | | | | | | | | | | | |
| | | | | $ | (0.75 | ) | | $ | 15.41 | | | | (1.17 | )% | | $ | 12 | | | | 1.05 | % | | | 3.70 | % | | | 3.77 | % | | | 57 | % |
| | | | | | (0.59 | ) | | | 16.35 | | | | 18.32 | | | | 116 | | | | 1.08 | | | | 5.34 | | | | 3.03 | | | | 71 | |
| | | | | | (0.39 | ) | | | 14.37 | | | | 8.59 | | | | 10 | | | | 1.05 | | | | 10.71 | | | | 3.13 | | | | 35 | |
| | | | | | — | | | | 13.60 | | | | (9.33 | ) | | | 22 | | | | 1.05 | (c)(d) | | | 11.62 | (c)(d) | | | 4.12 | (c)(d) | | | 16 | |
| | | | | | | | | | | | | | | | | | | | | | | | | | | | | | | | | | |
| | | | | $ | (0.69 | ) | | $ | 15.52 | | | | (1.01 | )% | | $ | 6,591 | | | | 0.95 | % | | | 3.68 | % | | | 3.83 | % | | | 57 | % |
| | | | | | (0.56 | ) | | | 16.37 | | | | 18.50 | | | | 8,687 | | | | 1.00 | | | | 5.74 | | | | 3.92 | | | | 71 | |
| | | | | | (0.44 | ) | | | 14.34 | | | | 8.73 | | | | 6,273 | | | | 0.95 | | | | 9.97 | | | | 3.90 | | | | 35 | |
| | | | | | — | | | | 13.61 | | | | (9.27 | ) | | | 2,915 | | | | 0.95 | (c)(d) | | | 11.18 | (c)(d) | | | 4.00 | (c)(d) | | | 16 | |
| | | | | | | | |
| See accompanying Notes to Financial Statements | | | September 30, 2018 | | | Annual Report | | | 281 | |
Financial Highlights (cont’d)
For a Share Outstanding for the Period ended:^
| | | | | | | | | | | | | | | | | | | | | | | | | | | | |
| | | Net Asset
Value,
Beginning
of Period | | | Net
Investment
Income (a) | | |
Net Realized
and Change in
Unrealized Gain
(Loss) | | | Total from
Investment
Operations | | | Dividends
from Net
Investment
Income | | | Distributions
from Net
Realized Capital
Gains | | | | |
| AllianzGI Global Dynamic Allocation: | | | | | | | | | | | | | | | | | | | | | |
| Class A | | | | | | | | | | | | | | | | | | | | | | | | | | | | |
9/30/2018 | | $ | 20.52 | | | $ | 0.28 | | | $ | 0.32 | | | $ | 0.60 | | | $ | (0.21 | ) | | $ | (0.72 | ) | | | | |
9/30/2017 | | | 18.32 | | | | 0.20 | | | | 2.00 | | | | 2.20 | | | | — | | | | — | | | | | |
9/30/2016 | | | 17.99 | | | | 0.17 | | | | 0.66 | | | | 0.83 | | | | (0.22 | ) | | | (0.28 | ) | | | | |
12/1/2014 - 9/30/2015# | | | 21.93 | | | | 0.39 | | | | (1.43 | ) | | | (1.04 | ) | | | (0.81 | ) | | | (2.09 | ) | | | | |
11/30/2014 | | | 24.70 | | | | 0.44 | | | | 0.31 | | | | 0.75 | | | | (0.66 | ) | | | (2.86 | ) | | | | |
11/30/2013 | | | 22.04 | | | | 0.42 | | | | 3.07 | | | | 3.49 | | | | (0.61 | ) | | | (0.22 | ) | | | | |
| Class C | | | | | | | | | | | | | | | | | | | | | | | | | | | | |
9/30/2018 | | $ | 20.05 | | | $ | 0.12 | | | $ | 0.31 | | | $ | 0.43 | | | $ | (0.20 | ) | | $ | (0.72 | ) | | | | |
9/30/2017 | | | 18.05 | | | | 0.08 | | | | 1.92 | | | | 2.00 | | | | — | | | | — | | | | | |
9/30/2016 | | | 17.63 | | | | 0.08 | | | | 0.62 | | | | 0.70 | | | | — | | | | (0.28 | ) | | | | |
12/1/2014 - 9/30/2015# | | | 21.52 | | | | 0.30 | | | | (1.45 | ) | | | (1.15 | ) | | | (0.65 | ) | | | (2.09 | ) | | | | |
11/30/2014 | | | 24.28 | | | | 0.25 | | | | 0.32 | | | | 0.57 | | | | (0.47 | ) | | | (2.86 | ) | | | | |
11/30/2013 | | | 21.71 | | | | 0.30 | | | | 2.97 | | | | 3.27 | | | | (0.48 | ) | | | (0.22 | ) | | | | |
| Class R | | | | | | | | | | | | | | | | | | | | | | | | | | | | |
9/30/2018 | | $ | 20.35 | | | $ | 0.21 | | | $ | 0.30 | | | $ | 0.51 | | | $ | (0.17 | ) | | $ | (0.72 | ) | | | | |
9/30/2017 | | | 18.23 | | | | 0.16 | | | | 1.96 | | | | 2.12 | | | | — | | | | — | | | | | |
9/30/2016 | | | 17.84 | | | | 0.16 | | | | 0.63 | | | | 0.79 | | | | (0.12 | ) | | | (0.28 | ) | | | | |
12/1/2014 - 9/30/2015# | | | 21.79 | | | | 0.36 | | | | (1.45 | ) | | | (1.09 | ) | | | (0.77 | ) | | | (2.09 | ) | | | | |
11/30/2014 | | | 24.62 | | | | 0.40 | | | | 0.30 | | | | 0.70 | | | | (0.67 | ) | | | (2.86 | ) | | | | |
11/30/2013 | | | 21.90 | | | | 0.23 | | | | 3.20 | | | | 3.43 | | | | (0.49 | ) | | | (0.22 | ) | | | | |
| Class P | | | | | | | | | | | | | | | | | | | | | | | | | | | | |
9/30/2018 | | $ | 20.48 | | | $ | 0.32 | | | $ | 0.31 | | | $ | 0.63 | | | $ | (0.32 | ) | | $ | (0.72 | ) | | | | |
9/30/2017 | | | 18.36 | | | | 0.28 | | | | 1.94 | | | | 2.22 | | | | (0.10 | ) | | | — | | | | | |
9/30/2016 | | | 17.97 | | | | 0.16 | | | | 0.71 | | | | 0.87 | | | | (0.20 | ) | | | (0.28 | ) | | | | |
12/1/2014 - 9/30/2015# | | | 21.94 | | | | 0.40 | | | | (1.42 | ) | | | (1.02 | ) | | | (0.86 | ) | | | (2.09 | ) | | | | |
11/30/2014 | | | 24.71 | | | | 0.46 | | | | 0.33 | | | | 0.79 | | | | (0.70 | ) | | | (2.86 | ) | | | | |
11/30/2013 | | | 22.08 | | | | 0.38 | | | | 3.14 | | | | 3.52 | | | | (0.67 | ) | | | (0.22 | ) | | | | |
| Institutional Class | | | | | | | | | | | | | | | | | | | | | | | | | | | | |
9/30/2018 | | $ | 20.61 | | | $ | 0.34 | | | $ | 0.32 | | | $ | 0.66 | | | $ | (0.33 | ) | | $ | (0.72 | ) | | | | |
9/30/2017 | | | 18.37 | | | | 0.27 | | | | 1.98 | | | | 2.25 | | | | (0.01 | ) | | | — | | | | | |
9/30/2016 | | | 18.02 | | | | 0.23 | | | | 0.65 | | | | 0.88 | | | | (0.25 | ) | | | (0.28 | ) | | | | |
12/1/2014 - 9/30/2015# | | | 22.00 | | | | 0.36 | | | | (1.37 | ) | | | (1.01 | ) | | | (0.88 | ) | | | (2.09 | ) | | | | |
11/30/2014 | | | 24.74 | | | | 0.48 | | | | 0.34 | | | | 0.82 | | | | (0.70 | ) | | | (2.86 | ) | | | | |
11/30/2013 | | | 22.10 | | | | 0.56 | | | | 2.99 | | | | 3.55 | | | | (0.69 | ) | | | (0.22 | ) | | | | |
| Class R6 | | | | | | | | | | | | | | | | | | | | | | | | | | | | |
9/30/2018 | | $ | 20.56 | | | $ | 0.34 | | | $ | 0.32 | | | $ | 0.66 | | | $ | (0.35 | ) | | $ | (0.72 | ) | | | | |
9/30/2017 | | | 18.38 | | | | 0.28 | | | | 1.99 | | | | 2.27 | | | | (0.09 | ) | | | — | | | | | |
2/1/2016* - 9/30/2016 | | | 17.30 | | | | 0.09 | | | | 0.99 | | | | 1.08 | | | | — | | | | — | | | | | |
| Administrative Class | | | | | | | | | | | | | | | | | | | | | | | | | | | | |
9/30/2018 | | $ | 20.55 | | | $ | 0.29 | | | $ | 0.32 | | | $ | 0.61 | | | $ | (0.29 | ) | | $ | (0.72 | ) | | | | |
9/30/2017 | | | 18.35 | | | | 0.23 | | | | 1.97 | | | | 2.20 | | | | — | | | | — | | | | | |
9/30/2016 | | | 17.93 | | | | 0.21 | | | | 0.63 | | | | 0.84 | | | | (0.14 | ) | | | (0.28 | ) | | | | |
12/1/2014 - 9/30/2015# | | | 21.90 | | | | 0.42 | | | | (1.46 | ) | | | (1.04 | ) | | | (0.84 | ) | | | (2.09 | ) | | | | |
11/30/2014 | | | 24.67 | | | | 0.42 | | | | 0.33 | | | | 0.75 | | | | (0.66 | ) | | | (2.86 | ) | | | | |
11/30/2013 | | | 22.04 | | | | 0.48 | | | | 3.01 | | | | 3.49 | | | | (0.64 | ) | | | (0.22 | ) | | | | |
| ^ | A — may reflect actual amounts rounding to less than $0.01 or 0.01%. |
| # | Fiscal year end changed from November 30th to September 30th. |
| * | Commencement of operations. |
| (a) | Calculated on average shares outstanding during the period. |
| | | | | | |
| 282 | | Annual Report | | | September 30, 2018 | | | See accompanying Notes to Financial Statements |
| | | | | | | | | | | | | | | | | | | | | | | | | | | | | | | | | | |
| | | | Total
Dividends and
Distributions | | | Net Asset
Value, End
of Period | | | Total Return (b) | | | Net Assets,
End of Period (000s) | | | Ratio of Expenses to
Average Net Assets with
Fee Waiver/
Reimbursement (c) | | | Ratio of Expenses to
Average Net Assets without Fee Waiver/
Reimbursement (c) | | | Ratio of Net
Investment
Income
to Average
Net Assets (c) | | | Portfolio
Turnover Rate | |
| | | | | | | | | | | | | | | | | | | | | | | | | | |
| | | | | | | | | | | | | | | | | | | | | | | | | | | | | | | | | | |
| | | | | $ | (0.93 | ) | | $ | 20.19 | | | | 2.93 | % | | $ | 2,015 | | | | 0.97 | % | | | 1.25 | % | | | 1.37 | % | | | 152 | % |
| | | | | | — | | | | 20.52 | | | | 12.01 | | | | 2,421 | | | | 1.02 | | | | 1.35 | | | | 1.05 | | | | 192 | |
| | | | | | (0.50 | ) | | | 18.32 | | | | 4.69 | | | | 5,198 | | | | 0.76 | | | | 1.73 | | | | 0.96 | | | | 79 | |
| | | | | | (2.90 | ) | | | 17.99 | | | | (5.30 | ) | | | 1,324 | | | | 0.63 | (d)(e) | | | 4.38(d | )(e) | | | 2.46 | (d)(e) | | | 121 | |
| | | | | | (3.52 | ) | | | 21.93 | | | | 3.40 | | | | 1,042 | | | | 0.40 | | | | 4.53 | | | | 2.00 | | | | 62 | |
| | | | | | (0.83 | ) | | | 24.70 | | | | 16.42 | | | | 1,344 | | | | 0.40 | | | | 3.84 | | | | 1.82 | | | | 101 | |
| | | | | | | | | | | | | | | | | | | | | | | | | | | | | | | | | | |
| | | | | $ | (0.92 | ) | | $ | 19.56 | | | | 2.09 | % | | $ | 1,195 | | | | 1.74 | % | | | 2.01 | % | | | 0.61 | % | | | 152 | % |
| | | | | | — | | | | 20.05 | | | | 11.08 | | | | 1,325 | | | | 1.77 | | | | 2.08 | | | | 0.42 | | | | 192 | |
| | | | | | (0.28 | ) | | | 18.05 | | | | 4.02 | | | | 1,029 | | | | 1.49 | | | | 2.69 | | | | 0.45 | | | | 79 | |
| | | | | | (2.74 | ) | | | 17.63 | | | | (5.95 | ) | | | 1,194 | | | | 1.37 | (d)(e) | | | 5.05 | (d)(e) | | | 1.90 | (d)(e) | | | 121 | |
| | | | | | (3.33 | ) | | | 21.52 | | | | 2.57 | | | | 1,346 | | | | 1.18 | | | | 5.31 | | | | 1.16 | | | | 62 | |
| | | | | | (0.70 | ) | | | 24.28 | | | | 15.52 | | | | 1,455 | | | | 1.18 | | | | 4.53 | | | | 1.33 | | | | 101 | |
| | | | | | | | | | | | | | | | | | | | | | | | | | | | | | | | | | |
| | | | | $ | (0.89 | ) | | $ | 19.97 | | | | 2.49 | % | | $ | 160 | | | | 1.34 | % | | | 1.58 | % | | | 1.05 | % | | | 152 | % |
| | | | | | — | | | | 20.35 | | | | 11.63 | | | | 137 | | | | 1.35 | | | | 1.70 | | | | 0.84 | | | | 192 | |
| | | | | | (0.40 | ) | | | 18.23 | | | | 4.50 | | | | 159 | | | | 1.01 | | | | 2.25 | | | | 0.90 | | | | 79 | |
| | | | | | (2.86 | ) | | | 17.84 | | | | (5.55 | ) | | | 152 | | | | 0.87 | (d)(e) | | | 4.80 | (d)(e) | | | 2.27 | (d)(e) | | | 121 | |
| | | | | | (3.53 | ) | | | 21.79 | | | | 3.17 | | | | 145 | | | | 0.63 | | | | 4.99 | | | | 1.79 | | | | 62 | |
| | | | | | (0.71 | ) | | | 24.62 | | | | 16.13 | | | | 111 | | | | 0.63 | | | | 4.28 | | | | 1.00 | | | | 101 | |
| | | | | | | | | | | | | | | | | | | | | | | | | | | | | | | | | | |
| | | | | $ | (1.04 | ) | | $ | 20.07 | | | | 3.08 | % | | $ | 13,436 | | | | 0.80 | % | | | 1.03 | % | | | 1.58 | % | | | 152 | % |
| | | | | | (0.10 | ) | | | 20.48 | | | | 12.18 | | | | 12,730 | | | | 0.82 | | | | 1.11 | | | | 1.44 | | | | 192 | |
| | | | | | (0.48 | ) | | | 18.36 | | | | 4.89 | | | | 186 | | | | 0.61 | | | | 1.47 | | | | 0.90 | | | | 79 | |
| | | | | | (2.95 | ) | | | 17.97 | | | | (5.19 | ) | | | 53 | | | | 0.47 | (d)(e) | | | 4.07 | (d)(e) | | | 2.53 | (d)(e) | | | 121 | |
| | | | | | (3.56 | ) | | | 21.94 | | | | 3.57 | | | | 43 | | | | 0.23 | | | | 4.40 | | | | 2.06 | | | | 62 | |
| | | | | | (0.89 | ) | | | 24.71 | | | | 16.62 | | | | 41 | | | | 0.23 | | | | 3.76 | | | | 1.65 | | | | 101 | |
| | | | | | | | | | | | | | | | | | | | | | | | | | | | | | | | | | |
| | | | | $ | (1.05 | ) | | $ | 20.22 | | | | 3.18 | % | | $ | 13,225 | | | | 0.70 | % | | | 0.94 | % | | | 1.65 | % | | | 152 | % |
| | | | | | (0.01 | ) | | | 20.61 | | | | 12.27 | | | | 31,783 | | | | 0.75 | | | | 1.03 | | | | 1.42 | | | | 192 | |
| | | | | | (0.53 | ) | | | 18.37 | | | | 4.98 | | | | 37,722 | | | | 0.51 | | | | 1.45 | | | | 1.27 | | | | 79 | |
| | | | | | (2.97 | ) | | | 18.02 | | | | (5.12 | ) | | | 4,714 | | | | 0.39 | (d)(e) | | | 4.10 | (d)(e) | | | 2.27 | (d)(e) | | | 121 | |
| | | | | | (3.56 | ) | | | 22.00 | | | | 3.69 | | | | 3,401 | | | | 0.13 | | | | 4.30 | | | | 2.16 | | | | 62 | |
| | | | | | (0.91 | ) | | | 24.74 | | | | 16.71 | | | | 3,296 | | | | 0.13 | | | | 3.48 | | | | 2.43 | | | | 101 | |
| | | | | | | | | | | | | | | | | | | | | | | | | | | | | | | | | | |
| | | | | $ | (1.07 | ) | | $ | 20.15 | | | | 3.19 | % | | $ | 192,375 | | | | 0.70 | % | | | 0.91 | % | | | 1.67 | % | | | 152 | % |
| | | | | | (0.09 | ) | | | 20.56 | | | | 12.39 | | | | 231,584 | | | | 0.70 | | | | 0.99 | | | | 1.49 | | | | 192 | |
| | | | | | — | | | | 18.38 | | | | 6.24 | | | | 9,029 | | | | 0.36 | (d) | | | 1.36 | (d) | | | 0.77 | (d) | | | 79 | |
| | | | | | | | | | | | | | | | | | | | | | | | | | | | | | | | | | |
| | | | | $ | (1.01 | ) | | $ | 20.15 | | | | 2.93 | % | | $ | 23 | | | | 0.96 | % | | | 1.17 | % | | | 1.42 | % | | | 152 | % |
| | | | | | — | | | | 20.55 | | | | 11.99 | | | | 23 | | | | 1.00 | | | | 1.25 | | | | 1.18 | | | | 192 | |
| | | | | | (0.42 | ) | | | 18.35 | | | | 4.73 | | | | 20 | | | | 0.76 | | | | 1.89 | | | | 1.15 | | | | 79 | |
| | | | | | (2.93 | ) | | | 17.93 | | | | (5.29 | ) | | | 19 | | | | 0.61 | (d)(e) | | | 4.29 | (d)(e) | | | 2.64 | (d)(e) | | | 121 | |
| | | | | | (3.52 | ) | | | 21.90 | | | | 3.38 | | | | 26 | | | | 0.38 | | | | 4.55 | | | | 1.90 | | | | 62 | |
| | | | | | (0.86 | ) | | | 24.67 | | | | 16.48 | | | | 20 | | | | 0.38 | | | | 3.79 | | | | 2.09 | | | | 101 | |
| | (b) | Total return is calculated assuming a purchase of a share on the first day of the period and a sale of a share on the last day of each period reported. Dividends and distributions, if any, are assumed, for purposes of this calculation, to be reinvested. Total return does not reflect sales charges and includes the effect of fee waivers and reimbursements. Total return may reflect adjustments to conform to U.S. GAAP. Total return for a period of less than one year is not annualized. |
| | (c) | Does not include expenses of the investment companies in which the Fund invests. |
| | (d) | Annualized, unless otherwise noted. |
| | (e) | Certain expenses incurred by the Fund were not annualized. |
| | | | | | | | |
| See accompanying Notes to Financial Statements | | | September 30, 2018 | | | Annual Report | | | 283 | |
Financial Highlights (cont’d)
For a Share Outstanding for the Period ended:^
| | | | | | | | | | | | | | | | | | | | | | | | | | | | |
| | | Net Asset
Value,
Beginning
of Period | | | Net
Investment
Income (a) | | |
Net Realized
and Change in
Unrealized
Gain (Loss) | | | Total from
Investment
Operations | | | Dividends
from Net
Investment
Income | | | Distributions
from Net
Realized Capital
Gains | | | | |
| AllianzGI Global High Yield: | | | | | | | | | | | | | |
| Class P | | | | | | | | | | | | | | | | | | | | | | | | | | | | |
9/30/2018 | | $ | 15.36 | | | $ | 0.67 | | | $ | (0.48 | ) | | $ | 0.19 | | | $ | (0.71 | ) | | $ | — | | | | | |
5/3/2017* - 9/30/2017 | | | 15.00 | | | | 0.26 | | | | 0.18 | | | | 0.44 | | | | (0.08 | ) | | | — | | | | | |
| Institutional Class | | | | | | | | | | | | | | | | | | | | | | | | | | | | |
9/30/2018 | | $ | 15.36 | | | $ | 0.68 | | | $ | (0.48 | ) | | $ | 0.20 | | | $ | (0.73 | ) | | $ | — | | | | | |
5/3/2017* - 9/30/2017 | | | 15.00 | | | | 0.27 | | | | 0.17 | | | | 0.44 | | | | (0.08 | ) | | | — | | | | | |
| AllianzGI Global Sustainability: | | | | | | | | | | | | | | | | | | | | | |
| Class A | | | | | | | | | | | | | | | | | | | | | | | | | | | | |
9/30/2018 | | $ | 17.96 | | | $ | 0.17 | | | $ | 1.98 | | | $ | 2.15 | | | $ | (0.21 | ) | | $ | (0.44 | ) | | | | |
9/30/2017 | | | 15.80 | | | | 0.13 | | | | 2.20 | | | | 2.33 | | | | (0.14 | ) | | | (0.03 | ) | | | | |
9/30/2016 | | | 14.10 | | | | 0.14 | | | | 1.76 | | | | 1.90 | | | | (0.20 | ) | | | — | | | | | |
12/9/2014* - 9/30/2015# | | | 15.00 | | | | 0.11 | | | | (1.01 | ) | | | (0.90 | ) | | | — | | | | — | | | | | |
| Class P | | | | | | | | | | | | | | | | | | | | | | | | | | | | |
9/30/2018 | | $ | 18.13 | | | $ | 0.16 | | | $ | 2.05 | | | $ | 2.21 | | | $ | (0.22 | ) | | $ | (0.44 | ) | | | | |
9/30/2017 | | | 15.91 | | | | 0.15 | | | | 2.23 | | | | 2.38 | | | | (0.13 | ) | | | (0.03 | ) | | | | |
9/30/2016 | | | 14.12 | | | | 0.17 | | | | 1.75 | | | | 1.92 | | | | (0.13 | ) | | | — | | | | | |
12/9/2014* - 9/30/2015# | | | 15.00 | | | | 0.15 | | | | (1.03 | ) | | | (0.88 | ) | | | — | | | | — | | | | | |
| Institutional Class | | | | | | | | | | | | | | | | | | | | | | | | | | | | |
9/30/2018 | | $ | 18.13 | | | $ | 0.22 | | | $ | 2.00 | | | $ | 2.22 | | | $ | (0.19 | ) | | $ | (0.44 | ) | | | | |
9/30/2017 | | | 15.92 | | | | 0.19 | | | | 2.20 | | | | 2.39 | | | | (0.15 | ) | | | (0.03 | ) | | | | |
9/30/2016 | | | 14.13 | | | | 0.22 | | | | 1.71 | | | | 1.93 | | | | (0.14 | ) | | | — | | | | | |
12/9/2014* - 9/30/2015# | | | 15.00 | | | | 0.16 | | | | (1.03 | ) | | | (0.87 | ) | | | — | | | | — | | | | | |
| ^ | A — may reflect actual amounts rounding to less than $0.01 or 0.01%. |
| # | Fiscal year end changed from November 30th to September 30th. |
| * | Commencement of operations. |
| (a) | Calculated on average shares outstanding during the period. |
| (b) | Total return is calculated assuming a purchase of a share on the first day of the period and a sale of a share on the last day of each period reported. Dividends and distributions, if any, are assumed, for purposes of this calculation, to be reinvested. Total return does not reflect sales charges and includes the effect of fee waivers and reimbursements. Total return may reflect adjustments to conform to U.S. GAAP. Total return for a period of less than one year is not annualized. |
| (c) | Annualized, unless otherwise noted. |
| (d) | Certain expenses incurred by the Fund were not annualized. |
| | | | | | |
| 284 | | Annual Report | | | September 30, 2018 | | | See accompanying Notes to Financial Statements |
| | | | | | | | | | | | | | | | | | | | | | | | | | | | | | | | | | |
| | | | Total
Dividends and
Distributions | | | Net Asset
Value, End
of Period | | | Total Return (b) | | | Net Assets,
End of Period
(000s) | | | Ratio of
Expenses to
Average Net
Assets with
Fee Waiver/
Reimbursement | | | Ratio of
Expenses to
Average Net
Assets without
Fee Waiver/
Reimbursement | | | Ratio of Net
Investment
Income
to Average
Net Assets | | | Portfolio
Turnover Rate | |
| | | | | | | | | | | | | | | | | | | | | | | | | | |
| | | | | | | | | | | | | | | | | | | | | | | | | | | | | | | | | | |
| | | | | $ | (0.71 | ) | | $ | 14.84 | | | | 1.26 | % | | $ | 11 | | | | 0.81 | % | | | 1.79 | % | | | 4.41 | % | | | 101 | % |
| | | | | | (0.08 | ) | | | 15.36 | | | | 2.91 | | | | 10 | | | | 0.80 | (c)(d) | | | 2.76 | (c)(d) | | | 4.22 | (c)(d) | | | 107 | |
| | | | | | | | | | | | | | | | | | | | | | | | | | | | | | | | | | |
| | | | | $ | (0.73 | ) | | $ | 14.83 | | | | 1.32 | % | | $ | 22,168 | | | | 0.71 | % | | | 1.78 | % | | | 4.52 | % | | | 101 | % |
| | | | | (0.08 | ) | | | 15.36 | | | | 2.96 | | | | 21,625 | | | | 0.70 | (c)(d) | | | 2.79 | (c)(d) | | | 4.32 | (c)(d) | | | 107 | |
| | | | | | | | | | | | | | | | | | | | | | | | | | |
| | | | | | | | | | | | | | | | | | | | | | | | | | | | | | | | | | |
| | | | | $ | (0.65 | ) | | $ | 19.46 | | | | 12.23 | % | | $ | 614 | | | | 1.09 | % | | | 1.70 | % | | | 0.92 | % | | | 20 | % |
| | | | | | (0.17 | ) | | | 17.96 | | | | 14.94 | | | | 402 | | | | 1.12 | | | | 7.55 | | | | 0.79 | | | | 27 | |
| | | | | | (0.20 | ) | | | 15.80 | | | | 13.54 | | | | 125 | | | | 1.20 | | | | 21.93 | | | | 0.94 | | | | 20 | |
| | | | | | — | | | | 14.10 | | | | (6.00 | ) | | | 62 | | | | 1.20 | (c)(d) | | | 15.36 | (c)(d) | | | 0.89 | (c)(d) | | | 25 | |
| | | | | | | | | | | | | | | | | | | | | | | | | | | | | | | | | | |
| | | | | $ | (0.66 | ) | | $ | 19.68 | | | | 12.44 | % | | $ | 11,362 | | | | 0.94 | % | | | 1.25 | % | | | 0.84 | % | | | 20 | % |
| | | | | | (0.16 | ) | | | 18.13 | | | | 15.13 | | | | 64 | | | | 0.96 | | | | 1.62 | | | | 0.88 | | | | 27 | |
| | | | | | (0.13 | ) | | | 15.91 | | | | 13.67 | | | | 11 | | | | 1.05 | | | | 3.44 | | | | 1.15 | | | | 20 | |
| | | | | | — | | | | 14.12 | | | | (5.87 | ) | | | 9 | | | | 1.05 | (c)(d) | | | 8.70 | (c)(d) | | | 1.22 | (c)(d) | | | 25 | |
| | | | | | | | | | | | | | | | | | | | | | | | | | | | | | | | | | |
| | | | | $ | (0.63 | ) | | $ | 19.72 | | | | 12.52 | % | | $ | 28,237 | | | | 0.84 | % | | | 1.43 | % | | | 1.18 | % | | | 20 | % |
| | | | | | (0.18 | ) | | | 18.13 | | | | 15.25 | | | | 26,615 | | | | 0.89 | | | | 1.63 | | | | 1.16 | | | | 27 | |
| | | | | | (0.14 | ) | | | 15.92 | | | | 13.77 | | | | 20,610 | | | | 0.95 | | | | 2.04 | | | | 1.47 | | | | 20 | |
| | | | | | — | | | | 14.13 | | | | (5.80 | ) | | | 2,826 | | | | 0.95 | (c)(d) | | | 8.70 | (c)(d) | | | 1.32 | (c)(d) | | | 25 | |
| | | | | | | | |
| See accompanying Notes to Financial Statements | | | September 30, 2018 | | | Annual Report | | | 285 | |
Financial Highlights (cont’d)
For a Share Outstanding for the Period ended:^
| | | | | | | | | | | | | | | | | | | | | | | | | | | | |
| | | Net Asset
Value,
Beginning
of Period | | | Net
Investment
Income
(Loss) (a) | | | Net Realized
and Change in
Unrealized Gain
(Loss) | | | Total from
Investment
Operations | | | Dividends
from Net
Investment
Income | | | Distributions
from Net
Realized Capital
Gains | | | | |
| AllianzGI Global Water: | | | | | | | | | | | | | | | | | | | | | |
| Class A | | | | | | | | | | | | | | | | | | | | | | | | | | | | |
9/30/2018 | | $ | 15.49 | | | $ | 0.13 | | | $ | 0.34 | | | $ | 0.47 | | | $ | (0.04 | ) | | $ | (0.38 | ) | | | | |
9/30/2017 | | | 14.46 | | | | 0.08 | | | | 1.08 | | | | 1.16 | | | | (0.05 | ) | | | (0.08 | ) | | | | |
9/30/2016 | | | 11.99 | | | | 0.08 | | | | 2.44 | | | | 2.52 | | | | (0.03 | ) | | | (0.02 | ) | | | | |
12/1/2014 - 9/30/2015# | | | 12.70 | | | | 0.06 | | | | (0.74 | ) | | | (0.68 | ) | | | (0.03 | ) | | | — | �� | | | | |
11/30/2014 | | | 12.41 | | | | 0.07 | | | | 0.25 | | | | 0.32 | | | | (0.03 | ) | | | — | | | | | |
11/30/2013 | | | 10.26 | | | | 0.07 | | | | 2.20 | | | | 2.27 | | | | (0.12 | ) | | | — | | | | | |
| Class C | | | | | | | | | | | | | | | | | | | | | | | | | | | | |
9/30/2018 | | $ | 14.82 | | | $ | 0.01 | | | $ | 0.34 | | | $ | 0.35 | | | $ | — | | | $ | (0.38 | ) | | | | |
9/30/2017 | | | 13.90 | | | | (0.01 | ) | | | 1.01 | | | | 1.00 | | | | — | | | | (0.08 | ) | | | | |
9/30/2016 | | | 11.59 | | | | (0.02 | ) | | | 2.35 | | | | 2.33 | | | | — | | | | (0.02 | ) | | | | |
12/1/2014 - 9/30/2015# | | | 12.33 | | | | (0.02 | ) | | | (0.72 | ) | | | (0.74 | ) | | | — | | | | — | | | | | |
11/30/2014 | | | 12.11 | | | | (0.03 | ) | | | 0.25 | | | | 0.22 | | | | — | | | | — | | | | | |
11/30/2013 | | | 10.02 | | | | (0.02 | ) | | | 2.16 | | | | 2.14 | | | | (0.05 | ) | | | — | | | | | |
| Class P | | | | | | | | | | | | | | | | | | | | | | | | | | | | |
9/30/2018 | | $ | 15.57 | | | $ | 0.17 | | | $ | 0.36 | | | $ | 0.53 | | | $ | (0.13 | ) | | $ | (0.38 | ) | | | | |
9/30/2017 | | | 14.54 | | | | 0.15 | | | | 1.04 | | | | 1.19 | | | | (0.08 | ) | | | (0.08 | ) | | | | |
9/30/2016 | | | 12.05 | | | | 0.11 | | | | 2.45 | | | | 2.56 | | | | (0.05 | ) | | | (0.02 | ) | | | | |
12/1/2014 - 9/30/2015# | | | 12.80 | | | | 0.09 | | | | (0.75 | ) | | | (0.66 | ) | | | (0.09 | ) | | | — | | | | | |
11/30/2014 | | | 12.49 | | | | 0.09 | | | | 0.27 | | | | 0.36 | | | | (0.05 | ) | | | — | | | | | |
11/30/2013 | | | 10.30 | | | | 0.09 | | | | 2.21 | | | | 2.30 | | | | (0.11 | ) | | | — | | | | | |
| Institutional Class | | | | | | | | | | | | | | | | | | | | | | | | | | | | |
9/30/2018 | | $ | 15.32 | | | $ | 0.17 | | | $ | 0.34 | | | $ | 0.51 | | | $ | (0.14 | ) | | $ | (0.38 | ) | | | | |
9/30/2017 | | | 14.33 | | | | 0.16 | | | | 1.02 | | | | 1.18 | | | | (0.11 | ) | | | (0.08 | ) | | | | |
9/30/2016 | | | 11.90 | | | | 0.11 | | | | 2.41 | | | | 2.52 | | | | (0.07 | ) | | | (0.02 | ) | | | | |
12/1/2014 - 9/30/2015# | | | 12.61 | | | | 0.09 | | | | (0.73 | ) | | | (0.64 | ) | | | (0.07 | ) | | | — | | | | | |
11/30/2014 | | | 12.37 | | | | 0.11 | | | | 0.24 | | | | 0.35 | | | | (0.11 | ) | | | — | | | | | |
11/30/2013 | | | 10.25 | | | | 0.09 | | | | 2.21 | | | | 2.30 | | | | (0.18 | ) | | | — | | | | | |
| ^ | A — may reflect actual amounts rounding to less than $0.01 or 0.01%. |
| # | Fiscal year end changed from November 30th to September 30th. |
| (a) | Calculated on average shares outstanding during the period. |
| (b) | Total return is calculated assuming a purchase of a share on the first day of the period and a sale of a share on the last day of each period reported. Dividends and distributions, if any, are assumed, for purposes of this calculation, to be reinvested. Total return does not reflect sales charges and includes the effect of fee waivers and reimbursements. Total return may reflect adjustments to conform to U.S. GAAP. Total return for a period of less than one year is not annualized. |
| (c) | Annualized, unless otherwise noted. |
| (d) | Certain expenses incurred by the Fund were not annualized. |
| | | | | | |
| 286 | | Annual Report | | | September 30, 2018 | | | See accompanying Notes to Financial Statements |
| | | | | | | | | | | | | | | | | | | | | | | | | | | | | | | | | | |
| | | | Total
Dividends and
Distributions | | | Net Asset
Value, End
of Period | | | Total Return (b) | | | Net Assets,
End of Period
(000s) | | | Ratio of
Expenses to
Average Net
Assets with
Fee Waiver/
Reimbursement | | | Ratio of
Expenses to
Average Net
Assets without
Fee Waiver/
Reimbursement | | | Ratio of Net
Investment
Income (Loss)
to Average
Net Assets | | | Portfolio
Turnover Rate | |
| | | | | | | | | | | | | | | | | | | | | | | | | | |
| | | | | | | | | | | | | | | | | | | | | | | | | | | | | | | | | | |
| | | | | $ | (0.42 | ) | | $ | 15.54 | | | | 3.05 | % | | $ | 172,374 | | | | 1.19 | % | | | 1.41 | % | | | 0.84 | % | | | 34 | % |
| | | | | | (0.13 | ) | | | 15.49 | | | | 8.18 | | | | 190,693 | | | | 1.33 | | | | 1.44 | | | | 0.59 | | | | 29 | |
| | | | | | (0.05 | ) | | | 14.46 | | | | 21.06 | | | | 237,785 | | | | 1.49 | | | | 1.49 | | | | 0.62 | | | | 55 | |
| | | | | | (0.03 | ) | | | 11.99 | | | | (5.37 | ) | | | 128,465 | | | | 1.44 | (c)(d) | | | 1.44 | (c)(d) | | | 0.58 | (c)(d) | | | 66 | |
| | | | | | — | | | | 12.70 | | | | 2.57 | | | | 138,219 | | | | 1.46 | | | | 1.46 | | | | 0.55 | | | | 28 | |
| | | | | | (0.12 | ) | | | 12.41 | | | | 22.31 | | | | 118,252 | | | | 1.54 | | | | 1.54 | | | | 0.63 | | | | 28 | |
| | | | | | | | | | | | | | | | | | | | | | | | | | | | | | | | | | |
| | | | | $ | (0.38 | ) | | $ | 14.79 | | | | 2.35 | % | | $ | 83,156 | | | | 1.94 | % | | | 2.16 | % | | | 0.07 | % | | | 34 | % |
| | | | | | (0.08 | ) | | | 14.82 | | | | 7.32 | | | | 89,250 | | | | 2.07 | | | | 2.19 | | | | (0.07 | ) | | | 29 | |
| | | | | | (0.02 | ) | | | 13.90 | | | | 20.13 | | | | 92,028 | | | | 2.25 | | | | 2.25 | | | | (0.18 | ) | | | 55 | |
| | | | | | — | | | | 11.59 | | �� | | (6.00 | ) | | | 69,700 | | | | 2.23 | (c)(d) | | | 2.23 | (c)(d) | | | (0.21 | )(c)(d) | | | 66 | |
| | | | | | — | | | | 12.33 | | | | 1.82 | | | | 77,082 | | | | 2.23 | | | | 2.23 | | | | (0.26 | ) | | | 28 | |
| | | | | | (0.05 | ) | | | 12.11 | | | | 21.41 | | | | 51,767 | | | | 2.33 | | | | 2.33 | | | | (0.18 | ) | | | 28 | |
| | | | | | | | | | | | | | | | | | | | | | | | | | | | | | | | | | |
| | | | | $ | (0.51 | ) | | $ | 15.59 | | | | 3.40 | % | | $ | 243,338 | | | | 0.93 | % | | | 1.15 | % | | | 1.12 | % | | | 34 | % |
| | | | | | (0.16 | ) | | | 15.57 | | | | 8.40 | | | | 210,746 | | | | 1.04 | | | | 1.16 | | | | 1.02 | | | | 29 | |
| | | | | | (0.07 | ) | | | 14.54 | | | | 21.37 | | | | 125,532 | | | | 1.24 | | | | 1.24 | | | | 0.82 | | | | 55 | |
| | | | | | (0.09 | ) | | | 12.05 | | | | (5.17 | ) | | | 82,847 | | | | 1.16 | (c)(d) | | | 1.16 | (c)(d) | | | 0.84 | (c)(d) | | | 66 | |
| | | | | | (0.05 | ) | | | 12.80 | | | | 2.87 | | | | 84,835 | | | | 1.21 | | | | 1.21 | | | | 0.67 | | | | 28 | |
| | | | | | (0.11 | ) | | | 12.49 | | | | 22.58 | | | | 42,448 | | | | 1.34 | | | | 1.34 | | | | 0.81 | | | | 28 | |
| | | | | | | | | | | | | | | | | | | | | | | | | | | | | | | | | | |
| | | | | $ | (0.52 | ) | | $ | 15.31 | | | | 3.36 | % | | $ | 164,322 | | | | 0.92 | % | | | 1.14 | % | | | 1.13 | % | | | 34 | % |
| | | | | | (0.19 | ) | | | 15.32 | | | | 8.49 | | | | 142,353 | | | | 1.01 | | | | 1.15 | | | | 1.13 | | | | 29 | |
| | | | | | (0.09 | ) | | | 14.33 | | | | 21.32 | | | | 68,550 | | | | 1.21 | | | | 1.21 | | | | 0.86 | | | | 55 | |
| | | | | | (0.07 | ) | | | 11.90 | | | | (5.08 | ) | | | 30,004 | | | | 1.17 | (c)(d) | | | 1.17 | (c)(d) | | | 0.87 | (c)(d) | | | 66 | |
| | | | | | (0.11 | ) | | | 12.61 | | | | 2.82 | | | | 23,685 | | | | 1.15 | | | | 1.15 | | | | 0.84 | | | | 28 | |
| | | | | | (0.18 | ) | | | 12.37 | | | | 22.77 | | | | 14,429 | | | | 1.19 | | | | 1.19 | | | | 0.77 | | | | 28 | |
| | | | | | | | |
| See accompanying Notes to Financial Statements | | | September 30, 2018 | | | Annual Report | | | 287 | |
Financial Highlights (cont’d)
For a Share Outstanding for the Period ended:^
| | | | | | | | | | | | | | | | | | | | | | | | | | | | |
| | | Net Asset
Value,
Beginning
of Period | | | Net
Investment
Income (a) | | | Net Realized
and Change in
Unrealized Gain
(Loss) | | | Total from
Investment
Operations | | |
Dividends
from Net
Investment
Income | | | Distributions
from Net
Realized Capital
Gains | | | | |
| AllianzGI High Yield Bond: | | | | | | | | | | | | | | | | | | | | | |
| Class A | | | | | | | | | | | | | | | | | | | | | | | | | | | | |
9/30/2018 | | $ | 9.31 | | | $ | 0.45 | | | $ | (0.39 | ) | | $ | 0.06 | | | $ | (0.46 | ) | | $ | — | | | | | |
9/30/2017 | | | 9.14 | | | | 0.48 | | | | 0.18 | | | | 0.66 | | | | (0.49 | ) | | | — | | | | | |
9/30/2016 | | | 8.92 | | | | 0.53 | | | | 0.24 | | | | 0.77 | | | | (0.55 | ) | | | — | | | | | |
12/1/2014 - 9/30/2015# | | | 9.85 | | | | 0.47 | | | | (0.91 | ) | | | (0.44 | ) | | | (0.49 | ) | | | — | | | | | |
11/30/2014 | | | 10.36 | | | | 0.61 | | | | (0.36 | ) | | | 0.25 | | | | (0.67 | ) | | | (0.09 | ) | | | | |
11/30/2013 | | | 10.16 | | | | 0.67 | | | | 0.22 | | | | 0.89 | | | | (0.68 | ) | | | (0.01 | ) | | | | |
| Class C | | | | | | | | | | | | | | | | | | | | | | | | | | | | |
9/30/2018 | | $ | 9.30 | | | $ | 0.39 | | | $ | (0.39 | ) | | $ | — | | | $ | (0.40 | ) | | $ | — | | | | | |
9/30/2017 | | | 9.12 | | | | 0.42 | | | | 0.20 | | | | 0.62 | | | | (0.44 | ) | | | — | | | | | |
9/30/2016 | | | 8.90 | | | | 0.46 | | | | 0.24 | | | | 0.70 | | | | (0.48 | ) | | | — | | | | | |
12/1/2014 - 9/30/2015# | | | 9.83 | | | | 0.42 | | | | (0.91 | ) | | | (0.49 | ) | | | (0.44 | ) | | | — | | | | | |
11/30/2014 | | | 10.35 | | | | 0.54 | | | | (0.37 | ) | | | 0.17 | | | | (0.60 | ) | | | (0.09 | ) | | | | |
11/30/2013 | | | 10.15 | | | | 0.59 | | | | 0.22 | | | | 0.81 | | | | (0.60 | ) | | | (0.01 | ) | | | | |
| Class R | | | | | | | | | | | | | | | | | | | | | | | | | | | | |
9/30/2018 | | $ | 8.94 | | | $ | 0.39 | | | $ | (0.37 | ) | | $ | 0.02 | | | $ | (0.42 | ) | | $ | — | | | | | |
9/30/2017 | | | 8.79 | | | | 0.43 | | | | 0.18 | | | | 0.61 | | | | (0.46 | ) | | | — | | | | | |
9/30/2016 | | | 8.61 | | | | 0.48 | | | | 0.22 | | | | 0.70 | | | | (0.52 | ) | | | — | | | | | |
12/1/2014 - 9/30/2015# | | | 9.53 | | | | 0.43 | | | | (0.90 | ) | | | (0.47 | ) | | | (0.45 | ) | | | — | | | | | |
11/30/2014 | | | 10.05 | | | | 0.54 | | | | (0.34 | ) | | | 0.20 | | | | (0.63 | ) | | | (0.09 | ) | | | | |
11/30/2013 | | | 9.88 | | | | 0.63 | | | | 0.21 | | | | 0.84 | | | | (0.66 | ) | | | (0.01 | ) | | | | |
| Class P | | | | | | | | | | | | | | | | | | | | | | | | | | | | |
9/30/2018 | | $ | 8.96 | | | $ | 0.46 | | | $ | (0.38 | ) | | $ | 0.08 | | | $ | (0.49 | ) | | $ | — | | | | | |
9/30/2017 | | | 8.80 | | | | 0.50 | | | | 0.19 | | | | 0.69 | | | | (0.53 | ) | | | — | | | | | |
9/30/2016 | | | 8.62 | | | | 0.53 | | | | 0.23 | | | | 0.76 | | | | (0.58 | ) | | | — | | | | | |
12/1/2014 - 9/30/2015# | | | 9.53 | | | | 0.49 | | | | (0.88 | ) | | | (0.39 | ) | | | (0.52 | ) | | | — | | | | | |
11/30/2014 | | | 10.05 | | | | 0.62 | | | | (0.35 | ) | | | 0.27 | | | | (0.70 | ) | | | (0.09 | ) | | | | |
11/30/2013 | | | 9.87 | | | | 0.66 | | | | 0.23 | | | | 0.89 | | | | (0.70 | ) | | | (0.01 | ) | | | | |
| Institutional Class | | | | | | | | | | | | | | | | | | | | | | | | | | | | |
9/30/2018 | | $ | 8.98 | | | $ | 0.46 | | | $ | (0.37 | ) | | $ | 0.09 | | | $ | (0.49 | ) | | $ | — | | | | | |
9/30/2017 | | | 8.83 | | | | 0.50 | | | | 0.18 | | | | 0.68 | | | | (0.53 | ) | | | — | | | | | |
9/30/2016 | | | 8.64 | | | | 0.53 | | | | 0.24 | | | | 0.77 | | | | (0.58 | ) | | | — | | | | | |
12/1/2014 - 9/30/2015# | | | 9.55 | | | | 0.49 | | | | (0.88 | ) | | | (0.39 | ) | | | (0.52 | ) | | | — | | | | | |
11/30/2014 | | | 10.08 | | | | 0.62 | | | | (0.35 | ) | | | 0.27 | | | | (0.71 | ) | | | (0.09 | ) | | | | |
11/30/2013 | | | 9.90 | | | | 0.68 | | | | 0.22 | | | | 0.90 | | | | (0.71 | ) | | | (0.01 | ) | | | | |
| Administrative Class | | | | | | | | | | | | | | | | | | | | | | | | | | | | |
9/30/2018 | | $ | 8.84 | | | $ | 0.44 | | | $ | (0.37 | ) | | $ | 0.07 | | | $ | (0.47 | ) | | $ | — | | | | | |
9/30/2017 | | | 8.70 | | | | 0.48 | | | | 0.17 | | | | 0.65 | | | | (0.51 | ) | | | — | | | | | |
9/30/2016 | | | 8.52 | | | | 0.50 | | | | 0.22 | | | | 0.72 | | | | (0.54 | ) | | | — | | | | | |
12/1/2014 - 9/30/2015# | | | 9.51 | | | | 0.46 | | | | (0.94 | ) | | | (0.48 | ) | | | (0.51 | ) | | | — | | | | | |
11/30/2014 | | | 10.04 | | | | 0.59 | | | | (0.36 | ) | | | 0.23 | | | | (0.67 | ) | | | (0.09 | ) | | | | |
11/30/2013 | | | 9.87 | | | | 0.65 | | | | 0.22 | | | | 0.87 | | | | (0.69 | ) | | | (0.01 | ) | | | | |
| ^ | A — may reflect actual amounts rounding to less than $0.01 or 0.01%. |
| # | Fiscal year end changed from November 30th to September 30th. |
| (a) | Calculated on average shares outstanding during the period. |
| (b) | Total return is calculated assuming a purchase of a share on the first day of the period and a sale of a share on the last day of each period reported. Dividends and distributions, if any, are assumed, for purposes of this calculation, to be reinvested. Total return does not reflect sales charges and includes the effect of fee waivers and reimbursements. Total return may reflect adjustments to conform to U.S. GAAP. Total return for a period of less than one year is not annualized. |
| | | | | | |
| 288 | | Annual Report | | | September 30, 2018 | | | See accompanying Notes to Financial Statements |
| | | | | | | | | | | | | | | | | | | | | | | | | | | | | | | | | | |
| | | | Total
Dividends and
Distributions | | | Net Asset
Value, End
of Period | | | Total Return (b) | | | Net Assets,
End of Period
(000s) | | | Ratio of
Expenses to
Average Net
Assets with Fee Waiver/
Reimbursement | | | Ratio of
Expenses to
Average Net
Assets without
Fee Waiver/
Reimbursement | | | Ratio of Net
Investment
Income
to Average
Net Assets | | | Portfolio
Turnover Rate | |
| | | | | | | | | | | | | | | | | | | | | | | | | | |
| | | | | | | | | | | | | | | | | | | | | | | | | | | | | | | | | | |
| | | | | $ | (0.46 | ) | | $ | 8.91 | | | | 0.67 | % | | $ | 33,768 | | | | 1.05 | % | | | 1.05 | % | | | 4.93 | % | | | 40 | % |
| | | | | | (0.49 | ) | | | 9.31 | | | | 7.42 | | | | 58,525 | | | | 1.09 | | | | 1.09 | | | | 5.19 | | | | 37 | |
| | | | | | (0.55 | ) | | | 9.14 | | | | 9.08 | | | | 58,004 | | | | 0.98 | | | | 0.98 | | | | 6.02 | | | | 59 | |
| | | | | | (0.49 | ) | | | 8.92 | | | | (4.72 | ) | | | 34,151 | | | | 1.03 | (c)(d) | | | 1.03 | (c)(d) | | | 5.88 | (c)(d) | | | 47 | |
| | | | | | (0.76 | ) | | | 9.85 | (e) | | | 2.39 | (e) | | | 76,274 | | | | 0.94 | | | | 0.94 | | | | 5.93 | | | | 66 | |
| | | | | | (0.69 | ) | | | 10.36 | | | | 8.98 | | | | 73,920 | | | | 0.91 | | | | 0.91 | | | | 6.49 | | | | 67 | |
| | | | | | | | | | | | | | | | | | | | | | | | | | | | | | | | | | |
| | | | | $ | (0.40 | ) | | $ | 8.90 | | | | 0.02 | % | | $ | 8,544 | | | | 1.71 | % | | | 1.71 | % | | | 4.27 | % | | | 40 | % |
| | | | | | (0.44 | ) | | | 9.30 | | | | 6.90 | | | | 11,723 | | | | 1.70 | | | | 1.70 | | | | 4.59 | | | | 37 | |
| | | | | | (0.48 | ) | | | 9.12 | | | | 8.32 | | | | 14,815 | | | | 1.71 | | | | 1.71 | | | | 5.28 | | | | 59 | |
| | | | | | (0.44 | ) | | | 8.90 | | | | (5.24 | ) | | | 17,866 | | | | 1.68 | (c)(d) | | | 1.68 | (c)(d) | | | 5.24 | (c)(d) | | | 47 | |
| | | | | | (0.69 | ) | | | 9.83 | (e) | | | 1.57 | (e) | | | 23,249 | | | | 1.68 | | | | 1.68 | | | | 5.23 | | | | 66 | |
| | | | | | (0.61 | ) | | | 10.35 | | | | 8.14 | | | | 27,525 | | | | 1.70 | | | | 1.70 | | | | 5.68 | | | | 67 | |
| | | | | | | | | | | | | | | | | | | | | | | | | | | | | | | | | | |
| | | | | $ | (0.42 | ) | | $ | 8.54 | | | | 0.33 | % | | $ | 878 | | | | 1.44 | % | | | 1.44 | % | | | 4.55 | % | | | 40 | % |
| | | | | | (0.46 | ) | | | 8.94 | | | | 7.12 | | | | 1,048 | | | | 1.44 | | | | 1.44 | | | | 4.84 | | | | 37 | |
| | | | | | (0.52 | ) | | | 8.79 | | | | 8.62 | | | | 1,310 | | | | 1.34 | | | | 1.34 | | | | 5.65 | | | | 59 | |
| | | | | | (0.45 | ) | | | 8.61 | | | | (5.20 | ) | | | 1,126 | | | | 1.46 | (c)(d) | | | 1.46 | (c)(d) | | | 5.47 | (c)(d) | | | 47 | |
| | | | | | (0.72 | ) | | | 9.53 | (e) | | | 1.91 | (e) | | | 2,823 | | | | 1.43 | | | | 1.45 | | | | 5.48 | | | | 66 | |
| | | | | | (0.67 | ) | | | 10.05 | | | | 8.72 | | | | 2,851 | | | | 1.15 | | | | 1.32 | | | | 6.24 | | | | 67 | |
| | | | | | | | | | | | | | | | | | | | | | | | | | | | | | | | | | |
| | | | | $ | (0.49 | ) | | $ | 8.55 | | | | 0.94 | % | | $ | 17,535 | | | | 0.70 | % | | | 0.70 | % | | | 5.26 | % | | | 40 | % |
| | | | | | (0.53 | ) | | | 8.96 | | | | 8.07 | | | | 35,931 | | | | 0.67 | | | | 0.67 | | | | 5.62 | | | | 37 | |
| | | | | | (0.58 | ) | | | 8.80 | | | | 9.31 | | | | 57,378 | | | | 0.69 | | | | 0.69 | | | | 6.30 | | | | 59 | |
| | | | | | (0.52 | ) | | | 8.62 | | | | (4.36 | ) | | | 63,324 | | | | 0.64 | (c)(d) | | | 0.64 | (c)(d) | | | 6.29 | (c)(d) | | | 47 | |
| | | | | | (0.79 | ) | | | 9.53 | (e) | | | 2.63 | (e) | | | 47,385 | | | | 0.71 | | | | 0.71 | | | | 6.21 | | | | 66 | |
| | | | | | (0.71 | ) | | | 10.05 | | | | 9.27 | | | | 77,649 | | | | 0.74 | | | | 0.74 | | | | 6.64 | | | | 67 | |
| | | | | | | | | | | | | | | | | | | | | | | | | | | | | | | | | | |
| | | | | $ | (0.49 | ) | | $ | 8.58 | | | | 1.03 | % | | $ | 122,078 | | | | 0.73 | % | | | 0.73 | % | | | 5.26 | % | | | 40 | % |
| | | | | | (0.53 | ) | | | 8.98 | | | | 7.91 | | | | 155,022 | | | | 0.69 | | | | 0.69 | | | | 5.61 | | | | 37 | |
| | | | | | (0.58 | ) | | | 8.83 | | | | 9.41 | | | | 227,149 | | | | 0.66 | | | | 0.66 | | | | 6.31 | | | | 59 | |
| | | | | | (0.52 | ) | | | 8.64 | | | | (4.32 | ) | | | 173,030 | | | | 0.63 | (c)(d) | | | 0.63 | (c)(d) | | | 6.29 | (c)(d) | | | 47 | |
| | | | | | (0.80 | ) | | | 9.55 | (e) | | | 2.59 | (e) | | | 163,567 | | | | 0.64 | | | | 0.64 | | | | 6.27 | | | | 66 | |
| | | | | | (0.72 | ) | | | 10.08 | | | | 9.35 | | | | 139,306 | | | | 0.62 | | | | 0.62 | | | | 6.76 | | | | 67 | |
| | | | | | | | | | | | | | | | | | | | | | | | | | | | | | | | | | |
| | | | | $ | (0.47 | ) | | $ | 8.44 | | | | 0.83 | % | | $ | 20 | | | | 0.88 | % | | | 0.88 | % | | | 4.93 | % | | | 40 | % |
| | | | | | (0.51 | ) | | | 8.84 | | | | 7.75 | | | | 1,490 | | | | 0.86 | | | | 0.86 | | | | 5.45 | | | | 37 | |
| | | | | | (0.54 | ) | | | 8.70 | | | | 8.97 | | | | 2,086 | | | | 1.07 | | | | 1.07 | | | | 5.94 | | | | 59 | |
| | | | | | (0.51 | ) | | | 8.52 | | | | (5.30 | ) | | | 2,073 | | | | 0.98 | (c)(d) | | | 0.98 | (c)(d) | | | 5.90 | (c)(d) | | | 47 | |
| | | | | | (0.76 | ) | | | 9.51 | (e) | | | 2.27 | (e) | | | 34,714 | | | | 0.97 | | | | 0.97 | | | | 5.93 | | | | 66 | |
| | | | | | (0.70 | ) | | | 10.04 | | | | 9.02 | | | | 32,789 | | | | 0.90 | | | | 0.91 | | | | 6.49 | | | | 67 | |
| | (c) | Annualized, unless otherwise noted. |
| | (d) | Certain expenses incurred by the Fund were not annualized. |
| | (e) | Payments from Affiliates increased the end of period net asset value and total return by less than $0.01 and 0.01%, respectively. |
| | | | | | | | |
| See accompanying Notes to Financial Statements | | | September 30, 2018 | | | Annual Report | | | 289 | |
Financial Highlights (cont’d)
For a Share Outstanding for the Period ended:^
| | | | | | | | | | | | | | | | | | | | | | | | | | | | |
| | | Net Asset
Value,
Beginning
of Period | | | Net
Investment
Income (a) | | | Net Realized
and Change
in Unrealized
Gain (Loss) | | | Total from
Investment
Operations | | |
Dividends
from Net
Investment
Income | | | Distributions
from Net
Realized
Capital
Gains | | | | |
| AllianzGI International Growth: | | | | | | | | | | | | | | | | | | | |
| Class A | | | | | | | | | | | | | | | | | | | | | | | | | | | | |
9/30/2018 | | $ | 19.73 | | | $ | 0.02 | | | $ | 0.82 | | | $ | 0.84 | | | $ | (0.31 | ) | | $ | (2.35 | ) | | | | |
9/30/2017 | | | 16.37 | | | | 0.04 | | | | 3.32 | | | | 3.36 | | | | — | | | | — | | | | | |
9/30/2016 | | | 14.13 | | | | 0.09 | | | | 2.29 | | | | 2.38 | | | | (0.14 | ) | | | — | | | | | |
2/2/2015* - 9/30/2015# | | | 15.00 | | | | 0.11 | | | | (0.98 | ) | | | (0.87 | ) | | | — | | | | — | | | | | |
| Institutional Class | | | | | | | | | | | | | | | | | | | | | | | | | | | | |
9/30/2018 | | $ | 19.90 | | | $ | 0.07 | | | $ | 0.82 | | | $ | 0.89 | | | $ | (0.12 | ) | | $ | (2.35 | ) | | | | |
9/30/2017 | | | 16.49 | | | | 0.08 | | | | 3.35 | | | | 3.43 | | | | (0.02 | ) | | | — | | | | | |
9/30/2016 | | | 14.15 | | | | 0.11 | | | | 2.33 | | | | 2.44 | | | | (0.10 | ) | | | — | | | | | |
2/2/2015* - 9/30/2015# | | | 15.00 | | | | 0.14 | | | | (0.99 | ) | | | (0.85 | ) | | | — | | | | — | | | | | |
| ^ | A — may reflect actual amounts rounding to less than $0.01 or 0.01%. |
| # | Fiscal year end changed from November 30th to September 30th. |
| * | Commencement of operations. |
| (a) | Calculated on average shares outstanding during the period. |
| (b) | Total return is calculated assuming a purchase of a share on the first day of the period and a sale of a share on the last day of each period reported. Dividends and distributions, if any, are assumed, for purposes of this calculation, to be reinvested. Total return does not reflect sales charges and includes the effect of fee waivers and reimbursements. Total return may reflect adjustments to conform to U.S. GAAP. Total return for a period of less than one year is not annualized. |
| (c) | Annualized, unless otherwise noted. |
| (d) | Certain expenses incurred by the Fund were not annualized. |
| | | | | | |
| 290 | | Annual Report | | | September 30, 2018 | | | See accompanying Notes to Financial Statements |
| | | | | | | | | | | | | | | | | | | | | | | | | | | | | | | | | | |
| | | | Total
Dividends and
Distributions | | | Net Asset
Value, End
of Period | | | Total Return (b) | | | Net Assets,
End of Period
(000s) | | | Ratio of
Expenses to
Average Net
Assets with
Fee Waiver/
Reimbursement | | | Ratio of
Expenses to
Average Net
Assets without
Fee Waiver/
Reimbursement | | | Ratio of Net
Investment
Income
to Average
Net Assets | | | Portfolio
Turnover Rate | |
| | | | | | | | | | | | | | | | | | | | | | | | | | |
| | | | | | | | | | | | | | | | | | | | | | | | | | | | | | | | | | |
| | | | | $ | (2.66 | ) | | $ | 17.91 | | | | 4.32 | % | | $ | 1,183 | | | | 1.05 | % | | | 1.89 | % | | | 0.10 | % | | | 17 | % |
| | | | | | — | | | | 19.73 | | | | 20.53 | | | | 72 | | | | 1.12 | | | | 1.82 | | | | 0.23 | | | | 18 | |
| | | | | | (0.14 | ) | | | 16.37 | | | | 16.97 | | | | 51 | | | | 1.20 | | | | 6.68 | | | | 0.60 | | | | 20 | |
| | | | | | — | | | | 14.13 | | | | (5.80 | ) | | | 10 | | | | 1.20 | (c)(d) | | | 8.22 | (c)(d) | | | 1.12 | (c)(d) | | | 3 | |
| | | | | | | | | | | | | | | | | | | | | | | | | | | | | | | | | | |
| | | | | $ | (2.47 | ) | | $ | 18.32 | | | | 4.54 | % | | $ | 27,427 | | | | 0.80 | % | | | 1.61 | % | | | 0.37 | % | | | 17 | % |
| | | | | | (0.02 | ) | | | 19.90 | | | | 20.82 | | | | 18,582 | | | | 0.87 | | | | 1.49 | | | | 0.49 | | | | 18 | |
| | | | | | (0.10 | ) | | | 16.49 | | | | 17.34 | | | | 28,386 | | | | 0.95 | | | | 5.77 | | | | 0.75 | | | | 20 | |
| | | | | | — | | | | 14.15 | | | | (5.67 | ) | | | 2,874 | | | | 0.95 | (c)(d) | | | 7.99 | (c)(d) | | | 1.38 | (c)(d) | | | 3 | |
| | | | | | | | |
| See accompanying Notes to Financial Statements | | | September 30, 2018 | | | Annual Report | | | 291 | |
Financial Highlights (cont’d)
For a Share Outstanding for the Period ended:^
| | | | | | | | | | | | | | | | | | | | | | | | | | | | |
| | | Net Asset
Value,
Beginning
of Period | | | Net
Investment
Income
(Loss ) (a) | | | Net Realized
and Change
in Unrealized
Gain (Loss) | | | Total from
Investment
Operations | | |
Dividends
from Net
Investment
Income | | | Distributions
from Net
Realized Capital
Gains | | | | |
| AllianzGI International Small-Cap: | | | | | | | | | | | | | | | | | | | | | |
| Class A | | | | | | | | | | | | | | | | | | | | | | | | | | | | |
9/30/2018 | | $ | 41.19 | | | $ | 0.42 | | | $ | 2.41 | | | $ | 2.83 | | | $ | (0.25 | ) | | $ | (0.68 | ) | | | | |
9/30/2017 | | | 34.57 | | | | — | | | | 6.93 | | | | 6.93 | | | | (0.31 | ) | | | — | | | | | |
9/30/2016 | | | 34.53 | | | | 0.10 | | | | 1.67 | | | | 1.77 | | | | (0.28 | ) | | | (1.45 | ) | | | | |
12/1/2014 - 9/30/2015# | | | 35.77 | | | | 0.26 | | | | 2.24 | | | | 2.50 | | | | (0.14 | ) | | | (3.60 | ) | | | | |
11/30/2014 | | | 42.30 | | | | 0.09 | | | | (2.41 | ) | | | (2.32 | ) | | | (0.64 | ) | | | (3.57 | ) | | | | |
11/30/2013 | | | 31.89 | | | | 0.09 | | | | 10.32 | | | | 10.41 | | | | — | | | | — | | | | | |
| Class C | | | | | | | | | | | | | | | | | | | | | | | | | | | | |
9/30/2018 | | $ | 40.01 | | | $ | (0.15 | ) | | $ | 2.55 | | | $ | 2.40 | | | $ | (0.10 | ) | | $ | (0.68 | ) | | | | |
9/30/2017 | | | 33.78 | | | | (0.19 | ) | | | 6.67 | | | | 6.48 | | | | (0.25 | ) | | | — | | | | | |
9/30/2016 | | | 33.94 | | | | (0.12 | ) | | | 1.61 | | | | 1.49 | | | | (0.20 | ) | | | (1.45 | ) | | | | |
12/1/2014 - 9/30/2015# | | | 35.33 | | | | 0.06 | | | | 2.18 | | | | 2.24 | | | | (0.03 | ) | | | (3.60 | ) | | | | |
11/30/2014 | | | 41.78 | | | | (0.18 | ) | | | (2.39 | ) | | | (2.57 | ) | | | (0.31 | ) | | | (3.57 | ) | | | | |
11/30/2013 | | | 31.75 | | | | (0.17 | ) | | | 10.22 | | | | 10.05 | | | | (0.02 | ) | | | — | | | | | |
| Class R | | | | | | | | | | | | | | | | | | | | | | | | | | | | |
9/30/2018 | | $ | 40.46 | | | $ | 0.13 | | | $ | 2.50 | | | $ | 2.63 | | | $ | (0.51 | ) | | $ | (0.68 | ) | | | | |
9/30/2017 | | | 34.07 | | | | 0.01 | | | | 6.70 | | | | 6.71 | | | | (0.32 | ) | | | — | | | | | |
9/30/2016 | | | 34.03 | | | | 0.03 | | | | 1.63 | | | | 1.66 | | | | (0.17 | ) | | | (1.45 | ) | | | | |
12/1/2014 - 9/30/2015# | | | 35.30 | | | | 0.16 | | | | 2.23 | | | | 2.39 | | | | (0.06 | ) | | | (3.60 | ) | | | | |
11/30/2014 | | | 42.23 | | | | 0.07 | | | | (2.47 | ) | | | (2.40 | ) | | | (0.96 | ) | | | (3.57 | ) | | | | |
11/30/2013 | | | 32.25 | | | | 0.02 | | | | 10.32 | | | | 10.34 | | | | (0.36 | ) | | | — | | | | | |
| Class P | | | | | | | | | | | | | | | | | | | | | | | | | | | | |
9/30/2018 | | $ | 41.33 | | | $ | 0.22 | | | $ | 2.68 | | | $ | 2.90 | | | $ | (0.49 | ) | | $ | (0.68 | ) | | | | |
9/30/2017 | | | 34.66 | | | | 0.19 | | | | 6.82 | | | | 7.01 | | | | (0.34 | ) | | | — | | | | | |
9/30/2016 | | | 34.49 | | | | 0.18 | | | | 1.64 | | | | 1.82 | | | | (0.20 | ) | | | (1.45 | ) | | | | |
12/1/2014 - 9/30/2015# | | | 35.65 | | | | 0.28 | | | | 2.25 | | | | 2.53 | | | | (0.09 | ) | | | (3.60 | ) | | | | |
11/30/2014 | | | 41.97 | | | | 0.16 | | | | (2.41 | ) | | | (2.25 | ) | | | (0.50 | ) | | | (3.57 | ) | | | | |
11/30/2013 | | | 31.92 | | | | 0.16 | | | | 10.24 | | | | 10.40 | | | | (0.35 | ) | | | — | | | | | |
| Institutional Class | | | | | | | | | | | | | | | | | | | | | | | | | | | | |
9/30/2018 | | $ | 42.85 | | | $ | 0.32 | | | $ | 2.71 | | | $ | 3.03 | | | $ | (0.55 | ) | | $ | (0.68 | ) | | | | |
9/30/2017 | | | 35.91 | | | | 0.36 | | | | 6.92 | | | | 7.28 | | | | (0.34 | ) | | | — | | | | | |
9/30/2016 | | | 35.65 | | | | 0.10 | | | | 1.81 | | | | 1.91 | | | | (0.20 | ) | | | (1.45 | ) | | | | |
12/1/2014 - 9/30/2015# | | | 36.68 | | | | 0.29 | | | | 2.34 | | | | 2.63 | | | | (0.06 | ) | | | (3.60 | ) | | | | |
11/30/2014 | | | 42.94 | | | | 0.21 | | | | (2.49 | ) | | | (2.28 | ) | | | (0.41 | ) | | | (3.57 | ) | | | | |
11/30/2013 | | | 32.60 | | | | 0.17 | | | | 10.48 | | | | 10.65 | | | | (0.31 | ) | | | — | | | | | |
| Class R6 | | | | | | | | | | | | | | | | | | | | | | | | | | | | |
9/30/2018 | | $ | 42.90 | | | $ | 0.40 | | | $ | 2.66 | | | $ | 3.06 | | | $ | (0.64 | ) | | $ | (0.68 | ) | | | | |
9/30/2017 | | | 35.94 | | | | 0.22 | | | | 7.09 | | | | 7.31 | | | | (0.35 | ) | | | — | | | | | |
2/1/2016* - 9/30/2016 | | | 33.52 | | | | 0.34 | | | | 2.08 | | | | 2.42 | | | | — | | | | — | | | | | |
| ^ | A — may reflect actual amounts rounding to less than $0.01 or 0.01%. |
| # | Fiscal year end changed from November 30th to September 30th. |
| * | Commencement of operations. |
| (a) | Calculated on average shares outstanding during the period. |
| (b) | Total return is calculated assuming a purchase of a share on the first day of the period and a sale of a share on the last day of each period reported. Dividends and distributions, if any, are assumed, for purposes of this calculation, to be reinvested. Total return does not reflect sales charges and includes the effect of fee waivers and reimbursements. Total return may reflect adjustments to conform to U.S. GAAP. Total return for a period of less than one year is not annualized. |
| | | | | | |
| 292 | | Annual Report | | | September 30, 2018 | | | See accompanying Notes to Financial Statements |
| | | | | | | | | | | | | | | | | | | | | | | | | | | | | | | | | | |
| | | | Total
Dividends and
Distributions | | | Net Asset
Value, End
of Period | | | Total Return (b) | | | Net Assets,
End of Period
(000s) | | | Ratio of
Expenses to
Average Net
Assets with
Fee Waiver/
Reimbursement | | | Ratio of Expenses to
Average Net
Assets without
Fee Waiver/
Reimbursement | | | Ratio of Net
Investment
Income (Loss)
to Average
Net Assets | | | Portfolio
Turnover Rate | |
| | | | | | | | | | | | | | | | | | | | | | | | | | |
| | | | | | | | | | | | | | | | | | | | | | | | | | | | | | | | | | |
| | | | | $ | (0.93 | ) | | $ | 43.09 | | | | 6.88 | % | | $ | 9,108 | | | | 1.25 | % | | | 1.50 | % | | | 0.95 | % | | | 62 | % |
| | | | | | (0.31 | ) | | | 41.19 | (c) | | | 20.34 | (c) | | | 6,068 | | | | 1.36 | | | | 1.93 | | | | 0.01 | | | | 67 | |
| | | | | | (1.73 | ) | | | 34.57 | | | | 5.07 | | | | 13,524 | | | | 1.45 | | | | 1.68 | | | | 0.30 | | | | 76 | |
| | | | | | (3.74 | ) | | | 34.53 | | | | 7.83 | | | | 11,816 | | | | 1.45 | (d)(e) | | | 1.63 | (d)(e) | | | 0.88 | (d)(e) | | | 39 | |
| | | | | | (4.21 | ) | | | 35.77 | | | | (5.84 | ) | | | 5,290 | | | | 1.45 | | | | 1.76 | | | | 0.23 | | | | 77 | |
| | | | | | — | | | | 42.30 | | | | 32.64 | | | | 4,569 | | | | 1.45 | | | | 1.83 | | | | 0.23 | | | | 92 | |
| | | | | | | | | | | | | | | | | | | | | | | | | | | | | | | | | | |
| | | | | $ | (0.78 | ) | | $ | 41.63 | | | | 5.99 | % | | $ | 2,610 | | | | 2.08 | % | | | 2.27 | % | | | (0.35 | )% | | | 62 | % |
| | | | | | (0.25 | ) | | | 40.01 | (c) | | | 19.39 | (c) | | | 2,829 | | | | 2.14 | | | | 2.50 | | | | (0.56 | ) | | | 67 | |
| | | | | | (1.65 | ) | | | 33.78 | | | | 4.30 | | | | 3,232 | | | | 2.19 | | | | 2.54 | | | | (0.35 | ) | | | 76 | |
| | | | | | (3.63 | ) | | | 33.94 | | | | 7.14 | | | | 2,837 | | | | 2.19 | (d)(e) | | | 2.42 | (d)(e) | | | 0.20 | (d)(e) | | | 39 | |
| | | | | | (3.88 | ) | | | 35.33 | | | | (6.52 | ) | | | 1,135 | | | | 2.19 | | | | 2.45 | | | | (0.47 | ) | | | 77 | |
| | | | | | (0.02 | ) | | | 41.78 | | | | 31.67 | | | | 702 | | | | 2.20 | | | | 2.43 | | | | (0.46 | ) | | | 92 | |
| | | | | | | | | | | | | | | | | | | | | | | | | | | | | | | | | | |
| | | | | $ | (1.19 | ) | | $ | 41.90 | | | | 6.51 | % | | $ | 845 | | | | 1.59 | % | | | 1.86 | % | | | 0.30 | % | | | 62 | % |
| | | | | | (0.32 | ) | | | 40.46 | (c) | | | 19.98 | (c) | | | 264 | | | | 1.64 | | | | 2.11 | | | | 0.02 | | | | 67 | |
| | | | | | (1.62 | ) | | | 34.07 | | | | 4.81 | | | | 130 | | | | 1.70 | | | | 2.17 | | | | 0.09 | | | | 76 | |
| | | | | | (3.66 | ) | | | 34.03 | | | | 7.60 | | | | 100 | | | | 1.70 | (d)(e) | | | 2.09 | (d)(e) | | | 0.57 | (d)(e) | | | 39 | |
| | | | | | (4.53 | ) | | | 35.30 | | | | (6.06 | ) | | | 73 | | | | 1.70 | | | | 2.10 | | | | 0.19 | | | | 77 | |
| | | | | | (0.36 | ) | | | 42.23 | | | | 32.29 | | | | 27 | | | | 1.70 | | | | 1.96 | | | | 0.05 | | | | 92 | |
| | | | | | | | | | | | | | | | | | | | | | | | | | | | | | | | | | |
| | | | | $ | (1.17 | ) | | $ | 43.06 | | | | 7.02 | % | | $ | 48,830 | | | | 1.10 | % | | | 1.29 | % | | | 0.51 | % | | | 62 | % |
| | | | | | (0.34 | ) | | | 41.33 | (c) | | | 20.55 | (c) | | | 55,843 | | | | 1.17 | | | | 1.42 | | | | 0.55 | | | | 67 | |
| | | | | | (1.65 | ) | | | 34.66 | | | | 5.25 | | | | 40,183 | | | | 1.28 | | | | 1.44 | | | | 0.54 | | | | 76 | |
| | | | | | (3.69 | ) | | | 34.49 | | | | 7.96 | | | | 36,377 | | | | 1.28 | (d)(e) | | | 1.37 | (d)(e) | | | 0.97 | (d)(e) | | | 39 | |
| | | | | | (4.07 | ) | | | 35.65 | | | | (5.68 | ) | | | 27,882 | | | | 1.29 | | | | 1.54 | | | | 0.41 | | | | 77 | |
| | | | | | (0.35 | ) | | | 41.97 | | | | 32.86 | | | | 33,574 | | | | 1.30 | | | | 1.52 | | | | 0.45 | | | | 92 | |
| | | | | | | | | | | | | | | | | | | | | | | | | | | | | | | | | | |
| | | | | $ | (1.23 | ) | | $ | 44.65 | | | | 7.09 | % | | $ | 49,443 | | | | 1.05 | % | | | 1.28 | % | | | 0.70 | % | | | 62 | % |
| | | | | | (0.34 | ) | | | 42.85 | (c) | | | 20.58 | (c) | | | 67,921 | | | | 1.11 | | | | 1.43 | | | | 0.94 | | | | 67 | |
| | | | | | (1.65 | ) | | | 35.91 | | | | 5.31 | | | | 29,031 | | | | 1.21 | | | | 1.48 | | | | 0.28 | | | | 76 | |
| | | | | | (3.66 | ) | | | 35.65 | | | | 8.04 | | | | 59,061 | | | | 1.21 | (d)(e) | | | 1.39 | (d)(e) | | | 0.97 | (d)(e) | | | 39 | |
| | | | | | (3.98 | ) | | | 36.68 | | | | (5.61 | ) | | | 55,743 | | | | 1.21 | | | | 1.46 | | | | 0.53 | | | | 77 | |
| | | | | | (0.31 | ) | | | 42.94 | | | | 32.96 | | | | 71,875 | | | | 1.21 | | | | 1.44 | | | | 0.46 | | | | 92 | |
| | | | | | | | | | | | | | | | | | | | | | | | | | | | | | | | | | |
| | | | | $ | (1.32 | ) | | $ | 44.64 | | | | 7.14 | % | | $ | 33,876 | | | | 1.00 | % | | | 1.22 | % | | | 0.87 | % | | | 62 | % |
| | | | | | (0.35 | ) | | | 42.90 | (c) | | | 20.66 | (c) | | | 17,804 | | | | 1.05 | | | | 1.42 | | | | 0.60 | | | | 67 | |
| | | | | | — | | | | 35.94 | | | | 7.22 | | | | 15,534 | | | | 1.11 | (d) | | | 1.56 | (d) | | | 1.48 | (d) | | | 76 | |
| | (c) | Payments from Affiliates increased the end of period net asset value and total return by less than $0.01 and 0.01%, respectively. |
| | (d) | Annualized, unless otherwise noted. |
| | (e) | Certain expenses incurred by the Fund were not annualized. |
| | | | | | | | |
| See accompanying Notes to Financial Statements | | | September 30, 2018 | | | Annual Report | | | 293 | |
Financial Highlights (cont’d)
For a Share Outstanding for the Period ended:^
| | | | | | | | | | | | | | | | | | | | | | | | | | | | |
| | | Net Asset
Value,
Beginning
of Period | | | Net
Investment
Loss (a) | | | Net Realized
and Change in
Unrealized
Gain (Loss) | | | Total from
Investment
Operations | | | Distributions
from Net
Realized Capital
Gains | | | Net Asset
Value, End
of Period | | | | |
| AllianzGI Micro Cap: | | | | | | | | | | | | | | | | | | | | | |
| Class A | | | | | | | | | | | | | | | | | | | | | | | | | | | | |
9/30/2018 | | $ | 15.85 | | | $ | (0.21 | ) | | $ | 1.87 | | | $ | 1.66 | | | $ | (0.89 | ) | | $ | 16.62 | | | | | |
9/30/2017 | | | 14.73 | | | | (0.18 | ) | | | 2.72 | | | | 2.54 | | | | (1.42 | ) | | | 15.85 | | | | | |
9/30/2016 | | | 13.99 | | | | (0.18 | ) | | | 1.75 | | | | 1.57 | | | | (0.83 | ) | | | 14.73 | | | | | |
12/1/2014 - 9/30/2015# | | | 14.88 | | | | (0.17 | ) | | | 0.54 | | | | 0.37 | | | | (1.26 | ) | | | 13.99 | | | | | |
11/30/2014 | | | 16.06 | | | | (0.21 | ) | | | — | | | | (0.21 | ) | | | (0.97 | ) | | | 14.88 | | | | | |
11/30/2013 | | | 11.62 | | | | (0.20 | ) | | | 5.57 | | | | 5.37 | | | | (0.93 | ) | | | 16.06 | | | | | |
| Class P | | | | | | | | | | | | | | | | | | | | | | | | | | | | |
9/30/2018 | | $ | 15.94 | | | $ | (0.20 | ) | | $ | 1.88 | | | $ | 1.68 | | | $ | (0.89 | ) | | $ | 16.73 | | | | | |
9/30/2017 | | | 14.80 | | | | (0.17 | ) | | | 2.73 | | | | 2.56 | | | | (1.42 | ) | | | 15.94 | | | | | |
9/30/2016 | | | 14.05 | | | | (0.16 | ) | | | 1.74 | | | | 1.58 | | | | (0.83 | ) | | | 14.80 | | | | | |
12/1/2014 - 9/30/2015# | | | 14.92 | | | | (0.16 | ) | | | 0.55 | | | | 0.39 | | | | (1.26 | ) | | | 14.05 | | | | | |
11/30/2014 | | | 16.08 | | | | (0.19 | ) | | | — | | | | (0.19 | ) | | | (0.97 | ) | | | 14.92 | | | | | |
11/30/2013 | | | 11.61 | | | | (0.17 | ) | | | 5.57 | | | | 5.40 | | | | (0.93 | ) | | | 16.08 | | | | | |
| Institutional Class | | | | | | | | | | | | | | | | | | | | | | | | | | | | |
9/30/2018 | | $ | 16.03 | | | $ | (0.20 | ) | | $ | 1.88 | | | $ | 1.68 | | | $ | (0.89 | ) | | $ | 16.82 | | | | | |
9/30/2017 | | | 14.87 | | | | (0.17 | ) | | | 2.75 | | | | 2.58 | | | | (1.42 | ) | | | 16.03 | | | | | |
9/30/2016 | | | 14.11 | | | | (0.16 | ) | | | 1.75 | | | | 1.59 | | | | (0.83 | ) | | | 14.87 | | | | | |
12/1/2014 - 9/30/2015# | | | 14.99 | | | | (0.16 | ) | | | 0.54 | | | | 0.38 | | | | (1.26 | ) | | | 14.11 | | | | | |
11/30/2014 | | | 16.15 | | | | (0.19 | ) | | | — | | | | (0.19 | ) | | | (0.97 | ) | | | 14.99 | | | | | |
11/30/2013 | | | 11.65 | | | | (0.15 | ) | | | 5.58 | | | | 5.43 | | | | (0.93 | ) | | | 16.15 | | | | | |
| ^ | A — may reflect actual amounts rounding to less than $0.01 or 0.01%. |
| # | Fiscal year end changed from November 30th to September 30th. |
| (a) | Calculated on average shares outstanding during the period. |
| (b) | Total return is calculated assuming a purchase of a share on the first day of the period and a sale of a share on the last day of each period reported. Dividends and distributions, if any, are assumed, for purposes of this calculation, to be reinvested. Total return does not reflect sales charges and includes the effect of fee waivers and reimbursements. Total return may reflect adjustments to conform to U.S. GAAP. Total return for a period of less than one year is not annualized. |
| (c) | Annualized, unless otherwise noted. |
| (d) | Certain expenses incurred by the Fund were not annualized. |
| | | | | | |
| 294 | | Annual Report | | | September 30, 2018 | | | See accompanying Notes to Financial Statements |
| | | | | | | | | | | | | | | | | | | | | | | | | | |
| | | | Total Return (b) | | | Net Assets,
End of Period
(000s) | | | Ratio of
Expenses to
Average Net
Assets with
Fee Waiver/
Reimbursement | | | Ratio of
Expenses to
Average Net
Assets without
Fee Waiver/
Reimbursement | | | Ratio of Net
Investment
Loss
to Average
Net Assets | | | Portfolio
Turnover Rate | |
| | | | | | | | | | | | | | | | | | | | |
| | | | | | | | | | | | | | | | | | | | | | | | | | |
| | | | | | 11.03 | % | | $ | 2,570 | | | | 1.57 | % | | | 2.13 | % | | | (1.34 | )% | | | 47 | % |
| | | | | | 18.74 | | | | 3,031 | | | | 1.62 | | | | 2.18 | | | | (1.27 | ) | | | 32 | |
| | | | | | 11.47 | | | | 3,388 | | | | 1.62 | | | | 2.16 | | | | (1.26 | ) | | | 39 | |
| | | | | | 2.77 | | | | 15,305 | | | | 1.62 | (c)(d) | | | 2.07 | (c)(d) | | | (1.35 | )(c)(d) | | | 55 | |
| | | | | | (1.11 | ) | | | 4,684 | | | | 1.66 | | | | 2.10 | | | | (1.40 | ) | | | 48 | |
| | | | | | 50.11 | | | | 1,065 | | | | 1.80 | | | | 2.07 | | | | (1.45 | ) | | | 63 | |
| | | | | | | | | | | | | | | | | | | | | | | | | | |
| | | | | | 11.10 | % | | $ | 1,722 | | | | 1.49 | % | | | 1.91 | % | | | (1.26 | )% | | | 47 | % |
| | | | | | 18.79 | | | | 1,568 | | | | 1.54 | | | | 1.89 | | | | (1.19 | ) | | | 32 | |
| | | | | | 11.50 | | | | 1,289 | | | | 1.54 | | | | 1.85 | | | | (1.17 | ) | | | 39 | |
| | | | | | 2.91 | | | | 2,264 | | | | 1.51 | (c)(d) | | | 1.80 | (c)(d) | | | (1.24 | )(c)(d) | | | 55 | |
| | | | | | (0.98 | ) | | | 1,550 | | | | 1.52 | | | | 1.81 | | | | (1.21 | ) | | | 48 | |
| | | | | | 50.42 | | | | 2,192 | | | | 1.63 | | | | 1.90 | | | | (1.25 | ) | | | 63 | |
| | | | | | | | | | | | | | | | | | | | | | | | | | |
| | | | | | 11.04 | % | | $ | 24,419 | | | | 1.49 | % | | | 1.93 | % | | | (1.26 | )% | | | 47 | % |
| | | | | | 18.84 | | | | 27,984 | | | | 1.54 | | | | 1.93 | | | | (1.20 | ) | | | 32 | |
| | | | | | 11.53 | | | | 30,768 | | | | 1.54 | | | | 1.91 | | | | (1.17 | ) | | | 39 | |
| | | | | | 2.83 | | | | 34,575 | | | | 1.54 | (c)(d) | | | 1.80 | (c)(d) | | | (1.26 | )(c)(d) | | | 55 | |
| | | | | | (0.97 | ) | | | 33,513 | | | | 1.54 | | | | 1.80 | | | | (1.25 | ) | | | 48 | |
| | | | | | 50.51 | | | | 41,713 | | | | 1.54 | | | | 2.01 | | | | (1.10 | ) | | | 63 | |
| | | | | | | | |
| See accompanying Notes to Financial Statements | | | September 30, 2018 | | | Annual Report | | | 295 | |
Financial Highlights (cont’d)
For a Share Outstanding for the Period ended:^
| | | | | | | | | | | | | | | | | | | | | | | | | | | | |
| | | Net Asset
Value,
Beginning
of Period | | | Net
Investment
Income (a) | | | Net Realized
and Change in
Unrealized Gain
(Loss) | | | Total from
Investment
Operations | | |
Dividends
from Net
Investment
Income | | | Distributions
from Net
Realized Capital
Gains | | | | |
| AllianzGI NFJ Emerging Markets Value: | | | | | | | | | | | | | | | | |
| Class A | | | | | | | | | | | | | | | | | | | | | | | | | | | | |
9/30/2018 | | $ | 17.24 | | | $ | 0.41 | | | $ | (1.14 | ) | | $ | (0.73 | ) | | $ | (0.26 | ) | | $ | (0.07 | ) | | | | |
9/30/2017 | | | 14.31 | | | | 0.40 | | | | 2.85 | | | | 3.25 | | | | (0.32 | ) | | | — | | | | | |
9/30/2016 | | | 12.34 | | | | 0.47 | | | | 1.90 | | | | 2.37 | | | | (0.40 | ) | | | — | | | | | |
12/1/2014 - 9/30/2015# | | | 15.45 | | | | 0.49 | | | | (2.74 | ) | | | (2.25 | ) | | | (0.62 | ) | | | (0.24 | ) | | | | |
11/30/2014 | | | 15.42 | | | | 0.37 | | | | 0.08 | | | | 0.45 | | | | (0.42 | ) | | | — | | | | | |
12/18/2012* - 11/30/2013 | | | 15.00 | | | | 0.35 | | | | 0.27 | | | | 0.62 | | | | (0.20 | ) | | | — | | | | | |
| Class C | | | | | | | | | | | | | | | | | | | | | | | | | | | | |
9/30/2018 | | $ | 17.33 | | | $ | 0.24 | | | $ | (1.11 | ) | | $ | (0.87 | ) | | $ | (0.16 | ) | | $ | (0.07 | ) | | | | |
9/30/2017 | | | 14.29 | | | | 0.34 | | | | 2.81 | | | | 3.15 | | | | (0.11 | ) | | | — | | | | | |
9/30/2016 | | | 12.31 | | | | 0.32 | | | | 1.96 | | | | 2.28 | | | | (0.30 | ) | | | — | | | | | |
12/1/2014 - 9/30/2015# | | | 15.40 | | | | 0.36 | | | | (2.68 | ) | | | (2.32 | ) | | | (0.53 | ) | | | (0.24 | ) | | | | |
11/30/2014 | | | 15.35 | | | | 0.28 | | | | 0.05 | | | | 0.33 | | | | (0.28 | ) | | | — | | | | | |
12/18/2012* - 11/30/2013 | | | 15.00 | | | | 0.14 | | | | 0.36 | | | | 0.50 | | | | (0.15 | ) | | | — | | | | | |
| Class P | | | | | | | | | | | | | | | | | | | | | | | | | | | | |
9/30/2018 | | $ | 17.13 | | | $ | 0.36 | | | $ | (1.08 | ) | | $ | (0.72 | ) | | $ | (0.18 | ) | | $ | (0.07 | ) | | | | |
9/30/2017 | | | 14.31 | | | | 0.46 | | | | 2.78 | | | | 3.24 | | | | (0.42 | ) | | | — | | | | | |
9/30/2016 | | | 12.46 | | | | 0.62 | | | | 1.80 | | | | 2.42 | | | | (0.57 | ) | | | — | | | | | |
12/1/2014 - 9/30/2015# | | | 15.56 | | | | 0.49 | | | | (2.74 | ) | | | (2.25 | ) | | | (0.61 | ) | | | (0.24 | ) | | | | |
11/30/2014 | | | 15.45 | | | | 0.43 | | | | 0.05 | | | | 0.48 | | | | (0.37 | ) | | | — | | | | | |
12/18/2012* - 11/30/2013 | | | 15.00 | | | | 0.36 | | | | 0.27 | | | | 0.63 | | | | (0.18 | ) | | | — | | | | | |
| Institutional Class | | | | | | | | | | | | | | | | | | | | | | | | | | | | |
9/30/2018 | | $ | 17.49 | | | $ | 0.42 | | | $ | (1.11 | ) | | $ | (0.69 | ) | | $ | (0.44 | ) | | $ | (0.07 | ) | | | | |
9/30/2017 | | | 14.46 | | | | 0.44 | | | | 2.91 | | | | 3.35 | | | | (0.32 | ) | | | — | | | | | |
9/30/2016 | | | 12.47 | | | | 0.43 | | | | 2.01 | | | | 2.44 | | | | (0.45 | ) | | | — | | | | | |
12/1/2014 - 9/30/2015# | | | 15.57 | | | | 0.51 | | | | (2.74 | ) | | | (2.23 | ) | | | (0.63 | ) | | | (0.24 | ) | | | | |
11/30/2014 | | | 15.46 | | | | 0.46 | | | | 0.03 | | | | 0.49 | | | | (0.38 | ) | | | — | | | | | |
12/18/2012* - 11/30/2013 | | | 15.00 | | | | 0.39 | | | | 0.26 | | | | 0.65 | | | | (0.19 | ) | | | — | | | | | |
| ^ | A — may reflect actual amounts rounding to less than $0.01 or 0.01%. |
| # | Fiscal year end changed from November 30th to September 30th. |
| * | Commencement of operations. |
| (a) | Calculated on average shares outstanding during the period. |
| (b) | Total return is calculated assuming a purchase of a share on the first day of the period and a sale of a share on the last day of each period reported. Dividends and distributions, if any, are assumed, for purposes of this calculation, to be reinvested. Total return does not reflect sales charges and includes the effect of fee waivers and reimbursements. Total return may reflect adjustments to conform to U.S. GAAP. Total return for a period of less than one year is not annualized. |
| (c) | Payments from Affiliates increased the end of year net asset value (“NAV”) and total return by $0.02 and 0.15%, respectively, for Class A, $0.02 and 0.14%, respectively, for Class C, $0.02 and 0.14%, respectively, for Class P and $0.01 and 0.07%, respectively for Institutional Class. If the Affiliates had not made these payments, the end of year NAV and total return would have been $17.22 and 22.92%, respectively, for Class A, $17.31 and 21.92%, respectively, for Class C, $17.11 and 23.08%, respectively, for Class P and $17.48 and 23.26%, respectively for Institutional Class. |
| (d) | Does not include expenses of the investment companies in which the Fund invests. |
| (e) | Payments from Affiliates increased the end of period net asset value and total return by less than $0.01 and 0.01%, respectively. |
| (f) | Annualized, unless otherwise noted. |
| (g) | Certain expenses incurred by the Fund were not annualized. |
| | | | | | |
| 296 | | Annual Report | | | September 30, 2018 | | | See accompanying Notes to Financial Statements |
| | | | | | | | | | | | | | | | | | | | | | | | | | | | | | | | | | |
| | | | Total
Dividends and
Distributions | | | Net Asset
Value, End
of Period | | | Total Return (b) | | | Net Assets,
End of Period
(000s) | | | Ratio of
Expenses to
Average Net
Assets with
Fee Waiver/
Reimbursement | | | Ratio of
Expenses to
Average Net
Assets without
Fee Waiver/
Reimbursement | | | Ratio of Net
Investment
Income
to Average
Net Assets | | | Portfolio
Turnover Rate | |
| | | | | | | | | | | | | | | | | | | | | | | | | | |
| | | | | | | | | | | | | | | | | | | | | | | | | | | | | | | | | | |
| | | | | $ | (0.33 | ) | | $ | 16.18 | | | | (4.36 | )% | | $ | 22,590 | | | | 1.14 | % | | | 1.65 | % | | | 2.31 | % | | | 116 | % |
| | | | | | (0.32 | ) | | | 17.24 | (c) | | | 23.07 | (c) | | | 11,026 | | | | 1.22 | (d) | | | 3.32 | (d) | | | 2.58 | (d) | | | 120 | |
| | | | | | (0.40 | ) | | | 14.31 | (e) | | | 19.57 | (e) | | | 2,141 | | | | 1.39 | | | | 7.84 | | | | 3.62 | | | | 104 | |
| | | | | | (0.86 | ) | | | 12.34 | | | | (15.12 | ) | | | 207 | | | | 1.55 | (f)(g) | | | 6.55 | (f)(g) | | | 4.13 | (f)(g) | | | 93 | |
| | | | | | (0.42 | ) | | | 15.45 | | | | 2.94 | | | | 110 | | | | 1.55 | | | | 4.86 | | | | 2.33 | | | | 85 | |
| | | | | | (0.20 | ) | | | 15.42 | | | | 4.14 | | | | 19 | | | | 1.55 | (f) | | | 17.07 | (f) | | | 2.41 | (f) | | | 67 | |
| | | | | | | | | | | | | | | | | | | | | | | | | | | | | | | | | | |
| | | | | $ | (0.23 | ) | | $ | 16.23 | | | | (5.08 | )% | | $ | 1,196 | | | | 1.90 | % | | | 2.38 | % | | | 1.35 | % | | | 116 | % |
| | | | | | (0.11 | ) | | | 17.33 | (c) | | | 22.06 | (c) | | | 527 | | | | 1.95 | (d) | | | 4.00 | (d) | | | 2.16 | (d) | | | 120 | |
| | | | | | (0.30 | ) | | | 14.29 | (e) | | | 18.80 | (e) | | | 113 | | | | 2.16 | | | | 8.01 | | | | 2.49 | | | | 104 | |
| | | | | | (0.77 | ) | | | 12.31 | | | | (15.62 | ) | | | 104 | | | | 2.30 | (f)(g) | | | 7.39 | (f)(g) | | | 3.12 | (f)(g) | | | 93 | |
| | | | | | (0.28 | ) | | | 15.40 | | | | 2.19 | | | | 73 | | | | 2.30 | | | | 5.60 | | | | 1.82 | | | | 85 | |
| | | | | | (0.15 | ) | | | 15.35 | | | | 3.40 | | | | 25 | | | | 2.30 | (f) | | | 19.41 | (f) | | | 1.00 | (f) | | | 67 | |
| | | | | | | | | | | | | | | | | | | | | | | | | | | | | | | | | | |
| | | | | $ | (0.25 | ) | | $ | 16.16 | | | | (4.30 | )% | | $ | 3,312 | | | | 0.98 | % | | | 1.48 | % | | | 2.03 | % | | | 116 | % |
| | | | | | (0.42 | ) | | | 17.13 | (c) | | | 23.22 | (c) | | | 19,899 | | | | 1.05 | (d) | | | 3.00 | (d) | | | 2.99 | (d) | | | 120 | |
| | | | | | (0.57 | ) | | | 14.31 | (e) | | | 19.95 | (e) | | | 139 | | | | 1.20 | | | | 7.47 | | | | 4.67 | | | | 104 | |
| | | | | | (0.85 | ) | | | 12.46 | | | | (15.03 | ) | | | 9 | | | | 1.39 | (f)(g) | | | 5.87 | (f)(g) | | | 4.12 | (f)(g) | | | 93 | |
| | | | | | (0.37 | ) | | | 15.56 | | | | 3.13 | | | | 11 | | | | 1.39 | | | | 4.64 | | | | 2.77 | | | | 85 | |
| | | | | | (0.18 | ) | | | 15.45 | | | | 4.25 | | | | 11 | | | | 1.41 | (f) | | | 7.72 | (f) | | | 2.49 | (f) | | | 67 | |
| | | | | | | | | | | | | | | | | | | | | | | | | | | | | | | | | | |
| | | | | $ | (0.51 | ) | | $ | 16.29 | | | | (4.12 | )% | | $ | 111,161 | | | | 0.90 | % | | | 1.39 | % | | | 2.41 | % | | | 116 | % |
| | | | | | (0.32 | ) | | | 17.49 | (c) | | | 23.33 | (c) | | | 34,444 | | | | 0.95 | (d) | | | 2.87 | (d) | | | 2.71 | (d) | | | 120 | |
| | | | | | (0.45 | ) | | | 14.46 | (e) | | | 19.95 | (e) | | | 6,370 | | | | 1.17 | | | | 6.98 | | | | 3.35 | | | | 104 | |
| | | | | | (0.87 | ) | | | 12.47 | | | | (14.91 | ) | | | 6,688 | | | | 1.30 | (f)(g) | | | 5.93 | (f)(g) | | | 4.25 | (f)(g) | | | 93 | |
| | | | | | (0.38 | ) | | | 15.57 | | | | 3.18 | | | | 7,889 | | | | 1.30 | | | | 4.63 | | | | 2.96 | | | | 85 | |
| | | | | | (0.19 | ) | | | 15.46 | | | | 4.38 | | | | 6,470 | | | | 1.30 | (f) | | | 7.78 | (f) | | | 2.70 | (f) | | | 67 | |
| | | | | | | | |
| See accompanying Notes to Financial Statements | | | September 30, 2018 | | | Annual Report | | | 297 | |
Financial Highlights (cont’d)
For a Share Outstanding for the Period ended:^
| | | | | | | | | | | | | | | | | | | | | | | | | | | | |
| | | Net Asset
Value,
Beginning
of Period | | | Net
Investment
Income (a) | | | Net Realized
and Change in
Unrealized Gain
(Loss) | | | Total from
Investment
Operations | | | Dividends
from Net
Investment
Income | | | Distributions
from Net
Realized Capital
Gains | | | | |
| AllianzGI NFJ International Small-Cap Value: | | | | |
| Class A | | | | | | | | | | | | | | | | | | | | | | | | | | | | |
9/30/2018 | | $ | 20.71 | | | $ | 0.34 | | | $ | (0.95 | ) | | $ | (0.61 | ) | | $ | (0.41 | ) | | $ | — | | | | | |
9/30/2017 | | | 18.19 | | | | 0.22 | | | | 2.86 | | | | 3.08 | | | | (0.56 | ) | | | — | | | | | |
9/30/2016 | | | 18.19 | | | | 0.46 | | | | 0.61 | | | | 1.07 | | | | (0.68 | ) | | | (0.39 | ) | | | | |
12/1/2014 - 9/30/2015# | | | 21.37 | | | | 0.40 | | | | (1.22 | ) | | | (0.82 | ) | | | (0.57 | ) | | | (1.79 | ) | | | | |
11/30/2014 | | | 21.06 | | | | 0.39 | | | | 0.62 | | | | 1.01 | | | | (0.26 | ) | | | (0.44 | ) | | | | |
11/30/2013 | | | 17.10 | | | | 0.35 | | | | 4.03 | | | | 4.38 | | | | (0.33 | ) | | | (0.09 | ) | | | | |
| Class C | | | | | | | | | | | | | | | | | | | | | | | | | | | | |
9/30/2018 | | $ | 19.70 | | | $ | 0.16 | | | $ | (0.90 | ) | | $ | (0.74 | ) | | $ | — | | | $ | — | | | | | |
9/30/2017 | | | 17.90 | | | | 0.14 | | | | 2.63 | | | | 2.77 | | | | (0.97 | ) | | | — | | | | | |
9/30/2016 | | | 17.91 | | | | 0.26 | | | | 0.66 | | | | 0.92 | | | | (0.54 | ) | | | (0.39 | ) | | | | |
12/1/2014 - 9/30/2015# | | | 21.11 | | | | 0.28 | | | | (1.21 | ) | | | (0.93 | ) | | | (0.48 | ) | | | (1.79 | ) | | | | |
11/30/2014 | | | 21.04 | | | | 0.23 | | | | 0.63 | | | | 0.86 | | | | (0.35 | ) | | | (0.44 | ) | | | | |
11/30/2013 | | | 17.04 | | | | 0.16 | | | | 4.09 | | | | 4.25 | | | | (0.16 | ) | | | (0.09 | ) | | | | |
| Class P | | | | | | | | | | | | | | | | | | | | | | | | | | | | |
9/30/2018 | | $ | 20.05 | | | $ | 0.37 | | | $ | (0.91 | ) | | $ | (0.54 | ) | | $ | (0.42 | ) | | $ | — | | | | | |
9/30/2017 | | | 18.33 | | | | 0.39 | | | | 2.58 | | | | 2.97 | | | | (1.25 | ) | | | — | | | | | |
9/30/2016 | | | 18.40 | | | | 0.46 | | | | 0.63 | | | | 1.09 | | | | (0.77 | ) | | | (0.39 | ) | | | | |
12/1/2014 - 9/30/2015# | | | 21.70 | | | | 0.46 | | | | (1.27 | ) | | | (0.81 | ) | | | (0.70 | ) | | | (1.79 | ) | | | | |
11/30/2014 | | | 21.27 | | | | 0.44 | | | | 0.62 | | | | 1.06 | | | | (0.19 | ) | | | (0.44 | ) | | | | |
11/30/2013 | | | 17.11 | | | | 0.39 | | | | 4.05 | | | | 4.44 | | | | (0.19 | ) | | | (0.09 | ) | | | | |
| Institutional Class | | | | | | | | | | | | | | | | | | | | | | | | | | | | |
9/30/2018 | | $ | 20.81 | | | $ | 0.41 | | | $ | (0.96 | ) | | $ | (0.55 | ) | | $ | (0.55 | ) | | $ | — | | | | | |
9/30/2017 | | | 18.69 | | | | 0.35 | | | | 2.77 | | | | 3.12 | | | | (1.00 | ) | | | — | | | | | |
9/30/2016 | | | 18.49 | | | | 0.42 | | | | 0.71 | | | | 1.13 | | | | (0.54 | ) | | | (0.39 | ) | | | | |
12/1/2014 - 9/30/2015# | | | 21.59 | | | | 0.46 | | | | (1.25 | ) | | | (0.79 | ) | | | (0.52 | ) | | | (1.79 | ) | | | | |
11/30/2014 | | | 21.28 | | | | 0.45 | | | | 0.63 | | | | 1.08 | | | | (0.33 | ) | | | (0.44 | ) | | | | |
11/30/2013 | | | 17.12 | | | | 0.43 | | | | 4.03 | | | | 4.46 | | | | (0.21 | ) | | | (0.09 | ) | | | | |
| Class R6 | | | | | | | | | | | | | | | | | | | | | | | | | | | | |
9/30/2018 | | $ | 19.90 | | | $ | 0.39 | | | $ | (0.90 | ) | | $ | (0.51 | ) | | $ | (0.43 | ) | | $ | — | | | | | |
9/30/2017 | | | 18.35 | | | | 0.35 | | | | 2.61 | | | | 2.96 | | | | (1.41 | ) | | | — | | | | | |
9/30/2016 | | | 18.49 | | | | 0.52 | | | | 0.62 | | | | 1.14 | | | | (0.89 | ) | | | (0.39 | ) | | | | |
9/8/2015* - 9/30/2015# | | | 19.04 | | | | 0.04 | | | | (0.59 | ) | | | (0.55 | ) | | | — | | | | — | | | | | |
| ^ | A — may reflect actual amounts rounding to less than $0.01 or 0.01%. |
| # | Fiscal year end changed from November 30th to September 30th. |
| * | Commencement of operations. |
| (a) | Calculated on average shares outstanding during the period. |
| (b) | Total return is calculated assuming a purchase of a share on the first day of the period and a sale of a share on the last day of each period reported. Dividends and distributions, if any, are assumed, for purposes of this calculation, to be reinvested. Total return does not reflect sales charges and includes the effect of fee waivers and reimbursements. Total return may reflect adjustments to conform to U.S. GAAP. Total return for a period of less than one year is not annualized. |
| (c) | Annualized, unless otherwise noted. |
| (d) | Certain expenses incurred by the Fund were not annualized. |
| (e) | Payments from Affiliates increased the end of period net asset value and total return by less than $0.01 and 0.01%, respectively. |
| | | | | | |
| 298 | | Annual Report | | | September 30, 2018 | | | See accompanying Notes to Financial Statements |
| | | | | | | | | | | | | | | | | | | | | | | | | | | | | | | | | | |
| | | | Total
Dividends and
Distributions | | | Net Asset
Value, End
of Period | | | Total Return (b) | | | Net Assets,
End of Period
(000s) | | | Ratio of
Expenses to
Average Net
Assets with
Fee Waiver/
Reimbursement | | | Ratio of
Expenses to
Average Net
Assets without
Fee Waiver/
Reimbursement | | | Ratio of Net
Investment
Income
to Average
Net Assets | | | Portfolio
Turnover Rate | |
| | | | | | | | | | | | | | | | | | | | | | | | | | |
| | | | | | | | | | | | | | | | | | | | | | | | | | | | | | | | | | |
| | | | | $ | (0.41 | ) | | $ | 19.69 | (e) | | | (3.05 | )%(e) | | $ | 1,086 | | | | 1.30 | % | | | 5.83 | % | | | 1.65 | % | | | 61 | % |
| | | | | | (0.56 | ) | | | 20.71 | | | | 17.71 | | | | 1,362 | | | | 1.30 | | | | 7.02 | | | | 1.21 | | | | 48 | |
| | | | | | (1.07 | ) | | | 18.19 | | | | 6.04 | | | | 7,397 | | | | 1.30 | | | | 4.50 | | | | 2.62 | | | | 95 | |
| | | | | | (2.36 | ) | | | 18.19 | | | | (4.14 | ) | | | 1,657 | | | | 1.46 | (c)(d) | | | 3.08 | (c)(d) | | | 2.43 | (c)(d) | | | 74 | |
| | | | | | (0.70 | ) | | | 21.37 | | | | 4.98 | | | | 2,736 | | | | 1.45 | | | | 2.64 | | | | 1.80 | | | | 76 | |
| | | | | | (0.42 | ) | | | 21.06 | | | | 26.08 | | | | 2,272 | | | | 1.45 | | | | 4.81 | | | | 1.81 | | | | 50 | |
| | | | | | | | | | | | | | | | | | | | | | | | | | | | | | | | | | |
| | | | | $ | — | | | $ | 18.96 | (e) | | | (3.76 | )%(e) | | $ | 169 | | | | 2.05 | % | | | 6.66 | % | | | 0.77 | % | | | 61 | % |
| | | | | | (0.97 | ) | | | 19.70 | | | | 16.83 | | | | 488 | | | | 2.05 | | | | 7.31 | | | | 0.78 | | | | 48 | |
| | | | | | (0.93 | ) | | | 17.90 | | | | 5.26 | | | | 928 | | | | 2.07 | | | | 5.04 | | | | 1.49 | | | | 95 | |
| | | | | | (2.27 | ) | | | 17.91 | | | | (4.78 | ) | | | 1,250 | | | | 2.21 | (c)(d) | | | 3.91 | (c)(d) | | | 1.73 | (c)(d) | | | 74 | |
| | | | | | (0.79 | ) | | | 21.11 | | | | 4.24 | | | | 1,340 | | | | 2.20 | | | | 3.40 | | | | 1.07 | | | | 76 | |
| | | | | | (0.25 | ) | | | 21.04 | | | | 25.20 | | | | 521 | | | | 2.20 | | | | 5.66 | | | | 0.80 | | | | 50 | |
| | | | | | | | | | | | | | | | | | | | | | | | | | | | | | | | | | |
| | | | | $ | (0.42 | ) | | $ | 19.09 | (e) | | | (2.79 | )%(e) | | $ | 47 | | | | 1.05 | % | | | 5.53 | % | | | 1.86 | % | | | 61 | % |
| | | | | | (1.25 | ) | | | 20.05 | | | | 17.98 | | | | 62 | | | | 1.08 | | | | 6.63 | | | | 2.20 | | | | 48 | |
| | | | | | (1.16 | ) | | | 18.33 | | | | 6.14 | | | | 69 | | | | 1.16 | | | | 4.08 | | | | 2.58 | | | | 95 | |
| | | | | | (2.49 | ) | | | 18.40 | | | | (4.03 | ) | | | 47 | | | | 1.31 | (c)(d) | | | 2.92 | (c)(d) | | | 2.74 | (c)(d) | | | 74 | |
| | | | | | (0.63 | ) | | | 21.70 | | | | 5.17 | | | | 39 | | | | 1.30 | | | | 2.39 | | | | 1.98 | | | | 76 | |
| | | | | | (0.28 | ) | | | 21.27 | | | | 26.28 | | | | 14 | | | | 1.31 | | | | 4.63 | | | | 2.04 | | | | 50 | |
| | | | | | | | | | | | | | | | | | | | | | | | | | | | | | | | | | |
| | | | | $ | (0.55 | ) | | $ | 19.71 | (e) | | | (2.75 | )%(e) | | $ | 1,770 | | | | 1.00 | % | | | 5.48 | % | | | 1.97 | % | | | 61 | % |
| | | | | | (1.00 | ) | | | 20.81 | | | | 18.11 | | | | 1,928 | | | | 1.03 | | | | 6.32 | | | | 1.88 | | | | 48 | |
| | | | | | (0.93 | ) | | | 18.69 | | | | 6.25 | | | | 1,889 | | | | 1.08 | | | | 3.84 | | | | 2.29 | | | | 95 | |
| | | | | | (2.31 | ) | | | 18.49 | | | | (3.92 | ) | | | 6,832 | | | | 1.21 | (c)(d) | | | 2.82 | (c)(d) | | | 2.75 | (c)(d) | | | 74 | |
| | | | | | (0.77 | ) | | | 21.59 | | | | 5.27 | | | | 13,979 | | | | 1.20 | | | | 2.31 | | | | 2.03 | | | | 76 | |
| | | | | | (0.30 | ) | | | 21.28 | | | | 26.40 | | | | 11,873 | | | | 1.21 | | | | 4.66 | | | | 2.22 | | | | 50 | |
| | | | | | | | | | | | | | | | | | | | | | | | | | | | | | | | | | |
| | | | | $ | (0.43 | ) | | $ | 18.96 | (e) | | | (2.67 | )%(e) | | $ | 500 | | | | 0.95 | % | | | 5.50 | % | | | 1.97 | % | | | 61 | % |
| | | | | | (1.41 | ) | | | 19.90 | | | | 18.10 | | | | 752 | | | | 0.95 | | | | 6.18 | | | | 1.96 | | | | 48 | |
| | | | | | (1.28 | ) | | | 18.35 | | | | 6.41 | | | | 1,667 | | | | 0.95 | | | | 4.92 | | | | 2.90 | | | | 95 | |
| | | | | | — | | | | 18.49 | | | | (2.89 | ) | | | 10 | | | | 1.10 | (c)(d) | | | 3.29 | (c)(d) | | | 3.68 | (c)(d) | | | 74 | |
| | | | | | | | |
| See accompanying Notes to Financial Statements | | | September 30, 2018 | | | Annual Report | | | 299 | |
Financial Highlights† (cont’d)
For a Share Outstanding for the Period ended:^
| | | | | | | | | | | | | | | | | | | | | | | | |
| | | Net Asset
Value,
Beginning
of Period | | | Net
Investment
Income (a) | | | Net Realized
and Change in
Unrealized Gain
(Loss) | | | Total from
Investment
Operations | | |
Dividends
from Net
Investment
Income | | | | |
| AllianzGI PerformanceFee Managed Futures Strategy:† | | | | | | | | | | | | |
| Class P | | | | | | | | | | | | | | | | | | | | | | | | |
12/18/2017* - 9/30/2018 | | $ | 10.00 | | | $ | 0.12 | | | $ | (0.51 | ) | | $ | (0.39 | ) | | $ | — | | | | | |
| Institutional Class | | | | | | | | | | | | | | | | | | | | | | | | |
12/18/2017* - 9/30/2018 | | $ | 10.00 | | | $ | 0.13 | | | $ | (0.53 | ) | | $ | (0.40 | ) | | $ | — | | | | | |
| Class R6 | | | | | | | | | | | | | | | | | | | | | | | | |
12/18/2017* - 9/30/2018 | | $ | 10.00 | | | $ | 0.13 | | | $ | (0.52 | ) | | $ | (0.39 | ) | | $ | — | | | | | |
| AllianzGI PerformanceFee Structured US Equity: | | | | | | | | | | | | |
| Class P | | | | | | | | | | | | | | | | | | | | | | | | |
12/18/2017* - 9/30/2018 | | $ | 10.00 | | | $ | 0.14 | | | $ | 0.98 | | | $ | 1.12 | | | $ | — | | | | | |
| Institutional Class | | | | | | | | | | | | | | | | | | | | | | | | |
12/18/2017* - 9/30/2018 | | $ | 10.00 | | | $ | 0.18 | | | $ | 0.95 | | | $ | 1.13 | | | $ | — | | | | | |
| Class R6 | | | | | | | | | | | | | | | | | | | | | | | | |
12/18/2017* - 9/30/2018 | | $ | 10.00 | | | $ | 0.13 | | | $ | 1.00 | | | $ | 1.13 | | | $ | — | | | | | |
| AllianzGI PerformanceFee Structured US Fixed Income: | | | | | | | | | | | | |
| Class P | | | | | | | | | | | | | | | | | | | | | | | | |
12/18/2017* - 9/30/2018 | | $ | 10.00 | | | $ | 0.16 | | | $ | (0.24 | ) | | $ | (0.08 | ) | | $ | — | | | | | |
| Institutional Class | | | | | | | | | | | | | | | | | | | | | | | | |
12/18/2017* - 9/30/2018 | | $ | 10.00 | | | $ | 0.09 | | | $ | (0.17 | ) | | $ | (0.08 | ) | | $ | — | | | | | |
| Class R6 | | | | | | | | | | | | | | | | | | | | | | | | |
12/18/2017* - 9/30/2018 | | $ | 10.00 | | | $ | 0.16 | | | $ | (0.24 | ) | | $ | (0.08 | ) | | $ | — | | | | | |
| AllianzGI Preferred Securities and Income: | | | | | | | | | | | | |
| Class P | | | | | | | | | | | | | | | | | | | | | | | | |
5/30/2018* - 9/30/2018 | | $ | 15.00 | | | $ | 0.23 | | | $ | 0.03 | | | $ | 0.26 | | | $ | (0.20 | ) | | | | |
| Institutional Class | | | | | | | | | | | | | | | | | | | | | | | | |
5/30/2018* - 9/30/2018 | | $ | 15.00 | | | $ | 0.26 | | | $ | — | | | $ | 0.26 | | | $ | (0.20 | ) | | | | |
| Class R6 | | | | | | | | | | | | | | | | | | | | | | | | |
5/30/2018* - 9/30/2018 | | $ | 15.00 | | | $ | 0.24 | | | $ | 0.03 | | | $ | 0.27 | | | $ | (0.21 | ) | | | | |
| AllianzGI Real Estate Debt: | | | | | | | | | | | | |
| Class P | | | | | | | | | | | | | | | | | | | | | | | | |
12/27/2017* - 9/30/2018 | | $ | 15.00 | | | $ | 0.20 | | | $ | (0.02 | ) | | $ | 0.18 | | | $ | (0.23 | ) | | | | |
| Institutional Class | | | | | | | | | | | | | | | | | | | | | | | | |
12/27/2017* - 9/30/2018 | | $ | 15.00 | | | $ | 0.21 | | | $ | (0.02 | ) | | $ | 0.19 | | | $ | (0.24 | ) | | | | |
| ^ | A — may reflect actual amounts rounding to less than $0.01 or 0.01%. |
| † | Consolidated Financial Highligths for the AllianzGI PerformanceFee Managed Futures Strategy Fund. These financial statements are consolidated to include the accounts of AllianzGI PerformanceFee Managed Futures Strategy Offshore Fund Ltd., a wholly-owned subsidiary of the AllianzGI PerformanceFee Managed Futures Strategy Fund. See Note 14. |
| * | Commencement of operations. |
| (a) | Calculated on average shares outstanding during the period. |
| (b) | Total return is calculated assuming a purchase of a share on the first day of the period and a sale of a share on the last day of each period reported. Dividends and distributions, if any, are assumed, for purposes of this calculation, to be reinvested. Total return does not reflect sales charges and includes the effect of fee waivers and reimbursements. Total return may reflect adjustments to conform to U.S. GAAP. Total return for a period of less than one year is not annualized. |
| (c) | Annualized, unless otherwise noted. |
| (d) | Certain expenses incurred by the Fund were not annualized. |
| | | | | | |
| 300 | | Annual Report | | | September 30, 2018 | | | See accompanying Notes to Financial Statements |
| | | | | | | | | | | | | | | | | | | | | | | | | | | | | | |
| | | | Net Asset
Value, End
of Period | | | Total Return (b) | | | Net Assets, End
of Period
(000s) | | | Ratio of
Expenses to
Average Net
Assets with
Fee Waiver/
Reimbursement (c)(d) | | | Ratio of
Expenses to
Average Net
Assets without
Fee Waiver/
Reimbursement (c)(d) | | | Ratio of Net
Investment
Income
to Average
Net Assets (c)(d) | | | Portfolio
Turnover Rate | |
| | | | | | | | | | | | | | | | | | | | | | | |
| | | | | | | | | | | | | | | | | | | | | | | | | | | | | | |
| | | | | $ | 9.61 | | | | (3.90 | )% | | $ | 10 | | | | 0.20 | % | | | 4.01 | % | | | 1.59 | % | | | 121 | % |
| | | | | | | | | | | | | | | | | | | | | | | | | | | | | | |
| | | | | $ | 9.60 | | | | (4.00 | )% | | $ | 515 | | | | 0.15 | % | | | 5.42 | % | | | 1.74 | % | | | 121 | % |
| | | | | | | | | | | | | | | | | | | | | | | | | | | | | | |
| | | | $ | 9.61 | | | | (3.90 | )% | | $ | 15,254 | | | | 0.10 | % | | | 4.00 | % | | | 1.70 | % | | | 121 | % |
| | | | | | | | | | | | | | | | | | | | | | | |
| | | | | | | | | | | | | | | | | | | | | | | | | | | | | | |
| | | | | $ | 11.12 | | | | 11.20 | % | | $ | 11 | | | | 0.61 | % | | | 1.75 | % | | | 1.71 | % | | | 2 | % |
| | | | | | | | | | | | | | | | | | | | | | | | | | | | | | |
| | | | | $ | 11.13 | | | | 11.30 | % | | $ | 40,290 | | | | 0.62 | % | | | 1.58 | % | | | 2.12 | % | | | 2 | % |
| | | | | | | | | | | | | | | | | | | | | | | | | | | | | | |
| | | | $ | 11.13 | | | | 11.30 | % | | $ | 42,774 | | | | 0.61 | % | | | 1.72 | % | | | 1.64 | % | | | 2 | % |
| | | | | | | | | | | | | | | | | | | | | | | |
| | | | | | | | | | | | | | | | | | | | | | | | | | | | | | |
| | | | | $ | 9.92 | | | | (0.80 | )% | | $ | 10 | | | | 0.30 | % | | | 1.97 | % | | | 2.04 | % | | | 1 | % |
| | | | | | | | | | | | | | | | | | | | | | | | | | | | | | |
| | | | | $ | 9.92 | | | | (0.80 | )% | | $ | 10 | | | | 0.30 | % | | | 34.22 | % | | | 1.17 | % | | | 1 | % |
| | | | | | | | | | | | | | | | | | | | | | | | | | | | | | |
| | | | $ | 9.92 | | | | (0.80 | )% | | $ | 24,958 | | | | 0.30 | % | | | 2.00 | % | | | 2.03 | % | | | 1 | % |
| | | | | | | | | | | | | | | | | | | | | | | |
| | | | | | | | | | | | | | | | | | | | | | | | | | | | | | |
| | | | | $ | 15.06 | | | | 1.74 | % | | $ | 10 | | | | 0.60 | % | | | 3.21 | % | | | 4.62 | % | | | 39 | % |
| | | | | | | | | | | | | | | | | | | | | | | | | | | | | | |
| | | | | $ | 15.06 | | | | 1.76 | % | | $ | 1,548 | | | | 0.56 | % | | | 4.22 | % | | | 5.28 | % | | | 39 | % |
| | | | | | | | | | | | | | | | | | | | | | | | | | | | | | |
| | | | $ | 15.06 | | | | 1.78 | % | | $ | 10,157 | | | | 0.50 | % | | | 3.22 | % | | | 4.71 | % | | | 39 | % |
| | | | | | | | | | | | | | | | | | | | | | | |
| | | | | | | | | | | | | | | | | | | | | | | | | | | | | | |
| | | | | $ | 14.95 | | | | 1.18 | % | | $ | 10 | | | | 0.68 | % | | | 3.39 | % | | | 1.75 | % | | | 39 | % |
| | | | | | | | | | | | | | | | | | | | | | | | | | | | | | |
| | | | | $ | 14.95 | | | | 1.25 | % | | $ | 15,237 | | | | 0.58 | % | | | 3.26 | % | | | 1.88 | % | | | 39 | % |
| | | | | | | | |
| See accompanying Notes to Financial Statements | | | September 30, 2018 | | | Annual Report | | | 301 | |
Financial Highlights (cont’d)
For a Share Outstanding for the Period ended:^
| | | | | | | | | | | | | | | | | | | | | | | | | | | | |
| | | Net Asset
Value,
Beginning
of Period | | | Net
Investment
Income (a) | | | Net Realized
and Change in
Unrealized Gain
(Loss) | | | Total from
Investment
Operations | | |
Dividends
from Net
Investment
Income | | | Distributions
from Net
Realized
Capital Gains | | | | |
| AllianzGI Short Duration High Income: | | | | | | | | | | | | | | | | | | | | | |
| Class A | | | | | | | | | | | | | | | | | | | | | | | | | | | | |
9/30/2018 | | $ | 15.18 | | | $ | 0.59 | | | $ | (0.16 | ) | | $ | 0.43 | | | $ | (0.68 | ) | | $ | — | | | | | |
9/30/2017 | | | 15.29 | | | | 0.60 | | | | 0.04 | | | | 0.64 | | | | (0.75 | ) | | | — | | | | | |
9/30/2016 | | | 15.04 | | | | 0.72 | | | | 0.38 | | | | 1.10 | | | | (0.85 | ) | | | — | | | | | |
12/1/2014 - 9/30/2015# | | | 15.59 | | | | 0.57 | | | | (0.46 | ) | | | 0.11 | | | | (0.66 | ) | | | — | | | | | |
11/30/2014 | | | 15.92 | | | | 0.64 | | | | (0.23 | ) | | | 0.41 | | | | (0.74 | ) | | | — | | | | | |
11/30/2013 | | | 15.97 | | | | 0.63 | | | | 0.09 | | | | 0.72 | | | | (0.76 | ) | | | (0.01 | ) | | | | |
| Class C | | | | | | | | | | | | | | | | | | | | | | | | | | | | |
9/30/2018 | | $ | 15.15 | | | $ | 0.55 | | | $ | (0.15 | ) | | $ | 0.40 | | | $ | (0.65 | ) | | $ | — | | | | | |
9/30/2017 | | | 15.27 | | | | 0.56 | | | | 0.03 | | | | 0.59 | | | | (0.71 | ) | | | — | | | | | |
9/30/2016 | | | 15.00 | | | | 0.68 | | | | 0.38 | | | | 1.06 | | | | (0.79 | ) | | | — | | | | | |
12/1/2014 - 9/30/2015# | | | 15.56 | | | | 0.53 | | | | (0.46 | ) | | | 0.07 | | | | (0.63 | ) | | | — | | | | | |
11/30/2014 | | | 15.89 | | | | 0.60 | | | | (0.23 | ) | | | 0.37 | | | | (0.70 | ) | | | — | | | | | |
11/30/2013 | | | 15.94 | | | | 0.59 | | | | 0.09 | | | | 0.68 | | | | (0.72 | ) | | | (0.01 | ) | | | | |
| Class P | | | | | | | | | | | | | | | | | | | | | | | | | | | | |
9/30/2018 | | $ | 15.13 | | | $ | 0.62 | | | $ | (0.15 | ) | | $ | 0.47 | | | $ | (0.72 | ) | | $ | — | | | | | |
9/30/2017 | | | 15.24 | | | | 0.63 | | | | 0.05 | | | | 0.68 | | | | (0.79 | ) | | | — | | | | | |
9/30/2016 | | | 15.03 | | | | 0.74 | | | | 0.38 | | | | 1.12 | | | | (0.91 | ) | | | — | | | | | |
12/1/2014 - 9/30/2015# | | | 15.58 | | | | 0.60 | | | | (0.47 | ) | | | 0.13 | | | | (0.68 | ) | | | — | | | | | |
11/30/2014 | | | 15.92 | | | | 0.66 | | | | (0.23 | ) | | | 0.43 | | | | (0.77 | ) | | | — | | | | | |
11/30/2013 | | | 15.96 | | | | 0.66 | | | | 0.10 | | | | 0.76 | | | | (0.79 | ) | | | (0.01 | ) | | | | |
| Institutional Class | | | | | | | | | | | | | | | | | | | | | | | | | | | | |
9/30/2018 | | $ | 15.14 | | | $ | 0.63 | | | $ | (0.15 | ) | | $ | 0.48 | | | $ | (0.73 | ) | | $ | — | | | | | |
9/30/2017 | | | 15.25 | | | | 0.64 | | | | 0.04 | | | | 0.68 | | | | (0.79 | ) | | | — | | | | | |
9/30/2016 | | | 15.05 | | | | 0.76 | | | | 0.37 | | | | 1.13 | | | | (0.93 | ) | | | — | | | | | |
12/1/2014 - 9/30/2015# | | | 15.60 | | | | 0.60 | | | | (0.45 | ) | | | 0.15 | | | | (0.70 | ) | | | — | | | | | |
11/30/2014 | | | 15.94 | | | | 0.68 | | | | (0.24 | ) | | | 0.44 | | | | (0.78 | ) | | | — | | | | | |
11/30/2013 | | | 15.99 | | | | 0.67 | | | | 0.09 | | | | 0.76 | | | | (0.80 | ) | | | (0.01 | ) | | | | |
| Class R6 | | | | | | | | | | | | | | | | | | | | | | | | | | | | |
9/30/2018 | | $ | 15.14 | | | $ | 0.64 | | | $ | (0.16 | ) | | $ | 0.48 | | | $ | (0.73 | ) | | $ | — | | | | | |
2/1/2017* - 9/30/2017 | | | 15.18 | | | | 0.42 | | | | 0.03 | | | | 0.45 | | | | (0.49 | ) | | | — | | | | | |
| ^ | A — may reflect actual amounts rounding to less than $0.01 or 0.01%. |
| # | Fiscal year end changed from November 30th to September 30th. |
| * | Commencement of operations. |
| (a) | Calculated on average shares outstanding during the period. |
| (b) | Total return is calculated assuming a purchase of a share on the first day of the period and a sale of a share on the last day of each period reported. Dividends and distributions, if any, are assumed, for purposes of this calculation, to be reinvested. Total return does not reflect sales charges and includes the effect of fee waivers and reimbursements. Total return may reflect adjustments to conform to U.S. GAAP. Total return for a period of less than one year is not annualized. |
| (c) | Annualized, unless otherwise noted. |
| (d) | Certain expenses incurred by the Fund were not annualized. |
| | | | | | |
| 302 | | Annual Report | | | September 30, 2018 | | | See accompanying Notes to Financial Statements |
| | | | | | | | | | | | | | | | | | | | | | | | | | | | | | | | | | |
| | | | Total
Dividends and
Distributions | | | Net Asset
Value, End
of Period | | | Total Return (b) | | | Net Assets, End
of Period
(000s) | | | Ratio of
Expenses to
Average Net
Assets with
Fee Waiver/
Reimbursement | | | Ratio of
Expenses to
Average Net
Assets without
Fee Waiver/
Reimbursement | | | Ratio of Net
Investment
Income
to Average
Net Assets | | | Portfolio
Turnover Rate | |
| | | | | | | | | | | | | | | | | | | | | | | | | | |
| | | | | | | | | | | | | | | | | | | | | | | | | | | | | | | | | | |
| | | | | $ | (0.68 | ) | | $ | 14.93 | | | | 2.95 | % | | $ | 150,899 | | | | 0.89 | % | | | 0.89 | % | | | 3.92 | % | | | 60 | % |
| | | | | | (0.75 | ) | | | 15.18 | | | | 4.27 | | | | 218,312 | | | | 0.89 | | | | 0.89 | | | | 3.94 | | | | 88 | |
| | | | | | (0.85 | ) | | | 15.29 | | | | 7.65 | | | | 226,149 | | | | 0.85 | | | | 0.85 | | | | 4.85 | | | | 63 | |
| | | | | | (0.66 | ) | | | 15.04 | | | | 0.67 | | | | 164,978 | | | | 0.86 | (c)(d) | | | 0.86 | (c)(d) | | | 4.44 | (c)(d) | | | 65 | |
| | | | | | (0.74 | ) | | | 15.59 | | | | 2.60 | | | | 163,070 | | | | 0.85 | | | | 0.88 | | | | 4.01 | | | | 94 | |
| | | | | | (0.77 | ) | | | 15.92 | | | | 4.60 | | | | 168,536 | | | | 0.85 | | | | 0.90 | | | | 3.98 | | | | 63 | |
| | | | | | | | | | | | | | | | | | | | | | | | | | | | | | | | | | |
| | | | | $ | (0.65 | ) | | $ | 14.90 | | | | 2.74 | % | | $ | 135,483 | | | | 1.11 | % | | | 1.11 | % | | | 3.70 | % | | | 60 | % |
| | | | | | (0.71 | ) | | | 15.15 | | | | 4.00 | | | | 148,587 | | | | 1.12 | | | | 1.12 | | | | 3.70 | | | | 88 | |
| | | | | | (0.79 | ) | | | 15.27 | | | | 7.42 | | | | 132,649 | | | | 1.13 | | | | 1.13 | | | | 4.58 | | | | 63 | |
| | | | | | (0.63 | ) | | | 15.00 | | | | 0.38 | | | | 100,557 | | | | 1.15 | (c)(d) | | | 1.15 | (c)(d) | | | 4.15 | (c)(d) | | | 65 | |
| | | | | | (0.70 | ) | | | 15.56 | | | | 2.38 | | | | 89,801 | | | | 1.10 | | | | 1.13 | | | | 3.78 | | | | 94 | |
| | | | | | (0.73 | ) | | | 15.89 | | | | 4.36 | | | | 63,680 | | | | 1.10 | | | | 1.16 | | | | 3.74 | | | | 63 | |
| | | | | | | | | | | | | | | | | | | | | | | | | | | | | | | | | | |
| | | | | $ | (0.72 | ) | | $ | 14.88 | | | | 3.21 | % | | $ | 411,367 | | | | 0.65 | % | | | 0.65 | % | | | 4.14 | % | | | 60 | % |
| | | | | | (0.79 | ) | | | 15.13 | | | | 4.56 | | | | 700,376 | | | | 0.63 | | | | 0.63 | | | | 4.19 | | | | 88 | |
| | | | | | (0.91 | ) | | | 15.24 | | | | 7.84 | | | | 554,281 | | | | 0.66 | | | | 0.66 | | | | 4.97 | | | | 63 | |
| | | | | | (0.68 | ) | | | 15.03 | | | | 0.83 | | | | 330,431 | | | | 0.64 | (c)(d) | | | 0.64 | (c)(d) | | | 4.65 | (c)(d) | | | 65 | |
| | | | | | (0.77 | ) | | | 15.58 | | | | 2.74 | | | | 248,345 | | | | 0.70 | | | | 0.70 | | | | 4.20 | | | | 94 | |
| | | | | | (0.80 | ) | | | 15.92 | | | | 4.83 | | | | 121,747 | | | | 0.70 | | | | 0.71 | | | | 4.14 | | | | 63 | |
| | | | | | | | | | | | | | | | | | | | | | | | | | | | | | | | | | |
| | | | | $ | (0.73 | ) | | $ | 14.89 | | | | 3.26 | % | | $ | 388,443 | | | | 0.60 | % | | | 0.60 | % | | | 4.20 | % | | | 60 | % |
| | | | | | (0.79 | ) | | | 15.14 | | | | 4.61 | | | | 539,078 | | | | 0.59 | | | | 0.59 | | | | 4.22 | | | | 88 | |
| | | | | | (0.93 | ) | | | 15.25 | | | | 7.90 | | | | 420,440 | | | | 0.58 | | | | 0.58 | | | | 5.10 | | | | 63 | |
| | | | | | (0.70 | ) | | | 15.05 | | | | 0.91 | | | | 445,473 | | | | 0.60 | (c)(d) | | | 0.60 | (c)(d) | | | 4.70 | (c)(d) | | | 65 | |
| | | | | | (0.78 | ) | | | 15.60 | | | | 2.81 | | | | 225,643 | | | | 0.60 | | | | 0.60 | | | | 4.28 | | | | 94 | |
| | | | | | (0.81 | ) | | | 15.94 | | | | 4.87 | | | | 179,676 | | | | 0.61 | | | | 0.61 | | | | 4.23 | | | | 63 | |
| | | | | | | | | | | | | | | | | | | | | | | | | | | | | | | | | | |
| | | | | $ | (0.73 | ) | | $ | 14.89 | | | | 3.29 | % | | $ | 52,922 | | | | 0.55 | % | | | 0.55 | % | | | 4.27 | % | | | 60 | % |
| | | | | | (0.49 | ) | | | 15.14 | | | | 3.04 | | | | 70,595 | | | | 0.56 | (c) | | | 0.56 | (c) | | | 4.25 | (c) | | | 88 | |
| | | | | | | | |
| See accompanying Notes to Financial Statements | | | September 30, 2018 | | | Annual Report | | | 303 | |
Financial Highlights (cont’d)
For a Share Outstanding for the Period ended:^
| | | | | | | | | | | | | | | | | | | | | | | | | | | | |
| | | Net Asset
Value,
Beginning
of Period | | | Net
Investment
Income (a) | | |
Net Realized
and Change in
Unrealized
Loss | | | Total from
Investment
Operations | | | Net Asset
Value, End
of Period | | | Total Return (b) | | | | |
| AllianzGI Short Term Bond: | | | | | | | | | | | | | | | | | | | | | |
| Class A | | | | | | | | | | | | | | | | | | | | | | | | | | | | |
8/23/2018* - 9/30/2018 | | $ | 15.00 | | | $ | 0.04 | | | $ | (0.02 | ) | | $ | 0.02 | | | $ | 15.02 | | | | 0.13 | % | | | | |
| Class P | | | | | | | | | | | | | | | | | | | | | | | | | | | | |
8/23/2018* - 9/30/2018 | | $ | 15.00 | | | $ | 0.04 | | | $ | (0.02 | ) | | $ | 0.02 | | | $ | 15.02 | | | | 0.13 | % | | | | |
| Institutional Class | | | | | | | | | | | | | | | | | | | | | | | | | | | | |
8/23/2018* - 9/30/2018 | | $ | 15.00 | | | $ | 0.04 | | | $ | (0.02 | ) | | $ | 0.02 | | | $ | 15.02 | | | | 0.13 | % | | | | |
| ^ | A — may reflect actual amounts rounding to less than $0.01 or 0.01%. |
| * | Commencement of operations. |
| (a) | Calculated on average shares outstanding during the period. |
| (b) | Total return is calculated assuming a purchase of a share on the first day of the period and a sale of a share on the last day of each period reported. Dividends and distributions, if any, are assumed, for purposes of this calculation, to be reinvested. Total return does not reflect sales charges and includes the effect of fee waivers and reimbursements. Total return may reflect adjustments to conform to U.S. GAAP. Total return for a period of less than one year is not annualized. |
| (c) | Annualized, unless otherwise noted. |
| (d) | Certain expenses incurred by the Fund were not annualized. |
| | | | | | |
| 304 | | Annual Report | | | September 30, 2018 | | | See accompanying Notes to Financial Statements |
| | | | | | | | | | | | | | | | | | | | | | |
| | | | Net Assets,
End of Period
(000s) | | | Ratio of
Expenses to
Average Net
Assets with
Fee Waiver/
Reimbursement (c)(d) | | | Ratio of Expenses to
Average Net Assets
without Fee Waiver/
Reimbursement (c)(d) | | | Ratio of Net
Investment
Income
to Average
Net Assets (c)(d) | | | Portfolio
Turnover Rate | |
| | | | | | | | | | | | | | | | | |
| | | | | | | | | | | | | | | | | | | | | | |
| | | | | $ | 10 | | | | 0.64 | % | | | 10.85 | % | | | 2.41 | % | | | — | % |
| | | | | | | | | | | | | | | | | | | | | | |
| | | | | $ | 10 | | | | 0.49 | % | | | 10.60 | % | | | 2.56 | % | | | — | % |
| | | | | | | | | | | | | | | | | | | | | | |
| | | | | $ | 5,164 | | | | 0.39 | % | | | 10.62 | % | | | 2.68 | % | | | — | % |
| | | | | | | | |
| See accompanying Notes to Financial Statements | | | September 30, 2018 | | | Annual Report | | | 305 | |
Financial Highlights (cont’d)
For a Share Outstanding for the Period ended:^
| | | | | | | | | | | | | | | | | | | | | | | | | | | | |
| | | Net Asset
Value,
Beginning
of Period | | | Net
Investment
Income
(Loss) (a) | | | Net Realized
and Change in
Unrealized Gain
(Loss) | | | Total from
Investment
Operations | | | Dividends
from Net
Investment
Income | | | Distributions
from Net
Realized Capital
Gains | | | | |
| AllianzGI Structured Return: | | | | | | | | | | | | | | | | | | |
| Class A | | | | | | | | | | | | | | | | | | | | | | | | | | | | |
9/30/2018 | | $ | 16.26 | | | $ | 0.10 | | | $ | 0.41 | | | $ | 0.51 | | | $ | (0.10 | ) | | $ | (0.51 | ) | | | | |
9/30/2017 | | | 15.85 | | | | 0.09 | | | | 0.74 | | | | 0.83 | | | | (0.06 | ) | | | (0.36 | ) | | | | |
9/30/2016 | | | 15.47 | | | | 0.15 | | | | 0.51 | | | | 0.66 | | | | (0.10 | ) | | | (0.18 | ) | | | | |
12/1/2014 - 9/30/2015# | | | 15.64 | | | | 0.16 | | | | 0.28 | | | | 0.44 | | | | — | | | | (0.61 | ) | | | | |
11/30/2014 | | | 15.87 | | | | (0.12 | ) | | | 0.65 | | | | 0.53 | | | | — | | | | (0.76 | ) | | | | |
12/3/2012* - 11/30/2013 | | | 15.00 | | | | (0.28 | ) | | | 1.15 | | | | 0.87 | | | | — | | | | — | | | | | |
| Class C | | | | | | | | | | | | | | | | | | | | | | | | | | | | |
9/30/2018 | | $ | 15.73 | | | $ | (0.03 | ) | | $ | 0.39 | | | $ | 0.36 | | | $ | — | | | $ | (0.51 | ) | | | | |
9/30/2017 | | | 15.39 | | | | (0.04 | ) | | | 0.74 | | | | 0.70 | | | | — | | | | (0.36 | ) | | | | |
9/30/2016 | | | 15.12 | | | | 0.02 | | | | 0.51 | | | | 0.53 | | | | (0.08 | ) | | | (0.18 | ) | | | | |
12/1/2014 - 9/30/2015# | | | 15.39 | | | | 0.09 | | | | 0.25 | | | | 0.34 | | | | — | | | | (0.61 | ) | | | | |
11/30/2014 | | | 15.73 | | | | (0.25 | ) | | | 0.67 | | | | 0.42 | | | | — | | | | (0.76 | ) | | | | |
12/3/2012* - 11/30/2013 | | | 15.00 | | | | (0.39 | ) | | | 1.12 | | | | 0.73 | | | | — | | | | — | | | | | |
| Class P | | | | | | | | | | | | | | | | | | | | | | | | | | | | |
9/30/2018 | | $ | 16.26 | | | $ | 0.13 | | | $ | 0.41 | | | $ | 0.54 | | | $ | (0.15 | ) | | $ | (0.51 | ) | | | | |
9/30/2017 | | | 15.87 | | | | 0.18 | | | | 0.69 | | | | 0.87 | | | | (0.12 | ) | | | (0.36 | ) | | | | |
9/30/2016 | | | 15.53 | | | | 0.17 | | | | 0.53 | | | | 0.70 | | | | (0.18 | ) | | | (0.18 | ) | | | | |
12/1/2014 - 9/30/2015# | | | 15.69 | | | | 0.21 | | | | 0.24 | | | | 0.45 | | | | — | | | | (0.61 | ) | | | | |
11/30/2014 | | | 15.89 | | | | (0.15 | ) | | | 0.71 | | | | 0.56 | | | | — | | | | (0.76 | ) | | | | |
12/3/2012* - 11/30/2013 | | | 15.00 | | | | (0.26 | ) | | | 1.15 | | | | 0.89 | | | | — | | | | — | | | | | |
| Institutional Class | | | | | | | | | | | | | | | | | | | | | | | | | | | | |
9/30/2018 | | $ | 16.42 | | | $ | 0.16 | | | $ | 0.40 | | | $ | 0.56 | | | $ | (0.15 | ) | | $ | (0.51 | ) | | | | |
9/30/2017 | | | 15.96 | | | | 0.14 | | | | 0.74 | | | | 0.88 | | | | (0.06 | ) | | | (0.36 | ) | | | | |
9/30/2016 | | | 15.54 | | | | 0.19 | | | | 0.52 | | | | 0.71 | | | | (0.11 | ) | | | (0.18 | ) | | | | |
12/1/2014 - 9/30/2015# | | | 15.72 | | | | 0.22 | | | | 0.24 | | | | 0.46 | | | | (0.03 | ) | | | (0.61 | ) | | | | |
11/30/2014 | | | 15.90 | | | | (0.08 | ) | | | 0.66 | | | | 0.58 | | | | — | | | | (0.76 | ) | | | | |
12/3/2012* - 11/30/2013 | | | 15.00 | | | | (0.24 | ) | | | 1.14 | | | | 0.90 | | | | — | | | | — | | | | | |
| Class R6 | | | | | | | | | | | | | | | | | | | | | | | | | | | | |
9/30/2018 | | $ | 16.32 | | | $ | 0.15 | | | $ | 0.40 | | | $ | 0.55 | | | $ | (0.12 | ) | | $ | (0.51 | ) | | | | |
12/5/2016* - 9/30/2017 | | | 16.13 | | | | 0.15 | | | | 0.58 | | | | 0.73 | | | | (0.18 | ) | | | (0.36 | ) | | | | |
| ^ | A — may reflect actual amounts rounding to less than $0.01 or 0.01%. |
| # | Fiscal year end changed from November 30th to September 30th. |
| * | Commencement of operations. |
| (a) | Calculated on average shares outstanding during the period. |
| (b) | Total return is calculated assuming a purchase of a share on the first day of the period and a sale of a share on the last day of each period reported. Dividends and distributions, if any, are assumed, for purposes of this calculation, to be reinvested. Total return does not reflect sales charges and includes the effect of fee waivers and reimbursements. Total return may reflect adjustments to conform to U.S. GAAP. Total return for a period of less than one year is not annualized. |
| (c) | Payments from Affiliates increased the end of period net asset value and total return by less than $0.01 and 0.01%, respectively. |
| (d) | Does not include expenses of the investment companies in which the Fund invests. |
| (e) | Annualized, unless otherwise noted. |
| (f) | Certain expenses incurred by the Fund were not annualized. |
| | | | | | |
| 306 | | Annual Report | | | September 30, 2018 | | | See accompanying Notes to Financial Statements |
| | | | | | | | | | | | | | | | | | | | | | | | | | | | | | | | | | |
| | | | Total
Dividends and
Distributions | | | Net Asset
Value, End
of Period | | | Total Return (b) | | | Net Assets,
End of Period
(000s) | | | Ratio of
Expenses to
Average Net
Assets with
Fee Waiver/
Reimbursement | | | Ratio of
Expenses to
Average Net
Assets without
Fee Waiver/
Reimbursement | | | Ratio of Net
Investment
Income (Loss)
to Average
Net Assets | | | Portfolio
Turnover Rate | |
| | | | | | | | | | | | | | | | | | | | | | | | | | |
| | | | | | | | | | | | | | | | | | | | | | | | | | | | | | | | | | |
| | | | | $ | (0.61 | ) | | $ | 16.16 | | | | 3.23 | % | | $ | 110,429 | | | | 0.98 | %(d) | | | 1.04 | %(d) | | | 0.61 | %(d) | | | 586 | % |
| | | | | | (0.42 | ) | | | 16.26 | (c) | | | 5.35 | (c) | | | 136,344 | | | | 1.02 | (d) | | | 1.15 | (d) | | | 0.57 | (d) | | | 680 | |
| | | | | | (0.28 | ) | | | 15.85 | | | | 4.32 | | | | 96,870 | | | | 1.15 | (d) | | | 1.17 | (d) | | | 0.95 | (d) | | | 500 | |
| | | | | | (0.61 | ) | | | 15.47 | | | | 2.93 | | | | 8,014 | | | | 1.15 | (d)(e)(f) | | | 1.58 | (d)(e)(f) | | | 1.28 | (d)(e)(f) | | | 34 | |
| | | | | | (0.76 | ) | | | 15.64 | | | | 3.52 | | | | 2,551 | | | | 1.52 | | | | 4.22 | | | | (0.75 | ) | | | 229 | |
| | | | | | — | | | | 15.87 | | | | 5.80 | | | | 517 | | | | 1.90 | (e) | | | 7.34 | (e) | | | (1.86 | )(e) | | | — | |
| | | | | | | | | | | | | | | | | | | | | | | | | | | | | | | | | | |
| | | | | $ | (0.51 | ) | | $ | 15.58 | | | | 2.34 | % | | $ | 16,862 | | | | 1.78 | %(d) | | | 1.78 | %(d) | | | (0.18 | )%(d) | | | 586 | % |
| | | | | | (0.36 | ) | | | 15.73 | (c) | | | 4.61 | (c) | | | 16,535 | | | | 1.80 | (d) | | | 1.87 | (d) | | | (0.24 | )(d) | | | 680 | |
| | | | | | (0.26 | ) | | | 15.39 | | | | 3.52 | | | | 12,605 | | | | 1.90 | (d) | | | 1.97 | (d) | | | 0.10 | (d) | | | 500 | |
| | | | | | (0.61 | ) | | | 15.12 | | | | 2.31 | | | | 3,803 | | | | 1.90 | (d)(e)(f) | | | 2.09 | (d)(e)(f) | | | 0.70 | (d)(e)(f) | | | 34 | |
| | | | | | (0.76 | ) | | | 15.39 | | | | 2.82 | | | | 138 | | | | 2.31 | | | | 4.74 | | | | (1.64 | ) | | | 229 | |
| | | | | | — | | | | 15.73 | | | | 4.87 | | | | 74 | | | | 2.65 | (e) | | | 6.91 | (e) | | | (2.60 | )(e) | | | — | |
| | | | | | | | | | | | | | | | | | | | | | | | | | | | | | | | | | |
| | | | | $ | (0.66 | ) | | $ | 16.14 | | | | 3.40 | % | | $ | 150,441 | | | | 0.77 | %(d) | | | 0.77 | %(d) | | | 0.85 | %(d) | | | 586 | % |
| | | | | | (0.48 | ) | | | 16.26 | (c) | | | 5.59 | (c) | | | 136,127 | | | | 0.79 | (d) | | | 0.83 | (d) | | | 1.12 | (d) | | | 680 | |
| | | | | | (0.36 | ) | | | 15.87 | | | | 4.55 | | | | 20,664 | | | | 0.96 | (d) | | | 0.96 | (d) | | | 1.11 | (d) | | | 500 | |
| | | | | | (0.61 | ) | | | 15.53 | | | | 2.99 | | | | 503 | | | | 1.00 | (d)(e)(f) | | | 1.16 | (d)(e)(f) | | | 1.67 | (d)(e)(f) | | | 34 | |
| | | | | | (0.76 | ) | | | 15.69 | | | | 3.72 | | | | 37 | | | | 1.50 | | | | 3.73 | | | | (1.00 | ) | | | 229 | |
| | | | | | — | | | | 15.89 | | | | 5.93 | | | | 61 | | | | 1.75 | (e) | | | 5.97 | (e) | | | (1.69 | )(e) | | | — | |
| | | | | | | | | | | | | | | | | | | | | | | | | | | | | | | | | | |
| | | | | $ | (0.66 | ) | | $ | 16.32 | | | | 3.52 | % | | $ | 345,453 | | | | 0.69 | %(d) | | | 0.77 | %(d) | | | 1.01 | %(d) | | | 586 | % |
| | | | | | (0.42 | ) | | | 16.42 | (c) | | | 5.62 | (c) | | | 205,068 | | | | 0.74 | (d) | | | 0.87 | (d) | | | 0.86 | (d) | | | 680 | |
| | | | | | (0.29 | ) | | | 15.96 | | | | 4.60 | | | | 146,194 | | | | 0.90 | (d) | | | 0.90 | (d) | | | 1.21 | (d) | | | 500 | |
| | | | | | (0.64 | ) | | | 15.54 | | | | 3.08 | | | | 55,028 | | | | 0.90 | (d)(e)(f) | | | 1.22 | (d)(e)(f) | | | 1.71 | (d)(e)(f) | | | 34 | |
| | | | | | (0.76 | ) | | | 15.72 | | | | 3.84 | | | | 15,142 | | | | 1.28 | | | | 3.65 | | | | (0.54 | ) | | | 229 | |
| | | | | | — | | | | 15.90 | | | | 6.00 | | | | 7,978 | | | | 1.65 | (e) | | | 5.64 | (e) | | | (1.60 | )(e) | | | — | |
| | | | | | | | | | | | | | | | | | | | | | | | | | | | | | | | | | |
| | | | | $ | (0.63 | ) | | $ | 16.24 | | | | 3.47 | % | | $ | 50,899 | | | | 0.67 | %(d) | | | 0.71 | %(d) | | | 0.97 | %(d) | | | 586 | % |
| | | | | | (0.54 | ) | | | 16.32 | (c) | | | 4.64 | (c) | | | 34,047 | | | | 0.68 | (d)(e) | | | 0.76 | (d)(e) | | | 1.17 | (d)(e) | | | 680 | |
| | | | | | | | |
| See accompanying Notes to Financial Statements | | | September 30, 2018 | | | Annual Report | | | 307 | |
Financial Highlights (cont’d)
For a Share Outstanding for the Period ended:^
| | | | | | | | | | | | | | | | | | | | | | | | | | | | |
| | | Net Asset
Value,
Beginning
of Period | | | Net
Investment
Income
(Loss) (a) | | | Net Realized
and Change in
Unrealized
Gain (Loss) | | | Total from
Investment
Operations | | | Dividends
from Net
Investment
Income | | | Distributions
from Net
Realized Capital
Gains | | | | |
| AllianzGI U.S. Equity Hedged: | | | | | | | | | | | | | | | | | | | | | |
| Class A | | | | | | | | | | | | | | | | | | | | | | | | | | | | |
9/30/2018 | | $ | 17.80 | | | $ | 0.09 | | | $ | 1.35 | | | $ | 1.44 | | | $ | (0.30 | ) | | $ | — | | | | | |
9/30/2017 | | | 16.20 | | | | 0.13 | | | | 1.71 | | | | 1.84 | | | | (0.24 | ) | | | — | | | | | |
9/30/2016 | | | 15.79 | | | | 0.11 | | | | 0.53 | | | | 0.64 | | | | (0.23 | ) | | | — | | | | | |
12/1/2014 - 9/30/2015# | | | 17.74 | | | | 0.14 | | | | (1.09 | ) | | | (0.95 | ) | | | (0.02 | ) | | | (0.98 | ) | | | | |
11/30/2014 | | | 17.26 | | | | 0.12 | | | | 1.45 | | | | 1.57 | | | | (0.15 | ) | | | (0.94 | ) | | | | |
12/3/2012* - 11/30/2013 | | | 15.00 | | | | 0.12 | | | | 2.14 | | | | 2.26 | | | | — | | | | — | | | | | |
| Class C | | | | | | | | | | | | | | | | | | | | | | | | | | | | |
9/30/2018 | | $ | 17.06 | | | $ | (0.05 | ) | | $ | 1.30 | | | $ | 1.25 | | | $ | (0.22 | ) | | $ | — | | | | | |
9/30/2017 | | | 15.59 | | | | — | | | | 1.63 | | | | 1.63 | | | | (0.16 | ) | | | — | | | | | |
9/30/2016 | | | 15.43 | | | | 0.01 | | | | 0.51 | | | | 0.52 | | | | (0.36 | ) | | | — | | | | | |
12/1/2014 - 9/30/2015# | | | 17.45 | | | | 0.05 | | | | (1.09 | ) | | | (1.04 | ) | | | — | | | | (0.98 | ) | | | | |
11/30/2014 | | | 17.14 | | | | (0.01 | ) | | | 1.44 | | | | 1.43 | | | | (0.18 | ) | | | (0.94 | ) | | | | |
12/3/2012* - 11/30/2013 | | | 15.00 | | | | — | | | | 2.14 | | | | 2.14 | | | | — | | | | — | | | | | |
| Class P | | | | | | | | | | | | | | | | | | | | | | | | | | | | |
9/30/2018 | | $ | 17.61 | | | $ | 0.12 | | | $ | 1.33 | | | $ | 1.45 | | | $ | (0.38 | ) | | $ | — | | | | | |
9/30/2017 | | | 16.18 | | | | 0.18 | | | | 1.65 | | | | 1.83 | | | | (0.40 | ) | | | — | | | | | |
9/30/2016 | | | 15.92 | | | | 0.14 | | | | 0.54 | | | | 0.68 | | | | (0.42 | ) | | | — | | | | | |
12/1/2014 - 9/30/2015# | | | 17.90 | | | | 0.15 | | | | (1.10 | ) | | | (0.95 | ) | | | (0.05 | ) | | | (0.98 | ) | | | | |
11/30/2014 | | | 17.29 | | | | 0.15 | | | | 1.47 | | | | 1.62 | | | | (0.07 | ) | | | (0.94 | ) | | | | |
12/3/2012* - 11/30/2013 | | | 15.00 | | | | 0.15 | | | | 2.14 | | | | 2.29 | | | | — | | | | — | | | | | |
| Institutional Class | | | | | | | | | | | | | | | | | | | | | | | | | | | | |
9/30/2018 | | $ | 17.92 | | | $ | 0.16 | | | $ | 1.33 | | | $ | 1.49 | | | $ | (0.20 | ) | | $ | — | | | | | |
9/30/2017 | | | 16.24 | | | | 0.14 | | | | 1.74 | | | | 1.88 | | | | (0.20 | ) | | | — | | | | | |
9/30/2016 | | | 15.86 | | | | 0.11 | | | | 0.59 | | | | 0.70 | | | | (0.32 | ) | | | — | | | | | |
12/1/2014 - 9/30/2015# | | | 17.89 | | | | 0.18 | | | | (1.11 | ) | | | (0.93 | ) | | | (0.12 | ) | | | (0.98 | ) | | | | |
11/30/2014 | | | 17.31 | | | | 0.17 | | | | 1.46 | | | | 1.63 | | | | (0.11 | ) | | | (0.94 | ) | | | | |
12/3/2012* - 11/30/2013 | | | 15.00 | | | | 0.17 | | | | 2.14 | | | | 2.31 | | | | — | | | | — | | | | | |
| ^ | A — may reflect actual amounts rounding to less than $0.01 or 0.01%. |
| # | Fiscal year end changed from November 30th to September 30th. |
| * | Commencement of operations. |
| (a) | Calculated on average shares outstanding during the period. |
| (b) | Total return is calculated assuming a purchase of a share on the first day of the period and a sale of a share on the last day of each period reported. Dividends and distributions, if any, are assumed, for purposes of this calculation, to be reinvested. Total return does not reflect sales charges and includes the effect of fee waivers and reimbursements. Total return may reflect adjustments to conform to U.S. GAAP. Total return for a period of less than one year is not annualized. |
| (c) | Does not include expenses of the investment companies in which the Fund invests. |
| (d) | Payments from Affiliates increased the end of period net asset value and total return by less than $0.01 and 0.01%, respectively. |
| (e) | Annualized, unless otherwise noted. |
| (f) | Certain expenses incurred by the Fund were not annualized. |
| | | | | | |
| 308 | | Annual Report | | | September 30, 2018 | | | See accompanying Notes to Financial Statements |
| | | | | | | | | | | | | | | | | | | | | | | | | | | | | | | | | | |
| | | | Total
Dividends and
Distributions | | | Net
Asset
Value,
End of
Period | | | Total Return (b) | | | Net Assets,
End of Period
(000s) | | | Ratio of
Expenses to
Average Net
Assets with
Fee Waiver/
Reimbursement | | | Ratio of
Expenses to
Average Net
Assets without
Fee Waiver/
Reimbursement | | | Ratio of Net
Investment
Income (Loss)
to Average
Net Assets | | | Portfolio
Turnover Rate | |
| | | | | | | | | | | | | | | | | | | | | | | | | | |
| | | | | | | | | | | | | | | | | | | | | | | | | | | | | | | | | | |
| | | | | $ | (0.30 | ) | | $ | 18.94 | | | | 8.13 | % | | $ | 544 | | | | 1.25 | %(c) | | | 7.40 | %(c) | | | 0.50 | %(c) | | | 21 | % |
| | | | | | (0.24 | ) | | | 17.80 | | | | 11.44 | | | | 582 | | | | 1.25 | (c) | | | 8.26 | (c) | | | 0.75 | (c) | | | — | |
| | | | | | (0.23 | ) | | | 16.20 | (d) | | | 4.11 | (d) | | | 624 | | | | 1.25 | (c) | | | 3.63 | (c) | | | 0.70 | (c) | | | 6 | |
| | | | | | (1.00 | ) | | | 15.79 | | | | (5.68 | ) | | | 1,067 | | | | 1.26 | (c)(e)(f) | | | 2.31 | (c)(e)(f) | | | 0.98 | (c)(e)(f) | | | 98 | |
| | | | | | (1.09 | ) | | | 17.74 | (d) | | | 9.57 | (d) | | | 1,491 | | | | 1.25 | | | | 3.70 | | | | 0.70 | | | | 5 | |
| | | | | | — | | | | 17.26 | | | | 15.07 | | | | 1,416 | | | | 1.25 | (e) | | | 9.81 | (e) | | | 0.74 | (e) | | | 6 | |
| | | | | | | | | | | | | | | | | | | | | | | | | | | | | | | | | | |
| | | | | $ | (0.22 | ) | | $ | 18.09 | | | | 7.35 | % | | $ | 230 | | | | 2.00 | %(c) | | | 8.20 | %(c) | | | (0.26 | )%(c) | | | 21 | % |
| | | | | | (0.16 | ) | | | 17.06 | | | | 10.51 | | | | 278 | | | | 2.00 | (c) | | | 6.58 | (c) | | | (0.01 | )(c) | | | — | |
| | | | | | (0.36 | ) | | | 15.59 | (d) | | | 3.42 | (d) | | | 271 | | | | 2.00 | (c) | | | 4.37 | (c) | | | 0.06 | (c) | | | 6 | |
| | | | | | (0.98 | ) | | | 15.43 | | | | (6.31 | ) | | | 280 | | | | 2.01 | (c)(e)(f) | | | 2.93 | (c)(e)(f) | | | 0.36 | (c)(e)(f) | | | 98 | |
| | | | | | (1.12 | ) | | | 17.45 | (d) | | | 8.78 | (d) | | | 180 | | | | 2.00 | | | | 4.48 | | | | (0.05 | ) | | | 5 | |
| | | | | | — | | | | 17.14 | | | | 14.27 | | | | 122 | | | | 2.00 | (e) | | | 11.10 | (e) | | | (0.01 | )(e) | | | 6 | |
| | | | | | | | | | | | | | | | | | | | | | | | | | | | | | | | | | |
| | | | | $ | (0.38 | ) | | $ | 18.68 | | | | 8.28 | % | | $ | 69 | | | | 1.10 | %(c) | | | 7.20 | %(c) | | | 0.65 | %(c) | | | 21 | % |
| | | | | | (0.40 | ) | | | 17.61 | | | | 11.51 | | | | 19 | | | | 1.10 | (c) | | | 5.59 | (c) | | | 1.05 | (c) | | | — | |
| | | | | | (0.42 | ) | | | 16.18 | (d) | | | 4.31 | (d) | | | 12 | | | | 1.10 | (c) | | | 3.29 | (c) | | | 0.91 | (c) | | | 6 | |
| | | | | | (1.03 | ) | | | 15.92 | | | | (5.62 | ) | | | 12 | | | | 1.11 | (c)(e)(f) | | | 1.91 | (c)(e)(f) | | | 1.06 | (c)(e)(f) | | | 98 | |
| | | | | | (1.01 | ) | | | 17.90 | (d) | | | 9.77 | (d) | | | 13 | | | | 1.10 | | | | 3.38 | | | | 0.85 | | | | 5 | |
| | | | | | — | | | | 17.29 | | | | 15.27 | | | | 12 | | | | 1.11 | (e) | | | 8.71 | (e) | | | 0.96 | (e) | | | 6 | |
| | | | | | | | | | | | | | | | | | | | | | | | | | | | | | | | | | |
| | | | | $ | (0.20 | ) | | $ | 19.21 | | | | 8.36 | % | | $ | 2,085 | | | | 1.00 | %(c) | | | 7.10 | %(c) | | | 0.86 | %(c) | | | 21 | % |
| | | | | | (0.20 | ) | | | 17.92 | | | | 11.66 | | | | 1,705 | | | | 1.00 | (c) | | | 5.12 | (c) | | | 0.81 | (c) | | | — | |
| | | | | | (0.32 | ) | | | 16.24 | (d) | | | 4.45 | (d) | | | 4,745 | | | | 1.00 | (c) | | | 3.09 | (c) | | | 0.68 | (c) | | | 6 | |
| | | | | | (1.10 | ) | | | 15.86 | | | | (5.55 | ) | | | 12,973 | | | | 1.01 | (c)(e)(f) | | | 1.98 | (c)(e)(f) | | | 1.27 | (c)(e)(f) | | | 98 | |
| | | | | | (1.05 | ) | | | 17.89 | (d) | | | 9.87 | (d) | | | 12,678 | | | | 1.00 | | | | 3.04 | | | | 1.00 | | | | 5 | |
| | | | | | — | | | | 17.31 | | | | 15.40 | | | | 5,395 | | | | 1.00 | (e) | | | 8.82 | (e) | | | 1.05 | (e) | | | 6 | |
| | | | | | | | |
| See accompanying Notes to Financial Statements | | | September 30, 2018 | | | Annual Report | | | 309 | |
Financial Highlights (cont’d)
For a Share Outstanding for the Period ended:
| | | | | | | | | | | | | | | | | | | | | | | | | | | | |
| | | Net Asset
Value,
Beginning
of Period | | | Net
Investment
Income
(Loss) (a) | | | Net Realized
and Change in
Unrealized Gain
(Loss) | | | Total from
Investment
Operations | | | Distributions
from Net
Realized Capital
Gains | | | Net Asset
Value, End
of Period | | | | |
| AllianzGI Ultra Micro Cap: | | | | | | | | | | | | | | | | | | | | | |
| Class A | | | | | | | | | | | | | | | | | | | | | | | | | | | | |
9/30/2018 | | $ | 23.68 | | | $ | (0.37 | ) | | $ | 2.79 | | | $ | 2.42 | | | $ | (5.58 | ) | | $ | 20.52 | | | | | |
9/30/2017 | | | 21.85 | | | | (0.42 | ) | | | 4.04 | | | | 3.62 | | | | (1.79 | ) | | | 23.68 | (c) | | | | |
9/30/2016 | | | 22.58 | | | | (0.38 | ) | | | 1.64 | | | | 1.26 | | | | (1.99 | ) | | | 21.85 | | | | | |
12/1/2014 - 9/30/2015# | | | 23.75 | | | | (0.35 | ) | | | (0.61 | ) | | | (0.96 | ) | | | (0.21 | ) | | | 22.58 | | | | | |
11/30/2014 | | | 24.34 | | | | (0.44 | ) | | | (0.04 | ) | | | (0.48 | ) | | | (0.11 | ) | | | 23.75 | | | | | |
11/30/2013 | | | 15.53 | | | | (0.29 | ) | | | 9.11 | | | | 8.82 | | | | (0.01 | ) | | | 24.34 | | | | | |
| Class P | | | | | | | | | | | | | | | | | | | | | | | | | | | | |
9/30/2018 | | $ | 24.03 | | | $ | (0.31 | ) | | $ | 2.85 | | | $ | 2.54 | | | $ | (5.58 | ) | | $ | 20.99 | | | | | |
9/30/2017 | | | 22.08 | | | | (0.35 | ) | | | 4.09 | | | | 3.74 | | | | (1.79 | ) | | | 24.03 | (c) | | | | |
9/30/2016 | | | 22.74 | | | | (0.32 | ) | | | 1.65 | | | | 1.33 | | | | (1.99 | ) | | | 22.08 | | | | | |
12/1/2014 - 9/30/2015# | | | 23.86 | | | | (0.30 | ) | | | (0.61 | ) | | | (0.91 | ) | | | (0.21 | ) | | | 22.74 | | | | | |
11/30/2014 | | | 24.40 | | | | (0.39 | ) | | | (0.04 | ) | | | (0.43 | ) | | | (0.11 | ) | | | 23.86 | | | | | |
11/30/2013 | | | 15.54 | | | | (0.24 | ) | | | 9.11 | | | | 8.87 | | | | (0.01 | ) | | | 24.40 | | | | | |
| Institutional Class | | | | | | | | | | | | | | | | | | | | | | | | | | | | |
9/30/2018 | | $ | 24.08 | | | $ | (0.31 | ) | | $ | 2.85 | | | $ | 2.54 | | | $ | (5.58 | ) | | $ | 21.04 | | | | | |
9/30/2017 | | | 22.13 | | | | (0.36 | ) | | | 4.10 | | | | 3.74 | | | | (1.79 | ) | | | 24.08 | (c) | | | | |
9/30/2016 | | | 22.77 | | | | (0.32 | ) | | | 1.67 | | | | 1.35 | | | | (1.99 | ) | | | 22.13 | | | | | |
12/1/2014 - 9/30/2015# | | | 23.93 | | | | (0.34 | ) | | | (0.61 | ) | | | (0.95 | ) | | | (0.21 | ) | | | 22.77 | | | | | |
11/30/2014 | | | 24.49 | | | | (0.40 | ) | | | (0.05 | ) | | | (0.45 | ) | | | (0.11 | ) | | | 23.93 | | | | | |
11/30/2013 | | | 15.59 | | | | (0.26 | ) | | | 9.17 | | | | 8.91 | | | | (0.01 | ) | | | 24.49 | | | | | |
| # | Fiscal year end changed from November 30th to September 30th. |
| (a) | Calculated on average shares outstanding during the period. |
| (b) | Total return is calculated assuming a purchase of a share on the first day of the period and a sale of a share on the last day of each period reported. Dividends and distributions, if any, are assumed, for purposes of this calculation, to be reinvested. Total return does not reflect sales charges and includes the effect of fee waivers and reimbursements. Total return may reflect adjustments to conform to U.S. GAAP. Total return for a period of less than one year is not annualized. |
| (c) | Payments from Affiliates increased the end of period net asset value and total return by less than $0.01 and 0.01%, respectively. |
| (d) | Annualized, unless otherwise noted. |
| (e) | Certain expenses incurred by the Fund were not annualized. |
| | | | | | |
| 310 | | Annual Report | | | September 30, 2018 | | | See accompanying Notes to Financial Statements |
| | | | | | | | | | | | | | | | | | | | | | | | | | |
| | | | Total Return (b) | | | Net Assets,
End of Period
(000s) | | | Ratio of
Expenses to
Average Net
Assets with
Fee Waiver/
Reimbursement | | | Ratio of
Expenses to
Average Net
Assets without
Fee Waiver/
Reimbursement | | | Ratio of Net
Investment
Income (Loss)
to Average
Net Assets | | | Portfolio
Turnover Rate | |
| | | | | | | | | | | | | | | | | | | | |
| | | | | | | | | | | | | | | | | | | | | | | | | | |
| | | | | | 13.62 | % | | $ | 8,898 | | | | 2.09 | % | | | 2.37 | % | | | (1.86 | )% | | | 41 | % |
| | | | | | 17.69 | (c) | | | 12,331 | | | | 2.35 | | | | 2.40 | | | | (1.93 | ) | | | 33 | |
| | | | | | 5.73 | | | | 19,312 | | | | 2.26 | | | | 2.26 | | | | (1.83 | ) | | | 32 | |
| | | | | | (4.08 | ) | | | 41,119 | | | | 2.08 | (d)(e) | | | 2.08 | (d)(e) | | | (1.70 | )(d)(e) | | | 43 | |
| | | | | | (1.98 | ) | | | 53,192 | | | | 2.16 | | | | 2.16 | | | | (1.81 | ) | | | 66 | |
| | | | | | 56.82 | | | | 61,525 | | | | 2.20 | | | | 2.30 | | | | (1.41 | ) | | | 59 | |
| | | | | | | | | | | | | | | | | | | | | | | | | | |
| | | | | | 13.98 | % | | $ | 5,925 | | | | 1.75 | % | | | 2.09 | % | | | (1.50 | )% | | | 41 | % |
| | | | | | 18.07 | (c) | | | 4,478 | | | | 2.02 | | | | 2.07 | | | | (1.62 | ) | | | 33 | |
| | | | | | 6.02 | | | | 5,343 | | | | 1.97 | | | | 1.97 | | | | (1.54 | ) | | | 32 | |
| | | | | | (3.84 | ) | | �� | 7,710 | | | | 1.81 | (d)(e) | | | 1.81 | (d)(e) | | | (1.42 | )(d)(e) | | | 43 | |
| | | | | | (1.77 | ) | | | 10,561 | | | | 1.94 | | | | 1.94 | | | | (1.67 | ) | | | 66 | |
| | | | | | 57.10 | | | | 858 | | | | 2.01 | | | | 2.07 | | | | (1.19 | ) | | | 59 | |
| | | | | | | | | | | | | | | | | | | | | | | | | | |
| | | | | | 13.95 | % | | $ | 18,979 | | | | 1.75 | % | | | 2.12 | % | | | (1.51 | )% | | | 41 | % |
| | | | | | 18.04 | (c) | | | 21,208 | | | | 2.06 | | | | 2.12 | | | | (1.65 | ) | | | 33 | |
| | | | | | 6.10 | | | | 23,504 | | | | 1.94 | | | | 1.94 | | | | (1.52 | ) | | | 32 | |
| | | | | | (4.00 | ) | | | 43,621 | | | | 1.97 | (d)(e) | | | 1.97 | (d)(e) | | | (1.60 | )(d)(e) | | | 43 | |
| | | | | | (1.84 | ) | | | 49,525 | | | | 2.00 | | | | 2.00 | | | | (1.65 | ) | | | 66 | |
| | | | | | 57.18 | | | | 62,641 | | | | 2.00 | | | | 2.00 | | | | (1.24 | ) | | | 59 | |
| | | | | | | | |
| See accompanying Notes to Financial Statements | | | September 30, 2018 | | | Annual Report | | | 311 | |
Notes to Financial Statements
September 30, 2018
| 1. | ORGANIZATION AND SIGNIFICANT ACCOUNTING POLICIES |
Allianz Funds Multi-Strategy Trust (the “Trust”) is registered under the Investment Company Act of 1940, as amended, (the “1940 Act”), as an open-end registered investment management company organized as a Massachusetts business trust and accordingly, follows the investment company accounting and reporting guidance of the Financial Accounting Standards Board (“FASB”) Accounting Standards Codification Topic 946 Financial Services-Investment Companies. As of September 30, 2018, the Trust consisted of forty separate investment series (each a “Fund” and together the “Funds”). Allianz Global Investors U.S. LLC (“AllianzGI U.S.” or the “Investment Manager”) serves as the Funds’ investment manager. The Investment Manager is an indirect, wholly-owned subsidiary of Allianz Asset Management of America L.P. (“AAM”). AAM is an indirect, wholly-owned subsidiary of Allianz SE, a publicly traded European insurance and financial services company. Currently, the Trust offers up to seven classes of shares to new and existing investors: A, C, R, P, Institutional, R6 and Administrative. Shares of AllianzGI Convertible are currently not available for purchase by any new investor, and shareholders of other series of the Trust or series of Allianz Funds are no longer permitted to exchange any of their shares for shares of AllianzGI Convertible, with certain exceptions.
The following Funds sold and issued shares of beneficial interest to Allianz Funds Investments, Inc. (“AFI”) during the periods or years ended September 30, 2018 and September 30, 2017. AFI is an indirect, wholly-owned subsidiary of Allianz SE.
| | | | | | | | | | | | |
| AllianzGI Multi Asset Income | |
| Class | | Date | | | Shares | | | Amount | |
Institutional | | | 2/1/18 | | | | 560 | | | $ | 10,000 | |
| | | | | | | | | | | | |
| AllianzGI Core Bond | |
| Class | | Date | | | Shares | | | Amount | |
P | | | 5/30/18 | | | | 667 | | | $ | 10,000 | |
Institutional | | | 5/30/18 | | | | 667 | | | | 10,000 | |
R6 | | | 5/30/18 | | | | 1,665,333 | | | | 24,980,000 | |
Totals | | | | | | | 1,666,667 | | | $ | 25,000,000 | |
| | | | | | | | | | | | |
| AllianzGI Core Plus Bond | |
| Class | | Date | | | Shares | | | Amount | |
P | | | 5/30/18 | | | | 667 | | | $ | 10,000 | |
Institutional | | | 5/30/18 | | | | 667 | | | | 10,000 | |
R6 | | | 5/30/18 | | | | 2,665,333 | | | | 39,980,000 | |
Totals | | | | | | | 2,666,667 | | | $ | 40,000,000 | |
| | | | | | | | | | | | |
| AllianzGI Global High Yield | |
| Class | | Date | | | Shares | | | Amount | |
P | | | 5/3/17 | | | | 667 | | | $ | 10,000 | |
Institutional | | | 5/3/17 | | | | 1,333,333 | | | | 20,000,000 | |
Totals | | | | | | | 1,334,000 | | | $ | 20,010,000 | |
| | | | | | | | | | | | |
| | | | | | | | | | | | |
| AllianzGI PerformanceFee Managed Futures Strategy | |
| Class | | Date | | | Shares | | | Amount | |
P | | | 12/18/17 | | | | 1,000 | | | $ | 10,000 | |
Institutional | | | 12/18/17 | | | | 1,000 | | | | 10,000 | |
R6 | | | 12/18/17 | | | | 3,000 | | | | 30,000 | |
Totals | | | | | | | 5,000 | | | $ | 50,000 | |
| | | | | | | | | | | | |
| AllianzGI Preferred Securities and Income | |
| Class | | Date | | | Shares | | | Amount | |
P | | | 5/30/18 | | | | 667 | | | $ | 10,000 | |
Institutional | | | 5/30/18 | | | | 667 | | | | 10,000 | |
R6 | | | 5/30/18 | | | | 665,333 | | | | 9,980,000 | |
Totals | | | | | | | 666,667 | | | $ | 10,000,000 | |
| | | | | | | | | | | | |
| AllianzGI Real Estate Debt | |
| Class | | Date | | | Shares | | | Amount | |
P | | | 12/27/17 | | | | 667 | | | $ | 10,000 | |
Institutional | | | 12/27/17 | | | | 666,666 | | | | 10,000,000 | |
Totals | | | | | | | 667,333 | | | $ | 10,010,000 | |
| | | | | | | | | | | | |
| AllianzGI Short Duration High Income | |
| Class | | Date | | | Shares | | | Amount | |
R6 | | | 2/1/17 | | | | 659 | | | $ | 10,000 | |
| | | | | | | | | | | | |
| AllianzGI Short Term Bond | |
| Class | | Date | | | Shares | | | Amount | |
A | | | 8/23/18 | | | | 667 | | | $ | 10,000 | |
P | | | 8/23/18 | | | | 667 | | | | 10,000 | |
Institutional | | | 8/23/18 | | | | 332,000 | | | | 4,980,000 | |
Totals | | | | | | | 333,334 | | | $ | 5,000,000 | |
| | | | | | | | | | | | |
| AllianzGI Structured Return | |
| Class | | Date | | | Shares | | | Amount | |
R6 | | | 12/2/16 | | | | 620 | | | $ | 10,000 | |
The following Funds sold and issued shares of beneficial interest to Allianz of America, Inc. (“Allianz of America”) during the period ended September 30, 2018. Allianz of America is an indirect, wholly-owned subsidiary of Allianz SE.
| | | | | | | | | | | | |
| AllianzGI PerformanceFee Structured US Equity | |
| Class | | Date | | | Shares | | | Amount | |
P | | | 12/18/17 | | | | 1,000 | | | $ | 10,000 | |
Institutional | | | 12/18/17 | | | | 1,000 | | | | 10,000 | |
R6 | | | 12/18/17 | | | | 2,498,000 | | | | 24,980,000 | |
Totals | | | | | | | 2,500,000 | | | $ | 25,000,000 | |
| | | | | | | | | | | | |
| AllianzGI PerformanceFee Structured US Fixed Income | |
| Class | | Date | | | Shares | | | Amount | |
P | | | 12/18/17 | | | | 1,000 | | | $ | 10,000 | |
Institutional | | | 12/18/17 | | | | 1,000 | | | | 10,000 | |
R6 | | | 12/18/17 | | | | 2,498,000 | | | | 24,980,000 | |
Totals | | | | | | | 2,500,000 | | | $ | 25,000,000 | |
| | | | | | |
| 312 | | September 30, 2018 | | | Annual Report | | |
The investment objective of each Fund is disclosed below. There can be no assurance that the Funds will meet their stated objectives.
| | |
| | | Investment Objective |
| AllianzGI Retirement 2020 | | The Funds seek capital growth and preservation consistent with its asset allocation as the target date in the Fund name approaches, and thereafter current income and, secondarily, capital appreciation. |
| AllianzGI Retirement 2025 |
| AllianzGI Retirement 2030 |
| AllianzGI Retirement 2035 | | |
| AllianzGI Retirement 2040 | | |
| AllianzGI Retirement 2045 | | |
| AllianzGI Retirement 2050 | | |
| AllianzGI Retirement 2055 | | |
| AllianzGI Multi Asset Income | | The Fund seeks current income, and secondarily, capital appreciation. The Fund is intended for investors who have already retired or begun withdrawing portions of their investments, or are seeking a conservative allocation fund. |
| AllianzGI Global Allocation | | The Fund seeks after-inflation capital appreciation and current income. |
| AllianzGI Best Styles Global Equity | | The Funds seek long-term capital appreciation. |
| AllianzGI Best Styles International Equity |
| AllianzGI Best Styles U.S. Equity |
| AllianzGI Emerging Markets Consumer |
| AllianzGI Emerging Markets Small-Cap |
| AllianzGI Europe Equity Dividend |
| AllianzGI Global Dynamic Allocation | | |
| AllianzGI Global Sustainability | | |
| AllianzGI Global Water | | |
| AllianzGI International Growth | | |
| AllianzGI NFJ Emerging Markets Value | | |
| AllianzGI NFJ International Small-Cap Value | | |
| AllianzGI PerformanceFee Managed Futures Strategy | | |
| AllianzGI Structured Return | | |
| AllianzGI Convertible | | The Fund seeks maximum total return, consisting of capital appreciation and current income. |
| AllianzGI Core Bond | | The Fund seeks current income, consistent with minimal fluctuations of principal. |
| AllianzGI Core Plus Bond | | The Fund seeks total return, consisting of current income and capital appreciation. |
| AllianzGI Emerging Markets Debt | | The Fund seeks long-term capital appreciation and current income. |
| AllianzGI Global High Yield | | The Fund seeks total return with a controlled level of portfolio risk. |
| AllianzGI High Yield Bond | | The Fund seeks a high level of current income and capital growth. |
| AllianzGI International Small-Cap | | The Funds seek maximum long-term capital appreciation. |
| AllianzGI Micro Cap |
| AllianzGI Ultra Micro Cap |
| AllianzGI PerformanceFee Structured US Equity | | The Fund seeks to earn total return that exceeds the return of the S&P 500 Index. |
| AllianzGI PerformanceFee Structured US Fixed Income | | The Fund seeks to earn total return that exceeds the return of the Bloomberg Barclays U.S. Aggregate Bond Index. |
| AllianzGI Preferred Securities and Income | | The Fund seeks total return consisting of high current income and capital appreciation. |
| AllianzGI Real Estate Debt | | The Fund seeks to achieve total return in excess of traditional, shorter-duration debt products while managing portfolio risk. |
| AllianzGI Short Duration High Income | | The Fund seeks a high level of current income with lower volatility than the broader high yield market. |
| AllianzGI Short Term Bond | | The Fund seeks capital preservation, followed by liquidity and positive total return. |
| AllianzGI U.S. Equity Hedged | | The Fund seeks capital appreciation, with added emphasis on the protection of capital during unfavorable market conditions. |
| | | | | | |
| | Annual Report | | | September 30, 2018 | | 313 |
Notes to Financial Statements (cont’d)
September 30, 2018
The preparation of the Funds’ financial statements in accordance with accounting principles generally accepted in the United States of America (“U.S. GAAP”) requires the Funds’ management to make estimates and assumptions that affect the reported amounts and disclosures in each Fund’s financial statements. Actual results could differ from those estimates.
In the normal course of business, the Funds enter into contracts that contain a variety of representations that provide general indemnifications. The Funds’ maximum exposures under these arrangements are unknown as this would involve future claims that may be made against the Funds that have not yet occurred. However, based on experience, the risk of loss is expected to be remote.
In March 2017, the FASB issued Accounting Standards update (“ASU”) 2017-08 which changes the amortization period for a callable debt security from the maturity date to the earliest call date. The ASU is effective for annual periods beginning after December 15, 2018, and interim periods within those annual periods. At this time, management is evaluating the implications of these changes on the financial statements.
In August 2018, the FASB issued ASU 2018-13 which changes the fair value measurement disclosure requirements for investment companies. The ASU is effective for annual periods beginning after December 15, 2019, and interim periods within those annual periods. At this time, management is evaluating the implications of these changes on the financial statements.
On October 17, 2018, the Securities and Exchange Commission (“SEC”) adopted changes to Regulation S-X to simplify the reporting of information by registered investment companies in financial statements. The amendments require presentation of the total, rather than the components, of distributable earnings on the Statement of Assets and Liabilities and also require presentation of the total, rather than the components, of distributions to shareholders, except for tax return of capital distributions, if any, on the Statement of Changes in Net Assets. The amendments also removed the requirement for parenthetical disclosure of undistributed net investment income on the Statement of Changes in Net Assets. These Regulation S-X amendments are reflected in the Funds’ financial statements for the year or period ended September 30, 2018. The distributions to shareholders in the September 30, 2017 Statement of Changes in Net Assets presented herein have not been reclassified to conform to the current year presentation.
The following is a summary of significant accounting policies consistently followed by the Funds:
(a) Valuation of Investments. Portfolio securities and other financial instruments for which market quotations are readily available are stated at market value. Market value is generally determined on the basis of official closing prices, last reported sales prices, or if no sales or closing prices are reported, on the basis of quotes obtained from a quotation reporting system, established market makers, or independent pricing services. Investments in mutual funds are valued at the net asset value (“NAV”) as reported on each business day. The Funds’ investments are
valued daily using prices supplied by an independent pricing service or broker/dealer quotations, or by using the last sale or settlement price on the exchange that is the primary market for such securities, or the mean between the last bid and ask quotations. The market value for NASDAQ Global Market and NASDAQ Capital Market securities may also be calculated using the NASDAQ Official Closing Price instead of the last reported sales price. Independent pricing services use information provided by market makers or estimates of market values obtained from yield data relating to investments or securities with similar characteristics. Exchange traded futures are valued at the price determined by the relevant exchange. Securities purchased on a when-issued or delayed-delivery basis are marked to market daily until settlement at the forward settlement date.
The Board of Trustees of each Fund (together, the “Board”) has adopted procedures for valuing portfolio securities and other financial instruments in circumstances where market quotations are not readily available (including in cases where available market quotations are deemed to be unreliable), and has delegated primary responsibility for applying the valuation methods to the Investment Manager. The Trust’s Valuation Committee was established by the Board to oversee the implementation of the Funds’ valuation methods and to make fair value determinations on behalf of the Board, as necessary. The Investment Manager monitors the continued appropriateness of methods applied and identifies circumstances and events that may require fair valuation. The Investment Manager determines if adjustments should be made in light of market changes, events affecting the issuer or other factors. If the Investment Manager determines that a valuation method may no longer be appropriate, another valuation method previously approved by the Trust’s Valuation Committee may be selected or the Trust’s Valuation Committee will be convened to consider the matter and take any appropriate action in accordance with procedures adopted by the Board. The Board shall review and ratify the appropriateness of the valuation methods and these methods may be amended or supplemented from time to time by the Trust’s Valuation Committee.
Synthetic convertible securities are valued based on quotations obtained from unaffiliated brokers who are the principal market-makers in such securities. Such valuations are derived by the brokers from proprietary models which are generally based on readily available market information including valuations of the common stock underlying the synthetic security.
Short-term debt instruments maturing in 60 days or less are valued at amortized cost, if their original term to maturity was 60 days or less, or by amortizing premiums or discounts based on their value on the 61st day prior to maturity, if the original term to maturity exceeded 60 days.
Investments initially valued in currencies other than the U.S. dollar are converted to the U.S. dollar using exchange rates obtained from pricing services. As a result, the NAV of each share class of a Fund may be affected by changes in the value of currencies in relation to the U.S. dollar. The value of securities traded in markets outside the United States or denominated in currencies other than the U.S. dollar may be affected significantly on a day that the New York Stock Exchange (“NYSE”) is closed.
| | | | | | |
| 314 | | September 30, 2018 | | | Annual Report | | |
The prices used by the Funds to value investments may differ from the value that would be realized if the investments were sold, and these differences could be material to the Funds’ financial statements. The NAV of each share class of a Fund is normally determined as of the close of regular trading (normally, 4:00 p.m., Eastern Time) on the NYSE on each day the NYSE is open for business. In unusual circumstances, the Board or the Valuation Committee may in good faith determine the NAV as of 4:00 p.m., Eastern Time, notwithstanding an earlier, unscheduled close or halt of trading on the NYSE.
The prices of certain portfolio securities or financial instruments may be determined at a time prior to the close of regular trading on the NYSE. When fair-valuing the securities, the Funds may, among other things, consider significant events (which may be considered to include changes in the value of U.S. securities or securities indices) that occur after the close of the relevant market and before the time the NAV of each share class of a Fund is calculated. With respect to certain foreign securities, the Funds may fair-value securities using modeling tools provided by third-party vendors. The Funds have retained a statistical research service to assist in determining the fair value of foreign securities. This service utilizes statistics and programs based on historical performance of markets and other economic data to assist in making fair value estimates. Fair value estimates used by the Funds for foreign securities may differ from the value realized from the sale of those securities and the difference could be material to the financial statements. Fair value pricing may require subjective determinations about the value of a security or other assets, and fair values used to determine the NAV of each share class of a Fund may differ from quoted or published prices, or from prices that are used by others, for the same investments. In addition, the use of fair value pricing may not always result in adjustments to the prices of securities or other assets held by a Fund.
(b) Fair Value Measurements. Fair value is defined as the price that would be received to sell an asset or paid to transfer a liability (i.e., the “exit price”) in an orderly transaction between market participants. The three levels of the fair value hierarchy are described below:
| ∎ | | Level 1—quoted prices in active markets for identical investments that the Funds have the ability to access |
| ∎ | | Level 2—valuations based on other significant observable inputs, which may include, but are not limited to, quoted prices for similar assets or liabilities, interest rates, yield curves, volatilities, prepayment speeds, loss severities, credit risks and default rates or other market corroborated inputs |
| ∎ | | Level 3—valuations based on significant unobservable inputs (including the Investment Manager’s or Trust’s Valuation Committee’s own assumptions and securities whose price was determined by using a single broker’s quote) |
The valuation techniques used by the Funds to measure fair value during the period or year ended September 30, 2018 were intended to maximize the use of observable inputs and to minimize the use of unobservable inputs.
The Funds’ policy is to recognize transfers between levels at the end of the reporting period. An investment asset’s or liability’s level within the fair value hierarchy is based on the lowest level input, individually or in
aggregate, that is significant to the fair value measurement. The objective of fair value measurement remains the same even when there is a significant decrease in the volume and level of activity for an asset or liability and regardless of the valuation techniques used. Investments categorized as Level 1 or 2 as of period end may have been transferred between Levels 1 and 2 since the prior period due to changes in the valuation method utilized in valuing the investments.
The inputs or methodology used for valuing securities are not necessarily an indication of the risk associated with investing in those securities. The following are certain inputs and techniques that the Funds generally use to evaluate how to classify each major category of assets and liabilities within Level 2 and Level 3, in accordance with U.S. GAAP.
Equity Securities (Common and Preferred Stock and Warrants)—Equity securities traded in inactive markets and certain foreign equity securities are valued using inputs which include broker-dealer quotes, recently executed transactions adjusted for changes in the benchmark index, or evaluated price quotes received from independent pricing services that take into account the integrity of the market sector and issuer, the individual characteristics of the security, and information received from broker-dealers and other market sources pertaining to the issuer or security. To the extent that these inputs are observable, the values of equity securities are categorized as Level 2. To the extent that these inputs are unobservable, the values are categorized as Level 3.
U.S. Treasury Obligations—U.S. Treasury obligations are valued by independent pricing services based on pricing models that evaluate the mean between the most recently quoted bid and ask price. The models also take into consideration data received from active market makers and broker-dealers, yield curves, and the spread over comparable U.S. Treasury issues. The spreads change daily in response to market conditions and are generally obtained from the new issue market and broker-dealer sources. To the extent that these inputs are observable, the values of U.S. Treasury obligations are categorized as Level 2. To the extent that these inputs are unobservable, the values are categorized as Level 3.
Government Sponsored Enterprise and Mortgage-Backed Securities—Government sponsored enterprise and mortgage-backed securities are valued by independent pricing services using pricing models based on inputs that include issuer type, coupon, cash flows, mortgage prepayment projection tables and Adjustable Rate Mortgage evaluations that incorporate index data, periodic life caps and the next coupon reset date. To the extent that these inputs are observable, the values of government sponsored enterprise and mortgage-backed securities are categorized as Level 2. To the extent that these inputs are unobservable, the values are categorized as Level 3.
Sovereign Debt Obligations—Sovereign debt obligations are valued by independent pricing services based on discounted cash flow models that incorporate option adjusted spreads along with benchmark curves and credit spreads. In addition, international bond markets are monitored regularly for information pertaining to the issuer and/or the specific issue. To the extent that these inputs are observable, the values of sovereign debt obligations are categorized as Level 2. To the extent that these inputs are unobservable, the values are categorized as Level 3.
| | | | | | |
| | Annual Report | | | September 30, 2018 | | 315 |
Notes to Financial Statements (cont’d)
September 30, 2018
Corporate Bonds & Notes—Corporate bonds & notes are generally comprised of two main categories: investment grade bonds and high yield bonds. Investment grade bonds are valued by independent pricing services using various inputs and techniques, which include broker-dealer quotations, live trading levels, recently executed transactions in securities of the issuer or comparable issuers, and option adjusted spread models that include base curve and spread curve inputs. Adjustments to individual bonds can be applied to recognize trading differences compared to other bonds issued by the same issuer. High yield bonds are valued by independent pricing services based primarily on broker-dealer quotations from relevant market makers and recently executed transactions in securities of the issuer or comparable issuers. The broker-dealer quotations received are supported by credit analysis of the issuer that takes into consideration credit quality assessments, daily trading activity, and the activity of the underlying equities, listed bonds and sector-specific trends. To the extent that these inputs are observable, the values of corporate bonds & notes are categorized as Level 2. To the extent that these inputs are unobservable, the values are categorized as Level 3.
Convertible Bonds & Notes—Convertible bonds & notes are valued by independent pricing services based on various inputs and techniques, which include broker-dealer quotations from relevant market makers and recently executed transactions in securities of the issuer or comparable issuers. The broker-dealer quotations received are supported by credit analysis of the issuer that takes into consideration credit quality assessments, daily trading activity, and the activity of the underlying equities, listed bonds and sector-specific trends. To the extent that these inputs are observable, the values of convertible bonds & notes are categorized as Level 2. To the extent that these inputs are unobservable, the values are categorized as Level 3.
Option Contracts—Option contracts traded over-the-counter (“OTC”) and FLexible EXchange (“FLEX”) options are valued by independent
pricing services based on pricing models that incorporate various inputs such as interest rates, credit spreads, currency exchange rates and volatility measurements for in-the-money, at-the-money, and out-of-the-money contracts based on a given strike price. To the extent that these inputs are observable, the values of OTC and FLEX option contracts are categorized as Level 2. To the extent that these inputs are unobservable, the values are categorized as Level 3.
Forward Foreign Currency Contracts— Forward foreign currency contracts are valued by independent pricing services using various inputs and techniques, which include broker-dealer quotations, actual trading information and foreign currency exchange rates gathered from leading market makers and foreign currency exchange trading centers throughout the world. To the extent that these inputs are observable, the values of forward foreign currency contracts are categorized as Level 2. To the extent that these inputs are unobservable, the values are categorized as Level 3.
Credit Default Swaps—OTC credit default swaps are valued by independent pricing services using pricing models that take into account, among other factors, information received from market makers and broker/dealers, default probabilities from index specific credit spread curves, recovery rates, and cash flows. To the extent that these inputs are observable, the values of credit default swaps are categorized as Level 2. To the extent that these inputs are unobservable, the values are categorized as Level 3.
Senior Loans—Senior Loans generally are valued by independent pricing services based on the average of quoted prices received from multiple dealers or valued relative to other benchmark securities when broker-dealer quotes are unavailable. These quoted prices are based on interest rates, yield curves, option adjusted spreads, credit spreads and/or other criteria. To the extent that these inputs are observable, the values of Senior Loans are categorized as Level 2. To the extent that these inputs are unobservable, the values are categorized as Level 3.
A summary of the inputs used at September 30, 2018 in valuing each Fund’s assets and liabilities is listed below (refer to the Schedules of Investments and Notes to the Schedules of Investments for more detailed information on Investments in Securities and Other Financial Instruments):
| | | | | | | | | | | | | | | | |
| AllianzGI Retirement 2020: | |
| Investments in Securities – Assets | | Level 1–
Quoted Prices | | | Level 2–
Other Significant
Observable Inputs | | | Level 3–
Significant
Unobservable Inputs | | | Value at
9/30/18 | |
Mutual Funds | | $ | 31,083,856 | | | | — | | | | — | | | $ | 31,083,856 | |
Exchange-Traded Funds | | | 2,313,567 | | | | — | | | | — | | | | 2,313,567 | |
Repurchase Agreements | | | — | | | $ | 892,000 | | | | — | | | | 892,000 | |
| | | | 33,397,423 | | | | 892,000 | | | | — | | | | 34,289,423 | |
Other Financial Instruments* – Assets | |
Foreign Exchange Contracts | | | 2,104 | | | | — | | | | — | | | | 2,104 | |
Market Price | | | 9,082 | | | | — | | | | — | | | | 9,082 | |
| | | | 11,186 | | | | — | | | | — | | | | 11,186 | |
Other Financial Instruments* – Liabilities | |
Foreign Exchange Contracts | | | (1,123 | ) | | | — | | | | — | | | | (1,123 | ) |
Interest Rate Contracts | | | (16,478 | ) | | | — | | | | — | | | | (16,478 | ) |
Market Price | | | (16,635 | ) | | | — | | | | — | | | | (16,635 | ) |
| | | (34,236 | ) | | | — | | | | — | | | | (34,236 | ) |
Totals | | $ | 33,374,373 | | | $ | 892,000 | | | | — | | | $ | 34,266,373 | |
| | | | | | |
| 316 | | September 30, 2018 | | | Annual Report | | |
| | | | | | | | | | | | | | | | |
| AllianzGI Retirement 2025: | |
| Investments in Securities – Assets | | Level 1–
Quoted Prices | | | Level 2–
Other Significant
Observable Inputs | | | Level 3–
Significant
Unobservable Inputs | | | Value at
9/30/18 | |
Mutual Funds | | $ | 48,727,738 | | | | — | | | | — | | | $ | 48,727,738 | |
Exchange-Traded Funds | | | 301,218 | | | | — | | | | — | | | | 301,218 | |
Repurchase Agreements | | | — | | | $ | 1,117,000 | | | | — | | | | 1,117,000 | |
| | | | 49,028,956 | | | | 1,117,000 | | | | — | | | | 50,145,956 | |
Other Financial Instruments* – Assets | |
Foreign Exchange Contracts | | | 2,104 | | | | — | | | | — | | | | 2,104 | |
Interest Rate Contracts | | | 7,522 | | | | — | | | | — | | | | 7,522 | |
Market Price | | | 21,570 | | | | — | | | | — | | | | 21,570 | |
| | | | 31,196 | | | | — | | | | — | | | | 31,196 | |
Other Financial Instruments* – Liabilities | |
Foreign Exchange Contracts | | | (2,245 | ) | | | — | | | | — | | | | (2,245 | ) |
Interest Rate Contracts | | | (663 | ) | | | — | | | | — | | | | (663 | ) |
Market Price | | | (19,720 | ) | | | — | | | | — | | | | (19,720 | ) |
| | | (22,628 | ) | | | — | | | | — | | | | (22,628 | ) |
Totals | | $ | 49,037,524 | | | $ | 1,117,000 | | | | — | | | $ | 50,154,524 | |
| | | | | | | | | | | | | | | | |
| AllianzGI Retirement 2030: | |
| Investments in Securities – Assets | | Level 1–
Quoted Prices | | | Level 2–
Other Significant
Observable Inputs | | | Level 3–
Significant
Unobservable Inputs | | | Value at
9/30/18 | |
Mutual Funds | | $ | 58,115,068 | | | | — | | | | — | | | $ | 58,115,068 | |
Exchange-Traded Funds | | | 235,255 | | | | — | | | | — | | | | 235,255 | |
Repurchase Agreements | | | — | | | $ | 1,169,000 | | | | — | | | | 1,169,000 | |
| | | | 58,350,323 | | | | 1,169,000 | | | | — | | | | 59,519,323 | |
Other Financial Instruments* – Assets | |
Foreign Exchange Contracts | | | 2,103 | | | | — | | | | — | | | | 2,103 | |
Interest Rate Contracts | | | 1,678 | | | | — | | | | — | | | | 1,678 | |
Market Price | | | 26,431 | | | | — | | | | — | | | | 26,431 | |
| | | | 30,212 | | | | — | | | | — | | | | 30,212 | |
Other Financial Instruments* – Liabilities | |
Foreign Exchange Contracts | | | (2,245 | ) | | | — | | | | — | | | | (2,245 | ) |
Market Price | | | (45,070 | ) | | | — | | | | — | | | | (45,070 | ) |
| | | (47,315 | ) | | | — | | | | — | | | | (47,315 | ) |
Totals | | $ | 58,333,220 | | | $ | 1,169,000 | | | | — | | | $ | 59,502,220 | |
| | | | | | | | | | | | | | | | |
| AllianzGI Retirement 2035: | |
| Investments in Securities – Assets | | Level 1–
Quoted Prices | | | Level 2–
Other Significant
Observable Inputs | | | Level 3–
Significant
Unobservable Inputs | | | Value at
9/30/18 | |
Mutual Funds | | $ | 42,772,568 | | | | — | | | | — | | | $ | 42,772,568 | |
Repurchase Agreements | | | — | | | $ | 873,000 | | | | — | | | | 873,000 | |
| | | | 42,772,568 | | | | 873,000 | | | | — | | | | 43,645,568 | |
Other Financial Instruments* – Assets | |
Foreign Exchange Contracts | | | 2,103 | | | | — | | | | — | | | | 2,103 | |
Market Price | | | 23,025 | | | | — | | | | — | | | | 23,025 | |
| | | | 25,128 | | | | — | | | | — | | | | 25,128 | |
Other Financial Instruments* – Liabilities | |
Foreign Exchange Contracts | | | (2,245 | ) | | | — | | | | — | | | | (2,245 | ) |
Market Price | | | (53,136 | ) | | | — | | | | — | | | | (53,136 | ) |
| | | (55,381 | ) | | | — | | | | — | | | | (55,381 | ) |
Totals | | $ | 42,742,315 | | | $ | 873,000 | | | | — | | | $ | 43,615,315 | |
| | | | | | |
| | Annual Report | | | September 30, 2018 | | 317 |
Notes to Financial Statements (cont’d)
September 30, 2018
| | | | | | | | | | | | | | | | |
| AllianzGI Retirement 2040: | |
| Investments in Securities – Assets | | Level 1–
Quoted Prices | | | Level 2–
Other Significant
Observable Inputs | | | Level 3–
Significant
Unobservable Inputs | | | Value at
9/30/18 | |
Mutual Funds | | $ | 45,185,814 | | | | — | | | | — | | | $ | 45,185,814 | |
Repurchase Agreements | | | — | | | $ | 805,000 | | | | — | | | | 805,000 | |
| | | | 45,185,814 | | | | 805,000 | | | | — | | | | 45,990,814 | |
Other Financial Instruments* – Assets | |
Foreign Exchange Contracts | | | 2,104 | | | | — | | | | — | | | | 2,104 | |
Market Price | | | 25,616 | | | | — | | | | — | | | | 25,616 | |
| | | | 27,720 | | | | — | | | | — | | | | 27,720 | |
Other Financial Instruments* – Liabilities | | | | | | | | | | | | | | | | |
Foreign Exchange Contracts | | | (1,123 | ) | | | — | | | | — | | | | (1,123 | ) |
Market Price | | | (68,283 | ) | | | — | | | | — | | | | (68,283 | ) |
| | | | (69,406 | ) | | | — | | | | — | | | | (69,406 | ) |
Totals | | $ | 45,144,128 | | | $ | 805,000 | | | | — | | | $ | 45,949,128 | |
| | | | | | | | | | | | | | | | |
| AllianzGI Retirement 2045: | | | | | | | | | | | | |
| Investments in Securities – Assets | | Level 1–
Quoted Prices | | | Level 2–
Other Significant
Observable Inputs | | | Level 3–
Significant
Unobservable Inputs | | | Value at
9/30/18 | |
Mutual Funds | | $ | 29,667,230 | | | | — | | | | — | | | $ | 29,667,230 | |
Repurchase Agreements | | | — | | | $ | 715,000 | | | | — | | | | 715,000 | |
| | | | 29,667,230 | | | | 715,000 | | | | — | | | | 30,382,230 | |
Other Financial Instruments* – Assets | | | | | | | | | | | | | | | | |
Foreign Exchange Contracts | | | 2,104 | | | | — | | | | — | | | | 2,104 | |
Market Price | | | 16,535 | | | | — | | | | — | | | | 16,535 | |
| | | | 18,639 | | | | — | | | | — | | | | 18,639 | |
Other Financial Instruments* – Liabilities | |
Foreign Exchange Contracts | | | (1,123 | ) | | | — | | | | — | | | | (1,123 | ) |
Market Price | | | (48,868 | ) | | | — | | | | — | | | | (48,868 | ) |
| | | (49,991 | ) | | | — | | | | — | | | | (49,991 | ) |
Totals | | $ | 29,635,878 | | | $ | 715,000 | | | | — | | | $ | 30,350,878 | |
| | | | | | | | | | | | | | | | |
| AllianzGI Retirement 2050: | | | | | | | | | | | | |
| Investments in Securities – Assets | | Level 1–
Quoted Prices | | | Level 2–
Other Significant
Observable Inputs | | | Level 3–
Significant
Unobservable Inputs | | | Value at
9/30/18 | |
Mutual Funds | | $ | 31,576,258 | | | | — | | | | — | | | $ | 31,576,258 | |
Repurchase Agreements | | | — | | | $ | 714,000 | | | | — | | | | 714,000 | |
| | | | 31,576,258 | | | | 714,000 | | | | — | | | | 32,290,258 | |
Other Financial Instruments* – Assets | |
Foreign Exchange Contracts | | | 2,104 | | | | — | | | | — | | | | 2,104 | |
Market Price | | | 19,620 | | | | — | | | | — | | | | 19,620 | |
| | | | 21,724 | | | | — | | | | — | | | | 21,724 | |
Other Financial Instruments* – Liabilities | |
Foreign Exchange Contracts | | | (1,123 | ) | | | — | | | | — | | | | (1,123 | ) |
Market Price | | | (53,356 | ) | | | — | | | | — | | | | (53,356 | ) |
| | | (54,479 | ) | | | — | | | | — | | | | (54,479 | ) |
Totals | | $ | 31,543,503 | | | $ | 714,000 | | | | — | | | $ | 32,257,503 | |
| | | | | | | | | | | | | | | | |
| | | | | | |
| 318 | | September 30, 2018 | | | Annual Report | | |
| | | | | | | | | | | | | | | | |
| AllianzGI Retirement 2055: | | | | | | | | | | | | |
| Investments in Securities – Assets | | Level 1–
Quoted Prices | | | Level 2–
Other Significant
Observable Inputs | | | Level 3–
Significant
Unobservable Inputs | | | Value at
9/30/18 | |
Mutual Funds | | $ | 15,377,660 | | | | — | | | | — | | | $ | 15,377,660 | |
Repurchase Agreements | | | — | | | $ | 307,000 | | | | — | | | | 307,000 | |
| | | | 15,377,660 | | | | 307,000 | | | | — | | | | 15,684,660 | |
Other Financial Instruments* – Assets | | | | | | | | | | | | | | | | |
Foreign Exchange Contracts | | | 2,104 | | | | — | | | | — | | | | 2,104 | |
Market Price | | | 10,217 | | | | — | | | | — | | | | 10,217 | |
| | | | 12,321 | | | | — | | | | — | | | | 12,321 | |
Other Financial Instruments* – Liabilities | |
Foreign Exchange Contracts | | | (1,123 | ) | | | — | | | | — | | | | (1,123 | ) |
Market Price | | | (26,669 | ) | | | — | | | | — | | | | (26,669 | ) |
| | | (27,792 | ) | | | — | | | | — | | | | (27,792 | ) |
Totals | | $ | 15,362,189 | | | $ | 307,000 | | | | — | | | $ | 15,669,189 | |
| | | | | | | | | | | | | | | | |
| AllianzGI Multi Asset Income: | | | | | | | | | | | | |
| Investments in Securities – Assets | | Level 1–
Quoted Prices | | | Level 2–
Other Significant
Observable Inputs | | | Level 3–
Significant
Unobservable Inputs | | | Value at
9/30/18 | |
Mutual Funds | | $ | 25,780,043 | | | | — | | | | — | | | $ | 25,780,043 | |
Common Stock | | | 4,820,280 | | | | — | | | | — | | | | 4,820,280 | |
Exchange-Traded Funds | | | 4,232,684 | | | | — | | | | — | | | | 4,232,684 | |
Repurchase Agreements | | | — | | | $ | 298,000 | | | | — | | | | 298,000 | |
| | | | 34,833,007 | | | | 298,000 | | | | — | | | | 35,131,007 | |
Other Financial Instruments* – Assets | | | | | | | | | | | | | | | | |
Interest Rate Contracts | | | 19,933 | | | | — | | | | — | | | | 19,933 | |
Market Price | | | 75,802 | | | | — | | | | — | | | | 75,802 | |
| | | | 95,735 | | | | — | | | | — | | | | 95,735 | |
Other Financial Instruments* – Liabilities | | | | | | | | | | | | | | | | |
Foreign Exchange Contracts | | | (544 | ) | | | — | | | | — | | | | (544 | ) |
Interest Rate Contracts | | | (157,182 | ) | | | — | | | | — | | | | (157,182 | ) |
Market Price | | | (16,580 | ) | | | — | | | | — | | | | (16,580 | ) |
| | | | (174,306 | ) | | | — | | | | — | | | | (174,306 | ) |
Totals | | $ | 34,754,436 | | | $ | 298,000 | | | | — | | | $ | 35,052,436 | |
| | | | | | | | | | | | | | | | |
| AllianzGI Global Allocation: | | | | | | | | | | | | |
| Investments in Securities – Assets | | Level 1–
Quoted Prices | | | Level 2–
Other Significant
Observable Inputs | | | Level 3–
Significant
Unobservable Inputs | | | Value at
9/30/18 | |
Mutual Funds | | $ | 302,864,165 | | | | — | | | | — | | | $ | 302,864,165 | |
Exchange-Traded Funds | | | 20,221,967 | | | | — | | | | — | | | | 20,221,967 | |
Repurchase Agreements | | | — | | | $ | 4,752,000 | | | | — | | | | 4,752,000 | |
| | | | 323,086,132 | | | | 4,752,000 | | | | — | | | | 327,838,132 | |
Other Financial Instruments* – Assets | | | | | | | | | | | | | | | | |
Foreign Exchange Contracts | | | 34,971 | | | | — | | | | — | | | | 34,971 | |
Market Price | | | 186,563 | | | | — | | | | — | | | | 186,563 | |
| | | | 221,534 | | | | — | | | | — | | | | 221,534 | |
Other Financial Instruments* – Liabilities | | | | | | | | | | | | | | | | |
Interest Rate Contracts | | | (179,292 | ) | | | — | | | | — | | | | (179,292 | ) |
Market Price | | | (129,965 | ) | | | — | | | | — | | | | (129,965 | ) |
| | | (309,257 | ) | | | — | | | | — | | | | (309,257 | ) |
Totals | | $ | 322,998,409 | | | $ | 4,752,000 | | | | — | | | $ | 327,750,409 | |
| | | | | | |
| | Annual Report | | | September 30, 2018 | | 319 |
Notes to Financial Statements (cont’d)
September 30, 2018
| | | | | | | | | | | | | | | | |
| AllianzGI Best Styles Global Equity: | | | | | | | | | | | | |
| Investments in Securities – Assets | | Level 1–
Quoted Prices | | | Level 2–
Other Significant
Observable Inputs | | | Level 3–
Significant
Unobservable Inputs | | | Value at
9/30/18 | |
Common Stock: | | | | | | | | | | | | | | | | |
Australia | | | — | | | $ | 7,071,103 | | | | — | | | $ | 7,071,103 | |
Austria | | | — | | | | 2,925,288 | | | | — | | | | 2,925,288 | |
Belgium | | | — | | | | 167,011 | | | | — | | | | 167,011 | |
China | | $ | 3,047,379 | | | | 17,662,843 | | | $ | 1,154 | | | | 20,711,376 | |
Finland | | | — | | | | 1,629,745 | | | | — | | | | 1,629,745 | |
France | | | 299,525 | | | | 25,345,215 | | | | — | | | | 25,644,740 | |
Germany | | | 249,689 | | | | 7,940,317 | | | | — | | | | 8,190,006 | |
Greece | | | — | | | | — | | | | 42,719 | | | | 42,719 | |
Hong Kong | | | — | | | | 5,029,472 | | | | — | | | | 5,029,472 | |
Hungary | | | — | | | | 411,733 | | | | — | | | | 411,733 | |
Indonesia | | | — | | | | 2,330,594 | | | | — | | | | 2,330,594 | |
Israel | | | — | | | | 1,150,130 | | | | — | | | | 1,150,130 | |
Italy | | | 201,109 | | | | 7,142,958 | | | | — | | | | 7,344,067 | |
Japan | | | — | | | | 37,031,089 | | | | — | | | | 37,031,089 | |
Korea (Republic of) | | | 2,224,231 | | | | 7,972,014 | | | | — | | | | 10,196,245 | |
Malaysia | | | — | | | | 2,826,128 | | | | — | | | | 2,826,128 | |
Netherlands | | | 662,745 | | | | 6,285,215 | | | | — | | | | 6,947,960 | |
New Zealand | | | — | | | | 712,640 | | | | — | | | | 712,640 | |
Norway | | | 141,810 | | | | 3,407,470 | | | | — | | | | 3,549,280 | |
Philippines | | | 492,385 | | | | 301,559 | | | | — | | | | 793,944 | |
Portugal | | | — | | | | 261,418 | | | | — | | | | 261,418 | |
Singapore | | | — | | | | 1,622,762 | | | | — | | | | 1,622,762 | |
South Africa | | | 520,527 | | | | 2,124,539 | | | | — | | | | 2,645,066 | |
Spain | | | — | | | | 5,008,905 | | | | — | | | | 5,008,905 | |
Sweden | | | — | | | | 4,199,618 | | | | — | | | | 4,199,618 | |
Switzerland | | | — | | | | 6,100,748 | | | | — | | | | 6,100,748 | |
Taiwan | | | 1,468,718 | | | | 5,772,194 | | | | — | | | | 7,240,912 | |
Thailand | | | — | | | | — | | | | 3,535,634 | | | | 3,535,634 | |
Turkey | | | — | | | | 1,131,999 | | | | — | | | | 1,131,999 | |
United Kingdom | | | 1,514,068 | | | | 22,421,742 | | | | — | | | | 23,935,810 | |
All Other | | | 318,384,041 | | | | — | | | | — | | | | 318,384,041 | |
Exchange-Traded Funds | | | 2,380,098 | | | | — | | | | — | | | | 2,380,098 | |
Preferred Stock | | | — | | | | 1,733,810 | | | | — | | | | 1,733,810 | |
Repurchase Agreements | | | — | | | | 135,000 | | | | — | | | | 135,000 | |
| | | | 331,586,325 | | | | 187,855,259 | | | | 3,579,507 | | | | 523,021,091 | |
Other Financial Instruments* – Liabilities | | | | | | | | | | | | | | | | |
Market Price | | | (14,105 | ) | | | — | | | | — | | | | (14,105 | ) |
Totals | | $ | 331,572,220 | | | $ | 187,855,259 | | | $ | 3,579,507 | | | $ | 523,006,986 | |
| | | | | �� | | | | | | | | | | | |
| | | | | | |
| 320 | | September 30, 2018 | | | Annual Report | | |
| | | | | | | | | | | | | | | | |
| AllianzGI Best Styles International Equity: | |
| Investments in Securities – Assets | | Level 1–
Quoted Prices | | | Level 2–
Other Significant
Observable Inputs | | | Level 3–
Significant
Unobservable Inputs | | | Value at
9/30/18 | |
Common Stock: | |
Austria | | $ | 2,184 | | | $ | 307,170 | | | | — | | | $ | 309,354 | |
Brazil | | | 71,611 | | | | — | | | | — | | | | 71,611 | |
Canada | | | 99,417 | | | | — | | | | — | | | | 99,417 | |
China | | | 36,460 | | | | 111,807 | | | | — | | | | 148,267 | |
France | | | 70,835 | | | | 2,796,206 | | | | — | | | | 2,867,041 | |
Ireland | | | 17,640 | | | | 68,233 | | | | — | | | | 85,873 | |
Italy | | | 51,672 | | | | 1,021,640 | | | | — | | | | 1,073,312 | |
Mexico | | | 61,885 | | | | — | | | | — | | | | 61,885 | |
Netherlands | | | 55,047 | | | | 648,943 | | | | — | | | | 703,990 | |
Thailand | | | — | | | | — | | | $ | 58,610 | | | | 58,610 | |
United Kingdom | | | 122,606 | | | | 4,275,377 | | | | — | | | | 4,397,983 | |
All Other | | | — | | | | 15,233,165 | | | | — | | | | 15,233,165 | |
Exchange-Traded Funds | | | 377,944 | | | | — | | | | — | | | | 377,944 | |
Preferred Stock | | | — | | | | 129,432 | | | | — | | | | 129,432 | |
Repurchase Agreements | | | — | | | | 112,000 | | | | — | | | | 112,000 | |
Totals | | $ | 967,301 | | | $ | 24,703,973 | | | $ | 58,610 | | | $ | 25,729,884 | |
| | | | | | | | | | | | | | | | |
| AllianzGI Best Styles U.S. Equity: | |
| Investments in Securities – Assets | | Level 1–
Quoted Prices | | | Level 2–
Other Significant
Observable Inputs | | | Level 3–
Significant
Unobservable Inputs | | | Value at
9/30/18 | |
Common Stock | | $ | 98,699,955 | | | | — | | | | — | | | $ | 98,699,955 | |
Repurchase Agreements | | | — | | | $ | 1,166,000 | | | | — | | | | 1,166,000 | |
Totals | | $ | 98,699,955 | | | $ | 1,166,000 | | | | — | | | $ | 99,865,955 | |
| | | | | | | | | | | | | | | | |
| AllianzGI Convertible: | |
| Investments in Securities – Assets | | Level 1–
Quoted Prices | | | Level 2–
Other Significant
Observable Inputs | | | Level 3–
Significant
Unobservable Inputs | | | Value at
9/30/18 | |
Convertible Bonds & Notes: | |
IT Services | | | — | | | | — | | | $ | 1,866,247 | | | $ | 1,866,247 | |
All Other | | | — | | | $ | 459,051,116 | | | | — | | | | 459,051,116 | |
Convertible Preferred Stock: | |
Banks | | $ | 15,360,003 | | | | — | | | | — | | | | 15,360,003 | |
Electric Utilities | | | 7,046,708 | | | | — | | | | — | | | | 7,046,708 | |
Insurance | | | 3,856,306 | | | | — | | | | — | | | | 3,856,306 | |
Metal Fabricate/Hardware | | | 2,999,750 | | | | — | | | | — | | | | 2,999,750 | |
Oil, Gas & Consumable Fuels | | | 4,797,413 | | | | — | | | | — | | | | 4,797,413 | |
All Other | | | — | | | | 34,957,332 | | | | — | | | | 34,957,332 | |
Common Stock | | | 1,007,268 | | | | — | | | | — | | | | 1,007,268 | |
Repurchase Agreements | | | — | | | | 27,206,000 | | | | — | | | | 27,206,000 | |
Totals | | $ | 35,067,448 | | | $ | 521,214,448 | | | $ | 1,866,247 | | | $ | 558,148,143 | |
| | | | | | | | | | | | | | | | |
| | | | | | |
| | Annual Report | | | September 30, 2018 | | 321 |
Notes to Financial Statements (cont’d)
September 30, 2018
| | | | | | | | | | | | | | | | |
| AllianzGI Core Bond: | |
| Investments in Securities – Assets | | Level 1–
Quoted Prices | | | Level 2–
Other Significant
Observable Inputs | | | Level 3–
Significant
Unobservable Inputs | | | Value at
9/30/18 | |
U.S. Government Agency Securities | | | — | | | $ | 9,664,285 | | | | — | | | $ | 9,664,285 | |
U.S. Treasury Obligations | | | — | | | | 8,148,442 | | | | — | | | | 8,148,442 | |
Asset-Backed Securities | | | — | | | | 7,557,167 | | | | — | | | | 7,557,167 | |
Corporate Bonds & Notes | | | — | | | | 6,623,198 | | | | — | | | | 6,623,198 | |
Mortgage-Backed Securities | | | — | | | | 944,419 | | | | — | | | | 944,419 | |
Sovereign Debt Obligations | | | — | | | | 571,389 | | | | — | | | | 571,389 | |
| | | | — | | | | 33,508,900 | | | | — | | | | 33,508,900 | |
Other Financial Instruments* – Assets | |
Credit Contracts | | | — | | | | 1,382 | | | | — | | | | 1,382 | |
Interest Rate Contracts | | $ | 27,674 | | | | — | | | | — | | | | 27,674 | |
| | | | 27,674 | | | | 1,382 | | | | — | | | | 29,056 | |
Other Financial Instruments* – Liabilities | |
Credit Contracts | | | — | | | | (4,049 | ) | | | — | | | | (4,049 | ) |
Interest Rate Contracts | | | (37,483 | ) | | | — | | | | — | | | | (37,483 | ) |
| | | (37,483 | ) | | | (4,049 | ) | | | — | | | | (41,532 | ) |
Totals | | $ | (9,809 | ) | | $ | 33,506,233 | | | | — | | | $ | 33,496,424 | |
| | | | | | | | | | | | | | | | |
| AllianzGI Core Plus Bond: | |
| Investments in Securities – Assets | | Level 1–
Quoted Prices | | | Level 2–
Other Significant
Observable Inputs | | | Level 3–
Significant
Unobservable Inputs | | | Value at
9/30/18 | |
U.S. Government Agency Securities | | | — | | | $ | 13,425,168 | | | | — | | | $ | 13,425,168 | |
Corporate Bonds & Notes | | | — | | | | 11,413,923 | | | | — | | | | 11,413,923 | |
Asset-Backed Securities | | | — | | | | 10,260,960 | | | | — | | | | 10,260,960 | |
U.S. Treasury Obligations | | | — | | | | 7,957,442 | | | | — | | | | 7,957,442 | |
Mortgage-Backed Securities | | | — | | | | 1,308,378 | | | | — | | | | 1,308,378 | |
Sovereign Debt Obligations | | | — | | | | 749,823 | | | | — | | | | 749,823 | |
| | | | — | | | | 45,115,694 | | | | — | | | | 45,115,694 | |
Other Financial Instruments* – Assets | |
Credit Contracts | | | — | | | | 2,073 | | | | — | | | | 2,073 | |
Interest Rate Contracts | | $ | 21,688 | | | | — | | | | — | | | | 21,688 | |
| | | | 21,688 | | | | 2,073 | | | | — | | | | 23,761 | |
Other Financial Instruments* – Liabilities | |
Credit Contracts | | | — | | | | (6,815 | ) | | | — | | | | (6,815 | ) |
Interest Rate Contracts | | | (49,930 | ) | | | — | | | | — | | | | (49,930 | ) |
| | | (49,930 | ) | | | (6,815 | ) | | | — | | | | (56,745 | ) |
Totals | | $ | (28,242 | ) | | $ | 45,110,952 | | | | — | | | $ | 45,082,710 | |
| | | | | | | | | | | | | | | | |
| AllianzGI Emerging Markets Consumer: | |
| Investments in Securities – Assets | | Level 1–
Quoted Prices | | | Level 2–
Other Significant
Observable Inputs | | | Level 3–
Significant
Unobservable Inputs | | | Value at
9/30/18 | |
Common Stock: | |
Brazil | | $ | 1,539,849 | | | | — | | | | — | | | $ | 1,539,849 | |
China | | | 2,666,042 | | | $ | 9,208,571 | | | | — | | | | 11,874,613 | |
Hong Kong | | | 114,316 | | | | 435,878 | | | | — | | | | 550,194 | |
India | | | 1,577,586 | | | | 2,116,936 | | | | — | | | | 3,694,522 | |
Mexico | | | 1,269,050 | | | | — | | | | — | | | | 1,269,050 | |
Russian Federation | | | 1,258,946 | | | | — | | | | — | | | | 1,258,946 | |
| | | | | | |
| 322 | | September 30, 2018 | | | Annual Report | | |
| | | | | | | | | | | | | | | | |
| AllianzGI Emerging Markets Consumer (cont’d): | |
| Investments in Securities – Assets | | Level 1–
Quoted Prices | | | Level 2–
Other Significant
Observable Inputs | | | Level 3–
Significant
Unobservable Inputs | | | Value at
9/30/18 | |
South Africa | | $ | 226,157 | | | | — | | | | — | | | $ | 226,157 | |
Thailand | | | — | | | | — | | | $ | 2,756,833 | | | | 2,756,833 | |
United States | | | 3,587,477 | | | | — | | | | — | | | | 3,587,477 | |
All Other | | | — | | | $ | 16,122,559 | | | | — | | | | 16,122,559 | |
Preferred Stock | | | 218,544 | | | | — | | | | — | | | | 218,544 | |
Repurchase Agreements | | | — | | | | 106,000 | | | | — | | | | 106,000 | |
Totals | | $ | 12,457,967 | | | $ | 27,989,944 | | | $ | 2,756,833 | | | $ | 43,204,744 | |
| | | | | | | | | | | | | | | | |
| AllianzGI Emerging Markets Debt: | |
| Investments in Securities – Assets | | Level 1–
Quoted Prices | | | Level 2–
Other Significant
Observable Inputs | | | Level 3–
Significant
Unobservable Inputs | | | Value at
9/30/18 | |
Sovereign Debt Obligations | | | — | | | $ | 14,992,278 | | | | — | | | $ | 14,992,278 | |
Corporate Bonds & Notes | | | — | | | | 2,419,752 | | | | — | | | | 2,419,752 | |
Repurchase Agreements | | | — | | | | 933,000 | | | | — | | | | 933,000 | |
Totals | | | — | | | $ | 18,345,030 | | | | — | | | $ | 18,345,030 | |
| | | | | | | | | | | | | | | | |
| AllianzGI Emerging Markets Small-Cap: | |
| Investments in Securities – Assets | | Level 1–
Quoted Prices | | | Level 2–
Other Significant
Observable Inputs | | | Level 3–
Significant
Unobservable Inputs | | | Value at
9/30/18 | |
Common Stock: | |
Brazil | | $ | 504,914 | | | | — | | | | — | | | $ | 504,914 | |
Czech Republic | | | — | | | $ | 53,512 | | | $ | 22,945 | | | | 76,457 | |
Greece | | | 205,044 | | | | 118,721 | | | | — | | | | 323,765 | |
India | | | 314,650 | | | | 1,265,572 | | | | — | | | | 1,580,222 | |
Korea (Republic of) | | | 144,105 | | | | 1,383,820 | | | | — | | | | 1,527,925 | |
Malaysia | | | 30,689 | | | | 251,792 | | | | — | | | | 282,481 | |
Mexico | | | 52,892 | | | | — | | | | — | | | | 52,892 | |
Russian Federation | | | 115,198 | | | | — | | | | 39,676 | | | | 154,874 | |
South Africa | | | 248,186 | | | | — | | | | — | | | | 248,186 | |
Taiwan | | | 18,779 | | | | 1,920,732 | | | | — | | | | 1,939,511 | |
Thailand | | | — | | | | 29,326 | | | | 760,251 | | | | 789,577 | |
United Arab Emirates | | | 32,207 | | | | — | | | | — | | | | 32,207 | |
All Other | | | — | | | | 2,180,482 | | | | — | | | | 2,180,482 | |
Preferred Stock: | |
Brazil | | | 62,255 | | | | — | | | | — | | | | 62,255 | |
Russian Federation | | | — | | | | — | | | | 292,702 | | | | 292,702 | |
Repurchase Agreements | | | — | | | | 289,000 | | | | — | | | | 289,000 | |
Totals | | $ | 1,728,919 | | | $ | 7,492,957 | | | $ | 1,115,574 | | | $ | 10,337,450 | |
| | | | | | | | | | | | | | | | |
| AllianzGI Europe Equity Dividend: | |
| Investments in Securities – Assets | | Level 1–
Quoted Prices | | | Level 2–
Other Significant
Observable Inputs | | | Level 3–
Significant
Unobservable Inputs | | | Value at
9/30/18 | |
Common Stock: | |
France | | $ | 189,244 | | | $ | 1,315,225 | | | | — | | | $ | 1,504,469 | |
All Other | | | — | | | | 5,521,528 | | | | — | | | | 5,521,528 | |
Totals | | $ | 189,244 | | | $ | 6,836,753 | | | | — | | | $ | 7,025,997 | |
| | | | | | |
| | Annual Report | | | September 30, 2018 | | 323 |
Notes to Financial Statements (cont’d)
September 30, 2018
| | | | | | | | | | | | | | | | |
| AllianzGI Global Dynamic Allocation: | |
| Investments in Securities – Assets | | Level 1–
Quoted Prices | | | Level 2–
Other Significant
Observable Inputs | | | Level 3–
Significant
Unobservable Inputs | | | Value at
9/30/18 | |
Common Stock: | |
Australia | | | — | | | $ | 940,680 | | | | — | | | $ | 940,680 | |
Austria | | $ | 68,393 | | | | 649,529 | | | | — | | | | 717,922 | |
Belgium | | | — | | | | 76,208 | | | | — | | | | 76,208 | |
China | | | 755,994 | | | | 5,589,289 | | | $ | 34 | | | | 6,345,317 | |
Czech Republic | | | 55,719 | | | | 62,207 | | | | — | | | | 117,926 | |
Denmark | | | 6,947 | | | | 159,832 | | | | — | | | | 166,779 | |
Finland | | | 2,296 | | | | 639,790 | | | | — | | | | 642,086 | |
France | | | 87,247 | | | | 5,760,156 | | | | — | | | | 5,847,403 | |
Germany | | | 8,449 | | | | 1,615,160 | | | | — | | | | 1,623,609 | |
Greece | | | 181,892 | | | | 70,581 | | | | 10,933 | | | | 263,406 | |
Hong Kong | | | 20,824 | | | | 1,474,951 | | | | — | | | | 1,495,775 | |
Hungary | | | — | | | | 387,045 | | | | — | | | | 387,045 | |
Indonesia | | | — | | | | 754,970 | | | | — | | | | 754,970 | |
Israel | | | 86,568 | | | | 612,516 | | | | — | | | | 699,084 | |
Italy | | | 11,033 | | | | 1,249,845 | | | | — | | | | 1,260,878 | |
Japan | | | 32,191 | | | | 13,656,235 | | | | — | | | | 13,688,426 | |
Korea (Republic of) | | | 773,513 | | | | 2,442,353 | | | | — | | | | 3,215,866 | |
Malaysia | | | — | | | | 750,898 | | | | — | | | | 750,898 | |
Netherlands | | | 172,803 | | | | 1,907,626 | | | | — | | | | 2,080,429 | |
New Zealand | | | 8,247 | | | | 475,533 | | | | — | | | | 483,780 | |
Norway | | | 92,626 | | | | 825,816 | | | | — | | | | 918,442 | |
Philippines | | | 202,563 | | | | 140,916 | | | | — | | | | 343,479 | |
Poland | | | — | | | | 101,211 | | | | — | | | | 101,211 | |
Russian Federation | | | 91,899 | | | | 2,762 | | | | — | | | | 94,661 | |
Singapore | | | 8,772 | | | | 1,182,634 | | | | — | | | | 1,191,406 | |
South Africa | | | — | | | | 384,010 | | | | — | | | | 384,010 | |
Spain | | | 1,395 | | | | 1,660,272 | | | | — | | | | 1,661,667 | |
Sweden | | | — | | | | 1,254,877 | | | | — | | | | 1,254,877 | |
Switzerland | | | — | | | | 1,868,093 | | | | — | | | | 1,868,093 | |
Taiwan | | | — | | | | 2,369,141 | | | | 2,868 | | | | 2,372,009 | |
Thailand | | | — | | | | 119,089 | | | | 1,304,292 | | | | 1,423,381 | |
Turkey | | | — | | | | 499,282 | | | | — | | | | 499,282 | |
United Kingdom | | | 811,669 | | | | 5,638,301 | | | | — | | | | 6,449,970 | |
All Other | | | 73,216,178 | | | | — | | | | — | | | | 73,216,178 | |
Corporate Bonds & Notes | | | — | | | | 32,921,845 | | | | — | | | | 32,921,845 | |
U.S. Government Agency Securities | | | — | | | | 15,484,842 | | | | — | | | | 15,484,842 | |
U.S. Treasury Obligations | | | — | | | | 13,955,886 | | | | — | | | | 13,955,886 | |
Exchange-Traded Funds | | | 13,395,166 | | | | — | | | | — | | | | 13,395,166 | |
Sovereign Debt Obligations | | | — | | | | 8,828,801 | | | | — | | | | 8,828,801 | |
Mutual Funds | | | 4,400,566 | | | | — | | | | — | | | | 4,400,566 | |
Preferred Stock: | |
Brazil | | | 22,796 | | | | — | | | | — | | | | 22,796 | |
Colombia | | | 102,429 | | | | — | | | | — | | | | 102,429 | |
All Other | | | — | | | | 573,212 | | | | — | | | | 573,212 | |
Repurchase Agreements | | | — | | | | 8,982,000 | | | | — | | | | 8,982,000 | |
| | | | 94,618,175 | | | | 136,068,394 | | | | 1,318,127 | | | | 232,004,696 | |
| | | | | | |
| 324 | | September 30, 2018 | | | Annual Report | | |
| | | | | | | | | | | | | | | | |
| AllianzGI Global Dynamic Allocation (cont’d): | |
| Investments in Securities – Assets | | Level 1–
Quoted Prices | | | Level 2–
Other Significant
Observable Inputs | | | Level 3–
Significant
Unobservable Inputs | | | Value at
9/30/18 | |
Other Financial Instruments* – Assets | |
Interest Rate Contracts | | $ | 36,776 | | | | — | | | | — | | | $ | 36,776 | |
Market Price | | | 239,881 | | | | — | | | | — | | | | 239,881 | |
| | | | 276,657 | | | | — | | | | — | | | | 276,657 | |
Other Financial Instruments* – Liabilities | |
Foreign Exchange Contracts | | | (3,376 | ) | | | — | | | | — | | | | (3,376 | ) |
Interest Rate Contracts | | | (332,981 | ) | | | — | | | | — | | | | (332,981 | ) |
Market Price | | | (353,626 | ) | | | — | | | | — | | | | (353,626 | ) |
| | | (689,983 | ) | | | — | | | | — | | | | (689,983 | ) |
Totals | | $ | 94,204,849 | | | $ | 136,068,394 | | | $ | 1,318,127 | | | $ | 231,591,370 | |
| | | | | | | | | | | | | | | | |
| AllianzGI Global High Yield: | |
| Investments in Securities – Assets | | Level 1–
Quoted Prices | | | Level 2–
Other Significant
Observable Inputs | | | Level 3–
Significant
Unobservable Inputs | | | Value at
9/30/18 | |
Corporate Bonds & Notes | | | — | | | $ | 21,089,377 | | | | — | | | $ | 21,089,377 | |
Sovereign Debt Obligations | | | — | | | | 146,770 | | | | — | | | | 146,770 | |
U.S. Treasury Obligations | | | — | | | | 399,787 | | | | — | | | | 399,787 | |
Repurchase Agreements | | | — | | | | 214,000 | | | | — | | | | 214,000 | |
| | | | — | | | | 21,849,934 | | | | — | | | | 21,849,934 | |
Other Financial Instruments* – Assets | |
Foreign Exchange Contracts | | | — | | | | 15,116 | | | | — | | | | 15,116 | |
Market Price | | $ | 3,081 | | | | — | | | | — | | | | 3,081 | |
| | | | 3,081 | | | | 15,116 | | | | — | | | | 18,197 | |
Other Financial Instruments* – Liabilities | |
Foreign Exchange Contracts | | | — | | | | (2,786 | ) | | | — | | | | (2,786 | ) |
Interest Rate Contracts | | | (3,467 | ) | | | — | | | | — | | | | (3,467 | ) |
| | | (3,467 | ) | | | (2,786 | ) | | | — | | | | (6,253 | ) |
Totals | | $ | (386 | ) | | $ | 21,862,264 | | | | — | | | $ | 21,861,878 | |
| | | | | | | | | | | | | | | | |
| AllianzGI Global Sustainability: | |
| Investments in Securities – Assets | | Level 1–
Quoted Prices | | | Level 2–
Other Significant
Observable Inputs | | | Level 3–
Significant
Unobservable Inputs | | | Value at
9/30/18 | |
Common Stock: | |
Australia | | | — | | | $ | 592,338 | | | | — | | | $ | 592,338 | |
Denmark | | | — | | | | 534,800 | | | | — | | | | 534,800 | |
France | | | — | | | | 1,085,857 | | | | — | | | | 1,085,857 | |
Germany | | | — | | | | 3,498,637 | | | | — | | | | 3,498,637 | |
Japan | | | — | | | | 1,999,094 | | | | — | | | | 1,999,094 | |
Korea (Republic of) | | | — | | | | 632,846 | | | | — | | | | 632,846 | |
Spain | | | — | | | | 1,779,751 | | | | — | | | | 1,779,751 | |
Sweden | | | — | | | | 1,838,772 | | | | — | | | | 1,838,772 | |
Switzerland | | | — | | | | 1,169,317 | | | | — | | | | 1,169,317 | |
United Kingdom | | | — | | | | 5,466,946 | | | | — | | | | 5,466,946 | |
All Other | | $ | 21,080,057 | | | | — | | | | — | | | | 21,080,057 | |
Repurchase Agreements | | | — | | | | 521,000 | | | | — | | | | 521,000 | |
Totals | | $ | 21,080,057 | | | $ | 19,119,358 | | | | — | | | $ | 40,199,415 | |
| | | | | | |
| | Annual Report | | | September 30, 2018 | | 325 |
Notes to Financial Statements (cont’d)
September 30, 2018
| | | | | | | | | | | | | | | | |
| AllianzGI Global Water: | |
| Investments in Securities – Assets | | Level 1–
Quoted Prices | | | Level 2–
Other Significant
Observable Inputs | | | Level 3–
Significant
Unobservable Inputs | | | Value at
9/30/18 | |
Common Stock: | |
Austria | | | — | | | $ | 24,886,432 | | | | — | | | $ | 24,886,432 | |
China | | | — | | | | 18,121,120 | | | | — | | | | 18,121,120 | |
Finland | | | — | | | | 14,258,973 | | | | — | | | | 14,258,973 | |
France | | | — | | | | 45,111,048 | | | | — | | | | 45,111,048 | |
Germany | | | — | | | | 3,493,059 | | | | — | | | | 3,493,059 | |
Japan | | | — | | | | 21,899,160 | | | | — | | | | 21,899,160 | |
Sweden | | | — | | | | 30,407,043 | | | | — | | | | 30,407,043 | |
Switzerland | | $ | 3,076,100 | | | | 40,335,767 | | | | — | | | | 43,411,867 | |
United Kingdom | | | — | | | | 56,210,534 | | | | — | | | | 56,210,534 | |
All Other | | | 384,658,513 | | | | — | | | | — | | | | 384,658,513 | |
Repurchase Agreements | | | — | | | | 9,725,000 | | | | — | | | | 9,725,000 | |
Totals | | $ | 387,734,613 | | | $ | 264,448,136 | | | | — | | | $ | 652,182,749 | |
| | | | | | | | | | | | | | | | |
| AllianzGI High Yield Bond: | | | | | | | | | | | | |
| Investments in Securities – Assets | | Level 1–
Quoted Prices | | | Level 2–
Other Significant
Observable Inputs | | | Level 3–
Significant
Unobservable Inputs | | | Value at
9/30/18 | |
Corporate Bonds & Notes: | | | | | | | | | | | | | | | | |
Commercial Services | | | — | | | $ | 7,865,126 | | | $ | 126,445 | | | $ | 7,991,571 | |
Media | | | — | | | | 8,951,353 | | | | 55 | | | | 8,951,408 | |
All Other | | | — | | | | 151,702,591 | | | | — | | | | 151,702,591 | |
Preferred Stock | | | — | | | | — | | | | 6,121,626 | | | | 6,121,626 | |
Common Stock | | | — | | | | — | | | | 577,518 | | | | 577,518 | |
Warrants | | | — | | | | — | | | | 4 | | | | 4 | |
Repurchase Agreements | | | — | | | | 1,315,000 | | | | — | | | | 1,315,000 | |
Totals | | | — | | | $ | 169,834,070 | | | $ | 6,825,648 | | | $ | 176,659,718 | |
| �� | | | | | | | | | | | | | | | |
| AllianzGI International Growth: | | | | | | | | | | | | |
| Investments in Securities – Assets | | Level 1–
Quoted Prices | | | Level 2–
Other Significant
Observable Inputs | | | Level 3–
Significant
Unobservable Inputs | | | Value at
9/30/18 | |
Common Stock: | | | | | | | | | | | | | | | | |
Brazil | | $ | 824,246 | | | | — | | | | — | | | $ | 824,246 | |
Canada | | | 2,955,250 | | | | — | | | | — | | | | 2,955,250 | |
China | | | 2,685,620 | | | $ | 1,239,502 | | | | — | | | | 3,925,122 | |
India | | | 486,497 | | | | 372,662 | | | | — | | | | 859,159 | |
Indonesia | | | 266,944 | | | | 239,639 | | | | — | | | | 506,583 | |
Ireland | | | 888,571 | | | | — | | | | — | | | | 888,571 | |
Mexico | | | 227,562 | | | | — | | | | — | | | | 227,562 | |
All Other | | | — | | | | 17,985,375 | | | | — | | | | 17,985,375 | |
Repurchase Agreements | | | — | | | | 837,000 | | | | — | | | | 837,000 | |
Totals | | $ | 8,334,690 | | | $ | 20,674,178 | | | | — | | | $ | 29,008,868 | |
| | | | | | | | | | | | | | | | |
| | | | | | |
| 326 | | September 30, 2018 | | | Annual Report | | |
| | | | | | | | | | | | | | | | |
| AllianzGI International Small-Cap: | | | | | | | | | | | | |
| Investments in Securities – Assets | | Level 1–
Quoted Prices | | | Level 2–
Other Significant
Observable Inputs | | | Level 3–
Significant
Unobservable Inputs | | | Value at
9/30/18 | |
Common Stock: | | | | | | | | | | | | | | | | |
Philippines | | $ | 203,887 | | | | — | | | | — | | | $ | 203,887 | |
All Other | | | — | | | $ | 164,586,708 | | | | — | | | | 164,586,708 | |
Preferred Stock | | | — | | | | 2,172,920 | | | | — | | | | 2,172,920 | |
Repurchase Agreements | | | — | | | | 1,105,000 | | | | — | | | | 1,105,000 | |
Totals | | $ | 203,887 | | | $ | 167,864,628 | | | | — | | | $ | 168,068,515 | |
| | | | | | | | | | | | | | | | |
| AllianzGI Micro Cap: | | | | | | | | | | | | |
| Investments in Securities – Assets | | Level 1–
Quoted Prices | | | Level 2–
Other Significant
Observable Inputs | | | Level 3–
Significant
Unobservable Inputs | | | Value at
9/30/18 | |
Common Stock | | $ | 28,224,076 | | | | — | | | | — | | | $ | 28,224,076 | |
Repurchase Agreements | | | — | | | $ | 489,000 | | | | — | | | | 489,000 | |
Totals | | $ | 28,224,076 | | | $ | 489,000 | | | | — | | | $ | 28,713,076 | |
| | | | | | | | | | | | | | | | |
| AllianzGI NFJ Emerging Markets Value: | | | | | | | | | | | | |
| Investments in Securities – Assets | | Level 1–
Quoted Prices | | | Level 2–
Other Significant
Observable Inputs | | | Level 3–
Significant
Unobservable Inputs | | | Value at
9/30/18 | |
Common Stock: | | | | | | | | | | | | | | | | |
Brazil | | $ | 5,623,648 | | | | — | | | | — | | | $ | 5,623,648 | |
Chile | | | 1,125,402 | | | | — | | | | — | | | | 1,125,402 | |
China | | | 1,090,428 | | | $ | 35,549,007 | | | $ | 921,981 | | | | 37,561,416 | |
Korea (Republic of) | | | 905,004 | | | | 14,319,272 | | | | — | | | | 15,224,276 | |
Mexico | | | 7,215,950 | | | | — | | | | — | | | | 7,215,950 | |
Peru | | | 914,851 | | | | — | | | | — | | | | 914,851 | |
Russian Federation | | | 2,269,212 | | | | — | | | | 3,731,478 | | | | 6,000,690 | |
South Africa | | | 2,954,745 | | | | 3,560,076 | | | | — | | | | 6,514,821 | |
Taiwan | | | 1,199,783 | | | | 13,849,335 | | | | — | | | | 15,049,118 | |
United States | | | 889,576 | | | | — | | | | — | | | | 889,576 | |
All Other | | | — | | | | 32,641,584 | | | | — | | | | 32,641,584 | |
Preferred Stock: | | | | | | | | | | | | | | | | |
Brazil | | | 3,213,033 | | | | — | | | | — | | | | 3,213,033 | |
Korea (Republic of) | | | 1,178,548 | | | | 2,377,962 | | | | — | | | | 3,556,510 | |
Totals | | $ | 28,580,180 | | | $ | 102,297,236 | | | $ | 4,653,459 | | | $ | 135,530,875 | |
| | | | | | | | | | | | | | | | |
| AllianzGI NFJ International Small-Cap Value: | | | | | | | | | | | | |
| Investments in Securities – Assets | | Level 1–
Quoted Prices | | | Level 2–
Other Significant
Observable Inputs | | | Level 3–
Significant
Unobservable Inputs | | | Value at
9/30/18 | |
Common Stock: | | | | | | | | | | | | | | | | |
Belgium | | $ | 39,775 | | | | — | | | | — | | | $ | 39,775 | |
Canada | | | 145,770 | | | | — | | | | — | | | | 145,770 | |
France | | | 36,695 | | | $ | 110,905 | | | | — | | | | 147,600 | |
Israel | | | 28,944 | | | | 31,630 | | | | — | | | | 60,574 | |
Mexico | | | 111,082 | | | | — | | | | — | | | | 111,082 | |
Norway | | | 22,706 | | | | 57,325 | | | | — | | | | 80,031 | |
Peru | | | 25,479 | | | | — | | | | — | | | | 25,479 | |
Russian Federation | | | 27,750 | | | | — | | | | — | | | | 27,750 | |
Singapore | | | 71,012 | | | | 120,075 | | | | — | | | | 191,087 | |
| | | | | | |
| | Annual Report | | | September 30, 2018 | | 327 |
Notes to Financial Statements (cont’d)
September 30, 2018
| | | | | | | | | | | | | | | | |
| AllianzGI NFJ International Small-Cap Value (cont’d): | | | | | | | | | | | | |
| Investments in Securities – Assets | | Level 1–
Quoted Prices | | | Level 2–
Other Significant
Observable Inputs | | | Level 3–
Significant
Unobservable Inputs | | | Value at
9/30/18 | |
South Africa | | $ | 48,670 | | | $ | 24,185 | | | | — | | | $ | 72,855 | |
Spain | | | 67,052 | | | | 83,966 | | | | — | | | | 151,018 | |
Sweden | | | 27,353 | | | | 61,129 | | | | — | | | | 88,482 | |
United Kingdom | | | 347,041 | | | | 519,493 | | | | — | | | | 866,534 | |
United States | | | 28,679 | | | | — | | | | — | | | | 28,679 | |
All Other | | | — | | | | 1,511,774 | | | | — | | | | 1,511,774 | |
Totals | | $ | 1,028,008 | | | $ | 2,520,482 | | | | — | | | $ | 3,548,490 | |
| | | | | | | | | | | | | | | | |
| AllianzGI PerformanceFee Managed Futures Strategy: | | | | | | | | | | | | |
| Investments in Securities – Assets | | Level 1–
Quoted Prices | | | Level 2–
Other Significant
Observable Inputs | | | Level 3–
Significant
Unobservable Inputs | | | Value at
9/30/18 | |
U.S. Treasury Obligations | | | — | | | $ | 13,421,289 | | | | — | | | $ | 13,421,289 | |
Repurchase Agreements | | | — | | | | 445,000 | | | | — | | | | 445,000 | |
| | | | — | | | | 13,866,289 | | | | — | | | | 13,866,289 | |
Other Financial Instruments* – Assets | | | | | | | | | | | | | | | | |
Commodity Contracts | | $ | 117,768 | | | | — | | | | — | | | | 117,768 | |
Credit Contracts | | | — | | | | 31,787 | | | | — | | | | 31,787 | |
Foreign Exchange Contracts | | | 84,501 | | | | — | | | | — | | | | 84,501 | |
Market Price | | | 104,670 | | | | — | | | | — | | | | 104,670 | |
| | | | 306,939 | | | | 31,787 | | | | — | | | | 338,726 | |
Other Financial Instruments* – Liabilities | | | | | | | | | | | | | | | | |
Commodity Contracts | | | (75,272 | ) | | | — | | | | — | | | | (75,272 | ) |
Credit Contracts | | | — | | | | (3,055 | ) | | | — | | | | (3,055 | ) |
Foreign Exchange Contracts | | | (21,654 | ) | | | — | | | | — | | | | (21,654 | ) |
Interest Rate Contracts | | | (44,858 | ) | | | — | | | | — | | | | (44,858 | ) |
Market Price | | | (7,451 | ) | | | — | | | | — | | | | (7,451 | ) |
| | | (149,235 | ) | | | (3,055 | ) | | | — | | | | (152,290 | ) |
Totals | | $ | 157,704 | | | $ | 13,895,021 | | | | — | | | $ | 14,052,725 | |
| | | | | | | | | | | | | | | | |
| AllianzGI PerformanceFee Structured US Equity: | | | | | | | | | | | | |
| Investments in Securities – Assets | | Level 1–
Quoted Prices | | | Level 2–
Other Significant
Observable Inputs | | | Level 3–
Significant
Unobservable Inputs | | | Value at
9/30/18 | |
Exchange-Traded Funds | | $ | 82,043,730 | | | | — | | | | — | | | $ | 82,043,730 | |
Options Purchased: | | | | | | | | | | | | | | | | |
Market Price | | | 295,201 | | | $ | 5,114 | | | | — | | | | 300,315 | |
| | | | 82,338,931 | | | | 5,114 | | | | — | | | | 82,344,045 | |
Investments in Securities – Liabilities | | | | | | | | | | | | | | | | |
Options Written: | | | | | | | | | | | | | | | | |
Market Price | | | (445,332 | ) | | | (5,852 | ) | | | — | | | | (451,184 | ) |
Totals | | $ | 81,893,599 | | | $ | (738 | ) | | | — | | | $ | 81,892,861 | |
| | | | | | | | | | | | | | | | |
| | | | | | |
| 328 | | September 30, 2018 | | | Annual Report | | |
| | | | | | | | | | | | | | | | |
| AllianzGI PerformanceFee Structured US Fixed Income: | | | | | | | | | | | | |
| Investments in Securities – Assets | | Level 1–
Quoted Prices | | | Level 2–
Other Significant
Observable Inputs | | | Level 3–
Significant
Unobservable Inputs | | | Value at
9/30/18 | |
Exchange-Traded Funds | | $ | 24,873,280 | | | | — | | | | — | | | $ | 24,873,280 | |
Options Purchased: | | | | | | | | | | | | | | | | |
Market Price | | | 36,192 | | | $ | 1,391 | | | | — | | | | 37,583 | |
| | | | 24,909,472 | | | | 1,391 | | | | — | | | | 24,910,863 | |
Investments in Securities – Liabilities | | | | | | | | | | | | | | | | |
Options Written: | | | | | | | | | | | | | | | | |
Market Price | | | (59,061 | ) | | | (1,592 | ) | | | — | | | | (60,653 | ) |
Totals | | $ | 24,850,411 | | | $ | (201 | ) | | | — | | | $ | 24,850,210 | |
| | | | | | | | | | | | | | | | |
| AllianzGI Preferred Securities and Income: | | | | | | | | | | | | |
| Investments in Securities – Assets | | Level 1–
Quoted Prices | | | Level 2–
Other Significant
Observable Inputs | | | Level 3–
Significant
Unobservable Inputs | | | Value at
9/30/18 | |
Corporate Bonds & Notes | | | — | | | $ | 10,543,153 | | | | — | | | $ | 10,543,153 | |
Convertible Preferred Stock | | $ | 681,564 | | | | — | | | | — | | | | 681,564 | |
Repurchase Agreements | | | — | | | | 388,000 | | | | — | | | | 388,000 | |
Totals | | $ | 681,564 | | | $ | 10,931,153 | | | | — | | | $ | 11,612,717 | |
| | | | | | | | | | | | | | | | |
| AllianzGI Real Estate Debt: | | | | | | | | | | | | |
| Investments in Securities – Assets | | Level 1–
Quoted Prices | | | Level 2–
Other Significant
Observable Inputs | | | Level 3–
Significant
Unobservable Inputs | | | Value at
9/30/18 | |
Mortgage-Backed Securities | | | — | | | $ | 11,818,497 | | | | — | | | $ | 11,818,497 | |
Corporate Bonds & Notes | | | — | | | | 939,311 | | | | — | | | | 939,311 | |
U.S. Government Agency Securities | | | — | | | | 773,824 | | | | — | | | | 773,824 | |
Asset-Backed Securities | | | — | | | | 501,185 | | | | — | | | | 501,185 | |
U.S. Treasury Obligations | | | — | | | | 1,196,832 | | | | — | | | | 1,196,832 | |
| | | | — | | | | 15,229,649 | | | | — | | | | 15,229,649 | |
Other Financial Instruments* – Assets | | | | | | | | | | | | | | | | |
Foreign Exchange Contracts | | | — | | | | 9,561 | | | | — | | | | 9,561 | |
Interest Rate Contracts | | $ | 1,719 | | | | — | | | | — | | | | 1,719 | |
| | | | 1,719 | | | | 9,561 | | | | — | | | | 11,280 | |
Other Financial Instruments* – Liabilities | | | | | | | | | | | | | | | | |
Foreign Exchange Contracts | | | — | | | | (101 | ) | | | — | | | | (101 | ) |
Interest Rate Contracts | | | (2,313 | ) | | | — | | | | — | | | | (2,313 | ) |
| | | (2,313 | ) | | | (101 | ) | | | — | | | | (2,414 | ) |
Totals | | $ | (594 | ) | | $ | 15,239,109 | | | | — | | | $ | 15,238,515 | |
| | | | | | | | | | | | | | | | |
| AllianzGI Short Duration High Income: | | | | | | | | | | | | |
| Investments in Securities – Assets | | Level 1–
Quoted Prices | | | Level 2–
Other Significant
Observable Inputs | | | Level 3–
Significant
Unobservable Inputs | | | Value at
9/30/18 | |
Corporate Bonds & Notes | | | — | | | $ | 974,464,489 | | | | — | | | $ | 974,464,489 | |
Senior Loans | | | — | | | | 111,763,140 | | | | — | | | | 111,763,140 | |
Repurchase Agreements | | | — | | | | 6,580,000 | | | | — | | | | 6,580,000 | |
Totals | | | — | | | $ | 1,092,807,629 | | | | — | | | $ | 1,092,807,629 | |
| | | | | | | | | | | | | | | | |
| | | | | | |
| | Annual Report | | | September 30, 2018 | | 329 |
Notes to Financial Statements (cont’d)
September 30, 2018
| | | | | | | | | | | | | | | | |
| AllianzGI Short Term Bond: | | | | | | | | | | | | |
| Investments in Securities – Assets | | Level 1–
Quoted Prices | | | Level 2–
Other Significant
Observable Inputs | | | Level 3–
Significant
Unobservable Inputs | | | Value at
9/30/18 | |
Corporate Bonds & Notes | | | — | | | $ | 3,910,143 | | | | — | | | $ | 3,910,143 | |
U.S. Treasury Obligations | | | — | | | | 796,437 | | | | — | | | | 796,437 | |
U.S. Government Agency Securities | | | — | | | | 400,503 | | | | — | | | | 400,503 | |
Totals | | | — | | | $ | 5,107,083 | | | | — | | | $ | 5,107,083 | |
| | | | | | | | | | | | | | | | |
| AllianzGI Structured Return: | | | | | | | | | | | | |
| Investments in Securities – Assets | | Level 1–
Quoted Prices | | | Level 2–
Other Significant
Observable Inputs | | | Level 3–
Significant
Unobservable Inputs | | | Value at
9/30/18 | |
Exchange-Traded Funds | | $ | 554,137,890 | | | | — | | | | — | | | $ | 554,137,890 | |
Repurchase Agreements | | | — | | | $ | 74,365,000 | | | | — | | | | 74,365,000 | |
Options Purchased: | | | | | | | | | | | | | | | | |
Market Price | | | 1,732,582 | | | | — | | | | — | | | | 1,732,582 | |
| | | | 555,870,472 | | | | 74,365,000 | | | | — | | | | 630,235,472 | |
Investments in Securities – Liabilities | | | | | | | | | | | | | | | | |
Options Written: | | | | | | | | | | | | | | | | |
Market Price | | | (26,906,483 | ) | | | — | | | | — | | | | (26,906,483 | ) |
Totals | | $ | 528,963,989 | | | $ | 74,365,000 | | | | — | | | $ | 603,328,989 | |
| | | | | | | | | | | | | | | | |
| AllianzGI U.S. Equity Hedged: | | | | | | | | | | | | |
| Investments in Securities – Assets | | Level 1–
Quoted Prices | | | Level 2–
Other Significant
Observable Inputs | | | Level 3–
Significant
Unobservable Inputs | | | Value at
9/30/18 | |
Exchange-Traded Funds | | $ | 2,863,592 | | | | — | | | | — | | | $ | 2,863,592 | |
Options Purchased: | | | | | | | | | | | | | | | | |
Market Price | | | 18,107 | | | $ | 14,210 | | | | — | | | | 32,317 | |
| | | | 2,881,699 | | | | 14,210 | | | | — | | | | 2,895,909 | |
Investments in Securities – Liabilities | | | | | | | | | | | | | | | | |
Options Written: | | | | | | | | | | | | | | | | |
Market Price | | | (4,755 | ) | | | — | | | | — | | | | (4,755 | ) |
Totals | | $ | 2,876,944 | | | $ | 14,210 | | | | — | | | $ | 2,891,154 | |
| | | | | | | | | | | | | | | | |
| AllianzGI Ultra Micro Cap: | | | | | | | | | | | | |
| Investments in Securities – Assets | | Level 1–
Quoted Prices | | | Level 2–
Other Significant
Observable Inputs | | | Level 3–
Significant
Unobservable Inputs | | | Value at
9/30/18 | |
Common Stock | | $ | 32,860,892 | | | | — | | | | — | | | $ | 32,860,892 | |
Repurchase Agreements | | | — | | | $ | 1,147,000 | | | | — | | | | 1,147,000 | |
Totals | | $ | 32,860,892 | | | $ | 1,147,000 | | | | — | | | $ | 34,007,892 | |
| | | | | | |
| 330 | | September 30, 2018 | | | Annual Report | | |
At September 30, 2018, the following Funds had transfers between Levels 1 and 2:
| | | | | | | | |
| | | Transfers | |
| | | Level 1 to Level 2(a) | | | Level 2 to Level 1(b) | |
AllianzGI Best Styles Global Equity | | $ | 3,753,337 | | | $ | 555,933 | |
AllianzGI Best Styles International Equity | | | 722,001 | | | | 94,121 | |
AllianzGI Convertible | | | 10,115,119 | | | | — | |
AllianzGI Emerging Markets Consumer | | | 94,377 | | | | — | |
AllianzGI Emerging Markets Small-Cap | | | 398,559 | | | | 39,130 | |
AllianzGI Europe Equity Dividend | | | — | | | | 189,244 | |
AllianzGI Global Dynamic Allocation | | | 1,505,588 | | | | 472,041 | |
AllianzGI Global Water | | | 6,248,265 | | | | — | |
AllianzGI International Growth | | | 902,118 | | | | — | |
AllianzGI International Small-Cap | | | 9,931,641 | | | | — | |
AllianzGI NFJ Emerging Markets Value | | | 3,946,922 | | | | — | |
AllianzGI NFJ International Small-Cap Value | | | 327,285 | | | | 89,758 | |
| (a) | This transfer was a result of securities trading outside the U.S. whose values were not adjusted by the application of a modeling tool September 30, 2017, which was applied on September 30, 2018. |
| (b) | This transfer was a result of securities trading outside the U.S. whose values were adjusted by the application of a modeling tool at September 30, 2017, which was not applied on September 30, 2018. |
A roll forward of fair value measurements using significant unobservable inputs (Level 3) for the period or year ended September 30, 2018, was as follows:
| | | | | | | | | | | | | | | | | | | | | | | | | | | | | | | | | | | | |
| AllianzGI Multi Asset Income: | | | | | | | | | | | | | | | | | | | | | | |
| Investments in Securities – Assets | | Beginning
Balance
9/30/17 | | | Purchases | | | Sales | | | Accrued
Discount
(Premiums) | | | Net
Realized
Gain (Loss) | | | Net Change
in Unrealized
Appreciation/
Depreciation | | | Transfers into
Level 3 | | | Transfers out
of Level 3 | | | Ending
Balance
9/30/18 | |
Rights: | |
Food & Staples Retailing | | $ | 9 | | | | — | | | $ | (1 | ) | | | — | | | $ | (16 | ) | | $ | 8 | | | | — | | | | — | | | | — | |
| | | | | | | | | | | | | | | | | | | | | | | | | | | | | | | | | | | | |
| AllianzGI Best Styles Global Equity: | | | | | | | | | | | | | | | | | | | | | | |
| Investments in Securities – Assets | | Beginning
Balance
9/30/17 | | | Purchases | | | Sales | | | Accrued
Discount
(Premiums) | | | Net
Realized
Gain (Loss) | | | Net Change
in Unrealized
Appreciation/
Depreciation | | | Transfers into
Level 3*** | | | Transfers out
of Level 3 | | | Ending
Balance
9/30/18 | |
Common Stock: | |
China | | $ | 327,578 | | | | — | | | $ | (291,658 | ) | | | — | | | $ | 7,462 | | | $ | (42,228 | ) | | | — | | | | — | | | $ | 1,154 | |
Greece | | | — | | | | — | | | | — | | | | — | | | | — | | | | — | | | $ | 42,719 | | | | — | | | | 42,719 | |
Thailand | | | 4,713,778 | | | $ | 2,669,071 | | | | (4,041,562 | ) | | | — | | | | 908,631 | | | | (714,284 | ) | | | — | | | | — | | | | 3,535,634 | |
Totals | | $ | 5,041,356 | | | $ | 2,669,071 | | | $ | (4,333,220 | ) | | | — | | | $ | 916,093 | | | $ | (756,512 | ) | | $ | 42,719 | | | | — | | | $ | 3,579,507 | |
| | | | | | | | | | | | | | | | | | | | | | | | | | | | | | | | | | | | |
| AllianzGI Best Styles International Equity: | | | | | | | | | | | | | | | | | | | | | | |
| Investments in Securities – Assets | | Beginning
Balance
9/30/17 | | | Purchases | | | Sales | | | Accrued
Discount
(Premiums) | | | Net
Realized
Gain (Loss) | | | Net Change
in Unrealized
Appreciation/
Depreciation | | | Transfers into
Level 3 | | | Transfers out
of Level 3 | | | Ending
Balance
9/30/18 | |
Common Stock: | |
Thailand | | | — | | | $ | 63,782 | | | $ | (17,786 | ) | | | — | | | $ | 4,783 | | | $ | 7,831 | | | | — | | | | — | | | $ | 58,610 | |
| | | | | | | | | | | | | | | | | | | | | | | | | | | | | | | | | | | | |
| | | | | | |
| | Annual Report | | | September 30, 2018 | | 331 |
Notes to Financial Statements (cont’d)
September 30, 2018
| | | | | | | | | | | | | | | | | | | | | | | | | | | | | | | | | | | | |
| AllianzGI Best Styles U.S. Equity: | | | | | | | | | | | | | | | | | | | | | | |
| Investments in Securities – Assets | | Beginning
Balance
9/30/17 | | | Purchases | | | Sales | | | Accrued
Discount
(Premiums) | | | Net
Realized
Gain (Loss) | | | Net Change
in Unrealized
Appreciation/
Depreciation | | | Transfers into
Level 3 | | | Transfers out
of Level 3 | | | Ending
Balance
9/30/18 | |
Rights: | |
Food & Staples Retailing | | $ | 97 | | | | — | | | $ | (15 | ) | | | — | | | $ | (174 | ) | | $ | 92 | | | | — | | | | — | | | | — | |
| | | | | | | | | | | | | | | | | | | | | | | | | | | | | | | | | | | | |
| AllianzGI Convertible: | | | | | | | | | | | | | | | | | | | | | | | | | | | |
| Investments in Securities – Assets | | Beginning
Balance
9/30/17 | | | Purchases | | | Sales | | | Accrued
Discount
(Premiums) | | | Net
Realized
Gain (Loss) | | | Net Change
in Unrealized
Appreciation/
Depreciation | | | Transfers into
Level 3 | | | Transfers out
of Level 3 | | | Ending
Balance
9/30/18 | |
Convertible Bonds & Notes: | |
IT Services | | $ | 5,583,172 | | | | — | | | $ | (3,897,039 | ) | | $ | 699 | | | $ | 302,039 | | | $ | (122,624 | ) | | | — | | | | — | | | $ | 1,866,247 | |
| | | | | | | | | | | | | | | | | | | | | | | | | | | | | | | | | | | | |
| AllianzGI Emerging Markets Consumer: | | | | | | | | | | | | | | | | | | | | | | |
| Investments in Securities – Assets | | Beginning
Balance
9/30/17 | | | Purchases | | | Sales | | | Accrued
Discount
(Premiums) | | | Net
Realized
Gain (Loss) | | | Net Change
in Unrealized
Appreciation/
Depreciation | | | Transfers into
Level 3 | | | Transfers out
of Level 3 | | | Ending
Balance
9/30/18 | |
Common Stock: | |
China | | $ | 568,706 | | | | — | | | $ | (587,099 | ) | | | — | | | $ | 101,375 | | | $ | (82,982 | ) | | | — | | | | — | | | | — | |
Russian Federation | | | 420,761 | | | $ | 2,806 | | | | (383,601 | ) | | | — | | | | 218,209 | | | | (258,175 | ) | | | — | | | | — | | | | — | |
Thailand | | | 1,685,931 | | | | 2,762,355 | | | | (1,792,849 | ) | | | — | | | | 128,752 | | | | (27,356 | ) | | | — | | | | — | | | $ | 2,756,833 | |
Totals | | $ | 2,675,398 | | | $ | 2,765,161 | | | $ | (2,763,549 | ) | | | — | | | $ | 448,336 | | | $ | (368,513 | ) | | | — | | | | — | | | $ | 2,756,833 | |
| | | | | | | | | | | | | | | | | | | | | | | | | | | | | | | | | | | | |
| AllianzGI Emerging Markets Small-Cap: | |
| Investments in Securities – Assets | | Beginning
Balance
9/30/17 | | | Purchases | | | Sales | | | Accrued
Discount
(Premiums) | | | Net
Realized
Gain (Loss) | | | Net Change
in Unrealized
Appreciation/
Depreciation | | | Transfers into
Level 3 | | | Transfers out
of Level 3 | | | Ending
Balance
9/30/18 | |
Common Stock: | |
Czech Republic | | | — | | | | — | | | | — | | | | — | | | | — | | | | — | | | $ | 22,945 | *** | | | — | | | $ | 22,945 | |
Russian Federation | | $ | 186,376 | | | $ | 85,791 | | | $ | (223,679 | ) | | | — | | | $ | 15,967 | | | $ | (24,779 | ) | | | — | | | | — | | | | 39,676 | |
Thailand | | | 281,516 | | | | 829,624 | | | | (394,062 | ) | | | — | | | | (9,994 | ) | | | 53,167 | | | | — | | | | — | | | | 760,251 | |
Rights: | |
Korea (Republic of) | | | 1,533 | | | | — | | | | — | # | | | — | | | | — | | | | (1,533 | ) | | | — | | | | — | | | | — | |
Preferred Stock: | |
Russian Federation | | | — | | | | 280,399 | | | | (15,073 | ) | | | — | | | | 333 | | | | 27,043 | | | | — | | | | — | | | | 292,702 | |
Totals | | $ | 469,425 | | | $ | 1,195,814 | | | $ | (632,814 | ) | | | — | | | $ | 6,306 | | | $ | 53,898 | | | $ | 22,945 | | | | — | | | $ | 1,115,574 | |
| | | | | | | | | | | | | | | | | | | | | | | | | | | | | | | | | | | | |
| AllianzGI Global Dynamic Allocation: | |
| Investments in Securities – Assets | | Beginning
Balance
9/30/17 | | | Purchases | | | Sales | | | Accrued
Discount
(Premiums) | | | Net
Realized
Gain (Loss) | | | Net Change
in Unrealized
Appreciation/
Depreciation | | | Transfers into
Level 3 | | | Transfers out
of Level 3 | | | Ending
Balance
9/30/18 | |
Common Stock: | |
China | | $ | 55,432 | | | | — | | | $ | (49,499 | ) | | | — | | | $ | 3,524 | | | $ | (9,423 | ) | | | — | | | | — | | | $ | 34 | |
Greece | | | — | | | | — | | | | — | | | | — | | | | — | | | | — | | | $ | 10,933 | *** | | | — | | | | 10,933 | |
Taiwan | | | — | | | | — | | | | — | | | | — | | | | — | | | | — | | | | 2,868 | ** | | | — | | | | 2,868 | |
Thailand | | | 891,846 | | | $ | 711,247 | | | | (599,628 | ) | | | — | | | | 49,157 | | | | 65,362 | | | | 186,308 | † | | | — | | | | 1,304,292 | |
Rights: | |
Thailand | | | 133 | | | | — | | | | — | # | | | — | | | | — | | | | (133 | ) | | | — | | | | — | | | | — | |
United States | | | 83 | | | | — | | | | (13 | ) | | | — | | | | (142 | ) | | | 72 | | | | — | | | | — | | | | — | |
Totals | | $ | 947,494 | | | $ | 711,247 | | | $ | (649,140 | ) | | | — | | | $ | 52,539 | | | $ | 55,878 | | | $ | 200,109 | | | | — | | | $ | 1,318,127 | |
| | | | | | |
| 332 | | September 30, 2018 | | | Annual Report | | |
| | | | | | | | | | | | | | | | | | | | | | | | | | | | | | | | | | | | |
| AllianzGI High Yield Bond: | |
| Investments in Securities – Assets | | Beginning
Balance
9/30/17 | | | Purchases | | | Sales | | | Accrued
Discount
(Premiums) | | | Net
Realized
Gain (Loss) | | | Net Change
in Unrealized
Appreciation/
Depreciation | | | Transfers into
Level 3††† | | | Transfers out
of Level 3 | | | Ending
Balance
9/30/18 | |
Corporate Bonds & Notes: | |
Commercial Services | | | — | | | | — | | | | — | | | | — | | | | — | | | | — | | | $ | 126,445 | | | | — | | | $ | 126,445 | |
Media | | $ | 17,256 | | | | — | | | | — | | | | — | | | | — | | | $ | (17,201 | ) | | | — | | | | — | | | | 55 | |
Preferred Stock | | | 6,385,000 | | | | — | | | $ | (489,341 | ) | | | — | | | $ | 136,715 | | | | 89,252 | | | | — | | | | — | | | | 6,121,626 | |
Common Stock: | |
Advertising | | | 489,997 | | | | — | | | | — | | | | — | | | | — | | | | (868 | ) | | | — | | | | — | | | | 489,129 | |
Aerospace & Defense | | | 77,816 | | | | — | | | | — | | | | — | | | | — | | | | 10,566 | | | | — | | | | — | | | | 88,382 | |
Media | | | 7 | | | | — | | | | — | | | | — | | | | — | | | | — | | | | — | | | | — | | | | 7 | |
Warrants: | |
Commercial Services | | | 45,640 | | | | — | | | | — | | | | — | | | | — | | | | (45,637 | ) | | | — | | | | — | | | | 3 | |
Media | | | 1 | | | | — | | | | — | | | | — | | | | — | | | | — | | | | — | | | | — | | | | 1 | |
Totals | | $ | 7,015,717 | | | | — | | | $ | (489,341 | ) | | | — | | | $ | 136,715 | | | $ | 36,112 | | | $ | 126,445 | | | | — | | | $ | 6,825,648 | |
| | | | | | | | | | | | | | | | | | | | | | | | | | | | | | | | | | | | |
| AllianzGI NFJ Emerging Markets Value: | |
| Investments in Securities – Assets | | Beginning
Balance
9/30/17 | | | Purchases | | | Sales | | | Accrued
Discount
(Premiums) | | | Net
Realized
Gain (Loss) | | | Net Change
in Unrealized
Appreciation/
Depreciation | | | Transfers into
Level 3 | | | Transfers out
of Level 3 | | | Ending
Balance
9/30/18 | |
Common Stock: | |
China | | | — | | | $ | 1,274,675 | | | $ | (11,943 | ) | | | — | | | $ | 1,980 | | | $ | (342,731 | ) | | | — | | | | — | | | $ | 921,981 | |
Russian Federation | | | — | | | | 3,879,682 | | | | (472,790 | ) | | | — | | | | 33,916 | | | | 290,670 | | | | — | | | | — | | | | 3,731,478 | |
Preferred Stock: | |
Russian Federation | | $ | 471,283 | | | | 96,838 | | | | (550,756 | ) | | | — | | | | (26,228 | ) | | | 8,863 | | | | — | | | | — | | | | — | |
Totals | | $ | 471,283 | | | $ | 5,251,195 | | | $ | (1,035,489 | ) | | | — | | | $ | 9,668 | | | $ | (43,198 | ) | | | — | | | | — | | | $ | 4,653,459 | |
| | | | | | | | | | | | | | | | | | | | | | | | | | | | | | | | | | | | |
| AllianzGI NFJ International Small-Cap Value: | |
| Investments in Securities – Assets | | Beginning
Balance
9/30/17 | | | Purchases | | | Sales | | | Accrued
Discount
(Premiums) | | | Net
Realized
Gain (Loss) | | | Net Change
in Unrealized
Appreciation/
Depreciation | | | Transfers into
Level 3 | | | Transfers out
of Level 3†† | | | Ending
Balance
9/30/18 | |
Common Stock: | |
Australia | | $ | 39,195 | | | | — | | | $ | (32,527 | ) | | | — | | | $ | 15,310 | | | $ | 27,099 | | | | — | | | $ | (49,077 | ) | | | — | |
The tables above may include Level 3 investments that are valued by brokers or independent pricing services.
The following table presents additional information about valuation techniques and inputs used for investments that are measured at fair value and categorized within Level 3 at September 30, 2018:
| | | | | | | | | | | | |
| AllianzGI High Yield Bond: | |
| Investments in Securities – Assets | | Ending
Balance
at 9/30/18 | | | Valuation
Technique Used | | Unobservable
Inputs | | Input Values (Ranges) | |
Preferred Stock | | $ | 363,526 | | | Market and Company Comparables | | EV Multiples | | | 0.73x (0.35x-1.22x | ) |
| | | | | | | | | Applicable Liquidity Multiple | | | 1.60 | |
| | | | | | | | | Illiquidity Discount | | | 25 | % |
| | | $ | 5,758,100 | | | Market and Company Comparables | | EV Multiples | | | 0.73x (0.35x-1.22x | ) |
| | | | | | | | | Illiquidity Discount | | | 25 | % |
| | | | | | |
| | Annual Report | | | September 30, 2018 | | 333 |
Notes to Financial Statements (cont’d)
September 30, 2018
| | | | | | | | | | | | |
| AllianzGI High Yield Bond (cont’d) | |
| Investments in Securities – Assets | | Ending
Balance
at 9/30/18 | | | Valuation
Technique Used | | Unobservable
Inputs | | Input Values (Ranges) | |
Common Stock | | $ | 489,129 | | | Market and Company Comparables | | EV Multiples | | | 5.14x (2.11x-10.04x | ) |
| | | | | | | | | Illiquidity Discount | | | 20 | % |
| | | $ | 88,382 | | | Market and Company Comparables | | EV Multiples | | | 0.74x (0.53x-1.15x | ) |
| | | | | | | | | M&A Transaction Multiples | | | 0.87x (0.32x-2.12x | ) |
| | | | | | | | | Illiquidity Discount | | | 40 | % |
| | | | | | | | | | | | |
The table above does not include Level 3 investments that are valued by brokers or independent pricing services.
| * | Other financial instruments are derivatives, such as swap agreements, futures contracts, and forward foreign currency contracts which are valued at the unrealized appreciation (depreciation) of the instrument. |
| ** | Transferred out of Level 2 and into Level 3 because trading on the security was halted. |
| *** | Transferred out of Level 1 and into Level 3 because trading on the security was halted. |
| † | Transferred out of Level 2 and into Level 3 due to an exchange traded closing price being unavailable or unreliable at September 30, 2018. |
| †† | Transferred out of Level 3 and into Level 2 because an evaluated price from a third-party independent pricing vendor was used on September 30, 2018. |
| ††† | Transferred out of Level 2 and into Level 3 due to a current evaluated price was not unavailable for the security at September 30, 2018. |
| # | Rights were exercised/expired. |
The net change in unrealized appreciation/depreciation of Level 3 investments which the following Funds held at September 30, 2018 was:
| | | | |
AllianzGI Best Styles Global Equity | | $ | (287,560 | ) |
AllianzGI Best Styles International Equity | | | 7,831 | |
AllianzGI Convertible | | | 17,290,120 | |
AllianzGI Emerging Markets Consumer | | | 213,862 | |
AllianzGI Emerging Markets Small-Cap | | | 98,081 | |
AllianzGI Global Dynamic Allocation | | | (21,498 | ) |
AllianzGI High Yield Bond | | | (1,864,984 | ) |
AllianzGI NFJ Emerging Markets Value | | | (52,061 | ) |
Net realized gain (loss) and net change in unrealized appreciation/depreciation are reflected on the Statements of Operations.
(c) Investment Transactions and Investment Income. Investment transactions are accounted for on the trade date. Securities purchased or sold on a when-issued or delayed-delivery basis may be settled beyond a standard settlement period for the security after the trade date. Realized gains and losses on investments are determined on an identified cost basis. Estimated tax liabilities on certain foreign securities are recorded on an accrual basis and are reflected as a component of net change in unrealized appreciation (depreciation) of investments on the Statements of Operations. Tax liabilities realized as a result of such security sales are reflected as a component of net realized gain (loss) on investments on the Statements of Operations. Interest income adjusted for the accretion of discounts and amortization of premiums is recorded on an accrual basis. Discounts or premiums on debt securities purchased are accreted or amortized, respectively, to interest income. Conversion premium is not amortized. Dividend income is recorded on the ex-dividend date, except for certain dividends from foreign securities where the ex-dividend date may have passed, and then are recorded as soon after the ex-dividend date as the Funds, using reasonable diligence, become aware of such dividends. Payments received on synthetic convertible securities are generally
included in dividends. Dividend and interest income on the Statements of Operations are shown net of any foreign taxes withheld on income from foreign securities. Payments received from real estate investment trust securities may be comprised of dividends, realized gains and return of capital. The payment may initially be recorded as dividend income and may subsequently be reclassified as realized gains and/or return of capital upon receipt of information from the issuer. Payments considered return of capital reduce the cost basis of the respective security. Distributions, if any, in excess of the cost basis of a security are recognized as capital gains. Dividends from underlying funds are recorded as dividend income, while capital gain distributions are recorded as net capital gain distributions received from underlying funds on the Statements of Operations. Facility fees and other fees (such as origination fees) received on settlement date are amortized as income over the expected term of the senior loan. Facility fees and other fees received after settlement date relating to senior loans, commitment fees received relating to unfunded purchase or lending commitments and consent fees relating to corporate actions are recorded as miscellaneous income upon receipt. Paydown gains and losses are netted and recorded as interest income on the Statements of Operations. Expenses are recorded on an accrual basis and such expenses exclude those of the underlying funds. Expenses of the underlying funds are reflected in the net asset values of those funds.
| | | | | | |
| 334 | | September 30, 2018 | | | Annual Report | | |
(d) Federal Income Taxes. The Funds intend to distribute all of their taxable income and to comply with the other requirements of Subchapter M of the U.S. Internal Revenue Code of 1986, as amended, applicable to regulated investment companies. Accordingly, no provision for U.S. federal income taxes is required. The Funds may be subject to excise tax based on distributions to shareholders.
Accounting for uncertainty in income taxes establishes for all entities, including pass-through entities such as the Funds, a minimum threshold for financial statement recognition of the benefit of positions taken in filing tax returns (including whether an entity is taxable in a particular jurisdiction), and requires certain expanded tax disclosures. In accordance with provisions set forth under U.S. GAAP, the Investment Manager has reviewed the Funds’ tax positions for all open tax years. As of September 30, 2018, the Funds have recorded no liability for net unrecognized tax benefits relating to uncertain income tax positions they have taken. The Funds’ federal income tax returns for the prior three years, as applicable, remain subject to examination by the Internal Revenue Service.
(e) Dividends and Distributions to Shareholders. The Funds (except AllianzGI Multi Asset Income, AllianzGI Global Allocation, AllianzGI Convertible, AllianzGI Core Bond, AllianzGI Core Plus Bond, AllianzGI Emerging Markets Debt, AllianzGI Europe Equity Dividend, AllianzGI Global High Yield, AllianzGI High Yield Bond, AllianzGI NFJ Emerging Markets Value, AllianzGI Preferred Securities and Income, AllianzGI Real Estate Debt, AllianzGI Short Duration High Income and AllianzGI Short Term Bond) declare dividends and distributions from net investment income and net realized capital gains, if any, annually. AllianzGI Global Allocation, AllianzGI Convertible, AllianzGI Emerging Markets Debt, AllianzGI Europe Equity Dividend, AllianzGI Global High Yield and AllianzGI NFJ Emerging Markets Value declare dividends from net investment income quarterly and distributions from net realized capital gains, if any, annually. AllianzGI Core Bond, AllianzGI Core Plus Bond, AllianzGI High Yield Bond, AllianzGI Preferred Securities and Income, AllianzGI Real Estate Debt, AllianzGI Short Duration High Income and AllianzGI Short Term Bond declare dividends from net investment income monthly and distributions from net realized capital gains, if any, annually. AllianzGI Multi Asset Income declares dividends from net investment income and/or distributions from short-term capital gains monthly. Net realized capital gains, if any, will continue to be distributed annually by the Fund. The Funds record dividends and distributions to their respective shareholders on the ex-dividend date. The amount of dividends from net investment income and distributions from net realized capital gains is determined in accordance with federal income tax regulations, which may differ from U.S. GAAP. These “book-tax” differences are considered either temporary or permanent in nature. To the extent these differences are permanent in nature, such amounts are reclassified within the capital accounts based on their federal income tax treatment. Temporary differences do not require reclassification. To the extent dividends and/or distributions exceed current and accumulated earnings and profits for federal income tax purposes, they are reported as dividends and/or distributions to shareholders from return of capital.
(f) Multi-Class Operations. Each class offered by the Trust has equal rights as to assets and voting privileges (except that shareholders of a class have exclusive voting rights regarding any matter relating solely to that class of shares). Income, non-class specific expenses, and realized and unrealized capital gains and losses of each Fund are allocated daily to each class of shares based on the relative net assets of each class. Class specific expenses, where applicable, include administration, administrative servicing, distribution, recoupment, servicing and sub-transfer agent fees.
(g) Foreign Currency Translation. The Funds’ accounting records are maintained in U.S. dollars as follows: (1) the foreign currency market values of investments and other assets and liabilities denominated in foreign currencies are translated at the prevailing exchange rate at the end of the period; and (2) purchases and sales, income and expenses are translated at the prevailing exchange rate on the respective dates of such transactions. The resulting net foreign currency gain (loss) is included in the Funds’ Statements of Operations.
The Funds do not generally isolate that portion of the results of operations arising as a result of changes in foreign currency exchange rates from the fluctuations arising from changes in the market prices of securities. Accordingly, such foreign currency gain (loss) is included in net realized and unrealized gain (loss) on investments. However, the Funds do isolate the effect of fluctuations in foreign currency exchange rates when determining the gain (loss) upon the sale or maturity of foreign currency denominated debt obligations pursuant to U.S. federal income tax regulations; such amount is categorized as foreign currency gain (loss) for both financial reporting and income tax reporting purposes.
(h) Repurchase Agreements. The Funds are parties to Master Repurchase Agreements (“Master Repo Agreements”) with select counterparties. The Master Repo Agreements include provisions for initiation of repurchase transactions, income payments, events of default, and maintenance of collateral.
The Funds enter into transactions, under the Master Repo Agreements, with their custodian bank or securities brokerage firms whereby they purchase securities under agreements (i.e., repurchase agreements) to resell such securities at an agreed upon price and date. The Funds, through their custodian, take possession of securities collateralizing the repurchase agreement. Such agreements are carried at the contract amount in the financial statements, which is considered to represent fair value. The collateral that is pledged (i.e. the securities received by the Funds), which consists primarily of U.S. government obligations and asset-backed securities, is held by the custodian bank for the benefit of the Funds until maturity of the repurchase agreement. Provisions of the repurchase agreements and the procedures adopted by the Funds require that the market value of the collateral, including accrued interest thereon, be sufficient in the event of default by the counterparty. If the counterparty defaults under the Master Repo Agreements and the value of the collateral declines or if the counterparty enters an insolvency proceeding, realization of the collateral by the Funds may be delayed or limited. The gross values are
| | | | | | |
| | Annual Report | | | September 30, 2018 | | 335 |
Notes to Financial Statements (cont’d)
September 30, 2018
included in the Funds’ Schedules of Investments. As of September 30, 2018, the value of the related collateral exceeded the value of the repurchase agreements.
(i) Warrants. The Funds may receive warrants. Warrants are securities that are usually issued together with a debt security or preferred stock and that give the holder the right to buy a proportionate amount of common stock at a specified price. Warrants may be freely transferable and are often traded on major exchanges. Warrants normally have a life that is measured in years and entitle the holder to buy common stock of a company at a price that is usually higher than the market price at the time the warrant is issued. Warrants may entail greater risks than certain other types of investments. Generally, warrants do not carry the right to receive dividends or exercise voting rights with respect to the underlying securities, and they do not represent any rights in the assets of the issuer. In addition, their value does not necessarily change with the value of the underlying securities, and they cease to have value if they are not exercised on or before their expiration date. If the market price of the underlying stock does not exceed the exercise price during the life of the warrant, the warrant will expire worthless. Warrants may increase the potential profit or loss to be realized from the investment as compared with investing the same amount in the underlying securities. Similarly, the percentage increase or decrease in the value of an equity security warrant may be greater than the percentage increase or decrease in the value of the underlying common stock. Warrants may relate to the purchase of equity or debt securities. Debt obligations with warrants attached to purchase equity securities have many characteristics of convertible securities and their prices may, to some degree, reflect the performance of the underlying stock. Debt obligations also may be issued with warrants attached to purchase additional debt securities at the same coupon rate. A decline in interest rates would permit a Fund to sell such warrants at a profit. If interest rates rise, these warrants would generally expire with no value.
(j) Rights. The Funds may receive rights. A right is a privilege granted to existing shareholders of a corporation to subscribe for shares of a new issue of common stock before it is issued. Rights normally have a short life, usually two to four weeks, are freely transferable and entitle the holder to buy the new common stock at a lower price than the public offering price. Rights may entail greater risks than certain other types of investments. Generally, rights do not carry the right to receive dividends or exercise voting rights with respect to the underlying securities, and they do not represent any rights in the assets of the issuer. In addition, their value does not necessarily change with the value of the underlying securities, and they cease to have value if they are not exercised on or before their expiration date. If the market price of the underlying stock does not exceed the exercise price during the life of the right, the right will expire worthless. Rights may increase the potential profit or loss to be realized from the investment as compared with investing the same amount in the underlying securities.
(k) Senior Loans. The Funds may purchase assignments of, and participations in, Senior Loans originated, negotiated and structured by a U.S. or foreign commercial bank, insurance company, finance
company or other financial institution for a lending syndicate of financial institutions (the “Lender”). When purchasing an assignment, the Funds succeed to all the rights and obligations under the loan agreement with the same rights and obligations as the assigning Lender. Assignments may, however, be arranged through private negotiations between potential assignees and potential assignors, and the rights and obligations acquired by the purchaser of an assignment may differ from, and be more limited than, those held by the assigning Lender. The Funds may also enter into lending arrangements involving unfunded loan commitments, which are contractual obligations for future funding. Unfunded loan commitments may include revolving credit facilities, which may obligate the Funds to supply additional cash to the borrower on demand. Unfunded loan commitments represent a future obligation, even though a percentage of the principal amounts may never be utilized by the borrower.
Certain Funds may purchase the securities of distressed companies (including assignments or direct investments), including companies engaged in restructurings or bankruptcy proceedings. Investments in distressed companies may include senior obligations of an issuer issued in connection with a restructuring under Chapter 11 of the U.S. Bankruptcy Code (commonly known as “debtor-in-possession” or “DIP” financings). Debtor-in-possession financings generally allow the issuer to continue its operations while reorganizing. Such financings constitute senior liens on unencumbered collateral (i.e., collateral not subject to other creditors’ claims). There is risk that the issuer under a debtor-in-possession financing will not emerge from Chapter 11 and be forced to liquidate its assets under Chapter 7 of the U.S. Bankruptcy Code. In the event of liquidation, the Funds’ only recourse would be against the collateral securing the debtor-in-possession financing.
(l) Payment In-Kind Securities. The Funds may invest in payment in-kind securities, which are debt or preferred stock securities that require or permit payment of interest in the form of additional securities. Payment in-kind securities allow the issuer to avoid or delay the need to generate cash to meet current interest payments and, as a result, may involve greater risk than securities that pay interest currently or in cash.
(m) U.S. Government Agencies or Government-Sponsored Enterprises. Securities issued by U.S. Government agencies or government-sponsored enterprises may not be guaranteed by the U.S. Treasury. The Government National Mortgage Association (“GNMA” or “Ginnie Mae”), a wholly-owned U.S. Government corporation, is authorized to guarantee, with the full faith and credit of the U.S. Government, the timely payment of principal and interest on securities issued by institutions approved by GNMA and backed by pools of mortgages insured by the Federal Housing Administration or guaranteed by the Department of Veterans Affairs. Government-related guarantors not backed by the full faith and credit of the U.S. Government include the Federal National Mortgage Association (“FNMA” or “Fannie Mae”) and the Federal Home Loan Mortgage Corporation (“FHLMC” or “Freddie Mac”). Pass-through securities issued by FNMA are guaranteed as to timely payment of principal and interest by FNMA, but are not backed by the full faith and credit of the
| | | | | | |
| 336 | | September 30, 2018 | | | Annual Report | | |
U.S. Government. FHLMC guarantees the timely payment of interest and ultimate collection of principal, but its participation certificates are not backed by the full faith and credit of the U.S. Government.
(n) Exchange-Traded Funds. Certain Funds may invest in exchange-traded funds (“ETFs”), which typically are index-based investment companies that hold substantially all of their assets in securities representing their specific index, but may also be actively-managed investment companies. Shares of ETFs trade throughout the day on an exchange and represent an investment in a portfolio of securities and other assets. As a shareholder of another investment company, the Funds would bear their pro rata portion of the other investment company’s expenses, including advisory fees, in addition to the expenses the Funds bear directly in connection with their own operations.
(o) Inflation-Indexed Bonds. Certain Funds may invest in inflation-indexed bonds. Inflation-indexed bonds are fixed income securities whose principal value is periodically adjusted to the rate of inflation. The interest rate on these bonds is generally fixed at issuance at a rate lower than typical bonds. Over the life of an inflation-indexed bond, however, interest will be paid based on a principal value which is adjusted for inflation.
(p) Convertible Securities. Certain Funds’ may invest a portion of their assets in convertible securities. Although convertible securities derive part of their value from that of the securities into which they are convertible, they are not considered derivative financial instruments. However, certain of the Funds’ investments in convertible securities include features which render them sensitive to price changes in their underlying securities. The value of structured/synthetic convertible securities can be affected by interest rate changes and credit risks of the issuer. Such securities may be structured in ways that limit their potential for capital appreciation and the entire value of the security may be at risk of loss depending on the performance of the underlying equity security. Consequently, the Funds are exposed to greater downside risk than traditional convertible securities, but typically still less than that of the underlying stock.
(q) When-Issued/Delayed-Delivery Transactions. When-issued or delayed-delivery transactions involve a commitment to purchase or sell securities for a predetermined price or yield, with payment and delivery taking place beyond the customary settlement period. When delayed-delivery purchases are outstanding, the Funds will set aside and maintain until the settlement date in a designated account, liquid assets in an amount sufficient to meet the purchase price. Upon entering into these when-issued or delayed-delivery transactions, the Funds and the counterparties are required to pledge to the other party an amount of cash or securities collateral when either party has a net exposure that exceeds the minimum transfer amount of the other party. When purchasing a security on a delayed-delivery basis, the Funds assume the rights and risks of ownership of the security, including the risk of price and yield fluctuations; consequently, such fluctuations are taken into account when determining the NAV. The Funds may dispose of or renegotiate a delayed-delivery transaction
after it is entered into, and may sell when-issued securities before they are delivered, which may result in a realized gain or loss. When a security is sold on a delayed-delivery basis, the Funds do not participate in future gains and losses with respect to the security.
(r) Securities Traded on To-Be-Announced Basis. The Funds may from time to time purchase securities on a to-be-announced (“TBA”) basis. In a TBA transaction, the Fund commits to purchasing or selling securities for which all specific information is not yet known at the time of the trade, particularly the face amount and maturity date of the underlying security transactions. Securities purchased on a TBA basis are not settled until they are delivered to the Fund, normally 15 to 45 days later. Beginning on the date the Fund enters into a TBA transaction, cash, U.S. government securities or other liquid securities are segregated in an amount equal in value to the purchase price of the TBA security. These transactions are subject to market fluctuations, and their current value is determined in the same manner as for other securities.
(s) Contingent Value Rights. A Fund may invest in contingent value rights (“CVRs”). A CVR gives the holder the right to receive an amount (which may be a fixed amount or determined by a formula) in the event that a specified corporate action, business milestone, or other trigger occurs (or does not occur) which is often subject to an expiration date. CVRs often are awarded to shareholders in the context of a corporate acquisition or major restructuring. For example, shareholders of an acquired company may receive a CVR that enables them to receive additional shares of the acquiring company in the event that the acquiring company’s share price falls below a certain level by a specified date. Risks associated with the use of CVRs are generally similar to risks associated with the use of options, such as the risk that the required trigger does not (or does) occur prior to a CVR’s expiration, causing the CVR to expire with no value. CVRs also present illiquidity risk, as they may not be registered securities or may otherwise be non-transferable or difficult to transfer, as well as counterparty risk and credit risk. Further, because CVRs are valued based on the likelihood of the occurrence of a trigger, valuation often requires modeling and judgment, which increases the risk of mispricing or improper valuation.
(t) Restricted Securities. The Funds are permitted to invest in securities that are subject to legal or contractual restrictions on resale. These securities generally may be resold in transactions exempt from registration or to the public if the securities are registered. Disposal of these securities may involve time-consuming negotiations and expenses, and prompt sale at an acceptable price may be difficult.
(u) Organizational and Offering Costs. Organizational costs are expensed at the inception of the Fund. Offering costs are amortized over a twelve-month period from the inception of the Fund.
(v) Loan Interest Expense. Loan interest expense relates to the amounts borrowed under the credit facility (See Note 12). Loan interest expense is recorded as it is incurred.
| | | | | | |
| | Annual Report | | | September 30, 2018 | | 337 |
Notes to Financial Statements (cont’d)
September 30, 2018
In the normal course of business, the Funds trade financial instruments and enter into financial transactions where risk of potential loss exists due to, among other things, changes in the market (market risk) or failure of the other party to a transaction to perform (counterparty risk).
The Funds are also exposed to other risks such as, but not limited to, interest rate, foreign currency, credit and leverage risks.
Interest rate risk is the risk that fixed income securities’ valuations will change because of changes in interest rates. During periods of rising nominal interest rates, the values of fixed income instruments are generally expected to decline. Conversely, during periods of declining nominal interest rates, the values of fixed income instruments are generally expected to rise. To the extent that a Fund effectively has short positions with respect to fixed income instruments, the values of such short positions would generally be expected to rise when nominal interest rates rise and to decline when nominal interest rates decline. A nominal interest rate can be described as the sum of a real interest rate and an expected inflation rate. Fixed income securities with longer durations tend to be more sensitive to changes in interest rates, usually making them more volatile than securities with shorter durations. Duration is used primarily as a measure of the sensitivity of a fixed income security’s market price to interest rate (i.e., yield) movements. Interest rate changes can be sudden and unpredictable, and the Funds may lose money as a result of movements in interest rates. High-yield or junk bonds are subject to greater levels of credit and liquidity risk, may be speculative and may decline in value due to increase in interest rates or an issuer’s deterioration or default. The Funds may not be able to hedge against changes in interest rates or may choose not to do so for cost or other reasons. In addition, any hedges may not work as intended. The values of equity and other non-fixed income securities may also decline due to fluctuations in interest rates.
Variable and floating rate securities generally are less sensitive to interest rate changes but may decline in value if their interest rates do not rise as much, or as quickly, as interest rates in general. Conversely, floating rate securities will not generally increase in value if interest rates decline. Inverse floating rate securities may decrease in value if interest rates increase. Inverse floating rate securities may also exhibit greater price volatility than a fixed rate obligation with similar credit quality. When the Funds hold variable or floating rate securities, a decrease (or, in the case of inverse floating rate securities, an increase) in market interest rates will adversely affect the income received from such securities and the NAV of the Funds’ shares.
The Funds are exposed to credit risk, which is the risk of losing money if the issuer or guarantor of a fixed income security is unable or unwilling, or is perceived (whether by market participants, rating agencies, pricing services or otherwise) as unable or unwilling, to make timely principal and/or interest payments, or to otherwise honor its obligations. Securities are subject to varying degrees of credit risk, which are often reflected in credit ratings.
To the extent the Funds directly invest in foreign currencies or in securities that trade in, and receive revenues in, foreign currencies, or in derivatives that provide exposure to foreign currencies, they will be subject to the risk that those currencies will decline in value relative to the U.S. dollar, or, in the case of hedging positions, that the U.S. dollar will decline in value relative to the currency being hedged. Currency rates in foreign countries may fluctuate significantly over short periods of time for a number of reasons, including economic growth, inflation, changes in interest rates, intervention (or the failure to intervene) by U.S. or foreign governments, central banks or supranational entities such as the International Monetary Fund, or the imposition of currency controls or other political developments in the United States or abroad. As a result, the Funds’ investments in foreign currency-denominated securities may reduce the returns of the Funds. The local emerging market currencies in which the Funds may be invested may experience substantially greater volatility against the U.S. dollar than the major convertible currencies in developed countries.
The Funds are subject to elements of risk not typically associated with investments in the U.S., due to concentrated investments in foreign issuers located in a specific country or region. Such concentrations will subject the Funds to additional risks resulting from future political or economic conditions in such country or region and the possible imposition of adverse governmental laws or currency exchange restrictions affecting such country or region, which could cause the securities and their markets to be less liquid and prices more volatile than those of comparable U.S. companies.
The market values of securities may decline due to general market conditions (market risk) which are not specifically related to a particular company, such as real or perceived adverse economic conditions, changes in the general outlook for corporate earnings, changes in interest or currency rates, adverse changes to credit markets or adverse investor sentiment. They may also decline due to factors that affect a particular industry or industries, such as labor shortages or increased production costs and competitive conditions within an industry. Equity securities and equity-related investments generally have greater market price volatility than fixed income securities, although under certain market conditions fixed income securities may have comparable or greater price volatility. Credit ratings downgrades may also negatively affect securities held by the Funds. Even when markets perform well, there is no assurance that the investments held by the Funds will increase in value along with the broader market. In addition, market risk includes the risk that geopolitical events will disrupt the economy on a national or global level.
The Funds are exposed to counterparty risk, or the risk that an institution or other entity with which the Funds have unsettled or open transactions will default. The potential loss to the Funds could exceed the value of the financial assets recorded in the Funds’ financial statements. Financial assets, which potentially expose the Funds to counterparty risk, consist principally of cash due from counterparties and investments. The Investment Manager seeks to minimize the Funds’ counterparty risk by performing reviews of each counterparty
| | | | | | |
| 338 | | September 30, 2018 | | | Annual Report | �� | |
and by minimizing concentration of counterparty risk by undertaking transactions with multiple customers and counterparties on recognized and reputable exchanges. Delivery of securities sold is only made once the Funds have received payment. Payment is made on a purchase once the securities have been delivered by the counterparty. The trade will fail if either party fails to meet its obligation.
The Funds are exposed to risks associated with leverage. Leverage may cause the value of the Funds’ shares to be more volatile than if the Funds did not use leverage. This is because leverage tends to exaggerate the effect of any increase or decrease in the value of the Funds’ portfolio securities. The Funds may engage in transactions or purchase instruments that give rise to forms of leverage. In addition, to the extent the Funds employ leverage, dividend and interest costs on such leverage may not be recovered by any appreciation of the securities purchased with the leverage proceeds and could exceed the Funds’ investment returns, resulting in greater losses.
The Funds may hold defaulted securities that may involve special considerations including bankruptcy proceedings, other regulatory and legal restrictions affecting the Funds’ ability to trade, and the availability of prices from independent pricing services or dealer quotations. Defaulted securities are often illiquid and may not be actively traded. Sale of securities in bankrupt companies at an acceptable price may be difficult and differences compared to the value of the securities used by the Funds could be material. A Fund may incur additional expenses to the extent it is required to seek recovery upon a portfolio security’s default in the payment of principal or interest. In any bankruptcy proceeding relating to a defaulted investment, a Fund may lose its entire investment or may be required to accept cash or securities with a value substantially less than its original investment.
Investments in senior loans and repurchase agreements also involve special risks. Although typically secured, senior loans may not be backed by sufficient collateral to satisfy their issuers’ obligations in the event of bankruptcy or similar scenarios. Senior loans may also be illiquid. Similarly, repurchase agreements may result in losses if the collateral associated with such positions is insufficient in the event of a counterparty default or similar scenario. Repurchase agreement positions may also be illiquid.
AllianzGI PerformanceFee Managed Futures Strategy may gain exposure to commodity markets by investing in a subsidiary of the Trust, the AllianzGI PerformanceFee Managed Futures Strategy Offshore Fund Ltd (the “Cayman Subsidiary”). By investing in the Cayman Subsidiary, the Fund is indirectly exposed to the risks associated with the Cayman Subsidiary’s investments. AllianzGI PerformanceFee Managed Futures Strategy may invest no more than 25% of its assets in the Cayman Subsidiary.
The Funds are party to International Swaps and Derivatives Association, Inc. Master Agreements (“ISDA Master Agreements”) with select counterparties that govern transactions, over-the-counter derivatives and foreign exchange contracts entered into by the Funds and those counterparties. The ISDA Master Agreements contain
provisions for general obligations, representations, agreements, collateral and events of default or termination. Events of termination include conditions that may entitle counterparties to elect to terminate early and cause settlement of all outstanding transactions under the applicable ISDA Master Agreement. Any election to terminate early could be material to the financial statements of the Funds.
The considerations and factors surrounding the settlement of certain purchases and sales made on a delayed-delivery basis are governed by Master Securities Forward Transaction Agreements (“Master Forward Agreements”) between the Funds and select counterparties. The Master Forward Agreements maintain provisions for, among other things, initiation and confirmation, payment and transfer, events of default, termination, and maintenance of collateral.
The counterparty risk associated with certain contracts may be reduced by master netting arrangements to the extent that if an event of default occurs, all amounts with the counterparty are terminated and settled on a net basis. The Funds’ overall exposure to counterparty risk with respect to transactions subject to master netting arrangements can change substantially within a short period, as it is affected by each transaction subject to the arrangement.
AllianzGI Retirement 2020, AllianzGI Retirement 2025, AllianzGI Retirement 2030, AllianzGI Retirement 2035, AllianzGI Retirement 2040, AllianzGI Retirement 2045, AllianzGI Retirement 2050, AllianzGI Retirement 2055, AllianzGI Multi Asset Income (collectively the “Target Funds”) and Global Allocation, intend to invest their assets significantly or primarily in series of the Trust, Allianz Funds, AllianzGI Institutional Multi-Series Trust, PIMCO Funds and PIMCO ETF Trust (together, “Affiliated Underlying Funds”). The Target Funds and Global Allocation may also invest a portion of their assets in ETFs and mutual funds and pooled vehicles other than Affiliated Underlying Funds (collectively, with the Affiliated Underlying Funds, the “Underlying Funds”). PerformanceFee Structured US Equity, PerformanceFee Structured US Fixed Income, Structured Return and U.S. Equity Hedged may have substantial exposure to Underlying Funds. Accordingly, the investment performance of the Funds depends upon a favorable allocation among the Underlying Funds as well as the ability of the Underlying Funds to achieve their objectives. There can be no assurance that the investment objective of any Underlying Fund will be achieved. The risks associated with investing in each Fund are closely related to the risks associated with the securities and other investments held by the Underlying Funds.
Investing in the Underlying Funds involves certain additional expenses and tax results that would not be present in a direct investment in the securities and other investments held by the Underlying Funds. Each Fund’s NAV will fluctuate in response to changes in the NAVs of the Underlying Funds in which it invests. The extent to which the investment performance and risks associated with each Fund correlate to those of a particular Underlying Fund will depend upon the extent to which each Fund’s assets are allocated from time to time
| | | | | | |
| | Annual Report | | | September 30, 2018 | | 339 |
Notes to Financial Statements (cont’d)
September 30, 2018
for investments in the Underlying Fund, which will vary. To the extent that a Fund invests a significant portion of its assets in an Underlying Fund it will be particularly sensitive to the risks associated with that Underlying Fund.
| 4. | FINANCIAL DERIVATIVE INSTRUMENTS |
Disclosure about derivatives and hedging activities requires qualitative disclosure regarding objectives and strategies for using derivatives, quantitative disclosure about fair value amounts of gains and losses on derivatives, and disclosure about credit-risk-related contingent features in derivative agreements. The disclosure requirements distinguish between derivatives which are accounted for as “hedges”, and those that do not qualify for such accounting. Although the Funds at times use derivatives for hedging purposes, the Funds reflect derivatives at fair value and recognize changes in fair value through the Funds’ Statements of Operations, and such derivatives do not qualify for hedge accounting treatment.
The U.S. Commodity Futures Trading Commission (the “CFTC”) has adopted regulations that subject registered investment companies and their investment advisers to regulation by the CFTC if the registered investment company invests more than a prescribed level of its liquidation value in commodity futures, options on commodities or commodity futures, swaps, or other financial instruments regulated under the Commodity Exchange Act, or if the fund markets itself as providing investment exposure to such instruments. The Investment Manager is registered as a commodity pool operator with respect to AllianzGI PerformanceFee Managed Futures Strategy and the Cayman Subsidiary.
Option Transactions. The Funds purchase put and call options on securities and indices for hedging purposes, risk management purposes or otherwise as part of their investment strategies. The risks associated with purchasing an option include the risk that the Funds pay a premium whether or not the option is exercised. Additionally, the Funds bear the risk of loss of premiums and changes in market value should the counterparty not perform under the contract. Put and call options purchased are accounted for in the same manner as portfolio securities. The cost of securities acquired through the exercise of call options is increased by the premiums paid. The proceeds from securities sold through the exercise of put options are decreased by the premiums paid.
The Funds may write (sell) put and call options on securities and indices to earn premiums, for hedging purposes, risk management purposes or otherwise as part of their investment strategies. When an option is written, the premium received is recorded as an asset with an equal liability that is subsequently marked to market to reflect the market value of the option written. These liabilities, if any, are reflected as options written in the Funds’ Statements of Assets and Liabilities. Premiums received from writing options which expire unexercised are recorded on the expiration date as a realized gain. The difference between the premium received and the amount paid on effecting a closing purchase transaction, including brokerage commissions, is also treated as a realized gain, or if the premium is less than the amount
paid for the closing purchase transaction, as a realized loss. If a call option written is exercised, the premium is added to the proceeds from the sale of the underlying security in determining whether there has been a realized gain or loss. If a put option written is exercised, the premium reduces the cost basis of the security. In writing an option, the Funds bear the market risk of an unfavorable change in the price of the security underlying the written option. Exercise of a written option could result in the Funds purchasing a security at a price different from its current market value.
There are several risks associated with option transactions on securities. For example, there are significant differences between the securities and options markets that could result in an imperfect correlation between these markets, causing a given transaction not to achieve its objective. The Funds’ ability to use options successfully will depend on the Investment Manager’s ability to predict pertinent market movements, which cannot be assured. As the writer of a covered call option, a Fund foregoes, during the option’s life, the opportunity to profit from increases in the market value of the security covering the call option above the sum of the premium and the strike price of the call, but has retained the risk of loss should the price of the underlying security decline.
Futures Contracts. The Funds use futures contracts to manage their exposure to the securities markets or the movements in interest rates and currency values. A futures contract is an agreement between two parties to buy and sell a financial instrument at a set price on a future date. Upon entering into such a contract, the Funds are required to pledge to the broker an amount of cash or securities equal to the minimum “initial margin” requirements of the exchange. Pursuant to the contracts, the Funds agree to receive from or pay to the broker an amount of cash or securities equal to the daily fluctuation in the value of the contracts. Such receipts or payments are known as “variation margin” and are recorded by the Funds as unrealized appreciation or depreciation. When the contracts are closed, the Funds record a realized gain or loss equal to the difference between the value of the contracts at the time they were opened and the value at the time they were closed. Any unrealized appreciation or depreciation recorded is simultaneously reversed. The use of futures transactions involves various risks, including the risk of an imperfect correlation in the movements in the price of futures contracts, interest rates and underlying hedging assets, and possible inability or unwillingness of counterparties to meet the terms of their contracts.
Swap Agreements. Swap agreements are bilaterally negotiated agreements between the Funds and a counterparty to exchange or swap investment cash flows, assets, foreign currencies or market or event-linked returns at specified, future intervals. Swap agreements may be privately negotiated in the over-the-counter market (“OTC swaps”) or may be executed in a multilateral or other trade facility platform, such as a registered commodities exchange (“centrally cleared swaps”). The Funds may enter into credit default, cross-currency, interest rate, total return, variance and other forms of swap agreements in order, among other things, manage their exposure to credit, currency and interest rate risk. In connection with these
| | | | | | |
| 340 | | September 30, 2018 | | | Annual Report | | |
agreements, securities or cash may be identified as collateral or margin in accordance with the terms of the respective swap agreements to provide assets of value and recourse in the event of default or bankruptcy/insolvency.
OTC swap payments received or made at the beginning of the measurement period, if any, are reflected as such on the Funds’ Statements of Assets and Liabilities and represent payments made or received upon entering into the swap agreement to compensate for differences between the stated terms of the swap agreement and prevailing market conditions (credit spreads, currency exchange rates, interest rates, and other relevant factors). These upfront payments are recorded as realized gains or losses on the Funds’ Statements of Operations upon termination or maturity of the swap. A liquidation payment received or made at the termination of the swap is recorded as realized gain or loss on the Funds’ Statements of Operations. Net periodic payments received or paid by the Funds are included as part of realized gains or losses on the Funds’ Statements of Operations. Changes in market value, if any, are reflected as a component of net changes in unrealized appreciation/depreciation on the Funds’ Statements of Operations. Daily changes in valuation of centrally cleared swaps, if any, are recorded as receivable or payable, as applicable, for variation margin on centrally cleared swaps on the Funds’ Statements of Assets and Liabilities.
Entering into these agreements involves, to varying degrees, elements of credit, legal, market and documentation risk in excess of the amounts recognized on the Funds’ Statements of Assets and Liabilities. Such risks include the possibility that there will be no liquid market for these agreements, that the counterparties to the agreements may default on their obligation to perform or disagree as to the meaning of contractual terms in the agreements and that there may be unfavorable changes in interest rates.
Credit Default Swap Agreements. Credit default swap agreements involve one party (referred to as the buyer of protection) making a stream of payments to another party (the seller of protection) in exchange for the right to receive a specified return in the event of a default or other credit event for the referenced entity, obligation or index. As the sellers of protection on credit default swap agreements, the Funds will generally receive from the buyer of protection a fixed rate of income throughout the term of the swap provided that there is no credit event. As the sellers, the Funds would effectively add leverage to their investment portfolios because, in addition to their total net assets, the Funds would be subject to investment exposure on the notional amount of the swap.
If the Funds are sellers of protection and a credit event occurs, as defined under the terms of that particular swap agreement, a Fund will either (i) pay to the buyer of protection an amount equal to the notional amount of the swap and take delivery of the referenced obligation, other deliverable obligations or underlying securities comprising the referenced index or (ii) pay a net settlement amount in the form of cash or securities equal to the notional amount of the swap less the recovery value of the referenced obligation or underlying
securities comprising the referenced index. If the Funds are buyers of protection and a credit event occurs, as defined under the terms of that particular swap agreement, a Fund will either (i) receive from the seller of protection an amount equal to the notional amount of the swap and deliver the referenced obligation, other deliverable obligations or underlying securities comprising the referenced index or (ii) receive a net settlement amount in the form of cash or securities equal to the notional amount of the swap less the recovery value of the referenced obligation or underlying securities comprising the referenced index. Recovery values are assumed by market makers considering either industry standard recovery rates or entity specific factors and considerations until a credit event occurs. If a credit event has occurred, the recovery value is determined by a facilitated auction whereby a minimum number of allowable broker bids, together with a specified valuation method, are used to calculate the settlement value.
Credit default swap agreements on credit indices involve one party making a stream of payments to another party in exchange for the right to receive a specified return in the event of a write-down, principal shortfall, interest shortfall or default of all or part of the referenced entities comprising the credit index. A credit index is a basket of credit instruments or exposures designed to be representative of some part of the credit market as a whole. These indices are made up of reference credits that are judged by a poll of dealers to be the most liquid entities in the credit default swap market based on the sector of the index. Components of the indices may include, but are not limited to, investment grade securities, high yield securities, asset backed securities, emerging markets, and/or various credit ratings within each sector. Credit indices are traded using credit default swaps with standardized terms including a fixed spread and standard maturity dates. An index credit default swap references all the names in the index, and if there is a default, the credit event is settled based on that name’s weight in the index, or in the case of a tranched index credit default swap, the credit event is settled based on the name’s weight in the index that falls within the tranche for which the Funds bear exposure. The composition of the indices changes periodically, usually every six months, and for most indices, each name has an equal weight in the index. The Funds use credit default swaps on credit indices to hedge a portfolio of credit default swaps or bonds, which is less expensive than it would be to buy many credit default swaps to achieve a similar effect. Credit default swaps on indices are benchmarks for protecting investors owning bonds against default, and traders use them to speculate on changes in credit quality.
Implied credit spreads, represented in absolute terms, utilized in determining the market value of credit default swap agreements on corporate or sovereign issues serve as an indicator of the current status of the payment/performance risk, and represent the likelihood or risk of default for the credit derivative. The implied credit spread of a particular referenced entity reflects the cost of buying/selling protection and may include upfront payments required to be made to enter into the agreement. For credit default swap agreements on asset-backed securities and credit indices, the quoted market prices and resulting values serve as the indicator of the current status of the
| | | | | | |
| | Annual Report | | | September 30, 2018 | | 341 |
Notes to Financial Statements (cont’d)
September 30, 2018
payment/performance risk. Wider credit spreads and increasing market values, in absolute terms when compared to the notional amount of the swap, represent a deterioration of the referenced entity’s credit soundness and a greater likelihood or risk of default or other credit event occurring as defined under the terms of the agreement.
The maximum potential amount of future payments (undiscounted) that the Funds as sellers of protection could be required to make under a credit default swap agreement would be an amount equal to the notional amount of the agreement. These potential amounts would be partially offset by any recovery values of the respective referenced obligations, upfront payments received upon entering into the agreement, or net amounts received from the settlement of buy protection credit default swap agreements entered into by the Funds for the same referenced entity or entities.
Forward Foreign Currency Contracts. A forward foreign currency contract is an agreement between two parties to buy and sell a currency at a set exchange rate on a future date. The Funds enter into
forward foreign currency contracts for the purpose of hedging against foreign currency risk arising from the investment or anticipated investment in securities denominated in foreign currencies. The Funds also enter into these contracts for purposes of increasing exposure to a foreign currency or shifting exposure to foreign currency fluctuations from one country to another. The market value of a forward foreign currency contract fluctuates with changes in foreign currency exchange rates. All commitments are marked to market daily at the applicable exchange rates and any resulting unrealized appreciation or depreciation is recorded. Realized gains or losses are recorded at the time the forward contract matures or by delivery of the currency. Risks may arise upon entering into these contracts from the potential inability of counterparties to meet the terms of their contracts and from unanticipated movements in the value of a foreign currency relative to the U.S. dollar. In addition, these contracts may involve market risk in excess of the unrealized appreciation (depreciation) reflected in the Funds’ Statements of Assets and Liabilities.
The following is a summary of the Funds’ derivatives categorized by risk exposure.
The effect of derivatives on the Statements of Assets and Liabilities at September 30, 2018:
| | | | | | | | | | | | | | | | |
| AllianzGI Retirement 2020: | |
| Location | | Market
Price | | | Interest
Rate
Contracts | | | Foreign
Exchange
Contracts | | | Total | |
Asset derivatives: | | | | | | | | | | | | | | | | |
Unrealized appreciation on futures contracts* | | $ | 9,082 | | | | — | | | $ | 2,104 | | | $ | 11,186 | |
Liability derivatives: | | | | | | | | | | | | | | | | |
Unrealized depreciation on futures contracts* | | $ | (16,635 | ) | | $ | (16,478 | ) | | $ | (1,123 | ) | | $ | (34,236 | ) |
| * | Included in net unrealized depreciation of $23,050 on futures contracts as reported in the Fund’s Notes to Schedule of Investments. Only variation margin is reported within the Statements of Assets and Liabilities. |
| | | | | | | | | | | | | | | | |
| AllianzGI Retirement 2025: | |
| Location | | Market
Price | | | Interest
Rate
Contracts | | | Foreign
Exchange
Contracts | | | Total | |
Asset derivatives: | | | | | | | | | | | | | | | | |
Unrealized appreciation on futures contracts* | | $ | 21,570 | | | $ | 7,522 | | | $ | 2,104 | | | $ | 31,196 | |
Liability derivatives: | | | | | | | | | | | | | | | | |
Unrealized depreciation on futures contracts* | | $ | (19,720 | ) | | $ | (663 | ) | | $ | (2,245 | ) | | $ | (22,628 | ) |
| * | Included in net unrealized appreciation of $8,568 on futures contracts as reported in the Fund’s Notes to Schedule of Investments. Only variation margin is reported within the Statements of Assets and Liabilities. |
| | | | | | | | | | | | | | | | |
| AllianzGI Retirement 2030: | |
| Location | | Market
Price | | | Interest
Rate
Contracts | | | Foreign
Exchange
Contracts | | | Total | |
Asset derivatives: | | | | | | | | | | | | | | | | |
Unrealized appreciation on futures contracts* | | $ | 26,431 | | | $ | 1,678 | | | $ | 2,103 | | | $ | 30,212 | |
Liability derivatives: | | | | | | | | | | | | | | | | |
Unrealized depreciation on futures contracts* | | $ | (45,070 | ) | | | — | | | $ | (2,245 | ) | | $ | (47,315 | ) |
| * | Included in net unrealized depreciation of $17,103 on futures contracts as reported in the Fund’s Notes to Schedule of Investments. Only variation margin is reported within the Statements of Assets and Liabilities. |
| | | | | | |
| 342 | | September 30, 2018 | | | Annual Report | | |
| | | | | | | | | | | | |
| AllianzGI Retirement 2035: | |
| Location | | Market
Price | | | Foreign
Exchange
Contracts | | | Total | |
Asset derivatives: | | | | | | | | | | | | |
Unrealized appreciation on futures contracts* | | $ | 23,025 | | | $ | 2,103 | | | $ | 25,128 | |
Liability derivatives: | | | | | | | | | | | | |
Unrealized depreciation on futures contracts* | | $ | (53,136 | ) | | $ | (2,245 | ) | | $ | (55,381 | ) |
| * | Included in net unrealized depreciation of $30,253 on futures contracts as reported in the Fund’s Notes to Schedule of Investments. Only variation margin is reported within the Statements of Assets and Liabilities. |
| | | | | | | | | | | | |
| AllianzGI Retirement 2040: | |
| Location | | Market
Price | | | Foreign
Exchange
Contracts | | | Total | |
Asset derivatives: | | | | | | | | | | | | |
Unrealized appreciation on futures contracts* | | $ | 25,616 | | | $ | 2,104 | | | $ | 27,720 | |
Liability derivatives: | | | | | | | | | | | | |
Unrealized depreciation on futures contracts* | | $ | (68,283 | ) | | $ | (1,123 | ) | | $ | (69,406 | ) |
| * | Included in net unrealized depreciation of $41,686 on futures contracts as reported in the Fund’s Notes to Schedule of Investments. Only variation margin is reported within the Statements of Assets and Liabilities. |
| | | | | | | | | | | | |
| AllianzGI Retirement 2045: | |
| Location | | Market
Price | | | Foreign
Exchange
Contracts | | | Total | |
Asset derivatives: | | | | | | | | | | | | |
Unrealized appreciation on futures contracts* | | $ | 16,535 | | | $ | 2,104 | | | $ | 18,639 | |
Liability derivatives: | | | | | | | | | | | | |
Unrealized depreciation on futures contracts* | | $ | (48,868 | ) | | $ | (1,123 | ) | | $ | (49,991 | ) |
| * | Included in net unrealized depreciation of $31,352 on futures contracts as reported in the Fund’s Notes to Schedule of Investments. Only variation margin is reported within the Statements of Assets and Liabilities. |
| | | | | | | | | | | | |
| AllianzGI Retirement 2050: | |
| Location | | Market
Price | | | Foreign
Exchange
Contracts | | | Total | |
Asset derivatives: | | | | | | | | | | | | |
Unrealized appreciation on futures contracts* | | $ | 19,620 | | | $ | 2,104 | | | $ | 21,724 | |
Liability derivatives: | | | | | | | | | | | | |
Unrealized depreciation on futures contracts* | | $ | (53,356 | ) | | $ | (1,123 | ) | | $ | (54,479 | ) |
| * | Included in net unrealized depreciation of $32,755 on futures contracts as reported in the Fund’s Notes to Schedule of Investments. Only variation margin is reported within the Statements of Assets and Liabilities. |
| | | | | | | | | | | | |
| AllianzGI Retirement 2055: | |
| Location | | Market
Price | | | Foreign
Exchange
Contracts | | | Total | |
Asset derivatives: | | | | | | | | | | | | |
Unrealized appreciation on futures contracts* | | $ | 10,217 | | | $ | 2,104 | | | $ | 12,321 | |
Liability derivatives: | | | | | | | | | | | | |
Unrealized depreciation on futures contracts* | | $ | (26,669 | ) | | $ | (1,123 | ) | | $ | (27,792 | ) |
| * | Included in net unrealized depreciation of $15,471 on futures contracts as reported in the Fund’s Notes to Schedule of Investments. Only variation margin is reported within the Statements of Assets and Liabilities. |
| | | | | | |
| | Annual Report | | | September 30, 2018 | | 343 |
Notes to Financial Statements (cont’d)
September 30, 2018
| | | | | | | | | | | | | | | | |
| AllianzGI Multi Asset Income: | |
| Location | | Market
Price | | | Interest
Rate
Contracts | | | Foreign
Exchange
Contracts | | | Total | |
Asset derivatives: | | | | | | | | | | | | | | | | |
Unrealized appreciation on futures contracts* | | $ | 75,802 | | | $ | 19,933 | | | | — | | | $ | 95,735 | |
Liability derivatives: | | | | | | | | | | | | | | | | |
Unrealized depreciation on futures contracts* | | $ | (16,580 | ) | | $ | (157,182 | ) | | $ | (544 | ) | | $ | (174,306 | ) |
| * | Included in net unrealized depreciation of $78,571 on futures contracts as reported in the Fund’s Notes to Schedule of Investments. Only variation margin is reported within the Statements of Assets and Liabilities. |
| | | | | | | | | | | | | | | | |
| AllianzGI Global Allocation: | | | | | | | | | | | | |
| Location | | Market
Price | | | Interest
Rate
Contracts | | | Foreign
Exchange
Contracts | | | Total | |
Asset derivatives: | | | | | | | | | | | | | | | | |
Unrealized appreciation on futures contracts* | | $ | 186,563 | | | | — | | | $ | 34,971 | | | $ | 221,534 | |
Liability derivatives: | | | | | | | | | | | | | | | | |
Unrealized depreciation on futures contracts* | | $ | (129,965 | ) | | $ | (179,292 | ) | | | — | | | $ | (309,257 | ) |
| * | Included in net unrealized depreciation of $87,723 on futures contracts as reported in the Fund’s Notes to Schedule of Investments. Only variation margin is reported within the Statements of Assets and Liabilities. |
| | | | |
| AllianzGI Best Styles Global Equity: | |
| Location | | Market
Price | |
Liability derivatives: | | | | |
Unrealized depreciation on futures contracts* | | $ | (14,105 | ) |
| * | Included in net unrealized depreciation of $14,105 on futures contracts as reported in the Fund’s Notes to Schedule of Investments. Only variation margin is reported within the Statements of Assets and Liabilities. |
| | | | | | | | | | | | |
| AllianzGI Core Bond: | | | | | | | | | |
| Location | | Interest
Rate
Contracts | | | Credit
Contracts | | | Total | |
Asset derivatives: | | | | | | | | | | | | |
Unrealized appreciation of swaps** | | | — | | | $ | 1,382 | | | $ | 1,382 | |
Unrealized appreciation on futures contracts* | | $ | 27,674 | | | | — | | | | 27,674 | |
Total asset derivatives | | $ | 27,674 | | | $ | 1,382 | | | $ | 29,056 | |
Liability derivatives: | | | | | | | | | | | | |
Unrealized depreciation of swaps** | | | — | | | $ | (4,049 | ) | | $ | (4,049 | ) |
Unrealized depreciation on futures contracts* | | $ | (37,483 | ) | | | — | | | | (37,483 | ) |
Total liability derivatives | | $ | (37,483 | ) | | $ | (4,049 | ) | | $ | (41,532 | ) |
| * | Included in net unrealized depreciation of $9,809 on futures contracts as reported in the Fund’s Notes to Schedule of Investments. Only variation margin is reported within the Statements of Assets and Liabilities. |
| ** | Included in net unrealized depreciation of $2,667 on swaps as reported in the Fund’s Notes to Schedule of Investments. Only variation margin is reported within the Statements of Assets and Liabilities. |
| | | | | | |
| 344 | | September 30, 2018 | | | Annual Report | | |
| | | | | | | | | | | | |
| AllianzGI Core Plus Bond: | | | | | | | | | |
| Location | | Interest
Rate
Contracts | | | Credit Contracts | | | Total | |
Asset derivatives: | | | | | | | | | | | | |
Unrealized appreciation of swaps** | | | — | | | $ | 2,073 | | | $ | 2,073 | |
Unrealized appreciation on futures contracts* | | $ | 21,688 | | | | — | | | | 21,688 | |
Total asset derivatives | | $ | 21,688 | | | $ | 2,073 | | | $ | 23,761 | |
Liability derivatives: | | | | | | | | | | | | |
Unrealized depreciation of swaps** | | | — | | | $ | (6,815 | ) | | $ | (6,815 | ) |
Unrealized depreciation on futures contracts* | | $ | (49,930 | ) | | | — | | | | (49,930 | ) |
Total liability derivatives | | $ | (49,930 | ) | | $ | (6,815 | ) | | $ | (56,745 | ) |
| * | Included in net unrealized depreciation of $28,242 on futures contracts as reported in the Fund’s Notes to Schedule of Investments. Only variation margin is reported within the Statements of Assets and Liabilities. |
| ** | Included in net unrealized depreciation of $4,742 on swaps as reported in the Fund’s Notes to Schedule of Investments. Only variation margin is reported within the Statements of Assets and Liabilities. |
| | | | | | | | | | | | | | | | |
| AllianzGI Global Dynamic Allocation: | | | | | | | | | | | | |
| Location | | Market Price | | | Interest Rate
Contracts | | | Foreign Exchange Contracts | | | Total | |
Asset derivatives: | | | | | | | | | | | | | | | | |
Unrealized appreciation on futures contracts* | | $ | 239,881 | | | $ | 36,776 | | | | — | | | $ | 276,657 | |
Liability derivatives: | | | | | | | | | | | | | | | | |
Unrealized depreciation on futures contracts* | | $ | (353,626 | ) | | $ | (332,981 | ) | | $ | (3,376 | ) | | $ | (689,983 | ) |
| * | Included in net unrealized depreciation of $413,326 on futures contracts as reported in the Fund’s Notes to Schedule of Investments. Only variation margin is reported within the Statements of Assets and Liabilities. |
| | | | | | | | | | | | | | | | |
| AllianzGI Global High Yield: | | | | | | | | | | | | |
| Location | | Market
Price | | | Interest
Rate
Contracts | | | Foreign
Exchange
Contracts | | | Total | |
Asset derivatives: | | | | | | | | | | | | | | | | |
Unrealized appreciation on futures contracts* | | $ | 3,081 | | | | — | | | | — | | | $ | 3,081 | |
Unrealized appreciation of forward foreign currency contracts | | | — | | | | — | | | $ | 15,116 | | | | 15,116 | |
Total asset derivatives | | $ | 3,081 | | | | — | | | $ | 15,116 | | | $ | 18,197 | |
Liability derivatives: | | | | | | | | | | | | | | | | |
Unrealized depreciation on futures contracts* | | | — | | | $ | (3,467 | ) | | | — | | | $ | (3,467 | ) |
Unrealized depreciation of forward foreign currency contracts | | | — | | | | — | | | $ | (2,786 | ) | | | (2,786 | ) |
Total liability derivatives | | | — | | | $ | (3,467 | ) | | $ | (2,786 | ) | | $ | (6,253 | ) |
| * | Included in net unrealized depreciation of $386 on futures contracts as reported in the Fund’s Notes to Schedule of Investments. Only variation margin is reported within the Statements of Assets and Liabilities. |
| | | | | | |
| | Annual Report | | | September 30, 2018 | | 345 |
Notes to Financial Statements (cont’d)
September 30, 2018
| | | | | | | | | | | | | | | | | | | | | | | | |
| AllianzGI PerformanceFee Managed Futures Strategy: | |
| Location | | Market
Price | | | Interest
Rate
Contracts | | | Credit
Contracts | | | Commodity
Contracts | | | Foreign
Exchange
Contracts | | | Total | |
Asset derivatives: | | | | | | | | | | | | | | | | | | | | | | | | |
Unrealized appreciation of swaps** | | | — | | | | — | | | $ | 31,787 | | | | — | | | | — | | | $ | 31,787 | |
Unrealized appreciation on futures contracts* | | $ | 104,670 | | | | — | | | | — | | | $ | 117,768 | | | $ | 84,501 | | | | 306,939 | |
Total asset derivatives | | $ | 104,670 | | | | — | | | $ | 31,787 | | | $ | 117,768 | | | $ | 84,501 | | | $ | 338,726 | |
Liability derivatives: | | | | | | | | | | | | | | | | | | | | | | | | |
Unrealized depreciation of swaps** | | | — | | | | — | | | $ | (3,055 | ) | | | — | | | | — | | | $ | (3,055 | ) |
Unrealized depreciation on futures contracts* | | $ | (7,451 | ) | | $ | (44,858 | ) | | | — | | | $ | (75,272 | ) | | $ | (21,654 | ) | | | (149,235 | ) |
Total liability derivatives | | $ | (7,451 | ) | | $ | (44,858 | ) | | $ | (3,055 | ) | | $ | (75,272 | ) | | $ | (21,654 | ) | | $ | (152,290 | ) |
| * | Included in net unrealized appreciation of $15,704 on futures contracts as reported in the Fund’s Notes to Schedule of Investments. Only variation margin is reported within the Statements of Assets and Liabilities. |
| ** | Included in net unrealized appreciation of $28,732 on swaps as reported in the Fund’s Notes to Schedule of Investments. Only variation margin is reported within the Statements of Assets and Liabilities. |
| | | | |
| AllianzGI PerformanceFee Structured US Equity: | | | |
| Location | | Market
Price | |
Asset derivatives: | | | | |
Investments, at value (options purchased) | | $ | 300,315 | |
Liability derivatives: | | | | |
Options written, at value | | $ | (451,184 | ) |
| | | | |
| AllianzGI PerformanceFee Structured US Fixed Income: | | | |
| Location | | Market
Price | |
Asset derivatives: | | | | |
Investments, at value (options purchased) | | $ | 37,583 | |
Liability derivatives: | | | | |
Options written, at value | | $ | (60,653 | ) |
| | | | | | | | | | | | |
| AllianzGI Real Estate Debt: | | | | | | | | | |
| Location | | Interest
Rate
Contracts | | | Foreign
Exchange
Contracts | | | Total | |
Asset derivatives: | | | | | | | | | | | | |
Unrealized appreciation on futures contracts* | | $ | 1,719 | | | | — | | | $ | 1,719 | |
Unrealized appreciation of forward foreign currency contracts | | | — | | | $ | 9,561 | | | | 9,561 | |
Total asset derivatives | | $ | 1,719 | | | $ | 9,561 | | | $ | 11,280 | |
Liability derivatives: | | | | | | | | | | | | |
Unrealized depreciation on futures contracts* | | $ | (2,313 | ) | | | — | | | $ | (2,313 | ) |
Unrealized depreciation of forward foreign currency contracts | | | — | | | $ | (101 | ) | | | (101 | ) |
Total liability derivatives | | $ | (2,313 | ) | | $ | (101 | ) | | $ | (2,414 | ) |
| * | Included in net unrealized depreciation of $594 on futures contracts as reported in the Fund’s Notes to Schedule of Investments. Only variation margin is reported within the Statements of Assets and Liabilities. |
| | | | |
| AllianzGI Structured Return: | | | |
| Location | | Market
Price | |
Asset derivatives: | | | | |
Investments, at value (options purchased) | | $ | 1,732,582 | |
Liability derivatives: | | | | |
Options written, at value | | $ | (26,906,483 | ) |
| | | | |
| AllianzGI U.S. Equity Hedged: | |
| Location | | Market
Price | |
Asset derivatives: | | | | |
Investments, at value (options purchased) | | $ | 32,317 | |
Liability derivatives: | | | | |
Options written, at value | | $ | (4,755 | ) |
| | | | | | |
| 346 | | September 30, 2018 | | | Annual Report | | |
The effect of derivatives on the Statements of Operations for the period or year ended September 30, 2018:
| | | | | | | | | | | | | | | | |
| AllianzGI Retirement 2020: | |
| Location | | Market
Price | | | Interest
Rate
Contracts | | | Foreign
Exchange
Contracts | | | Total | |
Net realized gain(loss) on: | | | | | | | | | | | | | | | | |
Futures contracts | | $ | 221,555 | | | $ | (154,591 | ) | | $ | (42,264 | ) | | $ | 24,700 | |
Net change in unrealized appreciation/depreciation of: | | | | | | | | | | | | | | | | |
Futures contracts | | $ | (18,226 | ) | | $ | 33,901 | | | $ | 16,699 | | | $ | 32,374 | |
| | | | | | | | | | | | | | | | |
| AllianzGI Retirement 2025: | |
| Location | | Market
Price | | | Interest
Rate
Contracts | | | Foreign
Exchange
Contracts | | | Total | |
Net realized gain(loss) on: | | | | | | | | | | | | | | | | |
Futures contracts | | $ | 475,160 | | | $ | (12,305 | ) | | $ | (49,432 | ) | | $ | 413,423 | |
Net change in unrealized appreciation/depreciation of: | | | | | | | | | | | | | | | | |
Futures contracts | | $ | (32,952 | ) | | $ | 31,516 | | | $ | 18,927 | | | $ | 17,491 | |
| | | | | | | | | | | | | | | | |
| AllianzGI Retirement 2030: | |
| Location | | Market
Price | | | Interest
Rate
Contracts | | | Foreign
Exchange
Contracts | | | Total | |
Net realized gain(loss) on: | | | | | | | | | | | | | | | | |
Futures contracts | | $ | 578,499 | | | $ | (1,557 | ) | | $ | (44,244 | ) | | $ | 532,698 | |
Net change in unrealized appreciation/depreciation of: | | | | | | | | | | | | | | | | |
Futures contracts | | $ | (65,236 | ) | | $ | 1,678 | | | $ | 18,194 | | | $ | (45,364 | ) |
| | | | | | | | | | | | |
| AllianzGI Retirement 2035: | |
| Location | | Market
Price | | | Foreign
Exchange
Contracts | | | Total | |
Net realized gain(loss) on: | | | | | | | | | | | | |
Futures contracts | | $ | 439,580 | | | $ | (34,443 | ) | | $ | 405,137 | |
Net change in unrealized appreciation/depreciation of: | | | | | | | | | | | | |
Futures contracts | | $ | (53,805 | ) | | $ | 15,102 | | | $ | (38,703 | ) |
| | | | | | | | | | | | |
| AllianzGI Retirement 2040: | |
| Location | | Market
Price | | | Foreign
Exchange
Contracts | | | Total | |
Net realized gain(loss) on: | | | | | | | | | | | | |
Futures contracts | | $ | 405,788 | | | $ | (35,544 | ) | | $ | 370,244 | |
Net change in unrealized appreciation/depreciation of: | | | | | | | | | | | | |
Futures contracts | | $ | (59,675 | ) | | $ | 14,279 | | | $ | (45,396 | ) |
| | | | | | | | | | | | |
| | | | | | |
| | Annual Report | | | September 30, 2018 | | 347 |
Notes to Financial Statements (cont’d)
September 30, 2018
| | | | | | | | | | | | |
| AllianzGI Retirement 2045: | |
| Location | | Market
Price | | | Foreign
Exchange
Contracts | | | Total | |
Net realized gain(loss) on: | | | | | | | | | | | | |
Futures contracts | | $ | 245,929 | | | $ | (32,393 | ) | | $ | 213,536 | |
Net change in unrealized appreciation/depreciation of: | | | | | | | | | | | | |
Futures contracts | | $ | (42,328 | ) | | $ | 13,865 | | | $ | (28,463 | ) |
| | | | | | | | | | | | |
| AllianzGI Retirement 2050: | |
| Location | | Market
Price | | | Foreign
Exchange
Contracts | | | Total | |
Net realized gain(loss) on: | | | | | | | | | | | | |
Futures contracts | | $ | 243,352 | | | $ | (28,932 | ) | | $ | 214,420 | |
Net change in unrealized appreciation/depreciation of: | | | | | | | | | | | | |
Futures contracts | | $ | (38,588 | ) | | $ | 13,865 | | | $ | (24,723 | ) |
| | | | | | | | | | | | |
| AllianzGI Retirement 2055: | |
| Location | | Market
Price | | | Foreign
Exchange
Contracts | | | Total | |
Net realized gain(loss) on: | | | | | | | | | | | | |
Futures contracts | | $ | 126,105 | | | $ | (16,331 | ) | | $ | 109,774 | |
Net change in unrealized appreciation/depreciation of: | | | | | | | | | | | | |
Futures contracts | | $ | (18,572 | ) | | $ | 7,423 | | | $ | (11,149 | ) |
| | | | | | | | | | | | | | | | |
| AllianzGI Multi Asset Income: | | | | | | | | | | | | |
| Location | | Market
Price | | | Interest Rate
Contracts | | | Foreign
Exchange
Contracts | | | Total | |
Net realized gain(loss) on: | | | | | | | | | | | | | | | | |
Investments (options purchased) | | | — | | | $ | (13,908 | ) | | | — | | | $ | (13,908 | ) |
Futures contracts | | $ | 629,157 | | | | (541,953 | ) | | $ | 62,297 | | | | 149,501 | |
Forward foreign currency contracts | | | — | | | | — | | | | (3,962 | ) | | | (3,962 | ) |
Total net realized gain(loss) | | $ | 629,157 | | | $ | (555,861 | ) | | $ | 58,335 | | | $ | 131,631 | |
Net change in unrealized appreciation/depreciation of: | | | | | | | | | | | | | | | | |
Futures contracts | | $ | (116,339 | ) | | $ | 17,163 | | | $ | (37,191 | ) | | $ | (136,367 | ) |
| | | | | | | | | | | | | | | | |
| AllianzGI Global Allocation: | |
| Location | | Market
Price | | | Interest Rate
Contracts | | | Foreign
Exchange
Contracts | | | Total | |
Net realized gain(loss) on: | | | | | | | | | | | | | | | | |
Futures contracts | | $ | 6,065,782 | | | $ | (1,369,595 | ) | | $ | (2,349,270 | ) | | $ | 2,346,917 | |
Net change in unrealized appreciation/depreciation of: | | | | | | | | | | | | | | | | |
Futures contracts | | $ | (550,395 | ) | | $ | 256,751 | | | $ | 274,211 | | | $ | (19,433 | ) |
| | | | | | |
| 348 | | September 30, 2018 | | | Annual Report | | |
| | | | | | | | | | | | |
| AllianzGI Best Styles Global Equity: | |
| Location | | Market
Price | | | Foreign
Exchange
Contracts | | | Total | |
Net realized gain(loss) on: | | | | | | | | | | | | |
Futures contracts | | $ | 146,900 | | | | — | | | $ | 146,900 | |
Forward foreign currency contracts | | | — | | | $ | (272,389 | ) | | | (272,389 | ) |
Total net realized gain(loss) | | $ | 146,900 | | | $ | (272,389 | ) | | $ | (125,489 | ) |
Net change in unrealized appreciation/depreciation of: | | | | | | | | | | | | |
Futures contracts | | $ | (14,105 | ) | | | — | | | $ | (14,105 | ) |
| | | | |
| AllianzGI Best Styles International Equity: | |
| Location | | Foreign
Exchange
Contracts | |
Net realized loss on: | | | | |
Forward foreign currency contracts | | $ | (12,874 | ) |
| | | | |
| AllianzGI Best Styles U.S. Equity: | |
| Location | | Market
Price | |
Net realized gain on: | | | | |
Futures contracts | | $ | 49,376 | |
Net change in unrealized appreciation/depreciation of: | | | | |
Futures contracts | | $ | (4,403 | ) |
| | | | | | | | | | | | |
| AllianzGI Core Bond: | |
| Location | | Interest
Rate
Contracts | | | Credit
Contracts | | | Total | |
Net realized gain(loss) on: | | | | | | | | | | | | |
Futures contracts | | $ | (22,491 | ) | | | — | | | $ | (22,491 | ) |
Swaps | | | — | | | $ | 503 | | | | 503 | |
Total net realized gain(loss) | | $ | (22,491 | ) | | $ | 503 | | | $ | (21,988 | ) |
Net change in unrealized appreciation/depreciation of: | | | | | | | | | | | | |
Futures contracts | | $ | (9,809 | ) | | | — | | | $ | (9,809 | ) |
Swaps | | | — | | | $ | (2,667 | ) | | | (2,667 | ) |
Total net change in unrealized appreciation/depreciation | | $ | (9,809 | ) | | $ | (2,667 | ) | | $ | (12,476 | ) |
| | | | | | | | | | | | | | | | |
| AllianzGI Core Plus Bond: | |
| Location | | Market
Price | | | Interest
Rate
Contracts | | | Credit
Contracts | | | Total | |
Net realized loss on: | | | | | | | | | | | | | | | | |
Futures contracts | | $ | (39 | ) | | $ | (23,559 | ) | | | — | | | $ | (23,598 | ) |
Swaps | | | — | | | | — | | | $ | (34,479 | ) | | | (34,479 | ) |
Total net realized loss | | $ | (39 | ) | | $ | (23,559 | ) | | $ | (34,479 | ) | | $ | (58,077 | ) |
Net change in unrealized appreciation/depreciation of: | | | | | | | | | | | | | | | | |
Futures contracts | | | — | | | $ | (28,242 | ) | | | — | | | $ | (28,242 | ) |
Swaps | | | — | | | | — | | | $ | (4,742 | ) | | | (4,742 | ) |
Total net change in unrealized appreciation/depreciation | | | — | | | $ | (28,242 | ) | | $ | (4, 742 | ) | | $ | (32,984 | ) |
| | | | |
| AllianzGI Emerging Markets Consumer: | | | |
| Location | | Foreign
Exchange
Contracts | |
Net realized loss on: | | | | |
Forward foreign currency contracts | | $ | (49,747 | ) |
Net change in unrealized appreciation/depreciation of: | | | | |
Forward foreign currency contracts | | $ | (144 | ) |
| | | | | | |
| | Annual Report | | | September 30, 2018 | | 349 |
Notes to Financial Statements (cont’d)
September 30, 2018
| | | | | | | | | | | | |
| AllianzGI Emerging Markets Debt: | |
| Location | | Interest
Rate
Contracts | | | Foreign
Exchange
Contracts | | | Total | |
Net realized gain(loss) on: | | | | | | | | | | | | |
Futures contracts | | $ | 21,019 | | | | — | | | $ | 21,019 | |
Forward foreign currency contracts | | | — | | | $ | (198,489 | ) | | | (198,489 | ) |
Total net realized gain(loss) | | $ | 21,019 | | | $ | (198,489 | ) | | $ | (177,470 | ) |
Net change in unrealized appreciation/depreciation of: | | | | | | | | | | | | |
Forward foreign currency contracts | | | — | | | $ | 12,500 | | | $ | 12,500 | |
| | | | |
| AllianzGI Emerging Markets Small-Cap: | | | |
| Location | | Foreign
Exchange
Contracts | |
Net realized loss on: | | | | |
Forward foreign currency contracts | | $ | (13,289 | ) |
| | | | |
| AllianzGI Europe Equity Dividend: | |
| Location | | Foreign
Exchange
Contracts | |
Net realized loss on: | | | | |
Forward foreign currency contracts | | $ | (30 | ) |
| | | | | | | | | | | | | | | | |
| AllianzGI Global Dynamic Allocation: | |
| Location | | Market Price | | | Interest
Rate
Contracts | | | Foreign
Exchange
Contracts | | | Total | |
Net realized gain(loss) on: | | | | | | | | | | | | | | | | |
Futures contracts | | $ | 3,320,462 | | | $ | (516,555 | ) | | $ | (1,352,512 | ) | | $ | 1,451,395 | |
Forward foreign currency contracts | | | — | | | | — | | | | (57,281 | ) | | | (57,281 | ) |
Total net realized gain(loss) | | $ | 3,320,462 | | | $ | (516,555 | ) | | $ | (1,409,793 | ) | | $ | 1,394,114 | |
Net change in unrealized appreciation/depreciation of: | | | | | | | | | | | | | | | | |
Futures contracts | | $ | (797,139 | ) | | $ | (106,756 | ) | | $ | 302,629 | | | $ | (601,266 | ) |
| | | | | | | | | | | | | | | | |
| AllianzGI Global High Yield: | |
| Location | | Market
Price | | | Interest
Rate
Contracts | | | Foreign
Exchange
Contracts | | | Total | |
Net realized gain(loss) on: | | | | | | | | | | | | | | | | |
Futures contracts | | $ | (22,416 | ) | | $ | 12,781 | | | | — | | | $ | (9,635 | ) |
Forward foreign currency contracts | | | — | | | | — | | | $ | (1,625,925 | ) | | | (1,625,925 | ) |
Total net realized gain(loss) | | $ | (22,416 | ) | | $ | 12,781 | | | $ | (1,625,925 | ) | | $ | (1,635,560 | ) |
Net change in unrealized appreciation/depreciation of: | | | | | | | | | | | | | | | | |
Futures contracts | | $ | 3,081 | | | $ | (2,811 | ) | | | — | | | $ | 270 | |
Forward foreign currency contracts | | | — | | | | — | | | $ | 97,413 | | | | 97,413 | |
Total net change in unrealized appreciation/depreciation | | $ | 3,081 | | | $ | (2,811 | ) | | $ | 97,413 | | | $ | 97,683 | |
| | | | |
| AllianzGI Global Sustainability: | | | |
| Location | | Foreign
Exchange
Contracts | |
Net realized loss on: | | | | |
Forward foreign currency contracts | | $ | (2,252 | ) |
| | | | |
| AllianzGI Global Water: | | | |
| Location | | Foreign
Exchange
Contracts | |
Net realized loss on: | | | | |
Forward foreign currency contracts | | $ | (109,205 | ) |
| | | | | | |
| 350 | | September 30, 2018 | | | Annual Report | | |
| | | | |
| AllianzGI International Growth: | | | |
| Location | | Foreign
Exchange
Contracts | |
Net realized loss on: | | | | |
Forward foreign currency contracts | | $ | (5,058 | ) |
Net change in unrealized appreciation/depreciation of: | | | | |
Forward foreign currency contracts | | $ | 69 | |
| | | | |
| AllianzGI International Small-Cap: | | | |
| Location | | Foreign
Exchange
Contracts | |
Net realized loss on: | | | | |
Forward foreign currency contracts | | $ | (331,629 | ) |
Net change in unrealized appreciation/depreciation of: | | | | |
Forward foreign currency contracts | | $ | 2,366 | |
| | | | |
| AllianzGI NFJ Emerging Markets Value: | | | |
| Location | | Foreign
Exchange
Contracts | |
Net realized loss on: | | | | |
Forward foreign currency contracts | | $ | (118,396 | ) |
Net change in unrealized appreciation/depreciation of: | | | | |
Forward foreign currency contracts | | $ | 58 | |
| | | | |
| AllianzGI NFJ International Small-Cap Value: | | | |
| Location | | Foreign
Exchange
Contracts | |
Net realized loss on: | | | | |
Forward foreign currency contracts | | $ | (2,593 | ) |
| | | | | | | | | | | | | | | | | | | | | | | | |
| AllianzGI PerformanceFee Managed Futures Strategy: | |
| Location | | Market
Price | | | Interest
Rate
Contracts | | | Credit
Contracts | | | Commodity
Contracts | | | Foreign
Exchange
Contracts | | | Total | |
Net realized gain(loss) on: | | | | | | | | | | | | | | | | | | | | | | | | |
Futures contracts | | $ | (281,693 | ) | | $ | (518,958 | ) | | | — | | | $ | 49,516 | | | $ | (115,221 | ) | | $ | (866,356 | ) |
Swaps | | | — | | | | (28,503 | ) | | $ | 3,429 | | | | — | | | | — | | | | (25,074 | ) |
Total net realized gain(loss) | | $ | (281,693 | ) | | $ | (547,461 | ) | | $ | 3,429 | | | $ | 49,516 | | | $ | (115,221 | ) | | $ | (891,430 | ) |
Net change in unrealized appreciation/depreciation of: | | | | | | | | | | | | | | | | | | | | | | | | |
Futures contracts | | $ | 97,219 | | | $ | (44,858 | ) | | $ | — | | | $ | 42,496 | | | $ | 62,847 | | | $ | 157,704 | |
Swaps | | | — | | | | — | | | | 28,732 | | | | — | | | | — | | | | 28,732 | |
Total net change in unrealized appreciation/depreciation | | $ | 97,219 | | | $ | (44,858 | ) | | $ | 28,732 | | | $ | 42,496 | | | $ | 62,847 | | | $ | 186,436 | |
| | | | |
| AllianzGI PerformanceFee Structured US Equity: | | | |
| Location | | Market Price | |
Net realized gain on: | | | | |
Investments (options purchased) | | $ | (1,122,101 | ) |
Options written | | | 1,871,258 | |
Total net realized gain | | $ | 749,157 | |
Net change in unrealized appreciation/depreciation of: | | | | |
Investments (options purchased) | | $ | (138,767 | ) |
Options written | | | 353,595 | |
Total net change in unrealized appreciation/depreciation | | $ | 214,828 | |
| | | | |
| AllianzGI PerformanceFee Structured US Fixed Income: | | | |
| Location | | Market Price | |
Net realized gain on: | | | | |
Investments (options purchased) | | $ | (446,742 | ) |
Options written | | | 711,470 | |
Total net realized gain | | $ | 264,728 | |
Net change in unrealized appreciation/depreciation of: | | | | |
Investments (options purchased) | | $ | (26,969 | ) |
Options written | | | 55,741 | |
Total net change in unrealized appreciation/depreciation | | $ | 28,772 | |
| | | | | | |
| | Annual Report | | | September 30, 2018 | | 351 |
Notes to Financial Statements (cont’d)
September 30, 2018
| | | | | | | | | | | | | | | | |
| AllianzGI Real Estate Debt: | | | | | | | | | | | | |
| Location | | Market
Price | | | Interest
Rate
Contracts | | | Foreign Exchange Contracts | | | Total | |
Net realized gain(loss) on: | | | | | | | | | | | | | | | | |
Futures contracts | | $ | (61 | ) | | $ | 63 | | | | — | | | $ | 2 | |
Forward foreign currency contracts | | | — | | | | — | | | $ | (676,399 | ) | | | (676,399 | ) |
Total net realized gain(loss) | | $ | (61 | ) | | $ | 63 | | | $ | (676,399 | ) | | $ | (676,397 | ) |
Net change in unrealized appreciation/depreciation of: | | | | | | | | | | | | | | | | |
Futures contracts | | | — | | | $ | (594 | ) | | | — | | | $ | (594 | ) |
Forward foreign currency contracts | | | — | | | | — | | | $ | 9,460 | | | | 9,460 | |
Total net change in unrealized appreciation/depreciation | | | — | | | $ | (594 | ) | | $ | 9,460 | | | $ | 8,866 | |
| | | | |
| AllianzGI Structured Return: | | | |
| Location | | Market Price | |
Net realized loss on: | | | | |
Investments (options purchased) | | $ | (9,679,382 | ) |
Futures contracts | | | 205,934 | |
Options written | | | (73,861,139 | ) |
Total net realized loss | | $ | (83,334,587 | ) |
Net change in unrealized appreciation/depreciation of: | |
Investments (options purchased) | | $ | (1,359,878 | ) |
Options written | | | 4,365,061 | |
Total net change in unrealized appreciation/depreciation | | $ | 3,005,183 | |
| | | | |
| AllianzGI U.S. Equity Hedged: | | | |
| Location | | Market
Price | |
Net realized loss on: | | | | |
Investments (options purchased) | | $ | 1,644 | |
Options written | | | (193,107 | ) |
Total net realized loss | | $ | (191,463 | ) |
Net change in unrealized appreciation/depreciation of: | | | | |
Investments (options purchased) | | $ | 15,178 | |
Options written | | | (7,827 | ) |
Total net change in unrealized appreciation/depreciation | | $ | 7,351 | |
The average volume (based on the open positions at each month-end) of derivative activity for the period or year ended September 30, 2018:
| | | | | | | | | | | | | | | | | | | | | | | | | | | | | | | | | | | | |
| | | Options
Purchased
Contracts(1) | | | Options
Written
Contracts(1) | | | Forward Foreign
Currency
Contracts(2) | | | Futures
Contracts(1) | | | Credit Default
Swap Agreements(3) | | | Interest Rate
Swap Agreements(3) | |
| | | Purchased | | | Sold | | | Long | | | Short | | | Buy | | | Sell | |
AllianzGI Retirement 2020 | | | — | | | | — | | | | — | | | | — | | | | 36 | | | | 25 | | | | — | | | | — | | | | — | |
AllianzGI Retirement 2025 | | | — | | | | — | | | | — | | | | — | | | | 36 | | | | 21 | | | | — | | | | — | | | | — | |
AllianzGI Retirement 2030 | | | — | | | | — | | | | — | | | | — | | | | 44 | | | | 31 | | | | — | | | | — | | | | — | |
AllianzGI Retirement 2035 | | | — | | | | — | | | | — | | | | — | | | | 44 | | | | 37 | | | | — | | | | — | | | | — | |
AllianzGI Retirement 2040 | | | — | | | | — | | | | — | | | | — | | | | 49 | | | | 42 | | | | — | | | | — | | | | — | |
AllianzGI Retirement 2045 | | | — | | | | — | | | | — | | | | — | | | | 35 | | | | 31 | | | | — | | | | — | | | | — | |
AllianzGI Retirement 2050 | | | — | | | | — | | | | — | | | | — | | | | 37 | | | | 33 | | | | — | | | | — | | | | — | |
AllianzGI Retirement 2055 | | | — | | | | — | | | | — | | | | — | | | | 19 | | | | 17 | | | | — | | | | — | | | | — | |
AllianzGI Multi Asset Income | | | — | † | | | — | | | | 11,258 | | | | 11,705 | | | | 204 | | | | 127 | | | | — | | | | — | | | | — | |
AllianzGI Global Allocation | | | — | | | | — | | | | — | | | | — | | | | 671 | | | | 78 | | | | — | | | | — | | | | — | |
AllianzGI Best Styles Global Equity | | | — | | | | — | | | | 16,396 | | | | 13,604 | | | | 25 | | | | — | | | | — | | | | — | | | | — | |
AllianzGI Best Styles International Equity | | | — | | | | — | | | | — | | | | 4,781 | | | | — | | | | — | | | | — | | | | — | | | | — | |
AllianzGI Best Styles U.S. Equity | | | — | | | | — | | | | — | | | | — | | | | 1 | | | | — | | | | — | | | | — | | | | — | |
AllianzGI Core Bond | | | — | | | | — | | | | — | | | | — | | | | 8 | | | | 4 | | | | 267 | | | | 269 | | | | — | |
AllianzGI Core Plus Bond | | | — | | | | — | | | | — | | | | — | | | | 10 | | | | 6 | | | | 677 | | | | 709 | | | | — | |
AllianzGI Emerging Markets Consumer | | | — | | | | — | | | | 30,522 | | | | 69,090 | | | | — | | | | — | | | | — | | | | — | | | | — | |
AllianzGI Emerging Markets Debt | | | — | | | | — | | | | 521,195 | | | | 896,391 | | | | 1 | | | | 7 | | | | — | | | | — | | | | — | |
AllianzGI Emerging Markets Small-Cap | | | — | | | | — | | | | — | † | | | — | † | | | — | | | | — | | | | — | | | | — | | | | — | |
AllianzGI Europe Equity Dividend | | | — | | | | — | | | | — | | | | 961 | | | | — | | | | — | | | | — | | | | — | | | | — | |
AllianzGI Global Dynamic Allocation | | | — | | | | — | | | | 98,869 | | | | 54,034 | | | | 860 | | | | 227 | | | | — | | | | — | | | | — | |
AllianzGI Global High Yield | | | — | | | | — | | | | 224,267 | | | | 7,432,642 | | | | 1 | | | | 4 | | | | — | | | | — | | | | — | |
| | | | | | |
| 352 | | September 30, 2018 | | | Annual Report | | |
| | | | | | | | | | | | | | | | | | | | | | | | | | | | | | | | | | | | |
| | | Options
Purchased
Contracts(1) | | | Options
Written
Contracts(1) | | | Forward Foreign
Currency
Contracts(2) | | | Futures
Contracts(1) | | | Credit Default
Swap Agreements(3) | | | Interest Rate
Swap Agreements(3) | |
| | | Purchased | | | Sold | | | Long | | | Short | | | Buy | | | Sell | |
AllianzGI Global Sustainability | | | — | | | | — | | | | — | † | | | — | † | | | — | | | | — | | | | — | | | | — | | | | — | |
AllianzGI Global Water | | | — | | | | — | | | | — | | | | 591,871 | | | | — | | | | — | | | | — | | | | — | | | | — | |
AllianzGI International Growth | | | — | | | | — | | | | 4,516 | | | | 3,443 | | | | — | | | | — | | | | — | | | | — | | | | — | |
AllianzGI International Small-Cap | | | — | | | | — | | | | 147,452 | | | | 101,032 | | | | — | | | | — | | | | — | | | | — | | | | — | |
AllianzGI NFJ Emerging Markets Value | | | — | | | | — | | | | 113,450 | | | | 13,650 | | | | — | | | | — | | | | — | | | | — | | | | — | |
AllianzGI NFJ International Small-Cap Value | | | — | | | | — | | | | 9,364 | | | | 2,815 | | | | — | | | | — | | | | — | | | | — | | | | — | |
AllianzGI PerformanceFee Managed Futures Strategy | | | — | | | | — | | | | — | | | | — | | | | 171 | | | | 167 | | | | 2,204 | | | | 2,066 | | | | 801 | |
AllianzGI PerformanceFee Structured US Equity | | | 592 | | | | (815 | ) | | | — | | | | — | | | | — | | | | — | | | | — | | | | — | | | | — | |
AllianzGI PerformanceFee Structured US Fixed Income | | | 195 | | | | (262 | ) | | | — | | | | — | | | | — | | | | — | | | | — | | | | — | | | | — | |
AllianzGI Real Estate Debt | | | — | | | | — | | | | 87,720 | | | | 2,743,636 | | | | 1 | | | | 2 | | | | — | | | | — | | | | — | |
AllianzGI Structured Return | | | 17,824 | | | | (9,207 | ) | | | — | | | | — | | | | — | † | | | — | | | | — | | | | — | | | | — | |
AllianzGI U.S. Equity Hedged | | | 32 | | | | (20 | ) | | | — | | | | — | | | | — | | | | — | | | | — | | | | — | | | | — | |
| † | Fund had derivative activity during the period but it did not have open positions at any month-end in the period. |
| (2) | U.S. $ value on origination date |
| (3) | Notional amount (in thousands) |
The following tables present by counterparty, the Funds’ derivative assets and liabilities net of related collateral held by the Funds at September 30, 2018 which has not been offset in the Statements of Assets and Liabilities, but would be available for offset to the extent of a default by the counterparty to the transaction.
Financial Assets and Derivative Assets, and Collateral Received at September 30, 2018:
| | | | | | | | | | | | | | | | |
| AllianzGI Global High Yield: | | | | | | | | | | | | |
| Gross Amounts Not Offset in the Statement of Assets and Liabilities | |
| Counterparty | | Gross Asset Derivatives
Presented in Statement of
Assets and Liabilities | | | Financial
Instrument/
Derivative
Offset | | | Cash
Collateral
Received | | | Net Amount | |
Foreign Currency Exchange Contracts | |
Goldman Sachs | | $ | 14,966 | | | | — | | | | — | | | $ | 14,966 | |
JPMorgan Chase | | | 150 | | | $ | (150 | ) | | | — | | | | — | |
Totals | | $ | 15,116 | | | $ | (150 | ) | | | — | | | $ | 14,966 | |
| | | | | | | | | | | | | | | | |
| AllianzGI Real Estate Debt: | | | | | | | | | | | | |
| Gross Amounts Not Offset in the Statement of Assets and Liabilities | |
| Counterparty | | Gross Asset Derivatives
Presented in Statement of
Assets and Liabilities | | | Financial
Instrument/
Derivative
Offset | | | Cash
Collateral
Received | | | Net Amount | |
Foreign Currency Exchange Contracts | |
Barclays Bank PLC | | $ | 1,255 | | | | — | | | | — | | | $ | 1,255 | |
Citibank N.A. | | | 8,306 | | | $ | (101 | ) | | | — | | | | 8,205 | |
Totals | | $ | 9,561 | | | $ | (101 | ) | | | — | | | $ | 9,460 | |
| | | | | | |
| | Annual Report | | | September 30, 2018 | | 353 |
Notes to Financial Statements (cont’d)
September 30, 2018
Financial Liabilities and Derivative Liabilities, and Collateral Received (Pledged) at September 30, 2018:
| | | | | | | | | | | | | | | | |
| AllianzGI Global High Yield: | | | | | | | | | | | | |
| Gross Amounts Not Offset in the Statement of Assets and Liabilities | |
| Counterparty | | Gross Liability Derivatives
Presented in Statement of
Assets and Liabilities | | | Financial
Instrument/
Derivative
Offset | | | Cash
Collateral
Received
(Pledged) | | | Net Amount | |
Foreign Currency Exchange Contracts | |
JPMorgan Chase | | $ | 2,786 | | | $ | (150 | ) | | | — | | | $ | 2,636 | |
| | | | | | | | | | | | | | | | |
| AllianzGI Real Estate Debt: | | | | | | | | | | | | |
| Gross Amounts Not Offset in the Statement of Assets and Liabilities | |
| Counterparty | | Gross Liability Derivatives
Presented in Statement of
Assets and Liabilities | | | Financial
Instrument/
Derivative
Offset | | | Cash
Collateral
Received
(Pledged) | | | Net Amount | |
Foreign Currency Exchange Contracts | |
Citibank N.A. | | $ | 101 | | | $ | (101 | ) | | | — | | | | — | |
| 5. | INVESTMENT MANAGER/ADMINISTRATOR/DISTRIBUTOR FEES/ DEFERRED COMPENSATION |
Investment Management Fee. Each Fund has an Investment Management Agreement (for the purpose of this section, the “Agreement”) with the Investment Manager. Subject to the supervision of the Trust’s Board, the Investment Manager is responsible for managing, either directly or through others selected by it, each Fund’s investment activities, business affairs and administrative matters. Pursuant to the Agreement, the Investment Manager receives an annual fee, payable monthly (net of any fee waivers, reimbursements and recoupment), at an annual rate of each Fund’s average daily net assets (the “Investment Management Fee”). With respect to AllianzGI PerformanceFee Managed Futures Strategy, the Investment Manager also serves as investment manager to the Cayman Subsidiary pursuant to an investment management agreement. The Investment Manager does not receive a fee for its services to the Cayman Subsidiary.
Each AllianzGI PerformanceFee Fund pays a monthly management fee (a “Management Fee”) to the Investment Manager in return for managing the investment activities of the Fund and the Fund’s business affairs and other administrative matters. For each AllianzGI PerformanceFee Fund, the Management Fee consists of two components: (i) a base fee (the “Base Fee”) calculated by applying a fixed advisory fee rate to the Fund’s average daily net assets during the previous month, and (ii) a positive or negative performance adjustment (the “Performance Adjustment”) calculated by applying a variable rate to the Fund’s average daily net assets during the applicable performance measurement period (the “Performance Period”). The Performance Period generally consists of the trailing twelve months, although no Performance Adjustment will be made during the period from the start of each Fund’s operations until December 31, 2018 (the “Initial Performance Period”). Only the Fund’s Base Fee applies during the Initial Performance Period, subject to applicable waiver and expense limitations. The Performance Adjustment, once effective, is calculated monthly in arrears and is added to or subtracted from the Base Fee to
determine the Management Fee. Because the Base Fee and Performance Adjustment are calculated with respect to the Fund’s average daily net assets over two different time periods (the previous month for the Base Fee and the Performance Period for the Performance Adjustment), the effective Management Fee may be less than 0.0% or greater than the Base Fee plus the Maximum Performance Adjustment described below for certain periods (subject to any fee limitations and waivers described below). The Management Fee is accrued daily. The Investment Manager has agreed to waive the Management Fee with respect to the Initial Performance Period in an amount, if any, equal to any negative Performance Adjustment that would have applied had the AllianzGI PerformanceFee Funds’ performance-based fee structure been in place for the period. As a result of this arrangement, each Fund’s effective fee with respect to the Initial Performance Period may be no higher than the Base Fee, but is subject to downward adjustment in the event the Fund underperforms the applicable benchmark for the Initial Performance Period. Other waivers and limitations may also apply.
With respect to AllianzGI PerformanceFee Managed Futures Strategy Fund, the Investment Manager’s Base Fee is calculated at an annualized rate of 0.75% of the Fund’s average daily net assets. The Management Fee is determined as the Base Fee plus or minus a Performance Adjustment that is based on whether, and to what extent, the investment performance of the Fund exceeds, or is exceeded by, the performance of the ICE BofAML 3-Month US T-Bill Index (the “Index ”) plus 5.00% (the “Index Hurdle”) over the Performance Period. The Performance Adjustment is calculated using the performance of the Class P share class of the Fund (the “Measurement Class”). The Performance Adjustment is calculated according to a schedule that adds or subtracts 0.0015% of the Fund’s average daily net assets for each 0.01% by which the performance of the Measurement Class exceeds or lags the performance of the Index Hurdle for the Performance Period. The maximum Performance Adjustment (positive or negative) will not exceed an annualized rate of +/- 0.75% (the “Maximum Performance Adjustment”) of the Fund’s
| | | | | | |
| 354 | | September 30, 2018 | | | Annual Report | | |
average daily net assets over the full Performance Period, which would occur when the performance of the Measurement Class exceeds, or is exceeded by, the Index Hurdle by 5.00% for the Performance Period.
With respect to AllianzGI PerformanceFee Structured US Equity Fund, the Investment Manager’s Base Fee is calculated at an annualized rate of 0.60% of the Fund’s average daily net assets. The Management Fee is determined as the Base Fee plus or minus a Performance Adjustment that is based on whether, and to what extent, the investment performance of the Fund exceeds, or is exceeded by, the performance of the S&P 500 Index (the “Index”) plus 1.25% (the “Index Hurdle”) over the Performance Period. The Performance Adjustment is calculated using the performance of the Class P share class of the Fund (the “Measurement Class”). The Performance Adjustment is calculated according to a schedule that adds or subtracts 0.0048% of the Fund’s average daily net assets for each 0.01% by which the performance of the Measurement Class exceeds or lags the performance of the Index Hurdle during the Performance Period. The maximum Performance Adjustment (positive or negative) will not exceed an annualized rate of +/- 0.60% (the “Maximum Performance Adjustment”) of the Fund’s average daily net assets over the full Performance Period, which would occur when the performance of the Measurement Class exceeds, or is exceeded by, the Index Hurdle by 1.25% for the Performance Period.
With respect to AllianzGI PerformanceFee Structured US Fixed Income Fund, the Investment Manager’s Base Fee is calculated at an annualized rate of 0.30% of the Fund’s average daily net assets. The Management Fee is determined as the Base Fee plus or minus a Performance Adjustment that is based on whether, and to what extent, the investment performance of the Fund exceeds, or is exceeded by, the performance of the Bloomberg Barclays U.S.
Aggregate Bond Index (the “Index”) plus 0.625% (the “Index Hurdle”) over the Performance Period. The Performance Adjustment is calculated using the performance of the Class P share class of the Fund (the “Measurement Class”). The Performance Adjustment is calculated according to a schedule that adds or subtracts 0.0048% of the Fund’s average daily net assets for each 0.01% by which the performance of the Measurement Class exceeds or lags the performance of the Index Hurdle during the Performance Period. The maximum Performance Adjustment (positive or negative) will not exceed an annualized rate of +/- 0.30% (the “Maximum Performance Adjustment”) of the Fund’s average daily net assets over the full Performance Period, which would occur when the performance of the Measurement Class exceeds, or is exceeded by, the Index Hurdle by 0.625% for the Performance Period.
“Due to Investment Manager” on the Statements of Assets and Liabilities represents the remaining amounts payable related to offering costs for AllianzGI Core Bond, AllianzGI Core Plus Bond, AllianzGI PerformanceFee Managed Futures Strategy, AllianzGI PerformanceFee Structured US Equity, AllianzGI PerformanceFee Structured US Fixed Income, AllianzGI Preferred Securities and Income, AllianzGI Real Estate Debt and AllianzGI Short Term Bond that were paid by the Investment Manager.
Administration Fee. The Investment Manager provides administrative services to the Target Funds and also bears the cost of most third-party administrative services required by the Target Funds, and in return it receives from each share class of each Target Fund a monthly administration fee based on each share class’ average daily net assets (the “Administration Fee”).
The Investment Management Fee and Administration Fee for all outstanding share classes are charged at an annual rate as indicated in the following table:
| | | | | | | | | | | | | | | | | | | | |
| | | All Classes | | | Class A,C
and R | | | Class P and
Administrative | | | Class R6 | |
| | | Management | | | Effective
Management | | | Administration Fee | |
| | | Fee | | | Fee | | | | | | | | | | |
AllianzGI Retirement 2020 | | | 0.05 | % | | | 0.05 | % | | | 0.30 | % | | | 0.15 | % | | | 0.05 | % |
AllianzGI Retirement 2025 | | | 0.05 | | | | 0.05 | | | | 0.30 | | | | 0.15 | | | | 0.05 | |
AllianzGI Retirement 2030 | | | 0.05 | | | | 0.05 | | | | 0.30 | | | | 0.15 | | | | 0.05 | |
AllianzGI Retirement 2035 | | | 0.05 | | | | 0.05 | | | | 0.30 | | | | 0.15 | | | | 0.05 | |
AllianzGI Retirement 2040 | | | 0.05 | | | | 0.05 | | | | 0.30 | | | | 0.15 | | | | 0.05 | |
AllianzGI Retirement 2045 | | | 0.05 | | | | 0.05 | | | | 0.30 | | | | 0.15 | | | | 0.05 | |
AllianzGI Retirement 2050 | | | 0.05 | | | | 0.05 | | | | 0.30 | | | | 0.15 | | | | 0.05 | |
AllianzGI Retirement 2055 | | | 0.05 | | | | 0.05 | | | | 0.30 | | | | 0.15 | | | | 0.05 | |
AllianzGI Multi Asset Income | | | 0.05 | | | | 0.05 | | | | 0.30 | | | | 0.15 | | | | 0.05 | |
AllianzGI Global Allocation | | | 0.70 | * | | | 0.17 | | | | N/A | | | | N/A | | | | N/A | |
AllianzGI Best Styles Global Equity | | | 0.30 | | | | 0.30 | | | | N/A | | | | N/A | | | | N/A | |
AllianzGI Best Styles International Equity | | | 0.30 | | | | 0.30 | | | | N/A | | | | N/A | | | | N/A | |
AllianzGI Best Styles U.S. Equity | | | 0.30 | | | | 0.30 | | | | N/A | | | | N/A | | | | N/A | |
AllianzGI Convertible | | | 0.57 | | | | 0.57 | | | | N/A | | | | N/A | | | | N/A | |
AllianzGI Core Bond | | | 0.25 | | | | 0.25 | | | | N/A | | | | N/A | | | | N/A | |
AllianzGI Core Plus Bond | | | 0.30 | | | | 0.30 | | | | N/A | | | | N/A | | | | N/A | |
AllianzGI Emerging Markets Consumer | | | 0.90 | | | | 0.90 | | | | N/A | | | | N/A | | | | N/A | |
| | | | | | |
| | Annual Report | | | September 30, 2018 | | 355 |
Notes to Financial Statements (cont’d)
September 30, 2018
| | | | | | | | | | | | | | | | | | | | |
| | | All Classes | | | Class A,C
and R | | | Class P and
Administrative | | | Class R6 | |
| | | Management | | | Effective
Management | | | Administration Fee | |
| | | Fee | | | Fee | | | | | | | | | | |
AllianzGI Emerging Markets Debt | | | 0.60 | † % | | | 0.73 | % | | | N/A | | | | N/A | | | | N/A | |
AllianzGI Emerging Markets Small-Cap | | | 1.20 | | | | 1.20 | | | | N/A | | | | N/A | | | | N/A | |
AllianzGI Europe Equity Dividend | | | 0.80 | | | | 0.80 | | | | N/A | | | | N/A | | | | N/A | |
AllianzGI Global Dynamic Allocation | | | 0.70 | * | | | 0.65 | | | | N/A | | | | N/A | | | | N/A | |
AllianzGI Global High Yield | | | 0.60 | | | | 0.60 | | | | N/A | | | | N/A | | | | N/A | |
AllianzGI Global Sustainability | | | 0.80 | * | | | 0.69 | | | | N/A | | | | N/A | | | | N/A | |
AllianzGI Global Water | | | 0.95 | * | | | 0.73 | | | | N/A | | | | N/A | | | | N/A | |
AllianzGI High Yield Bond | | | 0.48 | | | | 0.48 | | | | N/A | | | | N/A | | | | N/A | |
AllianzGI International Growth | | | 0.70 | | | | 0.70 | | | | N/A | | | | N/A | | | | N/A | |
AllianzGI International Small-Cap | | | 1.00 | * | | | 0.89 | | | | N/A | | | | N/A | | | | N/A | |
AllianzGI Micro Cap | | | 1.05 | † | | | 1.20 | | | | N/A | | | | N/A | | | | N/A | |
AllianzGI NFJ Emerging Markets Value | | | 0.85 | * | | | 0.65 | | | | N/A | | | | N/A | | | | N/A | |
AllianzGI NFJ International Small-Cap Value | | | 0.85 | | | | 0.85 | | | | N/A | | | | N/A | | | | N/A | |
AllianzGI PerformanceFee Managed Futures Strategy | | | 0.75 | *# | | | 0.00 | | | | N/A | | | | N/A | | | | N/A | |
AllianzGI PerformanceFee Structured US Equity | | | 0.60 | *@ | | | 0.60 | | | | N/A | | | | N/A | | | | N/A | |
AllianzGI PerformanceFee Structured US Fixed Income | | | 0.30 | *^ | | | 0.30 | | | | N/A | | | | N/A | | | | N/A | |
AllianzGI Preferred Securities and Income | | | 0.45 | | | | 0.45 | | | | N/A | | | | N/A | | | | N/A | |
AllianzGI Real Estate Debt | | | 0.45 | | | | 0.45 | | | | N/A | | | | N/A | | | | N/A | |
AllianzGI Short Duration High Income | | | 0.48 | | | | 0.48 | | | | N/A | | | | N/A | | | | N/A | |
AllianzGI Short Term Bond | | | 0.30 | | | | 0.30 | | | | N/A | | | | N/A | | | | N/A | |
AllianzGI Structured Return | | | 0.60 | | | | 0.60 | | | | N/A | | | | N/A | | | | N/A | |
AllianzGI U.S. Equity Hedged | | | 0.70 | | | | 0.70 | | | | N/A | | | | N/A | | | | N/A | |
AllianzGI Ultra Micro Cap | | | 1.10 | *† | | | 1.31 | | | | N/A | | | | N/A | | | | N/A | |
| * | See Note 6 for management fee waivers. |
| † | Effective July 1, 2018, the management fee was reduced from 0.75% to 0.60% for AllianzGI Emerging Markets Debt, from 1.25% to 1.05% for AllianzGI Micro Cap and from 1.50% to 1.10% for AllianzGI Ultra Micro Cap. |
| # | The management fee consists of a base fee at an annualized rate of 0.75% of the Fund’s average daily net assets, subject to a positive or negative performance adjustment of up to 0.75% based on the Fund’s performance relative to the ICE BofAML 3-Month US T-Bill Index plus 5.00% (annualized). The management fee does not become subject to the performance-based adjustment until after December 31, 2018. |
| @ | The management fee consists of a base fee at an annualized rate of 0.60% of the Fund’s average daily net assets, subject to a positive or negative performance adjustment of up to 0.60% based on the Fund’s performance relative to the S&P 500 Index plus 1.25% (annualized). The management fee does not become subject to the performance-based adjustment until after December 31, 2018. |
| ^ | The management fee consists of a base fee at an annualized rate of 0.30% of the Fund’s average daily net assets, subject to a positive or negative performance adjustment of up to 0.30% based on the Fund’s performance relative to the Bloomberg Barclays U.S. Aggregate Bond Index plus 0.625% (annualized). The management fee does not become subject to the performance-based adjustment until after December 31, 2018. |
Distribution and Servicing Fees. Allianz Global Investors Distributors LLC (the “Distributor”), an indirect, wholly-owned subsidiary of AAM and the Investment Manager serves as the distributor of the Funds’ shares pursuant to separate Distribution Servicing Plans for Class A, C and R. The Distributor, for each of the Funds, receives (i) servicing fees of 0.25% of the average daily net assets of each of Class A, C and R in connection with services rendered to shareholders of each class and the maintenance of shareholder accounts, and (ii) distribution fees of 0.75% of the average daily net assets of Class C (with the exception for AllianzGI Short Duration High Income which is 0.25%) and 0.25% of average daily net assets of Class R in connection with the distribution of Class C and R shares.
Pursuant to the Distribution and Servicing Plans adopted by the A, C and R classes, the Funds compensate the Distributor for services provided and expenses incurred in connection with assistance rendered in the sale of shares and services rendered to shareholders and for maintenance of shareholder accounts.
Pursuant to the Distribution Plan for the Administrative Class shares, the Funds are permitted to reimburse the Distributor out of the Administrative Class’ assets of each Fund offering Administrative Class shares, in an amount up to 0.25% on an annual basis of the average net assets of the Administrative Class, for payments made to financial intermediaries that provide services in connection with the distribution of shares or administration plans or programs that use fund shares as their funding medium. Unreimbursed costs may be carried forward for reimbursement for up to twelve months beyond the date in which they are incurred, subject always to the limit that no more than 0.25% of the average daily net assets attributable to the Administrative Class may be expensed.
The Distributor also receives the proceeds of the initial sales charges paid by the shareholders upon the purchase of Class A shares and contingent deferred sales charges (“CDSC”) paid by the shareholders upon certain redemptions of Class A and C shares. For the period or year ended September 30, 2018, the Distributor received $201,578, representing commissions (sales charges) and CDSC from the Funds.
| | | | | | |
| 356 | | September 30, 2018 | | | Annual Report | | |
Deferred Compensation. Trustees do not currently receive any pension or retirement benefits from the Trust. The Trust has adopted a deferred compensation plan (the “Plan”) for the Trustees, which permits the Trustees to defer their receipt of compensation from the Trust, at their election, in accordance with the terms of the Plan. Under the Plan, each Trustee may elect not to receive all or a portion of his or her fees from the Trust on a current basis but to receive in a subsequent period chosen by the Trustee an amount equal to the
value of such compensation if such compensation had been invested in one or more series of the Trust or Allianz Funds selected by the Trustees from and after the normal payment dates for such compensation. As a result of this arrangement, the Trust remains in substantially the same financial position as if the deferred compensation had been paid on the normal payment dates and immediately invested in shares of the series selected by the Trustees.
| 6. | EXPENSE LIMITATION/MANAGEMENT FEE WAIVER AND RECOUPMENT |
The Trust and the Investment Manager have entered into Expense Limitation and Management Fee Waiver Agreements as indicated below:
| | | | | | | | | | | | | | | | | | | | | | | | | | | | | | | | |
| | | | | | Expense Limitation | |
| | | Management Fee
Waiver | | | Class A | | | Class C | | | Class R | | | Class P | | | Institutional
Class | | | Class R6 | | | Administrative
Class | |
AllianzGI Retirement 2020(3) | | | N/A | | | | 0.95 | % | | | 1.70 | % | | | 1.30 | % | | | 0.65 | % | | | N/A | | | | 0.55 | %* | | | 0.90 | % |
AllianzGI Retirement 2025(3) | | | N/A | | | | 0.95 | | | | N/A | | | | 1.30 | | | | 0.65 | | | | N/A | | | | 0.55 | * | | | 0.90 | |
AllianzGI Retirement 2030(3) | | | N/A | | | | 0.95 | | | | 1.70 | | | | 1.30 | | | | 0.65 | | | | N/A | | | | 0.55 | * | | | 0.90 | |
AllianzGI Retirement 2035(3) | | | N/A | | | | 0.95 | | | | N/A | | | | 1.30 | | | | 0.65 | | | | N/A | | | | 0.55 | * | | | 0.90 | |
AllianzGI Retirement 2040(3) | | | N/A | | | | 0.95 | | | | 1.70 | | | | 1.30 | | | | 0.65 | | | | N/A | | | | 0.55 | | | | 0.90 | |
AllianzGI Retirement 2045(3) | | | N/A | | | | 0.95 | | | | N/A | | | | 1.30 | | | | 0.65 | | | | N/A | | | | 0.55 | | | | 0.90 | |
AllianzGI Retirement 2050(3) | | | N/A | | | | 0.95 | | | | 1.70 | | | | 1.30 | | | | 0.65 | | | | N/A | | | | 0.55 | | | | 0.90 | |
AllianzGI Retirement 2055(3) | | | N/A | | | | 0.95 | | | | N/A | | | | 1.30 | | | | 0.65 | | | | N/A | �� | | | 0.55 | | | | 0.90 | |
AllianzGI Multi Asset Income(3) | | | N/A | | | | 0.95 | | | | 1.70 | | | | 1.30 | | | | 0.65 | | | | 0.60 | % | | | 0.55 | * | | | 0.90 | |
AllianzGI Global Allocation(4) | | | 0.55 | %(1) | | | 0.60 | | | | 1.37 | | | | 0.80 | | | | 0.40 | | | | 0.40 | | | | 0.30 | | | | 0.55 | |
AllianzGI Best Styles Global Equity(5) | | | N/A | | | | 0.70 | | | | 1.40 | | | | N/A | | | | 0.50 | | | | 0.40 | | | | 0.40 | | | | N/A | |
AllianzGI Best Styles International Equity(5) | | | N/A | | | | 0.70 | | | | 1.45 | | | | N/A | | | | 0.55 | | | | 0.45 | | | | 0.45 | | | | N/A | |
AllianzGI Best Styles U.S. Equity(5) | | | N/A | | | | 0.65 | | | | 1.40 | | | | N/A | | | | 0.50 | | | | 0.50 | | | | 0.40 | | | | N/A | |
AllianzGI Convertible | | | N/A | | | | N/A | | | | N/A | | | | N/A | | | | N/A | | | | N/A | | | | N/A | | | | N/A | |
AllianzGI Core Bond(9) | | | N/A | | | | N/A | | | | N/A | | | | N/A | | | | 0.30 | | | | 0.25 | | | | 0.20 | | | | N/A | |
AllianzGI Core Plus Bond(9) | | | N/A | | | | N/A | | | | N/A | | | | N/A | | | | 0.35 | | | | 0.30 | | | | 0.25 | | | | N/A | |
AllianzGI Emerging Markets Consumer(6) | | | N/A | | | | 1.55 | | | | N/A | | | | N/A | | | | N/A | | | | 1.20 | | | | N/A | | | | N/A | |
AllianzGI Emerging Markets Debt(5) | | | N/A | | | | 1.05 | | | | 1.80 | | | | N/A | | | | 0.90 | | | | 0.80 | | | | N/A | | | | N/A | |
AllianzGI Emerging Markets Small-Cap(5) | | | N/A | | | | 1.85 | | | | N/A | | | | N/A | | | | N/A | | | | 1.50 | | | | N/A | | | | N/A | |
AllianzGI Europe Equity Dividend(5) | | | N/A | | | | 1.20 | | | | 1.95 | | | | N/A | | | | 1.05 | | | | 0.95 | | | | N/A | | | | N/A | |
AllianzGI Global Dynamic Allocation(4) | | | 0.55 | (1) | | | 0.97 | | | | 1.74 | | | | 1.34 | | | | 0.80 | | | | 0.70 | | | | 0.70 | | | | 0.95 | |
AllianzGI Global High Yield(5) | | | N/A | | | | N/A | | | | N/A | | | | N/A | | | | 0.80 | | | | 0.70 | | | | N/A | | | | N/A | |
AllianzGI Global Sustainability(5) | | | 0.11 | (2) | | | 1.09 | | | | N/A | | | | N/A | | | | 0.94 | | | | 0.84 | | | | N/A | | | | N/A | |
AllianzGI Global Water | | | 0.22 | (2) | | | N/A | | | | N/A | | | | N/A | | | | N/A | | | | N/A | | | | N/A | | | | N/A | |
AllianzGI High Yield Bond | | | N/A | | | | N/A | | | | N/A | | | | N/A | | | | N/A | | | | N/A | | | | N/A | | | | N/A | |
AllianzGI International Growth(5) | | | N/A | | | | 1.05 | | | | N/A | | | | N/A | | | | N/A | | | | 0.80 | | | | N/A | | | | N/A | |
AllianzGI International Small-Cap(5) | | | 0.11 | (2) | | | 1.25 | | | | 2.08 | | | | 1.59 | | | | 1.10 | | | | 1.04 | | | | 1.00 | | | | N/A | |
AllianzGI Micro Cap(5) | | | N/A | | | | 1.42 | | | | N/A | | | | N/A | | | | 1.34 | | | | 1.34 | | | | N/A | | | | N/A | |
AllianzGI NFJ Emerging Markets Value(6) | | | 0.20 | (2) | | | 1.14 | | | | 1.89 | | | | N/A | | | | 0.98 | | | | 0.89 | | | | N/A | | | | N/A | |
AllianzGI NFJ International Small-Cap Value(5) | | | N/A | | | | 1.30 | | | | 2.05 | | | | N/A | | | | 1.05 | | | | 0.99 | | | | 0.95 | | | | N/A | |
AllianzGI PerformanceFee Managed Futures Strategy(8) | | | 0.75 | (7) | | | N/A | | | | N/A | | | | N/A | | | | 0.19 | | | | 0.14 | | | | 0.09 | | | | N/A | |
AllianzGI PerformanceFee Structured US Equity(8) | | | 0.60 | (7) | | | N/A | | | | N/A | | | | N/A | | | | 0.00 | | | | 0.00 | | | | 0.00 | | | | N/A | |
AllianzGI PerformanceFee Structured US Fixed Income(8) | | | 0.30 | (7) | | | N/A | | | | N/A | | | | N/A | | | | 0.00 | | | | 0.00 | | | | 0.00 | | | | N/A | |
AllianzGI Preferred Securities and Income(9) | | | N/A | | | | N/A | | | | N/A | | | | N/A | | | | 0.60 | | | | 0.55 | | | | 0.50 | | | | N/A | |
AllianzGI Real Estate Debt(5) | | | N/A | | | | N/A | | | | N/A | | | | N/A | | | | 0.68 | | | | 0.58 | | | | N/A | | | | N/A | |
| | | | | | |
| | Annual Report | | | September 30, 2018 | | 357 |
Notes to Financial Statements (cont’d)
September 30, 2018
| | | | | | | | | | | | | | | | | | | | | | | | | | | | | | | | |
| | | | | | Expense Limitation | |
| | | Management Fee
Waiver | | | Class A | | | Class C | | | Class R | | | Class P | | | Institutional
Class | | | Class R6 | | | Administrative
Class | |
AllianzGI Short Duration High Income | | | N/A | | | | N/A | | | | N/A | | | | N/A | | | | N/A | | | | N/A | | | | N/A | | | | N/A | |
AllianzGI Short Term Bond(9) | | | N/A | | | | 0.64 | % | | | N/A | | | | N/A | | | | 0.49 | % | | | 0.39 | % | | | N/A | | | | N/A | |
AllianzGI Structured Return(6) | | | N/A | | | | 0.98 | | | | 1.77 | % | | | N/A | | | | 0.77 | | | | 0.69 | | | | 0.67 | % | | | N/A | |
AllianzGI U.S. Equity Hedged(6) | | | N/A | | | | 1.25 | | | | 2.00 | | | | N/A | | | | 1.10 | | | | 1.00 | | | | N/A | | | | N/A | |
AllianzGI Ultra Micro Cap(5) | | | N/A | (2) | | | 1.86 | | | | N/A | | | | N/A | | | | 1.57 | | | | 1.54 | | | | N/A | | | | N/A | |
| (1) | The Investment Manager has contractually agreed to irrevocably waive a portion of its management fee equal to 0.55% of the average daily net assets of each applicable Fund that are attributable to investments in Underlying Funds. This waiver with respect to investments in Underlying Funds for which the Investment Manager or an affiliated person thereof serves as investment adviser, is terminable only by the Board of Trustees of the Trust, and the waiver with respect to investments in unaffiliated Underlying Funds will continue through at least January 31, 2019. |
| (2) | The Investment Manager has agreed to waive a portion of the investment management fee, which reduces the annual percentage rate by the rate disclosed in the table above through January 31, 2019. AllianzGI Ultra Micro Cap had a waiver of 0.25% through January 31, 2018. Amounts waived pursuant to each of the investment management fee waivers are separate from and would not be included with the amounts subject to potential recoupment under the Expense Limitation Agreement. |
| (3) | The Investment Manager has contractually agreed, until January 31, 2020, to irrevocably waive its management and administrative fees and reimburse any additional Other Expenses or Acquired Fund Fees and Expenses, to the extent that Total Annual Fund Operating Expenses after Expense Reductions, excluding, interest, taxes, and extraordinary expenses, exceed the rates noted in the table above based on the Fund’s average net assets attributable to each share class. Under the Expense Limitation Agreement, the Investment Manager may recoup waived or reimbursed amounts for three years, provided total expenses, including such recoupment, do not exceed the annual expense limit in effect at the time of such waiver or reimbursement. The Expense Limitation Agreement is terminable by the Trust upon 90 days’ prior written notice to the Investment Manager or at any time by mutual agreement of the parties. |
| (4) | Effective February 1, 2018, the Investment Manager has contractually agreed, until January 31, 2019, to irrevocably waive its management fee, or reimburse the Fund, to the extent that, after the application of the fee waiver described in footnote (1) above, Total Annual Fund Operating Expenses, excluding interest, tax, and extraordinary expenses, Acquired Fund Fees and Expenses and certain credits and other expenses, exceed the rates noted in the table above based on the Fund’s average net assets attributable to each share class. Under the Expense Limitation Agreement, the Investment Manager may recoup waived or reimbursed amounts for three years, provided total expenses, including such recoupment, do not exceed the annual expense limit in effect at the time of such waiver/reimbursement or recoupment. The Expense Limitation Agreement is terminable by the Trust upon 90 days’ prior written notice to the Investment Manager or at any time by mutual agreement of the parties. |
| (5) | Effective February 1, 2018, (July 1, 2018 for AllianzGI Emerging Markets Debt, AllianzGI Micro Cap and AllianzGI Ultra Micro Cap), the Investment Manager has contractually agreed to irrevocably waive its management fee and/or reimburse the Fund through January 31, 2019 (January 31, 2020 for AllianzGI Emerging Markets Debt, AllianzGI Micro Cap and AllianzGI Ultra Micro Cap), to the extent that Total Annual Fund Operating Expenses, excluding interest, tax, and extraordinary expenses (after giving effect to the management fee waiver, if any, referred to in footnote (2) above), and certain credits and other expenses, exceed the rates noted in the table above based upon the Fund’s average net assets attributable to each share class. Under the Expense Limitation Agreement, the Investment Manager may recoup waived or reimbursed amounts for three years, provided total expenses, including such recoupment, do not exceed the annual expense limit in effect at the time of such waiver/reimbursement or recoupment. The Expense Limitation Agreement is terminable by the Trust upon 90 days’ prior written notice to the Investment Manager or at any time by mutual agreement of the parties. |
| (6) | Effective February 1, 2018, the Investment Manager has contractually agreed to irrevocably waive its management fee and/or reimburse the Fund through January 31, 2019 to the extent that Total Annual Fund Operating Expenses excluding interest, tax, and extraordinary expenses, Acquired Fund Fees and Expenses, and certain credits and other expenses (after giving effect to the management fee waiver, if any, referred to in footnote (2) above), exceed the rates noted in the table above based upon the Fund’s average net assets attributable to each share class. Under the Expense Limitation Agreement, the Investment Manager may recoup waived or reimbursed amounts for three years, provided total expenses, including such recoupment, do not exceed the annual expense limit in effect at the time of such waiver/reimbursement or recoupment. The Expense Limitation Agreement is terminable by the Trust upon 90 days’ prior written notice to the Investment Manager or at any time by mutual agreement of the parties. |
| (7) | The Investment Manager has agreed to waive its investment management fee for AllianzGI PerformanceFee Managed Futures up to 0.75% for any negative performance relative to the ICE BofAML 3-Month US T-Bill Index plus 5.00% (annualized). The Investment Manager has agreed to waive its investment management fee for AllianzGI PerformanceFee Structured US Equity up to 0.60% for any negative performance relative to the S&P 500 Index plus 1.25% (annualized). The Investment Manager has agreed to waive its investment management fee for AllianzGI PerformanceFee Structured US Fixed Income up to 0.30% for any negative performance relative to the Bloomberg Barclays U.S. Aggregate Bond Index plus 0.625% (annualized). The waivers are in effect from the Funds’ inception date through December 31, 2018. As of September 30, 2018, only AllianzGI PerformanceFee Managed Futures had negative performance relative to its index plus index hurdle for the period since inception which resulted in a waiver of $91,087 that is included in the “Fee Waiver/Reimbursement from Investment Manager” on the Statements of Operations. The amounts waived as of September 30, 2018 are subject to change until December 31, 2018. |
| (8) | Effective February 1, 2018, the Investment Manager has contractually agreed to irrevocably waive its management fee and/or reimburse the Fund through January 31, 2019 to the extent that Other Expenses, excluding interest, tax, and extraordinary expenses, Acquired Fund Fees and Expenses, and certain credits and other expenses, exceed the rates noted in the table above based on the Fund’s average net assets attributable to each share class. The Expense Limitation Agreement is terminable by the Trust upon 90 days’ prior written notice to the Investment Manager or at any time by mutual agreement of the parties. |
| (9) | The Investment Manager has contractually agreed to irrevocably waive its management fee and/or reimburse the Fund through January 31, 2022 to the extent that Total Annual Fund Operating Expenses excluding interest, tax, and extraordinary expenses, and certain credits and other expenses, exceed the rates noted in the table above based upon the Fund’s average net assets attributable to each share class. Under the Expense Limitation Agreement, the Investment Manager may recoup waived or reimbursed amounts for three years, provided total expenses, including such recoupment, do not exceed the annual expense limit in effect at the time of such waiver/reimbursement or recoupment. The Expense Limitation Agreement is terminable by the Trust upon 90 days’ prior written notice to the Investment Manager or at any time by mutual agreement of the parties. |
| * | As a result of reimbursing expenses inclusive of acquired fund fees and expenses, the Investment Manager reimbursed amounts in excess of the respective share class’ operating expenses. The aggregate excess reimbursement of each share class is accounted for as “Contribution from Investment Manager” on the Statements of Operations. |
| | | | | | |
| 358 | | September 30, 2018 | | | Annual Report | | |
The following Funds revised their expense limitation rates during the year ended September 30, 2018. The expense limitation rates in effect during the year (except as noted in the tables below) and at September 30, 2018 for all the Funds are disclosed in the table above.
| | | | | | | | | | | | | | | | | | | | | | | | |
| | | Expense Limitation (10/1/17 - 1/31/18) | | | Expense Limitation (2/1/18 - 6/30/18) | |
| | | Class A | | | Class P | | | Institutional
Class | | | Class A | | | Class P | | | Institutional
Class | |
AllianzGI Ultra Micro Cap | | | N/A | | | | N/A | | | | N/A | | | | 2.01 | % | | | 1.72 | % | | | 1.69 | % |
| | | | | | | | | | | | | | | | | | | | | | | | | | | | |
| | | Expense Limitation (10/1/17 - 1/31/18) | |
| | | Class A | | | Class C | | | Class R | | | Class P | | | Institutional
Class | | | Class R6 | | | Administrative
Class | |
AllianzGI Global Dynamic Allocation | | | 0.97 | % | | | 1.74 | % | | | 1.34 | % | | | 0.80 | % | | | 0.70 | % | | | 0.70 | % | | | 0.97 | % |
AllianzGI International Small-Cap | | | 1.25 | | | | 2.08 | | | | 1.59 | | | | 1.10 | | | | 1.07 | | | | 1.00 | | | | N/A | |
AllianzGI NFJ International Small-Cap Value | | | 1.30 | | | | 2.05 | | | | N/A | | | | 1.05 | | | | 1.01 | | | | 0.95 | | | | N/A | |
AllianzGI Short Duration High Income | | | N/A | | | | N/A | | | | N/A | | | | N/A | | | | N/A | | | | 0.57 | | | | N/A | |
AllianzGI Structured Return | | | 0.98 | | | | 1.78 | | | | N/A | | | | 0.77 | | | | 0.69 | | | | 0.67 | | | | N/A | |
| | | | | | | | | | | | | | | | | | | | |
| | | Expense Limitation (10/1/17 - 6/30/18) | |
| | | Class A | | | Class C | | | Class R | | | Class P | | | Institutional
Class | |
AllianzGI Emerging Markets Debt | | | 1.20 | % | | | 1.95 | % | | | N/A | | | | 1.05 | % | | | 0.95 | % |
AllianzGI Micro Cap | | | 1.62 | | | | N/A | | | | N/A | | | | 1.54 | | | | 1.54 | |
The Investment Manager, per the expense limitation agreements, may recoup waived/reimbursed amounts for a period of up to three years, provided total expenses, including such recoupment, do not exceed the annual expense limit in effect at the time of such waiver/reimbursement. During the period or year ended September 30, 2018, the Investment Manager recouped a total of $28,437 from the Funds as disclosed on the Statements of Operations. The following represents the amounts that still can be recouped by the Investment Manager as of September 30, 2018.
| | | | | | | | | | | | | | | | |
| | | Unrecouped Expenses Waived/Reimbursed through Fiscal
Period or Year ended | |
| | | 9/30/2016 | | | 9/30/2017 | | | 9/30/2018 | | | Totals | |
AllianzGI Retirement 2020 | | $ | 32,277 | | | $ | 88,906 | | | $ | 80,682 | | | $ | 201,865 | |
AllianzGI Retirement 2025 | | | 30,952 | | | | 116,776 | | | | 122,969 | | | | 270,697 | |
AllianzGI Retirement 2030 | | | 36,276 | | | | 123,768 | | | | 142,601 | | | | 302,645 | |
AllianzGI Retirement 2035 | | | 14,422 | | | | 63,406 | | | | 73,903 | | | | 151,731 | |
AllianzGI Retirement 2040 | | | 8,160 | | | | 25,645 | | | | 39,583 | | | | 73,388 | |
AllianzGI Retirement 2045 | | | 6,546 | | | | 7,838 | | | | 15,532 | | | | 29,916 | |
AllianzGI Retirement 2050 | | | 3,046 | | | | 3,702 | | | | 7,609 | | | | 14,357 | |
AllianzGI Retirement 2055 | | | 1,064 | | | | 1,712 | | | | 4,108 | | | | 6,884 | |
AllianzGI Multi Asset Income | | | 35,990 | | | | 92,776 | | | | 79,589 | | | | 208,355 | |
AllianzGI Global Allocation | | | — | | | | 14,256 | | | | — | | | | 14,256 | |
AllianzGI Best Styles Global Equity | | | 416,897 | | | | 222,208 | | | | 129,151 | | | | 768,256 | |
AllianzGI Best Styles International Equity | | | 394,405 | | | | 348,158 | | | | 267,293 | | | | 1,009,856 | |
AllianzGI Best Styles U.S. Equity | | | 195,811 | | | | 174,158 | | | | 119,713 | | | | 489,682 | |
AllianzGI Core Bond | | | — | | | | — | | | | 175,017 | | | | 175,017 | |
AllianzGI Core Plus Bond | | | — | | | | — | | | | 180,862 | | | | 180,862 | |
AllianzGI Emerging Markets Consumer | | | 257,727 | | | | 185,526 | | | | 82,270 | | | | 525,523 | |
AllianzGI Emerging Markets Debt | | | 162,697 | | | | 162,523 | | | | 187,669 | | | | 512,889 | |
AllianzGI Emerging Markets Small-Cap | | | 305,798 | | | | 251,209 | | | | 172,437 | | | | 729,444 | |
AllianzGI Europe Equity Dividend | | | 321,812 | | | | 307,860 | | | | 237,278 | | | | 866,950 | |
AllianzGI Global Dynamic Allocation | | | 199,996 | | | | 650,337 | | | | 457,777 | | | | 1,308,110 | |
AllianzGI Global High Yield | | | — | | | | 236,455 | | | | 236,908 | | | | 473,363 | |
AllianzGI Global Sustainability | | | 190,206 | | | | 175,647 | | | | 139,780 | | | | 505,633 | |
| | | | | | |
| | Annual Report | | | September 30, 2018 | | 359 |
Notes to Financial Statements (cont’d)
September 30, 2018
| | | | | | | | | | | | | | | | |
| | | Unrecouped Expenses Waived/Reimbursed through Fiscal
Period or Year ended | |
| | | 9/30/2016 | | | 9/30/2017 | | | 9/30/2018 | | | Totals | |
AllianzGI International Growth | | $ | 187,039 | | | $ | 172,093 | | | $ | 164,199 | | | $ | 523,331 | |
AllianzGI International Small-Cap | | | 258,005 | | | | 279,258 | | | | 190,541 | | | | 727,804 | |
AllianzGI Micro Cap | | | 153,921 | | | | 137,352 | | | | 133,846 | | | | 425,119 | |
AllianzGI NFJ Emerging Markets Value | | | 465,793 | | | | 548,032 | | | | 377,554 | | | | 1,391,379 | |
AllianzGI NFJ International Small-Cap Value | | | 349,447 | | | | 287,899 | | | | 186,509 | | | | 823,855 | |
AllianzGI Preferred Securities and Income | | | — | | | | — | | | | 151,931 | | | | 151,931 | |
AllianzGI Real Estate Debt | | | — | | | | — | | | | 278,716 | | | | 278,716 | |
AllianzGI Short Term Bond | | | — | | | | — | | | | 128,601 | | | | 128,601 | |
AllianzGI Structured Return | | | 16,609 | | | | 409,881 | | | | 296,727 | | | | 723,217 | |
AllianzGI U.S. Equity Hedged | | | 188,026 | | | | 193,599 | | | | 160,089 | | | | 541,714 | |
AllianzGI Ultra Micro Cap | | | — | | | | — | | | | 89,364 | | | | 89,364 | |
| 7. | RELATED PARTY TRANSACTIONS |
The Investment Manager and the Distributor are related parties. Fees payable to and amounts due from these parties are disclosed in Note 5 and Note 6 and the accrued related party fee and receivable amounts are disclosed on the Statements of Assets and Liabilities.
(a) Payments from Affiliates
During the year ended September 30, 2018, AllianzGI U.S. reimbursed AllianzGI Emerging Markets Small-Cap Fund and AllianzGI NFJ International Small-Cap Value Fund $6,843 and $18, respectively, for realized losses resulting from trading errors.
During the year ended September 30, 2017, AllianzGI U.S. reimbursed AllianzGI International Small-Cap, AllianzGI NFJ Emerging Markets Value, AllianzGI Structured Return and AllianzGI Ultra Micro Cap $1,442, $52,591, $5,650, and $2,886, respectively, for realized losses resulting from trading errors.
(b) In-Kind Fund Share Transactions
There were no in-kind fund share transactions for the period or year ended September 30, 2018.
During the year ended September 30, 2017, AllianzGI Best Styles Global Equity, AllianzGI Best Styles U.S. Equity and AllianzGI Convertible transferred securities and cash to affiliated entities in connection with redemption in-kind transactions. These transactions were treated as a sale of securities for U.S. GAAP, and the resulting gains and losses as shown in the table below were recognized based on the market value of the securities on the date of the transfer. For tax purposes, no gains or losses were recognized. The realized gains and losses from the redemption in-kind are netted and recorded as net realized gain on investments. The number of shares redeemed in-kind and redemption value as shown in the table below are included in the “Cost of shares redeemed” in Note 9. During the year ended September 30, 2017, AllianzGI Global Dynamic Allocation accepted securities from affiliated entities in connection with subscription in-kind transactions. For financial reporting and tax purposes, the cost basis of contributed securities is equal to the market value of the securities on the date of contribution. The Fund sold 1,985,501 shares of Class R6 in-kind with a subscription value of $36,374,375. The number of shares sold and subscription value are included in “Shares sold” in Note 9.
| | | | | | | | | | | | | | | | |
| | | Shares Redeemed
In-Kind | | | Redemption
Value | | | Realized
Gains | | | Realized
Losses | |
AllianzGI Best Styles Global Equity (Class R6) | | | 1,002,664 | | | $ | 15,791,959 | | | $ | 1,133,858 | | | $ | 438,244 | |
AllianzGI Best Styles U.S. Equity (Class R6) | | | 2,918,758 | | | | 45,202,958 | | | | 3,159,994 | | | | 1,690,309 | |
AllianzGI Convertible (Institutional Class) | | | 16,579,709 | | | | 552,103,654 | | | | 64,931,264 | | | | 6,282,257 | |
(c) Affiliated Transactions
The following tables show the transactions in and earnings from affiliates for the period or year ended September 30, 2018:
| | | | | | | | | | | | | | | | | | | | | | | | | | | | | | | | | | | | |
| AllianzGI Retirement 2020: | |
| | | Market Value
9/30/2017 | | | Purchases
at Cost | | | Proceeds
from
Sales | | | Change in
Unrealized
Appreciation
(Depreciation) | | | Market Value
9/30/2018 | | | Dividend
Income | | | Shares as of
9/30/2018 | | | Net
Realized
Gain (Loss) | | | Net Capital
Gain
Distributions
Received | |
AllianzGI Advanced Core Bond | | $ | 8,339,779 | | | $ | 1,506,420 | | | $ | 3,432,242 | | | $ | (149,631 | ) | | $ | 6,086,401 | | | $ | 194,037 | | | | 426,219 | | | $ | (177,925 | ) | | | — | |
AllianzGI Best Styles U.S. Equity | | | 3,541,309 | | | | 227,249 | | | | 1,942,747 | | | | (2,303 | ) | | | 2,122,354 | | | | 66,656 | | | | 103,732 | | | | 298,846 | | | $ | 160,593 | |
| | | | | | |
| 360 | | September 30, 2018 | | | Annual Report | | |
| | | | | | | | | | | | | | | | | | | | | | | | | | | | | | | | | | | | |
| AllianzGI Retirement 2020: | |
| | | Market Value
9/30/2017 | | | Purchases
at Cost | | | Proceeds
from
Sales | | | Change in
Unrealized
Appreciation
(Depreciation) | | | Market Value
9/30/2018 | | | Dividend
Income | | | Shares as of
9/30/2018 | | | Net
Realized
Gain (Loss) | | | Net Capital
Gain
Distributions
Received | |
AllianzGI Emerging Markets Debt | | $ | 687,359 | | | $ | 299,986 | | | $ | 965,860 | | | $ | (2,448 | ) | | | — | | | $ | 15,029 | | | | — | | | $ | (19,037 | ) | | $ | 6,881 | |
AllianzGI Emerging Markets Small-Cap | | | 320,480 | | | | 21,776 | | | | — | | | | (29,388 | ) | | $ | 312,868 | | | | 13,431 | | | | 19,019 | | | | — | | | | 8,344 | |
AllianzGI Global Dynamic Allocation | | | 34,086,296 | | | | 3,079,425 | | | | 14,191,368 | | | | (1,683,224 | ) | | | 22,138,654 | | | | 576,857 | | | | 1,098,692 | | | | 847,525 | | | | 1,214,401 | |
AllianzGI Short Duration High Income | | | 543,501 | | | | 63,196 | | | | 174,045 | | | | (11,485 | ) | | | 423,579 | | | | 27,344 | | | | 28,447 | | | | 2,412 | | | | — | |
Totals | | $ | 47,518,724 | | | $ | 5,198,052 | | | $ | 20,706,262 | | | $ | (1,878,479 | ) | | $ | 31,083,856 | | | $ | 893,354 | | | | 1,676,109 | | | $ | 951,821 | | | $ | 1,390,219 | |
| | | | | | | | | | | | | | | | | | | | | | | | | | | | | | | | | | | | |
| AllianzGI Retirement 2025: | |
| | | Market Value
9/30/2017 | | | Purchases
at Cost | | | Proceeds
from
Sales | | | Change in
Unrealized
Appreciation
(Depreciation) | | | Market Value
9/30/2018 | | | Dividend
Income | | | Shares as of
9/30/2018 | | | Net
Realized
Gain (Loss) | | | Net Capital
Gain
Distributions
Received | |
AllianzGI Advanced Core Bond | | $ | 7,019,821 | | | $ | 3,300,583 | | | $ | 3,201,451 | | | $ | (144,734 | ) | | $ | 6,809,345 | | | $ | 187,959 | | | | 476,845 | | | $ | (164,874 | ) | | | — | |
AllianzGI Best Styles U.S. Equity | | | 6,231,430 | | | | 509,027 | | | | 2,506,852 | | | | 340,507 | | | | 4,842,433 | | | | 117,289 | | | | 236,678 | | | | 268,321 | | | $ | 282,586 | |
AllianzGI Emerging Markets Debt | | | 648,718 | | | | 11,860 | | | | 650,968 | | | | (1,930 | ) | | | — | | | | 8,563 | | | | — | | | | (7,680 | ) | | | 3,297 | |
AllianzGI Emerging Markets Small-Cap | | | 344,099 | | | | 23,381 | | | | — | | | | (31,554 | ) | | | 335,926 | | | | 14,421 | | | | 20,421 | | | | — | | | | 8,959 | |
AllianzGI Global Dynamic Allocation | | | 48,368,729 | | | | 6,063,493 | | | | 16,804,857 | | | | (1,875,964 | ) | | | 36,606,454 | | | | 814,469 | | | | 1,816,697 | | | | 855,053 | | | | 1,714,618 | |
AllianzGI Short Duration High Income | | | 381 | | | | 337,543 | | | | 201,221 | | | | (1,093 | ) | | | 133,580 | | | | 6,517 | | | | 8,971 | | | | (2,030 | ) | | | — | |
Totals | | $ | 62,613,178 | | | $ | 10,245,887 | | | $ | 23,365,349 | | | $ | (1,714,768 | ) | | $ | 48,727,738 | | | $ | 1,149,218 | | | | 2,559,612 | | | $ | 948,790 | | | $ | 2,009,460 | |
| | | | | | | | | | | | | | | | | | | | | | | | | | | | | | | | | | | | |
| AllianzGI Retirement 2030: | |
| | | Market Value
9/30/2017 | | | Purchases
at Cost | | | Proceeds
from
Sales | | | Change in
Unrealized
Appreciation
(Depreciation) | | | Market Value
9/30/2018 | | | Dividend
Income | | | Shares as of
9/30/2018 | | | Net
Realized
Gain (Loss) | | | Net Capital
Gain
Distributions
Received | |
AllianzGI Advanced Core Bond | | $ | 690,578 | | | $ | 1,575,967 | | | $ | 424,680 | | | $ | (54,887 | ) | | $ | 1,774,485 | | | $ | 40,430 | | | | 124,264 | | | $ | (12,493 | ) | | | — | |
AllianzGI Best Styles Global Equity | | | 6,572,616 | | | | 1,128,943 | | | | 1,645,039 | | | | (428,036 | ) | | | 5,534,847 | | | | 225,116 | | | | 320,304 | | | | (93,637 | ) | | $ | 661,091 | |
AllianzGI Best Styles U.S. Equity | | | 9,461,330 | | | | 833,384 | | | | 3,403,348 | | | | 456,066 | | | | 7,819,716 | | | | 176,116 | | | | 382,195 | | | | 472,284 | | | | 424,317 | |
AllianzGI Emerging Markets Small-Cap | | | 780,480 | | | | 53,030 | | | | — | | | | (71,569 | ) | | | 761,941 | | | | 32,711 | | | | 46,319 | | | | — | | | | 20,320 | |
AllianzGI Global Dynamic Allocation | | | 52,549,025 | | | | 6,619,306 | | | | 15,782,098 | | | | (1,729,202 | ) | | | 42,224,079 | | | | 886,989 | | | | 2,095,488 | | | | 567,048 | | | | 1,867,291 | |
Totals | | $ | 70,054,029 | | | $ | 10,210,630 | | | $ | 21,255,165 | | | $ | (1,827,628 | ) | | $ | 58,115,068 | | | $ | 1,361,362 | | | | 2,968,570 | | | $ | 933,202 | | | $ | 2,973,019 | |
| | | | | | |
| | Annual Report | | | September 30, 2018 | | 361 |
Notes to Financial Statements (cont’d)
September 30, 2018
| | | | | | | | | | | | | | | | | | | | | | | | | | | | | | | | | | | | |
| AllianzGI Retirement 2035: | |
| | | Market Value
9/30/2017 | | | Purchases
at Cost | | | Proceeds
from
Sales | | | Change in
Unrealized
Appreciation
(Depreciation) | | | Market Value
9/30/2018 | | | Dividend
Income | | | Shares as of
9/30/2018 | | | Net
Realized
Gain (Loss) | | | Net Capital
Gain
Distributions
Received | |
AllianzGI Advanced Core Bond | | $ | 550,305 | | | $ | 975,404 | | | $ | 406,947 | | | $ | (31,237 | ) | | $ | 1,075,689 | | | $ | 27,048 | | | | 75,328 | | | $ | (11,836 | ) | | | — | |
AllianzGI Best Styles Global Equity | | | 18,125,278 | | | | 3,576,619 | | | | 6,598,794 | | | | (1,542,424 | ) | | | 13,581,150 | | | | 620,803 | | | | 785,946 | | | | 20,471 | | | $ | 1,823,090 | |
AllianzGI Best Styles U.S. Equity | | | 9,332,798 | | | | 911,429 | | | | 4,258,109 | | | | 263,685 | | | | 6,871,953 | | | | 173,531 | | | | 335,873 | | | | 622,150 | | | | 418,092 | |
AllianzGI Emerging Markets Small-Cap | | | 641,417 | | | | 43,582 | | | | — | | | | (58,817 | ) | | | 626,182 | | | | 26,883 | | | | 38,066 | | | | — | | | | 16,699 | |
AllianzGI Global Dynamic Allocation | | | 27,457,885 | | | | 4,318,345 | | | | 10,495,308 | | | | (1,046,411 | ) | | | 20,617,594 | | | | 463,641 | | | | 1,023,206 | | | | 383,083 | | | | 976,060 | |
Totals | | $ | 56,107,683 | | | $ | 9,825,379 | | | $ | 21,759,158 | | | $ | (2,415,204 | ) | | $ | 42,772,568 | | | $ | 1,311,906 | | | | 2,258,419 | | | $ | 1,013,868 | | | $ | 3,233,941 | |
| | | | | | | | | | | | | | | | | | | | | | | | | | | | | | | | | | | | |
| AllianzGI Retirement 2040: | |
| | | Market Value
9/30/2017 | | | Purchases
at Cost | | | Proceeds
from
Sales | | | Change in
Unrealized
Appreciation
(Depreciation) | | | Market Value
9/30/2018 | | | Dividend
Income | | | Shares as of
9/30/2018 | | | Net
Realized
Gain (Loss) | | | Net Capital
Gain
Distributions
Received | |
AllianzGI Best Styles Global Equity | | $ | 25,070,493 | | | $ | 4,601,236 | | | $ | 6,646,012 | | | $ | (2,007,936 | ) | | $ | 20,950,442 | | | $ | 866,190 | | | | 1,212,410 | | | $ | (67,339 | ) | | $ | 2,543,710 | |
AllianzGI Best Styles U.S. Equity | | | 9,687,342 | | | | 777,021 | | | | 2,950,924 | | | | 527,120 | | | | 8,448,286 | | | | 182,337 | | | | 412,917 | | | | 407,727 | | | | 439,307 | |
AllianzGI Emerging Markets Small-Cap | | | 544,837 | | | | 37,020 | | | | — | | | | (49,961 | ) | | | 531,896 | | | | 22,835 | | | | 32,334 | | | | — | | | | 14,185 | |
AllianzGI Global Dynamic Allocation | | | 16,998,199 | | | | 2,775,311 | | | | 4,123,519 | | | | (345,681 | ) | | | 15,255,190 | | | | 283,860 | | | | 757,081 | | | | (49,120 | ) | | | 597,583 | |
Totals | | $ | 52,300,871 | | | $ | 8,190,588 | | | $ | 13,720,455 | | | $ | (1,876,458 | ) | | $ | 45,185,814 | | | $ | 1,355,222 | | | | 2,414,742 | | | $ | 291,268 | | | $ | 3,594,785 | |
| | | | | | | | | | | | | | | | | | | | | | | | | | | | | | | | | | | | |
| AllianzGI Retirement 2045: | |
| | | Market Value
9/30/2017 | | | Purchases
at Cost | | | Proceeds
from
Sales | | | Change in
Unrealized
Appreciation
(Depreciation) | | | Market Value
9/30/2018 | | | Dividend
Income | | | Shares as of
9/30/2018 | | | Net
Realized
Gain (Loss) | | | Net Capital
Gain
Distributions
Received | |
AllianzGI Best Styles Global Equity | | $ | 18,313,605 | | | $ | 3,905,866 | | | $ | 3,997,169 | | | $ | (1,419,311 | ) | | $ | 16,700,795 | | | $ | 636,384 | | | | 966,481 | | | $ | (102,196 | ) | | $ | 1,868,844 | |
AllianzGI Best Styles U.S. Equity | | | 6,284,793 | | | | 737,800 | | | | 1,796,032 | | | | 417,731 | | | | 5,863,076 | | | | 118,293 | | | | 286,563 | | | | 218,784 | | | | 285,007 | |
AllianzGI Emerging Markets Small-Cap | | | 321,547 | | | | 21,848 | | | | — | | | | (29,486 | ) | | | 313,909 | | | | 13,477 | | | | 19,083 | | | | — | | | | 8,370 | |
AllianzGI Global Dynamic Allocation | | | 7,059,343 | | | | 1,636,641 | | | | 1,738,479 | | | | (135,176 | ) | | | 6,789,450 | | | | 120,330 | | | | 336,945 | | | | (32,879 | ) | | | 253,319 | |
Totals | | $ | 31,979,288 | | | $ | 6,302,155 | | | $ | 7,531,680 | | | $ | (1,166,242 | ) | | $ | 29,667,230 | | | $ | 888,484 | | | | 1,609,072 | | | $ | 83,709 | | | $ | 2,415,540 | |
| | | | | | | | | | | | | | | | | | | | | | | | | | | | | | | | | | | | |
| AllianzGI Retirement 2050: | |
| | | Market Value
9/30/2017 | | | Purchases
at Cost | | | Proceeds
from
Sales | | | Change in
Unrealized
Appreciation
(Depreciation) | | | Market Value
9/30/2018 | | | Dividend
Income | | | Shares as of
9/30/2018 | | | Net
Realized
Gain (Loss) | | | Net Capital
Gain
Distributions
Received | |
AllianzGI Best Styles Global Equity | | $ | 19,134,566 | | | $ | 5,192,104 | | | $ | 3,309,392 | | | $ | (1,393,670 | ) | | $ | 19,454,855 | | | $ | 666,437 | | | | 1,125,860 | | | $ | (168,753 | ) | | $ | 1,957,103 | |
AllianzGI Best Styles U.S. Equity | | | 5,857,590 | | | | 962,418 | | | | 1,360,312 | | | | 511,402 | | | | 6,073,759 | | | | 110,562 | | | | 296,860 | | | | 102,661 | | | | 266,379 | |
AllianzGI Emerging Markets Small-Cap | | | 309,055 | | | | 20,999 | | | | — | | | | (28,340 | ) | | | 301,714 | | | | 12,953 | | | | 18,341 | | | | — | | | | 8,046 | |
AllianzGI Global Dynamic Allocation | | | 5,658,483 | | | | 1,173,454 | | | | 962,635 | | | | (104,960 | ) | | | 5,745,930 | | | | 96,146 | | | | 285,158 | | | | (18,412 | ) | | | 202,406 | |
Totals | | $ | 30,959,694 | | | $ | 7,348,975 | | | $ | 5,632,339 | | | $ | (1,015,568 | ) | | $ | 31,576,258 | | | $ | 886,098 | | | | 1,726,219 | | | $ | (84,504 | ) | | $ | 2,433,934 | |
| | | | | | |
| 362 | | September 30, 2018 | | | Annual Report | | |
| | | | | | | | | | | | | | | | | | | | | | | | | | | | | | | | | | | | |
| AllianzGI Retirement 2055: | |
| | | Market Value
9/30/2017 | | | Purchases
at Cost | | | Proceeds
from
Sales | | | Change in
Unrealized
Appreciation
(Depreciation) | | | Market Value
9/30/2018 | | | Dividend
Income | | | Shares as of
9/30/2018 | | | Net
Realized
Gain (Loss) | | | Net Capital
Gain
Distributions
Received | |
AllianzGI Best Styles Global Equity | | $ | 8,609,987 | | | $ | 4,255,979 | | | $ | 2,657,614 | | | $ | (583,037 | ) | | $ | 9,433,238 | | | $ | 322,995 | | | | 545,905 | | | $ | (192,077 | ) | | $ | 948,529 | |
AllianzGI Best Styles U.S. Equity | | | 2,713,120 | | | | 929,888 | | | | 959,451 | | | | 264,648 | | | | 2,996,373 | | | | 53,325 | | | | 146,450 | | | | 48,168 | | | | 128,479 | |
AllianzGI Emerging Markets Small-Cap | | | 109,816 | | | | 63,200 | | | | — | | | | (14,785 | ) | | | 158,231 | | | | 4,603 | | | | 9,619 | | | | — | | | | 2,859 | |
AllianzGI Global Dynamic Allocation | | | 2,546,142 | | | | 1,090,505 | | | | 779,976 | | | | (43,773 | ) | | | 2,789,818 | | | | 46,373 | | | | 138,453 | | | | (23,080 | ) | | | 97,624 | |
Totals | | $ | 13,979,065 | | | $ | 6,339,572 | | | $ | 4,397,041 | | | $ | (376,947 | ) | | $ | 15,377,660 | | | $ | 427,296 | | | | 840,427 | | | $ | (166,989 | ) | | $ | 1,177,491 | |
| | | | | | | | | | | | | | | | | | | | | | | | | | | | | | | | | | | | |
| AllianzGI Multi Asset Income: | |
| | | Market Value
9/30/2017 | | | Purchases
at Cost | | | Proceeds
from
Sales | | | Change in
Unrealized
Appreciation
(Depreciation) | | | Market Value
9/30/2018 | | | Dividend
Income | | | Shares as of
9/30/2018 | | | Net
Realized
Gain (Loss) | | | Net Capital
Gain
Distributions
Received | |
AllianzGI Emerging Markets Debt | | $ | 2,791,922 | | | $ | 1,194,471 | | | $ | 1,326,171 | | | $ | (252,802 | ) | | $ | 2,265,579 | | | $ | 158,785 | | | | 171,246 | | | $ | (141,841 | ) | | $ | 25,065 | |
AllianzGI Europe Equity Dividend | | | 3,273,342 | | | | 131,542 | | | | 773,448 | | | | (136,757 | ) | | | 2,458,202 | | | | 131,542 | | | | 158,389 | | | | (36,477 | ) | | | — | |
AllianzGI Global High Yield | | | 1,024,740 | | | | 678,896 | | | | 389,496 | | | | (30,516 | ) | | | 1,271,475 | | | | 61,642 | | | | 85,737 | | | | (12,149 | ) | | | — | |
AllianzGI High Yield Bond | | | 3,294,971 | | | | 3,628,077 | | | | 5,966,319 | | | | (183,218 | ) | | | 782,746 | | | | 129,942 | | | | 91,229 | | | | 9,235 | | | | — | |
AllianzGI Real Estate Debt | | | — | | | | 4,528,590 | | | | 597,685 | | | | (8,661 | ) | | | 3,921,656 | | | | 45,171 | | | | 262,318 | | | | (588 | ) | | | — | |
AllianzGI Short Duration High Income | | | 8,402,079 | | | | 2,539,350 | | | | 6,473,168 | | | | 1,407 | | | | 4,387,608 | | | | 249,048 | | | | 294,668 | | | | (82,060 | ) | | | — | |
PIMCO Income | | | 5,767,960 | | | | 2,788,043 | | | | 2,791,206 | | | | (244,595 | ) | | | 5,495,035 | | | | 323,822 | | | | 462,156 | | | | (25,167 | ) | | | — | |
PIMCO Investment Grade Corporate Bond Index | | | — | | | | 5,934,030 | | | | 5,727,378 | | | | — | | | | — | | | | 86,146 | | | | — | | | | (206,652 | ) | | | 3,326 | |
PIMCO Long-Term Credit | | | 3,036,362 | | | | — | | | | 3,055,604 | | | | (91,091 | ) | | | — | | | | 4,922 | | | | — | | | | 110,333 | | | | — | |
PIMCO Mortgage Opportunities | | | 3,810,026 | | | | 1,301,977 | | | | 5,040,306 | | | | (25,129 | ) | | | — | | | | 93,780 | | | | — | | | | (46,568 | ) | | | — | |
PIMCO Preferred and Capital Securities | | | 2,013,097 | | | | 3,837,418 | | | | 3,541,345 | | | | (80,924 | ) | | | 2,163,806 | | | | 180,829 | | | | 214,451 | | | | (64,440 | ) | | | 7,190 | |
PIMCO Senior Floating Rate | | | — | | | | 2,138,123 | | | | 166,309 | | | | 15,958 | | | | 1,988,416 | | | | 22,074 | | | | 200,647 | | | | 644 | | | | — | |
Totals | | $ | 33,414,499 | | | $ | 28,700,517 | | | $ | 35,848,435 | | | $ | (1,036,328 | ) | | $ | 24,734,523 | | | $ | 1,487,703 | | | | 1,940,841 | | | $ | (495,730 | ) | | $ | 35,581 | |
| | | | | | | | | | | | | | | | | | | | | | | | | | | | | | | | | | | | |
| AllianzGI Global Allocation: | |
| | | Market Value
9/30/2017 | | | Purchases
at Cost | | | Proceeds
from
Sales | | | Change in
Unrealized
Appreciation
(Depreciation) | | | Market Value
9/30/2018 | | | Dividend
Income | | | Shares as of
9/30/2018 | | | Net
Realized
Gain (Loss) | | | Net Capital
Gain
Distributions
Received | |
AllianzGI Advanced Core Bond | | $ | 87,446,693 | | | $ | 11,146,221 | | | $ | 13,637,723 | | | $ | (2,857,765 | ) | | $ | 81,539,738 | | | $ | 2,097,095 | | | | 5,710,066 | | | $ | (557,688 | ) | | | — | |
AllianzGI Best Styles Global Equity | | | 144,308,772 | | | | 22,377,737 | | | | 23,417,478 | | | | (12,072,058 | ) | | | 132,579,267 | | | | 4,807,230 | | | | 7,672,411 | | | | 1,382,294 | | | $ | 14,117,227 | |
AllianzGI Best Styles Global Managed Volatility | | | 35,385,401 | | | | 2,482,014 | | | | 1,966,680 | | | | 540,796 | | | | 36,521,892 | | | | 1,187,383 | | | | 2,016,670 | | | | 80,361 | | | | 1,294,630 | |
| | | | | | |
| | Annual Report | | | September 30, 2018 | | 363 |
Notes to Financial Statements (cont’d)
September 30, 2018
| | | | | | | | | | | | | | | | | | | | | | | | | | | | | | | | | | | | |
| AllianzGI Global Allocation: | |
| | | Market Value
9/30/2017 | | | Purchases
at Cost | | | Proceeds
from
Sales | | | Change in
Unrealized
Appreciation
(Depreciation) | | | Market Value
9/30/2018 | | | Dividend
Income | | | Shares as of
9/30/2018 | | | Net
Realized
Gain (Loss) | | | Net Capital
Gain
Distributions
Received | |
AllianzGI Emerging Markets Debt | | $ | 15,413,937 | | | $ | 875,787 | | | | — | | | $ | (1,699,035 | ) | | $ | 14,590,689 | | | $ | 765,736 | | | | 1,102,849 | | | | — | | | $ | 110,051 | |
AllianzGI Emerging Markets Small-Cap | | | 4,609,381 | | | | 313,189 | | | | — | | | | (422,676 | ) | | | 4,499,894 | | | | 193,185 | | | | 273,550 | | | | — | | | | 120,005 | |
AllianzGI High Yield Bond | | | 4,928,245 | | | | 65,719 | | | $ | 4,907,843 | | | | (187,711 | ) | | | — | | | | 65,719 | | | | — | | | $ | 101,590 | | | | — | |
AllianzGI International Growth | | | 17,904,950 | | | | 2,224,577 | | | | — | | | | (1,411,842 | ) | | | 18,717,685 | | | | 109,347 | | | | 1,021,708 | | | | — | | | | 2,115,231 | |
AllianzGI PerformanceFee Managed Futures Strategy | | | — | | | | 15,000,000 | | | | — | | | | (585,000 | ) | | | 14,415,000 | | | | — | | | | 1,500,000 | | | | — | | | | — | |
Totals | | $ | 309,997,379 | | | $ | 54,485,244 | | | $ | 43,929,724 | | | $ | (18,695,291 | ) | | $ | 302,864,165 | | | $ | 9,225,695 | | | | 19,297,254 | | | $ | 1,006,557 | | | $ | 17,757,144 | |
| | | | | | | | | | | | | | | | | | | | | | | | | | | | | | | | | | | | |
| AllianzGI Global Dynamic Allocation: | |
| | | Market Value
9/30/2017 | | | Purchases
at Cost | | | Proceeds
from Sales | | | Change in
Unrealized
Appreciation
(Depreciation) | | | Market Value
9/30/2018 | | | Dividend
Income | | | Shares as of
9/30/2018 | | | Net
Realized
Gain (Loss) | | | Net Capital
Gain
Distributions
Received | |
AllianzGI International Growth | | $ | — | | | $ | 4,470,226 | | | $ | — | | | $ | (69,660 | ) | | $ | 4,400,566 | | | $ | — | | | | 240,206 | | | $ | — | | | $ | — | |
Certain Funds are permitted to purchase or sell securities from or to certain related affiliated funds under specified conditions outlined in procedures adopted by the Board. The procedures have been designed to ensure that any purchase or sale of securities by the Funds from or to another fund or portfolio that are, or could be, considered an affiliate by virtue of having a common investment adviser (or affiliated investment advisers), common Trustees and/or common officers comply with Rule 17a-7 of the 1940 Act. Further, as defined
under the procedures, each transaction is effected at the current market price.
During the period or year ended September 30, 2018, the following Fund engaged in sales of securities pursuant to Rule 17a-7 of the 1940 Act:
| | | | | | | | |
| | | Purchases | | | Sales | |
AllianzGI Short Duration High Income | | | — | | | $ | 95,927,965 | |
| 8. | SIGNIFICANT ACCOUNT HOLDERS |
From time to time, a Fund may have a concentration of shareholders, which may include the Investment Manager or affiliates of the Investment Manager, holding a significant percentage of shares outstanding. Investment activities of these shareholders could have a material impact to a Fund.
At September 30, 2018, the significant account-holders, owners of 5% or greater of each respective Fund’s outstanding shares were as follows:
| | | | | | | | | | | | | | | | | | | | |
| | | Unaffiliated | | | Affiliated | |
| | | Number of
Account
Holders | | | Approximate
Ownership | | | Number of
Account
Holders | | | Approximate
Ownership* | | | AFI/Allianz of
America | |
AllianzGI Retirement 2020 | | | 3 | | | | 71 | % | | | — | | | | — | | | | — | |
AllianzGI Retirement 2025 | | | 2 | | | | 75 | % | | | — | | | | — | | | | — | |
AllianzGI Retirement 2030 | | | 3 | | | | 76 | % | | | — | | | | — | | | | — | |
AllianzGI Retirement 2035 | | | 3 | | | | 80 | % | | | — | | | | — | | | | — | |
AllianzGI Retirement 2040 | | | 2 | | | | 76 | % | | | — | | | | — | | | | — | |
AllianzGI Retirement 2045 | | | 2 | | | | 77 | % | | | — | | | | — | | | | — | |
AllianzGI Retirement 2050 | | | 2 | | | | 74 | % | | | — | | | | — | | | | — | |
AllianzGI Retirement 2055 | | | 2 | | | | 76 | % | | | — | | | | — | | | | — | |
AllianzGI Multi Asset Income | | | 4 | | | | 67 | % | | | — | | | | — | | | | — | |
AllianzGI Global Allocation | | | 1 | | | | 23 | % | | | 2 | | | | 55 | % | | | — | |
AllianzGI Best Styles Global Equity | | | — | | | | — | | | | 4 | | | | 81 | % | | | — | |
| | | | | | |
| 364 | | September 30, 2018 | | | Annual Report | | |
| | | | | | | | | | | | | | | | | | | | |
| | | Unaffiliated | | | Affiliated | |
| | | Number of
Account
Holders | | | Approximate
Ownership | | | Number of
Account
Holders | | | Approximate
Ownership* | | | AFI/Allianz of
America | |
AllianzGI Best Styles International Equity | | | 1 | | | | 41 | % | | | 2 | | | | 52 | % | | | — | |
AllianzGI Best Styles U.S. Equity | | | 1 | | | | 8 | % | | | 7 | | | | 81 | % | | | — | |
AllianzGI Convertible | | | 6 | | | | 59 | % | | | — | | | | — | | | | — | |
AllianzGI Core Bond | | | — | | | | — | | | | 1 | | | | 15 | % | | | 85 | % |
AllianzGI Core Plus Bond | | | — | | | | — | | | | — | | | | — | | | | 100 | % |
AllianzGI Emerging Markets Consumer | | | 6 | | | | 98 | % | | | — | | | | — | | | | — | |
AllianzGI Emerging Markets Debt | | | 1 | | | | 7 | % | | | 2 | | | | 91 | % | | | — | |
AllianzGI Emerging Markets Small-Cap | | | 1 | | | | 20 | % | | | 4 | | | | 63 | % | | | — | |
AllianzGI Europe Equity Dividend | | | 2 | | | | 57 | % | | | 1 | | | | 35 | % | | | — | |
AllianzGI Global Dynamic Allocation | | | 2 | | | | 25 | % | | | 5 | | | | 62 | % | | | — | |
AllianzGI Global High Yield | | | — | | | | — | | | | 1 | | | | 6 | % | | | 94 | % |
AllianzGI Global Sustainability | | | 3 | | | | 97 | % | | | — | | | | — | | | | — | |
AllianzGI Global Water | | | 8 | | | | 83 | % | | | — | | | | — | | | | — | |
AllianzGI High Yield Bond | | | 5 | | | | 81 | % | | | — | | | | — | | | | — | |
AllianzGI International Growth | | | — | | | | — | | | | 3 | | | | 92 | % | | | — | |
AllianzGI International Small-Cap | | | 2 | | | | 72 | % | | | — | | | | — | | | | — | |
AllianzGI Micro Cap | | | 2 | | | | 80 | % | | | — | | | | — | | | | — | |
AllianzGI NFJ Emerging Markets Value | | | 2 | | | | 90 | % | | | — | | | | — | | | | — | |
AllianzGI NFJ International Small-Cap Value | | | 4 | | | | 89 | % | | | — | | | | — | | | | — | |
AllianzGI PerformanceFee Managed Futures Strategy | | | 1 | | | | 8 | % | | | 1 | | | | 91 | % | | | — | |
AllianzGI PerformanceFee Structured US Equity | | | 3 | | | | 64 | % | | | — | | | | — | | | | 33 | % |
AllianzGI PerformanceFee Structured US Fixed Income | | | — | | | | — | | | | — | | | | — | | | | 99 | % |
AllianzGI Preferred Securities and Income | | | 1 | | | | 13 | % | | | — | | | | — | | | | 87 | % |
AllianzGI Real Estate Debt | | | — | | | | — | | | | 2 | | | | 32 | % | | | 66 | % |
AllianzGI Short Duration High Income | | | 9 | | | | 80 | % | | | — | | | | — | | | | — | |
AllianzGI Short Term Bond | | | — | | | | — | | | | — | | | | — | | | | 97 | % |
AllianzGI Structured Return | | | 6 | | | | 74 | % | | | — | | | | — | | | | — | |
AllianzGI U.S. Equity Hedged | | | 4 | | | | 94 | % | | | — | | | | — | | | | — | |
AllianzGI Ultra Micro Cap | | | 4 | | | | 77 | % | | | — | | | | — | | | | — | |
| * | This represents the aggregate percentage of affiliated entities that own 5% or more of the Fund’s outstanding shares. These affiliated entities include funds/portfolios of the Trust, CollegeAccess 529 Plan, OklahomaDream 529 Plan and Allianz Multi-Series Collective Investment Trust. |
| | | | | | |
| | Annual Report | | | September 30, 2018 | | 365 |
Notes to Financial Statements (cont’d)
September 30, 2018
| 9. | SHARES OF BENEFICIAL INTEREST |
The Trust may issue an unlimited number of shares of beneficial interest with $0.0001 par value. Changes in shares of beneficial interest were as follows:
| | | | | | | | | | | | | | | | | | | | | | | | | | | | | | | | | | | | |
| | | AllianzGI Retirement 2020 | | | AllianzGI Retirement 2025 | | | | |
| | | Year ended
September 30, 2018 | | | Year ended
September 30, 2017 | | | Year ended
September 30, 2018 | | | Year ended
September 30, 2017 | | | | |
| | | Shares | | | Amount | | | Shares | | | Amount | | | Shares | | | Amount | | | Shares | | | Amount | | | | |
Shares sold: | | | | | | | | | | | | | | | | | | | | | | | | | | | | | |
Class A | | | 30,378 | | | $ | 616,318 | | | | 76,737 | | | $ | 1,476,887 | | | | 72,929 | | | $ | 1,336,155 | | | | 58,086 | | | $ | 1,010,886 | | | | | |
Class C | | | 2,648 | | | | 52,962 | | | | 6,921 | | | | 131,602 | | | | — | | | | — | | | | — | | | | — | | | | | |
Class R | | | 2,276 | | | | 45,999 | | | | 3,269 | | | | 64,108 | | | | 3,383 | | | | 61,727 | | | | 4,122 | | | | 69,053 | | | | | |
Class P | | | 185,370 | | | | 3,793,616 | | | | 133,356 | | | | 2,600,760 | | | | 203,211 | | | | 3,738,212 | | | | 246,556 | | | | 4,280,682 | | | | | |
Class R6 | | | 221,480 | | | | 4,544,238 | | | | 481,151 | | | | 9,346,062 | | | | 303,923 | | | | 5,570,574 | | | | 673,832 | | | | 11,717,365 | | | | | |
Administrative Class | | | 3,817 | | | | 78,298 | | | | 17,680 | | | | 340,652 | | | | 2,112 | | | | 39,074 | | | | 10,689 | | | | 184,331 | | | | | |
| | | | | | | |
Issued in reinvestment of dividends and distributions: | | | | | | | | | | | | | | | | | | | | | | | | | | | | | |
Class A | | | 20,754 | | | | 422,972 | | | | 16,725 | | | | 310,416 | | | | 17,564 | | | | 323,180 | | | | 7,078 | | | | 117,498 | | | | | |
Class C | | | 481 | | | | 9,782 | | | | 462 | | | | 8,548 | | | | — | | | | — | | | | — | | | | — | | | | | |
Class R | | | 2 | | | | 46 | | | | 500 | | | | 9,321 | | | | 31 | | | | 566 | | | | 915 | | | | 15,091 | | | | | |
Class P | | | 33,591 | | | | 689,954 | | | | 38,717 | | | | 724,018 | | | | 95,060 | | | | 1,746,256 | | | | 59,281 | | | | 982,280 | | | | | |
Class R6 | | | 31,248 | | | | 642,466 | | | | 19,701 | | | | 368,801 | | | | 53,770 | | | | 988,834 | | | | 21,665 | | | | 359,200 | | | | | |
Administrative Class | | | 1,059 | | | | 21,720 | | | | 773 | | | | 14,448 | | | | 672 | | | | 12,408 | | | | 755 | | | | 12,535 | | | | | |
| | | | | | | |
Cost of shares redeemed: | | | | | | | | | | | | | | | | | | | | | | | | | | | | | |
Class A | | | (522,132 | ) | | | (10,496,950 | ) | | | (87,720 | ) | | | (1,678,659 | ) | | | (165,081 | ) | | | (3,026,895 | ) | | | (35,255 | ) | | | (615,697 | ) | | | | |
Class C | | | (4,544 | ) | | | (92,179 | ) | | | (6,362 | ) | | | (122,830 | ) | | | — | | | | — | | | | — | | | | — | | | | | |
Class R | | | (92 | ) | | | (1,821 | ) | | | (35,437 | ) | | | (678,453 | ) | | | (2,437 | ) | | | (44,799 | ) | | | (42,549 | ) | | | (723,563 | ) | | | | |
Class P | | | (565,028 | ) | | | (11,507,964 | ) | | | (528,913 | ) | | | (10,285,749 | ) | | | (1,030,087 | ) | | | (18,804,115 | ) | | | (401,873 | ) | | | (6,967,829 | ) | | | | |
Class R6 | | | (304,062 | ) | | | (6,221,856 | ) | | | (315,208 | ) | | | (6,228,636 | ) | | | (322,507 | ) | | | (5,924,381 | ) | | | (295,135 | ) | | | (5,224,988 | ) | | | | |
Administrative Class | | | (11,758 | ) | | | (239,104 | ) | | | (5,654 | ) | | | (109,267 | ) | | | (32,368 | ) | | | (606,574 | ) | | | (5,975 | ) | | | (100,722 | ) | | | | |
Net increase (decrease) resulting from Fund share transactions | | | (874,512 | ) | | $ | (17,641,503 | ) | | | (183,302 | ) | | $ | (3,707,971 | ) | | | (799,825 | ) | | $ | (14,589,778 | ) | | | 302,192 | | | $ | 5,116,122 | | | | | |
| — | May reflect actual amounts rounding to less than $1 or less than 1 share. |
| | | | | | |
| 366 | | September 30, 2018 | | | Annual Report | | |
| | | | | | | | | | | | | | | | | | | | | | | | | | | | | | | | | | | | | | | | | | | | | | | | | | |
| | | | AllianzGI Retirement 2030 | | | AllianzGI Retirement 2035 | | | AllianzGI Retirement 2040 | |
| | | | Year ended
September 30, 2018 | | | Year ended
September 30, 2017 | | | Year ended
September 30, 2018 | | | Year ended
September 30, 2017 | | | Year ended
September 30, 2018 | | | Year ended
September 30, 2017 | |
| | | | Shares | | | Amount | | | Shares | | | Amount | | | Shares | | | Amount | | | Shares | | | Amount | | | Shares | | | Amount | | | Shares | | | Amount | |
| | | | | | | | | | | | | | | | | | | | | | | | | | | | | | | | | | | | | | | | | | | | | | | | | | |
| | | | | | 128,816 | | | $ | 2,880,864 | | | | 169,366 | | | $ | 3,631,028 | | | | 91,149 | | | $ | 1,820,020 | | | | 82,607 | | | $ | 1,535,318 | | | | 49,839 | | | $ | 1,151,137 | | | | 129,442 | | | $ | 2,832,313 | |
| | | | | | 8,078 | | | | 176,407 | | | | 9,201 | | | | 194,249 | | | | — | | | | — | | | | — | | | | — | | | | 256 | | | | 5,915 | | | | 556 | | | | 11,727 | |
| | | | | | 4,538 | | | | 101,176 | | | | 8,384 | | | | 169,358 | | | | 5,722 | | | | 113,399 | | | | 9,140 | | | | 164,152 | | | | 2,721 | | | | 62,393 | | | | 8,299 | | | | 170,224 | |
| | | | | | 241,695 | | | | 5,459,380 | | | | 231,370 | | | | 4,891,963 | | | | 188,459 | | | | 3,776,002 | | | | 214,806 | | | | 3,980,036 | | | | 182,080 | | | | 4,229,666 | | | | 194,498 | | | | 4,120,583 | |
| | | | | | 208,063 | | | | 4,693,327 | | | | 494,594 | | | | 10,525,400 | | | | 248,616 | | | | 4,961,281 | | | | 423,923 | | | | 7,975,286 | | | | 186,223 | | | | 4,340,560 | | | | 364,045 | | | | 7,862,454 | |
| | | | | | 5,790 | | | | 131,956 | | | | 11,561 | | | | 239,783 | | | | 5,066 | | | | 102,573 | | | | 23,561 | | | | 431,467 | | | | 3,510 | | | | 82,456 | | | | 2,570 | | | | 54,947 | |
| | | | | | | | | | | | |
| | | | | | | | | | | | | | | | | | | | | | | | | | | | | | | | | | | | | | | | | | | | | | | | | | |
| | | | | | 21,750 | | | | 483,287 | | | | 7,285 | | | | 144,389 | | | | 25,634 | | | | 506,780 | | | | 11,790 | | | | 206,201 | | | | 12,616 | | | | 289,017 | | | | 7,063 | | | | 142,180 | |
| | | | | | 1,677 | | | | 36,934 | | | | 627 | | | | 12,336 | | | | — | | | | — | | | | — | | | | — | | | | 341 | | | | 7,750 | | | | 206 | | | | 4,120 | |
| | | | | | 408 | | | | 9,075 | | | | 2,247 | | | | 44,419 | | | | 292 | | | | 5,756 | | | | 1,458 | | | | 25,406 | | | | 216 | | | | 4,926 | | | | 2,744 | | | | 54,691 | |
| | | | | | 93,948 | | | | 2,107,251 | | | | 46,942 | | | | 938,844 | | | | 102,945 | | | | 2,042,424 | | | | 50,349 | | | | 883,626 | | | | 68,278 | | | | 1,569,715 | | | | 46,345 | | | | 935,697 | |
| | | | | | 61,604 | | | | 1,385,473 | | | | 24,135 | | | | 483,657 | | | | 50,938 | | | | 1,012,145 | | | | 16,412 | | | | 288,351 | | | | 65,515 | | | | 1,509,472 | | | | 34,052 | | | | 688,539 | |
| | | | | | 1,114 | | | | 25,075 | | | | 1,496 | | | | 29,885 | | | | 749 | | | | 14,933 | | | | 996 | | | | 17,461 | | | | 1,154 | | | | 26,411 | | | | 656 | | | | 13,206 | |
| | | | | | | | | | | | |
| | | | | | | | | | | | | | | | | | | | | | | | | | | | | | | | | | | | | | | | | | | | | | | | | | |
| | | | | | (288,920 | ) | | | (6,455,145 | ) | | | (119,163 | ) | | | (2,553,450 | ) | | | (238,656 | ) | | | (4,729,935 | ) | | | (179,788 | ) | | | (3,296,808 | ) | | | (178,675 | ) | | | (4,133,703 | ) | | | (57,829 | ) | | | (1,260,230 | ) |
| | | | | | (6,334 | ) | | | (139,687 | ) | | | (9,054 | ) | | | (193,558 | ) | | | — | | | | — | | | | — | | | | — | | | | (1,858 | ) | | | (42,453 | ) | | | (894 | ) | | | (18,693 | ) |
| | | | | | (14,147 | ) | | | (318,017 | ) | | | (102,367 | ) | | | (2,095,862 | ) | | | (9,000 | ) | | | (177,281 | ) | | | (66,259 | ) | | | (1,205,411 | ) | | | (10,795 | ) | | | (249,540 | ) | | | (73,837 | ) | | | (1,538,720 | ) |
| | | | | | (739,266 | ) | | | (16,501,776 | ) | | | (331,551 | ) | | | (6,996,835 | ) | | | (902,876 | ) | | | (17,852,182 | ) | | | (342,148 | ) | | | (6,368,482 | ) | | | (525,765 | ) | | | (12,090,480 | ) | | | (206,337 | ) | | | (4,392,618 | ) |
| | | | | | (260,940 | ) | | | (5,859,379 | ) | | | (243,782 | ) | | | (5,253,796 | ) | | | (241,188 | ) | | | (4,795,297 | ) | | | (172,855 | ) | | | (3,231,813 | ) | | | (225,496 | ) | | | (5,222,617 | ) | | | (147,672 | ) | | | (3,185,036 | ) |
| | | | | | (46,986 | ) | | | (1,081,748 | ) | | | (13,077 | ) | | | (269,752 | ) | | | (31,938 | ) | | | (652,525 | ) | | | (16,571 | ) | | | (302,465 | ) | | | (899 | ) | | | (20,931 | ) | | | (3,134 | ) | | | (63,157 | ) |
| | | | | | (579,112 | ) | | $ | (12,865,547 | ) | | | 188,214 | | | $ | 3,942,058 | | | | (704,088 | ) | | $ | (13,851,907 | ) | | | 57,421 | | | $ | 1,102,325 | | | | (370,739 | ) | | $ | (8,480,306 | ) | | | 300,773 | | | $ | 6,432,227 | |
| | | | | | |
| | Annual Report | | | September 30, 2018 | | 367 |
Notes to Financial Statements (cont’d)
September 30, 2018
| | | | | | | | | | | | | | | | | | | | | | | | | | | | | | | | | | | | |
| | | AllianzGI Retirement 2045 | | | AllianzGI Retirement 2050 | | | | |
| | | Year ended
September 30, 2018 | | | Year ended
September 30, 2017 | | | Year ended
September 30, 2018 | | | Year ended
September 30, 2017 | | | | |
| | | Shares | | | Amount | | | Shares | | | Amount | | | Shares | | | Amount | | | Shares | | | Amount | | | | |
Shares sold: | | | | | | | | | | | | | | | | | | | | | | | | | | | | | | | | | | | | |
Class A | | | 56,069 | | | $ | 1,129,599 | | | | 48,719 | | | $ | 918,326 | | | | 48,528 | | | $ | 1,088,804 | | | | 106,379 | | | $ | 2,166,114 | | | | | |
Class C | | | — | | | | — | | | | — | | | | — | | | | 1,180 | | | | 26,124 | | | | 1,093 | | | | 22,259 | | | | | |
Class R | | | 4,109 | | | | 82,431 | | | | 7,653 | | | | 140,162 | | | | 2,705 | | | | 60,262 | | | | 3,766 | | | | 75,483 | | | | | |
Class P | | | 122,579 | | | | 2,493,760 | | | | 150,381 | | | | 2,830,332 | | | | 122,468 | | | | 2,781,748 | | | | 139,562 | | | | 2,913,729 | | | | | |
Institutional Class | | | — | | | | — | | | | — | | | | — | | | | — | | | | — | | | | — | | | | — | | | | | |
Class R6 | | | 193,863 | | | | 3,946,331 | | | | 306,694 | | | | 5,779,643 | | | | 200,778 | | | | 4,587,934 | | | | 267,214 | | | | 5,625,406 | | | | | |
Administrative Class | | | 5,743 | | | | 116,672 | | | | 14,449 | | | | 268,324 | | | | 4,039 | | | | 91,333 | | | | 6,581 | | | | 139,403 | | | | | |
| | | | | | | | | |
Issued in reinvestment of dividends and distributions: | | | | | | | | | | | | | | | | | | | | | | | | | | | | | | | | | | | | |
Class A | | | 13,781 | | | | 276,721 | | | | 9,827 | | | | 172,359 | | | | 9,057 | | | | 201,877 | | | | 4,463 | | | | 87,120 | | | | | |
Class C | | | — | | | | — | | | | — | | | | — | | | | 482 | | | | 10,589 | | | | 351 | | | | 6,764 | | | | | |
Class R | | | 411 | | | | 8,184 | | | | 1,786 | | | | 31,083 | | | | 79 | | | | 1,759 | | | | 1,794 | | | | 34,832 | | | | | |
Class P | | | 50,653 | | | | 1,018,130 | | | | 41,537 | | | | 729,383 | | | | 37,273 | | | | 836,401 | | | | 29,513 | | | | 579,934 | | | | | |
Institutional Class | | | — | | | | — | | | | — | | | | — | | | | — | | | | — | | | | — | | | | — | | | | | |
Class R6 | | | 42,722 | | | | 860,846 | | | | 26,400 | | | | 464,645 | | | | 50,642 | | | | 1,140,455 | | | | 29,933 | | | | 589,982 | | | | | |
Administrative Class | | | 1,746 | | | | 34,918 | | | | 1,669 | | | | 29,161 | | | | 2,445 | | | | 54,641 | | | | 1,708 | | | | 33,443 | | | | | |
| | | | | | | | | |
Cost of shares redeemed: | | | | | | | | | | | | | | | | | | | | | | | | | | | | | | | | | | | | |
Class A | | | (180,667 | ) | | | (3,655,251 | ) | | | (38,843 | ) | | | (721,757 | ) | | | (101,981 | ) | | | (2,312,616 | ) | | | (28,279 | ) | | | (578,951 | ) | | | | |
Class C | | | — | | | | — | | | | — | | | | — | | | | (588 | ) | | | (12,858 | ) | | | (917 | ) | | | (19,414 | ) | | | | |
Class R | | | (6,639 | ) | | | (132,098 | ) | | | (34,653 | ) | | | (631,153 | ) | | | (1,410 | ) | | | (31,747 | ) | | | (38,340 | ) | | | (780,732 | ) | | | | |
Class P | | | (261,605 | ) | | | (5,285,576 | ) | | | (136,429 | ) | | | (2,543,429 | ) | | | (186,882 | ) | | | (4,209,375 | ) | | | (148,241 | ) | | | (3,094,457 | ) | | | | |
Institutional Class | | | — | | | | — | | | | — | | | | — | | | | — | | | | — | | | | — | | | | — | | | | | |
Class R6 | | | (171,133 | ) | | | (3,434,564 | ) | | | (143,527 | ) | | | (2,725,283 | ) | | | (176,037 | ) | | | (3,964,780 | ) | | | (113,709 | ) | | | (2,410,543 | ) | | | | |
Administrative Class | | | (10,242 | ) | | | (209,921 | ) | | | (3,069 | ) | | | (59,582 | ) | | | (3,728 | ) | | | (83,533 | ) | | | (4,474 | ) | | | (93,586 | ) | | | | |
Net increase (decrease) resulting from Fund share transactions | | | (138,610 | ) | | $ | (2,749,818 | ) | | | 252,594 | | | $ | 4,682,214 | | | | 9,050 | | | $ | 267,018 | | | | 258,397 | | | $ | 5,296,786 | | | | | |
| – | May reflect actual amounts rounding to less than $1 or less than 1 share. |
| # | For the period February 1, 2018 (commencement of share class) through September 30, 2018. “Shares sold” includes shares sold to AFI. |
| | | | | | |
| 368 | | September 30, 2018 | | | Annual Report | | |
| | | | | | | | | | | | | | | | | | | | | | | | | | | | | | | | | | | | | | | | | | | | | | | | | | |
| | | | AllianzGI Retirement 2055 | | | AllianzGI Multi Asset Income | | | AllianzGI Global Allocation | |
| | | | Year ended
September 30, 2018 | | | Year ended
September 30, 2017 | | | Year ended
September 30, 2018 | | | Year ended
September 30, 2017 | | | Year ended
September 30, 2018 | | | Year ended
September 30, 2017 | |
| | | | Shares | | | Amount | | | Shares | | | Amount | | | Shares | | | Amount | | | Shares | | | Amount | | | Shares | | | Amount | | | Shares | | | Amount | |
| | | | | | | | | | | | | | | | | | | | | | | | | | | | | | | | | | | | | | | | | | | | | | | | | | |
| | | | | | 43,766 | | | $ | 852,643 | | | | 66,447 | | | $ | 1,173,048 | | | | 127,195 | | | $ | 2,263,468 | | | | 109,682 | | | $ | 2,004,214 | | | | 369,365 | | | $ | 4,313,644 | | | | 586,530 | | | $ | 6,839,242 | |
| | | | | | — | | | | — | | | | — | | | | — | | | | 50,760 | | | | 906,687 | | | | 35,951 | | | | 658,716 | | | | 289,992 | | | | 3,557,800 | | | | 165,667 | | | | 1,943,750 | |
| | | | | | 1,801 | | | | 35,093 | | | | 5,173 | | | | 89,205 | | | | 919 | | | | 17,167 | | | | 1,401 | | | | 26,397 | | | | 1,246 | | | | 14,717 | | | | 335 | | | | 3,936 | |
| | | | | | 160,198 | | | | 3,144,890 | | | | 133,236 | | | | 2,403,596 | | | | 91,953 | | | | 1,649,124 | | | | 211,230 | | | | 3,897,798 | | | | 165,981 | | | | 1,937,964 | | | | 228,639 | | | | 2,651,584 | |
| | | | | | — | | | | — | | | | — | | | | — | | | | 2,790 | # | | | 48,205 | # | | | — | | | | — | | | | 73,427 | | | | 852,991 | | | | 661,698 | | | | 7,440,593 | |
| | | | | | 208,405 | | | | 4,114,096 | | | | 191,577 | | | | 3,479,666 | | | | 225,653 | | | | 3,993,052 | | | | 325,863 | | | | 5,861,899 | | | | 11,653,880 | | | | 140,071,822 | | | | 9,283,971 | | | | 107,103,765 | |
| | | | | | 8,555 | | | | 166,304 | | | | 5,130 | | | | 92,175 | | | | 1,824 | | | | 32,811 | | | | 46,447 | | | | 857,264 | | | | 36 | | | | 449 | | | | 44 | | | | 500 | |
| | | | | | | | | | | | |
| | | |
|
|
| | | | | | | | | | | | | | | | | | | | | | | | | | | | | | | | | | | | | | | | | | | | |
| | | | | | 6,743 | | | | 129,807 | | | | 2,569 | | | | 43,180 | | | | 36,286 | | | | 648,381 | | | | 26,950 | | | | 488,639 | | | | 313,963 | | | | 3,642,134 | | | | 61,309 | | | | 692,252 | |
| | | | | | — | | | | — | | | | — | | | | — | | | | 10,887 | | | | 195,173 | | | | 6,922 | | | | 125,825 | | | | 223,202 | | | | 2,640,348 | | | | 25,252 | | | | 286,502 | |
| | | | | | 201 | | | | 3,864 | | | | 788 | | | | 13,177 | | | | 110 | | | | 2,058 | | | | 418 | | | | 7,743 | | | | 227 | | | | 2,606 | | | | 32 | | | | 362 | |
| | | | | | 21,627 | | | | 419,135 | | | | 10,413 | | | | 176,090 | | | | 51,634 | | | | 932,949 | | | | 48,673 | | | | 889,457 | | | | 12,039 | | | | 138,366 | | | | 1,725 | | | | 19,327 | |
| | | | | | — | | | | — | | | | — | | | | — | | | | 79 | # | | | 1,347 | # | | | — | | | | — | | | | 51,790 | | | | 598,913 | | | | 138,604 | | | | 1,517,409 | |
| | | | | | 23,693 | | | | 461,056 | | | | 8,828 | | | | 149,892 | | | | 77,749 | | | | 1,368,964 | | | | 64,655 | | | | 1,155,477 | | | | 2,417,281 | | | | 27,424,554 | | | | 733,174 | | | | 8,106,799 | |
| | | | | | 1,162 | | | | 22,436 | | | | 754 | | | | 12,694 | | | | 4,082 | | | | 74,968 | | | | 3,729 | | | | 68,924 | | | | 214 | | | | 2,546 | | | | 43 | | | | 499 | |
| | | | | | | | | | | | |
| | | | | | | | | | | | | | | | | | | | | | | | | | | | | | | | | | | | | | | | | | | | | | | | | | |
| | | | | | (69,984 | ) | | | (1,354,727 | ) | | | (23,665 | ) | | | (414,439 | ) | | | (202,417 | ) | | | (3,551,087 | ) | | | (142,903 | ) | | | (2,614,625 | ) | | | (934,682 | ) | | | (10,892,920 | ) | | | (4,383,743 | ) | | | (49,002,154 | ) |
| | | | | | — | | | | — | | | | — | | | | — | | | | (119,715 | ) | | | (2,094,141 | ) | | | (42,029 | ) | | | (766,759 | ) | | | (1,046,240 | ) | | | (12,371,273 | ) | | | (1,509,265 | ) | | | (17,572,955 | ) |
| | | | | | (977 | ) | | | (18,773 | ) | | | (21,770 | ) | | | (381,938 | ) | | | (2,140 | ) | | | (39,151 | ) | | | (22,534 | ) | | | (424,120 | ) | | | (349 | ) | | | (4,283 | ) | | | (1 | ) | | | (9 | ) |
| | | | | | (188,085 | ) | | | (3,661,247 | ) | | | (41,744 | ) | | | (759,078 | ) | | | (375,738 | ) | | | (6,664,172 | ) | | | (409,501 | ) | | | (7,528,815 | ) | | | (90,994 | ) | | | (1,081,462 | ) | | | (109,354 | ) | | | (1,256,218 | ) |
| | | | | | — | | | | — | | | | — | | | | — | | | | (15 | )# | | | (263 | )# | | | — | | | | — | | | | (109,728 | ) | | | (1,269,146 | ) | | | (6,417,388 | ) | | | (74,424,026 | ) |
| | | | | | (142,991 | ) | | | (2,779,986 | ) | | | (57,561 | ) | | | (1,064,620 | ) | | | (551,697 | ) | | | (9,584,831 | ) | | | (328,549 | ) | | | (5,951,323 | ) | | | (13,391,527 | ) | | | (159,822,093 | ) | | | (14,502,725 | ) | | | (171,896,055 | ) |
| | | | | | (11,981 | ) | | | (234,582 | ) | | | (2,563 | ) | | | (45,751 | ) | | | (58,582 | ) | | | (1,043,282 | ) | | | (11,971 | ) | | | (223,951 | ) | | | (426 | ) | | | (5,002 | ) | | | (765 | ) | | | (8,761 | ) |
| | | | | | 62,133 | | | $ | 1,300,009 | | | | 277,612 | | | $ | 4,966,897 | | | | (628,383 | ) | | $ | (10,842,573 | ) | | | (75,566 | ) | | $ | (1,467,240 | ) | | | (1,303 | ) | | $ | (247,325 | ) | | | (15,036,218 | ) | | $ | (177,553,658 | ) |
| | | | | | |
| | Annual Report | | | September 30, 2018 | | 369 |
Notes to Financial Statements (cont’d)
September 30, 2018
| | | | | | | | | | | | | | | | | | | | | | | | | | | | | | | | | | | | |
| | | AllianzGI Best Styles Global Equity | | | AllianzGI Best Styles International Equity | | | | |
| | | Year ended
September 30, 2018 | | | Year ended
September 30, 2017 | | | Year ended
September 30, 2018 | | | Year ended
September 30, 2017 | | | | |
| | | Shares | | | Amount | | | Shares | | | Amount | | | Shares | | | Amount | | | Shares | | | Amount | | | | |
Shares sold: | | | | | | | | | | | | | | | | | | | | | | | | | | | | | |
Class A | | | 20,397 | | | $ | 366,653 | | | | 68,959 | | | $ | 1,130,618 | | | | 26,557 | | | $ | 411,757 | | | | 31,284 | | | $ | 462,837 | | | | | |
Class C | | | 1,781 | | | | 32,689 | | | | 4,830 | | | | 87,436 | | | | 3,531 | | | | 52,918 | | | | 8,186 | | | | 119,746 | | | | | |
Class R | | | — | | | | — | | | | — | | | | — | | | | — | | | | — | | | | — | | | | — | | | | | |
Class P | | | 39,918 | | | | 717,027 | | | | 164,630 | | | | 2,742,675 | | | | — | | | | — | | | | 6,784 | | | | 100,000 | | | | | |
Institutional Class | | | 23,426 | | | | 413,192 | | | | 11,025 | | | | 192,141 | | | | 52,319 | | | | 797,120 | | | | 3,275 | | | | 50,000 | | | | | |
Class R6 | | | 6,392,913 | | | | 114,453,742 | | | | 14,837,402 | | | | 237,470,245 | | | | 253,973 | | | | 4,006,624 | | | | 413,391 | | | | 5,966,733 | | | | | |
Administrative Class | | | — | | | | — | | | | — | | | | — | | | | — | | | | — | | | | — | | | | — | | | | | |
| | | | | | | | | |
Issued in reinvestment of dividends and distributions: | | | | | | | | | | | | | | | | | | | | | | | | | | | | | | | | | | | | |
Class A | | | 9,117 | | | | 156,176 | | | | 396 | | | | 6,286 | | | | 1,219 | | | | 18,889 | | | | 87 | | | | 1,126 | | | | | |
Class C | | | 451 | | | | 7,589 | | | | 12 | | | | 183 | | | | 300 | | | | 4,603 | | | | 109 | | | | 1,403 | | | | | |
Class R | | | — | | | | — | | | | — | | | | — | | | | — | | | | — | | | | — | | | | — | | | | | |
Class P | | | 18,861 | | | | 322,713 | | | | 2,814 | | | | 44,744 | | | | 355 | | | | 5,511 | | | | 70 | | | | 898 | | | | | |
Institutional Class | | | 19,183 | | | | 324,963 | | | | 3,166 | | | | 49,946 | | | | 265 | | | | 4,124 | | | | 258 | | | | 3,340 | | | | | |
Class R6 | | | 4,650,001 | | | | 79,375,510 | | | | 991,084 | | | | 15,722,005 | | | | 68,138 | | | | 1,061,586 | | | | 213,849 | | | | 2,758,648 | | | | | |
Administrative Class | | | — | | | | — | | | | — | | | | — | | | | — | | | | — | | | | — | | | | — | | | | | |
| | | | | | | |
Cost of shares redeemed: | | | | | | | | | | | | | | | | | | | | | | | | | | | | | |
Class A | | | (26,890 | ) | | | (465,724 | ) | | | (2,321,093 | ) | | | (35,682,819 | ) | | | (26,324 | ) | | | (409,241 | ) | | | — | | | | (1 | ) | | | | |
Class C | | | (5,312 | ) | | | (96,392 | ) | | | — | | | | — | | | | (6,263 | ) | | | (96,644 | ) | | | — | | | | — | | | | | |
Class R | | | — | | | | — | | | | — | | | | — | | | | — | | | | — | | | | — | | | | — | | | | | |
Class P | | | (101,506 | ) | | | (1,758,564 | ) | | | (197,393 | ) | | | (3,329,411 | ) | | | (320 | ) | | | (4,963 | ) | | | — | | | | — | | | | | |
Institutional Class | | | (27,847 | ) | | | (485,711 | ) | | | (42,235 | ) | | | (691,732 | ) | | | (800 | ) | | | (12,814 | ) | | | (333 | ) | | | (5,000 | ) | | | | |
Class R6 | | | (12,640,288 | ) | | | (222,258,029 | ) | | | (19,667,990 | ) | | | (341,812,997 | ) | | | (347,045 | ) | | | (5,487,075 | ) | | | (4,003,229 | ) | | | (57,963,958 | ) | | | | |
Administrative Class | | | — | | | | — | | | | — | | | | — | | | | — | | | | — | | | | — | | | | — | | | | | |
Net increase (decrease) resulting from Fund share transactions | | | (1,625,795 | ) | | $ | (28,894,166 | ) | | | (6,144,393 | ) | | $ | (124,070,680 | ) | | | 25,905 | | | $ | 352,395 | | | | (3,326,269 | ) | | $ | (48,504,228 | ) | | | | |
| – | May reflect actual amounts rounding to less than $1 or less than 1 share. |
| † | Commencement of operations. |
| | | | | | |
| 370 | | September 30, 2018 | | | Annual Report | | |
| | | | | | | | | | | | | | | | | | | | | | | | | | | | | | | | | | | | | | | | | | |
| | | | AllianzGI Best Styles U.S. Equity | | | AllianzGI Convertible | | | AllianzGI Core Bond | |
| | | | Year ended
September 30, 2018 | | | Year ended
September 30, 2017 | | | Year ended
September 30, 2018 | | | Year ended
September 30, 2017 | | | Period from
May 30, 2018† through
September 30, 2018 | |
| | | | Shares | | | Amount | | | Shares | | | Amount | | | Shares | | | Amount | | | Shares | | | Amount | | | Shares | | | Amount | |
| | | | | | | | | | | | | | | | | | | | | | | | | | | | | | | | | | | | | | | | | | |
| | | | | | 15,181 | | | $ | 296,027 | | | | 30,990 | | | $ | 493,185 | | | | 207,449 | | | $ | 6,503,197 | | | | 421,297 | | | $ | 13,241,563 | | | | — | | | $ | — | |
| | | | | | 943 | | | | 18,015 | | | | 595 | | | | 9,956 | | | | 353,677 | | | | 11,048,314 | | | | 18,986 | | | | 604,884 | | | | — | | | | — | |
| | | | | | — | | | | — | | | | — | | | | — | | | | 775 | | | | 25,467 | | | | 2,394 | | | | 74,613 | | | | — | | | | — | |
| | | | | | 7,044 | | | | 139,403 | | | | 27,172 | | | | 477,904 | | | | 1,412,411 | | | | 43,072,476 | | | | 1,100,204 | | | | 34,977,199 | | | | — | | | | — | |
| | | | | | 3,537 | | | | 68,251 | | | | 2,923 | | | | 49,389 | | | | 1,934,862 | | | | 59,803,946 | | | | 608,383 | | | | 19,377,376 | | | | — | | | | — | |
| | | | | | 815,815 | | | | 15,612,646 | | | | 4,161,911 | | | | 67,097,951 | | | | — | | | | — | | | | — | | | | — | | | | 402,385 | | | | 6,016,814 | |
| | | | | | — | | | | — | | | | — | | | | — | | | | 1,379 | | | | 44,007 | | | | 944 | | | | 30,423 | | | | — | | | | — | |
| | | | | | | | | | |
| | | | | | | | | | | | | | | | | | | | | | | | | | | | | | | | | | | | | | | | | | |
| | | | | | 264 | | | | 4,958 | | | | 474 | | | | 7,605 | | | | 415,204 | | | | 12,056,650 | | | | 117,142 | | | | 3,690,187 | | | | — | | | | — | |
| | | | | | 107 | | | | 1,972 | | | | 9 | | | | 148 | | | | 228,935 | | | | 6,674,305 | | | | 26,301 | | | | 841,210 | | | | — | | | | — | |
| | | | | | — | | | | — | | | | — | | | | — | | | | 385 | | | | 11,580 | | | | 394 | | | | 12,358 | | | | — | | | | — | |
| | | | | | 1,675 | | | | 31,132 | | | | 26 | | | | 420 | | | | 439,297 | | | | 12,532,377 | | | | 61,160 | | | | 1,946,532 | | | | 4 | | | | 72 | |
| | | | | | 411 | | | | 7,666 | | | | 81 | | | | 1,298 | | | | 1,844,088 | | | | 53,040,379 | | | | 357,366 | | | | 11,312,875 | | | | 5 | | | | 73 | |
| | | | | | 395,294 | | | | 7,399,903 | | | | 100,771 | | | | 1,625,434 | | | | — | | | | — | | | | — | | | | — | | | | 14,480 | | | | 216,814 | |
| | | | | | — | | | | — | | | | — | | | | — | | | | 6,065 | | | | 174,529 | | | | 1,210 | | | | 38,602 | | | | — | | | | — | |
| | | | | | | | | | |
| | | | | | | | | | | | | | | | | | | | | | | | | | | | | | | | | | | | | | | | | | |
| | | | | | (748 | ) | | | (15,112 | ) | | | (31,989 | ) | | | (555,810 | ) | | | (984,752 | ) | | | (31,388,653 | ) | | | (6,677,007 | ) | | | (212,830,762 | ) | | | — | | | | — | |
| | | | | | (828 | ) | | | (15,605 | ) | | | (183 | ) | | | (3,200 | ) | | | (383,725 | ) | | | (12,080,360 | ) | | | (783,707 | ) | | | (25,010,423 | ) | | | — | | | | — | |
| | | | | | — | | | | — | | | | — | | | | — | | | | (1,606 | ) | | | (52,517 | ) | | | (36,419 | ) | | | (1,168,769 | ) | | | — | | | | — | |
| | | | | | (1,380 | ) | | | (27,125 | ) | | | (4,942 | ) | | | (87,116 | ) | | | (1,031,353 | ) | | | (31,440,570 | ) | | | (1,675,570 | ) | | | (53,087,878 | ) | | | — | | | | — | |
| | | | | | (3,726 | ) | | | (70,801 | ) | | | (1,967 | ) | | | (32,581 | ) | | | (3,032,900 | ) | | | (96,524,746 | ) | | | (26,875,233 | ) | | | (880,281,948 | ) | | | — | | | | — | |
| | | | | | (2,476,896 | ) | | | (48,767,732 | ) | | | (4,662,780 | ) | | | (75,839,011 | ) | | | — | | | | — | | | | — | | | | — | | | | (112,870 | ) | | | (1,686,282 | ) |
| | | | | | — | | | | — | | | | — | | | | — | | | | (13,095 | ) | | | (436,418 | ) | | | (11,893 | ) | | | (382,451 | ) | | | — | | | | — | |
| | | | | | (1,243,307 | ) | | $ | (25,316,402 | ) | | | (376,909 | ) | | $ | (6,754,428 | ) | | | 1,397,096 | | | $ | 33,063,963 | | | | (33,344,048 | ) | | $ | (1,086,614,409 | ) | | | 304,004 | | | $ | 4,547,491 | |
| | | | | | |
| | Annual Report | | | September 30, 2018 | | 371 |
Notes to Financial Statements (cont’d)
September 30, 2018
| | | | | | | | | | | | | | | | | | | | | | | | | | | | |
| | | AllianzGI Core Plus Bond | | | AllianzGI Emerging Markets Consumer | | | | |
| | | Period from
May 30, 2018† through
September 30, 2018 | | | Year ended
September 30, 2018 | | | Year ended
September 30, 2017 | | | | |
| | | Shares | | | Amount | | | Shares | | | Amount | | | Shares | | | Amount | | | | |
Shares sold: | | | | | | | | | | | | | | | | | | | | | | | | | | | | |
Class A | | | — | | | $ | — | | | | 433 | | | $ | 7,099 | | | | 6,214 | | | $ | 92,436 | | | | | |
Class C | | | — | | | | — | | | | — | | | | — | | | | — | | | | — | | | | | |
Class P | | | — | | | | — | | | | — | | | | — | | | | — | | | | — | | | | | |
Institutional Class | | | — | | | | — | | | | 1,045,849 | | | | 16,710,931 | | | | 651,142 | | | | 9,167,162 | | | | | |
Class R6 | | | — | | | | — | | | | — | | | | — | | | | — | | | | — | | | | | |
| | | | | | | |
Issued in reinvestment of dividends and distributions: | | | | | | | | | | | | | | | | | | | | | | | | | | | | |
Class A | | | — | | | | — | | | | 562 | | | | 8,911 | | | | 36 | | | | 441 | | | | | |
Class C | | | — | | | | — | | | | — | | | | — | | | | — | | | | — | | | | | |
Class P | | | 4 | | | | 72 | | | | — | | | | — | | | | — | | | | — | | | | | |
Institutional Class | | | 5 | | | | 74 | | | | 85,235 | | | | 1,364,614 | | | | 24,662 | | | | 305,562 | | | | | |
Class R6 | | | 20,063 | | | | 300,598 | | | | — | | | | — | | | | — | | | | — | | | | | |
| | | | | | |
Cost of shares redeemed: | | | | | | | | | | | | | | | | | | | | | | | | |
Class A | | | — | | | | — | | | | (5,782 | ) | | | (88,339 | ) | | | (29 | ) | | | (366 | ) | | | | |
Class C | | | — | | | | — | | | | — | | | | — | | | | — | | | | — | | | | | |
Class P | | | — | | | | — | | | | — | | | | — | | | | — | | | | — | | | | | |
Institutional Class | | | — | | | | — | | | | (788,915 | ) | | | (12,184,557 | ) | | | (1,196,133 | ) | | | (16,493,131 | ) | | | | |
Net increase (decrease) resulting from Fund share transactions | | | 20,072 | | | $ | 300,744 | | | | 337,382 | | | $ | 5,818,659 | | | | (514,108 | ) | | $ | (6,927,896 | ) | | | | |
| – | May reflect actual amounts rounding to less than $1 or less than 1 share. |
| † | Commencement of operations. |
| | | | | | |
| 372 | | September 30, 2018 | | | Annual Report | | |
| | | | | | | | | | | | | | | | | | | | | | | | | | | | | | | | | | | | | | | | | | | | | | | | | | |
| | | | AllianzGI Emerging Markets Debt | | | AllianzGI Emerging Markets Small-Cap | | | AllianzGI Europe Equity Dividend | |
| | | | Year ended
September 30, 2018 | | | Year ended
September 30, 2017 | | | Year ended
September 30, 2018 | | | Year ended
September 30, 2017 | | | Year ended
September 30, 2018 | | | Year ended
September 30, 2017 | |
| | | | Shares | | | Amount | | | Shares | | | Amount | | | Shares | | | Amount | | | Shares | | | Amount | | | Shares | | | Amount | | | Shares | | | Amount | |
| | | | | | | | | | | | | | | | | | | | | | | | | | | | | | | | | | | | | | | | | | | | | | | | | | |
| | | | | | 37,243 | | | $ | 533,756 | | | | 5,430 | | | $ | 79,259 | | | | 4,234 | | | $ | 75,615 | | | | 17,014 | | | $ | 272,123 | | | | 16,333 | | | $ | 266,009 | | | | 90,062 | | | $ | 1,397,356 | |
| | | | | | 207 | | | | 3,001 | | | | 1,552 | | | | 23,000 | | | | — | | | | — | | | | — | | | | — | | | | 699 | | | | 10,750 | | | | 2,524 | | | | 35,599 | |
| | | | | | — | | | | — | | | | — | | | | — | | | | — | | | | — | | | | — | | | | — | | | | — | | | | — | | | | 7,868 | | | | 129,886 | |
| | | | | | 171,295 | | | | 2,535,268 | | | | 395,365 | | | | 5,863,546 | | | | 67,521 | | | | 1,218,249 | | | | 66,508 | | | | 1,038,246 | | | | 19,312 | | | | 309,592 | | | | 221,432 | | | | 3,560,680 | |
| | | | | | — | | | | — | | | | — | | | | — | | | | — | | | | — | | | | — | | | | — | | | | — | | | | — | | | | — | | | | — | |
| | | | | | | | | | | | |
| | | | | | | | | | | | | | | | | | | | | | | | | | | | | | | | | | | | | | | | | | | | | | | | | | |
| | | | | | 449 | | | | 6,347 | | | | 489 | | | | 7,129 | | | | 873 | | | | 15,332 | | | | — | | | | — | | | | 1,848 | | | | 29,526 | | | | 1,557 | | | | 24,388 | |
| | | | | | 255 | | | | 3,645 | | | | 389 | | | | 5,697 | | | | — | | | | — | | | | — | | | | — | | | | 113 | | | | 1,767 | | | | 82 | | | | 1,227 | |
| | | | | | 47 | | | | 651 | | | | 51 | | | | 737 | | | | — | | | | — | | | | — | | | | — | | | | 340 | | | | 5,371 | | | | 115 | | | | 1,844 | |
| | | | | | 116,064 | | | | 1,642,180 | | | | 183,791 | | | | 2,665,777 | | | | 43,678 | | | | 758,248 | | | | 25,796 | | | | 364,501 | | | | 19,451 | | | | 307,662 | | | | 15,021 | | | | 222,697 | |
| | | | | | — | | | | — | | | | — | | | | — | | | | — | | | | — | | | | — | | | | — | | | | — | | | | — | | | | — | | | | — | |
| | | | | | | | | | | | |
| | | | | | | | | | | | | | | | | | | | | | | | | | | | | | | | | | | | | | | | | | | | | | | | | | |
| | | | | | (37,068 | ) | | | (518,006 | ) | | | (8,178 | ) | | | (118,777 | ) | | | (8,079 | ) | | | (142,593 | ) | | | (10,327 | ) | | | (156,324 | ) | | | (90,123 | ) | | | (1,448,584 | ) | | | (4,236 | ) | | | (64,704 | ) |
| | | | | | (4,613 | ) | | | (62,842 | ) | | | (1,698 | ) | | | (25,335 | ) | | | — | | | | — | | | | — | | | | — | | | | (25 | ) | | | (389 | ) | | | (19 | ) | | | (281 | ) |
| | | | | | — | | | | — | | | | — | | | | — | | | | — | | | | — | | | | — | | | | — | | | | (6,715 | ) | | | (104,985 | ) | | | (1,546 | ) | | | (25,003 | ) |
| | | | | | (1,352,252 | ) | | | (19,401,035 | ) | | | (1,041,227 | ) | | | (15,384,404 | ) | | | (125,120 | ) | | | (2,267,176 | ) | | | (342,154 | ) | | | (5,677,852 | ) | | | (144,621 | ) | | | (2,327,189 | ) | | | (143,068 | ) | | | (2,195,354 | ) |
| | | | | | (1,068,373 | ) | | $ | (15,257,035 | ) | | | (464,036 | ) | | $ | (6,883,371 | ) | | | (16,893 | ) | | $ | (342,325 | ) | | | (243,163 | ) | | $ | (4,159,306 | ) | | | (183,388 | ) | | $ | (2,950,470 | ) | | | 189,792 | | | $ | 3,088,335 | |
| | | | | | |
| | Annual Report | | | September 30, 2018 | | 373 |
Notes to Financial Statements (cont’d)
September 30, 2018
| | | | | | | | | | | | | | | | | | | | | | | | | | | | | | | | | | | | |
| | | AllianzGI Global Dynamic Allocation | | | AllianzGI Global High Yield | | | | |
| | | Year ended
September 30, 2018 | | | Year ended
September 30, 2017 | | | Year ended
September 30, 2018 | | | Period from
May 3, 2017† through
September 30, 2017 | | | | |
| | | Shares | | | Amount | | | Shares | | | Amount | | | Shares | | | Amount | | | Shares | | | Amount | | | | |
Shares sold: | | | | | | | | | | | | | | | | | | | | | | | | | | | | | | | | | | | | |
Class A | | | 24,968 | | | $ | 511,412 | | | | 82,230 | | | $ | 1,550,091 | | | | — | | | $ | — | | | | — | | | $ | — | | | | | |
Class C | | | 13,758 | | | | 276,697 | | | | 21,177 | | | | 406,739 | | | | — | | | | — | | | | — | | | | — | | | | | |
Class R | | | 987 | | | | 19,792 | | | | 2,093 | | | | 39,383 | | | | — | | | | — | | | | — | | | | — | | | | | |
Class P | | | 93,460 | | | | 1,911,803 | | | | 637,412 | | | | 11,545,607 | | | | — | | | | — | | | | — | | | | — | | | | | |
Institutional Class | | | 234,450 | | | | 4,759,989 | | | | 250,537 | | | | 4,749,438 | | | | 46,776 | | | | 703,903 | | | | 67,178 | | | | 1,029,723 | | | | | |
Class R6 | | | 1,008,881 | | | | 20,351,605 | | | | 12,476,865 | | | | 230,121,490 | | | | — | | | | — | | | | — | | | | — | | | | | |
Administrative Class | | | — | | | | — | | | | — | | | | — | | | | — | | | | — | | | | — | | | | — | | | | | |
| | | | | | | | | |
Issued in reinvestment of dividends and distributions: | | | | | | | | | | | | | | | | | | | | | | | | | | | | | | | | | | | | |
Class A | | | 5,385 | | | | 109,050 | | | | — | | | | 2 | | | | — | | | | — | | | | — | | | | — | | | | | |
Class C | | | 3,347 | | | | 66,066 | | | | — | | | | 2 | | | | — | | | | — | | | | — | | | | — | | | | | |
Class R | | | 309 | | | | 6,210 | | | | — | | | | — | | | | — | | | | — | | | | — | | | | — | | | | | |
Class P | | | 31,925 | | | | 642,005 | | | | 3,236 | | | | 58,830 | | | | 32 | | | | 482 | | | | 3 | | | | 51 | | | | | |
Institutional Class | | | 80,510 | | | | 1,630,333 | | | | 1,167 | | | | 21,336 | | | | 70,591 | | | | 1,055,110 | | | | 7,704 | | | | 117,951 | | | | | |
Class R6 | | | 602,641 | | | | 12,155,278 | | | | 48,683 | | | | 887,497 | | | | — | | | | — | | | | — | | | | — | | | | | |
Administrative Class | | | 54 | | | | 1,099 | | | | — | | | | — | | | | — | | | | — | | | | — | | | | — | | | | | |
| | | | | | | | | |
Cost of shares redeemed: | | | | | | | | | | | | | | | | | | | | | | | | | | | | | | | | | | | | |
Class A | | | (48,439 | ) | | | (975,886 | ) | | | (247,960 | ) | | | (4,695,890 | ) | | | — | | | | — | | | | — | | | | — | | | | | |
Class C | | | (22,094 | ) | | | (430,779 | ) | | | (12,099 | ) | | | (223,903 | ) | | | — | | | | — | | | | — | | | | — | | | | | |
Class R | | | (25 | ) | | | (493 | ) | | | (4,069 | ) | | | (79,817 | ) | | | — | | | | — | | | | — | | | | — | | | | | |
Class P | | | (77,585 | ) | | | (1,561,740 | ) | | | (29,299 | ) | | | (584,729 | ) | | | — | | | | — | | | | — | | | | — | | | | | |
Institutional Class | | | (1,202,910 | ) | | | (24,148,028 | ) | | | (763,320 | ) | | | (14,560,400 | ) | | | (30,638 | ) | | | (456,580 | ) | | | — | | | | — | | | | | |
Class R6 | | | (3,328,287 | ) | | | (66,510,687 | ) | | | (1,752,455 | ) | | | (32,951,122 | ) | | | — | | | | — | | | | — | | | | — | | | | | |
Administrative Class | | | — | | | | — | | | | — | | | | — | | | | — | | | | — | | | | — | | | | — | | | | | |
Net increase (decrease) resulting from Fund share transactions | | | (2,578,665 | ) | | $ | (51,186,274 | ) | | | 10,714,198 | | | $ | 196,284,554 | | | | 86,761 | | | $ | 1,302,915 | | | | 74,885 | | | $ | 1,147,725 | | | | | |
| – | May reflect actual amounts rounding to less than $1 or less than 1 share. |
| † | Commencement of operations. |
| | | | | | |
| 374 | | September 30, 2018 | | | Annual Report | | |
| | | | | | | | | | | | | | | | | | | | | | | | | | | | | | | | | | | | | | | | | | | | | | | | | | |
| | | | AllianzGI Global Sustainability | | | AllianzGI Global Water | | | AllianzGI High Yield Bond | |
| | | |
Year ended
September 30, 2018 | | | Year ended
September 30, 2017 | | | Year ended
September 30, 2018 | | | Year ended
September 30, 2017 | | | Year ended
September 30, 2018 | | | Year ended
September 30, 2017 | |
| | | | Shares | | | Amount | | | Shares | | | Amount | | | Shares | | | Amount | | | Shares | | | Amount | | | Shares | | | Amount | | | Shares | | | Amount | |
| | | | | | | | | | | | | | | | | | | | | | | | | | | | | | | | | | | | | | | | | | | | | | | | | | |
| | | | | | 10,545 | | | $ | 196,770 | | | | 15,373 | | | $ | 260,568 | | | | 2,670,501 | | | $ | 41,351,594 | | | | 4,227,699 | | | $ | 59,392,168 | | | | 796,523 | | | $ | 7,237,524 | | | | 2,250,464 | | | $ | 20,779,212 | |
| | | | | | — | | | | — | | | | — | | | | — | | | | 813,178 | | | | 12,057,027 | | | | 936,509 | | | | 12,595,838 | | | | 74,754 | | | | 684,819 | | | | 150,153 | | | | 1,383,378 | |
| | | | | | — | | | | — | | | | — | | | | — | | | | — | | | | — | | | | — | | | | — | | | | 51,238 | | | | 450,609 | | | | 85,090 | | | | 753,460 | |
| | | | | | 580,070 | | | | 11,049,588 | | | | 2,876 | | | | 49,080 | | | | 4,655,923 | | | | 72,110,173 | | | | 9,292,311 | | | | 128,906,188 | | | | 471,053 | | | | 4,141,566 | | | | 1,002,277 | | | | 8,939,017 | |
| | | | | | 138,230 | | | | 2,594,493 | | | | 394,593 | | | | 6,463,987 | | | | 3,524,902 | | | | 53,633,616 | | | | 5,545,111 | | | | 76,930,900 | | | | 4,191,771 | | | | 36,921,650 | | | | 15,548,838 | | | | 137,965,322 | |
| | | | | | — | | | | — | | | | — | | | | — | | | | — | | | | — | | | | — | | | | — | | | | — | | | | — | | | | — | | | | — | |
| | | | | | — | | | | — | | | | — | | | | — | | | | — | | | | — | | | | — | | | | — | | | | 10,209 | | | | 89,174 | | | | 61,696 | | | | 539,421 | |
| | | | | | | | | | | | |
|
|
| | | | | | | | | | | | | | | | | | | | | | | | | | | | | | | | | | | | | | | | | | | | | | | | |
| | | | | | 877 | | | | 15,922 | | | | 85 | | | | 1,290 | | | | 273,441 | | | | 4,252,010 | | | | 142,511 | | | | 1,875,321 | | | | 210,692 | | | | 1,903,097 | | | | 313,793 | | | | 2,891,255 | |
| | | | | | — | | | | — | | | | — | | | | — | | | | 117,917 | | | | 1,754,605 | | | | 30,215 | | | | 381,618 | | | | 45,134 | | | | 406,485 | | | | 59,067 | | | | 543,497 | |
| | | | | | — | | | | — | | | | — | | | | — | | | | — | | | | — | | | | — | | | | — | | | | 2,981 | | | | 25,763 | | | | 3,630 | | | | 32,166 | |
| | | | | | 121 | | | | 2,224 | | | | 7 | | | | 106 | | | | 297,452 | | | | 4,628,355 | | | | 66,753 | | | | 881,850 | | | | 149,349 | | | | 1,297,642 | | | | 321,038 | | | | 2,846,471 | |
| | | | | | 50,576 | | | | 928,569 | | | | 18,115 | | | | 278,227 | | | | 330,391 | | | | 5,051,676 | | | | 78,608 | | | | 1,022,047 | | | | 836,180 | | | | 7,265,664 | | | | 1,327,427 | | | | 11,798,372 | |
| | | | | | — | | | | — | | | | — | | | | — | | | | — | | | | — | | | | — | | | | — | | | | — | | | | — | | | | — | | | | — | |
| | | | | | — | | | | — | | | | — | | | | — | | | | — | | | | — | | | | — | | | | — | | | | 3,204 | | | | 28,001 | | | | 11,500 | | | | 100,699 | |
| | | | | | | | | | | | |
| | | | | | | | | | | | | | | | | | | | | | | | | | | | | | | | | | | | | | | | | | | | | | | | | | |
| | | | | | (2,241 | ) | | | (41,302 | ) | | | (1,021 | ) | | | (16,215 | ) | | | (4,165,975 | ) | | | (64,185,516 | ) | | | (8,498,821 | ) | | | (116,648,884 | ) | | | (3,503,149 | ) | | | (32,035,899 | ) | | | (2,629,012 | ) | | | (24,298,880 | ) |
| | | | | | — | | | | — | | | | — | | | | — | | | | (1,328,543 | ) | | | (19,492,116 | ) | | | (1,566,970 | ) | | | (21,242,249 | ) | | | (420,334 | ) | | | (3,804,191 | ) | | | (572,619 | ) | | | (5,267,230 | ) |
| | | | | | — | | | | — | | | | — | | | | — | | | | — | | | | — | | | | — | | | | — | | | | (68,530 | ) | | | (605,660 | ) | | | (120,559 | ) | | | (1,072,503 | ) |
| | | | | | (6,547 | ) | | | (127,128 | ) | | | — | | | | — | | | | (2,873,341 | ) | | | (44,427,404 | ) | | | (4,462,141 | ) | | | (62,679,947 | ) | | | (2,582,395 | ) | | | (22,768,371 | ) | | | (3,828,084 | ) | | | (34,059,826 | ) |
| | | | | | (225,433 | ) | | | (4,245,826 | ) | | | (239,136 | ) | | | (4,114,345 | ) | | | (2,414,086 | ) | | | (36,595,471 | ) | | | (1,114,186 | ) | | | (15,534,711 | ) | | | (8,055,626 | ) | | | (70,259,175 | ) | | | (25,343,034 | ) | | | (225,586,100 | ) |
| | | | | | — | | | | — | | | | — | | | | — | | | | — | | | | — | | | | — | | | | — | | | | — | | | | — | | | | — | | | | — | |
| | | | | | — | | | | — | | | | — | | | | — | | | | — | | | | — | | | | — | | | | — | | | | (179,529 | ) | | | (1,534,418 | ) | | | (144,305 | ) | | | (1,266,457 | ) |
| | | | | | 546,198 | | | $ | 10,373,310 | | | | 190,892 | | | $ | 2,922,698 | | | | 1,901,760 | | | $ | 30,138,549 | | | | 4,677,599 | | | $ | 65,880,139 | | | | (7,966,475 | ) | | $ | (70,555,720 | ) | | | (11,502,640 | ) | | $ | (102,978,726 | ) |
| | | | | | |
| | Annual Report | | | September 30, 2018 | | 375 |
Notes to Financial Statements (cont’d)
September 30, 2018
| | | | | | | | | | | | | | | | | | | | | | | | | | | | | | | | | | | | |
| | | AllianzGI International Growth | | | AllianzGI International Small-Cap | | | | |
| | | Year ended
September 30, 2018 | | | Year ended
September 30, 2017 | | | Year ended
September 30, 2018 | | | Year ended
September 30, 2017 | | | | |
| | | Shares | | | Amount | | | Shares | | | Amount | | | Shares | | | Amount | | | Shares | | | Amount | | | | |
Shares sold: | | | | | | | | | | | | | | | | | | | | | | | | | | | | | | | | | | | | |
Class A | | | 70,377 | | | $ | 1,293,246 | | | | 599 | | | $ | 10,884 | | | | 539,679 | | | $ | 24,176,578 | | | | 31,376 | | | $ | 1,116,483 | | | | | |
Class C | | | — | | | | — | | | | — | | | | — | | | | 20,361 | | | | 884,323 | | | | 11,600 | | | | 411,156 | | | | | |
Class R | | | — | | | | — | | | | — | | | | — | | | | 15,817 | | | | 672,491 | | | | 3,789 | | | | 142,713 | | | | | |
Class P | | | — | | | | — | | | | — | | | | — | | | | 294,664 | | | | 12,847,308 | | | | 465,348 | | | | 16,224,172 | | | | | |
Institutional Class | | | 502,575 | | | | 9,437,985 | | | | 22,007 | | | | 370,379 | | | | 587,195 | | | | 27,381,698 | | | | 1,175,684 | | | | 42,123,503 | | | | | |
Class R6 | | | — | | | | — | | | | — | | | | — | | | | 590,821 | | | | 26,609,280 | | | | 74,515 | | | | 2,735,661 | | | | | |
| | | | | | | | | |
Issued in reinvestment of dividends and distributions: | | | | | | | | | | | | | | | | | | | | | | | | | | | | | | | | | | | | |
Class A | | | 1,355 | | | | 24,200 | | | | — | | | | 1 | | | | 2,914 | | | | 125,294 | | | | 2,339 | | | | 73,368 | | | | | |
Class C | | | — | | | | — | | | | — | | | | — | | | | 1,313 | | | | 54,903 | | | | 545 | | | | 16,705 | | | | | |
Class R | | | — | | | | — | | | | — | | | | — | | | | 189 | | | | 7,918 | | | | 44 | | | | 1,374 | | | | | |
Class P | | | — | | | | — | | | | — | | | | — | | | | 36,896 | | | | 1,583,227 | | | | 12,138 | | | | 381,492 | | | | | |
Institutional Class | | | 126,340 | | | | 2,304,442 | | | | 1,973 | | | | 29,197 | | | | 41,071 | | | | 1,826,435 | | | | 6,928 | | | | 225,723 | | | | | |
Class R6 | | | — | | | | — | | | | — | | | | — | | | | 21,533 | | | | 957,134 | | | | 4,526 | | | | 147,555 | | | | | |
| | | | | | | | | |
Cost of shares redeemed: | | | | | | | | | | | | | | | | | | | | | | | | | | | | | | | | | | | | |
Class A | | | (9,345 | ) | | | (170,014 | ) | | | (29 | ) | | | (532 | ) | | | (478,533 | ) | | | (20,860,283 | ) | | | (277,593 | ) | | | (9,438,563 | ) | | | | |
Class C | | | — | | | | — | | | | — | | | | — | | | | (29,667 | ) | | | (1,237,253 | ) | | | (37,121 | ) | | | (1,208,650 | ) | | | | |
Class R | | | — | | | | — | | | | — | | | | — | | | | (2,355 | ) | | | (102,377 | ) | | | (1,128 | ) | | | (37,215 | ) | | | | |
Class P | | | — | | | | — | | | | — | | | | — | | | | (548,847 | ) | | | (24,412,812 | ) | | | (285,444 | ) | | | (9,839,257 | ) | | | | |
Institutional Class | | | (66,082 | ) | | | (1,344,090 | ) | | | (811,506 | ) | | | (15,688,204 | ) | | | (1,105,969 | ) | | | (49,769,907 | ) | | | (405,869 | ) | | | (14,772,977 | ) | | | | |
Class R6 | | | — | | | | — | | | | — | | | | — | | | | (268,488 | ) | | | (12,115,616 | ) | | | (96,287 | ) | | | (3,451,995 | ) | | | | |
Net increase (decrease) resulting from Fund share transactions | | | 625,220 | | | $ | 11,545,769 | | | | (786,956 | ) | | $ | (15,278,275 | ) | | | (281,406 | ) | | $ | (11,371,659 | ) | | | 685,390 | | | $ | 24,851,248 | | | | | |
| — | May reflect actual amounts rounding to less than $1 or less than 1 share. |
| | | | | | |
| 376 | | September 30, 2018 | | | Annual Report | | |
| | | | | | | | | | | | | | | | | | | | | | | | | | | | | | | | | | | | | | | | | | | | | | | | | | |
| | | | AllianzGI Micro Cap | | | AllianzGI NFJ Emerging Markets Value | | | AllianzGI NFJ International Small-Cap Value | |
| | | | Year ended
September 30, 2018 | | | Year ended
September 30, 2017 | | | Year ended
September 30, 2018 | | | Year ended
September 30, 2017 | | | Year ended
September 30, 2018 | | | Year ended
September 30, 2017 | |
| | | | Shares | | | Amount | | | Shares | | | Amount | | | Shares | | | Amount | | | Shares | | | Amount | | | Shares | | | Amount | | | Shares | | | Amount | |
| | | | | | | | | | | | | | | | | | | | | | | | | | | | | | | | | | | | | | | | | | | | | | | | | | |
| | | | | | 14,367 | | | $ | 229,885 | | | | 34,984 | | | $ | 510,734 | | | | 4,873,330 | | | $ | 88,876,479 | | | | 1,888,401 | | | $ | 28,562,394 | | | | 11,486 | | | $ | 241,166 | | | | 7,174 | | | $ | 136,780 | |
| | | | | | — | | | | — | | | | — | | | | — | | | | 50,026 | | | | 918,495 | | | | 27,622 | | | | 427,818 | | | | 1,937 | | | | 38,811 | | | | 322 | | | | 5,400 | |
| | | | | | — | | | | — | | | | — | | | | — | | | | — | | | | — | | | | — | | | | — | | | | — | | | | — | | | | — | | | | — | |
| | | | | | 85,615 | | | | 1,352,886 | | | | 66,792 | | | | 948,739 | | | | 686,711 | | | | 12,473,879 | | | | 1,308,844 | | | | 18,773,451 | | | | 261 | | | | 5,248 | | | | 4,670 | | | | 78,549 | |
| | | | | | 267,091 | | | | 4,313,712 | | | | 364,033 | | | | 5,245,516 | | | | 6,133,330 | | | | 109,674,069 | | | | 1,882,527 | | | | 32,101,012 | | | | 20,637 | | | | 421,052 | | | | 46,804 | | | | 888,387 | |
| | | | | | — | | | | — | | | | — | | | | — | | | | — | | | | — | | | | — | | | | — | | | | 14,377 | | | | 289,300 | | | | 11,524 | | | | 195,478 | |
| | | | | | | | | | | | |
| | | |
|
|
| | | | | | | | | | | | | | | | | | | | | | | | | | | | | | | | | | | | | | | | | | | | |
| | | | | | 9,998 | | | | 150,676 | | | | 21,951 | | | | 301,824 | | | | 29,652 | | | | 517,662 | | | | 8,888 | | | | 140,742 | | | | 1,288 | | | | 26,655 | | | | 3,144 | | | | 51,774 | |
| | | | | | — | | | | — | | | | — | | | | — | | | | 810 | | | | 13,580 | | | | 180 | | | | 3,055 | | | | — | | | | 1 | | | | 2,997 | | | | 47,236 | |
| | | | | | — | | | | — | | | | — | | | | — | | | | — | | | | — | | | | — | | | | — | | | | — | | | | — | | | | — | | | | — | |
| | | | | | 5,224 | | | | 79,191 | | | | 8,443 | | | | 116,680 | | | | 17,366 | | | | 301,427 | | | | 27,031 | | | | 401,473 | | | | 56 | | | | 1,130 | | | | 297 | | | | 4,723 | |
| | | | | | 99,908 | | | | 1,522,599 | | | | 210,089 | | | | 2,918,135 | | | | 134,628 | | | | 2,287,173 | | | | 21,879 | | | | 373,904 | | | | 2,362 | | | | 48,804 | | | | 5,231 | | | | 86,365 | |
| | | | | | — | | | | — | | | | — | | | | — | | | | — | | | | — | | | | — | | | | — | | | | 809 | | | | 16,040 | | | | 7,827 | | | | 123,590 | |
| | | | | | | | | | | | |
| | | | | | | | | | | | | | | | | | | | | | | | | | | | | | | | | | | | | | | | | | | | | | | | | | |
| | | | | | (60,904 | ) | | | (964,599 | ) | | | (95,730 | ) | | | (1,363,748 | ) | | | (4,146,038 | ) | | | (72,566,773 | ) | | | (1,407,408 | ) | | | (20,527,829 | ) | | | (23,391 | ) | | | (481,160 | ) | | | (351,203 | ) | | | (6,208,049 | ) |
| | | | | | — | | | | — | | | | — | | | | — | | | | (7,511 | ) | | | (131,017 | ) | | | (5,274 | ) | | | (86,437 | ) | | | (17,787 | ) | | | (353,774 | ) | | | (30,377 | ) | | | (529,550 | ) |
| | | | | | — | | | | — | | | | — | | | | — | | | | — | | | | — | | | | — | | | | — | | | | — | | | | — | | | | — | | | | — | |
| | | | | | (86,274 | ) | | | (1,355,798 | ) | | | (64,013 | ) | | | (928,658 | ) | | | (1,660,903 | ) | | | (27,625,591 | ) | | | (183,841 | ) | | | (2,931,998 | ) | | | (915 | ) | | | (18,547 | ) | | | (5,663 | ) | | | (100,466 | ) |
| | | | | | (661,408 | ) | | | (10,435,016 | ) | | | (897,902 | ) | | | (13,136,117 | ) | | | (1,412,420 | ) | | | (24,367,528 | ) | | | (375,482 | ) | | | (5,491,585 | ) | | | (25,803 | ) | | | (526,954 | ) | | | (60,439 | ) | | | (1,093,151 | ) |
| | | | | | — | | | | — | | | | — | | | | — | | | | — | | | | — | | | | — | | | | — | | | | (26,644 | ) | | | (544,791 | ) | | | (72,389 | ) | | | (1,278,290 | ) |
| | | | | | (326,383 | ) | | $ | (5,106,464 | ) | | | (351,353 | ) | | $ | (5,386,895 | ) | | | 4,698,981 | | | $ | 90,371,855 | | | | 3,193,367 | | | $ | 51,746,000 | | | | (41,327 | ) | | $ | (837,019 | ) | | | (430,081 | ) | | $ | (7,591,224 | ) |
| | | | | | |
| | Annual Report | | | September 30, 2018 | | 377 |
Notes to Financial Statements (cont’d)
September 30, 2018
| | | | | | | | | | | | | | | | | | | | |
| | | AllianzGI PerformanceFee
Managed Futures Strategy | | | AllianzGI PerformanceFee
Structured US Equity | | | | |
| | | Period from
December 18, 2017†
through September 30, 2018 | | | Period from
December 18, 2017†
through September 30, 2018 | | | | |
| | | Shares | | | Amount | | | Shares | | | Amount | | | | |
Shares sold: | | | | | | | | | | | | | | | | | | | | |
Class P | | | — | | | $ | — | | | | — | | | $ | — | | | | | |
Institutional Class | | | 57,095 | | | | 550,654 | | | | 3,656,574 | | | | 39,018,487 | | | | | |
Class R6 | | | 1,627,386 | | | | 16,230,568 | | | | 1,378,034 | | | | 14,214,731 | | | | | |
| | | | | |
Issued in reinvestment of dividends and distributions: | | | | | | | | | | | | | | | | | | | | |
Class P | | | — | | | | — | | | | — | | | | — | | | | | |
Institutional Class | | | — | | | | — | | | | — | | | | — | | | | | |
Class R6 | | | — | | | | — | | | | — | | | | — | | | | | |
| | | | | |
Cost of shares redeemed: | | | | | | | | | | | | | | | | | | | | |
Institutional Class | | | (4,395 | ) | | | (42,153 | ) | | | (37,753 | ) | | | (412,508 | ) | | | | |
Class R6 | | | (43,722 | ) | | | (423,518 | ) | | | (31,820 | ) | | | (347,913 | ) | | | | |
Net increase resulting from Fund share transactions | | | 1,636,364 | | | $ | 16,315,551 | | | | 4,965,035 | | | $ | 52,472,797 | | | | | |
| — | May reflect actual amounts rounding to less than $1 or less than 1 share. |
| † | Commencement of operations. |
| | | | | | |
| 378 | | September 30, 2018 | | | Annual Report | | |
| | | | | | | | | | | | | | | | | | | | | | | | | | |
| | | | AllianzGI PerformanceFee
Structured US Fixed Income | | | AllianzGI Preferred Securities and
Income | | | AllianzGI Real Estate Debt | |
| | | | Period from
December 18, 2017†
through
September 30, 2018 | | | Period from
May 30, 2018†
through
September 30, 2018 | | | Period from
December 27, 2017†
through
September 30, 2018 | |
| | | | Shares | | | Amount | | | Shares | | | Amount | | | Shares | | | Amount | |
| | | | | | | | | | | | | | | | | | | | | | | | | | |
| | | | | | — | | | $ | — | | | | — | | | $ | — | | | | — | | | $ | — | |
| | | | | | 18,871 | | | | 186,825 | | | | 101,706 | | | | 1,537,850 | | | | 378,510 | | | | 5,669,291 | |
| | | | | | 17,332 | | | | 171,151 | | | | — | | | | — | | | | — | | | | — | |
| | | | | | |
| | | | | | | | | | | | | | | | | | | | | | | | | | |
| | | | | | — | | | | — | | | | 9 | | | | 134 | | | | 10 | | | | 152 | |
| | | | | | — | | | | — | | | | 378 | | | | 5,686 | | | | 13,750 | | | | 205,805 | |
| | | | | | — | | | | — | | | | 9,113 | | | | 137,009 | | | | — | | | | — | |
| | | | | | |
| | | | | | | | | | | | | | | | | | | | | | | | | | |
| | | | | | (18,861 | ) | | | (186,725 | ) | | | — | | | | — | | | | (39,987 | ) | | | (598,878 | ) |
| | | | | | — | | | | — | | | | — | | | | — | | | | — | | | | — | |
| | | | | | 17,342 | | | $ | 171,251 | | | | 111,206 | | | $ | 1,680,679 | | | | 352,283 | | | $ | 5,276,370 | |
| | | | | | |
| | Annual Report | | | September 30, 2018 | | 379 |
Notes to Financial Statements (cont’d)
September 30, 2018
| | | | | | | | | | | | | | | | | | | | | | | | | | | | |
| | | AllianzGI Short Duration High Income | | | AllianzGI Short Term Bond | | | | |
| | | Year ended
September 30, 2018 | | | Year ended
September 30, 2017 | | | Period from
August 23, 2018† through
September 30, 2018 | | | | |
| | | Shares | | | Amount | | | Shares | | | Amount | | | Shares | | | Amount | | | | |
Shares sold: | | | | | | | | | | | | | | | | | | | | | |
Class A | | | 3,859,273 | | | $ | 57,794,244 | | | | 7,663,673 | | | $ | 116,660,118 | | | | — | | | $ | — | | | | | |
Class C | | | 2,143,605 | | | | 32,050,213 | | | | 3,717,496 | | | | 56,510,414 | | | | — | | | | — | | | | | |
Class P | | | 13,000,981 | | | | 194,110,884 | | | | 36,888,448 | | | | 559,642,113 | | | | — | | | | — | | | | | |
Institutional Class | | | 13,218,128 | | | | 197,275,694 | | | | 27,724,398 | | | | 420,876,270 | | | | 11,731 | | | | 176,000 | | | | | |
Class R6 | | | 2,773,793 | | | | 41,555,774 | | | | 6,115,096 | # | | | 92,406,206 | # | | | — | | | | — | | | | | |
| | | | | |
Issued in reinvestment of dividends and distributions: | | | | | | | | | | | | | | | | | | | | | |
Class A | | | 539,451 | | | | 8,065,229 | | | | 637,033 | | | | 9,673,820 | | | | — | | | | — | | | | | |
Class C | | | 354,329 | | | | 5,286,210 | | | | 375,917 | | | | 5,698,961 | | | | — | | | | — | | | | | |
Class P | | | 1,048,148 | | | | 15,625,723 | | | | 2,090,855 | | | | 31,643,057 | | | | — | | | | — | | | | | |
Institutional Class | | | 1,353,472 | | | | 20,185,213 | | | | 1,421,324 | | | | 21,526,416 | | | | — | | | | — | | | | | |
Class R6 | | | 177,574 | | | | 2,647,559 | | | | 138,225 | # | | | 2,094,252 | # | | | — | | | | — | | | | | |
| | | | | |
Cost of shares redeemed: | | | | | | | | | | | | | | | | | | | | | |
Class A | | | (8,675,606 | ) | | | (129,519,226 | ) | | | (8,708,544 | ) | | | (132,690,291 | ) | | | — | | | | — | | | | | |
Class C | | | (3,212,318 | ) | | | (48,022,048 | ) | | | (2,975,169 | ) | | | (45,203,613 | ) | | | — | | | | — | | | | | |
Class P | | | (32,694,772 | ) | | | (492,027,915 | ) | | | (29,048,159 | ) | | | (441,308,927 | ) | | | — | | | | — | | | | | |
Institutional Class | | | (24,090,831 | ) | | | (360,032,751 | ) | | | (21,096,420 | ) | | | (319,802,070 | ) | | | — | | | | — | | | | | |
Class R6 | | | (4,061,454 | ) | | | (60,996,929 | ) | | | (1,590,045 | )# | | | (24,146,772 | )# | | | — | | | | — | | | | | |
Net increase (decrease) resulting from Fund share transactions | | | (34,266,227 | ) | | $ | (516,002,126 | ) | | | 23,354,128 | | | $ | 353,579,954 | | | | 11,731 | | | $ | 176,000 | | | | | |
| – | May reflect actual amounts rounding to less than $1 or less than 1 share. |
| † | Commencement of operations. |
| # | For the period February 1, 2017 (commencement of share class) through September 30, 2017. “Shares sold” include shares sold to AFI. |
| ## | For the period December 2, 2016 (commencement of share class) through September 30, 2017. “Shares sold” include shares sold to AFI. |
| | | | | | |
| 380 | | September 30, 2018 | | | Annual Report | | |
| | | | | | | | | | | | | | | | | | | | | | | | | | | | | | | | | | | | | | | | | | | | | | | | | | |
| | | | AllianzGI Structured Return | | | AllianzGI U.S. Equity Hedged | | | AllianzGI Ultra Micro Cap | |
| | | | Year ended
September 30, 2018 | | | Year ended
September 30, 2017 | | | Year ended
September 30, 2018 | | | Year ended
September 30, 2017 | | | Year ended
September 30, 2018 | | | Year ended
September 30, 2017 | |
| | | | Shares | | | Amount | | | Shares | | | Amount | | | Shares | | | Amount | | | Shares | | | Amount | | | Shares | | | Amount | | | Shares | | | Amount | |
| | | | | | | | | | | | | | | | | | | | | | | | | | | | | | | | | | | | | | | | | | | | | | | | | | |
| | | | | | 3,578,492 | | | $ | 56,841,189 | | | | 5,646,557 | | | $ | 89,901,498 | | | | 4,954 | | | $ | 89,481 | | | | 2,816 | | | $ | 46,637 | | | | 46,639 | | | $ | 922,104 | | | | 43,791 | | | $ | 946,724 | |
| | | | | | 321,649 | | | | 4,970,252 | | | | 449,604 | | | | 6,938,013 | | | | — | | | | — | | | | 1,414 | | | | 22,050 | | | | — | | | | — | | | | — | | | | — | |
| | | | | | 5,325,709 | | | | 84,630,179 | | | | 8,847,535 | | | | 140,373,611 | | | | 2,900 | | | | 54,178 | | | | 300 | | | | 5,000 | | | | 109,692 | | | | 2,081,245 | | | | 111,746 | | | | 2,392,918 | |
| | | | | | 12,430,901 | | | | 198,879,500 | | | | 7,856,826 | | | | 126,112,229 | | | | 44,908 | | | | 830,267 | | | | 18,779 | | | | 317,106 | | | | 224,370 | | | | 4,812,076 | | | | 163,895 | | | | 3,605,950 | |
| | | | | | 1,112,999 | | | | 17,549,532 | | | | 2,478,327 | ## | | | 40,065,690 | ## | | | — | | | | — | | | | — | | | | — | | | | — | | | | — | | | | — | | | | — | |
| | | | | | | | | | | | |
| | | | | | | | | | | | | | | | | | | | | | | | | | | | | | | | | | | | | | | | | | | | | | | | | | |
| | | | | | 344,893 | | | | 5,452,751 | | | | 183,601 | | | | 2,875,299 | | | | 484 | | | | 8,868 | | | | 519 | | | | 8,563 | | | | 146,421 | | | | 2,623,868 | | | | 63,450 | | | | 1,323,561 | |
| | | | | | 37,382 | | | | 573,444 | | | | 20,935 | | | | 317,799 | | | | 202 | | | | 3,555 | | | | 157 | | | | 2,502 | | | | — | | | | — | | | | — | | | | — | |
| | | | | | 390,379 | | | | 6,156,276 | | | | 58,661 | | | | 919,019 | | | | 23 | | | | 409 | | | | 26 | | | | 428 | | | | 50,434 | | | | 922,434 | | | | 21,175 | | | | 447,225 | |
| | | | | | 596,378 | | | | 9,500,308 | | | | 181,425 | | | | 2,861,480 | | | | 1,044 | | | | 19,371 | | | | 2,825 | | | | 46,862 | | | | 266,881 | | | | 4,891,933 | | | | 84,707 | | | | 1,792,405 | |
| | | | | | 86,252 | | | | 1,367,964 | | | | 80,499 | ## | | | 1,266,928 | ## | | | — | | | | — | | | | — | | | | — | | | | — | | | | — | | | | — | | | | — | |
| | | | | | | | | | | | |
| | | | | | | | | | | | | | | | | | | | | | | | | | | | | | | | | | | | | | | | | | | | | | | | | | |
| | | | | | (5,471,305 | ) | | | (86,098,131 | ) | | | (3,558,616 | ) | | | (56,347,413 | ) | | | (9,392 | ) | | | (171,559 | ) | | | (9,170 | ) | | | (154,485 | ) | | | (280,049 | ) | | | (5,430,004 | ) | | | (470,286 | ) | | | (10,130,252 | ) |
| | | | | | (328,090 | ) | | | (5,034,992 | ) | | | (237,960 | ) | | | (3,669,265 | ) | | | (3,767 | ) | | | (65,379 | ) | | | (2,702 | ) | | | (42,843 | ) | | | — | | | | — | | | | — | | | | — | |
| | | | | | (4,765,862 | ) | | | (75,222,509 | ) | | | (1,837,863 | ) | | | (29,260,855 | ) | | | (306 | ) | | | (5,607 | ) | | | (7 | ) | | | (120 | ) | | | (64,153 | ) | | | (1,318,678 | ) | | | (188,518 | ) | | | (4,182,585 | ) |
| | | | | | (4,342,363 | ) | | | (69,149,955 | ) | | | (4,712,189 | ) | | | (75,867,393 | ) | | | (32,633 | ) | | | (603,115 | ) | | | (218,551 | ) | | | (3,714,881 | ) | | | (470,044 | ) | | | (9,691,341 | ) | | | (429,905 | ) | | | (9,395,661 | ) |
| | | | | | (151,513 | ) | | | (2,395,261 | ) | | | (472,671 | )## | | | (7,638,126 | )## | | | — | | | | — | | | | — | | | | — | | | | — | | | | — | | | | — | | | | — | |
| | | | | | 9,165,901 | | | $ | 148,020,547 | | | | 14,984,671 | | | $ | 238,848,514 | | | | 8,417 | | | $ | 160,469 | | | | (203,594 | ) | | $ | (3,463,181 | ) | | | 30,191 | | | $ | (186,363 | ) | | | (599,945 | ) | | $ | (13,199,715 | ) |
| | | | | | |
| | Annual Report | | | September 30, 2018 | | 381 |
Notes to Financial Statements (cont’d)
September 30, 2018
| 10. | INVESTMENTS IN SECURITIES |
For the period or year ended September 30, 2018, purchases and sales of investments, other than short-term securities and U.S. government obligations were:
| | | | | | | | |
| | | Purchases | | | Sales | |
AllianzGI Retirement 2020 | | $ | 11,360,875 | | | $ | 28,055,651 | |
AllianzGI Retirement 2025 | | | 11,741,335 | | | | 24,976,239 | |
AllianzGI Retirement 2030 | | | 11,326,468 | | | | 22,277,498 | |
AllianzGI Retirement 2035 | | | 10,789,293 | | | | 22,892,116 | |
AllianzGI Retirement 2040 | | | 9,389,619 | | | | 15,125,275 | |
AllianzGI Retirement 2045 | | | 7,182,716 | | | | 8,572,858 | |
AllianzGI Retirement 2050 | | | 8,248,251 | | | | 6,686,219 | |
AllianzGI Retirement 2055 | | | 6,805,964 | | | | 4,941,690 | |
AllianzGI Multi Asset Income | | | 73,171,156 | | | | 82,565,870 | |
AllianzGI Global Allocation | | | 61,433,051 | | | | 51,811,713 | |
AllianzGI Best Styles Global Equity | | | 515,930,148 | | | | 610,356,761 | |
AllianzGI Best Styles International Equity | | | 14,399,582 | | | | 14,302,122 | |
AllianzGI Best Styles U.S. Equity | | | 94,574,579 | | | | 125,215,618 | |
AllianzGI Convertible | | | 640,656,911 | | | | 692,358,513 | |
AllianzGI Core Bond | | | 46,614,089 | | | | 28,658,062 | |
AllianzGI Core Plus Bond | | | 73,639,874 | | | | 46,818,104 | |
AllianzGI Emerging Markets Consumer | | | 58,842,562 | | | | 53,879,276 | |
AllianzGI Emerging Markets Debt | | | 33,336,637 | | | | 48,168,959 | |
AllianzGI Emerging Markets Small-Cap | | | 13,065,022 | | | | 13,962,258 | |
AllianzGI Europe Equity Dividend | | | 4,812,846 | | | | 7,010,904 | |
AllianzGI Global Dynamic Allocation | | | 171,830,191 | | | | 201,514,512 | |
AllianzGI Global High Yield | | | 22,179,612 | | | | 20,887,279 | |
AllianzGI Global Sustainability | | | 15,709,907 | | | | 5,840,414 | |
AllianzGI Global Water | | | 244,724,276 | | | | 216,303,746 | |
AllianzGI High Yield Bond | | | 85,248,115 | | | | 157,309,515 | |
AllianzGI International Growth | | | 12,348,211 | | | | 3,406,108 | |
AllianzGI International Small-Cap | | | 120,449,372 | | | | 108,591,815 | |
AllianzGI Micro Cap | | | 13,657,945 | | | | 20,888,317 | |
AllianzGI NFJ Emerging Markets Value | | | 231,798,494 | | | | 141,671,545 | |
AllianzGI NFJ International Small-Cap Value | | | 2,463,680 | | | | 3,204,561 | |
AllianzGI PerformanceFee Managed Futures Strategy | | | 1,385,602 | | | | 1,346,018 | |
AllianzGI PerformanceFee Structured US Equity | | | 78,641,184 | | | | 699,907 | |
AllianzGI PerformanceFee Structured US Fixed Income | | | 26,000,041 | | | | 245,067 | |
AllianzGI Preferred Securities and Income | | | 15,510,074 | | | | 4,296,393 | |
AllianzGI Real Estate Debt | | | 17,548,786 | | | | 4,040,140 | |
AllianzGI Short Duration High Income | | | 723,797,092 | | | | 1,203,039,208 | |
AllianzGI Short Term Bond | | | 3,768,245 | | | | — | |
AllianzGI Structured Return | | | 3,218,993,594 | | | | 3,217,467,555 | |
AllianzGI U.S. Equity Hedged | | | 551,607 | | | | 557,100 | |
AllianzGI Ultra Micro Cap | | | 13,940,642 | | | | 23,784,658 | |
| | | | | | |
| 382 | | September 30, 2018 | | | Annual Report | | |
Purchases and sales in U.S. government obligations were:
| | | | | | | | |
| | | Purchases | | | Sales | |
AllianzGI Global Allocation | | | — | | | $ | 5,021,094 | |
AllianzGI Core Bond | | $ | 81,624,212 | | | | 65,992,181 | |
AllianzGI Core Plus Bond | | | 106,981,586 | | | | 88,497,949 | |
AllianzGI Global Dynamic Allocation | | | 243,249,818 | | | | 262,072,485 | |
AllianzGI PerformanceFee Managed Futures Strategy | | | 1,975,000 | | | | 396,375 | |
AllianzGI Real Estate Debt | | | 841,882 | | | | 63,777 | |
AllianzGI Short Term Bond | | | 1,199,940 | | | | — | |
| 11. | INCOME TAX INFORMATION |
The tax character of dividends and distributions paid was:
| | | | | | | | | | | | | | | | | | | | | | | | | | | | |
| | | Year ended September 30, 2018 | | | Year ended September 30, 2017 | |
| | | Ordinary
Income(1) | | | 15% Long-Term
Capital Gain | | | 25% Long-Term
Capital Gain | | | Return of
Capital | | | Ordinary
Income(1) | | | 15% Long-Term
Capital Gain | | | 25% Long-Term
Capital Gain | |
AllianzGI Retirement 2020 | | $ | 1,795,857 | | | | — | | | | — | | | | — | | | $ | 1,439,204 | | | | — | | | | — | |
AllianzGI Retirement 2025 | | | 2,739,562 | | | $ | 374,795 | | | | — | | | | — | | | | 1,452,297 | | | $ | 48,702 | | | | — | |
AllianzGI Retirement 2030 | | | 3,795,163 | | | | 298,456 | | | | — | | | | — | | | | 1,438,836 | | | | 233,932 | | | | — | |
AllianzGI Retirement 2035 | | | 3,426,175 | | | | 204,859 | | | | — | | | | — | | | | 1,336,657 | | | | 101,834 | | | | — | |
AllianzGI Retirement 2040 | | | 3,346,698 | | | | 169,469 | | | | — | | | | — | | | | 1,626,578 | | | | 224,957 | | | | — | |
AllianzGI Retirement 2045 | | | 2,159,524 | | | | 54,526 | | | | — | | | | — | | | | 1,021,464 | | | | 406,928 | | | | — | |
AllianzGI Retirement 2050 | | | 2,194,709 | | | | 57,549 | | | | — | | | | — | | | | 942,620 | | | | 392,171 | | | | — | |
AllianzGI Retirement 2055 | | | 1,004,318 | | | | 36,436 | | | | — | | | | — | | | | 346,380 | | | | 50,499 | | | | — | |
AllianzGI Multi Asset Income | | | 2,975,341 | | | | 28,682 | | | | — | | | $ | 261,103 | | | | 2,741,965 | | | | 25,549 | | | | — | |
AllianzGI Global Allocation | | | 19,171,468 | | | | 16,636,384 | | | | — | | | | — | | | | 10,848,889 | | | | — | | | | — | |
AllianzGI Best Styles Global Equity | | | 45,665,411 | | | | 34,628,218 | | | $ | 1,133 | | | | — | | | | 15,585,715 | | | | 256,710 | | | $ | 496 | |
AllianzGI Best Styles International Equity | | | 1,095,157 | | | | — | | | | — | | | | — | | | | 2,765,415 | | | | — | | | | — | |
AllianzGI Best Styles U.S. Equity | | | 5,472,853 | | | | 1,969,191 | | | | 3,997 | | | | — | | | | 1,635,305 | | | | — | | | | — | |
AllianzGI Convertible | | | 21,905,670 | | | | 68,007,497 | | | | 31,312 | | | | — | | | | 34,605,474 | | | | — | | | | — | |
AllianzGI Core Bond | | | 216,959 | | | | — | | | | — | | | | — | | | | — | | | | — | | | | — | |
AllianzGI Core Plus Bond | | | 300,744 | | | | — | | | | — | | | | — | | | | — | | | | — | | | | — | |
AllianzGI Emerging Markets Consumer | | | 773,623 | | | | 1,433,989 | | | | — | | | | — | | | | 459,013 | | | | — | | | | — | |
AllianzGI Emerging Markets Debt | | | 1,405,481 | | | | 248,069 | | | | — | | | | — | | | | 2,680,293 | | | | — | | | | — | |
AllianzGI Emerging Markets Small-Cap | | | 566,267 | | | | 207,314 | | | | — | | | | — | | | | 364,501 | | | | — | | | | — | |
AllianzGI Europe Equity Dividend | | | 344,326 | | | | — | | | | — | | | | — | | | | 250,156 | | | | — | | | | — | |
AllianzGI Global Dynamic Allocation | | | 10,980,742 | | | | 3,631,138 | | | | 778 | | | | — | | | | 967,667 | | | | — | | | | — | |
AllianzGI Global High Yield | | | 1,055,592 | | | | — | | | | — | | | | — | | | | 118,002 | | | | — | | | | — | |
AllianzGI Global Sustainability | | | 367,880 | | | | 578,835 | | | | — | | | | — | | | | 279,623 | | | | — | | | | — | |
AllianzGI Global Water | | | 8,199,770 | | | | 11,446,343 | | | | — | | | | — | | | | 2,170,836 | | | | 3,173,867 | | | | — | |
AllianzGI High Yield Bond | | | 11,770,105 | | | | — | | | | — | | | | — | | | | 19,081,404 | | | | — | | | | — | |
AllianzGI International Growth | | | 2,328,642 | | | | — | | | | — | | | | — | | | | 29,198 | | | | — | | | | — | |
AllianzGI International Small-Cap | | | 1,999,614 | | | | 2,617,998 | | | | — | | | | — | | | | 876,622 | | | | — | | | | — | |
AllianzGI Micro Cap | | | — | | | | 1,758,420 | | | | — | | | | — | | | | — | | | | 3,346,124 | | | | — | |
AllianzGI NFJ Emerging Markets Value | | | 3,118,250 | | | | 6,697 | | | | — | | | | — | | | | 919,285 | | | | — | | | | — | |
AllianzGI NFJ International Small-Cap Value | | | 93,407 | | | | — | | | | — | | | | — | | | | 314,661 | | | | — | | | | — | |
| | | | | | |
| | Annual Report | | | September 30, 2018 | | 383 |
Notes to Financial Statements (cont’d)
September 30, 2018
| | | | | | | | | | | | | | | | | | | | | | | | | | | | |
| | | Year ended September 30, 2018 | | | Year ended September 30, 2017 | |
| | | Ordinary
Income(1) | | | 15% Long-Term
Capital Gain | | | 25% Long-Term
Capital Gain | | | Return of
Capital | | | Ordinary
Income(1) | | | 15% Long-Term
Capital Gain | | | 25% Long-Term
Capital Gain | |
AllianzGI PerformanceFee Managed Futures Strategy | | | — | | | | — | | | | — | | | | — | | | | — | | | | — | | | | — | |
AllianzGI PerformanceFee Structured US Equity | | | — | | | | — | | | | — | | | | — | | | | — | | | | — | | | | — | |
AllianzGI PerformanceFee Structured US Fixed Income | | | — | | | | — | | | | — | | | | — | | | | — | | | | — | | | | — | |
AllianzGI Preferred Securities and Income | | $ | 142,829 | | | | — | | | | — | | | | — | | | | — | | | | — | | | | — | |
AllianzGI Real Estate Debt | | | 205,957 | | | | — | | | | — | | | | — | | | | — | | | | — | | | | — | |
AllianzGI Short Duration High Income | | | 59,914,825 | | | | — | | | | — | | | | — | | | $ | 79,900,069 | | | | — | | | | — | |
AllianzGI Short Term Bond | | | — | | | | — | | | | — | | | | — | | | | — | | | | — | | | | — | |
AllianzGI Structured Return | | | 20,416,712 | | | $ | 2,804,237 | | | | — | | | | — | | | | 6,641,280 | | | $ | 1,642,834 | | | | — | |
AllianzGI U.S. Equity Hedged | | | 32,203 | | | | — | | | | — | | | | — | | | | 58,355 | | | | — | | | | — | |
AllianzGI Ultra Micro Cap | | | — | | | | 8,526,928 | | | | — | | | | — | | | | — | | | | 3,631,497 | | | | — | |
| (1) | Includes short-term capital gains, if any. |
At September 30, 2018, the components of distributable earnings were:
| | | | | | | | | | | | | | | | | | | | | | | | |
| | | Ordinary
Income | | | Long-Term
Capital Gain | | | Capital Loss
Carryforwards(2) | | | Late Year
Ordinary
Loss(3) | | | Post-October Capital Loss (Gain)(4) | |
| | Short-Term | | | Long-Term | |
AllianzGI Retirement 2020 | | $ | 273,900 | | | $ | 1,210,056 | | | | — | | | $ | 213 | | | $ | 27,625 | | | | — | |
AllianzGI Retirement 2025 | | | 397,510 | | | | 1,867,945 | | | | — | | | | 398 | | | | — | | | | — | |
AllianzGI Retirement 2030 | | | 230,179 | | | | 2,399,390 | | | | — | | | | — | | | | — | | | | — | |
AllianzGI Retirement 2035 | | | 86,515 | | | | 2,821,759 | | | | — | | | | 15,566 | | | | — | | | | — | |
AllianzGI Retirement 2040 | | | 37,928 | | | | 2,405,128 | | | | — | | | | 41,274 | | | | — | | | | — | |
AllianzGI Retirement 2045 | | | 2,954 | | | | 1,552,664 | | | | — | | | | 36,629 | | | | 3,246 | | | | — | |
AllianzGI Retirement 2050 | | | 316,987 | | | | 1,148,415 | | | | — | | | | 38,871 | | | | — | | | | — | |
AllianzGI Retirement 2055 | | | 15,217 | | | | 670,042 | | | | — | | | | 20,864 | | | | — | | | | — | |
AllianzGI Multi Asset Income | | | — | | | | — | | | | — | | | | — | | | | 932,115 | | | $ | 26,914 | |
AllianzGI Global Allocation | | | 2,816,871 | | | | 10,422,719 | | | | — | | | | — | | | | — | | | | — | |
AllianzGI Best Styles Global Equity | | | 15,875,091 | | | | 49,545,506 | | | | — | | | | — | | | | — | | | | — | |
AllianzGI Best Styles International Equity | | | 905,536 | | | | 43,398 | | | | — | | | | — | | | | — | | | | — | |
AllianzGI Best Styles U.S. Equity | | | 5,025,637 | | | | 12,560,477 | | | | — | | | | — | | | | — | | | | — | |
AllianzGI Convertible | | | 41,767,236 | | | | 30,369,599 | | | | — | | | | — | | | | — | | | | — | |
AllianzGI Core Bond | | | 59,458 | | | | — | | | $ | 18,246 | | | | — | | | | — | | | | — | |
AllianzGI Core Plus Bond | | | 80,649 | | | | — | | | | 61,544 | | | | — | | | | — | | | | — | |
AllianzGI Emerging Markets Consumer | | | 608,953 | | | | — | | | | — | | | | 72,250 | | | | 2,868,847 | | | | (2,267,861 | ) |
AllianzGI Emerging Markets Debt | | | 122,322 | | | | — | | | | 3,993 | | | | 820,871 | | | | 841,099 | | | | 360,146 | |
AllianzGI Emerging Markets Small-Cap | | | 154,516 | | | | 379,504 | | | | — | | | | 6,924 | | | | 288,263 | | | | — | |
AllianzGI Europe Equity Dividend | | | 163,651 | | | | 126,324 | | | | — | | | | 9,774 | | | | — | | | | — | |
AllianzGI Global Dynamic Allocation | | | 5,004,557 | | | | 4,527,405 | | | | — | | | | — | | | | — | | | | — | |
AllianzGI Global High Yield | | | 381,294 | | | | — | | | | 54,952 | | | | — | | | | 297,997 | | | | (26,132 | ) |
AllianzGI Global Sustainability | | | 434,813 | | | | 1,240,974 | | | | — | | | | 4,278 | | | | — | | | | — | |
AllianzGI Global Water | | | 5,849,586 | | | | 11,174,567 | | | | — | | | | 397,203 | | | | 1,426,345 | | | | — | |
AllianzGI High Yield Bond | | | 159,182 | | | | — | | | | 27,687,679 | | | | — | | | | 463,640 | | | | — | |
AllianzGI International Growth | | | 164,262 | | | | 512,548 | | | | — | | | | 17,992 | | | | — | | | | — | |
AllianzGI International Small-Cap | | | 1,420,290 | | | | 14,976,610 | | | | — | | | | — | | | | 1,155,773 | | | | — | |
AllianzGI Micro Cap | | | — | | | | 4,572,021 | | | | — | | | | 268,330 | | | | — | | | | — | |
| | | | | | |
| 384 | | September 30, 2018 | | | Annual Report | | |
| | | | | | | | | | | | | | | | | | | | | | | | |
| | | Ordinary
Income | | | Long-Term
Capital Gain | | | Capital Loss
Carryforwards(2) | | | Late Year
Ordinary
Loss(3) | | | Post-October Capital Loss (Gain)(4) | |
| | Short-Term | | | Long-Term | |
AllianzGI NFJ Emerging Markets Value | | $ | 881,587 | | | | — | | | | — | | | $ | 239,981 | | | $ | 10,565,406 | | | $ | (1,973,017 | ) |
AllianzGI NFJ International Small-Cap Value | | | 87,318 | | | | — | | | $ | 278,172 | | | | — | | | | 2,005 | | | | — | |
AllianzGI PerformanceFee Managed Futures Strategy | | | 202,797 | | | | — | | | | 782,482 | | | | — | | | | — | | | | — | |
AllianzGI PerformanceFee Structured US Equity | | | 5,156,381 | | | $ | 453,217 | | | | — | | | | — | | | | — | | | | — | |
AllianzGI PerformanceFee Structured US Fixed Income | | | 511,382 | | | | 175,271 | | | | — | | | | — | | | | — | | | | — | |
AllianzGI Preferred Securities and Income | | | 38,409 | | | | — | | | | — | | | | — | | | | — | | | | — | |
AllianzGI Real Estate Debt | | | 81,199 | | | | 58,028 | | | | — | | | | — | | | | — | | | | — | |
AllianzGI Short Duration High Income | | | 5,804,902 | | | | — | | | | 44,719,694 | | | | — | | | | 4,867,664 | | | | 5,603,008 | |
AllianzGI Short Term Bond | | | 16,996 | | | | — | | | | — | | | | — | | | | — | | | | — | |
AllianzGI Structured Return | | | 11,202,843 | | | | 6,454,144 | | | | — | | | | — | | | | — | | | | — | |
AllianzGI U.S. Equity Hedged | | | 141,560 | | | | — | | | | 203,517 | | | | — | | | | — | | | | 4,652 | |
AllianzGI Ultra Micro Cap | | | — | | | | 6,323,426 | | | | — | | | | 391,416 | | | | — | | | | — | |
| (2) | Capital loss carryforwards available as a reduction, to the extent provided in the regulations, of any future net realized gains. To the extent that these losses are used to offset future realized capital gains, such gains will not be disbursed. |
| (3) | Certain ordinary losses realized during the period November 1, 2017 through September 30, 2018, and/or other ordinary losses realized during the period January 1, 2018 through September 30, 2018, which the Funds elected to defer to the following taxable year pursuant to income tax regulations. |
| (4) | Capital losses realized during the period November 1, 2017 through September 30, 2018 which the Funds elected to defer to the following taxable year pursuant to income tax regulations. |
Under the Regulated Investment Company Modernization Act of 2010, the Funds are permitted to carry forward capital losses incurred in taxable years beginning after December 22, 2010, for an unlimited period. Post-enactment capital loss carryforwards are required to be utilized prior to the losses incurred in pre-enactment taxable years. Unutilized pre-enactment capital loss carryforwards, if any, have expired at September 30, 2018 and can no longer be carried forward. All capital losses that are carried forward will retain their character as either short-term or long-term capital losses.
At September 30, 2018, capital loss carryforward amounts were:
| | | | | | | | |
| | | No Expiration(5) | |
| | | Short-Term | | | Long-Term | |
AllianzGI Core Bond | | | — | | | $ | 18,246 | |
AllianzGI Core Plus Bond | | | | | | | 61,544 | |
AllianzGI Emerging Markets Debt | | $ | 3,993 | | | | — | |
AllianzGI Global High Yield | | | 42,912 | | | | 12,040 | |
AllianzGI High Yield Bond | | | 5,066,962 | | | | 22,620,717 | |
AllianzGI NFJ International Small-Cap Value | | | 278,172 | | | | — | |
AllianzGI PerformanceFee Managed Futures Strategy | | | 449,377 | | | | 333,105 | |
AllianzGI Short Duration High Income | | | 13,431,244 | | | | 31,288,450 | |
AllianzGI U.S. Equity Hedged | | | — | | | | 203,517 | * |
| * | Subject to limitations under IRC Sections 381-384 |
| (5) | Carryforward amounts are subject to the provision of the Regulated Investment Company Modernization Act of 2010. |
For the year ended September 30, 2018, the Fund had capital loss carryforwards which were utilized as follows:
| | | | | | | | | | | | |
| | | | | | Post-Enactment Utilized | |
| | | Pre-Enactment
Utilized | | | Short-Term | | | Long-Term | |
AllianzGI Retirement 2020 | | | — | | | $ | 216,900 | | | | — | |
AllianzGI Best Styles International Equity | | | — | | | | 379,142 | | | $ | 1,144,758 | |
AllianzGI Emerging Markets Consumer | | | — | | | | 237,972 | | | | — | |
AllianzGI Emerging Markets Debt | | | — | | | | 77,729 | | | | — | |
AllianzGI Europe Equity Dividend | | | — | | | | — | | | | 11,938 | |
AllianzGI Global High Yield | | | — | | | | 24,288 | | | | — | |
| | | | | | |
| | Annual Report | | | September 30, 2018 | | 385 |
Notes to Financial Statements (cont’d)
September 30, 2018
| | | | | | | | | | | | |
| | | | | | Post-Enactment Utilized | |
| | | Pre-Enactment
Utilized | | | Short-Term | | | Long-Term | |
AllianzGI Global Water | | $ | 1,269,698 | | | | — | | | | — | |
AllianzGI High Yield Bond | | | — | | | $ | 25,063 | | | $ | 2,781,468 | |
AllianzGI NFJ International Small-Cap Value | | | — | | | | 47,971 | | | | 198,432 | |
AllianzGI U.S. Equity Hedged | | | — | | | | — | | | | 78,896 | |
For the year ended September 30, 2018, permanent “book-tax” adjustments were:
| | | | | | | | | | | | | | | | |
| | | Undistributed
(Dividends in Excess of)
Net Investment Income | | | Accumulated
Net Realized
Gain(Loss) | | | Paid-in
Capital | | | Unrealized
Appreciation
(Depreciation) | |
AllianzGI Retirement 2020(f)(g) | | $ | 844,636 | | | $ | (844,636 | ) | | | — | | | | — | |
AllianzGI Retirement 2025(f)(g) | | | 1,241,488 | | | | (1,241,488 | ) | | | — | | | | — | |
AllianzGI Retirement 2030(f)(g) | | | 1,736,822 | | | | (1,736,822 | ) | | | — | | | | — | |
AllianzGI Retirement 2035(f)(g) | | | 1,661,589 | | | | (1,661,589 | ) | | | — | | | | — | |
AllianzGI Retirement 2040(f)(g) | | | 1,735,862 | | | | (1,735,862 | ) | | | — | | | | — | |
AllianzGI Retirement 2045(a)(f)(g) | | | 1,133,334 | | | | (1,133,334 | ) | | | — | | | | — | |
AllianzGI Retirement 2050(f)(g) | | | 1,127,440 | | | | (1,127,440 | ) | | | — | | | | — | |
AllianzGI Retirement 2055(f)(g) | | | 545,321 | | | | (545,321 | ) | | | — | | | | — | |
AllianzGI Multi Asset Income(a)(b)(f)(g)(h)(i) | | | (49,799 | ) | | | 41,284 | | | | — | | | $ | 8,515 | |
AllianzGI Global Allocation(f)(g)(n) | | | 8,901,993 | | | | (8,901,993 | ) | | | — | | | | — | |
AllianzGI Best Styles Global Equity(b)(f)(h)(i)(r) | | | 2,492,918 | | | | (2,490,271 | ) | | | — | | | | (2,647 | ) |
AllianzGI Best Styles International Equity(b)(f)(r) | | | 112,038 | | | | (112,038 | ) | | | — | | | | — | |
AllianzGI Best Styles U.S. Equity(f)(h)(i)(r) | | | 34,648 | | | | 2,002 | | | $ | 7,862 | | | | (44,512 | ) |
AllianzGI Convertible(j)(k) | | | 12,269,336 | | | | (12,265,150 | ) | | | (4,186 | ) | | | — | |
AllianzGI Core Bond(c)(m)(q) | | | 5,327 | | | | (5,327 | ) | | | — | | | | — | |
AllianzGI Core Plus Bond(c)(m)(q) | | | (13,045 | ) | | | 13,045 | | | | — | | | | — | |
AllianzGI Emerging Markets Consumer(a)(b)(f)(l) | | | (94,356 | ) | | | 94,356 | | | | — | | | | — | |
AllianzGI Emerging Markets Debt(a)(c)(f) | | | (696,139 | ) | | | 696,139 | | | | — | | | | — | |
AllianzGI Emerging Markets Small-Cap(a)(b)(f)(l)(r) | | | 68,037 | | | | (68,037 | ) | | | — | | | | — | |
AllianzGI Europe Equity Dividend(f) | | | (6,813 | ) | | | 6,813 | | | | — | | | | — | |
AllianzGI Global Dynamic Allocation(b)(f)(h)(r) | | | 400,364 | | | | (358,395 | ) | | | — | | | | (41,969 | ) |
AllianzGI Global High Yield(c)(f) | | | 270,058 | | | | (270,058 | ) | | | — | | | | — | |
AllianzGI Global Sustainability(f)(i) | | | (16,140 | ) | | | 16,140 | | | | — | | | | — | |
AllianzGI Global Water(a)(f) | | | (440,028 | ) | | | 440,028 | | | | — | | | | — | |
AllianzGI High Yield Bond(c) | | | 679,194 | | | | (679,194 | ) | | | — | | | | — | |
AllianzGI International Growth(f) | | | (2,520 | ) | | | 2,520 | | | | — | | | | — | |
AllianzGI International Small-Cap(b)(f) | | | 582,333 | | | | (582,333 | ) | | | — | | | | — | |
AllianzGI Micro Cap(d)(p) | | | 424,572 | | | | (122,167 | ) | | | (302,405 | ) | | | — | |
AllianzGI NFJ Emerging Markets Value(a)(b)(f)(l)(r) | | | 95,581 | | | | (95,581 | ) | | | — | | | | — | |
AllianzGI NFJ International Small-Cap Value(b)(f) | | | 29,655 | | | | (29,655 | ) | | | — | | | | — | |
AllianzGI PerformanceFee Managed Futures Strategy(e)(f)(m)(o) | | | (82,200 | ) | | | 82,578 | | | | (378 | ) | | | — | |
AllianzGI PerformanceFee Structured US Equity(o) | | | 4,419 | | | | — | | | | (4,419 | ) | | | — | |
AllianzGI PerformanceFee Structured US Fixed Income(o) | | | 243 | | | | — | | | | (243 | ) | | | — | |
AllianzGI Preferred Securities and Income(c) | | | 27 | | | | (27 | ) | | | — | | | | — | |
AllianzGI Real Estate Debt(c)(f)(q) | | | 87,560 | | | | (87,560 | ) | | | — | | | | — | |
AllianzGI Short Duration High Income(c) | | | 10,114,397 | | | | (10,114,397 | ) | | | — | | | | — | |
AllianzGI Short Term Bond(o) | | | 3 | | | | — | | | | (3 | ) | | | — | |
AllianzGI Structured Return | | | — | | | | — | | | | — | | | | — | |
| | | | | | |
| 386 | | September 30, 2018 | | | Annual Report | | |
| | | | | | | | | | | | | | | | |
| | | Undistributed
(Dividends in Excess of)
Net Investment Income | | | Accumulated
Net Realized
Gain(Loss) | | | Paid-in
Capital | | | Unrealized
Appreciation
(Depreciation) | |
AllianzGI U.S. Equity Hedged | | | — | | | | — | | | | — | | | | — | |
AllianzGI Ultra Micro Cap(d)(o)(p) | | $ | 716,044 | | | $ | (293,962 | ) | | $ | (422,082 | ) | | | — | |
These permanent “book-tax” differences were primarily attributable to:
| (a) | Reclassification of dividends/distributions |
| (b) | Reclassification of gains from securities classified as Passive Foreign Investment Companies (“PFICs”) for tax purposes |
| (c) | Treatment of bond premium amortization |
| (e) | Reclassification related to wholly owned offshore subsidiary |
| (f) | Reclassification of gains and losses from foreign currency transactions |
| (g) | Reclassification of short-term capital gain dividends from underlying securities |
| (h) | Reclassifications related to investments in Real Estate Investment Trusts (REITs) |
| (i) | Reclassification from sales of securities with return of capital |
| (j) | Reclassification of contingent debt/convertible securities income/gains |
| (k) | Section 305 sales adjustments for accrual of deemed dividends from investments in convertible debt |
| (l) | Foreign capital gain tax |
| (m) | Reclassification of swap payments |
| (n) | Reclassification due to investments in partnerships |
| (o) | Non-deductible expenses |
| (p) | Reclassification of non-deductible net operating losses and short term capital gains |
| (q) | Reclassification paydown losses |
| (r) | Reclassification on sale of securities no longer classified as Passive Foreign Investment Companies (“PFICs”) for tax purposes. |
Net investment income, net realized gains or losses and net assets were not affected by these adjustments.
At September 30, 2018, the aggregate cost basis and the net unrealized appreciation (depreciation) of investments in securities and other financial instruments for federal income tax purposes were:
| | | | | | | | | | | | | | | | |
| | | Federal Tax
Cost Basis(6) | | | Unrealized
Appreciation | | | Unrealized
Deprecation | | | Net Unrealized
Appreciation
(Depreciation) | |
AllianzGI Retirement 2020 | | $ | 32,185,246 | | | $ | 2,395,850 | | | $ | 314,723 | | | $ | 2,081,127 | |
AllianzGI Retirement 2025 | | | 46,148,535 | | | | 4,266,884 | | | | 260,895 | | | | 4,005,989 | |
AllianzGI Retirement 2030 | | | 53,408,827 | | | | 6,200,134 | | | | 106,741 | | | | 6,093,393 | |
AllianzGI Retirement 2035 | | | 38,722,704 | | | | 4,979,600 | | | | 86,989 | | | | 4,892,611 | |
AllianzGI Retirement 2040 | | | 40,465,015 | | | | 5,553,518 | | | | 69,405 | | | | 5,484,113 | |
AllianzGI Retirement 2045 | | | 26,794,223 | | | | 3,606,645 | | | | 49,990 | | | | 3,556,655 | |
AllianzGI Retirement 2050 | | | 28,793,079 | | | | 3,518,903 | | | | 54,479 | | | | 3,464,424 | |
AllianzGI Retirement 2055 | | | 14,308,464 | | | | 1,388,517 | | | | 27,792 | | | | 1,360,725 | |
AllianzGI Multi Asset Income | | | 35,505,745 | | | | 259,935 | | | | 713,244 | | | | (453,309 | ) |
AllianzGI Global Allocation | | | 303,149,923 | | | | 30,476,293 | | | | 5,875,807 | | | | 24,600,486 | |
AllianzGI Best Styles Global Equity | | | 470,698,073 | | | | 67,624,071 | | | | 15,315,158 | | | | 52,308,913 | |
AllianzGI Best Styles International Equity | | | 24,780,576 | | | | 2,421,742 | | | | 1,472,434 | | | | 949,308 | |
AllianzGI Best Styles U.S. Equity | | | 83,291,415 | | | | 17,965,018 | | | | 1,390,478 | | | | 16,574,540 | |
AllianzGI Convertible | | | 494,916,038 | | | | 68,922,112 | | | | 5,690,007 | | | | 63,232,105 | |
AllianzGI Core Bond | | | 33,701,232 | | | | 48,386 | | | | 253,194 | | | | (204,808 | ) |
AllianzGI Core Plus Bond | | | 45,299,394 | | | | 73,677 | | | | 290,361 | | | | (216,684 | ) |
AllianzGI Emerging Markets Consumer | | | 40,389,809 | | | | 4,486,625 | | | | 1,671,690 | | | | 2,814,935 | |
AllianzGI Emerging Markets Debt | | | 18,517,388 | | | | 132,966 | | | | 305,324 | | | | (172,358 | ) |
AllianzGI Emerging Markets Small-Cap | | | 9,450,356 | | | | 1,108,053 | | | | 220,959 | | | | 887,094 | |
AllianzGI Europe Equity Dividend | | | 6,969,333 | | | | 534,898 | | | | 478,234 | | | | 56,664 | |
AllianzGI Global Dynamic Allocation | | | 216,045,175 | | | | 23,998,968 | | | | 8,452,773 | | | | 15,546,195 | |
AllianzGI Global High Yield | | | 22,190,616 | | | | 213,618 | | | | 542,356 | | | | (328,738 | ) |
AllianzGI Global Sustainability | | | 33,896,551 | | | | 7,146,984 | | | | 844,120 | | | | 6,302,864 | |
AllianzGI Global Water | | | 541,344,692 | | | | 135,947,844 | | | | 25,109,787 | | | | 110,838,057 | |
AllianzGI High Yield Bond | | | 184,309,867 | | | | 3,556,305 | | | | 11,206,454 | | | | (7,650,149 | ) |
| | | | | | |
| | Annual Report | | | September 30, 2018 | | 387 |
Notes to Financial Statements (cont’d)
September 30, 2018
| | | | | | | | | | | | | | | | |
| | | Federal Tax
Cost Basis(6) | | | Unrealized
Appreciation | | | Unrealized
Deprecation | | | Net Unrealized
Appreciation
(Depreciation) | |
AllianzGI International Growth | | $ | 25,160,373 | | | $ | 4,390,204 | | | $ | 541,709 | | | $ | 3,848,495 | |
AllianzGI International Small-Cap | | | 141,038,892 | | | | 31,476,684 | | | | 4,447,061 | | | | 27,029,623 | |
AllianzGI Micro Cap | | | 20,936,936 | | | | 8,650,396 | | | | 874,256 | | | | 7,776,140 | |
AllianzGI NFJ Emerging Markets Value | | | 140,797,876 | | | | 7,253,238 | | | | 12,520,239 | | | | (5,267,001 | ) |
AllianzGI NFJ International Small-Cap Value | | | 3,318,711 | | | | 421,149 | | | | 191,370 | | | | 229,779 | |
AllianzGI PerformanceFee Managed Futures Strategy | | | 13,999,660 | | | | 213,771 | | | | 160,706 | | | | 53,065 | |
AllianzGI PerformanceFee Structured US Equity | | | 81,892,861 | | | | — | | | | — | | | | — | |
AllianzGI PerformanceFee Structured US Fixed Income | | | 25,726,104 | | | | 59,419 | | | | 935,313 | | | | (875,894 | ) |
AllianzGI Preferred Securities and Income | | | 11,616,586 | | | | 43,895 | | | | 47,764 | | | | (3,869 | ) |
AllianzGI Real Estate Debt | | | 15,412,158 | | | | 26,625 | | | | 200,268 | | | | (173,643 | ) |
AllianzGI Short Duration High Income | | | 1,112,697,452 | | | | 3,114,055 | | | | 23,003,878 | | | | (198,899,823 | ) |
AllianzGI Short Term Bond | | | 5,115,610 | | | | 4,253 | | | | 12,780 | | | | (8,527 | ) |
AllianzGI Structured Return | | | 603,328,989 | | | | — | | | | — | | | | — | |
AllianzGI U.S. Equity Hedged | | | 2,891,154 | | | | — | | | | — | | | | — | |
AllianzGI Ultra Micro Cap | | | 23,141,918 | | | | 11,957,648 | | | | 1,091,674 | | | | 10,865,974 | |
| (6) | Differences, if any, between book and tax cost basis are primarily attributable to wash sale loss deferrals, return of capital distributions, PFIC mark-to-market, differing treatment of bond premium amortization, upfront premium on swaps, mixed straddle adjustments, Section 305 adjustments, basis adjustments from investments in partnerships, mark-to-market on section 1256 futures contracts, and mark-to-market on section 1256 forward contracts. |
The Trust has entered into a credit agreement (the “State Street Agreement”), among the Trust, AllianzGI Institutional Multi-Series Trust, Allianz Funds and Premier Multi-Series VIT, as borrowers (collectively, the “AllianzGI Borrowers” and each series thereof, an “AllianzGI Borrower Fund”), and State Street Bank and Trust Company, as agent and lender, for a committed line of credit. The State Street Agreement was amended on October 26, 2017 and has a term through October 25, 2018 and permits the AllianzGI Borrowers to borrow up to $200 million in aggregate, subject to (i) a requirement that each AllianzGI Borrower Fund’s asset coverage with respect to senior securities representing indebtedness be 300% or higher, and (ii) certain other limitations and conditions. Each AllianzGI Borrower Fund must pay interest on any amounts borrowed under the facility at a rate per annum equal to 1.25% plus the higher of the then-current federal funds overnight rate or the one-month LIBOR rate, subject to upward adjustment when any past due payments are outstanding. The AllianzGI Borrowers will also pay a usage fee at an annualized rate of 0.25% on undrawn amounts, allocated pro rata among the AllianzGI Borrower Funds on the basis of net assets. The State Street Agreement was extended by an additional 364-day period by an amendment effective October 25, 2018 with an expiration date of October 24, 2019 (the “Amendment”). The Amendment changed the 0.25% usage fee on undrawn amounts to an annualized rate of 0.20%. Amounts borrowed may be repaid and reborrowed on a revolving basis during the term of the facility.
The Funds did not utilize the line of credit during the period or year ended September 30, 2018.
Pursuant to an exemptive order issued by the SEC (the “Order”), the Funds are authorized to enter into a master interfund lending agreement (the “Interfund Program”) with each other and certain other funds advised by the Investment Manager (each a “Participating Fund”). The Interfund Program allows each Participating Fund, whose policies permit it to do so, to lend money directly to and borrow money directly from other Participating Funds for temporary purposes.
During the period or year ended September 30, 2018, the Funds did not participate as a borrower or lender in the Interfund Program.
(a) New Funds
On December 18, 2017, AllianzGI PerformanceFee Managed Futures Strategy Fund, AllianzGI PerformanceFee Structured US Equity Fund and AllianzGI PerformanceFee Structured US Fixed Income Fund commenced operations as series of the Trust, offering Class P, Institutional Class and Class R6 shares.
On December 27, 2017, AllianzGI Real Estate Debt Fund commenced operations as a series of the Trust, offering Class P and Institutional Class shares.
On May 30, 2018, AllianzGI Core Bond Fund, AllianzGI Core Plus Bond Fund and AllianzGI Preferred Securities and Income Fund commenced operations as series of the Trust, offering Class P, Institutional Class and Class R6 shares.
| | | | | | |
| 388 | | September 30, 2018 | | | Annual Report | | |
On August 23, 2018, AllianzGI Short Term Bond Fund commenced operations as a series of the Trust, offering Class A, Class P and Institutional Class shares.
(b) Transfer Agency Services Provider
On December 28, 2017, AllianzGI U.S. as Administrator, on behalf of the Trust, entered into a Novation Framework Agreement with State Street Bank and Trust Company (“SSB”) and DST Asset Manager Solutions, Inc. (“DST”) (formerly known as Boston Financial Data Services, Inc.) whereby SSB replaced DST as the named provider of transfer agency services to the Funds. SSB then delegates its duties and obligations as transfer agent to DST. This transition was undertaken solely to promote efficiency and administrative simplicity, allowing SSB and DST to consolidate certain contracts and streamline their relationship, and had no effect on the services provided to the Trust.
(c) Name Change
Effective February 1, 2018, AllianzGI Retirement Income Fund changed its name to AllianzGI Multi Asset Income Fund.
(d) New Share Class
Effective February 1, 2018, AllianzGI Multi Asset Income Fund began offering Institutional Class shares.
(e) Fund Liquidations
On May 18, 2018, the AllianzGI Global Fundamental Strategy Fund liquidated as a series of the Trust.
On September 24, 2018, the AllianzGI Best Styles Emerging Markets Equity Fund liquidated as a series of the Trust.
| 14. | BASIS FOR CONSOLIDATION |
The Cayman Subsidiary is a wholly-owned and controlled subsidiary of AllianzGI PerformanceFee Managed Futures Strategy (the “Consolidated Fund”). The Consolidated Fund is the sole shareholder of the Cayman Subsidiary and will continue to control the Cayman Subsidiary. The Consolidated Fund’s investment portfolio has been consolidated and includes the portfolio holdings of the Consolidated Fund and the Cayman Subsidiary. The consolidated financial statements include the accounts of the Consolidated Fund and the Cayman Subsidiary. All inter-company transactions and balances have been eliminated. As of September 30, 2018, consolidated net assets of the Consolidated Fund were $15,779,041, of which $653,002, or 4.1%, represented the Consolidated Fund’s ownership of all issued shares and voting rights of the Cayman Subsidiary.
In preparing these financial statements, the Funds’ management has evaluated events and transactions for potential recognition or disclosure through the date the financial statements were issued.
As of September 30, 2018 (the “Class C Conversion Date”), all Class C shares of a Fund that were purchased ten years or more prior to the Class C Conversion Date automatically converted to Class A shares of the same Fund. After the Class C Conversion Date, all Class C shares of a Fund held in accounts directly with the Trust’s transfer agent will automatically convert to Class A shares of the same Fund on or about the first business day of the month following the ten-year anniversary of purchase. After the Class C Conversion Date, all Class C shares of a Fund held through a financial intermediary (subject to the exceptions noted below) will automatically convert to Class A shares of the same Fund following the ten-year anniversary of purchase.
Although the timing of this conversion may differ from the timing stated above, it is expected to occur during the month following the ten-year anniversary of purchase. Such conversions will be effected on the basis of the relative net asset values of the Class C and Class A shares involved in the conversion. When Class C shares convert, any other Class C shares that were acquired by the shareholder by the reinvestment of dividends or distributions will also convert to Class A shares on a pro rata basis. The Board’s approval of the conversion feature in the Trust’s Twelfth Amended and Restated Multi-Class Plan is subject to the limitation that if, after the Class C Conversion Date, the Class A shareholders of a Fund approve any material increase in expenses allocated to that class (including 12b-1 Fees) without the approval of the then-existing Class C shareholders, Class C shares will cease automatically converting into Class A shares.
Class C shares held through a financial intermediary in an omnibus account will be converted into Class A shares only if the intermediary can document that the shareholder has met the required holding period. It is the financial intermediary’s (and not the Funds’) responsibility to keep records and to ensure that the shareholder is credited with the proper holding period. Not all financial intermediaries are able to track purchases to credit individual shareholder’s holding periods. In particular, the Trust understands that group retirement plans held through third party intermediaries that hold Class C shares in an omnibus account in certain instances do not track participant level share lot aging. Please consult with your financial intermediary about your eligibility to exercise this conversion privilege.
October 18, 2018, the following Funds declared per-share net investment income dividends to shareholders, payable October 18, 2018 to shareholders of record on October 17, 2018.
| | | | | | | | | | | | | | | | | | | | | | | | | | | | |
| | | Net Investment Income | |
| | | Class A | | | Class C | | | Class R | | | Class P | | | Institutional
Class | | | Class R6 | | | Administrative
Class | |
AllianzGI Multi Asset Income | | $ | 0.07568 | | | $ | 0.05976 | | | $ | 0.06989 | | | $ | 0.07980 | | | $ | 0.08058 | | | $ | 0.08070 | | | $ | 0.07611 | |
AllianzGI Core Bond | | | N/A | | | | N/A | | | | N/A | | | | 0.03623 | | | | 0.03688 | | | | 0.03750 | | | | N/A | |
AllianzGI Core Plus Bond | | | N/A | | | | N/A | | | | N/A | | | | 0.03625 | | | | 0.03686 | | | | 0.03750 | | | | N/A | |
| | | | | | |
| | Annual Report | | | September 30, 2018 | | 389 |
Notes to Financial Statements (cont’d)
September 30, 2018
| | | | | | | | | | | | | | | | | | | | | | | | | | | | |
| | | Net Investment Income | |
| | | Class A | | | Class C | | | Class R | | | Class P | | | Institutional
Class | | | Class R6 | | | Administrative
Class | |
AllianzGI High Yield Bond | | $ | 0.03626 | | | $ | 0.02993 | | | $ | 0.03643 | | | $ | 0.03894 | | | $ | 0.03900 | | | | N/A | | | $ | 0.00025 | |
AllianzGI Preferred Securities and Income | | | N/A | | | | N/A | | | | N/A | | | | 0.05865 | | | | 0.05930 | | | $ | 0.06000 | | | | N/A | |
AllianzGI Real Estate Debt | | | N/A | | | | N/A | | | | N/A | | | | 0.03270 | | | | 0.03400 | | | | N/A | | | | N/A | |
AllianzGI Short Duration High Income | | | 0.05500 | | | | 0.05183 | | | | N/A | | | | 0.05828 | | | | 0.05859 | | | | 0.05907 | | | | N/A | |
AllianzGI Short Term Bond | | | 0.04182 | | | | N/A | | | | N/A | | | | 0.04374 | | | | 0.04500 | | | | N/A | | | | N/A | |
On October 23, 2018, the Board approved a repositioning of the AllianzGI Real Estate Debt Fund (the “Repositioning”). It is expected that effective February 1, 2019, the AllianzGI Real Estate Debt Fund (“Real Estate Debt Fund”) will change its name to AllianzGI Floating Rate Note Fund (“Floating Rate Note Fund”) as part of the Repositioning. In connection with this change the Real Estate Debt Fund’s investment objective, principal investment strategies, fundamental investment restriction, management fee and operating expenses will be revised. The Floating Rate Note Fund will seek to maximize current income. In pursuing its investment objective, the Floating Rate Note Fund will normally invest 80% of net assets in floating rate notes, including floating rate debt securities, floating rate structured or securitized products and inflation-indexed securities. These revisions are all contingent upon shareholder approval of changes to the Real Estate Debt Fund’s fundamental investment restriction.
On November 15, 2018, the following Funds declared per-share net investment income dividends to shareholders, payable November 15, 2018 to shareholders of record on November 14, 2018.
| | | | | | | | | | | | | | | | | | | | | | | | | | | | |
| | | Net Investment Income | |
| | | Class A | | | Class C | | | Class R | | | Class P | | | Institutional
Class | | | Class R6 | | | Administrative
Class | |
AllianzGI Multi Asset Income | | $ | 0.06702 | | | $ | 0.05633 | | | $ | 0.06173 | | | $ | 0.07110 | | | $ | 0.07181 | | | $ | 0.07200 | | | $ | 0.06763 | |
AllianzGI Core Bond | | | N/A | | | | N/A | | | | N/A | | | | 0.03631 | | | | 0.03688 | | | | 0.03750 | | | | N/A | |
AllianzGI Core Plus Bond | | | N/A | | | | N/A | | | | N/A | | | | 0.03627 | | | | 0.03688 | | | | 0.03750 | | | | N/A | |
AllianzGI High Yield Bond | | | 0.03622 | | | | 0.03166 | | | | 0.03413 | | | | 0.03899 | | | | 0.03900 | | | | N/A | | | | 0.00699 | |
AllianzGI Preferred Securities and Income | | | N/A | | | | N/A | | | | N/A | | | | 0.05876 | | | | 0.05939 | | | | 0.06000 | | | | N/A | |
AllianzGI Real Estate Debt | | | N/A | | | | N/A | | | | N/A | | | | 0.03278 | | | | 0.03400 | | | | N/A | | | | N/A | |
AllianzGI Short Duration High Income | | | 0.05500 | | | | 0.05243 | | | | N/A | | | | 0.05832 | | | | 0.05819 | | | | 0.05905 | | | | N/A | |
AllianzGI Short Term Bond | | | 0.04187 | | | | N/A | | | | N/A | | | | 0.04370 | | | | 0.04500 | | | | N/A | | | | N/A | |
It is expected that on or about November 19, 2018, the AllianzGI Green Bond Fund will commence operations as a series of the Trust, offering Class A, Institutional Class and Class P shares. The investment objective of the Fund is to provide total return, through a combination of capital appreciation and current income by investing in “Green Bonds.” Green Bonds are considered to be interest-bearing securities that are issued in order to finance projects that the portfolio managers believe are intended and/or likely to have a positive impact on the environment. The portfolio managers will invest primarily in an investment grade portfolio of Green Bonds of issuers located in both developed and emerging markets.
There were no other subsequent events identified that require recognition or disclosure.
| | | | | | |
| 390 | | September 30, 2018 | | | Annual Report | | |
Report of Independent Registered Public Accounting Firm
To the Board of Trustees of Allianz Funds Multi-Strategy Trust and Shareholders of each of the forty funds listed in the table below
Opinions on the Financial Statements
We have audited the accompanying statements of assets and liabilities, including the schedules of investments, of each of the funds listed in the table below (constituting Allianz Funds Multi-Strategy Trust, hereafter collectively referred to as the “Funds”) as of September 30, 2018, the related statements of operations and the statements of changes in net assets for each of the periods indicated in the table below, including the related notes, and the financial highlights for each of the periods indicated therein (collectively referred to as the “financial statements”). In our opinion, the financial statements present fairly, in all material respects, the financial position of each of the Funds as of September 30, 2018, the results of each of their operations and the changes in each of their net assets for each of the periods indicated in the table below and each of the financial highlights for each of the periods indicated therein in conformity with accounting principles generally accepted in the United States of America.
| | |
| AllianzGI Retirement 2020 Fund(1) | | AllianzGI Global Dynamic Allocation Fund(1) |
| AllianzGI Retirement 2025 Fund(1) | | AllianzGI Global High Yield Fund(3) |
| AllianzGI Retirement 2030 Fund(1) | | AllianzGI Global Sustainability Fund(1) |
| AllianzGI Retirement 2035 Fund(1) | | AllianzGI Global Water Fund(1) |
| AllianzGI Retirement 2040 Fund(1) | | AllianzGI High Yield Bond Fund(1) |
| AllianzGI Retirement 2045 Fund(1) | | AllianzGI International Growth Fund(1) |
| AllianzGI Retirement 2050 Fund(1) | | AllianzGI International Small-Cap Fund(1) |
| AllianzGI Retirement 2055 Fund(1) | | AllianzGI Micro Cap Fund(1) |
| AllianzGI Multi Asset Income Fund(1) | | AllianzGI NFJ Emerging Markets Value Fund(1) |
| AllianzGI Global Allocation Fund(1) | | AllianzGI NFJ International Small-Cap Value Fund(1) |
| AllianzGI Best Styles Global Equity Fund(1) | | AllianzGI PerformanceFee Managed Futures Strategy Fund and its subsidiary(7)* |
| AllianzGI Best Styles International Equity Fund(1) | | AllianzGI PerformanceFee Structured US Equity Fund(4) |
| AllianzGI Best Styles U.S. Equity Fund(1) | | AllianzGI PerformanceFee Structured US Fixed Income Fund(4) |
| AllianzGI Convertible Fund(1) | | AllianzGI Preferred Securities and Income Fund(2) |
| AllianzGI Core Bond Fund(2) | | AllianzGI Real Estate Debt Fund(5) |
| AllianzGI Core Plus Bond Fund(2) | | AllianzGI Short Duration High Income Fund(1) |
| AllianzGI Emerging Markets Consumer Fund(1) | | AllianzGI Short Term Bond Fund(6) |
| AllianzGI Emerging Markets Debt Fund(1) | | AllianzGI Structured Return Fund(1) |
| AllianzGI Emerging Markets Small-Cap Fund(1) | | AllianzGI U.S. Equity Hedged Fund(1) |
| AllianzGI Europe Equity Dividend Fund(1) | | AllianzGI Ultra Micro Cap Fund(1) |
| * | Consolidated statement of assets and liabilities including the consolidated schedule of investments, statements of operations and of changes in net assets and consolidated financial highlights. |
| (1) | Statement of operations for the year ended September 30, 2018 and statement of changes in net assets for each of the two years in the period ended September 30, 2018 |
| (2) | Statements of operations and changes in net assets for the period May 30, 2018 (commencement of operations) through September 30, 2018 |
| (3) | Statement of operations for the year ended September 30, 2018 and statement of changes in net assets for the year ended September 30, 2018 and for the period May 3, 2017 (commencement of operations) through September 30, 2017 |
| (4) | Statements of operations and changes in net assets for the period December 18, 2017 (commencement of operations) through September 30, 2018 |
| (5) | Statement of operations and changes in net assets for the period December 27, 2017 (commencement of operations) through September 30, 2018 |
| (6) | Statement of operations and changes in net assets for the period August 23, 2018 (commencement of operations) through September 30, 2018 |
| (7) | Consolidated statements of operations and changes in net assets for the period December 18, 2017 (commencement of operations) through September 30, 2018 |
Basis for Opinions
These financial statements are the responsibility of the Funds’ management. Our responsibility is to express an opinion on the Funds’ financial statements based on our audits. We are a public accounting firm registered with the Public Company Accounting Oversight Board (United States) (“PCAOB”) and are required to be independent with respect to the Funds in accordance with the U.S. federal securities laws and the applicable rules and regulations of the Securities and Exchange Commission and the PCAOB.
We conducted our audits of these financial statements in accordance with the standards of the PCAOB. Those standards require that we plan and perform the audit to obtain reasonable assurance about whether the financial statements are free of material misstatement, whether due to error or fraud.
Our audits included performing procedures to assess the risks of material misstatement of the financial statements, whether due to error or fraud, and performing procedures that respond to those risks. Such procedures included examining, on a test basis, evidence regarding the amounts and disclosures in the financial statements. Our audits also included evaluating the accounting principles used and significant estimates made by management, as well as evaluating the overall presentation of the financial statements. Our procedures included confirmation of securities owned as of September 30, 2018 by correspondence with the custodian, agent banks, transfer agents and brokers; when replies were not received, we performed other auditing procedures. We believe that our audits provide a reasonable basis for our opinions.
PricewaterhouseCoopers LLP
New York, New York
November 20, 2018
We have served as the auditor of one or more of the investment companies in the Allianz Global Investors U.S. group of investment companies since at least 1995. We have not been able to determine the specific year we began serving as auditor.
| | | | | | |
| | Annual Report | | | September 30, 2018 | | 391 |
Unaudited
Tax Information
As required by the Internal Revenue Code, shareholders must be notified regarding certain tax attributes of distributions made by each Fund. During the period ended September 30, 2018, the following Funds distributed long-term capital gains in the amounts indicated (or the maximum amount allowable):
| | | | | | | | |
| | | 15% Long-Term
Capital Gain | | | 25% Long-Term
Capital Gain | |
AllianzGI Retirement 2025 | | $ | 374,795 | | | | — | |
AllianzGI Retirement 2030 | | | 298,456 | | | | — | |
AllianzGI Retirement 2035 | | | 204,859 | | | | — | |
AllianzGI Retirement 2040 | | | 169,469 | | | | — | |
AllianzGI Retirement 2045 | | | 54,526 | | | | — | |
AllianzGI Retirement 2050 | | | 57,549 | | | | — | |
AllianzGI Retirement 2055 | | | 36,436 | | | | — | |
AllianzGI Multi Asset Income | | | 28,682 | | | | — | |
AllianzGI Global Allocation | | | 16,636,384 | | | | — | |
AllianzGI Best Styles Global Equity | | | 34,628,218 | | | $ | 1,133 | |
AllianzGI Best Styles U.S. Equity | | | 1,969,191 | | | | 3,997 | |
AllianzGI Convertible | | | 68,007,497 | | | | 31,312 | |
AllianzGI Emerging Markets Consumer | | | 1,433,989 | | | | — | |
AllianzGI Emerging Markets Debt | | | 248,069 | | | | — | |
AllianzGI Emerging Markets Small-Cap | | | 207,314 | | | | — | |
AllianzGI Global Dynamic Allocation | | | 3,631,138 | | | | 778 | |
AllianzGI Global Sustainability | | | 578,835 | | | | — | |
AllianzGI Global Water | | | 11,446,343 | | | | — | |
AllianzGI International Small-Cap | | | 2,617,998 | | | | — | |
AllianzGI Micro Cap | | | 1,758,420 | | | | — | |
AllianzGI NFJ Emerging Markets Value | | | 6,697 | | | | — | |
AllianzGI Structured Return | | | 2,804,237 | | | | — | |
AllianzGI Ultra Micro Cap | | | 8,526,928 | | | | — | |
Under the Jobs and Growth Tax Relief Reconciliation Act of 2003, the following approximate percentages of ordinary dividends paid during the fiscal period ended September 30, 2018, are designated as “qualified dividend income” (or the maximum amount allowable):
| | | | |
AllianzGI Retirement 2020 | | | 31 | % |
AllianzGI Retirement 2025 | | | 34 | % |
AllianzGI Retirement 2030 | | | 36 | % |
AllianzGI Retirement 2035 | | | 37 | % |
AllianzGI Retirement 2040 | | | 37 | % |
AllianzGI Retirement 2045 | | | 38 | % |
AllianzGI Retirement 2050 | | | 38 | % |
AllianzGI Retirement 2055 | | | 37 | % |
AllianzGI Multi Asset Income | | | 12 | % |
AllianzGI Global Allocation | | | 27 | % |
AllianzGI Best Styles Global Equity | | | 40 | % |
AllianzGI Best Styles International Equity | | | 100 | % |
AllianzGI Best Styles U.S. Equity | | | 42 | % |
| | | | |
AllianzGI Convertible | | | 27 | % |
AllianzGI Core Bond | | | 0 | % |
AllianzGI Core Plus Bond | | | 0 | % |
AllianzGI Emerging Markets Consumer | | | 91 | % |
AllianzGI Emerging Markets Debt | | | 0 | % |
AllianzGI Emerging Markets Small-Cap | | | 61 | % |
AllianzGI Europe Equity Dividend | | | 97 | % |
AllianzGI Global Dynamic Allocation | | | 39 | % |
AllianzGI Global High Yield | | | 0 | % |
AllianzGI Global Sustainability | | | 100 | % |
AllianzGI Global Water | | | 100 | % |
AllianzGI High Yield Bond | | | 1 | % |
AllianzGI International Growth | | | 100 | % |
AllianzGI International Small-Cap | | | 100 | % |
AllianzGI Micro Cap | | | 0 | % |
AllianzGI NFJ Emerging Markets Value | | | 63 | % |
AllianzGI NFJ International Small-Cap Value | | | 100 | % |
AllianzGI PerformanceFee Managed Futures Strategy | | | 0 | % |
AllianzGI PerformanceFee Structured US Equity | | | 0 | % |
AllianzGI PerformanceFee Structured US Fixed Income | | | 0 | % |
AllianzGI Preferred Securities and Income | | | 7 | % |
AllianzGI Real Estate Debt | | | 0 | % |
AllianzGI Short Duration High Income | | | 0 | % |
AllianzGI Short Term Bond | | | 0 | % |
AllianzGI Structured Return | | | 0 | % |
AllianzGI U.S. Equity Hedged | | | 0 | % |
AllianzGI Ultra Micro Cap | | | 0 | % |
Corporate shareholders are generally entitled to take the dividend received deduction on the portion of a Fund’s dividend distribution that qualifies under tax law. The following approximate percentages of the following Funds’ ordinary income dividends paid during the fiscal period ended September 30, 2018, that qualify for the corporate dividend received deduction is set forth below (or the maximum amount allowable):
| | | | |
AllianzGI Retirement 2020 | | | 6 | % |
AllianzGI Retirement 2025 | | | 6 | % |
AllianzGI Retirement 2030 | | | 6 | % |
AllianzGI Retirement 2035 | | | 6 | % |
AllianzGI Retirement 2040 | | | 7 | % |
AllianzGI Retirement 2045 | | | 7 | % |
AllianzGI Retirement 2050 | | | 7 | % |
AllianzGI Retirement 2055 | | | 7 | % |
AllianzGI Multi Asset Income | | | 4 | % |
AllianzGI Global Allocation | | | 5 | % |
AllianzGI Best Styles Global Equity | | | 16 | % |
AllianzGI Best Styles International Equity | | | 0 | % |
AllianzGI Best Styles U.S. Equity | | | 39 | % |
AllianzGI Convertible | | | 24 | % |
AllianzGI Core Bond | | | 0 | % |
AllianzGI Core Plus Bond | | | 0 | % |
| | | | | | |
| 392 | | September 30, 2018 | | | Annual Report | | |
| | | | |
AllianzGI Emerging Markets Consumer | | | 3 | % |
AllianzGI Emerging Markets Debt | | | 0 | % |
AllianzGI Emerging Markets Small-Cap | | | 0 | % |
AllianzGI Europe Equity Dividend | | | 0 | % |
AllianzGI Global Dynamic Allocation | | | 14 | % |
AllianzGI Global High Yield | | | 0 | % |
AllianzGI Global Sustainability | | | 42 | % |
AllianzGI Global Water | | | 30 | % |
AllianzGI High Yield Bond | | | 1 | % |
AllianzGI International Growth | | | 0 | % |
AllianzGI International Small-Cap | | | 0 | % |
AllianzGI Micro Cap | | | 0 | % |
| | | | |
AllianzGI NFJ Emerging Markets Value | | | 0 | % |
AllianzGI NFJ International Small-Cap Value | | | 0 | % |
AllianzGI PerformanceFee Managed Futures Strategy | | | 0 | % |
AllianzGI PerformanceFee Structured US Equity | | | 0 | % |
AllianzGI PerformanceFee Structured US Fixed Income | | | 0 | % |
AllianzGI Preferred Securities and Income | | | 7 | % |
AllianzGI Real Estate Debt | | | 0 | % |
AllianzGI Short Duration High Income | | | 0 | % |
AllianzGI Short Term Bond | | | 0 | % |
AllianzGI Structured Return | | | 0 | % |
AllianzGI U.S. Equity Hedged | | | 0 | % |
AllianzGI Ultra Micro Cap | | | 0 | % |
The following Funds have elected to pass through the credit for tax paid in foreign countries. The foreign income and foreign tax per share outstanding on September 30, 2018 are as follows (or the maximum amount allowable):
| | | | | | | | | | | | | | | | |
| | | Gross
Foreign
Dividends | | | Gross
Foreign
Dividends
Per Share | | | Foreign Tax | | | Foreign Tax
Per Share | |
AllianzGI Best Styles International Equity | | $ | 955,444 | | | $ | 0.560028 | | | $ | 94,831 | | | $ | 0.055585 | |
AllianzGI Emerging Markets Consumer | | | 1,366,626 | | | | 0.443980 | | | | 170,419 | | | | 0.055364 | |
AllianzGI Emerging Markets Debt | | | 1,715,405 | | | | 0.875849 | | | | 1,642 | | | | 0.000838 | |
AllianzGI Emerging Markets Small-Cap | | | 373,022 | | | | 0.599547 | | | | 45,047 | | | | 0.072402 | |
AllianzGI Europe Equity Dividend | | | 455,261 | | | | 0.855828 | | | | 47,017 | | | | 0.088385 | |
AllianzGI International Growth | | | 265,284 | | | | 0.248385 | | | | 26,737 | | | | 0.025034 | |
AllianzGI International Small-Cap | | | 3,573,120 | | | | 0.876038 | | | | 367,753 | | | | 0.090164 | |
AllianzGI NFJ Emerging Markets Value | | | 4,722,752 | | | | 0.650046 | | | | 516,892 | | | | 0.071146 | |
AllianzGI NFJ International Small-Cap Value | | | 132,314 | | | | 0.656163 | | | | 9,859 | | | | 0.048893 | |
The following Fund of Funds have elected to pass through the credit for tax paid in foreign countries. The foreign income and foreign tax per share are as follows (or the maximum amount allowable):
| | | | | | | | | | | | | | | | |
| | | Year ended September 30, 2018 | |
| | | Gross
Foreign
Dividends | | | Gross
Foreign
Dividends
Per Share | | | Foreign Tax | | | Foreign Tax
Per Share | |
AllianzGI Retirement 2020 | | $ | 24,118 | | | $ | 0.010051 | | | $ | 1,499 | | | $ | 0.000625 | |
AllianzGI Retirement 2025 | | | 18,668 | | | | 0.005422 | | | | 1,604 | | | | 0.000466 | |
AllianzGI Retirement 2030 | | | 167,991 | | | | 0.051910 | | | | 17,130 | | | | 0.005293 | |
AllianzGI Retirement 2035 | | | 406,874 | | | | 0.140106 | | | | 40,217 | | | | 0.013849 | |
AllianzGI Retirement 2040 | | | 554,634 | | | | 0.238223 | | | | 54,486 | | | | 0.023402 | |
AllianzGI Retirement 2045 | | | 404,546 | | | | 0.239154 | | | | 39,664 | | | | 0.023448 | |
AllianzGI Retirement 2050 | | | 422,618 | | | | 0.281896 | | | | 41,409 | | | | 0.027621 | |
AllianzGI Retirement 2055 | | | 203,334 | | | | 0.235520 | | | | 19,883 | | | | 0.023031 | |
AllianzGI Multi Asset Income | | | 98,642 | | | | 0.037909 | | | | 4,833 | | | | 0.001857 | |
AllianzGI Global Allocation | | | 3,735,769 | | | | 0.122482 | | | | 349,674 | | | | 0.011464 | |
Since the Funds’ tax year is not the calendar year, another notification will be sent with respect to calendar year 2018. In January 2019, shareholders will be advised on IRS Form 1099-DIV as to the federal tax status of the dividends and distributions received during calendar year 2018. The amount that will be reported will be the amount to use on the shareholder’s 2018 federal income tax return and may differ from the amount which must be reported in connection with the Funds’ tax year ended September 30, 2018. Shareholders are advised to consult their tax advisers as to the federal, state and local tax status of the dividend income received from the Funds.
| | | | | | |
| | Annual Report | | | September 30, 2018 | | 393 |
Unaudited
Changes to the Board of Trustees and Fund Officers
Effective December 12, 2017, Barbara R. Claussen resigned as a Trustee of the Funds and Erick R. Holt became a Trustee of the Funds. Mr. Holt is an “interested person” of the Funds, as defined in Section 2(a) (19) of the 1940 Act, due to his positions with the Investment Manager and its affiliates.
Effective December 12, 2017, Craig A. Ruckman was appointed Assistant Secretary to the Funds.
Effective April 13, 2018, Lawrence G. Altadonna resigned as the Treasurer, Principal Financial and Accounting Officer of the Funds.
Effective April 13, 2018, Scott Whisten was appointed Treasurer, Principal Financial and Accounting Officer of the Funds.
Effective May 2, 2018, Morley D. Campbell resigned as Assistant Secretary to the Funds.
| | | | | | |
| 394 | | September 30, 2018 | | | Annual Report | | |
Unaudited
Matters Relating to the Trustees’ Consideration of the Investment Management Agreements
The Investment Company Act of 1940, as amended, requires that both the full Board of Trustees (the “Board” or the “Trustees”) and a majority of the non-interested Trustees (the “Independent Trustees”), voting separately, initially approve any new investment management agreement for a Fund, and annually approve the continuation of each Fund’s (as defined below) Investment Management Agreement (for purposes of this section, the “Advisory Agreements” or the “Agreements”) with Allianz Global Investors U.S. LLC (the “Investment Manager”).
The Board, including the Independent Trustees, met in person on June 13, 2018 (the “approval meeting”) for the specific purpose of considering whether to approve the continuation of the Advisory Agreements for an additional year for the Renewal Funds (as defined below). The Contracts Committee of the Board of Trustees, which is comprised of all of the Independent Trustees, met on May 30, 2018 and June 13, 2018 with respect to the Renewal Funds (together with the approval meeting, the “contract review meetings”) with independent counsel to discuss the materials provided by the Investment Manager in response to the Independent Trustees’ written request for information regarding the annual renewal. Representatives from fund management attended portions of those meetings to, among other topics, review the comparative fee and expense information and comparative performance information prepared and provided by Broadridge Financial Solutions, Inc. (“Broadridge”), an independent third party, for each Fund using its respective Broadridge peer groups for performance and expense comparisons.
New agreements approved during the period covered by this report relate to the organization of AllianzGI Short Term Bond Fund (“Short Term Bond Fund” or the “New Fund”), a new series of the Trust. The Board, including the Independent Trustees, met in person on June 13, 2018 for the purpose of considering whether to approve the Trust’s Amended and Restated Investment Management Agreement (the “New Fund Agreements”) with the Investment Manager, for an initial 2-year term with respect to Short Term Bond Fund.
At their meeting held on June 13, 2018 the Board, including the Independent Trustees, unanimously approved the continuation of the Agreements for an additional one-year period commencing July 1, 2018 with respect to AllianzGI Retirement 2020 Fund (the “2020 Fund”), AllianzGI Retirement 2025 Fund (the “2025 Fund”), AllianzGI Retirement 2030 Fund (the “2030 Fund”), AllianzGI Retirement 2035 Fund (the “2035 Fund”), AllianzGI Retirement 2040 Fund (the “2040 Fund”), AllianzGI Retirement 2045 Fund (the “2045 Fund”), AllianzGI Retirement 2050 Fund (the “2050 Fund”), AllianzGI Retirement 2055 Fund (the “2055 Fund”), AllianzGI Multi Asset Income Fund (the “Multi Asset Income Fund” and, together with the 2020 Fund, the 2025 Fund, the 2030 Fund, the 2035 Fund, the 2040 Fund, the 2045 Fund, the 2050 Fund and the 2055 Fund, the “Retirement Funds”), AllianzGI Global Allocation Fund (the “Global Allocation Fund”), AllianzGI Global Dynamic Allocation Fund (the “Global Dynamic Fund” and, together with the Global Allocation Fund, the “Allocation Funds”), AllianzGI Best Styles Emerging Markets Equity Fund (the “Best Styles Emerging Markets Fund”), AllianzGI Best Styles Global Equity Fund (the “Best
Styles Global Equity Fund”), AllianzGI Best Styles International Equity Fund (the “Best Styles International Equity Fund”), AllianzGI Best Styles U.S. Equity Fund (the “Best Styles U.S. Equity Fund”), AllianzGI Convertible Fund (the “Convertible Fund”), AllianzGI Emerging Markets Consumer Fund (the “Emerging Markets Consumer Fund”), AllianzGI Emerging Markets Debt Fund (the “Emerging Markets Debt Fund”), AllianzGI Emerging Markets Small-Cap Fund (the “Emerging Markets Small-Cap Fund”), AllianzGI Europe Equity Dividend Fund (the “Europe Equity Fund”), AllianzGI Global High Yield Fund (the “Global High Yield Fund”), AllianzGI Global Sustainability Fund (the “Global Sustainability Fund”), AllianzGI Global Water Fund (the “Global Water Fund”), AllianzGI High Yield Bond Fund (the “High Yield Bond Fund”), AllianzGI International Growth Fund (the “International Growth Fund”), AllianzGI International Small-Cap Fund (the “International Small-Cap Fund”), AllianzGI Micro Cap Fund (the “Micro Cap Fund”), AllianzGI Real Estate Debt Fund (the “Real Estate Debt Fund”), AllianzGI Short Duration High Income Fund (the “Short Duration High Income Fund”), AllianzGI Structured Return Fund (the “Structured Return Fund”), AllianzGI Ultra Micro Cap Fund (the “Ultra Micro Cap Fund”), AllianzGI U.S. Equity Hedged Fund (the “U.S. Equity Hedged Fund”), AllianzGI NFJ Emerging Markets Value Fund (the “NFJ Emerging Markets Value Fund”), AllianzGI NFJ International Small-Cap Value Fund (the “NFJ International Small-Cap Value Fund”, and, together with the Best Styles Emerging Markets Fund, Best Styles Global Equity Fund, the Best Styles International Equity Fund, the Best Styles U.S. Equity Fund, the Convertible Fund, the Emerging Markets Consumer Fund, the Emerging Markets Debt Fund, the Emerging Markets Small-Cap Fund, the Europe Equity Fund, the Global High Yield Fund, the Global Sustainability Fund, the Global Water Fund, the High Yield Bond Fund, the International Growth Fund, the International Small-Cap Fund, the Micro Cap Fund, the Real Estate Debt Fund, the Short Duration High Income Fund, the Structured Return Fund, the Ultra Micro Cap Fund, the U.S. Equity Hedged Fund, the NFJ Emerging Markets Value Fund, the “AllianzGI Funds” and, together with the Retirement Funds and the Allocation Funds, the “Renewal Funds”).
At their meeting held on June 13, 2018, the Board, including the Independent Trustees, unanimously approved, for an initial 2-year term, the New Fund Agreements with respect to Short Term Bond Fund.
The material factors and conclusions that formed the basis of these approvals for the Funds are discussed below.
In connection with their deliberations regarding the approval of the Agreements and the New Fund Agreements, the Independent Trustees considered such information and factors as they believed, in light of the legal advice furnished to them and their own business judgment, to be relevant. The Independent Trustees considered the nature, quality and extent of the various investment management, administrative and other services to be performed by the Investment Manager, Allianz Global Investors U.S. LLC (“AllianzGI U.S.”), under the Agreements and the New Fund Agreements.
| | | | | | |
| | Annual Report | | | September 30, 2018 | | 395 |
Unaudited
Matters Relating to the Trustees’ Consideration of the Investment Management Agreements (cont’d)
In connection with their contract review meetings, the Independent Trustees received and relied upon materials provided by the Investment Manager including, among other items: (i) information provided by Broadridge Financial Solutions, Inc. (“Broadridge”), an independent third party, for the Renewal Funds on the investment performance of a group of funds with investment classifications and/or objectives comparable to those of the Renewal Funds identified by Broadridge (the “Broadridge Performance Universe”), the performance of and applicable benchmark indices and the total return investment performance (based on net assets) of the Renewal Funds for various time periods; (ii) information on the Renewal Funds’ management fees and other expenses and information compiled by Broadridge, as applicable, on the management fees and other expenses of comparable funds identified by Broadridge (the “Broadridge Expense Group”); (iii) to the extent applicable, information regarding the investment performance and fees for other mutual funds and separately managed accounts managed by the Investment Manager or its affiliates with similar investment objective(s) and policies to those of the Renewal Funds; (iv) an estimate of the profitability to the Investment Manager from its relationship with the Renewal Funds for the twelve months ended December 31, 2017; (v) descriptions of various functions performed by the Investment Manager for the Renewal Funds, such as portfolio management, compliance monitoring, portfolio trading practices and oversight of third party service providers; (vi) information regarding the overall organization and business functions of the Investment Manager, including, without limitation, information regarding senior management, portfolio managers and other personnel providing or proposed to provide investment management, administrative and other services, and corporate ownership and business operations unrelated to the Renewal Funds; (vii) fact cards for each Renewal Fund including, among other information, performance comparisons between the Renewal Funds and their Broadridge Performance Universe, total return investment performance, investment objective, total net assets, annual fund operating expenses for each share class, portfolio managers, total expense ratio and management fee comparisons between each Renewal Fund and its Broadridge Expense Group and trends in profitability to the Investment Manager of its advisory relationship with each Renewal Fund; and (viii) summaries assigning a quadrant placement to each Renewal Fund for an institutional and retail share class based on an average of certain measures of performance and fees/expenses versus peer group medians.
In connection with their contract review meeting relating to Short Term Bond Fund, the Independent Trustees received and relied upon materials provided by the Investment Manager including, among other items: (i) information compiled from Morningstar Direct (“Morningstar”), an independent third party, on the investment performance, including annualized return performance information for certain time periods, of a group of funds with investment classifications and/or objectives comparable to those proposed for the
New Fund, (ii) information on the New Fund’s management fees and other anticipated expenses and information compiled from Morningstar on the management fees and other expenses of comparable funds, (iii) an estimate of the profitability to the Investment Manager from its relationship with the New Fund during its first year, (iv) descriptions of various functions to be performed by the Investment Manager for the New Fund, such as portfolio management, compliance monitoring and portfolio trading practices, and (v) information regarding the overall organization and business functions of the Investment Manager, including, without limitation, information regarding senior management, portfolio managers and other personnel proposed to provide investment management, administrative and other services to the New Fund.
The Independent Trustees’ conclusions as to the approval of the Agreements and the New Fund Agreements were based on a comprehensive consideration of all information provided to the Independent Trustees and were not the result of any single factor. Some of the factors that figured particularly in the Independent Trustees’ deliberations are described below, although individual Independent Trustees may have evaluated the information presented differently from one another, attributing different weights to various factors. The Independent Trustees recognized that the fee arrangements for the Renewal Funds are the result of review and discussion in the prior years between the Independent Trustees and the Investment Manager, that certain aspects of such arrangements may receive greater scrutiny in some years than in others, and that the Independent Trustees’ conclusions may be based, in part, on their consideration of these same arrangements during the course of the year and in prior years. The Independent Trustees evaluated information available to them on a Fund-by-Fund basis, and their determinations were made separately in respect of each Renewal Fund. However, they also took into account the common interests of all series of the Trust in their review. The Independent Trustees also took into account that the Investment Manager had agreed to certain advisory fee waivers and expense caps for the Renewal Funds with various proposed modifications and advisory fee reductions or waivers for certain Renewal Funds. The Independent Trustees also took into account that AllianzGI U.S. had proposed to observe an expense limitation for the New Fund. The Independent Trustees also considered the risk profiles of the Renewal Funds and the New Fund.
Performance Information
Comparative performance information was prepared and provided by Broadridge and was not independently verified by the Independent Trustees. With respect to all Renewal Funds, the Independent Trustees reviewed, among other information, comparative information showing performance for Class A and Institutional Class (or, in the case of the Target Funds, Class R6) shares of the Renewal Funds against their respective Broadridge Performance Universes for the one-, three-, five- and ten-year periods (to the extent each such Renewal Fund had been in existence), each ended March 31, 2018.
| | | | | | |
| 396 | | September 30, 2018 | | | Annual Report | | |
Institutional Class performance (or, in the case of the Target Funds, Class R6 performance) relative to the median for each Renewal Fund’s Broadridge Performance Universe is described below, and for those Renewal Funds with performance that ranked below median for their respective Broadridge Performance Universes, the specific quintile rankings for Institutional Class shares are also noted below with respect to the relevant periods of underperformance.
Target Funds and Allocation Funds.
For the 2020 Fund, performance was above median for the three-year period, and below median for the one- and five-year periods (in the third and fourth quintiles, respectively). For the 2025 Fund, performance was above median for the one- and three-year periods, and below median for the five-year period (in the fifth quintile). For the 2030 Fund, 2035 Fund, 2040 Fund, and 2045 Fund, performance was above median for the one- and three-year periods, and below median for the five-year period (in the fifth quintile for each). For the 2050 Fund, performance was above median for the one- and three-year periods, and below median for the five-year period (in the fifth quintile). For the 2055 Fund, performance was above median for the three-year period, and below median for the one- and five-year periods (in the third and fifth quintiles, respectively). For the Multi Asset Income Fund, performance was above median for the three-year period, and below median for the one- and five-year periods (in the fifth and third quintiles, respectively).
For the Global Dynamic Allocation Fund, performance was above median for the one-, three- and five-year periods. For the Global Allocation Fund, performance was above median for the one-, three-, five- and ten-year periods.
AllianzGI Funds.
For the Best Styles Emerging Markets Fund, Best Styles Global Equity Fund, Best Styles International Equity Fund, Best Styles U.S. Equity Fund, and International Growth Fund performance was above median for the one- and three-year periods. For the NFJ Emerging Markets Value Fund and Global Water Fund, performance was above median for the one-, three-, and five-year periods. For the Real Estate Debt Fund, performance was above median for the period since inception on December 27, 2017 ending March 31, 2018. For the Global High Yield Fund, performance was above median for the period since inception on May 3, 2017 ending March 31, 2018. For the Convertible Fund and International Small-Cap Fund, performance was above median for the one-, three-, five- and ten-year periods. For the Emerging Markets Consumer Fund, performance was below median for the one- and three-year periods (in the fourth and fifth quintiles, respectively). For the Emerging Markets Debt Fund, performance was below median for the one- and three-year periods (each in the third quintile). For the Global Sustainability Fund, performance was below median for the one- and three-year periods (each in the fourth quintile). For the Emerging Markets Small-Cap Fund and Europe Equity
Fund, performance was above median for the three-year period, and below median (in the fourth and third quintiles, respectively) for the one-year period. For the High Yield Bond Fund, performance was above median for the ten-year period, and below median for the one-, three-, and five-year periods (in the fifth, fourth, and fourth quintiles, respectively). For the Micro Cap Fund, performance was below median for the one-, three-, five-, and ten-year periods (in the fifth, fifth, third, and third quintiles, respectively). For the NFJ International Small-Cap Value Fund, performance was below median for the one-, three-, and five-year periods (in the fourth, fifth, and third quintiles, respectively). For the Short Duration High Income Fund, performance was above median for the three-year period, and below median for the one- and five-year periods (each in the third quintile). For the Structured Return Fund, performance was above median for the three- and five-year periods, and below median for the one-year period (in the fourth quintile). For the Ultra Micro Cap Fund, performance was above median for the ten-year period, and below median for the one-, three-, and five-year periods (each in the fifth quintile). For the U.S. Equity Hedged Fund, performance was above median for the five-year period, and below median for the one- and three-year periods (each in the third quintile).
In addition, the Independent Trustees considered matters bearing on the Funds and their advisory arrangements at their meetings throughout the year, including a review of performance data at each regular meeting (either by the full Board or by the Performance Committee of the Board).
As part of their review, the Independent Trustees examined the ability of the Investment Manager to provide high-quality investment management and other services to the Renewal Funds and the New Fund. Among other information, the Independent Trustees considered the investment philosophy and research and decision-making processes of the Investment Manager, as well as the Investment Manager’s broker selection process and trading operations; the experience of key advisory personnel and associated persons of the Investment Manager and its affiliates, as applicable, who are or would be responsible for portfolio management of the Renewal Funds and the New Fund; the ability of the Investment Manager to attract and retain capable personnel; the background and capabilities of the senior management and staff of the Investment Manager; employee compensation; and the operational infrastructure, including technology and systems, of the Investment Manager. In addition, the Independent Trustees reviewed the extent and quality of the Investment Manager’s services and expected services with respect to regulatory compliance and ability to comply with the investment policies of the Renewal Funds and the New Fund; the compliance programs and risk controls of the Investment Manager; the specific contractual obligations of the Investment Manager pursuant to the Agreements and the New Fund Agreements; the nature, extent and quality of certain administrative services the Investment Manager is responsible for providing to the Renewal Funds and the New Fund; the Investment Manager’s risk management function; and conditions that
| | | | | | |
| | Annual Report | | | September 30, 2018 | | 397 |
Unaudited
Matters Relating to the Trustees’ Consideration of the Investment Management Agreements (cont’d)
might affect the ability of the Investment Manager to provide high quality services to the Renewal Funds and the New Fund in the future under the Agreements and the New Fund Agreements, including, but not limited to, the organization’s financial condition and operational stability. Based on the foregoing, the Independent Trustees concluded that the Investment Manager’s investment processes, research capabilities and philosophy were well-suited to each Renewal Fund and the New Fund given its investment objective and policies, that the Investment Manager would be able to continue to meet any reasonably foreseeable obligations under each Agreement and the New Fund Agreements, and that the Investment Manager would otherwise be able to provide services to the Renewal Funds and the New Fund of sufficient extent and quality.
Fee and Expense Information
In assessing the reasonableness of the Renewal Funds’ fees and expenses under the Agreements and the New Fund’s proposed fees and expenses under the New Fund Agreement, the Independent Trustees considered, among other information, each Renewal Fund’s management fee (or, in the case of the Target Funds, each Target Fund’s advisory fee) and New Fund’s proposed management fee, the Renewal Fund’s total expense ratio as a percentage of average daily net assets and the management fees and total expense ratios (in comparison to such Fund’s Broadridge Expense Group) and the New Fund’s expected net expense ratio as a percentage of anticipated average daily net assets, taking into account the expense limitation arrangement that the Investment Manager would observe, and the advisory fees and net expense ratios of peer groups of funds based on information provided by Morningstar. The Independent Trustees also noted the management fee waiver and/or expense limitation agreements observed by the Investment Manager for the Renewal Funds that cap fees or expenses of their various share classes, as certain of these arrangements were proposed to be modified by the Investment Manager.
The Independent Trustees considered how the expected net expense ratio of the New Fund was expected to compare to its Morningstar peers, and considered comparisons of the New Fund’s proposed management fee with the advisory fees of the peer funds compiled from Morningstar. The Independent Trustees noted that the proposed management fees and estimated net expense ratio for Institutional Class shares of the New Fund were lower than both the average and median for Institutional Class shares of funds in the Morningstar peer group.
The Independent Trustees also considered various risks AllianzGI U.S. will bear as sponsoring adviser to the New Fund, which exceed or are in addition to those associated with the management of institutional accounts, including entrepreneurial, reputational, legal and regulatory risks.
In comparing the Renewal Funds to their respective Broadridge Expense Groups, with respect to expenses, the Independent Trustees
noted that the Renewal Funds (other than the Target Funds) were not charged a separate administration fee, recognizing that their management fee includes a component for administrative services, while many of the Renewal Funds’ Broadridge Expense Groups have separate advisory and administration agreements with separate fees. The Independent Trustees also took into account the “unitary” administrative fee structure applicable to the Target Funds, under which certain third-party services that are ordinarily the financial responsibility of a mutual fund (e.g., audit, custody, accounting, legal, transfer agency, and printing services) are, in the case of the Target Funds, paid for by the Investment Manager out of its administrative fee.
The Independent Trustees also considered information showing the contractual advisory fees charged by the Investment Manager to other funds and accounts, including institutional and separate accounts, with similar investment objective(s) and policies to those of the Renewal Funds, if any. In comparing these fees, the Independent Trustees considered information provided by the Investment Manager as to the generally broader and more extensive services provided to the Renewal Funds in comparison to institutional or separate accounts; the higher demands placed on the Investment Manager’s investment personnel and trading infrastructure as a result of the daily cash in-flows and out-flows of the Renewal Funds; the greater entrepreneurial risk in managing retail mutual funds; and the impact on the Investment Manager and expenses associated with the more extensive regulatory regime to which the Renewal Funds are subject in comparison to institutional or separate accounts.
The Independent Trustees reviewed, among other information, information provided by Broadridge comparing each Renewal Fund’s advisory fee or management fee, as applicable, and ratios of total expenses to net assets (“Total Expense Ratios”) for two share classes (Class A and Institutional Class share classes (or, in the case of the Target Funds, Class R6)) to the Renewal Funds’ respective Broadridge Expense Groups for the most recent fiscal year ended March 31, 2018. Class A shares of the applicable Broadridge-selected group of comparable funds are referred to below as the “retail expense group,” and Institutional Class or Class R6 shares, as applicable, are referred to as the “institutional expense group.” The Independent Trustees noted that the Broadridge data takes into account any fee reductions or expense limitations that were in effect during a Renewal Fund’s last fiscal year. The Fund-specific fee and expense results discussed below were prepared and provided by Broadridge and were not independently verified by the Independent Trustees. The Renewal Funds’ fee and expense rankings are discussed below relative to the median of the applicable Broadridge Expense Groups. A Renewal Fund whose fees and expenses were below median had fees and expenses that were less than the median fees and expenses of its peer group, while a Renewal Fund whose fees and expenses were above median had fees and expenses that were higher than the median fees and expenses of its peer group. For those Renewal Funds whose fees or expenses were higher than the median, the specific quintile rankings
| | | | | | |
| 398 | | September 30, 2018 | | | Annual Report | | |
are also noted below with respect to the relevant above-median fee or expense categories (unless quintile rankings were not provided to the Independent Trustees by Broadridge, in which case fund rankings are provided). For the purposes of Broadridge Expense Group quintile rankings, higher fees and expenses result in a lower quintile ranking, with the first quintile being the highest and the fifth quintile being the lowest ranking.
Target Funds and Allocation Funds.
For the 2020 Fund, 2025 Fund, 2030 Fund, 2035 Fund, 2040 Fund, 2045 Fund, and 2050 Fund contractual advisory fees were below median for the retail and institutional expense groups, and total expense ratios (taking fee waivers and/or expense limitations into account) were below median for the retail and institutional expense groups. For the 2055 Fund, contractual advisory fees were below median for the retail and institutional expense groups, and total expense ratios (taking fee waivers and/or expense limitations into account) were at the median for the retail expense group and below the median for the institutional expense group. For the Multi Asset Income Fund, contractual advisory fees were at the median for the retail expense group and below median for the institutional expense group, and total expense ratios (taking fee waivers and/or expense limitations into account) were above median (third quintile) for the retail expense group and below median for the institutional expense group.
For the Global Allocation Fund, contractual management fees were above median (third out of four) for the retail and institutional expense groups, and total expense ratios (taking fee waivers and/or expense limitations into account) were below median for the retail and institutional expense groups. For the Global Dynamic Allocation Fund, contractual management fees were below median for the retail and institutional expense groups, and total expense ratios (taking fee waivers and/or expense limitations into account) were below median for the retail and institutional expense groups.
AllianzGI Funds.
For the Best Styles Emerging Markets Fund, Best Styles Global Equity Fund, Best Styles International Equity Fund, Best Styles U.S. Equity Fund, Europe Equity Fund, Global Sustainability Fund, International Growth Fund, NFJ Emerging Markets Value Fund, NFJ International Small-Cap Value Fund, Short Duration Fund, Structured Return Fund, and U.S. Equity Hedged Fund, contractual management fees were below median for the retail and institutional expense groups, and total expense ratios (taking fee waivers and/or expense limitations into account) were below median for the retail and institutional expense groups. For the Convertible Fund, contractual management fees were below median for the retail and institutional expense groups, and total expense ratios (taking fee waivers and/or expense limitations into account) were at the median for the retail and institutional expense groups. For the Emerging Markets Consumer Fund, contractual
management fees were below median for the retail and institutional expense groups, and total expense ratios (taking fee waivers and/or expense limitations into account) were above median (third and fourth quintiles, respectively) for the retail and institutional expense groups. For the Emerging Markets Debt Fund, contractual management fees were at the median for the retail expense group and below median for the institutional expense group, and total expense ratios (taking fee waivers and/or expense limitations into account) were at the median for the retail expense group and above median (third quintile) for the institutional expense group. For the Emerging Markets Small-Cap Fund, contractual management fees were below median for the retail and institutional expense groups, and total expense ratios (taking fee waivers and/or expense limitations into account) were above median (fourth quintile) for the retail expense group and below median for the institutional expense group. For the Global Water Fund, contractual management fees were above median (both fifth quintiles) for the retail and institutional expense groups, and total expense ratios (taking fee waivers and/or expense limitations into account) were above median (both third quintiles) for the retail and institutional expense groups. For High Yield Bond Fund, contractual management fees were below median for the retail and institutional expense groups, and total expense ratios (taking fee waivers and/or expense limitations into account) were above median (fourth quintile) for the retail expense group and below median for the institutional expense group. For the International Small-Cap Fund, contractual management fees were at the median for the retail expense group and above median (third quintile) for the institutional expense group, and total expense ratios (taking fee waivers and/or expense limitations into account) were below median for the retail and institutional expense groups. For the Micro Cap Fund, contractual management fees were above median (fourth and third quintiles, respectively) for the retail and institutional expense groups, and total expense ratios (taking fee waivers and/or expense limitations into account) were below median for the retail expense group and above median (third quintile) for the institutional expense group. For the Ultra Micro Cap Fund, contractual management fees were above median (both fifth quintile) for the retail and institutional expense groups, and total expense ratios (taking fee waivers and/or expense limitations into account) were above median (both fifth quintile) for the retail and institutional expense groups.
Only the institutional expense group was considered for the Global High Yield Fund and the Real Estate Debt Fund. For the Global High Yield Fund, contractual management fees and total expense ratios (taking fee waivers and/or expense limitations into account) were below median. For the Real Estate Debt Fund, contractual management fees were at the median, and total expense ratios (taking fee waivers and/or expense limitations into account) were below median.
The Independent Trustees also considered the estimated profitability to the Investment Manager of its relationship with each Renewal Fund and determined that such profitability did not appear to be excessive.
| | | | | | |
| | Annual Report | | | September 30, 2018 | | 399 |
Unaudited
Matters Relating to the Trustees’ Consideration of the Investment Management Agreements (cont’d)
The Independent Trustees also considered the estimated profitability to the Investment Manager from its relationship with the New Fund and noted that such profitability was expected to be negative for the New Fund’s first year of operations based on average net asset assumptions. The Independent Trustees considered the extent to which the Investment Manager may realize economies of scale or other efficiencies in managing and supporting the Renewal Funds and the New Fund. The Independent Trustees took into account that, as open-end investment companies, the Renewal Funds and the New Fund intend to raise additional assets, so as the assets of the Renewal Funds and the New Fund grow over time, certain economies of scale and other efficiencies may be realized through spreading certain fixed costs across a larger asset base or across a variety of products and services, while also taking into account the fee waiver and expense limitation arrangements observed by the Investment Manager for applicable Renewal Funds and the New Fund. Additionally, the Independent Trustees considered so-called “fall-out benefits” to the Investment Manager, as a result of its advisory arrangements with the Renewal Funds and the New Fund, including research, statistical and quotation services from broker-dealers executing the Renewal Funds’ and the New Fund portfolio transactions on an agency basis, and enhanced visibility for marketing and distribution of other products managed by the Investment Manager. The Independent Trustees also took into account the entrepreneurial, legal, regulatory and business risks the Investment Manager has undertaken and will undertake as investment manager and sponsor of the Renewal Funds and the New Fund. The Trustees also took into account that the Investment Manager agreed to a permanent reduction of the management fee for certain Renewal Funds effective July 1, 2018 and agreed to continue various fee waiver and expense limitation arrangements for these and other Renewal Funds for an additional year.
After reviewing these and other factors described herein, the Independent Trustees concluded, within the context of their overall conclusions regarding the Agreements, that they were satisfied with the Investment Manager’s responses and on-going efforts relating to the investment performance of the Renewal Funds. The Independent Trustees also concluded that the fees payable under each Agreement represent reasonable compensation in light of the nature, extent and quality of services provided by the Investment Manager and should be continued. Based on their evaluation of factors that they deemed to be material, including, but not limited to, those factors described above, the Independent Trustees unanimously concluded that the continuation of the Agreements with respect to the Renewal Funds were in the interests of the applicable Renewal Funds and their shareholders, and determined to recommend that the continuance of the Agreements be approved by the full Board.
After reviewing these and other factors described herein, the Independent Trustees concluded, within the context of their overall conclusions regarding the New Fund Agreements, that the proposed fees payable under the New Fund Agreements represent reasonable compensation in light of the nature, extent and quality of the services
to be provided by the Investment Manager and should be approved for an initial two-year period. After further discussion, and based on their evaluation of factors they deemed to be material, including those factors described above, the Independent Trustees concluded that the initial approval of the New Fund Agreements was in the interests of the New Fund and its shareholders and determined to recommend that the New Fund Agreements be approved by the full Board.
| | | | | | |
| 400 | | September 30, 2018 | | | Annual Report | | |
Unaudited
Privacy Policy
Please read this Policy carefully. It gives you important information about how Allianz Global Investors U.S. and its U.S. affiliates (“AllianzGI US,” “we” or “us”) handle non-public personal information (“Personal Information”) that we may receive about you. It applies to all of the past, present and future clients and shareholders of AllianzGI US and the funds and accounts it manages, advises, administers or distributes, and will continue to apply when you are no longer a client or shareholder. As used throughout this Policy, “AllianzGI US” means Allianz Global Investors U.S. LLC, Allianz Global Investors Distributors LLC and the family of registered and unregistered funds managed by one or more of these firms. AllianzGI US is part of a global investment management group, and the privacy policies of other Allianz Global Investors entities outside of the United States may have provisions in their policies that differ from this Privacy Policy. Please refer to the website of the specific non-US Allianz Global Investors entity for its policy on privacy.
We Care about Your Privacy
We consider your privacy to be a fundamental aspect of our relationship with you, and we strive to maintain the confidentiality, integrity and security of your Personal Information. To ensure your privacy, we have developed policies that are designed to protect your Personal Information while allowing your needs to be served.
Information We May Collect
In the course of providing you with products and services, we may obtain Personal Information about you, which may come from sources such as account application and other forms, from other written, electronic, or verbal communications, from account transactions, from a brokerage or financial advisory firm, financial advisor or consultant, and/or from information you provide on our website.
You are not required to supply any of the Personal Information that we may request. However, failure to do so may result in us being unable to open and maintain your account, or to provide services to you.
How Your Information Is Shared
We do not disclose your Personal Information to anyone for marketing purposes. We disclose your Personal Information only to those service providers, affiliated and non-affiliated, who need the information for everyday business purposes, such as to respond to your inquiries, to perform services, and/or to service and maintain your account. This applies to all of the categories of Personal Information we collect about you. The affiliated and non-affiliated service providers who receive your Personal Information also may use it to process your transactions, provide you with materials (including preparing and mailing prospectuses and shareholder reports and gathering shareholder proxies), and provide you with account statements and other materials relating to your account. These service providers provide services at our direction, and under their agreements with us, are required to keep your Personal Information confidential and to use it only for providing the contractually required services. Our service providers may not use your Personal Information to market products and services to you except in conformance with applicable laws and regulations. We also may provide your Personal Information to your respective brokerage or financial advisory firm, custodian, and/or to your financial advisor or consultant.
In addition, we reserve the right to disclose or report Personal Information to non-affiliated third parties, in limited circumstances, where we believe in good faith that disclosure is required under law, to cooperate with regulators or law enforcement authorities or pursuant to other legal process, or to protect our rights or property, including to enforce our Privacy Policy or other agreements with you. Personal Information collected by us may also be transferred as part of a corporate sale, restructuring, bankruptcy, or other transfer of assets.
Security of Your Information
We maintain your Personal Information for as long as necessary for legitimate business purposes or otherwise as required by law. In maintaining this information, we have implemented appropriate procedures that are designed to restrict access to your Personal Information only to those who need to know that information in order to provide products and/or services to you. In addition, we have implemented physical, electronic and procedural safeguards to help protect your Personal Information.
Privacy and the Internet
The Personal Information that you provide through our website, as applicable, is handled in the same way as the Personal Information that you provide by any other means, as described above. This section of the Policy gives you additional information about the way in which Personal Information that is obtained online is handled.
| | ∎ | | Online Enrollment, Account Access and Transactions: When you visit our website, you can visit pages that are open to the general public, or, where available, log into protected pages to enroll online, access information about your account, or conduct certain transactions. Access to these secure pages is permitted only after you have created a User ID and Password. The User ID and Password must be supplied each time you want to |
| | | | | | |
| | Annual Report | | | September 30, 2018 | | 401 |
Unaudited
Privacy Policy (cont’d)
| | access your account information online. This information serves to verify your identity. When you enter Personal Information to enroll or access your account online, you will log into secure pages. By using our website, you consent to this Privacy Policy and to the use of your Personal Information in accordance with the practices described in this Policy. If you provide Personal Information to effect transactions, a record of the transactions you have performed while on the site is retained by us. For additional terms and conditions governing your use of our website, please refer to the Investor Mutual Fund Access — Disclaimer which is incorporated herein by reference and is available on our website. |
| | ∎ | | Cookies and Similar Technologies: Cookies are small text files stored in your computer’s hard drive when you visit certain web pages. Clear GIFs (also known as Web Beacons) are typically transparent very small graphic images (usually 1 pixel x 1 pixel) that are placed on a website that may be included on our services provided via our website and typically work in conjunction with cookies to identify our users and user behavior. We may use cookies and automatically collected information to: (i) personalize our website and the services provided via our website, such as remembering your information so that you will not have to re-enter it during your use of, or the next time you use, our website and the services provided via our website; (ii) provide customized advertisements, content, and information; (iii) monitor and analyze the effectiveness of our website and the services provided via our website and third-party marketing activities; (iv) monitor aggregate site usage metrics such as total number of visitors and pages viewed; and (v) track your entries, submissions, and status in any promotions or other activities offered through our website and the services provided via our website. Tracking technology also helps us manage and improve the usability of our website, (i) detecting whether there has been any contact between your computer and us in the past and (ii) to identify the most popular sections of our website. Because an industry-standard Do-Not-Track protocol is not yet established, our website will continue to operate as described in this Privacy Policy and will not be affected by any Do-Not-Track signals from any browser. |
| | ∎ | | Use of Social Media Plugins Our website uses the following Social Media Plugins (“Plugins”): |
| | ∎ | | Facebook Share Button operated by Facebook Inc., 1601 S. California Ave, Palo Alto, CA 94304, USA |
| | ∎ | | Tweet Button operated by Twitter Inc., 795 Folsom St., Suite 600, San Francisco, CA 94107, USA |
| | ∎ | | LinkedIn Share Button operated by LinkedIn Corporation, 2029 Stierlin Court, Mountain View, CA 94043, USA |
All Plugins are marked with the brand of the respective operators Facebook, Twitter and LinkedIn (“Operators”). When you visit our website that contains a social plugin, your browser establishes a direct connection to the servers of the Operator. The Operator directly transfers the plugin content to your browser which embeds the latter into our website, enabling the Operator to receive information about you having accessed the respective page of our website. Thus, AllianzGI US has no influence on the data gathered by the plugin and we inform you according to our state of knowledge: The embedded plugins provide the Operator with the information that you have accessed the corresponding page of our website. If you do not wish to have such data transferred to the Operators, you need to log out of your respective account before visiting our website. Please see the Operators’ data privacy statements in order to get further information about purpose and scope of the data collection and the processing and use:
| | ∎ | | Facebook: https://de-de.facebook.com/about/privacy |
| | ∎ | | Twitter: https://twitter.com/privacy |
| | ∎ | | Linked In: https://www.linkedin.com/legal/privacy-policy |
Changes to Our Privacy Policy
We may modify this Privacy Policy from time-to-time to reflect changes in related practices and procedures, or applicable laws and regulations. If we make changes, we will notify you on our website and the revised Policy will become effective immediately upon posting to our website. We also will provide account owners with a copy of our Privacy Policy, annually if required. We encourage you to visit our website periodically to remain up to date on our Privacy Policy. You acknowledge that by using our website after we have posted changes to this Privacy Policy, you are agreeing to the terms of the Privacy Policy as modified.
Obtaining Additional Information
If you have any questions about this Privacy Policy or our privacy related practices in the United States, you may contact us via our dedicated email at PrivacyUS@allianzgi.com.
| | | | | | |
| 402 | | September 30, 2018 | | | Annual Report | | |
Unaudited
Allianz Funds Multi-Strategy Trust—Board of Trustees
The chart below identifies the Trustees and Officers of the Trust. The “interested” Trustees defined by the 1940 Act, are indicated below. Unless otherwise indicated, the correspondence address of all persons below is: 1633 Broadway, New York, New York 10019. The Funds’ Statement of Additional Information contains additional information about the Trustees. The Statement of Additional Information is available without charge, upon request, by calling 1-800-988-8380 (retail classes: A, C and R) or 1-800-498-5413 ( Class P, Class R6, Institutional and Administrative classes).
| | | | | | | | |
|
Name, Year of Birth and Position Held with Trust | | Term of Office and Length of Time Served | | Principal Occupation(s) During Past 5 Years | | Number of Funds in Fund Complex* Overseen by Trustee | | Other Directorships Held by Trustee |
| | | |
| Independent Trustees(1) | | | | | | |
| | | | |
Davey S. Scoon 1946 Chairman of the Board of Trustees | | 12/2014 to present | | Adjunct Professor, University of Wisconsin-Madison (since 2011). | | 65 | | Director, Albireo Pharma, Inc. (since 2016); and Director, AMAG Pharmaceuticals, Inc. (since 2006). Formerly, Director, Biodel Inc. (2013-2016); Director, Orthofix International N.V. (2011-2015); and Chairman, Tufts Health Plan (1997-2014). |
| | | | |
Deborah A. DeCotis 1952 | | 3/2011 to present | | Advisory Director, Morgan Stanley & Co., Inc. (since 1996); Member, Circle Financial Group (since 2009); Member, Council on Foreign Relations (since 2013); Trustee, Smith College (since 2017); and Director, Watford Re (since 2017). Formerly, Co-Chair Special Projects Committee, Memorial Sloan Kettering (2005-2015); Trustee, Stanford University (2010-2015); and Principal, LaLoop LLC, a retail accessories company (1999-2014). | | 92 | | None. |
| | | | |
F. Ford Drummond 1962 | | 12/2014 to present | | Owner/Operator, Drummond Ranch; and Chairman , Oklahoma Water Resources Board. Formerly, Director, The Cleveland Bank; and General Counsel, BMI-Health Plans (benefits administration). | | 65 | | Director, Bancfirst Corporation. |
| | | | |
Bradford K. Gallagher 1944 | | 9/2010 to present | | Retired. Founder, Spyglass Investments LLC, a private investment vehicle (since 2001). Formerly, Chairman and Trustee, The Common Fund (2005-2014); and Partner, New Technology Ventures Capital Management LLC, a venture capital fund (2011-2013) | | 92 | | None. |
| | | | |
James A. Jacobson 1945 | | 12/2009 to present | | Retired. Trustee (since 2002) and Chairman of Investment Committee (since 2007), Ronald McDonald House of New York; and Trustee, New Jersey City University (since 2014). | | 92 | | Formerly, Trustee Alpine Mutual Funds Complex (consisting of 18 funds) (2009-2016). |
| | | | |
Hans W. Kertess 1939 | | 3/2008 to present | | President, H. Kertess & Co., a financial advisory company; and Senior Adviser (formerly Managing Director), Royal Bank of Canada Capital Markets (since 2004). | | 92 | | None. |
| | | | |
James S. MacLeod 1947 | | 12/2014 to present | | Executive Chairman of the Board, CoastalSouth Bancshares, Inc.; Chairman, CoastalStates Bank; Vice Chairman of the Board and Member of Executive Committee, University of Tampa; Trustee, MUSC Foundation and Director, Mortgage Bankers Association of America. Formerly, Executive Vice President, Mortgage Guaranty Insurance Corporation; and Chief Executive Officer, Homeowners Mortgage. | | 65 | | Non-Executive Chairman & Director, Sykes Enterprises, Inc. |
| | | | |
William B. Ogden, IV 1945 | | 3/2008 to present | | Retired. Formerly, Asset Management Industry Consultant; and Managing Director, Investment Banking Division of Citigroup Global Markets Inc. | | 92 | | None. |
| | | | | | |
| | Annual Report | | | September 30, 2018 | | 403 |
Unaudited
Allianz Funds Multi-Strategy Trust—Board of Trustees (cont’d)
| | | | | | | | |
Name, Year of Birth and Position Held with Trust | | Term of Office and Length of Time Served | | Principal Occupation(s) During Past 5 Years | | Number of Funds in Fund Complex* Overseen by Trustee | | Other Directorships Held by Trustee |
| | | | |
Alan Rappaport 1953 | | 6/2010 to present | | Advisory Director (formerly, Vice Chairman), Roundtable Investment Partners (since 2009); Adjunct Professor, New York University Stern School of Business (since 2011); Lecturer, Stanford University Graduate School of Business (since 2013); and Director, Victory Capital Holdings, Inc., an asset management firm (since 2013). Formerly, Trustee, American Museum of Natural History (2005-2015); and Trustee and Member of Board of Overseers, NYU Langone Medical Center (2007-2015). | | 65 | | None. |
| | | | |
A. Douglas Eu (2) 1961 | | 4/2016 to present | | Chief Executive Officer, Managing Director and Chairman of the Executive Committee of Allianz Global Investors U.S. Holdings LLC (since 2016); and Member of the Global Executive Committee of Allianz Global Investors GmbH (since 2006). Formerly, Chief Executive Officer of Allianz Global Investors Asia Pacific GmbH (2006-2015). | | 65 | | Formerly, Director, Securities and Futures Commission Advisory Committee Hong Kong (2007-2013). |
| | | | |
Erick R. Holt(2) 1952 | | 12/2017 to present | | Board Member, Global Chief Risk Officer, General Counsel and Chief Compliance Officer (2006 – December 2017) of Allianz Asset Management GmbH. | | 65 | | None. |
| * | Includes 27 PIMCO Funds that the Trustee currently presides over. |
| (1) | “Independent Trustees” are those Trustees who are not “Interested Persons” (as defined in Section 2(a)(19) of the 1940 Act), and “Interested Trustees” are those Trustees who are “Interested Persons” of the Funds. |
| (2) | Mr. Eu are Mr. Holt “Interested Persons” of the Trust, as defined in Section 2(a)(19) of the 1940 Act, due to their affiliation with the Investment Manager/Adviser and its affiliates. |
| | | | | | |
| 404 | | September 30, 2018 | | | Annual Report | | |
Unaudited
Allianz Funds Multi-Strategy Trust—Officers
| | | | |
Name, Address and Year of Birth
and Position Held with Trust | | Term of Office* and
Length of Time Served | | Principal Occupation(s) During Past 5 Years |
| | |
Thomas J. Fuccillo 1968 President and Chief Executive Officer | | 4/2016 to present | | Managing Director, Chief Regulatory Counsel and Head of Retail and Funds Legal of Allianz Global Investors U.S. Holdings LLC; Managing Director, Chief Legal Officer and Secretary of Allianz Global Investors Distributors LLC; Secretary and Chief Legal Officer of The Korea Fund, Inc. President and Chief Executive Officer of 65 funds in the Fund Complex. Formerly, Vice President, Secretary and Chief Legal Officer of numerous funds in the Fund Complex (2004-2016). |
| | |
Scott Whisten 1971 Treasurer, Principal Financial and Accounting Officer | | 3/2008 to present | | Director of Allianz Global Investors U.S. LLC; and Treasurer, Principal Financial and Accounting Officer of 65 funds in the Fund Complex. Formerly, Assistant Treasurer of numerous funds in the Fund Complex (2007-2018). |
| | |
Angela Borreggine 1964 Chief Legal Officer and Secretary | | 4/2016 to present | | Director and Senior Counsel of Allianz Global Investors U.S. Holdings LLC; Secretary and Chief Legal Officer of 65 funds in the Fund Complex. Formerly, Assistant Secretary of numerous funds in the Fund Complex (2015-2016). |
| | |
Thomas L. Harter, CFA 1975 Chief Compliance Officer | | 6/2013 to present | | Director of Allianz Global Investors U.S. Holdings LLC; Director, Deputy Chief Compliance Officer of Allianz Global Investors U.S. LLC; and Chief Compliance Officer of 65 funds in the Fund Complex and of The Korea Fund, Inc. |
| | |
Richard J. Cochran 1961 Assistant Treasurer | | 5/2018 to present | | Vice President of Allianz Global Investors U.S. LLC and Assistant Treasurer of 65 funds in the Fund Complex and of The Korea Fund, Inc. |
| | |
Orhan Dzemaili 1974 Assistant Treasurer | | 1/2011 to present | | Director of Allianz Global Investors U.S. LLC; Treasurer, Principal Financial and Accounting Officer of The Korea Fund, Inc.; and Assistant Treasurer of 65 funds in the Fund Complex. Formerly, Assistant Treasurer of The Korea Fund, Inc. (2016-2018). |
| | |
Debra Rubano 1975 Assistant Secretary | | 12/2015 to present | | Director and Senior Counsel of Allianz Global Investors U.S. Holdings LLC; and Assistant Secretary of 65 funds in the Fund Complex. |
| | |
Craig Ruckman 1977 Assistant Secretary | | 12/2017 to present | | Director and Senior Counsel of Allianz Global Investors U.S. Holdings LLC; and Assistant Secretary of 65 funds in the Fund Complex. Formerly, Associate of K&L Gates LLP (2012-2016). |
| | |
Paul Koo(1) 1964 Assistant Secretary | | 6/2013 to present | | Director, Head of US Compliance, Chief Compliance Officer of Allianz Global Investors U.S. LLC, Chief Compliance Officer of Allianz Global Investors Distributors LLC and Assistant Secretary of 58 funds in the Fund Complex. Formerly, Chief Compliance Officer of NFJ Investment Group LLC (2016-2017); and Associate Chief Compliance Officer, Dodge & Cox (2010-2011). |
| | |
Thomas W. Oliver(2) 1971 Assistant Secretary | | 12/2012 to present | | Portfolio Manager and Managing Director of Allianz Global Investors U.S. LLC (formerly, NFJ Investment Group LLC). Assistant Secretary of 41 funds in the Fund Complex. |
| * | The officers of the Trust are elected annually by the Board of Trustees |
Each of the Trust’s executive officers is an “interested person” of the Trust (as defined in Section 2(a)(19) of the 1940 Act) as a result of his or her position(s) set forth in the table above.
| (1) | Paul Koo is Assistant Secretary of the Trust with a limited authority to open, maintain and close certain custodial and trading accounts for all series of the Trust. |
| (2) | Thomas W. Oliver is an Assistant Secretary of the Trust with a limited authority to open, maintain and close certain custodial and trading accounts for AllianzGI NFJ Emerging Markets Value Fund. |
| | | | | | |
| | Annual Report | | | September 30, 2018 | | 405 |
Allianz Multi-Strategy Funds
Trustees
Davey S. Scoon
Chairman of the Board of Trustees
Deborah A. DeCotis
F. Ford Drummond
A. Douglas Eu
Bradford K. Gallagher
Erick R. Holt
James A. Jacobson
Hans W. Kertess
James S. MacLeod
William B. Ogden, IV
Alan Rappaport
Officers
Thomas J. Fuccillo
President and Chief Executive Officer
Scott Whisten
Treasurer, Principal Financial and Accounting Officer
Angela Borreggine
Chief Legal Officer and Secretary
Thomas L. Harter
Chief Compliance Officer
Richard J. Cochran
Assistant Treasurer
Orhan Dzemaili
Assistant Treasurer
Debra Rubano
Assistant Secretary
Paul Koo(1)
Assistant Secretary
Craig Ruckman
Assistant Secretary
Thomas W. Oliver(2)
Assistant Secretary
Investment Manager
Allianz Global Investors U.S. LLC
1633 Broadway
New York, NY 10019
Distributor
Allianz Global Investors Distributors LLC
1633 Broadway
New York, NY 10019
Custodian & Accounting Agent
State Street Bank & Trust Co.
801 Pennsylvania Avenue
Kansas City, MO 64105
Shareholder Servicing and Transfer Agents
State Street Bank & Trust Company, which has delegated its obligations
as transfer agent to:
DST Asset Management Solutions, Inc.
(Class A, Class C and Class R shares)
P.O. Box 219723
Kansas City, MO 64121-9723
(Class P, Institutional Class, Class R6 and Administrative Class shares)
P.O. Box 219968,
Kansas City, MO 64121-9968
Independent Registered Public Accounting Firm
PricewaterhouseCoopers LLP
300 Madison Avenue
New York, NY 10017
Legal Counsel
Ropes & Gray LLP
Prudential Tower
800 Boylston Street
Boston, MA 02199
This report, including the financial information herein, is transmitted to the shareholders of the Funds for their information. It is not a prospectus, circular or representation intended for use in the purchase of shares of each Fund or any securities mentioned in this report.
For Account Information
Contact your financial adviser, or if you receive account statements directly from Allianz Global Investors, you can also call (800) 988-8380 for Class A, C and R shares or (800) 498-5413 for Class P, Institutional, R6 and Administrative shares. Telephone representatives are available Monday-Friday 8:30 am to 6:00 pm Eastern Time. Or visit our website, us.allianzgi.com.
| (1) | Paul Koo is Assistant Secretary of the Trust with a limited authority to open, maintain and close certain custodial and trading accounts for all series of the Trust. |
| (2) | Thomas W. Oliver is an Assistant Secretary of the Trust with a limited authority to open, maintain and close certain custodial and training accounts for the AllianzGI NFJ Emerging Markets Value Fund. |
About Allianz Global Investors
Allianz Global Investors is a leading active asset manager with over 730 investment professionals in 25 offices worldwide and managing $621 billion in assets for individuals, families and institutions.*
Active is the most important word in our vocabulary. Active is how we create and share value with clients. We believe in solving, not selling, and in adding value beyond pure economic gain. We invest for the long term, employing our innovative investment expertise and global resources. Our goal is to ensure a superior experience for our clients, wherever they are based and whatever their investment needs.
Active is: Allianz Global Investors
* Data as of September 30, 2018.
For more information about any of our investment solutions or client services, call your financial advisor or visit us.allianzgi.com.
Investors should consider the investment objectives, risks, charges and expenses of the above mentioned Funds carefully before investing. This and other information is contained in each Fund’s prospectus, which may be obtained by contacting your financial advisor, by visiting us.allianzgi.com or by calling 1-800-988-8380 (retail classes: A, C & R) or 1-800-498-5413 (Class P, Class R6, Institutional & Administrative classes). Please read the prospectus carefully before you invest or send money.
Allianz Global Investors U.S. LLC serves as the investment manager for the Allianz Funds and the Allianz Multi-Strategy Funds. Allianz Funds and the Allianz Multi-Strategy Funds are distributed by Allianz Global Investors Distributors LLC. © 2018. For information about any product, contact your financial advisor.
us.allianzgi.com
Receive this report electronically and eliminate paper mailings.
To enroll, go to us.allianzgi.com/edelivery
612677
| (a) | As of the end of the period covered by this report, the registrant has adopted a code of ethics (the “Section 406 Standards for Investment Companies – Ethical Standards for Principal Executive and Financial Officers”) that applies to the registrant’s President and Chief Executive Officer and Principal Financial Officer; the registrant’s Principal Financial Officer also serves as the Principal Accounting Officer. The registrant undertakes to provide a copy of such code of ethics to any person upon request, without charge, by calling 1-800-926-4456. The code of ethics are included as an Exhibit 99.CODE ETH hereto. |
| (b) | During the period covered by this report, there were not any amendments to a provision of the code of ethics adopted in 2(a) above. |
| (c) | During the period covered by this report, there were not any waivers or implicit waivers to a provision of the code of ethics adopted in 2(a) above. |
| ITEM 3. | AUDIT COMMITTEE FINANCIAL EXPERT |
The registrant’s Board has determined that Messrs. James A. Jacobson and Davey S. Scoon, both of whom serve on the Trust’s Audit Oversight Committee, qualify as “audit committee financial experts,” and that they are “independent,” for purposes of this Item.
| ITEM 4. | PRINCIPAL ACCOUNTANT FEES AND SERVICES |
| a) | Audit fees. The aggregate fees billed for each of the last two fiscal years (the “Reporting Periods”) for professional services rendered by the Registrant’s principal accountant (the “Auditor”) for the audit of the Registrant’s annual financial statements, or services that are normally provided by the Auditor in connection with the statutory and regulatory filings or engagements for the Reporting Periods, were $828,188 in 2017 and $1,109,663 in 2018. |
| b) | Audit-Related Fees. The aggregate fees billed in the Reporting Periods for assurance and related services by the principal accountants that are reasonably related to the performance of the audit registrant’s financial statements and are not reported under paragraph (e) of this Item were $0 in 2017 and $0 in 2018. |
| c) | Tax Fees. The aggregate fees billed in the Reporting Periods for professional services rendered by the Auditor for tax compliance, tax service and tax planning (“Tax Services”) were $528,291 in 2017 and $557,792 in 2018. These services consisted of review or preparation of U.S. federal, state, local and excise tax returns and calculations of excise tax distributions. |
| d) | All Other Fees. There were no other Fees billed in the Reporting Periods for products and services provided by the Auditor to the Registrant. |
| e)1. | Audit Committee Pre-Approval Policies and Procedures. The Registrant’s Audit Oversight Committee has established policies and procedures for pre-approval of all audit and permissible non-audit services by the Auditor for the Registrant, as well as the Auditor’s engagements related directly to the operations and financial reporting of the Registrant. The Registrant’s policy is stated below. |
Allianz Funds Multi-Strategy Trust (The “Trust”)
AUDIT OVERSIGHT COMMITTEE POLICY
FOR
PRE-APPROVAL OF SERVICES PROVIDED BY THE INDEPENDENT ACCOUNTANTS
The Trust’s Audit Oversight Committee (“Committee”) is charged with the oversight of the Trust’s financial reporting policies and practices and their internal controls. As part of this responsibility, the Committee must pre-approve any independent accounting firm’s engagement to render audit and/or permissible non-audit services to the Trust as well as to the Trust’s investment adviser(1) or any entity controlling, controlled by or under common control with the investment adviser that provides ongoing services to the Trust (“Applicable Service Providers”), if the engagement relates directly to operations and financial reporting of the Trust. In evaluating a proposed engagement by the independent accountants, the Committee will assess the effect that the engagement might reasonably be expected to have on the accountant’s independence. The Committee’s evaluation will be based on:
a review of the nature of the professional services expected to be provided, the fees to be charged in connection with the services expected to be provided a review of the safeguards put into place by the accounting firm to safeguard independence, and periodic meetings with the accounting firm.
The Committee need not evaluate all four factors each time it pre-approves a service; it may rely on previous evaluations to the extent it considers appropriate.
POLICY FOR PRE-APPROVAL OF AUDIT AND NON-AUDIT SERVICES TO BE PROVIDED TO THE TRUST
On an annual basis, the Committee of the Trust will review and if the Committee so determines, pre-approve the scope of the audits of the Trust and proposed audit fees, and permitted non-audit (including audit-related) services that are proposed to be performed by the Trust’s independent accountants for the Trust and its Applicable Service Providers (to the extent the services to be provided to the Applicable Service Providers relate directly to the operations and financial reporting of the Trust). The Committee may also pre-approve services at any other in-person or telephonic Committee meeting. At least annually, the Committee will receive a report of all audit and non-audit services that were rendered in the previous calendar year by the independent accountants for the Trust and its Applicable Service Providers pursuant to this Policy.
In addition to the Committee’s pre-approval of services pursuant to this Policy, the engagement of the independent accounting firm for any permitted non-audit service provided to the fund with also require the separate pre-approval of the President, Treasurer or Assistant Treasurer of the Trust, who may only grant such approval if he or she believes that the accounting firm’s engagement will not adversely affect the firm’s independence. All non-audit services performed by the independent accounting firm will be disclosed, as required, in filings with the Securities and Exchange Commission.
AUDIT SERVICES
The categories of audit services and related fees to be reviewed and pre-approved annually by the Committee are:
Annual Trust financial statement audits
Seed audits (related to new product filings, as required)
SEC and regulatory filings and consents
Semiannual financial statement reviews
Individual audit services that fall within one of these categories and are not presented to the Committee as part of the annual pre-approval process described above, may be pre-approved, if deemed consistent with the accounting firm’s independence, by the Committee Chair (or any other Committee member who is a disinterested trustee under the Investment Company to whom this responsibility has been delegated) so long as the estimated fee for those services does not exceed $500,000. Any pre-approval by a Committee member shall be reported to the full Committee at its next regularly scheduled meeting.
(1) For purposes of this requirement, the term “adviser” does not include sub-advisers that are not affiliated with a Trust’s investment adviser, are overseen by that investment adviser, and whose role is primarily portfolio management.
AUDIT-RELATED SERVICES
The following categories of audit-related services are considered to be consistent with the role of the Trust’s independent accountants and services falling under one of these categories will be pre-approved by the Committee on an annual basis if the Committee deems those services to be consistent with the accounting firm’s independence:
Accounting consultations
Trust merger support services
Agreed upon procedure reports
Other Attestation reports
Comfort letters
Other internal control reports
Individual audit-related services that fall within one of these categories and are not presented to the Committee as part of the annual pre-approval process described above, may be pre-approved, if deemed consistent with the accounting firm’s independence, by the Committee Chair (or any other Committee member who is a disinterested trustee under the Investment Company to whom this responsibility has been delegated) so long as the estimated fee for those services does not exceed $500,000. Any pre-approval by a Committee member shall be reported to the full Committee at its next regularly scheduled meeting.
TAX SERVICES
The following categories of tax services are considered to be consistent with the role of the Trust’s independent accountants and services falling under one of these categories will be pre-approved by the Committee on an annual basis if the Committee deems those services to be consistent with the accounting firm’s independence:
Federal, state and local income tax compliance; and, sales and use tax compliance, including required filings and amendments
Timely RIC qualification reviews
Tax distribution analysis and planning
Tax authority examination services
Tax appeals support services
Accounting methods studies
Trust merger support services
Other tax consulting services and related projects
Individual tax services that fall within one of these categories and are not presented to the Committee as part of the annual pre-approval process described above, may be pre-approved, if deemed consistent with the accounting firm’s independence, by the Committee at any regular or special meeting. Such services may also be pre-approved by the Committee Chair (or any other Committee member who is a disinterested trustee under the Investment Company Act to whom this responsibility has been delegated) so long as the estimated fee for the particular service for which pre-approval is sought does not exceed $500,000. Any pre-approval by a Committee Member shall be reported to the full Committee at its next regularly scheduled meeting.
OTHER SERVICES
Services that are proposed to be provided to the Trust which are not audit, audit-related or tax services may be pre-approved, if deemed consistent with the accounting firm’s independence, by the Committee at any regular or special meeting. Such services may also be pre-approved by the Committee Chair (or any other Committee member who is a disinterested trustee under the Investment Company Act to whom this responsibility has been delegated) so long as the estimated fee for the particular service for which pre-approval is sought does not exceed $500,000. Any pre-approval by a Committee member shall be reported to the full Committee at its next regularly scheduled meeting.
PROHIBITED SERVICES
The Trust’s independent accountants will not render services in the following categories of non-audit services:
Bookkeeping or other services related to the accounting records or financial statements of the Trust
Financial information systems design and implementation
Appraisal or valuation services, fairness opinions, or contribution-in-kind reports
Actuarial services
Internal audit outsourcing services
Management functions or human resources
Broker or dealer, investment adviser or investment banking services
Legal services and expert services unrelated to the audit
Any other service that the Public Company Accounting Oversight Board determines, by regulation, is impermissible.
PRE-APPROVAL OF NON-AUDIT SERVICES PROVIDED TO OTHER ENTITIES WITHIN THE FUND COMPLEX
Rule 2-01(c)(7) of Regulation S-X provides that an accountant is not independent of the Trust unless the Trust’s Committee approves any permitted non-audit services to be provided to the Trust’s Applicable Service Providers, provided, in each case, that the engagement relates directly to the operations and financial reporting of the Trust.
Services to be provided to Applicable Service Providers that are required to be pre-approved, may be pre-approved, if deemed consistent with the accounting firm’s independence, by the Committee at a regular or special meeting or by the Committee Chair (or any other Committee member who is a disinterested trustee under the Investment Company Act to whom this responsibility has been delegated) so long as the estimated fee for those services does not exceed $500,000. If a service is approved by a Committee member, the full Committee is notified of such pre-approval at its next regularly scheduled meeting.
Although the Committee will not be required to pre-approve all services provided to Applicable Service Providers and their affiliates, the Committee will receive an annual report from the Trust’s independent accounting firm showing the aggregate fees for all services provided to Applicable Service Providers and their affiliates.
DE MINIMUS EXCEPTION TO REQUIREMENT OF PRE-APPROVAL OF NON-AUDIT SERVICES
With respect to the provision of permitted non-audit services to the Trust or Accounting Affiliates, the pre-approval requirement is waived if:
(1) The aggregate fees and costs of all non-audit services that, but for the limited exception provided by this section, would require pre-approval by the Committee constitutes no more than five percent of the total fees and costs paid by the Trust and Applicable Service Providers to the independent accountant during the fiscal year during which such non-audit services are provided;
(2) At the time of the engagement for such services, the Trust did not recognize that the services were “non-audit services” that required preapproval; and
(3) Each such service is brought promptly to the attention of the Committee and approved prior to the completion of the audit by the Committee, Committee Chair or any other Committee member who is a disinterested trustee under the Investment Company Act to whom this responsibility has been delegated.
e)2. No services were approved pursuant to the procedures contained in paragraph (C) (7) (i) (C) of Rule 2-01 of Registration S-X.
f) Not applicable.
g) Non-audit fees. The aggregate non-audit fees billed by the Auditor for services rendered to the Registrant, and rendered to the Adviser, for the 2017 Reporting Period was $4,080,639 and the 2018 Reporting Period was $2,998,017.
h) Auditor Independence. The Registrant’s Audit Oversight Committee has considered whether the provision of non-audit services that were rendered to the Adviser which were not pre-approved is compatible with maintaining the Auditor’s independence.
| ITEM 5. | AUDIT COMMITTEE OF LISTED REGISTRANT |
Disclosure not required for open-end management investment companies.
| (a) | Schedule of Investments is included as part of the report to shareholders filed under Item 1 of this form. |
| ITEM 7. | DISCLOSURE OF PROXY VOTING POLICIES AND PROCEDURES FOR CLOSED-END MANAGEMENT INVESTMENT COMPANIES |
Disclosure not required for open-end management investment companies.
| ITEM 8. | PORTFOLIO MANAGERS OF CLOSED-END MANAGEMENT INVESTMENT COMPANIES |
Disclosure not required for open-end management investment companies.
| ITEM 9. | PURCHASES OF EQUITY SECURITIES BY CLOSED-END MANAGEMENT INVESTMENT COMPANY AND AFFILIATED PURCHASERS |
Disclosure not required for open-end management investment companies.
| ITEM 10. | SUBMISSION OF MATTERS TO A VOTE OF SECURITY HOLDERS |
There have been no material changes to the procedures by which shareholders may recommend nominees to the Trust’s Board of Trustees since the Trust last provided disclosure in response to this item.
| ITEM 11. | CONTROLS AND PROCEDURES |
| (a) | The registrant’s President & Chief Executive Officer and Treasurer, Principal Financial & Accounting Officer have concluded that the registrant’s disclosure controls and procedures (as defined in Rule 30a-3(c) under the Investment Company Act of 1940 (the “1940 Act”) (17 CFR 270.30a-3(c)), as amended) are effective based on their evaluation of these controls and procedures as of a date within 90 days of the filing date of this document. |
| (b) | There were no changes in the registrant’s internal control over financial reporting (as defined in Rule 30a-3(d) under the 1940 Act (17 CFR 270.30a-3(d))) that occurred during the most recent fiscal half-year covered by this report that has materially affected, or is reasonably likely to materially affect, the registrant’s internal control over financial reporting. |
| ITEM 12. | DISCLOSURE OF SECURITIES LENDING ACTIVITIES FOR CLOSED-END MANAGEMENT INVESTMENT COMPANIES. |
Disclosure not required for open-end management investment companies.
(a)(1) Exhibit 99.CODE ETH – Code of Ethics
(a)(2) Exhibit 99_ CERT. – Certification pursuant to Section 302 of the Sarbanes-Oxley Act of 2002
(a)(3) Not applicable
(b) Exhibit 99.906 CERT. – Certification pursuant to Section 906 of the Sarbanes-Oxley Act of 2002
Signatures
Pursuant to the requirements of the Securities Exchange Act of 1934 and the Investment Company Act of 1940, the registrant has duly caused this report to be signed on its behalf by the undersigned, thereunto duly authorized.
| | |
| (Registrant) Allianz Funds Multi-Strategy Trust |
| |
| By: | | /s/ Thomas J. Fuccillo |
| | Thomas J. Fuccillo President & Chief Executive Officer |
|
Date: December 3, 2018 |
| |
| By: | | /s/ Scott Whisten |
| | Scott Whisten Treasurer, Principal Financial & Accounting Officer |
|
Date: December 3, 2018 |
Pursuant to the requirements of the Securities Exchange Act of 1934 and the Investment Company Act of 1940, this report has been signed below by the following persons on behalf of the registrant and in the capacities and on the dates indicated.
| | |
| By: | | /s/ Thomas J. Fuccillo |
| | Thomas J. Fuccillo President & Chief Executive Officer |
|
Date: December 3, 2018 |
| |
| By: | | /s/ Scott Whisten |
| | Scott Whisten Treasurer, Principal Financial & Accounting Officer |
|
Date: December 3, 2018 |