Table of Contents
UNITED STATES
SECURITIES AND EXCHANGE COMMISSION
Washington, D.C. 20549
FORM N-CSR
CERTIFIED SHAREHOLDER REPORT OF REGISTERED
MANAGEMENT INVESTMENT COMPANIES
Investment Company Act file number 811-22167
Allianz Funds Multi-Strategy Trust
(Exact name of registrant as specified in charter)
1633 Broadway, New York, New York 10019
(Address of principal executive offices) (Zip code)
Scott Whisten
1633 Broadway
New York, New York 10019
(Name and address of agent for service)
Registrant’s telephone number, including area code: 212-739-3367
Date of fiscal year end: September 30
Date of reporting period: September 30, 2020
Table of Contents
Item 1. Report to Shareholders

Allianz Funds
Multi-Strategy Trust
SHARE CLASSES A, C, R, P, INSTITUTIONAL, R6, ADMINISTRATIVE
Annual Report
September 30, 2020
AllianzGI Best Styles Global Equity Fund
AllianzGI Convertible Fund
AllianzGI Core Plus Bond Fund
AllianzGI Emerging Markets Consumer Fund
AllianzGI Emerging Markets Small-Cap Fund
AllianzGI Emerging Markets Value Fund (formerly AllianzGI NFJ Emerging Markets Value Fund)
AllianzGI Global Allocation Fund
AllianzGI Global Dynamic Allocation Fund
AllianzGI Global Sustainability Fund
AllianzGI Green Bond Fund
AllianzGI High Yield Bond Fund
AllianzGI International Small-Cap Fund
AllianzGI Multi Asset Income Fund
AllianzGI PerformanceFee Managed Futures Strategy Fund
AllianzGI PerformanceFee Structured US Equity Fund
AllianzGI Preferred Securities and Income Fund
AllianzGI Short Duration High Income Fund
AllianzGI Short Term Bond Fund
AllianzGI Structured Return Fund
AllianzGI Water Fund (formerly AllianzGI Global Water Fund)
This material is authorized for use only when preceded or accompanied by the current Allianz Funds Multi-Strategy Trust prospectus. Investors should consider the investment objectives, risks, charges and expenses of each Fund carefully before investing. This and other information is contained in the Funds’ prospectuses and summary prospectuses. Please read the prospectus carefully before you invest.
Beginning on January 1, 2021, as permitted by regulations adopted by the U.S. Securities and Exchange Commission, paper copies of shareholder reports will no longer be sent by mail, unless you specifically request paper copies of the reports. Instead, the reports will be made available on the Funds’ website (us.allianzgi.com), and you will be notified by mail each time a report is posted and provided with a website link to access the report.
If you already elected to receive shareholder reports electronically, you will not be affected by this change and you need not take any action. You may elect to receive shareholder reports and other communications from a Fund electronically anytime by contacting your financial intermediary (such as a broker-dealer or bank) or, if you are a direct investor, by enrolling at us.allianzgi.com/edelivery.
If you prefer to receive paper copies of your shareholder reports after January 1, 2021, direct investors may inform a Fund at any time. If you invest through a financial intermediary, you should contact your financial intermediary directly. Paper copies are provided free of charge and your election to receive reports in paper will apply to all funds held with the fund complex if you invest directly with a Fund or all funds held in your account if you invest through your financial intermediary.

Receive this report electronically and eliminate paper mailings.
To enroll, go to us.allianzgi.com/edelivery.
Table of Contents
A Word About Risk: A fund may be subject to various risks as described in its prospectus. Some of those risks may include, but are not limited to, the following: derivatives risk, smaller company risk, non-US investment risk, focused investment risk and specific sector investment risks. Use of derivative instruments may involve certain costs and risks such as liquidity risk, interest rate risk, market risk, credit risk, counterparty risk, management risk and the risk that a fund is unable to close out a position when it is most advantageous to do so. Portfolios investing in derivatives could lose more than the principal amount invested in those instruments. Investing in foreign securities may entail risk due to foreign economic and political developments; this risk may be enhanced when investing in emerging markets. Smaller companies may be more volatile than larger companies and may entail more risk. Concentrating investments in individual sectors may add additional risk and additional volatility compared to a diversified equity portfolio. AllianzGI target-date funds seek to manage risk and return by blending two separately-managed portfolios: a return-generating portfolio for growth potential, and a defensive portfolio for principal protection. The balance grows increasingly defensive over time until the target date is reached, after which the Fund’s assets roll into a retirement income strategy. The principal values of the Funds are not guaranteed at any time, including the target date. Please refer to each Fund’s applicable current prospectus for complete details.
Table of Contents

Thomas J. Fuccillo
President & CEO
Dear Shareholder,
The novel coronavirus (“COVID-19”) pandemic severely impacted the global economy during the 12-month fiscal reporting period ended September 30, 2020. Economic growth in the US and overseas contracted as countries instituted lockdown orders in an attempt to contain COVID-19. Over this period, global equities generated mixed results. Elsewhere, the overall US bond market posted positive returns.
12 Months in Review
For the 12-month period ended September 30, 2020, US stocks, as measured by the Standard & Poor’s 500 Index, returned 15.15%. Two measures of stock performance in developed international and global markets, the MSCI EAFE (Europe, Australasia and Far East) Index (net) and the MSCI World Index (net), returned 0.49% and 10.41%, respectively, in dollar-denominated terms. Elsewhere, the MSCI Emerging Markets Index (net) returned 10.54%. With respect to bonds, the Bloomberg Barclays US Credit Index returned 7.50%, whereas the Bloomberg Barclays Global High Yield Constrained Index returned 2.85%. The Bloomberg Barclays US Government Bond Index returned 10.56%, while the broader bond market index, as measured by the Bloomberg Barclays US Aggregate Bond Index, gained 6.98%. The Bloomberg Barclays Global Aggregate Index returned 6.24%.
Turning to the US economy, gross domestic product (“GDP”), the value of goods and services produced in the country, the broadest measure of economic activity and the principal indicator of economic performance, expanded at a 2.4% annual pace during the fourth quarter of 2019. The COVID-19 pandemic then started to take its toll on the economy, as GDP growth in the first quarter of 2020 was -5.0%. The Commerce Department then reported that second quarter annualized GDP growth was -31.4%, the steepest decline on record. Finally, the initial estimate for third quarter annualized GDP growth was 33.1%.
The US Federal Reserve (“Fed”) took a number of aggressive actions in an attempt to support the economy and keep the market functioning properly in the wake of the COVID-19 pandemic. On March 3, 2020, the Fed lowered the federal funds rate to a range between 1.00% and 1.25%, and on March 15, the federal funds rate was further reduced to a range between 0.00% and 0.25%. Then, on March 23, the Fed said it was “…committed to use its full range of tools to support the U.S. economy in this challenging time and thereby promote its maximum employment and price stability goals.” Among its actions, the Fed announced that it would make unlimited purchases of Treasury and mortgage securities. On June 15, 2020, the Fed announced it would purchase existing corporate bonds on the open market. In August 2020, the Fed updated its
| 2 | September 30, 2020 | | Annual Report |
Table of Contents
“Statement on Longer-Run Goals and Monetary Policy Strategy.” In summary, it is anticipated that the Fed’s new approach to setting U.S. monetary policy will include letting inflation and employment run higher, which could mean interest rates remain low for longer than previously anticipated. Finally, in September 2020, most members of the Federal Open Market Committee projected that the federal funds rate may stay anchored near zero through 2023.
Outlook
Since the market low on March 23, 2020, risk assets have rebounded impressively. While this year’s US equity rally was mostly dominated by the sectors well-positioned to capitalize on or be bolstered by certain of the circumstances caused by the COVID-19 pandemic (e.g., technology and healthcare), we have seen a broadening of leadership since mid-May: cyclical sectors such as industrials, financials and energy have performed well. In our view, investors should expect natural periods of consolidation in the coming months and be mindful of looming risks — from what is a second wave of rapidly increasing COVID-19 infections to the current state of controversy over the outcome of the US presidential election. Finally, as we continue to navigate the COVID-19 crisis, we believe it remains critical to make active bets and reposition for a post-COVID-19 world.
As announced on July 7, 2020, Allianz Global Investors plans to enter into a strategic alliance with Virtus Investment Partners (“Virtus”). If approved by shareholders of the Funds, wholly-owned subsidiaries of Virtus will become the investment adviser and administrator for the Funds and Virtus or an affiliate of Virtus will become the distributor for the Funds. With respect to all Funds other than the suite of value equity Funds, Allianz Global Investors U.S. LLC (“AllianzGI U.S.”) portfolio management teams will continue to be responsible for the day-to-day management of the Funds, through AllianzGI U.S. serving as sub-adviser to such Funds. With respect to the suite of value equity Funds managed by AllianzGI U.S.’s Dallas-based Value Equity US team, members of the Value Equity US team are expected to become employees of an affiliate of Virtus, NFJ Investment Group, LLC, and continue their day-to-day management of those Funds. On behalf of Allianz Global Investors, it was our honor to have served your Funds and look forward to continuing to do so in a sub-advisory capacity for applicable Funds.
On behalf of AllianzGI U.S., the Funds’ investment manager, thank you for investing with us. We encourage you to consult with your financial advisor and to visit our website, us.allianzgi.com, for additional information. We remain dedicated to serving your investment needs.
Sincerely,

Thomas J. Fuccillo
Trustee, President & Chief Executive Officer
Past performance is no guarantee of future results. Unless otherwise noted, index returns reflect the reinvestment of income dividends and capital gains, if any, but do not reflect fees, brokerage commissions or other expenses of investing. It is not possible to invest directly in an index.
Receive this report electronically and eliminate paper mailings.
To enroll, go to us.allianzgi.com/edelivery.
| Annual Report | | September 30, 2020 | 3 |
Table of Contents
Unaudited
AllianzGI Best Styles Global Equity Fund*
For the period of October 1, 2019 through September 30, 2020, as provided by Christian McCormick, Senior Product Specialist.
Fund Insights
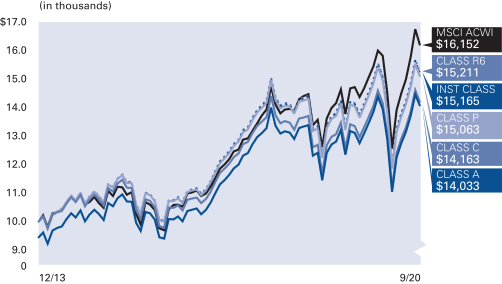
For the twelve-month period ended September 30, 2020, Class A shares at net asset value (“NAV”) of the AllianzGI Best Styles Global Equity Fund (the “Fund”) returned 7.50%, underperforming the MSCI ACWI (the “benchmark”), which returned 10.44%.
Market Overview
Global equities rallied over the third quarter of 2020, buoyed by positive trial results for potential COVID-19 vaccines, further stimulus measures and hopes that the global economy may be over the worst of its pandemic-induced recession. However, after recording their strongest August returns since 1986, stock markets weakened throughout September, undermined by political wrangling in the US over the size of further fiscal stimulus and concerns over a potentially destabilizing US presidential election. A surge in new COVID-19 infections in Europe further weighed on sentiment. In general, emerging markets outperformed developed markets, helped by a weaker tone to the US dollar.
Portfolio Review
The Best Styles strategies implement a well-diversified blend of the five long-term successful investment styles value, momentum, earnings revisions, growth and quality. Over the trailing twelve months, the style Value underperformed globally. It was one of the worst periods for Value versus the broad market and other investment styles in history. The trend-following styles of Momentum and Revisions did outperform, along with Growth, which had the strongest performance of the trend-following styles. Quality also performed well. From a capitalization perspective, small cap stocks underperformed mega cap and large cap stocks, which was an overall head wind to the strategy
The Fund has only moderate leeway for sector and regional allocation with a maximum deviation of 3% versus. the benchmark for active weightings. The overall contribution from active country/sector allocation was benign, as would be expected with our tight active collars.
The Fund holds a broad number of stocks to implement a well-diversified mix of investment styles and assigns a maximum active weighting of 1% to individual stocks. Therefore, we expect stock selection to be the biggest driver of relative returns and this was the case over the past twelve months. It was an unusually difficult period in terms of stock selection, for which the strategy posted a negative result in 9 of 11 sectors.
Outlook
COVID-19 has caused a global demand and supply shock. The recession started in the first quarter of 2020 and gross domestic product collapsed in the second quarter of 2020. In response to this crisis, governments and central banks all over the world have enacted fiscal and monetary stimulus measures to counteract the disruption caused by COVID-19. We anticipate that the third quarter of 2020 will probably see a V-shaped recovery. Due to the continued spread of COVID-19, however, the outlook for the fourth quarter of 2020 and 2021 is getting cloudier. The back-to-normal process will take some time.
* Effective on or about December 14, 2020, the AllianzGI Best Styles Global Equity Fund will be liquidated and dissolved, and any outstanding shares redeemed. As of December 7, 2020, shares of the Fund will no longer be available for purchase or exchange.
Average Annual Total Return for the period ended September 30, 2020
| 1 Year | 5 Year | Since Inception† | ||||||||||||
| AllianzGI Best Styles Global Equity Fund Class A | 7.50% | 7.74% | 5.96% | |||||||||||
| AllianzGI Best Styles Global Equity Fund Class A (adjusted) | 1.59% | 6.52% | 5.09% | ||||||||||
| AllianzGI Best Styles Global Equity Fund Class C | 6.71% | 7.01% | 5.23% | |||||||||||
| AllianzGI Best Styles Global Equity Fund Class C (adjusted) | 5.80% | 7.01% | 5.23% | ||||||||||
| AllianzGI Best Styles Global Equity Fund Class P | 7.73% | 7.98% | 6.19% | ||||||||||
| AllianzGI Best Styles Global Equity Fund Institutional Class | 7.84% | 8.09% | 6.29% | ||||||||||
| AllianzGI Best Styles Global Equity Fund Class R6 | 7.85% | 8.12% | 6.34% | ||||||||||
| MSCI ACWI | 10.44% | 10.30% | 7.27% | ||||||||||
| Lipper Global Multi-Cap Core Funds Average | 8.18% | 8.82% | 6.52% | |||||||||||
† The Fund began operations on December 2, 2013. Benchmark return comparisons began on the fund inception date. Lipper performance comparisons began on November 30, 2013.
Performance quoted represents past performance and is no guarantee of future results. Current performance may be lower or higher than performance shown. For performance current to the most recent month-end, visit our website at us.allianzgi.com. Investment return and the principal value will fluctuate. Shares may be worth more or less than original cost when redeemed. The adjusted returns take into account the maximum initial sales charge of 5.50% on Class A shares and the contingent deferred sales charge (CDSC) of 1% on Class C shares, which may apply to shares redeemed during the first year of ownership. Returns do not reflect deduction of taxes that a shareholder would pay on fund distributions or redemption of fund shares. See pages 63 and 64 for more information. The Fund’s gross expense ratios are 0.77% for Class A shares, 1.47% for Class C shares, 0.53% for Class P shares, 0.52% for Institutional Class shares and 0.40% for Class R6 shares. These ratios do not include an expense reduction, contractually guaranteed through at least January 31, 2021. The Funds expense ratios net of this reduction are 0.70% for Class A shares, 1.40% for Class C shares, 0.50% for Class P shares, 0.40% for Institutional Class shares and 0.40% for Class R6 shares. Expense ratio information is as of the Fund’s current prospectus dated February 1, 2020, as further revised or supplemented from time to time.
| 4 | September 30, 2020 | | Annual Report |
Table of Contents
Unaudited
AllianzGI Best Styles Global Equity Fund (cont’d)
Cumulative Returns Through September 30, 2020
Country/Location Allocation (as of September 30, 2020)
| United States | 52.6% | |||
| Japan | 6.3% | |||
| China | 5.4% | |||
| France | 3.6% | |||
| Canada | 3.0% | |||
| United Kingdom | 2.9% | |||
| Taiwan | 2.8% | |||
| Korea (Republic of) | 2.6% | |||
| Other | 19.5% | |||
| Cash & Equivalents — Net | 1.3% | |||
| Shareholder Expense Example | Actual Performance | |||||||||
| Class A | Class C | Class P | Institutional Class | Class R6 | ||||||
| Beginning Account Value (4/1/20) | $1,000.00 | $1,000.00 | $1,000.00 | $1,000.00 | $1,000.00 | |||||
| Ending Account Value (9/30/20) | $1,272.00 | $1,266.50 | $1,272.70 | $1,273.60 | $1,274.50 | |||||
| Expenses Paid During Period | $3.98 | $7.93 | $2.84 | $2.27 | $2.27 | |||||
| Hypothetical Performance | ||||||||||
| (5% return before expenses) | ||||||||||
| Class A | Class C | Class P | Institutional Class | Class R6 | ||||||
| Beginning Account Value (4/1/20) | $1,000.00 | $1,000.00 | $1,000.00 | $1,000.00 | $1,000.00 | |||||
| Ending Account Value (9/30/20) | $1,021.50 | $1,018.00 | $1,022.50 | $1,023.00 | $1,023.00 | |||||
| Expenses Paid During Period | $3.54 | $7.06 | $2.53 | $2.02 | $2.02 | |||||
For each class of the Fund, expenses (net of fee waiver and reimbursement, if any) are equal to the annualized expense ratio for the class (0.70% for Class A, 1.40% for Class C, 0.50% for Class P, 0.40% for Institutional Class and 0.40% for Class R6), multiplied by the average account value over the period, multiplied by 183/366. These expenses do not include the expenses of the investment companies in which the Fund invests, which are indirectly borne by Fund shareholders.
| Annual Report | | September 30, 2020 | 5 |
Table of Contents
Unaudited
AllianzGI Convertible Fund
For the period of October 1, 2019 through September 30, 2020, as provided by Douglas C. Forsyth, CFA, Portfolio Manager.
Fund Insights
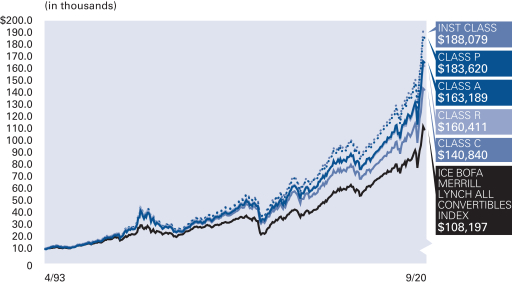
For the twelve-month period ended September 30, 2020, Class A shares at net asset value (“NAV”) of the AllianzGI Convertible Fund (the “Fund”) returned 38.44%, outperforming the ICE BofA US Convertibles Index (the “benchmark”), which returned 31.20%.
Market Overview
Despite historic equity and credit volatility, convertible securities produced a materially positive twelve-month return. Strong underlying equity performance and credit spread tightening over the latter half of the reporting period benefited the asset class.
Convertible securities gained over the fourth quarter of 2019 and into early 2020 before selling off aggressively in late February and much of March as the COVID-19 outbreak intensified. In connection with unprecedented monetary and fiscal policy responses, the convertible market rebounded from the March low and advanced over the remainder of period. Stabilizing investor confidence, accommodative US Federal Reserve (the “Fed”) commentary, positive economic surprise momentum, better-than-feared corporate earnings, US COVID-19 case trends and vaccine/treatment progress were all market supportive.
The Fed’s response was designed to ensure the normal functioning and stabilization of US credit markets and was also extraordinary in terms of its swiftness, scope, and willingness to take action. The Fed remained highly accommodative throughout the reporting period, pledging to keep interest rates near zero until at least the end of 2023. In addition, the Fed officially set a new inflation target of moderately above 2.0%, noting it would maintain an accommodative stance until inflation hits this level.
The fiscal response was also immediate with President Trump signing into law several bills including the $2.2 trillion Coronavirus Aid, Relief & Security Act.
As anticipated, the economy decelerated, and the unemployment rate surged. Although, economic data released later in the period improved and, in many cases, surprised to the upside as lockdowns, travel restrictions and social-distancing measures eased.
The first-quarter earnings season was weak, but second-quarter financial results exceeded estimates amid better-than-feared earnings. Management outlooks were also constructive, but fewer companies provided guidance.
Non-investment grade issuers outperformed investment grade issuers. Equity-sensitive structures outperformed total return (balanced) and yield alternative (busted).
Primary market activity was robust through September with $88.2 billion in proceeds year-to date—the highest annual level since 2007.
Portfolio Review
Sector allocations that helped relative performance in the period included technology, financials and utilities. Positive credit selection was the primary driver of relative performance in the technology sector whereas portfolio underweights were the main sources of strength in financials and utilities.
Consumer discretionary was the only sector that notably detracted from performance during the period. Security selection and a portfolio underweight adversely impacted the relative return.
Outlook
While uncertainty remains elevated, visibility around the macro outlook and corporate profitability path has improved.
Extraordinary monetary and fiscal policy measures have stabilized financial markets and the US economy. Furthermore, Fed Chair Jerome Powell and US Treasury Secretary Mnuchin have pledged additional support if needed to accelerate the recovery.
With economic progress, we believe that corporate profits should begin to trough and then start recovering over the second half of the year and into 2021. US companies are not only positioned to directly benefit from Fed programs and US government fiscal support but also from a potentially significant boost in operating leverage as strengthening demand is met with lower input costs and productivity gains.
Against this backdrop, several risks could surface triggering market volatility including geopolitical tensions, fiscal stimulus uncertainty, US elections and localized shutdowns due to increasing COVID-19 cases.
We expect continued growth of the US convertible bond market as scheduled maturities slow and the new issuance calendar remains strong. This environment could provide balanced convertible opportunities and help to broaden sectors and diversify the overall market. Going forward, we believe that the convertible market remains well positioned to participate in the upside and provide downside protection.
| 6 | September 30, 2020 | | Annual Report |
Table of Contents
Unaudited
AllianzGI Convertible Fund (cont’d)
Average Annual Total Return for the period ended September 30, 2020
| 1 Year | 5 Year | 10 Year | Since Inception† | |||||||||||||||
| AllianzGI Convertible Fund Class A | 38.44% | 15.44% | 12.31% | 10.94% | ||||||||||||||
| AllianzGI Convertible Fund Class A (adjusted) | 30.83% | 14.15% | 11.68% | 10.71% | |||||||||||||
| AllianzGI Convertible Fund Class C | 37.40% | 14.60% | 11.49% | 10.12% | ||||||||||||||
| AllianzGI Convertible Fund Class C (adjusted) | 36.40% | 14.60% | 11.49% | 10.12% | |||||||||||||
| AllianzGI Convertible Fund Class R | 38.17% | 15.14% | 11.97% | 10.64% | |||||||||||||
| AllianzGI Convertible Fund Class P | 38.78% | 15.74% | 12.58% | 11.18% | |||||||||||||
| AllianzGI Convertible Fund Institutional Class | 38.80% | 15.79% | 12.65% | 11.28% | |||||||||||||
| AllianzGI Convertible Fund Administrative Class | 38.53% | 15.52% | 12.38% | 10.96% | ||||||||||||||
| ICE BofA US Convertibles Index | 31.20% | 13.80% | 11.38% | 9.06% | |||||||||||||
| Lipper Convertible Securities Funds Average | 30.13% | 12.97% | 10.11% | 6.44% | ||||||||||||||
† The Fund began operations on April 19, 1993. Benchmark return comparisons began on the fund inception date. Lipper performance comparisons began on April 30, 1993.
Performance quoted represents past performance and is no guarantee of future results. Current performance may be lower or higher than performance shown. For performance current to the most recent month-end, visit our website at us.allianzgi.com. Investment return and the principal value will fluctuate. Shares may be worth more or less than original cost when redeemed. The adjusted returns take into account the maximum initial sales charge of 5.50% on Class A shares and the contingent deferred sales charge (CDSC) of 1% on Class C shares, which may apply to shares redeemed during the first year of ownership. Returns do not reflect deduction of taxes that a shareholder would pay on fund distributions or redemption of fund shares. See pages 63 and 64 for more information. The Fund’s gross expense ratios are 1.02% for Class A shares, 1.75% for Class C shares, 1.17% for Class R shares, 0.75% for Class P shares, 0.72% for Institutional Class shares and 0.97% for Administrative Class shares. These ratios do not include an expense reduction, contractually guaranteed through at least January 31, 2021. The Fund’s expense ratios net of this reduction are 0.96% for Class A shares, 1.73% for Class C shares, 1.17% for Class R shares, 0.74% for Class P shares, 0.71% for Institutional Class shares and 0.93% for Administrative Class shares. Expense ratio information is as of the Fund’s current prospectus dated February 1, 2020, as further revised or supplemented from time to time.
Cumulative Returns Through September 30, 2020
Industry Allocation (as of
September 30, 2020)
| Software | 18.2% | |||
| Internet | 12.7% | |||
| Healthcare-Products | 9.8% | |||
| Semiconductors | 8.1% | |||
| Auto Manufacturers | 4.9% | |||
| Banks | 3.9% | |||
| Diversified Financial Services | 3.3% | |||
| Commercial Services | 3.2% | |||
| Other | 34.5% | |||
| Cash & Equivalents — Net | 1.4% | |||
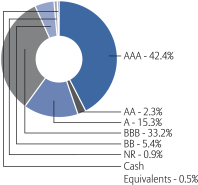
Credit Ratings* (as of September 30, 2020)
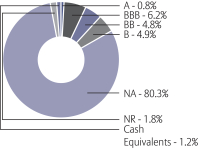
* As a percentage of total investments. Credit ratings refer to the underlying holdings of the Fund and are categorized from highest to lowest credit quality using ratings provided by S&P Global Ratings (“S&P”). S&P’s ratings have been selected for several reasons, including the portfolio managers’ usage of S&P ratings methodology among other credit quality information in managing the Fund, access to background information and other materials provided by S&P, as well as the Funds’ considerations of industry practice. The Fund also displays S&P credit ratings information in materials provided in client presentations. See “Important Information” for more detail on the selection of S&P for the Fund’s ratings presentation. Securities not rated by S&P and bonds that do not currently have a rating available are designated in the chart above as “NR” and “NA”, respectively.
| Annual Report | | September 30, 2020 | 7 |
Table of Contents
Unaudited
AllianzGI Convertible Fund (cont’d)
| Shareholder Expense Example | Actual Performance | |||||||||||
| Class A | Class C | Class R | Class P | Institutional Class | Administrative Class | |||||||
| Beginning Account Value (4/1/20) | $1,000.00 | $1,000.00 | $1,000.00 | $1,000.00 | $1,000.00 | $1,000.00 | ||||||
| Ending Account Value (9/30/20) | $1,454.30 | $1,448.70 | $1,453.30 | $1,456.20 | $1,456.20 | $1,454.50 | ||||||
| Expenses Paid During Period | $5.89 | $10.65 | $6.69 | $4.42 | $4.42 | $5.77 | ||||||
| Hypothetical Performance | ||||||||||||
| (5% return before expenses) | ||||||||||||
| Class A | Class C | Class R | Class P | Institutional Class | Administrative Class | |||||||
| Beginning Account Value (4/1/20) | $1,000.00 | $1,000.00 | $1,000.00 | $1,000.00 | $1,000.00 | $1,000.00 | ||||||
| Ending Account Value (9/30/20) | $1,020.20 | $1,016.30 | $1,019.55 | $1,021.40 | $1,021.40 | $1,020.30 | ||||||
| Expenses Paid During Period | $4.85 | $8.77 | $5.50 | $3.64 | $3.64 | $4.75 | ||||||
For each class of the Fund, expenses (net of fee waiver and reimbursement, if any) are equal to the annualized expense ratio for the class (0.96% for Class A, 1.74% for Class C, 1.09% for Class R, 0.72% for Class P, 0.72% for Institutional Class and 0.94% for Administrative Class), multiplied by the average account value over the period, multiplied by 183/366.
| 8 | September 30, 2020 | | Annual Report |
Table of Contents
Unaudited
AllianzGI Core Plus Bond Fund
For the period of October 1, 2019 through September 30, 2020, as provided by Carl W. Pappo, Jr., CFA, Portfolio Manager.
Fund Insights
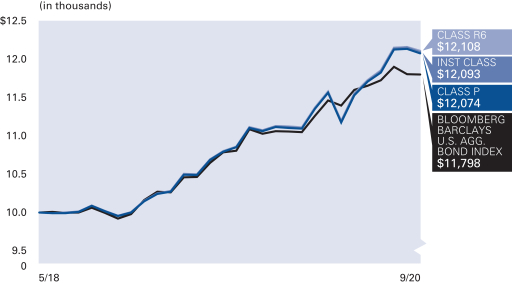
For the twelve-month period ended September 30, 2020, Institutional Class shares at net asset value (“NAV”) of the AllianzGI Core Plus Bond Fund (the “Fund”) returned 9.25%, outperforming the Bloomberg Barclays U.S. Aggregate Bond Index (the “benchmark”), which returned 6.98%.
Market Overview
Despite a strong performance during the first half of the twelve-month period, the economy beginning in March 2020 was dominated by the COVID-19 pandemic. As businesses closed and the US economy shut down in response to COVID-19, fixed income market liquidity dried up and forced-selling quickly drove valuations on risk assets to levels not seen since the global financial crisis in 2007-2008. Price dislocations, however, did present investment opportunities for the Fund. The US Federal Reserve (the “Fed”) participation in the fixed income markets through various purchase and lending programs, especially in the investment grade (“IG”) and high yield (“HY”) credit markets, as well as the massive fiscal response by the US Government helped drive spreads and valuations tighter. Uncertainty remains regarding further economic recovery, but robust monetary stimulus remains in place. Demand technicals for risk assets driven by Fed purchases should therefore continue to exert pressure on asset prices, overwhelm economic factors, and drive spreads tighter.
Portfolio Review
Fund performance for the twelve-month period was primarily driven by an underweight to treasuries and over-exposure to risk assets including IG and HY corporates, asset-backed securities (“ABS”), collateralized loan obligations (“CLO”), and preferred bonds. The Fund came into March 2020 overweight 0.20 years corporate credit and added substantially to the sector as spreads widened versus reducing exposure to mortgage-backed securities. The Fund’s initial overweight to agency mortgage-backed securities (“MBS”) before the pandemic was very supportive as the government announced their intention early on to purchase MBS to lower market volatility and provide liquidity for customer outflows. The Fund reduced Agency MBS exposure to 10% underweight to move into higher beta sectors such as corporate credit when spreads widened following the market disruption as government buying to bolster market liquidity was heavily concentrated in that sector. Ultimately, IG corporate bond spreads widened over 200 basis points due to the pandemic reaching levels not seen since the global financial crisis in 2007-2008, over three standard deviations cheap relative to historical measures. Moreover, the Fund which was underweight high-yield exposure entering the period increased high-yield positioning as high as 14% when spreads widened, ending the period at 11% overweight.
The Fund also began the period with significant overweights to high quality ABS including consumer auto loans and credit cards, mezzanine tranches of ABS backed by consumer loans, equipment leases and timeshares, and small business administration loans. Despite high fundamental credit quality—and in the case of small business administration loans, a full government guarantee—these assets were not sheltered from the extreme liquidity-driven selloff as secondary supply for the period grew 50% year-over-year, most notably in March 2020, as investment managers were forced to sell what they could to fund redemptions while dealer support dissipated. As technical forces began to normalize at the end of March 2020, fundamental considerations re-emerged, and the highest quality asset classes enjoyed an outsized share of the improvement. At the end of the period, ABS exposure was increased versus taking gains in corporates purchased throughout the pandemic, including the addition of collateralized loan obligations.
Outlook
Overweight exposure to corporate bonds was maintained, reflecting what we believe remains a strong risk/reward profile offered by credit spreads. The belief is supported by a second straight quarter of positive economic surprises across several readings, continued support for the asset class from the Fed, and a strong yield relative to the global opportunity set. The Fund remains focused in quality companies with great assets that will see limited impacts from COVID-19 shutdowns, including regulated utilities, telecommunications & cable, defense, food & beverage retailers, and diversified media. While we continue to mostly avoid companies who are generating significantly less revenue in this environment, the Fund has participated in some opportunities in the travel and leisure sector that offer high relative yields with strong downside protection, typically in the form of structural seniority. Now that imminent fear of liquidity shock has been calmed and the global recovery enters its next phases, we remain focused on what each business is likely to look like in 2021 and beyond—while many look to regain 2019 run-rate revenue in the near future, others can only hope 2022 brings normalcy. We believe strongly that bottom up research is more important than ever as the coming months and years will impact industries in very diverse ways and owning the right companies will be a big differentiator for total returns. Similarly, the 18% overweight ABS at the short end of the maturity spectrum continues to emphasize ABS structures which provide significant support even in the current uncertain economic environment. The overweight in collateralized CLO bonds features superior structural profiles where call risk is low, and payments get accelerated at par if economic conditions deteriorate. CLOs offer attractive spreads for assets with substantial credit enhancement. We intend to remain underweight MBS as mortgage originations driven by explosive sales in the housing market have caused considerable supply dislocations despite Fed purchases.
| Annual Report | | September 30, 2020 | 9 |
Table of Contents
Unaudited
AllianzGI Core Plus Bond Fund (cont’d)
Average Annual Total Return for the period ended September 30, 2020
| 1 Year | Since Inception† | |||||||||
| AllianzGI Core Plus Bond Fund Class P | 9.18% | 8.40% | |||||||
| AllianzGI Core Plus Bond Fund Institutional Class | 9.25% | 8.47% | |||||||
| AllianzGI Core Plus Bond Fund Class R6 | 9.35% | 8.53% | |||||||
| Bloomberg Barclays U.S. Aggregate Bond Index | 6.98% | 7.33% | |||||||
Lipper Core Plus Bond Funds Average | 7.32% | 7.23% | ||||||||
† The Fund began operations on May 30, 2018. Benchmark return comparisons began on the fund inception date. Lipper performance comparisons began on May 31, 2018.
Performance quoted represents past performance and is no guarantee of future results. Current performance may be lower or higher than performance shown. For performance current to the most recent month-end, visit our website at us.allianzgi.com. Investment return and the principal value will fluctuate. Shares may be worth more or less than original cost when redeemed. Returns do not reflect deduction of taxes that a shareholder would pay on funds distributions or redemption of fund shares. See pages 63 and 64 for more information. The Fund’s gross expense ratios are 0.83% for Class P shares, 20.93% for Institutional Class shares and 0.84% for Class R6 shares. These ratios do not include an expense reduction, contractually guaranteed through at least January 31, 2022. The Fund’s expense ratios net of this reduction are 0.35% for Class P shares, 0.30% for Institutional Class shares and 0.25% for Class R6 shares. Expense ratio information is as of the Fund’s current prospectus dated February 1, 2020, as further revised or supplemented from time to time.
Cumulative Returns Through September 30, 2020
Asset Allocation (as of September 30, 2020)
| Corporate Bonds & Notes | 52.1% | |||
| Asset-Backed Securities | 21.8% | |||
| U.S. Government Agency Securities | 16.4% | |||
| U.S. Treasury Obligations | 10.5% | |||
| Preferred Stock | 1.8% | |||
| Cash & Equivalents — Net | –2.6% | |||
Credit Ratings* (as of September 30, 2020)
* As a percentage of total investments. Credit ratings apply to the credit worthiness of the issuers of the underlying securities and not to the Fund or its shares. Ratings are subject to change. Ratings are based off of the highest available rating from S&P Global Ratings (“S&P”), Moody’s and Fitch. Bonds not rated by the aforementioned agencies are “unrated”. Ratings are shown based on the S&P rating scale, which ranges from AAA (highest) to D (lowest). Where applicable, securities ratings of an agency other than S&P have been converted to the S&P equivalent. “NR” denotes securities that are not rated. Not rated securities do not necessarily indicate low quality. Ratings are relative, subjective and not absolute standards of quality, and represent the opinions of the independent Nationally Recognized Statistical Rating Organizations (NRSRO). The security’s credit rating does not eliminate risk. The Fund is not rated by an independent rating agency.
| 10 | September 30, 2020 | | Annual Report |
Table of Contents
Unaudited
AllianzGI Core Plus Bond Fund (cont’d)
| Shareholder Expense Example | Actual Performance | |||||
| Class P | Institutional Class | Class R6 | ||||
| Beginning Account Value (4/1/20) | $1,000.00 | $1,000.00 | $1,000.00 | |||
| Ending Account Value (9/30/20) | $1,080.50 | $1,080.90 | $1,081.70 | |||
| Expenses Paid During Period | $1.82 | $1.56 | $1.30 | |||
| Hypothetical Performance | ||||||
| (5% return before expenses) | ||||||
| Class P | Institutional Class | Class R6 | ||||
| Beginning Account Value (4/1/20) | $1,000.00 | $1,000.00 | $1,000.00 | |||
| Ending Account Value (9/30/20) | $1,023.25 | $1,023.50 | $1,023.75 | |||
| Expenses Paid During Period | $1.77 | $1.52 | $1.26 | |||
For each class of the Fund, expenses (net of fee waiver and reimbursement, if any) are equal to the annualized expense ratio for the class (0.35% for Class P, 0.30% for Institutional Class and 0.25% for Class R6), multiplied by the average account value over the period, multiplied by 183/366.
| Annual Report | | September 30, 2020 | 11 |
Table of Contents
Unaudited
AllianzGI Emerging Markets Consumer Fund
For the period of October 1, 2019 through September 30, 2020, as provided by Lu Yu, CFA, CIPM, Portfolio Manager.
Fund Insights
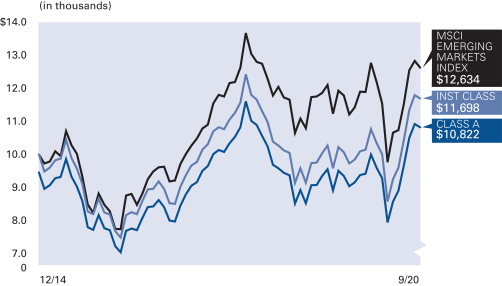
For the twelve-month period ended September 30, 2020, Class A shares at net asset value (“NAV”) of the AllianzGI Emerging Markets Consumer Fund (the “Fund”) returned 18.34%, outperforming the MSCI Emerging Markets Index (the “benchmark”), which returned 10.54%.
Market Overview
Emerging market equities were influenced by rapidly shifting macroeconomic conditions during the twelve-month period in light of moderating global growth expectations and impact from the COVID-19 pandemic.
Emerging markets equities initially advanced in October 2019 amid signs of easing trade tensions between the US and China as well as via interest rate cuts from central banks in both developed and developing economies. After a flat performance in November 2019, the positive asset class performance accelerated in December 2019 thanks in part to the agreement of a “phase one” trade deal between the US and China coupled with a rebound in global growth expectations. The economic outlook then shifted suddenly as emerging market equities declined meaningfully in the January to March 2020 period, crippled by the spread of the COVID-19 and global economic growth ground to a standstill. The market decline reversed in April 2020 as the prior draconian measures which were employed to curtail COVID-19 were gradually lifted. The resilient performance continued with positive gains in each month from the May to August 2020 period as equities were lifted amid optimism that the COVID-19 concerns which plagued the asset class were subsiding thanks to unprecedented government and central bank support buoyed stocks, helping investors overcome fears of a second wave of infections. The asset class declined modestly in September 2020 as COVID-19 cases spiked, particularly in Europe, and uncertainty over the US Presidential election began to weigh on sentiment.
Asian equities were the top performers with a 21.5% advance. Taiwan was the standout country in the region with a 35.0% gain thanks primarily to strength in the technology sector, led by semiconductor demand. Chinese equities were higher by 33.6% as the country was the first to be hit by the COVID-19 slowdown and subsequently the first to rebound once concerns were lessened. Meanwhile, Thailand and Indonesia were each down more than 25%. Emerging European stocks were collectively down 19.2% as all stocks in the region declined. Regional heavyweight Russia was lower by 16.0% due in part to lackluster energy demand. Latin American shares broadly declined, posting a 29.4% loss. Brazil, which is by far the largest benchmark weight in the region, declined 32.5% as falling commodity prices, slower global trade and the impact from COVID-19 depressed the country’s economic outlook.
Sector performance for the benchmark was divergent, with 5 out of 11 sectors advancing. Consumer discretionary gained 48.4% thanks to improving work from home demand trends while health care advanced 47.1% due to increased attention related to the search for tests, treatments and vaccines to tackle COVID-19. Information technology was up 42.5% due to resilient demand, followed by a 25.6% gain in communication services. Alternatively, cyclically-oriented sectors were the hardest hit, including financials, energy and utilities which were each down more than 18% during the annual reporting period.
Portfolio Review
The Fund seeks to capitalize on the long-term growth of the local emerging markets consumer, while limiting other risks including country and market capitalization. The Fund significantly outperformed the benchmark thanks to positive stock selection and allocation decisions.
During the reporting period, a focus on health care-related investments aided performance as the sector was the second-best benchmark performer. The avoidance of energy companies also positively impacted results given headwinds in the sector, as did bottom-up stock selection in communication services. Meanwhile, the inability to own key non-consumer-related segments of information technology, primarily semiconductors, offset results as did more conservative stock selection in consumer discretionary. From a country perspective, bottom-up stock selection in China and Malaysia led results to the upside and emerging markets consumer-related companies traded in the United States also contributed to the investment performance. Meanwhile, stock selection in Taiwan detracted from results, due primarily to the inability to own key non-consumer-related segments in the country. Short-term stockpicking in India offset results more modestly during the annual reporting period.
Outlook
Emerging market equities may continue to benefit from encouraging investor sentiment coupled against the backdrop of favorable fiscal and monetary policies. COVID-19 impacts remain a key determinant for market direction. While the number of COVID-19 cases continue to rise globally, investors appear to look past these near-term uncertainties and instead focus on earnings growth potential over the coming years. Market volatility may persist and be data-driven based on COVID-19 and US presidential election news. Over the last six months since the pandemic-led decline bottomed, emerging markets equities have outperformed their developed market counterparts, thanks in part to a more attractive growth vs. valuation mix. It is interesting to note that emerging and developed markets have alternated performance results over each of the prior four decades. Emerging markets outpaced developed markets in the 1980s and 2000s, while the opposite was true in the 1990s and 2010s. If history is any guide, it is our belief that this leadership position could again change hands and point to outperformance potential for emerging markets equities. The consumer-related focus may help to further capture opportunities thanks to a greater focus on drivers related to favorable demographic and consumption trends.
We continue to construct the Fund on a bottom-up basis with conviction at the stock level. In addition, we apply a dual risk-budget, targeting a tracking error of 5-10% and lower forecast risk than the benchmark, which may help protect capital during inevitable down-market periods and provide our clients with a greater level of return consistency. We believe investment results will be supported by earnings growth in consumer-related stocks and that our behavioral finance-focused investment process and focus on higher quality securities with attractive company fundamentals will be a driver of returns for the coming quarters.
| 12 | September 30, 2020 | | Annual Report |
Table of Contents
Unaudited
AllianzGI Emerging Markets Consumer Fund (cont’d)
Average Annual Total Return for the period ended September 30, 2020
| 1 Year | 5 Year | Since Inception† | ||||||||||||
AllianzGI Emerging Markets Consumer Fund Class A | 18.34% | 7.01% | 2.35% | |||||||||||
| AllianzGI Emerging Markets Consumer Fund Class A (adjusted) | 11.83% | 5.81% | 1.36% | ||||||||||
| AllianzGI Emerging Markets Consumer Fund Institutional Class | 18.84% | 7.40% | 2.72% | ||||||||||
| MSCI Emerging Markets Index | 10.54% | 8.97% | 4.09% | ||||||||||
Lipper Emerging Markets Funds Average | 10.80% | 8.39% | 3.41% | |||||||||||
† The Fund began operations on December 1, 2014. Benchmark return comparisons began on the fund inception date. Lipper performance comparisons began on November 30, 2014.
Performance quoted represents past performance and is no guarantee of future results. Current performance may be lower or higher than performance shown. For performance current to the most recent month-end, visit our website at us.allianzgi.com. Investment return and the principal value will fluctuate. Shares may be worth more or less than original cost when redeemed. The adjusted returns take into account the maximum initial sales charge of 5.50% on Class A shares. Returns do not reflect deduction of taxes that a shareholder would pay on fund distributions or redemption of fund shares. See pages 63 and 64 for more information. The Fund’s gross expense ratios are 1.71% for Class A shares and 1.39% for Institutional Class shares. These ratios do not include an expense reduction, contractually guaranteed through at least January 31, 2021. The Fund’s expense ratios net of this reduction are 1.39% for Class A shares and 1.05% for Institutional Class shares. Expense ratio information is as of the Fund’s current prospectus dated February 1, 2020, as further revised or supplemented from time to time.
Cumulative Returns Through September 30, 2020
Country/Location Allocation (as of September 30, 2020)
| China | 49.7% | |||
| Korea (Republic of) | 12.9% | |||
| United States | 8.8% | |||
| Taiwan | 8.6% | |||
| India | 4.8% | |||
| Switzerland | 2.4% | |||
| Malaysia | 1.9% | |||
| Hong Kong | 1.6% | |||
| Other | 7.9% | |||
| Cash & Equivalents — Net | 1.4% | |||
| Annual Report | | September 30, 2020 | 13 |
Table of Contents
Unaudited
AllianzGI Emerging Markets Consumer Fund (cont’d)
| Shareholder Expense Example | Actual Performance | |||
| Class A | Institutional Class | |||
| Beginning Account Value (4/1/20) | $1,000.00 | $1,000.00 | ||
| Ending Account Value (9/30/20) | $1,364.30 | $1,366.30 | ||
| Expenses Paid During Period | $8.22 | $6.21 | ||
| Hypothetical Performance | ||||
| (5% return before expenses) | ||||
| Class A | Institutional Class | |||
| Beginning Account Value (4/1/20) | $1,000.00 | $1,000.00 | ||
| Ending Account Value (9/30/20) | $1,018.05 | $1,019.75 | ||
| Expenses Paid During Period | $7.01 | $5.30 | ||
For each class of the Fund, expenses (net of fee waiver and reimbursement, if any) are equal to the annualized expense ratio for the class (1.39% for Class A and 1.05% for Institutional Class), multiplied by the average account value over the period, multiplied by 183/366.
| 14 | September 30, 2020 | | Annual Report |
Table of Contents
Unaudited
AllianzGI Emerging Markets Small-Cap Fund*
For the period of October 1, 2019 through September 30, 2020, as provided by Kunal Ghosh, Portfolio Manager.
Fund Insights
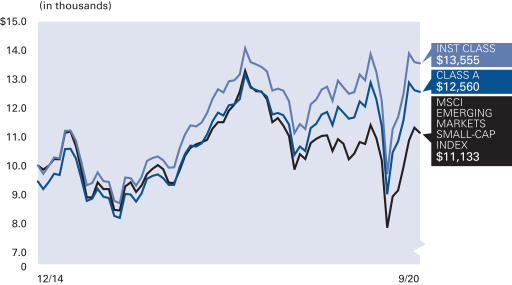
For the twelve-month period ended September 30, 2020, Class A shares at net asset value (“NAV”) of the AllianzGI Emerging Markets Small-Cap Fund (the “Fund”) returned 7.64%, outperforming the MSCI Emerging Markets Small-Cap Index (the “benchmark”), which returned 6.89%.
Market Overview
Emerging markets small cap equities were influenced by rapidly shifting macroeconomic conditions during the twelve-month period in light of moderating global growth expectations and impact from the COVID-19 pandemic.
Emerging markets small cap equities initially advanced in October 2019 amid signs of easing trade tensions between the US and China as well as via interest rate cuts from central banks in both developed and developing economies. After a flat performance in November 2019, the positive asset class performance accelerated in December 2019 thanks in part to the agreement of a “phase one” trade deal between the US and China coupled with a rebound in global growth expectations. The economic outlook then shifted suddenly as emerging market equities declined meaningfully in the January to March 2020 period, crippled by the spread COVID-19 and global economic growth ground to a standstill. The market decline reversed in April 2020 as the prior draconian measures which were employed to curtail COVID-19 were gradually lifted. The resilient performance continued with positive gains in each month from the May to August 2020 period as equities were lifted amid optimism that the COVID-19 concerns which plagued the asset class were subsiding thanks to unprecedented government and central bank support buoyed stocks, helping investors overcome fears of a second wave of infections. The asset class declined modestly in September 2020 as COVID-19 cases spiked, particularly in Europe, and uncertainty over the US Presidential election began to weigh on sentiment.
Asian small cap equities were the top performers with a 14.6% advance. South Korea was the best performer with a 36.6% gain thanks to strong performance in health care-oriented companies, followed by a 23.0% gain in Taiwan due to higher technology-related demand. Alternatively, Indonesian small cap equities were down 45.8% followed by a 31.5% loss in the Philippines. Emerging European stocks were collectively down 6.2% as returns were mixed with three out of six countries posting gains. Poland was higher by 6.8%, Russia gained 5.9% while the Czech Republic was notched a mere 0.8% advance. Hungary led results to the downside with a 20.7% decline. Latin American shares were broadly lower, posting a 25.2% loss. Brazil, which is by far the largest benchmark weight in the region, declined 24.5% as falling commodity prices, slower global trade and the impact from COVID-19 depressed the country’s economic outlook.
Sector performance for the benchmark was divergent, with 5 out of 11 sectors advancing. Health care gained 67.7% thanks to increased attention related to the search for tests, treatments and vaccines to tackle COVID-19, while information technology was higher by 32.7% due to resilient demand. Materials and communication services sectors were each up low double-digits for the period. Meanwhile, cyclically-oriented sectors were the hardest hit, including financials, energy and real estate which were each down more than 17% during the annual reporting period.
Portfolio Review
Our goal is to provide clients with a portfolio capitalizing on conviction at the stock level, while limiting other risks including country, industry and market capitalization. The Fund modestly topped the benchmark during the reporting period due to a combination of stock selection and allocation decisions.
During the twelve-month period, strong bottom-up stock selection in the materials sector led results to the upside. Allocation decisions, including an underweight to real estate and consumer discretionary, contributed to results as did stock selection in consumer staples. Conversely, more conservative stock selection in the health care sector, by far the benchmark’s top performer, and communication services offset results. From a country standpoint, bottom-up stockpicking in India, South Africa and Malaysia was a driver of investment performance. This was counterbalanced via stockpicking in South Korea, China and Mexico which trailed the benchmark during the twelve-month period.
Outlook
Emerging markets small cap equities may continue to benefit from encouraging investor sentiment coupled against the backdrop of favorable fiscal and monetary policies. COVID-19 impacts remain a key determinant for market direction. While the number of COVID-19 cases continue to rise globally, investors appear to look past these near-term uncertainties and instead focus on earnings growth potential over the coming years. Market volatility may persist and be data-driven based on COVID-19 and US presidential election news. Over the last six months since the pandemic-led decline bottomed, emerging markets equities have outperformed their developed market counterparts, thanks in part to a more attractive growth vs. valuation mix. It is interesting to note that emerging and developed markets have alternated performance results over each of the prior four decades. Emerging markets outpaced developed markets in the 1980s and 2000s, while the opposite was true in the 1990s and 2010s. If history is any guide, it is our belief that this leadership position could again change hands and point to outperformance potential for emerging markets equities. Additionally, the potential for higher outperformance due to greater inefficiencies in emerging markets small cap equities may further benefit investors.
We continue to construct the Strategy on a bottom-up basis with conviction at the stock level. In addition, we apply a dual risk-budget, targeting a tracking error of 4-6% and lower forecast risk than the benchmark, which may help protect capital during inevitable down market periods and provide our clients with a greater level of return consistency. We believe investment results will be supported by earnings growth and our behavioral finance-focused investment process and focus on higher quality securities with attractive company fundamentals will be a driver of returns for the coming quarters.
* On November 18, 2020, the AllianzGI Emerging Markets Small-Cap Fund liquidated. Please see the supplement to the Fund’s statutory prospectus for more information.
| Annual Report | | September 30, 2020 | 15 |
Table of Contents
Unaudited
AllianzGI Emerging Markets Small-Cap Fund (cont’d)
Average Annual Total Return for the period ended September 30, 2020
| 1 Year | 5 Year | Since Inception† | ||||||||||||
AllianzGI Emerging Markets Small-Cap Fund Class A | 7.64% | 7.26% | 5.00% | |||||||||||
| AllianzGI Emerging Markets Small-Cap Fund Class A (adjusted) | 1.72% | 6.05% | 3.99% | ||||||||||
| AllianzGI Emerging Markets Small-Cap Fund Institutional Class | 7.97% | 7.62% | 5.36% | ||||||||||
| MSCI Emerging Markets Small-Cap Index | 6.89% | 4.60% | 1.86% | ||||||||||
Lipper Emerging Markets Funds Average | 10.80% | 8.39% | 3.41% | |||||||||||
† The Fund began operations on December 1, 2014. Benchmark return comparisons began on the fund inception date. Lipper performance comparisons began on November 30, 2014.
Performance quoted represents past performance and is no guarantee of future results. Current performance may be lower or higher than performance shown. For performance current to the most recent month-end, visit our website at us.allianzgi.com. Investment return and the principal value will fluctuate. Shares may be worth more or less than original cost when redeemed. The adjusted returns take into account the maximum initial sales charge of 5.50% on Class A shares. Returns do not reflect deduction of taxes that a shareholder would pay on fund distributions or redemption of fund shares. See pages 63 and 64 for more information. The Fund’s gross expense ratios are 3.00% for Class A shares and 2.84% for Institutional Class shares. These ratios do not include an expense reduction, contractually guaranteed through at least January 31, 2021. The Fund’s expense ratios net of this reduction are 1.80% for Class A shares and 1.50% for Institutional Class shares. Expense ratio information is as of the Fund’s current prospectus dated February 1, 2020, as further revised or supplemented from time to time.
Cumulative Returns Through September 30, 2020
Country/Location Allocation
(as of September 30, 2020)
| Taiwan | 28.3% | |||
| Korea (Republic of) | 19.3% | |||
| India | 17.4% | |||
| China | 12.0% | |||
| South Africa | 5.2% | |||
| Brazil | 3.3% | |||
| Turkey | 2.7% | |||
| Russian Federation | 2.5% | |||
| Other | 8.7% | |||
| Cash & Equivalents — Net | 0.6% | |||
| 16 | September 30, 2020 | | Annual Report |
Table of Contents
Unaudited
AllianzGI Emerging Markets Small-Cap Fund (cont’d)
| Shareholder Expense Example | Actual Performance | |||
| Class A | Institutional Class | |||
| Beginning Account Value (4/1/20) | $1,000.00 | $1,000.00 | ||
| Ending Account Value (9/30/20) | $1,395.00 | $1,397.30 | ||
| Expenses Paid During Period | $10.78 | $8.99 | ||
| Hypothetical Performance | ||||
| (5% return before expenses) | ||||
| Class A | Institutional Class | |||
| Beginning Account Value (4/1/20) | $1,000.00 | $1,000.00 | ||
| Ending Account Value (9/30/20) | $1,016.00 | $1,017.50 | ||
| Expenses Paid During Period | $9.07 | $7.57 | ||
For each class of the Fund, expenses (net of fee waiver and reimbursement, if any) are equal to the annualized expense ratio for the class (1.80% for Class A and 1.50% for Institutional Class), multiplied by the average account value over the period, multiplied by 183/366.
| Annual Report | | September 30, 2020 | 17 |
Table of Contents
Unaudited
AllianzGI Emerging Markets Value Fund (formerly AllianzGI NFJ Emerging Markets Value Fund)*
For the period of October 1, 2019 through September 30, 2020, as provided by the Value Equity, US team.
Fund Insights
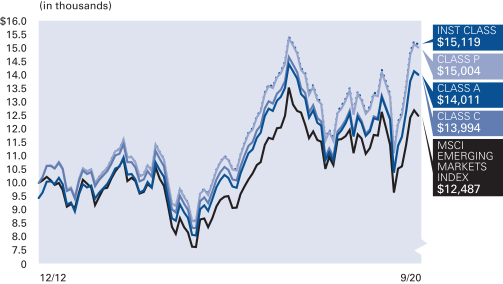
For the twelve-month period ended September 30, 2020, the Class A shares at net asset value (“NAV”) of the AllianzGI Emerging Markets Value Fund (the “Fund”) returned 17.63%, outperforming the MSCI Emerging Markets Index (the “benchmark”), which returned 10.54%.
Market overview
Emerging market equities largely outpaced their developed market counterparts, closing out a volatile twelve-month period with double-digit gains. In the face of a global pandemic, emerging market shares were buoyed by a weaker tone to the US dollar, signs of ongoing economic recovery in China and expectations that monetary policy would remain loose for an extended period. Several countries across the Aisa/Pacific region posted robust gains over the reporting period, led by China, which was the first major economy to report positive economic growth after being hit by COVID-19. Taiwan and South Korea also delivered particularly strong results, aided by better-than-expected returns from key technology firms. In contrast, Brazil was one of the worst affected countries by COVID-19; that, in conjuncture with a generally weak oil pricing environment precipitated a selloff in Brazilian equity prices. Similarly, Russian equities were also negatively impacted in part by lower oil prices. At the sector level, returns were led by strength across consumer discretionary, health care and technology companies. Conversely, financials, energy and utilities names were down more than 18% in the benchmark over the reporting period.
Portfolio review
Positive relative performance results over the trailing twelve months were due to robust stock selection and country allocations, while sector allocations detracted only modestly from performance. Strong selection across the consumer staples, real estate investment trusts, communication services and financials sectors boosted returns, and selection was negative across just two economic sectors during the reporting period—consumer discretionary and health care. The Fund’s underweight in communication services detracted from results while an overweight in technology contributed to relative returns. Selection by country was positive due to strength from the Fund’s China, Taiwan and Brazil-based holdings. These gains were only somewhat offset by South Korea and Russia-based stocks that failed to keep pace with benchmark shares. Country allocations were positive and driven by an overweight in Hong Kong and underweight in Thailand. This was only partially offset by an underweight in China and overweight in the UK, which detracted from relative results.
Outlook
Emerging markets have performed well over the period, boosted in part by strength from China, where notably, growth has rebounded sharply following the first-quarter downturn prompted by the COVID-19 pandemic. We believe the successful containment of the outbreak in China, in addition to the Chinese government’s swift and targeted stimulus measures, are significant contributing factors in sustaining a functioning economy. Importantly, China’s ongoing recovery should bode well for several other emerging economies—primarily those that are most closely linked to China and have had similar success in containing COVID-19. Furthermore, technological advances have become critical as the world increasingly relies on technology during the global pandemic. Economies with a focus on technology exports—such as South Korea and Taiwan—have experienced faster-than-anticipated export growth as the work/learn from home dynamic continues to drive demand for their technological products.
In contrast, more domestically oriented economies, countries where the pandemic hasn’t yet abated or that rely heavily on tourism may continue to face headwinds. Undoubtedly, there is volatility attached to trading in today’s markets. However, we believe a focus on quality and valuations can uncover buying opportunities. To this end, our team is focused on companies with strong fundamentals and industry leaders with clean balance sheets that are effectively “on sale,” trading at discounts to where we could have bought them before the COVID-19 pandemic. Furthermore, with interest rates likely to remain low for an extended period, dividend payers and companies that can grow their dividends could offer additional strength.
* Effective April 30, 2020, the Fund changed its name from “AllianzGI NFJ Emerging Markets Value Fund” to “AllianzGI Emerging Markets Value Fund”.
| 18 | September 30, 2020 | | Annual Report |
Table of Contents
Unaudited
AllianzGI Emerging Markets Value Fund (formerly AllianzGI NFJ Emerging Markets Value Fund) (cont’d)
Average Annual Total Return for the period ended September 30, 2020
| 1 Year | 5 Year | Since Inception† | ||||||||||||
AllianzGI Emerging Markets Value Fund Class A | 17.63% | 10.23% | 5.18% | |||||||||||
| AllianzGI Emerging Markets Value Fund Class A (adjusted) | 11.16% | 8.99% | 4.42% | ||||||||||
AllianzGI Emerging Markets Value Fund Class C | 16.83% | 9.42% | 4.40% | |||||||||||
| AllianzGI Emerging Markets Value Fund Class C (adjusted) | 15.83% | 9.42% | 4.40% | ||||||||||
| AllianzGI Emerging Markets Value Fund Class P | 17.85% | 10.40% | 5.35% | ||||||||||
| AllianzGI Emerging Markets Value Fund Institutional Class | 17.95% | 10.52% | 5.45% | ||||||||||
| MSCI Emerging Markets Index | 10.54% | 8.97% | 2.89% | ||||||||||
Lipper Emerging Markets Funds Average | 10.80% | 8.39% | 2.89% | |||||||||||
† The Fund began operations on December 18, 2012. Benchmark return comparisons began on the fund inception date. Lipper performance comparisons began on December 31, 2012.
Performance quoted represents past performance and is no guarantee of future results. Current performance may be lower or higher than performance shown. For performance current to the most recent month-end, visit our website at us.allianzgi.com. Investment return and the principal value will fluctuate. Shares may be worth more or less than original cost when redeemed. The adjusted returns take into account the maximum initial sales charge of 5.50% on Class A shares and the contingent deferred sales charge (CDSC) of 1% on Class C shares, which may apply to shares redeemed during the first year of ownership. Returns do not reflect deduction of taxes that a shareholder would pay on fund distributions or redemption of fund shares. See pages 63 and 64 for more information. The Fund’s gross expense ratios are 1.65% for Class A shares, 2.40% for Class C shares, 1.32% for Class P shares and 1.37% for Institutional Class shares. These ratios do not include an expense reduction, contractually guaranteed through at least January 31, 2021. The Fund’s expense ratios net of this reduction are 1.14% for Class A shares, 1.89% for Class C shares, 0.98% for Class P shares and 0.89% for Institutional Class shares. Expense ratio information is as of the Fund’s current prospectus dated February 1, 2020, as further revised or supplemented from time to time.
Cumulative Returns Through September 30, 2020
Country/Location Allocation
(as of September 30, 2020)
| China | 40.9% | |||
| Korea (Republic of) | 8.6% | |||
| Taiwan | 8.6% | |||
| India | 8.4% | |||
| United States | 6.4% | |||
| Hong Kong | 4.8% | |||
| Brazil | 3.3% | |||
| South Africa | 2.6% | |||
| Other | 10.6% | |||
| Cash & Equivalents — Net | 5.8% | |||
| Annual Report | | September 30, 2020 | 19 |
Table of Contents
Unaudited
AllianzGI Emerging Markets Value Fund (formerly AllianzGI NFJ Emerging Markets Value Fund) (cont’d)
| Shareholder Expense Example | Actual Performance | |||||||
| Class A | Class C | Class P | Institutional Class | |||||
| Beginning Account Value (4/1/20) | $1,000.00 | $1,000.00 | $1,000.00 | $1,000.00 | ||||
| Ending Account Value (9/30/20) | $1,350.10 | $1,345.20 | $1,351.40 | $1,352.00 | ||||
| Expenses Paid During Period | $6.76 | $11.08 | $5.76 | $5.23 | ||||
| Hypothetical Performance | ||||||||
| (5% return before expenses) | ||||||||
| Class A | Class C | Class P | Institutional Class | |||||
| Beginning Account Value (4/1/20) | $1,000.00 | $1,000.00 | $1,000.00 | $1,000.00 | ||||
| Ending Account Value (9/30/20) | $1,019.25 | $1,015.55 | $1,020.10 | $1,020.55 | ||||
| Expenses Paid During Period | $5.81 | $9.52 | $4.95 | $4.50 | ||||
For each class of the Fund, expenses (net of fee waiver and reimbursement, if any) are equal to the annualized expense ratio for the class (1.15% for Class A, 1.89% for Class C, 0.98% for Class P and 0.89% for Institutional Class), multiplied by the average account value over the period, multiplied by 183/366.
| 20 | September 30, 2020 | | Annual Report |
Table of Contents
Unaudited
AllianzGI Global Allocation Fund
For the period of October 1, 2019 through September 30, 2020, as provided by the Multi-Asset US Group.
Fund Insights
For the twelve-month period ended September 30, 2020, Class A shares at net asset value (“NAV”) of the AllianzGI Global Allocation Fund (the “Fund”) returned 10.21%, outperforming the 60% MSCI ACWI, 40% Bloomberg Barclays U.S. Aggregate Bond Index (the “benchmark”), which returned 9.69%.
Market Overview
It was a volatile twelve-month period for global equities. After a steady start to 2020, global stocks changed direction in mid-February 2020 as the COVID-19 outbreak started to spread beyond China. The sell-off gathered pace in March 2020 as the draconian measures employed to curtail COVID-19 caused the global economy to grind to a standstill, triggering fears of a severe global recession. After suffering their worst quarter since the 2008 financial crisis, global stocks rebounded in the second and third quarters, supported by unprecedented government stimulus and positive trial results for potential COVID-19 vaccines. By the end of the third quarter of 2020 global equities recovered the loses suffered from the first quarter of 2020 and posted a positive return for the twelve-month period.
Global government bond yields trended higher in the fourth quarter of 2019 amid growing optimism over the outlook for global growth but tumbled in 2020 on growing speculation that the COVID-19 pandemic would force central banks to slash interest rates and reinstate asset-purchase programs. In the US, the 10-year Treasury yield closed the period around 100 basis points lower, falling abruptly in the first quarter and remaining relatively stable thereafter. The US yield curve steepened in the aftermath, as yields on bonds with maturities of less than 10 years moved slightly lower, while longer dated yields rose modestly. Corporate bonds fell sharply over the first quarter of 2020, with credit spreads increasing to levels last seen following the 2008 financial crisis, before rallying in the second and third quarters of 2020 and ultimately closing with a positive return over the complete twelve-month period.
The COVID-19 pandemic looked almost certain to push the global economy into a severe recession. As the epicenter of the pandemic spread from China to the Pacific Basin, and then on to Europe and North America, purchasing managers’ indices of economic activity dropped to even lower levels than those seen during the 2008 financial crisis. In response, central banks slashed interest rates, provided liquidity and reinstated quantitative easing programs, while budget deficits ballooned as governments committed unprecedented amounts to support companies and individuals affected by COVID-19. While China’s recovery appeared to be picking up speed in the third quarter, elsewhere hopes of a robust rebound in second half of the year were jeopardized by surging COVID-19 infections, particularly in Europe where many countries saw the start of a second wave.
In the currency markets, the US dollar strengthened in the first quarter, before weakening in the COVID-19 aftermath. As the US Federal Reserve raised its inflation target and signaled it needed to maintain near-zero interest rates for an extended period, the euro, British pound and Japanese yen all strengthened relative to the US dollar.
Portfolio Review
In terms of relative performance, selection effects contributed to overall performance while allocation detracted. The Fund benefitted from positive selection across equity categories, with the most pronounced effect in US equities. In particular, the Fund benefited from the relative outperformance of the AllianzGI Global Sustainability Fund, which was added during the period as part of the broader transition of the Fund to a sustainable focus. Also, within equities, the Fund benefitted from growth-oriented exposures and clean energy positions, which were added in the third quarter. In fixed income the US Credit ESG strategy, which was launched in the fourth quarter of 2019 as part of the sustainable transition, was the primary driver of outperformance. Also, within fixed income, an underweight to long-dated treasuries in the second and third quarter benefited relative results as rates ended higher. During the equity market sell-off in the first quarter of 2020, a modest underweight to global equities combined with an overweight to US duration and a long exposure to the Japanese yen versus the US dollar helped offset losses related to corporate credit and emerging market debt exposure.
The largest detractors during the period were opportunistic exposures, such as managed futures, emerging market debt and emerging market equities. Within opportunistic, the primary driver of underperformance was the AllianzGI PerformanceFee Managed Futures Strategy Fund, which suffered in the first quarter of 2020 due to pro-cyclical positions, such as long global equities and credit exposure within fixed income. An additional detractor within equities was exposure to minimum volatility global equities, which lagged the broader equity market during the recovery in the second and third quarters.
Outlook
On one hand, monetary policy of major central banks continues to support equities, and the ratio between positive and negative corporate earnings revisions has also recently improved. On the other hand, fears of second pandemic wave, the US presidential election outcome and EU/UK trade negotiations pose significant uncertainties to markets. In view of the downside risks we expect key rates to remain low for longer and real interest rates to stay negative. Government bond yields look set to remain very low or even negative for some time to come. We believe that corporate bonds should continue to benefit from central bank support. However, companies’ high debt levels suggest that default rates may rise if the crisis returns. Overall, we believe that we are likely to see elevated volatility, posing opportunities for active managers to navigate across and within asset classes.
| Annual Report | | September 30, 2020 | 21 |
Table of Contents
Unaudited
AllianzGI Global Allocation Fund (cont’d)
Average Annual Total Return for the period ended September 30, 2020
| 1 Year | 5 Year | 10 Year | Since Inception† | |||||||||||||||
| AllianzGI Global Allocation Fund Class A | 10.21% | 6.80% | 5.80% | 5.70% | ||||||||||||||
| AllianzGI Global Allocation Fund Class A (adjusted) | 4.15% | 5.60% | 5.20% | 5.43% | |||||||||||||
| AllianzGI Global Allocation Fund Class C | 9.28% | 5.99% | 5.02% | 4.92% | ||||||||||||||
| AllianzGI Global Allocation Fund Class C (adjusted) | 8.28% | 5.99% | 5.02% | 4.92% | |||||||||||||
| AllianzGI Global Allocation Fund Class R | 9.96% | 6.58% | 5.60% | 5.47% | |||||||||||||
| AllianzGI Global Allocation Fund Class P | 10.39% | 7.09% | 6.06% | 5.94% | |||||||||||||
| AllianzGI Global Allocation Fund Institutional Class | 10.40% | 7.03% | 6.05% | 6.11% | |||||||||||||
| AllianzGI Global Allocation Fund Class R6 | 10.57% | 7.15% | 6.16% | 6.21% | |||||||||||||
| AllianzGI Global Allocation Fund Administrative Class | 10.24% | 6.88% | 5.85% | 5.76% | ||||||||||||||
| 60% MSCI ACWI, 40% Bloomberg Barclays U.S. Aggregate Bond Index | 9.69% | 8.10% | 6.82% | 6.00% | |||||||||||||
| MSCI ACWI | 10.44% | 10.30% | 8.55% | 6.21% | |||||||||||||
| Bloomberg Barclays U.S. Aggregate Bond Index | 6.98% | 4.18% | 3.64% | 4.85% | |||||||||||||
| Lipper Alternative Global Macro Funds Average | 2.57% | 3.87% | 3.32% | 5.01% | ||||||||||||||
† The Fund began operations on September 30, 1998. Benchmark return comparisons began on the fund inception date. Lipper performance comparisons began on September 30, 1998.
Performance quoted represents past performance and is no guarantee of future results. Current performance may be lower or higher than performance shown. For performance current to the most recent month-end, visit our website at us.allianzgi.com. Investment return and the principal value will fluctuate. Shares may be worth more or less than original cost when redeemed. The adjusted returns take into account the maximum sales charge of 5.50% on Class A shares and the contingent deferred sales charge (CDSC) of 1% on Class C shares, which may apply to shares redeemed during the first year of ownership. Returns do not reflect deduction of taxes that a shareholder would pay on fund distributions or redemption of fund shares. See pages 63 and 64 for more information. The Fund’s gross expense ratios, which include the Acquired Fund Fees and Expenses, are 1.54% for Class A shares, 2.31% for Class C shares, 1.86% for Class R shares, 1.31% for Class P shares, 1.29% for Institutional Class shares, 1.22% for Class R6 shares and 1.47% for Administrative Class shares. These ratios do not include an expense reduction, contractually guaranteed through at least January 31, 2021. The Fund’s expense ratios net of this reduction, which include the Acquired Fund Fees and Expenses, are 1.01% for Class A shares, 1.76% for Class C shares, 1.21% for Class R shares, 0.81% for Class P shares, 0.74% for Institutional Class shares, 0.71% for Class R6 shares and 0.96% for Administrative Class shares. Expense ratio information is as of the Fund’s current prospectus dated February 1, 2020, as further revised or supplemented from time to time.
Cumulative Returns Through September 30, 2020
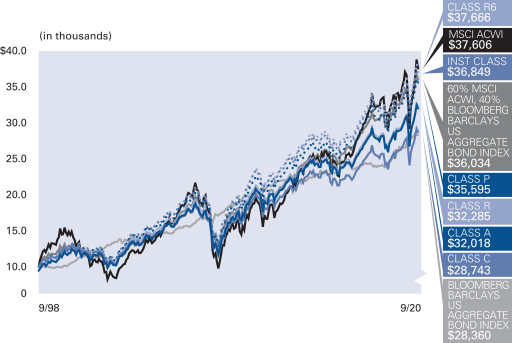
Fund Allocation (as of September 30, 2020)
| AllianzGI Global Sustainability | 40.9% | |||
| AllianzGI Best Styles Global Managed Volatility | 10.1% | |||
| AllianzGI PerformanceFee Managed Futures Strategy | 9.6% | |||
| AllianzGI Green Bond | 9.5% | |||
| Other | 21.0% | |||
| Cash & Equivalents — Net | 8.9% | |||
| 22 | September 30, 2020 | | Annual Report |
Table of Contents
Unaudited
AllianzGI Global Allocation Fund (cont’d)
| Shareholder Expense Example | Actual Performance | |||||||||||||
| Class A | Class C | Class R | Class P | Institutional Class | Class R6 | Administrative Class | ||||||||
| Beginning Account Value (4/1/20) | $1,000.00 | $1,000.00 | $1,000.00 | $1,000.00 | $1,000.00 | $1,000.00 | $1,000.00 | |||||||
| Ending Account Value (9/30/20) | $1,196.90 | $1,192.30 | $1,196.60 | $1,198.30 | $1,198.80 | $1,199.50 | $1,197.30 | |||||||
| Expenses Paid During Period | $2.97 | $7.12 | $4.06 | $1.92 | $1.43 | $1.32 | $2.69 | |||||||
| Hypothetical Performance | ||||||||||||||
| (5% return before expenses) | ||||||||||||||
| Class A | Class C | Class R | Class P | Institutional Class | Class R6 | Administrative Class | ||||||||
| Beginning Account Value (4/1/20) | $1,000.00 | $1,000.00 | $1,000.00 | $1,000.00 | $1,000.00 | $1,000.00 | $1,000.00 | |||||||
| Ending Account Value (9/30/20) | $1,022.30 | $1,018.50 | $1,021.30 | $1,023.25 | $1,023.70 | $1,023.80 | $1,022.55 | |||||||
| Expenses Paid During Period | $2.73 | $6.56 | $3.74 | $1.77 | $1.32 | $1.21 | $2.48 | |||||||
For each class of the Fund, expenses (net of fee waiver and reimbursement, if any) are equal to the annualized expense ratio for the class (0.54% for Class A, 1.30% for Class C, 0.74% for Class R, 0.35% for Class P, 0.26% for Institutional Class, 0.24% for Class R6 and 0.49% for Administrative Class), multiplied by the average account value over the period, multiplied by 183/366. These expenses do not include the expenses of the investment companies in which the Fund invests, which are indirectly borne by Fund shareholders.
| Annual Report | | September 30, 2020 | 23 |
Table of Contents
Unaudited
AllianzGI Global Dynamic Allocation Fund
For the period of October 1, 2019 through September 30, 2020, as provided by the Multi-Asset US Group.
Fund Insights
For the twelve-month period ended September 30, 2020, Class A shares at net asset value (“NAV”) of the AllianzGI Global Dynamic Allocation Fund (the “Fund”) returned 8.20%, underperforming the MSCI ACWI (the “benchmark”), which returned 10.44%.
Market Overview
It was a volatile twelve-month period for global equities. After a steady start to 2020, global stocks changed direction in mid-February 2020 as the COVID-19 outbreak started to spread beyond China. The sell-off gathered pace in March 2020 as the draconian measures employed to curtail COVID-19 caused the global economy to grind to a standstill, triggering fears of a severe global recession. After suffering their worst quarter since the 2008 financial crisis, global stocks rebounded in the second and third quarters, supported by unprecedented government stimulus and positive trial results for potential COVID-19 vaccines. By the end of the third quarter of 2020 global equities recovered the loses suffered from the first quarter of 2020 and posted a positive return for the twelve-month period.
Global government bond yields trended higher in the fourth quarter of 2019 amid growing optimism over the outlook for global growth but tumbled in 2020 on growing speculation that the COVID-19 pandemic would force central banks to slash interest rates and reinstate asset-purchase programs. In the US, the 10-year Treasury yield closed the period around 100 basis points lower, falling abruptly in the first quarter and remaining relatively stable thereafter. The US yield curve steepened in the aftermath, as yields on bonds with maturities of less than 10 years moved slightly lower, while longer dated yields rose modestly. Corporate bonds fell sharply over the first quarter of 2020, with credit spreads increasing to levels last seen following the 2008 financial crisis, before rallying in the second and third quarters of 2020 and ultimately closing with a positive return over the complete twelve-month period.
The COVID-19 pandemic looked almost certain to push the global economy into a severe recession. As the epicenter of the pandemic spread from China to the Pacific Basin, and then on to Europe and North America, purchasing managers’ indices of economic activity dropped to even lower levels than those seen during the 2008 financial crisis. In response, central banks slashed interest rates, provided liquidity and reinstated quantitative easing programs, while budget deficits ballooned as governments committed unprecedented amounts to support companies and individuals affected by COVID-19. While China’s recovery appeared to be picking up speed in the third quarter, elsewhere hopes of a robust rebound in second half of the year were jeopardized by surging COVID-19 infections, particularly in Europe where many countries saw the start of a second wave.
In the currency markets, the US dollar strengthened in the first quarter, before weakening in the COVID-19 aftermath. As the US Federal Reserve raised its inflation target and signaled it needed to maintain near-zero interest rates for an extended period, the euro, British pound and Japanese yen all strengthened relative to the US dollar.
Portfolio Review
At the start of the period, the Fund had an overweight to global equities and US corporate bonds through which it benefitted against the backdrop of easing trade tensions which supported risk assets into 2020. As the financial markets abruptly switched direction in late February 2020 due to the COVID-19 pandemic, overweights to global equities and US corporate bonds caused the Fund to underperform its benchmark. As the COVID-19 pandemic pushed global economies into recession, the Fund de-risked in equities and went overweight duration to take on a more defensive posture. As equity markets rebounded, the Fund has gradually rebuilt equity exposures and ended the period overweight to equities. Since de-risking in the first quarter of 2020, the Fund has remained overweight for the duration, while favoring investment grade corporate debt.
During the period, the primary driver of underperformance was an overweight to global equities during the COVID-19 sell-off in the first quarter of 2020 and an underweight to global equities as markets rebounded on hopes of an economic recovery and unprecedented fiscal and monetary stimulus in the second and third quarters. An additional driver of underperformance was the Fund’s strategy, which trailed the broader market, partly attributed to its tilt toward the Value investment style that underperformed Growth. The main contributors during the period were growth-oriented strategies, such as AllianzGI International Growth and AllianzGI Focused Growth, which both outperformed. In the fixed income portion of the portfolio, the Fund benefited from an overweight to credits during the rebound. Lastly, positions in precious metals, short duration high yield and currencies also contributed positively to performance.
Outlook
On one hand, monetary policy of major central banks continues to support equities, and the ratio between positive and negative corporate earnings revisions has also recently improved. On the other hand, fears of second pandemic wave, the US presidential election outcome and EU/UK trade negotiations pose significant uncertainties to markets. In view of the downside risks we expect key rates to remain low for longer and real interest rates to stay negative. Government bond yields look set to remain very low or even negative for some time to come. We believe that corporate bonds should continue to benefit from central bank support. However, companies’ high debt levels suggest that default rates may rise if the crisis returns. Overall, we believe that we are likely to see elevated volatility, posing opportunities for active managers to navigate across and within asset classes.
| 24 | September 30, 2020 | | Annual Report |
Table of Contents
Unaudited
AllianzGI Global Dynamic Allocation Fund (cont’d)
Average Annual Total Return for the period ended September 30, 2020
| 1 Year | 5 Year | 10 Year | Since Inception† | |||||||||||||||
| AllianzGI Global Dynamic Allocation Fund Class A | 8.20% | 5.43% | 5.50% | 8.30% | ||||||||||||||
| AllianzGI Global Dynamic Allocation Fund Class A (adjusted) | 2.25% | 4.24% | 4.91% | 7.77% | |||||||||||||
| AllianzGI Global Dynamic Allocation Fund Class C | 7.37% | 4.62% | 4.70% | 7.49% | ||||||||||||||
| AllianzGI Global Dynamic Allocation Fund Class C (adjusted) | 6.40% | 4.62% | 4.70% | 7.49% | |||||||||||||
| AllianzGI Global Dynamic Allocation Fund Class R | 7.86% | 5.08% | 5.20% | 8.01% | |||||||||||||
| AllianzGI Global Dynamic Allocation Fund Class P | 9.73% | 5.87% | 5.81% | 8.62% | |||||||||||||
| AllianzGI Global Dynamic Allocation Fund Institutional Class | 8.52% | 5.71% | 5.78% | 8.61% | |||||||||||||
| AllianzGI Global Dynamic Allocation Fund Class R6 | 8.54% | 5.75% | 5.85% | 8.69% | |||||||||||||
| AllianzGI Global Dynamic Allocation Fund Administrative Class | 8.24% | 5.44% | 5.52% | 8.33% | ||||||||||||||
| MSCI ACWI | 10.44% | 10.30% | 8.55% | 10.85% | |||||||||||||
| Bloomberg Barclays U.S. Aggregate Bond Index | 6.98% | 4.18% | 3.64% | 4.32% | |||||||||||||
| 60% MSCI ACWI, 40% Bloomberg Barclays U.S. Aggregate Bond Index | 9.69% | 8.10% | 6.82% | 8.49% | |||||||||||||
| Lipper Alternative Global Macro Funds Average | 2.57% | 3.87% | 3.32% | 4.81% | ||||||||||||||
† The Fund began operations on April 27, 2009. Benchmark return comparisons began on the fund inception date. Lipper performance comparisons began on April 30, 2009.
Performance quoted represents past performance and is no guarantee of future results. Current performance may be lower or higher than performance shown. For performance current to the most recent month-end, visit our website at us.allianzgi.com. Investment return and the principal value will fluctuate. Shares may be worth more or less than original cost when redeemed. The adjusted returns take into account the maximum initial sales charge of 5.50% on Class A shares and the contingent deferred sales charge (CDSC) of 1% on Class C shares, which may apply to shares redeemed during the first year of ownership. Returns do not reflect deduction of taxes that a shareholder would pay on fund distributions or redemption of fund shares. See pages 63 and 64 for more information. The Fund’s gross expense ratios, which include the Acquired Fund Fees and Expenses, are 1.35% for Class A shares, 2.11% for Class C shares, 1.68% for Class R shares, 1.13% for Class P shares, 1.04% for Institutional Class shares, 1.01% for Class R6 shares and 1.27% for Administrative Class shares. These ratios do not include an expense reduction, contractually guaranteed through at least January 31, 2021. The Fund’s expense ratios net of this reduction, which include the Acquired Fund Fees and Expenses, are 1.01% for Class A shares, 1.78% for Class C shares, 1.38% for Class R shares, 0.84% for Class P shares, 0.74% for Institutional Class shares, 0.74% for Class R6 shares and 0.99% for Administrative Class shares. Expense ratio information is as of the Fund’s current prospectus dated February 1, 2020, as further revised or supplemented from time to time.
Cumulative Returns Through September 30, 2020
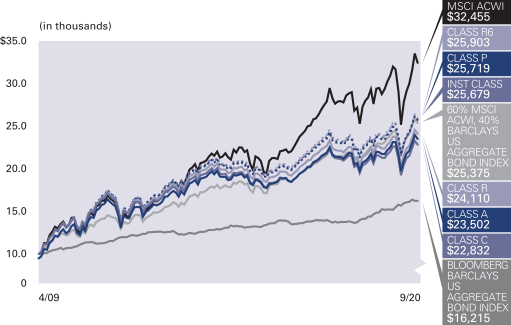
Country/Location Allocation
(as of September 30, 2020)
| United States | 53.9% | |||
| Japan | 2.8% | |||
| Taiwan | 1.5% | |||
| China | 1.4% | |||
| Switzerland | 1.3% | |||
| United Kingdom | 1.0% | |||
| Australia | 1.0% | |||
| Canada | 0.9% | |||
| Other | 14.2% | |||
| Cash & Equivalents — Net | 22.0% | |||
| Annual Report | | September 30, 2020 | 25 |
Table of Contents
Unaudited
AllianzGI Global Dynamic Allocation Fund (cont’d)
| Shareholder Expense Example | Actual Performance | |||||||||||||
| Class A | Class C | Class R | Class P | Institutional Class | Class R6 | Administrative Class | ||||||||
| Beginning Account Value (4/1/20) | $1,000.00 | $1,000.00 | $1,000.00 | $1,000.00 | $1,000.00 | $1,000.00 | $1,000.00 | |||||||
| Ending Account Value (9/30/20) | $1,191.40 | $1,186.50 | $1,189.70 | $1,189.90 | $1,192.90 | $1,193.50 | $1,191.40 | |||||||
| Expenses Paid During Period | $4.49 | $8.64 | $6.51 | $5.58 | $2.96 | $3.02 | $4.33 | |||||||
| Hypothetical Performance | ||||||||||||||
| (5% return before expenses) | ||||||||||||||
| Class A | Class C | Class R | Class P | Institutional Class | Class R6 | Administrative Class | ||||||||
| Beginning Account Value (4/1/20) | $1,000.00 | $1,000.00 | $1,000.00 | $1,000.00 | $1,000.00 | $1,000.00 | $1,000.00 | |||||||
| Ending Account Value (9/30/20) | $1,020.90 | $1,017.10 | $1,019.05 | $1,019.90 | $1,022.30 | $1,022.25 | $1,021.05 | |||||||
| Expenses Paid During Period | $4.14 | $7.97 | $6.01 | $5.15 | $2.73 | $2.78 | $3.99 | |||||||
For each class of the Fund, expenses (net of fee waiver and reimbursement, if any) are equal to the annualized expense ratio for the class (0.82% for Class A, 1.58% for Class C, 1.19% for Class R, 1.02% for Class P, 0.54% for Institutional Class, 0.55% for Class R6 and 0.79% for Administrative Class), multiplied by the average account value over the period, multiplied by 183/366. These expenses do not include the expenses of the investment companies in which the Fund invests, which are indirectly borne by Fund shareholders.
| 26 | September 30, 2020 | | Annual Report |
Table of Contents
Unaudited
AllianzGI Global Sustainability Fund
For the period of October 1, 2019 through September 30, 2020, as provided by the Global Equity Team.
Fund Insights
For the twelve-month period ended September 30, 2020, Class A shares at net asset value (“NAV”) of the AllianzGI Global Sustainability Fund (the “Fund”) returned 17.35%, outperforming the MSCI ACWI (the “benchmark”), which returned 10.44%.
Market Review
COVID-19 has made this year unlike any other in living memory. International lockdowns have halted large sections of the global economy, resulting in year-on-year hits to gross domestic product of 7% in China, 9.1% in the United States and 15% in the eurozone. At the same time, fiscal stimulus from governments and accommodative monetary policy from central banks, has kept most large listed companies afloat. As a result, global equity markets are up over 10% from this time last year. Entering autumn with a second COVID-19 wave and further lockdowns on the horizon, this uneven state of affairs feels increasingly precarious.
At a sector level, energy stocks have fared the worst. Reduced economic activity and travel has stifled oil prices, with West Texas Intermediate oil prices entering negative territory for the first time this year. Financials and real estate names have also lagged, with interest rates and demand for commercial property both slashed. By contrast, information technology stocks—largely uninterrupted by the pandemic, and in many cases, beneficiaries—have soared.
Portfolio Review
Performance has been consistently strong. In the market downturn, the Fund proved more resilient than its benchmark. Similarly, the stock market recovery has seen the Fund capture greater upside. In terms of stock selection, picks in financials, industrials and health care have made some of the largest positive contributions. This has been slightly offset by selection in the consumer discretionary sector.
As we have discussed in previous reports, sector allocation in the portfolio is largely dictated by stock selection. This is because we are led by our search for quality companies delivering sustainable growth, at reasonable valuations, rather than benchmark allocations. However, the Fund’s overweight position in information technology stocks, combined with its underweights in real estate and energy, have also made strong positive contributions to performance.
Apple made one of the largest positive contributions to performance. Like the other large US technology stocks making up the FAANG group (FAANG is an acronym that refers to the stocks of five prominent American technology companies: Facebook, Amazon, Apple, Netflix; and Alphabet (formerly known as Google)), it has found COVID-19 accelerating the rate at which consumers have adopted its products. Revenues for Apple’s June quarter rose 11%, defying expectations that store closures would hamper growth. Higher iPhone sales were matched by growth in the company’s wearable and services divisions, the latter of which includes TV, gaming and music. Since then, the shares have appreciated considerably, with its market capitalisation reaching over $2 trillion. Apple’s ability to maintain this success will rely on shifting consumers from cyclical product launches to subscription-based service consumption. However, with the iPhone 12 set to launch in the fourth quarter this year, and appetite seemingly undimmed, the transition feels manageable and we are comfortable with our position.
In the same vein, Microsoft has also boosted returns. The IT giant has demonstrated its resilience to macroeconomic headwinds, with consistently strong results. Microsoft’s Productivity and Business Processes and Intelligent Cloud segments, have both seen cloud usage and demand increase as customers work and learn from home. Likewise, the company’s More Personal Computing segment, including gaming, has also benefited from the pandemic. Microsoft is not entirely immune, with transactional license purchasing slowing, particularly in small and medium businesses. LinkedIn has also been negatively impacted by the weak job market and reductions in advertising spend. Despite this, the overall trends and our investment case remain intact. Overall, the company continues to be one of the best positioned companies poised to benefit from the adoption of cloud architectures.
Shell made the largest negative impact on performance. The integrated energy company continues to suffer as a result of an oil price which, despite some economic resurgence, remains stagnant: Brent crude has hovered around the $45 a barrel mark for six months. As a business, Shell is cash-flow breakeven at $30 and as such, the shares are cheaply valued. However, COVID-19 and Shell’s management decision to cut the dividend appears to have shifted investor focus on to the short-term. To counter this, Shell’s management has announced a strategy day for February, with the expectation that renewables will be a focus given recent announcements about a ‘North Sea Transition Deal’. Until then, the company has announced a redundancy package which is expected to save between $2-2.5 billion. Given that our position in the Fund is relatively small, we are comfortable holding at these levels.
Amadeus has also detracted from returns. The provider of global distribution software for the travel and hospitality industries has been a long-term contributor to the portfolio, harnessing both the growth in leisure travel and the digitalisation of its operations. Operating as an effective duopoly in most markets alongside US peer Sabre, Amadeus has grown through the technological expansion of its services and gradual price rises. However, COVID-19 is an unprecedented blow to the operations of its key clients. With data already indicating slower growth rates before the pandemic, and no clear timeline as to when “normal” travel volumes may resume, there is almost no visibility with regard to Amadeus’ medium-term operations. Thus, we took advantage of the share price recovery from its lowest point in May 2020 to exit the position.
We have also sold our holding in Covestro, a manufacturer of specialty plastics. Like its counterpart in software, current valuations are attractive, and the longer-term nature of the business remains intact. However, other names are at similar levels and offer clearer immediate visibility on growth.
We exited our position in EOG Resources. The shale exploration and production company continues to be one of the best capitalised firms within the sector, generating strong free cash flow. Likewise, following regular engagement, EOG has one of the industry’s most advanced approaches to ESG, with clear policies on disclosure and resource use. However, the quality of EOG’s business appears consistently under-appreciated by the market and subject to excessive volatility from external factors. As a result, we have taken advantage of the recent share price strength to exit our position.
| Annual Report | | September 30, 2020 | 27 |
Table of Contents
Unaudited
AllianzGI Global Sustainability Fund (cont’d)
We received and immediately sold our shares in M&G PLC following its spin out from Prudential. Although the investment manager has an estimated yield of over 6 per cent, there is no clear path to growth. New business flows are heavily dependent on one product, whilst more profitable legacy funds are seeing outflows, suggesting M&G is vulnerable to the same back-book versus front-book margin pressure that peers have faced.
Outlook
During the first phase of the pandemic, stock markets were grappling with the effects of containment policies that caused a major economic contraction, offset to some degree by a huge monetary and fiscal stimulus. This period saw a major outperformance of the “stay at home” stocks, in sectors such as technology, healthcare and other non-cyclical industries. As we head into the autumn and winter months, the big question is will this trend continue or could there be a major reversal.
One significant change is that most economies are no longer contracting. For sure, gross domestic product is still way down on 2019, but in most countries the recovery has begun, as economies have opened up again. At the same time, a second wave of infections has taken hold across Europe and parts of the US, although hospitalisations and deaths remain below the peak levels earlier in the year. Debate rages as to the reasons behind this.
Most Governments appear to be treading cautiously for now, bringing back restrictions where they think it is necessary to do so. In the short term, this is likely to put the brakes on the nascent recovery in business and economic activity. That said, we now know a lot more about COVID-19 and how it spreads. Treatments have improved and there are several vaccines in advanced trials. There are also signs that consumers and businesses are learning to adapt and live with COVID-19.
Just as this downturn was unlike any other, the recovery is also likely to be unusual. Certain cyclical industries, such as those related to housing, are already recovering quite rapidly, driven by pent up demand, shifts in consumer preferences and switching of spending from other areas like travel and leisure.
Several management meetings in recent weeks have confirmed to us that this is happening. On the other hand, other industries such as travel and leisure remain deeply depressed and we expect that they will continue to struggle as long as COVID-19 restrictions remain in place. Permanent behavioural change may also supress the recovery in some areas, such as business travel and certain parts of leisure.
We plan to remain true to style and approach, and await third quarter earnings results for further clarity on the strength of our holdings and broader market. We remain focussed on high quality companies, exposed to structural growth across a broadly diversified range of industries. In the face of more potential volatility, our diversified portfolios of resilient companies should ensure that stock picking remains the primary driver of returns.
Average Annual Total Return for the period ended September 30, 2020
| 1 Year | 5 Year | Since Inception† | ||||||||||||
AllianzGI Global Sustainability Fund Class A | 17.35% | 11.98% | 9.06% | |||||||||||
| AllianzGI Global Sustainability Fund Class A (adjusted) | 10.90% | 10.72% | 8.01% | ||||||||||
| AllianzGI Global Sustainability Fund Class P | 17.52% | 12.14% | 9.22% | ||||||||||
| AllianzGI Global Sustainability Fund Institutional Class | 17.59% | 12.23% | 9.31% | ||||||||||
| MSCI ACWI | 10.44% | 10.30% | 7.32% | ||||||||||
| Dow Jones Sustainability World Total Return Composite Net Index | 12.24% | 11.17% | 7.53% | ||||||||||
Lipper Global Large-Cap Growth Funds Average | 23.60% | 13.49% | 10.08% | |||||||||||
† The Fund began operations on December 9, 2014. Benchmark return comparisons began on the fund inception date. Lipper performance comparisons began on November 30, 2014.
Performance quoted represents past performance and is no guarantee of future results. Current performance may be lower or higher than performance shown. For performance current to the most recent month-end, visit our website at us.allianzgi.com. Investment return and the principal value will fluctuate. Shares may be worth more or less than original cost when redeemed. The adjusted returns take into account the maximum initial sales charge of 5.50% on Class A shares. Returns do not reflect deduction of taxes that a shareholder would pay on fund distributions or redemption of fund shares. See pages 63 and 64 for more information. The Fund’s gross expense ratios are 1.84% for Class A shares, 1.65% for Class P shares and 1.66% for Institutional Class shares. These ratios do not include an expense reduction, contractually guaranteed through at least January 31, 2021. The Fund’s expense ratios net of this reduction are 0.94% for Class A shares, 0.79% for Class P shares and 0.69% for Institutional Class shares. Expense ratio information is as of the Fund’s current prospectus dated February 1, 2020, as further revised or supplemented from time to time.
| 28 | September 30, 2020 | | Annual Report |
Table of Contents
Unaudited
AllianzGI Global Sustainability Fund (cont’d)
Cumulative Returns Through September 30, 2020
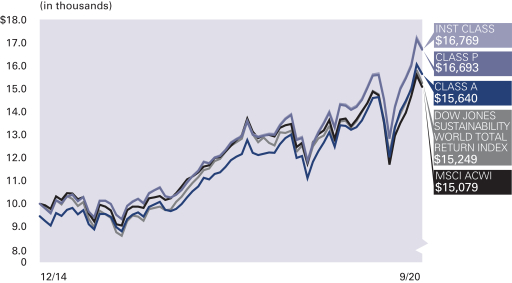
Country/Location Allocation (as of September 30, 2020)
| United States | 53.9% | |||
| United Kingdom | 8.3% | |||
| Germany | 6.6% | |||
| Japan | 5.4% | |||
| Sweden | 3.8% | |||
| Switzerland | 3.3% | |||
| France | 2.8% | |||
| Australia | 1.5% | |||
| Other | 6.2% | |||
| Cash & Equivalents — Net | 8.2% | |||
| Shareholder Expense Example | Actual Performance | |||||
| Class A | Class P | Institutional Class | ||||
| Beginning Account Value (4/1/20) | $1,000.00 | $1,000.00 | $1,000.00 | |||
| Ending Account Value (9/30/20) | $1,300.80 | $1,301.80 | $1,302.00 | |||
| Expenses Paid During Period | $5.41 | $4.55 | $3.97 | |||
| Hypothetical Performance | ||||||
| (5% return before expenses) | ||||||
| Class A | Class P | Institutional Class | ||||
| Beginning Account Value (4/1/20) | $1,000.00 | $1,000.00 | $1,000.00 | |||
| Ending Account Value (9/30/20) | $1,020.30 | $1,021.05 | $1,021.55 | |||
| Expenses Paid During Period | $4.75 | $3.99 | $3.49 | |||
For each class of the Fund, expenses (net of fee waiver and reimbursement, if any) are equal to the annualized expense ratio for the class (0.94% for Class A, 0.79% for Class P and 0.69% for Institutional Class), multiplied by the average account value over the period, multiplied by 183/366.
| Annual Report | | September 30, 2020 | 29 |
Table of Contents
Unaudited
AllianzGI Green Bond Fund*
For the period of October 1, 2019 through September 30, 2020, as provided by Julien Bras, CFA, Portfolio Manager.
Fund Insights
For the twelve-month period ended September 30, 2020, Class A shares at net asset value (“NAV”) of the AllianzGI Green Bond Fund (the “Fund”) returned 3.55%, underperforming the ICE BofA Green Bond Index (the “benchmark”), which returned 3.80%.
Market Overview
Global green bonds delivered a positive performance over the last twelve months, in a context marked by the COVID-19 pandemic which impacted the global economy and financial markets, especially in March 2020. While corporate bonds led the advance for much of the third quarter of 2020, they underperformed in September 2020 as equity markets retreated. Government bonds were mixed. Euro-zone bonds performed the best as yields fell following the agreement of €750bn Recovery Fund for countries worst hit by COVID-19. Meanwhile, the US yield curve steepened as yields on bonds with maturities of less than 10 years moved slightly lower, while longer dated yields rose modestly.
Second-quarter gross domestic product data confirmed that the COVID pandemic had plunged the global economy into a sharp contraction. The US economy shrank by an annualized 31.7%, while economic activity fell 11.8% and 7.9% in the euro zone and Japan respectively, on a quarterly basis. China stood out as a rare bright spot, with its economy expanding 3.2% between April and June 2020. While China’s recovery appeared to be picking up speed in the third quarter of 2020, elsewhere hopes of a robust rebound in second half of 2020 were jeopardized by surging COVID-19 infections, particularly in Europe where many countries saw the start of a second wave.
In this somehow difficult context, $32.2bn of new green bonds were issued in September 2020, the highest monthly volume since market inception, bringing the total for 2020 to $165bn according to the Climate Bonds Initiative database. After the month-end rebalancing, the benchmark is now composed of 654 securities from 280 issuers for a market value of €465bn equivalent.
Portfolio Review
The Fund slightly underperformed its benchmark over the twelve-month period. Most of this underperformance was due to March 2020 extreme conditions in which the Fund was penalized by its structural overweight on corporate issuers in a context of massive spreads widening. Over this month, spreads on the benchmark nearly doubled from 75 basis points to 143 basis points, negatively impacting performance. Over the reporting period and by sector, the positive contributors to the relative performance were mainly the overweight on electric companies, the selection on capital goods and the overweight on other financials. The main detractors were the respective underweights on treasuries and supranationals, those underweights being structural and based on the Fund’s investment philosophy to favor corporates. By country, the overweights in US and UK names were beneficial to the relative performance while the underweights in France and Supranationals cost in relative terms.
Outlook
We are maintaining our selective strategy on sectors strongly affected by the health crisis, while remaining attentive to the evolution of restrictions, the American elections and Brexit. However, we continue to benefit from a market supported by powerful technical factors, thanks to the increase in asset purchases by the European Central Bank. We expect the trend seen in September 2020 to continue, with a positive momentum of new issues notably from corporates non-financials and sovereigns. On the former, the auto sector played an important part with Volkswagen and Daimler both issuing sizeable green bonds with respective volumes of €2bn and €1bn. The Swedish carmaker Volvo is also expected to issue a green bond in October 2020, witnessing an increasing appetite for green bonds financing from those issuers, and more generally for corporate non-financials. On the latter, after Germany and Sweden, it is Egypt who became the first sovereign green bond in the Middle East and North Africa with a $750 million, 5 year maturity and 5.25% coupon green bond to finance projects that reflect Egypt’s commitment to the United Nations’ Sustainable Development Goals.
* Effective on or about December 14, 2020, the AllianzGI Green Bond Fund will be liquidated and dissolved, and any outstanding shares redeemed. As of December 7, 2020, shares of the Fund will no longer be available for purchase or exchange.
| 30 | September 30, 2020 | | Annual Report |
Table of Contents
Unaudited
AllianzGI Green Bond Fund (cont’d)
Average Annual Total Return for the period ended September 30, 2020
| 1 Year | Since Inception† | |||||||||
AllianzGI Green Bond Fund Class A | 3.55% | 8.00% | ||||||||
| AllianzGI Green Bond Fund Class A (adjusted) | –0.33% | 5.80% | |||||||
| AllianzGI Green Bond Fund Class P | 3.74% | 8.18% | |||||||
| AllianzGI Green Bond Fund Institutional Class | 3.78% | 8.25% | |||||||
| ICE BofA Green Bond Index | 3.80% | 8.88% | |||||||
Lipper Core Bond Funds Average | 6.90% | 9.30% | ||||||||
† The Fund began operations on November 19, 2018. Benchmark return comparisons began on the fund inception date. Lipper performance comparisons began on November 30, 2018.
Performance quoted represents past performance and is no guarantee of future results. Current performance may be lower or higher than performance shown. For performance current to the most recent month-end, visit our website at us.allianzgi.com. Investment return and the principal value will fluctuate. Shares may be worth more or less than original cost when redeemed. The adjusted returns take into account the maximum initial sales charge of 3.75% on Class A Shares. Returns do not reflect deduction of taxes that a shareholder would pay on funds distributions or redemption of fund shares. See pages 63 and 64 for more information. The Fund’s gross expense ratios are 4.16% for Class A shares, 4.24% for Class P shares and 3.54% for Institutional Class shares. These ratios do not include an expense reduction, contractually guaranteed through at least January 31, 2022. The Fund’s expense ratios net of this reduction are 0.75% for Class A shares, 0.55% for Class P shares and 0.50% for Institutional Class shares. Expense ratio information is as of the Fund’s current prospectus dated February 1, 2020, as further revised or supplemented from time to time.
Cumulative Returns Through September 30, 2020
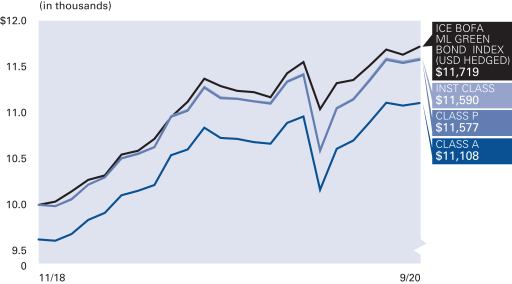
Country/Location Allocation (as of September 30, 2020)
| United States | 27.3% | |||
| Netherlands | 10.7% | |||
| France | 7.9% | |||
| Korea (Republic of) | 6.0% | |||
| Spain | 5.8% | |||
| Hong Kong | 5.6% | |||
| Supranational | 5.0% | |||
| Denmark | 4.2% | |||
| Other | 29.1% | |||
| Cash & Equivalents — Net | –1.6% | |||
Credit Ratings* (as of September 30, 2020)
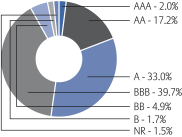
* As a percentage of total investments. Credit ratings apply to the credit worthiness of the issuers of the underlying securities and not to the Fund or its shares. Ratings are subject to change. Ratings are based off of the highest available rating from S&P Global Ratings (“S&P”), Moody’s and Fitch. Bonds not rated by the aforementioned agencies are “unrated”. Ratings are shown based on the S&P rating scale, which ranges from AAA (highest) to D (lowest). Where applicable, securities ratings of an agency other than S&P have been converted to the S&P equivalent. “NR” denotes securities that are not rated. Not rated securities do not necessarily indicate low quality. Ratings are relative, subjective and not absolute standards of quality, and represent the opinions of the independent Nationally Recognized Statistical Rating Organizations (NRSRO). The security’s credit rating does not eliminate risk. The Fund is not rated by an independent rating agency.
| Annual Report | | September 30, 2020 | 31 |
Table of Contents
Unaudited
AllianzGI Green Bond Fund (cont’d)
| Shareholder Expense Example | Actual Performance | |||||
| Class A | Class P | Institutional Class | ||||
| Beginning Account Value (4/1/20) | $1,000.00 | $1,000.00 | $1,000.00 | |||
| Ending Account Value (9/30/20) | $1,092.80 | $1,093.30 | $1,094.00 | |||
| Expenses Paid During Period | $3.98 | $2.93 | $2.67 | |||
| Hypothetical Performance | ||||||
| (5% return before expenses) | ||||||
| Class A | Class P | Institutional Class | ||||
| Beginning Account Value (4/1/20) | $1,000.00 | $1,000.00 | $1,000.00 | |||
| Ending Account Value (9/30/20) | $1,021.20 | $1,022.20 | $1,022.45 | |||
| Expenses Paid During Period | $3.84 | $2.83 | $2.58 | |||
For each class of the Fund, expenses (net of fee waiver and reimbursement, if any) are equal to the annualized expense ratio for the class (0.76% for Class A, 0.56% for Class P and 0.51% for Institutional Class), multiplied by the average account value over the period, multiplied by 183/366.
| 32 | September 30, 2020 | | Annual Report |
Table of Contents
Unaudited
AllianzGI High Yield Bond Fund
For the period of October 1, 2019 through September 30, 2020, as provided by Douglas C. Forsyth, CFA, Portfolio Manager.
Fund Insights
For the twelve-month period ended September 30, 2020, Class A shares at net asset value (“NAV”) of the AllianzGI High Yield Bond Fund (the “Fund”) returned -0.82%, underperforming the ICE BofA High Yield Master II Index (the “benchmark”), which returned 2.30%.
Market Overview
Despite historic equity and credit volatility, high yield produced a positive twelve-month return. A favorable technical backdrop benefited the asset class over the back half of the reporting period.
High-yield bonds gained over the fourth quarter of 2019 and into early 2020 before selling off aggressively in late February 2020 and much of March 2020 as COVID-19 outbreak intensified. In connection with unprecedented monetary and fiscal policy responses, the high-yield bond market rebounded from the March 2020 low and advanced over the remainder of period. Stabilizing investor confidence, accommodative US Federal Reserve (the “Fed”) commentary, positive economic surprise momentum, better-than-feared corporate earnings, US COVID-19 case trends and vaccine/treatment progress were all market supportive.
The Fed’s response was designed to ensure the normal functioning and stabilization of US credit markets and was also extraordinary in terms of its swiftness, scope, and willingness to take action. The Fed remained highly accommodative throughout the reporting period, pledging to keep interest rates near zero until at least the end of 2023. In addition, the Fed officially set a new inflation target of moderately above 2.0%, noting it would maintain an accommodative stance until inflation hits this level.
The fiscal response was also immediate with President Trump signing into law several bills including the $2.2 trillion Coronavirus Aid, Relief & Security Act.
As anticipated, the economy decelerated, and the unemployment rate surged. Although, economic data released later in the period improved and, in many cases, surprised to the upside as lockdowns, travel restrictions and social-distancing measures eased.
The first-quarter earnings season was weak, but second-quarter financial results exceeded estimates amid better-than-feared earnings. Management outlooks were also constructive, but fewer companies provided guidance.
Performance dispersion among credit ratings was notable as the highest-quality issues held up far better than the lowest-quality issues during the market selloff. The performance gap narrowed into period-end, however.
Despite a dormant March, high-yield new issuance has been heavy, supported by robust fund flows. Default rates increased before steadying late in the reporting period.
Portfolio Review
Most industries and issues in the portfolio finished higher. The portfolio’s underweight allocation to CCC rated bonds, which underperformed higher-quality credits, had a positive impact on relative performance.
Industry allocations that helped relative performance during the period included recreation & travel, technology & electronics and telecommunications. In recreation & travel, positive security selection and a portfolio underweight were beneficial. Security selection was the primary driver of relative outperformance in technology & electronics and telecommunications.
Industry allocations that hurt relative performance during the period included theaters & entertainment, financial services and support-services. In theaters & entertainment, a portfolio overweight was the primary detractor. Security selection weighed on relative performance in financial services and support-services.
Outlook
While uncertainty remains elevated, visibility around the macro outlook and corporate profitability path has improved.
Extraordinary monetary and fiscal policy measures have stabilized financial markets and the US economy. Furthermore, Fed Chair Jerome Powell and US Treasury Secretary Mnuchin have pledged additional support if needed to accelerate the recovery.
With economic progress, we believe corporate profits should begin to trough and then start recovering over the second half of the year and into 2021. US companies are not only positioned to directly benefit from Fed programs and US government fiscal support but also from a potentially significant boost in operating leverage as strengthening demand is met with lower input costs and productivity gains.
Against this backdrop, several risks could surface triggering market volatility including geopolitical tensions, fiscal stimulus uncertainty, US elections and localized shutdowns due to increasing COVID-19 cases.
Many data points indicate that the high-yield market has normalized and is functioning properly. Our constructive outlook for high yield and the opportunity to generate high income from the asset class remains unchanged. In our opinion, it is difficult to identify a better risk/reward option in fixed income. We believe that US high-yield bonds should contribute from both a diversification and a relative-performance perspective, offering a very compelling yield opportunity compared to negative and depressed yields globally with lower interest-rate sensitivity.
| Annual Report | | September 30, 2020 | 33 |
Table of Contents
Unaudited
AllianzGI High Yield Bond Fund (cont’d)
Average Annual Total Return for the period ended September 30, 2020
| 1 Year | 5 Year | 10 Year | Since Inception† | |||||||||||||||
| AllianzGI High Yield Bond Fund Class A | –0.82% | 4.24% | 4.72% | 6.59% | ||||||||||||||
| AllianzGI High Yield Bond Fund Class A (adjusted) | –4.53% | 3.44% | 4.32% | 6.42% | |||||||||||||
| AllianzGI High Yield Bond Fund Class C | –1.41% | 3.56% | 4.00% | 5.82% | ||||||||||||||
| AllianzGI High Yield Bond Fund Class C (adjusted) | –2.35% | 3.56% | 4.00% | 5.82% | |||||||||||||
| AllianzGI High Yield Bond Fund Class R | –1.28% | 3.82% | 4.32% | 6.27% | |||||||||||||
| AllianzGI High Yield Bond Fund Class P | –0.46% | 4.61% | 5.04% | 6.82% | |||||||||||||
| AllianzGI High Yield Bond Fund Institutional Class | –0.50% | 4.60% | 5.07% | 7.03% | |||||||||||||
| AllianzGI High Yield Bond Fund Administrative Class | –0.63% | 4.43% | 4.76% | 6.61% | ||||||||||||||
| ICE BofA High Yield Master II Index | 2.30% | 6.61% | 6.28% | 6.85% | |||||||||||||
| Lipper High Yield Funds Average | 1.70% | 5.42% | 5.37% | 5.26% | ||||||||||||||
† The Fund began operations on July 31, 1996. Benchmark return comparisons began on the fund inception date. Lipper performance comparisons began on July 31, 1996.
Performance quoted represents past performance and is no guarantee of future results. Current performance may be lower or higher than performance shown. For performance current to the most recent month-end, visit our website at us.allianzgi.com. Investment return and the principal value will fluctuate. Shares may be worth more or less than original cost when redeemed. The adjusted returns take into account the maximum initial sales charge of 3.75% on Class A shares and the contingent deferred sales charge (CDSC) of 1% on Class C shares, which may apply to shares redeemed during the first year of ownership. Returns do not reflect deduction of taxes that a shareholder would pay on fund distributions or redemption of fund shares. See pages 63 and 64 for more information. The Fund’s expense ratios are 1.07% for Class A shares, 1.76% for Class C shares, 1.48% for Class R shares, 0.73% for Class P shares, 0.79% for Institutional Class shares and 0.94% for Administrative Class shares. Expense ratio information is as of the Fund’s current prospectus dated February 1, 2020, as further revised or supplemented from time to time.
Cumulative Returns Through September 30, 2020
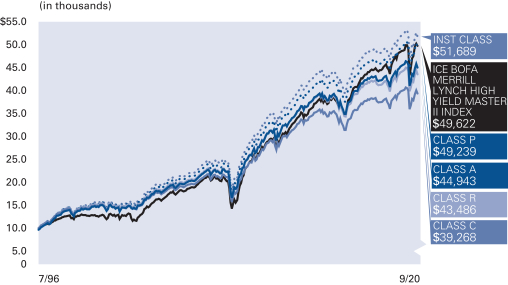
Industry Allocation (as of September 30, 2020)
| Media | 13.1% | |||
| Entertainment | 6.9% | |||
| Telecommunications | 6.6% | |||
| Diversified Financial Services | 5.8% | |||
| Oil, Gas & Consumable Fuels | 5.5% | |||
| Auto Manufactures | 4.2% | |||
| Healthcare-Services | 4.1% | |||
| Pipelines | 4.1% | |||
| Other | 46.5% | |||
| Cash & Equivalents — Net | 3.2% | |||
| 34 | September 30, 2020 | | Annual Report |
Table of Contents
Unaudited
AllianzGI High Yield Bond Fund (cont’d)
Credit Ratings* (as of September 30, 2020)
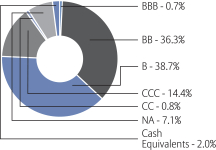
* As a percentage of total investments. Securities ratings refer to the underlying holdings of the Fund and are categorized from highest to lowest credit quality using ratings provided by S&P Global Ratings (“S&P”). S&P’s ratings have been selected for several reasons, including the portfolio managers’ usage of S&P ratings methodology among other credit quality information in managing the Fund, access to background information and other materials provided by S&P, as well as the Funds’ considerations of industry practice. The Fund also displays S&P credit ratings information in materials provided in client presentations. See “Important Information” for more detail on the selection of S&P for the Fund’s ratings presentation. Securities not rated by S&P and bonds that do not currently have a rating available are designated in the chart above as “NR” and “NA”, respectively.
| Shareholder Expense Example | Actual Performance | |||||||||||
| Class A | Class C | Class R | Class P | Institutional Class | Administrative Class | |||||||
| Beginning Account Value (4/1/20) | $1,000.00 | $1,000.00 | $1,000.00 | $1,000.00 | $1,000.00 | $1,000.00 | ||||||
| Ending Account Value (9/30/20) | $1,097.50 | $1,094.10 | $1,093.70 | $1,098.80 | $1,099.60 | $1,097.70 | ||||||
| Expenses Paid During Period | $5.61 | $9.32 | $7.90 | $4.09 | $4.15 | $5.24 | ||||||
| Hypothetical Performance | ||||||||||||
| (5% return before expenses) | ||||||||||||
| Class A | Class C | Class R | Class P | Institutional Class | Administrative Class | |||||||
| Beginning Account Value (4/1/20) | $1,000.00 | $1,000.00 | $1,000.00 | $1,000.00 | $1,000.00 | $1,000.00 | ||||||
| Ending Account Value (9/30/20) | $1,019.65 | $1,016.10 | $1,017.45 | $1,021.10 | $1,021.05 | $1,020.00 | ||||||
| Expenses Paid During Period | $5.40 | $8.97 | $7.62 | $3.94 | $3.99 | $5.05 | ||||||
For each class of the Fund, expenses are equal to the annualized expense ratio for the class (1.07% for Class A, 1.78% for Class C, 1.51% for Class R, 0.78% for Class P, 0.79% for Institutional Class and 1.00% for Administrative Class), multiplied by the average account value over the period, multiplied by 183/366.
| Annual Report | | September 30, 2020 | 35 |
Table of Contents
Unaudited
AllianzGI International Small-Cap Fund
For the period of October 1, 2019 through September 30, 2020, as provided by Andrew Neville, Portfolio Manager
Fund Insights
For the twelve-month period ended September 30, 2020, Class A shares at net asset value (“NAV”) of the AllianzGI International Small-Cap Fund (the “Fund”) returned 8.37%, outperforming the MSCI World ex USA Small Cap Index (the “benchmark”), which returned 6.88%.
Market Overview
It was a volatile twelve-month period for international equities. Steady gains over the final quarter of 2019 ended abruptly in early 2020 when COVID-19 swept around the world. International stocks plummeted over February and March 2020 as the extraordinary measures implemented to stem the pandemic plunged the global economy into a recession. However, stock markets subsequently recovered strongly over the second and third quarters as swift action from governments and central banks delivered unprecedented levels of fiscal and monetary support.
Portfolio Review
The Fund represents the highest conviction names from three underlying regional small cap strategies: Europe, Japan, and Asia ex-Japan. Stock selection is the key driver of relative returns as the regional allocation of the Fund is neutral to the benchmark and there are risk controls to ensure sector deviations do not become too large.
In absolute terms, all three small cap markets showed gains. European small caps registered the strongest gains followed by small caps from Japan and finally Asia ex Japan. In relative terms, the European and the Asia ex Japan sleeve portfolios were able to outperform their local markets, the Japanese sleeve portfolio closed nearly in-line with its index.
Our small cap portfolio of quality companies, exposed to structural growth trends has been better positioned than broader equity markets.
During the period, the Fund saw a negative contribution from the stock selection. Sector allocation contributed strong positive. The underweight in materials, utilities, and consumer staples weighed on the Fund’s relative performance. Nevertheless, our overweight in health care and information technology (“IT”) and the underweight in energy companies were favorable. Stock selection was most successful within communication services, health care and industrials. Stock selection detracted most within financials, consumer discretionary, and real estate.
The Fund’s largest contributors to performance came from the consumer discretionary and the IT industry. ASOS (UK) and Bechtle (Germany) particularly positively impacted performance. ASOS is a leader in the structurally growing online fashion market. ASOS looks to be one of the long-term beneficiaries of the crisis, which is accelerating the retail channel’s shift to online. The stock increased more than 100% over the year. As the market-leading IT system house in Germany and with its market leading position in the DACH region and France, Bechtle has been instrumental in supporting millions of people on their digital journey toward a proper work-from-home environment; the firm is one of the structural winners during and after the crisis. The largest detractor to performance was Tullow Oil, a leading UK-listed exploration company. At the end of last year, the company reported that production from flagship projects had disappointed. The departures of both the CEO and the Exploration Director was also not helpful. We sold the holding in the fourth quarter of 2019. Another detractor was Dalata Hotel Group, which was also sold during the twelve-month period. The UK-based hotel operator has clearly been affected by travel restrictions.
Portfolio companies have weathered the turbulences of February and March better than many other companies in the International small cap universe. In cases where portfolio companies were directly affected, we sold them immediately. We used the market weakness to pick up or increased long-term winners, even though their near-term earnings outlook might be depressed. We are willing to support those companies where they seek to raise additional equity capital to give them more comfort.
Outlook
While the economic rebound seems to be continuing, fears of a second wave of the pandemic might dampen the propensity to consume and to invest. In fact, some economic indicators are already suggesting that the momentum is slowing. Equity valuations appear mixed. They are highest in the US, but appear moderate in Europe, Japan and the emerging markets. The ratio between positive and negative corporate earnings revisions has recently improved. This is usually a good sign for the equity markets. Moreover, the very generous monetary policy stance of the major central banks should continue to support equities. Overall, we are likely to see elevated volatility.
We will keep our core focus on quality growth companies as we expect them to continue to outperform mid-term due to their sustainable business models in a low interest rate environment. Stock picking is key. We saw sharp dispersion between the winners of the crisis, the underappreciated long-term winners, and the laggards. Strong balance sheets and cash flows are required to survive the demand shock.
| 36 | September 30, 2020 | | Annual Report |
Table of Contents
Unaudited
AllianzGI International Small-Cap Fund (cont’d)
Average Annual Total Return for the period ended September 30, 2020
| 1 Year | 5 Year | 10 Year | Since Inception† | |||||||||||||||
| AllianzGI International Small-Cap Fund Class A | 8.37% | 5.19% | 6.63% | 10.47% | ||||||||||||||
| AllianzGI International Small-Cap Fund Class A (adjusted) | 2.41% | 4.01% | 6.03% | 10.20% | |||||||||||||
| AllianzGI International Small-Cap Fund Class C | 7.56% | 4.38% | 5.82% | 9.64% | ||||||||||||||
| AllianzGI International Small-Cap Fund Class C (adjusted) | 6.56% | 4.38% | 5.82% | 9.64% | |||||||||||||
| AllianzGI International Small-Cap Fund Class R | 8.01% | 4.86% | 6.33% | 10.18% | |||||||||||||
| AllianzGI International Small-Cap Fund Class P | 8.55% | 5.36% | 6.82% | 10.76% | |||||||||||||
| AllianzGI International Small-Cap Fund Institutional Class | 8.61% | 5.41% | 6.90% | 10.85% | |||||||||||||
| AllianzGI International Small-Cap Fund Class R6 | 8.63% | 5.48% | 6.99% | 10.95% | |||||||||||||
| MSCI World ex USA Small Cap Index | 6.88% | 7.35% | 6.55% | 7.24% | |||||||||||||
| MSCI EAFE Small Cap Index | 6.84% | 7.37% | 7.33% | 7.37% | |||||||||||||
| Lipper International Small/Mid-Cap Growth Funds Average | 13.06% | 8.21% | 7.43% | 8.22% | ||||||||||||||
† The Fund began operations on December 31, 1997. Benchmark return and Lipper performance comparisons began on the fund inception date.
Performance quoted represents past performance and is no guarantee of future results. Current performance may be lower or higher than performance shown. For performance current to the most recent month-end, visit our website at us.allianzgi.com. Investment return and the principal value will fluctuate. Shares may be worth more or less than original cost when redeemed. The adjusted returns take into account the maximum initial sales charge of 5.50% on Class A shares and the contingent deferred sales charge (CDSC) of 1% on Class C shares, which may apply to shares redeemed during the first year of ownership. Returns do not reflect deduction of taxes that a shareholder would pay on fund distributions or redemption of fund shares. See pages 63 and 64 for more information. The Fund’s gross expense ratios are 1.94% for Class A shares, 2.59% for Class C shares, 2.30% for Class R shares, 1.58% for Class P shares, 1.61% for Institutional Class shares and 1.49% for Class R6 shares. These ratios do not include expense reductions, contractually guaranteed through at least January 31, 2021. The Fund’s expense ratios net of this reduction are 1.25% for Class A shares, 2.00% for Class C shares, 1.59% for Class R shares, 1.10% for Class P shares, 1.04% for Institutional Class shares and 1.00% for Class R6 shares. Expense ratio information is as of the Fund’s current prospectus dated February 1, 2020, as further revised or supplemented from time to time.
Cumulative Returns Through September 30, 2020
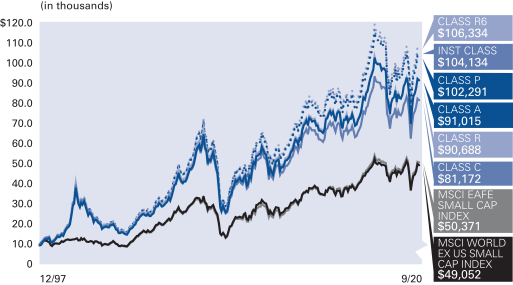
Country/Location Allocation (as of September 30, 2020)
| Japan | 30.7% | |||
| United Kingdom | 14.4% | |||
| Germany | 12.7% | |||
| Australia | 5.8% | |||
| Switzerland | 5.6% | |||
| France | 5.4% | |||
| Sweden | 3.0% | |||
| Italy | 3.0% | |||
| Other | 18.0% | |||
| Cash & Equivalents — Net | 1.4% | |||
| Annual Report | | September 30, 2020 | 37 |
Table of Contents
Unaudited
AllianzGI International Small-Cap Fund (cont’d)
| Shareholder Expense Example | Actual Performance | |||||||||||
| Class A | Class C | Class R | Class P | Institutional Class | Class R6 | |||||||
| Beginning Account Value (4/1/20) | $1,000.00 | $1,000.00 | $1,000.00 | $1,000.00 | $1,000.00 | $1,000.00 | ||||||
| Ending Account Value (9/30/20) | $1,310.50 | $1,305.90 | $1,308.00 | $1,311.80 | $1,312.00 | $1,312.30 | ||||||
| Expenses Paid During Period | $7.22 | $11.53 | $9.17 | $6.36 | $6.01 | $5.78 | ||||||
| Hypothetical Performance | ||||||||||||
| (5% return before expenses) | ||||||||||||
| Class A | Class C | Class R | Class P | Institutional Class | Class R6 | |||||||
| Beginning Account Value (4/1/20) | $1,000.00 | $1,000.00 | $1,000.00 | $1,000.00 | $1,000.00 | $1,000.00 | ||||||
| Ending Account Value (9/30/20) | $1,018.75 | $1,015.00 | $1,017.05 | $1,019.50 | $1,019.80 | $1,020.00 | ||||||
| Expenses Paid During Period | $6.31 | $10.08 | $8.02 | $5.55 | $5.25 | $5.05 | ||||||
For each class of the Fund, expenses (net of fee waiver and reimbursement, if any) are equal to the annualized expense ratio for the class (1.25% for Class A, 2.00% for Class C, 1.59% for Class R, 1.10% for Class P, 1.04% for Institutional Class and 1.00% for Class R6), multiplied by the average account value over the period, multiplied by 183/366.
| 38 | September 30, 2020 | | Annual Report |
Table of Contents
Unaudited
AllianzGI Multi Asset Income Fund*
For the period of October 1, 2019 through September 30, 2020, as provided by the Multi-Asset US Group.
Fund Insights
For the twelve-month period ended September 30, 2020, Class A shares at net asset value (“NAV”) of the AllianzGI Multi Asset Income Fund (the “Fund”) returned -4.02%, underperforming the Bloomberg Barclays U.S. Universal Bond Index (the “benchmark”), which returned 6.68%.
Market Overview
It was a volatile twelve-month period for global equities. After a steady start to 2020, global stocks changed direction in mid-February 2020 as the COVID-19 outbreak started to spread beyond China. The sell-off gathered pace in March 2020 as the draconian measures employed to curtail COVID-19 caused the global economy to grind to a standstill, triggering fears of a severe global recession. After suffering their worst quarter since the 2008 financial crisis, global stocks rebounded in the second and third quarter, supported by unprecedented government stimulus and positive trial results for potential COVID-19 vaccines. By the end of the third quarter of 2020 global equities recovered the loses suffered from the first quarter of 2020 and posted a positive return for the twelve-month period.
Global government bond yields trended higher in the fourth quarter of 2019 amid growing optimism over the outlook for global growth but tumbled in 2020 on growing speculation that the COVID-19 pandemic would force central banks to slash interest rates and reinstate asset-purchase programs. In the US, the 10-year Treasury yield closed the period around 100 basis points lower, falling abruptly in the first quarter and remaining relatively stable thereafter. The US yield curve steepened in the aftermath, as yields on bonds with maturities of less than 10 years moved slightly lower, while longer dated yields rose modestly. Corporate bonds fell sharply over the first quarter of 2020, with credit spreads increasing to levels last seen following the 2008 financial crisis, before rallying in the second and third quarters of 2020 and ultimately closing with a positive return over the complete twelve-month period.
The COVID-19 pandemic looked almost certain to push the global economy into a severe recession. As the epicenter of the pandemic spread from China to the Pacific Basin, and then onto Europe and North America, purchasing managers’ indices of economic activity dropped to even lower levels than those seen during the 2008 financial crisis. In response, central banks slashed interest rates, provided liquidity and reinstated quantitative easing programs, while budget deficits ballooned as governments committed unprecedented amounts to support companies and individuals affected by COVID-19. While China’s recovery appeared to be picking up speed in the third quarter, elsewhere hopes of a robust rebound in second half of the year were jeopardized by surging COVID-19 infections, particularly in Europe where many countries saw the start of a second wave.
In the currency markets, the US dollar strengthened in the first quarter, before weakening in the COVID-19 aftermath. As the US Federal Reserve (the “Fed”) raised its inflation target and signaled it needed to maintain near-zero interest rates for an extended period, the euro, British pound and Japanese yen all strengthened relative to the US dollar.
Portfolio Review
As markets reacted to the COVID-19 pandemic in late February 2020, and then to plummeting oil prices, credit market liquidity vanished around the globe, spreads widened to levels not seen since 2009 and corporate bonds and emerging market debt suffered significant losses. Asset classes that ordinarily offer some relative downside protection such as short-term high yield and real estate investment trusts suffered outsized losses as well. This led the Fund underperforming its benchmark significantly.
However, as credit spreads widened and the Fed stepped into the bond market to shore up liquidity at the end of the first quarter. Following the Fed intervention, many of the asset classes most adversely impacted in the first quarter rebounded. During the second and third quarters of 2020, the Fund outperformed its benchmark, driven by exposures to short-term high yield, high yield, preferreds and emerging market debt.
Outlook
On one hand, monetary policy of major central banks continues to support equities, and the ratio between positive and negative corporate earnings revisions has also recently improved. On the other hand, fears of second pandemic wave, US political landscape and EU/UK trade negotiations pose significant uncertainties to markets. In view of the downside risks we expect key rates to remain low for longer and real interest rates to stay negative. In our opinion, government bond yields look set to remain very low or even negative for some time to come. We believe that corporate bonds should continue to benefit from central bank support. However, companies’ high debt levels suggest that default rates may rise if the crisis returns. Overall, we believe that we are likely to see elevated volatility, posing opportunities for active managers to navigate across and within asset classes.
* Effective on or about December 14, 2020, the AllianzGI Multi Asset Income Fund will be liquidated and dissolved, and any outstanding shares redeemed. As of December 7, 2020, shares of the Fund will no longer be available for purchase or exchange.
| Annual Report | | September 30, 2020 | 39 |
Table of Contents
Unaudited
AllianzGI Multi Asset Income Fund (cont’d)
Average Annual Total Return for the period ended September 30, 2020
| 1 Year | 5 Year | 10 Year | Since Inception† | |||||||||||||||
AllianzGI Multi Asset Income Fund Class A | –4.02% | 4.08% | 3.63% | 5.50% | ||||||||||||||
| AllianzGI Multi Asset Income Fund Class A (adjusted) | –9.30% | 2.90% | 3.04% | 4.99% | |||||||||||||
AllianzGI Multi Asset Income Fund Class C | –4.77% | 3.29% | 2.84% | 4.71% | ||||||||||||||
| AllianzGI Multi Asset Income Fund Class C (adjusted) | –5.69% | 3.29% | 2.84% | 4.71% | |||||||||||||
| AllianzGI Multi Asset Income Fund Class R | –4.42% | 3.70% | 3.27% | 5.15% | |||||||||||||
| AllianzGI Multi Asset Income Fund Class P | –3.71% | 4.38% | 3.93% | 5.80% | |||||||||||||
| AllianzGI Multi Asset Income Fund Institutional Class | –3.69% | 4.43% | 3.98% | 5.85% | |||||||||||||
| AllianzGI Multi Asset Income Fund Class R6 | –3.64% | 4.50% | 4.03% | 5.90% | |||||||||||||
AllianzGI Multi Asset Income Fund Administrative Class | –4.04% | 3.65% | 3.44% | 5.35% | ||||||||||||||
| Bloomberg Barclays U.S. Universal Bond Index | 6.68% | 4.49% | 3.92% | 4.76% | |||||||||||||
| AllianzGI Multi Asset Income Strategic Benchmark | 9.61% | 6.42% | 4.89% | 5.87% | |||||||||||||
| MSCI World High Dividend Yield Index | –4.09% | 6.61% | 6.85% | 8.68% | |||||||||||||
Lipper Mixed-Asset Target Today Funds Average | 5.26% | 5.21% | 4.56% | 5.95% | ||||||||||||||
† The Fund began operations on December 29, 2008. Benchmark return comparisons began on the fund inception date. Lipper performance comparisons began on December 31, 2008.
Performance quoted represents past performance and is no guarantee of future results. Current performance may be lower or higher than performance shown. For performance current to the most recent month-end, visit our website at us.allianzgi.com. Investment return and the principal value will fluctuate. Shares may be worth more or less than original cost when redeemed. The adjusted returns take into account the maximum initial sales charge of 5.50% on Class A shares and the contingent deferred sales charge (CDSC) of 1% on Class C shares, which may apply to shares redeemed during the first year of ownership. Returns do not reflect deduction of taxes that a shareholder would pay on fund distributions or redemption of fund shares. See pages 63 and 64 for more information. The Fund’s gross expense ratios, which include the Acquired Fund Fees and Expenses, are 1.13% for Class A shares, 1.88% for Class C shares, 1.38% for Class R shares, 0.73% for Class P shares, 0.68% for Institutional Class, 0.63% for Class R6 shares and 0.98% for Administrative Class shares. These ratios do not include an expense reduction, contractually guaranteed through at least January 31, 2021. The Fund’s expense ratios net of this reduction, which include the Acquired Fund Fees and Expenses, are 0.95% for Class A shares, 1.70% for Class C shares, 1.30% for Class R shares, 0.65% for Class P shares, 0.60% for Institutional Class, 0.55% for Class R6 shares and 0.90% for Administrative Class shares. Expense ratio information is as of the Fund’s current prospectus dated February 1, 2020, as further revised or supplemented from time to time.
Cumulative Returns Through September 30, 2020
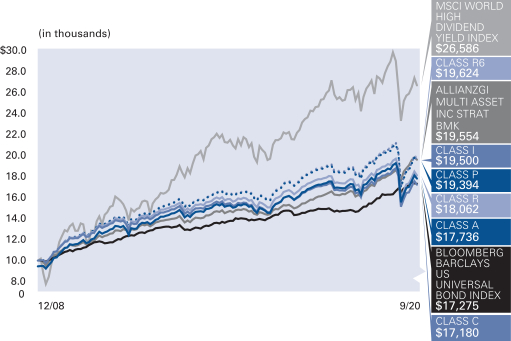
Fund Allocation (as of September 30, 2020)
| AllianzGI Short Duration High Income | 13.6% | |||
| AllianzGI Preferred Securities & Income | 10.1% | |||
| AllianzGI High Yield Bond | 9.8% | |||
| AllianzGI Short Term Bond | 8.7% | |||
| iShares JP Morgan USD Emerging Markets Bond | 7.5% | |||
| iShares Emerging Markets Dividend | 5.1% | |||
| VanEck Vectors Fallen Angel High Yield Bond | 5.0% | |||
| Invesco DB Gold | 4.9% | |||
| Other | 20.9% | |||
| Cash & Equivalents — Net | 14.4% | |||
| 40 | September 30, 2020 | | Annual Report |
Table of Contents
Unaudited
AllianzGI Multi Asset Income Fund (cont’d)
| Shareholder Expense Example | Actual Performance | |||||||||||||
| Class A | Class C | Class R | Class P | Institutional Class | Class R6 | Administrative Class | ||||||||
| Beginning Account Value (4/1/20) | $1,000.00 | $1,000.00 | $1,000.00 | $1,000.00 | $1,000.00 | $1,000.00 | $1,000.00 | |||||||
| Ending Account Value (9/30/20) | $1,144.50 | $1,139.20 | $1,141.20 | $1,145.40 | $1,146.20 | $1,146.40 | $1,144.00 | |||||||
| Expenses Paid During Period | $2.47 | $6.47 | $4.50 | $0.64 | $0.80 | $0.48 | $2.20 | |||||||
| Hypothetical Performance | ||||||||||||||
| (5% return before expenses) | ||||||||||||||
| Class A | Class C | Class R | Class P | Institutional Class | Class R6 | Administrative Class | ||||||||
| Beginning Account Value (4/1/20) | $1,000.00 | $1,000.00 | $1,000.00 | $1,000.00 | $1,000.00 | $1,000.00 | $1,000.00 | |||||||
| Ending Account Value (9/30/20) | $1,022.70 | $1,018.95 | $1,020.80 | $1,024.40 | $1,024.25 | $1,024.55 | $1,022.95 | |||||||
| Expenses Paid During Period | $2.33 | $6.11 | $4.24 | $0.61 | $0.76 | $0.46 | $2.07 | |||||||
For each class of the Fund, expenses (net of fee waiver and reimbursement, if any) are equal to the annualized expense ratio for the class (0.46% for Class A, 1.21% for Class C, 0.84% for Class R, 0.12% for Class P, 0.15% for Institutional Class, 0.09% for Class R6 and 0.41% for Administrative Class), multiplied by the average account value over the period, multiplied by 183/366. These expenses do not include the expenses of the investment companies in which the Fund invests, which are indirectly borne by Fund shareholders.
| Annual Report | | September 30, 2020 | 41 |
Table of Contents
Unaudited
AllianzGI PerformanceFee Managed Futures Strategy Fund*
For the period of October 1, 2019 through September 30, 2020, as provided by the Multi-Asset US Group.
Fund Insights
For the twelve-month period ended September 30, 2020, Institutional Class shares at net asset value (“NAV”) of the AllianzGI PerformanceFee Managed Futures Strategy Fund (the “Fund”) returned -12.44%, underperforming the ICE BofA 3-Month U.S. Treasury Bill Index (the “benchmark”), which returned 1.10%.
Market Overview
It was a volatile twelve-month period for global equities. After a steady start to 2020, global stocks changed direction in mid-February 2020 as the COVID-19 outbreak started to spread beyond China. The sell-off gathered pace in March 2020 as the draconian measures employed to curtail COVID-19 caused the global economy to grind to a standstill, triggering fears of a severe global recession. After suffering their worst quarter since the 2008 financial crisis, global stocks rebounded in the second and third quarters, supported by unprecedented government stimulus and positive trial results for potential COVID-19 vaccines. By the end of the third quarter of 2020 global equities recovered the loses suffered from the first quarter of 2020 and posted a positive return for the twelve-month period.
Global government bond yields trended higher in the fourth quarter of 2019 amid growing optimism over the outlook for global growth, but tumbled in 2020 on growing speculation that the COVID-19 pandemic would force central banks to slash interest rates and reinstate asset-purchase programs. In the US, the 10-year Treasury yield closed the period around 100 basis points lower, falling abruptly in the first quarter and remaining relatively stable thereafter. The US yield curve steepened in the aftermath, as yields on bonds with maturities of less than 10 years moved slightly lower, while longer dated yields rose modestly. Corporate bonds fell sharply over the first quarter of 2020, with credit spreads increasing to levels last seen following the 2008 financial crisis, before rallying in the second and third quarters of 2020 and ultimately closing with a positive return over the complete twelve-month period.
The COVID-19 pandemic looked almost certain to push the global economy into a severe recession. As the epicenter of the pandemic spread from China to the Pacific Basin, and then on to Europe and North America, purchasing managers’ indices of economic activity dropped to even lower levels than those seen during the 2008 financial crisis. In response, central banks slashed interest rates, provided liquidity and reinstated quantitative easing programs, while budget deficits ballooned as governments committed unprecedented amounts to support companies and individuals affected by COVID-19. While China’s recovery appeared to be picking up speed in the third quarter, elsewhere hopes of a robust rebound in second half of the year were jeopardized by surging COVID-19 infections, particularly in Europe where many countries saw the start of a second wave.
In the currency markets, the US dollar strengthened in the first quarter, before weakening in the COVID-19 aftermath. As the US Federal Reserve raised its inflation target and signaled it needed to maintain near-zero interest rates for an extended period, the euro, British pound and Japanese yen all strengthened relative to the US dollar.
Portfolio Review
The primary positive contributors to the Fund over the twelve-month period were short commodity exposures, long US Government bonds, long volatility and short commodity related currencies such as the Australian Dollar as financial markets were impacted by the COVID-19 pandemic. Conversely, long equity positions and credit exposure going into sell-off, along with currency positions, particularly in the Japanese Yen were the most notable detractors during this period of heightened volatility.
The Fund traded relatively flat following the turmoil during the first quarter of 2020, first underperforming due to short positions in risk assets at the beginning stages of the recovery and later benefiting from long exposure to US equities in the third quarter of 2020. Long exposure to global duration benefitted the Fund, as did long positions in silver and gold during the second and third quarters of 2020. The primary detractor for the post COVID-19 pandemic period was positioning within commodities besides gold and silver, which was net short.
Outlook
On one hand, monetary policy of major central banks continues to support equities, and the ratio between positive and negative corporate earnings revisions has also recently improved. In view of the downside risks we expect key rates to remain low for longer and real interest rates to stay negative. In our opinion, government bond yields look set to remain very low or even negative for some time to come. We believe that corporate bonds should continue to benefit from central bank support. However, companies’ high debt levels suggest that default rates may rise if the crisis returns. Overall, we believe that we are likely to see elevated volatility, posing opportunities for active managers to navigate across and within asset classes.
* Effective on or about December 14, 2020, the AllianzGI PerformanceFee Managed Futures Strategy Fund will be liquidated and dissolved, and any outstanding shares redeemed. As of December 7, 2020, shares of the Fund will no longer be available for purchase or exchange.
| 42 | September 30, 2020 | | Annual Report |
Table of Contents
Unaudited
AllianzGI PerformanceFee Managed Futures Strategy Fund (cont’d)
Average Annual Total Return for the period ended September 30, 2020
| 1 Year | Since Inception† | |||||||||
| AllianzGI PerformanceFee Managed Futures Strategy Fund Class P | –12.43% | –4.95% | |||||||
| AllianzGI PerformanceFee Managed Futures Strategy Fund Institutional Class | –12.44% | –4.97% | |||||||
| AllianzGI PerformanceFee Managed Futures Strategy Fund Class R6 | –12.33% | –4.87% | |||||||
| ICE BofA 3-Month U.S. Treasury Bill Index | 1.10% | 1.74% | |||||||
Lipper Alternative Managed Futures Funds Average | –6.85% | –2.80% | ||||||||
† The Fund began operations on December 18, 2017. Benchmark return comparisons began on the fund inception date. Lipper performance comparisons began on December 31, 2017.
Performance quoted represents past performance and is no guarantee of future results. Current performance may be lower or higher than performance shown. For performance current to the most recent month-end, visit our website at us.allianzgi.com. Investment return and the principal value will fluctuate. Shares may be worth more or less than original cost when redeemed. Returns do not reflect deduction of taxes that a shareholder would pay on funds distributions or redemption of fund shares. See pages 63 and 64 for more information. The Fund’s gross expense ratios, which include the Acquired Fund Fees and Expenses, are 1.17% for Class P shares, 1.30% for Institutional Class shares and 1.15% for Class R6 shares. These ratios do not include an expense reduction, contractually guaranteed through at least January 31, 2021. The Fund’s expense ratios net of this reduction, which include the Acquired Fund Fees and Expenses, are 0.26% for Institutional Class shares, 0.31% for Class P shares and 0.21% for Class R6 shares. Expense ratio information is as of the Fund’s current prospectus dated February 1, 2020, as further revised or supplemented from time to time.
Cumulative Returns Through September 30, 2020
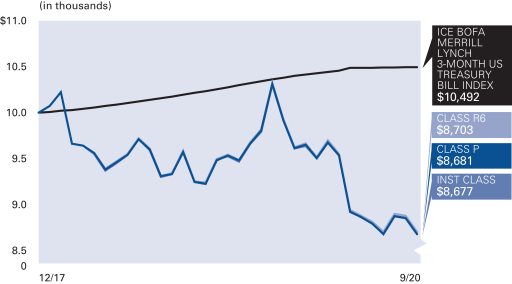
Asset Allocation (as of September 30, 2020)
| U.S. Treasury Obligations | 67.0% | |||
| Mutual Fund | 4.8% | |||
| Cash & Equivalents — Net | 28.2% | |||
| Annual Report | | September 30, 2020 | 43 |
Table of Contents
Unaudited
AllianzGI PerformanceFee Managed Futures Strategy Fund (cont’d)
| Shareholder Expense Example | Actual Performance | |||||
| Class P | Institutional Class | Class R6 | ||||
| Beginning Account Value (4/1/20) | $1,000.00 | $1,000.00 | $1,000.00 | |||
| Ending Account Value (9/30/20) | $973.30 | $972.10 | $973.30 | |||
| Expenses Paid During Period | $0.49 | $0.25 | $— | |||
| Hypothetical Performance | ||||||
| (5% return before expenses) | ||||||
| Class P | Institutional Class | Class R6 | ||||
| Beginning Account Value (4/1/20) | $1,000.00 | $1,000.00 | $1,000.00 | |||
| Ending Account Value (9/30/20) | $1,024.95 | $1,024.75 | $1,025.00 | |||
| Expenses Paid During Period | $0.51 | $0.25 | $— | |||
For each class of the Fund, expenses (net of fee waiver and reimbursement, if any) are equal to the annualized expense ratio for the class (0.10% for Class P, 0.05% for Institutional Class and 0.00% for Class R6), multiplied by the average account value over the period, multiplied by 183/366. These expenses do not include the expenses of the investment companies in which the Fund invests, which are indirectly borne by Fund shareholders.
| 44 | September 30, 2020 | | Annual Report |
Table of Contents
Unaudited
AllianzGI PerformanceFee Structured US Equity Fund*
For the period of October 1, 2019 through September 30, 2020, as provided by Greg Tournant and Stephen Bond-Nelson, Co-Portfolio Managers.
Fund Insights
For the twelve-month period ended September 30, 2020, Institutional Class shares at net asset value (“NAV”) of the AllianzGI PerformanceFee Structured US Equity Fund (the “Fund”) returned -13.39%, underperforming the S&P 500 Index (the “benchmark”), which returned 15.15%.
Market Overview
The Fund underperformed for the twelve-month period ended September 30, 2020, as a result of extremely challenging market conditions. The equity declines and implied volatility increases during this period were more extreme than many historical precedents, which had a significant impact on the performance of the Fund’s option portfolio. The Fund outperformed in the third quarter but was unable to recover underperformance incurred earlier in the year.
Portfolio Review
This year’s 30% drop in the S&P 500 Index happened in just 22 trading days, instead of the many months a similar decline took in 2008. This combination of extremely high market volatility coupled with significant drops in market valuations had a particularly large impact on the option positions held by the Fund. Throughout the market turmoil, we took significant steps to de-risk the option portfolio, primarily through closing out many short put positions.
Heading into the market decline, the Fund’s option portfolio had in place a ladder of hedging positions that was very much in line with what was in place during prior market events. A key feature of the Fund’s option portfolio is that it is a net buyer of long puts. That is consistent with our historical approach and was true as well for this period. The Fund’s option portfolio held approximately 1.8 times more long puts than short puts. We also had structured a layer of long puts slightly out of the money that were paired with an equal number of short puts as part of the strategy’s low-VIX (the CBOE Volatility Index (“VIX Index”)) configuration spreads.
The market decline was a multi-week move which, as compared with a one-day shock scenario, has real implications on the price appreciation that the deep-out-of-the-money long puts were able to provide. The Fund’s option portfolio is designed to navigate a multi-week move via its restructuring process, under which, in more typical circumstances, we address the existing short option positions while often relying on cost offsets from the existing long puts. Unfortunately, under the recent circumstances, a historic level of steepness of the inversion in the volatility term structure prevented many of the strategy’s existing long puts from providing as much benefit as expected. This steepness reduced the price appreciation of the existing layer of long puts, reducing the Fund’s ability to harvest gains on the long puts that it could in turn use to cover short put exposure, as it often has done in severe market corrections.
In addition, in late February 2020 we shifted certain out-of-the-money puts deeper out of the money in order to widen some of the short puts, a strategy that had worked well in prior market deteriorations. However, in this instance the market unpredictably continued to decline beyond the shifted positioning.
In light of these unprecedented market dynamics, we began restructuring the various put positions, and did so in advance of the index reaching their strikes and with wider extensions than in past market dislocations. Soon after, we began de-risking, i.e., covering short puts without relayering any new positions. But the daily market moves, many of which ranged between -7% and -12%, made it extremely difficult to implement all of these trades and to mitigate realized costs. Unlike in prior dislocations, in this particular case, the speed of the market moves was too severe.
As a result of these experiences, we instituted an important enhancement to the way we express our option portfolio hedging positions. To improve the option strategy’s downside risk profile and mitigate various risk factors, all downside positions on the S&P 500 Index are now sealed at inception with an accompanying nearby hedge, in a 1-to-1 ratio of short puts vs. long puts. This is expected to give each sealed position a maximum loss potential that is capped, and therefore not dependent on restructuring to limit risk exposure. At the same time, we do not expect this new hedging configuration to have a material impact on the Fund’s expected return potential over the longer term.
In the third quarter, the option portfolio delivered positive returns, as equity indexes shook off economic and public-health headwinds to continue their extraordinary rise. Volatility levels remained high, despite the market’s strength. Range-bound positions on the S&P 500 Index accounted for approximately half the performance during the quarter. More than a third came from range-bound call spreads on the VIX Index, and the remainder was attributable to S&P 500 Index directional positions to both the up and downside.
Our 1x1 positions fared well during the rising market of July and August, and positive relative performance continued during downside moves in September 2020. As part of the new enhancement, we did not restructure range-bound spreads when the S&P 500 Index, after reaching a record high of 3581 on September 2, 2020, fell to 3237 over the next 15 trading days. During the 9.6% peak-to-trough decline, the Fund’s option positions generated positive excess returns.
Outlook
While markets may remain challenging, we believe that a high-volatility environment is a favorable one for the Fund’s option portfolio when constructing new positions. As we saw in the third quarter, the option portfolio can perform in a rising market like July and August 2020, while September 2020 provided a brief example of relative outperformance during broader market downside moves.
* Effective on or about December 14, 2020, the AllianzGI PerformanceFee Structured US Equity Fund will be liquidated and dissolved, and any outstanding shares redeemed. As of December 7, 2020, shares of the Fund will no longer be available for purchase or exchange.
| Annual Report | | September 30, 2020 | 45 |
Table of Contents
Unaudited
AllianzGI PerformanceFee Structured US Equity Fund (cont’d)
On the volatility front, if there is a clear election outcome in November 2020, the resolution of at least some uncertainty could cause the volatility curve to normalize downward. But with the pandemic and its economic impact still front and center, there could just as well be a continuation of the volatility conditions we have been experiencing.
Average Annual Total Return for the period ended September 30, 2020
| 1 Year | Since Inception† | |||||||||
| AllianzGI PerformanceFee Structured US Equity Fund Class P | –13.43% | 0.23% | |||||||
| AllianzGI PerformanceFee Structured US Equity Fund Institutional Class | –13.39% | 0.23% | |||||||
| AllianzGI PerformanceFee Structured US Equity Fund Class R6 | –13.26% | 0.37% | |||||||
| S&P 500 Index | 15.15% | 10.48% | |||||||
Lipper Large-Cap Core Funds Average | 12.76% | 9.04% | ||||||||
† The Fund began operations on December 18, 2017. Benchmark return comparisons began on the fund inception date. Lipper performance comparisons began on December 31, 2017.
Performance quoted represents past performance and is no guarantee of future results. Current performance may be lower or higher than performance shown. For performance current to the most recent month-end, visit our website at us.allianzgi.com. Investment return and the principal value will fluctuate. Shares may be worth more or less than original cost when redeemed. Returns do not reflect deduction of taxes that a shareholder would pay on fund distributions or redemption of fund shares. See pages 63 and 64 for more information. The Fund’s gross expense ratios, which include the Acquired Fund Fees and Expenses, are 0.84% for Class P shares, 0.89% for Institutional Class shares and 0.80% for Class R6 shares. These ratios do not include an expense reduction, contractually guaranteed through at least January 31, 2021. The Fund’s expense ratios net of this reduction, which include the Acquired Fund Fees and Expenses, are 0.37% for Institutional Class shares, 0.37% for Class P shares and 0.37% for Class R6 shares. Expense ratio information is as of the Fund’s current prospectus dated February 1, 2020, as further revised or supplemented from time to time.
Cumulative Returns Through September 30, 2020
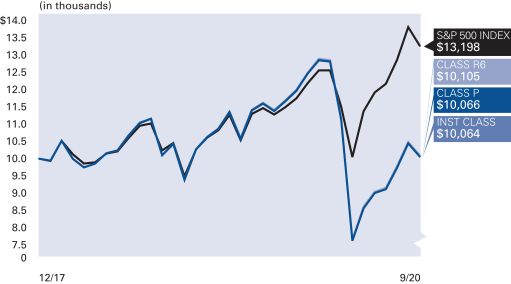
Asset Allocation (as of September 30, 2020)
| Exchange-Traded Funds | 99.6% | |||
| Cash & Equivalents — Net | 0.4% | |||
| 46 | September 30, 2020 | | Annual Report |
Table of Contents
Unaudited
AllianzGI PerformanceFee Structured US Equity Fund (cont’d)
| Shareholder Expense Example | Actual Performance | |||||
| Class P | Institutional Class | Class R6 | ||||
| Beginning Account Value (4/1/20) | $1,000.00 | $1,000.00 | $1,000.00 | |||
| Ending Account Value (9/30/20) | $1,309.70 | $1,309.30 | $1,310.00 | |||
| Expenses Paid During Period | $— | $— | $— | |||
| Hypothetical Performance | ||||||
| (5% return before expenses) | ||||||
| Class P | Institutional Class | Class R6 | ||||
| Beginning Account Value (4/1/20) | $1,000.00 | $1,000.00 | $1,000.00 | |||
| Ending Account Value (9/30/20) | $1,025.00 | $1,025.00 | $1,025.00 | |||
| Expenses Paid During Period | $— | $— | $— | |||
For each class of the Fund, expenses (net of fee waiver and reimbursement, if any) are equal to the annualized expense ratio for the class (0.00% for Class P , 0.00% for Institutional Class and 0.00% for Class R6), multiplied by the average account value over the period, multiplied by 183/366. These expenses do not include the expenses of the investment companies in which the Fund invests, which are indirectly borne by Fund shareholders.
| Annual Report | | September 30, 2020 | 47 |
Table of Contents
Unaudited
AllianzGI Preferred Securities and Income Fund
For the period of October 1, 2019 through September 30, 2020, as provided by Carl W. Pappo Jr., CFA, Portfolio Manager.
Fund Insights
For the twelve-month period ended September 30, 2020, Institutional Class shares at net asset value (“NAV”) of the AllianzGI Preferred Securities and Income Fund (the “Fund”) returned 1.19%, underperforming the ICE BofA Fixed Rate Preferred Securities Index USD Hedged (the “benchmark”), which returned 4.34%.
Market Overview
While strong economic performance characterized the first half of the twelve-month period, after March 2020 the environment was dominated by the pandemic response. As businesses closed and the US economy shut down to contain COVID-19, fixed income market liquidity dried up and forced-selling quickly drove valuations on risk assets to levels not seen since the Global Financial Crisis of 2008. Price dislocations, however, did present investment opportunities for investors. The US Federal Reserve’s (the “Fed”) participation in the fixed income markets through various purchase and lending programs, as well as the massive fiscal response by the US Government helped drive spreads and valuations tighter. While uncertainty remains regarding the path of the economic recovery, robust monetary stimulus programs persist. Demand technicals for risk assets driven by Fed purchases should continue to exert pressure on asset prices, overwhelming economic factors, driving spreads tighter.
Negative and zero bound global risk-free rates have reignited demand for higher income securities. Year-to date inflows into US preferred sector ETFs and mutual funds ended September 2020 up nearly $2 billion, despite significant March 2020 outflows of more than $2 billion. A strong rebound in risk assets after March’s decline, drove returns in the preferred market, for the twelve-month period ended September 30, 2020 to 4.34%, when measured by the ICE BofA Fixed Rate Preferred Securities Index. Preferreds underperformed the equity market, as measured by the S&P 500 Index, which returned 15.15%, but outperformed the S&P 500 Financials Sector Index, which returned -11.9%. The preferred market is heavily weighted toward financials, where banks and insurance companies represent 70% of market value. Preferreds also outperformed US high yield bonds, as measured by the ICE BofA US High Yield Index, which returned 2.3%, but underperformed the US investment grade corporate bond market, as measured by the ICE BofA US Corporate Index, which returned 7.84%. High quality, long duration assets benefited from the decline in yields. Within the preferred market, the $1000 over-the-counter market, represented by the ICE BofA US Investment Grade Institutional Capital Securities Index modestly outperformed the $25 listed market, represented by the ICE BofA US Listed Preferred Securities Index, returning 6.45% versus 5.20%, respectively. Post-March 2020, new issues structured using the 5-year Treasury as the base rate for future floating periods gained in popularity, attempting to remove investor uncertainty surrounding the elimination of the London Inter-Bank Offered Rate (“LIBOR”) after 2021.
Portfolio Review
The underperformance of the Fund during the period was primarily driven by three factors: 1) the Fund’s exposure to floating rate bonds, whose prices were negatively impacted by the Fed’s move to cut rates to zero; 2) the Fund’s overweight position in the Pipeline sector, where prices declined in sympathy with its oil and gas producing clients; and 3) an out of benchmark exposure to below investment grade preferreds, which lagged investment grade preferreds during the period. This was modestly offset by positive security selection in the insurance sector, and an overweight allocation to senior unsecured bonds in the first half of the period, which outperformed in March 2020, and provided liquidity when new issuance restarted in April 2020.
Outlook
The last six months have been a positive environment for preferreds and much of the stress that was built into the COVID-19 sell-off was unwarranted as liquidity dried up across all asset classes. While new issuance activity had been a source of opportunity to buy securities from high quality issuers with superior structures relative to the existing securities in the market, as we enter the fall, new issuance concessions in the market have compressed, leading us to become more selective. We believe that preferreds should continue to benefit from the recovery in the economy as valuations still have room to improve, spreads remain wide to their pre-COVID 19 levels and senior spreads for like credits have rallied even further, providing room for subordination spreads to come down. We continue to like financials in this environment, as they appear to have built significant reserves in the first half of 2020 to offset potential loan losses from the economic slowdown, and regulators continue to act like bank issuers are part of the solution to the present economic challenges. The Fed’s move at the end of September to extend their share repurchase restrictions and the common dividend net income test on US banks, capping distributions to common shareholders, is a credit positive that we believe will further preserve capital in the system.
| 48 | September 30, 2020 | | Annual Report |
Table of Contents
Unaudited
AllianzGI Preferred Securities and Income Fund (cont’d)
Average Annual Total Return for the period ended September 30, 2020
| 1 Year | Since Inception† | |||||||||
| AllianzGI Preferred Securities and Income Fund Class P | 1.01% | 5.03% | |||||||
| AllianzGI Preferred Securities and Income Fund Institutional Class | 1.19% | 5.13% | |||||||
| AllianzGI Preferred Securities and Income Fund Class R6 | 1.17% | 5.14% | |||||||
| ICE BofA Fixed Rate Preferred Securities Index USD Hedged | 4.34% | 6.66% | |||||||
| S&P 500 Financials Sector Index Total Return in USD | –11.87% | –3.08% | |||||||
| Lipper Flexible Income Funds Average | 3.47% | 4.80% | ||||||||
† The Fund began operations on May 30, 2018. Benchmark return comparisons began on the fund inception date. Lipper performance comparisons began on May 31, 2018.
Performance quoted represents past performance and is no guarantee of future results. Current performance may be lower or higher than performance shown. For performance current to the most recent month-end, visit our website at us.allianzgi.com. Investment return and the principal value will fluctuate. Shares may be worth more or less than original cost when redeemed. Returns do not reflect deduction of taxes that a shareholder would pay on funds distributions or redemption of fund shares. See pages 63 and 64 for more information. The Fund’s gross expense ratios are 1.69% for Class P shares, 1.91% for Institutional Class shares and 1.70% for Class R6 shares. These ratios do not include an expense reduction, contractually guaranteed through at least January 31, 2022. The Fund’s expense ratios net of this reduction are 0.60% for Class P shares, 0.55% for Institutional Class shares and 0.50% for Class R6 shares. Expense ratio information is as of the Fund’s current prospectus dated February 1, 2020, as further revised or supplemented from time to time.
Cumulative Returns Through September 30, 2020
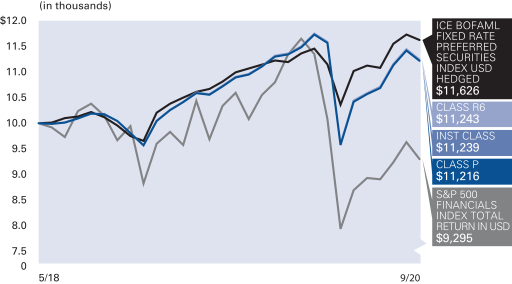
Industry Allocation (as of September 30, 2020)
| Banks | 44.1% | |||
| Insurance | 20.1% | |||
| Pipelines | 7.4% | |||
| Electric Utilities | 5.9% | |||
| Telecommunications | 5.0% | |||
| Diversified Financial Services | 3.7% | |||
| Consumer Finance | 2.3% | |||
| Miscellaneous Manufacturing | 2.2% | |||
| Other | 7.1% | |||
| Cash & Equivalents — Net | 2.2% | |||
Credit Ratings* (as of September 30, 2020)
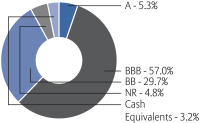
* As a percentage of total investments. Credit ratings apply to the credit worthiness of the issuers of the underlying securities and not to the Fund or its shares. Ratings are subject to change. Ratings are based off of the highest available rating from S&P Global Ratings (“S&P”), Moody’s and Fitch. Bonds not rated by the aforementioned agencies are “unrated”. Ratings are shown based on the S&P rating scale, which ranges from AAA (highest) to D (lowest). Where applicable, securities ratings of an agency other than S&P have been converted to the S&P equivalent. “NR” denotes securities that are not rated. Not rated securities do not necessarily indicate low quality. Ratings are relative, subjective and not absolute standards of quality, and represent the opinions of the independent Nationally Recognized Statistical Rating Organizations (NRSRO). The security’s credit rating does not eliminate risk. The Fund is not rated by an independent rating agency.
| Annual Report | | September 30, 2020 | 49 |
Table of Contents
Unaudited
AllianzGI Preferred Securities and Income Fund (cont’d)
| Shareholder Expense Example | Actual Performance | |||||
| Class P | Institutional Class | Class R6 | ||||
| Beginning Account Value (4/1/20) | $1,000.00 | $1,000.00 | $1,000.00 | |||
| Ending Account Value (9/30/20) | $1,171.50 | $1,171.80 | $1,172.10 | |||
| Expenses Paid During Period | $3.26 | $2.99 | $2.72 | |||
| Hypothetical Performance | ||||||
| (5% return before expenses) | ||||||
| Class P | Institutional Class | Class R6 | ||||
| Beginning Account Value (4/1/20) | $1,000.00 | $1,000.00 | $1,000.00 | |||
| Ending Account Value (9/30/20) | $1,022.00 | $1,022.25 | $1,022.50 | |||
| Expenses Paid During Period | $3.03 | $2.78 | $2.53 | |||
For each class of the Fund, expenses (net of fee waiver and reimbursement, if any) are equal to the annualized expense ratio for the class (0.60% for Class P, 0.55% for Institutional Class and 0.50% for Class R6), multiplied by the average account value over the period, multiplied by 183/366.
| 50 | September 30, 2020 | | Annual Report |
Table of Contents
Unaudited
AllianzGI Short Duration High Income Fund
For the period of October 1, 2019 through September 30, 2020, as provided by Douglas C. Forsyth, CFA, Portfolio Manager
Fund Insights
For the twelve-month period ended September 30, 2020, Class A shares at net asset value (“NAV”) of the AllianzGI Short Duration High Income Fund (the “Fund”) returned 0.37%, underperforming the ICE BofA 1-3 Year BB U.S. Cash Pay High Yield Index (the “benchmark”), which returned 3.29%.
Market Overview
Despite historic equity and credit volatility, high yield produced a positive twelve-month return. A favorable technical backdrop benefited the asset class over the back half of the reporting period.
High-yield bonds gained over the fourth quarter of 2019 and into early 2020 before selling off aggressively in late February and much of March as COVID-19 outbreak intensified. In connection with unprecedented monetary and fiscal policy responses, the high-yield bond market rebounded from the March low and advanced over the remainder of period. Stabilizing investor confidence, accommodative US Federal Reserve (the “Fed”) commentary, positive economic surprise momentum, better-than-feared corporate earnings, US COVID-19 case trends and vaccine/treatment progress were all market supportive.
The Fed’s response was designed to ensure the normal functioning and stabilization of US credit markets and was also extraordinary in terms of its swiftness, scope, and willingness to take action. The Fed remained highly accommodative throughout the reporting period, pledging to keep interest rates near zero until at least the end of 2023. In addition, the Fed officially set a new inflation target of moderately above 2.0%, noting it would maintain an accommodative stance until inflation hits this level.
The fiscal response was also immediate with President Trump signing into law several bills including the $2.2 trillion Coronavirus Aid, Relief & Security Act.
As anticipated, the economy decelerated, and the unemployment rate surged. Although, economic data released later in the period improved and, in many cases, surprised to the upside as lockdowns, travel restrictions and social-distancing measures eased.
The first-quarter earnings season was weak, but second-quarter financial results exceeded estimates amid better-than-feared earnings. Management outlooks were also constructive, but fewer companies provided guidance.
Performance dispersion among credit ratings was notable as the highest-quality issues held up far better than the lowest-quality issues during the market selloff. The performance gap narrowed into period-end, however.
Despite a dormant March, high-yield new issuance has been heavy, supported by robust fund flows. Default rates increased before steadying late in the reporting period.
Portfolio Review
The Fund gained with the broad high-yield bond market but trailed the benchmark return for the twelve-month reporting period.
Performance in the reporting period benefited from industry weightings and active credit selection. Industry exposures that had the greatest positive impact on performance were energy, support-services and automotive. Industry exposure that detracted the most from performance in the period were retail, financial services and aerospace/defense.
Emphasis remained on credit quality, liquidity and minimizing premiums paid. Average duration in the portfolio continued to remain low and well below the average yield and coupon.
Outlook
While uncertainty remains elevated, visibility around the macro outlook and corporate profitability path improved.
Extraordinary monetary and fiscal policy measures have stabilized financial markets and the US economy. Furthermore, Fed Chair Jerome Powell and US Treasury Secretary Mnuchin have pledged additional support if needed to accelerate the recovery.
With economic progress, corporate profits should begin to trough and then start recovering over the second half of the year and into 2021. We believe that US companies are not only positioned to directly benefit from Fed programs and US government fiscal support but also from a potentially significant boost in operating leverage as strengthening demand is met with lower input costs and productivity gains.
Against this backdrop, several risks could surface triggering market volatility including geopolitical tensions, fiscal stimulus uncertainty, US elections, tax policy and localized shutdowns due to increasing COVID-19 cases.
Many data points indicate that the high-yield market has normalized and is functioning properly.
Our constructive outlook for high yield remains unchanged. It is difficult to identify a better risk/reward option in fixed income. US high-yield bonds should contribute from both a diversification and a relative-performance perspective, offering a very compelling yield opportunity compared to negative and depressed yields globally with lower interest-rate sensitivity. Furthermore, we believe that the Short Duration High Income strategy remains an attractive solution as investors adjust to the significant change in the new Fed framework without taking excess credit risk or price volatility.
| Annual Report | | September 30, 2020 | 51 |
Table of Contents
Unaudited
AllianzGI Short Duration High Income Fund (cont’d)
Average Annual Total Return for the period ended September 30, 2020
| 1 Year | 5 Year | Since Inception† | ||||||||||||
AllianzGI Short Duration High Income Fund Class A | 0.37% | 3.59% | 4.11% | |||||||||||
| AllianzGI Short Duration High Income Fund Class A (adjusted) | –1.89% | 3.12% | 3.85% | ||||||||||
AllianzGI Short Duration High Income Fund Class C | 0.12% | 3.34% | 3.80% | |||||||||||
| AllianzGI Short Duration High Income Fund Class C (adjusted) | –0.83% | 3.34% | 3.80% | ||||||||||
| AllianzGI Short Duration High Income Fund Class P | 0.69% | 3.84% | 4.33% | ||||||||||
| AllianzGI Short Duration High Income Fund Institutional Class | 0.63% | 3.87% | 4.39% | ||||||||||
| AllianzGI Short Duration High Income Fund Class R6 | 0.70% | 3.92% | 4.43% | ||||||||||
| ICE BofA 1-3 Year BB U.S. Cash Pay High Yield Index | 3.29% | 4.76% | 5.17% | ||||||||||
Lipper Short High Yield Funds Average | 1.53% | 3.82% | 3.70% | |||||||||||
† The Fund began operations on October 3, 2011. Benchmark return comparisons began on the fund inception date. Lipper performance comparisons began on September 30, 2011.
Performance quoted represents past performance and is no guarantee of future results. Current performance may be lower or higher than performance shown. For performance current to the most recent month-end, visit our website at us.allianzgi.com. Investment return and the principal value will fluctuate. Shares may be worth more or less than original cost when redeemed. The adjusted returns take into account the maximum initial sales charge of 2.25% on Class A shares and the contingent deferred sales charge (CDSC) of 1% on Class C shares, which may apply to shares redeemed during the first year of ownership. Returns do not reflect deduction of taxes that a shareholder would pay on fund distributions or redemption of fund shares. See pages 63 and 64 for more information. The Fund’s gross expense ratios are 0.88% for Class A shares, 1.14% for Class C shares, 0.65% for Class P shares, 0.63% for Institutional Class shares and 0.57% for Class R6 shares. These ratios do not include an expense reduction, contractually guaranteed through at least January 31, 2021. The Fund’s expense ratios net of this reduction are 0.86% for Class A shares, 1.11% for Class C shares, 0.65% for Class P shares, 0.60% for Institutional Class shares and 0.55% for Class R6 shares. Expense ratio information is as of the Fund’s current prospectus dated February 1, 2020, as further revised or supplemented from time to time.
Cumulative Returns Through September 30, 2020
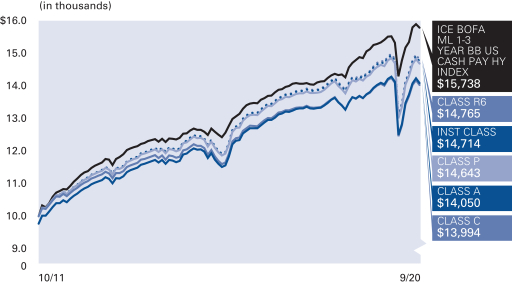
Industry Allocation (as of September 30, 2020)
| Pipelines | 11.9% | |||
| Diversified Financial Services | 8.9% | |||
| Oil, Gas, & Consumable Fuels | 8.9% | |||
| Retail | 7.9% | |||
| Commercial Services & Supplies | 7.7% | |||
| Distribution/Wholesale | 5.3% | |||
| Telecommunications | 4.6% | |||
| Transportation | 3.8% | |||
| Other | 36.5% | |||
| Cash & Equivalents — Net | 4.5% | |||
| 52 | September 30, 2020 | | Annual Report |
Table of Contents
Unaudited
AllianzGI Short Duration High Income Fund (cont’d)
Credit Ratings* (as of September 30, 2020)
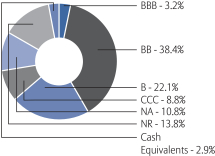
* As a percentage of total investments. Bond ratings refer to the underlying holdings of the Fund and are categorized from highest to lowest credit quality using ratings provided by S&P Global Ratings (“S&P”). S&P’s ratings have been selected for several reasons, including the portfolio managers’ usage of S&P ratings methodology among other credit quality information in managing the Fund, access to background information and other materials provided by S&P, as well as the Funds’ considerations of industry practice. The Fund also displays S&P credit ratings information in materials provided in client presentations. See “Important Information” for more detail on the selection of S&P for the Fund’s ratings presentation. Bonds not rated by S&P and bonds that do not currently have a rating available are designated in the chart above as “NR” and “NA”, respectively.
| Shareholder Expense Example | Actual Performance | |||||||||
| Class A | Class C | Class P | Institutional Class | Class R6 | ||||||
| Beginning Account Value (4/1/20) | $1,000.00 | $1,000.00 | $1,000.00 | $1,000.00 | $1,000.00 | |||||
| Ending Account Value (9/30/20) | $1,126.50 | $1,125.20 | $1,127.70 | $1,127.10 | $1,127.50 | |||||
| Expenses Paid During Period | $4.57 | $5.90 | $3.62 | $3.19 | $2.93 | |||||
| Hypothetical Performance | ||||||||||
| (5% return before expenses) | ||||||||||
| Class A | Class C | Class P | Institutional Class | Class R6 | ||||||
| Beginning Account Value (4/1/20) | $1,000.00 | $1,000.00 | $1,000.00 | $1,000.00 | $1,000.00 | |||||
| Ending Account Value (9/30/20) | $1,020.70 | $1,019.45 | $1,021.60 | $1,022.00 | $1,022.25 | |||||
| Expenses Paid During Period | $4.34 | $5.60 | $3.44 | $3.03 | $2.78 | |||||
For each class of the Fund, expenses (net of fee waiver and reimbursement, if any) are equal to the annualized expense ratio for the class (0.86% for Class A, 1.11% for Class C, 0.68% for Class P, 0.60% for Institutional Class and 0.55% for Class R6), multiplied by the average account value over the period, multiplied by 183/366.
| Annual Report | | September 30, 2020 | 53 |
Table of Contents
Unaudited
AllianzGI Short Term Bond Fund*
For the period of October 1, 2019 through September 30, 2020, as provided by Douglas C. Forsyth, CFA, Portfolio Manager.
Fund Insights
For the twelve-month period ended September 30, 2020, Class A shares at net asset value (“NAV”) of the AllianzGI Short Term Bond Fund (the “Fund”) returned 7.61%, outperforming the Bloomberg Barclays U.S. Government/Credit 1-3 Year Index (the “benchmark”), which returned 3.73%.
Market Overview
Short-maturity US Treasuries and investment grade corporates produced a positive return over the trailing twelve months.
Treasuries strengthened the first quarter of 2020 with falling interest rates and increasing demand for “safe haven” investments then steadied over the remainder of the reporting period. Short-maturity investment grade corporates were more volatile, declining in the first quarter but holding up much better than longer dated credit. Corporates then rebounded on unprecedented monetary and fiscal policy responses. Stabilizing investor confidence, accommodative US Federal Reserve (the “Fed”) commentary, positive economic surprise momentum, better-than-feared corporate earnings, US COVID-19 case trends and vaccine/treatment progress were all credit market supportive.
The Fed’s response was designed to ensure the normal functioning and stabilization of US credit markets and was also extraordinary in terms of its swiftness, scope, and willingness to take action. The Fed remained highly accommodative throughout the reporting period, pledging to keep interest rates near zero until at least the end of 2023. In addition, the Fed officially set a new inflation target of moderately above 2.0%, noting it would maintain an accommodative stance until inflation hits this level.
The fiscal response was also immediate with President Trump signing into law several bills including the $2.2 trillion Coronavirus Aid, Relief & Security Act.
As anticipated, the economy decelerated, and the unemployment rate surged. Although, economic data released later in the period improved and, in many cases, surprised to the upside as lockdowns, travel restrictions and social-distancing measures eased.
The first-quarter earnings season was weak, but second-quarter financial results exceeded estimates amid better-than-feared earnings. Management outlooks were also constructive, but fewer companies provided guidance.
Aggressive rate cuts, the reinstatement of bond-buying programs and “safe haven” demand caused the US Treasury yield curve to compress and steepen sharply.
Portfolio Review
The strongest-performing positions within the portfolio were corporate credit, including select high yield positions, followed by treasuries and government-sponsored enterprise holdings.
Within corporate credit, industries that contributed the most to portfolio performance were energy, financial services and automotive. Only one industry—media—detracted from performance in the period.
Outlook
While uncertainty remains elevated, visibility around the macro outlook and corporate profitability path improved.
Extraordinary monetary and fiscal policy measures have stabilized financial markets and the US economy. Furthermore, Fed Chair Jerome Powell and US Treasury Secretary Mnuchin have pledged additional support if needed to accelerate the recovery.
With economic progress, corporate profits should begin to trough and then start recovering over the second half of the year and into 2021. We believe that US companies are not only positioned to directly benefit from Fed programs and US government fiscal support but also from a potentially significant boost in operating leverage as strengthening demand is met with lower input costs and productivity gains.
Against this backdrop, several risks could surface triggering market volatility including geopolitical tensions, fiscal stimulus uncertainty, US elections, tax policy and localized shutdowns due to increasing COVID-19 cases.
The Fed and fiscal response to support the orderly flow and stabilization of credit continues to work with many data points indicating, in our view, that the investment grade and high-yield bond markets have normalized and are functioning properly.
* Effective on or about December 14, 2020, the AllianzGI Short Term Bond Fund will be liquidated and dissolved, and any outstanding shares redeemed. As of December 7, 2020, shares of the Fund will no longer be available for purchase or exchange.
| 54 | September 30, 2020 | | Annual Report |
Table of Contents
Unaudited
AllianzGI Short Term Bond Fund (cont’d)
Average Annual Total Return for the period ended September 30, 2020
| 1 Year | Since Inception† | |||||||||
| AllianzGI Short Term Bond Fund Class A | 7.61% | 6.32% | ||||||||
| AllianzGI Short Term Bond Fund Class A (adjusted) | 5.19% | 5.18% | |||||||
| AllianzGI Short Term Bond Fund Class P | 7.79% | 6.50% | |||||||
| AllianzGI Short Term Bond Fund Institutional Class | 7.92% | 6.61% | |||||||
| Bloomberg Barclays U.S. Government/Credit 1-3 Year Index | 3.73% | 3.95% | |||||||
| Lipper Short Investment Grade Debt Funds Average | 3.04% | 3.51% | ||||||||
† The Fund began operations on August 23, 2018. Benchmark return comparisons began on the fund inception date. Lipper performance comparisons began on August 31, 2018.
Performance quoted represents past performance and is no guarantee of future results. Current performance may be lower or higher than performance shown. For performance current to the most recent month-end, visit our website at us.allianzgi.com. Investment return and the principal value will fluctuate. Shares may be worth more or less than original cost when redeemed. The adjusted returns take into account the maximum sales charge of 2.25% on Class A shares. Returns do not reflect deduction of taxes that a shareholder would pay on funds distributions or redemption of fund shares. See pages 63 and 64 for more information. The Fund’s gross expense ratios are 2.81% for Class A shares, 22.10% for Class P shares and 2.38% for Institutional Class shares. These ratios do not include an expense reduction, contractually guaranteed through at least January 31, 2022. The Fund’s expense ratios net of this reduction are 0.64% for Class A shares, 0.49% for Class P shares, 0.39% for Institutional Class shares. Expense ratio information is as of the Fund’s current prospectus dated February 1, 2020, as further revised or supplemented from time to time.
Cumulative Returns Through September 30, 2020
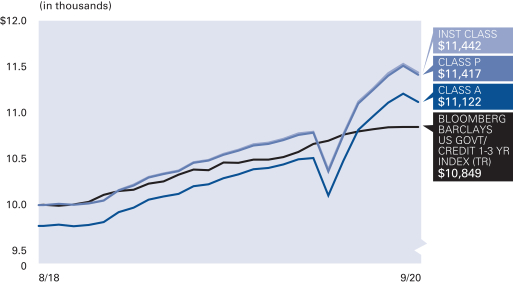
Asset Allocation (as of September 30,
2020)
| Corporate Bonds & Notes | 91.7% | |||
| U.S. Treasury Obligations | 2.9% | |||
| U.S. Government Agency Securities | 1.2% | |||
| Cash & Equivalents — Net | 4.2% | |||
Credit Ratings* (as of September 30, 2020)
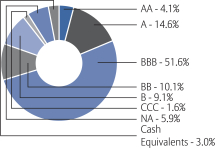
* As a percentage of total investments. Bond ratings refer to the underlying holdings of the Fund and are categorized from highest to lowest credit quality using ratings provided by S&P Global Ratings (“S&P”). S&P’s ratings have been selected for several reasons, including the portfolio managers’ usage of S&P ratings methodology among other credit quality information in managing the Fund, access to background information and other materials provided by S&P, as well as the Funds’ considerations of industry practice. The Fund also displays S&P credit ratings information in materials provided in client presentations. See “Important Information” for more detail on the selection of S&P for the Fund’s ratings presentation. Bonds not rated by S&P and bonds that do not currently have a rating available are designated in the chart above as “NR” and “NA”, respectively.
| Annual Report | | September 30, 2020 | 55 |
Table of Contents
Unaudited
AllianzGI Short Term Bond Fund (cont’d)
| Shareholder Expense Example | Actual Performance | |||||
| Class A | Class P | Institutional Class | ||||
| Beginning Account Value (4/1/20) | $1,000.00 | $1,000.00 | $1,000.00 | |||
| Ending Account Value (9/30/20) | $1,100.80 | $1,101.50 | $1,101.70 | |||
| Expenses Paid During Period | $3.36 | $2.57 | $2.05 | |||
| Hypothetical Performance | ||||||
| (5% return before expenses) | ||||||
| Class A | Class P | Institutional Class | ||||
| Beginning Account Value (4/1/20) | $1,000.00 | $1,000.00 | $1,000.00 | |||
| Ending Account Value (9/30/20) | $1,021.80 | $1,022.55 | $1,023.05 | |||
| Expenses Paid During Period | $3.23 | $2.48 | $1.97 | |||
For each class of the Fund, expenses (net of fee waiver and reimbursement, if any) are equal to the annualized expense ratio for the class (0.64% for Class A , 0.49% for Class P and 0.39% for Institutional Class), multiplied by the average account value over the period, multiplied by 183/366.
| 56 | September 30, 2020 | | Annual Report |
Table of Contents
Unaudited
AllianzGI Structured Return Fund*
For the period of October 1, 2019 through September 30, 2020, as provided by Greg Tournant and Stephen Bond-Nelson, Co-Portfolio Managers.
Fund Insights
For the twelve-month period ended September 30, 2020, the Class A shares at net asset value (“NAV”) of the AllianzGI Structured Return Fund (the “Fund”) returned -32.77%, underperforming the ICE BofA 3-Month U.S. Treasury Bill Index (the “benchmark”), which returned 1.10%
Market Overview
The Fund underperformed its benchmark for the twelve-month period as a result of extremely challenging market conditions in the first quarter of 2020. The equity declines and implied volatility increases during this period were more extreme than many historical precedents, which had a significant impact on the performance of the Fund’s option portfolio. The Fund delivered positive returns in the third quarter of 2020 but was unable to recover underperformance incurred earlier in the year.
Portfolio Review
This year’s 30% drop in the S&P 500 Index happened in just 22 trading days, instead of the many months a similar decline took in 2008. This combination of extremely high market volatility coupled with significant drops in market valuations had a particularly large impact on the option positions held by the Fund. Throughout the market turmoil, we took significant steps to de-risk the portfolio, primarily through closing out many short put positions.
Heading into the market decline, the Fund had in place a ladder of hedging positions that was very much in line with what was in place during prior market events, including 2015 and 2018. A key feature of the Fund is that it is a net buyer of long puts. That is consistent with our historical approach and was true as well for this period. The Fund held approximately 1.8 times more long puts than short puts heading into the market decline and maintained a similar ratio throughout. We also had structured a layer of long puts slightly out of the money that were paired with an equal number of short puts as part of the strategy’s low-VIX (the CBOE Volatility Index (“VIX Index”)) configuration spreads.
The market decline was a multi-week move which, as compared with a one-day shock scenario, has real implications on the price appreciation that the deep-out-of-the-money long puts were able to provide. The Fund is designed to navigate a multi-week move via its restructuring process, under which, in more typical circumstances, we address the existing short option positions while often relying on cost offsets from the existing long puts. Unfortunately, under the recent circumstances, a historic level of steepness of the inversion in the volatility term structure prevented many of the strategy’s existing long puts from providing as much benefit as expected. This steepness reduced the price appreciation of the existing layer of long puts, reducing the Fund’s ability to harvest gains on the long puts that it could in turn use to cover short put exposure, as it often has done in severe market corrections.
In addition, in late February 2020 we shifted certain out-of-the-money puts deeper out of the money in order to widen the short put end of our range-bound spreads, a strategy that had worked well in prior market deteriorations. However, in this instance the market unpredictably continued to decline beyond the shifted positioning. Considering these unprecedented market dynamics, we began restructuring the various put positions, and did so in advance of the index reaching their strikes and with wider extensions than in past market dislocations. Soon after, we began de-risking, i.e., covering short puts without relayering any new positions. But the daily market moves, many of which ranged between -7% and -12%, made it extremely difficult to implement all of these trades and to mitigate realized costs. Unlike in prior dislocations, in this particular case the speed of the market moves was too severe.
As a result of these experiences, we instituted an important enhancement to the way we express our hedging positions. To improve the strategy’s downside risk profile and mitigate various risk factors, all downside positions on the S&P 500 Index are now sealed at inception with an accompanying nearby hedge, in a 1-to-1 ratio of short puts vs. long puts. This is expected to give each sealed position a maximum loss potential that is capped, and therefore not dependent on restructuring to limit risk exposure. At the same time, we do not expect this new hedging configuration to have a material impact on the portfolio’s expected return potential over the longer term.
In the third quarter, the portfolio delivered positive returns, as equity indexes shook off economic and public-health headwinds to continue their extraordinary rise. Volatility levels remained high, despite the market’s strength. Range-bound positions on the S&P 500 Index accounted for approximately half the performance during the quarter. More than a third came from range-bound call spreads on the VIX Index, and the remainder was attributable to S&P 500 Index directional positions to both the up and downside.
Our 1x1 positions fared well during the rising market of July and August, and positive relative performance continued during downside moves in September 2020. As part of the new enhancement, we did not restructure range-bound spreads when the S&P 500 Index, after reaching a record high of 3581 on September 2, 2020, fell to 3237 over the next 15 trading days. During the 9.6% peak-to-trough decline, the Fund’s option positions generated positive excess returns.
Outlook
While markets may remain challenging, we believe that a high-volatility environment is a favorable one for the Fund’s option portfolio when constructing new positions. As we saw in the third quarter of 2020, the portfolio can perform in a rising market like July and August 2020, while September 2020 provided a brief example of relative outperformance during broader market downside moves.
On the volatility front, the potential resolution of at least some uncertainty in respect of the outcome of the US Presidential election could cause the volatility curve to normalize downward. But with pandemic and its economic impact still front and center, there could just as well be a continuation of the volatility conditions we have been experiencing.
* On December 14, 2020, the AllianzGI Structured Return Fund will be liquidated. Please see the supplement to the Fund’s statutory prospectus for more information.
| Annual Report | | September 30, 2020 | 57 |
Table of Contents
Unaudited
AllianzGI Structured Return Fund (cont’d)
Average Annual Total Return for the period ended September 30, 2020
1 Year | 5 Year | Since Inception† | ||||||||||||
AllianzGI Structured Return Fund Class A | –32.77% | –4.80% | –1.60% | |||||||||||
| AllianzGI Structured Return Fund Class A (adjusted) | –36.47% | –5.87% | –2.31% | ||||||||||
AllianzGI Structured Return Fund Class C | –33.29% | –5.52% | –2.34% | |||||||||||
| AllianzGI Structured Return Fund Class C (adjusted) | –33.93% | –5.52% | –2.34% | ||||||||||
| AllianzGI Structured Return Fund Class P | –32.59% | –4.57% | –1.40% | ||||||||||
| AllianzGI Structured Return Fund Institutional Class | –32.58% | –4.52% | –1.33% | ||||||||||
| AllianzGI Structured Return Fund Class R6 | –32.65% | –4.50% | –1.28% | ||||||||||
| ICE BofA 3-Month U.S. Treasury Bill Index | 1.10% | 1.20% | 0.78% | ||||||||||
Lipper Absolute Return Funds Average | 0.54% | 2.23% | 2.70% | |||||||||||
† The Fund began operations on December 3, 2012. Benchmark return comparisons began on the fund inception date. Lipper performance comparisons began on November 30, 2012.
Performance quoted represents past performance and is no guarantee of future results. Current performance may be lower or higher than performance shown. For performance current to the most recent month-end, visit our website at us.allianzgi.com. Investment return and the principal value will fluctuate. Shares may be worth more or less than original cost when redeemed. The adjusted returns take into account the maximum initial sales charge of 5.50% on Class A shares and the contingent deferred sales charge (CDSC) of 1% on Class C shares, which may apply to shares redeemed during the first year of ownership. Returns do not reflect deduction of taxes that a shareholder would pay on fund distributions or redemption of fund shares. See pages 63 and 64 for more information. The Fund’s gross expense ratios, which include the Acquired Fund Fees and Expenses, are 1.10% for Class A shares, 1.88% for Class C shares, 0.88% for Class P shares, 0.82% for Institutional Class shares and 0.75% for Class R6 shares. These ratios do not include an expense reduction, contractually guaranteed through at least January 31, 2021. The Fund’s expense ratios net of this reduction, which include the Acquired Fund Fees and Expenses, are 1.05% for Class A shares, 1.81% for Class C shares, 0.82% for Class P shares, 0.77% for Institutional Class shares and 0.74% for Class R6 shares. Expense ratio information is as of the Fund’s current prospectus dated February 1, 2020, as further revised or supplemented from time to time.
Cumulative Returns Through September 30, 2020
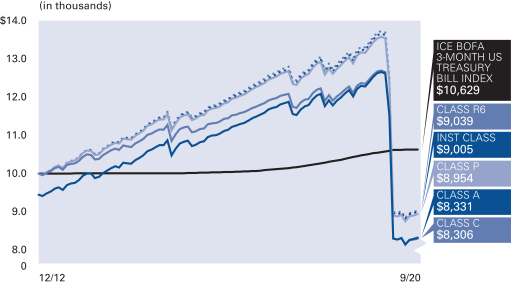
Asset Allocation (as of September 30, 2020)
| U.S. Treasury Obligations | 98.5% | |||
| Cash & Equivalents — Net | 1.5% | |||
| 58 | September 30, 2020 | | Annual Report |
Table of Contents
Unaudited
AllianzGI Structured Return Fund (cont’d)
| Shareholder Expense Example | Actual Performance | |||||||||
| �� | Class A | Class C | Class P | Institutional Class | Class R6 | |||||
| Beginning Account Value (4/1/20) | $1,000.00 | $1,000.00 | $1,000.00 | $1,000.00 | $1,000.00 | |||||
| Ending Account Value (9/30/20) | $1,002.90 | $999.00 | $1,004.80 | $1,003.80 | $1,003.90 | |||||
| Expenses Paid During Period | $5.06 | $8.85 | $3.91 | $3.66 | $3.51 | |||||
| Hypothetical Performance | ||||||||||
| (5% return before expenses) | ||||||||||
| Class A | Class C | Class P | Institutional Class | Class R6 | ||||||
| Beginning Account Value (4/1/20) | $1,000.00 | $1,000.00 | $1,000.00 | $1,000.00 | $1,000.00 | |||||
| Ending Account Value (9/30/20) | $1,019.95 | $1,016.15 | $1,021.10 | $1,021.35 | $1,021.50 | |||||
| Expenses Paid During Period | $5.10 | $8.92 | $3.94 | $3.69 | $3.54 | |||||
For each class of the Fund, expenses (net of fee waiver and reimbursement, if any) are equal to the annualized expense ratio for the class (1.01% for Class A, 1.77% for Class C, 0.78% for Class P, 0.73% for Institutional Class and 0.70% for Class R6), multiplied by the average account value over the period, multiplied by 183/366. These expenses do not include the expenses of the investment companies in which the Fund invests, which are indirectly borne by Fund shareholders.
| Annual Report | | September 30, 2020 | 59 |
Table of Contents
Unaudited
AllianzGI Water Fund (formerly AllianzGI Global Water Fund)*
For the period of October 1, 2019 through September 30, 2020, as provided by Andreas Fruschki, CFA, Portfolio Manager.
Fund Insights
For the twelve-month period ended September 30, 2020, Class A shares at net asset value (“NAV”) of the AllianzGI Water Fund (the “Fund”) returned 11.35%, outperforming the S&P Global Water Index (the “benchmark”), which returned 10.60%.
Market Overview
In the fourth quarter of 2019, global equities surged, with many markets closing the year at or near fresh/multi-month highs. The rally meant many equity markets recorded their strongest annual gains in several years. Sentiment was lifted by the agreement of a “phase one” trade deal between the US and China, better-than-expected third-quarter corporate earnings, further central bank easing and signs that the worst of the slowdown in the global economy may be over. A pick-up in corporate activity also lifted stocks. In addition, the Conservative Party’s decisive victory in the UK general election provided some clarity on Brexit. The “risk on” environment favored emerging markets over developed ones. At a sector level, health care and technology stocks led the advance, while the consumer staples, real estate and utilities sectors underperformed amid a rotation out of higher yielding, defensive assets.
After a steady start to 2020, global equities changed direction in mid-February amid growing evidence that the COVID-19 outbreak was spreading beyond China. The extended factory shutdowns in China also started to impact the global supply chain. The sell-off gathered pace as the quarter progressed, with a growing number of countries employing travel restrictions and draconian quarantine measures to try to control the spread of COVID-19 and avoid overloading health care systems. As fears increased that the global economy was heading for a severe recession, most markets entered an official bear market, defined as a retreat of at least 20% from a recent peak. The steep decline meant that global equities suffered their worst quarter since the 2008 financial crisis.
Global equities rallied over the second and third quarters of 2020, buoyed by positive trial results for potential COVID-19 vaccines, further stimulus measures and hopes that the global economy may be over the worst of its pandemic-induced recession. However, after recording their strongest August returns since 1986, stock markets weakened throughout September, undermined by political wrangling in the US over the size of further fiscal stimulus and concerns over a potentially destabilizing US presidential election. A surge in new COVID-19 infections in Europe further weighed on sentiment. In general, emerging markets outperformed developed markets, helped by a weaker tone to the US dollar.
Portfolio Review
Over the twelve-month period, water related investments delivered strong returns despite market turmoil. Water utilities have once again demonstrated the resilience of the water theme, outperforming their sector peers even during the COVID-19 market pull back.
The concentration of opportunities within the utility sector was particularly supportive as investors sought safety in more defensively oriented sectors. Conversely, during the recovery trade, the more growth-oriented water industrial and health care companies provided exposure to the rebound. The market has continued to recognize the secular support of the theme and the long-term drivers, which remain in place despite short to medium demand shifts resulting from COVID-19.
The Fund outperformed its benchmark, over the twelve-month period. Outperformance was largely driven by sector allocation, particularly the overweight in health care and our underweight to the utility sector. Stock selection was negative, with picks in information technology and industrials sectors detracting the most.
Due to the current market pullback, our focus on pure play companies with significant revenue exposure to water investments helped. Our portfolio holding Aalberts NV, a technology company that helps to enhance building and project efficiencies was positive for relative performance. Additionally, our active positions in Thermo Fisher Scientific, and PerkinElmer, Inc. added boosted relative results. Thermo Fisher Scientific is a health care company that manufactures scientific instruments, consumables and chemicals. They also develop environmental control measurement technology that is used for water, soil and air. In this market pullback, Thermo Fisher is rather insulated as pharma has held up well during the pandemic. In response to the COVID-19 outbreak, Thermo has mobilized support through their products that help analyze, diagnose and protect people from COVID-19. PerkinElmer, Inc., a leader provider of diagnostics and lifesceinces research was also beneficial largely due to its COVID-19 testing solutions.
In contrast, our Fund holding Itron, Inc. and Landis+Gyr and not holding Advanced Drainage were the largest relative detractors from results. Itron, Inc. provides solutions that measure, manage and analyze energy and water usage. While year-to-date, the security is down, we believe that it continues to be a solid long-term investment. Recently it announced a partnership with Panasonic to deliver smart metering solutions in Japan. Like many other countries, Japan has mandated the adoption of smart meters over the next 10 years to help manage utility supply and demand, and Itron is well positioned to capitalize on this trend. Landis+Gyr, also a leader in the metering business, experienced difficult performance during the COVID-19 environment however remains well positioned to benefit from the increased focus on improving water efficiency. Lastly, our decision not to hold Advanced Drainage was negative. The company is not considered a key water solutions provider despite delivering strong results during the period.
* Effective February 1, 2020, the Fund changed its name from “AllianzGI Global Water Fund” to “AllianzGI Water Fund”.
| 60 | September 30, 2020 | | Annual Report |
Table of Contents
Unaudited
AllianzGI Water Fund (formerly AllianzGI Global Water Fund) (cont’d)
Outlook
We believe that the Global Water strategy remains an attractive asset despite uncertainty due to the global economic impacts of COVID-19. The markets continue to be driven by investor sentiment and attempts to price the economic implications of COVID-19 outbreaks as well as the timeline for an effective vaccine. While there may be shorter-term slowdowns in certain end markets, the water theme remains unchanged as the investment needs continue to be supported by significant secular drivers, supporting the outlook for sustainable growth with lower correlation to the broad market. We have seen the strategy hold up during this time of uncertainty. The defensive nature of some of the investments may offer protection during risk off environments, while the portfolio also remains positioned to capture growth opportunities stemming from increased spending and innovation needs in the water space. In addition, the high-quality nature of the investments has allowed the companies to effectively manage through the difficult situation and effectively operate in an increasingly digital world. We will continue to monitor the effect of the human and economic activity in months to come, assessing the economic impact and the market moves. However, we remain convinced that the water theme offers an attractive diversification opportunity providing opportunity during this transient volatile time, but also offering attractive growth over the market cycle.
Adequate water infrastructure in the developed countries continues to be an issue with population growth, industrial evolution and climate change further increasing the need for investments, with current crisis only further emphasizing the need for clean water. We have begun to see developed nations like the United States make the very necessary investments. In developing regions, the attractive investment opportunity is anchored in the lack of adequate water infrastructure combined with rising living standards and growing income levels. For these nations to continue to progress, we believe that significant infrastructure investments are required. Given economic slowdown and low to negative interest rates globally, the prospects for infrastructure stimulus are increasingly attractive, with the US already proposing a $2tn bill. In Europe, we have seen environmental action a focus of its recovery plan, with water an area of focus. Water quality is also under growing scrutiny, with emerging contaminants on the rise. The negative health consequences and moral and legal responsibility to deliver water of sufficient quality is driving up the demand for enhanced water monitoring and treatment solutions. The global pandemic emphasizes this need given the need for clean water to combat the spread of COVID-19.
In order to capitalize on these opportunities, we invest in companies that offer solutions to growing water scarcity issues. These companies stand to benefit from the required investments in water infrastructure and resource management solutions. We seek to invest, under normal circumstances, at least 80% of the Fund’s net assets in equities that are substantially engaged in water-related activities. We target investments with the most attractive combination of alignment to the United Nation Sustainable Development Goals (“SDGs”) related to water resource management and clean water access, and high-quality companies with significant exposure to the water end markets. We believe this combination offers investors the most attractive and effective long-term exposure to the water theme.
Effective February 1, 2020, the Fund changed its name from “AllianzGI Global Water Fund” to “AllianzGI Water Fund”.
Average Annual Total Return for the period ended September 30, 2020
| 1 Year | 5 Year | 10 Year | Since Inception† | |||||||||||||||
| AllianzGI Water Fund Class A | 11.35% | 10.35% | 9.26% | 5.98% | ||||||||||||||
| AllianzGI Water Fund Class A (adjusted) | 5.22% | 9.11% | 8.65% | 5.50% | |||||||||||||
| AllianzGI Water Fund Class C | 10.48% | 9.51% | 8.43% | 5.17% | ||||||||||||||
| AllianzGI Water Fund Class C (adjusted) | 9.48% | 9.51% | 8.43% | 5.17% | |||||||||||||
| AllianzGI Water Fund Class P | 11.67% | 10.64% | 9.53% | 6.24% | |||||||||||||
| AllianzGI Water Fund Institutional Class | 11.71% | 10.65% | 9.58% | 6.30% | |||||||||||||
| S&P Global Water Index | 10.60% | 12.15% | 11.11% | 7.90% | |||||||||||||
| MSCI ACWI | 10.44% | 10.30% | 8.55% | 5.78% | |||||||||||||
| Lipper Specialty/Miscellaneous Funds Average | 12.17% | 2.96% | 8.14% | 7.40% | ||||||||||||||
† The Fund began operations on March 31, 2008. Benchmark return comparisons began on the fund inception date. Lipper performance comparisons began on March 31, 2008.
Performance quoted represents past performance and is no guarantee of future results. Current performance may be lower or higher than performance shown. For performance current to the most recent month-end, visit our website at us.allianzgi.com. Investment return and the principal value will fluctuate. Shares may be worth more or less than original cost when redeemed. The adjusted returns take into account the maximum initial sales charge of 5.50% on Class A shares and the contingent deferred sales charge (CDSC) of 1% on Class C shares, which may apply to shares redeemed during the first year of ownership. Returns do not reflect deduction of taxes that a shareholder would pay on fund distributions or redemption of fund shares. See pages 63 and 64 for more information. The Fund’s gross expense ratios are 1.40% for Class A shares, 2.15% for Class C shares, 1.17% for Class P shares and 1.18% for Institutional Class shares. These ratios do not include an expense reduction contractually guaranteed through at least January 31, 2021. The Fund’s expense ratios net of this reduction are 1.22% for Class A shares, 1.97% for Class C shares, 0.94% for Class P shares and 0.93% for Institutional Class shares. Expense ratio information is as of the Fund’s current prospectus dated February 1, 2020, as further revised or supplemented from time to time.
| Annual Report | | September 30, 2020 | 61 |
Table of Contents
Unaudited
AllianzGI Water Fund (formerly AllianzGI Global Water Fund) (cont’d)
Cumulative Returns Through September 30, 2020
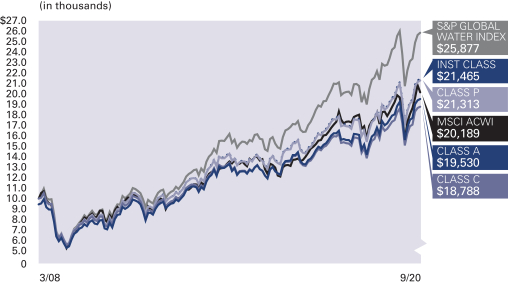
Country /Location Allocation (as of
September 30, 2020)
| United States | 54.6% | |||
| United Kingdom | 12.6% | |||
| Switzerland | 7.5% | |||
| France | 6.6% | |||
| Netherlands | 3.5% | |||
| Ireland | 2.7% | |||
| Sweden | 2.4% | |||
| Canada | 2.1% | |||
| Other | 3.0% | |||
| Cash & Equivalents — Net | 5.0% | |||
| Shareholder Expense Example | Actual Performance | |||||||
| Class A | Class C | Class P | Institutional Class | |||||
| Beginning Account Value (4/1/20) | $1,000.00 | $1,000.00 | $1,000.00 | $1,000.00 | ||||
| Ending Account Value (9/30/20) | $1,249.50 | $1,243.90 | $1,251.20 | $1,251.30 | ||||
| Expenses Paid During Period | $6.86 | $11.05 | $5.29 | $5.23 | ||||
| Hypothetical Performance | ||||||||
| (5% return before expenses) | ||||||||
| Class A | Class C | Class P | Institutional Class | |||||
| Beginning Account Value (4/1/20) | $1,000.00 | $1,000.00 | $1,000.00 | $1,000.00 | ||||
| Ending Account Value (9/30/20) | $1,018.90 | $1,015.15 | $1,020.30 | $1,020.35 | ||||
| Expenses Paid During Period | $6.16 | $9.92 | $4.75 | $4.70 | ||||
For each class of the Fund, expenses (net of fee waiver and reimbursement, if any) are equal to the annualized expense ratio for the class (1.22% for Class A, 1.97% for Class C, 0.94% for Class P and 0.93% for Institutional Class), multiplied by the average account value over the period, multiplied by 183/366.
| 62 | September 30, 2020 | | Annual Report |
Table of Contents
Unaudited
The inception date on each Fund Summary page is the inception date of the Fund’s oldest share class or classes. The AllianzGI Global Allocation Fund reorganized on May 4, 2009 when its predecessor merged into the Trust. The Global Allocation Fund’s shares were first offered in 9/98. On April 12, 2010, the following funds reorganized when their predecessors merged into series of the Trust (including fund’s inception date): AllianzGI Convertible Fund (4/93), AllianzGI High Yield Bond Fund (7/96), AllianzGI International Small-Cap Fund (12/97). For each of the reorganized funds, Institutional Class is the oldest share class, except that for AllianzGI International Small-Cap Fund, the oldest share class of the predecessor fund merged into Class P.
Returns measure performance from the inception of the oldest share class to the present, so some returns predate the inception of the actual share class. Those returns are calculated by adjusting the returns of the oldest share class to reflect the indicated share class’s different operating expenses. Total return performance assumes that all dividend and capital gain distributions were reinvested on the payable date.
Class A shares are subject to an initial sales charge. Class C shares are subject to a 1% contingent deferred sales charge (“CDSC”) for shares redeemed in the first year. Class R shares are generally available only to 401(k) plans, 457 plans, employer sponsored 403(b) plans, profit sharing and money purchase pension plans, defined benefit plans, non-qualified deferred compensation plans and healthcare benefit funding plans. Class P shares are offered primarily through certain asset allocation, wrap fee and other similar programs offered by broker-dealers and other intermediaries. Class P shares may also be offered for direct investment by other investors such as pension and profit sharing plans, employee benefit trusts and plan alliances, endowments, foundations and corporations. Institutional Class shares are offered primarily for direct investment by investors such as pension and profit sharing plans, employee benefit trusts, endowments, foundations, corporations and high net worth individuals. Administrative Class shares are offered primarily through employee benefit plan alliances, broker-dealers and other intermediaries. Class R6 shares are offered primarily for 401(k) plans, 457 plans, employer sponsored 403(b) plans, profit sharing and money purchase pension plans, defined benefit plans, non-qualified deferred compensation plans, healthcare benefit funding plans and other specified benefit plans and accounts whereby the plan or the plan’s broker, dealer or other financial Intermediary has an agreement with the Distributor or the Investment Manager to utilize Class R6 shares In certain Investment products or programs.
Class D and Class B shares were converted into Class A shares on November 13, 2015 and December 4, 2015, respectively.
The Lipper Averages are calculated by Lipper, Inc. They are based on the total return performance, with distributions reinvested and operating expenses deducted, of funds included by Lipper in the stated category. Lipper does not take into account sales charges.
The Cumulative Returns charts for each Fund assume the initial investment was made on the first day of the Fund’s initial fiscal year. The charts reflect any sales load that would have applied at the time of purchase or any CDSC that would have applied if a full redemption occurred on the last business day of the most recent fiscal year. Results assume that all dividends and capital gain distributions were reinvested. They do not take into account the effect of taxes. The
benchmark cumulative return began on the last day of the month of the respective Fund’s inception date.
“Cash & Equivalents—Net” in the Allocation Summaries may be comprised of cash, repurchase agreements, U.S. Treasury Bills, options purchased, options written and other assets net of other liabilities including net unrealized appreciation (depreciation) on futures contracts, forward foreign currency contracts and swap agreements, as applicable.
Proxy Voting
The Funds’ Investment Manager has adopted written proxy voting policies and procedures (the “Proxy Policy”) as required by Rule 206(4)-6 under the Investment Advisers Act of 1940. The Proxy Policy has been adopted by Allianz Funds Multi-Strategy Trust (the “Trust”) as the policies and procedures that the Investment Manager will use when voting proxies on behalf of the Funds. Copies of the written Proxy Policy and the factors that the Investment Manager may consider in determining how to vote proxies for each Fund, and information about how each Fund voted proxies relating to portfolio securities held during the most recent twelve-month period ended June 30, are available without charge, upon request, by calling 1-800-988-8380 (retail classes: A, C & R) or 1-800-498-5413 (Class P, R6, Institutional & Administrative classes), on the Allianz Global Investors Distributors LLC’s website at us.allianzgi.com, and on the Securities and Exchange Commission’s (“SEC”) website at http://www.sec.gov.
Form N-PORT
The Trust files complete schedules of each Fund’s portfolio holdings with the SEC on Form N-PORT for the first and third quarters of the fiscal year; such filings are available on the SEC’s website at http://www.sec.gov. A copy of the Trust’s Form N-PORT, when available, will be provided without charge, upon request, by calling 1-800-988-8380 (Class A, Class C and Class R) or 1-800-498-5413 (Class P, Class R6, Institutional and Administrative classes). A description of the Trust’s policies and procedures with respect to the disclosure of each Fund’s portfolio holdings is available in the Trust’s Statement of Additional Information. The Investment Manager will post each Fund’s holdings information on the Fund’s website at us.allianzgi.com. Each Fund’s website will contain a complete schedule of portfolio holdings as of the relevant month end. The information will be posted on the website approximately thirty (30) calendar days after the relevant month’s end. Portfolio holdings information for each Fund will remain accessible on its website until the Trust files its Form N-CSR, or Form N-PORT (for the last month of the Fund’s first or third fiscal quarters), with the SEC for the period that includes the date as of which the website information is current. The Trust’s policies with respect to the disclosure of the portfolio holdings are subject to change without notice.
The following disclosure provides important information regarding each Fund’s Shareholder Expense Example, which appears on each Fund Summary page in this Annual Report. Please refer to this information when reviewing the Shareholder Expense Example for a Fund.
Shareholder Expense Example
Shareholders of a Fund incur two types of costs: (1) transaction costs; and (2) ongoing costs, including investment management fees; distribution and/or service (12b-1) fees and other Fund expenses. The
| Annual Report | | September 30, 2020 | 63 |
Table of Contents
Unaudited
Important Information (cont’d)
Shareholder Expense Example is intended to help shareholders understand ongoing costs (in dollars) of investing in a Fund and to compare these costs with the ongoing costs of investing in other mutual funds. The Shareholder Expense Example is based on an investment of $1,000.00 invested at the beginning of the period, as indicated, and held for the entire period through September 30, 2020.
Actual Expenses
The information in the table under the heading “Actual Performance” provides information about actual account values and actual expenses. You may use the information in these columns, together with the amount you invested, to estimate the expenses that you paid over the period. Simply divide your account value by $1,000.00 (for example, an $8,600.00 account value divided by $1,000.00 = 8.6), then multiply the result by the number in the appropriate column for your share class, in the row entitled “Expenses Paid During Period”, to estimate the expenses you paid on your account during this period.
Hypothetical Example for Comparison Purposes
The information in the table under the heading “Hypothetical Performance (5% return before expenses)” provides information about hypothetical account values and hypothetical expenses based on a Fund’s actual expense ratio and an assumed rate of return of 5% per year before expenses, which is not a Fund’s actual return. The hypothetical account values and expenses may not be used to estimate the actual ending account balance or expenses you paid for the period. You may use this information to compare the ongoing costs of investing in a Fund and other funds. To do so, compare this 5% hypothetical example with the 5% hypothetical examples that appear in the shareholder reports of other funds.
Please note that the expenses shown in the table are meant to highlight your ongoing costs only and do not reflect any transactional costs. Therefore, the information under the heading “Hypothetical Performance (5% return before expenses)” is useful in comparing ongoing costs only, and will not help you determine the relative total costs of owning different funds. In addition, if these transactional costs were included, your costs would have been higher.
Shareholders may be subject to an annual fee of $15 for any accounts, including fiduciary accounts, with balances that fall below $1,000. This fee is not included in the shareholder expense example. If you are subject to the fee, keep it in mind when you are estimating the ongoing expenses of investing in the Funds and when comparing the expenses of these Funds with other funds.
Credit Ratings
Credit ratings apply to the underlying holdings of a Fund and not the Fund itself and are divided into categories ranging from highest to lowest credit quality.
With respect to AllianzGI Core Plus Bond Fund, AllianzGI Green Bond Fund and AllianzGI Preferred Securities and Income Fund, the presentation of credit ratings information in this report use the highest available rating provided by S&P, Moody’s or Fitch to ensure the quality of the portfolios.
With respect to AllianzGI Convertible Fund, AllianzGI High Yield Bond Fund, AllianzGI Short Duration High Income Fund and AllianzGI Short Term Bond Fund, presentations of credit ratings information in this report use ratings provided by S&P because of, among other reasons, the applicable portfolio managers’ usage of S&P ratings methodology among other credit quality information in managing the respective portfolios, access to background information and other materials provided by S&P, as well as the Funds’ considerations of industry practice. The Funds also display S&P credit ratings information in materials provided in client presentations.
Except for the methodologies described above for AllianzGI Green Bond Fund, securities not rated by Moody’s or S&P, or securities that do not have a rating available from Moody’s or S&P are designated as “NR” and “NA”, respectively. Credit quality ratings assigned by a rating agency are subjective opinions, not statements of fact, and are subject to change periodically, even as frequently as daily. Ratings assigned by Moody’s, S&P or another rating agency are not absolute standards of credit quality and do not evaluate market risk. Rating agencies may fail to make timely changes in credit ratings, and an issuer’s current financial condition may be better or worse than a rating indicates. In formulating investment decisions for the applicable Funds, Allianz Global Investors U.S. LLC develops its own analysis of the credit quality and risks associated with individual debt instruments, rather than relying exclusively on rating agencies or third-party research.
All the information on the Fund Summary pages, including Fund Insights, Average Annual Total Return tables and Cumulative Returns charts, Shareholder Expense Examples and Allocation/Credit Rating Summaries is unaudited.
Allianz Global Investors Distributors LLC, 1633 Broadway, New York, NY, 10019, us.allianzgi.com, 1-800-988-8380 (retail classes: A, C & R) or 1-800-498-5413 (Class P, R6, Institutional & Administrative classes).
| 64 | September 30, 2020 | | Annual Report |
Table of Contents
Unaudited
Unless otherwise noted, index returns reflect the reinvestment of income dividends and capital gains, if any, but do not reflect fees, brokerage commissions or other expenses of investing. It is not possible to invest directly in an index.
Prior to November 1, 2006, performance data for the MSCI Indices was calculated gross of dividend tax withholding. Performance data presently shown for the Indices is net of dividend tax withholding. This recalculation results in lower performance for the Indices.
| Index | Description | |
| AllianzGI Multi Asset Income Strategic Benchmark | The AllianzGI Multi Asset Income Strategic Benchmark represents the performance of a custom blended index developed by the Manager, it is comprised of three underlying indices: 20% MSCI USA Index, 10% MSCI ACWI ex USA Index and 70% Bloomberg Barclays US Aggregate Bond Index. | |
| Bloomberg Barclays Global High Yield Index | The Bloomberg Barclays Global High Yield Index is a multi-currency flagship measure of the global high yield debt market. The index represents the union of the U.S. High Yield, the Pan-European High Yield, and Emerging Markets (EM) Hard Currency High Yield Indices. | |
| Bloomberg Barclays U.S. Aggregate Bond Index | The Bloomberg Barclays U.S. Aggregate Bond Index represents securities that are SEC-registered, taxable, and U.S. dollar denominated. The index covers the U.S. investment grade fixed rate bond market, with index components for government and corporate securities, mortgage pass-through securities, and asset-backed securities. | |
| Bloomberg Barclays U.S. Credit Index | The Bloomberg Barclays U.S. Credit Index is the credit component of the U.S. Government/Credit Index. It includes publicly issued U.S. corporate and specified foreign debentures and secured notes that meet the specified maturity, liquidity and quality requirements. To qualify, bonds must be SEC-registered. | |
| Bloomberg Barclays U.S. Government Bond Index | The Bloomberg Barclays U.S. Bond Index is a market capitalization-weighted index, meaning the securities in the index are weighted according to the market size of each bond type. Most U.S. traded investment grade bonds are represented. | |
| Bloomberg Barclays U.S. Government/Credit 1-3 Year Index | The Bloomberg Barclays U.S. Government/Credit 1-3 Year Index is the 1-3 Year component of the U.S. Government/Credit Index. The Government Index includes treasuries and agencies. The Credit Index includes publicly issued U.S. corporate and foreign debentures and secured notes that meet specified maturity, liquidity, and quality requirements. | |
| Bloomberg Barclays US Treasury US TIPS Index | The Bloomberg Barclays U.S. Treasury U.S. TIPS Index consists of Inflation-Protection securities issued by the U.S. Treasury. | |
| Bloomberg Barclays U.S. Universal Bond Index | The Bloomberg Barclays U.S. Universal Bond Index represents the union of the U.S. Aggregate Index, the U.S. High-Yield Corporate Index, the 144A Index, the Eurodollar Index, the Emerging Markets Index, and the non-ERISA portion of the CMBS Index. Municipal debt, private placements, and non-dollar-denominated issues are excluded from the Universal Index. The only constituent of the index that includes floating-rate debt is the Emerging Markets Index. | |
| Dow Jones Sustainability World Total Return Composite Net Index | The Dow Jones Sustainability World Total Return Index tracks the performance of the top 10% of the 2500 largest companies in the S&P Global Broad Market Index that are the world’s sustainability leaders based on economic, environmental and social criteria. | |
| ICE BofA 1-3 Year BB U.S. Cash Pay High Yield Index | The ICE BofA 1-3 Year BB U.S. Cash Pay High Yield Index is a subset of the ICE BofA U.S. Cash Pay High Yield Index, including all securities with a remaining term to final maturity less than 3 years and rated BB1 through BB3, inclusive. The ICE BofA US Cash Pay High Yield Index tracks the performance of U.S. dollar-denominated below investment grade corporate debt, currently in a coupon paying period, that is publicly issued in the U.S. domestic market. | |
| ICE BofA 3-Month U.S. Treasury Bill Index | The ICE BofA 3-Month U.S. Treasury Bill Index tracks the performance of the 3-month U.S. Treasury markets. | |
| ICE BofA US Convertibles Index | The ICE BofA US Convertible Index is a widely used, unmanaged index that measures the performance of U.S. dollar-denominated convertible securities not currently in bankruptcy with a total market value greater than $50 million at issuance. | |
| Annual Report | | September 30, 2020 | 65 |
Table of Contents
Unaudited
Benchmark Descriptions (cont’d)
| Index | Description | |
| ICE BofA Fixed Rate Preferred Securities Index | The ICE BofA Fixed Rate Preferred Securities Index tracks the performance of fixed rate US dollar denominated preferred securities issued in the US domestic market. | |
| ICE BofA Green Bond Index | The ICE BofA Green Bond Index tracks the performance of securities issued for qualified “green” purposes. Qualifying bonds must have a clearly designated use of proceeds that is solely applied toward projects or activities that promote climate change mitigation or adaptation or other environmental sustainability purposes. | |
| ICE BofA High Yield Master II Index | The ICE BofA High Yield Master II Index is an unmanaged index consisting of US dollar-denominated bonds that are issued in countries having a BBB3 or higher debt rating with at least one year remaining until maturity. All bonds must have a credit rating below investment grade but not in default. | |
| ICE BofA US Treasury Bill Index | The ICE BofA US Treasury Bill Index tracks the performance of US dollar denominated US Treasury Bills publicly issued in the US domestic market. | |
| MSCI ACWI ex USA Growth Index | The MSCI ACWI ex USA Growth Index captures large and mid-cap securities exhibiting overall growth style characteristics across developed and emerging markets, excluding the United States. | |
| MSCI ACWI ex USA Index | The MSCI ACWI ex USA Index captures large and mid cap representation across Developed Markets countries (excluding the U.S.) and Emerging Markets countries. The index covers approximately 85% of the global equity opportunity set outside the US. | |
| MSCI All Country World Index (Also known as: MSCI AC World Index and MSCI ACWI) | The MSCI All Country World Index (ACWI) captures large and mid-cap representation across the Developed Markets and Emerging Markets countries. The index covers approximately 85% of the global investable equity opportunity set. | |
| MSCI EAFE Index | The MSCI EAFE Index is an equity index which captures large and mid-cap representation across Developed Markets countries around the world, excluding the US and Canada. | |
| MSCI EAFE Small Cap Index | The MSCI EAFE Small Cap Index is an equity index which captures small cap representation across Developed Markets countries around the world, excluding the US and Canada. | |
| MSCI Emerging Markets Index | The MSCI Emerging Markets Index captures large and mid-cap representation across Emerging Markets countries. The index covers approximately 85% of the free float-adjusted market capitalization in each country. | |
| MSCI Emerging Markets Small-Cap Index | The MSCI Emerging Markets Small-Cap Index includes small cap representation across Emerging Markets countries. The index covers approximately 14% of the free float-adjusted market capitalization in each country. The small cap segment tends to capture more local economic and sector characteristics relative to larger Emerging Markets capitalization segments. | |
| MSCI World ex USA Small Cap Index | The MSCI World ex USA Small Cap Index captures small cap representation across Developed Markets countries (excluding the United States). The index covers approximately 14% of the free float-adjusted market capitalization in each country. | |
| MSCI World High Dividend Yield Index | The MSCI World High Dividend Yield Index is based on the MSCI World Index, its parent index, and includes large and mid cap stocks across Developed Markets countries. The index is designed to reflect the performance of equities in the parent index (excluding real estate investment trusts (“REITs”)) with higher dividend income and quality characteristics than average dividend yields that are both sustainable and persistent. The index also applies quality screens and reviews 12-month past performance to omit stocks with potentially deteriorating fundamentals that could force them to cut or reduce dividends. | |
| MSCI World Index | The MSCI World Index captures large and mid cap representation across Developed Markets countries. The index covers approximately 85% of the free float-adjusted market capitalization in each country. | |
| 66 | September 30, 2020 | | Annual Report |
Table of Contents
Unaudited
Benchmark Descriptions (cont’d)
| Index | Description | |
| Russell 2000 Index | The Russell 2000 Index measures the performance of the small cap segment of the U.S. equity universe. The Russell 2000 Index is a subset of the Russell 3000 Index representing approximately 10% of total market capitalization of that index. It includes approximately 2000 of the smallest securities based on a combination of their market cap and current index membership. | |
| Russell Microcap Index | The Russell Microcap Index measures the performance of the microcap segment of the U.S. equity market. It makes up less than 3% of the U.S. equity market. | |
| S&P 500 Financials Index | The S&P 500 Financials Index comprises those companies included in the S&P 500 that are classified as members of the GICS® financials sector. | |
| S&P 500 Index | The S&P 500 Index is an unmanaged index of large capitalization common stocks. | |
| S&P Global Water Index | The S&P Global Water Index is comprised of 50 of the largest publicly traded companies in water-related businesses that meet specific investability requirements. This index is designed to provide liquid exposure to the leading publicly-listed companies in the global water industry, from both developed markets and emerging markets. | |
| USD Overnight LIBOR | USD Overnight LIBOR (London Inter-Bank Offered Rate) Index is the average interest rate at which leading banks in London borrow U.S. dollar funds from one another with a maturity of one day (overnight). | |
| Annual Report | | September 30, 2020 | 67 |
Table of Contents
September 30, 2020
AllianzGI Best Styles Global Equity Fund
| Shares | Value | |||||||
| Common Stock—97.8% |
| |||||||
| Argentina—0.2% |
| |||||||
MercadoLibre, Inc. (e) | 107 | $115,825 | ||||||
|
| |||||||
| Australia—1.3% |
| |||||||
Atlassian Corp. PLC, Class A (e) | 821 | 149,249 | ||||||
Austal Ltd. | 34,365 | 81,164 | ||||||
BHP Group Ltd. | 7,603 | 196,413 | ||||||
CSL Ltd. | 1,004 | 207,393 | ||||||
Fortescue Metals Group Ltd. | 12,426 | 145,981 | ||||||
Rio Tinto Ltd. | 2,068 | 141,247 | ||||||
|
| |||||||
| 921,447 | ||||||||
|
| |||||||
| Austria—0.5% |
| |||||||
ams AG (e) | 4,890 | 110,550 | ||||||
BAWAG Group AG (a)(e) | 1,747 | 63,162 | ||||||
EVN AG | 2,503 | 41,763 | ||||||
OMV AG (e) | 1,285 | 35,159 | ||||||
Raiffeisen Bank International AG (e) | 4,081 | 62,464 | ||||||
Wienerberger AG (e) | 2,885 | 76,242 | ||||||
|
| |||||||
| 389,340 | ||||||||
|
| |||||||
| Belgium—0.4% |
| |||||||
Ageas S.A. | 2,604 | 106,554 | ||||||
Bekaert S.A. (e) | 2,423 | 50,478 | ||||||
Euronav NV | 3,400 | 30,105 | ||||||
UCB S.A. | 1,076 | 122,205 | ||||||
|
| |||||||
| 309,342 | ||||||||
|
| |||||||
| Brazil—0.5% |
| |||||||
Banco do Brasil S.A. | 11,900 | 62,764 | ||||||
Engie Brasil Energia S.A. | 6,400 | 45,984 | ||||||
Iochpe Maxion S.A. | 23,400 | 57,084 | ||||||
Vale S.A. | 10,300 | 108,413 | ||||||
WEG S.A. | 7,400 | 86,572 | ||||||
|
| |||||||
| 360,817 | ||||||||
|
| |||||||
| Canada—3.0% |
| |||||||
B2Gold Corp. | 21,868 | 142,387 | ||||||
Canadian Tire Corp., Ltd., Class A | 1,248 | 125,705 | ||||||
Cascades, Inc. | 6,353 | 80,346 | ||||||
Cogeco Communications, Inc. | 1,522 | 124,807 | ||||||
DREAM Unlimited Corp. | 5,331 | 77,870 | ||||||
Exchange Income Corp. | 3,720 | 84,846 | ||||||
Franco-Nevada Corp. | 798 | 111,512 | ||||||
Genworth MI Canada, Inc. | 1,532 | 39,728 | ||||||
George Weston Ltd. | 2,213 | 162,724 | ||||||
IA Financial Corp., Inc. | 2,386 | 83,054 | ||||||
Loblaw Cos., Ltd. | 2,120 | 111,019 | ||||||
Lundin Mining Corp. | 19,374 | 108,106 | ||||||
Manulife Financial Corp. | 11,060 | 153,829 | ||||||
Mullen Group Ltd. | 13,852 | 93,730 | ||||||
Open Text Corp. | 2,495 | 105,455 | ||||||
Power Corp. of Canada | 8,017 | 157,083 | ||||||
Shopify, Inc., Class A (e) | 283 | 289,406 | ||||||
Sun Life Financial, Inc. | 3,040 | 123,879 | ||||||
|
| |||||||
| 2,175,486 | ||||||||
|
| |||||||
| Chile—0.1% |
| |||||||
Engie Energia Chile S.A. | 41,267 | 51,330 | ||||||
|
| |||||||
| China—5.4% |
| |||||||
Alibaba Group Holding Ltd. ADR (e) | 3,004 | 883,116 | ||||||
Bank of China Ltd., Class H | 384,000 | 119,432 | ||||||
BOC Aviation Ltd. (a) | 13,700 | 93,874 | ||||||
China Conch Venture Holdings Ltd. | 23,500 | 109,324 | ||||||
China Construction Bank Corp., Class H | 312,188 | 202,851 | ||||||
China Life Insurance Co., Ltd., Class H | 39,000 | 88,412 | ||||||
| Shares | Value | |||||||
China Lumena New Materials Corp. (c)(d)(e) | 1,505 | $ | — | † | ||||
China Minsheng Banking Corp., Ltd., Class H | 97,500 | 51,231 | ||||||
China Mobile Ltd. | 29,000 | 186,159 | ||||||
China Telecom Corp., Ltd., Class H | 210,000 | 63,094 | ||||||
CITIC Ltd. | 75,000 | 55,611 | ||||||
Country Garden Holdings Co., Ltd. | 62,000 | 76,770 | ||||||
Country Garden Services Holdings Co., Ltd. | 26,597 | 172,733 | ||||||
CSPC Pharmaceutical Group Ltd. | 67,200 | 131,178 | ||||||
Industrial & Commercial Bank of China Ltd., Class H | 276,000 | 143,767 | ||||||
JD.com, Inc. ADR (e) | 3,057 | 237,254 | ||||||
Lee & Man Paper Manufacturing Ltd. | 94,000 | 68,396 | ||||||
Lenovo Group Ltd. | 150,000 | 99,174 | ||||||
NetEase, Inc. ADR | 434 | 197,327 | ||||||
Postal Savings Bank of China Co., Ltd., Class H (a) | 121,000 | 50,973 | ||||||
Shenzhen International Holdings Ltd. | 33,000 | 52,650 | ||||||
Tencent Holdings Ltd. | 11,219 | 757,769 | ||||||
Yuexiu Transport Infrastructure Ltd. | 82,000 | 47,812 | ||||||
|
| |||||||
| 3,888,907 | ||||||||
|
| |||||||
| Colombia—0.2% |
| |||||||
Bancolombia S.A. | 6,990 | 44,348 | ||||||
Corp. Financiera Colombiana S.A. (e) | 10,343 | 71,890 | ||||||
|
| |||||||
| 116,238 | ||||||||
|
| |||||||
| Denmark—0.3% |
| |||||||
Carlsberg AS, Class B | 1,238 | 166,786 | ||||||
D/S Norden A/S | 3,474 | 56,460 | ||||||
|
| |||||||
| 223,246 | ||||||||
|
| |||||||
| Finland—0.2% |
| |||||||
Elisa Oyj | 1,668 | 98,064 | ||||||
TietoEVRY Oyj (e) | 1,390 | 38,430 | ||||||
|
| |||||||
| 136,494 | ||||||||
|
| |||||||
| France—3.6% |
| |||||||
Amundi S.A. (a) | 1,408 | 99,242 | ||||||
AXA S.A. | 10,130 | 187,486 | ||||||
BNP Paribas S.A. | 2,969 | 107,402 | ||||||
Bouygues S.A. | 5,057 | 174,751 | ||||||
CNP Assurances | 8,712 | 109,259 | ||||||
Coface S.A. (e) | 7,975 | 55,783 | ||||||
Credit Agricole S.A. (e) | 7,123 | 62,147 | ||||||
Klepierre S.A. REIT | 4,999 | 69,976 | ||||||
L’Oreal S.A. | 612 | 199,162 | ||||||
LVMH Moet Hennessy Louis Vuitton SE | 602 | 281,676 | ||||||
Orange S.A. | 10,755 | 112,019 | ||||||
Peugeot S.A. | 4,631 | 83,981 | ||||||
Publicis Groupe S.A. | 1,899 | 61,205 | ||||||
Sanofi | 2,579 | 258,446 | ||||||
Schneider Electric SE | 1,605 | 199,500 | ||||||
Teleperformance | 529 | 163,092 | ||||||
TOTAL SE | 5,199 | 178,547 | ||||||
Vinci S.A. | 2,204 | 184,159 | ||||||
|
| |||||||
| 2,587,833 | ||||||||
|
| |||||||
| Germany—2.0% |
| |||||||
Bayer AG | 3,524 | 217,409 | ||||||
Bayerische Motoren Werke AG | 2,051 | 148,856 | ||||||
Cewe Stiftung & Co. KGAA | 483 | 52,948 | ||||||
Daimler AG | 2,982 | 160,864 | ||||||
Deutsche Boerse AG | 816 | 143,061 | ||||||
Deutsche Lufthansa AG (e) | 6,030 | 52,230 | ||||||
| Shares | Value | |||||||
DWS Group GmbH & Co. KGaA (a)(e) | 1,912 | $ | 65,895 | |||||
HeidelbergCement AG | 2,048 | 125,145 | ||||||
Hornbach Holding AG & Co. KGaA | 745 | 86,998 | ||||||
Muenchener Rueckversicherungs-Gesellschaft AG in Muenchen | 668 | 169,817 | ||||||
Nordex SE (e) | 3,589 | 46,356 | ||||||
TeamViewer AG (a)(e) | 1,171 | 57,754 | ||||||
United Internet AG | 1,704 | 65,166 | ||||||
Varta AG (e) | 461 | 64,330 | ||||||
|
| |||||||
| 1,456,829 | ||||||||
|
| |||||||
| Greece—0.2% |
| |||||||
Hellenic Telecommunications Organization S.A. | 6,887 | 99,188 | ||||||
National Bank of Greece S.A. (e) | 38,607 | 48,379 | ||||||
|
| |||||||
| 147,567 | ||||||||
|
| |||||||
| Hong Kong—0.7% |
| |||||||
CK Hutchison Holdings Ltd. | 18,500 | 112,105 | ||||||
Kerry Properties Ltd. | 18,257 | 46,954 | ||||||
Sino Land Co., Ltd. | 42,000 | 49,170 | ||||||
Sun Hung Kai Properties Ltd. | 6,500 | 83,762 | ||||||
United Laboratories International Holdings Ltd. | 52,000 | 53,780 | ||||||
Vinda International Holdings Ltd. | 18,000 | 59,303 | ||||||
Wharf Holdings Ltd. | 43,000 | 86,240 | ||||||
|
| |||||||
| 491,314 | ||||||||
|
| |||||||
| Hungary—0.2% |
| |||||||
OTP Bank Nyrt (e) | 2,846 | 85,661 | ||||||
Richter Gedeon Nyrt | 3,577 | 75,504 | ||||||
|
| |||||||
| 161,165 | ||||||||
|
| |||||||
| Indonesia—0.1% |
| |||||||
Indofood CBP Sukses Makmur Tbk PT | 79,700 | 54,022 | ||||||
Media Nusantara Citra Tbk PT (e) | 1,061,100 | 51,592 | ||||||
|
| |||||||
| 105,614 | ||||||||
|
| |||||||
| Ireland—0.7% |
| |||||||
Horizon Therapeutics PLC (e) | 1,363 | 105,878 | ||||||
Medtronic PLC | 2,578 | 267,905 | ||||||
STERIS PLC | 810 | 142,714 | ||||||
|
| |||||||
| 516,497 | ||||||||
|
| |||||||
| Israel—0.2% |
| |||||||
Alony Hetz Properties & Investments Ltd. | 4,514 | 44,362 | ||||||
Formula Systems 1985 Ltd. | 859 | 72,751 | ||||||
|
| |||||||
| 117,113 | ||||||||
|
| |||||||
| Italy—1.0% |
| |||||||
Assicurazioni Generali SpA | 9,323 | 131,402 | ||||||
Enel SpA | 24,680 | 214,121 | ||||||
Intesa Sanpaolo SpA (e) | 98,412 | 185,154 | ||||||
Telecom Italia SpA | 275,478 | 110,808 | ||||||
Unipol Gruppo SpA | 10,703 | 46,772 | ||||||
|
| |||||||
| 688,257 | ||||||||
|
| |||||||
| Japan—6.3% |
| |||||||
Chubu Electric Power Co., Inc. | 7,000 | 85,144 | ||||||
Chugai Pharmaceutical Co., Ltd. | 2,700 | 121,164 | ||||||
ENEOS Holdings, Inc. | 28,500 | 101,684 | ||||||
Hitachi Ltd. | 4,400 | 148,982 | ||||||
Honda Motor Co., Ltd. | 6,800 | 161,481 | ||||||
ITOCHU Corp. | 5,723 | 146,542 | ||||||
| 68 | Annual Report | | September 30, 2020 | | See accompanying Notes to Financial Statements |
Table of Contents
Schedule of Investments
September 30, 2020
| Shares | Value | |||||||
Japan Post Holdings Co., Ltd. | 15,200 | $ | 103,650 | |||||
Japan Post Insurance Co., Ltd. | 7,200 | 113,366 | ||||||
Kajima Corp. | 6,700 | 80,723 | ||||||
KDDI Corp. | 5,700 | 143,364 | ||||||
Keyence Corp. | 400 | 186,992 | ||||||
Konica Minolta, Inc. | 21,400 | 60,697 | ||||||
Mitsubishi Corp. | 9,500 | 227,386 | ||||||
Mitsubishi UFJ Financial Group, Inc. | 39,900 | 159,236 | ||||||
Mitsubishi UFJ Lease & Finance Co., Ltd. | 15,100 | 70,160 | ||||||
Mitsui & Co., Ltd. | 6,000 | 103,097 | ||||||
Murata Manufacturing Co., Ltd. | 2,300 | 149,562 | ||||||
Nintendo Co., Ltd. | 300 | 170,007 | ||||||
Nippon Telegraph & Telephone Corp. | 5,796 | 118,335 | ||||||
NTT DOCOMO, Inc. | 5,000 | 183,731 | ||||||
Obayashi Corp. | 12,400 | 113,203 | ||||||
Ricoh Co., Ltd. | 13,800 | 93,153 | ||||||
Seven & i Holdings Co., Ltd. | 4,300 | 133,601 | ||||||
Softbank Corp. | 9,800 | 109,508 | ||||||
Sony Corp. | 2,900 | 222,262 | ||||||
Sumitomo Corp. | 11,900 | 143,448 | ||||||
Sumitomo Mitsui Financial Group, Inc. | 7,500 | 209,706 | ||||||
Sumitomo Rubber Industries Ltd. | 8,100 | 75,242 | ||||||
Takeda Pharmaceutical Co., Ltd. | 5,800 | 207,309 | ||||||
Tokyo Electron Ltd. | 700 | 182,878 | ||||||
Toyota Motor Corp. | 4,249 | 282,006 | ||||||
Tsuruha Holdings, Inc. | 800 | 113,414 | ||||||
|
| |||||||
| 4,521,033 | ||||||||
|
| |||||||
| Korea (Republic of)—2.6% |
| |||||||
CJ CheilJedang Corp. | 148 | 49,955 | ||||||
CJ Corp. | 733 | 50,899 | ||||||
Daelim Industrial Co., Ltd. | 1,493 | 98,677 | ||||||
Doosan Bobcat, Inc. | 2,470 | 57,017 | ||||||
GS Holdings Corp. | 2,924 | 77,416 | ||||||
Hana Financial Group, Inc. | 2,341 | 56,238 | ||||||
KB Financial Group, Inc. | 2,935 | 94,507 | ||||||
Kia Motors Corp. | 2,740 | 109,879 | ||||||
LG Innotek Co., Ltd. | 287 | 37,875 | ||||||
NCSoft Corp. | 191 | 131,624 | ||||||
POSCO | 563 | 94,254 | ||||||
Posco International Corp. | 4,260 | 48,645 | ||||||
Samsung Card Co., Ltd. | 3,356 | 81,026 | ||||||
Samsung Electronics Co., Ltd. | 8,787 | 436,223 | ||||||
Shinhan Financial Group Co., Ltd. | 4,322 | 101,397 | ||||||
SK Hynix, Inc. | 2,283 | 163,652 | ||||||
SK Telecom Co., Ltd. | 496 | 100,827 | ||||||
Woori Financial Group, Inc. | 14,476 | 105,850 | ||||||
|
| |||||||
| 1,895,961 | ||||||||
|
| |||||||
| Malaysia—0.1% |
| |||||||
MBM Resources BHD | 58,300 | 44,658 | ||||||
TIME dotCom Bhd. | 20,300 | 58,667 | ||||||
|
| |||||||
| 103,325 | ||||||||
|
| |||||||
| Mexico—0.4% |
| |||||||
Alfa S.A.B de C.V., Class A | 102,800 | 63,740 | ||||||
Alpek S.A.B de C.V. | 71,100 | 49,519 | ||||||
Grupo Financiero Banorte S.A.B de C.V., Class O (e) | 23,500 | 81,432 | ||||||
Macquarie Mexico Real Estate Management S.A. de C.V. REIT (a) | 48,600 | 59,696 | ||||||
|
| |||||||
| 254,387 | ||||||||
|
| |||||||
| Netherlands—1.9% |
| |||||||
Aegon NV | 24,193 | 62,619 | ||||||
AerCap Holdings NV (e) | 1,600 | 40,304 | ||||||
Airbus SE (e) | 1,714 | 124,309 | ||||||
ASM International NV | 878 | 125,855 | ||||||
ASML Holding NV | 799 | 295,129 | ||||||
| Shares | Value | |||||||
ASR Nederland NV | 2,124 | $71,437 | ||||||
Koninklijke Ahold Delhaize NV | 7,939 | 234,660 | ||||||
NN Group NV | 2,951 | 110,615 | ||||||
Signify NV (a)(e) | 2,144 | 79,300 | ||||||
VEON Ltd. ADR | 34,805 | 43,854 | ||||||
Wolters Kluwer NV | 1,958 | 167,022 | ||||||
|
| |||||||
| 1,355,104 | ||||||||
|
| |||||||
| New Zealand—0.5% |
| |||||||
a2 Milk Co., Ltd. (e) | 10,023 | 102,009 | ||||||
Fisher & Paykel Healthcare Corp. Ltd. | 5,850 | 129,112 | ||||||
Meridian Energy Ltd. | 50,073 | 164,684 | ||||||
|
| |||||||
| 395,805 | ||||||||
|
| |||||||
| Norway—0.6% |
| |||||||
Avance Gas Holding Ltd. (a) | 24,696 | 66,606 | ||||||
Frontline Ltd. | 5,471 | 36,025 | ||||||
Orkla ASA | 11,148 | 112,511 | ||||||
Sparebanken Vest | 9,012 | 60,693 | ||||||
TGS NOPEC Geophysical Co ASA | 4,285 | 52,294 | ||||||
Yara International ASA | 2,948 | 113,438 | ||||||
|
| |||||||
| 441,567 | ||||||||
|
| |||||||
| Poland—0.1% |
| |||||||
TEN Square Games S.A. | 708 | 105,334 | ||||||
|
| |||||||
| Portugal—0.1% |
| |||||||
Jeronimo Martins SGPS S.A. | 5,630 | 90,532 | ||||||
|
| |||||||
| Singapore—0.1% |
| |||||||
China Aviation Oil Singapore Corp. Ltd. | 65,800 | 45,119 | ||||||
Yangzijiang Shipbuilding Holdings Ltd. | 76,100 | 55,590 | ||||||
|
| |||||||
| 100,709 | ||||||||
|
| |||||||
| South Africa—0.9% |
| |||||||
Anglo American Platinum Ltd. | 1,521 | 105,306 | ||||||
Astral Foods Ltd. | 5,607 | 43,976 | ||||||
Gold Fields Ltd. | 10,899 | 133,334 | ||||||
Impala Platinum Holdings Ltd. | 11,402 | 99,069 | ||||||
MTN Group Ltd. | 24,220 | 81,261 | ||||||
Nedbank Group Ltd. | 9,694 | 58,009 | ||||||
Old Mutual Ltd. | 107,534 | 66,283 | ||||||
Sibanye Stillwater Ltd. | 26,311 | 73,023 | ||||||
|
| |||||||
| 660,261 | ||||||||
|
| |||||||
| Spain—1.1% |
| |||||||
Banco Santander S.A. | 58,213 | 108,582 | ||||||
Iberdrola S.A. | 18,196 | 223,967 | ||||||
Mapfre S.A. | 66,157 | 103,791 | ||||||
Mediaset Espana Comunicacion S.A. (e) | 11,704 | 43,346 | ||||||
Neinor Homes S.A. (a)(e) | 5,167 | 66,057 | ||||||
Repsol S.A. | 11,067 | 74,764 | ||||||
Telefonica S.A. | 41,004 | 140,462 | ||||||
|
| |||||||
| 760,969 | ||||||||
|
| |||||||
| Sweden—1.0% |
| |||||||
Arjo AB, Class B | 7,081 | 43,842 | ||||||
Atlas Copco AB, Class A | 3,167 | 150,998 | ||||||
Essity AB, Class B (e) | 3,796 | 128,158 | ||||||
L E Lundbergforetagen AB, Class B (e) | 2,961 | 146,300 | ||||||
Saab AB, Class B (e) | 4,139 | 121,697 | ||||||
Skanska AB, Class B (e) | 5,833 | 123,185 | ||||||
|
| |||||||
| 714,180 | ||||||||
|
| |||||||
| Switzerland—2.5% |
| |||||||
Allreal Holding AG (e) | 206 | 44,383 | ||||||
LafargeHolcim Ltd. (e) | 2,512 | 114,345 | ||||||
Nestle S.A. | 2,266 | 269,681 | ||||||
Novartis AG | 3,790 | 329,064 | ||||||
Roche Holding AG | 1,332 | 456,264 | ||||||
Sonova Holding AG (e) | 681 | 172,576 | ||||||
| Shares | Value | |||||||
Swiss Life Holding AG | 452 | $171,033 | ||||||
UBS Group AG | 20,084 | 224,397 | ||||||
VAT Group AG (a)(e) | 184 | 35,099 | ||||||
|
| |||||||
| 1,816,842 | ||||||||
|
| |||||||
| Taiwan—2.8% |
| |||||||
Asia Cement Corp. | 68,000 | 97,978 | ||||||
Cathay Financial Holding Co., Ltd. | 81,000 | 108,437 | ||||||
Compal Electronics, Inc. | 127,000 | 83,992 | ||||||
Fubon Financial Holding Co., Ltd. | 78,000 | 113,499 | ||||||
Fulgent Sun International Holding Co., Ltd. | 26,000 | 98,344 | ||||||
Hon Hai Precision Industry Co., Ltd. | 75,001 | 201,641 | ||||||
Pegatron Corp. | 49,000 | 108,800 | ||||||
Pou Chen Corp. | 45,000 | 40,873 | ||||||
Powertech Technology, Inc. | 31,000 | 93,225 | ||||||
Realtek Semiconductor Corp. | 10,000 | 128,183 | ||||||
Taiwan Semiconductor Manufacturing Co., Ltd. ADR | 5,741 | 465,423 | ||||||
United Microelectronics Corp. ADR | 39,814 | 190,709 | ||||||
Wistron Corp. | 73,000 | 75,706 | ||||||
Yuanta Financial Holding Co., Ltd. | 366,080 | 226,652 | ||||||
|
| |||||||
| 2,033,462 | ||||||||
|
| |||||||
| Thailand—0.1% |
| |||||||
Gulf Energy Development PCL (c)(d) | 53,600 | 51,727 | ||||||
Thanachart Capital PCL (c)(d) | 42,700 | 39,301 | ||||||
|
| |||||||
| 91,028 | ||||||||
|
| |||||||
| Turkey—0.3% |
| |||||||
Turkcell Iletisim Hizmetleri AS | 60,084 | 117,114 | ||||||
Turkiye Garanti Bankasi AS (e) | 59,989 | 54,830 | ||||||
Turkiye Sinai Kalkinma Bankasi AS (e) | 326,331 | 46,893 | ||||||
|
| |||||||
| 218,837 | ||||||||
|
| |||||||
| United Arab Emirates—0.1% |
| |||||||
Emaar Properties PJSC (e) | 76,276 | 58,579 | ||||||
|
| |||||||
| United Kingdom—2.9% |
| |||||||
Airtel Africa PLC (a) | 52,569 | 39,471 | ||||||
Anglo American PLC | 8,115 | 196,331 | ||||||
Aviva PLC | 19,019 | 70,365 | ||||||
BAE Systems PLC | 25,906 | 160,889 | ||||||
Barratt Developments PLC | 15,383 | 94,340 | ||||||
Bovis Homes Group PLC | 5,238 | 38,386 | ||||||
BT Group PLC | 100,798 | 127,673 | ||||||
Diversified Gas & Oil PLC | 40,496 | 54,823 | ||||||
IHS Markit Ltd. | 1,563 | 122,711 | ||||||
J Sainsbury PLC | 63,451 | 156,225 | ||||||
JD Sports Fashion PLC | 16,833 | 175,713 | ||||||
Keller Group PLC | 9,382 | 73,726 | ||||||
Legal & General Group PLC | 38,065 | 92,858 | ||||||
M&G PLC | 29,638 | 60,919 | ||||||
Micro Focus International PLC (e) | 15,904 | 50,559 | ||||||
Mitchells & Butlers PLC (e) | 27,725 | 48,351 | ||||||
Rio Tinto PLC | 3,452 | 207,715 | ||||||
Royal Dutch Shell PLC, Class A | 5,903 | 74,432 | ||||||
Royal Dutch Shell PLC, Class B | 6,211 | 75,321 | ||||||
Vodafone Group PLC | 125,459 | 166,287 | ||||||
|
| |||||||
| 2,087,095 | ||||||||
|
| |||||||
| United States—52.6% |
| |||||||
3M Co., | 1,285 | 205,831 | ||||||
Abbott Laboratories | 2,859 | 311,145 | ||||||
AbbVie, Inc. | 4,500 | 394,155 | ||||||
ACCO Brands Corp. | 14,730 | 85,434 | ||||||
Activision Blizzard, Inc. | 3,134 | 253,697 | ||||||
Adobe, Inc. (e) | 848 | 415,885 | ||||||
| See accompanying Notes to Financial Statements | | September 30, 2020 | | Annual Report | 69 |
Table of Contents
Schedule of Investments
September 30, 2020
| Shares | Value | |||||||
ADT, Inc. | 18,423 | $150,516 | ||||||
AES Corp. | 3,678 | 66,609 | ||||||
Aflac, Inc. | 4,477 | 162,739 | ||||||
AGNC Investment Corp. REIT | 14,911 | 207,412 | ||||||
Air Lease Corp. | 2,305 | 67,813 | ||||||
Air Products and Chemicals, Inc. | 677 | 201,651 | ||||||
Akamai Technologies, Inc. (e) | 1,741 | 192,450 | ||||||
Allstate Corp. | 2,631 | 247,682 | ||||||
Ally Financial, Inc. | 3,951 | 99,052 | ||||||
Alphabet, Inc., Class A (e) | 448 | 656,589 | ||||||
Alphabet, Inc., Class C (e) | 446 | 655,442 | ||||||
Amazon.com, Inc. (e) | 496 | 1,561,770 | ||||||
American Equity Investment Life Holding Co. | 3,290 | 72,347 | ||||||
American Financial Group, Inc. | 1,741 | 116,612 | ||||||
Ameriprise Financial, Inc. | 804 | 123,904 | ||||||
Amgen, Inc. | 991 | 251,873 | ||||||
Analog Devices, Inc. | 1,748 | 204,062 | ||||||
Anthem, Inc. | 958 | 257,309 | ||||||
Apple, Inc. | 23,315 | 2,700,110 | ||||||
Applied Materials, Inc. | 3,415 | 203,022 | ||||||
AT&T, Inc. | 12,576 | 358,542 | ||||||
Bank of America Corp. | 12,548 | 302,281 | ||||||
Best Buy Co., Inc. | 1,909 | 212,453 | ||||||
Biogen, Inc. (e) | 741 | 210,207 | ||||||
Bloom Energy Corp., Class A (e) | 4,516 | 81,153 | ||||||
Booz Allen Hamilton Holding Corp. | 1,490 | 123,640 | ||||||
Bristol-Myers Squibb Co. | 6,773 | 408,344 | ||||||
Broadcom, Inc. | 818 | 298,014 | ||||||
Cadence Design Systems, Inc. (e) | 2,189 | 233,413 | ||||||
Cardinal Health, Inc. | 4,357 | 204,561 | ||||||
Carrier Global Corp. | 6,814 | 208,100 | ||||||
Centene Corp. (e) | 4,039 | 235,595 | ||||||
CenturyLink, Inc. | 19,502 | 196,775 | ||||||
Chevron Corp. | 3,145 | 226,440 | ||||||
Cigna Corp. | 1,320 | 223,621 | ||||||
Cisco Systems, Inc. | 6,867 | 270,491 | ||||||
Citigroup, Inc. | 4,191 | 180,674 | ||||||
Citizens Financial Group, Inc. | 2,720 | 68,762 | ||||||
Citrix Systems, Inc. | 1,204 | 165,803 | ||||||
CNA Financial Corp. | 3,124 | 93,689 | ||||||
Computer Programs & Systems, Inc. | 3,935 | 108,645 | ||||||
Conagra Brands, Inc. | 2,616 | 93,417 | ||||||
Costco Wholesale Corp. | 838 | 297,490 | ||||||
CVS Health Corp. | 5,204 | 303,914 | ||||||
Danaher Corp. | 1,202 | 258,827 | ||||||
DaVita, Inc. (e) | 1,736 | 148,688 | ||||||
Delta Air Lines, Inc. | 3,151 | 96,358 | ||||||
DexCom, Inc. (e) | 480 | 197,870 | ||||||
Diamond S Shipping, Inc. (e) | 4,775 | 32,804 | ||||||
Dollar General Corp. | 1,185 | 248,400 | ||||||
Dover Corp. | 1,452 | 157,310 | ||||||
DR Horton, Inc. | 2,609 | 197,319 | ||||||
Dropbox, Inc., Class A (e) | 4,031 | 77,637 | ||||||
Duke Energy Corp. | 2,570 | 227,599 | ||||||
Eastman Chemical Co. | 1,339 | 104,603 | ||||||
eBay, Inc. | 3,154 | 164,323 | ||||||
Edwards Lifesciences Corp. (e) | 2,777 | 221,660 | ||||||
Electronic Arts, Inc. (e) | 1,224 | 159,622 | ||||||
Eli Lilly and Co. | 2,073 | 306,845 | ||||||
Equinix, Inc. REIT | 237 | 180,151 | ||||||
Exxon Mobil Corp. | 6,471 | 222,149 | ||||||
Facebook, Inc., Class A (e) | 1,805 | 472,729 | ||||||
Fidelity National Information Services, Inc. | 832 | 122,479 | ||||||
Fortinet, Inc. (e) | 1,403 | 165,287 | ||||||
FTI Consulting, Inc. (e) | 682 | 72,272 | ||||||
General Motors Co. | 6,996 | 207,012 | ||||||
H&E Equipment Services, Inc. | 2,222 | 43,685 | ||||||
Hartford Financial Services Group, Inc. | 5,764 | 212,461 | ||||||
Herc Holdings, Inc. (e) | 1,435 | 56,840 | ||||||
| Shares | Value | |||||||
Hewlett Packard Enterprise Co. | 10,968 | $102,770 | ||||||
Honeywell International, Inc. | 1,690 | 278,191 | ||||||
HP, Inc. | 11,441 | 217,265 | ||||||
Humana, Inc. | 464 | 192,045 | ||||||
Intel Corp. | 7,136 | 369,502 | ||||||
InterDigital, Inc. | 1,788 | 102,023 | ||||||
Johnson & Johnson | 3,287 | 489,369 | ||||||
Johnson Controls International PLC | 4,636 | 189,381 | ||||||
JPMorgan Chase & Co. | 4,023 | 387,294 | ||||||
Kimberly-Clark Corp. | 1,482 | 218,832 | ||||||
Kinder Morgan, Inc. | 11,397 | 140,525 | ||||||
KLA Corp. | 688 | 133,293 | ||||||
Kroger Co. | 8,012 | 271,687 | ||||||
L3Harris Technologies, Inc. | 1,682 | 285,671 | ||||||
Lam Research Corp. | 620 | 205,685 | ||||||
Leidos Holdings, Inc. | 2,135 | 190,335 | ||||||
Lowe’s Cos., Inc. | 2,390 | 396,405 | ||||||
LyondellBasell Industries NV, Class A | 1,607 | 113,277 | ||||||
MarketAxess Holdings, Inc. | 210 | 101,134 | ||||||
Masco Corp. | 1,392 | 76,741 | ||||||
Mastercard, Inc., Class A | 811 | 274,256 | ||||||
McDonald’s Corp. | 1,060 | 232,659 | ||||||
McGrath RentCorp | 1,880 | 112,029 | ||||||
Merck & Co., Inc. | 3,583 | 297,210 | ||||||
Methode Electronics, Inc. | 2,265 | 64,553 | ||||||
MetLife, Inc. | 5,381 | 200,012 | ||||||
Micron Technology, Inc. (e) | 3,900 | 183,144 | ||||||
Microsoft Corp. | 9,089 | 1,911,689 | ||||||
Molson Coors Brewing Co., Class B | 1,530 | 51,347 | ||||||
Mondelez International, Inc., Class A | 4,543 | 260,995 | ||||||
Morgan Stanley | 4,546 | 219,799 | ||||||
MSCI, Inc. | 470 | 167,687 | ||||||
MYR Group, Inc. (e) | 1,808 | 67,221 | ||||||
Nasdaq, Inc. | 918 | 112,648 | ||||||
Newell Brands, Inc. | 8,058 | 138,275 | ||||||
Newmont Corp. | 3,240 | 205,578 | ||||||
NIKE, Inc., Class B | 2,396 | 300,794 | ||||||
NVIDIA Corp. | 1,356 | 733,894 | ||||||
O’Reilly Automotive, Inc. (e) | 430 | 198,264 | ||||||
OneMain Holdings, Inc. | 2,702 | 84,438 | ||||||
Oracle Corp. | 3,621 | 216,174 | ||||||
Otis Worldwide Corp. | 3,360 | 209,731 | ||||||
PayPal Holdings, Inc. (e) | 1,809 | 356,427 | ||||||
Pfizer, Inc. | 8,139 | 298,701 | ||||||
Phillips 66 | 1,587 | 82,270 | ||||||
Photronics, Inc. (e) | 8,350 | 83,166 | ||||||
Popular, Inc. | 2,059 | 74,680 | ||||||
Procter & Gamble Co. | 3,539 | 491,886 | ||||||
Progressive Corp. | 1,733 | 164,063 | ||||||
Prudential Financial, Inc. | 2,694 | 171,123 | ||||||
Qorvo, Inc. (e) | 1,626 | 209,770 | ||||||
QUALCOMM, Inc. | 2,471 | 290,787 | ||||||
Regeneron Pharmaceuticals, Inc. (e) | 313 | 175,211 | ||||||
Reinsurance Group of America, Inc. | 1,376 | 130,981 | ||||||
Renewable Energy Group, Inc. (e) | 4,511 | 240,978 | ||||||
ScanSource, Inc. (e) | 2,196 | 43,547 | ||||||
Schweitzer-Mauduit International, Inc. | 1,706 | 51,845 | ||||||
Sherwin-Williams Co., | 299 | 208,325 | ||||||
Skyworks Solutions, Inc. | 1,168 | 169,944 | ||||||
Star Group L.P. | 11,860 | 115,635 | ||||||
Starbucks Corp. | 2,438 | 209,473 | ||||||
State Street Corp. | 2,723 | 161,556 | ||||||
Steel Dynamics, Inc. | 5,451 | 156,062 | ||||||
Stryker Corp. | 1,085 | 226,081 | ||||||
Sykes Enterprises, Inc. (e) | 2,435 | 83,301 | ||||||
Synchrony Financial | 4,729 | 123,758 | ||||||
Synopsys, Inc. (e) | 1,047 | 224,037 | ||||||
Target Corp. | 1,742 | 274,226 | ||||||
| Shares | Value | |||||||
TD Ameritrade Holding Corp. | 3,300 | $129,195 | ||||||
Teradyne, Inc. | 1,666 | 132,380 | ||||||
Thermo Fisher Scientific, Inc. | 726 | 320,544 | ||||||
Tyson Foods, Inc., Class A | 2,275 | 135,317 | ||||||
UnitedHealth Group, Inc. | 1,315 | 409,978 | ||||||
Unum Group | 4,414 | 74,288 | ||||||
Veeva Systems, Inc., Class A (e) | 1,041 | 292,719 | ||||||
Verizon Communications, Inc. | 7,472 | 444,509 | ||||||
Vertex Pharmaceuticals, Inc. (e) | 899 | 244,636 | ||||||
Visa, Inc., Class A | 1,664 | 332,750 | ||||||
Vistra Corp. | 5,184 | 97,770 | ||||||
Walgreens Boots Alliance, Inc. | 2,071 | 74,390 | ||||||
Walmart, Inc. | 2,410 | 337,183 | ||||||
WestRock Co. | 4,042 | 140,419 | ||||||
|
| |||||||
| 38,013,798 | ||||||||
|
| |||||||
| Total Common Stock (cost—$63,535,067) | 70,679,469 | |||||||
|
| |||||||
| Preferred Stock—0.9% |
| |||||||
| Brazil—0.4% |
| |||||||
Banco Bradesco S.A. | 26,700 | 92,282 | ||||||
Cia de Saneamento do Parana | 60,000 | 54,381 | ||||||
Cia Energetica de Minas Gerais | 20,672 | 37,178 | ||||||
Cia Paranaense de Energia | 4,500 | 49,689 | ||||||
Petroleo Brasileiro S.A. | 24,900 | 86,948 | ||||||
|
| |||||||
| 320,478 | ||||||||
|
| |||||||
| Chile—0.1% |
| |||||||
Embotelladora Andina S.A., Class B | 22,603 | 49,953 | ||||||
|
| |||||||
| Germany—0.4% |
| |||||||
Porsche Automobil Holding SE | 2,187 | 130,109 | ||||||
Volkswagen AG (e) | 781 | 125,671 | ||||||
|
| |||||||
| 255,780 | ||||||||
|
| |||||||
| Total Preferred Stock (cost—$725,405) | 626,211 | |||||||
|
| |||||||
| Principal Amount (000s) | ||||||||
| Repurchase Agreements—0.3% |
| |||||||
State Street Bank and Trust Co., dated 9/30/20, 0.00%, due 10/1/20, proceeds $231,000; collateralized by U.S. Treasury Notes, 0.25%, due 9/30/25, valued at $235,682 including accrued interest |
| |||||||
(cost—$231,000) | $231 | 231,000 | ||||||
|
| |||||||
| Total Investments (cost—$64,491,472) (b)—99.0% |
| 71,536,680 | ||||||
|
| |||||||
| Other assets less liabilities (f)—1.0% | 730,807 | |||||||
|
| |||||||
| Net Assets—100.0% |
| $72,267,487 | ||||||
|
| |||||||
| 70 | Annual Report | | September 30, 2020 | | See accompanying Notes to Financial Statements |
Table of Contents
Schedule of Investments
September 30, 2020
Notes to Schedule of Investments:
† Actual amount rounds to less than $1.
(a) 144A—Exempt from registration under Rule 144A of the Securities Act of 1933. These securities may be resold in transactions exempt from registration, typically only to qualified institutional buyers. Securities with an aggregate value of $777,129, representing 1.1% of net assets.
(b) Securities with an aggregate value of $26,561,575, representing 36.8% of net assets, were valued utilizing modeling tools provided by a third-party vendor. See Note 1(a) and Note 1(b) in the Notes to Financial Statements.
(c) Fair-Valued—Securities with an aggregate value of $91,028, representing 0.1% of net assets. See Note 1(a) and Note 1(b) in the Notes to Financial Statements.
(d) Level 3 security. See Note 1(a) and Note 1(b) in the Notes to Financial Statements.
(e) Non-income producing.
(f) Includes net unrealized appreciation (depreciation) of other financial instruments as follows:
| Forward foreign currency contracts outstanding at September 30, 2020: | ||||||||||||||||
| Description | Counterparty | U.S.$ Value on Origination Date | U.S.$ Value September 30, 2020 | Unrealized Appreciation (Depreciation) | ||||||||||||
Sold: | ||||||||||||||||
1,800 Hong Kong Dollar settling 10/5/20 | State Street Bank | $ | 232 | $ | 232 | $ | — | |||||||||
Glossary:
ADR—American Depositary Receipt
MSCI—Morgan Stanley Capital International
REIT—Real Estate Investment Trust
The industry classification of portfolio holdings and other assets less liabilities shown as a percentage of net assets were as follows:
Semiconductors & Semiconductor Equipment | 6.9% | |||
Insurance | 5.7% | |||
Technology Hardware, Storage & Peripherals | 5.5% | |||
Pharmaceuticals | 5.4% | |||
Software | 5.2% | |||
Banks | 4.9% | |||
Internet & Direct Marketing Retail | 4.1% | |||
Interactive Media & Services | 3.5% | |||
Metals & Mining | 3.1% | |||
IT Services | 2.9% | |||
Diversified Telecommunication Services | 2.8% | |||
Food & Staples Retailing | 2.7% | |||
Healthcare Providers & Services | 2.7% | |||
Healthcare Equipment & Supplies | 2.7% | |||
Oil, Gas & Consumable Fuels | 2.6% | |||
Capital Markets | 2.1% | |||
Biotechnology | 2.1% | |||
Automobiles | 1.9% | |||
Wireless Telecommunication Services | 1.6% | |||
Food Products | 1.5% | |||
Specialty Retail | 1.5% | |||
Construction & Engineering | 1.4% | |||
Entertainment | 1.4% | |||
Trading Companies & Distributors | 1.3% | |||
Electric Utilities | 1.3% | |||
Household Products | 1.2% | |||
Electronic Equipment, Instruments & Components | 1.2% | |||
Chemicals | 1.1% | |||
Aerospace & Defense | 1.1% | |||
Industrial Conglomerates | 1.1% | |||
Household Durables | 1.0% | |||
Diversified Financial Services | 1.0% | |||
Machinery | 1.0% | |||
Textiles, Apparel & Luxury Goods | 1.0% | |||
Multi-Line Retail | 0.9% | |||
Commercial Services & Supplies | 0.8% | |||
Electrical Equipment | 0.8% | |||
Professional Services | 0.7% | |||
Hotels, Restaurants & Leisure | 0.7% | |||
Building Products | 0.7% | |||
Independent Power Producers & Energy Traders | 0.6% |
Construction Materials | 0.6% | |||
Healthcare Technology | 0.6% | |||
Consumer Finance | 0.5% | |||
Communications Equipment | 0.5% | |||
Real Estate Management & Development | 0.5% | |||
Life Sciences Tools & Services | 0.4% | |||
Equity Real Estate Investment Trusts (REITs) | 0.4% | |||
Media | 0.4% | |||
Airlines | 0.3% | |||
Containers & Packaging | 0.3% | |||
Beverages | 0.3% | |||
Real Estate | 0.3% | |||
Mortgage Real Estate Investment Trusts (REITs) | 0.3% | |||
Personal Products | 0.3% | |||
Paper & Forest Products | 0.2% | |||
Gas Utilities | 0.2% | |||
Transportation Infrastructure | 0.1% | |||
Road & Rail | 0.1% | |||
Auto Components | 0.1% | |||
Marine | 0.1% | |||
Water Utilities | 0.1% | |||
Energy Equipment & Services | 0.1% | |||
Food & Beverage | 0.1% | |||
Distributors | 0.1% | |||
Thrifts & Mortgage Finance | 0.1% | |||
Repurchase Agreements | 0.3% | |||
Other assets less liabilities | 1.0% | |||
|
| |||
| 100.0% | ||||
|
|
| See accompanying Notes to Financial Statements | | September 30, 2020 | | Annual Report | 71 |
Table of Contents
Schedule of Investments
September 30, 2020
AllianzGI Convertible Fund
| Principal Amount (000s) | Value | |||||||
| Convertible Bonds & Notes—82.8% |
| |||||||
| Airlines—1.6% |
| |||||||
American Airlines Group, Inc., |
| |||||||
6.50%, 7/1/25 | $3,690 | $3,420,169 | ||||||
Southwest Airlines Co., |
| |||||||
1.25%, 5/1/25 | 21,945 | 28,747,950 | ||||||
|
| |||||||
| 32,168,119 | ||||||||
|
| |||||||
| Auto Manufacturers—4.9% |
| |||||||
Tesla, Inc., |
| |||||||
1.25%, 3/1/21 | 2,855 | 17,001,726 | ||||||
2.00%, 5/15/24 | 11,470 | 79,314,831 | ||||||
|
| |||||||
| 96,316,557 | ||||||||
|
| |||||||
| Banks—1.7% |
| |||||||
BofA Finance LLC, |
| |||||||
0.125%, 9/1/22 | 13,040 | 14,819,960 | ||||||
JPMorgan Chase Bank N.A. (a)(b), |
| |||||||
0.125%, 1/1/23 | 15,465 | 19,650,216 | ||||||
|
| |||||||
| 34,470,176 | ||||||||
|
| |||||||
| Biotechnology—3.1% |
| |||||||
Exact Sciences Corp., |
| |||||||
0.375%, 3/15/27 | 15,305 | 17,989,335 | ||||||
Halozyme Therapeutics, Inc. (a)(b), |
| |||||||
1.25%, 12/1/24 | 8,960 | 11,496,800 | ||||||
Insmed, Inc., |
| |||||||
1.75%, 1/15/25 | 13,470 | 14,685,243 | ||||||
Livongo Health, Inc. (a)(b), |
| |||||||
0.875%, 6/1/25 | 2,240 | 4,398,800 | ||||||
NeoGenomics, Inc., |
| |||||||
1.25%, 5/1/25 | 10,360 | 13,000,327 | ||||||
|
| |||||||
| 61,570,505 | ||||||||
|
| |||||||
| Capital Markets—0.8% |
| |||||||
Colony Capital Operating Co. LLC (a)(b), |
| |||||||
5.75%, 7/15/25 | 10,690 | 15,812,952 | ||||||
|
| |||||||
| Commercial Services—3.2% |
| |||||||
Chegg, Inc. (a)(b), |
| |||||||
zero coupon, 9/1/26 | 26,640 | 26,679,960 | ||||||
Square, Inc., |
| |||||||
0.125%, 3/1/25 (a)(b) | 12,520 | 19,087,509 | ||||||
0.50%, 5/15/23 | 8,030 | 17,415,550 | ||||||
|
| |||||||
| 63,183,019 | ||||||||
|
| |||||||
| Computers—2.0% |
| |||||||
Lumentum Holdings, Inc. (a)(b), |
| |||||||
0.50%, 12/15/26 | 15,730 | 16,780,889 | ||||||
Varonis Systems, Inc. (a)(b), |
| |||||||
1.25%, 8/15/25 | 6,830 | 9,748,532 | ||||||
Zscaler, Inc. (a)(b), |
| |||||||
0.125%, 7/1/25 | 10,175 | 12,058,401 | ||||||
|
| |||||||
| 38,587,822 | ||||||||
|
| |||||||
| Diversified Financial Services—1.9% |
| |||||||
Hannon Armstrong Sustainable Infrastructure Capital, Inc., |
| |||||||
zero coupon, 8/15/23 | 9,935 | 10,359,369 | ||||||
LendingTree, Inc. (a)(b), |
| |||||||
0.50%, 7/15/25 | 12,080 | 11,816,191 | ||||||
PRA Group, Inc., |
| |||||||
3.50%, 6/1/23 | 13,335 | 14,682,795 | ||||||
|
| |||||||
| 36,858,355 | ||||||||
|
| |||||||
| Electronics—0.7% |
| |||||||
II-VI, Inc., |
| |||||||
0.25%, 9/1/22 | 11,645 | 13,144,294 | ||||||
|
| |||||||
| Energy-Alternate Sources—2.5% |
| |||||||
Canadian Solar, Inc. (a)(b), |
| |||||||
2.50%, 10/1/25 | 12,200 | 14,269,443 | ||||||
| Principal Amount (000s) | Value | |||||||
Enphase Energy, Inc. (a)(b), |
| |||||||
0.25%, 3/1/25 | $ | 10,940 | $ | 14,016,977 | ||||
Plug Power, Inc. (a)(b), |
| |||||||
3.75%, 6/1/25 | 3,095 | 8,493,926 | ||||||
SolarEdge Technologies, Inc. (a)(b), |
| |||||||
zero coupon, 9/15/25 | 11,000 | 12,655,695 | ||||||
|
| |||||||
| 49,436,041 | ||||||||
|
| |||||||
| Entertainment—0.9% |
| |||||||
Cinemark Holdings, Inc. (a)(b), |
| |||||||
4.50%, 8/15/25 | 3,940 | 3,937,474 | ||||||
Penn National Gaming, Inc., |
| |||||||
2.75%, 5/15/26 | 4,495 | 14,448,976 | ||||||
|
| |||||||
| 18,386,450 | ||||||||
|
| |||||||
| Equity Real Estate Investment Trusts (REITs)—0.5% |
| |||||||
IIP Operating Partnership L.P. (a)(b), |
| |||||||
3.75%, 2/21/24 | 5,185 | 10,231,346 | ||||||
|
| |||||||
| Healthcare-Products—5.9% |
| |||||||
Insulet Corp. (a)(b), |
| |||||||
0.375%, 9/1/26 | 22,650 | 28,956,689 | ||||||
NanoString Technologies, Inc. (a)(b), |
| |||||||
2.625%, 3/1/25 | 10,150 | 12,220,448 | ||||||
Natera, Inc. (a)(b), |
| |||||||
2.25%, 5/1/27 | 9,995 | 20,413,579 | ||||||
Nevro Corp., |
| |||||||
1.75%, 6/1/21 | 1,395 | 2,090,422 | ||||||
2.75%, 4/1/25 | 7,690 | 11,922,377 | ||||||
Repligen Corp., |
| |||||||
0.375%, 7/15/24 | 15,130 | 21,597,717 | ||||||
Tandem Diabetes Care, Inc. (a)(b), |
| |||||||
1.50%, 5/1/25 | 14,490 | 18,800,586 | ||||||
|
| |||||||
| 116,001,818 | ||||||||
|
| |||||||
| Healthcare-Services—1.5% |
| |||||||
Teladoc Health, Inc. (a)(b), |
| |||||||
1.25%, 6/1/27 | 23,990 | 30,120,620 | ||||||
|
| |||||||
| Home Builders—0.5% |
| |||||||
Winnebago Industries, Inc. (a)(b), |
| |||||||
1.50%, 4/1/25 | 8,735 | 9,488,876 | ||||||
|
| |||||||
| Internet—12.7% |
| |||||||
Booking Holdings, Inc. (a)(b), |
| |||||||
0.75%, 5/1/25 | 12,375 | 15,951,239 | ||||||
Etsy, Inc., |
| |||||||
0.125%, 10/1/26 (b)(c) | 3,520 | 5,546,200 | ||||||
0.125%, 9/1/27 (a)(b) | 13,935 | 14,239,053 | ||||||
Farfetch Ltd. (a)(b), |
| |||||||
3.75%, 5/1/27 | 5,170 | 9,473,052 | ||||||
Lyft, Inc. (a)(b), |
| |||||||
1.50%, 5/15/25 | 5,980 | 6,249,100 | ||||||
Match Group Financeco 2, Inc. (a)(b), |
| |||||||
0.875%, 6/15/26 | 16,415 | 23,518,857 | ||||||
Okta, Inc., |
| |||||||
0.125%, 9/1/25 | 8,080 | 10,680,524 | ||||||
0.375%, 6/15/26 (a)(b) | 11,295 | 12,955,135 | ||||||
Palo Alto Networks, Inc., |
| |||||||
0.375%, 6/1/25 (a)(b) | 18,365 | 19,536,154 | ||||||
0.75%, 7/1/23 | 7,085 | 8,004,572 | ||||||
Shopify, Inc., | ||||||||
0.125%, 11/1/25 | 18,285 | 20,498,637 | ||||||
Snap, Inc., | ||||||||
0.75%, 8/1/26 | 18,495 | 25,673,372 | ||||||
Wayfair, Inc. (a)(b), | ||||||||
0.625%, 10/1/25 | 29,760 | 30,420,285 | ||||||
Zendesk, Inc. (a)(b), | ||||||||
0.625%, 6/15/25 | 10,015 | 11,930,547 | ||||||
| Principal Amount (000s) | Value | |||||||
Zillow Group, Inc., |
| |||||||
2.75%, 5/15/25 | $ | 21,065 | $ | 36,501,064 | ||||
|
| |||||||
| 251,177,791 | ||||||||
|
| |||||||
| Leisure—3.1% |
| |||||||
Callaway Golf Co. (a)(b), |
| |||||||
2.75%, 5/1/26 | 10,985 | 14,970,746 | ||||||
NCL Corp., Ltd. (a)(b), |
| |||||||
5.375%, 8/1/25 | 5,970 | 7,018,780 | ||||||
6.00%, 5/15/24 | 10,920 | 16,027,969 | ||||||
Royal Caribbean Cruises Ltd. (a)(b), |
| |||||||
4.25%, 6/15/23 | 18,950 | 22,208,159 | ||||||
|
| |||||||
| 60,225,654 | ||||||||
|
| |||||||
| Machinery-Diversified—0.7% |
| |||||||
Chart Industries, Inc. (a)(b), |
| |||||||
1.00%, 11/15/24 | 9,605 | 13,360,324 | ||||||
|
| |||||||
| Media—1.2% |
| |||||||
Liberty Broadband Corp. (a)(b), |
| |||||||
2.75%, 9/30/50 | 5,680 | 6,124,338 | ||||||
Liberty Media Corp., |
| |||||||
1.00%, 1/30/23 | 7,640 | 9,101,514 | ||||||
1.375%, 10/15/23 | 8,145 | 8,904,497 | ||||||
|
| |||||||
| 24,130,349 | ||||||||
|
| |||||||
| Mining—0.5% |
| |||||||
SSR Mining, Inc., |
| |||||||
2.50%, 4/1/39 | 7,500 | 10,050,000 | ||||||
|
| |||||||
| Oil, Gas & Consumable Fuels—1.4% |
| |||||||
EQT Corp. (a)(b), |
| |||||||
1.75%, 5/1/26 | 15,755 | 18,034,707 | ||||||
Pioneer Natural Resources Co. (a)(b), |
| |||||||
0.25%, 5/15/25 | 9,385 | 10,379,745 | ||||||
|
| |||||||
| 28,414,452 | ||||||||
|
| |||||||
| Pharmaceuticals—3.2% |
| |||||||
DexCom, Inc., |
| |||||||
0.25%, 11/15/25 (a)(b) | 27,655 | 29,297,016 | ||||||
0.75%, 12/1/23 | 1,950 | 4,931,063 | ||||||
Pacira BioSciences, Inc. (a)(b), |
| |||||||
0.75%, 8/1/25 | 14,960 | 16,200,691 | ||||||
Revance Therapeutics, Inc. (a)(b), |
| |||||||
1.75%, 2/15/27 | 4,970 | 5,262,893 | ||||||
Sarepta Therapeutics, Inc., |
| |||||||
1.50%, 11/15/24 | 3,430 | 7,120,748 | ||||||
|
| |||||||
| 62,812,411 | ||||||||
|
| |||||||
| Retail—2.9% |
| |||||||
Burlington Stores, Inc. (a)(b), |
| |||||||
2.25%, 4/15/25 | 12,820 | 15,339,441 | ||||||
Dick’s Sporting Goods, Inc. (a)(b), |
| |||||||
3.25%, 4/15/25 | 7,360 | 13,513,237 | ||||||
National Vision Holdings, Inc. (a)(b), |
| |||||||
2.50%, 5/15/25 | 7,210 | 10,274,250 | ||||||
RH, |
| |||||||
zero coupon, 6/15/23 | 2,630 | 5,344,719 | ||||||
zero coupon, | 6,740 | 12,880,773 | ||||||
|
| |||||||
| 57,352,420 | ||||||||
|
| |||||||
| Semiconductors—5.9% |
| |||||||
Advanced Micro Devices, Inc., |
| |||||||
2.125%, 9/1/26 | 1,595 | 16,314,571 | ||||||
Cree, Inc., |
| |||||||
0.875%, 9/1/23 | 3,790 | 4,712,149 | ||||||
1.75%, 5/1/26 (a)(b) | 5,325 | 8,177,203 | ||||||
Inphi Corp. (a)(b), |
| |||||||
0.75%, 4/15/25 | 16,445 | 19,766,163 | ||||||
Microchip Technology, Inc., |
| |||||||
1.625%, 2/15/27 | 22,740 | 35,091,663 | ||||||
| 72 | Annual Report | | September 30, 2020 | | See accompanying Notes to Financial Statements |
Table of Contents
Schedule of Investments
September 30, 2020
| Principal Amount (000s) | Value | |||||||
ON Semiconductor Corp., |
| |||||||
1.00%, 12/1/20 | $ | 8,325 | $ | 9,990,000 | ||||
1.625%, 10/15/23 | 5,900 | 7,806,437 | ||||||
Synaptics, Inc., |
| |||||||
0.50%, 6/15/22 | 12,125 | 15,026,294 | ||||||
|
| |||||||
| 116,884,480 | ||||||||
|
| |||||||
| Software—18.2% |
| |||||||
Akamai Technologies, Inc., |
| |||||||
0.125%, 5/1/25 | 18,345 | 23,681,044 | ||||||
Atlassian, Inc., |
| |||||||
0.625%, 5/1/23 | 8,120 | 18,280,150 | ||||||
Bandwidth Inc, (a)(b), |
| |||||||
0.25%, 3/1/26 | 5,150 | 10,310,485 | ||||||
Cerence, Inc. (a)(b), |
| |||||||
3.00%, 6/1/25 | 5,170 | 7,974,029 | ||||||
Cloudflare, Inc. (a)(b), |
| |||||||
0.75%, 5/15/25 | 9,730 | 13,148,664 | ||||||
Coupa Software, Inc. (a)(b), |
| |||||||
0.375%, 6/15/26 | 20,580 | 24,348,713 | ||||||
Datadog, Inc. (a)(b), |
| |||||||
0.125%, 6/15/25 | 11,800 | 15,635,000 | ||||||
DocuSign, Inc., |
| |||||||
0.50%, 9/15/23 | 5,060 | 15,301,946 | ||||||
Everbridge, Inc. (a)(b), |
| |||||||
0.125%, 12/15/24 | 9,825 | 13,069,846 | ||||||
Five9, Inc. (a)(b), |
| |||||||
0.50%, 6/1/25 | 13,325 | 16,169,705 | ||||||
HubSpot, Inc. (a)(b), |
| |||||||
0.375%, 6/1/25 | 11,885 | 15,125,360 | ||||||
MongoDB, Inc. (a)(b), |
| |||||||
0.25%, 1/15/26 | 16,105 | 21,074,668 | ||||||
Nuance Communications, Inc., |
| |||||||
1.25%, 4/1/25 | 8,890 | 15,791,307 | ||||||
Pegasystems, Inc. (a)(b), |
| |||||||
0.75%, 3/1/25 | 12,895 | 14,750,574 | ||||||
RingCentral, Inc. (a)(b), |
| |||||||
zero coupon, 3/1/25 | 30,970 | 33,137,900 | ||||||
Sea Ltd. (a)(b), |
| |||||||
2.375%, 12/1/25 | 5,530 | 10,365,690 | ||||||
ServiceNow, Inc., |
| |||||||
zero coupon, 6/1/22 | 2,895 | 10,471,911 | ||||||
Splunk, Inc. (a)(b), |
| |||||||
1.125%, 6/15/27 | 33,635 | 36,357,294 | ||||||
Twilio, Inc., |
| |||||||
0.25%, 6/1/23 | 3,870 | 13,498,261 | ||||||
Workday, Inc., |
| |||||||
0.25%, 10/1/22 | 9,775 | 15,062,713 | ||||||
Zynga, Inc., |
| |||||||
0.25%, 6/1/24 | 12,210 | 15,514,331 | ||||||
|
| |||||||
| 359,069,591 | ||||||||
|
| |||||||
| Telecommunications—1.0% |
| |||||||
GCI Liberty, Inc. (a)(b), |
| |||||||
1.75%, 9/30/46 | 5,175 | 8,893,237 | ||||||
Nice Ltd. (a)(b), |
| |||||||
zero coupon, 9/15/25 | 9,940 | 10,070,214 | ||||||
|
| |||||||
| 18,963,451 | ||||||||
|
| |||||||
| Transportation—0.3% |
| |||||||
CryoPort, Inc. (a)(b), |
| |||||||
3.00%, 6/1/25 | 2,890 | 6,149,462 | ||||||
|
| |||||||
| Total Convertible Bonds & Notes (cost—$1,319,404,332) |
| 1,634,367,335 | ||||||
|
| |||||||
| Shares | ||||||||
| Convertible Preferred Stock—15.8% |
| |||||||
| Auto Components—0.7% |
| |||||||
Aptiv PLC, Ser. A, |
| |||||||
5.50%, 6/15/23 | 118,045 | 13,388,664 | ||||||
|
| |||||||
| Shares | Value | |||||||
| Banks—2.2% |
| |||||||
Bank of America Corp., Ser. L (d), |
| |||||||
7.25% | 15,640 | $23,272,320 | ||||||
Wells Fargo & Co., Ser. L (d), |
| |||||||
7.50% | 14,835 | 19,909,312 | ||||||
|
| |||||||
| 43,181,632 | ||||||||
|
| |||||||
| Diversified Financial Services—1.4% |
| |||||||
2020 Mandatory Exchangeable Trust (a)(b), |
| |||||||
6.50%, 5/16/23 | 10,385 | 13,812,050 | ||||||
KKR & Co., Inc., Ser. C, |
| |||||||
6.00%, 9/15/23 | 263,030 | 13,677,560 | ||||||
|
| |||||||
| 27,489,610 | ||||||||
|
| |||||||
| Electric Utilities—1.7% |
| |||||||
NextEra Energy, Inc., |
| |||||||
5.279%, 3/1/23 | 629,345 | 29,377,825 | ||||||
6.219%, 9/1/23 | 90,550 | 4,323,762 | ||||||
|
| |||||||
| 33,701,587 | ||||||||
|
| |||||||
| Electronics—1.0% |
| |||||||
Fortive Corp., Ser. A, |
| |||||||
5.00%, 7/1/21 | 19,940 | 18,670,619 | ||||||
|
| |||||||
| Environmental Services—0.8% |
| |||||||
GFL Environmental Inc., |
| |||||||
6.00%, 3/15/23 | 293,960 | 15,671,008 | ||||||
|
| |||||||
| Hand/Machine Tools—0.9% |
| |||||||
Stanley Black & Decker, Inc., |
| |||||||
5.25%, 11/15/22 | 181,790 | 18,342,611 | ||||||
|
| |||||||
| Healthcare-Products—3.9% |
| |||||||
Avantor, Inc., Ser. A, |
| |||||||
6.25%, 5/15/22 | 252,630 | 18,376,306 | ||||||
Boston Scientific Corp., Ser. A, |
| |||||||
5.50%, 6/1/23 | 126,805 | 14,185,675 | ||||||
Danaher Corp., |
| |||||||
4.75%, 4/15/22, Ser. A | 25,930 | 38,268,791 | ||||||
5.00%, 4/15/23, Ser. B | 5,260 | 6,719,966 | ||||||
|
| |||||||
| 77,550,738 | ||||||||
|
| |||||||
| Semiconductors—2.2% |
| |||||||
Broadcom, Inc., Ser. A, |
| |||||||
8.00%, 9/30/22 | 34,850 | 43,449,237 | ||||||
|
| |||||||
| Telecommunications—1.0% |
| |||||||
2020 Cash Mandatory Exchangeable |
| |||||||
5.25%, 6/1/23 | 18,570 | 20,203,696 | ||||||
|
| |||||||
| Total Convertible Preferred Stock (cost—$276,240,966) |
| 311,649,402 | ||||||
|
| |||||||
| Principal Amount (000s) | ||||||||
| Repurchase Agreements—1.2% |
| |||||||
State Street Bank and Trust Co., dated 9/30/20, 0.00%, due 10/1/20, proceeds $23,684,000; collateralized by U.S. Treasury Notes, 0.25%—3.00%, due 9/30/25, valued at $24,157,712 including accrued interest |
| |||||||
(cost—$23,684,000) | $23,684 | 23,684,000 | ||||||
|
| |||||||
| Total Investments (cost—$1,619,329,298)—99.8% |
| 1,969,700,737 | ||||||
|
| |||||||
| Other assets less liabilities—0.2% | 4,820,331 | |||||||
|
| |||||||
| Net Assets—100.0% |
| $1,974,521,068 | ||||||
|
| |||||||
Notes to Schedule of Investments:
(a) Private Placement—Restricted as to resale and may not have a readily available market. Private placement securities include Rule 144A securities. Securities with an aggregate value of $1,004,842,353, representing 50.9% of net assets.
(b) 144A—Exempt from registration under Rule 144A of the Securities Act of 1933. These securities may be resold in transactions exempt from registration, typically only to qualified institutional buyers. Securities with an aggregate value of $1,010,388,553, representing 51.2% of net assets.
(c) When-issued or delayed-delivery. To be settled/delivered after September 30, 2020.
(d) Perpetual maturity. The date shown, if any, is the next call date.
Glossary:
REIT—Real Estate Investment Trust
| See accompanying Notes to Financial Statements | | September 30, 2020 | | Annual Report | 73 |
Table of Contents
Schedule of Investments
September 30, 2020
AllianzGI Core Plus Bond Fund
| Principal Amount (000s) | Value | |||||||
| Corporate Bonds & Notes—52.1% |
| |||||||
| Aerospace & Defense—2.7% |
| |||||||
BAE Systems PLC (a)(b), |
| |||||||
1.90%, 2/15/31 | $200 | $198,622 | ||||||
3.00%, 9/15/50 | 80 | 80,897 | ||||||
Boeing Co., |
| |||||||
5.705%, 5/1/40 | 222 | 258,953 | ||||||
Litton Industries, Inc., |
| |||||||
7.75%, 3/15/26 | 120 | 158,854 | ||||||
Lockheed Martin Corp., |
| |||||||
1.85%, 6/15/30 | 68 | 70,608 | ||||||
2.80%, 6/15/50 | 44 | 46,002 | ||||||
Northrop Grumman Corp., |
| |||||||
4.40%, 5/1/30 | 180 | 222,225 | ||||||
Northrop Grumman Systems Corp., |
| |||||||
7.875%, 3/1/26 | 240 | 318,727 | ||||||
|
| |||||||
| 1,354,888 | ||||||||
|
| |||||||
| Airlines—1.6% |
| |||||||
Delta Air Lines, Inc. (a)(b), |
| |||||||
4.50%, 10/20/25 | 174 | 178,676 | ||||||
7.00%, 5/1/25 | 175 | 192,396 | ||||||
Southwest Airlines Co., |
| |||||||
5.25%, 5/4/25 | 390 | 430,045 | ||||||
|
| |||||||
| 801,117 | ||||||||
|
| |||||||
| Auto Manufacturers—0.1% |
| |||||||
General Motors Financial Co., Inc., Ser. C, (converts to FRN on 9/30/30) (d)(e), |
| |||||||
5.70%, 9/30/30 | 60 | 60,375 | ||||||
|
| |||||||
| Banks—12.0% |
| |||||||
Australia & New Zealand Banking Group Ltd., (converts to FRN on 7/22/25) (a)(b)(e), |
| |||||||
2.95%, 7/22/30 | 227 | 235,241 | ||||||
Bank of Nova Scotia, (converts to FRN on 6/4/25) (d)(e), |
| |||||||
4.90%, 6/4/25 | 125 | 129,871 | ||||||
Citigroup, Inc., (converts to FRN on 1/30/25) (d)(e), |
| |||||||
4.70%, 1/30/25 | 172 | 166,658 | ||||||
Citizens Financial Group, Inc. (d)(e), |
| |||||||
5.65%, 10/6/25 (converts to FRN on 10/6/25) | 340 | 358,488 | ||||||
6.00%, 7/6/23, Ser. B (converts to FRN on 7/6/23) | 75 | 72,421 | ||||||
Comerica, Inc., (converts to FRN on 10/1/25) (d)(e), |
| |||||||
5.625%, 7/1/25 | 290 | 307,239 | ||||||
Credit Suisse Group AG, (converts to FRN on 8/21/26) (a)(b)(d)(e), |
| |||||||
6.375%, 8/21/26 | 185 | 197,873 | ||||||
First Horizon Bank, |
| |||||||
5.75%, 5/1/30 | 186 | 210,382 | ||||||
First Horizon National Corp., |
| |||||||
4.00%, 5/26/25 | 676 | 735,571 | ||||||
First Maryland Capital II, 3 mo. LIBOR + 0.850% (e), |
| |||||||
1.101%, 2/1/27 | 243 | 225,383 | ||||||
Huntington Bancshares, Inc. (d)(e), |
| |||||||
4.45%, 10/15/27 (converts to FRN on 10/15/27) | 90 | 89,190 | ||||||
5.625%, 7/15/30 (converts to FRN on 10/15/30) | 420 | 463,050 | ||||||
Huntington Capital Trust I, 3 mo. LIBOR + 0.700% (e), | ||||||||
0.961%, 2/1/27 | 107 | 98,333 | ||||||
JPMorgan Chase & Co., 3 mo. LIBOR + 0.950% (e), |
| |||||||
1.201%, 1/15/87 | 569 | 487,918 | ||||||
Lloyds Banking Group PLC, (converts to FRN on 9/27/25) (d)(e), |
| |||||||
7.50%, 9/27/25 | 630 | 671,230 | ||||||
| Principal Amount (000s) | Value | |||||||
Popular, Inc., |
| |||||||
6.125%, 9/14/23 | $ | 275 | $ | 291,127 | ||||
Regions Financial Corp., Ser. D, (converts to FRN on 9/15/25) (d)(e), |
| |||||||
5.75%, 6/15/25 | 340 | 363,800 | ||||||
State Street Corp., 3 mo. LIBOR + 1.000% (e), |
| |||||||
1.25%, 6/1/77 | 350 | 294,856 | ||||||
Truist Financial Corp., Ser. Q, (converts to FRN on 9/1/30) (d)(e), |
| |||||||
5.10%, 3/1/30 | 195 | 211,029 | ||||||
Wells Fargo & Co., | ||||||||
5.95%, 12/1/86 | 85 | 110,912 | ||||||
Westpac Banking Corp., (converts to FRN on 2/4/25) (e), |
| |||||||
2.894%, 2/4/30 | 335 | 345,880 | ||||||
|
| |||||||
| 6,066,452 | ||||||||
|
| |||||||
| Beverages—0.2% |
| |||||||
Anheuser-Busch Cos. LLC, |
| |||||||
4.90%, 2/1/46 | 85 | 105,691 | ||||||
|
| |||||||
| Biotechnology—0.4% |
| |||||||
Gilead Sciences, Inc., |
| |||||||
2.60%, 10/1/40 | 195 | 195,009 | ||||||
|
| |||||||
| Chemicals—0.3% |
| |||||||
Air Products and Chemicals, Inc., |
| |||||||
2.80%, 5/15/50 | 123 | 129,886 | ||||||
|
| |||||||
| Commercial Services—0.6% |
| |||||||
Massachusetts Institute of Technology, |
| |||||||
2.294%, 7/1/51 | 245 | 248,774 | ||||||
President & Fellows of Harvard College, |
| |||||||
3.15%, 7/15/46 | 34 | 39,534 | ||||||
|
| |||||||
| 288,308 | ||||||||
|
| |||||||
| Computers—1.0% |
| |||||||
Leidos, Inc., |
| |||||||
3.625%, 5/15/25 (a)(b) | 297 | 329,721 | ||||||
4.375%, 5/15/30 (a)(b) | 92 | 107,765 | ||||||
7.125%, 7/1/32 | 44 | 56,894 | ||||||
|
| |||||||
| 494,380 | ||||||||
|
| |||||||
| Diversified Financial Services—1.7% |
| |||||||
AerCap Ireland Capital DAC, |
| |||||||
3.15%, 2/15/24 | 175 | 173,665 | ||||||
Discover Financial Services, Ser. C, (converts to FRN on 10/30/27) (d)(e), |
| |||||||
5.50%, 10/30/27 | 135 | 128,899 | ||||||
Intercontinental Exchange, Inc., |
| |||||||
2.65%, 9/15/40 | 180 | 180,324 | ||||||
Synchrony Financial, |
| |||||||
3.70%, 8/4/26 | 125 | 132,988 | ||||||
4.50%, 7/23/25 | 204 | 224,812 | ||||||
|
| |||||||
| 840,688 | ||||||||
|
| |||||||
| Electric Utilities—6.4% |
| |||||||
Berkshire Hathaway Energy Co. (a)(b), |
| |||||||
4.25%, 10/15/50 | 101 | 126,467 | ||||||
Commonwealth Edison Co., |
| |||||||
5.90%, 3/15/36 | 135 | 194,589 | ||||||
Consolidated Edison Co. of New York, Inc., Ser. 06-E, |
| |||||||
5.70%, 12/1/36 | 45 | 61,140 | ||||||
DTE Electric Co., Ser. A, |
| |||||||
6.625%, 6/1/36 | 45 | 65,885 | ||||||
Duke Energy Indiana LLC, |
| |||||||
3.75%, 5/15/46 | 55 | 64,499 | ||||||
Duke Energy Ohio, Inc., |
| |||||||
2.125%, 6/1/30 | 135 | 141,623 | ||||||
Edison International, |
| |||||||
4.95%, 4/15/25 | 246 | 270,154 | ||||||
| Principal Amount (000s) | Value | |||||||
Jersey Central Power & Light Co., |
| |||||||
6.15%, 6/1/37 | $ | 190 | $ | 257,675 | ||||
National Rural Utilities Cooperative Finance Corp., |
| |||||||
1.35%, 3/15/31 | 150 | 149,357 | ||||||
Niagara Mohawk Power Corp. (a)(b), |
| |||||||
1.96%, 6/27/30 | 375 | 385,538 | ||||||
Pacific Gas and Electric Co., |
| |||||||
3.75%, 2/15/24 | 384 | 401,125 | ||||||
Pennsylvania Electric Co. (a)(b), |
| |||||||
3.25%, 3/15/28 | 60 | 66,031 | ||||||
3.60%, 6/1/29 | 136 | 152,748 | ||||||
4.15%, 4/15/25 | 165 | 181,884 | ||||||
Sempra Energy, (converts to FRN on 10/15/25) (d)(e), |
| |||||||
4.875%, 10/15/25 | 145 | 149,173 | ||||||
Southern California Edison Co., |
| |||||||
1.845%, 2/1/22 | 15 | 15,005 | ||||||
3.70%, 8/1/25, Ser. E | 250 | 278,353 | ||||||
3.90%, 12/1/41 | 56 | 58,267 | ||||||
Southern Co., Ser. B, (converts to FRN on 1/15/26) (e), |
| |||||||
4.00%, 1/15/51 | 153 | 153,474 | ||||||
Toledo Edison Co., |
| |||||||
6.15%, 5/15/37 | 25 | 36,203 | ||||||
|
| |||||||
| 3,209,190 | ||||||||
|
| |||||||
| Equity Real Estate Investment Trusts (REITs)—2.2% |
| |||||||
American Tower Corp., |
| |||||||
1.875%, 10/15/30 | 280 | 277,206 | ||||||
Crown Castle International Corp., |
| |||||||
2.25%, 1/15/31 | 310 | 313,827 | ||||||
CyrusOne LP, |
| |||||||
2.15%, 11/1/30 | 185 | 180,937 | ||||||
Equinix, Inc., |
| |||||||
1.00%, 9/15/25 | 345 | 342,179 | ||||||
|
| |||||||
| 1,114,149 | ||||||||
|
| |||||||
| Healthcare-Services—0.2% |
| |||||||
Universal Health Services, Inc. (a)(b), |
| |||||||
2.65%, 10/15/30 | 111 | 110,051 | ||||||
|
| |||||||
| Insurance—4.3% |
| |||||||
Athene Global Funding (a)(b), |
| |||||||
2.45%, 8/20/27 | 195 | 200,605 | ||||||
2.55%, 6/29/25 | 97 | 100,076 | ||||||
Belrose Funding Trust (a)(b), |
| |||||||
2.33%, 8/15/30 | 187 | 185,847 | ||||||
Five Corners Funding Trust II (a)(b), |
| |||||||
2.85%, 5/15/30 | 307 | 331,295 | ||||||
Lincoln National Corp., 3 mo. LIBOR + 2.358% (e), |
| |||||||
2.638%, 5/17/66 | 445 | 320,400 | ||||||
Loews Corp., | ||||||||
3.20%, 5/15/30 | 115 | 128,434 | ||||||
MetLife, Inc., |
| |||||||
9.25%, 4/8/68 (a)(b) | 55 | 83,468 | ||||||
10.75%, 8/1/69 | 304 | 498,323 | ||||||
New York Life Insurance Co. (a)(b), |
| |||||||
4.45%, 5/15/69 | 105 | 128,825 | ||||||
Northwestern Mutual Life Insurance |
| |||||||
3.85%, 9/30/47 | 170 | 193,669 | ||||||
|
| |||||||
| 2,170,942 | ||||||||
|
| |||||||
| Internet—0.2% |
| |||||||
Amazon.com, Inc., |
| |||||||
2.70%, 6/3/60 | 121 | 124,819 | ||||||
|
| |||||||
| Lodging—1.9% |
| |||||||
Marriott International, Inc., |
| |||||||
5.75%, 5/1/25 | 870 | 971,855 | ||||||
|
| |||||||
| Media—3.1% |
| |||||||
Charter Communications Operating LLC, |
| |||||||
4.908%, 7/23/25 | 50 | 57,736 | ||||||
| 74 | Annual Report | | September 30, 2020 | | See accompanying Notes to Financial Statements |
Table of Contents
Schedule of Investments
September 30, 2020
| Principal Amount (000s) | Value | |||||||
Comcast Corp., |
| |||||||
3.75%, 4/1/40 | $ | 181 | $ | 212,394 | ||||
Time Warner Cable LLC, |
| |||||||
4.50%, 9/15/42 | 115 | 124,823 | ||||||
6.55%, 5/1/37 | 45 | 59,835 | ||||||
Time Warner Entertainment Co., L.P., |
| |||||||
8.375%, 7/15/33 | 250 | 381,914 | ||||||
ViacomCBS, Inc., |
| |||||||
4.20%, 5/19/32 | 124 | 142,168 | ||||||
6.25%, 2/28/57 (converts to FRN on 2/28/27) (e) | 302 | 332,115 | ||||||
Walt Disney Co., |
| |||||||
3.60%, 1/13/51 | 104 | 117,280 | ||||||
7.30%, 4/30/28 | 100 | 138,127 | ||||||
|
| |||||||
| 1,566,392 | ||||||||
|
| |||||||
| Miscellaneous Manufacturing—0.5% |
| |||||||
General Electric Co., Ser. D, (converts to FRN on 1/21/21) (d)(e), |
| |||||||
5.00%, 1/21/21 | 285 | 225,863 | ||||||
|
| |||||||
| Oil, Gas & Consumable Fuels—2.3% |
| |||||||
Aker BP ASA (a)(b), |
| |||||||
2.875%, 1/15/26 | 105 | 104,088 | ||||||
Boston Gas Co. (a)(b), |
| |||||||
3.15%, 8/1/27 | 204 | 230,799 | ||||||
BP Capital Markets PLC, (converts to FRN on 6/22/30) (d)(e), |
| |||||||
4.875%, 3/22/30 | 248 | 265,477 | ||||||
Cenovus Energy, Inc., |
| |||||||
3.00%, 8/15/22 | 110 | 107,671 | ||||||
3.80%, 9/15/23 | 55 | 53,160 | ||||||
Hess Corp., |
| |||||||
7.125%, 3/15/33 | 87 | 104,802 | ||||||
NiSource, Inc., |
| |||||||
1.70%, 2/15/31 | 190 | 186,370 | ||||||
Noble Energy, Inc., |
| |||||||
5.25%, 11/15/43 | 60 | 79,284 | ||||||
6.00%, 3/1/41 | 35 | 48,852 | ||||||
|
| |||||||
| 1,180,503 | ||||||||
|
| |||||||
| Pharmaceuticals—1.4% |
| |||||||
Cigna Corp., |
| |||||||
4.80%, 8/15/38 | 115 | 142,927 | ||||||
CVS Health Corp., |
| |||||||
2.70%, 8/21/40 | 275 | 263,021 | ||||||
Johnson & Johnson, |
| |||||||
2.45%, 9/1/60 | 180 | 180,484 | ||||||
Takeda Pharmaceutical Co., Ltd., |
| |||||||
3.175%, 7/9/50 | 100 | 102,779 | ||||||
|
| |||||||
| 689,211 | ||||||||
|
| |||||||
| Pipelines—4.4% |
| |||||||
El Paso Natural Gas Co. LLC, |
| |||||||
8.375%, 6/15/32 | 125 | 173,929 | ||||||
Energy Transfer Operating L.P., |
| |||||||
2.90%, 5/15/25 | 252 | 253,361 | ||||||
4.75%, 1/15/26 | 295 | 314,796 | ||||||
6.50%, 2/1/42 | 110 | 115,196 | ||||||
7.125%, 5/15/30 (converts to FRN on 5/15/30) (d)(e) | 1,116 | 883,035 | ||||||
Kinder Morgan Energy Partners L.P., |
| |||||||
7.50%, 11/15/40 | 30 | 40,535 | ||||||
Plains All American Pipeline L.P., Ser. B, (converts to FRN on 11/15/22) (d)(e), |
| |||||||
6.125%, 11/15/22 | 667 | 423,979 | ||||||
|
| |||||||
| 2,204,831 | ||||||||
|
| |||||||
| Semiconductors—2.2% |
| |||||||
Broadcom Corp., |
| |||||||
3.875%, 1/15/27 | 405 | 448,969 | ||||||
Broadcom, Inc., |
| |||||||
4.15%, 11/15/30 | 235 | 263,344 | ||||||
4.70%, 4/15/25 | 350 | 396,324 | ||||||
|
| |||||||
| 1,108,637 | ||||||||
|
| |||||||
| Principal Amount (000s) | Value | |||||||
| Telecommunications—2.1% |
| |||||||
AT&T, Inc., |
| |||||||
3.10%, 2/1/43 | $181 | $177,062 | ||||||
4.30%, 2/15/30 | 195 | 230,898 | ||||||
T-Mobile USA, Inc. (a)(b), |
| |||||||
2.05%, 2/15/28 | 273 | 279,603 | ||||||
3.50%, 4/15/25 | 359 | 393,780 | ||||||
|
| |||||||
| 1,081,343 | ||||||||
|
| |||||||
| Transportation—0.3% |
| |||||||
Kansas City Southern, |
| |||||||
3.50%, 5/1/50 | 110 | 114,065 | ||||||
4.20%, 11/15/69 | 50 | 53,499 | ||||||
|
| |||||||
| 167,564 | ||||||||
|
| |||||||
| Total Corporate Bonds & Notes (cost—$25,652,870) |
| 26,262,144 | ||||||
|
| |||||||
| Asset-Backed Securities—21.8% |
| |||||||
American Express Credit Account (e), |
| |||||||
1 mo. LIBOR + 0.320%, 0.472%, 10/15/25 Series 2018-3, Class A | 100 | 100,250 | ||||||
1 mo. LIBOR + 0.340%, 0.492%, 12/15/25 Series 2018-5, Class A | 500 | 501,634 | ||||||
Bain Capital Credit CLO, 3 mo. LIBOR + 0.960%, Series 2018-1A, Class A1 (a)(b)(e), |
| |||||||
1.216%, 4/23/31 | 80 | 78,772 | ||||||
CarMax Auto Owner Trust, Series 2020-1, Class A4, |
| |||||||
2.03%, 6/16/25 | 585 | 608,418 | ||||||
Carmax Auto Owner Trust, |
| |||||||
2.30%, 4/15/25 Series 2019-3, Class A4 | 30 | 31,376 | ||||||
2.60%, 6/16/25 Series 2019-3, Class C | 400 | 415,931 | ||||||
Chesapeake Funding II LLC, Series 2019-2A, Class C (a)(b), |
| |||||||
2.27%, 9/15/31 | 400 | 405,083 | ||||||
Citibank Credit Card Issuance Trust, 1 mo. LIBOR + 0.620%, Series 2017-A5, Class A5 (e), |
| |||||||
0.776%, 4/22/26 | 715 | 720,485 | ||||||
CNH Equipment Trust, Series 2019-B, Class A3, |
| |||||||
2.52%, 8/15/24 | 105 | 107,532 | ||||||
Discover Card Execution Note Trust, 1 mo. LIBOR + 0.360%, Series 2017-A7, Class A7 (e), |
| |||||||
0.512%, 4/15/25 | 800 | 802,513 | ||||||
Dryden 68 CLO Ltd., 3 mo. USD-LIBOR + 1.310%, Series 2019-68A, Class A (a)(b)(e), |
| |||||||
1.585%, 7/15/32 | 515 | 514,373 | ||||||
Ford Credit Auto Owner Trust (a)(b), |
| |||||||
2.04%, 8/15/31 Series 2020-1, Class A | 232 | 243,432 | ||||||
3.19%, 7/15/31 Series 2018-1, Class A | 260 | 286,818 | ||||||
GM Financial Automobile Leasing Trust, Series 2019-3, Class C, |
| |||||||
2.35%, 7/20/23 | 400 | 407,636 | ||||||
GM Financial Consumer Automobile Receivables Trust 2020-2, Series 2020, Class A3, |
| |||||||
1.49%, 12/16/24 | 70 | 71,435 | ||||||
Honda Auto Receivables Owner Trust, Series 2017-2, Class A3, |
| |||||||
1.68%, 8/16/21 | 2 | 2,401 | ||||||
HPEFS Equipment Trust (a)(b), |
| |||||||
2.21%, 9/20/29 Series 2019-1A, Class A3 | 507 | 515,513 | ||||||
2.49%, 9/20/29 Series 2019-1A, Class C | 400 | 409,251 | ||||||
Hyundai Auto Receivables Trust, Series 2019-B, Class C, |
| |||||||
2.40%, 6/15/26 | 600 | 625,381 | ||||||
| Principal Amount (000s) | Value | |||||||
John Deere Owner Trust, Series 2019-B, Class A2, |
| |||||||
2.28%, 5/16/22 | $160 | $160,541 | ||||||
Madison Park Funding XI Ltd., 3 mo. LIBOR + 1.160%, Series 2013-11A, |
| |||||||
1.416%, 7/23/29 | 250 | 249,151 | ||||||
MVW LLC, Series 2019-2A, Class A (a)(b), |
| |||||||
2.22%, 10/20/38 | 477 | 486,950 | ||||||
Nissan Auto Receivables Owner Trust, Series 2019-A, Class A3, |
| |||||||
2.90%, 10/16/23 | 435 | 445,369 | ||||||
Octagon Investment Partners 30 Ltd., 3 mo. USD-LIBOR-BBA + 1.320%, Series 2017-1A, Class A1 (a)(b)(e), |
| |||||||
1.592%, 3/17/30 | 566 | 567,003 | ||||||
Race Point IX CLO Ltd., 3 mo. LIBOR + 1.210%, Series 2015-9A, |
| |||||||
1.485%, 10/15/30 | 194 | 194,345 | ||||||
Sofi Consumer Loan Program LLC, Series 2016-3, Class B (a)(b)(e), |
| |||||||
4.49%, 12/26/25 | 474 | 477,492 | ||||||
Toyota Auto Receivables Owner Trust, Series 2020-C, Class A3, |
| |||||||
0.44%, 10/15/24 | 310 | 310,812 | ||||||
Vantage Data Centers LLC, Series 2020-1A, Class A2 (a)(b), |
| |||||||
1.645%, 9/15/45 | 250 | 250,312 | ||||||
Verizon Owner Trust, Series 2019-C, Class A1A, |
| |||||||
1.94%, 4/22/24 | 755 | 773,224 | ||||||
Volvo Financial Equipment Master Owner Trust, 1 mo. LIBOR + 0.520%, Series 2018-A, Class A (a)(b)(e), |
| |||||||
0.672%, 7/17/23 | 253 | 253,593 | ||||||
|
| |||||||
| Total Asset-Backed Securities (cost—$10,876,041) |
| 11,017,026 | ||||||
|
| |||||||
| U.S. Government Agency Securities—16.4% |
| |||||||
Fannie Mae, MBS, Pool, |
| |||||||
2.50%, 11/1/31, 15 Year | 336 | 356,823 | ||||||
2.50%, 7/1/40, 20 Year | 463 | 486,438 | ||||||
3.00%, 7/1/50, 30 Year | 199 | 211,018 | ||||||
3.50%, 1/1/46, 30 Year | 1,593 | 1,711,372 | ||||||
Fannie Mae UMBS, MBS, TBA, 30 Year (c), |
| |||||||
2.00%, 11/15/50 | 1,785 | 1,840,973 | ||||||
2.50%, 12/25/49 | 1,000 | 1,046,748 | ||||||
United States Small Business Administration, ABS, |
| |||||||
2.60%, 6/1/39 Series 2019-20, Class F1 | 37 | 38,636 | ||||||
2.69%, 7/1/44 Series 2019-25, Class G1 | 145 | 158,527 | ||||||
2.88%, 5/1/39 Series 2019-20, Class E1 | 206 | 219,570 | ||||||
2.92%, 1/1/38 Series 2018-20, Class A1 | 211 | 231,764 | ||||||
3.20%, 3/1/39 Series 2019-20, Class C1 | 110 | 122,079 | ||||||
3.26%, 2/1/39 Series 2019-20, Class B1 | 99 | 109,528 | ||||||
3.37%, 1/1/39 Series 2019-20, Class A1 | 259 | 283,473 | ||||||
3.50%, 5/1/38 Series 2018-20, Class E1 | 266 | 295,187 | ||||||
3.53%, 9/1/38 Series 2018-20, Class I1 | 326 | 365,515 | ||||||
3.54%, 7/1/38 Series 2018-20, Class G1 | 240 | 266,548 | ||||||
3.58%, 8/1/38 Series 2018-20, Class H1 | 465 | 517,690 | ||||||
|
| |||||||
| Total U.S. Government Agency Securities (cost—$8,031,787) |
| 8,261,889 | ||||||
|
| |||||||
| See accompanying Notes to Financial Statements | | September 30, 2020 | | Annual Report | 75 |
Table of Contents
Schedule of Investments
September 30, 2020
| Principal Amount (000s) | Value | |||||||
| U.S. Treasury Obligations—10.5% |
| |||||||
U.S. Treasury Bonds, |
| |||||||
1.25%, 5/15/50 | $ | 333 | $ | 315,648 | ||||
U.S. Treasury Notes, |
| |||||||
0.125%, 9/30/22 | 270 | 269,916 | ||||||
0.125%, 8/15/23 | 342 | 341,679 | ||||||
0.25%, 9/30/25 | 742 | 741,014 | ||||||
0.625%, 8/15/30 | 719 | 714,843 | ||||||
1.875%, 12/15/20 (g) | 2,910 | 2,920,458 | ||||||
|
| |||||||
| Total U.S. Treasury Obligations (cost—$5,309,848) |
| 5,303,558 | ||||||
|
| |||||||
| Shares | ||||||||
| Preferred Stock—1.8% |
| |||||||
| Banks—1.8% |
| |||||||
Bank of America Corp. (d), |
| |||||||
6.00%, 5/16/23 | 8,746 | 238,853 | ||||||
Citigroup Capital XIII (e), |
| |||||||
6.638%, 10/30/40 | 11,980 | 323,220 | ||||||
| Shares | Value | |||||||
Wells Fargo & Co. (d), | ||||||||
4.75%, 3/15/25 | 13,260 | $ | 333,357 | |||||
|
| |||||||
| Total Preferred Stock (cost—$891,715) |
| 895,430 | ||||||
|
| |||||||
| Principal Amount (000s) | ||||||||
| Repurchase Agreements—0.5% |
| |||||||
State Street Bank and Trust Co., dated 9/30/20, 0.00%, due 10/1/20, proceeds $257,000; collateralized by U.S. Treasury Notes, 0.25%, due 9/30/25, valued at $262,180 including accrued interest |
| |||||||
(cost—$257,000) | $257 | 257,000 | ||||||
|
| |||||||
| Total Investments (cost—$51,019,261)—103.1% |
| 51,997,047 | ||||||
|
| |||||||
| Liabilities in excess of other assets (f)—(3.1)% |
| (1,563,087 | ) | |||||
|
| |||||||
| Net Assets—100.0% |
| $50,433,960 | ||||||
|
| |||||||
Notes to Schedule of Investments:
(a) Private Placement—Restricted as to resale and may not have a readily available market. Private placement securities include Rule 144A securities. Securities with an aggregate value of $9,708,053, representing 19.2% of net assets.
(b) 144A—Exempt from registration under Rule 144A of the Securities Act of 1933. These securities may be resold in transactions exempt from registration, typically only to qualified institutional buyers. Securities with an aggregate value of $9,708,053, representing 19.2% of net assets.
(c) When-issued or delayed-delivery. To be settled/delivered after September 30, 2020.
(d) Perpetual maturity. The date shown, if any, is the next call date.
(e) Variable or Floating Rate Security—Securities with an interest rate that changes periodically. The interest rate disclosed reflects the rate in effect on September 30, 2020.
(f) Includes net unrealized appreciation (depreciation) of other financial instruments as follows:
| Futures contracts outstanding at September 30, 2020: | ||||||||||||||||||||||
Type | Contracts | Expiration Date | Notional Amount (000s) | Market Value (000s) | Unrealized Appreciation (Depreciation) | |||||||||||||||||
Long position contracts: | ||||||||||||||||||||||
2-Year U.S. Treasury Note | 18 | 12/31/20 | $ | 3,600 | $ | 3,977 | $ | 653 | ||||||||||||||
U.S. Long Bond | 11 | 12/21/20 | 1,100 | 1,939 | (10,952 | ) | ||||||||||||||||
U.S. Ultra Treasury Bond | 14 | 12/21/20 | 1,400 | 3,106 | (36,265 | ) | ||||||||||||||||
|
| |||||||||||||||||||||
| $ | (46,564 | ) | ||||||||||||||||||||
|
| |||||||||||||||||||||
Short position contracts: | ||||||||||||||||||||||
5-Year U.S. Treasury Note | (6 | ) | 12/31/20 | $ | (600 | ) | $ | (756 | ) | $ | (8 | ) | ||||||||||
10-Year U.S. Treasury Note | (2 | ) | 12/21/20 | (200 | ) | (279 | ) | (658 | ) | |||||||||||||
10-Year Ultra U.S. Treasury Bond | (32 | ) | 12/21/20 | (3,200 | ) | (5,118 | ) | (450 | ) | |||||||||||||
|
| |||||||||||||||||||||
| $ | (1,116 | ) | ||||||||||||||||||||
|
| |||||||||||||||||||||
| $ | (47,680 | ) | ||||||||||||||||||||
|
| |||||||||||||||||||||
| Credit default swaps agreements outstanding at September 30, 2020: | ||||||||||||||||||||||||||||||||
Centrally cleared buy protection swap agreements:
|
| |||||||||||||||||||||||||||||||
| Broker (Exchange)/ Reference Debt Issuer | Notional Amount (000s)(1) | Implied Credit Spread | Termination Date | Fixed Deal Pay Rate | Payment Frequency | Value(2) | Upfront Premiums Paid (Received) | Unrealized Appreciation (Depreciation) | ||||||||||||||||||||||||
Goldman Sachs (ICE): |
| |||||||||||||||||||||||||||||||
American Express Co. | $ | 595 | 0.286 | % | 12/20/24 | (1.00 | )% | Quarterly | $ | (18,981 | ) | $ | (10,356 | ) | $ | (8,625 | ) | |||||||||||||||
Citigroup Inc. | 595 | 0.619 | % | 6/20/25 | (1.00 | )% | Quarterly | (11,327 | ) | 4,413 | (15,740 | ) | ||||||||||||||||||||
Energy Transfer Operating, L.P. | 2,640 | 1.534 | % | 12/20/24 | (1.00 | )% | Quarterly | 46,465 | 160,006 | (113,541 | ) | |||||||||||||||||||||
Hess Corp. | 615 | 1.913 | % | 6/20/25 | (1.00 | )% | Quarterly | 21,905 | 12,675 | 9,230 | ||||||||||||||||||||||
International Business Machines Corp. | 605 | 0.370 | % | 12/20/24 | (1.00 | )% | Quarterly | (17,435 | ) | (16,971 | ) | (464 | ) | |||||||||||||||||||
Kinder Morgan, Inc. | 690 | 0.808 | % | 6/20/25 | (1.00 | )% | Quarterly | (8,722 | ) | — | (8,722 | ) | ||||||||||||||||||||
Marriott International, Inc. | 590 | 1.622 | % | 6/20/25 | (1.00 | )% | Quarterly | 14,248 | 56,969 | (42,721 | ) | |||||||||||||||||||||
McKesson Corp. | 565 | 0.495 | % | 6/20/25 | (1.00 | )% | Quarterly | (13,476 | ) | (848 | ) | (12,628 | ) | |||||||||||||||||||
Morgan Stanley | 610 | 0.567 | % | 6/20/25 | (1.00 | )% | Quarterly | (13,270 | ) | 13,474 | (26,744 | ) | ||||||||||||||||||||
| 76 | Annual Report | | September 30, 2020 | | See accompanying Notes to Financial Statements |
Table of Contents
Schedule of Investments
September 30, 2020
| Credit default swaps agreements outstanding at September 30, 2020 (continued): | ||||||||||||||||||||||||||||||||
Centrally cleared buy protection swap agreements (continued):
|
| |||||||||||||||||||||||||||||||
| Broker (Exchange)/ Reference Debt Issuer | Notional Amount (000s)(1) | Implied Credit Spread | Termination Date | Fixed Deal Pay Rate | Payment Frequency | Value(2) | Upfront Premiums Paid (Received) | Unrealized Appreciation (Depreciation) | ||||||||||||||||||||||||
Prudential Financial, Inc. | 565 | 0.5312 | % | 6/20/25 | (1.00 | )% | Quarterly | $ | (14,361 | ) | $ | (13,215 | ) | $ | (1,146 | ) | ||||||||||||||||
Simon Property Group, L.P. | 725 | 1.512 | % | 6/20/25 | (1.00 | )% | Quarterly | 14,039 | 64,560 | (50,521 | ) | |||||||||||||||||||||
Southwest Airlines Co. | 260 | 1.567 | % | 6/20/25 | (1.00 | )% | Quarterly | 5,611 | 6,605 | (994 | ) | |||||||||||||||||||||
The Williams Companies, Inc. | 410 | 0.811 | % | 12/20/24 | (1.00 | )% | Quarterly | (4,653 | ) | 46,978 | (51,631 | ) | ||||||||||||||||||||
|
| |||||||||||||||||||||||||||||||
| $ | 43 | $ | 324,290 | $ | (324,247 | ) | ||||||||||||||||||||||||||
|
| |||||||||||||||||||||||||||||||
Centrally cleared sell protection swap agreements:
|
| |||||||||||||||||||||||||||||||
| Broker (Exchange)/ Referenced Debt Issuer | Notional Amount (000s)(1) | Implied Credit Spread | Termination Date | Fixed Deal Received Rate | Payment Frequency | Value(2) | Upfront Premiums Paid | Unrealized Appreciation (Depreciation) | ||||||||||||||||||||||||
Goldman Sachs (ICE): |
| |||||||||||||||||||||||||||||||
CDX.NA.HY.34 | $ | 5,580 | 3.85 | % | 6/20/25 | 5.00 | % | Quarterly | $ | 281,916 | $ | 290,572 | $ | (8,656 | ) | |||||||||||||||||
Verizon Communications Inc. | 615 | 0.54 | % | 12/20/24 | 1.00 | % | Quarterly | 13,414 | 11,989 | 1,425 | ||||||||||||||||||||||
|
| |||||||||||||||||||||||||||||||
| $ | 295,330 | $ | 302,561 | $ | (7,231 | ) | ||||||||||||||||||||||||||
|
| |||||||||||||||||||||||||||||||
(1) This represents the maximum potential amount the Fund could be required to make available as a seller of credit protection or receive as a buyer of credit protection if a credit event occurs as defined under the terms of that particular swap agreement.
(2) The quoted market prices and resulting values for credit default swap agreements serve as an indicator of the status at September 30, 2020 of the payment/performance risk and represent the likelihood of an expected liability (or profit) for the credit derivative should the notional amount of the swap agreement have been closed/sold as of the period end. Increasing market values, in absolute terms when compared to the notional amount of the swap, represent a deterioration of the referenced entity’s credit soundness and a greater likelihood or risk of default or other credit event occurring as defined under the terms of the agreement.
(g) At September 30, 2020, the Fund pledged $1,590,452 in cash as collateral for futures contracts and received $605,511 in cash as collateral for swap contracts. The Fund also pledged U.S. Treasury Obligations valued at $855,589 as collateral for swap contracts.
Glossary:
ABS—Asset-Backed Securities
BBA—British Bankers’ Association
CDX—Credit Derivatives Index
CLO—Collateralized Loan Obligation
FRN—Floating Rate Note
ICE—Intercontinental Exchange
LIBOR—London Inter-Bank Offered Rate
MBS—Mortgage-Backed Securities
REIT—Real Estate Investment Trust
TBA—To Be Announced
UMBS – Uniform Mortgage-Backed Securities
| See accompanying Notes to Financial Statements | | September 30, 2020 | | Annual Report | 77 |
Table of Contents
Schedule of Investments
September 30, 2020
AllianzGI Emerging Markets Consumer Fund
| Shares | Value | |||||||
| Common Stock—98.6% |
| |||||||
| Brazil—0.6% |
| |||||||
Cyrela Brazil Realty S.A. Empreendimentos e Participacoes | 24,100 | $99,732 | ||||||
Qualicorp Consultoria e Corretora de Seguros S.A. (e) | 16,400 | 99,260 | ||||||
|
| |||||||
| 198,992 | ||||||||
|
| |||||||
| Canada—0.8% |
| |||||||
Manulife Financial Corp. | 19,920 | 277,059 | ||||||
|
| |||||||
| China—49.7% |
| |||||||
Alibaba Group Holding Ltd. (e) | 22,700 | 833,342 | ||||||
Alibaba Group Holding Ltd. ADR (e) | 6,785 | 1,994,654 | ||||||
Autobio Diagnostics Co., Ltd., Class A | 13,794 | 327,647 | ||||||
BYD Electronic International Co., Ltd. | 109,000 | 553,176 | ||||||
China Galaxy Securities Co., Ltd., Class A | 73,200 | 137,181 | ||||||
China Medical System Holdings Ltd. | 55,000 | 60,859 | ||||||
China Merchants Bank Co., Ltd., Class H | 179,000 | 849,429 | ||||||
China Yuhua Education Corp., Ltd. (a) | 220,000 | 188,821 | ||||||
G-bits Network Technology Xiamen Co., Ltd. | 5,568 | 511,142 | ||||||
Geely Automobile Holdings Ltd. | 83,000 | 166,500 | ||||||
Greenland Holdings Corp., Ltd., Class A | 229,885 | 216,283 | ||||||
Hisense Home Appliances Group Co., Ltd., Class H | 62,000 | 76,866 | ||||||
JD.com, Inc. ADR (e) | 20,975 | 1,627,870 | ||||||
JD.com, Inc., Class A (e) | 5,350 | 206,003 | ||||||
KWG Group Holdings Ltd. | 189,500 | 326,367 | ||||||
Lenovo Group Ltd. | 224,000 | 148,101 | ||||||
Longfor Group Holdings Ltd. (a) | 52,000 | 294,641 | ||||||
Luye Pharma Group Ltd. (a) | 188,500 | 110,079 | ||||||
Meituan Dianping, Class B (e) | 30,600 | 963,939 | ||||||
NetEase, Inc. | 9,600 | 172,363 | ||||||
NetEase, Inc. ADR | 2,655 | 1,207,149 | ||||||
New Oriental Education & Technology Group, Inc. ADR (e) | 4,080 | 609,960 | ||||||
Ping An Insurance Group Co. of China Ltd., Class H | 102,500 | 1,064,037 | ||||||
Poly Developments and Holdings Group Co., Ltd., Class A | 166,200 | 390,129 | ||||||
Shenzhen Mindray Bio-Medical Electronics Co., Ltd., Class A | 18,900 | 968,132 | ||||||
Shimao Property Holdings Ltd. | 83,000 | 346,271 | ||||||
Tencent Holdings Ltd. | 39,600 | 2,674,718 | ||||||
Tianneng Power International Ltd. | 78,000 | 140,145 | ||||||
Wuliangye Yibin Co., Ltd., Class A | 9,601 | 313,014 | ||||||
Zhongsheng Group Holdings Ltd. | 29,000 | 182,425 | ||||||
|
| |||||||
| 17,661,243 | ||||||||
|
| |||||||
| Hong Kong—1.6% |
| |||||||
Brilliance China Automotive Holdings Ltd. | 344,000 | 325,101 | ||||||
Vinda International Holdings Ltd. | 77,000 | 253,685 | ||||||
|
| |||||||
| 578,786 | ||||||||
|
| |||||||
| Shares | Value | |||||||
| India—4.8% |
| |||||||
Bajaj Auto Ltd. | 3,355 | $ | 131,153 | |||||
Granules India Ltd. | 42,987 | 224,282 | ||||||
HDFC Bank Ltd. ADR (e) | 13,600 | 679,456 | ||||||
Hindustan Unilever Ltd. | 10,283 | 288,980 | ||||||
Reliance Industries Ltd. | 12,250 | 371,517 | ||||||
|
| |||||||
| 1,695,388 | ||||||||
|
| |||||||
| Indonesia—0.7% |
| |||||||
Indofood Sukses Makmur Tbk PT | 364,000 | 175,559 | ||||||
Media Nusantara Citra Tbk PT (e) | 1,265,300 | 61,521 | ||||||
|
| |||||||
| 237,080 | ||||||||
|
| |||||||
| Japan—0.2% |
| |||||||
Astellas Pharma, Inc. | 6,000 | 89,440 | ||||||
|
| |||||||
| Korea (Republic of)—12.9% |
| |||||||
CJ CheilJedang Corp. | 1,344 | 453,649 | ||||||
Hyundai Mobis Co., Ltd. | 744 | 145,961 | ||||||
Kakao Corp. | 495 | 153,922 | ||||||
Kia Motors Corp. | 16,669 | 668,459 | ||||||
KIWOOM Securities Co., Ltd. | 2,509 | 213,073 | ||||||
LG Electronics, Inc. | 12,437 | 974,226 | ||||||
Samsung Electronics Co., Ltd. | 40,080 | 1,989,736 | ||||||
|
| |||||||
| 4,599,026 | ||||||||
|
| |||||||
| Malaysia—1.9% |
| |||||||
Hartalega Holdings Bhd | 70,800 | 277,302 | ||||||
Top Glove Corp., Bhd | 192,100 | 385,162 | ||||||
|
| |||||||
| 662,464 | ||||||||
|
| |||||||
| Mexico—0.5% |
| |||||||
Gruma S.A.B de C.V., Class B | 14,935 | 165,517 | ||||||
|
| |||||||
| Philippines—0.3% |
| |||||||
Globe Telecom, Inc. | 2,480 | 106,375 | ||||||
|
| |||||||
| Poland—0.6% |
| |||||||
CD Projekt S.A. (e) | 767 | 83,049 | ||||||
Dino Polska S.A. (a)(e) | 2,189 | 128,769 | ||||||
|
| |||||||
| 211,818 | ||||||||
|
| |||||||
| Russian Federation—1.4% |
| |||||||
Mobile TeleSystems PJSC ADR | 58,735 | 512,756 | ||||||
|
| |||||||
| Singapore—0.3% |
| |||||||
IGG, Inc. | 101,000 | 116,017 | ||||||
|
| |||||||
| South Africa—0.4% |
| |||||||
Naspers Ltd., Class N (e) | 857 | 151,367 | ||||||
|
| |||||||
| Switzerland—2.4% |
| |||||||
Roche Holding AG | 2,489 | 852,583 | ||||||
|
| |||||||
| Taiwan—8.6% |
| |||||||
Asustek Computer, Inc. | 43,000 | 378,324 | ||||||
Chicony Electronics Co., Ltd. | 29,000 | 84,661 | ||||||
Chlitina Holding Ltd. | 16,000 | 100,953 | ||||||
Chong Hong Construction Co., Ltd. | 52,000 | 144,271 | ||||||
CTBC Financial Holding Co., Ltd. | 287,000 | 183,365 | ||||||
First Financial Holding Co., Ltd. | 351,690 | 250,976 | ||||||
Grape King Bio Ltd. | 16,000 | 93,673 | ||||||
Lite-On Technology Corp. | 231,000 | 369,993 | ||||||
Primax Electronics Ltd. | 225,000 | 334,904 | ||||||
Quanta Computer, Inc. | 106,000 | 278,350 | ||||||
TaiDoc Technology Corp. | 36,000 | 239,083 | ||||||
Wistron Corp. | 570,000 | 591,130 | ||||||
|
| |||||||
| 3,049,683 | ||||||||
|
| |||||||
| Thailand—1.6% |
| |||||||
Charoen Pokphand Foods PCL (c)(d) | 142,800 | 126,571 | ||||||
| Shares | Value | |||||||
Sri Trang Gloves Thailand | 131,700 | $ | 318,989 | |||||
Thanachart Capital PCL (c)(d) | 127,500 | 117,350 | ||||||
|
| |||||||
| 562,910 | ||||||||
|
| |||||||
| Turkey—0.5% |
| |||||||
Turkcell Iletisim Hizmetleri AS | 65,720 | 128,100 | ||||||
Ulker Biskuvi Sanayi AS (e) | 14,274 | 41,954 | ||||||
|
| |||||||
| 170,054 | ||||||||
|
| |||||||
| United States—8.8% |
| |||||||
Apple, Inc. | 7,960 | 921,848 | ||||||
Mastercard, Inc., Class A | 1,750 | 591,798 | ||||||
Microsoft Corp. | 3,040 | 639,403 | ||||||
Procter & Gamble Co. | 4,080 | 567,079 | ||||||
Thermo Fisher Scientific, Inc. | 935 | 412,821 | ||||||
|
| |||||||
| 3,132,949 | ||||||||
|
| |||||||
| Total Common Stock (cost—$24,470,651) |
| 35,031,507 | ||||||
|
| |||||||
| Principal Amount (000s) | ||||||||
| Repurchase Agreements—0.5% |
| |||||||
State Street Bank and Trust Co., dated 9/30/20, 0.00%, due 10/1/20, proceeds $160,000; collateralized by U.S. Treasury Notes, 0.25%, due 9/30/25, valued at $163,287 including accrued interest |
| |||||||
(cost—$160,000) | $160 | 160,000 | ||||||
|
| |||||||
| Total Investments (cost—$24,630,651) (b)—99.1% |
| 35,191,507 | ||||||
|
| |||||||
| Other assets less liabilities—0.9% | 319,085 | |||||||
|
| |||||||
| Net Assets—100.0% |
| $35,510,592 | ||||||
|
| |||||||
Notes to Schedule of Investments:
(a) 144A—Exempt from registration under Rule 144A of the Securities Act of 1933. These securities may be resold in transactions exempt from registration, typically only to qualified institutional buyers. Securities with an aggregate value of $722,310, representing 2.0% of net assets.
(b) Securities with an aggregate value of $24,062,235, representing 67.8% of net assets, were valued utilizing modeling tools provided by a third-party vendor. See Note 1(a) and Note 1(b) in the Notes to Financial Statements.
(c) Fair-Valued—Securities with an aggregate value of $562,910, representing 1.6% of net assets. See Note 1(a) and Note 1(b) in the Notes to Financial Statements.
(d) Level 3 security. See Note 1(a) and Note 1(b) in the Notes to Financial Statements.
(e) Non-income producing.
Glossary:
ADR—American Depositary Receipt
| 78 | Annual Report | | September 30, 2020 | | See accompanying Notes to Financial Statements |
Table of Contents
Schedule of Investments
September 30, 2020
The industry classification of portfolio holdings and other assets less liabilities shown as a percentage of net assets were as follows:
Internet & Direct Marketing Retail | 16.3% | |||
Technology Hardware, Storage & Peripherals | 14.3% | |||
Interactive Media & Services | 8.0% | |||
Healthcare Equipment & Supplies | 7.1% | |||
Entertainment | 5.9% | |||
Banks | 5.9% | |||
Real Estate Management & Development | 4.8% | |||
Insurance | 3.8% | |||
Pharmaceuticals | 3.8% | |||
Automobiles | 3.6% | |||
Household Durables | 3.2% | |||
Household Products | 3.1% | |||
Food Products | 2.7% | |||
Diversified Consumer Services | 2.2% | |||
Wireless Telecommunication Services | 2.1% | |||
Software | 1.8% | |||
IT Services | 1.7% | |||
Communications Equipment | 1.5% | |||
Life Sciences Tools & Services | 1.2% | |||
Oil, Gas & Consumable Fuels | 1.0% | |||
Capital Markets | 1.0% | |||
Beverages | 0.9% | |||
Auto Components | 0.8% | |||
Personal Products | 0.5% | |||
Specialty Retail | 0.5% | |||
Food & Staples Retailing | 0.4% | |||
Healthcare Providers & Services | 0.3% | |||
Media | 0.2% | |||
Repurchase Agreements | 0.5% | |||
Other assets less liabilities | 0.9% | |||
|
| |||
| 100.0% | ||||
|
|
AllianzGI Emerging Markets Small-Cap Fund
| Shares | Value | |||||||
| Common Stock—98.6% |
| |||||||
| Brazil—2.5% |
| |||||||
Camil Alimentos S.A. | 11,900 | $26,403 | ||||||
Qualicorp Consultoria e Corretora de Seguros S.A. | 5,500 | 33,288 | ||||||
Sao Martinho S.A. | 18,500 | 71,748 | ||||||
|
| |||||||
| 131,439 | ||||||||
|
| |||||||
| China—12.0% |
| |||||||
China Lesso Group Holdings Ltd. | 62,000 | 112,600 | ||||||
China National Building Material Co., Ltd., Class H | 90,000 | 114,700 | ||||||
China Power International Development Ltd. | 47,000 | 8,702 | ||||||
China Yuhua Education Corp., Ltd. (a) | 70,000 | 60,079 | ||||||
Hisense Home Appliances Group Co., Ltd., Class H | 42,000 | 52,070 | ||||||
Jiangsu Expressway Co., Ltd., Class H | 18,000 | 18,171 | ||||||
NetDragon Websoft Holdings Ltd. | 22,000 | 48,196 | ||||||
Tianneng Power International Ltd. | 38,000 | 68,276 | ||||||
West China Cement Ltd. | 398,000 | 58,906 | ||||||
YiChang HEC ChangJiang Pharmaceutical Co., Ltd., Class H (a) | 14,600 | 18,669 | ||||||
Zoomlion Heavy Industry Science and Technology Co., Ltd., Class H | 73,600 | 71,111 | ||||||
|
| |||||||
| 631,480 | ||||||||
|
| |||||||
| Czech Republic—0.5% |
| |||||||
Philip Morris CR AS | 43 | 25,473 | ||||||
|
| |||||||
| Hong Kong—0.6% |
| |||||||
K Wah International Holdings Ltd. | 68,197 | 32,966 | ||||||
|
| |||||||
| India—17.4% |
| |||||||
Amara Raja Batteries Ltd. | 5,308 | 55,062 | ||||||
Bajaj Auto Ltd. | 497 | 19,429 | ||||||
Bata India Ltd. | 1,057 | 18,958 | ||||||
Birlasoft Ltd. (e) | 29,779 | 78,970 | ||||||
Coforge Ltd. (e) | 1,754 | 55,327 | ||||||
DCM Shriram Ltd. | 5,988 | 29,619 | ||||||
Godfrey Phillips India Ltd. | 1,154 | 14,501 | ||||||
Granules India Ltd. | 35,685 | 186,184 | ||||||
Indraprastha Gas Ltd. | 3,716 | 19,573 | ||||||
Ipca Laboratories Ltd. | 4,587 | 135,027 | ||||||
Jindal Steel & Power Ltd. (e) | 21,435 | 54,716 | ||||||
Mindtree Ltd. | 3,087 | 56,101 | ||||||
Mphasis Ltd. | 3,630 | 68,225 | ||||||
REC Ltd. | 15,196 | 20,476 | ||||||
SRF Ltd. | 953 | 53,508 | ||||||
Strides Pharma Science Ltd. | 4,971 | 48,497 | ||||||
|
| |||||||
| 914,173 | ||||||||
|
| |||||||
| Indonesia—0.8% |
| |||||||
Media Nusantara Citra Tbk PT (e) | 428,700 | 20,844 | ||||||
Wijaya Karya Persero Tbk PT | 264,400 | 19,556 | ||||||
|
| |||||||
| 40,400 | ||||||||
|
| |||||||
| Korea (Republic of)—19.3% |
| |||||||
CJ CheilJedang Corp. | 410 | 138,390 | ||||||
Daelim Industrial Co., Ltd. | 370 | 24,454 | ||||||
DB HiTek Co., Ltd. | 3,306 | 105,919 | ||||||
F&F Co., Ltd. | 342 | 25,968 | ||||||
HAESUNG DS Co., Ltd. | 3,913 | 65,982 | ||||||
Hancom, Inc. (e) | 4,400 | 71,158 | ||||||
Hite Jinro Co., Ltd. | 1,186 | 36,693 | ||||||
Huons Co., Ltd. | 1,872 | 100,006 | ||||||
Hyosung Corp. | 1,317 | 82,039 | ||||||
Kginicis Co., Ltd. | 2,589 | 44,998 | ||||||
| Shares | Value | |||||||
Kumho Petrochemical Co., Ltd. | 1,167 | $ | 109,480 | |||||
LG Innotek Co., Ltd. | 554 | 73,110 | ||||||
NongShim Co., Ltd. | 241 | 64,645 | ||||||
Samjin Pharmaceutical Co., Ltd. | 1,248 | 30,707 | ||||||
SK Networks Co., Ltd. | 5,148 | 20,896 | ||||||
Unid Co., Ltd. | 460 | 17,570 | ||||||
|
| |||||||
| 1,012,015 | ||||||||
|
| |||||||
| Malaysia—1.7% |
| |||||||
Kossan Rubber Industries | 27,200 | 89,943 | ||||||
|
| |||||||
| Mexico—1.3% |
| |||||||
Fibra Uno Administracion S.A. de C.V. REIT | 20,300 | 16,057 | ||||||
Grupo Aeroportuario del Centro Norte S.A.B de C.V. (e) | 3,600 | 16,534 | ||||||
Qualitas Controladora S.A.B. de C.V. | 9,700 | 36,582 | ||||||
|
| |||||||
| 69,173 | ||||||||
|
| |||||||
| Poland—1.9% |
| |||||||
Dino Polska | 855 | 50,296 | ||||||
Energa S.A. (e) | 10,205 | 21,912 | ||||||
TEN Square Games S.A. | 176 | 26,185 | ||||||
|
| |||||||
| 98,393 | ||||||||
|
| |||||||
| Russian Federation—2.5% |
| |||||||
Federal Grid Co. Unified Energy System | 27,260,000 | 69,513 | ||||||
Magnitogorsk Iron & Steel Works PJSC GDR | 5,370 | 34,953 | ||||||
PIK Group | 3,604 | 26,349 | ||||||
|
| |||||||
| 130,815 | ||||||||
|
| |||||||
| South Africa—5.2% |
| |||||||
African Rainbow Minerals Ltd. | 5,882 | 67,903 | ||||||
Aspen Pharmacare Holdings Ltd. (e) | 5,522 | 39,422 | ||||||
Gold Fields Ltd. ADR | 11,950 | 146,866 | ||||||
Telkom S.A. SOC Ltd. | 12,978 | 20,300 | ||||||
|
| |||||||
| 274,491 | ||||||||
|
| |||||||
| Taiwan—28.3% |
| |||||||
Accton Technology Corp. | 10,000 | 77,367 | ||||||
Aten International Co., Ltd. | 11,000 | 31,529 | ||||||
BenQ Materials Corp. | 38,000 | 28,256 | ||||||
Bioteque Corp. | 23,000 | 109,875 | ||||||
Chipbond Technology Corp. | 23,000 | 50,689 | ||||||
ChipMOS Technologies, Inc. | 67,000 | 66,549 | ||||||
Darfon Electronics Corp. | 11,000 | 14,420 | ||||||
Farglory Land Development Co., Ltd. | 12,000 | 18,918 | ||||||
Formosa Advanced Technologies Co., Ltd. | 12,000 | 14,543 | ||||||
Greatek Electronics, Inc. | 10,000 | 17,039 | ||||||
ITE Technology, Inc. | 23,000 | 55,529 | ||||||
Lite-On Technology Corp. | 62,000 | 99,305 | ||||||
Micro-Star International Co., Ltd. | 18,000 | 83,098 | ||||||
Novatek Microelectronics Corp. | 10,000 | 92,243 | ||||||
Pixart Imaging, Inc. | 11,000 | 68,230 | ||||||
Radiant Opto-Electronics Corp. | 27,000 | 103,550 | ||||||
Sercomm Corp. | 45,000 | 113,048 | ||||||
Sunonwealth Electric Machine Industry Co., Ltd. | 49,000 | 105,810 | ||||||
Syncmold Enterprise Corp. | 25,250 | 73,623 | ||||||
| See accompanying Notes to Financial Statements | | September 30, 2020 | | Annual Report | 79 |
Table of Contents
Schedule of Investments
September 30, 2020
| Shares | Value | |||||||
TaiDoc Technology Corp. | 7,000 | $ | 46,488 | |||||
Taiwan Surface Mounting Technology Corp. | 10,000 | 36,235 | ||||||
Tripod Technology Corp. | 25,000 | 95,825 | ||||||
TXC Corp. | 34,000 | 85,296 | ||||||
|
| |||||||
| 1,487,465 | ||||||||
|
| |||||||
| Thailand—1.9% |
| |||||||
Carabao Group | 26,200 | 97,282 | ||||||
|
| |||||||
| Turkey—2.7% |
| |||||||
Anadolu Cam Sanayii AS | 26,604 | 21,634 | ||||||
Enerjisa Enerji AS (a) | 16,953 | 19,581 | ||||||
Soda Sanayii AS | 24,783 | 26,549 | ||||||
Torunlar Gayrimenkul Yatirim Ortakligi AS REIT (e) | 33,684 | 16,007 | ||||||
Trakya Cam Sanayii AS | 61,113 | 37,745 | ||||||
Vestel Elektronik Sanayi ve Ticaret AS (e) | 10,197 | 22,867 | ||||||
|
| |||||||
| 144,383 | ||||||||
|
| |||||||
Total Common Stock (cost—$4,296,979) |
| 5,179,891 | ||||||
|
| |||||||
| Preferred Stock—0.8% |
| |||||||
| Brazil—0.8% |
| |||||||
Marcopolo S.A. (cost—$40,949) | 80,900 | 38,607 | ||||||
|
| |||||||
| Total Investments (cost—$4,337,928) (b)—99.4% |
| 5,218,498 | ||||||
|
| |||||||
| Other assets less liabilities—0.6% | 33,905 | |||||||
|
| |||||||
| Net Assets—100.0% | $5,252,403 | |||||||
|
| |||||||
Notes to Schedule of Investments:
(a) 144A—Exempt from registration under Rule 144A of the Securities Act of 1933. These securities may be resold in transactions exempt from registration, typically only to qualified institutional buyers. Securities with an aggregate value of $148,625, representing 2.8% of net assets.
(b) Securities with an aggregate value of $4,560,135, representing 86.8% of net assets, were valued utilizing modeling tools provided by a third-party vendor. See Note 1(a) and Note 1(b) in the Notes to Financial Statements.
(c) Fair-Valued—Securities with an aggregate value of $193,144, representing 3.7% of net assets. See Note 1(a) and Note 1(b) in the Notes to Financial Statements.
(d) Level 3 security. See Note 1(a) and Note 1(b) in the Notes to Financial Statements.
(e) Non-income producing.
Glossary:
ADR—American Depositary Receipt
GDR—Global Depositary Receipt
REIT—Real Estate Investment Trust
The industry classification of portfolio holdings and other assets less liabilities shown as a percentage of net assets were as follows:
Semiconductors & Semiconductor Equipment | 12.9% | |||
Pharmaceuticals | 10.6% | |||
Electronic Equipment, Instruments & Components | 6.8% | |||
Metals & Mining | 5.8% | |||
Food Products | 5.7% | |||
Healthcare Equipment & Supplies | 4.7% | |||
Chemicals | 4.5% | |||
Technology Hardware, Storage & Peripherals | 4.3% | |||
IT Services | 4.3% | |||
Machinery | 4.1% | |||
Communications Equipment | 3.6% | |||
Construction Materials | 3.3% | |||
Building Products | 2.9% | |||
Software | 2.9% | |||
Beverages | 2.5% | |||
Electric Utilities | 2.1% | |||
Household Durables | 1.9% | |||
Industrial Conglomerates | 1.6% | |||
Entertainment | 1.4% | |||
Auto Components | 1.3% | |||
Diversified Consumer Services | 1.1% | |||
Electrical Equipment | 1.0% | |||
Real Estate Management & Development | 1.0% | |||
Food & Staples Retailing | 1.0% | |||
Textiles, Apparel & Luxury Goods | 0.9% | |||
Construction & Engineering | 0.8% | |||
Tobacco | 0.8% | |||
Insurance | 0.7% | |||
Transportation Infrastructure | 0.7% | |||
Healthcare Providers & Services | 0.6% | |||
Equity Real Estate Investment Trusts (REITs) | 0.6% | |||
Containers & Packaging | 0.4% | |||
Trading Companies & Distributors | 0.4% | |||
Media | 0.4% | |||
Diversified Financial Services | 0.4% | |||
Diversified Telecommunication Services | 0.4% | |||
Gas Utilities | 0.4% | |||
Automobiles | 0.4% | |||
Independent Power Producers & Energy Traders | 0.2% | |||
Other assets less liabilities | 0.6% | |||
|
| |||
| 100.0% | ||||
|
|
AllianzGI Emerging Markets Value Fund
| Shares | Value | |||||||
| Common Stock—92.9% |
| |||||||
| Brazil—3.3% |
| |||||||
B3 S.A.—Brasil Bolsa Balcao | 183,900 | $1,801,375 | ||||||
Cia de Locacao das Americas | 88,300 | 373,426 | ||||||
Magazine Luiza S.A. | 56,800 | 902,181 | ||||||
Notre Dame Intermedica Participacoes S.A. | 32,800 | 379,987 | ||||||
StoneCo Ltd., Class A (c) | 20,400 | 1,078,956 | ||||||
|
| |||||||
| 4,535,925 | ||||||||
|
| |||||||
| China—40.9% |
| |||||||
A-Living Services Co., Ltd., Class H (a) | 51,250 | 262,205 | ||||||
Aier Eye Hospital Group Co., Ltd., Class A | 101,150 | 766,535 | ||||||
Alibaba Group Holding Ltd. (c) | 360,400 | 13,230,682 | ||||||
Anhui Conch Cement Co., Ltd., Class H | 108,500 | 751,502 | ||||||
ANTA Sports Products Ltd. | 49,000 | 511,384 | ||||||
Bank of Ningbo Co., Ltd., Class A | 89,054 | 413,370 | ||||||
China Communications Services Corp., Ltd., Class H | 724,000 | 427,418 | ||||||
China Construction Bank Corp., Class H | 1,148,000 | 745,939 | ||||||
China Gas Holdings Ltd. | 133,600 | 382,323 | ||||||
China Lesso Group Holdings Ltd. | 304,000 | 552,105 | ||||||
China Merchants Bank Co., Ltd., Class A | 234,744 | 1,245,971 | ||||||
China Merchants Bank Co., Ltd., Class H | 759,600 | 3,604,616 | ||||||
CIFI Holdings Group Co., Ltd. | 606,000 | 450,168 | ||||||
CSPC Pharmaceutical Group Ltd. | 268,000 | 523,149 | ||||||
East Money Information Co., Ltd., Class A | 481,489 | 1,708,753 | ||||||
ENN Energy Holdings Ltd. | 101,200 | 1,110,493 | ||||||
Foshan Haitian Flavouring & Food Co., Ltd., Class A | 34,841 | 832,569 | ||||||
Gree Electric Appliances, Inc. of Zhuhai, Class A (c) | 54,400 | 428,324 | ||||||
Guangdong Investment Ltd. | 504,000 | 801,351 | ||||||
Henan Shuanghui Investment & Development Co., Ltd., Class A | 94,000 | 733,001 | ||||||
JD.com, Inc., Class A (c) | 22,500 | 866,367 | ||||||
Kweichow Moutai Co., Ltd., Class A | 2,800 | 688,649 | ||||||
Li Ning Co., Ltd. | 233,000 | 1,096,334 | ||||||
Logan Property Holdings Co., Ltd. | 332,000 | 528,276 | ||||||
Longfor Group Holdings Ltd. (a) | 224,000 | 1,269,224 | ||||||
Luxshare Precision Industry Co., Ltd., Class A | 117,530 | 992,458 | ||||||
Midea Group Co., Ltd., Class A | 57,400 | 615,203 | ||||||
NetEase, Inc. | 68,100 | 1,222,699 | ||||||
New Oriental Education & Technology Group, Inc. ADR (c) | 5,600 | 837,200 | ||||||
Ping An Insurance Group Co of China Ltd., Class A | 43,400 | 488,014 | ||||||
Ping An Insurance Group Co. of China Ltd., Class H | 126,000 | 1,307,987 | ||||||
Shandong Weigao Group Medical Polymer Co., Ltd., Class H | 376,000 | 752,309 | ||||||
Shenzhen Expressway Co., Ltd., Class H | 318,000 | 277,763 | ||||||
| 80 | Annual Report | | September 30, 2020 | | See accompanying Notes to Financial Statements |
Table of Contents
Schedule of Investments
September 30, 2020
| Shares | Value | |||||||
Shenzhou International Group Holdings Ltd. | 31,800 | $ | 541,518 | |||||
Sino Biopharmaceutical Ltd. | 439,500 | 481,271 | ||||||
Tencent Holdings Ltd. | 147,500 | 9,962,647 | ||||||
Tencent Holdings Ltd. ADR | 13,000 | 879,450 | ||||||
Times China Holdings Ltd. | 296,000 | 412,823 | ||||||
Wuliangye Yibin Co., Ltd., Class A | 40,355 | 1,315,664 | ||||||
Yealink Network Technology Corp., Ltd., Class A | 54,135 | 481,183 | ||||||
Yihai International Holding Ltd. (c) | 58,000 | 911,007 | ||||||
Yonghui Superstores Co., Ltd., Class A | 350,700 | 404,404 | ||||||
Zhangzhou Pientzehuang Pharmaceutical Co., Ltd., Class A | 26,673 | 956,546 | ||||||
|
| |||||||
| 56,770,854 | ||||||||
|
| |||||||
| Hong Kong—4.8% |
| |||||||
AIA Group Ltd. | 101,000 | 1,003,950 | ||||||
Ausnutria Dairy Corp. Ltd. (c) | 480,000 | 765,198 | ||||||
HKBN Ltd. | 133,500 | 254,767 | ||||||
Hong Kong Exchanges & Clearing Ltd. | 27,500 | 1,294,520 | ||||||
SITC International Holdings Co., Ltd. | 498,000 | 689,960 | ||||||
SUNeVision Holdings Ltd. | 1,073,000 | 879,587 | ||||||
Techtronic Industries Co., Ltd. | 87,000 | 1,156,726 | ||||||
Times Neighborhood Holdings Ltd. | 517,307 | 690,831 | ||||||
|
| |||||||
| 6,735,539 | ||||||||
|
| |||||||
| India—8.4% |
| |||||||
Aarti Industries Ltd. | 57,313 | 789,272 | ||||||
Atul Ltd. | 9,532 | 792,110 | ||||||
Bajaj Finserv Ltd. | 6,756 | 538,784 | ||||||
Britannia Industries Ltd. | 15,797 | 815,276 | ||||||
Coromandel International Ltd. | 87,308 | 915,509 | ||||||
HDFC Bank Ltd. | 68,435 | 1,004,612 | ||||||
Hindustan Unilever Ltd. | 21,178 | 595,159 | ||||||
Indraprastha Gas Ltd. | 165,993 | 874,311 | ||||||
Infosys Ltd. | 100,274 | 1,378,782 | ||||||
Manappuram Finance Ltd. | 274,480 | 589,142 | ||||||
Muthoot Finance Ltd. | 37,666 | 580,877 | ||||||
Reliance Industries Ltd. | 75,014 | 2,275,017 | ||||||
Sonata Software Ltd. | 109,018 | 464,612 | ||||||
|
| |||||||
| 11,613,463 | ||||||||
|
| |||||||
| Indonesia—0.7% |
| |||||||
Bank Central Asia Tbk PT | 391,000 | 713,733 | ||||||
Bank Rakyat Indonesia Persero Tbk PT | 1,376,300 | 282,354 | ||||||
|
| |||||||
| 996,087 | ||||||||
|
| |||||||
| Korea (Republic of)—7.3% |
| |||||||
Douzone Bizon Co., Ltd. | 6,618 | 589,743 | ||||||
Hansol Chemical Co., Ltd. | 6,412 | 821,100 | ||||||
Macquarie Korea Infrastructure Fund | 66,004 | 620,317 | ||||||
NCSoft Corp. | 3,954 | 2,724,832 | ||||||
Samsung Electronics Co., Ltd. | 108,215 | 5,372,239 | ||||||
|
| |||||||
| 10,128,231 | ||||||||
|
| |||||||
| Malaysia—0.6% |
| |||||||
Serba Dinamik Holdings Bhd. | 822,480 | 326,222 | ||||||
Top Glove Corp., Bhd | 234,400 | 469,974 | ||||||
|
| |||||||
| 796,196 | ||||||||
|
| |||||||
| Mexico—0.3% |
| |||||||
Prologis Property Mexico S.A. de C.V. REIT | 228,246 | 442,835 | ||||||
|
| |||||||
| Shares | Value | |||||||
| Netherlands—2.1% |
| |||||||
ASM International NV | 7,434 | $ | 1,065,610 | |||||
ASML Holding NV | 2,851 | 1,053,082 | ||||||
Prosus NV (c) | 9,368 | 864,691 | ||||||
|
| |||||||
| 2,983,383 | ||||||||
|
| |||||||
| Poland—0.7% |
| |||||||
Dino Polska | 15,368 | 904,033 | ||||||
|
| |||||||
| Russian Federation—1.5% |
| |||||||
Gazprom Neft PJSC | 19,372 | 365,032 | ||||||
Lukoil PJSC ADR | 9,696 | 560,244 | ||||||
Novatek PJSC GDR | 4,730 | 647,464 | ||||||
Sberbank of Russia PJSC ADR (c) | 43,849 | 511,718 | ||||||
|
| |||||||
| 2,084,458 | ||||||||
|
| |||||||
| Saudi Arabia—1.4% |
| |||||||
Abdullah Al Othaim Markets Co. | 25,704 | 889,522 | ||||||
Al Rajhi Bank | 29,349 | 514,412 | ||||||
Saudi Arabian Oil Co. (a) | 55,317 | 529,767 | ||||||
|
| |||||||
| 1,933,701 | ||||||||
|
| |||||||
| Singapore—1.5% |
| |||||||
Keppel DC REIT REIT | 477,300 | 1,020,196 | ||||||
Mapletree Industrial Trust REIT | 457,200 | 1,083,238 | ||||||
|
| |||||||
| 2,103,434 | ||||||||
|
| |||||||
| South Africa—2.6% |
| |||||||
AngloGold Ashanti Ltd. | 30,709 | 803,338 | ||||||
Capitec Bank Holdings Ltd. | 17,089 | 1,052,531 | ||||||
Clicks Group Ltd. | 63,171 | 838,496 | ||||||
Naspers Ltd., Class N (c) | 5,047 | 891,420 | ||||||
|
| |||||||
| 3,585,785 | ||||||||
|
| |||||||
| Taiwan—8.6% |
| |||||||
Accton Technology Corp. | 106,000 | 820,088 | ||||||
ASPEED Technology, Inc. | 23,000 | 910,057 | ||||||
Chailease Holding Co., Ltd. | 137,720 | 630,863 | ||||||
E.Sun Financial Holding Co., Ltd. | 876,022 | 780,173 | ||||||
Getac Technology Corp. | 173,000 | 273,850 | ||||||
Lotes Co., Ltd. | 58,000 | 930,242 | ||||||
Micro-Star International Co., Ltd. | 145,000 | 669,403 | ||||||
Parade Technologies Ltd. | 26,000 | 950,562 | ||||||
Poya International Co., Ltd. | 38,000 | 726,819 | ||||||
Realtek Semiconductor Corp. | 70,200 | 899,847 | ||||||
Sinbon Electronics Co., Ltd. | 118,000 | 734,616 | ||||||
Taiwan Union Technology Corp. | 89,000 | 346,434 | ||||||
Tripod Technology Corp. | 111,000 | 425,464 | ||||||
Uni-President Enterprises Corp. | 235,000 | 508,954 | ||||||
Unimicron Technology Corp. | 341,000 | 884,261 | ||||||
Voltronic Power Technology Corp. | 28,350 | 963,013 | ||||||
Wiwynn Corp. | 21,133 | 480,327 | ||||||
|
| |||||||
| 11,934,973 | ||||||||
|
| |||||||
| Thailand—1.8% |
| |||||||
Carabao Group PCL | 225,700 | 838,037 | ||||||
Fabrinet (c) | 14,900 | 939,147 | ||||||
Home Product Center PCL | 1,050,600 | 478,988 | ||||||
Tisco Financial Group PCL NVDR | 126,900 | 255,945 | ||||||
|
| |||||||
| 2,512,117 | ||||||||
|
| |||||||
| United States—6.4% |
| |||||||
Broadcom, Inc. | 2,979 | 1,085,309 | ||||||
Equinix, Inc. REIT | 1,350 | 1,026,176 | ||||||
Lam Research Corp. | 3,300 | 1,094,775 | ||||||
NVIDIA Corp. | 2,000 | 1,082,440 | ||||||
| Shares | Value | |||||||
Teradyne, Inc. | 45,500 | $ | 3,615,430 | |||||
Texas Instruments, Inc. | 7,400 | 1,056,646 | ||||||
|
| |||||||
| 8,960,776 | ||||||||
|
| |||||||
| Total Common Stock (cost—$107,104,364) | 129,021,790 | |||||||
|
| |||||||
| Preferred Stock—1.3% |
| |||||||
| Korea (Republic of)—1.3% |
| |||||||
LG Household & Health Care Ltd. | 409 | 247,128 | ||||||
Samsung Electronics Co., Ltd. | 38,144 | 1,641,755 | ||||||
|
| |||||||
| Total Preferred Stock (cost—$1,429,566) | 1,888,883 | |||||||
|
| |||||||
| Principal Amount (000s) | ||||||||
| Repurchase Agreements—2.4% |
| |||||||
State Street Bank and Trust Co., dated 9/30/20, 0.00%, due 10/1/20, proceeds $3,293,000; collateralized by U.S. Treasury Notes, 0.25%, due 9/30/25, valued at $3,358,938 including accrued interest |
| |||||||
(cost—$3,293,000) | $3,293 | 3,293,000 | ||||||
|
| |||||||
| Total Investments (cost—$111,826,930) (b)—96.6% |
| 134,203,673 | ||||||
|
| |||||||
| Other assets less liabilities—3.4% | 4,728,583 | |||||||
|
| |||||||
| Net Assets—100.0% | $138,932,256 | |||||||
|
| |||||||
Notes to Schedule of Investments:
(a) 144A—Exempt from registration under Rule 144A of the Securities Act of 1933. These securities may be resold in transactions exempt from registration, typically only to qualified institutional buyers. Securities with an aggregate value of $2,965,229, representing 2.1% of net assets.
(b) Securities with an aggregate value of $112,965,126, representing 81.3% of net assets, were valued utilizing modeling tools provided by a third-party vendor. See Note 1(a) and Note 1(b) in the Notes to Financial Statements.
(c) Non-income producing.
Glossary:
ADR—American Depositary Receipt
GDR—Global Depositary Receipt
NVDR—Non-Voting Depository Receipt
REIT—Real Estate Investment Trust
| See accompanying Notes to Financial Statements | | September 30, 2020 | | Annual Report | 81 |
Table of Contents
Schedule of Investments
September 30, 2020
The industry classification of portfolio holdings and other assets less liabilities shown as a percentage of net assets were as follows:
Internet & Direct Marketing Retail | 11.4% | |||
Semiconductors & Semiconductor Equipment | 9.2% | |||
Banks | 8.0% | |||
Interactive Media & Services | 7.8% | |||
Technology Hardware, Storage & Peripherals | 6.1% | |||
Capital Markets | 3.9% | |||
Electronic Equipment, Instruments & Components | 3.8% | |||
Food Products | 3.3% | |||
Oil, Gas & Consumable Fuels | 3.2% | |||
Entertainment | 2.8% | |||
IT Services | 2.7% | |||
Equity Real Estate Investment Trusts (REITs) | 2.6% | |||
Insurance | 2.4% | |||
Chemicals | 2.4% | |||
Food & Staples Retailing | 2.2% | |||
Beverages | 2.0% | |||
Real Estate Management & Development | 1.9% | |||
Gas Utilities | 1.7% | |||
Textiles, Apparel & Luxury Goods | 1.6% | |||
Pharmaceuticals | 1.4% | |||
Multi-Line Retail | 1.2% | |||
Communications Equipment | 0.9% | |||
Healthcare Equipment & Supplies | 0.9% | |||
Consumer Finance | 0.8% | |||
Machinery | 0.8% | |||
Healthcare Providers & Services | 0.8% | |||
Household Durables | 0.8% | |||
Electrical Equipment | 0.7% | |||
Commercial Services & Supplies | 0.7% | |||
Diversified Consumer Services | 0.6% | |||
Metals & Mining | 0.6% | |||
Water Utilities | 0.6% | |||
Construction Materials | 0.5% | |||
Marine | 0.5% | |||
Diversified Financial Services | 0.5% | |||
Household Products | 0.4% | |||
Software | 0.4% | |||
Building Products | 0.4% | |||
Specialty Retail | 0.3% | |||
Construction & Engineering | 0.3% | |||
Road & Rail | 0.3% | |||
Energy Equipment & Services | 0.2% | |||
Transportation Infrastructure | 0.2% | |||
Diversified Telecommunication Services | 0.2% | |||
Personal Products | 0.2% | |||
Repurchase Agreements | 2.4% | |||
Other assets less liabilities | 3.4% | |||
|
| |||
| 100.0% | ||||
|
|
AllianzGI Global Allocation Fund
| Shares | Value | |||||||
| Mutual Funds (d)—70.1% |
| |||||||
AllianzGI Best Styles Global Managed Volatility | 1,669,564 | $26,045,195 | ||||||
AllianzGI Global Sustainability (e) | 4,854,951 | 105,061,149 | ||||||
AllianzGI Green Bond (e) | 1,447,950 | 24,369,005 | ||||||
AllianzGI PerformanceFee Managed Futures Strategy (g) | 3,064,290 | 24,606,249 | ||||||
|
| |||||||
Total Mutual Funds (cost—$168,867,210) |
| 180,081,598 | ||||||
|
| |||||||
| Principal Amount (000s) | ||||||||
| Corporate Bonds & Notes—16.2% |
| |||||||
| Aerospace & Defense—1.1% |
| |||||||
BAE Systems PLC (a)(b), |
| |||||||
1.90%, 2/15/31 | $200 | 198,622 | ||||||
3.00%, 9/15/50 | 80 | 80,897 | ||||||
Boeing Co., |
| |||||||
5.705%, 5/1/40 | 203 | 236,791 | ||||||
L3Harris Technologies, Inc., |
| |||||||
3.95%, 5/28/24 | 285 | 313,129 | ||||||
4.40%, 6/15/28 | 540 | 645,186 | ||||||
Lockheed Martin Corp., |
| |||||||
1.85%, 6/15/30 | 59 | 61,263 | ||||||
2.80%, 6/15/50 | 39 | 40,774 | ||||||
Northrop Grumman Corp., |
| |||||||
3.20%, 2/1/27 | 510 | 569,468 | ||||||
3.25%, 1/15/28 | 275 | 308,893 | ||||||
Northrop Grumman Systems Corp., | ||||||||
7.875%, 3/1/26 | 210 | 278,886 | ||||||
Raytheon Technologies Corp. (a)(b), |
| |||||||
7.00%, 11/1/28 | 50 | 69,102 | ||||||
7.20%, 8/15/27 | 93 | 124,531 | ||||||
|
| |||||||
| 2,927,542 | ||||||||
|
| |||||||
| Airlines—0.3% |
| |||||||
Delta Air Lines, Inc. (a)(b), |
| |||||||
4.50%, 10/20/25 | 140 | 143,763 | ||||||
7.00%, 5/1/25 | 140 | 153,916 | ||||||
Southwest Airlines Co., |
| |||||||
5.25%, 5/4/25 | 330 | 363,884 | ||||||
|
| |||||||
| 661,563 | ||||||||
|
| |||||||
| Auto Manufacturers—0.0% |
| |||||||
General Motors Financial Co., Inc., Ser. C, (converts to FRN on 9/30/30) (c)(f), |
| |||||||
5.70%, 9/30/30 | 51 | 51,319 | ||||||
|
| |||||||
| Banks—2.8% |
| |||||||
Australia & New Zealand Banking Group Ltd., (converts to FRN on 7/22/25) (a)(b)(f), |
| |||||||
2.95%, 7/22/30 | 493 | 510,897 | ||||||
Bank of America Corp., (converts to FRN on 9/25/24) (f), |
| |||||||
0.981%, 9/25/25 | 375 | 375,321 | ||||||
Citigroup, Inc. (f), |
| |||||||
2.976%, 11/5/30 (converts to FRN on 11/5/29) | 370 | 399,759 | ||||||
3.887%, 1/10/28 (converts to FRN on 1/10/27) | 705 | 798,344 | ||||||
4.70%, 1/30/25 (converts to FRN on 1/30/25) (c) | 152 | 147,279 | ||||||
Comerica, Inc., |
| |||||||
3.70%, 7/31/23 | 560 | 606,595 | ||||||
| Principal Amount (000s) | Value | |||||||
5.625%, 7/1/25 (converts to FRN on 10/1/25) (c)(f) | $215 | $227,781 | ||||||
Credit Suisse Group AG, (converts to FRN on 8/21/26) (a)(b)(c)(f), |
| |||||||
6.375%, 8/21/26 | 235 | 251,352 | ||||||
First Horizon Bank, | ||||||||
5.75%, 5/1/30 | 171 | 193,416 | ||||||
First Horizon National Corp., |
| |||||||
4.00%, 5/26/25 | 730 | 794,330 | ||||||
Huntington Bancshares, Inc., (converts to FRN on 10/15/27) (c)(f), |
| |||||||
4.45%, 10/15/27 | 84 | 83,244 | ||||||
Huntington Capital Trust I, 3 mo. LIBOR + 0.700% (f), |
| |||||||
0.961%, 2/1/27 | 220 | 202,180 | ||||||
Lloyds Banking Group PLC, (converts to FRN on 9/27/25) (c)(f), |
| |||||||
7.50%, 9/27/25 | 130 | 138,508 | ||||||
Popular, Inc., |
| |||||||
6.125%, 9/14/23 | 550 | 582,255 | ||||||
State Street Corp. (f), |
| |||||||
3 mo. LIBOR + 1.000%, 1.25%, 6/1/77 | 320 | 269,583 | ||||||
2.354%, 11/1/25 (converts to FRN on 11/1/24) | 850 | 901,849 | ||||||
3.152%, 3/30/31 (converts to FRN on 3/30/30) (a)(b) | 65 | 74,043 | ||||||
Truist Financial Corp., Ser. Q, (converts to FRN on 9/1/30) (c)(f), |
| |||||||
5.10%, 3/1/30 | 170 | 183,974 | ||||||
Westpac Banking Corp., (converts to FRN on 2/4/25) (f), |
| |||||||
2.894%, 2/4/30 | 530 | 547,213 | ||||||
|
| |||||||
| 7,287,923 | ||||||||
|
| |||||||
| Beverages—0.1% |
| |||||||
Anheuser-Busch Cos. LLC, |
| |||||||
4.90%, 2/1/46 | 115 | 142,994 | ||||||
|
| |||||||
| Biotechnology—0.1% |
| |||||||
Gilead Sciences, Inc., |
| |||||||
2.60%, 10/1/40 | 181 | 181,008 | ||||||
|
| |||||||
| Chemicals—0.1% |
| |||||||
Air Products and Chemicals, Inc., |
| |||||||
1.50%, 10/15/25 | 215 | 222,830 | ||||||
2.80%, 5/15/50 | 156 | 164,734 | ||||||
|
| |||||||
| 387,564 | ||||||||
|
| |||||||
| Commercial Services—0.2% |
| |||||||
Massachusetts Institute of Technology, |
| |||||||
5.60%, 7/1/2111 | 120 | 212,197 | ||||||
President & Fellows of Harvard College, |
| |||||||
4.875%, 10/15/40 | 215 | 304,223 | ||||||
|
| |||||||
| 516,420 | ||||||||
|
| |||||||
| Computers—0.2% |
| |||||||
International Business Machines Corp., |
| |||||||
2.95%, 5/15/50 | 350 | 361,186 | ||||||
Leidos, Inc., |
| |||||||
3.625%, 5/15/25 (a)(b) | 78 | 86,593 | ||||||
4.375%, 5/15/30 (a)(b) | 78 | 91,366 | ||||||
7.125%, 7/1/32 | 38 | 49,136 | ||||||
|
| |||||||
| 588,281 | ||||||||
|
| |||||||
| Diversified Financial Services—0.9% |
| |||||||
AerCap Ireland Capital DAC, |
| |||||||
3.15%, 2/15/24 | 140 | 138,932 | ||||||
American Express Co., |
| |||||||
2.50%, 7/30/24 | 450 | 478,038 | ||||||
8.15%, 3/19/38 | 105 | 170,257 | ||||||
| 82 | Annual Report | | September 30, 2020 | | See accompanying Notes to Financial Statements |
Table of Contents
Schedule of Investments
September 30, 2020
| Principal Amount (000s) | Value | |||||||
Discover Financial Services, |
| |||||||
4.10%, 2/9/27 | $ | 305 | $ | 338,059 | ||||
5.50%, 10/30/27, Ser. C (converts to FRN on 10/30/27) (c)(f) | 230 | 219,606 | ||||||
Intercontinental Exchange, Inc., |
| |||||||
2.65%, 9/15/40 | 175 | 175,315 | ||||||
Synchrony Financial, |
| |||||||
3.70%, 8/4/26 | 270 | 287,255 | ||||||
4.50%, 7/23/25 | 179 | 197,261 | ||||||
Visa, Inc., |
| |||||||
1.90%, 4/15/27 | 285 | 302,010 | ||||||
|
| |||||||
| 2,306,733 | ||||||||
|
| |||||||
| Electric Utilities—2.5% |
| |||||||
Alabama Power Co., |
| |||||||
4.10%, 1/15/42 | 455 | 532,623 | ||||||
Arizona Public Service Co., |
| |||||||
2.65%, 9/15/50 | 330 | 325,230 | ||||||
5.50%, 9/1/35 | 90 | 122,553 | ||||||
Commonwealth Edison Co., |
| |||||||
5.90%, 3/15/36 | 130 | 187,382 | ||||||
Consolidated Edison Co. of New York, Inc., Ser. 06-E, |
| |||||||
5.70%, 12/1/36 | 40 | 54,347 | ||||||
DTE Electric Co., |
| |||||||
5.70%, 10/1/37 | 240 | 326,271 | ||||||
6.625%, 6/1/36, Ser. A | 40 | 58,565 | ||||||
DTE Energy Co., | ||||||||
2.95%, 3/1/30 | 75 | 80,763 | ||||||
Duke Energy Florida LLC, | ||||||||
2.50%, 12/1/29 | 233 | 253,681 | ||||||
Duke Energy Indiana LLC, | ||||||||
3.75%, 5/15/46 | 45 | 52,772 | ||||||
Edison International, |
| |||||||
2.95%, 3/15/23 | 270 | 277,173 | ||||||
4.95%, 4/15/25 | 201 | 220,736 | ||||||
Jersey Central Power & Light Co., |
| |||||||
6.15%, 6/1/37 | 185 | 250,894 | ||||||
National Rural Utilities Cooperative Finance Corp., |
| |||||||
1.35%, 3/15/31 | 475 | 472,965 | ||||||
Niagara Mohawk Power Corp. (a)(b), |
| |||||||
1.96%, 6/27/30 | 290 | 298,149 | ||||||
Pacific Gas and Electric Co., |
| |||||||
3.75%, 2/15/24 | 298 | 311,290 | ||||||
Pennsylvania Electric Co. (a)(b), |
| |||||||
3.60%, 6/1/29 | 110 | 123,546 | ||||||
4.15%, 4/15/25 | 74 | 81,572 | ||||||
PPL Electric Utilities Corp., |
| |||||||
5.20%, 7/15/41 | 360 | 472,469 | ||||||
Public Service Co of Colorado, | ||||||||
4.75%, 8/15/41 | 319 | 418,718 | ||||||
Sempra Energy, |
| |||||||
3.55%, 6/15/24 | 560 | 609,795 | ||||||
4.875%, 10/15/25 (converts to FRN on 10/15/25) (c)(f) | 123 | 126,540 | ||||||
Southern California Edison Co., |
| |||||||
3.70%, 8/1/25, Ser. E | 200 | 222,682 | ||||||
3.90%, 12/1/41 | 95 | 98,846 | ||||||
Southern Co., Ser. B, (converts to FRN on 1/15/26) (f), |
| |||||||
4.00%, 1/15/51 | 130 | 130,402 | ||||||
Toledo Edison Co., | ||||||||
6.15%, 5/15/37 | 23 | 33,307 | ||||||
Virginia Electric & Power Co., Ser. A, |
| |||||||
3.80%, 4/1/28 | 165 | 194,047 | ||||||
|
| |||||||
| 6,337,318 | ||||||||
|
| |||||||
| Equity Real Estate Investment Trusts (REITs)—0.8% |
| |||||||
American Tower Corp., |
| |||||||
1.30%, 9/15/25 | 182 | 183,709 | ||||||
1.875%, 10/15/30 | 235 | 232,655 | ||||||
2.25%, 1/15/22 | 655 | 669,652 | ||||||
3.375%, 5/15/24 | 237 | 256,585 | ||||||
| Principal Amount (000s) | Value | |||||||
Crown Castle International Corp., |
| |||||||
2.25%, 1/15/31 | $ | 230 | $ | 232,840 | ||||
CyrusOne LP, | ||||||||
2.15%, 11/1/30 | 155 | 151,596 | ||||||
Equinix, Inc., | ||||||||
1.00%, 9/15/25 | 280 | 277,710 | ||||||
|
| |||||||
| 2,004,747 | ||||||||
|
| |||||||
| Food & Beverage—0.3% |
| |||||||
Anheuser-Busch InBev Finance, Inc., |
| |||||||
3.65%, 2/1/26 | 650 | 727,284 | ||||||
|
| |||||||
| Healthcare-Services—0.0% |
| |||||||
Universal Health Services, Inc. (a)(b), |
| |||||||
2.65%, 10/15/30 | 93 | 92,205 | ||||||
|
| |||||||
| Insurance—1.0% |
| |||||||
American International Group, Inc., |
| |||||||
2.50%, 6/30/25 | 195 | 208,453 | ||||||
Athene Global Funding (a)(b), |
| |||||||
2.45%, 8/20/27 | 180 | 185,174 | ||||||
2.55%, 6/29/25 | 176 | 181,582 | ||||||
Belrose Funding Trust (a)(b), | ||||||||
2.33%, 8/15/30 | 175 | 173,921 | ||||||
Five Corners Funding Trust II (a)(b), |
| |||||||
2.85%, 5/15/30 | 225 | 242,805 | ||||||
Harborwalk Funding Trust, (converts to FRN on 2/15/49) (a)(b)(f), |
| |||||||
5.077%, 2/15/69 | 235 | 289,618 | ||||||
Lincoln National Corp., 3 mo. LIBOR + 2.358% (f), |
| |||||||
2.638%, 5/17/66 | 345 | 248,400 | ||||||
Loews Corp., | ||||||||
3.20%, 5/15/30 | 98 | 109,448 | ||||||
MetLife, Inc. (a)(b), | ||||||||
9.25%, 4/8/68 | 145 | 220,053 | ||||||
Metropolitan Life Insurance Co. (a)(b), |
| |||||||
7.80%, 11/1/25 | 215 | 281,282 | ||||||
New York Life Insurance Co. (a)(b), |
| |||||||
4.45%, 5/15/69 | 255 | 312,861 | ||||||
|
| |||||||
| 2,453,597 | ||||||||
|
| |||||||
| Lodging—0.2% |
| |||||||
Marriott International, Inc., |
| |||||||
5.75%, 5/1/25 | 450 | 502,684 | ||||||
|
| |||||||
| Media—1.4% |
| |||||||
Charter Communications Operating LLC, |
| |||||||
4.908%, 7/23/25 | 570 | 658,186 | ||||||
Comcast Corp., |
| |||||||
3.375%, 2/15/25 | 410 | 453,702 | ||||||
3.75%, 4/1/40 | 148 | 173,670 | ||||||
Discovery Communications LLC (a)(b), |
| |||||||
4.00%, 9/15/55 | 373 | 378,256 | ||||||
Time Warner Cable LLC, |
| |||||||
4.50%, 9/15/42 | 85 | 92,260 | ||||||
6.55%, 5/1/37 | 90 | 119,669 | ||||||
Time Warner Entertainment Co., L.P., |
| |||||||
8.375%, 7/15/33 | 240 | 366,638 | ||||||
ViacomCBS, Inc., |
| |||||||
3.45%, 10/4/26 | 200 | 216,866 | ||||||
4.20%, 5/19/32 | 102 | 116,945 | ||||||
5.25%, 4/1/44 | 225 | 265,086 | ||||||
6.25%, 2/28/57 (converts to FRN on 2/28/27) (f) | 258 | 283,728 | ||||||
Walt Disney Co., |
| |||||||
1.75%, 1/13/26 | 195 | 202,870 | ||||||
3.50%, 5/13/40 | 95 | 107,593 | ||||||
3.60%, 1/13/51 | 129 | 145,472 | ||||||
|
| |||||||
| 3,580,941 | ||||||||
|
| |||||||
| Miscellaneous Manufacturing—0.1% |
| |||||||
3M Co., | ||||||||
3.125%, 9/19/46 | 195 | 212,933 | ||||||
| Principal Amount (000s) | Value | |||||||
General Electric Co., Ser. D, (converts to FRN on 1/21/21) (c)(f), |
| |||||||
5.00%, 1/21/21 | $ | 160 | $ | 126,800 | ||||
|
| |||||||
| 339,733 | ||||||||
|
| |||||||
| Oil, Gas & Consumable Fuels—0.8% |
| |||||||
Aker BP ASA (a)(b), | ||||||||
2.875%, 1/15/26 | 84 | 83,271 | ||||||
Boston Gas Co. (a)(b), | ||||||||
3.15%, 8/1/27 | 700 | 791,957 | ||||||
Cenovus Energy, Inc., |
| |||||||
3.00%, 8/15/22 | 110 | 107,671 | ||||||
3.80%, 9/15/23 | 65 | 62,825 | ||||||
Hess Corp., |
| |||||||
4.30%, 4/1/27 | 280 | 292,429 | ||||||
7.125%, 3/15/33 | 125 | 150,577 | ||||||
Marathon Petroleum Corp., |
| |||||||
5.85%, 12/15/45 | 140 | 160,978 | ||||||
NiSource, Inc., |
| |||||||
1.70%, 2/15/31 | 175 | 171,656 | ||||||
Noble Energy, Inc., |
| |||||||
5.25%, 11/15/43 | 70 | 92,498 | ||||||
6.00%, 3/1/41 | 75 | 104,684 | ||||||
|
| |||||||
| 2,018,546 | ||||||||
|
| |||||||
| Pharmaceuticals—0.7% |
| |||||||
AbbVie, Inc. (a)(b), |
| |||||||
3.85%, 6/15/24 | 250 | 274,235 | ||||||
Cigna Corp., |
| |||||||
4.125%, 11/15/25 | 195 | 223,575 | ||||||
4.80%, 8/15/38 | 130 | 161,570 | ||||||
CVS Health Corp., |
| |||||||
2.70%, 8/21/40 | 225 | 215,199 | ||||||
4.30%, 3/25/28 | 353 | 413,329 | ||||||
Johnson & Johnson, | ||||||||
2.45%, 9/1/60 | 155 | 155,416 | ||||||
Shire Acquisitions Investments Ireland DAC, |
| |||||||
3.20%, 9/23/26 | 205 | 228,180 | ||||||
Takeda Pharmaceutical Co., Ltd., |
| |||||||
3.175%, 7/9/50 | 100 | 102,780 | ||||||
|
| |||||||
| 1,774,284 | ||||||||
|
| |||||||
| Pipelines—0.9% |
| |||||||
Columbia Pipeline Group, Inc., |
| |||||||
5.80%, 6/1/45 | 264 | 344,858 | ||||||
El Paso Natural Gas Co. LLC, |
| |||||||
8.375%, 6/15/32 | 205 | 285,244 | ||||||
Energy Transfer Operating L.P., |
| |||||||
6.50%, 2/1/42 | 280 | 293,228 | ||||||
7.125%, 5/15/30 (converts to FRN on 5/15/30) (c)(f) | 505 | 399,581 | ||||||
Kinder Morgan Energy Partners L.P., |
| |||||||
7.50%, 11/15/40 | 75 | 101,338 | ||||||
Plains All American Pipeline L.P., |
| |||||||
4.65%, 10/15/25 | 375 | 402,889 | ||||||
6.125%, 11/15/22, Ser. B (converts to FRN on 11/15/22) (c)(f) | 285 | 181,160 | ||||||
6.65%, 1/15/37 | 115 | 125,235 | ||||||
Transcontinental Gas Pipe Line Co. |
| |||||||
3.25%, 5/15/30 | 117 | 126,496 | ||||||
|
| |||||||
| 2,260,029 | ||||||||
|
| |||||||
| Retail—0.0% |
| |||||||
Lowe’s Cos., Inc., | ||||||||
4.65%, 4/15/42 | 90 | 114,220 | ||||||
|
| |||||||
| Semiconductors—0.4% |
| |||||||
Broadcom Corp., | ||||||||
3.875%, 1/15/27 | 285 | 315,941 | ||||||
Broadcom, Inc., |
| |||||||
4.15%, 11/15/30 | 195 | 218,520 | ||||||
4.70%, 4/15/25 | 240 | 271,765 | ||||||
| See accompanying Notes to Financial Statements | | September 30, 2020 | | Annual Report | 83 |
Table of Contents
Schedule of Investments
September 30, 2020
| Principal Amount (000s) | Value | |||||||
Intel Corp., | ||||||||
3.10%, 2/15/60 | $ | 225 | $ | 243,102 | ||||
|
| |||||||
| 1,049,328 | ||||||||
|
| |||||||
| Software—0.3% |
| |||||||
Fiserv, Inc., | ||||||||
4.40%, 7/1/49 | 165 | 206,793 | ||||||
Microsoft Corp., |
| |||||||
2.525%, 6/1/50 | 115 | 120,249 | ||||||
3.50%, 11/15/42 | 305 | 372,179 | ||||||
|
| |||||||
| 699,221 | ||||||||
|
| |||||||
| Telecommunications—0.8% |
| |||||||
AT&T, Inc., |
| |||||||
3.10%, 2/1/43 | 174 | 170,214 | ||||||
3.50%, 9/15/53 (a)(b) | 438 | 424,343 | ||||||
T-Mobile USA, Inc. (a)(b), |
| |||||||
2.05%, 2/15/28 | 207 | 212,007 | ||||||
3.50%, 4/15/25 | 276 | 302,739 | ||||||
Verizon Communications, Inc., | ||||||||
1.50%, 9/18/30 | 500 | 498,093 | ||||||
Verizon Communications, Inc., | ||||||||
5.25%, 3/16/37 | 270 | 374,267 | ||||||
|
| |||||||
| 1,981,663 | ||||||||
|
| |||||||
| Transportation—0.2% |
| |||||||
CSX Corp., | ||||||||
4.75%, 5/30/42 | 145 | 185,148 | ||||||
Kansas City Southern, |
| |||||||
3.50%, 5/1/50 | 95 | 98,510 | ||||||
4.20%, 11/15/69 | 175 | 187,246 | ||||||
Union Pacific Corp., | ||||||||
3.75%, 2/5/70 | 102 | 115,256 | ||||||
|
| |||||||
| 586,160 | ||||||||
|
| |||||||
Total Corporate Bonds & Notes (cost—$40,262,878) |
| 41,573,307 | ||||||
|
| |||||||
| Shares | ||||||||
| Exchange-Traded Funds—4.4% |
| |||||||
Invesco WilderHill Clean Energy | 23,000 | 1,397,940 | ||||||
iShares Global Clean Energy | 151,645 | 2,803,916 | ||||||
iShares JP Morgan USD Emerging Markets Bond | 41,431 | 4,594,283 | ||||||
| Shares | Value | |||||||
PIMCO 1-5 Year U.S. TIPS Index (d) | 46,000 | $ | 2,479,359 | |||||
|
| |||||||
Total Exchange-Traded Funds (cost—$10,914,253) |
| 11,275,498 | ||||||
|
| |||||||
| Principal Amount (000s) | ||||||||
| U.S. Treasury Obligations—0.3% |
| |||||||
U.S. Treasury Bonds, |
| |||||||
1.25%, 5/15/50 | $18 | 17,062 | ||||||
U.S. Treasury Notes, |
| |||||||
0.25%, 8/31/25 | 16 | 15,989 | ||||||
0.25%, 9/30/25 (i) | 126 | 125,833 | ||||||
0.625%, 8/15/30 | 528 | 524,947 | ||||||
|
| |||||||
Total U.S. Treasury Obligations (cost—$684,795) |
| 683,831 | ||||||
|
| |||||||
| Shares | ||||||||
| Preferred Stock (c)—0.1% |
| |||||||
| Banks—0.1% |
| |||||||
Bank of America Corp. | 5,079 | 138,708 | ||||||
Wells Fargo & Co. | 5,910 | 148,577 | ||||||
|
| |||||||
Total Preferred Stock (cost—$281,493) |
| 287,285 | ||||||
|
| |||||||
| Principal Amount (000s) | ||||||||
| Repurchase Agreements—3.2% |
| |||||||
State Street Bank and Trust Co., dated 9/30/20, 0.00%, due 10/1/20, proceeds $8,300,000; collateralized by U.S. Treasury Notes, 3.00%, due 9/30/25, valued at $8,466,009 including accrued interest |
| |||||||
(cost-$8,300,000) | $8,300 | 8,300,000 | ||||||
|
| |||||||
Total Investments (cost—$229,310,629)—94.3% |
| 242,201,519 | ||||||
|
| |||||||
| Other assets less liabilities (h)—5.7% | 14,633,837 | |||||||
|
| |||||||
| Net Assets—100.0% |
| $256,835,356 | ||||||
|
| |||||||
Notes to Schedule of Investments:
(a) Private Placement—Restricted as to resale and may not have a readily available market. Private placement securities include Rule 144A securities. Securities with an aggregate value of $6,861,154, representing 2.7% of net assets.
(b) 144A—Exempt from registration under Rule 144A of the Securities Act of 1933. These securities may be resold in transactions exempt from registration, typically only to qualified institutional buyers. Securities with an aggregate value of $6,861,154, representing 2.7% of net assets.
(c) Perpetual maturity. The date shown, if any, is the next call date.
(d) Affiliated fund.
(e) Institutional Class share.
(f) Variable or Floating Rate Security—Securities with an interest rate that changes periodically. The interest rate disclosed reflects the rate in effect on September 30, 2020.
(g) Class R6 share.
(h) Includes net unrealized appreciation (depreciation) of other financial instruments as follows:
| Futures contracts outstanding at September 30, 2020: | ||||||||||||||||||||||
| Type | Contracts | Expiration Date | Notional Amount (000s) | Market Value (000s) | Unrealized Appreciation (Depreciation) | |||||||||||||||||
Long position contracts: |
| |||||||||||||||||||||
2-Year U.S. Treasury Note | 131 | 12/31/20 | $ | 26,200 | $ | 28,946 | $ | 12,175 | ||||||||||||||
10-Year U.S. Treasury Note | 110 | 12/21/20 | 11,000 | 15,348 | 15,869 | |||||||||||||||||
E-mini Russell 1000 Index | 92 | 12/18/20 | 5 | 5,349 | (125,120 | ) | ||||||||||||||||
E-mini S&P 500 Index | 58 | 12/18/20 | 3 | 9,721 | 82,444 | |||||||||||||||||
Japanese Yen | 44 | 12/14/20 | 55 | 5,218 | 28,460 | |||||||||||||||||
MSCI EAFE Index | 60 | 12/18/20 | 3 | 5,560 | (134,163 | ) | ||||||||||||||||
MSCI Emerging Markets Index | 59 | 12/18/20 | 3 | 3,211 | (35,492 | ) | ||||||||||||||||
U.S. Long Bond | 10 | 12/21/20 | 1,000 | 1,763 | (10 | ) | ||||||||||||||||
|
| |||||||||||||||||||||
| $ | (155,837 | ) | ||||||||||||||||||||
|
| |||||||||||||||||||||
| 84 | Annual Report | | September 30, 2020 | | See accompanying Notes to Financial Statements |
Table of Contents
Schedule of Investments
September 30, 2020
| Futures contracts outstanding at September 30, 2020 (continued): | ||||||||||||||||||||||
| Type | Contracts | Expiration Date | Notional Amount (000s) | Market Value (000s) | Unrealized Appreciation (Depreciation) | |||||||||||||||||
Short position contracts: | ||||||||||||||||||||||
5-Year U.S. Treasury Note | (4 | ) | 12/31/20 | $ | (400 | ) | $ | (504 | ) | $ | (114 | ) | ||||||||||
10-Year Ultra U.S. Treasury Bond | (17 | ) | 12/21/20 | (1,700 | ) | (2,719 | ) | (2,456 | ) | |||||||||||||
Ultra U.S. Treasury Bond | (26 | ) | 12/21/20 | (2,600 | ) | (5,767 | ) | 65,473 | ||||||||||||||
|
| |||||||||||||||||||||
| $ | 62,903 | |||||||||||||||||||||
|
| |||||||||||||||||||||
| $ | (92,934 | ) | ||||||||||||||||||||
|
| |||||||||||||||||||||
| Credit default swaps agreements outstanding at September 30, 2020: | ||||||||||||||||||||||||||||||||
Centrally cleared buy protection swap agreements:
|
| |||||||||||||||||||||||||||||||
| Broker (Exchange)/ Reference Debt Issuer | Notional Amount (000s)(1) | Implied Credit Spread | Termination Date | Fixed Deal Pay Rate | Payment Frequency | Value(2) | Upfront Premiums Paid | Unrealized Appreciation (Depreciation) | ||||||||||||||||||||||||
Goldman Sachs (ICE): |
| |||||||||||||||||||||||||||||||
Marriott International, Inc. | $320 | 1.623 | % | 6/20/25 | (1.00 | )% | Quarterly | $ | 7,720 | $ | 5,328 | $ | 2,392 | |||||||||||||||||||
Southwest Airlines Co. | 220 | 1.567 | % | 6/20/25 | (1.00 | )% | Quarterly | 4,747 | 5,588 | (841 | ) | |||||||||||||||||||||
|
| |||||||||||||||||||||||||||||||
| $ | 12,467 | $ | 10,916 | $ | 1,551 | |||||||||||||||||||||||||||
|
| |||||||||||||||||||||||||||||||
(1) This represents the maximum potential amount the Fund could be required to make available as a seller of credit protection or receive as a buyer of credit protection if a credit event occurs as defined under the terms of that particular swap agreement.
(2) The quoted market prices and resulting values for credit default swap agreements serve as an indicator of the status at September 30, 2020 of the payment/performance risk and represent the likelihood of an expected liability (or profit) for the credit derivative should the notional amount of the swap agreement have been closed/sold as of the period end. Increasing market values, in absolute terms when compared to the notional amount of the swap, represent a deterioration of the referenced entity’s credit soundness and a greater likelihood or risk of default or other credit event occurring as defined under the terms of the agreement.
(i) At September 30, 2020, the Fund pledged $14,871,485 in cash as collateral for futures contracts and received $10,915 in cash as collateral for swap contracts. The Fund also pledged U.S. Treasury Obligations valued at $24,286 as collateral for swap contracts.
Glossary:
EAFE—Europe, Australasia and Far East
FRN—Floating Rate Note
ICE—Intercontinental Exchange
LIBOR—London Inter-Bank Offered Rate
MSCI—Morgan Stanley Capital International
REIT—Real Estate Investment Trust
TIPS—Treasury Inflation Protected Securities
| See accompanying Notes to Financial Statements | | September 30, 2020 | | Annual Report | 85 |
Table of Contents
Schedule of Investments
September 30, 2020
AllianzGI Global Dynamic Allocation Fund
| Shares | Value | |||||||
| Common Stock—30.9% |
| |||||||
| Argentina—0.0% |
| |||||||
MercadoLibre, Inc. (i) | 17 | $18,402 | ||||||
|
| |||||||
| Australia—0.4% |
| |||||||
Atlassian Corp. PLC, Class A (i) | 110 | 19,997 | ||||||
Austal Ltd. | 4,911 | 11,599 | ||||||
BHP Group Ltd. | 1,022 | 26,402 | ||||||
Brickworks Ltd. | 727 | 10,166 | ||||||
CSL Ltd. | 145 | 29,952 | ||||||
Fortescue Metals Group Ltd. | 1,671 | 19,631 | ||||||
Newcrest Mining Ltd. | 96 | 2,177 | ||||||
Rio Tinto Ltd. | 278 | 18,988 | ||||||
Saracen Mineral Holdings Ltd. (i) | 2,752 | 10,345 | ||||||
Silver Lake Resources Ltd. (i) | 3,883 | 6,518 | ||||||
Stockland REIT | 800 | 2,185 | ||||||
Telstra Corp. Ltd. | 2,292 | 4,589 | ||||||
Vicinity Centres REIT | 1,738 | 1,736 | ||||||
Woolworths Group Ltd. | 638 | 16,683 | ||||||
|
| |||||||
| 180,968 | ||||||||
|
| |||||||
| Austria—0.1% |
| |||||||
ams AG (i) | 657 | 14,853 | ||||||
BAWAG Group AG (b)(i) | 234 | 8,460 | ||||||
EVN AG | 336 | 5,606 | ||||||
Flughafen Wien AG | 67 | 1,740 | ||||||
OMV AG (i) | 199 | 5,445 | ||||||
Raiffeisen Bank International AG (i) | 548 | 8,388 | ||||||
Telekom Austria AG (i) | 357 | 2,524 | ||||||
Wienerberger AG (i) | 387 | 10,227 | ||||||
|
| |||||||
| 57,243 | ||||||||
|
| |||||||
| Belgium—0.1% |
| |||||||
Ageas S.A. | 304 | 12,439 | ||||||
Bekaert S.A. (i) | 325 | 6,771 | ||||||
Cofinimmo S.A. REIT | 37 | 5,564 | ||||||
Elia Group S.A. | 92 | 9,197 | ||||||
Euronav NV | 457 | 4,046 | ||||||
Proximus SADP | 340 | 6,203 | ||||||
UCB S.A. | 126 | 14,310 | ||||||
|
| |||||||
| 58,530 | ||||||||
|
| |||||||
| Bermuda—0.0% |
| |||||||
Arch Capital Group Ltd. (i) | 305 | 8,921 | ||||||
|
| |||||||
| Brazil—0.1% |
| |||||||
Banco do Brasil S.A. | 1,600 | 8,439 | ||||||
EDP—Energias do Brasil S.A. | 800 | 2,480 | ||||||
Engie Brasil Energia S.A. | 800 | 5,748 | ||||||
Iochpe Maxion S.A. | 3,100 | 7,562 | ||||||
Vale S.A. | 1,545 | 16,262 | ||||||
WEG S.A. | 800 | 9,359 | ||||||
|
| |||||||
| 49,850 | ||||||||
|
| |||||||
| Canada—0.8% |
| |||||||
B2Gold Corp. | 2,940 | 19,143 | ||||||
Barrick Gold Corp. | 319 | 8,960 | ||||||
Baytex Energy Corp. (i) | 1,346 | 465 | ||||||
Canadian Tire Corp., Ltd., Class A | 146 | 14,706 | ||||||
Cascades, Inc. | 717 | 9,068 | ||||||
Cogeco Communications, Inc. | 303 | 24,847 | ||||||
Crescent Point Energy Corp. | 346 | 422 | ||||||
DREAM Unlimited Corp. | 716 | 10,459 | ||||||
Emera, Inc. | 211 | 8,668 | ||||||
Empire Co., Ltd., Class A | 287 | 8,330 | ||||||
Exchange Income Corp. | 500 | 11,404 | ||||||
Fairfax Financial Holdings Ltd. | 23 | 6,773 | ||||||
Fortis, Inc. | 266 | 10,875 | ||||||
Franco-Nevada Corp. | 198 | 27,668 | ||||||
Genworth MI Canada, Inc. | 144 | 3,734 | ||||||
George Weston Ltd. | 297 | 21,839 | ||||||
Husky Energy, Inc. | 1,004 | 2,322 | ||||||
IA Financial Corp., Inc. | 320 | 11,139 | ||||||
| Shares | Value | |||||||
InterRent Real Estate Investment Trust REIT | 481 | $ | 4,551 | |||||
Killam Apartment Real Estate Investment Trust REIT | 284 | 3,703 | ||||||
Loblaw Cos., Ltd. | 247 | 12,935 | ||||||
Lundin Mining Corp. | 2,605 | 14,536 | ||||||
Manulife Financial Corp. | 1,495 | 20,793 | ||||||
Mullen Group Ltd. | 1,862 | 12,599 | ||||||
Open Text Corp. | 307 | 12,976 | ||||||
Power Corp. of Canada | 1,063 | 20,828 | ||||||
Restaurant Brands International, Inc. | 123 | 7,065 | ||||||
Shopify, Inc., Class A (i) | 38 | 38,860 | ||||||
Sun Life Financial, Inc. | 416 | 16,952 | ||||||
TC Energy Corp. | 239 | 10,033 | ||||||
|
| |||||||
| 376,653 | ||||||||
|
| |||||||
| Chile—0.0% |
| |||||||
Engie Energia Chile S.A. | 3,778 | 4,699 | ||||||
|
| |||||||
| China—1.4% |
| |||||||
Alibaba Group Holding Ltd. ADR (i) | 431 | 126,705 | ||||||
Baidu, Inc. ADR (i) | 90 | 11,393 | ||||||
Bank of China Ltd., Class H | 44,000 | 13,685 | ||||||
BOC Aviation Ltd. (b) | 2,700 | 18,501 | ||||||
China Conch Venture Holdings Ltd. | 3,000 | 13,956 | ||||||
China Construction Bank Corp., Class H | 41,812 | 27,168 | ||||||
China Dongxiang Group Co., Ltd. | 16,117 | 2,008 | ||||||
China Everbright Greentech Ltd. (b) | 10,000 | 4,022 | ||||||
China Life Insurance Co., Ltd., Class H | 4,000 | 9,068 | ||||||
China Lumena New Materials Corp. (d)(f)(i) | 44 | — | † | |||||
China Minsheng Banking Corp., Ltd., Class H | 9,000 | 4,729 | ||||||
China Mobile Ltd. | 7,500 | 48,145 | ||||||
China SCE Group Holdings Ltd. | 3,000 | 1,352 | ||||||
China Telecom Corp., Ltd., Class H | 36,000 | 10,816 | ||||||
China Water Affairs Group Ltd. | 2,000 | 1,575 | ||||||
Chongqing Rural Commercial Bank Co., Ltd., Class H | 6,488 | 2,398 | ||||||
CITIC Ltd. | 10,000 | 7,415 | ||||||
Country Garden Holdings Co., Ltd. | 8,000 | 9,906 | ||||||
Country Garden Services Holdings Co., Ltd. | 3,172 | 20,600 | ||||||
CSPC Pharmaceutical Group Ltd. | 8,400 | 16,397 | ||||||
EVA Precision Industrial Holdings Ltd. | 20,236 | 1,229 | ||||||
Golden Eagle Retail Group Ltd. | 3,000 | 2,725 | ||||||
Industrial & Commercial Bank of China Ltd., Class H | 37,000 | 19,273 | ||||||
JD.com, Inc. ADR (i) | 441 | 34,226 | ||||||
Jiangsu Expressway Co., Ltd., Class H | 3,189 | 3,219 | ||||||
Ju Teng International Holdings Ltd. | 4,744 | 1,430 | ||||||
Lee & Man Paper Manufacturing Ltd. | 10,000 | 7,276 | ||||||
Lenovo Group Ltd. | 36,000 | 23,802 | ||||||
NetEase, Inc. ADR | 62 | 28,190 | ||||||
Postal Savings Bank of China Co., Ltd., Class H (b) | 29,000 | 12,217 | ||||||
Shenzhen Expressway Co., Ltd., Class H | 7,700 | 6,726 | ||||||
Shenzhen International Holdings Ltd. | 3,000 | 4,786 | ||||||
Shenzhen Investment Holdings Bay Area Development Co., Ltd. | 6,000 | 1,848 | ||||||
Tencent Holdings Ltd. | 1,781 | 120,295 | ||||||
Topsports International Holdings Ltd. (b) | 2,000 | 2,781 | ||||||
Yuexiu Real Estate Investment Trust REIT | 5,000 | 2,336 | ||||||
| Shares | Value | |||||||
Yuexiu Transport Infrastructure Ltd. | 16,000 | $ | 9,329 | |||||
|
| |||||||
| 631,527 | ||||||||
|
| |||||||
| Colombia—0.0% |
| |||||||
Bancolombia S.A. | 939 | 5,958 | ||||||
Corp. Financiera Colombiana S.A. (i) | 1,390 | 9,661 | ||||||
|
| |||||||
| 15,619 | ||||||||
|
| |||||||
| Czech Republic—0.1% |
| |||||||
CEZ AS | 485 | 9,171 | ||||||
Moneta Money Bank AS (b) | 2,394 | 5,497 | ||||||
O2 Czech Republic AS | 593 | 5,636 | ||||||
|
| |||||||
| 20,304 | ||||||||
|
| |||||||
| Denmark—0.1% |
| |||||||
Carlsberg AS, Class B | 153 | 20,612 | ||||||
D/S Norden A/S | 467 | 7,590 | ||||||
Scandinavian Tobacco Group A/S, Class A (b) | 122 | 1,807 | ||||||
Solar A/S, Class B | 41 | 1,940 | ||||||
Spar Nord Bank A/S (i) | 137 | 1,023 | ||||||
Topdanmark A/S | 96 | 4,647 | ||||||
Tryg A/S | 398 | 12,530 | ||||||
|
| |||||||
| 50,149 | ||||||||
|
| |||||||
| Finland—0.1% |
| |||||||
Elisa Oyj | 388 | 22,811 | ||||||
Neste Oyj | 207 | 10,901 | ||||||
Oriola Oyj, Class B | 700 | 1,551 | ||||||
TietoEVRY Oyj (i) | 186 | 5,142 | ||||||
|
| |||||||
| 40,405 | ||||||||
|
| |||||||
| France—0.9% |
| |||||||
Air Liquide S.A. | 110 | 17,436 | ||||||
Amundi S.A. (b) | 189 | 13,322 | ||||||
APERAM S.A. | 51 | 1,435 | ||||||
AXA S.A. | 1,362 | 25,208 | ||||||
BNP Paribas S.A. | 425 | 15,374 | ||||||
Boiron S.A. | 31 | 1,485 | ||||||
Bouygues S.A. | 680 | 23,498 | ||||||
CNP Assurances | 1,014 | 12,717 | ||||||
Coface S.A. (i) | 855 | 5,980 | ||||||
Credit Agricole S.A. (i) | 957 | 8,350 | ||||||
Eiffage S.A. (i) | 113 | 9,222 | ||||||
Hermes International | 27 | 23,254 | ||||||
Klepierre S.A. REIT | 672 | 9,407 | ||||||
L’Oreal S.A. | 82 | 26,685 | ||||||
LVMH Moet Hennessy Louis Vuitton SE | 87 | 40,707 | ||||||
Orange S.A. | 1,231 | 12,822 | ||||||
Peugeot S.A. | 560 | 10,155 | ||||||
Publicis Groupe S.A. | 239 | 7,703 | ||||||
Sanofi | 350 | 35,074 | ||||||
Schneider Electric SE | 215 | 26,724 | ||||||
SEB S.A. | 7 | 1,139 | ||||||
Sodexo S.A. | 97 | 6,915 | ||||||
Teleperformance | 71 | 21,889 | ||||||
TOTAL SE | 699 | 24,005 | ||||||
Vinci S.A. | 438 | 36,598 | ||||||
|
| |||||||
| 417,104 | ||||||||
|
| |||||||
| Germany—0.6% |
| |||||||
Bayer AG | 514 | 31,711 | ||||||
Bayerische Motoren Werke AG | 275 | 19,959 | ||||||
Cewe Stiftung & Co. KGAA | 45 | 4,933 | ||||||
Daimler AG | 401 | 21,632 | ||||||
Deutsche Boerse AG | 99 | 17,357 | ||||||
Deutsche Lufthansa AG (i) | 810 | 7,016 | ||||||
Deutsche Telekom AG | 2,356 | 39,227 | ||||||
DWS Group GmbH & Co. KGaA (b)(i) | 252 | 8,685 | ||||||
HeidelbergCement AG | 275 | 16,804 | ||||||
| 86 | Annual Report | | September 30, 2020 | | See accompanying Notes to Financial Statements |
Table of Contents
Schedule of Investments
September 30, 2020
| Shares | Value | |||||||
Hornbach Holding AG & Co. KGaA | 100 | $ | 11,678 | |||||
Muenchener Rueckversicherungs-Gesellschaft AG in Muenchen | 177 | 44,996 | ||||||
Nordex SE (i) | 482 | 6,226 | ||||||
Talanx AG (i) | 213 | 6,877 | ||||||
TeamViewer AG (b)(i) | 157 | 7,743 | ||||||
TLG Immobilien AG (i) | 287 | 5,904 | ||||||
United Internet AG | 229 | 8,758 | ||||||
Varta AG (i) | 66 | 9,210 | ||||||
WCM Beteiligungs & Grundbesitz AG (i) | 967 | 3,560 | ||||||
|
| |||||||
| 272,276 | ||||||||
|
| |||||||
| Greece—0.0% |
| |||||||
Hellenic Telecommunications Organization S.A. | 687 | 9,894 | ||||||
National Bank of Greece S.A. (i) | 4,138 | 5,186 | ||||||
|
| |||||||
| 15,080 | ||||||||
|
| |||||||
| Hong Kong—0.2% |
| |||||||
Cathay Pacific Airways Ltd. | 1,543 | 1,069 | ||||||
CITIC Telecom International Holdings Ltd. | 11,000 | 3,519 | ||||||
CK Hutchison Holdings Ltd. | 2,000 | 12,119 | ||||||
CLP Holdings Ltd. | 2,281 | 21,298 | ||||||
Dah Sing Banking Group Ltd. | 1,623 | 1,411 | ||||||
Fairwood Holdings Ltd. | 2,000 | 4,697 | ||||||
Global Brands Group Holding Ltd. (i) | 61,400 | 1,563 | ||||||
Hang Seng Bank Ltd. | 400 | 5,926 | ||||||
Hui Xian Real Estate Investment Trust REIT | 6,000 | 1,309 | ||||||
Kerry Properties Ltd. | 2,243 | 5,769 | ||||||
Shanghai Industrial Urban Development Group Ltd. | 17,000 | 1,635 | ||||||
Sino Land Co., Ltd. | 6,000 | 7,024 | ||||||
Sun Hung Kai Properties Ltd. | 1,000 | 12,887 | ||||||
United Laboratories International Holdings Ltd. | 6,000 | 6,205 | ||||||
Vinda International Holdings Ltd. | 2,000 | 6,589 | ||||||
Wharf Holdings Ltd. | 5,000 | 10,028 | ||||||
Yue Yuen Industrial Holdings Ltd. | 698 | 1,131 | ||||||
|
| |||||||
| 104,179 | ||||||||
|
| |||||||
| Hungary—0.1% |
| |||||||
Magyar Telekom Telecommunications PLC | 5,446 | 6,367 | ||||||
MOL Hungarian Oil & Gas PLC (i) | 753 | 4,099 | ||||||
OTP Bank Nyrt (i) | 357 | 10,745 | ||||||
Richter Gedeon Nyrt | 384 | 8,106 | ||||||
|
| |||||||
| 29,317 | ||||||||
|
| |||||||
| Indonesia—0.0% |
| |||||||
Indofood CBP Sukses Makmur Tbk PT | 10,700 | 7,253 | ||||||
Media Nusantara Citra Tbk PT (i) | 142,600 | 6,933 | ||||||
|
| |||||||
| 14,186 | ||||||||
|
| |||||||
| Ireland—0.2% |
| |||||||
Horizon Therapeutics PLC (i) | 183 | 14,216 | ||||||
Irish Residential Properties REIT PLC | 403 | 666 | ||||||
Medtronic PLC | 422 | 43,854 | ||||||
Origin Enterprises PLC | 320 | 1,255 | ||||||
STERIS PLC | 108 | 19,029 | ||||||
|
| |||||||
| 79,020 | ||||||||
|
| |||||||
| Israel—0.1% |
| |||||||
Alony Hetz Properties & Investments Ltd. | 607 | 5,965 | ||||||
B Communications Ltd. (i) | 749 | 1,881 | ||||||
Equital Ltd. (i) | — | † | 3 | |||||
Formula Systems 1985 Ltd. | 115 | 9,740 | ||||||
Israel Discount Bank Ltd., Class A | 2,081 | 5,614 | ||||||
Mizrahi Tefahot Bank Ltd. | 372 | 6,599 | ||||||
| Shares | Value | |||||||
Nice Ltd. (i) | 42 | $ | 9,522 | |||||
Shufersal Ltd. | 278 | 2,174 | ||||||
|
| |||||||
| 41,498 | ||||||||
|
| |||||||
| Italy—0.3% |
| |||||||
Assicurazioni Generali SpA | 1,162 | 16,378 | ||||||
Enav SpA (b) | 918 | 3,485 | ||||||
Enel SpA | 5,430 | 47,110 | ||||||
Intesa Sanpaolo SpA (i) | 13,249 | 24,927 | ||||||
Snam SpA | 3,206 | 16,488 | ||||||
Telecom Italia SpA | 15,269 | 6,120 | ||||||
Unipol Gruppo SpA | 1,244 | 5,436 | ||||||
|
| |||||||
| 119,944 | ||||||||
|
| |||||||
| Japan—2.7% |
| |||||||
ADEKA Corp. | 26 | 374 | ||||||
Aida Engineering Ltd. | 142 | 977 | ||||||
Aoyama Trading Co., Ltd. | 111 | 585 | ||||||
Asahi Group Holdings Ltd. | 400 | 13,941 | ||||||
Astellas Pharma, Inc. | 992 | 14,787 | ||||||
Canon Marketing Japan, Inc. | 300 | 6,021 | ||||||
Canon, Inc. | 410 | 6,801 | ||||||
Cawachi Ltd. | 200 | 5,555 | ||||||
Chubu Electric Power Co., Inc. | 900 | 10,947 | ||||||
Chugai Pharmaceutical Co., Ltd. | 300 | 13,463 | ||||||
Daiwa Office Investment Corp. REIT | 1 | 5,723 | ||||||
DCM Holdings Co., Ltd. | 825 | 11,367 | ||||||
Doutor Nichires Holdings Co., Ltd. | 651 | 9,891 | ||||||
DTS Corp. | 198 | 4,214 | ||||||
DyDo Group Holdings, Inc. | 126 | 6,396 | ||||||
ENEOS Holdings, Inc. | 3,800 | 13,558 | ||||||
FUJIFILM Holdings Corp. | 421 | 20,752 | ||||||
Fukuyama Transporting Co., Ltd. | 145 | 7,066 | ||||||
Geo Holdings Corp. | 236 | 3,750 | ||||||
Hitachi Ltd. | 500 | 16,930 | ||||||
Honda Motor Co., Ltd. | 1,100 | 26,122 | ||||||
Honeys Holdings Co., Ltd. | 39 | 381 | ||||||
ITOCHU Corp. | 1,577 | 40,380 | ||||||
Iwatani Corp. | 200 | 7,498 | ||||||
Japan Airlines Co., Ltd. | 370 | 6,901 | ||||||
Japan Post Holdings Co., Ltd. | 3,900 | 26,594 | ||||||
Japan Post Insurance Co., Ltd. | 900 | 14,171 | ||||||
Japan Wool Textile Co., Ltd. | 600 | 5,802 | ||||||
Kajima Corp. | 900 | 10,843 | ||||||
Kamigumi Co., Ltd. | 400 | 7,882 | ||||||
Kandenko Co., Ltd. | 1,000 | 8,168 | ||||||
KDDI Corp. | 1,300 | 32,697 | ||||||
Kintetsu Group Holdings Co., Ltd. | 300 | 12,803 | ||||||
Konica Minolta, Inc. | 2,900 | 8,225 | ||||||
LaSalle Logiport REIT | 6 | 10,047 | ||||||
Lawson, Inc. | 200 | 9,537 | ||||||
McDonald’s Holdings Co. Japan Ltd. | 200 | 9,728 | ||||||
Mirait Holdings Corp. | 700 | 10,747 | ||||||
Mitsubishi Corp. | 1,400 | 33,510 | ||||||
Mitsubishi Research Institute, Inc. | 100 | 4,214 | ||||||
Mitsubishi UFJ Financial Group, Inc. | 5,300 | 21,152 | ||||||
Mitsubishi UFJ Lease & Finance Co., Ltd. | 1,600 | 7,434 | ||||||
Mitsuboshi Belting Ltd. | 71 | 1,155 | ||||||
Mitsui & Co., Ltd. | 800 | 13,746 | ||||||
Morinaga Milk Industry Co., Ltd. | 200 | 10,546 | ||||||
Murata Manufacturing Co., Ltd. | 300 | 19,508 | ||||||
NEC Corp. | 400 | 23,398 | ||||||
Nichias Corp. | 198 | 4,686 | ||||||
Nihon Unisys Ltd. | 321 | 10,128 | ||||||
Nippon Telegraph & Telephone Corp. | 2,316 | 47,285 | ||||||
Nishimatsu Construction Co., Ltd. | 300 | 5,959 | ||||||
Nisshin Seifun Group, Inc. | 600 | 9,523 | ||||||
NTT DOCOMO, Inc. | 2,643 | 97,120 | ||||||
Obayashi Corp. | 2,427 | 22,157 | ||||||
Okumura Corp. | 200 | 5,021 | ||||||
Oracle Corp. | 100 | 10,798 | ||||||
Raito Kogyo Co., Ltd. | 463 | 6,977 | ||||||
| Shares | Value | |||||||
Rengo Co., Ltd. | 400 | $ | 3,024 | |||||
Ricoh Co., Ltd. | 1,500 | 10,125 | ||||||
Rinnai Corp. | 200 | 19,508 | ||||||
Sankyo Co., Ltd. | 400 | 10,474 | ||||||
Sanyo Special Steel Co., Ltd. (i) | 182 | 1,739 | ||||||
Sawai Pharmaceutical Co., Ltd. | 225 | 11,353 | ||||||
Secom Co., Ltd. | 300 | 27,455 | ||||||
Sekisui House Ltd. | 600 | 10,632 | ||||||
Senko Group Holdings Co., Ltd. | 796 | 7,422 | ||||||
Seven & i Holdings Co., Ltd. | 500 | 15,535 | ||||||
Shibaura Electronics Co., Ltd. | 100 | 2,056 | ||||||
Softbank Corp. | 2,800 | 31,288 | ||||||
Sony Corp. | 400 | 30,657 | ||||||
Sugi Holdings Co., Ltd. | 200 | 14,141 | ||||||
Sumitomo Corp. | 2,400 | 28,931 | ||||||
Sumitomo Densetsu Co., Ltd. | 200 | 4,702 | ||||||
Sumitomo Mitsui Financial Group, Inc. | 1,100 | 30,757 | ||||||
Sumitomo Rubber Industries Ltd. | 1,000 | 9,289 | ||||||
Sushiro Global Holdings Ltd. | 600 | 15,261 | ||||||
Suzuken Co., Ltd. | 300 | 11,443 | ||||||
Takasago Thermal Engineering Co., Ltd. | 597 | 8,574 | ||||||
Takeda Pharmaceutical Co., Ltd. | 800 | 28,594 | ||||||
Tokyo Electron Ltd. | 100 | 26,125 | ||||||
Tokyo Gas Co., Ltd. | 400 | 9,128 | ||||||
Towa Pharmaceutical Co., Ltd. | 214 | 4,295 | ||||||
Toyo Seikan Group Holdings Ltd. | 400 | 3,957 | ||||||
Toyo Suisan Kaisha Ltd. | 300 | 15,842 | ||||||
Toyota Motor Corp. | 651 | 43,207 | ||||||
Tsuruha Holdings, Inc. | 100 | 14,177 | ||||||
Tv Tokyo Holdings Corp. | 166 | 3,796 | ||||||
Yurtec Corp. | 132 | 810 | ||||||
|
| |||||||
| 1,230,238 | ||||||||
|
| |||||||
| Korea (Republic of)—0.6% |
| |||||||
CJ CheilJedang Corp. | 19 | 6,413 | ||||||
CJ Corp. | 79 | 5,486 | ||||||
Daelim Industrial Co., Ltd. | 200 | 13,219 | ||||||
Doosan Bobcat, Inc. | 265 | 6,117 | ||||||
GS Holdings Corp. | 393 | 10,405 | ||||||
Hana Financial Group, Inc. | 314 | 7,543 | ||||||
HDC Hyundai Development Co-Engineering & Construction | 1 | 18 | ||||||
KB Financial Group, Inc. | 394 | 12,687 | ||||||
KC Co., Ltd. | 70 | 1,422 | ||||||
KC Tech Co., Ltd. | 103 | 1,997 | ||||||
Kia Motors Corp. | 368 | 14,758 | ||||||
KT Corp. | 80 | 1,565 | ||||||
KT&G Corp. | 123 | 8,687 | ||||||
LG Innotek Co., Ltd. | 38 | 5,015 | ||||||
Macquarie Korea Infrastructure Fund | 731 | 6,870 | ||||||
NCSoft Corp. | 22 | 15,161 | ||||||
POSCO | 75 | 12,556 | ||||||
Posco International Corp. | 457 | 5,218 | ||||||
Samsung Card Co., Ltd. | 451 | 10,889 | ||||||
Samsung Electronics Co., Ltd. | 306 | 15,191 | ||||||
Samsung Electronics Co., Ltd. GDR | 30 | 38,038 | ||||||
Shinhan Financial Group Co., Ltd. | 652 | 15,296 | ||||||
SK Hynix, Inc. | 327 | 23,440 | ||||||
SK Telecom Co., Ltd. | 91 | 18,499 | ||||||
Woori Financial Group, Inc. | 1,946 | 14,229 | ||||||
|
| |||||||
| 270,719 | ||||||||
|
| |||||||
| Malaysia—0.1% | ||||||||
Axis Real Estate Investment Trust REIT | 4,100 | 2,131 | ||||||
Bermaz Auto Bhd. | 3,500 | 1,167 | ||||||
Hong Leong Bank Bhd. | 1,700 | 6,168 | ||||||
KNM Group Bhd. (i) | 31,700 | 1,422 | ||||||
Malayan Banking Bhd. | 5,200 | 9,046 | ||||||
MBM Resources BHD | 7,800 | 5,975 | ||||||
MISC Bhd. | 2,100 | 3,800 | ||||||
| See accompanying Notes to Financial Statements | | September 30, 2020 | | Annual Report | 87 |
Table of Contents
Schedule of Investments
September 30, 2020
| Shares | Value | |||||||
Tenaga Nasional Bhd. | 2,700 | $ | 6,832 | |||||
TIME dotCom Bhd. | 1,900 | 5,491 | ||||||
|
| |||||||
| 42,032 | ||||||||
|
| |||||||
| Mexico—0.1% |
| |||||||
Alfa S.A.B de C.V., Class A | 10,100 | 6,262 | ||||||
Alpek S.A.B de C.V. | 7,700 | 5,363 | ||||||
Banco del Bajio S.A. (b)(i) | 3,200 | 2,397 | ||||||
Grupo Financiero Banorte S.A.B de C.V., Class O (i) | 3,100 | 10,742 | ||||||
Grupo Lala S.A.B de C.V. | 4,496 | 2,739 | ||||||
Macquarie Mexico Real Estate Management S.A. de C.V. REIT (b) | 5,300 | 6,510 | ||||||
Qualitas Controladora S.A.B. de C.V. | 1,400 | 5,280 | ||||||
|
| |||||||
| 39,293 | ||||||||
|
| |||||||
| Morocco—0.0% |
| |||||||
Cosumar | 136 | 2,810 | ||||||
Douja Promotion Groupe Addoha S.A. (i) | 1,239 | 780 | ||||||
|
| |||||||
| 3,590 | ||||||||
|
| |||||||
| Netherlands—0.5% |
| |||||||
Aegon NV | 2,593 | 6,711 | ||||||
AerCap Holdings NV (i) | 161 | 4,056 | ||||||
Airbus SE (i) | 234 | 16,971 | ||||||
ASM International NV | 118 | 16,914 | ||||||
ASML Holding NV | 115 | 42,478 | ||||||
ASR Nederland NV | 560 | 18,835 | ||||||
Coca-Cola European Partners PLC | 133 | 5,162 | ||||||
Koninklijke Ahold Delhaize NV | 1,787 | 52,820 | ||||||
NN Group NV | 396 | 14,844 | ||||||
Signify NV (b)(i) | 288 | 10,652 | ||||||
VEON Ltd. ADR | 3,730 | 4,700 | ||||||
Wolters Kluwer NV | 243 | 20,728 | ||||||
|
| |||||||
| 214,871 | ||||||||
|
| |||||||
| New Zealand—0.2% |
| |||||||
a2 Milk Co., Ltd. (i) | 1,347 | 13,709 | ||||||
Air New Zealand Ltd. (i) | 5,568 | 5,079 | ||||||
Arvida Group Ltd. | 3,328 | 3,740 | ||||||
Fisher & Paykel Healthcare Corp. Ltd. | 786 | 17,348 | ||||||
Kiwi Property Group Ltd. REIT | 1,590 | 1,120 | ||||||
Meridian Energy Ltd. | 6,733 | 22,144 | ||||||
Summerset Group Holdings Ltd. | 1,441 | 8,618 | ||||||
|
| |||||||
| 71,758 | ||||||||
|
| |||||||
| Norway—0.1% |
| |||||||
Avance Gas Holding Ltd. (b) | 3,418 | 9,218 | ||||||
Frontline Ltd. | 1,133 | 7,460 | ||||||
Orkla ASA | 1,499 | 15,129 | ||||||
Sparebanken Vest | 966 | 6,506 | ||||||
TGS NOPEC Geophysical Co ASA | 576 | 7,030 | ||||||
Yara International ASA | 344 | 13,237 | ||||||
|
| |||||||
| 58,580 | ||||||||
|
| |||||||
| Peru—0.0% | ||||||||
Ferreycorp SAA | 7,075 | 3,436 | ||||||
|
| |||||||
| Philippines—0.0% |
| |||||||
Globe Telecom, Inc. | 70 | 3,003 | ||||||
PLDT, Inc. | 125 | 3,435 | ||||||
|
| |||||||
| 6,438 | ||||||||
|
| |||||||
| Poland—0.1% | ||||||||
Asseco Poland S.A. | 406 | 7,299 | ||||||
Ciech S.A. (i) | 206 | 1,460 | ||||||
TEN Square Games S.A. | 95 | 14,134 | ||||||
|
| |||||||
| 22,893 | ||||||||
|
| |||||||
| Portugal—0.0% | ||||||||
Jeronimo Martins SGPS S.A. | 757 | 12,173 | ||||||
| Shares | Value | |||||||
REN—Redes Energeticas Nacionais SGPS S.A. | 627 | $ | 1,743 | |||||
|
| |||||||
| 13,916 | ||||||||
|
| |||||||
| Singapore—0.2% | ||||||||
Accordia Golf Trust | 4,600 | 2,447 | ||||||
CapitaLand Mall Trust REIT | 8,500 | 12,098 | ||||||
China Aviation Oil Singapore Corp. Ltd. | 8,800 | 6,034 | ||||||
ComfortDelGro Corp. Ltd. | 4,200 | 4,365 | ||||||
Fortune Real Estate Investment Trust REIT | 8,000 | 6,735 | ||||||
Frasers Logistics & Commercial Trust REIT | 9,700 | 9,932 | ||||||
Keppel DC REIT | 3,500 | 7,481 | ||||||
Mapletree Commercial Trust REIT | 5,401 | 7,759 | ||||||
Oversea-Chinese Banking Corp., Ltd. | 1,100 | 6,841 | ||||||
Sheng Siong Group Ltd. | 1,900 | 2,246 | ||||||
Singapore Airlines Ltd. | 2,100 | 5,374 | ||||||
Sino Grandness Food Industry Group Ltd. (i) | 25,900 | 404 | ||||||
Yangzijiang Shipbuilding Holdings Ltd. | 7,000 | 5,113 | ||||||
|
| |||||||
| 76,829 | ||||||||
|
| |||||||
| South Africa—0.2% | ||||||||
Anglo American Platinum Ltd. | 204 | 14,124 | ||||||
Astral Foods Ltd. | 984 | 7,718 | ||||||
Gold Fields Ltd. | 1,465 | 17,922 | ||||||
Impala Platinum Holdings Ltd. | 1,533 | 13,320 | ||||||
MTN Group Ltd. | 2,596 | 8,710 | ||||||
Nedbank Group Ltd. | 1,039 | 6,217 | ||||||
Old Mutual Ltd. | 11,523 | 7,103 | ||||||
Sibanye Stillwater Ltd. | 2,820 | 7,826 | ||||||
|
| |||||||
| 82,940 | ||||||||
|
| |||||||
| Spain—0.3% | ||||||||
Banco Santander S.A. | 8,047 | 15,010 | ||||||
Ebro Foods S.A. | 211 | 4,913 | ||||||
Iberdrola S.A. | 4,116 | 50,662 | ||||||
Lar Espana Real Estate Socimi S.A. REIT | 137 | 632 | ||||||
Mapfre S.A. | 8,896 | 13,957 | ||||||
Mediaset Espana Comunicacion S.A. (i) | 1,102 | 4,081 | ||||||
Neinor Homes S.A. (b)(i) | 694 | 8,872 | ||||||
Repsol S.A. | 1,488 | 10,052 | ||||||
Telefonica S.A. | 5,514 | 18,889 | ||||||
|
| |||||||
| 127,068 | ||||||||
|
| |||||||
| Sweden—0.2% | ||||||||
Arjo AB, Class B | 933 | 5,777 | ||||||
Atlas Copco AB, Class A | 425 | 20,263 | ||||||
Castellum AB | 299 | 6,792 | ||||||
Essity AB, Class B (i) | 510 | 17,218 | ||||||
L E Lundbergforetagen AB, Class B (i) | 398 | 19,665 | ||||||
Peab AB, Class B | 211 | 2,114 | ||||||
Saab AB, Class B (i) | 482 | 14,172 | ||||||
Skanska AB, Class B (i) | 784 | 16,557 | ||||||
|
| |||||||
| 102,558 | ||||||||
|
| |||||||
| Switzerland—1.1% | ||||||||
Allreal Holding AG (i) | 53 | 11,419 | ||||||
Amcor PLC | 51 | 563 | ||||||
Baloise Holding AG | 62 | 9,128 | ||||||
Banque Cantonale Vaudoise | 37 | 3,755 | ||||||
Barry Callebaut AG | 5 | 11,137 | ||||||
BKW AG | 16 | 1,704 | ||||||
Cembra Money Bank AG | 75 | 8,902 | ||||||
Galenica AG (b) | 83 | 5,771 | ||||||
Givaudan S.A. | 7 | 30,225 | ||||||
Intershop Holding AG | 5 | 3,230 | ||||||
LafargeHolcim Ltd. (i) | 343 | 15,613 | ||||||
| Shares | Value | |||||||
Nestle S.A. | 651 | $ | 77,477 | |||||
Novartis AG | 547 | 47,493 | ||||||
PSP Swiss Property AG | 58 | 7,006 | ||||||
Roche Holding AG | 323 | 110,641 | ||||||
Sonova Holding AG (i) | 92 | 23,314 | ||||||
Swiss Life Holding AG | 90 | 34,055 | ||||||
Swiss Prime Site AG (i) | 143 | 12,987 | ||||||
Swiss Re AG | 178 | 13,204 | ||||||
Swisscom AG | 16 | 8,476 | ||||||
UBS Group AG | 2,921 | 32,636 | ||||||
VAT Group AG (b)(i) | 24 | 4,578 | ||||||
Zurich Insurance Group AG | 106 | 36,964 | ||||||
|
| |||||||
| 510,278 | ||||||||
|
| |||||||
| Taiwan—1.5% |
| |||||||
Asia Cement Corp. | 13,000 | 18,731 | ||||||
Cathay Financial Holding Co., Ltd. | 10,000 | 13,387 | ||||||
Cheng Loong Corp. | 4,000 | 4,376 | ||||||
China Motor Corp. (i) | 2,000 | 2,913 | ||||||
Compal Electronics, Inc. | 17,000 | 11,243 | ||||||
CTBC Financial Holding Co., Ltd. | 17,000 | 10,861 | ||||||
E.Sun Financial Holding Co., Ltd. | 41,028 | 36,539 | ||||||
First Financial Holding Co., Ltd. | 86,851 | 61,979 | ||||||
Formosa Petrochemical Corp. | 2,900 | 8,048 | ||||||
Formosa Plastics Corp. | 1,900 | 5,191 | ||||||
Fubon Financial Holding Co., Ltd. | 10,000 | 14,551 | ||||||
Fulgent Sun International Holding Co., Ltd. | 4,000 | 15,130 | ||||||
Getac Technology Corp. | 6,000 | 9,498 | ||||||
Global Mixed Mode Technology, Inc. | 2,000 | 10,570 | ||||||
Great Wall Enterprise Co., Ltd. | 3,450 | 5,056 | ||||||
HannStar Display Corp. (i) | 27,000 | 7,985 | ||||||
Hon Hai Precision Industry Co., Ltd. | 9,200 | 24,734 | ||||||
Hua Nan Financial Holdings Co., Ltd. | 28,953 | 17,750 | ||||||
Lien Hwa Industrial Holdings Corp. | 17,110 | 23,624 | ||||||
Mega Financial Holding Co., Ltd. | 9,000 | 8,687 | ||||||
Pegatron Corp. | 5,000 | 11,102 | ||||||
Pou Chen Corp. | 8,000 | 7,266 | ||||||
Powertech Technology, Inc. | 7,000 | 21,051 | ||||||
Realtek Semiconductor Corp. | 2,000 | 25,637 | ||||||
Sinbon Electronics Co., Ltd. | 2,000 | 12,451 | ||||||
Taichung Commercial Bank Co., Ltd. | 39,294 | 14,571 | ||||||
Taiwan Cement Corp. | 15,750 | 22,660 | ||||||
Taiwan Fertilizer Co., Ltd. | 1,000 | 1,759 | ||||||
Taiwan PCB Techvest Co., Ltd. | 2,000 | 2,726 | ||||||
Taiwan Semiconductor Manufacturing Co., Ltd. | 2,000 | 30,088 | ||||||
Taiwan Semiconductor Manufacturing Co., Ltd. ADR | 831 | 67,369 | ||||||
Tripod Technology Corp. | 3,000 | 11,499 | ||||||
Uni-President Enterprises Corp. | 4,000 | 8,663 | ||||||
United Microelectronics Corp. ADR | 4,951 | 23,715 | ||||||
United Renewable Energy Co., Ltd. (i) | 3,340 | 1,345 | ||||||
Wisdom Marine Lines Co., Ltd. (i) | 2,118 | 1,600 | ||||||
Wistron Corp. | 9,000 | 9,334 | ||||||
WT Microelectronics Co., Ltd. | 1,707 | 2,231 | ||||||
Yuanta Financial Holding Co., Ltd. | 114,400 | 70,829 | ||||||
|
| |||||||
| 656,749 | ||||||||
|
| |||||||
| Thailand—0.0% |
| |||||||
Bangchak Corp. | 5,500 | 2,611 | ||||||
Thanachart Capital | 4,000 | 3,682 | ||||||
|
| |||||||
| 6,293 | ||||||||
|
| |||||||
| Turkey—0.1% |
| |||||||
Dogus Otomotiv Servis ve Ticaret AS | 909 | 1,820 | ||||||
Tupras Turkiye Petrol Rafinerileri AS (i) | 58 | 595 | ||||||
Turkcell Iletisim Hizmetleri AS | 8,079 | 15,747 | ||||||
| 88 | Annual Report | | September 30, 2020 | | See accompanying Notes to Financial Statements |
Table of Contents
Schedule of Investments
September 30, 2020
| Shares | Value | |||||||
Turkiye Garanti Bankasi AS (i) | 8,067 | $ | 7,373 | |||||
Turkiye Sinai Kalkinma Bankasi AS (i) | 34,966 | 5,025 | ||||||
|
| |||||||
| 30,560 | ||||||||
|
| |||||||
| United Kingdom—0.7% | ||||||||
Airtel Africa PLC (b) | 9,233 | 6,933 | ||||||
Anglo American PLC | 1,066 | 25,790 | ||||||
Aviva PLC | 2,238 | 8,280 | ||||||
BAE Systems PLC | 3,483 | 21,631 | ||||||
Barratt Developments PLC | 1,790 | 10,978 | ||||||
Berkeley Group Holdings PLC | 101 | 5,506 | ||||||
Bovis Homes Group PLC | 768 | 5,628 | ||||||
BT Group PLC | 13,555 | 17,169 | ||||||
Diageo PLC | 184 | 6,320 | ||||||
Diversified Gas & Oil PLC | 5,445 | 7,371 | ||||||
Gamma Communications PLC | 373 | 7,942 | ||||||
Highland Gold Mining Ltd. | 1,665 | 6,432 | ||||||
IHS Markit Ltd. | 210 | 16,487 | ||||||
J Sainsbury PLC | 8,532 | 21,007 | ||||||
JD Sports Fashion PLC | 2,210 | 23,069 | ||||||
Keller Group PLC | 1,261 | 9,909 | ||||||
Legal & General Group PLC | 5,118 | 12,485 | ||||||
M&G PLC | 3,176 | 6,528 | ||||||
Micro Focus International PLC (i) | 2,166 | 6,886 | ||||||
Mitchells & Butlers PLC (i) | 3,728 | 6,502 | ||||||
Primary Health Properties PLC REIT | 1,707 | 3,267 | ||||||
Rio Tinto PLC | 488 | 29,364 | ||||||
Royal Dutch Shell PLC, Class A | 832 | 10,386 | ||||||
Royal Dutch Shell PLC, Class A | 314 | 3,959 | ||||||
Royal Dutch Shell PLC, Class B | 897 | 10,878 | ||||||
Unilever PLC | 272 | 16,770 | ||||||
Valaris PLC (i) | 195 | 17 | ||||||
Virgin Money UK PLC (i) | 1,098 | 1,035 | ||||||
Vodafone Group PLC | 16,871 | 22,361 | ||||||
|
| |||||||
| 330,890 | ||||||||
|
| |||||||
| United States—16.6% |
| |||||||
3M Co., | 172 | 27,551 | ||||||
Abbott Laboratories | 413 | 44,947 | ||||||
AbbVie, Inc. | 650 | 56,933 | ||||||
Accenture PLC, Class A | 53 | 11,977 | ||||||
ACCO Brands Corp. | 1,980 | 11,484 | ||||||
Activision Blizzard, Inc. | 452 | 36,589 | ||||||
Adobe, Inc. (i) | 157 | 76,998 | ||||||
ADT, Inc. | 2,396 | 19,575 | ||||||
AES Corp. | 494 | 8,946 | ||||||
Aflac, Inc. | 933 | 33,915 | ||||||
AGNC Investment Corp. REIT | 3,053 | 42,467 | ||||||
Air Lease Corp. | 309 | 9,091 | ||||||
Air Products and Chemicals, Inc. | 91 | 27,105 | ||||||
Akamai Technologies, Inc. (i) | 234 | 25,866 | ||||||
Alleghany Corp. | 19 | 9,889 | ||||||
Allstate Corp. | 693 | 65,239 | ||||||
Ally Financial, Inc. | 531 | 13,312 | ||||||
Alphabet, Inc., Class A (i) | 63 | 92,333 | ||||||
Alphabet, Inc., Class C (i) | 63 | 92,585 | ||||||
Amazon.com, Inc. (i) | 77 | 242,452 | ||||||
Amdocs Ltd. | 150 | 8,612 | ||||||
Ameren Corp. | 191 | 15,104 | ||||||
American Electric Power Co., Inc. | 241 | 19,697 | ||||||
American Equity Investment Life Holding Co. | 442 | 9,720 | ||||||
American Financial Group, Inc. | 353 | 23,644 | ||||||
American Tower Corp. REIT | 25 | 6,043 | ||||||
Ameriprise Financial, Inc. | 108 | 16,644 | ||||||
Amgen, Inc. | 215 | 54,644 | ||||||
Analog Devices, Inc. | 252 | 29,418 | ||||||
Annaly Capital Management, Inc. REIT | 1,887 | 13,435 | ||||||
Anthem, Inc. | 195 | 52,375 | ||||||
Anworth Mortgage Asset Corp. REIT | 837 | 1,373 | ||||||
Apple, Inc. | 3,602 | 417,148 | ||||||
Applied Materials, Inc. | 459 | 27,288 | ||||||
AT&T, Inc. | 2,894 | 82,508 | ||||||
| Shares | Value | |||||||
Atmos Energy Corp. | 22 | $ | 2,103 | |||||
Automatic Data Processing, Inc. | 120 | 16,739 | ||||||
AutoZone, Inc. (i) | 23 | 27,086 | ||||||
AvalonBay Communities, Inc. REIT | 64 | 9,558 | ||||||
Bank of America Corp. | 1,813 | 43,675 | ||||||
Berkshire Hathaway, Inc., Class B (i) | 46 | 9,795 | ||||||
Best Buy Co., Inc. | 275 | 30,605 | ||||||
Biogen, Inc. (i) | 107 | 30,354 | ||||||
Bloom Energy Corp., Class A (i) | 607 | 10,908 | ||||||
Booz Allen Hamilton Holding Corp. | 200 | 16,596 | ||||||
Bright Horizons Family Solutions, Inc. (i) | 73 | 11,099 | ||||||
Bristol-Myers Squibb Co. | 1,271 | 76,629 | ||||||
Broadcom, Inc. | 118 | 42,990 | ||||||
Cadence Design Systems, Inc. (i) | 316 | 33,695 | ||||||
Campbell Soup Co. | 171 | 8,271 | ||||||
Cardinal Health, Inc. | 629 | 29,532 | ||||||
Carrier Global Corp. | 916 | 27,975 | ||||||
Casey’s General Stores, Inc. | 36 | 6,395 | ||||||
Cboe Global Markets, Inc. | 55 | 4,826 | ||||||
CBTX, Inc. | 103 | 1,683 | ||||||
Centene Corp. (i) | 583 | 34,006 | ||||||
CenturyLink, Inc. | 2,622 | 26,456 | ||||||
Chemed Corp. | 20 | 9,607 | ||||||
Chevron Corp. | 454 | 32,688 | ||||||
Chimera Investment Corp. REIT | 353 | 2,895 | ||||||
Church & Dwight Co., Inc. | 210 | 19,679 | ||||||
Cigna Corp. | 187 | 31,680 | ||||||
Cincinnati Financial Corp. | 154 | 12,007 | ||||||
Cisco Systems, Inc. | 1,324 | 52,152 | ||||||
Citigroup, Inc. | 563 | 24,271 | ||||||
Citizens Financial Group, Inc. | 388 | 9,809 | ||||||
Citrix Systems, Inc. | 208 | 28,644 | ||||||
CMS Energy Corp. | 192 | 11,791 | ||||||
CNA Financial Corp. | 420 | 12,596 | ||||||
Coca-Cola Co. | 442 | 21,822 | ||||||
Computer Programs & Systems, Inc. | 458 | 12,645 | ||||||
Conagra Brands, Inc. | 351 | 12,534 | ||||||
Consolidated Edison, Inc. | 495 | 38,511 | ||||||
Costco Wholesale Corp. | 185 | 65,675 | ||||||
Crown Castle International Corp. REIT | 34 | 5,661 | ||||||
CVS Health Corp. | 1,031 | 60,210 | ||||||
Danaher Corp. | 173 | 37,252 | ||||||
DaVita, Inc. (i) | 213 | 18,243 | ||||||
Delta Air Lines, Inc. | 423 | 12,935 | ||||||
DexCom, Inc. (i) | 64 | 26,383 | ||||||
Diamond S Shipping, Inc. (i) | 642 | 4,411 | ||||||
Dollar General Corp. | 321 | 67,288 | ||||||
Dover Corp. | 195 | 21,126 | ||||||
DR Horton, Inc. | 350 | 26,470 | ||||||
Dropbox, Inc., Class A (i) | 542 | 10,439 | ||||||
DTE Energy Co. | 155 | 17,831 | ||||||
Duke Energy Corp. | 732 | 64,826 | ||||||
Eastman Chemical Co. | 180 | 14,062 | ||||||
eBay, Inc. | 424 | 22,090 | ||||||
Edwards Lifesciences Corp. (i) | 373 | 29,773 | ||||||
Electronic Arts, Inc. (i) | 164 | 21,387 | ||||||
Eli Lilly and Co. | 529 | 78,303 | ||||||
Ellington Financial, Inc. REIT | 34 | 417 | ||||||
Encompass Health Corp. | 126 | 8,187 | ||||||
Ennis, Inc. | 150 | 2,616 | ||||||
Entergy Corp. | 176 | 17,341 | ||||||
Equinix, Inc. REIT | 32 | 24,324 | ||||||
Equity Commonwealth REIT | 210 | 5,592 | ||||||
Equity LifeStyle Properties, Inc. REIT | 147 | 9,011 | ||||||
Equity Residential REIT | 328 | 16,836 | ||||||
Essex Property Trust, Inc. REIT | 58 | 11,646 | ||||||
Exelon Corp. | 205 | 7,331 | ||||||
Exponent, Inc. | 95 | 6,843 | ||||||
Exxon Mobil Corp. | 878 | 30,142 | ||||||
Facebook, Inc., Class A (i) | 299 | 78,308 | ||||||
Fidelity National Information Services, Inc. | 195 | 28,706 | ||||||
First NBC Bank Holding Co. (i) | 1,041 | 39 | ||||||
| Shares | Value | |||||||
Fiserv, Inc. (i) | 144 | $ | 14,839 | |||||
Fortinet, Inc. (i) | 188 | 22,148 | ||||||
frontdoor, Inc. (i) | 203 | 7,899 | ||||||
FTI Consulting, Inc. (i) | 143 | 15,154 | ||||||
General Mills, Inc. | 308 | 18,997 | ||||||
General Motors Co. | 941 | 27,844 | ||||||
H&E Equipment Services, Inc. | 341 | 6,704 | ||||||
Hartford Financial Services Group, Inc. | 825 | 30,409 | ||||||
Herc Holdings, Inc. (i) | 192 | 7,605 | ||||||
Hershey Co. | 137 | 19,638 | ||||||
Hewlett Packard Enterprise Co. | 1,474 | 13,811 | ||||||
Honeywell International, Inc. | 244 | 40,165 | ||||||
HP, Inc. | 1,559 | 29,605 | ||||||
Humana, Inc. | 95 | 39,320 | ||||||
Insight Enterprises, Inc. (i) | 12 | 679 | ||||||
Intel Corp. | 1,371 | 70,990 | ||||||
InterDigital, Inc. | 240 | 13,694 | ||||||
Intuit, Inc. | 37 | 12,070 | ||||||
Intuitive Surgical, Inc. (i) | 28 | 19,867 | ||||||
Johnson & Johnson | 815 | 121,337 | ||||||
Johnson Controls International PLC | 619 | 25,286 | ||||||
JPMorgan Chase & Co. | 581 | 55,933 | ||||||
Kellogg Co. | 62 | 4,005 | ||||||
Kimberly-Clark Corp. | 404 | 59,655 | ||||||
Kinder Morgan, Inc. | 1,532 | 18,890 | ||||||
KLA Corp. | 92 | 17,824 | ||||||
Kroger Co. | 1,157 | 39,234 | ||||||
L3Harris Technologies, Inc. | 397 | 67,426 | ||||||
Laboratory Corp. of America Holdings (i) | 68 | 12,802 | ||||||
Lam Research Corp. | 89 | 29,526 | ||||||
Leidos Holdings, Inc. | 396 | 35,303 | ||||||
Lockheed Martin Corp. | 80 | 30,662 | ||||||
Lowe’s Cos., Inc. | 338 | 56,061 | ||||||
LyondellBasell Industries NV, Class A | 216 | 15,226 | ||||||
ManTech International Corp., Class A | 91 | 6,268 | ||||||
MarketAxess Holdings, Inc. | 33 | 15,892 | ||||||
Marsh & McLennan Cos., Inc. | 57 | 6,538 | ||||||
Masco Corp. | 187 | 10,309 | ||||||
Mastercard, Inc., Class A | 215 | 72,707 | ||||||
McDonald’s Corp. | 403 | 88,454 | ||||||
McGrath RentCorp | 360 | 21,452 | ||||||
Merck & Co., Inc. | 996 | 82,618 | ||||||
Methode Electronics, Inc. | 304 | 8,664 | ||||||
MetLife, Inc. | 723 | 26,874 | ||||||
Micron Technology, Inc. (i) | 524 | 24,607 | ||||||
Microsoft Corp. | 1,458 | 306,661 | ||||||
Molson Coors Brewing Co., Class B | 205 | 6,880 | ||||||
Mondelez International, Inc., Class A | 673 | 38,664 | ||||||
Morgan Stanley | 656 | 31,718 | ||||||
Motorola Solutions, Inc. | 88 | 13,799 | ||||||
MSCI, Inc. | 63 | 22,477 | ||||||
MYR Group, Inc. (i) | 195 | 7,250 | ||||||
Nasdaq, Inc. | 167 | 20,493 | ||||||
Newell Brands, Inc. | 1,083 | 18,584 | ||||||
Newmont Corp. | 731 | 46,382 | ||||||
NextEra Energy, Inc. | 166 | 46,075 | ||||||
NIKE, Inc., Class B | 340 | 42,684 | ||||||
Northrop Grumman Corp. | 42 | 13,251 | ||||||
NVIDIA Corp. | 185 | 100,126 | ||||||
NVR, Inc. (i) | 12 | 48,997 | ||||||
O’Reilly Automotive, Inc. (i) | 103 | 47,491 | ||||||
Old Republic International Corp. | 407 | 5,999 | ||||||
OneMain Holdings, Inc. | 290 | 9,062 | ||||||
Oracle Corp. | 523 | 31,223 | ||||||
Otis Worldwide Corp. | 485 | 30,274 | ||||||
Paychex, Inc. | 146 | 11,646 | ||||||
PayPal Holdings, Inc. (i) | 261 | 51,425 | ||||||
PepsiCo, Inc. | 237 | 32,848 | ||||||
Pfizer, Inc. | 2,003 | 73,510 | ||||||
Phillips 66 | 213 | 11,042 | ||||||
Photronics, Inc. (i) | 1,122 | 11,175 | ||||||
| See accompanying Notes to Financial Statements | | September 30, 2020 | | Annual Report | 89 |
Table of Contents
Schedule of Investments
September 30, 2020
| Shares | Value | |||||||
Pinnacle West Capital Corp. | 140 | $ | 10,437 | |||||
Popular, Inc. | 291 | 10,555 | ||||||
Portland General Electric Co. | 131 | 4,651 | ||||||
Procter & Gamble Co. | 916 | 127,315 | ||||||
Progressive Corp. | 527 | 49,891 | ||||||
Prospect Capital Corp. | 1,416 | 7,122 | ||||||
Prudential Financial, Inc. | 302 | 19,183 | ||||||
PS Business Parks, Inc. REIT | 43 | 5,263 | ||||||
Public Storage REIT | 7 | 1,559 | ||||||
QCR Holdings, Inc. | 33 | 905 | ||||||
Qorvo, Inc. (i) | 234 | 30,188 | ||||||
QUALCOMM, Inc. | 357 | 42,012 | ||||||
Quest Diagnostics, Inc. | 108 | 12,365 | ||||||
Raytheon Technologies Corp. | 104 | 5,984 | ||||||
Realty Income Corp. REIT | 171 | 10,388 | ||||||
Regeneron Pharmaceuticals, Inc. (i) | 42 | 23,511 | ||||||
Reinsurance Group of America, Inc. | 193 | 18,372 | ||||||
RenaissanceRe Holdings Ltd. | 130 | 22,066 | ||||||
Renewable Energy Group, Inc. (i) | 631 | 33,708 | ||||||
Republic Services, Inc. | 402 | 37,527 | ||||||
Ross Stores, Inc. | 211 | 19,691 | ||||||
S&P Global, Inc. | 33 | 11,900 | ||||||
ScanSource, Inc. (i) | 295 | 5,850 | ||||||
Schweitzer-Mauduit International, Inc. | 184 | 5,592 | ||||||
Sherwin-Williams Co., | 40 | 27,870 | ||||||
Skyworks Solutions, Inc. | 157 | 22,843 | ||||||
Southern Co. | 273 | 14,802 | ||||||
SP Plus Corp. (i) | 218 | 3,913 | ||||||
Star Group L.P. | 1,380 | 13,455 | ||||||
Starbucks Corp. | 651 | 55,934 | ||||||
State Street Corp. | 366 | 21,715 | ||||||
Steel Dynamics, Inc. | 733 | 20,986 | ||||||
STORE Capital Corp. REIT | 64 | 1,756 | ||||||
Stryker Corp. | 156 | 32,506 | ||||||
Sykes Enterprises, Inc. (i) | 261 | 8,929 | ||||||
Synchrony Financial | 635 | 16,618 | ||||||
Synopsys, Inc. (i) | 161 | 34,451 | ||||||
Sysco Corp. | 222 | 13,813 | ||||||
T-Mobile U.S., Inc. (i) | 158 | 18,069 | ||||||
Target Corp. | 378 | 59,505 | ||||||
TD Ameritrade Holding Corp. | 443 | 17,343 | ||||||
Teradyne, Inc. | 224 | 17,799 | ||||||
Thermo Fisher Scientific, Inc. | 104 | 45,918 | ||||||
TJX Cos., Inc. | 368 | 20,479 | ||||||
Tyson Foods, Inc., Class A | 441 | 26,231 | ||||||
United Therapeutics Corp. (i) | 69 | 6,969 | ||||||
UnitedHealth Group, Inc. | 256 | 79,813 | ||||||
Unum Group | 593 | 9,980 | ||||||
Valley National Bancorp | 201 | 1,377 | ||||||
Veeva Systems, Inc., Class A (i) | 152 | 42,741 | ||||||
Verizon Communications, Inc. | 1,873 | 111,425 | ||||||
Vertex Pharmaceuticals, Inc. (i) | 129 | 35,103 | ||||||
Visa, Inc., Class A | 289 | 57,791 | ||||||
Vistra Corp. | 697 | 13,145 | ||||||
Vulcan Materials Co. | 157 | 21,280 | ||||||
Walgreens Boots Alliance, Inc. | 326 | 11,710 | ||||||
Walmart, Inc. | 525 | 73,453 | ||||||
Walt Disney Co. | 48 | 5,956 | ||||||
Waste Management, Inc. | 504 | 57,038 | ||||||
Waterstone Financial, Inc. | 258 | 3,996 | ||||||
WEC Energy Group, Inc. | 429 | 41,570 | ||||||
WestRock Co. | 478 | 16,606 | ||||||
Xcel Energy, Inc. | 636 | 43,890 | ||||||
Zoetis, Inc. | 109 | 18,025 | ||||||
|
| |||||||
| 7,520,483 | ||||||||
|
| |||||||
| Total Common Stock (cost—$11,250,151) |
| 14,028,286 | ||||||
|
| |||||||
| Principal Amount (000s) | Value | |||||||
| Corporate Bonds & Notes—29.3% |
| |||||||
| Australia—0.6% |
| |||||||
Australia & New Zealand Banking Group Ltd., (converts to FRN on 7/22/25) (a)(b)(h), |
| |||||||
2.95%, 7/22/30 | $155 | $ | 160,627 | |||||
Westpac Banking Corp., (converts to FRN on 2/4/25) (h), |
| |||||||
2.894%, 2/4/30 | 105 | 108,410 | ||||||
|
| |||||||
| 269,037 | ||||||||
|
| |||||||
| Belgium—0.1% |
| |||||||
Anheuser-Busch InBev Finance, Inc., |
| |||||||
3.65%, 2/1/26 | 35 | 39,161 | ||||||
|
| |||||||
| Canada—0.1% |
| |||||||
Cenovus Energy, Inc., |
| |||||||
3.00%, 8/15/22 | 35 | 34,259 | ||||||
3.80%, 9/15/23 | 20 | 19,331 | ||||||
|
| |||||||
| 53,590 | ||||||||
|
| |||||||
| Ireland—0.1% |
| |||||||
AerCap Ireland Capital DAC, |
| |||||||
3.15%, 2/15/24 | 45 | 44,657 | ||||||
Shire Acquisitions Investments Ireland DAC, |
| |||||||
3.20%, 9/23/26 | 30 | 33,392 | ||||||
|
| |||||||
| 78,049 | ||||||||
|
| |||||||
| Japan—0.1% |
| |||||||
Takeda Pharmaceutical Co., Ltd., | ||||||||
3.025%, 7/9/40 | 40 | 41,797 | ||||||
|
| |||||||
| Norway—0.1% |
| |||||||
Aker BP ASA (a)(b), | ||||||||
2.875%, 1/15/26 | 27 | 26,766 | ||||||
|
| |||||||
| Puerto Rico—0.5% |
| |||||||
Popular, Inc., | ||||||||
6.125%, 9/14/23 | 210 | 222,315 | ||||||
|
| |||||||
| Switzerland—0.2% |
| |||||||
Credit Suisse Group AG, (converts to FRN on 8/21/26) (a)(b)(e)(h), |
| |||||||
6.375%, 8/21/26 | 80 | 85,567 | ||||||
|
| |||||||
| United Kingdom—0.3% |
| |||||||
BAE Systems PLC (a)(b), | ||||||||
3.40%, 4/15/30 | 80 | 89,778 | ||||||
Lloyds Banking Group PLC, (converts to FRN on 9/27/25) (e)(h), |
| |||||||
7.50%, 9/27/25 | 40 | 42,618 | ||||||
|
| |||||||
| 132,396 | ||||||||
|
| |||||||
| United States—27.2% |
| |||||||
3M Co., | ||||||||
3.125%, 9/19/46 | 50 | 54,598 | ||||||
AbbVie, Inc. (a)(b), | ||||||||
3.85%, 6/15/24 | 90 | 98,725 | ||||||
Air Products and Chemicals, Inc., |
| |||||||
1.50%, 10/15/25 | 45 | 46,639 | ||||||
2.80%, 5/15/50 | 22 | 23,232 | ||||||
Alabama Power Co., |
| |||||||
2.80%, 4/1/25 | 185 | 198,931 | ||||||
4.10%, 1/15/42 | 120 | 140,472 | ||||||
Alleghany Corp., | ||||||||
3.625%, 5/15/30 | 25 | 28,172 | ||||||
Amazon.com, Inc., |
| |||||||
2.50%, 6/3/50 | 40 | 40,795 | ||||||
2.70%, 6/3/60 | 19 | 19,600 | ||||||
American Express Co., |
| |||||||
2.50%, 7/30/24 | 55 | 58,427 | ||||||
8.15%, 3/19/38 | 90 | 145,935 | ||||||
American International Group, Inc., |
| |||||||
3.75%, 7/10/25 | 100 | 112,190 | ||||||
American Tower Corp., |
| |||||||
1.875%, 10/15/30 | 75 | 74,252 | ||||||
4.00%, 6/1/25 | 170 | 191,387 | ||||||
| Principal Amount (000s) | Value | |||||||
Anheuser- Busch InBev Finance, Inc., |
| |||||||
4.00%, 1/17/43 | $ | 145 | $ | 159,273 | ||||
Arizona Public Service Co., | ||||||||
5.50%, 9/1/35 | 95 | 129,362 | ||||||
AT&T, Inc., |
| |||||||
3.10%, 2/1/43 | 68 | 66,520 | ||||||
3.50%, 9/15/53 (a)(b) | 85 | 82,350 | ||||||
4.10%, 2/15/28 | 115 | 133,020 | ||||||
Athene Global Funding (a)(b), |
| |||||||
2.45%, 8/20/27 | 50 | 51,437 | ||||||
2.55%, 6/29/25 | 80 | 82,537 | ||||||
Bank of America Corp. (h), |
| |||||||
0.981%, 9/25/25 (converts to FRN on 9/25/24) | 125 | 125,107 | ||||||
2.881%, 4/24/23 (converts to FRN on 4/24/22) | 160 | 165,474 | ||||||
4.33%, 3/15/50 (converts to FRN on 3/15/49) | 35 | 44,782 | ||||||
Belrose Funding Trust (a)(b), |
| |||||||
2.33%, 8/15/30 | 40 | 39,753 | ||||||
Berkshire Hathaway Energy Co. (a)(b), |
| |||||||
4.25%, 10/15/50 | 8 | 10,017 | ||||||
Berkshire Hathaway Finance Corp., |
| |||||||
4.25%, 1/15/49 | 35 | 45,452 | ||||||
Boeing Co., |
| |||||||
4.875%, 5/1/25 | 80 | 87,369 | ||||||
5.04%, 5/1/27 | 70 | 77,190 | ||||||
5.705%, 5/1/40 | 7 | 8,165 | ||||||
5.93%, 5/1/60 | 15 | 18,559 | ||||||
Boston Gas Co. (a)(b), | ||||||||
3.15%, 8/1/27 | 100 | 113,137 | ||||||
Broadcom, Inc., |
| |||||||
4.15%, 11/15/30 | 90 | 100,855 | ||||||
4.70%, 4/15/25 | 160 | 181,177 | ||||||
Charter Communications Operating LLC, |
| |||||||
3.75%, 2/15/28 | 100 | 110,698 | ||||||
4.908%, 7/23/25 | 95 | 109,698 | ||||||
Cigna Corp., |
| |||||||
4.125%, 11/15/25 | 65 | 74,525 | ||||||
4.80%, 8/15/38 | 35 | 43,500 | ||||||
Citigroup, Inc., |
| |||||||
2.976%, 11/5/30 (converts to FRN on 11/5/29) (h) | 25 | 27,011 | ||||||
4.65%, 7/30/45 | 25 | 32,710 | ||||||
4.70%, 1/30/25 (converts to FRN on 1/30/25) (e)(h) | 29 | 28,099 | ||||||
Columbia Pipeline Group, Inc., |
| |||||||
5.80%, 6/1/45 | 65 | 84,908 | ||||||
Comcast Corp., |
| |||||||
3.20%, 7/15/36 | 85 | 94,157 | ||||||
3.75%, 4/1/40 | 26 | 30,510 | ||||||
Comerica, Inc., |
| |||||||
3.70%, 7/31/23 | 40 | 43,328 | ||||||
5.625%, 7/1/25 (converts to FRN on 10/1/25) (e)(h) | 50 | 52,972 | ||||||
Commonwealth Edison Co., |
| |||||||
5.90%, 3/15/36 | 30 | 43,242 | ||||||
Consolidated Edison Co. of New York, Inc., Ser. 06-E, |
| |||||||
5.70%, 12/1/36 | 5 | 6,793 | ||||||
Crown Castle International Corp., |
| |||||||
3.25%, 1/15/51 | 45 | 44,715 | ||||||
4.00%, 3/1/27 | 65 | 73,929 | ||||||
CSX Corp., |
| |||||||
4.75%, 5/30/42 | 30 | 38,307 | ||||||
CVS Health Corp., |
| |||||||
2.70%, 8/21/40 | 60 | 57,386 | ||||||
4.30%, 3/25/28 | 32 | 37,469 | ||||||
4.78%, 3/25/38 | 45 | 54,491 | ||||||
CyrusOne LP, |
| |||||||
2.15%, 11/1/30 | 45 | 44,012 | ||||||
Delta Air Lines, Inc. (a)(b), |
| |||||||
4.50%, 10/20/25 | 46 | 47,236 | ||||||
7.00%, 5/1/25 | 45 | 49,473 | ||||||
| 90 | Annual Report | | September 30, 2020 | | See accompanying Notes to Financial Statements |
Table of Contents
Schedule of Investments
September 30, 2020
| Principal Amount (000s) | Value | |||||||
Discover Financial Services, Ser. C, (converts to FRN on 10/30/27) (e)(h), |
| |||||||
5.50%, 10/30/27 | $ | 45 | $ | 42,966 | ||||
Discovery Communications LLC (a)(b), |
| |||||||
4.00%, 9/15/55 | 88 | 89,240 | ||||||
DTE Electric Co., |
| |||||||
5.70%, 10/1/37 | 20 | 27,189 | ||||||
6.625%, 6/1/36, Ser. A | 10 | 14,641 | ||||||
DTE Energy Co., |
| |||||||
2.95%, 3/1/30 | 60 | 64,610 | ||||||
Duke Energy Ohio, Inc., |
| |||||||
4.30%, 2/1/49 | 40 | 50,734 | ||||||
Duke Energy Progress LLC, |
| |||||||
6.125%, 9/15/33 | 20 | 27,677 | ||||||
Edison International, |
| |||||||
2.95%, 3/15/23 | 35 | 35,930 | ||||||
4.95%, 4/15/25 | 25 | 27,455 | ||||||
El Paso Natural Gas Co. LLC, |
| |||||||
8.375%, 6/15/32 | 167 | 232,369 | ||||||
Energy Transfer Operating L.P., |
| |||||||
4.75%, 1/15/26 | 65 | 69,362 | ||||||
6.50%, 2/1/42 | 35 | 36,653 | ||||||
7.125%, 5/15/30 (converts to FRN on 5/15/30) (e)(h) | 90 | 71,212 | ||||||
Equinix, Inc., |
| |||||||
1.00%, 9/15/25 | 90 | 89,264 | ||||||
Eversource Energy, Ser. K, |
| |||||||
2.75%, 3/15/22 | 85 | 87,636 | ||||||
First Horizon Bank, |
| |||||||
5.75%, 5/1/30 | 84 | 95,011 | ||||||
First Horizon National Corp., |
| |||||||
4.00%, 5/26/25 | 147 | 159,954 | ||||||
First Maryland Capital II, 3 mo. LIBOR + 0.850% (h), |
| |||||||
1.101%, 2/1/27 | 25 | 23,188 | ||||||
Fiserv, Inc., |
| |||||||
4.40%, 7/1/49 | 15 | 18,799 | ||||||
Five Corners Funding Trust II (a)(b), |
| |||||||
2.85%, 5/15/30 | 58 | 62,590 | ||||||
Ford Motor Credit Co. LLC, |
| |||||||
3.813%, 10/12/21 | 185 | 185,809 | ||||||
General Electric Co., Ser. D, (converts to FRN on 1/21/21) (e)(h), |
| |||||||
5.00%, 1/21/21 | 55 | 43,587 | ||||||
General Motors Co., |
| |||||||
4.875%, 10/2/23 | 90 | 98,080 | ||||||
General Motors Financial Co., Inc., |
| |||||||
3.55%, 7/8/22 | 95 | 98,284 | ||||||
5.70%, 9/30/30, Ser. C (converts to FRN on 9/30/30) (e)(h) | 15 | 15,094 | ||||||
Georgia Power Co., Ser. B, |
| |||||||
3.70%, 1/30/50 | 10 | 11,210 | ||||||
Gilead Sciences, Inc., |
| |||||||
2.60%, 10/1/40 | 58 | 58,003 | ||||||
Harborwalk Funding Trust, (converts to FRN on 2/15/49) (a)(b)(h), |
| |||||||
5.077%, 2/15/69 | 150 | 184,863 | ||||||
Hess Corp., |
| |||||||
4.30%, 4/1/27 | 50 | 52,219 | ||||||
7.125%, 3/15/33 | 65 | 78,300 | ||||||
Huntington Bancshares, Inc., (converts to FRN on 10/15/30) (e)(h), |
| |||||||
5.625%, 7/15/30 | 35 | 38,588 | ||||||
Huntington Capital Trust I, 3 mo. LIBOR + 0.700% (h), |
| |||||||
0.961%, 2/1/27 | 105 | 96,495 | ||||||
Intel Corp., |
| |||||||
3.10%, 2/15/60 | 35 | 37,816 | ||||||
Intercontinental Exchange, Inc., |
| |||||||
2.65%, 9/15/40 | 45 | 45,081 | ||||||
International Business Machines Corp., |
| |||||||
1.70%, 5/15/27 | 60 | 61,959 | ||||||
2.95%, 5/15/50 | 90 | 92,876 | ||||||
Jersey Central Power & Light Co., |
| |||||||
6.15%, 6/1/37 | 110 | 149,180 | ||||||
| Principal Amount (000s) | Value | |||||||
Johnson & Johnson, |
| |||||||
2.45%, 9/1/60 | $ | 45 | $ | 45,121 | ||||
JPMorgan Chase & Co., 3 mo. LIBOR + 0.950% (h), |
| |||||||
1.201%, 2/2/37 | 180 | 154,350 | ||||||
Kansas City Southern, |
| |||||||
3.50%, 5/1/50 | 40 | 41,478 | ||||||
4.20%, 11/15/69 | 35 | 37,449 | ||||||
Kinder Morgan Energy Partners L.P., |
| |||||||
7.50%, 11/15/40 | 40 | 54,047 | ||||||
Kinder Morgan, Inc., |
| |||||||
4.30%, 6/1/25 | 65 | 73,233 | ||||||
L3Harris Technologies, Inc., |
| |||||||
3.95%, 5/28/24 | 105 | 115,363 | ||||||
4.40%, 6/15/28 | 90 | 107,531 | ||||||
Leidos, Inc., |
| |||||||
3.625%, 5/15/25 (a)(b) | 89 | 98,805 | ||||||
4.375%, 5/15/30 (a)(b) | 26 | 30,455 | ||||||
7.125%, 7/1/32 | 8 | 10,344 | ||||||
Lincoln National Corp., 3 mo. LIBOR + 2.358% (h), |
| |||||||
2.638%, 5/17/66 | 60 | 43,200 | ||||||
Litton Industries, Inc., |
| |||||||
7.75%, 3/15/26 | 20 | 26,476 | ||||||
Lockheed Martin Corp., |
| |||||||
1.85%, 6/15/30 | 20 | 20,767 | ||||||
2.80%, 6/15/50 | 8 | 8,364 | ||||||
Loews Corp., |
| |||||||
3.20%, 5/15/30 | 17 | 18,986 | ||||||
Marathon Petroleum Corp., |
| |||||||
5.85%, 12/15/45 | 60 | 68,991 | ||||||
Marriott International, Inc., |
| |||||||
5.75%, 5/1/25 | 159 | 177,615 | ||||||
Massachusetts Institute of Technology, |
| |||||||
5.60%, 7/1/11 | 30 | 53,049 | ||||||
MetLife, Inc. (a)(b), |
| |||||||
9.25%, 4/8/38 | 95 | 144,173 | ||||||
Metropolitan Life Insurance Co. (a)(b), |
| |||||||
7.80%, 11/1/25 | 130 | 170,078 | ||||||
Microsoft Corp., |
| |||||||
2.525%, 6/1/50 | 100 | 104,564 | ||||||
National Rural Utilities Cooperative Finance Corp., |
| |||||||
1.35%, 3/15/31 | 155 | 154,336 | ||||||
New York Life Insurance Co. (a)(b), |
| |||||||
4.45%, 5/15/69 | 40 | 49,076 | ||||||
Niagara Mohawk Power Corp. (a)(b), |
| |||||||
1.96%, 6/27/30 | 45 | 46,264 | ||||||
NiSource, Inc., |
| |||||||
1.70%, 2/15/31 | 40 | 39,236 | ||||||
3.49%, 5/15/27 | 100 | 111,574 | ||||||
Noble Energy, Inc., |
| |||||||
5.25%, 11/15/43 | 15 | 19,821 | ||||||
6.00%, 3/1/41 | 15 | 20,937 | ||||||
Northrop Grumman Corp., |
| |||||||
3.20%, 2/1/27 | 100 | 111,660 | ||||||
4.03%, 10/15/47 | 10 | 12,163 | ||||||
Northrop Grumman Systems Corp., |
| |||||||
7.875%, 3/1/26 | 35 | 46,481 | ||||||
Oracle Corp., |
| |||||||
2.50%, 4/1/25 | 90 | 96,446 | ||||||
3.60%, 4/1/40 | 55 | 62,235 | ||||||
3.60%, 4/1/50 | 35 | 39,186 | ||||||
Pacific Gas and Electric Co., |
| |||||||
3.75%, 2/15/24 | 128 | 133,708 | ||||||
Pennsylvania Electric Co. (a)(b), |
| |||||||
3.60%, 6/1/29 | 27 | 30,325 | ||||||
4.15%, 4/15/25 | 32 | 35,274 | ||||||
PepsiCo, Inc., | ||||||||
4.45%, 4/14/46 | 50 | 66,371 | ||||||
Plains All American Pipeline L.P., |
| |||||||
4.65%, 10/15/25 | 115 | 123,553 | ||||||
6.125%, 11/15/22, Ser. B (converts to FRN on 11/15/22) (e)(h) | 70 | 44,495 | ||||||
6.65%, 1/15/37 | 35 | 38,115 | ||||||
| Principal Amount (000s) | Value | |||||||
PPL Electric Utilities Corp., |
| |||||||
5.20%, 7/15/41 | $ | 140 | $ | 183,738 | ||||
President & Fellows of Harvard College, |
| |||||||
3.15%, 7/15/46 | 7 | 8,139 | ||||||
4.875%, 10/15/40 | 25 | 35,375 | ||||||
Public Service Co of Colorado, |
| |||||||
4.75%, 8/15/41 | 22 | 28,877 | ||||||
Raytheon Technologies Corp. (a)(b), |
| |||||||
7.00%, 11/1/28 | 100 | 138,204 | ||||||
San Diego Gas & Electric Co., Ser. NNN, |
| |||||||
3.60%, 9/1/23 | 250 | 269,408 | ||||||
Sempra Energy, |
| |||||||
3.55%, 6/15/24 | 65 | 70,780 | ||||||
3.80%, 2/1/38 | 20 | 22,444 | ||||||
4.875%, 10/15/25 (converts to FRN on 10/15/25) (e)(h) | 39 | 40,122 | ||||||
Southern California Edison Co., |
| |||||||
3.70%, 8/1/25, Ser. E | 30 | 33,402 | ||||||
3.90%, 12/1/41 | 100 | 104,048 | ||||||
Southern Co., Ser. B, (converts to FRN on 1/15/26) (h), |
| |||||||
4.00%, 1/15/51 | 39 | 39,121 | ||||||
Southwest Airlines Co., |
| |||||||
5.25%, 5/4/25 | 95 | 104,755 | ||||||
State Street Corp., 3 mo. LIBOR + 1.000% (h), |
| |||||||
1.25%, 6/15/47 | 210 | 176,914 | ||||||
Synchrony Bank, |
| |||||||
3.65%, 5/24/21 | 40 | 40,613 | ||||||
Synchrony Financial, |
| |||||||
3.70%, 8/4/26 | 45 | 47,876 | ||||||
4.50%, 7/23/25 | 63 | 69,427 | ||||||
T-Mobile USA, Inc. (a)(b), |
| |||||||
3.50%, 4/15/25 | 79 | 86,654 | ||||||
4.375%, 4/15/40 | 22 | 25,770 | ||||||
4.50%, 4/15/50 | 15 | 18,013 | ||||||
Target Corp., |
| |||||||
3.90%, 11/15/47 | 10 | 13,201 | ||||||
TCI Communications, Inc., |
| |||||||
7.875%, 2/15/26 | 80 | 107,939 | ||||||
Time Warner Cable LLC, |
| |||||||
4.50%, 9/15/42 | 30 | 32,563 | ||||||
6.55%, 5/1/37 | 70 | 93,076 | ||||||
Toledo Edison Co., | ||||||||
6.15%, 5/15/37 | 4 | 5,793 | ||||||
Transcontinental Gas Pipe Line Co. LLC (a)(b), |
| |||||||
3.25%, 5/15/30 | 25 | 27,029 | ||||||
Truist Financial Corp., Ser. Q, (converts to FRN on 9/1/30) (e)(h), |
| |||||||
5.10%, 3/1/30 | 35 | 37,877 | ||||||
Union Pacific Corp., |
| |||||||
3.75%, 2/5/70 | 23 | 25,989 | ||||||
UnitedHealth Group, Inc., |
| |||||||
3.50%, 8/15/39 | 80 | 91,940 | ||||||
Universal Health Services, Inc. (a)(b), |
| |||||||
2.65%, 10/15/30 | 27 | 26,769 | ||||||
Verizon Communications, Inc., |
| |||||||
5.25%, 3/16/37 | 85 | 117,825 | ||||||
ViacomCBS, Inc., |
| |||||||
4.20%, 5/19/32 | 17 | 19,491 | ||||||
5.25%, 4/1/44 | 35 | 41,236 | ||||||
6.25%, 2/28/57 (converts to FRN on 2/28/27) (h) | 69 | 75,881 | ||||||
Virginia Electric & Power Co., |
| |||||||
2.75%, 3/15/23, Ser. C | 75 | 78,456 | ||||||
3.80%, 9/15/47, Ser. B | 35 | 42,464 | ||||||
Visa, Inc., |
| |||||||
1.90%, 4/15/27 | 95 | 100,670 | ||||||
2.70%, 4/15/40 | 20 | 21,576 | ||||||
Walt Disney Co., |
| |||||||
3.50%, 5/13/40 | 45 | 50,965 | ||||||
3.60%, 1/13/51 | 30 | 33,831 | ||||||
| See accompanying Notes to Financial Statements | | September 30, 2020 | | Annual Report | 91 |
Table of Contents
Schedule of Investments
September 30, 2020
| Principal Amount (000s) | Value | |||||||
Wells Fargo & Co., |
| |||||||
5.95%, 12/15/36 | $ | 30 | $ | 39,145 | ||||
|
| |||||||
| 12,371,075 | ||||||||
|
| |||||||
| Total Corporate Bonds & Notes (cost—$12,957,081) |
| 13,319,753 | ||||||
|
| |||||||
| Shares | ||||||||
| Mutual Fund—9.2% |
| |||||||
AllianzGI International Growth (g) (cost—$2,839,681) | 191,096 | 4,190,727 | ||||||
|
| |||||||
| Exchange-Traded Funds—7.4% |
| |||||||
Invesco DB Base Metals | 30,000 | 454,200 | ||||||
Invesco DB Gold | 32,172 | 1,781,042 | ||||||
iShares JP Morgan USD Emerging Markets Bond | 5,000 | 554,450 | ||||||
VanEck Vectors J.P. Morgan EM Local Currency Bond | 17,500 | 539,700 | ||||||
|
| |||||||
| Total Exchange-Traded Funds (cost—$3,413,449) |
| 3,329,392 | ||||||
|
| |||||||
| Principal Amount (000s) | ||||||||
| U.S. Treasury Obligations—0.8% |
| |||||||
U.S. Treasury Bonds, |
| |||||||
0.25%, 8/31/25 | $6 | 5,996 | ||||||
1.25%, 5/15/50 | 138 | 130,809 | ||||||
U.S. Treasury Notes, |
| |||||||
0.25%, 9/30/25 (k) | 145 | 144,807 | ||||||
0.625%, 8/15/30 | 90 | 89,480 | ||||||
|
| |||||||
| Total U.S. Treasury Obligations (cost—$372,411) |
| 371,092 | ||||||
|
| |||||||
| Shares | ||||||||
| Preferred Stock—0.4% |
| |||||||
| Brazil—0.1% |
| |||||||
Banco Bradesco S.A. | 2,900 | 10,023 | ||||||
Cia de Saneamento do Parana | 5,700 | 5,166 | ||||||
| Shares | Value | |||||||
Cia de Transmissao de Energia Eletrica Paulista | 1,400 | $ | 5,432 | |||||
Cia Energetica de Minas Gerais | 1,969 | 3,541 | ||||||
Cia Paranaense de Energia | 600 | 6,625 | ||||||
Petroleo Brasileiro S.A. | 3,300 | 11,523 | ||||||
Telefonica Brasil S.A. | 900 | 6,959 | ||||||
|
| |||||||
| 49,269 | ||||||||
|
| |||||||
| Chile—0.0% |
| |||||||
Embotelladora Andina S.A., Class B | 2,122 | 4,690 | ||||||
|
| |||||||
| Germany—0.1% |
| |||||||
Porsche Automobil Holding SE | 258 | 15,349 | ||||||
Volkswagen AG (i) | 105 | 16,895 | ||||||
|
| |||||||
| 32,244 | ||||||||
|
| |||||||
| Korea (Republic of)—0.1% |
| |||||||
Samsung Electronics Co., Ltd. | 593 | 25,523 | ||||||
|
| |||||||
| United States—0.1% |
| |||||||
Bank of America Corp. (e) | 1,253 | 34,219 | ||||||
Wells Fargo & Co. (e) | 1,905 | 47,892 | ||||||
|
| |||||||
| 82,111 | ||||||||
|
| |||||||
| Total Preferred Stock (cost—$191,643) |
| 193,837 | ||||||
|
| |||||||
| Principal Amount (000s) | ||||||||
| Repurchase Agreements—13.9% |
| |||||||
State Street Bank and Trust Co., dated 9/30/20, 0.00%, due 10/1/20, proceeds $6,306,000; collateralized by U.S. Treasury Notes, 0.25%, due 9/30/25, valued at $6,432,198 including accrued interest |
| |||||||
(cost—$6,306,000) | $6,306 | 6,306,000 | ||||||
|
| |||||||
| Total Investments (cost—$37,330,416) (c)—91.9% |
| 41,739,087 | ||||||
|
| |||||||
| Other assets less liabilities (j)—8.1% | 3,694,856 | |||||||
|
| |||||||
| Net Assets—100.0% |
| $45,433,943 | ||||||
|
| |||||||
Notes to Schedule of Investments:
† Actual amount rounds to less than $1 or less than 1 share.
(a) Private Placement—Restricted as to resale and may not have a readily available market. Private placement securities include Rule 144A securities. Securities with an aggregate value of $2,200,985, representing 4.8% of net assets.
(b) 144A—Exempt from registration under Rule 144A of the Securities Act of 1933. These securities may be resold in transactions exempt from registration, typically only to qualified institutional buyers. Securities with an aggregate value of $2,342,436, representing 5.2% of net assets.
(c) Securities with an aggregate value of $5,542,452, representing 12.2% of net assets, were valued utilizing modeling tools provided by a third-party vendor. See Note 1(a) and Note 1(b) in the Notes to Financial Statements.
(d) Fair-Valued—Securities with an aggregate value of $8,740, representing less than 0.05% of net assets. See Note 1(a) and Note 1(b) in the Notes to Financial Statements.
(e) Perpetual maturity. The date shown, if any, is the next call date.
(f) Level 3 security. See Note 1(a) and Note 1(b) in the Notes to Financial Statements.
(g) Affiliated fund.
(h) Variable or Floating Rate Security—Securities with an interest rate that changes periodically. The interest rate disclosed reflects the rate in effect on September 30, 2020.
(i) Non-income producing.
(j) Includes net unrealized appreciation (depreciation) of other financial instruments as follows:
| Futures contracts outstanding at September 30, 2020: | ||||||||||||||||||||||
| Type | Contracts | Expiration Date | Notional Amount (000s) | Market Value (000s) | Unrealized Appreciation (Depreciation) | |||||||||||||||||
Long position contracts: | ||||||||||||||||||||||
2-Year U.S. Treasury Note | 2 | 12/31/20 | $ | 400 | $ | 442 | $ | 170 | ||||||||||||||
5-Year U.S. Treasury Note | 30 | 12/31/20 | 3,000 | 3,781 | 3,351 | |||||||||||||||||
10-Year U.S. Treasury Note | 41 | 12/21/20 | 4,100 | 5,721 | 5,973 | |||||||||||||||||
Dow Jones U.S. Real Estate Index | 17 | 12/18/20 | 2 | 533 | (1,208 | ) | ||||||||||||||||
E-mini Russell 1000 Index | 75 | 12/18/20 | 4 | 4,361 | (102,000 | ) | ||||||||||||||||
E-mini Russell 1000 Index | 16 | 12/18/20 | 1 | 1,745 | 47,880 | |||||||||||||||||
Euro Currency | 8 | 12/14/20 | 1,000 | 1,174 | (8,196 | ) | ||||||||||||||||
MSCI EAFE Index | 10 | 12/18/20 | 1 | 927 | (22,361 | ) | ||||||||||||||||
MSCI Emerging Markets Index | 64 | 12/18/20 | 3 | 3,483 | (38,502 | ) | ||||||||||||||||
TOPIX Index | 10 | 12/10/20 | JPY | 100 | 1,541 | (21,849 | ) | |||||||||||||||
XAE Energy | 50 | 12/18/20 | $ | 5 | 1,549 | (3,450 | ) | |||||||||||||||
|
| |||||||||||||||||||||
| $ | (140,192 | ) | ||||||||||||||||||||
|
| |||||||||||||||||||||
| 92 | Annual Report | | September 30, 2020 | | See accompanying Notes to Financial Statements |
Table of Contents
Schedule of Investments
September 30, 2020
| Futures contracts outstanding at September 30, 2020 (continued): | ||||||||||||||||||||||
| Type | Contracts | Expiration Date | Notional Amount (000s) | Market Value (000s) | Unrealized Appreciation (Depreciation) | |||||||||||||||||
Short position contracts: | ||||||||||||||||||||||
British Pound | (14 | ) | 12/14/20 | $ | (875 | ) | $ | (1,129 | ) | $ | 7,673 | |||||||||||
Euro-Bund 10-Year Bond | (17 | ) | 12/8/20 | EUR | (1,700 | ) | (2,941 | ) | (2,092 | ) | ||||||||||||
Ultra U.S. Treasury Bond | (6 | ) | 12/21/20 | $ | (600 | ) | (1,331 | ) | 10,025 | |||||||||||||
|
| |||||||||||||||||||||
| $ | 15,606 | |||||||||||||||||||||
|
| |||||||||||||||||||||
| $ | (124,586 | ) | ||||||||||||||||||||
|
| |||||||||||||||||||||
| Credit default swaps agreements outstanding at September 30, 2020: | ||||||||||||||||||||||||||||||||
Centrally cleared buy protection swap agreements:
|
| |||||||||||||||||||||||||||||||
| Broker (Exchange)/ Reference Debt Issuer | Notional Amount (000s)(1) | Implied Credit Spread | Termination Date | Fixed Deal Pay Rate | Payment Frequency | Value(2) | Upfront Premiums Paid | Unrealized Appreciation (Depreciation) | ||||||||||||||||||||||||
Goldman Sachs (ICE): |
| |||||||||||||||||||||||||||||||
Marriott International, Inc. | $ | 95 | 1.623 | % | 6/20/25 | (1.00 | )% | Quarterly | $ | 2,292 | $ | 1,583 | $ | 709 | ||||||||||||||||||
Southwest Airlines Co. | 65 | 1.567 | % | 6/20/25 | (1.00 | )% | Quarterly | 1,403 | 1,650 | (247 | ) | |||||||||||||||||||||
|
| |||||||||||||||||||||||||||||||
| $ | 3,695 | $ | 3,233 | $ | 462 | |||||||||||||||||||||||||||
|
| |||||||||||||||||||||||||||||||
(1) This represents the maximum potential amount the Fund could be required to make available as a seller of credit protection or receive as a buyer of credit protection if a credit event occurs as defined under the terms of that particular swap agreement.
(2) The quoted market prices and resulting values for credit default swap agreements serve as an indicator of the status at September 30, 2020 of the payment/performance risk and represent the likelihood of an expected liability (or profit) for the credit derivative should the notional amount of the swap agreement have been closed/sold as of the period end. Increasing market values, in absolute terms when compared to the notional amount of the swap, represent a deterioration of the referenced entity’s credit soundness and a greater likelihood or risk of default or other credit event occurring as defined under the terms of the agreement.
| Volatility swap agreements outstanding at September 30, 2020: | ||||||||||||||||||||||||||||||
Over-the-counter total return swap agreements:
|
| |||||||||||||||||||||||||||||
| Counterparty | Pay/Receive Volatility | Reference Entity | Volatility Strike | Payment Frequency | Maturity Date | Notional Amount | Premiums Paid (Received) | Unrealized Appreciation (Depreciation) | ||||||||||||||||||||||
JP Morgan N.A. | Pay | S&P Index(3) | 27.60 | % | Maturity | 11/20/20 | $ | 5,000 | $ | — | $ | (5,943 | ) | |||||||||||||||||
UBS AG | Pay | Russell 2000 Index(3) | 31.75 | % | Maturity | 10/16/20 | 5,000 | — | 15,694 | |||||||||||||||||||||
|
| |||||||||||||||||||||||||||||
| $ | — | $ | 9,751 | |||||||||||||||||||||||||||
|
| |||||||||||||||||||||||||||||
(3) Variance swap
(k) At September 30, 2020, the Fund pledged $2,645,193 in cash as collateral for futures contracts and received $6,746 in cash as collateral for swap contracts. The Fund also pledged U.S. Treasury Obligations valued at $9,714 as collateral for swap contracts.
| See accompanying Notes to Financial Statements | | September 30, 2020 | | Annual Report | 93 |
Table of Contents
Schedule of Investments
September 30, 2020
Glossary:
ADR—American Depositary Receipt
EAFE—Europe, Australasia and Far East
EUR—Euro
FRN—Floating Rate Note
GDR—Global Depositary Receipt
ICE—Intercontinental Exchange
JPY—Japanese Yen
LIBOR—London Inter-Bank Offered Rate
MSCI—Morgan Stanley Capital International
REIT—Real Estate Investment Trust
TOPIX—Tokyo Stock Price Index
UNIT—More than one class of securities traded together
The industry classification of portfolio holdings and other assets less liabilities shown as a percentage of net assets were as follows:
Mutual Fund | 9.2% | |||
Exchange-Traded Funds | 7.4% | |||
Electric Utilities | 6.1% | |||
Banks | 6.1% | |||
Insurance | 4.0% | |||
Pharmaceuticals | 2.9% | |||
Aerospace & Defense | 2.3% | |||
Software | 2.1% | |||
Media | 2.1% | |||
Oil, Gas & Consumable Fuels | 2.0% | |||
Pipelines | 1.9% | |||
Semiconductors & Semiconductor Equipment | 1.7% | |||
Equity Real Estate Investment Trusts (REITs) | 1.6% | |||
Diversified Financial Services | 1.6% | |||
Technology Hardware, Storage & Peripherals | 1.4% | |||
Telecommunications | 1.2% | |||
Diversified Telecommunication Services | 1.0% | |||
IT Services | 1.0% | |||
Internet & Direct Marketing Retail | 1.0% | |||
Food & Staples Retailing | 0.9% | |||
Healthcare Providers & Services | 0.9% | |||
Auto Manufacturers | 0.9% | |||
Interactive Media & Services | 0.9% | |||
Metals & Mining | 0.8% | |||
U.S. Treasury Obligations | 0.8% | |||
Food Products | 0.8% | |||
Beverages | 0.7% | |||
Semiconductors | 0.7% | |||
Wireless Telecommunication Services | 0.7% | |||
Healthcare Equipment & Supplies | 0.7% | |||
Biotechnology | 0.7% | |||
Computers | 0.6% | |||
Specialty Retail | 0.6% | |||
Airlines | 0.6% | |||
Capital Markets | 0.5% | |||
Household Products | 0.5% |
Chemicals | 0.5% | |||
Construction & Engineering | 0.5% | |||
Hotels, Restaurants & Leisure | 0.5% | |||
Commercial Services & Supplies | 0.5% | |||
Automobiles | 0.4% | |||
Household Durables | 0.4% | |||
Lodging | 0.4% | |||
Trading Companies & Distributors | 0.4% | |||
Multi-Line Retail | 0.3% | |||
Transportation | 0.3% | |||
Textiles, Apparel & Luxury Goods | 0.3% | |||
Electronic Equipment, Instruments & Components | 0.3% | |||
Multi-Utilities | 0.3% | |||
Entertainment | 0.3% | |||
Healthcare-Services | 0.3% | |||
Construction Materials | 0.3% | |||
Industrial Conglomerates | 0.2% | |||
Machinery | 0.2% | |||
Miscellaneous Manufacturing | 0.2% | |||
Commercial Services | 0.2% | |||
Real Estate Management & Development | 0.2% | |||
Professional Services | 0.2% | |||
Communications Equipment | 0.2% | |||
Building Products | 0.2% | |||
Electrical Equipment | 0.2% | |||
Mortgage Real Estate Investment Trusts (REITs) | 0.1% | |||
Internet | 0.1% | |||
Consumer Finance | 0.1% | |||
Healthcare Technology | 0.1% | |||
Independent Power Producers & Energy Traders | 0.1% | |||
Life Sciences Tools & Services | 0.1% | |||
Road & Rail | 0.1% | |||
Food & Beverage | 0.1% | |||
Personal Products | 0.1% | |||
Gas Utilities | 0.1% | |||
Transportation Infrastructure | 0.1% | |||
Containers & Packaging | 0.1% | |||
Real Estate | 0.1% | |||
Diversified Consumer Services | 0.0% | |||
Retail | 0.0% | |||
Marine | 0.0% | |||
Paper & Forest Products | 0.0% | |||
Tobacco | 0.0% | |||
Leisure Equipment & Products | 0.0% | |||
Auto Components | 0.0% | |||
Energy Equipment & Services | 0.0% | |||
Thrifts & Mortgage Finance | 0.0% | |||
Water Utilities | 0.0% | |||
Distributors | 0.0% | |||
Repurchase Agreements | 13.9% | |||
Other assets less liabilities | 8.1% | |||
|
| |||
| 100.0% | ||||
|
|
AllianzGI Global Sustainability Fund
| Shares | Value | |||||||
| Common Stock—91.8% |
| |||||||
| Australia—1.5% |
| |||||||
CSL Ltd. | 11,647 | $2,405,882 | ||||||
|
| |||||||
| Canada—0.9% |
| |||||||
Gibson Energy, Inc. | 86,890 | 1,408,198 | ||||||
|
| |||||||
| Denmark—1.5% |
| |||||||
Novo Nordisk A/S, Class B | 36,167 | 2,505,815 | ||||||
|
| |||||||
| France—2.8% |
| |||||||
Bureau Veritas S.A. (b) | 63,950 | 1,441,517 | ||||||
Credit Agricole S.A. | 125,571 | 1,095,593 | ||||||
Kering S.A. | 3,116 | 2,066,975 | ||||||
|
| |||||||
| 4,604,085 | ||||||||
|
| |||||||
| Germany—6.6% |
| |||||||
Adidas AG (b) | 12,716 | 4,106,530 | ||||||
Muenchener Rueckversicherungs-Gesellschaft AG in Muenchen | 12,677 | 3,222,712 | ||||||
SAP SE | 22,137 | 3,447,132 | ||||||
|
| |||||||
| 10,776,374 | ||||||||
|
| |||||||
| Hong Kong—1.2% |
| |||||||
AIA Group Ltd. | 189,600 | 1,884,642 | ||||||
|
| |||||||
| Japan—5.4% |
| |||||||
Daikin Industries Ltd. | 22,400 | 4,138,942 | ||||||
Keyence Corp. | 10,100 | 4,721,539 | ||||||
|
| |||||||
| 8,860,481 | ||||||||
|
| |||||||
| Korea (Republic of)—1.5% |
| |||||||
Samsung Electronics Co., Ltd. GDR | 1,920 | 2,434,413 | ||||||
|
| |||||||
| Spain—1.1% |
| |||||||
Industria de Diseno Textil S.A. | 64,733 | 1,790,799 | ||||||
|
| |||||||
| Sweden—3.8% |
| |||||||
Assa Abloy AB, Class B | 98,064 | 2,292,747 | ||||||
Atlas Copco AB, Class A | 80,291 | 3,828,175 | ||||||
|
| |||||||
| 6,120,922 | ||||||||
|
| |||||||
| Switzerland—3.3% |
| |||||||
Roche Holding AG | 10,699 | 3,664,841 | ||||||
UBS Group AG | 157,360 | 1,758,168 | ||||||
|
| |||||||
| 5,423,009 | ||||||||
|
| |||||||
| United Kingdom—8.3% |
| |||||||
AstraZeneca PLC | 30,978 | 3,384,793 | ||||||
Prudential PLC | 143,406 | 2,057,633 | ||||||
Reckitt Benckiser Group PLC | 32,696 | 3,188,031 | ||||||
Royal Dutch Shell PLC, Class B | 105,314 | 1,277,148 | ||||||
Unilever PLC | 46,934 | 2,893,629 | ||||||
Vodafone Group PLC | 606,124 | 803,374 | ||||||
|
| |||||||
| 13,604,608 | ||||||||
|
| |||||||
| United States—53.9% |
| |||||||
AbbVie, Inc. | 22,630 | 1,982,162 | ||||||
Accenture PLC, Class A | 16,069 | 3,631,433 | ||||||
Adobe, Inc. | 12,150 | 5,958,724 | ||||||
Agilent Technologies, Inc. | 46,767 | 4,720,661 | ||||||
Alphabet, Inc., Class A | 2,336 | 3,423,642 | ||||||
American Express Co. | 29,380 | 2,945,345 | ||||||
Apple, Inc. | 71,220 | 8,247,988 | ||||||
Bright Horizons Family Solutions, Inc. | 15,097 | 2,295,348 | ||||||
Citigroup, Inc. | 30,367 | 1,309,121 | ||||||
Colgate-Palmolive Co. | 26,388 | 2,035,834 | ||||||
Eaton Corp. PLC | 22,464 | 2,292,002 | ||||||
Ecolab, Inc. | 14,864 | 2,970,422 | ||||||
Estee Lauder Cos., Inc., Class A | 12,578 | 2,745,149 | ||||||
| 94 | Annual Report | | September 30, 2020 | | See accompanying Notes to Financial Statements |
Table of Contents
Schedule of Investments
September 30, 2020
| Shares | Value | |||||||
International Flavors & Fragrances, Inc. | 21,483 | $ | 2,630,593 | |||||
Intuit, Inc. | 14,983 | 4,887,604 | ||||||
Johnson & Johnson | 17,324 | 2,579,197 | ||||||
Microsoft Corp. | 39,441 | 8,295,626 | ||||||
Mondelez International, Inc., Class A | 40,334 | 2,317,188 | ||||||
S&P Global, Inc. | 16,708 | 6,024,905 | ||||||
Starbucks Corp. | 43,666 | 3,751,783 | ||||||
UnitedHealth Group, Inc. | 12,578 | 3,921,443 | ||||||
Visa, Inc., Class A | 31,911 | 6,381,243 | ||||||
Xylem, Inc. | 27,966 | 2,352,500 | ||||||
|
| |||||||
| 87,699,913 | ||||||||
|
| |||||||
| Total Common Stock (cost—$123,945,019) |
| 149,519,141 | ||||||
|
| |||||||
| Principal Amount (000s) | ||||||||
| Repurchase Agreements—2.6% |
| |||||||
State Street Bank and Trust Co., |
| |||||||
(cost—$4,166,000) | $4,166 | 4,166,000 | ||||||
|
| |||||||
| Total Investments (cost—$128,111,019) (a)—94.4% |
| 153,685,141 | ||||||
|
| |||||||
| Other assets less liabilities—5.6% | 9,109,579 | |||||||
|
| |||||||
| Net Assets—100.0% |
| $162,794,720 | ||||||
|
| |||||||
Notes to Schedule of Investments:
(a) Securities with an aggregate value of $60,411,030, representing 37.1% of net assets, were valued utilizing modeling tools provided by a third-party vendor. See Note 1(a) and Note 1(b) in the Notes to Financial Statements.
(b) Non-income producing.
Glossary:
GDR—Global Depositary Receipt
The industry classification of portfolio holdings and other assets less liabilities shown as a percentage of net assets were as follows:
Software | 13.9% | |||
Pharmaceuticals | 7.5% | |||
Technology Hardware, Storage & Peripherals | 6.6% | |||
IT Services | 6.1% | |||
Capital Markets | 4.8% | |||
Insurance | 4.4% | |||
Building Products | 3.9% | |||
Machinery | 3.8% | |||
Textiles, Apparel & Luxury Goods | 3.8% | |||
Personal Products | 3.5% | |||
Chemicals | 3.4% | |||
Household Products | 3.2% | |||
Electronic Equipment, Instruments & Components | 2.9% | |||
Life Sciences Tools & Services | 2.9% | |||
Biotechnology | 2.7% | |||
Healthcare Providers & Services | 2.4% | |||
Hotels, Restaurants & Leisure | 2.3% | |||
Interactive Media & Services | 2.1% | |||
Consumer Finance | 1.8% | |||
Oil, Gas & Consumable Fuels | 1.6% | |||
Banks | 1.5% | |||
Food Products | 1.4% | |||
Diversified Consumer Services | 1.4% | |||
Electrical Equipment | 1.4% | |||
Specialty Retail | 1.1% | |||
Professional Services | 0.9% | |||
Wireless Telecommunication Services | 0.5% | |||
Repurchase Agreements | 2.6% | |||
Other assets less liabilities | 5.6% | |||
|
| |||
| 100.0% | ||||
|
|
AllianzGI Green Bond Fund
| Principal Amount (000s) | Value | |||||||||||
| Corporate Bonds & Notes—89.9% |
| |||||||||||
| Brazil—0.4% |
| |||||||||||
Fibria Overseas Finance Ltd., |
| |||||||||||
5.50%, 1/17/27 | $ | 100 | $113,370 | |||||||||
|
| |||||||||||
| British Virgin Islands—0.9% |
| |||||||||||
Talent Yield Euro Ltd., |
| |||||||||||
1.00%, 9/24/25 | 200 | 236,299 | ||||||||||
|
| |||||||||||
| China—1.5% |
| |||||||||||
Industrial & Commercial Bank of China Ltd. (d), |
| |||||||||||
3 mo. LIBOR + 0.720%, 0.965%, 4/25/22 | 200 | 200,012 | ||||||||||
3 mo. LIBOR + 0.830%, 1.075%, 4/25/24 | 200 | 199,235 | ||||||||||
|
| |||||||||||
| 399,247 | ||||||||||||
|
| |||||||||||
| Czech Republic—3.0% |
| |||||||||||
CPI Property Group S.A., | ||||||||||||
1.625%, 4/23/27 | € | 700 | 795,633 | |||||||||
|
| |||||||||||
| Denmark—4.2% |
| |||||||||||
Orsted A/S, | ||||||||||||
1.75%, 12/9/3019 (converts to FRN on 4/16/23) (d)(e) | 100 | 118,050 | ||||||||||
2.25%, 11/24/3017 (converts to FRN on 5/22/23) (d)(e) | 700 | 847,683 | ||||||||||
2.50%, 5/16/33 | £ | 100 | 147,132 | |||||||||
|
| |||||||||||
| 1,112,865 | ||||||||||||
|
| |||||||||||
| Finland—0.4% |
| |||||||||||
SATO Oyj, | ||||||||||||
1.375%, 2/24/28 | $ | 100 | 117,557 | |||||||||
|
| |||||||||||
| France—7.9% |
| |||||||||||
CNP Assurances, (converts to FRN on 7/27/30) (d), |
| |||||||||||
2.00%, 7/27/50 | € | 500 | 587,456 | |||||||||
Covivio, | ||||||||||||
1.125%, 9/17/31 | 100 | 113,247 | ||||||||||
Electricite de France S.A., | ||||||||||||
3.625%, 10/13/25 | $ | 100 | 112,110 | |||||||||
Engie S.A., | ||||||||||||
1.375%, 6/21/39 | € | 100 | 126,631 | |||||||||
Engie SA, (converts to FRN on 4/16/23) (c)(d), |
| |||||||||||
1.375%, 1/16/23 | 500 | 585,981 | ||||||||||
Paprec Holding S.A., | ||||||||||||
4.00%, 3/31/25 | 400 | 450,537 | ||||||||||
Societe Generale S.A., (converts to FRN on 9/22/27) (d), |
| |||||||||||
0.875%, 9/22/28 | $ | 100 | 116,863 | |||||||||
|
| |||||||||||
| 2,092,825 | ||||||||||||
|
| |||||||||||
| Germany—3.6% |
| |||||||||||
Commerzbank AG, (converts to FRN on 3/24/25) (d), |
| |||||||||||
0.75%, 3/24/26 | 100 | 116,865 | ||||||||||
Kreditanstalt fuer Wiederaufbau, |
| |||||||||||
0.75%, 9/30/30 | 200 | 198,271 | ||||||||||
Landesbank Baden-Wuerttemberg, |
| |||||||||||
1.125%, 12/8/25 | 300 | 391,133 | ||||||||||
Landesbank Baden-Wuerttemberg, |
| |||||||||||
1.50%, 2/3/25 | £ | 200 | 264,335 | |||||||||
|
| |||||||||||
| 970,604 | ||||||||||||
|
| |||||||||||
| Hong Kong—5.6% |
| |||||||||||
CGNPC International Ltd., |
| |||||||||||
2.75%, 7/2/24 | $ | 300 | 314,179 | |||||||||
MTR Corp CI Ltd, | ||||||||||||
2.50%, 11/2/26 | 600 | 642,322 | ||||||||||
Swire Properties MTN Financing Ltd, |
| |||||||||||
3.50%, 1/10/28 | 500 | 538,959 | ||||||||||
|
| |||||||||||
| 1,495,460 | ||||||||||||
|
| |||||||||||
| See accompanying Notes to Financial Statements | | September 30, 2020 | | Annual Report | 95 |
Table of Contents
Schedule of Investments
September 30, 2020
| Principal Amount (000s) | Value | |||||||||||
| India—1.5% |
| |||||||||||
ReNew Power Pvt Ltd., | ||||||||||||
5.875%, 3/5/27 | $ | 400 | $ | 401,381 | ||||||||
|
| |||||||||||
| Ireland—0.4% |
| |||||||||||
Johnson Controls International PLC, |
| |||||||||||
1.75%, 9/15/30 | 100 | 100,968 | ||||||||||
|
| |||||||||||
| Italy—3.5% |
| |||||||||||
Assicurazioni Generali SpA, |
| |||||||||||
2.124%, 10/1/30 | € | 500 | 589,795 | |||||||||
2.429%, 7/14/31 | 100 | 118,793 | ||||||||||
ERG SpA, |
| |||||||||||
0.50%, 9/11/27 | $ | 100 | 116,983 | |||||||||
Mediobanca Banca di Credito Finanziario SpA, |
| |||||||||||
1.00%, 9/8/27 | 100 | 117,801 | ||||||||||
|
| |||||||||||
| 943,372 | ||||||||||||
|
| |||||||||||
| Japan—0.8% |
| |||||||||||
Mitsubishi UFJ Financial Group, Inc., |
| |||||||||||
2.527%, 9/13/23 | 200 | 210,498 | ||||||||||
|
| |||||||||||
| Korea (Republic of)—2.9% |
| |||||||||||
LG Chem Ltd. (a)(b), |
| |||||||||||
3.25%, 10/15/24 | 500 | 537,766 | ||||||||||
3.625%, 4/15/29 | 200 | 221,389 | ||||||||||
|
| |||||||||||
| 759,155 | ||||||||||||
|
| |||||||||||
| Lithuania—0.5% |
| |||||||||||
AB Ignitis Grupe, |
| |||||||||||
2.00%, 7/14/27 | € | 100 | 126,269 | |||||||||
|
| |||||||||||
| Luxembourg—1.4% |
| |||||||||||
CPI Property Group S.A., |
| |||||||||||
2.75%, 5/12/26 | 300 | 363,705 | ||||||||||
|
| |||||||||||
| Netherlands—10.7% |
| |||||||||||
Cooperatieve Rabobank UA, (converts to FRN on 9/24/25) (d), |
| |||||||||||
1.004%, 9/24/26 | $ | 400 | 397,778 | |||||||||
de Volksbank NV, (converts to FRN on 10/22/25) (d), |
| |||||||||||
1.75%, 10/22/30 | € | 100 | 120,486 | |||||||||
Digital Dutch Finco BV, |
| |||||||||||
1.00%, 1/15/32 | $ | 100 | 116,134 | |||||||||
EDP Finance BV, |
| |||||||||||
1.71%, 1/24/28 | 400 | 398,956 | ||||||||||
ING Groep NV, (converts to FRN on 7/1/25) (d), |
| |||||||||||
1.40%, 7/1/26 | 400 | 404,202 | ||||||||||
LeasePlan Corp. NV, |
| |||||||||||
3.50%, 4/9/25 | € | 300 | 388,300 | |||||||||
NXP B.V. (a)(b), |
| |||||||||||
3.40%, 5/1/30 | $ | 250 | 273,777 | |||||||||
OI European Group BV, |
| |||||||||||
2.875%, 2/15/25 | € | 200 | 231,506 | |||||||||
Telefonica Europe BV, (converts to FRN on 5/5/27) (c)(d), |
| |||||||||||
2.502%, 2/5/27 | 200 | 222,490 | ||||||||||
TenneT Holding BV (c)(d), |
| |||||||||||
2.374%, 7/22/25 (converts to FRN on 10/22/25) | 150 | 178,399 | ||||||||||
2.995%, 3/1/24 (converts to FRN on 6/1/24) | 100 | 122,185 | ||||||||||
|
| |||||||||||
| 2,854,213 | ||||||||||||
|
| |||||||||||
| Portugal—0.9% |
| |||||||||||
EDP—Energias de Portugal S.A. (d), |
| |||||||||||
1.70%, 7/20/80 (converts to FRN on 2/12/25) | 100 | 112,974 | ||||||||||
4.496%, 4/30/79 (converts to FRN on 5/11/26) | 100 | 126,819 | ||||||||||
|
| |||||||||||
| 239,793 | ||||||||||||
|
| |||||||||||
| Principal Amount (000s) | Value | |||||||||||
| Russian Federation—0.9% |
| |||||||||||
Russian Railways Via RZD Capital PLC, |
| |||||||||||
2.20%, 5/23/27 | € | 200 | $ | 241,891 | ||||||||
|
| |||||||||||
| Spain—5.8% |
| |||||||||||
Banco Bilbao Vizcaya Argentaria S.A., (converts to FRN on 1/15/26) (c)(d), |
| |||||||||||
6.00%, 1/15/26 | 200 | 238,161 | ||||||||||
Banco Santander S.A., |
| |||||||||||
1.125%, 6/23/27 | 200 | 241,411 | ||||||||||
Bankinter S.A., |
| |||||||||||
0.625%, 10/6/27 | 200 | 229,526 | ||||||||||
Iberdrola International BV (c)(d), |
| |||||||||||
1.875%, 2/22/23 (converts to FRN on 5/22/23) | 600 | 709,781 | ||||||||||
3.25%, 11/12/24 (converts to FRN on 5/11/26) | 100 | 125,431 | ||||||||||
|
| |||||||||||
| 1,544,310 | ||||||||||||
|
| |||||||||||
| Sweden—1.7% |
| |||||||||||
Telia Co AB, (converts to FRN on 7/27/30) (d), |
| |||||||||||
1.375%, 5/11/81 | 400 | 460,542 | ||||||||||
|
| |||||||||||
| United Kingdom—4.1% |
| |||||||||||
Anglian Water Services Financing PLC, |
| |||||||||||
1.625%, 8/10/25 | £ | 400 | 536,430 | |||||||||
Bazalgette Finance PLC, |
| |||||||||||
2.375%, 11/29/27 | 100 | 140,017 | ||||||||||
Cadent Finance PLC, |
| |||||||||||
0.75%, 3/11/32 | € | 100 | 117,063 | |||||||||
Natwest Group PLC, (converts to FRN on 5/22/23) (d), |
| |||||||||||
2.359%, 5/22/24 | $ | 150 | 154,029 | |||||||||
Northern Powergrid Northeast PLC, |
| |||||||||||
1.875%, 6/16/62 | £ | 100 | 136,573 | |||||||||
|
| |||||||||||
| 1,084,112 | ||||||||||||
|
| |||||||||||
| United States—27.3% |
| |||||||||||
Analog Devices, Inc., |
| |||||||||||
2.95%, 4/1/25 | $ | 100 | 108,851 | |||||||||
Apple, Inc., |
| |||||||||||
3.00%, 6/20/27 | 500 | 562,937 | ||||||||||
Avangrid, Inc., |
| |||||||||||
3.20%, 4/15/25 | 200 | 220,316 | ||||||||||
3.80%, 6/1/29 | 300 | 346,511 | ||||||||||
Bank of America Corp. (d), |
| |||||||||||
2.456%, 10/22/25 (converts to FRN on 10/22/24) | 500 | 527,814 | ||||||||||
3.499%, 5/17/22 (converts to FRN on 5/17/21) | 400 | 407,507 | ||||||||||
Boston Properties L.P., |
| |||||||||||
3.40%, 6/21/29 | 300 | 326,569 | ||||||||||
Citigroup, Inc., (converts to FRN on 5/15/23) (d), |
| |||||||||||
1.678%, 5/15/24 | 350 | 358,679 | ||||||||||
DTE Electric Co., |
| |||||||||||
3.95%, 3/1/49 | 200 | 250,986 | ||||||||||
Duke Energy Carolinas LLC, |
| |||||||||||
3.95%, 11/15/28 | 100 | 120,042 | ||||||||||
Duke Realty L.P., |
| |||||||||||
2.875%, 11/15/29 | 400 | 437,086 | ||||||||||
Hanwha Energy USA Holdings Corp., |
| |||||||||||
2.375%, 7/30/22 | 400 | 411,406 | ||||||||||
Interstate Power & Light Co., |
| |||||||||||
4.10%, 9/26/28 | 100 | 118,922 | ||||||||||
Metropolitan Life Global Funding I, (converts to FRN on 5/15/23) (a)(b), |
| |||||||||||
0.95%, 7/2/25 | 400 | 404,020 | ||||||||||
NextEra Energy Capital Holdings, Inc., |
| |||||||||||
2.20%, 12/2/26 | AUD | 300 | 219,284 | |||||||||
Niagara Mohawk Power Corp. (a)(b), |
| |||||||||||
1.96%, 6/27/30 | $ | 200 | 205,620 | |||||||||
| Principal Amount (000s) | Value | |||||||||||
Northern States Power Co., |
| |||||||||||
2.60%, 6/1/51 | $ | 200 | $ | 202,864 | ||||||||
Public Service Co. of Colorado, Ser. 34, |
| |||||||||||
3.20%, 3/1/50 | 700 | 782,748 | ||||||||||
Southwestern Public Service Co., |
| |||||||||||
3.15%, 5/1/50 | 300 | 323,966 | ||||||||||
Verizon Communications, Inc., |
| |||||||||||
1.50%, 9/18/30 | 400 | 398,475 | ||||||||||
Verizon Communications, Inc., |
| |||||||||||
3.875%, 2/8/29 | 100 | 118,219 | ||||||||||
Welltower, Inc., |
| |||||||||||
2.70%, 2/15/27 | 400 | 422,654 | ||||||||||
|
| |||||||||||
| 7,275,476 | ||||||||||||
|
| |||||||||||
| Total Corporate Bonds & Notes (cost—$22,663,507) |
| 23,939,545 | ||||||||||
|
| |||||||||||
| Sovereign Debt Obligations—11.7% |
| |||||||||||
| Canada—0.5% |
| |||||||||||
Province of Quebec Canada, |
| |||||||||||
2.60%, 7/6/25 | CAD | 150 | 122,920 | |||||||||
|
| |||||||||||
| Chile—3.1% |
| |||||||||||
Chile Government International Bond, |
| |||||||||||
0.83%, 7/2/31 | € | 200 | 235,369 | |||||||||
1.25%, 1/29/40 | 500 | 590,484 | ||||||||||
|
| |||||||||||
| 825,853 | ||||||||||||
|
| |||||||||||
| Korea (Republic of)—3.1% |
| |||||||||||
Export-Import Bank of Korea (d), |
| |||||||||||
0.965%, 3/22/23 | $ | 400 | 402,736 | |||||||||
Korea Electric Power Corp., |
| |||||||||||
1.125%, 6/15/25 | 200 | 201,311 | ||||||||||
Korea South-East Power Co., Ltd., |
| |||||||||||
2.125%, 2/3/25 | 200 | 209,994 | ||||||||||
|
| |||||||||||
| 814,041 | ||||||||||||
|
| |||||||||||
| Supranational—5.0% |
| |||||||||||
Central American Bank for Economic Integration, 3 mo. LIBOR + 0.850% (d), |
| |||||||||||
1.13%, 11/15/24 | 750 | 750,649 | ||||||||||
Corp Andina de Fomento, |
| |||||||||||
0.625%, 11/20/26 | € | 200 | 232,482 | |||||||||
European Investment Bank, |
| |||||||||||
0.01%, 11/15/35 | $ | 300 | 354,815 | |||||||||
|
| |||||||||||
| 1,337,946 | ||||||||||||
|
| |||||||||||
| Total Sovereign Debt Obligations (cost—$3,015,083) |
| 3,100,760 | ||||||||||
|
| |||||||||||
| Total Investments (cost—$25,678,590)—101.6% |
| 27,040,305 | ||||||||||
|
| |||||||||||
Liabilities in excess of other assets (f)—(1.6)% |
| (418,642 | ) | |||||||||
|
| |||||||||||
| Net Assets—100.0% |
| $26,621,663 | ||||||||||
|
| |||||||||||
Notes to Schedule of Investments:
(a) Private Placement—Restricted as to resale and may not have a readily available market. Private placement securities include Rule 144A securities. Securities with an aggregate value of $1,642,572, representing 6.2% of net assets.
(b) 144A—Exempt from registration under Rule 144A of the Securities Act of 1933. These securities may be resold in transactions exempt from registration, typically only to qualified institutional buyers. Securities with an aggregate value of $1,642,572, representing 6.2% of net assets.
| 96 | Annual Report | | September 30, 2020 | | See accompanying Notes to Financial Statements |
Table of Contents
Schedule of Investments
September 30, 2020
(c) Perpetual maturity. The date shown, if any, is the next call date.
(d) Variable or Floating Rate Security—Securities with an interest rate that changes periodically. The interest rate disclosed reflects the rate in effect on September 30, 2020.
(e) Hybrid bond.
(f) Includes net unrealized appreciation (depreciation) of other financial instruments as follows:
| Futures contracts outstanding at September 30, 2020: | ||||||||||||||||||||||
| Type | Contracts | Expiration Date | Notional Amount (000s) | Market Value (000s) | Unrealized Appreciation (Depreciation) | |||||||||||||||||
Long position contracts: |
| |||||||||||||||||||||
Euro-Bund 10-Year Bond | 37 | 12/8/20 | EUR | 3,700 | $ | 7,571 | $ | 29,132 | ||||||||||||||
|
| |||||||||||||||||||||
Short position contracts: | ||||||||||||||||||||||
10-Year U.S. Treasury Note | (30 | ) | 12/21/20 | $ | (3,000 | ) | $ | (4,186 | ) | $ | (4,250 | ) | ||||||||||
|
| |||||||||||||||||||||
| $ | 24,882 | |||||||||||||||||||||
|
| |||||||||||||||||||||
| Forward foreign currency contracts outstanding at September 30, 2020: | ||||||||||||||||
| Description | Counterparty | U.S.$ Value on Origination Date | U.S.$ Value September 30, 2020 | Unrealized Depreciation | ||||||||||||
Sold: | ||||||||||||||||
310,000 Australian Dollar settling 12/18/20 | State Street Bank London | $ | 219,194 | $ | 222,084 | $ | (2,890 | ) | ||||||||
957,000 British Pound settling 12/18/20 | State Street Bank London | 1,232,185 | 1,235,478 | (3,293 | ) | |||||||||||
165,000 Canadian Dollar settling 12/18/20 | State Street Bank London | 123,393 | 123,959 | (566 | ) | |||||||||||
9,170,000 Euro Currency settling 12/18/20 | State Street Bank London | 10,712,585 | 10,770,135 | (57,550 | ) | |||||||||||
|
| |||||||||||||||
| $ | (64,299 | ) | ||||||||||||||
|
| |||||||||||||||
(g) At September 30, 2020, the Fund pledged $165,443 in cash as collateral for futures contracts.
Glossary:
AUD—Australian Dollar
£—British Pound
CAD—Canadian Dollar
€/EUR—Euro
FRN—Floating Rate Note
LIBOR—London Inter-Bank Offered Rate
| See accompanying Notes to Financial Statements | | September 30, 2020 | | Annual Report | 97 |
Table of Contents
Schedule of Investments
September 30, 2020
The industry classification of portfolio holdings and liabilities in excess of other assets shown as a percentage of net assets were as follows:
Electric Utilities | 27.0% | |||
Banks | 18.4% | |||
Sovereign Debt Obligations | 11.7% | |||
Real Estate | 6.8% | |||
Insurance | 6.4% | |||
Equity Real Estate Investment Trusts (REITs) | 5.3% | |||
Telecommunications | 4.5% | |||
Transportation | 3.3% | |||
Energy-Alternate Sources | 3.1% | |||
Chemicals | 2.9% | |||
Water Utilities | 2.5% | |||
Computers | 2.1% | |||
Environmental Services | 1.7% | |||
Diversified Financial Services | 1.5% | |||
Semiconductors | 1.4% | |||
Utilities | 0.9% | |||
Containers & Packaging | 0.9% | |||
Independent Power and Renewable Electricity Producers | 0.4% | |||
Paper & Forest Products | 0.4% | |||
Building Products | 0.4% | |||
Liabilities in excess of other assets | (1.6)% | |||
|
| |||
| 100.0% | ||||
|
|
AllianzGI High Yield Bond Fund
| Principal Amount (000s) | Value | |||||||
| Corporate Bonds & Notes—91.2% |
| |||||||
| Aerospace & Defense—1.7% |
| |||||||
TransDigm, Inc., |
| |||||||
5.50%, 11/15/27 | $635 | $611,473 | ||||||
Triumph Group, Inc. (a)(b), |
| |||||||
6.25%, 9/15/24 | 440 | 375,329 | ||||||
8.875%, 6/1/24 | 485 | 517,737 | ||||||
|
| |||||||
| 1,504,539 | ||||||||
|
| |||||||
| Airlines—0.9% |
| |||||||
American Airlines, Inc. (a)(b), |
| |||||||
11.75%, 7/15/25 | 370 | 357,696 | ||||||
Delta Air Lines, Inc., |
| |||||||
7.375%, 1/15/26 | 410 | 430,381 | ||||||
|
| |||||||
| 788,077 | ||||||||
|
| |||||||
| Auto Components—3.5% |
| |||||||
Adient U.S. LLC (a)(b), |
| |||||||
7.00%, 5/15/26 | 745 | 799,102 | ||||||
American Axle & Manufacturing, Inc., |
| |||||||
6.25%, 4/1/25 | 740 | 734,010 | ||||||
Clarios Global L.P. (a)(b), |
| |||||||
8.50%, 5/15/27 | 850 | 883,277 | ||||||
Goodyear Tire & Rubber Co., |
| |||||||
5.00%, 5/31/26 | 615 | 598,586 | ||||||
|
| |||||||
| 3,014,975 | ||||||||
|
| |||||||
| Auto Manufacturers—4.2% |
| |||||||
Ford Motor Co., |
| |||||||
9.00%, 4/22/25 | 725 | 832,151 | ||||||
9.625%, 4/22/30 | 775 | 1,001,963 | ||||||
Ford Motor Credit Co. LLC, |
| |||||||
5.125%, 6/16/25 | 270 | 278,606 | ||||||
Navistar International Corp. (a)(b), |
| |||||||
6.625%, 11/1/25 | 815 | 837,922 | ||||||
Tesla, Inc. (a)(b), |
| |||||||
5.30%, 8/15/25 | 620 | 642,475 | ||||||
|
| |||||||
| 3,593,117 | ||||||||
|
| |||||||
| Building Materials—0.6% |
| |||||||
Builders FirstSource, Inc. (a)(b), |
| |||||||
5.00%, 3/1/30 | 530 | 549,544 | ||||||
|
| |||||||
| Chemicals—1.3% |
| |||||||
PQ Corp. (a)(b), |
| |||||||
5.75%, 12/15/25 | 470 | 485,226 | ||||||
Tronox, Inc. (a)(b), |
| |||||||
6.50%, 4/15/26 | 600 | 601,125 | ||||||
|
| |||||||
| 1,086,351 | ||||||||
|
| |||||||
| Commercial Services—3.5% |
| |||||||
Avis Budget Car Rental LLC (a)(b), |
| |||||||
5.75%, 7/15/27 | 595 | 537,565 | ||||||
Cenveo Corp. (a)(b)(c)(d)(e), |
| |||||||
6.00%, 5/15/24 | 2,299 | 42,141 | ||||||
Herc Holdings, Inc. (a)(b), |
| |||||||
5.50%, 7/15/27 | 465 | 481,984 | ||||||
Laureate Education, Inc. (a)(b), |
| |||||||
8.25%, 5/1/25 | 710 | 754,811 | ||||||
RR Donnelley & Sons Co., |
| |||||||
7.00%, 2/15/22 | 618 | 624,807 | ||||||
United Rentals North America, Inc., |
| |||||||
5.25%, 1/15/30 | 535 | 584,822 | ||||||
|
| |||||||
| 3,026,130 | ||||||||
|
| |||||||
| Containers & Packaging—2.3% |
| |||||||
Berry Global, Inc. (a)(b), |
| |||||||
5.625%, 7/15/27 | 550 | 577,844 | ||||||
Owens-Brockway Glass Container, Inc. (a)(b), |
| |||||||
6.625%, 5/13/27 | 740 | 802,900 | ||||||
| Principal Amount (000s) | Value | |||||||
Trivium Packaging Finance BV (a)(b), |
| |||||||
8.50%, 8/15/27 | $ | 525 | $ | 567,000 | ||||
|
| |||||||
| 1,947,744 | ||||||||
|
| |||||||
| Distribution/Wholesale—1.6% |
| |||||||
H&E Equipment Services, Inc., |
| |||||||
5.625%, 9/1/25 | 580 | 605,375 | ||||||
Performance Food Group, Inc. (a)(b), |
| |||||||
5.50%, 10/15/27 | 790 | 815,146 | ||||||
|
| |||||||
| 1,420,521 | ||||||||
|
| |||||||
| Diversified Financial Services—5.8% |
| |||||||
CCF Holdings LLC, PIK 10.75% (a)(b)(d)(e), |
| |||||||
10.75%, 12/15/23 | 3,268 | 723,555 | ||||||
Community Choice Financial Issuer LLC |
| |||||||
9.00%, 6/15/23 | 2,000 | 2,000,000 | ||||||
Nationstar Mortgage Holdings, Inc. (a)(b), |
| |||||||
5.50%, 8/15/28 | 645 | 645,403 | ||||||
Navient Corp., |
| |||||||
5.00%, 3/15/27 | 275 | 258,613 | ||||||
6.75%, 6/15/26 | 875 | 876,641 | ||||||
OneMain Finance Corp., |
| |||||||
6.625%, 1/15/28 | 440 | 489,055 | ||||||
|
| |||||||
| 4,993,267 | ||||||||
|
| |||||||
| Electrical Equipment—1.6% |
| |||||||
Energizer Holdings, Inc. (a)(b), |
| |||||||
7.75%, 1/15/27 | 560 | 612,850 | ||||||
WESCO Distribution, Inc. (a)(b), |
| |||||||
7.25%, 6/15/28 | 720 | 789,898 | ||||||
|
| |||||||
| 1,402,748 | ||||||||
|
| |||||||
| Entertainment—6.9% |
| |||||||
AMC Entertainment Holdings, Inc. (a)(b), |
| |||||||
10.50%, 4/15/25 | 1,275 | 956,250 | ||||||
Caesars Entertainment, Inc. (a)(b), |
| |||||||
8.125%, 7/1/27 | 785 | 833,125 | ||||||
Cedar Fair L.P., |
| |||||||
5.375%, 4/15/27 | 620 | 618,450 | ||||||
International Game Technology PLC (a)(b), |
| |||||||
6.25%, 1/15/27 | 835 | 896,085 | ||||||
Lions Gate Capital Holdings LLC (a)(b), |
| |||||||
6.375%, 2/1/24 | 855 | 849,113 | ||||||
Scientific Games International, Inc. (a)(b), |
| |||||||
8.25%, 3/15/26 | 760 | 796,643 | ||||||
Stars Group Holdings BV (a)(b), |
| |||||||
7.00%, 7/15/26 | 955 | 1,016,478 | ||||||
|
| |||||||
| 5,966,144 | ||||||||
|
| |||||||
| Food & Beverage—3.3% |
| |||||||
Albertsons Cos., Inc. (a)(b), |
| |||||||
7.50%, 3/15/26 | 370 | 406,599 | ||||||
Kraft Heinz Foods Co., |
| |||||||
6.50%, 2/9/40 | 845 | 1,075,227 | ||||||
Post Holdings, Inc. (a)(b), |
| |||||||
5.75%, 3/1/27 | 530 | 558,654 | ||||||
U.S. Foods, Inc. (a)(b), |
| |||||||
6.25%, 4/15/25 | 810 | 858,669 | ||||||
|
| |||||||
| 2,899,149 | ||||||||
|
| |||||||
| Food Service—0.6% |
| |||||||
Aramark Services, Inc. (a)(b), |
| |||||||
5.00%, 2/1/28 | 500 | 504,572 | ||||||
|
| |||||||
| Healthcare-Services—4.1% |
| |||||||
Centene Corp. (a)(b), |
| |||||||
5.375%, 6/1/26 | 600 | 633,657 | ||||||
Encompass Health Corp., |
| |||||||
4.75%, 2/1/30 | 410 | 416,655 | ||||||
HCA, Inc., |
| |||||||
5.625%, 9/1/28 | 490 | 561,405 | ||||||
| 98 | Annual Report | | September 30, 2020 | | See accompanying Notes to Financial Statements |
Table of Contents
Schedule of Investments
September 30, 2020
| Principal Amount (000s) | Value | |||||||
Select Medical Corp. (a)(b), |
| |||||||
6.25%, 8/15/26 | $ | 605 | $ | 630,132 | ||||
Tenet Healthcare Corp. (a)(b), |
| |||||||
6.25%, 2/1/27 | 1,050 | 1,085,285 | ||||||
7.50%, 4/1/25 | 245 | 264,334 | ||||||
|
| |||||||
| 3,591,468 | ||||||||
|
| |||||||
| Home Builders—1.3% |
| |||||||
Picasso Finance Sub, Inc. (a)(b), |
| |||||||
6.125%, 6/15/25 | 620 | 668,726 | ||||||
Taylor Morrison Communities, Inc. (a)(b), |
| |||||||
5.75%, 1/15/28 | 400 | 446,750 | ||||||
|
| |||||||
| 1,115,476 | ||||||||
|
| |||||||
| Household Products/Wares—0.5% |
| |||||||
Prestige Brands, Inc. (a)(b), |
| |||||||
5.125%, 1/15/28 | 395 | 408,825 | ||||||
|
| |||||||
| Internet—1.9% |
| |||||||
Go Daddy Operating Co. LLC (a)(b), |
| |||||||
5.25%, 12/1/27 | 740 | 771,661 | ||||||
Netflix, Inc. (a)(b), |
| |||||||
5.375%, 11/15/29 | 375 | 442,462 | ||||||
Uber Technologies, Inc. (a)(b), |
| |||||||
6.25%, 1/15/28 | 165 | 169,641 | ||||||
7.50%, 9/15/27 | 255 | 272,531 | ||||||
|
| |||||||
| 1,656,295 | ||||||||
|
| |||||||
| Iron/Steel—0.7% |
| |||||||
Cleveland-Cliffs, Inc., |
| |||||||
5.875%, 6/1/27 | 650 | 605,312 | ||||||
|
| |||||||
| Leisure—1.4% |
| |||||||
Royal Caribbean Cruises Ltd. (a)(b), |
| |||||||
11.50%, 6/1/25 | 1,010 | 1,174,499 | ||||||
|
| |||||||
| Lodging—3.3% |
| |||||||
Boyd Gaming Corp. (a)(b), |
| |||||||
8.625%, 6/1/25 | 805 | 883,512 | ||||||
MGM Resorts International, |
| |||||||
6.75%, 5/1/25 | 550 | 577,283 | ||||||
Wyndham Hotels & Resorts, Inc. (a)(b), |
| |||||||
5.375%, 4/15/26 | 540 | 550,462 | ||||||
Wynn Las Vegas LLC (a)(b), |
| |||||||
5.50%, 3/1/25 | 880 | 846,450 | ||||||
|
| |||||||
| 2,857,707 | ||||||||
|
| |||||||
| Machinery-Construction & Mining—0.9% |
| |||||||
Terex Corp. (a)(b), |
| |||||||
5.625%, 2/1/25 | 770 | 775,775 | ||||||
|
| |||||||
| Media—7.6% |
| |||||||
CCO Holdings LLC (a)(b), |
| |||||||
5.125%, 5/1/27 | 775 | 816,505 | ||||||
5.375%, 6/1/29 | 500 | 542,445 | ||||||
Clear Channel Worldwide Holdings, Inc., |
| |||||||
9.25%, 2/15/24 | 667 | 648,327 | ||||||
CSC Holdings LLC (a)(b), |
| |||||||
7.50%, 4/1/28 | 860 | 951,259 | ||||||
DISH DBS Corp., |
| |||||||
7.375%, 7/1/28 | 745 | 768,281 | ||||||
Gray Television, Inc. (a)(b), |
| |||||||
5.875%, 7/15/26 | 730 | 758,744 | ||||||
LiveStyle, Inc. (cost—$2,761,001; purchased 1/31/2014-2/3/2014) (a)(b)(c)(d)(e)(g)(i), |
| |||||||
9.625%, 2/1/19 | 2,761 | 3 | ||||||
Meredith Corp., |
| |||||||
6.875%, 2/1/26 | 1,100 | 920,562 | ||||||
Nexstar Broadcasting, Inc. (a)(b), |
| |||||||
5.625%, 7/15/27 | 780 | 819,402 | ||||||
Virgin Media Secured Finance PLC (a)(b), |
| |||||||
5.50%, 5/15/29 | 350 | 376,264 | ||||||
|
| |||||||
| 6,601,792 | ||||||||
|
| |||||||
| Principal Amount (000s) | Value | |||||||
| Metal Fabricate/Hardware—1.0% |
| |||||||
Park-Ohio Industries, Inc., |
| |||||||
6.625%, 4/15/27 | $ | 980 | $ | 904,050 | ||||
|
| |||||||
| Mining—1.3% |
| |||||||
Alcoa Nederland Holding BV (a)(b), |
| |||||||
6.75%, 9/30/24 | 525 | 542,391 | ||||||
Joseph T. Ryerson & Son, Inc. (a)(b), |
| |||||||
8.50%, 8/1/28 | 540 | 569,700 | ||||||
|
| |||||||
| 1,112,091 | ||||||||
|
| |||||||
| Miscellaneous Manufacturing—0.9% |
| |||||||
Koppers, Inc. (a)(b), |
| |||||||
6.00%, 2/15/25 | 800 | 813,000 | ||||||
|
| |||||||
| Oil, Gas & Consumable Fuels—5.5% |
| |||||||
CNX Resources Corp. (a)(b), |
| |||||||
7.25%, 3/14/27 | 405 | 413,614 | ||||||
Continental Resources, Inc., |
| |||||||
4.375%, 1/15/28 | 335 | 290,221 | ||||||
EQT Corp., |
| |||||||
8.75%, 2/1/30 | 455 | 538,183 | ||||||
Occidental Petroleum Corp., |
| |||||||
5.55%, 3/15/26 | 1,100 | 998,063 | ||||||
6.625%, 9/1/30 | 380 | 351,263 | ||||||
PBF Holding Co. LLC (a)(b), |
| |||||||
6.00%, 2/15/28 | 505 | 339,827 | ||||||
PDC Energy, Inc., |
| |||||||
5.75%, 5/15/26 | 575 | 537,625 | ||||||
Sunoco L.P., |
| |||||||
5.50%, 2/15/26 | 330 | 330,762 | ||||||
5.875%, 3/15/28 | 205 | 210,342 | ||||||
USA Compression Partners L.P., |
| |||||||
6.875%, 9/1/27 | 495 | 491,688 | ||||||
WPX Energy, Inc., |
| |||||||
5.75%, 6/1/26 | 250 | 259,219 | ||||||
|
| |||||||
| 4,760,807 | ||||||||
|
| |||||||
| Paper & Forest Products—0.8% |
| |||||||
Mercer International, Inc., |
| |||||||
7.375%, 1/15/25 | 680 | 689,775 | ||||||
|
| |||||||
| Personal Products—0.6% |
| |||||||
Edgewell Personal Care Co. (a)(b), |
| |||||||
5.50%, 6/1/28 | 520 | 547,880 | ||||||
|
| |||||||
| Pharmaceuticals—2.1% |
| |||||||
Bausch Health Americas, Inc. (a)(b), |
| |||||||
8.50%, 1/31/27 | 950 | 1,045,157 | ||||||
Bausch Health Cos., Inc. (a)(b), |
| |||||||
7.25%, 5/30/29 | 755 | 813,841 | ||||||
|
| |||||||
| 1,858,998 | ||||||||
|
| |||||||
| Pipelines—4.1% |
| |||||||
Cheniere Energy Partners L.P., |
| |||||||
5.625%, 10/1/26 | 540 | 562,518 | ||||||
Crestwood Midstream Partners L.P., |
| |||||||
5.75%, 4/1/25 | 860 | 784,750 | ||||||
DCP Midstream Operating L.P., |
| |||||||
5.125%, 5/15/29 | 590 | 582,147 | ||||||
EQM Midstream Partners L.P. (a)(b), |
| |||||||
6.50%, 7/1/27 | 520 | 551,946 | ||||||
NuStar Logistics L.P., |
| |||||||
6.375%, 10/1/30 | 430 | 447,200 | ||||||
Targa Resources Partners L.P., |
| |||||||
6.50%, 7/15/27 | 585 | 611,325 | ||||||
|
| |||||||
| 3,539,886 | ||||||||
|
| |||||||
| Real Estate—1.2% |
| |||||||
Iron Mountain, Inc. (a)(b), |
| |||||||
4.875%, 9/15/27 | 525 | 536,900 | ||||||
Kennedy-Wilson, Inc., |
| |||||||
5.875%, 4/1/24 | 535 | 532,994 | ||||||
|
| |||||||
| 1,069,894 | ||||||||
|
| |||||||
| Principal Amount (000s) | Value | |||||||
| Retail—2.4% |
| |||||||
1011778 BC ULC (a)(b), |
| |||||||
5.00%, 10/15/25 | $ | 350 | $ | 359,469 | ||||
Asbury Automotive Group, Inc. (a)(b), |
| |||||||
4.75%, 3/1/30 | 440 | 444,125 | ||||||
Conn’s, Inc., |
| |||||||
7.25%, 7/15/22 | 920 | 822,466 | ||||||
L Brands, Inc. (a)(b), |
| |||||||
6.625%, 10/1/30 | 440 | 448,800 | ||||||
|
| |||||||
| 2,074,860 | ||||||||
|
| |||||||
| Semiconductors—0.3% |
| |||||||
Amkor Technology, Inc. (a)(b), |
| |||||||
6.625%, 9/15/27 | 245 | 263,420 | ||||||
|
| |||||||
| Software—3.1% |
| |||||||
j2 Cloud Services LLC (a)(b), |
| |||||||
6.00%, 7/15/25 | 200 | 208,260 | ||||||
Logan Merger Sub, Inc. (a)(b), |
| |||||||
5.50%, 9/1/27 | 540 | 549,112 | ||||||
Rackspace Technology Global, Inc. (a)(b), |
| |||||||
8.625%, 11/15/24 | 1,080 | 1,132,056 | ||||||
SS&C Technologies, Inc. (a)(b), |
| |||||||
5.50%, 9/30/27 | 745 | 792,658 | ||||||
|
| |||||||
| 2,682,086 | ||||||||
|
| |||||||
| Telecommunications—6.6% |
| |||||||
Avaya, Inc. (a)(b), |
| |||||||
6.125%, 9/15/28 | 600 | 615,000 | ||||||
CenturyLink, Inc., Ser. Y, |
| |||||||
7.50%, 4/1/24 | 705 | 790,199 | ||||||
Cincinnati Bell, Inc. (a)(b), |
| |||||||
7.00%, 7/15/24 | 960 | 991,205 | ||||||
CommScope Technologies LLC (a)(b), |
| |||||||
6.00%, 6/15/25 | 669 | 678,968 | ||||||
Consolidated Communications, Inc., |
| |||||||
6.50%, 10/1/22 | 650 | 650,861 | ||||||
Hughes Satellite Systems Corp., |
| |||||||
6.625%, 8/1/26 | 815 | 884,895 | ||||||
Sprint Corp., |
| |||||||
7.625%, 3/1/26 | 930 | 1,125,207 | ||||||
|
| |||||||
| 5,736,335 | ||||||||
|
| |||||||
| Toys/Games/Hobbies—0.4% |
| |||||||
Mattel, Inc. (a)(b), |
| |||||||
5.875%, 12/15/27 | 285 | 307,266 | ||||||
|
| |||||||
| Transportation—1.4% |
| |||||||
Fortress Transportation and Infrastructure Investors LLC (a)(b), |
| |||||||
9.75%, 8/1/27 | 810 | 866,194 | ||||||
XPO Logistics, Inc. (a)(b), |
| |||||||
6.125%, 9/1/23 | 375 | 383,456 | ||||||
|
| |||||||
| 1,249,650 | ||||||||
|
| |||||||
| Total Corporate Bonds & Notes (cost—$84,025,338) |
| 79,094,025 | ||||||
|
| |||||||
| Shares | ||||||||
| Preferred Stock (a)(d)(e)(h)(i)—5.5% |
| |||||||
| Media—5.5% |
| |||||||
LiveStyle, Inc., Ser. A | 2,672 | 399,464 | ||||||
LiveStyle, Inc., Ser. B (f) | 57,581 | 4,399,764 | ||||||
|
| |||||||
| Total Preferred Stock (cost—$5,907,093) |
| 4,799,228 | ||||||
|
| |||||||
| Common Stock (d)(e)(h)—0.1% |
| |||||||
| Aerospace & Defense—0.1% |
| |||||||
Erickson, Inc. (a) | 2,675 | 34,802 | ||||||
|
| |||||||
| See accompanying Notes to Financial Statements | | September 30, 2020 | | Annual Report | 99 |
Table of Contents
Schedule of Investments
September 30, 2020
| Shares | Value | |||||||
| Banks—0.0% |
| |||||||
CCF Holdings LLC Class A (cost—$0; purchased 12/18/18) (g) | 8,562 | $ | 1 | |||||
CCF Holdings LLC Class B (cost—$0; purchased 12/12/18) (f)(g) | 7,143 | — | † | |||||
|
| |||||||
| 1 | ||||||||
|
| |||||||
| Media—0.0% |
| |||||||
LiveStyle, Inc. (a)(i) | 67,983 | 7 | ||||||
|
| |||||||
| Total Common Stock (cost—$1,491,067) |
| 34,810 | ||||||
|
| |||||||
| Units | ||||||||
| Warrants (d)(e)(h)—0.0% |
| |||||||
| Advertising—0.0% |
| |||||||
Affinion Group Holdings, Inc., exercise price $67.12, expires 4/1/24 (cost—$769,740; purchased 4/10/19) (g) | 3,898 | 16,254 | ||||||
|
| |||||||
| Media—0.0% |
| |||||||
LiveStyle, Inc., Ser. C, expires 11/30/21 (a)(i) | 14,500 | 1 | ||||||
|
| |||||||
| Total Warrants (cost—$769,740) |
| 16,255 | ||||||
|
| |||||||
| Principal Amount (000s) | ||||||||
| Repurchase Agreements—2.0% |
| |||||||
State Street Bank and Trust Co., dated 9/30/20, 0.00%, due 10/1/20, proceeds $1,738,000; collateralized by U.S. Treasury Notes, 0.25%, due 9/30/25, valued at $1,772,762 including accrued interest |
| |||||||
(cost—$1,738,000) | $1,738 | 1,738,000 | ||||||
|
| |||||||
| Total Investments (cost—$93,931,238)—98.8% |
| 85,682,318 | ||||||
|
| |||||||
| Other assets less liabilities—1.2% |
| 1,015,796 | ||||||
|
| |||||||
| Net Assets—100.0% |
| $86,698,114 | ||||||
|
| |||||||
Notes to Schedule of Investments:
† Actual amount rounds to less than $1.
(a) Private Placement—Restricted as to resale and may not have a readily available market. Private placement securities include Rule 144A securities. Securities with an aggregate value of $56,414,325, representing 65.1% of net assets.
(b) 144A—Exempt from registration under Rule 144A of the Securities Act of 1933. These securities may be resold in transactions exempt from registration, typically only to qualified institutional buyers. Securities with an aggregate value of $51,580,287, representing 59.5% of net assets.
(c) In default.
(d) Fair-Valued—Securities with an aggregate value of $7,615,992, representing 8.8% of net assets. See Note 1(a) and Note 1(b) in the Notes to Financial Statements.
(e) Level 3 security. See Note 1(a) and Note 1(b) in the Notes to Financial Statements.
(f) Affiliated security.
(g) Restricted. The aggregate cost of such securities is $5,530,741. The aggregate value is $2,016,258, representing 2.3% of net assets.
(h) Non-income producing.
(i) A member of the Fund’s portfolio management team is a member of the board of directors of LiveStyle, Inc. The Fund’s aggregate value of investments in LiveStyle, Inc. represents 5.5% of net assets.
Glossary:
PIK—Payment-in-Kind
AllianzGI International Small-Cap Fund
| Shares | Value | |||||||
| Common Stock—97.0% |
| |||||||
| Australia—5.8% |
| |||||||
Ansell Ltd. | 12,252 | $325,935 | ||||||
Austal Ltd. | 257,157 | 607,359 | ||||||
Bapcor Ltd. | 72,114 | 354,622 | ||||||
Cleanaway Waste Management Ltd. | 337,853 | 510,151 | ||||||
JB Hi-Fi Ltd. | 5,445 | 185,130 | ||||||
NEXTDC Ltd. (e) | 73,764 | 654,590 | ||||||
Northern Star Resources Ltd. | 21,900 | 217,008 | ||||||
Paradigm Biopharmaceuticals Ltd. (e) | 54,978 | 105,465 | ||||||
Pro Medicus Ltd. | 19,500 | 380,340 | ||||||
Seven Group Holdings Ltd. | 41,200 | 535,066 | ||||||
Starpharma Holdings Ltd. (e) | 258,859 | 279,518 | ||||||
Worley Ltd. | 48,657 | 339,126 | ||||||
|
| |||||||
| 4,494,310 | ||||||||
|
| |||||||
| Austria—1.6% |
| |||||||
Wienerberger AG (e) | 47,324 | 1,250,632 | ||||||
|
| |||||||
| Denmark—2.8% |
| |||||||
Ambu A/S, Class B | 34,202 | 963,107 | ||||||
SimCorp A/S | 9,513 | 1,247,955 | ||||||
|
| |||||||
| 2,211,062 | ||||||||
|
| |||||||
| Finland—1.5% |
| |||||||
Huhtamaki Oyj | 24,180 | 1,191,661 | ||||||
|
| |||||||
| France—5.4% |
| |||||||
Korian S.A. (e) | 30,269 | 1,060,736 | ||||||
Nexity S.A. | 26,014 | 791,103 | ||||||
SCOR SE (e) | 41,310 | 1,150,151 | ||||||
SPIE S.A. (e) | 67,952 | 1,217,772 | ||||||
|
| |||||||
| 4,219,762 | ||||||||
|
| |||||||
| Germany—11.1% |
| |||||||
Alstria office REIT-AG (e) | 51,373 | 714,355 | ||||||
Bechtle AG | 6,025 | 1,219,119 | ||||||
CANCOM SE | 19,452 | 1,004,745 | ||||||
Evotec SE (e) | 41,788 | 1,101,713 | ||||||
Hella GmbH & Co. KGaA (e) | 23,823 | 1,201,603 | ||||||
Jenoptik AG | 41,401 | 1,110,079 | ||||||
Scout24 AG (a) | 12,804 | 1,116,854 | ||||||
Siltronic AG | 12,630 | 1,131,540 | ||||||
|
| |||||||
| 8,600,008 | ||||||||
|
| |||||||
| Hong Kong—2.5% |
| |||||||
Alphamab Oncology (a)(e) | 92,000 | 181,130 | ||||||
Hutchison China MediTech Ltd. ADR (e) | 17,700 | 571,710 | ||||||
Nissin Foods Co., Ltd. | 597,000 | 625,751 | ||||||
Techtronic Industries Co., Ltd. | 37,000 | 491,941 | ||||||
VTech Holdings Ltd. | 9,000 | 56,138 | ||||||
|
| |||||||
| 1,926,670 | ||||||||
|
| |||||||
| Italy—3.0% |
| |||||||
Buzzi Unicem SpA | 48,833 | 1,134,564 | ||||||
ERG SpA | 46,283 | 1,164,007 | ||||||
|
| |||||||
| 2,298,571 | ||||||||
|
| |||||||
| Japan—30.7% |
| |||||||
Anritsu Corp. | 10,900 | 248,391 | ||||||
Azbil Corp. | 47,400 | 1,776,075 | ||||||
COMSYS Holdings Corp. | 39,300 | 1,096,605 | ||||||
Fuji Electric Co., Ltd. | 40,300 | 1,277,536 | ||||||
Fuji Oil Holdings, Inc. | 30,000 | 944,328 | ||||||
Glory Ltd. | 33,100 | 742,157 | ||||||
Heiwa Real Estate Co., Ltd. | 30,900 | 853,750 | ||||||
Holon Co., Ltd. | 5,600 | 229,492 | ||||||
Itochu Techno-Solutions Corp. | 54,100 | 2,052,307 | ||||||
Jeol Ltd. | 40,800 | 1,406,530 | ||||||
Marui Group Co., Ltd. | 95,400 | 1,830,656 | ||||||
| 100 | Annual Report | | September 30, 2020 | | See accompanying Notes to Financial Statements |
Table of Contents
Schedule of Investments
September 30, 2020
| Shares | Value | |||||||
Mitsubishi UFJ Lease & Finance Co., Ltd. | 286,000 | $ | 1,328,858 | |||||
Nihon Unisys Ltd. | 44,300 | 1,397,674 | ||||||
NSK Ltd. | 88,500 | 677,410 | ||||||
Open House Co., Ltd. | 14,400 | 521,704 | ||||||
PALTAC Corp. | 14,800 | 748,589 | ||||||
Penta-Ocean Construction Co., Ltd. | 233,700 | 1,532,207 | ||||||
Ryohin Keikaku Co., Ltd. | 35,200 | 584,898 | ||||||
T&D Holdings, Inc. | 39,400 | 388,418 | ||||||
Taiyo Yuden Co., Ltd. | 7,800 | 245,685 | ||||||
TechnoPro Holdings, Inc. | 16,400 | 1,026,828 | ||||||
Tokyu Fudosan Holdings Corp. | 270,800 | 1,169,777 | ||||||
Tosoh Corp. | 80,900 | 1,313,492 | ||||||
ValueCommerce Co., Ltd. | 13,900 | 466,189 | ||||||
|
| |||||||
| 23,859,556 | ||||||||
|
| |||||||
| Korea (Republic of)—0.6% |
| |||||||
Koh Young Technology, Inc. | 6,590 | 504,240 | ||||||
|
| |||||||
| Netherlands—2.7% |
| |||||||
ASM International NV | 7,393 | 1,059,733 | ||||||
ASR Nederland NV | 31,826 | 1,070,413 | ||||||
|
| |||||||
| 2,130,146 | ||||||||
|
| |||||||
| New Zealand—0.1% |
| |||||||
Eroad Ltd. (e) | 38,075 | 110,176 | ||||||
|
| |||||||
| Norway—2.5% |
| |||||||
Elkem ASA (a) | 379,882 | 809,997 | ||||||
Storebrand ASA (e) | 208,036 | 1,095,851 | ||||||
|
| |||||||
| 1,905,848 | ||||||||
|
| |||||||
| Singapore—1.2% |
| |||||||
Mapletree Industrial Trust REIT | 378,400 | 896,538 | ||||||
|
| |||||||
| Sweden—3.0% |
| |||||||
AAK AB (e) | 60,120 | 1,118,919 | ||||||
Elekta AB, Class B | 95,953 | 1,205,792 | ||||||
|
| |||||||
| 2,324,711 | ||||||||
|
| |||||||
| Switzerland—5.6% |
| |||||||
Galenica AG (a) | 13,952 | 970,177 | ||||||
Georg Fischer AG | 1,226 | 1,273,068 | ||||||
Interroll Holding AG | 509 | 1,287,403 | ||||||
OC Oerlikon Corp. AG | 105,717 | 841,916 | ||||||
|
| |||||||
| 4,372,564 | ||||||||
|
| |||||||
| Shares | Value | |||||||
| Taiwan—1.8% |
| |||||||
ASMedia Technology, Inc. | 11,000 | $ | 557,726 | |||||
Unimicron Technology Corp. | 108,000 | 280,059 | ||||||
Win Semiconductors Corp. | 33,000 | 329,049 | ||||||
Yageo Corp. | 17,000 | 208,749 | ||||||
|
| |||||||
| 1,375,583 | ||||||||
|
| |||||||
| Thailand—0.7% |
| |||||||
Sri Trang Gloves Thailand PCL (c)(d)(e) | 219,600 | 531,891 | ||||||
|
| |||||||
| United Kingdom—14.4% |
| |||||||
ASOS PLC (e) | 18,890 | 1,254,219 | ||||||
Auto Trader Group PLC (a) | 170,479 | 1,237,746 | ||||||
Crest Nicholson Holdings PLC | 242,203 | 617,100 | ||||||
Genus PLC | 25,191 | 1,249,261 | ||||||
HomeServe PLC | 73,811 | 1,176,162 | ||||||
Howden Joinery Group PLC | 149,903 | 1,140,926 | ||||||
Intermediate Capital Group PLC | 62,209 | 956,765 | ||||||
Moneysupermarket.com Group PLC | 282,494 | 973,761 | ||||||
Rotork PLC | 222,695 | 807,408 | ||||||
Spectris PLC | 27,894 | 875,730 | ||||||
Wizz Air Holdings PLC (a)(e) | 23,399 | 937,940 | ||||||
|
| |||||||
| 11,227,018 | ||||||||
|
| |||||||
| Total Common Stock (cost—$63,107,276) |
| 75,430,947 | ||||||
|
| |||||||
| Preferred Stock—1.6% |
| |||||||
| Germany—1.6% |
| |||||||
Jungheinrich AG | 35,497 | 1,222,078 | ||||||
|
| |||||||
| Total Investments (cost—$63,986,648) (b)—98.6% |
| 76,653,025 | ||||||
|
| |||||||
| Other assets less liabilities (f)—1.4% |
| 1,118,812 | ||||||
|
| |||||||
| Net Assets—100.0% |
| $77,771,837 | ||||||
|
| |||||||
Notes to Schedule of Investments:
(a) 144A—Exempt from registration under Rule 144A of the Securities Act of 1933. These securities may be resold in transactions exempt from registration, typically only to qualified institutional buyers. Securities with an aggregate value of $5,253,844, representing 6.8% of net assets.
(b) Securities with an aggregate value of $72,272,658, representing 92.9% of net assets, were valued utilizing modeling tools provided by a third-party vendor. See Note 1(a) and Note 1(b) in the Notes to Financial Statements.
(c) Fair-Valued—Securities with an aggregate value of $531,891, representing 0.7% of net assets. See Note 1(a) and Note 1(b) in the Notes to Financial Statements.
(d) Level 3 security. See Note 1(a) and Note 1(b) in the Notes to Financial Statements.
(e) Non-income producing.
(f) Includes net unrealized appreciation (depreciation) of other financial instruments as follows:
| Forward foreign currency contracts outstanding at September 30, 2020: | ||||||||||||||||||
| Description | Counterparty | U.S.$ Value on Origination Date | U.S.$ Value September 30, 2020 | Unrealized Appreciation | Unrealized Depreciation | |||||||||||||
Purchased: |
| |||||||||||||||||
69,384 Australian Dollar settling 10/2/20 | State Street Bank London | $ | 49,413 | $ | 49,696 | $ | 283 | $ | — | |||||||||
214,436 Hong Kong Dollar settling 10/5/20 | State Street Bank London | 27,670 | 27,669 | — | (1 | ) | ||||||||||||
215,975 Hong Kong Dollar settling 10/6/20 | State Street Bank London | 27,867 | 27,868 | 1 | — | |||||||||||||
|
| |||||||||||||||||
| $ | 284 | $ | (1 | ) | ||||||||||||||
|
| |||||||||||||||||
Glossary:
ADR—American Depositary Receipt
REIT—Real Estate Investment Trust
| See accompanying Notes to Financial Statements | | September 30, 2020 | | Annual Report | 101 |
Table of Contents
Schedule of Investments
September 30, 2020
The industry classification of portfolio holdings and other assets less liabilities shown as a percentage of net assets were as follows:
Machinery | 9.4% | |||
IT Services | 8.1% | |||
Electronic Equipment, Instruments & Components | 6.2% | |||
Healthcare Equipment & Supplies | 5.7% | |||
Semiconductors & Semiconductor Equipment | 4.9% | |||
Insurance | 4.8% | |||
Commercial Services & Supplies | 3.7% | |||
Food Products | 3.5% | |||
Construction & Engineering | 3.4% | |||
Real Estate Management & Development | 3.2% | |||
Multi-Line Retail | 3.1% | |||
Construction Materials | 3.1% | |||
Interactive Media & Services | 3.0% | |||
Internet & Direct Marketing Retail | 2.9% | |||
Chemicals | 2.7% | |||
Healthcare Providers & Services | 2.6% | |||
Trading Companies & Distributors | 2.2% | |||
Equity Real Estate Investment Trusts (REITs) | 2.1% | |||
Biotechnology | 2.0% | |||
Diversified Financial Services | 1.7% | |||
Electrical Equipment | 1.7% | |||
Software | 1.6% | |||
Auto Components | 1.6% | |||
Containers & Packaging | 1.5% | |||
Independent Power Producers & Energy Traders | 1.5% | |||
Distributors | 1.4% | |||
Life Sciences Tools & Services | 1.4% | |||
Professional Services | 1.3% | |||
Capital Markets | 1.2% | |||
Airlines | 1.2% | |||
Real Estate | 1.1% | |||
Pharmaceuticals | 1.1% | |||
Household Durables | 0.8% | |||
Aerospace & Defense | 0.8% | |||
Media | 0.6% | |||
Healthcare Technology | 0.5% | |||
Energy Equipment & Services | 0.4% | |||
Metals & Mining | 0.3% | |||
Specialty Retail | 0.2% | |||
Communications Equipment | 0.1% | |||
Other assets less liabilities | 1.4% | |||
|
| |||
| 100.0% | ||||
|
|
AllianzGI Multi Asset Income Fund
| Shares | Value | |||||||
| Mutual Funds (a)—42.2% |
| |||||||
AllianzGI High Yield Bond (b) | 546,870 | $4,396,834 | ||||||
AllianzGI Preferred Securities & Income (c) | 306,357 | 4,512,636 | ||||||
AllianzGI Short Duration High Income (c) | 439,391 | 6,103,148 | ||||||
AllianzGI Short Term Bond (b) | 245,686 | 3,884,296 | ||||||
|
| |||||||
| Total Mutual Funds (cost—$18,065,726) |
| 18,896,914 | ||||||
|
| |||||||
| Exchange-Traded Funds—28.7% |
| |||||||
Invesco DB Base Metals | 36,000 | 545,040 | ||||||
Invesco DB Gold | 40,000 | 2,214,400 | ||||||
iShares Emerging Markets Dividend | 75,116 | 2,261,743 | ||||||
iShares J.P. Morgan EM High Yield Bond | 26,000 | 1,134,640 | ||||||
iShares JP Morgan USD Emerging Markets Bond | 30,300 | 3,359,967 | ||||||
VanEck Vectors Fallen Angel High Yield Bond | 75,000 | 2,230,500 | ||||||
VanEck Vectors J.P. Morgan EM Local Currency Bond | 36,100 | 1,113,324 | ||||||
|
| |||||||
| Total Exchange-Traded Funds (cost—$13,054,569) |
| 12,859,614 | ||||||
|
| |||||||
| Common Stock—14.7% |
| |||||||
| Equity Real Estate Investment Trusts (REITs)—9.3% |
| |||||||
American Tower Corp. | 1,400 | 338,422 | ||||||
Apple Hospitality REIT, Inc. | 30,000 | 288,300 | ||||||
CoreSite Realty Corp. | 1,300 | 154,544 | ||||||
Crown Castle International Corp. | 1,600 | 266,400 | ||||||
CubeSmart | 5,100 | 164,781 | ||||||
Digital Realty Trust, Inc. | 1,600 | 234,816 | ||||||
Equity Commonwealth | 5,330 | 141,938 | ||||||
Gaming and Leisure Properties, Inc. | 64 | 2,363 | ||||||
Iron Mountain, Inc. | 5,740 | 153,775 | ||||||
Macerich Co. | 22,500 | 152,775 | ||||||
MGM Growth Properties LLC, Class A | 5,000 | 139,900 | ||||||
Omega Healthcare Investors, Inc. | 2,500 | 74,850 | ||||||
Park Hotels & Resorts, Inc. | 20,000 | 199,800 | ||||||
Public Storage | 800 | 178,176 | ||||||
RLJ Lodging Trust | 22,500 | 194,850 | ||||||
Sabra Health Care REIT, Inc. | 18,000 | 248,130 | ||||||
Service Properties Trust | 20,000 | 159,000 | ||||||
Simon Property Group, Inc. | 3,600 | 232,848 | ||||||
STAG Industrial, Inc. | 5,200 | 158,548 | ||||||
VEREIT, Inc. | 25,320 | 164,580 | ||||||
VICI Properties, Inc. | 7,800 | 182,286 | ||||||
Vornado Realty Trust | 4,900 | 165,179 | ||||||
WP Carey, Inc. | 2,400 | 156,384 | ||||||
|
| |||||||
| 4,152,645 | ||||||||
|
| |||||||
| Mortgage Real Estate Investment Trusts (REITs)—1.9% |
| |||||||
Ladder Capital Corp. | 18,000 | 128,160 | ||||||
New Residential Investment Corp. | 28,000 | 222,600 | ||||||
PennyMac Mortgage Investment Trust | 16,000 | 257,120 | ||||||
Two Harbors Investment Corp. | 50,000 | 254,500 | ||||||
|
| |||||||
| 862,380 | ||||||||
|
| |||||||
| Shares | Value | |||||||
| Oil, Gas & Consumable Fuels—3.5% |
| |||||||
Chevron Corp. | 3,000 | $ | 216,000 | |||||
Enbridge, Inc. | 7,500 | 219,000 | ||||||
Exxon Mobil Corp. | 6,750 | 231,727 | ||||||
Kinder Morgan, Inc. | 18,000 | 221,940 | ||||||
Marathon Petroleum Corp. | 7,500 | 220,050 | ||||||
Phillips 66 | 4,200 | 217,728 | ||||||
Valero Energy Corp. | 5,000 | 216,600 | ||||||
|
| |||||||
| 1,543,045 | ||||||||
|
| |||||||
| Total Common Stock (cost—$6,503,931) |
| 6,558,070 | ||||||
|
| |||||||
| Principal Amount (000s) | ||||||||
| Repurchase Agreements—11.9% |
| |||||||
State Street Bank and Trust Co., dated 9/30/20, 0.00%, due 10/1/20, proceeds $5,332,000; collateralized by U.S. Treasury Notes, 0.25%, due 9/30/25, valued at $5,438,676 including accrued interest |
| |||||||
(cost—$5,332,000) | $5,332 | 5,332,000 | ||||||
|
| |||||||
| Total Investments (cost—$42,956,226)—97.5% |
| 43,646,598 | ||||||
|
| |||||||
| Other assets less liabilities (d)—2.5% |
| 1,129,868 | ||||||
|
| |||||||
| Net Assets—100.0% |
| $44,776,466 | ||||||
|
| |||||||
Notes to Schedule of Investments:
(a) Affiliated fund.
(b) Institutional Class share.
(c) Class R6 share.
| 102 | Annual Report | | September 30, 2020 | | See accompanying Notes to Financial Statements |
Table of Contents
Schedule of Investments
September 30, 2020
(d) Includes net unrealized appreciation (depreciation) of other financial instruments as follows:
| Futures contracts outstanding at September 30, 2020: | ||||||||||||
| Type | Contracts | Expiration Date | Notional Amount (000s) | Market Value (000s) | Unrealized Appreciation (Depreciation) | |||||||||||||||||
Long position contracts: | ||||||||||||||||||||||
10-Year Ultra U.S. Treasury Bond | 45 | 12/21/20 | $ | 4,500 | $ | 7,196 | $ | 39,093 | ||||||||||||||
10-Year U.S. Treasury Note | 50 | 12/21/20 | 5,000 | 6,977 | 7,369 | |||||||||||||||||
E-mini Russell 1000 Index | 54 | 12/18/20 | 3 | 3,139 | (73,440) | |||||||||||||||||
E-mini Russell 1000 Index | 20 | 12/18/20 | 1 | 2,182 | 59,850 | |||||||||||||||||
Euro Currency | 10 | 12/14/20 | 1,250 | 1,467 | (11,985) | |||||||||||||||||
MSCI EAFE Index | 24 | 12/18/20 | 1 | 2,224 | (40,390) | |||||||||||||||||
MSCI Emerging Markets Index | 30 | 12/18/20 | 2 | 1,633 | (18,081) | |||||||||||||||||
TOPIX Index | 9 | 12/10/20 | JPY | 90 | 1,387 | (19,664) | ||||||||||||||||
|
| |||||||||||||||||||||
| $ | (57,248) | |||||||||||||||||||||
|
| |||||||||||||||||||||
Short position contracts: | ||||||||||||||||||||||
British Pound | (18) | 12/14/20 | $ | (1,125) | $ | (1,452) | $ | 12,225 | ||||||||||||||
Dow Jones U.S. Real Estate Index | (75) | 12/18/20 | (8) | (2,351) | 71,221 | |||||||||||||||||
Euro-Bund 10-Year Bond | (17) | 12/8/20 | EUR | (1,700) | (2,942) | (2,069) | ||||||||||||||||
Ultra U.S. Treasury Bond | (8) | 12/21/20 | $ | (800) | (1,774) | 16,273 | ||||||||||||||||
|
| |||||||||||||||||||||
| $ | 97,650 | |||||||||||||||||||||
|
| |||||||||||||||||||||
| $ | 40,402 | |||||||||||||||||||||
|
| |||||||||||||||||||||
(e) At September 30, 2020, the Fund pledged $3,054,376 in cash as collateral for futures contracts.
Glossary:
EAFE—Europe, Australasia and Far East
EUR—Euro
JPY—Japanese Yen
MSCI—Morgan Stanley Capital International
REIT—Real Estate Investment Trust
TOPIX—Tokyo Stock Price Index
| See accompanying Notes to Financial Statements | | September 30, 2020 | | Annual Report | 103 |
Table of Contents
Schedule of Investments
September 30, 2020
AllianzGI PerformanceFee Managed Futures Strategy Fund
| Principal Amount (000s) | Value | |||||||
| U.S. Treasury Obligations—67.0% |
| |||||||
U.S. Treasury Notes, |
| |||||||
1.125%, 2/28/21 | $2,800 | $2,811,156 | ||||||
1.25%, 3/31/21 | 3,000 | 3,016,641 | ||||||
1.375%, 10/31/20 | 2,400 | 2,401,875 | ||||||
1.375%, 1/31/21 | 2,800 | 2,810,937 | ||||||
1.625%, 11/30/20 | 2,900 | 2,906,570 | ||||||
1.75%, 12/31/20 | 2,900 | 2,911,102 | ||||||
|
| |||||||
| Total U.S. Treasury Obligations (cost—$16,858,849) |
| 16,858,281 | ||||||
|
| |||||||
| Shares | ||||||||
| Mutual Fund—4.8% |
| |||||||
AllianzGI Short Duration High Income (a)(b) (cost—$1,255,352) | 87,205 | 1,211,276 | ||||||
|
| |||||||
| Principal Amount (000s) | Value | |||||||
| Repurchase Agreements—2.5% |
| |||||||
State Street Bank and Trust Co., dated 9/30/20, 0.00%, due 10/1/20, proceeds $618,000; collateralized by U.S. Treasury Notes, 0.25%, due 9/30/25, valued at $630,451 including accrued interest |
| |||||||
(cost—$618,000) | $618 | $ | 618,000 | |||||
|
| |||||||
| Total Investments (cost—$18,732,201)—74.3% |
| 18,687,557 | ||||||
|
| |||||||
| Other assets less liabilities (c)—25.7% |
| 6,466,158 | ||||||
|
| |||||||
| Net Assets—100.0% |
| $25,153,715 | ||||||
|
| |||||||
Notes to Consolidated Schedule of Investments:
(a) Affiliated fund.
(b) Class R6 share.
(c) Includes net unrealized appreciation (depreciation) of other financial instruments as follows:
| Futures contracts outstanding at September 30, 2020: | ||||||||||||||||||||||
| Type | Contracts | Expiration Date | Notional Amount (000s) | Market Value (000s) | Unrealized Appreciation (Depreciation) | |||||||||||||||||
Long position contracts: |
| |||||||||||||||||||||
10-Year U.S. Treasury Note | 142 | 12/21/20 | $ | 14,200 | $ | 19,813 | $ | 33,382 | ||||||||||||||
Aluminum† | 33 | 10/19/20 | 1 | 1,435 | 13,825 | |||||||||||||||||
Aluminum† | 15 | 11/16/20 | — | (e) | 657 | (3,879 | ) | |||||||||||||||
Aluminum† | 11 | 12/16/20 | — | (e) | 485 | (3,810 | ) | |||||||||||||||
Australia Government 10-Year Bond | 40 | 12/15/20 | AUD | 4,000 | 4,280 | 19,994 | ||||||||||||||||
Australian Dollar | 16 | 12/14/20 | $ | 1,600 | 1,146 | (16,337 | ) | |||||||||||||||
BIST 30 | 144 | 10/30/20 | TRY | 1 | 241 | 7,941 | ||||||||||||||||
Bovespa Index | 10 | 10/14/20 | BRL | — | (e) | 168 | (10,841 | ) | ||||||||||||||
Canada Government 10-Year Bond | 50 | 12/18/20 | CAD | 5,000 | 5,701 | 21,141 | ||||||||||||||||
Canadian Dollar | 18 | 12/15/20 | $ | 1,800 | 1,352 | (12,529 | ) | |||||||||||||||
Cocoa† | 16 | 7/15/21 | — | (e) | 403 | (9,570 | ) | |||||||||||||||
Coffee† | 2 | 7/20/21 | 75 | 87 | (13,447 | ) | ||||||||||||||||
Copper† | 13 | 5/26/21 | 325 | 989 | 7,649 | |||||||||||||||||
Cotton† | 6 | 7/8/21 | 300 | 204 | (336 | ) | ||||||||||||||||
DAX Mini Index | 9 | 12/18/20 | EUR | — | (e) | 674 | (18,792 | ) | ||||||||||||||
E-mini S&P 500 Index | 17 | 12/18/20 | $ | 1 | 2,849 | 24,207 | ||||||||||||||||
Euro Currency | 17 | 12/14/20 | 2,125 | 2,494 | (25,730 | ) | ||||||||||||||||
Euro-BTP | 23 | 12/8/20 | EUR | 2,300 | 3,980 | 63,266 | ||||||||||||||||
Euro-Bund 10-Year Bond | 7 | 12/8/20 | 700 | 1,432 | 5,644 | |||||||||||||||||
Euro-OAT | 10 | 12/8/20 | 1,000 | 1,976 | 13,426 | |||||||||||||||||
FTSE 100 Index | 1 | 12/18/20 | GBP | — | (e) | 75 | (1,904 | ) | ||||||||||||||
FTSE China A50 Index | 19 | 10/29/20 | $ | — | (e) | 287 | (1,657 | ) | ||||||||||||||
FTSE/JSE Top 40 Index | 8 | 12/17/20 | ZAR | — | (e) | 241 | (10,137 | ) | ||||||||||||||
FTSE/MIB Index | 2 | 12/18/20 | EUR | — | (e) | 222 | (8,443 | ) | ||||||||||||||
Gold 100 Oz† | 6 | 4/28/21 | $ | 1 | 1,145 | 1,364 | ||||||||||||||||
Japan Government 10-Year Bond | 4 | 12/14/20 | JPY | 400,000 | 5,769 | 5,500 | ||||||||||||||||
Japanese Yen | 26 | 12/14/20 | $ | 33 | 3,083 | 3,580 | ||||||||||||||||
KC HRW Wheat† | 2 | 5/14/21 | 10 | 53 | 3,135 | |||||||||||||||||
Live Cattle† | 1 | 4/30/21 | 40 | 47 | 498 | |||||||||||||||||
MSCI Taiwan Index | 9 | 10/29/20 | 1 | 444 | 2,318 | |||||||||||||||||
New Zealand Dollar | 15 | 12/14/20 | 1,500 | 992 | (4,656 | ) | ||||||||||||||||
Nickel† | 8 | 10/19/20 | — | (e) | 695 | 27,992 | ||||||||||||||||
Nickel† | 9 | 11/16/20 | — | (e) | 783 | (18,749 | ) | |||||||||||||||
Nickel† | 7 | 12/14/20 | — | (e) | 610 | (24,088 | ) | |||||||||||||||
| 104 | Annual Report | | September 30, 2020 | | See accompanying Notes to Financial Statements |
Table of Contents
Schedule of Investments
September 30, 2020
| Futures contracts outstanding at September 30, 2020 (continued): | ||||||||||||||||||||||
| Type | Contracts | Expiration Date | Notional Amount (000s) | Market Value (000s) | Unrealized Appreciation (Depreciation) | |||||||||||||||||
Long position contracts (continued): |
| |||||||||||||||||||||
Platinum† | 2 | 4/28/21 | $ | — | (e) | $ | 92 | $ | 2,138 | |||||||||||||
S&P/TSX 60 Index | 3 | 12/17/20 | CAD | 1 | 433 | (1,664 | ) | |||||||||||||||
Silver† | 3 | 5/26/21 | $ | 15 | 356 | (57,378 | ) | |||||||||||||||
Soybean† | 11 | 3/12/21 | 55 | 562 | 36,626 | |||||||||||||||||
SPI 200 | 1 | 12/17/20 | AUD | — | (e) | 104 | (235 | ) | ||||||||||||||
Sugar No. 11† | 3 | 9/30/21 | $ | 336 | 43 | 398 | ||||||||||||||||
TOPIX Index | 14 | 12/10/20 | JPY | 140 | 2,158 | 26,587 | ||||||||||||||||
United Kingdom Government 10-Year Gilt | 16 | 12/29/20 | GBP | 1,600 | 2,810 | 14,613 | ||||||||||||||||
|
| |||||||||||||||||||||
| $ | 91,042 | |||||||||||||||||||||
|
| |||||||||||||||||||||
| Short position contracts: |
| |||||||||||||||||||||
Aluminum† | (33 | ) | 10/19/20 | $ | (1 | ) | $ | (1,435 | ) | $ | (34,800 | ) | ||||||||||
Aluminum† | (15 | ) | 11/16/20 | (— | )(e) | (657 | ) | 8,030 | ||||||||||||||
Aluminum† | (1 | ) | 12/16/20 | (— | )(e) | (44 | ) | 369 | ||||||||||||||
Brent Crude† | (7 | ) | 12/30/20 | (7 | ) | (302 | ) | (3,403 | ) | |||||||||||||
British Pound | (5 | ) | 12/14/20 | (313 | ) | (403 | ) | (5,268 | ) | |||||||||||||
Cattle Feeder† | (1 | ) | 3/25/21 | (50 | ) | (70 | ) | (414 | ) | |||||||||||||
Corn† | (1 | ) | 5/14/21 | (5 | ) | (20 | ) | (1,101 | ) | |||||||||||||
Gas Oil† | (13 | ) | 12/10/20 | (1 | ) | (439 | ) | (5,949 | ) | |||||||||||||
Lean Hogs† | (13 | ) | 4/15/21 | (520 | ) | (375 | ) | (27,704 | ) | |||||||||||||
Natural Gas† | (2 | ) | 12/29/20 | (20 | ) | (65 | ) | 2,616 | ||||||||||||||
Nickel† | (8 | ) | 10/19/20 | (— | )(e) | (695 | ) | (25,190 | ) | |||||||||||||
Nickel† | (9 | ) | 11/16/20 | (— | )(e) | (783 | ) | 33,931 | ||||||||||||||
Nickel† | (1 | ) | 12/14/20 | (— | )(e) | (87 | ) | 140 | ||||||||||||||
WTI Crude Oil† | (7 | ) | 12/21/20 | (7 | ) | (286 | ) | (4,830 | ) | |||||||||||||
|
| |||||||||||||||||||||
| $ | (63,573 | ) | ||||||||||||||||||||
|
| |||||||||||||||||||||
| $ | 27,469 | |||||||||||||||||||||
|
| |||||||||||||||||||||
† All or a portion of this security is owned by AllianzGI PerformanceFee Managed Futures Strategy Offshore Fund Ltd., which is a wholly-owned subsidiary of the Fund.
| Credit default swaps agreements outstanding at September 30, 2020: | ||||||||||||||||||||||||||||||||
Centrally cleared sell protection swap agreements: |
| |||||||||||||||||||||||||||||||
| Broker (Exchange)/ Reference Debt Issuer | Notional Amount (000s)(1) | Implied Credit Spread | Termination Date | Fixed Deal Received Rate | Payment Frequency | Value(2) | Upfront Premiums Paid (Received) | Unrealized Appreciation (Depreciation) | ||||||||||||||||||||||||
Goldman Sachs (ICE): |
| |||||||||||||||||||||||||||||||
CDX.EM.33 Index | $ | 2,240 | 1.67 | % | 6/20/25 | 1.00 | % | Quarterly | $ | (85,715 | ) | $ | (82,135 | ) | $ | (3,580 | ) | |||||||||||||||
CDX.NA.HY.34 | 1,000 | 3.56 | % | 6/20/25 | 5.00 | % | Quarterly | 50,528 | 29,907 | 20,621 | ||||||||||||||||||||||
|
| |||||||||||||||||||||||||||||||
| $ | (35,187 | ) | $ | (52,228 | ) | $ | 17,041 | |||||||||||||||||||||||||
|
| |||||||||||||||||||||||||||||||
(1) This represents the maximum potential amount the Fund could be required to make available as a seller of credit protection or receive as a buyer of credit protection if a credit event occurs as defined under the terms of that particular swap agreement.
(2) The quoted market prices and resulting values for credit default swap agreements serve as an indicator of the status at September 30, 2020 of the payment/performance risk and represent the likelihood of an expected liability (or profit) for the credit derivative should the notional amount of the swap agreement have been closed/sold as of the period end. Increasing market values, in absolute terms when compared to the notional amount of the swap, represent a deterioration of the referenced entity’s credit soundness and a greater likelihood or risk of default or other credit event occurring as defined under the terms of the agreement.
(d) At September 30, 2020, the Fund pledged $5,699,853 in cash as collateral for futures contracts and $445,219 in cash as collateral for swap contracts.
(e) Notional amount rounds to less than 500.
| See accompanying Notes to Financial Statements | | September 30, 2020 | | Annual Report | 105 |
Table of Contents
Schedule of Investments
September 30, 2020
Glossary:
AUD—Australian Dollar
BIST—Borsa Istanbul
BRL—Brazilian Real
CAD—Canadian Dollar
CDX—Credit Derivatives Index
EUR—Euro
FTSE—Financial Times Stock Exchange
GBP—British Pound
ICE—Intercontinental Exchange
JPY—Japanese Yen
JSE—Johannesburg Stock Exchange Limited
MSCI—Morgan Stanley Capital International
OAT—Obligations Assimilables du Trésor
TOPIX—Tokyo Stock Price Index
TRY—Turkish Lira
WTI—West Texas Intermediate
ZAR—South African Rand
AllianzGI PerformanceFee Structured US Equity Fund
| Shares | Value | |||||||
| Exchange-Traded Funds—99.6% |
| |||||||
iShares Core S&P 500 (a) (cost—$45,253,716) | 148,866 | $50,027,908 | ||||||
|
| |||||||
| Principal Amount (000s) | ||||||||
| Repurchase Agreements—0.7% |
| |||||||
State Street Bank and Trust Co., dated 9/30/20, 0.00%, due 10/1/20, proceeds $347,000; collateralized by U.S. Treasury Notes, 0.25%, due 9/30/25, valued at $353,972 including accrued interest |
| |||||||
(cost—$347,000) | $347 | 347,000 | ||||||
|
| |||||||
| Total Options Purchased —0.4% (cost—$416,695) (b)(c)(d) |
| 202,097 | ||||||
|
| |||||||
| Total Investments, before options written (cost—$46,017,411)—100.7% |
| 50,577,005 | ||||||
|
| |||||||
| Total Options Written—(0.5)% (premiums received—$530,382) (b)(c)(d) |
| (263,560 | ) | |||||
|
| |||||||
| Total Investments, net of options written (cost—$45,487,029)—100.2% |
| 50,313,445 | ||||||
|
| |||||||
| Other liabilities in excess of other assets—(0.2)% |
| (122,662 | ) | |||||
|
| |||||||
| Net Assets—100.0% |
| $50,190,783 | ||||||
|
| |||||||
Notes to Schedule of Investments:
(a) All or partial amount segregated for the benefit of the counterparty as collateral for options written.
(b) Non-income producing.
(c) Exchange traded-Chicago Board Options Exchange.
(d) Exchange traded option contracts outstanding at September 30, 2020:
| Options purchased contracts outstanding at September 30, 2020: | ||||||||||||||||||||||||||||
| Description | Exercise Price | Expiration Date | Number of Contracts | Notional Amount | Market Value | Cost | Unrealized Appreciation (Depreciation) | |||||||||||||||||||||
Call options: |
| |||||||||||||||||||||||||||
S&P 500 Index | 3,640.00 USD | 10/2/20 | 2 | $ | 200 | $ | 5 | $ | 2,062 | $ | (2,057 | ) | ||||||||||||||||
S&P 500 Index | 4,000.00 USD | 10/2/20 | 6 | 600 | 15 | 373 | (358 | ) | ||||||||||||||||||||
S&P 500 Index | 3,575.00 USD | 10/5/20 | 2 | 200 | 45 | 2,198 | (2,153 | ) | ||||||||||||||||||||
S&P 500 Index | 4,000.00 USD | 10/5/20 | 6 | 600 | 15 | 271 | (256 | ) | ||||||||||||||||||||
S&P 500 Index | 3,600.00 USD | 10/7/20 | 2 | 200 | 95 | 3,230 | (3,135 | ) | ||||||||||||||||||||
S&P 500 Index | 4,000.00 USD | 10/7/20 | 6 | 600 | 15 | 379 | (364 | ) | ||||||||||||||||||||
S&P 500 Index | 3,525.00 USD | 10/9/20 | 2 | 200 | 610 | 3,490 | (2,880 | ) | ||||||||||||||||||||
S&P 500 Index | 4,000.00 USD | 10/9/20 | 6 | 600 | 30 | 235 | (205 | ) | ||||||||||||||||||||
S&P 500 Index | 3,525.00 USD | 10/12/20 | 2 | 200 | 780 | 4,874 | (4,094 | ) | ||||||||||||||||||||
S&P 500 Index | 4,000.00 USD | 10/12/20 | 6 | 600 | 30 | 265 | (235 | ) | ||||||||||||||||||||
S&P 500 Index | 3,550.00 USD | 10/14/20 | 2 | 200 | 780 | 4,400 | (3,620 | ) | ||||||||||||||||||||
S&P 500 Index | 4,000.00 USD | 10/14/20 | 6 | 600 | 45 | 247 | (202 | ) | ||||||||||||||||||||
S&P 500 Index | 3,440.00 USD | 10/16/20 | 2 | 200 | 4,540 | 4,956 | (416 | ) | ||||||||||||||||||||
S&P 500 Index | 3,740.00 USD | 10/16/20 | 1 | 100 | 70 | 2,826 | (2,756 | ) | ||||||||||||||||||||
S&P 500 Index | 4,200.00 USD | 10/16/20 | 3 | 300 | 8 | 366 | (358 | ) | ||||||||||||||||||||
S&P 500 Index | 3,420.00 USD | 10/19/20 | 2 | 200 | 6,570 | 3,286 | 3,284 | |||||||||||||||||||||
S&P 500 Index | 3,900.00 USD | 10/19/20 | 6 | 600 | 165 | 235 | (70 | ) | ||||||||||||||||||||
S&P 500 Index | 3,425.00 USD | 10/21/20 | 2 | 200 | 6,980 | 2,894 | 4,086 | |||||||||||||||||||||
S&P 500 Index | 3,900.00 USD | 10/21/20 | 6 | 600 | 240 | 234 | 6 | |||||||||||||||||||||
S&P 500 Index | 3,430.00 USD | 10/23/20 | 2 | 200 | 7,340 | 3,294 | 4,046 | |||||||||||||||||||||
S&P 500 Index | 3,600.00 USD | 10/23/20 | 1 | 100 | 530 | 1,917 | (1,387 | ) | ||||||||||||||||||||
S&P 500 Index | 3,625.00 USD | 10/23/20 | 1 | 100 | 410 | 2,445 | (2,035 | ) | ||||||||||||||||||||
S&P 500 Index | 3,675.00 USD | 10/23/20 | 1 | 100 | 257 | 1,927 | (1,670 | ) | ||||||||||||||||||||
S&P 500 Index | 3,900.00 USD | 10/23/20 | 6 | 600 | 315 | 241 | 74 | |||||||||||||||||||||
| 106 | Annual Report | | September 30, 2020 | | See accompanying Notes to Financial Statements |
Table of Contents
Schedule of Investments
September 30, 2020
| Options purchased contracts outstanding at September 30, 2020 (continued): | ||||||||||||||||||||||||||||
| Description | Exercise Price | Expiration Date | Number of Contracts | Notional Amount | Market Value | Cost | Unrealized Appreciation (Depreciation) | |||||||||||||||||||||
Call options (continued): |
| |||||||||||||||||||||||||||
S&P 500 Index | 4,000.00 USD | 10/23/20 | 3 | $ | 300 | $ | 83 | $ | 591 | $ | (508 | ) | ||||||||||||||||
S&P 500 Index | 4,100.00 USD | 10/23/20 | 6 | 600 | 90 | 798 | (708 | ) | ||||||||||||||||||||
S&P 500 Index | 3,500.00 USD | 10/26/20 | 2 | 200 | 3,630 | 4,234 | (604 | ) | ||||||||||||||||||||
S&P 500 Index | 3,900.00 USD | 10/26/20 | 6 | 600 | 375 | 409 | (34 | ) | ||||||||||||||||||||
S&P 500 Index | 3,525.00 USD | 10/28/20 | 2 | 200 | 3,140 | 4,018 | (878 | ) | ||||||||||||||||||||
S&P 500 Index | 3,900.00 USD | 10/28/20 | 6 | 600 | 480 | 499 | (19 | ) | ||||||||||||||||||||
S&P 500 Index | 3,550.00 USD | 10/30/20 | 1 | 100 | 1,355 | 2,886 | (1,531 | ) | ||||||||||||||||||||
S&P 500 Index | 4,000.00 USD | 10/30/20 | 3 | 300 | 172 | 447 | (275 | ) | ||||||||||||||||||||
S&P 500 Index | 3,570.00 USD | 11/2/20 | 1 | 100 | 1,245 | 3,235 | (1,990 | ) | ||||||||||||||||||||
S&P 500 Index | 4,100.00 USD | 11/2/20 | 3 | 300 | 105 | 339 | (234 | ) | ||||||||||||||||||||
S&P 500 Index | 3,590.00 USD | 11/4/20 | 1 | 100 | 1,465 | 3,666 | (2,201 | ) | ||||||||||||||||||||
S&P 500 Index | 4,100.00 USD | 11/4/20 | 3 | 300 | 165 | 386 | (221 | ) | ||||||||||||||||||||
S&P 500 Index | 3,450.00 USD | 11/6/20 | 2 | 200 | 11,540 | 6,466 | 5,074 | |||||||||||||||||||||
S&P 500 Index | 3,475.00 USD | 11/6/20 | 1 | 100 | 4,775 | 4,474 | 301 | |||||||||||||||||||||
S&P 500 Index | 4,000.00 USD | 11/6/20 | 6 | 600 | 570 | 577 | (7 | ) | ||||||||||||||||||||
S&P 500 Index | 4,100.00 USD | 11/6/20 | 3 | 300 | 202 | 343 | (141 | ) | ||||||||||||||||||||
S&P 500 Index | 3,475.00 USD | 11/13/20 | 1 | 100 | 5,655 | 3,323 | 2,332 | |||||||||||||||||||||
S&P 500 Index | 3,525.00 USD | 11/13/20 | 1 | 100 | 3,920 | 4,442 | (522 | ) | ||||||||||||||||||||
S&P 500 Index | 3,550.00 USD | 11/13/20 | 1 | 100 | 3,220 | 3,811 | (591 | ) | ||||||||||||||||||||
S&P 500 Index | 4,000.00 USD | 11/13/20 | 9 | 900 | 1,350 | 1,375 | (25 | ) | ||||||||||||||||||||
S&P 500 Index | 3,560.00 USD | 10/16/20 | 1 | 100 | 430 | 2,804 | (2,374 | ) | ||||||||||||||||||||
S&P 500 Index | 3,600.00 USD | 10/16/20 | 1 | 100 | 265 | 2,732 | (2,467 | ) | ||||||||||||||||||||
S&P 500 Index | 3,670.00 USD | 10/16/20 | 1 | 100 | 133 | 2,342 | (2,209 | ) | ||||||||||||||||||||
S&P 500 Index | 3,675.00 USD | 10/16/20 | 1 | 100 | 125 | 2,354 | (2,229 | ) | ||||||||||||||||||||
S&P 500 Index | 3,900.00 USD | 10/16/20 | 6 | 600 | 120 | 767 | (647 | ) | ||||||||||||||||||||
S&P 500 Index | 4,000.00 USD | 10/16/20 | 12 | 1,200 | 90 | 1,075 | (985 | ) | ||||||||||||||||||||
|
| |||||||||||||||||||||||||||
| Total call options |
| $ | 74,590 | $ | 105,038 | $ | (30,448 | ) | ||||||||||||||||||||
|
| |||||||||||||||||||||||||||
Put options: |
| |||||||||||||||||||||||||||
E-mini S&P 500 Index | 303.00 USD | 10/2/20 | 4 | $ | 400 | $ | 12 | $ | 1,035 | $ | (1,023 | ) | ||||||||||||||||
E-mini S&P 500 Index | 304.00 USD | 10/2/20 | 4 | 400 | 12 | 1,083 | (1,071 | ) | ||||||||||||||||||||
E-mini S&P 500 Index | 307.00 USD | 10/2/20 | 14 | 1,400 | 56 | 2,390 | (2,334 | ) | ||||||||||||||||||||
E-mini S&P 500 Index | 311.00 USD | 10/2/20 | 4 | 400 | 20 | 703 | (683 | ) | ||||||||||||||||||||
E-mini S&P 500 Index | 316.00 USD | 10/2/20 | 4 | 400 | 38 | 671 | (633 | ) | ||||||||||||||||||||
E-mini S&P 500 Index | 327.00 USD | 10/2/20 | 2 | 200 | 141 | 1,406 | (1,265 | ) | ||||||||||||||||||||
E-mini S&P 500 Index | 329.00 USD | 10/2/20 | 7 | 700 | 724 | 3,890 | (3,166 | ) | ||||||||||||||||||||
E-mini S&P 500 Index | 333.00 USD | 10/2/20 | 2 | 200 | 417 | 1,017 | (600 | ) | ||||||||||||||||||||
E-mini S&P 500 Index | 344.00 USD | 10/2/20 | 2 | 200 | 1,874 | 937 | 937 | |||||||||||||||||||||
E-mini S&P 500 Index | 300.00 USD | 10/5/20 | 4 | 400 | 16 | 963 | (947 | ) | ||||||||||||||||||||
E-mini S&P 500 Index | 302.00 USD | 10/5/20 | 4 | 400 | 20 | 1,119 | (1,099 | ) | ||||||||||||||||||||
E-mini S&P 500 Index | 307.00 USD | 10/5/20 | 4 | 400 | 30 | 715 | (685 | ) | ||||||||||||||||||||
E-mini S&P 500 Index | 308.00 USD | 10/5/20 | 4 | 400 | 30 | 675 | (645 | ) | ||||||||||||||||||||
E-mini S&P 500 Index | 310.00 USD | 10/5/20 | 14 | 1,400 | 133 | 1,815 | (1,682 | ) | ||||||||||||||||||||
E-mini S&P 500 Index | 326.00 USD | 10/5/20 | 2 | 200 | 195 | 1,365 | (1,170 | ) | ||||||||||||||||||||
E-mini S&P 500 Index | 329.00 USD | 10/5/20 | 2 | 200 | 308 | 1,129 | (821 | ) | ||||||||||||||||||||
E-mini S&P 500 Index | 330.00 USD | 10/5/20 | 2 | 200 | 357 | 1,390 | (1,033 | ) | ||||||||||||||||||||
E-mini S&P 500 Index | 332.00 USD | 10/5/20 | 9 | 900 | 2,133 | 4,268 | (2,135 | ) | ||||||||||||||||||||
E-mini S&P 500 Index | 343.00 USD | 10/5/20 | 2 | 200 | 1,756 | 941 | 815 | |||||||||||||||||||||
E-mini S&P 500 Index | 295.00 USD | 10/7/20 | 4 | 400 | 28 | 887 | (859 | ) | ||||||||||||||||||||
E-mini S&P 500 Index | 305.00 USD | 10/7/20 | 8 | 800 | 108 | 1,442 | (1,334 | ) | ||||||||||||||||||||
E-mini S&P 500 Index | 312.00 USD | 10/7/20 | 8 | 800 | 216 | 942 | (726 | ) | ||||||||||||||||||||
E-mini S&P 500 Index | 325.00 USD | 10/7/20 | 2 | 200 | 279 | 1,394 | (1,115 | ) | ||||||||||||||||||||
E-mini S&P 500 Index | 329.00 USD | 10/7/20 | 2 | 200 | 448 | 1,229 | (781 | ) | ||||||||||||||||||||
E-mini S&P 500 Index | 330.00 USD | 10/7/20 | 2 | 200 | 503 | 1,005 | (502 | ) | ||||||||||||||||||||
E-mini S&P 500 Index | 332.00 USD | 10/7/20 | 2 | 200 | 629 | 995 | (366 | ) | ||||||||||||||||||||
E-mini S&P 500 Index | 334.00 USD | 10/7/20 | 4 | 400 | 1,562 | 1,663 | (101 | ) | ||||||||||||||||||||
E-mini S&P 500 Index | 295.00 USD | 10/9/20 | 18 | 1,800 | 243 | 2,293 | (2,050 | ) | ||||||||||||||||||||
E-mini S&P 500 Index | 300.00 USD | 10/9/20 | 12 | 1,200 | 222 | 2,545 | (2,323 | ) | ||||||||||||||||||||
E-mini S&P 500 Index | 305.00 USD | 10/9/20 | 4 | 400 | 104 | 547 | (443 | ) | ||||||||||||||||||||
| See accompanying Notes to Financial Statements | | September 30, 2020 | | Annual Report | 107 |
Table of Contents
Schedule of Investments
September 30, 2020
| Options purchased contracts outstanding at September 30, 2020 (continued): | ||||||||||||||||||||||||||||
| Description | Exercise Price | Expiration Date | Number of Contracts | Notional Amount | Market Value | Cost | Unrealized Appreciation (Depreciation) | |||||||||||||||||||||
Put options (continued): |
| |||||||||||||||||||||||||||
E-mini S&P 500 Index | 317.00 USD | 10/9/20 | 7 | $ | 700 | $ | 606 | $ | 2,189 | $ | (1,583 | ) | ||||||||||||||||
E-mini S&P 500 Index | 325.00 USD | 10/9/20 | 2 | 200 | 398 | 1,462 | (1,064 | ) | ||||||||||||||||||||
E-mini S&P 500 Index | 328.00 USD | 10/9/20 | 2 | 200 | 533 | 1,248 | (715 | ) | ||||||||||||||||||||
E-mini S&P 500 Index | 330.00 USD | 10/9/20 | 4 | 400 | 1,290 | 2,647 | (1,357 | ) | ||||||||||||||||||||
E-mini S&P 500 Index | 331.00 USD | 10/9/20 | 2 | 200 | 708 | 1,011 | (303 | ) | ||||||||||||||||||||
E-mini S&P 500 Index | 332.00 USD | 10/9/20 | 2 | 200 | 776 | 806 | (30 | ) | ||||||||||||||||||||
E-mini S&P 500 Index | 295.00 USD | 10/12/20 | 14 | 1,400 | 266 | 1,730 | (1,464 | ) | ||||||||||||||||||||
E-mini S&P 500 Index | 300.00 USD | 10/12/20 | 8 | 800 | 204 | 1,222 | (1,018 | ) | ||||||||||||||||||||
E-mini S&P 500 Index | 316.00 USD | 10/12/20 | 5 | 500 | 505 | 2,033 | (1,528 | ) | ||||||||||||||||||||
E-mini S&P 500 Index | 321.00 USD | 10/12/20 | 2 | 200 | 323 | 857 | (534 | ) | ||||||||||||||||||||
E-mini S&P 500 Index | 325.00 USD | 10/12/20 | 2 | 200 | 465 | 1,119 | (654 | ) | ||||||||||||||||||||
E-mini S&P 500 Index | 329.00 USD | 10/12/20 | 2 | 200 | 661 | 735 | (74 | ) | ||||||||||||||||||||
E-mini S&P 500 Index | 330.00 USD | 10/12/20 | 2 | 200 | 721 | 1,131 | (410 | ) | ||||||||||||||||||||
E-mini S&P 500 Index | 331.00 USD | 10/12/20 | 2 | 200 | 785 | 1,063 | (278 | ) | ||||||||||||||||||||
E-mini S&P 500 Index | 295.00 USD | 10/14/20 | 10 | 1,000 | 290 | 1,289 | (999 | ) | ||||||||||||||||||||
E-mini S&P 500 Index | 300.00 USD | 10/14/20 | 4 | 400 | 160 | 715 | (555 | ) | ||||||||||||||||||||
E-mini S&P 500 Index | 316.00 USD | 10/14/20 | 3 | 300 | 423 | 1,403 | (980 | ) | ||||||||||||||||||||
E-mini S&P 500 Index | 320.00 USD | 10/14/20 | 4 | 400 | 778 | 1,997 | (1,219 | ) | ||||||||||||||||||||
E-mini S&P 500 Index | 331.00 USD | 10/14/20 | 2 | 200 | 907 | 873 | 34 | |||||||||||||||||||||
E-mini S&P 500 Index | 289.00 USD | 10/16/20 | 14 | 1,400 | 427 | 1,354 | (927 | ) | ||||||||||||||||||||
E-mini S&P 500 Index | 291.00 USD | 10/16/20 | 4 | 400 | 134 | 519 | (385 | ) | ||||||||||||||||||||
E-mini S&P 500 Index | 295.00 USD | 10/16/20 | 8 | 800 | 336 | 1,270 | (934 | ) | ||||||||||||||||||||
E-mini S&P 500 Index | 296.00 USD | 10/16/20 | 4 | 400 | 178 | 687 | (509 | ) | ||||||||||||||||||||
E-mini S&P 500 Index | 315.00 USD | 10/16/20 | 9 | 900 | 1,525 | 4,014 | (2,489 | ) | ||||||||||||||||||||
E-mini S&P 500 Index | 320.00 USD | 10/16/20 | 2 | 200 | 484 | 1,237 | (753 | ) | ||||||||||||||||||||
E-mini S&P 500 Index | 321.00 USD | 10/16/20 | 2 | 200 | 519 | 1,017 | (498 | ) | ||||||||||||||||||||
E-mini S&P 500 Index | 325.00 USD | 10/16/20 | 2 | 200 | 686 | 1,244 | (558 | ) | ||||||||||||||||||||
E-mini S&P 500 Index | 330.00 USD | 10/16/20 | 4 | 400 | 1,918 | 2,071 | (153 | ) | ||||||||||||||||||||
E-mini S&P 500 Index | 285.00 USD | 10/19/20 | 4 | 400 | 118 | 423 | (305 | ) | ||||||||||||||||||||
E-mini S&P 500 Index | 290.00 USD | 10/19/20 | 8 | 800 | 304 | 1,038 | (734 | ) | ||||||||||||||||||||
E-mini S&P 500 Index | 300.00 USD | 10/19/20 | 6 | 600 | 411 | 1,052 | (641 | ) | ||||||||||||||||||||
E-mini S&P 500 Index | 305.00 USD | 10/19/20 | 2 | 200 | 192 | 225 | (33 | ) | ||||||||||||||||||||
E-mini S&P 500 Index | 320.00 USD | 10/19/20 | 6 | 600 | 1,599 | 3,516 | (1,917 | ) | ||||||||||||||||||||
E-mini S&P 500 Index | 327.00 USD | 10/19/20 | 7 | 700 | 2,943 | 3,141 | (198 | ) | ||||||||||||||||||||
E-mini S&P 500 Index | 330.00 USD | 10/19/20 | 4 | 400 | 2,036 | 2,161 | (125 | ) | ||||||||||||||||||||
E-mini S&P 500 Index | 285.00 USD | 10/21/20 | 4 | 400 | 152 | 499 | (347 | ) | ||||||||||||||||||||
E-mini S&P 500 Index | 296.00 USD | 10/21/20 | 4 | 400 | 274 | 733 | (459 | ) | ||||||||||||||||||||
E-mini S&P 500 Index | 304.00 USD | 10/21/20 | 4 | 400 | 448 | 507 | (59 | ) | ||||||||||||||||||||
E-mini S&P 500 Index | 320.00 USD | 10/21/20 | 2 | 200 | 614 | 1,284 | (670 | ) | ||||||||||||||||||||
E-mini S&P 500 Index | 326.00 USD | 10/21/20 | 2 | 200 | 879 | 921 | (42 | ) | ||||||||||||||||||||
E-mini S&P 500 Index | 330.00 USD | 10/21/20 | 3 | 300 | 1,668 | 1,316 | 352 | |||||||||||||||||||||
E-mini S&P 500 Index | 285.00 USD | 10/23/20 | 4 | 400 | 186 | 575 | (389 | ) | ||||||||||||||||||||
E-mini S&P 500 Index | 290.00 USD | 10/23/20 | 12 | 1,200 | 720 | 1,980 | (1,260 | ) | ||||||||||||||||||||
E-mini S&P 500 Index | 302.50 USD | 10/23/20 | 4 | 400 | 492 | 535 | (43 | ) | ||||||||||||||||||||
E-mini S&P 500 Index | 315.00 USD | 10/23/20 | 2 | 200 | 517 | 1,229 | (712 | ) | ||||||||||||||||||||
E-mini S&P 500 Index | 320.00 USD | 10/23/20 | 6 | 600 | 2,067 | 4,022 | (1,955 | ) | ||||||||||||||||||||
E-mini S&P 500 Index | 326.00 USD | 10/23/20 | 2 | 200 | 966 | 1,000 | (34 | ) | ||||||||||||||||||||
E-mini S&P 500 Index | 329.00 USD | 10/23/20 | 2 | 200 | 1,140 | 915 | 225 | |||||||||||||||||||||
E-mini S&P 500 Index | 285.00 USD | 10/26/20 | 4 | 400 | 210 | 631 | (421 | ) | ||||||||||||||||||||
E-mini S&P 500 Index | 290.00 USD | 10/26/20 | 8 | 800 | 544 | 1,402 | (858 | ) | ||||||||||||||||||||
E-mini S&P 500 Index | 315.00 USD | 10/26/20 | 2 | 200 | 558 | 1,286 | (728 | ) | ||||||||||||||||||||
E-mini S&P 500 Index | 320.00 USD | 10/26/20 | 4 | 400 | 1,474 | 2,859 | (1,385 | ) | ||||||||||||||||||||
E-mini S&P 500 Index | 326.00 USD | 10/26/20 | 2 | 200 | 1,018 | 1,047 | (29 | ) | ||||||||||||||||||||
E-mini S&P 500 Index | 329.00 USD | 10/26/20 | 2 | 200 | 1,194 | 959 | 235 | |||||||||||||||||||||
E-mini S&P 500 Index | 301.00 USD | 10/28/20 | 4 | 400 | 584 | 471 | 113 | |||||||||||||||||||||
E-mini S&P 500 Index | 327.00 USD | 10/28/20 | 2 | 200 | 1,155 | 939 | 216 | |||||||||||||||||||||
E-mini S&P 500 Index | 290.00 USD | 10/30/20 | 4 | 400 | 376 | 863 | (487 | ) | ||||||||||||||||||||
E-mini S&P 500 Index | 297.00 USD | 10/30/20 | 4 | 400 | 542 | 587 | (45 | ) | ||||||||||||||||||||
E-mini S&P 500 Index | 298.00 USD | 10/30/20 | 4 | 400 | 572 | 467 | 105 | |||||||||||||||||||||
| 108 | Annual Report | | September 30, 2020 | | See accompanying Notes to Financial Statements |
Table of Contents
Schedule of Investments
September 30, 2020
| Options purchased contracts outstanding at September 30, 2020 (continued): | ||||||||||||||||||||||||||||
| Description | Exercise Price | Expiration Date | Number of Contracts | Notional Amount | Market Value | Cost | Unrealized Appreciation (Depreciation) | |||||||||||||||||||||
Put options (continued): |
| |||||||||||||||||||||||||||
E-mini S&P 500 Index | 320.00 USD | 10/30/20 | 2 | $ | 200 | $ | 884 | $ | 1,614 | $ | (730 | ) | ||||||||||||||||
E-mini S&P 500 Index | 325.00 USD | 10/30/20 | 2 | 200 | 1,126 | 1,167 | (41 | ) | ||||||||||||||||||||
E-mini S&P 500 Index | 326.00 USD | 10/30/20 | 2 | 200 | 1,181 | 973 | 208 | |||||||||||||||||||||
E-mini S&P 500 Index | 295.00 USD | 11/2/20 | 8 | 800 | 1,100 | 1,046 | 54 | |||||||||||||||||||||
E-mini S&P 500 Index | 325.00 USD | 11/2/20 | 4 | 400 | 2,392 | 2,227 | 165 | |||||||||||||||||||||
E-mini S&P 500 Index | 305.00 USD | 10/2/20 | 4 | 400 | 12 | 539 | (527 | ) | ||||||||||||||||||||
E-mini S&P 500 Index | 306.00 USD | 10/2/20 | 4 | 400 | 12 | 611 | (599 | ) | ||||||||||||||||||||
E-mini S&P 500 Index | 335.00 USD | 10/2/20 | 2 | 200 | 577 | 776 | (199 | ) | ||||||||||||||||||||
E-mini S&P 500 Index | 336.00 USD | 10/2/20 | 2 | 200 | 674 | 888 | (214 | ) | ||||||||||||||||||||
E-mini S&P 500 Index | 305.00 USD | 10/5/20 | 4 | 400 | 24 | 587 | (563 | ) | ||||||||||||||||||||
E-mini S&P 500 Index | 335.00 USD | 10/5/20 | 2 | 200 | 708 | 812 | (104 | ) | ||||||||||||||||||||
S&P 500 Index | 3,020.00 USD | 10/2/20 | 3 | 300 | 75 | 7,277 | (7,202 | ) | ||||||||||||||||||||
S&P 500 Index | 3,050.00 USD | 10/2/20 | 3 | 300 | 90 | 8,531 | (8,441 | ) | ||||||||||||||||||||
S&P 500 Index | 3,090.00 USD | 10/2/20 | 1 | 100 | 43 | 3,145 | (3,102 | ) | ||||||||||||||||||||
S&P 500 Index | 3,100.00 USD | 10/2/20 | 4 | 400 | 190 | 7,251 | (7,061 | ) | ||||||||||||||||||||
S&P 500 Index | 3,115.00 USD | 10/2/20 | 3 | 300 | 165 | 3,983 | (3,818 | ) | ||||||||||||||||||||
S&P 500 Index | 3,040.00 USD | 10/5/20 | 3 | 300 | 165 | 3,651 | (3,486 | ) | ||||||||||||||||||||
S&P 500 Index | 2,975.00 USD | 10/7/20 | 3 | 300 | 240 | 7,256 | (7,016 | ) | ||||||||||||||||||||
S&P 500 Index | 3,000.00 USD | 10/7/20 | 1 | 100 | 93 | 2,641 | (2,548 | ) | ||||||||||||||||||||
S&P 500 Index | 3,025.00 USD | 10/7/20 | 3 | 300 | 338 | 4,205 | (3,867 | ) | ||||||||||||||||||||
S&P 500 Index | 3,040.00 USD | 10/7/20 | 3 | 300 | 375 | 5,798 | (5,423 | ) | ||||||||||||||||||||
S&P 500 Index | 3,020.00 USD | 10/9/20 | 3 | 300 | 630 | 5,601 | (4,971 | ) | ||||||||||||||||||||
S&P 500 Index | 3,040.00 USD | 10/9/20 | 6 | 600 | 1,470 | 8,243 | (6,773 | ) | ||||||||||||||||||||
S&P 500 Index | 3,050.00 USD | 10/9/20 | 3 | 300 | 795 | 5,768 | (4,973 | ) | ||||||||||||||||||||
S&P 500 Index | 3,080.00 USD | 10/9/20 | 1 | 100 | 345 | 2,452 | (2,107 | ) | ||||||||||||||||||||
S&P 500 Index | 3,130.00 USD | 10/9/20 | 1 | 100 | 565 | 2,468 | (1,903 | ) | ||||||||||||||||||||
S&P 500 Index | 3,075.00 USD | 10/12/20 | 3 | 300 | 1,380 | 4,856 | (3,476 | ) | ||||||||||||||||||||
S&P 500 Index | 3,125.00 USD | 10/12/20 | 1 | 100 | 730 | 2,136 | (1,406 | ) | ||||||||||||||||||||
S&P 500 Index | 3,150.00 USD | 10/12/20 | 3 | 300 | 2,760 | 3,500 | (740 | ) | ||||||||||||||||||||
S&P 500 Index | 3,075.00 USD | 10/14/20 | 3 | 300 | 2,115 | 4,746 | (2,631 | ) | ||||||||||||||||||||
S&P 500 Index | 3,100.00 USD | 10/14/20 | 3 | 300 | 2,580 | 5,106 | (2,526 | ) | ||||||||||||||||||||
S&P 500 Index | 3,125.00 USD | 10/14/20 | 4 | 400 | 4,220 | 6,041 | (1,821 | ) | ||||||||||||||||||||
S&P 500 Index | 3,150.00 USD | 10/14/20 | 1 | 100 | 1,295 | 2,245 | (950 | ) | ||||||||||||||||||||
S&P 500 Index | 3,170.00 USD | 10/14/20 | 3 | 300 | 4,590 | 3,347 | 1,243 | |||||||||||||||||||||
S&P 500 Index | 2,975.00 USD | 10/16/20 | 3 | 300 | 1,380 | 4,506 | (3,126 | ) | ||||||||||||||||||||
S&P 500 Index | 2,985.00 USD | 10/16/20 | 3 | 300 | 1,470 | 4,748 | (3,278 | ) | ||||||||||||||||||||
S&P 500 Index | 3,050.00 USD | 10/16/20 | 1 | 100 | 775 | 2,206 | (1,431 | ) | ||||||||||||||||||||
S&P 500 Index | 3,070.00 USD | 10/16/20 | 1 | 100 | 895 | 2,348 | (1,453 | ) | ||||||||||||||||||||
S&P 500 Index | 2,925.00 USD | 10/19/20 | 3 | 300 | 1,305 | 4,671 | (3,366 | ) | ||||||||||||||||||||
S&P 500 Index | 3,000.00 USD | 10/19/20 | 1 | 100 | 690 | 2,441 | (1,751 | ) | ||||||||||||||||||||
S&P 500 Index | 2,900.00 USD | 10/21/20 | 3 | 300 | 1,470 | 5,168 | (3,698 | ) | ||||||||||||||||||||
S&P 500 Index | 2,975.00 USD | 10/21/20 | 4 | 400 | 3,000 | 7,359 | (4,359 | ) | ||||||||||||||||||||
S&P 500 Index | 3,040.00 USD | 10/21/20 | 1 | 100 | 1,115 | 2,318 | (1,203 | ) | ||||||||||||||||||||
S&P 500 Index | 2,910.00 USD | 10/23/20 | 3 | 300 | 1,905 | 5,156 | (3,251 | ) | ||||||||||||||||||||
S&P 500 Index | 2,915.00 USD | 10/23/20 | 3 | 300 | 1,950 | 4,805 | (2,855 | ) | ||||||||||||||||||||
S&P 500 Index | 2,960.00 USD | 10/23/20 | 1 | 100 | 840 | 2,293 | (1,453 | ) | ||||||||||||||||||||
S&P 500 Index | 2,990.00 USD | 10/23/20 | 1 | 100 | 1,000 | 2,341 | (1,341 | ) | ||||||||||||||||||||
S&P 500 Index | 3,025.00 USD | 10/26/20 | 3 | 300 | 4,050 | 4,475 | (425 | ) | ||||||||||||||||||||
S&P 500 Index | 3,075.00 USD | 10/26/20 | 1 | 100 | 1,810 | 2,136 | (326 | ) | ||||||||||||||||||||
S&P 500 Index | 3,000.00 USD | 10/28/20 | 3 | 300 | 4,140 | 4,616 | (476 | ) | ||||||||||||||||||||
S&P 500 Index | 3,050.00 USD | 10/28/20 | 3 | 300 | 5,460 | 4,217 | 1,243 | |||||||||||||||||||||
S&P 500 Index | 3,075.00 USD | 10/28/20 | 1 | 100 | 2,085 | 2,301 | (216 | ) | ||||||||||||||||||||
S&P 500 Index | 3,120.00 USD | 10/28/20 | 1 | 100 | 2,655 | 2,085 | 570 | |||||||||||||||||||||
|
| |||||||||||||||||||||||||||
| Total put options |
| $ | 127,507 | $ | 311,657 | $ | (184,150 | ) | ||||||||||||||||||||
|
| |||||||||||||||||||||||||||
| Total options purchased contracts |
| $ | 202,097 | $ | 416,695 | $ | (214,598 | ) | ||||||||||||||||||||
|
| |||||||||||||||||||||||||||
| See accompanying Notes to Financial Statements | | September 30, 2020 | | Annual Report | 109 |
Table of Contents
Schedule of Investments
September 30, 2020
| Options written contracts outstanding at September 30, 2020: | ||||||||||||||||||||||||||||
| Description | Exercise Price | Expiration Date | Number of Contracts | Notional Amount | Market Value | Premiums Received | Unrealized Appreciation (Depreciation) | |||||||||||||||||||||
Call options: |
| |||||||||||||||||||||||||||
S&P 500 Index | 3,800.00 USD | 10/2/20 | (8 | ) | $ | (800 | ) | $ | (20 | ) | $ | (1,623 | ) | $ | 1,603 | |||||||||||||
S&P 500 Index | 3,750.00 USD | 10/5/20 | (8 | ) | (800 | ) | (40 | ) | (1,407 | ) | 1,367 | |||||||||||||||||
S&P 500 Index | 3,725.00 USD | 10/7/20 | (8 | ) | (800 | ) | (80 | ) | (3,543 | ) | 3,463 | |||||||||||||||||
S&P 500 Index | 3,650.00 USD | 10/9/20 | (8 | ) | (800 | ) | (420 | ) | (3,447 | ) | 3,027 | |||||||||||||||||
S&P 500 Index | 3,675.00 USD | 10/12/20 | (8 | ) | (800 | ) | (460 | ) | (3,703 | ) | 3,243 | |||||||||||||||||
S&P 500 Index | 3,700.00 USD | 10/14/20 | (8 | ) | (800 | ) | (580 | ) | (3,199 | ) | 2,619 | |||||||||||||||||
S&P 500 Index | 3,575.00 USD | 10/16/20 | (8 | ) | (800 | ) | (2,840 | ) | (4,079 | ) | 1,239 | |||||||||||||||||
S&P 500 Index | 3,660.00 USD | 10/16/20 | (4 | ) | (400 | ) | (570 | ) | (4,060 | ) | 3,490 | |||||||||||||||||
S&P 500 Index | 3,700.00 USD | 10/16/20 | (4 | ) | (400 | ) | (400 | ) | (3,904 | ) | 3,504 | |||||||||||||||||
S&P 500 Index | 3,775.00 USD | 10/16/20 | (8 | ) | (800 | ) | (440 | ) | (7,411 | ) | 6,971 | |||||||||||||||||
S&P 500 Index | 3,850.00 USD | 10/16/20 | (4 | ) | (400 | ) | (120 | ) | (4,696 | ) | 4,576 | |||||||||||||||||
S&P 500 Index | 3,550.00 USD | 10/19/20 | (8 | ) | (800 | ) | (5,000 | ) | (2,839 | ) | (2,161 | ) | ||||||||||||||||
S&P 500 Index | 3,550.00 USD | 10/21/20 | (8 | ) | (800 | ) | (6,200 | ) | (2,552 | ) | (3,648 | ) | ||||||||||||||||
S&P 500 Index | 3,560.00 USD | 10/23/20 | (8 | ) | (800 | ) | (6,600 | ) | (2,759 | ) | (3,841 | ) | ||||||||||||||||
S&P 500 Index | 3,775.00 USD | 10/23/20 | (4 | ) | (400 | ) | (500 | ) | (3,016 | ) | 2,516 | |||||||||||||||||
S&P 500 Index | 3,800.00 USD | 10/23/20 | (4 | ) | (400 | ) | (420 | ) | (1,640 | ) | 1,220 | |||||||||||||||||
S&P 500 Index | 3,875.00 USD | 10/23/20 | (4 | ) | (400 | ) | (250 | ) | (1,780 | ) | 1,530 | |||||||||||||||||
S&P 500 Index | 3,650.00 USD | 10/26/20 | (8 | ) | (800 | ) | (3,543 | ) | (2,903 | ) | (640 | ) | ||||||||||||||||
S&P 500 Index | 3,675.00 USD | 10/28/20 | (8 | ) | (800 | ) | (2,800 | ) | (3,207 | ) | 407 | |||||||||||||||||
S&P 500 Index | 3,685.00 USD | 10/30/20 | (4 | ) | (400 | ) | (1,520 | ) | (3,812 | ) | 2,292 | |||||||||||||||||
S&P 500 Index | 3,670.00 USD | 11/2/20 | (4 | ) | (400 | ) | (1,920 | ) | (5,448 | ) | 3,528 | |||||||||||||||||
S&P 500 Index | 3,700.00 USD | 11/4/20 | (4 | ) | (400 | ) | (2,140 | ) | (5,856 | ) | 3,716 | |||||||||||||||||
S&P 500 Index | 3,575.00 USD | 11/6/20 | (12 | ) | (1,200 | ) | (24,420 | ) | (15,892 | ) | (8,528 | ) | ||||||||||||||||
S&P 500 Index | 3,600.00 USD | 11/13/20 | (4 | ) | (400 | ) | (8,560 | ) | (4,552 | ) | (4,008 | ) | ||||||||||||||||
S&P 500 Index | 3,625.00 USD | 11/13/20 | (4 | ) | (400 | ) | (6,980 | ) | (8,156 | ) | 1,176 | |||||||||||||||||
S&P 500 Index | 3,650.00 USD | 11/13/20 | (4 | ) | (400 | ) | (5,680 | ) | (6,748 | ) | 1,068 | |||||||||||||||||
|
| |||||||||||||||||||||||||||
| Total call options |
| $ | (82,503 | ) | $ | (112,232 | ) | $ | 29,729 | |||||||||||||||||||
|
| |||||||||||||||||||||||||||
Put options: |
| |||||||||||||||||||||||||||
E-mini S&P 500 Index | 315.00 USD | 10/2/20 | (6 | ) | $ | (600 | ) | $ | (51 | ) | $ | (2,498 | ) | $ | 2,447 | |||||||||||||
E-mini S&P 500 Index | 317.00 USD | 10/2/20 | (6 | ) | (600 | ) | (63 | ) | (2,444 | ) | 2,381 | |||||||||||||||||
E-mini S&P 500 Index | 318.00 USD | 10/2/20 | (21 | ) | (2,100 | ) | (262 | ) | (6,306 | ) | 6,044 | |||||||||||||||||
E-mini S&P 500 Index | 320.00 USD | 10/2/20 | (6 | ) | (600 | ) | (105 | ) | (1,309 | ) | 1,204 | |||||||||||||||||
E-mini S&P 500 Index | 321.00 USD | 10/2/20 | (6 | ) | (600 | ) | (126 | ) | (1,483 | ) | 1,357 | |||||||||||||||||
E-mini S&P 500 Index | 322.00 USD | 10/2/20 | (6 | ) | (600 | ) | (153 | ) | (1,748 | ) | 1,595 | |||||||||||||||||
E-mini S&P 500 Index | 330.00 USD | 10/2/20 | (4 | ) | (400 | ) | (496 | ) | (1,069 | ) | 573 | |||||||||||||||||
E-mini S&P 500 Index | 313.00 USD | 10/5/20 | (2 | ) | (200 | ) | (26 | ) | (790 | ) | 764 | |||||||||||||||||
E-mini S&P 500 Index | 316.00 USD | 10/5/20 | (6 | ) | (600 | ) | (114 | ) | (2,570 | ) | 2,456 | |||||||||||||||||
E-mini S&P 500 Index | 318.00 USD | 10/5/20 | (6 | ) | (600 | ) | (156 | ) | (1,868 | ) | 1,712 | |||||||||||||||||
E-mini S&P 500 Index | 320.00 USD | 10/5/20 | (12 | ) | (1,200 | ) | (432 | ) | (3,111 | ) | 2,679 | |||||||||||||||||
E-mini S&P 500 Index | 321.00 USD | 10/5/20 | (21 | ) | (2,100 | ) | (903 | ) | (5,025 | ) | 4,122 | |||||||||||||||||
E-mini S&P 500 Index | 328.00 USD | 10/5/20 | (6 | ) | (600 | ) | (795 | ) | (1,592 | ) | 797 | |||||||||||||||||
E-mini S&P 500 Index | 310.00 USD | 10/7/20 | (2 | ) | (200 | ) | (43 | ) | (764 | ) | 721 | |||||||||||||||||
E-mini S&P 500 Index | 317.00 USD | 10/7/20 | (12 | ) | (1,200 | ) | (594 | ) | (3,675 | ) | 3,081 | |||||||||||||||||
E-mini S&P 500 Index | 321.00 USD | 10/7/20 | (6 | ) | (600 | ) | (507 | ) | (1,610 | ) | 1,103 | |||||||||||||||||
E-mini S&P 500 Index | 323.00 USD | 10/7/20 | (12 | ) | (1,200 | ) | (1,302 | ) | (2,571 | ) | 1,269 | |||||||||||||||||
E-mini S&P 500 Index | 306.00 USD | 10/9/20 | (21 | ) | (2,100 | ) | (599 | ) | (3,430 | ) | 2,831 | |||||||||||||||||
E-mini S&P 500 Index | 310.00 USD | 10/9/20 | (2 | ) | (200 | ) | (83 | ) | (820 | ) | 737 | |||||||||||||||||
E-mini S&P 500 Index | 314.00 USD | 10/9/20 | (6 | ) | (600 | ) | (378 | ) | (1,904 | ) | 1,526 | |||||||||||||||||
E-mini S&P 500 Index | 315.00 USD | 10/9/20 | (12 | ) | (1,200 | ) | (840 | ) | (4,581 | ) | 3,741 | |||||||||||||||||
E-mini S&P 500 Index | 318.00 USD | 10/9/20 | (6 | ) | (600 | ) | (579 | ) | (1,538 | ) | 959 | |||||||||||||||||
E-mini S&P 500 Index | 321.00 USD | 10/9/20 | (6 | ) | (600 | ) | (798 | ) | (1,304 | ) | 506 | |||||||||||||||||
E-mini S&P 500 Index | 305.00 USD | 10/12/20 | (7 | ) | (700 | ) | (255 | ) | (1,430 | ) | 1,175 | |||||||||||||||||
E-mini S&P 500 Index | 310.00 USD | 10/12/20 | (12 | ) | (1,200 | ) | (684 | ) | (3,033 | ) | 2,349 | |||||||||||||||||
E-mini S&P 500 Index | 315.00 USD | 10/12/20 | (6 | ) | (600 | ) | (552 | ) | (1,802 | ) | 1,250 | |||||||||||||||||
E-mini S&P 500 Index | 317.00 USD | 10/12/20 | (6 | ) | (600 | ) | (669 | ) | (1,166 | ) | 497 | |||||||||||||||||
E-mini S&P 500 Index | 318.00 USD | 10/12/20 | (6 | ) | (600 | ) | (735 | ) | (1,658 | ) | 923 | |||||||||||||||||
E-mini S&P 500 Index | 305.00 USD | 10/14/20 | (5 | ) | (500 | ) | (288 | ) | (1,201 | ) | 913 | |||||||||||||||||
E-mini S&P 500 Index | 308.00 USD | 10/14/20 | (6 | ) | (600 | ) | (438 | ) | (1,382 | ) | 944 | |||||||||||||||||
| 110 | Annual Report | | September 30, 2020 | | See accompanying Notes to Financial Statements |
Table of Contents
Schedule of Investments
September 30, 2020
| Options written contracts outstanding at September 30, 2020 (continued): | ||||||||||||||||||||||||||||
| Description | Exercise Price | Expiration Date | Number of Contracts | Notional Amount | Market Value | Premiums Received | Unrealized Appreciation (Depreciation) | |||||||||||||||||||||
Put options (continued): |
| |||||||||||||||||||||||||||
E-mini S&P 500 Index | 309.00 USD | 10/14/20 | (6 | ) | $ | (600 | ) | $ | (474 | ) | $ | (1,778 | ) | $ | 1,304 | |||||||||||||
E-mini S&P 500 Index | 318.00 USD | 10/14/20 | (6 | ) | (600 | ) | (993 | ) | (1,370 | ) | 377 | |||||||||||||||||
E-mini S&P 500 Index | 302.00 USD | 10/16/20 | (13 | ) | (1,300 | ) | (871 | ) | (2,603 | ) | 1,732 | |||||||||||||||||
E-mini S&P 500 Index | 303.00 USD | 10/16/20 | (6 | ) | (600 | ) | (429 | ) | (1,502 | ) | 1,073 | |||||||||||||||||
E-mini S&P 500 Index | 308.00 USD | 10/16/20 | (12 | ) | (1,200 | ) | (1,230 | ) | (3,519 | ) | 2,289 | |||||||||||||||||
E-mini S&P 500 Index | 310.00 USD | 10/16/20 | (6 | ) | (600 | ) | (708 | ) | (1,964 | ) | 1,256 | |||||||||||||||||
E-mini S&P 500 Index | 316.00 USD | 10/16/20 | (12 | ) | (1,200 | ) | (2,190 | ) | (3,243 | ) | 1,053 | |||||||||||||||||
E-mini S&P 500 Index | 310.00 USD | 10/19/20 | (6 | ) | (600 | ) | (810 | ) | (2,072 | ) | 1,262 | |||||||||||||||||
E-mini S&P 500 Index | 315.00 USD | 10/19/20 | (10 | ) | (1,000 | ) | (1,905 | ) | (2,693 | ) | 788 | |||||||||||||||||
E-mini S&P 500 Index | 316.00 USD | 10/19/20 | (21 | ) | (2,100 | ) | (4,284 | ) | (4,690 | ) | 406 | |||||||||||||||||
E-mini S&P 500 Index | 300.00 USD | 10/21/20 | (6 | ) | (600 | ) | (522 | ) | (1,574 | ) | 1,052 | |||||||||||||||||
E-mini S&P 500 Index | 315.00 USD | 10/21/20 | (4 | ) | (400 | ) | (900 | ) | (961 | ) | 61 | |||||||||||||||||
E-mini S&P 500 Index | 319.00 USD | 10/21/20 | (9 | ) | (900 | ) | (2,597 | ) | (1,991 | ) | (606 | ) | ||||||||||||||||
E-mini S&P 500 Index | 300.00 USD | 10/23/20 | (6 | ) | (600 | ) | (633 | ) | (1,766 | ) | 1,133 | |||||||||||||||||
E-mini S&P 500 Index | 305.00 USD | 10/23/20 | (14 | ) | (1,400 | ) | (2,002 | ) | (4,755 | ) | 2,753 | |||||||||||||||||
E-mini S&P 500 Index | 314.00 USD | 10/23/20 | (6 | ) | (600 | ) | (1,461 | ) | (1,526 | ) | 65 | |||||||||||||||||
E-mini S&P 500 Index | 317.00 USD | 10/23/20 | (6 | ) | (600 | ) | (1,740 | ) | (1,358 | ) | (382 | ) | ||||||||||||||||
E-mini S&P 500 Index | 300.00 USD | 10/26/20 | (2 | ) | (200 | ) | (237 | ) | (632 | ) | 395 | |||||||||||||||||
E-mini S&P 500 Index | 305.00 USD | 10/26/20 | (8 | ) | (800 | ) | (1,260 | ) | (2,720 | ) | 1,460 | |||||||||||||||||
E-mini S&P 500 Index | 313.00 USD | 10/26/20 | (6 | ) | (600 | ) | (1,497 | ) | (1,550 | ) | 53 | |||||||||||||||||
E-mini S&P 500 Index | 317.00 USD | 10/26/20 | (6 | ) | (600 | ) | (1,875 | ) | (1,466 | ) | (409 | ) | ||||||||||||||||
E-mini S&P 500 Index | 314.00 USD | 10/28/20 | (6 | ) | (600 | ) | (1,773 | ) | (1,412 | ) | (361 | ) | ||||||||||||||||
E-mini S&P 500 Index | 305.00 USD | 10/30/20 | (6 | ) | (600 | ) | (1,245 | ) | (2,528 | ) | 1,283 | |||||||||||||||||
E-mini S&P 500 Index | 311.00 USD | 10/30/20 | (6 | ) | (600 | ) | (1,695 | ) | (1,766 | ) | 71 | |||||||||||||||||
E-mini S&P 500 Index | 312.00 USD | 10/30/20 | (6 | ) | (600 | ) | (1,782 | ) | (1,442 | ) | (340 | ) | ||||||||||||||||
E-mini S&P 500 Index | 310.00 USD | 11/2/20 | (12 | ) | (1,200 | ) | (3,528 | ) | (3,255 | ) | (273 | ) | ||||||||||||||||
S&P 500 Index | 3,150.00 USD | 10/2/20 | (4 | ) | (400 | ) | (330 | ) | (14,831 | ) | 14,501 | |||||||||||||||||
S&P 500 Index | 3,160.00 USD | 10/2/20 | (1 | ) | (100 | ) | (95 | ) | (4,003 | ) | 3,908 | |||||||||||||||||
S&P 500 Index | 3,165.00 USD | 10/2/20 | (3 | ) | (300 | ) | (300 | ) | (6,084 | ) | 5,784 | |||||||||||||||||
S&P 500 Index | 3,175.00 USD | 10/2/20 | (3 | ) | (300 | ) | (360 | ) | (12,595 | ) | 12,235 | |||||||||||||||||
S&P 500 Index | 3,180.00 USD | 10/2/20 | (3 | ) | (300 | ) | (375 | ) | (6,136 | ) | 5,761 | |||||||||||||||||
S&P 500 Index | 3,100.00 USD | 10/5/20 | (3 | ) | (300 | ) | (285 | ) | (5,699 | ) | 5,414 | |||||||||||||||||
S&P 500 Index | 3,075.00 USD | 10/7/20 | (1 | ) | (100 | ) | (170 | ) | (3,474 | ) | 3,304 | |||||||||||||||||
S&P 500 Index | 3,100.00 USD | 10/7/20 | (2 | ) | (200 | ) | (435 | ) | (7,656 | ) | 7,221 | |||||||||||||||||
S&P 500 Index | 3,160.00 USD | 10/7/20 | (3 | ) | (300 | ) | (1,320 | ) | (6,459 | ) | 5,139 | |||||||||||||||||
S&P 500 Index | 3,170.00 USD | 10/7/20 | (1 | ) | (100 | ) | (500 | ) | (3,235 | ) | 2,735 | |||||||||||||||||
S&P 500 Index | 3,175.00 USD | 10/7/20 | (3 | ) | (300 | ) | (1,590 | ) | (9,961 | ) | 8,371 | |||||||||||||||||
S&P 500 Index | 3,105.00 USD | 10/9/20 | (6 | ) | (600 | ) | (2,610 | ) | (13,035 | ) | 10,425 | |||||||||||||||||
S&P 500 Index | 3,145.00 USD | 10/9/20 | (1 | ) | (100 | ) | (665 | ) | (3,275 | ) | 2,610 | |||||||||||||||||
S&P 500 Index | 3,150.00 USD | 10/9/20 | (3 | ) | (300 | ) | (2,100 | ) | (9,955 | ) | 7,855 | |||||||||||||||||
S&P 500 Index | 3,180.00 USD | 10/9/20 | (3 | ) | (300 | ) | (2,895 | ) | (9,946 | ) | 7,051 | |||||||||||||||||
S&P 500 Index | 3,200.00 USD | 10/9/20 | (1 | ) | (100 | ) | (1,195 | ) | (3,316 | ) | 2,121 | |||||||||||||||||
S&P 500 Index | 3,190.00 USD | 10/12/20 | (1 | ) | (100 | ) | (1,345 | ) | (2,939 | ) | 1,594 | |||||||||||||||||
S&P 500 Index | 3,200.00 USD | 10/12/20 | (3 | ) | (300 | ) | (4,425 | ) | (8,980 | ) | 4,555 | |||||||||||||||||
S&P 500 Index | 3,215.00 USD | 10/12/20 | (3 | ) | (300 | ) | (5,085 | ) | (5,899 | ) | 814 | |||||||||||||||||
S&P 500 Index | 3,190.00 USD | 10/14/20 | (3 | ) | (300 | ) | (5,370 | ) | (6,475 | ) | 1,105 | |||||||||||||||||
S&P 500 Index | 3,200.00 USD | 10/14/20 | (1 | ) | (100 | ) | (1,940 | ) | (2,953 | ) | 1,013 | |||||||||||||||||
S&P 500 Index | 3,210.00 USD | 10/14/20 | (4 | ) | (400 | ) | (8,420 | ) | (12,034 | ) | 3,614 | |||||||||||||||||
S&P 500 Index | 3,220.00 USD | 10/14/20 | (3 | ) | (300 | ) | (6,825 | ) | (8,904 | ) | 2,079 | |||||||||||||||||
S&P 500 Index | 3,240.00 USD | 10/14/20 | (3 | ) | (300 | ) | (7,980 | ) | (5,938 | ) | (2,042 | ) | ||||||||||||||||
S&P 500 Index | 3,110.00 USD | 10/16/20 | (4 | ) | (400 | ) | (4,800 | ) | (11,763 | ) | 6,963 | |||||||||||||||||
S&P 500 Index | 3,120.00 USD | 10/16/20 | (3 | ) | (300 | ) | (3,885 | ) | (8,828 | ) | 4,943 | |||||||||||||||||
S&P 500 Index | 3,135.00 USD | 10/16/20 | (1 | ) | (100 | ) | (1,445 | ) | (3,191 | ) | 1,746 | |||||||||||||||||
S&P 500 Index | 3,050.00 USD | 10/19/20 | (4 | ) | (400 | ) | (3,860 | ) | (12,109 | ) | 8,249 | |||||||||||||||||
S&P 500 Index | 3,025.00 USD | 10/21/20 | (3 | ) | (300 | ) | (3,045 | ) | (9,616 | ) | 6,571 | |||||||||||||||||
S&P 500 Index | 3,030.00 USD | 10/21/20 | (1 | ) | �� | (100 | ) | (1,055 | ) | (3,094 | ) | 2,039 | ||||||||||||||||
S&P 500 Index | 3,100.00 USD | 10/21/20 | (4 | ) | (400 | ) | (6,580 | ) | (12,517 | ) | 5,937 | |||||||||||||||||
S&P 500 Index | 3,025.00 USD | 10/23/20 | (1 | ) | (100 | ) | (1,225 | ) | (3,141 | ) | 1,916 | |||||||||||||||||
S&P 500 Index | 3,040.00 USD | 10/23/20 | (3 | ) | (300 | ) | (4,035 | ) | (9,694 | ) | 5,659 | |||||||||||||||||
| See accompanying Notes to Financial Statements | | September 30, 2020 | | Annual Report | 111 |
Table of Contents
Schedule of Investments
September 30, 2020
| Options written contracts outstanding at September 30, 2020 (continued): | ||||||||||||||||||||||||||||
| Description | Exercise Price | Expiration Date | Number of Contracts | Notional Amount | Market Value | Premiums Received | Unrealized Appreciation (Depreciation) | |||||||||||||||||||||
Put options (continued): |
| |||||||||||||||||||||||||||
S&P 500 Index | 3,045.00 USD | 10/23/20 | (3 | ) | $ | (300 | ) | $ | (4,155 | ) | $ | (9,272 | ) | $ | 5,117 | |||||||||||||
S&P 500 Index | 3,050.00 USD | 10/23/20 | (1 | ) | (100 | ) | (1,425 | ) | (3,174 | ) | 1,749 | |||||||||||||||||
S&P 500 Index | 3,140.00 USD | 10/26/20 | (1 | ) | (100 | ) | (2,635 | ) | (3,014 | ) | 379 | |||||||||||||||||
S&P 500 Index | 3,160.00 USD | 10/26/20 | (3 | ) | (300 | ) | (8,850 | ) | (9,208 | ) | 358 | |||||||||||||||||
S&P 500 Index | 3,130.00 USD | 10/28/20 | (4 | ) | (400 | ) | (11,200 | ) | (12,338 | ) | 1,138 | |||||||||||||||||
S&P 500 Index | 3,180.00 USD | 10/28/20 | (4 | ) | (400 | ) | (14,580 | ) | (11,591 | ) | (2,989 | ) | ||||||||||||||||
|
| |||||||||||||||||||||||||||
| Total put options |
| $ | (181,057 | ) | $ | (418,150 | ) | $ | 237,093 | |||||||||||||||||||
|
| |||||||||||||||||||||||||||
| Total options written contracts |
| $ | (263,560 | ) | $ | (530,382 | ) | $ | 266,822 | |||||||||||||||||||
|
| |||||||||||||||||||||||||||
(e) At September 30, 2020, the Fund pledged $247,920 in cash as collateral for options written.
| 112 | Annual Report | | September 30, 2020 | | See accompanying Notes to Financial Statements |
Table of Contents
Schedule of Investments
September 30, 2020
AllianzGI Preferred Securities and Income Fund
| Principal Amount (000s) | Value | |||||||
| Corporate Bonds & Notes—71.5% |
| |||||||
| Auto Manufacturers—0.5% |
| |||||||
General Motors Financial Co., Inc., Ser. C, (converts to FRN on 9/30/30) (c)(d), |
| |||||||
5.70%, 9/30/30 | $127 | $127,794 | ||||||
|
| |||||||
| Banks—32.9% |
| |||||||
Barclays PLC, (converts to FRN on 6/15/26) (c)(d), |
| |||||||
6.125%, 12/15/25 | 417 | 423,729 | ||||||
Citizens Financial Group, Inc. (c)(d), |
| |||||||
5.65%, 10/6/25 (converts to FRN on 10/6/25) | 450 | 474,469 | ||||||
6.00%, 7/6/23, Ser. B (converts to FRN on 7/6/23) | 610 | 589,026 | ||||||
Comerica, Inc., (converts to FRN on 10/1/25) (c)(d), |
| |||||||
5.625%, 7/1/25 | 645 | 683,343 | ||||||
Credit Suisse Group AG (a)(b)(c)(d), |
| |||||||
5.25%, 2/11/27 (converts to FRN on 8/11/27) | 280 | 281,260 | ||||||
6.375%, 8/21/26 (converts to FRN on 8/21/26) | 600 | 641,751 | ||||||
First Horizon Bank, |
| |||||||
5.75%, 5/1/30 | 500 | 565,544 | ||||||
First Maryland Capital II, 3 mo. LIBOR + 0.850% (d), |
| |||||||
1.101%, 2/1/27 | 213 | 197,558 | ||||||
Huntington Bancshares, Inc. (c)(d), |
| |||||||
4.45%, 10/15/27 (converts to FRN on 10/15/27) | 200 | 198,200 | ||||||
5.625%, 7/15/30 (converts to FRN on 10/15/30) | 500 | 551,250 | ||||||
JPMorgan Chase & Co., 3 mo. LIBOR + 0.950% (d), |
| |||||||
1.201%, 2/2/37 | 857 | 734,877 | ||||||
Lloyds Banking Group PLC, (converts to FRN on 9/27/25) (c)(d), |
| |||||||
7.50%, 9/27/25 | 1,025 | 1,092,081 | ||||||
Natwest Group PLC, (converts to FRN on 6/29/26) (c)(d), |
| |||||||
6.00%, 12/29/25 | 1,230 | 1,256,843 | ||||||
NTC Capital II, 3 mo. LIBOR + 0.590%, Ser. B (d), |
| |||||||
0.865%, 4/15/27 | 230 | 213,095 | ||||||
Regions Financial Corp., Ser. D, (converts to FRN on 9/15/25) (c)(d), |
| |||||||
5.75%, 6/15/25 | 155 | 165,850 | ||||||
Truist Financial Corp., Ser. Q, (converts to FRN on 9/1/30) (c)(d), |
| |||||||
5.10%, 3/1/30 | 300 | 324,660 | ||||||
|
| |||||||
| 8,393,536 | ||||||||
|
| |||||||
| Diversified Financial Services—3.7% |
| |||||||
Discover Financial Services (c)(d), |
| |||||||
5.50%, 10/30/27, Ser. C (converts to FRN on 10/30/27) | 730 | 697,011 | ||||||
6.125%, 6/23/25 (converts to FRN on 9/23/25) | 225 | 238,567 | ||||||
|
| |||||||
| 935,578 | ||||||||
|
| |||||||
| Electric Utilities—5.9% |
| |||||||
Emera, Inc., Ser. 16-A, (converts to FRN on 6/15/26) (d), |
| |||||||
6.75%, 6/15/76 | 610 | 680,106 | ||||||
Sempra Energy, (converts to FRN on 10/15/25) (c)(d), |
| |||||||
4.875%, 10/15/25 | 515 | 529,820 | ||||||
Southern Co., Ser. B, (converts to FRN on 1/15/26) (d), |
| |||||||
4.00%, 1/15/51 | 292 | 292,904 | ||||||
|
| |||||||
| 1,502,830 | ||||||||
|
| |||||||
| Principal Amount (000s) | Value | |||||||
| Insurance—17.0% |
| |||||||
Allstate Corp., (converts to FRN on 5/15/37) (d), |
| |||||||
6.50%, 5/15/57 | $ | 170 | $ | 218,237 | ||||
American International Group, Inc. (d), |
| |||||||
5.75%, 4/1/48, Ser. A-9 (converts to FRN on 4/1/28) | 360 | 398,043 | ||||||
8.175%, 5/15/58 (converts to FRN on 5/15/38) | 374 | 528,832 | ||||||
Lincoln National Corp., 3 mo. LIBOR + 2.358% (d), |
| |||||||
2.638%, 5/17/66 | 1,470 | 1,058,400 | ||||||
MetLife, Inc., |
| |||||||
9.25%, 4/8/38 (a)(b) | 215 | 326,286 | ||||||
10.75%, 8/1/39 | 1,110 | 1,819,533 | ||||||
|
| |||||||
| 4,349,331 | ||||||||
|
| |||||||
| Media—1.9% |
| |||||||
ViacomCBS, Inc., (converts to FRN on 2/28/27) (d), |
| |||||||
6.25%, 2/28/57 | 440 | 483,877 | ||||||
|
| |||||||
| Miscellaneous Manufacturing—2.2% |
| |||||||
General Electric Co., Ser. D, (converts to FRN on 1/21/21) (c)(d), |
| |||||||
5.00%, 1/21/21 | 700 | 554,750 | ||||||
|
| |||||||
| Pipelines—7.4% |
| |||||||
Energy Transfer Operating L.P., (converts to FRN on 5/15/30) (c)(d), |
| |||||||
7.125%, 5/15/30 | 1,581 | 1,250,966 | ||||||
Plains All American Pipeline L.P., Ser. B, (converts to FRN on 11/15/22) (c)(d), |
| |||||||
6.125%, 11/15/22 | 801 | 509,156 | ||||||
Transcanada Trust, (converts to FRN on 9/15/29) (d), |
| |||||||
5.50%, 9/15/79 | 120 | 125,925 | ||||||
|
| |||||||
| 1,886,047 | ||||||||
|
| |||||||
| Total Corporate Bonds & Notes (cost—$18,201,737) |
| 18,233,743 | ||||||
|
| |||||||
| Shares | ||||||||
| Preferred Stock—21.4% |
| |||||||
| Banks—11.2% |
| |||||||
Citigroup Capital XIII, 3 mo. LIBOR + 6.370% (d) |
| |||||||
6.64%, 10/30/40 | 22,495 | 606,915 | ||||||
First Horizon National Corp. (c) 6.50%, 10/10/25 | 20,910 | 570,216 | ||||||
Regions Financial Corp., Ser. C, 3 mo. LIBOR + 3.148% (c)(d) |
| |||||||
5.70%, 5/15/29 | 17,918 | 485,399 | ||||||
Wells Fargo & Co. (c) 4.75%, 3/15/25 | 26,960 | 677,774 | ||||||
Wells Fargo & Co., Ser. Q, 3 mo. LIBOR + 3.090% (c)(d) |
| |||||||
5.85%, 9/15/23 | 20,350 | 530,321 | ||||||
|
| |||||||
| 2,870,625 | ||||||||
|
| |||||||
| Consumer Finance—2.3% |
| |||||||
Synchrony Financial, Ser. A (c) 5.625%, 11/15/24 | 23,785 | 585,587 | ||||||
|
| |||||||
| Telecommunications—1.9% |
| |||||||
AT&T, Inc., Ser. C (c) 4.75%, 2/18/25 | 19,100 | 487,050 | ||||||
|
| |||||||
| Equity Real Estate Investment Trusts (REITs)—1.5% |
| |||||||
Public Storage (c) | 15,000 | 372,000 | ||||||
|
| |||||||
Shares | Value | |||||||
| Insurance—3.1% |
| |||||||
Athene Holding Ltd., Ser. A, 3 mo. LIBOR + 4.253% (c)(d) |
| |||||||
6.35%, 6/30/2029 | 29,468 | $ | 791,216 | |||||
|
| |||||||
| Wireless Telecommunication Services—1.4% |
| |||||||
United States Cellular Corp. 6.25%, 9/1/69 | 13,670 | 357,880 | ||||||
|
| |||||||
| Total Preferred Stock (cost—$5,335,956) |
| 5,464,358 | ||||||
|
| |||||||
| Common Stock—4.9% |
| |||||||
| Oil, Gas & Consumable Fuels—1.8% |
| |||||||
Energy Transfer L.P. | 83,000 | 449,860 | ||||||
|
| |||||||
| Telecommunications—3.1% |
| |||||||
AT&T, Inc. | 27,490 | 783,740 | ||||||
|
| |||||||
| Total Common Stock (cost—$1,367,968) |
| 1,233,600 | ||||||
|
| |||||||
| Principal Amount (000s) | ||||||||
| Repurchase Agreements—3.2% |
| |||||||
State Street Bank and Trust Co., dated 9/30/20, 0.00%, due 10/1/20, proceeds $826,000; collateralized by U.S. Treasury Notes, 0.25%, due 9/30/25, valued at $842,534 including accrued interest |
| |||||||
(cost—$826,000) | $826 | 826,000 | ||||||
|
| |||||||
| Total Investments (cost—$25,731,661)—101.0% |
| 25,757,701 | ||||||
|
| |||||||
| Liabilities in excess of other assets (e)—(1.0)% | (245,650 | ) | ||||||
|
| |||||||
| Net Assets—100.0% | $25,512,051 | |||||||
|
| |||||||
Notes to Schedule of Investments:
(a) Private Placement—Restricted as to resale and may not have a readily available market. Private placement securities include Rule 144A securities. Securities with an aggregate value of $1,249,297, representing 4.9% of net assets.
(b) 144A—Exempt from registration under Rule 144A of the Securities Act of 1933. These securities may be resold in transactions exempt from registration, typically only to qualified institutional buyers. Securities with an aggregate value of $1,249,297, representing 4.9% of net assets.
(c) Perpetual maturity. The date shown, if any, is the next call date.
(d) Variable or Floating Rate Security—Securities with an interest rate that changes periodically. The interest rate disclosed reflects the rate in effect on September 30, 2020.
| See accompanying Notes to Financial Statements | | September 30, 2020 | | Annual Report | 113 |
Table of Contents
Schedule of Investments
September 30, 2020
(e) Includes net unrealized appreciation (depreciation) of other financial instruments as follows:
| Futures contracts outstanding at September 30, 2020: | ||||||||||||
Type | Contracts | Expiration Date | Notional Amount (000s) | Market Value (000s) | Unrealized Appreciation | |||||||||||||||||
Long position contracts: |
| |||||||||||||||||||||
5-Year U.S. Treasury Note | 3 | 12/31/20 | $ | 300 | $ | 378 | $ | 137 | ||||||||||||||
|
| |||||||||||||||||||||
| Credit default swaps agreements outstanding at September 30, 2020: | ||||||||||||||||||||||||||||||||
Centrally cleared buy protection swap agreements: |
| |||||||||||||||||||||||||||||||
| Broker (Exchange)/ Reference Debt Issuer | Notional Amount (000s)(1) | Implied Credit Spread | Termination Date | Fixed Deal Pay Rate | Payment Frequency | Value(2) | Upfront Premiums Paid (Received) | Unrealized Depreciation | ||||||||||||||||||||||||
Goldman Sachs (ICE): |
| |||||||||||||||||||||||||||||||
Energy Transfer Operating, L.P. | $ | 770 | 1.534 | % | 12/20/24 | (1.00 | )% | Quarterly | $ | 13,636 | $ | 85,737 | $ | (72,101 | ) | |||||||||||||||||
Marathon Petroleum Corp. | 260 | 0.904 | % | 6/20/25 | (5.00 | )% | Quarterly | (50,328 | ) | (44,184 | ) | (6,144 | ) | |||||||||||||||||||
Simon Property Group, L.P. | 210 | 1.517 | % | 6/20/25 | (1.00 | )% | Quarterly | 4,066 | 18,220 | (14,154 | ) | |||||||||||||||||||||
The Williams Companies, Inc. | 260 | 0.811 | % | 12/20/24 | (1.00 | )% | Quarterly | (2,922 | ) | 29,792 | (32,714 | ) | ||||||||||||||||||||
|
| |||||||||||||||||||||||||||||||
| $ | (35,548 | ) | $ | 89,565 | $ | (125,113 | ) | |||||||||||||||||||||||||
|
| |||||||||||||||||||||||||||||||
(1) This represents the maximum potential amount the Fund could be required to make available as a seller of credit protection or receive as a buyer of credit protection if a credit event occurs as defined under the terms of that particular swap agreement.
(2) The quoted market prices and resulting values for credit default swap agreements serve as an indicator of the status at September 30, 2020 of the payment/performance risk and represent the likelihood of an expected liability (or profit) for the credit derivative should the notional amount of the swap agreement have been closed/sold as of the period end. Increasing market values, in absolute terms when compared to the notional amount of the swap, represent a deterioration of the referenced entity’s credit soundness and a greater likelihood or risk of default or other credit event occurring as defined under the terms of the agreement.
(f) At September 30, 2020, the Fund pledged $31,764 in cash as collateral for futures contracts and received $40,437 in cash as collateral for swap contracts.
Glossary:
FRN—Floating Rate Note
ICE—Intercontinental Exchange
LIBOR—London Inter-Bank Offered Rate
REIT—Real Estate Investment Trust
| 114 | Annual Report | | September 30, 2020 | | See accompanying Notes to Financial Statements |
Table of Contents
Schedule of Investments
September 30, 2020
AllianzGI Short Duration High Income Fund
| Principal Amount (000s) | Value | |||||||
| Corporate Bonds & Notes—81.8% |
| |||||||
| Advertising—0.2% |
| |||||||
Outfront Media Capital LLC (a)(c), |
| |||||||
6.25%, 6/15/25 | $1,250 | $1,289,844 | ||||||
|
| |||||||
| Aerospace & Defense—1.7% |
| |||||||
Spirit AeroSystems, Inc. (a)(c), |
| |||||||
7.50%, 4/15/25 | 11,500 | 11,665,370 | ||||||
Triumph Group, Inc. (a)(c), |
| |||||||
6.25%, 9/15/24 | 1,550 | 1,322,181 | ||||||
8.875%, 6/1/24 | 500 | 533,750 | ||||||
|
| |||||||
| 13,521,301 | ||||||||
|
| |||||||
| Airlines—1.3% |
| |||||||
Delta Air Lines, Inc. (a)(c), |
| |||||||
4.50%, 10/20/25 | 2,000 | 2,053,750 | ||||||
Mileage Plus Holdings LLC (a)(c), |
| |||||||
6.50%, 6/20/27 | 6,450 | 6,715,277 | ||||||
Spirit Loyalty Cayman Ltd. (a)(c), |
| |||||||
8.00%, 9/20/25 | 2,000 | 2,121,540 | ||||||
|
| |||||||
| 10,890,567 | ||||||||
|
| |||||||
| Apparel & Textiles—0.2% |
| |||||||
Hanesbrands, Inc. (a)(c), | ||||||||
5.375%, 5/15/25 | 1,250 | 1,326,563 | ||||||
|
| |||||||
| Auto Components—1.8% |
| |||||||
Clarios Global LP (a)(c), | ||||||||
6.75%, 5/15/25 | 800 | 843,256 | ||||||
Goodyear Tire & Rubber Co., |
| |||||||
9.50%, 5/31/25 | 12,500 | 13,586,312 | ||||||
|
| |||||||
| 14,429,568 | ||||||||
|
| |||||||
| Auto Manufacturers—3.0% |
| |||||||
Ford Motor Co., |
| |||||||
8.50%, 4/21/23 | 15,050 | 16,428,505 | ||||||
9.00%, 4/22/25 | 7,000 | 8,034,565 | ||||||
|
| |||||||
| 24,463,070 | ||||||||
|
| |||||||
| Building Materials—0.3% |
| |||||||
Louisiana-Pacific Corp., |
| |||||||
4.875%, 9/15/24 | 2,686 | 2,765,237 | ||||||
|
| |||||||
| Chemicals—0.5% |
| |||||||
OCI NV (a)(c), |
| |||||||
6.625%, 4/15/23 | 4,285 | 4,436,046 | ||||||
|
| |||||||
| Coal—0.3% |
| |||||||
Cloud Peak Energy Resources LLC, |
| |||||||
12.00%, 5/1/25 | 9,151 | 2,882,582 | ||||||
|
| |||||||
| Commercial Services—2.3% |
| |||||||
APX Group, Inc., |
| |||||||
8.50%, 11/1/24 | 12,688 | 13,432,088 | ||||||
Brink’s Co. (a)(c), |
| |||||||
5.50%, 7/15/25 | 5,000 | 5,215,625 | ||||||
|
| |||||||
| 18,647,713 | ||||||||
|
| |||||||
| Distribution/Wholesale—5.3% |
| |||||||
KAR Auction Services, Inc. (a)(c), |
| |||||||
5.125%, 6/1/25 | 4,412 | 4,417,427 | ||||||
Wolverine Escrow LLC (a)(c), |
| |||||||
8.50%, 11/15/24 | 24,400 | 20,069,000 | ||||||
9.00%, 11/15/26 | 22,250 | 18,397,969 | ||||||
|
| |||||||
| 42,884,396 | ||||||||
|
| |||||||
| Diversified Financial Services—8.9% |
| |||||||
Alliance Data Systems Corp. (a)(c), |
| |||||||
4.75%, 12/15/24 | 34,000 | 31,860,550 | ||||||
7.00%, 1/15/26 | 6,000 | 5,981,850 | ||||||
Global Aircraft Leasing Co., Ltd., PIK 7.25% (a)(c), |
| |||||||
6.50%, 9/15/24 | 42,590 | 23,903,567 | ||||||
| Principal Amount (000s) | Value | |||||||
LPL Holdings, Inc. (a)(c), |
| |||||||
5.75%, 9/15/25 | $ | 9,107 | $ | 9,464,905 | ||||
Park Aerospace Holdings Ltd. (a)(c), |
| |||||||
5.25%, 8/15/22 | 1,000 | 1,004,375 | ||||||
|
| |||||||
| 72,215,247 | ||||||||
|
| |||||||
| Electric Utilities—0.5% |
| |||||||
AES Corp., |
| |||||||
5.50%, 4/15/25 | 3,700 | 3,821,897 | ||||||
|
| |||||||
| Engineering & Construction—0.4% |
| |||||||
PowerTeam Services LLC (a)(c), |
| |||||||
9.033%, 12/4/25 | 3,000 | 3,174,375 | ||||||
|
| |||||||
| Entertainment—2.9% |
| |||||||
Banijay Entertainment S.A.S. U. (a)(c), |
| |||||||
5.375%, 3/1/25 | 12,250 | 12,364,844 | ||||||
International Game Technology PLC (a)(c), |
| |||||||
6.25%, 2/15/22 | 7,930 | 8,113,381 | ||||||
SeaWorld Parks & Entertainment, Inc. (a)(c), |
| |||||||
9.50%, 8/1/25 | 1,500 | 1,552,470 | ||||||
Wynn Resorts Finance LLC (a)(c), |
| |||||||
7.75%, 4/15/25 | 1,800 | 1,908,540 | ||||||
|
| |||||||
| 23,939,235 | ||||||||
|
| |||||||
| Equity Real Estate Investment Trusts (REITs)—1.2% |
| |||||||
ESH Hospitality, Inc. (a)(c), |
| |||||||
5.25%, 5/1/25 | 9,300 | 9,406,717 | ||||||
|
| |||||||
| Food Service—0.6% |
| |||||||
Aramark Services, Inc. (a)(c), |
| |||||||
5.00%, 4/1/25 | 4,586 | 4,663,503 | ||||||
|
| |||||||
| Hand/Machine Tools—0.8% |
| |||||||
Colfax Corp. (a)(c), |
| |||||||
6.00%, 2/15/24 | 6,000 | 6,250,080 | ||||||
|
| |||||||
| Healthcare-Products—1.0% |
| |||||||
Fresenius U.S. Finance II, Inc. (a)(c), |
| |||||||
4.25%, 2/1/21 | 7,795 | 7,883,757 | ||||||
|
| |||||||
| Home Builders—0.1% |
| |||||||
Picasso Finance Sub, Inc. (a)(c), |
| |||||||
6.125%, 6/15/25 | 900 | 970,731 | ||||||
|
| |||||||
| Household Products/Wares—0.1% |
| |||||||
Spectrum Brands, Inc., |
| |||||||
5.75%, 7/15/25 | 500 | 516,750 | ||||||
|
| |||||||
| Lodging—2.1% |
| |||||||
Las Vegas Sands Corp., |
| |||||||
3.20%, 8/8/24 | 8,930 | 9,057,908 | ||||||
Wynn Las Vegas LLC (a)(c), |
| |||||||
5.50%, 3/1/25 | 8,000 | 7,695,000 | ||||||
|
| |||||||
| 16,752,908 | ||||||||
|
| |||||||
| Machinery-Diversified—0.3% |
| |||||||
CNH Industrial Capital LLC, |
| |||||||
4.375%, 4/5/22 | 2,675 | 2,805,401 | ||||||
|
| |||||||
| Media—3.7% |
| |||||||
AMC Networks, Inc., |
| |||||||
5.00%, 4/1/24 | 24,371 | 24,949,811 | ||||||
Clear Channel Worldwide Holdings, Inc., |
| |||||||
9.25%, 2/15/24 | 2,243 | 2,180,207 | ||||||
Sinclair Television Group, Inc. (a)(c), |
| |||||||
5.625%, 8/1/24 | 1,650 | 1,644,844 | ||||||
TEGNA, Inc. (a)(c), |
| |||||||
4.75%, 3/15/26 | 1,500 | 1,535,550 | ||||||
|
| |||||||
| 30,310,412 | ||||||||
|
| |||||||
| Principal Amount (000s) | Value | |||||||
| Miscellaneous Manufacturing—1.8% |
| |||||||
Hillenbrand, Inc., |
| |||||||
5.75%, 6/15/25 | $ | 2,000 | $ | 2,146,250 | ||||
LSB Industries, Inc. (a)(c), |
| |||||||
9.625%, 5/1/23 | 12,600 | 12,393,927 | ||||||
|
| |||||||
| 14,540,177 | ||||||||
|
| |||||||
| Oil, Gas & Consumable Fuels—8.9% |
| |||||||
AmeriGas Partners L.P., |
| |||||||
5.50%, 5/20/25 | 602 | 648,303 | ||||||
5.625%, 5/20/24 | 4,510 | 4,785,110 | ||||||
CVR Energy, Inc. (a)(c), |
| |||||||
5.25%, 2/15/25 | 38,449 | 33,570,783 | ||||||
PBF Holding Co. LLC, |
| |||||||
7.25%, 6/15/25 | 32,000 | 24,243,360 | ||||||
9.25%, 5/15/25 (a)(c) | 4,000 | 4,115,080 | ||||||
Sunoco L.P., |
| |||||||
4.875%, 1/15/23 | 4,500 | 4,538,902 | ||||||
|
| |||||||
| 71,901,538 | ||||||||
|
| |||||||
| Pipelines—11.1% |
| |||||||
Cheniere Energy Partners LP, |
| |||||||
5.25%, 10/1/25 | 13,200 | 13,516,800 | ||||||
EQM Midstream Partners LP (a)(c), |
| |||||||
6.00%, 7/1/25 | 8,000 | 8,260,000 | ||||||
MPLX L.P., |
| |||||||
6.25%, 10/15/22 | 745 | 745,819 | ||||||
New Fortress Energy, Inc. (a)(c), |
| |||||||
6.75%, 9/15/25 | 16,700 | 17,491,163 | ||||||
NuStar Logistics LP, |
| |||||||
5.75%, 10/1/25 | 3,450 | 3,571,785 | ||||||
PBF Logistics L.P., |
| |||||||
6.875%, 5/15/23 | 11,912 | 11,234,326 | ||||||
Tallgrass Energy Partners L.P. (a)(c), |
| |||||||
4.75%, 10/1/23 | 6,000 | 5,703,690 | ||||||
Targa Resources Partners L.P., |
| |||||||
5.25%, 5/1/23 | 29,290 | 29,298,933 | ||||||
|
| |||||||
| 89,822,516 | ||||||||
|
| |||||||
| Real Estate—2.8% |
| |||||||
Newmark Group, Inc., |
| |||||||
6.125%, 11/15/23 | 15,247 | 15,892,679 | ||||||
Realogy Group LLC (a)(c), |
| |||||||
4.875%, 6/1/23 | 1,500 | 1,487,813 | ||||||
7.625%, 6/15/25 | 5,000 | 5,245,075 | ||||||
|
| |||||||
| 22,625,567 | ||||||||
|
| |||||||
| Retail—7.5% |
| |||||||
Carvana Co. (a)(c), |
| |||||||
5.625%, 10/1/25 | 8,000 | 7,910,000 | ||||||
eG Global Finance PLC (a)(c), |
| |||||||
6.75%, 2/7/25 | 8,250 | 8,461,406 | ||||||
8.50%, 10/30/25 | 22,000 | 23,196,250 | ||||||
GameStop Corp. (a)(c), |
| |||||||
10.00%, 3/15/23 | 9,075 | 8,212,875 | ||||||
KGA Escrow LLC (a)(c), |
| |||||||
7.50%, 8/15/23 | 12,428 | 12,881,933 | ||||||
|
| |||||||
| 60,662,464 | ||||||||
|
| |||||||
| Semiconductors—0.7% |
| |||||||
ams AG (a)(c), |
| |||||||
7.00%, 7/31/25 | 5,250 | 5,573,164 | ||||||
|
| |||||||
| Software—1.1% |
| |||||||
j2 Cloud Services LLC (a)(c), |
| |||||||
6.00%, 7/15/25 | 2,000 | 2,082,600 | ||||||
Logan Merger Sub, Inc. (a)(c), |
| |||||||
5.50%, 9/1/27 | 2,000 | 2,033,750 | ||||||
Veritas U.S., Inc. (a)(c), |
| |||||||
7.50%, 2/1/23 | 2,000 | 2,002,710 | ||||||
| See accompanying Notes to Financial Statements | | September 30, 2020 | | Annual Report | 115 |
Table of Contents
Schedule of Investments
September 30, 2020
| Principal Amount (000s) | Value | |||||||
Veritas US, Inc. (a)(c), |
| |||||||
7.50%, 9/1/25 | $ | 3,000 | $ | 3,097,500 | ||||
|
| |||||||
| 9,216,560 | ||||||||
|
| |||||||
| Telecommunications—4.6% |
| |||||||
Connect Finco SARL (a)(c), |
| |||||||
6.75%, 10/1/26 | 29,550 | 29,688,885 | ||||||
Hughes Satellite Systems Corp., |
| |||||||
7.625%, 6/15/21 | 5,830 | 6,055,912 | ||||||
Level 3 Financing, Inc., |
| |||||||
5.375%, 1/15/24 | 1,925 | 1,949,727 | ||||||
|
| |||||||
| 37,694,524 | ||||||||
|
| |||||||
| Transportation—3.8% |
| |||||||
Fly Leasing Ltd., |
| |||||||
5.25%, 10/15/24 | 9,990 | 8,091,900 | ||||||
6.375%, 10/15/21 | 14,125 | 14,158,123 | ||||||
XPO Logistics, Inc. (a)(c), |
| |||||||
6.25%, 5/1/25 | 1,500 | 1,600,313 | ||||||
6.75%, 8/15/24 | 6,900 | 7,321,417 | ||||||
|
| |||||||
| 31,171,753 | ||||||||
|
| |||||||
| Total Corporate Bonds & Notes (cost—$713,962,663) |
| 663,456,163 | ||||||
|
| |||||||
| Senior Loans (a)(b)- 13.5% |
| |||||||
| Commercial Services & Supplies—7.7% |
| |||||||
APX Group, Inc., |
| |||||||
5.147%, 12/31/25, 1 mo. LIBOR + 5.000%, 2020 Term Loan | 21,492 | 21,171,845 | ||||||
7.25%, 12/31/25, 3 mo. Prime + 4.000%, 2020 Term Loan | 14 | 14,008 | ||||||
Asurion LLC, |
| |||||||
3.147%, 8/4/22, 1 mo. LIBOR + 3.000%, 2017 Term Loan B4 | 12,589 | 12,468,382 | ||||||
6.647%, 8/4/25, 1 mo. LIBOR + 6.500%, 2017 2nd Lien Term Loan | 29,121 | 29,227,359 | ||||||
|
| |||||||
| 62,881,594 | ||||||||
|
| |||||||
| Electric Utilities—2.2% |
| |||||||
Calpine Corp., 1 mo. LIBOR + 2.250%, Term Loan B5, |
| |||||||
2.40%, 1/15/24 | 2,953 | 2,878,899 | ||||||
Pacific Gas & Electric Company, 3 mo. LIBOR + 4.500%, 2020 Term Loan, |
| |||||||
5.50%, 6/23/25 | 14,963 | 14,688,162 | ||||||
|
| |||||||
| 17,567,061 | ||||||||
|
| |||||||
| Entertainment—0.3% |
| |||||||
Banijay Entertainment S.A.S, 1 mo. LIBOR + 3.750%, USD Term Loan, |
| |||||||
3.907%, 3/1/25 | 2,950 | 2,898,375 | ||||||
|
| |||||||
| Pipelines—0.8% |
| |||||||
Prairie ECI Acquiror LP, 1 mo. LIBOR + 4.750%, Term Loan B, |
| |||||||
4.897%, 3/11/26 | 7,200 | 6,525,176 | ||||||
|
| |||||||
| Retail—0.4% |
| |||||||
Whatabrands LLC, 1 mo. LIBOR + 2.750%, 2020 Term Loan B, |
| |||||||
2.906%, 7/31/26 | 2,978 | 2,921,709 | ||||||
|
| |||||||
| Specialty Retail—2.1% |
| |||||||
PetSmart, Inc., 3 mo. LIBOR + 3.500%, Consenting Term Loan (d), |
| |||||||
3/11/22 | 16,985 | 16,972,930 | ||||||
|
| |||||||
| Total Senior Loans (cost—$110,660,480) |
| 109,766,845 | ||||||
|
| |||||||
| Principal Amount (000s) | Value | |||||||
| Asset-backed Security—0.2% |
| |||||||
Navajo Transitional Energy Co. LLC, |
| |||||||
9.00%, 10/24/24 (cost—$10,045,457) | $ | 4,881 | $ | 1,537,377 | ||||
|
| |||||||
| Shares | ||||||||
| Common Stock—0.0% |
| |||||||
| Coal—0.0% |
| |||||||
Cloud Peak Energy, Inc. (e)(f) (cost—$0) | 40,020 | 1 | ||||||
|
| |||||||
| Principal Amount (000s) | ||||||||
| Repurchase Agreements—2.9% |
| |||||||
State Street Bank and Trust Co., dated 9/30/20, 0.00%, due 10/1/20, proceeds $23,764,000; collateralized by U.S. Treasury Notes, 0.25%, due 9/30/25, valued at $24,239,309 including accrued interest |
| |||||||
(cost—$23,764,000) | $23,764 | 23,764,000 | ||||||
|
| |||||||
| Total Investments (cost—$858,432,600)—98.4% |
| 798,524,386 | ||||||
|
| |||||||
| Other assets less liabilities—1.6% |
| 13,249,800 | ||||||
|
| |||||||
| Net Assets—100.0% |
| $811,774,186 | ||||||
|
| |||||||
Notes to Schedule of Investments:
(a) Private Placement—Restricted as to resale and may not have a readily available market. Private placement securities include Rule 144A securities. Securities with an aggregate value of $531,883,816, representing 65.5% of net assets.
(b) These securities generally pay interest at rates which are periodically pre-determined by reference to a base lending rate plus a premium. These base lending rates are generally either the lending rate offered by one or more major European banks, such as the “LIBOR” or the prime rate offered by one or more major United States banks, or the certificate of deposit rate. These securities are generally considered to be restricted as the Fund is ordinarily contractually obligated to receive approval from the Agent bank and/or borrower prior to disposition. Remaining maturities of senior loans may be less than the stated maturities shown as a result of contractual or optional payments by the borrower. Such prepayments cannot be predicted with certainty. The interest rate disclosed reflects the rate in effect on September 30, 2020.
(c) 144A—Exempt from registration under Rule 144A of the Securities Act of 1933. These securities may be resold in transactions exempt from registration, typically only to qualified institutional buyers. Securities with an aggregate value of $422,116,971, representing 52.0% of net assets.
(d) When-issued or delayed-delivery. To be settled/delivered after September 30, 2020.
(e) Fair-Valued—Security with a value of $1, representing less than 0.05% of net assets. See Note 1(a) and Note 1(b) in the Notes to Financial Statements.
(f) Level 3 security. See Note 1(a) and Note 1(b) in the Notes to Financial Statements.
Glossary:
LIBOR—London Inter-Bank Offered Rate
PIK—Payment-in-Kind
REIT—Real Estate Investment Trust
| 116 | Annual Report | | September 30, 2020 | | See accompanying Notes to Financial Statements |
Table of Contents
Schedule of Investments
September 30, 2020
AllianzGI Short Term Bond Fund
| Principal Amount (000s) | Value | |||||||
| Corporate Bonds & Notes—91.7% |
| |||||||
| Aerospace & Defense—3.3% |
| |||||||
Boeing Co., | ||||||||
4.508%, 5/1/23 | $150 | $158,163 | ||||||
Raytheon Co., | ||||||||
3.125%, 10/15/20 | 100 | 100,093 | ||||||
Spirit AeroSystems, Inc. (a)(b), | ||||||||
7.50%, 4/15/25 | 175 | 177,516 | ||||||
Triumph Group, Inc. (a)(b), | ||||||||
8.875%, 6/1/24 | 100 | 106,750 | ||||||
|
| |||||||
| 542,522 | ||||||||
|
| |||||||
| Airlines—3.1% |
| |||||||
Delta Air Lines, Inc. (a)(b), | ||||||||
4.50%, 10/20/25 | 300 | 308,062 | ||||||
Mileage Plus Holdings LLC (a)(b), |
| |||||||
6.50%, 6/20/27 | 200 | 208,226 | ||||||
|
| |||||||
| 516,288 | ||||||||
|
| |||||||
| Apparel & Textiles—0.9% |
| |||||||
PVH Corp. (a)(b), | ||||||||
4.625%, 7/10/25 | 150 | 156,605 | ||||||
|
| |||||||
| Auto Manufacturers—1.5% |
| |||||||
Ford Motor Co., | ||||||||
8.50%, 4/21/23 | 125 | 136,449 | ||||||
9.00%, 4/22/25 | 100 | 114,780 | ||||||
|
| |||||||
| 251,229 | ||||||||
|
| |||||||
| Banks—15.8% |
| |||||||
Bank of America Corp., | ||||||||
5.70%, 1/24/22 | 347 | 371,093 | ||||||
Barclays Bank PLC, 3 mo. LIBOR + 0.460% (c), |
| |||||||
0.726%, 1/11/21 | 100 | 100,076 | ||||||
Citigroup, Inc., | ||||||||
3.142%, 1/24/23 (converts to FRN on 1/24/22) (c) | 332 | 342,624 | ||||||
4.50%, 1/14/22 | 200 | 210,320 | ||||||
Fifth Third Bancorp, | ||||||||
3.50%, 3/15/22 | 500 | 520,978 | ||||||
Goldman Sachs Group, Inc., | ||||||||
5.25%, 7/27/21 | �� | 300 | 312,009 | |||||
JPMorgan Chase & Co., | ||||||||
4.625%, 5/10/21 | 300 | 307,960 | ||||||
Morgan Stanley, | ||||||||
5.50%, 7/28/21 | 425 | 442,871 | ||||||
|
| |||||||
| 2,607,931 | ||||||||
|
| |||||||
| Chemicals—0.6% |
| |||||||
CVR Partners L.P. (a)(b), | ||||||||
9.25%, 6/15/23 | 100 | 92,490 | ||||||
|
| |||||||
| Commercial Services—1.6% |
| |||||||
APX Group, Inc., | ||||||||
8.50%, 11/1/24 | 250 | 264,661 | ||||||
|
| |||||||
| Distribution/Wholesale—1.5% |
| |||||||
Wolverine Escrow LLC (a)(b), | ||||||||
8.50%, 11/15/24 | 300 | 246,750 | ||||||
|
| |||||||
| Diversified Financial Services—12.3% |
| |||||||
AerCap Ireland Capital DAC, | ||||||||
4.50%, 5/15/21 | 245 | 250,053 | ||||||
4.50%, 9/15/23 | 200 | 206,203 | ||||||
4.625%, 7/1/22 | 150 | 153,684 | ||||||
6.50%, 7/15/25 | 250 | 269,941 | ||||||
Aircastle Ltd., | ||||||||
4.40%, 9/25/23 | 350 | 347,552 | ||||||
5.00%, 4/1/23 | 150 | 150,554 | ||||||
| Principal Amount (000s) | Value | |||||||
American Express Co., | ||||||||
3.70%, 11/5/21 | $ | 200 | $ | 206,665 | ||||
Capital One Financial Corp., |
| |||||||
4.75%, 7/15/21 | 130 | 134,445 | ||||||
Charles Schwab Corp., |
| |||||||
3.25%, 5/21/21 | 200 | 203,372 | ||||||
Global Aircraft Leasing Co., Ltd., PIK 7.25% (a)(b), |
| |||||||
6.50%, 9/15/24 | 207 | 116,319 | ||||||
|
| |||||||
| 2,038,788 | ||||||||
|
| |||||||
| Electric Utilities—3.2% |
| |||||||
AES Corp. (a)(b), |
| |||||||
3.30%, 7/15/25 | 200 | 213,447 | ||||||
Public Service Enterprise Group, Inc., |
| |||||||
2.65%, 11/15/22 | 300 | 312,915 | ||||||
|
| |||||||
| 526,362 | ||||||||
|
| |||||||
| Engineering & Construction—1.0% |
| |||||||
PowerTeam Services LLC (a)(b), |
| |||||||
9.033%, 12/4/25 | 150 | 158,719 | ||||||
|
| |||||||
| Entertainment—1.1% |
| |||||||
Wynn Resorts Finance LLC (a)(b), |
| |||||||
7.75%, 4/15/25 | 175 | 185,553 | ||||||
|
| |||||||
| Equity Real Estate Investment Trusts (REITs)—2.2% |
| |||||||
American Tower Corp., |
| |||||||
3.375%, 5/15/24 | 75 | 81,198 | ||||||
CC Holdings GS V LLC, |
| |||||||
3.849%, 4/15/23 | 75 | 80,648 | ||||||
ERP Operating L.P., |
| |||||||
4.625%, 12/15/21 | 200 | 207,955 | ||||||
|
| |||||||
| 369,801 | ||||||||
|
| |||||||
| Food & Beverage—3.7% |
| |||||||
General Mills, Inc., |
| |||||||
3.15%, 12/15/21 | 275 | 282,297 | ||||||
Hershey Co., |
| |||||||
4.125%, 12/1/20 | 50 | 50,323 | ||||||
J M Smucker Co., |
| |||||||
3.00%, 3/15/22 | 275 | 285,193 | ||||||
|
| |||||||
| 617,813 | ||||||||
|
| |||||||
| Healthcare-Products—0.6% |
| |||||||
Fresenius U.S. Finance II, Inc. (a)(b), |
| |||||||
4.50%, 1/15/23 | 50 | 53,347 | ||||||
Medtronic, Inc., |
| |||||||
3.15%, 3/15/22 | 50 | 52,034 | ||||||
|
| |||||||
| 105,381 | ||||||||
|
| |||||||
| Healthcare-Services—1.0% |
| |||||||
HCA, Inc., |
| |||||||
4.75%, 5/1/23 | 150 | 163,670 | ||||||
|
| |||||||
| Home Builders—0.7% |
| |||||||
Picasso Finance Sub, Inc. (a)(b), |
| |||||||
6.125%, 6/15/25 | 100 | 107,859 | ||||||
|
| |||||||
| Insurance—6.6% |
| |||||||
American International Group, Inc., |
| |||||||
3.30%, 3/1/21 | 500 | 504,829 | ||||||
Aon PLC, |
| |||||||
4.00%, 11/27/23 | 175 | 191,474 | ||||||
Marsh & McLennan Cos., Inc., |
| |||||||
4.05%, 10/15/23 | 175 | 191,287 | ||||||
Prudential Financial, Inc., |
| |||||||
4.50%, 11/16/21 | 200 | 209,343 | ||||||
|
| |||||||
| 1,096,933 | ||||||||
|
| |||||||
| Lodging—6.1% |
| |||||||
Choice Hotels International, Inc., |
| |||||||
5.75%, 7/1/22 | 361 | 384,463 | ||||||
| Principal Amount (000s) | Value | |||||||
Hyatt Hotels Corp., |
| |||||||
3.375%, 7/15/23 | $ | 150 | $ | 152,436 | ||||
Marriott International, Inc., |
| |||||||
3.125%, 10/15/21 | 250 | 253,191 | ||||||
3.60%, 4/15/24 | 100 | 102,899 | ||||||
5.75%, 5/1/25 | 100 | 111,707 | ||||||
|
| |||||||
| 1,004,696 | ||||||||
|
| |||||||
| Machinery-Construction & Mining—1.2% |
| |||||||
Caterpillar Financial Services Corp., 3 mo. LIBOR + 0.350 (c), |
| |||||||
0.598%, 12/7/20 | 200 | 200,112 | ||||||
|
| |||||||
| Media—1.0% |
| |||||||
Cox Communications, Inc. (a)(b), |
| |||||||
3.25%, 12/15/22 | 150 | 157,928 | ||||||
|
| |||||||
| Oil, Gas & Consumable Fuels—7.6% |
| |||||||
CVR Energy, Inc. (a)(b), |
| |||||||
5.25%, 2/15/25 | 475 | 414,734 | ||||||
PBF Holding Co. LLC, |
| |||||||
7.25%, 6/15/25 | 500 | 378,803 | ||||||
9.25%, 5/15/25 (a)(b) | 450 | 462,946 | ||||||
|
| |||||||
| 1,256,483 | ||||||||
|
| |||||||
| Pharmaceuticals—3.1% |
| |||||||
Bausch Health Cos., Inc. (a)(b), |
| |||||||
7.00%, 3/15/24 | 100 | 103,600 | ||||||
Pfizer, Inc., |
| |||||||
3.00%, 9/15/21 | 175 | 179,587 | ||||||
Zoetis, Inc., |
| |||||||
3.25%, 8/20/21 | 225 | 230,871 | ||||||
|
| |||||||
| 514,058 | ||||||||
|
| |||||||
| Pipelines—2.5% |
| |||||||
New Fortress Energy, Inc. (a)(b), |
| |||||||
6.75%, 9/15/25 | 50 | 52,369 | ||||||
Rattler Midstream L.P. (a)(b), |
| |||||||
5.625%, 7/15/25 | 150 | 151,312 | ||||||
Tallgrass Energy Partners L.P. (a)(b), |
| |||||||
7.50%, 10/1/25 | 200 | 201,185 | ||||||
|
| |||||||
| 404,866 | ||||||||
|
| |||||||
| Retail—2.4% |
| |||||||
Dollar Tree, Inc., |
| |||||||
3.70%, 5/15/23 | 75 | 80,574 | ||||||
eG Global Finance PLC (a)(b), |
| |||||||
8.50%, 10/30/25 | 200 | 210,875 | ||||||
KGA Escrow LLC (a)(b), |
| |||||||
7.50%, 8/15/23 | 100 | 103,653 | ||||||
|
| |||||||
| 395,102 | ||||||||
|
| |||||||
| Software—3.3% |
| |||||||
Logan Merger Sub, Inc. (a)(b), |
| |||||||
5.50%, 9/1/27 | 200 | 203,375 | ||||||
VMware, Inc., |
| |||||||
2.95%, 8/21/22 | 325 | 338,162 | ||||||
|
| |||||||
| 541,537 | ||||||||
|
| |||||||
| Telecommunications—1.4% |
| |||||||
Sprint Spectrum Co. LLC (a)(b), |
| |||||||
3.36%, 9/20/21 | 125 | 126,425 | ||||||
T-Mobile USA, Inc., |
| |||||||
6.00%, 3/1/23 | 100 | 100,385 | ||||||
|
| |||||||
| 226,810 | ||||||||
|
| |||||||
| Transportation—2.4% |
| |||||||
Burlington Northern Santa Fe LLC, |
| |||||||
4.10%, 6/1/21 | 200 | 203,046 | ||||||
| See accompanying Notes to Financial Statements | | September 30, 2020 | | Annual Report | 117 |
Table of Contents
Schedule of Investments
September 30, 2020
| Principal Amount (000s) | Value | |||||||
Ryder System, Inc., |
| |||||||
4.625%, 6/1/25 | $ | 175 | $ | 201,157 | ||||
|
| |||||||
| 404,203 | ||||||||
|
| |||||||
| Total Corporate Bonds & Notes (cost—$14,644,050) |
| 15,155,150 | ||||||
|
| |||||||
| U.S. Government Agency Securities—2.9% |
| |||||||
Federal Home Loan Banks, |
| |||||||
3.00%, 9/10/21 | 100 | 102,697 | ||||||
3.125%, 9/9/22 | 100 | 105,748 | ||||||
5.00%, 12/10/21 | 250 | 264,478 | ||||||
|
| |||||||
| Total U.S. Government Agency Securities (cost—$460,567) |
| 472,923 | ||||||
|
| |||||||
| U.S. Treasury Obligations—1.2% |
| |||||||
U.S. Treasury Notes, |
| |||||||
2.75%, 9/15/21 | 100 | 102,469 | ||||||
3.125%, 5/15/21 | 100 | 101,852 | ||||||
|
| |||||||
| Total U.S. Treasury Obligations (cost—$202,651) |
| 204,321 | ||||||
|
| |||||||
| Repurchase Agreements—3.0% |
| |||||||
State Street Bank and Trust Co., dated 9/30/20, 0.00%, due 10/1/20, proceeds $496,000; collateralized by U.S. Treasury Notes, 0.25%, due 9/30/25, valued at $505,961 including accrued interest |
| |||||||
(cost—$496,000) | 496 | 496,000 | ||||||
|
| |||||||
| Total Investments (cost—$15,803,268)—98.8% |
| 16,328,394 | ||||||
|
| |||||||
| Other assets less liabilities—1.2% |
| 194,338 | ||||||
|
| |||||||
| Net Assets—100.0% |
| $16,522,732 | ||||||
|
| |||||||
Notes to Schedule of Investments:
(a) Private Placement—Restricted as to resale and may not have a readily available market. Private placement securities include Rule 144A securities. Securities with an aggregate value of $4,320,045, representing 26.1% of net assets.
(b) 144A—Exempt from registration under Rule 144A of the Securities Act of 1933. These securities may be resold in transactions exempt from registration, typically only to qualified institutional buyers. Securities with an aggregate value of $4,320,045, representing 26.1% of net assets.
(c) Variable or Floating Rate Security—Securities with an interest rate that changes periodically. The interest rate disclosed reflects the rate in effect on September 30, 2020.
Glossary:
FRN—Floating Rate Note
LIBOR—London Inter-Bank Offered Rate
PIK—Payment-in-Kind
REIT—Real Estate Investment Trust
AllianzGI Structured Return Fund
| Principal Amount (000s) | Value | |||||||
| Short-Term Investments—101.5% |
| |||||||
| U.S. Treasury Obligations—98.5% |
| |||||||
U.S. Treasury Bills, | ||||||||
0.070%, 10/1/20 | $2,700 | $2,700,000 | ||||||
0.015%, 10/1/20 | 1,000 | 1,000,000 | ||||||
0.089%, 10/8/20 (a) | 21,000 | 20,999,643 | ||||||
0.071%, 10/15/20 (a) | 3,800 | 3,799,897 | ||||||
0.081%, 10/22/20 | 2,500 | 2,499,883 | ||||||
|
| |||||||
| Total U.S. Treasury Obligations (cost—$30,999,423) |
| 30,999,423 | ||||||
|
| |||||||
| Repurchase Agreements—3.0% |
| |||||||
State Street Bank and Trust Co., dated 9/30/20, 0.00%, due 10/1/20, proceeds $946,000; collateralized by U.S. Treasury Notes, 0.25%, due 9/30/25, valued at $964,925 including accrued interest |
| |||||||
(cost—$946,000) | 946 | 946,000 | ||||||
|
| |||||||
| Total Short-Term Investments (cost—$31,945,423) |
| 31,945,423 | ||||||
|
| |||||||
| Total Options Purchased—1.0% (cost—$653,332) (b)(c)(d) |
| 300,932 | ||||||
|
| |||||||
| Total Investments, before options written (cost—$32,598,755)—102.5% |
| 32,246,355 | ||||||
|
| |||||||
| Total Options Written—(1.3)% (premiums received—$843,598) (b)(c)(d) |
| (399,314 | ) | |||||
|
| |||||||
| Total Investments, net of options written (cost—$31,755,157)—101.2% |
| 31,847,041 | ||||||
|
| |||||||
| Other liabilities in excess of other assets—(1.2)% |
| (389,269 | ) | |||||
|
| |||||||
| Net Assets—100.0% |
| $31,457,772 | ||||||
|
| |||||||
Notes to Schedule of Investments:
(a) All or partial amount segregated for the benefit of the counterparty as collateral for options written.
(b) Non-income producing.
(c) Exchange traded-Chicago Board Options Exchange.
(d) Exchange traded option contracts outstanding at September 30, 2020:
| 118 | Annual Report | | September 30, 2020 | | See accompanying Notes to Financial Statements |
Table of Contents
Schedule of Investments
September 30, 2020
| Options purchased contracts outstanding at September 30, 2020: | ||||||||||||||||||||||||||||
| Description | Exercise Price | Expiration Date | Number of Contracts | Notional Amount | Market Value | Cost | Unrealized Appreciation (Depreciation) | |||||||||||||||||||||
Call options: |
| |||||||||||||||||||||||||||
S&P 500 Index | 3,640.00 USD | 10/2/20 | 3 | $ | 300 | $ | 8 | $ | 3,093 | $ | (3,085 | ) | ||||||||||||||||
S&P 500 Index | 4,000.00 USD | 10/2/20 | 9 | 900 | 23 | 559 | (536 | ) | ||||||||||||||||||||
S&P 500 Index | 3,575.00 USD | 10/5/20 | 3 | 300 | 68 | 3,297 | (3,229 | ) | ||||||||||||||||||||
S&P 500 Index | 4,000.00 USD | 10/5/20 | 9 | 900 | 23 | 406 | (383 | ) | ||||||||||||||||||||
S&P 500 Index | 3,600.00 USD | 10/7/20 | 3 | 300 | 142 | 4,845 | (4,703 | ) | ||||||||||||||||||||
S&P 500 Index | 4,000.00 USD | 10/7/20 | 9 | 900 | 23 | 568 | (545 | ) | ||||||||||||||||||||
S&P 500 Index | 3,525.00 USD | 10/9/20 | 3 | 300 | 915 | 5,235 | (4,320 | ) | ||||||||||||||||||||
S&P 500 Index | 4,000.00 USD | 10/9/20 | 9 | 900 | 45 | 352 | (307 | ) | ||||||||||||||||||||
S&P 500 Index | 3,525.00 USD | 10/12/20 | 3 | 300 | 1,170 | 7,311 | (6,141 | ) | ||||||||||||||||||||
S&P 500 Index | 4,000.00 USD | 10/12/20 | 9 | 900 | 45 | 397 | (352 | ) | ||||||||||||||||||||
S&P 500 Index | 3,550.00 USD | 10/14/20 | 3 | 300 | 1,170 | 6,600 | (5,430 | ) | ||||||||||||||||||||
S&P 500 Index | 4,000.00 USD | 10/14/20 | 9 | 900 | 68 | 370 | (302 | ) | ||||||||||||||||||||
S&P 500 Index | 3,440.00 USD | 10/16/20 | 3 | 300 | 6,810 | 7,434 | (624 | ) | ||||||||||||||||||||
S&P 500 Index | 3,740.00 USD | 10/16/20 | 2 | 200 | 140 | 5,652 | (5,512 | ) | ||||||||||||||||||||
S&P 500 Index | 4,200.00 USD | 10/16/20 | 6 | 600 | 15 | 733 | (718 | ) | ||||||||||||||||||||
S&P 500 Index | 3,420.00 USD | 10/19/20 | 3 | 300 | 9,855 | 4,929 | 4,926 | |||||||||||||||||||||
S&P 500 Index | 3,900.00 USD | 10/19/20 | 9 | 900 | 247 | 352 | (105 | ) | ||||||||||||||||||||
S&P 500 Index | 3,425.00 USD | 10/21/20 | 3 | 300 | 10,470 | 4,341 | 6,129 | |||||||||||||||||||||
S&P 500 Index | 3,900.00 USD | 10/21/20 | 9 | 900 | 360 | 351 | 9 | |||||||||||||||||||||
S&P 500 Index | 3,430.00 USD | 10/23/20 | 3 | 300 | 11,010 | 4,941 | 6,069 | |||||||||||||||||||||
S&P 500 Index | 3,600.00 USD | 10/23/20 | 1 | 100 | 530 | 1,917 | (1,387 | ) | ||||||||||||||||||||
S&P 500 Index | 3,625.00 USD | 10/23/20 | 1 | 100 | 410 | 2,445 | (2,035 | ) | ||||||||||||||||||||
S&P 500 Index | 3,675.00 USD | 10/23/20 | 1 | 100 | 257 | 1,927 | (1,670 | ) | ||||||||||||||||||||
S&P 500 Index | 3,900.00 USD | 10/23/20 | 9 | 900 | 472 | 361 | 111 | |||||||||||||||||||||
S&P 500 Index | 4,000.00 USD | 10/23/20 | 3 | 300 | 83 | 591 | (508 | ) | ||||||||||||||||||||
S&P 500 Index | 4,100.00 USD | 10/23/20 | 6 | 600 | 90 | 798 | (708 | ) | ||||||||||||||||||||
S&P 500 Index | 3,500.00 USD | 10/26/20 | 3 | 300 | 5,445 | 6,351 | (906 | ) | ||||||||||||||||||||
S&P 500 Index | 3,900.00 USD | 10/26/20 | 9 | 900 | 562 | 613 | (51 | ) | ||||||||||||||||||||
S&P 500 Index | 3,525.00 USD | 10/28/20 | 3 | 300 | 4,710 | 6,027 | (1,317 | ) | ||||||||||||||||||||
S&P 500 Index | 3,900.00 USD | 10/28/20 | 9 | 900 | 720 | 748 | (28 | ) | ||||||||||||||||||||
S&P 500 Index | 3,550.00 USD | 10/30/20 | 1 | 100 | 1,355 | 2,886 | (1,531 | ) | ||||||||||||||||||||
S&P 500 Index | 4,000.00 USD | 10/30/20 | 3 | 300 | 172 | 447 | (275 | ) | ||||||||||||||||||||
S&P 500 Index | 3,570.00 USD | 11/2/20 | 1 | 100 | 1,245 | 3,235 | (1,990 | ) | ||||||||||||||||||||
S&P 500 Index | 4,100.00 USD | 11/2/20 | 3 | 300 | 105 | 339 | (234 | ) | ||||||||||||||||||||
S&P 500 Index | 3,590.00 USD | 11/4/20 | 1 | 100 | 1,465 | 3,666 | (2,201 | ) | ||||||||||||||||||||
S&P 500 Index | 4,100.00 USD | 11/4/20 | 3 | 300 | 165 | 386 | (221 | ) | ||||||||||||||||||||
S&P 500 Index | 3,450.00 USD | 11/6/20 | 2 | 200 | 11,540 | 6,466 | 5,074 | |||||||||||||||||||||
S&P 500 Index | 3,475.00 USD | 11/6/20 | 1 | 100 | 4,775 | 4,474 | 301 | |||||||||||||||||||||
S&P 500 Index | 4,000.00 USD | 11/6/20 | 6 | 600 | 570 | 577 | (7 | ) | ||||||||||||||||||||
S&P 500 Index | 4,100.00 USD | 11/6/20 | 3 | 300 | 202 | 343 | (141 | ) | ||||||||||||||||||||
S&P 500 Index | 3,475.00 USD | 11/13/20 | 1 | 100 | 5,655 | 3,323 | 2,332 | |||||||||||||||||||||
S&P 500 Index | 3,525.00 USD | 11/13/20 | 1 | 100 | 3,920 | 4,442 | (522 | ) | ||||||||||||||||||||
S&P 500 Index | 3,550.00 USD | 11/13/20 | 1 | 100 | 3,220 | 3,811 | (591 | ) | ||||||||||||||||||||
S&P 500 Index | 4,000.00 USD | 11/13/20 | 9 | 900 | 1,350 | 1,376 | (26 | ) | ||||||||||||||||||||
S&P 500 Index | 3,560.00 USD | 10/16/20 | 2 | 200 | 860 | 5,608 | (4,748 | ) | ||||||||||||||||||||
S&P 500 Index | 3,600.00 USD | 10/16/20 | 2 | 200 | 530 | 5,464 | (4,934 | ) | ||||||||||||||||||||
S&P 500 Index | 3,670.00 USD | 10/16/20 | 2 | 200 | 265 | 4,684 | (4,419 | ) | ||||||||||||||||||||
S&P 500 Index | 3,675.00 USD | 10/16/20 | 2 | 200 | 250 | 4,708 | (4,458 | ) | ||||||||||||||||||||
S&P 500 Index | 3,900.00 USD | 10/16/20 | 12 | 1,200 | 240 | 1,535 | (1,295 | ) | ||||||||||||||||||||
S&P 500 Index | 4,000.00 USD | 10/16/20 | 21 | 2,100 | 157 | 2,046 | (1,889 | ) | ||||||||||||||||||||
|
| |||||||||||||||||||||||||||
| Total call options |
| $ | 93,927 | $ | 143,360 | $ | (49,433 | ) | ||||||||||||||||||||
|
| |||||||||||||||||||||||||||
Put options: |
| |||||||||||||||||||||||||||
E-mini S&P 500 Index | 303.00 USD | 10/2/20 | 6 | $ | 600 | $ | 18 | $ | 1,552 | $ | (1,534 | ) | ||||||||||||||||
E-mini S&P 500 Index | 304.00 USD | 10/2/20 | 6 | 600 | 18 | 1,624 | (1,606 | ) | ||||||||||||||||||||
E-mini S&P 500 Index | 307.00 USD | 10/2/20 | 18 | 1,800 | 72 | 3,073 | (3,001 | ) | ||||||||||||||||||||
E-mini S&P 500 Index | 311.00 USD | 10/2/20 | 6 | 600 | 30 | 1,054 | (1,024 | ) | ||||||||||||||||||||
E-mini S&P 500 Index | 316.00 USD | 10/2/20 | 6 | 600 | 57 | 1,006 | (949 | ) | ||||||||||||||||||||
E-mini S&P 500 Index | 327.00 USD | 10/2/20 | 3 | 300 | 212 | 2,108 | (1,896 | ) | ||||||||||||||||||||
| See accompanying Notes to Financial Statements | | September 30, 2020 | | Annual Report | 119 |
Table of Contents
Schedule of Investments
September 30, 2020
| Options purchased contracts outstanding at September 30, 2020 (continued): | ||||||||||||||||||||||||||||
| Description | Exercise Price | Expiration Date | Number of Contracts | Notional Amount | Market Value | Cost | Unrealized Appreciation (Depreciation) | |||||||||||||||||||||
Put options (continued): |
| |||||||||||||||||||||||||||
E-mini S&P 500 Index | 329.00 USD | 10/2/20 | 9 | $ | 900 | $ | 931 | $ | 5,002 | $ | (4,071 | ) | ||||||||||||||||
E-mini S&P 500 Index | 333.00 USD | 10/2/20 | 3 | 300 | 626 | 1,526 | (900 | ) | ||||||||||||||||||||
E-mini S&P 500 Index | 344.00 USD | 10/2/20 | 3 | 300 | 2,811 | 1,406 | 1,405 | |||||||||||||||||||||
E-mini S&P 500 Index | 300.00 USD | 10/5/20 | 6 | 600 | 24 | 1,444 | (1,420 | ) | ||||||||||||||||||||
E-mini S&P 500 Index | 302.00 USD | 10/5/20 | 6 | 600 | 30 | 1,678 | (1,648 | ) | ||||||||||||||||||||
E-mini S&P 500 Index | 307.00 USD | 10/5/20 | 6 | 600 | 45 | 1,072 | (1,027 | ) | ||||||||||||||||||||
E-mini S&P 500 Index | 308.00 USD | 10/5/20 | 6 | 600 | 45 | 1,012 | (967 | ) | ||||||||||||||||||||
E-mini S&P 500 Index | 310.00 USD | 10/5/20 | 18 | 1,800 | 171 | 2,334 | (2,163 | ) | ||||||||||||||||||||
E-mini S&P 500 Index | 326.00 USD | 10/5/20 | 3 | 300 | 293 | 2,048 | (1,755 | ) | ||||||||||||||||||||
E-mini S&P 500 Index | 329.00 USD | 10/5/20 | 3 | 300 | 462 | 1,694 | (1,232 | ) | ||||||||||||||||||||
E-mini S&P 500 Index | 330.00 USD | 10/5/20 | 3 | 300 | 536 | 2,084 | (1,548 | ) | ||||||||||||||||||||
E-mini S&P 500 Index | 332.00 USD | 10/5/20 | 12 | 1,200 | 2,844 | 5,706 | (2,862 | ) | ||||||||||||||||||||
E-mini S&P 500 Index | 343.00 USD | 10/5/20 | 3 | 300 | 2,634 | 1,412 | 1,222 | |||||||||||||||||||||
E-mini S&P 500 Index | 295.00 USD | 10/7/20 | 6 | 600 | 42 | 1,330 | (1,288 | ) | ||||||||||||||||||||
E-mini S&P 500 Index | 305.00 USD | 10/7/20 | 12 | 1,200 | 162 | 2,163 | (2,001 | ) | ||||||||||||||||||||
E-mini S&P 500 Index | 312.00 USD | 10/7/20 | 12 | 1,200 | 324 | 1,413 | (1,089 | ) | ||||||||||||||||||||
E-mini S&P 500 Index | 325.00 USD | 10/7/20 | 3 | 300 | 419 | 2,090 | (1,671 | ) | ||||||||||||||||||||
E-mini S&P 500 Index | 329.00 USD | 10/7/20 | 3 | 300 | 672 | 1,844 | (1,172 | ) | ||||||||||||||||||||
E-mini S&P 500 Index | 330.00 USD | 10/7/20 | 3 | 300 | 755 | 1,508 | (753 | ) | ||||||||||||||||||||
E-mini S&P 500 Index | 332.00 USD | 10/7/20 | 3 | 300 | 943 | 1,493 | (550 | ) | ||||||||||||||||||||
E-mini S&P 500 Index | 334.00 USD | 10/7/20 | 6 | 600 | 2,343 | 2,494 | (151 | ) | ||||||||||||||||||||
E-mini S&P 500 Index | 295.00 USD | 10/9/20 | 24 | 2,400 | 324 | 3,156 | (2,832 | ) | ||||||||||||||||||||
E-mini S&P 500 Index | 300.00 USD | 10/9/20 | 18 | 1,800 | 333 | 3,817 | (3,484 | ) | ||||||||||||||||||||
E-mini S&P 500 Index | 305.00 USD | 10/9/20 | 6 | 600 | 156 | 820 | (664 | ) | ||||||||||||||||||||
E-mini S&P 500 Index | 317.00 USD | 10/9/20 | 9 | 900 | 778 | 2,815 | (2,037 | ) | ||||||||||||||||||||
E-mini S&P 500 Index | 325.00 USD | 10/9/20 | 3 | 300 | 597 | 2,192 | (1,595 | ) | ||||||||||||||||||||
E-mini S&P 500 Index | 328.00 USD | 10/9/20 | 3 | 300 | 799 | 1,871 | (1,072 | ) | ||||||||||||||||||||
E-mini S&P 500 Index | 330.00 USD | 10/9/20 | 6 | 600 | 1,935 | 3,970 | (2,035 | ) | ||||||||||||||||||||
E-mini S&P 500 Index | 331.00 USD | 10/9/20 | 3 | 300 | 1,062 | 1,517 | (455 | ) | ||||||||||||||||||||
E-mini S&P 500 Index | 332.00 USD | 10/9/20 | 3 | 300 | 1,164 | 1,208 | (44 | ) | ||||||||||||||||||||
E-mini S&P 500 Index | 295.00 USD | 10/12/20 | 22 | 2,200 | 418 | 2,710 | (2,292 | ) | ||||||||||||||||||||
E-mini S&P 500 Index | 300.00 USD | 10/12/20 | 12 | 1,200 | 306 | 1,833 | (1,527 | ) | ||||||||||||||||||||
E-mini S&P 500 Index | 316.00 USD | 10/12/20 | 8 | 800 | 808 | 3,253 | (2,445 | ) | ||||||||||||||||||||
E-mini S&P 500 Index | 321.00 USD | 10/12/20 | 3 | 300 | 485 | 1,286 | (801 | ) | ||||||||||||||||||||
E-mini S&P 500 Index | 325.00 USD | 10/12/20 | 3 | 300 | 698 | 1,679 | (981 | ) | ||||||||||||||||||||
E-mini S&P 500 Index | 329.00 USD | 10/12/20 | 3 | 300 | 991 | 1,103 | (112 | ) | ||||||||||||||||||||
E-mini S&P 500 Index | 330.00 USD | 10/12/20 | 3 | 300 | 1,081 | 1,697 | (616 | ) | ||||||||||||||||||||
E-mini S&P 500 Index | 331.00 USD | 10/12/20 | 3 | 300 | 1,177 | 1,595 | (418 | ) | ||||||||||||||||||||
E-mini S&P 500 Index | 295.00 USD | 10/14/20 | 16 | 1,600 | 464 | 2,068 | (1,604 | ) | ||||||||||||||||||||
E-mini S&P 500 Index | 300.00 USD | 10/14/20 | 6 | 600 | 240 | 1,072 | (832 | ) | ||||||||||||||||||||
E-mini S&P 500 Index | 316.00 USD | 10/14/20 | 5 | 500 | 705 | 2,339 | (1,634 | ) | ||||||||||||||||||||
E-mini S&P 500 Index | 320.00 USD | 10/14/20 | 6 | 600 | 1,167 | 2,996 | (1,829 | ) | ||||||||||||||||||||
E-mini S&P 500 Index | 331.00 USD | 10/14/20 | 3 | 300 | 1,360 | 1,310 | 50 | |||||||||||||||||||||
E-mini S&P 500 Index | 289.00 USD | 10/16/20 | 18 | 1,800 | 549 | 1,741 | (1,192 | ) | ||||||||||||||||||||
E-mini S&P 500 Index | 291.00 USD | 10/16/20 | 6 | 600 | 201 | 778 | (577 | ) | ||||||||||||||||||||
E-mini S&P 500 Index | 295.00 USD | 10/16/20 | 12 | 1,200 | 504 | 1,905 | (1,401 | ) | ||||||||||||||||||||
E-mini S&P 500 Index | 296.00 USD | 10/16/20 | 6 | 600 | 267 | 1,030 | (763 | ) | ||||||||||||||||||||
E-mini S&P 500 Index | 315.00 USD | 10/16/20 | 12 | 1,200 | 2,034 | 5,373 | (3,339 | ) | ||||||||||||||||||||
E-mini S&P 500 Index | 320.00 USD | 10/16/20 | 3 | 300 | 726 | 1,856 | (1,130 | ) | ||||||||||||||||||||
E-mini S&P 500 Index | 321.00 USD | 10/16/20 | 3 | 300 | 779 | 1,526 | (747 | ) | ||||||||||||||||||||
E-mini S&P 500 Index | 325.00 USD | 10/16/20 | 3 | 300 | 1,029 | 1,865 | (836 | ) | ||||||||||||||||||||
E-mini S&P 500 Index | 330.00 USD | 10/16/20 | 6 | 600 | 2,877 | 3,106 | (229 | ) | ||||||||||||||||||||
E-mini S&P 500 Index | 285.00 USD | 10/19/20 | 6 | 600 | 177 | 634 | (457 | ) | ||||||||||||||||||||
E-mini S&P 500 Index | 290.00 USD | 10/19/20 | 12 | 1,200 | 456 | 1,557 | (1,101 | ) | ||||||||||||||||||||
E-mini S&P 500 Index | 300.00 USD | 10/19/20 | 9 | 900 | 617 | 1,579 | (962 | ) | ||||||||||||||||||||
E-mini S&P 500 Index | 320.00 USD | 10/19/20 | 9 | 900 | 2,398 | 5,274 | (2,876 | ) | ||||||||||||||||||||
E-mini S&P 500 Index | 327.00 USD | 10/19/20 | 9 | 900 | 3,784 | 4,038 | (254 | ) | ||||||||||||||||||||
E-mini S&P 500 Index | 330.00 USD | 10/19/20 | 6 | 600 | 3,054 | 3,242 | (188 | ) | ||||||||||||||||||||
E-mini S&P 500 Index | 285.00 USD | 10/21/20 | 6 | 600 | 228 | 748 | (520 | ) | ||||||||||||||||||||
| 120 | Annual Report | | September 30, 2020 | | See accompanying Notes to Financial Statements |
Table of Contents
Schedule of Investments
September 30, 2020
| Options purchased contracts outstanding at September 30, 2020 (continued): | ||||||||||||||||||||||||||||
| Description | Exercise Price | Expiration Date | Number of Contracts | Notional Amount | Market Value | Cost | Unrealized Appreciation (Depreciation) | |||||||||||||||||||||
Put options (continued): |
| |||||||||||||||||||||||||||
E-mini S&P 500 Index | 296.00 USD | 10/21/20 | 6 | $ | 600 | $ | 411 | $ | 1,096 | $ | (685 | ) | ||||||||||||||||
E-mini S&P 500 Index | 304.00 USD | 10/21/20 | 6 | 600 | 672 | 760 | (88 | ) | ||||||||||||||||||||
E-mini S&P 500 Index | 308.00 USD | 10/21/20 | 1 | 100 | 145 | 112 | 33 | |||||||||||||||||||||
E-mini S&P 500 Index | 320.00 USD | 10/21/20 | 3 | 300 | 921 | 1,925 | (1,004 | ) | ||||||||||||||||||||
E-mini S&P 500 Index | 326.00 USD | 10/21/20 | 3 | 300 | 1,318 | 1,382 | (64 | ) | ||||||||||||||||||||
E-mini S&P 500 Index | 330.00 USD | 10/21/20 | 5 | 500 | 2,780 | 2,193 | 587 | |||||||||||||||||||||
E-mini S&P 500 Index | 285.00 USD | 10/23/20 | 6 | 600 | 279 | 862 | (583 | ) | ||||||||||||||||||||
E-mini S&P 500 Index | 290.00 USD | 10/23/20 | 18 | 1,800 | 1,080 | 2,971 | (1,891 | ) | ||||||||||||||||||||
E-mini S&P 500 Index | 302.50 USD | 10/23/20 | 6 | 600 | 738 | 803 | (65 | ) | ||||||||||||||||||||
E-mini S&P 500 Index | 315.00 USD | 10/23/20 | 3 | 300 | 776 | 1,844 | (1,068 | ) | ||||||||||||||||||||
E-mini S&P 500 Index | 320.00 USD | 10/23/20 | 9 | 900 | 3,100 | 6,033 | (2,933 | ) | ||||||||||||||||||||
E-mini S&P 500 Index | 326.00 USD | 10/23/20 | 3 | 300 | 1,449 | 1,500 | (51 | ) | ||||||||||||||||||||
E-mini S&P 500 Index | 329.00 USD | 10/23/20 | 3 | 300 | 1,710 | 1,373 | 337 | |||||||||||||||||||||
E-mini S&P 500 Index | 285.00 USD | 10/26/20 | 6 | 600 | 315 | 946 | (631 | ) | ||||||||||||||||||||
E-mini S&P 500 Index | 290.00 USD | 10/26/20 | 12 | 1,200 | 816 | 2,102 | (1,286 | ) | ||||||||||||||||||||
E-mini S&P 500 Index | 315.00 USD | 10/26/20 | 3 | 300 | 837 | 1,928 | (1,091 | ) | ||||||||||||||||||||
E-mini S&P 500 Index | 320.00 USD | 10/26/20 | 6 | 600 | 2,211 | 4,288 | (2,077 | ) | ||||||||||||||||||||
E-mini S&P 500 Index | 326.00 USD | 10/26/20 | 3 | 300 | 1,527 | 1,571 | (44 | ) | ||||||||||||||||||||
E-mini S&P 500 Index | 329.00 USD | 10/26/20 | 3 | 300 | 1,791 | 1,439 | 352 | |||||||||||||||||||||
E-mini S&P 500 Index | 301.00 USD | 10/28/20 | 6 | 600 | 876 | 706 | 170 | |||||||||||||||||||||
E-mini S&P 500 Index | 327.00 USD | 10/28/20 | 3 | 300 | 1,732 | 1,409 | 323 | |||||||||||||||||||||
E-mini S&P 500 Index | 290.00 USD | 10/30/20 | 6 | 600 | 564 | 1,294 | (730 | ) | ||||||||||||||||||||
E-mini S&P 500 Index | 297.00 USD | 10/30/20 | 6 | 600 | 813 | 880 | (67 | ) | ||||||||||||||||||||
E-mini S&P 500 Index | 298.00 USD | 10/30/20 | 6 | 600 | 858 | 700 | 158 | |||||||||||||||||||||
E-mini S&P 500 Index | 320.00 USD | 10/30/20 | 3 | 300 | 1,326 | 2,420 | (1,094 | ) | ||||||||||||||||||||
E-mini S&P 500 Index | 325.00 USD | 10/30/20 | 3 | 300 | 1,689 | 1,751 | (62 | ) | ||||||||||||||||||||
E-mini S&P 500 Index | 326.00 USD | 10/30/20 | 3 | 300 | 1,771 | 1,460 | 311 | |||||||||||||||||||||
E-mini S&P 500 Index | 295.00 USD | 11/2/20 | 12 | 1,200 | 1,650 | 1,568 | 82 | |||||||||||||||||||||
E-mini S&P 500 Index | 325.00 USD | 11/2/20 | 6 | 600 | 3,588 | 3,340 | 248 | |||||||||||||||||||||
E-mini S&P 500 Index | 305.00 USD | 10/2/20 | 8 | 800 | 24 | 1,078 | (1,054 | ) | ||||||||||||||||||||
E-mini S&P 500 Index | 306.00 USD | 10/2/20 | 8 | 800 | 24 | 1,222 | (1,198 | ) | ||||||||||||||||||||
E-mini S&P 500 Index | 335.00 USD | 10/2/20 | 4 | 400 | 1,154 | 1,551 | (397 | ) | ||||||||||||||||||||
E-mini S&P 500 Index | 336.00 USD | 10/2/20 | 4 | 400 | 1,348 | 1,775 | (427 | ) | ||||||||||||||||||||
E-mini S&P 500 Index | 305.00 USD | 10/5/20 | 8 | 800 | 48 | 1,174 | (1,126 | ) | ||||||||||||||||||||
E-mini S&P 500 Index | 335.00 USD | 10/5/20 | 4 | 400 | 1,416 | 1,623 | (207 | ) | ||||||||||||||||||||
S&P 500 Index | 3,020.00 USD | 10/2/20 | 5 | 500 | 125 | 12,129 | (12,004 | ) | ||||||||||||||||||||
S&P 500 Index | 3,050.00 USD | 10/2/20 | 5 | 500 | 150 | 14,219 | (14,069 | ) | ||||||||||||||||||||
S&P 500 Index | 3,090.00 USD | 10/2/20 | 2 | 200 | 85 | 6,290 | (6,205 | ) | ||||||||||||||||||||
S&P 500 Index | 3,100.00 USD | 10/2/20 | 7 | 700 | 333 | 13,190 | (12,857 | ) | ||||||||||||||||||||
S&P 500 Index | 3,115.00 USD | 10/2/20 | 5 | 500 | 275 | 6,638 | (6,363 | ) | ||||||||||||||||||||
S&P 500 Index | 3,040.00 USD | 10/5/20 | 5 | 500 | 275 | 6,085 | (5,810 | ) | ||||||||||||||||||||
S&P 500 Index | 2,975.00 USD | 10/7/20 | 5 | 500 | 400 | 12,094 | (11,694 | ) | ||||||||||||||||||||
S&P 500 Index | 3,000.00 USD | 10/7/20 | 2 | 200 | 185 | 5,282 | (5,097 | ) | ||||||||||||||||||||
S&P 500 Index | 3,025.00 USD | 10/7/20 | 5 | 500 | 563 | 7,009 | (6,446 | ) | ||||||||||||||||||||
S&P 500 Index | 3,040.00 USD | 10/7/20 | 5 | 500 | 625 | 9,664 | (9,039 | ) | ||||||||||||||||||||
S&P 500 Index | 3,020.00 USD | 10/9/20 | 5 | 500 | 1,050 | 9,335 | (8,285 | ) | ||||||||||||||||||||
S&P 500 Index | 3,040.00 USD | 10/9/20 | 10 | 1,000 | 2,450 | 13,739 | (11,289 | ) | ||||||||||||||||||||
S&P 500 Index | 3,050.00 USD | 10/9/20 | 5 | 500 | 1,325 | 9,614 | (8,289 | ) | ||||||||||||||||||||
S&P 500 Index | 3,080.00 USD | 10/9/20 | 2 | 200 | 690 | 4,904 | (4,214 | ) | ||||||||||||||||||||
S&P 500 Index | 3,130.00 USD | 10/9/20 | 2 | 200 | 1,130 | 4,936 | (3,806 | ) | ||||||||||||||||||||
S&P 500 Index | 3,075.00 USD | 10/12/20 | 5 | 500 | 2,300 | 8,094 | (5,794 | ) | ||||||||||||||||||||
S&P 500 Index | 3,125.00 USD | 10/12/20 | 2 | 200 | 1,460 | 4,272 | (2,812 | ) | ||||||||||||||||||||
S&P 500 Index | 3,150.00 USD | 10/12/20 | 5 | 500 | 4,600 | 5,834 | (1,234 | ) | ||||||||||||||||||||
S&P 500 Index | 3,075.00 USD | 10/14/20 | 5 | 500 | 3,525 | 7,910 | (4,385 | ) | ||||||||||||||||||||
S&P 500 Index | 3,100.00 USD | 10/14/20 | 5 | 500 | 4,300 | 8,510 | (4,210 | ) | ||||||||||||||||||||
S&P 500 Index | 3,125.00 USD | 10/14/20 | 7 | 700 | 7,385 | 10,763 | (3,378 | ) | ||||||||||||||||||||
S&P 500 Index | 3,150.00 USD | 10/14/20 | 2 | 200 | 2,590 | 4,490 | (1,900 | ) | ||||||||||||||||||||
S&P 500 Index | 3,170.00 USD | 10/14/20 | 5 | 500 | 7,650 | 5,579 | 2,071 | |||||||||||||||||||||
S&P 500 Index | 2,975.00 USD | 10/16/20 | 5 | 500 | 2,300 | 7,510 | (5,210 | ) | ||||||||||||||||||||
| See accompanying Notes to Financial Statements | | September 30, 2020 | | Annual Report | 121 |
Table of Contents
Schedule of Investments
September 30, 2020
| Options purchased contracts outstanding at September��30, 2020 (continued): | ||||||||||||||||||||||||||||
| Description | Exercise Price | Expiration Date | Number of Contracts | Notional Amount | Market Value | Cost | Unrealized Appreciation (Depreciation) | |||||||||||||||||||||
Put options (continued): |
| |||||||||||||||||||||||||||
S&P 500 Index | 2,985.00 USD | 10/16/20 | 5 | $ | 500 | $ | 2,450 | $ | 7,913 | $ | (5,463 | ) | ||||||||||||||||
S&P 500 Index | 3,050.00 USD | 10/16/20 | 2 | 200 | 1,550 | 4,412 | (2,862 | ) | ||||||||||||||||||||
S&P 500 Index | 3,070.00 USD | 10/16/20 | 2 | 200 | 1,790 | 4,695 | (2,905 | ) | ||||||||||||||||||||
S&P 500 Index | 2,925.00 USD | 10/19/20 | 5 | 500 | 2,175 | 7,785 | (5,610 | ) | ||||||||||||||||||||
S&P 500 Index | 3,000.00 USD | 10/19/20 | 2 | 200 | 1,380 | 4,882 | (3,502 | ) | ||||||||||||||||||||
S&P 500 Index | 2,900.00 USD | 10/21/20 | 5 | 500 | 2,450 | 8,614 | (6,164 | ) | ||||||||||||||||||||
S&P 500 Index | 2,975.00 USD | 10/21/20 | 7 | 700 | 5,250 | 13,042 | (7,792 | ) | ||||||||||||||||||||
S&P 500 Index | 3,040.00 USD | 10/21/20 | 2 | 200 | 2,230 | 4,636 | (2,406 | ) | ||||||||||||||||||||
S&P 500 Index | 2,910.00 USD | 10/23/20 | 5 | 500 | 3,175 | 8,594 | (5,419 | ) | ||||||||||||||||||||
S&P 500 Index | 2,915.00 USD | 10/23/20 | 5 | 500 | 3,250 | 8,008 | (4,758 | ) | ||||||||||||||||||||
S&P 500 Index | 2,960.00 USD | 10/23/20 | 2 | 200 | 1,680 | 4,586 | (2,906 | ) | ||||||||||||||||||||
S&P 500 Index | 2,990.00 USD | 10/23/20 | 2 | 200 | 2,000 | 4,682 | (2,682 | ) | ||||||||||||||||||||
S&P 500 Index | 3,025.00 USD | 10/26/20 | 5 | 500 | 6,750 | 7,459 | (709 | ) | ||||||||||||||||||||
S&P 500 Index | 3,075.00 USD | 10/26/20 | 2 | 200 | 3,621 | 4,272 | (651 | ) | ||||||||||||||||||||
S&P 500 Index | 3,000.00 USD | 10/28/20 | 5 | 500 | 6,900 | 7,694 | (794 | ) | ||||||||||||||||||||
S&P 500 Index | 3,050.00 USD | 10/28/20 | 5 | 500 | 9,100 | 7,029 | 2,071 | |||||||||||||||||||||
S&P 500 Index | 3,075.00 USD | 10/28/20 | 2 | 200 | 4,170 | 4,602 | (432 | ) | ||||||||||||||||||||
S&P 500 Index | 3,120.00 USD | 10/28/20 | 2 | 200 | 5,309 | 4,169 | 1,140 | |||||||||||||||||||||
|
| |||||||||||||||||||||||||||
| Total put options |
| $ | 207,005 | $ | 509,972 | $ | (302,967 | ) | ||||||||||||||||||||
|
| |||||||||||||||||||||||||||
| Total options purchased contracts |
| $ | 300,932 | $ | 653,332 | $ | (352,400 | ) | ||||||||||||||||||||
|
| |||||||||||||||||||||||||||
| Options written contracts outstanding at September 30, 2020: | ||||||||||||||||||||||||||||
| Description | Exercise Price | Expiration Date | Number of Contracts | Notional Amount | Market Value | Premiums Received | Unrealized Appreciation (Depreciation) | |||||||||||||||||||||
Call options: |
| |||||||||||||||||||||||||||
S&P 500 Index | 3,800.00 USD | 10/2/20 | (12 | ) | $ | (1,200 | ) | $ | (30 | ) | $ | (2,435 | ) | $ | 2,405 | |||||||||||||
S&P 500 Index | 3,750.00 USD | 10/5/20 | (12 | ) | (1,200 | ) | (60 | ) | (2,111 | ) | 2,051 | |||||||||||||||||
S&P 500 Index | 3,725.00 USD | 10/7/20 | (12 | ) | (1,200 | ) | (120 | ) | (5,315 | ) | 5,195 | |||||||||||||||||
S&P 500 Index | 3,650.00 USD | 10/9/20 | (12 | ) | (1,200 | ) | (630 | ) | (5,171 | ) | 4,541 | |||||||||||||||||
S&P 500 Index | 3,675.00 USD | 10/12/20 | (12 | ) | (1,200 | ) | (690 | ) | (5,555 | ) | 4,865 | |||||||||||||||||
S&P 500 Index | 3,700.00 USD | 10/14/20 | (12 | ) | (1,200 | ) | (870 | ) | (4,799 | ) | 3,929 | |||||||||||||||||
S&P 500 Index | 3,575.00 USD | 10/16/20 | (12 | ) | (1,200 | ) | (4,260 | ) | (6,119 | ) | 1,859 | |||||||||||||||||
S&P 500 Index | 3,660.00 USD | 10/16/20 | (8 | ) | (800 | ) | (1,140 | ) | (8,119 | ) | 6,979 | |||||||||||||||||
S&P 500 Index | 3,700.00 USD | 10/16/20 | (8 | ) | (800 | ) | (800 | ) | (7,807 | ) | 7,007 | |||||||||||||||||
S&P 500 Index | 3,775.00 USD | 10/16/20 | (16 | ) | (1,600 | ) | (880 | ) | (14,822 | ) | 13,942 | |||||||||||||||||
S&P 500 Index | 3,850.00 USD | 10/16/20 | (8 | ) | (800 | ) | (240 | ) | (9,391 | ) | 9,151 | |||||||||||||||||
S&P 500 Index | 3,550.00 USD | 10/19/20 | (12 | ) | (1,200 | ) | (7,500 | ) | (4,259 | ) | (3,241 | ) | ||||||||||||||||
S&P 500 Index | 3,550.00 USD | 10/21/20 | (12 | ) | (1,200 | ) | (9,300 | ) | (3,828 | ) | (5,472 | ) | ||||||||||||||||
S&P 500 Index | 3,560.00 USD | 10/23/20 | (12 | ) | (1,200 | ) | (9,900 | ) | (4,139 | ) | (5,761 | ) | ||||||||||||||||
S&P 500 Index | 3,775.00 USD | 10/23/20 | (4 | ) | (400 | ) | (500 | ) | (3,016 | ) | 2,516 | |||||||||||||||||
S&P 500 Index | 3,800.00 USD | 10/23/20 | (4 | ) | (400 | ) | (420 | ) | (1,639 | ) | 1,219 | |||||||||||||||||
S&P 500 Index | 3,875.00 USD | 10/23/20 | (4 | ) | (400 | ) | (250 | ) | (1,780 | ) | 1,530 | |||||||||||||||||
S&P 500 Index | 3,650.00 USD | 10/26/20 | (12 | ) | (1,200 | ) | (5,315 | ) | (4,355 | ) | (960 | ) | ||||||||||||||||
S&P 500 Index | 3,675.00 USD | 10/28/20 | (12 | ) | (1,200 | ) | (4,200 | ) | (4,811 | ) | 611 | |||||||||||||||||
S&P 500 Index | 3,685.00 USD | 10/30/20 | (4 | ) | (400 | ) | (1,520 | ) | (3,812 | ) | 2,292 | |||||||||||||||||
S&P 500 Index | 3,670.00 USD | 11/2/20 | (4 | ) | (400 | ) | (1,920 | ) | (5,448 | ) | 3,528 | |||||||||||||||||
S&P 500 Index | 3,700.00 USD | 11/4/20 | (4 | ) | (400 | ) | (2,140 | ) | (5,856 | ) | 3,716 | |||||||||||||||||
S&P 500 Index | 3,575.00 USD | 11/6/20 | (12 | ) | (1,200 | ) | (24,420 | ) | (15,891 | ) | (8,529 | ) | ||||||||||||||||
S&P 500 Index | 3,600.00 USD | 11/13/20 | (4 | ) | (400 | ) | (8,560 | ) | (4,552 | ) | (4,008 | ) | ||||||||||||||||
S&P 500 Index | 3,625.00 USD | 11/13/20 | (4 | ) | (400 | ) | (6,980 | ) | (8,156 | ) | 1,176 | |||||||||||||||||
S&P 500 Index | 3,650.00 USD | 11/13/20 | (4 | ) | (400 | ) | (5,680 | ) | (6,748 | ) | 1,068 | |||||||||||||||||
|
| |||||||||||||||||||||||||||
| Total call options |
| $ | (98,325 | ) | $ | (149,934 | ) | $ | 51,609 | |||||||||||||||||||
|
| |||||||||||||||||||||||||||
Put options: |
| |||||||||||||||||||||||||||
E-mini S&P 500 Index | 315.00 USD | 10/2/20 | (9 | ) | $ | (900 | ) | $ | (76 | ) | $ | (3,746 | ) | $ | 3,670 | |||||||||||||
E-mini S&P 500 Index | 317.00 USD | 10/2/20 | (9 | ) | (900 | ) | (94 | ) | (3,665 | ) | 3,571 | |||||||||||||||||
| 122 | Annual Report | | September 30, 2020 | | See accompanying Notes to Financial Statements |
Table of Contents
Schedule of Investments
September 30, 2020
| Options written contracts outstanding at September 30, 2020 (continued): | ||||||||||||||||||||||||||||
| Description | Exercise Price | Expiration Date | Number of Contracts | Notional Amount | Market Value | Premiums Received | Unrealized Appreciation (Depreciation) | |||||||||||||||||||||
Put options (continued): |
| |||||||||||||||||||||||||||
E-mini S&P 500 Index | 318.00 USD | 10/2/20 | (27 | ) | $ | (2,700 | ) | $ | (337 | ) | $ | (8,107 | ) | $ | 7,770 | |||||||||||||
E-mini S&P 500 Index | 320.00 USD | 10/2/20 | (12 | ) | (1,200 | ) | (210 | ) | (2,619 | ) | 2,409 | |||||||||||||||||
E-mini S&P 500 Index | 321.00 USD | 10/2/20 | (12 | ) | (1,200 | ) | (252 | ) | (2,967 | ) | 2,715 | |||||||||||||||||
E-mini S&P 500 Index | 322.00 USD | 10/2/20 | (9 | ) | (900 | ) | (229 | ) | (2,621 | ) | 2,392 | |||||||||||||||||
E-mini S&P 500 Index | 330.00 USD | 10/2/20 | (6 | ) | (600 | ) | (744 | ) | (1,604 | ) | 860 | |||||||||||||||||
E-mini S&P 500 Index | 313.00 USD | 10/5/20 | (3 | ) | (300 | ) | (39 | ) | (1,186 | ) | 1,147 | |||||||||||||||||
E-mini S&P 500 Index | 316.00 USD | 10/5/20 | (9 | ) | (900 | ) | (171 | ) | (3,854 | ) | 3,683 | |||||||||||||||||
E-mini S&P 500 Index | 318.00 USD | 10/5/20 | (9 | ) | (900 | ) | (234 | ) | (2,801 | ) | 2,567 | |||||||||||||||||
E-mini S&P 500 Index | 320.00 USD | 10/5/20 | (21 | ) | (2,100 | ) | (756 | ) | (5,367 | ) | 4,611 | |||||||||||||||||
E-mini S&P 500 Index | 321.00 USD | 10/5/20 | (27 | ) | (2,700 | ) | (1,161 | ) | (6,460 | ) | 5,299 | |||||||||||||||||
E-mini S&P 500 Index | 328.00 USD | 10/5/20 | (9 | ) | (900 | ) | (1,193 | ) | (2,387 | ) | 1,194 | |||||||||||||||||
E-mini S&P 500 Index | 310.00 USD | 10/7/20 | (3 | ) | (300 | ) | (64 | ) | (1,147 | ) | 1,083 | |||||||||||||||||
E-mini S&P 500 Index | 317.00 USD | 10/7/20 | (18 | ) | (1,800 | ) | (891 | ) | (5,513 | ) | 4,622 | |||||||||||||||||
E-mini S&P 500 Index | 321.00 USD | 10/7/20 | (9 | ) | (900 | ) | (760 | ) | (2,414 | ) | 1,654 | |||||||||||||||||
E-mini S&P 500 Index | 323.00 USD | 10/7/20 | (18 | ) | (1,800 | ) | (1,953 | ) | (3,857 | ) | 1,904 | |||||||||||||||||
E-mini S&P 500 Index | 306.00 USD | 10/9/20 | (27 | ) | (2,700 | ) | (769 | ) | (4,411 | ) | 3,642 | |||||||||||||||||
E-mini S&P 500 Index | 310.00 USD | 10/9/20 | (3 | ) | (300 | ) | (124 | ) | (1,231 | ) | 1,107 | |||||||||||||||||
E-mini S&P 500 Index | 314.00 USD | 10/9/20 | (9 | ) | (900 | ) | (567 | ) | (2,855 | ) | 2,288 | |||||||||||||||||
E-mini S&P 500 Index | 315.00 USD | 10/9/20 | (18 | ) | (1,800 | ) | (1,260 | ) | (6,872 | ) | 5,612 | |||||||||||||||||
E-mini S&P 500 Index | 318.00 USD | 10/9/20 | (9 | ) | (900 | ) | (868 | ) | (2,306 | ) | 1,438 | |||||||||||||||||
E-mini S&P 500 Index | 321.00 USD | 10/9/20 | (9 | ) | (900 | ) | (1,197 | ) | (1,956 | ) | 759 | |||||||||||||||||
E-mini S&P 500 Index | 305.00 USD | 10/12/20 | (12 | ) | (1,200 | ) | (438 | ) | (2,451 | ) | 2,013 | |||||||||||||||||
E-mini S&P 500 Index | 310.00 USD | 10/12/20 | (18 | ) | (1,800 | ) | (1,026 | ) | (4,550 | ) | 3,524 | |||||||||||||||||
E-mini S&P 500 Index | 315.00 USD | 10/12/20 | (9 | ) | (900 | ) | (828 | ) | (2,702 | ) | 1,874 | |||||||||||||||||
E-mini S&P 500 Index | 317.00 USD | 10/12/20 | (9 | ) | (900 | ) | (1,004 | ) | (1,749 | ) | 745 | |||||||||||||||||
E-mini S&P 500 Index | 318.00 USD | 10/12/20 | (9 | ) | (900 | ) | (1,103 | ) | (2,486 | ) | 1,383 | |||||||||||||||||
E-mini S&P 500 Index | 305.00 USD | 10/14/20 | (9 | ) | (900 | ) | (517 | ) | (2,162 | ) | 1,645 | |||||||||||||||||
E-mini S&P 500 Index | 308.00 USD | 10/14/20 | (9 | ) | (900 | ) | (657 | ) | (2,073 | ) | 1,416 | |||||||||||||||||
E-mini S&P 500 Index | 309.00 USD | 10/14/20 | (9 | ) | (900 | ) | (711 | ) | (2,666 | ) | 1,955 | |||||||||||||||||
E-mini S&P 500 Index | 318.00 USD | 10/14/20 | (9 | ) | (900 | ) | (1,490 | ) | (2,055 | ) | 565 | |||||||||||||||||
E-mini S&P 500 Index | 302.00 USD | 10/16/20 | (15 | ) | (1,500 | ) | (1,005 | ) | (3,004 | ) | 1,999 | |||||||||||||||||
E-mini S&P 500 Index | 303.00 USD | 10/16/20 | (9 | ) | (900 | ) | (643 | ) | (2,252 | ) | 1,609 | |||||||||||||||||
E-mini S&P 500 Index | 308.00 USD | 10/16/20 | (18 | ) | (1,800 | ) | (1,845 | ) | (5,279 | ) | 3,434 | |||||||||||||||||
E-mini S&P 500 Index | 310.00 USD | 10/16/20 | (9 | ) | (900 | ) | (1,062 | ) | (2,945 | ) | 1,883 | |||||||||||||||||
E-mini S&P 500 Index | 316.00 USD | 10/16/20 | (18 | ) | (1,800 | ) | (3,285 | ) | (4,865 | ) | 1,580 | |||||||||||||||||
E-mini S&P 500 Index | 310.00 USD | 10/19/20 | (9 | ) | (900 | ) | (1,215 | ) | (3,107 | ) | 1,892 | |||||||||||||||||
E-mini S&P 500 Index | 315.00 USD | 10/19/20 | (15 | ) | (1,500 | ) | (2,858 | ) | (4,039 | ) | 1,181 | |||||||||||||||||
E-mini S&P 500 Index | 316.00 USD | 10/19/20 | (27 | ) | (2,700 | ) | (5,508 | ) | (6,031 | ) | 523 | |||||||||||||||||
E-mini S&P 500 Index | 300.00 USD | 10/21/20 | (9 | ) | (900 | ) | (783 | ) | (2,361 | ) | 1,578 | |||||||||||||||||
E-mini S&P 500 Index | 315.00 USD | 10/21/20 | (6 | ) | (600 | ) | (1,350 | ) | (1,442 | ) | 92 | |||||||||||||||||
E-mini S&P 500 Index | 319.00 USD | 10/21/20 | (15 | ) | (1,500 | ) | (4,328 | ) | (3,319 | ) | (1,009 | ) | ||||||||||||||||
E-mini S&P 500 Index | 300.00 USD | 10/23/20 | (9 | ) | (900 | ) | (950 | ) | (2,648 | ) | 1,698 | |||||||||||||||||
E-mini S&P 500 Index | 305.00 USD | 10/23/20 | (21 | ) | (2,100 | ) | (3,003 | ) | (7,133 | ) | 4,130 | |||||||||||||||||
E-mini S&P 500 Index | 314.00 USD | 10/23/20 | (9 | ) | (900 | ) | (2,192 | ) | (2,289 | ) | 97 | |||||||||||||||||
E-mini S&P 500 Index | 317.00 USD | 10/23/20 | (9 | ) | (900 | ) | (2,610 | ) | (2,037 | ) | (573 | ) | ||||||||||||||||
E-mini S&P 500 Index | 300.00 USD | 10/26/20 | (3 | ) | (300 | ) | (355 | ) | (949 | ) | 594 | |||||||||||||||||
E-mini S&P 500 Index | 305.00 USD | 10/26/20 | (12 | ) | (1,200 | ) | (1,890 | ) | (4,080 | ) | 2,190 | |||||||||||||||||
E-mini S&P 500 Index | 313.00 USD | 10/26/20 | (9 | ) | (900 | ) | (2,246 | ) | (2,325 | ) | 79 | |||||||||||||||||
E-mini S&P 500 Index | 317.00 USD | 10/26/20 | (9 | ) | (900 | ) | (2,813 | ) | (2,198 | ) | (615 | ) | ||||||||||||||||
E-mini S&P 500 Index | 314.00 USD | 10/28/20 | (9 | ) | (900 | ) | (2,660 | ) | (2,117 | ) | (543 | ) | ||||||||||||||||
E-mini S&P 500 Index | 305.00 USD | 10/30/20 | (9 | ) | (900 | ) | (1,868 | ) | (3,791 | ) | 1,923 | |||||||||||||||||
E-mini S&P 500 Index | 311.00 USD | 10/30/20 | (9 | ) | (900 | ) | (2,543 | ) | (2,649 | ) | 106 | |||||||||||||||||
E-mini S&P 500 Index | 312.00 USD | 10/30/20 | (9 | ) | (900 | ) | (2,673 | ) | (2,162 | ) | (511 | ) | ||||||||||||||||
E-mini S&P 500 Index | 310.00 USD | 11/2/20 | (18 | ) | (1,800 | ) | (5,292 | ) | (4,883 | ) | (409 | ) | ||||||||||||||||
S&P 500 Index | 3,150.00 USD | 10/2/20 | (7 | ) | (700 | ) | (577 | ) | (25,993 | ) | 25,416 | |||||||||||||||||
S&P 500 Index | 3,160.00 USD | 10/2/20 | (2 | ) | (200 | ) | (190 | ) | (8,007 | ) | 7,817 | |||||||||||||||||
S&P 500 Index | 3,165.00 USD | 10/2/20 | (5 | ) | (500 | ) | (500 | ) | (10,140 | ) | 9,640 | |||||||||||||||||
S&P 500 Index | 3,175.00 USD | 10/2/20 | (5 | ) | (500 | ) | (600 | ) | (20,991 | ) | 20,391 | |||||||||||||||||
S&P 500 Index | 3,180.00 USD | 10/2/20 | (5 | ) | (500 | ) | (625 | ) | (10,228 | ) | 9,603 | |||||||||||||||||
| See accompanying Notes to Financial Statements | | September 30, 2020 | | Annual Report | 123 |
Table of Contents
Schedule of Investments
September 30, 2020
| Options written contracts outstanding at September 30, 2020 (continued): | ||||||||||||||||||||||||||||
| Description | Exercise Price | Expiration Date | Number of Contracts | Notional Amount | Market Value | Premiums Received | Unrealized Appreciation (Depreciation) | |||||||||||||||||||||
Put options (continued): |
| |||||||||||||||||||||||||||
S&P 500 Index | 3,100.00 USD | 10/5/20 | (5 | ) | $ | (500 | ) | $ | (475 | ) | $ | (9,498 | ) | $ | 9,023 | |||||||||||||
S&P 500 Index | 3,075.00 USD | 10/7/20 | (2 | ) | (200 | ) | (340 | ) | (6,949 | ) | 6,609 | |||||||||||||||||
S&P 500 Index | 3,100.00 USD | 10/7/20 | (3 | ) | (300 | ) | (652 | ) | (11,485 | ) | 10,833 | |||||||||||||||||
S&P 500 Index | 3,160.00 USD | 10/7/20 | (5 | ) | (500 | ) | (2,200 | ) | (10,765 | ) | 8,565 | |||||||||||||||||
S&P 500 Index | 3,170.00 USD | 10/7/20 | (2 | ) | (200 | ) | (1,000 | ) | (6,471 | ) | 5,471 | |||||||||||||||||
S&P 500 Index | 3,175.00 USD | 10/7/20 | (5 | ) | (500 | ) | (2,650 | ) | (16,601 | ) | 13,951 | |||||||||||||||||
S&P 500 Index | 3,105.00 USD | 10/9/20 | (10 | ) | (1,000 | ) | (4,350 | ) | (21,726 | ) | 17,376 | |||||||||||||||||
S&P 500 Index | 3,145.00 USD | 10/9/20 | (2 | ) | (200 | ) | (1,330 | ) | (6,551 | ) | 5,221 | |||||||||||||||||
S&P 500 Index | 3,150.00 USD | 10/9/20 | (5 | ) | (500 | ) | (3,500 | ) | (16,592 | ) | 13,092 | |||||||||||||||||
S&P 500 Index | 3,180.00 USD | 10/9/20 | (5 | ) | (500 | ) | (4,825 | ) | (16,576 | ) | 11,751 | |||||||||||||||||
S&P 500 Index | 3,200.00 USD | 10/9/20 | (2 | ) | (200 | ) | (2,390 | ) | (6,633 | ) | 4,243 | |||||||||||||||||
S&P 500 Index | 3,190.00 USD | 10/12/20 | (2 | ) | (200 | ) | (2,690 | ) | (5,879 | ) | 3,189 | |||||||||||||||||
S&P 500 Index | 3,200.00 USD | 10/12/20 | (5 | ) | (500 | ) | (7,375 | ) | (14,966 | ) | 7,591 | |||||||||||||||||
S&P 500 Index | 3,215.00 USD | 10/12/20 | (5 | ) | (500 | ) | (8,475 | ) | (9,831 | ) | 1,356 | |||||||||||||||||
S&P 500 Index | 3,190.00 USD | 10/14/20 | (5 | ) | (500 | ) | (8,950 | ) | (10,791 | ) | 1,841 | |||||||||||||||||
S&P 500 Index | 3,200.00 USD | 10/14/20 | (2 | ) | (200 | ) | (3,880 | ) | (5,907 | ) | 2,027 | |||||||||||||||||
S&P 500 Index | 3,210.00 USD | 10/14/20 | (7 | ) | (700 | ) | (14,735 | ) | (21,056 | ) | 6,321 | |||||||||||||||||
S&P 500 Index | 3,220.00 USD | 10/14/20 | (5 | ) | (500 | ) | (11,375 | ) | (14,840 | ) | 3,465 | |||||||||||||||||
S&P 500 Index | 3,240.00 USD | 10/14/20 | (5 | ) | (500 | ) | (13,300 | ) | (9,896 | ) | (3,404 | ) | ||||||||||||||||
S&P 500 Index | 3,110.00 USD | 10/16/20 | (7 | ) | (700 | ) | (8,400 | ) | (20,598 | ) | 12,198 | |||||||||||||||||
S&P 500 Index | 3,120.00 USD | 10/16/20 | (5 | ) | (500 | ) | (6,475 | ) | (14,713 | ) | 8,238 | |||||||||||||||||
S&P 500 Index | 3,135.00 USD | 10/16/20 | (2 | ) | (200 | ) | (2,890 | ) | (6,383 | ) | 3,493 | |||||||||||||||||
S&P 500 Index | 3,050.00 USD | 10/19/20 | (7 | ) | (700 | ) | (6,755 | ) | (21,238 | ) | 14,483 | |||||||||||||||||
S&P 500 Index | 3,025.00 USD | 10/21/20 | (5 | ) | (500 | ) | (5,075 | ) | (16,026 | ) | 10,951 | |||||||||||||||||
S&P 500 Index | 3,030.00 USD | 10/21/20 | (2 | ) | (200 | ) | (2,110 | ) | (6,189 | ) | 4,079 | |||||||||||||||||
S&P 500 Index | 3,100.00 USD | 10/21/20 | (7 | ) | (700 | ) | (11,515 | ) | (21,910 | ) | 10,395 | |||||||||||||||||
S&P 500 Index | 3,025.00 USD | 10/23/20 | (2 | ) | (200 | ) | (2,450 | ) | (6,283 | ) | 3,833 | |||||||||||||||||
S&P 500 Index | 3,040.00 USD | 10/23/20 | (5 | ) | (500 | ) | (6,725 | ) | (16,156 | ) | 9,431 | |||||||||||||||||
S&P 500 Index | 3,045.00 USD | 10/23/20 | (5 | ) | (500 | ) | (6,925 | ) | (15,454 | ) | 8,529 | |||||||||||||||||
S&P 500 Index | 3,050.00 USD | 10/23/20 | (2 | ) | (200 | ) | (2,850 | ) | (6,349 | ) | 3,499 | |||||||||||||||||
S&P 500 Index | 3,140.00 USD | 10/26/20 | (2 | ) | (200 | ) | (5,270 | ) | (6,029 | ) | 759 | |||||||||||||||||
S&P 500 Index | 3,160.00 USD | 10/26/20 | (5 | ) | (500 | ) | (14,750 | ) | (15,346 | ) | 596 | |||||||||||||||||
S&P 500 Index | 3,130.00 USD | 10/28/20 | (7 | ) | (700 | ) | (19,600 | ) | (21,590 | ) | 1,990 | |||||||||||||||||
S&P 500 Index | 3,180.00 USD | 10/28/20 | (7 | ) | (700 | ) | (25,515 | ) | (20,283 | ) | (5,232 | ) | ||||||||||||||||
|
| |||||||||||||||||||||||||||
| Total put options |
| $ | (300,989 | ) | $ | (693,664 | ) | $ | 392,675 | |||||||||||||||||||
|
| |||||||||||||||||||||||||||
| Total options written contracts |
| $ | (399,314 | ) | $ | (843,598 | ) | $ | 444,284 | |||||||||||||||||||
|
| |||||||||||||||||||||||||||
(e) At September 30, 2020, the Fund pledged $313,749 in cash as collateral for options written.
| 124 | Annual Report | | September 30, 2020 | | See accompanying Notes to Financial Statements |
Table of Contents
Schedule of Investments
September 30, 2020
AllianzGI Water Fund
| Shares | Value | |||||||
| Common Stock—95.0% |
| |||||||
| Canada—2.1% |
| |||||||
Algonquin Power & Utilities Corp. | 998,735 | $14,506,053 | ||||||
|
| |||||||
| China—1.8% |
| |||||||
China Water Affairs Group Ltd. | 8,212,000 | 6,468,799 | ||||||
Guangdong Investment Ltd. | 4,154,000 | 6,604,785 | ||||||
|
| |||||||
| 13,073,584 | ||||||||
|
| |||||||
| France—6.6% |
| |||||||
Suez S.A. | 1,209,941 | 22,356,120 | ||||||
Veolia Environnement S.A. | 1,126,865 | 24,313,321 | ||||||
|
| |||||||
| 46,669,441 | ||||||||
|
| |||||||
| Ireland—2.7% |
| |||||||
STERIS PLC | 45,000 | 7,928,550 | ||||||
Trane Technologies PLC | 90,000 | 10,912,500 | ||||||
|
| |||||||
| 18,841,050 | ||||||||
|
| |||||||
| Italy—1.2% |
| |||||||
Hera SpA (b) | 2,286,513 | 8,431,063 | ||||||
|
| |||||||
| Netherlands—3.5% |
| |||||||
Aalberts NV | 362,179 | 13,023,803 | ||||||
Arcadis NV | 528,577 | 11,472,513 | ||||||
|
| |||||||
| 24,496,316 | ||||||||
|
| |||||||
| Sweden—2.4% |
| |||||||
Alfa Laval AB (b) | 756,234 | 16,693,484 | ||||||
|
| |||||||
| Switzerland—7.5% |
| |||||||
Geberit AG | 56,584 | 33,476,451 | ||||||
Georg Fischer AG | 13,317 | 13,828,262 | ||||||
Landis+Gyr Group AG (b) | 99,104 | 5,396,274 | ||||||
|
| |||||||
| 52,700,987 | ||||||||
|
| |||||||
| United Kingdom—12.6% |
| |||||||
Halma PLC | 1,331,376 | 40,223,330 | ||||||
Pennon Group PLC | 1,388,141 | 18,468,426 | ||||||
Severn Trent PLC | 480,010 | 15,112,975 | ||||||
United Utilities Group PLC | 1,325,295 | 14,639,706 | ||||||
|
| |||||||
| 88,444,437 | ||||||||
|
| |||||||
| United States—54.6% |
| |||||||
Agilent Technologies, Inc. | 143,743 | 14,509,418 | ||||||
American States Water Co. | 136,450 | 10,226,928 | ||||||
American Water Works Co., Inc. | 401,184 | 58,123,538 | ||||||
Badger Meter, Inc. | 120,000 | 7,844,400 | ||||||
California Water Service Group | 15,533 | 674,909 | ||||||
Danaher Corp. | 203,862 | 43,897,604 | ||||||
Ecolab, Inc. | 102,546 | 20,492,793 | ||||||
Essential Utilities, Inc. | 641,834 | 25,833,818 | ||||||
Evoqua Water Technologies Corp. (b) | 474,476 | 10,068,381 | ||||||
Franklin Electric Co., Inc. | 120,000 | 7,059,600 | ||||||
IDEX Corp. | 233,384 | 42,571,575 | ||||||
Itron, Inc. (b) | 227,221 | 13,801,404 | ||||||
Mueller Water Products, Inc., Class A | 166,694 | 1,731,951 | ||||||
PerkinElmer, Inc. | 121,636 | 15,266,534 | ||||||
Tetra Tech, Inc. | 289,483 | 27,645,626 | ||||||
Thermo Fisher Scientific, Inc. | 56,509 | 24,949,854 | ||||||
Trimble, Inc. (b) | 140,000 | 6,818,000 | ||||||
Waste Management, Inc. | 123,575 | 13,984,983 | ||||||
Xylem, Inc. | 462,717 | 38,923,754 | ||||||
|
| |||||||
| 384,425,070 | ||||||||
|
| |||||||
| Total Common Stock (cost—$478,435,949) |
| 668,281,485 | ||||||
|
| |||||||
| Principal Amount (000s) | Value | |||||||
| Repurchase Agreements—3.2% |
| |||||||
State Street Bank and Trust Co., |
| |||||||
(cost—$22,555,000) | $22,555 | $22,555,000 | ||||||
|
| |||||||
| Total Investments (cost—$500,990,949) (a)—98.2% |
| 690,836,485 | ||||||
|
| |||||||
| Other assets less liabilities—1.8% |
| 12,690,202 | ||||||
|
| |||||||
| Net Assets—100.0% |
| $703,526,687 | ||||||
|
| |||||||
Notes to Schedule of Investments:
(a) Securities with an aggregate value of $250,509,312, representing 35.6% of net assets, were valued utilizing modeling tools provided by a third-party vendor. See Note 1(a) and Note 1(b) in the Notes to Financial Statements.
(b) Non-income producing.
The industry classification of portfolio holdings and other assets less liabilities shown as a percentage of net assets were as follows:
Water Utilities | 22.2% | |||
Machinery | 19.5% | |||
Electronic Equipment, Instruments & Components | 10.5% | |||
Multi-Utilities | 9.9% | |||
Life Sciences Tools & Services | 7.8% | |||
Healthcare Equipment & Supplies | 7.4% | |||
Building Products | 6.3% | |||
Commercial Services & Supplies | 5.9% | |||
Chemicals | 2.9% | |||
Construction & Engineering | 1.6% | |||
Electrical Equipment | 1.0% | |||
Repurchase Agreements | 3.2% | |||
Other assets less liabilities | 1.8% | |||
|
| |||
| 100.0% | ||||
|
|
| See accompanying Notes to Financial Statements | | September 30, 2020 | | Annual Report | 125 |
Table of Contents
Statements of Assets and Liabilities
September 30, 2020
| AllianzGI Best Styles Global Equity | AllianzGI Convertible | AllianzGI Core Plus Bond | AllianzGI Emerging Markets Consumer | AllianzGI Emerging Markets Small-Cap | ||||||||||||||||||||
| Assets: | ||||||||||||||||||||||||
| Investments, at value | $ | 71,305,680 | $ | 1,946,016,737 | $ | 51,740,047 | $ | 35,031,507 | $ | 5,218,498 | ||||||||||||||
| Investments in Affiliates, at value | — | — | — | — | — | |||||||||||||||||||
| Repurchase agreements, at value | 231,000 | 23,684,000 | 257,000 | 160,000 | — | |||||||||||||||||||
| Cash | 1,793 | 417 | 462,306 | 892 | — | |||||||||||||||||||
| Foreign currency, at value | 204,897 | — | — | 325,511 | 23,324 | |||||||||||||||||||
| Receivable for Fund shares sold | 1,310 | 8,175,732 | — | — | — | |||||||||||||||||||
| Receivable for investments sold | 171,229 | 6,275,869 | 428,749 | — | 165,291 | |||||||||||||||||||
| Dividends and interest receivable (net of foreign withholding taxes) | 162,868 | 5,002,384 | 335,576 | 38,123 | 10,840 | |||||||||||||||||||
| Investments in Affiliated Funds — Trustees Deferred Compensation Plan (see Note 5) | 99,908 | 171,810 | 1,211 | 7,392 | 1,820 | |||||||||||||||||||
| Receivable for variation margin on futures contracts | — | — | — | — | — | |||||||||||||||||||
| Swap premiums paid | — | — | 626,851 | — | — | |||||||||||||||||||
| Unrealized appreciation of forward foreign currency contracts | — | — | — | — | — | |||||||||||||||||||
| Unrealized appreciation of OTC swaps | — | — | — | — | — | |||||||||||||||||||
| Tax reclaims receivable | 354,007 | — | — | 10,058 | — | |||||||||||||||||||
| Receivable from Investment Manager | — | — | 6,539 | — | 11,441 | |||||||||||||||||||
| Receivable for TBA investments sold | — | — | 3,847,832 | — | — | |||||||||||||||||||
| Receivable for variation margin on centrally cleared swaps | — | — | 11,660 | — | — | |||||||||||||||||||
| Deposits with brokers for derivatives collateral | — | — | 984,941 | — | — | |||||||||||||||||||
| Prepaid expenses and other assets | 29,194 | 109,119 | 25,124 | 9,989 | 9,148 | |||||||||||||||||||
Total Assets | 72,561,886 | 1,989,436,068 | 58,727,836 | 35,583,472 | 5,440,362 | |||||||||||||||||||
| Liabilities: | ||||||||||||||||||||||||
| Payable for investments purchased | — | 11,741,422 | 1,472,779 | — | — | |||||||||||||||||||
| Payable for Fund shares redeemed | 30,760 | 1,279,068 | — | — | — | |||||||||||||||||||
| Investment management fees payable | 62,619 | 868,192 | — | 4,675 | — | |||||||||||||||||||
| Trustees Deferred Compensation Plan payable (see Note 5) | 99,908 | 171,810 | 1,211 | 7,392 | 1,820 | |||||||||||||||||||
| Servicing fees payable | 180 | 72,936 | — | 13 | 46 | |||||||||||||||||||
| Distribution fees payable | 9 | 70,549 | — | — | — | |||||||||||||||||||
| Payable for variation margin on futures contracts | — | — | 21,863 | — | — | |||||||||||||||||||
| Payable for TBA investments purchased | — | — | 6,735,847 | — | — | |||||||||||||||||||
| Payable to custodian for cash overdraft | — | — | — | — | 109,419 | |||||||||||||||||||
| Unrealized depreciation of forward foreign currency contracts | — | — | — | — | — | |||||||||||||||||||
| Unrealized depreciation of OTC swaps | — | — | — | — | — | |||||||||||||||||||
| Payable for variation margin on centrally cleared swaps | — | — | — | — | — | |||||||||||||||||||
| Accrued expenses and other liabilities | 100,923 | 711,023 | 62,176 | 60,800 | 76,674 | |||||||||||||||||||
Total Liabilities | 294,399 | 14,915,000 | 8,293,876 | 72,880 | 187,959 | |||||||||||||||||||
| Net Assets | $ | 72,267,487 | $ | 1,974,521,068 | $ | 50,433,960 | $ | 35,510,592 | $ | 5,252,403 | ||||||||||||||
| 126 | Annual Report | | September 30, 2020 | | See accompanying Notes to Financial Statements |
Table of Contents
| AllianzGI Emerging Markets Value | AllianzGI Global Allocation | AllianzGI Global Dynamic Allocation | AllianzGI Global Sustainability | AllianzGI Green Bond | AllianzGI High Yield Bond | AllianzGI International Small-Cap | ||||||||||||||||||||||||
| $ | 130,910,673 | $ | 51,340,562 | $ | 31,242,360 | $ | 149,519,141 | $ | 27,040,305 | $ | 79,544,554 | $ | 76,653,025 | |||||||||||||||||
| — | 182,560,957 | 4,190,727 | — | — | 4,399,764 | — | ||||||||||||||||||||||||
| 3,293,000 | 8,300,000 | 6,306,000 | 4,166,000 | — | 1,738,000 | — | ||||||||||||||||||||||||
| 187 | 461,204 | 172,942 | 596 | 86,330 | 222 | — | ||||||||||||||||||||||||
| 2,398,291 | — | 877,928 | 4 | 6,432 | — | 630,097 | ||||||||||||||||||||||||
| 60,902 | 2,926 | — | 9,101,543 | — | 29,086 | 2,236 | ||||||||||||||||||||||||
| 2,933,626 | 212,268 | 108,868 | — | — | 760,736 | 740,598 | ||||||||||||||||||||||||
| | 151,893 | 371,034 | 165,918 | 93,000 | 184,510 | 1,399,115 | 283,141 | |||||||||||||||||||||||
| | 15,441 | 65,986 | 35,648 | 4,316 | 46 | 47,269 | 26,677 | |||||||||||||||||||||||
| — | 144,577 | 49,923 | — | — | — | — | ||||||||||||||||||||||||
| — | 10,916 | 3,233 | — | — | — | — | ||||||||||||||||||||||||
| | — | — | — | — | — | — | 284 | |||||||||||||||||||||||
| — | — | 15,694 | — | — | — | — | ||||||||||||||||||||||||
| 7,075 | — | 81,528 | 69,661 | 1,222 | — | 346,833 | ||||||||||||||||||||||||
| — | — | 10,442 | — | — | — | — | ||||||||||||||||||||||||
| — | — | — | — | — | — | — | ||||||||||||||||||||||||
| | — | — | 3,509 | — | — | — | — | |||||||||||||||||||||||
| — | 14,860,570 | 2,638,447 | — | 165,443 | — | — | ||||||||||||||||||||||||
| 19,653 | 54,339 | 41,679 | 14,784 | 12,867 | 36,849 | 32,549 | ||||||||||||||||||||||||
| 139,790,741 | 258,385,339 | 45,944,846 | 162,969,045 | 27,497,155 | 87,955,595 | 78,715,440 | ||||||||||||||||||||||||
| 440,366 | 1,281,808 | 345,152 | — | 742,080 | 882,607 | 155,506 | ||||||||||||||||||||||||
| 186,860 | 34,785 | 30 | 31,595 | — | 165,989 | 319,774 | ||||||||||||||||||||||||
| 34,376 | 28,650 | — | 44,439 | 7,396 | 34,664 | 65,369 | ||||||||||||||||||||||||
| | 15,441 | 65,986 | 35,648 | 4,316 | 46 | 47,269 | 26,677 | |||||||||||||||||||||||
| 3,271 | 10,280 | 405 | 476 | 42 | 5,114 | 1,076 | ||||||||||||||||||||||||
| 624 | 2,677 | 902 | — | — | 2,362 | 616 | ||||||||||||||||||||||||
| — | — | — | — | 7,736 | — | — | ||||||||||||||||||||||||
| — | — | — | — | — | — | — | ||||||||||||||||||||||||
| — | — | — | — | — | — | 270,872 | ||||||||||||||||||||||||
| | — | — | — | — | 64,299 | — | 1 | |||||||||||||||||||||||
| — | — | 5,943 | — | — | — | — | ||||||||||||||||||||||||
| | — | 27 | — | — | — | — | — | |||||||||||||||||||||||
| 177,547 | 125,770 | 122,823 | 93,499 | 53,893 | 119,476 | 103,712 | ||||||||||||||||||||||||
| 858,485 | 1,549,983 | 510,903 | 174,325 | 875,492 | 1,257,481 | 943,603 | ||||||||||||||||||||||||
| $ | 138,932,256 | $ | 256,835,356 | $ | 45,433,943 | $ | 162,794,720 | $ | 26,621,663 | $ | 86,698,114 | $ | 77,771,837 | |||||||||||||||||
| See accompanying Notes to Financial Statements | | September 30, 2020 | | Annual Report | 127 |
Table of Contents
Statements of Assets and Liabilities (cont’d)
September 30, 2020
| AllianzGI Best Styles Global Equity | AllianzGI Convertible | AllianzGI Core Plus Bond | AllianzGI Emerging Markets Consumer | AllianzGI Emerging Markets Small-Cap | ||||||||||||||||||||
| Net Assets Consist of: | ||||||||||||||||||||||||
| Paid-in-capital | $ | 53,862,875 | $ | 1,487,043,566 | $ | 46,171,035 | $ | 29,723,602 | $ | 4,226,139 | ||||||||||||||
| Total distributable earnings (loss) | 18,404,612 | 487,477,502 | 4,262,925 | 5,786,990 | 1,026,264 | |||||||||||||||||||
| Net Assets | $ | 72,267,487 | $ | 1,974,521,068 | $ | 50,433,960 | $ | 35,510,592 | $ | 5,252,403 | ||||||||||||||
| Cost of Investments | $ | 64,260,472 | $ | 1,595,645,298 | $ | 50,762,261 | $ | 24,470,651 | $ | 4,337,928 | ||||||||||||||
| Cost of Investments in Affiliates | $ | — | $ | — | $ | — | $ | — | $ | — | ||||||||||||||
| Cost of Repurchase Agreements | $ | 231,000 | $ | 23,684,000 | $ | 257,000 | $ | 160,000 | $ | — | ||||||||||||||
| Cost of Foreign Currency | $ | 203,898 | $ | — | $ | — | $ | 322,159 | $ | 23,230 | ||||||||||||||
| Net Assets: | ||||||||||||||||||||||||
| Class A | $ | 865,434 | $ | 254,761,747 | $ | — | $ | 63,182 | $ | 217,463 | ||||||||||||||
| Class C | 13,357 | 112,522,868 | — | — | — | |||||||||||||||||||
| Class R | — | 298,349 | — | — | — | |||||||||||||||||||
| Class P | 393,852 | 547,783,020 | 12,078 | — | — | |||||||||||||||||||
| Institutional Class | 471,420 | 1,045,768,587 | 38,396 | 35,447,410 | 5,034,940 | |||||||||||||||||||
| Class R6 | 70,523,424 | — | 50,383,486 | — | — | |||||||||||||||||||
| Administrative Class | — | 13,386,497 | — | — | — | |||||||||||||||||||
| Shares Issued and Outstanding: | ||||||||||||||||||||||||
| Class A | 65,882 | 6,571,330 | — | 3,978 | 13,045 | |||||||||||||||||||
| Class C | 1,022 | 2,856,689 | — | — | — | |||||||||||||||||||
| Class R | — | 7,375 | — | — | — | |||||||||||||||||||
| Class P | 29,931 | 14,581,131 | 736 | — | — | |||||||||||||||||||
| Institutional Class | 36,423 | 27,494,374 | 2,340 | 2,230,913 | 304,631 | |||||||||||||||||||
| Class R6 | 5,369,032 | — | 3,070,869 | — | — | |||||||||||||||||||
| Administrative Class | — | 348,935 | — | — | — | |||||||||||||||||||
| Net Asset Value and Redemption Price Per Share:* | ||||||||||||||||||||||||
| Class A | $ | 13.14 | $ | 38.77 | $ | — | $ | 15.88 | $ | 16.67 | ||||||||||||||
| Class C | 13.07 | 39.39 | — | — | — | |||||||||||||||||||
| Class R | — | 40.45 | — | — | — | |||||||||||||||||||
| Class P | 13.16 | 37.57 | 16.41 | — | — | |||||||||||||||||||
| Institutional Class | 12.94 | 38.04 | 16.41 | 15.89 | 16.53 | |||||||||||||||||||
| Class R6 | 13.14 | — | 16.41 | — | — | |||||||||||||||||||
| Administrative Class | — | 38.36 | — | — | — | |||||||||||||||||||
| * | Net asset value and redemption price per share may not recalculate exactly due to rounding. |
| 128 | Annual Report | | September 30, 2020 | | See accompanying Notes to Financial Statements |
Table of Contents
| AllianzGI Emerging Markets Value | AllianzGI Global Allocation | AllianzGI Global Dynamic Allocation | AllianzGI Global Sustainability | AllianzGI Green Bond | AllianzGI High Yield Bond | AllianzGI International Small-Cap | ||||||||||||||||||||||||
| $ | 140,347,558 | $ | 230,291,210 | $ | 32,184,708 | $ | 132,673,369 | $ | 25,208,063 | $ | 130,800,861 | $ | 65,296,008 | |||||||||||||||||
| (1,415,302 | ) | 26,544,146 | 13,249,235 | 30,121,351 | 1,413,600 | (44,102,747 | ) | 12,475,829 | ||||||||||||||||||||||
| $ | 138,932,256 | $ | 256,835,356 | $ | 45,433,943 | $ | 162,794,720 | $ | 26,621,663 | $ | 86,698,114 | $ | 77,771,837 | |||||||||||||||||
| $ | 108,533,930 | $ | 49,669,539 | $ | 28,184,735 | $ | 123,945,019 | $ | 25,678,590 | $ | 86,548,090 | $ | 63,986,648 | |||||||||||||||||
| $ | — | $ | 171,341,090 | $ | 2,839,681 | $ | — | $ | — | $ | 5,645,148 | $ | — | |||||||||||||||||
| $ | 3,293,000 | $ | 8,300,000 | $ | 6,306,000 | $ | 4,166,000 | $ | — | $ | 1,738,000 | $ | — | |||||||||||||||||
| $ | 2,366,110 | $ | — | $ | 873,951 | $ | 4 | $ | 6,435 | $ | — | $ | 617,255 | |||||||||||||||||
| $ | 14,907,214 | $ | 46,505,921 | $ | 1,490,628 | $ | 2,350,039 | $ | 190,427 | $ | 20,250,621 | $ | 3,618,770 | |||||||||||||||||
| 1,016,088 | 3,548,918 | 525,273 | — | — | 3,880,018 | 722,053 | ||||||||||||||||||||||||
| — | 22,653 | 44,320 | — | — | 507,642 | 848,851 | ||||||||||||||||||||||||
| 7,192,276 | 5,371,240 | 58,749 | 28,371,985 | 553,224 | 10,112,809 | 10,751,155 | ||||||||||||||||||||||||
| 115,816,678 | 9,609,515 | 12,293,772 | 132,072,696 | 25,878,012 | 51,920,679 | 31,942,290 | ||||||||||||||||||||||||
| — | 191,749,733 | 30,996,236 | — | — | — | 29,888,718 | ||||||||||||||||||||||||
| — | 27,376 | 24,965 | — | — | 26,345 | — | ||||||||||||||||||||||||
| 824,148 | 4,184,958 | 79,532 | 111,614 | 11,321 | 2,413,281 | 105,306 | ||||||||||||||||||||||||
| 56,233 | 309,295 | 28,666 | — | — | 463,130 | 21,880 | ||||||||||||||||||||||||
| — | 2,062 | 2,379 | — | — | 63,607 | 26,473 | ||||||||||||||||||||||||
| 398,497 | 490,104 | 2,996 | 1,337,244 | 32,896 | 1,263,036 | 314,397 | ||||||||||||||||||||||||
| 6,432,070 | 869,500 | 645,283 | 6,103,415 | 1,537,642 | 6,461,371 | 900,052 | ||||||||||||||||||||||||
| — | 17,773,581 | 1,653,100 | — | — | — | 849,795 | ||||||||||||||||||||||||
| — | 2,389 | 1,337 | — | — | 3,286 | — | ||||||||||||||||||||||||
| $ | 18.09 | $ | 11.11 | $ | 18.74 | $ | 21.06 | $ | 16.82 | $ | 8.39 | $ | 34.36 | |||||||||||||||||
| 18.07 | 11.47 | 18.32 | — | — | 8.38 | 33.00 | ||||||||||||||||||||||||
| — | 10.98 | 18.63 | — | — | 7.98 | 32.06 | ||||||||||||||||||||||||
| 18.05 | 10.96 | 19.61 | 21.22 | 16.82 | 8.01 | 34.20 | ||||||||||||||||||||||||
| 18.01 | 11.05 | 19.05 | 21.64 | 16.83 | 8.04 | 35.49 | ||||||||||||||||||||||||
| — | 10.79 | 18.75 | — | — | — | 35.17 | ||||||||||||||||||||||||
| — | 11.46 | 18.67 | — | — | 8.02 | — | ||||||||||||||||||||||||
| See accompanying Notes to Financial Statements | | September 30, 2020 | | Annual Report | 129 |
Table of Contents
Statements of Assets and Liabilities† (cont’d)
September 30, 2020
| AllianzGI Multi Asset Income | AllianzGI PerformanceFee Managed Futures Strategy† | AllianzGI PerformanceFee Structured US Equity | AllianzGI Preferred Securities and Income | AllianzGI Short Duration High Income | ||||||||||||||||||||
| Assets: | ||||||||||||||||||||||||
| Investments, at value | $ | 19,417,684 | $ | 16,858,281 | $ | 50,230,005 | $ | 24,931,701 | $ | 774,760,386 | ||||||||||||||
| Investments in Affiliates, at value | 18,896,914 | 1,211,276 | — | — | — | |||||||||||||||||||
| Repurchase agreements, at value | 5,332,000 | 618,000 | 347,000 | 826,000 | 23,764,000 | |||||||||||||||||||
| Cash | 675 | 454,092 | — | 3,866 | 306,665 | |||||||||||||||||||
| Foreign currency, at value | — | — | — | — | — | |||||||||||||||||||
| Dividends and interest receivable (net of foreign withholding taxes) | 47,986 | 51,759 | — | 258,209 | 14,381,592 | |||||||||||||||||||
| Receivable for investments sold | 2,012,942 | — | 48,050 | — | 12,046,646 | |||||||||||||||||||
| Swap premiums paid | — | — | — | 89,565 | — | |||||||||||||||||||
| Receivable for investments in Affiliates sold | 1,115,138 | — | — | — | — | |||||||||||||||||||
| Deposits with brokers for derivatives collateral | 3,054,376 | 6,145,072 | 247,920 | — | — | |||||||||||||||||||
| Receivable for Fund shares sold | 11,125 | — | 129 | — | 429,413 | |||||||||||||||||||
| Receivable from Investment Manager | 16,765 | 30,988 | 61,677 | 11,998 | — | |||||||||||||||||||
| Tax reclaims receivable | 11,344 | — | — | — | — | |||||||||||||||||||
| Investments in Affiliated Funds — Trustees Deferred Compensation Plan (see Note 5) | 2,285 | 2,173 | 2,229 | 338 | 211,376 | |||||||||||||||||||
| Receivable for variation margin on centrally cleared swaps | — | 6,172 | — | 1,396 | — | |||||||||||||||||||
| Receivable for principal paydowns | — | — | — | — | 305,035 | |||||||||||||||||||
| Prepaid expenses and other assets | — | 11,636 | 14,773 | 24,995 | 79,568 | |||||||||||||||||||
Total Assets | 49,919,234 | 25,389,449 | 50,951,783 | 26,148,068 | 826,284,681 | |||||||||||||||||||
| Liabilities: | ||||||||||||||||||||||||
| Payable for investments purchased | 5,117,738 | — | 367,006 | 573,886 | 7,925,000 | |||||||||||||||||||
| Payable for Fund shares redeemed | 19,094 | — | 8,174 | 2 | 5,305,395 | |||||||||||||||||||
| Payable to custodian for cash overdraft | — | — | 9,376 | — | — | |||||||||||||||||||
| Deposits received from brokers for derivatives collateral | — | — | — | 8,673 | — | |||||||||||||||||||
| Payable for variation margin on futures contracts | 1,100 | 91,888 | — | 305 | — | |||||||||||||||||||
| Options written, at value | — | — | 263,560 | — | — | |||||||||||||||||||
| Investment management fees payable | — | — | — | — | 404,659 | |||||||||||||||||||
| Distribution fees payable | 1,097 | — | — | — | 18,865 | |||||||||||||||||||
| Servicing fees payable | 1,454 | — | — | — | 46,408 | |||||||||||||||||||
| Swap premiums received | — | 52,228 | — | — | — | |||||||||||||||||||
| Trustees Deferred Compensation Plan payable (see Note 5) | 2,285 | 2,173 | 2,229 | 338 | 211,376 | |||||||||||||||||||
| Accrued expenses and other liabilities | — | 89,445 | 110,655 | 52,813 | 598,792 | |||||||||||||||||||
Total Liabilities | 5,142,768 | 235,734 | 761,000 | 636,017 | 14,510,495 | |||||||||||||||||||
| Net Assets | $ | 44,776,466 | $ | 25,153,715 | $ | 50,190,783 | $ | 25,512,051 | $ | 811,774,186 | ||||||||||||||
| † | Consolidated Statement of Assets and Liabilities for the AllianzGI PerformanceFee Managed Futures Strategy Fund. These financial statements are consolidated to include the accounts of AllianzGI PerformanceFee Managed Futures Strategy Offshore Fund Ltd., a wholly-owned subsidiary of the AllianzGI PerformanceFee Managed Futures Strategy Fund. See Note 14. |
| 130 | Annual Report | | September 30, 2020 | | See accompanying Notes to Financial Statements |
Table of Contents
| AllianzGI Short Term Bond | AllianzGI Structured Return | AllianzGI Water | ||||||||||||
| $ | 15,832,394 | $ | 31,300,355 | $ | 668,281,485 | |||||||||
| — | — | — | ||||||||||||
| 496,000 | 946,000 | 22,555,000 | ||||||||||||
| 248 | 716 | 502 | ||||||||||||
| — | — | 2,241,349 | ||||||||||||
| | 202,776 | — | 748,215 | |||||||||||
| — | 58,352 | 9,330,232 | ||||||||||||
| — | — | — | ||||||||||||
| — | — | — | ||||||||||||
| — | 313,749 | — | ||||||||||||
| — | 1,267 | 648,753 | ||||||||||||
| 10,423 | — | — | ||||||||||||
| — | — | 1,184,859 | ||||||||||||
| | 112 | 80,651 | 101,033 | |||||||||||
| | — | — | — | |||||||||||
| — | — | — | ||||||||||||
| 32,145 | 19,726 | 49,057 | ||||||||||||
| 16,574,098 | 32,720,816 | 705,140,485 | ||||||||||||
| — | 41,861 | — | ||||||||||||
| — | 342,878 | 586,198 | ||||||||||||
| — | — | — | ||||||||||||
| | — | — | — | |||||||||||
| — | — | — | ||||||||||||
| — | 399,314 | — | ||||||||||||
| — | 226,863 | 378,177 | ||||||||||||
| — | 1,837 | 35,616 | ||||||||||||
| 1,185 | 1,391 | 52,280 | ||||||||||||
| — | — | — | ||||||||||||
| | 112 | 80,651 | 101,033 | |||||||||||
| 50,069 | 168,249 | 460,494 | ||||||||||||
| 51,366 | 1,263,044 | 1,613,798 | ||||||||||||
| $ | 16,522,732 | $ | 31,457,772 | $ | 703,526,687 | |||||||||
| See accompanying Notes to Financial Statements | | September 30, 2020 | | Annual Report | 131 |
Table of Contents
Statements of Assets and Liabilities† (cont’d)
September 30, 2020
| AllianzGI Multi Asset Income | AllianzGI PerformanceFee Managed Futures Strategy† | AllianzGI PerformanceFee Structured US Equity | AllianzGI Preferred Securities and Income | AllianzGI Short Duration | ||||||||||||||||||||
| Net Assets Consist of: | ||||||||||||||||||||||||
| Paid-in-capital | $ | 49,972,972 | $ | 29,023,086 | $ | 77,918,794 | $ | 25,532,457 | $ | 1,003,202,525 | ||||||||||||||
| Total distributable earnings (loss) | (5,196,506 | ) | (3,869,371 | ) | (27,728,011 | ) | (20,406 | ) | (191,428,339 | ) | ||||||||||||||
| Net Assets | $ | 44,776,466 | $ | 25,153,715 | $ | 50,190,783 | $ | 25,512,051 | $ | 811,774,186 | ||||||||||||||
| Cost of Investments | $ | 19,558,500 | $ | 16,858,849 | $ | 45,670,411 | $ | 24,905,661 | $ | 834,668,600 | ||||||||||||||
| Cost of Investments in Affiliates | $ | 18,065,726 | $ | 1,255,352 | $ | — | $ | — | $ | — | ||||||||||||||
| Cost of Repurchase Agreements | $ | 5,332,000 | $ | 618,000 | $ | 347,000 | $ | 826,000 | $ | 23,764,000 | ||||||||||||||
| Cost of Foreign Currency | $ | — | $ | — | $ | — | $ | — | $ | — | ||||||||||||||
| Premiums Received for Options Written | $ | — | $ | — | $ | 530,382 | $ | — | $ | — | ||||||||||||||
| Net Assets: | ||||||||||||||||||||||||
| Class A | $ | 4,114,365 | $ | — | $ | — | $ | — | $ | 136,690,608 | ||||||||||||||
| Class C | 1,090,566 | — | — | — | 90,863,030 | |||||||||||||||||||
| Class R | 537,588 | — | — | — | — | |||||||||||||||||||
| Class P | 449,124 | 8,679 | 377,527 | 11,219 | 264,907,875 | |||||||||||||||||||
| Institutional Class | 325,717 | 211,452 | 49,423,357 | 7,661,826 | 285,572,057 | |||||||||||||||||||
| Class R6 | 38,248,934 | 24,933,584 | 389,899 | 17,839,006 | 33,740,616 | |||||||||||||||||||
| Administrative Class | 10,172 | — | — | — | — | |||||||||||||||||||
| Shares Issued and Outstanding: | ||||||||||||||||||||||||
| Class A | 257,569 | — | — | — | 9,767,964 | |||||||||||||||||||
| Class C | 67,809 | — | — | — | 6,498,926 | |||||||||||||||||||
| Class R | 31,959 | — | — | — | — | |||||||||||||||||||
| Class P | 27,689 | 1,081 | 42,497 | 761 | 19,062,991 | |||||||||||||||||||
| Institutional Class | 20,840 | 26,359 | 5,558,334 | 519,964 | 20,552,579 | |||||||||||||||||||
| Class R6 | 2,445,816 | 3,106,000 | 43,309 | 1,210,796 | 2,428,735 | |||||||||||||||||||
| Administrative Class | 624 | — | — | — | — | |||||||||||||||||||
| Net Asset Value and Redemption Price Per Share:* | ||||||||||||||||||||||||
| Class A | $ | 15.97 | $ | — | $ | — | $ | — | $ | 13.99 | ||||||||||||||
| Class C | 16.08 | — | — | — | 13.98 | |||||||||||||||||||
| Class R | 16.82 | — | — | — | — | |||||||||||||||||||
| Class P | 16.22 | 8.03 | 8.88 | 14.73 | 13.90 | |||||||||||||||||||
| Institutional Class | 15.63 | 8.02 | 8.89 | 14.74 | 13.89 | |||||||||||||||||||
| Class R6 | 15.64 | 8.03 | 9.00 | 14.73 | 13.89 | |||||||||||||||||||
| Administrative Class | 16.31 | — | — | — | — | |||||||||||||||||||
| † | Consolidated Statement of Assets and Liabilities for the AllianzGI PerformanceFee Managed Futures Strategy Fund. These financial statements are consolidated to include the accounts of AllianzGI PerformanceFee Managed Futures Strategy Offshore Fund Ltd., a wholly-owned subsidiary of the AllianzGI PerformanceFee Managed Futures Strategy Fund. See Note 14. |
| * | Net asset value and redemption price per share may not recalculate exactly due to rounding. |
| 132 | Annual Report | | September 30, 2020 | | See accompanying Notes to Financial Statements |
Table of Contents
| AllianzGI Short Term Bond | AllianzGI Structured Return | AllianzGI Water | ||||||||||||
| $ | 14,968,294 | $ | 256,591,932 | $ | 506,057,205 | |||||||||
| 1,554,438 | (225,134,160 | ) | 197,469,482 | |||||||||||
| $ | 16,522,732 | $ | 31,457,772 | $ | 703,526,687 | |||||||||
| $ | 15,307,268 | $ | 31,652,755 | $ | 478,435,949 | |||||||||
| $ | — | $ | — | $ | — | |||||||||
| $ | 496,000 | $ | 946,000 | $ | 22,555,000 | |||||||||
| $ | — | $ | — | $ | 2,291,458 | |||||||||
| $ | — | $ | 843,598 | $ | — | |||||||||
| $ | 5,631,413 | $ | 3,675,086 | $ | 200,384,454 | |||||||||
| — | 2,830,714 | 57,900,521 | ||||||||||||
| — | — | — | ||||||||||||
| 11,415 | 9,452,770 | 240,922,001 | ||||||||||||
| 10,879,904 | 9,651,099 | 204,319,711 | ||||||||||||
| — | 5,848,103 | — | ||||||||||||
| — | — | — | ||||||||||||
| 357,162 | 349,715 | 11,368,125 | ||||||||||||
| — | 283,942 | 3,460,748 | ||||||||||||
| — | — | — | ||||||||||||
| 721 | 909,495 | 13,630,533 | ||||||||||||
| 688,291 | 920,175 | 11,791,784 | ||||||||||||
| — | 561,659 | — | ||||||||||||
| — | — | — | ||||||||||||
| $ | 15.77 | $ | 10.51 | $ | 17.63 | |||||||||
| — | 9.97 | 16.73 | ||||||||||||
| — | — | — | ||||||||||||
| 15.83 | 10.39 | 17.68 | ||||||||||||
| 15.81 | 10.49 | 17.33 | ||||||||||||
| — | 10.41 | — | ||||||||||||
| — | — | — | ||||||||||||
| See accompanying Notes to Financial Statements | | September 30, 2020 | | Annual Report | 133 |
Table of Contents
Year ended September 30, 2020
| AllianzGI Best Styles Global Equity | AllianzGI Convertible | AllianzGI Core Plus Bond | AllianzGI Emerging Markets Consumer | AllianzGI Emerging Markets Small-Cap | ||||||||||||||||||||
| Investment Income: | ||||||||||||||||||||||||
| Interest, net of foreign withholding taxes* | $ | 3,205 | $ | 10,670,229 | $ | 1,529,995 | $ | 448 | $ | 14 | ||||||||||||||
| Dividends, net of foreign withholding taxes* | 3,706,448 | 9,887,332 | 78,591 | 799,757 | 232,044 | |||||||||||||||||||
| Dividends from investments in Affiliates | — | — | — | — | — | |||||||||||||||||||
| Miscellaneous | — | 78,941 | — | — | — | |||||||||||||||||||
Total Investment Income | 3,709,653 | 20,636,502 | 1,608,586 | 800,205 | 232,058 | |||||||||||||||||||
| Expenses: | ||||||||||||||||||||||||
| Investment management | 511,618 | 6,585,999 | 171,328 | 312,628 | 81,902 | |||||||||||||||||||
| Distribution — Class C | 133 | 599,492 | — | — | — | |||||||||||||||||||
| Distribution — Class R | — | 527 | — | — | — | |||||||||||||||||||
| Servicing — Class A | 2,308 | 326,883 | — | 159 | 485 | |||||||||||||||||||
| Servicing — Class C | 44 | 199,830 | — | — | — | |||||||||||||||||||
| Servicing — Class R | — | 527 | — | — | — | |||||||||||||||||||
| Administrative servicing — Class P | 117 | 182,897 | — | — | — | |||||||||||||||||||
| Distribution and/or servicing — Administrative Class | — | 6,862 | — | — | — | |||||||||||||||||||
| Sub-transfer agent — Class A | 1,010 | 102,725 | — | 55 | 55 | |||||||||||||||||||
| Sub-transfer agent — Class C | 9 | 74,734 | — | — | — | |||||||||||||||||||
| Sub-transfer agent — Class R | — | 14 | — | — | — | |||||||||||||||||||
| Sub-transfer agent — Institutional Class | 368 | 383,143 | — | 13,883 | 421 | |||||||||||||||||||
| Sub-transfer agent — Administrative Class | — | 192 | — | — | — | |||||||||||||||||||
| Custodian and accounting agent | 256,274 | 199,424 | 97,913 | 116,349 | 89,201 | |||||||||||||||||||
| Registration | 71,681 | 133,119 | 45,296 | 34,075 | 32,944 | |||||||||||||||||||
| Audit and tax services | 41,508 | 85,713 | 51,349 | 39,134 | 37,611 | |||||||||||||||||||
| Trustees | 18,533 | 146,492 | 7,074 | 4,470 | 799 | |||||||||||||||||||
| Insurance | 15,887 | 25,071 | 5,793 | 5,533 | 4,651 | |||||||||||||||||||
| Legal | 15,645 | 95,352 | 33,066 | 14,476 | 13,551 | |||||||||||||||||||
| Transfer agent | 11,213 | 58,625 | 4,273 | 2,984 | 2,239 | |||||||||||||||||||
| Shareholder communications | 5,124 | 125,711 | 8,059 | 5,170 | 4,001 | |||||||||||||||||||
| Line of credit commitment | 3,551 | 35,217 | 1,389 | 800 | 151 | |||||||||||||||||||
| Excise tax | — | — | — | — | — | |||||||||||||||||||
| Offering | — | — | — | — | — | |||||||||||||||||||
| Recoupment | — | — | — | — | — | |||||||||||||||||||
| Miscellaneous | 30,599 | 10,026 | 5,984 | 4,332 | 8,231 | |||||||||||||||||||
Total Expenses | 985,622 | 9,378,575 | 431,524 | 554,048 | 276,242 | |||||||||||||||||||
Less: Fee Waiver/Reimbursement from Investment Manager | (295,605 | ) | (33,531 | ) | (287,267 | ) | (166,775 | ) | (173,098 | ) | ||||||||||||||
Net Expenses | 690,017 | 9,345,044 | 144,257 | 387,273 | 103,144 | |||||||||||||||||||
| Net Investment Income | 3,019,636 | 11,291,458 | 1,464,329 | 412,932 | 128,914 | |||||||||||||||||||
| 134 | Annual Report | | September 30, 2020 | | See accompanying Notes to Financial Statements |
Table of Contents
| AllianzGI Emerging Markets Value | AllianzGI Global Allocation | AllianzGI Global Dynamic Allocation | AllianzGI Global Sustainability | AllianzGI Green Bond | AllianzGI High Yield Bond | AllianzGI International Small-Cap | ||||||||||||||||||||||||
| $ | 1,357 | $ | 1,315,242 | $ | 963,827 | $ | 6,466 | $ | 527,006 | $ | 6,271,565 | $ | 1,469 | |||||||||||||||||
| 2,407,482 | 46,603 | 1,170,433 | 2,412,664 | — | 278,938 | 1,468,469 | ||||||||||||||||||||||||
| — | 3,830,040 | 206,469 | — | — | — | — | ||||||||||||||||||||||||
| 194 | 501 | 24 | — | — | 5,514 | — | ||||||||||||||||||||||||
| 2,409,033 | 5,192,386 | 2,340,753 | 2,419,130 | 527,006 | 6,556,017 | 1,469,938 | ||||||||||||||||||||||||
| 987,772 | 2,096,474 | 824,007 | 1,202,200 | 115,677 | 519,227 | 845,458 | ||||||||||||||||||||||||
| 7,419 | 36,740 | 4,524 | — | — | 30,178 | 5,930 | ||||||||||||||||||||||||
| — | 53 | 219 | — | — | 1,601 | 2,435 | ||||||||||||||||||||||||
| 35,988 | 115,763 | 3,650 | 4,570 | �� | 393 | 55,558 | 10,555 | |||||||||||||||||||||||
| 2,473 | 12,247 | 1,508 | — | — | 10,059 | 1,977 | ||||||||||||||||||||||||
| — | 53 | 219 | — | — | 1,601 | 2,435 | ||||||||||||||||||||||||
| 2,048 | 4,220 | 1,329 | 18,356 | 1,162 | 4,794 | 7,463 | ||||||||||||||||||||||||
| — | 62 | 59 | — | — | 64 | — | ||||||||||||||||||||||||
| �� | 20,512 | 28,994 | 1,053 | 2,232 | 116 | 25,806 | 2,810 | |||||||||||||||||||||||
| 1,154 | 220 | 387 | — | — | 2,408 | 423 | ||||||||||||||||||||||||
| — | 4 | 184 | — | — | 1,670 | 2,190 | ||||||||||||||||||||||||
| 92,408 | 1,577 | 7,816 | 1,788 | 411 | 52,124 | 26,205 | ||||||||||||||||||||||||
| — | — | — | — | — | — | — | ||||||||||||||||||||||||
| 272,295 | 66,785 | 410,897 | 192,259 | 48,790 | 64,086 | 177,016 | ||||||||||||||||||||||||
| 61,928 | 97,143 | 91,569 | 46,514 | 41,893 | 84,263 | 83,944 | ||||||||||||||||||||||||
| 48,469 | 32,728 | 50,232 | 37,108 | 51,125 | 58,207 | 39,447 | ||||||||||||||||||||||||
| 13,832 | 36,231 | 12,371 | 19,020 | 3,695 | 12,629 | 9,798 | ||||||||||||||||||||||||
| 7,803 | 13,330 | 9,467 | 5,974 | 4,776 | 8,007 | 7,205 | ||||||||||||||||||||||||
| 20,172 | 57,278 | 75,743 | 19,689 | 17,448 | 22,558 | 22,966 | ||||||||||||||||||||||||
| 9,455 | 53,867 | 12,104 | 8,294 | 3,392 | 17,023 | 12,330 | ||||||||||||||||||||||||
| 17,342 | 10,840 | 9,671 | 15,013 | 12,242 | 14,601 | 4,759 | ||||||||||||||||||||||||
| 2,761 | 6,470 | 2,491 | 3,883 | 715 | 2,623 | 1,943 | ||||||||||||||||||||||||
| 1,881 | — | — | — | — | — | — | ||||||||||||||||||||||||
| — | — | — | — | 18,006 | — | — | ||||||||||||||||||||||||
| — | 1,701 | — | — | — | — | — | ||||||||||||||||||||||||
| 5,223 | 7,843 | 11,510 | 6,065 | 12,487 | 11,852 | 5,772 | ||||||||||||||||||||||||
| 1,610,935 | 2,680,623 | 1,531,010 | 1,582,965 | 332,328 | 1,000,939 | 1,273,061 | ||||||||||||||||||||||||
| | (522,849 | ) | (1,814,685 | ) | (881,437 | ) | (441,367 | ) | (184,126 | ) | — | (372,809 | ) | |||||||||||||||||
| 1,088,086 | 865,938 | 649,573 | 1,141,598 | 148,202 | 1,000,939 | 900,252 | ||||||||||||||||||||||||
| 1,320,947 | 4,326,448 | 1,691,180 | 1,277,532 | 378,804 | 5,555,078 | 569,686 | ||||||||||||||||||||||||
| See accompanying Notes to Financial Statements | | September 30, 2020 | | Annual Report | 135 |
Table of Contents
Statements of Operations (cont’d)
Year ended September 30, 2020
| AllianzGI Best Styles Global Equity | AllianzGI Convertible | AllianzGI Core Plus Bond | AllianzGI Emerging Markets Consumer | AllianzGI Emerging Markets Small-Cap | ||||||||||||||||||||
| Realized and Change in Unrealized Gain (Loss): | ||||||||||||||||||||||||
| Net realized gain (loss) on: | ||||||||||||||||||||||||
Investments | $ | 21,908,386 | $ | 138,326,201 | $ | 3,015,949 | $ | (823,108 | ) | $ | 347,000 | |||||||||||||
Investments in Affiliates | — | — | — | — | — | |||||||||||||||||||
Futures contracts | — | — | 393,363 | — | — | |||||||||||||||||||
Swaps | — | — | 458,519 | — | — | |||||||||||||||||||
Forward foreign currency contracts | (9,099 | ) | — | — | — | — | ||||||||||||||||||
Foreign currency transactions | (24,634 | ) | — | — | (49,495 | ) | (8,199 | ) | ||||||||||||||||
| Net capital gain distributions received from underlying Affiliated funds | — | — | — | — | — | |||||||||||||||||||
| Payments from Affiliates (See Note 7) | — | — | — | 685 | — | |||||||||||||||||||
| Net change in unrealized appreciation/depreciation of: | ||||||||||||||||||||||||
Investments | (10,910,692 | ) | 296,228,404 | 86,848 | 5,536,608 | (89,208 | ) | |||||||||||||||||
Investments in Affiliates | — | — | — | — | — | |||||||||||||||||||
Futures contracts | — | — | (15,260 | ) | — | — | ||||||||||||||||||
Swaps | — | — | (329,279 | ) | — | — | ||||||||||||||||||
Forward foreign currency contracts | — | — | — | — | — | |||||||||||||||||||
Foreign currency transactions | 27,055 | — | — | 4,055 | (43 | ) | ||||||||||||||||||
| Net realized and change in unrealized gain (loss) | 10,991,016 | 434,554,605 | 3,610,140 | 4,668,745 | 249,550 | |||||||||||||||||||
| Net Increase (Decrease) in Net Assets Resulting from Investment Operations | $ | 14,010,652 | $ | 445,846,063 | $ | 5,074,469 | $ | 5,081,677 | $ | 378,464 | ||||||||||||||
| *Foreign withholding taxes | $ | 230,434 | $ | — | $ | — | $ | 109,237 | $ | 36,419 | ||||||||||||||
| 136 | Annual Report | | September 30, 2020 | | See accompanying Notes to Financial Statements |
Table of Contents
| AllianzGI Emerging Markets Value | AllianzGI Global Allocation | AllianzGI Global Dynamic Allocation | AllianzGI Global Sustainability | AllianzGI Green Bond | AllianzGI High Yield Bond | AllianzGI International Small-Cap | ||||||||||||||||||||||||
| $ | 1,258,453 | $ | 1,851,816 | $ | 5,873,862 | $ | 3,497,246 | $ | 610,018 | $ | (3,055,416 | ) | $ | 2,202,190 | ||||||||||||||||
| — | 10,869,798 | 5,132,285 | — | — | — | — | ||||||||||||||||||||||||
| — | 5,510,930 | (4,104,017 | ) | — | (286,395 | ) | — | — | ||||||||||||||||||||||
| — | 21 | 1,411,898 | — | — | — | — | ||||||||||||||||||||||||
| — | — | (1 | ) | (369 | ) | (706,338 | ) | — | 20,072 | |||||||||||||||||||||
| (71,911 | ) | — | 30,558 | (9,633 | ) | 297,316 | — | 30,620 | ||||||||||||||||||||||
| | — | 3,682,631 | 1,052,860 | — | — | — | — | |||||||||||||||||||||||
| — | — | — | — | — | — | — | ||||||||||||||||||||||||
| | 18,406,422 | 1,151,765 | (1,663,896 | ) | 22,090,710 | 1,088,108 | (1,784,995 | ) | 3,818,922 | |||||||||||||||||||||
| — | 2,119,909 | 1,660,251 | — | — | (1,358,336 | ) | — | |||||||||||||||||||||||
| — | 382,200 | 15,661 | — | 24,882 | — | — | ||||||||||||||||||||||||
| — | 1,551 | 10,213 | — | — | — | — | ||||||||||||||||||||||||
| — | — | — | — | (71,362 | ) | — | 283 | |||||||||||||||||||||||
| 30,199 | 28,180 | 12,520 | 4,718 | (135 | ) | — | 37,434 | |||||||||||||||||||||||
| 19,623,163 | 25,598,801 | 9,432,194 | 25,582,672 | 956,094 | (6,198,747 | ) | 6,109,521 | |||||||||||||||||||||||
$ | 20,944,110 |
| $ | 29,925,249 | $ | 11,123,374 | $ | 26,860,204 | $ | 1,334,898 | $ | (643,669 | ) | $ | 6,679,207 | |||||||||||||||
| $ | 292,226 | $ | — | $ | 53,490 | $ | 114,286 | $ | 314 | $ | — | $ | 144,905 | |||||||||||||||||
| See accompanying Notes to Financial Statements | | September 30, 2020 | | Annual Report | 137 |
Table of Contents
Statements of Operations† (cont’d)
Year ended September 30, 2020
| AllianzGI Multi Asset Income | AllianzGI PerformanceFee Managed Futures Strategy† | AllianzGI PerformanceFee Structured US Equity | AllianzGI Preferred Securities and Income | AllianzGI Short Duration High Income | ||||||||||||||||||||
| Investment Income: | ||||||||||||||||||||||||
| Interest | $ | 4,234 | $ | 340,886 | $ | 661 | $ | 840,937 | $ | 55,892,924 | ||||||||||||||
| Dividends from investments in Affiliates | 1,070,288 | 68,409 | — | — | — | |||||||||||||||||||
| Dividends, net of foreign withholding taxes* | 1,406,147 | — | 1,588,657 | 223,393 | — | |||||||||||||||||||
| Non-cash income | — | — | — | — | — | |||||||||||||||||||
| Miscellaneous | — | — | — | — | 341,832 | |||||||||||||||||||
Total Investment Income | 2,480,669 | 409,295 | 1,589,318 | 1,064,330 | 56,234,756 | |||||||||||||||||||
| Expenses: | ||||||||||||||||||||||||
| Investment management | 20,408 | 226,858 | 497,794 | 96,799 | 5,512,082 | |||||||||||||||||||
| Performance fee adjustment | — | (215,938 | ) | (189,705 | ) | — | — | |||||||||||||||||
| Administration | 54,358 | — | — | — | — | |||||||||||||||||||
| Distribution — Class C | 10,245 | — | — | — | 260,029 | |||||||||||||||||||
| Distribution — Class R | 560 | — | — | — | — | |||||||||||||||||||
| Servicing — Class A | 28,902 | — | — | — | 333,185 | |||||||||||||||||||
| Servicing — Class C | 3,415 | — | ��� | — | 260,029 | |||||||||||||||||||
| Servicing — Class R | 560 | — | — | — | — | |||||||||||||||||||
| Administrative servicing — Class P | — | — | 15,084 | — | 565,704 | |||||||||||||||||||
| Distribution and/or servicing — Administrative Class | 25 | — | — | — | — | |||||||||||||||||||
| Sub-transfer agent — Class A | — | — | — | — | 78,136 | |||||||||||||||||||
| Sub-transfer agent — Class C | — | — | — | — | 75,692 | |||||||||||||||||||
| Sub-transfer agent — Institutional Class | — | 53 | 45,694 | 3,025 | 276,778 | |||||||||||||||||||
| Custodian and accounting agent | — | 107,049 | 251,638 | 48,745 | 216,064 | |||||||||||||||||||
| Audit and tax services | — | 50,559 | 47,696 | 51,183 | 51,643 | |||||||||||||||||||
| Shareholder communications | — | 9,394 | 4,578 | 8,523 | 78,096 | |||||||||||||||||||
| Legal | 32 | 36,000 | 36,227 | 18,423 | 98,919 | |||||||||||||||||||
| Transfer agent | — | 3,266 | 4,644 | 3,092 | 90,350 | |||||||||||||||||||
| Trustees | — | 14,798 | 10,923 | 2,703 | 138,793 | |||||||||||||||||||
| Registration | — | 44,918 | 47,831 | 46,533 | 119,936 | |||||||||||||||||||
| Recoupment | 1 | — | — | — | — | |||||||||||||||||||
| Insurance | — | 5,329 | 6,763 | 4,979 | 35,904 | |||||||||||||||||||
| Line of credit commitment | 981 | 693 | 2,074 | 577 | 23,797 | |||||||||||||||||||
| Miscellaneous | 428 | 18,783 | 12,767 | 5,073 | 27,683 | |||||||||||||||||||
Total Expenses | 119,915 | 301,762 | 794,008 | 289,655 | 8,242,820 | |||||||||||||||||||
Less: Fee Waiver/Reimbursement from Investment Manager | (12,928 | ) | (263,461 | ) | (487,840 | ) | (178,890 | ) | (280,880 | ) | ||||||||||||||
Net Expenses | 106,987 | 38,301 | 306,168 | 110,765 | 7,961,940 | |||||||||||||||||||
| Net Investment Income | 2,373,682 | 370,994 | 1,283,150 | 953,565 | 48,272,816 | |||||||||||||||||||
| † | Consolidated Statement of Operations for the AllianzGI PerformanceFee Managed Futures Strategy Fund. These financial statements are consolidated to include the accounts of AllianzGI PerformanceFee Managed Futures Strategy Offshore Fund Ltd., which is a wholly-owned subsidiary of the AllianzGI PerformanceFee Managed Futures Strategy Fund. See Note 14. |
| 138 | Annual Report | | September 30, 2020 | | See accompanying Notes to Financial Statements |
Table of Contents
| AllianzGI Short Term Bond | AllianzGI Structured Return | AllianzGI Water | ||||||||||||
| $ | 705,120 | $ | 346,452 | $ | 14,296 | |||||||||
| — | — | — | ||||||||||||
| — | 5,214,124 | 9,314,908 | ||||||||||||
| — | — | 870,809 | ||||||||||||
| — | — | — | ||||||||||||
| 705,120 | 5,560,576 | 10,200,013 | ||||||||||||
| 51,273 | 2,106,432 | 6,043,882 | ||||||||||||
| — | — | — | ||||||||||||
| — | — | — | ||||||||||||
| — | 55,572 | 496,713 | ||||||||||||
| — | — | — | ||||||||||||
| 6,337 | 43,292 | 456,207 | ||||||||||||
| — | 18,524 | 165,571 | ||||||||||||
| — | — | — | ||||||||||||
| — | 56,578 | 188,153 | ||||||||||||
| — | — | — | ||||||||||||
| 141 | 9,290 | 147,884 | ||||||||||||
| — | 5,958 | 60,287 | ||||||||||||
| 1,556 | 206,620 | 100,721 | ||||||||||||
| 42,916 | 306,627 | 295,436 | ||||||||||||
| 50,063 | 41,452 | 55,897 | ||||||||||||
| 3,572 | 16,738 | 76,047 | ||||||||||||
| 10,891 | 30,699 | 71,919 | ||||||||||||
| 4,548 | 30,945 | 58,554 | ||||||||||||
| 1,979 | 43,109 | 77,598 | ||||||||||||
| 45,154 | 89,688 | 74,115 | ||||||||||||
| — | — | — | ||||||||||||
| 4,766 | 19,635 | 21,209 | ||||||||||||
| 468 | 7,557 | 15,226 | ||||||||||||
| 3,505 | 73,350 | 9,632 | ||||||||||||
| 227,169 | 3,162,066 | 8,415,051 | ||||||||||||
| | (153,699 | ) | (406,755 | ) | (1,242,119 | ) | ||||||||
| 73,470 | 2,755,311 | 7,172,932 | ||||||||||||
| 631,650 | 2,805,265 | 3,027,081 | ||||||||||||
| See accompanying Notes to Financial Statements | | September 30, 2020 | | Annual Report | 139 |
Table of Contents
Statements of Operations† (cont’d)
Year ended September 30, 2020
| AllianzGI Multi Asset Income | AllianzGI PerformanceFee Managed Futures Strategy† | AllianzGI PerformanceFee Structured US Equity | AllianzGI Preferred Securities and Income | AllianzGI Short Duration High Income | ||||||||||||||||||||
| Realized and Change in Unrealized Gain (Loss): | ||||||||||||||||||||||||
| Net realized gain (loss) on: | ||||||||||||||||||||||||
Investments | $ | (6,818,540 | ) | $ | 16,865 | $ | (2,361,009 | ) | $ | 526,193 | $ | (45,704,174 | ) | |||||||||||
Investments in Affiliates | (1,128,554 | ) | (8,354 | ) | — | — | — | |||||||||||||||||
Futures contracts | 2,035,994 | (3,351,306 | ) | — | 17,871 | — | ||||||||||||||||||
Options written | — | — | (25,885,941 | ) | — | — | ||||||||||||||||||
Swaps | — | (842,863 | ) | — | (195,057 | ) | — | |||||||||||||||||
Forward foreign currency contracts | — | — | — | — | — | |||||||||||||||||||
Foreign currency transactions | 5,843 | (9,727 | ) | — | — | — | ||||||||||||||||||
| Net capital gain distributions received from underlying Affiliated funds | 63,481 | — | — | — | — | |||||||||||||||||||
| Net change in unrealized appreciation/depreciation of: | ||||||||||||||||||||||||
Investments | (534,228 | ) | (15,897 | ) | (1,205,423 | ) | (564,915 | ) | (42,227,195 | ) | ||||||||||||||
Investments in Affiliates | 655,816 | (52,858 | ) | — | — | — | ||||||||||||||||||
Futures contracts | 240,040 | (88,568 | ) | — | 509 | — | ||||||||||||||||||
Options written | — | — | (455,740 | ) | — | — | ||||||||||||||||||
Swaps | — | 61,860 | — | (125,113 | ) | — | ||||||||||||||||||
Foreign currency transactions | 1,048 | 35,642 | — | — | — | |||||||||||||||||||
| Net realized and change in unrealized gain (loss) | (5,479,100 | ) | (4,255,206 | ) | (29,908,113 | ) | (340,512 | ) | (87,931,369 | ) | ||||||||||||||
| Net Increase (Decrease) in Net Assets Resulting from Investment Operations | $ | (3,105,418 | ) | $ | (3,884,212 | ) | $ | (28,624,963 | ) | $ | 613,053 | $ | (39,658,553 | ) | ||||||||||
| *Foreign withholding taxes | $ | 40,671 | $ | — | $ | — | $ | — | $ | — | ||||||||||||||
| † | Consolidated Statement of Operations for the AllianzGI PerformanceFee Managed Futures Strategy Fund. These financial statements are consolidated to include the accounts of AllianzGI PerformanceFee Managed Futures Strategy Offshore Fund Ltd., which is a wholly-owned subsidiary of the AllianzGI PerformanceFee Managed Futures Strategy Fund. See Note 14. |
| 140 | Annual Report | | September 30, 2020 | | See accompanying Notes to Financial Statements |
Table of Contents
| AllianzGI Short Term Bond | AllianzGI Structured Return | AllianzGI Water | ||||||||||||
| $ | 1,101,780 | $ | 74,988,947 | $ | 7,369,491 | |||||||||
| — | — | — | ||||||||||||
| — | — | — | ||||||||||||
| — | (241,143,473 | ) | — | |||||||||||
| — | — | — | ||||||||||||
| — | — | (6,885 | ) | |||||||||||
| — | — | (100 | ) | |||||||||||
| | — | — | — | |||||||||||
| | 377,995 | (52,606,730 | ) | 58,352,722 | ||||||||||
| — | — | — | ||||||||||||
| — | — | — | ||||||||||||
| — | 931,091 | — | ||||||||||||
| — | — | — | ||||||||||||
| — | — | 27,819 | ||||||||||||
| | 1,479,775 | (217,830,165 | ) | 65,743,047 | ||||||||||
$ | 2,111,425 |
| $ | (215,024,900 | ) | $ | 68,770,128 | |||||||
| $ | — | $ | — | $ | 484,539 | |||||||||
| See accompanying Notes to Financial Statements | | September 30, 2020 | | Annual Report | 141 |
Table of Contents
Statements of Changes in Net Assets
| AllianzGI Best Styles Global Equity | AllianzGI Convertible | |||||||||||||||||||
Year ended September 30, 2020 | Year ended September 30, 2019 | Year ended September 30, 2020 | Year ended September 30, 2019 | |||||||||||||||||
| Increase (Decrease) in Net Assets from: | ||||||||||||||||||||
Investment Operations: | ||||||||||||||||||||
| Net investment income | $ | 3,019,636 | $ | 10,861,253 | $ | 11,291,458 | $ | 6,304,664 | ||||||||||||
| Net realized gain (loss) | 21,874,653 | 14,108,203 | 138,326,201 | 29,128,468 | ||||||||||||||||
| Net change in unrealized appreciation/depreciation | (10,883,637 | ) | (37,439,039 | ) | 296,228,404 | (10,656,584 | ) | |||||||||||||
| Net increase (decrease) in net assets resulting from investment operations | 14,010,652 | (12,469,583 | ) | 445,846,063 | 24,776,548 | |||||||||||||||
| Distributions to Shareholders from: | ||||||||||||||||||||
| Distributable earnings: | ||||||||||||||||||||
Class A | (171,121 | ) | (133,530 | ) | (3,905,437 | ) | (8,353,498 | ) | ||||||||||||
Class C | (2,911 | ) | (1,808 | ) | (2,225,302 | ) | (6,532,887 | ) | ||||||||||||
Class R | — | — | (6,817 | ) | (13,215 | ) | ||||||||||||||
Class P | (129,756 | ) | (162,066 | ) | (11,071,629 | ) | (15,008,660 | ) | ||||||||||||
Institutional Class | (82,209 | ) | (276,295 | ) | (23,303,995 | ) | (47,761,194 | ) | ||||||||||||
Class R6 | (33,639,966 | ) | (66,179,468 | ) | — | — | ||||||||||||||
Administrative Class | — | — | (55,241 | ) | (116,747 | ) | ||||||||||||||
| Total distributions to shareholders | (34,025,963 | ) | (66,753,167 | ) | (40,568,421 | ) | (77,786,201 | ) | ||||||||||||
| Fund Share Transactions: | ||||||||||||||||||||
| Net proceeds from the sale of shares | 16,406,384 | 41,216,340 | 1,363,503,942 | 279,386,457 | ||||||||||||||||
| Issued in reinvestment of distributions | 34,003,323 | 66,731,633 | 38,820,500 | 74,563,876 | ||||||||||||||||
| Cost of shares redeemed | (319,733,413 | ) | (191,927,497 | ) | (489,553,720 | ) | (195,695,315 | ) | ||||||||||||
| Net increase (decrease) from Fund share transactions | (269,323,706 | ) | (83,979,524 | ) | 912,770,722 | 158,255,018 | ||||||||||||||
| Total increase (decrease) in net assets | (289,339,017 | ) | (163,202,274 | ) | 1,318,048,364 | 105,245,365 | ||||||||||||||
| Net Assets: | ||||||||||||||||||||
| Beginning of year | 361,606,504 | 524,808,778 | 656,472,704 | 551,227,339 | ||||||||||||||||
| End of year | $ | 72,267,487 | $ | 361,606,504 | $ | 1,974,521,068 | $ | 656,472,704 | ||||||||||||
| – | May reflect actual amounts rounding to less than $1. |
| 142 | Annual Report | | September 30, 2020 | | See accompanying Notes to Financial Statements |
Table of Contents
| AllianzGI Core Plus Bond | AllianzGI Emerging Markets Consumer | AllianzGI Emerging Markets Small-Cap | ||||||||||||||||||||||||
| Year ended September 30, 2020 | Year ended September 30, 2019 | Year ended September 30, 2020 | Year ended September 30, 2019 | Year ended September 30, 2020 | Year ended September 30, 2019 | |||||||||||||||||||||
| $ | 1,464,329 | $ | 1,325,823 | $ | 412,932 | $ | 516,779 | $ | 128,914 | $ | 200,702 | |||||||||||||||
| 3,867,831 | 1,971,692 | (871,918 | ) | (3,410,403 | ) | 338,801 | 123,303 | |||||||||||||||||||
| (257,691 | ) | 1,027,232 | 5,540,663 | 1,901,550 | (89,251 | ) | (119,008 | ) | ||||||||||||||||||
| 5,074,469 | 4,324,747 | 5,081,677 | (992,074 | ) | 378,464 | 204,997 | ||||||||||||||||||||
| — | — | (457 | ) | (207 | ) | (8,030 | ) | (5,633 | ) | |||||||||||||||||
| — | — | — | — | — | — | |||||||||||||||||||||
| — | — | — | — | — | — | |||||||||||||||||||||
| (693 | ) | (302 | ) | — | — | — | — | |||||||||||||||||||
| (875 | ) | (310 | ) | (437,367 | ) | (608,756 | ) | (282,337 | ) | (528,395 | ) | |||||||||||||||
| (3,642,611 | ) | (1,286,062 | ) | — | — | — | — | |||||||||||||||||||
| — | — | — | — | — | — | |||||||||||||||||||||
| (3,644,179 | ) | (1,286,674 | ) | (437,824 | ) | (608,963 | ) | (290,367 | ) | (534,028 | ) | |||||||||||||||
| 2,198,533 | 15,168,884 | 671,459 | 21,253,333 | 3,965,831 | 466,679 | |||||||||||||||||||||
| 3,644,179 | 1,286,674 | 388,159 | 442,815 | 290,367 | 534,028 | |||||||||||||||||||||
| (16,280,298 | ) | (147,681 | ) | (9,440,526 | ) | (24,249,417 | ) | (7,022,077 | ) | (2,906,507 | ) | |||||||||||||||
| (10,437,586 | ) | 16,307,877 | (8,380,908 | ) | (2,553,269 | ) | (2,765,879 | ) | (1,905,800 | ) | ||||||||||||||||
| (9,007,296 | ) | 19,345,950 | (3,737,055 | ) | (4,154,306 | ) | (2,677,782 | ) | (2,234,831 | ) | ||||||||||||||||
| 59,441,256 | 40,095,306 | 39,247,647 | 43,401,953 | 7,930,185 | 10,165,016 | |||||||||||||||||||||
| $ | 50,433,960 | $ | 59,441,256 | $ | 35,510,592 | $ | 39,247,647 | $ | 5,252,403 | $ | 7,930,185 | |||||||||||||||
| See accompanying Notes to Financial Statements | | September 30, 2020 | | Annual Report | 143 |
Table of Contents
Statements of Changes in Net Assets (cont’d)
| AllianzGI Emerging Markets Value | AllianzGI Global Allocation | |||||||||||||||||||
| Year ended September 30, 2020 | Year ended September 30, 2019 | Year ended September 30, 2020 | Year ended September 30, 2019 | |||||||||||||||||
| Increase (Decrease) in Net Assets from: | ||||||||||||||||||||
Investment Operations: | ||||||||||||||||||||
| Net investment income | $ | 1,320,947 | $ | 3,602,184 | $ | 4,326,448 | $ | 6,742,411 | ||||||||||||
| Net realized gain (loss) | 1,186,542 | (16,198,997 | ) | 21,915,196 | 18,854,482 | |||||||||||||||
| Net change in unrealized appreciation/depreciation | 18,436,621 | 8,838,136 | 3,683,605 | (15,592,813 | ) | |||||||||||||||
| Net increase (decrease) in net assets resulting from investment operations | 20,944,110 | (3,758,677 | ) | 29,925,249 | 10,004,080 | |||||||||||||||
| Distributions to Shareholders from: | ||||||||||||||||||||
| Distributable earnings: | ||||||||||||||||||||
Class A | (165,073 | ) | (356,129 | ) | (4,287,547 | ) | (3,251,123 | ) | ||||||||||||
Class C | (5,560 | ) | (20,510 | ) | (444,086 | ) | (368,972 | ) | ||||||||||||
Class R | — | — | (1,863 | ) | (1,966 | ) | ||||||||||||||
Class P | (65,991 | ) | (52,446 | ) | (674,026 | ) | (292,653 | ) | ||||||||||||
Institutional Class | (1,388,389 | ) | (3,312,431 | ) | (587,050 | ) | (418,147 | ) | ||||||||||||
Class R6 | — | — | (24,243,636 | ) | (16,591,827 | ) | ||||||||||||||
Administrative Class | — | — | (2,124 | ) | (1,312 | ) | ||||||||||||||
| Total distributions to shareholders | (1,625,013 | ) | (3,741,516 | ) | (30,240,332 | ) | (20,926,000 | ) | ||||||||||||
| Fund Share Transactions: | ||||||||||||||||||||
| Net proceeds from the sale of shares | 47,750,342 | 38,354,932 | 48,158,876 | 63,845,365 | ||||||||||||||||
| Issued in reinvestment of distributions | 1,622,648 | 3,737,331 | 29,041,225 | 20,228,963 | ||||||||||||||||
| Cost of shares redeemed | (37,893,396 | ) | (64,717,857 | ) | (137,213,249 | ) | (86,496,879 | ) | ||||||||||||
| Net increase (decrease) from Fund share transactions | 11,479,594 | (22,625,594 | ) | (60,013,148 | ) | (2,422,551 | ) | |||||||||||||
| Total increase (decrease) in net assets | 30,798,691 | (30,125,787 | ) | (60,328,231 | ) | (13,344,471 | ) | |||||||||||||
| Net Assets: | ||||||||||||||||||||
| Beginning of period | 108,133,565 | 138,259,352 | 317,163,587 | 330,508,058 | ||||||||||||||||
| End of period | $ | 138,932,256 | $ | 108,133,565 | $ | 256,835,356 | $ | 317,163,587 | ||||||||||||
| – | May reflect actual amounts rounding to less than $1. |
| * | Commencement of operations. |
| 144 | Annual Report | | September 30, 2020 | | See accompanying Notes to Financial Statements |
Table of Contents
| AllianzGI Global Dynamic Allocation | AllianzGI Global Sustainability | AllianzGI Green Bond | ||||||||||||||||||||||||
| Year ended September 30, 2020 | Year ended September 30, 2019 | Year ended September 30, 2020 | Year ended September 30, 2019 | Year ended September 30, 2020 | Period from November 19, 2018* September 30, 2019 | |||||||||||||||||||||
| $ | 1,691,180 | $ | 4,015,735 | $ | 1,277,532 | $ | 292,314 | $ | 378,804 | $ | 104,455 | |||||||||||||||
| 9,397,445 | 7,644,189 | 3,487,244 | 2,621,055 | (85,399 | ) | 257,000 | ||||||||||||||||||||
| 34,749 | (11,768,448 | ) | 22,095,428 | (2,796,738 | ) | 1,041,493 | 281,141 | |||||||||||||||||||
| 11,123,374 | (108,524 | ) | 26,860,204 | 116,631 | 1,334,898 | 642,596 | ||||||||||||||||||||
| (178,699 | ) | (93,517 | ) | (26,611 | ) | (44,718 | ) | (1,862 | ) | (1,313 | ) | |||||||||||||||
| (63,940 | ) | (17,748 | ) | — | — | — | — | |||||||||||||||||||
| (10,836 | ) | (3,802 | ) | — | — | — | — | |||||||||||||||||||
| (4,691 | ) | (573,450 | ) | (490,968 | ) | (876,192 | ) | (16,962 | ) | (8,287 | ) | |||||||||||||||
| (1,011,445 | ) | (356,643 | ) | (2,565,366 | ) | (822,141 | ) | (443,047 | ) | (92,825 | ) | |||||||||||||||
| (11,995,496 | ) | (8,485,926 | ) | — | — | — | — | |||||||||||||||||||
| (2,455 | ) | (975 | ) | — | — | — | — | |||||||||||||||||||
| (13,267,562 | ) | (9,532,061 | ) | (3,082,945 | ) | (1,743,051 | ) | (461,871 | ) | (102,425 | ) | |||||||||||||||
| 14,013,349 | 24,174,501 | 171,221,042 | 17,557,245 | 34,661,707 | 1,449,854 | |||||||||||||||||||||
| 13,265,491 | 9,531,384 | 3,082,945 | 1,743,051 | 461,854 | 102,301 | |||||||||||||||||||||
| (130,315,476 | ) | (95,879,882 | ) | (60,384,083 | ) | (32,789,644 | ) | (16,358,387 | ) | (108,864 | ) | |||||||||||||||
| (103,036,636 | ) | (62,173,997 | ) | 113,919,904 | (13,489,348 | ) | 18,765,174 | 1,443,291 | ||||||||||||||||||
| (105,180,824 | ) | (71,814,582 | ) | 137,697,163 | (15,115,768 | ) | 19,638,201 | 1,983,462 | ||||||||||||||||||
| 150,614,767 | 222,429,349 | 25,097,557 | 40,213,325 | 6,983,462 | 5,000,000 | |||||||||||||||||||||
| $ | 45,433,943 | $ | 150,614,767 | $ | 162,794,720 | $ | 25,097,557 | $ | 26,621,663 | $ | 6,983,462 | |||||||||||||||
| See accompanying Notes to Financial Statements | | September 30, 2020 | | Annual Report | 145 |
Table of Contents
Statements of Changes in Net Assets† (cont’d)
AllianzGI High Yield Bond | AllianzGI International Small-Cap | |||||||||||||||||||
| Year ended September 30, 2020 | Year ended September 30, 2019 | Year ended September 30, 2020 | Year ended September 30, 2019 | |||||||||||||||||
| Increase (Decrease) in Net Assets from: | ||||||||||||||||||||
Investment Operations: | ||||||||||||||||||||
| Net investment income | $ | 5,555,078 | $ | 7,365,238 | $ | 569,686 | $ | 1,369,256 | ||||||||||||
| Net realized gain (loss) | (3,055,416 | ) | (3,199,435 | ) | 2,252,882 | (397,025 | ) | |||||||||||||
| Net change in unrealized appreciation/depreciation | (3,143,331 | ) | 1,720,441 | 3,856,639 | (19,390,703 | ) | ||||||||||||||
| Net increase (decrease) in net assets resulting from investment operations | (643,669 | ) | 5,886,244 | 6,679,207 | (18,418,472 | ) | ||||||||||||||
| Distributions to Shareholders from: | ||||||||||||||||||||
| Distributable earnings: | ||||||||||||||||||||
Class A | (1,141,126 | ) | (1,536,708 | ) | (67,731 | ) | (825,408 | ) | ||||||||||||
Class C | (177,624 | ) | (253,579 | ) | (1,250 | ) | (220,455 | ) | ||||||||||||
Class R | (32,602 | ) | (39,565 | ) | (19,726 | ) | (167,366 | ) | ||||||||||||
Class P | (603,251 | ) | (793,003 | ) | (223,775 | ) | (4,463,787 | ) | ||||||||||||
Institutional Class | (4,000,073 | ) | (5,082,491 | ) | (628,894 | ) | (6,651,510 | ) | ||||||||||||
Class R6 | — | — | (690,384 | ) | (4,068,417 | ) | ||||||||||||||
Administrative Class | (1,419 | ) | (1,258 | ) | — | — | ||||||||||||||
| Return of capital: | ||||||||||||||||||||
Class A | — | — | — | — | ||||||||||||||||
Class C | — | — | — | — | ||||||||||||||||
Class R | — | — | — | — | ||||||||||||||||
Class P | — | — | — | — | ||||||||||||||||
Institutional Class | — | — | — | — | ||||||||||||||||
Class R6 | — | — | — | — | ||||||||||||||||
Administrative Class | — | — | — | — | ||||||||||||||||
| Total distributions to shareholders | (5,956,095 | ) | (7,706,604 | ) | (1,631,760 | ) | (16,396,943 | ) | ||||||||||||
| Fund Share Transactions: | ||||||||||||||||||||
| Net proceeds from the sale of shares | 33,347,960 | 28,252,863 | 15,589,889 | 23,342,926 | ||||||||||||||||
| Issued in reinvestment of distributions | 5,804,047 | 7,411,305 | 1,567,744 | 15,849,165 | ||||||||||||||||
| Cost of shares redeemed | (67,842,459 | ) | (94,678,330 | ) | (40,113,713 | ) | (53,408,177 | ) | ||||||||||||
| Net increase (decrease) from Fund share transactions | (28,690,452 | ) | (59,014,162 | ) | (22,956,080 | ) | (14,216,086 | ) | ||||||||||||
| Total increase (decrease) in net assets | (35,290,216 | ) | (60,834,522 | ) | (17,908,633 | ) | (49,031,501 | ) | ||||||||||||
| Net Assets: | ||||||||||||||||||||
| Beginning of year | 121,988,330 | 182,822,852 | 95,680,470 | 144,711,971 | ||||||||||||||||
| End of year | $ | 86,698,114 | $ | 121,988,330 | $ | 77,771,837 | $ | 95,680,470 | ||||||||||||
| – | May reflect actual amounts rounding to less than $1. |
| † | Consolidated Statement of Changes in Net Assets for the AllianzGI PerformanceFee Managed Futures Strategy Fund. These financial statements are consolidated to include the accounts of AllianzGI PerformanceFee Managed Futures Strategy Offshore Fund Ltd, a wholly-owned subsidiary of the AllianzGI PerformanceFee Managed Futures Strategy Fund. See Note 14. |
| 146 | Annual Report | | September 30, 2020 | | See accompanying Notes to Financial Statements |
Table of Contents
| AllianzGI Multi Asset Income | AllianzGI PerformanceFee Managed Futures Strategy † | AllianzGI PerformanceFee Structured US Equity | ||||||||||||||||||||||||
| Year ended September 30, 2020 | Year ended September 30, 2019 | Year ended September 30, 2020 | Year ended September 30, 2019 | Year ended September 30, 2020 | Year ended September 30, 2019 | |||||||||||||||||||||
| $ | 2,373,682 | $ | 1,908,396 | $ | 370,994 | $ | 640,725 | $ | 1,283,150 | $ | 1,898,984 | |||||||||||||||
| (5,841,776 | ) | 139,095 | (4,195,385 | ) | 1,134,370 | (28,246,950 | ) | 531,378 | ||||||||||||||||||
| 362,676 | 263,587 | (59,821 | ) | (86,597 | ) | (1,661,163 | ) | 2,179,668 | ||||||||||||||||||
| (3,105,418 | ) | 2,311,078 | (3,884,212 | ) | 1,688,498 | (28,624,963 | ) | 4,610,030 | ||||||||||||||||||
| (659,079 | ) | (628,310 | ) | — | — | — | — | |||||||||||||||||||
| (56,811 | ) | (68,590 | ) | — | — | — | — | |||||||||||||||||||
| (11,556 | ) | (4,813 | ) | — | — | — | — | |||||||||||||||||||
| (48,677 | ) | (442,685 | ) | (647 | ) | (81 | ) | (931,615 | ) | (5,757 | ) | |||||||||||||||
| (17,554 | ) | (4,881 | ) | (33,299 | ) | (4,473 | ) | (2,329,516 | ) | (2,775,165 | ) | |||||||||||||||
| (1,580,710 | ) | (653,978 | ) | (2,258,487 | ) | (305,782 | ) | (449,085 | ) | (2,828,770 | ) | |||||||||||||||
| (489 | ) | (12,480 | ) | — | — | — | — | |||||||||||||||||||
| (10,801 | ) | — | — | — | — | — | ||||||||||||||||||||
| (1,086 | ) | — | — | — | — | — | ||||||||||||||||||||
| (252 | ) | — | — | — | — | — | ||||||||||||||||||||
| (731 | ) | — | — | — | — | — | ||||||||||||||||||||
| (323 | ) | — | — | — | — | — | ||||||||||||||||||||
| (35,060 | ) | — | — | — | — | — | ||||||||||||||||||||
| (10 | ) | — | — | — | — | — | ||||||||||||||||||||
| (2,423,139 | ) | (1,815,737 | ) | (2,292,433 | ) | (310,336 | ) | (3,710,216 | ) | (5,609,692 | ) | |||||||||||||||
| 50,029,365 | 8,462,252 | 1,845,249 | 17,009,552 | 57,236,484 | 33,444,291 | |||||||||||||||||||||
| 2,417,353 | 1,798,604 | 2,292,433 | 310,336 | 3,693,261 | 5,609,691 | |||||||||||||||||||||
| (26,673,838 | ) | (22,353,244 | ) | (5,838,400 | ) | (1,446,013 | ) | (93,015,317 | ) | (6,517,994 | ) | |||||||||||||||
| 25,772,880 | (12,092,388 | ) | (1,700,718 | ) | 15,873,875 | (32,085,572 | ) | 32,535,988 | ||||||||||||||||||
| 20,244,323 | (11,597,047 | ) | (7,877,363 | ) | 17,252,037 | (64,420,751 | ) | 31,536,326 | ||||||||||||||||||
| 24,532,143 | 36,129,190 | 33,031,078 | 15,779,041 | 114,611,534 | 83,075,208 | |||||||||||||||||||||
| $ | 44,776,466 | $ | 24,532,143 | $ | 25,153,715 | $ | 33,031,078 | $ | 50,190,783 | $ | 114,611,534 | |||||||||||||||
| See accompanying Notes to Financial Statements | | September 30, 2020 | | Annual Report | 147 |
Table of Contents
Statements of Changes in Net Assets (cont’d)
| AllianzGI Preferred Securities and Income | AllianzGI Short Duration High Income | |||||||||||||||||||
| Year ended September 30, 2020 | Year ended September 30, 2019 | Year ended September 30, 2020 | Year ended September 30, 2019 | |||||||||||||||||
| Increase (Decrease) in Net Assets from: | ||||||||||||||||||||
Investment Operations: | ||||||||||||||||||||
| Net investment income | $ | 953,565 | $ | 690,870 | $ | 48,272,816 | $ | 42,380,614 | ||||||||||||
| Net realized gain (loss) | 349,007 | 195,391 | (45,704,174 | ) | 1,804,081 | |||||||||||||||
| Net change in unrealized appreciation/depreciation | (689,519 | ) | 593,715 | (42,227,195 | ) | (9,183,277 | ) | |||||||||||||
| Net increase (decrease) in net assets resulting from investment operations | 613,053 | 1,479,976 | (39,658,553 | ) | 35,001,418 | |||||||||||||||
| Distributions to Shareholders from: | ||||||||||||||||||||
| Distributable earnings: | ||||||||||||||||||||
Class A | — | — | (6,316,827 | ) | (7,162,693 | ) | ||||||||||||||
Class C | — | — | (4,670,485 | ) | (5,575,310 | ) | ||||||||||||||
Class P | (777 | ) | (506 | ) | (24,930,340 | ) | (25,427,233 | ) | ||||||||||||
Institutional Class | (289,815 | ) | (98,925 | ) | (17,988,728 | ) | (20,662,259 | ) | ||||||||||||
Class R6 | (1,120,300 | ) | (637,469 | ) | (2,118,099 | ) | (2,447,475 | ) | ||||||||||||
| Total distributions to shareholders | (1,410,892 | ) | (736,900 | ) | (56,024,479 | ) | (61,274,970 | ) | ||||||||||||
| Fund Share Transactions: | ||||||||||||||||||||
| Net proceeds from the sale of shares | 18,685,457 | 5,757,775 | 1,336,812,641 | 794,898,546 | ||||||||||||||||
| Issued in reinvestment of distributions | 1,409,958 | 736,900 | 50,999,324 | 54,086,373 | ||||||||||||||||
| Cost of shares redeemed | (11,477,144 | ) | (1,261,168 | ) | (1,662,542,975 | ) | (779,637,383 | ) | ||||||||||||
| Net increase (decrease) from Fund share transactions | 8,618,271 | 5,233,507 | (274,731,010 | ) | 69,347,536 | |||||||||||||||
| Total increase (decrease) in net assets | 7,820,432 | 5,976,583 | (370,414,042 | ) | 43,073,984 | |||||||||||||||
| Net Assets: | ||||||||||||||||||||
| Beginning of year | 17,691,619 | 11,715,036 | 1,182,188,228 | 1,139,114,244 | ||||||||||||||||
| End of year | $ | 25,512,051 | $ | 17,691,619 | $ | 811,774,186 | $ | 1,182,188,228 | ||||||||||||
| – | May reflect actual amounts rounding to less than $1. |
| † | See Note 9. |
| 148 | Annual Report | | September 30, 2020 | | See accompanying Notes to Financial Statements |
Table of Contents
AllianzGI Short Term Bond | AllianzGI Structured Return | AllianzGI Water | ||||||||||||||||||||||||
| Year ended September 30, 2020 | Year ended September 30, 2019 | Year ended September 30, 2020 | Year ended September 30, 2019 | Year ended September 30, 2020 | Year ended September 30, 2019 | |||||||||||||||||||||
| $ | 631,650 | $ | 223,256 | $ | 2,805,265 | $ | 8,847,282 | $ | 3,027,081 | $ | 4,818,285 | |||||||||||||||
| 1,101,780 | 35,302 | (166,154,526 | ) | (38,209,015 | ) | 7,362,506 | 19,046,207 | |||||||||||||||||||
| 377,995 | 152,784 | (51,675,639 | ) | 47,285,750 | 58,380,541 | 18,580,055 | ||||||||||||||||||||
| 2,111,425 | 411,342 | (215,024,900 | ) | 17,924,017 | 68,770,128 | 42,444,547 | ||||||||||||||||||||
| (111,637 | ) | (22,615 | ) | (921,601 | ) | (2,148,071 | ) | (5,630,824 | ) | (5,249,498 | ) | |||||||||||||||
| — | — | (418,026 | ) | (365,836 | ) | (1,775,781 | ) | (1,910,913 | ) | |||||||||||||||||
| (440 | ) | (392 | ) | (6,796,245 | ) | (3,115,188 | ) | (6,754,853 | ) | (7,916,135 | ) | |||||||||||||||
| (595,550 | ) | (246,170 | ) | (16,745,080 | ) | (10,621,296 | ) | (5,443,459 | ) | (4,962,595 | ) | |||||||||||||||
| — | — | (3,075,528 | ) | (1,407,534 | ) | — | — | |||||||||||||||||||
| (707,627 | ) | (269,177 | ) | (27,956,480 | ) | (17,657,925 | ) | (19,604,917 | ) | (20,039,141 | ) | |||||||||||||||
| 26,398,659 | 9,047,192 | �� | 182,519,409 | † | 319,452,174 | 203,646,972 | 131,364,152 | |||||||||||||||||||
| 693,757 | 269,177 | 27,391,104 | 17,258,570 | 15,915,920 | 15,949,272 | |||||||||||||||||||||
| (25,463,607 | ) | (1,152,862 | ) | (581,709,898 | ) | (364,822,631 | ) | (175,760,469 | ) | (222,350,140 | ) | |||||||||||||||
| 1,628,809 | 8,163,507 | (371,799,385 | ) | (28,111,887 | ) | 43,802,423 | (75,036,716 | ) | ||||||||||||||||||
| 3,032,607 | 8,305,672 | (614,780,765 | ) | (27,845,795 | ) | 92,967,634 | (52,631,310 | ) | ||||||||||||||||||
| 13,490,125 | 5,184,453 | 646,238,537 | 674,084,332 | 610,559,053 | 663,190,363 | |||||||||||||||||||||
| $ | 16,522,732 | $ | 13,490,125 | $ | 31,457,772 | $ | 646,238,537 | $ | 703,526,687 | $ | 610,559,053 | |||||||||||||||
| See accompanying Notes to Financial Statements | | September 30, 2020 | | Annual Report | 149 |
Table of Contents
For a Share Outstanding for the Period ended:^
Net Asset | Net | Net Realized | Total from Investment Operations | Dividends from Net Investment Income | Distributions from Net Realized Capital Gains | |||||||||||||||||||||||
| AllianzGI Best Styles Global Equity: | ||||||||||||||||||||||||||||
| Class A | ||||||||||||||||||||||||||||
9/30/2020 | $ | 14.44 | $ | 0.20 | $ | 0.92 | $ | 1.12 | $ | (0.73 | ) | $ | (1.69 | ) | ||||||||||||||
9/30/2019 | 17.30 | 0.29 | (1.02 | ) | (0.73 | ) | (0.38 | ) | (1.75 | ) | ||||||||||||||||||
9/30/2018 | 18.83 | 0.30 | 0.68 | 0.98 | (0.62 | ) | (1.89 | ) | ||||||||||||||||||||
9/30/2017 | 15.62 | 0.19 | 3.12 | 3.31 | — | (0.10 | ) | |||||||||||||||||||||
9/30/2016 | 14.60 | 0.28 | 0.89 | 1.17 | (0.15 | ) | — | |||||||||||||||||||||
| Class C | ||||||||||||||||||||||||||||
9/30/2020 | $ | 14.39 | $ | 0.12 | $ | 0.89 | $ | 1.01 | $ | (0.64 | ) | $ | (1.69 | ) | ||||||||||||||
9/30/2019 | 16.90 | 0.18 | (0.94 | ) | (0.76 | ) | — | (1.75 | ) | |||||||||||||||||||
9/30/2018 | 18.51 | 0.16 | 0.68 | 0.84 | (0.56 | ) | (1.89 | ) | ||||||||||||||||||||
9/30/2017 | 15.61 | 0.27 | 2.91 | 3.18 | (0.18 | ) | (0.10 | ) | ||||||||||||||||||||
4/26/2016* - 9/30/2016 | 15.29 | 0.11 | 0.21 | 0.32 | — | — | ||||||||||||||||||||||
| Class P | ||||||||||||||||||||||||||||
9/30/2020 | $ | 14.47 | $ | 0.23 | $ | 0.92 | $ | 1.15 | $ | (0.77 | ) | $ | (1.69 | ) | ||||||||||||||
9/30/2019 | 17.31 | 0.31 | (1.00 | ) | (0.69 | ) | (0.40 | ) | (1.75 | ) | ||||||||||||||||||
9/30/2018 | 18.82 | 0.32 | 0.69 | 1.01 | (0.63 | ) | (1.89 | ) | ||||||||||||||||||||
9/30/2017 | 15.79 | 0.36 | 3.01 | 3.37 | (0.24 | ) | (0.10 | ) | ||||||||||||||||||||
9/30/2016 | 14.68 | 0.32 | 0.89 | 1.21 | (0.10 | ) | — | |||||||||||||||||||||
| Institutional Class | ||||||||||||||||||||||||||||
9/30/2020 | $ | 14.26 | $ | 0.24 | $ | 0.91 | $ | 1.15 | $ | (0.78 | ) | $ | (1.69 | ) | ||||||||||||||
9/30/2019 | 17.15 | 0.30 | (0.98 | ) | (0.68 | ) | (0.46 | ) | (1.75 | ) | ||||||||||||||||||
9/30/2018 | 18.68 | 0.35 | 0.67 | 1.02 | (0.66 | ) | (1.89 | ) | ||||||||||||||||||||
9/30/2017 | 15.68 | 0.36 | 3.01 | 3.37 | (0.27 | ) | (0.10 | ) | ||||||||||||||||||||
9/30/2016 | 14.63 | 0.37 | 0.84 | 1.21 | (0.16 | ) | — | |||||||||||||||||||||
| Class R6 | ||||||||||||||||||||||||||||
9/30/2020 | $ | 14.39 | $ | 0.23 | $ | 0.93 | $ | 1.16 | $ | (0.72 | ) | $ | (1.69 | ) | ||||||||||||||
9/30/2019 | 17.28 | 0.33 | (1.01 | ) | (0.68 | ) | (0.46 | ) | (1.75 | ) | ||||||||||||||||||
9/30/2018 | 18.79 | 0.35 | 0.67 | 1.02 | (0.64 | ) | (1.89 | ) | ||||||||||||||||||||
9/30/2017 | 15.78 | 0.37 | 3.02 | 3.39 | (0.28 | ) | (0.10 | ) | ||||||||||||||||||||
9/30/2016 | 14.70 | 0.37 | 0.86 | 1.23 | (0.15 | ) | — | |||||||||||||||||||||
| ^ | A “—” may reflect actual amounts rounding to less than $0.01 or 0.01%. |
| * | Commencement of operations. |
| (a) | Calculated on average shares outstanding during the period. |
| (b) | Total return is calculated assuming a purchase of a share on the first day of the period and a sale of a share on the last day of each period reported. Dividends and distributions, if any, are assumed, for purposes of this calculation, to be reinvested. Total return does not reflect sales charges and includes the effect of fee waivers and reimbursements. Total return may reflect adjustments to conform to U.S. GAAP. Total return for a period of less than one year is not annualized. |
| (c) | Does not include expenses of the investment companies in which the Fund invests. |
| (d) | Portfolio turnover rate excludes securities received or delivered from in-kind fund share transactions. |
| (e) | Annualized, unless otherwise noted. |
| 150 | Annual Report | | September 30, 2020 | | See accompanying Notes to Financial Statements |
Table of Contents
| Total Dividends and Distributions | Net Asset Value, End of Period | Total Return (b) | Net Assets, End of Period (000s) | Ratio of Expenses to Average Net Assets with Fee Waiver/ Reimbursement | Ratio of Expenses to Average Net Assets without Fee Waiver/ Reimbursement | Ratio of Net Investment Income to Average Net Assets | Portfolio Turnover Rate | |||||||||||||||||||||||||||
| $ | (2.42 | ) | $ | 13.14 | 7.50 | % | $ | 865 | 0.70 | %(c) | 0.91 | %(c) | 1.57 | %(c) | 95 | % | ||||||||||||||||||
| (2.13 | ) | 14.44 | (2.23 | ) | 1,067 | 0.70 | (c) | 0.77 | (c) | 2.00 | (c) | 33 | ||||||||||||||||||||||
| (2.51 | ) | 17.30 | 5.33 | 1,255 | 0.70 | (c) | 0.75 | (c) | 1.71 | (c) | 87 | |||||||||||||||||||||||
| (0.10 | ) | 18.83 | 21.29 | 1,317 | 0.74 | (c) | 1.07 | (c) | 1.15 | (c) | 81 | (d) | ||||||||||||||||||||||
| (0.15 | ) | 15.62 | 8.09 | 36,257 | 0.75 | 0.79 | 1.88 | 70 | ||||||||||||||||||||||||||
| $ | (2.33 | ) | $ | 13.07 | 6.71 | % | $ | 13 | 1.40 | %(c) | 1.61 | %(c) | 0.91 | %(c) | 95 | % | ||||||||||||||||||
| (1.75 | ) | 14.39 | (2.87 | ) | 18 | 1.40 | (c) | 1.47 | (c) | 1.22 | (c) | 33 | ||||||||||||||||||||||
| (2.45 | ) | 16.90 | 4.57 | 41 | 1.40 | (c) | 1.49 | (c) | 0.89 | (c) | 87 | |||||||||||||||||||||||
| (0.28 | ) | 18.51 | 20.68 | 102 | 1.40 | (c) | 1.44 | (c) | 1.62 | (c) | 81 | (d) | ||||||||||||||||||||||
| — | 15.61 | 2.09 | 10 | 1.49 | (e) | 1.49 | (e) | 1.68 | (e) | 70 | ||||||||||||||||||||||||
| $ | (2.46 | ) | $ | 13.16 | 7.73 | % | $ | 394 | 0.50 | %(c) | 0.59 | %(c) | 1.75 | %(c) | 95 | % | ||||||||||||||||||
| (2.15 | ) | 14.47 | (2.00 | ) | 691 | 0.50 | (c) | 0.53 | (c) | 2.07 | (c) | 33 | ||||||||||||||||||||||
| (2.52 | ) | 17.31 | 5.52 | 1,868 | 0.50 | (c) | 0.52 | (c) | 1.83 | (c) | 87 | |||||||||||||||||||||||
| (0.34 | ) | 18.82 | 21.72 | 2,835 | 0.53 | (c) | 0.56 | (c) | 2.09 | (c) | 81 | (d) | ||||||||||||||||||||||
| (0.10 | ) | 15.79 | 8.28 | 2,851 | 0.60 | 0.62 | 2.13 | 70 | ||||||||||||||||||||||||||
| $ | (2.47 | ) | $ | 12.94 | 7.84 | % | $ | 472 | 0.40 | %(c) | 0.62 | %(c) | 1.89 | %(c) | 95 | % | ||||||||||||||||||
| (2.21 | ) | 14.26 | (1.88 | ) | 575 | 0.40 | (c) | 0.52 | (c) | 2.01 | (c) | 33 | ||||||||||||||||||||||
| (2.55 | ) | 17.15 | 5.63 | 2,386 | 0.40 | (c) | 0.49 | (c) | 2.01 | (c) | 87 | |||||||||||||||||||||||
| (0.37 | ) | 18.68 | 21.88 | 2,323 | 0.42 | (c) | 0.54 | (c) | 2.15 | (c) | 81 | (d) | ||||||||||||||||||||||
| (0.16 | ) | 15.68 | 8.31 | 2,390 | 0.50 | 0.51 | 2.44 | 70 | ||||||||||||||||||||||||||
| $ | (2.41 | ) | $ | 13.14 | 7.85 | % | $ | 70,523 | 0.40 | %(c) | 0.58 | %(c) | 1.77 | %(c) | 95 | % | ||||||||||||||||||
| (2.21 | ) | 14.39 | (1.88 | ) | 359,256 | 0.40 | (c) | 0.40 | (c) | 2.30 | (c) | 33 | ||||||||||||||||||||||
| (2.53 | ) | 17.28 | 5.61 | 519,259 | 0.40 | (c) | 0.42 | (c) | 2.02 | (c) | 87 | |||||||||||||||||||||||
| (0.38 | ) | 18.79 | 21.92 | 594,634 | 0.40 | (c) | 0.43 | (c) | 2.20 | (c) | 81 | (d) | ||||||||||||||||||||||
| (0.15 | ) | 15.78 | 8.41 | 560,066 | 0.40 | 0.49 | 2.42 | 70 | ||||||||||||||||||||||||||
| See accompanying Notes to Financial Statements | | September 30, 2020 | | Annual Report | 151 |
Table of Contents
Financial Highlights (cont’d)
For a Share Outstanding for the Year ended:^
Net Asset | Net Investment Income (a) | Net Realized | Total from Investment Operations | Dividends from Net Investment Income | Distributions from Net Realized Capital Gains | |||||||||||||||||||||||
| AllianzGI Convertible: | ||||||||||||||||||||||||||||
| Class A | ||||||||||||||||||||||||||||
9/30/2020 | $ | 29.25 | $ | 0.27 | $ | 10.59 | $ | 10.86 | $ | (0.43 | ) | $ | (0.91 | ) | ||||||||||||||
9/30/2019 | 32.78 | 0.29 | 0.63 | 0.92 | (0.90 | ) | (3.55 | ) | ||||||||||||||||||||
9/30/2018 | 34.27 | 0.32 | 4.58 | 4.90 | (1.30 | ) | (5.09 | ) | ||||||||||||||||||||
9/30/2017 | 31.02 | 0.38 | 3.64 | 4.02 | (0.77 | ) | — | |||||||||||||||||||||
9/30/2016 | 32.13 | 0.64 | 1.29 | 1.93 | (0.53 | ) | (2.51 | ) | ||||||||||||||||||||
| Class C | ||||||||||||||||||||||||||||
9/30/2020 | $ | 29.61 | $ | 0.02 | $ | 10.77 | $ | 10.79 | $ | (0.10 | ) | $ | (0.91 | ) | ||||||||||||||
9/30/2019 | 32.95 | 0.08 | 0.67 | 0.75 | (0.54 | ) | (3.55 | ) | ||||||||||||||||||||
9/30/2018 | 34.36 | 0.08 | 4.59 | 4.67 | (0.99 | ) | (5.09 | ) | ||||||||||||||||||||
9/30/2017 | 31.19 | 0.17 | 3.65 | 3.82 | (0.65 | ) | — | |||||||||||||||||||||
9/30/2016 | 32.20 | 0.42 | 1.30 | 1.72 | (0.22 | ) | (2.51 | ) | ||||||||||||||||||||
| Class R | ||||||||||||||||||||||||||||
9/30/2020 | $ | 30.43 | $ | 0.21 | $ | 11.04 | $ | 11.25 | $ | (0.32 | ) | $ | (0.91 | ) | ||||||||||||||
9/30/2019 | 33.92 | 0.26 | 0.66 | 0.92 | (0.86 | ) | (3.55 | ) | ||||||||||||||||||||
9/30/2018 | 34.19 | 0.27 | 4.70 | 4.97 | (0.15 | ) | (5.09 | ) | ||||||||||||||||||||
9/30/2017 | 30.97 | 0.26 | 3.64 | 3.90 | (0.68 | ) | — | |||||||||||||||||||||
9/30/2016 | 32.08 | 0.52 | 1.27 | 1.79 | (0.39 | ) | (2.51 | ) | ||||||||||||||||||||
| Class P | ||||||||||||||||||||||||||||
9/30/2020 | $ | 28.45 | $ | 0.34 | $ | 10.27 | $ | 10.61 | $ | (0.58 | ) | $ | (0.91 | ) | ||||||||||||||
9/30/2019 | 32.12 | 0.35 | 0.60 | 0.95 | (1.07 | ) | (3.55 | ) | ||||||||||||||||||||
9/30/2018 | 33.95 | 0.38 | 4.50 | 4.88 | (1.62 | ) | (5.09 | ) | ||||||||||||||||||||
9/30/2017 | 30.84 | 0.48 | 3.61 | 4.09 | (0.98 | ) | — | |||||||||||||||||||||
9/30/2016 | 32.07 | 0.72 | 1.27 | 1.99 | (0.71 | ) | (2.51 | ) | ||||||||||||||||||||
| Institutional Class | ||||||||||||||||||||||||||||
9/30/2020 | $ | 28.76 | $ | 0.34 | $ | 10.40 | $ | 10.74 | $ | (0.55 | ) | $ | (0.91 | ) | ||||||||||||||
9/30/2019 | 32.41 | 0.37 | 0.61 | 0.98 | (1.08 | ) | (3.55 | ) | ||||||||||||||||||||
9/30/2018 | 33.89 | 0.40 | 4.52 | 4.92 | (1.31 | ) | (5.09 | ) | ||||||||||||||||||||
9/30/2017 | 30.76 | 0.49 | 3.61 | 4.10 | (0.97 | ) | — | |||||||||||||||||||||
9/30/2016 | 32.02 | 0.74 | 1.26 | 2.00 | (0.75 | ) | (2.51 | ) | ||||||||||||||||||||
| Administrative Class | ||||||||||||||||||||||||||||
9/30/2020 | $ | 28.95 | $ | 0.35 | $ | 10.42 | $ | 10.77 | $ | (0.45 | ) | $ | (0.91 | ) | ||||||||||||||
9/30/2019 | 32.46 | 0.30 | 0.61 | 0.91 | (0.87 | ) | (3.55 | ) | ||||||||||||||||||||
9/30/2018 | 34.08 | 0.33 | 4.54 | 4.87 | (1.40 | ) | (5.09 | ) | ||||||||||||||||||||
9/30/2017 | 30.96 | 0.42 | 3.62 | 4.04 | (0.92 | ) | — | |||||||||||||||||||||
9/30/2016 | 32.14 | 0.66 | 1.29 | 1.95 | (0.62 | ) | (2.51 | ) | ||||||||||||||||||||
| ^ | A “—” may reflect actual amounts rounding to less than $0.01 or 0.01%. |
| (a) | Calculated on average shares outstanding during the year. |
| (b) | Total return is calculated assuming a purchase of a share on the first day of the year and a sale of a share on the last day of each year reported. Dividends and distributions, if any, are assumed, for purposes of this calculation, to be reinvested. Total return does not reflect sales charges and includes the effect of fee waivers and reimbursements. Total return may reflect adjustments to conform to U.S. GAAP. |
| (c) | Portfolio turnover rate excludes securities received or delivered from in-kind fund share transactions. |
| 152 | Annual Report | | September 30, 2020 | | See accompanying Notes to Financial Statements |
Table of Contents
| Total Dividends and Distributions | Net Asset Value, End of Year | Total Return (b) | Net Assets, End of Year (000s) | Ratio of Expenses to Average Net Assets with Fee Waiver/ Reimbursement | Ratio of Expenses to Average Net Assets without Fee Waiver/ Reimbursement | Ratio of Net Net Assets | Portfolio Turnover Rate | |||||||||||||||||||||||||||
| $ | (1.34 | ) | $ | 38.77 | 38.44 | % | $ | 254,762 | 0.96 | % | 0.98 | % | 0.83 | % | 145 | % | ||||||||||||||||||
| (4.45 | ) | 29.25 | 5.29 | 69,611 | 1.02 | 1.02 | 0.99 | 143 | ||||||||||||||||||||||||||
| (6.39 | ) | 32.78 | 16.83 | 61,385 | 0.96 | 0.96 | 1.02 | 133 | ||||||||||||||||||||||||||
| (0.77 | ) | 34.27 | 13.14 | 76,586 | 1.02 | 1.02 | 1.19 | 124 | (c) | |||||||||||||||||||||||||
| (3.04 | ) | 31.02 | 6.42 | 259,711 | 0.99 | 0.99 | 2.12 | 101 | ||||||||||||||||||||||||||
| $ | (1.01 | ) | $ | 39.39 | 37.40 | % | $ | 112,523 | 1.73 | % | 1.74 | % | 0.06 | % | 145 | % | ||||||||||||||||||
| (4.09 | ) | 29.61 | 4.53 | 60,434 | 1.75 | 1.75 | 0.26 | 143 | ||||||||||||||||||||||||||
| (6.08 | ) | 32.95 | 15.90 | 53,461 | 1.73 | 1.73 | 0.24 | 133 | ||||||||||||||||||||||||||
| (0.65 | ) | 34.36 | 12.41 | 48,905 | 1.69 | 1.69 | 0.51 | 124 | (c) | |||||||||||||||||||||||||
| (2.73 | ) | 31.19 | 5.65 | 67,423 | 1.71 | 1.71 | 1.40 | 101 | ||||||||||||||||||||||||||
| $ | (1.23 | ) | $ | 40.45 | 38.14 | % | $ | 298 | 1.15 | % | 1.15 | % | 0.63 | % | 145 | % | ||||||||||||||||||
| (4.41 | ) | 30.43 | 5.12 | 166 | 1.17 | 1.17 | 0.87 | 143 | ||||||||||||||||||||||||||
| (5.24 | ) | 33.92 | 16.59 | 98 | 1.17 | 1.17 | 0.81 | 133 | ||||||||||||||||||||||||||
| (0.68 | ) | 34.19 | 12.79 | 114 | 1.42 | 1.42 | 0.82 | 124 | (c) | |||||||||||||||||||||||||
| (2.90 | ) | 30.97 | 5.95 | 1,145 | 1.43 | 1.43 | 1.73 | 101 | ||||||||||||||||||||||||||
| $ | (1.49 | ) | $ | 37.57 | 38.78 | % | $ | 547,783 | 0.71 | % | 0.71 | % | 1.08 | % | 145 | % | ||||||||||||||||||
| (4.62 | ) | 28.45 | 5.59 | 155,601 | 0.75 | 0.75 | 1.26 | 143 | ||||||||||||||||||||||||||
| (6.71 | ) | 32.12 | 17.08 | 102,412 | 0.74 | 0.74 | 1.24 | 133 | ||||||||||||||||||||||||||
| (0.98 | ) | 33.95 | 13.52 | 80,392 | 0.72 | 0.72 | 1.49 | 124 | (c) | |||||||||||||||||||||||||
| (3.22 | ) | 30.84 | 6.67 | 88,900 | 0.73 | 0.73 | 2.38 | 101 | ||||||||||||||||||||||||||
| $ | (1.46 | ) | $ | 38.04 | 38.80 | % | $ | 1,045,769 | 0.71 | % | 0.71 | % | 1.07 | % | 145 | % | ||||||||||||||||||
| (4.63 | ) | 28.76 | 5.62 | 370,111 | 0.72 | 0.72 | 1.29 | 143 | ||||||||||||||||||||||||||
| (6.40 | ) | 32.41 | 17.10 | 332,874 | 0.71 | 0.71 | 1.27 | 133 | ||||||||||||||||||||||||||
| (0.97 | ) | 33.89 | 13.58 | 322,732 | 0.68 | 0.68 | 1.54 | 124 | (c) | |||||||||||||||||||||||||
| (3.26 | ) | 30.76 | 6.73 | 1,089,974 | 0.67 | 0.67 | 2.47 | 101 | ||||||||||||||||||||||||||
| $ | (1.36 | ) | $ | 38.36 | 38.50 | % | $ | 13,386 | 0.93 | % | 0.93 | % | 0.99 | % | 145 | % | ||||||||||||||||||
| (4.42 | ) | 28.95 | 5.29 | 550 | 0.97 | 0.97 | 1.03 | 143 | ||||||||||||||||||||||||||
| (6.49 | ) | 32.46 | 16.88 | 997 | 0.93 | 0.93 | 1.05 | 133 | ||||||||||||||||||||||||||
| (0.92 | ) | 34.08 | 13.30 | 1,240 | 0.89 | 0.89 | 1.32 | 124 | (c) | |||||||||||||||||||||||||
| (3.13 | ) | 30.96 | 6.52 | 1,428 | 0.90 | 0.90 | 2.20 | 101 | ||||||||||||||||||||||||||
| See accompanying Notes to Financial Statements | | September 30, 2020 | | Annual Report | 153 |
Table of Contents
Financial Highlights (cont’d)
For a Share Outstanding for the Period ended:^
| Net Asset Value, Beginning of Period | Net Investment Income (a) | Net Realized | Total from Investment Operations | Dividends from Net Investment Income | Distributions from Net Realized Capital Gains | |||||||||||||||||||||||
| AllianzGI Core Plus Bond: | ||||||||||||||||||||||||||||
| Class P | ||||||||||||||||||||||||||||
9/30/2020 | $ | 16.00 | $ | 0.39 | $ | 1.00 | $ | 1.39 | $ | (0.41 | ) | $ | (0.57 | ) | ||||||||||||||
9/30/2019 | 14.92 | 0.46 | 1.06 | 1.52 | (0.44 | ) | — | |||||||||||||||||||||
5/30/2018* - 9/30/2018 | 15.00 | 0.14 | (0.11 | ) | 0.03 | (0.11 | ) | — | ||||||||||||||||||||
| Institutional Class | ||||||||||||||||||||||||||||
9/30/2020 | $ | 16.00 | $ | 0.40 | $ | 1.00 | $ | 1.40 | $ | (0.42 | ) | $ | (0.57 | ) | ||||||||||||||
9/30/2019 | 14.92 | 0.47 | 1.06 | 1.53 | (0.45 | ) | — | |||||||||||||||||||||
5/30/2018* - 9/30/2018 | 15.00 | 0.14 | (0.11 | ) | 0.03 | (0.11 | ) | — | ||||||||||||||||||||
| Class R6 | ||||||||||||||||||||||||||||
9/30/2020 | $ | 16.00 | $ | 0.41 | $ | 1.00 | $ | 1.41 | $ | (0.43 | ) | $ | (0.57 | ) | ||||||||||||||
9/30/2019 | 14.92 | 0.48 | 1.07 | 1.55 | (0.47 | ) | — | |||||||||||||||||||||
5/30/2018* - 9/30/2018 | 15.00 | 0.15 | (0.12 | ) | 0.03 | (0.11 | ) | — | ||||||||||||||||||||
| AllianzGI Emerging Markets Consumer: | ||||||||||||||||||||||||||||
| Class A | ||||||||||||||||||||||||||||
9/30/2020 | $ | 13.51 | $ | 0.12 | $ | 2.35 | $ | 2.47 | $ | (0.10 | ) | $ | — | |||||||||||||||
9/30/2019 | 13.88 | 0.12 | (0.45 | ) | (0.33 | ) | (0.04 | ) | — | |||||||||||||||||||
9/30/2018 | 15.76 | 0.11 | (1.11 | ) | (1.00 | ) | (0.26 | ) | (0.62 | ) | ||||||||||||||||||
9/30/2017 | 13.60 | 0.21 | 2.07 | 2.28 | (0.12 | ) | — | |||||||||||||||||||||
9/30/2016 | 12.24 | 0.11 | 1.31 | 1.42 | (0.06 | ) | — | |||||||||||||||||||||
| Institutional Class | ||||||||||||||||||||||||||||
9/30/2020 | $ | 13.51 | $ | 0.16 | $ | 2.37 | $ | 2.53 | $ | (0.15 | ) | $ | — | |||||||||||||||
9/30/2019 | 14.05 | 0.17 | (0.48 | ) | (0.31 | ) | (0.23 | ) | — | |||||||||||||||||||
9/30/2018 | 15.86 | 0.21 | (1.17 | ) | (0.96 | ) | (0.23 | ) | (0.62 | ) | ||||||||||||||||||
9/30/2017 | 13.68 | 0.22 | 2.11 | 2.33 | (0.15 | ) | — | |||||||||||||||||||||
9/30/2016 | 12.28 | 0.19 | 1.28 | 1.47 | (0.07 | ) | — | |||||||||||||||||||||
| ^ | A “—” may reflect actual amounts rounding to less than $0.01 or 0.01%. |
| * | Commencement of operations. |
| (a) | Calculated on average shares outstanding during the period. |
| (b) | Total return is calculated assuming a purchase of a share on the first day of the period and a sale of a share on the last day of each period reported. Dividends and distributions, if any, are assumed, for purposes of this calculation, to be reinvested. Total return does not reflect sales charges and includes the effect of fee waivers and reimbursements. Total return may reflect adjustments to conform to U.S. GAAP. Total return for a period of less than one year is not annualized. |
| (c) | Annualized, unless otherwise noted. |
| (d) | Certain expenses incurred by the Fund were not annualized. |
| (e) | Payments from Affiliates increased the end of period net asset value and total return by less than $0.01 and 0.01%, respectively. |
| 154 | Annual Report | | September 30, 2020 | | See accompanying Notes to Financial Statements |
Table of Contents
| Total Dividends and Distributions | Net Asset Value, End of Period | Total Return (b) | Net Assets, End of Period (000s) | Ratio of Expenses to Average Net Assets with Fee Waiver/ Reimbursement | Ratio of Expenses to Average Net Assets without Fee Waiver/ Reimbursement | Ratio of Net Investment | Portfolio Turnover Rate | |||||||||||||||||||||||||||
| $ | (0.98 | ) | $ | 16.41 | 9.18 | % | $ | 12 | 0.35 | % | 0.73 | % | 2.46 | % | 552 | % | ||||||||||||||||||
| (0.44 | ) | 16.00 | 10.39 | 11 | 0.35 | 0.93 | 3.01 | 864 | ||||||||||||||||||||||||||
| (0.11 | ) | 14.92 | 0.18 | 10 | 0.35 | (c)(d) | 1.19 | (c)(d) | 2.81 | (c)(d) | 302 | |||||||||||||||||||||||
| $ | (0.99 | ) | $ | 16.41 | 9.25 | % | $ | 39 | 0.30 | % | 0.74 | % | 2.49 | % | 552 | % | ||||||||||||||||||
| (0.45 | ) | 16.00 | 10.47 | 11 | 0.30 | 21.03 | 3.06 | 864 | ||||||||||||||||||||||||||
| (0.11 | ) | 14.92 | 0.20 | 10 | 0.30 | (c)(d) | 1.19 | (c)(d) | 2.86 | (c)(d) | 302 | |||||||||||||||||||||||
| $ | (1.00 | ) | $ | 16.41 | 9.28 | % | $ | 50,383 | 0.25 | % | 0.76 | % | 2.56 | % | 552 | % | ||||||||||||||||||
| (0.47 | ) | 16.00 | 10.56 | 59,419 | 0.25 | 0.94 | 3.11 | 864 | ||||||||||||||||||||||||||
| (0.11 | ) | 14.92 | 0.22 | 40,075 | 0.25 | (c)(d) | 1.19 | (c)(d) | 2.91 | (c)(d) | 302 | |||||||||||||||||||||||
| $ | (0.10 | ) | $ | 15.88 | (e) | 18.34 | %(e) | $ | 63 | 1.40 | % | 1.81 | % | 0.86 | % | 57 | % | |||||||||||||||||
| (0.04 | ) | 13.51 | (2.34 | ) | 62 | 1.52 | 1.75 | 0.90 | 82 | |||||||||||||||||||||||||
| (0.88 | ) | 13.88 | (7.04 | ) | 69 | 1.55 | 1.78 | 0.68 | 115 | |||||||||||||||||||||||||
| (0.12 | ) | 15.76 | 16.97 | 155 | 1.55 | 16.84 | 1.47 | 122 | ||||||||||||||||||||||||||
| (0.06 | ) | 13.60 | 11.67 | 48 | 1.58 | 38.88 | 0.90 | 91 | ||||||||||||||||||||||||||
| $ | (0.15 | ) | $ | 15.89 | (e) | 18.84 | %(e) | $ | 35,448 | 1.05 | % | 1.51 | % | 1.12 | % | 57 | % | |||||||||||||||||
| (0.23 | ) | 13.51 | (2.05 | ) | 39,186 | 1.16 | 1.43 | 1.30 | 82 | |||||||||||||||||||||||||
| (0.85 | ) | 14.05 | (6.69 | ) | 43,333 | 1.20 | 1.37 | 1.36 | 115 | |||||||||||||||||||||||||
| (0.15 | ) | 15.86 | 17.37 | 43,487 | 1.20 | 1.64 | 1.55 | 122 | ||||||||||||||||||||||||||
| (0.07 | ) | 13.68 | 12.06 | 44,630 | 1.22 | 2.04 | 1.49 | 91 | ||||||||||||||||||||||||||
| See accompanying Notes to Financial Statements | | September 30, 2020 | | Annual Report | 155 |
Table of Contents
Financial Highlights (cont’d)
For a Share Outstanding for the Year ended:^
| Net Asset Value, Beginning of Year | Net Investment Income (a) | Net Realized | Total from Investment Operations | Dividends from Net Investment Income | Distributions from Net Realized Capital Gains | |||||||||||||||||||||||
| AllianzGI Emerging Markets Small-Cap: | ||||||||||||||||||||||||||||
| Class A | ||||||||||||||||||||||||||||
9/30/2020 | $ | 16.15 | $ | 0.28 | $ | 0.96 | $ | 1.24 | $ | (0.72 | ) | $ | — | |||||||||||||||
9/30/2019 | 16.61 | 0.24 | 0.03 | 0.27 | (0.10 | ) | (0.63 | ) | ||||||||||||||||||||
9/30/2018 | 18.36 | 0.16 | (0.59 | ) | (0.43 | ) | (0.85 | ) | (0.47 | ) | ||||||||||||||||||
9/30/2017 | 15.15 | 0.23 | 2.98 | 3.21 | — | — | ||||||||||||||||||||||
9/30/2016 | 14.04 | 0.16 | 1.16 | 1.32 | (0.21 | ) | — | |||||||||||||||||||||
| Institutional Class | ||||||||||||||||||||||||||||
9/30/2020 | $ | 15.87 | $ | 0.29 | $ | 0.98 | $ | 1.27 | $ | (0.61 | ) | $ | — | |||||||||||||||
9/30/2019 | 16.45 | 0.34 | (0.03 | ) | 0.31 | (0.26 | ) | (0.63 | ) | |||||||||||||||||||
9/30/2018 | 18.04 | 0.26 | (0.62 | ) | (0.36 | ) | (0.76 | ) | (0.47 | ) | ||||||||||||||||||
9/30/2017 | 15.30 | 0.24 | 2.95 | 3.19 | (0.45 | ) | — | |||||||||||||||||||||
9/30/2016 | 14.08 | 0.30 | 1.06 | 1.36 | (0.14 | ) | — | |||||||||||||||||||||
| ^ | A “—” may reflect actual amounts rounding to less than $0.01 or 0.01%. |
| (a) | Calculated on average shares outstanding during the year. |
| (b) | Total return is calculated assuming a purchase of a share on the first day of the year and a sale of a share on the last day of each year reported. Dividends and distributions, if any, are assumed, for purposes of this calculation, to be reinvested. Total return does not reflect sales charges and includes the effect of fee waivers and reimbursements. Total return may reflect adjustments to conform to U.S. GAAP. |
| (c) | Payments from Affiliates increased the end of year net asset value (“NAV”) and total return by $0.01 and 0.06%, respectively, for Class A and $0.01 and 0.05%, respectively, for Institutional Class. If the Affiliates had not made these payments, the end of year NAV and total return would have been $16.60 and (2.78)%, respectively, for Class A and $16.44 and (2.43)%, respectively, for Institutional Class. |
| (d) | Due to a change in accounting estimate resulting from a revised agreement with the Fund’s custodian and accounting agent, in order to lower costs and seek economies of scale for all Funds in the Trust, the custodian and accounting agent expense was reduced for the period. The effect on the Ratio of Expenses to Average Net Assets without Fee Waiver/Reimbursement was a decrease in the ratio of 0.90%. |
| 156 | Annual Report | | September 30, 2020 | | See accompanying Notes to Financial Statements |
Table of Contents
| Total Dividends and Distributions | Net Asset Value, End of Year | Total Return (b) | Net Assets, End of Year (000s) | Ratio of Expenses to Average Net Assets with Fee Waiver/ Reimbursement | Ratio of Expenses to Average Net Assets without Fee Waiver/ Reimbursement | Ratio of Net Investment Income to Average Net Assets | Portfolio Turnover Rate | |||||||||||||||||||||||||||
| $ | (0.72 | ) | $ | 16.67 | 7.64 | % | $ | 217 | 1.82 | % | 4.38 | % | 1.80 | % | 59 | % | ||||||||||||||||||
| (0.73 | ) | 16.15 | 2.14 | 116 | 1.85 | 3.00 | (d) | 1.55 | 73 | |||||||||||||||||||||||||
| (1.32 | ) | 16.61 | (c) | (2.72 | )(c) | 135 | 1.85 | 3.71 | 0.90 | 119 | ||||||||||||||||||||||||
| — | 18.36 | 21.19 | 204 | 1.85 | 15.72 | 1.39 | 121 | |||||||||||||||||||||||||||
| (0.21 | ) | 15.15 | 9.54 | 67 | 1.85 | 6.84 | 1.14 | 147 | ||||||||||||||||||||||||||
| $ | (0.61 | ) | $ | 16.53 | 7.97 | % | $ | 5,035 | 1.50 | % | 4.04 | % | 1.89 | % | 59 | % | ||||||||||||||||||
| (0.89 | ) | 15.87 | 2.52 | 7,814 | 1.50 | 2.84 | (d) | 2.19 | 73 | |||||||||||||||||||||||||
| (1.23 | ) | 16.45 | (c) | (2.38 | )(c) | 10,030 | 1.50 | 3.05 | 1.46 | 119 | ||||||||||||||||||||||||
| (0.45 | ) | 18.04 | 21.69 | 11,251 | 1.50 | 3.38 | 1.47 | 121 | ||||||||||||||||||||||||||
| (0.14 | ) | 15.30 | 9.80 | 13,367 | 1.50 | 4.72 | 2.08 | 147 | ||||||||||||||||||||||||||
| See accompanying Notes to Financial Statements | | September 30, 2020 | | Annual Report | 157 |
Table of Contents
Financial Highlights (cont’d)
For a Share Outstanding for the Year ended:^
| Net Asset Value, Beginning of Year | Net Investment Income (a) | Net Realized | Total from Investment Operations | Dividends from Net Investment Income | Distributions from Net Realized Capital Gains | |||||||||||||||||||||||
| AllianzGI Emerging Markets Value: | ||||||||||||||||||||||||||||
| Class A | ||||||||||||||||||||||||||||
9/30/2020 | $ | 15.55 | $ | �� 0.15 | $ | 2.58 | $ | 2.73 | $ | (0.19 | ) | $ | — | |||||||||||||||
9/30/2019 | 16.18 | 0.42 | (0.68 | ) | (0.26 | ) | (0.37 | ) | — | |||||||||||||||||||
9/30/2018 | 17.24 | 0.41 | (1.14 | ) | (0.73 | ) | (0.26 | ) | (0.07 | ) | ||||||||||||||||||
9/30/2017 | 14.31 | 0.40 | 2.85 | 3.25 | (0.32 | ) | — | |||||||||||||||||||||
9/30/2016 | 12.34 | 0.47 | 1.90 | 2.37 | (0.40 | ) | — | |||||||||||||||||||||
| Class C | ||||||||||||||||||||||||||||
9/30/2020 | $ | 15.56 | $ | 0.03 | $ | 2.57 | $ | 2.60 | $ | (0.09 | ) | $ | — | |||||||||||||||
9/30/2019 | 16.23 | 0.35 | (0.73 | ) | (0.38 | ) | (0.29 | ) | — | |||||||||||||||||||
9/30/2018 | 17.33 | 0.24 | (1.11 | ) | (0.87 | ) | (0.16 | ) | (0.07 | ) | ||||||||||||||||||
9/30/2017 | 14.29 | 0.34 | 2.81 | 3.15 | (0.11 | ) | — | |||||||||||||||||||||
9/30/2016 | 12.31 | 0.32 | 1.96 | 2.28 | (0.30 | ) | — | |||||||||||||||||||||
| Class P | ||||||||||||||||||||||||||||
9/30/2020 | $ | 15.53 | $ | 0.22 | $ | 2.53 | $ | 2.75 | $ | (0.23 | ) | $ | — | |||||||||||||||
9/30/2019 | 16.16 | 0.45 | (0.69 | ) | (0.24 | ) | (0.39 | ) | — | |||||||||||||||||||
9/30/2018 | 17.13 | 0.36 | (1.08 | ) | (0.72 | ) | (0.18 | ) | (0.07 | ) | ||||||||||||||||||
9/30/2017 | 14.31 | 0.46 | 2.78 | 3.24 | (0.42 | ) | — | |||||||||||||||||||||
9/30/2016 | 12.46 | 0.62 | 1.80 | 2.42 | (0.57 | ) | — | |||||||||||||||||||||
| Institutional Class | ||||||||||||||||||||||||||||
9/30/2020 | $ | 15.48 | $ | 0.19 | $ | 2.57 | $ | 2.76 | $ | (0.23 | ) | $ | — | |||||||||||||||
9/30/2019 | 16.29 | 0.49 | (0.73 | ) | (0.24 | ) | (0.57 | ) | — | |||||||||||||||||||
9/30/2018 | 17.49 | 0.42 | (1.11 | ) | (0.69 | ) | (0.44 | ) | (0.07 | ) | ||||||||||||||||||
9/30/2017 | 14.46 | 0.44 | 2.91 | 3.35 | (0.32 | ) | — | |||||||||||||||||||||
9/30/2016 | 12.47 | 0.43 | 2.01 | 2.44 | (0.45 | ) | — | |||||||||||||||||||||
| ^ | A “—” may reflect actual amounts rounding to less than $0.01 or 0.01%. |
| (a) | Calculated on average shares outstanding during the year. |
| (b) | Total return is calculated assuming a purchase of a share on the first day of the year and a sale of a share on the last day of each year reported. Dividends and distributions, if any, are assumed, for purposes of this calculation, to be reinvested. Total return does not reflect sales charges and includes the effect of fee waivers and reimbursements. Total return may reflect adjustments to conform to U.S. GAAP. |
| (c) | Payments from Affiliates increased the end of year net asset value (“NAV”) and total return by $0.02 and 0.15%, respectively, for Class A, $0.02 and 0.14%, respectively, for Class C, $0.02 and 0.14%, respectively, for Class P and $0.01 and 0.07%, respectively for Institutional Class. If the Affiliates had not made these payments, the end of year NAV and total return would have been $17.22 and 22.92%, respectively, for Class A, $17.31 and 21.92%, respectively, for Class C, $17.11 and 23.08%, respectively, for Class P and $17.48 and 23.26%, respectively for Institutional Class. |
| (d) | Does not include expenses of the investment companies in which the Fund invests. |
| (e) | Payments from Affiliates increased the end of year net asset value and total return by less than $0.01 and 0.01%, respectively. |
| 158 | Annual Report | | September 30, 2020 | | See accompanying Notes to Financial Statements |
Table of Contents
| Total Dividends and Distributions | Net Asset Value, End of Year | Total Return (b) | Net Assets, End of Year (000s) | Ratio of Expenses to Average Net Assets with Fee Waiver/ Reimbursement | Ratio of Expenses to Average Net Assets without Fee Waiver/ Reimbursement | Ratio of Net Investment Income to Average Net Assets | Portfolio Turnover Rate | |||||||||||||||||||||||||||
| $ | (0.19 | ) | $ | 18.09 | 17.63 | % | $ | 14,907 | 1.14 | % | 1.64 | % | 0.89 | % | 105 | % | ||||||||||||||||||
| (0.37 | ) | 15.55 | (1.68 | ) | 14,395 | 1.15 | 1.65 | 2.69 | 101 | |||||||||||||||||||||||||
| (0.33 | ) | 16.18 | (4.36 | ) | 22,590 | 1.14 | 1.65 | 2.31 | 116 | |||||||||||||||||||||||||
| (0.32 | ) | 17.24 | (c) | 23.07 | (c) | 11,026 | 1.22 | (d) | 3.32 | (d) | 2.58 | (d) | 120 | |||||||||||||||||||||
| (0.40 | ) | 14.31 | (e) | 19.57 | (e) | 2,141 | 1.39 | 7.84 | 3.62 | 104 | ||||||||||||||||||||||||
| $ | (0.09 | ) | $ | 18.07 | 16.75 | % | $ | 1,016 | 1.89 | % | 2.37 | % | 0.16 | % | 105 | % | ||||||||||||||||||
| (0.29 | ) | 15.56 | (2.38 | ) | 1,006 | 1.90 | 2.40 | 2.24 | 101 | |||||||||||||||||||||||||
| (0.23 | ) | 16.23 | (5.08 | ) | 1,196 | 1.90 | 2.38 | 1.35 | 116 | |||||||||||||||||||||||||
| (0.11 | ) | 17.33 | (c) | 22.06 | (c) | 527 | 1.95 | (d) | 4.00 | (d) | 2.16 | (d) | 120 | |||||||||||||||||||||
| (0.30 | ) | 14.29 | (e) | 18.80 | (e) | 113 | 2.16 | 8.01 | 2.49 | 104 | ||||||||||||||||||||||||
| $ | (0.23 | ) | $ | 18.05 | 17.85 | % | $ | 7,192 | 0.99 | % | 1.27 | % | 1.33 | % | 105 | % | ||||||||||||||||||
| (0.39 | ) | 15.53 | (1.53 | ) | 2,022 | 0.99 | 1.32 | 2.90 | 101 | |||||||||||||||||||||||||
| (0.25 | ) | 16.16 | (4.30 | ) | 3,312 | 0.98 | 1.48 | 2.03 | 116 | |||||||||||||||||||||||||
| (0.42 | ) | 17.13 | (c) | 23.22 | (c) | 19,899 | 1.05 | (d) | 3.00 | (d) | 2.99 | (d) | 120 | |||||||||||||||||||||
| (0.57 | ) | 14.31 | (e) | 19.95 | (e) | 139 | 1.20 | 7.47 | 4.67 | 104 | ||||||||||||||||||||||||
| $ | (0.23 | ) | $ | 18.01 | 17.95 | % | $ | 115,817 | 0.89 | % | 1.34 | % | 1.18 | % | 105 | % | ||||||||||||||||||
| (0.57 | ) | 15.48 | (1.45 | ) | 90,711 | 0.90 | 1.37 | 3.13 | 101 | |||||||||||||||||||||||||
| (0.51 | ) | 16.29 | (4.12 | ) | 111,161 | 0.90 | 1.39 | 2.41 | 116 | |||||||||||||||||||||||||
| (0.32 | ) | 17.49 | (c) | 23.33 | (c) | 34,444 | 0.95 | (d) | 2.87 | (d) | 2.71 | (d) | 120 | |||||||||||||||||||||
| (0.45 | ) | 14.46 | (e) | 19.95 | (e) | 6,370 | 1.17 | 6.98 | 3.35 | 104 | ||||||||||||||||||||||||
| See accompanying Notes to Financial Statements | | September 30, 2020 | | Annual Report | 159 |
Table of Contents
Financial Highlights (cont’d)
For a Share Outstanding for the Year ended:^
| Net Asset Value, Beginning of Year | Net Investment Income (Loss) (a) | Net Realized | Total from Investment Operations | Dividends from Net Investment Income | Distributions from Net Realized Capital Gains | |||||||||||||||||||||||
| AllianzGI Global Allocation: | ||||||||||||||||||||||||||||
| Class A | ||||||||||||||||||||||||||||
9/30/2020 | $ | 11.05 | $ | 0.13 | $ | 0.94 | $ | 1.07 | $ | (0.12 | ) | $ | (0.89 | ) | ||||||||||||||
9/30/2019 | 11.47 | 0.21 | 0.06 | 0.27 | (0.25 | ) | (0.44 | ) | ||||||||||||||||||||
9/30/2018 | 12.34 | 0.26 | 0.07 | 0.33 | (0.55 | ) | (0.65 | ) | ||||||||||||||||||||
9/30/2017 | 11.23 | 0.20 | 1.11 | 1.31 | (0.20 | ) | — | |||||||||||||||||||||
9/30/2016 | 10.98 | 0.07 | 0.63 | 0.70 | (0.05 | ) | (0.40 | ) | ||||||||||||||||||||
| Class C | ||||||||||||||||||||||||||||
9/30/2020 | $ | 11.37 | $ | 0.06 | $ | 0.95 | $ | 1.01 | $ | (0.02 | ) | $ | (0.89 | ) | ||||||||||||||
9/30/2019 | 11.67 | 0.13 | 0.08 | 0.21 | (0.07 | ) | (0.44 | ) | ||||||||||||||||||||
9/30/2018 | 12.47 | 0.19 | 0.06 | 0.25 | (0.40 | ) | (0.65 | ) | ||||||||||||||||||||
9/30/2017 | 11.32 | 0.13 | 1.12 | 1.25 | (0.10 | ) | — | |||||||||||||||||||||
9/30/2016 | 11.13 | (0.01 | ) | 0.63 | 0.62 | (0.03 | ) | (0.40 | ) | |||||||||||||||||||
| Class R | ||||||||||||||||||||||||||||
9/30/2020 | $ | 10.93 | $ | 0.10 | $ | 0.93 | $ | 1.03 | $ | (0.09 | ) | $ | (0.89 | ) | ||||||||||||||
9/30/2019 | 11.34 | 0.26 | (0.01 | ) | 0.25 | (0.22 | ) | (0.44 | ) | |||||||||||||||||||
9/30/2018 | 12.22 | 0.21 | 0.10 | 0.31 | (0.54 | ) | (0.65 | ) | ||||||||||||||||||||
9/30/2017 | 11.15 | 0.18 | 1.11 | 1.29 | (0.22 | ) | — | |||||||||||||||||||||
9/30/2016 | 10.93 | 0.05 | 0.62 | 0.67 | (0.05 | ) | (0.40 | ) | ||||||||||||||||||||
| Class P | ||||||||||||||||||||||||||||
9/30/2020 | $ | 10.94 | $ | 0.17 | $ | 0.90 | $ | 1.07 | $ | (0.16 | ) | $ | (0.89 | ) | ||||||||||||||
9/30/2019 | 11.38 | 0.18 | 0.12 | 0.30 | (0.30 | ) | (0.44 | ) | ||||||||||||||||||||
9/30/2018 | 12.28 | 0.27 | 0.09 | 0.36 | (0.61 | ) | (0.65 | ) | ||||||||||||||||||||
9/30/2017 | 11.24 | 0.24 | 1.11 | 1.35 | (0.31 | ) | — | |||||||||||||||||||||
9/30/2016 | 10.98 | 0.12 | 0.61 | 0.73 | (0.07 | ) | (0.40 | ) | ||||||||||||||||||||
| Institutional Class | ||||||||||||||||||||||||||||
9/30/2020 | $ | 11.02 | $ | 0.14 | $ | 0.94 | $ | 1.08 | $ | (0.16 | ) | $ | (0.89 | ) | ||||||||||||||
9/30/2019 | 11.45 | 0.24 | 0.06 | 0.30 | (0.29 | ) | (0.44 | ) | ||||||||||||||||||||
9/30/2018 | 12.15 | 0.28 | 0.08 | 0.36 | (0.41 | ) | (0.65 | ) | ||||||||||||||||||||
9/30/2017 | 11.11 | 0.26 | 1.05 | 1.31 | (0.27 | ) | — | |||||||||||||||||||||
9/30/2016 | 10.86 | 0.10 | 0.61 | 0.71 | (0.06 | ) | (0.40 | ) | ||||||||||||||||||||
| Class R6 | ||||||||||||||||||||||||||||
9/30/2020 | $ | 10.78 | $ | 0.16 | $ | 0.92 | $ | 1.08 | $ | (0.18 | ) | $ | (0.89 | ) | ||||||||||||||
9/30/2019 | 11.23 | 0.23 | 0.06 | 0.29 | (0.30 | ) | (0.44 | ) | ||||||||||||||||||||
9/30/2018 | 12.13 | 0.29 | 0.07 | 0.36 | (0.61 | ) | (0.65 | ) | ||||||||||||||||||||
9/30/2017 | 11.10 | 0.23 | 1.11 | 1.34 | (0.31 | ) | — | |||||||||||||||||||||
9/30/2016 | 10.85 | 0.05 | 0.67 | 0.72 | (0.07 | ) | (0.40 | ) | ||||||||||||||||||||
| Administrative Class | ||||||||||||||||||||||||||||
9/30/2020 | $ | 11.38 | $ | 0.13 | $ | 0.98 | $ | 1.11 | $ | (0.14 | ) | $ | (0.89 | ) | ||||||||||||||
9/30/2019 | 11.77 | 0.22 | 0.08 | 0.30 | (0.25 | ) | (0.44 | ) | ||||||||||||||||||||
9/30/2018 | 12.64 | 0.28 | 0.07 | 0.35 | (0.57 | ) | (0.65 | ) | ||||||||||||||||||||
9/30/2017 | 11.52 | 0.22 | 1.15 | 1.37 | (0.25 | ) | — | |||||||||||||||||||||
9/30/2016 | 11.25 | 0.08 | 0.64 | 0.72 | (0.05 | ) | (0.40 | ) | ||||||||||||||||||||
| ^ | A “—” may reflect actual amounts rounding to less than $0.01 or 0.01%. |
| (a) | Calculated on average shares outstanding during the year. |
| (b) | Total return is calculated assuming a purchase of a share on the first day of the year and a sale of a share on the last day of each year reported. Dividends and distributions, if any, are assumed, for purposes of this calculation, to be reinvested. Total return does not reflect sales charges and includes the effect of fee waivers and reimbursements. Total return may reflect adjustments to conform to U.S. GAAP. |
| (c) | Does not include expenses of the investment companies in which the Fund invests. |
| (d) | Payments from Affiliates increased the end of year net asset value and total return by less than $0.01 and 0.01%, respectively. |
| 160 | Annual Report | | September 30, 2020 | | See accompanying Notes to Financial Statements |
Table of Contents
| Total Dividends and Distributions | Net Asset Value, End of Year | Total Return (b) | Net Assets, End of Year (000s) | Ratio of Expenses to Average Net Assets with Fee Waiver/ Reimbursement (c) | Ratio of Expenses to Average Net Assets without Fee Waiver/ Reimbursement (c) | Ratio of Net Investment Income (Loss) to Average Net Assets (c) | Portfolio Turnover Rate | |||||||||||||||||||||||||||
| $ | (1.01 | ) | $ | 11.11 | 10.21 | % | $ | 46,506 | 0.52 | % | 1.14 | % | 1.18 | % | 141 | % | ||||||||||||||||||
| (0.69 | ) | 11.05 | (d) | 3.05 | (d) | 49,259 | 0.61 | 1.14 | 1.95 | 29 | ||||||||||||||||||||||||
| (1.20 | ) | 11.47 | 2.62 | 40,974 | 0.59 | 1.12 | 2.24 | 17 | ||||||||||||||||||||||||||
| (0.20 | ) | 12.34 | 11.88 | 47,170 | 0.60 | 1.12 | 1.73 | 15 | ||||||||||||||||||||||||||
| (0.45 | ) | 11.23 | 6.55 | 84,852 | 0.60 | 1.13 | 0.68 | 57 | ||||||||||||||||||||||||||
| $ | (0.91 | ) | $ | 11.47 | 9.28 | % | $ | 3,549 | 1.27 | % | 1.83 | % | 0.55 | % | 141 | % | ||||||||||||||||||
| (0.51 | ) | 11.37 | (d) | 2.29 | (d) | 6,393 | 1.34 | 1.91 | 1.14 | 29 | ||||||||||||||||||||||||
| (1.05 | ) | 11.67 | 1.90 | 26,220 | 1.33 | 1.86 | 1.56 | 17 | ||||||||||||||||||||||||||
| (0.10 | ) | 12.47 | 11.09 | 34,670 | 1.35 | 1.87 | 1.12 | 15 | ||||||||||||||||||||||||||
| (0.43 | ) | 11.32 | 5.72 | 46,387 | 1.38 | 1.90 | (0.06 | ) | 57 | |||||||||||||||||||||||||
| $ | (0.98 | ) | $ | 10.98 | 9.96 | % | $ | 23 | 0.72 | % | 1.34 | % | 0.94 | % | 141 | % | ||||||||||||||||||
| (0.66 | ) | 10.93 | (d) | 2.80 | (d) | 21 | 0.81 | 1.46 | 2.43 | 29 | ||||||||||||||||||||||||
| (1.19 | ) | 11.34 | 2.43 | 35 | 0.80 | 1.32 | 1.85 | 17 | ||||||||||||||||||||||||||
| (0.22 | ) | 12.22 | 11.78 | 24 | 0.78 | 1.31 | 1.55 | 15 | ||||||||||||||||||||||||||
| (0.45 | ) | 11.15 | 6.25 | 17 | 0.81 | 1.33 | 0.45 | 57 | ||||||||||||||||||||||||||
| $ | (1.05 | ) | $ | 10.96 | 10.39 | % | $ | 5,371 | 0.32 | % | 0.90 | % | 1.63 | % | 141 | % | ||||||||||||||||||
| (0.74 | ) | 10.94 | (d) | 3.30 | (d) | 6,173 | 0.37 | 0.91 | 1.68 | 29 | ||||||||||||||||||||||||
| (1.26 | ) | 11.38 | 2.92 | 4,292 | 0.35 | 0.88 | 2.30 | 17 | ||||||||||||||||||||||||||
| (0.31 | ) | 12.28 | 12.31 | 3,563 | 0.32 | 0.85 | 2.05 | 15 | ||||||||||||||||||||||||||
| (0.47 | ) | 11.24 | 6.78 | 1,901 | 0.30 | 0.83 | 1.10 | 57 | ||||||||||||||||||||||||||
| $ | (1.05 | ) | $ | 11.05 | 10.40 | % | $ | 9,609 | 0.29 | % | 0.88 | % | 1.28 | % | 141 | % | ||||||||||||||||||
| (0.73 | ) | 11.02 | (d) | 3.34 | (d) | 6,026 | 0.36 | 0.89 | 2.25 | 29 | ||||||||||||||||||||||||
| (1.06 | ) | 11.45 | 2.92 | 6,652 | 0.33 | 0.86 | 2.43 | 17 | ||||||||||||||||||||||||||
| (0.27 | ) | 12.15 | 12.08 | 6,871 | 0.40 | 0.95 | 2.35 | 15 | ||||||||||||||||||||||||||
| (0.46 | ) | 11.11 | 6.72 | 68,709 | 0.40 | 0.92 | 0.89 | 57 | ||||||||||||||||||||||||||
| $ | (1.07 | ) | $ | 10.79 | 10.57 | % | $ | 191,750 | 0.22 | % | 0.83 | % | 1.52 | % | 141 | % | ||||||||||||||||||
| (0.74 | ) | 10.78 | (d) | 3.34 | (d) | 249,269 | 0.28 | 0.82 | 2.23 | 29 | ||||||||||||||||||||||||
| (1.26 | ) | 11.23 | 2.95 | 252,313 | 0.28 | 0.81 | 2.48 | 17 | ||||||||||||||||||||||||||
| (0.31 | ) | 12.13 | 12.40 | 264,255 | 0.28 | 0.80 | 1.99 | 15 | ||||||||||||||||||||||||||
| (0.47 | ) | 11.10 | 6.81 | 291,767 | 0.30 | 0.83 | 0.48 | 57 | ||||||||||||||||||||||||||
| $ | (1.03 | ) | $ | 11.46 | 10.24 | % | $ | 27 | 0.47 | % | 1.08 | % | 1.17 | % | 141 | % | ||||||||||||||||||
| (0.69 | ) | 11.38 | (d) | 3.17 | (d) | 23 | 0.53 | 1.07 | 1.97 | 29 | ||||||||||||||||||||||||
| (1.22 | ) | 11.77 | 2.68 | 22 | 0.53 | 1.06 | 2.28 | 17 | ||||||||||||||||||||||||||
| (0.25 | ) | 12.64 | 12.07 | 26 | 0.53 | 1.06 | 1.86 | 15 | ||||||||||||||||||||||||||
| (0.45 | ) | 11.52 | 6.58 | 32 | 0.56 | 1.08 | 0.67 | 57 | ||||||||||||||||||||||||||
| See accompanying Notes to Financial Statements | | September 30, 2020 | | Annual Report | 161 |
Table of Contents
Financial Highlights (cont’d)
For a Share Outstanding for the Period ended:^
| Net Asset Value, Beginning of Period | Net Investment Income (a) | Net Realized | Total from Investment Operations | Dividends from Net Investment Income | Distributions from Net Realized Capital Gains | |||||||||||||||||||||||
| AllianzGI Global Dynamic Allocation: | ||||||||||||||||||||||||||||
| Class A | ||||||||||||||||||||||||||||
9/30/2020 | $ | 19.21 | $ | 0.21 | $ | 1.34 | $ | 1.55 | $ | (0.72 | ) | $ | (1.30 | ) | ||||||||||||||
9/30/2019 | 20.19 | 0.34 | (0.48 | ) | (0.14 | ) | (0.36 | ) | (0.48 | ) | ||||||||||||||||||
9/30/2018 | 20.52 | 0.28 | 0.32 | 0.60 | (0.21 | ) | (0.72 | ) | ||||||||||||||||||||
9/30/2017 | 18.32 | 0.20 | 2.00 | 2.20 | — | — | ||||||||||||||||||||||
9/30/2016 | 17.99 | 0.17 | 0.66 | 0.83 | (0.22 | ) | (0.28 | ) | ||||||||||||||||||||
| Class C | ||||||||||||||||||||||||||||
9/30/2020 | $ | 18.84 | $ | 0.07 | $ | 1.30 | $ | 1.37 | $ | (0.59 | ) | $ | (1.30 | ) | ||||||||||||||
9/30/2019 | 19.56 | 0.19 | (0.43 | ) | (0.24 | ) | — | (0.48 | ) | |||||||||||||||||||
9/30/2018 | 20.05 | 0.12 | 0.31 | 0.43 | (0.20 | ) | (0.72 | ) | ||||||||||||||||||||
9/30/2017 | 18.05 | 0.08 | 1.92 | 2.00 | — | — | ||||||||||||||||||||||
9/30/2016 | 17.63 | 0.08 | 0.62 | 0.70 | — | (0.28 | ) | |||||||||||||||||||||
| Class R | ||||||||||||||||||||||||||||
9/30/2020 | $ | 19.10 | $ | 0.16 | $ | 1.32 | $ | 1.48 | $ | (0.65 | ) | $ | (1.30 | ) | ||||||||||||||
9/30/2019 | 19.97 | 0.26 | (0.45 | ) | (0.19 | ) | (0.20 | ) | (0.48 | ) | ||||||||||||||||||
9/30/2018 | 20.35 | 0.21 | 0.30 | 0.51 | (0.17 | ) | (0.72 | ) | ||||||||||||||||||||
9/30/2017 | 18.23 | 0.16 | 1.96 | 2.12 | — | — | ||||||||||||||||||||||
9/30/2016 | 17.84 | 0.16 | 0.63 | 0.79 | (0.12 | ) | (0.28 | ) | ||||||||||||||||||||
| Class P | ||||||||||||||||||||||||||||
9/30/2020 | $ | 19.09 | $ | 0.21 | $ | 1.61 | $ | 1.82 | $ | — | $ | (1.30 | ) | |||||||||||||||
9/30/2019 | 20.07 | 0.36 | (0.46 | ) | (0.10 | ) | (0.40 | ) | (0.48 | ) | ||||||||||||||||||
9/30/2018 | 20.48 | 0.32 | 0.31 | 0.63 | (0.32 | ) | (0.72 | ) | ||||||||||||||||||||
9/30/2017 | 18.36 | 0.28 | 1.94 | 2.22 | (0.10 | ) | — | |||||||||||||||||||||
9/30/2016 | 17.97 | 0.16 | 0.71 | 0.87 | (0.20 | ) | (0.28 | ) | ||||||||||||||||||||
| Institutional Class | ||||||||||||||||||||||||||||
9/30/2020 | $ | 19.50 | $ | 0.26 | $ | 1.37 | $ | 1.63 | $ | (0.78 | ) | $ | (1.30 | ) | ||||||||||||||
9/30/2019 | 20.22 | 0.39 | (0.45 | ) | (0.06 | ) | (0.18 | ) | (0.48 | ) | ||||||||||||||||||
9/30/2018 | 20.61 | 0.34 | 0.32 | 0.66 | (0.33 | ) | (0.72 | ) | ||||||||||||||||||||
9/30/2017 | 18.37 | 0.27 | 1.98 | 2.25 | (0.01 | ) | — | |||||||||||||||||||||
9/30/2016 | 18.02 | 0.23 | 0.65 | 0.88 | (0.25 | ) | (0.28 | ) | ||||||||||||||||||||
| Class R6 | ||||||||||||||||||||||||||||
9/30/2020 | $ | 19.18 | $ | 0.27 | $ | 1.33 | $ | 1.60 | $ | (0.73 | ) | $ | (1.30 | ) | ||||||||||||||
9/30/2019 | 20.15 | 0.39 | (0.48 | ) | (0.09 | ) | (0.40 | ) | (0.48 | ) | ||||||||||||||||||
9/30/2018 | 20.56 | 0.34 | 0.32 | 0.66 | (0.35 | ) | (0.72 | ) | ||||||||||||||||||||
9/30/2017 | 18.38 | 0.28 | 1.99 | 2.27 | (0.09 | ) | — | |||||||||||||||||||||
2/1/2016* - 9/30/2016 | 17.30 | 0.09 | 0.99 | 1.08 | — | — | ||||||||||||||||||||||
| Administrative Class | ||||||||||||||||||||||||||||
9/30/2020 | $ | 19.16 | $ | 0.21 | $ | 1.34 | $ | 1.55 | $ | (0.74 | ) | $ | (1.30 | ) | ||||||||||||||
9/30/2019 | 20.15 | 0.34 | (0.48 | ) | (0.14 | ) | (0.37 | ) | (0.48 | ) | ||||||||||||||||||
9/30/2018 | 20.55 | 0.29 | 0.32 | 0.61 | (0.29 | ) | (0.72 | ) | ||||||||||||||||||||
9/30/2017 | 18.35 | 0.23 | 1.97 | 2.20 | — | — | ||||||||||||||||||||||
9/30/2016 | 17.93 | 0.21 | 0.63 | 0.84 | (0.14 | ) | (0.28 | ) | ||||||||||||||||||||
| ^ | A “—” may reflect actual amounts rounding to less than $0.01 or 0.01%. |
| * | Commencement of operations. |
| (a) | Calculated on average shares outstanding during the period. |
| (b) | Total return is calculated assuming a purchase of a share on the first day of the period and a sale of a share on the last day of each period reported. Dividends and distributions, if any, are assumed, for purposes of this calculation, to be reinvested. Total return does not reflect sales charges and includes the effect of fee waivers and reimbursements. Total return may reflect adjustments to conform to U.S. GAAP. Total return for a period of less than one year is not annualized. |
| 162 | Annual Report | | September 30, 2020 | | See accompanying Notes to Financial Statements |
Table of Contents
| Total Dividends and Distributions | Net Asset Value, End of Period | Total Return (b) | Net Assets, End of Period (000s) | Ratio of Expenses to Average Net Assets with Fee Waiver/ Reimbursement (c) | Ratio of Expenses to Average Net Assets without Fee Waiver/ Reimbursement (c) | Ratio of Net Investment Income to Average Net Assets (c) | Portfolio Turnover Rate | |||||||||||||||||||||||||||
| $ | (2.02 | ) | $ | 18.74 | 8.20 | % | $ | 1,491 | 0.82 | % | 1.62 | % | 1.17 | % | 221 | % | ||||||||||||||||||
| (0.84 | ) | 19.21 | (0.25 | ) | 1,812 | 0.97 | 1.32 | 1.78 | 222 | |||||||||||||||||||||||||
| (0.93 | ) | 20.19 | 2.93 | 2,015 | 0.97 | 1.25 | 1.37 | 152 | ||||||||||||||||||||||||||
| — | 20.52 | 12.01 | 2,421 | 1.02 | 1.35 | 1.05 | 192 | |||||||||||||||||||||||||||
| (0.50 | ) | 18.32 | 4.69 | 5,198 | 0.76 | 1.73 | 0.96 | 79 | ||||||||||||||||||||||||||
| $ | (1.89 | ) | $ | 18.32 | 7.37 | % | $ | 525 | 1.58 | % | 2.38 | % | 0.40 | % | 221 | % | ||||||||||||||||||
| (0.48 | ) | 18.84 | (1.00 | ) | 588 | 1.74 | 2.08 | 1.00 | 222 | |||||||||||||||||||||||||
| (0.92 | ) | 19.56 | 2.09 | 1,195 | 1.74 | 2.01 | 0.61 | 152 | ||||||||||||||||||||||||||
| — | 20.05 | 11.08 | 1,325 | 1.77 | 2.08 | 0.42 | 192 | |||||||||||||||||||||||||||
| (0.28 | ) | 18.05 | 4.02 | 1,029 | 1.49 | 2.69 | 0.45 | 79 | ||||||||||||||||||||||||||
| $ | (1.95 | ) | $ | 18.63 | 7.86 | % | $ | 44 | 1.18 | % | 2.00 | % | 0.87 | % | 221 | % | ||||||||||||||||||
| (0.68 | ) | 19.10 | (0.60 | ) | 121 | 1.34 | 1.67 | 1.38 | 222 | |||||||||||||||||||||||||
| (0.89 | ) | 19.97 | 2.49 | 160 | 1.34 | 1.58 | 1.05 | 152 | ||||||||||||||||||||||||||
| — | 20.35 | 11.63 | 137 | 1.35 | 1.70 | 0.84 | 192 | |||||||||||||||||||||||||||
| (0.40 | ) | 18.23 | 4.50 | 159 | 1.01 | 2.25 | 0.90 | 79 | ||||||||||||||||||||||||||
| $ | (1.30 | ) | $ | 19.61 | 9.73 | % | $ | 59 | 0.68 | % | 1.19 | % | 1.05 | % | 221 | % | ||||||||||||||||||
| (0.88 | ) | 19.09 | (0.05 | ) | 11,456 | 0.80 | 1.12 | 1.95 | 222 | |||||||||||||||||||||||||
| (1.04 | ) | 20.07 | 3.08 | 13,436 | 0.80 | 1.03 | 1.58 | 152 | ||||||||||||||||||||||||||
| (0.10 | ) | 20.48 | 12.18 | 12,730 | 0.82 | 1.11 | 1.44 | 192 | ||||||||||||||||||||||||||
| (0.48 | ) | 18.36 | 4.89 | 186 | 0.61 | 1.47 | 0.90 | 79 | ||||||||||||||||||||||||||
| $ | (2.08 | ) | $ | 19.05 | 8.52 | % | $ | 12,294 | 0.54 | % | 1.40 | % | 1.42 | % | 221 | % | ||||||||||||||||||
| (0.66 | ) | 19.50 | 0.03 | 9,330 | 0.70 | 1.12 | 2.05 | 222 | ||||||||||||||||||||||||||
| (1.05 | ) | 20.22 | 3.18 | 13,225 | 0.70 | 0.94 | 1.65 | 152 | ||||||||||||||||||||||||||
| (0.01 | ) | 20.61 | 12.27 | 31,783 | 0.75 | 1.03 | 1.42 | 192 | ||||||||||||||||||||||||||
| (0.53 | ) | 18.37 | 4.98 | 37,722 | 0.51 | 1.45 | 1.27 | 79 | ||||||||||||||||||||||||||
| $ | (2.03 | ) | $ | 18.75 | 8.54 | % | $ | 30,996 | 0.54 | % | 1.28 | % | 1.45 | % | 221 | % | ||||||||||||||||||
| (0.88 | ) | 19.18 | (0.01 | ) | 127,285 | 0.70 | 1.01 | 2.08 | 222 | |||||||||||||||||||||||||
| (1.07 | ) | 20.15 | 3.19 | 192,375 | 0.70 | 0.91 | 1.67 | 152 | ||||||||||||||||||||||||||
| (0.09 | ) | 20.56 | 12.39 | 231,584 | 0.70 | 0.99 | 1.49 | 192 | ||||||||||||||||||||||||||
| — | 18.38 | 6.24 | 9,029 | 0.36 | (d) | 1.36 | (d) | 0.77 | (d) | 79 | ||||||||||||||||||||||||
| $ | (2.04 | ) | $ | 18.67 | 8.24 | % | $ | 25 | 0.79 | % | 1.57 | % | 1.18 | % | 221 | % | ||||||||||||||||||
| (0.85 | ) | 19.16 | (0.26 | ) | 23 | 0.95 | 1.27 | 1.80 | 222 | |||||||||||||||||||||||||
| (1.01 | ) | 20.15 | 2.93 | 23 | 0.96 | 1.17 | 1.42 | 152 | ||||||||||||||||||||||||||
| — | 20.55 | 11.99 | 23 | 1.00 | 1.25 | 1.18 | 192 | |||||||||||||||||||||||||||
| (0.42 | ) | 18.35 | 4.73 | 20 | 0.76 | 1.89 | 1.15 | 79 | ||||||||||||||||||||||||||
| (c) | Does not include expenses of the investment companies in which the Fund invests. |
| (d) | Annualized, unless otherwise noted |
| See accompanying Notes to Financial Statements | | September 30, 2020 | | Annual Report | 163 |
Table of Contents
Financial Highlights (cont’d)
For a Share Outstanding for the Period ended:^
| Net Asset Value, Beginning of Period | Net Investment Income (a) | Net Realized | Total from Investment Operations | Dividends from Net Investment Income | Distributions from Net Realized Capital Gains | |||||||||||||||||||||||
| AllianzGI Global Sustainability: | ||||||||||||||||||||||||||||
| Class A | ||||||||||||||||||||||||||||
9/30/2020 | $ | 18.27 | $ | 0.11 | $ | 3.03 | $ | 3.14 | $ | (0.02 | ) | $ | (0.33 | ) | ||||||||||||||
9/30/2019 | 19.46 | 0.14 | 0.04 | 0.18 | (0.30 | ) | (1.07 | ) | ||||||||||||||||||||
9/30/2018 | 17.96 | 0.17 | 1.98 | 2.15 | (0.21 | ) | (0.44 | ) | ||||||||||||||||||||
9/30/2017 | 15.80 | 0.13 | 2.20 | 2.33 | (0.14 | ) | (0.03 | ) | ||||||||||||||||||||
9/30/2016 | 14.10 | 0.14 | 1.76 | 1.90 | (0.20 | ) | — | |||||||||||||||||||||
| Class P | ||||||||||||||||||||||||||||
9/30/2020 | $ | 18.39 | $ | 0.14 | $ | 3.05 | $ | 3.19 | $ | (0.03 | ) | $ | (0.33 | ) | ||||||||||||||
9/30/2019 | 19.68 | 0.21 | (0.02 | ) | 0.19 | (0.41 | ) | (1.07 | ) | |||||||||||||||||||
9/30/2018 | 18.13 | 0.16 | 2.05 | 2.21 | (0.22 | ) | (0.44 | ) | ||||||||||||||||||||
9/30/2017 | 15.91 | 0.15 | 2.23 | 2.38 | (0.13 | ) | (0.03 | ) | ||||||||||||||||||||
9/30/2016 | 14.12 | 0.17 | 1.75 | 1.92 | (0.13 | ) | — | |||||||||||||||||||||
| Institutional Class | ||||||||||||||||||||||||||||
9/30/2020 | $ | 18.75 | $ | 0.17 | $ | 3.10 | $ | 3.27 | $ | (0.05 | ) | $ | (0.33 | ) | ||||||||||||||
9/30/2019 | 19.72 | 0.19 | 0.06 | 0.25 | (0.15 | ) | (1.07 | ) | ||||||||||||||||||||
9/30/2018 | 18.13 | 0.22 | 2.00 | 2.22 | (0.19 | ) | (0.44 | ) | ||||||||||||||||||||
9/30/2017 | 15.92 | 0.19 | 2.20 | 2.39 | (0.15 | ) | (0.03 | ) | ||||||||||||||||||||
9/30/2016 | 14.13 | 0.22 | 1.71 | 1.93 | (0.14 | ) | — | |||||||||||||||||||||
| AllianzGI Green Bond: | ||||||||||||||||||||||||||||
| Class A | ||||||||||||||||||||||||||||
9/30/2020 | $ | 16.46 | $ | 0.18 | $ | 0.40 | $ | 0.58 | $ | (0.15 | ) | $ | (0.07 | ) | ||||||||||||||
11/19/2018* - 9/30/2019 | 15.00 | 0.26 | 1.45 | 1.71 | (0.25 | ) | — | |||||||||||||||||||||
| Class P | ||||||||||||||||||||||||||||
9/30/2020 | $ | 16.45 | $ | 0.21 | $ | 0.40 | $ | 0.61 | $ | (0.17 | ) | $ | (0.07 | ) | ||||||||||||||
11/19/2018* - 9/30/2019 | 15.00 | 0.29 | 1.44 | 1.73 | (0.28 | ) | — | |||||||||||||||||||||
| Institutional Class | ||||||||||||||||||||||||||||
9/30/2020 | $ | 16.47 | $ | 0.21 | $ | 0.40 | $ | 0.61 | $ | (0.18 | ) | $ | (0.07 | ) | ||||||||||||||
11/19/2018* - 9/30/2019 | 15.00 | 0.28 | 1.46 | 1.74 | (0.27 | ) | — | |||||||||||||||||||||
| ^ | A “—” may reflect actual amounts rounding to less than $0.01 or 0.01%. |
| * | Commencement of operations. |
| (a) | Calculated on average shares outstanding during the period. |
| (b) | Total return is calculated assuming a purchase of a share on the first day of the period and a sale of a share on the last day of each period reported. Dividends and distributions, if any, are assumed, for purposes of this calculation, to be reinvested. Total return does not reflect sales charges and includes the effect of fee waivers and reimbursements. Total return may reflect adjustments to conform to U.S. GAAP. Total return for a period of less than one year is not annualized. |
| (c) | Annualized, unless otherwise noted. |
| (d) | Certain expenses incurred by the Fund were not annualized. |
| 164 | Annual Report | | September 30, 2020 | | See accompanying Notes to Financial Statements |
Table of Contents
| Total Dividends and Distributions | Net Asset Value, End of Period | Total Return (b) | Net Assets, End of Period (000s) | Ratio of Expenses to Average Net Assets with Fee Waiver/ Reimbursement | Ratio of Expenses to Average Net Assets without Fee Waiver/ Reimbursement | Ratio of Net Investment Income to Average Net Assets | Portfolio Turnover Rate | |||||||||||||||||||||||||||
| $ | (0.35 | ) | $ | 21.06 | 17.35 | % | $ | 2,350 | 0.98 | % | 1.44 | % | 0.58 | % | 31 | % | ||||||||||||||||||
| (1.37 | ) | 18.27 | 2.43 | 1,444 | 1.09 | 1.84 | 0.77 | 49 | ||||||||||||||||||||||||||
| (0.65 | ) | 19.46 | 12.23 | 614 | 1.09 | 1.70 | 0.92 | 20 | ||||||||||||||||||||||||||
| (0.17 | ) | 17.96 | 14.94 | 402 | 1.12 | 7.55 | 0.79 | 27 | ||||||||||||||||||||||||||
| (0.20 | ) | 15.80 | 13.54 | 125 | 1.20 | 21.93 | 0.94 | 20 | ||||||||||||||||||||||||||
| $ | (0.36 | ) | $ | 21.22 | 17.52 | % | $ | 28,372 | 0.84 | % | 1.13 | % | 0.74 | % | 31 | % | ||||||||||||||||||
| (1.48 | ) | 18.39 | 2.56 | 21,582 | 0.94 | 1.65 | 1.17 | 49 | ||||||||||||||||||||||||||
| (0.66 | ) | 19.68 | 12.44 | 11,362 | 0.94 | 1.25 | 0.84 | 20 | ||||||||||||||||||||||||||
| (0.16 | ) | 18.13 | 15.13 | 64 | 0.96 | 1.62 | 0.88 | 27 | ||||||||||||||||||||||||||
| (0.13 | ) | 15.91 | 13.67 | 11 | 1.05 | 3.44 | 1.15 | 20 | ||||||||||||||||||||||||||
| $ | (0.38 | ) | $ | 21.64 | 17.59 | % | $ | 132,073 | 0.74 | % | 1.03 | % | 0.88 | % | 31 | % | ||||||||||||||||||
| (1.22 | ) | 18.75 | 2.63 | 2,072 | 0.84 | 1.66 | 1.05 | 49 | ||||||||||||||||||||||||||
| (0.63 | ) | 19.72 | 12.52 | 28,237 | 0.84 | 1.43 | 1.18 | 20 | ||||||||||||||||||||||||||
| (0.18 | ) | 18.13 | 15.25 | 26,615 | 0.89 | 1.63 | 1.16 | 27 | ||||||||||||||||||||||||||
| (0.14 | ) | 15.92 | 13.77 | 20,610 | 0.95 | 2.04 | 1.47 | 20 | ||||||||||||||||||||||||||
| $ | (0.22 | ) | $ | 16.82 | 3.55 | % | $ | 191 | 0.76 | % | 1.54 | % | 1.11 | % | 98 | % | ||||||||||||||||||
| (0.25 | ) | 16.46 | 11.45 | 95 | 0.77 | (c)(d) | 5.73 | (c)(d) | 1.89 | (c)(d) | 121 | |||||||||||||||||||||||
| $ | (0.24 | ) | $ | 16.82 | 3.74 | % | $ | 553 | 0.56 | % | 1.43 | % | 1.28 | % | 98 | % | ||||||||||||||||||
| (0.28 | ) | 16.45 | 11.60 | 1,093 | 0.56 | (c)(d) | 5.51 | (c)(d) | 2.11 | (c)(d) | 121 | |||||||||||||||||||||||
| $ | (0.25 | ) | $ | 16.83 | 3.78 | % | $ | 25,878 | 0.51 | % | 1.14 | % | 1.31 | % | 98 | % | ||||||||||||||||||
| (0.27 | ) | 16.47 | 11.68 | 5,795 | 0.52 | (c)(d) | 6.33 | (c)(d) | 2.06 | (c)(d) | 121 | |||||||||||||||||||||||
| See accompanying Notes to Financial Statements | | September 30, 2020 | | Annual Report | 165 |
Table of Contents
Financial Highlights (cont’d)
For a Share Outstanding for the Year ended:^
| Net Asset Value, Beginning of Year | Net Investment Income (a) | Net Realized | Total from Investment Operations | Dividends from Net Investment Income | ||||||||||||||||||||
| AllianzGI High Yield Bond: | ||||||||||||||||||||||||
| Class A | ||||||||||||||||||||||||
9/30/2020 | $ | 8.91 | $ | 0.42 | $ | (0.50 | ) | $ | (0.08 | ) | $ | (0.44 | ) | |||||||||||
9/30/2019 | 8.91 | 0.43 | 0.01 | 0.44 | (0.44 | ) | ||||||||||||||||||
9/30/2018 | 9.31 | 0.45 | (0.39 | ) | 0.06 | (0.46 | ) | |||||||||||||||||
9/30/2017 | 9.14 | 0.48 | 0.18 | 0.66 | (0.49 | ) | ||||||||||||||||||
9/30/2016 | 8.92 | 0.53 | 0.24 | 0.77 | (0.55 | ) | ||||||||||||||||||
| Class C | ||||||||||||||||||||||||
9/30/2020 | $ | 8.89 | $ | 0.36 | $ | (0.49 | ) | $ | (0.13 | ) | $ | (0.38 | ) | |||||||||||
9/30/2019 | 8.90 | 0.37 | — | 0.37 | (0.38 | ) | ||||||||||||||||||
9/30/2018 | 9.30 | 0.39 | (0.39 | ) | — | (0.40 | ) | |||||||||||||||||
9/30/2017 | 9.12 | 0.42 | 0.20 | 0.62 | (0.44 | ) | ||||||||||||||||||
9/30/2016 | 8.90 | 0.46 | 0.24 | 0.70 | (0.48 | ) | ||||||||||||||||||
| Class R | ||||||||||||||||||||||||
9/30/2020 | $ | 8.51 | $ | 0.37 | $ | (0.49 | ) | $ | (0.12 | ) | $ | (0.41 | ) | |||||||||||
9/30/2019 | 8.54 | 0.38 | — | 0.38 | (0.41 | ) | ||||||||||||||||||
9/30/2018 | 8.94 | 0.39 | (0.37 | ) | 0.02 | (0.42 | ) | |||||||||||||||||
9/30/2017 | 8.79 | 0.43 | 0.18 | 0.61 | (0.46 | ) | ||||||||||||||||||
9/30/2016 | 8.61 | 0.48 | 0.22 | 0.70 | (0.52 | ) | ||||||||||||||||||
| Class P | ||||||||||||||||||||||||
9/30/2020 | $ | 8.53 | $ | 0.43 | $ | (0.48 | ) | $ | (0.05 | ) | $ | (0.47 | ) | |||||||||||
9/30/2019 | 8.55 | 0.44 | 0.01 | 0.45 | (0.47 | ) | ||||||||||||||||||
9/30/2018 | 8.96 | 0.46 | (0.38 | ) | 0.08 | (0.49 | ) | |||||||||||||||||
9/30/2017 | 8.80 | 0.50 | 0.19 | 0.69 | (0.53 | ) | ||||||||||||||||||
9/30/2016 | 8.62 | 0.53 | 0.23 | 0.76 | (0.58 | ) | ||||||||||||||||||
| Institutional Class | ||||||||||||||||||||||||
9/30/2020 | $ | 8.56 | $ | 0.43 | $ | (0.48 | ) | $ | (0.05 | ) | $ | (0.47 | ) | |||||||||||
9/30/2019 | 8.58 | 0.44 | 0.01 | 0.45 | (0.47 | ) | ||||||||||||||||||
9/30/2018 | 8.98 | 0.46 | (0.37 | ) | 0.09 | (0.49 | ) | |||||||||||||||||
9/30/2017 | 8.83 | 0.50 | 0.18 | 0.68 | (0.53 | ) | ||||||||||||||||||
9/30/2016 | 8.64 | 0.53 | 0.24 | 0.77 | (0.58 | ) | ||||||||||||||||||
| Administrative Class | ||||||||||||||||||||||||
9/30/2020 | $ | 8.54 | $ | 0.42 | $ | (0.48 | ) | $ | (0.06 | ) | $ | (0.46 | ) | |||||||||||
9/30/2019 | 8.44 | 0.43 | 0.03 | 0.46 | (0.36 | ) | ||||||||||||||||||
9/30/2018 | 8.84 | 0.44 | (0.37 | ) | 0.07 | (0.47 | ) | |||||||||||||||||
9/30/2017 | 8.70 | 0.48 | 0.17 | 0.65 | (0.51 | ) | ||||||||||||||||||
9/30/2016 | 8.52 | 0.50 | 0.22 | 0.72 | (0.54 | ) | ||||||||||||||||||
| ^ | A “—” may reflect actual amounts rounding to less than $0.01 or 0.01%. |
| (a) | Calculated on average shares outstanding during the year. |
| (b) | Total return is calculated assuming a purchase of a share on the first day of the year and a sale of a share on the last day of each year reported. Dividends and distributions, if any, are assumed, for purposes of this calculation, to be reinvested. Total return does not reflect sales charges and includes the effect of fee waivers and reimbursements. Total return may reflect adjustments to conform to U.S. GAAP. |
| 166 | Annual Report | | September 30, 2020 | | See accompanying Notes to Financial Statements |
Table of Contents
| Net Asset Value, End of Year | Total Return (b) | Net Assets, End of Year (000s) | Ratio of Expenses to Average Net Assets | Ratio of Net Investment Income to Average Net Assets | Portfolio Turnover Rate | |||||||||||||||||||||
| $ | 8.39 | (0.82 | )% | $ | 20,251 | 1.12 | % | 4.96 | % | 143 | % | |||||||||||||||
| 8.91 | 5.18 | 26,937 | 1.07 | 4.98 | 70 | |||||||||||||||||||||
| 8.91 | 0.67 | 33,768 | 1.05 | 4.93 | 40 | |||||||||||||||||||||
| 9.31 | 7.42 | 58,525 | 1.09 | 5.19 | 37 | |||||||||||||||||||||
| 9.14 | 9.08 | 58,004 | 0.98 | 6.02 | 59 | |||||||||||||||||||||
| $ | 8.38 | (1.41 | )% | $ | 3,880 | 1.81 | % | 4.26 | % | 143 | % | |||||||||||||||
| 8.89 | 4.33 | 4,880 | 1.76 | 4.28 | 70 | |||||||||||||||||||||
| 8.90 | 0.02 | 8,544 | 1.71 | 4.27 | 40 | |||||||||||||||||||||
| 9.30 | 6.90 | 11,723 | 1.70 | 4.59 | 37 | |||||||||||||||||||||
| 9.12 | 8.32 | 14,815 | 1.71 | 5.28 | 59 | |||||||||||||||||||||
| $ | 7.98 | (1.28 | )% | $ | 508 | 1.52 | % | 4.57 | % | 143 | % | |||||||||||||||
| 8.51 | 4.68 | 654 | 1.48 | 4.56 | 70 | |||||||||||||||||||||
| 8.54 | 0.33 | 878 | 1.44 | 4.55 | 40 | |||||||||||||||||||||
| 8.94 | 7.12 | 1,048 | 1.44 | 4.84 | 37 | |||||||||||||||||||||
| 8.79 | 8.62 | 1,310 | 1.34 | 5.65 | 59 | |||||||||||||||||||||
| $ | 8.01 | (0.46 | )% | $ | 10,113 | 0.80 | % | 5.28 | % | 143 | % | |||||||||||||||
| 8.53 | 5.56 | 12,128 | 0.73 | 5.31 | 70 | |||||||||||||||||||||
| 8.55 | 0.94 | 17,535 | 0.70 | 5.26 | 40 | |||||||||||||||||||||
| 8.96 | 8.07 | 35,931 | 0.67 | 5.62 | 37 | |||||||||||||||||||||
| 8.80 | 9.31 | 57,378 | 0.69 | 6.30 | 59 | |||||||||||||||||||||
| $ | 8.04 | (0.50 | )% | $ | 51,920 | 0.83 | % | 5.22 | % | 143 | % | |||||||||||||||
| 8.56 | 5.48 | 77,365 | 0.79 | 5.25 | 70 | |||||||||||||||||||||
| 8.58 | 1.03 | 122,078 | 0.73 | 5.26 | 40 | |||||||||||||||||||||
| 8.98 | 7.91 | 155,022 | 0.69 | 5.61 | 37 | |||||||||||||||||||||
| 8.83 | 9.41 | 227,149 | 0.66 | 6.31 | 59 | |||||||||||||||||||||
| $ | 8.02 | (0.63 | )% | $ | 26 | 1.00 | % | 5.14 | % | 143 | % | |||||||||||||||
| 8.54 | 5.60 | 24 | 0.94 | 5.10 | 70 | |||||||||||||||||||||
| 8.44 | 0.83 | 20 | 0.88 | 4.93 | 40 | |||||||||||||||||||||
| 8.84 | 7.75 | 1,490 | 0.86 | 5.45 | 37 | |||||||||||||||||||||
| 8.70 | 8.97 | 2,086 | 1.07 | 5.94 | 59 | |||||||||||||||||||||
| See accompanying Notes to Financial Statements | | September 30, 2020 | | Annual Report | 167 |
Table of Contents
Financial Highlights (cont’d)
For a Share Outstanding for the Period ended:^
| Net Asset Value, Beginning of Period | Net Investment Income (Loss) (a) | Net Realized | Total from Investment Operations | Dividends from Net Investment Income | Distributions from Net Realized Capital Gains | |||||||||||||||||||||||
| AllianzGI International Small-Cap: | ||||||||||||||||||||||||||||
| Class A | ||||||||||||||||||||||||||||
9/30/2020 | $ | 32.15 | $ | 0.15 | $ | 2.54 | $ | 2.69 | $ | (0.48 | ) | $ | — | |||||||||||||||
9/30/2019 | 43.09 | 0.34 | (6.28 | ) | (5.94 | ) | (0.10 | ) | (4.90 | ) | ||||||||||||||||||
9/30/2018 | 41.19 | 0.42 | 2.41 | 2.83 | (0.25 | ) | (0.68 | ) | ||||||||||||||||||||
9/30/2017 | 34.57 | — | 6.93 | 6.93 | (0.31 | ) | — | |||||||||||||||||||||
9/30/2016 | 34.53 | 0.10 | 1.67 | 1.77 | (0.28 | ) | (1.45 | ) | ||||||||||||||||||||
| Class C | ||||||||||||||||||||||||||||
9/30/2020 | $ | 30.72 | $ | (0.08 | ) | $ | 2.40 | $ | 2.32 | $ | (0.04 | ) | $ | — | ||||||||||||||
9/30/2019 | 41.63 | 0.05 | (6.06 | ) | (6.01 | ) | — | (4.90 | ) | |||||||||||||||||||
9/30/2018 | 40.01 | (0.15 | ) | 2.55 | 2.40 | (0.10 | ) | (0.68 | ) | |||||||||||||||||||
9/30/2017 | 33.78 | (0.19 | ) | 6.67 | 6.48 | (0.25 | ) | — | ||||||||||||||||||||
9/30/2016 | 33.94 | (0.12 | ) | 1.61 | 1.49 | (0.20 | ) | (1.45 | ) | |||||||||||||||||||
| Class R | ||||||||||||||||||||||||||||
9/30/2020 | $ | 30.19 | $ | 0.05 | $ | 2.37 | $ | 2.42 | $ | (0.55 | ) | $ | — | |||||||||||||||
9/30/2019 | 41.90 | 0.27 | (6.28 | ) | (6.01 | ) | (0.80 | ) | (4.90 | ) | ||||||||||||||||||
9/30/2018 | 40.46 | 0.13 | 2.50 | 2.63 | (0.51 | ) | (0.68 | ) | ||||||||||||||||||||
9/30/2017 | 34.07 | 0.01 | 6.70 | 6.71 | (0.32 | ) | — | |||||||||||||||||||||
9/30/2016 | 34.03 | 0.03 | 1.63 | 1.66 | (0.17 | ) | (1.45 | ) | ||||||||||||||||||||
| Class P | ||||||||||||||||||||||||||||
9/30/2020 | $ | 31.91 | $ | 0.17 | $ | 2.56 | $ | 2.73 | $ | (0.44 | ) | $ | — | |||||||||||||||
9/30/2019 | 43.06 | 0.33 | (6.25 | ) | (5.92 | ) | (0.33 | ) | (4.90 | ) | ||||||||||||||||||
9/30/2018 | 41.33 | 0.22 | 2.68 | 2.90 | (0.49 | ) | (0.68 | ) | ||||||||||||||||||||
9/30/2017 | 34.66 | 0.19 | 6.82 | 7.01 | (0.34 | ) | — | |||||||||||||||||||||
9/30/2016 | 34.49 | 0.18 | 1.64 | 1.82 | (0.20 | ) | (1.45 | ) | ||||||||||||||||||||
| Institutional Class | ||||||||||||||||||||||||||||
9/30/2020 | $ | 33.21 | $ | 0.23 | $ | 2.63 | $ | 2.86 | $ | (0.58 | ) | $ | — | |||||||||||||||
9/30/2019 | 44.65 | 0.47 | (6.58 | ) | (6.11 | ) | (0.43 | ) | (4.90 | ) | ||||||||||||||||||
9/30/2018 | 42.85 | 0.32 | 2.71 | 3.03 | (0.55 | ) | (0.68 | ) | ||||||||||||||||||||
9/30/2017 | 35.91 | 0.36 | 6.92 | 7.28 | (0.34 | ) | — | |||||||||||||||||||||
9/30/2016 | 35.65 | 0.10 | 1.81 | 1.91 | (0.20 | ) | (1.45 | ) | ||||||||||||||||||||
| Class R6 | ||||||||||||||||||||||||||||
9/30/2020 | $ | 33.03 | $ | 0.26 | $ | 2.59 | $ | 2.85 | $ | (0.71 | ) | $ | — | |||||||||||||||
9/30/2019 | 44.64 | 0.48 | (6.59 | ) | (6.11 | ) | (0.60 | ) | (4.90 | ) | ||||||||||||||||||
9/30/2018 | 42.90 | 0.40 | 2.66 | 3.06 | (0.64 | ) | (0.68 | ) | ||||||||||||||||||||
9/30/2017 | 35.94 | 0.22 | 7.09 | 7.31 | (0.35 | ) | — | |||||||||||||||||||||
2/1/2016* - 9/30/2016 | 33.52 | 0.34 | 2.08 | 2.42 | — | — | ||||||||||||||||||||||
| ^ | A “—” may reflect actual amounts rounding to less than $0.01 or 0.01%. |
| * | Commencement of operations. |
| (a) | Calculated on average shares outstanding during the period. |
| (b) | Total return is calculated assuming a purchase of a share on the first day of the period and a sale of a share on the last day of each period reported. Dividends and distributions, if any, are assumed, for purposes of this calculation, to be reinvested. Total return does not reflect sales charges and includes the effect of fee waivers and reimbursements. Total return may reflect adjustments to conform to U.S. GAAP. Total return for a period of less than one year is not annualized. |
| (c) | Payments from Affiliates increased the end of period net asset value and total return by less than $0.01 and 0.01%, respectively. |
| (d) | Annualized, unless otherwise noted. |
| 168 | Annual Report | | September 30, 2020 | | See accompanying Notes to Financial Statements |
Table of Contents
| Total Dividends and Distributions | Net Asset Value, End of Period | Total Return (b) | Net Assets, End of Period (000s) | Ratio of Expenses to Average Net Assets with Fee Waiver/ Reimbursement | Ratio of Expenses to Average Net Assets without Fee Waiver/ Reimbursement | Ratio of Net Investment Income (Loss) to Average Net Assets | Portfolio Turnover Rate | |||||||||||||||||||||||||||
| $ | (0.48 | ) | $ | 34.36 | 8.37 | % | $ | 3,619 | 1.25 | % | 1.75 | % | 0.47 | % | 60 | % | ||||||||||||||||||
| (5.00 | ) | 32.15 | (12.05 | ) | 4,826 | 1.25 | 1.94 | 1.05 | 55 | |||||||||||||||||||||||||
| (0.93 | ) | 43.09 | 6.88 | 9,108 | 1.25 | 1.50 | 0.95 | 62 | ||||||||||||||||||||||||||
| (0.31 | ) | 41.19 | (c) | 20.34 | (c) | 6,068 | 1.36 | 1.93 | 0.01 | 67 | ||||||||||||||||||||||||
| (1.73 | ) | 34.57 | 5.07 | 13,524 | 1.45 | 1.68 | 0.30 | 76 | ||||||||||||||||||||||||||
| $ | (0.04 | ) | $ | 33.00 | 7.56 | % | $ | 722 | 2.00 | % | 2.49 | % | (0.27 | )% | 60 | % | ||||||||||||||||||
| (4.90 | ) | 30.72 | (12.75 | ) | 963 | 2.04 | 2.59 | 0.16 | 55 | |||||||||||||||||||||||||
| (0.78 | ) | 41.63 | 5.99 | 2,610 | 2.08 | 2.27 | (0.35 | ) | 62 | |||||||||||||||||||||||||
| (0.25 | ) | 40.01 | (c) | 19.39 | (c) | 2,829 | 2.14 | 2.50 | (0.56 | ) | 67 | |||||||||||||||||||||||
| (1.65 | ) | 33.78 | 4.30 | 3,232 | 2.19 | 2.54 | (0.35 | ) | 76 | |||||||||||||||||||||||||
| $ | (0.55 | ) | $ | 32.06 | 8.01 | % | $ | 849 | 1.59 | % | 2.16 | % | 0.15 | % | 60 | % | ||||||||||||||||||
| (5.70 | ) | 30.19 | (12.36 | ) | 1,044 | 1.59 | 2.30 | 0.89 | 55 | |||||||||||||||||||||||||
| (1.19 | ) | 41.90 | 6.51 | 845 | 1.59 | 1.86 | 0.30 | 62 | ||||||||||||||||||||||||||
| (0.32 | ) | 40.46 | (c) | 19.98 | (c) | 264 | 1.64 | 2.11 | 0.02 | 67 | ||||||||||||||||||||||||
| (1.62 | ) | 34.07 | 4.81 | 130 | 1.70 | 2.17 | 0.09 | 76 | ||||||||||||||||||||||||||
| $ | (0.44 | ) | $ | 34.20 | 8.55 | % | $ | 10,751 | 1.10 | % | 1.49 | % | 0.53 | % | 60 | % | ||||||||||||||||||
| (5.23 | ) | 31.91 | (11.92 | ) | 19,740 | 1.10 | 1.58 | 1.01 | 55 | |||||||||||||||||||||||||
| (1.17 | ) | 43.06 | 7.02 | 48,830 | 1.10 | 1.29 | 0.51 | 62 | ||||||||||||||||||||||||||
| (0.34 | ) | 41.33 | (c) | 20.55 | (c) | 55,843 | 1.17 | 1.42 | 0.55 | 67 | ||||||||||||||||||||||||
| (1.65 | ) | 34.66 | 5.25 | 40,183 | 1.28 | 1.44 | 0.54 | 76 | ||||||||||||||||||||||||||
| $ | (0.58 | ) | $ | 35.49 | 8.61 | % | $ | 31,942 | 1.04 | % | 1.51 | % | 0.69 | % | 60 | % | ||||||||||||||||||
| (5.33 | ) | 33.21 | (11.88 | ) | 40,477 | 1.04 | 1.61 | 1.39 | 55 | |||||||||||||||||||||||||
| (1.23 | ) | 44.65 | 7.09 | 49,443 | 1.05 | 1.28 | 0.70 | 62 | ||||||||||||||||||||||||||
| (0.34 | ) | 42.85 | (c) | 20.58 | (c) | 67,921 | 1.11 | 1.43 | 0.94 | 67 | ||||||||||||||||||||||||
| (1.65 | ) | 35.91 | 5.31 | 29,031 | 1.21 | 1.48 | 0.28 | 76 | ||||||||||||||||||||||||||
| $ | (0.71 | ) | $ | 35.17 | 8.63 | % | $ | 29,889 | 1.00 | % | 1.43 | % | 0.80 | % | 60 | % | ||||||||||||||||||
| (5.50 | ) | 33.03 | (11.82 | ) | 28,630 | 1.00 | 1.49 | 1.44 | 55 | |||||||||||||||||||||||||
| (1.32 | ) | 44.64 | 7.14 | 33,876 | 1.00 | 1.22 | 0.87 | 62 | ||||||||||||||||||||||||||
| (0.35 | ) | 42.90 | (c) | 20.66 | (c) | 17,804 | 1.05 | 1.42 | 0.60 | 67 | ||||||||||||||||||||||||
| — | 35.94 | 7.22 | 15,534 | 1.11 | (d) | 1.56 | (d) | 1.48 | (d) | 76 | ||||||||||||||||||||||||
| See accompanying Notes to Financial Statements | | September 30, 2020 | | Annual Report | 169 |
Table of Contents
Financial Highlights (cont’d)
For a Share Outstanding for the Period ended:^
| Net Asset Value, Beginning of Period | Net Investment Income (a) | Net Realized | Total from Investment Operations | Dividends from Net Investment Income | Distributions from Net Realized Capital Gains | Distributions from Return of Capital | ||||||||||||||||||||||||||
| AllianzGI Multi Asset Income: | ||||||||||||||||||||||||||||||||
| Class A | ||||||||||||||||||||||||||||||||
9/30/2020 | $ | 17.64 | $ | 0.93 | $ | (1.65 | ) | $ | (0.72 | ) | $ | (0.93 | ) | $ | — | $ | (0.02 | ) | ||||||||||||||
9/30/2019 | 17.35 | 0.99 | 0.25 | 1.24 | (0.95 | ) | — | — | ||||||||||||||||||||||||
9/30/2018 | 18.53 | 0.73 | (0.71 | ) | 0.02 | (0.85 | ) | (0.23 | ) | (0.12 | ) | |||||||||||||||||||||
9/30/2017 | 18.31 | 0.94 | 0.22 | 1.16 | (0.85 | ) | (0.09 | ) | — | |||||||||||||||||||||||
9/30/2016 | 17.34 | 0.75 | 1.09 | 1.84 | (0.80 | ) | (0.07 | ) | — | |||||||||||||||||||||||
| Class C | ||||||||||||||||||||||||||||||||
9/30/2020 | $ | 17.64 | $ | 0.78 | $ | (1.63 | ) | $ | (0.85 | ) | $ | (0.70 | ) | $ | — | $ | (0.01 | ) | ||||||||||||||
9/30/2019 | 17.36 | 0.84 | 0.26 | 1.10 | (0.82 | ) | — | — | ||||||||||||||||||||||||
9/30/2018 | 18.53 | 0.62 | (0.72 | ) | (0.10 | ) | (0.74 | ) | (0.23 | ) | (0.10 | ) | ||||||||||||||||||||
9/30/2017 | 18.21 | 0.80 | 0.22 | 1.02 | (0.61 | ) | (0.09 | ) | — | |||||||||||||||||||||||
9/30/2016 | 17.16 | 0.66 | 1.04 | 1.70 | (0.58 | ) | (0.07 | ) | — | |||||||||||||||||||||||
| Class R | ||||||||||||||||||||||||||||||||
9/30/2020 | $ | 18.49 | $ | 0.77 | $ | (1.59 | ) | $ | (0.82 | ) | $ | (0.84 | ) | $ | — | $ | (0.01 | ) | ||||||||||||||
9/30/2019 | 18.14 | 0.97 | 0.26 | 1.23 | (0.88 | ) | — | — | ||||||||||||||||||||||||
9/30/2018 | 19.31 | 0.71 | (0.74 | ) | (0.03 | ) | (0.80 | ) | (0.23 | ) | (0.11 | ) | ||||||||||||||||||||
9/30/2017 | 18.97 | 0.84 | 0.30 | 1.14 | (0.71 | ) | (0.09 | ) | — | |||||||||||||||||||||||
9/30/2016 | 17.92 | 0.73 | 1.11 | 1.84 | (0.72 | ) | (0.07 | ) | — | |||||||||||||||||||||||
| Class P | ||||||||||||||||||||||||||||||||
9/30/2020 | $ | 17.83 | $ | 0.93 | $ | (1.60 | ) | $ | (0.67 | ) | $ | (0.92 | ) | $ | — | $ | (0.02 | ) | ||||||||||||||
9/30/2019 | 17.54 | 1.08 | 0.21 | 1.29 | (1.00 | ) | — | — | ||||||||||||||||||||||||
9/30/2018 | 18.71 | 0.82 | (0.73 | ) | 0.09 | (0.90 | ) | (0.23 | ) | (0.13 | ) | |||||||||||||||||||||
9/30/2017 | 18.51 | 0.99 | 0.23 | 1.22 | (0.93 | ) | (0.09 | ) | — | |||||||||||||||||||||||
9/30/2016 | 17.58 | 0.83 | 1.09 | 1.92 | (0.92 | ) | (0.07 | ) | — | |||||||||||||||||||||||
| Institutional Class | ||||||||||||||||||||||||||||||||
9/30/2020 | $ | 17.35 | $ | 0.93 | $ | (1.58 | ) | $ | (0.65 | ) | $ | (1.05 | ) | $ | — | $ | (0.02 | ) | ||||||||||||||
9/30/2019 | 17.08 | 1.00 | 0.28 | 1.28 | (1.01 | ) | — | — | ||||||||||||||||||||||||
2/1/2018* - 9/30/2018 | 17.08 | 0.42 | (0.64 | ) | (0.22 | ) | (0.44 | ) | — | (0.13 | ) | |||||||||||||||||||||
| Class R6 | ||||||||||||||||||||||||||||||||
9/30/2020 | $ | 17.36 | $ | 0.92 | $ | (1.56 | ) | $ | (0.64 | ) | $ | (1.06 | ) | $ | — | $ | (0.02 | ) | ||||||||||||||
9/30/2019 | 17.09 | 1.03 | 0.25 | 1.28 | (1.01 | ) | — | — | ||||||||||||||||||||||||
9/30/2018 | 18.26 | 0.81 | (0.71 | ) | 0.10 | (0.91 | ) | (0.23 | ) | (0.13 | ) | |||||||||||||||||||||
9/30/2017 | 18.08 | 1.00 | 0.21 | 1.21 | (0.94 | ) | (0.09 | ) | — | |||||||||||||||||||||||
9/30/2016 | 17.21 | 0.82 | 1.07 | 1.89 | (0.95 | ) | (0.07 | ) | — | |||||||||||||||||||||||
| Administrative Class | ||||||||||||||||||||||||||||||||
9/30/2020 | $ | 17.87 | $ | 0.91 | $ | (1.65 | ) | $ | (0.74 | ) | $ | (0.80 | ) | $ | — | $ | (0.02 | ) | ||||||||||||||
9/30/2019 | 17.66 | 0.93 | 0.12 | 1.05 | (0.84 | ) | — | — | ||||||||||||||||||||||||
9/30/2018 | 18.82 | 0.80 | (0.75 | ) | 0.05 | (0.86 | ) | (0.23 | ) | (0.12 | ) | |||||||||||||||||||||
9/30/2017 | 18.61 | 1.00 | �� | 0.19 | 1.19 | (0.89 | ) | (0.09 | ) | — | ||||||||||||||||||||||
9/30/2016 | 17.60 | 0.75 | 0.94 | 1.69 | (0.61 | ) | (0.07 | ) | — | |||||||||||||||||||||||
| ^ | A “—” may reflect actual amounts rounding to less than $0.01 or 0.01%. |
| * | Commencement of operations. |
| (a) | Calculated on average shares outstanding during the period. |
| (b) | Total return is calculated assuming a purchase of a share on the first day of the period and a sale of a share on the last day of each period reported. Dividends and distributions, if any, are assumed, for purposes of this calculation, to be reinvested. Total return does not reflect sales charges and includes the effect of fee waivers and reimbursements. Total return may reflect adjustments to conform to U.S. GAAP. Total return for a period of less than one year is not annualized. |
| 170 | Annual Report | | September 30, 2020 | | See accompanying Notes to Financial Statements |
Table of Contents
| Total Dividends and Distributions | Net Asset Value, End of Period | Total Return (b) | Net Assets, End of Period (000s) | Ratio of Expenses to Average Net Assets with Fee Waiver/ Reimbursement (c) | Ratio of Expenses to Average Net Assets without Fee Waiver/ Reimbursement (c) | Ratio of Net Investment Income to Average Net Assets (c) | Portfolio Turnover Rate | |||||||||||||||||||||||||||
| $ | (0.95 | ) | $ | 15.97 | (4.02 | )% | $ | 4,114 | 0.50 | % | 0.60 | % | 5.65 | % | 427 | % | ||||||||||||||||||
| (0.95 | ) | 17.64 | 7.47 | 12,460 | 0.41 | 0.60 | 5.79 | 277 | ||||||||||||||||||||||||||
| (1.20 | ) | 17.35 | 0.12 | 8,826 | 0.36 | 0.61 | 4.12 | 172 | ||||||||||||||||||||||||||
| (0.94 | ) | 18.53 | 6.55 | 10,145 | 0.35 | 0.61 | 5.12 | 151 | ||||||||||||||||||||||||||
| (0.87 | ) | 18.31 | 10.97 | 10,140 | 0.40 | 0.60 | 4.25 | 116 | ||||||||||||||||||||||||||
| $ | (0.71 | ) | $ | 16.08 | (4.77 | )% | $ | 1,091 | 1.25 | % | 1.35 | % | 4.68 | % | 427 | % | ||||||||||||||||||
| (0.82 | ) | 17.64 | 6.58 | 1,520 | 1.16 | 1.35 | 4.90 | 277 | ||||||||||||||||||||||||||
| (1.07 | ) | 17.36 | (0.58 | ) | 2,210 | 1.11 | 1.36 | 3.51 | 172 | |||||||||||||||||||||||||
| (0.70 | ) | 18.53 | 5.78 | 3,435 | 1.10 | 1.36 | 4.37 | 151 | ||||||||||||||||||||||||||
| (0.65 | ) | 18.21 | 10.16 | 3,361 | 1.15 | 1.35 | 3.75 | 116 | ||||||||||||||||||||||||||
| $ | (0.85 | ) | $ | 16.82 | (4.42 | )% | $ | 538 | 0.85 | % | 0.85 | % | 4.56 | % | 427 | % | ||||||||||||||||||
| (0.88 | ) | 18.49 | 7.08 | 103 | 0.76 | 0.85 | 5.39 | 277 | ||||||||||||||||||||||||||
| (1.14 | ) | 18.14 | (0.20 | ) | 100 | 0.71 | 0.86 | 3.82 | 172 | |||||||||||||||||||||||||
| (0.80 | ) | 19.31 | 6.17 | 128 | 0.70 | 0.86 | 4.38 | 151 | ||||||||||||||||||||||||||
| (0.79 | ) | 18.97 | 10.59 | 519 | 0.75 | 0.85 | 4.00 | 116 | ||||||||||||||||||||||||||
| $ | (0.94 | ) | $ | 16.22 | (3.71 | )% | $ | 449 | 0.20 | % | 0.20 | % | 5.46 | % | 427 | % | ||||||||||||||||||
| (1.00 | ) | 17.83 | 7.68 | 2,119 | 0.11 | 0.20 | 6.21 | 277 | ||||||||||||||||||||||||||
| (1.26 | ) | 17.54 | 0.46 | 9,526 | 0.06 | 0.21 | 4.56 | 172 | ||||||||||||||||||||||||||
| (1.02 | ) | 18.71 | 6.86 | 14,507 | 0.05 | 0.21 | 5.37 | 151 | ||||||||||||||||||||||||||
| (0.99 | ) | 18.51 | 11.32 | 17,120 | 0.10 | 0.20 | 4.63 | 116 | ||||||||||||||||||||||||||
| $ | (1.07 | ) | $ | 15.63 | (3.69 | )% | $ | 326 | 0.15 | % | 0.15 | % | 5.88 | % | 427 | % | ||||||||||||||||||
| (1.01 | ) | 17.35 | 7.84 | 199 | 0.06 | 0.15 | 6.00 | 277 | ||||||||||||||||||||||||||
| (0.57 | ) | 17.08 | (1.16 | ) | 49 | 0.01 | (d) | 0.15 | (d) | 3.72 | (d) | 172 | ||||||||||||||||||||||
| $ | (1.08 | ) | $ | 15.64 | (3.64 | )% | $ | 38,248 | 0.10 | % | 0.10 | % | 5.97 | % | 427 | % | ||||||||||||||||||
| (1.01 | ) | 17.36 | 7.88 | 8,121 | 0.01 | 0.10 | 6.12 | 277 | ||||||||||||||||||||||||||
| (1.27 | ) | 17.09 | 0.56 | 14,894 | — | (e) | 0.11 | 4.60 | 172 | |||||||||||||||||||||||||
| (1.03 | ) | 18.26 | 6.99 | 20,448 | — | (e) | 0.11 | 5.54 | 151 | |||||||||||||||||||||||||
| (1.02 | ) | 18.08 | 11.40 | 19,128 | — | 0.10 | 4.70 | 116 | ||||||||||||||||||||||||||
| $ | (0.82 | ) | $ | 16.31 | (4.04 | )% | $ | 10 | 0.45 | % | 0.45 | % | 5.44 | % | 427 | % | ||||||||||||||||||
| (0.84 | ) | 17.87 | 6.17 | 10 | 0.36 | 0.45 | 5.46 | 277 | ||||||||||||||||||||||||||
| (1.21 | ) | 17.66 | 0.25 | 524 | 0.31 | 0.46 | 4.36 | 172 | ||||||||||||||||||||||||||
| (0.98 | ) | 18.82 | 6.62 | 1,550 | 0.30 | 0.46 | 5.38 | 151 | ||||||||||||||||||||||||||
| (0.68 | ) | 18.61 | 9.87 | 822 | 0.35 | 0.45 | 4.13 | 116 | ||||||||||||||||||||||||||
| (c) | Does not include expenses of the investment companies in which the Fund invests. |
| (d) | Annualized, unless otherwise noted. |
| (e) | As a result of reimbursing expenses inclusive of estimated acquired fund fees and expenses, the Investment Manager reimbursed amounts in excess of the respective share class’ operating expenses. |
| See accompanying Notes to Financial Statements | | September 30, 2020 | | Annual Report | 171 |
Table of Contents
Financial Highlights† (cont’d)
For a Share Outstanding for the Period ended:^
| Net Asset Value, Beginning of Period | Net Investment Income (a) | Net Realized | Total from Investment Operations | Dividends from Net Investment Income | Distributions from Net Realized Capital Gains | |||||||||||||||||||||||
| AllianzGI PerformanceFee Managed Futures Strategy:† | ||||||||||||||||||||||||||||
| Class P | ||||||||||||||||||||||||||||
9/30/2020 | $ | 9.83 | $ | 0.10 | $ | (1.26 | ) | $ | (1.16 | ) | $ | (0.52 | ) | $ | (0.12 | ) | ||||||||||||
9/30/2019 | 9.61 | 0.19 | 0.11 | 0.30 | (0.08 | ) | — | |||||||||||||||||||||
12/18/2017* - 9/30/2018 | 10.00 | 0.12 | (0.51 | ) | (0.39 | ) | — | — | ||||||||||||||||||||
| Institutional Class | ||||||||||||||||||||||||||||
9/30/2020 | $ | 9.82 | $ | 0.10 | $ | (1.26 | ) | $ | (1.16 | ) | $ | (0.52 | ) | $ | (0.12 | ) | ||||||||||||
9/30/2019 | 9.60 | 0.20 | 0.11 | 0.31 | (0.09 | ) | — | |||||||||||||||||||||
12/18/2017* - 9/30/2018 | 10.00 | 0.13 | (0.53 | ) | (0.40 | ) | — | — | ||||||||||||||||||||
| Class R6 | ||||||||||||||||||||||||||||
9/30/2020 | $ | 9.83 | $ | 0.11 | $ | (1.26 | ) | $ | (1.15 | ) | $ | (0.53 | ) | $ | (0.12 | ) | ||||||||||||
9/30/2019 | 9.61 | 0.20 | 0.11 | 0.31 | (0.09 | ) | — | |||||||||||||||||||||
12/18/2017* - 9/30/2018 | 10.00 | 0.13 | (0.52 | ) | (0.39 | ) | — | — | ||||||||||||||||||||
| AllianzGI PerformanceFee Structured US Equity: | ||||||||||||||||||||||||||||
| Class P | ||||||||||||||||||||||||||||
9/30/2020 | $ | 10.67 | $ | 0.11 | $ | (1.44 | ) | $ | (1.33 | ) | $ | (0.30 | ) | $ | (0.16 | ) | ||||||||||||
9/30/2019 | 11.12 | 0.33 | (0.02 | ) | 0.31 | (0.09 | ) | (0.67 | ) | |||||||||||||||||||
12/18/2017* - 9/30/2018 | 10.00 | 0.14 | 0.98 | 1.12 | — | — | ||||||||||||||||||||||
| Institutional Class | ||||||||||||||||||||||||||||
9/30/2020 | $ | 10.67 | $ | 0.16 | $ | (1.49 | ) | $ | (1.33 | ) | $ | (0.29 | ) | $ | (0.16 | ) | ||||||||||||
9/30/2019 | 11.13 | 0.21 | 0.09 | 0.30 | (0.09 | ) | (0.67 | ) | ||||||||||||||||||||
12/18/2017* - 9/30/2018 | 10.00 | 0.18 | 0.95 | 1.13 | — | — | ||||||||||||||||||||||
| Class R6 | ||||||||||||||||||||||||||||
9/30/2020 | $ | 10.73 | $ | 0.15 | $ | (1.49 | ) | $ | (1.34 | ) | $ | (0.23 | ) | $ | (0.16 | ) | ||||||||||||
9/30/2019 | 11.13 | 0.23 | 0.10 | 0.33 | (0.06 | ) | (0.67 | ) | ||||||||||||||||||||
12/18/2017* - 9/30/2018 | 10.00 | 0.13 | 1.00 | 1.13 | — | — | ||||||||||||||||||||||
| AllianzGI Preferred Securities and Income: | ||||||||||||||||||||||||||||
| Class P | ||||||||||||||||||||||||||||
9/30/2020 | $ | 15.65 | $ | 0.63 | $ | (0.48 | ) | $ | 0.15 | $ | (0.68 | ) | $ | (0.39 | ) | |||||||||||||
9/30/2019 | 15.06 | 0.68 | 0.64 | 1.32 | (0.71 | ) | (0.02 | ) | ||||||||||||||||||||
5/30/2018* - 9/30/2018 | 15.00 | 0.23 | 0.03 | 0.26 | (0.20 | ) | — | |||||||||||||||||||||
| Institutional Class | ||||||||||||||||||||||||||||
9/30/2020 | $ | 15.65 | $ | 0.66 | $ | (0.50 | ) | $ | 0.16 | $ | (0.68 | ) | $ | (0.39 | ) | |||||||||||||
9/30/2019 | 15.06 | 0.69 | 0.64 | 1.33 | (0.72 | ) | (0.02 | ) | ||||||||||||||||||||
5/30/2018* - 9/30/2018 | 15.00 | 0.26 | — | 0.26 | (0.20 | ) | — | |||||||||||||||||||||
| Class R6 | ||||||||||||||||||||||||||||
9/30/2020 | $ | 15.65 | $ | 0.65 | $ | (0.49 | ) | $ | 0.16 | $ | (0.69 | ) | $ | (0.39 | ) | |||||||||||||
9/30/2019 | 15.06 | 0.70 | 0.64 | 1.34 | (0.73 | ) | (0.02 | ) | ||||||||||||||||||||
5/30/2018* - 9/30/2018 | 15.00 | 0.24 | 0.03 | 0.27 | (0.21 | ) | — | |||||||||||||||||||||
| ^ | A “—” may reflect actual amounts rounding to less than $0.01 or 0.01%. |
| † | Consolidated Financial Highlights for the AllianzGI PerformanceFee Managed Futures Strategy Fund. These financial statements are consolidated to include the accounts of AllianzGI PerformanceFee Managed Futures Strategy Offshore Fund Ltd., a wholly-owned subsidiary of the AllianzGI PerformanceFee Managed Futures Strategy Fund. See Note 14. |
| * | Commencement of operations. |
| (a) | Calculated on average shares outstanding during the period. |
| (b) | Total return is calculated assuming a purchase of a share on the first day of the period and a sale of a share on the last day of each period reported. Dividends and distributions, if any, are assumed, for purposes of this calculation, to be reinvested. Total return does not reflect sales charges and includes the effect of fee waivers and reimbursements. Total return may reflect adjustments to conform to U.S. GAAP. Total return for a period of less than one year is not annualized. |
| (c) | Does not include expenses of the investment companies in which the Fund invests. |
| 172 | Annual Report | | September 30, 2020 | | See accompanying Notes to Financial Statements |
Table of Contents
| Total Dividends and Distributions | Net Asset of Period | Total Return (b) | Net Assets, End of Period (000s) | Ratio of Expenses to Average Net Assets with Fee Waiver/ Reimbursement | Ratio of Expenses to Average Net Assets without Fee Waiver/ Reimbursement | Ratio of Net Investment Income to Average Net Assets | Portfolio Turnover Rate | |||||||||||||||||||||||||||
| $ | (0.64 | ) | $ | 8.03 | (12.43 | )% | $ | 9 | 0.22 | %(c) | 0.97 | %(c) | 1.13 | %(c) | 42 | % | ||||||||||||||||||
| (0.08 | ) | 9.83 | 3.17 | 10 | 0.28 | (c) | 1.28 | (c) | 2.02 | (c) | 184 | |||||||||||||||||||||||
| — | 9.61 | (3.90 | ) | 10 | 0.20 | (d)(e) | 4.01 | (d)(e) | 1.59 | (d)(e) | 121 | |||||||||||||||||||||||
| $ | (0.64 | ) | $ | 8.02 | (12.44 | )% | $ | 211 | 0.20 | %(c) | 1.00 | %(c) | 1.18 | %(c) | 42 | % | ||||||||||||||||||
| (0.09 | ) | 9.82 | 3.24 | 605 | 0.22 | (c) | 1.39 | (c) | 2.11 | (c) | 184 | |||||||||||||||||||||||
| — | 9.60 | (4.00 | ) | 515 | 0.15 | (d)(e) | 5.42 | (d)(e) | 1.74 | (d)(e) | 121 | |||||||||||||||||||||||
| $ | (0.65 | ) | $ | 8.03 | (12.33 | )% | $ | 24,934 | 0.13 | %(c) | 1.00 | %(c) | 1.23 | %(c) | 42 | % | ||||||||||||||||||
| (0.09 | ) | 9.83 | 3.31 | 32,416 | 0.18 | (c) | 1.24 | (c) | 2.13 | (c) | 184 | |||||||||||||||||||||||
| — | 9.61 | (3.90 | ) | 15,254 | 0.10 | (d)(e) | 4.00 | (d)(e) | 1.70 | (d)(e) | 121 | |||||||||||||||||||||||
| $ | (0.46 | ) | $ | 8.88 | (13.43 | )% | $ | 378 | 0.48 | %(c) | 1.02 | %(c) | 1.16 | %(c) | 70 | % | ||||||||||||||||||
| (0.76 | ) | 10.67 | 4.55 | 20,458 | 0.25 | (c)(f) | 0.70 | (c) | 3.16 | (c) | 8 | |||||||||||||||||||||||
| — | 11.12 | 11.20 | 11 | 0.61 | (d)(e) | 1.75 | (e) | 1.71 | (d)(e) | 2 | ||||||||||||||||||||||||
| $ | (0.45 | ) | $ | 8.89 | (13.39 | )% | $ | 49,423 | 0.21 | %(c) | 0.88 | %(c) | 1.70 | %(c) | 70 | % | ||||||||||||||||||
| (0.76 | ) | 10.67 | 4.39 | 51,188 | 0.17 | (c)(f) | 0.94 | (c) | 2.06 | (c) | 8 | |||||||||||||||||||||||
| — | 11.13 | 11.30 | 40,290 | 0.62 | (e)(d) | 1.58 | (d)(e) | 2.12 | (d)(e) | 2 | ||||||||||||||||||||||||
| $ | (0.39 | ) | $ | 9.00 | (13.26 | )% | $ | 390 | 0.88 | %(c) | 1.22 | %(c) | 1.34 | %(c) | 70 | % | ||||||||||||||||||
| (0.73 | ) | 10.73 | 4.66 | 42,966 | (0.08 | )(c)(f) | 0.86 | (c) | 2.27 | (c) | 8 | |||||||||||||||||||||||
| — | 11.13 | 11.30 | 42,774 | 0.61 | (d)(e) | 1.72 | (d)(e) | 1.64 | (d)(e) | 2 | ||||||||||||||||||||||||
| $ | (1.07 | ) | $ | 14.73 | 1.01 | % | $ | 11 | 0.60 | % | 1.36 | % | 4.27 | % | 166 | % | ||||||||||||||||||
| (0.73 | ) | 15.65 | 9.14 | 11 | 0.60 | 2.04 | 4.55 | 98 | ||||||||||||||||||||||||||
| (0.20 | ) | 15.06 | 1.74 | 10 | 0.60 | (d)(e) | 3.21 | (d)(e) | 4.62 | (d)(e) | 39 | |||||||||||||||||||||||
| $ | (1.07 | ) | $ | 14.74 | 1.13 | % | $ | 7,662 | 0.55 | % | 1.34 | % | 4.52 | % | 166 | % | ||||||||||||||||||
| (0.74 | ) | 15.65 | 9.21 | 3,035 | 0.55 | 2.09 | 4.62 | 98 | ||||||||||||||||||||||||||
| (0.20 | ) | 15.06 | 1.76 | 1,548 | 0.56 | (d)(e) | 4.22 | (d)(e) | 5.28 | (d)(e) | 39 | |||||||||||||||||||||||
| $ | (1.08 | ) | $ | 14.73 | 1.10 | % | $ | 17,839 | 0.50 | % | 1.35 | % | 4.41 | % | 166 | % | ||||||||||||||||||
| (0.75 | ) | 15.65 | 9.26 | 14,646 | 0.50 | 2.00 | 4.66 | 98 | ||||||||||||||||||||||||||
| (0.21 | ) | 15.06 | 1.78 | 10,157 | 0.50 | (d)(e) | 3.22 | (d)(e) | 4.71 | (d)(e) | 39 | |||||||||||||||||||||||
| (d) | Annualized, unless otherwise noted. |
| (e) | Certain expenses incurred by the Fund were not annualized. |
| (f) | Inclusive of management fee waivers of less than 0.005% for Class P, 0.23% for Institutional Class and 0.49% for Class R6 for the period from the commencement of the Fund’s operations until December 31, 2018 (the “Initial Performance Period”). |
| See accompanying Notes to Financial Statements | | September 30, 2020 | | Annual Report | 173 |
Table of Contents
Financial Highlights (cont’d)
For a Share Outstanding for the Period ended:^
| Net Asset Value, Beginning of Period | Net Investment Income (a) | Net Realized | Total from Investment Operations | Dividends from Net Investment Income | ||||||||||||||||||||
| AllianzGI Short Duration High Income: | ||||||||||||||||||||||||
| Class A | ||||||||||||||||||||||||
9/30/2020 | $ | 14.62 | $ | 0.58 | $ | (0.54 | ) | $ | 0.04 | $ | (0.67 | ) | ||||||||||||
9/30/2019 | 14.93 | 0.51 | (0.11 | ) | 0.40 | (0.71 | ) | |||||||||||||||||
9/30/2018 | 15.18 | 0.59 | (0.16 | ) | 0.43 | (0.68 | ) | |||||||||||||||||
9/30/2017 | 15.29 | 0.60 | 0.04 | 0.64 | (0.75 | ) | ||||||||||||||||||
9/30/2016 | 15.04 | 0.72 | 0.38 | 1.10 | (0.85 | ) | ||||||||||||||||||
| Class C | ||||||||||||||||||||||||
9/30/2020 | $ | 14.61 | $ | 0.54 | $ | (0.54 | ) | $ | — | $ | (0.63 | ) | ||||||||||||
9/30/2019 | 14.90 | 0.47 | (0.10 | ) | 0.37 | (0.66 | ) | |||||||||||||||||
9/30/2018 | 15.15 | 0.55 | (0.15 | ) | 0.40 | (0.65 | ) | |||||||||||||||||
9/30/2017 | 15.27 | 0.56 | 0.03 | 0.59 | (0.71 | ) | ||||||||||||||||||
9/30/2016 | 15.00 | 0.68 | 0.38 | 1.06 | (0.79 | ) | ||||||||||||||||||
| Class P | ||||||||||||||||||||||||
9/30/2020 | $ | 14.51 | $ | 0.59 | $ | (0.51 | ) | $ | 0.08 | $ | (0.69 | ) | ||||||||||||
9/30/2019 | 14.88 | 0.53 | (0.10 | ) | 0.43 | (0.80 | ) | |||||||||||||||||
9/30/2018 | 15.13 | 0.62 | (0.15 | ) | 0.47 | (0.72 | ) | |||||||||||||||||
9/30/2017 | 15.24 | 0.63 | 0.05 | 0.68 | (0.79 | ) | ||||||||||||||||||
9/30/2016 | 15.03 | 0.74 | 0.38 | 1.12 | (0.91 | ) | ||||||||||||||||||
| Institutional Class | ||||||||||||||||||||||||
9/30/2020 | $ | 14.52 | $ | 0.61 | $ | (0.54 | ) | $ | 0.07 | $ | (0.70 | ) | ||||||||||||
9/30/2019 | 14.89 | 0.54 | (0.11 | ) | 0.43 | (0.80 | ) | |||||||||||||||||
9/30/2018 | 15.14 | 0.63 | (0.15 | ) | 0.48 | (0.73 | ) | |||||||||||||||||
9/30/2017 | 15.25 | 0.64 | 0.04 | 0.68 | (0.79 | ) | ||||||||||||||||||
9/30/2016 | 15.05 | 0.76 | 0.37 | 1.13 | (0.93 | ) | ||||||||||||||||||
| Class R6 | ||||||||||||||||||||||||
9/30/2020 | $ | 14.52 | $ | 0.62 | $ | (0.54 | ) | $ | 0.08 | $ | (0.71 | ) | ||||||||||||
9/30/2019 | 14.89 | 0.56 | (0.11 | ) | 0.45 | (0.82 | ) | |||||||||||||||||
9/30/2018 | 15.14 | 0.64 | (0.16 | ) | 0.48 | (0.73 | ) | |||||||||||||||||
2/1/2017* - 9/30/2017 | 15.18 | 0.42 | 0.03 | 0.45 | (0.49 | ) | ||||||||||||||||||
| ^ | A “—” may reflect actual amounts rounding to less than $0.01 or 0.01%. |
| * | Commencement of operations. |
| (a) | Calculated on average shares outstanding during the period. |
| (b) | Total return is calculated assuming a purchase of a share on the first day of the period and a sale of a share on the last day of each period reported. Dividends and distributions, if any, are assumed, for purposes of this calculation, to be reinvested. Total return does not reflect sales charges and includes the effect of fee waivers and reimbursements. Total return may reflect adjustments to conform to U.S. GAAP. Total return for a period of less than one year is not annualized. |
| (c) | Annualized, unless otherwise noted. |
| 174 | Annual Report | | September 30, 2020 | | See accompanying Notes to Financial Statements |
Table of Contents
| Net Asset Value, End of Period | Total Return (b) | Net Assets, End of Period (000s) | Ratio of Expenses to Average Net Assets with Fee Waiver/ Reimbursement | Ratio of Expenses to Average Net Assets without Fee Waiver/ Reimbursement | Ratio of Net Investment Income to Average Net Assets | Portfolio Turnover Rate | ||||||||||||||||||||||||
| $ | 13.99 | 0.37 | % | $ | 136,690 | 0.86 | % | 0.87 | % | 4.13 | % | 81 | % | |||||||||||||||||
| 14.62 | 2.85 | 136,086 | 0.88 | 0.88 | 3.52 | 47 | ||||||||||||||||||||||||
| 14.93 | 2.95 | 150,899 | 0.89 | 0.89 | 3.92 | 60 | ||||||||||||||||||||||||
| 15.18 | 4.27 | 218,312 | 0.89 | 0.89 | 3.94 | 88 | ||||||||||||||||||||||||
| 15.29 | 7.65 | 226,149 | 0.85 | 0.85 | 4.85 | 63 | ||||||||||||||||||||||||
| $ | 13.98 | 0.12 | % | $ | 90,863 | 1.12 | % | 1.13 | % | 3.86 | % | 81 | % | |||||||||||||||||
| 14.61 | 2.58 | 117,058 | 1.14 | 1.14 | 3.25 | 47 | ||||||||||||||||||||||||
| 14.90 | 2.74 | 135,483 | 1.11 | 1.11 | 3.70 | 60 | ||||||||||||||||||||||||
| 15.15 | 4.00 | 148,587 | 1.12 | 1.12 | 3.70 | 88 | ||||||||||||||||||||||||
| 15.27 | 7.42 | 132,649 | 1.13 | 1.13 | 4.58 | 63 | ||||||||||||||||||||||||
| $ | 13.90 | 0.69 | % | $ | 264,908 | 0.63 | % | 0.67 | % | 4.16 | % | 81 | % | |||||||||||||||||
| 14.51 | 3.05 | 501,138 | 0.65 | 0.65 | 3.70 | 47 | ||||||||||||||||||||||||
| 14.88 | 3.21 | 411,367 | 0.65 | 0.65 | 4.14 | 60 | ||||||||||||||||||||||||
| 15.13 | 4.56 | 700,376 | 0.63 | 0.63 | 4.19 | 88 | ||||||||||||||||||||||||
| 15.24 | 7.84 | 554,281 | 0.66 | 0.66 | 4.97 | 63 | ||||||||||||||||||||||||
| $ | 13.89 | 0.63 | % | $ | 285,572 | 0.61 | % | 0.64 | % | 4.35 | % | 81 | % | |||||||||||||||||
| 14.52 | 3.06 | 388,672 | 0.63 | 0.63 | 3.74 | 47 | ||||||||||||||||||||||||
| 14.89 | 3.26 | 388,443 | 0.60 | 0.60 | 4.20 | 60 | ||||||||||||||||||||||||
| 15.14 | 4.61 | 539,078 | 0.59 | 0.59 | 4.22 | 88 | ||||||||||||||||||||||||
| 15.25 | 7.90 | 420,440 | 0.58 | 0.58 | 5.10 | 63 | ||||||||||||||||||||||||
| $ | 13.89 | 0.70 | % | $ | 33,741 | 0.55 | % | 0.56 | % | 4.49 | % | 81 | % | |||||||||||||||||
| 14.52 | 3.20 | 39,234 | 0.57 | 0.57 | 3.89 | 47 | ||||||||||||||||||||||||
| 14.89 | 3.29 | 52,922 | 0.55 | 0.55 | 4.27 | 60 | ||||||||||||||||||||||||
| 15.14 | 3.04 | 70,595 | 0.56 | (c) | 0.56 | (c) | 4.25 | (c) | 88 | |||||||||||||||||||||
| See accompanying Notes to Financial Statements | | September 30, 2020 | | Annual Report | 175 |
Table of Contents
Financial Highlights (cont’d)
For a Share Outstanding for the Period ended:^
Net Asset | Net Investment Income (a) | Net Realized and Change in Unrealized Gain (Loss) | Total from Investment Operations | Dividends from Net Investment Income | Distributions from Net Realized Capital Gains | |||||||||||||||||||||||
| AllianzGI Short Term Bond: | ||||||||||||||||||||||||||||
| Class A | ||||||||||||||||||||||||||||
9/30/2020 | $ | 15.28 | $ | 0.56 | $ | 0.58 | $ | 1.14 | $ | (0.62 | ) | $ | (0.03 | ) | ||||||||||||||
9/30/2019 | 15.02 | 0.45 | 0.37 | 0.82 | (0.56 | ) | — | |||||||||||||||||||||
8/23/2018* - 9/30/2018 | 15.00 | 0.04 | (0.02 | ) | 0.02 | — | — | |||||||||||||||||||||
| Class P | ||||||||||||||||||||||||||||
9/30/2020 | $ | 15.29 | $ | 0.55 | $ | 0.61 | $ | 1.16 | $ | (0.59 | ) | $ | (0.03 | ) | ||||||||||||||
9/30/2019 | 15.02 | 0.47 | 0.38 | 0.85 | (0.58 | ) | — | |||||||||||||||||||||
8/23/2018* - 9/30/2018 | 15.00 | 0.04 | (0.02 | ) | 0.02 | — | — | |||||||||||||||||||||
| Institutional Class | ||||||||||||||||||||||||||||
9/30/2020 | $ | 15.29 | $ | 0.57 | $ | 0.61 | $ | 1.18 | $ | (0.63 | ) | $ | (0.03 | ) | ||||||||||||||
9/30/2019 | 15.02 | 0.48 | 0.38 | 0.86 | (0.59 | ) | — | |||||||||||||||||||||
8/23/2018* - 9/30/2018 | 15.00 | 0.04 | (0.02 | ) | 0.02 | — | — | |||||||||||||||||||||
| ^ | A “—” may reflect actual amounts rounding to less than $0.01 or 0.01%. |
| * | Commencement of operations. |
| (a) | Calculated on average shares outstanding during the period. |
| (b) | Total return is calculated assuming a purchase of a share on the first day of the period and a sale of a share on the last day of each period reported. Dividends and distributions, if any, are assumed, for purposes of this calculation, to be reinvested. Total return does not reflect sales charges and includes the effect of fee waivers and reimbursements. Total return may reflect adjustments to conform to U.S. GAAP. Total return for a period of less than one year is not annualized. |
| (c) | Annualized, unless otherwise noted. |
| (d) | Certain expenses incurred by the Fund were not annualized. |
| 176 | Annual Report | | September 30, 2020 | | See accompanying Notes to Financial Statements |
Table of Contents
| Total Dividends and Distributions | Net Asset Value, End of Period | Total Return (b) | Net Assets, End of Period (000s) | Ratio of Expenses to Average Net Assets with Fee Waiver/ Reimbursement | Ratio of Expenses to Average Net Assets without Fee Waiver/ Reimbursement | Ratio of Net Investment Income to Average Net Assets | Portfolio Turnover Rate | |||||||||||||||||||||||||||
| $ | (0.65 | ) | $ | 15.77 | 7.61 | % | $ | 5,632 | 0.64 | % | 1.47 | % | 3.64 | % | 133 | % | ||||||||||||||||||
| (0.56 | ) | 15.28 | 5.58 | 770 | 0.64 | 4.48 | 3.00 | 46 | ||||||||||||||||||||||||||
| — | 15.02 | 0.13 | 10 | 0.64 | (c)(d) | 10.85 | (c)(d) | 2.41 | (c)(d) | — | ||||||||||||||||||||||||
| $ | (0.62 | ) | $ | 15.83 | 7.79 | % | $ | 11 | 0.49 | % | 1.36 | % | 3.53 | % | 133 | % | ||||||||||||||||||
| (0.58 | ) | 15.29 | 5.78 | 11 | 0.49 | 23.90 | 3.12 | 46 | ||||||||||||||||||||||||||
| — | 15.02 | 0.13 | 10 | 0.49 | (c)(d) | 10.60 | (c)(d) | 2.56 | (c)(d) | — | ||||||||||||||||||||||||
| $ | (0.66 | ) | $ | 15.81 | 7.92 | % | $ | 10,880 | 0.39 | % | 1.30 | % | 3.70 | % | 133 | % | ||||||||||||||||||
| (0.59 | ) | 15.29 | 5.88 | 12,709 | 0.39 | 4.13 | 3.23 | 46 | ||||||||||||||||||||||||||
| — | 15.02 | 0.13 | 5,164 | 0.39 | (c)(d) | 10.62 | (c)(d) | 2.68 | (c)(d) | — | ||||||||||||||||||||||||
| See accompanying Notes to Financial Statements | | September 30, 2020 | | Annual Report | 177 |
Table of Contents
Financial Highlights (cont’d)
For a Share Outstanding for the Period ended:^
| Net Asset Value, Beginning of Period | Net Investment Income (Loss) (a) | Net Realized | Total from Investment Operations | Dividends from Net Investment Income | Distributions from Net Realized Capital Gains | |||||||||||||||||||||||
| AllianzGI Structured Return: | ||||||||||||||||||||||||||||
| Class A | ||||||||||||||||||||||||||||
9/30/2020 | $ | 16.20 | $ | 0.07 | $ | (5.18 | ) | $ | (5.11 | ) | $ | (0.14 | ) | $ | (0.44 | ) | ||||||||||||
9/30/2019 | 16.16 | 0.15 | 0.24 | 0.39 | — | (0.35 | ) | |||||||||||||||||||||
9/30/2018 | 16.26 | 0.10 | 0.41 | 0.51 | (0.10 | ) | (0.51 | ) | ||||||||||||||||||||
9/30/2017 | 15.85 | 0.09 | 0.74 | 0.83 | (0.06 | ) | (0.36 | ) | ||||||||||||||||||||
9/30/2016 | 15.47 | 0.15 | 0.51 | 0.66 | (0.10 | ) | (0.18 | ) | ||||||||||||||||||||
| Class C | ||||||||||||||||||||||||||||
9/30/2020 | $ | 15.50 | $ | (0.05 | ) | $ | (4.91 | ) | $ | (4.96 | ) | $ | (0.13 | ) | $ | (0.44 | ) | |||||||||||
9/30/2019 | 15.58 | 0.05 | 0.22 | 0.27 | — | (0.35 | ) | |||||||||||||||||||||
9/30/2018 | 15.73 | (0.03 | ) | 0.39 | 0.36 | — | (0.51 | ) | ||||||||||||||||||||
9/30/2017 | 15.39 | (0.04 | ) | 0.74 | 0.70 | — | (0.36 | ) | ||||||||||||||||||||
9/30/2016 | 15.12 | 0.02 | 0.51 | 0.53 | (0.08 | ) | (0.18 | ) | ||||||||||||||||||||
| Class P | ||||||||||||||||||||||||||||
9/30/2020 | $ | 16.17 | $ | 0.11 | $ | (5.13 | ) | $ | (5.02 | ) | $ | (0.32 | ) | $ | (0.44 | ) | ||||||||||||
9/30/2019 | 16.14 | 0.22 | 0.21 | 0.43 | (0.05 | ) | (0.35 | ) | ||||||||||||||||||||
9/30/2018 | 16.26 | 0.13 | 0.41 | 0.54 | (0.15 | ) | (0.51 | ) | ||||||||||||||||||||
9/30/2017 | 15.87 | 0.18 | 0.69 | 0.87 | (0.12 | ) | (0.36 | ) | ||||||||||||||||||||
9/30/2016 | 15.53 | 0.17 | 0.53 | 0.70 | (0.18 | ) | (0.18 | ) | ||||||||||||||||||||
| Institutional Class | ||||||||||||||||||||||||||||
9/30/2020 | $ | 16.29 | $ | 0.14 | $ | (5.18 | ) | $ | (5.04 | ) | $ | (0.32 | ) | $ | (0.44 | ) | ||||||||||||
9/30/2019 | 16.32 | 0.22 | 0.21 | 0.43 | (0.11 | ) | (0.35 | ) | ||||||||||||||||||||
9/30/2018 | 16.42 | 0.16 | 0.40 | 0.56 | (0.15 | ) | (0.51 | ) | ||||||||||||||||||||
9/30/2017 | 15.96 | 0.14 | 0.74 | 0.88 | (0.06 | ) | (0.36 | ) | ||||||||||||||||||||
9/30/2016 | 15.54 | 0.19 | 0.52 | 0.71 | (0.11 | ) | (0.18 | ) | ||||||||||||||||||||
| Class R6 | ||||||||||||||||||||||||||||
9/30/2020 | $ | 16.23 | $ | 0.08 | $ | (5.11 | ) | $ | (5.03 | ) | $ | (0.35 | ) | $ | (0.44 | ) | ||||||||||||
9/30/2019 | 16.24 | 0.23 | 0.22 | 0.45 | (0.11 | ) | (0.35 | ) | ||||||||||||||||||||
9/30/2018 | 16.32 | 0.15 | 0.40 | 0.55 | (0.12 | ) | (0.51 | ) | ||||||||||||||||||||
12/5/2016* - 9/30/2017 | 16.13 | 0.15 | 0.58 | 0.73 | (0.18 | ) | (0.36 | ) | ||||||||||||||||||||
| ^ | A “—” may reflect actual amounts rounding to less than $0.01 or 0.01%. |
| * | Commencement of operations. |
| (a) | Calculated on average shares outstanding during the period. |
| (b) | Total return is calculated assuming a purchase of a share on the first day of the period and a sale of a share on the last day of each period reported. Dividends and distributions, if any, are assumed, for purposes of this calculation, to be reinvested. Total return does not reflect sales charges and includes the effect of fee waivers and reimbursements. Total return may reflect adjustments to conform to U.S. GAAP. Total return for a period of less than one year is not annualized. |
| (c) | Does not include expenses of the investment companies in which the Fund invests. |
| (d) | Payments from Affiliates increased the end of period net asset value and total return by less than $0.01 and 0.01%, respectively. |
| (e) | Annualized, unless otherwise noted. |
| 178 | Annual Report | | September 30, 2020 | | See accompanying Notes to Financial Statements |
Table of Contents
| Total Dividends and Distributions | Net Asset Value, End of Period | Total Return (b) | Net Assets, End of Period (000s) | Ratio of Expenses to Average Net Assets with Fee Waiver/ Reimbursement (c) | Ratio of Expenses to Average Net Assets without Fee Waiver/ Reimbursement (c) | Ratio of Net Investment Income (Loss) to Average Net Assets (c) | Portfolio Turnover Rate | |||||||||||||||||||||||||||
| $ | (0.58 | ) | $ | 10.51 | (32.77 | )% | $ | 3,675 | 1.02 | % | 1.12 | % | 0.45 | % | 16 | % | ||||||||||||||||||
| (0.35 | ) | 16.20 | 2.55 | 38,397 | 0.99 | 1.06 | 0.97 | 96 | ||||||||||||||||||||||||||
| (0.61 | ) | 16.16 | 3.23 | 110,429 | 0.98 | 1.04 | 0.61 | 586 | ||||||||||||||||||||||||||
| (0.42 | ) | 16.26 | (d) | 5.35 | (d) | 136,344 | 1.02 | 1.15 | 0.57 | 680 | ||||||||||||||||||||||||
| (0.28 | ) | 15.85 | 4.32 | 96,870 | 1.15 | 1.17 | 0.95 | 500 | ||||||||||||||||||||||||||
| $ | (0.57 | ) | $ | 9.97 | (33.29 | )% | $ | 2,831 | 1.78 | % | 1.97 | % | (0.41 | )% | 16 | % | ||||||||||||||||||
| (0.35 | ) | 15.50 | 1.84 | 12,179 | 1.76 | 1.84 | 0.31 | 96 | ||||||||||||||||||||||||||
| (0.51 | ) | 15.58 | 2.34 | 16,862 | 1.78 | 1.78 | (0.18 | ) | 586 | |||||||||||||||||||||||||
| (0.36 | ) | 15.73 | (d) | 4.61 | (d) | 16,535 | 1.80 | 1.87 | (0.24 | ) | 680 | |||||||||||||||||||||||
| (0.26 | ) | 15.39 | 3.52 | 12,605 | 1.90 | 1.97 | 0.10 | 500 | ||||||||||||||||||||||||||
| $ | (0.76 | ) | $ | 10.39 | (32.66 | )% | $ | 9,453 | 0.80 | % | 0.87 | % | 0.75 | % | 16 | % | ||||||||||||||||||
| (0.40 | ) | 16.17 | 2.83 | 153,249 | 0.79 | 0.84 | 1.37 | 96 | ||||||||||||||||||||||||||
| (0.66 | ) | 16.14 | 3.40 | 150,441 | 0.77 | 0.77 | 0.85 | 586 | ||||||||||||||||||||||||||
| (0.48 | ) | 16.26 | (d) | 5.59 | (d) | 136,127 | 0.79 | 0.83 | 1.12 | 680 | ||||||||||||||||||||||||
| (0.36 | ) | 15.87 | 4.55 | 20,664 | 0.96 | 0.96 | 1.11 | 500 | ||||||||||||||||||||||||||
| $ | (0.76 | ) | $ | 10.49 | (32.54 | )% | $ | 9,651 | 0.74 | % | 0.87 | % | 0.94 | % | 16 | % | ||||||||||||||||||
| (0.46 | ) | 16.29 | 2.85 | 385,323 | 0.71 | 0.78 | 1.41 | 96 | ||||||||||||||||||||||||||
| (0.66 | ) | 16.32 | 3.52 | 345,453 | 0.69 | 0.77 | 1.01 | 586 | ||||||||||||||||||||||||||
| (0.42 | ) | 16.42 | (d) | 5.62 | (d) | 205,068 | 0.74 | 0.87 | 0.86 | 680 | ||||||||||||||||||||||||
| (0.29 | ) | 15.96 | 4.60 | 146,194 | 0.90 | 0.90 | 1.21 | 500 | ||||||||||||||||||||||||||
| $ | (0.79 | ) | $ | 10.41 | (32.65 | )% | $ | 5,848 | 0.71 | % | 0.80 | % | 0.55 | % | 16 | % | ||||||||||||||||||
| (0.46 | ) | 16.23 | 2.93 | 57,091 | 0.69 | 0.71 | 1.46 | 96 | ||||||||||||||||||||||||||
| (0.63 | ) | 16.24 | 3.47 | 50,899 | 0.67 | 0.71 | 0.97 | 586 | ||||||||||||||||||||||||||
| (0.54 | ) | 16.32 | (d) | 4.64 | (d) | 34,047 | 0.68 | (e) | 0.76 | (e) | 1.17 | (e) | 680 | |||||||||||||||||||||
| See accompanying Notes to Financial Statements | | September 30, 2020 | | Annual Report | 179 |
Table of Contents
Financial Highlights (cont’d)
For a Share Outstanding for the Year ended:^
| Net Asset Value, Beginning of Year | Net Investment Income (Loss) (a) | Net Realized | Total from Investment Operations | Dividends from Net Investment Income | Distributions from Net Realized Capital Gains | |||||||||||||||||||||||
| AllianzGI Water: | ||||||||||||||||||||||||||||
| Class A | ||||||||||||||||||||||||||||
9/30/2020 | $ | 16.31 | $ | 0.06 | $ | 1.77 | $ | 1.83 | $ | (0.11 | ) | $ | (0.40 | ) | ||||||||||||||
9/30/2019 | 15.54 | 0.11 | 1.15 | 1.26 | (0.13 | ) | (0.36 | ) | ||||||||||||||||||||
9/30/2018 | 15.49 | 0.13 | 0.34 | 0.47 | (0.04 | ) | (0.38 | ) | ||||||||||||||||||||
9/30/2017 | 14.46 | 0.08 | 1.08 | 1.16 | (0.05 | ) | (0.08 | ) | ||||||||||||||||||||
9/30/2016 | 11.99 | 0.08 | 2.44 | 2.52 | (0.03 | ) | (0.02 | ) | ||||||||||||||||||||
| Class C | ||||||||||||||||||||||||||||
9/30/2020 | $ | 15.52 | $ | (0.06 | ) | $ | 1.67 | $ | 1.61 | $ | — | $ | (0.40 | ) | ||||||||||||||
9/30/2019 | 14.79 | — | 1.10 | 1.10 | (0.01 | ) | (0.36 | ) | ||||||||||||||||||||
9/30/2018 | 14.82 | 0.01 | 0.34 | 0.35 | — | (0.38 | ) | |||||||||||||||||||||
9/30/2017 | 13.90 | (0.01 | ) | 1.01 | 1.00 | — | (0.08 | ) | ||||||||||||||||||||
9/30/2016 | 11.59 | (0.02 | ) | 2.35 | 2.33 | — | (0.02 | ) | ||||||||||||||||||||
| Class P | ||||||||||||||||||||||||||||
9/30/2020 | $ | 16.33 | $ | 0.11 | $ | 1.77 | $ | 1.88 | $ | (0.13 | ) | $ | (0.40 | ) | ||||||||||||||
9/30/2019 | 15.59 | 0.15 | 1.14 | 1.29 | (0.19 | ) | (0.36 | ) | ||||||||||||||||||||
9/30/2018 | 15.57 | 0.17 | 0.36 | 0.53 | (0.13 | ) | (0.38 | ) | ||||||||||||||||||||
9/30/2017 | 14.54 | 0.15 | 1.04 | �� | 1.19 | (0.08 | ) | (0.08 | ) | |||||||||||||||||||
9/30/2016 | 12.05 | 0.11 | 2.45 | 2.56 | (0.05 | ) | (0.02 | ) | ||||||||||||||||||||
| Institutional Class | ||||||||||||||||||||||||||||
9/30/2020 | $ | 16.03 | $ | 0.11 | $ | 1.74 | $ | 1.85 | $ | (0.15 | ) | $ | (0.40 | ) | ||||||||||||||
9/30/2019 | 15.31 | 0.15 | 1.11 | 1.26 | (0.18 | ) | (0.36 | ) | ||||||||||||||||||||
9/30/2018 | 15.32 | 0.17 | 0.34 | 0.51 | (0.14 | ) | (0.38 | ) | ||||||||||||||||||||
9/30/2017 | 14.33 | 0.16 | 1.02 | 1.18 | (0.11 | ) | (0.08 | ) | ||||||||||||||||||||
9/30/2016 | 11.90 | 0.11 | 2.41 | 2.52 | (0.07 | ) | (0.02 | ) | ||||||||||||||||||||
| ^ | A “—” may reflect actual amounts rounding to less than $0.01 or 0.01%. |
| (a) | Calculated on average shares outstanding during the year. |
| (b) | Total return is calculated assuming a purchase of a share on the first day of the year and a sale of a share on the last day of each year reported. Dividends and distributions, if any, are assumed, for purposes of this calculation, to be reinvested. Total return does not reflect sales charges and includes the effect of fee waivers and reimbursements. Total return may reflect adjustments to conform to U.S. GAAP. |
| 180 | Annual Report | | September 30, 2020 | | See accompanying Notes to Financial Statements |
Table of Contents
| Total Dividends and Distributions | Net Asset Value, End of Year | Total Return (b) | Net Assets, End of Year (000s) | Ratio of Expenses to Average Net Assets with Fee Waiver/ Reimbursement | Ratio of Expenses to Average Net Assets without Fee Waiver/ Reimbursement | Ratio of Net Investment Income (Loss) to Average Net Assets | Portfolio Turnover Rate | |||||||||||||||||||||||||||
| $ | (0.51 | ) | $ | 17.63 | 11.35 | % | $ | 200,384 | 1.22 | % | 1.40 | % | 0.37 | % | 28 | % | ||||||||||||||||||
| (0.49 | ) | 16.31 | 8.88 | 177,463 | 1.23 | 1.40 | 0.76 | 33 | ||||||||||||||||||||||||||
| (0.42 | ) | 15.54 | 3.05 | 172,374 | 1.19 | 1.41 | 0.84 | 34 | ||||||||||||||||||||||||||
| (0.13 | ) | 15.49 | 8.18 | 190,693 | 1.33 | 1.44 | 0.59 | 29 | ||||||||||||||||||||||||||
| (0.05 | ) | 14.46 | 21.06 | 237,785 | 1.49 | 1.49 | 0.62 | 55 | ||||||||||||||||||||||||||
| $ | (0.40 | ) | $ | 16.73 | 10.48 | % | $ | 57,901 | 1.97 | % | 2.16 | % | (0.38 | )% | 28 | % | ||||||||||||||||||
| (0.37 | ) | 15.52 | 8.02 | 70,175 | 1.98 | 2.15 | 0.01 | 33 | ||||||||||||||||||||||||||
| (0.38 | ) | 14.79 | 2.35 | 83,156 | 1.94 | 2.16 | 0.07 | 34 | ||||||||||||||||||||||||||
| (0.08 | ) | 14.82 | 7.32 | 89,250 | 2.07 | 2.19 | (0.07 | ) | 29 | |||||||||||||||||||||||||
| (0.02 | ) | 13.90 | 20.13 | 92,028 | 2.25 | 2.25 | (0.18 | ) | 55 | |||||||||||||||||||||||||
| $ | (0.53 | ) | $ | 17.68 | 11.67 | % | $ | 240,922 | 0.94 | % | 1.16 | % | 0.66 | % | 28 | % | ||||||||||||||||||
| (0.55 | ) | 16.33 | 9.14 | 210,425 | 0.95 | 1.17 | 1.03 | 33 | ||||||||||||||||||||||||||
| (0.51 | ) | 15.59 | 3.40 | 243,338 | 0.93 | 1.15 | 1.12 | 34 | ||||||||||||||||||||||||||
| (0.16 | ) | 15.57 | 8.40 | 210,746 | 1.04 | 1.16 | 1.02 | 29 | ||||||||||||||||||||||||||
| (0.07 | ) | 14.54 | 21.37 | 125,532 | 1.24 | 1.24 | 0.82 | 55 | ||||||||||||||||||||||||||
| $ | (0.55 | ) | $ | 17.33 | 11.71 | % | $ | 204,320 | 0.93 | % | 1.13 | % | 0.68 | % | 28 | % | ||||||||||||||||||
| (0.54 | ) | 16.03 | 9.12 | 152,496 | 0.94 | 1.18 | 1.04 | 33 | ||||||||||||||||||||||||||
| (0.52 | ) | 15.31 | 3.36 | 164,322 | 0.92 | 1.14 | 1.13 | 34 | ||||||||||||||||||||||||||
| (0.19 | ) | 15.32 | 8.49 | 142,353 | 1.01 | 1.15 | 1.13 | 29 | ||||||||||||||||||||||||||
| (0.09 | ) | 14.33 | 21.32 | 68,550 | 1.21 | 1.21 | 0.86 | 55 | ||||||||||||||||||||||||||
| See accompanying Notes to Financial Statements | | September 30, 2020 | | Annual Report | 181 |
Table of Contents
September 30, 2020
| 1. | ORGANIZATION AND SIGNIFICANT ACCOUNTING POLICIES |
Allianz Funds Multi-Strategy Trust (the “Trust”) is registered under the Investment Company Act of 1940, as amended, (the “1940 Act”), as an open-end registered investment management company organized as a Massachusetts business trust and accordingly, follows the investment company accounting and reporting guidance of the Financial Accounting Standards Board (“FASB”) Accounting Standards Codification Topic 946 Financial Services-Investment Companies. As of September 30, 2020, the Trust consisted of twenty separate investment series (each a “Fund” and collectively the “Funds”). Allianz
Global Investors U.S. LLC (“AllianzGI U.S.” or the “Investment Manager”) serves as the Funds’ investment manager. AllianzGI U.S. is an indirect wholly-owned subsidiary of PFP Holdings, Inc. and is a member of Munich-based Allianz Group. Currently, the Trust offers up to seven classes of shares to new and existing investors: A, C, R, P, Institutional, R6 and Administrative. Class C shares of a Fund will automatically convert to Class A shares of the same Fund following the ten-year anniversary of purchase. Such conversions are subject to certain limitations.
The investment objective of each Fund is disclosed below. There can be no assurance that the Funds will meet their stated objectives.
| Investment Objective | ||
| AllianzGI Best Styles Global Equity | The Funds seek long-term capital appreciation. | |
| AllianzGI Emerging Markets Consumer | ||
| AllianzGI Emerging Markets Small-Cap | ||
| AllianzGI Emerging Markets Value | ||
| AllianzGI Global Dynamic Allocation | ||
| AllianzGI Global Sustainability | ||
| AllianzGI PerformanceFee Managed Futures Strategy | ||
| AllianzGI Structured Return | ||
| AllianzGI Water | ||
| AllianzGI Convertible | The Fund seeks maximum total return, consisting of capital appreciation and current income. | |
| AllianzGI Core Plus Bond | The Fund seeks total return, consisting of current income and capital appreciation. | |
| AllianzGI Global Allocation | The Fund seeks after-inflation capital appreciation and current income. | |
| AllianzGI Green Bond | The Fund seeks to provide total return, through a combination of capital appreciation and current income by investing in Green Bonds. | |
| AllianzGI High Yield Bond | The Fund seeks a high level of current income and capital growth. | |
| AllianzGI International Small-Cap | The Fund seeks maximum long-term capital appreciation. | |
| AllianzGI Multi Asset Income | The Fund seeks current income, and secondarily, capital appreciation. The Fund is intended for investors who have already retired or begun withdrawing portions of their investments, or are seeking a conservative allocation fund. | |
| AllianzGI PerformanceFee Structured US Equity | The Fund seeks to earn total return that exceeds the return of the S&P 500 Index. | |
| AllianzGI Preferred Securities and Income | The Fund seeks total return consisting of high current income and capital appreciation. | |
| AllianzGI Short Duration High Income | The Fund seeks a high level of current income with lower volatility than the broader high yield market. | |
| AllianzGI Short Term Bond | The Fund seeks capital preservation, followed by liquidity and positive total return. |
The preparation of the Funds’ financial statements in accordance with accounting principles generally accepted in the United States of America (“U.S. GAAP”) requires the Funds’ management to make estimates and assumptions that affect the reported amounts and disclosures in each Fund’s financial statements. Actual results could differ from those estimates.
Like many other companies, the Trust’s organizational documents provide that its officers (“Officers”) and the Board of Trustees (the “Board” or the “Trustees”) are indemnified against certain liabilities arising out of the performance of their duties to the Trust. In addition, both in some of its principal service contracts and in the normal course of its business, the Trust enters into contracts that provide
indemnification to other parties for certain types of losses or liabilities. The Trust’s maximum exposure under these arrangements is unknown as this could involve future claims against the Trust.
The following is a summary of significant accounting policies consistently followed by the Funds:
(a) Valuation of Investments. Portfolio securities and other financial instruments for which market quotations are readily available are valued at market value. Market values for various types of securities and other instruments are determined on the basis of closing prices or last sales prices on an exchange or other market, based on quotes or other market information obtained from quotation reporting systems, established market makers or independent pricing
| 182 | September 30, 2020 | | Annual Report |
Table of Contents
services. Investments in mutual funds are valued at the net asset value (“NAV”) as reported on each business day, and under normal circumstances. Exchange-traded funds (“ETFs”) are valued at their current market trading price. The Funds’ investments are valued daily using prices supplied by an independent pricing service or broker/dealer quotations, or by using the last sale or settlement price on the exchange that is the primary market for such securities, or the mean between the last bid and ask quotations. The market value for NASDAQ Global Market and NASDAQ Capital Market securities may also be calculated using the NASDAQ Official Closing Price instead of the last reported sales price. Independent pricing services use information provided by market makers or estimates of market values obtained from yield data relating to investments or securities with similar characteristics. Exchange traded futures are valued at the price determined by the relevant exchange. Securities purchased on a when-issued or delayed-delivery basis are marked to market daily until settlement at the forward settlement date.
The Board has adopted procedures for valuing portfolio securities and other financial instruments in circumstances where market quotes are not readily available (including in cases where available market quotes are deemed to be unreliable), and has delegated primary responsibility for applying the valuation methods to the Investment Manager. The Trust’s Valuation Committee was established by the Board to oversee the implementation of the Funds’ valuation methods and to make fair value determinations on behalf of the Board, as instructed. The Investment Manager monitors the continued appropriateness of methods applied and identifies circumstances and events that may require fair valuation. The Investment Manager determines if adjustments should be made in light of market changes, events affecting the issuer or other factors. If the Investment Manager determines that a valuation method may no longer be appropriate, another valuation method previously approved by the Trust’s Valuation Committee may be selected or the Trust’s Valuation Committee will be convened to consider the matter and take any appropriate action in accordance with procedures set forth by the Board. The Board shall review and ratify the appropriateness of the valuation methods and these methods may be amended or supplemented from time to time by the Trust’s Valuation Committee.
Short-term debt investments having a remaining maturity of 60 days or less are valued at amortized cost unless the Board or its Valuation Committee determines that particular circumstances dictate otherwise.
Investments initially valued in currencies other than the U.S. dollar are converted to the U.S. dollar using exchange rates obtained from pricing services. As a result, the NAV of each share class of a Fund may be affected by changes in the value of currencies in relation to the U.S. dollar. The value of securities traded in markets outside the United States or denominated in currencies other than the U.S. dollar may be affected significantly on a day that the New York Stock Exchange (“NYSE”) is closed and the NAV of a Fund’s shares may change on days when an investor is not able to purchase or redeem or exchange shares.
The prices used by the Funds to value investments may differ from the value that would be realized if the investments were sold, and these differences could be material to the Funds’ financial statements. The NAV of each share class of a Fund is normally determined as of the close of regular trading (normally, 4:00 p.m., Eastern Time) on the NYSE on each day the NYSE is open for business. In unusual circumstances, the Board or the Valuation Committee may in good faith determine the NAV as of 4:00 p.m., Eastern Time, notwithstanding an earlier, unscheduled close or halt of trading on the NYSE.
The prices of certain portfolio securities or financial instruments may be determined at a time prior to the close of regular trading on the NYSE. In considering whether fair value pricing is required and in determining fair values, the Funds may, among other things, consider significant events (which may be considered to include changes in the value of U.S. securities or securities indices) that occur after the close of the relevant market and before the time the NAV of each share class of a Fund is calculated. With respect to certain foreign securities, the Funds may fair value securities using modeling tools provided by third-party vendors, where appropriate. The Funds have retained a statistical research service to assist in determining the fair value of foreign securities. This service utilizes statistics and programs based on historical performance of markets and other economic data to assist in making fair value estimates. Fair value estimates used by the Funds for foreign securities may differ from the value realized from the sale of those securities and the difference could be material to the financial statements. Fair value pricing may require subjective determinations about the value of a security or other assets, and fair values used to determine the NAV of each share class of a Fund may differ from quoted or published prices, or from prices that are used by others, for the same investments. In addition, the use of fair value pricing may not always result in adjustments to the prices of securities or other assets held by a Fund.
(b) Fair Value Measurements. Fair value is defined as the price that would be received to sell an asset or paid to transfer a liability (i.e., the “exit price”) in an orderly transaction between market participants. The three levels of the fair value hierarchy are described below:
| ∎ | Level 1—quoted prices in active markets for identical investments that the Funds have the ability to access |
| ∎ | Level 2—valuations based on other significant observable inputs, which may include, but are not limited to, quoted prices for similar assets or liabilities, interest rates, yield curves, volatilities, prepayment speeds, loss severities, credit risks and default rates or other market corroborated inputs |
| ∎ | Level 3—valuations based on significant unobservable inputs (including the Investment Manager’s or the Trust’s Valuation Committee’s own assumptions and securities whose price was determined by using a single broker’s quote) |
The valuation techniques used by the Funds to measure fair value during the year ended September 30, 2020 were intended to maximize the use of observable inputs and to minimize the use of unobservable inputs.
| Annual Report | | September 30, 2020 | 183 |
Table of Contents
Notes to Financial Statements (cont’d)
September 30, 2020
An investment asset’s or liability’s level within the fair value hierarchy is based on the lowest level input, individually or in aggregate, that is significant to the fair value measurement. The objective of fair value measurement remains the same even when there is a significant decrease in the volume and level of activity for an asset or liability and regardless of the valuation techniques used.
The inputs or methodology used for valuing securities are not necessarily an indication of the risk associated with investing in those securities. The following are certain inputs and techniques that the Funds generally use to evaluate how to classify each major category of assets and liabilities within Level 2 and Level 3, in accordance with U.S. GAAP.
An asset or liability for which market values cannot be measured using the methodologies described above is valued by methods deemed reasonable in good faith by the Valuation Committee, following the procedures established by the Board, to represent fair value. Under these procedures, the Funds generally use a market-based approach which may use related or comparable assets or liabilities, recent transactions, market multiples, book values and other relevant information. Fair value determinations involve the consideration of a number of subjective factors, an analysis of applicable facts and circumstances and the exercise of judgment. As a result, it is possible that the fair value for a security determined in good faith in accordance with the Funds’ valuation procedures may differ from valuations for the same security determined by other funds using their own valuation procedures. Although the Funds’ valuation procedures are designed to value a security at the price the Funds may reasonably expect to receive upon the security’s sale in an orderly transaction, there can be no assurance that any fair value determination thereunder would, in fact, approximate the amount that the Funds would actually realize upon the sale of the security or the price at which the security would trade if a reliable market price were readily available.
Equity Securities (Common and Preferred Stock and Warrants)—Equity securities traded in inactive markets and certain foreign equity securities are valued using inputs which include broker-dealer quotes, recently executed transactions adjusted for changes in the benchmark index, or evaluated price quotes received from independent pricing services that take into account the integrity of the market sector and issuer, the individual characteristics of the security, and information received from broker-dealers and other market sources pertaining to the issuer or security. To the extent that these inputs are observable, the values of equity securities are categorized as Level 2. To the extent that these inputs are unobservable, the values are categorized as Level 3.
U.S. Treasury Obligations—U.S. Treasury obligations are valued by independent pricing services based on pricing models that evaluate the mean between the most recently quoted bid and ask price. The models also take into consideration data received from active market makers and broker-dealers, yield curves, and the spread over comparable U.S. Treasury issues. The spreads change daily in response to market conditions and are generally obtained from the new issue market and broker-dealer sources. To the extent that these inputs are
observable, the values of U.S. Treasury obligations are categorized as Level 2. To the extent that these inputs are unobservable, the values are categorized as Level 3.
Government Sponsored Enterprise and Mortgage-Backed Securities—Government sponsored enterprise and mortgage-backed securities are valued by independent pricing services using pricing models based on inputs that include issuer type, coupon, cash flows, mortgage prepayment projection tables and Adjustable Rate Mortgage evaluations that incorporate index data, periodic life caps and the next coupon reset date. To the extent that these inputs are observable, the values of government sponsored enterprise and mortgage-backed securities are categorized as Level 2. To the extent that these inputs are unobservable, the values are categorized as Level 3.
Sovereign Debt Obligations—Sovereign debt obligations are valued by independent pricing services based on discounted cash flow models that incorporate option adjusted spreads along with benchmark curves and credit spreads. In addition, international bond markets are monitored regularly for information pertaining to the issuer and/or the specific issue. To the extent that these inputs are observable, the values of sovereign debt obligations are categorized as Level 2. To the extent that these inputs are unobservable, the values are categorized as Level 3.
Corporate Bonds & Notes—Corporate bonds & notes are generally comprised of two main categories: investment grade bonds and high yield bonds. Investment grade bonds are valued by independent pricing services using various inputs and techniques, which include broker-dealer quotations, live trading levels, recently executed transactions in securities of the issuer or comparable issuers, and option adjusted spread models that include base curve and spread curve inputs. Adjustments to individual bonds can be applied to recognize trading differences compared to other bonds issued by the same issuer. High yield bonds are valued by independent pricing services based primarily on broker-dealer quotations from relevant market makers and recently executed transactions in securities of the issuer or comparable issuers. The broker-dealer quotations received are supported by credit analysis of the issuer that takes into consideration credit quality assessments, daily trading activity, and the activity of the underlying equities, listed bonds and sector-specific trends. To the extent that these inputs are observable, the values of corporate bonds & notes are categorized as Level 2. To the extent that these inputs are unobservable, the values are categorized as Level 3.
Convertible Bonds & Notes—Convertible bonds & notes are valued by independent pricing services based on various inputs and techniques, which include broker-dealer quotations from relevant market makers and recently executed transactions in securities of the issuer or comparable issuers. The broker-dealer quotations received are supported by credit analysis of the issuer that takes into consideration credit quality assessments, daily trading activity, and the activity of the underlying equities, listed bonds and sector-specific trends. To the extent that these inputs are observable, the values of
| 184 | September 30, 2020 | | Annual Report |
Table of Contents
convertible bonds & notes are categorized as Level 2. To the extent that these inputs are unobservable, the values are categorized as Level 3.
Option Contracts—Option contracts traded over-the-counter (“OTC”) and FLexible EXchange (“FLEX”) options are valued by independent pricing services based on pricing models that incorporate various inputs such as interest rates, credit spreads, currency exchange rates and volatility measurements for in-the-money, at-the-money, and out-of-the-money contracts based on a given strike price. To the extent that these inputs are observable, the values of OTC and FLEX option contracts are categorized as Level 2. To the extent that these inputs are unobservable, the values are categorized as Level 3.
Forward Foreign Currency Contracts—Forward foreign currency contracts are valued by independent pricing services using various inputs and techniques, which include broker-dealer quotations, actual trading information and foreign currency exchange rates gathered from leading market makers and foreign currency exchange trading centers throughout the world. To the extent that these inputs are observable, the values of forward foreign currency contracts are categorized as Level 2. To the extent that these inputs are unobservable, the values are categorized as Level 3.
Credit Default Swaps—OTC credit default swaps are valued by independent pricing services using pricing models that take into account, among other factors, information received from market makers and broker/dealers, default probabilities from index specific credit spread curves, recovery rates, and cash flows. To the extent that these inputs are observable, the values of credit default swaps are categorized as Level 2. To the extent that these inputs are unobservable, the values are categorized as Level 3.
Total Return Swaps—OTC centrally cleared and total return swaps are valued by independent pricing services using pricing models that take into account among other factors, index spread curves, nominal values, modified duration values and cash flows. To the extent that these inputs are observable, the values of OTC centrally cleared and total return swaps are categorized as Level 2. To the extent that these inputs are unobservable, the values are categorized as Level 3.
Senior Loans—Senior Loans generally are valued by independent pricing services based on the average of quoted prices received from multiple dealers or valued relative to other benchmark securities when broker-dealer quotes are unavailable. These quoted prices are based on interest rates, yield curves, option adjusted spreads, credit spreads and/or other criteria. To the extent that these inputs are observable, the values of Senior Loans are categorized as Level 2. To the extent that these inputs are unobservable, the values are categorized as Level 3.
| Annual Report | | September 30, 2020 | 185 |
Table of Contents
Notes to Financial Statements (cont’d)
September 30, 2020
A summary of the inputs used at September 30, 2020 in valuing each Fund’s assets and liabilities is listed below (refer to the Schedules of Investments and Notes to the Schedules of Investments for more detailed information on Investments in Securities and Other Financial Instruments):
| AllianzGI Best Styles Global Equity: | ||||||||||||||||
| Investments in Securities – Assets | Level 1– Quoted Prices | Level 2– Other Significant | Level 3– Significant | Value at 9/30/20 | ||||||||||||
Common Stock: |
| |||||||||||||||
Australia | $ | 149,249 | $ | 772,198 | — | $ | 921,447 | |||||||||
Austria | 76,242 | 313,098 | — | 389,340 | ||||||||||||
Belgium | — | 309,342 | — | 309,342 | ||||||||||||
Chile | — | 51,330 | — | 51,330 | ||||||||||||
China | 1,317,697 | 2,571,210 | — | † | 3,888,907 | |||||||||||
Denmark | — | 223,246 | — | 223,246 | ||||||||||||
Finland | — | 136,494 | — | 136,494 | ||||||||||||
France | — | 2,587,833 | — | 2,587,833 | ||||||||||||
Germany | 205,841 | 1,250,988 | — | 1,456,829 | ||||||||||||
Greece | — | 147,567 | — | 147,567 | ||||||||||||
Hong Kong | — | 491,314 | — | 491,314 | ||||||||||||
Hungary | — | 161,165 | — | 161,165 | ||||||||||||
Indonesia | — | 105,614 | — | 105,614 | ||||||||||||
Israel | — | 117,113 | — | 117,113 | ||||||||||||
Italy | — | 688,257 | — | 688,257 | ||||||||||||
Japan | — | 4,521,033 | — | 4,521,033 | ||||||||||||
Korea (Republic of) | — | 1,895,961 | — | 1,895,961 | ||||||||||||
Malaysia | — | 103,325 | — | 103,325 | ||||||||||||
Netherlands | 84,158 | 1,270,946 | — | 1,355,104 | ||||||||||||
New Zealand | — | 395,805 | — | 395,805 | ||||||||||||
Norway | — | 441,567 | — | 441,567 | ||||||||||||
Poland | — | 105,334 | — | 105,334 | ||||||||||||
Portugal | — | 90,532 | — | 90,532 | ||||||||||||
Singapore | — | 100,709 | — | 100,709 | ||||||||||||
South Africa | — | 660,261 | — | 660,261 | ||||||||||||
Spain | — | 760,969 | — | 760,969 | ||||||||||||
Sweden | 43,842 | 670,338 | — | 714,180 | ||||||||||||
Switzerland | — | 1,816,842 | — | 1,816,842 | ||||||||||||
Taiwan | 656,132 | 1,377,330 | — | 2,033,462 | ||||||||||||
Thailand | — | — | $ | 91,028 | 91,028 | |||||||||||
Turkey | — | 218,837 | — | 218,837 | ||||||||||||
United Arab Emirates | — | 58,579 | — | 58,579 | ||||||||||||
United Kingdom | 196,437 | 1,890,658 | — | 2,087,095 | ||||||||||||
All Other | 41,553,048 | — | — | 41,553,048 | ||||||||||||
Preferred Stock: | ||||||||||||||||
Germany | — | 255,780 | — | 255,780 | ||||||||||||
All Other | 370,431 | — | — | 370,431 | ||||||||||||
Repurchase Agreements | — | 231,000 | — | 231,000 | ||||||||||||
| 44,653,077 | 26,792,575 | 91,028 | 71,536,680 | |||||||||||||
Other Financial Instruments* – Assets | ||||||||||||||||
Foreign Exchange Contracts | — | — | — | — | ||||||||||||
Totals | $ | 44,653,077 | $ | 26,792,575 | $ | 91,028 | $ | 71,536,680 | ||||||||
| 186 | September 30, 2020 | | Annual Report |
Table of Contents
| AllianzGI Convertible: | ||||||||||||||||
| Investments in Securities – Assets | Level 1– Quoted Prices | Level 2– Other Significant Observable Inputs | Level 3– Significant Unobservable Inputs | Value at 9/30/20 | ||||||||||||
Convertible Bonds & Notes | — | $ | 1,634,367,335 | — | $ | 1,634,367,335 | ||||||||||
Convertible Preferred Stock: |
| |||||||||||||||
Diversified Financial Services | $ | 13,677,560 | 13,812,050 | — | 27,489,610 | |||||||||||
Telecommunications | — | 20,203,696 | — | 20,203,696 | ||||||||||||
All Other | 263,956,096 | — | — | 263,956,096 | ||||||||||||
Repurchase Agreements | — | 23,684,000 | — | 23,684,000 | ||||||||||||
Totals | $ | 277,633,656 | $ | 1,692,067,081 | — | $ | 1,969,700,737 | |||||||||
| AllianzGI Core Plus Bond: | ||||||||||||||||
| Investments in Securities – Assets | Level 1– Quoted Prices | Level 2– Other Significant Observable Inputs | Level 3– Significant Unobservable Inputs | Value at 9/30/20 | ||||||||||||
Corporate Bonds & Notes | — | $ | 26,262,144 | — | $ | 26,262,144 | ||||||||||
Asset-Backed Securities | — | 11,017,026 | — | 11,017,026 | ||||||||||||
U.S. Government Agency Securities | — | 8,261,889 | — | 8,261,889 | ||||||||||||
U.S. Treasury Obligations | — | 5,303,558 | — | 5,303,558 | ||||||||||||
Preferred Stock | $ | 895,430 | — | — | 895,430 | |||||||||||
Repurchase Agreements | — | 257,000 | — | 257,000 | ||||||||||||
| 895,430 | 51,101,617 | — | 51,997,047 | |||||||||||||
Other Financial Instruments* – Assets | ||||||||||||||||
Credit Contracts | — | 10,655 | — | 10,655 | ||||||||||||
Interest Rate Contracts | 653 | — | — | 653 | ||||||||||||
| 653 | 10,655 | — | 11,308 | |||||||||||||
Other Financial Instruments* – Liabilities | ||||||||||||||||
Credit Contracts | — | (342,133 | ) | — | (342,133 | ) | ||||||||||
Interest Rate Contracts | (48,333 | ) | — | — | (48,333 | ) | ||||||||||
| (48,333 | ) | (342,133 | ) | — | (390,466 | ) | ||||||||||
Totals | $ | 847,750 | $ | 50,770,139 | — | $ | 51,617,889 | |||||||||
| AllianzGI Emerging Markets Consumer: | ||||||||||||||||
| Investments in Securities – Assets | Level 1– Quoted Prices | Level 2– Other Significant Observable Inputs | Level 3– Significant Unobservable Inputs | Value at 9/30/20 | ||||||||||||
Common Stock: | ||||||||||||||||
Brazil | $ | 198,992 | — | — | $ | 198,992 | ||||||||||
Canada | 277,059 | — | — | 277,059 | ||||||||||||
China | 5,439,633 | $ | 12,221,610 | — | 17,661,243 | |||||||||||
India | 679,456 | 1,015,932 | — | 1,695,388 | ||||||||||||
Mexico | 165,517 | — | — | 165,517 | ||||||||||||
Russian Federation | 512,756 | — | — | 512,756 | ||||||||||||
Thailand | — | — | $ | 562,910 | 562,910 | |||||||||||
United States | 3,132,949 | — | — | 3,132,949 | ||||||||||||
All Other | — | 10,824,693 | — | 10,824,693 | ||||||||||||
Repurchase Agreements | — | 160,000 | — | 160,000 | ||||||||||||
Totals | $ | 10,406,362 | $ | 24,222,235 | $ | 562,910 | $ | 35,191,507 | ||||||||
| Annual Report | | September 30, 2020 | 187 |
Table of Contents
Notes to Financial Statements (cont’d)
September 30, 2020
| AllianzGI Emerging Markets Small-Cap: | ||||||||||||||||
| Investments in Securities – Assets | Level 1– Quoted Prices | Level 2– Other Significant Observable Inputs | Level 3– Significant Unobservable Inputs | Value at 9/30/20 | ||||||||||||
Common Stock: | ||||||||||||||||
Brazil | $ | 131,439 | — | — | $ | 131,439 | ||||||||||
Mexico | 69,173 | — | — | 69,173 | ||||||||||||
Poland | 21,912 | $ | 76,481 | — | 98,393 | |||||||||||
Russian Federation | — | 34,953 | $ | 95,862 | 130,815 | |||||||||||
South Africa | 146,866 | 127,625 | — | 274,491 | ||||||||||||
Thailand | — | — | 97,282 | 97,282 | ||||||||||||
Turkey | 57,222 | 87,161 | — | 144,383 | ||||||||||||
All Other | — | 4,233,915 | — | 4,233,915 | ||||||||||||
Preferred Stock | 38,607 | — | — | 38,607 | ||||||||||||
Totals | $ | 465,219 | $ | 4,560,135 | $ | 193,144 | $ | 5,218,498 | ||||||||
| AllianzGI Emerging Markets Value: | ||||||||||||||||
| Investments in Securities – Assets | Level 1– Quoted Prices | Level 2– Other Significant Observable Inputs | Level 3– Significant Unobservable Inputs | Value at 9/30/20 | ||||||||||||
Common Stock: | ||||||||||||||||
Brazil | $ | 4,535,925 | — | — | $ | 4,535,925 | ||||||||||
China | 1,716,650 | $ | 55,054,204 | — | 56,770,854 | |||||||||||
Mexico | 442,835 | — | — | 442,835 | ||||||||||||
Russian Federation | 511,718 | 1,572,740 | — | 2,084,458 | ||||||||||||
South Africa | 838,496 | 2,747,289 | — | 3,585,785 | ||||||||||||
Thailand | 939,147 | 1,572,970 | — | 2,512,117 | ||||||||||||
United States | 8,960,776 | — | — | 8,960,776 | ||||||||||||
All Other | — | 50,129,040 | — | 50,129,040 | ||||||||||||
Preferred Stock | — | 1,888,883 | — | 1,888,883 | ||||||||||||
Repurchase Agreements | — | 3,293,000 | — | 3,293,000 | ||||||||||||
Totals | $ | 17,945,547 | $ | 116,258,126 | — | $ | 134,203,673 | |||||||||
| AllianzGI Global Allocation: | ||||||||||||||||
| Investments in Securities – Assets | Level 1– Quoted Prices | Level 2– Other Significant Observable Inputs | Level 3– Significant Unobservable Inputs | Value at 9/30/20 | ||||||||||||
Mutual Funds | $ | 180,081,598 | — | — | $ | 180,081,598 | ||||||||||
Corporate Bonds & Notes | — | $ | 41,573,307 | — | 41,573,307 | |||||||||||
Exchange-Traded Funds | 11,275,498 | — | — | 11,275,498 | ||||||||||||
U.S. Treasury Obligations | — | 683,831 | — | 683,831 | ||||||||||||
Preferred Stock | 287,285 | — | — | 287,285 | ||||||||||||
Repurchase Agreements | — | 8,300,000 | — | 8,300,000 | ||||||||||||
| 191,644,381 | 50,557,138 | — | 242,201,519 | |||||||||||||
Other Financial Instruments* – Assets | ||||||||||||||||
Credit Contracts | — | 2,392 | — | 2,392 | ||||||||||||
Foreign Exchange Contracts | 28,460 | — | — | 28,460 | ||||||||||||
Interest Rate Contracts | 93,517 | — | — | 93,517 | ||||||||||||
Market Price | 82,444 | — | — | 82,444 | ||||||||||||
| 204,421 | 2,392 | — | 206,813 | |||||||||||||
Other Financial Instruments* – Liabilities | ||||||||||||||||
Credit Contracts | — | (841 | ) | — | (841 | ) | ||||||||||
Interest Rate Contracts | (2,580 | ) | — | — | (2,580 | ) | ||||||||||
Market Price | (294,775 | ) | — | — | (294,775 | ) | ||||||||||
| (297,355 | ) | (841 | ) | — | (298,196 | ) | ||||||||||
Totals | $ | 191,551,447 | $ | 50,558,689 | — | $ | 242,110,136 | |||||||||
| 188 | September 30, 2020 | | Annual Report |
Table of Contents
| AllianzGI Global Dynamic Allocation: | ||||||||||||||||
| Investments in Securities – Assets | Level 1– Quoted Prices | Level 2– Other Significant Observable Inputs | Level 3– Significant Unobservable Inputs | Value at 9/30/20 | ||||||||||||
Common Stock: |
| |||||||||||||||
Australia | $ | 19,997 | $ | 160,971 | — | $ | 180,968 | |||||||||
Austria | 12,751 | 44,492 | — | 57,243 | ||||||||||||
Belgium | — | 58,530 | — | 58,530 | ||||||||||||
Chile | — | 4,699 | — | 4,699 | ||||||||||||
China | 203,239 | 428,288 | — | † | 631,527 | |||||||||||
Czech Republic | — | 20,304 | — | 20,304 | ||||||||||||
Denmark | 1,940 | 48,209 | — | 50,149 | ||||||||||||
Finland | 1,551 | 38,854 | — | 40,405 | ||||||||||||
France | 1,485 | 415,619 | — | 417,104 | ||||||||||||
Germany | 28,856 | 243,420 | — | 272,276 | ||||||||||||
Greece | — | 15,080 | — | 15,080 | ||||||||||||
Hong Kong | — | 104,179 | — | 104,179 | ||||||||||||
Hungary | — | 29,317 | — | 29,317 | ||||||||||||
Indonesia | — | 14,186 | — | 14,186 | ||||||||||||
Ireland | 77,765 | 1,255 | — | 79,020 | ||||||||||||
Israel | — | 41,498 | — | 41,498 | ||||||||||||
Italy | — | 119,944 | — | 119,944 | ||||||||||||
Japan | — | 1,230,238 | — | 1,230,238 | ||||||||||||
Korea (Republic of) | — | 270,719 | — | 270,719 | ||||||||||||
Malaysia | — | 42,032 | — | 42,032 | ||||||||||||
Morocco | 780 | 2,810 | — | 3,590 | ||||||||||||
Netherlands | 13,918 | 200,953 | — | 214,871 | ||||||||||||
New Zealand | — | 71,758 | — | 71,758 | ||||||||||||
Norway | — | 58,580 | — | 58,580 | ||||||||||||
Philippines | — | 6,438 | — | 6,438 | ||||||||||||
Poland | — | 22,893 | — | 22,893 | ||||||||||||
Portugal | — | 13,916 | — | 13,916 | ||||||||||||
Singapore | — | 74,382 | $ | 2,447 | 76,829 | |||||||||||
South Africa | — | 82,940 | — | 82,940 | ||||||||||||
Spain | 4,913 | 122,155 | — | 127,068 | ||||||||||||
Sweden | 5,777 | 96,781 | — | 102,558 | ||||||||||||
Switzerland | 3,793 | 506,485 | — | 510,278 | ||||||||||||
Taiwan | 91,084 | 565,665 | — | 656,749 | ||||||||||||
Thailand | — | — | 6,293 | 6,293 | ||||||||||||
Turkey | — | 30,560 | — | 30,560 | ||||||||||||
United Kingdom | 34,355 | 296,535 | — | 330,890 | ||||||||||||
All Other | 8,032,657 | — | — | 8,032,657 | ||||||||||||
Corporate Bonds & Notes | — | 13,319,753 | — | 13,319,753 | ||||||||||||
Mutual Funds | 4,190,727 | — | — | 4,190,727 | ||||||||||||
Exchange-Traded Funds | 3,329,392 | — | — | 3,329,392 | ||||||||||||
U.S. Treasury Obligations | — | 371,092 | — | 371,092 | ||||||||||||
Preferred Stock: |
| |||||||||||||||
Germany | — | 32,244 | — | 32,244 | ||||||||||||
Korea (Republic of) | — | 25,523 | — | 25,523 | ||||||||||||
All Other | 136,070 | — | — | 136,070 | ||||||||||||
Repurchase Agreements | — | 6,306,000 | — | 6,306,000 | ||||||||||||
| 16,191,050 | 25,539,297 | 8,740 | 41,739,087 | |||||||||||||
| Annual Report | | September 30, 2020 | 189 |
Table of Contents
Notes to Financial Statements (cont’d)
September 30, 2020
| AllianzGI Global Dynamic Allocation (cont’d): | ||||||||||||||||
| Investments in Securities – Assets | Level 1– Quoted Prices | Level 2– Other Significant Observable Inputs | Level 3– Significant Unobservable Inputs | Value at 9/30/20 | ||||||||||||
Other Financial Instruments* – Assets | ||||||||||||||||
Credit Contracts | — | 709 | — | 709 | ||||||||||||
Foreign Exchange Contracts | 7,673 | — | — | 7,673 | ||||||||||||
Interest Rate Contracts | 19,519 | — | — | 19,519 | ||||||||||||
Market Price | 47,880 | 15,694 | — | 63,574 | ||||||||||||
| 75,072 | 16,403 | — | 91,475 | |||||||||||||
Other Financial Instruments* – Liabilities | ||||||||||||||||
Credit Contracts | — | (247 | ) | — | (247 | ) | ||||||||||
Foreign Exchange Contracts | (8,196 | ) | — | — | (8,196 | ) | ||||||||||
Interest Rate Contracts | (2,092 | ) | — | — | (2,092 | ) | ||||||||||
Market Price | (189,370 | ) | (5,943 | ) | — | (195,313 | ) | |||||||||
| (199,658 | ) | (6,190 | ) | — | (205,848 | ) | ||||||||||
Totals | $ | 16,066,464 | $ | 25,549,510 | $ | 8,740 | $ | 41,624,714 | ||||||||
| AllianzGI Global Sustainability: | ||||||||||||||||
| Investments in Securities – Assets | Level 1– Quoted Prices | Level 2– Other Significant Observable Inputs | Level 3– Significant Unobservable Inputs | Value at 9/30/20 | ||||||||||||
Common Stock: | ||||||||||||||||
Australia | — | $ | 2,405,882 | — | $ | 2,405,882 | ||||||||||
Denmark | — | 2,505,815 | — | 2,505,815 | ||||||||||||
France | — | 4,604,085 | — | 4,604,085 | ||||||||||||
Germany | — | 10,776,374 | — | 10,776,374 | ||||||||||||
Hong Kong | — | 1,884,642 | — | 1,884,642 | ||||||||||||
Japan | — | 8,860,481 | — | 8,860,481 | ||||||||||||
Korea (Republic of) | — | 2,434,413 | — | 2,434,413 | ||||||||||||
Spain | — | 1,790,799 | — | 1,790,799 | ||||||||||||
Sweden | — | 6,120,922 | — | 6,120,922 | ||||||||||||
Switzerland | — | 5,423,009 | — | 5,423,009 | ||||||||||||
United Kingdom | — | 13,604,608 | — | 13,604,608 | ||||||||||||
All Other | $ | 89,108,111 | — | — | 89,108,111 | |||||||||||
Repurchase Agreements | — | 4,166,000 | — | 4,166,000 | ||||||||||||
Totals | $ | 89,108,111 | $ | 64,577,030 | — | $ | 153,685,141 | |||||||||
| AllianzGI Green Bond: | ||||||||||||||||
| Investments in Securities – Assets | Level 1– Quoted Prices | Level 2– Other Significant Observable Inputs | Level 3– Significant Unobservable Inputs | Value at 9/30/20 | ||||||||||||
Corporate Bonds & Notes | — | $ | 23,939,545 | — | $ | 23,939,545 | ||||||||||
Sovereign Debt Obligations | — | 3,100,760 | — | 3,100,760 | ||||||||||||
| — | 27,040,305 | — | 27,040,305 | |||||||||||||
Other Financial Instruments* – Assets | ||||||||||||||||
Interest Rate Contracts | 29,132 | — | — | 29,132 | ||||||||||||
Other Financial Instruments* – Liabilities | ||||||||||||||||
Foreign Exchange Contracts | — | (64,299 | ) | — | (64,299 | ) | ||||||||||
Interest Rate Contracts | (4,250 | ) | — | — | (4,250 | ) | ||||||||||
| (4,250 | ) | (64,299 | ) | — | (68,549 | ) | ||||||||||
Totals | $ | 24,882 | $ | 26,976,006 | — | $ | 27,000,888 | |||||||||
| 190 | September 30, 2020 | | Annual Report |
Table of Contents
| AllianzGI High Yield Bond: | ||||||||||||||||
| Investments in Securities – Assets | Level 1– Quoted Prices | Level 2– Other Significant Observable Inputs | Level 3– Significant Unobservable Inputs | Value at 9/30/20 | ||||||||||||
Corporate Bonds & Notes: | ||||||||||||||||
Commercial Services | — | $ | 2,983,989 | $ | 42,141 | $ | 3,026,130 | |||||||||
Diversified Financial Services | — | 2,269,712 | 2,723,555 | 4,993,267 | ||||||||||||
Media | — | 6,601,789 | 3 | 6,601,792 | ||||||||||||
All Other | — | 64,472,836 | — | 64,472,836 | ||||||||||||
Preferred Stock | — | — | 4,799,228 | 4,799,228 | ||||||||||||
Common Stock | — | — | 34,810 | 34,810 | ||||||||||||
Warrants | — | — | 16,255 | 16,255 | ||||||||||||
Repurchase Agreements | — | 1,738,000 | — | 1,738,000 | ||||||||||||
Totals | — | $ | 78,066,326 | $ | 7,615,992 | $ | 85,682,318 | |||||||||
| AllianzGI International Small-Cap: | ||||||||||||||||
| Investments in Securities – Assets | Level 1– Quoted Prices | Level 2– Other Significant Observable Inputs | Level 3– Significant Unobservable Inputs | Value at 9/30/20 | ||||||||||||
Common Stock: | ||||||||||||||||
Austria | $ | 1,250,632 | — | — | $ | 1,250,632 | ||||||||||
Germany | 1,915,958 | $ | 6,684,050 | — | 8,600,008 | |||||||||||
Hong Kong | 571,710 | 1,354,960 | — | 1,926,670 | ||||||||||||
New Zealand | 110,176 | — | — | 110,176 | ||||||||||||
Thailand | — | — | $ | 531,891 | 531,891 | |||||||||||
All Other | — | 63,011,570 | — | 63,011,570 | ||||||||||||
Preferred Stock | — | 1,222,078 | — | 1,222,078 | ||||||||||||
| 3,848,476 | 72,272,658 | 531,891 | 76,653,025 | |||||||||||||
Other Financial Instruments* – Assets | ||||||||||||||||
Foreign Exchange Contracts | — | 284 | — | 284 | ||||||||||||
Other Financial Instruments* – Liabilities | ||||||||||||||||
Foreign Exchange Contracts | — | (1 | ) | — | (1 | ) | ||||||||||
Totals | $ | 3,848,476 | $ | 72,272,941 | $ | 531,891 | $ | 76,653,308 | ||||||||
| AllianzGI Multi Asset Income: | ||||||||||||||||
| Investments in Securities – Assets | Level 1– Quoted Prices | Level 2– Other Significant Observable Inputs | Level 3– Significant Unobservable Inputs | Value at 9/30/20 | ||||||||||||
Mutual Funds | $ | 18,896,914 | — | — | $ | 18,896,914 | ||||||||||
Exchange-Traded Funds | 12,859,614 | — | — | 12,859,614 | ||||||||||||
Common Stock | 6,558,070 | — | — | 6,558,070 | ||||||||||||
Repurchase Agreements | — | $ | 5,332,000 | — | 5,332,000 | |||||||||||
| 38,314,598 | 5,332,000 | — | 43,646,598 | |||||||||||||
Other Financial Instruments* – Assets |
| |||||||||||||||
Foreign Exchange Contracts | 12,225 | — | — | 12,225 | ||||||||||||
Interest Rate Contracts | 62,735 | — | — | 62,735 | ||||||||||||
Market Price | 131,071 | — | — | 131,071 | ||||||||||||
| 206,031 | — | — | 206,031 | |||||||||||||
Other Financial Instruments* – Liabilities |
| |||||||||||||||
Foreign Exchange Contracts | (11,985 | ) | — | — | (11,985 | ) | ||||||||||
Interest Rate Contracts | (2,069 | ) | — | — | (2,069 | ) | ||||||||||
Market Price | (151,575 | ) | — | — | (151,575 | ) | ||||||||||
| (165,629 | ) | — | — | (165,629 | ) | |||||||||||
Totals | $ | 38,355,000 | $ | 5,332,000 | — | $ | 43,687,000 | |||||||||
| Annual Report | | September 30, 2020 | 191 |
Table of Contents
Notes to Financial Statements (cont’d)
September 30, 2020
| AllianzGI PerformanceFee Managed Futures Strategy: | ||||||||||||||||
| Investments in Securities – Assets | Level 1– Quoted Prices | Level 2– Other Significant Observable Inputs | Level 3– Significant Unobservable Inputs | Value at 9/30/20 | ||||||||||||
U.S. Treasury Obligations | — | $ | 16,858,281 | — | $ | 16,858,281 | ||||||||||
Mutual Funds | $ | 1,211,276 | — | — | 1,211,276 | |||||||||||
Repurchase Agreements | — | 618,000 | — | 618,000 | ||||||||||||
| 1,211,276 | 17,476,281 | — | 18,687,557 | |||||||||||||
Other Financial Instruments* – Assets |
| |||||||||||||||
Commodity Contracts | 138,711 | — | — | 138,711 | ||||||||||||
Credit Contracts | — | 20,621 | — | 20,621 | ||||||||||||
Foreign Exchange Contracts | 3,580 | — | — | 3,580 | ||||||||||||
Interest Rate Contracts | 176,966 | — | — | 176,966 | ||||||||||||
Market Price | 61,053 | — | — | 61,053 | ||||||||||||
| 380,310 | 20,621 | — | 400,931 | |||||||||||||
Other Financial Instruments* – Liabilities |
| |||||||||||||||
Commodity Contracts | (234,648 | ) | — | — | (234,648 | ) | ||||||||||
Credit Contracts | — | (3,580 | ) | — | (3,580 | ) | ||||||||||
Foreign Exchange Contracts | (64,520 | ) | — | — | (64,520 | ) | ||||||||||
Market Price | (53,673 | ) | — | — | (53,673 | ) | ||||||||||
| (352,841 | ) | (3,580 | ) | — | (356,421 | ) | ||||||||||
Totals | $ | 1,238,745 | $ | 17,493,322 | — | $ | 18,732,067 | |||||||||
| AllianzGI PerformanceFee Structured US Equity: | ||||||||||||||||
| Investments in Securities – Assets | Level 1– Quoted Prices | Level 2– Other Significant Observable Inputs | Level 3– Significant Unobservable Inputs | Value at 9/30/20 | ||||||||||||
Exchange-Traded Funds | $ | 50,027,908 | — | — | $ | 50,027,908 | ||||||||||
Repurchase Agreements | — | $ | 347,000 | — | 347,000 | |||||||||||
Options Purchased: |
| |||||||||||||||
Market Price | 202,097 | — | — | 202,097 | ||||||||||||
| 50,230,005 | 347,000 | — | 50,577,005 | |||||||||||||
Investments in Securities – Liabilities |
| |||||||||||||||
Options Written: |
| |||||||||||||||
Market Price | (260,017 | ) | (3,543 | ) | — | (263,560 | ) | |||||||||
Totals | $ | 49,969,988 | $ | 343,457 | — | $ | 50,313,445 | |||||||||
| AllianzGI Preferred Securities and Income: | ||||||||||||||||
| Investments in Securities – Assets | Level 1– Quoted Prices | Level 2– Other Significant Observable Inputs | Level 3– Significant Unobservable Inputs | Value at 9/30/20 | ||||||||||||
Corporate Bonds & Notes | — | $ | 18,233,743 | — | $ | 18,233,743 | ||||||||||
Preferred Stock | $ | 5,464,358 | — | — | 5,464,358 | |||||||||||
Common Stock | 1,233,600 | — | — | 1,233,600 | ||||||||||||
Repurchase Agreements | — | 826,000 | — | 826,000 | ||||||||||||
| 6,697,958 | 19,059,743 | — | 25,757,701 | |||||||||||||
Other Financial Instruments* – Assets |
| |||||||||||||||
Interest Rate Contracts | 137 | — | — | 137 | ||||||||||||
Other Financial Instruments* – Liabilities |
| |||||||||||||||
Credit Contracts | — | (125,113 | ) | — | (125,113 | ) | ||||||||||
Totals | $ | 6,698,095 | $ | 18,934,630 | — | $ | 25,632,725 | |||||||||
| 192 | September 30, 2020 | | Annual Report |
Table of Contents
| AllianzGI Short Duration High Income: | ||||||||||||||||
| Investments in Securities – Assets | Level 1– Quoted Prices | Level 2– Other Significant Observable Inputs | Level 3– Significant Unobservable Inputs | Value at 9/30/20 | ||||||||||||
Corporate Bonds & Notes | — | $ | 663,456,163 | — | $ | 663,456,163 | ||||||||||
Senior Loans | — | 109,766,845 | — | 109,766,845 | ||||||||||||
Asset-Backed Securities | — | 1,537,377 | — | 1,537,377 | ||||||||||||
Common Stock | — | — | $ | 1 | 1 | |||||||||||
Repurchase Agreements | — | 23,764,000 | — | 23,764,000 | ||||||||||||
Totals | — | $ | 798,524,385 | $ | 1 | $ | 798,524,386 | |||||||||
| AllianzGI Short Term Bond: | ||||||||||||||||
| Investments in Securities – Assets | Level 1– Quoted Prices | Level 2– Other Significant Observable Inputs | Level 3– Significant Unobservable Inputs | Value at 9/30/20 | ||||||||||||
Corporate Bonds & Notes | — | $ | 15,155,150 | — | $ | 15,155,150 | ||||||||||
U.S. Government Agency Securities | — | 472,923 | — | 472,923 | ||||||||||||
U.S. Treasury Obligations | — | 204,321 | — | 204,321 | ||||||||||||
Repurchase Agreements | — | 496,000 | — | 496,000 | ||||||||||||
Totals | — | $ | 16,328,394 | — | $ | 16,328,394 | ||||||||||
| AllianzGI Structured Return: | ||||||||||||||||
| Investments in Securities – Assets | Level 1– Quoted Prices | Level 2– Other Significant Observable Inputs | Level 3– Significant Unobservable Inputs | Value at 9/30/20 | ||||||||||||
U.S. Treasury Obligations | — | $ | 30,999,423 | — | $ | 30,999,423 | ||||||||||
Repurchase Agreements | — | 946,000 | — | 946,000 | ||||||||||||
Options Purchased: |
| |||||||||||||||
Market Price | $ | 300,932 | — | — | 300,932 | |||||||||||
| 300,932 | 31,945,423 | — | 32,246,355 | |||||||||||||
Investments in Securities – Liabilities |
| |||||||||||||||
Options Written: |
| |||||||||||||||
Market Price | (393,999 | ) | (5,315 | ) | — | (399,314 | ) | |||||||||
Totals | $ | (93,067 | ) | $ | 31,940,108 | — | $ | 31,847,041 | ||||||||
| AllianzGI Water: | ||||||||||||||||
| Investments in Securities – Assets | Level 1– Quoted Prices | Level 2– Other Significant Observable Inputs | Level 3– Significant Unobservable Inputs | Value at 9/30/20 | ||||||||||||
Common Stock: | ||||||||||||||||
China | — | $ | 13,073,584 | — | $ | 13,073,584 | ||||||||||
France | — | 46,669,441 | — | 46,669,441 | ||||||||||||
Italy | — | 8,431,063 | — | 8,431,063 | ||||||||||||
Netherlands | — | 24,496,316 | — | 24,496,316 | ||||||||||||
Sweden | — | 16,693,484 | — | 16,693,484 | ||||||||||||
Switzerland | — | 52,700,987 | — | 52,700,987 | ||||||||||||
United Kingdom | — | 88,444,437 | — | 88,444,437 | ||||||||||||
All Other | $ | 417,772,173 | — | — | 417,772,173 | |||||||||||
Repurchase Agreements | — | 22,555,000 | — | 22,555,000 | ||||||||||||
Totals | $ | 417,772,173 | $ | 273,064,312 | — | $ | 690,836,485 | |||||||||
| Annual Report | | September 30, 2020 | 193 |
Table of Contents
Notes to Financial Statements (cont’d)
September 30, 2020
A roll forward of fair value measurements using significant unobservable inputs (Level 3) for the year ended September 30, 2020, was as follows:
| AllianzGI Best Styles Global Equity: | ||||||||||||||||||||||||||||||||||||
| Investments in Securities – Assets | Beginning Balance 9/30/19 | Purchases | Sales | Accrued Discount (Premiums) | Net Realized Gain (Loss) | Net Change in Unrealized Appreciation/ Depreciation | Transfers into Level 3 | Transfers out of Level 3 | Ending Balance 9/30/20 | |||||||||||||||||||||||||||
Common Stock: |
| |||||||||||||||||||||||||||||||||||
China | $ | 1,153 | — | — | †,@ | — | $ | (6 | ) | $ | (1,147 | ) | — | — | — | † | ||||||||||||||||||||
Greece | — | † | — | $ | (1,069 | ) | — | (386,601 | ) | 387,670 | — | — | — | |||||||||||||||||||||||
Thailand | 1,829,586 | $ | 188,630 | (1,859,118 | ) | — | (82,597 | ) | 14,527 | — | — | $ | 91,028 | |||||||||||||||||||||||
Totals | $ | 1,830,739 | $ | 188,630 | $ | (1,860,187 | ) | — | $ | (469,204 | ) | $ | 401,050 | — | — | $ | 91,028 | |||||||||||||||||||
| AllianzGI Emerging Markets Consumer: | ||||||||||||||||||||||||||||||||||||
| Investments in Securities – Assets | Beginning Balance 9/30/19 | Purchases | Sales | Accrued Discount (Premiums) | Net Realized Gain (Loss) | Net Change in Unrealized Appreciation/ Depreciation | Transfers into Level 3 | Transfers out of Level 3 | Ending Balance 9/30/20 | |||||||||||||||||||||||||||
Common Stock: |
| |||||||||||||||||||||||||||||||||||
Philippines | $ | 575 | — | $ | (1,058 | ) | — | $ | 547 | $ | (64 | ) | — | — | — | |||||||||||||||||||||
Thailand | 2,327,954 | $ | 370,357 | (1,710,039 | ) | — | (78,503 | ) | (346,859 | ) | — | — | $ | 562,910 | ||||||||||||||||||||||
Totals | $ | 2,328,529 | $ | 370,357 | $ | (1,711,097 | ) | — | $ | (77,956 | ) | $ | (346,923 | ) | — | — | $ | 562,910 | ||||||||||||||||||
| AllianzGI Emerging Markets Small-Cap: | ||||||||||||||||||||||||||||||||||||
| Investments in Securities – Assets | Beginning Balance 9/30/19 | Purchases | Sales | Accrued Discount (Premiums) | Net Realized Gain (Loss) | Net Change in Unrealized Appreciation/ Depreciation | Transfers into Level 3 | Transfers out of Level 3 | Ending Balance 9/30/20 | |||||||||||||||||||||||||||
Common Stock: |
| |||||||||||||||||||||||||||||||||||
Russian Federation | $ | 36,894 | $ | 151,369 | $ | (49,830 | ) | — | $ | (13,244 | ) | $ | (29,327 | ) | — | — | $ | 95,862 | ||||||||||||||||||
Thailand | 496,692 | — | (364,544 | ) | — | (4,998 | ) | (29,868 | ) | — | — | 97,282 | ||||||||||||||||||||||||
Preferred Stock: |
| |||||||||||||||||||||||||||||||||||
Russian Federation | 221,365 | — | (209,127 | ) | — | 9,515 | (21,753 | ) | — | — | — | |||||||||||||||||||||||||
Totals | $ | 754,951 | $ | 151,369 | $ | (623,501 | ) | — | $ | (8,727 | ) | $ | (80,948 | ) | — | — | $ | 193,144 | ||||||||||||||||||
| AllianzGI High Yield Bond: | ||||||||||||||||||||||||||||||||||||
| Investments in Securities – Assets | Beginning Balance 9/30/19 | Purchases | Sales | Accrued Discount (Premiums) | Net Realized Gain (Loss) | Net Change in Unrealized Appreciation/ Depreciation | Transfers into Level 3** | Transfers out of Level 3 | Ending Balance 9/30/20 | |||||||||||||||||||||||||||
Corporate Bonds & Notes: |
| |||||||||||||||||||||||||||||||||||
Commercial Services | $ | 126,445 | — | $ | (27,988 | )@ | — | — | $ | (56,316 | ) | — | — | $ | 42,141 | |||||||||||||||||||||
Diversified Financial Services | 1,447,756 | $ | 324,896 | †† | — | $ | 27,053 | — | (1,076,150 | ) | $ | 2,000,000 | — | 2,723,555 | ||||||||||||||||||||||
Media | 3 | — | — | — | — | — | — | — | 3 | |||||||||||||||||||||||||||
Preferred Stock | 6,148,346 | — | — | — | — | (1,349,118 | ) | — | — | 4,799,228 | ||||||||||||||||||||||||||
Common Stock: |
| |||||||||||||||||||||||||||||||||||
Aerospace & Defense | 68,454 | — | — | — | — | (33,652 | ) | — | — | 34,802 | ||||||||||||||||||||||||||
Banks | 1 | — | — | — | — | — | — | — | 1 | |||||||||||||||||||||||||||
Media | 7 | — | — | — | — | — | — | — | 7 | |||||||||||||||||||||||||||
Warrants: |
| |||||||||||||||||||||||||||||||||||
Advertising | 38,238 | — | — | — | — | (21,984 | ) | — | — | 16,254 | ||||||||||||||||||||||||||
Media | 1 | — | — | — | — | — | — | — | 1 | |||||||||||||||||||||||||||
Totals | $ | 7,829,251 | $ | 324,896 | $ | (27,988 | ) | $ | 27,053 | — | $ | (2,537,220 | ) | $ | 2,000,000 | — | $ | 7,615,992 | ||||||||||||||||||
| 194 | September 30, 2020 | | Annual Report |
Table of Contents
| AllianzGI International Small-Cap: | ||||||||||||||||||||||||||||||||||||
| Investments in Securities – Assets | Beginning Balance 9/30/19 | Purchases | Sales | Accrued Discount (Premiums) | Net Realized Gain (Loss) | Net Change in Unrealized Appreciation/ Depreciation | Transfers into Level 3 | Transfers out of Level 3 | Ending Balance 9/30/20 | |||||||||||||||||||||||||||
Common Stock: |
| |||||||||||||||||||||||||||||||||||
Thailand | $ | 494,789 | $ | 540,832 | $ | (279,088 | ) | — | $ | (159,143 | ) | $ | (65,499 | ) | — | — | $ | 531,891 | ||||||||||||||||||
The tables above may include Level 3 investments that are valued by brokers or independent pricing services. The inputs for these investments are not readily available or cannot be reasonably estimated and are generally those inputs described in Note 1(b).
The following table presents additional information about valuation techniques and inputs used for investments that are measured at fair value and categorized within Level 3 at September 30, 2020:
| AllianzGI High Yield Bond: | ||||||||||||
| Investments in Securities – Assets | Ending Balance | Valuation Technique Used | Unobservable Inputs | Input Values (Ranges) | ||||||||
Corporate Bonds & Notes: | ||||||||||||
Diversified Financial Services | $ | 723,555 | Market and Company Comparables | EV Multiples | 0.93x (0.55x – 1.54x) | |||||||
| 2.96x (0.82x – 4.67x) | ||||||||||||
| 0.58x (0.38x – 0.66x) | ||||||||||||
| Illiquidity Discount | 20% | |||||||||||
Preferred Stock: | ||||||||||||
Media | $ | 399,464 | Market and Company Comparables | EV Multiples | 0.85x (0.43x – 1.88x) | |||||||
| Illiquidity Discount | (1% – 25%) | |||||||||||
| $ | 4,399,764 | Market and Company Comparables | EV Multiples | 0.85x (0.43x – 1.88x) | ||||||||
| Illiquidity Discount | 25% | |||||||||||
Common Stock: | ||||||||||||
Aerospace & Defense | $ | 34,802 | Market and Company Comparables | EV Multiples | 0.69x (0.43x – 1.96x) | |||||||
| 7.08x (3.06x – 14.03x) | ||||||||||||
| 0.51x (0.37x – 0.74x) | ||||||||||||
| M&A Transaction Multiples | 0.92x (0.43x – 1.96x) | |||||||||||
| Illiquidity Discount | 40% | |||||||||||
Warrants: | ||||||||||||
Advertising | $ | 16,254 | Market and Company Comparables | EV Multiples | 1.75x (0.99x – 7.35x) | |||||||
| 10.34x (4.93x – 34.0x) | ||||||||||||
| Black-Scholes Model | Volatility | 34.53% | ||||||||||
| Implied Price | $ 40.62 | |||||||||||
The table above does not include Level 3 investments that are valued by brokers or independent pricing services.
| * | Other financial instruments are derivatives, such as futures contracts, swap agreements and forward foreign currency contracts, which are valued at the unrealized appreciation (depreciation) of the instrument. |
| ** | Transferred out of Level 2 and into Level 3 due to a third-party independent pricing vendor price being unavailable or unreliable at September 30, 2020. |
| † | Actual amount rounds to less than $1. |
| †† | Payment-in-Kind |
| @ | Issued or removed via corporate action. |
The net change in unrealized appreciation/depreciation of Level 3 investments which the following Funds held at September 30, 2020 was:
AllianzGI Best Styles Global Equity | $ | (36,149 | ) | |
AllianzGI Emerging Markets Consumer | (149,604 | ) | ||
AllianzGI Emerging Markets Small-Cap | 79 | |||
AllianzGI High Yield Bond | (2,567,707 | ) | ||
AllianzGI International Small-Cap | 69,949 |
The net realized gain (loss) and net change in unrealized appreciation/depreciation are reflected on the Statements of Operations.
(c) Investment Transactions and Investment Income. Investment transactions are accounted for on the trade date. Securities purchased and sold on a when-issued or delayed-delivery basis may be settled beyond a standard settlement period for the security after the trade date. Realized gains and losses on investments are determined on an identified cost basis. Estimated tax liabilities on certain foreign securities are recorded on an accrual basis and are reflected as a
| Annual Report | | September 30, 2020 | 195 |
Table of Contents
Notes to Financial Statements (cont’d)
September 30, 2020
component of net change in unrealized appreciation (depreciation) of investments on the Statements of Operations. Tax liabilities realized as a result of such security sales are reflected as a component of net realized gain (loss) on investments on the Statements of Operations. Interest income adjusted for the accretion of discounts and amortization of premiums is recorded on an accrual basis. Discounts or premiums on debt securities purchased are accreted or amortized, respectively, to interest income. Conversion premium is not amortized. Dividend income is recorded on the ex-dividend date, except for certain dividends from foreign securities where the ex-dividend date may have passed, and then are recorded as soon after the ex-dividend date as the Funds, using reasonable diligence, become aware of such dividends. Payments received on synthetic convertible securities are generally included in dividends. Dividend and interest income on the Statements of Operations are shown net of any foreign taxes withheld on income from foreign securities. Payments received from certain investments may be comprised of dividends, realized gains and return of capital. These payments may initially be recorded as dividend income and may subsequently be reclassified as realized gains and/or return of capital upon receipt of information from the issuer. Payments considered return of capital reduce the cost basis of the respective security. Distributions, if any, in excess of the cost basis of a security are recognized as capital gains. Dividends from underlying funds are recorded as dividend income, while capital gain distributions are recorded as net capital gain distributions received from underlying funds on the Statements of Operations. Facility fees and other fees (such as origination fees) received on settlement date are amortized as income over the expected term of the senior loan. Facility fees and other fees received after settlement date relating to senior loans, commitment fees received relating to unfunded purchase or lending commitments and consent fees relating to corporate actions are recorded as miscellaneous income upon receipt. Paydown gains and losses are netted and recorded as interest income on the Statements of Operations. Expenses are recorded on an accrual basis and such expenses exclude those of the underlying funds. Expenses of the underlying funds are reflected in the NAV of those funds.
(d) Federal Income Taxes. The Funds intend to distribute all of their taxable income and to comply with the other requirements of Subchapter M of the U.S. Internal Revenue Code of 1986, as amended, applicable to regulated investment companies. Accordingly, no provision for U.S. federal income taxes is required. The Funds may be subject to excise tax based on distributions to shareholders.
Accounting for uncertainty in income taxes establishes for all entities, including pass-through entities such as the Funds, a minimum threshold for financial statement recognition of the benefit of positions taken in filing tax returns (including whether an entity is taxable in a particular jurisdiction), and requires certain expanded tax disclosures. In accordance with provisions set forth under U.S. GAAP, the Investment Manager has reviewed the Funds’ tax positions for all open tax years. As of September 30, 2020, the Funds have recorded no liability for net unrecognized tax benefits relating to uncertain income
tax positions they have taken. The Funds’ U.S. federal income tax returns for the prior three years, as applicable, remain subject to examination by the Internal Revenue Service.
(e) Dividends and Distributions to Shareholders. AllianzGI Best Styles Global Equity, AllianzGI Emerging Markets Consumer, AllianzGI Emerging Markets Small-Cap, AllianzGI Global Dynamic Allocation, AllianzGI Global Sustainability, AllianzGI International Small-Cap, AllianzGI PerformanceFee Managed Futures Strategy, AllianzGI PerformanceFee Structured US Equity, AllianzGI Structured Return and AllianzGI Water declare dividends and distributions from net investment income and net realized capital gains, if any, annually. AllianzGI Convertible, AllianzGI Emerging Markets Value and AllianzGI Global Allocation declare dividends from net investment income quarterly and distributions from net realized capital gains, if any, annually. AllianzGI Core Plus Bond, AllianzGI Green Bond, AllianzGI High Yield Bond, AllianzGI Preferred Securities and Income, AllianzGI Short Duration High Income and AllianzGI Short Term Bond declare dividends from net investment income monthly and distributions from net realized capital gains, if any, annually. AllianzGI Multi Asset Income declares dividends from net investment income and/or distributions from short-term capital gains monthly. Net realized capital gains, if any, will continue to be distributed annually by each Fund. The Funds record dividends and distributions to their respective shareholders on the ex-dividend date. The amount of dividends from net investment income and distributions from net realized capital gains is determined in accordance with U.S federal income tax regulations, which may differ from U.S. GAAP. These “book-tax” differences are considered either temporary or permanent in nature. To the extent these differences are permanent in nature, such amounts are reclassified within the capital accounts based on their U.S. federal income tax treatment. Temporary differences do not require reclassification. To the extent dividends and/or distributions exceed current and accumulated earnings and profits for U.S. federal income tax purposes, they are reported as dividends and/or distributions to shareholders from return of capital.
(f) Multi-Class Operations. Each class offered by the Trust has equal rights as to assets and voting privileges (except that shareholders of a class have exclusive voting rights regarding any matter relating solely to that class of shares). Income, non-class specific expenses, and realized and unrealized capital gains and losses of each Fund are allocated daily to each class of shares based on the relative net assets of each class. Class specific expenses, where applicable, include administration, administrative servicing, distribution, recoupment, servicing and sub-transfer agent fees.
(g) Foreign Currency Translation. The Funds’ accounting records are maintained in U.S. dollars as follows: (1) the foreign currency market values of investments and other assets and liabilities denominated in foreign currencies are translated at the prevailing exchange rate at the end of the period; and (2) purchases and sales, income and expenses are translated at the prevailing exchange rate on the respective dates of such transactions. The resulting net foreign currency gain (loss) is included in the Funds’ Statements of Operations.
| 196 | September 30, 2020 | | Annual Report |
Table of Contents
The Funds do not generally isolate that portion of the results of operations arising as a result of changes in foreign currency exchange rates from the fluctuations arising from changes in the market prices of securities. Accordingly, such foreign currency gain (loss) is included in net realized and unrealized gain (loss) on investments. However, the Funds do isolate the effect of fluctuations in foreign currency exchange rates when determining the gain (loss) upon the sale or maturity of foreign currency denominated debt obligations pursuant to U.S. federal income tax regulations; such amount is categorized as foreign currency gain (loss) for both financial reporting and income tax reporting purposes.
(h) Repurchase Agreements. The Funds are parties to Master Repurchase Agreements (“Master Repo Agreements”) with select counterparties. The Master Repo Agreements include provisions for initiation of repurchase transactions, income payments, events of default, and maintenance of collateral.
The Funds enter into transactions, under the Master Repo Agreements, with their custodian bank or securities brokerage firms whereby they purchase securities under agreements (i.e., repurchase agreements) to resell such securities at an agreed upon price and date. The Funds, through their custodian, take possession of securities collateralizing the repurchase agreement. Such agreements are carried at the contract amount in the financial statements, which is considered to represent fair value. The collateral that is pledged (i.e. the securities received by the Funds), which consists primarily of U.S. government obligations and asset-backed securities, is held by the custodian bank for the benefit of the Funds until maturity of the repurchase agreement. Provisions of the repurchase agreements and the procedures adopted by the Funds require that the market value of the collateral, including accrued interest thereon, be sufficient in the event of default by the counterparty. If the counterparty defaults under the Master Repo Agreements and the value of the collateral declines or if the counterparty enters an insolvency proceeding, realization of the collateral by the Funds may be delayed or limited. The gross values are included in the Funds’ Schedules of Investments. As of September 30, 2020, the value of the related collateral exceeded the value of the repurchase agreements for each Fund.
(i) Warrants. The Funds may receive warrants. Warrants are securities that are usually issued together with a debt security or preferred stock and that give the holder the right to buy a proportionate amount of common stock at a specified price. Warrants may be freely transferable and are often traded on major exchanges. Warrants normally have a life that is measured in years and entitle the holder to buy common stock of a company at a price that is usually higher than the market price at the time the warrant is issued. Warrants may entail greater risks than certain other types of investments. Generally, warrants do not carry the right to receive dividends or exercise voting rights with respect to the underlying securities, and they do not represent any rights in the assets of the issuer. In addition, their value does not necessarily change with the value of the underlying securities, and they cease to have value if they are not exercised on or before their expiration date. If the market price
of the underlying stock does not exceed the exercise price during the life of the warrant, the warrant will expire worthless. Warrants may increase the potential profit or loss to be realized from the investment as compared with investing the same amount in the underlying securities. Similarly, the percentage increase or decrease in the value of an equity security warrant may be greater than the percentage increase or decrease in the value of the underlying common stock. Warrants may relate to the purchase of equity or debt securities. Debt obligations with warrants attached to purchase equity securities have many characteristics of convertible securities and their prices may, to some degree, reflect the performance of the underlying stock. Debt obligations also may be issued with warrants attached to purchase additional debt securities at the same coupon rate. A decline in interest rates would permit a Fund to sell such warrants at a profit. If interest rates rise, these warrants would generally expire with no value.
(j) Rights. The Funds may receive rights. A right is a privilege granted to existing shareholders of a corporation to subscribe for shares of a new issue of common stock before it is issued. Rights normally have a short life, usually two to four weeks, are freely transferable and entitle the holder to buy the new common stock at a lower price than the public offering price. Rights may entail greater risks than certain other types of investments. Generally, rights do not carry the right to receive dividends or exercise voting rights with respect to the underlying securities, and they do not represent any rights in the assets of the issuer. In addition, their value does not necessarily change with the value of the underlying securities, and they cease to have value if they are not exercised on or before their expiration date. If the market price of the underlying stock does not exceed the exercise price during the life of the right, the right will expire worthless. Rights may increase the potential profit or loss to be realized from the investment as compared with investing the same amount in the underlying securities.
(k) Senior Loans. The Funds may purchase assignments of, and participations in, Senior Loans originated, negotiated and structured by a U.S. or foreign commercial bank, insurance company, finance company or other financial institution for a lending syndicate of financial institutions (the “Lender”). When purchasing an assignment, the Funds succeed to all the rights and obligations under the loan agreement with the same rights and obligations as the assigning Lender. Assignments may, however, be arranged through private negotiations between potential assignees and potential assignors, and the rights and obligations acquired by the purchaser of an assignment may differ from, and be more limited than, those held by the assigning Lender. The Funds may also enter into lending arrangements involving unfunded loan commitments, which are contractual obligations for future funding. Unfunded loan commitments may include revolving credit facilities, which may obligate the Funds to supply additional cash to the borrower on demand. Unfunded loan commitments represent a future obligation in full, even though a percentage of the principal amounts may never be utilized by the borrower.
Certain Funds may purchase the securities of distressed companies (including assignments or direct investments), including companies
| Annual Report | | September 30, 2020 | 197 |
Table of Contents
Notes to Financial Statements (cont’d)
September 30, 2020
engaged in restructurings or bankruptcy proceedings. Investments in distressed companies may include senior obligations of an issuer issued in connection with a restructuring under Chapter 11 of the U.S. Bankruptcy Code (commonly known as “debtor-in-possession” or “DIP” financings). Debtor-in-possession financings generally allow the issuer to continue its operations while reorganizing. Such financings constitute senior liens on unencumbered collateral (i.e., collateral not subject to other creditors’ claims). There is risk that the issuer under a debtor-in-possession financing will not emerge from Chapter 11 and be forced to liquidate its assets under Chapter 7 of the U.S. Bankruptcy Code. In the event of liquidation, the Funds’ only recourse would be against the collateral securing the debtor-in-possession financing.
(l) Payment In-Kind Securities. The Funds may invest in payment in-kind securities, which are debt or preferred stock securities that require or permit payment of interest in the form of additional securities. Payment in-kind securities allow the issuer to avoid or delay the need to generate cash to meet current interest payments and, as a result, may involve greater risk than securities that pay interest currently or in cash.
(m) U.S. Government Agencies or Government-Sponsored Enterprises. Securities issued by U.S. Government agencies or government-sponsored enterprises may not be guaranteed by the U.S. Treasury. The Government National Mortgage Association (“GNMA” or “Ginnie Mae”), a wholly-owned U.S. Government corporation, is authorized to guarantee, with the full faith and credit of the U.S. Government, the timely payment of principal and interest on securities issued by institutions approved by GNMA and backed by pools of mortgages insured by the Federal Housing Administration or guaranteed by the Department of Veterans Affairs. Government-related guarantors not backed by the full faith and credit of the U.S. Government include the Federal National Mortgage Association (“FNMA” or “Fannie Mae”) and the Federal Home Loan Mortgage Corporation (“FHLMC” or “Freddie Mac”). Pass-through securities issued by FNMA are guaranteed as to timely payment of principal and interest by FNMA, but are not backed by the full faith and credit of the U.S. Government. FHLMC guarantees the timely payment of interest and ultimate collection of principal, but its participation certificates are not backed by the full faith and credit of the U.S. Government.
(n) Exchange-Traded Funds. Certain Funds may invest in ETFs, which typically are index-based investment companies that hold substantially all of their assets in securities representing their specific index, but may also be actively-managed investment companies. Shares of ETFs trade throughout the day on an exchange and represent an investment in a portfolio of securities and other assets. As a shareholder of another investment company, the Funds would bear their pro rata portion of the other investment company’s expenses, including advisory fees, in addition to the expenses the Funds bear directly in connection with their own operations.
(o) Inflation-Indexed Bonds. Certain Funds may invest in inflation-indexed bonds. Inflation-indexed bonds are fixed income securities whose principal value is periodically adjusted to the rate of inflation.
The interest rate on these bonds is generally fixed at issuance at a rate lower than typical bonds. Over the life of an inflation-indexed bond, however, interest will be paid based on a principal value which is adjusted for inflation.
(p) Convertible Securities. Certain Funds may invest a portion of their assets in convertible securities. Although convertible securities derive part of their value from that of the securities into which they are convertible, they are not considered derivative financial instruments. However, certain of the Funds’ investments in convertible securities include features which render them sensitive to price changes in their underlying securities. The value of structured/synthetic convertible securities can be affected by interest rate changes and credit risks of the issuer. Such securities may be structured in ways that limit their potential for capital appreciation and the entire value of the security may be at risk of loss depending on the performance of the underlying equity security. Consequently, the Funds are exposed to greater downside risk than traditional convertible securities, but typically still less than that of the underlying stock.
(q) When-Issued/Delayed-Delivery Transactions. When-issued or delayed-delivery transactions involve a commitment to purchase or sell securities for a predetermined price or yield, with payment and delivery taking place beyond the customary settlement period. When delayed-delivery purchases are outstanding, the Funds will set aside and maintain until the settlement date in a designated account, liquid assets in an amount sufficient to meet the purchase price. Upon entering into these when-issued or delayed-delivery transactions, the Funds and the counterparties are required to pledge to the other party an amount of cash or securities collateral when either party has a net exposure that exceeds the minimum transfer amount of the other party. When purchasing a security on a delayed-delivery basis, the Funds assume the rights and risks of ownership of the security, including the risk of price and yield fluctuations; consequently, such fluctuations are taken into account when determining the NAV. The Funds may dispose of or renegotiate a delayed-delivery transaction after it is entered into, and may sell when-issued securities before they are delivered, which may result in a realized gain or loss. When a security is sold on a delayed-delivery basis, the Funds do not participate in future gains and losses with respect to the security.
(r) Securities Traded on To-Be-Announced Basis. The Funds may from time to time purchase securities on a to-be-announced (“TBA”) basis. In a TBA transaction, the Fund commits to purchasing or selling securities for which all specific information is not yet known at the time of the trade, particularly the face amount and maturity date of the underlying security transactions. Securities purchased on a TBA basis are not settled until they are delivered to the Fund, normally 15 to 45 days later. Beginning on the date the Fund enters into a TBA transaction, cash, U.S. government securities or other liquid securities are segregated in an amount equal in value to the purchase price of the TBA security. These transactions are subject to market fluctuations, and their current value is determined in the same manner as for other securities.
| 198 | September 30, 2020 | | Annual Report |
Table of Contents
(s) Contingent Value Rights. A Fund may invest in contingent value rights (“CVRs”). A CVR gives the holder the right to receive an amount (which may be a fixed amount or determined by a formula) in the event that a specified corporate action, business milestone, or other trigger occurs (or does not occur) which is often subject to an expiration date. CVRs often are awarded to shareholders in the context of a corporate acquisition or major restructuring. For example, shareholders of an acquired company may receive a CVR that enables them to receive additional shares of the acquiring company in the event that the acquiring company’s share price falls below a certain level by a specified date. Risks associated with the use of CVRs are generally similar to risks associated with the use of options, such as the risk that the required trigger does not (or does) occur prior to a CVR’s expiration, causing the CVR to expire with no value. CVRs also present illiquidity risk, as they may not be registered securities or may otherwise be non-transferable or difficult to transfer, as well as counterparty risk and credit risk. Further, because CVRs are valued based on the likelihood of the occurrence of a trigger, valuation often requires modeling and judgment, which increases the risk of mispricing or improper valuation.
(t) Restricted Securities. The Funds are permitted to invest in securities that are subject to legal or contractual restrictions on resale. These securities generally may be resold in transactions exempt from registration or to the public if the securities are registered. Disposal of these securities may involve time-consuming negotiations and expenses, and prompt sale at an acceptable price may be difficult.
(u) Organizational and Offering Costs. Organizational costs are expensed at the inception of the Fund. Offering costs are amortized over a twelve-month period from the inception of the Fund.
(v) Loan Interest Expense. Loan interest expense relates to the amounts borrowed under the credit facility (See Note 12). Loan interest expense is recorded as it is incurred.
(w) New Accounting Pronouncements. In March 2020, the FASB issued Accounting Standards Update (“ASU”) 2020-04, which provides optional expedients and exceptions for contracts, hedging relationships and other transactions affected by reference rate reform if certain criteria are met. The adoption of the ASU is elective. At this time, management is evaluating the implications of these changes on the financial statements.
| 2. | PRINCIPAL RISKS |
In the normal course of business, the Funds trade financial instruments and enter into financial transactions where risk of potential loss exists due to, among other things, changes in the market (market risk) or failure of the other party to a transaction to perform (counterparty risk). The Funds are also exposed to other risks such as, but not limited to, interest rate, foreign currency, credit and leverage risks.
Interest rate risk is the risk that fixed income securities’ valuations will change because of changes in interest rates. During periods of rising nominal interest rates, the values of fixed income instruments are
generally expected to decline. Conversely, during periods of declining nominal interest rates, the values of fixed income instruments are generally expected to rise. To the extent that a Fund effectively has short positions with respect to fixed income instruments, the values of such short positions would generally be expected to rise when nominal interest rates rise and to decline when nominal interest rates decline. A nominal interest rate can be described as the sum of a real interest rate and an expected inflation rate. Fixed income securities with longer durations tend to be more sensitive to changes in interest rates, usually making them more volatile than securities with shorter durations. Duration is used primarily as a measure of the sensitivity of a fixed income security’s market price to interest rate (i.e., yield) movements. Interest rate changes can be sudden and unpredictable, and the Funds may lose money as a result of movements in interest rates. High-yield or junk bonds are subject to greater levels of credit and liquidity risk, may be speculative and may decline in value due to increase in interest rates or an issuer’s deterioration and/or default. The Funds may not be able to hedge against changes in interest rates or may choose not to do so for cost or other reasons. In addition, any hedges may not work as intended. The values of equity and other non-fixed income securities may also decline due to fluctuations in interest rates.
Variable and floating rate securities generally are less sensitive to interest rate changes but may decline in value if their interest rates do not rise as much, or as quickly, as interest rates in general. Conversely, floating rate securities will not generally increase in value if interest rates decline. Inverse floating rate securities may decrease in value if interest rates increase. Inverse floating rate securities may also exhibit greater price volatility than a fixed rate obligation with similar credit quality. When the Funds hold variable or floating rate securities, a decrease (or, in the case of inverse floating rate securities, an increase) in market interest rates will adversely affect the income received from such securities and the NAV of the Funds’ shares.
The Funds are exposed to credit risk, which is the risk of losing money if the issuer or guarantor of a fixed income security is unable or unwilling, or is perceived (whether by market participants, rating agencies, pricing services or otherwise) as unable or unwilling, to make timely principal and/or interest payments, or to otherwise honor its obligations. Securities are subject to varying degrees of credit risk, which are often reflected in credit ratings.
To the extent the Funds directly invest in foreign currencies or in securities that trade in, and receive revenues in, foreign currencies, or in derivatives that provide exposure to foreign currencies, they will be subject to the risk that those currencies will decline in value relative to the U.S. dollar, or, in the case of hedging positions, that the U.S. dollar will decline in value relative to the currency being hedged. Currency rates in foreign countries may fluctuate significantly over short periods of time for a number of reasons, including economic growth, inflation, changes in interest rates, intervention (or the failure to intervene) by U.S. or foreign governments, central banks or supranational entities such as the International Monetary Fund, or the imposition of currency controls or other political developments in the United States or
| Annual Report | | September 30, 2020 | 199 |
Table of Contents
Notes to Financial Statements (cont’d)
September 30, 2020
abroad. As a result, the Funds’ investments in foreign currency-denominated securities may reduce the returns of the Funds. The local emerging market currencies in which the Funds may be invested may experience substantially greater volatility against the U.S. dollar than the major convertible currencies in developed countries.
The Funds are subject to elements of risk not typically associated with investments in the U.S., due to concentrated investments in foreign issuers located in a specific country or region. Such concentrations will subject the Funds to additional risks resulting from future political or economic conditions in such country or region and the possible imposition of adverse governmental laws or currency exchange restrictions affecting such country or region, which could cause the securities and their markets to be less liquid and prices more volatile than those of comparable U.S. companies.
Funds may be subject to increased risk to the extent they allocate assets among investment styles and certain styles under-perform relative to other investment styles.
The market values of securities may decline due to general market conditions (market risk) which are not specifically related to a particular company, such as real or perceived adverse economic conditions, changes in the general outlook for corporate earnings, changes in interest or currency rates, adverse changes to credit markets or adverse investor sentiment. They may also decline due to factors that affect a particular industry or industries, such as labor shortages or increased production costs and competitive conditions within an industry. Equity securities and equity-related investments generally have greater market price volatility than fixed income securities, although under certain market conditions fixed income securities may have comparable or greater price volatility. Credit ratings downgrades may also negatively affect securities held by the Funds. Even when markets perform well, there is no assurance that the investments held by the Funds will increase in value along with the broader market. In addition, market risk includes the risk that local, regional or global events, including geopolitical and other events may disrupt the economy on a national or global level. For example, events such as war, acts of terrorism, the spread of infectious illness or other public health issues, recessions, or other events could have a significant impact on the economy or the markets for financial instruments and, as a result, could have a significant impact on a Fund and its investments. As a further example, an outbreak of respiratory disease caused by a novel coronavirus designated as COVID-19 was first detected in China in December 2019 and subsequently spread globally, being designated as a pandemic in early 2020. The transmission of COVID-19 and efforts to contain its spread have resulted in, among other things, border closings and other significant travel restrictions and disruptions; mandatory stay-at-home and work-from-home orders in numerous countries, including the United States; significant disruptions to business operations, supply chains and customer activity, as well as mandatory business closures; lower consumer demand for goods and services; event cancellations and restrictions; cancellations, reductions and other changes in services; significant challenges in healthcare service preparation and delivery;
public gathering limitations and prolonged quarantines; and general concern and uncertainty. These effects have exacerbated the significant risks inherent in market investments, and the COVID-19 pandemic has already meaningfully disrupted the global economy and markets, causing market losses across a range of asset classes, as well as both heightened market volatility and increased illiquidity for trading. Although the long-term economic fallout of COVID-19 is difficult to predict, it has the potential to continue to have ongoing material adverse effects on the global economy, the economies of individual countries, and the financial performance of individual issuers, sectors, industries, asset classes, and markets in significant and unforeseen ways. Health crises caused by the outbreak of COVID-19 may also exacerbate other pre-existing political, social, economic, market and financial risks. The effects of the outbreak in developing or emerging market countries may be greater due to less established health care systems. The COVID-19 pandemic and its effects may be short term or may last for an extended period of time, and in either case could result in significant market volatility, exchange trading suspensions and closures, declines in global financial markets, higher default rates, and a substantial economic downturn or recession. Furthermore, the ability of the Investment Manager or its affiliates to operate effectively, including the ability of personnel to function, communicate and travel to the extent necessary to carry out each Fund’s investment strategies and objectives, may be materially impaired. All of the foregoing could impair a Fund’s ability to maintain operational standards (such as with respect to satisfying redemption requests), providers, adversely affect the value and liquidity of each Fund’s investments, and negatively impact each Fund’s performance and your investment in the respective Fund.
Certain of the Funds invest in ETFs. Shareholders will indirectly bear fees and expenses associated with the ETFs in which a Fund invests, in addition to a Fund’s direct fees and expenses. The cost of investing in a Fund, therefore, may be higher than the cost of investing in a mutual fund that invests directly in individual stocks and bonds. In addition, a Fund’s NAV will be subject to fluctuations in the market values of the ETFs in which it invests. A Fund is also subject to the risks associated with the securities or other investments in which the ETFs invest, and the ability of a Fund to meet its investment objective will directly depend on the ability of the ETFs to meet their investment objectives. An index based ETF’s performance may not match that of the index it seeks to track.
The Funds are exposed to counterparty risk, or the risk that an institution or other entity with which the Funds have unsettled or open transactions will default. The potential loss to the Funds could exceed the value of the financial assets recorded in the Funds’ financial statements. Financial assets, which potentially expose the Funds to counterparty risk, consist principally of cash due from counterparties and investments. The Investment Manager seeks to minimize the Funds’ counterparty risk by performing reviews of each counterparty and by minimizing concentration of counterparty risk by undertaking transactions with multiple customers and counterparties on recognized and reputable exchanges. Delivery of securities sold is only
| 200 | September 30, 2020 | | Annual Report |
Table of Contents
made once the Funds have received payment. Payment is made on a purchase once the securities have been delivered by the counterparty. The trade will fail if either party fails to meet its obligation.
The Funds are exposed to risks associated with leverage. Leverage may cause the value of the Funds’ shares to be more volatile than if the Funds did not use leverage. This is because leverage tends to exaggerate the effect of any increase or decrease in the value of the Funds’ portfolio securities. The Funds may engage in transactions or purchase instruments that give rise to forms of leverage. In addition, to the extent the Funds employ leverage, dividend and interest costs on such leverage may not be recovered by any appreciation of the securities purchased with the leverage proceeds and could exceed the Funds’ investment returns, resulting in greater losses.
The Funds may hold defaulted securities that may involve special considerations including bankruptcy proceedings, other regulatory and legal restrictions affecting the Funds’ ability to trade, and the availability of prices from independent pricing services or dealer quotations. Defaulted securities are often illiquid and may not be actively traded. Sale of securities in bankrupt companies at an acceptable price may be difficult and differences compared to the value of the securities used by the Funds could be material. A Fund may incur additional expenses to the extent it is required to seek recovery upon a portfolio security’s default in the payment of principal or interest. In any bankruptcy proceeding relating to a defaulted investment, a Fund may lose its entire investment or may be required to accept cash or securities with a value substantially less than its original investment.
Short sales may be used by certain Funds. When a Fund engages in a short sale on a security, it must borrow the security sold short and deliver it to the counterparty. The Fund will ordinarily have to pay a fee or premium to borrow particular securities and be obligated to repay the lender of the security any dividends or interest that accrue on the security during the period of the loan. The amount of any gain from a short sale will be decreased, and the amount of any loss increased, by the amount of the premium, dividends, interest or expenses a Fund pays in connection with the short sale. Short sales expose a Fund to the risk that it will be required to cover its short position at a time when the securities have appreciated in value, thus resulting in a loss to the Fund.
Investments in senior loans and repurchase agreements also involve special risks. Although typically secured, senior loans may not be backed by sufficient collateral to satisfy their issuers’ obligations in the event of bankruptcy or similar scenarios. Senior loans may also be illiquid. Similarly, repurchase agreements may result in losses if the collateral associated with such positions is insufficient in the event of a counterparty default or similar scenario. Repurchase agreement positions may also be illiquid.
AllianzGI PerformanceFee Managed Futures Strategy may gain exposure to commodity markets by investing in a subsidiary of the Trust, the AllianzGI PerformanceFee Managed Futures Strategy Offshore Fund Ltd. (the “Cayman Subsidiary”). By investing in the
Cayman Subsidiary, the Fund is indirectly exposed to the risks associated with the Cayman Subsidiary’s investments. AllianzGI PerformanceFee Managed Futures Strategy may invest no more than 25% of its assets in the Cayman Subsidiary.
The Funds are party to International Swaps and Derivatives Association, Inc. Master Agreements (“ISDA Master Agreements”) with select counterparties that govern transactions, over-the-counter derivatives and foreign exchange contracts entered into by the Funds and those counterparties. The ISDA Master Agreements contain provisions for general obligations, representations, agreements, collateral and events of default or termination. Events of termination include conditions that may entitle counterparties to elect to terminate early and cause settlement of all outstanding transactions under the applicable ISDA Master Agreement. Any election to terminate early could be material to the financial statements of the Funds.
The considerations and factors surrounding the settlement of certain purchases and sales made on a delayed-delivery basis are governed by Master Securities Forward Transaction Agreements (“Master Forward Agreements”) between the Funds and select counterparties. The Master Forward Agreements maintain provisions for, among other things, initiation and confirmation, payment and transfer, events of default, termination, and maintenance of collateral.
The counterparty risk associated with certain contracts may be reduced by master netting arrangements to the extent that if an event of default occurs, all amounts with the counterparty are terminated and settled on a net basis. The Funds’ overall exposure to counterparty risk with respect to transactions subject to master netting arrangements can change substantially within a short period, as it is affected by each transaction subject to the arrangement.
| 3. | UNDERLYING FUNDS |
AllianzGI Global Allocation and AllianzGI Multi Asset Income intend to invest their assets significantly or primarily in series of the Trust, Allianz Funds, AllianzGI Institutional Multi-Series Trust, PIMCO Funds and PIMCO ETF Trust (together, “Affiliated Underlying Funds”). AllianzGI Global Allocation and AllianzGI Multi Asset Income may also invest a portion of their assets in ETFs and mutual funds and pooled vehicles other than Affiliated Underlying Funds (collectively, with the Affiliated Underlying Funds, the “Underlying Funds”) and may invest directly in securities and other instruments. PerformanceFee Structured US Equity and Structured Return may have substantial exposure to Underlying Funds. Accordingly, the investment performance of the Funds depends upon a favorable allocation among the Underlying Funds as well as the ability of the Underlying Funds to achieve their objectives. There can be no assurance that the investment objective of any Underlying Fund will be achieved. The risks associated with investing in each Fund are closely related to the risks associated with the securities and other investments held by the Underlying Funds.
| Annual Report | | September 30, 2020 | 201 |
Table of Contents
Notes to Financial Statements (cont’d)
September 30, 2020
Investing in the Underlying Funds involves certain additional expenses and tax results that would not be present in a direct investment in the securities and other investments held by the Underlying Funds. Each Fund’s NAV will fluctuate in response to changes in the NAVs of the Underlying Funds in which it invests. The extent to which the investment performance and risks associated with each Fund correlate to those of a particular Underlying Fund will depend upon the extent to which each Fund’s assets are allocated from time to time for investments in the Underlying Fund, which will vary. To the extent that a Fund invests a significant portion of its assets in an Underlying Fund it will be particularly sensitive to the risks associated with that Underlying Fund.
| 4. | FINANCIAL DERIVATIVE INSTRUMENTS |
Disclosure about derivatives and hedging activities requires qualitative disclosure regarding objectives and strategies for using derivatives, quantitative disclosure about fair value amounts of gains and losses on derivatives, and disclosure about credit-risk-related contingent features in derivative agreements. The disclosure requirements distinguish between derivatives which are accounted for as “hedges”, and those that do not qualify for such accounting. Although the Funds at times use derivatives for hedging purposes, the Funds reflect derivatives at fair value and recognize changes in fair value through the Funds’ Statements of Operations, and such derivatives do not qualify for hedge accounting treatment.
The U.S. Commodity Futures Trading Commission (the “CFTC”) has adopted regulations that subject registered investment companies and their investment advisers to regulation by the CFTC if the registered investment company invests more than a prescribed level of its liquidation value in commodity futures, options on commodities or commodity futures, swaps, or other financial instruments regulated under the Commodity Exchange Act, or if the fund markets itself as providing investment exposure to such instruments. The Investment Manager is registered as a commodity pool operator with respect to AllianzGI PerformanceFee Managed Futures Strategy and the Cayman Subsidiary.
Option Transactions. The Funds purchase put and call options on securities and indices for hedging purposes, risk management purposes or otherwise as part of their investment strategies. The risks associated with purchasing an option include the risk that the Funds pay a premium whether or not the option is exercised. Additionally, the Funds bear the risk of loss of premiums and changes in market value should the counterparty not perform under the contract. Put and call options purchased are accounted for in the same manner as portfolio securities. The cost of securities acquired through the exercise of call options is increased by the premiums paid. The proceeds from securities sold through the exercise of put options are decreased by the premiums paid.
The Funds may write (sell) put and call options on securities and indices to earn premiums, for hedging purposes, risk management purposes or otherwise as part of their investment strategies. When an option is written, the premium received is recorded as an asset with an
equal liability that is subsequently marked to market to reflect the market value of the option written. These liabilities, if any, are reflected as options written in the Funds’ Statements of Assets and Liabilities. Premiums received from writing options which expire unexercised are recorded on the expiration date as a realized gain. The difference between the premium received and the amount paid on effecting a closing purchase transaction, including brokerage commissions, is also treated as a realized gain, or if the premium is less than the amount paid for the closing purchase transaction, as a realized loss. If a call option written is exercised, the premium is added to the proceeds from the sale of the underlying security in determining whether there has been a realized gain or loss. If a put option written is exercised, the premium reduces the cost basis of the security. In writing an option, the Funds bear the market risk of an unfavorable change in the price of the security underlying the written option. Exercise of a written option could result in the Funds purchasing a security at a price different from its current market value.
There are several risks associated with option transactions on securities. For example, there are significant differences between the securities and options markets that could result in an imperfect correlation between these markets, causing a given transaction not to achieve its objective. The Funds’ ability to use options successfully will depend on the Investment Manager’s ability to predict pertinent market movements, which cannot be assured. As the writer of a covered call option, a Fund foregoes, during the option’s life, the opportunity to profit from increases in the market value of the security covering the call option above the sum of the premium and the strike price of the call, but has retained the risk of loss should the price of the underlying security decline.
Futures Contracts. The Funds use futures contracts to manage their exposure to the securities markets or the movements in interest rates and currency values. A futures contract is an agreement between two parties to buy and sell a financial instrument at a set price on a future date. Upon entering into such a contract, the Funds are required to pledge to the broker an amount of cash or securities equal to the minimum “initial margin” requirements of the exchange. Pursuant to the contracts, the Funds agree to receive from or pay to the broker an amount of cash or securities equal to the daily fluctuation in the value of the contracts. Such receipts or payments are known as “variation margin” and are recorded by the Funds as unrealized appreciation or depreciation. When the contracts are closed, the Funds record a realized gain or loss equal to the difference between the value of the contracts at the time they were opened and the value at the time they were closed. Any unrealized appreciation or depreciation recorded is simultaneously reversed. The use of futures transactions involves various risks, including the risk of an imperfect correlation in the movements in the price of futures contracts, interest rates and underlying hedging assets, and possible inability or unwillingness of counterparties to meet the terms of their contracts.
Swap Agreements. Swap agreements are bilaterally negotiated agreements between the Funds and a counterparty to exchange or swap investment cash flows, assets, foreign currencies or market or
| 202 | September 30, 2020 | | Annual Report |
Table of Contents
event-linked returns at specified, future intervals. Swap agreements may be privately negotiated in the over-the-counter market (“OTC swaps”) or may be executed in a multilateral or other trade facility platform, such as a registered commodities exchange (“centrally cleared swaps”). The Funds may enter into credit default, cross-currency, interest rate, total return, variance and other forms of swap agreements in order, among other things, manage their exposure to credit, currency and interest rate risk. In connection with these agreements, securities or cash may be identified as collateral or margin in accordance with the terms of the respective swap agreements to provide assets of value and recourse in the event of default or bankruptcy/insolvency.
OTC swap payments received or made at the beginning of the measurement period, if any, are reflected as such on the Funds’ Statements of Assets and Liabilities and represent payments made or received upon entering into the swap agreement to compensate for differences between the stated terms of the swap agreement and prevailing market conditions (credit spreads, currency exchange rates, interest rates, and other relevant factors). These upfront payments are recorded as realized gains or losses on the Funds’ Statements of Operations upon termination or maturity of the swap. A liquidation payment received or made at the termination of the swap is recorded as realized gain or loss on the Funds’ Statements of Operations. Net periodic payments received or paid by the Funds are included as part of realized gains or losses on the Funds’ Statements of Operations. Changes in market value, if any, are reflected as a component of net changes in unrealized appreciation/depreciation on the Funds’ Statements of Operations. Daily changes in valuation of centrally cleared swaps, if any, are recorded as receivable or payable, as applicable, for variation margin on centrally cleared swaps on the Funds’ Statements of Assets and Liabilities.
Entering into these agreements involves, to varying degrees, elements of credit, legal, market and documentation risk in excess of the amounts recognized on the Funds’ Statements of Assets and Liabilities. Such risks include the possibility that there will be no liquid market for these agreements, that the counterparties to the agreements may default on their obligation to perform or disagree as to the meaning of contractual terms in the agreements and that there may be unfavorable changes in interest rates.
Credit Default Swap Agreements. Credit default swap agreements involve one party (referred to as the buyer of protection) making a stream of payments to another party (the seller of protection) in exchange for the right to receive a specified return in the event of a default or other credit event for the referenced entity, obligation or index. As the sellers of protection on credit default swap agreements, the Funds will generally receive from the buyer of protection a fixed rate of income throughout the term of the swap provided that there is no credit event. As the sellers, the Funds would effectively add leverage to their investment portfolios because, in addition to their total net assets, the Funds would be subject to investment exposure on the notional amount of the swap.
If the Funds are sellers of protection and a credit event occurs, as defined under the terms of that particular swap agreement, a Fund will either (i) pay to the buyer of protection an amount equal to the notional amount of the swap and take delivery of the referenced obligation, other deliverable obligations or underlying securities comprising the referenced index or (ii) pay a net settlement amount in the form of cash or securities equal to the notional amount of the swap less the recovery value of the referenced obligation or underlying securities comprising the referenced index. If the Funds are buyers of protection and a credit event occurs, as defined under the terms of that particular swap agreement, a Fund will either (i) receive from the seller of protection an amount equal to the notional amount of the swap and deliver the referenced obligation, other deliverable obligations or underlying securities comprising the referenced index or (ii) receive a net settlement amount in the form of cash or securities equal to the notional amount of the swap less the recovery value of the referenced obligation or underlying securities comprising the referenced index. Recovery values are assumed by market makers considering either industry standard recovery rates or entity specific factors and considerations until a credit event occurs. If a credit event has occurred, the recovery value is determined by a facilitated auction whereby a minimum number of allowable broker bids, together with a specified valuation method, are used to calculate the settlement value.
Credit default swap agreements on credit indices involve one party making a stream of payments to another party in exchange for the right to receive a specified return in the event of a write-down, principal shortfall, interest shortfall or default of all or part of the referenced entities comprising the credit index. A credit index is a basket of credit instruments or exposures designed to be representative of some part of the credit market as a whole. These indices are made up of reference credits that are judged by a poll of dealers to be the most liquid entities in the credit default swap market based on the sector of the index. Components of the indices may include, but are not limited to, investment grade securities, high yield securities, asset backed securities, emerging markets, and/or various credit ratings within each sector. Credit indices are traded using credit default swaps with standardized terms including a fixed spread and standard maturity dates. An index credit default swap references all the names in the index, and if there is a default, the credit event is settled based on that name’s weight in the index, or in the case of a tranched index credit default swap, the credit event is settled based on the name’s weight in the index that falls within the tranche for which the Funds bear exposure. The composition of the indices changes periodically, usually every six months, and for most indices, each name has an equal weight in the index. The Funds use credit default swaps on credit indices to hedge a portfolio of credit default swaps or bonds, which is less expensive than it would be to buy many credit default swaps to achieve a similar effect. Credit default swaps on indices are benchmarks for protecting investors owning bonds against default, and traders use them to speculate on changes in credit quality.
| Annual Report | | September 30, 2020 | 203 |
Table of Contents
Notes to Financial Statements (cont’d)
September 30, 2020
Implied credit spreads, represented in absolute terms, utilized in determining the market value of credit default swap agreements on corporate or sovereign issues serve as an indicator of the current status of the payment/performance risk, and represent the likelihood or risk of default for the credit derivative. The implied credit spread of a particular referenced entity reflects the cost of buying/selling protection and may include upfront payments required to be made to enter into the agreement. For credit default swap agreements on asset-backed securities and credit indices, the quoted market prices and resulting values serve as the indicator of the current status of the payment/performance risk. Wider credit spreads and increasing market values, in absolute terms when compared to the notional amount of the swap, represent a deterioration of the referenced entity’s credit soundness and a greater likelihood or risk of default or other credit event occurring as defined under the terms of the agreement.
The maximum potential amount of future payments (undiscounted) that the Funds as sellers of protection could be required to make under a credit default swap agreement would be an amount equal to the notional amount of the agreement. These potential amounts would be partially offset by any recovery values of the respective referenced obligations, upfront payments received upon entering into the agreement, or net amounts received from the settlement of buy protection credit default swap agreements entered into by the Funds for the same referenced entity or entities.
Total Return Swap Agreements. Total return swap agreements are entered into gain or mitigate exposure to the underlying reference asset. Total return swap agreements involve commitments where single or multiple cash flows are exchanged based on the price of an underlying reference asset and on a fixed or variable interest rate. One counterparty pays out the total return of a specific underlying reference asset, and in return receives a fixed or variable rate. At maturity date, a net cash flow is exchanged where the total return is equivalent to the return of the underlying reference asset less a financing rate, if any. As a receiver, a Fund would receive payments based on any net positive total return and would owe payments in the event of a net negative total return. As a payer, a Fund would owe payments on any net positive total return and would receive payments in the event of a net negative return.
Volatility Swap Agreements. Volatility swap agreements are agreements in which the counterparties agree to make payments in connection with changes in the volatility of an underlying referenced instrument, such as a currency, rate, index, security or other financial instrument. Volatility swap agreements permit the parties to attempt to hedge volatility risk and/or take positions on the projected future volatility of an underlying referenced instrument. At the maturity date, a net cash flow is exchanged, where the payoff amount is equivalent to the difference between the realized price volatility of the referenced instrument and the strike multiplied by the notional amount. As a receiver of the realized price volatility, a Fund would receive the payoff amount when the realized price volatility of the referenced instrument is greater than the strike and would owe the payoff amount when the
volatility is less than the strike. As a payer of the realized price volatility, a Fund would owe the payoff amount when the realized price volatility of the referenced instrument is greater than the strike and would receive the payoff amount when the volatility is less than the strike. Payments on a volatility swap will be greater if they are based upon the mathematical square of volatility (i.e., the measured volatility multiplied by itself, which is referred to as “variance”). This type of volatility swap is frequently referred to as a variance swap.
Forward Foreign Currency Contracts. A forward foreign currency contract is an agreement between two parties to buy and sell a currency at a set exchange rate on a future date. The Funds enter into forward foreign currency contracts for the purpose of hedging against foreign currency risk arising from the investment or anticipated investment in securities denominated in foreign currencies. The Funds also enter into these contracts for purposes of increasing exposure to a foreign currency or shifting exposure to foreign currency fluctuations from one country to another. The market value of a forward foreign currency contract fluctuates with changes in foreign currency exchange rates. All commitments are marked to market daily at the applicable exchange rates and any resulting unrealized appreciation or depreciation is recorded. Realized gains or losses are recorded at the time the forward contract matures or by delivery of the currency. Risks may arise upon entering into these contracts from the potential inability of counterparties to meet the terms of their contracts and from unanticipated movements in the value of a foreign currency relative to the U.S. dollar. In addition, these contracts may involve market risk in excess of the unrealized appreciation (depreciation) reflected in the Funds’ Statements of Assets and Liabilities.
The following is a summary of the Funds’ derivatives categorized by risk exposure.
The effect of derivatives on the Statements of Assets and Liabilities at September 30, 2020:
| AllianzGI Best Styles Global Equity: | ||||
| Location | Foreign Exchange Contracts | |||
Liability derivatives: | ||||
Unrealized depreciation of forward foreign currency contracts | — | |||
| 204 | September 30, 2020 | | Annual Report |
Table of Contents
| AllianzGI Core Plus Bond: | ||||||||||||
| Location | Interest Rate Contracts | Credit Contracts | Total | |||||||||
Asset derivatives: | ||||||||||||
Unrealized appreciation of swaps** | — | $ | 10,655 | $ | 10,655 | |||||||
Unrealized appreciation on futures contracts* | $ | 653 | — | 653 | ||||||||
Total asset derivatives | $ | 653 | $ | 10,655 | $ | 11,308 | ||||||
Liability derivatives: | ||||||||||||
Unrealized depreciation of swaps** | — | $ | (342,133 | ) | $ | (342,133 | ) | |||||
Unrealized depreciation on futures contracts* | $ | (48,333 | ) | — | (48,333 | ) | ||||||
Total liability derivatives | $ | (48,333 | ) | $ | (342,133 | ) | $ | (390,466 | ) | |||
| * | Included in net unrealized depreciation of $47,680 on futures contracts as reported in the Fund’s Notes to Schedule of Investments. Only variation margin is reported within the Statements of Assets and Liabilities. |
| ** | Included in net unrealized depreciation of $331,478 on swaps as reported in the Fund’s Notes to Schedule of Investments. Only variation margin is reported within the Statements of Assets and Liabilities. |
| AllianzGI Global Allocation: | ||||||||||||||||||||
| Location | Market Price | Interest Rate Contracts | Credit Contracts | Foreign Exchange Contracts | Total | |||||||||||||||
Asset derivatives: | ||||||||||||||||||||
Unrealized appreciation of swaps** | — | — | $ | 2,392 | — | $ | 2,392 | |||||||||||||
Unrealized appreciation on futures contracts* | $ | 82,444 | $ | 93,517 | — | $ | 28,460 | 204,421 | ||||||||||||
Total asset derivatives | $ | 82,444 | $ | 93,517 | $ | 2,392 | $ | 28,460 | $ | 206,813 | ||||||||||
Liability derivatives: | ||||||||||||||||||||
Unrealized depreciation of swaps** | — | — | $ | (841 | ) | — | $ | (841 | ) | |||||||||||
Unrealized depreciation on futures contracts* | $ | (294,775 | ) | $ | (2,580 | ) | — | — | (297,355 | ) | ||||||||||
Total liability derivatives | $ | (294,775 | ) | $ | (2,580 | ) | $ | (841 | ) | — | $ | (298,196 | ) | |||||||
| * | Included in net unrealized depreciation of $92,934 on futures contracts as reported in the Fund’s Notes to Schedule of Investments. Only variation margin is reported within the Statements of Assets and Liabilities. |
| ** | Included in net unrealized appreciation of $1,551 on swaps as reported in the Fund’s Notes to Schedule of Investments. Only variation margin is reported within the Statements of Assets and Liabilities. |
| AllianzGI Global Dynamic Allocation: | ||||||||||||||||||||
| Location | Market Price | Interest Rate Contracts | Credit Contracts | Foreign Exchange Contracts | Total | |||||||||||||||
Asset derivatives: | ||||||||||||||||||||
Unrealized appreciation of swaps** | $ | 15,694 | — | $ | 709 | — | $ | 16,403 | ||||||||||||
Unrealized appreciation on futures contracts* | 47,880 | $ | 19,519 | — | $ | 7,673 | 75,072 | |||||||||||||
Total asset derivatives | $ | 63,574 | $ | 19,519 | $ | 709 | $ | 7,673 | $ | 91,475 | ||||||||||
Liability derivatives: | ||||||||||||||||||||
Unrealized depreciation of swaps** | $ | (5,943 | ) | — | $ | (247 | ) | — | $ | (6,190 | ) | |||||||||
Unrealized depreciation on futures contracts* | (189,370 | ) | $ | (2,092 | ) | — | $ | (8,196 | ) | (199,658 | ) | |||||||||
Total liability derivatives | $ | (195,313 | ) | $ | (2,092 | ) | $ | (247 | ) | $ | (8,196 | ) | $ | (205,848 | ) | |||||
| * | Included in net unrealized depreciation of $124,586 on futures contracts as reported in the Fund’s Notes to Schedule of Investments. Only variation margin is reported within the Statements of Assets and Liabilities. |
| ** | Included in net unrealized appreciation of $10,213 on swaps as reported in the Fund’s Notes to Schedule of Investments. Only variation margin is reported within the Statements of Assets and Liabilities. |
| Annual Report | | September 30, 2020 | 205 |
Table of Contents
Notes to Financial Statements (cont’d)
September 30, 2020
| AllianzGI Green Bond: | ||||||||||||
| Location | Interest Rate Contracts | Foreign Exchange Contracts | Total | |||||||||
Asset derivatives: | ||||||||||||
Unrealized appreciation on futures contracts* | $ | 29,132 | — | $ | 29,132 | |||||||
Liability derivatives: | ||||||||||||
Unrealized depreciation on futures contracts* | $ | (4,250 | ) | — | $ | (4,250 | ) | |||||
Unrealized depreciation of forward foreign currency contracts | — | $ | (64,299 | ) | (64,299 | ) | ||||||
Total liability derivatives | $ | (4,250 | ) | $ | (64,299 | ) | $ | (68,549 | ) | |||
| * | Included in net unrealized appreciation of $24,882 on futures contracts as reported in the Fund’s Notes to Schedule of Investments. Only variation margin is reported within the Statements of Assets and Liabilities. |
| AllianzGI International Small-Cap: | ||||
| Location | Foreign Exchange Contracts | |||
Asset derivatives: | ||||
Unrealized appreciation of forward foreign currency contracts | $ | 284 | ||
Liability derivatives: | ||||
Unrealized depreciation of forward foreign currency contracts | $ | (1 | ) | |
| AllianzGI Multi Asset Income: | ||||||||||||||||
| Location | Market Price | Interest Rate Contracts | Foreign Exchange Contracts | Total | ||||||||||||
Asset derivatives: | ||||||||||||||||
Unrealized appreciation on futures contracts* | $ | 131,071 | $ | 62,735 | $ | 12,225 | $ | 206,031 | ||||||||
Liability derivatives: | ||||||||||||||||
Unrealized depreciation on futures contracts* | $ | (151,575 | ) | $ | (2,069 | ) | $ | (11,985 | ) | $ | (165,629 | ) | ||||
| * | Included in net unrealized appreciation of $40,402 on futures contracts as reported in the Fund’s Notes to Schedule of Investments. Only variation margin is reported within the Statements of Assets and Liabilities. |
| AllianzGI PerformanceFee Managed Futures Strategy: | ||||||||||||||||||||||||
| Location | Market Price | Interest Rate Contracts | Credit Contracts | Commodity Contracts | Foreign Exchange Contracts | Total | ||||||||||||||||||
Asset derivatives: | ||||||||||||||||||||||||
Unrealized appreciation of swaps** | — | — | $ | 20,621 | — | — | $ | 20,621 | ||||||||||||||||
Unrealized appreciation on futures contracts* | $ | 61,053 | $ | 176,966 | — | $ | 138,711 | $ | 3,580 | 380,310 | ||||||||||||||
Total asset derivatives | $ | 61,053 | $ | 176,966 | $ | 20,621 | $ | 138,711 | $ | 3,580 | $ | 400,931 | ||||||||||||
Liability derivatives: | ||||||||||||||||||||||||
Unrealized depreciation of swaps** | — | — | $ | (3,580 | ) | — | — | $ | (3,580 | ) | ||||||||||||||
Unrealized depreciation on futures contracts* | $ | (53,673 | ) | — | — | $ | (234,648 | ) | $ | (64,520 | ) | (352,841 | ) | |||||||||||
Total liability derivatives | $ | (53,673 | ) | — | $ | (3,580 | ) | $ | (234,648 | ) | $ | (64,520 | ) | $ | (356,421 | ) | ||||||||
| * | Included in net unrealized appreciation of $27,469 on futures contracts as reported in the Fund’s Notes to Consolidated Schedule of Investments. Only variation margin is reported within the Statements of Assets and Liabilities. |
| ** | Included in net unrealized appreciation of $17,041 on swaps as reported in the Fund’s Notes to Consolidated Schedule of Investments. Only variation margin is reported within the Statements of Assets and Liabilities. |
| AllianzGI PerformanceFee Structured US Equity: | ||||
| Location | Market Price | |||
Asset derivatives: | ||||
Investments, at value (options purchased) | $ | 202,097 | ||
Liability derivatives: | ||||
Options written, at value | $ | (263,560 | ) | |
| 206 | September 30, 2020 | | Annual Report |
Table of Contents
| AllianzGI Preferred Securities and Income: | ||||||||||||
| Location | Interest Rate Contracts | Credit Contracts | Total | |||||||||
Asset derivatives: | ||||||||||||
Unrealized appreciation on futures contracts* | $ | 137 | — | $ | 137 | |||||||
Liability derivatives: | ||||||||||||
Unrealized depreciation of swaps** | — | $ | (125,113 | ) | $ | (125,113 | ) | |||||
| * | Included in net unrealized appreciation of $137 on futures contracts as reported in the Fund’s Notes to Schedule of Investments. Only variation margin is reported within the Statements of Assets and Liabilities. |
| ** | Included in net unrealized depreciation of $125,113 on swaps as reported in the Fund’s Notes to Schedule of Investments. Only variation margin is reported within the Statements of Assets and Liabilities. |
| AllianzGI Structured Return: | ||||
| Location | Market Price | |||
Asset derivatives: | ||||
Investments, at value (options purchased) | $ | 300,932 | ||
Liability derivatives: | ||||
Options written, at value | $ | (399,314 | ) | |
The effect of derivatives on the Statements of Operations for the year ended September 30, 2020:
| AllianzGI Best Styles Global Equity: | ||||
| Location | Foreign Exchange Contracts | |||
Net realized loss on: | ||||
Forward foreign currency contracts | $ | (9,099 | ) | |
| AllianzGI Core Plus Bond: | ||||||||||||
| Location | Interest Rate Contracts | Credit Contracts | Total | |||||||||
Net realized gain (loss) on: | ||||||||||||
Futures contracts | $ | 393,363 | — | $ | 393,363 | |||||||
Swaps | — | $ | 458,519 | 458,519 | ||||||||
Total net realized gain (loss) | $ | 393,363 | $ | 458,519 | $ | 851,882 | ||||||
Net change in unrealized appreciation/depreciation of: | ||||||||||||
Futures contracts | $ | (15,260 | ) | — | $ | (15,260 | ) | |||||
Swaps | — | $ | (329,279 | ) | (329,279 | ) | ||||||
Total net change in unrealized appreciation/depreciation | $ | (15,260 | ) | $ | (329,279 | ) | $ | (344,539 | ) | |||
| AllianzGI Global Allocation: | ||||||||||||||||||||
| Location | Market Price | Interest Rate Contracts | Credit Contracts | Foreign Exchange Contracts | Total | |||||||||||||||
Net realized gain (loss) on: | ||||||||||||||||||||
Futures contracts | $ | 3,137,064 | $ | 2,476,327 | — | $ | (102,461 | ) | $ | 5,510,930 | ||||||||||
Swaps | — | — | $ | 21 | — | 21 | ||||||||||||||
Total net realized gain (loss) | $ | 3,137,064 | $ | 2,476,327 | $ | 21 | $ | (102,461 | ) | $ | 5,510,951 | |||||||||
Net change in unrealized appreciation/depreciation of: | ||||||||||||||||||||
Futures contracts | $ | (137,536 | ) | $ | 461,322 | — | $ | 58,414 | $ | 382,200 | ||||||||||
Swaps | — | — | $ | 1,551 | — | 1,551 | ||||||||||||||
Total net change in unrealized appreciation/depreciation | $ | (137,536 | ) | $ | 461,322 | $ | 1,551 | $ | 58,414 | $ | 383,751 | |||||||||
| Annual Report | | September 30, 2020 | 207 |
Table of Contents
Notes to Financial Statements (cont’d)
September 30, 2020
| AllianzGI Global Dynamic Allocation: | ||||||||||||||||||||
| Location | Market Price | Interest Rate Contracts | Credit Contracts | Foreign Exchange Contracts | Total | |||||||||||||||
Net realized gain (loss) on: | ||||||||||||||||||||
Futures contracts | $ | (4,717,241 | ) | $ | 1,070,493 | — | $ | (457,269 | ) | $ | (4,104,017 | ) | ||||||||
Swaps | — | 509,157 | $ | 902,741 | — | 1,411,898 | ||||||||||||||
Forward foreign currency contracts | — | — | — | (1 | ) | (1 | ) | |||||||||||||
Total net realized gain (loss) | $ | (4,717,241 | ) | $ | 1,579,650 | $ | 902,741 | $ | (457,270 | ) | $ | (2,692,120 | ) | |||||||
Net change in unrealized appreciation/depreciation of: | ||||||||||||||||||||
Futures contracts | $ | (13,949 | ) | $ | (4,908 | ) | — | $ | 34,518 | $ | 15,661 | |||||||||
Swaps | 9,751 | — | $ | 462 | — | 10,213 | ||||||||||||||
Total net change in unrealized appreciation/depreciation | $ | (4,198 | ) | $ | (4,908 | ) | $ | 462 | $ | 34,518 | $ | 25,874 | ||||||||
| AllianzGI Global Sustainability: | ||||
| Location | Foreign Exchange Contracts | |||
Net realized loss on: | ||||
Forward foreign currency contracts | $ | (369 | ) | |
| AllianzGI Green Bond: | ||||||||||||
| Location | Interest Rate Contracts | Foreign Exchange Contracts | Total | |||||||||
Net realized loss on: | ||||||||||||
Futures contracts | $ | (286,395 | ) | — | $ | (286,395 | ) | |||||
Forward foreign currency contracts | — | $ | (706,338 | ) | (706,338 | ) | ||||||
Total net realized loss | $ | (286,395 | ) | $ | (706,338 | ) | $ | (992,733 | ) | |||
Net change in unrealized appreciation/depreciation of: | ||||||||||||
Futures contracts | $ | 24,882 | — | $ | 24,882 | |||||||
Forward foreign currency contracts | — | $ | (71,362 | ) | (71,362 | ) | ||||||
Total net change in unrealized appreciation/depreciation | $ | 24,882 | $ | (71,362 | ) | $ | (46,480 | ) | ||||
| AllianzGI International Small-Cap: | ||||
| Location | Foreign Exchange Contracts | |||
Net realized gain on: | ||||
Forward foreign currency contracts | $ | 20,072 | ||
Net change in unrealized appreciation/depreciation of: | ||||
Forward foreign currency contracts | $ | 283 | ||
| AllianzGI Multi Asset Income: | ||||||||||||||||
| Location | Market Price | Interest Rate Contracts | Foreign Exchange Contracts | Total | ||||||||||||
Net realized gain (loss) on: | ||||||||||||||||
Futures contracts | $ | 1,361,664 | $ | 751,457 | $ | (77,127 | ) | $ | 2,035,994 | |||||||
Net change in unrealized appreciation/depreciation of: | ||||||||||||||||
Futures contracts | $ | 75,411 | $ | 152,520 | $ | 12,109 | $ | 240,040 | ||||||||
| 208 | September 30, 2020 | | Annual Report |
Table of Contents
| AllianzGI PerformanceFee Managed Futures Strategy: | ||||||||||||||||||||||||
| Location | Market Price | Interest Rate Contracts | Credit Contracts | Commodity Contracts | Foreign Exchange Contracts | Total | ||||||||||||||||||
Net realized gain (loss) on: | ||||||||||||||||||||||||
Futures contracts | $ | (3,067,142 | ) | $ | 402,945 | — | $ | (161,098 | ) | $ | (526,011 | ) | $ | (3,351,306 | ) | |||||||||
Swaps | — | — | $ | (842,863 | ) | — | — | (842,863 | ) | |||||||||||||||
Total net realized gain (loss) | $ | (3,067,142 | ) | $ | 402,945 | $ | (842,863 | ) | $ | (161,098 | ) | $ | (526,011 | ) | $ | (4,194,169 | ) | |||||||
Net change in unrealized appreciation/depreciation of: | ||||||||||||||||||||||||
Futures contracts | $ | 52,014 | $ | 246,148 | — | $ | (71,319 | ) | $ | (315,411 | ) | $ | (88,568 | ) | ||||||||||
Swaps | — | — | $ | 61,860 | — | — | 61,860 | |||||||||||||||||
Total net change in unrealized appreciation/depreciation | $ | 52,014 | $ | 246,148 | $ | 61,860 | $ | (71,319 | ) | $ | (315,411 | ) | $ | (26,708 | ) | |||||||||
| AllianzGI PerformanceFee Structured US Equity: | ||||
| Location | Market Price | |||
Net realized gain (loss) on: | ||||
Investments (options purchased) | $ | 2,226,196 | ||
Options written | (25,885,941 | ) | ||
Total net realized loss | $ | (23,659,745 | ) | |
Net change in unrealized appreciation/depreciation of: | ||||
Investments (options purchased) | $ | 38,080 | ||
Options written | (455,740 | ) | ||
Total net change in unrealized appreciation/depreciation | $ | (417,660 | ) | |
| AllianzGI Preferred Securities and Income: | ||||||||||||
| Location | Interest Rate Contracts | Credit Contracts | Total | |||||||||
Net realized gain (loss) on: | ||||||||||||
Futures contracts | $ | 17,871 | — | $ | 17,871 | |||||||
Swaps | — | $ | (195,057 | ) | (195,057 | ) | ||||||
Total net realized gain (loss) | $ | 17,871 | $ | (195,057 | ) | $ | (177,186 | ) | ||||
Net change in unrealized appreciation/depreciation of: | ||||||||||||
Futures contracts | $ | 509 | — | $ | 509 | |||||||
Swaps | — | $ | (125,113 | ) | (125,113 | ) | ||||||
Total net change in unrealized appreciation/depreciation | $ | 509 | $ | (125,113 | ) | $ | (124,604 | ) | ||||
| AllianzGI Structured Return: | ||||
| Location | Market Price | |||
Net realized gain (loss) on: | ||||
Investments (options purchased) | $ | 67,998,340 | ||
Options written | (241,143,473 | ) | ||
Total net realized loss | $ | (173,145,133 | ) | |
Net change in unrealized appreciation/depreciation of: | ||||
Investments (options purchased) | $ | 2,352,559 | ||
Options written | 931,091 | |||
Total net change in unrealized appreciation/depreciation | $ | 3,283,650 | ||
| AllianzGI Water: | ||||
| Location | Foreign Exchange Contracts | |||
Net realized loss on: | ||||
Forward foreign currency contracts | $ | (6,885 | ) | |
| Annual Report | | September 30, 2020 | 209 |
Table of Contents
Notes to Financial Statements (cont’d)
September 30, 2020
The average volume (based on the open positions at each month-end) of derivative activity for the year ended September 30, 2020:
| Options Purchased Contracts(1) | Options Written Contracts(1) | Forward Foreign Currency Contracts(2) | Futures Contracts(1) | Credit Default Swap Agreements(3) | Total Return Swap Agreements(3) | |||||||||||||||||||||||||||||||
| Purchased | Sold | Long | Short | Buy | Sell | |||||||||||||||||||||||||||||||
AllianzGI Best Styles Global Equity | — | — | — | $ | 18 | — | — | — | — | — | ||||||||||||||||||||||||||
AllianzGI Core Plus Bond | — | — | — | — | 60 | 25 | $ | 18,827 | $ | 18,865 | — | |||||||||||||||||||||||||
AllianzGI Global Allocation | — | — | — | — | 633 | 47 | 51 | 50 | — | |||||||||||||||||||||||||||
AllianzGI Global Dynamic Allocation | — | — | — | 20 | 530 | 61 | 12,765 | 13,165 | $ | 5 | ||||||||||||||||||||||||||
AllianzGI Global Sustainability | — | — | — | — | † | — | — | — | — | — | ||||||||||||||||||||||||||
AllianzGI Green Bond | — | — | $ | 705,332 | 15,242,942 | 40 | 24 | — | — | — | ||||||||||||||||||||||||||
AllianzGI International Small-Cap | — | — | 68,484 | 76,932 | — | — | — | — | — | |||||||||||||||||||||||||||
AllianzGI Multi Asset Income | — | — | — | — | 185 | 50 | — | — | — | |||||||||||||||||||||||||||
AllianzGI PerformanceFee Managed Futures Strategy | — | — | — | — | 738 | 536 | 6,135 | 6,021 | — | |||||||||||||||||||||||||||
AllianzGI PerformanceFee Structured US Equity | 4,487 | (5,498 | ) | — | — | — | — | — | — | — | ||||||||||||||||||||||||||
AllianzGI Preferred Securities and Income | — | — | — | — | 3 | — | 1,567 | 1,463 | — | |||||||||||||||||||||||||||
AllianzGI Structured Return | 41,594 | (46,164 | ) | — | — | — | — | — | — | — | ||||||||||||||||||||||||||
| † | Fund had derivative activity during the period but it did not have open positions at any month-end in the period. |
| (1) | Number of contracts. |
| (2) | U.S. $ value on origination date. |
| (3) | Notional amount (in thousands). |
The following tables present by counterparty, the Funds’ derivative assets and liabilities net of related collateral held by the Funds at September 30, 2020 which has not been offset in the Statements of Assets and Liabilities, but would be available for offset to the extent of a default by the counterparty to the transaction.
Financial Assets and Derivative Assets, and Collateral Received (Pledged) at September 30, 2020:
| AllianzGI Global Dynamic Allocation: | ||||||||||||||||
| Gross Amounts Not Offset in the Statements of Assets and Liabilities | ||||||||||||||||
| Counterparty | Gross Asset Derivatives Presented in Statements of Assets and Liabilities | Financial Instrument/ Derivative Offset | Cash Collateral Received | Net Amount | ||||||||||||
Volatility swaps | ||||||||||||||||
UBS AG | $ | 15,694 | — | — | $ | 15,694 | ||||||||||
| AllianzGI International Small-Cap: | ||||||||||||||||
| Gross Amounts Not Offset in the Statements of Assets and Liabilities | ||||||||||||||||
| Counterparty | Gross Asset Derivatives Presented in Statements of Assets and Liabilities | Financial Instrument/ | Cash Collateral Received | Net Amount | ||||||||||||
Foreign Currency Exchange Contracts |
| |||||||||||||||
State Street Bank London | $ | 284 | $ | (1 | ) | — | $ | 283 | ||||||||
Financial Liabilities and Derivative Liabilities, and Collateral Received (Pledged) at September 30, 2020:
| AllianzGI Global Dynamic Allocation: | ||||||||||||||||
| Gross Amounts Not Offset in the Statements of Assets and Liabilities | ||||||||||||||||
| Counterparty | Gross Liability Derivatives Presented in Statements of Assets and Liabilities | Financial Instrument/ | Cash Collateral Received (Pledged) | Net Amount | ||||||||||||
Volatility swaps |
| |||||||||||||||
JP Morgan N.A. | $ | 5,943 | — | — | $ | 5,943 | ||||||||||
| 210 | September 30, 2020 | | Annual Report |
Table of Contents
| AllianzGI Green Bond: | ||||||||||||||||
| Gross Amounts Not Offset in the Statements of Assets and Liabilities | ||||||||||||||||
| Counterparty | Gross Liability Derivatives Presented in Statements of Assets and Liabilities | Financial Instrument/ Derivative Offset | Cash Collateral Received (Pledged) | Net Amount | ||||||||||||
Foreign Currency Exchange Contracts |
| |||||||||||||||
State Street Bank London | $ | 64,299 | — | — | $ | 64,299 | ||||||||||
| AllianzGI International Small-Cap: | ||||||||||||||||
| Gross Amounts Not Offset in the Statements of Assets and Liabilities | ||||||||||||||||
| Counterparty | Gross Liability Derivatives Presented in Statements of Assets and Liabilities | Financial Instrument/ Derivative Offset | Cash Collateral Received (Pledged) | Net Amount | ||||||||||||
Foreign Currency Exchange Contracts |
| |||||||||||||||
State Street Bank London | $ | 1 | $ | (1 | ) | — | — | |||||||||
| 5. | INVESTMENT MANAGER/ADMINISTRATOR/DISTRIBUTOR FEES/DEFERRED COMPENSATION |
Investment Management Fee and Performance Fee. Each Fund has an Investment Management Agreement (for the purpose of this section, the “Agreement”) with the Investment Manager. Subject to the supervision of the Trust’s Board, the Investment Manager is responsible for managing, either directly or through others selected by it, each Fund’s investment activities, business affairs and administrative matters. Pursuant to the Agreement, the Investment Manager receives an annual fee, payable monthly (net of any fee waivers, reimbursements and recoupment), at an annual rate of each Fund’s average daily net assets (the “Investment Management Fee”).With respect to AllianzGI PerformanceFee Managed Futures Strategy, the Investment Manager also serves as investment manager to the Cayman Subsidiary pursuant to an investment management agreement. The Investment Manager does not receive a fee for its services to the Cayman Subsidiary.
Each of AllianzGI PerformanceFee Structured US Equity Fund and AllianzGI PerformanceFee Managed Futures Strategy Fund, (together the “AllianzGI PerformanceFee Funds”) pays a monthly management fee (a “Management Fee”) to the Investment Manager in return for managing the investment activities of the Fund and the Fund’s business affairs and other administrative matters. For each AllianzGI PerformanceFee Fund, the Management Fee consists of two components: (i) a base fee (the “Base Fee”) calculated by applying a fixed advisory fee rate to the Fund’s average daily net assets during the previous month, and (ii) a positive or negative performance adjustment (the “Performance Adjustment”) calculated by applying a variable rate to the Fund’s average daily net assets during the applicable performance measurement period (the “Performance Period”). The Performance Period generally consists of the trailing twelve months. The Performance Adjustment is calculated monthly in arrears and is added to or subtracted from the Base Fee to determine the Management Fee. Because the Base Fee and Performance Adjustment are calculated with respect to the Fund’s average daily net assets over two different time periods (the previous month for the Base Fee and the Performance Period for the Performance Adjustment), the effective Management Fee may be less than 0.0% or
greater than the Base Fee plus the Maximum Performance Adjustment described below for certain periods (subject to any fee limitations and waivers described below).
With respect to AllianzGI PerformanceFee Managed Futures Strategy Fund, the Investment Manager’s Base Fee is calculated at an annualized rate of 0.75% of the Fund’s average daily net assets. The Management Fee is determined as the Base Fee plus or minus a Performance Adjustment that is based on whether, and to what extent, the investment performance of the Fund exceeds, or is exceeded by, the performance of the ICE BofA 3-Month US T-Bill Index (the “Index “) plus 5.00% (the “Index Hurdle”) over the Performance Period. The Performance Adjustment is calculated using the performance of the Class P share class of the Fund (the “Measurement Class”). The Performance Adjustment is calculated according to a schedule that adds or subtracts 0.0015% of the Fund’s average daily net assets for each 0.01% by which the performance of the Measurement Class exceeds or lags the performance of the Index Hurdle for the Performance Period. The maximum Performance Adjustment (positive or negative) will not exceed an annualized rate of +/- 0.75% (the “Maximum Performance Adjustment”) of the Fund’s average daily net assets over the full Performance Period, which would occur when the performance of the Measurement Class exceeds, or is exceeded by, the Index Hurdle by 5.00% for the Performance Period.
With respect to AllianzGI PerformanceFee Structured US Equity Fund, the Investment Manager’s Base Fee is calculated at an annualized rate of 0.60% of the Fund’s average daily net assets. The Management Fee is determined as the Base Fee plus or minus a Performance Adjustment that is based on whether, and to what extent, the investment performance of the Fund exceeds, or is exceeded by, the performance of the S&P 500 Index (the “Index”) plus 1.25% (the “Index Hurdle”) over the Performance Period. The Performance Adjustment is calculated using the performance of the Class P share class of the Fund (the “Measurement Class”). The Performance Adjustment is calculated according to a schedule that adds or subtracts 0.0048% of the Fund’s average daily net assets for each 0.01% by which the performance of the Measurement Class exceeds or lags the performance of the Index Hurdle during the Performance Period. The maximum Performance Adjustment (positive or negative)
| Annual Report | | September 30, 2020 | 211 |
Table of Contents
Notes to Financial Statements (cont’d)
September 30, 2020
will not exceed an annualized rate of +/- 0.60% (the “Maximum Performance Adjustment”) of the Fund’s average daily net assets over the full Performance Period, which would occur when the performance of the Measurement Class exceeds, or is exceeded by, the Index Hurdle by 1.25% for the Performance Period.
Administration Fee. The Investment Manager provides administrative services to AllianzGI Multi Asset Income and also bears the cost of most third-party administrative services required by AllianzGI Multi Asset Income, and in return it receives from each share class of AllianzGI Multi Asset Income a monthly administration fee based on each share class’ average daily net assets (the “Administration Fee”).
The Investment Management Fee and Administration Fee for all outstanding share classes are charged at an annual rate as indicated in the following table:
| Class A, C and R | Class P and Administrative | Class R6 | Institutional Class | |||||||||||||||||||||
| Management Fee | Effective Management Fee | Administration Fee | ||||||||||||||||||||||
AllianzGI Best Styles Global Equity | 0.30 | % | 0.30 | % | N/A | N/A | N/A | N/A | ||||||||||||||||
AllianzGI Convertible | 0.57 | 0.57 | N/A | N/A | N/A | N/A | ||||||||||||||||||
AllianzGI Core Plus Bond | 0.30 | 0.30 | N/A | N/A | N/A | N/A | ||||||||||||||||||
AllianzGI Emerging Markets Consumer | 0.85 | 0.85 | N/A | N/A | N/A | N/A | ||||||||||||||||||
AllianzGI Emerging Markets Small-Cap | 1.20 | 1.20 | N/A | N/A | N/A | N/A | ||||||||||||||||||
AllianzGI Emerging Markets Value | 0.85 | 0.85 | N/A | N/A | N/A | N/A | ||||||||||||||||||
AllianzGI Global Allocation | 0.70 | * | 0.27 | N/A | N/A | N/A | N/A | |||||||||||||||||
AllianzGI Global Dynamic Allocation | 0.70 | * | 0.53 | N/A | N/A | N/A | N/A | |||||||||||||||||
AllianzGI Global Sustainability | 0.80 | 0.80 | N/A | N/A | N/A | N/A | ||||||||||||||||||
AllianzGI Green Bond | 0.40 | 0.40 | N/A | N/A | N/A | N/A | ||||||||||||||||||
AllianzGI High Yield Bond | 0.48 | 0.48 | N/A | N/A | N/A | N/A | ||||||||||||||||||
AllianzGI International Small-Cap | 1.00 | 1.00 | N/A | N/A | N/A | N/A | ||||||||||||||||||
AllianzGI Multi Asset Income | 0.05 | 0.05 | 0.30 | % | 0.15 | % | 0.05 | % | 0.10 | % | ||||||||||||||
AllianzGI PerformanceFee Managed Futures Strategy | 0.75 | *# | 0.04 | N/A | N/A | N/A | N/A | |||||||||||||||||
AllianzGI PerformanceFee Structured US Equity | 0.60 | *@ | 0.37 | N/A | N/A | N/A | N/A | |||||||||||||||||
AllianzGI Preferred Securities and Income | 0.45 | 0.45 | N/A | N/A | N/A | N/A | ||||||||||||||||||
AllianzGI Short Duration High Income | 0.48 | 0.48 | N/A | N/A | N/A | N/A | ||||||||||||||||||
AllianzGI Short Term Bond | 0.30 | 0.30 | N/A | N/A | N/A | N/A | ||||||||||||||||||
AllianzGI Structured Return | 0.60 | 0.60 | N/A | N/A | N/A | N/A | ||||||||||||||||||
AllianzGI Water | 0.95 | 0.95 | N/A | N/A | N/A | N/A | ||||||||||||||||||
| * | See Note 6 for management fee waivers. |
| # | The management fee consists of a base fee at an annualized rate of 0.75% of the Fund’s average daily net assets, subject to a positive or negative performance adjustment of up to 0.75% of the Fund’s average daily net assets over the Performance Period based on the Fund’s performance relative to the ICE BofA 3-Month US T-Bill Index plus 5.00% (annualized). |
| @ | The management fee consists of a base fee at an annualized rate of 0.60% of the Fund’s average daily net assets, subject to a positive or negative performance adjustment of up to 0.60% of the Fund’s average daily net assets over the Performance Period based on the Fund’s performance relative to the S&P 500 Index plus 1.25% (annualized). |
Distribution and Servicing Fees. Allianz Global Investors Distributors LLC (the “Distributor”), an affiliate of the of the Investment Manager serves as the distributor of the Funds’ shares pursuant to separate Distribution Servicing Plans for Class A, C and R. The Distributor, for each of the Funds, receives (i) servicing fees of 0.25% of the average daily net assets of each of Class A, C and R in connection with services rendered to shareholders of each class and the maintenance of shareholder accounts, and (ii) distribution fees of 0.75% of the average daily net assets of Class C (with the exception for AllianzGI Short Duration High Income which is 0.25%) and 0.25% of average daily net assets of Class R in connection with the distribution of Class C and R shares.
Pursuant to the Distribution and Servicing Plans adopted by the A, C and R classes, the Funds compensate the Distributor for services provided and expenses incurred in connection with assistance rendered in the sale of shares and services rendered to shareholders and for maintenance of shareholder accounts.
Pursuant to the Distribution Plan for the Administrative Class shares, the Funds are permitted to reimburse the Distributor out of the Administrative Class’ assets of each Fund offering Administrative Class shares, in an amount up to 0.25% on an annual basis of the average net assets of the Administrative Class, for payments made to financial intermediaries that provide services in connection with the distribution of shares or administration plans or programs that use
| 212 | September 30, 2020 | | Annual Report |
Table of Contents
fund shares as their funding medium. Unreimbursed costs may be carried forward for reimbursement for up to twelve months beyond the date in which they are incurred, subject always to the limit that no more than 0.25% of the average daily net assets attributable to the Administrative Class may be expensed.
The Distributor also receives the proceeds of the initial sales charges paid by the shareholders upon the purchase of Class A shares and contingent deferred sales charges (“CDSC”) paid by the shareholders upon certain redemptions of Class A and C shares. For the year ended September 30, 2020, the Distributor received $300,403, representing commissions (sales charges) and CDSC from the Funds.
Deferred Compensation. The Trustees do not currently receive any pension or retirement benefits from the Trust. In calendar year 2018 and certain prior periods, the Trust maintained a deferred compensation plan pursuant to which each Independent Trustee had
the opportunity to elect not to receive all or a portion of his or her fees from the Trust on a current basis, but instead to receive in a subsequent period chosen by the Trustee an amount equal to the value of such compensation if such compensation had been invested in one or more series of Allianz Funds or the Trust selected by the Trustees from and after the normal payment dates for such compensation. The deferred compensation program was closed to new deferrals effective January 1, 2019, and all Trustee fees earned with respect to service in calendar year 2019 and beyond have been or will be paid in cash, on a current basis, unless the Board of Trustees of the Allianz-Sponsored Funds reopens the program to new deferrals. The Trust still has obligations with respect to Trustee fees deferred in 2018 and in prior periods, and will continue to have such obligations until all deferred Trustee fees are paid out pursuant to the terms of the deferred compensation plan.
| 6. | EXPENSE LIMITATION/MANAGEMENT FEE WAIVER AND RECOUPMENT |
The Trust and the Investment Manager have entered into Expense Limitation and Management Fee Waiver Agreements as indicated below:
| Expense Limitation | ||||||||||||||||||||||||||||||||
| Management Fee Waiver | Class A | Class C | Class R | Class P | Institutional Class | Class R6 | Administrative Class | |||||||||||||||||||||||||
AllianzGI Best Styles Global Equity(3) | N/A | 0.70 | % | 1.40 | % | N/A | 0.50 | % | 0.40 | % | 0.40 | % | N/A | |||||||||||||||||||
AllianzGI Convertible(3) | N/A | 0.96 | 1.73 | 1.17 | % | 0.74 | 0.71 | N/A | 0.93 | % | ||||||||||||||||||||||
AllianzGI Core Plus Bond(4) | N/A | N/A | N/A | N/A | 0.35 | 0.30 | 0.25 | N/A | ||||||||||||||||||||||||
AllianzGI Emerging Markets Consumer(3) | N/A | 1.39 | N/A | N/A | N/A | 1.05 | N/A | N/A | ||||||||||||||||||||||||
AllianzGI Emerging Markets Small-Cap(3) | N/A | 1.80 | N/A | N/A | N/A | 1.50 | N/A | N/A | ||||||||||||||||||||||||
AllianzGI Emerging Markets Value(3) | N/A | 1.14 | 1.89 | N/A | 0.98 | 0.89 | N/A | N/A | ||||||||||||||||||||||||
AllianzGI Global Allocation(5) | 0.55 | %(1) | 1.01 | 1.76 | 1.21 | 0.81 | 0.74 | 0.71 | 0.96 | |||||||||||||||||||||||
AllianzGI Global Dynamic Allocation(5) | 0.55 | (1) | 1.01 | 1.78 | 1.38 | 0.84 | 0.74 | 0.74 | 0.99 | |||||||||||||||||||||||
AllianzGI Global Sustainability(3) | N/A | 0.94 | N/A | N/A | 0.79 | 0.69 | N/A | N/A | ||||||||||||||||||||||||
AllianzGI Green Bond(4) | N/A | 0.75 | N/A | N/A | 0.55 | 0.50 | N/A | N/A | ||||||||||||||||||||||||
AllianzGI High Yield Bond | N/A | N/A | N/A | N/A | N/A | N/A | N/A | N/A | ||||||||||||||||||||||||
AllianzGI International Small-Cap(3) | N/A | 1.25 | 2.00 | 1.59 | 1.10 | 1.04 | 1.00 | N/A | ||||||||||||||||||||||||
AllianzGI Multi Asset Income(6) | N/A | 0.95 | 1.70 | 1.30 | 0.65 | 0.60 | 0.55 | 0.90 | ||||||||||||||||||||||||
AllianzGI PerformanceFee Managed Futures | (2) | N/A | N/A | N/A | 0.19 | 0.14 | 0.09 | N/A | ||||||||||||||||||||||||
AllianzGI PerformanceFee Structured US Equity(7) | (2) | N/A | N/A | N/A | 0.00 | 0.00 | 0.00 | N/A | ||||||||||||||||||||||||
AllianzGI Preferred Securities and Income(4) | N/A | N/A | N/A | N/A | 0.60 | 0.55 | 0.50 | N/A | ||||||||||||||||||||||||
AllianzGI Short Duration High Income(3) | N/A | 0.86 | 1.11 | N/A | 0.65 | 0.60 | 0.55 | N/A | ||||||||||||||||||||||||
AllianzGI Short Term Bond(4) | N/A | 0.64 | N/A | N/A | 0.49 | 0.39 | N/A | N/A | ||||||||||||||||||||||||
AllianzGI Structured Return(8) | N/A | 1.01 | 1.77 | N/A | 0.78 | 0.73 | 0.70 | N/A | ||||||||||||||||||||||||
AllianzGI Water(3) | N/A | 1.22 | 1.97 | N/A | 0.94 | 0.93 | N/A | N/A | ||||||||||||||||||||||||
| (1) | The Investment Manager has contractually agreed to irrevocably waive a portion of its management fee equal to 0.55% of the average daily net assets of each applicable Fund that are attributable to investments in Underlying Funds. This waiver with respect to investments in Underlying Funds for which the Investment Manager or an affiliated person thereof serves as investment adviser, is terminable only by the Board of Trustees of the Trust, and the waiver with respect to investments in unaffiliated Underlying Funds will continue through at least January 31, 2021. |
| (2) | The Investment Manager has agreed to waivers with respect to each AllianzGI PerformanceFee Fund such that (i) its monthly Management Fee (including Base Fee plus Performance Adjustment) will not exceed the product of the maximum percentage fee rate (equal to the Base Fee plus the maximum upward Performance Adjustment) and the Fund’s average daily net assets over the preceding month, and (ii) the Investment Manager will not collect a Management Fee with respect to any month in which the Measurement Class has failed to outperform the Index. |
| (3) | The Investment Manager has contractually agreed to irrevocably waive its management fee and/or reimburse the Fund through January 31, 2021, to the extent that Total Annual Fund Operating Expenses, excluding interest, tax, and extraordinary expenses, and certain credits and other expenses, exceed the rates noted in the table above based on the Fund’s average net assets attributable to each share class. Under the Expense Limitation Agreement, the Investment Manager may recoup waived or reimbursed amounts for three years, provided total expenses, including such recoupment, do not exceed the annual expense limit in effect at the time of such waiver/reimbursement or recoupment. The Expense Limitation Agreement is terminable by the Trust by mutual agreement of the parties. |
| Annual Report | | September 30, 2020 | 213 |
Table of Contents
Notes to Financial Statements (cont’d)
September 30, 2020
| (4) | The Investment Manager has contractually agreed to irrevocably waive its management fee and/or reimburse the Fund through January 31, 2022 to the extent that Total Annual Fund Operating Expenses excluding interest, tax, and extraordinary expenses, and certain credits and other expenses, exceed the rates noted in the table above based upon the Fund’s average net assets attributable to each share class. Under the Expense Limitation Agreement, the Investment Manager may recoup waived or reimbursed amounts for three years, provided total expenses, including such recoupment, do not exceed the annual expense limit in effect at the time of such waiver/reimbursement or recoupment. The Expense Limitation Agreement is terminable by the Trust or by mutual agreement of the parties. |
| (5) | The Investment Manager has contractually agreed, until January 31, 2021, to irrevocably waive its management fee, or reimburse the Fund, to the extent that, after the application of the fee waiver described in footnote (1) above, Total Annual Fund Operating Expenses, including Acquired Fund Fees and Expenses, but excluding interest, tax, and extraordinary expenses, and certain credits and other expenses, exceed the rates noted in the table above based on the Fund’s average net assets attributable to each share class. Under the Expense Limitation Agreement, the Investment Manager may recoup waived or reimbursed amounts for three years, provided total expenses, including such recoupment, do not exceed the annual expense limit in effect at the time of such waiver/reimbursement or recoupment. The Expense Limitation Agreement is terminable by the Trust or by mutual agreement of the parties. |
| (6) | The Investment Manager has contractually agreed, until January 31, 2021, to irrevocably waive its management and administrative fees and reimburse any additional Other Expenses or Acquired Fund Fees and Expenses, to the extent that Total Annual Fund Operating Expenses after Expense Reductions, excluding, interest, taxes, and extraordinary expenses, exceed the rates noted in the table above based on the Fund’s average net assets attributable to each share class. Under the Expense Limitation Agreement, the Investment Manager may recoup waived or reimbursed amounts for three years, provided total expenses, including such recoupment, do not exceed the annual expense limit in effect at the time of such waiver or reimbursement. The Expense Limitation Agreement is terminable by the Trust or by mutual agreement of the parties. |
| (7) | Effective February 1, 2020, the Investment Manager has contractually agreed to irrevocably waive its management fee and/or reimburse the Fund through January 31, 2021 to the extent that Other Expenses, excluding interest, tax, and extraordinary expenses, Acquired Fund Fees and Expenses, and certain credits and other expenses, exceed the rates noted in the table above based on the Fund’s average net assets attributable to each share class. The Expense Limitation Agreement is terminable by the Trust or by mutual agreement of the parties. |
| (8) | The Investment Manager has contractually agreed to irrevocably waive its management fee and/or reimburse the Fund through January 31, 2021 to the extent that Total Annual Fund Operating Expenses excluding interest, tax, and extraordinary expenses, Acquired Fund Fees and Expenses, and certain credits and other expenses exceed the rates noted in the table above based upon the Fund’s average net assets attributable to each share class. Under the Expense Limitation Agreement, the Investment Manager may recoup waived or reimbursed amounts for three years, provided total expenses, including such recoupment, do not exceed the annual expense limit in effect at the time of such waiver/reimbursement or recoupment. The Expense Limitation Agreement is terminable by the Trust or by mutual agreement of the parties. |
The following Funds revised their expense limitation rates during the year ended September 30, 2020. The expense limitation rates in effect during the period (except as noted in the tables below) and at September 30, 2020 for all the Funds are disclosed in the table above. In January 2020, the Board approved (i) new expense limitation arrangements for AllianzGI Convertible Fund and AllianzGI Short Duration High Income Fund and (ii) revised expense limits for AllianzGI Emerging Markets Consumer Fund, AllianzGI Emerging Markets Small-Cap Fund, AllianzGI Global Allocation Fund, AllianzGI Global Dynamic Allocation Fund, AllianzGI Global Sustainability Fund and AllianzGI Structured Return Fund.
| Expense Limitation (10/1/19 – 1/31/20) | ||||||||||||||||||||||||||||
| Class A | Class C | Class R | Class P | Institutional Class | Class R6 | Administrative Class | ||||||||||||||||||||||
AllianzGI Convertible | N/A | N/A | N/A | N/A | N/A | N/A | N/A | |||||||||||||||||||||
AllianzGI Emerging Markets Consumer | 1.40 | % | N/A | N/A | N/A | 1.05 | % | N/A | N/A | |||||||||||||||||||
AllianzGI Emerging Markets Small-Cap | 1.85 | N/A | N/A | N/A | 1.50 | N/A | N/A | |||||||||||||||||||||
AllianzGI Global Allocation | 1.01 | 1.76 | % | 1.21 | % | 0.81 | % | 0.76 | 0.71 | % | 0.96 | % | ||||||||||||||||
AllianzGI Global Sustainability | 1.09 | N/A | N/A | 0.94 | 0.84 | N/A | N/A | |||||||||||||||||||||
AllianzGI Short Duration High Income | N/A | N/A | N/A | N/A | N/A | N/A | N/A | |||||||||||||||||||||
AllianzGI Structured Return | 1.00 | 1.75 | N/A | 0.79 | 0.71 | 0.69 | N/A | |||||||||||||||||||||
| Expense Limitation (10/1/19 – 10/10/19) | ||||||||||||||||||||||||||||
| Class A | Class C | Class R | Class P | Institutional Class | Class R6 | Administrative Class | ||||||||||||||||||||||
AllianzGI Global Dynamic Allocation | 0.97 | % | 1.74 | % | 1.34 | % | 0.80 | % | 0.70 | % | 0.70 | % | 0.95 | % | ||||||||||||||
| 214 | September 30, 2020 | | Annual Report |
Table of Contents
The Investment Manager, per the expense limitation agreements, may recoup waived/reimbursed amounts for a period of up to three years, provided total expenses, including such recoupment, do not exceed the annual expense limit in effect at the time of such waiver/reimbursement. During the year ended September 30, 2020, the Investment Manager recouped a total of $1,702 from the Funds as disclosed on the Statements of Operations. The following represents the amounts that still can be recouped by the Investment Manager as of September 30, 2020.
| Unrecouped Expenses Waived/Reimbursed through Fiscal Period or Year ended | ||||||||||||||||
| 9/30/2018 | 9/30/2019 | 9/30/2020 | Totals | |||||||||||||
AllianzGI Best Styles Global Equity | $ | 129,151 | $ | 4,556 | $ | 295,605 | $ | 429,312 | ||||||||
AllianzGI Convertible | — | — | 33,531 | 33,531 | ||||||||||||
AllianzGI Core Plus Bond | 180,862 | 292,997 | 287,267 | 761,126 | ||||||||||||
AllianzGI Emerging Markets Consumer | 82,270 | 104,650 | 166,775 | 353,695 | ||||||||||||
AllianzGI Emerging Markets Small-Cap | 172,437 | 122,389 | 173,098 | 467,924 | ||||||||||||
AllianzGI Emerging Markets Value | 377,554 | 488,649 | 522,849 | 1,389,052 | ||||||||||||
AllianzGI Global Allocation | — | 4,732 | 519,276 | 524,008 | ||||||||||||
AllianzGI Global Dynamic Allocation | 457,777 | 535,503 | 683,542 | 1,676,822 | ||||||||||||
AllianzGI Global Sustainability | 139,780 | 186,454 | 441,367 | 767,601 | ||||||||||||
AllianzGI Green Bond | — | 301,543 | 184,126 | 485,669 | ||||||||||||
AllianzGI International Small-Cap | 190,541 | 530,473 | 372,809 | 1,093,823 | ||||||||||||
AllianzGI Multi Asset Income | 79,589 | 42,141 | 12,928 | 134,658 | ||||||||||||
AllianzGI Preferred Securities and Income | 151,931 | 223,469 | 178,890 | 554,290 | ||||||||||||
AllianzGI Short Duration High Income | — | — | 280,880 | 280,880 | ||||||||||||
AllianzGI Short Term Bond | 128,601 | 262,202 | 153,699 | 544,502 | ||||||||||||
AllianzGI Structured Return | 296,727 | 413,146 | 406,755 | 1,116,628 | ||||||||||||
AllianzGI Water | — | 767,632 | 1,242,119 | 2,009,751 | ||||||||||||
| 7. | RELATED PARTY TRANSACTIONS |
The Investment Manager and the Distributor are related parties. Fees payable to these parties are disclosed in Note 5 and Note 6 and the accrued related party fee and receivable amounts are disclosed on the Statements of Assets and Liabilities.
(a) Payments from Affiliates
During the year ended September 30, 2020, AllianzGI U.S. reimbursed AllianzGI Emerging Markets Consumer Fund $685 for realized losses resulting from trading errors.
During the year ended September 30, 2019, AllianzGI U.S. reimbursed AllianzGI Global Allocation Fund $36,174 for realized losses resulting from trading errors.
| Annual Report | | September 30, 2020 | 215 |
Table of Contents
Notes to Financial Statements (cont’d)
September 30, 2020
(b) Affiliated Transactions
The following tables show the transactions in and earnings from affiliates for the year ended September 30, 2020:
| AllianzGI Global Allocation: | ||||||||||||||||||||||||||||||||||||
| Market Value 9/30/2019 | Purchases at Cost | Proceeds from Sales | Change in Unrealized Appreciation (Depreciation) | Market Value 9/30/2020 | Dividend Income | Shares as of 9/30/2020 | Net Realized Gain (Loss) | Net Capital Gain Distributions Received | ||||||||||||||||||||||||||||
AllianzGI Advanced Core Bond | $ | 61,014,797 | — | $ | 60,814,355 | $ | (1,388,184 | ) | — | — | — | $ | 1,187,742 | — | ||||||||||||||||||||||
AllianzGI Best Styles Global Equity | 123,606,164 | — | 125,539,588 | (3,106,359 | ) | — | — | — | 5,039,783 | — | ||||||||||||||||||||||||||
AllianzGI Best Styles Global Managed Volatility | 38,652,884 | $ | 1,696,127 | 12,933,281 | (2,021,538 | ) | $ | 26,045,195 | $ | 796,142 | 1,669,564 | 651,003 | $ | 899,985 | ||||||||||||||||||||||
AllianzGI Emerging Markets Small-Cap | 4,613,387 | 177,304 | 3,932,584 | (196,738 | ) | — | 177,303 | — | (661,369 | ) | — | |||||||||||||||||||||||||
AllianzGI Emerging Markets SRI Debt† | 16,006,721 | 416,381 | 16,727,240 | (69,235 | ) | — | 416,380 | — | 373,373 | — | ||||||||||||||||||||||||||
AllianzGI Global Sustainability | — | 133,459,237 | 45,815,074 | 13,532,769 | 105,061,149 | 305,860 | 4,854,951 | 3,884,217 | 2,215,175 | |||||||||||||||||||||||||||
AllianzGI Green Bond | — | 33,151,219 | 9,632,730 | 636,135 | 24,369,005 | 284,610 | 1,447,950 | 214,381 | 146,075 | |||||||||||||||||||||||||||
AllianzGI International Growth | 18,480,225 | — | 19,166,063 | 49,879 | — | — | — | 635,959 | — | |||||||||||||||||||||||||||
AllianzGI PerformanceFee Managed Futures Strategy | 31,666,254 | 3,818,936 | 4,931,220 | (5,146,231 | ) | 24,606,249 | 1,790,314 | 3,064,290 | (801,490 | ) | 421,396 | |||||||||||||||||||||||||
PIMCO 1-5 Year U.S. TIPS Index | — | 2,473,880 | — | 5,479 | 2,479,359 | — | 46,000 | — | — | |||||||||||||||||||||||||||
PIMCO 15+ Year U.S. TIPS Index | 3,180,908 | 4,605,702 | 7,951,801 | (176,068 | ) | — | 49,876 | — | 341,259 | — | ||||||||||||||||||||||||||
PIMCO Broad U.S. TIPS Index | — | 2,945,670 | 2,950,610 | — | — | 9,555 | — | 4,940 | — | |||||||||||||||||||||||||||
Totals | $ | 297,221,340 | $ | 182,744,456 | $ | 310,394,546 | $ | 2,119,909 | $ | 182,560,957 | $ | 3,830,040 | 11,082,755 | $ | 10,869,798 | $ | 3,682,631 | |||||||||||||||||||
| AllianzGI Global Dynamic Allocation: | ||||||||||||||||||||||||||||||||||||
| Market Value 9/30/2019 | Purchases at Cost | Proceeds Sales | Change in Unrealized Appreciation (Depreciation) | Market Value 9/30/2020 | Dividend Income | Shares as of 9/30/2020 | Net (Loss) | Net Capital Gain Distributions Received | ||||||||||||||||||||||||||||
AllianzGI Focused Growth | $ | 4,246,825 | $ | 905,967 | $ | 6,493,593 | $ | 89,815 | — | — | — | $ | 1,250,986 | $ | 593,340 | |||||||||||||||||||||
AllianzGI Global Small-Cap Opportunities | 2,828,496 | 46,525 | 2,872,925 | 38,674 | — | $ | 46,525 | — | (40,770 | ) | — | |||||||||||||||||||||||||
AllianzGI International Growth | 11,148,486 | 11,469 | 10,965,224 | 1,583,959 | $ | 4,190,727 | 3,360 | 191,096 | 2,412,037 | 8,109 | ||||||||||||||||||||||||||
AllianzGI Mid-Cap | 4,244,775 | 533,473 | 6,154,584 | 59,409 | — | — | — | 1,316,927 | 174,818 | |||||||||||||||||||||||||||
AllianzGI Mid-Cap Value | 4,272,200 | 2,644,524 | 6,486,263 | 20,032 | — | 58,866 | — | (450,493 | ) | 276,593 | ||||||||||||||||||||||||||
AllianzGI Short Duration High Income | — | 5,334,806 | 5,758,716 | — | — | 34,166 | — | 423,910 | — | |||||||||||||||||||||||||||
AllianzGI Small-Cap | 2,819,302 | 268,031 | 3,171,338 | 47,732 | — | 11,757 | — | 36,273 | — | |||||||||||||||||||||||||||
PIMCO 15+ Year U.S. TIPS Index | 6,727,995 | 17,670,500 | 24,402,540 | (179,370 | ) | — | 51,795 | — | 183,415 | — | ||||||||||||||||||||||||||
Totals | $ | 36,288,079 | $ | 27,415,295 | $ | 66,305,183 | $ | 1,660,251 | $ | 4,190,727 | $ | 206,469 | 191,096 | $ | 5,132,285 | $ | 1,052,860 | |||||||||||||||||||
| 216 | September 30, 2020 | | Annual Report |
Table of Contents
| AllianzGI High Yield Bond: | ||||||||||||||||||||||||||||||||||||||||||||
| Market Value 9/30/2019 | Purchases at Cost | Proceeds from Sales | Change in Unrealized Appreciation (Depreciation) | Market Value 9/30/2020 | Dividend Income | Shares as of 9/30/2020 | Net Realized Gain (Loss) | Net Capital Gain Distributions Received | ||||||||||||||||||||||||||||||||||||
CCF Holdings LLC Class B | — | * | — | — | — | — | * | — | 7,143 | — | — | |||||||||||||||||||||||||||||||||
LiveStyle, Inc., Ser. B | $ | 5,758,100 | — | — | $ | (1,358,336 | ) | $ | 4,399,764 | — | 57,581 | — | — | |||||||||||||||||||||||||||||||
Totals | $ | 5,758,100 | — | — | $ | (1,358,336 | ) | $ | 4,399,764 | — | 64,724 | — | — | |||||||||||||||||||||||||||||||
| AllianzGI Multi Asset Income: | ||||||||||||||||||||||||||||||||||||
| Market Value 9/30/2019 | Purchases at Cost | Proceeds Sales | Change in Unrealized Appreciation (Depreciation) | Market Value 9/30/2020 | Dividend Income | Shares as of 9/30/2020 | Net Realized Gain (Loss) | Net Capital Gain Distributions Received | ||||||||||||||||||||||||||||
AllianzGI Emerging Markets SRI Debt† | $ | 2,415,623 | $ | 5,250,650 | $ | 7,943,139. | $ | 22,351 | — | $ | 107,745 | — | $ | 254,515 | — | |||||||||||||||||||||
AllianzGI Floating Rate Note† | 2,451,582 | 1,409,530 | 3,835,464 | 19,387 | — | 25,486 | — | (45,035 | ) | $ | 1,237 | |||||||||||||||||||||||||
AllianzGI Global High Yield† | 1,467,350 | 4,333,155 | 5,473,124 | (1,634 | ) | — | 38,648 | — | (325,747 | ) | — | |||||||||||||||||||||||||
AllianzGI High Yield Bond | — | 5,860,803 | 1,731,179 | 212,488 | $ | 4,396,834 | 120,141 | 546,870 | 54,722 | — | ||||||||||||||||||||||||||
AllianzGI Preferred Securities & Income | 2,464,147 | 4,444,043 | 2,044,629 | (238,054 | ) | 4,512,636 | 191,681 | 306,357 | (112,871 | ) | 62,244 | |||||||||||||||||||||||||
AllianzGI Short Duration High Income | 3,195,801 | 14,672,065 | 11,437,647 | 332,869 | 6,103,148 | 367,453 | 439,391 | (659,940 | ) | — | ||||||||||||||||||||||||||
AllianzGI Short Term Bond | 1,226,783 | 7,724,362 | 5,628,191 | 312,171 | 3,884,296 | 117,136 | 245,686 | 249,171 | — | |||||||||||||||||||||||||||
PIMCO 15 Year U.S. TIPS Index | — | 2,015,392 | 2,111,272 | — | — | — | — | 95,880 | — | |||||||||||||||||||||||||||
PIMCO Mortgage Opportunities | — | 2,805,007 | 2,828,371 | — | — | 11,576 | — | 23,364 | — | |||||||||||||||||||||||||||
PIMCO Preferred and Capital Securities | — | 5,900,117 | 5,603,165 | — | — | 48,681 | — | (296,952 | ) | — | ||||||||||||||||||||||||||
PIMCO Senior Floating Rate | 1,230,042 | 4,140,298 | 5,000,917 | (3,762 | ) | — | 41,741 | — | (365,661 | ) | — | |||||||||||||||||||||||||
Totals | $ | 14,451,328 | $ | 58,555,422 | $ | 53,637,098 | $ | 655,816 | $ | 18,896,914 | $ | 1,070,288 | 1,538,304 | $ | (1,128,554 | ) | $ | 63,481 | ||||||||||||||||||
| AllianzGI PerformanceFee Managed Futures Strategy: | ||||||||||||||||||||||||||||||||||||
| Market Value 9/30/2019 | Purchases at Cost | Proceeds from Sales | Change in Unrealized Appreciation (Depreciation) | Market Value 9/30/2020 | Dividend Income | Shares as of 9/30/2020 | Net Realized Gain (Loss) | Net Capital Gain Distributions Received | ||||||||||||||||||||||||||||
AllianzGI Short Duration High Income | $ | 1,412,329 | $ | 68,409 | $ | 208,250 | $ | (52,858 | ) | $ | 1,211,276 | $ | 68,409 | 87,205 | $ | (8,354 | ) | — | ||||||||||||||||||
| * | Actual amount rounds to less than $1. |
| † | See Note 13(b) in the Notes to Financial Statements. |
| Annual Report | | September 30, 2020 | 217 |
Table of Contents
Notes to Financial Statements (cont’d)
September 30, 2020
Certain Funds are permitted to purchase or sell securities from or to certain related affiliated funds under specified conditions outlined in procedures adopted by the Board. The procedures have been designed to ensure that any purchase or sale of securities by the Funds from or to another fund or portfolio that are, or could be, considered an affiliate by virtue of having a common investment adviser (or affiliated investment advisers), common Trustees and/or common officers comply with Rule 17a-7 of the 1940 Act. Further, as defined under the procedures, each transaction is effected at the current market price.
During the year ended September 30, 2020, the following Funds engaged in sales of securities pursuant to Rule 17a-7 of the 1940 Act:
| Purchases | Sales | |||||||
AllianzGI Short Duration High Income | — | $ | 122,264,528 | |||||
AllianzGI Short Term Bond | — | 1,721,451 | ||||||
| 8. | SIGNIFICANT ACCOUNT HOLDERS |
From time to time, a Fund may have a concentration of shareholders, which may include the Investment Manager or affiliates of the Investment Manager, holding a significant percentage of shares outstanding. Investment activities of these shareholders could have a material impact to a Fund.
At September 30, 2020, the significant account-holders, owners of 5% or greater of each respective Fund’s outstanding shares were as follows:
| Unaffiliated | Affiliated | |||||||||||||||||||
| Number of Account Holders | Approximate Ownership | Number of Account Holders | Approximate Ownership* | AFI** | ||||||||||||||||
AllianzGI Best Styles Global Equity | 1 | 9 | % | 1 | 89 | % | — | |||||||||||||
AllianzGI Convertible | 9 | 80 | % | — | — | — | ||||||||||||||
AllianzGI Core Plus Bond | — | — | — | — | 96 | % | ||||||||||||||
AllianzGI Emerging Markets Consumer | 5 | 94 | % | — | — | — | ||||||||||||||
AllianzGI Emerging Markets Small-Cap | 1 | 12 | % | — | — | 85 | % | |||||||||||||
AllianzGI Emerging Markets Value | 2 | 87 | % | — | — | — | ||||||||||||||
AllianzGI Global Allocation | 1 | 31 | % | 1 | 45 | % | — | |||||||||||||
AllianzGI Global Dynamic Allocation | 3 | 94 | % | — | — | — | ||||||||||||||
AllianzGI Global Sustainability | 2 | 32 | % | 1 | 64 | % | — | |||||||||||||
AllianzGI Green Bond | — | — | 1 | 92 | % | — | ||||||||||||||
AllianzGI High Yield Bond | 3 | 61 | % | 2 | 17 | % | — | |||||||||||||
AllianzGI International Small-Cap | 2 | 76 | % | — | — | — | ||||||||||||||
AllianzGI Multi Asset Income | — | — | 1 | 82 | % | — | ||||||||||||||
AllianzGI PerformanceFee Managed Futures Strategy | — | — | 1 | 98 | % | — | ||||||||||||||
AllianzGI PerformanceFee Structured US Equity | 2 | 91 | % | — | — | — | ||||||||||||||
AllianzGI Preferred Securities and Income | 2 | 35 | % | 1 | 18 | % | 44 | % | ||||||||||||
AllianzGI Short Duration High Income | 8 | 79 | % | — | — | — | ||||||||||||||
AllianzGI Short Term Bond | 2 | 46 | % | 1 | 23 | % | — | |||||||||||||
AllianzGI Structured Return | 7 | 85 | % | — | — | — | ||||||||||||||
AllianzGI Water | 8 | 81 | % | — | — | — | ||||||||||||||
| * | This represents the aggregate percentage of affiliated entities that own 5% or more of the Fund’s outstanding shares. These affiliated entities include funds/portfolios of the Trust, Allianz Funds and CollegeAccess 529 Plan. |
| ** | Allianz Funds Investments, Inc. (“AFI”) is indirect, wholly-owned subsidiary of Allianz SE. |
| 218 | September 30, 2020 | | Annual Report |
Table of Contents
(THIS PAGE INTENTIONALLY LEFT BLANK)
| Annual Report | | September 30, 2020 | 219 |
Table of Contents
Notes to Financial Statements (cont’d)
September 30, 2020
| 9. | SHARES OF BENEFICIAL INTEREST |
The Trust may issue an unlimited number of shares of beneficial interest with $0.0001 par value. Changes in shares of beneficial interest were as follows:
| AllianzGI Best Styles Global Equity | AllianzGI Convertible | |||||||||||||||||||||||||||||||||||
| Year ended September 30, 2020 | Year ended September 30, 2019 | Year ended September 30, 2020 | Year ended September 30, 2019 | |||||||||||||||||||||||||||||||||
| Shares | Amount | Shares | Amount | Shares | Amount | Shares | Amount | |||||||||||||||||||||||||||||
Shares sold: | ||||||||||||||||||||||||||||||||||||
Class A | 3,080 | $ | 38,727 | 18,318 | $ | 254,679 | 5,360,325 | $ | 176,137,365 | 927,069 | $ | 27,007,767 | ||||||||||||||||||||||||
Class C | — | — | 73 | 1,000 | 1,496,827 | 49,314,122 | 835,945 | 24,294,977 | ||||||||||||||||||||||||||||
Class R | — | — | — | — | 1,780 | 62,067 | 2,421 | 74,232 | ||||||||||||||||||||||||||||
Class P | 18,604 | 260,156 | 31,398 | 433,985 | 13,169,157 | 406,955,186 | 3,280,675 | 92,499,330 | ||||||||||||||||||||||||||||
Institutional Class | 7,415 | 87,790 | 17,279 | 240,568 | 22,968,199 | 718,717,185 | 4,715,339 | 135,402,514 | ||||||||||||||||||||||||||||
Class R6 | 1,274,756 | 16,019,711 | 2,781,064 | 40,286,108 | — | — | — | — | ||||||||||||||||||||||||||||
Administrative Class | — | — | — | — | 345,848 | 12,318,017 | 3,695 | 107,637 | ||||||||||||||||||||||||||||
Issued in reinvestment of dividends and distributions: | ||||||||||||||||||||||||||||||||||||
Class A | 11,139 | 148,481 | 8,996 | 111,996 | 120,304 | 3,677,305 | 323,724 | 8,061,431 | ||||||||||||||||||||||||||||
Class C | 218 | 2,911 | 145 | 1,808 | 63,483 | 1,943,210 | 227,221 | 5,693,349 | ||||||||||||||||||||||||||||
Class R | — | — | — | — | 215 | 6,786 | 492 | 12,717 | ||||||||||||||||||||||||||||
Class P | 9,734 | 129,756 | 13,017 | 162,066 | 335,211 | 9,975,702 | 537,881 | 13,089,974 | ||||||||||||||||||||||||||||
Institutional Class | 6,276 | 82,209 | 22,536 | 276,295 | 770,836 | 23,162,256 | 1,940,013 | 47,589,658 | ||||||||||||||||||||||||||||
Class R6 | 2,529,321 | 33,639,966 | 5,349,997 | 66,179,468 | — | — | — | — | ||||||||||||||||||||||||||||
Administrative Class | — | — | — | — | 1,655 | 55,241 | 4,758 | 116,747 | ||||||||||||||||||||||||||||
Cost of shares redeemed: | ||||||||||||||||||||||||||||||||||||
Class A | (22,188 | ) | (273,206 | ) | (26,033 | ) | (383,931 | ) | (1,289,181 | ) | (41,935,176 | ) | (743,559 | ) | (21,015,895 | ) | ||||||||||||||||||||
Class C | (444 | ) | (5,758 | ) | (1,386 | ) | (22,108 | ) | (744,408 | ) | (24,393,928 | ) | (644,782 | ) | (18,689,403 | ) | ||||||||||||||||||||
Class R | — | — | — | — | (66 | ) | (2,220 | ) | (362 | ) | (11,089 | ) | ||||||||||||||||||||||||
Class P | (46,127 | ) | (549,691 | ) | (104,629 | ) | (1,459,278 | ) | (4,393,435 | ) | (132,223,296 | ) | (1,536,819 | ) | (42,210,655 | ) | ||||||||||||||||||||
Institutional Class | (17,567 | ) | (237,132 | ) | (138,631 | ) | (1,772,912 | ) | (9,114,615 | ) | (290,448,061 | ) | (4,054,854 | ) | (113,207,612 | ) | ||||||||||||||||||||
Class R6 | (23,406,781 | ) | (318,667,626 | ) | (13,210,270 | ) | (188,289,268 | ) | — | — | — | — | ||||||||||||||||||||||||
Administrative Class | — | — | — | — | (17,557 | ) | (551,039 | ) | (20,190 | ) | (560,661 | ) | ||||||||||||||||||||||||
Net increase (decrease) resulting from Fund share transactions | (19,632,564 | ) | $ | (269,323,706 | ) | (5,238,126 | ) | $ | (83,979,524 | ) | 29,074,578 | $ | 912,770,722 | 5,798,667 | $ | 158,255,018 | ||||||||||||||||||||
| – | May reflect actual amounts rounding to less than $1 or less than 1 share. |
| 220 | September 30, 2020 | | Annual Report |
Table of Contents
| AllianzGI Core Plus Bond | AllianzGI Emerging Markets Consumer | AllianzGI Emerging Markets Small-Cap | ||||||||||||||||||||||||||||||||||||||||||||||||
| Year ended September 30, 2020 | Year ended September 30, 2019 | Year ended September 30, 2020 | Year ended September 30, 2019 | Year ended September 30, 2020 | Year ended September 30, 2019 | |||||||||||||||||||||||||||||||||||||||||||||
| Shares | Amount | Shares | Amount | Shares | Amount | Shares | Amount | Shares | Amount | Shares | Amount | |||||||||||||||||||||||||||||||||||||||
| — | — | — | — | 4,191 | $ | 60,222 | 80 | $ | 1,025 | 11,961 | $ | 190,406 | 4,660 | $ | 76,707 | |||||||||||||||||||||||||||||||||||
| — | — | — | — | — | — | — | — | — | — | — | — | |||||||||||||||||||||||||||||||||||||||
| — | — | — | — | — | — | — | — | — | — | — | — | |||||||||||||||||||||||||||||||||||||||
| — | — | — | — | — | — | — | — | — | — | — | — | |||||||||||||||||||||||||||||||||||||||
| 1,592 | $ | 25,984 | — | — | 41,628 | 611,237 | 1,608,568 | 21,252,308 | 286,010 | 3,775,425 | 24,943 | 389,972 | ||||||||||||||||||||||||||||||||||||||
| 135,169 | 2,172,549 | 954,928 | $ | 15,168,884 | — | — | — | — | — | — | — | — | ||||||||||||||||||||||||||||||||||||||
| — | — | — | — | — | — | — | — | — | — | — | — | |||||||||||||||||||||||||||||||||||||||
| — | — | — | — | 31 | 457 | 17 | 207 | 477 | 8,030 | 389 | 5,633 | |||||||||||||||||||||||||||||||||||||||
| — | — | — | — | — | — | — | — | — | — | — | — | |||||||||||||||||||||||||||||||||||||||
| — | — | — | — | — | — | — | — | — | — | — | — | |||||||||||||||||||||||||||||||||||||||
| 45 | 693 | 20 | 302 | — | — | — | — | — | — | — | — | |||||||||||||||||||||||||||||||||||||||
| 56 | 875 | 20 | 310 | 26,628 | 387,702 | 35,465 | 442,608 | 16,957 | 282,337 | 37,237 | 528,395 | |||||||||||||||||||||||||||||||||||||||
| 234,541 | 3,642,611 | 84,166 | 1,286,062 | — | — | — | — | — | — | — | — | |||||||||||||||||||||||||||||||||||||||
| — | — | — | — | — | — | — | — | — | — | — | — | |||||||||||||||||||||||||||||||||||||||
| — | — | — | — | (4,833 | ) | (68,848 | ) | (507 | ) | (7,035 | ) | (6,577 | ) | (104,911 | ) | (6,001 | ) | (95,663 | ) | |||||||||||||||||||||||||||||||
| — | — | — | — | — | — | — | — | — | — | — | — | |||||||||||||||||||||||||||||||||||||||
| — | — | — | — | — | — | — | — | — | — | — | — | |||||||||||||||||||||||||||||||||||||||
| — | — | — | — | — | — | — | — | — | — | — | — | |||||||||||||||||||||||||||||||||||||||
| — | — | — | — | (738,026 | ) | (9,371,678 | ) | (1,828,055 | ) | (24,242,382 | ) | (490,757 | ) | (6,917,166 | ) | (179,420 | ) | (2,810,844 | ) | |||||||||||||||||||||||||||||||
| (1,013,547 | ) | (16,280,298 | ) | (9,784 | ) | (147,681 | ) | — | — | — | — | — | — | — | — | |||||||||||||||||||||||||||||||||||
| — | — | — | — | — | — | — | — | — | — | — | — | |||||||||||||||||||||||||||||||||||||||
| (642,144 | ) | $ | (10,437,586) | 1,029,350 | $ | 16,307,877 | (670,381) | $ | (8,380,908) | (184,432) | $ | (2,553,269) | (181,929) | $ | (2,765,879) | (118,192) | $ | (1,905,800) | |||||||||||||||||||||||||||||||
| Annual Report | | September 30, 2020 | 221 |
Table of Contents
Notes to Financial Statements (cont’d)
September 30, 2020
| AllianzGI Emerging Markets Value | AllianzGI Global Allocation | |||||||||||||||||||||||||||||||||||
Year ended | Year ended September 30, 2019 | Year ended September 30, 2020 | Year ended September 30, 2019 | |||||||||||||||||||||||||||||||||
| Shares | Amount | Shares | Amount | Shares | Amount | Shares | Amount | |||||||||||||||||||||||||||||
Shares sold: | ||||||||||||||||||||||||||||||||||||
Class A | 319,555 | $ | 5,098,352 | 219,385 | $ | 3,367,289 | 339,921 | $ | 3,633,733 | 1,759,689 | $ | 19,613,414 | ||||||||||||||||||||||||
Class C | 1,799 | 30,042 | 32,404 | 509,060 | 97,235 | 1,083,076 | 119,762 | 1,250,907 | ||||||||||||||||||||||||||||
Class R | — | — | — | — | — | — | 160 | 1,735 | ||||||||||||||||||||||||||||
Class P | 364,179 | 5,920,668 | 42,135 | 658,306 | 354,618 | 3,696,965 | 333,520 | 3,328,407 | ||||||||||||||||||||||||||||
Institutional Class | 2,326,621 | 36,701,280 | 2,197,656 | 33,820,277 | 441,421 | 4,729,055 | 94,795 | 1,030,055 | ||||||||||||||||||||||||||||
Class R6 | — | — | — | — | 3,422,749 | 35,014,173 | 3,703,382 | 38,620,649 | ||||||||||||||||||||||||||||
Administrative Class | — | — | — | — | 180 | 1,874 | 17 | 198 | ||||||||||||||||||||||||||||
Issued in reinvestment of dividends and distributions: | ||||||||||||||||||||||||||||||||||||
Class A | 9,568 | 162,847 | 21,910 | 351,944 | 342,737 | 3,622,560 | 278,260 | 2,798,425 | ||||||||||||||||||||||||||||
Class C | 320 | 5,560 | 1,283 | 20,510 | 33,633 | 369,764 | 28,248 | 290,703 | ||||||||||||||||||||||||||||
Class R | — | — | — | — | 178 | 1,863 | 199 | 1,965 | ||||||||||||||||||||||||||||
Class P | 3,857 | 65,991 | 3,267 | 52,446 | 25,204 | 262,712 | 12,825 | 127,708 | ||||||||||||||||||||||||||||
Institutional Class | 82,910 | 1,388,250 | 213,903 | 3,312,431 | 51,338 | 538,566 | 41,540 | 417,023 | ||||||||||||||||||||||||||||
Class R6 | — | — | — | — | 2,365,902 | 24,243,636 | 1,685,062 | 16,591,827 | ||||||||||||||||||||||||||||
Administrative Class | — | — | — | — | 195 | 2,124 | 127 | 1,312 | ||||||||||||||||||||||||||||
Cost of shares redeemed: | ||||||||||||||||||||||||||||||||||||
Class A | (430,708 | ) | (6,650,798 | ) | (711,983 | ) | (10,974,346 | ) | (953,519 | ) | (10,095,495 | ) | (1,153,312 | ) | (12,396,960 | ) | ||||||||||||||||||||
Class C | (10,576 | ) | (178,519 | ) | (42,723 | ) | (658,495 | ) | (384,010 | ) | (4,208,450 | ) | (1,832,217 | ) | (20,828,729 | ) | ||||||||||||||||||||
Class R | — | — | — | — | — | — | (1,534 | ) | (15,480 | ) | ||||||||||||||||||||||||||
Class P | (99,730 | ) | (1,631,048 | ) | (120,149 | ) | (1,843,801 | ) | (453,965 | ) | (4,754,739 | ) | (159,246 | ) | (1,673,173 | ) | ||||||||||||||||||||
Institutional Class | (1,836,620 | ) | (29,433,031 | ) | (3,377,357 | ) | (51,241,215 | ) | (170,252 | ) | (1,748,395 | ) | (170,380 | ) | (1,806,024 | ) | ||||||||||||||||||||
Class R6 | — | — | — | — | (11,129,047 | ) | (116,406,025 | ) | (4,746,544 | ) | (49,776,513 | ) | ||||||||||||||||||||||||
Administrative Class | — | — | — | — | (15 | ) | (145 | ) | — | — | ||||||||||||||||||||||||||
Net increase (decrease) resulting from Fund share transactions | 731,175 | $ | 11,479,594 | (1,520,269 | ) | $ | (22,625,594 | ) | (5,615,497 | ) | $ | (60,013,148 | ) | (5,647 | ) | $ | (2,422,551 | ) | ||||||||||||||||||
| – | May reflect actual amounts rounding to less than $1 or less than 1 share. |
| * | Commencement of operations. |
| 222 | September 30, 2020 | | Annual Report |
Table of Contents
| AllianzGI Global Dynamic Allocation | AllianzGI Global Sustainability | AllianzGI Green Bond | ||||||||||||||||||||||||||||||||||||||||||||||||
| Year ended September 30, 2020 | Year ended September 30, 2019 | Year ended September 30, 2020 | Year ended September 30, 2019 | Year ended September 30, 2020 | Period from November 19, 2018* through September 30, 2019 | |||||||||||||||||||||||||||||||||||||||||||||
| Shares | Amount | Shares | Amount | Shares | Amount | Shares | Amount | Shares | Amount | Shares | Amount | |||||||||||||||||||||||||||||||||||||||
| 22,644 | $ | 418,515 | 47,994 | $ | 919,957 | 61,722 | $ | 1,167,236 | 115,395 | $ | 2,114,648 | 6,859 | $ | 112,433 | 5,017 | $ | 76,142 | |||||||||||||||||||||||||||||||||
| 7,118 | 130,239 | 4,461 | 82,898 | — | — | — | — | — | — | — | — | |||||||||||||||||||||||||||||||||||||||
| 481 | 8,692 | 795 | 14,907 | — | — | — | — | — | — | — | — | |||||||||||||||||||||||||||||||||||||||
| 5 | 100 | 14,883 | 272,835 | 738,742 | 14,120,188 | 839,758 | 14,425,605 | 13,207 | 215,800 | 65,759 | 1,050,700 | |||||||||||||||||||||||||||||||||||||||
| 171,561 | 3,130,127 | 21,516 | 404,272 | 8,161,406 | 155,933,618 | 55,785 | 1,016,992 | 2,093,522 | 34,333,474 | 20,174 | 323,012 | |||||||||||||||||||||||||||||||||||||||
| 560,123 | 10,325,676 | 1,181,860 | 22,479,632 | — | — | — | — | — | — | — | — | |||||||||||||||||||||||||||||||||||||||
| — | — | — | — | — | — | — | — | — | — | — | — | |||||||||||||||||||||||||||||||||||||||
| 9,553 | 176,628 | 5,336 | 92,840 | 1,364 | 26,611 | 2,973 | 44,718 | 114 | 1,862 | 83 | 1,313 | |||||||||||||||||||||||||||||||||||||||
| 3,517 | 63,940 | 1,034 | 17,748 | — | — | — | — | — | — | — | — | |||||||||||||||||||||||||||||||||||||||
| 588 | 10,836 | 219 | 3,802 | — | — | — | — | — | — | — | — | |||||||||||||||||||||||||||||||||||||||
| 247 | 4,691 | 33,205 | 573,450 | 24,998 | 490,968 | 57,911 | 876,192 | 1,044 | 16,945 | 504 | 8,163 | |||||||||||||||||||||||||||||||||||||||
| 53,944 | 1,011,445 | 20,229 | 356,643 | 128,204 | 2,565,366 | 53,317 | 822,141 | 27,238 | 443,047 | 5,846 | 92,825 | |||||||||||||||||||||||||||||||||||||||
| 650,162 | 11,995,496 | 489,384 | 8,485,926 | — | — | — | — | — | — | — | — | |||||||||||||||||||||||||||||||||||||||
| 133 | 2,455 | 57 | 975 | — | — | — | — | — | — | — | — | |||||||||||||||||||||||||||||||||||||||
| (47,002 | ) | (815,174 | ) | (58,861 | ) | (1,092,588 | ) | (30,523 | ) | (593,953 | ) | (70,883 | ) | (1,286,395 | ) | (1,419 | ) | (23,550 | ) | — | — | |||||||||||||||||||||||||||||
| (13,160 | ) | (236,423 | ) | (35,403 | ) | (669,078 | ) | — | — | — | — | — | — | — | — | |||||||||||||||||||||||||||||||||||
| (5,052 | ) | (88,971 | ) | (2,663 | ) | (50,381 | ) | — | — | — | — | — | — | — | — | |||||||||||||||||||||||||||||||||||
| (597,472 | ) | (11,737,306 | ) | (117,170 | ) | (2,142,526 | ) | (600,117 | ) | (11,854,461 | ) | (301,248 | ) | (5,343,279 | ) | (47,796 | ) | (801,610 | ) | (489 | ) | (7,930 | ) | |||||||||||||||||||||||||||
| (58,640 | ) | (1,075,288 | ) | (217,234 | ) | (4,167,618 | ) | (2,296,682 | ) | (47,935,669 | ) | (1,430,354 | ) | (26,159,970 | ) | (935,007 | ) | (15,533,227 | ) | (6,131 | ) | (100,934 | ) | |||||||||||||||||||||||||||
| (6,192,616 | ) | (116,362,314 | ) | (4,583,267 | ) | (87,757,691 | ) | — | — | — | — | — | — | — | — | |||||||||||||||||||||||||||||||||||
| — | — | — | — | — | — | — | — | — | — | — | — | |||||||||||||||||||||||||||||||||||||||
| (5,433,866 | ) | $ | (103,036,636 | ) | (3,193,625 | ) | $ | (62,173,997 | ) | 6,189,114 | $ | 113,919,904 | (677,346 | ) | $ | (13,489,348 | ) | 1,157,762 | $ | 18,765,174 | 90,763 | $ | 1,443,291 | |||||||||||||||||||||||||||
| Annual Report | | September 30, 2020 | 223 |
Table of Contents
Notes to Financial Statements (cont’d)
September 30, 2020
| AllianzGI High Yield Bond | AllianzGI International Small-Cap | |||||||||||||||||||||||||||||||||||
| Year ended September 30, 2020 | Year ended September 30, 2019 | Year ended September 30, 2020 | Year ended September 30, 2019 | |||||||||||||||||||||||||||||||||
| Shares | Amount | Shares | Amount | Shares | Amount | Shares | Amount | |||||||||||||||||||||||||||||
Shares sold: | ||||||||||||||||||||||||||||||||||||
Class A | 427,233 | $ | 3,690,470 | 744,048 | $ | 6,483,990 | 14,308 | $ | 462,738 | 45,024 | $ | 1,513,968 | ||||||||||||||||||||||||
Class C | 71,535 | 609,436 | 94,473 | 805,389 | 220 | 6,784 | 1,796 | 55,502 | ||||||||||||||||||||||||||||
Class R | 98,536 | 792,854 | 87,935 | 729,106 | 6,214 | 181,010 | 14,224 | 496,464 | ||||||||||||||||||||||||||||
Class P | 350,233 | 2,857,637 | 760,572 | 6,286,286 | 19,186 | 581,477 | 101,230 | 3,421,259 | ||||||||||||||||||||||||||||
Institutional Class | 3,084,998 | 25,393,732 | 1,661,437 | 13,894,508 | 77,726 | 2,457,518 | 365,319 | 12,608,298 | ||||||||||||||||||||||||||||
Class R6 | — | — | — | — | 360,781 | 11,900,362 | 166,939 | 5,247,432 | ||||||||||||||||||||||||||||
Administrative Class | 458 | 3,831 | 6,348 | 53,584 | — | — | — | — | ||||||||||||||||||||||||||||
Issued in reinvestment of dividends and distributions: | ||||||||||||||||||||||||||||||||||||
Class A | 127,293 | 1,077,155 | 164,994 | 1,438,431 | 1,918 | 66,312 | 28,989 | 810,249 | ||||||||||||||||||||||||||||
Class C | 19,800 | 167,197 | 26,644 | 231,665 | 36 | 1,196 | 8,012 | 215,286 | ||||||||||||||||||||||||||||
Class R | 3,194 | 25,779 | 3,136 | 26,160 | 610 | 19,726 | 6,359 | 167,366 | ||||||||||||||||||||||||||||
Class P | 73,485 | 594,620 | 93,832 | 783,115 | 6,420 | 220,655 | 159,754 | 4,426,791 | ||||||||||||||||||||||||||||
Institutional Class | 486,601 | 3,937,877 | 588,936 | 4,930,676 | 15,974 | 569,471 | 213,703 | 6,161,056 | ||||||||||||||||||||||||||||
Class R6 | — | — | — | — | 19,547 | 690,384 | 141,955 | 4,068,417 | ||||||||||||||||||||||||||||
Administrative Class | 176 | 1,419 | 150 | 1,258 | — | — | — | — | ||||||||||||||||||||||||||||
Cost of shares redeemed: | ||||||||||||||||||||||||||||||||||||
Class A | (1,164,633 | ) | (10,073,406 | ) | (1,673,896 | ) | (14,642,983 | ) | (61,009 | ) | (1,973,484 | ) | (135,306 | ) | (4,608,453 | ) | ||||||||||||||||||||
Class C | (176,870 | ) | (1,533,669 | ) | (532,830 | ) | (4,651,423 | ) | (9,731 | ) | (304,284 | ) | (41,167 | ) | (1,381,885 | ) | ||||||||||||||||||||
Class R | (114,949 | ) | (931,552 | ) | (117,093 | ) | (974,669 | ) | (14,912 | ) | (406,822 | ) | (6,194 | ) | (189,894 | ) | ||||||||||||||||||||
Class P | (582,812 | ) | (4,727,469 | ) | (1,482,333 | ) | (12,310,235 | ) | (329,810 | ) | (10,374,948 | ) | (776,355 | ) | (25,582,703 | ) | ||||||||||||||||||||
Institutional Class | (6,151,897 | ) | (50,574,719 | ) | (7,435,928 | ) | (62,047,291 | ) | (412,505 | ) | (14,070,174 | ) | (467,635 | ) | (15,005,607 | ) | ||||||||||||||||||||
Class R6 | — | — | — | — | (397,418 | ) | (12,984,001 | ) | (200,875 | ) | (6,639,632 | ) | ||||||||||||||||||||||||
Administrative Class | (197 | ) | (1,644 | ) | (6,061 | ) | (51,729 | ) | — | — | — | — | ||||||||||||||||||||||||
Net increase (decrease) resulting from Fund share transactions | (3,447,816 | ) | $ | (28,690,452 | ) | (7,015,636 | ) | $ | (59,014,162 | ) | (702,445 | ) | $ | (22,956,080 | ) | (374,228 | ) | $ | (14,216,086 | ) | ||||||||||||||||
| † | Commencement of operations. |
| 224 | September 30, 2020 | | Annual Report |
Table of Contents
| AllianzGI Multi Asset Income | AllianzGI PerformanceFee Managed Futures Strategy | AllianzGI PerformanceFee Structured US Equity | ||||||||||||||||||||||||||||||||||||||||||||||
| Year ended September 30, 2020 | Year ended September 30, 2019 | Year ended September 30, 2020 | Year ended September 30, 2019 | Year ended September 30, 2020 | Year ended September 30, 2019 | |||||||||||||||||||||||||||||||||||||||||||
| Shares | Amount | Shares | Amount | Shares | Amount | Shares | Amount | Shares | Amount | Shares | Amount | |||||||||||||||||||||||||||||||||||||
| 219,908 | $ | 3,739,802 | 312,863 | $ | 5,281,026 | — | — | — | — | — | — | — | — | |||||||||||||||||||||||||||||||||||
| 15,782 | 282,182 | 30,338 | 509,546 | — | — | — | — | — | — | — | — | |||||||||||||||||||||||||||||||||||||
| 25,974 | 428,918 | 482 | 8,636 | — | — | — | — | — | — | — | — | |||||||||||||||||||||||||||||||||||||
| 25,689 | 438,369 | 85,102 | 1,472,847 | — | — | — | — | 915,937 | $ | 9,634,393 | 1,929,421 | $ | 19,945,782 | |||||||||||||||||||||||||||||||||||
| 14,099 | 230,929 | 10,350 | 176,024 | 1,623 | $ | 13,216 | 112,309 | $ | 1,070,810 | 4,585,512 | 46,828,667 | 1,058,546 | 10,946,436 | |||||||||||||||||||||||||||||||||||
| 2,645,608 | 44,909,165 | 59,036 | 993,049 | 193,892 | 1,832,033 | 1,729,780 | 15,938,742 | 96,543 | 773,424 | 275,101 | 2,552,073 | |||||||||||||||||||||||||||||||||||||
| — | — | 1,228 | 21,124 | — | — | — | — | — | — | — | — | |||||||||||||||||||||||||||||||||||||
| 41,049 | 667,447 | 35,907 | 614,376 | — | — | — | — | — | — | — | — | |||||||||||||||||||||||||||||||||||||
| 3,566 | 57,784 | 4,015 | 68,590 | — | — | — | — | — | — | — | — | |||||||||||||||||||||||||||||||||||||
| 513 | 8,643 | 91 | 1,615 | — | — | — | — | — | — | — | — | |||||||||||||||||||||||||||||||||||||
| 2,970 | 49,408 | 25,743 | 442,685 | 72 | 647 | 9 | 81 | 82,298 | 931,615 | 675 | 5,757 | |||||||||||||||||||||||||||||||||||||
| 1,136 | 17,877 | 289 | 4,881 | 3,737 | 33,299 | 474 | 4,473 | 204,110 | 2,312,561 | 324,961 | 2,775,164 | |||||||||||||||||||||||||||||||||||||
| 106,766 | 1,615,695 | 39,088 | 653,978 | 253,478 | 2,258,487 | 32,392 | 305,782 | 39,221 | 449,085 | 330,464 | 2,828,770 | |||||||||||||||||||||||||||||||||||||
| 31 | 499 | 737 | 12,479 | — | — | — | — | — | — | — | — | |||||||||||||||||||||||||||||||||||||
| (709,877) | (11,709,921 | ) | (150,949 | ) | (2,569,046 | ) | — | — | — | — | — | — | — | — | ||||||||||||||||||||||||||||||||||
| (37,728) | (597,966 | ) | (75,511 | ) | (1,293,717 | ) | — | — | — | — | — | — | — | — | ||||||||||||||||||||||||||||||||||
| (89) | (1,503 | ) | (533 | ) | (9,369 | ) | — | — | — | — | — | — | — | — | ||||||||||||||||||||||||||||||||||
| (119,761) | (2,007,188 | ) | (535,136 | ) | (9,471,935 | ) | — | — | — | — | (2,873,415 | ) | (23,007,543 | ) | (13,419 | ) | (141,192 | ) | ||||||||||||||||||||||||||||||
| (5,861) | (91,339 | ) | (2,027 | ) | (32,947 | ) | (40,655 | ) | (351,069 | ) | (104,829 | ) | (961,460 | ) | (4,027,474 | ) | (28,530,833 | ) | (207,142 | ) | (2,067,716 | ) | ||||||||||||||||||||||||||
| (774,450) | (12,265,921 | ) | (501,706 | ) | (8,442,035 | ) | (637,942 | ) | (5,487,331 | ) | (52,264 | ) | (484,553 | ) | (4,097,587 | ) | (41,476,941 | ) | (444,647 | ) | (4,309,086 | ) | ||||||||||||||||||||||||||
| — | — | (31,039 | ) | (534,195 | ) | — | — | — | — | — | — | — | — | |||||||||||||||||||||||||||||||||||
1,455,325 | $ | 25,772,880 | (691,632 | ) | $ | (12,092,388 | ) | (225,795 | ) | $ | (1,700,718 | ) | 1,717,871 | $ | 15,873,875 | (5,074,855 | ) | $ | (32,085,572 | ) | 3,253,960 | $ | 32,535,988 | |||||||||||||||||||||||||
| Annual Report | | September 30, 2020 | 225 |
Table of Contents
Notes to Financial Statements (cont’d)
September 30, 2020
| AllianzGI Preferred Securities and Income | AllianzGI Short Duration High Income | |||||||||||||||||||||||||||||||||||
| Year ended September 30, 2020 | Year ended September 30, 2019 | Year ended September 30, 2020 | Year ended September 30, 2019 | |||||||||||||||||||||||||||||||||
| Shares | Amount | Shares | Amount | Shares | Amount | Shares | Amount | |||||||||||||||||||||||||||||
Shares sold: | ||||||||||||||||||||||||||||||||||||
Class A | — | — | — | — | 5,584,271 | $ | 79,619,684 | 5,692,412 | $ | 82,896,626 | ||||||||||||||||||||||||||
Class C | — | — | — | — | 1,833,843 | 26,112,022 | 2,696,853 | 39,150,889 | ||||||||||||||||||||||||||||
Class P | — | — | — | — | 69,044,554 | 992,957,066 | 30,969,732 | 446,971,610 | ||||||||||||||||||||||||||||
Institutional Class | 851,446 | $ | 12,388,519 | 97,673 | $ | 1,491,677 | 14,160,445 | 199,832,491 | 13,461,959 | 195,008,059 | ||||||||||||||||||||||||||
Class R6 | 408,622 | 6,296,938 | 288,347 | 4,266,098 | 2,853,830 | 38,291,378 | 2,137,280 | 30,871,362 | ||||||||||||||||||||||||||||
Issued in reinvestment of dividends and distributions: | ||||||||||||||||||||||||||||||||||||
Class A | — | — | — | — | 396,028 | 5,521,281 | 441,306 | 6,401,352 | ||||||||||||||||||||||||||||
Class C | — | — | — | — | 292,482 | 4,076,736 | 336,506 | 4,878,351 | ||||||||||||||||||||||||||||
Class P | 51 | 777 | 34 | 506 | 1,519,206 | 21,455,898 | 1,425,882 | 20,529,506 | ||||||||||||||||||||||||||||
Institutional Class | 19,713 | 289,805 | 6,603 | 98,925 | 1,287,104 | 17,827,310 | 1,376,229 | 19,830,219 | ||||||||||||||||||||||||||||
Class R6 | 75,305 | 1,119,376 | 42,699 | 637,469 | 153,825 | 2,118,099 | 169,926 | 2,446,945 | ||||||||||||||||||||||||||||
Cost of shares redeemed: | ||||||||||||||||||||||||||||||||||||
Class A | — | — | — | — | (5,520,989 | ) | (75,974,850 | ) | (6,932,123 | ) | (100,602,728 | ) | ||||||||||||||||||||||||
Class C | — | — | — | — | (3,641,283 | ) | (50,732,741 | ) | (4,112,920 | ) | (59,871,987 | ) | ||||||||||||||||||||||||
Class P | — | — | — | — | (86,028,179 | ) | (1,196,629,668 | ) | (25,514,747 | ) | (368,867,801 | ) | ||||||||||||||||||||||||
Institutional Class | (545,140 | ) | (8,319,097 | ) | (13,082 | ) | (199,741 | ) | (21,663,814 | ) | (294,426,028 | ) | (14,164,781 | ) | (204,589,918 | ) | ||||||||||||||||||||
Class R6 | (209,238 | ) | (3,158,047 | ) | (69,385 | ) | (1,061,427 | ) | (3,281,051 | ) | (44,779,688 | ) | (3,158,264 | ) | (45,704,949 | ) | ||||||||||||||||||||
Net increase (decrease) resulting from Fund share transactions | 600,759 | $ | 8,618,271 | 352,889 | $ | 5,233,507 | (23,009,728 | ) | $ | (274,731,010 | ) | 4,825,250 | $ | 69,347,536 | ||||||||||||||||||||||
| – | May reflect actual amounts rounding to less than $1 or less than 1 share. |
| † | The Fund was reimbursed $419,245 for an operational error. This amount is included in “Shares sold” for the year ended September 30, 2020. |
| 226 | September 30, 2020 | | Annual Report |
Table of Contents
| AllianzGI Short Term Bond | AllianzGI Structured Return† | AllianzGI Water | ||||||||||||||||||||||||||||||||||||||||||||||||
| Year ended September 30, 2020 | Year ended September 30, 2019 | Year ended September 30, 2020 | Year ended September 30, 2019 | Year ended September 30, 2020 | Year ended September 30, 2019 | |||||||||||||||||||||||||||||||||||||||||||||
| Shares | Amount | Shares | Amount | Shares | Amount | Shares | Amount | Shares | Amount | Shares | Amount | |||||||||||||||||||||||||||||||||||||||
| 541,874 | $ | 8,316,778 | 68,247 | $ | 1,022,997 | 185,522 | $ | 2,862,592 | 1,712,573 | $ | 26,894,471 | 3,111,235 | $ | 52,000,961 | 2,286,105 | $ | 35,090,817 | |||||||||||||||||||||||||||||||||
| — | — | — | — | 13,361 | 197,865 | 115,831 | 1,748,836 | 422,568 | 6,789,056 | 414,437 | 5,966,725 | |||||||||||||||||||||||||||||||||||||||
| — | — | — | — | 1,621,606 | 24,026,308 | 6,880,663 | 108,150,719 | 3,909,541 | 63,391,353 | 2,823,956 | 41,892,641 | |||||||||||||||||||||||||||||||||||||||
| 1,195,793 | 18,081,881 | 527,485 | 8,024,195 | 6,961,470 | 108,200,784 | 10,951,308 | 173,893,497 | 5,086,870 | 81,465,602 | 3,247,348 | 48,413,969 | |||||||||||||||||||||||||||||||||||||||
| — | — | — | — | 3,149,974 | 47,231,860 | 548,876 | 8,764,651 | — | — | — | — | |||||||||||||||||||||||||||||||||||||||
| 6,267 | 97,767 | 1,500 | 22,615 | 57,421 | 916,446 | 140,751 | 2,142,234 | 277,313 | 4,678,272 | 327,536 | 4,297,269 | |||||||||||||||||||||||||||||||||||||||
| — | — | — | — | 27,322 | 416,121 | 24,914 | 364,737 | 89,591 | 1,443,306 | 123,952 | 1,556,835 | |||||||||||||||||||||||||||||||||||||||
| 28 | 440 | 26 | 392 | 431,097 | 6,794,088 | 205,402 | 3,113,889 | 258,241 | 4,359,113 | 392,540 | 5,146,199 | |||||||||||||||||||||||||||||||||||||||
| 38,613 | 595,550 | 16,342 | 246,170 | 1,018,812 | 16,188,921 | 669,953 | 10,230,176 | 328,413 | 5,435,229 | 384,535 | 4,948,969 | |||||||||||||||||||||||||||||||||||||||
| — | — | — | — | 194,777 | 3,075,528 | 92,540 | 1,407,534 | — | — | — | — | |||||||||||||||||||||||||||||||||||||||
| (241,402 | ) | (3,799,362 | ) | (19,991 | ) | (302,984 | ) | (2,263,816 | ) | (30,037,116 | ) | (6,318,012 | ) | (98,981,983 | ) | (2,902,541 | ) | (46,929,908 | ) | (2,821,095 | ) | (41,821,369 | ) | |||||||||||||||||||||||||||
| — | — | — | — | (542,694 | ) | (6,128,672 | ) | (437,098 | ) | (6,633,312 | ) | (1,574,139 | ) | (24,807,639 | ) | (1,639,837 | ) | (23,408,048 | ) | |||||||||||||||||||||||||||||||
| — | — | — | — | (10,623,480 | ) | (126,075,304 | ) | (6,926,461 | ) | (109,557,797 | ) | (3,424,732 | ) | (54,723,672 | ) | (5,940,274 | ) | (86,920,412 | ) | |||||||||||||||||||||||||||||||
| (1,377,344 | ) | (21,664,245 | ) | (56,329 | ) | (849,878 | ) | (30,707,334 | ) | (352,764,940 | ) | (9,144,614 | ) | (145,586,918 | ) | (3,134,461 | ) | (49,299,250 | ) | (4,854,572 | ) | (70,200,311 | ) | |||||||||||||||||||||||||||
| — | — | — | — | (6,300,984 | ) | (66,703,866 | ) | (257,417 | ) | (4,062,621 | ) | — | — | — | — | |||||||||||||||||||||||||||||||||||
| 163,829 | $ | 1,628,809 | 537,280 | $ | 8,163,507 | (36,776,946 | ) | $ | (371,799,385 | ) | (1,740,791 | ) | $ | (28,111,887 | ) | 2,447,899 | $ | 43,802,423 | (5,255,369 | ) | $ | (75,036,716 | ) | |||||||||||||||||||||||||||
| Annual Report | | September 30, 2020 | 227 |
Table of Contents
Notes to Financial Statements (cont’d)
September 30, 2020
| 10. | INVESTMENTS IN SECURITIES |
For the year ended September 30, 2020, purchases and sales of investments, other than short-term securities and U.S. government obligations were:
| Purchases | Sales | |||||||
AllianzGI Best Styles Global Equity | $ | 162,077,024 | $ | 473,063,074 | ||||
AllianzGI Convertible | 2,503,265,710 | 1,612,437,034 | ||||||
AllianzGI Core Plus Bond | 137,381,848 | 135,901,000 | ||||||
AllianzGI Emerging Markets Consumer | 20,335,466 | 28,733,143 | ||||||
AllianzGI Emerging Markets Small-Cap | 3,977,481 | 6,973,614 | ||||||
AllianzGI Emerging Markets Value | 126,552,715 | 118,039,999 | ||||||
AllianzGI Global Allocation | 338,295,223 | 429,738,760 | ||||||
AllianzGI Global Dynamic Allocation | 185,623,564 | 292,757,627 | ||||||
AllianzGI Global Sustainability | 144,546,212 | 44,830,833 | ||||||
AllianzGI Green Bond | 44,605,826 | 26,078,714 | ||||||
AllianzGI High Yield Bond | 147,386,077 | 174,168,431 | ||||||
AllianzGI International Small-Cap | 49,540,407 | 72,548,854 | ||||||
AllianzGI Multi Asset Income | 184,728,064 | 160,898,043 | ||||||
| Purchases | Sales | |||||||
AllianzGI PerformanceFee Managed Futures Strategy | $ | 68,409 | $ | 208,250 | ||||
AllianzGI PerformanceFee Structured US Equity | 57,565,263 | 116,063,989 | ||||||
AllianzGI Preferred Securities and Income | 42,963,604 | 35,155,255 | ||||||
AllianzGI Short Duration High Income | 851,860,432 | 1,080,817,921 | ||||||
AllianzGI Short Term Bond | 23,335,580 | 18,799,467 | ||||||
AllianzGI Structured Return | 43,755,075 | 597,392,747 | ||||||
AllianzGI Water | 176,707,058 | 177,603,863 | ||||||
Purchases and sales in U.S. government obligations were:
| Purchases | Sales | |||||||
AllianzGI Core Plus Bond | $ | 176,501,062 | $ | 199,893,549 | ||||
AllianzGI Global Allocation | 54,357,949 | 53,710,682 | ||||||
AllianzGI Global Dynamic Allocation | 36,803,080 | 36,797,950 | ||||||
AllianzGI PerformanceFee Managed Futures Strategy | 499,824 | 4,799,438 | ||||||
AllianzGI Short Term Bond | 666,961 | 1,014,298 | ||||||
| 11. | INCOME TAX INFORMATION |
The tax character of dividends and distributions paid was:
| Year ended September 30, 2020 | Year ended September 30, 2019 | |||||||||||||||||||||||||||
| Ordinary Income(1) | 20% Long-Term Capital Gain | 25% Long-Term Capital Gain | Return of Capital | Ordinary Income(1) | 20% Long-Term Capital Gain | 25% Long-Term Capital Gain | ||||||||||||||||||||||
AllianzGI Best Styles Global Equity | $ | 10,762,191 | $ | 23,263,772 | — | — | $ | 17,207,372 | $ | 49,543,068 | $ | 2,727 | ||||||||||||||||
AllianzGI Convertible | 19,171,363 | 21,397,058 | — | — | 47,416,570 | 30,369,631 | — | |||||||||||||||||||||
AllianzGI Core Plus Bond | 3,559,652 | 84,527 | — | — | 1,286,674 | — | — | |||||||||||||||||||||
AllianzGI Emerging Markets Consumer | 437,824 | — | — | — | 608,963 | — | — | |||||||||||||||||||||
AllianzGI Emerging Markets Small-Cap | 290,367 | — | — | — | 154,524 | 379,504 | — | |||||||||||||||||||||
AllianzGI Emerging Markets Value | 1,625,013 | — | — | — | 3,741,516 | — | — | |||||||||||||||||||||
AllianzGI Global Allocation | 9,516,687 | 20,723,645 | — | — | 10,503,114 | 10,422,886 | — | |||||||||||||||||||||
AllianzGI Global Dynamic Allocation | 5,941,083 | 7,325,938 | $ | 541 | — | 4,683,078 | 4,847,569 | 1,414 | ||||||||||||||||||||
AllianzGI Global Sustainability | 439,909 | 2,643,036 | — | — | 502,073 | 1,240,978 | — | |||||||||||||||||||||
AllianzGI Green Bond | 461,871 | — | — | — | 102,425 | — | — | |||||||||||||||||||||
AllianzGI High Yield Bond | 5,956,095 | — | — | — | 7,706,604 | — | — | |||||||||||||||||||||
AllianzGI International Small-Cap | 1,631,760 | — | — | — | 1,420,333 | 14,976,610 | — | |||||||||||||||||||||
AllianzGI Multi Asset Income | 2,374,876 | — | — | $ | 48,263 | 1,815,737 | — | — | ||||||||||||||||||||
AllianzGI PerformanceFee Managed Futures Strategy | 1,855,566 | 436,867 | — | — | 310,336 | — | — | |||||||||||||||||||||
AllianzGI PerformanceFee Structured US Equity | 2,814,654 | 895,562 | — | — | 5,156,461 | 453,231 | — | |||||||||||||||||||||
AllianzGI Preferred Securities and Income | 1,209,443 | 201,449 | — | — | 736,900 | — | — | |||||||||||||||||||||
AllianzGI Short Duration High Income | 56,024,479 | — | — | — | 61,274,970 | — | — | |||||||||||||||||||||
AllianzGI Short Term Bond | 707,627 | — | — | — | 269,177 | — | — | |||||||||||||||||||||
AllianzGI Structured Return | 27,956,480 | — | — | — | 11,203,781 | 6,454,144 | — | |||||||||||||||||||||
AllianzGI Water | 4,315,416 | 15,289,501 | — | — | 5,849,690 | 14,189,451 | — | |||||||||||||||||||||
| (1) | Includes short-term capital gains, if any. |
| 228 | September 30, 2020 | | Annual Report |
Table of Contents
At September 30, 2020, the components of distributable earnings were:
| Ordinary Income | Long-Term Capital Gain | Capital Loss Carryforwards(2) | Late Year Ordinary Loss(3) | |||||||||||||||||||||
| Post-October Capital Loss (Gain)(4) | ||||||||||||||||||||||||
| Short-Term | Long-Term | |||||||||||||||||||||||
AllianzGI Best Styles Global Equity | $ | 2,740,384 | $ | 9,471,916 | — | — | — | — | ||||||||||||||||
AllianzGI Convertible | 104,355,681 | 39,979,977 | — | — | — | — | ||||||||||||||||||
AllianzGI Core Plus Bond | 3,330,548 | 354,428 | — | — | — | — | ||||||||||||||||||
AllianzGI Emerging Markets Consumer | 468,099 | — | $ | 3,687,593 | — | $ | 532,486 | $ | 458,562 | |||||||||||||||
AllianzGI Emerging Markets Small-Cap | 141,239 | 87,049 | — | — | — | — | ||||||||||||||||||
AllianzGI Emerging Markets Value | 1,570,977 | — | 19,842,900 | — | 2,995,194 | — | ||||||||||||||||||
AllianzGI Global Allocation | 7,403,409 | 6,289,496 | — | — | — | — | ||||||||||||||||||
AllianzGI Global Dynamic Allocation | 5,411,082 | 3,752,299 | — | — | — | — | ||||||||||||||||||
AllianzGI Global Sustainability | 4,419,512 | 560,481 | — | $ | 36,823 | — | — | |||||||||||||||||
AllianzGI Green Bond | 221,950 | ��� | — | 79,725 | — | — | ||||||||||||||||||
AllianzGI High Yield Bond | 54,734 | — | 31,751,599 | — | 1,078,153 | 2,196,800 | ||||||||||||||||||
AllianzGI International Small-Cap | 842,306 | 182,520 | — | — | 181,365 | — | ||||||||||||||||||
AllianzGI Multi Asset Income | — | — | 86,329 | — | 5,942,645 | (940,440 | ) | |||||||||||||||||
AllianzGI PerformanceFee Managed Futures Strategy | 525,354 | — | 832,432 | — | 2,711,583 | 742,138 | ||||||||||||||||||
AllianzGI PerformanceFee Structured US Equity | 793,673 | — | — | — | 7,533,563 | 9,792,464 | ||||||||||||||||||
AllianzGI Preferred Securities and Income | 27,334 | 97,157 | — | — | — | — | ||||||||||||||||||
AllianzGI Short Duration High Income | 7,168,693 | — | 65,567,033 | — | 16,781,585 | 48,646,382 | ||||||||||||||||||
AllianzGI Short Term Bond | 1,105,020 | 32,612 | — | — | — | — | ||||||||||||||||||
AllianzGI Structured Return | 24,218 | — | — | 47,446 | 94,455,690 | 130,574,587 | ||||||||||||||||||
AllianzGI Water | 2,720,169 | 7,753,598 | — | 5,748 | — | — | ||||||||||||||||||
| (2) | Capital loss carryforwards available as a reduction, to the extent provided in the regulations, of any future net realized gains. To the extent that these losses are used to offset future realized capital gains, such gains will not be disbursed. |
| (3) | Certain ordinary losses realized during the period November 1, 2019 through September 30, 2020, and/or other ordinary losses realized during the period January 1, 2019 through September 30, 2020, which the Funds elected to defer to the following taxable year pursuant to income tax regulations. |
| (4) | Capital losses realized during the period November 1, 2019 through September 30, 2020 which the Funds elected to defer to the following taxable year pursuant to income tax regulations. |
Under the Regulated Investment Company Modernization Act of 2010, the Funds will be permitted to carry forward capital losses incurred in taxable years beginning after December 22, 2010, for an unlimited period. Post-enactment capital losses that are carried forward will retain their character as either short-term or long-term capital losses rather than being
At September 30, 2020, capital loss carryforward amounts were:
| No Expiration(5) | ||||||||
| Short-Term | Long-Term | |||||||
AllianzGI Emerging Markets Consumer | $ | 3,253,018 | $ | 434,575 | ||||
AllianzGI Emerging Markets Value | 19,842,900 | — | ||||||
AllianzGI High Yield Bond | 5,319,115 | 26,432,484 | ||||||
AllianzGI Multi Asset Income | 40,208 | 46,121 | ||||||
AllianzGI PerformanceFee Managed Futures Strategy | 336,617 | 495,815 | ||||||
AllianzGI Short Duration High Income | 17,424,763 | 48,142,270 | ||||||
| (5) | Carryforward amounts are subject to the provision of the Regulated Investment Company Modernization Act of 2010. |
For the year ended September 30,2020, the Fund had capital loss carryforwards which were utilized as follows:
| Short-Term | Long-Term | |||||||
AllianzGI Emerging Markets Small-Cap | $ | 120,616 | — | |||||
AllianzGI High Yield Bond | 440,892 | — | ||||||
AllianzGI International Small-Cap | 1,682,674 | — | ||||||
AllianzGI Short Duration High Income | 804,619 | — | ||||||
| Annual Report | | September 30, 2020 | 229 |
Table of Contents
Notes to Financial Statements (cont’d)
September 30, 2020
For the year ended September 30, 2020, permanent “book-tax” adjustments were:
| Undistributed (Dividends in Excess of) Net Investment Income | Accumulated Net Realized Gain (Loss) | Paid-in Capital | Unrealized Appreciation (Depreciation) | |||||||||||||
AllianzGI Best Styles Global Equity (b)(f)(h)(i) | $ | 1,670,105 | $ | (1,672,360 | ) | — | $ | 2,255 | ||||||||
AllianzGI Convertible (j)(k) | 4,162,328 | (4,162,328 | ) | — | — | |||||||||||
AllianzGI Core Plus Bond (c)(m)(o) | 217,473 | (217,473 | ) | — | — | |||||||||||
AllianzGI Emerging Markets Consumer (b)(f) | 12,323 | (12,323 | ) | — | — | |||||||||||
AllianzGI Emerging Markets Small-Cap (b)(d)(f) | 79,707 | 75,213 | $ | (154,920 | ) | — | ||||||||||
AllianzGI Emerging Markets Value (b)(f)(p) | 160,648 | (158,767 | ) | (1,881 | ) | — | ||||||||||
AllianzGI Global Allocation (g)(m) | (359,570 | ) | 359,570 | — | — | |||||||||||
AllianzGI Global Dynamic Allocation (b)(f)(g)(h)(i)(l)(m)(n) | (40,988 | ) | 20,506 | (828 | ) | 21,310 | ||||||||||
AllianzGI Global Sustainability (b)(f)(i) | (20,098 | ) | 20,098 | — | — | |||||||||||
AllianzGI Green Bond (c)(f) | (128,177 | ) | 128,177 | — | — | |||||||||||
AllianzGI High Yield Bond (c) | 467,340 | (467,340 | ) | — | — | |||||||||||
AllianzGI International Small-Cap (b)(f) | 619,625 | (619,625 | ) | — | — | |||||||||||
AllianzGI Multi Asset Income (d)(f)(g)(h)(i)(n) | (133,227 | ) | 1,452,167 | (1,328,381 | ) | 9,441 | ||||||||||
AllianzGI PerformanceFee Managed Futures Strategy (a)(e)(f)(m) | 366,802 | 23,250 | (390,052 | ) | — | |||||||||||
AllianzGI PerformanceFee Structured US Equity (a) | (33 | ) | 33 | — | — | |||||||||||
AllianzGI Preferred Securities and Income (a)(c)(m) | (6,692 | ) | 6,692 | — | — | |||||||||||
AllianzGI Short Duration High Income (a)(c) | 20,489,841 | (20,489,841 | ) | — | — | |||||||||||
AllianzGI Short Term Bond (c) | 75,578 | (75,578 | ) | — | — | |||||||||||
AllianzGI Structured Return (a) | (286 | ) | 286 | — | — | |||||||||||
AllianzGI Water (f) | (6,985 | ) | 6,985 | — | — | |||||||||||
| These | permanent “book-tax” differences were primarily attributable to: |
| (a) | Reclassification of dividends/distributions |
| (b) | Reclassification of gains from securities classified as Passive Foreign Investment Companies (“PFICs”) for tax purposes |
| (c) | Treatment of bond premium amortization |
| (d) | Capital loss carryforward disallowed |
| (e) | Reclassification related to wholly owned offshore subsidiary |
| (f) | Reclassification of gains and losses from foreign currency transactions |
| (g) | Reclassification of short-term capital gain dividends from underlying securities |
| (h) | Reclassifications related to investments in Real Estate Investment Trusts (REITs) |
| (i) | Reclassification from sales of securities with return of capital |
| (j) | Reclassification of contingent debt/convertible securities income/gains |
| (k) | Section 305 sales adjustments for accrual of deemed dividends from investments in convertible debt |
| (l) | Reclassification on sale of securities no longer classified as Passive Foreign Investment Companies (“PFICs”) for tax purposes. |
| (m) | Reclassification of swap payments |
| (n) | Reclassification due to investments in partnerships |
| (o) | Reclassification paydown losses |
| (p) | Non-deductible excise tax |
Net investment income, net realized gains or losses and net assets were not affected by these adjustments.
At September 30, 2020, the aggregate cost basis and the net unrealized appreciation (depreciation) of investments in securities and other financial instruments for federal income tax purposes were:
| Federal Tax Cost Basis(6) | Unrealized Appreciation | Unrealized Deprecation | Net Unrealized Appreciation (Depreciation) | |||||||||||||
AllianzGI Best Styles Global Equity | $ | 65,261,641 | $ | 12,010,865 | $ | 5,735,826 | $ | 6,275,039 | ||||||||
AllianzGI Convertible | 1,626,390,847 | 346,377,868 | 3,067,978 | 343,309,890 | ||||||||||||
AllianzGI Core Plus Bond | 51,033,477 | 1,481,013 | 896,601 | 584,412 | ||||||||||||
AllianzGI Emerging Markets Consumer | 25,189,892 | 10,622,752 | 621,137 | 10,001,615 | ||||||||||||
AllianzGI Emerging Markets Small-Cap | 4,397,927 | 1,120,446 | 299,875 | 820,571 | ||||||||||||
AllianzGI Emerging Markets Value | 114,364,111 | 22,572,351 | 2,732,789 | 19,839,562 | ||||||||||||
AllianzGI Global Allocation | 229,220,503 | 17,743,907 | 4,854,274 | 12,889,633 | ||||||||||||
AllianzGI Global Dynamic Allocation | 37,510,665 | 5,245,354 | 1,131,305 | 4,114,049 | ||||||||||||
| 230 | September 30, 2020 | | Annual Report |
Table of Contents
| Federal Tax Cost Basis(6) | Unrealized Appreciation | Unrealized Deprecation | Net Unrealized Appreciation (Depreciation) | |||||||||||||
AllianzGI Global Sustainability | $ | 128,506,207 | $ | 29,763,316 | $ | 4,584,382 | $ | 25,178,934 | ||||||||
AllianzGI Green Bond | 25,668,402 | 1,415,551 | 83,065 | 1,332,486 | ||||||||||||
AllianzGI High Yield Bond | 94,765,983 | 3,602,762 | 12,686,427 | (9,083,665 | ) | |||||||||||
AllianzGI International Small-Cap | 65,016,559 | 15,812,054 | 4,175,305 | 11,636,749 | ||||||||||||
AllianzGI Multi Asset Income | 43,747,242 | 533,398 | 593,640 | (60,242 | ) | |||||||||||
AllianzGI PerformanceFee Managed Futures Strategy | 18,775,342 | 747,031 | 790,306 | (43,275 | ) | |||||||||||
AllianzGI PerformanceFee Structured US Equity | 48,093,677 | 2,490,311 | 270,543 | 2,219,768 | ||||||||||||
AllianzGI Preferred Securities and Income | 25,777,861 | 743,371 | 888,507 | (145,136 | ) | |||||||||||
AllianzGI Short Duration High Income | 865,915,046 | 11,119,798 | 78,510,458 | (67,390,660 | ) | |||||||||||
AllianzGI Short Term Bond | 15,911,476 | 563,133 | 146,215 | 416,918 | ||||||||||||
AllianzGI Structured Return | 31,847,041 | — | — | — | ||||||||||||
AllianzGI Water | 503,729,824 | 198,475,835 | 11,369,174 | 187,106,661 | ||||||||||||
| (6) | Differences, if any, between book and tax cost basis are primarily attributable to wash sale loss deferrals, return of capital distributions, PFIC mark-to-market, differing treatment of bond premium amortization, upfront premium on swaps, mixed straddle adjustments, Section 305 adjustments, basis adjustments from investments in partnerships, mark-to-market on section 1256 futures contracts, and mark-to-market on section 1256 forward contracts. |
| 12. | BORROWINGS |
The Trust entered into a credit agreement (the “State Street Agreement”), among the Trust, AllianzGI Institutional Multi- Series Trust and Allianz Funds, as borrowers (collectively, the “AllianzGI Borrowers” and each series thereof, an “AllianzGI Borrower Fund”), and State Street Bank and Trust Company, as agent and lender, for a committed line of credit. The State Street Agreement permits the AllianzGI Borrowers to borrow up to $200 million in aggregate, subject to (i) a requirement that each AllianzGI Borrower Fund’s asset coverage with respect to senior securities representing indebtedness be 300% or higher, and (ii) certain other limitations and conditions. For the period from October 24, 2019 through October 1, 2020, pursuant to the terms of the State Street Agreement then in effect, each AllianzGI Borrower Fund paid interest on any amounts borrowed under the facility at a rate per annum equal to 1.25% plus the higher of the then-current federal funds overnight rate or the one-month LIBOR rate, subject to upward adjustment for outstanding past due payments. The State Street Agreement was extended by an additional 364-day period by an amendment effective October 2, 2020 with an expiration date of October 1, 2021 (the “Amendment”). In the Amendment, State Street consents to the change in investment adviser and administrator under the Virtus strategic partnership and agrees to continue the Credit Agreement for the Funds. In addition, effective October 2, 2020, each AllianzGI Borrower Fund must pay interest on any amounts borrowed under the facility at a rate per annum equal to the sum of (a) 0.10% plus (b) the “applicable margin” of 1.25% plus (c) the higher of the then-current federal funds overnight rate or an overnight bank lending rate. Amounts borrowed may be repaid and reborrowed on a revolving basis during the term of the facility. The Funds did not utilize the line of credit during the year ended September 30, 2020. Prior to October 2, 2020, in connection with their use of leverage as well as their investment activities, the Funds may have had exposure to the London Interbank Offered Rate (“LIBOR”). LIBOR is an average interest rate, determined by the ICE Benchmark Administration, that banks charge one another for the use
of short-term money. The United Kingdom’s Financial Conduct Authority, which regulates LIBOR, has announced plans to phase out the use of LIBOR by the end of 2021.
Pursuant to an exemptive order issued by the SEC (the “Order”), the Funds are authorized to enter into a master interfund lending agreement (the “Interfund Program”) with each other and certain funds advised by the Investment Manager (each a “Participating Fund”). The Interfund Program allows each Participating Fund, whose policies permit it to do so, to lend money directly to and borrow money directly from other Funds for temporary purposes. During the period or year ended September 30, 2020, the Funds did not participate as a borrower or lender in the Interfund Program.
| 13. | FUND EVENTS |
(a) Name and Investment Strategy Changes
Effective October 11, 2019, AllianzGI Global Allocation Fund changed its investment strategy. The Fund incorporated a new ESG benchmarked US credit sleeve and transitioned positions in certain affiliated funds to each of AllianzGI Global Sustainability Fund, AllianzGI Emerging Markets SRI Debt Fund and AllianzGI Green Bond Fund. Each of these funds includes either an ESG integrated, sustainable or ESG informed investment strategy.
Effective February 1, 2020, AllianzGI Global Water Fund changed its name to AllianzGI Water Fund.
Effective April 30, 2020, AllianzGI NFJ Emerging Markets Value Fund changed its name to AllianzGI Emerging Markets Value Fund.
(b) Fund Liquidations
On March 4, 2020, AllianzGI Best Styles International Equity Fund liquidated as a series of the Trust.
On June 11, 2020, AllianzGI Global High Yield Fund and AllianzGI U.S. Equity Hedged Fund liquidated as series of the Trust.
| Annual Report | | September 30, 2020 | 231 |
Table of Contents
Notes to Financial Statements (cont’d)
September 30, 2020
On June 24, 2020, AllianzGI PerformanceFee Structured US Fixed Income Fund liquidated as a series of the Trust.
On June 26, 2020, AllianzGI Micro Cap Fund and AllianzGI Ultra Micro Cap Fund liquidated as series of the Trust.
On September 15, 2020, AllianzGI Retirement 2020 Fund, AllianzGI Retirement 2025 Fund, AllianzGI Retirement 2030 Fund, AllianzGI Retirement 2035 Fund, AllianzGI Retirement 2040 Fund, AllianzGI Retirement 2045 Fund, AllianzGI Retirement 2050 Fund and AllianzGI Retirement 2055 Fund liquidated as series of the Trust.
On September 17, 2020, AllianzGI Best Styles U.S. Equity Fund liquidated as a series of the Trust.
On September 28, 2020, AllianzGI Core Bond Fund, AllianzGI Emerging Markets SRI Debt Fund and AllianzGI Floating Rate Note Fund liquidated as series of the Trust.
(c) Investment Management Agreement
On July 7, 2020, AllianzGI U.S. and Virtus Investment Partners, Inc. (“Virtus”) announced that they have entered into an agreement providing for a strategic alliance between the two parties. As part of this strategic alliance, wholly-owned subsidiaries of Virtus are expected to become the investment adviser, distributor, administrator, and transfer agent for the Funds (the “Transition”). With respect to all Funds other than AllianzGI Emerging Markets Value, AllianzGI U.S. portfolio management teams are expected to continue to be responsible for the day-to-day management of the Funds, through AllianzGI U.S. serving as sub-adviser to the AllianzGI U.S. Funds. With respect to AllianzGI Emerging Markets Value, members of the Value Equity U.S. team are expected to become employees of Virtus or an affiliate of Virtus and continue their day-to-day management of the Fund. Certain of the new arrangements, including the new management agreements and sub-advisory agreements, must be approved by the Funds’ Board of Trustees and Fund shareholders in order to take effect. The new management agreements are substantially similar to the existing management agreements. The Board of Trustees’ considerations in approving the new management agreement and sub-advisory agreements will be included in a future shareholder report.
The Funds’ Board of Trustees has granted approval for each of these and certain other related items. Each such item was also submitted for shareholder approval at a special meeting of shareholders held on October 28, 2020. Shareholders of record as of September 10, 2020 were entitled to vote at the special meeting of shareholders. At the meeting quorum was achieved and required approvals were obtained with respect to the election of trustees to the Board of Trustees. In addition, required approvals were also obtained for AllianzGI Core Plus Bond Fund, AllianzGI Global Allocation Fund, AllianzGI Global Dynamic Allocation Fund, AllianzGI Global Sustainability Fund and AllianzGI Preferred Securities and Income Fund with respect to (i) the new management agreements and sub-advisory agreements and (ii) Virtus’s power to hire, terminate and replace affiliated and unaffiliated subadvisers or to modify subadvisory agreements for the Funds without shareholder approval, but the meeting was adjourned to November 24, 2020 to allow for the solicitation of additional proxies for other Funds. Results of the vote of the special meeting of shareholders will be included in the Trust’s March 31, 2021 Semiannual Report. Consummation of the Transition is conditioned on, among other things, the obtainment of all required approvals and consents representing a minimum threshold of assets under AllianzGI U.S.’s management. The closing of the Transition is expected to occur on or around February 1, 2021.
| 14. | BASIS FOR CONSOLIDATION |
The Cayman Subsidiary is a wholly-owned and controlled subsidiary of AllianzGI PerformanceFee Managed Futures Strategy (the “Consolidated Fund”). The Consolidated Fund is the sole shareholder of the Cayman Subsidiary and will continue to control the Cayman Subsidiary. The Consolidated Fund’s investment portfolio has been consolidated and includes the portfolio holdings of the Consolidated Fund and the Cayman Subsidiary. The consolidated financial statements include the accounts of the Consolidated Fund and the Cayman Subsidiary. All inter-company transactions and balances have been eliminated. As of September 30, 2020, consolidated net assets of the Consolidated Fund were $25,153,715, of which $2,518,363, or 10.0%, represented the Consolidated Fund’s ownership of all issued shares and voting rights of the Cayman Subsidiary.
| 232 | September 30, 2020 | | Annual Report |
Table of Contents
| 15. | SUBSEQUENT EVENTS |
In preparing these financial statements, the Funds’ management has evaluated events and transactions for potential recognition or disclosure through the date the financial statements were issued.
On October 22, 2020, the following Funds declared per-share net investment income dividends to shareholders, payable October 22, 2020 to shareholders of record on October 21, 2020.
| Net Investment Income | ||||||||||||||||||||||||||||
| Class A | Class C | Class R | Class P | Institutional Class | Class R6 | Administrative Class | ||||||||||||||||||||||
AllianzGI Core Plus Bond | N/A | N/A | N/A | $ | 0.04114 | $ | 0.04183 | $ | 0.04250 | N/A | ||||||||||||||||||
AllianzGI Green Bond | $ | 0.00641 | N/A | N/A | $ | 0.00928 | $ | 0.01000 | N/A | N/A | ||||||||||||||||||
AllianzGI High Yield Bond | $ | 0.03681 | $ | 0.03172 | $ | 0.03071 | $ | 0.03933 | $ | 0.03900 | N/A | $ | 0.03807 | |||||||||||||||
AllianzGI Multi Asset Income | $ | 0.07013 | $ | 0.05994 | $ | 0.06506 | $ | 0.07426 | $ | 0.07532 | $ | 0.07600 | $ | 0.07129 | ||||||||||||||
AllianzGI Preferred Securities and Income | N/A | N/A | N/A | $ | 0.05376 | $ | 0.05432 | $ | 0.05500 | N/A | ||||||||||||||||||
AllianzGI Short Duration High Income | $ | 0.06000 | $ | 0.05699 | N/A | $ | 0.06228 | $ | 0.06311 | $ | 0.06396 | N/A | ||||||||||||||||
AllianzGI Short Term Bond | $ | 0.07228 | N/A | N/A | $ | 0.06754 | $ | 0.07000 | N/A | N/A | ||||||||||||||||||
On November 12, 2020, AllianzGI Emerging Markets Small-Cap declared per-share net investment income dividends and short-term and long-term capital gain distributions to shareholders, payable November 12, 2020 to shareholders of record on November 11, 2020 as follows:
| Share Class | Net | Short-Term Capital Gains | Long-Term Capital Gains | |||||||||
Class A | $ | 0.46500 | $ | 1.33342 | $ | 1.45422 | ||||||
Institutional Class | $ | 0.45194 | $ | 1.33342 | $ | 1.45422 | ||||||
On November 18, 2020, AllianzGI Emerging Markets Small-Cap Fund liquidated as a series of the Trust.
On November 19, 2020, the following Funds declared per-share net investment income dividends to shareholders, payable November 19, 2020, to shareholders of record on November 18, 2020.
| Class A | Class C | Class R | Class P | Institutional Class | Class R6 | Administrative Class | ||||||||||||||||||||||
AllianzGI Core Plus Bond | N/A | N/A | N/A | $ | 0.04367 | $ | 0.04431 | $ | 0.04500 | N/A | ||||||||||||||||||
AllianzGI Green Bond | $ | 0.00673 | N/A | N/A | $ | 0.00867 | $ | 0.01000 | N/A | N/A | ||||||||||||||||||
AllianzGI High Yield Bond | $ | 0.03669 | $ | 0.03218 | $ | 0.03586 | $ | 0.03916 | $ | 0.03900 | N/A | $ | 0.03793 | |||||||||||||||
AllianzGI Multi Asset Income | $ | 0.07071 | $ | 0.06122 | $ | 0.06597 | $ | 0.07482 | $ | 0.07539 | $ | 0.07600 | $ | 0.07179 | ||||||||||||||
AllianzGI Preferred Securities and Income | N/A | N/A | N/A | $ | 0.05372 | $ | 0.05419 | $ | 0.05500 | N/A | ||||||||||||||||||
AllianzGI Short Duration High Income | $ | 0.06000 | $ | 0.05726 | N/A | $ | 0.06233 | $ | 0.06277 | $ | 0.06375 | N/A | ||||||||||||||||
AllianzGI Short Term Bond | $ | 0.07280 | N/A | N/A | $ | 0.06803 | $ | 0.07000 | N/A | N/A | ||||||||||||||||||
During the period, the Board approved a plan of liquidation, termination and dissolution to liquidate and terminate each of AllianzGI Best Styles Global Equity Fund, AllianzGI Green Bond Fund, AllianzGI Multi Asset Income Fund, AllianzGI PerformanceFee Managed Futures Strategy Fund and AllianzGI Short Term Bond Fund on or about December 14, 2020.
Subsequent to the period end, the Board approved a plan of liquidation, termination and dissolution to liquidate and terminate each of AllianzGI PerformanceFee Structured US Equity Fund and AllianzGI Structured Return Fund, both of which will liquidate on or about December 14, 2020.
There were no other subsequent events identified that require recognition or disclosure.
| Annual Report | | September 30, 2020 | 233 |
Table of Contents
Report of Independent Registered Public Accounting Firm
To the Board of Trustees of Allianz Funds Multi-Strategy Trust and Shareholders of each of the twenty funds listed in the table below
Opinions on the Financial Statements
We have audited the accompanying statements of assets and liabilities, including the schedules of investments, of each of the funds listed in the table below (constituting Allianz Funds Multi-Strategy Trust, hereafter collectively referred to as the “Funds”) as of September 30, 2020, the related statements of operations and the statements of changes in net assets for each of the periods indicated in the table below, including the related notes, and the financial highlights for each of the periods indicated therein (collectively referred to as the “financial statements”). In our opinion, the financial statements present fairly, in all material respects, the financial position of each of the Funds as of September 30, 2020, the results of each of their operations and the changes in each of their net assets for each of the periods indicated in the table below and each of the financial highlights for each of the periods indicated therein in conformity with accounting principles generally accepted in the United States of America.
AllianzGI Best Styles Global Equity Fund(1)
AllianzGI Convertible Fund(1)
AllianzGI Core Plus Bond Fund(1)
AllianzGI Emerging Markets Consumer Fund(1)
AllianzGI Emerging Markets Small-Cap Fund(1)
AllianzGI Emerging Markets Value Fund(1)
AllianzGI Global Allocation Fund(1)
AllianzGI Global Dynamic Allocation Fund(1)
AllianzGI Global Sustainability Fund(1)
AllianzGI Green Bond Fund(2)
AllianzGI High Yield Bond Fund(1)
AllianzGI International Small-Cap Fund(1)
AllianzGI Multi Asset Income Fund(1)
AllianzGI PerformanceFee Managed Futures Strategy Fund and its subsidiary(1)*
AllianzGI PerformanceFee Structured US Equity Fund(1)
AllianzGI Preferred Securities and Income Fund(1)
AllianzGI Short Duration High Income Fund(1)
AllianzGI Short Term Bond Fund(1)
AllianzGI Structured Return Fund(1)
AllianzGI Water Fund(1)
| * | Consolidated statement of assets and liabilities including the consolidated schedule of investments, statements of operations and of changes in net assets and consolidated financial highlights. |
| (1) | Statement of operations for the year ended September 30, 2020 and statements of changes in net assets for each of the two years in the period ended September 30, 2020 |
| (2) | Statement of operations for the year ended September 30, 2020 and statements of changes in net assets for the year ended September 30, 2020 and for the period November 19, 2018 (commencement of operations) through September 30, 2019 |
Basis for Opinions
These financial statements are the responsibility of the Funds’ management. Our responsibility is to express an opinion on the Funds’ financial statements based on our audits. We are a public accounting firm registered with the Public Company Accounting Oversight Board (United States) (PCAOB) and are required to be independent with respect to the Funds in accordance with the U.S. federal securities laws and the applicable rules and regulations of the Securities and Exchange Commission and the PCAOB.
We conducted our audits of these financial statements in accordance with the standards of the PCAOB. Those standards require that we plan and perform the audit to obtain reasonable assurance about whether the financial statements are free of material misstatement, whether due to error or fraud.
Our audits included performing procedures to assess the risks of material misstatement of the financial statements, whether due to error or fraud, and performing procedures that respond to those risks. Such procedures included examining, on a test basis, evidence regarding the amounts and disclosures in the financial statements. Our audits also included evaluating the accounting principles used and significant estimates made by management, as well as evaluating the overall presentation of the financial statements. Our procedures included confirmation of securities owned as of September 30, 2020 by correspondence with the custodian, agent banks, transfer agents and brokers; when replies were not received, we performed other auditing procedures. We believe that our audits provide a reasonable basis for our opinions.
PricewaterhouseCoopers LLP
New York, New York
November 25, 2020
We have served as the auditor of one or more of the investment companies in the Allianz Global Investors U.S. group of investment companies since at least 1995. We have not been able to determine the specific year we began serving as auditor.
| 234 | September 30, 2020 | | Annual Report |
Table of Contents
Unaudited
As required by the Internal Revenue Code, shareholders must be notified regarding certain tax attributes of distributions made by each Fund. During the period ended September 30, 2020, the following Funds distributed long-term capital gains in the amounts indicated (or the maximum amount allowable):
| 20% Long-Term Capital Gain | 25% Long-Term Capital Gain | |||||||
AllianzGI Best Styles Global Equity | $ | 23,263,772 | — | |||||
AllianzGI Convertible | 21,397,058 | — | ||||||
AllianzGI Core Plus Bond | 84,527 | — | ||||||
AllianzGI Global Allocation | 20,723,645 | — | ||||||
AllianzGI Global Dynamic Allocation | 7,325,938 | $ | 541 | |||||
AllianzGI Global Sustainability | 2,643,036 | — | ||||||
AllianzGI PerformanceFee Managed Futures Strategy | 436,867 | — | ||||||
AllianzGI PerformanceFee Structured US Equity | 895,562 | — | ||||||
AllianzGI Preferred Securities and Income | 201,449 | — | ||||||
AllianzGI Water | 15,289,501 | — | ||||||
Under the Jobs and Growth Tax Relief Reconciliation Act of 2003, the following approximate percentages of ordinary dividends paid during the fiscal period ended September 30, 2020, are designated as “qualified dividend income” (or the maximum amount allowable):
AllianzGI Best Styles Global Equity | 96.72 | % | ||
AllianzGI Convertible | 15.20 | % | ||
AllianzGI Core Plus Bond | 0.70 | % | ||
AllianzGI Emerging Markets Consumer | 95.25 | % | ||
AllianzGI Emerging Markets Small-Cap | 62.05 | % | ||
AllianzGI Emerging Markets Value | 55.86 | % | ||
AllianzGI Global Allocation | 11.24 | % | ||
AllianzGI Global Dynamic Allocation | 62.37 | % | ||
AllianzGI Global Sustainability | 84.41 | % | ||
AllianzGI Green Bond | 0.00 | % | ||
AllianzGI High Yield Bond | 0.00 | % | ||
AllianzGI International Small-Cap | 100.00 | % |
AllianzGI Multi Asset Income | 4.23 | % | ||
AllianzGI PerformanceFee Managed Futures Strategy | 1.43 | % | ||
AllianzGI PerformanceFee Structured US Equity | 74.47 | % | ||
AllianzGI Preferred Securities and Income | 17.85 | % | ||
AllianzGI Short Duration High Income | 0.00 | % | ||
AllianzGI Short Term Bond | 0.00 | % | ||
AllianzGI Structured Return | 0.00 | % | ||
AllianzGI Water | 100.00 | % |
Corporate shareholders are generally entitled to take the dividend received deduction on the portion of a Fund’s dividend distribution that qualifies under tax law. The following approximate percentages of the following Funds’ ordinary income dividends paid during the fiscal period ended September 30, 2020, that qualify for the corporate dividend received deduction is set forth below (or the maximum amount allowable):
AllianzGI Best Styles Global Equity | 44.24 | % | ||
AllianzGI Convertible | 14.23 | % | ||
AllianzGI Core Plus Bond | 0.72 | % | ||
AllianzGI Emerging Markets Consumer | 8.39 | % | ||
AllianzGI Emerging Markets Small-Cap | 0.00 | % | ||
AllianzGI Emerging Markets Value | 3.32 | % | ||
AllianzGI Global Allocation | 0.10 | % | ||
AllianzGI Global Dynamic Allocation | 20.28 | % | ||
AllianzGI Global Sustainability | 40.32 | % | ||
AllianzGI Green Bond | 0.00 | % | ||
AllianzGI High Yield Bond | 0.00 | % | ||
AllianzGI International Small-Cap | 0.00 | % | ||
AllianzGI Multi Asset Income | 2.25 | % | ||
AllianzGI PerformanceFee Managed Futures Strategy | 0.00 | % | ||
AllianzGI PerformanceFee Structured US Equity | 0.00 | % | ||
AllianzGI Preferred Securities and Income | 15.42 | % | ||
AllianzGI Short Duration High Income | 0.00 | % | ||
AllianzGI Short Term Bond | 0.00 | % | ||
AllianzGI Structured Return | 0.00 | % | ||
AllianzGI Water | 98.72 | % |
The following Funds have elected to pass through the credit for tax paid in foreign countries. The foreign income and foreign tax per share outstanding on September 30, 2020 are as follows (or the maximum amount allowable):
| Gross Foreign Dividends | Gross Foreign Dividends Per Share | Foreign Tax | Foreign Tax Per Share | |||||||||||||
AllianzGI Emerging Markets Consumer | $ | 875,978 | $ | 0.391956 | $ | 109,237 | $ | 0.048878 | ||||||||
AllianzGI Emerging Markets Small- Cap | 268,459 | 0.845074 | 36,419 | 0.114643 | ||||||||||||
AllianzGI Emerging Markets Value | 2,574,988 | 0.333939 | 287,834 | 0.037328 | ||||||||||||
AllianzGI International Small-Cap | 1,613,375 | 0.074171 | 136,759 | 0.006287 | ||||||||||||
| Annual Report | | September 30, 2020 | 235 |
Table of Contents
Unaudited
Tax Information (cont’d)
The following Fund of Fund have elected to pass through the credit for tax paid in foreign countries. The foreign income and foreign tax per share outstanding on September 30, 2020 are as follows (or the maximum amount allowable):
| Gross Foreign Dividends | Gross Foreign Dividends Per Share | Foreign Tax | Foreign Tax Per Share | |||||||||||||
AllianzGI Global Allocation | $ | 288,810 | $ | 0.012221 | $ | 33,309 | $ | 0.001410 | ||||||||
Since the Funds’ tax year is not the calendar year, another notification will be sent with respect to calendar year 2020. In January 2021, shareholders will be advised on IRS Form 1099-DIV as to the federal tax status of the dividends and distributions received during calendar year 2020. The amount that will be reported will be the amount to use on the shareholder’s 2020 federal income tax return and may differ from the amount which must be reported in connection with the Funds’ tax year ended September 30, 2020. Shareholders are advised to consult their tax advisers as to the federal, state and local tax status of the dividend income received from the Funds.
| 236 | September 30, 2020 | | Annual Report |
Table of Contents
Unaudited
Changes to the Board of Trustees/Liquidity Risk Management Program
Changes to the Board of Trustees:
Effective December 31, 2019, Bradford K. Gallagher retired as an Independent Trustee of the Trust.
Liquidity Risk Management Program:
Consistent with Rule 22e-4 under the 1940 Act (the “Liquidity Rule”), the Funds have adopted a liquidity risk management program (the “Program”) on April 23, 2019. The Board appointed the Investment Manager, acting principally through its US Risk Committee, to administer the Program (the “Program Administrator”). The Program governs the Funds’ approach to managing liquidity risk, and its principal objectives include assessing, managing and periodically reviewing each Fund’s liquidity risk, based on factors specific to the circumstances of the Fund. Liquidity risk is defined as the risk that a Fund could not meet redemption requests without significant dilution of remaining investors’ interests in the Fund.
During the period, the Board reviewed a report prepared by the Program Administrator regarding the operation and effectiveness of the Program for the period from June 1, 2019 through April 30, 2020 (the “Program Period”), the key conclusions of which are summarize as follows. During the Program Period, there were no liquidity events that materially affected the performance of any Fund or its ability to timely meet redemptions without dilution to remaining investors. The Funds maintained a high level of liquidity during the Program Period and primarily held assets that are defined under the Liquidity Rule as “Highly Liquid Investments,” which are defined to include securities a Fund expects to be convertible into cash in current market conditions in three business days without significantly changing their market value. The Funds that had previously established “Highly Liquid Investment Minimum” (HLIM) thresholds, as defined under the Liquidity Rule, operated significantly above their respective HLIM thresholds during the reporting period. The Program Administrator determined that, during the Program reporting period, the Program operated adequately and effectively to manage each Fund’s liquidity risk.
There can be no assurance that the Program will achieve its objectives under all circumstances in the future. Please refer to your Fund’s prospectus for more information regarding exposure to liquidity and other risks.
| Annual Report | | September 30, 2020 | 237 |
Table of Contents
Unaudited
Matters Relating to the Trustees’ Consideration of the Investment Management Agreements
The Investment Company Act of 1940, as amended (the “1940 Act”), requires that both the full Board of Trustees (the “Board” or the “Trustees”), including a majority of the Trustees who are not “interested persons” of the Trust, as that term is defined in the 1940 Act (the “Independent Trustees”), voting separately, annually approve the continuation of each Fund’s (as defined below) Investment Management Agreement (for purposes of this section, the “Advisory Agreements” or the “Agreements”) with Allianz Global Investors U.S. LLC (the “Investment Manager”). Throughout the process, the Independent Trustees received separate legal advice from independent legal counsel that is experienced in 1940 Act matters and that is independent of the Investment Manager (“Independent Counsel”), and with whom they met separately from the Investment Manager during the contract review process.
At their meeting held on June 25, 2020, the Board, including the Independent Trustees, unanimously approved the continuation of the Agreements through June 30, 2021 with respect to AllianzGI Retirement 2020 Fund (the “2020 Fund”), AllianzGI Retirement 2025 Fund (the “2025 Fund”), AllianzGI Retirement 2030 Fund (the “2030 Fund”), AllianzGI Retirement 2035 Fund (the “2035 Fund”), AllianzGI Retirement 2040 Fund (the “2040 Fund”), AllianzGI Retirement 2045 Fund (the “2045 Fund”), AllianzGI Retirement 2050 Fund (the “2050 Fund”), AllianzGI Retirement 2055 Fund (the “2055 Fund”), AllianzGI Multi Asset Income Fund (the “Multi Asset Income Fund” and, together with the 2020 Fund, the 2025 Fund, the 2030 Fund, the 2035 Fund, the 2040 Fund, the 2045 Fund, the 2050 Fund and the 2055 Fund, the “Retirement Funds”), AllianzGI Global Allocation Fund (the “Global Allocation Fund”), AllianzGI Global Dynamic Allocation Fund (the “Global Dynamic Allocation Fund” and, together with the Global Allocation Fund, the “Allocation Funds”), AllianzGI Green Bond Fund (the “Green Bond Fund”), AllianzGI Best Styles Global Equity Fund (the “Best Styles Global Equity Fund”), AllianzGI Best Styles U.S. Equity Fund (the “Best Styles U.S. Equity Fund”), AllianzGI Convertible Fund (the “Convertible Fund”), AllianzGI Core Bond Fund (the “Core Bond Fund”), AllianzGI Core Plus Bond Fund (the “Core Plus Bond Fund”), AllianzGI Emerging Markets Consumer Fund (the “Emerging Markets Consumer Fund”), AllianzGI Emerging Markets SRI Debt Fund (the “Emerging Markets SRI Debt Fund”)1, AllianzGI Emerging Markets Small-Cap Fund (the “Emerging Markets Small-Cap Fund”), AllianzGI Floating Rate Note Fund (the “Floating Rate Note Fund”), AllianzGI Global High Yield Fund (the “Global High Yield Fund”), AllianzGI Global Sustainability Fund (the “Global Sustainability Fund”), AllianzGI Water Fund (the “Water Fund”)2, AllianzGI High Yield Bond Fund (the “High Yield Bond Fund”), AllianzGI International Small-Cap Fund (the “International Small-Cap Fund”), AllianzGI Micro Cap Fund (the “Micro Cap Fund”), AllianzGI Short Duration High Income Fund (the “Short Duration High Income Fund”), AllianzGI Structured Return Fund (the
| 1 | Effective August 1, 2019, the “AllianzGI Emerging Markets Debt Fund” changed its name to “AllianzGI Emerging Markets SRI Debt Fund.” |
| 2 | Effective on February 1, 2020 the “AllianzGI Global Water Fund” changed its name to the “AllianzGI Water Fund.” |
“Structured Return Fund”), AllianzGI Ultra Micro Cap Fund (the “Ultra Micro Cap Fund”), AllianzGI U.S. Equity Hedged Fund (the “U.S. Equity Hedged Fund”), AllianzGI Emerging Markets Value Fund (the “Emerging Markets Value Fund”), AllianzGI PerformanceFee Managed Futures Strategy Fund (the “PerformanceFee Managed Futures Strategy Fund”), AllianzGI PerformanceFee Structured US Equity Fund (the “PerformanceFee Structured US Equity Fund”), AllianzGI PerformanceFee Structured US Fixed Income Fund (the “PerformanceFee Structured US Fixed Income Fund”), AllianzGI Preferred Securities and Income Fund (the “Preferred Securities and Income Fund”), AllianzGI Short Term Bond Fund (the “Short Term Bond Fund”) and, together with the Best Styles Global Equity Fund, the Best Styles U.S. Equity Fund, the Convertible Fund, the Core Bond Fund, the Core Plus Bond Fund, the Emerging Markets Consumer Fund, the Emerging Markets SRI Debt Fund, the Emerging Markets Small-Cap Fund, the Global High Yield Fund, the Global Sustainability Fund, the Water Fund, the High Yield Bond Fund, the International Small-Cap Fund, the Micro Cap Fund, the Floating Rate Note Fund, the Short Duration High Income Fund, the Structured Return Fund, the Ultra Micro Cap Fund, the U.S. Equity Hedged Fund, the Emerging Markets Value Fund, the PerformanceFee Managed Futures Strategy Fund, the PerformanceFee Structured US Equity Fund, the PerformanceFee Structured US Fixed Income Fund, the Preferred Securities and Income Fund, the “AllianzGI Funds” and, together with the Retirement Funds and the Allocation Funds, the “Funds”)3
The contract review process consisted of multiple meetings and discussions that included the meetings of the Contracts Committee and meetings of the Independent Trustees and Independent Trustee Counsel leading up to the full Board’s consideration of the Agreement. Representatives from fund management participated in portions of those meetings and discussions to, among other topics, review the comparative fee and expense information and comparative performance information prepared and provided by Broadridge Financial Solutions, Inc. (“Broadridge”), an independent third party, for each Fund using its respective Broadridge peer groups for performance and expense comparisons. The Board’s review and approval process reflected developments through the first half of the calendar year 2020, but did not reflect subsequent events, including the strategic alliance announced on July 7, 2020, between the Investment Manager and Virtus Investment Partners, Inc (“Virtus”). On August 27, 2020, the
| 3 | The Board, including a majority of the Independent Trustees, determined to rely on the relief granted by an exemptive order issued by the U.S. Securities and Exchange Commission (the “SEC”) that permits mutual fund boards of directors to remotely approve advisory contracts rather than in-person in response to the impact of COVID-19 on investment advisers and funds. The Board determined that reliance on the exemptive order was necessary and appropriate due to circumstances related to current or potential effects of COVID-19, and prior to commencing the approval meeting, the Board confirmed that all Board members could hear each other simultaneously during the meeting. The Board noted that it would ratify any actions taken at this meeting pursuant to the SEC relief at its next in-person meeting. |
| 238 | September 30, 2020 | | Annual Report |
Table of Contents
Board, including a majority of the Independent Trustees, approved, subject to shareholder approval and certain other conditions, including the consummation of the strategic alliance, certain arrangements, including (i) a form of investment advisory agreement between the Trust and Virtus; (ii) a form of sub-advisory agreement by and among the Trust, Virtus and AllianzGI U.S.; and (iii) a form of sub-advisory agreement by and among the Trust, Virtus and NFJ Investment Group, LLC (“NFJ”), a newly-formed entity that is expected to be staffed by current members of the AllianzGI U.S. value equity team and will sub-advise certain Funds. The reasons for the Board’s recommendation that shareholders approve the above-referenced arrangements are included in the related proxy statement filed by the Trust with the U.S. Securities and Exchange Commission on September 16, 2020 (SEC Accession No. 0001193125-20-259061), a copy of which was sent to all shareholder of record as of September 10, 2020. The Proxy Statement and any definitive additional soliciting materials are available on the Funds’ website at https://us.allianzgi.com/documents/Allianz-Funds-and-Allianz-Multi-Strategy-Trust-Funds-Proxy.
In connection with their deliberations regarding the approval of the Agreements, the Independent Trustees considered such information and factors as they believed, in light of the legal advice furnished to them and their own business judgment, to be relevant. As described below, the Trustees considered the nature, quality and extent of the various investment management, administrative, and other services to be performed by the Investment Manager under the Agreements.
In evaluating the Agreement with respect to each Fund, the Board, including the Independent Trustees, reviewed extensive materials provided by the Investment Manager in response to questions submitted by the Independent Trustees and Independent Counsel, and met with senior representatives of the Investment Manager regarding its personnel, operations, and financial condition as they relate to the Funds. The Board also considered the broad range of information relevant to the annual contract review that is provided to the Board (including its various standing committees) at meetings throughout the year, including reports on investment performance, portfolio risk, and other portfolio information for each Fund, including the use of derivatives if used as part of the Fund’s principal investment strategy, as well as periodic reports on, among other matters, pricing and valuation; quality and cost of portfolio trade execution; compliance; and shareholder and other services provided by the Investment Manager and its affiliates. To assist with their review, the Independent Trustees reviewed a summary for each Fund prepared by the Investment Manager that included, among other information, performance comparisons between the Funds and their Broadridge Performance Universe (as defined below), total return investment performance, investment objective, total net assets, annual fund operating expenses, portfolio managers, total expense ratio and management fee comparisons between each Fund and its Broadridge Expense Group (as defined below), and trends in the Investment Manager’s profitability from its advisory relationship with each Fund. They also considered summaries assigning a quadrant placement to
each Fund for an institutional and retail share class based on an average of certain measures of performance (including in relation to risk) and fees/expenses versus peer group medians. The Independent Trustees also considered the risk profiles of the Funds.
The Independent Trustees’ conclusions as to the approval of each Agreement were based on a comprehensive consideration of all information provided to the Independent Trustees and were not the result of any single factor. Individual Independent Trustees may have evaluated the information presented differently from one another, attributing different weights to various factors. The Independent Trustees recognized that the fee arrangements for the Funds are the result of review and discussion in the prior years between the Independent Trustees and the Investment Manager, that certain aspects of such arrangements may receive greater scrutiny in some years than in others, and that the Independent Trustees’ conclusions may be based, in part, on their consideration of these same arrangements during the course of the year and in prior years. The Independent Trustees evaluated information available to them on a Fund-by-Fund basis, and their determinations were made separately in respect of each Fund. However, they also took into account the common interests of all series of the Trust in their review.
Performance Information
With respect to investment performance, the Independent Trustees considered information regarding each Fund’s short-, intermediate- and long-term performance, as applicable, net of the Fund’s fees and expenses, both on an absolute basis and relative to an appropriate benchmark index that does not deduct the fees or expenses of investing. The Independent Trustees also considered information provided by Broadridge for each Fund relative to the investment performance of a group of funds with investment classifications and/or objectives comparable to the Fund as identified by Broadridge (the “Broadridge Performance Universe”). The Independent Trustees recognized that the performance information, including the Broadridge performance information, was as of March 31, 2020, and, as such, included the period of extreme market volatility resulting from COVID-19. The Trustees also reviewed performance in relation to certain measures of the degree of investment risk undertaken by the portfolio managers.
For Funds that underperformed, the Board considered the magnitude and duration of that underperformance relative to the Broadridge Performance Universe and/or the benchmark (e.g., the amount by which a Fund underperformed, including, for example, whether the Fund slightly underperformed or significantly underperformed). To the extent that the Independent Trustees identified a Fund as having underperformed its benchmark indices and/or Broadridge Performance Universes to an extent, or over a period of time, that the Independent Trustees felt warranted additional inquiry, the Trustees discussed with the Investment Manager the Fund’s performance, potential reasons for the underperformance, and, if necessary, steps that the Investment Manager had taken, or intended to take, to
| Annual Report | | September 30, 2020 | 239 |
Table of Contents
Unaudited
Matters Relating to the Trustees’ Consideration of the Investment Management Agreements (cont’d)
improve performance. The Independent Trustees also met with the portfolio managers of certain Funds during the 12 months prior to voting on the contract renewal and had the opportunity to discuss the Funds’ performance. The Trustees considered the Investment Manager’s responsiveness with respect to the Funds that experienced lagging performance. In this regard, with respect to the group of Funds managed by the AllianzGI U.S. Value Equity team, they noted changes in leadership and recent additions to the portfolio management and research personnel within the last couple of years. The Independent Trustees noted that performance, is only one of the factors that they deem relevant to their consideration of each Agreement and that, after considering all relevant factors, it may be appropriate to approve the continuation of the Agreement notwithstanding a Fund’s relative performance.
Nature, Extent, and Quality of Services
As part of their review, the Independent Trustees received and considered descriptions of various functions performed by the Investment Manager for the Funds, such as portfolio management, compliance monitoring, portfolio trading practices and oversight of third party service providers. They also considered information regarding the overall organization and business functions of the Investment Manager, including, without limitation, information regarding senior management, portfolio managers and other personnel providing or proposed to provide investment management, administrative and other services, and corporate ownership and business operations unrelated to the Funds. They considered certain changes to the executive leadership and the organization of the governance structure, as well as the availability of research and other capabilities within the global organization. The Independent Trustees examined the ability of the Investment Manager to provide high-quality investment management and other services to the Funds. Among other information, the Independent Trustees considered the investment philosophy and research and decision-making processes of the Investment Manager, as well as the Investment Manager’s broker selection process and trading operations; the experience of key advisory personnel of the Investment Manager and its affiliates, as applicable, responsible for portfolio management of the Funds; the ability of the Investment Manager to attract and retain capable personnel; the philosophy of employee compensation; and the operational infrastructure, including technology and systems, of the Investment Manager. The Independent Trustees also considered actions taken by the Investment Manager to manage the impact on the Funds and their portfolio holdings of the market volatility resulting from COVID-19.
In addition, the Independent Trustees noted the extensive range of services that the Investment Manager provides to the Funds beyond the investment management services. In this regard, the Independent Trustees reviewed the extent and quality of the Investment Manager’s services with respect to regulatory compliance and ability to comply with the investment policies of the Funds; the compliance programs
and risk controls of the Investment Manager; the specific contractual obligations of the Investment Manager pursuant to the Agreements; the nature, extent and quality of certain administrative services the Investment Manager is responsible for providing to the Funds; the Investment Manager’s risk management function; and conditions that might affect the ability of the Investment Manager to provide high quality services to the Funds in the future under the Agreements, including, but not limited to, the organization’s financial condition and operational stability. The Independent Trustees also considered that the Investment Manager assumes significant ongoing risks with respect to all Funds, including entrepreneurial and business risks the Investment Manager has undertaken in serving as Investment Manager and sponsor of the Funds, for which it is entitled to reasonable compensation. Specifically, its responsibilities include continual management of investment, operational, enterprise, legal, regulatory and compliance risks as they relate to the Funds. The Trustees also noted the Investment Manager’s activities under its contractual obligation to oversee the Funds’ various outside service providers, including its ongoing evaluation of the quality of the services provided, negotiation of certain service providers’ fees and its evaluation of service providers’ infrastructure, cybersecurity programs, compliance programs, and business continuity programs, among other matters. It also considered the Investment Manager’s ongoing development of its own infrastructure and information technology to support the Funds through, among other things, cybersecurity, business continuity planning, and risk management. The Independent Trustees also noted the Investment Manager’s effective operation and implementation of its business continuity plan in response to COVID-19 and its oversight of the service providers’ business continuity plans during this period.
The Trustees considered that the Investment Manager provides the Funds with office space, administrative services and personnel to serve as Fund officers, and that the Investment Manager and its affiliates pay all of the compensation of the Funds’ interested Trustees and officers (in their capacities as employees of the Investment Manager or such affiliates). Based on the foregoing, the Trustees concluded that the Investment Manager’s investment processes, research capabilities and philosophy were well-suited to each Fund given its investment objective and policies, that the Investment Manager would be able to continue to meet any reasonably foreseeable obligations under the Agreement, and that the Investment Manager would otherwise be able to provide services to the Funds of sufficient extent and quality.
Fee and Expense Information and Comparisons
In assessing the reasonableness of the Funds’ fees and expenses under the Agreements, the Independent Trustees considered, among other information, each Fund’s management fee (or, in the case of the Retirement Funds, each Retirement Fund’s advisory fee), the Fund’s total expense ratio as a percentage of average daily net assets and the management fees and total expense ratios (in comparison to such Fund’s Broadridge Expense Group), taking into account the expense
| 240 | September 30, 2020 | | Annual Report |
Table of Contents
limitation arrangement that the Investment Manager would observe, and the advisory fees and net expense ratios of peer groups of funds based on information provided by Broadridge. The Independent Trustees also noted the management fee waiver and/or expense limitation agreements observed by the Investment Manager for the Funds that cap fees or expenses of their various share classes.
In comparing the Funds to their respective Broadridge Expense Groups, with respect to expenses, the Independent Trustees noted that the Funds (other than the Retirement Funds) were not charged a separate administration fee, recognizing that their management fee includes a component for administrative services, while many of the Funds’ Broadridge Expense Groups have separate advisory and administration agreements with separate fees. The Independent Trustees also took into account the “unitary” administrative fee structure applicable to the Retirement Funds, under which certain third-party services that are ordinarily the financial responsibility of a mutual fund (e.g., audit, custody, accounting, legal, transfer agency, and printing services) are, in the case of the Retirement Funds, paid for by the Investment Manager out of its administrative fee.
To the extent applicable, the Independent Trustees considered information regarding the investment performance and fees for other funds and/or separately managed accounts, including institutional accounts, managed by the Investment Manager or its affiliates pursuing a similar investment strategy, if any (“similar accounts”). Specifically, the Independent Trustees reviewed information showing the net advisory fees charged by the Investment Manager to the similar accounts. In comparing these fees, the Independent Trustees considered information provided by the Investment Manager as to the generally broader and more extensive services provided to the Funds in comparison to institutional or separate accounts; the higher demands placed on the Investment Manager to provide considerable shareholder services due to the volume of investors, including shareholder communications and client relation services and account administration services; investment personnel and trading infrastructure as a result of the daily cash in-flows and out-flows of the Funds; the greater entrepreneurial; enterprise, and reputational risk in managing retail mutual funds; and the impact on the Investment Manager and expenses associated with the more extensive regulatory and compliance requirements to which the Funds are subject in comparison to institutional or separate accounts.
Economies of Scale and “Fall-Out” Benefits
The Independent Trustees considered the extent to which the Investment Manager may realize economies of scale or other efficiencies in managing and supporting the Funds. The Independent Trustees took into account that, as open-end investment companies, the Funds intend to raise additional assets, so that, as the assets of the Funds grow over time, certain economies of scale and other efficiencies may be realized through spreading certain fixed costs across a larger asset base or across a variety of products and services, while also taking into account the fee waiver and expense limitation
arrangements observed by the Investment Manager for applicable Funds. The Independent Trustees also considered that the Investment Manager shares the benefits of economies of scale with the Funds and their shareholders by adding and enhancing services to the Funds over time, including expenditures in staff, technology, and infrastructure.
Additionally, the Independent Trustees considered so-called “fall-out benefits” to the Investment Manager and its affiliates, such as reputational value derived from serving as Investment Manager to the Funds. The Independent Trustees also took into account the entrepreneurial, legal, regulatory and business risks the Investment Manager has undertaken and will undertake as investment manager and sponsor of the Funds as well as the reputational value derived from serving as investment manager to the Funds. They also considered that the Retirement Funds’ unitary administrative fee generally results in increased profitability benefits as the asset base of the Funds increases and such benefits generally inure to the Investment Manager, and that the Investment Manager’s profitability likewise generally declines under the unitary administrative fee structure when Fund assets decline. The Independent Trustees considered that the Retirement Funds’ unitary administrative fee also insulates shareholders from increased expense ratios arising from declines in net assets or from increases in the costs of third-party services, such as custodial, transfer agent or audit services.
Profitability
The Independent Trustees considered the overall estimated profitability to the Investment Manager with respect to combined advisory and administrative fees for each Fund, as well as profitability separately as to each of the advisory fees and administrative fees for each Retirement Fund, on a Fund-by-Fund basis for the twelve months ended December 31, 2019. They also reviewed the Investment Manager’s aggregate profitability with respect to the Fund complex and the Investment Manager’s overall profitability with respect to all products globally. As part of its considerations, the Board considered the cost allocation methodology that the Investment Manager used in developing its estimated profitability figures. In this connection, the Independent Trustees considered that for certain Funds profitability had increased as a result of expense reduction efforts, although the Funds’ assets had declined over the last year.
The Independent Trustees recognized that it is difficult to make comparisons of profitability from mutual fund advisory and administration contracts because comparative information is not generally available and is affected by numerous factors, including the structure of the particular adviser, the types of funds it manages, its business mix, numerous assumptions about allocations and the adviser’s capital structure and cost of capital. The Independent Trustees concluded that the Investment Manager’s estimated pre-tax profitability for advisory services was not excessive or unreasonable, although it was sizeable for certain Funds, and that estimated pre-tax profitability for advisory and administrative services combined, including when calculated on a net revenue basis regarding the
| Annual Report | | September 30, 2020 | 241 |
Table of Contents
Unaudited
Matters Relating to the Trustees’ Consideration of the Investment Management Agreements (cont’d)
administrative fee, was sizeable for certain Retirement Funds, but generally not unreasonable under the circumstances. The Independent Trustees recognized that the Investment Manager and its affiliates should be entitled to earn a reasonable level of profits for services they provide to each Fund and, based on their review, determined that the estimated profitability to the Investment Manager with respect to its relationship with each Fund did not, in any case, appear to be excessive.
Fund-by-Fund Analysis
With regard to the investment performance of each Fund and the fees charged to each Fund, the Independent Trustees considered the following information. The comparative performance, fee, and expense information was prepared and provided by Broadridge and was not independently verified by the Independent Trustees.
With respect to all Funds, the Independent Trustees reviewed, among other information, comparative information showing performance for Class A and Institutional Class (or, in the case of the Retirement Funds, Class R6) shares of the Funds against their respective Broadridge Performance Universes for the one-year, three-year, five-year and ten-year periods (to the extent each such Fund had been in existence), each ended March 31, 2020. Institutional Class performance (or, in the case of the Retirement Funds, Class R6 performance) relative to the median for each Fund’s Broadridge Performance Universe is described below, and for those Funds with performance that ranked below median for their respective Broadridge Performance Universes, the specific quintile rankings for Institutional Class (or, in the case of the Retirement Funds, Class R6) shares are also noted below with respect to the relevant periods of underperformance. With respect to performance quintile rankings for a Fund compared to its Broadridge Performance Universe, the first quintile represents the highest (best) performance and the fifth quintile represents the lowest performance.
The Independent Trustees reviewed, among other information, data provided by Broadridge comparing each Fund’s advisory fee, and ratios of total expenses to net assets (“Total Expense Ratios”) for two share classes (Class A and Institutional Class, or in the case of the Retirement Funds, Class R6) to the Funds’ respective Broadridge Expense Groups for the most recently reported fiscal year. Class A shares of the applicable Broadridge-selected group of comparable funds are referred to below as the “retail expense group,” and Institutional Class shares or Class R6 shares, as applicable, are referred to as the “institutional expense group.” The Independent Trustees noted that the Broadridge data takes into account any fee reductions or expense limitations that were in effect during a Fund’s last fiscal year. For those Funds whose fees or expenses were higher than the Broadridge Expense Group median, the specific quintile rankings are also noted below with respect to the relevant above-median fee or expense categories (unless quintile rankings were not provided to the Independent Trustees by Broadridge, in which case fund rankings are provided). For the purposes of Broadridge Expense Group quintile
rankings, higher fees and expenses result in a lower quintile ranking, with the first quintile corresponding to low fees and expenses and the fifth quintile corresponding to high fees and expenses.
Retirement Funds and Allocation Funds:
| ∎ | 2020 Fund: As compared to its Broadridge Performance Universe, the Fund’s performance was above median for the one-, three- and five-year periods and below median for the ten-year period (in the fifth quintile). As compared to its Broadridge Expense Group, the Fund’s advisory fees were at median for both the retail and institutional expense groups, and total expense ratios were above median for both the retail and institutional expense groups (on a net basis). |
| ∎ | 2025 Fund: As compared to its Broadridge Performance Universe, the Fund’s performance was above median for the one- and five-year periods and below median for the three-year period (in the fourth quintile). The Fund’s inception date was December 19, 2011, and does not accordingly have all performance periods reflected. As compared to its Broadridge Expense Group, the Fund’s advisory fees were at median for both the retail and institutional expense groups, and total expense ratios were below median for the retail expense group and above median for the institutional expense group (on a net basis). |
| ∎ | 2030 Fund: As compared to its Broadridge Performance Universe, the Fund’s performance was above median for the one- and five-year periods and below median for the three- and ten-year periods (in the fourth quintile for the three-year period and in the fifth quintile for the ten-year period). As compared to its Broadridge Expense Group, the Fund’s advisory fees were at median for both the retail and institutional expense groups, and total expense ratios were above median for the retail expense group and at median for the institutional expense group (on a net basis). |
| ∎ | 2035 Fund: As compared to its Broadridge Performance Universe, the Fund’s performance was above median for the one- and three-years period and below median for the five-year period (in the third quintile). The Fund’s inception date was December 19, 2011, and does not accordingly have all performance periods reflected. As compared to its Broadridge Expense Group, the Fund’s advisory fees were at median for both the retail and institutional expense groups, and total expense ratios were below median for the retail expense group and above median for the institutional expense group (on a net basis). |
| ∎ | 2040 Fund: As compared to its Broadridge Performance Universe, the Fund’s performance was above median for the one- and five-years period and below median for the three- and ten-year periods (in the fourth quintile for the three-year period and in the fifth quintile for the ten-year period). As compared to its Broadridge Expense Group, the Fund’s advisory fees were at median for the retail expense group and above median for the institutional expense group, and total expense ratios were below median for both the retail and institutional expense groups (on a net basis). |
| ∎ | 2045 Fund: As compared to its Broadridge Performance Universe, the Fund’s performance was above median for the one-year period and below median for the three- and five-year periods (in the fourth quintile for the three-year period and in the third quintile for the five-year period). The Fund’s inception date was December 19, 2011, and does not accordingly have all performance periods reflected. As |
| 242 | September 30, 2020 | | Annual Report |
Table of Contents
compared to its Broadridge Expense Group, the Fund’s advisory fees were at median for the retail expense group and above median for the institutional expense group, and total expense ratios were below median for both the retail and institutional expense groups (on a net basis). |
| ∎ | 2050 Fund: As compared to its Broadridge Performance Universe, the Fund’s performance was above the median for the one-year period and below median for the one-, three-, five- and ten-year periods (in the fourth quintile for the three-year period, in the third quintile for the five year period and in the fifth quintile for the ten-year period). As compared to its Broadridge Expense Group, the Fund’s advisory fees were at median for the retail expense group and above median for the institutional expense group, and total expense ratios were below median for both the retail and institutional expense groups (on a net basis). |
| ∎ | 2055 Fund: As compared to its Broadridge Performance Universe, the Fund’s performance was below median for the one-, three- and five-year periods (in the third quintile for the one-year period and in the fifth quintile for the three-year period and fourth quintile for the five-year period). As compared to its Broadridge Expense Group, the Fund’s advisory fees were at median for the retail expense group and above median for the institutional expense group, and total expense ratios were below median for both the retail and institutional expense groups (on a net basis). |
| ∎ | Multi Asset Income Fund: As compared to its Broadridge Performance Universe, the Fund’s performance was below median for the one-, three-, five- and ten-year periods (in the fifth quintile for the one-, three- and five-year periods and in the fourth quintile for the ten-year period). As compared to its Broadridge Expense Group, the Fund’s advisory fees were at median for the retail expense group and institutional expense group, and total expense ratios were above median for the retail expense group and below median for the institutional expense group (on a net basis). |
| ∎ | Global Allocation Fund: As compared to its Broadridge Performance Universe, the Fund’s performance was above median for the one-, three-, five- and ten-year periods. As compared to its Broadridge Expense Group, the Fund’s management fees were above the median for the retail expense group and below the median for the institutional expense group and total expense ratios were below median for both the retail and institutional expense groups (on a net basis). |
| ∎ | Global Dynamic Allocation Fund: As compared to its Broadridge Performance Universe, the Fund’s performance was at the median for the one-year period and above median for the three-, five- and ten-year periods. As compared to its Broadridge Expense Group, the Fund’s management fees were below the median for the retail and institutional expense groups and total expense ratios were below median for both the retail and institutional expense groups (on a net basis). |
AllianzGI Funds:
| ∎ | Best Styles Global Equity Fund: As compared to its Broadridge Performance Universe, the Fund’s performance was above the median for the one-year period and below the median for the three- and five-year periods (in the fourth quintile for the three-year period and in the |
third quintile for the five-year period). The Fund’s inception date was September 2, 2014, and does not accordingly have all performance periods reflected. As compared to its Broadridge Expense Group, the Fund’s management fees were below median for the both the retail and institutional expense groups, and actual total expense ratios were below the median for both the retail and institutional expense groups (on a net basis). |
| ∎ | Best Styles U.S. Equity Fund: As compared to its Broadridge Performance Universe, the Fund’s performance was above median for the one-, three- and five-year periods. The Fund’s inception date was December 1, 2014, and does not accordingly have all performance periods reflected. As compared to its Broadridge Expense Group, the Fund’s management fees were below median for the both the retail and institutional expense groups, and actual total expense ratios were below the median for both the retail and institutional expense groups (on a net basis). |
| ∎ | Convertible Fund: As compared to its Broadridge Performance Universe, the Fund’s performance was above median for the one-, three-, five- and ten-year periods. As compared to its Broadridge Expense Group, the Fund’s management fees were below median for the both the retail and institutional expense groups, and actual total expense ratios were below the median for both the retail and institutional expense groups (on a net basis). |
| ∎ | Core Bond Fund: As compared to its Broadridge Performance Universe, the Fund’s performance was above median for the one-year period. The Fund’s inception date was May 30, 2018, and does not accordingly have all performance periods reflected. As compared to its Broadridge Expense Group, the Fund’s management fee was below median for the institutional expense group, and actual total expense ratio was below the median for the institutional expense group (on a net basis). |
| ∎ | Core Plus Bond Fund: As compared to its Broadridge Performance Universe, the Fund’s performance was above median for the one-year period. The Fund’s inception date was May 30, 2018, and does not accordingly have all performance periods reflected. As compared to its Broadridge Expense Group, the Fund’s management fee was below median for the institutional expense group, and actual total expense ratio was below the median for the institutional expense group (on a net basis). |
| ∎ | Emerging Markets Consumer Fund: As compared to its Broadridge Performance Universe, the Fund’s performance was above median for the one-year period and below the median for the three- and five-year periods (in the fourth quintile for both periods). The Fund’s inception date was December 1, 2014, and does not accordingly have all performance periods reflected. As compared to its Broadridge Expense Group, the Fund’s management fees were above median for the retail expense group and below median for the institutional expense group, and actual total expense ratios were above median for the retail expense group and at median for the institutional expense group (on a net basis). |
| ∎ | Emerging Markets SRI Debt Fund: As compared to its Broadridge Performance Universe, the Fund’s performance was above median for the one-, three- and five-year periods. The Fund’s inception date was September 15, 2014, and does not accordingly have all performance |
| Annual Report | | September 30, 2020 | 243 |
Table of Contents
Unaudited
Matters Relating to the Trustees’ Consideration of the Investment Management Agreements (cont’d)
| periods reflected. As compared to its Broadridge Expense Group, the Fund’s management fees were below median for the both the retail and institutional expense groups, and actual total expense ratios were below the median for both the retail and institutional expense groups (on a net basis). |
| ∎ | Emerging Markets Small-Cap Fund: As compared to its Broadridge Performance Universe, the Fund’s performance was below median for the one- and three-year periods (in the fifth quintile for the one-year period and in the fourth quintile for the three-year period) and above the median for the five-year period. The Fund’s inception date was December 1, 2014, and does not accordingly have all performance periods reflected. As compared to its Broadridge Expense Group, the Fund’s management fees were below median for both the retail and institutional expense groups, and actual total expense ratios were above median for the retail expense group and at median for the institutional expense group (on a net basis). |
| ∎ | Emerging Markets Value Fund: As compared to its Broadridge Performance Universe, the Fund’s performance was above median for the one-, three- and five-year periods. The Fund’s inception date was December 18, 2012, and does not accordingly have all performance periods reflected. As compared to its Broadridge Expense Group, the Fund’s management fees were below median for the both the retail and institutional expense groups, and actual total expense ratios were below the median for both the retail and institutional expense groups (on a net basis). |
| ∎ | Floating Rate Note Fund: As compared to its Broadridge Performance Universe, the Fund’s performance was below median for the one-year period (in the fifth quintile). The Fund’s inception date was December 27, 2017, and does not accordingly have all performance periods reflected. As compared to its Broadridge Expense Group, the Fund’s management fee was below median for the institutional expense group, and actual total expense ratio was at the median for the institutional expense group (on a net basis). |
| ∎ | Global High Yield Fund: As compared to its Broadridge Performance Universe, the Fund’s performance was above median for the one-year period. The Fund’s inception date was May 3, 2017, and does not accordingly have all performance periods reflected. As compared to its Broadridge Expense Group, the Fund’s management fee was below median for the institutional expense group, and actual total expense ratio was below median for the institutional expense group (on a net basis). |
| ∎ | Global Sustainability Fund: As compared to its Broadridge Performance Universe, the Fund’s performance was above the median for the one-year period and below median for the three- and five-year periods (in the fourth quintile for the three-year period and in the third quintile for the five-year period). The Fund’s inception date was December 9, 2014, and does not accordingly have all performance periods reflected. As compared to its Broadridge Expense Group, the Fund’s management fees were below median for both the retail and institutional expense groups, and total expense ratios were below median for both the retail and institutional expense groups (on a net basis). |
| ∎ | Green Bond Fund: As compared to its Broadridge Performance Universe, the Fund’s performance was below median for the one-year period (in the fifth quintile). The Fund’s inception date was |
November 19, 2018, and does not accordingly have all performance periods reflected. As compared to its Broadridge Expense Group, the Fund’s management fees were below median for both the retail and institutional expense groups, and total expense ratios were below median for both the retail and institutional expense groups (on a net basis). |
| ∎ | High Yield Bond Fund: As compared to its Broadridge Performance Universe, the Fund’s performance was above median for the one- and ten-year periods and below median for the three- and five-year periods (in the third quintile). As compared to its Broadridge Expense Group, the Fund’s management fees were below median for both the retail and institutional expense groups, and total expense ratios were above median for both the retail and institutional expense groups (on a net basis). |
| ∎ | International Small-Cap Fund: As compared to its Broadridge Performance Universe, the Fund’s performance was above median for the one-, three- and ten-year periods and below median for the five-year period (in the third quintile). As compared to its Broadridge Expense Group, the Fund’s management fees were below median for both the retail and institutional expense groups, and total expense ratios were below median for both the retail and institutional expense groups (on a net basis). |
| ∎ | Micro Cap Fund: As compared to its Broadridge Performance Universe, the Fund’s performance was below median for the one-, three-, five- and ten-year periods (in the fifth quintile). As compared to its Broadridge Expense Group, the Fund’s management fees were below median for both the retail and institutional expense groups, and total expense ratios were above median for both the retail and institutional expense groups (on a net basis). |
| ∎ | PerformanceFee Managed Futures Strategy Fund: As compared to its Broadridge Performance Universe, the Fund’s performance was below median for the one-year period (in the fifth quintile). The Fund’s inception date was December 18, 2017, and does not accordingly have all performance periods reflected. As compared to its Broadridge Expense Group, the Fund’s management fee was below median for the institutional expense group, and actual total expense ratio was below the median for the institutional expense group (on a net basis). |
| ∎ | PerformanceFee Structured US Equity Fund: As compared to its Broadridge Performance Universe, the Fund’s performance was below median for the one-year period (in the fifth quintile). The Fund’s inception date was December 18, 2017, and does not accordingly have all performance periods reflected. As compared to its Broadridge Expense Group, the Fund’s management fee was below median for the institutional expense group, and actual total expense ratio was below the median for the institutional expense group (on a net basis). |
| ∎ | PerformanceFee Structured US Fixed Income Fund: As compared to its Broadridge Performance Universe, the Fund’s performance was below median for the one-year period (in the fourth quintile). The Fund’s inception date was December 18, 2017, and does not accordingly have all performance periods reflected. As compared to its Broadridge Expense Group, the Fund’s management fee was below median for the institutional expense group, and actual total expense ratio was below the median for the institutional expense group (on a net basis). |
| 244 | September 30, 2020 | | Annual Report |
Table of Contents
| ∎ | Preferred Securities and Income Fund: As compared to its Broadridge Performance Universe, the Fund’s performance was below median for the one-year period (in the fourth quintile). The Fund’s inception date was May 30, 2018, and does not accordingly have all performance periods reflected. As compared to its Broadridge Expense Group, the Fund’s management fee was below median for the institutional expense group, and actual total expense ratio was below the median for the institutional expense group (on a net basis). |
| ∎ | Short Duration High Income Fund: As compared to its Broadridge Performance Universe, the Fund’s performance was below median for the one-, three-, and five-year periods (in the fourth quintile for the one- and three-year periods and in the third quintile for the five-year period). The Fund’s inception date was October 3, 2011, and does not accordingly have all performance periods reflected. As compared to its Broadridge Expense Group, the Fund’s advisory fees were below median for both the retail and institutional expense groups, and total expense ratios were below median for both the retail and institutional expense groups (on a net basis). |
| ∎ | Short Term Bond Fund: As compared to its Broadridge Performance Universe, the Fund’s performance was above median for the one-year period. The Fund’s inception date was August 23, 2018, and does not accordingly have all performance periods reflected. As compared to its Broadridge Expense Group, the Fund’s advisory fees were below median for both the retail and institutional expense groups, and total expense ratios were below median for both the retail and institutional expense groups (on a net basis). |
| ∎ | Structured Return Fund: As compared to its Broadridge Performance Universe, the Fund’s performance was below median for the one-, three-, and five-year periods (each in the fifth quintile). The Fund’s inception date was December 3, 2012 and does not accordingly have all performance periods reflected. As compared to its Broadridge Expense Group, the Fund’s advisory fees were at median for the retail expense group and below median for the institutional expense group, and total expense ratios were below median for both the retail and institutional expense groups (on a net basis). |
| ∎ | Ultra Micro Cap Fund: As compared to its Broadridge Performance Universe, the Fund’s performance was below median for the one-, three-, five-, and ten-year periods (each in the fifth quintile). As compared to its Broadridge Expense Group, the Fund’s advisory fees were below median for both the retail and institutional expense groups, and total expense ratios were above median for both the retail and institutional expense groups (on a net basis). |
| ∎ | U.S. Equity Hedged Fund: As compared to its Broadridge Performance Universe, the Fund’s performance was above median for the one-, three-, and five-year periods. The Fund’s inception date was December 3, 2012, and does not accordingly have all performance periods reflected. As compared to its Broadridge Expense Group, the Fund’s advisory fees were below median for both the retail and institutional expense groups, and total expense ratios were below median for both the retail and institutional expense groups (on a net basis). |
| ∎ | Water Fund: As compared to its Broadridge Performance Universe, the Fund’s performance was above median for the one-, three-, five- and ten-year periods. As compared to its Broadridge Expense Group, the Fund’s management fees were above median for the retail expense group and below median for the institutional expense group, and actual total expense ratios were below the median for the retail expense group and above median for the institutional expense group (on a net basis). |
Conclusion
After reviewing these and other factors described herein, the Independent Trustees concluded, with respect to each Fund, within the context of their overall conclusions regarding the Agreements and in their business judgement, that they were satisfied with the Investment Manager’s responses and on-going efforts relating to the investment performance of the Funds, including efforts to improve performance for underperforming Funds. The Independent Trustees also concluded that the fees payable under the Agreements represent reasonable compensation in light of the nature, extent and quality of services provided by the Investment Manager and should be continued, taking into account the Investment Manager’s agreement to observe waivers and/or breakpoints for certain Funds. Based on their evaluation of factors that they deemed to be material, including, but not limited to, those factors described above, the Independent Trustees unanimously concluded that the continuation of the Agreements with respect to the Funds was in the interests of the applicable Funds and their shareholders, and determined to recommend that the continuance of the Agreements be approved by the full Board.
| Annual Report | | September 30, 2020 | 245 |
Table of Contents
Unaudited
Privacy Policy
Please read this Policy carefully. It gives you important information about how Allianz Global Investors U.S. and its U.S. affiliates (“AllianzGI US,” “we” or “us”) handle non-public personal information (“Personal Information”) that we may receive about you. It applies to all of the past, present and future clients and shareholders of AllianzGI US and the funds and accounts it manages, advises, administers or distributes, and will continue to apply when you are no longer a client or shareholder. As used throughout this Policy, “AllianzGI US” means Allianz Global Investors U.S. LLC, Allianz Global Investors Distributors LLC, and the family of registered and unregistered funds managed by one or more of these firms. AllianzGI US is part of a global investment management group, and the privacy policies of other Allianz Global Investors entities outside of the United States may have provisions in their policies that differ from this Privacy Policy. Please refer to the website of the specific non-US Allianz Global Investors entity for its policy on privacy.
We Care about Your Privacy
We consider your privacy to be a fundamental aspect of our relationship with you, and we strive to maintain the confidentiality, integrity and security of your Personal Information. To ensure your privacy, we have developed policies that are designed to protect your Personal Information while allowing your needs to be served.
Information We May Collect
In the course of providing you with products and services, we may obtain Personal Information about you, which may come from sources such as account application and other forms, from other written, electronic, or verbal communications, from account transactions, from a brokerage or financial advisory firm, financial advisor or consultant, and/or from information you provide on our website.
You are not required to supply any of the Personal Information that we may request. However, failure to do so may result in us being unable to open and maintain your account, or to provide services to you.
How Your Information Is Shared
We do not disclose your Personal Information to anyone for marketing purposes. We disclose your Personal Information only to those service providers, affiliated and non-affiliated, who need the information for everyday business purposes, such as to respond to your inquiries, to perform services, and/or to service and maintain your account. This applies to all of the categories of Personal Information we collect about you. The affiliated and non-affiliated service providers who receive your Personal Information also may use it to process your transactions, provide you with materials (including preparing and mailing prospectuses and shareholder reports and gathering shareholder proxies), and provide you with account statements and other materials relating to your account. These service providers provide services at our direction, and under their agreements with us, are required to keep your Personal Information confidential and to use it only for providing the contractually required services. Our service providers may not use your Personal Information to market products and services to you except in conformance with applicable laws and regulations. We also may provide your Personal Information to your respective brokerage or financial advisory firm, custodian, and/or to your financial advisor or consultant.
In addition, we reserve the right to disclose or report Personal Information to non-affiliated third parties, in limited circumstances, where we believe in good faith that disclosure is required under law, to cooperate with regulators or law enforcement authorities or pursuant to other legal process, or to protect our rights or property, including to enforce our Privacy Policy or other agreements with you. Personal Information collected by us may also be transferred as part of a corporate sale, restructuring, bankruptcy, or other transfer of assets.
Security of Your Information
We maintain your Personal Information for as long as necessary for legitimate business purposes or otherwise as required by law. In maintaining this information, we have implemented appropriate procedures that are designed to restrict access to your Personal Information only to those who need to know that information in order to provide products and/or services to you. In addition, we have implemented physical, electronic and procedural safeguards to help protect your Personal Information.
Privacy and the Internet
The Personal Information that you provide through our website, as applicable, is handled in the same way as the Personal Information that you provide by any other means, as described above. This section of the Policy gives you additional information about the way in which Personal Information that is obtained online is handled.
| ∎ | Online Enrollment, Account Access and Transactions: When you visit our website, you can visit pages that are open to the general public, or, where available, log into protected pages to enroll online, access information about your account, or conduct certain transactions. Access to these |
| 246 | September 30, 2020 | | Annual Report |
Table of Contents
secure pages is permitted only after you have created a User ID and Password. The User ID and Password must be supplied each time you want to access your account information online. This information serves to verify your identity. When you enter Personal Information into our website to enroll or access your account online, you will log into secure pages. By using our website, you consent to this Privacy Policy and to the use of your Personal Information in accordance with the practices described in this Policy. If you provide Personal Information to effect transactions, a record of the transactions you have performed while on the site is retained by us. For additional terms and conditions governing your use of our website, please refer to the Investor Mutual Fund Access – Disclaimer which is incorporated herein by reference and is available on our website. |
| ∎ | Cookies and Similar Technologies: Cookies are small text files stored in your computer’s hard drive when you visit certain web pages. Clear GIFs (also known as Web Beacons) are typically transparent very small graphic images (usually 1 pixel x 1 pixel) that are placed on a website that may be included on our services provided via our website and typically work in conjunction with cookies to identify our users and user behavior. We may use cookies and automatically collected information to: (i) personalize our website and the services provided via our website, such as remembering your information so that you will not have to re-enter it during your use of, or the next time you use, our website and the services provided via our website; (ii) provide customized advertisements, content, and information; (iii) monitor and analyze the effectiveness of our website and the services provided via our website and third-party marketing activities; (iv) monitor aggregate site usage metrics such as total number of visitors and pages viewed; and (v) track your entries, submissions, and status in any promotions or other activities offered through our website and the services provided via our website. Tracking technology also helps us manage and improve the usability of our website, (i) detecting whether there has been any contact between your computer and us in the past and (ii) to identify the most popular sections of our website. Because an industry-standard Do-Not-Track protocol is not yet established, our website will continue to operate as described in this Privacy Policy and will not be affected by any Do-Not-Track signals from any browser. |
| ∎ | Use of Social Media Plugins Our website uses the following Social Media Plugins (“Plugins”): |
| ∎ | Facebook Share Button operated by Facebook Inc., 1601 S. California Ave, Palo Alto, CA 94304, USA |
| ∎ | Tweet Button operated by Twitter Inc., 795 Folsom St., Suite 600, San Francisco, CA 94107, USA |
| ∎ | LinkedIn Share Button operated by LinkedIn Corporation, 2029 Stierlin Court, Mountain View, CA 94043, USA |
All Plugins are marked with the brand of the respective operators Facebook, Twitter and LinkedIn (“Operators”). When you visit our website that contains a social plugin, your browser establishes a direct connection to the servers of the Operator. The Operator directly transfers the plugin content to your browser which embeds the latter into our website, enabling the Operator to receive information about you having accessed the respective page of our website. Thus, AllianzGI US has no influence on the data gathered by the plugin and we inform you according to our state of knowledge: The embedded plugins provide the Operator with the information that you have accessed the corresponding page of our website. If you do not wish to have such data transferred to the Operators, you need to log out of your respective account before visiting our website. Please see the Operators’ data privacy statements in order to get further information about purpose and scope of the data collection and the processing and use:
| ∎ | Facebook: https://de-de.facebook.com/about/privacy |
| ∎ | Twitter: https://twitter.com/privacy |
| ∎ | LinkedIn: https://www.linkedin.com/legal/privacy-policy |
Changes to Our Privacy Policy
We may modify this Privacy Policy from time-to-time to reflect changes in related practices and procedures, or applicable laws and regulations. If we make changes, we will notify you on our website and the revised Policy will become effective immediately upon posting to our website. We also will provide account owners with a copy of our Privacy Policy, annually if required. We encourage you to visit our website periodically to remain up to date on our Privacy Policy. You acknowledge that by using our website after we have posted changes to this Privacy Policy, you are agreeing to the terms of the Privacy Policy as modified.
Obtaining Additional Information
If you have any questions about this Privacy Policy or our privacy related practices in the United States, you may contact us via our dedicated email at PrivacyUS@allianzgi.com.
| Annual Report | | September 30, 2020 | 247 |
Table of Contents
Unaudited
Allianz Funds Multi-Strategy Trust
The chart below identifies the Trustees and Officers of the Trust. The “interested” Trustees defined by the 1940 Act, are indicated below. Unless otherwise indicated, the correspondence address of all persons below is: 1633 Broadway, New York, New York 10019. The Funds’ Statement of Additional Information contains additional information about the Trustees. The Statement of Additional Information is available without charge, upon request, by calling 1-800-988-8380 (retail classes: A, C and R) or 1-800-498-5413 (Class P, Class R6, Institutional and Administrative classes).
Name, Year of Birth and Position Held with Trust | Term of Office and Length of Time Served | Principal Occupation(s) During Past 5 Years | Number of Funds in Fund Complex Overseen by Trustee | Other Directorships Held by Trustee | ||||
| Interested Trustees | ||||||||
Thomas J. Fuccillo† 1968 | 3/2019 to present | Managing Director and Head of US Funds of Allianz Global Investors U.S. Holdings LLC; Managing Director of Allianz Global Investors Distributors LLC; Trustee, President and Chief Executive Officer of 43 funds in the Fund Complex; and President and Chief Executive Officer of The Korea Fund, Inc. and The Taiwan Fund, Inc. Formerly, Associate General Counsel, Head of US Funds and Retail Legal; Chief Legal Officer and Secretary of Allianz Global Investors Distributors LLC; Vice President, Secretary and Chief Legal Officer of numerous funds in the Fund Complex; and Secretary and Chief Legal Officer of The Korea Fund, Inc. | 40 | None | ||||
Erick R. Holt† 1952 | 12/2017 to present | Board Member, Global Chief Risk Officer, General Counsel and Chief Compliance Officer of Allianz Asset Management GmbH (2006-2018). | 40 | None | ||||
| Independent Trustees | ||||||||
Alan Rappaport 1953 Chairman of the Board of Trustees | 12/2014 to present | Adjunct Professor, New York University Stern School of Business (since 2011); Lecturer, Stanford University Graduate School of Business (since 2013); and Director, Victory Capital Holdings, Inc., an asset management firm (since 2013). Formerly, Trustee, American Museum of Natural History (2005-2015); Trustee and Member of Board of Overseers, NYU Langone Medical Center (2007-2015). and Advisory Director (formerly, Vice Chairman), Roundtable Investment Partners (2009-2018). | 40 | None. | ||||
Sarah E. Cogan 1956 | 1/2019 to present | Retired partner of Simpson Thacher & Bartlett LLP (law firm) (“STB”); Formerly, Partner, STB (1989-2018); Director, Girl Scouts of Greater New York (since 2016); and Trustee, Natural Resources Defense Council, Inc. (since 2013). | 69* | None. | ||||
Deborah A DeCotis 1952 | 6/2014 to present | Advisory Director, Morgan Stanley & Co., Inc. (since 1996); Member, Circle Financial Group (since 2009); Member, Council on Foreign Relations (since 2013); Trustee, Smith College (since 2017); and Director, Watford Re (Since 2017). Formerly, Co-Chair Special Projects Committee, Memorial Sloan Kettering (2005-2015); Trustee, Stanford University (2010-2015); and Principal, LaLoop LLC, a retail accessories company (1999-2014). | 69* | None. | ||||
F. Ford Drummond 1962 | 1/2006 to present | Owner/Operator, Drummond Ranch; and Director, Oklahoma Water Resources Board. Formerly, Director, The Cleveland Bank; and General Counsel, BMI-Health Plans (benefits administration). and Chairman, Oklahoma Water Resources Board. | 40 | Director, Bancfirst Corporation | ||||
| 248 | September 30, 2020 | | Annual Report |
Table of Contents
Unaudited
Allianz Funds Multi-Strategy Trust (cont’d)
Name, Year of Birth and Position Held with Trust | Term of Office and Length of Time Served | Principal Occupation(s) During Past 5 Years | Number of Funds in Fund Complex Overseen by Trustee | Other Directorships Held by Trustee | ||||
James A. Jacobson 1945 | 12/2014 to present | Retired. Trustee (since 2002) and Chairman of Investment Committee (since 2007), Ronald McDonald House of New York; and Trustee, New Jersey City University (since 2014). | 69* | Formerly, Trustee Alpine Mutual Funds Complex (consisting of 18 funds) (2009-2016). | ||||
Hans W. Kertess 1939 | 12/2014 to present | President, H. Kertess & Co., a financial advisory company; and Senior Adviser (formerly Managing Director), Royal Bank of Canada Capital Markets (since 2004). | 69* | None. | ||||
James S. MacLeod 1947 | 12/2014 to present | Non-Executive Chairman, CoastalSouth Bancshares, Inc. (since 2018); Director, Coastal States Bank; Director, Coastal States Mortgage, Inc.; Vice Chairman, MUSC Foundation; Chairman of the Board of Trustees, University of Tampa. Formerly, Chief Executive Officer of CoastalSouth Bancshares (2010-2018); President and Chief Operating Officer, Coastal States Bank (2007-2018); Managing Director and President, Homeowners Mortgage, a subsidiary of Coastal States Bank (2007-2018), Executive Vice President, Mortgage Guaranty Insurance Corporation (1984-2004). | 40 | Non-Executive Chairman & Director, Sykes Enterprises, Inc. | ||||
William B. Ogden, IV 1945 | 12/2014 to present | Retired. Formerly, Asset Management Industry Consultant; and Managing Director, Investment Banking Division of Citigroup Global Markets Inc. | 69* | None. | ||||
Davey S. Scoon 1946 | 1/2006 to present | Formerly Adjunct Professor, University of Wisconsin-Madison (2011-2019). | 40 | Director, Albireo Pharma, Inc. (since 2016); and Director, AMAG Pharmaceuticals, Inc. (since 2006). Formerly, Director, Biodel Inc. (2013- 2016). | ||||
| * | Inclusive of 29 funds managed by Pacific Investment Management Company, LLC (“PIMCO”). |
| † | Each of Mr. Fuccillo and Mr. Holt is an “Interested Person” of the Trust, as defined in Section 2(a)(19) of the 1940 Act, due to her or his affiliation with the Manager and its affiliates. |
| Annual Report | | September 30, 2020 | 249 |
Table of Contents
Unaudited
Allianz Funds—Officers
Name, Address and Year of Birth and Position Held with Trust | Term of Office* and Time Served | Principal Occupation(s) During Past 5 Years | ||
Thomas J. Fuccillo 1968 President and Chief Executive Officer | 4/2016 to present | Managing Director, and Head of US Funds of Allianz Global Investors U.S. Holdings LLC; Managing Director of Allianz Global Investors Distributors LLC; Trustee, President and Chief Executive Officer of 40 funds in the Fund Complex and President and Chief Executive Officer of The Korea Fund, Inc. and The Taiwan Fund, Inc. Formerly, Associate General Counsel, Head of US Funds and Retail Legal; Chief Legal Officer and Secretary of Allianz Global Investors Distributors LLC; Vice President, Secretary and Chief Legal Officer of numerous funds in the Fund Complex (2004-2016); and Secretary and Chief Legal Officer of The Korea Fund, Inc. | ||
Scott Whisten 1971 Treasurer, Principal Financial and Accounting Officer | 4/2018 to present | Director of Allianz Global Investors U.S. LLC; and Treasurer, Principal Financial and Accounting Officer of 40 funds in the Fund Complex. Formerly, Assistant Treasurer of numerous funds in the Fund Complex (2007-2018). | ||
Angela Borreggine 1964 Chief Legal Officer and Secretary | 4/2016 to present | Director and Senior Counsel of Allianz Global Investors U.S. Holdings LLC; Secretary and Chief Legal Officer of 40 funds in the Fund Complex; and Secretary and Chief Legal Officer of The Korea Fund, Inc. Formerly, Assistant Secretary of numerous funds in the Fund Complex (2015-2016). | ||
Thomas L. Harter, CFA 1975 Chief Compliance Officer | 4/2013 to present | Director, Senior Compliance Manager of Allianz Global Investors U.S. Holdings LLC; Director, Deputy Chief Compliance Officer of Allianz Global Investors U.S. LLC; and Chief Compliance Officer of 40 funds in the Fund Complex and of The Korea Fund, Inc. | ||
Richard J. Cochran 1961 Assistant Treasurer | 5/2008 to present | Vice President of Allianz Global Investors U.S. LLC and Assistant Treasurer of 40 funds in the Fund Complex and of The Korea Fund, Inc. | ||
Orhan Dzemaili 1974 Assistant Treasurer | 1/2011 to present | Director of Allianz Global Investors U.S. LLC; Treasurer, Principal Financial and Accounting Officer of The Korea Fund, Inc.; and Assistant Treasurer of 40 funds in the Fund Complex. Formerly, Assistant Treasurer of The Korea Fund, Inc. (2016 – 2018). | ||
Craig Ruckman 1977 Assistant Secretary | 12/2017 to present | Director and Senior Counsel of Allianz Global Investors U.S. Holdings LLC; Chief Legal Officer of Allianz Global Investors Distributors LLC; and Assistant Secretary of 40 funds in the Fund Complex. Formerly, Associate of K&L Gates LLP (2012-2016). | ||
| * | The officers of the Trust are elected annually by the Board of Trustees. |
Each of the Trust’s executive officers is an “interested person” of the Trust (as defined in Section 2(a)(19) of the 1940 Act) as a result of his or her position(s) set forth in the table above.
| 250 | September 30, 2020 | | Annual Report |
Table of Contents
Allianz Funds Multi-Strategy Trust
Trustees
Alan Rappaport
Chairman of the Board of Trustees
Sarah E. Cogan
Deborah A. DeCotis
F. Ford Drummond
Thomas J. Fuccillo
Erick R. Holt
James A. Jacobson
Hans W. Kertess
James S. MacLeod
William B. Ogden, IV
Davey S. Scoon
Officers
Thomas J. Fuccillo
President and Chief Executive Officer
Scott Whisten
Treasurer, Principal Financial and Accounting Officer
Angela Borreggine
Chief Legal Officer and Secretary
Thomas L. Harter
Chief Compliance Officer
Richard J. Cochran
Assistant Treasurer
Orhan Dzemaili
Assistant Treasurer
Craig A. Ruckman
Assistant Secretary
Investment Manager
Allianz Global Investors U.S. LLC
1633 Broadway
New York, NY 10019
Distributor
Allianz Global Investors Distributors LLC
1633 Broadway
New York, NY 10019
Custodian & Accounting Agent
State Street Bank and Trust Co.
801 Pennsylvania Avenue
Kansas City, MO 64105
Shareholder Servicing and Transfer Agents
State Street Bank and Trust Company, which has delegated its obligations
as transfer agent to:
DST Asset Manager Solutions, Inc.
(Class A, Class C and Class R shares)
P.O. Box 219723
Kansas City, MO 64121-9723
(Class P, Institutional Class, Class R6 and Administrative Class shares)
P.O. Box 219968,
Kansas City, MO 64121-9968
Independent Registered Public Accounting Firm
PricewaterhouseCoopers LLP
300 Madison Avenue
New York, NY 10017
Legal Counsel
Ropes & Gray LLP
Prudential Tower
800 Boylston Street
Boston, MA 02199
This report, including the financial information herein, is transmitted to the shareholders of the Funds for their information. It is not a prospectus, circular or representation intended for use in the purchase of shares of each Fund or any securities mentioned in this report.
For Account Information
Contact your financial adviser, or if you receive account statements directly from Allianz Global Investors Distributors LLC, you can also call (800) 988-8380 for Class A, C and R shares or (800) 498-5413 for Class P, Institutional, R6 and Administrative shares. Telephone representatives are available Monday-Friday 8:30 am to 6:00 pm Eastern Time. Or visit our website, us.allianzgi.com.
Table of Contents
About Allianz Global Investors
Allianz Global Investors is a leading active asset manager with 754 investment professionals in 25 offices worldwide and managing $641 billion in assets for individuals, families and institutions.*
Active is the most important word in our vocabulary. Active is how we create and share value with clients. We believe in solving, not selling, and in adding value beyond pure economic gain. We invest for the long term, employing our innovative investment expertise and global resources. Our goal is to ensure a superior experience for our clients, wherever they are based and whatever their investment needs.
Active is: Allianz Global Investors
* Data as of September 30, 2020.
For more information about any of our investment solutions or client services, call your financial advisor or visit us.allianzgi.com.
Investors should consider the investment objectives, risks, charges and expenses of the above mentioned Funds carefully before investing. This and other information is contained in each Fund’s prospectus, which may be obtained by contacting your financial advisor, by visiting us.allianzgi.com or by calling 1-800-988-8380 (retail classes: A, C & R) or 1-800-498-5413 (Class P, Class R6, Institutional & Administrative classes). Please read the prospectus carefully before you invest or send money.
Allianz Global Investors U.S. LLC serves as the investment manager for the Allianz Funds and the Allianz Funds Multi-Strategy Trust. Allianz Funds and the Allianz Funds Multi-Strategy Trust are distributed by Allianz Global Investors Distributors LLC. © 2019. For information about any product, contact your financial advisor.
us.allianzgi.com
Receive this report electronically and eliminate paper mailings.
To enroll, go to us.allianzgi.com/edelivery
AZ750AR_093020 |
1344007
Table of Contents
| ITEM 2. | CODE OF ETHICS |
| (a) | As of the end of the period covered by this report, the registrant has adopted a code of ethics (the “Section 406 Standards for Investment Companies – Ethical Standards for Principal Executive and Financial Officers”) that applies to the registrant’s President and Chief Executive Officer and Principal Financial Officer; the registrant’s Principal Financial Officer also serves as the Principal Accounting Officer. The registrant undertakes to provide a copy of such code of ethics to any person upon request, without charge, by calling 1-800-926-4456. The code of ethics are included as an Exhibit 99.CODE ETH hereto. |
| (b) | During the period covered by this report, there were not any amendments to a provision of the code of ethics adopted in 2(a) above. |
| (c) | During the period covered by this report, there were not any waivers or implicit waivers to a provision of the code of ethics adopted in 2(a) above. |
| ITEM 3. | AUDIT COMMITTEE FINANCIAL EXPERT |
The registrant’s Board has determined that Messrs. James A. Jacobson and Davey S. Scoon, both of whom serve on the Trust’s Audit Oversight Committee, qualify as “audit committee financial experts,” and that they are “independent,” for purposes of this Item.
| ITEM 4. | PRINCIPAL ACCOUNTANT FEES AND SERVICES |
| a) | Audit fees. The aggregate fees billed for each of the last two fiscal years (the “Reporting Periods”) for professional services rendered by the Registrant’s principal accountant (the “Auditor”) for the audit of the Registrant’s annual financial statements, or services that are normally provided by the Auditor in connection with the statutory and regulatory filings or engagements for the Reporting Periods, were $1,150,392 in 2019 and $717,922 in 2020. |
| b) | Audit-Related Fees. The aggregate fees billed in the Reporting Periods for assurance and related services by the principal accountants that are reasonably related to the performance of the audit registrant’s financial statements and are not reported under paragraph (e) of this Item were $0 in 2019 and $0 in 2020. |
| c) | Tax Fees. The aggregate fees billed in the Reporting Periods for professional services rendered by the Auditor for tax compliance, tax service and tax planning (“Tax Services”) were $514,451 in 2019 and $405,000 in 2020. These services consisted of review or preparation of U.S. federal, state, local and excise tax returns and calculations of excise tax distributions. |
| d) | All Other Fees. There were no other Fees billed in the Reporting Periods for products and services provided by the Auditor to the Registrant. |
| e)1. | Audit Committee Pre-Approval Policies and Procedures. The Registrant’s Audit Oversight Committee has established policies and procedures for pre-approval of all audit and permissible non-audit services by the Auditor for the Registrant, as well as the Auditor’s engagements related directly to the operations and financial reporting of the Registrant. The Registrant’s policy is stated below. |
Table of Contents
Allianz Funds Multi-Strategy Trust (The “Trust”)
AUDIT OVERSIGHT COMMITTEE POLICY
FOR
PRE-APPROVAL OF SERVICES PROVIDED BY THE INDEPENDENT ACCOUNTANTS
The Trust’s Audit Oversight Committee (“Committee”) is charged with the oversight of the Trust’s financial reporting policies and practices and their internal controls. As part of this responsibility, the Committee must pre-approve any independent accounting firm’s engagement to render audit and/or permissible non-audit services to the Trust as well as to the Trust’s investment adviser(1) or any entity controlling, controlled by or under common control with the investment adviser that provides ongoing services to the Trust (“Applicable Service Providers”), if the engagement relates directly to operations and financial reporting of the Trust. In evaluating a proposed engagement by the independent accountants, the Committee will assess the effect that the engagement might reasonably be expected to have on the accountant’s independence. The Committee’s evaluation will be based on:
a review of the nature of the professional services expected to be provided; the fees to be charged in connection with the services expected to be provided; a review of the safeguards put into place by the accounting firm to safeguard independence; and periodic meetings with the accounting firm.
The Committee need not evaluate all four factors each time it pre-approves a service; it may rely on previous evaluations to the extent it considers appropriate.
POLICY FOR PRE-APPROVAL OF AUDIT AND NON-AUDIT SERVICES TO BE PROVIDED TO THE TRUST
On an annual basis, the Committee of the Trust will review and if the Committee so determines, pre-approve the scope of the audits of the Trust and proposed audit fees, and permitted non-audit (including audit-related) services that are proposed to be performed by the Trust’s independent accountants for the Trust and its Applicable Service Providers (to the extent the services to be provided to the Applicable Service Providers relate directly to the operations and financial reporting of the Trust). The Committee may also pre-approve services at any other in-person or telephonic Committee meeting. At least annually, the Committee will receive a report of all audit and non-audit services that were rendered in the previous calendar year by the independent accountants for the Trust and its Applicable Service Providers pursuant to this Policy.
In addition to the Committee’s pre-approval of services pursuant to this Policy, the engagement of the independent accounting firm for any permitted non-audit service provided to the fund with also require the separate pre-approval of the President, Treasurer or Assistant Treasurer of the Trust, who may only grant such approval if he or she believes that the accounting firm’s engagement will not adversely affect the firm’s independence. All non-audit services performed by the independent accounting firm will be disclosed, as required, in filings with the Securities and Exchange Commission.
AUDIT SERVICES
The categories of audit services and related fees to be reviewed and pre-approved annually by the Committee are:
Annual Trust financial statement audits
Seed audits (related to new product filings, as required)
SEC and regulatory filings and consents
Semiannual financial statement reviews
Individual audit services that fall within one of these categories and are not presented to the Committee as part of the annual pre-approval process described above, may be pre-approved, if deemed consistent with the accounting firm’s independence, by the Committee Chair (or any other Committee member who is a disinterested trustee under the Investment Company to whom this responsibility has been delegated) so long as the estimated fee for those services does not exceed $500,000. Any pre-approval by a Committee member shall be reported to the full Committee at its next regularly scheduled meeting.
Table of Contents
(1) For purposes of this requirement, the term “adviser” does not include sub-advisers that are not affiliated with a Trust’s investment adviser, are overseen by that investment adviser, and whose role is primarily portfolio management.
AUDIT-RELATED SERVICES
The following categories of audit-related services are considered to be consistent with the role of the Trust’s independent accountants and services falling under one of these categories will be pre-approved by the Committee on an annual basis if the Committee deems those services to be consistent with the accounting firm’s independence:
Accounting consultations Trust
Fund merger support services
Agreed upon procedure reports
Other Attestation reports
Comfort letters
Other internal control reports
Individual audit-related services that fall within one of these categories and are not presented to the Committee as part of the annual pre-approval process described above, may be pre-approved, if deemed consistent with the accounting firm’s independence, by the Committee Chair (or any other Committee member who is a disinterested trustee under the Investment Company to whom this responsibility has been delegated) so long as the estimated fee for those services does not exceed $500,000. Any pre-approval by a Committee member shall be reported to the full Committee at its next regularly scheduled meeting.
TAX SERVICES
The following categories of tax services are considered to be consistent with the role of the Trust’s independent accountants and services falling under one of these categories will be pre-approved by the Committee on an annual basis if the Committee deems those services to be consistent with the accounting firm’s independence:
Federal, state and local income tax compliance; and, sales and use tax compliance, including required filings and amendments
Timely RIC qualification reviews
Tax distribution analysis and planning
Tax authority examination services
Tax appeals support services
Accounting methods studies
Trust merger support services
Other tax consulting services and related projects
Individual tax services that fall within one of these categories and are not presented to the Committee as part of the annual pre-approval process described above, may be pre-approved, if deemed consistent with the accounting firm’s independence, by the Committee at any regular or special meeting. Such services may also be pre-approved by the Committee Chair (or any other Committee member who is a disinterested trustee under the Investment Company Act to whom this responsibility has been delegated) so long as the estimated fee for the particular service for which pre-approval is sought does not exceed $500,000. Any pre-approval by a Committee Member shall be reported to the full Committee at its next regularly scheduled meeting.
Table of Contents
OTHER SERVICES
Services that are proposed to be provided to the Trust which are not audit, audit-related or tax services may be pre-approved, if deemed consistent with the accounting firm’s independence, by the Committee at any regular or special meeting. Such services may also be pre-approved by the Committee Chair (or any other Committee member who is a disinterested trustee under the Investment Company Act to whom this responsibility has been delegated) so long as the estimated fee for the particular service for which pre-approval is sought does not exceed $500,000. Any pre-approval by a Committee member shall be reported to the full Committee at its next regularly scheduled meeting.
PROHIBITED SERVICES
The Trust’s independent accountants will not render services in the following categories of non-audit services:
Bookkeeping or other services related to the accounting records or financial statements of the Trust
Financial information systems design and implementation
Appraisal or valuation services, fairness opinions, or contribution-in-kind reports
Actuarial services
Internal audit outsourcing services
Management functions or human resources
Broker or dealer, investment adviser or investment banking services
Legal services and expert services unrelated to the audit
Any other service that the Public Company Accounting Oversight Board determines, by regulation, is impermissible.
PRE-APPROVAL OF NON-AUDIT SERVICES PROVIDED TO OTHER ENTITIES WITHIN THE FUND COMPLEX
Rule 2-01(c)(7) of Regulation S-X provides that an accountant is not independent of the Trust unless the Trust’s Committee approves any permitted non-audit services to be provided to the Trust’s Applicable Service Providers, provided, in each case, that the engagement relates directly to the operations and financial reporting of the Trust.
Services to be provided to Applicable Service Providers that are required to be pre-approved, may be pre-approved, if deemed consistent with the accounting firm’s independence, by the Committee at a regular or special meeting or by the Committee Chair (or any other Committee member who is a disinterested trustee under the Investment Company Act to whom this responsibility has been delegated) so long as the estimated fee for those services does not exceed $500,000. If a service is approved by a Committee member, the full Committee is notified of such pre-approval at its next regularly scheduled meeting.
Although the Committee will not be required to pre-approve all services provided to Applicable Service Providers and their affiliates, the Committee will receive an annual report from the Trust’s independent accounting firm showing the aggregate fees for all services provided to Applicable Service Providers and their affiliates.
DE MINIMUS EXCEPTION TO REQUIREMENT OF PRE-APPROVAL OF NON-AUDIT SERVICES
With respect to the provision of permitted non-audit services to the Trust or Accounting Affiliates, the pre-approval requirement is waived if:
(1) The aggregate fees and costs of all non-audit services that, but for the limited exception provided by this section, would require pre-approval by the Committee constitutes no more than five percent of the total fees and costs paid by the Trust and Applicable Service Providers to the independent accountant during the fiscal year during which such non-audit services are provided;
Table of Contents
(2) At the time of the engagement for such services, the Trust did not recognize that the services were “non-audit services” that required preapproval; and
(3) Each such service is brought promptly to the attention of the Committee and approved prior to the completion of the audit by the Committee, Committee Chair or any other Committee member who is a disinterested trustee under the Investment Company Act to whom this responsibility has been delegated.
e)2. No services were approved pursuant to the procedures contained in paragraph (C) (7) (i) (C) of Rule 2-01 of Registration S-X.
f) Not applicable.
g) Non-audit fees. The aggregate non-audit fees billed by the Auditor for services rendered to the Registrant, and rendered to the Adviser, for the 2019 Reporting Period was $1,594,163 and the 2020 Reporting Period was $1,623,815.
h) Auditor Independence. The Registrant’s Audit Oversight Committee has considered whether the provision of non-audit services that were rendered to the Adviser which were not pre-approved is compatible with maintaining the Auditor’s independence.
| ITEM 5. | AUDIT COMMITTEE OF LISTED REGISTRANT |
Disclosure not required for open-end management investment companies.
| ITEM 6. | INVESTMENTS |
| (a) | Schedule of Investments is included as part of the report to shareholders filed under Item 1 of this form. |
| (b) | Not applicable. |
| ITEM 7. | DISCLOSURE OF PROXY VOTING POLICIES AND PROCEDURES FOR CLOSED-END MANAGEMENT INVESTMENT COMPANIES |
Disclosure not required for open-end management investment companies.
| ITEM 8. | PORTFOLIO MANAGERS OF CLOSED-END MANAGEMENT INVESTMENT COMPANIES |
Disclosure not required for open-end management investment companies.
| ITEM 9. | PURCHASES OF EQUITY SECURITIES BY CLOSED-END MANAGEMENT INVESTMENT COMPANY AND AFFILIATED PURCHASERS |
Disclosure not required for open-end management investment companies.
| ITEM 10. | SUBMISSION OF MATTERS TO A VOTE OF SECURITY HOLDERS |
There have been no material changes to the procedures by which shareholders may recommend nominees to the Trust’s Board of Trustees since the Trust last provided disclosure in response to this item.
Table of Contents
| ITEM 11. | CONTROLS AND PROCEDURES |
| (a) | The registrant’s President & Chief Executive Officer and Treasurer, Principal Financial & Accounting Officer have concluded that the registrant’s disclosure controls and procedures (as defined in Rule 30a-3(c) under the Investment Company Act of 1940 (the “1940 Act”) (17 CFR 270.30a-3(c)), as amended) are effective based on their evaluation of these controls and procedures as of a date within 90 days of the filing date of this document. |
| (b) | There were no changes in the registrant’s internal control over financial reporting (as defined in Rule 30a-3(d) under the 1940 Act (17 CFR 270.30a-3(d))) that occurred during the most recent fiscal half-year covered by this report that has materially affected, or is reasonably likely to materially affect, the registrant’s internal control over financial reporting. |
| ITEM 12. | DISCLOSURE OF SECURITIES LENDING ACTIVITIES FOR CLOSED-END MANAGEMENT INVESTMENT COMPANIES. |
Disclosure not required for open-end management investment companies.
| ITEM 13. | EXHIBITS |
(a)(1) Exhibit 99.CODE ETH – Code of Ethics
(a)(2) Exhibit 99_ CERT. – Certification pursuant to Section 302 of the Sarbanes-Oxley Act of 2002
(a)(3) Not applicable
(b) Exhibit 99.906 CERT. – Certification pursuant to Section 906 of the Sarbanes-Oxley Act of 2002
Table of Contents
Signatures
Pursuant to the requirements of the Securities Exchange Act of 1934 and the Investment Company Act of 1940, the registrant has duly caused this report to be signed on its behalf by the undersigned, thereunto duly authorized.
Allianz Funds Multi-Strategy Trust
| By: | /s/ Thomas J. Fuccillo | |
| Thomas J. Fuccillo | ||
| President & Chief Executive Officer | ||
Date: December 7, 2020
| By: | /s/ Scott Whisten | |
| Scott Whisten | ||
Treasurer, Principal Financial & Accounting Officer |
Date: December 7, 2020
Pursuant to the requirements of the Securities Exchange Act of 1934 and the Investment Company Act of 1940, this report has been signed below by the following persons on behalf of the registrant and in the capacities and on the dates indicated.
| By: | /s/ Thomas J. Fuccillo | |
| Thomas J. Fuccillo | ||
| President & Chief Executive Officer | ||
Date: December 7, 2020
| By: | /s/ Scott Whisten | |
| Scott Whisten | ||
Treasurer, Principal Financial & Accounting Officer |
Date: December 7, 2020