UNITED STATES
SECURITIES AND EXCHANGE COMMISSION
Washington, D.C. 20549
FORM N-CSR
CERTIFIED SHAREHOLDER REPORT OF REGISTERED
MANAGEMENT INVESTMENT COMPANIES
Investment Company Act file number 811-22167
Virtus Strategy Trust
(Exact name of registrant as specified in charter)
101 Munson Street
Greenfield, MA 01301-9668
(Address of principal executive offices) (Zip code)
Jennifer Fromm, Esq.
Vice President, Chief Legal Officer, Counsel and Secretary for Registrant
One Financial Plaza
Hartford, CT 06103-2608
(Name and address of agent for service)
Registrant’s telephone number, including area code: (800) 243-1574
Date of fiscal year end: September 30
Date of reporting period: September 30, 2023
Form N-CSR is to be used by management investment companies to file reports with the Commission not later than 10 days after the transmission to stockholders of any report that is required to be transmitted to stockholders under Rule 30e-1 under the Investment Company Act of 1940 (17 CFR 270.30e-1). The Commission may use the information provided on Form N-CSR in its regulatory, disclosure review, inspection, and policymaking roles.
A registrant is required to disclose the information specified by Form N-CSR, and the Commission will make this information public. A registrant is not required to respond to the collection of information contained in Form N-CSR unless the Form displays a currently valid Office of Management and Budget (“OMB”) control number. Please direct comments concerning the accuracy of the information collection burden estimate and any suggestions for reducing the burden to Secretary, Securities and Exchange Commission, 450 Fifth Street, NW, Washington, DC 20549-0609. The OMB has reviewed this collection of information under the clearance requirements of 44 U.S.C. § 3507.
Item 1. Reports to Stockholders.
| (a) | The Report to Shareholders is attached herewith. |

| Virtus Convertible Fund |
| Virtus Duff & Phelps Water Fund |
| Virtus Global Allocation Fund |
| Virtus International Small-Cap Fund* |
| Virtus Newfleet Short Duration High Income Fund |
| Virtus NFJ Emerging Markets Value Fund |
| Virtus NFJ Global Sustainability Fund |
| Virtus Seix High Yield Income Fund |
| 1 | ||
| 2 | ||
| 5 | ||
| Fund | Fund Summary | Schedule of Investments |
| 9 | 37 | |
| 12 | 40 | |
| 16 | 41 | |
| 20 | 48 | |
| 23 | 50 | |
| 27 | 54 | |
| 30 | 56 | |
| 33 | 57 | |
| 62 | ||
| 66 | ||
| 68 | ||
| 71 | ||
| 78 | ||
| 98 | ||
| 99 | ||
| 100 | ||
| 101 | ||


President and Trustee, Virtus Funds
November 2023
| Beginning Account Value April 1, 2023 | Ending Account Value September 30, 2023 | Annualized Expense Ratio | Expenses Paid During Period* | |||||
Convertible Fund | ||||||||
| Class A | $ 1,000.00 | $ 989.90 | 0.96 % | $ 4.79 | ||||
| Class C | 1,000.00 | 985.70 | 1.73 | 8.61 | ||||
| Class P | 1,000.00 | 990.90 | 0.71 | 3.54 | ||||
| Institutional Class | 1,000.00 | 991.10 | 0.71 | 3.54 | ||||
| Class R6 | 1,000.00 | 991.50 | 0.62 | 3.10 | ||||
| Administrative Class | 1,000.00 | 990.00 | 0.93 | 4.64 | ||||
Duff & Phelps Water Fund | ||||||||
| Class A | 1,000.00 | 937.60 | 1.22 | 5.93 | ||||
| Class C | 1,000.00 | 934.10 | 1.97 | 9.55 | ||||
| Class P | 1,000.00 | 938.70 | 0.94 | 4.57 | ||||
| Institutional Class | 1,000.00 | 939.50 | 0.93 | 4.52 | ||||
Global Allocation Fund | ||||||||
| Class A | 1,000.00 | 966.10 | 0.52 | 2.56 | ||||
| Class C | 1,000.00 | 961.70 | 1.27 | 6.25 | ||||
| Class P | 1,000.00 | 966.50 | 0.32 | 1.58 | ||||
| Institutional Class | 1,000.00 | 965.80 | 0.29 | 1.43 | ||||
| Class R6 | 1,000.00 | 966.90 | 0.22 | 1.08 | ||||
| Administrative Class | 1,000.00 | 965.50 | 0.47 | 2.32 | ||||
International Small-Cap Fund | ||||||||
| Class A | 1,000.00 | 1,031.10 | 1.29 | 6.57 | ||||
| Class C | 1,000.00 | 1,027.00 | 2.04 | 10.37 | ||||
| Class P | 1,000.00 | 1,031.90 | 1.14 | 5.81 | ||||
| Institutional Class | 1,000.00 | 1,032.40 | 1.08 | 5.50 | ||||
| Class R6 | 1,000.00 | 1,032.40 | 1.03 | 5.25 | ||||
Newfleet Short Duration High Income Fund | ||||||||
| Class A | 1,000.00 | 1,045.20 | 0.87 | 4.46 | ||||
| Class C | 1,000.00 | 1,043.70 | 1.12 | 5.74 | ||||
| Class P | 1,000.00 | 1,045.80 | 0.66 | 3.38 | ||||
| Institutional Class | 1,000.00 | 1,046.30 | 0.61 | 3.13 | ||||
| Class R6 | 1,000.00 | 1,046.70 | 0.56 | 2.87 |
| Beginning Account Value April 1, 2023 | Ending Account Value September 30, 2023 | Annualized Expense Ratio | Expenses Paid During Period* | |||||
NFJ Emerging Markets Value Fund | ||||||||
| Class A | $1,000.00 | $ 974.60 | 1.14% | $ 5.64 | ||||
| Class C | 1,000.00 | 971.00 | 1.89 | 9.34 | ||||
| Class P | 1,000.00 | 975.60 | 0.99 | 4.90 | ||||
| Institutional Class | 1,000.00 | 975.20 | 0.89 | 4.41 | ||||
NFJ Global Sustainability Fund | ||||||||
| Class A | 1,000.00 | 976.60 | 0.94 | 4.66 | ||||
| Class P | 1,000.00 | 977.70 | 0.79 | 3.92 | ||||
| Institutional Class | 1,000.00 | 977.80 | 0.69 | 3.42 | ||||
Seix High Yield Income Fund | ||||||||
| Class A | 1,000.00 | 1,037.10 | 1.16 | 5.92 | ||||
| Class C | 1,000.00 | 1,034.50 | 1.84 | 9.38 | ||||
| Class P | 1,000.00 | 1,040.20 | 0.85 | 4.35 | ||||
| Institutional | 1,000.00 | 1,038.00 | 0.87 | 4.44 | ||||
| Administrative Class | 1,000.00 | 1,038.90 | 1.04 | 5.32 |
| * | Expenses are equal to the relevant Fund’s annualized expense ratio, which is net of waived fees and reimbursed expenses, if applicable, multiplied by the average account value over the period, multiplied by the number of days (183) expenses were accrued in the most recent fiscal half-year, then divided by 365 to reflect the one-half year period. |
| Beginning Account Value April 1, 2023 | Ending Account Value September 30, 2023 | Annualized Expense Ratio | Expenses Paid During Period* | |||||
Convertible Fund | ||||||||
| Class A | $ 1,000.00 | $ 1,020.26 | 0.96 % | $ 4.86 | ||||
| Class C | 1,000.00 | 1,016.39 | 1.73 | 8.74 | ||||
| Class P | 1,000.00 | 1,021.51 | 0.71 | 3.60 | ||||
| Institutional Class | 1,000.00 | 1,021.51 | 0.71 | 3.60 | ||||
| Class R6 | 1,000.00 | 1,021.96 | 0.62 | 3.14 | ||||
| Administrative Class | 1,000.00 | 1,020.41 | 0.93 | 4.71 | ||||
Duff & Phelps Water Fund | ||||||||
| Class A | 1,000.00 | 1,018.95 | 1.22 | 6.17 | ||||
| Class C | 1,000.00 | 1,015.19 | 1.97 | 9.95 | ||||
| Class P | 1,000.00 | 1,020.36 | 0.94 | 4.76 | ||||
| Institutional Class | 1,000.00 | 1,020.41 | 0.93 | 4.71 | ||||
Global Allocation Fund | ||||||||
| Class A | 1,000.00 | 1,022.46 | 0.52 | 2.64 | ||||
| Class C | 1,000.00 | 1,018.70 | 1.27 | 6.43 | ||||
| Class P | 1,000.00 | 1,023.46 | 0.32 | 1.62 | ||||
| Institutional Class | 1,000.00 | 1,023.61 | 0.29 | 1.47 | ||||
| Class R6 | 1,000.00 | 1,023.97 | 0.22 | 1.12 | ||||
| Administrative Class | 1,000.00 | 1,022.71 | 0.47 | 2.38 |
| Beginning Account Value April 1, 2023 | Ending Account Value September 30, 2023 | Annualized Expense Ratio | Expenses Paid During Period* | |||||
International Small-Cap Fund | ||||||||
| Class A | $1,000.00 | $1,018.60 | 1.29% | $ 6.53 | ||||
| Class C | 1,000.00 | 1,014.84 | 2.04 | 10.30 | ||||
| Class P | 1,000.00 | 1,019.35 | 1.14 | 5.77 | ||||
| Institutional Class | 1,000.00 | 1,019.65 | 1.08 | 5.47 | ||||
| Class R6 | 1,000.00 | 1,019.90 | 1.03 | 5.22 | ||||
Newfleet Short Duration High Income Fund | ||||||||
| Class A | 1,000.00 | 1,020.71 | 0.87 | 4.41 | ||||
| Class C | 1,000.00 | 1,019.45 | 1.12 | 5.67 | ||||
| Class P | 1,000.00 | 1,021.76 | 0.66 | 3.35 | ||||
| Institutional Class | 1,000.00 | 1,022.01 | 0.61 | 3.09 | ||||
| Class R6 | 1,000.00 | 1,022.26 | 0.56 | 2.84 | ||||
NFJ Emerging Markets Value Fund | ||||||||
| Class A | 1,000.00 | 1,019.35 | 1.14 | 5.77 | ||||
| Class C | 1,000.00 | 1,015.59 | 1.89 | 9.55 | ||||
| Class P | 1,000.00 | 1,020.10 | 0.99 | 5.01 | ||||
| Institutional Class | 1,000.00 | 1,020.61 | 0.89 | 4.51 | ||||
NFJ Global Sustainability Fund | ||||||||
| Class A | 1,000.00 | 1,020.36 | 0.94 | 4.76 | ||||
| Class P | 1,000.00 | 1,021.11 | 0.79 | 4.00 | ||||
| Institutional Class | 1,000.00 | 1,021.61 | 0.69 | 3.50 | ||||
Seix High Yield Income Fund | ||||||||
| Class A | 1,000.00 | 1,019.25 | 1.16 | 5.87 | ||||
| Class C | 1,000.00 | 1,015.84 | 1.84 | 9.30 | ||||
| Class P | 1,000.00 | 1,020.81 | 0.85 | 4.31 | ||||
| Institutional | 1,000.00 | 1,020.71 | 0.87 | 4.41 | ||||
| Administrative Class | 1,000.00 | 1,019.85 | 1.04 | 5.27 |
| * | Expenses are equal to the relevant Fund’s annualized expense ratio, which is net of waived fees and reimbursed expenses, if applicable, multiplied by the average account value over the period, multiplied by the number of days (183) expenses were accrued in the most recent fiscal half-year, then divided by 365 to reflect the one-half year period. |
September 30, 2023
September 30, 2023
September 30, 2023
| Ticker Symbols: | |
| Class A : ANZAX | |
| Class C: ANZCX | |
| Class P: ANCMX | |
| Institutional Class: ANNPX | |
| Class R6: VAADX | |
| Administrative Class: ANNAX |
Voya Investment Management Co., LLC
| ■ | The Fund is diversified and has an investment objective of seeking maximum total return, consisting of capital appreciation and current income. There is no guarantee that the Fund will meet its objective. |
| ■ | For the fiscal year ended September 30, 2023, the Fund’s Class A shares at NAV returned 4.19%, Class C shares at NAV returned 3.37%, Class P shares at NAV returned 4.45%, Institutional Class shares at NAV returned 4.47%†, Class R6 shares at NAV returned 4.55% and Administrative Class shares at NAV returned 4.23%. For the fiscal year ended September 30, 2023, the ICE BofA U.S. Convertibles Index, the Fund’s style-specific benchmark appropriate for comparison, returned 7.49%. |
| Convertible Bonds and Notes | 91% | |
| Software | 14% | |
| Internet | 11 | |
| Entertainment | 6 | |
| All other Convertible Bonds and Notes | 60 | |
| Convertible Preferred Stocks | 6 | |
| Short-Term Investment | 2 | |
| Equity-Linked Note | 1 | |
| Total | 100% |
| 1 Year | 5 Years | 10 Years | Since inception | Inception date | ||
| Class A shares at NAV2 | 4.19 % | 8.83 % | 8.79 % | — % | — | |
| Class A shares at POP3,4 | -1.54 | 7.60 | 8.18 | — | — | |
| Class C shares at NAV2 and with CDSC4 | 3.37 | 8.00 | 7.99 | — | — | |
| Class P shares at NAV2 | 4.45 | 9.10 | 9.07 | — | — | |
| Institutional Class shares at NAV2 | 4.47 5 | 9.11 | 9.11 | — | — | |
| Class R6 shares at NAV2 | 4.55 | — | — | -5.99 | 1/31/22 | |
| Administrative Class shares at NAV2 | 4.23 | 8.86 | 8.86 | — | — | |
| ICE BofA U.S. Convertibles Index | 7.49 | 8.36 | 8.83 | -4.87 6 | — | |
| Fund Expense Ratios7: Class A shares: Gross 1.10%, Net 0.97%; Class C shares: Gross 1.83%, Net 1.74%; Class P shares: Gross 0.84%, Net 0.72%; Institutional Class shares: Gross 0.84%, Net 0.72%; Class R6 shares: Gross 0.84%, Net 0.63%; Administrative Class shares: Gross 1.17%, Net 0.94%. | ||||||
| All returns represent past performance which is no guarantee of future results. Current performance may be higher or lower than the performance shown. The investment return and principal value of an investment will fluctuate so that an investor’s shares, when redeemed, may be worth more or less than their original cost. The above table and graph below do not reflect the deduction of taxes that a shareholder would pay on fund distributions or the redemption of shares. Please visit Virtus.com for performance data current to the most recent month-end. |
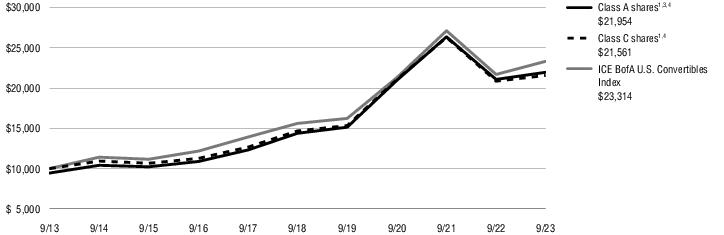

| 1 | Total returns are historical and include changes in share price and the reinvestment of both dividends and capital gain distributions. |
| 2 | “NAV” (Net Asset Value) total returns do not include the effect of any sales charge. |
| 3 | “POP” (Public Offering Price) total returns include the effect of the maximum front-end 5.50% sales charge. |
| 4 | “CDSC” (contingent deferred sales charge) is applied to redemptions of certain classes of shares that do not have a sales charge applied at the time of purchase. CDSC for certain redemptions of Class A shares made within 18 months of a finder’s fee being paid and all Class C shares are 1% within the first year and 0% thereafter. |
| 5 | Total Return for the report period presented in the table differs from the return in the Financial Highlights. The total return presented in the above table is calculated based on the NAV at which shareholder transactions were processed. The total return presented in the Financial Highlights section of the report is calculated in the same manner, but also takes into account certain adjustments that are necessary under generally accepted accounting principles required in the annual report and semiannual report. |
| 6 | The since inception index return is from the inception date of Class R6 shares. |
| 7 | The expense ratios of the Fund are set forth according to the prospectus for the Fund effective January 27, 2023, as supplemented and revised, and may differ from the expense ratios disclosed in the Financial Highlights tables in this report. See the Financial Highlights for more current expense ratios. Net Expense: Expenses reduced by a contractual expense limitation in effect through February 1, 2024. Gross Expense: Does not reflect the effect of the expense limitation. Expense ratios include fees and expenses associated with any underlying funds. |
| Ticker Symbols: | |
| Class A : AWTAX | |
| Class C: AWTCX | |
| Class P: AWTPX | |
| Institutional Class: AWTIX |
Duff & Phelps Investment Management Co.
| ■ | The Fund is non-diversified and has an investment objective of seeking long-term capital appreciation. There is no guarantee that the Fund will meet its objective. |
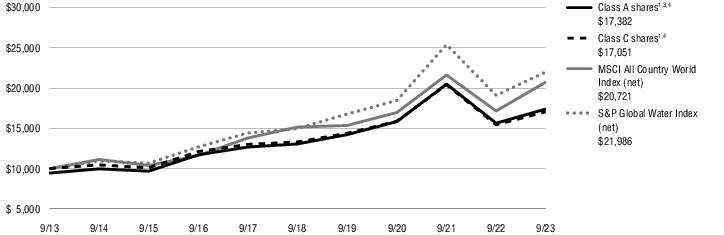
| ■ | For the fiscal year ended September 30, 2023, the Fund’s Class A shares at NAV returned 11.17%, Class C shares at NAV returned 10.40%, Class P shares at NAV returned 11.53%, and Institutional Class shares at NAV returned 11.55%. For the same period, the S&P Global Water Index (net), the Fund’s style-specific benchmark appropriate for comparison, returned 15.13% and MSCI All Country World Index (net), a broad-based index, returned 20.80%. |
| Water Utilities | 29% |
| Machinery | 20 |
| Life Sciences Tools & Services | 9 |
| Construction & Engineering | 8 |
| Commercial Services & Supplies | 7 |
| Building Products | 6 |
| Multi-Utilities | 6 |
| Trading Companies & Distributors | 5 |
| Electronic Equipment, Instruments & Components | 4 |
| Chemicals | 4 |
| Other | 2 |
| Total | 100% |
| 1 Year | 5 Years | 10 Years | ||
| Class A shares at NAV2 | 11.17 % | 5.88% | 6.28% | |
| Class A shares at POP3,4 | 5.06 | 4.69 | 5.68 | |
| Class C shares at NAV2 and with CDSC4 | 10.40 | 5.08 | 5.48 | |
| Class P shares at NAV2 | 11.53 | 6.17 | 6.57 | |
| Institutional Class shares at NAV2 | 11.55 | 6.19 | 6.59 | |
| MSCI All Country World Index (net) | 20.80 | 6.46 | 7.56 | |
| S&P Global Water Index (net) | 15.13 | 7.98 | 8.20 | |
| Fund Expense Ratios5: Class A shares: Gross 1.48%, Net 1.22%; Class C shares: Gross 2.22%, Net 1.97%; Class P shares: Gross 1.19%, Net 0.94%; Institutional Class shares: Gross 1.22%, Net 0.93%. | ||||
| All returns represent past performance which is no guarantee of future results. Current performance may be higher or lower than the performance shown. The investment return and principal value of an investment will fluctuate so that an investor’s shares, when redeemed, may be worth more or less than their original cost. The above table and graph below do not reflect the deduction of taxes that a shareholder would pay on fund distributions or the redemption of shares. Please visit Virtus.com for performance data current to the most recent month-end. |

| 1 | Total returns are historical and include changes in share price and the reinvestment of both dividends and capital gain distributions. |
| 2 | “NAV” (Net Asset Value) total returns do not include the effect of any sales charge. |
| 3 | “POP” (Public Offering Price) total returns include the effect of the maximum front-end 5.50% sales charge. |
| 4 | “CDSC” (contingent deferred sales charge) is applied to redemptions of certain classes of shares that do not have a sales charge applied at the time of purchase. CDSC for certain redemptions of Class A shares made within 18 months of a finder’s fee being paid and all Class C shares are 1% within the first year and 0% thereafter. |
| 5 | The expense ratios of the Fund are set forth according to the prospectus for the Fund effective January 27, 2023, as supplemented and revised, and may differ from the expense ratios disclosed in the Financial Highlights tables in this report. See the Financial Highlights for more current expense ratios. Net Expense: Expenses reduced by a contractual expense limitation in effect through February 1, 2024. Gross Expense: Does not reflect the effect of the expense limitation. Expense ratios include fees and expenses associated with any underlying funds. |
| Ticker Symbols: | |
| Class A : PALAX | |
| Class C: PALCX | |
| Class P: AGAPX | |
| Institutional Class: PALLX | |
| Class R6: AGASX | |
| Administrative Class: AGAMX |
Virtus Investment Advisers, Inc.
| ■ | The Fund is diversified and has an investment objective of seeking after-inflation capital appreciation and current income. There is no guarantee that the Fund will meet its objectives. |
| ■ | For the fiscal year ended September 30, 2023, the Fund’s Class A shares at NAV returned 9.49%, Class C shares at NAV returned 8.55%, Class P shares at NAV returned 9.71%, Institutional Class shares at NAV returned 9.64%, Class R6 shares at NAV returned 9.71%, and Administrative Class shares at NAV returned 9.56%. For the same period, the 60% MSCI All Country World Index (net) / 40% Bloomberg U.S. Aggregate Bond Index, the Fund’s style-specific benchmark appropriate for comparison, returned 12.50%, Bloomberg U.S. Aggregate Bond Index and MSCI All Country World Index (net), both broad-based indexes, returned 0.64%, and 20.80%, respectively. |
| Affiliated Mutual Funds | 24% | |
| Corporate Bonds and Notes | 17 | |
| Banks | 6% | |
| Electric Utilities | 2 | |
| Financial Services | 2 | |
| All other Corporate Bonds and Notes | 7 | |
| Exchange-Traded Funds | 16 | |
| Common Stocks | 12 | |
| Software | 1 | |
| Healthcare Providers & Services | 1 | |
| Technology Hardware, Storage & Peripherals | 1 | |
| All other Common Stocks | 9 | |
| Mortgage-Backed Securities | 11 | |
| U.S. Government Securities | 7 | |
| Asset-Backed Securities | 6 | |
| Other (includes short-term investment) | 7 | |
| Total | 100% |
| 1 Year | 5 Years | 10 Years | Since inception | Inception date | ||
| Class A shares at NAV2 | 9.49 % | 3.35 % | 3.95 % | — % | — | |
| Class A shares at POP3,4 | 3.46 | 2.19 | 3.36 | — | — | |
| Class C shares at NAV2 and with CDSC4 | 8.55 | 2.55 | 3.16 | — | — | |
| Class P shares at NAV2 | 9.71 | 3.55 | 4.19 | — | — | |
| Institutional Class shares at NAV2 | 9.64 | 3.59 | 4.18 | — | — | |
| Class R6 shares at NAV2 | 9.71 | 3.65 | — | 4.82 | 9/8/15 | |
| Administrative Class shares at NAV2 | 9.56 | 3.69 | 4.14 | — | — | |
| 60% MSCI All Country World Index (net) / 40% Bloomberg U.S. Aggregate Bond Index | 12.50 | 4.21 | 5.18 | 5.61 5 | — | |
| MSCI All Country World Index (net) | 20.80 | 6.46 | 7.56 | 8.62 5 | — | |
| Bloomberg U.S. Aggregate Bond Index | 0.64 | 0.10 | 1.13 | 0.63 5 | — | |
| Fund Expense Ratios6: Class A shares: Gross 1.51%, Net 0.77%; Class C shares: Gross 2.28%, Net 1.52%; Class P shares: Gross 1.25%, Net 0.57%; Institutional Class shares: Gross 1.26%, Net 0.54%; Class R6 shares: Gross 1.18%, Net 0.47%; Administrative Class shares: Gross 1.48%, Net 0.72%. | ||||||
| All returns represent past performance which is no guarantee of future results. Current performance may be higher or lower than the performance shown. The investment return and principal value of an investment will fluctuate so that an investor’s shares, when redeemed, may be worth more or less than their original cost. The above table and graph below do not reflect the deduction of taxes that a shareholder would pay on fund distributions or the redemption of shares. Please visit Virtus.com for performance data current to the most recent month-end. |


| 1 | Total returns are historical and include changes in share price and the reinvestment of both dividends and capital gain distributions. |
| 2 | “NAV” (Net Asset Value) total returns do not include the effect of any sales charge. |
| 3 | “POP” (Public Offering Price) total returns include the effect of the maximum front-end 5.50% sales charge. |
| 4 | “CDSC” (contingent deferred sales charge) is applied to redemptions of certain classes of shares that do not have a sales charge applied at the time of purchase. CDSC for certain redemptions of Class A shares made within 18 months of a finder’s fee being paid and all Class C shares are 1% within the first year and 0% thereafter. |
| 5 | The since inception index return is from the inception date of Class R6 shares. |
| 6 | The expense ratios of the Fund are set forth according to the prospectus for the Fund effective January 27, 2023, as supplemented and revised, and may differ from the expense ratios disclosed in the Financial Highlights tables in this report. See the Financial Highlights for more current expense ratios. Net Expense: Expenses reduced by a contractual expense limitation in effect through February 1, 2024. Gross Expense: Does not reflect the effect of the expense limitation. Expense ratios include fees and expenses associated with any underlying funds. |
| Ticker Symbols: | |
| Class A : AOPAX | |
| Class C: AOPCX | |
| Class P: ALOPX | |
| Institutional Class: ALOIX | |
| Class R6: AIISX |
Virtus Investment Advisers, Inc.
| ■ | The Fund is diversified and has an investment objective of seeking maximum long-term capital appreciation. There is no guarantee that the Fund will meet its objective. |
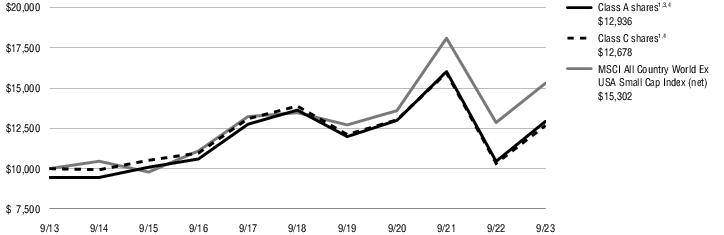
| ■ | For the fiscal year ended September 30, 2023, the Fund’s Class A shares at NAV returned 23.80%†, Class C shares at NAV returned 22.80%, Class P shares at NAV returned 24.00%, Institutional Class shares at NAV returned 24.05%†, and Class R6 shares at NAV returned 24.11%. For the same period, the MSCI All Country World Ex USA Small Cap Index (net), which serves as both the Fund’s broad-based and style-specific index appropriate for comparison, returned 19.01%. |
| Trading Companies & Distributors | 9% |
| Banks | 9 |
| Specialty Retail | 6 |
| Oil, Gas & Consumable Fuels | 6 |
| Metals & Mining | 4 |
| Machinery | 4 |
| Capital Markets | 4 |
| Insurance | 3 |
| Electronic Equipment, Instruments & Components | 3 |
| Semiconductors & Semiconductor Equipment | 3 |
| Other (includes short-term investment) | 49 |
| Total | 100% |
| 1 Year | 5 Years | 10 Years | Since inception | Inception date | ||
| Class A shares at NAV2 | 23.80 % 3 | -1.04 % | 3.19 % | — % | — | |
| Class A shares at POP4,5 | 16.99 | -2.15 | 2.61 | — | — | |
| Class C shares at NAV2 and with CDSC5 | 22.80 | -1.80 | 2.40 | — | — | |
| Class P shares at NAV2 | 24.00 | -0.89 | 3.35 | — | — | |
| Institutional Class shares at NAV2 | 24.05 3 | -0.83 | 3.41 | — | — | |
| Class R6 shares at NAV2 | 24.11 | -0.79 | — | 3.81 | 2/1/16 | |
| MSCI All Country World Ex USA Small Cap Index (net) | 19.01 | 2.58 | 4.35 | 6.25 6 | — | |
| Fund Expense Ratios7: Class A shares: Gross 1.79%, Net 1.26%; Class C shares: Gross 2.49%, Net 2.01%; Class P shares: Gross 1.37%, Net 1.11%; Institutional Class shares: Gross 1.47%, Net 1.05%; Class R6 shares: Gross 1.37%, Net 1.01%. | ||||||
| All returns represent past performance which is no guarantee of future results. Current performance may be higher or lower than the performance shown. The investment return and principal value of an investment will fluctuate so that an investor’s shares, when redeemed, may be worth more or less than their original cost. The above table and graph below do not reflect the deduction of taxes that a shareholder would pay on fund distributions or the redemption of shares. Please visit Virtus.com for performance data current to the most recent month-end. |

| 1 | Total returns are historical and include changes in share price and the reinvestment of both dividends and capital gain distributions. |
| 2 | “NAV” (Net Asset Value) total returns do not include the effect of any sales charge. |
| 3 | Total Return for the report period presented in the table differs from the return in the Financial Highlights. The total return presented in the above table is calculated based on the NAV at which shareholder transactions were processed. The total return presented in the Financial Highlights section of the report is calculated in the same manner, but also takes into account certain adjustments that are necessary under generally accepted accounting principles required in the annual report and semiannual report. |
| 4 | “POP” (Public Offering Price) total returns include the effect of the maximum front-end 5.50% sales charge. |
| 5 | “CDSC” (contingent deferred sales charge) is applied to redemptions of certain classes of shares that do not have a sales charge applied at the time of purchase. CDSC for certain redemptions of Class A shares made within 18 months of a finder’s fee being paid and all Class C shares are 1% within the first year and 0% thereafter. |
| 6 | The since inception index return is from the inception date of Class R6 shares. |
| 7 | The expense ratios of the Fund are set forth according to the prospectus for the Fund effective January 27, 2023, as supplemented and revised, and may differ from the expense ratios disclosed in the Financial Highlights tables in this report. See the Financial Highlights for more current expense ratios. Net Expense: Expenses reduced by a contractual expense limitation in effect through February 1, 2024. Gross Expense: Does not reflect the effect of the expense limitation. Expense ratios include fees and expenses associated with any underlying funds. |
| Ticker Symbols: | |
| Class A : ASHAX | |
| Class C: ASHCX | |
| Class P: ASHPX | |
| Institutional Class: ASHIX | |
| Class R6: ASHSX |
Newfleet Asset Management
| ■ | The Fund is diversified and has an investment objective of seeking a high level of current income with lower volatility than the broader high yield market. There is no guarantee that the Fund will meet its objective. |
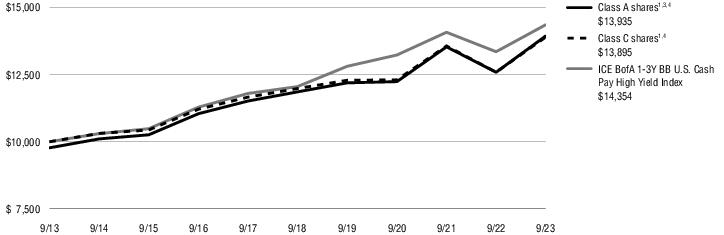
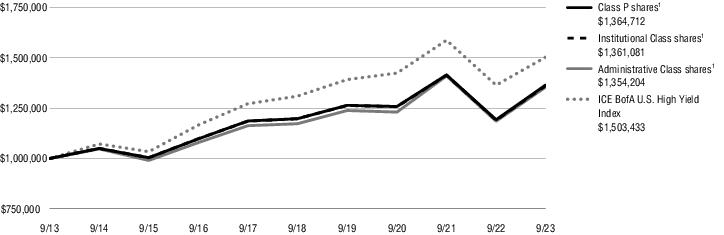
| ■ | For the fiscal year ended September 30, 2023, the Fund’s Class A shares at NAV returned 10.70%, Class C shares at NAV returned 10.37%, Class P shares at NAV returned 10.92%, Institutional Class shares at NAV returned 10.93%, and Class R6 shares at NAV returned 11.00%. For the same period, the ICE BofA 1-3 Year BB U.S. Cash Pay High Yield Index, the Fund’s style-specific benchmark appropriate for comparison, returned 7.50%. |
| Corporate Bonds and Notes | 88% | |
| Industrials | 15% | |
| Energy | 14 | |
| Consumer Discretionary | 13 | |
| All other Corporate Bonds and Notes | 46 | |
| Leveraged Loans | 11 | |
| Other | 1 | |
| Total | 100% |
| 1 Year | 5 Years | 10 Years | Since inception | Inception date | ||
| Class A shares at NAV2 | 10.70 % | 3.28 % | 3.61 % | — % | — | |
| Class A shares at POP3,4 | 8.20 | 2.82 | 3.37 | — | — | |
| Class C shares at NAV2 and with CDSC4 | 10.37 | 3.01 | 3.34 | — | — | |
| Class P shares at NAV2 | 10.92 | 3.50 | 3.83 | — | — | |
| Institutional Class shares at NAV2 | 10.93 | 3.53 | 3.88 | — | — | |
| Class R6 shares at NAV2 | 11.00 | 3.60 | — | 3.66 | 2/1/17 | |
| ICE BofA 1-3 Year BB U.S. Cash Pay High Yield Index | 7.50 | 3.56 | 3.68 | 3.47 5 | — | |
| Fund Expense Ratios6: Class A shares: Gross 0.98%, Net 0.86%; Class C shares: Gross 1.24%, Net 1.11%; Class P shares: Gross 0.65%, Net 0.65%; Institutional Class shares: Gross 0.75%, Net 0.60%; Class R6 shares: Gross 0.66%, Net 0.55%. | ||||||
| All returns represent past performance which is no guarantee of future results. Current performance may be higher or lower than the performance shown. The investment return and principal value of an investment will fluctuate so that an investor’s shares, when redeemed, may be worth more or less than their original cost. The above table and graph below do not reflect the deduction of taxes that a shareholder would pay on fund distributions or the redemption of shares. Please visit Virtus.com for performance data current to the most recent month-end. |

| 1 | Total returns are historical and include changes in share price and the reinvestment of both dividends and capital gain distributions. |
| 2 | “NAV” (Net Asset Value) total returns do not include the effect of any sales charge. |
| 3 | “POP” (Public Offering Price) total returns include the effect of the maximum front-end 2.25% sales charge. |
| 4 | “CDSC” (contingent deferred sales charge) is applied to redemptions of certain classes of shares that do not have a sales charge applied at the time of purchase. CDSC for certain redemptions of Class A shares made within 18 months of a finder’s fee being paid and all Class C shares are 1% within the first year and 0% thereafter. |
| 5 | The since inception index return is from the inception date of Class R6 shares. |
| 6 | The expense ratios of the Fund are set forth according to the prospectus for the Fund effective January 27, 2023, as supplemented and revised, and may differ from the expense ratios disclosed in the Financial Highlights tables in this report. See the Financial Highlights for more current expense ratios. Net Expense: Expenses reduced by a contractual expense limitation in effect through February 1, 2024. Gross Expense: Does not reflect the effect of the expense limitation. Expense ratios include fees and expenses associated with any underlying funds. |
| Ticker Symbols: | |
| Class A : AZMAX | |
| Class C: AZMCX | |
| Class P: AZMPX | |
| Institutional Class: AZMIX |
NFJ Investment Group, LLC
| ■ | The Fund is diversified and has an investment objective of seeking long-term capital appreciation. There is no guarantee that the Fund will meet its objective. |
| ■ | For the fiscal year ended September 30, 2023, the Fund’s Class A shares at NAV returned 18.29%†, Class C shares at NAV returned 17.42%†, Class P shares at NAV returned 18.58%†, and Institutional Class shares at NAV returned 18.55%†. For the same period, the MSCI Emerging Markets Index (net), the Fund’s style-specific benchmark appropriate for comparison, returned 11.70%. |
| Financials | 18% |
| Information Technology | 18 |
| Consumer Discretionary | 16 |
| Industrials | 12 |
| Materials | 9 |
| Communication Services | 8 |
| Utilities | 7 |
| Other | 12 |
| Total | 100% |
| 1 Year | 5 Years | 10 Years | ||
| Class A shares at NAV2 | 18.29 % 3 | 0.59% | 2.67% | |
| Class A shares at POP4,5 | 11.78 | -0.54 | 2.09 | |
| Class C shares at NAV2 and with CDSC5 | 17.42 3 | -0.14 | 1.91 | |
| Class P shares at NAV2 | 18.58 3 | 0.76 | 2.84 | |
| Institutional Class shares at NAV2 | 18.55 3 | 0.84 | 2.93 | |
| MSCI Emerging Markets Index (net) | 11.70 | 0.55 | 2.07 | |
| Fund Expense Ratios6: Class A shares: Gross 1.52%, Net 1.14%; Class C shares: Gross 2.24%, Net 1.89%; Class P shares: Gross 1.45%, Net 0.99%; Institutional Class shares: Gross 1.24%, Net 0.89%. | ||||
| All returns represent past performance which is no guarantee of future results. Current performance may be higher or lower than the performance shown. The investment return and principal value of an investment will fluctuate so that an investor’s shares, when redeemed, may be worth more or less than their original cost. The above table and graph below do not reflect the deduction of taxes that a shareholder would pay on fund distributions or the redemption of shares. Please visit Virtus.com for performance data current to the most recent month-end. |


| 1 | Total returns are historical and include changes in share price and the reinvestment of both dividends and capital gain distributions. |
| 2 | “NAV” (Net Asset Value) total returns do not include the effect of any sales charge. |
| 3 | Total Return for the report period presented in the table differs from the return in the Financial Highlights. The total return presented in the above table is calculated based on the NAV at which shareholder transactions were processed. The total return presented in the Financial Highlights section of the report is calculated in the same manner, but also takes into account certain adjustments that are necessary under generally accepted accounting principles required in the annual report and semiannual report. |
| 4 | “POP” (Public Offering Price) total returns include the effect of the maximum front-end 5.50% sales charge. |
| 5 | “CDSC” (contingent deferred sales charge) is applied to redemptions of certain classes of shares that do not have a sales charge applied at the time of purchase. CDSC for certain redemptions of Class A shares made within 18 months of a finder’s fee being paid and all Class C shares are 1% within the first year and 0% thereafter. |
| 6 | The expense ratios of the Fund are set forth according to the prospectus for the Fund effective January 27, 2023, as supplemented and revised, and may differ from the expense ratios disclosed in the Financial Highlights tables in this report. See the Financial Highlights for more current expense ratios. Net Expense: Expenses reduced by a contractual expense limitation in effect through February 1, 2024. Gross Expense: Does not reflect the effect of the expense limitation. Expense ratios include fees and expenses associated with any underlying funds. |
| Ticker Symbols: | |
| Class A : ASUAX | |
| Class P: ASTPX | |
| Institutional Class: ASTNX |
NFJ Investment Group, LLC
| ■ | The Fund is diversified and has an investment objective of seeking long-term capital appreciation. There is no guarantee that the Fund will meet its objective. |
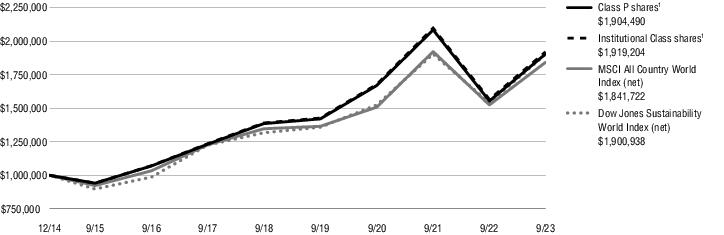
| ■ | For the fiscal year ended September 30, 2023, the Fund’s Class A shares at NAV returned 22.38%, Class P shares at NAV returned 22.61%, and Institutional Class shares at NAV returned 22.66%. For the same period, the MSCI All Country World Index (net), the Fund’s style-specific benchmark appropriate for comparison, returned 20.80% and Dow Jones Sustainability World Index (net), a broad-based index, returned 23.53%. |
| Software | 15% |
| Life Sciences Tools & Services | 11 |
| Healthcare Equipment & Supplies | 7 |
| Professional Services | 6 |
| Banks | 5 |
| Electric Utilities | 5 |
| Trading Companies & Distributors | 5 |
| Healthcare Providers & Services | 5 |
| Semiconductors & Semiconductor Equipment | 4 |
| Gas Utilities | 4 |
| Other | 33 |
| Total | 100% |
| 1 Year | 5 Years | Since inception | Inception date | ||
| Class A shares at NAV2 | 22.38 % | 6.42 % | 7.43 % | 12/9/14 | |
| Class A shares at POP3,4 | 15.65 | 5.23 | 6.74 | 12/9/14 | |
| Class P shares at NAV2 | 22.61 | 6.58 | 7.59 | 12/9/14 | |
| Institutional Class shares at NAV2 | 22.66 5 | 6.67 | 7.68 | 12/9/14 | |
| MSCI All Country World Index (net) | 20.80 | 6.46 | 7.18 6 | — | |
| Dow Jones Sustainability World Index (net) | 23.53 | 7.61 | 7.56 6 | — | |
| Fund Expense Ratios7: Class A shares: Gross 1.42%, Net 0.94%; Class P shares: Gross 1.13%, Net 0.79%; Institutional Class shares: Gross 1.06%, Net 0.69%. | |||||
| All returns represent past performance which is no guarantee of future results. Current performance may be higher or lower than the performance shown. The investment return and principal value of an investment will fluctuate so that an investor’s shares, when redeemed, may be worth more or less than their original cost. The above table and graph below do not reflect the deduction of taxes that a shareholder would pay on fund distributions or the redemption of shares. Please visit Virtus.com for performance data current to the most recent month-end. |

| 1 | Total returns are historical and include changes in share price and the reinvestment of both dividends and capital gain distributions. |
| 2 | “NAV” (Net Asset Value) total returns do not include the effect of any sales charge. |
| 3 | “POP” (Public Offering Price) total returns include the effect of the maximum front-end 5.50% sales charge. |
| 4 | “CDSC” (contingent deferred sales charge) is applied to redemptions of certain classes of shares that do not have a sales charge applied at the time of purchase. CDSC for certain redemptions of Class A shares made within 18 months of a finder’s fee being paid and all Class C shares are 1% within the first year and 0% thereafter. |
| 5 | Total Return for the report period presented in the table differs from the return in the Financial Highlights. The total return presented in the above table is calculated based on the NAV at which shareholder transactions were processed. The total return presented in the Financial Highlights section of the report is calculated in the same manner, but also takes into account certain adjustments that are necessary under generally accepted accounting principles required in the annual report and semiannual report. |
| 6 | The since inception index return is from the Fund’s inception date. |
| 7 | The expense ratios of the Fund are set forth according to the prospectus for the Fund effective January 27, 2023, as supplemented and revised, and may differ from the expense ratios disclosed in the Financial Highlights tables in this report. See the Financial Highlights for more current expense ratios. Net Expense: Expenses reduced by a contractual expense limitation in effect through February 1, 2024. Gross Expense: Does not reflect the effect of the expense limitation. Expense ratios include fees and expenses associated with any underlying funds. |
| Ticker Symbols: | |
| Class A : AYBAX | |
| Class C: AYBCX | |
| Class P: AYBPX | |
| Institutional: AYBIX | |
| Administrative Class: AYBVX |
Seix Investment Advisors
| ■ | The Fund is diversified and has an investment objective of seeking a high level of current income and capital growth. There is no guarantee that the Fund will meet its objectives. |
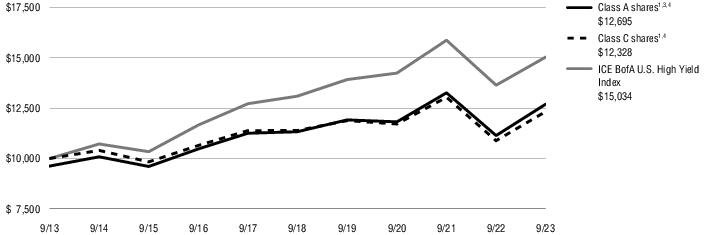
| ■ | For the fiscal year ended September 30, 2023, the Fund’s Class A shares at NAV returned 13.95%†, Class C shares at NAV returned 13.24%†, Class P shares at NAV returned 14.42%†, Institutional Class shares at NAV returned 14.31%†, and Administrative Class shares at NAV returned 14.23%†. For the fiscal year ended September 30, 2023, the ICE BofA U.S. High Yield Index, the Fund’s style-specific benchmark appropriate for comparison, returned 10.19%. |
| Corporate Bonds and Notes | 89% | |
| Financials | 19% | |
| Consumer Discretionary | 18 | |
| Energy | 16 | |
| All other Corporate Bonds and Notes | 36 | |
| Affiliated Exchange-Traded Fund | 4 | |
| Common Stocks | 4 | |
| Preferred Stock | 2 | |
| Other (includes short-term investment) | 1 | |
| Total | 100% |
| 1 Year | 5 Years | 10 Years | ||
| Class A shares at NAV2 | 13.95 % 3 | 2.30% | 2.81% | |
| Class A shares at POP4,5 | 9.67 | 1.52 | 2.42 | |
| Class C shares at NAV2 and with CDSC5 | 13.24 3 | 1.60 | 2.12 | |
| Class P shares at NAV2 | 14.42 3 | 2.65 | 3.16 | |
| Institutional Class shares at NAV2 | 14.31 3 | 2.59 | 3.13 | |
| Administrative Class shares at NAV2 | 14.23 3 | 2.92 | 3.08 | |
| ICE BofA U.S. High Yield Index | 10.19 | 2.80 | 4.16 | |
| Fund Expense Ratios6: Class A shares: Gross 1.32%, Net 1.12%; Class C shares: Gross 1.87%, Net 1.81%; Class P shares: Gross 1.00%, Net 0.80%; Institutional Class shares: Gross 0.99%, Net 0.83%; Administrative Class shares: Gross 1.13%, Net 1.00%. | ||||
| All returns represent past performance which is no guarantee of future results. Current performance may be higher or lower than the performance shown. The investment return and principal value of an investment will fluctuate so that an investor’s shares, when redeemed, may be worth more or less than their original cost. The above table and graph below do not reflect the deduction of taxes that a shareholder would pay on fund distributions or the redemption of shares. Please visit Virtus.com for performance data current to the most recent month-end. |
| 1 | Total returns are historical and include changes in share price and the reinvestment of both dividends and capital gain distributions. |
| 2 | “NAV” (Net Asset Value) total returns do not include the effect of any sales charge. |
| 3 | Total Return for the report period presented in the table differs from the return in the Financial Highlights. The total return presented in the above table is calculated based on the NAV at which shareholder transactions were processed. The total return presented in the Financial Highlights section of the report is calculated in the same manner, but also takes into account certain adjustments that are necessary under generally accepted accounting principles required in the annual report and semiannual report. |
| 4 | “POP” (Public Offering Price) total returns include the effect of the maximum front-end 3.75% sales charge. |
| 5 | “CDSC” (contingent deferred sales charge) is applied to redemptions of certain classes of shares that do not have a sales charge applied at the time of purchase. CDSC for certain redemptions of Class A shares made within 18 months of a finder’s fee being paid and all Class C shares are 1% within the first year and 0% thereafter. |
| 6 | The expense ratios of the Fund are set forth according to the prospectus for the Fund effective January 27, 2023, as supplemented and revised, and may differ from the expense ratios disclosed in the Financial Highlights tables in this report. See the Financial Highlights for more current expense ratios. Net Expense: Expenses reduced by a contractual expense limitation in effect through February 1, 2024. Gross Expense: Does not reflect the effect of the expense limitation. Expense ratios include fees and expenses associated with any underlying funds. |
| Par Value | Value | ||
| Convertible Bonds and Notes—89.1% | |||
| Auto Manufacturers—2.4% | |||
| Ford Motor Co. 0.000%, 3/15/26(1) | $ 17,320 | $ 17,017 | |
| Lucid Group, Inc. 144A 1.250%, 12/15/26(2) | 8,275 | 4,969 | |
| Rivian Automotive, Inc. 144A 4.625%, 3/15/29(2) | 9,220 | 13,351 | |
| 35,337 | |||
| Automotive Parts & Equipment—0.6% | |||
| Luminar Technologies, Inc. 144A 1.250%, 12/15/26(2) | 12,555 | 8,217 | |
| Banks—1.9% | |||
| Barclays Bank plc 0.000%, 2/18/25(1) | 16,485 | 16,755 | |
| BofA Finance LLC 0.600%, 5/25/27 | 10,080 | 10,765 | |
| 27,520 | |||
| Biotechnology—3.1% | |||
| Alnylam Pharmaceuticals, Inc. 1.000%, 9/15/27 | 860 | 794 | |
| Apellis Pharmaceuticals, Inc. 3.500%, 9/15/26 | 2,385 | 2,950 | |
| Bridgebio Pharma, Inc. | |||
| 2.500%, 3/15/27 | 6,800 | 6,494 | |
| 2.250%, 2/1/29 | 5,450 | 4,060 | |
| Halozyme Therapeutics, Inc. 1.000%, 8/15/28 | 6,005 | 5,607 | |
| Insmed, Inc. | |||
| 1.750%, 1/15/25 | 9,940 | 9,781 | |
| 0.750%, 6/1/28 | 5,525 | 5,481 | |
| Sarepta Therapeutics, Inc. 1.250%, 9/15/27 | 8,880 | 9,918 | |
| 45,085 | |||
| Chemicals—0.3% | |||
| Livent Corp. 4.125%, 7/15/25 | 1,930 | 4,180 | |
| Commercial Services—3.8% | |||
| Affirm Holdings, Inc. 0.000%, 11/15/26(1) | 27,810 | 20,754 | |
| Block, Inc. 0.125%, 3/1/25 | 8,005 | 7,429 | |
| Repay Holdings Corp. 144A 0.000%, 2/1/26(1)(2) | 16,410 | 13,241 | |
| Shift4 Payments, Inc. 0.500%, 8/1/27 | 16,815 | 14,367 | |
| 55,791 | |||
| Computers—5.9% | |||
| CyberArk Software Ltd. 0.000%, 11/15/24(1) | 10,595 | 12,211 | |
| Par Value | Value | ||
| Computers—continued | |||
| Lumentum Holdings, Inc. 144A 1.500%, 12/15/29(2) | $ 17,645 | $ 16,039 | |
| Parsons Corp. 0.250%, 8/15/25 | 11,515 | 14,618 | |
| Seagate HDD Cayman 144A 3.500%, 6/1/28(2) | 21,230 | 21,773 | |
| Varonis Systems, Inc. 1.250%, 8/15/25 | 6,205 | 7,248 | |
| Zscaler, Inc. 0.125%, 7/1/25 | 11,850 | 14,232 | |
| 86,121 | |||
| Electric Utilities—3.3% | |||
| FirstEnergy Corp. 144A 4.000%, 5/1/26(2) | 19,035 | 18,321 | |
| Southern Co. (The) 144A 3.875%, 12/15/25(2) | 30,620 | 29,763 | |
| 48,084 | |||
| Electronics—1.3% | |||
| Advanced Energy Industries, Inc. 144A 2.500%, 9/15/28(2) | 12,695 | 12,805 | |
| Vishay Intertechnology, Inc. 144A 2.250%, 9/15/30(2) | 5,950 | 5,828 | |
| 18,633 | |||
| Energy-Alternate Sources—2.1% | |||
| Array Technologies, Inc. 1.000%, 12/1/28 | 11,970 | 13,634 | |
| Sunnova Energy International, Inc. 2.625%, 2/15/28 | 27,400 | 16,837 | |
| 30,471 | |||
| Engineering & Construction—2.2% | |||
| Fluor Corp. 144A 1.125%, 8/15/29(2) | 20,275 | 20,954 | |
| Granite Construction, Inc. 144A 3.750%, 5/15/28(2) | 10,660 | 11,178 | |
| 32,132 | |||
| Entertainment—6.0% | |||
| DraftKings Holdings, Inc. 0.000%, 3/15/28(1) | 24,150 | 18,269 | |
| IMAX Corp. 0.500%, 4/1/26 | 20,075 | 18,720 | |
| Live Nation Entertainment, Inc. | |||
| 2.000%, 2/15/25 | 20,395 | 20,772 | |
| 144A 3.125%, 1/15/29(2) | 8,550 | 8,866 | |
| Penn Entertainment, Inc. 2.750%, 5/15/26 | 3,865 | 4,691 | |
| Par Value | Value | ||
| Entertainment—continued | |||
| Vail Resorts, Inc. 0.000%, 1/1/26(1) | $ 17,090 | $ 15,039 | |
| 86,357 | |||
| Environmental Services—1.0% | |||
| Tetra Tech, Inc. 144A 2.250%, 8/15/28(2) | 14,940 | 14,716 | |
| Financial Services—2.4% | |||
| Encore Capital Group, Inc. 144A 4.000%, 3/15/29(2) | 21,365 | 20,466 | |
| JPMorgan Chase Financial Co., LLC 0.500%, 6/15/27 | 12,525 | 13,899 | |
| 34,365 | |||
| Health Care REITs—2.4% | |||
| Welltower OP LLC 144A 2.750%, 5/15/28(2) | 34,340 | 35,045 | |
| Healthcare-Products—3.0% | |||
| Alphatec Holdings, Inc. 0.750%, 8/1/26 | 8,460 | 8,106 | |
| Exact Sciences Corp. 0.375%, 3/15/27 | 21,925 | 19,842 | |
| Integer Holdings Corp. 144A 2.125%, 2/15/28(2) | 8,195 | 8,904 | |
| Natera, Inc. 2.250%, 5/1/27 | 5,390 | 7,128 | |
| 43,980 | |||
| Internet—10.8% | |||
| Booking Holdings, Inc. 0.750%, 5/1/25 | 8,445 | 14,103 | |
| Match Group Financeco 3, Inc. 144A 2.000%, 1/15/30(2) | 9,855 | 8,580 | |
| Palo Alto Networks, Inc. 0.375%, 6/1/25 | 14,905 | 35,109 | |
| Snap, Inc. 0.750%, 8/1/26 | 4,440 | 3,889 | |
| Uber Technologies, Inc. 0.000%, 12/15/25(1) | 34,685 | 32,358 | |
| Wayfair, Inc. | |||
| 1.125%, 11/1/24 | 11,380 | 11,146 | |
| 1.000%, 8/15/26 | 14,710 | 12,025 | |
| 3.250%, 9/15/27 | 9,450 | 11,378 | |
| Zillow Group, Inc. 2.750%, 5/15/25 | 27,540 | 28,270 | |
| 156,858 | |||
| Leisure Time—2.5% | |||
| Carnival Corp. 5.750%, 10/1/24 | 2,369 | 3,540 | |
| NCL Corp., Ltd. 1.125%, 2/15/27 | 23,145 | 19,153 | |
| Royal Caribbean Cruises Ltd. | |||
| 2.875%, 11/15/23 | 6,295 | 7,088 | |
| Par Value | Value | ||
| Leisure Time—continued | |||
| 6.000%, 8/15/25 | $ 3,430 | $ 6,762 | |
| 36,543 | |||
| Media—5.0% | |||
| DISH Network Corp. 0.000%, 12/15/25(1) | 7,710 | 5,146 | |
| Liberty Broadband Corp. 144A 3.125%, 3/31/53(2) | 40,870 | 42,566 | |
| Liberty Media Corp. 144A 3.750%, 3/15/28(2) | 6,595 | 7,495 | |
| Liberty Media Corp.-Liberty Formula One 2.250%, 8/15/27 | 17,240 | 16,775 | |
| 71,982 | |||
| Mining—0.4% | |||
| SSR Mining, Inc. 2.500%, 4/1/39 | 5,615 | 5,828 | |
| Miscellaneous Manufacturing—1.5% | |||
| Axon Enterprise, Inc. 144A 0.500%, 12/15/27(2) | 20,025 | 21,327 | |
| Oil, Gas & Consumable Fuels—4.5% | |||
| EQT Corp. 1.750%, 5/1/26 | 2,150 | 5,967 | |
| Nabors Industries, Inc. 144A 1.750%, 6/15/29(2) | 8,915 | 7,841 | |
| Northern Oil & Gas, Inc. 144A 3.625%, 4/15/29(2) | 17,660 | 21,815 | |
| Pioneer Natural Resources Co. 0.250%, 5/15/25 | 9,125 | 22,351 | |
| Transocean, Inc. 4.625%, 9/30/29 | 2,605 | 6,757 | |
| 64,731 | |||
| Passenger Airlines—0.3% | |||
| American Airlines Group, Inc. 6.500%, 7/1/25 | 3,965 | 4,231 | |
| Pharmaceuticals—1.7% | |||
| Amphastar Pharmaceuticals, Inc. 144A 2.000%, 3/15/29(2) | 10,635 | 10,571 | |
| Dexcom, Inc. 0.250%, 11/15/25 | 6,035 | 5,688 | |
| Mirum Pharmaceuticals, Inc. 144A 4.000%, 5/1/29(2) | 6,725 | 8,495 | |
| 24,754 | |||
| Retail—2.0% | |||
| Freshpet, Inc. 144A 3.000%, 4/1/28(2) | 10,345 | 12,238 | |
| Par Value | Value | ||
| Retail—continued | |||
| Shake Shack, Inc. 0.000%, 3/1/28(1) | $ 22,370 | $ 16,582 | |
| 28,820 | |||
| Semiconductors—4.3% | |||
| MACOM Technology Solutions Holdings, Inc. 0.250%, 3/15/26 | 9,170 | 10,417 | |
| ON Semiconductor Corp. 144A 0.500%, 3/1/29(2) | 25,065 | 27,521 | |
| SMART Global Holdings, Inc. 2.000%, 2/1/29 | 3,800 | 4,986 | |
| Veeco Instruments, Inc. 144A 2.875%, 6/1/29(2) | 4,850 | 5,711 | |
| Wolfspeed, Inc. 0.250%, 2/15/28 | 21,390 | 14,417 | |
| 63,052 | |||
| Software—13.6% | |||
| Akamai Technologies, Inc. 0.125%, 5/1/25 | 24,155 | 28,489 | |
| Bentley Systems, Inc. 0.125%, 1/15/26 | 19,310 | 18,634 | |
| BILL Holdings, Inc. | |||
| 0.000%, 12/1/25(1) | 16,170 | 16,251 | |
| 0.000%, 4/1/27(1) | 3,940 | 3,189 | |
| Confluent, Inc. 0.000%, 1/15/27(1) | 11,185 | 9,123 | |
| CSG Systems International, Inc. 144A 3.875%, 9/15/28(2) | 3,600 | 3,503 | |
| Datadog, Inc. 0.125%, 6/15/25 | 9,420 | 11,054 | |
| Envestnet, Inc. 144A 2.625%, 12/1/27(2) | 6,640 | 6,052 | |
| HubSpot, Inc. 0.375%, 6/1/25 | 6,070 | 10,817 | |
| MicroStrategy, Inc. 0.750%, 12/15/25 | 11,315 | 12,178 | |
| MongoDB, Inc. 0.250%, 1/15/26 | 7,835 | 13,390 | |
| Splunk, Inc. | |||
| 1.125%, 9/15/25 | 10,430 | 11,207 | |
| 1.125%, 6/15/27 | 13,940 | 13,152 | |
| Tyler Technologies, Inc. 0.250%, 3/15/26 | 21,885 | 21,130 | |
| Workiva, Inc. 144A 1.250%, 8/15/28(2) | 19,970 | 19,701 | |
| 197,870 | |||
| Transportation—0.8% | |||
| Air Transport Services Group, Inc. 144A 3.875%, 8/15/29(2) | 11,940 | 11,719 | |
| Total Convertible Bonds and Notes (Identified Cost $1,276,184) | 1,293,749 | ||
| Shares | Value | ||
| Convertible Preferred Stocks—6.1% | |||
| Banks—2.6% | |||
| Wells Fargo & Co. Series L, 7.500% | 34,575 | $ 38,551 | |
| Electric Utilities—0.5% | |||
| NextEra Energy, Inc., 6.926% | 193,010 | 7,302 | |
| Financial Services—1.2% | |||
| Apollo Global Management, Inc., 6.750% | 310,155 | 17,089 | |
| Machinery—1.8% | |||
| Chart Industries, Inc. Series B, 6.750% | 190,060 | 12,673 | |
| RBC Bearings, Inc. Series A, 5.000% | 123,335 | 13,581 | |
| 26,254 | |||
| Total Convertible Preferred Stocks (Identified Cost $91,690) | 89,196 | ||
| Equity-Linked Note—0.5% | |||
| Financial Services—0.5% | |||
| Goldman Sachs Finance Corp.(3) | 8,170,000 | 7,151 | |
| Total Equity-Linked Note (Identified Cost $8,275) | 7,151 | ||
| Total Long-Term Investments—95.7% (Identified Cost $1,376,149) | 1,390,096 | ||
| Short-Term Investment—2.3% | |||
| Money Market Mutual Fund—2.3% | |||
| BlackRock Liquidity FedFund - Institutional Shares (seven-day effective yield 5.236%)(4) | 33,367,110 | 33,367 | |
| Total Short-Term Investment (Identified Cost $33,367) | 33,367 | ||
| TOTAL INVESTMENTS—98.0% (Identified Cost $1,409,516) | $1,423,463 | ||
| Other assets and liabilities, net—2.0% | 29,178 | ||
| NET ASSETS—100.0% | $1,452,641 | ||
| Abbreviation: | |
| LLC | Limited Liability Company |
| Footnote Legend: | |
| (1) | Issued with a zero coupon. Income is recognized through the accretion of discount. |
| (2) | Security exempt from registration under Rule 144A of the Securities Act of 1933. These securities may be resold in transactions exempt from registration, normally to qualified institutional buyers. At September 30, 2023, these securities amounted to a value of $479,571 or 33.0% of net assets. |
| (3) | The value of this security was determined using significant unobservable inputs and is reported as a Level 3 security in the Fair Value Hierarchy table located after the Schedule of Investments. |
| (4) | Shares of this fund are publicly offered, and its prospectus and annual report are publicly available. |
| Country Weightings (Unaudited)† | |
| United States | 91% |
| Cayman Islands | 3 |
| Canada | 2 |
| Bermuda | 1 |
| United Kingdom | 1 |
| Liberia | 1 |
| Israel | 1 |
| Total | 100% |
| † % of total investments as of September 30, 2023. | |
| Total Value at September 30, 2023 | Level 1 Quoted Prices | Level 2 Significant Observable Inputs | Level 3 Significant Unobservable Inputs | ||||
| Assets: | |||||||
| Debt Instruments: | |||||||
| Convertible Bonds and Notes | $1,293,749 | $ — | $1,293,749 | $ — | |||
| Convertible Preferred Stocks | 89,196 | 89,196 | — | — | |||
| Equity-Linked Note | 7,151 | — | — | 7,151 | |||
| Money Market Mutual Fund | 33,367 | 33,367 | — | — | |||
| Total Investments | $1,423,463 | $122,563 | $1,293,749 | $7,151 |
| Shares | Value | ||
| Common Stocks—99.4% | |||
| Brazil—2.6% | |||
| Cia de Saneamento Basico do Estado de Sao Paulo ADR | 1,250,000 | $ 15,150 | |
| Canada—3.6% | |||
| Stantec, Inc. | 321,815 | 20,881 | |
| China—1.1% | |||
| China Water Affairs Group Ltd. | 10,300,000 | 6,669 | |
| France—5.7% | |||
| Veolia Environnement S.A. | 1,158,809 | 33,606 | |
| Japan—1.5% | |||
| Kurita Water Industries Ltd. | 254,600 | 8,883 | |
| Netherlands—2.9% | |||
| Aalberts N.V. | 115,000 | 4,216 | |
| Arcadis N.V. | 283,414 | 12,765 | |
| 16,981 | |||
| Switzerland—3.1% | |||
| Geberit AG Registered Shares | 20,404 | 10,231 | |
| Georg Fischer AG Registered Shares | 144,238 | 8,139 | |
| 18,370 | |||
| United Kingdom—14.3% | |||
| Ferguson plc | 55,000 | 9,046 | |
| Halma plc | 339,532 | 8,031 | |
| Pentair plc | 149,900 | 9,706 | |
| Severn Trent plc | 1,310,990 | 37,829 | |
| United Utilities Group plc | 1,646,339 | 19,046 | |
| 83,658 | |||
| Shares | Value | ||
| United States—64.6% | |||
| Advanced Drainage Systems, Inc. | 125,200 | $ 14,252 | |
| AECOM | 143,400 | 11,908 | |
| American Water Works Co., Inc. | 363,600 | 45,025 | |
| Badger Meter, Inc. | 90,500 | 13,020 | |
| Core & Main, Inc. Class A(1) | 620,000 | 17,887 | |
| Danaher Corp. | 173,700 | 43,095 | |
| Ecolab, Inc. | 124,200 | 21,039 | |
| Essential Utilities, Inc. | 1,207,690 | 41,460 | |
| Franklin Electric Co., Inc. | 101,700 | 9,075 | |
| IDEX Corp. | 60,700 | 12,627 | |
| Lindsay Corp. | 61,500 | 7,237 | |
| Mueller Water Products, Inc. Class A | 560,800 | 7,111 | |
| SJW Group | 98,239 | 5,905 | |
| Tetra Tech, Inc. | 179,000 | 27,213 | |
| Thermo Fisher Scientific, Inc. | 24,500 | 12,401 | |
| Valmont Industries, Inc. | 48,000 | 11,530 | |
| Veralto Corp.(1) | 30,000 | 2,537 | |
| Waste Management, Inc. | 93,700 | 14,284 | |
| Xylem, Inc. | 545,904 | 49,694 | |
| Zurn Elkay Water Solutions Corp. | 424,100 | 11,883 | |
| 379,183 | |||
| Total Common Stocks (Identified Cost $444,658) | 583,381 | ||
| Total Long-Term Investments—99.4% (Identified Cost $444,658) | 583,381 | ||
| TOTAL INVESTMENTS—99.4% (Identified Cost $444,658) | $583,381 | ||
| Other assets and liabilities, net—0.6% | 3,770 | ||
| NET ASSETS—100.0% | $587,151 | ||
| Abbreviation: | |
| ADR | American Depositary Receipt |
| Footnote Legend: | |
| (1) | Non-income producing. |
| Country Weightings (Unaudited)† | |
| United States | 65% |
| United Kingdom | 14 |
| France | 6 |
| Canada | 4 |
| Switzerland | 3 |
| Netherlands | 3 |
| Brazil | 3 |
| Other | 2 |
| Total | 100% |
| † % of total investments as of September 30, 2023. | |
| Total Value at September 30, 2023 | Level 1 Quoted Prices | ||
| Assets: | |||
| Equity Securities: | |||
| Common Stocks | $583,381 | $583,381 | |
| Total Investments | $583,381 | $583,381 |
| Par Value(1) | Value | ||
| U.S. Government Securities—6.1% | |||
| Tennessee Valley Authority 1.500%, 9/15/31 | $ 775 | $ 599 | |
| U.S. Treasury Bonds | |||
| 3.250%, 5/15/42 | 2,546 | 2,029 | |
| 2.250%, 2/15/52 | 4,000 | 2,455 | |
| 3.625%, 5/15/53 | 250 | 207 | |
| U.S. Treasury Notes | |||
| 2.625%, 5/31/27 | 2,200 | 2,045 | |
| 2.875%, 5/15/32 | 2,000 | 1,755 | |
| 3.375%, 5/15/33 | 3,600 | 3,265 | |
| Total U.S. Government Securities (Identified Cost $14,548) | 12,355 | ||
| Foreign Government Security—0.9% | |||
| Japan Government Thirty Year Bond 1.400%, 9/20/52 | 300,000 JPY | 1,893 | |
| Total Foreign Government Security (Identified Cost $2,234) | 1,893 | ||
| Mortgage-Backed Securities—10.4% | |||
| Agency—7.9% | |||
| Federal Home Loan Mortgage Multiclass Certificates 2021-P009, A2 1.878%, 1/25/31 | 921 | 738 | |
| Federal National Mortgage Association ACES | |||
| 2021-M1S, A2 1.429%, 12/25/30(2) | 2,000 | 1,551 | |
| 2021-M3G, A2 1.287%, 1/25/31(2) | 1,000 | 764 | |
| 2021-M2G, A2 1.421%, 3/25/31(2) | 1,000 | 765 | |
| 2021-M2S, A2 1.868%, 10/25/31(2) | 1,000 | 780 | |
| Government National Mortgage Association II | |||
| Pool #784446 3.000%, 2/20/48 | 651 | 545 | |
| Pool #784648 3.000%, 11/20/48 | 1,489 | 1,280 | |
| Pool #BV0838 2.500%, 8/20/50 | 4,096 | 3,336 | |
| Pool #MA6985 2.000%, 11/20/50 | 978 | 747 | |
| Pool #MA7366 2.000%, 5/20/51 | 1,740 | 1,380 | |
| Pool #CK8204 3.000%, 2/20/52 | 4,723 | 3,977 | |
| 15,863 | |||
| Par Value(1) | Value | ||
| Non-Agency—2.5% | |||
| BBCMS Mortgage Trust | |||
| 2018-TALL, A (1 month Term SOFR + 0.919%, Cap N/A, Floor 0.872%) 144A 6.252%, 3/15/37(2)(3) | $ 500 | $ 463 | |
| 2018-TALL, C (1 month Term SOFR + 1.318%, Cap N/A, Floor 1.271%) 144A 6.651%, 3/15/37(2)(3) | 200 | 158 | |
| BX Trust | |||
| 2023-LIFE, A 144A 5.045%, 2/15/28(3) | 500 | 470 | |
| 2018-BILT, A (1 month Term SOFR + 1.097%, Cap N/A, Floor 0.800%) 144A 6.430%, 5/15/30(2)(3) | 1,000 | 992 | |
| DBGS Mortgage Trust 2018-BIOD, A (1 month Term SOFR + 1.099%, Cap N/A, Floor 0.803%) 144A 6.431%, 5/15/35(2)(3) | 914 | 909 | |
| Grace Trust 2020-GRCE, A 144A 2.347%, 12/10/40(3) | 1,250 | 953 | |
| SLG Office Trust 2021-OVA, A 144A 2.585%, 7/15/41(3) | 1,500 | 1,170 | |
| 5,115 | |||
| Total Mortgage-Backed Securities (Identified Cost $25,683) | 20,978 | ||
| Asset-Backed Securities—5.4% | |||
| Agency—2.9% | |||
| United States Small Business Administration | |||
| 2017-20E, 1 2.880%, 5/1/37 | 1,137 | 1,011 | |
| 2020-20G, 1 1.030%, 7/1/40 | 1,689 | 1,332 | |
| 2020-25L, 1 1.210%, 12/1/45 | 1,226 | 923 | |
| 2021-25A, 1 1.280%, 1/1/46 | 2,594 | 1,956 | |
| 2021-25B, 1 1.340%, 2/1/46 | 523 | 400 | |
| 2021-25I, 1 1.560%, 9/1/46 | 226 | 173 | |
| 5,795 | |||
| Automobiles—0.3% | |||
| Toyota Auto Receivables Owner Trust 2021-B, A3 0.260%, 11/17/25 | 542 | 527 | |
| Par Value(1) | Value | ||
| Collateralized Loan Obligations—1.2% | |||
| Flatiron CLO 17 Ltd. 2017-1A, AR (3 month Term SOFR + 1.242%, Cap N/A, Floor 0.980%) 144A 6.606%, 5/15/30(2)(3) | $ 1,245 | $ 1,240 | |
| Venture 42 CLO Ltd. 2021-42A, A1A (3 month Term SOFR + 1.392%, Cap N/A, Floor 1.130%) 144A 6.700%, 4/15/34(2)(3) | 1,220 | 1,195 | |
| 2,435 | |||
| Consumer Loans—0.7% | |||
| OneMain Financial Issuance Trust | |||
| 2021-1A, A1 144A 1.550%, 6/16/36(3) | 500 | 434 | |
| 2022-S1, A 144A 4.130%, 5/14/35(3) | 1,000 | 960 | |
| 1,394 | |||
| Equipment—0.1% | |||
| Dell Equipment Finance Trust 2021-2, A3 144A 0.530%, 12/22/26(3) | 188 | 185 | |
| Other—0.2% | |||
| Verizon Master Trust 2021-1, A 0.500%, 5/20/27 | 500 | 483 | |
| Total Asset-Backed Securities (Identified Cost $12,693) | 10,819 | ||
| Corporate Bonds and Notes—15.7% | |||
| Apparel—0.2% | |||
| Tapestry, Inc. 3.050%, 3/15/32 | 550 | 403 | |
| Auto Manufacturers—0.2% | |||
| Nissan Motor Acceptance Co. LLC 144A 7.050%, 9/15/28(3) | 435 | 435 | |
| Banks—5.3% | |||
| Bank of America Corp. | |||
| 3.384%, 4/2/26 | 425 | 407 | |
| 2.972%, 2/4/33 | 359 | 283 | |
| Barclays plc 7.437%, 11/2/33 | 825 | 847 | |
| BNP Paribas S.A. 144A 1.675%, 6/30/27(3) | 200 | 177 | |
| Citigroup, Inc. 1.281%, 11/3/25 | 940 | 888 | |
| Cooperatieve Rabobank UA 144A 1.106%, 2/24/27(3) | 750 | 666 | |
| Deutsche Bank AG 2.129%, 11/24/26 | 650 | 588 | |
| Par Value(1) | Value | ||
| Banks—continued | |||
| Fifth Third Bancorp. 1.707%, 11/1/27 | $ 525 | $ 454 | |
| Goldman Sachs Group, Inc. (The) 0.855%, 2/12/26 | 730 | 677 | |
| HSBC Holdings plc | |||
| 4.250%, 3/14/24 | 250 | 248 | |
| 2.804%, 5/24/32 | 780 | 604 | |
| JPMorgan Chase & Co. 5.350%, 6/1/34 | 185 | 175 | |
| Kreditanstalt fuer Wiederaufbau 1.000%, 10/1/26 | 1,500 | 1,340 | |
| Morgan Stanley | |||
| 4.210%, 4/20/28 | 250 | 235 | |
| Series I 0.864%, 10/21/25 | 560 | 528 | |
| Sumitomo Mitsui Financial Group, Inc. 0.508%, 1/12/24 | 428 | 422 | |
| Truist Financial Corp. 1.267%, 3/2/27 | 400 | 354 | |
| UBS AG 5.650%, 9/11/28 | 875 | 860 | |
| Wells Fargo & Co. | |||
| 2.879%, 10/30/30 | 625 | 520 | |
| 3.350%, 3/2/33 | 360 | 291 | |
| 10,564 | |||
| Biotechnology—0.3% | |||
| Amgen, Inc. | |||
| 5.150%, 3/2/28 | 300 | 295 | |
| 5.650%, 3/2/53 | 325 | 304 | |
| 599 | |||
| Commercial Services—0.2% | |||
| Ashtead Capital, Inc. 144A 4.000%, 5/1/28(3) | 475 | 432 | |
| Computers—0.2% | |||
| Leidos, Inc. 5.750%, 3/15/33 | 425 | 407 | |
| Electric Utilities—2.2% | |||
| AES Corp. (The) 5.450%, 6/1/28 | 475 | 458 | |
| DTE Electric Co. Series A 4.050%, 5/15/48 | 120 | 91 | |
| Duke Energy Florida LLC | |||
| 2.500%, 12/1/29 | 143 | 121 | |
| 2.400%, 12/15/31 | 250 | 198 | |
| Duke Energy Progress LLC 3.450%, 3/15/29 | 330 | 299 | |
| Enel Finance International N.V. 144A 5.500%, 6/15/52(3) | 575 | 477 | |
| MidAmerican Energy Co. | |||
| 3.650%, 4/15/29 | 250 | 228 | |
| 4.250%, 7/15/49 | 50 | 39 | |
| New York State Electric & Gas Corp. | |||
| 144A 5.650%, 8/15/28(3) | 150 | 149 | |
| Par Value(1) | Value | ||
| Electric Utilities—continued | |||
| 144A 2.150%, 10/1/31(3) | $ 255 | $ 190 | |
| Niagara Mohawk Power Corp. 144A 1.960%, 6/27/30(3) | 240 | 187 | |
| Northern States Power Co. 4.500%, 6/1/52 | 690 | 561 | |
| PacifiCorp. 5.350%, 12/1/53 | 650 | 539 | |
| Southern California Edison Co. 2.750%, 2/1/32 | 525 | 420 | |
| Wisconsin Public Service Corp. 2.850%, 12/1/51 | 670 | 391 | |
| 4,348 | |||
| Electronics—0.2% | |||
| Arrow Electronics, Inc. 6.125%, 3/1/26 | 300 | 299 | |
| Engineering & Construction—0.1% | |||
| Jacobs Engineering Group, Inc. 6.350%, 8/18/28 | 155 | 155 | |
| Entertainment—0.2% | |||
| Warnermedia Holdings, Inc. 5.050%, 3/15/42 | 510 | 394 | |
| Environmental Services—0.2% | |||
| Veralto Corp. 144A 5.450%, 9/18/33(3) | 440 | 426 | |
| Equity Real Estate Investment Trusts (REITs)—0.6% | |||
| AvalonBay Communities, Inc. 1.900%, 12/1/28 | 420 | 354 | |
| Boston Properties LP 3.400%, 6/21/29 | 500 | 419 | |
| Kimco Realty OP LLC 2.700%, 10/1/30 | 507 | 407 | |
| 1,180 | |||
| Financial Services—1.4% | |||
| Air Lease Corp. 5.850%, 12/15/27 | 450 | 444 | |
| American Express Co. 4.050%, 5/3/29 | 560 | 521 | |
| Capital One Financial Corp. 6.377%, 6/8/34 | 670 | 632 | |
| Charles Schwab Corp. (The) 6.136%, 8/24/34 | 425 | 414 | |
| Discover Financial Services | |||
| 4.100%, 2/9/27 | 190 | 174 | |
| 6.700%, 11/29/32 | 325 | 314 | |
| Synchrony Financial 4.375%, 3/19/24 | 375 | 370 | |
| 2,869 | |||
| Par Value(1) | Value | ||
| Food & Beverage—0.6% | |||
| Bacardi Ltd. 144A 5.250%, 1/15/29(3) | $ 665 | $ 643 | |
| PepsiCo, Inc. | |||
| 3.900%, 7/18/32 | 400 | 364 | |
| 2.875%, 10/15/49 | 200 | 131 | |
| 1,138 | |||
| Hand/Machine Tools—0.3% | |||
| Regal Rexnord Corp. 144A 6.050%, 4/15/28(3) | 675 | 657 | |
| Healthcare-Services—0.1% | |||
| HCA, Inc. 5.200%, 6/1/28 | 290 | 280 | |
| Machinery-Diversified—0.1% | |||
| Ingersoll Rand, Inc. 5.700%, 8/14/33 | 260 | 251 | |
| Multi-National—0.5% | |||
| International Bank for Reconstruction & Development (SOFR + 0.370%) 5.712%, 2/11/31(2) | 1,000 | 992 | |
| Oil, Gas & Consumable Fuels—0.2% | |||
| BP Capital Markets America, Inc. 4.893%, 9/11/33 | 450 | 423 | |
| Paper & Forest Products—0.2% | |||
| Suzano Austria GmbH 3.750%, 1/15/31 | 460 | 379 | |
| Personal Care Products—0.4% | |||
| Haleon U.S. Capital LLC 144A 3.375%, 3/24/27(3) | 250 | 232 | |
| Kenvue, Inc. 144A 5.000%, 3/22/30(3) | 500 | 487 | |
| 719 | |||
| Pharmaceuticals—0.4% | |||
| Pfizer Investment Enterprises Pte Ltd. 5.110%, 5/19/43 | 950 | 872 | |
| Pipelines—0.0% | |||
| Energy Transfer LP 6.000%, 6/15/48 | 100 | 89 | |
| Semiconductors—0.3% | |||
| NXP B.V. 2.500%, 5/11/31 | 660 | 514 | |
| Software—0.6% | |||
| Autodesk, Inc. 2.400%, 12/15/31 | 442 | 348 | |
| Concentrix Corp. 6.650%, 8/2/26 | 395 | 393 | |
| Par Value(1) | Value | ||
| Software—continued | |||
| Oracle Corp. 3.600%, 4/1/50 | $ 680 | $ 440 | |
| 1,181 | |||
| Telecommunications—0.7% | |||
| AT&T, Inc. 5.400%, 2/15/34 | 675 | 632 | |
| Sprint Capital Corp. 6.875%, 11/15/28 | 200 | 206 | |
| T-Mobile USA, Inc. 3.875%, 4/15/30 | 700 | 620 | |
| 1,458 | |||
| Total Corporate Bonds and Notes (Identified Cost $34,253) | 31,464 | ||
| Shares | ||
| Preferred Stock—0.1% | ||
| Oil, Gas & Consumable Fuels—0.1% | ||
| Petroleo Brasileiro S.A., 10.350% | 18,800 | 129 |
| Total Preferred Stock (Identified Cost $99) | 129 | |
| Common Stocks—10.8% | ||
| Automobiles—0.2% | ||
| Tesla, Inc.(4) | 915 | 229 |
| Toyota Motor Corp. | 6,900 | 124 |
| Yamaha Motor Co., Ltd. | 2,700 | 71 |
| 424 | ||
| Banks—0.7% | ||
| Bank Central Asia Tbk PT | 292,800 | 167 |
| Bank Hapoalim BM | 5,795 | 51 |
| Bank Leumi Le-Israel BM | 8,221 | 68 |
| Bank Mandiri Persero Tbk PT | 1,175,900 | 458 |
| BDO Unibank, Inc. | 42,478 | 107 |
| BOC Hong Kong Holdings Ltd. | 41,000 | 112 |
| CTBC Financial Holding Co., Ltd. | 109,000 | 83 |
| HSBC Holdings plc | 8,953 | 70 |
| ICICI Bank Ltd. Sponsored ADR | 1,973 | 46 |
| JPMorgan Chase & Co. | 1,040 | 151 |
| Sumitomo Mitsui Trust Holdings, Inc. | 1,900 | 72 |
| 1,385 | ||
| Beverages—0.2% | ||
| Anadolu Efes Biracilik Ve Malt Sanayii AS | 24,898 | 96 |
| Coca-Cola Co. (The) | 1,888 | 106 |
| Coca-Cola Icecek AS | 2,685 | 39 |
| PepsiCo, Inc. | 823 | 139 |
| Shares | Value | ||
| Beverages—continued | |||
| Sino Grandness Food Industry Group Ltd.(4)(5) | 77,400 | $ — | |
| 380 | |||
| Broadline Retail—0.0% | |||
| Amazon.com, Inc.(4) | 393 | 50 | |
| Building Products—0.6% | |||
| Carrier Global Corp. | 5,052 | 279 | |
| Daikin Industries Ltd. | 1,300 | 204 | |
| Johnson Controls International plc | 3,687 | 196 | |
| Lennox International, Inc. | 854 | 320 | |
| Trane Technologies plc | 1,282 | 260 | |
| 1,259 | |||
| Chemicals—0.0% | |||
| Daicel Corp. | 5,500 | 46 | |
| Commercial Services & Supplies—0.1% | |||
| Waste Management, Inc. | 983 | 150 | |
| Communications Equipment—0.2% | |||
| Cisco Systems, Inc. | 7,649 | 411 | |
| Motorola Solutions, Inc. | 248 | 68 | |
| 479 | |||
| Consumer Staples Distribution & Retail—0.1% | |||
| Carrefour S.A. | 2,034 | 35 | |
| Walmart, Inc. | 1,425 | 228 | |
| 263 | |||
| Diversified Telecommunication Services—0.2% | |||
| Deutsche Telekom AG Registered Shares | 5,247 | 110 | |
| Koninklijke KPN NV | 18,677 | 62 | |
| Orange S.A. | 14,565 | 167 | |
| Swisscom AG Registered Shares | 119 | 71 | |
| Telefonica Deutschland Holding AG | 26,878 | 48 | |
| 458 | |||
| Electric Utilities—0.5% | |||
| Chubu Electric Power Co., Inc. | 37,600 | 480 | |
| Duke Energy Corp. | 899 | 79 | |
| Iberdrola S.A. | 3,124 | 35 | |
| Kansai Electric Power Co., Inc. (The) | 5,200 | 72 | |
| PG&E Corp.(4) | 19,154 | 309 | |
| 975 | |||
| Electrical Equipment—0.2% | |||
| ABB Ltd. Registered Shares | 6,999 | 251 | |
| Shares | Value | ||
| Electrical Equipment—continued | |||
| Signify N.V. | 6,294 | $ 170 | |
| 421 | |||
| Electronic Equipment, Instruments & Components—0.2% | |||
| Canon Marketing Japan, Inc. | 2,200 | 57 | |
| Delta Electronics, Inc. | 30,000 | 301 | |
| Yokogawa Electric Corp. | 3,600 | 70 | |
| 428 | |||
| Financial Services—0.1% | |||
| Visa, Inc. Class A | 1,046 | 241 | |
| Food Products—0.4% | |||
| Bunge Ltd. | 1,002 | 109 | |
| Hershey Co. (The) | 2,230 | 446 | |
| Mondelez International, Inc. Class A | 1,791 | 124 | |
| Nestle S.A. Registered Shares | 919 | 104 | |
| 783 | |||
| Gas Utilities—0.1% | |||
| Tokyo Gas Co. Ltd. | 8,100 | 184 | |
| Ground Transportation—0.2% | |||
| Hankyu Hanshin Holdings, Inc. | 8,100 | 276 | |
| Kintetsu Group Holdings Co. Ltd. | 2,100 | 60 | |
| 336 | |||
| Healthcare Providers & Services—0.9% | |||
| Cardinal Health, Inc. | 1,587 | 138 | |
| Cigna Group (The) | 2,129 | 609 | |
| DaVita, Inc.(4) | 2,949 | 279 | |
| Humana, Inc. | 728 | 354 | |
| Molina Healthcare, Inc.(4) | 800 | 262 | |
| Quest Diagnostics, Inc. | 432 | 53 | |
| UnitedHealth Group, Inc. | 358 | 180 | |
| 1,875 | |||
| Hotels, Restaurants & Leisure—0.1% | |||
| McDonald’s Corp. | 441 | 116 | |
| Household Durables—0.3% | |||
| Haseko Corp. | 2,700 | 34 | |
| PulteGroup, Inc. | 5,926 | 439 | |
| Sekisui House Ltd. | 2,900 | 58 | |
| 531 | |||
| Household Products—0.2% | |||
| Clorox Co. (The) | 2,842 | 372 | |
| Kimberly-Clark de Mexico SAB de C.V. Class A | 31,000 | 62 | |
| 434 | |||
| Shares | Value | ||
| Insurance—0.5% | |||
| Allianz SE Registered Shares | 314 | $ 75 | |
| Arch Capital Group Ltd.(4) | 3,850 | 307 | |
| Assicurazioni Generali SpA | 2,752 | 56 | |
| Chubb Ltd. | 1,037 | 216 | |
| Marsh & McLennan Cos., Inc. | 447 | 85 | |
| People’s Insurance Co. Group of China Ltd. (The) Class H | 322,000 | 116 | |
| Samsung Fire & Marine Insurance Co., Ltd. | 369 | 71 | |
| 926 | |||
| Interactive Media & Services—0.2% | |||
| Alphabet, Inc. Class A(4) | 924 | 121 | |
| Meta Platforms, Inc. Class A(4) | 783 | 235 | |
| 356 | |||
| IT Services—0.4% | |||
| Accenture plc Class A | 290 | 89 | |
| International Business Machines Corp. | 2,633 | 369 | |
| NEC Corp. | 5,600 | 310 | |
| 768 | |||
| Machinery—0.2% | |||
| Caterpillar, Inc. | 269 | 74 | |
| Ingersoll Rand, Inc. | 4,251 | 271 | |
| PACCAR, Inc. | 896 | 76 | |
| 421 | |||
| Marine Transportation—0.2% | |||
| Kuehne + Nagel International AG Registered Shares | 453 | 129 | |
| Mitsui OSK Lines Ltd. | 8,300 | 228 | |
| 357 | |||
| Mortgage Real Estate Investment Trusts (REITs)—0.1% | |||
| Hannon Armstrong Sustainable Infrastructure Capital, Inc. | 6,211 | 132 | |
| Multi-Utilities—0.5% | |||
| Centrica plc | 153,983 | 290 | |
| Consolidated Edison, Inc. | 1,633 | 140 | |
| E.ON SE | 5,462 | 65 | |
| Engie S.A. | 13,677 | 210 | |
| National Grid plc | 6,791 | 81 | |
| NiSource, Inc. | 9,100 | 224 | |
| 1,010 | |||
| Shares | Value | ||
| Oil, Gas & Consumable Fuels—0.1% | |||
| Parkland Corp. | 5,400 | $ 158 | |
| Phillips 66 | 675 | 81 | |
| 239 | |||
| Pharmaceuticals—0.3% | |||
| Johnson & Johnson | 568 | 89 | |
| Merck & Co., Inc. | 2,821 | 290 | |
| Novartis AG Registered Shares | 1,530 | 157 | |
| Novo Nordisk A/S Class B | 1,263 | 115 | |
| 651 | |||
| Professional Services—0.1% | |||
| Automatic Data Processing, Inc. | 448 | 108 | |
| Booz Allen Hamilton Holding Corp. Class A | 784 | 85 | |
| 193 | |||
| Semiconductors & Semiconductor Equipment—0.3% | |||
| Broadcom, Inc. | 152 | 126 | |
| NVIDIA Corp. | 863 | 376 | |
| 502 | |||
| Software—1.1% | |||
| Adobe, Inc. (4) | 159 | 81 | |
| Cadence Design Systems, Inc.(4) | 711 | 167 | |
| Gen Digital, Inc. | 12,225 | 216 | |
| Microsoft Corp. | 2,482 | 784 | |
| Oracle Corp. | 2,376 | 252 | |
| Roper Technologies, Inc. | 947 | 459 | |
| Salesforce, Inc.(4) | 416 | 84 | |
| ServiceNow, Inc.(4) | 117 | 65 | |
| 2,108 | |||
| Specialty Retail—0.2% | |||
| AutoZone, Inc.(4) | 69 | 175 | |
| Home Depot, Inc. (The) | 360 | 109 | |
| O’Reilly Automotive, Inc.(4) | 235 | 214 | |
| 498 | |||
| Technology Hardware, Storage & Peripherals—0.7% | |||
| Apple, Inc. | 4,634 | 793 | |
| FUJIFILM Holdings Corp. | 1,279 | 74 | |
| Lite-On Technology Corp. | 35,000 | 132 | |
| Micro-Star International Co., Ltd. | 27,000 | 137 | |
| Quanta Computer, Inc. | 43,000 | 319 | |
| 1,455 | |||
| Textiles, Apparel & Luxury Goods—0.1% | |||
| Deckers Outdoor Corp.(4) | 316 | 162 | |
| Shares | Value | ||
| Trading Companies & Distributors—0.3% | |||
| ITOCHU Corp. | 5,300 | $ 192 | |
| Mitsui & Co., Ltd. | 3,400 | 123 | |
| Rexel SA | 10,149 | 229 | |
| Sojitz Corp. | 3,100 | 68 | |
| Sumitomo Corp. | 3,800 | 76 | |
| 688 | |||
| Transportation Infrastructure—0.0% | |||
| Kamigumi Co., Ltd. | 2,000 | 41 | |
| Total Common Stocks (Identified Cost $19,835) | 21,725 | ||
| Affiliated Mutual Funds—22.9% | |||
| Virtus Duff & Phelps Water Fund Institutional Shares(6)(7) | 350,002 | 6,034 | |
| Virtus NFJ Global Sustainability Fund Institutional Shares(6)(7) | 2,591,042 | 39,876 | |
| Total Affiliated Mutual Funds (Identified Cost $51,606) | 45,910 | ||
| Exchange-Traded Funds—15.4% | |||
| iShares ESG Aware MSCI USA ETF(7) | 131,711 | 12,369 | |
| iShares Trust iShares ESG Aware MSCI EAFE ETF(7) | 81,568 | 5,639 | |
| iShares, Inc. iShares ESG Aware MSCI EM ETF(7) | 67,904 | 2,056 | |
| PIMCO Enhanced Short Maturity Active ESG Exchange-Traded Fund(7) | 110,000 | 10,793 | |
| Total Exchange-Traded Funds (Identified Cost $31,589) | 30,857 | ||
| Affiliated Exchange-Traded Fund—2.1% | |||
| Capital Markets—2.1% | |||
| Virtus Duff & Phelps Clean Energy ETF(6)(7) | 244,000 | 4,170 | |
| Total Affiliated Exchange-Traded Fund (Identified Cost $4,512) | 4,170 | ||
| Total Long-Term Investments—89.8% (Identified Cost $197,052) | 180,300 | ||
| Shares | Value | ||
| Short-Term Investment—4.1% | |||
| Money Market Mutual Fund—4.1% | |||
| BlackRock Liquidity FedFund - Institutional Shares (seven-day effective yield 5.236%)(7) | 8,215,458 | $ 8,215 | |
| Total Short-Term Investment (Identified Cost $8,215) | 8,215 | ||
| TOTAL INVESTMENTS—93.9% (Identified Cost $205,267) | $188,515 | ||
| Other assets and liabilities, net—6.1% | 12,348 | ||
| NET ASSETS—100.0% | $200,863 | ||
| Abbreviations: | |
| ACES | Alternative Credit Enhancements Securities |
| ADR | American Depositary Receipt |
| BIST | Borsa Istanbul |
| BTP | Italian Buonie |
| CDX.EM | Markit CDX® Emerging Markets Index |
| CLO | Collateralized Loan Obligation |
| DAX | Deutsche Boerse AG German Stock Index |
| EAFE | Europe, Australasia and Far East |
| ETF | Exchange-Traded Fund |
| FTSE | Financial Times Stock Exchange |
| HSBC | Hong Kong & Shanghai Bank |
| IBEX | Spanish Stock Exchange |
| LLC | Limited Liability Company |
| LP | Limited Partnership |
| MIB | Milano Indice di Borsa |
| MSCI | Morgan Stanley Capital International |
| OAT | Obligations Assimilables du Trésor |
| REIT | Real Estate Investment Trust |
| S&P | Standard & Poor’s |
| SOFR | Secured Overnight Financing Rate |
| TOPIX | Tokyo Stock Price Index |
| Foreign Currencies: | |
| JPY | Japanese Yen |
| Footnote Legend: | |
| (1) | Par Value disclosed in foreign currency is reported in thousands. |
| (2) | Variable rate security. Rate disclosed is as of September 30, 2023. Information in parenthesis represents benchmark and reference rate for each security. Certain variable rate securities are not based on a published reference rate and spread but are determined by the issuer or agent and are based on current market conditions, or, for mortgage-backed securities, are impacted by the individual mortgages which are paying off over time. These securities do not indicate a reference rate and spread in their descriptions. |
| (3) | Security exempt from registration under Rule 144A of the Securities Act of 1933. These securities may be resold in transactions exempt from registration, normally to qualified institutional buyers. At September 30, 2023, these securities amounted to a value of $14,287 or 7.1% of net assets. |
| (4) | Non-income producing. |
| (5) | The value of this security was determined using significant unobservable inputs and is reported as a Level 3 security in the Fair Value Hierarchy table located after the Schedule of Investments. |
| (6) | Affiliated investment. See Note 4I in Notes to Financial Statements. |
| (7) | Shares of this fund are publicly offered, and its prospectus and annual report are publicly available. |
| Country Weightings (Unaudited)† | |
| Equity: North America | 36% |
| Equity: Developed Markets ex U.S. | 19 |
| Equity: Emerging Markets | 8 |
| Fixed Income | 45 |
| Other | (3) |
| Cash and Ultrashort bonds | (5) |
| Total | 100% |
| †% of total investments as of September 30, 2023 | |
| Exchange-traded futures contracts as of September 30, 2023 were as follows: | |||||
| Issue | Expiration | Contracts Purchased/(Sold) | Notional Value | Value / Unrealized Appreciation | Value / Unrealized Depreciation |
| Long Contracts: | |||||
| BIST 30 Index Future | October 2023 | 28 | $ 93 | $ 4 | $ — |
| Bovespa Index Future | October 2023 | 30 | 140 | — | (4) |
| FTSE China Index Future | October 2023 | 7 | 88 | — | — (1) |
| FTSE Taiwan Index Future | October 2023 | 4 | 228 | 2 | — |
| IBEX 35 Index Future | October 2023 | 2 | 200 | — | (1) |
| Brazil Real Future | November 2023 | 113 | 2,240 | 14 | — |
| 10 Year Euro-Bund Future | December 2023 | 5 | 680 | — | (13) |
| 10 Year U.K. Gilt Future | December 2023 | 8 | 919 | — | (5) |
| 10 Year U.S. Treasury Note Future | December 2023 | 68 | 7,348 | — | (28) |
| 10 Year U.S. Ultra Future | December 2023 | 61 | 6,805 | — | (204) |
| 2 Year U.S. Treasury Note Future | December 2023 | 37 | 7,500 | — | (18) |
| 30 Year U.S. Treasury Bond Future | December 2023 | 19 | 2,162 | — | (117) |
| 5 Year U.S. Treasury Note Future | December 2023 | 46 | 4,846 | — | (39) |
| Canadian Dollar Future | December 2023 | 5 | 369 | — | (2) |
| DAX Mini Index Future | December 2023 | 1 | 82 | — | (2) |
| FTSE 100 Index Future | December 2023 | 5 | 468 | — | (3) |
| Exchange-traded futures contracts as of September 30, 2023 were as follows (continued): | ||||||
| Issue | Expiration | Contracts Purchased/(Sold) | Notional Value | Value / Unrealized Appreciation | Value / Unrealized Depreciation | |
| FTSE/MIB Index Future | December 2023 | 1 | $ 149 | $ — | $ (2) | |
| MSCI EAFE Index Future | December 2023 | 81 | 8,268 | — | (344) | |
| MSCI Emerging Index Future | December 2023 | 92 | 4,395 | — | (174) | |
| Nasdaq 100® E-Mini Index Future | December 2023 | 1 | 297 | — | (16) | |
| Ressell 2000® E-Mini Index Future | December 2023 | 28 | 2,518 | — | (105) | |
| S&P 500® E-Mini Index Future | December 2023 | 116 | 22,227 | — | (1,132) | |
| S&P E-Mini Utilities Sector Future | December 2023 | 25 | 1,497 | — | (4) | |
| TOPIX Index Future | December 2023 | 18 | 2,799 | — | (49) | |
| $ 20 | $ (2,262) | |||||
| Short Contracts: | ||||||
| 10 Year Australian Bond Future | December 2023 | (13) | (936) | — | (1) | |
| 10 Year Canadian Bond Future | December 2023 | (28) | (2,373) | — | (8) | |
| 10 Year Japanese Bond Future | December 2023 | (13) | (12,610) | 106 | — | |
| Australian Dollar Future | December 2023 | (6) | (387) | — | (1) | |
| British Pound Future | December 2023 | (17) | (1,297) | 2 | — | |
| Euro FX Currency Future | December 2023 | (2) | (265) | — | (1) | |
| Euro-BTP Future | December 2023 | (8) | (928) | — | (8) | |
| Euro-OAT Future | December 2023 | (4) | (521) | 1 | — | |
| FTSE/JSE Future | December 2023 | (1) | (36) | 1 | — | |
| Japanese Yen Future | December 2023 | (40) | (3,389) | 14 | — | |
| Mexican Peso Future | December 2023 | (82) | (2,326) | 38 | — | |
| New Zealand Dollar Future | December 2023 | (12) | (720) | — | (10) | |
| S&P 500® E-Mini Index Future | December 2023 | (17) | (3,677) | 99 | — | |
| S&P E-Mini Health Care Sector Future | December 2023 | (11) | (1,443) | 3 | — | |
| S&P Future | December 2023 | (1) | (173) | — (1) | — | |
| S&P Mid 400® E-Mini Index Future | December 2023 | (9) | (2,268) | 75 | — | |
| U.S. Treasury Ultra Bond Future | December 2023 | (20) | (2,374) | 67 | — | |
| 406 | (29) | |||||
| Total | $426 | $ (2,291) | ||||
| Centrally cleared credit default swaps - sell protection(2) outstanding as of September 30, 2023 was as follows: | ||||||||||||||
| Reference Entity | Payment Frequency | Fixed Rate | Expiration Date | Notional Amount(3) | Value | Premiums Paid (Received) | Unrealized Appreciation | Unrealized Depreciation | ||||||
| CDX.EM.39 | Quarterly | 1.000% | 6/20/28 | $1,700 | $(76) | $(107) | $31 | $— | ||||||
| Total | $(76) | $(107) | $31 | $— | ||||||||||
| Footnote Legend: | |
| (1) | Amount is less than $500 (not in thousands). |
| (2) | If the Fund is a seller of protection and a credit event occurs, as defined under the terms of that particular swap agreement, the Fund will either (i) pay to the buyer of protection an amount equal to the notional amount of the swap and take delivery of the referenced obligation or underlying investments comprising the referenced index or (ii) pay a net settlement amount in the form of cash or investments equal to the notional amount of the swap less the recovery value of the referenced obligation or underlying investments comprising the referenced index. |
| (3) | The maximum potential amount the Fund could be required to pay as a seller of credit protection or receive as a buyer of credit protection if a credit event occurs as defined under the terms of that particular swap agreement. |
| Total Value at September 30, 2023 | Level 1 Quoted Prices | Level 2 Significant Observable Inputs | Level 3 Significant Unobservable Inputs | ||||
| Assets: | |||||||
| Debt Instruments: | |||||||
| Asset-Backed Securities | $ 10,819 | $ — | $10,819 | $— | |||
| Corporate Bonds and Notes | 31,464 | — | 31,464 | — | |||
| Foreign Government Security | 1,893 | — | 1,893 | — | |||
| Mortgage-Backed Securities | 20,978 | — | 20,978 | — | |||
| U.S. Government Securities | 12,355 | — | 12,355 | — | |||
| Equity Securities: | |||||||
| Common Stocks | 21,725 | 21,725 | — | — (1) | |||
| Preferred Stock | 129 | 129 | — | — | |||
| Affiliated Exchange-Traded Fund | 4,170 | 4,170 | — | — | |||
| Affiliated Mutual Funds | 45,910 | 45,910 | — | — | |||
| Exchange-Traded Funds | 30,857 | 30,857 | — | — | |||
| Money Market Mutual Fund | 8,215 | 8,215 | — | — | |||
| Other Financial Instruments: | |||||||
| Futures Contracts | 426 | 426 | — | — | |||
| Total Assets | 188,941 | 111,432 | 77,509 | — (1) | |||
| Liabilities: | |||||||
| Other Financial Instruments: | |||||||
| Futures Contracts | (2,291) | (2,291) | — | — | |||
| Centrally Cleared Credit Default Swaps | (76) | — | (76) | — | |||
| Total Liabilities | (2,367) | (2,291) | (76) | — | |||
| Total Investments | $186,574 | $109,141 | $77,433 | $— (1) |
| (1) | Includes internally fair valued securities currently priced at zero ($0). |
| Shares | Value | ||
| Preferred Stocks—2.0% | |||
| Brazil—1.6% | |||
| Metalurgica Gerdau S.A., 11.020% | 199 (1) | $ 441 | |
| Randon S.A. Implementos e Participacoes, 4.640% | 42,600 | 99 | |
| 540 | |||
| Chile—0.4% | |||
| Embotelladora Andina S.A., 7.730% | 64,660 | 146 | |
| Total Preferred Stocks (Identified Cost $772) | 686 | ||
| Common Stocks—89.1% | |||
| Australia—3.7% | |||
| AUB Group Ltd. | 11,154 | 209 | |
| Iluka Resources Ltd. | 27,074 | 134 | |
| JB Hi-Fi Ltd. | 5,908 | 172 | |
| Super Retail Group Ltd. | 95,617 | 737 | |
| 1,252 | |||
| Austria—2.3% | |||
| Raiffeisen Bank International AG(2) | 15,603 | 228 | |
| Wienerberger AG | 22,297 | 567 | |
| 795 | |||
| Bermuda—0.8% | |||
| Kunlun Energy Co., Ltd. | 314,000 | 271 | |
| Brazil—0.9% | |||
| Cia de Saneamento de Minas Gerais Copasa MG | 85,500 | 295 | |
| Canada—3.9% | |||
| Boardwalk Real Estate Investment Trust | 4,545 | 224 | |
| Dream Industrial Real Estate Investment Trust | 20,375 | 193 | |
| Granite Real Estate Investment Trust | 1,478 | 78 | |
| H&R Real Estate Investment Trust | 18,078 | 123 | |
| Parex Resources, Inc. | 17,878 | 335 | |
| Russel Metals, Inc. | 13,288 | 372 | |
| 1,325 | |||
| China—0.9% | |||
| Bank of Jiangsu Co., Ltd. Class A | 326,762 | 321 | |
| Denmark—0.9% | |||
| Pandora A/S | 3,100 | 322 | |
| France—3.6% | |||
| Ipsen S.A. | 3,808 | 500 | |
| Verallia S.A. | 18,794 | 741 | |
| 1,241 | |||
| Shares | Value | ||
| Germany—2.3% | |||
| Aurubis AG | 1,042 | $ 77 | |
| HUGO BOSS AG | 7,206 | 457 | |
| TeamViewer SE(2) | 14,488 | 244 | |
| 778 | |||
| Greece—2.1% | |||
| Motor Oil Hellas Corinth Refineries S.A. | 14,660 | 371 | |
| Mytilineos S.A. | 9,489 | 350 | |
| 721 | |||
| Hungary—0.6% | |||
| Richter Gedeon Nyrt | 8,343 | 202 | |
| Indonesia—0.3% | |||
| Matahari Department Store Tbk PT | 725,600 | 113 | |
| Israel—1.9% | |||
| Mizrahi Tefahot Bank Ltd. | 17,720 | 642 | |
| Italy—4.8% | |||
| A2A SpA | 257,424 | 459 | |
| Banca Mediolanum SpA | 63,417 | 543 | |
| Saras SpA | 438,758 | 629 | |
| 1,631 | |||
| Japan—22.9% | |||
| 77 Bank Ltd. (The) | 9,500 | 202 | |
| Adastria Co., Ltd. | 13,200 | 254 | |
| Citizen Watch Co., Ltd. | 58,200 | 358 | |
| Cosmo Energy Holdings Co., Ltd. | 5,800 | 204 | |
| Doutor Nichires Holdings Co., Ltd. | 4,900 | 76 | |
| Ebara Corp. | 5,000 | 234 | |
| H.U. Group Holdings, Inc. | 6,700 | 114 | |
| H2O Retailing Corp. | 47,600 | 578 | |
| Hanwa Co., Ltd. | 16,400 | 521 | |
| INFRONEER Holdings, Inc. | 71,300 | 739 | |
| Kaga Electronics Co., Ltd. | 6,400 | 278 | |
| Kanematsu Corp. | 17,300 | 239 | |
| Lawson, Inc. | 3,900 | 179 | |
| Mazda Motor Corp. | 54,800 | 622 | |
| Mizuno Corp. | 3,800 | 121 | |
| Nippon Yusen KK | 6,600 | 172 | |
| Onward Holdings Co., Ltd. | 70,300 | 246 | |
| SCREEN Holdings Co., Ltd. | 3,200 | 156 | |
| Senko Group Holdings Co., Ltd. | 35,800 | 251 | |
| Seven Bank Ltd. | 165,700 | 345 | |
| Sojitz Corp. | 41,400 | 908 | |
| Takashimaya Co., Ltd. | 13,200 | 193 | |
| Toyota Tsusho Corp. | 12,700 | 747 | |
| United Arrows Ltd. | 6,100 | 80 | |
| 7,817 | |||
| Jersey—0.3% | |||
| WNS Holdings Ltd. ADR(2) | 1,255 | 86 | |
| Shares | Value | ||
| Luxembourg—1.6% | |||
| B&M European Value Retail S.A. | 77,729 | $ 556 | |
| Malaysia—0.3% | |||
| Bermaz Auto Bhd | 191,200 | 101 | |
| Mauritius—0.5% | |||
| Golden Agri-Resources Ltd. | 941,000 | 182 | |
| Mexico—1.2% | |||
| Arca Continental SAB de C.V. | 46,400 | 423 | |
| Netherlands—4.4% | |||
| ABN AMRO Bank N.V. CVA GDR | 39,289 | 558 | |
| AMG Critical Materials N.V. | 3,146 | 95 | |
| ASR Nederland N.V. | 7,507 | 282 | |
| Fugro N.V.(2) | 6,722 | 103 | |
| Randstad N.V. | 8,043 | 446 | |
| 1,484 | |||
| Singapore—1.8% | |||
| First Resources Ltd. | 95,800 | 107 | |
| Sembcorp Industries Ltd. | 52,500 | 196 | |
| Yangzijiang Shipbuilding Holdings Ltd. | 246,500 | 299 | |
| 602 | |||
| South Africa—1.4% | |||
| AECI Ltd. | 13,365 | 80 | |
| Nedbank Group Ltd. | 11,162 | 119 | |
| Tiger Brands Ltd. | 14,603 | 118 | |
| Truworths International Ltd. | 37,713 | 153 | |
| 470 | |||
| South Korea—4.9% | |||
| Doosan Bobcat, Inc. | 20,356 | 769 | |
| Hyundai Marine & Fire Insurance Co., Ltd. | 16,333 | 393 | |
| JB Financial Group Co., Ltd. | 13,520 | 100 | |
| LG Uplus Corp. | 35,234 | 270 | |
| LX International Corp. | 6,894 | 146 | |
| 1,678 | |||
| Spain—2.1% | |||
| Cia de Distribucion Integral Logista Holdings S.A. | 27,920 | 714 | |
| Sweden—0.8% | |||
| Betsson AB Class B(2) | 24,453 | 269 | |
| Switzerland—0.8% | |||
| Cembra Money Bank AG | 955 | 65 | |
| u-blox Holding AG(2) | 2,350 | 200 | |
| 265 | |||
| Taiwan—5.5% | |||
| ChipMOS Technologies, Inc. | 99,000 | 115 | |
| Gamania Digital Entertainment Co., Ltd. | 57,000 | 117 | |
| Micro-Star International Co., Ltd. | 71,000 | 361 | |
| Shares | Value | ||
| Taiwan—continued | |||
| Novatek Microelectronics Corp. | 13,000 | $ 170 | |
| Simplo Technology Co., Ltd. | 19,000 | 197 | |
| Sitronix Technology Corp. | 45,000 | 388 | |
| Taichung Commercial Bank Co., Ltd. | 682,374 | 310 | |
| TaiDoc Technology Corp. | 22,000 | 101 | |
| Tung Ho Steel Enterprise Corp. | 67,000 | 126 | |
| 1,885 | |||
| Thailand—1.3% | |||
| AP Thailand PCL Foreign Shares | 370,700 | 120 | |
| Chularat Hospital PCL Foreign Shares | 832,700 | 75 | |
| PTT Exploration & Production PCL Foreign Shares | 52,000 | 244 | |
| 439 | |||
| Turkey—0.4% | |||
| BIM Birlesik Magazalar AS | 14,909 | 149 | |
| United Kingdom—7.6% | |||
| 4imprint Group plc | 9,491 | 608 | |
| Beazley plc | 32,575 | 220 | |
| Britvic plc | 15,397 | 164 | |
| Centrica plc | 164,719 | 310 | |
| Dunelm Group plc | 23,566 | 302 | |
| Games Workshop Group plc | 3,665 | 473 | |
| Greggs plc | 6,629 | 198 | |
| OSB Group plc | 27,081 | 108 | |
| Pagegroup plc | 22,049 | 113 | |
| SThree plc | 16,890 | 77 | |
| 2,573 | |||
| Shares | Value | ||
| United States—2.3% | |||
| Vishay Intertechnology, Inc. | 8,744 | $ 216 | |
| Warrior Met Coal, Inc. | 11,237 | 574 | |
| 790 | |||
| Total Common Stocks (Identified Cost $27,122) | 30,392 | ||
| Exchange-Traded Fund—3.6% | |||
| iShares MSCI India Small-Cap ETF(3) | 19,408 | 1,225 | |
| Total Exchange-Traded Fund (Identified Cost $984) | 1,225 | ||
| Total Long-Term Investments—94.7% (Identified Cost $28,878) | 32,303 | ||
| Short-Term Investment—0.3% | |||
| Money Market Mutual Fund—0.3% | |||
| BlackRock Liquidity FedFund - Institutional Shares (seven-day effective yield 5.236%)(3) | 97,152 | 97 | |
| Total Short-Term Investment (Identified Cost $97) | 97 | ||
| TOTAL INVESTMENTS—95.0% (Identified Cost $28,975) | $32,400 | ||
| Other assets and liabilities, net—5.0% | 1,701 | ||
| NET ASSETS—100.0% | $34,101 | ||
| Abbreviations: | |
| ADR | American Depositary Receipt |
| ETF | Exchange-Traded Fund |
| GDR | Global Depositary Receipt |
| MSCI | Morgan Stanley Capital International |
| Footnote Legend: | |
| (1) | Value shown as par value. |
| (2) | Non-income producing. |
| (3) | Shares of this fund are publicly offered, and its prospectus and annual report are publicly available. |
| Country Weightings (Unaudited)† | |
| Japan | 24% |
| United Kingdom | 8 |
| United States | 7 |
| Taiwan | 6 |
| South Korea | 5 |
| Italy | 5 |
| Netherlands | 5 |
| Other | 40 |
| Total | 100% |
| † % of total investments as of September 30, 2023. | |
| Total Value at September 30, 2023 | Level 1 Quoted Prices | ||
| Assets: | |||
| Equity Securities: | |||
| Common Stocks | $30,392 | $30,392 | |
| Preferred Stocks | 686 | 686 | |
| Exchange-Traded Fund | 1,225 | 1,225 | |
| Money Market Mutual Fund | 97 | 97 | |
| Total Investments | $32,400 | $32,400 |
| Par Value | Value | ||
| U.S. Government Security—1.1% | |||
| U.S. Treasury Note 4.125%, 6/15/26 | $ 6,070 | $ 5,958 | |
| Total U.S. Government Security (Identified Cost $6,005) | 5,958 | ||
| Asset-Backed Security—0.5% | |||
| Other—0.5% | |||
| Conn’s Receivables Funding LLC 2023-A, B 144A 10.000%, 1/17/28(1) | 2,885 | 2,891 | |
| Total Asset-Backed Security (Identified Cost $2,827) | 2,891 | ||
| Corporate Bonds and Notes—86.1% | |||
| Communication Services—11.8% | |||
| Connect Finco S.a.r.l. 144A 6.750%, 10/1/26(1) | 7,640 | 7,126 | |
| CSC Holdings LLC 5.250%, 6/1/24 | 5,890 | 5,603 | |
| DirecTV Financing LLC 144A 5.875%, 8/15/27(1) | 11,250 | 9,947 | |
| DISH DBS Corp. 144A 5.250%, 12/1/26(1) | 12,350 | 10,495 | |
| Gray Television, Inc. 144A 7.000%, 5/15/27(1) | 5,135 | 4,416 | |
| Millennium Escrow Corp. 144A 6.625%, 8/1/26(1) | 12,950 | 10,322 | |
| Nexstar Media, Inc. 144A 5.625%, 7/15/27(1) | 3,800 | 3,382 | |
| Radiate Holdco LLC 144A 4.500%, 9/15/26(1) | 7,285 | 5,534 | |
| Summer BC Bidco B LLC 144A 5.500%, 10/31/26(1) | 5,054 | 4,532 | |
| Townsquare Media, Inc. 144A 6.875%, 2/1/26(1) | 4 | 4 | |
| Univision Communications, Inc. 144A 6.625%, 6/1/27(1) | 6,578 | 6,126 | |
| 67,487 | |||
| Consumer Discretionary—12.4% | |||
| Caesars Entertainment, Inc. 144A 6.250%, 7/1/25(1) | 5,945 | 5,864 | |
| Carnival Corp. 144A 7.000%, 8/15/29(1) | 510 | 503 | |
| CCM Merger, Inc. 144A 6.375%, 5/1/26(1) | 2,900 | 2,774 | |
| Churchill Downs, Inc. 144A 6.750%, 5/1/31(1) | 3,420 | 3,232 | |
| Clarios Global LP | |||
| 144A 6.750%, 5/15/25(1) | 720 | 715 | |
| 144A 6.750%, 5/15/28(1) | 350 | 342 | |
| eG Global Finance plc | |||
| 144A 6.750%, 2/7/25(1) | 5,857 | 5,754 | |
| 144A 8.500%, 10/30/25(1) | 5,523 | 5,436 | |
| Par Value | Value | ||
| Consumer Discretionary—continued | |||
| Ford Motor Credit Co. LLC | |||
| 6.950%, 3/6/26 | $ 1,000 | $ 998 | |
| 7.350%, 11/4/27 | 6,310 | 6,434 | |
| 6.800%, 5/12/28 | 600 | 599 | |
| Gates Global LLC 144A 6.250%, 1/15/26(1) | 5,873 | 5,723 | |
| Goodyear Tire & Rubber Co. (The) 9.500%, 5/31/25 | 2,200 | 2,233 | |
| Hilton Worldwide Finance LLC 4.875%, 4/1/27 | 2,165 | 2,059 | |
| Light & Wonder International, Inc. 144A 7.000%, 5/15/28(1) | 5,150 | 5,062 | |
| Newell Brands, Inc. 6.375%, 9/15/27 | 4,460 | 4,255 | |
| NMG Holding Co., Inc. 144A 7.125%, 4/1/26(1) | 5,000 | 4,690 | |
| Ontario Gaming GTA LP 144A 8.000%, 8/1/30(1) | 3,535 | 3,535 | |
| Royal Caribbean Cruises Ltd. 144A 9.250%, 1/15/29(1) | 177 | 187 | |
| Sally Holdings LLC 5.625%, 12/1/25 | 3,534 | 3,444 | |
| SeaWorld Parks & Entertainment, Inc. 144A 8.750%, 5/1/25(1) | 3,500 | 3,535 | |
| Six Flags Theme Parks, Inc. 144A 7.000%, 7/1/25(1) | 3,526 | 3,517 | |
| 70,891 | |||
| Consumer Staples—2.0% | |||
| Albertsons Cos., Inc. 144A 6.500%, 2/15/28(1) | 2,927 | 2,893 | |
| Coty, Inc. 144A 6.625%, 7/15/30(1) | 3,290 | 3,212 | |
| Energizer Holdings, Inc. 144A 6.500%, 12/31/27(1) | 5,500 | 5,177 | |
| 11,282 | |||
| Energy—13.4% | |||
| Alliance Resource Operating Partners LP 144A 7.500%, 5/1/25(1) | 4,262 | 4,259 | |
| CITGO Petroleum Corp. 144A 7.000%, 6/15/25(1) | 2,375 | 2,340 | |
| Civitas Resources, Inc. 144A 8.375%, 7/1/28(1) | 3,585 | 3,648 | |
| Cloud Peak Energy Resources LLC PIK 12.000%, 5/1/25(2) | 2,593 | 2,359 | |
| CVR Energy, Inc. 144A 5.250%, 2/15/25(1) | 12,594 | 12,286 | |
| Delek Logistics Partners LP 144A 7.125%, 6/1/28(1) | 2,000 | 1,827 | |
| Enerflex Ltd. 144A 9.000%, 10/15/27(1) | 3,045 | 3,007 | |
| EQM Midstream Partners LP | |||
| 144A 6.000%, 7/1/25(1) | 2,937 | 2,891 | |
| Par Value | Value | ||
| Energy—continued | |||
| 144A 7.500%, 6/1/27(1) | $ 950 | $ 952 | |
| Genesis Energy LP 8.000%, 1/15/27 | 4,000 | 3,856 | |
| Hess Midstream Operations LP 144A 5.625%, 2/15/26(1) | 3,000 | 2,899 | |
| Hilcorp Energy I LP 144A 6.000%, 4/15/30(1) | 4,500 | 4,057 | |
| Holly Energy Partners LP 144A 6.375%, 4/15/27(1) | 3,675 | 3,608 | |
| New Fortress Energy, Inc. 144A 6.750%, 9/15/25(1) | 6,500 | 6,205 | |
| NuStar Logistics LP 5.750%, 10/1/25 | 5,200 | 5,057 | |
| SM Energy Co. 5.625%, 6/1/25 | 5,000 | 4,894 | |
| Sunoco LP 144A 7.000%, 9/15/28(1) | 5,735 | 5,659 | |
| Targa Resources Partners LP 6.500%, 7/15/27 | 3,000 | 3,023 | |
| Transocean, Inc. 144A 8.750%, 2/15/30(1) | 4,133 | 4,225 | |
| 77,052 | |||
| Financials—9.2% | |||
| Albion Financing 2 S.a.r.l. 144A 8.750%, 4/15/27(1) | 4,000 | 3,710 | |
| Alliant Holdings Intermediate LLC 144A 6.750%, 4/15/28(1) | 4,500 | 4,343 | |
| Blackstone Mortgage Trust, Inc. 144A 3.750%, 1/15/27(1) | 3,000 | 2,521 | |
| Castlelake Aviation Finance DAC 144A 5.000%, 4/15/27(1) | 7,500 | 6,850 | |
| HUB International Ltd. 144A 7.250%, 6/15/30(1) | 4,000 | 3,993 | |
| LD Holdings Group LLC 144A 6.500%, 11/1/25(1) | 5,025 | 4,172 | |
| Midcap Financial Issuer Trust 144A 6.500%, 5/1/28(1) | 5,595 | 4,829 | |
| NCR Atleos Escrow Corp. 144A 9.500%, 4/1/29(1) | 3,724 | 3,602 | |
| PennyMac Financial Services, Inc. 144A 5.375%, 10/15/25(1) | 2,750 | 2,614 | |
| SLM Corp. 4.200%, 10/29/25 | 8,950 | 8,375 | |
| Starwood Property Trust, Inc. 144A 3.750%, 12/31/24(1) | 900 | 857 | |
| United Wholesale Mortgage LLC 144A 5.500%, 11/15/25(1) | 7,200 | 6,848 | |
| 52,714 | |||
| Par Value | Value | ||
| Health Care—7.1% | |||
| Akumin, Inc. 144A 7.000%, 11/1/25(1) | $ 9,875 | $ 7,406 | |
| Catalent Pharma Solutions, Inc. 144A 5.000%, 7/15/27(1) | 4,000 | 3,670 | |
| Cheplapharm Arzneimittel GmbH 144A 5.500%, 1/15/28(1) | 3,500 | 3,176 | |
| HCA, Inc. 5.375%, 2/1/25 | 1,500 | 1,484 | |
| LifePoint Health, Inc. | |||
| 144A 9.875%, 8/15/30(1) | 1,455 | 1,409 | |
| 144A 11.000%, 10/15/30(1) | 2,900 | 2,900 | |
| Medline Borrower LP 144A 5.250%, 10/1/29(1) | 6,705 | 5,795 | |
| RP Escrow Issuer LLC 144A 5.250%, 12/15/25(1) | 3,400 | 2,466 | |
| Select Medical Corp. 144A 6.250%, 8/15/26(1) | 6,000 | 5,862 | |
| Star Parent, Inc. 144A 9.000%, 10/1/30(1) | 130 | 131 | |
| Teva Pharmaceutical Finance Netherlands III B.V. | |||
| 6.000%, 4/15/24 | 1,819 | 1,805 | |
| 7.125%, 1/31/25 | 3,700 | 3,706 | |
| 7.875%, 9/15/29 | 825 | 835 | |
| 40,645 | |||
| Industrials—14.6% | |||
| Beacon Roofing Supply, Inc. 144A 6.500%, 8/1/30(1) | 3,380 | 3,276 | |
| Brink’s Co. (The) 144A 5.500%, 7/15/25(1) | 5,000 | 4,901 | |
| Chart Industries, Inc. 144A 7.500%, 1/1/30(1) | 2,970 | 2,986 | |
| Fly Leasing Ltd. 144A 7.000%, 10/15/24(1) | 10,990 | 10,084 | |
| Fortress Transportation & Infrastructure Investors LLC 144A 6.500%, 10/1/25(1) | 7,792 | 7,658 | |
| Global Aircraft Leasing Co. Ltd. PIK 144A 6.500%, 9/15/24(1)(2) | 5,627 | 5,360 | |
| Mileage Plus Holdings LLC 144A 6.500%, 6/20/27(1) | 7,088 | 7,022 | |
| Neptune Bidco U.S., Inc. 144A 9.290%, 4/15/29(1) | 4,535 | 4,106 | |
| Prime Security Services Borrower LLC 144A 5.250%, 4/15/24(1) | 4,800 | 4,767 | |
| Shift4 Payments LLC 144A 4.625%, 11/1/26(1) | 12,250 | 11,550 | |
| TransDigm, Inc. | |||
| 144A 6.875%, 12/15/30(1) | 1,750 | 1,716 | |
| 5.500%, 11/15/27 | 5,200 | 4,869 | |
| Uber Technologies, Inc. 144A 8.000%, 11/1/26(1) | 10,459 | 10,582 | |
| Par Value | Value | ||
| Industrials—continued | |||
| WESCO Distribution, Inc. 144A 7.125%, 6/15/25(1) | $ 5,000 | $ 5,012 | |
| 83,889 | |||
| Information Technology—6.6% | |||
| ACI Worldwide, Inc. 144A 5.750%, 8/15/26(1) | 8,500 | 8,241 | |
| ams-OSRAM AG 144A 7.000%, 7/31/25(1) | 5,250 | 5,176 | |
| Central Parent LLC 144A 8.000%, 6/15/29(1) | 1,220 | 1,215 | |
| Central Parent, Inc. 144A 7.250%, 6/15/29(1) | 4,000 | 3,878 | |
| Consensus Cloud Solutions, Inc. | |||
| 144A 6.000%, 10/15/26(1) | 4,250 | 3,912 | |
| 144A 6.500%, 10/15/28(1) | 5,900 | 5,028 | |
| GTCR W-2 Merger Sub LLC 144A 7.500%, 1/15/31(1) | 2,975 | 2,979 | |
| Veritas U.S., Inc. 144A 7.500%, 9/1/25(1) | 5,000 | 4,178 | |
| Viasat, Inc. 144A 5.625%, 9/15/25(1) | 3,400 | 3,141 | |
| 37,748 | |||
| Materials—2.2% | |||
| LSB Industries, Inc. 144A 6.250%, 10/15/28(1) | 10,250 | 9,287 | |
| Mauser Packaging Solutions Holding Co. 144A 7.875%, 8/15/26(1) | 3,710 | 3,579 | |
| 12,866 | |||
| Real Estate—2.5% | |||
| Forestar Group, Inc. 144A 3.850%, 5/15/26(1) | 4,000 | 3,631 | |
| HAT Holdings I LLC 144A 3.375%, 6/15/26(1) | 2,000 | 1,778 | |
| Newmark Group, Inc. 6.125%, 11/15/23 | 9,197 | 9,178 | |
| 14,587 | |||
| Utilities—4.3% | |||
| Alexander Funding Trust II 144A 7.467%, 7/31/28(1) | 3,600 | 3,605 | |
| Calpine Corp. 144A 5.250%, 6/1/26(1) | 1,096 | 1,064 | |
| Ferrellgas LP 144A 5.375%, 4/1/26(1) | 5,835 | 5,469 | |
| Sunnova Energy Corp. 144A 5.875%, 9/1/26(1) | 11,800 | 10,114 | |
| Par Value | Value | ||
| Utilities—continued | |||
| Vistra Operations Co. LLC 144A 5.500%, 9/1/26(1) | $ 4,500 | $ 4,291 | |
| 24,543 | |||
| Total Corporate Bonds and Notes (Identified Cost $525,211) | 493,704 | ||
| Leveraged Loans—10.3% | |||
| Chemicals—0.3% | |||
| Starfruit Finco B.V. (1 month Term SOFR + 3.100%) 8.427%, 10/1/25(3) | 1,775 | 1,772 | |
| Consumer Non-Durables—1.0% | |||
| Kronos Acquisition Holdings, Inc. Tranche B-1 (3 month Term SOFR + 4.012%) 9.402%, 12/22/26(3) | 5,756 | 5,720 | |
| Energy—1.2% | |||
| Prairie ECI Acquiror LP (1 month Term SOFR + 4.850%) 10.166%, 3/11/26(3) | 6,935 | 6,916 | |
| Financials—1.4% | |||
| Asurion LLC Tranche B-8 (1 month Term SOFR + 3.364%) 8.681%, 12/23/26(3) | 7,867 | 7,690 | |
| Health Care—1.5% | |||
| LifePoint Health, Inc. Tranche B, First Lien (3 month Term SOFR + 4.012%) 9.377%, 11/16/25(3) | 4,637 | 4,622 | |
| Select Medical Corp. Tranche B-1 (1 month Term SOFR + 3.000%) 8.316%, 3/8/27(3) | 993 | 989 | |
| Sotera Health Holdings LLC (1 month Term SOFR + 3.750%) 9.073%, 12/11/26(3) | 2,992 | 2,992 | |
| 8,603 | |||
| Media / Telecom - Cable/Wireless Video—0.5% | |||
| CSC Holdings LLC 2017 (1 month LIBOR + 2.250%) 7.697%, 7/17/25(3) | 2,943 | 2,847 | |
| Metals / Minerals—0.7% | |||
| Covia Holdings Corp. (3 month Term SOFR + 4.262%) 9.530%, 7/31/26(3) | 4,240 | 4,208 | |
| Service—3.2% | |||
| APX Group, Inc. (1 month Term SOFR + 3.364%) 8.689%, 7/10/28(3) | 9,800 | 9,787 | |
| Par Value | Value | ||
| Service—continued | |||
| Pike Corp. | |||
| 2028 (1 month Term SOFR + 3.114%) 8.431%, 1/21/28(3) | $ 3,000 | $ 2,993 | |
| 2028, Tranche B (1 month Term SOFR + 3.500%) 8.816%, 1/21/28(3) | 1,153 | 1,153 | |
| Spin Holdco, Inc. (3 month Term SOFR + 4.262%) 9.664%, 3/4/28(3) | 1,950 | 1,681 | |
| Summer BC Bidco B LLC Tranche B-2 (3 month Term SOFR + 4.760%) 10.150%, 12/4/26(3) | 2,940 | 2,834 | |
| 18,448 | |||
| Transportation - Automotive—0.5% | |||
| Clarios Global LP 2023 (1 month Term SOFR + 3.750%) 9.066%, 5/6/30(3) | 2,925 | 2,916 | |
| Total Leveraged Loans (Identified Cost $59,235) | 59,120 | ||
| Shares | ||
| Common Stock—0.0% | ||
| Energy—0.0% | ||
| Cloud Peak Energy, Inc.(4)(5)(6) | 40,020 | — |
| Total Common Stock (Identified Cost $—) | — | |
| Total Long-Term Investments—98.0% (Identified Cost $593,278) | 561,673 | |
| Shares | Value | ||
| Short-Term Investment—0.0% | |||
| Money Market Mutual Fund—0.0% | |||
| BlackRock Liquidity FedFund - Institutional Shares (seven-day effective yield 5.236%)(7) | 45,251 | $ 45 | |
| Total Short-Term Investment (Identified Cost $45) | 45 | ||
| TOTAL INVESTMENTS—98.0% (Identified Cost $593,323) | $561,718 | ||
| Other assets and liabilities, net—2.0% | 11,657 | ||
| NET ASSETS—100.0% | $573,375 | ||
| Abbreviations: | |
| DAC | Designated Activity Company |
| LIBOR | London Interbank Offered Rate |
| LLC | Limited Liability Company |
| LP | Limited Partnership |
| PIK | Payment-in-Kind Security |
| SOFR | Secured Overnight Financing Rate |
| Footnote Legend: | |
| (1) | Security exempt from registration under Rule 144A of the Securities Act of 1933. These securities may be resold in transactions exempt from registration, normally to qualified institutional buyers. At September 30, 2023, these securities amounted to a value of $421,529 or 73.5% of net assets. |
| (2) | 100% of the income received was in cash. |
| (3) | Variable rate security. Rate disclosed is as of September 30, 2023. Information in parenthesis represents benchmark and reference rate for each security. Certain variable rate securities are not based on a published reference rate and spread but are determined by the issuer or agent and are based on current market conditions, or, for mortgage-backed securities, are impacted by the individual mortgages which are paying off over time. These securities do not indicate a reference rate and spread in their descriptions. |
| (4) | The value of this security was determined using significant unobservable inputs and is reported as a Level 3 security in the Fair Value Hierarchy table located after the Schedule of Investments. |
| (5) | Non-income producing. |
| (6) | All or a portion of the security is restricted. |
| (7) | Shares of this fund are publicly offered, and its prospectus and annual report are publicly available. |
| Country Weightings (Unaudited)† | |
| United States | 86% |
| Luxembourg | 2 |
| United Kingdom | 2 |
| Canada | 2 |
| Bermuda | 2 |
| Cayman Islands | 2 |
| Ireland | 1 |
| Other | 3 |
| Total | 100% |
| † % of total investments as of September 30, 2023. | |
| Total Value at September 30, 2023 | Level 1 Quoted Prices | Level 2 Significant Observable Inputs | Level 3 Significant Unobservable Inputs | ||||
| Assets: | |||||||
| Debt Instruments: | |||||||
| Asset-Backed Security | $ 2,891 | $— | $ 2,891 | $— | |||
| Corporate Bonds and Notes | 493,704 | — | 493,704 | — | |||
| Leveraged Loans | 59,120 | — | 59,120 | — | |||
| U.S. Government Security | 5,958 | — | 5,958 | — | |||
| Equity Securities: | |||||||
| Common Stock | — | — | — | — (1) | |||
| Money Market Mutual Fund | 45 | 45 | — | — | |||
| Total Investments | $561,718 | $45 | $561,673 | $— (1) |
| (1) | Includes internally fair valued securities currently priced at zero ($0). |
| Total | Corporate Bonds And Notes | Common stock | |||
| Investments in Securities | |||||
| Balance as of September 30, 2022: | $ 2,919 | $ 2,919 | $ — (a) | ||
| Net realized gain (loss) | (1,020) | (1,020) | — | ||
| Net change in unrealized appreciation (depreciation) | 1,223 | 1,223 | — | ||
| Sales (b) | (763) | (763) | — | ||
| Transfers from Level 3(c) | (2,359) | (2,359) | — | ||
| Balance as of September 30, 2023 | $ —(a) | $ — | $ — (a) |
| Shares | Value | ||
| Common Stocks—105.0% | |||
| Brazil—3.9% | |||
| Cia Siderurgica Nacional S.A. | 59,472 | $ 144 | |
| Localiza Rent a Car S.A. | 19,769 | 231 | |
| Lojas Renner S.A. | 77,493 | 207 | |
| PRIO S.A.(1) | 28,286 | 264 | |
| TOTVS S.A. | 46,151 | 247 | |
| WEG S.A. | 65,818 | 476 | |
| 1,569 | |||
| Cayman Islands—0.9% | |||
| Baidu, Inc. Class A(1) | 11,714 | 199 | |
| ZTO Express Cayman, Inc. | 7,758 | 189 | |
| 388 | |||
| China—45.7% | |||
| Alibaba Group Holding Ltd.(1) | 102,723 | 1,123 | |
| ANTA Sports Products Ltd. | 154,359 | 1,738 | |
| Asymchem Laboratories Tianjin Co., Ltd. Class A | 10,760 | 223 | |
| Bank of Ningbo Co., Ltd. Class A | 42,254 | 155 | |
| BYD Co., Ltd. Class H | 9,795 | 303 | |
| China Merchants Bank Co., Ltd. Class A | 395,982 | 1,787 | |
| Contemporary Amperex Technology Co., Ltd. Class A | 11,080 | 308 | |
| East Money Information Co., Ltd. Class A | 221,906 | 462 | |
| ENN Energy Holdings Ltd. | 229,814 | 1,908 | |
| ENN Natural Gas Co., Ltd. Class A | 156,400 | 373 | |
| Inner Mongolia Yili Industrial Group Co., Ltd. Class A | 117,100 | 425 | |
| JD.com, Inc. Class A | 63,627 | 935 | |
| Kweichow Moutai Co., Ltd. Class A | 1,500 | 369 | |
| Li Ning Co., Ltd. | 318,512 | 1,340 | |
| LONGi Green Energy Technology Co., Ltd. Class A | 105,300 | 393 | |
| Luxshare Precision Industry Co., Ltd. Class A | 254,930 | 1,041 | |
| Meituan Class B(1) | 28,028 | 410 | |
| Ping An Bank Co., Ltd. Class A | 245,171 | 376 | |
| Shenzhen Mindray Bio-Medical Electronics Co., Ltd. Class A | 8,300 | 307 | |
| Tencent Holdings Ltd. | 48,580 | 1,900 | |
| Thunder Software Technology Co., Ltd. Class A | 29,600 | 310 | |
| Weihai Guangwei Composites Co., Ltd. Class A | 78,640 | 296 | |
| Wuliangye Yibin Co., Ltd. Class A | 7,055 | 151 | |
| Shares | Value | ||
| China—continued | |||
| WuXi AppTec Co., Ltd. Class H | 32,047 | $ 384 | |
| Wuxi Biologics Cayman, Inc.(1) | 54,457 | 317 | |
| Yantai Jereh Oilfield Services Group Co., Ltd. Class A | 87,501 | 382 | |
| Yealink Network Technology Corp., Ltd. Class A | 54,720 | 267 | |
| Yunda Holding Co., Ltd. Class A | 206,200 | 278 | |
| Zhejiang Dingli Machinery Co., Ltd. Class A | 49,300 | 356 | |
| 18,617 | |||
| Colombia—1.0% | |||
| Interconexion Electrica S.A. ESP | 106,637 | 390 | |
| France—0.7% | |||
| BioMerieux | 2,835 | 275 | |
| Hong Kong—1.3% | |||
| AIA Group Ltd. | 35,417 | 289 | |
| China Mengniu Dairy Co., Ltd.(1) | 72,087 | 242 | |
| 531 | |||
| India—8.9% | |||
| Bajaj Finance Ltd. | 4,854 | 456 | |
| Bandhan Bank Ltd. | 50,508 | 153 | |
| Berger Paints India Ltd. | 167,297 | 1,146 | |
| Eicher Motors Ltd. | 7,628 | 317 | |
| HDFC Bank Ltd. | 25,134 | 462 | |
| ICICI Lombard General Insurance Co., Ltd. | 18,186 | 287 | |
| Indraprastha Gas Ltd. | 62,440 | 342 | |
| Info Edge India Ltd. | 3,076 | 154 | |
| Kotak Mahindra Bank Ltd. | 15,351 | 321 | |
| 3,638 | |||
| Indonesia—1.3% | |||
| Aneka Tambang Tbk | 2,248,853 | 264 | |
| Semen Indonesia Persero Tbk PT | 662,174 | 275 | |
| 539 | |||
| Israel—7.7% | |||
| Bank Hapoalim BM | 41,639 | 370 | |
| Bank Leumi Le-Israel BM | 43,246 | 357 | |
| Israel Discount Bank Ltd. Class A | 65,893 | 356 | |
| Mizrahi Tefahot Bank Ltd. | 10,039 | 364 | |
| Nice Ltd.(1) | 10,071 | 1,703 | |
| 3,150 | |||
| Japan—3.9% | |||
| MonotaRO Co., Ltd. Unsponsored ADR | 148,467 | 1,575 | |
| Shares | Value | ||
| Luxembourg—0.7% | |||
| Globant S.A.(1) | 1,390 | $ 275 | |
| Malaysia—0.8% | |||
| MR DIY Group M Bhd | 1,033,966 | 333 | |
| Netherlands—0.6% | |||
| ASML Holding N.V. | 410 | 242 | |
| Philippines—2.6% | |||
| Ayala Corp. | 29,039 | 320 | |
| Ayala Land, Inc. | 621,430 | 324 | |
| JG Summit Holdings, Inc. | 611,700 | 412 | |
| 1,056 | |||
| Poland—1.1% | |||
| Bank Polska Kasa Opieki S.A. | 8,131 | 188 | |
| Dino Polska S.A.(1) | 3,339 | 271 | |
| 459 | |||
| Qatar—1.9% | |||
| Qatar Islamic Bank SAQ | 74,527 | 380 | |
| Qatar National Bank QPSC | 92,459 | 391 | |
| 771 | |||
| Russia—0.0% | |||
| Polyus PJSC GDR(1)(2)(3) | 4,887 | — (4) | |
| Saudi Arabia—2.6% | |||
| Saudi Arabian Oil Co. | 113,989 | 1,064 | |
| South Africa—5.9% | |||
| Anglo American Platinum Ltd. | 10,838 | 404 | |
| Capitec Bank Holdings Ltd. | 6,350 | 576 | |
| Clicks Group Ltd. | 18,334 | 250 | |
| Impala Platinum Holdings Ltd. | 76,082 | 397 | |
| Northam Platinum Holdings Ltd. | 66,704 | 405 | |
| Sibanye Stillwater Ltd. | 242,686 | 375 | |
| 2,407 | |||
| South Korea—5.6% | |||
| Cheil Worldwide, Inc. | 54,518 | 810 | |
| CJ Logistics Corp. | 2,613 | 157 | |
| Coupang, Inc. Class A(1) | 15,487 | 263 | |
| NAVER Corp. | 2,455 | 367 | |
| NICE Information Service Co., Ltd. | 43,603 | 319 | |
| Saramin Co., Ltd. | 22,501 | 352 | |
| 2,268 | |||
| Taiwan—7.0% | |||
| Taiwan Semiconductor Manufacturing Co., Ltd. | 175,000 | 2,835 | |
| Shares | Value | ||
| United States—0.9% | |||
| Enphase Energy, Inc.(1) | 2,908 | $ 349 | |
| Total Common Stocks (Identified Cost $45,835) | 42,731 | ||
| Rights—0.0% | |||
| Brazil—0.0% | |||
| Localiza Rent a Car S.A., 11/17/23(1) | 197 | 1 | |
| Total Rights (Identified Cost $—) | 1 | ||
| Total Long-Term Investments—105.0% (Identified Cost $45,835) | 42,732 | ||
| TOTAL INVESTMENTS—105.0% (Identified Cost $45,835) | $ 42,732 | ||
| Other assets and liabilities, net—(5.0)% | (2,022) | ||
| NET ASSETS—100.0% | $ 40,710 | ||
| Abbreviations: | |
| ADR | American Depositary Receipt |
| GDR | Global Depositary Receipt |
| PJSC | Public Joint Stock Company |
| Footnote Legend: | |
| (1) | Non-income producing. |
| (2) | The value of this security was determined using significant unobservable inputs and is reported as a Level 3 security in the Fair Value Hierarchy table located after the Schedule of Investments. |
| (3) | The Fund is unable to trade and repatriate proceeds due to U.S. sanctions related to the Russia/Ukraine war. |
| (4) | Amount is less than $500 (not in thousands). |
| Country Weightings (Unaudited)† | |
| China | 44% |
| India | 8 |
| Israel | 7 |
| Taiwan | 7 |
| South Africa | 6 |
| South Korea | 5 |
| Japan | 4 |
| Other | 19 |
| Total | 100% |
| † % of total investments as of September 30, 2023. | |
| Total Value at September 30, 2023 | Level 1 Quoted Prices | Level 3 Significant Unobservable Inputs | |||
| Assets: | |||||
| Equity Securities: | |||||
| Common Stocks | $42,731 | $42,731 | $— (1) | ||
| Rights | 1 | 1 | — | ||
| Total Investments | $42,732 | $42,732 | $— (1) |
| (1) | Amount is less than $500 (not in thousands). |
| Shares | Value | ||
| Common Stocks—98.6% | |||
| Austria—0.9% | |||
| Erste Group Bank AG Sponsored ADR | 28,691 | $ 495 | |
| Belgium—1.0% | |||
| Warehouses De Pauw CVA | 20,545 | 509 | |
| Canada—2.1% | |||
| RB Global, Inc. | 18,137 | 1,135 | |
| China—17.6% | |||
| BYD Co., Ltd. Class H | 35,814 | 1,107 | |
| China Merchants Bank Co., Ltd. Class H | 403,227 | 1,684 | |
| ENN Energy Holdings Ltd. | 266,561 | 2,212 | |
| JD.com, Inc. Class A | 103,945 | 1,528 | |
| WuXi AppTec Co., Ltd. Class H | 139,263 | 1,667 | |
| Wuxi Biologics Cayman, Inc.(1) | 213,281 | 1,243 | |
| 9,441 | |||
| Finland—2.7% | |||
| Kesko Oyj Class B | 30,539 | 548 | |
| Neste Oyj | 25,727 | 874 | |
| 1,422 | |||
| France—5.6% | |||
| BioMerieux | 17,027 | 1,653 | |
| Dassault Systemes SE | 35,955 | 1,342 | |
| 2,995 | |||
| Germany—3.1% | |||
| Bechtle AG | 12,979 | 607 | |
| Puma SE | 17,259 | 1,073 | |
| 1,680 | |||
| Israel—4.0% | |||
| Nice Ltd. Sponsored ADR(1) | 12,604 | 2,143 | |
| Japan—5.3% | |||
| GMO Payment Gateway, Inc. | 15,122 | 827 | |
| Shares | Value | ||
| Japan—continued | |||
| MonotaRO Co., Ltd. | 189,959 | $ 2,035 | |
| 2,862 | |||
| Netherlands—4.0% | |||
| ASML Holding N.V. | 1,697 | 1,003 | |
| Euronext N.V. | 8,813 | 615 | |
| IMCD N.V. | 3,936 | 499 | |
| 2,117 | |||
| Switzerland—2.7% | |||
| Partners Group Holding AG | 420 | 475 | |
| Tecan Group AG Registered Shares | 2,917 | 985 | |
| 1,460 | |||
| Taiwan—0.9% | |||
| Taiwan Semiconductor Manufacturing Co., Ltd. Sponsored ADR | 5,358 | 466 | |
| United Kingdom—3.9% | |||
| Segro plc | 180,141 | 1,581 | |
| Spirax-Sarco Engineering plc | 4,333 | 504 | |
| 2,085 | |||
| United States—44.8% | |||
| Addus HomeCare Corp.(1) | 9,498 | 809 | |
| Agilent Technologies, Inc. | 9,389 | 1,050 | |
| Alexandria Real Estate Equities, Inc. | 14,832 | 1,485 | |
| Autodesk, Inc.(1) | 10,368 | 2,145 | |
| Crown Castle, Inc. | 12,499 | 1,150 | |
| Edwards Lifesciences Corp.(1) | 18,835 | 1,305 | |
| Enphase Energy, Inc.(1) | 6,659 | 800 | |
| Eversource Energy | 25,794 | 1,500 | |
| Humana, Inc. | 3,389 | 1,649 | |
| IDEXX Laboratories, Inc.(1) | 1,097 | 480 | |
| Intuit, Inc. | 2,558 | 1,307 | |
| MarketAxess Holdings, Inc. | 4,525 | 967 | |
| Microsoft Corp. | 1,328 | 419 | |
| NextEra Energy, Inc. | 20,404 | 1,169 | |
| Paycom Software, Inc. | 4,980 | 1,291 | |
| Shares | Value | ||
| United States—continued | |||
| Paylocity Holding Corp.(1) | 8,750 | $ 1,590 | |
| PayPal Holdings, Inc.(1) | 14,292 | 836 | |
| PNC Financial Services Group, Inc. (The) | 4,519 | 555 | |
| Salesforce, Inc.(1) | 2,739 | 555 | |
| Teleflex, Inc. | 2,275 | 447 | |
| Thermo Fisher Scientific, Inc. | 1,707 | 864 | |
| Veeva Systems, Inc. Class A(1) | 5,330 | 1,084 | |
| Zoetis, Inc. Class A | 3,041 | 529 | |
| 23,986 | |||
| Total Common Stocks (Identified Cost $56,332) | 52,796 | ||
| Total Long-Term Investments—98.6% (Identified Cost $56,332) | 52,796 | ||
| TOTAL INVESTMENTS—98.6% (Identified Cost $56,332) | $52,796 | ||
| Other assets and liabilities, net—1.4% | 761 | ||
| NET ASSETS—100.0% | $53,557 | ||
| Abbreviation: | |
| ADR | American Depositary Receipt |
| Footnote Legend: | |
| (1) | Non-income producing. |
| Country Weightings (Unaudited)† | |
| United States | 45% |
| China | 18 |
| France | 6 |
| Japan | 5 |
| Israel | 4 |
| Netherlands | 4 |
| United Kingdom | 4 |
| Other | 14 |
| Total | 100% |
| † % of total investments as of September 30, 2023. | |
| Total Value at September 30, 2023 | Level 1 Quoted Prices | ||
| Assets: | |||
| Equity Securities: | |||
| Common Stocks | $52,796 | $52,796 | |
| Total Investments | $52,796 | $52,796 |
| Par Value | Value | ||
| Corporate Bonds and Notes—85.7% | |||
| Communication Services—7.2% | |||
| Allen Media LLC 144A 10.500%, 2/15/28(1) | $ 110 | $ 63 | |
| Altice France S.A. 144A 8.125%, 2/1/27(1) | 200 | 177 | |
| Cable One, Inc. 144A 4.000%, 11/15/30(1) | 225 | 171 | |
| Charter Communications Operating LLC 5.750%, 4/1/48 | 90 | 72 | |
| CMG Media Corp. 144A 8.875%, 12/15/27(1) | 115 | 90 | |
| CSC Holdings LLC | |||
| 144A 11.250%, 5/15/28(1) | 200 | 199 | |
| 144A 6.500%, 2/1/29(1) | 300 | 249 | |
| DISH Network Corp. 144A 11.750%, 11/15/27(1) | 240 | 242 | |
| Frontier Communications Holdings LLC 144A 5.875%, 10/15/27(1) | 87 | 79 | |
| iHeartCommunications, Inc. | |||
| 6.375%, 5/1/26 | 120 | 103 | |
| 8.375%, 5/1/27 | 143 | 103 | |
| Iliad Holding SASU 144A 6.500%, 10/15/26(1) | 270 | 254 | |
| LCPR Senior Secured Financing DAC 144A 6.750%, 10/15/27(1) | 200 | 184 | |
| Virgin Media Secured Finance plc 144A 5.500%, 5/15/29(1) | 365 | 325 | |
| 2,311 | |||
| Consumer Discretionary—17.7% | |||
| Ashton Woods USA LLC 144A 6.625%, 1/15/28(1) | 168 | 158 | |
| Bath & Body Works, Inc. | |||
| 6.950%, 3/1/33 | 120 | 107 | |
| 144A 6.625%, 10/1/30(1) | 295 | 277 | |
| Caesars Entertainment, Inc. | |||
| 144A 6.250%, 7/1/25(1) | 155 | 153 | |
| 144A 8.125%, 7/1/27(1) | 330 | �� 332 | |
| Carnival Corp. | |||
| 144A 4.000%, 8/1/28(1) | 191 | 166 | |
| 144A 10.500%, 6/1/30(1) | 238 | 245 | |
| Clarios Global LP 144A 8.500%, 5/15/27(1) | 335 | 334 | |
| Dream Finders Homes, Inc. 144A 8.250%, 8/15/28(1) | 80 | 81 | |
| FirstCash, Inc. 144A 5.625%, 1/1/30(1) | 378 | 340 | |
| Ford Motor Credit Co. LLC 6.950%, 3/6/26 | 400 | 399 | |
| Installed Building Products, Inc. 144A 5.750%, 2/1/28(1) | 350 | 322 | |
| Marriott Ownership Resorts, Inc. 4.750%, 1/15/28 | 265 | 232 | |
| Par Value | Value | ||
| Consumer Discretionary—continued | |||
| MGM Resorts International 5.500%, 4/15/27 | $ 190 | $ 177 | |
| Michaels Cos., Inc. (The) | |||
| 144A 5.250%, 5/1/28(1) | 266 | 212 | |
| 144A 7.875%, 5/1/29(1) | 107 | 70 | |
| NCL Corp., Ltd. 144A 7.750%, 2/15/29(1) | 210 | 195 | |
| Patrick Industries, Inc. 144A 7.500%, 10/15/27(1) | 187 | 179 | |
| QVC, Inc. | |||
| 4.450%, 2/15/25 | 42 | 37 | |
| 5.450%, 8/15/34 | 435 | 193 | |
| Royal Caribbean Cruises Ltd. | |||
| 144A 11.500%, 6/1/25(1) | 114 | 120 | |
| 144A 5.375%, 7/15/27(1) | 210 | 194 | |
| 144A 7.250%, 1/15/30(1) | 240 | 238 | |
| SeaWorld Parks & Entertainment, Inc. 144A 5.250%, 8/15/29(1) | 345 | 303 | |
| Six Flags Entertainment Corp. 144A 7.250%, 5/15/31(1) | 90 | 85 | |
| Taylor Morrison Communities, Inc. 144A 5.750%, 1/15/28(1) | 225 | 210 | |
| VOC Escrow Ltd. 144A 5.000%, 2/15/28(1) | 360 | 327 | |
| 5,686 | |||
| Consumer Staples—1.9% | |||
| Simmons Foods, Inc. 144A 4.625%, 3/1/29(1) | 360 | 295 | |
| Vector Group Ltd. 144A 5.750%, 2/1/29(1) | 376 | 320 | |
| 615 | |||
| Energy—15.0% | |||
| Ascent Resources Utica Holdings LLC 144A 8.250%, 12/31/28(1) | 345 | 341 | |
| California Resources Corp. 144A 7.125%, 2/1/26(1) | 125 | 126 | |
| Callon Petroleum Co. 144A 8.000%, 8/1/28(1) | 127 | 127 | |
| Chesapeake Energy Corp. 144A 6.750%, 4/15/29(1) | 162 | 159 | |
| CITGO Petroleum Corp. 144A 6.375%, 6/15/26(1) | 255 | 252 | |
| Civitas Resources, Inc. | |||
| 144A 8.375%, 7/1/28(1) | 156 | 159 | |
| 144A 8.750%, 7/1/31(1) | 62 | 63 | |
| Comstock Resources, Inc. 144A 6.750%, 3/1/29(1) | 350 | 322 | |
| Crestwood Midstream Partners LP | |||
| 144A 6.000%, 2/1/29(1) | 170 | 164 | |
| 144A 7.375%, 2/1/31(1) | 55 | 56 | |
| Par Value | Value | ||
| Energy—continued | |||
| Ensign Drilling, Inc. 144A 9.250%, 4/15/24(1) | $ 145 | $ 144 | |
| EQM Midstream Partners LP 144A 6.500%, 7/1/27(1) | 110 | 107 | |
| Hilcorp Energy I LP 144A 6.250%, 11/1/28(1) | 330 | 309 | |
| Nabors Industries, Inc. 144A 7.375%, 5/15/27(1) | 229 | 222 | |
| Patterson-UTI Energy, Inc. 5.150%, 11/15/29 | 85 | 77 | |
| PDC Energy, Inc. 5.750%, 5/15/26 | 225 | 224 | |
| Rockies Express Pipeline LLC 144A 7.500%, 7/15/38(1) | 176 | 166 | |
| Southwestern Energy Co. 5.375%, 3/15/30 | 150 | 137 | |
| Sunoco LP 5.875%, 3/15/28 | 235 | 225 | |
| Talos Production, Inc. 12.000%, 1/15/26 | 227 | 237 | |
| Transocean Titan Financing Ltd. 144A 8.375%, 2/1/28(1) | 94 | 96 | |
| Transocean, Inc. 144A 8.750%, 2/15/30(1) | 94 | 96 | |
| USA Compression Partners LP 6.875%, 9/1/27 | 355 | 344 | |
| Valaris Ltd. 144A 8.375%, 4/30/30(1) | 156 | 156 | |
| Vital Energy, Inc. | |||
| 10.125%, 1/15/28 | 80 | 82 | |
| 144A 7.750%, 7/31/29(1) | 93 | 87 | |
| Weatherford International Ltd. 144A 8.625%, 4/30/30(1) | 325 | 328 | |
| 4,806 | |||
| Financials—18.7% | |||
| Alliant Holdings Intermediate LLC 144A 6.750%, 4/15/28(1) | 172 | 166 | |
| Altice France Holding S.A. 144A 10.500%, 5/15/27(1) | 200 | 125 | |
| Arsenal AIC Parent LLC 144A 8.000%, 10/1/30(1) | 161 | 160 | |
| CCO Holdings LLC 144A 7.375%, 3/1/31(1) | 347 | 335 | |
| CDI Escrow Issuer, Inc. 144A 5.750%, 4/1/30(1) | 165 | 149 | |
| Domtar Corp. 144A 6.750%, 10/1/28(1) | 148 | 123 | |
| Enact Holdings, Inc. 144A 6.500%, 8/15/25(1) | 327 | 322 | |
| Entegris Escrow Corp. 144A 5.950%, 6/15/30(1) | 342 | 317 | |
| Par Value | Value | ||
| Financials—continued | |||
| Freedom Mortgage Corp. | |||
| 144A 8.125%, 11/15/24(1) | $ 64 | $ 64 | |
| 144A 7.625%, 5/1/26(1) | 190 | 177 | |
| 144A 12.000%, 10/1/28(1) | 117 | 119 | |
| Gray Escrow II, Inc. 144A 5.375%, 11/15/31(1) | 245 | 160 | |
| Hightower Holding LLC 144A 6.750%, 4/15/29(1) | 380 | 326 | |
| Hilton Grand Vacations Borrower Escrow LLC 144A 5.000%, 6/1/29(1) | 109 | 95 | |
| INEOS Finance plc 144A 6.750%, 5/15/28(1) | 200 | 187 | |
| Kinetik Holdings LP 144A 5.875%, 6/15/30(1) | 171 | 160 | |
| Level 3 Financing, Inc. 144A 10.500%, 5/15/30(1) | 262 | 264 | |
| LSF11 A5 HoldCo. LLC 144A 6.625%, 10/15/29(1) | 125 | 104 | |
| Macquarie Airfinance Holdings Ltd. 144A 8.125%, 3/30/29(1) | 52 | 52 | |
| Macy’s Retail Holdings LLC 144A 6.125%, 3/15/32(1) | 120 | 99 | |
| Midcap Financial Issuer Trust 144A 6.500%, 5/1/28(1) | 290 | 250 | |
| MPH Acquisition Holdings LLC 144A 5.500%, 9/1/28(1) | 96 | 82 | |
| MPT Operating Partnership LP 5.250%, 8/1/26 | 200 | 170 | |
| Nationstar Mortgage Holdings, Inc. 144A 5.750%, 11/15/31(1) | 170 | 141 | |
| NFP Corp. 144A 8.500%, 10/1/31(1) | 83 | 83 | |
| Noble Finance II LLC 144A 8.000%, 4/15/30(1) | 157 | 159 | |
| OneMain Finance Corp. 9.000%, 1/15/29 | 107 | 107 | |
| Organon & Co. 144A 5.125%, 4/30/31(1) | 205 | 164 | |
| PennyMac Financial Services, Inc. | |||
| 144A 5.375%, 10/15/25(1) | 34 | 32 | |
| 144A 5.750%, 9/15/31(1) | 155 | 127 | |
| Radian Group, Inc. | |||
| 4.500%, 10/1/24 | 75 | 73 | |
| 6.625%, 3/15/25 | 175 | 174 | |
| Scripps Escrow II, Inc. 144A 5.375%, 1/15/31(1) | 225 | 138 | |
| United Wholesale Mortgage LLC 144A 5.500%, 11/15/25(1) | 400 | 380 | |
| Viking Cruises Ltd. | |||
| 144A 6.250%, 5/15/25(1) | 163 | 160 | |
| 144A 9.125%, 7/15/31(1) | 156 | 156 | |
| Par Value | Value | ||
| Financials—continued | |||
| Vistra Operations Co. LLC 144A 7.750%, 10/15/31(1) | $ 82 | $ 81 | |
| 5,981 | |||
| Health Care—3.0% | |||
| DaVita, Inc. 144A 4.625%, 6/1/30(1) | 355 | 292 | |
| Horizon Therapeutics USA, Inc. 144A 5.500%, 8/1/27(1) | 325 | 334 | |
| Star Parent, Inc. 144A 9.000%, 10/1/30(1) | 3 | 3 | |
| Surgery Center Holdings, Inc. 144A 10.000%, 4/15/27(1) | 20 | 20 | |
| Tenet Healthcare Corp. | |||
| 6.125%, 10/1/28 | 170 | 160 | |
| 6.125%, 6/15/30 | 170 | 159 | |
| 968 | |||
| Industrials—10.7% | |||
| Allegiant Travel Co. 144A 7.250%, 8/15/27(1) | 249 | 234 | |
| American Airlines, Inc. | |||
| 144A 11.750%, 7/15/25(1) | 305 | 328 | |
| 144A 5.500%, 4/20/26(1) | 298 | 291 | |
| AmeriGas Partners LP 144A 9.375%, 6/1/28(1) | 54 | 55 | |
| BlueLinx Holdings, Inc. 144A 6.000%, 11/15/29(1) | 202 | 178 | |
| Bombardier, Inc. 144A 7.500%, 3/15/25(1) | 86 | 86 | |
| Brundage-Bone Concrete Pumping Holdings, Inc. 144A 6.000%, 2/1/26(1) | 170 | 162 | |
| Fertitta Entertainment LLC 144A 6.750%, 1/15/30(1) | 260 | 212 | |
| Griffon Corp. 5.750%, 3/1/28 | 140 | 127 | |
| Macquarie Airfinance Holdings Ltd. 144A 8.375%, 5/1/28(1) | 77 | 78 | |
| Mileage Plus Holdings LLC 144A 6.500%, 6/20/27(1) | 165 | 163 | |
| Rand Parent LLC 144A 8.500%, 2/15/30(1) | 87 | 80 | |
| Spirit AeroSystems, Inc. | |||
| 144A 7.500%, 4/15/25(1) | 82 | 80 | |
| 144A 9.375%, 11/30/29(1) | 73 | 74 | |
| Terex Corp. 144A 5.000%, 5/15/29(1) | 85 | 76 | |
| TMS International Corp. 144A 6.250%, 4/15/29(1) | 265 | 219 | |
| TransDigm, Inc. 144A 6.250%, 3/15/26(1) | 315 | 310 | |
| Par Value | Value | ||
| Industrials—continued | |||
| Uber Technologies, Inc. 144A 7.500%, 9/15/27(1) | $ 340 | $ 343 | |
| XPO, Inc. 144A 6.250%, 6/1/28(1) | 354 | 343 | |
| 3,439 | |||
| Information Technology—3.7% | |||
| Cloud Software Group, Inc. 144A 6.500%, 3/31/29(1) | 213 | 188 | |
| RingCentral, Inc. 144A 8.500%, 8/15/30(1) | 164 | 158 | |
| Sabre GLBL, Inc. 144A 8.625%, 6/1/27(1) | 95 | 81 | |
| Seagate HDD Cayman | |||
| 144A 8.250%, 12/15/29(1) | 98 | 101 | |
| 144A 9.625%, 12/1/32(1) | 54 | 58 | |
| Viasat, Inc. 144A 5.625%, 4/15/27(1) | 250 | 217 | |
| Virtusa Corp. 144A 7.125%, 12/15/28(1) | 46 | 37 | |
| WESCO Distribution, Inc. 144A 7.250%, 6/15/28(1) | 345 | 347 | |
| 1,187 | |||
| Materials—4.1% | |||
| First Quantum Minerals Ltd. 144A 7.500%, 4/1/25(1) | 200 | 199 | |
| Knife River Corp. 144A 7.750%, 5/1/31(1) | 95 | 95 | |
| Owens-Brockway Glass Container, Inc. 144A 6.625%, 5/13/27(1) | 310 | 302 | |
| Standard Industries, Inc. 144A 5.000%, 2/15/27(1) | 330 | 306 | |
| Summit Materials LLC 144A 5.250%, 1/15/29(1) | 285 | 259 | |
| Warrior Met Coal, Inc. 144A 7.875%, 12/1/28(1) | 70 | 70 | |
| Windsor Holdings III LLC 144A 8.500%, 6/15/30(1) | 82 | 81 | |
| 1,312 | |||
| Real Estate—2.9% | |||
| Brookfield Property REIT, Inc. 144A 5.750%, 5/15/26(1) | 328 | 301 | |
| Forestar Group, Inc. | |||
| 144A 3.850%, 5/15/26(1) | 159 | 144 | |
| 144A 5.000%, 3/1/28(1) | 139 | 125 | |
| Howard Hughes Corp. (The) 144A 5.375%, 8/1/28(1) | 388 | 342 | |
| 912 | |||
| Par Value | Value | ||
| Utilities—0.8% | |||
| Pacific Gas & Electric Co. 4.950%, 7/1/50 | $ 220 | $ 164 | |
| Venture Global Calcasieu Pass LLC 144A 6.250%, 1/15/30(1) | 85 | 81 | |
| 245 | |||
| Total Corporate Bonds and Notes (Identified Cost $28,303) | 27,462 | ||
| Shares | ||
| Preferred Stock—2.4% | ||
| Communication Services—2.4% | ||
| LiveStyle, Inc. Series B(2)(3)(4) | 9,250 | 772 |
| Total Preferred Stock (Identified Cost $907) | 772 | |
| Common Stocks—3.6% | ||
| Communication Services—0.0% | ||
| LiveStyle, Inc. (2)(3)(4) | 67,983 | — |
| Financials—3.6% | ||
| CCF Holdings LLC (2)(3) | 1,570,753 | 942 |
| CCF Holdings LLC Class M(2)(3) | 293,320 | 176 |
| Erickson, Inc.(2)(3) | 2,675 | 38 |
| 1,156 | ||
| Total Common Stocks (Identified Cost $4,945) | 1,156 | |
| Warrants—0.5% | ||
| Communication Services—0.0% | ||
| Tenerity, Inc., 04/01/24(2)(3)(4) | 3,898 | — |
| Shares | Value | ||
| Financials—0.5% | |||
| CCF Holdings LLC, 04/01/24(2)(3) | 485,227 | $ 160 | |
| Total Warrants (Identified Cost $770) | 160 | ||
| Affiliated Exchange-Traded Fund—3.7% | |||
| Financials—3.7% | |||
| Virtus Seix Senior Loan ETF(5)(6) | 49,157 | 1,174 | |
| Total Affiliated Exchange-Traded Fund (Identified Cost $1,175) | 1,174 | ||
| Total Long-Term Investments—95.9% (Identified Cost $36,100) | 30,724 | ||
| Short-Term Investment—0.0% | |||
| Money Market Mutual Fund—0.0% | |||
| BlackRock Liquidity FedFund - Institutional Shares (seven-day effective yield 5.236%)(6) | 10,978 | 11 | |
| Total Short-Term Investment (Identified Cost $11) | 11 | ||
| TOTAL INVESTMENTS—95.9% (Identified Cost $36,111) | $30,735 | ||
| Other assets and liabilities, net—4.1% | 1,320 | ||
| NET ASSETS—100.0% | $32,055 | ||
| Abbreviations: | |
| DAC | Designated Activity Company |
| ETF | Exchange-Traded Fund |
| EV | Enterprise Value |
| LLC | Limited Liability Company |
| LP | Limited Partnership |
| REIT | Real Estate Investment Trust |
| Footnote Legend: | |
| (1) | Security exempt from registration under Rule 144A of the Securities Act of 1933. These securities may be resold in transactions exempt from registration, normally to qualified institutional buyers. At September 30, 2023, these securities amounted to a value of $23,579 or 73.6% of net assets. |
| (2) | The value of this security was determined using significant unobservable inputs and is reported as a Level 3 security in the Fair Value Hierarchy table located after the Schedule of Investments. |
| (3) | Non-income producing. |
| (4) | All or a portion of the security is restricted. |
| (5) | Affiliated investment. See Note 4I in Notes to Financial Statements. |
| (6) | Shares of this fund are publicly offered, and its prospectus and annual report are publicly available. |
| Country Weightings (Unaudited)† | |
| United States | 86% |
| Bermuda | 4 |
| United Kingdom | 2 |
| Liberia | 2 |
| France | 1 |
| Canada | 1 |
| Panama | 1 |
| Other | 3 |
| Total | 100% |
| † % of total investments as of September 30, 2023. | |
| Total Value at September 30, 2023 | Level 1 Quoted Prices | Level 2 Significant Observable Inputs | Level 3 Significant Unobservable Inputs | ||||
| Assets: | |||||||
| Debt Instruments: | |||||||
| Corporate Bonds and Notes | $27,462 | $ — | $27,462 | $ — | |||
| Equity Securities: | |||||||
| Common Stocks | 1,156 | — | — | 1,156 (1) | |||
| Preferred Stock | 772 | — | — | 772 | |||
| Warrants | 160 | — | — | 160 (1) | |||
| Affiliated Exchange-Traded Fund | 1,174 | 1,174 | — | — | |||
| Money Market Mutual Fund | 11 | 11 | — | — | |||
| Total Investments | $30,735 | $1,185 | $27,462 | $2,088 |
| (1) | Includes internally fair valued securities currently priced at zero ($0). |
| Total | Common Stocks | Preferred Stocks | Warrants | ||||
| Investments in Securities | |||||||
| Balance as of September 30, 2022: | $ 1,907 | $ 482 | $ 1,396 | $ 29(a) | |||
| Net realized gain (loss) | 19 | — | 19 | — | |||
| Net change in unrealized appreciation (depreciation)(b) | 1,132 | 675 | 326 | 131 | |||
| Sales (c) | (970) | (1) | (969) | — | |||
| Balance as of September 30, 2023 | $ 2,088 | $ 1,156 (a) | $ 772 | $ 160 (a) |
| Investments in Securities – Assets | Ending Balance at September 30, 2023 | Valuation Technique Used | Unobservable Inputs | Input Values | ||||
| Preferred Stock: | ||||||||
| LiveStyle, Inc. Series B | $772 | Discounted cash flows liquidation approach | Discount rate | 28.05% (27.60% - 28.50%) | ||||
| Common Stocks: | ||||||||
| CCF Holdings LLC | $942 | Market and Company Comparables | EV Multiples | 1.15x (0.55x - 1.93x) | ||||
| 5.42x (4.19x - 6.89x) | ||||||||
| 0.52x (0.14x - 0.84x) | ||||||||
| Illiquidity Discount | 20% | |||||||
| CCF Holdings LLC Class M | $176 | Market and Company Comparables | EV Multiples | 1.15x (0.55x - 1.93x) | ||||
| 5.42x (4.19x - 6.89x) | ||||||||
| 0.52x (0.14x - 0.84x) | ||||||||
| Illiquidity Discount | 20% | |||||||
| Erickson, Inc. | $ 38 | Market and Company Comparables | EV Multiples | 1.19x (0.61x - 3.13x) | ||||
| 11.18x (10.91x - 14.33x) | ||||||||
| 1.04x (0.50x - 1.92x) | ||||||||
| M&A Transaction Multiples | 1.13x (0.62x - 1.35x) | |||||||
| Illiquidity Discount | 20% | |||||||
| Warrants: | ||||||||
| CCF Holdings LLC | $160 | Market and Company Comparables | EV Multiples | 1.15x (0.55x - 1.93x) | ||||
| 5.42x (4.19x - 6.89x) | ||||||||
| 0.52x (0.14x - 0.84x) | ||||||||
| Illiquidity Discount | 20% | |||||||
| Black-Scholes Model | Volatility | 44.28% | ||||||
September 30, 2023
| Convertible Fund | Duff & Phelps Water Fund | Global Allocation Fund | International Small-Cap Fund | ||||
| Assets | |||||||
Investment in securities at value(1) | $ 1,423,463 | $ 583,381 | $ 138,435 | $ 32,400 | |||
Investment in affiliates at value(2) | — | — | 50,080 | — | |||
Foreign currency at value(3) | — | 93 | 68 | 43 | |||
Cash | 63,071 | 2,530 | 7,230 | 1,304 | |||
Due from broker | — | — | 1,239 | — | |||
Cash pledged as collateral for futures contracts | — | — | 2,828 | — | |||
Cash pledged as collateral for swap contracts | — | — | 215 | — | |||
| Receivables | |||||||
Investment securities sold | 2,246 | 3,190 | 311 | 6 | |||
Fund shares sold | 598 | 306 | 83 | 2 | |||
Dividends and interest | 4,646 | 307 | 731 | 163 | |||
Receivable from adviser | — | — | 22 | — | |||
Tax reclaims | — | 1,315 | 33 | 271 | |||
Prepaid Trustees’ retainer | 29 | 13 | 4 | 1 | |||
Prepaid expenses | 63 | 30 | 37 | 17 | |||
Other assets | 178 | 103 | 60 | 1 | |||
Total assets | 1,494,294 | 591,268 | 201,376 | 34,208 | |||
| Liabilities | |||||||
Variation margin payable on swap contracts | — | — | 3 | — | |||
Variation margin payable on futures contracts | — | — | 54 | — | |||
| Payables | |||||||
Fund shares repurchased | 1,433 | 880 | 65 | 1 | |||
Investment securities purchased | 38,799 | 2,455 | 239 | 51 | |||
Investment advisory fees | 570 | 349 | — | 4 | |||
Distribution and service fees | 110 | 75 | 9 | 1 | |||
Administration and accounting fees | 125 | 52 | 19 | 3 | |||
Transfer agent and sub-transfer agent fees and expenses | 268 | 121 | 16 | 5 | |||
Professional fees | 68 | 14 | 17 | 28 | |||
Trustee deferred compensation plan | 178 | 103 | 60 | 1 | |||
Interest expense and/or commitment fees | 3 | 1 | — (a) | — (a) | |||
Other accrued expenses | 99 | 67 | 31 | 13 | |||
Total liabilities | 41,653 | 4,117 | 513 | 107 | |||
Net Assets | $ 1,452,641 | $ 587,151 | $ 200,863 | $ 34,101 | |||
| Net Assets Consist of: | |||||||
Capital paid in on shares of beneficial interest | $ 1,585,707 | $ 432,642 | $ 216,009 | $ 32,209 | |||
Accumulated earnings (loss) | (133,066) | 154,509 | (15,146) | 1,892 | |||
Net Assets | $ 1,452,641 | $ 587,151 | $ 200,863 | $ 34,101 | |||
| Net Assets: | |||||||
Class A | $ 196,478 | $ 201,139 | $ 34,586 | $ 3,167 | |||
Class C | $ 78,057 | $ 36,154 | $ 1,866 | $ 157 | |||
Class P | $ 328,205 | $ 128,873 | $ 1,580 | $ 4,009 | |||
Institutional Class | $ 844,174 | $ 220,985 | $ 5,327 | $ 14,596 | |||
Class R6 | $ 226 | $ — | $ 157,400 | $ 12,172 | |||
Administrative Class | $ 5,501 | $ — | $ 104 | $ — |
| Convertible Fund | Duff & Phelps Water Fund | Global Allocation Fund | International Small-Cap Fund | ||||
| Shares Outstanding (unlimited number of shares authorized, no par value): | |||||||
Class A | 6,338,810 | 11,446,191 | 3,680,405 | 113,650 | |||
Class C | 2,482,713 | 2,197,472 | 190,554 | 5,805 | |||
Class P | 11,047,265 | 7,250,630 | 171,041 | 144,269 | |||
Institutional Class | 27,955,745 | 12,820,338 | 571,325 | 503,588 | |||
Class R6 | 7,492 | — | 17,385,498 | 425,018 | |||
Administrative Class | 180,314 | — | 10,571 | — | |||
| Net Asset Value and Redemption Price Per Share:* | |||||||
Class A | $ 31.00 | $ 17.57 | $ 9.40 | $ 27.87 | |||
Class C | $ 31.44 | $ 16.45 | $ 9.79 | $ 26.98 | |||
Class P | $ 29.71 | $ 17.77 | $ 9.24 | $ 27.79 | |||
Institutional Class | $ 30.20 | $ 17.24 | $ 9.32 | $ 28.98 | |||
Class R6 | $ 30.15 | $ — | $ 9.05 | $ 28.64 | |||
Administrative Class | $ 30.51 | $ — | $ 9.79 | $ — | |||
| Maximum Offering Price Per Share (NAV/(1-Maximum Sales Charge)): | |||||||
Class A | $ 32.80 | $ 18.59 | $ 9.95 | $ 29.49 | |||
Maximum Sales Charge - Class A | 5.50% | 5.50% | 5.50% | 5.50% | |||
(1) Investment in securities at cost | $ 1,409,516 | $ 444,658 | $ 149,150 | $ 28,975 | |||
(2) Investment in affiliates at cost | $ — | $ — | $ 56,117 | $ — | |||
(3) Foreign currency at cost | $ — | $ 99 | $ 65 | $ 43 |
| (a) | Amount is less than $500 (not in thousands). |
| * | Net Asset Value and Redemption Price Per Share are calculated using unrounded net assets. |
| Newfleet Short Duration High Income Fund | NFJ Emerging Markets Value Fund | NFJ Global Sustainability Fund | Seix High Yield Income Fund | ||||
| Assets | |||||||
Investment in securities at value(1) | $ 561,718 | $ 42,732 | $ 52,796 | $ 29,561 | |||
Investment in affiliates at value(2) | — | — | — | 1,174 | |||
Foreign currency at value(3) | — | 925 | 55 | — | |||
Cash | 4,601 | — (a) | 478 | 1,102 | |||
| Receivables | |||||||
Investment securities sold | 2,258 | 7,010 | — | 49 | |||
Fund shares sold | 3,764 | 41 | — (a) | 15 | |||
Dividends and interest | 10,057 | 95 | 75 | 547 | |||
Receivable from adviser | — | — (a) | — | — | |||
Tax reclaims | — | 5 | 204 | 3 | |||
Prepaid Trustees’ retainer | 11 | 1 | 1 | 1 | |||
Prepaid expenses | 52 | 16 | 16 | 19 | |||
Other assets | 192 | 15 | 5 | 39 | |||
Total assets | 582,653 | 50,840 | 53,630 | 32,510 | |||
| Liabilities | |||||||
| Payables | |||||||
Fund shares repurchased | 463 | 447 | 2 | 8 | |||
Investment securities purchased | 8,193 | 550 | — | 348 | |||
Foreign capital gains tax | — | 31 | — | — | |||
Borrowings | — | 9,000 | — | — | |||
Investment advisory fees | 143 | — | 18 | 4 | |||
Distribution and service fees | 43 | 2 | 2 | 3 | |||
Administration and accounting fees | 48 | 5 | 5 | 3 | |||
Transfer agent and sub-transfer agent fees and expenses | 119 | 13 | 4 | 8 | |||
Professional fees | 35 | 46 | 30 | 35 | |||
Trustee deferred compensation plan | 192 | 15 | 5 | 39 | |||
Interest expense and/or commitment fees | 1 | — (a) | — (a) | — (a) | |||
Other accrued expenses | 41 | 21 | 7 | 7 | |||
Total liabilities | 9,278 | 10,130 | 73 | 455 | |||
Net Assets | $ 573,375 | $ 40,710 | $ 53,557 | $ 32,055 | |||
| Net Assets Consist of: | |||||||
Capital paid in on shares of beneficial interest | $ 799,038 | $ 61,372 | $ 48,232 | $ 79,417 | |||
Accumulated earnings (loss) | (225,663) | (20,662) | 5,325 | (47,362) | |||
Net Assets | $ 573,375 | $ 40,710 | $ 53,557 | $ 32,055 | |||
| Net Assets: | |||||||
Class A | $ 110,220 | $ 6,606 | $ 7,776 | $ 12,680 | |||
Class C | $ 49,229 | $ 463 | $ — | $ 668 | |||
Class P | $ 162,838 | $ 2,786 | $ 2,153 | $ 3,587 | |||
Institutional Class | $ 238,135 | $ 30,855 | $ 43,628 | $ 14,997 | |||
Class R6 | $ 12,953 | $ — | $ — | $ — | |||
Administrative Class | $ — | $ — | $ — | $ 123 | |||
| Shares Outstanding (unlimited number of shares authorized, no par value): | |||||||
Class A | 8,246,556 | 423,793 | 533,282 | 1,635,592 | |||
Class C | 3,670,510 | 29,927 | — | 86,284 | |||
Class P | 12,251,830 | 178,869 | 144,152 | 488,895 | |||
Institutional Class | 17,981,947 | 1,991,817 | 2,834,187 | 2,036,813 | |||
Class R6 | 977,691 | — | — | — | |||
Administrative Class | — | — | — | 16,837 |
| Newfleet Short Duration High Income Fund | NFJ Emerging Markets Value Fund | NFJ Global Sustainability Fund | Seix High Yield Income Fund | ||||
| Net Asset Value and Redemption Price Per Share:* | |||||||
Class A | $ 13.37 | $ 15.59 | $ 14.58 | $ 7.75 | |||
Class C | $ 13.41 | $ 15.48 | $ — | $ 7.75 | |||
Class P | $ 13.29 | $ 15.57 | $ 14.94 | $ 7.34 | |||
Institutional Class | $ 13.24 | $ 15.49 | $ 15.39 | $ 7.36 | |||
Class R6 | $ 13.25 | $ — | $ — | $ — | |||
Administrative Class | $ — | $ — | $ — | $ 7.31 | |||
| Maximum Offering Price Per Share (NAV/(1-Maximum Sales Charge)): | |||||||
Class A | $ 13.68 | $ 16.50 | $ 15.43 | $ 8.05 | |||
Maximum Sales Charge - Class A | 2.25% | 5.50% | 5.50% | 3.75% | |||
(1) Investment in securities at cost | $ 593,323 | $ 45,835 | $ 56,332 | $ 34,936 | |||
(2) Investment in affiliates at cost | $ — | $ — | $ — | $ 1,175 | |||
(3) Foreign currency at cost | $ — | $ 926 | $ 56 | $ — |
| (a) | Amount is less than $500 (not in thousands). |
| * | Net Asset Value and Redemption Price Per Share are calculated using unrounded net assets. |
YEAR ENDED September 30, 2023
| Convertible Fund | Duff & Phelps Water Fund | Global Allocation Fund | International Small-Cap Fund | ||||
| Investment Income | |||||||
Dividends | $ 10,536 | $11,810 | $ 2,352 | $ 2,575 | |||
Dividends from affiliates | — | — | 614 | — | |||
Interest | 31,277 | — | 3,591 | — | |||
Foreign taxes withheld | — | (511) | (82) | (322) | |||
Total investment income | 41,813 | 11,299 | 6,475 | 2,253 | |||
| Expenses | |||||||
Investment advisory fees | 8,907 | 6,338 | 1,626 | 463 | |||
Distribution and service fees, Class A | 574 | 561 | 93 | 8 | |||
Distribution and service fees, Class C | 858 | 421 | 21 | 2 | |||
Distribution and service fees, Administrative Class | 16 | — | — (1) | — | |||
Administration and accounting fees | 1,596 | 686 | 244 | 55 | |||
Transfer agent fees and expenses | 667 | 288 | 105 | 21 | |||
Sub-transfer agent fees and expenses, Class A | 209 | 205 | 27 | 3 | |||
Sub-transfer agent fees and expenses, Class C | 68 | 39 | 1 | — (1) | |||
Sub-transfer agent fees and expenses, Class P | 264 | 128 | 2 | 3 | |||
Sub-transfer agent fees and expenses, Institutional Class | 946 | 254 | 5 | 18 | |||
Sub-transfer agent fees and expenses, Administrative Class | 7 | — | — | — | |||
Excise tax | 8 | — | — | — | |||
Custodian fees | 3 | 2 | 1 | 4 | |||
Printing fees and expenses | 148 | 64 | 21 | 6 | |||
Professional fees | 85 | 37 | 47 | 29 | |||
Interest expense and/or commitment fees | 3 | 2 | 1 | 8 | |||
Registration fees | 170 | 83 | 83 | 52 | |||
Trustees’ fees and expenses | 123 | 53 | 18 | 4 | |||
Miscellaneous expenses | 74 | 45 | 91 | 33 | |||
Total expenses | 14,726 | 9,206 | 2,386 | 709 | |||
Less net expenses reimbursed and/or waived by investment adviser(2) | (2,157) | (1,897) | (1,733) | (215) | |||
Less low balance account fees | — (1) | — (1) | — (1) | — | |||
Net expenses | 12,569 | 7,309 | 653 | 494 | |||
Net investment income (loss) | 29,244 | 3,990 | 5,822 | 1,759 | |||
| Net Realized and Unrealized Gain (Loss) on Investments | |||||||
| Net realized gain (loss) from: | |||||||
Investments | (44,226) | 23,185 | (5,540) | 10 | |||
Investments in affiliates | — | — | (8,160) | — | |||
Foreign currency transactions | — | 82 | — (1) | (19) | |||
Futures | — | — | 4,502 | — | |||
Swaps | — | — | 18 | — | |||
Capital gains received from investments in affiliates | — | — | 9,519 | — | |||
| Net change in unrealized appreciation (depreciation) on: | |||||||
Investments | 85,472 | 48,765 | 7,633 | 8,607 | |||
Investments in affiliates | — | — | 9,432 | — | |||
Foreign currency transactions | — | 110 | 38 | 17 | |||
Futures | — | — | (632) | — | |||
Swaps | — | — | (131) | — | |||
Net realized and unrealized gain (loss) on investments | 41,246 | 72,142 | 16,679 | 8,615 | |||
Net increase (decrease) in net assets resulting from operations | $ 70,490 | $76,132 | $22,501 | $10,374 |
| (1) | Amount is less than $500 (not in thousands). |
| (2) | See Note 4D in Notes to Financial Statements. |
| Newfleet Short Duration High Income Fund | NFJ Emerging Markets Value Fund | NFJ Global Sustainability Fund | Seix High Yield Income Fund | ||||
| Investment Income | |||||||
Dividends | $ 590 | $ 1,293 | $ 1,056 | $ 35 | |||
Interest | 39,766 | — | — | 2,199 | |||
Foreign taxes withheld | — | (135) | (95) | — | |||
Total investment income | 40,356 | 1,158 | 961 | 2,234 | |||
| Expenses | |||||||
Investment advisory fees | 2,654 | 458 | 498 | 160 | |||
Distribution and service fees, Class A | 279 | 19 | 13 | 34 | |||
Distribution and service fees, Class C | 271 | 5 | — | 8 | |||
Distribution and service fees, Administrative Class | — | — | — | — (1) | |||
Administration and accounting fees | 570 | 63 | 71 | 41 | |||
Transfer agent fees and expenses | 262 | 23 | 27 | 16 | |||
Sub-transfer agent fees and expenses, Class A | 68 | 10 | 4 | 15 | |||
Sub-transfer agent fees and expenses, Class C | 46 | — (1) | — | 1 | |||
Sub-transfer agent fees and expenses, Class P | 154 | 10 | 2 | 2 | |||
Sub-transfer agent fees and expenses, Institutional Class | 210 | 31 | 1 | 16 | |||
Excise tax | 25 | — | — | 7 | |||
Custodian fees | 7 | 16 | 1 | 3 | |||
Printing fees and expenses | 51 | 7 | 7 | 5 | |||
Professional fees | 35 | 53 | 23 | 27 | |||
Interest expense and/or commitment fees | 10 | 2 | 1 | — (1) | |||
Registration fees | 104 | 55 | 41 | 59 | |||
Trustees’ fees and expenses | 43 | 5 | 5 | 3 | |||
Miscellaneous expenses | 54 | 31 | 16 | 14 | |||
Total expenses | 4,843 | 788 | 710 | 411 | |||
Less net expenses reimbursed and/or waived by investment adviser(2) | (847) | (275) | (264) | (79) | |||
Less low balance account fees | — | — | — | — (1) | |||
Net expenses | 3,996 | 513 | 446 | 332 | |||
Net investment income (loss) | 36,360 | 645 | 515 | 1,902 | |||
| Net Realized and Unrealized Gain (Loss) on Investments | |||||||
| Net realized gain (loss) from: | |||||||
Investments | (19,600) | (11,485) | 11,101 | (1,164) | |||
Foreign currency transactions | — | (53) | 13 | — | |||
Foreign capital gains tax | — | (37) | — | — | |||
Net increase from payment by affiliate(3) | — | — | — | 3 | |||
| Net change in unrealized appreciation (depreciation) on: | |||||||
Investments | 39,602 | 18,831 | 2,224 | 3,496 | |||
Investments in affiliates | — | — | — | (1) | |||
Foreign currency transactions | — | (5) | 8 | — | |||
Foreign capital gains tax | — | (31) | — | — | |||
Net realized and unrealized gain (loss) on investments | 20,002 | 7,220 | 13,346 | 2,334 | |||
Net increase (decrease) in net assets resulting from operations | $ 56,362 | $ 7,865 | $13,861 | $ 4,236 |
| (1) | Amount is less than $500 (not in thousands). |
| (2) | See Note 4D in Notes to Financial Statements. |
| (3) | See Note 4G in Notes to Financial Statements. |
| Convertible Fund | Duff & Phelps Water Fund | Global Allocation Fund | |||||||||
| Year Ended September 30, 2023 | Year Ended September 30, 2022 | Year Ended September 30, 2023 | Year Ended September 30, 2022 | Year Ended September 30, 2023 | Year Ended September 30, 2022 | ||||||
| Increase (Decrease) in Net Assets Resulting from Operations | |||||||||||
Net investment income (loss) | $ 29,244 | $ 13,911 | $ 3,990 | $ 3,727 | $ 5,822 | $ 3,191 | |||||
Net realized gain (loss) | (44,226) | (67,311) | 23,267 | (9,127) | 339 | 13,118 | |||||
Net increase from payment by affiliate | — | — | — | 105 | — | — | |||||
Net change in unrealized appreciation (depreciation) | 85,472 | (462,594) | 48,875 | (225,369) | 16,340 | (62,745) | |||||
Increase (decrease) in net assets resulting from operations | 70,490 | (515,994) | 76,132 | (230,664) | 22,501 | (46,436) | |||||
| Dividends and Distributions to Shareholders | |||||||||||
| Net Investment Income and Net Realized Gains: | |||||||||||
Class A | (3,889) | (65,809) | (953) | (22,884) | (1,869) | (4,207) | |||||
Class C | (763) | (21,956) | — | (5,076) | (104) | (190) | |||||
Class P | (7,238) | (122,685) | (457) | (23,588) | (101) | (483) | |||||
Institutional Class | (18,035) | (307,162) | (1,930) | (31,397) | (304) | (1,049) | |||||
Class R6 | (4) | (1) | — | — | (9,542) | (20,157) | |||||
Administrative Class | (101) | (4,687) | — | — | (5) | (4) | |||||
Total dividends and distributions to shareholders | (30,030) | (522,300) | (3,340) | (82,945) | (11,925) | (26,090) | |||||
| Change in Net Assets from Capital Transactions (See Note 6): | |||||||||||
Class A | (46,661) | (22,408) | (30,007) | 11,535 | (3,047) | (1,454) | |||||
Class C | (12,134) | (5,248) | (9,898) | (7,048) | (361) | 220 | |||||
Class P | (28,925) | (224,366) | (43,110) | (101,945) | (798) | (3,155) | |||||
Institutional Class | (108,585) | (102,547) | (40,411) | 29,236 | (1,042) | (2,346) | |||||
Class R6 | 140 | 100 | — | — | (26,654) | 14,973 | |||||
Administrative Class | (10,480) | (607) | — | — | (14) | 92 | |||||
Increase (decrease) in net assets from capital transactions | (206,645) | (355,076) | (123,426) | (68,222) | (31,916) | 8,330 | |||||
Net increase (decrease) in net assets | (166,185) | (1,393,370) | (50,634) | (381,831) | (21,340) | (64,196) | |||||
| Net Assets | |||||||||||
Beginning of period | 1,618,826 | 3,012,196 | 637,785 | 1,019,616 | 222,203 | 286,399 | |||||
End of Period | $ 1,452,641 | $ 1,618,826 | $ 587,151 | $ 637,785 | $ 200,863 | $ 222,203 | |||||
| International Small-Cap Fund | Newfleet Short Duration High Income Fund | NFJ Emerging Markets Value Fund | |||||||||
| Year Ended September 30, 2023 | Year Ended September 30, 2022 | Year Ended September 30, 2023 | Year Ended September 30, 2022 | Year Ended September 30, 2023 | Year Ended September 30, 2022 | ||||||
| Increase (Decrease) in Net Assets Resulting from Operations | |||||||||||
Net investment income (loss) | $ 1,759 | $ 1,092 | $ 36,360 | $ 34,276 | $ 645 | $ 864 | |||||
Net realized gain (loss) | (9) | (1,935) | (19,600) | (22,264) | (11,575) | 3,998 | |||||
Net increase from payment by affiliate | — | 86 | — | — | — | — | |||||
Net change in unrealized appreciation (depreciation) | 8,624 | (24,158) | 39,602 | (60,565) | 18,795 | (45,392) | |||||
Increase (decrease) in net assets resulting from operations | 10,374 | (24,915) | 56,362 | (48,553) | 7,865 | (40,530) | |||||
| Dividends and Distributions to Shareholders | |||||||||||
| Net Investment Income and Net Realized Gains: | |||||||||||
Class A | (34) | (791) | (6,812) | (7,220) | (172) | (24) | |||||
Class C | — | (52) | (3,146) | (3,534) | (9) | — | |||||
Class P | (64) | (1,698) | (10,186) | (12,640) | (81) | (39) | |||||
Institutional Class | (228) | (4,717) | (14,183) | (16,671) | (1,003) | (372) | |||||
Class R6 | (254) | (5,137) | (451) | (1,035) | — | — | |||||
Total dividends and distributions to shareholders | (580) | (12,395) | (34,778) | (41,100) | (1,265) | (435) | |||||
| Change in Net Assets from Capital Transactions (See Note 6): | |||||||||||
Class A | (304) | 369 | (8,465) | (14,906) | (2,809) | (2,818) | |||||
Class C | (43) | (43) | (11,360) | (10,375) | (87) | (176) | |||||
Class P | (1,979) | (1,304) | 16,137 | (81,279) | (7,585) | 5,424 | |||||
Institutional Class | (6,520) | 1,769 | (1,986) | 17,284 | (20,030) | (46,508) | |||||
Class R6 | (10,891) | 3,516 | 2,225 | (8,424) | — | — | |||||
Increase (decrease) in net assets from capital transactions | (19,737) | 4,307 | (3,449) | (97,700) | (30,511) | (44,078) | |||||
Net increase (decrease) in net assets | (9,943) | (33,003) | 18,135 | (187,353) | (23,911) | (85,043) | |||||
| Net Assets | |||||||||||
Beginning of period | 44,044 | 77,047 | 555,240 | 742,593 | 64,621 | 149,664 | |||||
End of Period | $ 34,101 | $ 44,044 | $ 573,375 | $ 555,240 | $ 40,710 | $ 64,621 | |||||
| NFJ Global Sustainability Fund | Seix High Yield Income Fund | ||||||
| Year Ended September 30, 2023 | Year Ended September 30, 2022 | Year Ended September 30, 2023 | Year Ended September 30, 2022 | ||||
| Increase (Decrease) in Net Assets Resulting from Operations | |||||||
Net investment income (loss) | $ 515 | $ 1,264 | $ 1,902 | $ 2,445 | |||
Net realized gain (loss) | 11,114 | 12,437 | (1,164) | (2,595) | |||
Net increase from payment by affiliate(1) | — | 42 | 3 | — | |||
Net change in unrealized appreciation (depreciation) | 2,232 | (42,909) | 3,495 | (8,051) | |||
Increase (decrease) in net assets resulting from operations | 13,861 | (29,166) | 4,236 | (8,201) | |||
| Dividends and Distributions to Shareholders | |||||||
| Net Investment Income and Net Realized Gains: | |||||||
Class A | (888) | (1,195) | (709) | (836) | |||
Class C | — | — | (40) | (66) | |||
Class P | (581) | (1,079) | (132) | (185) | |||
Institutional Class | (10,848) | (22,956) | (1,000) | (1,683) | |||
Administrative Class | — | — | (7) | (4) | |||
Total dividends and distributions to shareholders | (12,317) | (25,230) | (1,888) | (2,774) | |||
| Change in Net Assets from Capital Transactions (See Note 6): | |||||||
Class A | 4,710 | 625 | (1,400) | (4,165) | |||
Class C | — | — | (618) | (721) | |||
Class P | (506) | (565) | 1,943 | (1,962) | |||
Institutional Class | (33,179) | 9,799 | (2,786) | (19,621) | |||
Administrative Class | — | — | 1 | 20 | |||
Increase (decrease) in net assets from capital transactions | (28,975) | 9,859 | (2,860) | (26,449) | |||
Net increase (decrease) in net assets | (27,431) | (44,537) | (512) | (37,424) | |||
| Net Assets | |||||||
Beginning of period | 80,988 | 125,525 | 32,567 | 69,991 | |||
End of Period | $ 53,557 | $ 80,988 | $ 32,055 | $ 32,567 | |||
| (1) | See Note 4G in Notes to Financial Statements. |
THROUGHOUT EACH PERIOD
| Net Asset Value, Beginning of Period | Net Investment Income (Loss)(1) | Capital Gains Distributions Received from Underlying Funds(1) | Net Realized and Unrealized Gain (Loss) | Total from Investment Operations | Dividends from Net Investment Income | Distributions from Net Realized Gains | Total Distributions | Payment from Affiliate | Change in Net Asset Value | Net Asset Value, End of Period | Total Return(2)(3) | Net Assets, End of Period (in thousands) | Ratio of Net Expenses to Average Net Assets(4)(5) | Ratio of Gross Expenses to Average Net Assets(4)(5) | Ratio of Net Investment Income (Loss) to Average Net Assets(4) | Portfolio Turnover Rate(3) | ||
| Convertible Fund | ||||||||||||||||||
| Class A | ||||||||||||||||||
| 10/1/22 to 9/30/23 | $30.27 | 0.54 | — | 0.73 | 1.27 | (0.54) | — | (0.54) | — | 0.73 | $31.00 | 4.19 % | $ 196,478 | 0.96 % | 1.10 % | 1.71 % | 136 % | |
| 10/1/21 to 9/30/22 | 45.74 | 0.16 | — | (7.94) | (7.78) | (0.19) | (7.50) | (7.69) | — | (15.47) | 30.27 | (20.06) | 236,603 | 0.96 | 1.10 | 0.45 | 121 | |
| 10/1/20 to 9/30/21 | 38.77 | 0.11 | — | 9.73 | 9.84 | (0.20) | (2.67) | (2.87) | — | 6.97 | 45.74 | 25.71 | 396,378 | 0.95 (6) | 1.02 | 0.25 | 130 | |
| 10/1/19 to 9/30/20 | 29.25 | 0.27 | — | 10.59 | 10.86 | (0.43) | (0.91) | (1.34) | — | 9.52 | 38.77 | 38.44 | 254,762 | 0.96 | 0.98 | 0.83 | 145 | |
| 10/1/18 to 9/30/19 | 32.78 | 0.29 | — | 0.63 | 0.92 | (0.90) | (3.55) | (4.45) | — | (3.53) | 29.25 | 5.29 | 69,611 | 1.02 | 1.02 | 0.99 | 143 | |
| Class C | ||||||||||||||||||
| 10/1/22 to 9/30/23 | $30.69 | 0.30 | — | 0.73 | 1.03 | (0.28) | — | (0.28) | — | 0.75 | $31.44 | 3.37 % | $ 78,057 | 1.73 % | 1.83 % | 0.95 % | 136 % | |
| 10/1/21 to 9/30/22 | 46.36 | (0.12) | — | (8.05) | (8.17) | — (7) | (7.50) | (7.50) | — | (15.67) | 30.69 | (20.67) | 87,842 | 1.73 | 1.82 | (0.32) | 121 | |
| 10/1/20 to 9/30/21 | 39.39 | (0.24) | — | 9.88 | 9.64 | — (7) | (2.67) | (2.67) | — | 6.97 | 46.36 | 24.75 | 141,138 | 1.72 (6) | 1.77 | (0.52) | 130 | |
| 10/1/19 to 9/30/20 | 29.61 | 0.02 | — | 10.77 | 10.79 | (0.10) | (0.91) | (1.01) | — | 9.78 | 39.39 | 37.40 | 112,523 | 1.73 | 1.74 | 0.06 | 145 | |
| 10/1/18 to 9/30/19 | 32.95 | 0.08 | — | 0.67 | 0.75 | (0.54) | (3.55) | (4.09) | — | (3.34) | 29.61 | 4.53 | 60,434 | 1.75 | 1.75 | 0.26 | 143 | |
| Class P | ||||||||||||||||||
| 10/1/22 to 9/30/23 | $29.05 | 0.60 | — | 0.69 | 1.29 | (0.63) | — | (0.63) | — | 0.66 | $29.71 | 4.45 % | $ 328,205 | 0.71 % | 0.83 % | 1.97 % | 136 % | |
| 10/1/21 to 9/30/22 | 44.23 | 0.23 | — | (7.63) | (7.40) | (0.28) | (7.50) | (7.78) | — | (15.18) | 29.05 | (19.86) | 348,324 | 0.71 | 0.83 | 0.64 | 121 | |
| 10/1/20 to 9/30/21 | 37.57 | 0.22 | — | 9.42 | 9.64 | (0.31) | (2.67) | (2.98) | — | 6.66 | 44.23 | 26.03 | 808,844 | 0.69 (8) | 0.81 | 0.51 | 130 | |
| 10/1/19 to 9/30/20 | 28.45 | 0.34 | — | 10.27 | 10.61 | (0.58) | (0.91) | (1.49) | — | 9.12 | 37.57 | 38.78 | 547,783 | 0.71 | 0.71 | 1.08 | 145 | |
| 10/1/18 to 9/30/19 | 32.12 | 0.35 | — | 0.60 | 0.95 | (1.07) | (3.55) | (4.62) | — | (3.67) | 28.45 | 5.59 | 155,601 | 0.75 | 0.75 | 1.26 | 143 | |
| Institutional Class | �� | |||||||||||||||||
| 10/1/22 to 9/30/23 | $29.52 | 0.60 | — | 0.71 | 1.31 | (0.63) | — | (0.63) | — | 0.68 | $30.20 | 4.43 % | $ 844,174 | 0.71 % | 0.86 % | 1.96 % | 136 % | |
| 10/1/21 to 9/30/22 | 44.81 | 0.24 | — | (7.74) | (7.50) | (0.29) | (7.50) | (7.79) | — | (15.29) | 29.52 | (19.84) | 930,359 | 0.71 | 0.83 | 0.68 | 121 | |
| 10/1/20 to 9/30/21 | 38.04 | 0.23 | — | 9.53 | 9.76 | (0.32) | (2.67) | (2.99) | — | 6.77 | 44.81 | 26.02 | 1,640,171 | 0.69 | 0.77 | 0.51 | 130 | |
| 10/1/19 to 9/30/20 | 28.76 | 0.34 | — | 10.40 | 10.74 | (0.55) | (0.91) | (1.46) | — | 9.28 | 38.04 | 38.80 | 1,045,769 | 0.71 | 0.71 | 1.07 | 145 | |
| 10/1/18 to 9/30/19 | 32.41 | 0.37 | — | 0.61 | 0.98 | (1.08) | (3.55) | (4.63) | — | (3.65) | 28.76 | 5.62 | 370,111 | 0.72 | 0.72 | 1.29 | 143 | |
| Class R6 | ||||||||||||||||||
| 10/1/22 to 9/30/23 | $29.49 | 0.65 | — | 0.69 | 1.34 | (0.68) | — | (0.68) | — | 0.66 | $30.15 | 4.55 % | $ 226 | 0.62 % | 0.75 % | 2.12 % | 136 % | |
| 1/31/22 (9) to 9/30/22 | 34.43 | 0.24 | — | (4.94) | (4.70) | (0.24) | — | (0.24) | — | (4.94) | 29.49 | (13.67) | 86 | 0.62 | 0.83 | 1.11 | 121 (10) | |
| Administrative Class | ||||||||||||||||||
| 10/1/22 to 9/30/23 | $29.78 | 0.52 | — | 0.74 | 1.26 | (0.53) | — | (0.53) | — | 0.73 | $30.51 | 4.23 % | $ 5,501 | 0.93 % | 1.11 % | 1.67 % | 136 % | |
| 10/1/21 to 9/30/22 | 45.15 | 0.17 | — | (7.83) | (7.66) | (0.21) | (7.50) | (7.71) | — | (15.37) | 29.78 | (20.05) | 15,612 | 0.93 | 1.16 | 0.46 | 121 | |
| 10/1/20 to 9/30/21 | 38.36 | 0.14 | — | 9.62 | 9.76 | (0.30) | (2.67) | (2.97) | — | 6.79 | 45.15 | 25.79 | 25,665 | 0.91 | 0.97 | 0.31 | 130 | |
| 10/1/19 to 9/30/20 | 28.95 | 0.35 | — | 10.42 | 10.77 | (0.45) | (0.91) | (1.36) | — | 9.41 | 38.36 | 38.50 | 13,386 | 0.93 | 0.93 | 0.99 | 145 | |
| 10/1/18 to 9/30/19 | 32.46 | 0.30 | — | 0.61 | 0.91 | (0.87) | (3.55) | (4.42) | — | (3.51) | 28.95 | 5.29 | 550 | 0.97 | 0.97 | 1.03 | 143 | |
| Duff & Phelps Water Fund | ||||||||||||||||||
| Class A | ||||||||||||||||||
| 10/1/22 to 9/30/23 | $15.87 | 0.09 | — | 1.68 | 1.77 | (0.07) | — | (0.07) | — | 1.70 | $17.57 | 11.17 % | $ 201,139 | 1.22 % | 1.48 % | 0.48 % | 19 % | |
| 10/1/21 to 9/30/22 | 22.45 | 0.05 | — | (4.87) | (4.82) | (0.25) | (1.51) | (1.76) | — (7) | (6.58) | 15.87 | (23.71) (11) | 207,428 | 1.22 | 1.48 | 0.27 | 27 | |
| 10/1/20 to 9/30/21 | 17.63 | 0.26 | — | 4.87 | 5.13 | (0.04) | (0.27) | (0.31) | — | 4.82 | 22.45 | 29.41 | 286,453 | 1.22 | 1.45 | 1.23 | 32 | |
| 10/1/19 to 9/30/20 | 16.31 | 0.06 | — | 1.77 | 1.83 | (0.11) | (0.40) | (0.51) | — | 1.32 | 17.63 | 11.35 | 200,384 | 1.22 | 1.40 | 0.37 | 28 | |
| 10/1/18 to 9/30/19 | 15.54 | 0.11 | — | 1.15 | 1.26 | (0.13) | (0.36) | (0.49) | — | 0.77 | 16.31 | 8.88 | 177,463 | 1.23 | 1.40 | 0.76 | 33 |
| Net Asset Value, Beginning of Period | Net Investment Income (Loss)(1) | Capital Gains Distributions Received from Underlying Funds(1) | Net Realized and Unrealized Gain (Loss) | Total from Investment Operations | Dividends from Net Investment Income | Distributions from Net Realized Gains | Total Distributions | Payment from Affiliate | Change in Net Asset Value | Net Asset Value, End of Period | Total Return(2)(3) | Net Assets, End of Period (in thousands) | Ratio of Net Expenses to Average Net Assets(4)(5) | Ratio of Gross Expenses to Average Net Assets(4)(5) | Ratio of Net Investment Income (Loss) to Average Net Assets(4) | Portfolio Turnover Rate(3) | ||
| Duff & Phelps Water Fund (Continued) | ||||||||||||||||||
| Class C | ||||||||||||||||||
| 10/1/22 to 9/30/23 | $14.90 | (0.05) | — | 1.60 | 1.55 | — | — | — | — | 1.55 | $16.45 | 10.40 % | $ 36,154 | 1.97 % | 2.23 % | (0.28) % | 19 % | |
| 10/1/21 to 9/30/22 | 21.18 | (0.09) | — | (4.60) | (4.69) | (0.08) | (1.51) | (1.59) | — (7) | (6.28) | 14.90 | (24.32) (11) | 41,415 | 1.97 | 2.22 | (0.50) | 27 | |
| 10/1/20 to 9/30/21 | 16.73 | 0.09 | — | 4.63 | 4.72 | — (7) | (0.27) | (0.27) | — | 4.45 | 21.18 | 28.48 | 68,805 | 1.97 | 2.20 | 0.43 | 32 | |
| 10/1/19 to 9/30/20 | 15.52 | (0.06) | — | 1.67 | 1.61 | — | (0.40) | (0.40) | — | 1.21 | 16.73 | 10.48 | 57,901 | 1.97 | 2.16 | (0.38) | 28 | |
| 10/1/18 to 9/30/19 | 14.79 | — | — | 1.10 | 1.10 | (0.01) | (0.36) | (0.37) | — | 0.73 | 15.52 | 8.02 | 70,175 | 1.98 | 2.15 | 0.01 | 33 | |
| Class P | ||||||||||||||||||
| 10/1/22 to 9/30/23 | $15.98 | 0.14 | — | 1.70 | 1.84 | (0.05) | — | (0.05) | — | 1.79 | $17.77 | 11.53 % | $ 128,873 | 0.94 % | 1.22 % | 0.75 % | 19 % | |
| 10/1/21 to 9/30/22 | 22.53 | 0.10 | — | (4.91) | (4.81) | (0.23) | (1.51) | (1.74) | — (7) | (6.55) | 15.98 | (23.53) (11) | 153,863 | 0.94 | 1.19 | 0.50 | 27 | |
| 10/1/20 to 9/30/21 | 17.68 | 0.32 | — | 4.88 | 5.20 | (0.08) | (0.27) | (0.35) | — | 4.85 | 22.53 | 29.77 | 339,111 | 0.94 | 1.25 | 1.51 | 32 | |
| 10/1/19 to 9/30/20 | 16.33 | 0.11 | — | 1.77 | 1.88 | (0.13) | (0.40) | (0.53) | — | 1.35 | 17.68 | 11.67 | 240,922 | 0.94 | 1.16 | 0.66 | 28 | |
| 10/1/18 to 9/30/19 | 15.59 | 0.15 | — | 1.14 | 1.29 | (0.19) | (0.36) | (0.55) | — | 0.74 | 16.33 | 9.14 | 210,425 | 0.95 | 1.17 | 1.03 | 33 | |
| Institutional Class | ||||||||||||||||||
| 10/1/22 to 9/30/23 | $15.57 | 0.14 | — | 1.66 | 1.80 | (0.13) | — | (0.13) | — | 1.67 | $17.24 | 11.55 % | $ 220,985 | 0.93 % | 1.24 % | 0.76 % | 19 % | |
| 10/1/21 to 9/30/22 | 22.06 | 0.11 | — | (4.77) | (4.66) | (0.32) | (1.51) | (1.83) | — (7) | (6.49) | 15.57 | (23.48) (11) | 235,079 | 0.93 | 1.23 | 0.59 | 27 | |
| 10/1/20 to 9/30/21 | 17.33 | 0.33 | — | 4.77 | 5.10 | (0.10) | (0.27) | (0.37) | — | 4.73 | 22.06 | 29.76 | 325,247 | 0.93 | 1.21 | 1.57 | 32 | |
| 10/1/19 to 9/30/20 | 16.03 | 0.11 | — | 1.74 | 1.85 | (0.15) | (0.40) | (0.55) | — | 1.30 | 17.33 | 11.71 | 204,320 | 0.93 | 1.13 | 0.68 | 28 | |
| 10/1/18 to 9/30/19 | 15.31 | 0.15 | — | 1.11 | 1.26 | (0.18) | (0.36) | (0.54) | — | 0.72 | 16.03 | 9.12 | 152,496 | 0.94 | 1.18 | 1.04 | 33 | |
| Global Allocation Fund | ||||||||||||||||||
| Class A | ||||||||||||||||||
| 10/1/22 to 9/30/23 | $ 9.03 | 0.22 | 0.40 | 0.23 | 0.85 | (0.01) | (0.47) | (0.48) | — | 0.37 | $ 9.40 | 9.49 % | $ 34,586 | 0.52 % | 1.30 % | 2.33 % | 55 % | |
| 10/1/21 to 9/30/22 | 11.99 | 0.10 | 0.74 | (2.75) | (1.91) | (0.22) | (0.83) | (1.05) | — | (2.96) | 9.03 | (17.65) | 36,036 | 0.52 | 1.26 | 0.91 | 88 | |
| 10/1/20 to 9/30/21 | 11.11 | 0.14 | 0.16 | 1.33 | 1.63 | (0.22) | (0.53) | (0.75) | — (7) | 0.88 | 11.99 | 15.16 (11) | 49,743 | 0.56 (8) | 1.22 | 1.19 | 168 | |
| 10/1/19 to 9/30/20 | 11.05 | 0.13 | — | 0.94 | 1.07 | (0.12) | (0.89) | (1.01) | — | 0.06 | 11.11 | 10.21 | 46,506 | 0.52 | 1.14 | 1.18 | 141 | |
| 10/1/18 to 9/30/19 | 11.47 | 0.21 | — | 0.06 | 0.27 | (0.25) | (0.44) | (0.69) | — | (0.42) | 11.05 (12) | 3.05 (12) | 49,259 | 0.61 | 1.14 | 1.95 | 29 | |
| Class C | ||||||||||||||||||
| 10/1/22 to 9/30/23 | $ 9.46 | 0.17 | 0.41 | 0.22 | 0.80 | — | (0.47) | (0.47) | — | 0.33 | $ 9.79 | 8.55 % | $ 1,866 | 1.27 % | 2.05 % | 1.68 % | 55 % | |
| 10/1/21 to 9/30/22 | 12.50 | 0.06 | 0.74 | (2.88) | (2.08) | (0.13) | (0.83) | (0.96) | — | (3.04) | 9.46 | (18.21) | 2,136 | 1.27 | 2.03 | 0.53 | 88 | |
| 10/1/20 to 9/30/21 | 11.47 | 0.07 | 0.21 | 1.32 | 1.60 | (0.04) | (0.53) | (0.57) | — (7) | 1.03 | 12.50 | 14.29 (11) | 2,558 | 1.31 (8) | 1.94 | 0.59 | 168 | |
| 10/1/19 to 9/30/20 | 11.37 | 0.06 | — | 0.95 | 1.01 | (0.02) | (0.89) | (0.91) | — | 0.10 | 11.47 | 9.28 | 3,549 | 1.27 | 1.83 | 0.55 | 141 | |
| 10/1/18 to 9/30/19 | 11.67 | 0.13 | — | 0.08 | 0.21 | (0.07) | (0.44) | (0.51) | — | (0.30) | 11.37 (12) | 2.29 (12) | 6,393 | 1.34 | 1.91 | 1.14 | 29 | |
| Class P | ||||||||||||||||||
| 10/1/22 to 9/30/23 | $ 8.87 | 0.25 | 0.39 | 0.21 | 0.85 | (0.01) | (0.47) | (0.48) | — | 0.37 | $ 9.24 | 9.71 % | $ 1,580 | 0.32 % | 1.04 % | 2.68 % | 55 % | |
| 10/1/21 to 9/30/22 | 11.79 | 0.24 | 0.70 | (2.79) | (1.85) | (0.24) | (0.83) | (1.07) | — | (2.92) | 8.87 | (17.46) | 2,270 | 0.32 | 1.00 | 2.21 | 88 | |
| 10/1/20 to 9/30/21 | 10.96 | 0.16 | 0.16 | 1.30 | 1.62 | (0.26) | (0.53) | (0.79) | — (7) | 0.83 | 11.79 | 15.30 (11) | 6,536 | 0.36 (8) | 1.03 | 1.38 | 168 | |
| 10/1/19 to 9/30/20 | 10.94 | 0.17 | — | 0.90 | 1.07 | (0.16) | (0.89) | (1.05) | — | 0.02 | 10.96 | 10.39 | 5,371 | 0.32 | 0.90 | 1.63 | 141 | |
| 10/1/18 to 9/30/19 | 11.38 | 0.18 | — | 0.12 | 0.30 | (0.30) | (0.44) | (0.74) | — | (0.44) | 10.94 (12) | 3.30 (12) | 6,173 | 0.37 | 0.91 | 1.68 | 29 |
| Net Asset Value, Beginning of Period | Net Investment Income (Loss)(1) | Capital Gains Distributions Received from Underlying Funds(1) | Net Realized and Unrealized Gain (Loss) | Total from Investment Operations | Dividends from Net Investment Income | Distributions from Net Realized Gains | Total Distributions | Payment from Affiliate | Change in Net Asset Value | Net Asset Value, End of Period | Total Return(2)(3) | Net Assets, End of Period (in thousands) | Ratio of Net Expenses to Average Net Assets(4)(5) | Ratio of Gross Expenses to Average Net Assets(4)(5) | Ratio of Net Investment Income (Loss) to Average Net Assets(4) | Portfolio Turnover Rate(3) | ||
| Global Allocation Fund (Continued) | ||||||||||||||||||
| Institutional Class | ||||||||||||||||||
| 10/1/22 to 9/30/23 | $ 8.95 | 0.25 | 0.39 | 0.21 | 0.85 | (0.01) | (0.47) | (0.48) | — | 0.37 | $ 9.32 | 9.64 % | $ 5,327 | 0.29 % | 1.05 % | 2.64 % | 55 % | |
| 10/1/21 to 9/30/22 | 11.89 | 0.36 | 0.72 | (2.95) | (1.87) | (0.24) | (0.83) | (1.07) | — | (2.94) | 8.95 | (17.42) | 6,085 | 0.29 | 1.01 | 3.29 | 88 | |
| 10/1/20 to 9/30/21 | 11.05 | 0.17 | 0.16 | 1.32 | 1.65 | (0.28) | (0.53) | (0.81) | — (7) | 0.84 | 11.89 | 15.46 (11) | 10,820 | 0.31 (8) | 0.86 | 1.43 | 168 | |
| 10/1/19 to 9/30/20 | 11.02 | 0.14 | — | 0.94 | 1.08 | (0.16) | (0.89) | (1.05) | — | 0.03 | 11.05 | 10.40 | 9,609 | 0.29 | 0.88 | 1.28 | 141 | |
| 10/1/18 to 9/30/19 | 11.45 | 0.24 | — | 0.06 | 0.30 | (0.29) | (0.44) | (0.73) | — | (0.43) | 11.02 (12) | 3.34 (12) | 6,026 | 0.36 | 0.89 | 2.25 | 29 | |
| Class R6 | ||||||||||||||||||
| 10/1/22 to 9/30/23 | $ 8.70 | 0.24 | 0.38 | 0.21 | 0.83 | (0.01) | (0.47) | (0.48) | — | 0.35 | $ 9.05 | 9.71 % | $ 157,400 | 0.22 % | 0.96 % | 2.55 % | 55 % | |
| 10/1/21 to 9/30/22 | 11.59 | 0.12 | 0.71 | (2.64) | (1.81) | (0.25) | (0.83) | (1.08) | — | (2.89) | 8.70 | (17.37) | 175,564 | 0.22 | 0.93 | 1.19 | 88 | |
| 10/1/20 to 9/30/21 | 10.79 | 0.17 | 0.16 | 1.28 | 1.61 | (0.28) | (0.53) | (0.81) | — (7) | 0.80 | 11.59 | 15.46 (11) | 216,700 | 0.26 (8) | 0.91 | 1.50 | 168 | |
| 10/1/19 to 9/30/20 | 10.78 | 0.16 | — | 0.92 | 1.08 | (0.18) | (0.89) | (1.07) | — | 0.01 | 10.79 | 10.57 | 191,750 | 0.22 | 0.83 | 1.52 | 141 | |
| 10/1/18 to 9/30/19 | 11.23 | 0.23 | — | 0.06 | 0.29 | (0.30) | (0.44) | (0.74) | — | (0.45) | 10.78 (12) | 3.34 (12) | 249,269 | 0.28 | 0.82 | 2.23 | 29 | |
| Administrative Class | ||||||||||||||||||
| 10/1/22 to 9/30/23 | $ 9.38 | 0.22 | 0.41 | 0.26 | 0.89 | (0.01) | (0.47) | (0.48) | — | 0.41 | $ 9.79 | 9.56 % | $ 104 | 0.47 % | 1.25 % | 2.22 % | 55 % | |
| 10/1/21 to 9/30/22 | 12.42 | 0.11 | 0.54 | (2.63) | (1.98) | (0.23) | (0.83) | (1.06) | — | (3.04) | 9.38 | (17.61) | 112 | 0.47 | 0.59 | 1.02 | 88 | |
| 10/1/20 to 9/30/21 | 11.46 | 0.33 | 0.16 | 1.37 | 1.86 | (0.37) | (0.53) | (0.90) | — (7) | 0.96 | 12.42 | 16.73 (11) | 42 | 0.47 (8) | 2.34 | 2.68 | 168 | |
| 10/1/19 to 9/30/20 | 11.38 | 0.13 | — | 0.98 | 1.11 | (0.14) | (0.89) | (1.03) | — | 0.08 | 11.46 | 10.24 | 27 | 0.47 | 1.08 | 1.17 | 141 | |
| 10/1/18 to 9/30/19 | 11.77 | 0.22 | — | 0.08 | 0.30 | (0.25) | (0.44) | (0.69) | — | (0.39) | 11.38 (12) | 3.17 (12) | 23 | 0.53 | 1.07 | 1.97 | 29 | |
| International Small-Cap Fund | ||||||||||||||||||
| Class A | ||||||||||||||||||
| 10/1/22 to 9/30/23 | $22.77 | 0.96 | — | 4.42 | 5.38 | (0.28) | — | (0.28) | — | 5.10 | $27.87 | 23.74 % | $ 3,167 | 1.27 % (13) | 1.83 % | 3.60 % | 70 % | |
| 10/1/21 to 9/30/22 | 41.91 | 0.48 | — | (12.74) | (12.26) | (0.86) | (6.06) | (6.92) | 0.04 | (19.14) | 22.77 | (34.75) (11) | 2,845 | 1.25 | 1.78 | 1.53 | 131 | |
| 10/1/20 to 9/30/21 | 34.36 | 0.22 | — | 7.76 | 7.98 | (0.30) | (0.13) | (0.43) | — | 7.55 | 41.91 | 23.32 | 4,853 | 1.25 | 1.77 | 0.54 | 51 | |
| 10/1/19 to 9/30/20 | 32.15 | 0.15 | — | 2.54 | 2.69 | (0.48) | — | (0.48) | — | 2.21 | 34.36 | 8.37 | 3,619 | 1.25 | 1.75 | 0.47 | 60 | |
| 10/1/18 to 9/30/19 | 43.09 | 0.34 | — | (6.28) | (5.94) | (0.10) | (4.90) | (5.00) | — | (10.94) | 32.15 | (12.05) | 4,826 | 1.25 | 1.94 | 1.05 | 55 | |
| Class C | ||||||||||||||||||
| 10/1/22 to 9/30/23 | $21.97 | 0.73 | — | 4.28 | 5.01 | — | — | — | — | 5.01 | $26.98 | 22.80 % | $ 157 | 2.02 % (13) | 2.63 % | 2.83 % | 70 % | |
| 10/1/21 to 9/30/22 | 40.12 | 0.20 | — | (12.28) | (12.08) | (0.05) | (6.06) | (6.11) | 0.04 | (18.15) | 21.97 | (35.24) (11) | 166 | 2.00 | 2.49 | 0.66 | 131 | |
| 10/1/20 to 9/30/21 | 33.00 | (0.24) | — | 7.60 | 7.36 | (0.11) | (0.13) | (0.24) | — | 7.12 | 40.12 | 22.36 | 373 | 2.00 | 2.47 | (0.62) | 51 | |
| 10/1/19 to 9/30/20 | 30.72 | (0.08) | — | 2.40 | 2.32 | (0.04) | — | (0.04) | — | 2.28 | 33.00 | 7.56 | 722 | 2.00 | 2.49 | (0.27) | 60 | |
| 10/1/18 to 9/30/19 | 41.63 | 0.05 | — | (6.06) | (6.01) | — | (4.90) | (4.90) | — | (10.91) | 30.72 | (12.75) | 963 | 2.04 | 2.59 | 0.16 | 55 | |
| Class P | ||||||||||||||||||
| 10/1/22 to 9/30/23 | $22.68 | 0.92 | — | 4.49 | 5.41 | (0.30) | — | (0.30) | — | 5.11 | $27.79 | 24.00 % | $ 4,009 | 1.12 % (13) | 1.52 % | 3.48 % | 70 % | |
| 10/1/21 to 9/30/22 | 41.77 | 0.47 | — | (12.63) | (12.16) | (0.91) | (6.06) | (6.97) | 0.04 | (19.09) | 22.68 | (34.67) (11) | 4,965 | 1.10 | 1.36 | 1.48 | 131 | |
| 10/1/20 to 9/30/21 | 34.20 | 0.27 | — | 7.72 | 7.99 | (0.29) | (0.13) | (0.42) | — | 7.57 | 41.77 | 23.45 | 10,911 | 1.10 | 1.53 | 0.65 | 51 | |
| 10/1/19 to 9/30/20 | 31.91 | 0.17 | — | 2.56 | 2.73 | (0.44) | — | (0.44) | — | 2.29 | 34.20 | 8.55 | 10,751 | 1.10 | 1.49 | 0.53 | 60 | |
| 10/1/18 to 9/30/19 | 43.06 | 0.33 | — | (6.25) | (5.92) | (0.33) | (4.90) | (5.23) | — | (11.15) | 31.91 | (11.92) | 19,740 | 1.10 | 1.58 | 1.01 | 55 |
| Net Asset Value, Beginning of Period | Net Investment Income (Loss)(1) | Capital Gains Distributions Received from Underlying Funds(1) | Net Realized and Unrealized Gain (Loss) | Total from Investment Operations | Dividends from Net Investment Income | Distributions from Net Realized Gains | Total Distributions | Payment from Affiliate | Change in Net Asset Value | Net Asset Value, End of Period | Total Return(2)(3) | Net Assets, End of Period (in thousands) | Ratio of Net Expenses to Average Net Assets(4)(5) | Ratio of Gross Expenses to Average Net Assets(4)(5) | Ratio of Net Investment Income (Loss) to Average Net Assets(4) | Portfolio Turnover Rate(3) | ||
| International Small-Cap Fund (Continued) | ||||||||||||||||||
| Institutional Class | ||||||||||||||||||
| 10/1/22 to 9/30/23 | $23.66 | 1.07 | — | 4.58 | 5.65 | (0.33) | — | (0.33) | — | 5.32 | $28.98 | 24.01 % | $ 14,596 | 1.06 % (13) | 1.55 % | 3.84 % | 70 % | |
| 10/1/21 to 9/30/22 | 43.24 | 0.56 | — | (13.22) | (12.66) | (0.90) | (6.06) | (6.96) | 0.04 | (19.58) | 23.66 | (34.62) (11) | 17,202 | 1.04 | 1.47 | 1.73 | 131 | |
| 10/1/20 to 9/30/21 | 35.49 | 0.29 | — | 8.03 | 8.32 | (0.44) | (0.13) | (0.57) | — | 7.75 | 43.24 | 23.55 | 29,125 | 1.04 | 1.50 | 0.69 | 51 | |
| 10/1/19 to 9/30/20 | 33.21 | 0.23 | — | 2.63 | 2.86 | (0.58) | — | (0.58) | — | 2.28 | 35.49 | 8.61 | 31,942 | 1.04 | 1.51 | 0.69 | 60 | |
| 10/1/18 to 9/30/19 | 44.65 | 0.47 | — | (6.58) | (6.11) | (0.43) | (4.90) | (5.33) | — | (11.44) | 33.21 | (11.88) | 40,477 | 1.04 | 1.61 | 1.39 | 55 | |
| Class R6 | ||||||||||||||||||
| 10/1/22 to 9/30/23 | $23.36 | 1.06 | — | 4.54 | 5.60 | (0.32) | — | (0.32) | — | 5.28 | $28.64 | 24.11 % | $ 12,172 | 1.01 % (13) | 1.45 % | 3.88 % | 70 % | |
| 10/1/21 to 9/30/22 | 42.86 | 0.59 | — | (13.08) | (12.49) | (0.99) | (6.06) | (7.05) | 0.04 | (19.50) | 23.36 | (34.60) (11) | 18,866 | 1.00 | 1.37 | 1.86 | 131 | |
| 10/1/20 to 9/30/21 | 35.17 | 0.32 | — | 7.94 | 8.26 | (0.44) | (0.13) | (0.57) | — | 7.69 | 42.86 | 23.60 | 31,785 | 1.00 | 1.41 | 0.77 | 51 | |
| 10/1/19 to 9/30/20 | 33.03 | 0.26 | — | 2.59 | 2.85 | (0.71) | — | (0.71) | — | 2.14 | 35.17 | 8.63 | 29,889 | 1.00 | 1.43 | 0.80 | 60 | |
| 10/1/18 to 9/30/19 | 44.64 | 0.48 | — | (6.59) | (6.11) | (0.60) | (4.90) | (5.50) | — | (11.61) | 33.03 | (11.82) | 28,630 | 1.00 | 1.49 | 1.44 | 55 | |
| Newfleet Short Duration High Income Fund | ||||||||||||||||||
| Class A | ||||||||||||||||||
| 10/1/22 to 9/30/23 | $12.84 | 0.85 | — | 0.49 | 1.34 | (0.81) | — | (0.81) | — | 0.53 | $13.37 | 10.70 % | $ 110,220 | 0.87 % | 1.01 % | 6.43 % | 43 % | |
| 10/1/21 to 9/30/22 | 14.59 | 0.64 | — | (1.63) | (0.99) | (0.76) | — | (0.76) | — | (1.75) | 12.84 | (7.05) | 114,099 | 0.86 | 0.98 | 4.59 | 56 | |
| 10/1/20 to 9/30/21 | 13.99 | 0.62 | — | 0.84 | 1.46 | (0.86) | — | (0.86) | — | 0.60 | 14.59 | 10.65 | 145,424 | 0.86 | 0.93 | 4.24 | 69 | |
| 10/1/19 to 9/30/20 | 14.62 | 0.58 | — | (0.54) | 0.04 | (0.67) | — | (0.67) | — | (0.63) | 13.99 | 0.37 | 136,690 | 0.86 | 0.87 | 4.13 | 81 | |
| 10/1/18 to 9/30/19 | 14.93 | 0.51 | — | (0.11) | 0.40 | (0.71) | — | (0.71) | — | (0.31) | 14.62 | 2.85 | 136,086 | 0.88 | 0.88 | 3.52 | 47 | |
| Class C | ||||||||||||||||||
| 10/1/22 to 9/30/23 | $12.88 | 0.82 | — | 0.48 | 1.30 | (0.77) | — | (0.77) | — | 0.53 | $13.41 | 10.37 % | $ 49,229 | 1.12 % | 1.28 % | 6.17 % | 43 % | |
| 10/1/21 to 9/30/22 | 14.63 | 0.61 | — | (1.63) | (1.02) | (0.73) | — | (0.73) | — | (1.75) | 12.88 | (7.27) | 58,284 | 1.11 | 1.24 | 4.34 | 56 | |
| 10/1/20 to 9/30/21 | 13.98 | 0.58 | — | 0.84 | 1.42 | (0.77) | — | (0.77) | — | 0.65 | 14.63 | 10.34 | 77,032 | 1.11 | 1.20 | 4.00 | 69 | |
| 10/1/19 to 9/30/20 | 14.61 | 0.54 | — | (0.54) | — | (0.63) | — | (0.63) | — | (0.63) | 13.98 | 0.12 | 90,863 | 1.12 | 1.13 | 3.86 | 81 | |
| 10/1/18 to 9/30/19 | 14.90 | 0.47 | — | (0.10) | 0.37 | (0.66) | — | (0.66) | — | (0.29) | 14.61 | 2.58 | 117,058 | 1.14 | 1.14 | 3.25 | 47 | |
| Class P | ||||||||||||||||||
| 10/1/22 to 9/30/23 | $12.77 | 0.88 | — | 0.48 | 1.36 | (0.84) | — | (0.84) | — | 0.52 | $13.29 | 10.92 % | $ 162,838 | 0.66 % | 0.79 % | 6.65 % | 43 % | |
| 10/1/21 to 9/30/22 | 14.52 | 0.66 | — | (1.62) | (0.96) | (0.79) | — | (0.79) | — | (1.75) | 12.77 | (6.90) | 140,949 | 0.65 (6)(14) | 0.65 | 4.72 | 56 | |
| 10/1/20 to 9/30/21 | 13.90 | 0.65 | — | 0.83 | 1.48 | (0.86) | — | (0.86) | — | 0.62 | 14.52 | 10.81 | 247,819 | 0.65 | 0.76 | 4.45 | 69 | |
| 10/1/19 to 9/30/20 | 14.51 | 0.59 | — | (0.51) | 0.08 | (0.69) | — | (0.69) | — | (0.61) | 13.90 | 0.69 | 264,908 | 0.63 | 0.67 | 4.16 | 81 | |
| 10/1/18 to 9/30/19 | 14.88 | 0.53 | — | (0.10) | 0.43 | (0.80) | — | (0.80) | — | (0.37) | 14.51 | 3.05 | 501,138 | 0.65 | 0.65 | 3.70 | 47 | |
| Institutional Class | ||||||||||||||||||
| 10/1/22 to 9/30/23 | $12.73 | 0.88 | — | 0.47 | 1.35 | (0.84) | — | (0.84) | — | 0.51 | $13.24 | 10.93 % | $ 238,135 | 0.61 % | 0.78 % | 6.69 % | 43 % | |
| 10/1/21 to 9/30/22 | 14.47 | 0.67 | — | (1.61) | (0.94) | (0.80) | — | (0.80) | — | (1.74) | 12.73 | (6.78) | 231,407 | 0.60 | 0.76 | 4.86 | 56 | |
| 10/1/20 to 9/30/21 | 13.89 | 0.65 | — | 0.84 | 1.49 | (0.91) | — | (0.91) | — | 0.58 | 14.47 | 10.91 | 251,201 | 0.60 | 0.70 | 4.50 | 69 | |
| 10/1/19 to 9/30/20 | 14.52 | 0.61 | — | (0.54) | 0.07 | (0.70) | — | (0.70) | — | (0.63) | 13.89 | 0.63 | 285,572 | 0.61 | 0.64 | 4.35 | 81 | |
| 10/1/18 to 9/30/19 | 14.89 | 0.54 | — | (0.11) | 0.43 | (0.80) | — | (0.80) | — | (0.37) | 14.52 | 3.06 | 388,672 | 0.63 | 0.63 | 3.74 | 47 |
| Net Asset Value, Beginning of Period | Net Investment Income (Loss)(1) | Capital Gains Distributions Received from Underlying Funds(1) | Net Realized and Unrealized Gain (Loss) | Total from Investment Operations | Dividends from Net Investment Income | Distributions from Net Realized Gains | Total Distributions | Payment from Affiliate | Change in Net Asset Value | Net Asset Value, End of Period | Total Return(2)(3) | Net Assets, End of Period (in thousands) | Ratio of Net Expenses to Average Net Assets(4)(5) | Ratio of Gross Expenses to Average Net Assets(4)(5) | Ratio of Net Investment Income (Loss) to Average Net Assets(4) | Portfolio Turnover Rate(3) | ||
| Newfleet Short Duration High Income Fund (Continued) | ||||||||||||||||||
| Class R6 | ||||||||||||||||||
| 10/1/22 to 9/30/23 | $12.74 | 0.89 | — | 0.47 | 1.36 | (0.85) | — | (0.85) | — | 0.51 | $13.25 | 11.00 % | $ 12,953 | 0.56 % | 0.69 % | 6.75 % | 43 % | |
| 10/1/21 to 9/30/22 | 14.48 | 0.68 | — | (1.61) | (0.93) | (0.81) | — | (0.81) | — | (1.74) | 12.74 | (6.74) | 10,501 | 0.55 | 0.66 | 4.87 | 56 | |
| 10/1/20 to 9/30/21 | 13.89 | 0.66 | — | 0.83 | 1.49 | (0.90) | — | (0.90) | — | 0.59 | 14.48 | 10.95 | 21,117 | 0.55 | 0.63 | 4.59 | 69 | |
| 10/1/19 to 9/30/20 | 14.52 | 0.62 | — | (0.54) | 0.08 | (0.71) | — | (0.71) | — | (0.63) | 13.89 | 0.70 | 33,741 | 0.55 | 0.56 | 4.49 | 81 | |
| 10/1/18 to 9/30/19 | 14.89 | 0.56 | — | (0.11) | 0.45 | (0.82) | — | (0.82) | — | (0.37) | 14.52 | 3.20 | 39,234 | 0.57 | 0.57 | 3.89 | 47 | |
| NFJ Emerging Markets Value Fund | ||||||||||||||||||
| Class A | ||||||||||||||||||
| 10/1/22 to 9/30/23 | $13.47 | 0.16 | — | 2.32 | 2.48 | (0.36) | — | (0.36) | — | 2.12 | $15.59 | 18.52 % | $ 6,606 | 1.14 % | 1.71 % | 1.03 % | 92 % | |
| 10/1/21 to 9/30/22 | 20.11 | 0.09 | — | (6.70) | (6.61) | (0.03) | — | (0.03) | — | (6.64) | 13.47 | (32.92) | 8,246 | 1.15 | 1.53 | 0.52 | 83 | |
| 10/1/20 to 9/30/21 | 18.09 | 0.05 | — | 2.17 | 2.22 | (0.20) | — | (0.20) | — | 2.02 | 20.11 | 12.24 | 15,565 | 1.14 | 1.50 | 0.26 | 56 | |
| 10/1/19 to 9/30/20 | 15.55 | 0.15 | — | 2.58 | 2.73 | (0.19) | — | (0.19) | — | 2.54 | 18.09 | 17.63 | 14,907 | 1.14 | 1.64 | 0.89 | 105 | |
| 10/1/18 to 9/30/19 | 16.18 | 0.42 | — | (0.68) | (0.26) | (0.37) | — | (0.37) | — | (0.63) | 15.55 | (1.68) | 14,395 | 1.15 | 1.65 | 2.69 | 101 | |
| Class C | ||||||||||||||||||
| 10/1/22 to 9/30/23 | $13.40 | 0.05 | — | 2.29 | 2.34 | (0.26) | — | (0.26) | — | 2.08 | $15.48 | 17.57 % | $ 463 | 1.89 % | 2.44 % | 0.35 % | 92 % | |
| 10/1/21 to 9/30/22 | 20.12 | (0.05) | — | (6.67) | (6.72) | — | — | — | — | (6.72) | 13.40 | (33.40) | 476 | 1.90 | 2.24 | (0.25) | 83 | |
| 10/1/20 to 9/30/21 | 18.07 | (0.11) | — | 2.17 | 2.06 | (0.01) | — | (0.01) | — | 2.05 | 20.12 | 11.40 | 914 | 1.89 | 2.25 | (0.51) | 56 | |
| 10/1/19 to 9/30/20 | 15.56 | 0.03 | — | 2.57 | 2.60 | (0.09) | — | (0.09) | — | 2.51 | 18.07 | 16.75 | 1,016 | 1.89 | 2.37 | 0.16 | 105 | |
| 10/1/18 to 9/30/19 | 16.23 | 0.35 | — | (0.73) | (0.38) | (0.29) | — | (0.29) | — | (0.67) | 15.56 | (2.38) | 1,006 | 1.90 | 2.40 | 2.24 | 101 | |
| Class P | ||||||||||||||||||
| 10/1/22 to 9/30/23 | $13.38 | 0.17 | — | 2.32 | 2.49 | (0.30) | — | (0.30) | — | 2.19 | $15.57 | 18.73 % | $ 2,786 | 0.99 % | 1.45 % | 1.07 % | 92 % | |
| 10/1/21 to 9/30/22 | 19.99 | 0.14 | — | (6.69) | (6.55) | (0.06) | — | (0.06) | — | (6.61) | 13.38 | (32.84) | 11,220 | 1.00 | 1.46 | 0.83 | 83 | |
| 10/1/20 to 9/30/21 | 18.05 | 0.09 | — | 2.15 | 2.24 | (0.30) | — | (0.30) | — | 1.94 | 19.99 | 12.40 | 10,449 | 0.99 (8) | 1.47 | 0.44 | 56 | |
| 10/1/19 to 9/30/20 | 15.53 | 0.22 | — | 2.53 | 2.75 | (0.23) | — | (0.23) | — | 2.52 | 18.05 | 17.85 | 7,192 | 0.99 | 1.27 | 1.33 | 105 | |
| 10/1/18 to 9/30/19 | 16.16 | 0.45 | — | (0.69) | (0.24) | (0.39) | — | (0.39) | — | (0.63) | 15.53 | (1.53) | 2,022 | 0.99 | 1.32 | 2.90 | 101 | |
| Institutional Class | ||||||||||||||||||
| 10/1/22 to 9/30/23 | $13.39 | 0.19 | — | 2.31 | 2.50 | (0.40) | — | (0.40) | — | 2.10 | $15.49 | 18.78 % | $ 30,855 | 0.89 % | 1.40 % | 1.27 % | 92 % | |
| 10/1/21 to 9/30/22 | 19.98 | 0.13 | — | (6.65) | (6.52) | (0.07) | — | (0.07) | — | (6.59) | 13.39 | (32.75) | 44,679 | 0.89 | 1.24 | 0.75 | 83 | |
| 10/1/20 to 9/30/21 | 18.01 | 0.11 | — | 2.15 | 2.26 | (0.29) | — | (0.29) | — | 1.97 | 19.98 | 12.50 | 122,736 | 0.89 | 1.27 | 0.50 | 56 | |
| 10/1/19 to 9/30/20 | 15.48 | 0.19 | — | 2.57 | 2.76 | (0.23) | — | (0.23) | — | 2.53 | 18.01 | 17.95 | 115,817 | 0.89 | 1.34 | 1.18 | 105 | |
| 10/1/18 to 9/30/19 | 16.29 | 0.49 | — | (0.73) | (0.24) | (0.57) | — | (0.57) | — | (0.81) | 15.48 | (1.45) | 90,711 | 0.90 | 1.37 | 3.13 | 101 |
| Net Asset Value, Beginning of Period | Net Investment Income (Loss)(1) | Capital Gains Distributions Received from Underlying Funds(1) | Net Realized and Unrealized Gain (Loss) | Total from Investment Operations | Dividends from Net Investment Income | Distributions from Net Realized Gains | Total Distributions | Payment from Affiliate | Change in Net Asset Value | Net Asset Value, End of Period | Total Return(2)(3) | Net Assets, End of Period (in thousands) | Ratio of Net Expenses to Average Net Assets(4)(5) | Ratio of Gross Expenses to Average Net Assets(4)(5) | Ratio of Net Investment Income (Loss) to Average Net Assets(4) | Portfolio Turnover Rate(3) | ||
| NFJ Global Sustainability Fund | ||||||||||||||||||
| Class A | ||||||||||||||||||
| 10/1/22 to 9/30/23 | $15.37 | 0.09 | — | 3.06 | 3.15 | (0.25) | (3.69) | (3.94) | — | (0.79) | $14.58 | 22.38 % | $ 7,776 | 0.94 % | 1.45 % | 0.58 % | 114 % | |
| 10/1/21 to 9/30/22 | 25.50 | 0.18 | — | (5.11) | (4.93) | (0.15) | (5.06) | (5.21) | 0.01 | (10.13) | 15.37 | (25.53) (11) | 3,451 | 0.94 | 1.42 | 0.85 | 70 | |
| 10/1/20 to 9/30/21 | 21.06 | 0.13 | — | 4.97 | 5.10 | (0.16) | (0.50) | (0.66) | — | 4.44 | 25.50 | 24.61 | 5,305 | 0.94 | 1.37 | 0.54 | 30 | |
| 10/1/19 to 9/30/20 | 18.27 | 0.11 | — | 3.03 | 3.14 | (0.02) | (0.33) | (0.35) | — | 2.79 | 21.06 | 17.35 | 2,350 | 0.98 | 1.44 | 0.58 | 31 | |
| 10/1/18 to 9/30/19 | 19.46 | 0.14 | — | 0.04 | 0.18 | (0.30) | (1.07) | (1.37) | — | (1.19) | 18.27 | 2.43 | 1,444 | 1.09 | 1.84 | 0.77 | 49 | |
| Class P | ||||||||||||||||||
| 10/1/22 to 9/30/23 | $15.63 | 0.12 | — | 3.12 | 3.24 | (0.24) | (3.69) | (3.93) | — | (0.69) | $14.94 | 22.61 % | $ 2,153 | 0.79 % | 1.21 % | 0.75 % | 114 % | |
| 10/1/21 to 9/30/22 | 25.72 | 0.20 | — | (5.20) | (5.00) | (0.04) | (5.06) | (5.10) | 0.01 | (10.09) | 15.63 | (25.44) (11) | 2,689 | 0.79 | 0.98 | 0.94 | 70 | |
| 10/1/20 to 9/30/21 | 21.22 | 0.10 | — | 5.07 | 5.17 | (0.17) | (0.50) | (0.67) | — | 4.50 | 25.72 | 24.78 | 5,336 | 0.79 | 1.17 | 0.44 | 30 | |
| 10/1/19 to 9/30/20 | 18.39 | 0.14 | — | 3.05 | 3.19 | (0.03) | (0.33) | (0.36) | — | 2.83 | 21.22 | 17.52 | 28,372 | 0.84 | 1.13 | 0.74 | 31 | |
| 10/1/18 to 9/30/19 | 19.68 | 0.21 | — | (0.02) | 0.19 | (0.41) | (1.07) | (1.48) | — | (1.29) | 18.39 | 2.56 | 21,582 | 0.94 | 1.65 | 1.17 | 49 | |
| Institutional Class | ||||||||||||||||||
| 10/1/22 to 9/30/23 | $15.96 | 0.14 | — | 3.19 | 3.33 | (0.21) | (3.69) | (3.90) | — | (0.57) | $15.39 | 22.74 % | $ 43,628 | 0.69 % | 1.11 % | 0.85 % | 114 % | |
| 10/1/21 to 9/30/22 | 26.28 | 0.24 | — | (5.33) | (5.09) | (0.18) | (5.06) | (5.24) | 0.01 | (10.32) | 15.96 | (25.39) (11) | 74,848 | 0.69 | 1.06 | 1.11 | 70 | |
| 10/1/20 to 9/30/21 | 21.64 | 0.18 | — | 5.13 | 5.31 | (0.17) | (0.50) | (0.67) | — | 4.64 | 26.28 | 24.95 | 114,884 | 0.69 | 1.09 | 0.72 | 30 | |
| 10/1/19 to 9/30/20 | 18.75 | 0.17 | — | 3.10 | 3.27 | (0.05) | (0.33) | (0.38) | — | 2.89 | 21.64 | 17.59 | 132,073 | 0.74 | 1.03 | 0.88 | 31 | |
| 10/1/18 to 9/30/19 | 19.72 | 0.19 | — | 0.06 | 0.25 | (0.15) | (1.07) | (1.22) | — | (0.97) | 18.75 | 2.63 | 2,072 | 0.84 | 1.66 | 1.05 | 49 | |
| Seix High Yield Income Fund | ||||||||||||||||||
| Class A | ||||||||||||||||||
| 10/1/22 to 9/30/23 | $ 7.15 | 0.43 | — | 0.58 | 1.01 | (0.41) | — | (0.41) | — (7) | 0.60 | $ 7.75 | 14.27 % (11) | $ 12,680 | 1.14 % (15) | 1.37 % | 5.57 % | 83 % | |
| 10/1/21 to 9/30/22 | 8.97 | 0.37 | — | (1.78) | (1.41) | (0.41) | — | (0.41) | — | (1.82) | 7.15 | (16.24) | 12,984 | 1.13 | 1.33 | 4.41 | 51 | |
| 10/1/20 to 9/30/21 | 8.39 | 0.43 | — | 0.58 | 1.01 | (0.43) | — | (0.43) | — | 0.58 | 8.97 | 12.20 | 20,763 | 1.13 (6) | 1.14 | 4.93 | 153 | |
| 10/1/19 to 9/30/20 | 8.91 | 0.42 | — | (0.50) | (0.08) | (0.44) | — | (0.44) | — | (0.52) | 8.39 | (0.82) | 20,251 | 1.12 | 1.12 | 4.96 | 143 | |
| 10/1/18 to 9/30/19 | 8.91 | 0.43 | — | 0.01 | 0.44 | (0.44) | — | (0.44) | — | — | 8.91 | 5.18 | 26,937 | 1.07 | 1.07 | 4.98 | 70 | |
| Class C | ||||||||||||||||||
| 10/1/22 to 9/30/23 | $ 7.14 | 0.37 | — | 0.59 | 0.96 | (0.35) | — | (0.35) | — (7) | 0.61 | $ 7.75 | 13.56 % (11) | $ 668 | 1.82 % (15) | 2.00 % | 4.84 % | 83 % | |
| 10/1/21 to 9/30/22 | 8.95 | 0.31 | — | (1.77) | (1.46) | (0.35) | — | (0.35) | — | (1.81) | 7.14 | (16.76) | 1,195 | 1.82 | 1.88 | 3.72 | 51 | |
| 10/1/20 to 9/30/21 | 8.38 | 0.37 | — | 0.56 | 0.93 | (0.36) | — | (0.36) | — | 0.57 | 8.95 | 11.32 | 2,255 | 1.86 (6) | 1.89 | 4.21 | 153 | |
| 10/1/19 to 9/30/20 | 8.89 | 0.36 | — | (0.49) | (0.13) | (0.38) | — | (0.38) | — | (0.51) | 8.38 | (1.41) | 3,880 | 1.81 | 1.81 | 4.26 | 143 | |
| 10/1/18 to 9/30/19 | 8.90 | 0.37 | — | — | 0.37 | (0.38) | — | (0.38) | — | (0.01) | 8.89 | 4.33 | 4,880 | 1.76 | 1.76 | 4.28 | 70 | |
| Class P | ||||||||||||||||||
| 10/1/22 to 9/30/23 | $ 6.79 | 0.44 | — | 0.55 | 0.99 | (0.44) | — | (0.44) | — (7) | 0.55 | $ 7.34 | 14.76 % (11) | $ 3,587 | 0.84 % (15) | 1.09 % | 5.94 % | 83 % | |
| 10/1/21 to 9/30/22 | 8.54 | 0.37 | — | (1.69) | (1.32) | (0.43) | — | (0.43) | — | (1.75) | 6.79 | (15.97) | 1,561 | 0.81 | 0.90 | 4.73 | 51 | |
| 10/1/20 to 9/30/21 | 8.01 | 0.44 | — | 0.54 | 0.98 | (0.45) | — | (0.45) | — | 0.53 | 8.54 | 12.47 | 4,196 | 0.85 | 0.95 | 5.20 | 153 | |
| 10/1/19 to 9/30/20 | 8.53 | 0.43 | — | (0.48) | (0.05) | (0.47) | — | (0.47) | — | (0.52) | 8.01 | (0.46) | 10,113 | 0.80 | 0.80 | 5.28 | 143 | |
| 10/1/18 to 9/30/19 | 8.55 | 0.44 | — | 0.01 | 0.45 | (0.47) | — | (0.47) | — | (0.02) | 8.53 | 5.56 | 12,128 | 0.73 | 0.73 | 5.31 | 70 |
| Net Asset Value, Beginning of Period | Net Investment Income (Loss)(1) | Capital Gains Distributions Received from Underlying Funds(1) | Net Realized and Unrealized Gain (Loss) | Total from Investment Operations | Dividends from Net Investment Income | Distributions from Net Realized Gains | Total Distributions | Payment from Affiliate | Change in Net Asset Value | Net Asset Value, End of Period | Total Return(2)(3) | Net Assets, End of Period (in thousands) | Ratio of Net Expenses to Average Net Assets(4)(5) | Ratio of Gross Expenses to Average Net Assets(4)(5) | Ratio of Net Investment Income (Loss) to Average Net Assets(4) | Portfolio Turnover Rate(3) | ||
| Seix High Yield Income Fund (Continued) | ||||||||||||||||||
| Institutional | ||||||||||||||||||
| 10/1/22 to 9/30/23 | $ 6.81 | 0.43 | — | 0.55 | 0.98 | (0.43) | — | (0.43) | — (7) | 0.55 | $ 7.36 | 14.65 % (11) | $ 14,997 | 0.85 % (15) | 1.10 % | 5.85 % | 83 % | |
| 10/1/21 to 9/30/22 | 8.57 | 0.37 | — | (1.70) | (1.33) | (0.43) | — | (0.43) | — | (1.76) | 6.81 | (16.02) | 16,713 | 0.84 | 0.99 | 4.66 | 51 | |
| 10/1/20 to 9/30/21 | 8.04 | 0.44 | — | 0.54 | 0.98 | (0.45) | — | (0.45) | — | 0.53 | 8.57 | 12.43 | 42,666 | 0.87 | 0.88 | 5.19 | 153 | |
| 10/1/19 to 9/30/20 | 8.56 | 0.43 | — | (0.48) | (0.05) | (0.47) | — | (0.47) | — | (0.52) | 8.04 | (0.50) | 51,920 | 0.83 | 0.83 | 5.22 | 143 | |
| 10/1/18 to 9/30/19 | 8.58 | 0.44 | — | 0.01 | 0.45 | (0.47) | — | (0.47) | — | (0.02) | 8.56 | 5.48 | 77,365 | 0.79 | 0.79 | 5.25 | 70 | |
| Administrative Class | ||||||||||||||||||
| 10/1/22 to 9/30/23 | $ 6.76 | 0.41 | — | 0.56 | 0.97 | (0.42) | — | (0.42) | — (7) | 0.55 | $ 7.31 | 14.57 % (11) | $ 123 | 1.02 % (15) | 1.30 % | 5.69 % | 83 % | |
| 10/1/21 to 9/30/22 | 8.52 | 0.35 | — | (1.68) | (1.33) | (0.43) | — | (0.43) | — | (1.76) | 6.76 | (16.19) | 114 | 1.01 (6)(14) | 0.88 | 4.47 | 51 | |
| 10/1/20 to 9/30/21 | 8.02 | 0.74 | — | 0.40 | 1.14 | (0.64) | — | (0.64) | — | 0.50 | 8.52 | 14.60 | 111 | 1.00 | 2.16 | 8.73 | 153 | |
| 10/1/19 to 9/30/20 | 8.54 | 0.42 | — | (0.48) | (0.06) | (0.46) | — | (0.46) | — | (0.52) | 8.02 | (0.63) | 26 | 1.00 | 1.00 | 5.14 | 143 | |
| 10/1/18 to 9/30/19 | 8.44 | 0.43 | — | 0.03 | 0.46 | (0.36) | — | (0.36) | — | 0.10 | 8.54 | 5.60 | 24 | 0.94 | 0.94 | 5.10 | 70 |
| Footnote Legend: | |
| (1) | Calculated using average shares outstanding. |
| (2) | Sales charges, where applicable, are not reflected in the total return calculation. |
| (3) | Not annualized for periods less than one year. |
| (4) | Annualized for periods less than one year. |
| (5) | The Funds will also indirectly bear their prorated share of expenses of any underlying funds in which they invest. Such expenses are not included in the calculation of this ratio. |
| (6) | See Note 4D in Notes to Financial Statements for information on recapture of expenses previously reimbursed and/or waived. |
| (7) | Amount is less than $0.005 per share. |
| (8) | Due to a change in expense cap, the ratio shown is a blended expense ratio. |
| (9) | Inception date. |
| (10) | Portfolio turnover is representative of the Fund for the entire period. |
| (11) | Payment from affiliate had no impact on total return. |
| (12) | Payments from affiliates increased the end of period net asset value and total return by less than $0.01 and 0.01%, respectively. |
| (13) | Includes interest expense on borrowings. |
| (14) | The share class is currently under its expense limitation. |
| (15) | Inclusive of excise tax expense of 0.02% for the year ended September 30, 2023. |
NOTES TO FINANCIAL STATEMENTS
September 30, 2023
| A. | Security Valuation |
| The Funds’ Board of Trustees (the “Board”) has designated the Investment Adviser as the valuation designee to perform fair valuations pursuant to Rule 2a-5 under the Investment Company Act of 1940. Each Fund utilizes a fair value hierarchy which prioritizes the inputs to valuation techniques used to measure fair value into three broad levels. The Funds’ policy is to recognize transfers into or out of Level 3 at the end of the reporting period. |
| • | Level 1 | – | quoted prices in active markets for identical securities (security types generally include listed equities). |
| • | Level 2 | – | prices determined using other significant observable inputs (including quoted prices for similar securities, interest rates, prepayment speeds, credit risk, etc.). |
| • | Level 3 | – | prices determined using significant unobservable inputs (including the Investment Adviser’s Valuation Committee’s own assumptions in determining the fair value of investments). |
| B. | Security Transactions and Investment Income |
| Security transactions are recorded on the trade date. Realized gains and losses from the sale of securities are determined on the identified cost basis. Dividend income and capital gain distributions are recognized on the ex-dividend date or, in the case of certain foreign securities, as soon as a Fund is notified. Interest income is recorded on the accrual basis. Each Fund amortizes premiums and accretes discounts using the effective interest method. Premiums on callable debt instruments are amortized to interest income to the earliest call date using the effective interest method. Conversion premium is not amortized. Any distributions from underlying funds are recorded in accordance with the character of the distributions as designated by the underlying funds. | |
| Dividend income from REITs is recorded using management’s estimate of the percentage of income included in distributions received from such investments based on historical information and other industry sources. The return of capital portion of the estimate is a reduction to investment income and a reduction in the cost basis of each investment which increases net realized gain (loss) and net change in unrealized appreciation (depreciation). If the return of capital distributions exceed their cost basis, the distributions are treated as realized gains. The actual amounts of income, return of capital, and capital gains are only determined by each REIT after its fiscal year-end, and may differ from the estimated amounts. | |
| C. | Income Taxes |
| Each Fund is treated as a separate taxable entity. It is the intention of each Fund to comply with the requirements of Subchapter M of the Internal Revenue Code of 1986, as amended (the “Code”) and to distribute substantially all of its taxable income to its shareholders. Therefore, no provision for federal income taxes or excise taxes has been made. | |
| Certain Funds may be subject to foreign taxes on income, gains on investments or currency repatriation, a portion of which may be recoverable. Each Fund will accrue such taxes and recoveries as applicable based upon current interpretations of the tax rules and regulations that exist in the markets in which it invests. | |
| Management of the Funds has concluded that there are no significant uncertain tax positions that would require recognition in the financial statements. Each Fund’s U.S. federal income tax return is generally subject to examination by the Internal Revenue Service for a period of three years after it is filed. State, local and/or non-U.S. tax returns and/or other filings may be subject to examination for different periods, depending upon the tax rules of each applicable jurisdiction. | |
| D. | Distributions to Shareholders |
| Distributions are recorded by each Fund on the ex-dividend date. Income and capital gain distributions are determined in accordance with income tax regulations which may differ from U.S. GAAP. | |
| E. | Expenses |
| Expenses incurred together by a Fund and other affiliated mutual funds are allocated in proportion to the net assets of each such fund, except where allocation of direct expenses to each Fund and each such other fund, or an alternative allocation method, can be more appropriately used. | |
| In addition to the net annual operating expenses that a Fund bears directly, the shareholders of a Fund indirectly bear the pro-rata expenses of any underlying mutual funds in which the Fund invests. | |
| F. | Foreign Currency Transactions |
| Non-U.S. investment securities and other assets and liabilities denominated in foreign currencies are translated into U.S. dollar amounts at the foreign currency exchange rate effective at the end of the reporting period. Cost of investments is translated at the currency exchange rate effective at the trade date. The gain or loss resulting from a change in currency exchange rates between the trade and settlement date of a portfolio transaction is treated as a gain or loss on foreign currency. Likewise, the gain or loss resulting from a change in currency exchange rates between the date income is accrued and the date it is paid is treated as a gain or loss on foreign currency. For fixed income instruments, the Funds bifurcate that portion of the results of operations arising from changes in foreign exchange rates on investments from the fluctuations arising from changes in the market prices of securities held and such fluctuations are included with the net realized and unrealized gain or loss on foreign currency transactions. For equity securities, the Funds do not isolate that portion of the results of operations arising from changes in foreign exchange rates on investments from the fluctuations arising from changes in the market prices of securities held and such fluctuations are included with the net realized and unrealized gain or loss on investments. | |
| G. | Convertible Securities |
| Certain Funds may invest a portion of their assets in convertible securities. Although convertible securities derive part of their value from that of the securities into which they are convertible, they are not considered derivative financial instruments. However, certain of the Funds’ investments in convertible securities include features which render them sensitive to price changes in their underlying securities. The value of structured/synthetic convertible securities can be affected by interest rate changes and credit risks of the issuer. Such securities may be structured in ways that limit their potential for capital appreciation, and the entire value of the security may be at risk of loss depending on the performance of the underlying equity security. Consequently, the Funds are exposed to greater downside risk than traditional convertible securities, but typically still less than that of the underlying stock. |
| H. | Payment-In-Kind Securities |
| Certain Funds may invest in payment-in-kind securities, which are debt or preferred stock securities that require or permit payment of interest in the form of additional securities. Payment-in-kind securities allow the issuer to avoid or delay the need to generate cash to meet current interest payments and, as a result, may involve greater risk than securities that pay interest currently or in cash. | |
| I. | Securities Traded on a To-Be-Announced Basis |
| Certain Funds may trade securities on a to-be-announced (“TBA”) basis. In a TBA transaction, a Fund commits to purchasing or selling securities which have not yet been issued by the issuer and for which specific information, such as the face amount, maturity date and underlying pool of investments in U.S. government agency mortgage pass-through securities, is not announced. Securities purchased on a TBA basis are not settled until they are delivered to the Fund. Beginning on the date a Fund enters into a TBA transaction, cash, U.S. government securities or other liquid high-grade debt obligations are segregated in an amount equal in value to the purchase price of the TBA security. These securities are subject to market fluctuations and their current value is determined in the same manner as for other securities. | |
| J. | When-Issued Purchases and Forward Commitments (Delayed Delivery) |
| Certain Funds may engage in when-issued or forward commitment transactions. Securities purchased on a when-issued or forward commitment basis are also known as delayed delivery transactions. Delayed delivery transactions involve a commitment by a Fund to purchase or sell a security at a future date (ordinarily up to 90 days later). When-issued or forward commitments enable the Funds to lock in what is believed to be an attractive price or yield on a particular security for a period of time, regardless of future changes in interest rates. Each Fund records when-issued and forward commitment securities on the trade date. Each Fund maintains collateral for the securities purchased. Securities purchased on a when-issued or forward commitment basis begin earning interest on the settlement date. | |
| K. | Leveraged Loans |
| Certain Funds may invest in direct debt instruments which are interests in amounts owed by a corporate, governmental, or other borrower to lenders or lending syndicates. Leveraged loans are generally non-investment grade and often involve borrowers that are highly leveraged. The Funds may invest in obligations of borrowers who are in bankruptcy proceedings. Leveraged loans are typically senior in the corporate capital structure of the borrower. A loan is often administered by a bank or other financial institution (the “lender”) that acts as agent for all holders. The agent administers the terms of the loan, as specified in the leveraged loan. A Fund’s investments in loans may be in the form of participations in loans or assignments of all or a portion of loans from third parties. When investing in loan participations, a Fund has the right to receive payments of principal, interest and any fees to which it is entitled only from the lender selling the loan participation and only upon receipt by the lender of payments from the borrower. A Fund generally has no right to enforce compliance with the terms of the leveraged loan with the borrower. As a result, a Fund may be subject to the credit risk of both the borrower and the lender that is selling the leveraged loan. When a Fund purchases assignments from lenders it acquires direct rights against the borrower on the loan. | |
| A Fund may invest in multiple series or tranches of a loan, which may have varying terms and carry different associated risks. Leveraged loans may involve foreign borrowers and investments may be denominated in foreign currencies. Direct indebtedness of emerging countries involves a risk that the government entities responsible for the repayment of the debt may be unable, or unwilling, to pay the principal and interest when due. | |
| The leveraged loans have floating rate loan interests which generally pay interest at rates that are periodically determined by reference to a base lending rate plus a premium. The base lending rates are generally LIBOR, SOFR, the prime rate offered by one or more U.S. banks or the certificate of deposit rate. When a leveraged loan is purchased a Fund may pay an assignment fee. On an ongoing basis, a Fund may receive a commitment fee based on the undrawn portion of the underlying line of credit portion of a leveraged loan. Prepayment penalty fees are received upon the prepayment of a leveraged loan by a borrower. Prepayment penalty, facility, commitment, consent and amendment fees are recorded to income as earned or paid. | |
| A Fund may invest in both secured loans and “covenant lite” loans which have few or no financial maintenance covenants that would require a borrower to maintain certain financial metrics. The lack of financial maintenance covenants in covenant lite loans increases the risk that the applicable Fund will experience difficulty or delays in enforcing its rights on its holdings of such loans, which may result in losses, especially during a downturn in the credit cycle. | |
| L. | Warrants |
| The Funds may receive warrants. Warrants are securities that are usually issued together with a debt instrument or preferred stock and that give the holder the right to buy a proportionate amount of common stock at a specified price. Warrants may be freely transferable and are often traded on major exchanges. Warrants normally have a life that is measured in years and entitle the holder to buy common stock of a company at a price that is usually higher than the market price at the time the warrant is issued. Warrants may entail greater risks than certain other types of investments. Generally, warrants do not carry the right to receive dividends or exercise voting rights with respect to the underlying securities, and they do not represent any rights in the assets of the issuer. In addition, their value does not necessarily change with the value of the underlying securities, and they cease to have value if they are not exercised on or before their expiration date. If the market price of the underlying stock does not exceed the exercise price during the life of the warrant, the warrant will expire worthless. Warrants may increase the potential profit or loss to be realized from the investment as compared with investing the same amount in the underlying securities. Similarly, the percentage increase or decrease in the value of an equity security warrant may be greater than the percentage increase or decrease in the value of the underlying common stock. Warrants may relate to the purchase of equity or debt instruments. Debt obligations with warrants attached to purchase equity securities have many characteristics of convertible securities and their prices may, to some degree, reflect the performance of the underlying stock. Debt obligations also may be issued with warrants attached to purchase additional debt instruments at the same coupon rate. A decline in interest rates would permit a Fund to sell such warrants at a profit. If interest rates rise, these warrants would generally expire with no value. |
| M. | Securities Lending |
| The Funds may loan securities to qualified brokers through a securities lending agency agreement with The Bank of New York Mellon (“BNYM”). Under the securities lending policy, when lending securities a Fund is required to maintain collateral with a market value not less than 100% of the market value of loaned securities. Collateral is adjusted daily in connection with changes in the market value of securities on loan bringing the collateral market value in line with the required percent. Due to timing of collateral adjustments, the market value of collateral held with respect to a loaned security, may be more or less than the value of the security on loan. | |
| Collateral may consist of cash and securities issued by the U.S. government or its agencies. Cash collateral is invested in a short-term money market fund. Dividends earned on the collateral and premiums paid by the broker are recorded as income by the Fund net of fees and rebates charged/paid by BNYM for its services as securities lending agent and in connection with this securities lending program. Lending portfolio securities involves a risk of delay in the recovery of the loaned securities or in the declining value of the collateral. | |
| Securities lending transactions are entered into by each Fund under a Master Securities Lending Agreement (“MSLA”) which permits the Fund, under certain circumstances including an event of default (such as bankruptcy or insolvency), to offset amounts payable by the Fund to the same counterparty against amounts to be received and create one single net payment due to or from the Fund. | |
| As of September 30, 2023, none of the Funds were lending under the agreement with BNYM. |
| A. | Futures Contracts |
| A futures contract is an agreement between two parties to purchase (long) or sell (short) a security at a set price for delivery on a future date. Upon entering into a futures contract, a Fund is required to pledge to the broker an amount of cash and/or securities equal to the “initial margin” requirements of the futures exchange on which the contract is traded. Pursuant to the contract, the Fund agrees to receive from or pay to the broker an amount of cash equal to the daily fluctuation in value of the contract. Such receipts or payments are known as variation margin and are recorded by a Fund for financial statement purposes on a daily basis as unrealized appreciation or depreciation. When the contract expires or is closed, gain or loss equal to the difference between the value of the contract at the time it was opened and the value at the time it was closed is realized. This is presented in the Statement of Operations as net realized gain (loss) from future contracts. | |
| During the year ended September 30, 2023, the Global Allocation Fund utilized futures to optimize performance by gaining exposure to broad markets or to hedge the risk of securities within the portfolios. The potential risks of doing so are that 1) the use of futures may result in larger losses or smaller gains than the use of more traditional investments, 2) the prices of futures and the price movements of the securities that the future is intended to simulate may not correlate well, 3) the Fund’s success in using futures will be dependent upon the subadviser’s ability to correctly predict such price movements, 4) liquidity of futures can be adversely affected by market factors, and the prices of such securities may move in unexpected ways, and 5) if the Fund cannot close out a futures position, it may be compelled to continue to make daily cash payments to the broker to meet margin requirements, thus increasing transaction costs. Futures contracts outstanding at period end, if any, are listed after each Fund’s Schedule of Investments. Securities deposited as margin are designated on the Schedule of Investments and cash deposited is recorded on the Statements of Assets and Liabilities as “Cash pledged as collateral for futures contracts”. | |
| B. | Forward Foreign Currency Exchange Contracts |
| A forward foreign currency exchange contract is an agreement between two parties to buy and sell a currency at a set exchange rate on a future date. Forward foreign currency exchange contracts, when used by a Fund, help to manage the overall exposure to the currencies in which some of the investments held by the Fund are denominated. The contract is marked to market daily and the change in market value is recorded by the Fund as an unrealized appreciation or depreciation. When the contract is closed, the Fund records a realized gain or loss equal to the difference between the value at the time it was opened and the value at the time it was closed. The use of forward foreign currency exchange contracts involves the risk that the value of the contract changes unfavorably due to movements in the value of the referenced foreign currencies. Non-deliverable forward foreign currency exchange contracts are settled with the counterparty in U.S. dollars without the delivery of foreign currency. | |
| During the year ended September 30, 2023, none of the Funds entered into forward foreign currency exchange contracts. | |
| C. | Swaps |
| Certain Funds enter into swap agreements, in which the Fund and a counterparty agree either to make periodic net payments on a specified notional amount or a net payment upon termination. Swap agreements are negotiated in the OTC market and may be entered into as a bilateral contract “Over-the-counter swaps at value” for OTC swaps and as “variation margin receivable/payable” for centrally cleared swaps. Swaps are marked-to-market daily and changes in value are recorded as “Net change in unrealized appreciation (depreciation) on swaps” in the Statements of Operations. | |
| Any upfront premiums paid are recorded as assets and any upfront fees received are recorded as liabilities and are shown under “Swaps at value” in the Statements of Assets and Liabilities and are amortized over the term of the swap for OTC swaps. When a swap is terminated, the Fund records a realized gain or loss equal to the difference between the proceeds from (or cost of) the closing transaction and the Fund’s basis in the contract, if any. Generally, the basis of the contracts is the unamortized premium received or paid. Cash settlements between the Fund and the |
| counterparty are recognized as “Net realized gain (loss) on swaps” in the Statements of Operations. Swap contracts outstanding at period end, if any, are listed after each Fund’s Schedule of Investments. | |
| In a centrally cleared swap, immediately following execution of the swap agreement, the swap agreement is submitted to a central counterparty (the “CCP”) and the Fund’s counterparty on the swap agreement becomes the CCP. The Fund is required to interface with the CCP through a clearing broker. Upon entering into a centrally cleared swap, a Fund is required to deposit initial margin with the clearing broker in the form of cash or securities in an amount that varies depending on the size and risk profile of the particular swap. | |
| Securities deposited as margin are designated on the Schedule of Investments and cash deposited is recorded on the Statements of Assets and Liabilities as “Cash pledged as collateral for cleared swaps”. | |
| Swap transactions involve, to varying degrees, elements of interest rate, credit and market risk in excess of the amounts recognized in the Statements of Assets and Liabilities. Such risks involve the possibility that there will be no liquid market for these agreements, that the counterparty to the agreements may default on its obligation to perform or disagree as to the meaning of the contractual terms in the agreements, and that there may be unfavorable changes in interest rates and/or market values associated with these transactions. | |
| Credit default swaps – A Fund may either buy or sell (write) credit default swaps on single-name issuers (corporate or sovereign), a combination or basket of single-name issuers or traded indexes. Credit default swaps on single-name issuers are agreements in which the buyer pays fixed periodic payments to the seller in consideration for a guarantee from the protection seller to make specific payment should a negative credit event take place with respect to the referenced entity (e.g., bankruptcy, failure to pay, obligation accelerators, repudiation, moratorium or restructuring). Credit default swaps on a combination or basket of single-name issuers are agreements in which the buyer pays fixed periodic payments to the seller in consideration for a guarantee from the protection seller to make specific payment should a negative credit event take place with respect to any of the referenced entities (e.g., bankruptcy, failure to pay, obligation accelerators, repudiation, moratorium or restructuring). Credit default swaps on traded indexes are agreements in which the buyer pays fixed periodic payments to the seller in consideration for a guarantee from the seller to make a specific payment should a write-down, principal or interest shortfall or default of all or individual underlying securities included in the index occurs. As a buyer, if an underlying credit event occurs, the Fund will either receive from the seller an amount equal to the notional amount of the swap and deliver the referenced security or underlying securities comprising the index or receive a net settlement of cash equal to the notional amount of the swap less the recovery value of the security or underlying securities comprising the index. As a seller (writer), if an underlying credit event occurs, the Fund will either pay the buyer an amount equal to the notional amount of the swap and take delivery of the referenced security or underlying securities comprising the index or pay a net settlement of cash equal to the notional amount of the swap less the recovery value of the security or underlying securities comprising the index. The Funds may enter into credit default swaps to manage their exposure to the market or certain sectors of the market, to reduce their risk exposure to defaults of corporate and/or sovereign issuers or to create exposure to corporate and/or sovereign issuers to which they are not otherwise exposed (credit risk). | |
| During the year ended September 30, 2023, the Global Allocation Fund utilized both single name credit default swaps and credit index swaps to gain exposure to short individual securities or to gain exposure to a credit or asset-backed index. | |
| The following is a summary of derivative instruments categorized by primary risk exposure, presented in the Statements of Assets and Liabilities at September 30, 2023: |
| Statement Line Description | Primary Risk | Global Allocation Fund | ||
| Asset Derivatives | ||||
| Variation margin payable on swap contracts(1) | Credit contracts | $ 31 | ||
| Variation margin payable on futures contracts(1) | Equity contracts | 184 | ||
| Variation margin payable on futures contracts(1) | Foreign currency contracts | 68 | ||
| Variation margin payable on futures contracts(1) | Interest rate contracts | 174 | ||
| Total Assets | $ 457 | |||
| Liability Derivatives | ||||
| Variation margin payable on futures contracts(1) | Equity contracts | $(1,836) | ||
| Variation margin payable on futures contracts(1) | Foreign currency contracts | (14) | ||
| Variation margin payable on futures contracts(1) | Interest rate contracts | (441) | ||
| Total Liabilities | $(2,291) | |||
| (1) | Represents cumulative appreciation (depreciation) on futures contracts and swap contracts as reported in the Schedule of Investments. Only current day’s variation margin is shown in the Statements of Assets and Liabilities for exchange traded swap contracts. |
| Statement Line Description | Primary Risk | Global Allocation Fund | ||
| Net Realized Gain (Loss) from | ||||
| Swaps | Credit contracts | $ 18 | ||
| Futures | Equity contracts | 6,828 | ||
| Futures | Foreign currency contracts | (1,235) | ||
| Futures | Interest rate contracts | (1,091) | ||
| Total | $ 4,520 | |||
| Net Change in Unrealized Appreciation (Depreciation) on | ||||
| Futures | Equity contracts | $ (656) | ||
| Swaps | Credit contracts | (131) | ||
| Futures | Foreign currency contracts | (67) | ||
| Futures | Interest rate contracts | 91 | ||
| Total | $ (763) | |||
| Global Allocation Fund | |
Futures Contracts - Long Positions(1) | $ (710) |
Futures Contracts - Short Positions(1) | 275 |
Credit Default Swap Contracts - Buy Protection(2) | (4,393) |
Credit Default Swap Contracts - Sell Protection(2) | 2,096 |
| (1) Average unrealized for the period. |
| (2) Notional amount. |
| D. | Derivative Risks |
| A derivative contract may suffer a mark-to-market loss if the value of the contract decreases due to an unfavorable change in the market rates or values of the underlying instrument. Losses can also occur if the counterparty does not perform under the contract. | |
| A Fund’s risk of loss from counterparty credit risk on derivatives bought or sold OTC, rather than traded on a securities exchange, is generally limited to the aggregate unrealized gain netted against any collateral held by such Fund. For OTC purchased options, each Fund bears the risk of loss of the amount of the premiums paid plus the positive change in market values net of any collateral held by such Fund should the counterparty fail to perform under the contracts. Options written by a Fund do not typically give rise to counterparty credit risk, as options written generally obligate the Fund, and not the counterparty to perform. | |
| With exchange traded purchased options and futures and centrally cleared swaps generally speaking, there is less counterparty credit risk to the Fund since the exchange or clearinghouse, as counterparty to such instruments, guarantees against a possible default. The clearinghouse stands between the buyer and the seller of the contract; therefore, credit risk is limited to failure of the clearinghouse. While offset rights may exist under applicable law, a Fund does not have a contractual right of offset against a clearing broker or clearinghouse in the event of a default (including the bankruptcy or insolvency) of the clearing broker or clearinghouse. Additionally, credit risk exists in exchange traded futures and centrally cleared swaps with respect to initial and variation margin that is held in a clearing broker’s customer accounts. While clearing brokers are required to segregate customer margin from their own assets, in the event that a clearing broker becomes insolvent or goes into bankruptcy and at that time there is a shortfall in the aggregate amount of margin held by the clearing broker for all its clients, typically the shortfall would be allocated on a pro-rata basis across all the clearing broker’s customers, potentially resulting in losses to the Fund. | |
| In order to better define its contractual rights and to secure rights that will help a Fund mitigate its counterparty risk, each Fund may enter into an International Swaps and Derivatives Association, Inc. Master Agreement (“ISDA Master Agreement”) or similar agreement with its derivative contract counterparties. An ISDA Master Agreement is a bilateral agreement between a Fund and a counterparty that governs certain OTC derivatives and typically contains, among other things, collateral posting terms and netting provisions in the event of a default and/or termination event. Under an ISDA Master Agreement, a Fund may, under certain circumstances, offset with the counterparty certain derivative financial instruments’ payables and/or receivables with collateral held and/or posted and create one single net payment. The provisions of the ISDA Master Agreement typically permit a single net payment in the event of default including the bankruptcy or insolvency of the counterparty. However, bankruptcy or insolvency laws of a particular jurisdiction may impose restrictions on or prohibitions against the right of offset in bankruptcy, insolvency or other events. In addition, certain ISDA Master Agreements allow counterparties to OTC derivatives to terminate derivative contracts |
| prior to maturity in the event a Fund’s net assets decline by a stated percentage or the Fund fails to meet the terms of its ISDA Master Agreements, which would cause the Fund to accelerate payment of any net liability owed to the counterparty. | |
| E. | Collateral Requirements and Master Netting Agreements (“MNA”) |
| For derivatives traded under an ISDA Master Agreement, the collateral requirements are typically calculated by netting the mark-to-market amount for each transaction under such agreement and comparing that amount to the value of any collateral currently pledged by the Funds and the counterparty. | |
| Cash collateral that has been pledged to cover obligations of a Fund and cash collateral received from the counterparty, if any, is reported separately on the Statements of Assets and Liabilities as cash pledged as collateral and cash received as collateral, respectively. Non-cash collateral pledged by a Fund, if any, is noted in the Schedules of Investments. Typically, the Funds and counterparties are not permitted to sell, re-pledge or use the collateral they receive. To the extent amounts due to a Fund from its counterparties are not fully collateralized, contractually or otherwise, the Fund bears the risk of loss from counterparty non-performance. The Funds attempt to mitigate counterparty risk by only entering into agreements with counterparties that they believe have the financial resources to honor their obligations and by monitoring the financial stability of those counterparties. | |
| For financial reporting purposes, the Funds do not offset derivative assets and derivative liabilities that are subject to netting arrangements in the Statements of Assets and Liabilities. | |
| The following table presents the Global Allocation Fund’s derivative assets and liabilities by counterparty net of amounts available for offset under a MNA and net of the related collateral received/pledged by the Fund as of September 30, 2023: |
| At September 30, 2023, the Funds’ derivative assets and liabilities (by type) are as follows: | |||||
| Global Allocation Fund | |||||
| Assets | Liabilities | ||||
| Derivative Financial Instruments: | |||||
| Futures contracts | $— | $ 54 | |||
| Centrally cleared swaps | — | 3 | |||
| Total derivative assets and liabilities in the Statements of Assets and Liabilities | $— | $ 57 | |||
| Derivatives not subject to a MNA or similar agreement | — | (57) | |||
| Total assets and liabilities subject to a MNA | $— | $ — | |||
| A. | Investment Adviser |
| Virtus Investment Advisers, Inc. (the “Adviser”), an indirect, wholly-owned subsidiary of Virtus Investment Partners, Inc. (“Virtus”), is the investment adviser to the Funds. The Adviser manages the Funds’ investment programs and general operations of the Funds, including oversight of the Funds’ subadvisers. | |
| As compensation for its services to the Funds, the Adviser is entitled to a fee, which is calculated daily and paid monthly based upon the following annual rates as a percentage of the average daily net assets of each Fund: |
| Fund | Advisory Fee | |
Convertible Fund | 0.57% | |
Duff & Phelps Water Fund | 0.95 | |
Global Allocation Fund | 0.70 | |
International Small-Cap Fund | 1.00 | |
Newfleet Short Duration High Income Fund | 0.48 | |
NFJ Emerging Markets Value Fund | 0.85 | |
NFJ Global Sustainability Fund | 0.80 | |
Seix High Yield Income Fund | 0.48 |
| B. | Subadvisers |
| The subadvisers manage the investments of each Fund for which they are paid a fee by the Adviser. A list of the subadvisers and the Funds they serve as of the end of the period is as follows: |
| Fund | Subadviser | |
Convertible Fund | Voya IM(1) | |
Duff & Phelps Water Fund | Duff & Phelps(2) | |
Global Allocation Fund | N/A | |
International Small-Cap Fund | N/A | |
Newfleet Short Duration High Income Fund | Newfleet (3) | |
NFJ Emerging Markets Value Fund | NFJ (4) | |
NFJ Global Sustainability Fund | NFJ (4) | |
Seix High Yield Income Fund | Seix (5) |
| (1) | Voya Investment Management Co. LLC (“Voya IM”). |
| (2) | Duff & Phelps Investment Management Co. (“Duff & Phelps”), an indirect, wholly-owned subsidiary of Virtus. |
| (3) | Newfleet Asset Management (“Newfleet”), a division of Virtus Fixed Income Advisers LLC (“VFIA”), an indirect, wholly-owned subsidiary of Virtus. |
| (4) | NFJ Investment Group, LLC (“NFJ”), an indirect, wholly-owned subsidiary of Virtus. |
| (5) | Seix Investment Advisors, LLC (“Seix”), a division of VFIA, an indirect, wholly-owned subsidiary of Virtus. |
| C. | Expense Limitations |
| The Adviser has contractually agreed to limit each Fund’s annual total operating expenses, subject to the exceptions listed below, so that such expenses do not exceed, on an annualized basis, the following respective percentages of average daily net assets through February 1, 2024. Following the contractual period, the Adviser may discontinue these expense limitation arrangements at any time. The waivers and reimbursements are accrued daily and received monthly. |
| Fund | Class A | Class C | Class P | Institutional Class | Class R6 | Administrative Class | ||||||
Convertible Fund | 0.96% | 1.73% | 0.71 % | 0.71 % | 0.62% | 0.93 % | ||||||
Duff & Phelps Water Fund | 1.22 | 1.97 | 0.94 | 0.93 | N/A | N/A | ||||||
Global Allocation Fund | 0.52 | 1.27 | 0.32 | 0.29 | 0.22 | 0.47 | ||||||
International Small-Cap Fund | 1.25 | 2.00 | 1.10 | 1.04 | 1.00 | N/A | ||||||
Newfleet Short Duration High Income Fund | 0.86 | 1.11 | 0.65 | 0.60 | 0.55 | N/A | ||||||
NFJ Emerging Markets Value Fund | 1.14 | 1.89 | 0.99 | 0.89 | N/A | N/A | ||||||
NFJ Global Sustainability Fund | 0.94 | N/A | 0.79 | 0.69 | N/A | N/A | ||||||
Seix High Yield Income Fund | 1.12 | 1.81 | 0.80 | 0.83 | N/A | 1.00 |
| D. | Expense Recapture |
| Under certain conditions, the Adviser may recapture operating expenses reimbursed or fees waived under these arrangements within three years after the date on which such amounts were incurred or waived. A Fund must pay its ordinary operating expenses before the Adviser is entitled to any reimbursement and must remain in compliance with any applicable expense limitations or, if none, the expense limitation in effect at the time of the waiver or reimbursement. All or a portion of the following Adviser reimbursed expenses may be recaptured by the year ending September 30: |
| Expiration | ||||||||
| Fund | 2024 | 2025 | 2026 | Total | ||||
| Convertible Fund | ||||||||
Class A | $ 302 | $ 436 | $ 311 | $ 1,049 | ||||
Class C | 72 | 101 | 88 | 261 | ||||
Class P | 844 | 704 | 418 | 1,966 | ||||
Institutional Class | 1,161 | 1,580 | 1,328 | 4,069 | ||||
Class R6 | — | — (1) | — (1) | — (1) | ||||
Administrative Class | 14 | 51 | 12 | 77 | ||||
| Expiration | ||||||||
| Fund | 2024 | 2025 | 2026 | Total | ||||
| Duff & Phelps Water Fund | ||||||||
Class A | $ 571 | $ 685 | $ 584 | $1,840 | ||||
Class C | 157 | 148 | 111 | 416 | ||||
Class P | 921 | 707 | 428 | 2,056 | ||||
Institutional Class | 756 | 985 | 774 | 2,515 | ||||
| Global Allocation Fund | ||||||||
Class A | 193 | 225 | 226 | 644 | ||||
Class C | 11 | 12 | 13 | 36 | ||||
Class P | 24 | 20 | 11 | 55 | ||||
Institutional Class | 29 | 42 | 34 | 105 | ||||
Class R6 | 840 | 948 | 1,051 | 2,839 | ||||
Administrative Class | — (1) | — (1) | 1 | 1 | ||||
| International Small-Cap Fund | ||||||||
Class A | 23 | 21 | 18 | 62 | ||||
Class C | 3 | 1 | 1 | 5 | ||||
Class P | 54 | 24 | 18 | 96 | ||||
Institutional Class | 178 | 98 | 94 | 370 | ||||
Class R6 | 148 | 103 | 84 | 335 | ||||
| Newfleet Short Duration High Income Fund | ||||||||
Class A | 105 | 158 | 156 | 419 | ||||
Class C | 80 | 88 | 87 | 255 | ||||
Class P | 230 | 199 | 206 | 635 | ||||
Institutional Class | 289 | 439 | 389 | 1,117 | ||||
Class R6 | 21 | 19 | 9 | 49 | ||||
| NFJ Emerging Markets Value Fund | ||||||||
Class A | 62 | 49 | 42 | 153 | ||||
Class C | 4 | 3 | 3 | 10 | ||||
Class P | 47 | 54 | 36 | 137 | ||||
Institutional Class | 491 | 328 | 194 | 1,013 | ||||
| NFJ Global Sustainability Fund | ||||||||
Class A | 18 | 24 | 26 | 68 | ||||
Class P | 70 | 14 | 10 | 94 | ||||
Institutional Class | 528 | 391 | 228 | 1,147 | ||||
| Seix High Yield Income Fund | ||||||||
Class A | 1 | 34 | 31 | 66 | ||||
Class C | 1 | 2 | 2 | 5 | ||||
Class P | 3 | 6 | 5 | 14 | ||||
Institutional | 1 | 49 | 41 | 91 | ||||
Administrative Class | 1 | — (1) | — (1) | 1 | ||||
| (1) | Amount is less than $500 (not in thousands). |
| Fund | Administrative Class | |
Global Allocation Fund | $— (1) | |
Seix High Yield Income Fund | — (1) |
| (1) | Amount is less than $500 (not in thousands). |
| E. | Distributor |
| VP Distributors, LLC (“VP Distributors”), an indirect, wholly-owned subsidiary of Virtus, serves as the distributor of each Fund’s shares. VP Distributors has advised the Funds that for the year ended September 30, 2023, it retained net commissions of $47 for Class A shares and CDSC of $9 and $12 for Class A shares and Class C shares, respectively. | |
| In addition, each Fund pays VP Distributors 12b-1 fees under a 12b-1 Plan as a percentage of the average daily net assets of each respective class at the annual rates of 0.25% for Class A shares, and 1.00% for Class C shares (0.50% for Newfleet Short Duration High Income Fund and 0.90% for Seix High Yield Income Bond Fund). Administrative Class shares pay a 0.25% Administrative Distribution fee. Class P shares, Institutional Class shares, Class R6 shares, and Administrative Class shares are not subject to a 12b-1 Plan. |
| Under certain circumstances, shares of certain Virtus Funds may be exchanged for shares of the same class of certain other Virtus Funds on the basis of the relative NAV per share at the time of the exchange. On exchanges with share classes that carry a CDSC, the CDSC schedule of the original shares purchased continues to apply. | |
| F. | Administrator and Transfer Agent |
| Virtus Fund Services, LLC, an indirect, wholly-owned subsidiary of Virtus, serves as the administrator and transfer agent to the Funds. | |
| For the year ended September 30, 2023, the Funds incurred administration fees totaling $3,033 which are included in the Statements of Operations within the line item “Administration and accounting fees.” The fees are calculated daily and paid monthly. | |
| For the year ended September 30, 2023, the Funds incurred transfer agent fees totaling $1,358 which are included in the Statements of Operations within the line item “Transfer agent fees and expenses.” The fees are calculated daily and paid monthly. | |
| G. | Payment from Affiliates |
| The Seix High Yield Income Fund was reimbursed $3 by the Adviser for losses incurred due to a valuation error during the year ended September 30, 2023. | |
| H. | Affiliated Shareholders |
| At September 30, 2023, Virtus and its affiliates held shares of the following Fund, which may be redeemed at any time, that aggregated to the following: |
| Shares | Aggregate Net Asset Value | ||
| NFJ Global Sustainability Fund | |||
Institutional Class | 2,595,928 | $39,951 |
| I. | Investments with Affiliates |
| The Funds are permitted to purchase assets from or sell assets to certain related affiliates under specified conditions outlined in procedures adopted by the Board. The procedures have been designed to ensure that any purchase or sale of assets by the Funds from or to another fund or portfolio that are, or could be, considered an affiliate by virtue of having a common investment adviser (or affiliated investment advisers), common Trustees and/or common officers comply with Rule 17a-7 under the 1940 Act. Further, as defined under the procedures, each transaction is effected at the current market price. During the year ended September 30, 2023, the Funds did not engage in any transactions pursuant to Rule 17a-7 under the 1940 Act. | |
| Outside of Rule 17a-7 transactions, other investments with affiliated issuers are separately reported in this note. An affiliated issuer includes any company in which the Fund held 5% or more of a company’s outstanding voting shares at any point during the period, as well as other circumstances where an investment adviser or subadviser to the Fund is deemed to exercise, directly or indirectly, a certain level of control over the company. | |
| A summary of the Global Allocation Fund’s total long-term and short-term purchases and sales of the respective shares of the affiliated investments(1) during the year ended September 30, 2023, is as follows: |
| Value, beginning of period | Purchases (2) | Sales proceeds | Net realized gain (loss) on affiliated securities | Net change in unrealized appreciation (depreciation) on affiliated securities | Value, end of period | Shares | Dividend income | Distributions of realized gains | |||||||||
| Global Allocation Fund | |||||||||||||||||
| Affiliated Mutual Funds—22.8% | |||||||||||||||||
Virtus Duff & Phelps Water Fund Institutional Shares(3) | $ — | $ 6,989 | $ 683 | $ 7 | $ (279) | $ 6,034 | 350,002 | $ 50 | $ — | ||||||||
Virtus NFJ Global Sustainability Fund Institutional Shares(3) | 69,100 | 10,082 | 41,192 | (8,167) | 10,053 | 39,876 | 2,591,042 | 564 | 9,519 | ||||||||
| $69,100 | $17,071 | $41,875 | $(8,160) | $ 9,774 | $45,910 | $614 | $9,519 | ||||||||||
| Value, beginning of period | Purchases (2) | Sales proceeds | Net realized gain (loss) on affiliated securities | Net change in unrealized appreciation (depreciation) on affiliated securities | Value, end of period | Shares | Dividend income | Distributions of realized gains | |||||||||
| Global Allocation Fund | |||||||||||||||||
| Affiliated Exchange-Traded Fund—2.1% | |||||||||||||||||
Virtus Duff & Phelps Clean Energy ETF(3) | $ — | $ 4,512 | $ — | $ — | $ (342) | $ 4,170 | 244,000 | $ — | $ — | ||||||||
| Total | $69,100 | $21,583 | $41,875 | $(8,160) | $ 9,432 | $50,080 | $614 | $9,519 | |||||||||
| Value, beginning of period | Purchases | Sales proceeds | Net realized gain (loss) on affiliated securities | Net change in unrealized appreciation (depreciation) on affiliated securities | Value, end of period | Shares | Dividend income | Distributions of realized gains | |||||||||
| Seix High Yield Income Fund | |||||||||||||||||
| Affiliated Exchange-Traded Fund—3.7% | |||||||||||||||||
Virtus Seix Senior Loan ETF(3) | $— | $1,175 | $— | $— | $(1) | $1,174 | 49,157 | $— | $— | ||||||||
| Total | $— | $1,175 | $— | $— | $(1) | $1,174 | $— | $— | |||||||||
| Footnote Legend: | |
| (1) | The Global Allocation Fund does not invest in the underlying funds for the purpose of exercising management or control; however, investments made by the Fund within each of its principal investment strategies may represent a significant portion of an underlying fund’s net assets. At September 30, 2023, the Fund was the owner of record of 74% of the NFJ Global Sustainability Fund Institutional Class, 61% of the Duff & Phelps Clean Energy ETF and less than 10% of Duff & Phelps Water Fund Institutional shares. |
| (2) | Includes reinvested dividends from income and capital gain distributions. |
| (3) | Shares of this fund are publicly offered, and its prospectus and annual report are publicly available. |
| (4) | The Seix High Yield Income Fund does not invest in the underlying funds for the purpose of exercising management or control; however, investments made by the Fund within each of its principal investment strategies may represent a significant portion of an underlying fund’s net assets. At September 30, 2023, the Fund was the owner of record of less than 10% of the affiliated underlying fund. |
| J. | Trustee Deferred Compensation Plan |
| The Trust provides a deferred compensation plan for its Trustees who receive compensation from the Trust. Under the deferred compensation plan, Trustees may elect to defer all or a portion of their compensation. Amounts deferred are retained by the Trust, and then, to the extent permitted by the 1940 Act, in turn, may be invested in the shares of affiliated or unaffiliated mutual funds selected by the participating Trustees. Investments in such instruments are included in “Other assets” in the Statements of Assets and Liabilities at September 30, 2023. | |
| In calendar year 2018 and certain other periods prior to January 1, 2020, the Funds maintained a different deferred compensation plan pursuant to which each Trustee who was not affiliated with AllianzGI U.S. had the opportunity to elect not to receive all or a portion of his or her fees from the respective Fund on a current basis, but instead to receive in a subsequent period chosen by the Trustee an amount equal to the value of such compensation if such compensation had been invested in one or more series of Virtus Investment Trust (then known as Allianz Funds) and Virtus Strategy Trust (then known as Allianz Funds Multi-Strategy Trust) selected by such Trustee from and after the normal payment dates for such compensation. The deferred compensation program was closed to new deferrals effective January 1, 2020, and all Trustee fees earned with respect to service in calendar year 2020 were paid in cash, on a current basis. The Trustees do not currently receive any pension or retirement benefits from the Funds. | |
| In addition to the Trustee fees deferred in the current period, the Funds still have obligations with respect to Trustee fees deferred in 2018 and in other periods prior to January 1, 2020, and will continue to have such obligations until all deferred Trustee fees are paid out pursuant to the terms of the applicable deferred compensation plan. |
| Purchases | Sales | ||
Convertible Fund | $2,008,272 | $2,218,006 | |
Duff & Phelps Water Fund | 123,452 | 238,108 | |
Global Allocation Fund | 101,956 | 114,163 | |
International Small-Cap Fund | 30,690 | 47,850 | |
Newfleet Short Duration High Income Fund | 233,976 | 222,106 | |
NFJ Emerging Markets Value Fund | 47,737 | 75,157 | |
NFJ Global Sustainability Fund | 69,414 | 109,471 | |
Seix High Yield Income Fund | 26,120 | 28,863 |
| Purchases | Sales | ||
Global Allocation Fund | $ 3,722 | $8,198 | |
Newfleet Short Duration High Income Fund | 10,942 | 4,905 |
| Convertible Fund | Duff & Phelps Water Fund | ||||||||||||||
| Year Ended September 30, 2023 | Year Ended September 30, 2022 | Year Ended September 30, 2023 | Year Ended September 30, 2022 | ||||||||||||
| SHARES | AMOUNT | SHARES | AMOUNT | SHARES | AMOUNT | SHARES | AMOUNT | ||||||||
| Class A | |||||||||||||||
| Shares sold | 1,003 | $ 31,453 | 2,508 | $ 94,383 | 790 | $ 14,612 | 2,518 | $ 51,372 | |||||||
| Reinvestment of distributions | 117 | 3,647 | 1,675 | 62,135 | 44 | 786 | 844 | 18,705 | |||||||
| Shares repurchased | (2,597) | (81,761) | (5,033) | (178,926) | (2,462) | (45,405) | (3,049) | (58,542) | |||||||
| Net Increase / (Decrease) | (1,477) | $ (46,661) | (850) | $ (22,408) | (1,628) | $ (30,007) | 313 | $ 11,535 | |||||||
| Class C | |||||||||||||||
| Shares sold | 361 | $ 11,476 | 497 | $ 18,503 | 97 | $ 1,682 | 383 | $ 7,729 | |||||||
| Reinvestment of distributions | 22 | 684 | 491 | 18,549 | — | — | 228 | 4,782 | |||||||
| Shares repurchased | (762) | (24,294) | (1,170) | (42,300) | (678) | (11,580) | (1,081) | (19,559) | |||||||
| Net Increase / (Decrease) | (379) | $ (12,134) | (182) | $ (5,248) | (581) | $ (9,898) | (470) | $ (7,048) | |||||||
| Class P | |||||||||||||||
| Shares sold | 4,047 | $ 122,063 | 6,451 | $ 233,386 | 707 | $ 13,008 | 2,554 | $ 53,134 | |||||||
| Reinvestment of distributions | 203 | 6,057 | 3,020 | 107,525 | 17 | 305 | 728 | 16,200 | |||||||
| Shares repurchased | (5,192) | (157,045) | (15,769) | (565,277) | (3,100) | (56,423) | (8,710) | (171,279) | |||||||
| Net Increase / (Decrease) | (942) | $ (28,925) | (6,298) | $ (224,366) | (2,376) | $ (43,110) | (5,428) | $ (101,945) | |||||||
| Institutional Class | |||||||||||||||
| Shares sold | 6,215 | $ 191,619 | 15,085 | $ 563,211 | 1,802 | $ 32,417 | 7,140 | $ 148,120 | |||||||
| Reinvestment of distributions | 590 | 17,877 | 8,448 | 305,429 | 109 | 1,923 | 1,441 | 31,231 | |||||||
| Shares repurchased | (10,369) | (318,081) | (28,613) | (971,187) | (4,190) | (74,751) | (8,224) | (150,115) | |||||||
| Net Increase / (Decrease) | (3,564) | $ (108,585) | (5,080) | $ (102,547) | (2,279) | $ (40,411) | 357 | $ 29,236 | |||||||
| Convertible Fund | Duff & Phelps Water Fund | ||||||||||||||
| Year Ended September 30, 2023 | Year Ended September 30, 2022 | Year Ended September 30, 2023 | Year Ended September 30, 2022 | ||||||||||||
| SHARES | AMOUNT | SHARES | AMOUNT | SHARES | AMOUNT | SHARES | AMOUNT | ||||||||
| Class R6(3) | |||||||||||||||
| Shares sold | 5 | $ 143 | 3 | $ 100 | — | $ — | — | $ — | |||||||
| Reinvestment of distributions | — (1) | 2 | — | — | — | — | — | — | |||||||
| Shares repurchased | (—) (1) | (5) | — | — | — | — | — | — | |||||||
| Net Increase / (Decrease) | 5 | $ 140 | 3 | $ 100 | — | $ — | — | $ — | |||||||
| Administrative Class | |||||||||||||||
| Shares sold | 26 | $ 805 | 151 | $ 5,789 | — | $ — | — | $ — | |||||||
| Reinvestment of distributions | 3 | 100 | 128 | 4,687 | — | — | — | — | |||||||
| Shares repurchased | (373) | (11,385) | (323) | (11,083) | — | — | — | — | |||||||
| Net Increase / (Decrease) | (344) | $ (10,480) | (44) | $ (607) | — | $ — | — | $ — | |||||||
| Global Allocation Fund | International Small-Cap Fund | ||||||||||||||
| Year Ended September 30, 2023 | Year Ended September 30, 2022 | Year Ended September 30, 2023 | Year Ended September 30, 2022 | ||||||||||||
| SHARES | AMOUNT | SHARES | AMOUNT | SHARES | AMOUNT | SHARES | AMOUNT | ||||||||
| Class A | |||||||||||||||
| Shares sold | 235 | $ 2,276 | 313 | $ 3,524 | 11 | $ 282 | 33 | $ 1,026 | |||||||
| Reinvestment of distributions | 175 | 1,612 | 313 | 3,554 | 1 | 34 | 23 | 782 | |||||||
| Shares repurchased | (720) | (6,935) | (786) | (8,532) | (24) �� | (620) | (47) | (1,439) | |||||||
| Net Increase / (Decrease) | (310) | $ (3,047) | (160) | $ (1,454) | (12) | $ (304) | 9 | $ 369 | |||||||
| Class C | |||||||||||||||
| Shares sold | 36 | $ 358 | 88 | $ 960 | — (1) | $ 7 | — (1) | $ —(2) | |||||||
| Reinvestment of distributions | 9 | 89 | 15 | 185 | — | — | 2 | 53 | |||||||
| Shares repurchased | (80) | (808) | (82) | (925) | (2) | (50) | (4) | (96) | |||||||
| Net Increase / (Decrease) | (35) | $ (361) | 21 | $ 220 | (2) | $ (43) | (2) | $ (43) | |||||||
| Class P | |||||||||||||||
| Shares sold | 36 | $ 347 | 110 | $ 1,223 | 3 | $ 77 | 3 | $ 85 | |||||||
| Reinvestment of distributions | 7 | 62 | 14 | 156 | 2 | 60 | 48 | 1,649 | |||||||
| Shares repurchased | (128) | (1,207) | (423) | (4,534) | (80) | (2,116) | (93) | (3,038) | |||||||
| Net Increase / (Decrease) | (85) | $ (798) | (299) | $ (3,155) | (75) | $ (1,979) | (42) | $ (1,304) | |||||||
| Institutional Class | |||||||||||||||
| Shares sold | 44 | $ 418 | 155 | $ 1,873 | 108 | $ 3,045 | 98 | $ 2,984 | |||||||
| Reinvestment of distributions | 31 | 287 | 89 | 1,000 | 9 | 226 | 130 | 4,644 | |||||||
| Shares repurchased | (184) | (1,747) | (474) | (5,219) | (340) | (9,791) | (175) | (5,859) | |||||||
| Net Increase / (Decrease) | (109) | $ (1,042) | (230) | $ (2,346) | (223) | $ (6,520) | 53 | $ 1,769 | |||||||
| Class R6 | |||||||||||||||
| Shares sold | 3,166 | $ 29,505 | 3,528 | $ 35,328 | 92 | $ 2,446 | 248 | $ 7,772 | |||||||
| Reinvestment of distributions | 1,077 | 9,542 | 1,852 | 20,157 | 9 | 226 | 146 | 5,137 | |||||||
| Shares repurchased | (7,039) | (65,701) | (3,896) | (40,512) | (483) | (13,563) | (328) | (9,393) | |||||||
| Net Increase / (Decrease) | (2,796) | $ (26,654) | 1,484 | $ 14,973 | (382) | $ (10,891) | 66 | $ 3,516 | |||||||
| Administrative Class | |||||||||||||||
| Shares sold | — (1) | $ —(2) | 11 | $ 115 | — | $ — | — | $ — | |||||||
| Reinvestment of distributions | — (1) | 1 | — (1) | 4 | — | — | — | — | |||||||
| Shares repurchased | (1) | (15) | (3) | (27) | — | — | — | — | |||||||
| Net Increase / (Decrease) | (1) | $ (14) | 8 | $ 92 | — | $ — | — | $ — | |||||||
| Newfleet Short Duration High Income Fund | NFJ Emerging Markets Value Fund | ||||||||||||||
| Year Ended September 30, 2023 | Year Ended September 30, 2022 | Year Ended September 30, 2023 | Year Ended September 30, 2022 | ||||||||||||
| SHARES | AMOUNT | SHARES | AMOUNT | SHARES | AMOUNT | SHARES | AMOUNT | ||||||||
| Class A | |||||||||||||||
| Shares sold | 1,920 | $ 25,376 | 2,122 | $ 29,513 | 379 | $ 6,076 | 331 | $ 5,977 | |||||||
| Reinvestment of distributions | 442 | 5,832 | 448 | 6,226 | 12 | 172 | 1 | 23 | |||||||
| Shares repurchased | (3,004) | (39,673) | (3,652) | (50,645) | (579) | (9,057) | (494) | (8,818) | |||||||
| Net Increase / (Decrease) | (642) | $ (8,465) | (1,082) | $ (14,906) | (188) | $ (2,809) | (162) | $ (2,818) | |||||||
| Class C | |||||||||||||||
| Shares sold | 620 | $ 8,220 | 779 | $ 10,845 | 1 | $ 20 | 4 | $ 61 | |||||||
| Reinvestment of distributions | 220 | 2,909 | 232 | 3,240 | 1 | 9 | — | — | |||||||
| Shares repurchased | (1,696) | (22,489) | (1,751) | (24,460) | (8) | (116) | (14) | (237) | |||||||
| Net Increase / (Decrease) | (856) | $ (11,360) | (740) | $ (10,375) | (6) | $ (87) | (10) | $ (176) | |||||||
| Class P | |||||||||||||||
| Shares sold | 6,738 | $ 88,835 | 10,262 | $ 147,298 | 745 | $ 12,116 | 453 | $ 7,829 | |||||||
| Reinvestment of distributions | 565 | 7,411 | 695 | 9,706 | 5 | 81 | 2 | 39 | |||||||
| Shares repurchased | (6,087) | (80,109) | (16,992) | (238,283) | (1,409) | (19,782) | (139) | (2,444) | |||||||
| Net Increase / (Decrease) | 1,216 | $ 16,137 | (6,035) | $ (81,279) | (659) | $ (7,585) | 316 | $ 5,424 | |||||||
| Institutional Class | |||||||||||||||
| Shares sold | 6,569 | $ 86,486 | 13,772 | $ 192,971 | 452 | $ 7,230 | 440 | $ 7,713 | |||||||
| Reinvestment of distributions | 1,083 | 14,164 | 1,208 | 16,648 | 67 | 1,003 | 20 | 372 | |||||||
| Shares repurchased | (7,852) | (102,636) | (14,158) | (192,335) | (1,865) | (28,263) | (3,265) | (54,593) | |||||||
| Net Increase / (Decrease) | (200) | $ (1,986) | 822 | $ 17,284 | (1,346) | $ (20,030) | (2,805) | $ (46,508) | |||||||
| Class R6 | |||||||||||||||
| Shares sold | 683 | $ 9,071 | 888 | $ 12,291 | — | $ — | — | $ — | |||||||
| Reinvestment of distributions | 32 | 416 | 75 | 1,036 | — | — | — | — | |||||||
| Shares repurchased | (562) | (7,262) | (1,597) | (21,751) | — | — | — | — | |||||||
| Net Increase / (Decrease) | 153 | $ 2,225 | (634) | $ (8,424) | — | $ — | — | $ — | |||||||
| NFJ Global Sustainability Fund | Seix High Yield Income Fund | ||||||||||||||
| Year Ended September 30, 2023 | Year Ended September 30, 2022 | Year Ended September 30, 2023 | Year Ended September 30, 2022 | ||||||||||||
| SHARES | AMOUNT | SHARES | AMOUNT | SHARES | AMOUNT | SHARES | AMOUNT | ||||||||
| Class A | |||||||||||||||
| Shares sold | 349 | $ 5,392 | 53 | $ 1,208 | 252 | $ 1,930 | 371 | $ 3,250 | |||||||
| Reinvestment of distributions | 65 | 888 | 54 | 1,195 | 87 | 670 | 96 | 792 | |||||||
| Shares repurchased | (105) | (1,570) | (90) | (1,778) | (520) | (4,000) | (965) | (8,207) | |||||||
| Net Increase / (Decrease) | 309 | $ 4,710 | 17 | $ 625 | (181) | $ (1,400) | (498) | $ (4,165) | |||||||
| Class C | |||||||||||||||
| Shares sold | — | $ — | — | $ — | 3 | $ 23 | 6 | $ 46 | |||||||
| Reinvestment of distributions | — | — | — | — | 5 | 40 | 8 | 66 | |||||||
| Shares repurchased | — | — | — | — | (89) | (681) | (98) | (833) | |||||||
| Net Increase / (Decrease) | — | $ — | — | $ — | (81) | $ (618) | (84) | $ (721) | |||||||
| Class P | |||||||||||||||
| Shares sold | 16 | $ 254 | 52 | $ 1,227 | 408 | $ 3,055 | 36 | $ 287 | |||||||
| Reinvestment of distributions | 42 | 581 | 48 | 1,076 | 18 | 129 | 23 | 182 | |||||||
| Shares repurchased | (86) | (1,341) | (135) | (2,868) | (167) | (1,241) | (320) | (2,431) | |||||||
| Net Increase / (Decrease) | (28) | $ (506) | (35) | $ (565) | 259 | $ 1,943 | (261) | $ (1,962) | |||||||
| NFJ Global Sustainability Fund | Seix High Yield Income Fund | ||||||||||||||
| Year Ended September 30, 2023 | Year Ended September 30, 2022 | Year Ended September 30, 2023 | Year Ended September 30, 2022 | ||||||||||||
| SHARES | AMOUNT | SHARES | AMOUNT | SHARES | AMOUNT | SHARES | AMOUNT | ||||||||
| Institutional Class | |||||||||||||||
| Shares sold | 80 | $ 1,245 | 202 | $ 4,419 | 1,415 | $ 10,580 | 814 | $ 6,510 | |||||||
| Reinvestment of distributions | 740 | 10,584 | 990 | 22,702 | 137 | 999 | 212 | 1,679 | |||||||
| Shares repurchased | (2,674) | (45,008) | (876) | (17,322) | (1,969) | (14,365) | (3,551) | (27,810) | |||||||
| Net Increase / (Decrease) | (1,854) | $ (33,179) | 316 | $ 9,799 | (417) | $ (2,786) | (2,525) | $ (19,621) | |||||||
| Administrative Class | |||||||||||||||
| Shares sold | — | $ — | — | $ — | — (1) | $ 1 | 15 | $ 106 | |||||||
| Reinvestment of distributions | — | — | — | — | — (1) | 2 | — (1) | 3 | |||||||
| Shares repurchased | — | — | — | — | (—) (1) | (2) | (11) | (89) | |||||||
| Net Increase / (Decrease) | — | $ — | — | $ — | — (1) | $ 1 | 4 | $ 20 | |||||||
| (1) | Amount is less than 500 shares (not in thousands). |
| (2) | Amount is less than $500 (not in thousands). |
| (3) | Inception date January 31, 2022. |
| % of Shares Outstanding | Number of Accounts | ||
Convertible Fund | 28 % | 2 | |
Duff & Phelps Water Fund | 22 | 2 | |
Global Allocation Fund | 32 | 1 | |
International Small-Cap Fund | 71 | 2 | |
Newfleet Short Duration High Income Fund | 23 | 2 | |
NFJ Emerging Markets Value Fund | 66 | 1 | |
NFJ Global Sustainability Fund | 84 | 2 * | |
Seix High Yield Income Fund | 43 | 2 |
| * | Includes affiliated shareholder account(s). |
| Fund | Sector | Percentage of Total Investments | ||
Duff & Phelps Water Fund | Water Utilities | 29% |
| Fund | Investment | Date of Acquisition | Cost | Value | Percentage of Net Assets | |||||
Newfleet Short Duration High Income Fund | Cloud Peak Energy, Inc. | 8/14/2020 | $ — | $ — | 0.0% | |||||
Seix High Yield Income Fund | LiveStyle, Inc. | 12/01/2016 | — | — | 0.0 | |||||
| LiveStyle, Inc. Series B | 9/28/2016 | 907 | 772 | 2.4 | ||||||
| Tenerity, Inc. | 11/04/2015 | 770 | — | 0.0 |
| Fund | Interest Incurred on Borrowing | Average Borrowing | Weighted Average Interest Rate | Days Outstanding | ||||
Convertible Fund | $1 | $24,700 | 1.34% | 1 | ||||
International Small-Cap Fund | 8 | 44,500 | 6.25 | 10 | ||||
Newfleet Short Duration High Income Fund | 8 | 6,300 | 4.56 | 10 | ||||
NFJ Emerging Markets Value Fund | 3 | 8,333 | 4.96 | 3 |
| Fund | Federal Tax Cost | Unrealized Appreciation | Unrealized (Depreciation) | Net Unrealized Appreciation (Depreciation) | ||||
Convertible Fund | $ 1,422,991 | $ 61,792 | $ (61,320) | $ 472 | ||||
Duff & Phelps Water Fund | 445,652 | 166,934 | (29,205) | 137,729 | ||||
Global Allocation Fund | 203,408 | 3,002 | (19,729) | (16,727) | ||||
International Small-Cap Fund | 29,084 | 5,384 | (2,068) | 3,316 | ||||
Newfleet Short Duration High Income Fund | 597,159 | 880 | (36,321) | (35,441) | ||||
NFJ Emerging Markets Value Fund | 47,952 | 2,949 | (8,169) | (5,220) | ||||
NFJ Global Sustainability Fund | 56,747 | 3,266 | (7,217) | (3,951) | ||||
Seix High Yield Income Fund | 36,171 | 558 | (5,994) | (5,436) |
| Fund | Short-Term | Long-Term | ||
Convertible Fund | $95,859 | $ — | ||
Global Allocation Fund | 2,898 | — | ||
International Small-Cap Fund | 2,924 | — | ||
Newfleet Short Duration High Income Fund | 47,014 | 129,488 | ||
NFJ Emerging Markets Value Fund | 6,738 | 4,033 | ||
Seix High Yield Income Fund | 6,699 | 34,105 |
| Fund | Undistributed Ordinary Income | Undistributed Long-Term Capital Gains | Post-October Capital Loss Deferred | Capital Loss Deferred | ||||
Convertible Fund | $10,808 | $ — | $ 48,309 | $ 95,859 | ||||
Duff & Phelps Water Fund | 3,695 | 13,170 | — | — | ||||
Global Allocation Fund | 4,536 | — | — | 2,898 | ||||
International Small-Cap Fund | 1,519 | — | — | 2,924 | ||||
Newfleet Short Duration High Income Fund | 2,445 | — | 15,974 | 176,502 | ||||
NFJ Emerging Markets Value Fund | 391 | — | 5,000 | 10,771 | ||||
NFJ Global Sustainability Fund | 514 | 8,771 | — | — | ||||
Seix High Yield Income Fund | 55 | — | 1,136 | 40,804 |
| Ordinary Income | Long-Term Capital Gains | Total | |||
Convertible Fund | |||||
9/30/23 | $ 30,030 | $ — | $ 30,030 | ||
9/30/22 | 288,132 | 234,168 | 522,300 | ||
Duff & Phelps Water Fund | |||||
9/30/23 | 3,340 | — | 3,340 | ||
9/30/22 | 16,939 | 66,006 | 82,945 | ||
Global Allocation Fund | |||||
9/30/23 | 271 | 11,654 | 11,925 | ||
9/30/22 | 14,725 | 11,365 | 26,090 | ||
International Small-Cap Fund | |||||
9/30/23 | 580 | — | 580 | ||
9/30/22 | 2,257 | 10,138 | 12,395 | ||
Newfleet Short Duration High Income Fund | |||||
9/30/23 | 34,778 | — | 34,778 | ||
9/30/22 | 41,100 | — | 41,100 | ||
NFJ Emerging Markets Value Fund | |||||
9/30/23 | 1,265 | — | 1,265 | ||
9/30/22 | 435 | — | 435 | ||
NFJ Global Sustainability Fund | |||||
9/30/23 | 700 | 11,617 | 12,317 | ||
9/30/22 | 4,995 | 20,235 | 25,230 | ||
Seix High Yield Income Fund | |||||
9/30/23 | 1,888 | — | 1,888 | ||
9/30/22 | 2,774 | — | 2,774 |

Philadelphia, Pennsylvania
November 27, 2023
| Fund | Qualified Dividend Income % (non-corporate shareholder) | Dividend Received Deduction % (corporate shareholders) | Long-Term Capital Gain Distributions ($) | |||
Convertible Fund | 20.94 % | 19.56 % | $ — | |||
Duff & Phelps Water Fund | 100.00 | 100.00 | 13,170 | |||
Global Allocation Fund | 33.45 | 17.10 | — | |||
International Small-Cap Fund | 100.00 | 0.92 | — | |||
Newfleet Short Duration High Income Fund | — | — | — | |||
NFJ Emerging Markets Value Fund | 56.76 | 0.66 | — | |||
NFJ Global Sustainability Fund | 100.00 | 42.89 | 9,716 | |||
Seix High Yield Income Fund | — | — | — |
| Foreign Source Income Recognized | Foreign Taxes Paid on Foreign Source Income | ||
International Small-Cap Fund | $ 2,502 | $ 320 | |
NFJ Emerging Markets Value Fund | 1,245 | 172 | |
NFJ Global Sustainability Fund | 706 | 95 |
| Name, Year of Birth, Length of Time Served and Number of Portfolios in Fund Complex Overseen by Trustee | Principal Occupation(s) During Past 5 Years | Other Directorships Held by Trustee During Past 5 Years |
| Burke, Donald C. YOB: 1960 Served Since: 2021 107 Portfolios | Private investor (since 2009). Formerly, President and Chief Executive Officer, BlackRock U.S. Funds (2007 to 2009); Managing Director, BlackRock, Inc. (2006 to 2009); and Managing Director, Merrill Lynch Investment Managers (1990 to 2006). | Trustee (since May 2023) and Advisory Board Member (May 2023), Virtus Artificial Intelligence & Technology Opportunities Fund, Virtus Dividend, Interest & Premium Strategy Fund and Virtus Equity & Convertible Income Fund; Advisory Board Member (since May 2023), Virtus Convertible & Income 2024 Target Term Fund, Virtus Convertible & Income Fund, Virtus Convertible & Income Fund II and Virtus Diversified Income & Convertible Fund; Trustee (since 2022), Virtus Stone Harbor Emerging Markets Income Fund and Virtus Stone Harbor Emerging Markets Total Income Fund; Trustee (since 2021), The Merger Fund®, The Merger Fund® VL, Virtus Event Opportunities Trust (2 portfolios), Virtus Investment Trust (13 portfolios) and Virtus Strategy Trust (8 portfolios); Director (2020 to 2021), Duff & Phelps Select MLP and Midstream Energy Fund Inc.; Director (since 2020), Virtus Total Return Fund Inc.; Trustee (since 2020), Virtus Global Multi-Sector Income Fund; Trustee (since 2016), Virtus Mutual Fund Family (56 portfolios), Virtus Variable Insurance Trust (8 portfolios) and Virtus Alternative Solutions Trust (4 portfolios); Director (since 2014), closed-end funds managed by Duff & Phelps Investment Management Co. (3 funds); Director, Avista Corp. (energy company) (since 2011); Trustee, Goldman Sachs Fund Complex (2010 to 2014); and Director, BlackRock Luxembourg and Cayman Funds (2006 to 2010). |
| Cogan, Sarah E. YOB: 1956 Served Since: 2019 104 Portfolios | Retired Partner, Simpson Thacher & Bartlett LLP (“STB”) (law firm) (since 2019); Director, Girl Scouts of Greater New York (since 2016); Trustee, Natural Resources Defense Council, Inc. (since 2013); and formerly, Partner, STB (1989 to 2018). | Trustee (since 2022) and Advisory Board Member (2021 to 2022), Virtus Alternative Solutions Trust (4 portfolios), Virtus Mutual Fund Family (56 portfolios) and Virtus Variable Insurance Trust (8 portfolios); Trustee (since 2022), Virtus Stone Harbor Emerging Markets Income Fund and Virtus Stone Harbor Emerging Markets Total Income Fund; Trustee (since 2022), PIMCO Access Income Fund and PIMCO California Flexible Municipal Income Fund; Trustee (since 2021), PIMCO Flexible Emerging Markets Income Fund; Trustee (since 2021), The Merger Fund®, The Merger Fund®VL, Virtus Event Opportunities Trust (2 portfolios), and Virtus Global Multi-Sector Income Fund; Advisory Board Member (February 2021 to June 2021), Duff & Phelps Select MLP and Midstream Energy Fund Inc.; Director (since 2021), Virtus Total Return Fund Inc.; Trustee (since 2019), Virtus Investment Trust (13 portfolios) and Virtus Strategy Trust (8 portfolios); Trustee (since 2019), Virtus Artificial Intelligence & Technology Opportunities Fund, Virtus Convertible & Income 2024 Target Term Fund, Virtus Convertible & Income Fund, Virtus Convertible & Income Fund II, Virtus Diversified Income & Convertible Fund, Virtus Equity & Convertible Income Fund, and Virtus Dividend, Interest & Premium Strategy Fund; Trustee (since 2019), PIMCO California Municipal Income Fund, PIMCO California Municipal Income Fund II, PIMCO California Municipal Income Fund III, PIMCO Municipal Income Fund, PIMCO Municipal Income Fund II, PIMCO Municipal Income Fund III, PIMCO New York Municipal Income Fund, PIMCO New York Municipal Income Fund II, PIMCO New York Municipal Income Fund III, PIMCO Energy and Tactical Credit Opportunities Fund, PCM Fund, Inc, PIMCO Corporate & Income Strategy Fund, PIMCO Corporate & Income Opportunity Fund, PIMCO Dynamic Income Fund, PIMCO Global StocksPLUS®& Income Fund, PIMCO High Income Fund, PIMCO Income Strategy Fund, PIMCO Income Strategy Fund II, PIMCO Strategic Income Fund, Inc., PIMCO Flexible Credit Income Fund and PIMCO Flexible Municipal Income Fund; Trustee (since 2019), PIMCO Managed Accounts Trust (5 portfolios); and Trustee (2019 to 2021), PIMCO Dynamic Credit and Mortgage Income Fund and PIMCO Income Opportunity Fund. |
| Name, Year of Birth, Length of Time Served and Number of Portfolios in Fund Complex Overseen by Trustee | Principal Occupation(s) During Past 5 Years | Other Directorships Held by Trustee During Past 5 Years |
| DeCotis, Deborah A. YOB: 1952 Served Since: 2011 104 Portfolios | Director, Cadre Holdings Inc. (since 2022); Advisory Director, Morgan Stanley & Co., Inc. (since 1996); Member, Circle Financial Group (since 2009); Member, Council on Foreign Relations (since 2013); and Trustee, Smith College (since 2017). Formerly, Director, Watford Re (2017 to 2021); Co-Chair Special Projects Committee, Memorial Sloan Kettering (2005 to 2015); and Trustee, Stanford University (2010 to 2015). | Trustee (since 2022) and Advisory Board Member (2021 to 2022), Virtus Alternative Solutions Trust (4 portfolios), Virtus Mutual Fund Family (56 portfolios) and Virtus Variable Insurance Trust (8 portfolios); Trustee (since 2022), Virtus Stone Harbor Emerging Markets Income Fund and Virtus Stone Harbor Emerging Markets Total Income Fund; Trustee (since 2022), PIMCO Access Income Fund and PIMCO California Flexible Municipal Income Fund; Trustee (since 2021), PIMCO Flexible Emerging Markets Income Fund; Trustee (since 2021), The Merger Fund®, The Merger Fund® VL, Virtus Event Opportunities Trust (2 portfolios), and Virtus Global Multi-Sector Income Fund; Advisory Board Member (February 2021 to June 2021), Duff & Phelps Select MLP and Midstream Energy Fund Inc.; Director (since 2021), Virtus Total Return Fund Inc.; Trustee (since 2020), PIMCO Dynamic Income Opportunities Fund; Trustee (since 2019), PIMCO Energy and Tactical Credit Opportunities Fund and Virtus Artificial Intelligence & Technology Opportunities Fund; Trustee (since 2018), PIMCO Flexible Municipal Income Fund; Trustee (since 2017), PIMCO Flexible Credit Income Fund and Virtus Convertible & Income 2024 Target Term Fund; Trustee (since 2015), Virtus Diversified Income & Convertible Fund; Trustee (since 2014), Virtus Investment Trust (13 portfolios); Trustee (2013 to 2021), PIMCO Dynamic Credit and Mortgage Income Fund; Trustee (since 2012), PIMCO Dynamic Income Fund; Trustee (since 2011), Virtus Strategy Trust (8 portfolios); Trustee (since 2011), PIMCO California Municipal Income Fund II, PIMCO California Municipal Income Fund III, PIMCO Municipal Income Fund, PIMCO Municipal Income Fund II, PIMCO Municipal Income Fund III, PIMCO New York Municipal Income Fund, PIMCO New York Municipal Income Fund II, PIMCO New York Municipal Income Fund III, PCM Fund, Inc., PIMCO Corporate & Income Strategy Fund, PIMCO Corporate & Income Opportunity Fund, PIMCO Global StocksPLUS®& Income Fund, PIMCO High Income Fund, PIMCO Income Strategy Fund, PIMCO Income Strategy Fund II, PIMCO Strategic Income Fund, Inc., and PIMCO Managed Accounts Trust (5 portfolios); Trustee (since 2011), Virtus Convertible & Income Fund, Virtus Convertible & Income Fund II, Virtus Equity & Convertible Income Fund, and Virtus Dividend, Interest & Premium Strategy Fund; and Trustee (2011 to 2021), PIMCO Income Opportunity Fund. |
| Drummond, F. Ford YOB: 1962 Served Since: 2014 104 Portfolios | President (since 1998), F.G. Drummond Ranches, Inc.; and Director (since 2015), Texas and Southwestern Cattle Raisers Association. Formerly Chairman, Oklahoma Nature Conservancy (2019 to 2020); Board Member (2006 to 2020) and Chairman (2016 to 2018), Oklahoma Water Resources Board; Trustee (since 2014), Frank Phillips Foundation; Director (1998 to 2008), The Cleveland Bank; and General Counsel (1998 to 2008), BMIHealth Plans (benefits administration). | Trustee (since 2022) and Advisory Board Member (2021 to 2022), Virtus Alternative Solutions Trust (4 portfolios), Virtus Mutual Fund Family (56 portfolios), and Virtus Variable Insurance Trust (8 portfolios); Trustee (since 2022), Virtus Stone Harbor Emerging Markets Income Fund and Virtus Stone Harbor Emerging Markets Total Income Fund; Trustee (since 2021), The Merger Fund®, The Merger Fund®VL, and Virtus Event Opportunities Trust (2 portfolios); Advisory Board Member (February 2021 to June 2021), Duff & Phelps Select MLP and Midstream Energy Fund Inc.; Trustee (since 2021), Virtus Global Multi-Sector Income Fund; Director (since 2021), Virtus Total Return Fund Inc.; Trustee (since 2019), Virtus Artificial Intelligence & Technology Opportunities Fund; Trustee (since 2017), Virtus Convertible & Income 2024 Target Term Fund; Trustee (since 2015), Virtus Convertible & Income Fund, Virtus Convertible & Income Fund II, Virtus Diversified Income & Convertible Fund, Virtus Dividend, Interest & Premium Strategy Fund and Virtus Equity & Convertible Income Fund; Trustee (since 2014), Virtus Strategy Trust (8 portfolios); Director (since 2011), Bancfirst Corporation; and Trustee (since 2006), Virtus Investment Trust (13 portfolios). |
| Name, Year of Birth, Length of Time Served and Number of Portfolios in Fund Complex Overseen by Trustee | Principal Occupation(s) During Past 5 Years | Other Directorships Held by Trustee During Past 5 Years |
| Harris, Sidney E. YOB: 1949 Served Since: 2021 97 Portfolios | Private Investor (since 2021); Dean Emeritus (since 2015), Professor (2015 to 2021 and 1997 to 2014), and Dean (1997 to 2004), J. Mack Robinson College of Business, Georgia State University. | Trustee (since 2022), Virtus Stone Harbor Emerging Markets Income Fund and Virtus Stone Harbor Emerging Markets Total Income Fund; Trustee (since 2021), The Merger Fund®, The Merger Fund® VL, Virtus Event Opportunities Trust (2 portfolios), Virtus Investment Trust (13 portfolios) and Virtus Strategy Trust (8 portfolios); Director (2020 to 2021), Duff & Phelps Select MLP and Midstream Energy Fund Inc.; Director (since 2020), Virtus Total Return Fund Inc.; Trustee (since 2020), Virtus Global Multi-Sector Income Fund; Trustee (since 2019), Mutual Fund Directors Forum; Trustee (since 2017), Virtus Mutual Fund Family (56 portfolios), Virtus Variable Insurance Trust (8 portfolios), and Virtus Alternative Solutions Trust (4 portfolios); Trustee (2013 to 2020) and Honorary Trustee (since 2020), KIPP Metro Atlanta; Director (1999 to 2019), Total System Services, Inc.; Trustee (2004 to 2017), RidgeWorth Funds; Chairman (2012 to 2017), International University of the Grand Bassam Foundation; Trustee (since 2012), International University of the Grand Bassam Foundation; and Trustee (2011 to 2015), Genspring Family Offices, LLC. |
| Mallin, John R. YOB: 1950 Served Since: 2021 97 Portfolios | Partner/Attorney (since 2003), McCarter & English LLP (law firm) Real Property Practice Group; and Member (2014 to 2022), Counselors of Real Estate. | Trustee (since 2022), Virtus Stone Harbor Emerging Markets Income Fund and Virtus Stone Harbor Emerging Markets Total Income Fund; Trustee (since 2021), The Merger Fund®, The Merger Fund ® VL, Virtus Event Opportunities Trust (2 portfolios), Virtus Investment Trust (13 portfolios) and Virtus Strategy Trust (8 portfolios); Director (2020 to 2021), Duff & Phelps Select MLP and Midstream Energy Fund Inc.; Director (since 2020), Virtus Total Return Fund Inc.; Trustee (since 2020), Virtus Global Multi-Sector Income Fund; Trustee (since 2016), Virtus Mutual Fund Family (56 portfolios) and Virtus Alternative Solutions Trust (4 portfolios); Director (since 2019), 1892 Club, Inc. (non-profit); Director (2013 to 2020), Horizons, Inc. (non-profit); and Trustee (since 1999), Virtus Variable Insurance Trust (8 portfolios). |
| McDaniel, Connie D. YOB: 1958 Served Since: 2021 104 Portfolios | Retired (since 2013). Vice President, Chief of Internal Audit, Corporate Audit Department (2009 to 2013); Vice President, Global Finance Transformation (2007 to 2009); and Vice President and Controller (1999 to 2007), The Coca-Cola Company. | Trustee (since May 2023) and Advisory Board Member (May 2023), Virtus Artificial Intelligence & Technology Opportunities Fund, Virtus Convertible & Income 2024 Target Term Fund, Virtus Convertible & Income Fund, Virtus Convertible & Income Fund II, Virtus Diversified Income & Convertible Fund, Virtus Dividend, Interest & Premium Strategy Fund and Virtus Equity & Convertible Income Fund; Trustee (since 2022), Virtus Stone Harbor Emerging Markets Income Fund and Virtus Stone Harbor Emerging Markets Total Income Fund; Trustee (since 2021), The Merger Fund®, The Merger Fund® VL, Virtus Event Opportunities Trust (2 portfolios), Virtus Investment Trust (13 portfolios) and Virtus Strategy Trust (8 portfolios); Director (2020 to 2021), Duff & Phelps Select MLP and Midstream Energy Fund Inc.; Director (since 2020), Virtus Total Return Fund Inc.; Trustee (since 2020), Virtus Global Multi-Sector Income Fund; Director (since 2019), Global Payments Inc.; Chairperson (since 2021), Governance & Nominating Committee, Global Payments Inc; Trustee (since 2017), Virtus Mutual Fund Family (56 portfolios), Virtus Variable Insurance Trust (8 portfolios), and Virtus Alternative Solutions Trust (4 portfolios); Director (since 2021), North Florida Land Trust; Director (2014 to 2019), Total System Services, Inc.; Member (2011 to 2022) and Chair (2014 to 2016), Georgia State University, Robinson College of Business Board of Advisors; and Trustee (2005 to 2017), RidgeWorth Funds. |
| Name, Year of Birth, Length of Time Served and Number of Portfolios in Fund Complex Overseen by Trustee | Principal Occupation(s) During Past 5 Years | Other Directorships Held by Trustee During Past 5 Years |
| McLoughlin, Philip YOB: 1946 Served Since: 2021 107 Portfolios | Private investor since 2010. | Trustee and Chairman (since 2022), Virtus Stone Harbor Emerging Markets Income Fund and Virtus Stone Harbor Emerging Markets Total Income Fund; Trustee (since 2021), The Merger Fund®, The Merger Fund®VL, Virtus Event Opportunities Trust (2 portfolios), Virtus Investment Trust (13 portfolios) and Virtus Strategy Trust (8 portfolios); Chairman (since 2023) and Trustee (since 2021), Virtus Artificial Intelligence & Technology Opportunities Fund, Virtus Convertible & Income Fund II, Virtus Diversified Income & Convertible Fund, Virtus Equity & Convertible Income Fund and Virtus Dividend, Interest & Premium Strategy Fund; Chairman (since 2023), Trustee (since 2022) and Advisory Board Member (2021), Virtus Convertible & Income 2024 Target Term Fund and Virtus Convertible & Income Fund; Director and Chairman (since 2016), Virtus Total Return Fund Inc.; Director and Chairman (2016 to 2019), the former Virtus Total Return Fund Inc.; Director and Chairman (2014 to 2021), Duff & Phelps Select MLP and Midstream Energy Fund Inc.; Trustee and Chairman (since 2013), Virtus Alternative Solutions Trust (4 portfolios); Trustee and Chairman (since 2011), Virtus Global Multi-Sector Income Fund; Chairman and Trustee (since 2003), Virtus Variable Insurance Trust (8 portfolios); Director (since 1995), closed-end funds managed by Duff & Phelps Investment Management Co. (3 funds); Director (1991 to 2019) and Chairman (2010 to 2019), Lazard World Trust Fund (closed-end investment firm in Luxembourg); and Trustee (since 1989) and Chairman (since 2002), Virtus Mutual Fund Family (56 portfolios). |
| McNamara, Geraldine M. YOB: 1951 Served Since: 2021 107 Portfolios | Private investor (since 2006); and Managing Director, U.S. Trust Company of New York (1982 to 2006). | Trustee (since May 2023) and Advisory Board Member (January 2023 to May 2023), Virtus Convertible & Income Fund, Virtus Convertible & Income Fund II, Virtus Diversified Income & Convertible Fund and Virtus Dividend, Interest & Premium Strategy Fund; Trustee (since 2023), Virtus Artificial Intelligence & Technology Opportunities Fund and Virtus Equity & Convertible Income Fund; Advisory Board Member (since 2023), Virtus Convertible & Income 2024 Target Term Fund; Trustee (since 2022), Virtus Stone Harbor Emerging Markets Income Fund and Virtus Stone Harbor Emerging Markets Total Income Fund; Trustee (since 2021), The Merger Fund®, The Merger Fund®VL, Virtus Event Opportunities Trust (2 portfolios), Virtus Investment Trust (13 portfolios) and Virtus Strategy Trust (8 portfolios); Director (2020 to 2021), Duff & Phelps Select MLP and Midstream Energy Fund Inc.; Director (since 2020), Virtus Total Return Fund Inc.; Trustee (since 2020), Virtus Global Multi-Sector Income Fund; Trustee (since 2016) Virtus Alternative Solutions Trust (4 portfolios); Trustee (since 2015), Virtus Variable Insurance Trust (8 portfolios); Director (since 2003), closed-end funds managed by Duff & Phelps Investment Management Co. (3 funds); and Trustee (since 2001), Virtus Mutual Fund Family (56 portfolios). |
| Walton, R. Keith YOB: 1964 Served Since: 2021 104 Portfolios | Senior Adviser (since 2022), Brightwood Capital LLC; Venture and Operating Partner (since 2020), Plexo Capital, LLC; Venture Partner (since 2019) and Senior Adviser (2018 to 2019), Plexo, LLC; and Partner (since 2006), Global Infrastructure Partners. Formerly, Managing Director (2020 to 2021), Lafayette Square Holding Company LLC; Senior Adviser (2018 to 2019), Vatic Labs, LLC; Executive Vice President, Strategy (2017 to 2019), Zero Mass Water, LLC; and Vice President, Strategy (2013 to 2017), Arizona State University. | Trustee (since 2023) and Advisory Board Member (2022 to 2023), Virtus Convertible & Income 2024 Target Term Fund; Trustee (since 2023) and Advisory Board Member (2022 to 2023), Virtus Convertible & Income Fund II and Virtus Dividend, Interest & Premium Strategy Fund; Trustee (since 2022) and Advisory Board Member (January 2022 to July 2022), Virtus Artificial Intelligence & Technology Opportunities Fund, Virtus Convertible & Income Fund and Virtus Equity & Convertible Income Fund; Trustee (since 2022), Virtus Stone Harbor Emerging Markets Income Fund and Virtus Stone Harbor Emerging Markets Total Income Fund; Trustee (since 2022), Virtus Diversified Income & Convertible Fund; Trustee (since 2021), The Merger Fund®, The Merger Fund® VL, Virtus Event Opportunities Trust (2 portfolios), Virtus Investment Trust (13 portfolios) and Virtus Strategy Trust (8 portfolios); Trustee (since 2020) Virtus Alternative Solutions Trust (4 portfolios), Virtus Variable Insurance Trust (8 portfolios) and Virtus Mutual Fund Family (56 portfolios); Director (since 2017), certain funds advised by Bessemer Investment Management LLC; Director (2016 to 2021), Duff & Phelps Select MLP and Midstream Energy Fund Inc.; Trustee (since 2016), Virtus Global Multi-Sector Income Fund; Director (2006 to 2019), Systematica Investments Limited Funds; Director (2006 to 2017), BlueCrest Capital Management Funds; Trustee (2014 to 2017), AZ Service; Director (since 2004), Virtus Total Return Fund Inc.; and Director (2004 to 2019), the former Virtus Total Return Fund Inc. |
| Name, Year of Birth, Length of Time Served and Number of Portfolios in Fund Complex Overseen by Trustee | Principal Occupation(s) During Past 5 Years | Other Directorships Held by Trustee During Past 5 Years |
| Zino, Brian T. YOB: 1952 Served Since: 2021 104 Portfolios | Retired. Various roles (1982 to 2009), J. & W. Seligman & Co. Incorporated, including President (1994 to 2009). | Trustee (since 2022), Virtus Stone Harbor Emerging Markets Income Fund and Virtus Stone Harbor Emerging Markets Total Income Fund; Trustee (since 2021), The Merger Fund®, The Merger Fund®VL, Virtus Event Opportunities Trust (2 portfolios), Virtus Investment Trust (13 portfolios) and Virtus Strategy Trust (8 portfolios); Trustee (since 2022) and Advisory Board Member (2021), Virtus Artificial Intelligence & Technology Opportunities Fund, Virtus Convertible & Income 2024 Target Term Fund, Virtus Convertible & Income Fund, Virtus Convertible & Income Fund II, Virtus Diversified Income & Convertible Fund, Virtus Equity & Convertible Income Fund, and Virtus Dividend, Interest & Premium Strategy Fund; Trustee (since 2020) Virtus Alternative Solutions Trust (4 portfolios), Virtus Variable Insurance Trust (8 portfolios) and Virtus Mutual Fund Family (56 portfolios); Director (2016 to 2021), Duff & Phelps Select MLP and Midstream Energy Fund Inc.; Trustee (since 2016), Virtus Global Multi-Sector Income Fund; Director (since 2014), Virtus Total Return Fund Inc.; Director (2014 to 2019), the former Virtus Total Return Fund Inc.; Trustee (since 2011), Bentley University; Director (1986 to 2009) and President (1994 to 2009), J&W Seligman Co. Inc.; Director (1998 to 2009), Chairman (2002 to 2004) and Vice Chairman (2000 to 2002), ICI Mutual Insurance Company; Member, Board of Governors of ICI (1998 to 2008). |
| Name, Year of Birth, Length of Time Served and Number of Funds Overseen | Principal Occupation(s) During Past 5 Years | Principal Occupation(s) During Past 5 Years and Other Directorships Held by Trustee |
| Aylward, George R.* Trustee and President YOB: 1964 Served Since: 2021 110 Portfolios | Director, President and Chief Executive Officer (since 2008), Virtus Investment Partners, Inc. and/or certain of its subsidiaries, and various senior officer positions with Virtus affiliates (since 2005). | Director (since 2023), Stone Harbor Investment Funds plc (21 sub-funds) and Stone Harbor Global Funds plc (27 sub-funds); Trustee, President and Chief Executive Officer (since 2022), Virtus Stone Harbor Emerging Markets Income Fund and Virtus Stone Harbor Emerging Markets Total Income Fund; Member, Board of Governors of the Investment Company Institute (since 2021); Trustee and President (since 2021), The Merger Fund®, The Merger Fund®VL, Virtus Event Opportunities Trust (2 portfolios), Virtus Investment Trust (13 portfolios) and Virtus Strategy Trust (8 portfolios); Trustee, President and Chief Executive Officer (since 2021), Virtus Artificial Intelligence & Technology Opportunities Fund, Virtus Convertible & Income 2024 Target Term Fund, Virtus Convertible & Income Fund, Virtus Convertible & Income Fund II, Virtus Diversified Income & Convertible Fund, Virtus Equity & Convertible Income Fund, and Virtus Dividend, Interest & Premium Strategy Fund; Chairman and Trustee (since 2015), Virtus ETF Trust II (6 portfolios); Director, President and Chief Executive Officer (2014 to 2021), Duff & Phelps Select MLP and Midstream Energy Fund Inc.; Trustee and President (since 2013), Virtus Alternative Solutions Trust (4 portfolios); Director (since 2013), Virtus Global Funds, plc (5 portfolios); Trustee (since 2012) and President (since 2010), Virtus Variable Insurance Trust (8 portfolios); Trustee, President and Chief Executive Officer (since 2011), Virtus Global Multi-Sector Income Fund; Trustee and President (since 2006) and Executive Vice President (2004 to 2006), Virtus Mutual Fund Family (56 portfolios); Director, President and Chief Executive Officer (since 2006), Virtus Total Return Fund Inc.; and Director, President and Chief Executive Officer (2006 to 2019), the former Virtus Total Return Fund Inc. |
| Name, Address and Year of Birth | Position(s) Held withTrust and Length of Time Served | Principal Occupation(s) During Past 5 Years |
| Batchelar, Peter J. YOB: 1970 | Senior Vice President (since 2021). | Senior Vice President, Product Development (since 2017), Vice President, Product Development (2008 to 2017), and various officer positions (since 2008), Virtus Investment Partners, Inc. and/or certain of its subsidiaries; various officer positions (since 2008) of various registered funds advised by subsidiaries of Virtus Investment Partners, Inc. |
| Bradley, W. Patrick YOB: 1972 | Executive Vice President, Chief Financial Officer and Treasurer (since 2021). | Executive Vice President, Fund Services (since 2016), Director (since 2023), Stone Harbor Investment Funds plc and Stone Harbor Global Funds plc; Director (since 2019), Virtus Global Funds ICAV; Director (since 2013), Virtus Global Funds, plc; Senior Vice President, Fund Services (2010 to 2016) and various officer positions (since 2004), Virtus Investment Partners, Inc. and/or certain of its subsidiaries; various officer positions (since 2006) of various registered funds advised by subsidiaries of Virtus Investment Partners, Inc.; Member (since 2022), BNY Mellon Asset Servicing Client Advisory Board. |
| Branigan, Timothy YOB: 1976 | Vice President and Fund Chief Compliance Officer (since 2022); Assistant Vice President and Deputy Fund Chief Compliance Officer (March to May 2022); and Assistant Vice President and Assistant Chief Compliance Officer (2021 to 2022). | Various officer positions (since 2019) of various registered funds advised by subsidiaries of Virtus Investment Partners, Inc. |
| Chisolm, Daphne YOB: 1969 | Vice President, Counsel and Assistant Secretary (since 2023) | Vice President and Senior Counsel (since 2023), Virtus Investment Partners, Inc.; Attorney at Law engaged in private practice as a solo practitioner (2018 to 2023); and various officer positions (since 2023) of various registered funds advised by subsidiaries of Virtus Investment Partners, Inc. |
| Fromm, Jennifer YOB: 1973 | Chief Legal Officer, Counsel and Secretary (since 2021). | Vice President (since 2016) and Senior Counsel, Legal (since 2007) and various officer positions (since 2008), Virtus Investment Partners, Inc. and/or certain of its subsidiaries; various officer positions (since 2008) of various registered funds advised by subsidiaries of Virtus Investment Partners, Inc. |
| Griswold, Heidi YOB: 1973 | Vice President (since 2021). | Vice President, Head of Transfer Agent & Servicing, Mutual Fund Services (since 2018), Virtus Investment Partners, Inc. and/or certain of its subsidiaries; and Vice President (since 2016) of various registered funds advised by subsidiaries of Virtus Investment Partners, Inc. |
| Hackett, Amy YOB: 1968 | Vice President and Assistant Treasurer (since 2021). | Vice President (since 2010) and Assistant Vice President (2007 to 2010), Fund Services, Virtus Investment Partners, Inc. and/or certain of its subsidiaries; and various officer positions (since 2007) of various registered funds advised by subsidiaries of Virtus Investment Partners, Inc. |
| Krishnan, Suneeta YOB: 1965 | Vice President and Assistant Treasurer (since 2021). | Vice President (since 2017) and Assistant Treasurer (since 2007), Mutual Fund Administration, Virtus Investment Partners, Inc. and/or certain of its subsidiaries; and various officer positions (since 2009) of various registered funds advised by subsidiaries of Virtus Investment Partners, Inc. |
| Lowe, Benjamin YOB: 1978 | Vice President, Controller and Assistant Treasurer (since 2021). | Vice President, Fund Services (since 2017), Virtus Investment Partners, Inc. and/or certain of its subsidiaries; and various officer positions (since 2018) of various registered funds advised by subsidiaries of Virtus Investment Partners, Inc. |
| Martin, David YOB: 1959 | Anti-Money Laundering Compliance Officer (since 2021). | Vice President, Compliance – Broker/Dealer (since 2009), Virtus Investment Partners, Inc.; and Vice President and Chief Compliance Officer of certain Virtus subsidiaries (since 2004). |
| Rahman, Mahmood YOB: 1967 | Assistant Vice President (since 2021). | Vice President (since 2023), Tax Director (since 2020) and Assistant Vice President (2020 to 2023), Fund Administration, Virtus Investment Partners, Inc.; Assistant Vice President (since 2021) of various registered funds advised by subsidiaries of Virtus Investment Partners, Inc.; and Assistant Treasurer and Tax Director, Grantham, Mayo, Van Otterloo & Co. LLC (2007 to 2019). |
| Short, Julia R. YOB: 1972 | Senior Vice President (since 2021). | Senior Vice President, Product Development (since 2017), Virtus Investment Partners, Inc. and/or certain of its subsidiaries; Senior Vice President (since 2017) of various registered funds advised by subsidiaries of Virtus Investment Partners, Inc.; and Managing Director, Product Manager, RidgeWorth Investments (2004 to 2017). |
| Name, Address and Year of Birth | Position(s) Held withTrust and Length of Time Served | Principal Occupation(s) During Past 5 Years |
| Smirl, Richard W. YOB: 1967 | Executive Vice President (since 2021). | Chief Operating Officer (since 2021), Virtus Investment Partners, Inc.; Executive Vice President (since 2021), Virtus Investment Partners, Inc. and/or certain of its subsidiaries; Executive Vice President (since 2021) of various registered funds advised by subsidiaries of Virtus Investment Partners, Inc.; Chief Operating Officer (2018 to 2021), Russell Investments; Executive Director (Jan. to July 2018), State of Wisconsin Investment Board; and Partner and Chief Operating Officer (2004 to 2018), William Blair Investment Management. |
| Suss, Amanda YOB: 1969 | Vice President, Controller and Assistant Treasurer (since 2022). | Vice President and Controller (since 2022), Mutual Fund Administration and Financial Reporting, Virtus Investment Partners, Inc.; Vice President, Controller and Assistant Treasurer (since 2022) of various registered funds advised by subsidiaries of Virtus Investment Partners, Inc.; and Senior Finance Associate (2011 to 2022), Stone Harbor Investment Partners LP. |
Accounting Firm
| Mutual Fund Services | 1-800-243-1574 |
| Adviser Consulting Group | 1-800-243-4361 |
| Website | Virtus.com |
The Securities and Exchange Commission has modified mailing regulations for semiannual and annual shareholder fund reports to allow mutual fund companies to send a single copy of these reports to shareholders who share the same mailing address. If you would like additional copies, please call Mutual Fund Services at 1-800-243-1574.

please contact us at 1-800-243-1574, or visit Virtus.com.
| 8068 | 11-23 |
Item 1. Reports to Stockholders (cont.).
| (b) | Not applicable. |
Item 2. Code of Ethics.
| (a) | The registrant, as of the end of the period covered by this report, has adopted a code of ethics that applies to the registrant’s principal executive officer, principal financial officer, principal accounting officer or controller, or persons performing similar functions, regardless of whether these individuals are employed by the registrant or a third party. |
| (c) | There have been no amendments during the period covered by this report, to a provision of the code of ethics that applies to the registrant’s principal executive officer, principal financial officer, principal accounting officer or controller, or persons performing similar functions, regardless of whether these individuals are employed by the registrant or a third party, and that relates to any element of the code of ethics described in Item 2(b) of the instructions for completion of Form N-CSR. A copy of the currently applicable code is included as an exhibit. |
| (d) | The registrant has not granted any waivers, including an implicit waiver, from a provision of the code of ethics that applies to the registrant’s principal executive officer, principal financial officer, principal accounting officer or controller, or persons performing similar functions, regardless of whether these individuals are employed by the registrant or a third party, that relates to one or more of the items set forth in paragraph (b) of this item’s instructions. |
Item 3. Audit Committee Financial Expert.
| (a)(1) | The Registrant’s Board of Trustees has determined that the Registrant has an “audit committee financial expert” serving on its Audit Committee. |
| (a)(2) | The Registrant’s Board of Trustees has determined that each of Donald C. Burke, Connie D. McDaniel and Brian T. Zino possesses the technical attributes identified in Instruction 2(b) of Item 3 to Form N-CSR to qualify as an “audit committee financial expert.” Each of such individual is an “independent” trustee pursuant to paragraph (a)(2) of Item 3 to Form N-CSR. |
| (a)(3) | Not applicable. |
Item 4. Principal Accountant Fees and Services.
Audit Fees
| (a) | The aggregate fees billed for each of the last two fiscal years for professional services rendered by the principal accountant for the audit of the registrant’s annual financial statements or services that are normally provided by the accountant in connection with statutory and regulatory filings or engagements for fiscal years ended September 30, 2022 and September 30, 2023 are $208,131 and $213,334, respectively. |
Audit-Related Fees
| (b) | The aggregate fees billed in each of the last two fiscal years for assurance and related services by the principal accountant that are reasonably related to the performance of the audit of the registrant’s financial statements and are not reported under paragraph (a) of this Item for fiscal years ended September 30, 2022 and September 30, 2023 are $44,273 and $9,793, respectively. Such audit-related fees include out of pocket expenses. |
Tax Fees
| (c) | The aggregate fees billed in each of the last two fiscal years for professional services rendered by the principal accountant for tax compliance, tax advice, and tax planning for fiscal years ended September 30, 2022 and September 30, 2023 are $52,804 and $50,119, respectively. |
“Tax Fees” are those primarily associated with review of the Trust’s tax provision and qualification as a regulated investment company (RIC) in connection with audits of the Trust’s financial statement, review of year-end distributions by the Fund to avoid excise tax for the Trust, periodic discussion with management on tax issues affecting the Trust, and reviewing and signing the Fund’s federal income tax returns.
All Other Fees
| (d) | The aggregate fees billed in each of the last two fiscal years for products and services provided by the principal accountant, other than the services reported in paragraphs (a) through (c) of this Item are for fiscal years ended September 30, 2022 and September 30, 2023 are $0 and $24,621, respectively. |
| (e)(1) | Disclose the audit committee’s pre-approval policies and procedures described in paragraph (c)(7) of Rule 2-01 of Regulation S-X. |
The Board of Trustees of Virtus Strategy Trust (the “Fund”) has adopted policies and procedures with regard to the pre-approval of services provided by its independent auditors. Audit, audit-related and tax compliance services provided to the Fund on an annual basis require specific pre-approval by the Audit Committee. The Audit Committee must also approve other non-audit services provided to the Fund and those non-audit services provided to the Fund’s Affiliated Service Providers that relate directly to the operations and financial reporting of the Fund. Certain of these non-audit services that the Audit Committee believes are a) consistent with the SEC’s auditor independence rules and b) routine and recurring services that will not impair the independence of the independent auditors may be approved by the Audit Committee without consideration on a specific case-by-case basis (“general pre-approval”).
The Audit Committee has determined that the Chair of the Audit Committee, may provide pre-approval for such services that meet the above requirements but are not included in the general pre-approval in the event such approval is sought between regularly scheduled meetings. In any event, the Audit Committee is informed of, and ratifies, each service approved subject to general pre-approval at the next regularly scheduled in-person Audit Committee meeting.
| (e)(2) | The percentage of services described in each of paragraphs (b) through (d) of this Item that were approved by the audit committee pursuant to paragraph (c)(7)(i)(C) of Rule 2-01 of Regulation S-X are as follows: |
| (b) | 0% |
| (c) | 0% |
| (d) | N/A |
| (f) | The percentage of hours expended on the principal accountant’s engagement to audit the registrant’s financial statements for the most recent fiscal year that were attributed to work performed by persons other than the principal accountant’s full-time, permanent employees was less than fifty percent. |
| (g) | The aggregate non-audit fees billed by the registrant’s accountant for services rendered to the registrant, and rendered to the registrant’s investment adviser (not including any sub-adviser whose role is primarily portfolio management and is subcontracted with or overseen by another investment adviser), and any entity controlling, controlled by, or under common control with the adviser that provides ongoing services to the registrant for fiscal years ended September 30, 2022 and September 30, 2023 are $252,404 and $84,533, respectively. |
| (h) | The registrant’s audit committee of the board of directors has considered whether the provision of non-audit services that were rendered to the registrant’s investment adviser (not including any sub-adviser whose role is primarily portfolio management and is subcontracted with or overseen by another investment adviser), and any entity controlling, controlled by, or under common control with the investment adviser that provides ongoing services to the registrant that were not pre-approved pursuant to paragraph (c)(7)(ii) of Rule 2-01 of Regulation S-X is compatible with maintaining the principal accountant’s independence. |
| (i) | Not applicable. |
| (j) | Not applicable. |
Item 5. Audit Committee of Listed Registrants.
Disclosure not required for open-end management investment companies.
Item 6. Investments.
| (a) | Schedule of Investments in securities of unaffiliated issuers as of the close of the reporting period is included as part of the report to shareholders filed under Item 1(a) of this form. |
| (b) | Not applicable. |
Item 7. Disclosure of Proxy Voting Policies and Procedures for Closed-End Management Investment Companies.
Not applicable.
Item 8. Portfolio Managers of Closed-End Management Investment Companies.
Disclosure not required for open-end management investment companies.
Item 9. Purchases of Equity Securities by Closed-End Management Investment Company and Affiliated Purchasers.
Disclosure not required for open-end management investment companies.
Item 10. Submission of Matters to a Vote of Security Holders.
There have been no material changes to the procedures by which the shareholders may recommend nominees to the registrant’s board of trustees, where those changes were implemented after the registrant last provided disclosure in response to the requirements of Item 407(c)(2)(iv) of Regulation S-K (17 CFR 229.407) (as required by Item 22(b)(15) of Schedule 14A (17 CFR 240.14a-101)), or this Item.
Item 11. Controls and Procedures.
| (a) | The registrant’s principal executive and principal financial officers, or persons performing similar functions, have concluded that the registrant’s disclosure controls and procedures (as defined in Rule 30a-3(c) under the Investment Company Act of 1940, as amended (the “1940 Act”) (17 CFR 270.30a-3(c))) are effective, as of a date within 90 days of the filing date of the report that includes the disclosure required by this paragraph, based on their evaluation of these controls and procedures required by Rule 30a-3(b) under the 1940 Act (17 CFR 270.30a-3(b)) and Rules 13a-15(b) or 15d-15(b) under the Securities Exchange Act of 1934, as amended (17 CFR 240.13a-15(b) or 240.15d-15(b)). |
| (b) | There were no changes in the registrant’s internal control over financial reporting (as defined in Rule 30a-3(d) under the 1940 Act (17 CFR 270.30a-3(d))) that occurred during the period covered by this report that has materially affected, or is reasonably likely to materially affect, the registrant’s internal control over financial reporting. |
Item 12. Disclosure of Securities Lending Activities for Closed-End Management Investment Companies.
Disclosure not required for open-end management investment companies.
Item 13. Exhibits.
| (a)(2)(1) | There were no written solicitations to purchase securities under Rule 23c-1 under the Act sent or given during the period covered by the report by or on behalf of the Registrant to 10 or more persons. |
| (a)(2)(2) | There was no change in the Registrant’s independent public accountant during the period covered by the report. |
SIGNATURES
Pursuant to the requirements of the Securities Exchange Act of 1934 and the Investment Company Act of 1940, the registrant has duly caused this report to be signed on its behalf by the undersigned, thereunto duly authorized.
| (Registrant) | Virtus Strategy Trust |
| By (Signature and Title)* | /s/ George R. Aylward | |||
| George R. Aylward, President | ||||
| (principal executive officer) | ||||
| Date | 12/6/23 | |||
Pursuant to the requirements of the Securities Exchange Act of 1934 and the Investment Company Act of 1940, this report has been signed below by the following persons on behalf of the registrant and in the capacities and on the dates indicated.
| By (Signature and Title)* | /s/ George R. Aylward | |||
| George R. Aylward, President | ||||
| (principal executive officer) |
| Date | 12/6/23 | |||
| By (Signature and Title)* | /s/ W. Patrick Bradley | |||
| W. Patrick Bradley, Executive Vice President, Chief Financial Officer, and Treasurer | ||||
| (principal financial officer) | ||||
| Date | 12/5/23 | |||
| * | Print the name and title of each signing officer under his or her signature. |